UNITED STATES
SECURITIES AND EXCHANGE COMMISSION
Washington, D.C. 20549
FORM N-CSRS
CERTIFIED SHAREHOLDER REPORT OF REGISTERED
MANAGEMENT INVESTMENT COMPANIES
Investment Company Act file number 811-07257
SEI Institutional Investments Trust
(Exact name of registrant as specified in charter)
SEI Investments
One Freedom Valley Drive
Oaks, PA 19456
(Address of principal executive offices) (Zip code)
Timothy D. Barto, Esq.
SEI Investments
One Freedom Valley Drive
Oaks, PA 19456
(Name and address of agent for service)
Registrant’s telephone number, including area code: 610-676-1000
Date of fiscal year end: May 31, 2021
Date of reporting period: November 30, 2020
| Item 1. | Reports to Stockholders. |

SEI Institutional Investments Trust
| | |
| › Large Cap Fund | | › Emerging Markets Equity Fund |
| › Large Cap Disciplined Equity Fund | | › Opportunistic Income Fund |
| › Large Cap Index Fund | | › Core Fixed Income Fund |
| › S&P 500 Index Fund | | › High Yield Bond Fund |
| › Extended Market Index Fund | | › Long Duration Fund |
| › Small Cap Fund | | › Long Duration Credit Fund |
| › Small Cap II Fund | | › Ultra Short Duration Bond Fund |
| › Small/Mid Cap Equity Fund | | › Emerging Markets Debt Fund |
| › U.S. Equity Factor Allocation Fund | | › Real Return Fund |
| › U.S. Managed Volatility Fund | | › Limited Duration Bond Fund |
| › Global Managed Volatility Fund | | › Intermediate Duration Credit Fund |
| › World Equity Ex-US Fund | | › Dynamic Asset Allocation Fund |
| › Screened World Equity Ex-US Fund | | › Multi-Asset Real Return Fund |
| › World Select Equity Fund | | |
Paper copies of the Funds’ shareholder reports are no longer sent by mail, unless you specifically request them from the Funds or from your financial intermediary, such as a broker-dealer or bank. Shareholder reports are available online and you will be notified by mail each time a report is posted on the Funds’ website and provided with a link to access the report online.
You may elect to receive all future reports in paper free of charge. If you invest through a financial intermediary, you can contact your financial intermediary to inform it that you wish to continue receiving paper copies of your shareholder reports. If you invest directly with the Funds, you can inform the Funds that you wish to continue receiving paper copies of your shareholder reports by calling 1-800-DIAL-SEI. Your election to receive reports in paper will apply to all funds held with the SEI Funds or your financial intermediary.

TABLE OF CONTENTS
The Trust files its complete schedule of portfolio holdings with the Securities and Exchange Commission for the first and third quarter of each fiscal year on Form N-PORT. The Trust’s Forms N-PORT are available on the Commission’s website at http://www.sec.gov.
A description of the policies and procedures that the Trust uses to determine how to vote proxies relating to portfolio securities, as well as information relating to how a Fund voted proxies relating to portfolio securities during the most recent 12-month period ended June 30, is available (i) without charge, upon request, by calling 1-800-DIAL-SEI; and (ii) on the Commission’s website at http://www.sec.gov.
SUMMARY SCHEDULE OF INVESTMENTS (Unaudited)
November 30, 2020
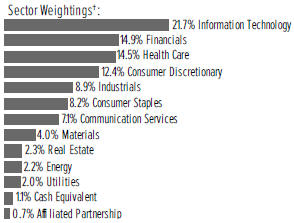
Large Cap Fund
†Percentages are based on total investments. Includes investments held as collateral for securities held on loan (see Note 12).
| | | | | | | | | | | | |
| | | | |
| Description | | Percentage of
Net Assets (%) | | Shares | | Market Value
($ Thousands) |
COMMON STOCK — 98.4% | |
|
Communication Services — 7.1% | |
Alphabet Inc, Cl A * | | | 0.5 | % | | | 2,676 | | | $ | 4,695 | |
Alphabet Inc, Cl C * | | | 1.3 | | | | 7,828 | | | | 13,783 | |
AT&T Inc | | | 0.7 | | | | 257,690 | | | | 7,409 | |
Comcast Corp, Cl A | | | 0.7 | | | | 143,672 | | | | 7,218 | |
Facebook Inc, Cl A * | | | 1.3 | | | | 49,808 | | | | 13,795 | |
Verizon Communications Inc | | | 0.8 | | | | 131,799 | | | | 7,962 | |
Other Securities (A) | | | 1.8 | | | | | | | | 18,781 | |
| | | | | | | | | | | | |
| | | | | | | | | | | 73,643 | |
| | | | | | | | | | | | |
|
Consumer Discretionary — 12.4% | |
Amazon.com Inc* | | | 2.7 | | | | 8,870 | | | | 28,101 | |
Lowe’s Cos Inc | | | 0.9 | | | | 61,674 | | | | 9,610 | |
NIKE Inc, Cl B | | | 0.7 | | | | 52,767 | | | | 7,108 | |
Ross Stores Inc | | | 0.6 | | | | 56,398 | | | | 6,064 | |
Target Corp | | | 1.1 | | | | 62,218 | | | | 11,170 | |
Other Securities (A) | | | 6.4 | | | | | | | | 67,137 | |
| | | | | | | | | | | | |
| | | | | | | | | | | 129,190 | |
| | | | | | | | | | | | |
|
Consumer Staples — 8.2% | |
Kroger Co/The | | | 0.8 | | | | 246,130 | | | | 8,122 | |
Philip Morris International Inc | | | 0.9 | | | | 123,785 | | | | 9,377 | |
Unilever PLC ADR | | | 1.2 | | | | 204,931 | | | | 12,513 | |
Other Securities | | | 5.3 | | | | | | | | 55,642 | |
| | | | | | | | | | | | |
| | | | | | | | | | | 85,654 | |
| | | | | | | | | | | | |
|
Energy — 2.2% | |
Chevron Corp | | | 0.8 | | | | 93,948 | | | | 8,190 | |
Other Securities (B) | | | 1.4 | | | | | | | | 14,657 | |
| | | | | | | | | | | | |
| | | | | | | | | | | 22,847 | |
| | | | | | | | | | | | |
|
Financials — 14.9% | |
Bank of America Corp | | | 0.9 | | | | 325,400 | | | | 9,163 | |
Berkshire Hathaway Inc, Cl B * | | | 1.0 | | | | 46,470 | | | | 10,637 | |
Chubb Ltd | | | 0.6 | | | | 40,761 | | | | 6,026 | |
Citigroup Inc | | | 0.8 | | | | 145,000 | | | | 7,985 | |
First Republic Bank/CA | | | 0.7 | | | | 54,668 | | | | 7,083 | |
JPMorgan Chase & Co | | | 1.1 | | | | 92,685 | | | | 10,926 | |
Markel Corp * | | | 0.6 | | | | 6,307 | | | | 6,142 | |
Morgan Stanley | | | 1.0 | | | | 166,512 | | | | 10,295 | |
| | | | | | | | | | | | |
| | | | |
| Description | | Percentage of
Net Assets (%) | | Shares | | Market Value
($ Thousands) |
COMMON STOCK (continued) | |
State Street Corp | | | 0.6 | % | | | 90,286 | | | $ | 6,363 | |
US Bancorp | | | 0.7 | | | | 173,814 | | | | 7,511 | |
Other Securities ‡(B) | | | 6.9 | | | | | | | | 72,378 | |
| | | | | | | | | | | | |
| | | | | | | | | | | 154,509 | |
| | | | | | | | | | | | |
|
Health Care — 14.5% | |
Amgen Inc | | | 0.7 | | | | 33,880 | | | | 7,523 | |
CVS Health Corp | | | 0.9 | | | | 140,113 | | | | 9,498 | |
Johnson & Johnson | | | 1.8 | | | | 128,854 | | | | 18,643 | |
Medtronic PLC | | | 0.9 | | | | 82,267 | | | | 9,354 | |
Merck & Co Inc | | | 1.2 | | | | 151,048 | | | | 12,143 | |
Pfizer Inc | | | 1.0 | | | | 285,445 | | | | 10,935 | |
Teleflex Inc | | | 0.6 | | | | 16,063 | | | | 6,148 | |
UnitedHealth Group Inc | | | 1.0 | | | | 31,543 | | | | 10,609 | |
Other Securities (A) | | | 6.4 | | | | | | | | 65,427 | |
| | | | | | | | | | | | |
| | | | | | | | | | | 150,280 | |
| | | | | | | | | | | | |
|
Industrials — 9.0% | |
3M Co | | | 0.6 | | | | 35,550 | | | | 6,141 | |
Honeywell International Inc | | | 0.7 | | | | 35,725 | | | | 7,285 | |
Johnson Controls International PLC | | | 0.6 | | | | 130,036 | | | | 5,987 | |
Other Securities (A) | | | 7.1 | | | | | | | | 73,400 | |
| | | | | | | | | | | | |
| | | | | | | | | | | 92,813 | |
| | | | | | | | | | | | |
|
Information Technology — 21.8% | |
Adobe Inc* | | | 1.4 | | | | 31,084 | | | | 14,873 | |
Apple Inc | | | 2.9 | | | | 254,104 | | | | 30,251 | |
Applied Materials Inc | | | 0.8 | | | | 93,378 | | | | 7,702 | |
Cisco Systems Inc | | | 0.6 | | | | 149,124 | | | | 6,415 | |
Intel Corp | | | 1.0 | | | | 210,006 | | | | 10,154 | |
Intuit Inc | | | 1.0 | | | | 29,284 | | | | 10,309 | |
Microchip Technology Inc | | | 1.2 | | | | 93,473 | | | | 12,562 | |
Microsoft Corp | | | 2.7 | | | | 133,106 | | | | 28,494 | |
PayPal Holdings Inc* | | | 0.6 | | | | 28,846 | | | | 6,176 | |
salesforce.com* | | | 1.1 | | | | 44,301 | | | | 10,889 | |
Visa Inc, Cl A | | | 1.3 | | | | 62,556 | | | | 13,159 | |
Other Securities | | | 7.2 | | | | | | | | 74,545 | |
| | | | | | | | | | | | |
| | | | | | | | | | | 225,529 | |
| | | | | | | | | | | | |
|
Materials — 4.0% | |
Other Securities | | | 4.0 | | | | | | | | 41,296 | |
| | | | | | | | | | | | |
| | | | | | | | | | | | |
|
Real Estate — 2.3% | |
American Tower Corp, Cl A ‡ | | | 0.6 | | | | 29,404 | | | | 6,798 | |
Other Securities ‡ | | | 1.7 | | | | | | | | 16,886 | |
| | | | | | | | | | | | |
| | | | | | | | | | | 23,684 | |
| | | | | | | | | | | | |
|
Utilities — 2.0% | |
NextEra Energy Inc | | | 0.6 | | | | 87,800 | | | | 6,461 | |
Other Securities | | | 1.4 | | | | | | | | 14,049 | |
| | | | | | | | | | | | |
| | | | | | | | | | | 20,510 | |
| | | | | | | | | | | | |
Total Common Stock | |
(Cost $767,761) ($ Thousands) | | | | 1,019,955 | |
| | | | | | | | | | | | |
| | |
SEI Institutional Investments Trust / Semi-Annual Report / November 30, 2020 | | 1 |
SUMMARY SCHEDULE OF INVESTMENTS (Unaudited)
November 30, 2020
Large Cap Fund (Concluded)
| | | | | | | | | | | | |
| | | | |
| Description | | Percentage of
Net Assets (%) | | Shares | | Market Value
($ Thousands) |
|
AFFILIATED PARTNERSHIP — 0.7% | |
SEI Liquidity Fund, L.P.
0.070% **† (C) | | | 0.7 | % | | | 7,164,678 | | | $ | 7,168 | |
| | | | | | | | | | | | |
Total Affiliated Partnership | |
(Cost $7,165) ($ Thousands) | | | | | | | | 7,168 | |
| | | | | | | | | | | | |
| | | | | | | | | | | | |
| | | | |
| Description | | Percentage of
Net Assets (%) | | Shares | | Market Value
($ Thousands) |
|
CASH EQUIVALENT — 1.1% | |
SEI Daily Income Trust,
Government Fund, Cl F
0.010% **† | | | 1.1 | % | | | 11,056,298 | | | $ | 11,056 | |
| | | | | | | | | | | | |
Total Cash Equivalent | | | | | |
(Cost $11,056) ($ Thousands) | | | | | | | | | | | 11,056 | |
| | | | | | | | | | | | |
Total Investments in Securities — 100.2% | |
(Cost $785,982) ($ Thousands) | | | $ | 1,038,179 | |
| | | | | | | | | | | | |
A list of the open futures contracts held by the Fund at November 30, 2020, is as follows:
| | | | | | | | | | | | | | | | | | | | |
| | | | | | |
Type of
Contract | | Number of
Contracts
Long/(Short) | | | Expiration
Date | | | Notional Amount
(Thousands) | | | Value
(Thousands) | | | Unrealized
Appreciation
(Depreciation)
(Thousands) | |
S&P 500 Index E-MINI | | | 25 | | | | Dec-2020 | | | $ | 4,544 | | | $ | 4,529 | | | $ | (15) | |
S&P Mid Cap 400 Index E-MINI | | | 2 | | | | Dec-2020 | | | | 443 | | | | 434 | | | | (9) | |
| | | | | | | | | | | | |
| | | | | | | | | | $ | 4,987 | | | $ | 4,963 | | | $ | (24) | |
| | | | | | | | | | | | |
Percentages are based on Net Assets of $1,035,884 ($ Thousands).
| * | Non-income producing security. |
| ** | The rate reported is the 7-day effective yield as of November 30, 2020. |
| † | Investment in Affiliated Security (See Note 6). |
| ‡ | Real Estate Investment Trust. |
| (A) | Certain securities or partial positions of certain securities are on loan at November 30, 2020 (See Note 12). The total market value of securities on loan at November 30, 2020, was $6,912 ($ Thousands). |
| (B) | Security is a Master Limited Partnership. At November 30, 2020, such securities amounted to $317 ($ Thousands), or 0.0% of Net Assets of the Fund (See Note 2). |
| (C) | This security was purchased with cash collateral held from securities on loan (See Note 12). The total market value of such securities as of November 30, 2020 was $7,168 ($ Thousands). |
ADR — American Depositary Receipt
Cl — Class
L.P. — Limited Partnership
Ltd. — Limited
PLC — Public Limited Company
The Summary Schedule of Investments does not reflect the complete portfolio holdings. It includes the Fund’s 50 largest holdings and each investment of any issuer that exceeds 1% of the Fund’s net assets. “Other Securities” represent all issues not required to be disclosed under the rules adopted by the U.S. Securities and Exchange Commission (“SEC”). In certain instances, securities for which footnotes listed above may otherwise apply are included in the Other Securities caption. The complete
schedule of portfolio holdings is available (i) without charge, upon request, by calling (800) 342-5734; and (ii) on the SEC’s website at http://www.sec.gov.
The following is a list of the level of inputs used as of November 30, 2020, in valuing the Fund’s investments and other financial instruments carried at value ($ Thousands):
| | | | | | | | | | | | | | | | |
| | | | | |
| Investments in Securities | | Level 1
($) | | | Level 2
($) | | | Level 3
($) | | | Total ($) | |
Common Stock | | | 1,019,955 | | | | – | | | | – | | | | 1,019,955 | |
Affiliated Partnership | | | – | | | | 7,168 | | | | – | | | | 7,168 | |
Cash Equivalent | | | 11,056 | | | | – | | | | – | | | | 11,056 | |
| | | | | | | | | | | | | | | | |
Total Investments in Securities | | | 1,031,011 | | | | 7,168 | | | | – | | | | 1,038,179 | |
| | | | | | | | | | | | | | | | |
| | | | |
| | | | | | | | | | | | | | | | |
| | | | | |
| Other Financial Instruments | | Level 1
($) | | | Level 2
($) | | | Level 3
($) | | | Total ($) | |
Futures Contracts* | | | | | | | | | | | | | | | | |
Unrealized Depreciation | | | (24 | ) | | | – | | | | – | | | | (24 | ) |
| | | | | | | | | | | | | | | | |
Total Other Financial Instruments | | | (24 | ) | | | – | | | | – | | | | (24 | ) |
| | | | | | | | | | | | | | | | |
*Futures contracts are valued at the unrealized depreciation on the instrument.
For the period ended November 30, 2020, there were no transfers in or out of Level 3.
For more information on valuation inputs, see Note 2 — Significant Accounting Policies in Notes to Financial Statements.
| | |
2 | | SEI Institutional Investments Trust / Semi-Annual Report / November 30, 2020 |
The following is a summary of the Fund’s transactions with affiliates for the period ended November 30, 2020 ($ Thousands):
| | | | | | | | | | | | | | | | | | | | | | | | | | | | | | | | | | | | |
| | | | | | | | | | |
| Security Description | | Value
5/31/2020 | | Purchases at Cost | | Proceeds
from Sales | | Realized Gain/
(Loss) | | Change in
Unrealized
Appreciation/
(Depreciation) | | Value
11/30/2020 | | Shares | | Income | | Capital
Gains |
SEI Liquidity Fund, L.P. | | | $ 28,649 | | | | $ 69,284 | | | | $ (90,760) | | | | $ 3 | | | | $ (8) | | | | $ 7,168 | | | | 7,164,678 | | | | $ 74 | | | | $ — | |
SEI Daily Income Trust, Government Fund, Cl F | | | 12,188 | | | | 164,034 | | | | (165,166) | | | | — | | | | — | | | | 11,056 | | | | 11,056,298 | | | | 1 | | | | — | |
| | | | | | | | | | | | | | | | | | | | | | | | | | | | | | | | | | | | |
Totals | | | $ 40,837 | | | | $ 233,318 | | | | $ (255,926) | | | | $ 3 | | | | $ (8) | | | | $ 18,224 | | | | | | | | $ 75 | | | | $ — | |
| | | | | | | | | | | | | | | | | | | | | | | | | | | | | | | | | | | | |
Amounts designated as “—” are either $0 or have been rounded to $0.
The accompanying notes are an integral part of the financial statements.
| | |
SEI Institutional Investments Trust / Semi-Annual Report / November 30, 2020 | | 3 |
SUMMARY SCHEDULE OF INVESTMENTS (Unaudited)
November 30, 2020
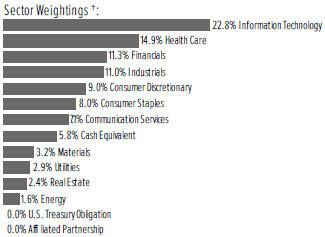
Large Cap Disciplined Equity Fund
†Percentages are based on total investments. Includes investments held as collateral for securities held on loan (see Note 12).
| | | | | | | | | | | | |
| | | | |
Description | | Percentage of Net Assets
(%) | | Shares | | Market Value ($ Thousands) |
|
COMMON STOCK — 90.9% | |
Communication Services — 6.9% | |
Alphabet Inc, Cl A * | | | 1.3% | | | | 10,774 | | | $ | 18,902 | |
Alphabet Inc, Cl C * | | | 0.4 | | | | 3,761 | | | | 6,622 | |
Facebook Inc, Cl A * | | | 1.9 | | | | 106,421 | | | | 29,476 | |
Verizon Communications Inc | | | 1.1 | | | | 273,583 | | | | 16,527 | |
Other Securities | | | 2.2 | | | | | | | | 32,638 | |
| | | | | | | | | | | | |
| | | | | | | | | | | 104,165 | |
| | | | | | | | | | | | |
Consumer Discretionary — 8.7% | |
Amazon.com Inc* | | | 2.3 | | | | 10,800 | | | | 34,215 | |
BorgWarner Inc (A) | | | 0.5 | | | | 201,607 | | | | 7,832 | |
Home Depot Inc/The | | | 0.6 | | | | 35,078 | | | | 9,731 | |
Lowe’s Cos Inc | | | 0.7 | | | | 68,176 | | | | 10,623 | |
Target Corp | | | 0.7 | | | | 55,833 | | | | 10,024 | |
Other Securities (A) | | | 3.9 | | | | | | | | 58,965 | |
| | | | | | | | | | | | |
| | | | | | | | | | | 131,390 | |
| | | | | | | | | | | | |
Consumer Staples — 7.7% | | | | | | | | | |
Altria Group Inc | | | 0.6 | | | | 217,962 | | | | 8,681 | |
Coca-Cola Co/The | | | 0.6 | | | | 180,768 | | | | 9,328 | |
Kroger Co/The | | | 0.5 | | | | 240,882 | | | | 7,949 | |
Procter & Gamble Co/The | | | 1.2 | | | | 132,918 | | | | 18,458 | |
Sysco Corp | | | 0.6 | | | | 137,455 | | | | 9,799 | |
Walmart Inc | | | 0.6 | | | | 57,500 | | | | 8,785 | |
Other Securities | | | 3.7 | | | | | | | | 54,207 | |
| | | | | | | | | | | | |
| | | | | | | | | | | 117,207 | |
| | | | | | | | | | | | |
Energy — 1.6% | | | | | | | | | |
Other Securities (B) | | | 1.6 | | | | | | | | 23,958 | |
| | | | | | | | | | | | |
| | | | | | | | | |
Financials — 10.8% | | | | | | | | | |
Aflac Inc | | | 0.5 | | | | 171,329 | | | | 7,526 | |
Bank of America Corp | | | 1.3 | | | | 677,110 | | | | 19,067 | |
Berkshire Hathaway Inc, Cl B * | | | 0.6 | | | | 37,711 | | | | 8,632 | |
Capital One Financial Corp | | | 0.9 | | | | 155,984 | | | | 13,358 | |
Citigroup Inc | | | 0.6 | | | | 159,000 | | | | 8,756 | |
JPMorgan Chase & Co | | | 0.9 | | | | 112,569 | | | | 13,270 | |
| | | | | | | | | | | | |
| | | | |
Description | | Percentage of Net Assets
(%) | | Shares | | Market Value ($ Thousands) |
|
COMMON STOCK (continued) | |
Willis Towers Watson PLC | | | 0.6% | | | | 42,601 | | | $ | 8,869 | |
Other Securities ‡ | | | 5.4 | | | | | | | | 84,996 | |
| | | | | | | | | | | | |
| | | | | | | | | | | 164,474 | |
| | | | | | | | | | | | |
Health Care — 14.4% | | | | | | | | | |
Abbott Laboratories | | | 0.5 | | | | 69,600 | | | | 7,532 | |
Amgen Inc | | | 0.6 | | | | 41,264 | | | | 9,162 | |
Becton Dickinson and Co | | | 1.0 | | | | 66,180 | | | | 15,542 | |
CVS Health Corp | | | 0.7 | | | | 148,365 | | | | 10,058 | |
Humana Inc | | | 0.7 | | | | 25,234 | | | | 10,107 | |
Johnson & Johnson | | | 1.3 | | | | 131,429 | | | | 19,015 | |
Medtronic PLC | | | 0.8 | | | | 113,190 | | | | 12,870 | |
Merck & Co Inc | | | 1.3 | | | | 246,040 | | | | 19,779 | |
Pfizer Inc | | | 0.6 | | | | 228,900 | | | | 8,769 | |
Thermo Fisher Scientific Inc | | | 0.5 | | | | 16,200 | | | | 7,533 | |
UnitedHealth Group Inc | | | 1.5 | | | | 66,058 | | | | 22,218 | |
Zimmer Biomet Holdings Inc | | | 0.5 | | | | 55,315 | | | | 8,249 | |
Other Securities | | | 4.4 | | | | | | | | 66,787 | |
| | | | | | | | | | | | |
| | | | | | | | | | | 217,621 | |
| | | | | | | | | | | | |
Industrials — 10.6% | | | | | | | | | |
AMETEK Inc | | | 0.6 | | | | 71,662 | | | | 8,494 | |
Emerson Electric Co | | | 0.5 | | | | 102,323 | | | | 7,860 | |
Honeywell International Inc | | | 0.7 | | | | 54,070 | | | | 11,026 | |
Raytheon Technologies Corp | | | 0.8 | | | | 168,513 | | | | 12,086 | |
Stanley Black & Decker Inc | | | 0.8 | | | | 64,883 | | | | 11,959 | |
Other Securities | | | 7.2 | | | | | | | | 109,782 | |
| | | | | | | | | | | | |
| | | | | | | | | | | 161,207 | |
| | | | | | | | | | | | |
Information Technology — 22.0% | |
Adobe Inc* | | | 0.7 | | | | 21,553 | | | | 10,312 | |
Apple Inc | | | 4.7 | | | | 598,443 | | | | 71,245 | |
Broadcom Inc | | | 0.6 | | | | 24,390 | | | | 9,795 | |
Cisco Systems Inc | | | 0.6 | | | | 197,982 | | | | 8,517 | |
Global Payments Inc | | | 0.8 | | | | 59,800 | | | | 11,672 | |
Microsoft Corp | | | 4.6 | | | | 321,796 | | | | 68,887 | |
Motorola Solutions Inc | | | 0.5 | | | | 44,077 | | | | 7,561 | |
NVIDIA Corp | | | 0.6 | | | | 15,958 | | | | 8,554 | |
QUALCOMM Inc | | | 1.0 | | | | 106,812 | | | | 15,719 | |
Other Securities | | | 7.9 | | | | | | | | 121,590 | |
| | | | | | | | | | | | |
| | | | | | | | | | | 333,852 | |
| | | | | | | | | | | | |
Materials — 3.1% | | | | | | | | | |
Air Products and Chemicals Inc | | | 0.6 | | | | 33,969 | | | | 9,516 | |
Other Securities | | | 2.5 | | | | | | | | 37,716 | |
| | | | | | | | | | | | |
| | | | | | | | | | | 47,232 | |
| | | | | | | | | | | | |
Real Estate — 2.3% | | | | | | | | | |
Crown Castle International | | | | | | | | | | | | |
Corp‡ | | | 0.8 | | | | 69,103 | | | | 11,580 | |
Other Securities ‡ | | | 1.5 | | | | | | | | 23,004 | |
| | | | | | | | | | | | |
| | | | | | | | | | | 34,584 | |
| | | | | | | | | | | | |
| | |
4 | | SEI Institutional Investments Trust / Semi-Annual Report / November 30, 2020 |
| | | | | | | | | | | | |
| | | | |
| Description | | Percentage of
Net Assets (%) | | Shares | | Market Value
($ Thousands) |
COMMON STOCK (continued) | |
Utilities — 2.8% | | | | | | | | | |
NextEra Energy Inc | | | 0.6% | | | | 118,061 | | | $ | 8,688 | |
Other Securities | | | 2.2 | | | | | | | | 33,529 | |
| | | | | | | | | | | | |
| | | | | | | | | | | 42,217 | |
| | | | | | | | | | | | |
Total Common Stock | | | | | | | | | |
| |
(Cost $1,040,781) ($ Thousands) | | | | 1,377,907 | |
| | | | | | | | | | | | |
|
U.S. TREASURY OBLIGATION — 0.0% | |
Other Securities | | | 0.0 | | | | | | | | 120 | |
| | | | | | | | | | | | |
| | |
Total U.S. Treasury Obligation | | | | | | | | | |
(Cost $120) ($ Thousands) | | | | | | | | 120 | |
| | | | | | | | | | | | |
| | | | | | | | | | | | |
| | | | |
| Description | | Percentage of
Net Assets (%) | | Shares | | Market Value
($ Thousands) |
AFFILIATED PARTNERSHIP — 0.0% | | | | | | | | | |
SEI Liquidity Fund, L.P.
0.070% **†(C) | | | 0.0% | | | | 49,583 | | | $ | 48 | |
| | | | | | | | | | | | |
| | |
Total Affiliated Partnership | | | | | | | | | |
(Cost $49) ($ Thousands) | | | | | | | | 48 | |
| | | | | | | | | | | | |
|
CASH EQUIVALENT — 5.6% | |
SEI Daily Income Trust,
Government Fund, Cl F
0.010% **† | | | 5.6 | | | | 84,155,071 | | | | 84,155 | |
| | | | | | | | | | | | |
| |
Total Cash Equivalent | | | | | |
(Cost $84,155) ($ Thousands) | | | | 84,155 | |
| | | | | | | | | | | | |
| |
Total Investments in Securities — 96.5% | | | | | |
(Cost $1,125,105) ($ Thousands) | | | $ | 1,462,230 | |
| | | | | | | | | | | | |
A list of the open futures contracts held by the Fund at November 30, 2020, is as follows:
| | | | | | | | | | | | | | | | | | | | |
| | | | | | |
Type of
Contract | | Number of
Contracts
Long | | | Expiration
Date | | | Notional Amount
(Thousands) | | | Value
(Thousands) | | | Unrealized
Appreciation
(Thousands) | |
S&P 500 Index E-MINI | | | 264 | | | | Dec-2020 | | | $ | 44,984 | | | $ | 47,826 | | | $ | 2,842 | |
| | | | | | | | | | | | |
A list of the open OTC Swap agreement held by the Fund at November 30, 2020, is as follows:
| | | | | | | | | | | | | | | | | | | | | | | | |
| Total Return Swaps | |
| | | | | | | | | | |
| Counterparty | | Reference Entity/ Obligation | | Fund Pays | | Fund Receives | | Payment
Frequency | | Termination Date | | Currency | | Notional
Amount
(Thousands) | | | Value
(Thousands) | | | Net Unrealized
(Depreciation)
(Thousands) | |
BAML | | United States Custom Basket of Securities | | 1 Month + 0.15% | | Asset Return | | Monthly | | 02/28/2022 | | USD | | $ | 74,541 | | | $ | (975) | | | $ | (975) | |
| | | | | | | | | | | | | | | | | | | | | | | | |
The following table represents the individual stock exposures comprising the Net Long Custom Basket Total Return Swaps as of November 30, 2020:
United States Custom Basket of Long Securities
| | | | | | | | | | | | | | | | | | | | | | |
| | | | | | | |
| Shares | | | Description | | Currency | | Notional Amount
(Thousands) | | | Net Unrealized Appreciation (Depreciation) (Thousands) | | | Fair Value (Thousands) | | | Percentage Value of Underlying Investment | |
| | 21,700 | | | AGCO CORP | | USD | | $ | 2,095 | | | $ | (84) | | | $ | (84) | | | | (21.59 | )% |
| | 1,186 | | | ALIGN TECHNOLOGY INC | | USD | | | 542 | | | | 28 | | | | 28 | | | | 7.20 | |
| | 13,700 | | | ALEXION PHARM | | USD | | | 1,751 | | | | (78) | | | | (78) | | | | (20.05) | |
| | 4,000 | | | AMEDISYS INC | | USD | | | 978 | | | | 1 | | | | 1 | | | | 0.26 | |
| | 16,300 | | | AMERICAN HOMES 4 RENT- A | | USD | | | 484 | | | | (16) | | | | (16) | | | | (4.11) | |
| | 16,300 | | | AMERIPRISE FINANCIAL INC | | USD | | | 3,031 | | | | 4 | | | | 4 | | | | 1.03 | |
| | 5,178 | | | AMAZON.COM INC | | USD | | | 16,213 | | | | 188 | | | | 188 | | | | 48.33 | |
| | 4,416 | | | BIO-RAD LABORATORIES-A | | USD | | | 2,637 | | | | (260) | | | | (260) | | | | (66.84) | |
| | 57,700 | | | BJ’S WHOLESALE C | | USD | | | 2,425 | | | | (61) | | | | (61) | | | | (15.68) | |
| | 1,133 | | | BOOKING HOLDINGS INC | | USD | | | 2,390 | | | | (92) | | | | (92) | | | | (23.65) | |
| | — | | | BLUEPRINT MEDICINES CORP | | USD | | | — | | | | 3 | | | | 3 | | | | 0.77 | |
| | |
SEI Institutional Investments Trust / Semi-Annual Report / November 30, 2020 | | 5 |
SUMMARY SCHEDULE OF INVESTMENTS (Unaudited)
November 30, 2020
Large Cap Disciplined Equity Fund (Continued)
| | | | | | | | | | | | | | | | | | | | | | |
| | | | | | | |
| Shares | | | Description | | Currency | | Notional Amount
(Thousands) | | | Net Unrealized Appreciation (Depreciation) (Thousands) | | | Fair Value (Thousands) | | | Percentage Value of Underlying Investment | |
| | 4,619 | | | BERKSHIRE HATH-B | | USD | | $ | 1,077 | | | $ | (20) | | | $ | (20) | | | | (5.14 | )% |
| | 72,700 | | | CONAGRA BRANDS INC | | USD | | | 2,656 | | | | 21 | | | | 21 | | | | 5.40 | |
| | 19,700 | | | CBRE GROUP INC—A | | USD | | | 1,180 | | | | 24 | | | | 24 | | | | 6.17 | |
| | 24,600 | | | CHURCH & DWIGHT CO INC | | USD | | | 2,164 | | | | 1 | | | | 1 | | | | 0.26 | |
| | 5,973 | | | CHARTER COMMUN-A | | USD | | | 3,831 | | | | 62 | | | | 62 | | | | 15.94 | |
| | 122,100 | | | CENTERPOINT ENERGY INC | | USD | | | 3,063 | | | | (214) | | | | (214) | | | | (55.01) | |
| | 11,500 | | | CITRIX SYSTEMS INC | | USD | | | 1,363 | | | | 62 | | | | 62 | | | | 15.94 | |
| | 10,100 | | | CUBESMART | | USD | | | 330 | | | | (2) | | | | (2) | | | | (0.51) | |
| | 17,600 | | | DROPBOX INC-CLASS A | | USD | | | 329 | | | | 22 | | | | 22 | | | | 5.66 | |
| | — | | | DISH NETWORK CORP-A | | USD | | | — | | | | (16) | | | | (16) | | | | (4.11) | |
| | 7,700 | | | DOLBY LABORATO-A | | USD | | | 685 | | | | (2) | | | | (2) | | | | (0.51) | |
| | 384 | | | DOMINO’S PIZZA INC | | USD | | | 148 | | | | 3 | | | | 3 | | | | 0.77 | |
| | 21,400 | | | ELECTRONIC ARTS INC | | USD | | | 2,538 | | | | 195 | | | | 195 | | | | 50.13 | |
| | 18,500 | | | EURONET WORLDWIDE INC | | USD | | | 2,371 | | | | 125 | | | | 125 | | | | 32.13 | |
| | 87,900 | | | EQUITABLE HOLDINGS INC | | USD | | | 2,161 | | | | 84 | | | | 84 | | | | 21.59 | |
| | 32,800 | | | EXELIXIS INC | | USD | | | 642 | | | | (14) | | | | (14) | | | | (3.60) | |
| | 13,500 | | | DIAMONDBACK ENERGY INC | | USD | | | 543 | | | | (4) | | | | (4) | | | | (1.03) | |
| | — | | | FIRSTENERGY CORP | | USD | | | — | | | | 5 | | | | 5 | | | | 1.29 | |
| | 1,658 | | | FAIR ISAAC CORP | | USD | | | 785 | | | | (1) | | | | (1) | | | | (0.26) | |
| | 21,000 | | | FORTINET INC | | USD | | | 2,451 | | | | 136 | | | | 136 | | | | 34.96 | |
| | 10,500 | | | GILEAD SCIENCES INC | | USD | | | 641 | | | | (5) | | | | (5) | | | | (1.29) | |
| | 35,600 | | | GAMING AND LEISU | | USD | | | 1,486 | | | | 9 | | | | 9 | | | | 2.31 | |
| | 6,077 | | | ALPHABET INC-CL A | | USD | | | 10,781 | | | | (122) | | | | (122) | | | | (31.36) | |
| | 160,900 | | | HUNTINGTON BANCSHARES INC | | USD | | | 1,936 | | | | 8 | | | | 8 | | | | 2.06 | |
| | — | | | HD SUPPLY HOLDINGS INC | | USD | | | — | | | | — | | | | — | | | | — | |
| | 17,800 | | | HOLLYFRONTIER CORP | | USD | | | 430 | | | | (8) | | | | (8) | | | | (2.06) | |
| | 16,500 | | | HARTFORD FINL SV | | USD | | | 765 | | | | (30) | | | | (30) | | | | (7.71) | |
| | 6,307 | | | HUMANA INC | | USD | | | 2,703 | | | | (177) | | | | (177) | | | | (45.50) | |
| | 19,700 | | | HOWMET AEROSPACE INC | | USD | | | 457 | | | | 5 | | | | 5 | | | | 1.29 | |
| | 1,007 | | | ILLUMINA INC | | USD | | | 299 | | | | 25 | | | | 25 | | | | 6.43 | |
| | 36,300 | | | KNIGHT-SWIFT TRA | | USD | | | 1,515 | | | | (17) | | | | (17) | | | | (4.37) | |
| | 2,900 | | | COCA-COLA CO/THE | | USD | | | 156 | | | | (5) | | | | (5) | | | | (1.29) | |
| | 74,500 | | | KROGER CO | | USD | | | 2,406 | | | | 65 | | | | 65 | | | | 16.71 | |
| | 6,500 | | | LITHIA MOTORS INC-CL A | | USD | | | 1,729 | | | | 153 | | | | 153 | | | | 39.33 | |
| | 19,500 | | | LAMAR ADVERTISING CO-A | | USD | | | 1,500 | | | | 52 | | | | 52 | | | | 13.37 | |
| | 116,500 | | | LIBERTY GLOBAL PLC- C | | USD | | | 2,546 | | | | (25) | | | | (25) | | | | (6.43) | |
| | 2,000 | | | LHC GROUP INC | | USD | | | 421 | | | | (29) | | | | (29) | | | | (7.46) | |
| | 29,800 | | | LKQ CORP | | USD | | | 1,097 | | | | (47) | | | | (47) | | | | (12.08) | |
| | 6,100 | | | LOWE’S COS INC | | USD | | | 988 | | | | (37) | | | | (37) | | | | (9.51) | |
| | — | | | LATTICE SEMICOND | | USD | | | — | | | | 5 | | | | 5 | | | | 1.29 | |
| | 42,300 | | | MASCO CORP | | USD | | | 2,339 | | | | (69) | | | | (69) | | | | (17.74) | |
| | 17,800 | | | MCKESSON CORP | | USD | | | 3,269 | | | | (60) | | | | (60) | | | | (15.42) | |
| | 26,400 | | | MARSH & MCLENNAN COS | | USD | | | 3,053 | | | | (28) | | | | (28) | | | | (7.20) | |
| | 95,900 | | | MOSAIC CO/THE | | USD | | | 1,801 | | | | 305 | | | | 305 | | | | 78.41 | |
| | 400 | | | MONOLITHIC POWER | | USD | | | 121 | | | | 7 | | | | 7 | | | | 1.80 | |
| | 52,997 | | | NEXTERA ENERGY INC | | USD | | | 4,121 | | | | (203) | | | | (203) | | | | (52.19) | |
| | 17,700 | | | NEXTERA ENERGY PARTNERS LP | | USD | | | 1,149 | | | | (26) | | | | (26) | | | | (6.68) | |
| | 12,300 | | | NIKE INC -CL B | | USD | | | 1,600 | | | | 56 | | | | 56 | | | | 14.40 | |
| | 91,800 | | | NOV INC | | USD | | | 1,105 | | | | 20 | | | | 20 | | | | 5.14 | |
| | — | | | NOVAVAX INC | | USD | | | — | | | | (13) | | | | (13) | | | | (3.34) | |
| | 68,700 | | | NEWS CORP—CLASS A | | USD | | | 1,195 | | | | 18 | | | | 18 | | | | 4.63 | |
| | 67,000 | | | NY COMM BANCORP | | USD | | | 604 | | | | 57 | | | | 57 | | | | 14.65 | |
| | 2,400 | | | OKTA INC | | USD | | | 535 | | | | 53 | | | | 53 | | | | 13.62 | |
| | 4,200 | | | PALO ALTO NETWORKS INC | | USD | | | 1,170 | | | | 65 | | | | 65 | | | | 16.71 | |
| | 6,300 | | | PERFORMANCE FOOD GROUP CO | | USD | | | 275 | | | | (2) | | | | (2) | | | | (0.51) | |
| | 19,300 | | | PULTEGROUP INC | | USD | | | 827 | | | | 14 | | | | 14 | | | | 3.60 | |
| | 20,200 | | | PERKINELMER INC | | USD | | | 2,693 | | | | (7) | | | | (7) | | | | (1.80) | |
| | |
6 | | SEI Institutional Investments Trust / Semi-Annual Report / November 30, 2020 |
| | | | | | | | | | | | | | | | | | | | | | |
| | | | | | | |
| Shares | | | Description | | Currency | | Notional Amount
(Thousands) | | | Net Unrealized
Appreciation
(Depreciation) (Thousands) | | | Fair Value (Thousands) | | | Percentage Value of
Underlying Investment | |
| | - | | | PLUG POWER INC | | USD | | $ | - | | | $ | 43 | | | $ | 43 | | | | 11.05 | % |
| | 4,821 | | | POOL CORP | | USD | | | 1,643 | | | | 16 | | | | 16 | | | | 4.11 | |
| | - | | | PLURALSIGHT INC - A | | USD | | | - | | | | 35 | | | | 35 | | | | 9.00 | |
| | 28,500 | | | QUANTA SERVICES INC | | USD | | | 1,976 | | | | (29) | | | | (29) | | | | (7.46) | |
| | 1,300 | | | PAYPAL HOLDINGS INC | | USD | | | 250 | | | | 29 | | | | 29 | | | | 7.46 | |
| | 2,945 | | | REGENERON PHARMACEUTICALS | | USD | | | 1,647 | | | | (128) | | | | (128) | | | | (32.90) | |
| | - | | | RH | | USD | | | - | | | | 35 | | | | 35 | | | | 9.00 | |
| | 16,000 | | | RELIANCE STEEL & ALUMINUM | | USD | | | 1,933 | | | | (39) | | | | (39) | | | | (10.03) | |
| | 1,616 | | | SBA COMMUNICATIONS CORP | | USD | | | 477 | | | | (13) | | | | (13) | | | | (3.34) | |
| | 6,600 | | | SITEONE LANDSCAP | | USD | | | 893 | | | | 28 | | | | 28 | | | | 7.20 | |
| | 27,000 | | | SCHNEIDER NATL-B | | USD | | | 594 | | | | 24 | | | | 24 | | | | 6.17 | |
| | 14,400 | | | SYNNEX CORP | | USD | | | 2,268 | | | | 40 | | | | 40 | | | | 10.28 | |
| | - | | | SOUTH STATE CORP | | USD | | | - | | | | (1) | | | | (1) | | | | (0.26) | |
| | 2,090 | | | THERMO FISHER | | USD | | | 1,005 | | | | (34) | | | | (34) | | | | (8.74) | |
| | 1,200 | | | T ROWE PRICE GROUP INC | | USD | | | 173 | | | | (1) | | | | (1) | | | | (0.26) | |
| | 8,500 | | | UNIVERSAL HLTH-B | | USD | | | 1,130 | | | | (20) | | | | (20) | | | | (5.14) | |
| | 1,000 | | | UNITED PARCEL-B | | USD | | | 168 | | | | 4 | | | | 4 | | | | 1.03 | |
| | 1,200 | | | UNITED RENTALS INC | | USD | | | 261 | | | | 19 | | | | 19 | | | | 4.88 | |
| | 5,400 | | | MARRIOTT VACATIONS WORLD | | USD | | | 704 | | | | (16) | | | | (16) | | | | (4.11) | |
| | 109,200 | | | WELLS FARGO & CO | | USD | | | 2,719 | | | | 276 | | | | 276 | | | | 70.95 | |
| | 15,800 | | | WP CAREY INC | | USD | | | 1,134 | | | | (40) | | | | (40) | | | | (10.28) | |
| | 49,500 | | | WEYERHAEUSER CO | | USD | | | 1,453 | | | | (16) | | | | (16) | | | | (4.11) | |
| | 3,300 | | | XPO LOGISTICS INC | | USD | | | 351 | | | | 1 | | | | 1 | | | | 0.26 | |
| | 14,300 | | | XEROX HOLDINGS CORP | | USD | | | 325 | | | | (12) | | | | (12) | | | | (3.10) | |
| | 6,900 | | | ZENDESK INC | | USD | | | 845 | | | | 81 | | | | 81 | | | | 20.79 | |
| | | | | | | | | | |
| | | | | | | | $ | 140,525 | | | $ | 389 | | | $ | 389 | | | | 100.00 | % |
| | | | | | | | | | |
The following table represents the individual stock exposures comprising the Net Short Custom Basket Total Return Swaps as of November 30, 2020:
United States Custom Basket of Short Securities
| | | | | | | | | | | | | | | | | | | | | | |
| | | | | | | |
| Shares | | | Description | | Currency | | Notional Amount
(Thousands) | | | Net Unrealized
Appreciation
(Depreciation)
(Thousands) | | | Fair Value (Thousands) | | | Percentage Value of Underlying Investment | |
| | (74,300) | | | AMERICAN AIRLINE | | USD | | $ | (954) | | | $ | (96) | | | $ | (96) | | | | 7.04 | % |
| | (22,300) | | | ADAPTIVE BIOTECHNOLOGIES | | USD | | | (1,041) | | | | (34) | | | | (34) | | | | 2.49 | |
| | (91,800) | | | ADT INC | | USD | | | (695) | | | | (44) | | | | (44) | | | | 3.23 | |
| | (20,100) | | | AEROJET ROCKETDY | | USD | | | (747) | | | | (6) | | | | (6) | | | | 0.44 | |
| | (14,200) | | | ALLOGENE THERAPEUTICS INC | | USD | | | (469) | | | | 28 | | | | 28 | | | | -2.05 | |
| | (3,200) | | | ALLAKOS INC | | USD | | | (320) | | | | (22) | | | | (22) | | | | 1.61 | |
| | (10,500) | | | APELLIS PHARMACE | | USD | | | (496) | | | | 1 | | | | 1 | | | | -0.07 | |
| | (11,500) | | | ARROWHEAD PHARMA | | USD | | | (794) | | | | 75 | | | | 75 | | | | -5.50 | |
| | (9,200) | | | ATMOS ENERGY CORP | | USD | | | (932) | | | | 44 | | | | 44 | | | | -3.23 | |
| | (10,500) | | | AMERICAN STATES WATER CO | | USD | | | (831) | | | | 52 | | | | 52 | | | | -3.81 | |
| | (10,300) | | | BRIDGEBIO PHARMA INC | | USD | | | (457) | | | | (61) | | | | (61) | | | | 4.47 | |
| | (1,200) | | | BRIGHT HORIZONS FAMILY SOLUT | | USD | | | (204) | | | | - | | | | - | | | | 0.00 | |
| | (5,900) | | | BIOHAVEN PHARMAC | | USD | | | (568) | | | | 43 | | | | 43 | | | | -3.15 | |
| | (11,300) | | | BILL.COM HOLDINGS INC | | USD | | | (1,090) | | | | (297) | | | | (297) | | | | 21.77 | |
| | (19,500) | | | BLACKBAUD INC | | USD | | | (1,020) | | | | (55) | | | | (55) | | | | 4.03 | |
| | (11,300) | | | BLUEBIRD BIO INC | | USD | | | (524) | | | | 26 | | | | 26 | | | | -1.91 | |
| | (13,800) | | | BANK OF HAWAII CORP | | USD | | | (1,039) | | | | (4) | | | | (4) | | | | 0.29 | |
| | (12,900) | | | BOK FINANCIAL CORPORATION | | USD | | | (912) | | | | 41 | | | | 41 | | | | -3.01 | |
| | (25,400) | | | BLACKSTONE MOR-A | | USD | | | (660) | | | | - | | | | - | | | | 0.00 | |
| | (13,700) | | | COMMUNITY BANK SYSTEM INC | | USD | | | (909) | | | | 56 | | | | 56 | | | | -4.11 | |
| | (12,100) | | | CHEGG INC | | USD | | | (822) | | | | (121) | | | | (121) | | | | 8.87 | |
| | (44,000) | | | CLEVELAND-CLIFFS INC | | USD | | | (466) | | | | (19) | | | | (19) | | | | 1.39 | |
| | (9,700) | | | DECIPHERA PHARMA | | USD | | | (642) | | | | 42 | | | | 42 | | | | -3.08 | |
| | |
SEI Institutional Investments Trust / Semi-Annual Report / November 30, 2020 | | 7 |
SUMMARY SCHEDULE OF INVESTMENTS (Unaudited)
November 30, 2020
Large Cap Disciplined Equity Fund (Continued)
| | | | | | | | | | | | | | | | | | | | | | |
| | | | | | | |
| Shares | | | Description | | Currency | | Notional Amount
(Thousands) | | | Net Unrealized
Appreciation
(Depreciation)
(Thousands) | | | Fair Value (Thousands) | | | Percentage Value of Underlying Investment | |
| | (5,000) | | | DENALI THERAPEUTICS INC | | USD | | $ | (320) | | | $ | 16 | | | $ | 16 | | | | -1.17 | % |
| | (2,400) | | | EDISON INTERNATIONAL | | USD | | | (156) | | | | 9 | | | | 9 | | | | -0.66 | |
| | (19,100) | | | EQUITY COMMONWEALTH | | USD | | | (515) | | | | 8 | | | | 8 | | | | -0.59 | |
| | (2,000) | | | ELASTIC NV | | USD | | | (203) | | | | (44) | | | | (44) | | | | 3.23 | |
| | (13,400) | | | FATE THERAPEUTICS INC | | USD | | | (708) | | | | (76) | | | | (76) | | | | 5.57 | |
| | (50,800) | | | FIRST HAWAIIAN INC | | USD | | | (1,135) | | | | 9 | | | | 9 | | | | -0.66 | |
| | (14,100) | | | FOX FACTORY HOLDING CORP | | USD | | | (1,156) | | | | (75) | | | | (75) | | | | 5.50 | |
| | (8,100) | | | FASTLY INC - CLASS A | | USD | | | (639) | | | | (48) | | | | (48) | | | | 3.52 | |
| | (11,500) | | | GATX CORP | | USD | | | (940) | | | | 22 | | | | 22 | | | | -1.61 | |
| | (20,100) | | | GLACIER BANCORP INC | | USD | | | (887) | | | | 67 | | | | 67 | | | | -4.91 | |
| | (1,669) | | | GRAHAM HOLDING-B | | USD | | | (754) | | | | 7 | | | | 7 | | | | -0.51 | |
| | (6,500) | | | GOOSEHEAD INSU-A | | USD | | | (807) | | | | 7 | | | | 7 | | | | -0.51 | |
| | (14,400) | | | HOWARD HUGHES CORP/THE | | USD | | | (1,026) | | | | (21) | | | | (21) | | | | 1.54 | |
| | (41,300) | | | HOME BANCSHARES INC | | USD | | | (815) | | | | 45 | | | | 45 | | | | -3.30 | |
| | (88,800) | | | H&R BLOCK INC | | USD | | | (1,565) | | | | (105) | | | | (105) | | | | 7.70 | |
| | (2,300) | | | IDACORP INC | | USD | | | (217) | | | | 9 | | | | 9 | | | | -0.66 | |
| | (6,000) | | | IMMUNOVANT INC | | USD | | | (316) | | | | 21 | | | | 21 | | | | -1.54 | |
| | (18,300) | | | INSMED INC | | USD | | | (671) | | | | (43) | | | | (43) | | | | 3.15 | |
| | (3,400) | | | INSPIRE MEDICAL | | USD | | | (591) | | | | (40) | | | | (40) | | | | 2.93 | |
| | (73,700) | | | JETBLUE AIRWAYS CORP | | USD | | | (1,090) | | | | (22) | | | | (22) | | | | 1.61 | |
| | (4,500) | | | KINSALE CAPITAL GROUP INC | | USD | | | (1,006) | | | | (75) | | | | (75) | | | | 5.50 | |
| | (4,100) | | | QUAKER CHEMICAL CORP | | USD | | | (1,060) | | | | 47 | | | | 47 | | | | -3.45 | |
| | (10,800) | | | OPEN LENDING CORP - CL A | | USD | | | (325) | | | | 21 | | | | 21 | | | | -1.54 | |
| | (170,800) | | | Lumen Technologies | | USD | | | (1,720) | | | | (108) | | | | (108) | | | | 7.92 | |
| | (21,800) | | | LIVE NATION ENTE | | USD | | | (1,489) | | | | 58 | | | | 58 | | | | -4.25 | |
| | (8,600) | | | MERCURY SYSTEMS INC | | USD | | | (591) | | | | (22) | | | | (22) | | | | 1.61 | |
| | (700) | | | MIRATI THERAPEUTICS INC | | USD | | | (160) | | | | (6) | | | | (6) | | | | 0.44 | |
| | (4,600) | | | NEW FORTRESS ENERGY INC | | USD | | | (172) | | | | (27) | | | | (27) | | | | 1.98 | |
| | (28,500) | | | NEW JERSEY RESOURCES CORP | | USD | | | (1,066) | | | | 125 | | | | 125 | | | | -9.16 | |
| | (8,500) | | | NIKOLA CORP | | USD | | | (186) | | | | 12 | | | | 12 | | | | -0.88 | |
| | (88,900) | | | NEW RESIDENT | | USD | | | (767) | | | | (56) | | | | (56) | | | | 4.11 | |
| | (8,200) | | | NUTANIX INC - A | | USD | | | (219) | | | | (6) | | | | (6) | | | | 0.44 | |
| | (10,800) | | | ONEOK INC | | USD | | | (349) | | | | (38) | | | | (38) | | | | 2.79 | |
| | (8,600) | | | 1LIFE HEALTHCARE INC | | USD | | | (282) | | | | - | | | | - | | | | 0.00 | |
| | (2,200) | | | ORMAT TECHNOLOGIES INC | | USD | | | (180) | | | | 6 | | | | 6 | | | | -0.44 | |
| | (41,100) | | | OWL ROCK CAPITAL CORP | | USD | | | (559) | | | | 3 | | | | 3 | | | | -0.22 | |
| | (152,200) | | | P G & E CORP | | USD | | | (1,756) | | | | (177) | | | | (177) | | | | 12.98 | |
| | (8,700) | | | PENNYMAC FINANCI | | USD | | | (495) | | | | (7) | | | | (7) | | | | 0.51 | |
| | (84,000) | | | PARK HOTELS & RESORTS INC | | USD | | | (1,216) | | | | (155) | | | | (155) | | | | 11.36 | |
| | (19,500) | | | PINNACLE FINL | | USD | | | (1,081) | | | | 22 | | | | 22 | | | | -1.61 | |
| | (8,100) | | | REATA PHARMACE-A | | USD | | | (1,380) | | | | 143 | | | | 143 | | | | -10.48 | |
| | (5,400) | | | ROYAL GOLD INC | | USD | | | (617) | | | | 20 | | | | 20 | | | | -1.47 | |
| | (9,300) | | | ROCKET COS INC-CLASS A | | USD | | | (211) | | | | 18 | | | | 18 | | | | -1.32 | |
| | (4,700) | | | ROKU INC | | USD | | | (1,094) | | | | (286) | | | | (286) | | | | 20.97 | |
| | (33,484) | | | ROOT INC/OH -CLASS A | | USD | | | (573) | | | | (20) | | | | (20) | | | | 1.47 | |
| | (55,300) | | | SABRE CORP | | USD | | | (544) | | | | (79) | | | | (79) | | | | 5.79 | |
| | (9,500) | | | SAGE THERAPEUTICS INC | | USD | | | (698) | | | | (6) | | | | (6) | | | | 0.44 | |
| | (113) | | | SEABOARD CORP | | USD | | | (361) | | | | (1) | | | | (1) | | | | 0.07 | |
| | (5,100) | | | SVB FINANCIAL GROUP | | USD | | | (1,809) | | | | 50 | | | | 50 | | | | -3.67 | |
| | (1,300) | | | SNOWFLAKE INC-CLASS A | | USD | | | (314) | | | | (109) | | | | (109) | | | | 7.99 | |
| | (25,700) | | | SPIRIT AEROSYS-A | | USD | | | (832) | | | | (42) | | | | (42) | | | | 3.08 | |
| | (42,200) | | | SUNPOWER CORP | | USD | | | (833) | | | | (103) | | | | (103) | | | | 7.55 | |
| | (16,600) | | | SPIRE INC | | USD | | | (1,058) | | | | (3) | | | | (3) | �� | | | 0.22 | |
| | (3,500) | | | STAMPS.COM INC | | USD | | | (633) | | | | (23) | | | | (23) | | | | 1.69 | |
| | (2,200) | | | SPRINGWORKS THER | | USD | | | (152) | | | | 8 | | | | 8 | | | | -0.59 | |
| | (13,800) | | | SOUTHWEST GAS HO | | USD | | | (972) | | | | 77 | | | | 77 | | | | -5.65 | |
| | |
8 | | SEI Institutional Investments Trust / Semi-Annual Report / November 30, 2020 |
| | | | | | | | | | | | | | | | | | | | | | |
| | | | | | | |
| Shares | | | Description | | Currency | | Notional Amount
(Thousands) | | | Net Unrealized
Appreciation
(Depreciation)
(Thousands) | | | Fair Value (Thousands) | | | Percentage Value of Underlying Investment | |
| | (4,100) | | | TEXAS CAPITAL BA | | USD | | $ | (233) | | | $ | 4 | | | $ | 4 | | | | -0.29 | % |
| | (6,300) | | | TCF FINANCIAL CORP | | USD | | | (212) | | | | (2) | | | | (2) | | | | 0.15 | |
| | (4,200) | | | THOR INDUSTRIES INC | | USD | | | (373) | | | | (32) | | | | (32) | | | | 2.35 | |
| | (9,200) | | | TAYLOR MORRISON HOME CORP | | USD | | | (228) | | | | (5) | | | | (5) | | | | 0.37 | |
| | (10,200) | | | TOOTSIE ROLL INDS | | USD | | | (331) | | | | 15 | | | | 15 | | | | -1.10 | |
| | (3,400) | | | TRUPANION INC | | USD | | | (306) | | | | (38) | | | | (38) | | | | 2.79 | |
| | (1,800) | | | TWIST BIOSCIENCE CORP | | USD | | | (188) | | | | (14) | | | | (14) | | | | 1.03 | |
| | (3,568) | | | UNITED AIRLINES | | USD | | | (146) | | | | (41) | | | | (41) | | | | 3.01 | |
| | (75,000) | | | UMPQUA HOLDINGS CORP | | USD | | | (1,091) | | | | 34 | | | | 34 | | | | -2.49 | |
| | (7,400) | | | VIR BIOTECHNOLOGY INC | | USD | | | (198) | | | | (38) | | | | (38) | | | | 2.79 | |
| | (20,300) | | | VORNADO REALTY TRUST | | USD | | | (811) | | | | 10 | | | | 10 | | | | -0.73 | |
| | (3,900) | | | VROOM INC | | USD | | | (131) | | | | (9) | | | | (9) | | | | 0.66 | |
| | (12,600) | | | VERTIV HOLDINGS CO | | USD | | | (230) | | | | (6) | | | | (6) | | | | 0.44 | |
| | (11,600) | | | VIASAT INC | | USD | | | (425) | | | | 31 | | | | 31 | | | | -2.27 | |
| | (78,200) | | | Vistra Corp. | | USD | | | (1,548) | | | | 87 | | | | 87 | | | | -6.38 | |
| | (15,200) | | | VIVINT SMART HOME INC | | USD | | | (310) | | | | (25) | | | | (25) | | | | 1.82 | |
| | (29,700) | | | ESSENTIAL UTILITIES INC | | USD | | | (1,360) | | | | 9 | | | | 9 | | | | -0.67 | |
| | | | | | | | | | |
| | | | | | | | $ | (65,984) | | | $ | (1,364) | | | $ | (1,364) | | | | 100.00 | % |
| | | | | | | | | | |
Percentages are based on a Net Assets of $1,515,192 ($ Thousands).
| * | Non-income producing security. |
| ** | The rate reported is the 7-day effective yield as of November 30, 2020. |
| ‡ | Real Estate Investment Trust. |
| † | Investment in Affiliated Security (see Note 6). |
| (A) | Certain securities or partial positions of certain securities are on loan at November 30, 2020 (see Note 12). The total market value of securities on loan at November 30, 2020, was $83 ($ Thousands). |
| (B) | Security is a Master Limited Partnership. At November 30, 2020, such securities amounted to $247 ($ Thousands), or 0.0% of Net Assets (see Note 2). |
| (C) | This security was purchased with cash collateral held from securities on loan (see Note 12). The total market value of such securities as of November 30, 2020 was $48 ($ Thousands). |
Cl — Class
L.P. — Limited Partnership
PLC — Public Limited Company
S&P— Standard & Poor’s
The Summary Schedule of Investments does not reflect the complete portfolio holdings. It includes the Fund’s 50 largest holdings and each investment of any issuer that exceeds 1% of the Fund’s net assets. “Other Securities” represent all issues not required to be disclosed under the rules adopted by the U.S. Securities and Exchange Commission (“SEC”). In certain instances, securities for which footnotes listed above may otherwise apply are included in the Other Securities caption. The complete schedule of portfolio holdings is available (i) without charge, upon request, by calling (800) 342-5734; and (ii) on the SEC’s website at http://www.sec.gov.
The following is a list of the level of inputs used as of November 30, 2020, in valuing the Fund’s investments and other financial instruments carried at value ($ Thousands):
| | | | | | | | | | | | | | | | |
| | | | | |
| Investments in Securities | | Level 1
($) | | | Level 2
($) | | | Level 3
($) | | | Total
($) | |
Common Stock | | | 1,377,907 | | | | – | | | | – | | | | 1,377,907 | |
U.S. Treasury Obligation | | | – | | | | 120 | | | | – | | | | 120 | |
Affiliated Partnership | | | – | | | | 48 | | | | – | | | | 48 | |
Cash Equivalent | | | 84,155 | | | | – | | | | – | | | | 84,155 | |
| | | | | | | | | | | | | | | | |
| | | | |
Total Investments in Securities | | | 1,462,062 | | | | 168 | | | | – | | | | 1,462,230 | |
| | | | | | | | | | | | | | | | |
| | | | | | | | | | | | | | | | |
| | | | | |
| Other Financial Instruments | | Level 1
($) | | | Level 2
($) | | | Level 3
($) | | | Total
($) | |
Futures Contracts* | | | | | | | | | | | | | | | | |
Unrealized Appreciation | | | 2,842 | | | | – | | | | – | | | | 2,842 | |
Total Return Swaps* | | | | | | | | | | | | | | | | |
Unrealized Depreciation | | | – | | | | (975 | ) | | | – | | | | (975) | |
| | | | | | | | | | | | | | | | |
| | | | |
Total Other Financial Instruments | | | 2,842 | | | | (975 | ) | | | – | | | | 1,867 | |
| | | | | | | | | | | | | | | | |
* Futures and swap contracts are valued at the unrealized appreciation (depreciation) on the instrument.
For the period ended November 30, 2020, there were no transfers in or out of Level 3.
For more information on valuation inputs, see Note 2 — Significant Accounting Policies in Notes to Financial Statements.
| | |
SEI Institutional Investments Trust / Semi-Annual Report / November 30, 2020 | | 9 |
SUMMARY SCHEDULE OF INVESTMENTS (Unaudited)
November 30, 2020
Large Cap Disciplined Equity Fund (Concluded)
The following is a summary of the Fund’s transactions with affiliates for the period ended November 30, 2020 ($ Thousands):
| | | | | | | | | | | | | | | | | | |
| | | | | | | | | | |
| Security Description | | Value 5/31/2020 | | Purchases
at Cost | | Proceeds
from Sales | | Realized
Gain/
(Loss) | | Change in
Unrealized
Appreciation/
(Depreciation) | | Value
11/30/2020 | | Shares | | Income | | Capital
Gains |
SEI Liquidity Fund, L.P. | | $ 22,577 | | $ 60,460 | | $ (82,985) | | $ 1 | | $ (5) | | $ 48 | | 49,583 | | $ 7 | | $ — |
SEI Daily Income Trust, Government Fund, Cl F | | 37,160 | | 326,427 | | (279,432) | | — | | — | | 84,155 | | 84,155,071 | | 4 | | — |
| | | | | | | | | | | | | | | | | | |
Totals | | $ 59,737 | | $ 386,887 | | $ (362,417) | | $ 1 | | $ (5) | | $ 84,203 | | | | $ 11 | | $ — |
| | | | | | | | | | | | | | | | | | |
Amounts designated as “—” are either $0 or have been rounded to $0.
The accompanying notes are an integral part of the financial statements.
| | |
10 | | SEI Institutional Investments Trust / Semi-Annual Report / November 30, 2020 |
SUMMARY SCHEDULE OF INVESTMENTS (Unaudited)
November 30, 2020
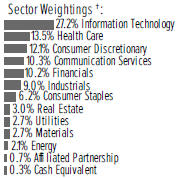
Large Cap Index Fund
†Percentages are based on total investments. Includes investments held as collateral for securities held on loan (see Note 12).
| | | | | | | | | | | | |
| | | | |
| Description | | Percentage of Net Assets
(%) | | Shares | | Market Value
($ Thousands) |
|
COMMON STOCK — 99.3% | |
|
Communication Services — 10.3% | |
Alphabet Inc, Cl A * | | | 1.5% | | | | 18,129 | | | $ | 31,805 | |
Alphabet Inc, Cl C * | | | 1.5 | | | | 17,899 | | | | 31,515 | |
AT&T Inc | | | 0.6 | | | | 425,785 | | | | 12,241 | |
Comcast Corp, Cl A | | | 0.7 | | | | 273,150 | | | | 13,723 | |
Facebook Inc, Cl A * | | | 1.9 | | | | 144,900 | | | | 40,133 | |
Netflix Inc* | | | 0.6 | | | | 25,700 | | | | 12,611 | |
Verizon Communications Inc | | | 0.7 | | | | 250,676 | | | | 15,143 | |
Walt Disney Co/The | | | 0.8 | | | | 108,950 | | | | 16,126 | |
Other Securities (A) | | | 2.0 | | | | | | | | 40,626 | |
| | | | | | | | | | | | |
| | | | | | | | | | | 213,923 | |
| | | | | | | | | | | | |
|
Consumer Discretionary — 12.2% | |
Amazon.com Inc* | | | 3.9 | | | | 25,489 | | | | 80,750 | |
Home Depot Inc/The | | | 0.9 | | | | 65,015 | | | | 18,036 | |
McDonald’s Corp | | | 0.5 | | | | 45,280 | | | | 9,846 | |
NIKE Inc, Cl B | | | 0.5 | | | | 73,568 | | | | 9,910 | |
Tesla Inc* | | | 1.2 | | | | 44,685 | | | | 25,363 | |
Other Securities (A) | | | 5.2 | | | | | | | | 107,878 | |
| | | | | | | | | | | | |
| | | | | | | | | | | 251,783 | |
| | | | | | | | | | | | |
|
Consumer Staples — 6.2% | |
Coca-Cola Co/The | | | 0.6 | | | | 230,740 | | | | 11,906 | |
Costco Wholesale Corp | | | 0.5 | | | | 26,581 | | | | 10,414 | |
PepsiCo Inc | | | 0.6 | | | | 82,852 | | | | 11,950 | |
Procter & Gamble Co/The | | | 1.0 | | | | 147,254 | | | | 20,449 | |
Walmart Inc | | | 0.6 | | | | 83,179 | | | | 12,709 | |
Other Securities (A) | | | 2.9 | | | | | | | | 59,888 | |
| | | | | | | | | | | | |
| | | | | | | | | | | 127,316 | |
| | | | | | | | | | | | |
| | | |
Energy — 2.1% | | | | | | | | | | | | |
Chevron Corp | | | 0.5 | | | | 115,498 | | | | 10,069 | |
Exxon Mobil Corp | | | 0.5 | | | | 255,138 | | | | 9,729 | |
Other Securities | | | 1.1 | | | | | | | | 23,970 | |
| | | | | | | | | | | | |
| | | | | | | | | | | 43,768 | |
| | | | | | | | | | | | |
| | | |
Financials — 10.3% | | | | | | | | | | | | |
Bank of America Corp | | | 0.6 | | | | 462,063 | | | | 13,012 | |
Berkshire Hathaway Inc, Cl B * | | | 1.3 | | | | 115,600 | | | | 26,462 | |
JPMorgan Chase & Co | | | 1.1 | | | | 182,934 | | | | 21,564 | |
| | | | | | | | | | | | |
| | | | |
| Description | | Percentage of Net Assets
(%) | | Shares | | Market Value
($ Thousands) |
|
COMMON STOCK (continued) | |
SEI Investments Co † | | | 0.0% | | | | 6,742 | | | $ | 356 | |
Other Securities ‡(A)(B) | | | 7.3 | | | | | | | | 150,473 | |
| | | | | | | | | | | | |
| | | | | | | | | | | 211,867 | |
| | | | | | | | | | | | |
|
Health Care — 13.5% | |
Abbott Laboratories | | | 0.6 | | | | 105,137 | | | | 11,378 | |
AbbVie Inc | | | 0.5 | | | | 106,301 | | | | 11,117 | |
Bristol-Myers Squibb Co | | | 0.4 | | | | 136,419 | | | | 8,513 | |
Danaher Corp | | | 0.4 | | | | 38,102 | | | | 8,559 | |
Johnson & Johnson | | | 1.1 | | | | 159,009 | | | | 23,005 | |
Medtronic PLC | | | 0.5 | | | | 80,826 | | | | 9,190 | |
Merck & Co Inc | | | 0.6 | | | | 150,843 | | | | 12,126 | |
Pfizer Inc | | | 0.6 | | | | 331,922 | | | | 12,716 | |
Thermo Fisher Scientific Inc | | | 0.5 | | | | 23,525 | | | | 10,939 | |
UnitedHealth Group Inc | | | 0.9 | | | | 57,020 | | | | 19,178 | |
Other Securities (A) | | | 7.4 | | | | | | | | 152,488 | |
| | | | | | | | | | | | |
| | | | | | | | | | | 279,209 | |
| | | | | | | | | | | | |
|
Industrials — 9.0% | |
Honeywell International Inc | | | 0.4 | | | | 42,190 | | | | 8,603 | |
Union Pacific Corp | | | 0.4 | | | | 40,932 | | | | 8,353 | |
Other Securities (A) | | | 8.2 | | | | | | | | 169,258 | |
| | | | | | | | | | | | |
| | | | | | | | | | | 186,214 | |
| | | | | | | | | | | | |
|
Information Technology — 27.3% | |
Accenture PLC, Cl A | | | 0.5 | | | | 38,400 | | | | 9,565 | |
Adobe Inc* | | | 0.7 | | | | 28,702 | | | | 13,733 | |
Apple Inc | | | 5.6 | | | | 970,700 | | | | 115,562 | |
Broadcom Inc | | | 0.5 | | | | 23,532 | | | | 9,450 | |
Cisco Systems Inc | | | 0.5 | | | | 256,327 | | | | 11,027 | |
Intel Corp | | | 0.6 | | | | 252,958 | | | | 12,231 | |
Mastercard Inc, Cl A | | | 0.9 | | | | 53,400 | | | | 17,970 | |
Microsoft Corp | | | 4.7 | | | | 450,300 | | | | 96,396 | |
NVIDIA Corp | | | 0.9 | | | | 35,656 | | | | 19,114 | |
PayPal Holdings Inc* | | | 0.7 | | | | 70,211 | | | | 15,034 | |
QUALCOMM Inc | | | 0.5 | | | | 67,759 | | | | 9,972 | |
salesforce.com Inc* | | | 0.6 | | | | 52,184 | | | | 12,827 | |
Texas Instruments Inc | | | 0.4 | | | | 55,308 | | | | 8,918 | |
Visa Inc, Cl A | | | 1.0 | | | | 102,000 | | | | 21,456 | |
Other Securities (A) | | | 9.2 | | | | | | | | 191,313 | |
| | | | | | | | | | | | |
| | | | | | | | | | | 564,568 | |
| | | | | | | | | | | | |
|
Materials — 2.7% | |
Linde PLC | | | 0.4 | | | | 31,625 | | | | 8,109 | |
Other Securities (A) | | | 2.3 | | | | | | | | 48,457 | |
| | | | | | | | | | | | |
| | | | | | | | | | | 56,566 | |
| | | | | | | | | | | | |
|
Real Estate — 3.0% | |
Other Securities ‡(A) | | | 3.0 | | | | | | | | 61,859 | |
| | | | | | | | | | | | |
|
Utilities — 2.7% | |
NextEra Energy Inc | | | 0.4 | | | | 118,692 | | | | 8,735 | |
Other Securities | | | 2.3 | | | | | | | | 47,838 | |
| | | | | | | | | | | | |
| | | | | | | | | | | 56,573 | |
| | | | | | | | | | | | |
Total Common Stock | | | | | | | | | | | | |
(Cost $664,160) ($ Thousands) | | | | | | | | 2,053,646 | |
| | | | | | | | | | | | |
| | |
SEI Institutional Investments Trust / Semi-Annual Report / November 30, 2020 | | 11 |
SUMMARY SCHEDULE OF INVESTMENTS (Unaudited)
November 30, 2020
Large Cap Index Fund (Concluded)
| | | | | | | | | | | | |
| | | | |
| Description | | Percentage of Net Assets
(%) | | Shares | | Market Value ($ Thousands) |
|
AFFILIATED PARTNERSHIP — 0.7% | |
SEI Liquidity Fund, L.P. 0.070% **†(C) | | | 0.7% | | | | 14,178,074 | | | $ | 14,178 | |
| | | | | | | | | | | | |
| | | |
Total Affiliated Partnership | | | | | | | | | | | | |
(Cost $14,178) ($ Thousands) | | | | 14,178 | |
| | | | | | | | | | | | |
| | | | | | | | | | | | |
| | | | |
| Description | | Percentage of Net Assets
(%) | | Shares | | Market Value ($ Thousands) |
|
CASH EQUIVALENT — 0.3% | |
SEI Daily Income Trust, Government Fund, Cl F 0.010% **† | | | 0.3% | | | | 6,858,192 | | | $ | 6,858 | |
| | | | | | | | | | | | |
| | |
Total Cash Equivalent | | | | | | | | | |
(Cost $6,858) ($ Thousands) | | | | | | | | 6,858 | |
| | | | | | | | | | | | |
| |
Total Investments in Securities — 100.3% | | | | | |
(Cost $685,196) ($ Thousands) | | | $ | 2,074,682 | |
| | | | | | | | | | | | |
A list of the open futures contracts held by the Fund at November 30, 2020, is as follows:
| | | | | | | | | | | | | | | | | | | | |
| | | | | | |
| Type of Contract | | Number of
Contracts
Long | | | Expiration
Date | | | Notional Amount
(Thousands) | | | Value
(Thousands) | | | Unrealized
Appreciation
(Thousands) | |
S&P 500 Index E-MINI | | | 84 | | | | Dec-2020 | | | $ | 13,974 | | | $ | 15,217 | | | $ | 1,243 | |
S&P Mid Cap 400 Index E-MINI | | | 13 | | | | Dec-2020 | | | | 2,447 | | | | 2,819 | | | | 372 | |
| | | | | | | | | | | | |
| | | | | | | | | | $ | 16,421 | | | $ | 18,036 | | | $ | 1,615 | |
| | | | | | | | | | | | |
| | Percentages are based on a Net Assets of $2,067,456 ($ Thousands). |
| * | Non-income producing security. |
| ** | The rate reported is the 7-day effective yield as of November 30, 2020. |
| ‡ | Real Estate Investment Trust. |
| † | Investment in Affiliated Security (see Note 6). |
| (A) | Certain securities or partial positions of certain securities are on loan at November 30, 2020 (see Note 12). The total market value of securities on loan at November 30, 2020, was $13,867 ($ Thousands). |
| (B) | Security is a Master Limited Partnership. At November 30, 2020, such securities amounted to $258 ($ Thousands), or 0.0% of Net Assets of the Fund (see Note 2). |
| (C) | This security was purchased with cash collateral held from securities on loan (see Note 12). The total market value of such securities as of November 30, 2020 was $14,178 ($ Thousands). |
Cl — Class
L.P. — Limited Partnership
PLC — Public Limited Company
S&P — Standard & Poor’s
The Summary Schedule of Investments does not reflect the complete portfolio holdings. It includes the Fund’s 50 largest holdings and each investment of any issuer that exceeds 1% of the Fund’s net assets. “Other Securities” represent all issues not required to be disclosed under the rules adopted by the U.S. Securities and Exchange Commission (“SEC”). In certain instances, securities for which footnotes listed above may otherwise apply are included in the Other Securities caption. The complete schedule
of portfolio holdings is available (i) without charge, upon request, by calling (800) 342-5734; and (ii) on the SEC’s website at http://www.sec.gov.
The following is a list of the level of inputs used as of November 30, 2020, in valuing the Fund’s investments and other financial instruments carried at value ($ Thousands):
| | | | | | | | | | | | | | | | |
| | | | | |
| Investments in Securities | | Level 1 ($) | | | Level 2 ($) | | | Level 3 ($) | | | Total ($) | |
Common Stock | | | 2,053,646 | | | | – | | | | – | | | | 2,053,646 | |
Affiliated Partnership | | | – | | | | 14,178 | | | | – | | | | 14,178 | |
Cash Equivalent | | | 6,858 | | | | – | | | | – | | | | 6,858 | |
| | | | | | | | | | | | | | | | |
Total Investments in Securities | | | 2,060,504 | | | | 14,178 | | | | – | | | | 2,074,682 | |
| | | | | | | | | | | | | | | | |
| | | | | | | | | | | | | | | | |
| | | | | |
| Other Financial Instruments | | Level 1 ($) | | | Level 2
($) | | | Level 3
($) | | | Total ($) | |
Futures Contracts* | | | | | | | | | | | | | | | | |
Unrealized Appreciation | | | 1,615 | | | | – | | | | – | | | | 1,615 | |
| | | | | | | | | | | | | | | | |
Total Other Financial Instruments | | | 1,615 | | | | – | | | | – | | | | 1,615 | |
| | | | | | | | | | | | | | | | |
* Futures contracts are valued at the unrealized appreciation on the instrument.
For the period ended November 30, 2020, there were no transfers in or out of Level 3.
For more information on valuation inputs, see Note 2 — Significant Accounting Policies in Notes to Financial Statements.
The following is a summary of the Fund’s transactions with affiliates for the period ended November 30, 2020 ($ Thousands):
| | | | | | | | | | | | | | | | | | |
| | | | | | | | | | |
| Security Description | | Value
5/31/2020 | | Purchases
at Cost | | Proceeds
from Sales | | Realized
Gain/
(Loss) | | Change in
Unrealized
Appreciation/
(Depreciation) | | Value
11/30/2020 | | Shares | | Income | | Capital
Gains |
SEI Investment Co. | | $ 366 | | $ — | | $ — | | $— | | $(10) | | $ 356 | | 6,742 | | $ 2 | | $— |
SEI Liquidity Fund, L.P. | | 27,289 | | 69,416 | | (82,520) | | 2 | | (9) | | 14,178 | | 14,178,074 | | 38 | | — |
SEI Daily Income Trust, Government Fund, Cl F | | 6,854 | | 100,020 | | (100,016) | | — | | — | | 6,858 | | 6,858,192 | | 1 | | — |
| | | | | | | | | | | | | | | | | | |
Totals | | $34,509 | | $169,436 | | $(182,536) | | $ 2 | | $(19) | | $21,392 | | | | $41 | | $— |
| | | | | | | | | | | | | | | | | | |
Amounts designated as “—” are either $0 or have been rounded to $0.
The accompanying notes are an integral part of the financial statements.
| | |
12 | | SEI Institutional Investments Trust / Semi-Annual Report / November 30, 2020 |
SUMMARY SCHEDULE OF INVESTMENTS (Unaudited)
November 30, 2020
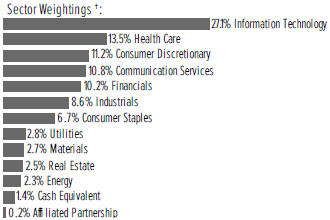
S&P 500 Index Fund
†Percentages are based on total investments. Includes investments held as collateral for securities held on loan (see Note 12).
| | | | | | | | | | | | |
| | | | |
| Description | | Percentage of
Net Assets (%) | | Shares | | Market Value
($ Thousands) |
|
COMMON STOCK — 98.3% | |
|
Communication Services — 10.8% | |
Alphabet Inc, Cl A* | | | 1.7% | | | | 54,641 | | | $ | 95,862 | |
Alphabet Inc, Cl C* | | | 1.7 | | | | 53,363 | | | | 93,958 | |
AT&T Inc | | | 0.7 | | | | 1,292,791 | | | | 37,168 | |
Comcast Corp, Cl A | | | 0.7 | | | | 827,248 | | | | 41,561 | |
Facebook Inc, Cl A* | | | 2.2 | | | | 436,978 | | | | 121,030 | |
Netflix Inc* | | | 0.7 | | | | 79,979 | | | | 39,246 | |
Verizon Communications Inc | | | 0.8 | | | | 751,052 | | | | 45,371 | |
Walt Disney Co/The* | | | 0.9 | | | | 328,019 | | | | 48,550 | |
Other Securities (A) | | | 1.4 | | | | | | | | 79,145 | |
| | | | | | | | | | | | |
| | | | | | | | | | | 601,891 | |
| | | | | | | | | | | | |
|
Consumer Discretionary — 11.1% | |
Amazon.com Inc* | | | 4.4 | | | | 77,360 | | | | 245,080 | |
Home Depot Inc/The | | | 1.0 | | | | 195,387 | | | | 54,202 | |
McDonald’s Corp | | | 0.5 | | | | 134,887 | | | | 29,330 | |
NIKE Inc, Cl B | | | 0.5 | | | | 226,582 | | | | 30,521 | |
Other Securities (A) | | | 4.7 | | | | | | | | 259,668 | |
| | | | | | | | | | | | |
| | | | | | | | | | | 618,801 | |
| | | | | | | | | | | | |
Consumer Staples — 6.7% | |
Coca-Cola Co/The | | | 0.7 | | | | 701,457 | | | | 36,195 | |
Costco Wholesale Corp | | | 0.6 | | | | 80,300 | | | | 31,459 | |
PepsiCo Inc | | | 0.6 | | | | 251,278 | | | | 36,242 | |
Procter & Gamble Co/The | | | 1.1 | | | | 452,667 | | | | 62,862 | |
Walmart Inc | | | 0.7 | | | | 251,983 | | | | 38,501 | |
Other Securities (A) | | | 3.0 | | | | | | | | 164,914 | |
| | | | | | | | | | | | |
| | | | | | | | | | | 370,173 | |
| | | | | | | | | | | | |
| | | |
Energy — 2.3% | | | | | | | | | | | | |
Chevron Corp | | | 0.6 | | | | 348,901 | | | | 30,417 | |
Exxon Mobil Corp | | | 0.5 | | | | 766,300 | | | | 29,219 | |
Other Securities | | | 1.2 | | | | | | | | 66,173 | |
| | | | | | | | | | | | |
| | | | | | | | | | | 125,809 | |
| | | | | | | | | | | | |
|
Financials — 10.2% | |
Bank of America Corp | | | 0.7 | | | | 1,383,483 | | | | 38,959 | |
Berkshire Hathaway Inc, Cl B* | | | 1.5 | | | | 360,328 | | | | 82,483 | |
| | | | | | | | | | | | |
| | | | |
| Description | | Percentage of
Net Assets (%) | | Shares | | Market Value
($ Thousands) |
|
COMMON STOCK (continued) | |
JPMorgan Chase & Co | | | 1.2% | | | | 554,057 | | | $ | 65,312 | |
Other Securities | | | 6.8 | | | | | | | | 381,379 | |
| | | | | | | | | | | | |
| | | | | | | | | | | 568,133 | |
| | | | | | | | | | | | |
Health Care — 13.4% | |
Abbott Laboratories | | | 0.6 | | | | 321,248 | | | | 34,766 | |
AbbVie Inc | | | 0.6 | | | | 319,913 | | | | 33,456 | |
Amgen Inc | | | 0.4 | | | | 106,691 | | | | 23,690 | |
Bristol-Myers Squibb Co | | | 0.5 | | | | 408,370 | | | | 25,482 | |
Danaher Corp | | | 0.5 | | | | 114,400 | | | | 25,698 | |
Johnson & Johnson | | | 1.2 | | | | 478,670 | | | | 69,254 | |
Medtronic PLC | | | 0.5 | | | | 243,561 | | | | 27,693 | |
Merck & Co Inc | | | 0.7 | | | | 458,970 | | | | 36,897 | |
Pfizer Inc | | | 0.7 | | | | 1,008,235 | | | | 38,625 | |
Thermo Fisher Scientific Inc | | | 0.6 | | | | 71,791 | | | | 33,381 | |
UnitedHealth Group Inc | | | 1.0 | | | | 172,487 | | | | 58,014 | |
Other Securities | | | 6.1 | | | | | | | | 339,357 | |
| | | | | | | | | | | | |
| | | | | | | | | | | 746,313 | |
| | | | | | | | | | | | |
|
Industrials — 8.6% | |
Honeywell International Inc | | | 0.5 | | | | 127,787 | | | | 26,058 | |
Union Pacific Corp | | | 0.5 | | | | 122,987 | | | | 25,099 | |
Other Securities (A) | | | 7.6 | | | | | | | | 426,358 | |
| | | | | | | | | | | | |
| | | | | | | | | | | 477,515 | |
| | | | | | | | | | | | |
Information Technology — 27.1% | |
Accenture PLC, Cl A | | | 0.5 | | | | 115,296 | | | | 28,719 | |
Adobe Inc* | | | 0.8 | | | | 87,095 | | | | 41,672 | |
Apple Inc | | | 6.3 | | | | 2,920,984 | | | | 347,743 | |
Broadcom Inc | | | 0.5 | | | | 73,159 | | | | 29,379 | |
Cisco Systems Inc | | | 0.6 | | | | 767,343 | | | | 33,011 | |
Intel Corp | | | 0.7 | | | | 771,652 | | | | 37,309 | |
Mastercard Inc, Cl A | | | 1.0 | | | | 160,347 | | | | 53,958 | |
Microsoft Corp | | | 5.3 | | | | 1,375,004 | | | | 294,347 | |
NVIDIA Corp | | | 1.1 | | | | 111,983 | | | | 60,030 | |
PayPal Holdings Inc* | | | 0.8 | | | | 212,883 | | | | 45,583 | |
QUALCOMM Inc | | | 0.5 | | | | 204,478 | | | | 30,093 | |
salesforce.com Inc* | | | 0.7 | | | | 165,191 | | | | 40,604 | |
Texas Instruments Inc | | | 0.5 | | | | 165,983 | | | | 26,765 | |
Visa Inc, Cl A | | | 1.2 | | | | 306,570 | | | | 64,487 | |
Other Securities | | | 6.6 | | | | | | | | 371,144 | |
| | | | | | | | | | | | |
| | | | | | | | | | | 1,504,844 | |
| | | | | | | | | | | | |
|
Materials — 2.7% | |
Linde PLC | | | 0.5 | | | | 95,660 | | | | 24,529 | |
Other Securities (A) | | | 2.2 | | | | | | | | 123,079 | |
| | | | | | | | | | | | |
| | | | | | | | | | | 147,608 | |
| | | | | | | | | | | | |
|
Real Estate — 2.5% | |
OtherSecurities ‡(A) | | | 2.5 | | | | | | | | 138,082 | |
| | | | | | | | | | | | |
| | |
SEI Institutional Investments Trust / Semi-Annual Report / November 30, 2020 | | 13 |
SUMMARY SCHEDULE OF INVESTMENTS (Unaudited)
November 30, 2020
S&P 500 Index Fund (Concluded)
| | | | | | | | | | | | |
| | | | |
| Description | | Percentage of
Net Assets (%) | | Shares | | Market Value
($ Thousands) |
|
COMMON STOCK (continued) | |
|
Utilities — 2.9% | |
NextEra Energy Inc | | | 0.5% | | | | 354,900 | | | $ | 26,117 | |
Other Securities | | | 2.4 | | | | | | | | 132,053 | |
| | | | | | | | | | | | |
| | | | | | | | | | | 158,170 | |
| | | | | | | | | | | | |
Total Common Stock | | | | | | | | | |
(Cost $3,070,259) ($ Thousands) | | | | 5,457,339 | |
| | | | | | | | | | | | |
|
AFFILIATED PARTNERSHIP — 0.2% | |
SEI Liquidity Fund, L.P. 0.070% **†(B) | | | 0.2 | | | | 13,811,270 | | | | 13,806 | |
| | | | | | | | | | | | |
| |
Total Affiliated Partnership | | | | | |
(Cost $13,810) ($ Thousands) | | | | 13,806 | |
| | | | | | | | | | | | |
| | | | | | | | | | | | |
| | | | |
| Description | | Percentage of
Net Assets (%) | | Shares | | Market Value
($ Thousands) |
|
CASH EQUIVALENT — 1.4% | |
SEI Daily Income Trust, Government Fund, Cl F 0.010% **† | | | 1.4% | | | | 75,326,229 | | | $ | 75,326 | |
| | | | | | | | | | | | |
| | |
Total Cash Equivalent | | | | | | | | | |
(Cost $75,326) ($ Thousands) | | | | 75,326 | |
| | | | | | | | | | | | |
| |
Total Investments in Securities — 99.9% | | | | | |
(Cost $3,159,395) ($ Thousands) | | | $ | 5,546,471 | |
| | | | | | | | | | | | |
A list of the open futures contracts held by the Fund at November 30, 2020, is as follows:
| | | | | | | | | | | | | | | | |
| | | | | | |
Type of
Contract | | Number of
Contracts
Long | | Expiration
Date | | Notional Amount
(Thousands) | | | Value
(Thousands) | | | Unrealized
Appreciation
(Thousands) | |
S&P 500 Index E-MINI | | 535 | | Dec-2020 | | $ | 88,452 | | | $ | 96,921 | | | $ | 8,469 | |
| | | | | | | | |
Percentages are based on a Net Assets of $5,551,784 ($ Thousands).
| * | Non-income producing security. |
| ** | The rate reported is the 7-day effective yield as of November 30, 2020. |
| ‡ | Real Estate Investment Trust. |
| † | Investment in Affiliated Security (see Note 6). |
| (A) | Certain securities or partial positions of certain securities are on loan at November 30, 2020 (see Note 12). The total market value of securities on loan at November 30, 2020, was $13,405 ($ Thousands). |
| (B) | This security was purchased with cash collateral held from securities on loan (see Note 12). The total market value of such securities as of November 30, 2020 was $13,806 ($ Thousands). |
Cl — Class
L.P. — Limited Partnership
PLC — Public Limited Company
S&P — Standard & Poor’s
The Summary Schedule of Investments does not reflect the complete portfolio holdings. It includes the Fund’s 50 largest holdings and each investment of any issuer that exceeds 1% of the Fund’s net assets. “Other Securities” represent all issues not required to be disclosed under the rules adopted by the U.S. Securities and Exchange Commission (“SEC”). In certain instances, securities for which footnotes listed above may otherwise apply are included in the Other Securities caption. The complete schedule of portfolio holdings is available (i) without charge, upon request, by calling (800) 342-5734; and (ii) on the SEC’s website at http://www.sec.gov.
The following is a list of the level of inputs used as of November 30, 2020, in valuing the Fund’s investments and other financial instruments carried at value ($ Thousands):
| | | | | | | | | | | | | | | | |
| | | | | |
| Investments in Securities | | Level 1
($) | | Level 2
($) | | Level 3
($) | | Total
($) |
Common Stock | | | 5,457,339 | | | | – | | | | – | | | | 5,457,339 | |
Affiliated Partnership | | | – | | | | 13,806 | | | | – | | | | 13,806 | |
Cash Equivalent | | | 75,326 | | | | – | | | | – | | | | 75,326 | |
| | | | | | | | | | | | | | | | |
Total Investments in Securities | | | 5,532,665 | | | | 13,806 | | | | – | | | | 5,546,471 | |
| | | | | | | | | | | | | | | | |
| | | | | | | | | | | | | | | | |
| | | | | |
| Other Financial Instruments | | Level 1
($) | | Level 2
($) | | Level 3
($) | | Total
($) |
Futures Contracts* | | | | | | | | | | | | | | | | |
Unrealized Appreciation | | | 8,469 | | | | – | | | | – | | | | 8,469 | |
| | | | | | | | | | | | | | | | |
Total Other Financial Instruments | | | 8,469 | | | | – | | | | – | | | | 8,469 | |
| | | | | | | | | | | | | | | | |
* Futures contracts are valued at the unrealized appreciation on the instrument.
For the period ended November 30, 2020, there were no transfers in or out of Level 3.
For more information on valuation inputs, see Note 2 — Significant Accounting Policies in Notes to Financial Statements.
| | |
14 | | SEI Institutional Investments Trust / Semi-Annual Report / November 30, 2020 |
The following is a summary of the Fund’s transactions with affiliates for the period ended November 30, 2020 ($ Thousands):
| | | | | | | | | | | | | | | | | | |
| | | | | | | | | | |
| Security Description | | Value 5/31/2020 | | Purchases at Cost | | Proceeds
from Sales | | Realized
Gain/ (Loss) | | Change in
Unrealized
Appreciation/
(Depreciation) | | Value
11/30/2020 | | Shares | | Income | | Capital Gains |
SEI Liquidity Fund, L.P. | | $ 49,600 | | $ 96,031 | | $(131,818) | | $12 | | $(19) | | $13,806 | | 13,811,270 | | $50 | | $— |
SEI Daily Income Trust, Government Fund, Cl F | | 66,287 | | 550,211 | | (541,172) | | — | | — | | 75,326 | | 75,326,229 | | 7 | | — |
| | | | | | | | | | | | | | | | | | |
Totals | | $115,887 | | $646,242 | | $(672,990) | | $12 | | $(19) | | $89,132 | | | | $57 | | $— |
| | | | | | | | | | | | | | | | | | |
Amounts designated as “—” are either $0 or have been rounded to $0.
The accompanying notes are an integral part of the financial statements.
| | |
SEI Institutional Investments Trust / Semi-Annual Report / November 30, 2020 | | 15 |
SUMMARY SCHEDULE OF INVESTMENTS (Unaudited)
November 30, 2020
Extended Market Index Fund

†Percentages are based on total investments. Includes investments held as collateral for securities held on loan (see Note 12).
| | | | | | | | | | | | |
| | | | |
| Description | | Percentage of
Net Assets (%) | | Shares | | Market Value
($ Thousands) |
|
COMMON STOCK — 99.4% | |
|
Communication Services — 4.6% | |
Liberty Broadband Corp, Cl A * | | | 0.1% | | | | 6,783 | | | $ | 1,063 | |
Liberty Broadband Corp, Cl C * | | | 0.3 | | | | 25,868 | | | | 4,070 | |
Liberty Media Corp-Liberty Braves, Cl A * | | | 0.0 | | | | 1,803 | | | | 45 | |
Liberty Media Corp-Liberty Braves, Cl C * | | | 0.0 | | | | 10,465 | | | | 262 | |
Liberty Media Corp-Liberty Formula One, Cl A * | | | 0.0 | | | | 7,308 | | | | 276 | |
Liberty Media Corp-Liberty Formula One, Cl C * | | | 0.1 | | | | 47,242 | | | | 1,974 | |
Liberty Media Corp-Liberty SiriusXM, Cl A * | | | 0.1 | | | | 19,835 | | | | 812 | |
Liberty Media Corp-Liberty SiriusXM, Cl C * | | | 0.1 | | | | 45,422 | | | | 1,863 | |
Match Group Inc* | | | 0.5 | | | | 54,636 | | | | 7,606 | |
Roku Inc, Cl A * | | | 0.5 | | | | 26,400 | | | | 7,750 | |
Sirius XM Holdings Inc (A) | | | 0.1 | | | | 280,381 | | | | 1,820 | |
Spotify Technology SA * | | | 0.6 | | | | 32,800 | | | | 9,557 | |
Zillow Group Inc, Cl A * | | | 0.1 | | | | 15,191 | | | | 1,676 | |
Zillow Group Inc, Cl C * | | | 0.2 | | | | 34,482 | | | | 3,717 | |
Other Securities (A) | | | 1.9 | | | | | | | | 32,252 | |
| | | | | | | | | | | | |
| | | | | | | | | | | 74,743 | |
| | | | | | | | | | | | |
|
Consumer Discretionary — 16.8% | |
Burlington Stores Inc* | | | 0.2 | | | | 16,000 | | | | 3,497 | |
Lululemon Athletica Inc* | | | 0.6 | | | | 28,000 | | | | 10,366 | |
Pinterest Inc, Cl A * | | | 0.4 | | | | 100,400 | | | | 7,030 | |
Tesla Inc* | | | 6.4 | | | | 183,495 | | | | 104,152 | |
Wayfair Inc, Cl A *(A) | | | 0.3 | | | | 16,200 | | | | 4,121 | |
Yum China Holdings Inc | | | 0.4 | | | | 99,100 | | | | 5,587 | |
Other Securities (A) | | | 8.5 | | | | | | | | 138,501 | |
| | | | | | | | | | | | |
| | | | | | | | | | | 273,254 | |
| | | | | | | | | | | | |
|
Consumer Staples — 2.6% | |
Other Securities (A) | | | 2.6 | | | | | | | | 43,230 | |
| | | | | | | | | | | | |
| | | | | | | | | | | | |
| | | | |
| Description | | Percentage of
Net Assets (%) | | Shares | | Market Value
($ Thousands) |
|
COMMON STOCK (continued) | |
|
Energy — 1.7% | |
Other Securities (A) | | | 1.7% | | | | | | | $ | 27,703 | |
| | | | | | | | | | | | |
|
Financials — 11.4% | |
KKR & Co Inc | | | 0.3 | | | | 131,500 | | | | 4,988 | |
KKR Real Estate Finance Trust Inc‡ | | | 0.0 | | | | 5,800 | | | | 106 | |
SEI Investments Co.† | | | 0.1 | | | | 30,319 | | | | 1,599 | |
Other Securities ‡(A)(B) | | | 11.0 | | | | | | | | 178,418 | |
| | | | | | | | | | | | |
| | | | | | | | | | | 185,111 | |
| | | | | | | | | | | | |
Health Care — 15.0% | |
Alnylam Pharmaceuticals Inc* | | | 0.2 | | | | 27,989 | | | | 3,636 | |
Exact Sciences Corp * | | | 0.3 | | | | 37,180 | | | | 4,501 | |
Insulet Corp * | | | 0.3 | | | | 16,121 | | | | 4,155 | |
Moderna Inc *(A) | | | 0.7 | | | | 71,200 | | | | 10,875 | |
Seagen Inc* | | | 0.3 | | | | 30,000 | | | | 5,109 | |
Teladoc Health Inc *(A) | | | 0.3 | | | | 25,424 | | | | 5,054 | |
Veeva Systems Inc, Cl A * | | | 0.6 | | | | 32,900 | | | | 9,109 | |
Other Securities (A) | | | 12.3 | | | | | | | | 200,154 | |
| | | | | | | | | | | | |
| | | | | | | | | | | 242,593 | |
| | | | | | | | | | | | |
|
Industrials — 12.1% | |
CoStar Group Inc* | | | 0.6 | | | | 9,763 | | | | 8,890 | |
HEICO Corp | | | 0.1 | | | | 11,818 | | | | 1,460 | |
HEICO Corp, Cl A | | | 0.1 | | | | 18,582 | | | | 2,058 | |
TransUnion | | | 0.3 | | | | 46,800 | | | | 4,263 | |
Uber Technologies Inc* | | | 1.1 | | | | 343,800 | | | | 17,073 | |
Other Securities (A) | | | 9.9 | | | | | | | | 163,264 | |
| | | | | | | | | | | | |
| | | | | | | | | | | 197,008 | |
| | | | | | | | | | | | |
|
Information Technology — 23.4% | |
Atlassian Corp PLC, Cl A * | | | 0.4 | | | | 31,800 | | | | 7,157 | |
Coupa Software Inc* | | | 0.3 | | | | 16,400 | | | | 5,394 | |
Crowdstrike Holdings Inc, Cl A * | | | 0.3 | | | | 37,500 | | | | 5,748 | |
Datadog Inc, Cl A * | | | 0.2 | | | | 38,000 | | | | 3,759 | |
Dell Technologies Inc, Cl C * | | | 0.3 | | | | 61,972 | | | | 4,278 | |
DocuSign Inc, Cl A * | | | 0.6 | | | | 44,000 | | | | 10,027 | |
Enphase Energy Inc* | | | 0.2 | | | | 26,500 | | | | 3,619 | |
EPAM Systems Inc* | | | 0.3 | | | | 13,100 | | | | 4,223 | |
HubSpot Inc* | | | 0.3 | | | | 10,200 | | | | 4,022 | |
Marvell Technology Group Ltd | | | 0.5 | | | | 163,357 | | | | 7,562 | |
MongoDB Inc, Cl A *(A) | | | 0.2 | | | | 12,300 | | | | 3,534 | |
Okta Inc, Cl A * | | | 0.4 | | | | 28,500 | | | | 6,984 | |
Palo Alto Networks Inc* | | | 0.4 | | | | 23,633 | | | | 6,946 | |
RingCentral Inc, Cl A * | | | 0.4 | | | | 19,200 | | | | 5,703 | |
Slack Technologies Inc, Cl A *(A) | | | 0.3 | | | | 93,100 | | | | 3,992 | |
Splunk Inc* | | | 0.5 | | | | 39,884 | | | | 8,144 | |
Square Inc, Cl A * | | | 1.2 | | | | 91,300 | | | | 19,261 | |
SS&C Technologies Holdings Inc | | | 0.2 | | | | 55,218 | | | | 3,804 | |
Trade Desk Inc/The, Cl A * | | | 0.6 | | | | 10,300 | | | | 9,281 | |
Trimble Inc* | | | 0.2 | | | | 61,820 | | | | 3,701 | |
Twilio Inc, Cl A * | | | 0.7 | | | | 33,816 | | | | 10,824 | |
Workday Inc, Cl A * | | | 0.6 | | | | 42,289 | | | | 9,506 | |
Zendesk Inc* | | | 0.2 | | | | 28,300 | | | | 3,778 | |
| | |
16 | | SEI Institutional Investments Trust / Semi-Annual Report / November 30, 2020 |
| | | | | | | | | | | | |
| | | | |
| Description | | Percentage of
Net Assets
(%) | | Shares | | Market Value
($ Thousands) |
COMMON STOCK (continued) | |
Zoom Video Communications Inc, Cl A * | | | 1.2% | | | | 41,300 | | | $ | 19,756 | |
Other Securities (A) | | | 12.9 | | | | | | | | 210,150 | |
| | | | | | | | | | | | |
| | | | | | | | | | | 381,153 | |
| | | | | | | | | | | | |
|
Materials — 3.4% | |
Other Securities (A) | | | 3.4 | | | | | | | | 55,245 | |
| | | | | | | | | | | | |
|
Real Estate — 6.3% | |
Invitation Homes Inc ‡ | | | 0.3 | | | | 137,981 | | | | 3,944 | |
Other Securities ‡(A) | | | 6.0 | | | | | | | | 99,857 | |
| | | | | | | | | | | | |
| | | | | | | | | | | 103,801 | |
| | | | | | | | | | | | |
|
Utilities — 2.1% | |
PG&E Corp * | | | 0.3 | | | | 318,700 | | | | 4,047 | |
Other Securities (A) | | | 1.8 | | | | | | | | 29,673 | |
| | | | | | | | | | | | |
| | | | | | | | | | | 33,720 | |
| | | | | | | | | | | | |
| |
Total Common Stock | | | | | |
(Cost $1,024,802) ($ Thousands) | | | | 1,617,561 | |
| | | | | | | | | | | | |
|
RIGHTS* — 0.0% | |
Other Securities(C)# | | | 0.0 | | | | | | | | 5 | |
| | | | | | | | | | | | |
| | |
Total Rights | | | | | | | | | |
(Cost $3) ($ Thousands) | | | | | | | | 5 | |
| | | | | | | | | | | | |
| | | | | | | | | | | | |
| | | | |
| Description | | Percentage of
Net Assets
(%) | | Shares | | Market Value
($ Thousands) |
|
WARRANTS * — 0.0% | |
Other Securities | | | 0.0% | | | | | | | $ | – | |
| | | | | | | | | | | | |
Total Warrants | | | | | | | | | | | | |
(Cost $–) ($ Thousands) | | | | | | | | – | |
| | | | | | | | | | | | |
|
AFFILIATED PARTNERSHIP — 7.9% | |
SEI Liquidity Fund, L.P. 0.070% **†(D) | | | 7.9 | | | | 129,101,211 | | | | 129,129 | |
| | | | | | | | | | | | |
Total Affiliated Partnership | | | | | |
(Cost $129,102) ($ Thousands) | | | | 129,129 | |
| | | | | | | | | | | | |
|
CASH EQUIVALENT — 0.0% | |
SEI Daily Income Trust, Government Fund, Cl F 0.010% **† | | | 0.0 | | | | 363,054 | | | | 363 | |
| | | | | | | | | | | | |
| | |
Total Cash Equivalent | | | | | | | | | |
(Cost $363) ($ Thousands) | | | | 336 | |
| | | | | | | | | | | | |
| |
Total Investments in Securities — 107.3% | | | | | |
(Cost $1,154,270) ($ Thousands) | | | $ | 1,747,058 | |
| | | | | | | | | | | | |
A list of the open futures contracts held by the Fund at November 30, 2020 is as follows:
| | | | | | | | | | | | | | | | | | | | |
| | | | | | |
| Type of Contract | | Number of
Contracts
Long | | | Expiration
Date | | | Notional
Amount
(Thousands) | | | Value
(Thousands) | | | Unrealized
Appreciation
(Thousands) | |
Russell 2000 Index E-MINI | | | 76 | | | | Dec-2020 | | | $ | 5,624 | | | $ | 6,916 | | | $ | 1,292 | |
S&P Mid Cap 400 Index E-MINI | | | 27 | | | | Dec-2020 | | | | 4,896 | | | | 5,855 | | | | 959 | |
| | | | | | | | | | | | |
| | | | | | | | | | $ | 10,520 | | | $ | 12,771 | | | $ | 2,251 | |
| | | | | | | | | | | | |
Percentages are based on a Net Assets of $1,628,378 ($ Thousands).
| * | Non-income producing security. |
| ** | The rate reported is the 7-day effective yield as of November 30, 2020. |
| ‡ | Real Estate Investment Trust. |
| † | Investment in Affiliated Security (see Note 6). |
| # | Expiration date not available. |
| (A) | Certain securities or partial positions of certain securities are on loan at November 30, 2020 (see Note 12). The total market value of securities on loan at November 30, 2020, was $126,421 ($ Thousands). |
| (B) | Security is a Master Limited Partnership. At November 30, 2020, such securities amounted to $901 ($ Thousands), or 0.1% of Net Assets of the Fund (see Note 2). |
| (C) | Level 3 security in accordance with fair value hierarchy. |
| (D) | This security was purchased with cash collateral held from securities on loan (see Note 12). The total market value of such securities as of November 30, 2020 was $129,129 ($ Thousands). |
Cl — Class
PLC — Public Limited Company
L.P.— Limited Partnership
S&P— Standard & Poor’s
The Summary Schedule of Investments does not reflect the complete portfolio holdings. It includes the Fund’s 50 largest holdings and each investment of any issuer that exceeds 1% of the Fund’s net assets. “Other Securities” represent all issues not required to be disclosed under the rules adopted by the U.S. Securities and Exchange Commission (“SEC”). In certain instances, securities for which footnotes listed above may otherwise apply are included in the Other Securities caption. The complete schedule of portfolio holdings is available (i) without charge, upon request, by calling (800) 342-5734; and (ii) on the SEC’s website at http://www.sec.gov.
| | |
SEI Institutional Investments Trust / Semi-Annual Report / November 30, 2020 | | 17 |
SUMMARY SCHEDULE OF INVESTMENTS (Unaudited)
November 30, 2020
Extended Market Index Fund (Concluded)
The following is a list of the level of inputs used as of November 30, 2020, in valuing the Fund’s investments and other financial instruments carried at value ($ Thousands):
| | | | | | | | | | | | | | | | |
| | | | | |
| Investments in Securities | | Level 1
($) | | | Level 2
($) | | | Level 3
($)(1) | | | Total
($) | |
Common Stock | | | 1,617,561 | | | | – | | | | – | | | | 1,617,561 | |
Rights | | | 3 | | | | – | | | | 2 | | | | 5 | |
Warrants | | | – | | | | – | | | | – | | | | – | |
Affiliated Partnership | | | – | | | | 129,129 | | | | – | | | | 129,129 | |
Cash Equivalent | | | 363 | | | | – | | | | – | | | | 363 | |
| | | | | | | | | | | | | | | | |
Total Investments in Securities | | | 1,617,927 | | | | 129,129 | | | | 2 | | | | 1,747,058 | |
| | | | | | | | | | | | | | | | |
| | | | | | | | | | | | | | | | |
| | | | | |
| Other Financial Instruments | | Level 1
($) | | | Level 2
($) | | | Level 3
($) | | | Total
($) | |
Futures Contracts* | | | | | | | | | | | | | | | | |
Unrealized Appreciation | | | 2,251 | | | | – | | | | – | | | | 2,251 | |
| | | | | | | | | | | | | | | | |
Total Other Financial Instruments | | | 2,251 | | | | – | | | | – | | | | 2,251 | |
| | | | | | | | | | | | | | | | |
(1) A reconciliation of Level 3 instruments is presented when the Fund has a significant amount of Level 3 investments at the beginning and/or end of the period in relation to the net assets. Management has concluded that Level 3 investments are not material in relation to net assets.
* Futures contracts are valued at the unrealized appreciation on the instrument.
For the period ended November 30, 2020, there were no transfers in or out of Level 3.
For more information on valuation inputs, see Note 2 — Significant Accounting Policies in Notes to Financial Statements.
The following is a summary of the Fund’s transactions with affiliates for the period ended November 30, 2020 ($ Thousands):
| | | | | | | | | | | | | | | | | | |
| | | | | | | | | | |
| Security Description | | Value
5/31/2020 | | Purchases
at Cost | | Proceeds
from Sales | | Realized
Gain/ (Loss) | | Change in
Unrealized
Appreciation/
(Depreciation) | | Value
11/30/2020 | | Shares | | Income | | Capital Gains |
SEI Investments Co | | $ 1,828 | | $ 140 | | $ (328) | | $ (20) | | $ (21) | | $ 1,599 | | 30,319 | | $ 12 | | $ — |
SEI Liquidity Fund, L.P. | | 155,062 | | 294,693 | | (320,576) | | (4) | | (46) | | 129,129 | | 129,101,211 | | 495 | | — |
SEI Daily Income Trust, Government Fund, Cl F | | — | | 123,257 | | (122,894) | | — | | — | | 363 | | 363,054 | | 1 | | — |
| | | | | | | | | | | | | | | | | | |
Totals | | $ 156,890 | | $ 418,090 | | $ (443,798) | | $ (24) | | $ (67) | | $ 131,091 | | | | $ 508 | | $ — |
| | | | | | | | | | | | | | | | | | |
Amounts designated as “—” are either $0 or have been rounded to $0.
The accompanying notes are an integral part of the financial statements.
| | |
18 | | SEI Institutional Investments Trust / Semi-Annual Report / November 30, 2020 |
SUMMARY SCHEDULE OF INVESTMENTS (Unaudited)
November 30, 2020
Small Cap Fund
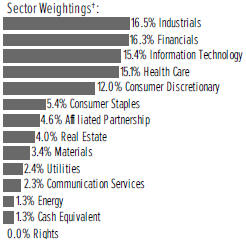
†Percentages are based on total investments. Includes investments held as collateral for securities held on loan (see Note 12).
| | | | | | | | | | | | |
| | | | |
| Description | | Percentage of
Net Assets (%) | | Shares | | Market Value
($ Thousands) |
|
COMMON STOCK — 98.9% | |
|
Communication Services — 2.4% | |
Other Securities (A) | | | 2.4 | % | | | | | | $ | 6,622 | |
| | | | | | | | | | | | |
|
Consumer Discretionary — 12.6% | |
Ethan Allen Interiors Inc | | | 0.3 | | | | 47,440 | | | | 867 | |
Green Brick Partners Inc* | | | 0.3 | | | | 36,741 | | | | 800 | |
Group 1 Automotive Inc (A) | | | 0.3 | | | | 7,618 | | | | 905 | |
Haverty Furniture Cos Inc (A) | | | 0.4 | | | | 38,906 | | | | 1,059 | |
Hibbett Sports Inc* | | | 0.3 | | | | 19,315 | | | | 795 | |
TopBuild Corp * | | | 0.7 | | | | 10,825 | | | | 1,886 | |
Williams-Sonoma Inc | | | 0.3 | | | | 7,404 | | | | 811 | |
Wingstop Inc | | | 0.5 | | | | 10,450 | | | | 1,330 | |
Other Securities (A)(B) | | | 9.5 | | | | | | | | 26,682 | |
| | | | | | | | | | | | |
| | | | | | | | | | | 35,135 | |
| | | | | | | | | | | | |
|
Consumer Staples — 5.7% | |
Freshpet Inc* | | | 0.9 | | | | 18,137 | | | | 2,483 | |
WD-40 Co | | | 0.3 | | | | 3,461 | | | | 880 | |
Other Securities (A) | | | 4.5 | | | | | | | | 12,605 | |
| | | | | | | | | | | | |
| | | | | | | | | | | 15,968 | |
| | | | | | | | | | | | |
|
Energy — 1.3% | |
Other Securities (A) | | | 1.3 | | | | | | | | 3,747 | |
| | | | | | | | | | | | |
|
Financials — 17.2% | |
CNO Financial Group Inc | | | 0.4 | | | | 57,500 | | | | 1,224 | |
CryoPort Inc *(A) | | | 0.3 | | | | 16,595 | | | | 807 | |
First Horizon Corp | | | 0.4 | | | | 79,500 | | | | 972 | |
Hamilton Lane Inc, Cl A | | | 0.5 | | | | 20,575 | | | | 1,438 | |
Hanover Insurance Group Inc/ The | | | 0.3 | | | | 7,500 | | | | 843 | |
Kinsale Capital Group Inc | | | 0.6 | | | | 7,356 | | | | 1,767 | |
Synovus Financial Corp | | | 0.4 | | | | 33,400 | | | | 1,054 | |
Walker & Dunlop Inc | | | 0.3 | | | | 10,400 | | | | 832 | |
Other Securities ‡(A) | | | 14.0 | | | | | | | | 39,037 | |
| | | | | | | | | | | | |
| | | | | | | | | | | 47,974 | |
| | | | | | | | | | | | |
| | | | | | | | | | | | |
| | | | |
| Description | | Percentage of
Net Assets (%) | | Shares | | Market Value
($ Thousands) |
|
COMMON STOCK (continued) | |
|
Health Care — 15.8% | |
Addus HomeCare Corp * | | | 0.4 | % | | | 11,100 | | | $ | 1,102 | |
Ensign Group Inc/The | | | 0.7 | | | | 28,501 | | | | 2,048 | |
Halozyme Therapeutics Inc* | | | 0.4 | | | | 27,893 | | | | 1,091 | |
Natera Inc* | | | 0.9 | | | | 27,523 | | | | 2,429 | |
Progyny Inc *(A) | | | 0.4 | | | | 29,759 | | | | 1,056 | |
Repligen Corp * | | | 0.9 | | | | 12,881 | | | | 2,443 | |
United Therapeutics Corp * | | | 0.3 | | | | 6,800 | | | | 902 | |
Other Securities (A) | | | 11.8 | | | | | | | | 33,166 | |
| | | | | | | | | | | | |
| | | | | | | | | | | 44,237 | |
| | | | | | | | | | | | |
Industrials — 17.4% | |
Air Transport Services Group Inc* | | | 0.7 | | | | 59,341 | | | | 1,824 | |
Altra Industrial Motion Corp | | | 0.6 | | | | 29,691 | | | | 1,685 | |
Builders FirstSource Inc* | | | 0.3 | | | | 24,965 | | | | 934 | |
CRA International Inc | | | 0.3 | | | | 18,352 | | | | 841 | |
Exponent Inc | | | 0.8 | | | | 27,495 | | | | 2,282 | |
Federal Signal Corp | | | 0.3 | | | | 27,320 | | | | 848 | |
Generac Holdings Inc* | | | 0.8 | | | | 10,143 | | | | 2,187 | |
MSA Safety Inc (A) | | | 0.4 | | | | 7,465 | | | | 1,116 | |
Trex Co Inc* | | | 0.8 | | | | 30,243 | | | | 2,263 | |
Triton International Ltd/Bermuda | | | 0.4 | | | | 22,602 | | | | 1,023 | |
Vertiv Holdings Co, Cl A | | | 0.5 | | | | 76,660 | | | | 1,434 | |
Other Securities (A) | | | 11.5 | | | | | | | | 32,020 | |
| | | | | | | | | | | | |
| | | | | | | | | | | 48,457 | |
| | | | | | | | | | | | |
|
Information Technology — 16.2% | |
Avalara Inc* | | | 0.8 | | | | 13,140 | | | | 2,257 | |
Brightcove Inc* | | | 0.3 | | | | 49,032 | | | | 819 | |
Littelfuse Inc | | | 0.5 | | | | 6,096 | | | | 1,466 | |
LivePerson Inc *(A) | | | 0.4 | | | | 19,035 | | | | 1,112 | |
Monolithic Power Systems Inc | | | 0.9 | | | | 7,587 | | | | 2,428 | |
Nova Measuring Instruments | | | | | | | | | | | | |
Ltd*(A) | | | 0.3 | | | | 14,705 | | | | 949 | |
Novanta Inc* | | | 0.4 | | | | 9,389 | | | | 1,126 | |
Silicon Laboratories Inc* | | | 0.4 | | | | 10,580 | | | | 1,240 | |
WNS Holdings Ltd ADR * | | | 0.4 | | | | 16,860 | | | | 1,187 | |
Other Securities (A) | | | 11.8 | | | | | | | | 32,555 | |
| | | | | | | | | | | | |
| | | | | | | | | | | 45,139 | |
| | | | | | | | | | | | |
|
Materials — 3.6% | |
Greif Inc, Cl A | | | 0.4 | | | | 21,600 | | | | 1,050 | |
Other Securities | | | 3.2 | | | | | | | | 9,049 | |
| | | | | | | | | | | | |
| | | | | | | | | | | 10,099 | |
| | | | | | | | | | | | |
|
Real Estate — 4.2% | |
Rexford Industrial Realty Inc ‡ | | | 0.4 | | | | 23,258 | | | | 1,114 | |
Other Securities ‡(A) | | | 3.8 | | | | | | | | 10,558 | |
| | | | | | | | | | | | |
| | | | | | | | | | | 11,672 | |
| | | | | | | | | | | | |
| | |
SEI Institutional Investments Trust / Semi-Annual Report / November 30, 2020 | | 19 |
SUMMARY SCHEDULE OF INVESTMENTS (Unaudited)
November 30, 2020
Small Cap Fund (Concluded)
| | | | | | | | | | | | |
| | | | |
| Description | | Percentage of
Net Assets (%) | | Shares | | Market Value
($ Thousands) |
|
COMMON STOCK (continued) | |
|
Utilities — 2.5% | |
National Fuel Gas Co | | | 0.4 | % | | | 24,500 | | | $ | 1,009 | |
Other Securities | | | 2.1 | | | | | | | | 6,071 | |
| | | | | | | | | | | | |
| | | | | | | | | | | 7,080 | |
| | | | | | | | | | | | |
| |
Total Common Stock
(Cost $235,408) ($ Thousands) | | | | 276,130 | |
| | | | | | | | | | | | |
|
RIGHTS — 0.0% | |
Other Securities* (B) | | | 0.0 | | | | | | | | — | |
| | | | | | | | | | | | |
| | |
Total Rights
(Cost $–) ($ Thousands) | | | | | | | | — | |
| | | | | | | | | | | | |
|
AFFILIATED PARTNERSHIP — 4.8% | |
SEI Liquidity Fund, L.P. 0.070% **† (C) | | | 4.8 | | | | 13,427,347 | | | | 13,430 | |
| | | | | | | | | | | | |
| | |
Total Affiliated Partnership (Cost $13,427) ($ Thousands) | | | | | | | | 13,430 | |
| | | | | | | | | | | | |
|
CASH EQUIVALENT — 1.3% | |
SEI Daily Income Trust, Government Fund, Cl F 0.010% **† | | | 1.3 | | | | 3,732,394 | | | | 3,732 | |
| | | | | | | | | | | | |
| | |
Total Cash Equivalent (Cost $3,732) ($ Thousands) | | | | | | | | 3,732 | |
| | | | | | | | | | | | |
| | |
Total Investments in Securities — 105.0%
(Cost $252,567) ($ Thousands) | | | | | | | $ | 293,292 | |
| | | | | | | | | | | | |
Percentages are based on Net Assets of $279,366 ($ Thousands).
| * | Non-income producing security. |
| ** | The rate reported is the 7-day effective yield as of November 30, 2020. |
| † | Investment in Affiliated Security (See Note 6). |
| ‡ | Real Estate Investment Trust. |
| (A) | Certain securities or partial positions of certain securities are on loan at November 30, 2020 (See Note 12). The total market value of securities on loan at November 30, 2020 was $12,914 ($ Thousands). |
| (B) | Level 3 security in accordance with fair value hierarchy. |
| (C) | This security was purchased with cash collateral held from securities on loan (See Note 12). The total market value of such securities as of November 30, 2020 was $13,430 ($ Thousands). |
ADR — American Depositary Receipt
Cl — Class
L.P. — Limited Partnership
Ltd. — Limited
The Summary Schedule of Investments does not reflect the complete portfolio holdings. It includes the Fund’s 50 largest holdings and each investment of any issuer that exceeds 1% of the Fund’s net assets. “Other Securities” represent all issues not required to be disclosed under the rules adopted by the U.S. Securities and Exchange Commission (“SEC”). In certain instances, securities for which footnotes listed above may otherwise apply are included in the Other Securities caption. The complete schedule of portfolio holdings is available (i) without charge, upon request, by calling (800) 342-5734; and (ii) on the SEC’s website at http://www.sec.gov.
The following is a list of the level of inputs used as of November 30, 2020, in valuing the Fund’s investments ($ Thousands):
| | | | | | | | | | | | | | | | |
| | | | | |
| Investments in Securities | | Level 1
($) | | Level 2
($) | | Level 3
($)(1) | | Total ($) |
Common Stock | | | 276,130 | | | | – | | | | – | | | | 276,130 | |
Rights | | | – | | | | – | | | | –^ | | | | –^ | |
Affiliated Partnership | | | – | | | | 13,430 | | | | – | | | | 13,430 | |
Cash Equivalent | | | 3,732 | | | | – | | | | – | | | | 3,732 | |
| | | | | | | | | | | | | | | | |
Total Investments in Securities | | | 279,862 | | | | 13,430 | | | | –^ | | | | 293,292 | |
| | | | | | | | | | | | | | | | |
(1) A reconciliation of Level 3 instruments is presented when the Fund has a significant amount of Level 3 investments at the beginning and/or end of the period in relation to net assets. Management has concluded that Level 3 investments are not material in relation to net assets.
^ Securities market value less than $500.
For the period ended November 30, 2020, there were no transfers in or out of Level 3.
For more information on valuation inputs, see Note 2 — Significant Accounting Policies in Notes to Financial Statements.
| | |
20 | | SEI Institutional Investments Trust / Semi-Annual Report / November 30, 2020 |
The following is a summary of the Fund’s transactions with affiliates for the period ended November 30, 2020 ($ Thousands):
| | | | | | | | | | | | | | | | | | |
| | | | | | | | | | |
| Security Description | | Value 5/31/2020 | | Purchases at Cost | | Proceeds from Sales | | Realized Gain/
(Loss) | | Change in
Unrealized
Appreciation/
(Depreciation) | | Value
11/30/2020 | | Shares | | Income | | Capital Gains |
SEI Liquidity Fund, L.P. | | $19,356 | | $ 34,288 | | $(40,209) | | $ — | | $(5) | | $ 13,430 | | 13,427,347 | | $ 62 | | $— |
SEI Daily Income Trust, Government Fund, Cl F | | 2,845 | | 35,903 | | (35,016) | | — | | — | | 3,732 | | 3,732,394 | | — | | — |
| | | | | | | | | | | | | | | | | | |
Totals | | $22,201 | | $ 70,191 | | $(75,225) | | $ — | | $(5) | | $ 17,162 | | | | $ 62 | | $— |
| | | | | | | | | | | | | | | | | | |
Amounts designated as “—” are either $0 or have been rounded to $0.
The accompanying notes are an integral part of the financial statements.
| | |
SEI Institutional Investments Trust / Semi-Annual Report / November 30, 2020 | | 21 |
SUMMARY SCHEDULE OF INVESTMENTS (Unaudited)
November 30, 2020
Small Cap II Fund
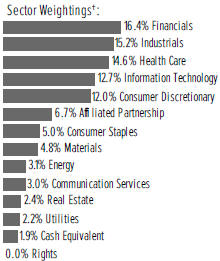
†Percentages are based on total investments. Includes investments held as collateral for securities held on loan (see Note 12).
| | | | | | | | | | | | |
| | | | |
| Description | | Percentage of
Net Assets (%) | | Shares | | Market Value
($ Thousands) |
|
COMMON STOCK — 98.1% | |
| | |
Communication Services — 3.2% | | | | | | | | | |
| | | | | | | | | | | | |
Cinemark Holdings Inc (A) | | | 0.4% | | | | 100,978 | | | $ | 1,560 | |
Lions Gate Entertainment Corp, Cl A * | | | 0.5 | | | | 197,222 | | | | 1,921 | |
Other Securities (A) | | | 2.3 | | | | | | | | 9,119 | |
| | | | | | | | | | | | |
| | | | | | | | | | | 12,600 | |
| | | | | | | | | | | | |
| | |
Consumer Discretionary — 12.9% | | | | | | | | | |
American Eagle Outfitters Inc (A) | | | 0.8 | | | | 176,250 | | | | 3,171 | |
Modine Manufacturing Co * | | | 0.9 | | | | 336,570 | | | | 3,675 | |
Norwegian Cruise Line Holdings Ltd*(A) | | | 0.3 | | | | 56,632 | | | | 1,295 | |
Urban Outfitters Inc* | | | 0.4 | | | | 51,751 | | | | 1,417 | |
Other Securities (A) | | | 10.5 | | | | | | | | 41,473 | |
| | | | | | | | | | | | |
| | | | | | | | | | | 51,031 | |
| | | | | | | | | | | | |
| | |
Consumer Staples — 5.4% | | | | | | | | | |
TreeHouse Foods Inc* | | | 0.4 | | | | 39,748 | | | | 1,635 | |
Other Securities (A) | | | 5.0 | | | | | | | | 19,699 | |
| | | | | | | | | | | | |
| | | | | | | | | | | 21,334 | |
| | | | | | | | | | | | |
| | |
Energy — 3.4% | | | | | | | | | |
Cimarex Energy Co | | | 0.5 | | | | 58,159 | | | | 2,091 | |
Delek US Holdings Inc | | | 0.5 | | | | 148,955 | | | | 1,980 | |
Murphy USA Inc | | | 0.5 | | | | 14,963 | | | | 1,918 | |
Other Securities (A) | | | 1.9 | | | | | | | | 7,330 | |
| | | | | | | | | | | | |
| | | | | | | | | | | 13,319 | |
| | | | | | | | | | | | |
| | |
Financials — 17.6% | | | | | | | | | |
Argo Group International | | | | | | | | | | | | |
Holdings Ltd | | | 0.6 | | | | 56,631 | | | | 2,219 | |
Bank of NT Butterfield & Son Ltd/The | | | 0.4 | | | | 46,218 | | | | 1,463 | |
BankUnited Inc | | | 1.1 | | | | 147,707 | | | | 4,211 | |
CNO Financial Group Inc | | | 0.9 | | | | 163,400 | | | | 3,477 | |
First Commonwealth Financial Corp | | | 0.4 | | | | 149,129 | | | | 1,442 | |
| | | | | | | | | | |
| | | | |
| Description | | Percentage of
Net Assets (%) | | Shares | | Market Value
($ Thousands) |
COMMON STOCK (continued) | | | | | | | | |
First Horizon Corp | | 1.4% | | | 450,950 | | | $ | 5,511 | |
FNB Corp/PA | | 1.1 | | | 470,832 | | | | 4,157 | |
Hanover Insurance Group Inc/The | | 0.4 | | | 12,987 | | | | 1,459 | |
Hercules Capital | | 0.3 | | | 96,786 | | | | 1,291 | |
Lincoln National Corp | | 0.7 | | | 57,340 | | | | 2,707 | |
MGIC Investment Corp | | 0.4 | | | 140,245 | | | | 1,677 | |
Pinnacle Financial Partners Inc | | 0.4 | | | 30,432 | | | | 1,648 | |
Sterling Bancorp/DE | | 0.4 | | | 101,446 | | | | 1,621 | |
TCF Financial Corp | | 0.9 | | | 102,028 | | | | 3,428 | |
Umpqua Holdings Corp | | 0.9 | | | 243,590 | | | | 3,383 | |
Western Alliance Bancorp | | 0.4 | | | 27,409 | | | | 1,405 | |
Other Securities ‡(A) | | 6.9 | | | | | | | 28,720 | |
| | | | | | | | | | |
| | | | | | | | | 69,819 | |
| | | | | | | | | | |
| | |
Health Care — 15.5% | | | | | | | | |
AMN Healthcare Services Inc* | | 0.5 | | | 33,071 | | | | 2,155 | |
Ensign Group Inc/The | | 0.5 | | | 28,077 | | | | 2,018 | |
Integra LifeSciences Holdings Corp* | | 0.6 | | | 43,232 | | | | 2,366 | |
Veracyte Inc* | | 0.3 | | | 24,458 | | | | 1,333 | |
Other Securities (A) | | 13.6 | | | | | | | 53,910 | |
| | | | | | | | | | |
| | | | | | | | | 61,782 | |
| | | | | | | | | | |
| | |
Industrials — 16.4% | | | | | | | | |
ABM Industries Inc | | 0.3 | | | 33,879 | | | | 1,304 | |
ACCO Brands Corp | | 0.5 | | | 276,834 | | | | 2,121 | |
Altra Industrial Motion Corp | | 0.5 | | | 32,377 | | | | 1,838 | |
BWX Technologies Inc | | 0.5 | | | 33,761 | | | | 1,920 | |
Clean Harbors Inc* | | 0.5 | | | 27,012 | | | | 1,955 | |
ITT Inc | | 0.4 | | | 20,639 | | | | 1,499 | |
JetBlue Airways Corp * | | 0.6 | | | 164,485 | | | | 2,482 | |
Masonite International Corp * | | 0.4 | | | 13,656 | | | | 1,366 | |
Regal Beloit Corp | | 0.4 | | | 13,378 | | | | 1,593 | |
Tetra Tech Inc | | 0.5 | | | 14,708 | | | | 1,754 | |
WESCO International Inc * | | 0.8 | | | 48,725 | | | | 3,178 | |
Other Securities (A) | | 11.0 | | | | | | | 43,694 | |
| | | | | | | | | | |
| | | | | | | | | 64,704 | |
| | | | | | | | | | |
| | |
Information Technology — 13.6% | | | | | | | | |
J2 Global Inc | | 0.6 | | | 28,698 | | | | 2,572 | |
ManTech International Corp/ VA, Cl A | | 0.4 | | | 19,157 | | | | 1,475 | |
NCR Corp * | | 0.6 | | | 86,575 | | | | 2,395 | |
Power Integrations Inc | | 0.4 | | | 23,329 | | | | 1,665 | |
Rogers Corp * | | 0.4 | | | 9,537 | | | | 1,401 | |
Super Micro Computer Inc* | | 0.7 | | | 92,479 | | | | 2,609 | |
Other Securities (A)(B)(C) | | 10.5 | | | | | | | 41,831 | |
| | | | | | | | | | |
| | | | | | | | | 53,948 | |
| | | | | | | | | | |
| | |
Materials — 5.2% | | | | | | | | |
Commercial Metals Co | | 0.7 | | | 142,450 | | | | 2,836 | |
Livent Corp *(A) | | 0.4 | | | 107,365 | | | | 1,629 | |
Other Securities (A) | | 4.1 | | | | | | | 15,957 | |
| | | | | | | | | | |
| | | | | | | | | 20,422 | |
| | | | | | | | | | |
| | |
22 | | SEI Institutional Investments Trust / Semi-Annual Report / November 30, 2020 |
| | | | | | | | | | | | |
| | | | |
| Description | | Percentage of
Net Assets (%) | | Shares | | Market Value
($ Thousands) |
COMMON STOCK (continued) | | | | | | | | | |
| | | |
Real Estate — 2.5% | | | | | | | | | | | | |
Other Securities ‡(A) | | | 2.5% | | | | | | | $ | 10,049 | |
| | | | | | | | | | | | |
| | | |
Utilities — 2.4% | | | | | | | | | | | | |
Portland General Electric Co | | | 0.7 | | | | 62,105 | | | | 2,570 | |
Other Securities | | | 1.7 | | | | | | | | 6,858 | |
| | | | | | | | | | | | |
| | | | | | | | | | | 9,428 | |
| | | | | | | | | | | | |
| | |
Total Common Stock (Cost $314,181) ($ Thousands) | | | | | | | | 388,436 | |
| | | | | | | | | | | | |
| | | |
RIGHTS* — 0.0% | | | | | | | | | | | | |
Other Securities#(B)(C) | | | 0.0 | | | | | | | | — | |
| | | | | | | | | | | | |
| | |
Total Rights
(Cost $–) ($ Thousands) | | | | | | | | — | |
| | | | | | | | | | | | |
| |
AFFILIATED PARTNERSHIP — 7.2% | | | | | |
SEI Liquidity Fund, L.P. 0.070% **†(D) | | | 7.2 | | | | 28,500,233 | | | | 28,508 | |
| | | | | | | | | | | | |
| | |
Total Affiliated Partnership
(Cost $28,501) ($ Thousands) | | | | | | | | 28,508 | |
| | | | | | | | | | | | |
| | |
CASH EQUIVALENT — 2.1% | | | | | | | | | |
SEI Daily Income Trust, Government Fund, Cl F 0.010% **† | | | 2.1 | | | | 8,156,082 | | | | 8,156 | |
| | | | | | | | | | | | |
|
Total Cash Equivalent | |
(Cost $8,156) ($ Thousands) | | | | | | | | 8,156 | |
| | | | | | | | | | | | |
|
Total Investments in Securities — 107.4% | |
(Cost $350,838)($ Thousands) | | | | | | | $ | 425,100 | |
| | | | | | | | | | | | |
| Percentages | are based on a Net Assets of $395,922 ($ Thousands). |
| * | Non-income producing security. |
| ** | The rate reported is the 7-day effective yield as of November 30, 2020. |
| ‡ | Real Estate Investment Trust. |
| † | Investment in Affiliated Security (see Note 6). |
| # | Expiration date not available. |
| (A) | Certain securities or partial positions of certain securities are on loan at November 30, 2020 (see Note 12). The total market value of securities on loan at November 30, 2020, was $27,057 ($ Thousands). |
| (B) | Level 3 security in accordance with fair value hierarchy. |
| (C) | Security fair valued using methods determined in good faith by the Valuation Committee of the Board of Trustees. The total market value of such securities as of November 30, 2020 was $2 ($ Thousands) and represented 0.0% of the Net Assets of the Fund. |
| (D) | This security was purchased with cash collateral held from securities on loan (see Note 12). The total market value of such securities as of November 30, 2020 was $28,508 ($ Thousands). |
Cl — Class
The Summary Schedule of Investments does not reflect the complete portfolio holdings. It includes the Fund’s 50 largest holdings and each investment of any issuer that exceeds 1% of the Fund’s net assets. “Other Securities” represent all issues not required to be disclosed under the rules adopted by the U.S. Securities and Exchange Commission (“SEC”). In certain instances, securities for which footnotes listed above may otherwise apply are included in the Other Securities caption. The complete schedule of portfolio holdings is available (i) without charge, upon request, by calling (800) 342-5734; and (ii) on the SEC’s website at http://www.sec.gov.
The following is a list of the level of inputs used as of November 30, 2020, in valuing the Fund’s investments carried at value ($ Thousands):
| | | | | | | | | | | | | | | | |
| | | | | |
| Investments in Securities | | Level 1
($) | | | Level 2
($) | | | Level 3
($)(1) | | | Total
($) | |
Common Stock | | | 388,434 | | | | – | | | | 2 | | | | 388,436 | |
Rights | | | – | | | | – | | | | –^ | | | | – | |
Affiliated Partnership | | | – | | | | 28,508 | | | | – | | | | 28,508 | |
Cash Equivalent | | | 8,156 | | | | – | | | | – | | | | 8,156 | |
| | | | | | | | | | | | | | | | |
Total Investments in Securities | | | 396,590 | | | | 28,508 | | | | 2 | | | | 425,100 | |
| | | | | | | | | | | | | | | | |
(1) A reconciliation of Level 3 instruments is presented when the Fund has a significant amount of Level 3 investments at the beginning and/or end of the period in relation to net assets. Management has concluded that Level 3 investments are not material in relation to net assets.
^ Securities market value less than $500.
For the period ended November 30, 2020, there were no transfers in or out of Level 3.
For more information on valuation inputs, see Note 2 — Significant Accounting Policies in Notes to Financial Statements.
The following is a summary of the Fund’s transactions with affiliates for the period ended November 30, 2020 ($ Thousands):
| | | | | | | | | | | | | | | | | | |
| | | | | | | | | | |
| Security Description | | Value 5/31/2020 | | Purchases at Cost | | Proceeds from Sales | | Realized Gain/
(Loss) | | Change in
Unrealized
Appreciation/
(Depreciation) | | Value
11/30/2020 | | Shares | | Income | | Capital
Gains |
SEI Liquidity Fund, L.P. | | $40,682 | | $ 86,261 | | $(98,423) | | $— | | $(12) | | $ 28,508 | | 28,500,233 | | $ 129 | | $— |
SEI Daily Income Trust, Government Fund, Cl F | | 8,951 | | 76,071 | | (76,866) | | — | | — | | 8,156 | | 8,156,082 | | 1 | | — |
| | | | | | | | | | | | | | | | | | |
Totals | | $49,633 | | $162,332 | | $(175,289) | | $— | | $(12) | | $ 36,664 | | | | $ 130 | | $— |
| | | | | | | | | | | | | | | | | | |
Amounts designated as “—” are either $0 or have been rounded to $0.
The accompanying notes are an integral part of the financial statements.
| | |
SEI Institutional Investments Trust / Semi-Annual Report / November 30, 2020 | | 23 |
SUMMARY SCHEDULE OF INVESTMENTS (Unaudited)
November 30, 2020
Small/Mid Cap Equity Fund
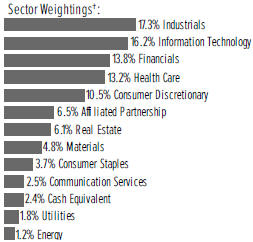
†Percentages are based on total investments. Includes investments held as collateral for securities held on loan (see Note 12).
| | | | | | | | | | |
| | | | |
| Description | | Percentage of
Net Assets (%) | | Shares | | Market Value
($ Thousands) |
|
COMMON STOCK — 96.6% | |
|
Communication Services — 2.7% | |
Nexstar Media Group Inc, Cl A | | 0.9% | | | 94,631 | | | $ | 9,960 | |
Other Securities (A) | | 1.8 | | | | | | | 19,533 | |
| | | | | | | | | | |
| | | | | | | | | 29,493 | |
| | | | | | | | | | |
|
Consumer Discretionary — 11.2% | |
Lithia Motors Inc, Cl A | | 0.5 | | | 19,052 | | | | 5,512 | |
TopBuild Corp * | | 0.5 | | | 31,965 | | | | 5,569 | |
Wingstop Inc | | 0.5 | | | 43,304 | | | | 5,513 | |
Other Securities (A) | | 9.7 | | | | | | | 105,216 | |
| | | | | | | | | | |
| | | | | | | | | 121,810 | |
| | | | | | | | | | |
|
Consumer Staples — 3.9% | |
Freshpet Inc* | | 0.7 | | | 51,861 | | | | 7,099 | |
Hostess Brands Inc, Cl A *(A) | | 0.4 | | | 353,072 | | | | 4,784 | |
Other Securities (A) | | 2.8 | | | | | | | 30,590 | |
| | | | | | | | | | |
| | | | | | | | | 42,473 | |
| | | | | | | | | | |
|
Energy — 1.3% | |
Other Securities (A)(B) | | 1.3 | | | | | | | 13,882 | |
| | | | | | | | | | |
|
Financials — 14.6% | |
Bank OZK | | 0.4 | | | 170,992 | | | | 4,781 | |
Hamilton Lane Inc, Cl A | | 0.4 | | | 67,300 | | | | 4,703 | |
PacWest Bancorp | | 0.6 | | | 276,999 | | | | 6,443 | |
PROG Holdings Inc | | 0.4 | | | 75,008 | | | | 4,720 | |
Starwood Property Trust Inc ‡ | | 0.5 | | | 291,542 | | | | 5,230 | |
Other Securities ‡(A) | | 12.3 | | | | | | | 133,214 | |
| | | | | | | | | | |
| | | | | | | | | 159,091 | |
| | | | | | | | | | |
|
Health Care — 14.0% | |
Change Healthcare Inc* | | 0.5 | | | 302,250 | | | | 5,178 | |
Ensign Group Inc/The | | 1.2 | | | 181,333 | | | | 13,032 | |
Natera Inc* | | 0.7 | | | 87,815 | | | | 7,751 | |
Pennant Group Inc/The * | | 0.1 | | | 22,100 | | | | 1,120 | |
Repligen Corp * | | 0.7 | | | 41,772 | | | | 7,923 | |
STERIS PLC | | 0.8 | | | 43,677 | | | | 8,465 | |
| | | | | | | | | | | | |
| | | | |
| Description | | Percentage of
Net Assets (%) | | Shares | | Market Value
($ Thousands) |
|
COMMON STOCK (continued) | |
Syneos Health Inc, Cl A * | | | 0.7% | | | | 110,519 | | | $ | 7,277 | |
Other Securities (A) | | | 9.3 | | | | | | | | 101,418 | |
| | | | | | | | | | | | |
| | | | | | | | | | | 152,164 | |
| | | | | | | | | | | | |
|
Industrials — 18.3% | |
ABM Industries Inc | | | 0.6 | | | | 157,499 | | | | 6,064 | |
Air Transport Services Group Inc* | | | 0.6 | | | | 203,328 | | | | 6,250 | |
Altra Industrial Motion Corp | | | 0.5 | | | | 99,205 | | | | 5,631 | |
BWX Technologies Inc | | | 0.7 | | | | 141,161 | | | | 8,029 | |
Colfax Corp * | | | 0.5 | | | | 152,533 | | | | 5,503 | |
Exponent Inc | | | 0.8 | | | | 107,946 | | | | 8,961 | |
Generac Holdings Inc * | | | 0.8 | | | | 42,525 | | | | 9,168 | |
Huntington Ingalls Industries Inc | | | 0.4 | | | | 29,142 | | | | 4,668 | |
KAR Auction Services Inc | | | 0.4 | | | | 266,765 | | | | 4,815 | |
MSC Industrial Direct Co Inc, Cl A | | | 0.4 | | | | 53,454 | | | | 4,454 | |
Ritchie Bros Auctioneers Inc | | | 0.4 | | | | 62,603 | | | | 4,496 | |
Snap-on Inc | | | 0.5 | | | | 33,722 | | | | 5,930 | |
Trex Co Inc* | | | 0.7 | | | | 98,930 | | | | 7,402 | |
TriNet Group Inc* | | | 0.4 | | | | 61,035 | | | | 4,578 | |
Vertiv Holdings Co, Cl A | | | 0.4 | | | | 250,775 | | | | 4,692 | |
Other Securities (A) | | | 10.2 | | | | | | | | 108,730 | |
| | | | | | | | | | | | |
| | | | | | | | | | | 199,371 | |
| | | | | | | | | | | | |
|
Information Technology — 17.2% | |
ACI Worldwide Inc* | | | 0.6 | | | | 190,691 | | | | 6,213 | |
Avalara Inc* | | | 0.7 | | | | 42,985 | | | | 7,383 | |
Euronet Worldwide Inc* | | | 0.4 | | | | 35,044 | | | | 4,711 | |
J2 Global Inc* | | | 1.3 | | | | 158,479 | | | | 14,201 | |
Littelfuse Inc | | | 0.8 | | | | 35,292 | | | | 8,489 | |
Monolithic Power Systems Inc | | | 0.6 | | | | 20,891 | | | | 6,684 | |
ON Semiconductor Corp * | | | 0.4 | | | | 173,597 | | | | 4,991 | |
Silicon Motion Technology Corp ADR | | | 0.4 | | | | 120,143 | | | | 4,767 | |
Verint Systems Inc* | | | 0.4 | | | | 86,825 | | | | 4,946 | |
Other Securities (A) | | | 11.6 | | | | | | | | 125,236 | |
| | | | | | | | | | | | |
| | | | | | | | | | | 187,621 | |
| | | | | | | | | | | | |
|
Materials — 5.1% | |
Axalta Coating Systems Ltd * | | | 0.4 | | | | 157,269 | | | | 4,499 | |
FMC Corp | | | 0.8 | | | | 75,726 | | | | 8,785 | |
Quaker Chemical Corp | | | 0.4 | | | | 18,103 | | | | 4,471 | |
Silgan Holdings Inc | | | 0.8 | | | | 243,983 | | | | 8,247 | |
Other Securities | | | 2.7 | | | | | | | | 29,038 | |
| | | | | | | | | | | | |
| | | | | | | | | | | 55,040 | |
| | | | | | | | | | | | |
|
Real Estate — 6.5% | |
Gaming and Leisure Properties Inc‡ | | | 0.6 | | | | 161,747 | | | | 6,719 | |
Medical Properties Trust Inc ‡ | | | 0.6 | | | | 363,229 | | | | 7,047 | |
Rexford Industrial Realty Inc ‡ | | | 0.4 | | | | 93,381 | | | | 4,475 | |
Other Securities ‡(A) | | | 4.9 | | | | | | | | 52,610 | |
| | | | | | | | | | | | |
| | | | | | | | | | | 70,851 | |
| | | | | | | | | | | | |
| | |
24 | | SEI Institutional Investments Trust / Semi-Annual Report / November 30, 2020 |
| | | | | | | | | | |
| | | | |
| Description | | Percentage of
Net Assets (%) | | Shares | | Market Value
($ Thousands) |
|
COMMON STOCK (continued) | |
|
Utilities — 1.8% | |
Other Securities (A) | | 1.8% | | | | | | $ | 20,294 | |
| | | | | | | | | | |
| | |
Total Common Stock (Cost $856,292) ($ Thousands) | | | | | | | 1,052,090 | |
| | | | | | | | | | |
|
AFFILIATED PARTNERSHIP — 6.9% | |
SEI Liquidity Fund, L.P. 0.070% **†(C) | | 6.9 | | | 75,095,493 | | | | 75,105 | |
| | | | | | | | | | |
| | |
Total Affiliated Partnership (Cost $75,095) ($ Thousands) | | | | | | | 75,105 | |
| | | | | | | | | | |
|
CASH EQUIVALENT — 2.6% | |
SEI Daily Income Trust, Government Fund, Cl F 0.010% **† | | 2.6 | | | 28,238,588 | | | | 28,239 | |
| | | | | | | | | | |
| | |
Total Cash Equivalent (Cost $28,239) ($ Thousands) | | | | | | | 28,239 | |
| | | | | | | | | | |
| |
Total Investments in Securities — 106.1% (Cost $959,626)($ Thousands) | | | $ | 1,155,434 | |
| | | | | | | | | | |
| Percentages | are based on Net Assets of $1,088,667 ($ Thousands). |
| * | Non-income producing security. |
| ** | The rate reported is the 7-day effective yield as of November 30, 2020. |
| † | Investment in Affiliated Security (See Note 6). |
| ‡ | Real Estate Investment Trust. |
| (A) | Certain securities or partial positions of certain securities are on loan at November 30, 2020 (See Note 12). The total market value of securities on loan at November 30, 2020, was $72,156 ($ Thousands). |
| (B) | Security is a Master Limited Partnership. At November 30, 2020, such securities amounted to $2,223 ($ Thousands), or 0.2% of Net Assets (See Note 2). |
| (C) | This security was purchased with cash collateral held from securities on loan (See Note 12). The total market value of such securities as of November 30, 2020 was $75,105 ($ Thousands). |
ADR — American Depositary Receipt
Cl — Class
L.P. —Limited Partnership
Ltd. —Limited
PLC — Public Limited Company
The Summary Schedule of Investments does not reflect the complete portfolio holdings. It includes the Fund’s 50 largest holdings and each investment of any issuer that exceeds 1% of the Fund’s net assets. “Other Securities” represent all issues not required to be disclosed under the rules adopted by the U.S. Securities and Exchange Commission (“SEC”). In certain instances, securities for which footnotes listed above may otherwise apply are included in the Other Securities caption. The complete schedule of portfolio holdings is available (i) without charge, upon request, by calling (800) 342-5734; and (ii) on the SEC’s website at http://www.sec.gov.
The following is a list of the level of inputs used as of November 30, 2020, in valuing the Fund’s investments carried at value ($ Thousands):
| | | | | | | | | | | | | | | | |
| | | | | |
| Investments in Securities | | Level 1
($) | | | Level 2
($) | | | Level 3
($) | | | Total
($) | |
Common Stock | | | 1,052,090 | | | | – | | | | – | | | | 1,052,090 | |
Affiliated Partnership | | | – | | | | 75,105 | | | | – | | | | 75,105 | |
Cash Equivalent | | | 28,239 | | | | – | | | | – | | | | 28,239 | |
| | | | | | | | | | | | | | | | |
Total Investments in Securities | | | 1,080,329 | | | | 75,105 | | | | – | | | | 1,155,434 | |
| | | | | | | | | | | | | | | | |
For the period ended November 30, 2020, there were no transfers in or out of Level 3.
For more information on valuation inputs, see Note 2 — Significant Accounting Policies in Notes to Financial Statements.
| | |
SEI Institutional Investments Trust / Semi-Annual Report / November 30, 2020 | | 25 |
SUMMARY SCHEDULE OF INVESTMENTS (Unaudited)
November 30, 2020
Small/Mid Cap Equity Fund (Concluded)
The following is a summary of the Fund’s transactions with affiliates for the period ended November 30, 2020 ($ Thousands):
| | | | | | | | | | | | | | | | | | |
| | | | | | | | | | |
| Security Description | | Value 5/31/2020 | | Purchases at Cost | | Proceeds from Sales | | Realized Gain/
(Loss) | | Change in
Unrealized
Appreciation/
(Depreciation) | | Value
11/30/2020 | | Shares | | Income | | Capital Gains |
SEI Liquidity Fund, L.P. | | $140,805 | | $176,844 | | $ (242,509) | | $ 8 | | $(43) | | $75,105 | | 75,095,493 | | $ 269 | | $— |
SEI Daily Income Trust, Government Fund, Cl F | | 49,188 | | 168,814 | | (189,763) | | — | | — | | 28,239 | | 28,238,588 | | 3 | | — |
| | | | | | | | | | | | | | | | | | |
Totals | | $189,993 | | $345,658 | | $ (432,272) | | $ 8 | | $(43) | | $ 103,344 | | | | $ 272 | | $— |
| | | | | | | | | | | | | | | | | | |
Amounts designated as “—” are either $0 or have been rounded to $0.
The accompanying notes are an integral part of the financial statements.
| | |
26 | | SEI Institutional Investments Trust / Semi-Annual Report / November 30, 2020 |
SUMMARY SCHEDULE OF INVESTMENTS (Unaudited)
November 30, 2020
U.S. Equity Factor Allocation Fund
| | | | | | | | | | | | |
| |
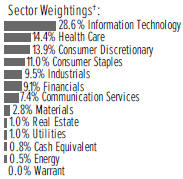
†Percentages are based on total investments. | |
| | | | |
| Description | | Percentage of
Net Assets (%) | | Shares | | Market Value
($ Thousands) |
|
COMMON STOCK — 98.6% | |
|
Communication Services — 7.4% | |
Alphabet Inc, Cl A * | | | 1.3 | % | | | 7,902 | | | $ | 13,863 | |
Alphabet Inc, Cl C * | | | 1.3 | | | | 7,851 | | | | 13,824 | |
AT&T Inc | | | 0.6 | | | | 212,926 | | | | 6,122 | |
Discovery Inc, Cl A * | | | 0.0 | | | | 6,900 | | | | 186 | |
Discovery Inc, Cl C * | | | 0.6 | | | | 261,037 | | | | 6,270 | |
Facebook Inc, Cl A * | | | 1.2 | | | | 44,292 | | | | 12,267 | |
Omnicom Group Inc | | | 0.5 | | | | 90,683 | | | | 5,713 | |
Verizon Communications Inc | | | 0.6 | | | | 101,880 | | | | 6,155 | |
Other Securities | | | 1.3 | | | | | | | | 14,030 | |
| | | | | | | | | | | | |
| | | | | | | | | | | 78,430 | |
| | | | | | | | | | | | |
|
Consumer Discretionary — 13.9% | |
Amazon.com Inc * | | | 1.9 | | | | 6,296 | | | | 19,946 | |
Best Buy Co Inc | | | 0.9 | | | | 87,488 | | | | 9,519 | |
eBay Inc | | | 1.3 | | | | 272,139 | | | | 13,724 | |
Lennar Corp, Cl A | | | 0.5 | | | | 69,097 | | | | 5,242 | |
Lennar Corp, Cl B | | | 0.1 | | | | 12,480 | | | | 758 | |
Target Corp | | | 1.5 | | | | 90,077 | | | | 16,172 | |
Other Securities | | | 7.7 | | | | | | | | 81,934 | |
| | | | | | | | | | | | |
| | | | | | | | | | | 147,295 | |
| | | | | | | | | | | | |
| | |
Consumer Staples — 10.9% | | | | | | | | | |
Clorox Co/The | | | 0.6 | | | | 29,316 | | | | 5,950 | |
Colgate-Palmolive Co | | | 0.6 | | | | 75,155 | | | | 6,436 | |
Kroger Co/The | | | 1.1 | | | | 355,262 | | | | 11,724 | |
PepsiCo Inc | | | 0.5 | | | | 36,600 | | | | 5,279 | |
Procter & Gamble Co/The | | | 1.8 | | | | 135,054 | | | | 18,755 | |
Walmart Inc | | | 1.6 | | | | 110,376 | | | | 16,864 | |
Other Securities | | | 4.7 | | | | | | | | 51,357 | |
| | | | | | | | | | | | |
| | | | | | | | | | | 116,365 | |
| | | | | | | | | | | | |
|
Energy — 0.5% | |
Other Securities | | | 0.5 | | | | | | | | 5,205 | |
| | | | | | | | | | | | |
|
Financials — 9.1% | |
Bank of New York Mellon Corp/ The | | | 1.1 | | | | 302,332 | | | | 11,827 | |
Citigroup Inc | | | 0.9 | | | | 169,996 | | | | 9,362 | |
Synchrony Financial | | | 0.6 | | | | 215,034 | | | | 6,552 | |
| | | | | | | | | | | | |
| | | | |
| Description | | Percentage of
Net Assets (%) | | Shares | | Market Value
($ Thousands) |
|
COMMON STOCK (continued) | |
T Rowe Price Group Inc | | | 1.5 | % | | | 108,328 | | | $ | 15,535 | |
Other Securities | | | 5.0 | | | | | | | | 53,115 | |
| | | | | | | | | | | | |
| | | | | | | | | | | 96,391 | |
| | | | | | | | | | | | |
|
Health Care — 14.3% | |
AmerisourceBergen Corp, Cl A | | | 0.6 | | | | 62,096 | | | | 6,403 | |
Amgen Inc | | | 1.0 | | | | 47,110 | | | | 10,460 | |
Bristol-Myers Squibb Co | | | 0.5 | | | | 84,508 | | | | 5,273 | |
Cardinal Health Inc | | | 0.5 | | | | 102,730 | | | | 5,608 | |
DaVita Inc * | | | 0.9 | | | | 84,652 | | | | 9,299 | |
Humana Inc | | | 0.6 | | | | 14,672 | | | | 5,876 | |
Johnson & Johnson | | | 0.7 | | | | 51,146 | | | | 7,400 | |
McKesson Corp | | | 1.0 | | | | 59,336 | | | | 10,675 | |
Medtronic PLC | | | 0.5 | | | | 47,440 | | | | 5,394 | |
Merck & Co Inc | | | 1.3 | | | | 172,154 | | | | 13,839 | |
Pfizer Inc | | | 0.7 | | | | 178,928 | | | | 6,855 | |
UnitedHealth Group Inc | | | 0.9 | | | | 28,824 | | | | 9,695 | |
Other Securities | | | 5.1 | | | | | | | | 55,251 | |
| | | | | | | | | | | | |
| | | | | | | | | | | 152,028 | |
| | | | | | | | | | | | |
|
Industrials — 9.5% | |
Expeditors International of Washington Inc | | | 0.7 | | | | 78,664 | | | | 7,030 | |
Honeywell International Inc | | | 0.8 | | | | 41,808 | | | | 8,525 | |
PACCAR Inc | | | 1.0 | | | | 121,193 | | | | 10,551 | |
Robert Half International Inc | | | 0.6 | | | | 101,424 | | | | 6,509 | |
Other Securities | | | 6.4 | | | | | | | | 67,994 | |
| | | | | | | | | | | | |
| | | | | | | | | | | 100,609 | |
| | | | | | | | | | | | |
|
Information Technology — 28.4% | |
Accenture PLC, Cl A | | | 1.1 | | | | 47,368 | | | | 11,799 | |
Apple Inc | | | 4.4 | | | | 390,948 | | | | 46,542 | |
Arrow Electronics Inc * | | | 0.6 | | | | 69,520 | | | | 6,371 | |
Cisco Systems Inc | | | 1.1 | | | | 260,716 | | | | 11,216 | |
Cognizant Technology Solutions Corp, Cl A | | | 1.1 | | | | 150,143 | | | | 11,731 | |
HP Inc | | | 0.9 | | | | 434,530 | | | | 9,529 | |
Intel Corp | | | 1.2 | | | | 264,586 | | | | 12,793 | |
Intuit Inc | | | 1.4 | | | | 40,967 | | | | 14,421 | |
Microsoft Corp | | | 4.7 | | | | 235,113 | | | | 50,331 | |
Nuance Communications Inc * | | | 0.7 | | | | 161,580 | | | | 6,969 | |
Oracle Corp | | | 1.3 | | | | 234,695 | | | | 13,547 | |
Other Securities | | | 9.9 | | | | | | | | 107,092 | |
| | | | | | | | | | | | |
| | | | | | | | | | | 302,341 | |
| | | | | | | | | | | | |
|
Materials — 2.7% | |
PPG Industries Inc | | | 0.6 | | | | 46,855 | | | | 6,877 | |
Other Securities | | | 2.1 | | | | | | | | 22,827 | |
| | | | | | | | | | | | |
| | | | | | | | | | | 29,704 | |
| | | | | | | | | | | | |
|
Real Estate — 1.0% | |
Other Securities ‡ | | | 1.0 | | | | | | | | 10,587 | |
| | | | | | | | | | | | |
| | |
SEI Institutional Investments Trust / Semi-Annual Report / November 30, 2020 | | 27 |
SUMMARY SCHEDULE OF INVESTMENTS (Unaudited)
November 30, 2020
U.S. Equity Factor Allocation Fund (Concluded)
| | | | | | | | | | | | |
| | | | |
| Description | | Percentage of
Net Assets (%) | | Shares | | Market Value
($ Thousands) |
|
COMMON STOCK (continued) | |
|
Utilities — 0.9% | |
Exelon Corp | | | 0.6 | % | | | 159,948 | | | $ | 6,569 | |
Other Securities | | | 0.3 | | | | | | | | 3,509 | |
| | | | | | | | | | | | |
| | | | | | | | | | | 10,078 | |
| | | | | | | | | | | | |
| | |
Total Common Stock (Cost $839,135) ($ Thousands) | | | | | | | | 1,049,033 | |
| | | | | | | | | | | | |
| | | |
WARRANT — 0.0% | | | | | | | | | | | | |
Other Securities* | | | 0.0 | | | | | | | | – | |
| | | | | | | | | | | | |
| | |
Total Warrant (Cost $–) ($ Thousands) | | | | | | | | – | |
| | | | | | | | | | | | |
| | |
CASH EQUIVALENT — 0.8% | | | | | | | | | |
SEI Daily Income Trust, Government Fund, Cl F 0.010% **† | | | 0.8 | | | | 8,324,263 | | | | 8,324 | |
| | | | | | | | | | | | |
Total Cash Equivalent (Cost $8,324) ($ Thousands) | | | | | | | | 8,324 | |
| | | | | | | | | | | | |
Total Investments in Securities — 99.4% (Cost $847,459)($ Thousands) | | | $ | 1,057,357 | |
| | | | | | | | | | | | |
A list of the open future contracts held by the Fund at November 30, 2020, is as follows:
| | | | | | | | | | | | | | | | |
| | | | | | |
| Type of Contract | | Number of
Contracts Long | | Expiration
Date | | Notional Amount
(Thousands) | | Value
(Thousands) | | Unrealized
Appreciation
(Thousands) |
S&P 500 Index E-MINI | | | 48 | | | | Dec-2020 | | | | $ 8,206 | | | $ 8,696 | | $ 490 |
| | | | | | | | | | | | | | | | |
| | Percentages are based on a Net Assets of $1,063,512 ($ Thousands). |
| * | Non-income producing security. |
| ** | The rate reported is the 7-day effective yield as of November 30, 2020. |
| ‡ | Real Estate Investment Trust. |
| † | Investment in Affiliated Security (see Note 6). |
Cl — Class
PLC — Public Limited Company
S&P — Standard & Poor’s
The Summary Schedule of Investments does not reflect the complete portfolio holdings. It includes the Fund’s 50 largest holdings and each investment of any issuer that exceeds 1% of the Fund’s net assets. “Other Securities” represent all issues not required to be disclosed under the rules adopted by the U.S. Securities and Exchange Commission (“SEC”). In certain instances, securities for which footnotes listed above may otherwise apply are included in the Other Securities caption. The complete schedule of portfolio holdings is available (i) without charge, upon request, by calling (800) 342-5734; and (ii) on the SEC’s website at http://www.sec.gov.
The following is a list of the level of inputs used as of November 30, 2020, in valuing the Fund’s investments and other financial instruments carried at value ($ Thousands):
| | | | | | | | | | | | | | | | |
| | | | | |
| Investments in Securities | | Level 1 ($) | | Level 2
($) | | Level 3
($) | | Total
($) |
Common Stock | | | 1,049,033 | | | | – | | | | – | | | | 1,049,033 | |
Warrant | | | – | | | | – | | | | – | | | | – | |
Cash Equivalent | | | 8,324 | | | | – | | | | – | | | | 8,324 | |
| | | | | | | | | | | | | | | | |
Total Investments in Securities | | | 1,057,357 | | | | – | | | | – | | | | 1,057,357 | |
| | | | | | | | | | | | | | | | |
| | | | | | | | | |
| | | | | |
| Other Financial Instruments | | Level 1 ($) | | Level 2 ($) | | Level 3 ($) | | Total ($) |
Futures Contracts* | | | | | | | | | | | | | | | | |
Unrealized Appreciation | | | 490 | | | | – | | | | – | | | | 490 | |
| | | | | | | | | | | | | | | | |
Total Other Financial Instruments | | | 490 | | | | – | | | | – | | | | 490 | |
| | | | | | | | | | | | | | | | |
* Future contracts are valued at the unrealized appreciation on the instrument.
For the period ended November 30, 2020, there were no transfers in or out of Level 3.
For more information on valuation inputs, see Note 2 — Significant Accounting Policies in the Notes to Financial Statements.
| | |
28 | | SEI Institutional Investments Trust / Semi-Annual Report / November 30, 2020 |
The following is a summary of the Fund’s transactions with affiliates for the period ended November 30, 2020 ($ Thousands):
| | | | | | | | | | | | | | | | | | |
| | | | | | | | | | |
| Security Description | | Value 5/31/2020 | | Purchases at Cost | | Proceeds from
Sales | | Realized Gain/
(Loss) | | Change in
Unrealized
Appreciation/
(Depreciation) | | Value
11/30/2020 | | Shares | | Income | | Capital Gains |
SEI Daily Income Trust, Government Fund, Cl F | | $ 15,622 | | $ 45,929 | | $ (53,227) | | $ — | | $ — | | $ 8,324 | | 8,324,263 | | $ 1 | | $ — |
| | | | | | | | | | | | | | | | | | |
Amounts designated as “—” are either $0 or have been rounded to $0.
The accompanying notes are an integral part of the financial statements.
| | |
SEI Institutional Investments Trust / Semi-Annual Report / November 30, 2020 | | 29 |
SUMMARY SCHEDULE OF INVESTMENTS (Unaudited)
November 30, 2020
U.S. Managed Volatility Fund
| | | | | | | | | | | | |
| |
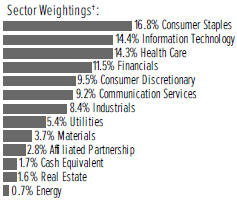
†Percentages are based on total investments. Includes investments held
as collateral for securities held on loan (see Note 12). | |
| | | | |
| Description | | Percentage of
Net Assets (%) | | Shares | | Market Value
($ Thousands) |
|
COMMON STOCK — 98.1% | |
|
Communication Services — 9.5% | |
AT&T Inc | | | 1.6 | % | | | 727,100 | | | $ | 20,904 | |
Comcast Corp, Cl A | | | 1.5 | | | | 389,200 | | | | 19,553 | |
Omnicom Group Inc | | | 0.5 | | | | 116,900 | | | | 7,365 | |
Verizon Communications Inc | | | 2.4 | | | | 520,653 | | | | 31,453 | |
Other Securities (A) | | | 3.5 | | | | | | | | 46,517 | |
| | | | | | | | | | | | |
| | | | | | | | | | | 125,792 | |
| | | | | | | | | | | | |
|
Consumer Discretionary — 9.8% | |
AutoZone Inc * | | | 1.1 | | | | 13,000 | | | | 14,790 | |
eBay Inc | | | 1.4 | | | | 364,700 | | | | 18,392 | |
Target Corp | | | 2.7 | | | | 198,600 | | | | 35,654 | |
Other Securities (A) | | | 4.6 | | | | | | | | 61,288 | |
| | | | | | | | | | | | |
| | | | | | | | | | | 130,124 | |
| | | | | | | | | | | | |
|
Consumer Staples — 17.2% | |
Altria Group Inc | | | 0.7 | | | | 226,400 | | | | 9,018 | |
General Mills Inc | | | 1.4 | | | | 306,217 | | | | 18,624 | |
J M Smucker Co/The | | | 1.5 | | | | 173,270 | | | | 20,307 | |
Kellogg Co | | | 0.8 | | | | 163,728 | | | | 10,464 | |
Kimberly-Clark Corp | | | 0.8 | | | | 72,600 | | | | 10,114 | |
Kroger Co/The | | | 1.5 | | | | 620,574 | | | | 20,479 | |
Tyson Foods Inc, Cl A | | | 1.1 | | | | 223,400 | | | | 14,566 | |
Walmart Inc | | | 1.6 | | | | 139,744 | | | | 21,351 | |
Other Securities (A) | | | 7.8 | | | | | | | | 103,717 | |
| | | | | | | | | | | | |
| | | | | | | | | | | 228,640 | |
| | | | | | | | | | | | |
|
Energy — 0.7% | |
Other Securities (A) | | | 0.7 | | | | | | | | 9,454 | |
| | | | | | | | | | | | |
|
Financials — 11.9% | |
Aflac Inc | | | 0.9 | | | | 258,600 | | | | 11,360 | |
Allstate Corp/The | | | 1.4 | | | | 177,400 | | | | 18,157 | |
American Financial Group Inc/OH | | | 0.9 | | | | 133,500 | | | | 11,936 | |
Annaly Capital Management Inc‡ | | | 0.6 | | | | 902,000 | | | | 7,216 | |
Berkshire Hathaway Inc, Cl B * | | | 2.0 | | | | 116,400 | | | | 26,645 | |
National Bank of Canada | | | 0.5 | | | | 122,700 | | | | 6,812 | |
| | | | | | | | | | | | |
| | | | |
| Description | | Percentage of
Net Assets (%) | | Shares | | Market Value
($ Thousands) |
|
COMMON STOCK (continued) | |
US Bancorp | | | 0.5 | % | | | 158,300 | | | $ | 6,840 | |
Other Securities ‡(A) | | | 5.1 | | | | | | | | 68,546 | |
| | | | | | | | | | | | |
| | | | | | | | | | | 157,512 | |
| | | | | | | | | | | | |
|
Health Care — 14.7% | |
AbbVie Inc | | | 0.6 | | | | 71,100 | | | | 7,435 | |
Amgen Inc | | | 0.8 | | | | 50,100 | | | | 11,124 | |
Bristol-Myers Squibb Co | | | 1.8 | | | | 374,270 | | | | 23,354 | |
CVS Health Corp | | | 1.0 | | | | 197,400 | | | | 13,382 | |
Gilead Sciences Inc | | | 0.8 | | | | 167,200 | | | | 10,144 | |
Johnson & Johnson | | | 2.3 | | | | 209,423 | | | | 30,299 | |
Merck & Co Inc | | | 2.3 | | | | 380,442 | | | | 30,584 | |
Pfizer Inc | | | 1.4 | | | | 481,800 | | | | 18,458 | |
Other Securities (A) | | | 3.7 | | | | | | | | 50,212 | |
| | | | | | | | | | | | |
| | | | | | | | | | | 194,992 | |
| | | | | | | | | | | | |
|
Industrials — 8.6% | |
3M Co | | | 0.8 | | | | 64,300 | | | | 11,107 | |
Allison Transmission Holdings Inc, Cl A | | | 0.6 | | | | 179,500 | | | | 7,368 | |
Cummins Inc | | | 0.6 | | | | 33,700 | | | | 7,791 | |
Republic Services Inc, Cl A | | | 0.7 | | | | 91,300 | | | | 8,831 | |
Waste Management Inc | | | 0.7 | | | | 72,800 | | | | 8,673 | |
Other Securities (A) | | | 5.2 | | | | | | | | 70,926 | |
| | | | | | | | | | | | |
| | | | | | | | | | | 114,696 | |
| | | | | | | | | | | | |
|
Information Technology — 14.7% | |
Amdocs Ltd | | | 2.0 | | | | 393,545 | | | | 25,899 | |
Cisco Systems Inc | | | 1.2 | | | | 371,300 | | | | 15,973 | |
F5 Networks Inc * | | | 1.1 | | | | 89,233 | | | | 14,528 | |
Intel Corp | | | 1.6 | | | | 458,300 | | | | 22,159 | |
International Business Machines Corp | | | 1.2 | | | | 127,800 | | | | 15,786 | |
Juniper Networks Inc | | | 0.8 | | | | 495,700 | | | | 10,791 | |
Oracle Corp | | | 2.2 | | | | 508,500 | | | | 29,351 | |
Western Union Co/The | | | 1.1 | | | | 627,600 | | | | 14,159 | |
Other Securities (A) | | | 3.5 | | | | | | | | 47,130 | |
| | | | | | | | | | | | |
| | | | | | | | | | | 195,776 | |
| | | | | | | | | | | | |
|
Materials — 3.8% | |
Berry Global Group Inc * | | | 0.6 | | | | 149,797 | | | | 7,939 | |
Sonoco Products Co | | | 0.6 | | | | 127,100 | | | | 7,379 | |
Other Securities | | | 2.6 | | | | | | | | 35,180 | |
| | | | | | | | | | | | |
| | | | | | | | | | | 50,498 | |
| | | | | | | | | | | | |
|
Real Estate — 1.7% | |
Other Securities ‡(A) | | | 1.7 | | | | | | | | 21,873 | |
| | | | | | | | | | | | |
|
Utilities — 5.5% | |
Entergy Corp | | | 1.2 | | | | 150,600 | | | | 16,393 | |
Evergy Inc | | | 1.1 | | | | 258,200 | | | | 14,307 | |
Exelon Corp | | | 1.5 | | | | 476,400 | | | | 19,566 | |
Other Securities (A) | | | 1.7 | | | | | | | | 23,142 | |
| | | | | | | | | | | | |
| | | | | | | | | | | 73,408 | |
| | | | | | | | | | | | |
| | |
Total Common Stock (Cost $1,075,279) ($ Thousands) | | | | | | | | 1,302,765 | |
| | | | | | | | | | | | |
| | |
30 | | SEI Institutional Investments Trust / Semi-Annual Report / November 30, 2020 |
| | | | | | | | | | |
| | | | |
| Description | | Percentage of
Net Assets (%) | | Shares | | Market Value
($ Thousands) |
|
AFFILIATED PARTNERSHIP — 2.8% | |
| | | |
SEI Liquidity Fund, L.P. 0.070% **†(B) | | 2.8% | | | 37,731,208 | | | $ | 37,738 | |
| | | | | | | | | | |
| | |
Total Affiliated Partnership (Cost $37,737) ($ Thousands) | | | | | | | 37,738 | |
| | | | | | | | | | |
| | | | | | | | | | |
| | | | |
| Description | | Percentage of
Net Assets (%) | | Shares | | Market Value
($ Thousands) |
| |
CASH EQUIVALENT — 1.7% | | | | | |
| | | |
SEI Daily Income Trust, Government Fund, Cl F 0.010% **† | | 1.7% | | | 22,615,933 | | | $ | 22,616 | |
| | | | | | | | | | |
| | |
Total Cash Equivalent (Cost $22,616) ($ Thousands) | | | | | | | 22,616 | |
| | | | | | | | | | |
| | |
Total Investments in Securities – 102.6% (Cost $1,135,632)($ Thousands) | | | | | | $ | 1,363,119 | |
| | | | | | | | | | |
A list of the open futures contracts held by the Fund at November 30, 2020, is as follows:
| | | | | | | | | | | | | | | | | | | | |
| | | | | | |
Type of Contract | | Number of
Contracts
Long | | | Expiration
Date | | | Notional Amount
(Thousands) | | | Value
(Thousands) | | | Unrealized
Appreciation
(Thousands) | |
| | | | | |
S&P 500 Index E-MINI | | | 75 | | | | Dec-2020 | | | $ | 13,177 | | | $ | 13,587 | | | $ | 410 | |
| | | | | | | | | | | | |
Percentages are based on Net Assets of $1,328,438 ($ Thousands).
| * | Non-income producing security. |
| ** | The rate reported is the 7-day effective yield as of November 30, 2020. |
| † | Investment in Affiliated Security (See Note 6). |
| ‡ | Real Estate Investment Trust. |
| (A) | Certain securities or partial positions of certain securities are on loan at November 30, 2020 (See Note 12). The total market value of securities on loan at November 30, 2020, was $36,640 ($ Thousands). |
| (B) | This security was purchased with cash collateral held from securities on loan (See Note 12). The total market value of such securities as of November 30, 2020 was $37,738 ($ Thousands). |
Cl – Class
L.P. – Limited Partnership
Ltd. – Limited
The Summary Schedule of Investments does not reflect the complete portfolio holdings. It includes the Fund’s 50 largest holdings and each investment of any issuer that exceeds 1% of the Fund’s net assets. “Other Securities” represent all issues not required to be disclosed under the rules adopted by the U.S. Securities and Exchange Commission (“SEC”). In certain instances, securities for which footnotes listed above may otherwise apply are included in the Other Securities caption. The complete schedule of portfolio holdings is available (i) without charge, upon request, by calling (800) 342-5734; and (ii) on the SEC’s website at http://www.sec.gov.
The following is a list of the level of inputs used as of November 30, 2020, in valuing the Fund’s investments and other financial instruments carried at value ($ Thousands):
| | | | | | | | | | | | | | | | |
| | | | | |
| Investments in Securities | | Level 1 ($) | | | Level 2
($) | | | Level 3
($) | | | Total ($) | |
Common Stock | | | 1,302,765 | | | | – | | | | – | | | | 1,302,765 | |
| | | | |
Affiliated Partnership | | | – | | | | 37,738 | | | | – | | | | 37,738 | |
| | | | |
Cash Equivalent | | | 22,616 | | | | – | | | | – | | | | 22,616 | |
| | | | | | | | | | | | | | | | |
| | | | |
Total Investments in Securities | | | 1,325,381 | | | | 37,738 | | | | – | | | | 1,363,119 | |
| | | | | | | | | | | | | | | | |
| | | | | | | | | | | | | | | | |
| | | | | |
| Other Financial Instruments | | Level 1
($) | | | Level 2
($) | | | Level 3
($) | | | Total
($) | |
| | | | |
Futures Contracts* Unrealized Appreciation | | | 410 | | | | – | | | | – | | | | 410 | |
| | | | | | | | | | | | | | | | |
| | | | |
Total Other Financial Instruments | | | 410 | | | | – | | | | – | | | | 410 | |
| | | | | | | | | | | | | | | | |
*Futures contracts are valued at the unrealized appreciation on the instrument.
For the period ended November 30, 2020, there were no transfers in or out of Level 3.
For more information on valuation inputs, see Note 2 — Significant Accounting Policies in Notes to Financial Statements.
| | |
SEI Institutional Investments Trust / Semi-Annual Report / November 30, 2020 | | 31 |
SUMMARY SCHEDULE OF INVESTMENTS (Unaudited)
November 30, 2020
U.S. Managed Volatility Fund (Concluded)
The following is a summary of the Fund’s transactions with affiliates for the period ended November 30, 2020 ($ Thousands):
| | | | | | | | | | | | | | | | | | |
| | | | | | | | | | |
| Security Description | | Value 5/31/2020 | | Purchases at Cost | | Proceeds from
Sales | | Realized Gain/
(Loss) | | Change in
Unrealized
Appreciation/
(Depreciation) | | Value
11/30/2020 | | Shares | | Income | | Capital Gains |
SEI Liquidity Fund, L.P. | | $ 19,825 | | $ 92,031 | | $ (74,114) | | $ – | | $(4) | | $ 37,738 | | 37,731,208 | | $ 55 | | $ – |
SEI Daily Income Trust, Government Fund, Cl F | | 39,061 | | 126,803 | | (143,248) | | – | | – | | 22,616 | | 22,615,933 | | 2 | | – |
| | | | | | | | | | | | | | | | | | |
Totals | | $ 58,886 | | $ 218,834 | | $ (217,362) | | $ – | | $(4) | | $60,354 | | | | $ 57 | | $ – |
| | | | | | | | | | | | | | | | | | |
Amounts designated as “–” are either $0 or have been rounded to $0.
The accompanying notes are an integral part of the financial statements.
| | |
32 | | SEI Institutional Investments Trust / Semi-Annual Report / November 30, 2020 |
SUMMARY SCHEDULE OF INVESTMENTS (Unaudited)
November 30, 2020
Global Managed Volatility Fund
| | | | | | | | | | | | |
| |
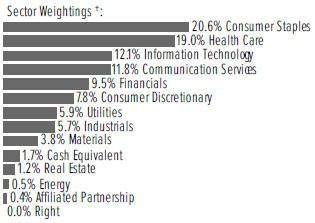
†Percentages are based on total investments. Includes investments held
as collateral for securities held on loan (see Note 12). | |
| | | | |
| Description | | Percentage of
Net Assets (%) | | Shares | | Market Value
($ Thousands) |
|
COMMON STOCK — 96.7% | |
|
Australia — 1.3% | |
Other Securities | | | 1.3 | % | | | | | | $ | 37,895 | |
| | | | | | | | | | | | |
|
Austria — 0.0% | |
Other Securities | | | 0.0 | | | | | | | | 553 | |
| | | | | | | | | | | | |
|
Belgium — 0.5% | |
Other Securities | | | 0.5 | | | | | | | | 13,720 | |
| | | | | | | | | | | | |
|
Canada — 3.8% | |
Loblaw Cos Ltd | | | 0.5 | | | | 289,651 | | | | 14,350 | |
Other Securities (A) | | | 3.3 | | | | | | | | 95,471 | |
| | | | | | | | | | | | |
| | | | | | | | | | | 109,821 | |
| | | | | | | | | | | | |
|
Denmark — 0.5% | |
Other Securities | | | 0.5 | | | | | | | | 16,167 | |
| | | | | | | | | | | | |
|
Finland — 0.1% | |
Other Securities | | | 0.1 | | | | | | | | 3,969 | |
| | | | | | | | | | | | |
|
France — 1.8% | |
Sanofi | | | 0.8 | | | | 237,112 | | | | 24,026 | |
Other Securities | | | 1.0 | | | | | | | | 27,369 | |
| | | | | | | | | | | | |
| | | | | | | | | | | 51,395 | |
| | | | | | | | | | | | |
|
Germany — 1.4% | |
Deutsche Telekom AG | | | 0.8 | | | | 1,204,297 | | | | 21,774 | |
Other Securities | | | 0.6 | | | | | | | | 18,306 | |
| | | | | | | | | | | | |
| | | | | | | | | | | 40,080 | |
| | | | | | | | | | | | |
|
Hong Kong — 0.9% | |
Other Securities | | | 0.9 | | | | | | | | 27,504 | |
| | | | | | | | | | | | |
| | | | | | | | | | | | |
| | | | |
| Description | | Percentage of
Net Assets (%) | | Shares | | Market Value
($ Thousands) |
|
COMMON STOCK (continued) | |
|
Israel — 0.7% | |
Other Securities | | | 0.7 | % | | | | | | $ | 19,301 | |
| | | | | | | | | | | | |
|
Italy — 0.8% | |
Enel SpA | | | 0.5 | | | | 1,513,300 | | | | 15,151 | |
Other Securities | | | 0.3 | | | | | | | | 7,826 | |
| | | | | | | | | | | | |
| | | | | | | | | | | 22,977 | |
| | | | | | | | | | | | |
|
Japan — 9.3% | |
Japan Tobacco Inc | | | 0.6 | | | | 919,200 | | | | 18,688 | |
KDDI Corp | | | 0.8 | | | | 828,700 | | | | 23,703 | |
Nintendo Co Ltd | | | 0.6 | | | | 29,000 | | | | 16,481 | |
Nippon Telegraph & Telephone Corp | | | 1.0 | | | | 1,206,700 | | | | 28,526 | |
Okinawa Cellular Telephone Co | | | 0.0 | | | | 3,311 | | | | 138 | |
Oracle Corp Japan | | | 0.2 | | | | 44,654 | | | | 4,955 | |
SoftBank Corp | | | 0.8 | | | | 1,958,300 | | | | 24,123 | |
Other Securities | | | 5.3 | | | | | | | | 154,810 | |
| | | | | | | | | | | | |
| | | | | | | | | | | 271,424 | |
| | | | | | | | | | | | |
|
Netherlands — 1.5% | |
Koninklijke Ahold Delhaize NV | | | 1.1 | | | | 1,093,213 | | | | 31,372 | |
Other Securities | | | 0.4 | | | | | | | | 12,463 | |
| | | | | | | | | | | | |
| | | | | | | | | | | 43,835 | |
| | | | | | | | | | | | |
|
New Zealand — 0.4% | |
Other Securities ‡ | | | 0.4 | | | | | | | | 10,389 | |
| | | | | | | | | | | | |
|
Norway — 0.7% | |
Other Securities | | | 0.7 | | | | | | | | 20,758 | |
| | | | | | | | | | | | |
|
Portugal — 0.0% | |
Other Securities | | | 0.0 | | | | | | | | 938 | |
| | | | | | | | | | | | |
|
Singapore — 0.9% | |
Other Securities | | | 0.9 | | | | | | | | 26,967 | |
| | | | | | | | | | | | |
|
Spain — 1.0% | |
Iberdrola SA | | | 0.5 | | | | 1,127,050 | | | | 15,430 | |
Other Securities | | | 0.5 | | | | | | | | 15,195 | |
| | | | | | | | | | | | |
| | | | | | | | | | | 30,625 | |
| | | | | | | | | | | | |
|
Sweden — 0.9% | |
Other Securities | | | 0.9 | | | | | | | | 26,866 | |
| | | | | | | | | | | | |
|
Switzerland — 4.4% | |
Novartis AG | | | 0.9 | | | | 287,233 | | | | 26,103 | |
Roche Holding AG | | | 1.4 | | | | 121,074 | | | | 39,995 | |
Other Securities | | | 2.1 | | | | | | | | 61,708 | |
| | | | | | | | | | | | |
| | | | | | | | | | | 127,806 | |
| | | | | | | | | | | | |
| | |
SEI Institutional Investments Trust / Semi-Annual Report / November 30, 2020 | | 33 |
SUMMARY SCHEDULE OF INVESTMENTS (Unaudited)
November 30, 2020
Global Managed Volatility Fund (Continued)
| | | | | | | | | | | | |
| | | | |
| Description | | Percentage of
Net Assets (%) | | Shares | | Market Value
($ Thousands) |
|
COMMON STOCK (continued) | |
|
United Kingdom — 3.8% | |
GlaxoSmithKline PLC | | | 0.9 | % | | | 1,455,383 | | | $ | 26,619 | |
Other Securities ‡ | | | 2.9 | | | | | | | | 84,860 | |
| | | | | | | | | | | | |
| | | | | | | | | | | 111,479 | |
| | | | | | | | | | | | |
|
United States — 62.0% | |
Allstate Corp/The | | | 0.8 | | | | 218,900 | | | | 22,404 | |
Amdocs Ltd | | | 1.0 | | | | 449,470 | | | | 29,580 | |
Amgen Inc | | | 0.8 | | | | 110,740 | | | | 24,589 | |
AT&T Inc | | | 1.3 | | | | 1,291,361 | | | | 37,127 | |
Berkshire Hathaway Inc, Cl B * | | | 0.8 | | | | 99,400 | | | | 22,754 | |
Bristol-Myers Squibb Co | | | 0.8 | | | | 374,111 | | | | 23,345 | |
Church & Dwight Co Inc | | | 0.6 | | | | 182,208 | | | | 15,992 | |
Cisco Systems Inc | | | 0.9 | | | | 613,332 | | | | 26,385 | |
Clorox Co/The | | | 0.6 | | | | 85,054 | | | | 17,263 | |
Colgate-Palmolive Co | | | 0.6 | | | | 189,074 | | | | 16,192 | |
Comcast Corp, Cl A | | | 1.0 | | | | 595,741 | | | | 29,930 | |
Costco Wholesale Corp | | | 0.8 | | | | 56,376 | | | | 22,086 | |
Dollar General Corp | | | 0.6 | | | | 79,177 | | | | 17,306 | |
eBay Inc | | | 0.7 | | | | 423,300 | | | | 21,347 | |
Exelon Corp | | | 0.7 | | | | 504,000 | | | | 20,699 | |
F5 Networks Inc * | | | 0.6 | | | | 101,961 | | | | 16,600 | |
General Mills Inc | | | 0.9 | | | | 446,568 | | | | 27,160 | |
Gilead Sciences Inc | | | 0.6 | | | | 279,665 | | | | 16,967 | |
Intel Corp | | | 0.8 | | | | 463,300 | | | | 22,401 | |
International Business Machines Corp | | | 0.7 | | | | 165,800 | | | | 20,480 | |
J M Smucker Co/The | | | 0.6 | | | | 154,913 | | | | 18,156 | |
Johnson & Johnson | | | 1.5 | | | | 307,401 | | | | 44,475 | |
Kellogg Co | | | 0.5 | | | | 231,352 | | | | 14,786 | |
Kimberly-Clark Corp | | | 0.6 | | | | 116,573 | | | | 16,240 | |
Kroger Co/The | | | 1.1 | | | | 984,727 | | | | 32,496 | |
Lockheed Martin Corp | | | 0.6 | | | | 49,010 | | | | 17,889 | |
Merck & Co Inc | | | 1.3 | | | | 485,703 | | | | 39,046 | |
Newmont Corp | | | 0.9 | | | | 439,203 | | | | 25,834 | |
Northrop Grumman Corp | | | 0.7 | | | | 63,734 | | | | 19,264 | |
Oracle Corp | | | 1.5 | | | | 756,020 | | | | 43,637 | |
Pfizer Inc | | | 1.1 | | | | 838,519 | | | | 32,124 | |
Public Service Enterprise Group Inc | | | 0.5 | | | | 262,900 | | | | 15,322 | |
Target Corp | | | 2.0 | | | | 318,782 | | | | 57,231 | |
Universal Health Services Inc, Cl B | | | 0.6 | | | | 135,970 | | | | 17,755 | |
Verizon Communications Inc | | | 1.8 | | | | 878,128 | | | | 53,048 | |
Walmart Inc | | | 1.1 | | | | 207,367 | | | | 31,684 | |
Other Securities ‡(B) | | | 30.0 | | | | | | | | 884,417 | |
| | | | | | | | | | | | |
| | | | | | | | | | | 1,814,011 | |
| | | | | | | | | | | | |
| | |
Total Common Stock (Cost $2,622,211) ($ Thousands) | | | | | | | | 2,828,480 | |
| | | | | | | | | | | | |
| | | | | | | | | | | | |
| | | | |
| Description | | Percentage of
Net Assets (%) | | Shares | | Market Value
($ Thousands) |
|
PREFERRED STOCK — 0.3% | |
|
Germany — 0.3% | |
Other Securities (C) | | | 0.3 | % | | | | | | $ | 9,376 | |
| | | | | | | | | | | | |
| | |
Total Preferred Stock (Cost $8,443) ($ Thousands) | | | | | | | | 9,376 | |
| | | | | | | | | | | | |
|
RIGHT — 0.0% | |
|
Switzerland — 0.0% | |
Other Securities* | | | 0.0 | | | | | | | | – | |
| | | | | | | | | | | | |
| | |
Total Right (Cost $–) ($ Thousands) | | | | | | | | – | |
| | | | | | | | | | | | |
|
AFFILIATED PARTNERSHIP — 0.4% | |
SEI Liquidity Fund, L.P. 0.070% **†(D) | | | 0.4 | | | | 10,248,915 | | | | 10,253 | |
| | | | | | | | | | | | |
| | |
Total Affiliated Partnership (Cost $10,253) ($ Thousands) | | | | | | | | 10,253 | |
| | | | | | | | | | | | |
|
CASH EQUIVALENT — 1.7% | |
SEI Daily Income Trust, Government Fund, Cl F 0.010% **† | | | 1.7 | | | | 50,179,553 | | | | 50,180 | |
| | | | | | | | | | | | |
| | |
Total Cash Equivalent (Cost $50,180) ($ Thousands) | | | | | | | | 50,180 | |
| | | | | | | | | | | | |
| | |
Total Investments in Securities – 99.1% (Cost $2,691,087) ($ Thousands) | | | | | | | $ | 2,898,289 | |
| | | | | | | | | | | | |
| | |
34 | | SEI Institutional Investments Trust / Semi-Annual Report / November 30, 2020 |
A list of the open futures contracts held by the Fund at November 30, 2020, is as follows:
| | | | | | | | | | | | | | | | | | | | |
| | | | | | |
| Type of Contract | | Number of
Contracts Long | | | Expiration
Date | | | Notional Amount
(Thousands) | | | Value
(Thousands) | | | Unrealized Appreciation
(Depreciation) (Thousands) | |
Euro STOXX 50 | | | 102 | | | | Dec-2020 | | | $ | 3,881 | | | $ | 4,277 | | | $ | 325 | |
FTSE 100 Index | | | 22 | | | | Dec-2020 | | | | 1,735 | | | | 1,848 | | | | 84 | |
Hang Seng Index | | | 3 | | | | Jan-2021 | | | | 515 | | | | 511 | | | | (4 | ) |
S&P 500 Index E-MINI | | | 137 | | | | Dec-2020 | | | | 23,666 | | | | 24,819 | | | | 1,153 | |
SPI 200 Index | | | 9 | | | | Dec-2020 | | | | 1,073 | | | | 1,083 | | | | 1 | |
TOPIX Index | | | 18 | | | | Dec-2020 | | | | 2,907 | | | | 3,030 | | | | 110 | |
| | | | | | | | | | | | | | | | | | | | |
| | | | | | | | | | $ | 33,777 | | | $ | 35,568 | | | $ | 1,669 | |
| | | | | | | | | | | | | | | | | | | | |
A list of the open forward foreign currency contracts held by the Fund at November 30, 2020, is as follows:
| | | | | | | | | | | | | | | | | | | | | | | | |
| | | | | | | |
| Counterparty | | Settlement Date | | | | | | Currency to Deliver
(Thousands) | | | | | | Currency to Receive
(Thousands) | | | Unrealized
Appreciation
(Depreciation)
(Thousands) | |
| | | | | | |
Brown Brothers Harriman | | | 12/14/20 | | | | USD | | | | 131 | | | | NZD | | | | 189 | | | $ | 2 | |
| | | | | | |
Brown Brothers Harriman | | | 12/14/20 | | | | USD | | | | 69 | | | | NZD | | | | 99 | | | | – | |
| | | | | | |
Brown Brothers Harriman | | | 12/14/20 | | | | USD | | | | 228 | | | | DKK | | | | 1,426 | | | | 2 | |
| | | | | | |
Brown Brothers Harriman | | | 12/14/20 | | | | USD | | | | 214 | | | | SGD | | | | 288 | | | | 1 | |
| | | | | | |
Brown Brothers Harriman | | | 12/14/20 | | | | USD | | | | 95 | | | | SGD | | | | 127 | | | | – | |
| | | | | | |
Brown Brothers Harriman | | | 12/14/20 | | | | USD | | | | 218 | | | | SEK | | | | 1,876 | | | | 1 | |
| | | | | | |
Brown Brothers Harriman | | | 12/14/20 | | | | USD | | | | 98 | | | | SEK | | | | 836 | | | | (1 | ) |
| | | | | | |
Brown Brothers Harriman | | | 12/14/20 | | | | USD | | | | 213 | | | | HKD | | | | 1,650 | | | | – | |
| | | | | | |
Brown Brothers Harriman | | | 12/14/20 | | | | USD | | | | 163 | | | | HKD | | | | 1,266 | | | | – | |
| | | | | | |
Brown Brothers Harriman | | | 12/14/20 | | | | USD | | | | 313 | | | | NOK | | | | 2,814 | | | | 4 | |
| | | | | | |
Brown Brothers Harriman | | | 12/14/20 | | | | USD | | | | 97 | | | | NOK | | | | 852 | | | | – | |
| | | | | | |
Brown Brothers Harriman | | | 12/14/20 | | | | USD | | | | 609 | | | | AUD | | | | 834 | | | | 6 | |
| | | | | | |
Brown Brothers Harriman | | | 12/14/20 | | | | USD | | | | 401 | | | | AUD | | | | 541 | | | | (2 | ) |
| | | | | | |
Brown Brothers Harriman | | | 12/14/20 | | | | USD | | | | 1,401 | | | | CAD | | | | 1,829 | | | | 11 | |
| | | | | | |
Brown Brothers Harriman | | | 12/14/20 | | | | USD | | | | 1,464 | | | | GBP | | | | 1,103 | | | | 9 | |
| | | | | | |
Brown Brothers Harriman | | | 12/14/20 | | | | USD | | | | 1,072 | | | | CHF | | | | 977 | | | | 8 | |
| | | | | | |
Brown Brothers Harriman | | | 12/14/20 | | | | USD | | | | 634 | | | | CHF | | | | 573 | | | | (1 | ) |
| | | | | | |
Brown Brothers Harriman | | | 12/14/20 | | | | USD | | | | 2,716 | | | | EUR | | | | 2,286 | | | | 20 | |
| | | | | | |
Brown Brothers Harriman | | | 12/14/20 | | | | USD | | | | 1,472 | | | | JPY | | | | 153,972 | | | | 5 | |
| | | | | | |
Brown Brothers Harriman | | | 12/14/20 | | | | USD | | | | 3,228 | | | | JPY | | | | 335,172 | | | | (13 | ) |
| | | | | | |
Brown Brothers Harriman | | | 12/14/20 | | | | NZD | | | | 9,045 | | �� | | USD | | | | 6,215 | | | | (142 | ) |
| | | | | | |
Brown Brothers Harriman | | | 12/14/20 | | | | SGD | | | | 17,498 | | | | USD | | | | 12,964 | | | | (99 | ) |
| | | | | | |
Brown Brothers Harriman | | | 12/14/20 | | | | GBP | | | | 438 | | | | USD | | | | 586 | | | | 1 | |
| | | | | | |
Brown Brothers Harriman | | | 12/14/20 | | | | GBP | | | | 40,450 | | | | USD | | | | 53,400 | | | | (613 | ) |
| | | | | | |
Brown Brothers Harriman | | | 12/14/20 | | | | AUD | | | | 47,218 | | | | USD | | | | 34,299 | | | | (496 | ) |
| | | | | | |
Brown Brothers Harriman | | | 12/14/20 | | | | DKK | | | | 59,013 | | | | USD | | | | 9,324 | | | | (165 | ) |
| | | | | | |
Brown Brothers Harriman | | | 12/14/20 | | | | CHF | | | | 61,061 | | | | USD | | | | 66,542 | | | | (957 | ) |
| | | | | | |
Brown Brothers Harriman | | | 12/14/20 | | | | CAD | | | | 78,776 | | | | USD | | | | 60,262 | | | | (540 | ) |
| | | | | | |
Brown Brothers Harriman | | | 12/14/20 | | | | EUR | | | | 94,782 | | | | USD | | | | 111,520 | | | | (1,912 | ) |
| | | | | | |
Brown Brothers Harriman | | | 12/14/20 | | | | NOK | | | | 100,852 | | | | USD | | | | 11,103 | | | | (288 | ) |
| | | | | | |
Brown Brothers Harriman | | | 12/14/20 | | | | HKD | | | | 1,603 | | | | USD | | | | 207 | | | | – | |
| | | | | | |
Brown Brothers Harriman | | | 12/14/20 | | | | HKD | | | | 118,481 | | | | USD | | | | 15,282 | | | | (2 | ) |
| | | | | | |
Brown Brothers Harriman | | | 12/14/20 | | | | SEK | | | | 265 | | | | USD | | | | 31 | | | | – | |
| | | | | | |
Brown Brothers Harriman | | | 12/14/20 | | | | SEK | | | | 128,558 | | | | USD | | | | 14,852 | | | | (192 | ) |
| | | | | | |
Brown Brothers Harriman | | | 12/14/20 | | | | JPY | | | | 76,420 | | | | USD | | | | 734 | | | | 1 | |
| | |
SEI Institutional Investments Trust / Semi-Annual Report / November 30, 2020 | | 35 |
SUMMARY SCHEDULE OF INVESTMENTS (Unaudited)
November 30, 2020
Global Managed Volatility Fund (Concluded)
| | | | | | | | | | | | | | | | | | | | |
| | | | | | | |
| Counterparty | | Settlement Date | | | | | Currency to Deliver
(Thousands) | | | | | Currency to Receive
(Thousands) | | | Unrealized
Appreciation
(Depreciation)
(Thousands) | |
Brown Brothers Harriman | | | 12/14/20 | | | JPY | | | 15,214,554 | | | USD | | | 144,084 | | | $ | (1,890) | |
| | | | | | | | | | | | | | | | | | | | |
| | | | | | | | | | | | | | | | | | $ | (7,242) | |
| | | | | | | | | | | | | | | | | | | | |
| | Percentages are based on a Net Assets of $2,925,166 ($ Thousands). |
| * | Non-income producing security. |
| ** | The rate reported is the 7-day effective yield as of November 30, 2020. |
| ‡ | Real Estate Investment Trust. |
| † | Investment in Affiliated Security (see Note 6). |
| (A) | Certain securities or partial positions of certain securities are on loan at November 30, 2020 (see Note 12). The total market value of securities on loan at November 30, 2020, was $9,761 ($ Thousands). |
| (B) | Security is a Master Limited Partnership. At November 30, 2020, such securities amounted to $31 ($ Thousands), or 0.00% of Net Assets of the Fund (see Note 2). |
| (C) | There is currently no rate available. |
| (D) | This security was purchased with cash collateral held from securities on loan (see Note 12). The total market value of such securities as of November 30, 2020 was $10,253 ($ Thousands). |
AUD — Australian Dollar
CAD — Canadian Dollar
CHF — Swiss Franc
Cl — Class
DKK — Danish Krone
EUR — Euro
FTSE— Financial Times Stock Exchange
GBP — British Pound Sterling
HKD — Hong Kong Dollar
JPY — Japanese Yen
NOK — Norwegian Krone
NZD — New Zealand Dollar
PLC — Public Limited Company
S&P — Standard & Poor’s
SEK — Swedish Krona
SGD — Singapore Dollar
SPI — Share Price Index
TOPIX — Tokyo Price Index
USD — United States Dollar
The Summary Schedule of Investments does not reflect the complete portfolio holdings. It includes the Fund’s 50 largest holdings and each investment of any issuer that exceeds 1% of the Fund’s net assets. “Other Securities” represent all issues not required to be disclosed under the rules adopted by the U.S. Securities and Exchange Commission (“SEC”). In certain instances, securities for which footnotes listed above may otherwise apply are included in the Other Securities caption. The complete schedule of portfolio holdings is available (i) without charge, upon request, by calling (800) 342-5734; and (ii) on the SEC’s website at http://www.sec.gov.
The following is a list of the level of inputs used as of November 30, 2020, in valuing the Fund’s investments and other financial instruments carried at value ($ Thousands):
| | | | | | | | | | | | | | | | |
| | | | | |
| Investments in Securities | | Level 1 ($) | | | Level 2 ($) | | | Level 3 ($) | | | Total ($) | |
Common Stock | | | 2,828,304 | | | | 176 | | | | – | | | | 2,828,480 | |
Preferred Stock | | | 9,376 | | | | – | | | | – | | | | 9,376 | |
Right | | | – | | | | – | | | | – | | | | – | |
Affiliated Partnership | | | – | | | | 10,253 | | | | – | | | | 10,253 | |
Cash Equivalent | | | 50,180 | | | | – | | | | – | | | | 50,180 | |
| | | | | | | | | | | | | | | | |
| | | | |
Total Investments in Securities | | | 2,887,860 | | | | 10,429 | | | | – | | | | 2,898,289 | |
| | | | | | | | | | | | | | | | |
| | | | | | | | | | | | | | | | |
| | | | | |
| Other Financial Instruments | | Level 1 ($) | | | Level 2 ($) | | | Level 3 ($) | | | Total ($) | |
Futures Contracts* | | | | | | | | | | | | | | | | |
Unrealized Appreciation | | | 1,673 | | | | – | | | | – | | | | 1,673 | |
Unrealized Depreciation | | | (4) | | | | – | | | | – | | | | (4) | |
Forwards Contracts* | | | | | | | | | | | | | | | | |
Unrealized Appreciation | | | – | | | | 71 | | | | – | | | | 71 | |
Unrealized Depreciation | | | – | | | | (7,313) | | | | – | | | | (7,313) | |
| | | | | | | | | | | | | | | | |
Total Other Financial Instruments | | | 1,669 | | | | (7,242) | | | | – | | | | (5,573) | |
| | | | | | | | | | | | | | | | |
* Futures contracts and forwards contracts are valued at the unrealized appreciation (depreciation) on the instrument.
For the period ended November 30, 2020, there were no transfers in or out of Level 3.
For more information on valuation inputs, see Note 2 — Significant Accounting Policies in Notes to Financial Statements.
The following is a summary of the Fund’s transactions with affiliates for the period ended November 30, 2020 ($ Thousands):
| | | | | | | | | | | | | | | | | | |
| | | | | | | | | | |
| Security Description | | Value
5/31/2020 | | Purchases
at Cost | | Proceeds
from Sales | | Realized
Gain/
(Loss) | | Change in
Unrealized
Appreciation/
(Depreciation) | | Value
11/30/2020 | | Shares | | Income | | Capital
Gains |
SEI Liquidity Fund, L.P. | | $ — | | $61,071 | | $(50,818) | | $ — | | $ — | | $10,253 | | 10,248,915 | | $ — | | $ — |
SEI Daily Income Trust, Government Fund, ClF | | 36,578 | | 168,442 | | (154,840) | | — | | — | | 50,180 | | 50,179,553 | | 3 | | — |
| | | | | | | | | | | | | | | | | | |
Totals | | $36,578 | | $229,513 | | $ (205,658) | | $ — | | $ — | | $60,433 | | | | $ 3 | | $ — |
| | | | | | | | | | | | | | | | | | |
Amounts designated as “—” are either $0 or have been rounded to $0.
The accompanying notes are an integral part of the financial statements.
| | |
36 | | SEI Institutional Investments Trust / Semi-Annual Report / November 30, 2020 |
SUMMARY SCHEDULE OF INVESTMENTS (Unaudited)
November 30, 2020
World Equity Ex-US Fund
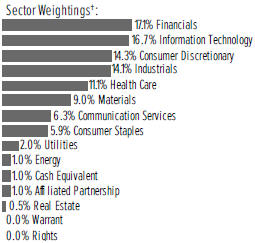
†Percentages are based on total investments. Includes investments held as collateral for securities held on loan (see Note 12).
| | | | | | | | | | | | |
| | | | |
| Description | | Percentage of Net Assets (%) | | Shares | | Market Value ($ Thousands) |
|
COMMON STOCK — 95.9% | |
|
Australia — 4.8% | |
BlueScope Steel Ltd | | | 0.5 | % | | | 4,013,344 | | | $ | 50,569 | |
Qantas Airways Ltd | | | 0.6 | | | | 13,878,374 | | | | 55,017 | |
Rio Tinto Ltd | | | 0.2 | | | | 297,980 | | | | 22,264 | |
Other Securities | | | 3.5 | | | | | | | | 337,197 | |
| | | | | | | | | | | | |
| | | | | | | | | | | 465,047 | |
| | | | | | | | | | | | |
|
Austria — 0.0% | |
Other Securities | | | 0.0 | | | | | | | | 2,482 | |
| | | | | | | | | | | | |
|
Belgium — 0.6% | |
Other Securities | | | 0.6 | | | | | | | | 54,068 | |
| | | | | | | | | | | | |
|
Brazil — 0.7% | |
Other Securities | | | 0.7 | | | | | | | | 71,751 | |
| | | | | | | | | | | | |
|
Canada — 2.3% | |
Other Securities | | | 2.3 | | | | | | | | 220,023 | |
| | | | | | | | | | | | |
|
China — 2.0% | |
Alibaba Group Holding Ltd ADR * | | | 0.2 | | | | 54,209 | | | | 14,277 | |
Other Securities | | | 1.8 | | | | | | | | 180,138 | |
| | | | | | | | | | | | |
| | | | | | | | | | | 194,415 | |
| | | | | | | | | | | | |
|
Denmark — 3.7% | |
Danske Bank A/S | | | 0.5 | | | | 3,044,600 | | | | 50,323 | |
Orsted A/S | | | 0.5 | | | | 271,576 | | | | 49,056 | |
Vestas Wind Systems A/S | | | 0.7 | | | | 330,006 | | | | 67,645 | |
Other Securities | | | 2.0 | | | | | | | | 190,473 | |
| | | | | | | | | | | | |
| | | | | | | | | | | 357,497 | |
| | | | | | | | | | | | |
| | | | | | | | | | | | |
| | | | |
| Description | | Percentage of Net Assets (%) | | Shares | | Market Value ($ Thousands) |
|
COMMON STOCK (continued) | |
|
Finland — 0.9% | |
Other Securities (A) | | | 0.9 | % | | | | | | $ | 85,354 | |
| | | | | | | | | | | | |
|
France — 5.5% | |
Cie de Saint-Gobain | | | 0.6 | | | | 1,217,514 | | | | 57,993 | |
L’Oreal SA | | | 0.5 | | | | 138,822 | | | | 50,947 | |
Sanofi | | | 0.9 | | | | 868,773 | | | | 88,033 | |
Other Securities | | | 3.5 | | | | | | | | 339,701 | |
| | | | | | | | | | | | |
| | | | | | | | | | | 536,674 | |
| | | | | | | | | | | | |
|
Germany — 5.6% | |
Deutsche Boerse AG | | | 0.7 | | | | 412,164 | | | | 68,901 | |
Rheinmetall AG | | | 0.7 | | | | 720,131 | | | | 64,228 | |
SAP SE | | | 0.7 | | | | 577,469 | | | | 70,445 | |
Other Securities | | | 3.5 | | | | | | | | 339,476 | |
| | | | | | | | | | | | |
| | | | | | | | | | | 543,050 | |
| | | | | | | | | | | | |
|
Greece — 0.0% | |
Other Securities | | | 0.0 | | | | | | | | 4,465 | |
| | | | | | | | | | | | |
|
Hong Kong — 7.3% | |
Alibaba Group Holding Ltd * | | | 0.9 | | | | 2,494,080 | | | | 84,096 | |
Alibaba Health Information Technology Ltd * | | | 0.0 | | | | 1,650,000 | | | | 4,853 | |
Hong Kong Exchanges & Clearing Ltd | | | 0.7 | | | | 1,295,432 | | | | 64,400 | |
Shanghai Pharmaceuticals Holding Co Ltd, Cl H | | | 0.6 | | | | 33,263,300 | | | | 56,293 | |
Other Securities | | | 5.1 | | | | | | | | 498,758 | |
| | | | | | | | | | | | |
| | | | | | | | | | | 708,400 | |
| | | | | | | | | | | | |
|
India — 1.7% | |
Tech Mahindra Ltd | | | 0.6 | | | | 4,730,873 | | | | 55,956 | |
Other Securities | | | 1.1 | | | | | | | | 104,971 | |
| | | | | | | | | | | | |
| | | | | | | | | | | 160,927 | |
| | | | | | | | | | | | |
|
Ireland — 1.8% | |
ICON PLC * | | | 0.8 | | | | 412,160 | | | | 80,322 | |
Other Securities | | | 1.0 | | | | | | | | 90,227 | |
| | | | | | | | | | | | |
| | | | | | | | | | | 170,549 | |
| | | | | | | | | | | | |
|
Israel — 0.7% | |
Other Securities (A) | | | 0.7 | | | | | | | | 65,452 | |
| | | | | | | | | | | | |
|
Italy — 1.4% | |
Other Securities | | | 1.4 | | | | | | | | 138,847 | |
| | | | | | | | | | | | |
|
Japan — 14.6% | |
Hitachi Ltd | | | 0.7 | | | | 1,749,000 | | | | 66,522 | |
Kobayashi Pharmaceutical Co Ltd | | | 0.5 | | | | 414,374 | | | | 49,872 | |
Mitsubishi UFJ Financial Group Inc | | | 0.6 | | | | 14,265,000 | | | | 61,356 | |
Nintendo Co Ltd | | | 0.7 | | | | 118,300 | | | | 67,230 | |
| | |
SEI Institutional Investments Trust / Semi-Annual Report / November 30, 2020 | | 37 |
SUMMARY SCHEDULE OF INVESTMENTS (Unaudited)
November 30, 2020
World Equity Ex-US Fund (Continued)
| | | | | | | | | | | | |
| | | | |
| Description | | Percentage of Net Assets (%) | | Shares | | Market Value ($ Thousands) |
|
COMMON STOCK (continued) | |
|
Japan (continued) | |
Nippon Telegraph & Telephone Corp | | | 0.5 | % | | | 2,113,200 | | | $ | 49,955 | |
PeptiDream Inc * | | | 0.5 | | | | 1,001,200 | | | | 51,080 | |
Recruit Holdings Co Ltd | | | 0.6 | | | | 1,316,200 | | | | 55,538 | |
SBI Holdings Inc/Japan | | | 0.5 | | | | 1,857,915 | | | | 50,423 | |
Sony Corp | | | 0.6 | | | | 585,400 | | | | 54,478 | |
Other Securities | | | 9.4 | | | | | | | | 906,970 | |
| | | | | | | | | | | | |
| | | | | | | | | | | 1,413,424 | |
| | | | | | | | | | | | |
|
Malaysia — 0.0% | |
Other Securities | | | 0.0 | | | | | | | | 998 | |
| | | | | | | | | | | | |
|
Mexico — 0.0% | |
Other Securities | | | 0.0 | | | | | | | | 2,675 | |
| | | | | | | | | | | | |
|
Netherlands — 5.8% | |
AerCap Holdings NV * | | | 0.5 | | | | 1,343,580 | | | | 49,390 | |
ASML Holding NV | | | 0.8 | | | | 187,897 | | | | 81,780 | |
NN Group NV | | | 1.1 | | | | 2,602,176 | | | | 105,988 | |
Prosus NV | | | 0.7 | | | | 591,814 | | | | 64,308 | |
Other Securities | | | 2.7 | | | | | | | | 260,274 | |
| | | | | | | | | | | | |
| | | | | | | | | | | 561,740 | |
| | | | | | | | | | | | |
|
New Zealand — 0.1% | |
Other Securities | | | 0.1 | | | | | | | | 10,561 | |
| | | | | | | | | | | | |
|
Norway — 1.3% | |
DNB ASA * | | | 0.7 | | | | 3,705,459 | | | | 67,423 | |
Other Securities | | | 0.6 | | | | | | | | 60,961 | |
| | | | | | | | | | | | |
| | | | | | | | | | | 128,384 | |
| | | | | | | | | | | | |
|
Poland — 0.1% | |
Other Securities | | | 0.1 | | | | | | | | 5,857 | |
| | | | | | | | | | | | |
|
Portugal — 0.4% | |
Other Securities | | | 0.4 | | | | | | | | 37,970 | |
| | | | | | | | | | | | |
| | | |
Russia — 1.0% | | | | | | | | | | | | |
Mobile TeleSystems PJSC ADR | | | 0.5 | | | | 5,740,066 | | | | 49,537 | |
Other Securities | | | 0.5 | | | | | | | | 44,027 | |
| | | | | | | | | | | | |
| | | | | | | | | | | 93,564 | |
| | | | | | | | | | | | |
|
Saudi Arabia — 0.0% | |
Other Securities | | | 0.0 | | | | | | | | 1,938 | |
| | | | | | | | | | | | |
|
Singapore — 0.1% | |
Other Securities | | | 0.1 | | | | | | | | 10,624 | |
| | | | | | | | | | | | |
| | | | | | | | | | | | |
| | | | |
| Description | | Percentage of Net Assets (%) | | Shares | | Market Value ($ Thousands) |
|
COMMON STOCK (continued) | |
|
South Africa — 0.1% | |
Other Securities | | | 0.1 | % | | | | | | $ | 12,060 | |
| | | | | | | | | | | | |
|
South Korea — 6.7% | |
Hana Financial Group Inc | | | 0.7 | | | | 2,086,412 | | | | 63,825 | |
NAVER Corp | | | 0.7 | | | | 272,034 | | | | 68,221 | |
Samsung Electronics Co Ltd | | | 2.3 | | | | 3,663,763 | | | | 220,842 | |
SK Hynix Inc | | | 0.9 | | | | 1,036,695 | | | | 91,345 | |
Other Securities | | | 2.1 | | | | | | | | 203,074 | |
| | | | | | | | | | | | |
| | | | | | | | | | | 647,307 | |
| | | | | | | | | | | | |
|
Spain — 1.5% | |
Siemens Gamesa Renewable Energy SA | | | 0.6 | | | | 1,691,505 | | | | 60,560 | |
Other Securities | | | 0.9 | | | | | | | | 81,132 | |
| | | | | | | | | | | | |
| | | | | | | | | | | 141,692 | |
| | | | | | | | | | | | |
|
Sweden — 1.8% | |
Other Securities | | | 1.8 | | | | | | | | 176,507 | |
| | | | | | | | | | | | |
|
Switzerland — 5.0% | |
Idorsia Ltd *(A) | | | 0.5 | | | | 1,647,203 | | | | 49,200 | |
LafargeHolcim Ltd | | | 0.7 | | | | 1,279,460 | | | | 67,358 | |
Novartis AG | | | 0.9 | | | | 946,442 | | | | 86,009 | |
Roche Holding AG | | | 1.5 | | | | 433,747 | | | | 143,281 | |
Other Securities | | | 1.4 | | | | | | | | 136,731 | |
| | | | | | | | | | | | |
| | | | | | | | | | | 482,579 | |
| | | | | | | | | | | | |
|
Taiwan — 3.1% | |
Taiwan Semiconductor Manufacturing Co Ltd | | | 1.1 | | | | 6,427,000 | | | | 108,347 | |
Other Securities | | | 2.0 | | | | | | | | 194,765 | |
| | | | | | | | | | | | |
| | | | | | | | | | | 303,112 | |
| | | | | | | | | | | | |
|
Thailand — 0.4% | |
Other Securities | | | 0.4 | | | | | | | | 39,484 | |
| | | | | | | | | | | | |
|
Turkey — 0.3% | |
Other Securities | | | 0.3 | | | | | | | | 28,629 | |
| | | | | | | | | | | | |
|
United Kingdom — 9.4% | |
Aptiv PLC | | | 0.5 | | | | 421,574 | | | | 50,041 | |
Atlassian Corp PLC, Cl A * | | | 0.6 | | | | 268,158 | | | | 60,349 | |
ConvaTec Group PLC | | | 0.5 | | | | 19,040,479 | | | | 52,568 | |
Rio Tinto PLC | | | 0.3 | | | | 402,588 | | | | 25,981 | |
Rio Tinto PLC ADR (A) | | | 0.0 | | | | 68,668 | | | | 4,461 | |
Other Securities (A) | | | 7.5 | | | | | | | | 721,181 | |
| | | | | | | | | | | | |
| | | | | | | | | | | 914,581 | |
| | | | | | | | | | | | |
|
United States — 5.2% | |
Accenture PLC, Cl A | | | 0.5 | | | | 209,369 | | | | 52,152 | |
| | |
38 | | SEI Institutional Investments Trust / Semi-Annual Report / November 30, 2020 |
| | | | | | | | | | | | |
| | | | |
| Description | | Percentage of
Net Assets (%) | | Shares | | Market Value ($ Thousands) |
|
COMMON STOCK (continued) | |
|
United States (continued) | |
Check Point Software Technologies Ltd * | | | 0.6 | % | | | 462,233 | | | $ | 54,395 | |
IHS Markit Ltd | | | 0.6 | | | | 608,689 | | | | 60,540 | |
MercadoLibre Inc * | | | 0.8 | | | | 50,111 | | | | 77,839 | |
Nomad Foods Ltd * | | | 0.7 | | | | 2,677,134 | | | | 64,653 | |
Other Securities (A) | | | 2.0 | | | | | | | | 193,317 | |
| | | | | | | | | | | | |
| | | | | | | | | | | 502,896 | |
| | | | | | | | | | | | |
|
Total Common Stock | |
(Cost $6,979,617) ($ Thousands) | | | | | | | | | | | 9,295,583 | |
| | | | | | | | | | | | |
|
PREFERRED STOCK — 0.2% | |
|
Brazil — 0.1% | |
Other Securities (B) | | | 0.1 | | | | | | | | 6,040 | |
| | | | | | | | | | | | |
|
Germany — 0.1% | |
Other Securities (B) | | | 0.1 | | | | | | | | 14,497 | |
| | | | | | | | | | | | |
|
Spain — 0.0% | |
Other Securities (B) | | | 0.0 | | | | | | | | 2,531 | |
| | | | | | | | | | | | |
|
Total Preferred Stock | |
(Cost $27,002) ($ Thousands) | | | | | | | | | | | 23,068 | |
| | | | | | | | | | | | |
|
WARRANT — 0.0% | |
|
Switzerland — 0.0% | |
| | | | | | | | | | | | |
| | | | |
| Description | | Percentage of
Net Assets (%) | | Shares | | Market Value ($ Thousands) |
|
PREFERRED STOCK (continued) | |
|
Spain (continued) | |
Other Securities* | | | 0.0 | % | | | | | | $ | 10 | |
| | | | | | | | | | | | |
| | | |
Total Warrant | �� | | | | | | | | | | | |
(Cost $–) ($ Thousands) | | | | | | | | | | | 10 | |
| | | | | | | | | | | | |
|
RIGHTS — 0.0% | |
|
Taiwan — 0.0% | |
Other Securities* (C) | | | 0.0 | | | | | | | | – | |
| | | | | | | | | | | | |
| | | |
Total Rights | | | | | | | | | | | | |
(Cost $–) ($ Thousands) | | | | | | | | | | | – | |
| | | | | | | | | | | | |
|
AFFILIATED PARTNERSHIP — 1.0% | |
SEI Liquidity Fund, L.P. 0.070% **†(D) | | | 1.0 | | | | 93,112,091 | | | | 93,131 | |
| | | | | | | | | | | | |
|
Total Affiliated Partnership | |
(Cost $93,114) ($ Thousands) | | | | | | | | | | | 93,131 | |
| | | | | | | | | | | | |
|
CASH EQUIVALENT — 1.0% | |
SEI Daily Income Trust, Government Fund, Cl F 0.010% **† | | | 1.0 | | | | 94,391,178 | | | | 94,391 | |
| | | | | | | | | | | | |
|
Total Cash Equivalent | |
(Cost $94,391) ($ Thousands) | | | | | | | | | | | 94,391 | |
| | | | | | | | | | | | |
|
Total Investments in Securities — 98.1% | |
(Cost $7,194,124) ($ Thousands) | | | | | | | | | | $ | 9,506,183 | |
| | | | | | | | | | | | |
A list of the open futures contracts held by the Fund at November 30, 2020 is as follows:
| | | | | | | | | | | | | | | | | | | | |
| | | | | | |
| Type of Contract | | Number of
Contracts Long | | | Expiration
Date | | | Notional Amount
(Thousands) | | | Value
(Thousands) | | | Unrealized Appreciation
(Depreciation) (Thousands) | |
Euro STOXX 50 | | | 824 | | | | Dec-2020 | | | $ | 33,198 | | | $ | 34,548 | | | $ | 952 | |
FTSE 100 Index | | | 155 | | | | Dec-2020 | | | | 12,585 | | | | 13,021 | | | | 239 | |
Hang Seng Index | | | 38 | | | | Jan-2021 | | | | 6,525 | | | | 6,478 | | | | (46 | ) |
S&P TSX 60 Index | | | 74 | | | | Dec-2020 | | | | 11,146 | | | | 11,684 | | | | 525 | |
SPI 200 Index | | | 69 | | | | Dec-2020 | | | | 7,921 | | | | 8,299 | | | | 291 | |
TOPIX Index | | | 166 | | | | Dec-2020 | | | | 26,519 | | | | 27,947 | | | | 1,127 | |
| | | | | | | | | | | | | | | | | | | | |
| | | | | | | | | | $ | 97,894 | | | $ | 101,977 | | | $ | 3,088 | |
| | | | | | | | | | | | | | | | | | | | |
A list of the open forward foreign currency contracts held by the Fund at November 30, 2020 is as follows:
| | | | | | | | | | | | | | | | | | | | | | | | |
| | | | | | | |
| Counterparty | | Settlement Date | | | | | | Currency to Deliver
(Thousands) | | | | | | Currency to Receive
(Thousands) | | | Unrealized
Appreciation
(Depreciation)
(Thousands) | |
Bank of America | | | 03/15/21 | | | | USD | | | | 1,396 | | | | EUR | | | | 1,178 | | | $ | 16 | |
Barclays PLC | | | 01/14/21 | | | | KRW | | | | 27,624,370 | | | | USD | | | | 24,945 | | | | 7 | |
Barclays PLC | | | 03/15/21 | | | | GBP | | | | 7,972 | | | | USD | | | | 10,675 | | | | 24 | |
Citigroup | | | 01/05/21 | | | | USD | | | | 7,364 | | | | BRL | | | | 39,296 | | | | (70 | ) |
| | |
SEI Institutional Investments Trust / Semi-Annual Report / November 30, 2020 | | 39 |
SUMMARY SCHEDULE OF INVESTMENTS (Unaudited)
November 30, 2020
World Equity Ex-US Fund (Concluded)
| | | | | | | | | | | | | | | | | | | | | | | | |
| | | | | | | |
| Counterparty | | Settlement Date | | | | | | Currency to Deliver
(Thousands) | | | | | | Currency to Receive
(Thousands) | | | Unrealized
Appreciation
(Depreciation)
(Thousands) | |
| | | | | | |
Citigroup | | | 01/14/21 | | | | KRW | | | | 2,635,226 | | | | USD | | | | 2,377 | | | $ | (2) | |
| | | | | | |
Citigroup | | | 03/15/21 | | | | USD | | | | 50,857 | | | | CHF | | | | 46,034 | | | | 178 | |
| | | | | | |
Citigroup | | | 03/15/21 | | | | USD | | | | 63,493 | | | | CNY | | | | 420,580 | | | | (85) | |
| | | | | | |
Citigroup | | | 03/15/21 | | | | EUR | | | | 125,929 | | | | USD | | | | 150,129 | | | | (900) | |
| | | | | | |
Credit Suisse First Boston | | | 03/15/21 | | | | USD | | | | 39,719 | | | | SEK | | | | 338,056 | | | | (99) | |
| | | | | | |
Goldman Sachs | | | 01/22/21 | | | | RUB | | | | 493,981 | | | | USD | | | | 6,481 | | | | 54 | |
| | | | | | |
Goldman Sachs | | | 03/15/21 | | | | USD | | | | 90,739 | | | | CAD | | | | 117,967 | | | | 349 | |
| | | | | | |
Goldman Sachs | | | 03/16/21 | | | | USD | | | | 8,579 | | | | MXN | | | | 174,153 | | | | (32) | |
| | | | | | |
HSBC | | | 03/15/21 | | | | ILS | | | | 82,232 | | | | USD | | | | 24,773 | | | | (145) | |
| | | | | | |
JPMorgan Chase Bank | | | 03/15/21 | | | | USD | | | | 9,924 | | | | EUR | | | | 8,405 | | | | 157 | |
| | | | | | |
JPMorgan Chase Bank | | | 03/15/21 | | | | USD | | | | 25,077 | | | | CNY | | | | 166,232 | | | | (16) | |
| | | | | | |
Morgan Stanley | | | 02/18/21 | | | | GBP | | | | 26,639 | | | | USD | | | | 35,158 | | | | (429) | |
| | | | | | |
Morgan Stanley | | | 02/18/21 | | | | USD | | | | 35,416 | | | | GBP | | | | 26,639 | | | | 170 | |
| | | | | | |
Morgan Stanley | | | 03/15/21 | | | | HKD | | | | 152,846 | | | | USD | | | | 19,721 | | | | 1 | |
| | | | | | |
RBS | | | 03/15/21 | | | | USD | | | | 9,649 | | | | EUR | | | | 8,149 | | | | 124 | |
| | | | | | |
RBS | | | 03/15/21 | | | | EUR | | | | 61,960 | | | | USD | | | | 72,281 | | | | (2,029) | |
| | | | | | |
Standard Bank | | | 01/15/21 | | | | USD | | | | 6,891 | | | | INR | | | | 510,750 | | | | (16) | |
| | | | | | | | | | | | | | | | | | | | | | | | |
| | | | | | | | | | | | | | | | | | | | | | $ | (2,743) | |
| | | | | | | | | | | | | | | | | | | | | | | | |
| | Percentages are based on a Net Assets of $9,686,845 ($ Thousands). |
| * | Non-income producing security. |
| ** | The rate reported is the 7-day effective yield as of November 30, 2020. |
| † | Investment in Affiliated Security (see Note 6). |
| (A) | Certain securities or partial positions of certain securities are on loan at November 30, 2020 (see Note 12). The total market value of securities on loan at November 30, 2020, was $88,627 ($ Thousands). |
| (B) | There is currently no rate available. |
| (C) | Level 3 security in accordance with fair value hierarchy. |
| (D) | This security was purchased with cash collateral held from securities on loan (see Note 12). The total market value of such securities as of November 30, 2020 was $93,131 ($ Thousands). |
| ADR | — American Depositary Receipt |
| CNY | — Chinese Yuan Onshore |
| FTSE— | Financial Times and Stock Exchange |
| GBP | — British Pound Sterling |
| ILS | — Israeli New Sheckels |
| L.P. | — Limited Partnership |
| PJSC | — Public Joint-Stock Company |
| PLC | — Public Limited Company |
| TSX | — Toronto Stock Exchange |
The Summary Schedule of Investments does not reflect the complete portfolio holdings. It includes the Fund’s 50 largest holdings and each investment of any issuer that exceeds 1% of the Fund’s net assets. “Other Securities” represent all issues not required to be disclosed under the rules adopted by the U.S. Securities and Exchange Commission (“SEC”). In certain instances, securities for which footnotes listed above may otherwise apply are included in the Other Securities caption. The complete schedule of portfolio holdings is available (i) without charge, upon request, by calling (800) 342-5734; and (ii) on the SEC’s website at http://www.sec.gov.
| | |
40 | | SEI Institutional Investments Trust / Semi-Annual Report / November 30, 2020 |
The following is a list of the level of inputs used as of November 30, 2020, in valuing the Fund’s investments and other financial instruments carried at value ($ Thousands):
| | | | | | | | | | | | | | | | |
| | | | | |
| Investments in Securities | | Level 1 ($) | | Level 2
($) | | Level 3
($)(1) | | Total ($) |
| | | | |
Common Stock | | | 9,257,298 | | | | 38,285 | | | | – | | | | 9,295,583 | |
| | | | |
Preferred Stock | | | 20,537 | | | | 2,531 | | | | – | | | | 23,068 | |
| | | | |
Warrant | | | – | | | | 10 | | | | – | | | | 10 | |
| | | | |
Rights | | | – | | | | – | | | | –^ | | | | – | |
| | | | |
Affiliated Partnership | | | – | | | | 93,131 | | | | – | | | | 93,131 | |
| | | | |
Cash Equivalent | | | 94,391 | | | | – | | | | – | | | | 94,391 | |
| | | | | | | | | | | | | | | | |
| | | | |
Total Investments in Securities | | | 9,372,226 | | | | 133,957 | | | | – | | | | 9,506,183 | |
| | | | | | | | | | | | | | | | |
| | | | |
| | | | | | | | | | | | | | | | |
| | | | | |
| Other Financial Instruments | | Level 1
($) | | Level 2
($) | | Level 3
($) | | Total ($) |
Futures Contracts* | | | | | | | | | | | | | | | | |
Unrealized Appreciation | | | 3,134 | | | | – | | | | – | | | | 3,134 | |
Unrealized Depreciation | | | (46 | ) | | | – | | | | – | | | | (46 | ) |
| | | | | | | | | | | | | | | | |
| | | | | |
| Other Financial Instruments | | Level 1 ($) | | Level 2 ($) | | Level 3 ($) | | Total ($) |
| | | | |
Forwards Contracts* | | | | | | | | | | | | | | | | |
| | | | |
Unrealized Appreciation | | | – | | | | 1,080 | | | | – | | | | 1,080 | |
| | | | |
Unrealized Depreciation | | | – | | | | (3,823 | ) | | | – | | | | (3,823 | ) |
| | | | | | | | | | | | | | | | |
| | | | |
Total Other Financial Instruments | | | 3,088 | | | | (2,743 | ) | | | – | | | | 345 | |
| | | | | | | | | | | | | | | | |
(1) A reconciliation of Level 3 investments is presented when the Fund has a significant amount of Level 3 investments at the beginning and/or end of the period in relation to net assets. Management has concluded that Level 3 investments are not material in relation to net assets.
^ Securities market value less than $500.
* Futures contracts and forward contracts are valued at the unrealized appreciation (depreciation) on the instrument.
For the period ended November 30, 2020, there were no transfers in our out of Level 3.
For more information on valuation inputs, see Note 2 — Significant Accounting Policies in Notes to Financial Statements.
The following is a summary of the Fund’s transactions with affiliates for the period ended November 30, 2020 ($ Thousands):
| | | | | | | | | | | | | | | | | | |
| | | | | | | | | | |
| Security Description | | Value 5/31/2020 | | Purchases at Cost | | Proceeds from
Sales | | Realized
Gain/
(Loss) | | Change in
Unrealized
Appreciation/
(Depreciation) | | Value
11/30/2020 | | Shares | | Income | | Capital Gains |
| | | | | | | | | |
SEI Liquidity Fund, L.P. | | $73,249 | | $ 495,049 | | $ (475,128) | | $(13) | | $(26) | | $ 93,131 | | 93,112,091 | | $ 1,216 | | $ — |
| | | | | | | | | |
SEI Daily Income Trust, Government Fund, Cl F | | 156,154 | | 460,187 | | (521,950) | | — | | — | | 94,391 | | 94,391,178 | | 6 | | — |
| | | | | | | | | | | | | | | | | | |
| | | | | | | | | |
Totals | | $229,403 | | $ 955,236 | | $ (997,078) | | $(13) | | $(26) | | $ 187,522 | | | | $ 1,222 | | $ — |
| | | | | | | | | | | | | | | | | | |
Amounts designated as “—” are either $0 or have been rounded to $0.
The accompanying notes are an integral part of the financial statements.
| | |
SEI Institutional Investments Trust / Semi-Annual Report / November 30, 2020 | | 41 |
SUMMARY SCHEDULE OF INVESTMENTS (Unaudited)
November 30, 2020
Screened World Equity Ex-US Fund
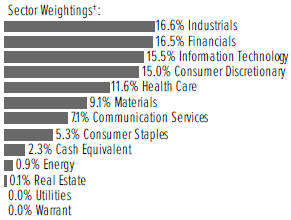
†Percentages are based on total investments.
| | | | | | | | | | | | |
| | | | |
| Description | | Percentage of
Net Assets (%) | | Shares | | Market Value
($ Thousands) |
|
COMMON STOCK — 94.5% | |
|
Australia — 4.6% | |
BHP Group Ltd | | | 0.4 | % | | | 16,495 | | | $ | 463 | |
Fortescue Metals Group Ltd | | | 0.8 | | | | 66,393 | | | | 892 | |
Qantas Airways Ltd * | | | 0.9 | | | | 241,331 | | | | 957 | |
Rio Tinto Ltd | | | 0.4 | | | | 6,011 | | | | 449 | |
Other Securities | | | 2.1 | | | | | | | | 2,441 | |
| | | | | | | | | | | | |
| | | | | | | | | | | 5,202 | |
| | | | | | | | | | | | |
|
Austria — 0.3% | |
Other Securities | | | 0.3 | | | | | | | | 283 | |
| | | | | | | | | | | | |
|
Belgium — 0.6% | |
Other Securities | | | 0.6 | | | | | | | | 645 | |
| | | | | | | | | | | | |
|
Brazil — 0.3% | |
Other Securities | | | 0.3 | | | | | | | | 277 | |
| | | | | | | | | | | | |
|
Canada — 2.4% | |
Lundin Mining Corp | | | 0.7 | | | | 98,300 | | | | 787 | |
Other Securities | | | 1.7 | | | | | | | | 1,874 | |
| | | | | | | | | | | | |
| | | | | | | | | | | 2,661 | |
| | | | | | | | | | | | |
|
China — 3.3% | |
Alibaba Group Holding Ltd ADR * | | | 0.5 | | | | 2,160 | | | | 569 | |
Midea Group Co Ltd, Cl A | | | 0.6 | | | | 50,300 | | | | 664 | |
Other Securities | | | 2.2 | | | | | | | | 2,492 | |
| | | | | | | | | | | | |
| | | | | | | | | | | 3,725 | |
| | | | | | | | | | | | |
|
Denmark — 3.8% | |
Danske Bank A/S * | | | 0.8 | | | | 51,934 | | | | 858 | |
Novo Nordisk A/S, Cl B | | | 0.9 | | | | 15,787 | | | | 1,065 | |
Other Securities | | | 2.1 | | | | | | | | 2,326 | |
| | | | | | | | | | | | |
| | | |
| | | | | | | | | | | 4,249 | |
| | | | | | | | | | | | |
| | | | | | | | | | | | |
| | | | |
| Description | | Percentage of
Net Assets (%) | | Shares | | Market Value
($ Thousands) |
|
COMMON STOCK (continued) | |
|
Finland — 1.3% | |
Other Securities | | | 1.3 | % | | | | | | $ | 1,430 | |
| | | | | | | | | | | | |
|
France — 4.2% | |
Cie de Saint-Gobain * | | | 0.9 | | | | 20,787 | | | | 990 | |
Sanofi | | | 1.0 | | | | 11,056 | | | | 1,120 | |
Other Securities | | | 2.3 | | | | | | | | 2,572 | |
| | | | | | | | | | | | |
| | | | | | | | | | | 4,682 | |
| | | | | | | | | | | | |
|
Germany — 5.4% | |
Muenchener Rueckversicherungs- Gesellschaft AG in Muenchen | | | 0.8 | | | | 3,124 | | | | 873 | |
Rheinmetall AG | | | 1.0 | | | | 12,280 | | | | 1,095 | |
Other Securities | | | 3.6 | | | | | | | | 4,152 | |
| | | | | | | | | | | | |
| | | | | | | | | | | 6,120 | |
| | | | | | | | | | | | |
|
Greece — 0.2% | |
Other Securities | | | 0.2 | | | | | | | | 177 | |
| | | | | | | | | | | | |
|
Hong Kong — 7.8% | |
Alibaba Group Holding Ltd * | | | 1.4 | | | | 45,400 | | | | 1,531 | |
Alibaba Health Information Technology Ltd * | | | 0.2 | | | | 52,000 | | | | 153 | |
Industrial & Commercial Bank of China Ltd, Cl H | | | 0.6 | | | | 1,059,000 | | | | 672 | |
Shanghai Pharmaceuticals Holding Co Ltd, Cl H | | | 0.7 | | | | 423,500 | | | | 717 | |
Tencent Holdings Ltd | | | 0.8 | | | | 11,900 | | | | 864 | |
Topsports International Holdings | | | 0.7 | | | | 507,000 | | | | 755 | |
Xinyi Glass Holdings Ltd | | | 0.8 | | | | 394,000 | | | | 885 | |
Other Securities | | | 2.6 | | | | | | | | 3,234 | |
| | | | | | | | | | | | |
| | | | | | | | | | | 8,811 | |
| | | | | | | | | | | | |
|
India — 2.6% | |
Tech Mahindra Ltd | | | 0.9 | | | | 84,476 | | | | 999 | |
Other Securities | | | 1.7 | | | | | | | | 1,885 | |
| | | | | | | | | | | | |
| | | | | | | | | | | 2,884 | |
| | | | | | | | | | | | |
|
Indonesia — 0.1% | |
Other Securities | | | 0.1 | | | | | | | | 65 | |
| | | | | | | | | | | | |
|
Ireland — 1.4% | |
ICON PLC * | | | 0.6 | | | | 3,669 | | | | 715 | |
Other Securities | | | 0.8 | | | | | | | | 889 | |
| | | | | | | | | | | | |
| | | | | | | | | | | 1,604 | |
| | | | | | | | | | | | |
|
Israel — 0.5% | |
Other Securities | | | 0.5 | | | | | | | | 563 | |
| | | | | | | | | | | | |
|
Italy — 0.9% | |
Other Securities | | | 0.9 | | | | | | | | 1,014 | |
| | | | | | | | | | | | |
| | |
42 | | SEI Institutional Investments Trust / Semi-Annual Report / November 30, 2020 |
| | | | | | | | | | | | |
| | | | |
| Description | | Percentage of
Net Assets (%) | | Shares | | Market Value
($ Thousands) |
|
COMMON STOCK (continued) | |
|
Japan — 11.1% | |
Alps Alpine Co Ltd | | | 0.6 | % | | | 53,900 | | | $ | 676 | |
Daiwa Securities Group Inc | | | 0.7 | | | | 189,700 | | | | 826 | |
Fujitsu Ltd | | | 0.7 | | | | 5,500 | | | | 765 | |
Hitachi Ltd | | | 1.0 | | | | 30,000 | | | | 1,141 | |
KDDI Corp | | | 0.6 | | | | 24,500 | | | | 701 | |
Nintendo Co Ltd | | | 0.9 | | | | 1,800 | | | | 1,023 | |
Nippon Telegraph & Telephone Corp | | | 0.6 | | | | 28,040 | | | | 663 | |
Okinawa Cellular Telephone Co | | | 0.0 | | | | 700 | | | | 29 | |
Takeda Pharmaceutical Co Ltd | | | 0.7 | | | | 22,600 | | | | 812 | |
Other Securities | | | 5.3 | | | | | | | | 5,837 | |
| | | | | | | | | | | | |
| | | | | | | | | | | 12,473 | |
| | | | | | | | | | | | |
|
Malaysia — 0.6% | |
Other Securities | | | 0.6 | | | | | | | | 694 | |
| | | | | | | | | | | | |
|
Mexico — 0.0% | |
Other Securities | | | 0.0 | | | | | | | | 16 | |
| | | | | | | | | | | | |
|
Netherlands — 5.8% | |
Koninklijke Ahold Delhaize NV | | | 0.6 | | | | 24,230 | | | | 695 | |
Koninklijke Philips NV * | | | 1.4 | | | | 29,952 | | | | 1,554 | |
NN Group NV | | | 1.3 | | | | 36,856 | | | | 1,501 | |
Other Securities | | | 2.5 | | | | | | | | 2,718 | |
| | | | | | | | | | | | |
| | | | | | | | | | | 6,468 | |
| | | | | | | | | | | | |
|
New Zealand — 0.3% | |
Other Securities | | | 0.3 | | | | | | | | 344 | |
| | | | | | | | | | | | |
|
Norway — 1.2% | |
DNB ASA * | | | 1.2 | | | | 71,364 | | | | 1,299 | |
Other Securities | | | 0.0 | | | | | | | | 60 | |
| | | | | | | | | | | | |
| | | | | | | | | | | 1,359 | |
| | | | | | | | | | | | |
|
Peru — 0.0% | |
Other Securities | | | 0.0 | | | | | | | | 9 | |
| | | | | | | | | | | | |
|
Philippines — 0.0% | |
Other Securities | | | 0.0 | | | | | | | | 24 | |
| | | | | | | | | | | | |
|
Poland — 0.4% | |
Other Securities | | | 0.4 | | | | | | | | 391 | |
| | | | | | | | | | | | |
|
Portugal — 0.0% | |
Other Securities | | | 0.0 | | | | | | | | 28 | |
| | | | | | | | | | | | |
|
Qatar — 0.1% | |
Other Securities | | | 0.1 | | | | | | | | 146 | |
| | | | | | | | | | | | |
| | | | | | | | | | | | |
| | | | |
| Description | | Percentage of
Net Assets (%) | | Shares | | Market Value
($ Thousands) |
|
COMMON STOCK (continued) | |
|
Russia — 1.1% | |
Mobile TeleSystems PJSC ADR | | | 0.7 | % | | | 97,849 | | | $ | 845 | |
Other Securities | | | 0.4 | | | | | | | | 436 | |
| | | | | | | | | | | | |
| | | | | | | | | | | 1,281 | |
| | | | | | | | | | | | |
|
Singapore — 0.9% | |
Other Securities | | | 0.9 | | | | | | | | 953 | |
| | | | | | | | | | | | |
|
South Africa — 0.3% | |
Other Securities | | | 0.3 | | | | | | | | 351 | |
| | | | | | | | | | | | |
|
South Korea — 6.4% | |
Coway Co Ltd * | | | 0.8 | | | | 14,795 | | | | 928 | |
Hana Financial Group Inc | | | 0.8 | | | | 30,934 | | | | 946 | |
Samsung Electronics Co Ltd | | | 1.7 | | | | 31,109 | | | | 1,875 | |
Samsung Electronics Co Ltd GDR | | | 1.2 | | | | 885 | | | | 1,340 | |
Other Securities | | | 1.9 | | | | | | | | 2,135 | |
| | | | | | | | | | | | |
| | | | | | | | | | | 7,224 | |
| | | | | | | | | | | | |
|
Spain — 0.9% | |
Other Securities | | | 0.9 | | | | | | | | 1,017 | |
| | | | | | | | | | | | |
|
Sweden — 3.6% | |
Swedish Match AB | | | 0.6 | | | | 8,970 | | | | 725 | |
Volvo AB, Cl B * | | | 0.6 | | | | 29,287 | | | | 667 | |
Other Securities | | | 2.4 | | | | | | | | 2,676 | |
| | | | | | | | | | | | |
| | | | | | | | | | | 4,068 | |
| | | | | | | | | | | | |
|
Switzerland — 5.9% | |
LafargeHolcim Ltd | | | 1.0 | | | | 22,022 | | | | 1,159 | |
Novartis AG | | | 1.6 | | | | 19,873 | | | | 1,806 | |
Roche Holding AG | | | 0.9 | | | | 3,245 | | | | 1,072 | |
Other Securities | | | 2.4 | | | | | | | | 2,648 | |
| | | | | | | | | | | | |
| | | | | | | | | | | 6,685 | |
| | | | | | | | | | | | |
|
Taiwan — 2.3% | |
Hon Hai Precision Industry Co Ltd | | | 0.6 | | | | 242,000 | | | | 699 | |
Taiwan Semiconductor Manufacturing Co Ltd | | | 1.0 | | | | 66,000 | | | | 1,112 | |
Other Securities | | | 0.7 | | | | | | | | 800 | |
| | | | | | | | | | | | |
| | | | | | | | | | | 2,611 | |
| | | | | | | | | | | | |
|
Thailand — 0.6% | |
Siam Commercial Bank PCL/The | | | 0.6 | | | | 246,500 | | | | 697 | |
| | | | | | | | | | | | |
| | | | | | | | | | | 697 | |
| | | | | | | | | | | | |
|
Turkey — 1.0% | |
Other Securities | | | 1.0 | | | | | | | | 1,166 | |
| | | | | | | | | | | | |
|
United Kingdom — 7.7% | |
BHP Group PLC | | | 0.2 | | | | 8,900 | | | | 202 | |
Kingfisher PLC * | | | 0.6 | | | | 181,771 | | | | 664 | |
| | |
SEI Institutional Investments Trust / Semi-Annual Report / November 30, 2020 | | 43 |
SUMMARY SCHEDULE OF INVESTMENTS (Unaudited)
November 30, 2020
Screened World Equity Ex-US Fund (Concluded)
| | | | | | | | | | | | |
| | | | |
| Description | | Percentage of
Net Assets (%) | | Shares | | Market Value
($ Thousands) |
|
COMMON STOCK (continued) | |
|
United Kingdom (continued) | |
Rio Tinto PLC | | | 0.2 | % | | | 2,953 | | | $ | 191 | |
Rio Tinto PLC ADR | | | 0.3 | | | | 5,359 | | | | 348 | |
Smiths Group PLC | | | 0.9 | | | | 51,883 | | | | 1,011 | |
Other Securities | | | 5.5 | | | | | | | | 6,250 | |
| | | | | | | | | | | | |
| | | | | | | | | | | 8,666 | |
| | | | | | | | | | | | |
|
United States — 4.6% | |
Check Point Software Technologies Ltd* | | | 1.3 | | | | 11,984 | | | | 1,410 | |
MercadoLibre Inc* | | | 0.8 | | | | 601 | | | | 933 | |
Nomad Foods Ltd * | | | 1.0 | | | | 45,991 | | | | 1,111 | |
Other Securities | | | 1.5 | | | | | | | | 1,764 | |
| | | | | | | | | | | | |
| | | | | | | | | | | 5,218 | |
| | | | | | | | | | | | |
Total Common Stock (Cost $82,701) ($ Thousands) | | | | | | | | | | | 106,281 | |
| | | | | | | | | | | | |
|
PREFERRED STOCK — 0.3% | |
|
Brazil — 0.1% | |
Other Securities (A) | | | 0.1 | | | | | | | | 49 | |
| | | | | | | | | | | | |
| | | | | | | | | | | | |
| | | | |
| Description | | Percentage of
Net Assets (%) | | Shares | | Market Value
($ Thousands) |
|
PREFERRED STOCK (continued) | |
|
Germany — 0.2% | |
Other Securities (A) | | | 0.2 | % | | | | | | $ | 242 | |
| | | | | | | | | | | | |
| | | |
Total Preferred Stock (Cost $346) ($ Thousands) | | | | | | | | | | | 291 | |
|
WARRANT — 0.0% | |
|
Switzerland — 0.0% | |
Other Securities* | | | 0.0 | | | | | | | | – | |
| | | | | | | | | | | | |
| | | |
Total Warrant (Cost $–) ($ Thousands) | | | | | | | | | | | – | |
| | | | | | | | | | | | |
|
CASH EQUIVALENT — 2.2% | |
SEI Daily Income Trust, Government Fund, Cl F 0.010% **† | | | 2.2 | | | | 2,521,893 | | | | 2,522 | |
| | | | | | | | | | | | |
| | | |
Total Cash Equivalent (Cost $2,522) ($ Thousands) | | | | | | | | | | | 2,522 | |
| | | | | | | | | | | | |
| | | |
Total Investments in Securities — 97.0% (Cost $85,569)($ Thousands) | | | | | | | | | | $ | 109,094 | |
| | | | | | | | | | | | |
A list of the open futures contracts held by the Fund at November 30, 2020, is as follows:
| | | | | | | | | | | | | | | | | | | | |
| | | | | | |
| Type of Contract | | Number of
Contracts Long | | | Expiration
Date | | | Notional Amount
(Thousands) | | | Value
(Thousands) | | | Unrealized Appreciation
(Depreciation) (Thousands) | |
| | | | | |
Euro STOXX 50 | | | 22 | | | | Dec-2020 | | | $ | 889 | | | $ | 922 | | | $ | 23 | |
| | | | | |
FTSE 100 Index | | | 4 | | | | Dec-2020 | | | | 339 | | | | 336 | | | | (4) | |
| | | | | |
Hang Seng Index | | | 1 | | | | Jan-2021 | | | | 173 | | | | 170 | | | | (2) | |
| | | | | |
S&P TSX 60 Index | | | 2 | | | | Dec-2020 | | | | 316 | | | | 316 | | | | (1) | |
| | | | | |
SPI 200 Index | | | 2 | | | | Dec-2020 | | | | 238 | | | | 241 | | | | – | |
| | | | | |
TOPIX Index | | | 5 | | | | Dec-2020 | | | | 841 | | | | 842 | | | | (3) | |
| | | | | | | | | | | | | | | | | | | | |
| | | | | |
| | | | | | | | | | $ | 2,796 | | | $ | 2,827 | | | $ | 13 | |
| | | | | | | | | | | | | | | | | | | | |
A list of the open forward foreign currency contracts held by the Fund at November 30, 2020, is as follows:
| | | | | | | | | | | | | | | | | | | | | | | | |
| | | | | | | |
| Counterparty | | Settlement Date | | | | | | Currency to Deliver
(Thousands) | | | | | | Currency to Receive
(Thousands) | | | Unrealized
Appreciation
(Depreciation)
(Thousands) | |
| | | | | | |
Brown Brothers Harriman | | | 02/18/21 | | | | GBP | | | | 530 | | | | USD | | | | 699 | | | $ | (9) | |
| | | | | | |
Brown Brothers Harriman | | | 02/18/21 | | | | USD | | | | 704 | | | | GBP | | | | 530 | | | | 4 | |
| | | | | | | | | | | | | | | | | | | | | | | | |
| | | | | | |
| | | | | | | | | | | | | | | | | | | | | | $ | (5) | |
| | | | | | | | | | | | | | | | | | | | | | | | |
| | Percentages are based on a Net Assets of $112,427 ($ Thousands). |
| * | Non-income producing security. |
| ** | The rate reported is the 7-day effective yield as of November 30, 2020. |
| † | Investment in Affiliated Security (see Note 6). |
| (A) | There is currently no rate available. |
| ADR | — American Depositary Receipt |
| FTSE— | Financial Times Stock Exchange |
| GBP | — British Pound Sterling |
| GDR | — Global Depositary Receipt |
| | |
44 | | SEI Institutional Investments Trust / Semi-Annual Report / November 30, 2020 |
PJSC – Public Joint-Stock Company
PLC – Public Limited Company
S&P– Standard & Poor’s
SPI – Share Price Index
TOPIX - Tokyo Price Index
TSX – Toronto Stock Exchange
USD – U.S. Dollar
The Summary Schedule of Investments does not reflect the complete portfolio holdings. It includes the Fund’s 50 largest holdings and each investment of any issuer that exceeds 1% of the Fund’s net assets. “Other Securities” represent all issues not required to be disclosed under the rules adopted by the U.S. Securities and Exchange Commission (“SEC”). In certain instances, securities for which footnotes listed above may otherwise apply are included in the Other Securities caption. The complete schedule of portfolio holdings is available (i) without charge, upon request, by calling (800) 342-5734; and (ii) on the SEC’s website at http://www.sec.gov.
The following is a list of the level of inputs used as of November 30, 2020, in valuing the Fund’s investments and other financial instruments carried at value ($ Thousands):
| | | | | | | | | | | | | | | | |
| | | | | |
| Investments in Securities | | Level 1
($) | | Level 2
($) | | Level 3
($) | | Total ($) |
| | | | |
Common Stock | | | 103,834 | | | | 2,447 | | | | – | | | | 106,281 | |
| | | | |
Preferred Stock | | | 291 | | | | – | | | | – | | | | 291 | |
| | | | |
Warrant | | | – | | | | – | | | | – | | | | – | |
| | | | |
Cash Equivalent | | | 2,522 | | | | – | | | | – | | | | 2,522 | |
| | | | |
| | | | | | | | | | | | | | | | |
| | | | |
Total Investments in Securities | | | 106,647 | | | | 2,447 | | | | – | | | | 109,094 | |
| | | | |
| | | | | | | | | | | | | | | | |
| | | | | | | | | | | | | | | | |
| | | | | |
| Other Financial Instruments | | Level 1
($) | | Level 2
($) | | Level 3
($) | | Total ($) |
| | | | |
Futures Contracts* | | | | | | | | | | | | | | | | |
| | | | |
Unrealized Appreciation | | | 23 | | | | – | | | | – | | | | 23 | |
| | | | |
Unrealized Depreciation | | | (10 | ) | | | – | | | | – | | | | (10 | ) |
| | | | |
Forward Contracts* | | | | | | | | | | | | | | | | |
| | | | |
Unrealized Appreciation | | | – | | | | 4 | | | | – | | | | 4 | |
| | | | |
Unrealized Depreciation | | | – | | | | (9 | ) | | | – | | | | (9 | ) |
| | | | |
| | | | | | | | | | | | | | | | |
| | | | |
Total Other Financial Instruments | | | 13 | | | | (5 | ) | | | – | | | | 8 | |
| | | | | | | | | | | | | | | | |
* Futures contracts and Forward contracts are valued at the unrealized appreciation (depreciation) on the instrument.
For the period ended November 30, 2020, there were no transfers in or out of Level 3.
For more information on valuation inputs, see Note 2 — Significant Accounting Policies in the Notes to Financial Statements.
The following is a summary of the Fund’s transactions with affiliates for the period ended November 30, 2020 ($ Thousands):
| | | | | | | | | | | | | | | | | | |
| | | | | | | | | | |
Security
Description | | Value 5/31/2020 | | Purchases at Cost | | Proceeds from
Sales | | Realized Gain/
(Loss) | | Change in
Unrealized
Appreciation/
(Depreciation) | | Value
11/30/2020 | | Shares | | Income | | Capital Gains |
SEI Daily Income Trust, Government Fund, Cl F | | $ 1,456 | | $ 5,501 | | $ (4,435) | | $ – | | $ – | | $ 2,522 | | 2,521,893 | | $ – | | $ – |
| | | | | | | | | | | | | | | | | | |
Amounts designated as “—” are either $0 or have been rounded to $0.
The accompanying notes are an integral part of the financial statements.
| | |
SEI Institutional Investments Trust / Semi-Annual Report / November 30, 2020 | | 45 |
SUMMARY SCHEDULE OF INVESTMENTS (Unaudited)
November 30, 2020
World Select Equity Fund
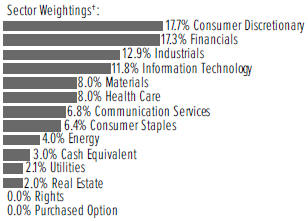
†Percentages are based on total investments.
| | | | | | | | | | | | |
| | | | |
| Description | | Percentage of
Net Assets (%) | | Shares | | Market Value
($ Thousands) |
COMMON STOCK — 92.1% | |
|
Argentina — 0.0% | |
Other Securities | | | 0.0% | | | | | | | $ | 117 | |
| | | | | | | | | | | | |
|
Australia — 0.4% | |
Other Securities | | | 0.4 | | | | | | | | 1,765 | |
| | | | | | | | | | | | |
|
Austria — 0.2% | |
Other Securities | | | 0.2 | | | | | | | | 1,242 | |
| | | | | | | | | | | | |
|
Belgium — 0.1% | |
Other Securities | | | 0.1 | | | | | | | | 544 | |
| | | | | | | | | | | | |
|
Brazil — 0.3% | |
Other Securities | | | 0.3 | | | | | | | | 1,692 | |
| | | | | | | | | | | | |
|
Canada — 1.5% | |
Alimentation Couche-Tard Inc, Cl B | | | 0.5 | | | | 68,244 | | | | 2,271 | |
Other Securities | | | 1.0 | | | | | | | | 5,363 | |
| | | | | | | | | | | | |
| | | | | | | | | | | 7,634 | |
| | | | | | | | | | | | |
|
China — 2.3% | |
Alibaba Group Holding Ltd ADR * | | | 0.8 | | | | 14,573 | | | | 3,838 | |
Other Securities | | | 1.5 | | | | | | | | 7,764 | |
| | | | | | | | | | | | |
| | | | | | | | | | | 11,602 | |
| | | | | | | | | | | | |
|
Croatia — 0.1% | |
Other Securities | | | 0.1 | | | | | | | | 524 | |
| | | | | | | | | | | | |
| | | | | | | | | | | | |
| | | | |
| Description | | Percentage of
Net Assets (%) | | Shares | | Market Value
($ Thousands) |
|
COMMON STOCK (continued) | |
|
Czech Republic — 0.2% | |
Other Securities | | | 0.2% | | | | | | | $ | 734 | |
| | | | | | | | | | | | |
| | | |
Denmark — 0.2% | | | | | | | | | | | | |
Other Securities | | | 0.2 | | | | | | | | 1,161 | |
| | | | | | | | | | | | |
| | | |
Egypt — 0.0% | | | | | | | | | | | | |
Other Securities | | | 0.0 | | | | | | | | 203 | |
| | | | | | | | | | | | |
| | | |
Estonia — 0.1% | | | | | | | | | | | | |
Other Securities | | | 0.1 | | | | | | | | 222 | |
| | | | | | | | | | | | |
| | | |
Finland — 0.7% | | | | | | | | | | | | |
Other Securities | | | 0.7 | | | | | | | | 3,447 | |
| | | | | | | | | | | | |
| | | |
France — 3.8% | | | | | | | | | | | | |
BNP Paribas SA | | | 0.6 | | | | 56,694 | | | | 2,914 | |
| | | |
Other Securities | | | 3.2 | | | | | | | | 16,660 | |
| | | | | | | | | | | | |
| | | |
| | | | | | | | | | | 19,574 | |
| | | | | | | | | | | | |
| | | |
Germany — 3.3% | | | | | | | | | | | | |
Allianz SE | | | 0.8 | | | | 16,438 | | | | 3,887 | |
BASF SE | | | 0.4 | | | | 28,870 | | | | 2,118 | |
HeidelbergCement AG | | | 0.4 | | | | 30,845 | | | | 2,197 | |
Other Securities | | | 1.7 | | | | | | | | 8,856 | |
| | | | | | | | | | | | |
| | | |
| | | | | | | | | | | 17,058 | |
| | | | | | | | | | | | |
| | | |
Greece — 0.1% | | | | | | | | | | | | |
Other Securities | | | 0.1 | | | | | | | | 570 | |
| | | | | | | | | | | | |
| | | |
Hong Kong — 2.1% | | | | | | | | | | | | |
Tencent Holdings Ltd | | | 0.5 | | | | 33,990 | | | | 2,468 | |
Other Securities | | | 1.6 | | | | | | | | 8,096 | |
| | | | | | | | | | | | |
| | | |
| | | | | | | | | | | 10,564 | |
| | | |
Hungary — 0.3% | | | | | | | | | | | | |
Other Securities | | | 0.3 | | | | | | | | 1,555 | |
| | | | | | | | | | | | |
| | | |
India — 1.0% | | | | | | | | | | | | |
Other Securities | | | 1.0 | | �� | | | | | | 5,283 | |
| | | | | | | | | | | | |
| | | |
Indonesia — 0.1% | | | | | | | | | | | | |
Other Securities | | | 0.1 | | | | | | | | 335 | |
| | | | | | | | | | | | |
| | |
46 | | SEI Institutional Investments Trust / Semi-Annual Report / November 30, 2020 |
| | | | | | | | | | | | |
| | | | |
| Description | | Percentage of
Net Assets (%) | | Shares | | Market Value
($ Thousands) |
COMMON STOCK (continued) | |
|
Ireland — 0.0% | |
Other Securities | | | 0.0 | % | | | | | | $ | 43 | |
| | | | | | | | | | | | |
|
Italy — 1.2% | |
Enel SpA | | | 0.5 | | | | 233,177 | | | | 2,335 | |
Intesa Sanpaolo SpA | | | 0.4 | | | | 976,543 | | | | 2,249 | |
Other Securities | | | 0.3 | | | | | | | | 1,662 | |
| | | | | | | | | | | | |
| | | |
| | | | | | | | | | | 6,246 | |
| | | | | | | | | | | | |
|
Japan — 11.9% | |
Honda Motor Co Ltd | | | 0.4 | | | | 77,565 | | | | 2,136 | |
Nippon Telegraph & Telephone Corp | | | 0.8 | | | | 164,808 | | | | 3,896 | |
Sony Corp | | | 0.5 | | | | 27,000 | | | | 2,513 | |
Other Securities ‡ | | | 10.2 | | | | | | | | 52,585 | |
| | | | | | | | | | | | |
| | | |
| | | | | | | | | | | 61,130 | |
| | | | | | | | | | | | |
|
Luxembourg — 0.4% | |
Other Securities | | | 0.4 | | | | | | | | 1,933 | |
|
Malaysia — 0.3% | |
Other Securities | | | 0.3 | | | | | | | | 1,427 | |
| | | | | | | | | | | | |
|
Mexico — 0.1% | |
Other Securities | | | 0.1 | | | | | | | | 440 | |
| | | | | | | | | | | | |
|
Netherlands — 1.6% | |
CNH Industrial NV | | | 0.5 | | | | 205,500 | | | | 2,236 | |
Koninklijke Ahold Delhaize NV | | | 0.5 | | | | 95,762 | | | | 2,748 | |
Other Securities | | | 0.6 | | | | | | | | 3,402 | |
| | | | | | | | | | | | |
| | | |
| | | | | | | | | | | 8,386 | |
| | | | | | | | | | | | |
|
Nigeria — 0.0% | |
Other Securities | | | 0.0 | | | | | | | | 126 | |
| | | | | | | | | | | | |
|
Norway — 0.1% | |
Other Securities | | | 0.1 | | | | | | | | 230 | |
| | | | | | | | | | | | |
|
Pakistan — 0.0% | |
Other Securities | | | 0.0 | | | | | | | | 179 | |
| | | | | | | | | | | | |
|
Philippines — 0.1% | |
Other Securities | | | 0.1 | | | | | | | | 622 | |
| | | | | | | | | | | | |
| | | | | | | | | | | | |
| | | | |
| Description | | Percentage of
Net Assets (%) | | Shares | | Market Value
($ Thousands) |
|
COMMON STOCK (continued) | |
|
Poland — 1.4% | |
Other Securities | | | 1.4 | % | | | | | | $ | 6,962 | |
| | | | | | | | | | | | |
|
Portugal — 0.0% | |
Other Securities | | | 0.0 | | | | | | | | 204 | |
| | | | | | | | | | | | |
|
Qatar — 0.0% | |
Other Securities | | | 0.0 | | | | | | | | 60 | |
| | | | | | | | | | | | |
| | | |
Romania — 0.3% | | | | | | | | | | | | |
Other Securities | | | 0.3 | | | | | | | | 1,756 | |
| | | | | | | | | | | | |
|
Russia — 1.0% | |
Other Securities | | | 1.0 | | | | | | | | 5,293 | |
| | | | | | | | | | | | |
|
Saudi Arabia — 0.2% | |
Other Securities | | | 0.2 | | | | | | | | 845 | |
| | | | | | | | | | | | |
|
Singapore — 0.1% | |
Other Securities | | | 0.1 | | | | | | | | 647 | |
| | | | | | | | | | | | |
|
Slovenia — 0.4% | |
Other Securities | | | 0.4 | | | | | | | | 1,948 | |
| | | | | | | | | | | | |
|
South Africa — 0.5% | |
Other Securities | | | 0.5 | | | | | | | | 2,619 | |
| | | | | | | | | | | | |
|
South Korea — 2.4% | |
Samsung Electronics Co Ltd | | | 0.4 | | | | 34,913 | | | | 2,104 | |
Samsung Electronics Co Ltd GDR | | | 0.6 | | | | 2,121 | | | | 3,196 | |
Other Securities | | | 1.4 | | | | | | | | 6,982 | |
| | | | | | | | | | | | |
| | | |
| | | | | | | | | | | 12,282 | |
| | | | | | | | | | | | |
|
Spain — 0.5% | |
Other Securities | | | 0.5 | | | | | | | | 2,715 | |
| | | | | | | | | | | | |
|
Sweden — 0.8% | |
Other Securities | | | 0.8 | | | | | | | | 3,917 | |
| | | | | | | | | | | | |
| | |
SEI Institutional Investments Trust / Semi-Annual Report / November 30, 2020 | | 47 |
SUMMARY SCHEDULE OF INVESTMENTS (Unaudited)
November 30, 2020
World Select Equity Fund (Continued)
| | | | | | | | | | | | |
| | | | |
| Description | | Percentage of
Net Assets (%) | | Shares | | Market Value
($ Thousands) |
COMMON STOCK (continued) | |
|
Switzerland — 0.8% | |
Other Securities | | | 0.8% | | | | | | | $ | 4,283 | |
| | | | | | | | | | | | |
|
Taiwan — 2.2% | |
Taiwan Semiconductor Manufacturing Co Ltd | | | 0.6 | | | | 192,020 | | | | 3,237 | |
Other Securities | | | 1.6 | | | | | | | | 7,857 | |
| | | | | | | | | | | | |
| | | |
| | | | | | | | | | | 11,094 | |
| | | | | | | | | | | | |
|
Thailand — 0.1% | |
Other Securities | | | 0.1 | | | | | | | | 415 | |
| | | | | | | | | | | | |
|
Turkey — 0.3% | |
Other Securities | | | 0.3 | | | | | | | | 1,526 | |
| | | | | | | | | | | | |
|
United Arab Emirates — 0.0% | |
Other Securities | | | 0.0 | | | | | | | | 180 | |
| | | | | | | | | | | | |
|
United Kingdom — 4.8% | |
Adient PLC * | | | 0.5 | | | | 75,030 | | | | 2,348 | |
Other Securities | | | 4.3 | | | | | | | | 22,182 | |
| | | | | | | | | | | | |
| | | |
| | | | | | | | | | | 24,530 | |
| | | | | | | | | | | | |
|
United States — 43.8% | |
|
Communication Services — 2.3% | |
Alphabet Inc, Cl A * | | | 0.5 | | | | 1,416 | | | | 2,484 | |
AT&T Inc | | | 0.6 | | | | 112,584 | | | | 3,237 | |
Other Securities | | | 1.2 | | | | | | | | 6,340 | |
| | | | | | | | | | | | |
| | | | | | | | | | | 12,061 | |
| | | | | | | | | | | | |
|
Consumer Discretionary — 8.7% | |
Advance Auto Parts Inc | | | 0.5 | | | | 17,700 | | | | 2,614 | |
AutoZone Inc * | | | 0.5 | | | | 2,236 | | | | 2,544 | |
Lowe’s Cos Inc | | | 0.6 | | | | 19,459 | | | | 3,032 | |
Target Corp | | | 0.5 | | | | 13,102 | | | | 2,352 | |
Other Securities | | | 6.6 | | | | | | | | 33,978 | |
| | | | | | | | | | | | |
| | | | | | | | | | | 44,520 | |
| | | | | | | | | | | | |
|
Consumer Staples — 2.5% | |
Sysco Corp | | | 0.4 | | | | 31,601 | | | | 2,253 | |
Other Securities | | | 2.1 | | | | | | | | 10,717 | |
| | | | | | | | | | | | |
| | | | | | | | | | | 12,970 | |
| | | | | | | | | | | | |
| | | | | | | | | | | | |
| | | | |
| Description | | Percentage of
Net Assets (%) | | Shares | | Market Value
($ Thousands) |
COMMON STOCK (continued) | |
|
Energy — 1.2% | |
Chevron Corp | | | 0.5% | | | | 28,600 | | | $ | 2,494 | |
Other Securities | | | 0.7 | | | | | | | | 3,682 | |
| | | | | | | | | | | | |
| | | | | | | | | | | 6,176 | |
| | | | | | | | | | | | |
|
Financials — 8.4% | |
Aflac Inc | | | 0.5 | | | | 62,094 | | | | 2,728 | |
Ally Financial Inc | | | 0.9 | | | | 151,930 | | | | 4,505 | |
American Express Co | | | 0.5 | | | | 20,219 | | | | 2,398 | |
American International Group Inc | | | 0.6 | | | | 74,000 | | | | 2,845 | |
Equitable Holdings Inc | | | 0.6 | | | | 113,239 | | | | 2,874 | |
Moody’s Corp | | | 0.6 | | | | 11,501 | | | | 3,247 | |
Morgan Stanley | | | 0.5 | | | | 40,893 | | | | 2,528 | |
Progressive Corp/The | | | 0.7 | | | | 38,669 | | | | 3,368 | |
US Bancorp | | | 0.5 | | | | 62,185 | | | | 2,687 | |
Wells Fargo & Co | | | 0.5 | | | | 84,000 | | | | 2,297 | |
Other Securities ‡ | | | 2.5 | | | | | | | | 13,819 | |
| | | | | | | | | | | | |
| | | | | | | | | | | 43,296 | |
| | | | | | | | | | | | |
|
Health Care — 4.9% | |
AmerisourceBergen Corp, Cl A | | | 0.5 | | | | 24,400 | | | | 2,516 | |
Johnson & Johnson | | | 0.5 | | | | 16,065 | | | | 2,324 | |
Merck & Co Inc | | | 0.7 | | | | 43,603 | | | | 3,505 | |
UnitedHealth Group Inc | | | 0.8 | | | | 12,418 | | | | 4,177 | |
Other Securities | | | 2.4 | | | | | | | | 12,499 | |
| | | | | | | | | | | | |
| | | | | | | | | | | 25,021 | |
| | | | | | | | | | | | |
|
Industrials — 5.4% | |
Fluor Corp | | | 0.5 | | | | 138,670 | | | | 2,395 | |
Parker-Hannifin Corp | | | 0.4 | | | | 8,283 | | | | 2,214 | |
Union Pacific Corp | | | 0.5 | | | | 13,059 | | | | 2,665 | |
Other Securities | | | 4.0 | | | | | | | | 20,283 | |
| | | | | | | | | | | | |
| | | | | | | | | | | 27,557 | |
| | | | | | | | | | | | |
|
Information Technology — 6.9% | |
DXC Technology Co | | | 0.7 | | | | 155,810 | | | | 3,414 | |
Intel Corp | | | 0.7 | | | | 68,880 | | | | 3,330 | |
International Business Machines Corp | | | 0.7 | | | | 29,032 | | | | 3,586 | |
Mastercard Inc, Cl A | | | 0.5 | | | | 6,963 | | | | 2,343 | |
Microsoft Corp | | | 0.7 | | | | 16,641 | | | | 3,562 | |
Oracle Corp | | | 0.4 | | | | 39,681 | | | | 2,290 | |
Other Securities | | | 3.2 | | | | | | | | 16,925 | |
| | | | | | | | | | | | |
| | | | | | | | | | | 35,450 | |
| | | | | | | | | | | | |
|
Materials — 2.6% | |
Nucor Corp | | | 0.5 | | | | 45,000 | | | | 2,417 | |
| | |
48 | | SEI Institutional Investments Trust / Semi-Annual Report / November 30, 2020 |
| | | | | | | | | | | | |
| | | | |
| Description | | Percentage of
Net Assets (%) | | Shares | | Market Value
($ Thousands) |
COMMON STOCK (continued) | |
|
Materials (continued) | |
Packaging Corp of America | | | 0.5 | % | | | 19,885 | | | $ | 2,585 | |
Other Securities | | | 1.6 | | | | | | | | 8,352 | |
| | | | | | | | | | | | |
| | | | | | | | | | | 13,354 | |
| | | | | | | | | | | | |
|
Real Estate — 0.4% | |
Other Securities ‡ | | | 0.4 | | | | | | | | 1,873 | |
| | | | | | | | | | | | |
|
Utilities — 0.5% | |
Other Securities | | | 0.5 | | | | | | | | 2,644 | |
| | | | | | | | | | | | |
| | | |
| | | | | | | | | | | 224,922 | |
| | | | | | | | | | | | |
| | |
Total Common Stock
(Cost $414,599) ($ Thousands) | | | | | | | | 472,786 | |
| | | | | | | | | | | | |
|
PREFERRED STOCK — 0.4% | |
|
Brazil — 0.1% | |
Other Securities (A) | | | 0.1 | | | | | | | | 707 | |
| | | | | | | | | | | | |
|
Germany — 0.2% | |
Other Securities (A) | | | 0.2 | | | | | | | | 921 | |
| | | | | | | | | | | | |
|
Russia — 0.1% | |
Other Securities (A) | | | 0.1 | | | | | | | | 311 | |
| | | | | | | | | | | | |
| | | | | | | | | | | | |
| | | | |
| Description | | Percentage of
Net Assets (%) | | Shares | | Market Value
($ Thousands) |
PREFERRED STOCK (continued) | |
|
South Korea — 0.0% | |
Samsung Electronics Co Ltd | | | 0.0 | % | | | 437 | | | $ | 24 | |
| | | | | | | | | | | | |
| | |
Total Preferred Stock
(Cost $2,155) ($ Thousands) | | | | | | | | 1,963 | |
| | | | | | | | | | | | |
|
RIGHTS — 0.0% | |
|
Hong Kong — 0.0% | |
Other Securities | | | 0.0 | | | | | | | | — | |
|
Spain — 0.0% | |
Other Securities | | | 0.0 | | | | | | | | 88 | |
| | | | | | | | | | | | |
|
Taiwan — 0.0% | |
Other Securities | | | 0.0 | | | | | | | | — | |
| | | | | | | | | | | | |
| | |
Total Rights
(Cost $–) ($ Thousands) | | | | | | | | 88 | |
| | | | | | | | | | | | |
|
CASH EQUIVALENT — 2.9% | |
SEI Daily Income Trust, Government Fund, Cl F 0.010% **† | | | 2.9 | | | | 14,730,889 | | | | 14,731 | |
| | | | | | | | | | | | |
| | |
Total Cash Equivalent (Cost $14,731) ($ Thousands) | | | | | | | | 14,731 | |
| | | | | | | | | | | | |
| |
Total Investments in Securities — 95.4%
(Cost $431,485)($ Thousands) | | | $ | 489,568 | |
| | | | | | | | | | | | |
| | | | | Contracts | | |
|
PURCHASED OPTION* — 0.0% | |
Total Purchased Option (B)
(Premiums Received $44) ($ Thousands) | | | | 25,190,520 | | | $ | 7 | |
| | | | | | | | | | | | |
A list of the open exchange traded options contracts held by the Fund at November 30, 2020 is as follows:
| | | | | | | | | | | | | | | | | | | | |
| | | | | |
| Description | | Number of Contracts | | Notional Amount
(Thousands)† | | Exercise Price | | Expiration Date | | Value
(Thousands) |
PURCHASED OPTION — 0.0% | | | | | | | | | | | | | | | | | |
Call Options | | | | | | | | | | | | | | | | | | | | |
December 2020, AUD Call USD Put* | | | 25,190,520 | | | $ | 44 | | | | $0.74 | | | | 12/1/2020 | | | $ | 7 | |
| | | | | | | | | | | | | | | | | | | | |
| | | | | |
Total Purchased Option | | | | | | $ | 44 | | | | | | | | | | | $ | 7 | |
| | | | | | | | | | | | | | | | | | | | |
A list of the open futures contracts held by the Fund at November 30, 2020 is as follows:
| | | | | | | | | | | | | | | | | | | | |
| | | | | | |
| Type of Contract | | Number of
Contracts Long
(Short) | | | Expiration
Date | | | Notional Amount
(Thousands) | | | Value
(Thousands) | | | Unrealized Appreciation
(Depreciation) (Thousands) | |
Euro STOXX 50 | | | (2 | ) | | | Dec-2020 | | | $ | (84 | ) | | $ | (84 | ) | | $ | – | |
Hang Seng Index | | | 19 | | | | Jan-2021 | | | | 3,262 | | | | 3,239 | | | | (23 | ) |
| | |
SEI Institutional Investments Trust / Semi-Annual Report / November 30, 2020 | | 49 |
SUMMARY SCHEDULE OF INVESTMENTS (Unaudited)
November 30, 2020
World Select Equity Fund (Continued)
| | | | | | | | | | | | | | | | | | | | |
| | | | | | |
| Type of Contract | | Number of
Contracts Long
(Short) | | | Expiration
Date | | Notional Amount
(Thousands) | | Value
(Thousands) | | Unrealized Appreciation
(Depreciation) (Thousands) |
MSCI Emerging Markets | | | (409) | | | | Dec-2020 | | | $ | (22,797 | ) | | $ | (24,587 | ) | | $ | (1,790 | ) |
MSCI Singapore Index | | | 41 | | | | Jan-2021 | | | | 1,004 | | | | 982 | | | | (23 | ) |
OMX Stockholm 30 | | | 26 | | | | Dec-2020 | | | | 582 | | | | 582 | | | | (3 | ) |
S&P 500 Index E-MINI | | | 331 | | | | Dec-2020 | | | | 55,573 | | | | 59,964 | | | | 4,391 | |
S&P TSX 60 Index | | | 62 | | | | Dec-2020 | | | | 9,096 | | | | 9,790 | | | | 541 | |
SPI 200 Index | | | 55 | | | | Dec-2020 | | | | 5,941 | | | | 6,615 | | | | 574 | |
TOPIX Index | | | (152) | | | | Dec-2020 | | | | (23,145 | ) | | | (25,590 | ) | | | (2,102 | ) |
| | | | | | | | | | | | | | | | | | | | |
| | | | | | | | | | $ | 29,432 | | | $ | 30,911 | | | $ | 1,565 | |
| | | | | | | | | | | | | | | | | | | | |
A list of the open forward foreign currency contracts held by the Fund at November 30, 2020 is as follows:
| | | | | | | | | | | | | | | | | | | | | | | | |
| | | | | | | |
| Counterparty | | Settlement Date | | | | | | Currency to Deliver
(Thousands) | | | | | | Currency to Receive
(Thousands) | | | Unrealized
Appreciation
(Depreciation)
(Thousands) | |
| | | | | | |
Brown Brothers Harriman | | | 12/14/20 | | | | NZD | | | | 4 | | | | USD | | | | 3 | | | $ | — | |
| | | | | | |
Brown Brothers Harriman | | | 12/14/20 | | | | NZD | | | | 37 | | | | USD | | | | 25 | | | | (1) | |
| | | | | | |
Brown Brothers Harriman | | | 12/14/20 | | | | USD | | | | 427 | | | | NZD | | | | 622 | | | | 10 | |
| | | | | | |
Brown Brothers Harriman | | | 12/14/20 | | | | USD | | | | 0 | | | | NZD | | | | 0 | | | | — | |
| | | | | | |
Brown Brothers Harriman | | | 12/14/20 | | | | USD | | | | 807 | | | | NOK | | | | 7,324 | | | | 20 | |
| | | | | | |
Brown Brothers Harriman | | | 12/14/20 | | | | USD | | | | 2 | | | | NOK | | | | 14 | | | | — | |
| | | | | | |
Brown Brothers Harriman | | | 12/14/20 | | | | SGD | | | | 12 | | | | USD | | | | 9 | | | | — | |
| | | | | | |
Brown Brothers Harriman | | | 12/14/20 | | | | SGD | | | | 852 | | | | USD | | | | 631 | | | | (5) | |
| | | | | | |
Brown Brothers Harriman | | | 12/14/20 | | | | USD | | | | 1,503 | | | | SGD | | | | 2,028 | | | | 11 | |
| | | | | | |
Brown Brothers Harriman | | | 12/14/20 | | | | USD | | | | 3 | | | | SGD | | | | 4 | | | | — | |
| | | | | | |
Brown Brothers Harriman | | | 12/14/20 | | | | NOK | | | | 43 | | | | USD | | | | 5 | | | | — | |
| | | | | | |
Brown Brothers Harriman | | | 12/14/20 | | | | NOK | | | | 2,395 | | | | USD | | | | 264 | | | | (7) | |
| | | | | | |
Brown Brothers Harriman | | | 12/14/20 | | | | AUD | | | | 80 | | | | USD | | | | 59 | | | | — | |
| | | | | | |
Brown Brothers Harriman | | | 12/14/20 | | | | AUD | | | | 2,796 | | | | USD | | | | 2,031 | | | | (29) | |
| | | | | | |
Brown Brothers Harriman | | | 12/14/20 | | | | HKD | | | | 363 | | | | USD | | | | 47 | | | | — | |
| | | | | | |
Brown Brothers Harriman | | | 12/14/20 | | | | HKD | | | | 3,001 | | | | USD | | | | 387 | | | | — | |
| | | | | | |
Brown Brothers Harriman | | | 12/14/20 | | | | USD | | | | 3,602 | | | | DKK | | | | 22,784 | | | | 62 | |
| | | | | | |
Brown Brothers Harriman | | | 12/14/20 | | | | USD | | | | 4,674 | | | | HKD | | | | 36,235 | | | | 1 | |
| | | | | | |
Brown Brothers Harriman | | | 12/14/20 | | | | USD | | | | 134 | | | | HKD | | | | 1,040 | | | | — | |
| | | | | | |
Brown Brothers Harriman | | | 12/14/20 | | | | USD | | | | 4,733 | | | | SEK | | | | 40,956 | | | | 59 | |
| | | | | | |
Brown Brothers Harriman | | | 12/14/20 | | | | USD | | | | 95 | | | | SEK | | | | 809 | | | | — | |
| | | | | | |
Brown Brothers Harriman | | | 12/14/20 | | | | CHF | | | | 83 | | | | USD | | | | 92 | | | | — | |
| | | | | | |
Brown Brothers Harriman | | | 12/14/20 | | | | CHF | | | | 5,492 | | | | USD | | | | 5,988 | | | | (82) | |
| | | | | | |
Brown Brothers Harriman | | | 12/14/20 | | | | DKK | | | | 9,016 | | | | USD | | | | 1,425 | | | | (24) | |
| | | | | | |
Brown Brothers Harriman | | | 12/14/20 | | | | USD | | | | 9,694 | | | | AUD | | | | 13,340 | | | | 136 | |
| | | | | | |
Brown Brothers Harriman | | | 12/14/20 | | | | USD | | | | 15 | | | | AUD | | | | 21 | | | | — | |
| | | | | | |
Brown Brothers Harriman | | | 12/14/20 | | | | CAD | | | | 10,429 | | | | USD | | | | 7,978 | | | | (71) | |
| | | | | | |
Brown Brothers Harriman | | | 12/14/20 | | | | USD | | | | 15,043 | | | | CAD | | | | 19,663 | | | | 132 | |
| | | | | | |
Brown Brothers Harriman | | | 12/14/20 | | | | USD | | | | 15,174 | | | | CHF | | | | 13,920 | | | | 212 | |
| | | | | | |
Brown Brothers Harriman | | | 12/14/20 | | | | USD | | | | 47 | | | | CHF | | | | 43 | | | | — | |
| | | | | | |
Brown Brothers Harriman | | | 12/14/20 | | | | GBP | | | | 500 | | | | USD | | | | 669 | | | | 2 | |
| | | | | | |
Brown Brothers Harriman | | | 12/14/20 | | | | GBP | | | | 15,094 | | | | USD | | | | 19,931 | | | | (224) | |
| | | | | | |
Brown Brothers Harriman | | | 12/14/20 | | | | USD | | | | 20,209 | | | | GBP | | | | 15,305 | | | | 227 | |
| | | | | | |
Brown Brothers Harriman | | | 12/14/20 | | | | USD | | | | 562 | | | | GBP | | | | 420 | | | | (1) | |
| | |
50 | | SEI Institutional Investments Trust / Semi-Annual Report / November 30, 2020 |
| | | | | | | | | | | | | | | | | | | | | | | | |
| | | | | | | |
| Counterparty | | Settlement Date | | | | | | Currency to Deliver
(Thousands) | | | | | | Currency to Receive
(Thousands) | | | Unrealized
Appreciation
(Depreciation)
(Thousands) |
| | | | | | |
Brown Brothers Harriman | | | 12/14/20 | | | | SEK | | | | 759 | | | | USD | | | | 89 | | | $ | — | |
| | | | | | |
Brown Brothers Harriman | | | 12/14/20 | | | | SEK | | | | 25,968 | | | | USD | | | | 3,000 | | | | (38 | ) |
| | | | | | |
Brown Brothers Harriman | | | 12/14/20 | | | | USD | | | | 36,866 | | | | JPY | | | | 3,891,305 | | | | 465 | |
| | | | | | |
Brown Brothers Harriman | | | 12/14/20 | | | | USD | | | | 1,740 | | | | JPY | | | | 180,908 | | | | (4 | ) |
| | | | | | |
Brown Brothers Harriman | | | 12/14/20 | | | | USD | | | | 48,732 | | | | EUR | | | | 41,385 | | | | 794 | |
| | | | | | |
Brown Brothers Harriman | | | 12/14/20 | | | | EUR | | | | 50,439 | | | | USD | | | | 59,387 | | | | (973 | ) |
| | | | | | |
Brown Brothers Harriman | | | 12/14/20 | | | | JPY | | | | 165,918 | | | | USD | | | | 1,597 | | | | 5 | |
| | | | | | |
Brown Brothers Harriman | | | 12/14/20 | | | | JPY | | | | 6,680,222 | | | | USD | | | | 63,275 | | | | (813 | ) |
| | | | | | | | | | | | | | | | | | | | | | | | |
| | | | | | | | | | | | | | | | | | | | | | $ | (136 | ) |
| | | | | | | | | | | | | | | | | | | | | | | | |
| | Percentages are based on Net Assets of $513,027 ($ Thousands). |
| * | Non-income producing security. |
| ** | The rate reported is the 7-day effective yield as of November 30, 2020. |
| ‡ | Real Estate Investment Trust. |
| † | Investment in Affiliated Security (see Note 6). |
| (A) | There is currently no rate available. |
| (B) | Refer to table below for details on Options Contracts. |
ADR — American Depositary Receipt
AUD — Australian Dollar
CAD — Canadian Dollar
CHF — Swiss Franc
Cl — Class
DKK — Danish Krone
EUR — Euro
GBP — British Pound Sterling
GDR — Global Depositary Receipt
HKD — Hong Kong Dollar
JPY — Japanese Yen
Ltd. — Limited
MSCI — Morgan Stanley Capital International
NOK — Norwegian Krone
NZD — New Zealand Dollar
OMX — Offset Market Exchange
PLC — Public Limited Company
S&P— Standard & Poor’s
SGD — Singapore Dollar
SEK — Swedish Krona
SPI — Share Price Index
TOPIX- Tokyo Price Index
TSX — Toronto Stock Exchange
USD — U.S. Dollar
The Summary Schedule of Investments does not reflect the complete portfolio holdings. It includes the Fund’s 50 largest holdings and each investment of any issuer that exceeds 1% of the Fund’s net assets. “Other Securities” represent all issues not required to be disclosed under the rules adopted by the U.S. Securities and Exchange Commission (“SEC”). In certain instances, securities for which footnotes listed above may otherwise apply are included in the Other Securities caption. The complete schedule of portfolio holdings is available (i) without charge, upon request, by calling (800) 342-5734; and (ii) on the SEC’s website at http://www.sec.gov.
| | |
SEI Institutional Investments Trust / Semi-Annual Report / November 30, 2020 | | 51 |
SUMMARY SCHEDULE OF INVESTMENTS (Unaudited)
November 30, 2020
World Select Equity Fund (Concluded)
The following is a list of the level of inputs used as of November 30, 2020, in valuing the Fund’s investments and other financial instruments carried at value ($ Thousands):
| | | | | | | | | | | | | | | | |
| | | | | |
| Investments in Securities | | Level 1 ($) | | Level 2 ($) | | Level 3 ($) | | Total
($) |
Common Stock | | | 471,899 | | | | 862 | | | | 25 | | | | 472,786 | |
Preferred Stock | | | 1,963 | | | | – | | | | – | | | | 1,963 | |
Rights | | | 88 | | | | – | | | | – | | | | 88 | |
Cash Equivalent | | | 14,731 | | | | – | | | | – | | | | 14,731 | |
| | | | | | | | | | | | | | | | |
Total Investments in Securities | | | 488,681 | | | | 862 | | | | 25 | | | | 489,568 | |
| | | | | | | | | | | | | | | | |
| | | | |
| | | | | | | | | |
| Other Financial Instruments | | Level 1
($) | | Level 2
($) | | Level 3
($) | | Total
($) |
Purchased Option | | | 7 | | | | – | | | | – | | | | 7 | |
Futures Contracts* | | | | | | | | | | | | | | | | |
Unrealized Appreciation | | | 5,506 | | | | – | | | | – | | | | 5,506 | |
Unrealized Depreciation | | | (3,941) | | | | – | | | | – | | | | (3,941) | |
Forwards Contracts* | | | | | | | | | | | | | | | | |
Unrealized Appreciation | | | – | | | | 2,136 | | | | – | | | | 2,136 | |
Unrealized Depreciation | | | – | | | | (2,272) | | | | – | | | | (2,272) | |
| | | | | | | | | | | | | | | | |
Total Other Financial Instruments | | | 1,572 | | | | (136) | | | | – | | | | 1,436 | |
| | | | | | | | | | | | | | | | |
* Futures contracts and Forward contracts are valued at the unrealized appreciation (depreciation) on the instrument.
For the period ended November 30, 2020, there were transfers in or out of Level 3.
For more information on valuation inputs, see Note 2 — Significant Accounting Policies in Notes to Financial Statements.
The following is a summary of the Fund’s transactions with affiliates for the period ended November 30, 2020 ($ Thousands):
| | | | | | | | | | | | | | | | | | |
| | | | | | | | | | |
| Security Description | | Value 5/31/2020 | | Purchases at Cost | | Proceeds from
Sales | | Realized Gain/
(Loss) | | Change in
Unrealized
Appreciation/
(Depreciation) | | Value
11/30/2020 | | Shares | | Income | | Capital Gains |
SEI Daily Income Trust, Government Fund, Cl F | | $ 3,966 | | $ 53,805 | | $ (43,040) | | $ - | | $ - | | $ 14,731 | | $ 14,730,889 | | $ 1 | | $ - |
| | | | | | | | | | | | | | | | | | |
Amounts designated as “—” are either $0 or have been rounded to $0.
The accompanying notes are an integral part of the financial statements.
| | |
52 | | SEI Institutional Investments Trust / Semi-Annual Report / November 30, 2020 |
SUMMARY SCHEDULE OF INVESTMENTS (Unaudited)
November 30, 2020
Emerging Markets Equity Fund
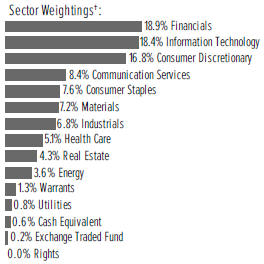
†Percentages are based on total investments.
| | | | | | | | | | | | |
| | | | |
| Description | | Percentage of
Net Assets (%) | | Shares | | Market Value
($ Thousands) |
|
COMMON STOCK — 95.0% | |
|
Argentina — 0.1% | |
Other Securities | | | 0.1 | % | | | | | | $ | 1,037 | |
| | | | | | | | | | | | |
|
Bangladesh — 0.4% | |
Other Securities | | | 0.4 | | | | | | | | 5,041 | |
| | | | | | | | | | | | |
|
Brazil — 3.6% | |
Vale SA ADR, Cl B | | | 0.5 | | | | 377,135 | | | | 5,491 | |
Other Securities | | | 3.1 | | | | | | | | 38,345 | |
| | | | | | | | | | | | |
| | | |
| | | | | | | | | | | 43,836 | |
| | | | | | | | | | | | |
|
Canada — 1.2% | |
First Quantum Minerals Ltd | | | 0.4 | | | | 362,530 | | | | 5,156 | |
Other Securities | | | 0.8 | | | | | | | | 8,657 | |
| | | | | | | | | | | | |
| | | |
| | | | | | | | | | | 13,813 | |
| | | | | | | | | | | | |
|
Chile — 0.8% | |
Sociedad Quimica y Minera de Chile | |
SA ADR | | | 0.4 | | | | 112,867 | | | | 5,313 | |
Other Securities | | | 0.4 | | | | | | | | 4,850 | |
| | | | | | | | | | | | |
| | | |
| | | | | | | | | | | 10,163 | |
| | | | | | | | | | | | |
|
China — 15.0% | |
Alibaba Group Holding Ltd ADR * | | | 3.3 | | | | 150,610 | | | | 39,665 | |
Baidu Inc ADR * | | | 0.4 | | | | 34,194 | | | | 4,753 | |
China Construction Bank Corp, Cl H | | | 1.4 | | | | 21,954,000 | | | | 17,218 | |
China Mobile Ltd | | | 0.3 | | | | 598,500 | | | | 3,582 | |
China Mobile Ltd ADR | | | 0.1 | | | | 48,173 | | | | 1,438 | |
JD.com Inc ADR * | | | 0.6 | | | | 83,846 | | | | 7,156 | |
Kweichow Moutai Co Ltd, Cl A | | | 0.5 | | | | 23,975 | | | | 6,243 | |
| | | | | | | | | | | | |
| | | | |
| Description | | Percentage of
Net Assets (%) | | Shares | | Market Value
($ Thousands) |
|
COMMON STOCK (continued) | |
|
China (continued) | |
NetEase Inc ADR | | | 0.9 | % | | | 118,084 | | | $ | 10,671 | |
Ping An Insurance Group Co of China Ltd, Cl H | | | 0.9 | | | | 950,000 | | | | 11,151 | |
Shenzhou International Group Holdings Ltd | | | 0.4 | | | | 309,000 | | | | 5,230 | |
Wuhu Sanqi Interactive Entertainment Network Technology Group Co Ltd, Cl A | | | 0.5 | | | | 1,655,400 | | | | 6,572 | |
Wuliangye Yibin Co Ltd, Cl A | | | 0.5 | | | | 154,715 | | | | 5,970 | |
Other Securities | | | 5.2 | | | | | | | | 61,011 | |
| | | | | | | | | | | | |
| | | |
| | | | | | | | | | | 180,660 | |
| | | | | | | | | | | | |
|
Colombia — 0.3% | |
Other Securities | | | 0.3 | | | | | | | | 3,635 | |
| | | | | | | | | | | | |
|
Czech Republic — 0.1% | |
Other Securities | | | 0.1 | | | | | | | | 1,574 | |
| | | | | | | | | | | | |
|
Egypt — 0.4% | |
Other Securities | | | 0.4 | | | | | | | | 4,545 | |
| | | | | | | | | | | | |
|
Germany — 0.3% | |
Other Securities | | | 0.3 | | | | | | | | 3,487 | |
| | | | | | | | | | | | |
|
Ghana — 0.0% | |
Other Securities | | | 0.0 | | | | | | | | 170 | |
| | | | | | | | | | | | |
|
Greece — 0.3% | |
Other Securities | | | 0.3 | | | | | | | | 3,660 | |
| | | | | | | | | | | | |
|
Hong Kong — 10.7% | |
AIA Group Ltd | | | 0.6 | | | | 626,240 | | | | 6,862 | |
Anhui Conch Cement Co Ltd, Cl H | | | 0.5 | | | | 936,500 | | | | 5,992 | |
China Mengniu Dairy Co Ltd | | | 0.4 | | | | 1,003,000 | | | | 5,072 | |
Meituan, Cl B * | | | 0.6 | | | | 201,100 | | | | 7,523 | |
Tencent Holdings Ltd | | | 2.2 | | | | 368,581 | | | | 26,767 | |
Zhongsheng Group Holdings Ltd | | | 0.6 | | | | 937,000 | | | | 7,034 | |
Other Securities | | | 5.8 | | | | | | | | 70,139 | |
| | | | | | | | | | | | |
| | | |
| | | | | | | | | | | 129,389 | |
| | | | | | | | | | | | |
| | |
SEI Institutional Investments Trust / Semi-Annual Report / November 30, 2020 | | 53 |
SUMMARY SCHEDULE OF INVESTMENTS (Unaudited)
November 30, 2020
Emerging Markets Equity Fund (Continued)
| | | | | | | | | | | | |
| | | | |
| Description | | Percentage of
Net Assets (%) | | Shares | | Market Value
($ Thousands) |
|
COMMON STOCK (continued) | |
|
Hungary — 0.4% | |
Other Securities | | | 0.4 | % | | | | | | $ | 4,782 | |
| | | | | | | | | | | | |
|
India — 7.5% | |
HDFC Bank Ltd ADR * | | | 0.6 | | | | 99,269 | | | | 6,850 | |
Infosys Ltd | | | 0.4 | | | | 298,524 | | | | 4,465 | |
Infosys Ltd ADR | | | 0.3 | | | | 284,206 | | | | 4,326 | |
Reliance Industries Ltd | | | 0.4 | | | | 196,922 | | | | 5,122 | |
WNS Holdings Ltd ADR * | | | 0.6 | | | | 100,877 | | | | 7,103 | |
Other Securities | | | 5.2 | | | | | | | | 63,030 | |
| | | | | | | | | | | | |
| | | |
| | | | | | | | | | | 90,896 | |
| | | | | | | | | | | | |
|
Indonesia — 2.2% | |
Other Securities | | | 2.2 | | | | | | | | 26,648 | |
| | | | | | | | | | | | |
|
Ivory Coast — 0.1% | |
Other Securities | | | 0.1 | | | | | | | | 665 | |
| | | | | | | | | | | | |
|
Kenya — 0.4% | |
Other Securities | | | 0.4 | | | | | | | | 5,308 | |
| | | | | | | | | | | | |
|
Malaysia — 0.8% | |
Other Securities | | | 0.8 | | | | | | | | 10,023 | |
| | | | | | | | | | | | |
|
Mauritius — 0.1% | |
Other Securities | | | 0.1 | | | | | | | | 608 | |
| | | | | | | | | | | | |
|
Mexico — 1.7% | |
Wal-Mart de Mexico SAB de CV | | | 0.4 | | | | 1,850,551 | | | | 4,884 | |
Other Securities | | | 1.3 | | | | | | | | 16,161 | |
| | | | | | | | | | | | |
| | | |
| | | | | | | | | | | 21,045 | |
| | | | | | | | | | | | |
|
Morocco — 0.3% | |
Other Securities | | | 0.3 | | | | | | | | 3,827 | |
| | | | | | | | | | | | |
|
Nigeria — 0.4% | |
Other Securities | | | 0.4 | | | | | | | | 4,346 | |
| | | | | | | | | | | | |
| | | | | | | | | | | | |
| | | | |
| Description | | Percentage of
Net Assets (%) | | Shares | | Market Value
($ Thousands) |
|
COMMON STOCK (continued) | |
|
Oman — 0.0% | |
Other Securities | | | 0.0 | % | | | | | | $ | 370 | |
| | | | | | | | | | | | |
|
Pakistan — 0.2% | |
Other Securities | | | 0.2 | | | | | | | | 2,438 | |
| | | | | | | | | | | | |
|
Peru — 0.3% | |
Other Securities | | | 0.3 | | | | | | | | 3,927 | |
| | | | | | | | | | | | |
|
Philippines — 3.6% | |
Ayala Corp | | | 0.5 | | | | 375,259 | | | | 6,455 | |
GT Capital Holdings Inc | | | 0.4 | | | | 423,650 | | | | 5,130 | |
Robinsons Land Corp | | | 0.5 | | | | 16,594,032 | | | | 5,754 | |
Other Securities | | | 2.2 | | | | | | | | 25,943 | |
| | | | | | | | | | | | |
| | | |
| | | | | | | | | | | 43,282 | |
| | | | | | | | | | | | |
|
Poland — 0.7% | |
Other Securities | | | 0.7 | | | | | | | | 8,833 | |
| | | | | | | | | | | | |
|
Qatar — 0.2% | |
Other Securities | | | 0.2 | | | | | | | | 2,217 | |
| | | | | | | | | | | | |
|
Romania — 0.2% | |
Other Securities | | | 0.2 | | | | | | | | 2,416 | |
| | | | | | | | | | | | |
|
Russia — 3.1% | |
LUKOIL PJSC ADR | | | 0.5 | | | | 102,433 | | | | 6,711 | |
Sberbank of Russia PJSC ADR | | | 0.6 | | | | 506,098 | | | | 6,734 | |
Yandex NV, Cl A * | | | 0.8 | | | | 138,529 | | | | 9,553 | |
Other Securities | | | 1.2 | | | | | | | | 14,857 | |
| | | | | | | | | | | | |
| | | |
| | | | | | | | | | | 37,855 | |
| | | | | | | | | | | | |
|
Saudi Arabia — 0.7% | |
Other Securities | | | 0.7 | | | | | | | | 8,042 | |
| | | | | | | | | | | | |
|
South Africa — 2.9% | |
Naspers Ltd, Cl N | | | 0.9 | | | | 55,448 | | | | 11,210 | |
Other Securities | | | 2.0 | | | | | | | | 23,898 | |
| | | | | | | | | | | | |
| | | |
| | | | | | | | | | | 35,108 | |
| | | | | | | | | | | | |
| | |
54 | | SEI Institutional Investments Trust / Semi-Annual Report / November 30, 2020 |
| | | | | | | | | | | | |
| | | | |
| Description | | Percentage of
Net Assets (%) | | Shares | | Market Value
($ Thousands) |
|
COMMON STOCK (continued) | |
|
South Korea — 10.1% | |
CJ ENM Co Ltd | | | 0.6 | % | | | 59,851 | | | $ | 7,205 | |
KB Financial Group Inc | | | 0.5 | | | | 144,847 | | | | 5,936 | |
NCSoft Corp | | | 0.5 | | | | 8,369 | | | | 6,126 | |
Samsung Electronics Co Ltd | | | 2.8 | | | | 553,987 | | | | 33,393 | |
Other Securities | | | 5.7 | | | | | | | | 68,752 | |
| | | | | | | | | | | | |
| | | |
| | | | | | | | | | | 121,412 | |
| | | | | | | | | | | | |
|
Sri Lanka — 0.1% | |
Other Securities | | | 0.1 | | | | | | | | 1,547 | |
| | | | | | | | | | | | |
|
Taiwan — 12.0% | |
Chailease Holding Co Ltd | | | 0.5 | | | | 1,089,448 | | | | 5,963 | |
Delta Electronics Inc | | | 0.6 | | | | 849,000 | | | | 6,687 | |
Silergy Corp | | | 0.5 | | | | 73,947 | | | | 5,760 | |
Taiwan Semiconductor Manufacturing Co Ltd | | | 1.6 | | | | 1,125,000 | | | | 18,966 | |
Taiwan Semiconductor Manufacturing Co Ltd ADR | | | 3.7 | | | | 459,588 | | | | 44,589 | |
Other Securities | | | 5.1 | | | | | | | | 62,290 | |
| | | | | | | | | | | | |
| | | |
| | | | | | | | | | | 144,255 | |
| | | | | | | | | | | | |
|
Thailand — 3.2% | |
Home Product Center PCL | | | 0.6 | | | | 14,760,445 | | | | 7,173 | |
Other Securities | | | 2.6 | | | | | | | | 30,794 | |
| | | | | | | | | | | | |
| | | |
| | | | | | | | | | | 37,967 | |
| | | | | | | | | | | | |
|
Turkey — 0.3% | |
Other Securities | | | 0.3 | | | | | | | | 3,233 | |
| | | | | | | | | | | | |
|
United Arab Emirates — 1.0% | |
Emaar Properties PJSC | | | 0.4 | | | | 6,093,155 | | | | 5,275 | |
Other Securities | | | 0.6 | | | | | | | | 7,082 | |
| | | | | | | | | | | | |
| | | |
| | | | | | | | | | | 12,357 | |
| | | | | | | | | | | | |
|
United Kingdom — 4.2% | |
Halyk Savings Bank of Kazakhstan JSC GDR | | | 0.6 | | | | 580,564 | | | | 6,880 | |
NAC Kazatomprom JSC GDR | | | 0.5 | | | | 400,789 | | | | 5,671 | |
Vivo Energy PLC | | | 0.6 | | | | 6,310,306 | | | | 7,127 | |
Wizz Air Holdings PLC * | | | 0.5 | | | | 91,076 | | | | 5,474 | |
Other Securities | | | 2.0 | | | | | | | | 25,867 | |
| | | | | | | | | | | | |
| | | |
| | | | | | | | | | | 51,019 | |
| | | | | | | | | | | | |
|
United States — 2.6% | |
Credicorp Ltd | | | 0.5 | | | | 40,242 | | | | 6,194 | |
EPAM Systems Inc* | | | 0.4 | | | | 14,525 | | | | 4,682 | |
| | | | | | | | | | | | |
| | | | |
| Description | | Percentage of
Net Assets (%) | | Shares | | Market Value
($ Thousands) |
|
COMMON STOCK (continued) | |
|
United States (continued) | |
MercadoLibre Inc* | | | 0.7 | % | | | 5,481 | | | $ | 8,514 | |
Other Securities | | | 1.0 | | | | | | | | 11,334 | |
| | | | | | | | | | | | |
| | | |
| | | | | | | | | | | 30,724 | |
| | | | | | | | | | | | |
|
Vietnam — 2.5% | |
Military Commercial Joint Stock Bank* | | | 0.5 | | | | 6,531,653 | | | | 5,744 | |
Other Securities | | | 2.0 | | | | | | | | 24,076 | |
| | | | | | | | | | | | |
| | | |
| | | | | | | | | | | 29,820 | |
| | | | | | | | | | | | |
Total Common Stock (Cost $869,641) ($ Thousands) | | | | | | | | | | | 1,145,980 | |
| | | | | | | | | | | | |
|
PREFERRED STOCK — 1.5% | |
|
Brazil — 0.6% | |
Other Securities (A) | | | 0.6 | | | | | | | | 7,160 | |
| | | | | | | | | | | | |
|
Chile — 0.1% | |
Other Securities (A) | | | 0.1 | | | | | | | | 484 | |
| | | | | | | | | | | | |
|
Colombia — 0.2% | |
Other Securities (A) | | | 0.2 | | | | | | | | 2,614 | |
| | | | | | | | | | | | |
|
South Korea — 0.6% | |
Samsung Electronics Co Ltd (A) | | | 0.2 | | | | 50,103 | | | | 2,767 | |
Other Securities (A) | | | 0.4 | | | | | | | | 4,814 | |
| | | | | | | | | | | | |
| | | |
| | | | | | | | | | | 7,581 | |
| | | | | | | | | | | | |
Total Preferred Stock (Cost $15,399) ($ Thousands) | | | | | | | | | | | 17,839 | |
| | | | | | | | | | | | |
| | |
| | | | | Number of Warrants |
|
WARRANTS * — 1.3% | |
|
India — 0.1% | |
Other Securities | | | 0.1 | | | | | | | | 1,726 | |
| | | | | | | | | | | | |
|
Luxembourg — 0.2% | |
Other Securities | | | 0.2 | | | | | | | | 1,860 | |
| | | | | | | | | | | | |
|
Thailand — 0.0% | |
Other Securities | | | 0.0 | | | | | | | | 36 | |
| | | | | | | | | | | | |
|
United States — 0.8% | |
FPT Corp, Expires 03/31/21 | | | 0.5 | | | | 2,586,532 | | | | 6,130 | |
| | |
SEI Institutional Investments Trust / Semi-Annual Report / November 30, 2020 | | 55 |
SUMMARY SCHEDULE OF INVESTMENTS (Unaudited)
November 30, 2020
Emerging Markets Equity Fund (Concluded)
| | | | | | | | | | | | |
| | | | |
| Description | | Percentage of
Net Assets (%) | | | | Market Value
($ Thousands) |
|
WARRANTS (continued) | |
Other Securities | | | 0.3 | % | | | | | | $ | 3,817 | |
| | | | | | | | | | | | |
| | | | | | | | | | | 9,947 | |
| | | | | | | | | | | | |
|
Vietnam — 0.2% | |
Other Securities | | | 0.2 | | | | | | | | 1,836 | |
| | | | | | | | | | | | |
| |
Total Warrants (Cost $9,762) ($ Thousands) | | | | 15,405 | |
| | | | | | | | | | | | |
EXCHANGE TRADED FUND — 0.3% | |
Other Securities | | | 0.3 | | | | | | | | 2,869 | |
| | | | | | | | | | | | |
Total Exchange Traded Fund (Cost $2,330) ($ Thousands) | | | | 2,869 | |
| | | | | | | | | | | | |
|
RIGHTS — 0.0% | |
|
Hong Kong — 0.0% | |
Other Securities | | | 0.0 | | | | | | | | – | |
| | | | | | | | | | | | |
|
Taiwan — 0.0% | |
Other Securities | | | 0.0 | | | | | | | | 13 | |
| | | | | | | | | | | | |
| |
Total Rights
(Cost $–) ($ Thousands) | | | | 13 | |
| | | | | | | | | | | | |
| | | | | | | | | | | | |
| | | | |
| Description | | Percentage of
Net Assets (%) | | Shares | | Market Value
($ Thousands) |
|
CASH EQUIVALENT — 0.6% | |
SEI Daily Income Trust, Government Fund, Cl F 0.010% **† | | | 0.6% | | | | 7,552,959 | | | $ | 7,553 | |
| | | | | | | | | | | | |
Total Cash Equivalent
(Cost $7,553) ($ Thousands) | | | | 7,553 | |
| | | | | | | | | | | | |
| |
| | | | | |
Total Investments in Securities — 98.7%
(Cost $904,685)($ Thousands) | | | $ | 1,189,659 | |
| | | | | | | | | | | | |
A list of the open futures contracts held by the Fund at November 30, 2020 is as follows:
| | | | | | | | | | | | | | | | | | | | |
| | | | | | |
| Type of Contract | | Number of
Contracts Long | | | Expiration
Date | | | Notional Amount
(Thousands) | | | Value
(Thousands) | | | Unrealized
Appreciation (Thousands) | |
MSCI Emerging Markets | | | 144 | | | | Dec-2020 | | | $ | 8,576 | | | $ | 8,656 | | | $ | 80 | |
| | | | | | | | | | | | | | | | | | | | |
| | Percentages are based on a Net Assets of $1,205,925 ($ Thousands). |
| * | Non-income producing security. |
| ** | The rate reported is the 7-day effective yield as of November 30, 2020. |
| † | Investment in Affiliated Security (see Note 6). |
| (A) | There is currently no rate available. |
ADR — American Depositary Receipt
Cl — Class
GDR — Global Depositary Receipt
JSC — Joint-Stock Company
Ltd — Limited
MSCI — Morgan Stanley Capital International
PCL — Public Company Limited
PJSC — Public Joint-Stock Company
PLC — Public Limited Company
The Summary Schedule of Investments does not reflect the complete portfolio holdings. It includes the Fund’s 50 largest holdings and each investment of any issuer that exceeds 1% of the Fund’s net assets. “Other Securities” represent all issues not required to be disclosed under the rules adopted by the U.S. Securities and Exchange Commission (“SEC”). In certain instances, securities for which footnotes listed above may otherwise apply are included in the Other Securities caption. The complete schedule of portfolio holdings is available (i) without charge, upon request, by calling (800) 342-5734; and (ii) on the SEC’s website at http://www.sec.gov.
The following is a list of the level of inputs used as of November 30, 2020, in valuing the Fund’s investments and other financial instruments carried at value ($ Thousands):
| | | | | | | | | | | | | | | | |
| | | | | |
| Investments in Securities | | Level 1
($) | | | Level 2
($) | | | Level 3
($) | | | Total
($) | |
Common Stock | | | 1,001,783 | | | | 144,197 | | | | – | | | | 1,145,980 | |
Preferred Stock | | | 17,839 | | | | – | | | | – | | | | 17,839 | |
Warrants | | | 11,807 | | | | 3,598 | | | | – | | | | 15,405 | |
Exchange Traded Fund | | | 2,869 | | | | – | | | | – | | | | 2,869 | |
Rights | | | 13 | | | | – | | | | – | | | | 13 | |
Cash Equivalent | | | 7,553 | | | | – | | | | – | | | | 7,553 | |
| | | | | | | | | | | | | | | | |
Total Investments in Securities | | | 1,041,864 | | | | 147,795 | | | | – | | | | 1,189,659 | |
| | | | | | | | | | | | | | | | |
| | | | | | | | | | | | | | | | |
| | | | | |
| Other Financial Instruments | | Level 1
($) | | | Level 2
($) | | | Level 3
($) | | | Total
($) | |
Futures Contracts* | | | | | | | | | | | | | | | | |
Unrealized Appreciation | | | 80 | | | | – | | | | – | | | | 80 | |
| | | | | | | | | | | | | | | | |
Total Other Financial Instruments | | | 80 | | | | – | | | | – | | | | 80 | |
| | | | | | | | | | | | | | | | |
*Futures contracts are valued at the unrealized appreciation on the instrument.
| | |
56 | | SEI Institutional Investments Trust / Semi-Annual Report / November 30, 2020 |
For the period ended November 30, 2020, there were transfers in or out of Level 3.
For more information on valuation inputs, see Note 2 — Significant Accounting Policies in Notes to Financial Statements.
The following is a summary of Fund’s transactions with affiliates for the period ended November 30, 2020 ($ Thousands):
| | | | | | | | | | | | | | | | | | |
| | | | | | | | | | |
| Security Description | | Value
5/31/2020 | | Purchases
at Cost | | Proceeds
from Sales | | Realized Gain
(Loss) | | Change in
Unrealized
Appreciation
(Depreciation) | | Value
11/30/2020 | | Shares | | Income | | Capital Gains |
SEI Daily Income Trust, Government Fund, Cl F | | $ 18,307 | | $ 89,417 | | $ (100,171) | | $ — | | $ — | | $ 7,553 | | 7,552,959 | | $ 1 | | $ — |
| | | | | | | | | | | | | | | | | | |
Amounts designated as “—” are either $0 or have been rounded to $0.
The accompanying notes are an integral part of the financial statements.
| | |
SEI Institutional Investments Trust / Semi-Annual Report / November 30, 2020 | | 57 |
SCHEDULE OF INVESTMENTS (Unaudited)
November 30, 2020
Opportunistic Income Fund
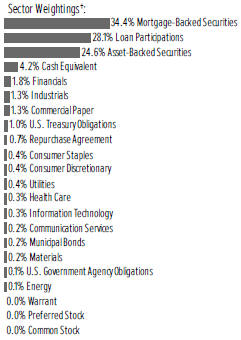
†Percentages based on total investments.
| | | | | | | | |
| | | |
| Description | | Face Amount
(Thousands) | | | Market Value
($ Thousands) | |
|
MORTGAGE-BACKED SECURITIES — 35.9% | |
|
Agency Mortgage-Backed Obligations — 4.5% | |
FHLMC | | | | | | | | |
3.000%, 05/01/2050 | | $ | 1,629 | | | $ | 1,748 | |
1.500%, 11/01/2050 | | | 4,986 | | | | 5,042 | |
FHLMC ARM | | | | | | | | |
3.950%, VAR ICE LIBOR USD 12 Month+2.470%, 03/01/2036 | | | 781 | | | | 833 | |
2.733%, VAR US Treas Yield Curve Rate T Note Const Mat 1 Yr+2.250%, 06/01/2035 | | | 581 | | | | 612 | |
FHLMC CMO, Ser 2020-5008, Cl IE, IO | | | | | | | | |
2.000%, 09/25/2050 | | | 415 | | | | 36 | |
FHLMC CMO, Ser 2020-5052, Cl KI, | | | | | | | | |
IO 4.000%, 12/25/2050 | | | 1,450 | | | | 200 | |
FHLMC CMO, Ser 2020-5052, Cl IO, IO | | | | | | | | |
3.500%, 12/25/2050 | | | 1,094 | | | | 146 | |
FHLMC Multifamily Structured Pass-Through Certificates, Ser K018, Cl X1, IO | | | | | | | | |
1.420%, 01/25/2022 (A) | | | 12,815 | | | | 116 | |
FHLMC Multifamily Structured Pass-Through Certificates, Ser K028, Cl X1, IO | | | | | | | | |
0.375%, 02/25/2023 (A) | | | 141,989 | | | | 667 | |
FHLMC REMIC, Ser 2010-83, Cl BA | | | | | | | | |
5.000%, 08/25/2040 | | | 195 | | | | 218 | |
FHLMC REMICS CMO, Ser 2007-3311, Cl FN | | | | | | | | |
0.441%, VAR ICE LIBOR USD 1 Month+0.300%, 05/15/2037 | | | 340 | | | | 341 | |
FNMA | | | | | | | | |
6.000%, 09/01/2039 to 04/01/2040 | | | 387 | | | | 456 | |
3.000%, 05/01/2022 to 02/01/2050 | | | 3,099 | | | | 3,279 | |
| | | | | | | | |
| | | |
| Description | | Face Amount
(Thousands) | | | Market Value
($ Thousands) | |
|
MORTGAGE-BACKED SECURITIES (continued) | |
2.500%, 05/01/2050 to 06/01/2050 | | $ | 12,068 | | | $ | 12,698 | |
2.000%, 12/01/2050 | | | 3,300 | | | | 3,459 | |
FNMA ARM | | | | | | | | |
3.530%, VAR US Treas Yield Curve Rate T Note Const Mat 1 Yr+2.193%, 10/01/2024 | | | 21 | | | | 22 | |
3.446%, VAR US Treas Yield Curve Rate T Note Const Mat 1 Yr+2.332%, 04/01/2034 | | | 350 | | | | 369 | |
3.288%, VAR US Treas Yield Curve Rate T Note Const Mat 1 Yr+2.141%, 10/01/2033 | | | 396 | | | | 411 | |
3.265%, VAR US Treas Yield Curve Rate T Note Const Mat 1 Yr+2.184%, 07/01/2036 | | | 587 | | | | 618 | |
3.186%, VAR US Treas Yield Curve Rate T Note Const Mat 1 Yr+2.205%, 05/01/2035 | | | 201 | | | | 211 | |
3.040%, VAR ICE LIBOR USD 12 Month+1.665%, 04/01/2033 | | | 115 | | | | 116 | |
2.958%, VAR ICE LIBOR USD 12 Month+1.565%, 05/01/2037 | | | 514 | | | | 536 | |
2.738%, VAR ICE LIBOR USD 12 Month+1.601%, 06/01/2035 | | | 119 | | | | 120 | |
2.734%, VAR ICE LIBOR USD 12 Month+1.557%, 06/01/2035 | | | 46 | | | | 47 | |
2.714%, VAR ICE LIBOR USD 12 Month+1.770%, 10/01/2033 | | | 198 | | | | 199 | |
2.675%, VAR ICE LIBOR USD 12 Month+1.800%, 05/01/2034 | | | 220 | | | | 230 | |
2.674%, VAR ICE LIBOR USD 12 Month+1.873%, 10/01/2033 | | | 175 | | | | 183 | |
2.614%, VAR US Treas Yield Curve Rate T Note Const Mat 1 Yr+2.247%, 08/01/2034 | | | 683 | | | | 719 | |
2.465%, VAR ICE LIBOR USD 12 Month+1.777%, 09/01/2034 | | | 454 | | | | 457 | |
2.187%, VAR ICE LIBOR USD 6 Month+1.580%, 07/01/2034 | | | 155 | | | | 160 | |
2.136%, VAR ICE LIBOR USD 12 Month+1.490%, 10/01/2035 | | | 420 | | | | 435 | |
1.798%, VAR ICE LIBOR USD 6 Month+1.433%, 03/01/2035 | | | 404 | | | | 418 | |
FNMA REMICS CMO, Ser 2011-63, Cl FG | | | | | | | | |
0.600%, VAR ICE LIBOR USD 1 Month+0.450%, 07/25/2041 | | | 644 | | | | 652 | |
FNMA REMICS CMO, Ser 2012-112, Cl BI, IO | | | | | | | | |
3.000%, 09/25/2031 | | | 4,316 | | | | 235 | |
FNMA REMICS CMO, Ser 2012-136, Cl DC | | | | | | | | |
1.750%, 09/25/2041 | | | 314 | | | | 316 | |
FNMA REMICS CMO, Ser 2012-137, Cl UE | | | | | | | | |
1.750%, 09/25/2041 | | | 266 | | | | 270 | |
| | |
58 | | SEI Institutional Investments Trust / Semi-Annual Report / November 30, 2020 |
| | | | | | | | |
| | | |
| Description | | Face Amount
(Thousands) | | Market Value
($ Thousands) |
|
MORTGAGE-BACKED SECURITIES (continued) | |
FNMA REMICS CMO, Ser 2015-46, Cl BA | | | | | | | | |
3.000%, 05/25/2041 | | $ | 211 | | | $ | 215 | |
FNMA STRIPS CMO, Ser 2011-406, Cl 6, IO | | | | | | | | |
4.000%, 01/25/2041 (A) | | | 459 | | | | 60 | |
FNMA, Ser 2017-M13, Cl FA | | | | | | | | |
0.550%, VAR ICE LIBOR USD 1 Month+0.400%, 10/25/2024 | | | 166 | | | | 165 | |
GNMA ARM | | | | | | | | |
1.828%, VAR ICE LIBOR USD 1 Month+1.693%, 12/20/2060 | | | 1,390 | | | | 1,438 | |
1.560%, VAR US Treas Yield Curve Rate T Note Const Mat 1 Yr+1.410%, 09/20/2060 to 11/20/2060 | | | 1,202 | | | | 1,222 | |
1.263%, VAR US Treas Yield Curve Rate T Note Const Mat 1 Yr+1.125%, 11/20/2060 | | | 1,307 | | | | 1,325 | |
1.199%, VAR ICE LIBOR USD 1 Month+1.040%, 12/20/2060 | | | 1,680 | | | | 1,716 | |
GNMA CMO, Ser 2020-167, Cl IW, IO | | | | | | | | |
2.000%, 11/20/2050 | | | 415 | | | | 45 | |
GNMA CMO, Ser 2020-173, Cl MI, IO | | | | | | | | |
2.500%, 11/20/2050 | | | 1,700 | | | | 206 | |
GNMA, Ser 2015-171, Cl IO, IO | | | | | | | | |
0.853%, 11/16/2055 (A) | | | 16,424 | | | | 733 | |
Mortgage-Linked Amortizing Notes, Ser 2012-1, Cl A10 2.060%, | | | 484 | | | | 493 | |
01/15/2022 | | | | | | | | |
NCUA Guaranteed Notes CMO, Ser 2010-R3,Cl 2A | | | | | | | | |
0.698%, VAR ICE LIBOR USD 1 Month+0.560%, 12/08/2020 | | | 224 | | | | 224 | |
| | | | | | | | |
| | |
| | | | | | | 44,417 | |
| | | | | | | | |
|
Non-Agency Mortgage-Backed Obligations — 31.4% | |
280 Park Avenue Mortgage Trust, Ser 2017-280P, Cl D | | | | | | | | |
1.677%, VAR ICE LIBOR USD 1 Month+1.537%, 09/15/2034 (B) | | | 3,000 | | | | 2,932 | |
Adjustable Rate Mortgage Trust, Ser 2005-1, Cl 5M1 | | | | | | | | |
1.200%, VAR ICE LIBOR USD 1 Month+1.050%, 05/25/2035 | | | 2,740 | | | | 2,825 | |
Alternative Loan Trust, Ser 2007-8CB, Cl A5 | | | | | | | | |
0.650%, VAR ICE LIBOR USD 1 Month+0.500%, 05/25/2037 | | | 3,025 | | | | 1,559 | |
American Home Mortgage Investment Trust, Ser 2005-2, Cl 4A1 | | | | | | | | |
1.743%, VAR ICE LIBOR USD 6 Month+1.500%, 09/25/2045 | | | 213 | | | | 213 | |
Angel Oak Mortgage Trust I LLC, Ser 2017-2, Cl A1 | | | | | | | | |
2.478%, 07/25/2047 (A)(B) | | | 61 | | | | 61 | |
| | | | | | | | |
| | | |
| Description | | Face Amount
(Thousands) | | Market Value
($ Thousands) |
|
MORTGAGE-BACKED SECURITIES (continued) | |
Angel Oak Mortgage Trust I LLC, Ser 2018-3, Cl A1 | | | | | | | | |
3.649%, 09/25/2048 (A)(B) | | $ | 84 | | | $ | 85 | |
Angel Oak Mortgage Trust I LLC, Ser 2019-1, Cl A1 | | | | | | | | |
3.920%, 11/25/2048 (A)(B) | | | 1,257 | | | | 1,288 | |
Angel Oak Mortgage Trust I LLC, Ser 2019-2, Cl A1 | | | | | | | | |
3.628%, 03/25/2049 (A)(B) | | | 263 | | | | 269 | |
Angel Oak Mortgage Trust I LLC, Ser 2019-4, Cl A1 | | | | | | | | |
2.993%, 07/26/2049 (A)(B) | | | 163 | | | | 166 | |
Angel Oak Mortgage Trust LLC, Ser 2017-1, | | | | | | | | |
Cl A1 2.810%, 01/25/2047 (A)(B) | | | 2 | | | | 2 | |
Angel Oak Mortgage Trust LLC, Ser 2017-3, | | | | | | | | |
Cl A1 2.708%, 11/25/2047 (A)(B) | | | 27 | | | | 27 | |
Angel Oak Mortgage Trust, Ser 2020-1, Cl A1 | | | 63 | | | | 63 | |
2.466%, 12/25/2059 (A)(B) | | | | | | | | |
Angel Oak Mortgage Trust, Ser 2020-3, Cl A1 | | | 361 | | | | 364 | |
1.691%, 04/25/2065 (A)(B) | | | | | | | | |
Angel Oak Mortgage Trust, Ser 2020-4, Cl A1 | | | 169 | | | | 170 | |
1.469%, 06/25/2065 (A)(B) | | | | | | | | |
Arroyo Mortgage Trust, Ser 2018-1, Cl A1 | | | 1,321 | | | | 1,340 | |
3.763%, 04/25/2048 (A)(B) | | | | | | | | |
Arroyo Mortgage Trust, Ser 2019-1, Cl A1 | | | 1,478 | | | | 1,530 | |
3.805%, 01/25/2049 (A)(B) | | | | | | | | |
Banc of America Funding, Ser 2005-F, Cl 4A1 | | | 52 | | | | 48 | |
2.935%, 09/20/2035 (A) | | | | | | | | |
Banc of America Funding, Ser 2006-D, Cl 3A1 | | | 48 | | | | 48 | |
3.531%, 05/20/2036 (A) | | | | | | | | |
Banc of America Funding, Ser 2006-I, Cl 1A1 | | | 1,989 | | | | 2,021 | |
2.909%, 12/20/2036 (A) | | | | | | | | |
Banc of America Mortgage Trust, Ser 2003-K, Cl 2A1 | | | | | | | | |
3.086%, 12/25/2033 (A) | | | 769 | | | | 760 | |
Banc of America Mortgage Trust, Ser 2004-A, Cl 2A2 | | | | | | | | |
3.904%, 02/25/2034 (A) | | | 823 | | | | 826 | |
Banc of America Mortgage Trust, Ser 2004-D, Cl 2A1 | | | | | | | | |
3.790%, 05/25/2034 (A) | | | 373 | | | | 372 | |
Banc of America Mortgage Trust, Ser 2004-L, Cl 1A1 | | | | | | | | |
4.393%, 01/25/2035 (A) | | | 121 | | | | 121 | |
Banc of America Mortgage Trust, Ser 2005-A, Cl 2A1 | | | | | | | | |
3.672%, 02/25/2035 (A) | | | 20 | | | | 20 | |
Bayview Commercial Asset Trust, Ser 2003-2, Cl A | | | | | | | | |
1.020%, VAR ICE LIBOR USD 1 Month+0.870%, 12/25/2033 (B) | | | 705 | | | | 694 | |
| | |
SEI Institutional Investments Trust / Semi-Annual Report / November 30, 2020 | | 59 |
SCHEDULE OF INVESTMENTS (Unaudited)
November 30, 2020
Opportunistic Income Fund (Continued)
| | | | | | | | |
| | | |
| Description | | Face Amount
(Thousands) | | Market Value
($ Thousands) |
|
MORTGAGE-BACKED SECURITIES (continued) | |
Bayview Commercial Asset Trust, Ser 2004-1, Cl A | | | | | | | | |
0.690%, VAR ICE LIBOR USD 1 Month+0.540%, 04/25/2034 (B) | | $ | 3,421 | | | $ | 3,410 | |
Bayview Commercial Asset Trust, Ser 2004-3, Cl A1 | | | | | | | | |
0.705%, VAR ICE LIBOR USD 1 Month+0.555%, 01/25/2035 (B) | | | 2,061 | | | | 2,031 | |
Bayview Commercial Asset Trust, Ser 2004-3, Cl M2 | | | | | | | | |
1.650%, VAR ICE LIBOR USD 1 Month+1.500%, 01/25/2035 (B) | | | 161 | | | | 161 | |
Bayview Commercial Asset Trust, Ser 2005-1A, Cl A2 | | | | | | | | |
0.675%, VAR ICE LIBOR USD 1 Month+0.525%, 04/25/2035 (B) | | | 1,191 | | | | 1,135 | |
Bayview Commercial Asset Trust, Ser 2005-3A, Cl M5 | | | | | | | | |
1.110%, VAR ICE LIBOR USD 1 Month+0.960%, 11/25/2035 (B) | | | 718 | | | | 643 | |
Bayview Commercial Asset Trust, Ser 2006-2A, Cl A2 | | | | | | | | |
0.570%, VAR ICE LIBOR USD 1 Month+0.420%, 07/25/2036 (B) | | | 1,253 | | | | 1,168 | |
Bayview Commercial Asset Trust, Ser 2006-2A, Cl A1 | | | | | | | | |
0.495%, VAR ICE LIBOR USD 1 Month+0.345%, 07/25/2036 (B) | | | 731 | | | | 679 | |
Bayview Commercial Asset Trust, Ser 2006-4A, Cl A1 | | | | | | | | |
0.380%, VAR ICE LIBOR USD 1 Month+0.230%, 12/25/2036 (B) | | | 516 | | | | 482 | |
Bayview Commercial Asset Trust, Ser 2007-1, Cl A2 | | | | | | | | |
0.420%, VAR ICE LIBOR USD 1 Month+0.270%, 03/25/2037 (B) | | | 474 | | | | 438 | |
Bayview Commercial Asset Trust, Ser 2007-1, Cl A1 | | | | | | | | |
0.370%, VAR ICE LIBOR USD 1 Month+0.220%, 03/25/2037 (B) | | | 1,263 | | | | 1,176 | |
BBCMS Mortgage Trust, Ser 2017-DELC, Cl B | | | | | | | | |
1.171%, VAR ICE LIBOR USD 1 Month+1.030%, 08/15/2036 (B) | | | 5,000 | | | | 4,794 | |
BBCMS Mortgage Trust, Ser 2018-TALL, Cl C | | | | | | | | |
1.262%, VAR ICE LIBOR USD 1 Month+1.121%, 03/15/2037 (B) | | | 3,000 | | | | 2,805 | |
Bear Stearns Alt-A Trust, Ser 2003-5, Cl 2A1 | | | 998 | | | | 1,000 | |
2.819%, 12/25/2033 (A) | | | | | | | | |
Bear Stearns Alt-A Trust, Ser 2004-7, Cl 2A1 | | | 1,551 | | | | 1,592 | |
3.216%, 08/25/2034 (A) | | | | | | | | |
Bear Stearns ARM Trust, Ser 2003-8, Cl 4A1 | | | 2,025 | | | | 2,067 | |
3.068%, 01/25/2034 (A) | | | | | | | | |
| | | | | | | | |
| | | |
| Description | | Face Amount
(Thousands) | | Market Value
($ Thousands) |
|
MORTGAGE-BACKED SECURITIES (continued) | |
Bear Stearns ARM Trust, Ser 2004-1, Cl 21A1 | | $ | 301 | | | $ | 297 | |
2.986%, 04/25/2034 (A) | | | | | | | | |
Bear Stearns ARM Trust, Ser 2004-1, Cl 12A3 | | | 1,247 | | | | 1,215 | |
3.756%, 04/25/2034 (A) | | | | | | | | |
Bear Stearns ARM Trust, Ser 2004-2, Cl 12A2 | | | 1,086 | | | | 1,021 | |
3.329%, 05/25/2034 (A) | | | | | | | | |
Bear Stearns ARM Trust, Ser 2004-3, Cl 2A | | | 1,059 | | | | 1,021 | |
3.272%, 07/25/2034 (A) | | | | | | | | |
Bear Stearns ARM Trust, Ser 2004-5, Cl 2A | | | 949 | | | | 962 | |
3.417%, 07/25/2034 (A) | | | | | | | | |
Bear Stearns ARM Trust, Ser 2004-9, Cl 22A1 | | | 756 | | | | 740 | |
3.138%, 11/25/2034 (A) | | | | | | | | |
Bear Stearns Commercial Mortgage Securities Trust, Ser 2007-PW17, Cl C | | | | | | | | |
5.936%, 06/11/2050 (A)(B) | | | 1,510 | | | | 1,471 | |
Bear Stearns Commercial Mortgage Securities Trust, Ser 2007-T26, Cl AM | | | | | | | | |
5.513%, 01/12/2045 (A) | | | 568 | | | | 568 | |
Bellemeade Re, Ser 2018-3A, Cl M1B | | | | | | | | |
2.000%, VAR ICE LIBOR USD 1 Month+1.850%, 10/25/2028 (B) | | | 1,637 | | | | 1,638 | |
Bellemeade Re, Ser 2019-2A, Cl M1B | | | | | | | | |
1.600%, VAR ICE LIBOR USD 1 Month+1.450%, 04/25/2029 (B) | | | 490 | | | | 489 | |
Bellemeade Re, Ser 2019-3A, Cl M1A | | | | | | | | |
1.250%, VAR ICE LIBOR USD 1 Month+1.100%, 07/25/2029 (B) | | | 606 | | | | 605 | |
Bellemeade Re, Ser 2019-3A, Cl M1B | | | | | | | | |
1.750%, VAR ICE LIBOR USD 1 Month+1.600%, 07/25/2029 (B) | | | 3,000 | | | | 2,978 | |
Bellemeade Re, Ser 2020-2A, Cl M1B | | | | | | | | |
3.350%, VAR ICE LIBOR USD 1 Month+3.200%, 08/26/2030 (B) | | | 1,700 | | | | 1,719 | |
Benchmark Mortgage Trust, Ser 2020-B19, Cl A5 | | | | | | | | |
1.850%, 09/15/2053 | | | 1,139 | | | | 1,166 | |
Benchmark Mortgage Trust, Ser 2020-B20, Cl A5 | | | | | | | | |
2.034%, 10/15/2053 | | | 1,128 | | | | 1,172 | |
Benchmark Mortgage Trust, Ser 2020-IG1, Cl A3 | | | | | | | | |
2.687%, 09/15/2043 | | | 1,811 | | | | 1,983 | |
BRAVO Residential Funding Trust, Ser 2019-1, Cl A1C | | | | | | | | |
3.500%, 03/25/2058 (B) | | | 1,724 | | | | 1,779 | |
BRAVO Residential Funding Trust, Ser 2019-NQM1, Cl A1 | | | | | | | | |
2.666%, 07/25/2059 (A)(B) | | | 1,671 | | | | 1,710 | |
BRAVO Residential Funding Trust, Ser 2019-NQM2, Cl A1 | | | | | | | | |
2.748%, 11/25/2059 (A)(B) | | | 1,383 | | | | 1,410 | |
| | |
60 | | SEI Institutional Investments Trust / Semi-Annual Report / November 30, 2020 |
| | | | | | | | |
| | | |
| Description | | Face Amount (Thousands) | | Market Value ($ Thousands) |
|
MORTGAGE-BACKED SECURITIES (continued) | |
BRAVO Residential Funding Trust, Ser 2020-NQM1, Cl A1 | | | | | | | | |
1.449%, 05/25/2060 (A)(B) | | $ | 253 | | | $ | 254 | |
Bunker Hill Loan Depositary Trust, Ser 2019-1, Cl A2 | | | | | | | | |
3.817%, 10/26/2048 (B) | | | 196 | | | | 204 | |
Bunker Hill Loan Depositary Trust, Ser 2019-1, Cl A1 | | | | | | | | |
3.613%, 10/26/2048 (B) | | | 1,697 | | | | 1,767 | |
Bunker Hill Loan Depositary Trust, Ser 2020-1, Cl A1 | | | | | | | | |
1.724%, 02/25/2055 (A)(B) | | | 148 | | | | 149 | |
BWAY Mortgage Trust, Ser 2013-1515, Cl A1 | | | | | | | | |
2.809%, 03/10/2033 (B) | | | 166 | | | | 172 | |
BX Commercial Mortgage Trust, Ser 2018-BIOA, Cl D | | | | | | | | |
1.462%, VAR ICE LIBOR USD 1 Month+1.321%, 03/15/2037 (B) | | | 2,000 | | | | 1,988 | |
BX Commercial Mortgage Trust, Ser 2018-BIOA, Cl C | | | | | | | | |
1.262%, VAR ICE LIBOR USD 1 Month+1.121%, 03/15/2037 (B) | | | 2,939 | | | | 2,930 | |
BX Commercial Mortgage Trust, Ser 2018-IND, Cl A | | | | | | | | |
0.891%, VAR ICE LIBOR USD 1 Month+0.750%, 11/15/2035 (B) | | | 120 | | | | 120 | |
BX Commercial Mortgage Trust, Ser 2018-IND, Cl D | | | | | | | | |
1.441%, VAR ICE LIBOR USD 1 Month+1.300%, 11/15/2035 (B) | | | 700 | | | | 697 | |
BX Commercial Mortgage Trust, Ser 2019-XL, Cl A | | | | | | | | |
1.061%, VAR ICE LIBOR USD 1 Month+0.920%, 10/15/2036 (B) | | | 285 | | | | 285 | |
BX Commercial Mortgage Trust, Ser 2019-XL, Cl E | | | | | | | | |
1.941%, VAR ICE LIBOR USD 1 Month+1.800%, 10/15/2036 (B) | | | 1,187 | | | | 1,180 | |
BX Commercial Mortgage Trust, Ser 2020-BXLP, Cl E | | | | | | | | |
1.741%, VAR ICE LIBOR USD 1 Month+1.600%, 12/15/2036 (B) | | | 1,998 | | | | 1,964 | |
BX Commercial Mortgage Trust, Ser VKNG, Cl C | | | | | | | | |
1.541%, VAR ICE LIBOR USD 1 Month+1.400%, 10/15/2037 (B) | | | 1,000 | | | | 997 | |
CAMB Commercial Mortgage Trust, Ser 2019-LIFE, Cl B | | | | | | | | |
1.391%, VAR ICE LIBOR USD 1 Month+1.250%, 12/15/2037 (B) | | | 3,000 | | | | 2,996 | |
| | | | | | | | |
| | | |
| Description | | Face Amount (Thousands) | | Market Value ($ Thousands) |
|
MORTGAGE-BACKED SECURITIES (continued) | |
CAMB Commercial Mortgage Trust, Ser 2019-LIFE, Cl E | | | | | | | | |
2.291%, VAR ICE LIBOR USD 1 Month+2.150%, 12/15/2037 (B) | | $ | 4,090 | | | $ | 4,018 | |
CGDBB Commercial Mortgage Trust, Ser 2017-BIOC, Cl D | | | | | | | | |
1.741%, VAR ICE LIBOR USD 1 Month+1.600%, 07/15/2032 (B) | | | 2,284 | | | | 2,280 | |
CGDBB Commercial Mortgage Trust, Ser 2017-BIOC, Cl B | | | | | | | | |
1.111%, VAR ICE LIBOR USD 1 Month+0.970%, 07/15/2032 (B) | | | 2,193 | | | | 2,191 | |
Chase Mortgage Finance Trust, Ser 2005-A1, Cl 2A3 | | | | | | | | |
3.320%, 12/25/2035 (A) | | | 510 | | | | 500 | |
Chase Mortgage Finance Trust, Ser 2007-A1, Cl 1A3 | | | | | | | | |
3.260%, 02/25/2037 (A) | | | 342 | | | | 342 | |
Chase Mortgage Finance Trust, Ser 2007-A1, Cl 7A1 | | | | | | | | |
3.385%, 02/25/2037 (A) | | | 345 | | | | 347 | |
Chase Mortgage Finance Trust, Ser 2007-A2, Cl 2A3 | | | | | | | | |
2.999%, 06/25/2035 (A) | | | 557 | | | | 559 | |
CHL Mortgage Pass-Through Trust, Ser 2003-46, Cl 2A1 | | | | | | | | |
2.803%, 01/19/2034 (A) | | | 685 | | | | 677 | |
CHL Mortgage Pass-Through Trust, Ser 2004-11, Cl 2A1 | | | | | | | | |
2.605%, 07/25/2034 (A) | | | 753 | | | | 759 | |
CHL Mortgage Pass-Through Trust, Ser 2004-8, Cl 2A1 | | | | | | | | |
4.500%, 06/25/2019 | | | 6 | | | | 6 | |
CHT Mortgage Trust, Ser 2017-CSMO, Cl B | | | | | | | | |
1.541%, VAR ICE LIBOR USD 1 Month+1.400%, 11/15/2036 (B) | | | 2,000 | | | | 1,955 | |
CIM Trust, Ser 2017-7, Cl A | | | | | | | | |
3.000%, 04/25/2057 (A)(B) | | | 473 | | | | 483 | |
Citigroup Commercial Mortgage Trust, Ser 2006-C4, Cl C | | | | | | | | |
6.396%, 03/15/2049 (A) | | | 1,087 | | | | 1,091 | |
Citigroup Commercial Mortgage Trust, Ser 2018-TBR, Cl A | | | | | | | | |
0.971%, VAR ICE LIBOR USD 1 Month+0.830%, 12/15/2036 (B) | | | 4,000 | | | | 3,874 | |
Citigroup Commercial Mortgage Trust, Ser 2019-SST2, Cl A | | | | | | | | |
1.061%, VAR ICE LIBOR USD 1 Month+0.920%, 12/15/2036 (B) | | | 700 | | | | 700 | |
Citigroup Mortgage Loan Trust, Ser 2005-2, Cl 1A2A | | | | | | | | |
3.555%, 05/25/2035 (A) | | | 628 | | | | 644 | |
| | |
SEI Institutional Investments Trust / Semi-Annual Report / November 30, 2020 | | 61 |
SCHEDULE OF INVESTMENTS (Unaudited)
November 30, 2020
Opportunistic Income Fund (Continued)
| | | | | | | | |
| | | |
| Description | | Face Amount (Thousands) | | Market Value ($ Thousands) |
|
MORTGAGE-BACKED SECURITIES (continued) | |
Citigroup Mortgage Loan Trust, Ser 2007-AR5, Cl 1A2A | | | | | | | | |
3.835%, 04/25/2037 (A) | | $ | 252 | | | $ | 240 | |
Citigroup Mortgage Loan Trust, Ser 2015-2, Cl 5A1 | | | | | | | | |
0.399%, VAR ICE LIBOR USD 1 Month+0.250%, 03/25/2047 (B) | | | 232 | | | | 234 | |
Citigroup Mortgage Loan Trust, Ser 2019-IMC1, Cl A1 | | | | | | | | |
2.720%, 07/25/2049 (A)(B) | | | 59 | | | | 60 | |
Cold Storage Trust, Ser ICE5, Cl D | | | | | | | | |
2.241%, VAR ICE LIBOR USD 1 Month+2.100%, 11/15/2037 (B) | | | 1,500 | | | | 1,500 | |
COLT Mortgage Loan Trust, Ser 2019-1, Cl A1 | | | | | | | | |
3.705%, 03/25/2049 (A)(B) | | | 1,123 | | | | 1,135 | |
COLT Mortgage Loan Trust, Ser 2019-3, Cl A1 | | | | | | | | |
2.764%, 08/25/2049 (A)(B) | | | 800 | | | | 807 | |
COLT Mortgage Loan Trust, Ser 2019-4, Cl A1 | | | | | | | | |
2.579%, 11/25/2049 (A)(B) | | | 1,214 | | | | 1,229 | |
COLT Mortgage Loan Trust, Ser 2020-1R, Cl A1 | | | | | | | | |
1.255%, 09/25/2065 (A)(B) | | | 302 | | | | 302 | |
COLT Mortgage Loan Trust, Ser 2020-2, Cl A1 | | | | | | | | |
1.853%, 03/25/2065 (A)(B) | | | 1,029 | | | | 1,042 | |
COLT Mortgage Loan Trust, Ser 2020-2R, Cl A1 | | | | | | | | |
1.325%, 10/26/2065 (A)(B) | | | 192 | | | | 192 | |
COLT Mortgage Loan Trust, Ser 2020-3, Cl A1 | | | | | | | | |
1.506%, 04/27/2065 (A)(B) | | | 164 | | | | 166 | |
COMM Mortgage Trust, Ser 2013-300P, Cl E | | | | | | | | |
4.540%, 08/10/2030 (A)(B) | | | 800 | | | | 749 | |
COMM Mortgage Trust, Ser 2013-CR10, Cl XA, IO | | | | | | | | |
0.817%, 08/10/2046 (A) | | | 37,675 | | | | 581 | |
COMM Mortgage Trust, Ser 2014-CR14, Cl XA, IO | | | | | | | | |
0.727%, 02/10/2047 (A) | | | 25,904 | | | | 413 | |
COMM Mortgage Trust, Ser 2014-CR15, Cl A2 | | | | | | | | |
2.928%, 02/10/2047 | | | 391 | | | | 391 | |
COMM Mortgage Trust, Ser 2014-CR15, Cl D | | | | | | | | |
4.891%, 02/10/2047 (A)(B) | | | 700 | | | | 703 | |
Credit Suisse First Boston Mortgage Securities, Ser 2004-AR8, Cl 6A1 | | | | | | | | |
2.999%, 09/25/2034 (A) | | | 152 | | | | 152 | |
Credit Suisse First Boston Mortgage Securities, Ser 2005-5, Cl 3A2 | | | | | | | | |
0.450%, VAR ICE LIBOR USD 1 Month+0.300%, 07/25/2035 | | | 1,197 | | | | 1,158 | |
CSFB Mortgage-Backed Pass-Through Certificates, Ser 2004-AR5, Cl 6A1 | | | | | | | | |
3.061%, 06/25/2034 (A) | | | 1,914 | | | | 1,982 | |
CSMC Trust, Ser 2019-AFC1, Cl A1 | | | | | | | | |
2.573%, 07/25/2049 (B) | | | 1,365 | | | | 1,396 | |
| | | | | | | | |
| | | |
| Description | | Face Amount (Thousands) | | Market Value ($ Thousands) |
|
MORTGAGE-BACKED SECURITIES (continued) | |
DBCG Mortgage Trust, Ser 2017-BBG, Cl C | | | | | | | | |
1.141%, VAR ICE LIBOR USD 1 Month+1.000%, 06/15/2034 (B) | | $ | 1,100 | | | $ | 1,068 | |
DBGS Mortgage Trust, Ser 2018-BIOD, Cl A | | | | | | | | |
0.944%, VAR ICE LIBOR USD 1 Month+0.803%, 05/15/2035 (B) | | | 2,784 | | | | 2,784 | |
DBUBS Mortgage Trust, Ser 2011-LC2A, Cl XA, IO | | | | | | | | |
1.143%, 07/10/2044 (A)(B) | | | 21,402 | | | | 15 | |
DBUBS Mortgage Trust, Ser 2011-LC3A, Cl A4 | | | | | | | | |
4.551%, 08/10/2044 | | | 1,139 | | | | 1,147 | |
Deephaven Residential Mortgage Trust, Ser 2017-1A, Cl A1 | | | | | | | | |
2.725%, 12/26/2046 (A)(B) | | | 15 | | | | 15 | |
Deephaven Residential Mortgage Trust, Ser 2017-2A, Cl A1 | | | | | | | | |
2.453%, 06/25/2047 (A)(B) | | | 47 | | | | 47 | |
Deephaven Residential Mortgage Trust, Ser 2017-3A, Cl A1 | | | | | | | | |
2.577%, 10/25/2047 (A)(B) | | | 46 | | | | 46 | |
Deephaven Residential Mortgage Trust, Ser 2018-1A, Cl A1 | | | | | | | | |
2.976%, 12/25/2057 (A)(B) | | | 85 | | | | 85 | |
Deephaven Residential Mortgage Trust, Ser 2018-3A, Cl A1 | | | | | | | | |
3.789%, 08/25/2058 (A)(B) | | | 144 | | | | 144 | |
Deephaven Residential Mortgage Trust, Ser 2019-3A, Cl A1 | | | | | | | | |
2.964%, 07/25/2059 (A)(B) | | | 132 | | | | 134 | |
Deephaven Residential Mortgage Trust, Ser 2019-4A, Cl A1 | | | | | | | | |
2.791%, 10/25/2059 (A)(B) | | | 159 | | | | 161 | |
Deephaven Residential Mortgage Trust, Ser 2020-2, Cl A1 | | | | | | | | |
1.692%, 05/25/2065 (B) | | | 217 | | | | 218 | |
Deutsche Mortgage Securities Re-REMIC Trust Certificates, Ser 2007-WM1, Cl A1 | | | | | | | | |
3.252%, 06/27/2037 (A)(B) | | | 1,176 | | | | 1,168 | |
Eagle Re, Ser 2020-1, Cl M1A | | | | | | | | |
1.050%, VAR ICE LIBOR USD 1 Month+0.900%, 01/25/2030 (B) | | | 1,950 | | | | 1,942 | |
Ellington Financial Mortgage Trust, Ser 2019-1, Cl A1 | | | | | | | | |
2.934%, 06/25/2059 (A)(B) | | | 504 | | | | 519 | |
Ellington Financial Mortgage Trust, Ser 2019-2, Cl A2 | | | | | | | | |
2.892%, 11/25/2059 (A)(B) | | | 1,487 | | | | 1,520 | |
Ellington Financial Mortgage Trust, Ser 2020-1, Cl A1 | | | | | | | | |
2.006%, 05/25/2065 (A)(B) | | | 1,108 | | | | 1,124 | |
Ellington Financial Mortgage Trust, Ser 2020-2, Cl A1 | | | | | | | | |
1.178%, 10/25/2065 (A)(B) | | | 2,024 | | | | 2,025 | |
| | |
62 | | SEI Institutional Investments Trust / Semi-Annual Report / November 30, 2020 |
| | | | | | | | |
| | | |
| Description | | Face Amount (Thousands) | | Market Value ($ Thousands) |
|
MORTGAGE-BACKED SECURITIES (continued) | |
FHLMC STACR REMIC Trust, Ser 2020-DNA3, Cl M1 | | | | | | | | |
1.650%, VAR ICE LIBOR USD 1 Month+1.500%, 06/25/2050 (B) | | $ | 1,630 | | | $ | 1,632 | |
FHLMC STACR REMIC Trust, Ser 2020-DNA4, Cl M1 | | | | | | | | |
1.650%, VAR ICE LIBOR USD 1 Month+1.500%, 08/25/2050 (B) | | | 1,000 | | | | 1,002 | |
FHLMC STACR REMIC Trust, Ser 2020-DNA5, Cl M1 | | | | | | | | |
1.388%, VAR SOFR30A+1.300%, 10/25/2050 (B) | | | 2,557 | | | | 2,562 | |
FHLMC STACR REMIC Trust, Ser 2020-HQA3, Cl M1 | | | | | | | | |
1.700%, VAR ICE LIBOR USD 1 Month+1.550%, 07/25/2050 (B) | | | 2,950 | | | | 2,954 | |
FHLMC STACR REMIC Trust, Ser 2020-HQA4, Cl M1 | | | | | | | | |
1.450%, VAR ICE LIBOR USD 1 Month+1.300%, 09/25/2050 (B) | | | 2,000 | | | | 2,003 | |
FHLMC STACR Trust, Ser 2019-FTR2, Cl M1 | | | | | | | | |
1.100%, VAR ICE LIBOR USD 1 Month+0.950%, 11/25/2048 (B) | | | 1,266 | | | | 1,264 | |
FHLMC Structured Agency Credit Risk Debt Notes, Ser 2014-HQ1, Cl M3 | | | | | | | | |
4.250%, VAR ICE LIBOR USD 1 Month+4.100%, 08/25/2024 | | | 532 | | | | 538 | |
FHLMC Structured Agency Credit Risk Debt Notes, Ser 2014-HQ2, Cl M3 | | | | | | | | |
3.900%, VAR ICE LIBOR USD 1 Month+3.750%, 09/25/2024 | | | 1,597 | | | | 1,642 | |
FHLMC Structured Agency Credit Risk Debt Notes, Ser 2014-HQ3, Cl M3 | | | | | | | | |
4.900%, VAR ICE LIBOR USD 1 Month+4.750%, 10/25/2024 | | | 460 | | | | 466 | |
FHLMC Structured Agency Credit Risk Debt Notes, Ser 2015-DN1, Cl M3 | | | | | | | | |
4.300%, VAR ICE LIBOR USD 1 Month+4.150%, 01/25/2025 | | | 595 | | | | 602 | |
FHLMC Structured Agency Credit Risk Debt Notes, Ser 2015-DNA3, Cl M3F | | | | | | | | |
3.850%, VAR ICE LIBOR USD 1 Month+3.700%, 04/25/2028 | | | 929 | | | | 957 | |
FHLMC Structured Agency Credit Risk Debt Notes, Ser 2015-DNA3, Cl M3 | | | | | | | | |
4.850%, VAR ICE LIBOR USD 1 Month+4.700%, 04/25/2028 | | | 744 | | | | 774 | |
FHLMC Structured Agency Credit Risk Debt Notes, Ser 2015-HQ1, Cl M3 | | | | | | | | |
3.950%, VAR ICE LIBOR USD 1 Month+3.800%, 03/25/2025 | | | 71 | | | | 71 | |
| | | | | | | | |
| | | |
| Description | | Face Amount (Thousands) | | Market Value ($ Thousands) |
|
MORTGAGE-BACKED SECURITIES (continued) | |
FHLMC Structured Agency Credit Risk Debt Notes, Ser 2015-HQ2, Cl M3 | | | | | | | | |
3.400%, VAR ICE LIBOR USD 1 Month+3.250%, 05/25/2025 | | $ | 1,831 | | | $ | 1,866 | |
FHLMC Structured Agency Credit Risk Debt Notes, Ser 2018-DNA1, Cl M2 | | | | | | | | |
1.950%, VAR ICE LIBOR USD 1 Month+1.800%, 07/25/2030 | | | 867 | | | | 851 | |
FHLMC Structured Agency Credit Risk Debt Notes, Ser 2018-HQA1, Cl M2 | | | | | | | | |
2.450%, VAR ICE LIBOR USD 1 Month+2.300%, 09/25/2030 | | | 1,187 | | | | 1,174 | |
FHLMC Structured Agency Credit Risk Debt Notes, Ser 2020-HQA5, Cl M1 | | | | | | | | |
1.191%, VAR SOFR30A+1.100%, 11/25/2050 (B) | | | 2,750 | | | | 2,750 | |
Flagstar Mortgage Trust, Ser 2018-5, Cl A7 | | | | | | | | |
4.000%, 09/25/2048 (A)(B) | | | 13 | | | | 13 | |
FNMA Connecticut Avenue Securities, Ser 2014-C04, Cl 1M2 | | | | | | | | |
5.050%, VAR ICE LIBOR USD 1 Month+4.900%, 11/25/2024 | | | 2,535 | | | | 2,588 | |
FNMA Connecticut Avenue Securities, Ser 2016-C03, Cl 2M2 | | | | | | | | |
6.050%, VAR ICE LIBOR USD 1 Month+5.900%, 10/25/2028 | | | 252 | | | | 269 | |
FNMA Connecticut Avenue Securities, Ser 2016-C06, Cl 1M2 | | | | | | | | |
4.400%, VAR ICE LIBOR USD 1 Month+4.250%, 04/25/2029 | | | 1,158 | | | | 1,212 | |
FNMA Connecticut Avenue Securities, Ser 2018-C03, Cl 1M2 | | | | | | | | |
2.300%, VAR ICE LIBOR USD 1 Month+2.150%, 10/25/2030 | | | 759 | | | | 752 | |
FNMA Connecticut Avenue Securities, Ser 2018-C03, Cl 1EA2 | | | | | | | | |
1.000%, VAR ICE LIBOR USD 1 Month+0.850%, 10/25/2030 | | | 86 | | | | 86 | |
FNMA Connecticut Avenue Securities, Ser 2018-C05, Cl 1M2 | | | | | | | | |
2.500%, VAR ICE LIBOR USD 1 Month+2.350%, 01/25/2031 | | | 1,177 | | | | 1,169 | |
FREMF Mortgage Trust, Ser 2013-K28, Cl C | | | | | | | | |
3.609%, 06/25/2046 (A)(B) | | | 1,460 | | | | 1,529 | |
FREMF Mortgage Trust, Ser 2015-K718, Cl B | | | | | | | | |
3.647%, 02/25/2048 (A)(B) | | | 1,500 | | | | 1,536 | |
Galton Funding Mortgage Trust, Ser 2018-1, Cl A43 | | | | | | | | |
3.500%, 11/25/2057 (A)(B) | | | 931 | | | | 939 | |
GCAT Trust, Ser 2020-NQM2, Cl A1 | | | | | | | | |
1.555%, 04/25/2065 (B) | | | 94 | | | | 94 | |
| | |
SEI Institutional Investments Trust / Semi-Annual Report / November 30, 2020 | | 63 |
SCHEDULE OF INVESTMENTS (Unaudited)
November 30, 2020
Opportunistic Income Fund (Continued)
| | | | | | | | |
| | | |
| Description | | Face Amount (Thousands) | | Market Value ($ Thousands) |
|
MORTGAGE-BACKED SECURITIES (continued) | |
GS Mortgage Securities Trust, Ser 2011-GC3, Cl X, IO | | | | | | | | |
0.523%, 03/10/2044 (A)(B) | | $ | 11,928 | | | $ | – | |
GS Mortgage Securities Trust, Ser 2012-ALOHA, Cl D | | | | | | | | |
4.267%, 04/10/2034 (A)(B) | | | 1,000 | | | | 929 | |
GS Mortgage Securities Trust, Ser 2017-500K, Cl D | | | | | | | | |
1.441%, VAR ICE LIBOR USD 1 Month+1.300%, 07/15/2032 (B) | | | 3,750 | | | | 3,727 | |
GS Mortgage Securities Trust, Ser 2017-500K, Cl A | | | | | | | | |
0.841%, VAR ICE LIBOR USD 1 Month+0.700%, 07/15/2032 (B) | | | 535 | | | | 535 | |
GS Mortgage Securities Trust, Ser 2020-DUNE, Cl B | | | | | | | | |
1.491%, VAR ICE LIBOR USD 1 Month+1.350%, 12/15/2036 (B) | | | 500 | | | | 472 | |
GS Mortgage Securities Trust, Ser 2020-DUNE, Cl E | | | | | | | | |
2.641%, VAR ICE LIBOR USD 1 Month+2.500%, 12/15/2036 (B) | | | 400 | | | | 348 | |
GSR Mortgage Loan Trust, Ser 2005-AR1, Cl 1A1 | | | | | | | | |
3.422%, 01/25/2035 (A) | | | 79 | | | | 76 | |
GSR Mortgage Loan Trust, Ser 2005-AR2, Cl 1A2 | | | | | | | | |
3.862%, 04/25/2035 (A) | | | 345 | | | | 340 | |
GSR Mortgage Loan Trust, Ser 2005-AR6, Cl 3A1 | | | | | | | | |
3.640%, 09/25/2035 (A) | | | 222 | | | | 225 | |
HarborView Mortgage Loan Trust, Ser 2004-6, Cl 4A | | | | | | | | |
3.034%, 08/19/2034 (A) | | | 1,177 | | | | 1,235 | |
Hilton Orlando Trust, Ser 2018-ORL, Cl B | | | | | | | | |
1.191%, VAR ICE LIBOR USD 1 Month+1.050%, 12/15/2034 (B) | | | 2,900 | | | | 2,766 | |
Hilton USA Trust, Ser 2016-HHV, Cl D | | | | | | | | |
4.333%, 11/05/2038 (A)(B) | | | 3,910 | | | | 3,874 | |
HMH Trust, Ser 2017-NSS, Cl E | | | | | | | | |
6.292%, 07/05/2031 (B) | | | 3,613 | | | | 3,026 | |
Homeward Opportunities Fund I Trust, Ser 2018-1, Cl A1 | | | | | | | | |
3.766%, 06/25/2048 (A)(B) | | | 754 | | | | 759 | |
Hudson’s Bay Simon JV Trust, Ser 2015-HBFL, Cl BFL | | | | | | | | |
2.538%, VAR ICE LIBOR USD 1 Month+2.400%, 08/05/2034 (B) | | | 2,000 | | | | 1,572 | |
Impac CMB Trust, Ser 2004-5, Cl 1A1 | | | | | | | | |
0.870%, VAR ICE LIBOR USD 1 Month+0.720%, 10/25/2034 | | | 1,400 | | | | 1,449 | |
| | | | | | | | |
| | | |
| Description | | Face Amount (Thousands) | | Market Value ($ Thousands) |
|
MORTGAGE-BACKED SECURITIES (continued) | |
Impac CMB Trust, Ser 2004-6, Cl 1A2 | | | | | | | | |
0.930%, VAR ICE LIBOR USD 1 Month+0.780%, 10/25/2034 | | $ | 1,247 | | | $ | 1,246 | |
Impac Secured Assets Trust, Ser 2007-2, Cl 2A | | | | | | | | |
0.650%, VAR ICE LIBOR USD 1 Month+0.500%, 04/25/2037 | | | 315 | | | | 329 | |
IndyMac INDA Mortgage Loan Trust, Ser 2007-AR3, Cl 1A1 | | | | | | | | |
3.575%, 07/25/2037 (A) | | | 1,316 | | | | 1,207 | |
IndyMac INDX Mortgage Loan Trust, Ser 2007-FLX3, Cl A1 | | | | | | | | |
0.390%, VAR ICE LIBOR USD 1 Month+0.240%, 06/25/2037 | | | 479 | | | | 465 | |
JPMorgan Mortgage Trust, Ser 2018-7FRB, Cl A2 | | | | | | | | |
0.900%, VAR ICE LIBOR USD 1 Month+0.750%, 04/25/2046 (B) | | | 179 | | | | 179 | |
JPMorgan Chase Commercial Mortgage Securities Trust, Ser 2006-CIBC15, Cl AM | | | | | | | | |
5.855%, 06/12/2043 (A) | | | 313 | | | | 313 | |
JPMorgan Chase Commercial Mortgage Securities Trust, Ser 2006-LDP8, Cl E | | | | | | | | |
6.095%, 05/15/2045 (A)(B) | | | 330 | | | | 325 | |
JPMorgan Chase Commercial Mortgage Securities Trust, Ser 2011-C3, Cl XA, IO | | | | | | | | |
1.192%, 02/15/2046 (A)(B) | | | 7,428 | | | | 35 | |
JPMorgan Chase Commercial Mortgage Securities Trust, Ser 2019-MFP, Cl B | | | | | | | | |
1.301%, VAR ICE LIBOR USD 1 Month+1.160%, 07/15/2036 (B) | | | 2,000 | | | | 1,940 | |
JPMorgan Chase Commercial Mortgage Securities Trust, Ser 2020-NNN, Cl CFL | | | | | | | | |
1.441%, VAR ICE LIBOR USD 1 Month+1.300%, 01/16/2037 (B) | | | 1,044 | | | | 993 | |
JPMorgan Chase Commercial Mortgage Securities Trust, Ser 2020-NNN, Cl XAFX, IO | | | | | | | | |
2.032%, 01/16/2037 (A)(B) | | | 12,500 | | | | 830 | |
JPMorgan Mortgage Trust, Ser 2005-A3, Cl 6A5 | | | | | | | | |
3.785%, 06/25/2035 (A) | | | 473 | | | | 477 | |
JPMorgan Mortgage Trust, Ser 2005-A3, Cl 6A2 | | | | | | | | |
3.785%, 06/25/2035 (A) | | | 468 | | | | 471 | |
JPMorgan Mortgage Trust, Ser 2005-A4, Cl 4A2 | | | | | | | | |
3.395%, 07/25/2035 (A) | | | 883 | | | | 868 | |
JPMorgan Mortgage Trust, Ser 2006-A2, Cl 5A3 | | | | | | | | |
2.531%, 11/25/2033 (A) | | | 173 | | | | 178 | |
| | |
64 | | SEI Institutional Investments Trust / Semi-Annual Report / November 30, 2020 |
| | | | | | | | |
| | | |
| Description | | Face Amount (Thousands) | | Market Value ($ Thousands) |
|
MORTGAGE-BACKED SECURITIES (continued) | |
JPMorgan Mortgage Trust, Ser 2007-A1, Cl 1A1 | | | | | | | | |
3.252%, 07/25/2035 (A) | | $ | 1,186 | | | $ | 1,210 | |
JPMorgan Mortgage Trust, Ser 2007-A1, Cl 4A2 | | | | | | | | |
2.959%, 07/25/2035 (A) | | | 189 | | | | 189 | |
JPMorgan Mortgage Trust, Ser 2007-A1, Cl 5A2 | | | | | | | | |
3.197%, 07/25/2035 (A) | | | 597 | | | | 592 | |
JPMorgan Mortgage Trust, Ser 2007-A4, Cl 1A1 | | | | | | | | |
3.580%, 06/25/2037 (A) | | | 41 | | | | 37 | |
KNDL Mortgage Trust, Ser 2019-KNSQ, Cl A | | | | | | | | |
0.941%, VAR ICE LIBOR USD 1 Month+0.800%, 05/15/2036 (B) | | | 150 | | | | 150 | |
LSTAR Securities Investment, Ser 2019-4, Cl A1 | | | | | | | | |
1.655%, VAR ICE LIBOR USD 1 Month+1.500%, 05/01/2024 (B) | | | 323 | | | | 319 | |
MASTR Adjustable Rate Mortgages Trust, Ser 2005-6, Cl 5A1 | | | | | | | | |
3.001%, 07/25/2035 (A) | | | 31 | | | | 30 | |
MASTR Alternative Loan Trust, Ser 2003-5, Cl 4A1 | | | | | | | | |
5.500%, 07/25/2033 | | | 1,328 | | | | 1,385 | |
Mellon Residential Funding, Ser 1999-TBC3, Cl A2 | | | | | | | | |
2.610%, 10/20/2029 (A) | | | 188 | | | | 187 | |
Merit, Ser HILL, Cl A | | | | | | | | |
1.291%, VAR ICE LIBOR USD 1 Month+1.150%, 08/15/2037 (B) | | | 385 | | | | 386 | |
Merrill Lynch Mortgage Investors Trust, Ser 2003-E, Cl A1 | | | | | | | | |
0.770%, VAR ICE LIBOR USD 1 Month+0.620%, 10/25/2028 | | | 641 | | | | 639 | |
Merrill Lynch Mortgage Investors Trust, Ser 2003-G, Cl A1 | | | | | | | | |
0.790%, VAR ICE LIBOR USD 1 Month+0.640%, 01/25/2029 | | | 481 | | | | 468 | |
Merrill Lynch Mortgage Investors Trust, Ser 2004-1, Cl 2A1 | | | | | | | | |
2.634%, 12/25/2034 (A) | | | 867 | | | | 869 | |
Merrill Lynch Mortgage Investors Trust, Ser 2005-A, Cl A1 | | | | | | | | |
0.610%, VAR ICE LIBOR USD 1 Month+0.460%, 03/25/2030 | | | 1,054 | | | | 1,036 | |
Merrill Lynch Mortgage Investors Trust, Ser 2005-A2, Cl A5 | | | | | | | | |
3.790%, 02/25/2035 (A) | | | 452 | | | | 469 | |
Merrill Lynch Mortgage Investors Trust, Ser 2005-A2, Cl A2 | | | | | | | | |
3.790%, 02/25/2035 (A) | | | 2,202 | | | | 2,287 | |
| | | | | | | | |
| | | |
| Description | | Face Amount (Thousands) | | Market Value ($ Thousands) |
|
MORTGAGE-BACKED SECURITIES (continued) | |
Merrill Lynch Mortgage Investors Trust, Ser 2005-A2, Cl A3 | | | | | | | | |
3.790%, 02/25/2035 (A) | | $ | 609 | | | $ | 630 | |
Merrill Lynch Mortgage Investors Trust, Ser 2005-A4, Cl 1A | | | | | | | | |
3.004%, 07/25/2035 (A) | | | 303 | | | | 204 | |
Merrill Lynch Mortgage Investors Trust, Ser 2007-1, Cl 2A1 | | | | | | | | |
2.983%, 01/25/2037 (A) | | | 2,236 | | | | 2,132 | |
MFA Trust, Ser 2017-RPL1, Cl A1 | | | | | | | | |
2.588%, 02/25/2057 (A)(B) | | | 84 | | | | 85 | |
Morgan Stanley Capital I Trust, Ser 2006-T23, Cl D | | | | | | | | |
6.372%, 08/12/2041 (A)(B) | | | 892 | | | | 895 | |
Morgan Stanley Capital I Trust, Ser 2007-T25, Cl AJ | | | | | | | | |
5.574%, 11/12/2049 (A) | | | 2,303 | | | | 1,849 | |
Morgan Stanley Capital I Trust, Ser 2007-T27, Cl AJ | | | | | | | | |
6.215%, 06/11/2042 (A) | | | 1,553 | | | | 1,555 | |
Morgan Stanley Capital I Trust, Ser 2011-C1, Cl G | | | | | | | | |
4.193%, 09/15/2047 (B) | | | 1,000 | | | | 933 | |
Morgan Stanley Capital I Trust, Ser 2017-CLS, Cl D | | | | | | | | |
1.541%, VAR ICE LIBOR USD 1 Month+1.400%, 11/15/2034 (B) | | | 3,400 | | | | 3,381 | |
Morgan Stanley Capital I Trust, Ser 2018-BOP, Cl E | | | | | | | | |
2.091%, VAR ICE LIBOR USD 1 Month+1.950%, 06/15/2035 (B) | | | 3,316 | | | | 2,985 | |
Morgan Stanley Capital I Trust, Ser 2018-SUN, Cl A | | | | | | | | |
1.041%, VAR ICE LIBOR USD 1 Month+0.900%, 07/15/2035 (B) | | | 3,000 | | | | 2,921 | |
Morgan Stanley Mortgage Loan Trust, Ser 2004-10AR, Cl 1A | | | | | | | | |
3.634%, 11/25/2034 (A) | | | 709 | | | | 709 | |
Morgan Stanley Mortgage Loan Trust, Ser 2004-5AR, Cl 3A1 | | | | | | | | |
2.785%, 07/25/2034 (A) | | | 444 | | | | 457 | |
Morgan Stanley Mortgage Loan Trust, Ser 2004-8AR, Cl 4A2 | | | | | | | | |
2.834%, 10/25/2034 (A) | | | 1,362 | | | | 1,403 | |
MortgageIT Trust, Ser 2005-1, Cl 2A | | | | | | | | |
1.399%, VAR ICE LIBOR USD 1 Month+1.250%, 02/25/2035 | | | 496 | | | | 490 | |
MRFC Mortgage Pass-Through Trust, Ser 2002-TBC2, Cl A | | | | | | | | |
1.001%, VAR ICE LIBOR USD 1 Month+0.860%, 08/15/2032 | | | 379 | | | | 370 | |
| | |
SEI Institutional Investments Trust / Semi-Annual Report / November 30, 2020 | | 65 |
SCHEDULE OF INVESTMENTS (Unaudited)
November 30, 2020
Opportunistic Income Fund (Continued)
| | | | | | | | |
| | | |
| Description | | Face Amount (Thousands) | | Market Value ($ Thousands) |
|
MORTGAGE-BACKED SECURITIES (continued) | |
MSCG Trust, Ser 2018-SELF, Cl D | | | | | | | | |
1.791%, VAR ICE LIBOR USD 1 Month+1.650%, 10/15/2037 (B) | | $ | 2,102 | | | $ | 2,060 | |
MSCG Trust, Ser 2018-SELF, Cl A | | | | | | | | |
1.041%, VAR ICE LIBOR USD 1 Month+0.900%, 10/15/2037 (B) | | | 245 | | | | 245 | |
MSSG Trust, Ser 2017-237P, Cl XB, IO | | | | | | | | |
0.175%, 09/13/2039 (A)(B) | | | 16,790 | | | | 97 | |
MSSG Trust, Ser 2017-237P, Cl D | | | | | | | | |
3.865%, 09/13/2039 (A)(B) | | | 2,457 | | | | 2,427 | |
MSSG Trust, Ser 2017-237P, Cl XA, IO | | | | | | | | |
0.468%, 09/13/2039 (A)(B) | | | 27,151 | | | | 594 | |
MTRO Commercial Mortgage Trust, Ser 2019-TECH, Cl A | | | | | | | | |
1.041%, VAR ICE LIBOR USD 1 Month+0.900%, 12/15/2033 (B) | | | 455 | | | | 453 | |
New Residential Mortgage Loan Trust, Ser 2017-3A, Cl A1 | | | | | | | | |
4.000%, 04/25/2057 (A)(B) | | | 237 | | | | 251 | |
New Residential Mortgage Loan Trust, Ser 2017-5A, Cl A1 | | | | | | | | |
1.650%, VAR ICE LIBOR USD 1 Month+1.500%, 06/25/2057 (B) | | | 1,758 | | | | 1,778 | |
New Residential Mortgage Loan Trust, Ser 2017-6A, Cl A1 | | | | | | | | |
4.000%, 08/27/2057 (A)(B) | | | 604 | | | | 652 | |
New Residential Mortgage Loan Trust, Ser 2018-1A, Cl A1A | | | | | | | | |
4.000%, 12/25/2057 (A)(B) | | | 868 | | | | 938 | |
New Residential Mortgage Loan Trust, Ser 2018-4A, Cl A1S | | | | | | | | |
0.900%, VAR ICE LIBOR USD 1 Month+0.750%, 01/25/2048 (B) | | | 3,742 | | | | 3,745 | |
New Residential Mortgage Loan Trust, Ser 2020-NQM2, Cl A1 | | | | | | | | |
1.650%, 05/24/2060 (A)(B) | | | 146 | | | | 147 | |
Nomura Asset Acceptance Alternative Loan Trust, Ser 2004-AR3, Cl M1 | | | | | | | | |
1.290%, VAR ICE LIBOR USD 1 Month+1.140%, 11/25/2034 | | | 1,331 | | | | 1,385 | |
Nomura Asset Acceptance Alternative Loan Trust, Ser 2004-AR4, Cl M1 | | | | | | | | |
1.250%, VAR ICE LIBOR USD 1 Month+1.100%, 12/25/2034 | | | 1,639 | | | | 1,678 | |
Nomura Resecuritization Trust, Ser 2015-1R, Cl 5A1 | | | | | | | | |
1.873%, VAR 12 Month Treas Avg+0.990%, 06/26/2046 (B) | | | 1,408 | | | | 1,400 | |
Oaktown Re V, Ser 2020-2A, Cl M1A | | | | | | | | |
2.550%, VAR ICE LIBOR USD 1 Month+2.400%, 10/25/2030 (B) | | | 1,504 | | | | 1,506 | |
| | | | | | | | |
| | | |
| Description | | Face Amount (Thousands) | | Market Value ($ Thousands) |
|
MORTGAGE-BACKED SECURITIES (continued) | |
OBX Trust, Ser 2018-1, Cl A2 | | | | | | | | |
0.800%, VAR ICE LIBOR USD 1 Month+0.650%, 06/25/2057 (B) | | $ | 1,610 | | | $ | 1,602 | |
OBX Trust, Ser 2018-EXP1, Cl 2A1 | | | | | | | | |
1.000%, VAR ICE LIBOR USD 1 Month+0.850%, 04/25/2048 (B) | | | 2,016 | | | | 2,027 | |
OBX Trust, Ser 2018-EXP2, Cl 1A1 | | | | | | | | |
4.000%, 07/25/2058 (A)(B) | | | 726 | | | | 738 | |
OBX Trust, Ser 2019-INV1, Cl A8 | | | | | | | | |
4.000%, 11/25/2048 (A)(B) | | | 87 | | | | 87 | |
OBX Trust, Ser 2020-INV1, Cl A11 | | | | | | | | |
1.049%, VAR ICE LIBOR USD 1 Month+0.900%, 12/25/2049 (B) | | | 1,335 | | | | 1,336 | |
One Market Plaza Trust, Ser 2017-1MKT, Cl D | | | | | | | | |
4.146%, 02/10/2032 (B) | | | 1,275 | | | | 1,298 | |
One Market Plaza Trust, Ser 2017-MKT, Cl C | | | | | | | | |
4.016%, 02/10/2032 (B) | | | 1,935 | | | | 1,984 | |
PHH Mortgage Trust, Ser 2008-CIM2, Cl 1A1 | | | | | | | | |
2.399%, VAR ICE LIBOR USD 1 Month+2.250%, 07/25/2038 | | | 654 | | | | 631 | |
Radnor Re, Ser 2019-2, Cl M1B | | | | | | | | |
1.900%, VAR ICE LIBOR USD 1 Month+1.750%, 06/25/2029 (B) | | | 1,000 | | | | 997 | |
Radnor Re, Ser 2020-1, Cl M1A | | | | | | | | |
1.100%, VAR ICE LIBOR USD 1 Month+0.950%, 02/25/2030 (B) | | | 1,503 | | | | 1,498 | |
RALI Trust, Ser 2007-QO3, Cl A1 | | | | | | | | |
0.310%, VAR ICE LIBOR USD 1 Month+0.160%, 03/25/2047 | | | 626 | | | | 586 | |
Residential Accredit Loans, Ser 2006-QO10, Cl A1 | | | | | | | | |
0.310%, VAR ICE LIBOR USD 1 Month+0.160%, 01/25/2037 | | | 2,372 | | | | 2,262 | |
Residential Asset Securitization Trust, Ser 2007-A8, Cl 3A1 | | | | | | | | |
6.204%, 08/25/2022 (A) | | | 468 | | | | 339 | |
Residential Mortgage Loan Trust, Ser 2020-1, Cl A1 | | | | | | | | |
2.376%, 02/25/2024 (A)(B) | | | 112 | | | | 114 | |
RESIMAC Premier, Ser 2020-1A, Cl A1B | | | | | | | | |
1.274%, 02/07/2052 (B) | | | 769 | | | | 770 | |
RMF Buyout Issuance Trust, Ser 2020-1, Cl A | | | | | | | | |
2.158%, 02/25/2030 (A)(B) | | | 139 | | | | 140 | |
Sequoia Mortgage Trust, Ser 2002-10, Cl 1A | | | | | | | | |
0.947%, VAR ICE LIBOR USD 1 Month+0.800%, 10/20/2027 | | | 1,916 | | | | 1,911 | |
Sequoia Mortgage Trust, Ser 2002-9, Cl 1A | | | | | | | | |
0.847%, VAR ICE LIBOR USD 1 Month+0.700%, 09/20/2032 | | | 588 | | | | 565 | |
Sequoia Mortgage Trust, Ser 2004-12, Cl A1 | | | | | | | | |
0.687%, VAR ICE LIBOR USD 1 Month+0.540%, 01/20/2035 | | | 2,216 | | | | 2,133 | |
| | |
66 | | SEI Institutional Investments Trust / Semi-Annual Report / November 30, 2020 |
| | | | | | | | |
| | | |
| Description | | Face Amount (Thousands) | | Market Value ($ Thousands) |
|
MORTGAGE-BACKED SECURITIES (continued) | |
Sequoia Mortgage Trust, Ser 2004-3, Cl A | | | | | | | | |
0.758%, VAR ICE LIBOR USD 6 Month+0.500%, 05/20/2034 | | $ | 897 | | | $ | 889 | |
Sequoia Mortgage Trust, Ser 2004-5, Cl A1 | | | | | | | | |
1.921%, 06/20/2034 (A) | | | 1,203 | | | | 1,174 | |
Sequoia Mortgage Trust, Ser 2013-1, Cl 1A1 | | | | | | | | |
1.450%, 02/25/2043 (A) | | | 417 | | | | 420 | |
Spruce Hill Mortgage Loan Trust, Ser 2019-SH1, Cl A1 | | | | | | | | |
3.395%, 04/29/2049 (A)(B) | | | 134 | | | | 136 | |
Starwood Mortgage Residential Trust, Ser 2018-IMC1, Cl A1 | | | | | | | | |
3.793%, 03/25/2048 (A)(B) | | | 1,183 | | | | 1,187 | |
Starwood Mortgage Residential Trust, Ser 2020-1, Cl A1 | | | | | | | | |
2.275%, 02/25/2050 (A)(B) | | | 195 | | | | 199 | |
Starwood Mortgage Residential Trust, Ser 2020-3, Cl A1 | | | | | | | | |
1.486%, 04/25/2065 (A)(B) | | | 1,934 | | | | 1,946 | |
Structured Adjustable Rate Mortgage Loan Trust, Ser 2004-2, Cl 4A2 | | | | | | | | |
2.873%, 03/25/2034 (A) | | | 894 | | | | 867 | |
Structured Adjustable Rate Mortgage Loan Trust, Ser 2004-9XS, Cl A | | | | | | | | |
0.520%, VAR ICE LIBOR USD 1 Month+0.370%, 07/25/2034 | | | 2,719 | | | | 2,746 | |
Structured Adjustable Rate Mortgage Loan Trust, Ser 2005-7, Cl 1A3 | | | | | | | | |
3.042%, 04/25/2035 (A) | | | 860 | | | | 848 | |
Structured Asset Mortgage Investments II Trust, Ser 2004-AR5, Cl 1A1 | | | | | | | | |
0.810%, VAR ICE LIBOR USD 1 Month+0.660%, 10/19/2034 | | | 884 | | | | 887 | |
Structured Asset Mortgage Investments II Trust, Ser 2004-AR8, Cl A1 | | | | | | | | |
0.830%, VAR ICE LIBOR USD 1 Month+0.680%, 05/19/2035 | | | 1,798 | | | | 1,782 | |
Thornburg Mortgage Securities Trust, Ser 2003-4, Cl A1 | | | | | | | | |
0.790%, VAR ICE LIBOR USD 1 Month+0.640%, 09/25/2043 | | | 705 | | | | 704 | |
Thornburg Mortgage Securities Trust, Ser 2004-3, Cl A | | | | | | | | |
0.890%, VAR ICE LIBOR USD 1 Month+0.740%, 09/25/2034 | | | 2,656 | | | | 2,622 | |
Thornburg Mortgage Securities Trust, Ser 2005-1, Cl A3 | | | | | | | | |
3.626%, 04/25/2045 (A) | | | 1,200 | | | | 1,203 | |
Thornburg Mortgage Securities Trust, Ser 2007-1, Cl A2B | | | | | | | | |
1.636%, VAR ICE LIBOR USD 12 Month+1.300%, 03/25/2037 | | | 985 | | | | 901 | |
| | | | | | | | |
| | | |
| Description | | Face Amount (Thousands) | | Market Value ($ Thousands) |
|
MORTGAGE-BACKED SECURITIES (continued) | |
Thornburg Mortgage Securities Trust, Ser 2007-4, Cl 3A1 | | | | | | | | |
2.526%, 09/25/2037 (A) | | $ | 12 | | | $ | 12 | |
UBS Commercial Mortgage Trust, Ser 2012-C1, Cl XA, IO | | | | | | | | |
2.246%, 05/10/2045 (A)(B) | | | 9,320 | | | | 163 | |
Velocity Commercial Capital Loan Trust, Ser 2017-1, Cl AFL | | | | | | | | |
1.400%, VAR ICE LIBOR USD 1 Month+1.250%, 05/25/2047 (B) | | | 235 | | | | 234 | |
Velocity Commercial Capital Loan Trust, Ser 2020-1, Cl AFX | | | | | | | | |
2.610%, 02/25/2050 (A)(B) | | | 1,312 | | | | 1,328 | |
Verus Securitization Trust, Ser 2019-1, Cl A1 | | | | | | | | |
3.836%, 02/25/2059 (A)(B) | | | 84 | | | | 85 | |
Verus Securitization Trust, Ser 2019-2, Cl A1 | | | | | | | | |
3.211%, 05/25/2059 (A)(B) | | | 160 | | | | 162 | |
Verus Securitization Trust, Ser 2019-4, Cl A1 | | | | | | | | |
2.642%, 11/25/2059 (B) | | | 158 | | | | 161 | |
Verus Securitization Trust, Ser 2019-INV3, Cl A1 | | | | | | | | |
2.692%, 11/25/2059 (A)(B) | | | 133 | | | | 136 | |
Verus Securitization Trust, Ser 2020-1, Cl A1 | | | | | | | | |
2.417%, 01/25/2060 (B) | | | 101 | | | | 103 | |
Verus Securitization Trust, Ser 2020-4, Cl A1 | | | | | | | | |
1.502%, 05/25/2065 (B) | | | 93 | | | | 94 | |
Verus Securitization Trust, Ser 2020-5, Cl A1 | | | | | | | | |
1.218%, 05/25/2065 (B) | | | 1,948 | | | | 1,950 | |
WaMu Commercial Mortgage Securities Trust, Ser 2007-SL2, Cl D | | | | | | | | |
3.315%, 12/27/2049 (A)(B) | | | 1,431 | | | | 1,425 | |
WaMu Mortgage Pass-Through Certificates, Ser 2003-AR10, Cl A7 | | | | | | | | |
2.570%, 10/25/2033 (A) | | | 926 | | | | 931 | |
WaMu Mortgage Pass-Through Certificates, Ser 2003-AR7, Cl A7 | | | | | | | | |
2.713%, 08/25/2033 (A) | | | 638 | | | | 631 | |
WaMu Mortgage Pass-Through Certificates, Ser 2003-AR9, Cl 1A6 | | | | | | | | |
2.801%, 09/25/2033 (A) | | | 969 | | | | 964 | |
WaMu Mortgage Pass-Through Certificates, Ser 2004-AR1, Cl A | | | | | | | | |
3.805%, 03/25/2034 (A) | | | 2,985 | | | | 3,093 | |
WaMu Mortgage Pass-Through Certificates, Ser 2004-AR10, Cl A1B | | | | | | | | |
0.570%, VAR ICE LIBOR USD 1 Month+0.420%, 07/25/2044 | | | 259 | | | | 257 | |
WaMu Mortgage Pass-Through Certificates, Ser 2004-AR11, Cl A | | | | | | | | |
2.809%, 10/25/2034 (A) | | | 745 | | | | 753 | |
WaMu Mortgage Pass-Through Certificates, Ser 2004-AR14, Cl A1 | | | | | | | | |
3.836%, 01/25/2035 (A) | | | 1,477 | | | | 1,506 | |
| | |
SEI Institutional Investments Trust / Semi-Annual Report / November 30, 2020 | | 67 |
SCHEDULE OF INVESTMENTS (Unaudited)
November 30, 2020
Opportunistic Income Fund (Continued)
| | | | | | | | |
| | | |
| Description | | Face Amount (Thousands) | | Market Value ($ Thousands) |
|
MORTGAGE-BACKED SECURITIES (continued) | |
WaMu Mortgage Pass-Through Certificates, Ser 2004-AR2, Cl A | | | | | | | | |
2.143%, VAR 12 Month Treas Avg+1.400%, 04/25/2044 | | $ | 2,587 | | | $ | 2,565 | |
WaMu Mortgage Pass-Through Certificates, Ser 2004-AR9, Cl A7 | | | | | | | | |
2.988%, 08/25/2034 (A) | | | 2,512 | | | | 2,543 | |
WaMu Mortgage Pass-Through Certificates, Ser 2004-CB2, Cl 1A | | | | | | | | |
5.000%, 07/25/2034 | | | 225 | | | | 234 | |
WaMu Mortgage Pass-Through Certificates, Ser 2005-AR13, Cl A1A2 | | | | | | | | |
2.193%, VAR 12 Month Treas Avg+1.450%, 10/25/2045 | | | 212 | | | | 216 | |
WaMu Mortgage Pass-Through Certificates, Ser 2006-AR1, Cl 2A1A | | | | | | | | |
1.813%, VAR 12 Month Treas Avg+1.070%, 01/25/2046 | | | – | | | | – | |
Wells Fargo Commercial Mortgage Trust, Ser 2012-LC5, Cl AS | | | | | | | | |
3.539%, 10/15/2045 | | | 275 | | | | 285 | |
Wells Fargo Commercial Mortgage Trust, Ser 2020-SOP, Cl B | | | | | | | | |
1.651%, VAR ICE LIBOR USD 1 Month+1.510%, 01/15/2035 (B) | | | 2,000 | | | | 1,920 | |
Wells Fargo Mortgage-Backed Securities Trust, Ser 2004-K, Cl 1A2 | | | | | | | | |
3.011%, 07/25/2034 (A) | | | 263 | | | | 260 | |
Wells Fargo Mortgage-Backed Securities Trust, Ser 2004-U, Cl A1 | | | | | | | | |
3.377%, 10/25/2034 (A) | | | 1,265 | | | | 1,254 | |
| | | | | | | | |
| | | | | | | 307,938 | |
| | | | | | | | |
Total Mortgage-Backed Securities (Cost $355,997) ($ Thousands) | | | | | | | 352,355 | |
| | | | | | | | |
|
LOAN PARTICIPATIONS — 29.3% | |
| | |
Aerospace & Defense — 0.2% | | | | | | | | |
Bleriot US Bidco Inc., Delayed Draw Term Loan, 1st Lien | | | | | | | | |
5.058%, VAR LIBOR+4.750%, 10/31/2026 | | | 237 | | | | 235 | |
Bleriot US Bidco Inc., Initial Term Loan, 1st Lien | | | | | | | | |
4.970%, VAR LIBOR+4.750%, 10/30/2026 | | | 1,514 | | | | 1,503 | |
| | | | | | | | |
| | | | | | | 1,738 | |
| | | | | | | | |
| | | | | | | | |
| | | |
| Description | | Face Amount (Thousands) | | Market Value ($ Thousands) |
|
LOAN PARTICIPATIONS (continued) | |
|
Air Transport — 0.3% | |
American Airlines, Inc., 2017 Replacement Term Loan (New), 1st Lien | | | | | | | | |
1.896%, VAR LIBOR+1.750%, 01/29/2027 | | $ | 1,125 | | | $ | 944 | |
Mileage Plus Holdings LLC (Mileage Plus Intellectual Property Assets, Ltd.), Initial Term Loan, 1st Lien | | | | | | | | |
6.250%, VAR LIBOR+5.250%, 06/21/2027 | | | 905 | | | | 932 | |
SkyMiles IP Ltd. (Delta Air Lines, Inc.), Initial Term Loan, 1st Lien | | | | | | | | |
4.750%, VAR LIBOR+3.750%, 10/20/2027 (C) | | | 1,175 | | | | 1,200 | |
| | | | | | | | |
| | | | | | | 3,076 | |
| | | | | | | | |
|
Automotive — 0.4% | |
American Airlines, Inc., 218 Replacement Term Loan, 1st Lien | | | | | | | | |
1.893%, 06/27/2025 (A)(C) | | | 950 | | | | 695 | |
Clarios Global LP, Initial Dollar Term Loan, 1st Lien | | | | | | | | |
3.646%, VAR LIBOR+3.500%, 04/30/2026 | | | 2,271 | | | | 2,244 | |
Truck Hero, Inc., Initial Term Loan, 1st Lien | | | | | | | | |
3.896%, VAR LIBOR+3.750%, 04/22/2024 | | | 627 | | | | 611 | |
Wand Newco 3, Inc., Tranche B-1 1st Lien, Term Loan | | | | | | | | |
3.146%, VAR LIBOR+3.000%, 02/05/2026 | | | 770 | | | | 748 | |
| | | | | | | | |
| | | | | | | 4,298 | |
| | | | | | | | |
|
Building & Development — 1.1% | |
Brookfield WEC Holdings Inc., Initial Term Loan (2020), 1st Lien | | | | | | | | |
3.750%, VAR LIBOR+3.000%, 08/01/2025 | | | 2,302 | | | | 2,278 | |
Core & Main LP, Initial Term Loan, 1st Lien | | | | | | | | |
3.750%, VAR LIBOR+2.750%, 08/01/2024 | | | 1,997 | | | | 1,966 | |
CP Atlas Buyer, Inc., Initial Tranche B-1 Term Loan, 1st Lien | | | | | | | | |
5.250%, VAR LIBOR+4.500%, 11/19/2027 (C) | | | 2,726 | | | | 2,720 | |
HD Supply Waterworks, Initial Term Loan, 1st Lien | | | | | | | | |
3.750%, VAR LIBOR+2.750%, 08/01/2024 | | | 432 | | | | 426 | |
KREF Holdings X LLC, Initial Term Loan, 1st Lien | | | | | | | | |
5.750%, VAR LIBOR+4.750%, 09/01/2027 | | | 1,247 | | | | 1,240 | |
| | |
68 | | SEI Institutional Investments Trust / Semi-Annual Report / November 30, 2020 |
| | | | | | | | |
| | | |
| Description | | Face Amount (Thousands) | | Market Value ($ Thousands) |
|
LOAN PARTICIPATIONS (continued) | |
MI Windows and Doors, LLC, Initial Term Loan, 1st Lien | | | | | | | | |
6.500%, VAR LIBOR+5.500%, 11/06/2026 | | $ | 1,983 | | | $ | 1,981 | |
| | | | | | | | |
| | | | | | | 10,611 | |
| | | | | | | | |
|
Business Equipment & Services — 2.2% | |
AI Aqua Merger Sub, Inc., 2017 Incremental Term Loan, 1st Lien | | | | | | | | |
4.250%, VAR LIBOR+3.250%, 12/13/2023 | | | 739 | | | | 724 | |
Arches Buyer Inc., Initial Term Loan, 1st Lien | | | | | | | | |
4.500%, VAR LIBOR+4.000%, 11/24/2027 (C) | | | 1,840 | | | | 1,833 | |
AVSC Holding Corp., Initial Loan, 2nd Lien | | | | | | | | |
8.250%, VAR LIBOR+7.250%, 09/01/2025 | | | 1,132 | | | | 684 | |
Change Healthcare Holdings, Inc. (fka Emdeon Inc.), Closing Date Term Loan, 1st Lien | | | | | | | | |
3.500%, VAR LIBOR+2.500%, 03/01/2024 | | | 52 | | | | 52 | |
LegalZoom.com, Inc., 2018 Term Loan, 1st Lien | | | | | | | | |
4.646%, VAR LIBOR+4.500%, 11/21/2024 | | | 2,905 | | | | 2,867 | |
Navicure, Inc., 2020 Incremental Term Loan, 1st Lien | | | | | | | | |
4.750%, VAR LIBOR+4.000%, 10/22/2026 | | | 812 | | | | 805 | |
Packers Holdings, LLC, 2020 Incremental Term Loan | | | | | | | | |
4.750%, VAR LIBOR+4.000%, 12/04/2024 (C) | | | 1,395 | | | | 1,388 | |
Packers Holdings, LLC, Initial Term Loan, 1st Lien | | | | | | | | |
4.000%, VAR LIBOR+3.000%, 12/04/2024 | | | 2,309 | | | | 2,272 | |
PAE Incorporated, Delayed Draw, 1st Lien, Term Loan | | | | | | | | |
5.250%, 10/14/2027 (A) | | | 153 | | | | 152 | |
PAE Incorporated, Initial Term Loan, 1st Lien | | | | | | | | |
5.250%, VAR LIBOR+4.500%, 10/14/2027 | | | 757 | | | | 752 | |
Project Accelerate Parent, LLC, Term Loan, 1st Lien | | | | | | | | |
5.250%, VAR LIBOR+4.250%, 01/02/2025 (C) | | | 1,355 | | | | 1,230 | |
Sedgwick Claims Management Services, Inc. (Lightning Cayman Merger Sub, Ltd.), Initial Term Loan, 1st Lien | | | | | | | | |
3.396%, VAR LIBOR+3.250%, 12/31/2025 | | | 1,720 | | | | 1,679 | |
| | | | | | | | |
| | | |
| Description | | Face Amount (Thousands) | | Market Value ($ Thousands) |
|
LOAN PARTICIPATIONS (continued) | |
Service Logic Acquisition, Inc., Closing Date Initial Term Loan, 1st Lien | | | | | | | | |
4.750%, VAR LIBOR+4.000%, 10/23/2027 | | $ | 2,150 | | | $ | 2,147 | |
Tempo Acquisition, LLC, Extended Term Loan, 1st Lien | | | | | | | | |
3.750%, VAR LIBOR+3.250%, 11/02/2026 | | | 1,544 | | | | 1,516 | |
TGG TS Acquisition Company, Term B Loan, 1st Lien | | | | | | | | |
6.643%, VAR LIBOR+6.500%, 12/14/2025 | | | 1,346 | | | | 1,321 | |
Vertical Midco GmbH, Facility B (USD), 1st Lien | | | | | | | | |
4.570%, VAR LIBOR+4.250%, 07/30/2027 | | | 1,189 | | | | 1,185 | |
William Morris Endeavor Entertainment, LLC (IMG Worldwide Holdings, LLC), Term B-1 Loan, 1st Lien | | | | | | | | |
2.900%, VAR LIBOR+2.750%, 05/18/2025 | | | 1,200 | | | | 1,083 | |
| | | | | | | | |
| | | | | | | 21,690 | |
| | | | | | | | |
|
Cable & Satellite Television — 0.9% | |
Altice Financing S.A., October 2017 USD Term Loan, 1st Lien | | | | | | | | |
2.896%, VAR LIBOR+2.750%, 01/31/2026 | | | 2,763 | | | | 2,658 | |
Diamond Sports Group, LLC, Term Loan, 1st Lien | | | | | | | | |
3.400%, VAR LIBOR+3.250%, 08/24/2026 | | | 905 | | | | 751 | |
Numericable U.S. LLC, USD TLB-[12] Term Loan, 1st Lien | | | | | | | | |
3.828%, VAR LIBOR+3.688%, 01/31/2026 | | | 571 | | | | 562 | |
Numericable U.S. LLC, USD TLB-11 Term Loan, 1st Lien | | | | | | | | |
2.896%, VAR LIBOR+2.750%, 07/31/2025 | | | 2,576 | | | | 2,492 | |
Terrier Media Buyer, Inc., Term B Loan, 1st Lien | | | | | | | | |
4.396%, VAR LIBOR+4.250%, 12/17/2026 | | | 1,626 | | | | 1,604 | |
| | | | | | | | |
| | | | | | | 8,067 | |
| | | | | | | | |
|
Cargo Transport — 0.0% | |
Genesee & Wyoming Inc., Initial Term Loan, 1st Lien | | | | | | | | |
2.220%, VAR LIBOR+2.000%, 12/30/2026 | | | 2 | | | | 2 | |
| | | | | | | | |
| | |
SEI Institutional Investments Trust / Semi-Annual Report / November 30, 2020 | | 69 |
SCHEDULE OF INVESTMENTS (Unaudited)
November 30, 2020
Opportunistic Income Fund (Continued)
| | | | | | | | |
| | | |
| Description | | Face Amount (Thousands) | | Market Value ($ Thousands) |
|
LOAN PARTICIPATIONS (continued) | |
|
Chemicals & Plastics — 1.0% | |
Cambrex Corporation, Initial Dollar Term Loan, 1st Lien | | | | | | | | |
6.000%, VAR LIBOR+5.000%, 12/04/2026 | | $ | 3,772 | | | $ | 3,772 | |
Cambrex Corporation, Tranche B-1 Dollar Term Loan, 1st Lien | | | | | | | | |
5.500%, VAR LIBOR+4.500%, 12/04/2026 (C) | | | 286 | | | | 286 | |
DuBois Chemicals, Term Loan B, 1st Lien | | | | | | | | |
4.650%, 09/30/2026 (A) | | | 2,131 | | | | 2,056 | |
Ring Container Technologies Group, LLC, Initial Term Loan, 1st Lien | | | | | | | | |
2.896%, VAR LIBOR+2.750%, 10/31/2024 | | | 1,155 | | | | 1,128 | |
SCIH Salt Holdings Inc., Closing Date Term Loan, 1st Lien | | | | | | | | |
5.500%, VAR LIBOR+4.500%, 03/16/2027 | | | 437 | | | | 435 | |
Wilsonart LLC, Tranche D Term Loan, 1st Lien | | | | | | | | |
4.250%, VAR LIBOR+3.250%, 12/19/2023 | | | 2,527 | | | | 2,501 | |
| | | | | | | | |
| | | | | | | 10,178 | |
| | | | | | | | |
|
Computers & Electronics — 0.9% | |
Anchor Packaging, LLC, Initial Term Loan B, 1st Lien | | | | | | | | |
3.896%, VAR LIBOR+7.000%, 07/18/2026 (C)(D) | | | 3,415 | | | | 3,389 | |
Applied Systems, Inc., Initial Term Loan, 1st Lien | | | | | | | | |
4.250%, VAR LIBOR+3.000%, 09/19/2024 (C) | | | 1,557 | | | | 1,550 | |
Cvent, Inc., Term Loan, 1st Lien | | | | | | | | |
3.896%, VAR LIBOR+3.750%, 11/29/2024 | | | 1,782 | | | | 1,682 | |
ION Trading, Term Loan, 1st Lien | | | | | | | | |
5.000%, VAR Euribor+3.250%, 11/21/2024 | | | 1,424 | | | | 1,403 | |
Regionalcare Hospital Partners Holdings, Inc., Term B Loan, 2nd Lien | | | | | | | | |
3.896%, VAR LIBOR+3.750%, 11/16/2025 (C) | | | 874 | | | | 860 | |
| | | | | | | | |
| | | | | | | 8,884 | |
| | | | | | | | |
|
Construction — 0.2% | |
PI UK Holdco II Limited, Facility B1, Term Loan, 1st Lien | | | | | | | | |
4.500%, VAR LIBOR+3.500%, 01/03/2025 | | | 1,757 | | | | 1,732 | |
| | | | | | | | |
| | | | | | | | |
| | | |
| Description | | Face Amount (Thousands) | | Market Value ($ Thousands) |
|
LOAN PARTICIPATIONS (continued) | |
|
Consumer Nondurables — 0.4% | |
Diamond (BC) B.V., Initial USD Term Loan, 1st Lien | | | | | | | | |
3.214%, VAR LIBOR+3.000%, 09/06/2024 | | $ | 1,005 | | | $ | 982 | |
Kronos Acquisition Intermediate Inc., Initial Loan, 1st Lien | | | | | | | | |
5.000%, VAR LIBOR+4.000%, 05/15/2023 | | | 176 | | | | 175 | |
Kronos Acquisition Intermediate Inc., Initial Loan, 2nd Lien U | | | | | | | | |
5.000%, VAR LIBOR+4.000%, 05/15/2023 (C) | | | 1,451 | | | | 1,446 | |
Leslie’s Poolmart, Term Loan, 1st Lien | | | | | | | | |
5.577%, 08/16/2023 (A)(C) | | | 1,365 | | | | 1,345 | |
| | | | | | | | |
| | | | | | | 3,948 | |
| | | | | | | | |
|
Containers & Glass Products — 1.7% | |
BWay Holding Company , Initial Term Loan, 1st Lien | | | | | | | | |
3.480%, VAR LIBOR+3.250%, 04/03/2024 | | | 2,775 | | | | 2,639 | |
Charter NEX US, Inc., Initial Term Loan, 1st Lien | | | | | | | | |
5.000%, VAR Prime Rate by Country+3.250%, 05/16/2024 | | | 2,032 | | | | 2,025 | |
0.000%, 11/24/2027 (A)(C)(E) | | | 2,630 | | | | 2,623 | |
Packaging Coordinators Midco, Inc., Term B Loan, 1st Lien | | | | | | | | |
4.500%, VAR LIBOR+3.750%, 09/25/2027 (C) | | | 1,020 | | | | 1,011 | |
Pregis TopCo LLC, Initial Term Loan, 1st Lien | | | | | | | | |
3.896%, VAR LIBOR+3.750%, 07/31/2026 | | | 1,882 | | | | 1,855 | |
Pretium PKG Holdings, Inc., Initial Term Loan, 1st Lien | | | | | | | | |
0.000%, 10/29/2027 (E) | | | 1,477 | | | | 1,459 | |
Pretium PKG Holdings, Inc., Initial Term Loan, 2nd Lien | | | | | | | | |
0.000%, 10/29/2027 (A)(E) | | | 907 | | | | 893 | |
Tank Holding Corp., 2020 Refinancing Term Loan, 1st Lien | | | | | | | | |
3.396%, VAR LIBOR+3.250%, 03/26/2026 | | | 2,590 | | | | 2,547 | |
Trident TPI Holdings, Inc., Tranche B-1 Term Loan, 1st Lien | | | | | | | | |
4.000%, VAR LIBOR+3.000%, 10/17/2024 | | | 1,916 | | | | 1,876 | |
| | | | | | | | |
| | | | | | | 16,928 | |
| | | | | | | | |
| | |
70 | | SEI Institutional Investments Trust / Semi-Annual Report / November 30, 2020 |
| | | | | | | | |
| | | |
| Description | | Face Amount
(Thousands) | | Market Value ($ Thousands) |
|
LOAN PARTICIPATIONS (continued) | |
| | |
Diversified/Conglomerate Service — 0.3% | | | | | | | | |
AI Aqua Merger Sub, Inc., Term Loan B-1, 1st Lien | | | | | | | | |
4.250%, VAR Euribor+4.500%, 12/13/2023 | | $ | 2,462 | | | $ | 2,406 | |
| | | | | | | | |
| | |
Ecological Services & Equipment — 0.3% | | | | | | | | |
Cast & Crew Payroll, LLC, Initial Term Loan, 1st Lien | | | | | | | | |
3.896%, VAR LIBOR+3.750%, 02/09/2026 | | | 3,035 | | | | 2,933 | |
| | | | | | | | |
| | |
Education Services — 0.3% | | | | | | | | |
Global Education Management Systems Establishment, Term Loan, 1st Lien | | | | | | | | |
6.000%, VAR LIBOR+5.000%, 07/31/2026 | | | 2,571 | | | | 2,526 | |
| | | | | | | | |
| | |
Electronics/Electrical — 3.4% | | | | | | | | |
Cardtronics USA, Inc., Initial Term Loan,2nd Lien | | | | | | | | |
5.000%, VAR LIBOR+4.000%, 06/29/2027 | | | 1,319 | | | | 1,316 | |
ECi Macola/MAX Holding, LLC, Initial Term Loan, 1st Lien | | | | | | | | |
4.500%, VAR LIBOR+3.750%, 09/17/2027 | | | 1,540 | | | | 1,525 | |
Epicor Software Corporation (fka Eagle Parent Inc.), Initial Term Loan, 2nd Lien | | | | | | | | |
8.750%, VAR LIBOR+7.750%, 07/31/2028 | | | 436 | | | | 448 | |
Epicor Software Corporation (fka Eagle Parent Inc.), Term B Loan (2020), 1st Lien | | | | | | | | |
5.250%, VAR LIBOR+4.250%, 07/30/2027 | | | 1,119 | | | | 1,119 | |
Hyland Software, Inc., 2018 Refinancing Term Loan, 1st Lien | | | | | | | | |
4.250%, VAR LIBOR+3.500%, 07/01/2024 | | | 1,749 | | | | 1,740 | |
Idera, Inc., Initial Term Loan, 1st Lien | | | | | | | | |
5.000%, VAR LIBOR+4.000%, 06/28/2024 | | | 1,424 | | | | 1,414 | |
Imprivata, Inc., Initial Term Loan | | | | | | | | |
0.000%, 11/24/2027 (C)(E) | | | 1,518 | | | | 1,508 | |
Insurity Holdings, Term Loan, 1st Lien | | | | | | | | |
4.179%, VAR LIBOR+4.000%, 07/31/2026 (C) | | | 2,080 | | | | 2,045 | |
LANDesk Software, Delayed Draw, Term Loan, 1st Lien | | | | | | | | |
0.000%, 11/22/2027 (A)(C)(E) | | | 1,857 | | | | 1,837 | |
LANDesk Software, Term Loan, 1st Lien | | | | | | | | |
5.750%, VAR LIBOR+4.750%, 11/22/2027 (C) | | | 1,943 | | | | 1,922 | |
| | | | | | | | |
| | | |
| Description | | Face Amount
(Thousands) | | Market Value
($ Thousands) |
|
LOAN PARTICIPATIONS (continued) | |
LANDesk Software, Term Loan, 2nd Lien | | | | | | | | |
0.000%, 11/09/2028 (A)(C)(E) | | $ | 1,130 | | | $ | 1,096 | |
MA Financeco., LLC, Tranche B-4 Term Loan, 1st Lien | | | | | | | | |
5.250%, VAR LIBOR+4.250%, 06/05/2025 (D) | | | 1,163 | | | | 1,161 | |
MH Sub I, LLC (Micro Holding Corp.), 2020 June New Term Loan, 1st Lien | | | | | | | | |
4.750%, VAR LIBOR+3.750%, 09/13/2024 | | | 1,183 | | | | 1,170 | |
MH Sub I, LLC (Micro Holding Corp.), Amendment No. 2 Initial Term Loan, 1st Lien | | | | | | | | |
3.646%, VAR LIBOR+3.500%, 09/13/2024 | | | 1,520 | | | | 1,487 | |
Misys Limited, Dollar Term Loan, 1st Lien | | | | | | | | |
4.500%, VAR LIBOR+3.500%, 06/13/2024 | | | 673 | | | | 652 | |
Mitchell International, Inc., Amendment No. 2 New Term Loan Facility, 1st Lien | | | | | | | | |
4.750%, VAR LIBOR+4.250%, 11/29/2024 | | | 750 | | | | 738 | |
Netsmart, Inc., Initial Term Loan, 1st Lien | | | | | | | | |
4.750%, VAR LIBOR+4.000%, 09/29/2027 | | | 1,718 | | | | 1,703 | |
Orion Advisor Solutions, Inc., Initial Term Loan, 1st Lien | | | | | | | | |
5.000%, VAR LIBOR+4.000%, 09/24/2027 | | | 727 | | | | 723 | |
Perforce Software, Inc., New Term Loan, 1st Lien | | | | | | | | |
3.896%, VAR LIBOR+3.750%, 07/01/2026 (C) | | | 1,094 | | | | 1,069 | |
Project Boost Purchaser, LLC, Term Loan, 1st Lien | | | | | | | | |
3.646%, VAR LIBOR+3.500%, 06/01/2026 | | | 1,304 | | | | 1,267 | |
Renaissance Holding Corp., Initial Term Loan, 1st Lien | | | | | | | | |
3.396%, VAR LIBOR+3.250%, 05/30/2025 | | | 510 | | | | 497 | |
Renaissance Holding Corp., Initial Term Loan, 2nd Lien | | | | | | | | |
7.146%, VAR LIBOR+7.000%, 05/29/2026 | | | 438 | | | | 427 | |
Sophia, L.P., Closing Date Loan (Second Lien), Term Loan | | | | | | | | |
9.000%, VAR LIBOR+8.000%, 09/22/2028 | | | 1,000 | | | | 990 | |
Sophia, L.P., Closing Date Term Loan, 1st Lien | | | | | | | | |
4.500%, VAR LIBOR+3.750%, 09/23/2027 | | | 2,998 | | | | 2,976 | |
| | |
SEI Institutional Investments Trust / Semi-Annual Report / November 30, 2020 | | 71 |
SCHEDULE OF INVESTMENTS (Unaudited)
November 30, 2020
Opportunistic Income Fund (Continued)
| | | | | | | | |
| | | |
| Description | | Face Amount
(Thousands) | | Market Value
($ Thousands) |
|
LOAN PARTICIPATIONS (continued) | |
TIBCO Software Inc., Term B-3 Loan, 1st Lien | | | | | | | | |
3.900%, VAR LIBOR+3.750%, 06/30/2026 | | $ | 2,336 | | | $ | 2,283 | |
| | | | | | | | |
| | | | | | | 33,113 | |
| | | | | | | | |
| | |
Entertainment & Leisure — 0.1% | | | | | | | | |
Alphabet Holding Company Inc., Initial Term Loan, 2nd Lien | | | | | | | | |
7.896%, VAR LIBOR+3.000%, 09/26/2025 | | | 705 | | | | 686 | |
Crown Finance US, Inc., Initial Dollar Tracnhe Term Loan | | | | | | | | |
2.769%, VAR LIBOR+2.500%, 02/28/2025 (C) | | | 2 | | | | 2 | |
| | | | | | | | |
| | | | | | | 688 | |
| | | | | | | | |
| | |
Financial Intermediaries — 1.2% | | | | | | | | |
Alchemy Copyrights, LLC, 2020 Term Loan, 1st Lien | | | | | | | | |
4.000%, VAR LIBOR+3.250%, 08/16/2027 | | | 1,334 | | | | 1,330 | |
Aruba Investments, Term Loan, 1st Lien | | | | | | | | |
4.750%, 10/28/2027 (A)(C) | | | 509 | | | | 506 | |
Aruba Investments, Term Loan, 2nd Lien | | | | | | | | |
8.500%, 10/27/2028 (A)(C) | | | 1,467 | | | | 1,464 | |
AssuredPartners, Inc., 2020 June Incremental Term Loan, 1st Lien | | | | | | | | |
5.500%, VAR LIBOR+4.500%, 02/12/2027 | | | 748 | | | | 748 | |
Cinemark USA, Term Loan, 1st Lien | | | | | | | | |
1.900%, 03/31/2025 (A)(C) | | | 627 | | | | 572 | |
Deerfield Dakota Holding, LLC , Initial Dollar Term Loan, 1st Lien | | | | | | | | |
4.750%, VAR LIBOR+3.750%, 04/09/2027 | | | 623 | | | | 621 | |
LS Group Opco Acquisition LLC (LS Group PropCo Acquisition LLC), Initial Term Loan, 1st Lien | | | | | | | | |
4.250%, VAR LIBOR+3.500%, 10/26/2027 | | | 2,650 | | | | 2,623 | |
MSG National, Term Loan, 1st Lien | | | | | | | | |
7.000%, 12/31/2049 (A)(C) | | | 570 | | | | 553 | |
Nexus Buyer LLC, Term Loan, 1st Lien | | | | | | | | |
3.900%, VAR LIBOR+3.750%, 11/09/2026 | | | 1,078 | | | | 1,065 | |
Quirch Foods Holdings, LLC, Initial Term Loan, 1st Lien | | | | | | | | |
6.250%, VAR LIBOR+5.250%, 10/19/2027 | | | 1,230 | | | | 1,224 | |
Valkyr Purchaser, LLC, Initial Term Loan | | | | | | | | |
4.750%, VAR LIBOR+4.000%, 10/29/2027 | | | 1,073 | | | | 1,063 | |
| | | | | | | | |
| | | | | | | 11,769 | |
| | | | | | | | |
| | | | | | | | |
| | | |
| Description | | Face Amount
(Thousands) | | Market Value
($ Thousands) |
|
LOAN PARTICIPATIONS (continued) | |
| | |
Financial Services — 0.1% | | | | | | | | |
Particle Investment S.a.r.l. (WebPros), Term Loan, 1st Lien | | | | | | | | |
5.750%, 02/18/2027 (A) | | $ | 1,425 | | | $ | 1,406 | |
| | | | | | | | |
| | | | | | | 1,406 | |
| | | | | | | | |
| | |
Food Service — 0.8% | | | | | | | | |
Froneri International Limited, Second Lien Facility (USD), 2nd Lien | | | | | | | | |
5.896%, VAR LIBOR+5.750%, 01/31/2028 | | | 564 | | | | 560 | |
IRB Holding Corp., 2020 Replacement Term B Loan, 1st Lien | | | | | | | | |
3.750%, VAR LIBOR+2.750%, 02/05/2025 | | | 3,120 | | | | 3,063 | |
IRB Holding Corp., Fourth Amendment Incremental Term Loan, 1st Lien | | | | | | | | |
4.250%, 11/19/2027 (A)(C) | | | 1,922 | | | | 1,906 | |
Simply Good Foods USA, Inc., 2019 Incremental Term Loan, 1st Lien | | | | | | | | |
4.750%, VAR LIBOR+3.750%, 07/07/2024 | | | 2,634 | | | | 2,636 | |
| | | | | | | | |
| | | | | | | 8,165 | |
| | | | | | | | |
| | |
Health Care — 3.5% | | | | | | | | |
Air Methods Corporation, Initial Term Loan, 1st Lien | | | | | | | | |
4.500%, VAR LIBOR+3.500%, 04/22/2024 (C) | | | 1,197 | | | | 1,116 | |
Capital Vision/MED Delayed Incremental Term Loan, 1st Lien | | | | | | | | |
0.327%, 08/31/2026 (A) | | | 475 | | | | 468 | |
Capital Vision/MED Delayed Term Loan, 1st Lien | | | | | | | | |
4.396%, VAR LIBOR+4.250%, 08/31/2026 | | | 287 | | | | 275 | |
Capital Vision/MED Term Loan, 1st Lien | | | | | | | | |
4.396%, VAR LIBOR+4.250%, 08/31/2026 | | | 1,633 | | | | 1,565 | |
CNT Holdings I Corp, Initial Term Loan, 1st Lien | | | | | | | | |
4.500%, VAR LIBOR+3.750%, 10/16/2027 | | | 1,528 | | | | 1,513 | |
CNT Holdings I Corp, Initial Term Loan, 2nd Lien | | | | | | | | |
7.500%, VAR LIBOR+6.750%, 10/16/2028 | | | 765 | | | | 767 | |
Envision Healthcare Corporation, Initial Term Loan, 1st Lien | | | | | | | | |
3.896%, VAR LIBOR+3.750%, 10/10/2025 | | | 2,375 | | | | 1,930 | |
| | |
72 | | SEI Institutional Investments Trust / Semi-Annual Report / November 30, 2020 |
| | | | | | | | |
| | | |
| Description | | Face Amount
(Thousands) | | Market Value
($ Thousands) |
|
LOAN PARTICIPATIONS (continued) | |
eResearchTechnology, Inc., Initial Term Loan, 1st Lien | | | | | | | | |
5.500%, VAR LIBOR+4.500%, 02/04/2027 | | $ | 3,471 | | | $ | 3,465 | |
Global Medical Response, Inc., 2020 Refinancing Term Loan, 1st Lien | | | | | | | | |
5.750%, VAR LIBOR+4.750%, 09/24/2025 | | | 1,198 | | | | 1,182 | |
Jaguar Holding Company I, LLC (fka Jaguar Holding Company I), 2018 Term Loan, 1st Lien | | | | | | | | |
3.500%, VAR LIBOR+2.500%, 08/18/2022 | | | — | | | | — | |
Life Time Fitness Inc., Term Loan, 1st Lien | | | | | | | | |
3.750%, VAR LIBOR+2.750%, 06/10/2022 | | | 1,044 | | | | 977 | |
Maravai Intermediate Holdings, LLC, Initial Term Loan, 1st Lien | | | | | | | | |
6.250%, VAR LIBOR+4.250%, 10/15/2027 | | | 1,617 | | | | 1,619 | |
National Mentor Holdings, Inc., Initial Term C Loan, 1st Lien | | | | | | | | |
4.400%, VAR LIBOR+4.250%, 03/09/2026 | | | 126 | | | | 125 | |
National Mentor Holdings, Inc., Initial Term Loan, 1st Lien | | | | | | | | |
4.400%, VAR LIBOR+4.250%, 03/09/2026 | | | 2,770 | | | | 2,745 | |
Navicure Inc., Initial Term Loan, 1st Lien | | | | | | | | |
4.146%, VAR LIBOR+4.000%, 10/22/2026 (D) | | | 266 | | | | 261 | |
NBTY (Nature’s Bounty), Term Loan, 1st Lien | | | | | | | | |
3.646%, VAR LIBOR+3.500%, 09/26/2024 | | | 2,307 | | | | 2,256 | |
Option Care Health, Inc., Term B Loan, 1st Lien | | | | | | | | |
4.396%, VAR LIBOR+4.250%, 08/06/2026 | | | 3,087 | | | | 3,075 | |
Ortho-Clinical Diagnostics, Inc., Second Amendment New Term Loan, 1st Lien | | | | | | | | |
3.390%, VAR LIBOR+3.250%, 06/30/2025 | | | 1,212 | | | | 1,187 | |
Precision Medicine Group, LLC, Initial Term Loan, 1st Lien | | | | | | | | |
4.500%, VAR LIBOR+3.750%, 10/29/2027 | | | 2,067 | | | | 2,049 | |
Radnet Management, Inc., Term B-1 Loan, 1st Lien | | | | | | | | |
4.750%, VAR LIBOR+3.750%, 06/30/2023 | | | 1,082 | | | | 1,077 | |
| | | | | | | | |
| | | |
| Description | | Face Amount
(Thousands) | | Market Value
($ Thousands) |
|
LOAN PARTICIPATIONS (continued) | |
Sotera Health Holdings, LLC, Initial Term Loan, 1st Lien | | | | | | | | |
5.500%, VAR LIBOR+4.500%, 12/11/2026 | | $ | 3,407 | | | $ | 3,404 | |
Team Health Holdings, Inc., Initial Term Loan, 1st Lien | | | | | | | | |
3.750%, VAR LIBOR+2.750%, 02/06/2024 | | | 744 | | | | 647 | |
Tecostar Holdings, 2017 Term Loan | | | | | | | | |
4.500%, VAR LIBOR+3.500%, 05/01/2024 | | | 365 | | | | 355 | |
Universal Hospital/Agiliti Health, Incremental Term Loan, 1st Lien | | | | | | | | |
3.750%, 01/04/2026 (A)(C) | | | 692 | | | | 686 | |
WCG Purchaser Corp., Initial Term Loan, 1st Lien | | | | | | | | |
5.000%, VAR LIBOR+4.000%, 01/08/2027 | | | 1,720 | | | | 1,718 | |
| | | | | | | | |
| | | | | | | 34,462 | |
| | | | | | | | |
| | |
Home Furnishings — 0.4% | | | | | | | | |
Diamond (BC) B.V., New Term Loan, 1st Lien | | | | | | | | |
6.000%, VAR LIBOR+5.000%, 09/06/2024 | | | 854 | | | | 844 | |
6.000%, VAR LIBOR+5.000%, 09/26/2024 | | | 2 | | | | 2 | |
Hillman Group, Inc., The, Initial Term Loan, 1st Lien | | | | | | | | |
4.146%, VAR LIBOR+4.000%, 05/30/2025 | | | 2,029 | | | | 2,009 | |
Pactiv Evergreen Inc., Tranche B-1 U.S. Term Loan, 1st Lien | | | | | | | | |
2.896%, VAR LIBOR+2.750%, 02/05/2023 (C) | | | 526 | | | | 519 | |
| | | | | | | | |
| | | | | | | 3,374 | |
| | | | | | | | |
| | |
Industrial Equipment — 1.4% | | | | | | | | |
Alliance Laundry Systems LLC, Initial Term B Loan, 1st Lien | | | | | | | | |
4.250%, VAR LIBOR+3.500%, 09/30/2027 | | | 3,003 | | | | 2,994 | |
CPI Holdco, LLC, Closing Date Term Loan, 1st Lien | | | | | | | | |
4.396%, VAR LIBOR+4.250%, 11/04/2026 | | | 1,322 | | | | 1,313 | |
Dynacast International LLC, Term B-2 Loan, 1st Lien | | | | | | | | |
4.250%, VAR LIBOR+3.250%, 01/28/2022 | | | 2,610 | | | | 2,467 | |
Pro Mach Group, Inc., Third Amendment Delayed Draw Term Loan, 1st Lien | | | | | | | | |
0.000%, 03/07/2025 (E) | | | 389 | | | | 400 | |
| | |
SEI Institutional Investments Trust / Semi-Annual Report / November 30, 2020 | | 73 |
SCHEDULE OF INVESTMENTS (Unaudited)
November 30, 2020
Opportunistic Income Fund (Continued)
| | | | | | | | |
| | | |
| Description | | Face Amount
(Thousands) | | Market Value
($ Thousands) |
|
LOAN PARTICIPATIONS (continued) | |
Pro Mach Group, Inc., Third Amendment Incremental Term Loan, 1st Lien | | | | | | | | |
4.500%, VAR LIBOR+3.500%, 03/07/2025 | | $ | 767 | | | $ | 749 | |
Restaurant Technologies, Inc., Initial Loan, 2nd Lien | | | | | | | | |
6.656%, VAR LIBOR+6.500%, 10/01/2026 | | | 119 | | | | 111 | |
Star US Bidco LLC, Initial Term Loan, 1st Lien | | | | | | | | |
5.250%, VAR LIBOR+4.250%, 03/17/2027 | | | 2,540 | | | | 2,458 | |
TMK Hawk Parent, Corp., Initial Tranche A Loan (Super Senior Priority), Term Loan | | | | | | | | |
8.500%, 05/30/2024 (A) | | | 715 | | | | 686 | |
TMK Hawk Parent, Corp., Initial Tranche B Loan (Super Senior Priority), Term Loan | | | | | | | | |
4.500%, VAR LIBOR+3.500%, 08/28/2024 | | | 958 | | | | 819 | |
Welbilt, Inc. (fka Manitowoc Foodservice, Inc.), Term B Loan (2018), 1st Lien | | | | | | | | |
2.647%, VAR LIBOR+2.500%, 10/23/2025 | | | 1,955 | | | | 1,839 | |
| | | | | | | | |
| | | | | | | 13,836 | |
| | | | | | | | |
| | |
Information Technology — 0.3% | | | | | | | | |
Infoblox, Cov-Lite, 2nd Lien | | | | | | | | |
8.000%, VAR LIBOR+7.250%, 10/06/2028 (C) | | | 1,118 | | | | 1,122 | |
Mitchell International, Inc., Initial Term Loan, 1st Lien | | | | | | | | |
3.396%, VAR LIBOR+3.250%, 11/29/2024 | | | 1,849 | | | | 1,785 | |
| | | | | | | | |
| | | | | | | 2,907 | |
| | | | | | | | |
| | |
Insurance — 1.7% | | | | | | | | |
Acrisure, LLC, 2020 Term Loan, 1st Lien | | | | | | | | |
3.646%, VAR LIBOR+3.500%, 02/15/2027 | | | 3,726 | | | | 3,643 | |
Alliant Holdings Intermediate, LLC, Term Loan B2, 1st Lien | | | | | | | | |
3.393%, VAR LIBOR+3.000%, 05/09/2025 | | | 795 | | | | 775 | |
AqGen Ascensus, Inc., Seventh Amendment Replacement Term Loan, 1st Lien | | | | | | | | |
5.000%, VAR LIBOR+4.000%, 12/03/2026 | | | 545 | | | | 540 | |
Asurion, LLC (fka Asurion Corporation), Second Lien Replacement B-2 Term Loan, 2nd Lien | | | | | | | | |
6.646%, VAR LIBOR+6.000%, 08/04/2025 | | | 2,357 | | | | 2,370 | |
| | | | | | | | |
| | | |
| Description | | Face Amount
(Thousands) | | Market Value
($ Thousands) |
|
LOAN PARTICIPATIONS (continued) | |
Broadstreet Partners, Cov-Lite, Term Loan, 1st Lien | | | | | | | | |
4.750%, VAR LIBOR+3.750%, 01/27/2027 | | $ | 1,338 | | | $ | 1,318 | |
Cross Financial Corp., Initial Term Loan, 1st Lien | | | | | | | | |
5.500%, VAR LIBOR+4.500%, 09/15/2027 | | | 1,250 | | | | 1,247 | |
HIG Finance 2 Limited, 2020 Dollar Incremental Term Loan, 1st Lien | | | | | | | | |
4.750%, VAR LIBOR+3.750%, 10/22/2027 (C) | | | 1,022 | | | | 1,014 | |
Hub International Limited, B-2 Incremental Term Loan, 1st Lien | | | | | | | | |
5.000%, VAR LIBOR+4.000%, 04/25/2025 | | | 786 | | | | 786 | |
Hyperion Insurance, Delayed Draw, Term Loan, 1st Lien | | | | | | | | |
0.000%, 10/22/2027 (A)(C)(E) | | | 384 | | | | 381 | |
OneDigital Borrower LLC, Delayed Draw Term Loan, 1st Lien | | | | | | | | |
5.250%, 10/29/2027 (A)(C) | | | 330 | | | | 327 | |
OneDigital Borrower LLC, Initial Term Loan, 1st Lien | | | | | | | | |
5.250%, VAR LIBOR+4.500%, 10/29/2027 (C) | | | 1,780 | | | | 1,768 | |
USI, Inc., 2019 New Term Loan, 1st Lien | | | | | | | | |
4.220%, VAR LIBOR+4.000%, 12/02/2026 | | | 1,999 | | | | 1,990 | |
| | | | | | | | |
| | | | | | | 16,159 | |
| | | | | | | | |
| | |
Leasing — 0.4% | | | | | | | | |
AVSC Holding Corp., Initial Term Loan, 1st Lien | | | | | | | | |
5.580%, VAR LIBOR+3.250%, 03/03/2025 | | | 43 | | | | 37 | |
4.250%, VAR LIBOR+3.250%, 03/03/2025 | | | 2,422 | | | | 2,135 | |
Hyland Software, Inc., Initial Term Loan, 2nd Lien | | | | | | | | |
7.750%, VAR LIBOR+7.000%, 07/07/2025 | | | 1,624 | | | | 1,632 | |
| | | | | | | | |
| | | | | | | 3,804 | |
| | | | | | | | |
| | |
Leisure Goods/Activities/Movies — 1.0% | | | | | | | | |
Alterra Mountain Company, Additional Term Loan, 1st Lien | | | | | | | | |
5.500%, VAR LIBOR+4.500%, 08/01/2026 (C) | | | 1,413 | | | | 1,413 | |
AMC Entertainment Holdings, Inc. (fka AMC Entertainment Inc.), Term B-1 Loan, 1st Lien | | | | | | | | |
3.230%, VAR LIBOR+3.000%, 04/22/2026 (C) | | | 2 | | | | 2 | |
| | |
74 | | SEI Institutional Investments Trust / Semi-Annual Report / November 30, 2020 |
| | | | | | | | |
| | | |
| Description | | Face Amount
(Thousands) | | Market Value
($ Thousands) |
|
LOAN PARTICIPATIONS (continued) | |
Formula One Management Limited, Facility B3 (USD), 1st Lien | | | | | | | | |
3.500%, VAR LIBOR+2.500%, 02/01/2024 (C) | | $ | 741 | | | $ | 720 | |
Hoya Midco, LLC, Initial Term Loan, 1st Lien | | | | | | | | |
4.500%, VAR LIBOR+3.500%, 06/30/2024 (C) | | | 1,309 | | | | 1,183 | |
Live Nation Entertainment, Inc., Term B-4 Loan, 1st Lien | | | | | | | | |
1.938%, VAR LIBOR+1.750%, 10/19/2026 | | | 270 | | | | 259 | |
NewCo I B.V., Facility AV1, 1st Lien | | | | | | | | |
3.673%, VAR LIBOR+3.500%, 01/31/2029 | | | 728 | | | | 719 | |
UFC Holdings, LLC, B-2 Term Loan, 1st Lien | | | | | | | | |
4.250%, VAR LIBOR+3.250%, 04/29/2026 | | | 770 | | | | 759 | |
UFC Holdings, LLC, Term B-1 Loan, 1st Lien | | | | | | | | |
4.250%, VAR LIBOR+3.250%, 04/29/2026 | | | 3,075 | | | | 3,042 | |
United PF Holdings, LLC, Initial Term Loan, 1st Lien | | | | | | | | |
4.220%, VAR LIBOR+4.000%, 12/30/2026 | | | 1,259 | | | | 1,167 | |
UPC Financing Partnership , Facility AV, 1st Lien | | | | | | | | |
3.677%, VAR LIBOR+3.500%, 01/31/2029 | | | 728 | | | | 720 | |
| | | | | | | | |
| | | | | | | 9,984 | |
| | | | | | | | |
| | |
Lodging & Casinos — 0.2% | | | | | | | | |
Caesars Resort Collection, LLC, Term B-1 Loan, 1st Lien | | | | | | | | |
4.646%, VAR LIBOR+4.500%, 07/21/2025 | | | 900 | | | | 891 | |
Mohegan Tribal Gaming Authority, Term B Loan, 1st Lien | | | | | | | | |
6.375%, VAR LIBOR+4.000%, 10/13/2023 | | | 1,476 | | | | 1,370 | |
| | | | | | | | |
| | | | | | | 2,261 | |
| | | | | | | | |
| | |
Media — 0.2% | | | | | | | | |
Merrill Communications, LLC, Term Loan B (2019), 2nd Lien | | | | | | | | |
6.000%, 10/05/2026 (A) | | | 1,840 | | | | 1,829 | |
| | | | | | | | |
| | |
Oil & Gas — 0.3% | | | | | | | | |
Equinox Fitness Clubs, Term Loan B-1, 1st Lien | | | | | | | | |
4.000%, VAR LIBOR+4.500%, 03/08/2024 | | | 856 | | | | 717 | |
| | | | | | | | |
| | | |
| Description | | Face Amount
(Thousands) | | Market Value
($ Thousands) |
|
LOAN PARTICIPATIONS (continued) | |
Equinox Fitness Clubs, Term Loan B-2, 1st Lien | | | | | | | | |
10.000%, VAR LIBOR+9.000%, 03/08/2024 | | $ | 763 | | | $ | 763 | |
Medallion Midland, Term Loan B, 1st Lien | | | | | | | | |
4.250%, VAR LIBOR+3.250%, 10/30/2024 | | | 785 | | | | 751 | |
Woodford Express LLC, Term Loan B, 1st Lien | | | | | | | | |
6.000%, VAR LIBOR+5.000%, 01/27/2025 | | | 1,458 | | | | 991 | |
| | | | | | | | |
| | | | | | | 3,222 | |
| | | | | | | | |
| | |
Personal Transportation — 0.1% | | | | | | | | |
JetBlue Airways Corporation, Term Loan, 1st Lien | | | | | | | | |
6.250%, VAR LIBOR+5.250%, 06/17/2024 | | | 723 | | | | 734 | |
| | | | | | | | |
| | |
Printing, Publishing & Broadcasting — 0.0% | | | | | | | | |
Clear Channel Outdoor Holdings, Inc., Term B Loan, 1st Lien | | | | | | | | |
3.666%, VAR LIBOR+3.500%, 08/21/2026 | | | 1 | | | | 1 | |
| | | | | | | | |
| | |
Professional & Business Services — 1.1% | | | | | | | | |
Applied Systems, Inc., Initial Term Loan, 2nd Lien | | | | | | | | |
8.000%, VAR LIBOR+7.000%, 09/19/2025 | | | 1,819 | | | | 1,823 | |
Big Ass Fans, LLC, Repricing Term Loan, 1st Lien | | | | | | | | |
4.750%, VAR LIBOR+3.750%, 05/21/2024 | | | 2,040 | | | | 1,999 | |
Brookfield Property REIT Inc., Intial Term Loan A-2, 1st Lien | | | | | | | | |
3.146%, VAR LIBOR+2.250%, 08/28/2023 | | | 499 | | | | 459 | |
GFL Environmental, Incremental Term Loan, 2nd Lien | | | | | | | | |
4.000%, VAR LIBOR+3.250%, 05/30/2025 | | | 2,619 | | | | 2,612 | |
Hanger, Inc., Term Loan B, 1st Lien | | | | | | | | |
3.646%, VAR LIBOR+3.500%, 03/06/2025 (C) | | | 447 | | | | 444 | |
Learning Care, Term Loan B, 1st Lien | | | | | | | | |
4.250%, VAR LIBOR+3.250%, 03/13/2025 | | | 1,727 | | | | 1,635 | |
0.250%, VAR LIBOR+3.250%, 03/13/2025 | | | 396 | | | | 375 | |
SAI Global, Term Loan B, 1st Lien | | | | | | | | |
5.500%, VAR LIBOR+4.500%, 12/20/2023 | | | 1,962 | | | | 1,589 | |
| | |
SEI Institutional Investments Trust / Semi-Annual Report / November 30, 2020 | | 75 |
SCHEDULE OF INVESTMENTS (Unaudited)
November 30, 2020
Opportunistic Income Fund (Continued)
| | | | | | | | |
| | | |
| Description | | Face Amount
(Thousands) | | Market Value
($ Thousands) |
|
LOAN PARTICIPATIONS (continued) | |
Sedgwick CMS,Term Loan B,1st Lien | | | | | | | | |
4.146%, VAR LIBOR+4.000%,
09/03/2026 | | $ | 119 | | | $ | 117 | |
| | | | | | | | |
| | |
| | | | | | | 11,053 | |
| | | | | | | | |
|
Publishing — 0.4% | |
Clear Channel Outdoor Holdings, Inc., Term B Loan, 1st Lien | | | | | | | | |
3.714%, VAR LIBOR+3.500%,
08/21/2026 (C) | | | 1,104 | | | | 1,038 | |
Dun & Bradstreet Corporation, The, Initial
Term Borrowing, 1st Lien | | | | | | | | |
3.893%, VAR LIBOR+3.750%,
02/06/2026 (C) | | | 3,080 | | | | 3,058 | |
| | | | | | | | |
| | | | | | | 4,096 | |
| | | | | | | | |
|
Real Estate — 0.1% | |
BrookField Property REIT Inc., Initial Term
A-2 Loan | | | | | | | | |
3.146%, VAR LIBOR+2.250%,
08/28/2023 | | | 1,296 | | | | 1,191 | |
| | | | | | | | |
| | |
Retail Food & Drug — 0.2% | | | | | | | | |
Albany Molecular Research, Inc., Cov-Lite,
1st Lien | | | | | | | | |
4.250%, VAR LIBOR+3.000%,
08/30/2024 | | | 6 | | | | 6 | |
Albany Molecular Research, Inc., Initial Term Loan, 1st Lien | | | | | | | | |
4.250%, VAR LIBOR+3.250%,
08/30/2024 (C) | | | 2,209 | | | | 2,201 | |
| | | | | | | | |
| | | | | | | 2,207 | |
| | | | | | | | |
| | |
Retailers (except food & drug) — 0.3% | | | | | | | | |
Bass Pro Group, LLC, Initial Term Loan, 1st
Lien | | | | | | | | |
5.750%, VAR LIBOR+5.000%,
09/25/2024 | | | 516 | | | | 515 | |
Learning Care Group (US) No. 2 Inc., 2020 Incremental Term Loan | | | | | | | | |
9.500%, VAR LIBOR+8.500%,
03/13/2025 | | | 524 | | | | 526 | |
Mister Car Wash Holdings, Inc., Initial Term
Loan, 1st Lien | | | | | | | | |
3.397%, VAR LIBOR+3.250%,
05/14/2026 | | | 2,412 | | | | 2,305 | |
| | | | | | | | |
| | | | | | | 3,346 | |
| | | | | | | | |
| | |
Securities & Trusts — 0.2% | | | | | | | | |
Titan Acquisition Limited, Initial Term Loan,
1st Lien | | | | | | | | |
3.361%, VAR LIBOR+3.000%, 03/28/2025 | | | 2,186 | | | | 2,100 | |
| | | | | | | | |
| | | | | | | | |
| | | |
| Description | | Face Amount
(Thousands) | | Market Value
($ Thousands) |
|
LOAN PARTICIPATIONS (continued) | |
| | |
Surface Transport — 0.3% | | | | | | | | |
Dynasty Acquisition Co., Inc., 2020 Term B-1Loan, 1st Lien | | | | | | | | |
3.720%, VAR LIBOR+3.500%,
04/06/2026 | | $ | 1,317 | | | $ | 1,227 | |
Dynasty Acquisition Co., Inc., 2020 Term B-2 Loan, 1st Lien | | | | | | | | |
3.720%, VAR LIBOR+3.500%,
04/06/2026 | | | 708 | | | | 659 | |
Lineage Logistics, LLC, Term Loan, 1st Lien | | | | | | | | |
4.000%, VAR LIBOR+3.000%,
02/27/2025 | | | 1,046 | | | | 1,039 | |
| | | | | | | | |
| | | | | | | 2,925 | |
| | | | | | | | |
|
Telecommunications — 1.2% | |
Avaya Inc., Tranche B Term Loan, 1st Lien | | | | | | | | |
4.391%, VAR LIBOR+4.250%,
12/15/2024 | | | 845 | | | | 844 | |
Genesis Energy, 1st Lien | | | | | | | | |
4.750%, VAR LIBOR+4.000%,
10/08/2027 (C) | | | 2,604 | | | | 2,593 | |
iHeartCommunications, Inc. (fka Clear Channel Communications, Inc.), Term Loan | | | | | | | | |
4.750%, VAR LIBOR+4.000%,
05/01/2026 | | | 1,103 | | | | 1,086 | |
Intelsat Jackson Holdings S.A., DIP Facility, 1st Lien | | | | | | | | |
6.500%, VAR LIBOR+5.500%,
07/13/2022 | | | 118 | | | | 120 | |
Intelsat Jackson Holdings S.A., Tranche B-3 Term Loan, 1st Lien | | | | | | | | |
8.000%, VAR Prime Rate by
Country+4.750%, 11/27/2023 | | | 1,953 | | | | 1,974 | |
Intelsat Jackson Holdings S.A., Tranche B-4 Term Loan, 1st Lien | | | | | | | | |
8.750%, VAR Prime Rate by
Country+5.500%, 01/02/2024 | | | 355 | | | | 359 | |
Iridium Satellite LLC, Initial Term Loan, 1st
Lien | | | | | | | | |
4.750%, VAR LIBOR+3.750%,
11/04/2026 | | | 3,015 | | | | 3,014 | |
Lumos Networks, Term Loan B, 1st Lien | | | | | | | | |
5.000%, VAR LIBOR+4.000%,
11/17/2024 | | | 372 | | | | 370 | |
MTN Infrastructure TopCo, Inc., Initial Term Loan, 1st Lien | | | | | | | | |
4.000%, VAR LIBOR+3.000%,
11/15/2024 | | | 1,031 | | | | 1,014 | |
| | |
76 | | SEI Institutional Investments Trust / Semi-Annual Report / November 30, 2020 |
| | | | | | | | |
| | | |
| Description | | Face Amount
(Thousands) | | Market Value
($ Thousands) |
|
LOAN PARTICIPATIONS (continued) | |
Zayo Group Holdings, Inc., Initial Dollar Term Loan, 1st Lien | | | | | | | | |
3.146%, VAR LIBOR+3.000%, 03/09/2027 (C) | | $ | 540 | | | $ | 530 | |
| | | | | | | | |
| | | | | | | 11,904 | |
| | | | | | | | |
| | |
Utilities — 0.2% | | | | | | | | |
Edgewater Generation, L.L.C., Term Loan, 1st Lien | | | | | | | | |
3.896%, VAR LIBOR+3.750%, 12/13/2025 | | | 599 | | | | 585 | |
Granite Acquisition, Inc., Term B Loan (First Lien) | | | | | | | | |
4.750%, VAR LIBOR+3.750%, 10/15/2021 | | | 1,380 | | | | 1,377 | |
Traverse Midstream Partners LLC, Advance, 1st Lien | | | | | | | | |
6.500%, VAR LIBOR+5.500%, 09/27/2024 (D) | | | 397 | | | | 373 | |
| | | | | | | | |
| | | | | | | 2,335 | |
| | | | | | | | |
| | |
Total Loan Participations
(Cost $289,438) ($ Thousands) | | | | | | | 287,888 | |
| | | | | | | | |
|
ASSET-BACKED SECURITIES — 25.7% | |
|
Automotive — 4.1% | |
| | |
Ally Auto Receivables Trust, Ser 2019-4, Cl A3 | | | | | | | | |
1.840%, 06/17/2024 | | | 1,070 | | | | 1,087 | |
American Credit Acceptance Receivables Trust, Ser 2019-3, Cl A | | | | | | | | |
2.440%, 12/12/2022 (B) | | | 25 | | | | 25 | |
American Credit Acceptance Receivables Trust, Ser 2020-1, Cl A | | | | | | | | |
1.890%, 04/13/2023 (B) | | | 126 | | | | 126 | |
American Credit Acceptance Receivables Trust, Ser 2020-3, Cl A | | | | | | | | |
0.620%, 10/13/2023 (B) | | | 217 | | | | 218 | |
American Credit Acceptance Receivables Trust, Ser 2020-4, Cl A | | | | | | | | |
0.530%, 03/13/2024 (B) | | | 375 | | | | 375 | |
AmeriCredit Automobile Receivables Trust, Ser 2020-2, Cl A2A | | | | | | | | |
0.600%, 12/18/2023 | | | 190 | | | | 190 | |
AmeriCredit Automobile Receivables Trust, Ser 2020-3, Cl A2 | | | | | | | | |
0.420%, 03/18/2024 | | | 520 | | | | 520 | |
ARI Fleet Lease Trust, Ser 2018-A, Cl A2 | | | | | | | | |
2.550%, 10/15/2026 (B) | | | 8 | | | | 8 | |
ARI Fleet Lease Trust, Ser 2020-A, Cl A2 | | | | | | | | |
1.770%, 08/15/2028 (B) | | | 155 | | | | 157 | |
| | | | | | | | |
| | | |
| Description | | Face Amount
(Thousands) | | Market Value
($ Thousands) |
|
ASSET-BACKED SECURITIES (continued) | |
Avid Automobile Receivables Trust, Ser 2019-1, Cl A | | | | | | | | |
2.620%, 02/15/2024 (B) | | $ | 919 | | | $ | 928 | |
Avis Budget Rental Car Funding AESOP LLC, Ser 2019-1A, Cl A | | | | | | | | |
3.450%, 03/20/2023 (B) | | | 2,000 | | | | 2,053 | |
BMW Vehicle Owner Trust, Ser 2020-A, Cl A2 | | | | | | | | |
0.390%, 02/27/2023 | | | 190 | | | | 190 | |
Canadian Pacer Auto Receivables Trust, Ser 2020-1A, Cl A2A | | | | | | | | |
1.770%, 11/21/2022 (B) | | | 317 | | | | 319 | |
CarMax Auto Owner Trust, Ser 2018-2, Cl A3 | | | | | | | | |
2.980%, 01/17/2023 | | | 2,048 | | | | 2,073 | |
CarMax Auto Owner Trust, Ser 2020-4, Cl A2 | | | | | | | | |
0.310%, 01/16/2024 | | | 395 | | | | 395 | |
CarMax Auto Owner Trust, Ser 2020-4, Cl A3 | | | | | | | | |
0.500%, 08/15/2025 | | | 1,000 | | | | 1,003 | |
Carvana Auto Receivables Trust, Ser 2019-4A, Cl A2 | | | | | | | | |
2.200%, 07/15/2022 (B) | | | 48 | | | | 48 | |
Chesapeake Funding II LLC, Ser 2017-2A, Cl A1 | | | | | | | | |
1.990%, 05/15/2029 (B) | | | 29 | | | | 29 | |
Chesapeake Funding II LLC, Ser 2017-4A, Cl A1 | | | | | | | | |
2.120%, 11/15/2029 (B) | | | 209 | | | | 210 | |
Chesapeake Funding II LLC, Ser 2019-2A, Cl A1 | | | | | | | | |
1.950%, 09/15/2031 (B) | | | 434 | | | | 441 | |
CPS Auto Receivables Trust, Ser 2020-A, Cl A | | | | | | | | |
2.090%, 05/15/2023 (B) | | | 120 | | | | 121 | |
CPS Auto Receivables Trust, Ser 2020-C, Cl A | | | | | | | | |
0.630%, 03/15/2024 (B) | | | 246 | | | | 246 | |
Credit Acceptance Auto Loan Trust, Ser 2020-1A, Cl A | | | | | | | | |
2.010%, 02/15/2029 (B) | | | 600 | | | | 614 | |
Drive Auto Receivables Trust, Ser 2019-4, Cl A3 | | | | | | | | |
2.160%, 05/15/2023 | | | 219 | | | | 220 | |
Drive Auto Receivables Trust, Ser 2020-1, Cl A3 | | | | | | | | |
2.020%, 11/15/2023 | | | 200 | | | | 202 | |
Drive Auto Receivables Trust, Ser 2020-2, Cl A2A | | | | | | | | |
0.850%, 07/17/2023 | | | 115 | | | | 115 | |
DT Auto Owner Trust, Ser 2019-3A, Cl A | | | | | | | | |
2.550%, 08/15/2022 (B) | | | 34 | | | | 34 | |
DT Auto Owner Trust, Ser 2020-1A, Cl A | | | | | | | | |
1.940%, 09/15/2023 (B) | | | 91 | | | | 92 | |
DT Auto Owner Trust, Ser 2020-3A, Cl A | | | | | | | | |
0.540%, 04/15/2024 (B) | | | 287 | | | | 287 | |
| | |
SEI Institutional Investments Trust / Semi-Annual Report / November 30, 2020 | | 77 |
SCHEDULE OF INVESTMENTS (Unaudited)
November 30, 2020
Opportunistic Income Fund (Continued)
| | | | | | | | |
| | | |
| Description | | Face Amount
(Thousands) | | Market Value
($ Thousands) |
|
ASSET-BACKED SECURITIES (continued) | |
Enterprise Fleet Financing LLC, Ser 2019-3, Cl A2 | | | | | | | | |
2.060%, 05/20/2025 (B) | | $ | 404 | | | $ | 411 | |
Enterprise Fleet Financing LLC, Ser 2020-2, Cl A1 | | | | | | | | |
0.240%, 10/20/2021 (B) | | | 363 | | | | 363 | |
Exeter Automobile Receivables Trust, Ser 2020-1A, Cl A | | | | | | | | |
2.050%, 06/15/2023 (B) | | | 72 | | | | 72 | |
Exeter Automobile Receivables Trust, Ser 2020-2A, Cl A | | | | | | | | |
1.130%, 08/15/2023 (B) | | | 1,290 | | | | 1,293 | |
Exeter Automobile Receivables Trust, Ser 2020-3A, Cl A2 | | | | | | | | |
0.460%, 10/17/2022 | | | 360 | | | | 360 | |
Flagship Credit Auto Trust, Ser 2018-3, Cl A | | | | | | | | |
3.070%, 02/15/2023 (B) | | | 32 | | | | 32 | |
Flagship Credit Auto Trust, Ser 2019-1, Cl A | | | | | | | | |
3.110%, 08/15/2023 (B) | | | 114 | | | | 116 | |
Flagship Credit Auto Trust, Ser 2019-2, Cl A | | | | | | | | |
2.830%, 10/16/2023 (B) | | | 229 | | | | 231 | |
Flagship Credit Auto Trust, Ser 2019-3, Cl A | | | | | | | | |
2.330%, 02/15/2024 (B) | | | 221 | | | | 224 | |
Flagship Credit Auto Trust, Ser 2020-1, Cl A | | | | | | | | |
1.900%, 08/15/2024 (B) | | | 222 | | | | 225 | |
Flagship Credit Auto Trust, Ser 2020-3, Cl A | | | | | | | | |
0.700%, 04/15/2025 (B) | | | 88 | | | | 88 | |
Flagship Credit Auto Trust, Ser 2020-4, Cl A | | | | | | | | |
0.530%, 04/15/2025 (B) | | | 575 | | | | 575 | |
Ford Credit Auto Lease Trust, Ser 2019-A, Cl A4 | | | | | | | | |
2.980%, 06/15/2022 | | | 150 | | | | 152 | |
Ford Credit Auto Lease Trust, Ser 2020-A, Cl A2 | | | | | | | | |
1.800%, 07/15/2022 | | | 172 | | | | 173 | |
Ford Credit Auto Lease Trust, Ser 2020-B, Cl A2A | | | | | | | | |
0.500%, 12/15/2022 | | | 225 | | | | 225 | |
Ford Credit Auto Owner Trust, Ser 2017-2, Cl A | | | | | | | | |
2.360%, 03/15/2029 (B) | | | 450 | | | | 465 | |
Ford Credit Auto Owner Trust, Ser 2020-B,Cl A2 | | | | | | | | |
0.500%, 02/15/2023 | | | 567 | | | | 568 | |
Ford Credit Auto Owner Trust, Ser 2020-C, Cl A2 | | | | | | | | |
0.250%, 10/15/2023 | | | 320 | | | | 320 | |
Foursight Capital Automobile Receivables Trust, Ser 2020-1, Cl A2 | | | | | | | | |
1.970%, 09/15/2023 (B) | | | 197 | | | | 198 | |
GLS Auto Receivables Issuer Trust, Ser 2019-1A, Cl A | | | | | | | | |
3.370%, 01/17/2023 (B) | | | 37 | | | | 37 | |
| | | | | | | | |
| | | |
| Description | | Face Amount
(Thousands) | | Market Value
($ Thousands) |
|
ASSET-BACKED SECURITIES (continued) | |
GLS Auto Receivables Issuer Trust, Ser 2019-3A, Cl A | | | | | | | | |
2.580%, 07/17/2023 (B) | | $ | 120 | | | $ | 121 | |
GLS Auto Receivables Issuer Trust, Ser 2019-4A, Cl A | | | | | | | | |
2.470%, 11/15/2023 (B) | | | 121 | | | | 122 | |
GLS Auto Receivables Issuer Trust, Ser 2020-1A, Cl A | | | | | | | | |
2.170%, 02/15/2024 (B) | | | 164 | | | | 166 | |
GLS Auto Receivables Issuer Trust, Ser 2020-3A, Cl A | | | | | | | | |
0.690%, 10/16/2023 (B) | | | 144 | | | | 144 | |
GLS Auto Receivables Trust, Ser 2018-1A, Cl A | | | | | | | | |
2.820%, 07/15/2022 (B) | | | 30 | | | | 30 | |
GLS Auto Receivables Trust, Ser 2018-3A, Cl A | | | | | | | | |
3.350%, 08/15/2022 (B) | | | 1 | | | | 1 | |
GM Financial Automobile Leasing Trust, Ser 2020-2, Cl A2A | | | | | | | | |
0.710%, 10/20/2022 | | | 136 | | | | 136 | |
GM Financial Automobile Leasing Trust, Ser 2020-3, Cl A2A | | | | | | | | |
0.350%, 11/21/2022 | | | 305 | | | | 305 | |
GM Financial Consumer Automobile Receivables Trust, Ser 2020-3, Cl A2 | | | | | | | | |
0.350%, 07/17/2023 | | | 460 | | | | 460 | |
GM Financial Consumer Automobile Receivables Trust, Ser 2020-4, Cl A2 | | | | | �� | | | |
0.260%, 11/16/2023 | | | 145 | | | | 145 | |
Hertz Fleet Lease Funding, Ser 2019-1, Cl A2 | | | | | | | | |
2.700%, 01/10/2033 (B) | | | 344 | | | | 349 | |
Honda Auto Receivables Owner Trust, Ser 2020-2, Cl A2 | | | | | | | | |
0.740%, 11/15/2022 | | | 78 | | | | 78 | |
Honda Auto Receivables Owner Trust, Ser 2020-2, Cl A3 | | | | | | | | |
0.820%, 07/15/2024 | | | 3,000 | | | | 3,027 | |
Hyundai Auto Lease Securitization Trust, Ser 2020-B, Cl A2 | | | | | | | | |
0.360%, 01/17/2023 (B) | | | 335 | | | | 335 | |
Hyundai Auto Receivables Trust, Ser 2017-A, Cl B | | | | | | | | |
2.380%, 04/17/2023 | | | 1,000 | | | | 1,007 | |
Mercedes-Benz Auto Lease Trust, Ser 2020- A, Cl A2 | | | | | | | | |
1.820%, 03/15/2022 | | | 76 | | | | 77 | |
Mercedes-Benz Auto Receivables Trust, Ser 2020-1, Cl A2 | | | | | | | | |
0.460%, 03/15/2023 | | | 290 | | | | 290 | |
Nissan Auto Lease Trust, Ser 2020-A, Cl A2A | | | | | | | | |
1.800%, 05/16/2022 | | | 239 | | | | 240 | |
Nissan Auto Lease Trust, Ser 2020-B, Cl A2 | | | | | | | | |
0.340%, 12/15/2022 | | | 390 | | | | 390 | |
| | |
78 | | SEI Institutional Investments Trust / Semi-Annual Report / November 30, 2020 |
| | | | | | | | |
| | | |
| Description | | Face Amount
(Thousands) | | Market Value
($ Thousands) |
|
ASSET-BACKED SECURITIES (continued) | |
Nissan Auto Receivables Owner Trust, Ser 2020-B, Cl A2A | | | | | | | | |
0.470%, 10/17/2022 | | $ | 450 | | | $ | 451 | |
Prestige Auto Receivables Trust, Ser 2020-1A, Cl A2 | | | | | | | | |
0.520%, 02/15/2024 (B) | | | 480 | | | | 480 | |
Santander Consumer Auto Receivables Trust, Ser 2020-AA, Cl A | | | | | | | | |
1.370%, 10/15/2024 (B) | | | 250 | | | | 253 | |
Santander Consumer Auto Receivables Trust, Ser 2020-BA, Cl A2 | | | | | | | | |
0.380%, 02/15/2023 (B) | | | 400 | | | | 400 | |
Santander Drive Auto Receivables Trust, Ser 2020-2, Cl A2A | | | | | | | | |
0.620%, 05/15/2023 | | | 272 | | | | 272 | |
Santander Drive Auto Receivables Trust, Ser 2020-2, Cl C | | | | | | | | |
1.460%, 09/15/2025 | | | 1,000 | | | | 1,011 | |
Santander Drive Auto Receivables Trust, Ser 2020-3, Cl A2 | | | | | | | | |
0.460%, 09/15/2023 | | | 245 | | | | 245 | |
Santander Drive Auto Receivables Trust, Ser 2020-4, Cl A2 | | | | | | | | |
0.420%, 09/15/2023 | | | 595 | | | | 595 | |
Santander Retail Auto Lease Trust, Ser 2020- B, Cl A2 | | | | | | | | |
0.420%, 11/20/2023 (B) | | | 315 | | | | 315 | |
Securitized Term Auto Receivables Trust, Ser 2019-1A, Cl A3 | | | | | | | | |
2.986%, 02/27/2023 (B) | | | 475 | | | | 482 | |
Securitized Term Auto Receivables Trust, Ser 2019-CRTA, Cl D | | | | | | | | |
4.572%, 03/25/2026 (B) | | | 781 | | | | 802 | |
Tesla Auto Lease Trust, Ser 2020-A, Cl A2 | | | | | | | | |
0.550%, 05/22/2023 (B) | | | 115 | | | | 115 | |
Tesla Auto Lease Trust, Ser 2020-A, Cl B | | | | | | | | |
1.180%, 01/22/2024 (B) | | | 1,000 | | | | 1,012 | |
Tidewater Auto Receivables Trust, Ser 2020-AA, Cl C | | | | | | | | |
1.910%, 09/15/2026 (B) | | | 2,000 | | | | 1,994 | |
United Auto Credit Securitization Trust, Ser 2020-1, Cl A | | | | | | | | |
0.850%, 05/10/2022 (B) | | | 83 | | | | 83 | |
Volkswagen Auto Lease Trust, Ser 2020-A, Cl A2 | | | | | | | | |
0.270%, 04/20/2023 | | | 635 | | | | 633 | |
Volkswagen Auto Loan Enhanced Trust, Ser 2020-1, Cl A2A | | | | | | | | |
0.930%, 12/20/2022 | | | 1,710 | | | | 1,715 | |
Westlake Automobile Receivables Trust, Ser 2017-2A, Cl D | | | | | | | | |
3.280%, 12/15/2022 (B) | | | 328 | | | | 329 | |
| | | | | | | | |
| | | |
| Description | | Face Amount
(Thousands) | | Market Value
($ Thousands) |
|
ASSET-BACKED SECURITIES (continued) | |
Westlake Automobile Receivables Trust, Ser 2019-1A, Cl A2A | | | | | | | | |
3.060%, 05/16/2022 (B) | | $ | 26 | | | $ | 26 | |
Westlake Automobile Receivables Trust, Ser 2020-2A, Cl A2A | | | | | | | | |
0.930%, 02/15/2024 (B) | | | 588 | | | | 590 | |
Westlake Automobile Receivables Trust, Ser 2020-3A, Cl A2 | | | | | | | | |
0.560%, 05/15/2024 (B) | | | 525 | | | | 525 | |
Wheels SPV 2 LLC, Ser 2020-1A, Cl A2 | | | | | | | | |
0.510%, 08/20/2029 (B) | | | 200 | | | | 200 | |
World Omni Auto Receivables Trust, Ser 2020-B, Cl A2A | | | | | | | | |
0.550%, 07/17/2023 | | | 285 | | | | 285 | |
World Omni Auto Receivables Trust, Ser 2020-C, Cl A2 | | | | | | | | |
0.350%, 12/15/2023 | | | 540 | | | | 540 | |
World Omni Automobile Lease Securitization Trust, Ser 2020-B, Cl A2 | | | | | | | | |
0.320%, 09/15/2023 | | | 125 | | | | 125 | |
World Omni Select Auto Trust, Ser 2020-A, Cl A2 | | | | | | | | |
0.470%, 06/17/2024 | | | 330 | | | | 330 | |
| | | | | | | | |
| | | | | | | 39,685 | |
| | | | | | | | |
|
Credit Cards — 0.4% | |
| | |
Capital One Multi-Asset Execution Trust, Ser 2018-A2, Cl A2 | | | | | | | | |
0.491%, VAR ICE LIBOR USD 1
Month+0.350%, 03/16/2026 | | | 2,000 | | | | 2,003 | |
Citibank Credit Card Issuance Trust, Ser 2018-A2, Cl A2 | | | | | | | | |
0.477%, VAR ICE LIBOR USD 1
Month+0.330%, 01/20/2025 | | | 2,000 | | | | 2,003 | |
Master Credit Card Trust II, Ser 2019-2A, Cl A | | | | | | | | |
0.536%, VAR ICE LIBOR USD 1
Month+0.390%, 01/21/2023 (B) | | | 330 | | | | 331 | |
Trillium Credit Card Trust II, Ser 2020-1A, Cl A | | | | | | | | |
0.516%, VAR ICE LIBOR USD 1
Month+0.370%, 12/26/2024 (B) | | | 405 | | | | 405 | |
| | | | | | | | |
| | | | | | | 4,742 | |
| | | | | | | | |
|
Mortgage Related Securities — 2.6% | |
| | |
ABFC Trust, Ser 2002-NC1, Cl M1 | | | | | | | | |
1.170%, VAR ICE LIBOR USD 1
Month+1.020%, 03/25/2032 | | | 2,388 | | | | 2,373 | |
ABFC Trust, Ser 2004-HE1, Cl M1 | | | | | | | | |
1.050%, VAR ICE LIBOR USD 1
Month+0.900%, 03/25/2034 | | | 965 | | | | 957 | |
| | |
SEI Institutional Investments Trust / Semi-Annual Report / November 30, 2020 | | 79 |
SCHEDULE OF INVESTMENTS (Unaudited)
November 30, 2020
Opportunistic Income Fund (Continued)
| | | | | | | | |
| | | |
| Description | | Face Amount
(Thousands) | | Market Value
($ Thousands) |
|
ASSET-BACKED SECURITIES (continued) | |
ABFC Trust, Ser 2005-OPT1, Cl M1 | | | | | | | | |
0.840%, VAR ICE LIBOR USD 1
Month+0.690%, 07/25/2035 | | $ | 901 | | | $ | 898 | |
ABFC Trust, Ser 2005-WF1, Cl M1 | | | | | | | | |
0.690%, VAR ICE LIBOR USD 1
Month+0.540%, 11/25/2034 | | | 1,095 | | | | 1,090 | |
Accredited Mortgage Loan Trust, Ser 2004-4, Cl A1A | | | | | | | | |
0.830%, VAR ICE LIBOR USD 1
Month+0.680%, 01/25/2035 | | | 32 | | | | 32 | |
Accredited Mortgage Loan Trust, Ser 2006-2, Cl M1 | | | | | | | | |
0.420%, VAR ICE LIBOR USD 1
Month+0.270%, 09/25/2036 | | | 1,230 | | | | 1,108 | |
ACE Securities Home Equity Loan Trust, Ser 2005-SD1, Cl M2 | | | | | | | | |
2.025%, VAR ICE LIBOR USD 1
Month+1.875%, 11/25/2050 | | | 1,606 | | | | 1,604 | |
Aegis Asset-Backed Securities Trust Mortgage Pass-Through Certificates, Ser 2004-3, Cl M1 | | | | | | | | |
1.050%, VAR ICE LIBOR USD 1
Month+0.900%, 09/25/2034 | | | 1,643 | | | | 1,638 | |
GMACM Home Equity Loan Trust, Ser 2007-HE2, Cl A2 | | | | | | | | |
6.054%, 12/25/2037 (A) | | | 572 | | | | 593 | |
GMACM Home Equity Loan Trust, Ser 2007-HE2, Cl A3 | | | | | | | | |
6.193%, 12/25/2037 (A) | | | 213 | | | | 222 | |
GSAA Home Equity Trust, Ser 2005-11, Cl 2A2 | | | | | | | | |
0.790%, VAR ICE LIBOR USD 1
Month+0.640%, 10/25/2035 | | | 1,742 | | | | 1,772 | |
Home Equity Asset Trust, Ser 2005-5, Cl M2 | | | | | | | | |
0.914%, VAR ICE LIBOR USD 1
Month+0.765%, 11/25/2035 | | | 92 | | | | 92 | |
Home Equity Asset Trust, Ser 2005-7, Cl M1 | | | | | | | | |
0.600%, VAR ICE LIBOR USD 1
Month+0.450%, 01/25/2036 | | | 1,561 | | | | 1,556 | |
Irwin Home Equity Loan Trust, Ser 2006-1,Cl 2A3 | | | | | | | | |
6.270%, 09/25/2035 (B) | | | 931 | | | | 966 | |
Master Asset-Backed Securities Trust,Ser 2006-NC3, Cl A3 | | | | | | | | |
0.250%, VAR ICE LIBOR USD 1
Month+0.100%, 10/25/2036 | | | 2,270 | | | | 1,469 | |
Morgan Stanley Capital I Trust, Ser 2004- HE7, Cl M1 | | | | | | | | |
1.050%, VAR ICE LIBOR USD 1
Month+0.900%, 08/25/2034 | | | 2,153 | | | | 2,126 | |
Morgan Stanley Capital I Trust, Ser 2005- HE2, Cl M1 | | | | | | | | |
0.750%, VAR ICE LIBOR USD 1
Month+0.600%, 01/25/2035 | | | 812 | | | | 809 | |
| | | | | | | | |
| | | |
| Description | | Face Amount
(Thousands) | | Market Value
($ Thousands) |
|
ASSET-BACKED SECURITIES (continued) | |
Morgan Stanley Dean Witter Capital I Trust, Ser 2002-AM3, Cl M1 | | | | | | | | |
1.575%, VAR ICE LIBOR USD 1
Month+1.425%, 02/25/2033 | | $ | 4 | | | $ | 4 | |
Morgan Stanley Dean Witter Capital I Trust, Ser 2002-HE2, Cl A1 | | | | | | | | |
1.010%, VAR ICE LIBOR USD 1
Month+0.860%, 08/25/2032 (B) | | | 1,794 | | | | 1,787 | |
New Century Home Equity Loan Trust, Ser 2005-4, Cl M2 | | | | | | | | |
0.915%, VAR ICE LIBOR USD 1
Month+0.765%, 09/25/2035 | | | 609 | | | | 611 | |
NovaStar Mortgage Funding Trust, Ser 2003-3, Cl A1 | | | | | | | | |
0.860%, VAR ICE LIBOR USD 1
Month+0.710%, 12/25/2033 | | | 2,082 | | | | 2,047 | |
NovaStar Mortgage Funding Trust, Ser 2004-4, Cl M5 | | | | | | | | |
1.875%, VAR ICE LIBOR USD 1
Month+1.725%, 03/25/2035 | | | 1,069 | | | | 1,076 | |
Option One Mortgage Loan Trust, Ser 2003-4, Cl A1 | | | | | | | | |
0.790%, VAR ICE LIBOR USD 1
Month+0.640%, 07/25/2033 | | | – | | | | – | |
Structured Asset Securities Mortgage Loan Trust, Ser 2005-NC2, Cl M4 | | | | | | | | |
0.855%, VAR ICE LIBOR USD 1
Month+0.705%, 05/25/2035 | | | 1,251 | | | | 1,245 | |
| | | | | | | | |
| | | | | | | 26,075 | |
| | | | | | | | |
|
Other Asset-Backed Securities — 18.6% | |
| | |
321 Henderson Receivables I LLC, Ser 2007-1A, Cl A1 | | | | | | | | |
0.341%, VAR ICE LIBOR USD 1
Month+0.200%, 03/15/2042 (B) | | | 1,839 | | | | 1,747 | |
ACIS CLO, Ser 2017-7A, Cl B | | | | | | | | |
1.964%, VAR ICE LIBOR USD 3
Month+1.750%, 05/01/2027 (B) | | | 1,500 | | | | 1,494 | |
Affirm Asset Securitization Trust, Ser 2020-Z1, Cl A | | | | | | | | |
3.460%, 10/15/2024 (B) | | | 106 | | | | 108 | |
Affirm Asset Securitization Trust, Ser 2020-Z2, Cl A | | | | | | | | |
1.900%, 01/15/2025 (B) | | | 275 | | | | 276 | |
Ajax Mortgage Loan Trust, Ser 2017-B, Cl A | | | | | | | | |
3.163%, 09/25/2056 (A)(B) | | | 370 | | | | 370 | |
Allegro CLO I, Ser 2017-1A, Cl A2R | | | | | | | | |
1.864%, VAR ICE LIBOR USD 3
Month+1.650%, 01/30/2026 (B) | | | 240 | | | | 240 | |
| | |
80 | | SEI Institutional Investments Trust / Semi-Annual Report / November 30, 2020 |
| | | | | | | | |
| | | |
| Description | | Face Amount
(Thousands) | | Market Value
($ Thousands) |
|
ASSET-BACKED SECURITIES (continued) | |
Ameriquest Mortgage Securities Pass-Through Certificates, Ser 2004-R2, Cl A1A | | | | | | | | |
0.840%, VAR ICE LIBOR USD 1 Month+0.690%, 04/25/2034 | | $ | 359 | | | $ | 359 | |
AMMC CLO, Ser 2017-16A, Cl CR | | | | | | | | |
2.579%, VAR ICE LIBOR USD 3 Month+2.350%, 04/14/2029 (B) | | | 1,000 | | | | 991 | |
Apidos CLO XII, Ser 2018-12A, Cl AR | | | | | | | | |
1.317%, VAR ICE LIBOR USD 3 Month+1.080%, 04/15/2031 (B) | | | 725 | | | | 718 | |
Ares XLIII CLO, Ser 2017-43A, Cl D | | | | | | | | |
3.977%, VAR ICE LIBOR USD 3 Month+3.740%, 10/15/2029 (B) | | | 700 | | | | 682 | |
Avant Loans Funding Trust, Ser 2019-B, Cl A | | | | | | | | |
2.720%, 10/15/2026 (B) | | | 96 | | | | 97 | |
Avery Point IV CLO, Ser 2014-1A, Cl D | | | | | | | | |
3.715%, VAR ICE LIBOR USD 3 Month+3.500%, 04/25/2026 (B) | | | 800 | | | | 793 | |
Avery Point IV CLO, Ser 2017-1A, Cl AR | | | | | | | | |
1.315%, VAR ICE LIBOR USD 3 Month+1.100%, 04/25/2026 (B) | | | 65 | | | | 65 | |
Avery Point IV CLO, Ser 2017-1A, Cl CR | | | | | | | | |
2.565%, VAR ICE LIBOR USD 3 Month+2.350%, 04/25/2026 (B) | | | 2,000 | | | | 1,992 | |
Bayview Opportunity Master Fund IVa Trust, Ser 2017-RT1, Cl A1 | | | | | | | | |
3.000%, 03/28/2057 (A)(B) | | | 1,585 | | | | 1,612 | |
Bayview Opportunity Master Fund IVb Trust, Ser 2017-RT6, Cl A | | | | | | | | |
3.500%, 10/28/2057 (A)(B) | | | 529 | | | | 543 | |
Bear Stearns Asset Backed Securities Trust, Ser 2005-SD2, Cl 2M2 | | | | | | | | |
1.650%, VAR ICE LIBOR USD 1 Month+1.500%, 12/25/2044 | | | 1,986 | | | | 1,976 | |
Black Diamond CLO, Ser 2017-1A, Cl A1A | | | | | | | | |
1.505%, VAR ICE LIBOR USD 3 Month+1.290%, 04/24/2029 (B) | | | 2,000 | | | | 1,988 | |
BlueMountain CLO, Ser 2017-2A, Cl A1R | | | | | | | | |
1.396%, VAR ICE LIBOR USD 3 Month+1.180%, 10/22/2030 (B) | | | 913 | | | | 908 | |
BlueMountain CLO, Ser 2018-2A, Cl A | | | | | | | | |
1.331%, VAR ICE LIBOR USD 3 Month+1.110%, 08/15/2031 (B) | | | 3,455 | | | | 3,428 | |
Bravo Mortgage Asset Trust, Ser 2006-1A, Cl A2 | | | | | | | | |
0.390%, VAR ICE LIBOR USD 1 Month+0.240%, 07/25/2036 (B) | | | 216 | | | | 215 | |
Brazos Student Finance, Ser 2010-1, Cl A1 | | | | | | | | |
1.125%, VAR ICE LIBOR USD 3 Month+0.900%, 06/25/2035 | | | 1,342 | | | | 1,334 | |
BRE Grand Islander Timeshare Issuer LLC, Ser 2019-A, Cl A | | | | | | | | |
3.280%, 09/26/2033 (B) | | | 1,369 | | | | 1,419 | |
| | | | | | | | |
| | | |
| Description | | Face Amount
(Thousands) | | Market Value
($ Thousands) |
|
ASSET-BACKED SECURITIES (continued) | |
Carlyle Global Market Strategies CLO, Ser 2018-1A, Cl A1R2 | | | | | | | | |
1.188%, VAR ICE LIBOR USD 3 Month+0.970%, 04/17/2031 (B) | | $ | 648 | | | $ | 641 | |
Cent CLO XXIV, Ser 2018-24A, Cl A2R | | | | | | | | |
1.887%, VAR ICE LIBOR USD 3 Month+1.650%, 10/15/2026 (B) | | | 1,000 | | | | 991 | |
CIFC Funding, Ser 2017-5A, Cl A1 | | | | | | | | |
1.398%, VAR ICE LIBOR USD 3 Month+1.180%, 11/16/2030 (B) | | | 1,717 | | | | 1,708 | |
CIT Mortgage Loan Trust, Ser 2007-1, Cl 1A | | | | | | | | |
1.500%, VAR ICE LIBOR USD 1 Month+1.350%, 10/25/2037 (B) | | | – | | | | – | |
Citigroup Mortgage Loan Trust, Ser 2007-WFH4, Cl A2C | | | | | | | | |
1.450%, VAR ICE LIBOR USD 1 Month+1.300%, 07/25/2037 | | | 519 | | | | 517 | |
CNH Equipment Trust, Ser 2019-B, Cl A2 | | | | | | | | |
2.550%, 09/15/2022 | | | 359 | | | | 360 | |
CNH Equipment Trust, Ser 2020-A, Cl A2 | | | | | | | | |
1.080%, 07/17/2023 | | | 135 | | | | 135 | |
Cole Park CLO, Ser 2018-1A, Cl AR | | | | | | | | |
1.268%, VAR ICE LIBOR USD 3 Month+1.050%, 10/20/2028 (B) | | | 700 | | | | 699 | |
Columbia Cent CLO, Ser 2018-27A, Cl A1 | | | | | | | | |
1.365%, VAR ICE LIBOR USD 3 Month+1.150%, 10/25/2028 (B) | | | 600 | | | | 597 | |
Conn’s Receivables Funding LLC, Ser 2020-A,Cl A | | | | | | | | |
1.710%, 06/16/2025 (B) | | | 337 | | | | 338 | |
Consumer Loan Underlying Bond CLUB Credit Trust, Ser 2020-P1, Cl A | | | | | | | | |
2.260%, 03/15/2028 (B) | | | 252 | | | | 254 | |
CoreVest American Finance Trust, Ser 2018-1, Cl A | | | | | | | | |
3.804%, 06/15/2051 (B) | | | 2,295 | | | | 2,400 | |
Credit-Based Asset Servicing & Securitization LLC, Ser 2005-CB7, Cl M1 | | | | | | | | |
0.765%, VAR ICE LIBOR USD 1 Month+0.615%, 11/25/2035 | | | 1,601 | | | | 1,595 | |
CWABS Revolving Home Equity Loan Trust, Ser 2004-I, Cl A | | | | | | | | |
0.431%, VAR ICE LIBOR USD 1 Month+0.290%, 02/15/2034 | | | 1,693 | | | | 1,680 | |
CWHEQ Revolving Home Equity Loan Resecuritization Trust, Ser 2006-RES, Cl 4L1A | | | | | | | | |
0.421%, VAR ICE LIBOR USD 1 Month+0.280%, 02/15/2034 (B) | | | 731 | | | | 721 | |
CWHEQ Revolving Home Equity Loan Trust,Ser 2006-I, Cl 2A | | | | | | | | |
0.281%, VAR ICE LIBOR USD 1 Month+0.140%, 01/15/2037 | | | 1,366 | | | | 1,304 | |
| | |
SEI Institutional Investments Trust / Semi-Annual Report / November 30, 2020 | | 81 |
SCHEDULE OF INVESTMENTS (Unaudited)
November 30, 2020
Opportunistic Income Fund (Continued)
| | | | | | | | |
| | | |
| Description | | Face Amount
(Thousands) | | Market Value ($ Thousands) |
|
ASSET-BACKED SECURITIES (continued) | |
DB Master Finance LLC, Ser 2019-1A, Cl A2I | | | | | | | | |
3.787%, 05/20/2049 (B) | | $ | 119 | | | $ | 122 | |
Dell Equipment Finance Trust, Ser 2018-2, Cl A3 | | | | | | | | |
3.370%, 10/22/2023 (B) | | | 627 | | | | 632 | |
Denali Capital CLO XI, Ser 2018-1A, Cl A2RR | | | | | | | | |
1.868%, VAR ICE LIBOR USD 3 Month+1.650%, 10/20/2028 (B) | | | 1,000 | | | | 976 | |
Domino’s Pizza Master Issuer LLC, Ser 2017-1A, Cl A2I | | | | | | | | |
1.465%, VAR ICE LIBOR USD 3 Month+1.250%, 07/25/2047 (B) | | | 3,880 | | | | 3,886 | |
ECMC Group Student Loan Trust, Ser 2020-3A, Cl A1B | | | | | | | | |
1.174%, VAR ICE LIBOR USD 1 Month+1.000%, 01/27/2070 (B) | | | 1,000 | | | | 1,003 | |
Education Loan Asset-Backed Trust I, Ser 2013-1, Cl A1 | | | | | | | | |
0.950%, VAR ICE LIBOR USD 1 Month+0.800%, 06/25/2026 (B) | | | 6 | | | | 6 | |
Educational Funding of the South, Ser 2011-1, Cl A2 | | | | | | | | |
0.865%, VAR ICE LIBOR USD 3 Month+0.650%, 04/25/2035 | | | 229 | | | | 228 | |
Elara HGV Timeshare Issuer, Ser 2017-A, Cl A | | | | | | | | |
2.690%, 03/25/2030 (B) | | | 751 | | | | 771 | |
Encore Credit Receivables Trust, Ser 2005-3, Cl M3 | | | | | | | | |
0.915%, VAR ICE LIBOR USD 1 Month+0.765%, 10/25/2035 | | | 1,432 | | | | 1,430 | |
First Franklin Mortgage Loan Trust, Ser 2006-FFA, Cl A3 | | | | | | | | |
0.390%, VAR ICE LIBOR USD 1 Month+0.240%, 09/25/2026 | | | 7 | | | | 7 | |
FirstKey Homes Trust, Ser 2020-SFR1, Cl A | | | | | | | | |
1.339%, 09/17/2025 (B) | | | 689 | | | | 694 | |
FirstKey Homes Trust, Ser 2020-SFR2, Cl A | | | | | | | | |
1.266%, 10/19/2037 (B) | | | 614 | | | | 615 | |
Gallatin CLO VIII, Ser 2017-1A, Cl B | | | | | | | | |
1.887%, VAR ICE LIBOR USD 3 Month+1.650%, 07/15/2027 (B) | | | 1,500 | | | | 1,479 | |
Great American Auto Leasing, Ser 2019-1, Cl A2 | | | | | | | | |
2.970%, 06/15/2021 (B) | | | 20 | | | | 20 | |
GreatAmerica Leasing Receivables Funding LLC, Ser 2020-1, Cl A2 | | | | | | | | |
1.760%, 06/15/2022 (B) | | | 369 | | | | 372 | |
Greenpoint Manufactured Housing, Ser 1999-5, Cl M1A | | | | | | | | |
8.300%, 10/15/2026 (A) | | | 295 | | | | 303 | |
| | | | | | | | |
| | | |
| Description | | Face Amount
(Thousands) | | Market Value
($ Thousands) |
|
ASSET-BACKED SECURITIES (continued) | |
Greenpoint Manufactured Housing, Ser 2000-4, Cl A3 | | | | | | | | |
2.146%, VAR ICE LIBOR USD 1 Month+2.000%, 08/21/2031 | | $ | 2,000 | | | $ | 1,936 | |
Greenwood Park CLO Ltd., Ser 2018-1A, Cl A2 | | | | | | | | |
1.247%, VAR ICE LIBOR USD 3 Month+1.010%, 04/15/2031 (B) | | | 1,367 | | | | 1,352 | |
GSAMP Trust, Ser 2005-HE6, Cl M1 | | | | | | | | |
0.810%, VAR ICE LIBOR USD 1 Month+0.660%, 11/25/2035 | | | 36 | | | | 36 | |
GSAMP Trust, Ser 2005-SEA2, Cl B1 | | | | | | | | |
2.025%, VAR ICE LIBOR USD 1 Month+1.875%, 01/25/2045 (B) | | | 1,442 | | | | 1,444 | |
Home Partners of America Trust, Ser 2017-1, Cl A | | | | | | | | |
0.953%, VAR ICE LIBOR USD 1 Month+0.817%, 07/17/2034 (B) | | | 3,823 | | | | 3,810 | |
Home Partners of America Trust, Ser 2017-1, Cl B | | | | | | | | |
1.486%, VAR ICE LIBOR USD 1 Month+1.350%, 07/17/2034 (B) | | | 2,250 | | | | 2,247 | |
Home Partners of America Trust, Ser 2018-1, Cl A | | | | | | | | |
1.037%, VAR ICE LIBOR USD 1 Month+0.900%, 07/17/2037 (B) | | | 1,511 | | | | 1,514 | |
HPEFS Equipment Trust, Ser 2019-1A, Cl A2 | | | | | | | | |
2.190%, 09/20/2029 (B) | | | 76 | | | | 77 | |
HPEFS Equipment Trust, Ser 2020-1A, Cl A2 | | | | | | | | |
1.730%, 02/20/2030 (B) | | | 189 | | | | 191 | |
HPEFS Equipment Trust, Ser 2020-2A, Cl A2 | | | | | | | | |
0.650%, 07/22/2030 (B) | | | 825 | | | | 827 | |
Invitation Homes Trust, Ser 2017-SFR2, Cl A | | | | | | | | |
0.986%, VAR ICE LIBOR USD 1 Month+0.850%, 12/17/2036 (B) | | | 1,214 | | | | 1,215 | |
Invitation Homes Trust, Ser 2017-SFR2, Cl B | | | | | | | | |
1.286%, VAR ICE LIBOR USD 1 Month+1.150%, 12/17/2036 (B) | | | 1,000 | | | | 998 | |
Invitation Homes Trust, Ser 2018-SFR1, Cl A | | | | | | | | |
0.836%, VAR ICE LIBOR USD 1 Month+0.700%, 03/17/2037 (B) | | | 1,753 | | | | 1,738 | |
Invitation Homes Trust, Ser 2018-SFR1, Cl C | | | | | | | | |
1.386%, VAR ICE LIBOR USD 1 Month+1.250%, 03/17/2037 (B) | | | 2,000 | | | | 2,008 | |
Invitation Homes Trust, Ser 2018-SFR3, Cl A | | | | | | | | |
1.136%, VAR ICE LIBOR USD 1 Month+1.000%, 07/17/2037 (B) | | | 2,005 | | | | 2,008 | |
Invitation Homes Trust, Ser 2018-SFR3, Cl C | | | | | | | | |
1.436%, VAR ICE LIBOR USD 1 Month+1.300%, 07/17/2037 (B) | | | 2,000 | | | | 1,995 | |
Invitation Homes Trust, Ser 2018-SFR4, Cl A | | | | | | | | |
1.236%, VAR ICE LIBOR USD 1 Month+1.100%, 01/17/2038 (B) | | | 692 | | | | 697 | |
| | |
82 | | SEI Institutional Investments Trust / Semi-Annual Report / November 30, 2020 |
| | | | | | | | |
| | | |
| Description | | Face Amount
(Thousands) | | Market Value
($ Thousands) |
|
ASSET-BACKED SECURITIES (continued) | |
Iowa State Student Loan Liquidity, Ser 2011-1, Cl A | | | | | | | | |
1.475%, VAR ICE LIBOR USD 3 Month+1.250%, 06/25/2042 | | $ | 363 | | | $ | 364 | |
Kentucky Higher Education Student Loan, Ser 2020-1, Cl A1B | | | | | | | | |
1.223%, VAR ICE LIBOR USD 1 Month+1.050%, 11/25/2050 | | | 2,000 | | | | 2,003 | |
Keycorp Student Loan Trust, Ser 2000-B, Cl A2 | | | | | | | | |
0.525%, VAR ICE LIBOR USD 3 Month+0.310%, 07/25/2029 | | | 1,080 | | | | 1,069 | |
KKR CLO, Ser 2018-21, Cl A | | | | | | | | |
1.237%, VAR ICE LIBOR USD 3 Month+1.000%, 04/15/2031 (B) | | | 580 | | | | 574 | |
Kubota Credit Owner Trust, Ser 2020-2A, Cl A2 | | | | | | | | |
0.410%, 06/15/2023 (B) | | | 160 | | | | 160 | |
LCM XXV, Ser 2017-25A, Cl A | | | | | | | | |
1.428%, VAR ICE LIBOR USD 3 Month+1.210%, 07/20/2030 (B) | | | 3,828 | | | | 3,806 | |
Long Beach Mortgage Loan Trust, Ser 2004-1, Cl M1 | | | | | | | | |
0.900%, VAR ICE LIBOR USD 1 Month+0.750%, 02/25/2034 | | | 760 | | | | 743 | |
Long Beach Mortgage Loan Trust, Ser 2004-1, Cl M2 | | | | | | | | |
0.975%, VAR ICE LIBOR USD 1 Month+0.825%, 02/25/2034 | | | 2,331 | | | | 2,326 | |
Madison Park Funding XII, Ser 2017-12A, Cl AR | | | | | | | | |
1.478%, VAR ICE LIBOR USD 3 Month+1.260%, 07/20/2026 (B) | | | 25 | | | | 25 | |
Madison Park Funding XV, Ser 2017-15A, Cl A2R | | | | | | | | |
1.717%, VAR ICE LIBOR USD 3 Month+1.500%, 01/27/2026 (B) | | | 550 | | | | 547 | |
Madison Park Funding XXX, Ser 2018-30A, Cl A | | | | | | | | |
0.987%, VAR ICE LIBOR USD 3 Month+0.750%, 04/15/2029 (B) | | | 1,000 | | | | 990 | |
Magnetite VIII, Ser 2018-8A, Cl AR2 | | | | | | | | |
1.217%, VAR ICE LIBOR USD 3 Month+0.980%, 04/15/2031 (B) | | | 780 | | | | 773 | |
Marlette Funding Trust, Ser 2018-4A, Cl A | | | | | | | | |
3.710%, 12/15/2028 (B) | | | 24 | | | | 24 | |
Marlette Funding Trust, Ser 2019-1A, Cl A | | | | | | | | |
3.440%, 04/16/2029 (B) | | | 80 | | | | 81 | |
Marlette Funding Trust, Ser 2019-2A, Cl A | | | | | | | | |
3.130%, 07/16/2029 (B) | | | 123 | | | | 124 | |
Marlette Funding Trust, Ser 2020-1A, Cl A | | | | | | | | |
2.240%, 03/15/2030 (B) | | | 63 | | | | 63 | |
| | | | | | | | |
| | | |
| Description | | Face Amount
(Thousands) | | Market Value
($ Thousands) |
|
ASSET-BACKED SECURITIES (continued) | |
Marlette Funding Trust, Ser 2020-2A, Cl A | | | | | | | | |
1.020%, 09/16/2030 (B) | | $ | 153 | | | $ | 154 | |
MetLife Securitization Trust, Ser 2017-1A, Cl A | | | | | | | | |
3.000%, 04/25/2055 (A)(B) | | | 269 | | | | 283 | |
MFA Trust, Ser 2020-NQM1, Cl A1 | | | | | | | | |
1.479%, 03/25/2065 | | | 1,949 | | | | 1,960 | |
Michigan Finance Authority, Ser 2015-1, Cl A1 | | | | | | | | |
0.897%, VAR ICE LIBOR USD 1 Month+0.750%, 04/29/2030 | | | 2,089 | | | | 2,075 | |
Mid-State Capital Trust, Ser 2004-1, Cl M1 | | | | | | | | |
6.497%, 08/15/2037 | | | 539 | | | | 576 | |
Mill City Mortgage Loan Trust, Ser 2017-3, Cl A1 | | | | | | | | |
2.750%, 01/25/2061 (A)(B) | | | 358 | | | | 368 | |
MMAF Equipment Finance LLC, Ser 2019-B, Cl A2 | | | | | | | | |
2.070%, 10/12/2022 (B) | | | 135 | | | | 136 | |
MMAF Equipment Finance LLC, Ser 2020-BA, Cl A2 | | | | | | | | |
0.380%, 08/14/2023 (B) | | | 115 | | | | 115 | |
MP CLO VIII, Ser 2018-2A, Cl BR | | | | | | | | |
1.642%, VAR ICE LIBOR USD 3 Month+1.420%, 10/28/2027 (B) | | | 2,000 | | | | 1,976 | |
MVW Owner Trust, Ser 2014-1A, Cl A | | | | | | | | |
2.250%, 09/22/2031 (B) | | | 778 | | | | 780 | |
MVW Owner Trust, Ser 2015-1A, Cl A | | | | | | | | |
2.520%, 12/20/2032 (B) | | | 1,116 | | | | 1,123 | |
Nationstar HECM Loan Trust, Ser 2019-2A, Cl A | | | | | | | | |
2.272%, 11/26/2029 (A)(B) | | | 81 | | | | 81 | |
Navient Private Education Refi Loan Trust, Ser 2020-EA, Cl A | | | | | | | | |
1.690%, 05/15/2069 (B) | | | 3,036 | | | | 3,082 | |
Navient Private Education Refi Loan Trust, Ser 2020-FA, Cl A | | | | | | | | |
1.220%, 07/15/2069 (B) | | | 664 | | | | 668 | |
Navient Private Education Refi Loan Trust, Ser 2020-GA, Cl A | | | | | | | | |
1.170%, 09/16/2069 (B) | | | 1,199 | | | | 1,205 | |
Navient Private Education Refi Loan Trust, Ser 2020-HA, Cl A | | | | | | | | |
1.310%, 01/15/2069 (B) | | | 2,000 | | | | 2,016 | |
Nelnet Student Loan Trust, Ser 2007-1, Cl B1 | | | | | | | | |
0.357%, VAR ICE LIBOR USD 3 Month+0.150%, 08/25/2037 | | | 51 | | | | 51 | |
New Hampshire Higher Education Loan, Ser 2020-1, Cl A1B | | | | | | | | |
1.380%, VAR ICE LIBOR USD 1 Month+1.200%, 09/25/2060 | | | 1,200 | | | | 1,213 | |
New Residential Mortgage LLC, Ser 2018-FNT1, Cl B | | | | | | | | |
3.910%, 05/25/2023 (B) | | | 1,340 | | | | 1,335 | |
| | |
SEI Institutional Investments Trust / Semi-Annual Report / November 30, 2020 | | 83 |
SCHEDULE OF INVESTMENTS (Unaudited)
November 30, 2020
Opportunistic Income Fund (Continued)
| | | | | | | | |
| | | |
| Description | | Face Amount
(Thousands) | | Market Value
($ Thousands) |
|
ASSET-BACKED SECURITIES (continued) | |
New Residential Mortgage LLC, Ser 2018-FNT2, Cl A | | | | | | | | |
3.790%, 07/25/2054 (B) | | $ | 1,661 | | | $ | 1,649 | |
NRZ Excess Spread-Collateralized Notes,Ser 2018-PLS1, Cl A | | | | | | | | |
3.193%, 01/25/2023 (B) | | | 2,000 | | | | 2,004 | |
NRZ Excess Spread-Collateralized Notes, Ser 2018-PLS2, Cl A | | | | | | | | |
3.265%, 02/25/2023 (B) | | | 1,559 | | | | 1,560 | |
OCP CLO, Ser 2017-10A, Cl BR | | | | | | | | |
2.065%, VAR ICE LIBOR USD 3 Month+1.850%, 10/26/2027 (B) | | | 2,000 | | | | 1,966 | |
OCP CLO, Ser 2017-8A, Cl A1R | | | | | | | | |
1.068%, VAR ICE LIBOR USD 3 Month+0.850%, 04/17/2027 (B) | | | 225 | | | | 224 | |
OneMain Financial Issuance Trust, Ser 2019-2A, Cl A | | | | | | | | |
3.140%, 10/14/2036 (B) | | | 1,117 | | | | 1,208 | |
OneMain Financial Issuance Trust, Ser 2020-1A, Cl A | | | | | | | | |
3.840%, 05/14/2032 (B) | | | 500 | | | | 528 | |
OneMain Financial Issuance Trust, Ser 2020-2A, Cl A | | | | | | | | |
1.750%, 09/14/2035 (B) | | | 1,253 | | | | 1,272 | |
Oxford Finance Funding LLC, Ser 2020-1A, Cl A2 | | | | | | | | |
3.101%, 02/15/2028 (B) | | | 1,500 | | | | 1,530 | |
OZLM XII, Ser 2018-12A, Cl A1R | | | | | | | | |
1.264%, VAR ICE LIBOR USD 3 Month+1.050%, 04/30/2027 (B) | | | 424 | | | | 423 | |
Palmer Square Loan Funding, Ser 2018-4A, Cl A1 | | | | | | | | |
1.121%, VAR ICE LIBOR USD 3 Month+0.900%, 11/15/2026 (B) | | | 1,072 | | | | 1,067 | |
PFS Financing, Ser 2020-B, Cl A | | | | | | | | |
1.210%, 06/15/2024 (B) | | | 190 | | | | 192 | |
PFS Financing, Ser 2020-G, Cl A | | | | | | | | |
0.970%, 02/15/2026 (B) | | | 1,057 | | | | 1,060 | |
Recette CLO, Ser 2017-1A, Cl DR | | | | | | | | |
2.968%, VAR ICE LIBOR USD 3 Month+2.750%, 10/20/2027 (B) | | | 1,000 | | | | 1,000 | |
SACO I Trust, Ser 2005-GP1, Cl A1 | | | | | | | | |
0.510%, VAR ICE LIBOR USD 1 Month+0.360%, 08/25/2030 | | | 122 | | | | 121 | |
SACO I Trust, Ser 2005-WM3, Cl A1 | | | | | | | | |
0.670%, VAR ICE LIBOR USD 1 Month+0.520%, 09/25/2035 | | | 113 | | | | 113 | |
SACO I Trust, Ser 2006-6, Cl A | | | | | | | | |
0.410%, VAR ICE LIBOR USD 1 Month+0.260%, 06/25/2036 | | | 377 | | | | 371 | |
| | | | | | | | |
| | | |
| Description | | Face Amount
(Thousands) | | Market Value
($ Thousands) |
|
ASSET-BACKED SECURITIES (continued) | |
Saxon Asset Securities Trust, Ser 2006-2, Cl A3C | | | | | | | | |
0.300%, VAR ICE LIBOR USD 1 Month+0.150%, 09/25/2036 | | $ | 432 | | | $ | 430 | |
SCF Equipment Leasing LLC, Ser 2020-1A, Cl A2 | | | | | | | | |
0.680%, 10/20/2025 (B) | | | 320 | | | | 320 | |
Shackleton CLO, Ser 2015-8A, Cl A1R | | | | | | | | |
1.138%, VAR ICE LIBOR USD 3 Month+0.920%, 10/20/2027 (B) | | | 901 | | | | 896 | |
SMB Private Education Loan Trust, Ser 2020-PTB, Cl A2B | | | | | | | | |
1.000%, VAR ICE LIBOR USD 1 Month+0.850%, 09/15/2054 (B) | | | 2,500 | | | | 2,472 | |
SoFi Consumer Loan Program Trust, Ser 2019-1, Cl A | | | | | | | | |
3.240%, 02/25/2028 (B) | | | 77 | | | | 78 | |
SoFi Consumer Loan Program Trust, Ser 2019-3, Cl A | | | | | | | | |
2.900%, 05/25/2028 (B) | | | 192 | | | | 194 | |
SoFi Consumer Loan Program Trust, Ser 2019-4, Cl A | | | | | | | | |
2.450%, 08/25/2028 (B) | | | 208 | | | | 210 | |
SoFi Consumer Loan Program Trust, Ser 2020-1, Cl A | | | | | | | | |
2.020%, 01/25/2029 (B) | | | 163 | | | | 165 | |
SoFi Professional Loan Program Trust, Ser 2020-C, Cl AFX | | | | | | | | |
1.950%, 02/15/2046 (B) | | | 446 | | | | 456 | |
Sonic Capital LLC, Ser 2018-1A, Cl A2 | | | | | | | | |
4.026%, 02/20/2048 (B) | | | 417 | | | | 432 | |
SpringCastle America Funding LLC, Ser 2020-AA, Cl A | | | | | | | | |
1.970%, 09/25/2037 (B) | | | 3,079 | | | | 3,100 | |
Starwood Waypoint Homes Trust, Ser 2017-1, Cl A | | | | | | | | |
1.091%, VAR ICE LIBOR USD 1 Month+0.950%, 01/17/2035 (B) | | | 2,386 | | | | 2,384 | |
Structured Asset Investment Loan Trust, Ser 2003-BC11, Cl A3 | | | | | | | | |
1.100%, VAR ICE LIBOR USD 1 Month+0.950%, 10/25/2033 | | | 2,865 | | | | 2,820 | |
Structured Asset Investment Loan Trust, Ser 2003-BC12, Cl 2A | | | | | | | | |
0.870%, VAR ICE LIBOR USD 1 Month+0.720%, 11/25/2033 | | | 2,641 | | | | 2,577 | |
Structured Asset Investment Loan Trust,Ser 2004-8, Cl A8 | | | | | | | | |
1.150%, VAR ICE LIBOR USD 1 Month+1.000%, 09/25/2034 | | | 3,374 | | | | 3,351 | |
| | |
84 | | SEI Institutional Investments Trust / Semi-Annual Report / November 30, 2020 |
| | | | | | | | |
| | | |
| Description | | Face Amount
(Thousands) | | Market Value
($ Thousands) |
|
ASSET-BACKED SECURITIES (continued) | |
Structured Asset Investment Loan Trust, Ser 2004-BNC1, Cl A4 | | | | | | | | |
1.090%, VAR ICE LIBOR USD 1 Month+0.940%, 09/25/2034 | | $ | 1,077 | | | $ | 1,058 | |
Structured Asset Securities Mortgage Loan Trust, Ser 2007-BC3, Cl 2A3 | | | | | | | | |
0.330%, VAR ICE LIBOR USD 1 Month+0.180%, 05/25/2047 | | | 1,986 | | | | 1,915 | |
Symphony CLO XVIII, Ser 2016-18A, Cl B | | | | | | | | |
2.009%, VAR ICE LIBOR USD 3 Month+1.800%, 01/23/2028 (B) | | | 750 | | | | 745 | |
TAL Advantage VII LLC, Ser 2020-1A, Cl A | | | | | | | | |
2.050%, 09/20/2045 (B) | | | 3,460 | | | | 3,467 | |
TCI-Flatiron CLO, Ser 2017-1A, Cl B | | | | | | | | |
1.782%, VAR ICE LIBOR USD 3 Month+1.560%, 11/18/2030 (B) | | | 500 | | | | 492 | |
Telos CLO, Ser 2017-3A, Cl AR | | | | | | | | |
1.518%, VAR ICE LIBOR USD 3 Month+1.300%, 07/17/2026 (B) | | | 832 | | | | 831 | |
Textainer Marine Containers VIII, Ser 2020-2A, Cl A | | | | | | | | |
2.100%, 09/20/2045 (B) | | | 918 | | | | 920 | |
Textainer Marine Containers VIII, Ser 2020-3A, Cl A | | | | | | | | |
2.110%, 09/20/2045 (B) | | | 2,499 | | | | 2,496 | |
Thacher Park CLO, Ser 2017-1A, Cl AR | | | | | | | | |
1.378%, VAR ICE LIBOR USD 3 Month+1.160%, 10/20/2026 (B) | | | 407 | | | | 407 | |
Towd Point Mortgage Trust, Ser 2015-2, Cl 2A11 | | | | | | | | |
3.000%, 11/25/2057 (A)(B) | | | 103 | | | | 104 | |
Towd Point Mortgage Trust, Ser 2015-4, Cl A1B | | | | | | | | |
2.750%, 04/25/2055 (A)(B) | | | 22 | | | | 22 | |
Towd Point Mortgage Trust, Ser 2015-5, Cl A1B | | | | | | | | |
2.750%, 05/25/2055 (A)(B) | | | 35 | | | | 35 | |
Towd Point Mortgage Trust, Ser 2016-1, Cl A1B | | | | | | | | |
2.750%, 02/25/2055 (A)(B) | | | 31 | | | | 32 | |
Towd Point Mortgage Trust, Ser 2016-3, Cl A1 | | | | | | | | |
2.250%, 04/25/2056 (A)(B) | | | 108 | | | | 109 | |
Towd Point Mortgage Trust, Ser 2016-4, Cl A1 | | | | | | | | |
2.250%, 07/25/2056 (A)(B) | | | 225 | | | | 229 | |
Towd Point Mortgage Trust, Ser 2017-1, Cl A1 | | | | | | | | |
2.750%, 10/25/2056 (A)(B) | | | 403 | | | | 413 | |
Towd Point Mortgage Trust, Ser 2017-2, Cl A1 | | | | | | | | |
2.750%, 04/25/2057 (A)(B) | | | 333 | | | | 341 | |
Towd Point Mortgage Trust, Ser 2017-4, Cl A1 | | | | | | | | |
2.750%, 06/25/2057 (A)(B) | | | 1,519 | | | | 1,573 | |
Towd Point Mortgage Trust, Ser 2017-5, Cl A1 | | | | | | | | |
0.750%, VAR ICE LIBOR USD 1 Month+0.600%, 02/25/2057 (B) | | | 1,801 | | | | 1,789 | |
| | | | | | | | |
| | | |
| Description | | Face Amount
(Thousands) | | Market Value
($ Thousands) |
|
ASSET-BACKED SECURITIES (continued) | |
Towd Point Mortgage Trust, Ser 2017-6, Cl A1 | | | | | | | | |
2.750%, 10/25/2057 (A)(B) | | $ | 382 | | | $ | 393 | |
Towd Point Mortgage Trust, Ser 2018-3, Cl A1 | | | | | | | | |
3.750%, 05/25/2058 (A)(B) | | | 1,341 | | | | 1,432 | |
Towd Point Mortgage Trust, Ser 2019-HY1, Cl A1 | | | | | | | | |
1.150%, VAR ICE LIBOR USD 1 Month+1.000%, 10/25/2048 (B) | | | 1,115 | | | | 1,115 | |
Towd Point Mortgage Trust, Ser 2020-MH1, Cl A1 | | | | | | | | |
2.250%, 02/25/2060 (A)(B) | | | 2,615 | | | | 2,669 | |
Treman Park CLO, Ser 2018-1A, Cl ARR | | | | | | | | |
1.288%, VAR ICE LIBOR USD 3 Month+1.070%, 10/20/2028 (B) | | | 550 | | | | 549 | |
Trestles CLO, Ser 2017-1A, Cl A1A | | | | | | | | |
1.505%, VAR ICE LIBOR USD 3 Month+1.290%, 07/25/2029 (B) | | | 5,000 | | | | 4,994 | |
Tricon American Homes Trust, Ser 2020-SFR2, Cl A | | | | | | | | |
1.482%, 11/17/2039 (B) | | | 564 | | | | 565 | |
Tryon Park CLO, Ser 2018-1A, Cl A1SR | | | | | | | | |
1.127%, VAR ICE LIBOR USD 3 Month+0.890%, 04/15/2029 (B) | | | 270 | | | | 269 | |
Venture XX CLO, Ser 2017-20A, Cl CR | | | | | | | | |
2.137%, VAR ICE LIBOR USD 3 Month+1.900%, 04/15/2027 (B) | | | 750 | | | | 730 | |
Verizon Owner Trust, Ser 2020-A, Cl A1A | | | | | | | | |
1.850%, 07/22/2024 | | | 350 | | | | 359 | |
Verizon Owner Trust, Ser 2020-B, Cl A | | | | | | | | |
0.470%, 02/20/2025 | | | 225 | | | | 226 | |
Volvo Financial Equipment LLC, Ser 2020-1A,Cl A2 | | | | | | | | |
0.370%, 04/17/2023 (B) | | | 135 | | | | 135 | |
Voya CLO, Ser 2017-3A, Cl A1R | | | | | | | | |
0.935%, VAR ICE LIBOR USD 3 Month+0.720%, 07/25/2026 (B) | | | 501 | | | | 499 | |
Voya CLO, Ser 2018-3A, Cl A2R | | | | | | | | |
1.618%, VAR ICE LIBOR USD 3 Month+1.400%, 10/18/2031 (B) | | | 818 | | | | 812 | |
Voya CLO, Ser 2020-2A, Cl A1RR | | | | | | | | |
1.238%, VAR ICE LIBOR USD 3 Month+1.020%, 04/17/2030 (B) | | | 4,376 | | | | 4,328 | |
VSE VOI Mortgage, Ser 2017-A, Cl A | | | | | | | | |
2.330%, 03/20/2035 (B) | | | 1,109 | | | | 1,131 | |
Westgate Resorts LLC, Ser 2020-1A, Cl A | | | | | | | | |
2.713%, 03/20/2034 (B) | | | 1,799 | | | | 1,843 | |
| | | | | | | | |
| | | | | | | 182,001 | |
| | | | | | | | |
| | |
Total Asset-Backed Securities (Cost $251,461) ($ Thousands) | | | | | | | 252,503 | |
| | | | | | | | |
| | |
SEI Institutional Investments Trust / Semi-Annual Report / November 30, 2020 | | 85 |
SCHEDULE OF INVESTMENTS (Unaudited)
November 30, 2020
Opportunistic Income Fund (Continued)
| | | | | | | | |
| | | |
| Description | | Face Amount (Thousands) | | Market Value ($ Thousands) |
|
CORPORATE OBLIGATIONS — 5.7% | |
|
Communication Services — 0.2% | |
Arches Buyer | | | | | | | | |
4.250%, 06/01/2028 (B) | | $ | 291 | | | $ | 292 | |
Cinemark USA | | | | | | | | |
5.125%, 12/15/2022 | | | 580 | | | | 563 | |
Comcast | | | | | | | | |
0.665%, VAR ICE LIBOR USD 3 Month+0.440%, 10/01/2021 | | | 700 | | | | 702 | |
Diamond Sports Group LLC | | | | | | | | |
5.375%, 08/15/2026 (B) | | | 508 | | | | 394 | |
NBCUniversal Enterprise | | | | | | | | |
0.625%, VAR ICE LIBOR USD 3 Month+0.400%, 04/01/2021 (B) | | | 300 | | | | 300 | |
| | | | | | | | |
| | | | | | | 2,251 | |
| | | | | | | | |
|
Consumer Discretionary — 0.4% | |
American Honda Finance MTN | | | | | | | | |
0.329%, VAR ICE LIBOR USD 3 Month+0.120%, 01/21/2022 | | | 325 | | | | 325 | |
Ford Motor Credit LLC | | | | | | | | |
1.503%, VAR ICE LIBOR USD 3 Month+1.270%, 03/28/2022 | | | 500 | | | | 493 | |
Marriott International | | | | | | | | |
0.876%, VAR ICE LIBOR USD 3 Month+0.650%, 03/08/2021 | | | 350 | | | | 350 | |
0.846%, VAR ICE LIBOR USD 3 Month+0.600%, 12/01/2020 | | | 475 | | | | 475 | |
Nissan Motor Acceptance MTN | | | | | | | | |
1.114%, VAR ICE LIBOR USD 3 Month+0.890%, 01/13/2022 (B) | | | 800 | | | | 794 | |
Specialty Building Products Holdings LLC | | | | | | | | |
6.375%, 09/30/2026 (B) | | | 1,100 | | | | 1,144 | |
Volkswagen Group of America Finance LLC | | | | | | | | |
2.500%, 09/24/2021 (B) | | | 200 | | | | 203 | |
1.154%, VAR ICE LIBOR USD 3 Month+0.940%, 11/12/2021 (B) | | | 300 | | | | 302 | |
| | | | | | | | |
| | | | | | | 4,086 | |
| | | | | | | | |
|
Consumer Staples — 0.5% | |
Altria Group | | | | | | | | |
4.750%, 05/05/2021 | | | 525 | | | | 535 | |
Bausch Health | | | | | | | | |
5.000%, 02/15/2029 (B) | | | 585 | | | | 590 | |
GEMS MENASA Cayman | | | | | | | | |
7.125%, 07/31/2026 (B) | | | 587 | | | | 596 | |
Global Medical Response | | | | | | | | |
6.500%, 10/01/2025 (B) | | | 890 | | | | 917 | |
Howard University | | | | | | | | |
2.801%, 10/01/2023 | | | 240 | | | | 250 | |
2.638%, 10/01/2021 | | | 100 | | | | 101 | |
LifePoint Health | | | | | | | | |
5.375%, 01/15/2029 (B) | | | 306 | | | | 306 | |
| | | | | | | | |
| | | |
| Description | | Face Amount (Thousands) | | Market Value ($ Thousands) |
|
CORPORATE OBLIGATIONS (continued) | |
Sabre Global | | | | | | | | |
7.375%, 09/01/2025 (B) | | $ | 558 | | | $ | 601 | |
Skandinaviska Enskilda Banken | | | | | | | | |
0.550%, 09/01/2023 (B) | | | 200 | | | | 200 | |
Viatris | | | | | | | | |
1.125%, 06/22/2022 (B) | | | 250 | | | | 252 | |
| | | | | | | | |
| | | | | | | 4,348 | |
| | | | | | | | |
| | |
Energy — 0.1% | | | | | | | | |
Kinder Morgan Energy Partners | | | | | | | | |
3.500%, 03/01/2021 | | | 200 | | | | 201 | |
Occidental Petroleum | | | | | | | | |
1.163%, VAR ICE LIBOR USD 3 Month+0.950%, 02/08/2021 | | | 300 | | | | 298 | |
Phillips 66 | | | | | | | | |
0.833%, VAR ICE LIBOR USD 3 Month+0.600%, 02/26/2021 | | | 400 | | | | 400 | |
| | | | | | | | |
| | | | | | | 899 | |
| | | | | | | | |
|
Financials — 2.0% | |
ABN AMRO Bank MTN | | | | | | | | |
0.628%, VAR ICE LIBOR USD 3 Month+0.410%, 01/19/2021 (B) | | | 750 | | | | 750 | |
Assurant | | | | | | | | |
1.483%, VAR ICE LIBOR USD 3 Month+1.250%, 03/26/2021 | | | 97 | | | | 97 | |
Bank of Montreal MTN | | | | | | | | |
0.766%, VAR United States Secured Overnight Financing Rate+0.680%, 03/10/2023 | | | 350 | | | | 352 | |
BPCE MTN | | | | | | | | |
3.000%, 05/22/2022 (B) | | | 450 | | | | 467 | |
Canadian Imperial Bank of Commerce | | | | | | | | |
0.884%, VAR United States Secured Overnight Financing Rate+0.800%, 03/17/2023 | | | 300 | | | | 303 | |
Capital One Bank USA | | | | | | | | |
2.014%, VAR United States Secured Overnight Financing Rate+0.616%, 01/27/2023 | | | 300 | | | | 305 | |
Cooperatieve Rabobank UA | | | | | | | | |
1.054%, VAR ICE LIBOR USD 3 Month+0.830%, 01/10/2022 | | | 1,000 | | | | 1,008 | |
Credit Suisse Group Funding Guernsey | | | | | | | | |
3.125%, 12/10/2020 | | | 450 | | | | 450 | |
Credit Suisse NY | | | | | | | | |
0.550%, VAR United States Secured Overnight Financing Rate+0.450%, 02/04/2022 | | | 600 | | | | 601 | |
Danske Bank | | | | | | | | |
3.001%, VAR ICE LIBOR USD 3 Month+1.249%, 09/20/2022 (B) | | | 250 | | | | 254 | |
2.000%, 09/08/2021 (B) | | | 200 | | | | 203 | |
| | |
86 | | SEI Institutional Investments Trust /Semi-Annual Report /November 30, 2020 |
| | | | | | | | |
| | | |
| Description | | Face Amount (Thousands) | | Market Value ($ Thousands) |
|
CORPORATE OBLIGATIONS (continued) | |
Deutsche Bank NY | | | | | | | | |
4.250%, 02/04/2021 | | $ | 300 | | | $ | 302 | |
1.031%, VAR ICE LIBOR USD 3 Month+0.815%, 01/22/2021 | | | 550 | | | | 550 | |
Goldman Sachs Group | | | | | | | | |
1.325%, VAR ICE LIBOR USD 3 Month+1.110%, 04/26/2022 | | | 750 | | | | 753 | |
HSBC Holdings | | | | | | | | |
4.000%, 03/30/2022 | | | 200 | | | | 209 | |
ING Groep | | | | | | | | |
1.368%, VAR ICE LIBOR USD 3 Month+1.150%, 03/29/2022 | | | 700 | | | | 708 | |
Intercontinental Exchange | | | | | | | | |
0.903%, VAR ICE LIBOR USD 3 Month+0.650%, 06/15/2023 | | | 325 | | | | 326 | |
Marsh & McLennan | | | | | | | | |
3.500%, 12/29/2020 | | | 95 | | | | 95 | |
Metropolitan Life Global Funding I MTN | | | | | | | | |
0.653%, VAR United States Secured Overnight Financing Rate+0.570%, 01/13/2023 (B) | | | 350 | | | | 352 | |
Mizuho Financial Group | | | | | | | | |
0.837%, VAR ICE LIBOR USD 3 Month+0.630%, 05/25/2024 | | | 525 | | | | 526 | |
Morgan Stanley | | | | | | | | |
1.398%, VAR ICE LIBOR USD 3 Month+1.180%, 01/20/2022 | | | 625 | | | | 626 | |
Morgan Stanley MTN | | | | | | | | |
0.782%, VAR United States Secured Overnight Financing Rate+0.700%, 01/20/2023 | | | 400 | | | | 401 | |
National Australia Bank | | | | | | | | |
1.875%, 12/13/2022 | | | 250 | | | | 258 | |
National Bank of Canada | | | | | | | | |
0.900%, VAR US Treas Yield Curve Rate T Note Const Mat 1 Yr+0.770%, 08/15/2023 | | | 250 | | | | 252 | |
Nationwide Building Society | | | | | | | | |
2.000%, 01/27/2023 (B) | | | 200 | | | | 206 | |
NFP | | | | | | | | |
7.000%, 05/15/2025 (B) | | | 733 | | | | 784 | |
NMI Holdings | | | | | | | | |
7.375%, 06/01/2025 (B) | | | 266 | | | | 294 | |
Pacific Life Global Funding II | | | | | | | | |
0.500%, 09/23/2023 (B) | | | 185 | | | | 185 | |
PNC Bank | | | | | | | | |
0.530%, VAR ICE LIBOR USD 3 Month+0.325%, 02/24/2023 | | | 350 | | | | 351 | |
Royal Bank of Canada MTN | | | | | | | | |
0.532%, VAR United States Secured Overnight Financing Rate+0.450%, 10/26/2023 | | | 225 | | | | 225 | |
| | | | | | | | |
| | | |
| Description | | Face Amount (Thousands) | | Market Value ($ Thousands) |
|
CORPORATE OBLIGATIONS (continued) | |
Santander UK | | | | | | | | |
2.100%, 01/13/2023 | | $ | 200 | | | $ | 207 | |
Standard Chartered | | | | | | | | |
2.744%, VAR ICE LIBOR USD 3 Month+1.200%, 09/10/2022 (B) | | | 345 | | | | 350 | |
Toronto-Dominion Bank MTN | | | | | | | | |
0.562%, VAR United States Secured Overnight Financing Rate+0.480%, 01/27/2023 | | | 250 | | | | 251 | |
0.534%, VAR United States Secured Overnight Financing Rate+0.450%, 09/28/2023 | | | 250 | | | | 250 | |
UniCredit MTN | | | | | | | | |
6.572%, 01/14/2022 (B) | | | 350 | | | | 370 | |
United Shore Financial Services LLC | | | | | | | | |
5.500%, 11/15/2025 (B) | | | 515 | | | | 541 | |
Vista Point | | | | | | | | |
1.763%, 03/25/2065 | | | 2,595 | | | | 2,614 | |
Zions Bancorp | | | | | | | | |
3.350%, 03/04/2022 | | | 2,000 | | | | 2,062 | |
| | | | | | | | |
| | | | | | | 18,838 | |
| | | | | | | | |
|
Health Care — 0.3% | |
Bristol-Myers Squibb | | | | | | | | |
0.537%, 11/13/2023 | | | 250 | | | | 250 | |
Cigna | | | | | | | | |
0.896%, VAR ICE LIBOR USD 3 Month+0.650%, 09/17/2021 | | | 400 | | | | 400 | |
CVS Health | | | | | | | | |
0.962%, VAR ICE LIBOR USD 3 Month+0.720%, 03/09/2021 | | | 1,540 | | | | 1,543 | |
Gilead Sciences | | | | | | | | |
0.370%, VAR ICE LIBOR USD 3 Month+0.150%, 09/17/2021 | | | 325 | | | | 325 | |
Royalty Pharma | | | | | | | | |
0.750%, 09/02/2023 (B) | | | 200 | | | | 201 | |
Stryker | | | | | | | | |
0.600%, 12/01/2023 | | | 160 | | | | 160 | |
Syneos Health | | | | | | | | |
3.625%, 01/15/2029 (B) | | | 324 | | | | 327 | |
| | | | | | | | |
| | | | | | | 3,206 | |
| | | | | | | | |
|
Industrials — 1.3% | |
AerCap Ireland Capital DAC | | | | | | | | |
4.450%, 12/16/2021 | | | 2,000 | | | | 2,060 | |
AerCap Ireland Capital DAC / AerCap Global Aviation Trust | | | | | | | | |
4.500%, 05/15/2021 | | | 350 | | | | 355 | |
Ardagh Packaging Finance | | | | | | | | |
5.250%, 04/30/2025 (B) | | | 573 | | | | 604 | |
Boeing | | | | | | | | |
2.300%, 08/01/2021 | | | 210 | | | | 212 | |
| | |
SEI Institutional Investments Trust / Semi-Annual Report / November 30, 2020 | | 87 |
SCHEDULE OF INVESTMENTS (Unaudited)
November 30, 2020
Opportunistic Income Fund (Continued)
| | | | | | | | |
| | | |
| Description | | Face Amount (Thousands) | | Market Value ($ Thousands) |
|
CORPORATE OBLIGATIONS (continued) | |
Clark Equipment | | | | | | | | |
5.875%, 06/01/2025 (B) | | $ | 932 | | | $ | 982 | |
CP Atlas Buyer | | | | | | | | |
7.000%, 12/01/2028 (B) | | | 207 | | | | 214 | |
DAE Funding LLC | | | | | | | | |
5.250%, 11/15/2021 (B) | | | 325 | | | | 334 | |
General Electric MTN | | | | | | | | |
5.300%, 02/11/2021 | | | 200 | | | | 202 | |
GFL Environmental | | | | | | | | |
8.500%, 05/01/2027 (B) | | | 990 | | | | 1,094 | |
Honeywell International | | | | | | | | |
0.483%, 08/19/2022 | | | 325 | | | | 326 | |
Intelligent Packaging Finco | | | | | | | | |
6.000%, 09/15/2028 (B) | | | 1,714 | | | | 1,822 | |
L3Harris Technologies | | | | | | | | |
1.000%, VAR ICE LIBOR USD 3 Month+0.750%, 03/10/2023 | | | 350 | | | | 353 | |
Mileage Plus Holdings LLC | | | | | | | | |
6.500%, 06/20/2027 (B) | | | 776 | | | | 842 | |
Otis Worldwide | | | | | | | | |
0.684%, VAR ICE LIBOR USD 3 Month+0.450%, 04/05/2023 | | | 360 | | | | 360 | |
PowerTeam Services LLC | | | | | | | | |
9.033%, 12/04/2025 (B) | | | 700 | | | | 768 | |
Raytheon Technologies | | | | | | | | |
3.100%, 11/15/2021 (B) | | | 393 | | | | 400 | |
2.800%, 03/15/2022 (B) | | | 275 | | | | 283 | |
Roper Technologies | | | | | | | | |
0.450%, 08/15/2022 | | | 90 | | | | 90 | |
SRM Escrow Issuer LLC | | | | | | | | |
6.000%, 11/01/2028 (B) | | | 1,044 | | | | 1,083 | |
Vertical Holdco GmbH | | | | | | | | |
7.625%, 07/15/2028 (B) | | | 460 | | | | 493 | |
Vertical US Newco | | | | | | | | |
5.250%, 07/15/2027 (B) | | | 492 | | | | 516 | |
XPO Logistics | | | | | | | | |
6.250%, 05/01/2025 (B) | | | 380 | | | | 407 | |
| | | | | | | | |
| | | | | | | 13,800 | |
| | | | | | | | |
|
Information Technology — 0.3% | |
Avaya | | | | | | | | |
6.125%, 09/15/2028 (B) | | | 496 | | | | 523 | |
Diebold Nixdorf | | | | | | | | |
9.375%, 07/15/2025 (B) | | | 1,083 | | | | 1,188 | |
Hewlett Packard Enterprise | | | | | | | | |
0.954%, VAR ICE LIBOR USD 3 Month+0.720%, 10/05/2021 | | | 300 | | | | 300 | |
Microchip Technology | | | | | | | | |
3.922%, 06/01/2021 | | | 465 | | | | 473 | |
| | | | | | | | |
| | | |
| Description | | Face Amount (Thousands) | | Market Value ($ Thousands) |
|
CORPORATE OBLIGATIONS (continued) | |
Tempo Acquisition LLC | | | | | | | | |
5.750%, 06/01/2025 (B) | | $ | 441 | | | $ | 470 | |
| | | | | | | | |
| | | | | | | 2,954 | |
| | | | | | | | |
|
Materials — 0.2% | |
Chemours | | | | | | | | |
5.750%, 11/15/2028 (B) | | | 687 | | | | 698 | |
LYB International Finance III LLC | | | | | | | | |
1.230%, VAR ICE LIBOR USD 3 Month+1.000%, 10/01/2023 | | | 275 | | | | 275 | |
Nutrition & Biosciences | | | | | | | | |
0.697%, 09/15/2022 (B) | | | 105 | | | | 106 | |
Owens-Brockway Glass Container | | | | | | | | |
6.625%, 05/13/2027 (B) | | | 291 | | | | 315 | |
Venator Finance Sarl | | | | | | | | |
9.500%, 07/01/2025 (B) | | | 324 | | | | 355 | |
| | | | | | | | |
| | | | | | | 1,749 | |
| | | | | | | | |
|
Utilities — 0.4% | |
Dominion Energy | | | | | | | | |
2.450%, 01/15/2023 (B) | | | 250 | | | | 260 | |
0.776%, VAR ICE LIBOR USD 3 Month+0.530%, 09/15/2023 | | | 275 | | | | 275 | |
DTE Energy | | | | | | | | |
0.550%, 11/01/2022 | | | 275 | | | | 276 | |
Duke Energy Progress LLC | | | | | | | | |
0.400%, VAR ICE LIBOR USD 3 Month+0.180%, 02/18/2022 | | | 450 | | | | 450 | |
Edison International | | | | | | | | |
3.125%, 11/15/2022 | | | 2,000 | | | | 2,068 | |
NextEra Energy Capital Holdings | | | | | | | | |
3.300%, 08/15/2022 | | | 140 | | | | 147 | |
Southern Power | | | | | | | | |
0.777%, VAR ICE LIBOR USD 3 Month+0.550%, 12/20/2020 (B) | | | 375 | | | | 375 | |
| | | | | | | | |
| | | | | | | 3,851 | |
| | | | | | | | |
| | | | | | | | |
Total Corporate Obligations
(Cost $54,828) ($ Thousands) | | | | | | | 55,982 | |
| | | | | | | | |
| | | | | | | | |
|
COMMERCIAL PAPER — 1.4% | |
Australia & New Zealand | | | | | | | | |
0.110%, 12/11/2020 (F) | | | 12,000 | | | | 12,000 | |
Toronto-Dominion Bank | | | | | | | | |
0.110%, 12/03/2020 (F) | | | 1,500 | | | | 1,500 | |
| | | | | | | | |
| | |
Total Commercial Paper
(Cost $13,500) ($ Thousands) | | | | | | | 13,500 | |
| | | | | | | | |
| | |
88 | | SEI Institutional Investments Trust / Semi-Annual Report / November 30, 2020 |
| | | | | | | | |
| | | |
| Description | | Face Amount (Thousands) | | Market Value ($ Thousands) |
|
U.S. TREASURY OBLIGATIONS — 1.0% | |
U.S. Treasury Bills | | | | | | | | |
0.160%, 05/20/2021 (F) | | $ | 850 | | | $ | 850 | |
0.140%, 08/12/2021 (F) | | | 2,300 | | | | 2,298 | |
0.140%, 10/07/2021 (F) | | | 1,150 | | | | 1,149 | |
U.S. Treasury Notes | | | | | | | | |
2.875%, 11/15/2021 | | | 2,500 | | | | 2,566 | |
2.375%, 03/15/2022 | | | 1,000 | | | | 1,029 | |
2.000%, 05/31/2024 | | | 2,000 | | | | 2,123 | |
| | | | | | | | |
| | |
Total U.S. Treasury Obligations
(Cost $9,857) ($ Thousands) | | | | | | | 10,015 | |
| | | | | | | | |
|
MUNICIPAL BONDS — 0.2% | |
|
California — 0.1% | |
California State, GO Callable 10/01/2021 @ 100 | | | | | | | | |
0.933%, 04/01/2047 (G) | | | 925 | | | | 925 | |
California State, Infrastructure & Economic Development Bank, AMT, RB Callable 07/01/2021 @ 100 | | | | | | | | |
0.450%, 01/01/2050 (B)(G) | | | 300 | | | | 300 | |
University of California, Ser BF, RB | | | | | | | | |
0.455%, 05/15/2022 | | | 30 | | | | 30 | |
| | | | | | | | |
| | | | | | | 1,255 | |
| | | | | | | | |
|
Illinois — 0.0% | |
Chicago, Transit Authority, Ser B, RB | | | | | | | | |
1.838%, 12/01/2023 | | | 110 | | | | 111 | |
| | | | | | | | |
|
Nevada — 0.0% | |
Nevada State, Department of Business & Industry, AMT, RB Callable 07/01/2021 @ 100 | | | | | | | | |
0.500%, 01/01/2050 (B)(G) | | | 125 | | | | 125 | |
| | | | | | | | |
|
Ohio — 0.1% | |
Buckeye, Tobacco Settlement Financing Authority, RB | | | | | | | | |
1.850%, 06/01/2029 | | | 445 | | | | 450 | |
| | | | | | | | |
|
Texas — 0.0% | |
Central Texas, Turnpike System, Ser B, RB | | | | | | | | |
1.980%, 08/15/2042 (G) | | | 190 | | | | 192 | |
City of Houston, Texas Airport System Revenue, Sub-Ser C, RB | | | | | | | | |
0.883%, 07/01/2022 | | | 45 | | | | 45 | |
| | | | | | | | |
| | | | | | | 237 | |
| | | | | | | | |
| | |
Total Municipal Bonds
(Cost $2,170) ($ Thousands) | | | | | | | 2,178 | |
| | | | | | | | |
| | | | | | | | |
| | | |
| Description | | Face Amount (Thousands) | | Market Value ($ Thousands) |
|
U.S. GOVERNMENT AGENCY OBLIGATIONS — 0.1% | |
FFCB | | | | | | | | |
1.900%, 06/24/2021 | | $ | 470 | | | $ | 475 | |
0.530%, 01/18/2022 | | | 500 | | | | 502 | |
| | | | | | | | |
| | |
Total U.S. Government Agency Obligations
(Cost $974) ($ Thousands) | | | | | | | 977 | |
| | | | | | | | |
| | |
| | | Number of Warrants | | |
|
WARRANT — 0.0% | |
Lion Holdings, Expires 12/30/2027 | | | | | | | | |
Strike Price $– *(D)(H) | | | 29,715 | | | | – | |
| | | | | | | | |
| | |
Total Warrant
(Cost $—) ($ Thousands) | | | | | | | – | |
| | | | | | | | |
| | |
| | | Shares | | |
|
COMMON STOCK — 0.0% | |
TE Holdcorp *(D) | | | 102,547 | | | | – | |
| | | | | | | | |
| | |
Total Common Stock
(Cost $3,175) ($ Thousands) | | | | | | | – | |
| | | | | | | | |
|
PREFERRED STOCK — 0.0% | |
TE Holdcorp *(D)(I) | | | 179,484 | | | | – | |
| | | | | | | | |
| | |
Total Preferred Stock
(Cost $1,427) ($ Thousands) | | | | | | | – | |
| | | | | | | | |
|
CASH EQUIVALENT — 4.4% | |
SEI Daily Income Trust, Government Fund, Cl F | | | | | | | | |
0.010%**† | | | 43,348,443 | | | | 43,348 | |
| | | | | | | | |
| | |
Total Cash Equivalent
(Cost $43,348) ($ Thousands) | | | | | | | 43,348 | |
| | | | | | | | |
| | |
SEI Institutional Investments Trust / Semi-Annual Report / November 30, 2020 | | 89 |
SCHEDULE OF INVESTMENTS (Unaudited)
November 30, 2020
Opportunistic Income Fund (Concluded)
| | | | | | | | |
| | | |
| Description | | Face Amount (Thousands) | | Market Value ($ Thousands) |
|
REPURCHASE AGREEMENT — 0.7% | |
BNP Paribas | | | | | | | | |
0.090%, dated 11/30/20, to be repurchased on 12/01/20, repurchase price $6,900,017 (collateralized by U.S. Government Obligations, ranging in par value $32 - $4,961,207, 2.500% -5.000%, 5/01/2034 - 5/01/2050; total market value $7,038,000) (J) | | $ | 6,900 | | | $ | 6,900 | |
| | | | | | | | |
| | |
Total Repurchase Agreement
(Cost $6,900) ($ Thousands) | | | | | | | 6,900 | |
| | | | | | | | |
| | |
Total Investments in Securities — 104.4%
(Cost $1,033,075) ($ Thousands) | | | | | | $ | 1,025,646 | |
| | | | | | | | |
A list of the open future contracts held by the Fund at November 30, 2020, is as follows:
| | | | | | | | | | | | | | | | | | | | |
| | | | | | |
Type of
Contract | | Number of
Contracts
Long/(Short) | | | Expiration
Date | | | Notional Amount
(Thousands) | | | Value
(Thousands) | | | Unrealized
(Depreciation)
(Thousands) | |
U.S. 10-Year Treasury Note | | | (53) | | | | Mar-2021 | | | $ | (7,310) | | | $ | (7,323) | | | $ | (13) | |
U.S. 2-Year Treasury Note | | | (142) | | | | Apr-2021 | | | | (31,349) | | | | (31,361) | | | | (12) | |
U.S. 5-Year Treasury Note | | | (118) | | | | Apr-2021 | | | | (14,854) | | | | (14,872) | | | | (18) | |
U.S. Long Treasury Bond | | | (1) | | | | Mar-2021 | | | | (174) | | | | (175) | | | | (1) | |
| | | | | | | | | | | | |
| | | $ | (53,687) | | | $ | (53,731) | | | $ | (44) | |
| | | | | | | | | | | | |
| | Percentages are based on Net Assets of $982,163 ($ Thousands). |
| * | Non-income producing security. |
| ** | The rate reported is the 7-day effective yield as of November 30, 2020. |
| † | Investment in Affiliated Security (see Note 6). |
| (A) | Variable or floating rate security, the interest rate of which adjusts periodically based on changes in current interest rates and prepayments on the underlying pool of assets. |
| (B) | Security exempt from registration under Rule 144A of the Securities Act of 1933. These securities may be resold in transactions exempt from registration normally to qualified institutions. On November 30, 2020, the value of these securities amounted to $381,038 ($ Thousands), representing 38.8% of the Net Assets of the Fund. |
| (C) | Unsettled bank loan. Interest rate may not be available. |
| (D) | Level 3 security in accordance with fair value hierarchy. |
| (E) | Interest rate unavailable. |
| (F) | Zero coupon security. The rate shown on the Schedule of Investments is the security’s effective yield at the time of purchase. |
| (G) | Variable or floating rate security, the interest rate of which adjusts periodically based on prevailing interest rates. |
| (H) | Security fair valued using methods determined in good faith by the Valuation Committee of the Board of Trustees. The total market value of such securities as of November 30, 2020 was $- ($ |
| | Thousands) and represented 0.0% of the Net Assets of the Fund. |
| (I) | There is currently no rate available. |
| (J) | Tri-Party Repurchase Agreement. |
AMT — Alternative Minimum Tax
ARM — Adjustable Rate Mortgage
Cl — Class
CLO — Collateralized Loan Obligation
CMO — Collateralized Mortgage Obligation
DAC — Designated Activity Company
FFCB — Federal Farm Credit Bank
FHLMC — Federal Home Loan Mortgage Corporation
FNMA — Federal National Mortgage Association
FREMF — Freddie Mac Multi-Family
GNMA — Government National Mortgage Association
GO — General Obligation
ICE — Intercontinental Exchange
IO — Interest Only — face amount represents notional amount.
LIBOR— London Interbank Offered Rate
LLC — Limited Liability Company
LP — Limited Partnership Ltd. — Limited
MTN — Medium Term Note
NCUA — National Credit Union Association
RB — Revenue Bond
REIT — Real Estate investment Trust
REMIC — Real Estate Mortgage Investment Conduit Ser — Series
STRIPS — Separately Traded Registered Interest and Principal Securities
USD — United States Dollar
VAR — Variable Rate
| | |
90 | | SEI Institutional Investments Trust / Semi-Annual Report / November 30, 2020 |
The following is a list of the level of inputs used as of November 30, 2020, in valuing the Fund’s investments and other financial instruments carried at value ($ Thousands):
| | | | | | | | | | | | | | | | |
| | | | | |
| Investments in Securities | | Level 1
($) | | Level 2 ($) | | Level 3
($)(1) | | Total ($) |
Mortgage-Backed Securities | | | – | | | | 352,355 | | | | – | | | | 352,355 | |
Loan Participations | | | – | | | | 282,704 | | | | 5,184 | | | | 287,888 | |
Asset-Backed Securities | | | – | | | | 252,503 | | | | – | | | | 252,503 | |
Corporate Obligations | | | – | | | | 55,982 | | | | – | | | | 55,982 | |
Commercial Paper | | | – | | | | 13,500 | | | | – | | | | 13,500 | |
U.S. Treasury Obligations | | | – | | | | 10,015 | | | | – | | | | 10,015 | |
Municipal Bonds | | | – | | | | 2,178 | | | | – | | | | 2,178 | |
U.S. Government Agency Obligations | | | – | | | | 977 | | | | – | | | | 977 | |
Warrant | | | – | | | | – | | | | – | | | | – | |
Common Stock | | | – | | | | – | | | | – | | | | – | |
Preferred Stock | | | – | | | | – | | | | – | | | | – | |
Cash Equivalent | | | 43,348 | | | | – | | | | – | | | | 43,348 | |
Repurchase Agreement | | | – | | | | 6,900 | | | | – | | | | 6,900 | |
| | | | | | | | | | | | | | | | |
Total Investments in Securities | | | 43,348 | | | | 977,114 | | | | 5,184 | | | | 1,025,646 | |
| | | | | | | | | | | | | | | | |
| | | | | | | | | | | | | | | | |
| Other Financial Instruments | | Level 1
($) | | Level 2
($) | | Level 3
($) | | Total
($) |
Future Contracts* | | | | | | | | | | | | | | | | |
Unrealized Depreciation | | | (44) | | | | – | | | | – | | | | (44) | |
| | | | | | | | | | | | | | | | |
Total Other Financial Instruments | | | (44) | | | | – | | | | – | | | | (44) | |
| | | | | | | | | | | | | | | | |
* Future contracts are valued at the unrealized depreciation on the instrument.
The following is a reconciliation of investments in which significant unobservable inputs (Level 3) were used in determining value ($ Thousands):
| | | | | | | | |
| | | |
| | | Investments
in Corporate
Obligations | | Investments
in Loan
Participations |
Balance as of June 1, 2020 | | $ | 676 | | | $ | 23,123 | |
Accrued discounts/premiums | | | (1,240 | ) | | | 6 | |
Realized gain/(loss) | | | – | | | | 236 | |
Change in unrealized appreciation/ (depreciation) | | | 1,240 | | | | 510 | |
Purchases | | | – | | | | (26 | ) |
Sales | | | – | | | | (5,810 | ) |
Net transfer into Level 3 | | | – | | | | 373 | |
Net transfer out of Level 3 | | | (676 | ) | | | (13,228 | ) |
| | | | |
Ending Balance as of November 30, 2020 | | $ | – | | | $ | 5,184 | |
| | | | |
Changes in unrealized gains/(losses) included in earnings related to securities still held at reporting date | | $ | (1,240 | ) | | $ | 510 | |
| | | | |
For the period ended November 30, 2020, there were transfers in and out of Level 3. The transfers were due to changes in the availability of observable inputs used to determine fair value.
For more information on valuation inputs, see Note 2 – Significant Accounting Policies in Notes to Financial Statements.
The following is a summary of the Fund’s transactions with affiliates for the period ended November 30, 2020 ($ Thousands):
| | | | | | | | | | | | | | | | | | |
| | | | | | | | | | |
| Security Description | | Value
5/31/2020 | | Purchases at
Cost | | Proceeds from
Sales | | Realized Gain/
(Loss) | | Change in
Unrealized
Appreciation/
(Depreciation) | | Value
11/30/2020 | | Shares | | Income | | Capital Gains |
SEI Daily Income Trust, Government Fund, Cl F | | $ 62,317 | | $ 229,502 | | $ (248,471) | | $ — | | $ — | | $ 43,348 | | 43,348,443 | | $ 3 | | $ — |
| | | | | | | | | | | | | | | | | | |
Amounts designated as “—” are $0 or have been rounded to $0.
The accompanying notes are an integral part of the financial statements.
| | |
SEI Institutional Investments Trust / Semi-Annual Report / November 30, 2020 | | 91 |
SCHEDULE OF INVESTMENTS (Unaudited)
November 30, 2020
Core Fixed Income Fund
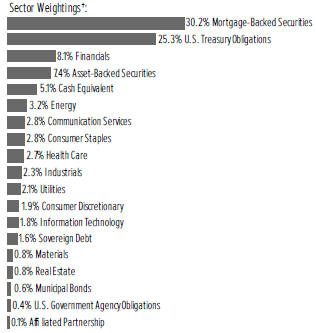
†Percentages are based on total investments. Includes investments held as collateral for securities held on loan (see Note 12).
| | | | | | | | |
| | | |
| Description | | Face Amount
(Thousands) | | Market Value
($ Thousands) |
|
MORTGAGE-BACKED SECURITIES — 33.0% | |
|
Agency Mortgage-Backed Obligations — 28.7% | |
FHLMC | | | | | | | | |
10.000%, 03/17/2026 | | $ | 1 | | | $ | 1 | |
7.500%, 08/01/2030 to 12/01/2036 | | | 312 | | | | 356 | |
7.000%, 05/01/2024 to 03/01/2039 | | | 97 | | | | 110 | |
6.500%, 10/01/2031 to 09/01/2039 | | | 643 | | | | 746 | |
6.000%, 09/01/2021 to 08/01/2038 | | | 699 | | | | 806 | |
5.500%, 02/01/2035 to 12/01/2038 | | | 1,769 | | | | 2,092 | |
5.000%, 08/01/2033 to 03/01/2050 | | | 32,423 | | | | 36,140 | |
4.500%, 11/01/2025 to 06/01/2050 | | | 34,969 | | | | 38,619 | |
4.000%, 01/01/2035 to 10/01/2050 | | | 66,667 | | | | 73,313 | |
3.500%, 03/01/2033 to 05/01/2050 | | | 144,143 | | | | 155,705 | |
3.000%, 03/01/2031 to 08/01/2050 | | | 77,296 | | | | 81,741 | |
2.500%, 10/01/2031 to 09/01/2050 | | | 14,755 | | | | 15,562 | |
2.000%, 10/01/2032 to 09/01/2040 | | | 10,138 | | | | 10,553 | |
FHLMC ARM | | | | | | | | |
4.129%, VAR ICE LIBOR USD 12 Month+2.330%, 05/01/2036 | | | 46 | | | | 50 | |
3.908%, VAR ICE LIBOR USD 12 Month+1.924%, 12/01/2036 | | | 52 | | | | 55 | |
2.376%, VAR US Treas Yield Curve Rate T Note Const Mat 5 Yr+1.286%, 03/01/2047 | | | 1,159 | | | | 1,200 | |
2.147%, VAR ICE LIBOR USD 12 Month+1.595%, 10/01/2036 | | | 11 | | | | 11 | |
FHLMC CMO, Ser 2020-4988, Cl AF | | | | | | | | |
0.499%, VAR ICE LIBOR USD 1 Month+0.350%, 10/15/2037 | | | 5,985 | | | | 5,983 | |
| | | | | | | | |
| | | |
| Description | | Face Amount
(Thousands) | | Market Value
($ Thousands) |
|
MORTGAGE-BACKED SECURITIES (continued) | |
FHLMC CMO, Ser 2020-5010, Cl JI, IO | | | | | | | | |
2.500%, 09/25/2050 | | $ | 1,385 | | | $ | 172 | |
FHLMC CMO, Ser 2020-5010, Cl IK, IO | | | | | | | | |
2.500%, 09/25/2050 | | | 593 | | | | 69 | |
FHLMC CMO, Ser 2020-5013, Cl IN, IO | | | | | | | | |
2.500%, 09/25/2050 | | | 596 | | | | 77 | |
FHLMC CMO, Ser 2020-5018, Cl MI, IO | | | | | | | | |
2.000%, 10/25/2050 | | | 994 | | | | 125 | |
FHLMC CMO, Ser 2020-5040, Cl IB, IO | | | | | | | | |
2.500%, 11/25/2050 | | | 399 | | | | 46 | |
FHLMC Multiclass Certificates, Ser 2020- RR02, Cl BX, IO | | | | | | | | |
1.666%, 08/27/2028 (A) | | | 2,000 | | | | 214 | |
FHLMC Multifamily Structured Pass-Through Certificates, Ser 1514, Cl A2 | | | | | | | | |
2.859%, 10/25/2034 | | | 825 | | | | 948 | |
FHLMC Multifamily Structured Pass-Through Certificates, Ser K016, Cl X1, IO | | | | | | | | |
1.638%, 10/25/2021 (A) | | | 437 | | | | 3 | |
FHLMC Multifamily Structured Pass-Through Certificates, Ser K032, Cl X1, IO | | | | | | | | |
0.204%, 05/25/2023 (A) | | | 59,917 | | | | 154 | |
FHLMC Multifamily Structured Pass-Through Certificates, Ser K047, Cl A2 | | | | | | | | |
3.329%, 05/25/2025 (A) | | | 605 | | | | 674 | |
FHLMC Multifamily Structured Pass-Through Certificates, Ser K091, Cl X1, IO | | | | | | | | |
0.704%, 03/25/2029 (A) | | | 3,938 | | | | 167 | |
FHLMC Multifamily Structured Pass-Through Certificates, Ser K092, Cl X1, IO | | | | | | | | |
0.852%, 04/25/2029 (A) | | | 9,985 | | | | 529 | |
FHLMC Multifamily Structured Pass-Through Certificates, Ser K093, Cl X1, IO | | | | | | | | |
1.092%, 05/25/2029 (A) | | | 3,990 | | | | 277 | |
FHLMC Multifamily Structured Pass-Through Certificates, Ser K094, Cl XAM, IO | | | | | | | | |
1.283%, 06/25/2029 (A) | | | 4,850 | | | | 436 | |
FHLMC Multifamily Structured Pass-Through Certificates, Ser K094, Cl X1, IO | | | | | | | | |
1.016%, 06/25/2029 (A) | | | 2,997 | | | | 197 | |
FHLMC Multifamily Structured Pass-Through Certificates, Ser K095, Cl XAM, IO | | | | | | | | |
1.372%, 06/25/2029 (A) | | | 700 | | | | 68 | |
FHLMC Multifamily Structured Pass-Through Certificates, Ser K095, Cl X1, IO | | | | | | | | |
1.082%, 06/25/2029 (A) | | | 2,395 | | | | 168 | |
FHLMC Multifamily Structured Pass-Through Certificates, Ser K099, Cl X1, IO | | | | | | | | |
1.006%, 09/25/2029 (A) | | | 1,088 | | | | 73 | |
FHLMC Multifamily Structured Pass-Through Certificates, Ser K101, Cl X1, IO | | | | | | | | |
0.949%, 10/25/2029 (A) | | | 1,198 | | | | 77 | |
| | |
92 | | SEI Institutional Investments Trust / Semi-Annual Report / November 30, 2020 |
| | | | | | | | |
| | | |
| Description | | Face Amount
(Thousands) | | Market Value
($ Thousands) |
|
MORTGAGE-BACKED SECURITIES (continued) | |
FHLMC Multifamily Structured Pass-Through Certificates, Ser K1516, Cl A1 | | | | | | | | |
1.238%, 01/25/2035 | | $ | 3,214 | | | $ | 3,169 | |
FHLMC Multifamily Structured Pass-Through Certificates, Ser K157, Cl A3 | | | | | | | | |
3.990%, 08/25/2033 (A) | | | 4,400 | | | | 5,441 | |
FHLMC Multifamily Structured Pass-Through Certificates, Ser K158, Cl A3 | | | | | | | | |
3.900%, 10/25/2033 (A) | | | 3,345 | | | | 4,104 | |
FHLMC Multifamily Structured Pass-Through Certificates, Ser K726, Cl X1, IO | | | | | | | | |
1.024%, 04/25/2024 (A) | | | 12,399 | | | | 285 | |
FHLMC Multifamily Structured Pass-Through Certificates, Ser K735, Cl X1, IO | | | | | | | | |
1.095%, 05/25/2026 (A) | | | 2,275 | | | | 106 | |
FHLMC Multifamily Structured Pass-Through Certificates, Ser K736, Cl X1, IO | | | | | | | | |
1.437%, 07/25/2026 (A) | | | 1,999 | | | | 123 | |
FHLMC Multifamily Structured Pass-Through Certificates, Ser K737, Cl X1, IO | | | | | | | | |
0.751%, 10/25/2026 (A) | | | 6,991 | | | | 229 | |
FHLMC Multifamily Structured Pass-Through Certificates, Ser KC05, Cl X1, IO | | | | | | | | |
1.342%, 06/25/2027 (A) | | | 1,577 | | | | 90 | |
FHLMC Multifamily Structured Pass-Through Certificates, Ser KLU1, Cl A4 | | | | | | | | |
2.854%, 01/25/2031 | | | 1,115 | | | | 1,241 | |
FHLMC Multifamily Structured Pass-Through Certificates, Ser KSG1, Cl A2 | | | | | | | | |
1.503%, 09/25/2030 | | | 1,685 | | | | 1,733 | |
FHLMC Multifamily Structured Pass-Through Certificates, Ser X3FX, Cl A2FX | | | | | | | | |
3.000%, 06/25/2027 | | | 2,210 | | | | 2,380 | |
FHLMC Reference REMIC CMO, Ser 2006-R007, Cl ZA | | | | | | | | |
6.000%, 05/15/2036 | | | 876 | | | | 1,041 | |
FHLMC REMIC CMO, Ser 1999-2174, Cl PN | | | | | | | | |
6.000%, 07/15/2029 | | | 11 | | | | 12 | |
FHLMC REMIC CMO, Ser 2001-2312, Cl Z | | | | | | | | |
6.500%, 05/15/2031 | | | 108 | | | | 121 | |
FHLMC REMIC CMO, Ser 2002-2399, Cl XG | | | | | | | | |
6.500%, 01/15/2032 | | | 31 | | | | 35 | |
FHLMC REMIC CMO, Ser 2003-2671, Cl S | | | | | | | | |
14.500%, 09/15/2033 (A) | | | 41 | | | | 58 | |
FHLMC REMIC CMO, Ser 2003-2684, Cl ZN | | | | | | | | |
4.000%, 10/15/2033 | | | 86 | | | | 95 | |
FHLMC REMIC CMO, Ser 2004-2733, Cl ME | | | | | | | | |
5.000%, 01/15/2034 | | | 206 | | | | 237 | |
FHLMC REMIC CMO, Ser 2007-3316, Cl JO, PO | | | | | | | | |
0.000%, 05/15/2037 (B) | | | 4 | | | | 4 | |
FHLMC REMIC CMO, Ser 2008-3451, Cl SB, IO | | | | | | | | |
5.809%, 05/15/2038 (A) | | | 155 | | | | 26 | |
| | | | | | | | |
| | | |
| Description | | Face Amount
(Thousands) | | Market Value
($ Thousands) |
|
MORTGAGE-BACKED SECURITIES (continued) | |
FHLMC REMIC CMO, Ser 2009-3546, Cl A | | | | | | | | |
2.346%, 02/15/2039 (A) | | $ | 54 | | | $ | 56 | |
FHLMC REMIC CMO, Ser 2010-3621, Cl SB, IO | | | | | | | | |
6.089%, 01/15/2040 (A) | | | 86 | | | | 19 | |
FHLMC REMIC CMO, Ser 2011-3866, Cl SA, IO | | | | | | | | |
5.809%, 05/15/2041 (A) | | | 516 | | | | 73 | |
FHLMC REMIC CMO, Ser 2012-4010, Cl KM | | | | | | | | |
3.000%, 01/15/2042 | | | 566 | | | | 605 | |
FHLMC REMIC CMO, Ser 2012-4030, Cl HS, IO | | | | | | | | |
6.469%, 04/15/2042 (A) | | | 51 | | | | 11 | |
FHLMC REMIC CMO, Ser 2012-4102, Cl TC | | | | | | | | |
2.500%, 09/15/2041 | | | 2,014 | | | | 2,099 | |
FHLMC REMIC CMO, Ser 2012-4119, Cl IN, IO | | | | | | | | |
3.500%, 10/15/2032 | | | 429 | | | | 44 | |
FHLMC REMIC CMO, Ser 2013-4161, Cl BA | | | | | | | | |
2.500%, 12/15/2041 | | | 4,650 | | | | 4,831 | |
FHLMC REMIC CMO, Ser 2013-4194, Cl BI, IO | | | | | | | | |
3.500%, 04/15/2043 | | | 306 | | | | 31 | |
FHLMC REMIC CMO, Ser 2013-4205, Cl PA | | | | | | | | |
1.750%, 05/15/2043 | | | 1,025 | | | | 1,058 | |
FHLMC REMIC CMO, Ser 2013-4210, Cl Z | | | | | | | | |
3.000%, 05/15/2043 | | | 1,687 | | | | 1,705 | |
FHLMC REMIC CMO, Ser 2013-4227, Cl VA | | | | | | | | |
3.500%, 10/15/2037 | | | 1,300 | | | | 1,366 | |
FHLMC REMIC CMO, Ser 2014-4368, Cl CA | | | | | | | | |
3.750%, 11/15/2036 | | | 541 | | | | 559 | |
FHLMC REMIC CMO, Ser 2015-4426, Cl QC | | | | | | | | |
1.750%, 07/15/2037 | | | 1,817 | | | | 1,879 | |
FHLMC REMIC CMO, Ser 2015-4479, Cl HA | | | | | | | | |
3.750%, 05/15/2039 | | | 1,507 | | | | 1,565 | |
FHLMC REMIC CMO, Ser 2017-4705, Cl A | | | | | | | | |
4.500%, 09/15/2042 | | | 813 | | | | 838 | |
FHLMC REMIC CMO, Ser 2017-4742, Cl PA | | | | | | | | |
3.000%, 10/15/2047 | | | 4,032 | | | | 4,215 | |
FHLMC REMIC CMO, Ser 2018-4763, Cl CA | | | | | | | | |
3.000%, 09/15/2038 | | | 513 | | | | 554 | |
FHLMC REMIC CMO, Ser 2018-4767, Cl KA | | | | | | | | |
3.000%, 03/15/2048 | | | 1,122 | | | | 1,213 | |
FHLMC REMIC CMO, Ser 2018-4786, Cl DP | | | | | | | | |
4.500%, 07/15/2042 | | | 158 | | | | 159 | |
FHLMC REMIC CMO, Ser 2018-4813, Cl CJ | | | | | | | | |
3.000%, 08/15/2048 | | | 948 | | | | 979 | |
FHLMC REMIC CMO, Ser 2018-4846, Cl PF | | | | | | | | |
0.491%, VAR ICE LIBOR USD 1 Month+0.350%, 12/15/2048 | | | 410 | | | | 412 | |
FHLMC REMIC CMO, Ser 2019-4880, Cl DA | | | | | | | | |
3.000%, 05/15/2050 | | | 2,252 | | | | 2,423 | |
FHLMC STRIPS CMO, Ser 2012-264, Cl 30 | | | | | | | | |
3.000%, 07/15/2042 | | | 3,612 | | | | 3,870 | |
FHLMC STRIPS CMO, Ser 2012-271, Cl 30 | | | | | | | | |
3.000%, 08/15/2042 | | | 1,534 | | | | 1,640 | |
| | |
SEI Institutional Investments Trust / Semi-Annual Report / November 30, 2020 | | 93 |
SCHEDULE OF INVESTMENTS (Unaudited)
November 30, 2020
Core Fixed Income Fund (Continued)
| | | | | | | | |
| | | |
| Description | | Face Amount
(Thousands) | | Market Value
($ Thousands) |
|
MORTGAGE-BACKED SECURITIES (continued) | |
FHLMC STRIPS CMO, Ser 2015-343, Cl F4 | | | | | | | | |
0.499%, VAR ICE LIBOR USD 1 Month+0.350%, 10/15/2037 | | $ | 1,484 | | | $ | 1,479 | |
FHLMC STRIPS CMO, Ser 2016-353, Cl S1, IO | | | | | | | | |
5.859%, 12/15/2046 (A) | | | 858 | | | | 194 | |
FHLMC STRIPS CMO, Ser 2017-356, Cl 300 | | | | | | | | |
3.000%, 09/15/2047 | | | 4,317 | | | | 4,556 | |
FNMA | | | | | | | | |
8.000%, 05/01/2023 to 06/01/2031 | | | 26 | | | | 30 | |
7.500%, 06/01/2030 to 11/01/2038 | | | 157 | | | | 180 | |
7.000%, 09/01/2026 to 02/01/2039 | | | 907 | | | | 1,060 | |
6.500%, 12/01/2022 to 10/01/2037 | | | 329 | | | | 369 | |
6.000%, 02/01/2032 to 07/01/2041 | | | 2,839 | | | | 3,361 | |
5.500%, 12/01/2033 to 06/01/2049 | | | 11,993 | | | | 13,964 | |
5.000%, 07/01/2033 to 03/01/2050 | | | 71,672 | | | | 81,223 | |
4.500%, 08/01/2023 to 01/01/2059 | | | 119,616 | | | | 132,851 | |
4.381%, 06/01/2021 (A) | | | 1,336 | | | | 1,339 | |
4.262%, 11/01/2021 (A) | | | 1,612 | | | | 1,616 | |
4.200%, 01/01/2029 | | | 1,665 | | | | 1,946 | |
4.000%, 09/01/2033 to 06/01/2057 | | | 136,160 | | | | 148,543 | |
3.980%, 08/01/2021 | | | 3,856 | | | | 3,886 | |
3.820%, 07/01/2027 | | | 249 | | | | 285 | |
3.790%, 12/01/2025 | | | 3,185 | | | | 3,472 | |
3.500%, 07/01/2029 to 03/01/2057 | | | 117,825 | | | | 126,007 | |
3.380%, 05/01/2028 | | | 118 | | | | 126 | |
3.310%, 03/01/2028 | | | 1,905 | | | | 2,119 | |
3.210%, 11/01/2037 | | | 4,548 | | | | 5,246 | |
3.160%, 05/01/2029 | | | 324 | | | | 368 | |
3.080%, 01/01/2028 | | | 160 | | | | 177 | |
3.040%, 06/01/2029 | | | 1,000 | | | | 1,135 | |
3.020%, 06/01/2024 to 05/01/2026 | | | 3,400 | | | | 3,555 | |
3.000%, 05/01/2029 to 09/01/2050 | | | 132,932 | | | | 140,771 | |
2.810%, 04/01/2025 | | | 250 | | | | 270 | |
2.790%, 08/01/2029 | | | 600 | | | | 669 | |
2.698%, 04/01/2023 (A) | | | 133 | | | | 138 | |
2.500%, 06/01/2028 to 11/01/2050 | | | 52,969 | | | | 56,094 | |
2.455%, 04/01/2040 | | | 3,020 | | | | 3,141 | |
2.320%, 02/01/2032 | | | 200 | | | | 216 | |
2.260%, 04/01/2030 | | | 1,087 | | | | 1,169 | |
2.240%, 10/01/2031 | | | 300 | | | | 321 | |
2.140%, 04/01/2030 | | | 200 | | | | 213 | |
2.000%, 11/01/2035 to 10/01/2040 | | | 25,572 | | | | 26,628 | |
1.950%, 04/01/2032 | | | 200 | | | | 209 | |
1.210%, 11/01/2030 | | | 300 | | | | 299 | |
FNMA ACES, Ser 2014-M3, Cl X2, IO | | | | | | | | |
0.101%, 01/25/2024 (A) | | | 28,875 | | | | 227 | |
FNMA ACES, Ser 2015-M8, Cl X2, IO | | | | | | | | |
0.227%, 01/25/2025 (A) | | | 75,329 | | | | 351 | |
FNMA ACES, Ser 2016-M11, Cl AL | | | | | | | | |
2.944%, 07/25/2039 | | | 405 | | | | 412 | |
FNMA ACES, Ser 2017-M7, Cl A2 | | | | | | | | |
2.961%, 02/25/2027 (A) | | | 690 | | | | 775 | |
| | | | | | | | |
| | | |
| Description | | Face Amount
(Thousands) | | Market Value
($ Thousands) |
|
MORTGAGE-BACKED SECURITIES (continued) | |
FNMA ACES, Ser 2017-M8, Cl A2 | | | | | | | | |
3.061%, 05/25/2027 (A) | | $ | 200 | | | $ | 224 | |
FNMA ACES, Ser 2018-M15, Cl 1A2 | | | | | | | | |
3.700%, 01/25/2036 | | | 600 | | | | 712 | |
FNMA ACES, Ser 2019-M27, Cl A2 | | | | | | | | |
2.700%, 11/25/2040 | | | 400 | | | | 457 | |
FNMA ACES, Ser 2019-M28, Cl AV | | | | | | | | |
2.232%, 02/25/2027 | | | 1,482 | | | | 1,579 | |
FNMA ACES, Ser 2019-M4, Cl A2 | | | | | | | | |
3.610%, 02/25/2031 | | | 730 | | | | 868 | |
FNMA ACES, Ser 2019-M5, Cl A2 | | | | | | | | |
3.273%, 02/25/2029 | | | 1,260 | | | | 1,456 | |
FNMA ACES, Ser 2020-M6, Cl A | | | | | | | | |
2.500%, 10/25/2037 | | | 193 | | | | 203 | |
FNMA ARM | | | | | | | | |
3.594%, VAR ICE LIBOR USD 12 Month+1.594%, 12/01/2035 | | | 25 | | | | 25 | |
3.565%, VAR ICE LIBOR USD 12 Month+1.565%, 05/01/2037 | | | 3 | | | | 3 | |
2.761%, VAR ICE LIBOR USD 12 Month+1.580%, 06/01/2045 | | | 1,174 | | | | 1,219 | |
2.678%, VAR ICE LIBOR USD 12 Month+1.585%, 01/01/2046 | | | 4,128 | | | | 4,286 | |
FNMA CMO, Ser 2020-74, Cl EI, IO | | | | | | | | |
2.500%, 10/25/2050 | | | 495 | | | | 67 | |
FNMA CMO, Ser 2020-89, Cl DI, IO | | | | | | | | |
2.500%, 12/25/2050 | | | 3,100 | | | | 373 | |
FNMA Interest STRIPS CMO, Ser 2002-323, Cl 16, IO | | | | | | | | |
7.000%, 01/25/2032 | | | 153 | | | | 24 | |
FNMA Interest STRIPS CMO, Ser 2003-334, Cl 16, IO | | | | | | | | |
6.500%, 02/25/2033 | | | 206 | | | | 41 | |
FNMA Interest STRIPS CMO, Ser 2012-409, Cl C2, IO | | | | | | | | |
3.000%, 04/25/2027 | | | 804 | | | | 43 | |
FNMA Interest STRIPS CMO, Ser 2012-409, Cl C17, IO | | | | | | | | |
4.000%, 11/25/2041 | | | 691 | | | | 93 | |
FNMA Interest STRIPS CMO, Ser 2012-409, Cl C13, IO | | | | | | | | |
3.500%, 11/25/2041 | | | 645 | | | | 57 | |
FNMA Interest STRIPS CMO, Ser 2012-409, Cl C22, IO | | | | | | | | |
4.500%, 11/25/2039 | | | 635 | | | | 97 | |
FNMA Interest STRIPS CMO, Ser 2012-409, Cl C1, IO | | | | | | | | |
3.000%, 11/25/2026 | | | 1,069 | | | | 57 | |
FNMA Interest STRIPS CMO, Ser 2012-411, Cl A3 | | | | | | | | |
3.000%, 08/25/2042 | | | 2,375 | | | | 2,488 | |
| | |
94 | | SEI Institutional Investments Trust / Semi-Annual Report / November 30, 2020 |
| | | | | | | | |
| | | |
| Description | | Face Amount
(Thousands) | | Market Value
($ Thousands) |
|
MORTGAGE-BACKED SECURITIES (continued) | |
FNMA Interest STRIPS CMO, Ser 2012-414,Cl A35 | | | | | | | | |
3.500%, 10/25/2042 | | $ | 3,315 | | | $ | 3,552 | |
FNMA REMIC CMO, Ser 1992-143, Cl M | | | | | | | | |
8.000%, 09/25/2022 | | | 17 | | | | 17 | |
FNMA REMIC CMO, Ser 1992-69, Cl Z | | | | | | | | |
8.000%, 05/25/2022 | | | 12 | | | | 13 | |
FNMA REMIC CMO, Ser 1993-149, Cl SH | | | | | | | | |
11.500%, 08/25/2023 (A) | | | 16 | | | | 18 | |
FNMA REMIC CMO, Ser 1993-99, Cl Z | | | | | | | | |
7.000%, 07/25/2023 | | | 76 | | | | 80 | |
FNMA REMIC CMO, Ser 1994-31, Cl ZC | | | | | | | | |
6.500%, 02/25/2024 | | | 61 | | | | 65 | |
FNMA REMIC CMO, Ser 1994-63, Cl PK | | | | | | | | |
7.000%, 04/25/2024 | | | 62 | | | | 66 | |
FNMA REMIC CMO, Ser 1997-32, Cl PG | | | | | | | | |
6.500%, 04/25/2027 | | | 78 | | | | 87 | |
FNMA REMIC CMO, Ser 1999-11, Cl Z | | | | | | | | |
5.500%, 03/25/2029 | | | 97 | | | | 103 | |
FNMA REMIC CMO, Ser 2001-52, Cl YZ | | | | | | | | |
6.500%, 10/25/2031 | | | 15 | | | | 17 | |
FNMA REMIC CMO, Ser 2003-124, Cl TS | | | | | | | | |
9.800%, 01/25/2034 (A) | | | 8 | | | | 10 | |
FNMA REMIC CMO, Ser 2005-29, Cl ZA | | | | | | | | |
5.500%, 04/25/2035 | | | 293 | | | | 343 | |
FNMA REMIC CMO, Ser 2005-74, Cl CS | | | | | | | | |
19.607%, 05/25/2035 (A) | | | 57 | | | | 73 | |
FNMA REMIC CMO, Ser 2006-104, Cl MI, IO | | | | | | | | |
6.600%, 11/25/2036 (A) | | | 535 | | | | 73 | |
FNMA REMIC CMO, Ser 2006-125, Cl SM, IO | | | | | | | | |
7.050%, 01/25/2037 (A) | | | 396 | | | | 87 | |
FNMA REMIC CMO, Ser 2006-33, Cl LS | | | | | | | | |
29.474%, 05/25/2036 (A) | | | 58 | | | | 98 | |
FNMA REMIC CMO, Ser 2006-46, Cl SW | | | | | | | | |
23.649%, 06/25/2036 (A) | | | 44 | | | | 72 | |
FNMA REMIC CMO, Ser 2006-51, Cl SP, IO | | | | | | | | |
6.500%, 03/25/2036 (A) | | | 67 | | | | 10 | |
FNMA REMIC CMO, Ser 2007-64, Cl FA | | | | | | | | |
0.620%, VAR ICE LIBOR USD 1 Month+0.470%, 07/25/2037 | | | 8 | | | | 8 | |
FNMA REMIC CMO, Ser 2007-68, Cl SC, IO | | | | | | | | |
6.550%, 07/25/2037 (A) | | | 147 | | | | 29 | |
FNMA REMIC CMO, Ser 2008-22, Cl SI, IO | | | | | | | | |
6.280%, 03/25/2037 (A) | | | 523 | | | | 11 | |
FNMA REMIC CMO, Ser 2008-24, Cl NA | | | | | | | | |
6.750%, 06/25/2037 | | | 13 | | | | 15 | |
FNMA REMIC CMO, Ser 2009-103, Cl MB | | | | | | | | |
3.004%, 12/25/2039 (A) | | | 79 | | | | 82 | |
FNMA REMIC CMO, Ser 2009-86, Cl BO, PO | | | | | | | | |
0.000%, 03/25/2037 (B) | | | 862 | | | | 819 | |
FNMA REMIC CMO, Ser 2010-123, Cl PM | | | | | | | | |
4.000%, 07/25/2040 | | | 2,215 | | | | 2,362 | |
| | | | | | | | |
| | | |
| Description | | Face Amount
(Thousands) | | Market Value
($ Thousands) |
|
MORTGAGE-BACKED SECURITIES (continued) | |
FNMA REMIC CMO, Ser 2010-150, Cl SK, IO | | | | | | | | |
6.380%, 01/25/2041 (A) | | $ | 514 | | | $ | 132 | |
FNMA REMIC CMO, Ser 2010-27, Cl AS, IO | | | | | | | | |
6.330%, 04/25/2040 (A) | | | 598 | | | | 144 | |
FNMA REMIC CMO, Ser 2011-2, Cl WA | | | | | | | | |
5.852%, 02/25/2051 (A) | | | 81 | | | | 94 | |
FNMA REMIC CMO, Ser 2011-75, Cl FA | | | | | | | | |
0.700%, VAR ICE LIBOR USD 1 Month+0.550%, 08/25/2041 | | | 77 | | | | 77 | |
FNMA REMIC CMO, Ser 2011-96, Cl SA, IO | | | | | | | | |
6.400%, 10/25/2041 (A) | | | 1,215 | | | | 255 | |
FNMA REMIC CMO, Ser 2012-133, Cl CS, IO | | | | | | | | |
6.000%, 12/25/2042 (A) | | | 740 | | | | 146 | |
FNMA REMIC CMO, Ser 2012-134, Cl MS, IO | | | | | | | | |
6.000%, 12/25/2042 (A) | | | 312 | | | | 62 | |
FNMA REMIC CMO, Ser 2012-151, Cl NX | | | | | | | | |
1.500%, 01/25/2043 | | | 1,402 | | | | 1,449 | |
FNMA REMIC CMO, Ser 2012-28, Cl B | | | | | | | | |
6.500%, 06/25/2039 | | | 14 | | | | 16 | |
FNMA REMIC CMO, Ser 2012-35, Cl SC, IO | | | | | | | | |
6.350%, 04/25/2042 (A) | | | 337 | | | | 73 | |
FNMA REMIC CMO, Ser 2012-46, Cl BA | | | | | | | | |
6.000%, 05/25/2042 | | | 412 | | | | 483 | |
FNMA REMIC CMO, Ser 2012-70, Cl YS, IO | | | | | | | | |
6.500%, 02/25/2041 (A) | | | 98 | | | | 7 | |
FNMA REMIC CMO, Ser 2012-74, Cl SA, IO | | | | | | | | |
6.500%, 03/25/2042 (A) | | | 545 | | | | 107 | |
FNMA REMIC CMO, Ser 2012-74, Cl OA, PO | | | | | | | | |
0.000%, 03/25/2042 (B) | | | 37 | | | | 35 | |
FNMA REMIC CMO, Ser 2012-75, Cl NS, IO | | | | | | | | |
6.450%, 07/25/2042 (A) | | | 171 | | | | 38 | |
FNMA REMIC CMO, Ser 2012-75, Cl AO, PO | | | | | | | | |
0.000%, 03/25/2042 (B) | | | 74 | | | | 70 | |
FNMA REMIC CMO, Ser 2013-101, Cl BO, PO | | | | | | | | |
0.000%, 10/25/2043 (B) | | | 1,065 | | | | 929 | |
FNMA REMIC CMO, Ser 2013-101, Cl CO, PO | | | | | | | | |
0.000%, 10/25/2043 (B) | | | 2,388 | | | | 2,082 | |
FNMA REMIC CMO, Ser 2013-11, Cl AP | | | | | | | | |
1.500%, 01/25/2043 | | | 3,596 | | | | 3,677 | |
FNMA REMIC CMO, Ser 2013-124, Cl SB, IO | | | | | | | | |
5.800%, 12/25/2043 (A) | | | 599 | | | | 118 | |
FNMA REMIC CMO, Ser 2013-26, Cl HI, IO | | | | | | | | |
3.000%, 04/25/2032 | | | 482 | | | | 16 | |
FNMA REMIC CMO, Ser 2013-30, Cl CA | | | | | | | | |
1.500%, 04/25/2043 | | | 435 | | | | 445 | |
FNMA REMIC CMO, Ser 2013-43, Cl BP | | | | | | | | |
1.750%, 05/25/2043 | | | 1,464 | | | | 1,523 | |
FNMA REMIC CMO, Ser 2013-54, Cl BS, IO | | | | | | | | |
6.000%, 06/25/ 2043 (A) | | | 361 | | | | 80 | |
FNMA REMIC CMO, Ser 2013-9, Cl CB | | | | | | | | |
5.500%, 04/25/2042 | | | 1,069 | | | | 1,235 | |
| | |
SEI Institutional Investments Trust / Semi-Annual Report / November 30, 2020 | | 95 |
SCHEDULE OF INVESTMENTS (Unaudited)
November 30, 2020
Core Fixed Income Fund (Continued)
| | | | | | | | |
| | | |
| Description | | Face Amount
(Thousands) | | Market Value
($ Thousands) |
|
MORTGAGE-BACKED SECURITIES (continued) | |
FNMA REMIC CMO, Ser 2013-9, Cl BC | | | | | | | | |
6.500%, 07/25/2042 | | $ | 982 | | | $ | 1,183 | |
FNMA REMIC CMO, Ser 2014-73, Cl MA | | | | | | | | |
2.500%, 11/25/2044 | | | 942 | | | | 1,003 | |
FNMA REMIC CMO, Ser 2015-84, Cl PA | | | | | | | | |
1.700%, 08/25/2033 | | | 4,573 | | | | 4,730 | |
FNMA REMIC CMO, Ser 2016-37, Cl MJ | | | | | | | | |
3.500%, 08/25/2043 | | | 572 | | | | 595 | |
FNMA REMIC CMO, Ser 2016-48, Cl MA | | | | | | | | |
2.000%, 06/25/2038 | | | 4,638 | | | | 4,847 | |
FNMA REMIC CMO, Ser 2016-57, Cl PC | | | | | | | | |
1.750%, 06/25/2046 | | | 6,593 | | | | 6,861 | |
FNMA REMIC CMO, Ser 2016-60, Cl QS, IO | | | | | | | | |
5.950%, 09/25/2046 (A) | | | 1,149 | | | | 235 | |
FNMA REMIC CMO, Ser 2017-13, Cl PA | | | | | | | | |
3.000%, 08/25/2046 | | | 1,506 | | | | 1,590 | |
FNMA REMIC CMO, Ser 2017-42, Cl H | | | | | | | | |
3.000%, 11/25/2043 | | | 1,096 | | | | 1,135 | |
FNMA REMIC CMO, Ser 2017-76, Cl SB, IO | | | | | | | | |
5.950%, 10/25/2057 (A) | | | 2,087 | | | | 447 | |
FNMA REMIC CMO, Ser 2017-85, Cl SC, IO | | | | | | | | |
6.050%, 11/25/2047 (A) | | | 680 | | | | 136 | |
FNMA REMIC CMO, Ser 2018-14, Cl KC | | | | | | | | |
3.000%, 03/25/2048 | | | 2,643 | | | | 2,847 | |
FNMA REMIC CMO, Ser 2018-15, Cl AB | | | | | | | | |
3.000%, 03/25/2048 | | | 596 | | | | 643 | |
FNMA REMIC CMO, Ser 2018-38, Cl PA | | | | | | | | |
3.500%, 06/25/2047 | | | 2,503 | | | | 2,620 | |
FNMA REMIC CMO, Ser 2018-43, Cl CT | | | | | | | | |
3.000%, 06/25/2048 | | | 3,441 | | | | 3,596 | |
FNMA REMIC CMO, Ser 2018-8, Cl KL | | | | | | | | |
2.500%, 03/25/2047 | | | 1,945 | | | | 2,030 | |
FNMA REMIC CMO, Ser 2018-86, Cl JA | | | | | | | | |
4.000%, 05/25/2047 | | | 546 | | | | 566 | |
FNMA REMIC CMO, Ser 2019-1, Cl AB | | | | | | | | |
3.500%, 02/25/2049 | | | 1,759 | | | | 1,870 | |
FNMA REMIC CMO, Ser 2019-25, Cl PA | | | | | | | | |
3.000%, 05/25/2048 | | | 2,821 | | | | 3,026 | |
FNMA REMIC CMO, Ser 2019-35, Cl A | | | | | | | | |
3.000%, 07/25/2049 | | | 1,332 | | | | 1,400 | |
FNMA REMIC CMO, Ser 2019-45, Cl PA | | | | | | | | |
3.000%, 08/25/2049 | | | 1,351 | | | | 1,421 | |
FNMA REMIC CMO, Ser 2019-52, Cl PA | | | | | | | | |
3.000%, 09/25/2049 | | | 524 | | | | 545 | |
FNMA REMIC CMO, Ser 2019-79, Cl FA | | | | | | | | |
0.650%, VAR ICE LIBOR USD 1 | | | | | | | | |
Month+0.500%, 01/25/2050 | | | 3,996 | | | | 4,032 | |
FNMA REMIC CMO, Ser 2020-47, Cl GZ | | | | | | | | |
2.000%, 07/25/2050 | | | 706 | | | | 715 | |
FNMA REMIC CMO, Ser 2020-56, Cl DI, IO | | | | | | | | |
2.500%, 08/25/2050 | | | 983 | | | | 133 | |
| | | | | | | | |
| | | |
| Description | | Face Amount
(Thousands) | | Market Value
($ Thousands) |
|
MORTGAGE-BACKED SECURITIES (continued) | |
FNMA TBA | | | | | | | | |
5.000%, 12/01/2037 | | $ | 4,830 | | | $ | 5,344 | |
4.000%, 12/14/2039 | | | 6,990 | | | | 7,457 | |
3.500%, 12/01/2040 | | | 1,706 | | | | 1,805 | |
3.000%, 12/25/2028 | | | 1,450 | | | | 1,518 | |
2.500%, 12/01/2027 | | | 1,934 | | | | 2,011 | |
FREMF Mortgage Trust, Ser 2011-K11, Cl B | | | | | | | | |
4.570%, 12/25/2048 (A)(C) | | | 74 | | | | 74 | |
FREMF Mortgage Trust, Ser 2012-K20, Cl X2A, IO | | | | | | | | |
0.200%, 05/25/2045 (C) | | | 24,305 | | | | 56 | |
GNMA | | | | | | | | |
7.000%, 04/15/2026 to 10/15/2032 | | | 511 | | | | 561 | |
6.500%, 01/15/2024 to 07/15/2035 | | | 1,038 | | | | 1,172 | |
6.000%, 12/15/2023 to 10/20/2040 | | | 3,153 | | | | 3,723 | |
5.000%, 10/15/2039 to 04/20/2050 | | | 34,885 | | | | 38,561 | |
4.700%, 09/20/2061 (A) | | | 1,047 | | | | 1,081 | |
4.500%, 01/20/2040 to 09/20/2049 | | | 35,353 | | | | 38,660 | |
4.187%, 01/20/2069 (A) | | | 93 | | | | 97 | |
4.000%, 06/20/2047 to 07/20/2050 | | | 59,185 | | | | 63,918 | |
3.769%, 04/20/2063 (A) | | | 335 | | | | 344 | |
3.500%, 06/20/2044 to 05/15/2050 | | | 40,107 | | | | 43,267 | |
3.000%, 09/15/2042 to 09/20/2050 | | | 67,099 | | | | 70,864 | |
GNMA ARM | | | | | | | | |
3.250%, VAR US Treas Yield | | | | | | | | |
Curve Rate T Note Const Mat 1 Yr+1.500%, 07/20/2034 | | | 6 | | | | 6 | |
1.590%, VAR US Treas Yield Curve Rate | | | | | | | | |
T Note Const Mat 1 Yr+1.440%, 01/20/2060 | | | 565 | | | | 575 | |
GNMA CMO, Ser 2003-60, Cl GS | | | | | | | | |
12.182%, 05/16/2033 (A) | | | 9 | | | | 10 | |
GNMA CMO, Ser 2005-7, Cl JM | | | | | | | | |
16.410%, 05/18/2034 (A) | | | 1 | | | | 2 | |
GNMA CMO, Ser 2006-16, Cl GS, IO | | | | | | | | |
6.844%, 04/20/2036 (A) | | | 373 | | | | 78 | |
GNMA CMO, Ser 2007-78, Cl SA, IO | | | | | | | | |
6.389%, 12/16/2037 (A) | | | 2,600 | | | | 435 | |
GNMA CMO, Ser 2009-106, Cl KS, IO | | | | | | | | |
6.254%, 11/20/2039 (A) | | | 2,953 | | | | 551 | |
GNMA CMO, Ser 2009-66, Cl XS, IO | | | | | | | | |
6.659%, 07/16/2039 (A) | | | 23 | | | | 4 | |
GNMA CMO, Ser 2009-66, Cl LC | | | | | | | | |
6.000%, 08/16/2039 | | | 1,708 | | | | 1,963 | |
GNMA CMO, Ser 2009-8, Cl PS, IO | | | | | | | | |
6.159%, 08/16/2038 (A) | | | 21 | | | | 2 | |
GNMA CMO, Ser 2010-31, Cl GS, IO | | | | | | | | |
6.349%, 03/20/2039 (A) | | | – | | | | – | |
GNMA CMO, Ser 2010-4, Cl NS, IO | | | | | | | | |
6.249%, 01/16/2040 (A) | | | 4,264 | | | | 889 | |
GNMA CMO, Ser 2010-4, Cl SL, IO | | | | | | | | |
6.259%, 01/16/2040 (A) | | | 92 | | | | 20 | |
| | |
96 | | SEI Institutional Investments Trust / Semi-Annual Report / November 30, 2020 |
| | | | | | | | |
| | | |
| Description | | Face Amount
(Thousands) | | Market Value
($ Thousands) |
|
MORTGAGE-BACKED SECURITIES (continued) | |
GNMA CMO, Ser 2010-59, Cl LB | | | | | | | | |
4.500%, 10/20/2039 | | $ | 575 | | | $ | 611 | |
GNMA CMO, Ser 2010-85, Cl HS, IO | | | | | | | | |
6.504%, 01/20/2040 (A) | | | 181 | | | | 15 | |
GNMA CMO, Ser 2010-H10, Cl FC | | | | | | | | |
1.156%, VAR ICE LIBOR USD 1 | | | | | | | | |
Month+1.000%, 05/20/2060 | | | 1,839 | | | | 1,863 | |
GNMA CMO, Ser 2010-H26, Cl LF | | | | | | | | |
0.490%, VAR ICE LIBOR USD 1 | | | | | | | | |
Month+0.350%, 08/20/2058 | | | 2,661 | | | | 2,658 | |
GNMA CMO, Ser 2011-146, Cl EI, IO | | | | | | | | |
5.000%, 11/16/2041 | | | 42 | | | | 8 | |
GNMA CMO, Ser 2011-H09, Cl AF | | | | | | | | |
0.640%, VAR ICE LIBOR USD 1 | | | | | | | | |
Month+0.500%, 03/20/2061 | | | 761 | | | | 762 | |
GNMA CMO, Ser 2012-112, IO | | | | | | | | |
0.182%, 02/16/2053 (A) | | | 4,487 | | | | 39 | |
GNMA CMO, Ser 2012-124, Cl AS, IO | | | | | | | | |
6.059%, 10/16/2042 (A) | | | 543 | | | | 126 | |
GNMA CMO, Ser 2012-141, Cl WA | | | | | | | | |
4.537%, 11/16/2041 (A) | | | 455 | | | | 508 | |
GNMA CMO, Ser 2012-142, IO | | | | | | | | |
0.681%, 04/16/2054 (A) | | | 12,841 | | | | 217 | |
GNMA CMO, Ser 2012-27, IO | | | | | | | | |
0.894%, 04/16/2053 (A) | | | 8,513 | | | | 196 | |
GNMA CMO, Ser 2012-66, Cl CI, IO | | | | | | | | |
3.500%, 02/20/2038 | | | 314 | | | | 7 | |
GNMA CMO, Ser 2012-98, Cl SA, IO | | | | | | | | |
5.959%, 08/16/2042 (A) | | | 437 | | | | 95 | |
GNMA CMO, Ser 2012-H07, Cl KI, IO | | | | | | | | |
1.242%, 03/20/2062 (A) | | | 469 | | | | 14 | |
GNMA CMO, Ser 2013-145, IO | | | | | | | | |
1.180%, 09/16/2044 (A) | | | 160 | | | | 16 | |
GNMA CMO, Ser 2013-163, IO | | | | | | | | |
1.234%, 02/16/2046 (A) | | | 4,779 | | | | 214 | |
GNMA CMO, Ser 2013-H01, Cl JA | | | | | | | | |
0.460%, VAR ICE LIBOR USD 1 | | | | | | | | |
Month+0.320%, 01/20/2063 | | | 763 | | | | 762 | |
GNMA CMO, Ser 2013-H01, Cl TA | | | | | | | | |
0.640%, VAR ICE LIBOR USD 1 | | | | | | | | |
Month+0.500%, 01/20/2063 | | | 15 | | | | 15 | |
GNMA CMO, Ser 2014-186, IO | | | | | | | | |
0.695%, 08/16/2054 (A) | | | 7,906 | | | | 259 | |
GNMA CMO, Ser 2014-47, Cl IA, IO | | | | | | | | |
0.128%, 02/16/2048 (A) | | | 943 | | | | 13 | |
GNMA CMO, Ser 2014-50, IO | | | | | | | | |
0.671%, 09/16/2055 (A) | | | 3,718 | | | | 142 | |
GNMA CMO, Ser 2014-H04, Cl FB | | | | | | | | |
0.790%, VAR ICE LIBOR USD 1 | | | | | | | | |
Month+0.650%, 02/20/2064 | | | 1,743 | | | | 1,753 | |
GNMA CMO, Ser 2016-135, Cl SB, IO | | | | | | | | |
5.959%, 10/16/2046 (A) | | | 443 | | | | 129 | |
| | | | | | | | |
| | | |
| Description | | Face Amount
(Thousands) | | Market Value
($ Thousands) |
|
MORTGAGE-BACKED SECURITIES (continued) | |
GNMA CMO, Ser 2016-84, Cl IG, IO | | | | | | | | |
4.500%, 11/16/2045 | | $ | 162 | | | $ | 30 | |
GNMA CMO, Ser 2017-167, Cl BQ | | | | | | | | |
2.500%, 08/20/2044 | | | 1,638 | | | | 1,698 | |
GNMA CMO, Ser 2018-11, Cl PC | | | | | | | | |
2.750%, 12/20/2047 | | | 3,401 | | | | 3,544 | |
GNMA CMO, Ser 2018-H06, Cl PF | | | | | | | | |
0.440%, VAR ICE LIBOR USD 1 | | | | | | | | |
Month+0.300%, 02/20/2068 | | | 785 | | | | 783 | |
GNMA CMO, Ser 2018-H07, Cl FD | | | | | | | | |
0.440%, VAR ICE LIBOR USD 1 | | | | | | | | |
Month+0.300%, 05/20/2068 | | | 1,396 | | | | 1,392 | |
GNMA CMO, Ser 2019-123, Cl A | | | | | | | | |
3.000%, 10/20/2049 | | | 543 | | | | 559 | |
GNMA CMO, Ser 2019-132, Cl NA | | | | | | | | |
3.500%, 09/20/2049 | | | 2,466 | | | | 2,593 | |
GNMA CMO, Ser 2019-15, Cl GT | | | | | | | | |
3.500%, 02/20/2049 | | | 2,779 | | | | 2,960 | |
GNMA CMO, Ser 2019-31, Cl JC | | | | | | | | |
3.500%, 03/20/2049 | | | 1,469 | | | | 1,552 | |
GNMA CMO, Ser 2019-71, Cl PT | | | | | | | | |
3.000%, 06/20/2049 | | | 613 | | | | 636 | |
GNMA CMO, Ser 2019-90, Cl AB | | | | | | | | |
3.000%, 07/20/2049 | | | 750 | | | | 778 | |
GNMA CMO, Ser 2020-123, Cl NI, IO | | | | | | | | |
2.500%, 08/20/2050 | | | 1,295 | | | | 179 | |
GNMA CMO, Ser 2020-123, Cl IL, IO | | | | | | | | |
2.500%, 08/20/2050 | | | 399 | | | | 54 | |
GNMA CMO, Ser 2020-127, Cl IN, IO | | | | | | | | |
2.500%, 08/20/2050 | | | 597 | | | | 78 | |
GNMA CMO, Ser 2020-129, Cl IE, IO | | | | | | | | |
2.500%, 09/20/2050 | | | 496 | | | | 66 | |
GNMA CMO, Ser 2020-160, Cl IH, IO | | | | | | | | |
2.500%, 10/20/2050 | | | 400 | | | | 56 | |
GNMA CMO, Ser 2020-160, Cl VI, IO | | | | | | | | |
2.500%, 10/20/2050 | | | 596 | | | | 84 | |
GNMA CMO, Ser 2020-160, Cl YI, IO | | | | | | | | |
2.500%, 10/20/2050 | | | 1,900 | | | | 265 | |
GNMA CMO, Ser 2020-47, Cl NI, IO | | | | | | | | |
3.500%, 04/20/2050 | | | 387 | | | | 66 | |
GNMA CMO, Ser 2020-47, Cl MI, IO | | | | | | | | |
3.500%, 04/20/2050 | | | 1,161 | | | | 193 | |
GNMA CMO, Ser 2020-H12, Cl F | | | | | | | | |
0.647%, VAR ICE LIBOR USD 1 | | | | | | | | |
Month+0.500%, 07/20/2070 | | | 199 | | | | 200 | |
GNMA CMO, Ser 2020-H13, Cl FA | | | | | | | | |
0.597%, VAR ICE LIBOR USD 1 | | | | | | | | |
Month+0.450%, 07/20/2070 | | | 797 | | | | 797 | |
GNMA TBA | | | | | | | | |
2.500%, 05/09/2026 to 01/15/2051 | | | 52,300 | | | | 55,043 | |
2.000%, 04/20/2050 to 01/15/2051 | | | 109,825 | | | | 114,647 | |
| | |
SEI Institutional Investments Trust / Semi-Annual Report / November 30, 2020 | | 97 |
SCHEDULE OF INVESTMENTS (Unaudited)
November 30, 2020
Core Fixed Income Fund (Continued)
| | | | | | | | |
| | | |
| Description | | Face Amount
(Thousands) | | Market Value
($ Thousands) |
|
MORTGAGE-BACKED SECURITIES (continued) | |
GNMA, Ser 2013-107, Cl AD | | | | | | | | |
2.695%, 11/16/2047 (A) | | $ | 780 | | | $ | 824 | |
GNMA, Ser 2015-167, Cl OI, IO | | | | | | | | |
4.000%, 04/16/2045 | | | 321 | | | | 46 | |
GNMA, Ser 2016-128, IO | | | | | | | | |
0.897%, 09/16/2056 (A) | | | 9,423 | | | | 546 | |
GNMA, Ser 2017-135, Cl AG | | | | | | | | |
2.600%, 08/16/2058 | | | 752 | | | | 787 | |
GNMA, Ser 2017-145, IO | | | | | | | | |
0.623%, 04/16/2057 (A) | | | 4,143 | | | | 198 | |
GNMA, Ser 2017-157, IO | | | | | | | | |
0.567%, 12/16/2059 (A) | | | 3,220 | | | | 158 | |
GNMA, Ser 2017-190, IO | | | | | | | | |
0.621%, 03/16/2060 (A) | | | 5,755 | | | | 281 | |
GNMA, Ser 2017-8, IO | | | | | | | | |
0.649%, 08/16/2058 (A) | | | 3,356 | | | | 166 | |
GNMA, Ser 2019-28, Cl AB | | | | | | | | |
3.150%, 06/16/2060 | | | 1,421 | | | | 1,493 | |
GNMA, Ser 2020-41, IO | | | | | | | | |
0.708%, 07/16/2058 (A) | | | 1,467 | | | | 74 | |
GNMA, Ser 2020-H09, Cl NF | | | | | | | | |
1.397%, VAR ICE LIBOR USD 1 | | | | | | | | |
Month+1.250%, 04/20/2070 | | | 374 | | | | 386 | |
GNMA, Ser 2020-H09, Cl FL | | | | | | | | |
1.297%, VAR ICE LIBOR USD 1 | | | | | | | | |
Month+1.150%, 05/20/2070 | | | 1,398 | | | | 1,465 | |
NCUA Guaranteed Notes CMO, Ser 2010-R3, Cl 2A | | | | | | | | |
0.698%, VAR ICE LIBOR USD 1 | | | | | | | | |
Month+0.560%, 12/08/2020 | | | 178 | | | | 178 | |
NCUA Guaranteed Notes CMO, Ser 2010-R3, Cl 1A | | | | | | | | |
0.698%, VAR ICE LIBOR USD 1 | | | | | | | | |
Month+0.560%, 12/08/2020 | | | 194 | | | | 194 | |
UMBS TBA | | | | | | | | |
4.500%, 12/01/2040 | | | 11,214 | | | | 12,153 | |
4.000%, 11/12/2039 | | | 6,990 | | | | 7,440 | |
3.500%, 12/01/2040 | | | 20,953 | | | | 22,101 | |
3.000%, 12/12/2042 | | | 11,795 | | | | 12,321 | |
2.500%, 12/01/2042 to 01/01/2043 | | | 49,452 | | | | 51,772 | |
2.000%, 12/15/2035 to 02/15/2051 | | | 365,482 | | | | 378,749 | |
1.500%, 12/15/2035 to 02/15/2051 | | | 37,028 | | | | 37,734 | |
| | | | | | | | |
| | | | | | | 2,348,011 | |
| | | | | | | | |
|
Non-Agency Mortgage-Backed Obligations — 4.3% | |
American Home Mortgage Investment Trust, Ser 2005-1, Cl 1A2 | | | | | | | | |
0.709%, VAR ICE LIBOR USD 1 | | | | | | | | |
Month+0.280%, 06/25/2045 | | | 2,324 | | | | 2,282 | |
Angel Oak Mortgage Trust I LLC, Ser 2019-2, Cl A1 | | | | | | | | |
3.628%, 03/25/2049 (A)(C) | | | 585 | | | | 599 | |
| | | | | | | | |
| | | |
| Description | | Face Amount
(Thousands) | | Market Value
($ Thousands) |
|
MORTGAGE-BACKED SECURITIES (continued) | |
Angel Oak Mortgage Trust, Ser 2020-2, Cl A1A | | | | | | | | |
2.531%, 01/26/2065 (A)(C) | | $ | 2,278 | | | $ | 2,325 | |
Angel Oak Mortgage Trust, Ser 2020-5, Cl A1 | | | | | | | | |
1.373%, 05/25/2065 (A)(C) | | | 786 | | | | 787 | |
Aventura Mall Trust, Ser 2018-AVM, Cl A | | | | | | | | |
4.249%, 07/05/2040 (A)(C) | | | 750 | | | | 809 | |
BAMLL Commercial Mortgage Securities Trust, Ser 2018-PARK, Cl A | | | | | | | | |
4.227%, 08/10/2038 (A)(C) | | | 2,640 | | | | 3,069 | |
Banc of America Alternative Loan Trust, Ser 2006-8, Cl 3A1 | | | | | | | | |
4.085%, 11/25/2021 (A) | | | 9 | | | | 7 | |
Banc of America Alternative Loan Trust, Ser 2007-1, Cl 2A1 | | | | | | | | |
5.888%, 04/25/2037 (A) | | | 73 | | | | 74 | |
Banc of America Funding Trust, Ser 2003-2, Cl 1A1 | | | | | | | | |
6.500%, 06/25/2032 | | | 6 | | | | 6 | |
Banc of America Funding Trust, Ser 2004-2, Cl 1CB1 | | | | | | | | |
5.750%, 09/20/2034 | | | 77 | | | | 83 | |
Banc of America Funding Trust, Ser 2004-C, Cl 1A1 | | | | | | | | |
3.232%, 12/20/2034 (A) | | | 25 | | | | 25 | |
Banc of America Funding Trust, Ser 2005-B, Cl 2A1 | | | | | | | | |
3.608%, 04/20/2035 (A) | | | 968 | | | | 899 | |
Banc of America Funding Trust, Ser 2006-G, Cl 2A4 | | | | | | | | |
0.727%, VAR ICE LIBOR USD 1 | | | | | | | | |
Month+0.580%, 07/20/2036 | | | 1,158 | | | | 1,168 | |
Banc of America Funding Trust, Ser 2015-R2, Cl 9A1 | | | | | | | | |
0.365%, VAR ICE LIBOR USD 1 | | | | | | | | |
Month+0.215%, 03/27/2036 (C) | | | 659 | | | | 659 | |
BANK, Ser 2017-BNK7, Cl A5 | | | | | | | | |
3.435%, 09/15/2060 | | | 1,170 | | | | 1,326 | |
BANK, Ser 2019-BN19, Cl A3 | | | | | | | | |
3.183%, 08/15/2061 | | | 385 | | | | 435 | |
BANK, Ser 2019-BN23, Cl A3 | | | | | | | | |
2.920%, 12/15/2052 | | | 165 | | | | 183 | |
BBCMS Mortgage Trust, Ser 2020-C6, Cl A2 | | | | | | | | |
2.690%, 02/15/2053 | | | 1,205 | | | | 1,268 | |
BBCMS Trust, Ser 2015-SRCH, Cl A1 | | | | | | | | |
3.312%, 08/10/2035 (C) | | | 835 | | | | 878 | |
BBCMS Trust, Ser 2018-CBM, Cl A | | | | | | | | |
1.141%, VAR ICE LIBOR USD 1 | | | | | | | | |
Month+1.000%, 07/15/2037 (C) | | | 2,705 | | | | 2,597 | |
BCAP LLC Trust, Ser 2009-RR5, Cl 8A1 | | | | | | | | |
5.500%, 11/26/2034 (A)(C) | | | 15 | | | | 15 | |
| | |
98 | | SEI Institutional Investments Trust / Semi-Annual Report / November 30, 2020 |
| | | | | | | | |
| | | |
| Description | | Face Amount
(Thousands) | | Market Value
($ Thousands) |
|
MORTGAGE-BACKED SECURITIES (continued) | |
Bear Stearns Adjustable Rate Mortgage Trust, Ser 2004-2, Cl 14A | | | | | | | | |
3.651%, 05/25/2034 (A) | | $ | 20 | | | $ | 20 | |
Bear Stearns Commercial Mortgage Securities Trust, Ser 2005-PWR8, Cl X1, IO | | | | | | | | |
0.716%, 06/11/2041 (A)(C) | | | 4 | | | | – | |
Benchmark Mortgage Trust, Ser 2018-B1, Cl ASB | | | | | | | | |
3.602%, 01/15/2051 (A) | | | 263 | | | | 294 | |
Benchmark Mortgage Trust, Ser 2020-B20, Cl A5 | | | | | | | | |
2.034%, 10/15/2053 | | | 3,483 | | | | 3,619 | |
Benchmark Mortgage Trust, Ser B21, Cl A5 | | | | | | | | |
1.978%, 12/15/2053 | | | 1,745 | | | | 1,800 | |
BFLD, Ser 2019-DPLO, Cl A | | | | | | | | |
1.231%, VAR ICE LIBOR USD 1 | | | | | | | | |
Month+1.090%, 10/15/2034 (C) | | | 1,600 | | | | 1,568 | |
Bunker Hill Loan Depositary Trust, Ser 2019-1, Cl A1 | | | | | | | | |
3.613%, 10/26/2048 (C) | | | 849 | | | | 884 | |
Bunker Hill Loan Depositary Trust, Ser 2019-2, Cl A1 | | | | | | | | |
2.879%, 07/25/2049 (C) | | | 1,509 | | | | 1,551 | |
Bunker Hill Loan Depositary Trust, Ser 2019-3, Cl A1 | | | | | | | | |
2.724%, 11/25/2059 (C) | | | 1,683 | | | | 1,729 | |
BWAY Mortgage Trust, Ser 2015-1740, Cl A | | | | | | | | |
2.917%, 01/10/2035 (C) | | | 2,420 | | | | 2,459 | |
BX Commercial Mortgage Trust, Ser 2019- XL, Cl A | | | | | | | | |
1.061%, VAR ICE LIBOR USD 1 | | | | | | | | |
Month+0.920%, 10/15/2036 (C) | | | 1,751 | | | | 1,751 | |
BX Commercial Mortgage Trust, Ser 2020- FOX, Cl A | | | | | | | | |
1.141%, VAR ICE LIBOR USD 1 | | | | | | | | |
Month+1.000%, 11/15/2032 (C) | | | 4,320 | | | | 4,327 | |
BX Trust, Ser 2019-MMP, Cl A | | | | | | | | |
1.141%, VAR ICE LIBOR USD 1 | | | | | | | | |
Month+1.000%, 08/15/2036 (C) | | | 520 | | | | 517 | |
BX Trust, Ser 2019-OC11, Cl A | | | | | | | | |
3.202%, 12/09/2041 (C) | | | 995 | | | | 1,062 | |
CALI Mortgage Trust, Ser 2019-101C, Cl A | | | | | | | | |
3.957%, 03/10/2029 | | | 1,905 | | | | 2,188 | |
CAMB Commercial Mortgage Trust, Ser 2019- LIFE, Cl A | | | | | | | | |
1.211%, VAR ICE LIBOR USD 1 | | | | | | | | |
Month+1.070%, 12/15/2037 (C) | | | 1,715 | | | | 1,714 | |
CD Commercial Mortgage Trust, Ser 2006- CD2, Cl X, IO | | | | | | | | |
0.023%, 01/15/2046 (A)(C) | | | 276 | | | | – | |
CD Commercial Mortgage Trust, Ser 2007- CD4, Cl XC, IO | | | | | | | | |
1.379%, 12/11/2049 (A)(C) | | | 24 | | | | – | |
| | | | | | | | |
| | | |
| Description | | Face Amount
(Thousands) | | Market Value
($ Thousands) |
|
MORTGAGE-BACKED SECURITIES (continued) | |
CD Commercial Mortgage Trust, Ser 2017- CD3, Cl A4 | | | | | | | | |
3.631%, 02/10/2050 | | $ | 1,240 | | | $ | 1,400 | |
CD Commercial Mortgage Trust, Ser 2017- CD4, Cl ASB | | | | | | | | |
3.317%, 05/10/2050 | | | 734 | | | | 800 | |
CD Commercial Mortgage Trust, Ser 2017-CD6, Cl ASB | | | | | | | | |
3.332%, 11/13/2050 | | | 1,764 | | | | 1,942 | |
Century Plaza Towers, Ser 2019-CPT, Cl A | | | | | | | | |
2.865%, 11/13/2039 (C) | | | 1,865 | | | | 2,031 | |
CFCRE Commercial Mortgage Trust, Ser 2017-C8, Cl ASB | | | | | | | | |
3.367%, 06/15/2050 | | | 763 | | | | 830 | |
CFCRE Commercial Mortgage Trust, Ser 2017-C8, Cl A1 | | | | | | | | |
1.965%, 06/15/2050 | | | 54 | | | | 54 | |
Chase Mortgage Finance Trust, Ser 2007-A1, Cl 2A1 | | | | | | | | |
3.160%, 02/25/2037 (A) | | | 26 | | | | 26 | |
Chase Mortgage Finance Trust, Ser 2007-A1, Cl 9A1 | | | | | | | | |
3.715%, 02/25/2037 (A) | | | 22 | | | | 22 | |
Chase Mortgage Finance Trust, Ser 2007-A2, Cl 1A1 | | | | | | | | |
3.496%, 06/25/2035 (A) | | | 46 | | | | 44 | |
Chevy Chase Funding Mortgage-Backed Certificates, Ser 2003-4X, Cl A2 | | | | | | | | |
0.930%, VAR ICE LIBOR USD 1 | | | | | | | | |
Month+0.780%, 10/25/2034 | | | 1,582 | | | | 1,556 | |
Citigroup Commercial Mortgage Trust, Ser 2014-GC25, Cl AS | | | | | | | | |
4.017%, 10/10/2047 | | | 880 | | | | 960 | |
Citigroup Commercial Mortgage Trust, Ser 2016-P5, Cl A1 | | | | | | | | |
1.410%, 10/10/2049 | | | 54 | | | | 54 | |
Citigroup Commercial Mortgage Trust, Ser 2019-GC41, Cl A5 | | | | | | | | |
2.869%, 08/10/2056 | | | 4,120 | | | | 4,547 | |
Citigroup Global Markets Mortgage Securities VII, Ser 2003-HYB1, Cl A | | | | | | | | |
2.595%, 09/25/2033 (A) | | | 43 | | | | 43 | |
Citigroup Mortgage Loan Trust, Ser 2004- HYB1, Cl A41 | | | | | | | | |
2.921%, 02/25/2034 (A) | | | 5 | | | | 5 | |
Citigroup Mortgage Loan Trust, Ser 2004- UST1, Cl A6 | | | | | | | | |
2.634%, 08/25/2034 (A) | | | 10 | | | | 10 | |
Citigroup Mortgage Loan Trust, Ser 2009-10, Cl 1A1 | | | | | | | | |
2.801%, 09/25/2033 (A)(C) | | | 63 | | | | 63 | |
COLT Mortgage Loan Trust, Ser 2019-1, Cl A1 | | | | | | | | |
3.705%, 03/25/2049 (A)(C) | | | 458 | | | | 463 | |
| | |
SEI Institutional Investments Trust / Semi-Annual Report / November 30, 2020 | | 99 |
SCHEDULE OF INVESTMENTS (Unaudited)
November 30, 2020
Core Fixed Income Fund (Continued)
| | | | | | | | |
| | | |
| Description | | Face Amount
(Thousands) | | Market Value
($ Thousands) |
|
MORTGAGE-BACKED SECURITIES (continued) | |
COLT Mortgage Loan Trust, Ser 2019-2, Cl A1 | | | | | | | | |
3.337%, 05/25/2049 (A)(C) | | $ | 882 | | | $ | 888 | |
COLT Mortgage Loan Trust, Ser 2019-4, Cl A1 | | | | | | | | |
2.579%, 11/25/2049 (A)(C) | | | 1,277 | | | | 1,293 | |
COLT Mortgage Loan Trust, Ser 2020-2, Cl A1 | | | | | | | | |
1.853%, 03/25/2065 (A)(C) | | | 1,416 | | | | 1,434 | |
COMM Mortgage Trust, Ser 2013-CR12, Cl AM | | | | | | | | |
4.300%, 10/10/2046 | | | 220 | | | | 229 | |
COMM Mortgage Trust, Ser 2013-CR12, Cl C | | | | | | | | |
5.241%, 10/10/2046 (A) | | | 90 | | | | 89 | |
COMM Mortgage Trust, Ser 2013-CR12, Cl B | | | | | | | | |
4.762%, 10/10/2046 (A) | | | 190 | | | | 192 | |
COMM Mortgage Trust, Ser 2013-CR6, Cl A4 | | | | | | | | |
3.101%, 03/10/2046 | | | 2,879 | | | | 2,981 | |
COMM Mortgage Trust, Ser 2013-LC13, Cl B | | | | | | | | |
5.009%, 08/10/2046 (A)(C) | | | 1,150 | | | | 1,208 | |
COMM Mortgage Trust, Ser 2013-LC6, Cl AM | | | | | | | | |
3.282%, 01/10/2046 | | | 885 | | | | 920 | |
COMM Mortgage Trust, Ser 2014-CR14, Cl B | | | | | | | | |
4.767%, 02/10/2047 (A) | | | 350 | | | | 381 | |
COMM Mortgage Trust, Ser 2014-CR15, Cl A2 | | | | | | | | |
2.928%, 02/10/2047 | | | 35 | | | | 35 | |
COMM Mortgage Trust, Ser 2014-UBS2, Cl XA, IO | | | | | | | | |
1.317%, 03/10/2047 (A) | | | 12,445 | | | | 370 | |
COMM Mortgage Trust, Ser 2014-UBS3, Cl AM | | | | | | | | |
4.012%, 06/10/2047 | | | 510 | | | | 553 | |
COMM Mortgage Trust, Ser 2014-UBS4, Cl A4 | | | | | | | | |
3.420%, 08/10/2047 | | | 1,530 | | | | 1,622 | |
COMM Mortgage Trust, Ser 2015CR26, Cl C | | | | | | | | |
4.629%, 10/10/2048 (A) | | | 165 | | | | 173 | |
COMM Mortgage Trust, Ser 2015-DC1, Cl A2 | | | | | | | | |
2.870%, 02/10/2048 | | | 17 | | | | 18 | |
COMM Mortgage Trust, Ser 2015-LC19, Cl XA, IO | | | | | | | | |
1.261%, 02/10/2048 (A) | | | 16,119 | | | | 623 | |
COMM Mortgage Trust, Ser 2015-LC21, Cl A4 | | | | | | | | |
3.708%, 07/10/2048 | | | 614 | | | | 680 | |
COMM Mortgage Trust, Ser 2017-PANW, Cl A | | | | | | | | |
3.244%, 10/10/2029 (C) | | | 1,780 | | | | 1,863 | |
COMM Mortgage Trust, Ser 2020-CBM, Cl A2 | | | | | | | | |
2.896%, 02/10/2037 (C) | | | 2,230 | | | | 2,221 | |
COMM Mortgage Trust, Ser 2020-CX, Cl A | | | | | | | | |
2.173%, 11/10/2046 (C) | | | 3,290 | | | | 3,425 | |
Core Mortgage Trust, Ser 2019-CORE, Cl A | | | | | | | | |
1.021%, VAR ICE LIBOR USD 1 | | | | | | | | |
Month+0.880%, 12/15/2031 (C) | | | 1,380 | | | | 1,374 | |
Countrywide Alternative Loan Trust, Ser 2004-27CB, Cl A1 | | | | | | | | |
6.000%, 12/25/2034 | | | 487 | | | | 489 | |
| | | | | | | | |
| | | |
| Description | | Face Amount
(Thousands) | | Market Value
($ Thousands) |
|
MORTGAGE-BACKED SECURITIES (continued) | |
Countrywide Alternative Loan Trust, Ser 2004-J6, PO | | | | | | | | |
0.000%, 11/25/2031 (B) | | $ | 25 | | | $ | 24 | |
Countrywide Alternative Loan Trust, Ser 2004-J6, Cl 2A1 | | | | | | | | |
6.500%, 11/25/2031 | | | 204 | | | | 213 | |
Countrywide Home Loan Mortgage Pass- Through Trust, Ser 2004-14, Cl 4A1 | | | | | | | | |
2.662%, 08/25/2034 (A) | | | 108 | | | | 103 | |
Countrywide Home Loan Mortgage Pass- Through Trust, Ser 2005-20, Cl A7 | | | | | | | | |
5.250%, 12/25/2027 | | | 139 | | | | 120 | |
Credit Suisse Commercial Mortgage Securities, Ser 2019-SKLZ, Cl A | | | | | | | | |
1.391%, VAR ICE LIBOR USD 1 | | | | | | | | |
Month+1.250%, 01/15/2034 (C) | | | 3,660 | | | | 3,547 | |
Credit Suisse Mortgage Capital Certificates, Ser 2019-ICE4, Cl A | | | | | | | | |
1.121%, VAR ICE LIBOR USD 1 | | | | | | | | |
Month+0.980%, 05/15/2036 (C) | | | 7,100 | | | | 7,102 | |
Credit Suisse Mortgage Trust, Ser 2019- NQM1, Cl A3 | | | | | | | | |
3.064%, 10/25/2059 (C) | | | 3,622 | | | | 3,711 | |
CSAIL Commercial Mortgage Trust, Ser 2015- C3, Cl A2 | | | | | | | | |
3.033%, 08/15/2048 | | | 106 | | | | 106 | |
CSAIL Commercial Mortgage Trust, Ser 2015- C3, Cl A3 | | | | | | | | |
3.447%, 08/15/2048 | | | 975 | | | | 1,047 | |
CSAIL Commercial Mortgage Trust, Ser 2015- C4, Cl A4 | | | | | | | | |
3.808%, 11/15/2048 | | | 695 | | | | 778 | |
CSAIL Commercial Mortgage Trust, Ser 2020- C19, Cl AS | | | | | | | | |
2.971%, 03/15/2053 | | | 1,060 | | | | 1,140 | |
CSAIL Commercial Mortgage Trust, Ser 2020- C19, Cl C | | | | | | | | |
3.735%, 03/15/2053 (A) | | | 900 | | | | 884 | |
CSFB Mortgage-Backed Pass-Through Certificates, Ser 2003-27, Cl 5A3 | | | | | | | | |
5.250%, 11/25/2033 | | | 32 | | | | 33 | |
CSFB Mortgage-Backed Pass-Through Certificates, Ser 2003-29, Cl 5A1 | | | | | | | | |
7.000%, 12/25/2033 | | | 57 | | | | 59 | |
CSMC Trust, Ser 2014-USA, Cl B | | | | | | | | |
4.185%, 09/15/2037 (C) | | | 3,900 | | | | 3,559 | |
CSMC Trust, Ser 2014-USA, Cl A2 | | | | | | | | |
3.953%, 09/15/2037 (C) | | | 3,530 | | | | 3,601 | |
CSMC Trust, Ser 2015-5R, Cl 1A1 | | | | | | | | |
1.803%, 09/27/2046 (A)(C) | | | 1,976 | | | | 1,968 | |
CSMC Trust, Ser 2018-J1, Cl A2 | | | | | | | | |
3.500%, 02/25/2048 (A)(C) | | | 8,254 | | | | 8,481 | |
| | |
100 | | SEI Institutional Investments Trust / Semi-Annual Report / November 30, 2020 |
| | | | | | | | |
| | | |
| Description | | Face Amount
(Thousands) | | Market Value
($ Thousands) |
|
MORTGAGE-BACKED SECURITIES (continued) | |
CSMC Trust, Ser 2018-RPL9, Cl A | | | | | | | | |
3.850%, 09/25/2057 (A)(C) | | $ | 5,574 | | | $ | 6,113 | |
CSMC Trust, Ser 2019-AFC1, Cl A1 | | | | | | | | |
2.573%, 07/25/2049 (C) | | | 3,106 | | | | 3,176 | |
CSMC Trust, Ser 2020-FACT, Cl A | |
1.491%, VAR ICE LIBOR USD 1 Month+1.350%, 10/15/2037 (C) | | | 4,280 | | | | 4,286 | |
DBCCRE Mortgage Trust, Ser 2014-ARCP, Cl C | | | | | | | | |
5.099%, 01/10/2034 (A)(C) | | | 560 | | | | 588 | |
DBCCRE Mortgage Trust, Ser 2014-ARCP, Cl A | | | | | | | | |
4.238%, 01/10/2034 (C) | | | 2,450 | | | | 2,604 | |
DBJPM Mortgage Trust, Ser 2016-C1, Cl B | | | | | | | | |
4.195%, 05/10/2049 (A) | | | 1,780 | | | | 1,857 | |
DBJPM Mortgage Trust, Ser 2017-C6, Cl ASB | | | | | | | | |
3.121%, 06/10/2050 | | | 433 | | | | 469 | |
DBJPM Mortgage Trust, Ser 2020-C9, Cl A5 | | | | | | | | |
1.926%, 09/15/2053 | | | 341 | | | | 351 | |
DC Office Trust, Ser 2019-MTC, Cl A | | | | | | | | |
2.965%, 09/15/2045 (C) | | | 1,995 | | | | 2,185 | |
DSLA Mortgage Loan Trust, Ser 2004-AR2, Cl A2B | | | | | | | | |
0.950%, VAR ICE LIBOR USD 1 Month+0.800%, 11/19/2044 | | | 477 | | | | 440 | |
EverBank Mortgage Loan Trust, Ser 2018-1, Cl A22 | | | | | | | | |
3.500%, 02/25/2048 (A)(C) | | | 1,890 | | | | 1,950 | |
FHLMC STACR REMIC Trust, Ser 2020-DNA5, Cl M1 | | | | | | | | |
1.388%, VAR SOFR30A+1.300%, 10/25/2050 (C) | | | 1,830 | | | | 1,833 | |
FHLMC Structured Agency Credit Risk Debt Notes, Ser 2014-DN1, Cl M2 | | | | | | | | |
2.350%, VAR ICE LIBOR USD 1 Month+2.200%, 02/25/2024 | | | 106 | | | | 106 | |
First Horizon Alternative Mortgage Securities Trust, Ser 2004-AA3, Cl A1 | | | | | | | | |
2.479%, 09/25/2034 (A) | | | 48 | | | | 47 | |
Flagstar Mortgage Trust, Ser 2018-2, Cl A4 | | | | | | | | |
3.500%, 04/25/2048 (A)(C) | | | 3,053 | | | | 3,095 | |
FNMA Connecticut Avenue Securities, Ser 2016-C02, Cl 1M2 | | | | | | | | |
6.150%, VAR ICE LIBOR USD 1 Month+6.000%, 09/25/2028 | | | 2,208 | | | | 2,332 | |
FNMA Connecticut Avenue Securities, Ser 2017-C01, Cl 1ED1 | | | | | | | | |
1.400%, VAR ICE LIBOR USD 1 Month+1.250%, 07/25/2029 | | | 2,275 | | | | 2,261 | |
FWDSecuritization Trust, Ser 2019-INV1, Cl A1 | | | | | | | | |
2.810%, 06/25/2049 (A)(C) | | | 1,614 | | | | 1,653 | |
GCAT LLC, Ser 2019-NQM1, Cl A1 | | | | | | | | |
2.985%, 02/25/2059 (C) | | | 542 | | | | 552 | |
Grace Trust, Ser 2020-GRCE, Cl A | | | | | | | | |
2.347%, 12/10/2040 (C) | | | 4,175 | | | | 4,374 | |
| | | | | | | | |
| | | |
| Description | | Face Amount
(Thousands) | | Market Value
($ Thousands) |
|
MORTGAGE-BACKED SECURITIES (continued) | |
GS Mortgage Securities Trust, Ser 2006-GG8, Cl X, IO | | | | | | | | |
1.270%, 11/10/2039 (A)(C) | | $ | 814 | | | $ | 1 | |
GS Mortgage Securities Trust, Ser 2010-C1, Cl A2 | | | | | | | | |
4.592%, 08/10/2043 (C) | | | 586 | | | | 586 | |
GS Mortgage Securities Trust, Ser 2012-GC6, Cl A3 | | | | | | | | |
3.482%, 01/10/2045 | | | 2,007 | | | | 2,042 | |
GS Mortgage Securities Trust, Ser 2012-GC6, Cl C | | | | | | | | |
5.839%, 01/10/2045 (A)(C) | | | 1,473 | | | | 1,375 | |
GS Mortgage Securities Trust, Ser 2012-GCJ7, Cl AAB | | | | | | | | |
2.935%, 05/10/2045 | | | 4 | | | | 4 | |
GS Mortgage Securities Trust, Ser 2013-GC16, Cl B | | | | | | | | |
5.161%, 11/10/2046 (A) | | | 390 | | | | 411 | |
GS Mortgage Securities Trust, Ser 2014-GC18, Cl A4 | | | | | | | | |
4.074%, 01/10/2047 | | | 2,005 | | | | 2,162 | |
GS Mortgage Securities Trust, Ser 2014-GC18, Cl A3 | | | | | | | | |
3.801%, 01/10/2047 | | | 606 | | | | 628 | |
GS Mortgage Securities Trust, Ser 2015-GC32, Cl XA, IO | | | | | | | | |
0.886%, 07/10/2048 (A) | | | 33,914 | | | | 980 | |
GS Mortgage Securities Trust, Ser 2015-GC34, Cl A4 | | | | | | | | |
3.506%, 10/10/2048 | | | 1,144 | | | | 1,261 | |
GS Mortgage Securities Trust, Ser 2017-GS8, Cl A4 | | | | | | | | |
3.469%, 11/10/2050 | | | 1,698 | | | | 1,923 | |
GS Mortgage Securities Trust, Ser 2017-SLP, Cl C | | | | | | | | |
3.924%, 10/10/2032 (C) | | | 4,610 | | | | 4,584 | |
GS Mortgage Securities Trust, Ser 2018-SRP5, Cl B | | | | | | | | |
4.481%, 06/09/2021 | | | 3,770 | | | | 3,148 | |
GS Mortgage Securities Trust, Ser 2018-SRP5, Cl A | | | | | | | | |
3.281%, 06/09/2021 | | | 3,770 | | | | 3,163 | |
GS Mortgage-Backed Securities Trust, Ser 2018-RPL1, Cl A1A | | | | | | | | |
3.750%, 10/25/2057 (C) | | | 6,141 | | | | 6,538 | |
GSMPS Mortgage Loan Trust, Ser 1998-1, Cl A | | | | | | | | |
8.000%, 09/19/2027 (A)(C) | | | 1 | | | | 1 | |
GSMPS Mortgage Loan Trust, Ser 2005-RP3, Cl 1AS, IO | | | | | | | | |
4.252%, 09/25/2035 (A)(C) | | | 192 | | | | 26 | |
GSR Mortgage Loan Trust, Ser 2004-8F, Cl 2A3 | | | | | | | | |
6.000%, 09/25/2034 | | | 53 | | | | 54 | |
| | |
SEI Institutional Investments Trust / Semi-Annual Report / November 30, 2020 | | 101 |
SCHEDULE OF INVESTMENTS (Unaudited)
November 30, 2020
Core Fixed Income Fund (Continued)
| | | | | | | | |
| | | |
| Description | | Face Amount
(Thousands) | | Market Value
($ Thousands) |
|
MORTGAGE-BACKED SECURITIES (continued) | |
GSR Mortgage Loan Trust, Ser 2007-1F, Cl 2A4 | | | | | | | | |
5.500%, 01/25/2037 | | $ | 13 | | | $ | 15 | |
Hudson Yards Mortgage Trust, Ser 2019- 30HY, Cl A | | | | | | | | |
3.228%, 07/10/2039 (C) | | | 1,900 | | | | 2,134 | |
Hudson Yards Mortgage Trust, Ser 2019- 55HY, Cl A | | | | | | | | |
3.041%, 12/10/2041 (A)(C) | | | 1,995 | | | | 2,204 | |
Impac CMB Trust, Ser 2005-4, Cl 2A1 | | | | | | | | |
0.750%, VAR ICE LIBOR USD 1 Month+0.600%, 05/25/2035 | | | 93 | | | | 89 | |
Impac Funding, Ser 2010-1, Cl A1 | | | | | | | | |
5.314%, 01/25/2051 (C) | | | 2,091 | | | | 2,260 | |
Impac Secured Assets Trust, Ser 2006-2, Cl 2A1 | | | | | | | | |
0.500%, VAR ICE LIBOR USD 1 Month+0.350%, 08/25/2036 | | | 246 | | | | 246 | |
Indymac Index Mortgage Loan Trust, Ser 2004-AR7, Cl A2 | | | | | | | | |
1.010%, VAR ICE LIBOR USD 1 Month+0.860%, 09/25/2034 | | | 13 | | | | 13 | |
Indymac Index Mortgage Loan Trust, Ser 2004-AR8, Cl 2A2A | | | | | | | | |
0.950%, VAR ICE LIBOR USD 1 Month+0.800%, 11/25/2034 | | | 22 | | | | 21 | |
JPMBB Commercial Mortgage Securities Trust, Ser 2013-C12, Cl ASB | | | | | | | | |
3.157%, 07/15/2045 | | | 197 | | | | 200 | |
JPMBB Commercial Mortgage Securities Trust, Ser 2013-C17, Cl B | | | | | | | | |
5.051%, 01/15/2047 (A) | | | 230 | | | | 246 | |
JPMBB Commercial Mortgage Securities Trust, Ser 2014-C22, Cl C | | | | | | | | |
4.705%, 09/15/2047 (A) | | | 750 | | | | 658 | |
JPMBB Commercial Mortgage Securities Trust, Ser 2014-C23, Cl A4 | | | | | | | | |
3.670%, 09/15/2047 | | | 844 | | | | 906 | |
JPMBB Commercial Mortgage Securities Trust, Ser 2015-C28, Cl A3 | | | | | | | | |
2.912%, 10/15/2048 | | | 3,443 | | | | 3,621 | |
JPMBB Commercial Mortgage Securities Trust, Ser 2015-C29, Cl A4 | | | | | | | | |
3.611%, 05/15/2048 | | | 921 | | | | 1,017 | |
JPMCC Commercial Mortgage Securities Trust, Ser 2017-JP6, Cl ASB | | | | | | | | |
3.283%, 07/15/2050 | | | 813 | | | | 886 | |
JPMCC Commercial Mortgage Securities Trust, Ser 2019-BOLT, Cl A | | | | | | | | |
1.291%, VAR ICE LIBOR USD 1 Month+1.150%, 07/15/2034 (C) | | | 1,670 | | | | 1,592 | |
| | | | | | | | |
| | | |
| Description | | Face Amount
(Thousands) | | Market Value
($ Thousands) |
|
MORTGAGE-BACKED SECURITIES (continued) | |
JPMDB Commercial Mortgage Securities Trust, Ser 2017-C5, Cl B | | | | | | | | |
4.009%, 03/15/2050 (A) | | $ | 1,740 | | | $ | 1,865 | |
JPMDB Commercial Mortgage Securities Trust, Ser 2017-C5, Cl A3 | | | | | | | | |
3.597%, 03/15/2050 | | | 550 | | | | 575 | |
JPMDB Commercial Mortgage Securities Trust, Ser 2017-C5, Cl ASB | | | | | | | | |
3.492%, 03/15/2050 | | | 291 | | | | 317 | |
JPMDB Commercial Mortgage Securities Trust, Ser 2018-C8, Cl ASB | | | | | | | | |
4.145%, 06/15/2051 | | | 1,000 | | | | 1,149 | |
JPMorgan Chase Commercial Mortgage Securities Trust, Ser 2006-CB15, Cl X1, IO | | | | | | | | |
0.393%, 06/12/2043 (A) | | | 2,102 | | | | 2 | |
JPMorgan Chase Commercial Mortgage Securities Trust, Ser 2016-JP2, Cl A4 | | | | | | | | |
2.822%, 08/15/2049 | | | 1,400 | | | | 1,518 | |
JPMorgan Chase Commercial Mortgage Securities Trust, Ser 2018-BCON, Cl B | | | | | | | | |
3.881%, 01/05/2031 (A)(C) | | | 2,415 | | | | 2,455 | |
JPMorgan Chase Commercial Mortgage Securities Trust, Ser 2018-PHH, Cl A | | | | | | | | |
2.410%, VAR ICE LIBOR USD 1 Month+0.910%, 06/15/2035 (C) | | | 2,031 | | | | 1,921 | |
JPMorgan Chase Commercial Mortgage Securities Trust, Ser 2019-OSB, Cl A | | | | | | | | |
3.397%, 06/05/2039 (C) | | | 2,000 | | | | 2,262 | |
JPMorgan Mortgage Trust, Ser 2004-A3, Cl SF3 | | | | | | | | |
2.728%, 06/25/2034 (A) | | | 255 | | | | 249 | |
JPMorgan Mortgage Trust, Ser 2005-A1, Cl 3A4 | | | | | | | | |
3.286%, 02/25/2035 (A) | | | 77 | | | | 75 | |
JPMorgan Mortgage Trust, Ser 2005-A2, Cl 5A2 | | | | | | | | |
2.785%, 04/25/2035 (A) | | | 17 | | | | 18 | |
JPMorgan Mortgage Trust, Ser 2006-A2, Cl 4A1 | | | | | | | | |
3.075%, 08/25/2034 (A) | | | 109 | | | | 112 | |
JPMorgan Mortgage Trust, Ser 2006-A2, Cl 5A3 | | | | | | | | |
2.531%, 11/25/2033 (A) | | | 110 | | | | 113 | |
JPMorgan Mortgage Trust, Ser 2017-5, Cl A2 | | | | | | | | |
3.125%, 10/26/2048 (A)(C) | | | 3,308 | | | | 3,430 | |
JPMorgan Mortgage Trust, Ser 2018-3, Cl A1 | | | | | | | | |
3.500%, 09/25/2048 (A)(C) | | | 1,749 | | | | 1,798 | |
JPMorgan Mortgage Trust, Ser 2018-4, Cl A1 | | | | | | | | |
3.500%, 10/25/2048 (A)(C) | | | 1,386 | | | | 1,424 | |
JPMorgan Mortgage Trust, Ser 2018-5, Cl A1 | | | | | | | | |
3.500%, 10/25/2048 (A)(C) | | | 1,596 | | | | 1,638 | |
| | |
102 | | SEI Institutional Investments Trust / Semi-Annual Report / November 30, 2020 |
| | | | | | | | |
| | | |
| Description | | Face Amount
(Thousands) | | Market Value
($ Thousands) |
|
MORTGAGE-BACKED SECURITIES (continued) | |
LB-UBS Commercial Mortgage Trust, Ser 2006-C1, Cl XCL, IO | | | | | | | | |
0.386%, 02/15/2041 (A)(C) | | $ | 957 | | | $ | – | |
Manhattan West, Ser 2020-1MW, Cl A | | | | | | | | |
2.130%, 09/10/2039 (C) | | | 2,300 | | | | 2,386 | |
MASTR Adjustable Rate Mortgages Trust, Ser 2004-13, Cl 3A7A | | | | | | | | |
3.191%, 11/21/2034 (A) | | | 1,252 | | | | 1,267 | |
MASTR Adjustable Rate Mortgages Trust, Ser 2004-5, Cl 3A1 | | | | | | | | |
4.125%, 06/25/2034 (A) | | | 7 | | | | 7 | |
MASTR Alternative Loans Trust, Ser 2004-4, Cl 1A1 | | | | | | | | |
5.500%, 05/25/2034 | | | 353 | | | | 366 | |
MASTR Alternative Loans Trust, Ser 2006-3, Cl 1A3 | | | | | | | | |
6.250%, 07/25/2036 | | | 220 | | | | 184 | |
MASTR Reperforming Loan Trust, Ser 2005-1, Cl 1A1 | | | | | | | | |
6.000%, 08/25/2034 (C) | | | 1,349 | | | | 1,045 | |
MASTR Reperforming Loan Trust, Ser 2005-2, Cl 1A1F | | | | | | | | |
0.500%, VAR ICE LIBOR USD 1 Month+0.350%, 05/25/2035 (C) | | | 246 | | | | 134 | |
MASTR Resecuritization Trust, Ser 2005-PO, Cl 3, PO | | | | | | | | |
0.000%, 05/28/2035 (B)(C) | | | 10 | | | | 9 | |
MASTR Seasoned Securitization Trust, Ser 2004-1, Cl 4A1 | | | | | | | | |
2.693%, 10/25/2032 (A) | | | 3 | | | | 3 | |
MASTR Seasoned Securitization Trust, Ser 2005-1, Cl 4A1 | | | | | | | | |
2.625%, 10/25/2032 (A) | | | 24 | | | | 25 | |
Mello Warehouse Securitization Trust, Ser 2020-1, Cl A | | | | | | | | |
1.050%, VAR ICE LIBOR USD 1 Month+0.900%, 10/25/2053 (C) | | | 1,715 | | | | 1,718 | |
Merrill Lynch Mortgage Investors Trust, Ser 2003-A4, Cl 2A | | | | | | | | |
3.321%, 07/25/2033 (A) | | | 36 | | | | 36 | |
Merrill Lynch Mortgage Investors Trust, Ser 2004-1, Cl 2A1 | | | | | | | | |
2.634%, 12/25/2034 (A) | | | 87 | | | | 87 | |
Merrill Lynch Mortgage Investors Trust, Ser 2004-A1, Cl 2A1 | | | | | | | | |
3.024%, 02/25/2034 (A) | | | 33 | | | | 33 | |
Merrill Lynch Mortgage Investors Trust, Ser 2004-A1, Cl 4A | | | | | | | | |
4.000%, 02/25/2034 (A) | | | 40 | | | | 40 | |
Merrill Lynch Mortgage Investors Trust, Ser 2004-A4, Cl A2 | | | | | | | | |
3.193%, 08/25/2034 (A) | | | 49 | | | | 50 | |
| | | | | | | | |
| | | |
| Description | | Face Amount
(Thousands) | | Market Value
($ Thousands) |
|
MORTGAGE-BACKED SECURITIES (continued) | |
Merrill Lynch Mortgage Investors Trust, Ser 2004-D, Cl A2 | | | | | | | | |
1.034%, VAR ICE LIBOR USD 6 Month+0.720%, 09/25/2029 | | $ | 74 | | | $ | 71 | |
Merrill Lynch Mortgage Investors Trust, Ser 2006-1, Cl 1A | | | | | | | | |
2.648%, 02/25/2036 (A) | | | 37 | | | | 37 | |
MKT Mortgage Trust, Ser 2020-525M, Cl A | | | | | | | | |
2.694%, 02/12/2040 (C) | | | 3,000 | | | | 3,177 | |
ML-CFC Commercial Mortgage Trust, Ser 2006-4, Cl XC, IO | | | | | | | | |
0.741%, 12/12/2049 (A)(C) | | | 199 | | | | – | |
Morgan Stanley Bank of America Merrill Lynch Trust, Ser 2015-C20, Cl A4 | | | | | | | | |
3.249%, 02/15/2048 | | | 262 | | | | 283 | |
Morgan Stanley Capital I Trust, Ser 2007-HQ11, Cl X, IO | | | | | | | | |
0.365%, 02/12/2044 (A)(C) | | | 200 | | | | – | |
Morgan Stanley Capital I Trust, Ser 2007-T27, Cl AJ | | | | | | | | |
6.215%, 06/11/2042 (A) | | | 2,581 | | | | 2,584 | |
Morgan Stanley Capital I Trust, Ser 2011-C1, Cl C | | | | | | | | |
5.795%, 09/15/2047 (A)(C) | | | 1,007 | | | | 1,006 | |
Morgan Stanley Capital I Trust, Ser 2016-BNK2, Cl XA, IO | | | | | | | | |
1.181%, 11/15/2049 (A) | | | 15,697 | | | | 685 | |
Morgan Stanley Capital I Trust, Ser 2019-BPR, Cl A | | | | | | | | |
1.541%, VAR ICE LIBOR USD 1 Month+1.400%, 05/15/2036 (C) | | | 3,030 | | | | 2,910 | |
Morgan Stanley Capital I Trust, Ser 2020-L4, Cl ASB | | | | | | | | |
2.624%, 02/15/2053 | | | 3,930 | | | | 4,261 | |
Morgan Stanley Mortgage Loan Trust, Ser 2004-3, Cl 4A | | | | | | | | |
5.625%, 04/25/2034 (A) | | | 109 | | | | 117 | |
Mortgage Loan Resecuritization Trust, Ser 2009-RS1, Cl A85 | | | | | | | | |
0.489%, VAR ICE LIBOR USD 1 Month+0.340%, 04/16/2036 (C) | | | 3,931 | | | | 3,500 | |
MSBAM Commercial Mortgage Securities Trust, Ser 2012-CKSV, Cl A2 | | | | | | | | |
3.277%, 10/15/2030 (C) | | | 150 | | | | 139 | |
MSCG Trust, Ser 2015-ALDR, Cl A2 | | | | | | | | |
3.577%, 06/07/2035 (A)(C) | | | 3,115 | | | | 3,063 | |
Natixis Commercial Mortgage Securities Trust, Ser 2020-2PAC, Cl A | | | | | | | | |
2.966%, 12/15/2038 (C) | | | 2,085 | | | | 2,180 | |
New Residential Mortgage Loan Trust, Ser 2015-2A, Cl A1 | | | | | | | | |
3.750%, 08/25/2055 (A)(C) | | | 1,951 | | | | 2,078 | |
| | |
SEI Institutional Investments Trust / Semi-Annual Report / November 30, 2020 | | 103 |
SCHEDULE OF INVESTMENTS (Unaudited)
November 30, 2020
Core Fixed Income Fund (Continued)
| | | | | | | | |
| | | |
| Description | | Face Amount
(Thousands) | | Market Value
($ Thousands) |
|
MORTGAGE-BACKED SECURITIES (continued) | |
New Residential Mortgage Loan Trust, Ser 2017-4A, Cl A1 | | | | | | | | |
4.000%, 05/25/2057 (A)(C) | | $ | 3,955 | | | $ | 4,290 | |
New Residential Mortgage Loan Trust, Ser 2019-4A, Cl A1B | | | | | | | | |
3.500%, 12/25/2058 (A)(C) | | | 2,991 | | | | 3,155 | |
New Residential Mortgage Loan Trust, Ser 2019-6A, Cl A1B | | | | | | | | |
3.500%, 09/25/2059 (A)(C) | | | 3,513 | | | | 3,711 | |
New Residential Mortgage Loan Trust, Ser 2019-NQM2, Cl A1 | | | | | | | | |
3.600%, 04/25/2049 (A)(C) | | | 662 | | | | 672 | |
New Residential Mortgage Loan Trust, Ser 2019-NQM4, Cl A1 | | | | | | | | |
2.492%, 09/25/2059 (A)(C) | | | 1,194 | | | | 1,216 | |
New York Mortgage Trust, Ser 2006-1, Cl 2A2 | | | | | | | | |
3.688%, 05/25/2036 (A) | | | 85 | | | | 77 | |
Nomura Resecuritization Trust, Ser 2015-5R, Cl 2A1 | | | | | | | | |
3.253%, 03/26/2035 (A)(C) | | | 375 | | | | 376 | |
OBX Trust, Ser 2019-EXP1, Cl 1A3 | | | | | | | | |
4.000%, 01/25/2059 (A)(C) | | | 462 | | | | 480 | |
OBX Trust, Ser 2019-INV1, Cl A8 | | | | | | | | |
4.000%, 11/25/2048 (A)(C) | | | 435 | | | | 436 | |
OBX Trust, Ser 2020-EXP1, Cl 2A1A | | | | | | | | |
0.900%, VAR ICE LIBOR USD 1 Month+0.750%, 02/25/2060 (C) | | | 1,960 | | | | 1,989 | |
OBX Trust, Ser 2020-EXP3, Cl 2A1A | | | | | | | | |
1.050%, VAR ICE LIBOR USD 1 Month+0.900%, 01/25/2060 (C) | | | 1,592 | | | | 1,595 | |
One Bryant Park Trust, Ser 2019-OBP, Cl A | | | | | | | | |
2.516%, 09/15/2054 (C) | | | 2,490 | | | | 2,648 | |
Opteum Mortgage Acceptance Pass-Through Certificates, Ser 2005-1, Cl M6 | | | | | | | | |
1.455%, VAR ICE LIBOR USD 1 Month+1.305%, 02/25/2035 | | | 2,158 | | | | 2,179 | |
Prime Mortgage Trust, Ser 2004-CL1, Cl 1A1 | | | | | | | | |
6.000%, 02/25/2034 | | | 38 | | | | 41 | |
Prime Mortgage Trust, Ser 2004-CL1, Cl 1, PO | | | | | | | | |
0.000%, 02/25/2034 (B) | | | 9 | | | | 7 | |
RALI Trust, Ser 2005-QO2, Cl A1 | | | | | | | | |
2.103%, VAR 12 Month Treas Avg+1.360%, 09/25/2045 | | | 307 | | | | 292 | |
RALI Trust, Ser 2005-QO5, Cl A1 | | | | | | | | |
1.743%, VAR 12 Month Treas Avg+1.000%, 01/25/2046 | | | 441 | | | | 401 | |
RAMP Trust, Ser 2004-SL1, Cl A7 | | | | | | | | |
7.000%, 11/25/2031 | | | 33 | | | | 35 | |
RAMP Trust, Ser 2005-SL1, Cl A5 | | | | | | | | |
6.500%, 05/25/2032 | | | 5 | | | | 5 | |
RBS Commercial Funding Trust, Ser 2013-GSP, Cl A | | | | | | | | |
3.961%, 01/15/2032 (A)(C) | | | 670 | | | | 697 | |
| | | | | | | | |
| | | |
| Description | | ��Face Amount
(Thousands) | | Market Value
($ Thousands) |
|
MORTGAGE-BACKED SECURITIES (continued) | |
Residential Asset Securitization Trust, Ser 2004-IP2, Cl 2A1 | | | | | | | | |
3.232%, 12/25/2034 (A) | | $ | 237 | | | $ | 235 | |
Residential Mortgage Loan Trust, Ser 2020-2, Cl A1 | | | | | | | | |
1.654%, 05/25/2060 (A)(C) | | | 5,357 | | | | 5,402 | |
Rosslyn Portfolio Trust, Ser 2017-ROSS, Cl A | | | | | | | | |
1.939%, VAR ICE LIBOR USD 1 Month+0.950%, 06/15/2033 (C) | | | 1,143 | | | | 1,142 | |
Sequoia Mortgage Trust, Ser 2004-12, Cl A3 | | | | | | | | |
0.745%, VAR ICE LIBOR USD 6 Month+0.320%, 01/20/2035 | | | 122 | | | | 115 | |
SFAVE Commercial Mortgage Securities Trust, Ser 2015-5AVE, Cl A2B | | | | | | | | |
4.144%, 01/05/2043 (A)(C) | | | 115 | | | | 111 | |
SG Residential Mortgage Trust, Ser 2019-3, Cl A1 | | | | | | | | |
2.703%, 09/25/2059 (A)(C) | | | 1,085 | | | | 1,100 | |
Starwood Mortgage Residential Trust, Ser 2019-INV1, Cl A1 | | | | | | | | |
2.610%, 09/27/2049 (A)(C) | | | 1,329 | | | | 1,352 | |
Starwood Mortgage Residential Trust, Ser 2020-1, Cl A1 | | | | | | | | |
2.275%, 02/25/2050 (A)(C) | | | 2,240 | | | | 2,288 | |
Starwood Mortgage Residential Trust, Ser 2020-3, Cl A1 | | | | | | | | |
1.486%, 04/25/2065 (A)(C) | | | 2,047 | | | | 2,059 | |
Structured Adjustable Rate Mortgage Loan Trust, Ser 2005-19XS, Cl 1A1 | | | | | | | | |
0.470%, VAR ICE LIBOR USD 1 Month+0.320%, 10/25/2035 | | | 1,118 | | | | 1,079 | |
Structured Asset Mortgage Investments II Trust, Ser 2004-AR5, Cl 1A1 | | | | | | | | |
0.810%, VAR ICE LIBOR USD 1 Month+0.660%, 10/19/2034 | | | 79 | | | | 79 | |
Structured Asset Mortgage Investments II Trust, Ser 2005-AR1, Cl A1 | | | | | | | | |
0.630%, VAR ICE LIBOR USD 1 Month+0.480%, 04/19/2035 | | | 1,311 | | | | 1,307 | |
Structured Asset Securities, Ser 2003-31A, Cl 2A7 | | | | | | | | |
2.508%, 10/25/2033 (A) | | | 1,423 | | | | 1,430 | |
Structured Asset Securities, Ser 2003-37A, Cl 2A | | | | | | | | |
2.501%, 12/25/2033 (A) | | | 38 | | | | 38 | |
Thornburg Mortgage Securities Trust, Ser 2003-4, Cl A1 | | | | | | | | |
0.790%, VAR ICE LIBOR USD 1 Month+0.640%, 09/25/2043 | | | 139 | | | | 139 | |
UBS Commercial Mortgage Trust, Ser 2018-C11, Cl B | | | | | | | | |
4.713%, 06/15/2051 (A) | | | 1,750 | | | | 1,861 | |
| | |
104 | | SEI Institutional Investments Trust / Semi-Annual Report / November 30, 2020 |
| | | | | | | | |
| | | |
| Description | | Face Amount
(Thousands) | | Market Value
($ Thousands) |
|
MORTGAGE-BACKED SECURITIES (continued) | |
Verus Securitization Trust, Ser 2019-1, Cl A1 | | | | | | | | |
3.836%, 02/25/2059 (A)(C) | | $ | 464 | | | $ | 467 | |
Verus Securitization Trust, Ser 2019-2, Cl A1 | | | | | | | | |
3.211%, 05/25/2059 (A)(C) | | | 1,678 | | | | 1,699 | |
Verus Securitization Trust, Ser 2019-3, Cl A1 | | | | | | | | |
2.784%, 07/25/2059 (C) | | | 2,446 | | | | 2,500 | |
Verus Securitization Trust, Ser 2019-4, Cl A1 | | | | | | | | |
2.642%, 11/25/2059 (C) | | | 3,323 | | | | 3,399 | |
Verus Securitization Trust, Ser 2019-INV1, Cl A1 | | | | | | | | |
3.402%, 12/25/2059 (A)(C) | | | 900 | | | | 926 | |
Verus Securitization Trust, Ser 2019-INV2, Cl A1 | | | | | | | | |
2.913%, 07/25/2059 (A)(C) | | | 1,304 | | | | 1,338 | |
Verus Securitization Trust, Ser 2019-INV3, Cl A1 | | | | | | | | |
2.692%, 11/25/2059 (A)(C) | | | 2,490 | | | | 2,555 | |
Verus Securitization Trust, Ser 2020-2, Cl A1 | | | | | | | | |
2.226%, 05/25/2060 (A)(C) | | | 3,134 | | | | 3,165 | |
Verus Securitization Trust, Ser 2020-5, Cl A1 | | | | | | | | |
1.218%, 05/25/2065 (C) | | | 611 | | | | 611 | |
Visio Trust, Ser 2019-1, Cl A1 | | | | | | | | |
3.572%, 06/25/2054 (A)(C) | | | 686 | | | | 695 | |
Visio Trust, Ser 2020-1R, Cl A1 | | | | | | | | |
1.312%, 11/25/2055 (C) | | | 1,619 | | | | 1,619 | |
VNDO Mortgage Trust, Ser 2012-6AVE, Cl A | | | | | | | | |
2.996%, 11/15/2030 (C) | | | 100 | | | | 103 | |
VNDO Mortgage Trust, Ser 2016-350P, Cl A | | | | | | | | |
3.805%, 01/10/2035 (C) | | | 1,210 | | | | 1,318 | |
WaMu Mortgage Pass-Through Certificates, Ser 2003-AR10, Cl A7 | | | | | | | | |
2.570%, 10/25/2033 (A) | | | 62 | | | | 62 | |
WaMu Mortgage Pass-Through Certificates, Ser 2003-AR6, Cl A1 | | | | | | | | |
3.114%, 06/25/2033 (A) | | | 57 | | | | 58 | |
WaMu Mortgage Pass-Through Certificates, Ser 2003-AR7, Cl A7 | | | | | | | | |
2.713%, 08/25/2033 (A) | | | 51 | | | | 51 | |
WaMu Mortgage Pass-Through Certificates, Ser 2003-AR9, Cl 1A6 | | | | | | | | |
2.801%, 09/25/2033 (A) | | | 125 | | | | 125 | |
WaMu Mortgage Pass-Through Certificates, Ser 2003-S4, Cl 2A10 | | | | | | | | |
17.050%, 06/25/2033 (A) | | | 15 | | | | 19 | |
WaMu Mortgage Pass-Through Certificates, Ser 2003-S9, Cl A8 | | | | | | | | |
5.250%, 10/25/2033 | | | 201 | | | | 207 | |
WaMu Mortgage Pass-Through Certificates, Ser 2004-AR3, Cl A2 | | | | | | | | |
3.650%, 06/25/2034 (A) | | | 41 | | | | 42 | |
WaMu Mortgage Pass-Through Certificates, Ser 2004-AR4, Cl A6 | | | | | | | | |
2.960%, 06/25/2034 (A) | | | 3,711 | | | | 3,743 | |
| | | | | | | | |
| | | |
| Description | | Face Amount
(Thousands) | | Market Value
($ Thousands) |
|
MORTGAGE-BACKED SECURITIES (continued) | |
WaMu Mortgage Pass-Through Certificates, Ser 2004-AR7, Cl A6 | | | | | | | | |
2.872%, 07/25/2034 (A) | | $ | 4,254 | | | $ | 4,314 | |
WaMu Mortgage Pass-Through Certificates, Ser 2005-AR15, Cl A1A1 | | | | | | | | |
0.410%, VAR ICE LIBOR USD 1 Month+0.260%, 11/25/2045 | | | 8,420 | | | | 8,247 | |
WaMu Mortgage Pass-Through Certificates, Ser 2005-AR19, Cl A1A1 | | | | | | | | |
0.690%, VAR ICE LIBOR USD 1 Month+0.540%, 12/25/2045 | | | 5,286 | | | | 5,255 | |
WaMu Mortgage Pass-Through Certificates, Ser 2006-AR1, CI 1A1B | | | | | | | | |
1.813%, VAR 12 Month Treas Avg+1.070%, 01/25/2046 | | | 1,301 | | | | 737 | |
WaMu Mortgage Pass-Through Certificates, Ser 2006-AR14, Cl 1A4 | | | | | | | | |
2.643%, 11/25/2036 (A) | | | 94 | | | | 93 | |
WaMu Mortgage Pass-Through Certificates, Ser 2006-AR17, Cl 2A | | | | | | | | |
2.029%, VAR Cost of Funds 11th District of San Fran+1.500%, 12/25/2046 | | | 212 | | | | 200 | |
WaMu Mortgage Pass-Through Certificates, Ser 2006-AR17, Cl 1A1B | | | | | | | | |
1.693%, VAR 12 Month Treas Avg+0.810%, 12/25/2046 | | | 127 | | | | 84 | |
Washington Mutual Alternative Mortgage Pass-Through Certificates, Ser 2005-3, Cl CX, IO | | | | | | | | |
5.500%, 05/25/2035 | | | 175 | | | | 30 | |
Washington Mutual MSC Mortgage Pass-Through Certificates, Ser 2003-MS2, Cl 1A1 | | | | | | | | |
5.750%, 02/25/2033 | | | 7 | | | | 7 | |
Washington Mutual MSC Mortgage Pass-Through Certificates, Ser 2003-MS8, Cl 1P, PO | | | | | | | | |
0.000%, 05/25/2033 (B) | | | 14 | | | | 13 | |
Washington Mutual MSC Mortgage Pass-Through Certificates, Ser 2003-MS9, Cl 2P, PO | | | | | | | | |
0.000%, 04/25/2033 (B) | | | 37 | | | | 36 | |
Wells Fargo Commercial Mortgage Trust, Ser 2012-LC5, Cl B | | | | | | | | |
4.142%, 10/15/2045 | | | 1,220 | | | | 1,264 | |
Wells Fargo Mortgage-Backed Securities Trust, Ser 2005-AR14, Cl A1 | | | | | | | | |
3.093%, 08/25/2035 (A) | | | 38 | | | | 38 | |
WFRBS Commercial Mortgage Trust, Ser 2012-C7, Cl XA, IO | | | | | | | | |
1.463%, 06/15/2045 (A)(C) | | | 2,521 | | | | 31 | |
| | |
SEI Institutional Investments Trust / Semi-Annual Report / November 30, 2020 | | 105 |
SCHEDULE OF INVESTMENTS (Unaudited)
November 30. 2020
Core Fixed Income Fund (Continued)
| | | | | | | | |
| | | |
| Description | | Face Amount
(Thousands) | | Market Value
($ Thousands) |
|
MORTGAGE-BACKED SECURITIES (continued) | |
WFRBS Commercial Mortgage Trust, Ser 2013-C12, Cl C | | | | | | | | |
4.460%, 03/15/2048 (A) | | $ | 490 | | | $ | 495 | |
WFRBS Commercial Mortgage Trust, Ser 2013-C12, Cl XA, IO | | | | | | | | |
1.333%, 03/15/2048 (A)(C) | | | 8,671 | | | | 179 | |
WFRBS Commercial Mortgage Trust, Ser 2013-C15, Cl A4 | | | | | | | | |
4.153%, 08/15/2046 (A) | | | 150 | | | | 162 | |
WFRBS Commercial Mortgage Trust, Ser 2013-C17, Cl A4 | | | | | | | | |
4.023%, 12/15/2046 | | | 120 | | | | 130 | |
WFRBS Commercial Mortgage Trust, Ser 2014-C19, Cl A3 | | | | | | | | |
3.660%, 03/15/2047 | | | 371 | | | | 375 | |
WFRBS Commercial Mortgage Trust, Ser 2014-C19, Cl B | | | | | | | | |
4.723%, 03/15/2047 (A) | | | 210 | | | | 227 | |
WFRBS Commercial Mortgage Trust, Ser 2014-C19, Cl XA, IO | | | | | | | | |
1.182%, 03/15/2047 (A) | | | 4,282 | | | | 102 | |
WFRBS Commercial Mortgage Trust, Ser 2014-C21, Cl B | | | | | | | | |
4.213%, 08/15/2047 (A) | | | 2,180 | | | | 2,254 | |
WFRBS Commercial Mortgage Trust, Ser 2014-C21, Cl XA, IO | | | | | | | | |
1.185%, 08/15/2047 (A) | | | 12,433 | | | | 368 | |
WFRBS Commercial Mortgage Trust, Ser 2014-C22, Cl B | | | | | | | | |
4.371%, 09/15/2057 (A) | | | 775 | | | | 831 | |
WFRBS Commercial Mortgage Trust, Ser 2014-C23, Cl XA, IO | | | | | | | | |
0.710%, 10/15/2057 (A) | | | 4,586 | | | | 82 | |
WFRBS Commercial Mortgage Trust, Ser 2014-C24, Cl AS | | | | | | | | |
3.931%, 11/15/2047 | | | 1,330 | | | | 1,358 | |
WinWater Mortgage Loan Trust, Ser 2015-5, Cl A5 | | | | | | | | |
3.500%, 08/20/2045 (A)(C) | | | 279 | | | | 279 | |
| | | | | | | | |
| | |
| | | | | | | 354,965 | |
| | | | | | | | |
Total Mortgage-Backed Securities
(Cost $2,644,419) ($ Thousands) | | | | | | | 2,702,976 | |
| | | | | | | | |
|
CORPORATE OBLIGATIONS — 32.1% | |
|
Communication Services — 3.1% | |
Activision Blizzard | | | | | | | | |
2.500%, 09/15/2050 | | | 1,167 | | | | 1,126 | |
Alphabet | | | | | | | | |
2.250%, 08/15/2060 | | | 953 | | | | 941 | |
2.050%, 08/15/2050 | | | 630 | | | | 611 | |
| | | | | | | | |
| | | |
| Description | | Face Amount
(Thousands) | | Market Value
($ Thousands) |
|
CORPORATE OBLIGATIONS (continued) | |
1.100%, 08/15/2030 | | $ | 400 | | | $ | 397 | |
0.800%, 08/15/2027 | | | 350 | | | | 349 | |
0.450%, 08/15/2025 | | | 180 | | | | 180 | |
AT&T | | | | | | | | |
6.500%, 09/01/2037 | | | 2,770 | | | | 3,904 | |
5.350%, 09/01/2040 | | | 80 | | | | 105 | |
5.250%, 03/01/2037 | | | 3,910 | | | | 5,075 | |
4.850%, 03/01/2039 | | | 414 | | | | 519 | |
4.800%, 06/15/2044 | | | 7,125 | | | | 8,950 | |
4.750%, 05/15/2046 | | | 2,585 | | | | 3,206 | |
4.500%, 03/09/2048 | | | 1,395 | | | | 1,705 | |
4.350%, 03/01/2029 | | | 515 | | | | 615 | |
4.350%, 06/15/2045 | | | 1,082 | | | | 1,276 | |
4.300%, 02/15/2030 | | | 70 | | | | 84 | |
3.850%, 06/01/2060 | | | 712 | | | | 754 | |
3.650%, 09/15/2059 (C) | | | 1,006 | | | | 1,019 | |
3.550%, 09/15/2055 (C) | | | 1,987 | | | | 2,036 | |
3.500%, 06/01/2041 | | | 712 | | | | 773 | |
3.500%, 09/15/2053 (C) | | | 5,082 | | | | 5,185 | |
3.300%, 02/01/2052 | | | 3,059 | | | | 3,053 | |
3.100%, 02/01/2043 | | | 3,117 | | | | 3,204 | |
3.000%, 06/30/2022 | | | 1,644 | | | | 1,705 | |
2.750%, 06/01/2031 | | | 2,142 | | | | 2,277 | |
2.300%, 06/01/2027 | | | 4,752 | | | | 5,048 | |
2.250%, 02/01/2032 | | | 1,627 | | | | 1,641 | |
1.650%, 02/01/2028 | | | 5,506 | | | | 5,590 | |
Charter Communications Operating LLC / Charter Communications Operating Capital | | | | | | | | |
6.484%, 10/23/2045 | | | 110 | | | | 157 | |
6.384%, 10/23/2035 | | | 170 | | | | 237 | |
5.750%, 04/01/2048 | | | 570 | | | | 753 | |
5.375%, 04/01/2038 | | | 1,800 | | | | 2,269 | |
5.375%, 05/01/2047 | | | 250 | | | | 317 | |
5.050%, 03/30/2029 | | | 2,060 | | | | 2,494 | |
4.908%, 07/23/2025 | | | 2,469 | | | | 2,859 | |
4.800%, 03/01/2050 | | | 1,793 | | | | 2,141 | |
4.464%, 07/23/2022 | | | 635 | | | | 671 | |
4.200%, 03/15/2028 | | | 980 | | | | 1,127 | |
3.750%, 02/15/2028 | | | 681 | | | | 763 | |
Comcast | | | | | | | | |
7.050%, 03/15/2033 | | | 50 | | | | 77 | |
4.700%, 10/15/2048 | | | 250 | | | | 355 | |
4.600%, 10/15/2038 | | | 1,809 | | | | 2,394 | |
4.400%, 08/15/2035 | | | 3,055 | | | | 3,919 | |
4.250%, 10/15/2030 | | | 1,010 | | | | 1,247 | |
4.250%, 01/15/2033 | | | 360 | | | | 450 | |
4.200%, 08/15/2034 | | | 570 | | | | 716 | |
4.150%, 10/15/2028 | | | 4,291 | | | | 5,164 | |
4.000%, 03/01/2048 | | | 110 | | | | 140 | |
3.969%, 11/01/2047 | | | 120 | | | | 152 | |
3.950%, 10/15/2025 | | | 1,579 | | | | 1,810 | |
| | |
106 | | SEI Institutional Investments Trust / Semi-Annual Report / November 30, 2020 |
| | | | | | | | |
| | | |
| Description | | Face Amount
(Thousands) | | Market Value
($ Thousands) |
|
CORPORATE OBLIGATIONS (continued) | |
3.750%, 04/01/2040 | | $ | 1,727 | | | $ | 2,098 | |
3.700%, 04/15/2024 | | | 1,100 | | | | 1,212 | |
3.600%, 03/01/2024 | | | 340 | | | | 374 | |
3.450%, 02/01/2050 | | | 570 | | | | 676 | |
3.400%, 04/01/2030 | | | 3,655 | | | | 4,226 | |
3.400%, 07/15/2046 | | | 60 | | | | 70 | |
3.300%, 04/01/2027 | | | 310 | | | | 350 | |
3.250%, 11/01/2039 | | | 250 | | | | 286 | |
3.150%, 03/01/2026 | | | 800 | | | | 892 | |
3.100%, 04/01/2025 | | | 714 | | | | 785 | |
2.800%, 01/15/2051 | | | 422 | | | | 445 | |
2.450%, 08/15/2052 | | | 1,612 | | | | 1,585 | |
1.950%, 01/15/2031 | | | 955 | | | | 984 | |
1.500%, 02/15/2031 | | | 5,810 | | | | 5,785 | |
Comcast Cable Communications Holdings | | | | | | | | |
9.455%, 11/15/2022 | | | 240 | | | | 283 | |
Comcast Cable Holdings LLC | | | | | | | | |
10.125%, 04/15/2022 | | | 190 | | | | 214 | |
Cox Communications | | | | | | | | |
4.800%, 02/01/2035 (C) | | | 1,665 | | | | 2,096 | |
3.250%, 12/15/2022 (C) | | | 1,010 | | | | 1,064 | |
Fox | | | | | | | | |
5.476%, 01/25/2039 | | | 270 | | | | 375 | |
4.709%, 01/25/2029 | | | 240 | | | | 290 | |
3.500%, 04/08/2030 | | | 1,125 | | | | 1,280 | |
NBCUniversal Media LLC | | | | | | | | |
5.950%, 04/01/2041 | | | 375 | | | | 576 | |
Rogers Communications | | | | | | | | |
4.100%, 10/01/2023 | | | 133 | | | | 145 | |
Sky | | | | | | | | |
3.750%, 09/16/2024 (C) | | | 2,045 | | | | 2,277 | |
Sprint Capital | | | | | | | | |
8.750%, 03/15/2032 | | | 200 | | | | 307 | |
Sprint Spectrum LLC | | | | | | | | |
5.152%, 03/20/2028 (C) | | | 7,425 | | | | 8,608 | |
4.738%, 03/20/2025 (C) | | | 3,630 | | | | 3,911 | |
3.360%, 09/20/2021 (C) | | | 3,356 | | | | 3,392 | |
Telefonica Emisiones | | | | | | | | |
5.462%, 02/16/2021 | | | 69 | | | | 70 | |
4.103%, 03/08/2027 | | | 150 | | | | 172 | |
Tencent Holdings MTN | | | | | | | | |
3.595%, 01/19/2028 (C) | | | 2,370 | | | | 2,609 | |
Time Warner Cable LLC | | | | | | | | |
7.300%, 07/01/2038 | | | 100 | | | | 147 | |
6.750%, 06/15/2039 | | | 170 | | | | 242 | |
6.550%, 05/01/2037 | | | 498 | | | | 689 | |
5.875%, 11/15/2040 | | | 210 | | | | 272 | |
5.500%, 09/01/2041 | | | 4,882 | | | | 6,155 | |
Time Warner Entertainment | | | | | | | | |
8.375%, 07/15/2033 | | | 1,380 | | | | 2,152 | |
T-Mobile USA | | | | | | | | |
4.375%, 04/15/2040 (C) | | | 2,770 | | | | 3,383 | |
| | | | | | | | |
| | | |
| Description | | Face Amount
(Thousands) | | Market Value
($ Thousands) |
|
CORPORATE OBLIGATIONS (continued) | |
3.875%, 04/15/2030 (C) | | $ | 3,360 | | | $ | 3,855 | |
3.750%, 04/15/2027 (C) | | | 2,332 | | | | 2,633 | |
3.500%, 04/15/2025 (C) | | | 2,829 | | | | 3,121 | |
3.300%, 02/15/2051 (C) | | | 210 | | | | 220 | |
3.000%, 02/15/2041 (C) | | | 791 | | | | 817 | |
2.550%, 02/15/2031 (C) | | | 2,700 | | | | 2,813 | |
2.250%, 11/15/2031 (C) | | | 790 | | | | 801 | |
2.050%, 02/15/2028 (C) | | | 3,763 | | | | 3,866 | |
1.500%, 02/15/2026 (C) | | | 1,777 | | | | 1,808 | |
Verizon Communications | | | | | | | | |
5.500%, 03/16/2047 | | | 100 | | | | 148 | |
5.250%, 03/16/2037 | | | 1,100 | | | | 1,526 | |
4.862%, 08/21/2046 | | | 270 | | | | 372 | |
4.522%, 09/15/2048 | | | 2,538 | | | | 3,415 | |
4.500%, 08/10/2033 | | | 470 | | | | 599 | |
4.400%, 11/01/2034 | | | 5,373 | | | | 6,792 | |
4.329%, 09/21/2028 | | | 3,074 | | | | 3,732 | |
4.272%, 01/15/2036 | | | 285 | | | | 358 | |
4.125%, 03/16/2027 | | | 330 | | | | 391 | |
4.125%, 08/15/2046 | | | 430 | | | | 542 | |
4.016%, 12/03/2029 | | | 2,139 | | | | 2,552 | |
4.000%, 03/22/2050 | | | 1,330 | | | | 1,664 | |
3.850%, 11/01/2042 | | | 1,750 | | | | 2,117 | |
3.500%, 11/01/2024 | | | 1,557 | | | | 1,719 | |
3.376%, 02/15/2025 | | | 967 | | | | 1,074 | |
3.150%, 03/22/2030 | | | 580 | | | | 653 | |
3.000%, 03/22/2027 | | | 889 | | | | 988 | |
3.000%, 11/20/2060 | | | 1,356 | | | | 1,429 | |
2.875%, 11/20/2050 | | | 2,320 | | | | 2,423 | |
2.650%, 11/20/2040 | | | 4,893 | | | | 5,049 | |
2.625%, 08/15/2026 | | | 1,200 | | | | 1,312 | |
1.750%, 01/20/2031 | | | 5,591 | | | | 5,656 | |
0.850%, 11/20/2025 | | | 220 | | | | 221 | |
ViacomCBS | | | | | | | | |
6.875%, 04/30/2036 | | | 1,175 | | | | 1,677 | |
5.900%, 10/15/2040 | | | 840 | | | | 1,109 | |
5.850%, 09/01/2043 | | | 466 | | | | 638 | |
4.950%, 05/19/2050 | | | 24 | | | | 31 | |
4.750%, 05/15/2025 | | | 2,914 | | | | 3,376 | |
4.600%, 01/15/2045 | | | 125 | | | | 147 | |
4.375%, 03/15/2043 | | | 193 | | | | 224 | |
4.200%, 05/19/2032 | | | 2,100 | | | | 2,490 | |
3.875%, 04/01/2024 | | | 230 | | | | 251 | |
3.700%, 08/15/2024 | | | 1,505 | | | | 1,648 | |
Vodafone Group | | | | | | | | |
5.250%, 05/30/2048 | | | 2,370 | | | | 3,244 | |
4.875%, 06/19/2049 | | | 3,011 | | | | 3,944 | |
4.375%, 05/30/2028 | | | 1,380 | | | | 1,657 | |
4.250%, 09/17/2050 | | | 2,006 | | | | 2,456 | |
Walt Disney | | | | | | | | |
8.875%, 04/26/2023 | | | 150 | | | | 179 | |
6.650%, 11/15/2037 | | | 260 | | | | 405 | |
| | |
SEI Institutional Investments Trust / Semi-Annual Report / November 30, 2020 | | 107 |
SCHEDULE OF INVESTMENTS (Unaudited)
November 30, 2020
Core Fixed Income Fund (Continued)
| | | | | | | | |
| | | |
| Description | | Face Amount
(Thousands) | | Market Value
($ Thousands) |
|
CORPORATE OBLIGATIONS (continued) | |
6.400%, 12/15/2035 | | $ | 69 | | | $ | 106 | |
6.200%, 12/15/2034 | | | 265 | | | | 400 | |
4.700%, 03/23/2050 | | | 1,035 | | | | 1,442 | |
4.625%, 03/23/2040 | | | 1,680 | | | | 2,221 | |
3.800%, 05/13/2060 | | | 507 | | | | 627 | |
3.600%, 01/13/2051 | | | 3,665 | | | | 4,354 | |
3.500%, 05/13/2040 | | | 813 | | | | 947 | |
2.650%, 01/13/2031 | | | 1,990 | | | | 2,168 | |
| | | | | | | | |
| | |
| | | | | | | 252,424 | |
| | | | | | | | |
|
Consumer Discretionary — 2.0% | |
Advance Auto Parts | | | | | | | | |
3.900%, 04/15/2030 | | | 2,851 | | | | 3,277 | |
1.750%, 10/01/2027 | | | 1,388 | | | | 1,401 | |
Alimentation Couche-Tard | | | | | | | | |
3.550%, 07/26/2027 (C) | | | 2,200 | | | | 2,466 | |
Amazon.com | | | | | | | | |
4.950%, 12/05/2044 | | | 600 | | | | 886 | |
4.800%, 12/05/2034 | | | 187 | | | | 259 | |
4.250%, 08/22/2057 | | | 160 | | | | 228 | |
4.050%, 08/22/2047 | | | 570 | | | | 764 | |
3.875%, 08/22/2037 | | | 1,780 | | | | 2,254 | |
3.150%, 08/22/2027 | | | 160 | | | | 182 | |
2.700%, 06/03/2060 | | | 709 | | | | 780 | |
2.500%, 06/03/2050 | | | 1,659 | | | | 1,754 | |
1.500%, 06/03/2030 | | | 1,020 | | | | 1,042 | |
1.200%, 06/03/2027 | | | 1,090 | | | | 1,111 | |
0.800%, 06/03/2025 | | | 880 | | | | 892 | |
American Honda Finance MTN | | | | | | | | |
1.000%, 09/10/2025 | | | 4,200 | | | | 4,238 | |
AutoZone | | | | | | | | |
2.500%, 04/15/2021 | | | 44 | | | | 44 | |
BMW US Capital LLC | | | | | | | | |
4.150%, 04/09/2030 (C) | | | 1,460 | | | | 1,767 | |
3.800%, 04/06/2023 (C) | | | 4,495 | | | | 4,839 | |
1.850%, 09/15/2021 (C) | | | 180 | | | | 182 | |
BorgWarner | | | | | | | | |
2.650%, 07/01/2027 | | | 1,481 | | | | 1,579 | |
Daimler Finance North America LLC | | | | | | | | |
3.350%, 05/04/2021 (C) | | | 1,740 | | | | 1,761 | |
2.700%, 06/14/2024 (C) | | | 990 | | | | 1,056 | |
1.121%, VAR ICE LIBOR USD 3
Month+0.900%, 02/15/2022 (C) | | | 2,000 | | | | 2,013 | |
Dollar General | | | | | | | | |
3.250%, 04/15/2023 | | | 70 | | | | 74 | |
Ford Motor Credit LLC | | | | | | | | |
5.875%, 08/02/2021 | | | 1,570 | | | | 1,607 | |
5.750%, 02/01/2021 | | | 590 | | | | 593 | |
5.085%, 01/07/2021 | | | 2,000 | | | | 2,005 | |
4.271%, 01/09/2027 | | | 1,985 | | | | 2,055 | |
3.813%, 10/12/2021 | | | 925 | | | | 936 | |
3.339%, 03/28/2022 | | | 3,990 | | | | 4,015 | |
| | | | | | | | |
| | | |
| Description | | Face Amount
(Thousands) | | Market Value
($ Thousands) |
|
CORPORATE OBLIGATIONS (continued) | |
3.336%, 03/18/2021 | | $ | 500 | | | $ | 501 | |
3.096%, 05/04/2023 | | | 200 | | | | 201 | |
1.503%, VAR ICE LIBOR USD 3 Month+1.270%, 03/28/2022 | | | 2,200 | | | | 2,170 | |
1.104%, VAR ICE LIBOR USD 3 Month+0.880%, 10/12/2021 | | | 3,020 | | | | 2,970 | |
1.044%, VAR ICE LIBOR USD 3 Month+0.810%, 04/05/2021 | | | 2,510 | | | | 2,497 | |
General Motors | | | | | | | | |
6.250%, 10/02/2043 | | | 940 | | | | 1,269 | |
5.400%, 04/01/2048 | | | 1,339 | | | | 1,691 | |
5.150%, 04/01/2038 | | | 150 | | | | 179 | |
4.875%, 10/02/2023 | | | 2,230 | | | | 2,465 | |
General Motors Financial | | | | | | | | |
5.200%, 03/20/2023 | | | 1,514 | | | | 1,660 | |
4.375%, 09/25/2021 | | | 2,985 | | | | 3,070 | |
4.350%, 01/17/2027 | | | 180 | | | | 205 | |
4.200%, 11/06/2021 | | | 375 | | | | 387 | |
3.550%, 04/09/2021 | | | 2,000 | | | | 2,020 | |
3.450%, 04/10/2022 | | | 1,950 | | | | 2,010 | |
3.200%, 07/06/2021 | | | 835 | | | | 845 | |
3.150%, 06/30/2022 | | | 3,095 | | | | 3,198 | |
2.750%, 06/20/2025 | | | 2,220 | | | | 2,347 | |
2.700%, 08/20/2027 | | | 3,108 | | | | 3,280 | |
1.700%, 08/18/2023 | | | 2,203 | | | | 2,251 | |
Genuine Parts | | | | | | | | |
1.875%, 11/01/2030 | | | 1,235 | | | | 1,226 | |
Harley-Davidson Financial Services | | | | | | | | |
3.350%, 06/08/2025 (C) | | | 1,367 | | | | 1,468 | |
Home Depot | | | | | | | | |
3.900%, 12/06/2028 | | | 80 | | | | 96 | |
3.900%, 06/15/2047 | | | 100 | | | | 127 | |
3.350%, 04/15/2050 | | | 2,886 | | | | 3,423 | |
3.300%, 04/15/2040 | | | 817 | | | | 967 | |
3.125%, 12/15/2049 | | | 1,896 | | | | 2,174 | |
2.950%, 06/15/2029 | | | 378 | | | | 428 | |
2.700%, 04/15/2030 | | | 3,604 | | | | 4,005 | |
2.500%, 04/15/2027 | | | 430 | | | | 470 | |
Hyundai Capital America | | | | | | | | |
2.375%, 10/15/2027 (C) | | | 1,038 | | | | 1,071 | |
1.800%, 10/15/2025 (C) | | | 1,038 | | | | 1,048 | |
1.250%, 09/18/2023 (C) | | | 1,038 | | | | 1,045 | |
Kohl’s | | | | | | | | |
5.550%, 07/17/2045 | | | 610 | | | | 598 | |
Las Vegas Sands Corp | | | | | | | | |
3.200%, 08/08/2024 | | | 1,480 | | | | 1,547 | |
2.900%, 06/25/2025 | | | 140 | | | | 144 | |
Lowe’s | | | | | | | | |
5.000%, 04/15/2040 | | | 2,025 | | | | 2,739 | |
4.500%, 04/15/2030 | | | 320 | | | | 396 | |
4.000%, 04/15/2025 | | | 722 | | | | 821 | |
3.000%, 10/15/2050 | | | 420 | | | | 451 | |
| | |
108 | | SEI Institutional Investments Trust / Semi-Annual Report / November 30, 2020 |
| | | | | | | | |
| | | |
| Description | | Face Amount
(Thousands) | | | Market Value
($ Thousands) | |
|
CORPORATE OBLIGATIONS (continued) | |
2.500%, 04/15/2026 | | $ | 260 | | | $ | 281 | |
1.700%, 10/15/2030 | | | 1,794 | | | | 1,803 | |
Marriott International Inc/MD | | | | | | | | |
5.750%, 05/01/2025 | | | 1,230 | | | | 1,424 | |
4.625%, 06/15/2030 | | | 263 | | | | 304 | |
McDonald’s MTN | | | | | | | | |
4.875%, 12/09/2045 | | | 670 | | | | 915 | |
4.200%, 04/01/2050 | | | 800 | | | | 1,030 | |
3.800%, 04/01/2028 | | | 1,220 | | | | 1,425 | |
3.700%, 01/30/2026 | | | 2,085 | | | | 2,366 | |
3.625%, 09/01/2049 | | | 355 | | | | 417 | |
3.600%, 07/01/2030 | | | 460 | | | | 540 | |
3.500%, 03/01/2027 | | | 180 | | | | 205 | |
3.500%, 07/01/2027 | | | 510 | | | | 584 | |
3.300%, 07/01/2025 | | | 480 | | | | 534 | |
2.125%, 03/01/2030 | | | 610 | | | | 642 | |
1.450%, 09/01/2025 | | | 1,367 | | | | 1,416 | |
Newell Brands | | | | | | | | |
4.700%, 04/01/2026 | | | 560 | | | | 603 | |
4.350%, 04/01/2023 | | | 376 | | | | 396 | |
NIKE | | | | | | | | |
3.375%, 03/27/2050 | | | 1,332 | | | | 1,608 | |
3.250%, 03/27/2040 | | | 330 | | | | 387 | |
2.850%, 03/27/2030 | | | 1,296 | | | | 1,466 | |
2.750%, 03/27/2027 | | | 1,296 | | | | 1,439 | |
2.400%, 03/27/2025 | | | 1,385 | | | | 1,488 | |
Nissan Motor | | | | | | | | |
4.810%, 09/17/2030 (C) | | | 777 | | | | 854 | |
4.345%, 09/17/2027 (C) | | | 1,746 | | | | 1,879 | |
3.522%, 09/17/2025 (C) | | | 632 | | | | 660 | |
O’Reilly Automotive | | | | | | | | |
4.200%, 04/01/2030 | | | 692 | | | | 831 | |
1.750%, 03/15/2031 | | | 2,162 | | | | 2,152 | |
QVC | | | | | | | | |
4.850%, 04/01/2024 | | | 735 | | | | 774 | |
Ralph Lauren | | | | | | | | |
2.950%, 06/15/2030 | | | 2,243 | | | | 2,377 | |
1.700%, 06/15/2022 | | | 1,157 | | | | 1,180 | |
Sands China | | | | | | | | |
5.125%, 08/08/2025 | | | 810 | | | | 890 | |
4.600%, 08/08/2023 | | | 700 | | | | 749 | |
Starbucks | | | | | | | | |
4.450%, 08/15/2049 | | | 745 | | | | 969 | |
3.500%, 11/15/2050 | | | 3,515 | | | | 4,032 | |
3.350%, 03/12/2050 | | | 927 | | | | 1,016 | |
1.300%, 05/07/2022 | | | 847 | | | | 858 | |
Target | | | | | | | | |
2.250%, 04/15/2025 | | | 710 | | | | 758 | |
TJX | | | | | | | | |
3.750%, 04/15/2027 | | | 4,905 | | | | 5,682 | |
3.500%, 04/15/2025 | | | 460 | | | | 512 | |
| | | | | | | | |
| | | |
| Description | | Face Amount
(Thousands) | | | Market Value
($ Thousands) | |
|
CORPORATE OBLIGATIONS (continued) | |
Toyota Motor Credit MTN | | | | | | | | |
2.900%, 03/30/2023 | | $ | 4,170 | | | $ | 4,411 | |
0.500%, 08/14/2023 | | | 970 | | | | 973 | |
Tractor Supply | | | | | | | | |
1.750%, 11/01/2030 | | | 840 | | | | 842 | |
Volkswagen Group of America Finance LLC | | | | | | | | |
2.900%, 05/13/2022 (C) | | | 3,135 | | | | 3,236 | |
1.250%, 11/24/2025 (C) | | | 2,520 | | | | 2,523 | |
0.875%, 11/22/2023 (C) | | | 5,190 | | | | 5,201 | |
| | | | | | | | |
| | | | | | | 170,152 | |
| | | | | | | | |
|
Consumer Staples — 3.2% | |
Adani Ports & Special Economic Zone | | | | | | | | |
4.200%, 08/04/2027 (C) | | | 1,207 | | | | 1,286 | |
Advocate Health & Hospitals | | | | | | | | |
2.211%, 06/15/2030 | | | 2,835 | | | | 2,961 | |
Aetna | | | | | | | | |
3.875%, 08/15/2047 | | | 888 | | | | 1,069 | |
2.800%, 06/15/2023 | | | 3,648 | | | | 3,835 | |
Altria Group | | | | | | | | |
5.950%, 02/14/2049 | | | 280 | | | | 399 | |
5.800%, 02/14/2039 | | | 1,065 | | | | 1,409 | |
4.800%, 02/14/2029 | | | 1,200 | | | | 1,437 | |
4.750%, 05/05/2021 | | | 490 | | | | 499 | |
4.450%, 05/06/2050 | | | 602 | | | | 710 | |
4.400%, 02/14/2026 | | | 2,985 | | | | 3,458 | |
3.875%, 09/16/2046 | | | 582 | | | | 627 | |
3.800%, 02/14/2024 | | | 400 | | | | 437 | |
3.490%, 02/14/2022 | | | 360 | | | | 374 | |
2.350%, 05/06/2025 | | | 470 | | | | 498 | |
Anheuser-Busch Cos LLC / Anheuser-Busch InBev Worldwide | | | | | | | | |
4.700%, 02/01/2036 | | | 2,594 | | | | 3,309 | |
3.650%, 02/01/2026 | | | 1,978 | | | | 2,236 | |
Anheuser-Busch InBev Worldwide | | | | | | | | |
5.550%, 01/23/2049 | | | 1,600 | | | | 2,303 | |
5.450%, 01/23/2039 | | | 2,180 | | | | 2,969 | |
4.900%, 02/01/2046 | | | 8,716 | | | | 11,389 | |
4.750%, 01/23/2029 | | | 1,540 | | | | 1,892 | |
4.600%, 04/15/2048 | | | 2,836 | | | | 3,600 | |
4.500%, 06/01/2050 | | | 1,850 | | | | 2,320 | |
4.375%, 04/15/2038 | | | 1,364 | | | | 1,689 | |
4.350%, 06/01/2040 | | | 970 | | | | 1,204 | |
4.150%, 01/23/2025 | | | 1,714 | | | | 1,947 | |
4.000%, 04/13/2028 | | | 360 | | | | 422 | |
3.750%, 07/15/2042 | | | 271 | | | | 310 | |
3.500%, 06/01/2030 | | | 380 | | | | 440 | |
Bacardi | | | | | | | | |
5.300%, 05/15/2048 (C) | | | 850 | | | | 1,147 | |
5.150%, 05/15/2038 (C) | | | 572 | | | | 720 | |
4.700%, 05/15/2028 (C) | | | 2,807 | | | | 3,249 | |
| | |
SEI Institutional Investments Trust / Semi-Annual Report / November 30, 2020 | | 109 |
SCHEDULE OF INVESTMENTS (Unaudited)
November 30, 2020
Core Fixed Income Fund (Continued)
| | | | | | | | |
| | | |
| Description | | Face Amount
(Thousands) | | | Market Value
($ Thousands) | |
|
CORPORATE OBLIGATIONS (continued) | |
BAT Capital | | | | | | | | |
4.906%, 04/02/2030 | | $ | 365 | | | $ | 439 | |
4.700%, 04/02/2027 | | | 1,426 | | | | 1,670 | |
4.540%, 08/15/2047 | | | 4,805 | | | | 5,428 | |
3.984%, 09/25/2050 | | | 1,035 | | | | 1,087 | |
3.557%, 08/15/2027 | | | 4,712 | | | | 5,238 | |
3.215%, 09/06/2026 | | | 2,435 | | | | 2,656 | |
2.726%, 03/25/2031 | | | 4,101 | | | | 4,211 | |
2.259%, 03/25/2028 | | | 73 | | | | 75 | |
BAT International Finance | | | | | | | | |
1.668%, 03/25/2026 | | | 3,723 | | | | 3,791 | |
BayCare Health System | | | | | | | | |
3.831%, 11/15/2050 | | | 2,765 | | | | 3,425 | |
Bayer US Finance II LLC | | | | | | | | |
4.875%, 06/25/2048 (C) | | | 5,825 | | | | 7,472 | |
4.700%, 07/15/2064 (C) | | | 400 | | | | 463 | |
4.400%, 07/15/2044 (C) | | | 1,250 | | | | 1,449 | |
4.375%, 12/15/2028 (C) | | | 3,750 | | | | 4,406 | |
4.250%, 12/15/2025 (C) | | | 1,325 | | | | 1,517 | |
Bayer US Finance LLC | | | | | | | | |
3.375%, 10/08/2024 (C) | | | 3,255 | | | | 3,546 | |
Bon Secours Mercy Health | | | | | | | | |
3.464%, 06/01/2030 | | | 1,480 | | | | 1,688 | |
Bunge Finance | | | | | | | | |
3.750%, 09/25/2027 | | | 1,257 | | | | 1,401 | |
3.250%, 08/15/2026 | | | 1,445 | | | | 1,587 | |
1.630%, 08/17/2025 | | | 1,770 | | | | 1,807 | |
Cargill | | | | | | | | |
1.375%, 07/23/2023 (C) | | | 690 | | | | 709 | |
Coca-Cola | | | | | | | | |
3.375%, 03/25/2027 | | | 330 | | | | 379 | |
2.950%, 03/25/2025 | | | 320 | | | | 352 | |
2.875%, 10/27/2025 | | | 185 | | | | 206 | |
2.600%, 06/01/2050 | | | 560 | | | | 593 | |
2.500%, 06/01/2040 | | | 310 | | | | 335 | |
2.500%, 03/15/2051 | | | 1,540 | | | | 1,601 | |
1.450%, 06/01/2027 | | | 2,510 | | | | 2,585 | |
CommonSpirit Health | | | | | | | | |
4.187%, 10/01/2049 | | | 1,205 | | | | 1,335 | |
3.347%, 10/01/2029 | | | 1,025 | | | | 1,104 | |
2.782%, 10/01/2030 | | | 750 | | | | 774 | |
Constellation Brands | | | | | | | | |
4.400%, 11/15/2025 | | | 873 | | | | 1,015 | |
3.700%, 12/06/2026 | | | 203 | | | | 233 | |
3.200%, 02/15/2023 | | | 325 | | | | 343 | |
Costco Wholesale | | | | | | | | |
1.750%, 04/20/2032 | | | 1,019 | | | | 1,054 | |
1.600%, 04/20/2030 | | | 7,568 | | | | 7,760 | |
1.375%, 06/20/2027 | | | 1,220 | | | | 1,253 | |
CVS Pass-Through Trust | | | | | | | | |
6.036%, 12/10/2028 | | | 1,459 | | | | 1,661 | |
5.926%, 01/10/2034 (C) | | | 149 | | | | 178 | |
| | | | | | | | |
| | | |
| Description | | Face Amount
(Thousands) | | | Market Value
($ Thousands) | |
|
CORPORATE OBLIGATIONS (continued) | |
5.880%, 01/10/2028 | | $ | 93 | | | $ | 106 | |
5.789%, 01/10/2026 (C) | | | 710 | | | | 775 | |
Danone | | | | | | | | |
2.947%, 11/02/2026 (C) | | | 450 | | | | 497 | |
2.589%, 11/02/2023 (C) | | | 1,580 | | | | 1,664 | |
2.077%, 11/02/2021 (C) | | | 1,030 | | | | 1,045 | |
Diageo Investment | | | | | | | | |
2.875%, 05/11/2022 | | | 980 | | | | 1,016 | |
DP World MTN | | | | | | | | |
5.625%, 09/25/2048 (C) | | | 2,790 | | | | 3,398 | |
Element Fleet Management | | | | | | | | |
3.850%, 06/15/2025 (C)(D) | | | 1,367 | | | | 1,461 | |
General Mills | | | | | | | | |
2.875%, 04/15/2030 | | | 479 | | | | 533 | |
Health Care Service, A Mutual Legal Reserve | | | | | | | | |
2.200%, 06/01/2030 (C) | | | 1,535 | | | | 1,600 | |
1.500%, 06/01/2025 (C) | | | 1,380 | | | | 1,416 | |
Hershey | | | | | | | | |
0.900%, 06/01/2025 | | | 210 | | | | 213 | |
Hutama Karya Persero MTN | | | | | | | | |
3.750%, 05/11/2030 (C) | | | 760 | | | | 844 | |
Kaiser Foundation Hospitals | | | | | | | | |
4.150%, 05/01/2047 | | | 70 | | | | 91 | |
Keurig Dr Pepper | | | | | | | | |
4.417%, 05/25/2025 | | | 380 | | | | 438 | |
3.800%, 05/01/2050 | | | 696 | | | | 832 | |
3.430%, 06/15/2027 | | | 1,015 | | | | 1,157 | |
Kimberly-Clark | | | | | | | | |
3.100%, 03/26/2030 | | | 200 | | | | 231 | |
Kraft Heinz Foods | | | | | | | | |
5.000%, 07/15/2035 | | | 445 | | | | 525 | |
5.000%, 06/04/2042 | | | 4,795 | | | | 5,495 | |
4.875%, 10/01/2049 (C) | | | 4,975 | | | | 5,611 | |
4.375%, 06/01/2046 | | | 4,385 | | | | 4,683 | |
3.950%, 07/15/2025 | | | 76 | | | | 84 | |
3.000%, 06/01/2026 | | | 630 | | | | 658 | |
Kroger | | | | | | | | |
5.400%, 01/15/2049 | | | 1,760 | | | | 2,559 | |
3.950%, 01/15/2050 | | | 260 | | | | 318 | |
Land O’ Lakes | | | | | | | | |
6.000%, 11/15/2022 (C) | | | 1,890 | | | | 2,005 | |
Leland Stanford Junior University | | | | | | | | |
1.289%, 06/01/2027 | | | 273 | | | | 280 | |
Mars | | | | | | | | |
1.625%, 07/16/2032 (C) | | | 1,721 | | | | 1,713 | |
Molson Coors Beverage | | | | | | | | |
3.500%, 05/01/2022 | | | 220 | | | | 229 | |
Mondelez International | | | | | | | | |
2.125%, 04/13/2023 | | | 240 | | | | 249 | |
1.875%, 10/15/2032 | | | 1,250 | | | | 1,275 | |
1.500%, 05/04/2025 | | | 1,070 | | | | 1,107 | |
| | |
110 | | SEI Institutional Investments Trust / Semi-Annual Report / November 30, 2020 |
| | | | | | | | |
| | | |
| Description | | Face Amount
(Thousands) | | Market Value ($ Thousands) |
| |
CORPORATE OBLIGATIONS (continued) | | | | | |
Mondelez International Holdings Netherlands BV | | | | | | | | |
2.125%, 09/19/2022 (C) | | $ | 450 | | | $ | 464 | |
2.000%, 10/28/2021 (C) | | | 6,425 | | | | 6,513 | |
Nestle Holdings | | | | | | | | |
3.500%, 09/24/2025 (C) | | | 800 | | | | 900 | |
3.350%, 09/24/2023 (C) | | | 1,055 | | | | 1,139 | |
Partners Healthcare System | | | | | | | | |
3.342%, 07/01/2060 | | | 1,380 | | | | 1,533 | |
3.192%, 07/01/2049 | | | 245 | | | | 261 | |
PepsiCo | | | | | | | | |
3.875%, 03/19/2060 | | | 200 | | | | 267 | |
3.625%, 03/19/2050 | | | 110 | | | | 138 | |
3.600%, 03/01/2024 | | | 150 | | | | 164 | |
2.875%, 10/15/2049 | | | 250 | | | | 280 | |
2.625%, 03/19/2027 | | | 80 | | | | 88 | |
2.250%, 03/19/2025 | | | 80 | | | | 85 | |
1.625%, 05/01/2030 | | | 670 | | | | 690 | |
0.750%, 05/01/2023 | | | 820 | | | | 829 | |
Philip Morris International | | | | | | | | |
2.900%, 11/15/2021 | | | 550 | | | | 564 | |
2.875%, 05/01/2024 | | | 3,585 | | | | 3,852 | |
2.500%, 08/22/2022 | | | 1,530 | | | | 1,589 | |
2.500%, 11/02/2022 | | | 1,250 | | | | 1,301 | |
2.100%, 05/01/2030 | | | 460 | | | | 476 | |
1.125%, 05/01/2023 | | | 1,655 | | | | 1,687 | |
Procter & Gamble | | | | | | | | |
3.100%, 08/15/2023 | | | 140 | | | | 151 | |
3.000%, 03/25/2030 | | | 5,130 | | | | 5,942 | |
2.800%, 03/25/2027 | | | 130 | | | | 145 | |
Reckitt Benckiser Treasury Services | | | | | | | | |
2.750%, 06/26/2024 (C) | | | 3,675 | | | | 3,931 | |
Reynolds American | | | | | | | | |
8.125%, 05/01/2040 | | | 1,060 | | | | 1,553 | |
6.150%, 09/15/2043 | | | 480 | | | | 628 | |
5.850%, 08/15/2045 | | | 4,055 | | | | 5,189 | |
RWJ Barnabas Health | | | | | | | | |
3.949%, 07/01/2046 | | | 2,445 | | | | 2,794 | |
Shire Acquisitions Investments Ireland | | | | | | | | |
2.875%, 09/23/2023 | | | 4,747 | | | | 5,036 | |
Smith & Nephew | | | | | | | | |
2.032%, 10/14/2030 | | | 1,245 | | | | 1,269 | |
Sysco | | | | | | | | |
6.600%, 04/01/2050 | | | 350 | | | | 543 | |
Takeda Pharmaceutical | | | | | | | | |
4.400%, 11/26/2023 | | | 4,109 | | | | 4,559 | |
3.175%, 07/09/2050 | | | 2,522 | | | | 2,701 | |
2.050%, 03/31/2030 | | | 2,451 | | | | 2,498 | |
Trustees of the University of Pennsylvania | | | | | | | | |
3.610%, 02/15/2119 | | | 43 | | | | 47 | |
Walgreens Boots Alliance | | | | | | | | |
4.800%, 11/18/2044 | | | 1,430 | | | | 1,644 | |
| | | | | | | | |
| | | |
| Description | | Face Amount
(Thousands) | | Market Value ($ Thousands) |
| |
CORPORATE OBLIGATIONS (continued) | | | | | |
3.450%, 06/01/2026 | | $ | 690 | | | $ | 765 | |
3.300%, 11/18/2021 | | | 888 | | | | 908 | |
Walmart | | | | | | | | |
4.050%, 06/29/2048 | | | 15 | | | | 21 | |
3.950%, 06/28/2038 | | | 855 | | | | 1,110 | |
3.700%, 06/26/2028 | | | 1,560 | | | | 1,842 | |
3.550%, 06/26/2025 | | | 230 | | | | 260 | |
3.400%, 06/26/2023 | | | 305 | | | | 328 | |
3.300%, 04/22/2024 | | | 175 | | | | 190 | |
3.050%, 07/08/2026 | | | 1,695 | | | | 1,904 | |
Yale University | | | | | | | | |
1.482%, 04/15/2030 | | | 1,020 | | | | 1,033 | |
0.873%, 04/15/2025 | | | 1,190 | | | | 1,208 | |
| | | | | | | | |
| | | | | | | 252,098 | |
| | | | | | | | |
| | |
Energy — 3.7% | | | | | | | | |
Aker BP | | | | | | | | |
4.000%, 01/15/2031 (C) | | | 944 | | | | 954 | |
2.875%, 01/15/2026 (C) | | | 1,832 | | | | 1,835 | |
Apache | | | | | | | | |
5.100%, 09/01/2040 | | | 110 | | | | 114 | |
4.750%, 04/15/2043 | | | 420 | | | | 419 | |
4.375%, 10/15/2028 | | | 990 | | | | 1,010 | |
4.250%, 01/15/2030 | | | 20 | | | | 20 | |
4.250%, 01/15/2044 | | | 1,130 | | | | 1,085 | |
3.250%, 04/15/2022 | | | 45 | | | | 45 | |
BG Energy Capital | | | | | | | | |
4.000%, 10/15/2021 (C) | | | 2,775 | | | | 2,859 | |
BP Capital Markets | | | | | | | | |
3.561%, 11/01/2021 | | | 110 | | | | 113 | |
3.535%, 11/04/2024 | | | 150 | | | | 166 | |
3.506%, 03/17/2025 | | | 340 | | | | 379 | |
BP Capital Markets America | | | | | | | | |
3.796%, 09/21/2025 | | | 90 | | | | 102 | |
3.790%, 02/06/2024 | | | 150 | | | | 164 | |
3.633%, 04/06/2030 | | | 3,390 | | | | 3,953 | |
3.543%, 04/06/2027 | | | 1,670 | | | | 1,876 | |
3.245%, 05/06/2022 | | | 950 | | | | 989 | |
3.216%, 11/28/2023 | | | 1,630 | | | | 1,750 | |
3.194%, 04/06/2025 | | | 3,648 | | | | 4,006 | |
3.119%, 05/04/2026 | | | 400 | | | | 442 | |
3.000%, 02/24/2050 | | | 2,300 | | | | 2,393 | |
2.937%, 04/06/2023 | | | 60 | | | | 63 | |
2.772%, 11/10/2050 | | | 1,633 | | | | 1,628 | |
1.749%, 08/10/2030 | | | 1,361 | | | | 1,372 | |
Cameron LNG LLC | | | | | | | | |
3.302%, 01/15/2035 (C) | | | 1,110 | | | | 1,250 | |
2.902%, 07/15/2031 (C) | | | 2,020 | | | | 2,218 | |
Canadian Natural Resources | | | | | | | | |
6.450%, 06/30/2033 | | | 200 | | | | 252 | |
3.850%, 06/01/2027 | | | 644 | | | | 712 | |
| | |
SEI Institutional Investments Trust / Semi-Annual Report / November 30, 2020 | | 111 |
SCHEDULE OF INVESTMENTS (Unaudited)
November 30, 2020
Core Fixed Income Fund (Continued)
| | | | | | | | |
| | | |
| Description | | Face Amount
(Thousands) | | Market Value ($ Thousands) |
| |
CORPORATE OBLIGATIONS (continued) | | | | | |
Chevron | | | | | |
3.191%, 06/24/2023 | | $ | 95 | | | $ | 101 | |
3.078%, 05/11/2050 | | | 950 | | | | 1,059 | |
2.978%, 05/11/2040 | | | 650 | | | | 721 | |
2.954%, 05/16/2026 | | | 1,100 | | | | 1,218 | |
2.355%, 12/05/2022 | | | 290 | | | | 301 | |
1.995%, 05/11/2027 | | | 1,280 | | | | 1,356 | |
1.554%, 05/11/2025 | | | 830 | | | | 862 | |
Chevron USA | | | | | | | | |
1.018%, 08/12/2027 | | | 2,045 | | | | 2,048 | |
Cimarex Energy | | | | | | | | |
4.375%, 06/01/2024 | | | 80 | | | | 86 | |
4.375%, 03/15/2029 | | | 800 | | | | 897 | |
3.900%, 05/15/2027 | | | 1,670 | | | | 1,829 | |
CNOOC Finance 2013 | | | | | | | | |
3.000%, 05/09/2023 | | | 253 | | | | 265 | |
CNOOC Finance 2015 USA LLC | | | | | | | | |
4.375%, 05/02/2028 | | | 1,510 | | | | 1,746 | |
3.500%, 05/05/2025 | | | 2,900 | | | | 3,135 | |
Concho Resources | | | | | | | | |
4.300%, 08/15/2028 | | | 1,130 | | | | 1,344 | |
3.750%, 10/01/2027 | | | 1,385 | | | | 1,575 | |
2.400%, 02/15/2031 | | | 851 | | | | 890 | |
ConocoPhillips | | | | | | | | |
6.950%, 04/15/2029 | | | 995 | | | | 1,387 | |
4.150%, 11/15/2034 | | | 753 | | | | 892 | |
Continental Resources/Oklahoma | | | | | | | | |
4.900%, 06/01/2044 (D) | | | 340 | | | | 317 | |
4.500%, 04/15/2023 | | | 480 | | | | 492 | |
4.375%, 01/15/2028 (D) | | | 810 | | | | 808 | |
3.800%, 06/01/2024 | | | 770 | | | | 778 | |
Devon Energy | | | | | | | | |
7.875%, 09/30/2031 | | | 1,230 | | | | 1,647 | |
5.850%, 12/15/2025 | | | 1,000 | | | | 1,156 | |
5.600%, 07/15/2041 | | | 1,047 | | | | 1,223 | |
5.000%, 06/15/2045 | | | 1,453 | | | | 1,641 | |
4.750%, 05/15/2042 | | | 157 | | | | 170 | |
Diamondback Energy | | | | | | | | |
5.375%, 05/31/2025 | | | 200 | | | | 208 | |
3.500%, 12/01/2029 | | | 976 | | | | 1,021 | |
3.250%, 12/01/2026 | | | 1,319 | | | | 1,396 | |
2.875%, 12/01/2024 | | | 280 | | | | 292 | |
Ecopetrol | | | | | | | | |
5.875%, 05/28/2045 | | | 5,653 | | | | 6,720 | |
4.125%, 01/16/2025 | | | 167 | | | | 181 | |
Enbridge | | | | | | | | |
3.125%, 11/15/2029 | | | 1,444 | | | | 1,566 | |
2.500%, 01/15/2025 | | | 3,157 | | | | 3,326 | |
Energy Transfer Operating | | | | | | | | |
8.250%, 11/15/2029 | | | 3,042 | | | | 4,015 | |
6.250%, 04/15/2049 | | | 460 | | | | 537 | |
6.050%, 06/01/2041 | | | 311 | | | | 346 | |
| | | | | | | | |
| | | |
| Description | | Face Amount
(Thousands) | | Market Value ($ Thousands) |
| |
CORPORATE OBLIGATIONS (continued) | | | | | |
5.500%, 06/01/2027 | | $ | 344 | | | $ | 396 | |
5.300%, 04/15/2047 | | | 570 | | | | 607 | |
5.250%, 04/15/2029 | | | 2,085 | | | | 2,363 | |
5.150%, 03/15/2045 | | | 1,604 | | | | 1,663 | |
5.000%, 05/15/2050 | | | 1,505 | | | | 1,583 | |
4.950%, 06/15/2028 | | | 410 | | | | 459 | |
4.750%, 01/15/2026 | | | 474 | | | | 527 | |
4.500%, 04/15/2024 | | | 217 | | | | 234 | |
4.250%, 03/15/2023 | | | 976 | | | | 1,027 | |
4.200%, 04/15/2027 | | | 507 | | | | 550 | |
4.050%, 03/15/2025 | | | 2,409 | | | | 2,589 | |
3.750%, 05/15/2030 | | | 2,340 | | | | 2,421 | |
3.600%, 02/01/2023 | | | 170 | | | | 177 | |
2.900%, 05/15/2025 | | | 1,392 | | | | 1,448 | |
Energy Transfer Partners LP / Regency Energy Finance | | | | | | | | |
4.500%, 11/01/2023 | | | 321 | | | | 346 | |
Eni Spa | | | | | | | | |
4.000%, 09/12/2023 (C) | | | 3,600 | | | | 3,917 | |
Enterprise Products Operating LLC | | | | | | | | |
7.550%, 04/15/2038 | | | 60 | | | | 89 | |
6.125%, 10/15/2039 | | | 145 | | | | 196 | |
4.850%, 03/15/2044 | | | 60 | | | | 73 | |
4.800%, 02/01/2049 | | | 100 | | | | 126 | |
4.200%, 01/31/2050 | | | 2,790 | | | | 3,249 | |
4.150%, 10/16/2028 | | | 1,580 | | | | 1,867 | |
4.050%, 02/15/2022 | | | 14 | | | | 15 | |
3.950%, 01/31/2060 | | | 949 | | | | 1,028 | |
3.700%, 01/31/2051 | | | 1,053 | | | | 1,145 | |
3.125%, 07/31/2029 | | | 350 | | | | 388 | |
2.800%, 01/31/2030 | | | 1,800 | | | | 1,942 | |
EOG Resources | | | | | | | | |
4.950%, 04/15/2050 | | | 1,730 | | | | 2,375 | |
4.375%, 04/15/2030 | | | 860 | | | | 1,049 | |
4.150%, 01/15/2026 | | | 1,030 | | | | 1,192 | |
3.900%, 04/01/2035 | | | 590 | | | | 688 | |
EQT | | | | | | | | |
3.900%, 10/01/2027 | | | 575 | | | | 570 | |
Equinor | | | | | | | | |
3.250%, 11/18/2049 | | | 490 | | | | 543 | |
3.000%, 04/06/2027 | | | 2,845 | | | | 3,159 | |
2.875%, 04/06/2025 | | | 5,195 | | | | 5,646 | |
1.750%, 01/22/2026 | | | 838 | | | | 876 | |
Exxon Mobil | | | | | | | | |
4.327%, 03/19/2050 (D) | | | 3,500 | | | | 4,521 | |
4.227%, 03/19/2040 | | | 1,380 | | | | 1,706 | |
4.114%, 03/01/2046 | | | 910 | | | | 1,117 | |
3.482%, 03/19/2030 | | | 1,990 | | | | 2,306 | |
3.043%, 03/01/2026 | | | 1,140 | | | | 1,261 | |
1.571%, 04/15/2023 | | | 130 | | | | 134 | |
Exxon Mobil Corp | | | | | | | | |
2.992%, 03/19/2025 | | | 10,020 | | | | 10,934 | |
| | |
112 | | SEI Institutional Investments Trust / Semi-Annual Report / November 30, 2020 |
| | | | | | | | |
| | | |
| Description | | Face Amount
(Thousands) | | Market Value ($ Thousands) |
| |
CORPORATE OBLIGATIONS (continued) | | | | | |
Galaxy Pipeline Assets Bidco | | | | | | | | |
2.625%, 03/31/2036 (C) | | $ | 964 | | | $ | 997 | |
1.750%, 09/30/2027 (C) | | | 3,719 | | | | 3,740 | |
Gray Oak Pipeline LLC | | | | | | | | |
2.600%, 10/15/2025 (C) | | | 715 | | | | 726 | |
Halliburton | | | | | | | | |
3.800%, 11/15/2025 | | | 66 | | | | 73 | |
Hess | | | | | | | | |
6.000%, 01/15/2040 | | | 1,600 | | | | 1,946 | |
5.600%, 02/15/2041 | | | 2,000 | | | | 2,351 | |
HollyFrontier | | | | | | | | |
2.625%, 10/01/2023 | | | 721 | | | | 727 | |
KazMunayGas National JSC | | | | | | | | |
6.375%, 10/24/2048 (C) | | | 470 | | | | 668 | |
5.750%, 04/19/2047 (C) | | | 1,390 | | | | 1,833 | |
5.375%, 04/24/2030 (C) | | | 1,520 | | | | 1,864 | |
Kinder Morgan | | | | | | | | |
5.550%, 06/01/2045 | | | 270 | | | | 342 | |
5.200%, 03/01/2048 | | | 1,070 | | | | 1,315 | |
5.050%, 02/15/2046 | | | 260 | | | | 311 | |
4.300%, 06/01/2025 | | | 1,105 | | | | 1,257 | |
4.300%, 03/01/2028 | | | 590 | | | | 686 | |
Kinder Morgan Energy Partners | | | | | | | | |
5.500%, 03/01/2044 | | | 715 | | | | 886 | |
5.400%, 09/01/2044 | | | 40 | | | | 49 | |
5.000%, 03/01/2043 | | | 50 | | | | 58 | |
3.500%, 03/01/2021 | | | 300 | | | | 301 | |
Marathon Oil | | | | | | | | |
6.800%, 03/15/2032 | | | 250 | | | | 296 | |
5.200%, 06/01/2045 | | | 348 | | | | 379 | |
4.400%, 07/15/2027 | | | 1,309 | | | | 1,428 | |
MPLX | | | | | | | | |
5.500%, 02/15/2049 | | | 580 | | | | 725 | |
4.800%, 02/15/2029 | | | 120 | | | | 141 | |
4.700%, 04/15/2048 | | | 1,410 | | | | 1,585 | |
4.500%, 04/15/2038 | | | 810 | | | | 898 | |
4.000%, 03/15/2028 | | | 350 | | | | 395 | |
2.650%, 08/15/2030 | | | 1,429 | | | | 1,447 | |
1.750%, 03/01/2026 | | | 1,063 | | | | 1,077 | |
Noble Energy | | | | | | | | |
5.250%, 11/15/2043 | | | 150 | | | | 208 | |
5.050%, 11/15/2044 | | | 186 | | | | 254 | |
4.950%, 08/15/2047 | | | 330 | | | | 456 | |
3.850%, 01/15/2028 | | | 990 | | | | 1,147 | |
Occidental Petroleum | | | | | | | | |
7.875%, 09/15/2031 | | | 140 | | | | 149 | |
7.500%, 05/01/2031 | | | 240 | | | | 252 | |
6.950%, 07/01/2024 | | | 3,107 | | | | 3,278 | |
5.550%, 03/15/2026 | | | 2,180 | | | | 2,164 | |
4.625%, 06/15/2045 | | | 400 | | | | 332 | |
4.500%, 07/15/2044 | | | 1,000 | | | | 825 | |
4.400%, 04/15/2046 | | | 200 | | | | 168 | |
| | | | | | | | |
| | | |
| Description | | Face Amount
(Thousands) | | Market Value ($ Thousands) |
| |
CORPORATE OBLIGATIONS (continued) | | | | | |
4.200%, 03/15/2048 | | $ | 390 | | | $ | 314 | |
4.100%, 02/15/2047 | | | 1,040 | | | | 816 | |
3.400%, 04/15/2026 | | | 100 | | | | 90 | |
3.200%, 08/15/2026 | | | 1,740 | | | | 1,540 | |
3.125%, 02/15/2022 | | | 810 | | | | 808 | |
3.000%, 02/15/2027 | | | 510 | | | | 446 | |
2.900%, 08/15/2024 | | | 1,260 | | | | 1,175 | |
2.700%, 08/15/2022 | | | 700 | | | | 690 | |
2.700%, 02/15/2023 | | | 150 | | | | 144 | |
Oleoducto Central | | | | | | | | |
4.000%, 07/14/2027 (C) | | | 884 | | | | 955 | |
Pertamina Persero | | | | | | | | |
6.000%, 05/03/2042 (C) | | | 1,220 | | | | 1,555 | |
Petrobras Global Finance | | | | | | | | |
6.850%, 06/05/2115 | | | 1,090 | | | | 1,282 | |
6.250%, 03/17/2024 | | | 1,930 | | | | 2,198 | |
Petroleos del Peru | | | | | | | | |
4.750%, 06/19/2032 (C) | | | 4,690 | | | | 5,347 | |
Petroleos Mexicanos | | | | | | | | |
7.690%, 01/23/2050 | | | 1,840 | | | | 1,698 | |
6.950%, 01/28/2060 | | | 210 | | | | 180 | |
6.625%, 06/15/2035 | | | 2,202 | | | | 2,028 | |
6.500%, 03/13/2027 | | | 1,640 | | | | 1,646 | |
5.625%, 01/23/2046 | | | 1,650 | | | | 1,319 | |
2.460%, 12/15/2025 | | | 1,722 | | | | 1,797 | |
2.378%, 04/15/2025 | | | 783 | | | | 817 | |
Petroleos Mexicanos MTN | | | | | | | | |
6.875%, 08/04/2026 | | | 90 | | | | 93 | |
6.750%, 09/21/2047 | | | 4,865 | | | | 4,184 | |
Phillips | | | | | | | | |
66 1.300%, 02/15/2026 | | | 925 | | | | 932 | |
Pioneer Natural Resources | | | | | | | | |
1.900%, 08/15/2030 | | | 1,783 | | | | 1,754 | |
Plains All American Pipeline/PAA Finance | | | | | | | | |
4.900%, 02/15/2045 | | | 288 | | | | 290 | |
4.650%, 10/15/2025 | | | 2,300 | | | | 2,518 | |
3.550%, 12/15/2029 | | | 1,494 | | | | 1,532 | |
Rockies Express Pipeline LLC | | | | | | | | |
6.875%, 04/15/2040 (C) | | | 1,270 | | | | 1,346 | |
4.950%, 07/15/2029 (C) | | | 3,655 | | | | 3,682 | |
Ruby Pipeline | | | | | | | | |
7.750%, 04/01/2022 (C)(D) | | | 1,886 | | | | 1,773 | |
Sabine Pass Liquefaction LLC | | | | | | | | |
5.750%, 05/15/2024 | | | 2,230 | | | | 2,539 | |
5.625%, 03/01/2025 | | | 1,500 | | | | 1,734 | |
5.000%, 03/15/2027 | | | 2,235 | | | | 2,588 | |
Saudi Arabian Oil | | | | | | | | |
2.250%, 11/24/2030 (C) | | | 1,063 | | | | 1,078 | |
1.625%, 11/24/2025 (C) | | | 1,903 | | | | 1,938 | |
1.250%, 11/24/2023 (C) | | | 840 | | | | 849 | |
Schlumberger Finance Canada | | | | | | | | |
1.400%, 09/17/2025 | | | 850 | | | | 868 | |
| | |
SEI Institutional Investments Trust / Semi-Annual Report / November 30, 2020 | | 113 |
SCHEDULE OF INVESTMENTS (Unaudited)
November 30, 2020
Core Fixed Income Fund (Continued)
| | | | | | | | |
| | | |
| Description | | Face Amount
(Thousands) | | Market Value ($ Thousands) |
| |
CORPORATE OBLIGATIONS (continued) | | | | | |
Schlumberger Holdings | | | | | | | | |
4.000%, 12/21/2025 (C) | | $ | 660 | | | $ | 741 | |
3.900%, 05/17/2028 (C) | | | 857 | | | | 954 | |
Schlumberger Investment | | | | | | | | |
3.650%, 12/01/2023 | | | 100 | | | | 108 | |
Shell International Finance BV | | | | | | | | |
6.375%, 12/15/2038 | | | 660 | | | | 1,024 | |
4.550%, 08/12/2043 | | | 490 | | | | 647 | |
4.375%, 05/11/2045 | | | 990 | | | | 1,277 | |
4.125%, 05/11/2035 | | | 2,605 | | | | 3,254 | |
4.000%, 05/10/2046 | | | 170 | | | | 211 | |
3.750%, 09/12/2046 | | | 100 | | | | 119 | |
3.250%, 04/06/2050 | | | 930 | | | | 1,049 | |
2.750%, 04/06/2030 | | | 660 | | | | 730 | |
Sinopec Group Overseas Development 2014 | | | | | | | | |
4.375%, 04/10/2024 (C) | | | 1,020 | | | | 1,117 | |
Spectra Energy Partners | | | | | | | | |
3.500%, 03/15/2025 | | | 1,025 | | | | 1,119 | |
3.375%, 10/15/2026 | | | 140 | | | | 155 | |
Suncor Energy | | | | | | | | |
3.100%, 05/15/2025 | | | 1,415 | | | | 1,540 | |
Sunoco Logistics Partners Operations | | | | | | | | |
5.400%, 10/01/2047 | | | 1,000 | | | | 1,073 | |
5.350%, 05/15/2045 | | | 1,265 | | | | 1,323 | |
5.300%, 04/01/2044 | | | 60 | | | | 63 | |
4.250%, 04/01/2024 | | | 436 | | | | 467 | |
4.000%, 10/01/2027 | | | 1,150 | | | | 1,237 | |
3.900%, 07/15/2026 | | | 250 | | | | 268 | |
3.450%, 01/15/2023 | | | 165 | | | | 171 | |
Tengizchevroil Finance International | | | | | | | | |
2.625%, 08/15/2025 (C) | | | 1,089 | | | | 1,126 | |
Tennessee Gas Pipeline LLC | | | | | | | | |
8.375%, 06/15/2032 | | | 2,200 | | | | 3,126 | |
2.900%, 03/01/2030 (C) | | | 2,770 | | | | 2,923 | |
Total Capital International | | | | | | | | |
3.127%, 05/29/2050 | | | 1,043 | | | | 1,144 | |
TransCanada PipeLines | | | | | | | | |
4.625%, 03/01/2034 | | | 2,125 | | | | 2,537 | |
Transcontinental Gas Pipe Line LLC | | | | | | | | |
7.850%, 02/01/2026 | | | 1,390 | | | | 1,805 | |
3.950%, 05/15/2050 (C) | | | 1,130 | | | | 1,251 | |
3.250%, 05/15/2030 (C) | | | 704 | | | | 780 | |
Valero Energy | | | | | | | | |
1.200%, 03/15/2024 | | | 2,726 | | | | 2,730 | |
Western Midstream Operating | | | | | | | | |
4.350%, 02/01/2025 | | | 330 | | | | 329 | |
2.074%, VAR ICE LIBOR USD 3 Month+1.850%, 01/13/2023 | | | 220 | | | | 213 | |
Williams | | | | | | | | |
8.750%, 03/15/2032 | | | 1,284 | | | | 1,849 | |
7.875%, 09/01/2021 | | | 130 | | | | 137 | |
7.750%, 06/15/2031 | | | 339 | | | | 455 | |
| | | | | | | | |
| | | |
| Description | | Face Amount
(Thousands) | | Market Value ($ Thousands) |
| |
CORPORATE OBLIGATIONS (continued) | | | | | |
7.500%, 01/15/2031 | | $ | 9 | | | $ | 12 | |
5.100%, 09/15/2045 | | | 100 | | | | 121 | |
3.900%, 01/15/2025 | | | 1,972 | | | | 2,178 | |
3.750%, 06/15/2027 | | | 410 | | | | 462 | |
3.600%, 03/15/2022 | | | 124 | | | | 128 | |
| | | | | | | | |
| | | | | | | 286,453 | |
| | | | | | | | |
| | |
Financials — 8.8% | | | | | | | | |
Aegon | | | | | | | | |
0.871%, VAR USD ICE Swap 11:00 NY 10 Yr+0.100%(E) | | | 2,180 | | | | 1,790 | |
Affiliated Managers Group | | | | | | | | |
3.300%, 06/15/2030 | | | 2,130 | | | | 2,320 | |
Ally Financial | | | | | | | | |
5.750%, 11/20/2025 | | | 2,396 | | | | 2,799 | |
5.125%, 09/30/2024 | | | 2,202 | | | | 2,526 | |
1.450%, 10/02/2023 | | | 4,003 | | | | 4,081 | |
American Express | | | | | | | | |
4.200%, 11/06/2025 | | | 250 | | | | 290 | |
4.050%, 12/03/2042 | | | 70 | | | | 89 | |
3.700%, 08/03/2023 | | | 1,305 | | | | 1,417 | |
3.400%, 02/27/2023 | | | 285 | | | | 303 | |
2.500%, 08/01/2022 | | | 3,890 | | | | 4,023 | |
2.500%, 07/30/2024 | | | 3,000 | | | | 3,194 | |
American Express Credit MTN | | | | | | | | |
0.932%, VAR ICE LIBOR USD 3 Month+0.700%, 03/03/2022 | | | 2,560 | | | | 2,579 | |
American Financial Group | | | | | | | | |
5.250%, 04/02/2030 | | | 1,717 | | | | 2,074 | |
American International Group | | | | | | | | |
6.250%, VAR ICE LIBOR USD 3 Month+2.056%, 03/15/2037 | | | 2,578 | | | | 2,891 | |
4.750%, 04/01/2048 | | | 1,578 | | | | 2,135 | |
4.500%, 07/16/2044 | | | 890 | | | | 1,144 | |
4.200%, 04/01/2028 | | | 1,001 | | | | 1,192 | |
3.900%, 04/01/2026 | | | 1,300 | | | | 1,485 | |
3.400%, 06/30/2030 | | | 1,503 | | | | 1,711 | |
2.500%, 06/30/2025 | | | 410 | | | | 440 | |
Andrew W Mellon Foundation | | | | | | | | |
0.947%, 08/01/2027 | | | 812 | | | | 811 | |
Apollo Management Holdings | | | | | | | | |
5.000%, 03/15/2048 (C) | | | 1,450 | | | | 1,789 | |
4.400%, 05/27/2026 (C) | | | 1,015 | | | | 1,180 | |
Arch Capital Group | | | | | | | | |
3.635%, 06/30/2050 | | | 884 | | | | 1,043 | |
Ares Capital | | | | | | | | |
3.875%, 01/15/2026 | | | 1,247 | | | | 1,310 | |
Athene Global Funding | | | | | | | | |
3.000%, 07/01/2022 (C) | | | 1,105 | | | | 1,141 | |
2.950%, 11/12/2026 (C) | | | 3,910 | | | | 4,149 | |
Athene Holding | | | | | | | | |
6.150%, 04/03/2030 | | | 1,047 | | | | 1,305 | |
| | |
114 | | SEI Institutional Investments Trust / Semi-Annual Report / November 30, 2020 |
| | | | | | | | |
| | | |
| Description | | Face Amount
(Thousands) | | Market Value ($ Thousands) |
| |
CORPORATE OBLIGATIONS (continued) | | | | | |
4.125%, 01/12/2028 | | $ | 1,140 | | | $ | 1,264 | |
3.500%, 01/15/2031 | | | 502 | | | | 531 | |
Aviation Capital Group LLC | | | | | | | | |
5.500%, 12/15/2024 (C) | | | 1,774 | | | | 1,899 | |
Avolon Holdings Funding | | | | | | | | |
5.250%, 05/15/2024 (C) | | | 185 | | | | 197 | |
5.125%, 10/01/2023 (C) | | | 195 | | | | 205 | |
3.950%, 07/01/2024 (C) | | | 535 | | | | 549 | |
2.875%, 02/15/2025 (C) | | | 1,420 | | | | 1,388 | |
Banco Bilbao Vizcaya Argentaria | | | | | | | | |
1.125%, 09/18/2025 | | | 1,400 | | | | 1,405 | |
Banco Nacional de Comercio Exterior SNC | | | | | | | | |
3.800%, VAR US Treas Yield Curve Rate T Note Const Mat 5 Yr+3.000%, 08/11/2026 (C) | | | 1,390 | | | | 1,388 | |
Banco Santander | | | | | | | | |
3.848%, 04/12/2023 | | | 1,200 | | | | 1,287 | |
3.490%, 05/28/2030 | | | 600 | | | | 670 | |
2.749%, 12/03/2030 | | | 1,600 | | | | 1,600 | |
2.746%, 05/28/2025 | | | 3,400 | | | | 3,619 | |
1.344%, VAR ICE LIBOR USD 3 Month+1.120%, 04/12/2023 | | | 400 | | | | 403 | |
Bank of America | | | | | | | | |
3.419%, VAR ICE LIBOR USD 3 Month+1.040%, 12/20/2028 | | | 5,899 | | | | 6,643 | |
3.366%, VAR ICE LIBOR USD 3 Month+0.810%, 01/23/2026 | | | 1,660 | | | | 1,821 | |
3.004%, VAR ICE LIBOR USD 3 Month+0.790%, 12/20/2023 | | | 3,732 | | | | 3,919 | |
2.592%, VAR United States Secured Overnight Financing Rate+2.150%, 04/29/2031 | | | 2,653 | | | | 2,823 | |
Bank of America MTN | | | | | | | | |
5.000%, 01/21/2044 | | | 1,800 | | | | 2,573 | |
4.450%, 03/03/2026 | | | 5,035 | | | | 5,879 | |
4.330%, VAR ICE LIBOR USD 3 Month+1.520%, 03/15/2050 | | | 1,305 | | | | 1,727 | |
4.271%, VAR ICE LIBOR USD 3 Month+1.310%, 07/23/2029 | | | 625 | | | | 744 | |
4.250%, 10/22/2026 | | | 130 | | | | 152 | |
4.200%, 08/26/2024 | | | 2,720 | | | | 3,045 | |
4.183%, 11/25/2027 | | | 1,888 | | | | 2,182 | |
4.125%, 01/22/2024 | | | 223 | | | | 247 | |
4.083%, VAR ICE LIBOR USD 3 Month+3.150%, 03/20/2051 | | | 5,390 | | | | 6,870 | |
4.000%, 04/01/2024 | | | 2,110 | | | | 2,338 | |
4.000%, 01/22/2025 | | | 2,815 | | | | 3,156 | |
3.970%, VAR ICE LIBOR USD 3 Month+1.070%, 03/05/2029 | | | 1,780 | | | | 2,071 | |
3.864%, VAR ICE LIBOR USD 3 Month+0.940%, 07/23/2024 | | | 1,225 | | | | 1,329 | |
3.593%, VAR ICE LIBOR USD 3 Month+1.370%, 07/21/2028 | | | 710 | | | | 804 | |
| | | | | | | | |
| | | |
| Description | | Face Amount
(Thousands) | | Market Value ($ Thousands) |
| |
CORPORATE OBLIGATIONS (continued) | | | | | |
3.550%, VAR ICE LIBOR USD 3 Month+0.780%, 03/05/2024 | | $ | 1,310 | | | $ | 1,395 | |
3.500%, 04/19/2026 | | | 2,575 | | | | 2,914 | |
3.300%, 01/11/2023 | | | 3,643 | | | | 3,863 | |
3.194%, VAR ICE LIBOR USD 3 Month+1.180%, 07/23/2030 | | | 1,170 | | | | 1,307 | |
3.093%, VAR ICE LIBOR USD 3 Month+1.090%, 10/01/2025 | | | 3,680 | | | | 3,979 | |
2.884%, VAR ICE LIBOR USD 3 Month+1.190%, 10/22/2030 | | | 1,480 | | | | 1,620 | |
2.625%, 04/19/2021 | | | 70 | | | | 71 | |
2.496%, VAR ICE LIBOR USD 3 Month+0.990%, 02/13/2031 | | | 1,874 | | | | 1,977 | |
2.456%, VAR ICE LIBOR USD 3 Month+0.870%, 10/22/2025 | | | 4,090 | | | | 4,334 | |
2.015%, VAR ICE LIBOR USD 3 Month+0.640%, 02/13/2026 | | | 339 | | | | 354 | |
1.922%, VAR United States Secured Overnight Financing Rate+1.370%, 10/24/2031 | | | 1,115 | | | | 1,125 | |
1.898%, VAR United States Secured Overnight Financing Rate+1.530%, 07/23/2031 | | | 2,730 | | | | 2,746 | |
1.389%, VAR ICE LIBOR USD 3 Month+1.180%, 10/21/2022 | | | 165 | | | | 166 | |
1.319%, VAR United States Secured Overnight Financing Rate+1.150%, 06/19/2026 | | | 4,570 | | | | 4,628 | |
1.197%, VAR United States Secured Overnight Financing Rate+1.010%, 10/24/2026 | | | 3,436 | | | | 3,462 | |
0.981%, VAR United States Secured Overnight Financing Rate+0.910%, 09/25/2025 | | | 3,007 | | | | 3,027 | |
0.810%, VAR United States Secured Overnight Financing Rate+0.740%, 10/24/2024 | | | 3,569 | | | | 3,583 | |
Bank of Montreal MTN | | | | | | | | |
2.550%, 11/06/2022 | | | 200 | | | | 208 | |
1.850%, 05/01/2025 | | | 1,360 | | | | 1,425 | |
Bank of New York Mellon | | | | | | | | |
3.550%, 09/23/2021 | | | 144 | | | | 147 | |
Bank of New York Mellon MTN | | | | | | | | |
3.650%, 02/04/2024 | | | 150 | | | | 164 | |
3.442%, VAR ICE LIBOR USD 3 Month+1.069%, 02/07/2028 | | | 1,920 | | | | 2,201 | |
3.250%, 09/11/2024 | | | 270 | | | | 296 | |
3.250%, 05/16/2027 | | | 270 | | | | 305 | |
1.600%, 04/24/2025 | | | 410 | | | | 427 | |
Bank of Nova Scotia | | | | | | | | |
4.900%, VAR US Treas Yield Curve Rate T Note Const Mat 5 Yr+4.551%(E) | | | 1,140 | | | | 1,222 | |
| | |
SEI Institutional Investments Trust / Semi-Annual Report / November 30, 2020 | | 115 |
SCHEDULE OF INVESTMENTS (Unaudited)
November 30, 2020
Core Fixed Income Fund (Continued)
| | | | | | | | |
| | | |
| Description | | Face Amount
(Thousands) | | Market Value ($ Thousands) |
| |
CORPORATE OBLIGATIONS (continued) | | | | | |
2.000%, 11/15/2022 | | $ | 2,095 | | | $ | 2,164 | |
1.300%, 06/11/2025 | | | 760 | | | | 777 | |
Barclays | | | | | | | | |
5.088%, VAR ICE LIBOR USD 3 Month+3.054%, 06/20/2030 | | | 2,245 | | | | 2,647 | |
3.684%, 01/10/2023 | | | 1,220 | | | | 1,259 | |
Barclays MTN | | | | | | | | |
4.972%, VAR ICE LIBOR USD 3 Month+1.902%, 05/16/2029 | | | 1,070 | | | | 1,283 | |
4.338%, VAR ICE LIBOR USD 3 Month+1.356%, 05/16/2024 | | | 1,285 | | | | 1,387 | |
Barclays Bank | | | | | | | | |
1.700%, 05/12/2022 | | | 2,860 | | | | 2,911 | |
BBVA USA | | | | | | | | |
3.875%, 04/10/2025 | | | 910 | | | | 1,011 | |
Berkshire Hathaway | | | | | | | | |
3.750%, 08/15/2021 (D) | | | 488 | | | | 500 | |
Berkshire Hathaway Finance | | | | | | | | |
4.250%, 01/15/2049 | | | 1,260 | | | | 1,707 | |
4.200%, 08/15/2048 | | | 805 | | | | 1,081 | |
Blackstone | | | | | | | | |
3.625%, 01/15/2026 (C) | | | 1,255 | | | | 1,284 | |
BNP Paribas | | | | | | | | |
5.198%, VAR ICE LIBOR USD 3 Month+2.567%, 01/10/2030 (C) | | | 1,220 | | | | 1,517 | |
4.705%, VAR ICE LIBOR USD 3 Month+2.235%, 01/10/2025 (C) | | | 1,450 | | | | 1,610 | |
4.400%, 08/14/2028 (C) | | | 1,420 | | | | 1,682 | |
3.375%, 01/09/2025 (C) | | | 420 | | | | 458 | |
2.219%, VAR United States Secured Overnight Financing Rate+2.074%, 06/09/2026 (C) | | | 950 | | | | 989 | |
BNP Paribas MTN | | | | | | | | |
4.375%, VAR USD Swap Semi 30/360 5 Yr Curr+1.483%, 03/01/2033 (C) | | | 380 | | | | 432 | |
BPCE | | | | | | | | |
5.150%, 07/21/2024 (C) | | | 1,550 | | | | 1,756 | |
Brighthouse Financial | | | | | | | | |
4.700%, 06/22/2047 | | | 751 | | | | 777 | |
Brookfield Finance | | | | | | | | |
4.350%, 04/15/2030 | | | 1,746 | | | | 2,112 | |
Canadian Imperial Bank of Commerce | | | | | | | | |
0.950%, 06/23/2023 | | | 750 | | | | 759 | |
0.950%, 10/23/2025 (D) | | | 1,750 | | | | 1,762 | |
Chubb INA Holdings | | | | | | | | |
3.350%, 05/03/2026 | | | 420 | | | | 475 | |
Citadel | | | | | | | | |
4.875%, 01/15/2027 (C) | | | 1,240 | | | | 1,350 | |
Citibank | | | | | | | | |
0.824%, VAR ICE LIBOR USD 3 Month+0.600%, 05/20/2022 | | | 4,745 | | | | 4,754 | |
Citigroup | | | | | | | | |
8.125%, 07/15/2039 | | | 1,871 | | | | 3,391 | |
| | | | | | | | |
| | | |
| Description | | Face Amount
(Thousands) | | Market Value ($ Thousands) |
| |
CORPORATE OBLIGATIONS (continued) | | | | | |
5.500%, 09/13/2025 | | $ | 1,370 | | | $ | 1,649 | |
5.316%, VAR United States Secured Overnight Financing Rate+4.548%, 03/26/2041 | | | 1,260 | | | | 1,786 | |
5.300%, 05/06/2044 | | | 255 | | | | 360 | |
4.750%, 05/18/2046 | | | 150 | | | | 201 | |
4.650%, 07/30/2045 | | | 1,140 | | | | 1,550 | |
4.650%, 07/23/2048 | | | 795 | | | | 1,105 | |
4.600%, 03/09/2026 | | | 2,785 | | | | 3,253 | |
4.500%, 01/14/2022 | | | 50 | | | | 52 | |
4.450%, 09/29/2027 | | | 1,380 | | | | 1,619 | |
4.412%, VAR United States Secured Overnight Financing Rate+3.914%, 03/31/2031 | | | 2,020 | | | | 2,434 | |
4.400%, 06/10/2025 | | | 2,040 | | | | 2,336 | |
4.300%, 11/20/2026 | | | 590 | | | | 683 | |
4.125%, 07/25/2028 | | | 260 | | | | 303 | |
3.887%, VAR ICE LIBOR USD 3 Month+1.563%, 01/10/2028 | | | 545 | | | | 622 | |
3.875%, 10/25/2023 | | | 1,340 | | | | 1,472 | |
3.700%, 01/12/2026 | | | 625 | | | | 707 | |
3.500%, 05/15/2023 | | | 930 | | | | 996 | |
3.352%, VAR ICE LIBOR USD 3 Month+0.897%, 04/24/2025 | | | 3,600 | | | | 3,899 | |
3.200%, 10/21/2026 | | | 3,504 | | | | 3,892 | |
3.142%, VAR ICE LIBOR USD 3 Month+0.722%, 01/24/2023 | | | 780 | | | | 803 | |
3.106%, VAR United States Secured Overnight Financing Rate+2.750%, 04/08/2026 | | | 560 | | | | 608 | |
2.572%, VAR United States Secured Overnight Financing Rate+2.107%, 06/03/2031 | | | 8,390 | | | | 8,914 | |
1.678%, VAR United States Secured Overnight Financing Rate+1.667%, 05/15/2024 | | | 800 | | | | 821 | |
0.776%, VAR United States Secured Overnight Financing Rate+0.686%, 10/30/2024 | | | 2,296 | | | | 2,303 | |
CME Group | | | | | | | | |
3.000%, 09/15/2022 | | | 400 | | | | 419 | |
Cooperatieve Rabobank UA | | | | | | | | |
4.625%, 12/01/2023 | | | 2,060 | | | | 2,293 | |
4.375%, 08/04/2025 | | | 1,580 | | | | 1,806 | |
Cooperatieve Rabobank UA MTN | | | | | | | | |
3.875%, 02/08/2022 | | | 300 | | | | 313 | |
1.339%, VAR US Treas Yield Curve Rate T Note Const Mat 1 Yr+1.000%, 06/24/2026 (C) | | | 570 | | | | 579 | |
Credit Agricole SA/London MTN | | | | | | | | |
1.907%, VAR United States Secured Overnight Financing Rate+1.676%, 06/16/2026 (C) | | | 630 | | | | 650 | |
| | |
116 | | SEI Institutional Investments Trust / Semi-Annual Report / November 30, 2020 |
| | | | | | | | |
| | | |
| Description | | Face Amount
(Thousands) | | Market Value ($ Thousands) |
| |
CORPORATE OBLIGATIONS (continued) | | | | | |
Credit Suisse AG/New York NY | | | | | | | | |
2.950%, 04/09/2025 | | $ | 790 | | | $ | 865 | |
1.000%, 05/05/2023 | | | 4,510 | | | | 4,571 | |
Credit Suisse AG/New York NY MTN | | | | | | | | |
3.625%, 09/09/2024 | | | 1,360 | | | | 1,511 | |
Credit Suisse Group | | | | | | | | |
4.207%, VAR ICE LIBOR USD 3 Month+1.240%, 06/12/2024 (C) | | | 1,295 | | | | 1,404 | |
4.194%, VAR United States Secured Overnight Financing Rate+3.730%, 04/01/2031 (C) | | | 4,517 | | | | 5,317 | |
2.997%, VAR ICE LIBOR USD 3 Month+1.200%, 12/14/2023 (C) | | | 1,203 | | | | 1,257 | |
2.593%, VAR United States Secured Overnight Financing Rate+1.560%, 09/11/2025 (C) | | | 473 | | | | 499 | |
2.193%, VAR United States Secured Overnight Financing Rate+2.044%, 06/05/2026 (C) | | | 2,517 | | | | 2,620 | |
Credit Suisse Group Funding Guernsey | | | | | | | | |
3.800%, 06/09/2023 | | | 1,084 | | | | 1,167 | |
Danske Bank | | | | | | | | |
5.375%, 01/12/2024 (C) | | | 940 | | | | 1,059 | |
5.000%, 01/12/2022 (C) | | | 2,677 | | | | 2,802 | |
3.244%, VAR ICE LIBOR USD 3 Month+1.591%, 12/20/2025 (C) | | | 4,342 | | | | 4,640 | |
3.001%, VAR ICE LIBOR USD 3 Month+1.249%, 09/20/2022 (C) | | | 3,817 | | | | 3,882 | |
1.226%, 06/22/2024 (C) | | | 550 | | | | 557 | |
1.171%, VAR US Treas Yield Curve Rate T Note Const Mat 1 Yr+1.030%, 12/08/2023 (C) | | | 2,714 | | | | 2,725 | |
Deutsche Bank NY | | | | | | | | |
2.222%, VAR United States Secured Overnight Financing Rate+2.159%, 09/18/2024 | | | 1,375 | | | | 1,403 | |
2.129%, VAR United States Secured Overnight Financing Rate+1.870%, 11/24/2026 | | | 2,061 | | | | 2,086 | |
Equitable Holdings | | | | | | | | |
3.900%, 04/20/2023 | | | 1,400 | | | | 1,511 | |
Farmers Exchange Capital | | | | | | | | |
7.200%, 07/15/2048 (C) | | | 1,788 | | | | 2,364 | |
Farmers Exchange Capital II | | | | | | | | |
6.151%, VAR ICE LIBOR USD 3 Month+3.744%, 11/01/2053 (C) | | | 4,120 | | | | 5,252 | |
Fidelity & Guaranty Life Holdings | | | | | | | | |
5.500%, 05/01/2025 (C) | | | 682 | | | | 788 | |
Fidelity National Financial | | | | | | | | |
3.400%, 06/15/2030 | | | 860 | | | | 948 | |
Fifth Third Bank | | | | | | | | |
2.875%, 10/01/2021 | | | 1,870 | | | | 1,906 | |
| | | | | | | | |
| | | |
| Description | | Face Amount
(Thousands) | | Market Value ($ Thousands) |
| |
CORPORATE OBLIGATIONS (continued) | | | | | |
Franklin Resources | | | | | | | | |
1.600%, 10/30/2030 | | $ | 1,616 | | | $ | 1,596 | |
Goldman Sachs Capital II | | | | | | | | |
4.000%, VAR ICE LIBOR USD 3 Month+0.768%(E) | | | 595 | | | | 570 | |
Goldman Sachs Group | | | | | | | | |
6.750%, 10/01/2037 | | | 2,762 | | | | 4,232 | |
6.250%, 02/01/2041 | | | 1,290 | | | | 2,033 | |
5.250%, 07/27/2021 | | | 3,660 | | | | 3,778 | |
5.150%, 05/22/2045 | | | 1,870 | | | | 2,624 | |
4.750%, 10/21/2045 | | | 780 | | | | 1,091 | |
4.250%, 10/21/2025 | | | 1,090 | | | | 1,252 | |
4.223%, VAR ICE LIBOR USD 3 Month+1.301%, 05/01/2029 | | | 500 | | | | 594 | |
3.800%, 03/15/2030 | | | 5,120 | | | | 5,997 | |
3.750%, 05/22/2025 | | | 500 | | | | 559 | |
3.750%, 02/25/2026 | | | 1,445 | | | | 1,640 | |
3.691%, VAR ICE LIBOR USD 3 Month+1.510%, 06/05/2028 | | | 640 | | | | 734 | |
3.625%, 01/22/2023 | | | 508 | | | | 542 | |
3.500%, 01/23/2025 | | | 150 | | | | 165 | |
3.500%, 04/01/2025 | | | 3,470 | | | | 3,841 | |
3.500%, 11/16/2026 | | | 3,382 | | | | 3,792 | |
3.272%, VAR ICE LIBOR USD 3 Month+1.201%, 09/29/2025 | | | 3,770 | | | | 4,111 | |
3.200%, 02/23/2023 | | | 670 | | | | 709 | |
2.908%, VAR ICE LIBOR USD 3 Month+1.053%, 06/05/2023 | | | 410 | | | | 425 | |
1.325%, VAR ICE LIBOR USD 3 Month+1.110%, 04/26/2022 | | | 225 | | | | 226 | |
0.627%, VAR United States Secured Overnight Financing Rate+0.538%, 11/17/2023 | | | 5,552 | | | | 5,566 | |
Goldman Sachs Group MTN | | | | | | | | |
4.800%, 07/08/2044 | | | 260 | | | | 362 | |
2.905%, VAR ICE LIBOR USD 3 Month+0.990%, 07/24/2023 | | | 1,060 | | | | 1,102 | |
Golub Capital BDC | | | | | | | | |
3.375%, 04/15/2024 | | | 3,439 | | | | 3,462 | |
Guardian Life Global Funding | | | | | | | | |
1.100%, 06/23/2025 (C) | | | 1,330 | | | | 1,345 | |
HSBC Bank PLC | | | | | | | | |
7.650%, 05/01/2025 | | | 796 | | | | 990 | |
4.750%, 01/19/2021 (C) | | | 250 | | | | 251 | |
HSBC Bank USA | | | | | | | | |
7.000%, 01/15/2039 | | | 510 | | | | 801 | |
HSBC Holdings | | | | | | | | |
4.950%, 03/31/2030 | | | 785 | | | | 978 | |
4.583%, VAR ICE LIBOR USD 3 Month+1.535%, 06/19/2029 | | | 4,685 | | | | 5,525 | |
4.300%, 03/08/2026 | | | 5,405 | | | | 6,206 | |
4.250%, 03/14/2024 | | | 1,190 | | | | 1,305 | |
4.250%, 08/18/2025 | | | 1,290 | | | | 1,453 | |
| | |
SEI Institutional Investments Trust / Semi-Annual Report / November 30, 2020 | | 117 |
SCHEDULE OF INVESTMENTS (Unaudited)
November 30, 2020
Core Fixed Income Fund (Continued)
| | | | | | | | |
| | | |
| Description | | Face Amount
(Thousands) | | Market Value ($ Thousands) |
| |
CORPORATE OBLIGATIONS (continued) | | | | | |
4.041%, VAR ICE LIBOR USD 3 Month+1.546%, 03/13/2028 | | $ | 830 | | | $ | 943 | |
3.973%, VAR ICE LIBOR USD 3 Month+1.610%, 05/22/2030 | | | 1,720 | | | | 1,982 | |
3.262%, VAR ICE LIBOR USD 3 Month+1.055%, 03/13/2023 | | | 155 | | | | 160 | |
2.633%, VAR ICE LIBOR USD 3 Month+1.140%, 11/07/2025 | | | 755 | | | | 796 | |
2.099%, VAR United States Secured Overnight Financing Rate+1.929%, 06/04/2026 | | | 200 | | | | 206 | |
2.013%, VAR United States Secured Overnight Financing Rate+1.732%, 09/22/2028 | | | 6,723 | | | | 6,832 | |
1.645%, VAR United States Secured Overnight Financing Rate+1.538%, 04/18/2026 | | | 3,299 | | | | 3,347 | |
1.589%, VAR United States Secured Overnight Financing Rate+1.290%, 05/24/2027 | | | 6,215 | | | | 6,267 | |
ING Bank | | | | | | | | |
5.800%, 09/25/2023 (C) | | | 202 | | | | 228 | |
Intercontinental Exchange | | | | | | | | |
2.650%, 09/15/2040 | | | 499 | | | | 519 | |
1.850%, 09/15/2032 | | | 1,427 | | | | 1,441 | |
Intesa Sanpaolo | | | | | | | | |
3.375%, 01/12/2023 (C) | | | 490 | | | | 512 | |
3.125%, 07/14/2022 (C) | | | 1,420 | | | | 1,469 | |
Intesa Sanpaolo MTN | | | | | | | | |
5.710%, 01/15/2026 (C) | | | 1,260 | | | | 1,430 | |
5.017%, 06/26/2024 (C) | | | 870 | | | | 950 | |
JPMorgan Chase | | | | | | | | |
8.750%, 09/01/2030 | | | 1,725 | | | | 2,558 | |
6.400%, 05/15/2038 | | | 385 | | | | 609 | |
4.950%, 06/01/2045 | | | 300 | | | | 428 | |
4.452%, VAR ICE LIBOR USD 3 Month+1.330%, 12/05/2029 | | | 740 | | | | 898 | |
4.250%, 10/01/2027 | | | 2,590 | | | | 3,053 | |
4.203%, VAR ICE LIBOR USD 3 Month+1.260%, 07/23/2029 | | | 940 | | | | 1,118 | |
4.125%, 12/15/2026 | | | 2,420 | | | | 2,830 | |
4.032%, VAR ICE LIBOR USD 3 Month+1.460%, 07/24/2048 | | | 725 | | | | 932 | |
4.023%, VAR ICE LIBOR USD 3 Month+1.000%, 12/05/2024 | | | 6,275 | | | | 6,909 | |
3.900%, 07/15/2025 | | | 1,635 | | | | 1,851 | |
3.897%, VAR ICE LIBOR USD 3 Month+1.220%, 01/23/2049 | | | 245 | | | | 312 | |
3.882%, VAR ICE LIBOR USD 3 Month+1.360%, 07/24/2038 | | | 215 | | | | 262 | |
3.875%, 09/10/2024 | | | 440 | | | | 491 | |
3.797%, VAR ICE LIBOR USD 3 Month+0.890%, 07/23/2024 | | | 2,010 | | | | 2,179 | |
| | | | | | | | |
| | | |
| Description | | Face Amount
(Thousands) | | Market Value ($ Thousands) |
| |
CORPORATE OBLIGATIONS (continued) | | | | | |
3.625%, 05/13/2024 | | $ | 1,490 | | | $ | 1,643 | |
3.625%, 12/01/2027 | | | 1,000 | | | | 1,134 | |
3.200%, 06/15/2026 | | | 740 | | | | 827 | |
3.109%, VAR United States Secured Overnight Financing Rate+2.440%, 04/22/2051 | | | 210 | | | | 235 | |
2.972%, 01/15/2023 | | | 165 | | | | 170 | |
2.956%, VAR United States Secured Overnight Financing Rate+2.515%, 05/13/2031 | | | 3,245 | | | | 3,543 | |
2.739%, VAR United States Secured Overnight Financing Rate+1.510%, 10/15/2030 | | | 370 | | | | 401 | |
2.700%, 05/18/2023 | | | 1,310 | | | | 1,379 | |
2.522%, VAR United States Secured Overnight Financing Rate+2.040%, 04/22/2031 | | | 1,060 | | | | 1,138 | |
2.301%, VAR United States Secured Overnight Financing Rate+1.160%, 10/15/2025 | | | 3,120 | | | | 3,299 | |
2.182%, VAR United States Secured Overnight Financing Rate+1.890%, 06/01/2028 | | | 2,044 | | | | 2,148 | |
2.083%, VAR United States Secured Overnight Financing Rate+1.850%, 04/22/2026 | | | 1,280 | | | | 1,343 | |
2.005%, VAR United States Secured Overnight Financing Rate+1.585%, 03/13/2026 | | | 75 | | | | 78 | |
1.764%, VAR United States Secured Overnight Financing Rate+1.105%, 11/19/2031 | | | 2,043 | | | | 2,053 | |
1.514%, VAR United States Secured Overnight Financing Rate+1.455%, 06/01/2024 | | | 2,130 | | | | 2,182 | |
1.045%, VAR United States Secured Overnight Financing Rate+0.800%, 11/19/2026 | | | 4,085 | | | | 4,108 | |
0.760%, VAR ICE LIBOR USD 3 Month+0.550%, 02/01/2027 | | | 2,740 | | | | 2,548 | |
KKR Group Finance II LLC | | | | | | | | |
5.500%, 02/01/2043 (C) | | | 120 | | | | 160 | |
KKR Group Finance III LLC | | | | | | | | |
5.125%, 06/01/2044 (C) | | | 1,005 | | | | 1,290 | |
Landwirtschaftliche Rentenbank | | | | | | | | |
0.500%, 05/27/2025 (D) | | | 4,087 | | | | 4,096 | |
Lehman Brothers Holdings | | | | | | | | |
6.500%, 12/31/2049 (F) | | | 4,040 | | | | – | |
Lehman Brothers Holdings MTN | | | | | | | | |
6.750%, 12/31/2049 (F) | | | 10,370 | | | | – | |
| | |
118 | | SEI Institutional Investments Trust / Semi-Annual Report / November 30, 2020 |
| | | | | | | | |
| | | |
| Description | | Face Amount
(Thousands) | | Market Value ($ Thousands) |
| |
CORPORATE OBLIGATIONS (continued) | | | | | |
Lehman Brothers Holdings Capital Trust VII MTN | | | | | | | | |
5.857%, VAR ICE LIBOR USD 3 Month+0.840%(E)(F) | | $ | 20,630 | | | $ | – | |
Lloyds Bank | | | | | | | | |
3.500%, 05/14/2025 | | | 100 | | | | 111 | |
Lloyds Banking Group | | | | | | | | |
4.375%, 03/22/2028 | | | 1,180 | | | | 1,400 | |
4.050%, 08/16/2023 | | | 530 | | | | 578 | |
3.900%, 03/12/2024 | | | 2,530 | | | | 2,772 | |
3.100%, 07/06/2021 | | | 2,610 | | | | 2,653 | |
2.907%, VAR ICE LIBOR USD 3 Month+0.810%, 11/07/2023 | | | 2,545 | | | | 2,657 | |
Macquarie Bank | | | | | | | | |
3.624%, 06/03/2030 (C) | | | 765 | | | | 830 | |
MassMutual Global Funding II | | | | | | | | |
2.500%, 10/17/2022 (C) | | | 261 | | | | 272 | |
2.250%, 07/01/2022 (C) | | | 2,640 | | | | 2,722 | |
MassMutual Global Funding II MTN | | | | | | | | |
0.850%, 06/09/2023 (C) | | | 2,220 | | | | 2,245 | |
Mercury General | | | | | | | | |
4.400%, 03/15/2027 | | | 1,720 | | | | 1,888 | |
MetLife | | | | | | | | |
6.400%, 12/15/2036 | | | 1,400 | | | | 1,789 | |
Metropolitan Life Global Funding I | | | | | | | | |
3.450%, 12/18/2026 (C) | | | 2,865 | | | | 3,276 | |
0.900%, 06/08/2023 (C) | | | 1,540 | | | | 1,560 | |
Morgan Stanley | | | | | | | | |
3.737%, VAR ICE LIBOR USD 3 Month+0.847%, 04/24/2024 | | | 1,810 | | | | 1,946 | |
3.625%, 01/20/2027 | | | 1,801 | | | | 2,058 | |
Morgan Stanley MTN | | | | | | | | |
5.500%, 07/28/2021 | | | 200 | | | | 207 | |
4.431%, VAR ICE LIBOR USD 3 Month+1.628%, 01/23/2030 | | | 725 | | | | 884 | |
4.350%, 09/08/2026 | | | 235 | | | | 276 | |
4.100%, 05/22/2023 | | | 2,290 | | | | 2,480 | |
4.000%, 07/23/2025 | | | 2,956 | | | | 3,380 | |
3.875%, 04/29/2024 | | | 4,325 | | | | 4,782 | |
3.772%, VAR ICE LIBOR USD 3 Month+1.140%, 01/24/2029 | | | 280 | | | | 324 | |
3.700%, 10/23/2024 | | | 370 | | | | 411 | |
3.622%, VAR United States Secured Overnight Financing Rate+3.120%, 04/01/2031 | | | 4,771 | | | | 5,559 | |
3.591%, VAR ICE LIBOR USD 3 Month+1.340%, 07/22/2028 | | | 270 | | | | 307 | |
3.125%, 07/27/2026 | | | 525 | | | | 586 | |
2.720%, VAR United States Secured Overnight Financing Rate+1.152%, 07/22/2025 | | | 2,085 | | | | 2,229 | |
| | | | | | | | |
| | | |
| Description | | Face Amount
(Thousands) | | Market Value ($ Thousands) |
| |
CORPORATE OBLIGATIONS (continued) | | | | | |
2.699%, VAR United States Secured Overnight Financing Rate+1.143%, 01/22/2031 | | $ | 890 | | | $ | 967 | |
2.188%, VAR United States Secured Overnight Financing Rate+1.990%, 04/28/2026 | | | 2,360 | | | | 2,489 | |
1.794%, VAR United States Secured Overnight Financing Rate+1.034%, 02/13/2032 | | | 4,090 | | | | 4,122 | |
0.864%, VAR United States Secured Overnight Financing Rate+0.745%, 10/21/2025 | | | 2,403 | | | | 2,414 | |
0.560%, VAR United States Secured Overnight Financing Rate+0.466%, 11/10/2023 | | | 2,386 | | | | 2,388 | |
National Australia Bank MTN | | | | | | | | |
2.332%, 08/21/2030 (C) | | | 1,898 | | | | 1,922 | |
National Securities Clearing | | | | | | | | |
1.500%, 04/23/2025 (C) | | | 6,290 | | | | 6,513 | |
1.200%, 04/23/2023 (C) | | | 620 | | | | 632 | |
Nationwide Building Society | | | | | | | | |
4.363%, VAR ICE LIBOR USD 3 Month+1.392%, 08/01/2024 (C) | | | 3,490 | | | | 3,791 | |
3.766%, VAR ICE LIBOR USD 3 Month+1.064%, 03/08/2024 (C) | | | 1,250 | | | | 1,328 | |
Nationwide Financial Services | | | | | | | | |
5.375%, 03/25/2021 (C) | | | 150 | | | | 152 | |
3.900%, 11/30/2049 (C) | | | 1,603 | | | | 1,750 | |
Nationwide Mutual Insurance | | | | | | | | |
4.350%, 04/30/2050 (C) | | | 858 | | | | 1,005 | |
2.540%, VAR ICE LIBOR USD 3 Month+2.290%, 12/15/2024 (C) | | | 4,407 | | | | 4,402 | |
Natwest Group | | | | | | | | |
4.519%, VAR ICE LIBOR USD 3 Month+1.550%, 06/25/2024 | | | 820 | | | | 892 | |
3.875%, 09/12/2023 | | | 1,340 | | | | 1,452 | |
3.754%, VAR US Treas Yield Curve Rate T Note Const Mat 5 Yr+2.100%, 11/01/2029 | | | 1,022 | | | | 1,081 | |
3.073%, VAR US Treas Yield Curve Rate T Note Const Mat 1 Yr+2.550%, 05/22/2028 | | | 1,028 | | | | 1,106 | |
2.359%, VAR US Treas Yield Curve Rate T Note Const Mat 1 Yr+2.150%, 05/22/2024 | | | 567 | | | | 588 | |
New York Life Global Funding | | | | | | | | |
2.875%, 04/10/2024 (C) | | | 2,155 | | | | 2,316 | |
0.950%, 06/24/2025 (C) | | | 550 | | | | 557 | |
New York Life Insurance | | | | | | | | |
6.750%, 11/15/2039 (C) | | | 765 | | | | 1,179 | |
3.750%, 05/15/2050 (C) | | | 1,300 | | | | 1,550 | |
Nomura Holdings | | | | | | | | |
3.103%, 01/16/2030 | | | 2,186 | | | | 2,379 | |
| | |
SEI Institutional Investments Trust / Semi-Annual Report / November 30, 2020 | | 119 |
SCHEDULE OF INVESTMENTS (Unaudited)
November 30, 2020
Core Fixed Income Fund (Continued)
| | | | | | | | |
| | | |
| Description | | Face Amount
(Thousands) | | Market Value ($ Thousands) |
| |
CORPORATE OBLIGATIONS (continued) | | | | | |
2.679%, 07/16/2030 | | $ | 992 | | | $ | 1,050 | |
2.648%, 01/16/2025 | | | 2,049 | | | | 2,177 | |
Nordea Bank ABP | | | | | | | | |
4.875%, 05/13/2021 (C) | | | 1,730 | | | | 1,764 | |
1.000%, 06/09/2023 (C) | | | 1,370 | | | | 1,389 | |
Northern Trust | | | | | | | | |
2.375%, 08/02/2022 | | | 300 | | | | 311 | |
Northwestern Mutual Life Insurance | | | | | | | | |
3.625%, 09/30/2059 (C) | | | 2,550 | | | | 2,935 | |
Ohio National Financial Services | | | | | | | | |
5.550%, 01/24/2030 (C) | | | 1,155 | | | | 1,159 | |
Park Aerospace Holdings | | | | | | | | |
5.500%, 02/15/2024 (C) | | | 850 | | | | 908 | |
4.500%, 03/15/2023 (C) | | | 4,470 | | | | 4,657 | |
PNC Financial Services Group | | | | | | | | |
3.500%, 01/23/2024 | | | 255 | | | | 277 | |
Principal Life Global Funding II | | | | | | | | |
1.250%, 06/23/2025 (C) | | | 270 | | | | 276 | |
Raymond James Financial | | | | | | | | |
4.950%, 07/15/2046 | | | 1,525 | | | | 2,095 | |
Royal Bank of Canada | | | | | | | | |
0.438%, 06/29/2085 (B) | | | 860 | | | | 679 | |
Royal Bank of Canada MTN | | | | | | | | |
3.200%, 04/30/2021 | | | 760 | | | | 769 | |
2.250%, 11/01/2024 | | | 170 | | | | 181 | |
1.600%, 04/17/2023 | | | 1,170 | | | | 1,203 | |
1.150%, 06/10/2025 | | | 730 | | | | 744 | |
Santander Holdings USA | | | | | | | | |
4.500%, 07/17/2025 | | | 148 | | | | 165 | |
4.400%, 07/13/2027 | | | 771 | | | | 874 | |
3.450%, 06/02/2025 | | | 4,015 | | | | 4,347 | |
3.400%, 01/18/2023 | | | 489 | | | | 514 | |
3.244%, 10/05/2026 | | | 1,529 | | | | 1,652 | |
Santander UK Group Holdings | | | | | | | | |
5.625%, 09/15/2045 (C) | | | 210 | | | | 287 | |
4.796%, VAR ICE LIBOR USD 3 Month+1.570%, 11/15/2024 | | | 4,580 | | | | 5,085 | |
1.532%, VAR US Treas Yield Curve Rate T Note Const Mat 1 Yr+1.250%, 08/21/2026 | | | 4,370 | | | | 4,400 | |
Scentre Group Trust 1 | | | | | | | | |
4.375%, 05/28/2030 (C) | | | 1,135 | | | | 1,293 | |
3.625%, 01/28/2026 (C) | | | 2,190 | | | | 2,377 | |
Societe Generale | | | | | | | | |
0.335%, VAR ICE LIBOR USD 6 Month+0.075%(E) | | | 860 | | | | 757 | |
Societe Generale MTN | | | | | | | | |
3.653%, VAR US Treas Yield Curve Rate T Note Const Mat 5 Yr+3.000%, 07/08/2035 (C) | | | 876 | | | | 921 | |
2.625%, 01/22/2025 (C) | | | 1,345 | | | | 1,415 | |
| | | | | | | | |
| | | |
| Description | | Face Amount
(Thousands) | | Market Value ($ Thousands) |
| |
CORPORATE OBLIGATIONS (continued) | | | | | |
Standard Chartered | | | | | | | | |
5.700%, 03/26/2044 (C) | | $ | 427 | | | $ | 565 | |
5.200%, 01/26/2024 (C) | | | 410 | | | | 450 | |
State Street | | | | | | | | |
3.300%, 12/16/2024 | | | 310 | | | | 344 | |
3.152%, VAR United States Secured Overnight Financing Rate+2.650%, 03/30/2031 | | | 1,500 | | | | 1,721 | |
Swedbank | | | | | | | | |
1.300%, 06/02/2023 (C) | | | 930 | | | | 948 | |
Teachers Insurance & Annuity Association of America | | | | | | | | |
6.850%, 12/16/2039 (C) | | | 148 | | | | 229 | |
4.900%, 09/15/2044 (C) | | | 600 | | | | 804 | |
4.270%, 05/15/2047 (C) | | | 175 | | | | 216 | |
3.300%, 05/15/2050��(C) | | | 4,055 | | | | 4,425 | |
Toronto-Dominion Bank MTN | | | | | | | | |
3.250%, 06/11/2021 | | | 930 | | | | 945 | |
1.900%, 12/01/2022 | | | 770 | | | | 794 | |
1.150%, 06/12/2025 | | | 730 | | | | 746 | |
0.750%, 06/12/2023 | | | 1,430 | | | | 1,442 | |
Travelers | | | | | | | | |
4.600%, 08/01/2043 | | | 50 | | | | 69 | |
Truist Bank | | | | | | | | |
3.800%, 10/30/2026 | | | 250 | | | | 288 | |
2.450%, 08/01/2022 | | | 250 | | | | 259 | |
Truist Financial MTN | | | | | | | | |
2.750%, 04/01/2022 | | | 375 | | | | 386 | |
2.200%, 03/16/2023 | | | 5,475 | | | | 5,688 | |
Trust Fibra Uno | | | | | | | | |
6.390%, 01/15/2050 (C) | | | 588 | | | | 649 | |
4.869%, 01/15/2030 (C) | | | 831 | | | | 918 | |
UBS Group | | | | | | | | |
4.253%, 03/23/2028 (C) | | | 1,940 | | | | 2,268 | |
4.125%, 09/24/2025 (C) | | | 1,010 | | | | 1,155 | |
3.491%, 05/23/2023 (C) | | | 1,710 | | | | 1,781 | |
2.859%, VAR ICE LIBOR USD 3 Month+0.954%, 08/15/2023 (C) | | | 240 | | | | 249 | |
1.364%, VAR US Treas Yield Curve Rate T Note Const Mat 1 Yr+1.080%, 01/30/2027 (C) | | | 2,091 | | | | 2,113 | |
UBS/London | | | | | | | | |
1.750%, 04/21/2022 (C) | | | 1,310 | | | | 1,335 | |
US Bancorp | | | | | | | | |
2.400%, 07/30/2024 | | | 3,710 | | | | 3,945 | |
1.450%, 05/12/2025 | | | 1,610 | | | | 1,662 | |
US Bancorp MTN | | | | | | | | |
3.600%, 09/11/2024 | | | 160 | | | | 177 | |
2.950%, 07/15/2022 | | | 497 | | | | 517 | |
US Bank North America/Cincinnatti, Ohio | | | | | | | | |
3.150%, 04/26/2021 | | | 750 | | | | 757 | |
| | |
120 | | SEI Institutional Investments Trust / Semi-Annual Report / November 30, 2020 |
| | | | | | | | |
| | | |
| Description | | Face Amount
(Thousands) | | Market Value
($ Thousands) |
|
CORPORATE OBLIGATIONS (continued) | |
USAA Capital | | | | | | | | |
1.500%, 05/01/2023 (C) | | $ | 150 | | | $ | 154 | |
Validus Holdings | | | | | | | | |
8.875%, 01/26/2040 | | | 1,460 | | | | 2,411 | |
Wachovia Capital Trust III | | | | | | | | |
5.570%, VAR ICE LIBOR USD 3 Month+0.930%(E) | | | 4,442 | | | | 4,493 | |
WEA Finance LLC / Westfield UK & Europe Finance | | | | | | | | |
3.750%, 09/17/2024 (C) | | | 1,370 | | | | 1,435 | |
Wells Fargo | | | | | | | | |
7.950%, 11/15/2029 | | | 925 | | | | 1,244 | |
5.950%, 12/15/2036 | | | 520 | | | | 694 | |
5.606%, 01/15/2044 | | | 700 | | | | 1,003 | |
5.375%, 11/02/2043 | | | 220 | | | | 311 | |
4.480%, 01/16/2024 | | | 392 | | | | 434 | |
3.069%, 01/24/2023 | | | 1,340 | | | | 1,379 | |
3.068%, VAR United States Secured Overnight Financing Rate+2.530%, 04/30/2041 | | | 5,960 | | | | 6,492 | |
3.000%, 10/23/2026 | | | 1,640 | | | | 1,806 | |
2.188%, VAR United States Secured Overnight Financing Rate+2.000%, 04/30/2026 | | | 3,865 | | | | 4,046 | |
Wells Fargo MTN | | | | | | | | |
5.013%, VAR ICE LIBOR USD 3 Month+4.240%, 04/04/2051 | | | 13,775 | | | | 19,672 | |
4.900%, 11/17/2045 | | | 1,310 | | | | 1,752 | |
4.750%, 12/07/2046 | | | 2,365 | | | | 3,147 | |
4.650%, 11/04/2044 | | | 560 | | | | 722 | |
4.600%, 04/01/2021 | | | 500 | | | | 507 | |
4.478%, VAR ICE LIBOR USD 3 Month+3.770%, 04/04/2031 | | | 5,855 | | | | 7,135 | |
4.400%, 06/14/2046 | | | 220 | | | | 279 | |
4.300%, 07/22/2027 | | | 1,180 | | | | 1,377 | |
4.150%, 01/24/2029 | | | 1,450 | | | | 1,718 | |
3.750%, 01/24/2024 | | | 360 | | | | 391 | |
3.584%, VAR ICE LIBOR USD 3 Month+1.310%, 05/22/2028 | | | 2,075 | | | | 2,346 | |
3.500%, 03/08/2022 | | | 250 | | | | 260 | |
3.450%, 02/13/2023 | | | 685 | | | | 727 | |
3.196%, VAR ICE LIBOR USD 3 Month+1.170%, 06/17/2027 | | | 3,675 | | | | 4,057 | |
2.879%, VAR ICE LIBOR USD 3 Month+1.170%, 10/30/2030 | | | 3,925 | | | | 4,267 | |
2.572%, VAR ICE LIBOR USD 3 Month+1.000%, 02/11/2031 | | | 415 | | | | 441 | |
2.406%, VAR ICE LIBOR USD 3 Month+0.825%, 10/30/2025 | | | 2,570 | | | | 2,710 | |
2.393%, VAR United States Secured Overnight Financing Rate+2.100%, 06/02/2028 | | | 2,410 | | | | 2,543 | |
| | | | | | | | |
| | | |
| Description | | Face Amount
(Thousands) | | Market Value
($ Thousands) |
|
CORPORATE OBLIGATIONS (continued) | |
Westpac Banking | | | | | | | | |
2.963%, 11/16/2040 | | $ | 411 | | | $ | 443 | |
2.668%, VAR US Treas Yield Curve Rate T Note Const Mat 5 Yr+1.750%, 11/15/2035 | | | 2,545 | | | | 2,631 | |
| | | | | | | | |
| | | | | | | 724,116 | |
| | | | | | | | |
|
Health Care — 2.9% | |
Abbott Laboratories | | | | | | | | |
4.900%, 11/30/2046 | | | 840 | | | | 1,255 | |
4.750%, 11/30/2036 | | | 440 | | | | 606 | |
3.750%, 11/30/2026 | | | 1,245 | | | | 1,451 | |
1.150%, 01/30/2028 | | | 600 | | | | 608 | |
AbbVie | | | | | | | | |
5.000%, 12/15/2021 | | | 173 | | | | 179 | |
4.875%, 11/14/2048 | | | 1,100 | | | | 1,498 | |
4.500%, 05/14/2035 | | | 845 | | | | 1,074 | |
4.450%, 05/14/2046 | | | 659 | | | | 836 | |
4.400%, 11/06/2042 | | | 2,350 | | | | 2,956 | |
4.300%, 05/14/2036 | | | 483 | | | | 598 | |
4.250%, 11/14/2028 | | | 1,295 | | | | 1,564 | |
4.250%, 11/21/2049 | | | 9,570 | | | | 12,091 | |
4.050%, 11/21/2039 | | | 1,690 | | | | 2,052 | |
3.800%, 03/15/2025 | | | 4,538 | | | | 5,070 | |
3.750%, 11/14/2023 | | | 339 | | | | 370 | |
3.600%, 05/14/2025 | | | 1,605 | | | | 1,786 | |
3.450%, 03/15/2022 | | | 470 | | | | 486 | |
3.200%, 05/14/2026 | | | 145 | | | | 161 | |
3.200%, 11/21/2029 | | | 5,061 | | | | 5,723 | |
2.950%, 11/21/2026 | | | 1,276 | | | | 1,411 | |
2.900%, 11/06/2022 | | | 2,488 | | | | 2,601 | |
2.600%, 11/21/2024 | | | 4,419 | | | | 4,730 | |
2.300%, 11/21/2022 | | | 4,991 | | | | 5,167 | |
Amgen | | | | | | | | |
5.150%, 11/15/2041 | | | 316 | | | | 439 | |
4.663%, 06/15/2051 | | | 389 | | | | 526 | |
3.625%, 05/22/2024 | | | 220 | | | | 241 | |
3.150%, 02/21/2040 | | | 1,006 | | | | 1,090 | |
2.770%, 09/01/2053 (C) | | | 438 | | | | 433 | |
Anthem | | | | | | | | |
4.625%, 05/15/2042 | | | 219 | | | | 288 | |
3.700%, 08/15/2021 | | | 290 | | | | 294 | |
3.650%, 12/01/2027 | | | 330 | | | | 379 | |
3.500%, 08/15/2024 | | | 1,950 | | | | 2,137 | |
3.350%, 12/01/2024 | | | 1,190 | | | | 1,310 | |
3.300%, 01/15/2023 | | | 133 | | | | 141 | |
3.125%, 05/15/2022 | | | 740 | | | | 769 | |
2.950%, 12/01/2022 | | | 560 | | | | 587 | |
2.250%, 05/15/2030 | | | 1,767 | | | | 1,857 | |
AstraZeneca | | | | | | | | |
3.500%, 08/17/2023 | | | 1,735 | | | | 1,872 | |
0.700%, 04/08/2026 | | | 1,383 | | | | 1,379 | |
| | |
SEI Institutional Investments Trust / Semi-Annual Report / November 30, 2020 | | 121 |
SCHEDULE OF INVESTMENTS (Unaudited)
November 30, 2020
Core Fixed Income Fund (Continued)
| | | | | | | | |
| | | |
| Description | | Face Amount
(Thousands) | | Market Value
($ Thousands) |
|
CORPORATE OBLIGATIONS (continued) | |
Baxalta | | | | | | | | |
3.600%, 06/23/2022 | | $ | 870 | | | $ | 906 | |
Baxter International | | | | | | | | |
3.950%, 04/01/2030 (C) | | | 890 | | | | 1,066 | |
Becton Dickinson | | | | | | | | |
4.685%, 12/15/2044 | | | 469 | | | | 607 | |
3.734%, 12/15/2024 | | | 1,630 | | | | 1,800 | |
3.363%, 06/06/2024 | | | 1,170 | | | | 1,266 | |
2.823%, 05/20/2030 | | | 1,000 | | | | 1,094 | |
Biogen | | | | | | | | |
5.200%, 09/15/2045 | | | 250 | | | | 334 | |
3.625%, 09/15/2022 | | | 815 | | | | 861 | |
Bristol-Myers Squibb | | | | | | | | |
5.000%, 08/15/2045 | | | 130 | | | | 189 | |
4.350%, 11/15/2047 | | | 319 | | | | 434 | |
4.250%, 10/26/2049 | | | 542 | | | | 734 | |
3.900%, 02/20/2028 | | | 1,032 | | | | 1,223 | |
3.875%, 08/15/2025 | | | 1,200 | | | | 1,368 | |
3.550%, 08/15/2022 | | | 550 | | | | 580 | |
3.450%, 11/15/2027 | | | 961 | | | | 1,106 | |
3.400%, 07/26/2029 | | | 1,686 | | | | 1,970 | |
3.200%, 06/15/2026 | | | 1,170 | | | | 1,314 | |
2.900%, 07/26/2024 | | | 3,170 | | | | 3,416 | |
2.600%, 05/16/2022 | | | 830 | | | | 858 | |
2.550%, 11/13/2050 | | | 1,641 | | | | 1,695 | |
2.350%, 11/13/2040 | | | 535 | | | | 551 | |
2.250%, 08/15/2021 | | | 660 | | | | 669 | |
1.450%, 11/13/2030 | | | 2,497 | | | | 2,507 | |
1.125%, 11/13/2027 | | | 2,140 | | | | 2,152 | |
0.750%, 11/13/2025 | | | 1,427 | | | | 1,429 | |
Centene | | | | | | | | |
3.000%, 10/15/2030 | | | 8,506 | | | | 8,953 | |
Cigna | | | | | | | | |
4.900%, 12/15/2048 | | | 1,000 | | | | 1,378 | |
4.375%, 10/15/2028 | | | 1,454 | | | | 1,750 | |
4.125%, 11/15/2025 | | | 585 | | | | 673 | |
3.875%, 10/15/2047 | | | 2,185 | | | | 2,622 | |
3.750%, 07/15/2023 | | | 1,347 | | | | 1,458 | |
3.400%, 09/17/2021 | | | 2,048 | | | | 2,097 | |
3.400%, 03/01/2027 | | | 1,034 | | | | 1,162 | |
3.400%, 03/15/2050 | | | 250 | | | | 282 | |
3.250%, 04/15/2025 | | | 1,000 | | | | 1,098 | |
2.400%, 03/15/2030 | | | 800 | | | | 851 | |
CommonSpirit Health | | | | | | | | |
4.350%, 11/01/2042 | | | 885 | | | | 1,027 | |
CVS Health | | | | | | | | |
5.125%, 07/20/2045 | | | 170 | | | | 229 | |
5.050%, 03/25/2048 | | | 9,523 | | | | 12,846 | |
4.780%, 03/25/2038 | | | 513 | | | | 651 | |
4.300%, 03/25/2028 | | | 7,809 | | | | 9,176 | |
4.250%, 04/01/2050 | | | 10 | | | | 13 | |
4.125%, 04/01/2040 | | | 240 | | | | 286 | |
| | | | | | | | |
| | | |
| Description | | Face Amount
(Thousands) | | Market Value
($ Thousands) |
|
CORPORATE OBLIGATIONS (continued) | |
4.100%, 03/25/2025 | | $ | 155 | | | $ | 176 | |
3.875%, 07/20/2025 | | | 929 | | | | 1,048 | |
3.750%, 04/01/2030 | | | 1,835 | | | | 2,127 | |
3.700%, 03/09/2023 | | | 830 | | | | 888 | |
3.625%, 04/01/2027 | | | 1,975 | | | | 2,244 | |
3.375%, 08/12/2024 | | | 95 | | | | 103 | |
3.000%, 08/15/2026 | | | 719 | | | | 790 | |
2.750%, 12/01/2022 | | | 230 | | | | 239 | |
2.700%, 08/21/2040 | | | 496 | | | | 501 | |
1.750%, 08/21/2030 | | | 349 | | | | 348 | |
1.300%, 08/21/2027 | | | 1,575 | | | | 1,579 | |
Danaher | | | | | | | | |
3.350%, 09/15/2025 | | | 667 | | | | 742 | |
2.600%, 10/01/2050 | | | 852 | | | | 896 | |
DH Europe Finance II Sarl | | | | | | | | |
3.400%, 11/15/2049 | | | 13 | | | | 16 | |
2.600%, 11/15/2029 | | | 1,977 | | | | 2,183 | |
2.200%, 11/15/2024 | | | 1,825 | | | | 1,936 | |
2.050%, 11/15/2022 | | | 1,065 | | | | 1,100 | |
Eli Lilly | | | | | | | | |
2.500%, 09/15/2060 | | | 681 | | | | 688 | |
2.250%, 05/15/2050 | | | 1,011 | | | | 985 | |
Gilead Sciences | | | | | | | | |
4.750%, 03/01/2046 | | | 40 | | | | 53 | |
3.700%, 04/01/2024 | | | 1,540 | | | | 1,682 | |
3.650%, 03/01/2026 | | | 890 | | | | 1,009 | |
2.800%, 10/01/2050 | | | 506 | | | | 505 | |
2.600%, 10/01/2040 | | | 818 | | | | 831 | |
1.650%, 10/01/2030 | | | 1,085 | | | | 1,082 | |
1.200%, 10/01/2027 | | | 1,085 | | | | 1,090 | |
GlaxoSmithKline Capital | | | | | | | | |
3.000%, 06/01/2024 | | | 670 | | | | 723 | |
2.850%, 05/08/2022 | | | 50 | | | | 52 | |
HCA | | | | | | | | |
5.250%, 04/15/2025 | | | 750 | | | | 875 | |
5.250%, 06/15/2049 | | | 3,259 | | | | 4,313 | |
5.125%, 06/15/2039 | | | 1,608 | | | | 2,069 | |
5.000%, 03/15/2024 | | | 2,635 | | | | 2,964 | |
Humana | | | | | | | | |
4.950%, 10/01/2044 | | | 200 | | | | 271 | |
4.800%, 03/15/2047 | | | 50 | | | | 68 | |
4.500%, 04/01/2025 | | | 120 | | | | 138 | |
3.950%, 03/15/2027 | | | 860 | | | | 990 | |
3.850%, 10/01/2024 | | | 2,530 | | | | 2,801 | |
3.150%, 12/01/2022 | | | 190 | | | | 199 | |
Johnson & Johnson | | | | | | | | |
3.700%, 03/01/2046 | | | 970 | | | | 1,249 | |
2.450%, 09/01/2060 | | | 2,424 | | | | 2,545 | |
2.100%, 09/01/2040 | | | 238 | | | | 242 | |
0.950%, 09/01/2027 | | | 990 | | | | 994 | |
0.550%, 09/01/2025 | | | 490 | | | | 491 | |
| | |
122 | | SEI Institutional Investments Trust / Semi-Annual Report / November 30, 2020 |
| | | | | | | | |
| | | |
| Description | | Face Amount
(Thousands) | | Market Value
($ Thousands) |
|
CORPORATE OBLIGATIONS (continued) | |
Medtronic | | | | | | | | |
4.625%, 03/15/2045 | | $ | 123 | | | $ | 175 | |
Merck | | | | | | | | |
3.700%, 02/10/2045 | | | 463 | | | | 583 | |
2.450%, 06/24/2050 | | | 484 | | | | 502 | |
2.350%, 06/24/2040 | | | 484 | | | | 506 | |
1.450%, 06/24/2030 | | | 4,280 | | | | 4,352 | |
0.750%, 02/24/2026 | | | 840 | | | | 841 | |
Perrigo Finance | | | | | | | | |
4.900%, 12/15/2044 | | | 574 | | | | 646 | |
3.150%, 06/15/2030 | | | 1,184 | | | | 1,254 | |
Pfizer | | | | | | | | |
4.000%, 12/15/2036 | | | 1,050 | | | | 1,340 | |
2.800%, 03/11/2022 | | | 640 | | | | 660 | |
2.700%, 05/28/2050 | | | 2,870 | | | | 3,059 | |
2.625%, 04/01/2030 | | | 2,390 | | | | 2,658 | |
1.700%, 05/28/2030 | | | 680 | | | | 702 | |
0.800%, 05/28/2025 | | | 1,050 | | | | 1,061 | |
Regeneron Pharmaceuticals | | | | | | | | |
2.800%, 09/15/2050 | | | 825 | | | | 806 | |
1.750%, 09/15/2030 | | | 2,723 | | | | 2,679 | |
Royalty Pharma | | | | | | | | |
3.550%, 09/02/2050 (C) | | | 901 | | | | 927 | |
2.200%, 09/02/2030 (C) | | | 1,430 | | | | 1,447 | |
1.750%, 09/02/2027 (C) | | | 1,350 | | | | 1,371 | |
1.200%, 09/02/2025 (C) | | | 1,325 | | | | 1,336 | |
0.750%, 09/02/2023 (C) | | | 1,995 | | | | 2,004 | |
Stryker | | | | | | | | |
2.900%, 06/15/2050 | | | 1,001 | | | | 1,067 | |
1.950%, 06/15/2030 | | | 629 | | | | 651 | |
1.150%, 06/15/2025 | | | 1,428 | | | | 1,452 | |
Teva Pharmaceutical Finance | | | | | | | | |
3.650%, 11/10/2021 | | | 184 | | | | 185 | |
Thermo Fisher Scientific | | | | | | | | |
4.497%, 03/25/2030 | | | 2,957 | | | | 3,715 | |
UnitedHealth Group | | | | | | | | |
6.625%, 11/15/2037 | | | 200 | | | | 323 | |
5.800%, 03/15/2036 | | | 560 | | | | 829 | |
4.625%, 07/15/2035 | | | 940 | | | | 1,275 | |
4.450%, 12/15/2048 | | | 140 | | | | 195 | |
4.250%, 06/15/2048 | | | 180 | | | | 244 | |
3.875%, 12/15/2028 | | | 250 | | | | 302 | |
3.875%, 08/15/2059 | | | 934 | | | | 1,232 | |
3.750%, 07/15/2025 | | | 330 | | | | 376 | |
3.750%, 10/15/2047 | | | 573 | | | | 721 | |
3.700%, 12/15/2025 | | | 719 | | | | 823 | |
3.700%, 08/15/2049 | | | 140 | | | | 177 | |
3.500%, 06/15/2023 | | | 230 | | | | 248 | |
3.500%, 08/15/2039 | | | 227 | | | | 270 | |
3.375%, 11/15/2021 | | | 400 | | | | 408 | |
3.125%, 05/15/2060 | | | 90 | | | | 104 | |
2.900%, 05/15/2050 | | | 660 | | | | 735 | |
| | | | | | | | |
| | | |
| Description | | Face Amount
(Thousands) | | Market Value
($ Thousands) |
|
CORPORATE OBLIGATIONS (continued) | |
2.875%, 12/15/2021 | | $ | 450 | | | $ | 462 | |
2.875%, 03/15/2023 | | | 150 | | | | 159 | |
2.750%, 05/15/2040 | | | 2,125 | | | | 2,329 | |
2.375%, 10/15/2022 | | | 100 | | | | 104 | |
2.000%, 05/15/2030 | | | 1,280 | | | | 1,360 | |
1.250%, 01/15/2026 | | | 260 | | | | 267 | |
Utah Acquisition Sub | | | | | | | | |
3.950%, 06/15/2026 | | | 1,115 | | | | 1,272 | |
Viatris | | | | | | | | |
4.000%, 06/22/2050 (C) | | | 1,455 | | | | 1,660 | |
2.300%, 06/22/2027 (C) | | | 420 | | | | 443 | |
Wyeth LLC | | | | | | | | |
6.450%, 02/01/2024 | | | 365 | | | | 432 | |
5.950%, 04/01/2037 | | | 320 | | | | 482 | |
Zimmer Biomet Holdings | | | | | | | | |
3.550%, 04/01/2025 | | | 225 | | | | 248 | |
| | | | | | | | |
| | | | | | | 243,980 | |
| | | | | | | | |
|
Industrials — 2.5% | |
3M | | | | | | | | |
3.700%, 04/15/2050 | | | 1,370 | | | | 1,714 | |
3.250%, 08/26/2049 | | | 460 | | | | 533 | |
3.050%, 04/15/2030 | | | 511 | | | | 584 | |
2.375%, 08/26/2029 | | | 2,320 | | | | 2,528 | |
AerCap Ireland Capital DAC / AerCap Global Aviation Trust | | | | | | | | |
6.500%, 07/15/2025 | | | 1,337 | | | | 1,546 | |
5.000%, 10/01/2021 | | | 2,025 | | | | 2,090 | |
4.875%, 01/16/2024 | | | 635 | | | | 685 | |
4.625%, 07/01/2022 | | | 289 | | | | 303 | |
4.125%, 07/03/2023 | | | 1,935 | | | | 2,049 | |
3.950%, 02/01/2022 | | | 341 | | | | 350 | |
3.650%, 07/21/2027 | | | 1,120 | | | | 1,159 | |
3.500%, 05/26/2022 | | | 3,366 | | | | 3,462 | |
3.150%, 02/15/2024 | | | 1,379 | | | | 1,424 | |
Air Lease | | | | | | | | |
3.500%, 01/15/2022 | | | 1,000 | | | | 1,028 | |
3.375%, 07/01/2025 | | | 490 | | | | 517 | |
3.250%, 03/01/2025 | | | 525 | | | | 551 | |
Air Lease MTN | | | | | | | | |
2.300%, 02/01/2025 | | | 605 | | | | 614 | |
American Airlines Pass-Through Trust, Ser 2011-1, Cl A | | | | | | | | |
5.250%, 01/31/2021 | | | 29 | | | | 29 | |
American Airlines Pass-Through Trust, Ser 2015-1, Cl A | | | | | | | | |
3.375%, 05/01/2027 | | | 98 | | | | 84 | |
BAE Systems | | | | | | | | |
4.750%, 10/11/2021 (C) | | | 2,455 | | | | 2,543 | |
Boeing | | | | | | | | |
7.250%, 06/15/2025 | | | 107 | | | | 129 | |
5.930%, 05/01/2060 | | | 700 | | | | 947 | |
| | |
SEI Institutional Investments Trust / Semi-Annual Report / November 30, 2020 | | 123 |
SCHEDULE OF INVESTMENTS (Unaudited)
November 30, 2020
Core Fixed Income Fund (Continued)
| | | | | | | | |
| | | |
| Description | | Face Amount
(Thousands) | | Market Value
($ Thousands) |
|
CORPORATE OBLIGATIONS (continued) | |
5.805%, 05/01/2050 | | $ | 2,578 | | | $ | 3,409 | |
5.705%, 05/01/2040 | | | 910 | | | | 1,151 | |
5.150%, 05/01/2030 | | | 1,240 | | | | 1,462 | |
5.040%, 05/01/2027 | | | 355 | | | | 407 | |
4.875%, 05/01/2025 | | | 2,290 | | | | 2,555 | |
4.508%, 05/01/2023 | | | 2,225 | | | | 2,380 | |
3.750%, 02/01/2050 | | | 1,136 | | | | 1,143 | |
3.625%, 02/01/2031 | | | 1,818 | | | | 1,932 | |
3.250%, 02/01/2028 | | | 1,444 | | | | 1,509 | |
3.250%, 02/01/2035 | | | 1,480 | | | | 1,455 | |
3.200%, 03/01/2029 | | | 720 | | | | 738 | |
3.100%, 05/01/2026 | | | 230 | | | | 239 | |
2.800%, 03/01/2027 | | | 280 | | | | 283 | |
2.700%, 02/01/2027 | | | 1,165 | | | | 1,175 | |
Burlington Northern Santa Fe LLC | | | | | | | | |
7.290%, 06/01/2036 | | | 200 | | | | 318 | |
4.550%, 09/01/2044 | | | 1,220 | | | | 1,703 | |
4.100%, 06/01/2021 | | | 449 | | | | 453 | |
3.650%, 09/01/2025 | | | 140 | | | | 159 | |
3.050%, 09/01/2022 | | | 300 | | | | 312 | |
3.050%, 02/15/2051 | | | 476 | | | | 550 | |
Canadian Pacific Railway | | | | | | | | |
6.125%, 09/15/2115 | | | 34 | | | | 55 | |
Carrier Global | | | | | | | | |
3.577%, 04/05/2050 (C) | | | 340 | | | | 384 | |
3.377%, 04/05/2040 (C) | | | 360 | | | | 397 | |
2.722%, 02/15/2030 (C) | | | 570 | | | | 607 | |
2.700%, 02/15/2031 (C) | | | 340 | | | | 363 | |
Caterpillar | | | | | | | | |
4.300%, 05/15/2044 | | | 50 | | | | 67 | |
Caterpillar Financial Services MTN | | | | | | | | |
2.850%, 05/17/2024 | | | 370 | | | | 399 | |
CCL Industries | | | | | | | | |
3.050%, 06/01/2030 (C) | | | 1,530 | | | | 1,665 | |
Cintas No. 2 | | | | | | | | |
3.700%, 04/01/2027 | | | 590 | | | | 679 | |
2.900%, 04/01/2022 | | | 610 | | | | 630 | |
CNH Industrial Capital LLC | | | | | | | | |
1.875%, 01/15/2026 | | | 1,890 | | | | 1,935 | |
Continental Airlines Pass-Through Trust, Ser 2007-1, Cl A | | | | | | | | |
5.983%, 04/19/2022 | | | 4,111 | | | | 4,106 | |
Continental Airlines Pass-Through Trust, Ser 2007-1, Cl B | | | | | | | | |
6.903%, 04/19/2022 | | | 10 | | | | 10 | |
Continental Airlines Pass-Through Trust, Ser 2010-1, Cl A | | | | | | | | |
4.750%, 01/12/2021 | | | 63 | | | | 63 | |
Continental Airlines Pass-Through Trust, Ser 2012-2, Cl A | | | | | | | | |
4.000%, 10/29/2024 | | | 49 | | | | 48 | |
| | | | | | | | |
| | | |
| Description | | Face Amount
(Thousands) | | Market Value
($ Thousands) |
|
CORPORATE OBLIGATIONS (continued) | |
CoStar Group | | | | | | | | |
2.800%, 07/15/2030 (C) | | $ | 1,485 | | | $ | 1,557 | |
Crowley Conro LLC | | | | | | | | |
4.181%, 08/15/2043 | | | 846 | | | | 1,021 | |
CSX | | | | | | | | |
4.750%, 11/15/2048 | | | 461 | | | | 643 | |
4.300%, 03/01/2048 | | | 82 | | | | 108 | |
Deere | | | | | | | | |
3.750%, 04/15/2050 | | | 2,538 | | | | 3,304 | |
3.100%, 04/15/2030 | | | 160 | | | | 184 | |
2.750%, 04/15/2025 | | | 1,391 | | | | 1,514 | |
Delta Air Lines | | | | | | | | |
4.750%, 10/20/2028 (C) | | | 2,702 | | | | 2,907 | |
4.500%, 10/20/2025 (C) | | | 3,477 | | | | 3,670 | |
Delta Air Lines Pass-Through Trust, Ser 2020-1, Cl AA | | | | | | | | |
2.000%, 06/10/2028 | | | 3,000 | | | | 2,972 | |
Eaton | | | | | | | | |
7.625%, 04/01/2024 | | | 325 | | | | 388 | |
4.150%, 11/02/2042 | | | 530 | | | | 667 | |
4.000%, 11/02/2032 | | | 99 | | | | 121 | |
2.750%, 11/02/2022 | | | 1,740 | | | | 1,819 | |
Equifax | | | | | | | | |
3.950%, 06/15/2023 | | | 3,015 | | | | 3,258 | |
2.600%, 12/15/2025 | | | 445 | | | | 482 | |
GE Capital Funding LLC | | | | | | | | |
4.400%, 05/15/2030 (C) | | | 3,612 | | | | 4,161 | |
3.450%, 05/15/2025 (C) | | | 805 | | | | 875 | |
GE Capital International Funding Unlimited | | | | | | | | |
4.418%, 11/15/2035 | | | 14,077 | | | | 16,228 | |
General Dynamics | | | | | | | | |
4.250%, 04/01/2040 | | | 1,915 | | | | 2,517 | |
4.250%, 04/01/2050 | | | 2,380 | | | | 3,295 | |
General Electric | | | | | | | | |
4.350%, 05/01/2050 | | | 942 | | | | 1,111 | |
4.250%, 05/01/2040 | | | 1,420 | | | | 1,616 | |
3.625%, 05/01/2030 | | | 2,844 | | | | 3,190 | |
3.450%, 05/01/2027 | | | 2,134 | | | | 2,348 | |
General Electric MTN | | | | | | | | |
6.875%, 01/10/2039 | | | 1,546 | | | | 2,185 | |
6.750%, 03/15/2032 | | | 190 | | | | 259 | |
5.875%, 01/14/2038 | | | 1,221 | | | | 1,582 | |
3.450%, 05/15/2024 | | | 140 | | | | 152 | |
3.100%, 01/09/2023 | | | 233 | | | | 245 | |
0.701%, VAR ICE LIBOR USD 3 Month+0.480%, 08/15/2036 | | | 3,035 | | | | 2,116 | |
Honeywell International | | | | | | | | |
1.950%, 06/01/2030 | | | 2,035 | | | | 2,153 | |
1.350%, 06/01/2025 | | | 510 | | | | 526 | |
IHS Markit | | | | | | | | |
5.000%, 11/01/2022 (C) | | | 2,000 | | | | 2,145 | |
4.750%, 02/15/2025 (C) | | | 1,000 | | | | 1,149 | |
| | |
124 | | SEI Institutional Investments Trust / Semi-Annual Report / November 30, 2020 |
| | | | | | | | |
| | | |
| Description | | Face Amount
(Thousands) | | Market Value
($ Thousands) |
|
CORPORATE OBLIGATIONS (continued) | |
4.750%, 08/01/2028 | | $ | 1,000 | | | $ | 1,208 | |
ILFC E-Capital Trust II | | | | | | | | |
3.230%, 12/21/2065 (B) (C) | | | 1,200 | | | | 746 | |
JetBlue Pass-Through Trust, Ser 2019-1, Cl AA | | | | | | | | |
2.750%, 05/15/2032 | | | 159 | | | | 159 | |
John Deere Capital MTN | | | | | | | | |
2.150%, 09/08/2022 | | | 145 | | | | 150 | |
1.750%, 03/09/2027 | | | 942 | | | | 992 | |
1.200%, 04/06/2023 | | | 1,571 | | | | 1,605 | |
0.550%, 07/05/2022 | | | 2,040 | | | | 2,050 | |
L3Harris Technologies | | | | | | | | |
5.054%, 04/27/2045 | | | 480 | | | | 665 | |
4.950%, 02/15/2021 | | | 537 | | | | 538 | |
4.854%, 04/27/2035 | | | 210 | | | | 277 | |
Lockheed Martin | | | | | | | | |
3.550%, 01/15/2026 | | | 1,440 | | | | 1,631 | |
3.100%, 01/15/2023 | | | 110 | | | | 116 | |
Northrop Grumman | | | | | | | | |
5.250%, 05/01/2050 | | | 3,645 | | | | 5,500 | |
5.150%, 05/01/2040 | | | 1,038 | | | | 1,447 | |
4.030%, 10/15/2047 | | | 1,486 | | | | 1,888 | |
3.850%, 04/15/2045 | | | 350 | | | | 428 | |
3.250%, 08/01/2023 | | | 1,944 | | | | 2,098 | |
3.250%, 01/15/2028 | | | 1,683 | | | | 1,899 | |
2.930%, 01/15/2025 | | | 2,114 | | | | 2,296 | |
2.550%, 10/15/2022 | | | 3,249 | | | | 3,377 | |
Otis Worldwide | | | | | | | | |
3.112%, 02/15/2040 | | | 1,185 | | | | 1,299 | |
2.565%, 02/15/2030 | | | 660 | | | | 709 | |
2.056%, 04/05/2025 | | | 340 | | | | 358 | |
Parker-Hannifin | | | | | | | | |
2.700%, 06/14/2024 | | | 830 | | | | 890 | |
Penske Truck Leasing/PTL Finance | | | | | | | | |
3.950%, 03/10/2025 (C) | | | 225 | | | | 251 | |
Raytheon Technologies | | | | | | | | |
5.400%, 05/01/2035 | | | 640 | | | | 880 | |
4.500%, 06/01/2042 | | | 560 | | | | 741 | |
4.450%, 11/16/2038 | | | 895 | | | | 1,149 | |
4.125%, 11/16/2028 | | | 480 | | | | 573 | |
3.950%, 08/16/2025 | | | 1,761 | | | | 2,013 | |
3.650%, 08/16/2023 | | | 136 | | | | 147 | |
3.150%, 12/15/2024 (C) | | | 320 | | | | 345 | |
3.125%, 07/01/2050 | | | 1,290 | | | | 1,454 | |
2.250%, 07/01/2030 | | | 680 | | | | 720 | |
Republic Services | | | | | | | | |
4.750%, 05/15/2023 | | | 215 | | | | 235 | |
2.500%, 08/15/2024 | | | 2,035 | | | | 2,169 | |
1.750%, 02/15/2032 | | | 1,427 | | | | 1,438 | |
1.450%, 02/15/2031 | | | 3,670 | | | | 3,612 | |
Roper Technologies | | | | | | | | |
1.000%, 09/15/2025 | | | 940 | | | | 946 | |
| | | | | | | | |
| | | |
| Description | | Face Amount
(Thousands) | | Market Value
($ Thousands) |
|
CORPORATE OBLIGATIONS (continued) | |
Southwest Airlines | | | | | | | | |
5.125%, 06/15/2027 | | $ | 2,140 | | | $ | 2,490 | |
4.750%, 05/04/2023 | | | 1,426 | | | | 1,547 | |
Union Pacific | | | | | | | | |
3.950%, 09/10/2028 | | | 1,555 | | | | 1,842 | |
3.839%, 03/20/2060 | | | 1,460 | | | | 1,799 | |
3.750%, 07/15/2025 | | | 530 | | | | 599 | |
3.750%, 02/05/2070 | | | 912 | | | | 1,088 | |
3.250%, 02/05/2050 | | | 4,212 | | | | 4,834 | |
3.150%, 03/01/2024 | | | 566 | | | | 611 | |
2.973%, 09/16/2062 (C) | | | 175 | | | | 186 | |
2.950%, 03/01/2022 | | | 1,182 | | | | 1,221 | |
2.400%, 02/05/2030 | | | 1,306 | | | | 1,415 | |
2.150%, 02/05/2027 | | | 1,325 | | | | 1,406 | |
United Parcel Service | | | | | | | | |
5.300%, 04/01/2050 | | | 870 | | | | 1,338 | |
5.200%, 04/01/2040 | | | 525 | | | | 752 | |
2.350%, 05/16/2022 | | | 235 | | | | 241 | |
US Airways Pass-Through Trust, Ser 2012-1, Cl A | | | | | | | | |
5.900%, 10/01/2024 | | | 28 | | | | 27 | |
US Airways Pass-Through Trust, Ser 2012-2, Cl A | | | | | | | | |
4.625%, 06/03/2025 | | | 2,942 | | | | 2,452 | |
Waste Management 4.150%, 07/15/2049 | | | 440 | | | | 583 | |
3.900%, 03/01/2035 | | | 39 | | | | 48 | |
3.500%, 05/15/2024 | | | 845 | | | | 921 | |
2.500%, 11/15/2050 | | | 340 | | | | 344 | |
| | | | | | | | |
| | | | | | | 206,821 | |
| | | | | | | | |
|
Information Technology — 2.0% | |
Adobe | | | | | | | | |
2.300%, 02/01/2030 | | | 2,210 | | | | 2,402 | |
Apple | | | | | | | | |
4.650%, 02/23/2046 | | | 2,460 | | | | 3,550 | |
4.375%, 05/13/2045 | | | 820 | | | | 1,138 | |
4.250%, 02/09/2047 | | | 481 | | | | 662 | |
3.850%, 05/04/2043 | | | 375 | | | | 483 | |
3.450%, 05/06/2024 | | | 350 | | | | 385 | |
2.750%, 01/13/2025 | | | 675 | | | | 731 | |
2.650%, 05/11/2050 | | | 1,643 | | | | 1,764 | |
2.550%, 08/20/2060 | | | 1,565 | | | | 1,616 | |
2.450%, 08/04/2026 | | | 2,560 | | | | 2,787 | |
2.400%, 05/03/2023 | | | 95 | | | | 100 | |
2.150%, 02/09/2022 | | | 90 | | | | 92 | |
1.125%, 05/11/2025 | | | 1,720 | | | | 1,757 | |
Applied Materials | | | | | | | | |
1.750%, 06/01/2030 | | | 2,030 | | | | 2,114 | |
Avnet | | | | | | | | |
4.875%, 12/01/2022 | | | 1,570 | | | | 1,688 | |
| | |
SEI Institutional Investments Trust / Semi-Annual Report / November 30, 2020 | | 125 |
SCHEDULE OF INVESTMENTS (Unaudited)
November 30, 2020
Core Fixed Income Fund (Continued)
| | | | | | | | |
| | | |
| Description | | Face Amount
(Thousands) | | Market Value
($ Thousands) |
|
CORPORATE OBLIGATIONS (continued) | |
Broadcom | | | | | | | | |
4.700%, 04/15/2025 | | $ | 3,350 | | | $ | 3,835 | |
4.250%, 04/15/2026 | | | 1,144 | | | | 1,307 | |
4.150%, 11/15/2030 | | | 3,630 | | | | 4,216 | |
3.875%, 01/15/2027 | | | 1,616 | | | | 1,815 | |
3.150%, 11/15/2025 | | | 7,798 | | | | 8,473 | |
3.125%, 10/15/2022 | | | 1,000 | | | | 1,047 | |
2.250%, 11/15/2023 | | | 1,110 | | | | 1,159 | |
Corning | | | | | | | | |
5.450%, 11/15/2079 | | | 1,685 | | | | 2,316 | |
Dell International LLC / EMC | | | | | | | | |
6.100%, 07/15/2027 (C) | | | 679 | | | | 835 | |
5.300%, 10/01/2029 (C) | | | 682 | | | | 824 | |
4.900%, 10/01/2026 (C) | | | 339 | | | | 398 | |
Fiserv | | | | | | | | |
3.500%, 07/01/2029 | | | 330 | | | | 378 | |
3.200%, 07/01/2026 | | | 1,144 | | | | 1,283 | |
Flex | | | | | | | | |
4.875%, 05/12/2030 | | | 1,783 | | | | 2,121 | |
Hewlett Packard Enterprise | | | | | | | | |
4.650%, 10/01/2024 | | | 3,955 | | | | 4,486 | |
HP | | | | | | | | |
2.200%, 06/17/2025 | | | 2,142 | | | | 2,264 | |
Intel | | | | | | | | |
4.950%, 03/25/2060 | | | 20 | | | | 30 | |
4.750%, 03/25/2050 | | | 5,100 | | | | 7,215 | |
4.600%, 03/25/2040 | | | 817 | | | | 1,099 | |
4.100%, 05/19/2046 | | | 885 | | | | 1,145 | |
3.734%, 12/08/2047 | | | 119 | | | | 146 | |
3.300%, 10/01/2021 | | | 75 | | | | 77 | |
3.250%, 11/15/2049 | | | 1,510 | | | | 1,740 | |
3.100%, 07/29/2022 | | | 75 | | | | 78 | |
International Business Machines | | | | | | | | |
4.150%, 05/15/2039 | | | 167 | | | | 214 | |
3.300%, 05/15/2026 | | | 387 | | | | 437 | |
3.000%, 05/15/2024 | | | 2,340 | | | | 2,534 | |
KLA | | | | | | | | |
3.300%, 03/01/2050 | | | 908 | | | | 1,021 | |
Lam Research | | | | | | | | |
3.800%, 03/15/2025 | | | 150 | | | | 168 | |
Marvell Technology Group | | | | | | | | |
4.200%, 06/22/2023 | | | 1,800 | | | | 1,946 | |
Mastercard | | | | | | | | |
3.850%, 03/26/2050 | | | 2,850 | | | | 3,723 | |
3.375%, 04/01/2024 | | | 720 | | | | 791 | |
3.350%, 03/26/2030 | | | 1,340 | | | | 1,574 | |
Micron Technology | | | | | | | | |
2.497%, 04/24/2023 | | | 2,766 | | | | 2,886 | |
Microsoft | | | | | | | | |
4.100%, 02/06/2037 | | | 917 | | | | 1,205 | |
3.950%, 08/08/2056 | | | 281 | | | | 387 | |
3.700%, 08/08/2046 | | | 620 | | | | 798 | |
| | | | | | | | |
| | | |
| Description | | Face Amount
(Thousands) | | Market Value
($ Thousands) |
|
CORPORATE OBLIGATIONS (continued) | |
3.500%, 02/12/2035 | | $ | 460 | | | $ | 573 | |
3.450%, 08/08/2036 | | | 1,648 | | | | 2,041 | |
3.300%, 02/06/2027 | | | 1,570 | | | | 1,793 | |
2.875%, 02/06/2024 | | | 970 | | | | 1,041 | |
2.700%, 02/12/2025 | | | 360 | | | | 391 | |
2.675%, 06/01/2060 | | | 835 | | | | 918 | |
2.525%, 06/01/2050 | | | 240 | | | | 258 | |
2.400%, 08/08/2026 | | | 2,510 | | | | 2,737 | |
2.375%, 02/12/2022 | | | 50 | | | | 51 | |
2.375%, 05/01/2023 | | | 50 | | | | 52 | |
NVIDIA | | | | | | | | |
3.700%, 04/01/2060 | | | 680 | | | | 877 | |
3.500%, 04/01/2040 | | | 990 | | | | 1,201 | |
3.500%, 04/01/2050 | | | 5,362 | | | | 6,530 | |
2.850%, 04/01/2030 | | | 3,516 | | | | 3,940 | |
NXP BV/ NXP Funding LLC/ NXP USA | | | | | | | | |
4.300%, 06/18/2029 (C) | | | 892 | | | | 1,048 | |
3.875%, 06/18/2026 (C) | | | 2,717 | | | | 3,078 | |
3.150%, 05/01/2027 (C) | | | 1,149 | | | | 1,254 | |
2.700%, 05/01/2025 (C) | | | 430 | | | | 462 | |
Oracle | | | | | | | | |
4.300%, 07/08/2034 | | | 285 | | | | 364 | |
4.000%, 11/15/2047 | | | 1,025 | | | | 1,255 | |
3.900%, 05/15/2035 | | | 3,620 | | | | 4,449 | |
3.850%, 04/01/2060 | | | 1,124 | | | | 1,387 | |
3.800%, 11/15/2037 | | | 481 | | | | 576 | |
3.600%, 04/01/2040 | | | 1,815 | | | | 2,115 | |
2.950%, 11/15/2024 | | | 1,147 | | | | 1,245 | |
2.950%, 05/15/2025 | | | 695 | | | | 759 | |
2.950%, 04/01/2030 | | | 1,815 | | | | 2,035 | |
2.800%, 04/01/2027 | | | 2,037 | | | | 2,243 | |
2.625%, 02/15/2023 | | | 884 | | | | 925 | |
PayPal Holdings | | | | | | | | |
2.300%, 06/01/2030 | | | 5,500 | | | | 5,909 | |
1.650%, 06/01/2025 | | | 3,217 | | | | 3,345 | |
1.350%, 06/01/2023 | | | 2,461 | | | | 2,522 | |
QUALCOMM | | | | | | | | |
1.650%, 05/20/2032 (C) | | | 119 | | | | 120 | |
1.300%, 05/20/2028 (C) | | | 1,795 | | | | 1,802 | |
salesforce.com | | | | | | | | |
3.250%, 04/11/2023 | | | 740 | | | | 789 | |
Texas Instruments | | | | | | | | |
4.150%, 05/15/2048 | | | 1,250 | | | | 1,725 | |
1.750%, 05/04/2030 | | | 440 | | | | 454 | |
1.375%, 03/12/2025 | | | 844 | | | | 872 | |
TSMC Global | | | | | | | | |
1.375%, 09/28/2030 (C) | | | 4,320 | | | | 4,224 | |
1.000%, 09/28/2027 (C) | | | 630 | | | | 625 | |
0.750%, 09/28/2025 (C) | | | 480 | | | | 477 | |
Visa | | | | | | | | |
4.300%, 12/14/2045 | | | 810 | | | | 1,117 | |
3.150%, 12/14/2025 | | | 660 | | | | 737 | |
| | |
126 | | SEI Institutional Investments Trust / Semi-Annual Report / November 30, 2020 |
| | | | | | | | |
| | | |
| Description | | Face Amount
(Thousands) | | Market Value
($ Thousands) |
|
CORPORATE OBLIGATIONS (continued) | |
2.200%, 12/14/2020 | | $ | 480 | | | $ | 480 | |
1.900%, 04/15/2027 | | | 1,580 | | | | 1,672 | |
| | | | | | | | |
| | | | | | | 159,708 | |
| | | | | | | | |
|
Materials — 0.8% | |
Air Liquide Finance | | | | | | | | |
2.250%, 09/27/2023 (C) | | | 1,215 | | | | 1,271 | |
Amcor Finance USA | | | | | | | | |
4.500%, 05/15/2028 | | | 865 | | | | 1,026 | |
3.625%, 04/28/2026 | | | 2,000 | | | | 2,236 | |
Anglo American Capital | | | | | | | | |
4.000%, 09/11/2027 (C) | | | 280 | | | | 316 | |
3.625%, 09/11/2024 (C) | | | 1,810 | | | | 1,968 | |
ArcelorMittal | | | | | | | | |
3.600%, 07/16/2024 | | | 1,540 | | | | 1,638 | |
Barrick Gold | | | | | | | | |
5.250%, 04/01/2042 | | | 740 | | | | 1,027 | |
Barrick North America Finance LLC | | | | | | | | |
5.700%, 05/30/2041 | | | 883 | | | | 1,272 | |
BHP Billiton Finance USA | | | | | | | | |
5.000%, 09/30/2043 | | | 40 | | | | 58 | |
2.875%, 02/24/2022 | | | 79 | | | | 81 | |
Dow Chemical | | | | | | | | |
4.800%, 05/15/2049 | | | 925 | | | | 1,204 | |
4.375%, 11/15/2042 | | | 341 | | | | 417 | |
3.600%, 11/15/2050 | | | 723 | | | | 805 | |
2.100%, 11/15/2030 | | | 2,044 | | | | 2,093 | |
DuPont de Nemours Inc | | | | | | | | |
4.493%, 11/15/2025 | | | 3,605 | | | | 4,212 | |
Equate Petrochemical MTN | | | | | | | | |
4.250%, 11/03/2026 (C) | | | 1,640 | | | | 1,788 | |
Glencore Funding LLC | | | | | | | | |
4.125%, 05/30/2023 (C) | | | 50 | | | | 54 | |
4.125%, 03/12/2024 (C) | | | 70 | | | | 76 | |
4.000%, 03/27/2027 (C) | | | 1,610 | | | | 1,804 | |
Industrias Penoles | | | | | | | | |
4.150%, 09/12/2029 (C) | | | 1,830 | | | | 2,045 | |
International Flavors & Fragrances | | | | | | | | |
5.000%, 09/26/2048 (D) | | | 2,365 | | | | 3,156 | |
LYB International Finance III LLC | | | | | | | | |
3.625%, 04/01/2051 | | | 626 | | | | 677 | |
3.375%, 10/01/2040 | | | 445 | | | | 469 | |
2.250%, 10/01/2030 | | | 342 | | | | 349 | |
1.250%, 10/01/2025 | | | 797 | | | | 805 | |
Nacional del Cobre de Chile | | | | | | | | |
4.250%, 07/17/2042 (C) | | | 1,790 | | | | 2,071 | |
3.625%, 08/01/2027 (C) | | | 2,770 | | | | 3,073 | |
Newcrest Finance Pty | | | | | | | | |
3.250%, 05/13/2030 (C) | | | 1,140 | | | | 1,256 | |
Newmont | | | | | | | | |
2.250%, 10/01/2030 | | | 4,531 | | | | 4,752 | |
| | | | | | | | |
| | | |
| Description | | Face Amount
(Thousands) | | Market Value
($ Thousands) |
|
CORPORATE OBLIGATIONS (continued) | |
Nucor | | | | | | | | |
2.700%, 06/01/2030 (D) | | $ | 912 | | | $ | 990 | |
2.000%, 06/01/2025 | | | 711 | | | | 747 | |
Nutrien | | | | | | | | |
5.000%, 04/01/2049 | | | 1,032 | | | | 1,432 | |
Nutrition & Biosciences | | | | | | | | |
3.468%, 12/01/2050 (C) | | | 1,980 | | | | 2,163 | |
2.300%, 11/01/2030 (C) | | | 1,081 | | | | 1,112 | |
1.230%, 10/01/2025 (C) | | | 6,305 | | | | 6,385 | |
OCP | | | | | | | | |
4.500%, 10/22/2025 (C) | | | 1,860 | | | | 2,000 | |
Reliance Steel & Aluminum | | | | | | | | |
2.150%, 08/15/2030 | | | 1,459 | | | | 1,489 | |
1.300%, 08/15/2025 | | | 561 | | | | 567 | |
Southern Copper | | | | | | | | |
5.250%, 11/08/2042 | | | 4,400 | | | | 5,818 | |
Suzano Austria GmbH | | | | | | | | |
6.000%, 01/15/2029 | | | 2,540 | | | | 3,028 | |
Syngenta Finance | | | | | | | | |
3.933%, 04/23/2021 (C) | | | 370 | | | | 374 | |
Teck Resources | | | | | | | | |
6.250%, 07/15/2041 | | | 836 | | | | 1,040 | |
5.200%, 03/01/2042 | | | 522 | | | | 584 | |
Vale Overseas | | | | | | | | |
6.875%, 11/21/2036 | | | 1,595 | | | | 2,261 | |
6.250%, 08/10/2026 | | | 2,140 | | | | 2,637 | |
WestRock RKT LLC | | | | | | | | |
4.000%, 03/01/2023 | | | 330 | | | | 350 | |
| | | | | | | | |
| | | | | | | 74,976 | |
| | | | | | | | |
|
Real Estate — 0.9% | |
Agree | | | | | | | | |
2.900%, 10/01/2030 | | | 496 | | | | 520 | |
American Campus Communities Operating Partnership | | | | | | | | |
3.750%, 04/15/2023 | | | 2,255 | | | | 2,379 | |
American Tower | | | | | | | | |
1.875%, 10/15/2030 | | | 3,215 | | | | 3,247 | |
AvalonBay Communities MTN | | | | | | | | |
4.350%, 04/15/2048 | | | 235 | | | | 302 | |
2.450%, 01/15/2031 | | | 2,490 | | | | 2,664 | |
Boston Properties | | | | | | | | |
3.800%, 02/01/2024 | | | 2,000 | | | | 2,174 | |
3.400%, 06/21/2029 | | | 1,510 | | | | 1,665 | |
2.900%, 03/15/2030 | | | 125 | | | | 133 | |
Camden Property Trust | | | | | | | | |
2.800%, 05/15/2030 | | | 925 | | | | 1,017 | |
CC Holdings GS V LLC | | | | | | | | |
3.849%, 04/15/2023 | | | 580 | | | | 623 | |
Crown Castle International | | | | | | | | |
4.000%, 03/01/2027 | | | 332 | | | | 379 | |
3.300%, 07/01/2030 | | | 569 | | | | 636 | |
| | |
SEI Institutional Investments Trust / Semi-Annual Report / November 30, 2020 | | 127 |
SCHEDULE OF INVESTMENTS (Unaudited)
November 30, 2020
Core Fixed Income Fund (Continued)
| | | | | | | | |
| | | |
| Description | | Face Amount
(Thousands) | | Market Value
($ Thousands) |
|
CORPORATE OBLIGATIONS (continued) | |
CyrusOne/CyrusOne Finance | | | | | | | | |
2.900%, 11/15/2024 | | $ | 1,985 | | | $ | 2,113 | |
Equinix | | | | | | | | |
2.950%, 09/15/2051 | | | 1,620 | | | | 1,672 | |
2.900%, 11/18/2026 | | | 1,878 | | | | 2,048 | |
2.625%, 11/18/2024 | | | 900 | | | | 959 | |
ERP Operating | | | | | | | | |
4.625%, 12/15/2021 | | | 200 | | | | 207 | |
Federal Realty Investment Trust | | | | | | | | |
3.950%, 01/15/2024 | | | 1,058 | | | | 1,150 | |
GLP Capital/GLP Financing II | | | | | | | | |
5.750%, 06/01/2028 | | | 1,250 | | | | 1,459 | |
5.375%, 04/15/2026 | | | 1,555 | | | | 1,758 | |
5.300%, 01/15/2029 | | | 2,449 | | | | 2,811 | |
5.250%, 06/01/2025 | | | 1,250 | | | | 1,384 | |
4.000%, 01/15/2030 | | | 1,212 | | | | 1,299 | |
4.000%, 01/15/2031 | | | 330 | | | | 357 | |
Healthcare Trust of America Holdings | | | | | | | | |
3.500%, 08/01/2026 | | | 1,010 | | | | 1,139 | |
Healthpeak Properties | | | | | | | | |
3.875%, 08/15/2024 | | | 4,926 | | | | 5,454 | |
2.875%, 01/15/2031 | | | 470 | | | | 504 | |
Highwoods Realty | | | | | | | | |
2.600%, 02/01/2031 | | | 590 | | | | 595 | |
Kimco Realty | | | | | | | | |
1.900%, 03/01/2028 | | | 709 | | | | 713 | |
Life Storage | | | | | | | | |
3.875%, 12/15/2027 | | | 935 | | | | 1,057 | |
Mid-America Apartments | | | | | | | | |
4.300%, 10/15/2023 | | | 685 | | | | 748 | |
4.000%, 11/15/2025 | | | 818 | | | | 925 | |
3.950%, 03/15/2029 | | | 670 | | | | 784 | |
3.750%, 06/15/2024 | | | 1,563 | | | | 1,694 | |
3.600%, 06/01/2027 | | | 99 | | | | 112 | |
1.700%, 02/15/2031 | | | 628 | | | | 624 | |
Piedmont Operating Partnership | | | | | | | | |
4.450%, 03/15/2024 | | | 125 | | | | 133 | |
Prologis | | | | | | | | |
3.000%, 04/15/2050 | | | 255 | | | | 283 | |
Realty Income | | | | | | | | |
3.250%, 01/15/2031 | | | 1,524 | | | | 1,722 | |
Regency Centers | | | | | | | | |
2.950%, 09/15/2029 | | | 1,453 | | | | 1,525 | |
Sabra Health Care | | | | | | | | |
3.900%, 10/15/2029 | | | 1,335 | | | | 1,382 | |
Simon Property Group | | | | | | | | |
3.800%, 07/15/2050 | | | 1,540 | | | | 1,660 | |
2.450%, 09/13/2029 | | | 1,915 | | | | 1,959 | |
2.000%, 09/13/2024 | | | 750 | | | | 779 | |
SL Green Realty | | | | | | | | |
4.500%, 12/01/2022 | | | 500 | | | | 525 | |
| | | | | | | | |
| | | |
| Description | | Face Amount
(Thousands) | | Market Value
($ Thousands) |
|
CORPORATE OBLIGATIONS (continued) | |
Spirit Realty | | | | | | | | |
4.450%, 09/15/2026 | | $ | 81 | | | $ | 91 | |
4.000%, 07/15/2029 | | | 386 | | | | 428 | |
3.400%, 01/15/2030 | | | 805 | | | | 856 | |
3.200%, 02/15/2031 | | | 1,582 | | | | 1,655 | |
STORE Capital | | | | | | | | |
4.625%, 03/15/2029 | | | 852 | | | | 974 | |
4.500%, 03/15/2028 | | | 2,514 | | | | 2,827 | |
2.750%, 11/18/2030 | | | 1,180 | | | | 1,192 | |
Ventas Realty | | | | | | | | |
3.000%, 01/15/2030 | | | 1,500 | | | | 1,596 | |
VEREIT Operating Partnership | | | | | | | | |
3.400%, 01/15/2028 | | | 709 | | | | 768 | |
2.850%, 12/15/2032 | | | 500 | | | | 512 | |
2.200%, 06/15/2028 | | | 714 | | | | 719 | |
Welltower | | | | | | | | |
4.500%, 01/15/2024 | | | 183 | | | | 202 | |
| | | | | | | | |
| | | | | | | 69,093 | |
| | | | | | | | |
|
Utilities — 2.2% | |
AES | | | | | | | | |
1.375%, 01/15/2026 (C) | | | 1,438 | | | | 1,450 | |
Alabama Power | | | | | | | | |
3.700%, 12/01/2047 | | | 2,745 | | | | 3,363 | |
Alabama Power Capital Trust V | | | | | | | | |
3.325%, VAR ICE LIBOR USD 3 Month+3.100%, 10/01/2042 | | | 100 | | | | 100 | |
Appalachian Power | | | | | | | | |
4.500%, 03/01/2049 | | | 60 | | | | 77 | |
4.450%, 06/01/2045 | | | 1,600 | | | | 2,048 | |
Berkshire Hathaway Energy | | | | | | | | |
2.850%, 05/15/2051 (C) | | | 2,430 | | | | 2,560 | |
Black Hills | | | | | | | | |
3.875%, 10/15/2049 | | | 600 | | | | 688 | |
3.050%, 10/15/2029 | | | 818 | | | | 894 | |
Boston Gas | | | | | | | | |
4.487%, 02/15/2042 (C) | | | 140 | | | | 178 | |
CenterPoint Energy | | | | | | | | |
3.600%, 11/01/2021 | | | 1,095 | | | | 1,127 | |
2.950%, 03/01/2030 | | | 569 | | | | 623 | |
2.500%, 09/01/2022 | | | 135 | | | | 140 | |
2.500%, 09/01/2024 | | | 1,455 | | | | 1,545 | |
CenterPoint Energy Houston Electric LLC | | | | | | | | |
2.900%, 07/01/2050 | | | 461 | | | | 502 | |
CenterPoint Energy Resources | | | | | | | | |
4.100%, 09/01/2047 | | | 653 | | | | 800 | |
Comision Federal de Electricidad | | | | | | | | |
4.875%, 01/15/2024 (C) | | | 300 | | | | 330 | |
4.750%, 02/23/2027 (C) | | | 1,410 | | | | 1,588 | |
Commonwealth Edison | | | | | | | | |
3.400%, 09/01/2021 | | | 140 | | | | 142 | |
| | |
128 | | SEI Institutional Investments Trust / Semi-Annual Report / November 30, 2020 |
| | | | | | | | |
| | | |
| Description | | Face Amount
(Thousands) | | Market Value
($ Thousands) |
|
CORPORATE OBLIGATIONS (continued) | |
Consolidated Edison of New York | | | | | | | | |
4.650%, 12/01/2048 | | $ | 2,000 | | | $ | 2,699 | |
4.450%, 03/15/2044 | | | 2,375 | | | | 3,032 | |
3.950%, 04/01/2050 | | | 210 | | | | 261 | |
3.350%, 04/01/2030 | | | 260 | | | | 300 | |
Consumers Energy | | | | | | | | |
2.500%, 05/01/2060 | | | 565 | | | | 570 | |
Delmarva Power & Light | | | | | | | | |
3.500%, 11/15/2023 | | | 170 | | | | 184 | |
Dominion Energy | | | | | | | | |
3.071%, 08/15/2024 | | | 1,800 | | | | 1,947 | |
2.000%, 08/15/2021 | | | 940 | | | | 949 | |
DTE Electric | | | | | | | | |
2.950%, 03/01/2050 | | | 1,476 | | | | 1,648 | |
DTE Energy | | | | | | | | |
3.800%, 03/15/2027 | | | 1,346 | | | | 1,535 | |
2.950%, 03/01/2030 | | | 895 | | | | 979 | |
2.529%, 10/01/2024 | | | 1,955 | | | | 2,081 | |
1.050%, 06/01/2025 | | | 4,591 | | | | 4,633 | |
Duke Energy | | | | | | | | |
3.550%, 09/15/2021 | | | 952 | | | | 968 | |
3.150%, 08/15/2027 | | | 850 | | | | 948 | |
2.400%, 08/15/2022 | | | 1,380 | | | | 1,424 | |
1.800%, 09/01/2021 | | | 1,408 | | | | 1,421 | |
0.900%, 09/15/2025 | | | 1,955 | | | | 1,964 | |
Duke Energy Carolinas LLC | | | | | | | | |
4.250%, 12/15/2041 | | | 1,000 | | | | 1,274 | |
4.000%, 09/30/2042 | | | 1,512 | | | | 1,863 | |
Duke Energy Florida LLC | | | | | | | | |
3.850%, 11/15/2042 | | | 720 | | | | 859 | |
3.200%, 01/15/2027 | | | 1,600 | | | | 1,799 | |
Duke Energy Indiana LLC | | | | | | | | |
2.750%, 04/01/2050 | | | 605 | | | | 644 | |
Duke Energy Progress LLC | | | | | | | | |
4.150%, 12/01/2044 | | | 250 | | | | 318 | |
2.800%, 05/15/2022 | | | 215 | | | | 222 | |
2.500%, 08/15/2050 | | | 815 | | | | 825 | |
Enel Finance International | | | | | | | | |
4.625%, 09/14/2025 (C) | | | 2,420 | | | | 2,824 | |
Entergy Arkansas LLC | | | | | | | | |
2.650%, 06/15/2051 | | | 2,677 | | | | 2,785 | |
Entergy Texas | | | | | | | | |
3.450%, 12/01/2027 | | | 1,625 | | | | 1,780 | |
1.750%, 03/15/2031 | | | 902 | | | | 905 | |
Evergy | | | | | | | | |
5.292%, 06/15/2022 | | | 1,216 | | | | 1,289 | |
2.900%, 09/15/2029 | | | 887 | | | | 964 | |
2.450%, 09/15/2024 | | | 1,248 | | | | 1,321 | |
Evergy Kansas Central | | | | | | | | |
3.450%, 04/15/2050 | | | 1,452 | | | | 1,702 | |
Evergy Metro | | | | | | | | |
5.300%, 10/01/2041 | | | 250 | | | | 339 | |
| | | | | | | | |
| | | |
| Description | | Face Amount
(Thousands) | | Market Value
($ Thousands) |
|
CORPORATE OBLIGATIONS (continued) | |
2.250%, 06/01/2030 | | $ | 871 | | | $ | 926 | |
Evergy Missouri West | | | | | | | | |
8.270%, 11/15/2021 | | | 2,894 | | | | 3,091 | |
Eversource Energy | | | | | | | | |
2.900%, 10/01/2024 | | | 3,730 | | | | 4,027 | |
Exelon | | | | | | | | |
5.625%, 06/15/2035 | | | 1,720 | | | | 2,340 | |
4.700%, 04/15/2050 | | | 1,291 | | | | 1,747 | |
3.950%, 06/15/2025 | | | 1,395 | | | | 1,579 | |
FEL Energy VI Sarl | | | | | | | | |
5.750%, 12/01/2040 (C) | | | 694 | | | | 730 | |
FirstEnergy | | | | | | | | |
7.375%, 11/15/2031 | | | 4,905 | | | | 6,741 | |
4.250%, 03/15/2023 | | | 2,040 | | | | 2,155 | |
3.900%, 07/15/2027 | | | 1,310 | | | | 1,447 | |
1.600%, 01/15/2026 | | | 300 | | | | 293 | |
Florida Power & Light | | | | | | | | |
3.950%, 03/01/2048 | | | 120 | | | | 159 | |
3.250%, 06/01/2024 | | | 455 | | | | 491 | |
Interstate Power & Light | | | | | | | | |
3.500%, 09/30/2049 | | | 511 | | | | 576 | |
ITC Holdings | | | | | | | | |
4.050%, 07/01/2023 | | | 2,075 | | | | 2,231 | |
2.700%, 11/15/2022 | | | 1,345 | | | | 1,399 | |
KeySpan Gas East | | | | | | | | |
2.742%, 08/15/2026 (C) | | | 1,175 | | | | 1,290 | |
Metropolitan Edison | | | | | | | | |
4.300%, 01/15/2029 (C) | | | 1,493 | | | | 1,711 | |
4.000%, 04/15/2025 (C) | | | 1,000 | | | | 1,088 | |
3.500%, 03/15/2023 (C) | | | 5,050 | | | | 5,268 | |
MidAmerican Energy | | | | | | | | |
4.800%, 09/15/2043 | | | 1,500 | | | | 2,037 | |
3.650%, 04/15/2029 | | | 1,330 | | | | 1,592 | |
3.650%, 08/01/2048 | | | 709 | | | | 870 | |
Mississippi Power | | | | | | | | |
4.250%, 03/15/2042 | | | 985 | | | | 1,204 | |
3.950%, 03/30/2028 | | | 1,640 | | | | 1,892 | |
Monongahela Power | | | | | | | | |
5.400%, 12/15/2043 (C) | | | 2,000 | | | | 2,767 | |
NextEra Energy Capital Holdings | | | | | | | | |
2.750%, 05/01/2025 | | | 1,148 | | | | 1,244 | |
2.403%, 09/01/2021 | | | 70 | | | | 71 | |
2.250%, 06/01/2030 | | | 1,088 | | | | 1,139 | |
NiSource 5.800%, 02/01/2042 | | | 471 | | | | 660 | |
NRG Energy | | | | | | | | |
2.000%, 12/02/2025 (C) | | | 925 | | | | 939 | |
Oncor Electric Delivery LLC | | | | | | | | |
2.750%, 05/15/2030 | | | 1,950 | | | | 2,179 | |
Pacific Gas and Electric | | | | | | | | |
4.550%, 07/01/2030 | | | 1,489 | | | | 1,700 | |
4.500%, 07/01/2040 | | | 339 | | | | 381 | |
| | |
SEI Institutional Investments Trust / Semi-Annual Report / November 30, 2020 | | 129 |
SCHEDULE OF INVESTMENTS (Unaudited)
November 30, 2020
Core Fixed Income Fund (Continued)
| | | | | | | | |
| | | |
| Description | | Face Amount
(Thousands) | | Market Value
($ Thousands) |
|
CORPORATE OBLIGATIONS (continued) | |
3.950%, 12/01/2047 | | $ | 1,092 | | | $ | 1,143 | |
3.500%, 08/01/2050 | | | 220 | | | | 222 | |
3.300%, 12/01/2027 | | | 2,422 | | | | 2,571 | |
3.300%, 08/01/2040 | | | 538 | | | | 541 | |
3.150%, 01/01/2026 | | | 287 | | | | 303 | |
2.500%, 02/01/2031 | | | 4,639 | | | | 4,666 | |
2.100%, 08/01/2027 | | | 3,614 | | | | 3,634 | |
1.750%, 06/16/2022 | | | 4,600 | | | | 4,607 | |
PECO Energy | | | | | | | | |
4.150%, 10/01/2044 | | | 1,985 | | | | 2,552 | |
Pennsylvania Electric | | | | | | | | |
3.250%, 03/15/2028 (C) | | | 565 | | | | 610 | |
Perusahaan Listrik Negara MTN | | | | | | | | |
6.150%, 05/21/2048 (C) | | | 2,090 | | | | 2,775 | |
5.450%, 05/21/2028 (C) | | | 1,030 | | | | 1,236 | |
4.125%, 05/15/2027 (C) | | | 1,990 | | | | 2,201 | |
PPL Capital Funding | | | | | | | | |
5.000%, 03/15/2044 | | | 543 | | | | 710 | |
4.125%, 04/15/2030 | | | 1,735 | | | | 2,050 | |
3.400%, 06/01/2023 | | | 192 | | | | 204 | |
3.100%, 05/15/2026 | | | 1,623 | | | | 1,804 | |
Progress Energy | | | | | | | | |
6.000%, 12/01/2039 | | | 200 | | | | 284 | |
Public Service Electric and Gas MTN | | | | | | | | |
3.700%, 05/01/2028 | | | 3,090 | | | | 3,611 | |
2.700%, 05/01/2050 | | | 1,483 | | | | 1,577 | |
2.050%, 08/01/2050 | | | 272 | | | | 253 | |
Public Service of New Hampshire | | | | | | | | |
3.500%, 11/01/2023 | | | 960 | | | | 1,038 | |
Sempra Energy | | | | | | | | |
2.900%, 02/01/2023 | | | 1,240 | | | | 1,300 | |
Southern California Edison | | | | | | | | |
4.650%, 10/01/2043 | | | 320 | | | | 399 | |
4.125%, 03/01/2048 | | | 749 | | | | 915 | |
2.850%, 08/01/2029 | | | 679 | | | | 735 | |
Southern California Gas | | | | | | | | |
2.550%, 02/01/2030 | | | 1,840 | | | | 1,985 | |
Southern Gas Capital | | | | | | | | |
5.875%, 03/15/2041 | | | 430 | | | | 611 | |
3.250%, 06/15/2026 | | | 1,550 | | | | 1,720 | |
1.750%, 01/15/2031 | | | 1,362 | | | | 1,374 | |
Southwestern Electric Power | | | | | | | | |
2.750%, 10/01/2026 | | | 1,000 | | | | 1,080 | |
Southwestern Public Service | | | | | | | | |
3.750%, 06/15/2049 | | | 2,000 | | | | 2,395 | |
Trans-Allegheny Interstate Line | | | | | | | | |
3.850%, 06/01/2025 (C) | | | 468 | | | | 510 | |
Virginia Electric & Power | | | | | | | | |
4.650%, 08/15/2043 | | | 1,205 | | | | 1,649 | |
3.450%, 02/15/2024 | | | 150 | | | | 162 | |
2.950%, 01/15/2022 | | | 1,720 | | | | 1,759 | |
| | | | | | | | |
| | | |
| Description | | Face Amount
(Thousands) | | Market Value ($ Thousands) |
|
CORPORATE OBLIGATIONS (continued) | |
Vistra Operations LLC | | | | | | | | |
4.300%, 07/15/2029 (C) | | $ | 2,725 | | | $ | 3,041 | |
WEC Energy Group | | | | | | | | |
1.375%, 10/15/2027 | | | 1,494 | | | | 1,503 | |
| | | | | | | | |
| | | | | | | 185,105 | |
| | | | | | | | |
| | |
Total Corporate Obligations
(Cost $2,388,891) ($ Thousands) | | | | | | | 2,624,926 | |
| | | | | | | | |
|
U.S. TREASURY OBLIGATIONS — 27.6% | |
U.S. Treasury Bills | | | | | | | | |
0.180%, 12/03/2020 (B) | | | 16,360 | | | | 16,360 | |
0.175%, 12/10/2020 (B) | | | 9,160 | | | | 9,160 | |
0.110%, 04/29/2021 (B) | | | 26,400 | | | | 26,390 | |
0.101%, 04/01/2021 (B) | | | 11,370 | | | | 11,366 | |
0.100%, 01/05/2021 (B) | | | 3,710 | | | | 3,710 | |
0.098%, 01/21/2021 (B) | | | 33,975 | | | | 33,971 | |
0.097%, 03/18/2021 (B) | | | 1,180 | | | | 1,180 | |
0.095%, 01/28/2021 (B) | | | 1,345 | | | | 1,345 | |
0.090%, 02/18/2021 (B) | | | 21,190 | | | | 21,186 | |
0.090%, 05/04/2021 (B) | | | 25,670 | | | | 25,660 | |
0.087%, 12/15/2020 (B) | | | 9,750 | | | | 9,750 | |
0.083%, 12/08/2020 (B) | | | 103,280 | | | | 103,279 | |
0.072%, 01/19/2021 (B) | | | 10,935 | | | | 10,934 | |
0.061%, 01/07/2021 (B) | | | 7,120 | | | | 7,119 | |
0.060%, 12/17/2020 (B) | | | 13,910 | | | | 13,909 | |
0.059%, 12/22/2020 (B) | | | 8,525 | | | | 8,525 | |
|
U.S. Treasury Bonds | |
2.875%, 05/15/2043 | | | 17,966 | | | | 23,029 | |
2.500%, 02/15/2045 | | | 5,172 | | | | 6,252 | |
2.000%, 02/15/2050 | | | 7,650 | | | | 8,442 | |
1.625%, 11/15/2050 | | | 118,730 | | | | 120,270 | |
1.375%, 11/15/2040 | | | 60,952 | | | | 61,066 | |
1.375%, 08/15/2050 | | | 89,185 | | | | 84,921 | |
1.250%, 05/15/2050 | | | 142,258 | | | | 131,255 | |
1.125%, 05/15/2040 | | | 50,637 | | | | 48,730 | |
1.125%, 08/15/2040 | | | 39,185 | | | | 37,605 | |
|
U.S. Treasury Inflation-Protected Securities | |
2.125%, 02/15/2040 | | | 3,203 | | | | 4,934 | |
2.125%, 02/15/2041 | | | 1,545 | | | | 2,407 | |
1.375%, 02/15/2044 | | | 4,255 | | | | 6,097 | |
1.000%, 02/15/2046 | | | 3,691 | | | | 5,006 | |
1.000%, 02/15/2048 | | | 8,834 | | | | 12,240 | |
1.000%, 02/15/2049 | | | 6,454 | | | | 9,045 | |
0.750%, 02/15/2042 | | | 2,442 | | | | 3,089 | |
0.750%, 02/15/2045 | | | 1,868 | | | | 2,395 | |
0.250%, 02/15/2050 | | | 3,895 | | | | 4,618 | |
0.125%, 07/15/2030 | | | 9,242 | | | | 10,237 | |
U.S. Treasury Notes | | | | | | | | |
3.125%, 05/15/2021 | | | 9,121 | | | | 9,248 | |
2.250%, 04/30/2021 | | | 9,759 | | | | 9,847 | |
| | |
130 | | SEI Institutional Investments Trust / Semi-Annual Report / November 30, 2020 |
| | | | | | | | |
| | | |
| Description | | Face Amount
(Thousands) | | Market Value
($ Thousands) |
|
U.S. TREASURY OBLIGATIONS (continued) | |
2.125%, 05/15/2022 | | $ | 908 | | | $ | 934 | |
1.375%, 01/31/2021 | | | 32,740 | | | | 32,807 | |
1.375%, 05/31/2021 | | | 37,156 | | | | 37,397 | |
0.875%, 11/15/2030 | | | 108,324 | | | | 108,680 | |
0.625%, 11/30/2027 | | | 71,540 | | | | 71,607 | |
0.500%, 06/30/2027 | | | 17,260 | | | | 17,186 | |
0.500%, 08/31/2027 | | | 13,830 | | | | 13,752 | |
0.500%, 10/31/2027 | | | 11,252 | | | | 11,169 | |
0.375%, 11/30/2025 | | | 195,923 | | | | 196,076 | |
0.250%, 06/15/2023 | | | 6,483 | | | | 6,496 | |
0.250%, 11/15/2023 | | | 79,626 | | | | 79,782 | |
0.250%, 05/31/2025 | | | 40 | | | | 40 | |
0.250%, 06/30/2025 | | | 480 | | | | 478 | |
0.250%, 08/31/2025 | | | 8,719 | | | | 8,683 | |
0.250%, 09/30/2025 | | | 12,381 | | | | 12,323 | |
0.250%, 10/31/2025 | | | 171,280 | | | | 170,424 | |
0.125%, 05/31/2022 | | | 6,424 | | | | 6,423 | |
0.125%, 06/30/2022 | | | 7,705 | | | | 7,704 | |
0.125%, 07/31/2022 | | | 13,977 | | | | 13,973 | |
0.125%, 08/31/2022 | | | 50,732 | | | | 50,718 | |
0.125%, 09/30/2022 | | | 253,150 | | | | 253,071 | |
0.125%, 10/31/2022 | | | 100,666 | | | | 100,627 | |
0.125%, 11/30/2022 | | | 86,433 | | | | 86,392 | |
0.125%, 09/15/2023 | | | 36,488 | | | | 36,434 | |
0.125%, 10/15/2023 | | | 29,482 | | | | 29,434 | |
| | | | | | | | |
| | |
Total U.S. Treasury Obligations
(Cost $2,249,014) ($ Thousands) | | | | | | | 2,257,187 | |
| | | | | | | | |
|
ASSET-BACKED SECURITIES — 8.1% | |
|
Automotive — 1.4% | |
| | |
Ally Auto Receivables Trust, Ser 2018-1, Cl A3 | | | | | | | | |
2.350%, 06/15/2022 | | | 173 | | | | 173 | |
Ally Auto Receivables Trust, Ser 2019-3, Cl A4 | | | | | | | | |
1.960%, 12/16/2024 | | | 1,440 | | | | 1,488 | |
Ally Auto Receivables Trust, Ser 2019-4, Cl A3 | | | | | | | | |
1.840%, 06/17/2024 | | | 420 | | | | 427 | |
AmeriCredit Automobile Receivables Trust, Ser 2020-1, Cl A2A | | | | | | | | |
1.100%, 03/20/2023 | | | 327 | | | | 328 | |
AmeriCredit Automobile Receivables Trust, Ser 2020-2, Cl A2A | | | | | | | | |
0.600%, 12/18/2023 | | | 3,349 | | | | 3,355 | |
AmeriCredit Automobile Receivables Trust, Ser 2020-3, Cl A2 | | | | | | | | |
0.420%, 03/18/2024 | | | 2,140 | | | | 2,141 | |
AmeriCredit Automobile Receivables Trust, Ser 2020-3, Cl A3 | | | | | | | | |
0.530%, 06/18/2025 | | | 1,909 | | | | 1,912 | |
| | | | | | | | |
| | | |
| Description | | Face Amount
(Thousands) | | Market Value
($ Thousands) |
|
ASSET-BACKED SECURITIES (continued) | |
Avis Budget Rental Car Funding AESOP LLC, Ser 2017-1A, Cl A | | | | | | | | |
3.070%, 09/20/2023 (C) | | $ | 610 | | | $ | 626 | |
Avis Budget Rental Car Funding AESOP LLC, Ser 2019-3A, Cl A | | | | | | | | |
2.360%, 03/20/2026 (C) | | | 1,317 | | | | 1,356 | |
Avis Budget Rental Car Funding AESOP LLC, Ser 2020-1A, Cl A | | | | | | | | |
2.330%, 08/20/2026 (C) | | | 3,290 | | | | 3,380 | |
Avis Budget Rental Car Funding AESOP LLC, Ser 2020-2A, Cl A | | | | | | | | |
2.020%, 02/20/2027 (C) | | | 6,745 | | | | 6,836 | |
Bank of The West Auto Trust, Ser 2019-1, Cl A2 | | | | | | | | |
2.400%, 10/17/2022 (C) | | | 346 | | | | 347 | |
Chase Auto Credit Linked Notes, Ser 2020-2, Cl B | | | | | | | | |
0.840%, 02/25/2028 (C) | | | 2,010 | | | | 2,011 | |
Chesapeake Funding II LLC, Ser 2017-4A, Cl A1 | | | | | | | | |
2.120%, 11/15/2029 (C) | | | 709 | | | | 713 | |
Chesapeake Funding II LLC, Ser 2018-1A, Cl B | | | | | | | | |
3.450%, 04/15/2030 (C) | | | 2,380 | | | | 2,443 | |
Chesapeake Funding II LLC, Ser 2019-1A, Cl A1 | | | | | | | | |
2.940%, 04/15/2031 (C) | | | 1,741 | | | | 1,775 | |
Chesapeake Funding II LLC, Ser 2020-1A, Cl A1 | | | | | | | | |
0.870%, 08/16/2032 (C) | | | 4,347 | | | | 4,355 | |
Chesapeake Funding II LLC, Ser 2020-1A, Cl B | | | | | | | | |
1.240%, 08/16/2032 (C) | | | 1,830 | | | | 1,839 | |
Drive Auto Receivables Trust, Ser 2019-3, Cl A3 | | | | | | | | |
2.490%, 06/15/2023 | | | 1,598 | | | | 1,604 | |
Drive Auto Receivables Trust, Ser 2020-1, Cl A2 | | | | | | | | |
1.990%, 12/15/2022 | | | 556 | | | | 558 | |
Drive Auto Receivables Trust, Ser 2020-2, Cl A2A | | | | | | | | |
0.850%, 07/17/2023 | | | 773 | | | | 775 | |
Enterprise Fleet Financing LLC, Ser 2019-1, Cl A2 | | | | | | | | |
2.980%, 10/20/2024 (C) | | | 633 | | | | 644 | |
Exeter Automobile Receivables Trust, Ser 2019-4A, Cl A | | | | | | | | |
2.180%, 01/17/2023 (C) | | | 325 | | | | 326 | |
Exeter Automobile Receivables Trust, Ser 2020-2A, Cl A | | | | | | | | |
1.130%, 08/15/2023 (C) | | | 2,776 | | | | 2,783 | |
Ford Credit Auto Lease Trust, Ser 2020-B, Cl A3 | | | | | | | | |
0.620%, 08/15/2023 | | | 3,832 | | | | 3,847 | |
| | |
SEI Institutional Investments Trust / Semi-Annual Report / November 30, 2020 | | 131 |
SCHEDULE OF INVESTMENTS (Unaudited)
November 30, 2020
Core Fixed Income Fund (Continued)
| | | | | | | | |
| | | |
| Description | | Face Amount
(Thousands) | | Market Value
($ Thousands) |
|
ASSET-BACKED SECURITIES (continued) | |
Ford Credit Auto Owner Trust, Ser 2017-B, Cl A4 | | | | | | | | |
1.870%, 09/15/2022 | | $ | 423 | | | $ | 425 | |
Ford Credit Auto Owner Trust, Ser 2018-1, Cl A | | | | | | | | |
3.190%, 07/15/2031 (C) | | | 5,715 | | | | 6,266 | |
Ford Credit Auto Owner Trust, Ser 2018-2, Cl A | | | | | | | | |
3.470%, 01/15/2030 (C) | | | 3,776 | | | | 4,055 | |
Ford Credit Auto Owner Trust, Ser 2018-A, Cl A3 | | | | | | | | |
3.030%, 11/15/2022 | | | 250 | | | | 252 | |
Ford Credit Auto Owner Trust, Ser 2019-REV1, Cl A | | | | | | | | |
3.520%, 07/15/2030 (C) | | | 4,099 | | | | 4,472 | |
Ford Credit Auto Owner Trust, Ser 2020-2, Cl A | | | | | | | | |
1.060%, 04/15/2033 (C) | | | 5,112 | | | | 5,138 | |
Ford Credit Auto Owner Trust, Ser 2020-A, Cl A3 | | | | | | | | |
1.040%, 08/15/2024 | | | 1,757 | | | | 1,777 | |
Ford Credit Auto Owner Trust, Ser 2020-C, Cl A3 | | | | | | | | |
0.410%, 07/15/2025 | | | 1,873 | | | | 1,875 | |
Ford Credit Auto Owner Trust, Ser 2020-C, Cl A4 | | | | | | | | |
0.510%, 08/15/2026 | | | 1,341 | | | | 1,346 | |
Ford Credit Auto Owner Trust, Ser 2020-REV1, Cl A | | | | | | | | |
2.040%, 08/15/2031 (C) | | | 4,882 | | | | 5,132 | |
Ford Credit Floorplan Master Owner Trust A, Ser 2018-4, Cl A | | | | | | | | |
4.060%, 11/15/2030 | | | 2,740 | | | | 3,232 | |
GM Financial Automobile Leasing Trust, Ser 2020-2, Cl A2A | | | | | | | | |
0.710%, 10/20/2022 | | | 233 | | | | 234 | |
GM Financial Automobile Leasing Trust, Ser 2020-2, Cl A4 | | | | | | | | |
1.010%, 07/22/2024 | | | 392 | | | | 397 | |
GM Financial Consumer Automobile Receivables Trust, Ser 2020-1, Cl A2 | | | | | | | | |
1.830%, 01/17/2023 | | | 445 | | | | 448 | |
Hertz Fleet Lease Funding, Ser 2019-1, Cl D | | | | | | | | |
3.440%, 01/10/2033 (C) | | | 2,900 | | | | 2,782 | |
Honda Auto Receivables Owner Trust, Ser 2019-3, Cl A4 | | | | | | | | |
1.850%, 08/15/2025 | | | 1,160 | | | | 1,195 | |
Hyundai Auto Receivables Trust, Ser 2019-B, Cl A3 | | | | | | | | |
1.940%, 02/15/2024 | | | 370 | | | | 377 | |
Hyundai Auto Receivables Trust, Ser 2020-A, Cl A1 | | | | | | | | |
1.198%, 05/17/2021 | | | 31 | | | | 31 | |
| | | | | | | | |
| | | |
| Description | | Face Amount
(Thousands) | | Market Value
($ Thousands) |
|
ASSET-BACKED SECURITIES (continued) | |
Hyundai Auto Receivables Trust, Ser 2020-B, Cl A2 | | | | | | | | |
0.380%, 03/15/2023 | | $ | 2,725 | | | $ | 2,727 | |
JPMorgan Chase Bank, Ser 2020-1, Cl B | | | | | | | | |
0.991%, 01/25/2028 (C) | | | 1,225 | | | | 1,228 | |
Prestige Auto Receivables Trust, Ser 2018-1A, Cl A3 | | | | | | | | |
3.290%, 09/15/2022 (C) | | | 77 | | | | 77 | |
Prestige Auto Receivables Trust, Ser 2020-1A, Cl A2 | | | | | | | | |
0.520%, 02/15/2024 (C) | | | 1,255 | | | | 1,255 | |
Santander Drive Auto Receivables Trust, Ser 2020-1, Cl A3 | | | | | | | | |
2.030%, 02/15/2024 | | | 765 | | | | 776 | |
Santander Drive Auto Receivables Trust, Ser 2020-2, Cl A2A | | | | | | | | |
0.620%, 05/15/2023 | | | 4,652 | | | | 4,656 | |
Santander Drive Auto Receivables Trust, Ser 2020-3, Cl A2 | | | | | | | | |
0.460%, 09/15/2023 | | | 3,280 | | | | 3,280 | |
Santander Drive Auto Receivables Trust, Ser 2020-3, Cl A3 | | | | | | | | |
0.520%, 07/15/2024 | | | 1,411 | | | | 1,414 | |
Santander Drive Auto Receivables Trust, Ser 2020-4, Cl A2 | | | | | | | | |
0.420%, 09/15/2023 | | | 1,260 | | | | 1,260 | |
Santander Drive Auto Receivables Trust, Ser 2020-4, Cl A3 | | | | | | | | |
0.480%, 07/15/2024 | | | 1,310 | | | | 1,311 | |
Santander Revolving Auto Loan Trust, Ser 2019-A, Cl A | | | | | | | | |
2.510%, 01/26/2032 (C) | | | 4,109 | | | | 4,373 | |
Tesla Auto Lease Trust, Ser 2020-A, Cl A2 | | | | | | | | |
0.550%, 05/22/2023 (C) | | | 2,825 | | | | 2,830 | |
Tidewater Auto Receivables Trust, Ser 2020-AA, Cl A2 | | | | | | | | |
1.390%, 08/15/2024 (C) | | | 898 | | | | 904 | |
Toyota Auto Receivables Owner Trust, Ser 2019-D, Cl A2 | | | | | | | | |
1.920%, 07/15/2022 | | | 276 | | | | 277 | |
Toyota Auto Receivables Owner Trust, Ser 2019-D, Cl A3 | | | | | | | | |
1.920%, 01/16/2024 | | | 530 | | | | 541 | |
Toyota Auto Receivables Owner Trust, Ser 2020-A, Cl A2 | | | | | | | | |
1.670%, 11/15/2022 | | | 297 | | | | 299 | |
Wheels SPV 2 LLC, Ser 2020-1A, Cl A2 | | | | | | | | |
0.510%, 08/20/2029 (C) | | | 2,460 | | | | 2,463 | |
| | | | | | | | |
| | | | | | | 115,147 | |
| | | | | | | | |
| | |
132 | | SEI Institutional Investments Trust / Semi-Annual Report / November 30, 2020 |
| | | | | | | | |
| | | |
| Description | | Face Amount
(Thousands) | | Market Value
($ Thousands) |
|
ASSET-BACKED SECURITIES (continued) | |
|
Credit Cards — 0.3% | |
| | |
Capital One Multi-Asset Execution Trust, Ser 2016-A2, Cl A2 | | | | | | | | |
0.771%, VAR ICE LIBOR USD 1 Month+0.630%, 02/15/2024 | | $ | 2,927 | | | $ | 2,933 | |
Capital One Multi-Asset Execution Trust, Ser 2016-A7, Cl A7 | | | | | | | | |
0.651%, VAR ICE LIBOR USD 1 Month+0.510%, 09/16/2024 | | | 1,758 | | | | 1,766 | |
Capital One Multi-Asset Execution Trust, Ser 2017-A5, Cl A5 | | | | | | | | |
0.721%, VAR ICE LIBOR USD 1 Month+0.580%, 07/15/2027 | | | 1,070 | | | | 1,074 | |
Citibank Credit Card Issuance Trust, Ser 2017-A5, Cl A5 | | | | | | | | |
0.766%, VAR ICE LIBOR USD 1 Month+0.620%, 04/22/2026 | | | 3,325 | | | | 3,354 | |
Citibank Credit Card Issuance Trust, Ser 2017-A6, Cl A6 | | | | | | | | |
0.911%, VAR ICE LIBOR USD 1 Month+0.770%, 05/14/2029 | | | 7,790 | | | | 7,771 | |
Discover Card Execution Note Trust, Ser 2017-A5, Cl A5 | | | | | | | | |
0.741%, VAR ICE LIBOR USD 1 Month+0.600%, 12/15/2026 | | | 2,895 | | | | 2,909 | |
Discover Card Execution Note Trust, Ser 2018-A2, Cl A2 | | | | | | | | |
0.471%, VAR ICE LIBOR USD 1 Month+0.330%, 08/15/2025 | | | 5,360 | | | | 5,367 | |
| | | | | | | | |
| | | | | | | 25,174 | |
| | | | | | | | |
|
Mortgage Related Securities — 0.3% | |
| | |
Aames Mortgage Trust, Ser 2002-1, Cl A3 | | | | | | | | |
7.396%, 06/25/2032 | | | 24 | | | | 24 | |
ABFC Trust, Ser 2005-AQ1, Cl A4 | | | | | | | | |
4.622%, 01/25/2034 | | | 47 | | | | 47 | |
Accredited Mortgage Loan Trust, Ser 2005-3, Cl M3 | | | | | | | | |
0.630%, VAR ICE LIBOR USD 1 Month+0.480%, 09/25/2035 | | | 7,222 | | | | 7,116 | |
Centex Home Equity Loan Trust, Ser 2005-A, Cl M1 | | | | | | | | |
0.870%, VAR ICE LIBOR USD 1 Month+0.720%, 01/25/2035 | | | 3,832 | | | | 3,773 | |
Centex Home Equity Loan Trust, Ser 2006-A, Cl AV4 | | | | | | | | |
0.400%, VAR ICE LIBOR USD 1 Month+0.250%, 06/25/2036 | | | 4 | | | | 4 | |
Delta Funding Home Equity Loan Trust, Ser 1999-3, Cl A1A | | | | | | | | |
0.961%, VAR ICE LIBOR USD 1 Month+0.820%, 09/15/2029 | | | 210 | | | | 205 | |
| | | | | | | | |
| | | |
| Description | | Face Amount
(Thousands) | | Market Value
($ Thousands) |
|
ASSET-BACKED SECURITIES (continued) | |
GSAMP Trust, Ser 2006-HE2, Cl A3 | | | | | | | | |
0.669%, VAR ICE LIBOR USD 1 Month+0.260%, 03/25/2046 | | $ | 628 | | | $ | 628 | |
Master Asset-Backed Securities Trust, Ser 2006-WMC3, Cl A4 | | | | | | | | |
0.310%, VAR ICE LIBOR USD 1 Month+0.160%, 08/25/2036 | | | 795 | | | | 369 | |
Morgan Stanley Asset-Backed Securities Capital I Trust, Ser 2005-WMC3, Cl M4 | | | | | | | | |
1.080%, VAR ICE LIBOR USD 1 Month+0.930%, 03/25/2035 | | | 1,262 | | | | 1,289 | |
Morgan Stanley Mortgage Loan Trust, Ser 2007-3XS, Cl 2A3S | | | | | | | | |
5.858%, 01/25/2047 | | | 15 | | | | 8 | |
RASC Trust, Ser 2005-KS9, Cl M5 | | | | | | | | |
1.095%, VAR ICE LIBOR USD 1 Month+0.945%, 10/25/2035 | | | 8,000 | | | | 7,877 | |
Soundview Home Loan Trust, Ser 2006-OPT3, Cl 2A3 | | | | | | | | |
0.320%, VAR ICE LIBOR USD 1 Month+0.170%, 06/25/2036 | | | 557 | | | | 551 | |
Structured Asset Securities Pass-Through Certificates, Ser 2002-AL1, Cl A2 | | | | | | | | |
3.450%, 02/25/2032 | | | 47 | | | | 45 | |
Wells Fargo Home Equity Asset-Backed Securities Trust, Ser 2004-2, Cl A33 | | | | | | | | |
1.150%, VAR ICE LIBOR USD 1 Month+1.000%, 10/25/2034 | | | 3,403 | | | | 3,343 | |
| | | | | | | | |
| | | | | | | 25,279 | |
| | | | | | | | |
|
Non-Agency Mortgage-Backed Obligations — 0.0% | |
| | |
Citicorp Residential Mortgage Trust, Ser 2007-1, Cl A5 | | | | | | | | |
5.165%, 03/25/2037 | | | 906 | | | | 935 | |
| | | | | | | | |
|
Other Asset-Backed Securities — 6.1% | |
| | |
AccessLex Institute, Ser 2007-A, Cl A3 | | | | | | | | |
0.507%, VAR ICE LIBOR USD 3 Month+0.300%, 05/25/2036 | | | 3,089 | | | | 2,994 | |
ACIS CLO, Ser 2014-4A, Cl A | | | | | | | | |
1.634%, VAR ICE LIBOR USD 3 Month+1.420%, 05/01/2026 (C) | | | 10 | | | | 10 | |
ACIS CLO, Ser 2015-6A, Cl A1 | | | | | | | | |
1.804%, VAR ICE LIBOR USD 3 Month+1.590%, 05/01/2027 (C) | | | 176 | | | | 176 | |
AGL Core CLO VIII, Ser 2020-8A, Cl A1 | | | | | | | | |
1.718%, VAR ICE LIBOR USD 3 Month+1.500%, 10/20/2031 (C) | | | 1,110 | | | | 1,109 | |
Aimco CLO XI, Ser 2020-11A, Cl A1 | | | | | | | | |
1.605%, VAR ICE LIBOR USD 3 Month+1.380%, 10/15/2031 (C) | | | 5,500 | | | | 5,500 | |
| | |
SEI Institutional Investments Trust / Semi-Annual Report / November 30, 2020 | | 133 |
SCHEDULE OF INVESTMENTS (Unaudited)
November 30, 2020
Core Fixed Income Fund (Continued)
| | | | | | | | |
| | | |
| Description | | Face Amount
(Thousands) | | Market Value
($ Thousands) |
|
ASSET-BACKED SECURITIES (continued) | |
Allegro CLO V, Ser 2017-1A, Cl A | | | | | | | | |
1.470%, VAR ICE LIBOR USD 3 Month+1.240%, 10/16/2030 (C) | | $ | 3,100 | | | $ | 3,093 | |
American Tower Trust I, Ser 2013-13, Cl 2A | | | | | | | | |
3.070%, 03/15/2048 (C) | | | 700 | | | | 714 | |
AMMC CLO IX, Ser 2019-19A, Cl AR | | | | | | | | |
1.377%, VAR ICE LIBOR USD 3 Month+1.140%, 10/16/2028 (C) | | | 2,400 | | | | 2,392 | |
AMMC CLO XII, Ser 2017-12A, Cl AR | | | | | | | | |
1.406%, VAR ICE LIBOR USD 3 Month+1.200%, 11/10/2030 (C) | | | 750 | | | | 747 | |
AMMC CLO XXIII, Ser 2020-23A, Cl A1L | | | | | | | | |
1.635%, VAR ICE LIBOR USD 3 Month+1.400%, 10/17/2031 (C) | | | 640 | | | | 640 | |
Antares CLO, Ser 2020-1A, Cl A1 | | | | | | | | |
2.113%, VAR ICE LIBOR USD 3 Month+1.900%, 10/23/2031 (C) | | | 2,500 | | | | 2,512 | |
Apex Credit CLO, Ser 2017-1A, Cl A1 | | | | | | | | |
1.685%, VAR ICE LIBOR USD 3 Month+1.470%, 04/24/2029 (C) | | | 783 | | | | 784 | |
Apidos CLO XXI, Ser 2018-21A, Cl A1R | | | | | | | | |
1.148%, VAR ICE LIBOR USD 3 Month+0.930%, 07/18/2027 (C) | | | 1,141 | | | | 1,139 | |
Applebee’s Funding LLC / IHOP Funding LLC, Ser 2019-1A, Cl A2I | | | | | | | | |
4.194%, 06/07/2049 (C) | | | 2,000 | | | | 1,954 | |
ARES LII CLO, Ser 2019-52A, Cl B | | | | | | | | |
2.066%, VAR ICE LIBOR USD 3 Month+1.850%, 04/22/2031 (C) | | | 750 | | | | 751 | |
ARES XLVII CLO, Ser 2018-47A, Cl A1 | | | | | | | | |
1.157%, VAR ICE LIBOR USD 3 Month+0.920%, 04/15/2030 (C) | | | 1,040 | | | | 1,029 | |
Balboa Bay Loan Funding, Ser 2020-1A, Cl A | | | | | | | | |
0.000%, 01/20/2032 (A)(C)(G) | | | 2,610 | | | | 2,610 | |
Barings CLO, Ser 2017-IA, Cl AR | | | | | | | | |
1.018%, VAR ICE LIBOR USD 3 Month+0.800%, 01/20/2028 (C) | | | 3,579 | | | | 3,561 | |
BCC Funding XVI LLC, Ser 2019-1A, Cl A2 | | | | | | | | |
2.460%, 08/20/2024 (C) | | | 3,411 | | | | 3,459 | |
BlueMountain CLO, Ser 2016-1A, Cl A1R | | | | | | | | |
1.554%, VAR ICE LIBOR USD 3 Month+1.330%, 04/13/2027 (C) | | | 309 | | | | 308 | |
BlueMountain CLO, Ser 2018-2A, Cl AR2 | | | | | | | | |
1.274%, VAR ICE LIBOR USD 3 Month+1.050%, 11/20/2028 (C) | | | 1,000 | | | | 994 | |
Brazos Education Loan Authority, Ser 2012-1, Cl A1 | | | | | | | | |
0.850%, VAR ICE LIBOR USD 1 Month+0.700%, 12/26/2035 | | | 1,466 | | | | 1,453 | |
Brazos Higher Education Authority, Ser 2010-1, Cl A2 | | | | | | | | |
1.407%, VAR ICE LIBOR USD 3 Month+1.200%, 02/25/2035 | | | 4,835 | | | | 4,869 | |
| | | | | | | | |
| | | |
| Description | | Face Amount
(Thousands) | | Market Value
($ Thousands) |
|
ASSET-BACKED SECURITIES (continued) | |
Brazos Higher Education Authority, Ser 2011-1, Cl A2 | | | | | | | | |
1.007%, VAR ICE LIBOR USD 3 Month+0.800%, 02/25/2030 | | $ | 502 | | | $ | 504 | |
Brazos Higher Education Authority, Ser 2011-2, Cl A3 | | | | | | | | |
1.215%, VAR ICE LIBOR USD 3 Month+1.000%, 10/27/2036 | | | 3,520 | | | | 3,515 | |
Canyon CLO, Ser 2020-2A, Cl A | | | | | | | | |
1.660%, VAR ICE LIBOR USD 3 Month+1.450%, 10/15/2031 (C) | | | 1,500 | | | | 1,498 | |
Carlyle Global Market Strategies CLO, Ser 2018-3RA, Cl A1A | | | | | | | | |
1.267%, VAR ICE LIBOR USD 3 Month+1.050%, 07/27/2031 (C) | | | 863 | | | | 857 | |
Catskill Park CLO, Ser 2017-1A, Cl A2 | | | | | | | | |
1.918%, VAR ICE LIBOR USD 3 Month+1.700%, 04/20/2029 (C) | | | 1,500 | | | | 1,496 | |
CBAM, Ser 2017-1A, Cl A1 | | | | | | | | |
1.468%, VAR ICE LIBOR USD 3 Month+1.250%, 07/20/2030 (C) | | | 750 | | | | 749 | |
Cedar Funding V CLO, Ser 2020-5A, Cl AFRR | | | | | | | | |
1.937%, 07/17/2031 (C) | | | 1,580 | | | | 1,577 | |
Cerberus Loan Funding XXVIII, Ser 2020-1A, Cl A | | | | | | | | |
2.058%, VAR ICE LIBOR USD 3 Month+1.850%, 10/15/2031 (C) | | | 700 | | | | 702 | |
Chase Funding Trust, Ser 2003-6, Cl 1A5 | | | | | | | | |
4.996%, 11/25/2034 | | | 156 | | | | 164 | |
Chase Funding Trust, Ser 2003-6, Cl 1A7 | | | | | | | | |
4.996%, 11/25/2034 | | | 155 | | | | 163 | |
CIT Education Loan Trust, Ser 2007-1, Cl A | | | | | | | | |
0.315%, VAR ICE LIBOR USD 3 Month+0.090%, 03/25/2042 (C) | | | 1,622 | | | | 1,557 | |
Citicorp Residential Mortgage Trust, Ser 2006-2, Cl A5 | | | | | | | | |
5.217%, 09/25/2036 | | | 3,141 | | | | 3,216 | |
College Ave Student Loans LLC, Ser 2018-A, Cl A2 | | | | | | | | |
4.130%, 12/26/2047 (C) | | | 659 | | | | 696 | |
College Ave Student Loans LLC, Ser 2019-A, Cl A2 | | | | | | | | |
3.280%, 12/28/2048 (C) | | | 4,928 | | | | 5,129 | |
College Avenue Student Loans LLC, Ser 2017-A, Cl A1 | | | | | | | | |
1.800%, VAR ICE LIBOR USD 1 Month+1.650%, 11/26/2046 (C) | | | 1,002 | | | | 1,012 | |
Columbia Cent CLO XXIX, Ser 2020-29A, Cl A1N | | | | | | | | |
1.919%, VAR ICE LIBOR USD 3 Month+1.700%, 07/20/2031 (C) | | | 1,030 | | | | 1,034 | |
COOF Securitization Trust, Ser 2014-1, Cl A, IO | | | | | | | | |
2.801%, 06/25/2040 (A)(C) | | | 241 | | | | 22 | |
| | |
134 | | SEI Institutional Investments Trust / Semi-Annual Report / November 30, 2020 |
| | | | | | | | |
| | | |
| Description | | Face Amount
(Thousands) | | Market Value
($ Thousands) |
|
ASSET-BACKED SECURITIES (continued) | |
Countrywide Asset-Backed Certificates Trust, Ser 2004-6, Cl 1A1 | | | | | | | | |
0.690%, VAR ICE LIBOR USD 1 Month+0.540%, 12/25/2034 | | $ | 2,611 | | | $ | 2,505 | |
Countrywide Asset-Backed Certificates Trust, Ser 2007-13, Cl 2A1 | | | | | | | | |
1.050%, VAR ICE LIBOR USD 1 Month+0.900%, 10/25/2047 | | | 304 | | | | 297 | |
Countrywide Asset-Backed Certificates, Ser 2006-15, Cl A3 | | | | | | | | |
4.540%, 10/25/2046 (A) | | | 26 | | | | 26 | |
Countrywide Asset-Backed Certificates, Ser 2006-SD3, Cl A1 | | | | | | | | |
0.810%, VAR ICE LIBOR USD 1 Month+0.660%, 07/25/2036 (C) | | | 68 | | | | 65 | |
Countrywide Home Equity Loan Revolving Home Equity Loan Trust, Ser 2007-A, Cl A | | | | | | | | |
0.261%, VAR ICE LIBOR USD 1 Month+0.120%, 04/15/2037 | | | 2,248 | | | | 2,143 | |
Countrywide Revolving Home Equity Loan Trust, Ser 2004-K, Cl 2A | | | | | | | | |
0.441%, VAR ICE LIBOR USD 1 Month+0.300%, 02/15/2034 | | | 25 | | | | 25 | |
Credit-Based Asset Servicing & Securitization LLC, Ser 2003-CB3, Cl AF1 | | | | | | | | |
3.379%, 12/25/2032 | | | 31 | | | | 32 | |
Credit-Based Asset Servicing & Securitization LLC, Ser 2006-CB2, Cl AF2 | | | | | | | | |
3.179%, 12/25/2036 | | | 385 | | | | 378 | |
CSMC Trust, Ser 2017-RPL1, Cl A1 | | | | | | | | |
2.750%, 07/25/2057 (A)(C) | | | 7,245 | | | | 7,604 | |
CVP CLO, Ser 2018-2A, Cl A | | | | | | | | |
1.408%, VAR ICE LIBOR USD 3 Month+1.190%, 01/20/2031 (C) | | | 1,500 | | | | 1,498 | |
Denali Capital CLO X LLC, Ser 2017-1A, Cl A1LR | | | | | | | | |
1.265%, VAR ICE LIBOR USD 3 Month+1.050%, 10/26/2027 (C) | | | 1,061 | | | | 1,058 | |
Dryden LXXV CLO, Ser 2019-75A, Cl AR | | | | | | | | |
1.437%, VAR ICE LIBOR USD 3 Month+1.200%, 07/15/2030 (C) | | | 1,260 | | | | 1,255 | |
Dryden XXV Senior Loan Fund, Ser 2017-25A, Cl ARR | | | | | | | | |
1.137%, VAR ICE LIBOR USD 3 Month+0.900%, 10/15/2027 (C) | | | 841 | | | | 839 | |
Dryden XXVI Senior Loan Fund, Ser 2018-26A, Cl AR | | | | | | | | |
1.137%, VAR ICE LIBOR USD 3 Month+0.900%, 04/15/2029 (C) | | | 4,120 | | | | 4,097 | |
Educational Funding of the South, Ser 2011-1, Cl A2 | | | | | | | | |
0.865%, VAR ICE LIBOR USD 3 Month+0.650%, 04/25/2035 | | | 947 | | | | 943 | |
| | | | | | | | |
| | | |
| Description | | Face Amount
(Thousands) | | Market Value
($ Thousands) |
|
ASSET-BACKED SECURITIES (continued) | |
EFS Volunteer No. 3 LLC, Ser 2012-1, Cl A3 | | | | | | | | |
1.150%, VAR ICE LIBOR USD 1 Month+1.000%, 04/25/2033 (C) | | $ | 3,315 | | | $ | 3,302 | |
Elmwood CLO II, Ser 2019-2A, Cl A | | | | | | | | |
1.668%, VAR ICE LIBOR USD 3 Month+1.450%, 04/20/2031 (C) | | | 3,100 | | | | 3,096 | |
FNMA Grantor Trust, Ser 2017-T1, Cl A | | | | | | | | |
2.898%, 06/25/2027 | | | 299 | | | | 329 | |
Ford Credit Floorplan Master Owner Trust A, Ser 2020-1, Cl A1 | | | | | | | | |
0.700%, 09/15/2025 | | | 5,188 | | | | 5,213 | |
Ford Credit Floorplan Master Owner Trust A, Ser 2020-2, Cl A | | | | | | | | |
1.060%, 09/15/2027 | | | 7,311 | | | | 7,389 | |
Global SC Finance II SRL, Ser 2014-1A, Cl A2 | | | | | | | | |
3.090%, 07/17/2029 (C) | | | 1,010 | | | | 1,012 | |
GMF Floorplan Owner Revolving Trust, Ser 2020-2, Cl A | | | | | | | | |
0.690%, 10/15/2025 (C) | | | 1,599 | | | | 1,601 | |
Golub Capital Partners CLO, Ser 2019-45A, Cl A | | | | | | | | |
1.938%, VAR ICE LIBOR USD 3 Month+1.720%, 10/20/2031 (C) | | | 1,500 | | | | 1,496 | |
Halcyon Loan Advisors Funding, Ser 2018-2A, Cl AR | | | | | | | | |
1.295%, VAR ICE LIBOR USD 3 Month+1.080%, 07/25/2027 (C) | | | 504 | | | | 502 | |
Halsey Point CLO I, Ser 2019-1A, Cl A1A1 | | | | | | | | |
1.568%, VAR ICE LIBOR USD 3 Month+1.350%, 01/20/2033 (C) | | | 590 | | | | 590 | |
HalseyPoint CLO III, Ser 2020-3A, Cl A1A | | | | | | | | |
1.629%, VAR ICE LIBOR USD 3 Month+1.450%, 11/30/2032 (C) | | | 700 | | | | 700 | |
Higher Education Funding I, Ser 2014-1, Cl A | | | | | | | | |
1.257%, VAR ICE LIBOR USD 3 Month+1.050%, 05/25/2034 (C) | | | 2,525 | | | | 2,538 | |
Hildene Community Funding CDO, Ser 2020-1A, Cl AR | | | | | | | | |
3.250%, 11/01/2035 (C) | | | 910 | | | | 910 | |
Hilton Grand Vacations Trust, Ser 2020-AA, Cl A | | | | | | | | |
2.740%, 02/25/2039 (C) | | | 1,458 | | | | 1,518 | |
Home Partners of America Trust, Ser 2019-2, Cl A | | | | | | | | |
2.703%, 10/19/2039 (C) | | | 3,706 | | | | 3,894 | |
HPEFS Equipment Trust, Ser 2020-2A, Cl A2 | | | | | | | | |
0.650%, 07/22/2030 (C) | | | 4,750 | | | | 4,759 | |
HSI Asset Securitization Trust, Ser 2006-OPT1, Cl 2A4 | | | | | | | | |
0.450%, VAR ICE LIBOR USD 1 Month+0.300%, 12/25/2035 | | | 215 | | | | 215 | |
| | |
SEI Institutional Investments Trust / Semi-Annual Report / November 30, 2020 | | 135 |
SCHEDULE OF INVESTMENTS (Unaudited)
November 30, 2020
Core Fixed Income Fund (Continued)
| | | | | | | | |
| | | |
| Description | | Face Amount
(Thousands) | | Market Value
($ Thousands) |
|
ASSET-BACKED SECURITIES (continued) | |
HSI Asset Securitization Trust, Ser 2006-OPT3, Cl 3A3 | | | | | | | | |
0.330%, VAR ICE LIBOR USD 1 Month+0.180%, 02/25/2036 | | $ | 286 | | | $ | 285 | |
Jamestown CLO IV, Ser 2017-4A, Cl A2R | | | | | | | | |
1.587%, VAR ICE LIBOR USD 3 Month+1.350%, 07/15/2026 (C) | | | 1,000 | | | | 994 | |
JFIN CLO, Ser 2017-2A, Cl A1AR | | | | | | | | |
1.388%, VAR ICE LIBOR USD 3 Month+1.170%, 07/20/2026 (C) | | | 146 | | | | 146 | |
JGWPT XXX LLC, Ser 2013-3A, Cl A | | | | | | | | |
4.080%, 01/17/2073 (C) | | | 1,453 | | | | 1,665 | |
JGWPT XXXII LLC, Ser 2014-2A, Cl A | | | | | | | | |
3.610%, 01/17/2073 (C) | | | 1,964 | | | | 2,198 | |
John Deere Owner Trust, Ser 2018-B, Cl A3 | | | | | | | | |
3.080%, 11/15/2022 | | | 906 | | | | 916 | |
John Deere Owner Trust, Ser 2020-B, Cl A2 | | | | | | | | |
0.410%, 03/15/2023 | | | 1,415 | | | | 1,416 | |
KGS-Alpha SBA COOF Trust, Ser 2012-A, Cl A, IO | | | | | | | | |
0.542%, 08/25/2038 (A)(C) | | | 1,185 | | | | 25 | |
KGS-Alpha SBA COOF Trust, Ser 2014-2, Cl A, IO | | | | | | | | |
2.203%, 04/25/2040 (A)(C) | | | 213 | | | | 18 | |
KKR CLO XVI, Ser 2019-16, Cl A1R | | | | | | | | |
1.468%, VAR ICE LIBOR USD 3 Month+1.250%, 01/20/2029 (C) | | | 1,640 | | | | 1,638 | |
KKR CLO XVI, Ser 2019-16, Cl A2R | | | | | | | | |
2.018%, VAR ICE LIBOR USD 3 Month+1.800%, 01/20/2029 (C) | | | 730 | | | | 725 | |
KKR CLO XXXII, Ser 2020-32A, Cl A1 | | | | | | | | |
1.938%, VAR ICE LIBOR USD 3 Month+1.320%, 01/15/2032 (C) | | | 900 | | | | 900 | |
LCM Loan Income Fund I Income Note Issuer, Ser 2018-27A, Cl A1 | | | | | | | | |
1.310%, VAR ICE LIBOR USD 3 Month+1.080%, 07/16/2031 (C) | | | 925 | | | | 917 | |
LCM XIII, Ser 2019-13A, Cl ARR | | | | | | | | |
1.358%, VAR ICE LIBOR USD 3 Month+1.140%, 07/19/2027 (C) | | | 2,485 | | | | 2,482 | |
LCM XVIII, Ser 2019-19A, Cl AR | | | | | | | | |
1.477%, VAR ICE LIBOR USD 3 Month+1.240%, 07/15/2027 (C) | | | 387 | | | | 387 | |
LCM XXI, Ser 2018-21A, Cl AR | | | | | | | | |
1.098%, VAR ICE LIBOR USD 3 Month+0.880%, 04/20/2028 (C) | | | 1,950 | | | | 1,944 | |
LCM XXIV, Ser 2017-24A, Cl A | | | | | | | | |
1.528%, VAR ICE LIBOR USD 3 Month+1.310%, 03/20/2030 (C) | | | 1,500 | | | | 1,496 | |
Magnetite XIV-R, Ser 2018-14RA, Cl A2 | | | | | | | | |
3.939%, 10/18/2031 (C) | | | 2,910 | | | | 2,890 | |
| | | | | | | | |
| | | |
| Description | | Face Amount
(Thousands) | | Market Value
($ Thousands) |
|
ASSET-BACKED SECURITIES (continued) | |
Magnetite XXVIII, Ser 2020-28A, Cl A | | | | | | | | |
1.487%, VAR ICE LIBOR USD 3 Month+1.270%, 10/25/2031 (C) | | $ | 3,300 | | | $ | 3,296 | |
Marathon CLO XIII, Ser 2019-1A, Cl A1BL | | | | | | | | |
2.237%, VAR ICE LIBOR USD 3 Month+2.000%, 04/15/2032 (C) | | | 1,000 | | | | 999 | |
MF1, Ser 2020-FL4, Cl A | | | | | | | | |
1.851%, VAR ICE LIBOR USD 1 Month+1.700%, 11/15/2035 (C) | | | 1,830 | | | | 1,832 | |
Mid-State Capital Trust, Ser 2004-1, Cl A | | | | | | | | |
6.005%, 08/15/2037 | | | 172 | | | | 183 | |
Mid-State Capital Trust, Ser 2006-1, Cl A | | | | | | | | |
5.787%, 10/15/2040 (C) | | | 3,164 | | | | 3,416 | |
Mid-State Trust XI, Ser 2003-11, Cl A1 | | | | | | | | |
4.864%, 07/15/2038 | | | 1,498 | | | | 1,600 | |
Mill City Mortgage Trust, Ser 2015-2, Cl A2 | | | | | | | | |
3.000%, 09/25/2057 (A)(C) | | | 998 | | | | 1,009 | |
MMAF Equipment Finance LLC, Ser 2020-BA, Cl A2 | | | | | | | | |
0.380%, 08/14/2023 (C) | | | 1,215 | | | | 1,215 | |
MMAF Equipment Finance LLC, Ser 2020-BA, Cl A3 | | | | | | | | |
0.490%, 08/14/2025 (C) | | | 2,285 | | | | 2,284 | |
MVW LLC, Ser 2019-2A, Cl A | | | | | | | | |
2.220%, 10/20/2038 (C) | | | 156 | | | | 160 | |
MVW LLC, Ser 2020-1A, Cl A | | | | | | | | |
1.740%, 10/20/2037 (C) | | | 1,696 | | | | 1,726 | |
Myers Park CLO, Ser 2018-1A, Cl B1 | | | | | | | | |
1.818%, VAR ICE LIBOR USD 3 Month+1.600%, 10/20/2030 (C) | | | 890 | | | | 888 | |
Navient Private Education Loan Trust, Ser 2016-AA, Cl A2B | | | | | | | | |
2.291%, VAR ICE LIBOR USD 1 Month+2.150%, 12/15/2045 (C) | | | 667 | | | | 682 | |
Navient Private Education Loan Trust, Ser 2018-BA, Cl A2A | | | | | | | | |
3.610%, 12/15/2059 (C) | | | 656 | | | | 684 | |
Navient Private Education Refi Loan Trust, Ser 2018-A, Cl A2 | | | | | | | | |
3.190%, 02/18/2042 (C) | | | 547 | | | | 558 | |
Navient Private Education Refi Loan Trust, Ser 2018-CA, Cl A2 | | | | | | | | |
3.520%, 06/16/2042 (C) | | | 429 | | | | 437 | |
Navient Private Education Refi Loan Trust, Ser 2018-DA, Cl A2A | | | | | | | | |
4.000%, 12/15/2059 (C) | | | 3,150 | | | | 3,331 | |
Navient Private Education Refi Loan Trust, Ser 2019-A, Cl A2A | | | | | | | | |
3.420%, 01/15/2043 (C) | | | 3,533 | | | | 3,695 | |
Navient Private Education Refi Loan Trust, Ser 2019-CA, Cl A2 | | | | | | | | |
3.130%, 02/15/2068 (C) | | | 2,096 | | | | 2,154 | |
| | |
136 | | SEI Institutional Investments Trust / Semi-Annual Report / November 30, 2020 |
| | | | | | | | |
| | | |
| Description | | Face Amount
(Thousands) | | Market Value
($ Thousands) |
|
ASSET-BACKED SECURITIES (continued) | |
Navient Private Education Refi Loan Trust, Ser 2019-D, Cl A2A | | | | | | | | |
3.010%, 12/15/2059 (C) | | $ | 3,368 | | | $ | 3,541 | |
Navient Private Education Refi Loan Trust, Ser 2019-D, Cl A2B | | | | | | | | |
1.191%, VAR ICE LIBOR USD 1 Month+1.050%, 12/15/2059 (C) | | | 1,601 | | | | 1,605 | |
Navient Private Education Refi Loan Trust, Ser 2019-FA, Cl A2 | | | | | | | | |
2.600%, 08/15/2068 (C) | | | 7,017 | | | | 7,245 | |
Navient Private Education Refi Loan Trust, Ser 2019-GA, Cl A | | | | | | | | |
2.400%, 10/15/2068 (C) | | | 2,591 | | | | 2,653 | |
Navient Private Education Refi Loan Trust, Ser 2020-A, Cl A2A | | | | | | | | |
2.460%, 11/15/2068 (C) | | | 2,606 | | | | 2,714 | |
Navient Private Education Refi Loan Trust, Ser 2020-A, Cl A2B | | | | | | | | |
1.041%, VAR ICE LIBOR USD 1 Month+0.900%, 11/15/2068 (C) | | | 1,634 | | | | 1,627 | |
Navient Private Education Refi Loan Trust, Ser 2020-BA, Cl A1 | | | | | | | | |
1.800%, 01/15/2069 (C) | | | 365 | | | | 366 | |
Navient Private Education Refi Loan Trust, Ser 2020-BA, Cl A2 | | | | | | | | |
2.120%, 01/15/2069 (C) | | | 1,473 | | | | 1,512 | |
Navient Private Education Refi Loan Trust, Ser 2020-DA, Cl A | | | | | | | | |
1.690%, 05/15/2069 (C) | | | 2,374 | | | | 2,415 | |
Navient Private Education Refi Loan Trust, Ser 2020-EA, Cl A | | | | | | | | |
1.690%, 05/15/2069 (C) | | | 2,765 | | | | 2,807 | |
Navient Private Education Refi Loan Trust, Ser 2020-FA, Cl A | | | | | | | | |
1.220%, 07/15/2069 (C) | | | 1,385 | | | | 1,393 | |
Navient Private Education Refi Loan Trust, Ser 2020-GA, Cl A | | | | | | | | |
1.170%, 09/16/2069 (C) | | | 5,294 | | | | 5,324 | |
Navient Private Education Refi Loan Trust, Ser 2020-HA, Cl A | | | | | | | | |
1.310%, 01/15/2069 (C) | | | 7,565 | | | | 7,624 | |
Navient Student Loan Trust, Ser 2014-1, Cl A3 | | | | | | | | |
0.660%, VAR ICE LIBOR USD 1 Month+0.510%, 06/25/2031 | | | 3,566 | | | | 3,470 | |
Navient Student Loan Trust, Ser 2014-3, Cl A | | | | | | | | |
0.770%, VAR ICE LIBOR USD 1 Month+0.620%, 03/25/2083 | | | 4,044 | | | | 3,995 | |
Navient Student Loan Trust, Ser 2014-4, Cl A | | | | | | | | |
0.770%, VAR ICE LIBOR USD 1 Month+0.620%, 03/25/2083 | | | 2,775 | | | | 2,703 | |
| | | | | | | | |
| | | |
| Description | | Face Amount
(Thousands) | | Market Value
($ Thousands) |
|
ASSET-BACKED SECURITIES (continued) | |
Navient Student Loan Trust, Ser 2016-3A, Cl A2 | | | | | | | | |
1.000%, VAR ICE LIBOR USD 1 Month+0.850%, 06/25/2065 (C) | | $ | 43 | | | $ | 43 | |
Navient Student Loan Trust, Ser 2017-3A, Cl A3 | | | | | | | | |
1.200%, VAR ICE LIBOR USD 1 Month+1.050%, 07/26/2066 (C) | | | 6,630 | | | | 6,660 | |
Navient Student Loan Trust, Ser 2018-EA, Cl A2 | | | | | | | | |
4.000%, 12/15/2059 (C) | | | 1,694 | | | | 1,755 | |
Navient Student Loan Trust, Ser 2019-BA, Cl A2A | | | | | | | | |
3.390%, 12/15/2059 (C) | | | 2,612 | | | | 2,740 | |
Navient Student Loan Trust, Ser 2020-2A, Cl A1A | | | | | | | | |
1.320%, 08/26/2069 (C) | | | 4,678 | | | | 4,678 | |
Navient Student Loan Trust, Ser 2020-2A, Cl A1B | | | | | | | | |
1.046%, VAR ICE LIBOR USD 1 Month+0.900%, 08/26/2069 (C) | | | 1,913 | | | | 1,919 | |
Nelnet Student Loan Trust, Ser 2004-3, Cl A5 | | | | | | | | |
0.395%, VAR ICE LIBOR USD 3 Month+0.180%, 10/27/2036 | | | 1,034 | | | | 1,016 | |
Nelnet Student Loan Trust, Ser 2004-4, Cl A5 | | | | | | | | |
0.375%, VAR ICE LIBOR USD 3 Month+0.160%, 01/25/2037 | | | 2,037 | | | | 1,999 | |
Nelnet Student Loan Trust, Ser 2005-1, Cl A5 | | | | | | | | |
0.325%, VAR ICE LIBOR USD 3 Month+0.110%, 10/25/2033 | | | 6,686 | | | | 6,489 | |
Nelnet Student Loan Trust, Ser 2005-2, Cl A5 | | | | | | | | |
0.325%, VAR ICE LIBOR USD 3 Month+0.100%, 03/23/2037 | | | 5,914 | | | | 5,731 | |
Nelnet Student Loan Trust, Ser 2005-3, Cl A5 | | | | | | | | |
0.345%, VAR ICE LIBOR USD 3 Month+0.120%, 12/24/2035 | | | 5,140 | | | | 5,048 | |
Nelnet Student Loan Trust, Ser 2005-4, Cl A4 | | | | | | | | |
0.405%, VAR ICE LIBOR USD 3 Month+0.180%, 03/22/2032 | | | 781 | | | | 736 | |
Nelnet Student Loan Trust, Ser 2007-1, Cl A4 | | | | | | | | |
0.317%, VAR ICE LIBOR USD 3 Month+0.110%, 08/27/2036 | | | 3,390 | | | | 3,231 | |
Nelnet Student Loan Trust, Ser 2014-4A, Cl A2 | | | | | | | | |
1.100%, VAR ICE LIBOR USD 1 Month+0.950%, 11/25/2048 (C) | | | 3,735 | | | | 3,741 | |
New Hampshire Higher Education Loan, Ser 2020-1, Cl A1A | | | | | | | | |
1.550%, 09/25/2060 | | | 6,105 | | | | 6,168 | |
Newcastle Mortgage Securities Trust, Ser 2007-1, Cl 1A1 | | | | | | | | |
0.340%, VAR ICE LIBOR USD 1 Month+0.190%, 04/25/2037 | | | 10,375 | | | | 9,963 | |
| | |
SEI Institutional Investments Trust / Semi-Annual Report / November 30, 2020 | | 137 |
SCHEDULE OF INVESTMENTS (Unaudited)
November 30, 2020
Core Fixed Income Fund (Continued)
| | | | | | | | |
| | | |
| Description | | Face Amount
(Thousands) | | Market Value
($ Thousands) |
ASSET-BACKED SECURITIES (continued) | |
Northstar Education Finance, Ser 2007-1, Cl A2 | | | | | | | | |
0.972%, VAR ICE LIBOR USD 3 Month+0.750%, 01/29/2046 | | $ | 32 | | | $ | 32 | |
Ocean Trails CLO IX, Ser 2020-9A, Cl A1 | | | | | | | | |
2.153%, VAR ICE LIBOR USD 3 Month+1.870%, 10/15/2029 (C) | | | 3,000 | | | | 3,007 | |
Octagon Investment Partners L, Ser 2020-4A, Cl A1 | | | | | | | | |
1.470%, VAR ICE LIBOR USD 3 Month+1.300%, 10/15/2033 (C) | | | 3,235 | | | | 3,236 | |
Octagon Investment Partners XLV, Ser 2019-1A, Cl A | | | | | | | | |
1.567%, VAR ICE LIBOR USD 3 Month+1.330%, 10/15/2032 (C) | | | 1,500 | | | | 1,499 | |
OHA Credit Funding VII, Ser 2020-7A, Cl A | | | | | | | | |
1.475%, VAR ICE LIBOR USD 3 Month+1.250%, 10/19/2032 (C) | | | 760 | | | | 760 | |
Orange Lake Timeshare Trust, Ser 2018-A, Cl A | | | | | | | | |
3.100%, 11/08/2030 (C) | | | 299 | | | | 306 | |
Orange Lake Timeshare Trust, Ser 2019-A, Cl A | | | | | | | | |
3.060%, 04/09/2038 (C) | | | 1,646 | | | | 1,708 | |
Owl Rock CLO III, Ser 2020-3A, Cl A1L | | | | | | | | |
2.018%, VAR ICE LIBOR USD 3 Month+1.800%, 04/20/2032 (C) | | | 1,620 | | | | 1,605 | |
Parallel, Ser 2020-1A, Cl A1 | | | | | | | | |
1.983%, VAR ICE LIBOR USD 3 Month+1.825%, 07/20/2031 (C) | | | 1,500 | | | | 1,505 | |
Parliament Funding II, Ser 2020-1A, Cl A | | | | | | | | |
2.764%, VAR ICE LIBOR USD 3 Month+2.450%, 08/12/2030 (C) | | | 1,525 | | | | 1,529 | |
PFS Financing, Ser 2018-F, Cl A | | | | | | | | |
3.520%, 10/15/2023 (C) | | | 1,100 | | | | 1,130 | |
RASC Trust, Ser 2006-KS2, Cl M2 | | | | | | | | |
0.735%, VAR ICE LIBOR USD 1 Month+0.585%, 03/25/2036 | | | 3,625 | | | | 3,585 | |
RASC Trust, Ser 2007-RZ1, Cl A3 | | | | | | | | |
0.400%, VAR ICE LIBOR USD 1 Month+0.250%, 02/25/2037 | | | 10,124 | | | | 9,905 | |
Recette CLO, Ser 2017-1A, Cl AR | | | | | | | | |
1.138%, VAR ICE LIBOR USD 3 Month+0.920%, 10/20/2027 (C) | | | 459 | | | | 457 | |
Rockford Tower CLO, Ser 2019-2A, Cl A | | | | | | | | |
1.554%, VAR ICE LIBOR USD 3 Month+1.330%, 08/20/2032 (C) | | | 5,000 | | | | 4,996 | |
RR III, Ser 2018-3A, Cl A1R2 | | | | | | | | |
1.327%, VAR ICE LIBOR USD 3 Month+1.090%, 01/15/2030 (C) | | | 1,100 | | | | 1,092 | |
SBA Small Business Investment, Ser 2018-10B, Cl 1 | | | | | | | | |
3.548%, 09/10/2028 | | | 2,248 | | | | 2,401 | |
| | | | | | | | |
| | | |
| Description | | Face Amount
(Thousands) | | Market Value
($ Thousands) |
|
ASSET-BACKED SECURITIES (continued) | |
SBA Small Business Investment, Ser 2019-10A, Cl 1 | | | | | | | | |
3.113%, 03/10/2029 | | $ | 1,080 | | | $ | 1,150 | |
Seven Sticks CLO, Ser 2018-1A, Cl A1R | | | | | | | | |
1.287%, VAR ICE LIBOR USD 3 Month+1.050%, 07/15/2028 (C) | | | 676 | | | | 673 | |
Silver Rock CLO I, Ser 2020-1A, Cl A | | | | | | | | |
1.847%, VAR ICE LIBOR USD 3 Month+1.650%, 10/20/2031 (C) | | | 2,350 | | | | 2,347 | |
SLC Student Loan Trust, Ser 2008-1, Cl A4A | | | | | | | | |
1.850%, VAR ICE LIBOR USD 3 Month+1.600%, 12/15/2032 | | | 1,080 | | | | 1,096 | |
SLM Student Loan Trust, Ser 2003-1, Cl A5C | | | | | | | | |
1.000%, VAR ICE LIBOR USD 3 Month+0.750%, 12/15/2032 (C) | | | 1,065 | | | | 1,012 | |
SLM Student Loan Trust, Ser 2003-4, Cl A5D | | | | | | | | |
1.000%, VAR ICE LIBOR USD 3 Month+0.750%, 03/15/2033 (C) | | | 967 | | | | 922 | |
SLM Student Loan Trust, Ser 2003-7A, Cl A5A | | | | | | | | |
1.450%, VAR ICE LIBOR USD 3
Month+1.200%, 12/15/2033 (C) | | | 3,516 | | | | 3,445 | |
SLM Student Loan Trust, Ser 2006-8, Cl A6 | | | | | | | | |
0.375%, VAR ICE LIBOR USD 3 Month+0.160%, 01/25/2041 | | | 4,250 | | | | 4,006 | |
SLM Student Loan Trust, Ser 2007-2, Cl A4 | | | | | | | | |
0.275%, VAR ICE LIBOR USD 3 Month+0.060%, 07/25/2022 | | | 2,188 | | | | 2,094 | |
SLM Student Loan Trust, Ser 2008-2, Cl B | | | | | | | | |
1.415%, VAR ICE LIBOR USD 3 Month+1.200%, 01/25/2083 | | | 1,155 | | | | 1,025 | |
SLM Student Loan Trust, Ser 2008-3, Cl B | | | | | | | | |
1.415%, VAR ICE LIBOR USD 3 Month+1.200%, 04/26/2083 | | | 1,155 | | | | 1,054 | |
SLM Student Loan Trust, Ser 2008-4, Cl B | | | | | | | | |
2.065%, VAR ICE LIBOR USD 3 Month+1.850%, 04/25/2073 | | | 1,155 | | | | 1,053 | |
SLM Student Loan Trust, Ser 2008-5, Cl B | | | | | | | | |
2.065%, VAR ICE LIBOR USD 3 Month+1.850%, 07/25/2073 | | | 1,155 | | | | 1,106 | |
SLM Student Loan Trust, Ser 2008-6, Cl A4 | | | | | | | | |
1.315%, VAR ICE LIBOR USD 3 Month+1.100%, 07/25/2023 | | | 4,798 | | | | 4,724 | |
SLM Student Loan Trust, Ser 2008-6, Cl B | | | | | | | | |
2.065%, VAR ICE LIBOR USD 3 Month+1.850%, 07/26/2083 | | | 1,155 | | | | 1,093 | |
SLM Student Loan Trust, Ser 2008-7, Cl B | | | | | | | | |
2.065%, VAR ICE LIBOR USD 3 Month+1.850%, 07/26/2083 | | | 1,155 | | | | 1,117 | |
SLM Student Loan Trust, Ser 2008-8, Cl B | | | | | | | | |
2.465%, VAR ICE LIBOR USD 3 Month+2.250%, 10/25/2075 | | | 1,155 | | | | 1,136 | |
| | |
138 | | SEI Institutional Investments Trust / Semi-Annual Report / November 30, 2020 |
| | | | | | | | |
| | | |
| Description | | Face Amount
(Thousands) | | Market Value
($ Thousands) |
|
ASSET-BACKED SECURITIES (continued) | |
SLM Student Loan Trust, Ser 2008-9, Cl A | | | | | | | | |
1.715%, VAR ICE LIBOR USD 3 Month+1.500%, 04/25/2023 | | $ | 3,322 | | | $ | 3,313 | |
SLM Student Loan Trust, Ser 2008-9, Cl B | | | | | | | | |
2.465%, VAR ICE LIBOR USD 3 Month+2.250%, 10/25/2083 | | | 1,155 | | | | 1,141 | |
SLM Student Loan Trust, Ser 2010-1, Cl A | | | | | | | | |
0.550%, VAR ICE LIBOR USD 1 Month+0.400%, 03/25/2025 | | | 131 | | | | 127 | |
SLM Student Loan Trust, Ser 2011-2, Cl A2 | | | | | | | | |
1.350%, VAR ICE LIBOR USD 1 Month+1.200%, 10/25/2034 | | | 495 | | | | 502 | |
SLM Student Loan Trust, Ser 2012-1, Cl A3 | | | | | | | | |
1.100%, VAR ICE LIBOR USD 1 Month+0.950%, 09/25/2028 | | | 3,488 | | | | 3,371 | |
SLM Student Loan Trust, Ser 2012-2, Cl A | | | | | | | | |
0.850%, VAR ICE LIBOR USD 1 Month+0.700%, 01/25/2029 | | | 3,035 | | | | 2,879 | |
SLM Student Loan Trust, Ser 2012-6, Cl A3 | | | | | | | | |
0.900%, VAR ICE LIBOR USD 1 Month+0.750%, 05/26/2026 | | | 638 | | | | 618 | |
SLM Student Loan Trust, Ser 2014-3A, Cl A6A | | | | | | | | |
0.765%, VAR ICE LIBOR USD 3 Month+0.550%, 10/25/2064 (C) | | | 7,720 | | | | 7,582 | |
SMB Private Education Loan Trust, Ser 2016-A, Cl A2A | | | | | | | | |
2.700%, 05/15/2031 (C) | | | 1,884 | | | | 1,931 | |
SMB Private Education Loan Trust, Ser 2016-B, Cl A2A | | | | | | | | |
2.430%, 02/17/2032 (C) | | | 921 | | | | 941 | |
SMB Private Education Loan Trust, Ser 2016-B, Cl A2B | | | | | | | | |
1.591%, VAR ICE LIBOR USD 1 Month+1.450%, 02/17/2032 (C) | | | 2,895 | | | | 2,916 | |
SMB Private Education Loan Trust, Ser 2016-C, Cl A2B | | | | | | | | |
1.241%, VAR ICE LIBOR USD 1 Month+1.100%, 09/15/2034 (C) | | | 1,007 | | | | 1,008 | |
SMB Private Education Loan Trust, Ser 2018-C, Cl A2A | | | | | | | | |
3.630%, 11/15/2035 (C) | | | 1,193 | | | | 1,265 | |
SMB Private Education Loan Trust, Ser 2019-A, Cl A2A | | | | | | | | |
3.440%, 07/15/2036 (C) | | | 5,742 | | | | 6,056 | |
SMB Private Education Loan Trust, Ser 2020-BA, Cl A1A | | | | | | | | |
1.290%, 07/15/2053 (C) | | | 3,863 | | | | 3,874 | |
SMB Private Education Loan Trust, Ser 2020-PTA, Cl A2A | | | | | | | | |
1.600%, 09/15/2054 (C) | | | 3,490 | | | | 3,516 | |
SMB Private Education Loan Trust, Ser 2020-PTB, Cl A2A | | | | | | | | |
1.600%, 09/15/2054 (C) | | | 9,101 | | | | 9,148 | |
| | | | | | | | |
| | | |
| Description | | Face Amount
(Thousands) | | Market Value
($ Thousands) |
|
ASSET-BACKED SECURITIES (continued) | |
SoFi Consumer Loan Program LLC, Ser 2017-4, Cl A | | | | | | | | |
2.500%, 05/26/2026 (C) | | $ | 111 | | | $ | 111 | |
SoFi Consumer Loan Program LLC, Ser 2017-6, Cl A2 | | | | | | | | |
2.820%, 11/25/2026 (C) | | | 86 | | | | 86 | |
SoFi Consumer Loan Program Trust, Ser 2018-1, Cl A2 | | | | | | | | |
3.140%, 02/25/2027 (C) | | | 885 | | | | 889 | |
SoFi Consumer Loan Program Trust, Ser 2019-4, Cl A | | | | | | | | |
2.450%, 08/25/2028 (C) | | | 1,844 | | | | 1,864 | |
SoFi Professional Loan Program LLC, Ser 2016-A, Cl A2 | | | | | | | | |
2.760%, 12/26/2036 (C) | | | 535 | | | | 543 | |
SoFi Professional Loan Program LLC, Ser 2016-D, Cl A1 | | | | | | | | |
1.100%, VAR ICE LIBOR USD 1 Month+0.950%, 01/25/2039 (C) | | | 82 | | | | 83 | |
SoFi Professional Loan Program LLC, Ser 2016-E, Cl A1 | | | | | | | | |
1.000%, VAR ICE LIBOR USD 1 Month+0.850%, 07/25/2039 (C) | | | 154 | | | | 154 | |
SoFi Professional Loan Program LLC, Ser 2017-A, Cl A1 | | | | | | | | |
0.850%, VAR ICE LIBOR USD 1 Month+0.700%, 03/26/2040 (C) | | | 180 | | | | 180 | |
SoFi Professional Loan Program LLC, Ser 2017-D, Cl A2FX | | | | | | | | |
2.650%, 09/25/2040 (C) | | | 142 | | | | 146 | |
SoFi Professional Loan Program LLC, Ser 2017-E, Cl A1 | | | | | | | | |
0.650%, VAR ICE LIBOR USD 1 Month+0.500%, 11/26/2040 (C) | | | 100 | | | | 100 | |
SoFi Professional Loan Program LLC, Ser 2017-E, Cl A2B | | | | | | | | |
2.720%, 11/26/2040 (C) | | | 951 | | | | 966 | |
SoFi Professional Loan Program LLC, Ser 2018-A, Cl A2B | | | | | | | | |
2.950%, 02/25/2042 (C) | | | 949 | | | | 970 | |
SoFi Professional Loan Program Trust, Ser 2018-B, Cl A2FX | | | | | | | | |
3.340%, 08/25/2047 (C) | | | 2,949 | | | | 3,034 | |
SoFi Professional Loan Program Trust, Ser 2020-A, Cl A2FX | | | | | | | | |
2.540%, 05/15/2046 (C) | | | 4,293 | | | | 4,434 | |
SoFi Professional Loan Program Trust, Ser 2020-C, Cl AFX | | | | | | | | |
1.950%, 02/15/2046 (C) | | | 3,871 | | | | 3,952 | |
South Carolina Student Loan, Ser 2015-A, Cl A | | | | | | | | |
1.650%, VAR ICE LIBOR USD 1 Month+1.500%, 01/25/2036 | | | 1,845 | | | | 1,850 | |
| | |
SEI Institutional Investments Trust / Semi-Annual Report / November 30, 2020 | | 139 |
SCHEDULE OF INVESTMENTS (Unaudited)
November 30, 2020
Core Fixed Income Fund (Continued)
| | | | | | | | |
| | | |
| Description | | Face Amount
(Thousands) | | Market Value
($ Thousands) |
|
ASSET-BACKED SECURITIES (continued) | |
Stack Infrastructure Issuer LLC, Ser 2020-1A, Cl A2 | | | | | | | | |
1.893%, 08/25/2045 (C) | | $ | 2,480 | | | $ | 2,506 | |
Structured Asset Investment Loan Trust, Ser 2004-8, Cl A2 | | | | | | | | |
0.700%, VAR ICE LIBOR USD 1 Month+0.550%, 09/25/2034 | | | 3,243 | | | | 3,122 | |
Structured Asset Securities Mortgage Loan Trust, Ser 2006-BC5, Cl A4 | | | | | | | | |
0.320%, VAR ICE LIBOR USD 1 Month+0.170%, 12/25/2036 | | | 4,937 | | | | 4,821 | |
Symphony CLO XIX, Ser 2018-19A, Cl A | | | | | | | | |
1.190%, VAR ICE LIBOR USD 3 Month+0.960%, 04/16/2031 (C) | | | 3,135 | | | | 3,094 | |
TCI-Flatiron CLO, Ser 2019-1A, Cl AR | | | | | | | | |
1.438%, VAR ICE LIBOR USD 3 Month+1.220%, 07/17/2028 (C) | | | 500 | | | | 499 | |
TCI-Symphony CLO, Ser 2018-1A, Cl BR | | | | | | | | |
1.874%, VAR ICE LIBOR USD 3 Month+1.650%, 10/13/2029 (C) | | | 1,500 | | | | 1,482 | |
Towd Point Mortgage Trust, Ser 2015-5,Cl A1B | | | | | | | | |
2.750%, 05/25/2055 (A)(C) | | | 371 | | | | 374 | |
Towd Point Mortgage Trust, Ser 2018-2, Cl A1 | | | | | | | | |
3.250%, 03/25/2058 (A)(C) | | | 1,183 | | | | 1,235 | |
Towd Point Mortgage Trust, Ser 2019-4, Cl A1 | | | | | | | | |
2.900%, 10/25/2059 (A)(C) | | | 2,481 | | | | 2,606 | |
Towd Point Mortgage Trust, Ser 2019-MH1, Cl A1 | | | | | | | | |
3.000%, 11/25/2058 (A)(C) | | | 1,136 | | | | 1,164 | |
Towd Point Mortgage Trust, Ser 2020-3, Cl A1 | | | | | | | | |
3.088%, 02/25/2063 (A)(C) | | | 3,560 | | | | 3,706 | |
Tralee CLO III, Ser 2017-3A, Cl AR | | | | | | | | |
1.248%, VAR ICE LIBOR USD 3 Month+1.030%, 10/20/2027 (C) | | | 769 | | | | 768 | |
Tralee CLO V, Ser 2018-5A, Cl B | | | | | | | | |
1.918%, VAR ICE LIBOR USD 3 Month+1.700%, 10/20/2028 (C) | | | 990 | | | | 978 | |
Tralee CLO VI, Ser 2019-6A, Cl AS | | | | | | | | |
1.515%, VAR ICE LIBOR USD 3 Month+1.300%, 10/25/2032 (C) | | | 1,760 | | | | 1,758 | |
Triton Container Finance VIII LLC, Ser 2020-1A, Cl A | | | | | | | | |
2.110%, 09/20/2045 (C) | | | 1,607 | | | | 1,614 | |
U.S. Small Business Administration, Ser 2019-20D, Cl 1 | | | | | | | | |
2.980%, 04/01/2039 | | | 584 | | | | 634 | |
U.S. Small Business Administration, Ser 2019-25G, Cl 1 | | | | | | | | |
2.690%, 07/01/2044 | | | 589 | | | | 636 | |
Venture XXXII CLO, Ser 2018-32A, Cl A2A | | | | | | | | |
1.288%, VAR ICE LIBOR USD 3 Month+1.070%, 07/18/2031 (C) | | | 900 | | | | 894 | |
| | | | | | | | |
| | | |
| Description | | Face Amount
(Thousands) | | Market Value
($ Thousands) |
|
ASSET-BACKED SECURITIES (continued) | |
Verizon Owner Trust, Ser 2019-C, Cl A1A | | | | | | | | |
1.940%, 04/22/2024 | | $ | 4,029 | | | $ | 4,118 | |
Verizon Owner Trust, Ser 2020-A, Cl A1A | | | | | | | | |
1.850%, 07/22/2024 | | | 3,894 | | | | 3,989 | |
Verizon Owner Trust, Ser 2020-C, Cl A | | | | | | | | |
0.410%, 04/21/2025 | | | 1,512 | | | | 1,513 | |
Voya CLO, Ser 2017-2A, Cl A2A | | | | | | | | |
1.947%, VAR ICE LIBOR USD 3 Month+1.710%, 06/07/2030 (C) | | | 1,000 | | | | 994 | |
Voya CLO, Ser 2018-3A, Cl A1A | | | | | | | | |
1.387%, VAR ICE LIBOR USD 3 Month+1.150%, 10/15/2031 (C) | | | 2,810 | | | | 2,804 | |
Voya CLO, Ser 2018-3A, Cl A1R | | | | | | | | |
1.408%, VAR ICE LIBOR USD 3 Month+1.190%, 10/18/2031 (C) | | | 750 | | | | 749 | |
Wellfleet CLO, Ser 2020-2A, Cl A | | | | | | | | |
2.054%, VAR ICE LIBOR USD 3 Month+1.850%, 07/15/2031 (C) | | | 1,020 | | | | 1,023 | |
Wells Fargo Home Equity Asset-Backed Securities Trust, Ser 2006-2, Cl M2 | | | | | | | | |
0.440%, VAR ICE LIBOR USD 1 Month+0.290%, 07/25/2036 | | | 10,500 | | | | 10,037 | |
Whitebox CLO II, Ser 2020-2A, Cl A1 | | | | | | | | |
1.992%, VAR ICE LIBOR USD 3 Month+1.750%, 10/24/2031 (C) | | | 1,710 | | | | 1,708 | |
Zais CLO II, Ser 2017-2A, Cl A1BR | | | | | | | | |
2.920%, 07/25/2026 (C) | | | 117 | | | | 117 | |
Zais CLO V, Ser 2016-2A, Cl A1 | | | | | | | | |
1.767%, VAR ICE LIBOR USD 3 Month+1.530%, 10/15/2028 (C) | | | 976 | | | | 975 | |
Zais CLO XIII, Ser 2019-13A, Cl A1A | | | | | | | | |
1.727%, VAR ICE LIBOR USD 3 Month+1.490%, 07/15/2032 (C) | | | 1,302 | | | | 1,301 | |
Zais CLO XVI, Ser 2020-16A, Cl A2 | | | | | | | | |
2.590%, VAR ICE LIBOR USD 3 Month+2.300%, 10/20/2031 (C) | | | 2,775 | | | | 2,774 | |
| | | | | | | | |
| | | | | | | 493,969 | |
| | | | | | | | |
| | |
Total Asset-Backed Securities (Cost $652,848) ($ Thousands) | | | | | | | 660,504 | |
| | | | | | | | |
| | |
SOVEREIGN DEBT — 1.8% | | | | | | | | |
| | |
Abu Dhabi Government International Bond | | | | | | | | |
3.875%, 04/16/2050 (C) | | | 1,010 | | | | 1,253 | |
2.500%, 10/11/2022 (C) | | | 4,020 | | | | 4,163 | |
2.500%, 04/16/2025 (C) | | | 3,681 | | | | 3,929 | |
1.700%, 03/02/2031 (C) | | | 440 | | | | 440 | |
Asian Development Bank MTN | | | | | | | | |
0.625%, 04/07/2022 | | | 2,566 | | | | 2,581 | |
Bermuda Government International Bond | | | | | | | | |
3.375%, 08/20/2050 (C) | | | 777 | | | | 823 | |
| | |
140 | | SEI Institutional Investments Trust / Semi-Annual Report / November 30, 2020 |
| | | | | | | | |
| | | |
| Description | | Face Amount
(Thousands) | | Market Value
($ Thousands) |
|
SOVEREIGN DEBT (continued) | |
| | |
China Government Bond | | | | | | | | |
3.310%, 11/30/2025 | | CNY | 5,000 | | | $ | 783 | |
Colombia Government International Bond | | | | | | | | |
5.625%, 02/26/2044 | | $ | 2,570 | | | | 3,272 | |
5.200%, 05/15/2049 | | | 3,300 | | | | 4,154 | |
5.000%, 06/15/2045 | | | 1,840 | | | | 2,212 | |
3.125%, 04/15/2031 | | | 1,010 | | | | 1,060 | |
Export-Import Bank of India | | | | | | | | |
3.375%, 08/05/2026 (C) | | | 1,410 | | | | 1,515 | |
Indonesia Government International Bond | | | | | | | | |
5.875%, 01/15/2024 (C) | | | 1,264 | | | | 1,454 | |
5.250%, 01/08/2047 (C) | | | 1,210 | | | | 1,630 | |
5.125%, 01/15/2045 (C) | | | 2,040 | | | | 2,660 | |
4.875%, 05/05/2021 | | | 500 | | | | 508 | |
4.750%, 07/18/2047 (C) | | | 400 | | | | 507 | |
4.450%, 04/15/2070 | | | 1,025 | | | | 1,266 | |
3.850%, 07/18/2027 (C) | | | 1,610 | | | | 1,835 | |
3.750%, 04/25/2022 | | | 500 | | | | 520 | |
Inter-American Development Bank MTN | | | | | | | | |
0.875%, 04/03/2025 | | | 2,633 | | | | 2,683 | |
Israel Government AID Bond | | | | | | | | |
5.500%, 09/18/2033 | | | 1,000 | | | | 1,472 | |
4.120%, 11/01/2024 (B) | | | 1,000 | | | | 972 | |
3.487%, 02/15/2025 (B) | | | 1,000 | | | | 968 | |
3.425%, 08/15/2025 (B) | | | 1,000 | | | | 965 | |
Israel Government International Bond | | | | | | | | |
4.500%, 04/03/2120 | | | 477 | | | | 631 | |
3.875%, 07/03/2050 | | | 400 | | | | 478 | |
3.375%, 01/15/2050 | | | 748 | | | | 826 | |
2.750%, 07/03/2030 | | | 720 | | | | 795 | |
Japan Bank for International Cooperation | | | | | | | | |
1.750%, 10/17/2024 | | | 1,894 | | | | 1,982 | |
Kazakhstan Government International Bond | | | | | | | | |
4.875%, 10/14/2044 (C) | | | 2,480 | | | | 3,351 | |
Kuwait International Government Bond | | | | | | | | |
3.500%, 03/20/2027 (C) | | | 1,810 | | | | 2,059 | |
Mexico Government International Bond | | | | | | | | |
6.050%, 01/11/2040 | | | 4,408 | | | | 5,764 | |
4.750%, 03/08/2044 | | | 5,026 | | | | 5,786 | |
4.600%, 02/10/2048 | | | 608 | | | | 691 | |
4.500%, 04/22/2029 | | | 2,944 | | | | 3,396 | |
4.350%, 01/15/2047 (D) | | | 716 | | | | 789 | |
4.000%, 10/02/2023 (D) | | | 810 | | | | 880 | |
3.900%, 04/27/2025 | | | 1,640 | | | | 1,816 | |
3.771%, 05/24/2061 | | | 622 | | | | 621 | |
3.600%, 01/30/2025 | | | 3,190 | | | | 3,485 | |
2.659%, 05/24/2031 | | | 6,061 | | | | 6,067 | |
Panama Government International Bond | | | | | | | | |
6.700%, 01/26/2036 | | | 1,830 | | | | 2,688 | |
4.500%, 05/15/2047 | | | 2,430 | | | | 3,074 | |
4.500%, 04/01/2056 | | | 830 | | | | 1,054 | |
4.300%, 04/29/2053 | | | 950 | | | | 1,185 | |
| | | | | | | | |
| | | |
| Description | | Face Amount
(Thousands) | | Market Value
($ Thousands) |
|
SOVEREIGN DEBT (continued) | |
3.160%, 01/23/2030 | | $ | 110 | | | $ | 121 | |
2.252%, 09/29/2032 | | | 870 | | | | 882 | |
Paraguay Government International Bond | | | | | | | | |
5.400%, 03/30/2050 (C) | | | 1,023 | | | | 1,276 | |
4.950%, 04/28/2031 (C) | | | 833 | | | | 987 | |
Peruvian Government International Bond | | | | | | | | |
6.550%, 03/14/2037 | | | 2,280 | | | | 3,397 | |
5.625%, 11/18/2050 | | | 2,400 | | | | 3,666 | |
3.230%, 07/28/2121 | | | 272 | | | | 268 | |
2.780%, 12/01/2060 | | | 564 | | | | 558 | |
2.392%, 01/23/2026 | | | 1,791 | | | | 1,885 | |
1.862%, 12/01/2032 | | | 1,020 | | | | 1,012 | |
Poland Government International Bond | | | | | | | | |
4.000%, 01/22/2024 | | | 7,630 | | | | 8,466 | |
Qatar Government International Bond | | | | | | | | |
4.817%, 03/14/2049 (C) | | | 2,970 | | | | 4,110 | |
4.000%, 03/14/2029 (C) | | | 1,380 | | | | 1,629 | |
3.875%, 04/23/2023 | | | 2,870 | | | | 3,081 | |
Russian Foreign Bond - Eurobond | | | | | | | | |
5.625%, 04/04/2042 | | | 7,000 | | | | 9,562 | |
Saudi Government International Bond MTN | | | | | | | | |
2.875%, 03/04/2023 (C) | | | 530 | | | | 554 | |
Svensk Exportkredit MTN | | | | | | | | |
0.750%, 04/06/2023 | | | 3,407 | | | | 3,442 | |
Uruguay Government International Bond | | | | | | | | |
5.100%, 06/18/2050 | | | 2,630 | | | | 3,613 | |
4.375%, 01/23/2031 | | | 3,280 | | | | 3,961 | |
| | | | | | | | |
| | |
Total Sovereign Debt (Cost $125,256) ($ Thousands) | | | | | | | 143,513 | |
| | | | | | | | |
|
MUNICIPAL BONDS — 0.6% | |
California — 0.2% | |
Los Angeles, Community College District, Build America Project, GO | | | | | | | | |
6.750%, 08/01/2049 | | | 725 | | | | 1,299 | |
Los Angeles, Community College District, GO Callable 08/01/2030 @ 100 | | | | | | | | |
2.106%, 08/01/2032 | | | 2,165 | | | | 2,231 | |
Los Angeles, Department of Airports, Ser D, RB Callable 05/15/2030 @ 100 | | | | | | | | |
4.000%, 05/15/2048 | | | 945 | | | | 1,117 | |
Los Angeles, Unified School District, Ser C, GO Callable 07/01/2030 @ 100 | | | | | | | | |
4.000%, 07/01/2033 | | | 670 | | | | 833 | |
Regents of the University of California, Ser N, RB Callable 11/15/2059 @ 100 | | | | | | | | |
3.256%, 05/15/2060 | | | 5,165 | | | | 5,597 | |
| | |
SEI Institutional Investments Trust / Semi-Annual Report / November 30, 2020 | | 141 |
SCHEDULE OF INVESTMENTS (Unaudited)
November 30, 2020
Core Fixed Income Fund (Continued)
| | | | | | | | |
| | | |
| Description | | Face Amount
(Thousands) | | Market Value
($ Thousands) |
|
MUNICIPAL BONDS (continued) | |
San Francisco City & County, Airport Commission, San Francisco International Airport, Ser A, AMT, RB Callable 05/01/2029 @ 100 | | | | | | | | |
5.000%, 05/01/2049 | | $ | 990 | | | $ | 1,214 | |
| | | | | | | | |
| | | | | | | 12,291 | |
| | | | | | | | |
|
Florida — 0.0% | |
County of Miami-Dade, Aviation Revenue, Ser A, AMT, RB Callable 10/01/2029 @ 100 | | | | | | | | |
5.000%, 10/01/2049 | | | 920 | | | | 1,111 | |
Greater Orlando, Aviation Authority, Ser A, AMT, RB Callable 10/01/2029 @ 100 | | | | | | | | |
4.000%, 10/01/2049 | | | 980 | | | | 1,113 | |
| | | | | | | | |
| | | | | | | 2,224 | |
| | | | | | | | |
|
Georgia — 0.1% | |
Georgia State, Municipal Electric Authority, Build America Project, RB | | | | | | | | |
7.055%, 04/01/2057 | | | 161 | | | | 231 | |
6.637%, 04/01/2057 | | | 2,353 | | | | 3,530 | |
| | | | | | | | |
| | | | | | | 3,761 | |
| | | | | | | | |
|
Massachusetts — 0.1% | |
Massachusetts State, Ser C, GO Callable 03/01/2030 @ 100 | | | | | | | | |
3.000%, 03/01/2049 | | | 3,250 | | | | 3,539 | |
| | | | | | | | |
|
Missouri — 0.0% | |
Missouri State, Health and Education Facilities, RB Callable 11/15/2049 @ 100 | | | | | | | | |
3.229%, 05/15/2050 | | | 650 | | | | 748 | |
Missouri State, Health and Education Facilities, RB Callable 02/15/2057 @ 100 | | | | | | | | |
3.652%, 08/15/2057 | | | 885 | | | | 1,113 | |
| | | | | | | | |
| | | | | | | 1,861 | |
| | | | | | | | |
|
Nevada — 0.0% | |
Clark County, Airport System Revenue, Build America Project, Ser C, RB | | | | | | | | |
6.820%, 07/01/2045 | | | 1,170 | | | | 1,932 | |
| | | | | | | | |
|
New York — 0.2% | |
New York & New Jersey, Port Authority, RB | | | | | | | | |
4.458%, 10/01/2062 | | | 1,600 | | | | 2,084 | |
New York City, Build America Project, Ser F-1, GO Callable 12/01/2020 @ 100 | | | | | | | | |
6.646%, 12/01/2031 | | | 2,000 | | | | 2,000 | |
| | | | | | | | |
| | | |
| Description | | Face Amount
(Thousands) | | Market Value
($ Thousands) |
|
MUNICIPAL BONDS (continued) | |
New York City, Transitional Finance Authority Future Tax Secured Revenue, Ser D-3, RB Callable 11/01/2030 @ 100 | | | | | | | | |
2.400%, 11/01/2032 | | $ | 1,085 | | | $ | 1,094 | |
New York City, Transitional Finance Authority Future Tax Secured Revenue, Sub-Ser S, RB Callable 11/01/2030 @ 100 | | | | | | | | |
4.000%, 05/01/2043 | | | 900 | | | | 1,068 | |
New York City, Water & Sewer System, Ser GG, RB Callable 06/15/2030 @ 100 | | | | | | | | |
4.000%, 06/15/2050 | | | 500 | | | | 591 | |
New York City, Water & Sewer System, Sub-Ser, RB Callable 12/15/2030 @ 100 | | | | | | | | |
5.000%, 06/15/2050 | | | 860 | | | | 1,124 | |
New York State, Dormitory Authority, Ser A, RB Callable 07/01/2030 @ 100 | | | | | | | | |
4.000%, 07/01/2050 | | | 1,945 | | | | 2,225 | |
New York State, Dormitory Authority, Ser A, RB Callable 09/15/2030 @ 100 | | | | | | | | |
4.000%, 03/15/2044 | | | 2,845 | | | | 3,353 | |
New York State, Environmental Facilities, Ser B, RB Callable 06/15/2029 @ 100 | | | | | | | | |
4.000%, 06/15/2037 | | | 1,420 | | | | 1,721 | |
New York State, Transportation Authority, Ser C2, RB | | | | | | | | |
5.175%, 11/15/2049 | | | 1,685 | | | | 1,889 | |
| | | | | | | | |
| | | | | | | 17,149 | |
| | | | | | | | |
|
Ohio — 0.0% | |
Ohio State University, Build America Project, Ser A, RB | | | | | | | | |
4.800%, 06/01/2111 | | | 689 | | | | 993 | |
| | | | | | | | |
|
Oregon — 0.0% | |
Oregon State, GO | | | | | | | | |
5.762%, 06/01/2023 | | | 1,340 | | | | 1,456 | |
| | | | | | | | |
|
Texas — 0.0% | |
North Texas, Tollway Authority, Build America Project, RB | | | | | | | | |
6.718%, 01/01/2049 | | | 1,154 | | | | 1,999 | |
University of Texas System, Ser B, RB Callable 02/15/2049 @ 100 | | | | | | | | |
2.439%, 08/15/2049 | | | 585 | | | | 597 | |
| | | | | | | | |
| | | | | | | 2,596 | |
| | | | | | | | |
| | |
142 | | SEI Institutional Investments Trust / Semi-Annual Report / November 30, 2020 |
| | | | | | | | |
| | | |
| Description | | Face Amount
(Thousands) | | Market Value
($ Thousands) |
|
MUNICIPAL BONDS (continued) | |
|
Virginia — 0.0% | |
University of Virginia, RB Callable 03/01/2050 @ 100 | | | | | | | | |
2.256%, 09/01/2050 | | $ | 1,595 | | | $ | 1,578 | |
Virginia State, Housing Development Authority, Ser 2006-C, Cl CTFS, RB | | | | | | | | |
6.000%, 06/25/2034 | | | 106 | | | | 112 | |
| | | | | | | | |
| | | | | | | 1,690 | |
| | | | | | | | |
Total Municipal Bonds (Cost $43,885) ($ Thousands) | | | | | | | 49,492 | |
| | | | | | | | |
|
U.S. GOVERNMENT AGENCY OBLIGATIONS — 0.4% | |
FHLB DN | | | | | | | | |
0.098%, 01/29/2021 (B) | | | 2,670 | | | | 2,670 | |
FHLMC | | | | | | | | |
2.375%, 01/13/2022 | | | 565 | | | | 579 | |
1.449%, 07/15/2031 (B) | | | 600 | | | | 515 | |
1.434%, 07/15/2032 (B) | | | 1,280 | | | | 1,078 | |
1.304%, 03/15/2031 (B) | | | 4,615 | | | | 3,992 | |
FNMA | | | | | | | | |
2.625%, 09/06/2024 | | | 510 | | | | 555 | |
2.000%, 01/05/2022 | | | 70 | | | | 71 | |
1.353%, 11/15/2030 (B) | | | 445 | | | | 389 | |
0.500%, 06/17/2025 | | | 7,405 | | | | 7,431 | |
FNMA DN | | | | | | | | |
0.160%, 01/15/2021 (B) | | | 10,000 | | | | 9,999 | |
Resolution Funding Interest STRIP | | | | | | | | |
1.322%, 01/15/2030 (B) | | | 1,930 | | | | 1,718 | |
Resolution Funding Principal STRIP | | | | | | | | |
1.357%, 01/15/2030 (B) | | | 960 | | | | 854 | |
1.304%, 04/15/2030 (B) | | | 2,570 | | | | 2,281 | |
Tennessee Valley Authority | | | | | | | | |
0.750%, 05/15/2025 | | | 1,895 | | | | 1,918 | |
Tennessee Valley Authority Principal STRIP, PO | | | | | | | | |
0.000%, 11/01/2025 (B) | | | 1,000 | | | | 959 | |
| | | | | | | | |
Total U.S. Government Agency Obligations (Cost $34,683) ($ Thousands) | | | | | | | 35,009 | |
| | | | | | | | |
| | | | | | | | |
| | | |
| Description | | Shares | | Market Value
($ Thousands) |
|
AFFILIATED PARTNERSHIP — 0.1% | |
SEI Liquidity Fund, L.P. | | | | | | | | |
0.070% **†(H) | | | 9,927,271 | | | $ | 9,931 | |
| | | | | | | | |
| | |
Total Affiliated Partnership (Cost $9,929) ($ Thousands) | | | | | | | 9,931 | |
| | | | | | | | |
|
CASH EQUIVALENT — 5.6% | |
SEI Daily Income Trust, Government Fund, Cl F | | | | | | | | |
0.010%**† | | | 454,913,219 | | | | 454,913 | |
| | | | | | | | |
| | |
Total Cash Equivalent (Cost $454,913) ($ Thousands) | | | | | | | 454,913 | |
| | | | | | | | |
| | |
Total Investments in Securities — 109.3%
(Cost $8,603,838) ($ Thousands) | | | | | | $ | 8,938,451 | |
| | | | | | | | |
| | |
| | | Contracts | | | | | |
| | | | | | | | |
|
PURCHASED OPTIONS* — 0.0% | |
| | |
Total Purchased Options (I) (Cost $317) ($ Thousands) | | | 3,296 | | | $ | 133 | |
| | | | | | | | |
|
WRITTEN OPTIONS* — 0.0% | |
| | |
Total Written Options (I) (Premiums Received $355) ($ Thousands) | | | (1,368 | ) | | $ | (233 | ) |
| | | | | | | | |
| | |
SEI Institutional Investments Trust / Semi-Annual Report / November 30, 2020 | | 143 |
SCHEDULE OF INVESTMENTS (Unaudited)
November 30, 2020
Core Fixed Income Fund (Concluded)
A list of the exchange traded option contracts held by the Fund at November 30, 2020 is as follows:
| | | | | | | | | | | | | | | | | | | | |
| | | | | |
| Description | | Number of Contracts | | | Notional Amount
(Thousands)†† | | | Exercise Price | | | Expiration Date | | | Value
(Thousands) | |
| | | | | |
PURCHASED OPTIONS — 0.0% | | | | | | | | | | | | | | | | | | | | |
| | | | | |
Put Options | | | | | | | | | | | | | | | | | | | | |
December 2020, U.S. 10 Year Future Option* | | | 840 | | | $ | 80 | | | $ | 137.25 | | | | 12/19/2020 | | | $ | 13 | |
March 2022, Euro Future Option* | | | 1,616 | | | | 158 | | | | 99.63 | | | | 3/19/2022 | | | | 81 | |
| | | | | | | | | | | | | | | | | | | | |
| | | | | | | 238 | | | | | | | | | | | | 94 | |
| | | | | | | | | | | | | | | | | | | | |
| | | | | |
Call Options | | | | | | | | | | | | | | | | | | | | |
December 2020, U.S. 10 Year Future Option* | | | 840 | | | | 80 | | | | 138.75 | | | | 12/19/2020 | | | | 39 | |
| | | | | | | | | | | | | | | | | | | | |
| | | | | |
Total Purchased Options | | | | | | $ | 318 | | | | | | | | | | | $ | 133 | |
| | | | | | | | | | | | | | | | | | | | |
| | | | | |
WRITTEN OPTIONS — (0.0)% | | | | | | | | | | | | | | | | | | | | |
| | | | | |
Put Options | | | | | | | | | | | | | | | | | | | | |
December 2020, U.S. Treasury Future Option* | | | (280 | ) | | $ | (83 | ) | | | 138.00 | | | | 12/19/2020 | | | $ | (39 | ) |
March 2022, Euro Future Option* | | | (808 | ) | | | (180 | ) | | | 99.75 | | | | 3/19/2022 | | | | (106 | ) |
| | | | | | | | | | | | | | | | | | | | |
| | | | | | | (263 | ) | | | | | | | | | | | (145 | ) |
| | | | | | | | | | | | | | | | | | | | |
| | | | | |
Call Options | | | | | | | | | | | | | | | | | | | | |
December 2020, U.S. Treasury Future Option* | | | (280 | ) | | | (92 | ) | | | 138.00 | | | | 12/19/2020 | | | | (88 | ) |
| | | | | | | | | | | | | | | | | | | | |
| | | | | | | (92 | ) | | | | | | | | | | | (88 | ) |
| | | | | | | | | | | | | | | | | | | | |
| | | | | |
Total Written Options | | | | | | $ | (355 | ) | | | | | | | | | | $ | (233 | ) |
| | | | | | | | | | | | | | | | | | | | |
A list of the open futures contracts held by the Fund at November 30, 2020 is as follows:
| | | | | | | | | | | | | | | | | | | | |
| | | | | | |
| Type of Contract | | Number of
Contracts Long
(Short) | | Expiration
Date | | Notional Amount
(Thousands) | | Value
(Thousands) | | Unrealized Appreciation
(Depreciation) (Thousands) |
90-Day Euro$ | | | (1,112 | ) | | | Dec-2021 | | | $ | (275,639 | ) | | $ | (277,333 | ) | | $ | (1,694 | ) |
90-Day Euro$ | | | (1,102 | ) | | | Mar-2021 | | | | (274,721 | ) | | | (274,921 | ) | | | (200 | ) |
Euro-Bund | | | (221 | ) | | | Dec-2020 | | | | (45,580 | ) | | | (46,329 | ) | | | (673 | ) |
Euro-Bund | | | (142) | | | | Mar-2021 | | | | (30,167 | ) | | | (30,167 | ) | | | 32 | |
U.S. 2-Year Treasury Note | | | (269) | | | | Apr-2021 | | | | (59,385 | ) | | | (59,409 | ) | | | (24 | ) |
U.S. 5-Year Treasury Note | | | 86 | | | | Apr-2021 | | | | 10,826 | | | | 10,839 | | | | 13 | |
U.S. 5-Year Treasury Note | | | (1,631 | ) | | | Apr-2021 | | | | (205,287 | ) | | | (205,557 | ) | | | (270 | ) |
U.S. 10-Year Treasury Note | | | 1,382 | | | | Mar-2021 | | | | 190,689 | | | | 190,954 | | | | 265 | |
U.S. Long Treasury Bond | | | 829 | | | | Mar-2021 | | | | 144,526 | | | | 144,997 | | | | 471 | |
U.S. Long Treasury Bond | | | (442 | ) | | | Mar-2021 | | | | (76,842 | ) | | | (77,309 | ) | | | (467 | ) |
U.S. Ultra Long Treasury Bond | | | 212 | | | | Mar-2021 | | | | 45,917 | | | | 45,798 | | | | (119 | ) |
U.S. Ultra Long Treasury Bond | | | 580 | | | | Mar-2021 | | | | 124,773 | | | | 125,298 | | | | 525 | |
Ultra 10-Year U.S. Treasury Note | | | (620 | ) | | | Mar-2021 | | | | (97,291 | ) | | | (97,418 | ) | | | (127 | ) |
| | | | | | | | | | | | | | | | | | | | |
| | | | | | | | | | $ | (548,181 | ) | | $ | (550,557 | ) | | $ | (2,268 | ) |
| | | | | | | | | | | | | | | | | | | | |
| | |
144 | | SEI Institutional Investments Trust / Semi-Annual Report / November 30, 2020 |
A list of the open forward foreign currency contracts held by the Fund at November 30, 2020 is as follows:
| | | | | | | | | | | | | | | | | | | | | | | | |
| | | | | | | |
| Counterparty | | Settlement Date | | | | | | Currency to Deliver
(Thousands) | | | | | | Currency to Receive
(Thousands) | | | Unrealized
Appreciation
(Depreciation)
(Thousands) | |
BNP Paribas | | | 01/19/21 | | | | EUR | | | | 3,150 | | | | USD | | | | 3,722 | | | $ | (52) | |
BNP Paribas | | | 01/19/21 | | | | CNH | | | | 9,709 | | | | USD | | | | 1,435 | | | | (36) | |
Citigroup | | | 01/19/21 | | | | EUR | | | | 2,790 | | | | USD | | | | 3,293 | | | | (49) | |
Citigroup | | | 01/19/21 | | | | USD | | | | 3,702 | | | | AUD | | | | 5,148 | | | | 92 | |
Citigroup | | | 01/19/21 | | | | USD | | | | 8,529 | | | | BRL | | | | 48,360 | | | | 444 | |
Citigroup | | | 01/19/21 | | | | USD | | | | 14,785 | | | | CAD | | | | 19,600 | | | | 348 | |
Goldman Sachs | | | 01/19/21 | | | | GBP | | | | 1,568 | | | | USD | | | | 2,029 | | | | (65) | |
Goldman Sachs | | | 01/19/21 | | | | EUR | | | | 3,998 | | | | USD | | | | 4,723 | | | | (66) | |
Goldman Sachs | | | 01/19/21 | | | | USD | | | | 4,354 | | | | BRL | | | | 24,767 | | | | 241 | |
| | | | | | | | | | | | | | | | | | | | | | | | |
| | | | | | | | | | | | | | | | | | | | | | $ | 857 | |
| | | | | | | | | | | | | | | | | | | | | | | | |
A list of the open centrally cleared swap agreements held by the Fund at November 30, 2020 is as follows:
| | | | | | | | | | | | | | | | | | | | | | | | | | | | | | | | |
| |
Credit Default Swaps | |
Reference Entity/
Obligation | | Buy/Sell
Protection | | | (Pays)/
Receives
Rate | | | Payment
Frequency | | | Termination
Date | | | Notional
Amount
(Thousands) | | | Value
(Thousands) | | | Upfront
Payments/
Receipts
(Thousands) | | | Net
Unrealized
Appreciation
(Depreciation)
(Thousands) | |
CDX.NA.IG.3406 | | | Sell | | | | 1.00% | | | | Quarterly | | | | 06/20/2025 | | | | (229,898 | ) | | $ | 3,960 | | | $ | (495 | ) | | $ | 4,455 | |
CDX.NA.IG.3506 | | | Sell | | | | 1.00% | | | | Quarterly | | | | 12/20/2025 | | | | (23,967 | ) | | | 303 | | | | 568 | | | | (265 | ) |
| | | | | | | | | | | | | | | | | | | | | | | | | | | | | | | | |
| | | | | | | | | | | | | | | | | | | | | | $ | 4,263 | | | $ | 73 | | | $ | 4,190 | |
| | | | | | | | | | | | | | | | | | | | | | | | | | | | | | | | |
| | | | | | | | | | | | | | | | | | | | | | | | | | | | | | | | |
| |
Interest Rate Swaps | |
| Fund Pays | | Fund Receives | | | Payment
Frequency | | | Termination Date | | | Currency | | | Notional
Amount
(Thousands) | | | Value
(Thousands) | | Upfront
Payments/
Receipts
(Thousands) | | Net Unrealized
Appreciation
(Depreciation)
(Thousands) |
USD-LIBOR-BBA | | | 0.19% | | | | Semi-Annually | | | | 06/15/2022 | | | | USD | | | | 64,527 | | | $ | (36 | ) | | $ | – | | | $ | (36 | ) |
0.56% | | | USD-SOFTRATE | | | | Annually | | | | 07/20/2045 | | | | USD | | | | 7,490 | | | | 750 | | | | 95 | | | | 655 | |
USD-SOFRRATE | | | 0.74% | | | | Annually | | | | 08/19/2045 | | | | USD | | | | 4,960 | | | | 298 | | | | – | | | | 298 | |
0.80% | | | USD-LIBOR-BBA | | | | Quarterly | | | | 11/15/2045 | | | | USD | | | | 21,290 | | | | 2,154 | | | | 445 | | | | 1,709 | |
1.20% | | | USD - LIBOR -BBA | | | | Quarterly | | | | 02/15/2047 | | | | USD | | | | 4,144 | | | | 60 | | | | 23 | | | | 37 | |
1.23% | | | USD - LIBOR -BBA | | | | Quarterly | | | | 02/15/2047 | | | | USD | | | | 1,991 | | | | 17 | | | | 1 | | | | 16 | |
1.00% | | | USD-LIBOR-BBA | | | | Quarterly | | | | 02/15/2047 | | | | USD | | | | 11,120 | | | | 679 | | | | 133 | | | | 546 | |
0.90% | | | 3-MONTH USD - LIBOR | | | | Quarterly | | | | 03/17/2050 | | | | USD | | | | 6,235 | | | | 592 | | | | 7 | | | | 585 | |
1.20% | | | US LIBOR BBA | | | | Quarterly | | | | 10/07/2050 | | | | USD | | | | 8,946 | | | | 164 | | | | 45 | | | | 119 | |
| | | | | | | | | | | | | | | | | | | | | | | | | | | | | | | | |
| | | | | | | | | | | | | | | | | | | | | | $ | 4,678 | | | $ | 749 | | | $ | 3 ,929 | |
| | | | | | | | | | | | | | | | | | | | | | | | | | | | | | | | |
| | Percentages are based on Net Assets of $8,179,101 ($ Thousands). |
| * | Non-income producing security. |
| ** | The rate reported is the 7-day effective yield as of November 30, 2020. |
| † | Investment in Affiliated Security (see Note 6). |
| (A) | Zero coupon security. The rate shown on the Schedule of Investments is the security’s effective yield at the time of purchase. |
| (B) | Variable or floating rate security, the interest rate of which adjusts periodically based on changes in current interest rates and prepayments on the underlying pool of assets. |
| (C) | Security exempt from registration under Rule 144A of the Securities Act of 1933. These securities may be resold in transactions exempt from registration normally to qualified institutions. On November 30, 2020, the value of these securities amounted to $1,109,914 ($ Thousands), representing 13.6% of the Net Assets of the Fund. |
| (D) | Certain securities or partial positions of certain securities are on loan at November 30, 2020 (see Note 12). The total market value of securities on loan at November 30, 2020 was $9,808 ($ Thousands). |
| (E) | Perpetual security with no stated maturity date. |
| (F) | Security is in default on interest payment. |
| (G) | Interest rate is unavailable. |
| (H) | This security was purchased with cash collateral held from securities on loan (see Note 12). The total market value of such securities as of November 30, 2020 was $9,931 ($ Thousands). (I) Refer to table below for details on Options Contracts. |
ACES — Alternative Credit Enhancement Securities
AID — Agency for International Development
ARM — Adjustable Rate Mortgage AUD — Australian Dollar
BRL — Brazilian Real
| | |
SEI Institutional Investments Trust / Semi-Annual Report / November 30, 2020 | | 145 |
SCHEDULE OF INVESTMENTS (Unaudited)
November 30, 2020
Core Fixed Income Fund (Concluded)
CAD — Canadian Dollar
Cl — Class
CLO — Collateralized Loan Obligation
CMO — Collateralized Mortgage Obligation
CNH — Chinese Yuan Offshore
CNY — Chinese Yuan Offshore
DAC — Designated Activity Company
DN — Discount Note
EUR — Euro
FHLB — Federal Home Loan Bank
FHLMC — Federal Home Loan Mortgage Corporation
FNMA — Federal National Mortgage Association
FREMF— Freddie Mac Multi-Family
GBP — British Pound Sterling
GNMA — Government National Mortgage Association
GO — General Obligation
ICE— Intercontinental Exchange
IO — Interest Only — face amount represents notional amount.
JSC — Joint-Stock Company
LIBOR— London Interbank Offered Rate
LLC — Limited Liability Company
L.P. — Limited Partnership
MTN — Medium Term Note
NCUA — National Credit Union Association
PLC — Public Limited Company
PO — Principal Only
RB — Revenue Bond
REMIC — Real Estate Mortgage Investment Conduit
Ser — Series
STRIPS — Separately Traded Registered Interest and Principal Securities TBA — To Be Announced
UMBS — Uniform Mortgage Backed Securities
USD — United States Dollar
VAR — Variable Rate
The following is a list of the level of inputs used as of November 30, 2020, in valuing the Fund’s investments and other financial instruments carried at value ($ Thousands)
| | | | | | | | | | | | | | | | |
| | | | | |
| Investments in Securities | | Level 1
($) | | Level 2
($) | | Level 3
($) | | | Total
($) |
Mortgage-Backed Securities | | | – | | | | 2,702,976 | | | | – | | | | 2,702,976 | |
Corporate Obligations | | | – | | | | 2,624,926 | | | | – | | | | 2,624,926 | |
U.S. Treasury Obligations | | | – | | | | 2,257,187 | | | | – | | | | 2,257,187 | |
Asset-Backed Securities | | | – | | | | 660,504 | | | | – | | | | 660,504 | |
Sovereign Debt | | | – | | | | 143,513 | | | | – | | | | 143,513 | |
Municipal Bonds | | | – | | | | 49,492 | | | | – | | | | 49,492 | |
U.S. Government Agency Obligations | | | – | | | | 35,009 | | | | – | | | | 35,009 | |
Affiliated Partnership | | | – | | | | 9,931 | | | | – | | | | 9,931 | |
Cash Equivalent | | | 454,913 | | | | – | | | | – | | | | 454,913 | |
| | | | | | | | | | | | | | | | |
Total Investments in Securities | | | 454,913 | | | | 8,483,538 | | | | – | | | | 8,938,451 | |
| | | | | | | | | | | | | | | | |
| | | | | | | | | | | | | | | | |
| | | | | |
| Other Financial Instruments | | Level 1
($) | | Level 2
($) | | Level 3
($) | | | Total
($) |
Purchased Options | | | 133 | | | | – | | | | – | | | | 133 | |
Written Options | | | (233) | | | | – | | | | – | | | | (233) | |
Futures Contracts* | | | | | | | | | | | | | | | | |
Unrealized Appreciation | | | 1,306 | | | | – | | | | – | | | | 1,306 | |
Unrealized Depreciation | | | (3,574) | | | | – | | | | – | | | | (3,574) | |
Forwards Contracts* | | | | | | | | | | | | | | | | |
Unrealized Appreciation | | | – | | | | 1,125 | | | | – | | | | 1,125 | |
Unrealized Depreciation | | | – | | | | (268) | | | | – | | | | (268) | |
Centrally Cleared Swaps | | | | | | | | | | | | | | | | |
Credit Default Swaps* | | | | | | | | | | | | | | | | |
Unrealized Appreciation | | | – | | | | 4,455 | | | | – | | | | 4,455 | |
Unrealized Depreciation | | | – | | | | (265) | | | | – | | | | (265) | |
Interest Rate Swaps* | | | | | | | | | | | | | | | | |
Unrealized Appreciation | | | – | | | | 3,965 | | | | – | | | | 3,965 | |
Unrealized Depreciation | | | – | | | | (36) | | | | – | | | | (36) | |
| | | | | | | | | | | | | | | | |
Total Other Financial Instruments | | | (2,368) | | | | 8,976 | | | | – | | | | 6,608 | |
| | | | | | | | | | | | | | | | |
* Futures contracts, forward contracts and swap contracts are valued at the unrealized appreciation (depreciation) on the instrument.
For the period ended November 30, 2020, there were no transfers in or out of Level 3.
For more information on valuation inputs, see Note 2 – Significant Accounting Policies in Notes to Financial Statements.
The following is a summary of the Fund’s transactions with affiliates for the period ended November 30, 2020 ($ Thousands):
| | | | | | | | | | | | | | | | | | |
| | | | | | | | | | |
| Security Description | | Value
5/31/2020 | | Purchases at Cost | | Proceeds from
Sales | | Realized Gain/
(Loss) | | Change in
Unrealized
Appreciation/
(Depreciation) | | Value
11/30/2020 | | Shares | | Income | | Capital Gains |
SEI Liquidity Fund, L.P. | | $ — | | $ 46,490 | | $ (36,556) | | $(5) | | $2 | | $ 9,931 | | 9,927,271 | | $ 1 | | $— |
SEI Daily Income Trust, Government Fund, Cl F | | 360,500 | | 3,205,105 | | (3,110,692) | | — | | — | | 454,913 | | 454,913,219 | | 40 | | — |
| | | | | | | | | | | | | | | | | | |
Totals | | $ 360,500 | | $ 3,251,595 | | $ (3,147,248) | | $(5) | | $2 | | $ 464,844 | | | | $ 41 | | $— |
| | | | | | | | | | | | | | | | | | |
Amounts designated as “—” are $0 or have been rounded to $0.
The accompanying notes are an integral part of the financial statements.
| | |
146 | | SEI Institutional Investments Trust / Semi-Annual Report / November 30, 2020 |
SCHEDULE OF INVESTMENTS (Unaudited)
November 30, 2020
High Yield Bond Fund
Sector Weightings†:
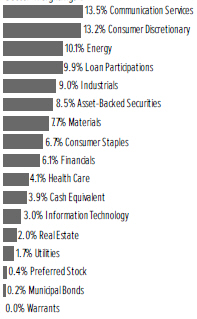
†Percentages are based on total investments.
| | | | | | | | |
| | | |
| Description | | Face Amount
(Thousands) | | Market Value
($ Thousands) |
|
CORPORATE OBLIGATIONS — 76.1% | |
|
Communication Services — 13.3% | |
Altice Financing | | | | | | | | |
7.500%, 05/15/2026 (A) | | $ | 2,020 | | | $ | 2,131 | |
5.000%, 01/15/2028 (A) | | | 5,351 | | | | 5,485 | |
Altice France | | | | | | | | |
8.125%, 02/01/2027 (A) | | | 1,647 | | | | 1,816 | |
7.375%, 05/01/2026 (A) | | | 5,421 | | | | 5,692 | |
Altice France Holding | | | | | | | | |
10.500%, 05/15/2027 (A) | | | 1,135 | | | | 1,279 | |
6.000%, 02/15/2028 (A) | | | 5,758 | | | | 5,844 | |
AMC Entertainment Holdings | | | | | | | | |
12.000%, 06/15/2026 (A) | | | 169 | | | | 44 | |
10.500%, 04/24/2026 (A) | | | 61 | | | | 46 | |
6.125%, 05/15/2027 | | | 680 | | | | 112 | |
5.750%, 06/15/2025 | | | 370 | | | | 61 | |
ANGI Group LLC | | | | | | | | |
3.875%, 08/15/2028 (A) | | | 3,539 | | | | 3,499 | |
Arches Buyer | | | | | | | | |
6.125%, 12/01/2028 (A) | | | 1,626 | | | | 1,669 | |
4.250%, 06/01/2028 (A) | | | 188 | | | | 188 | |
Belo | | | | | | | | |
7.250%, 09/15/2027 | | | 442 | | | | 504 | |
CCO Holdings LLC | | | | | | | | |
5.750%, 02/15/2026 (A) | | | 4,545 | | | | 4,710 | |
5.500%, 05/01/2026 (A) | | | 5,140 | | | | 5,353 | |
5.125%, 05/01/2027 (A) | | | 2,896 | | | | 3,047 | |
5.000%, 02/01/2028 (A) | | | 6,240 | | | | 6,575 | |
4.750%, 03/01/2030 (A) | | | 600 | | | | 637 | |
4.500%, 08/15/2030 (A) | | | 740 | | | | 780 | |
4.250%, 02/01/2031 (A) | | | 6,791 | | | | 7,045 | |
| | | | | | | | |
| | | |
| Description | | Face Amount
(Thousands) | | Market Value
($ Thousands) |
|
CORPORATE OBLIGATIONS (continued) | |
CenturyLink | | | | | | | | |
7.500%, 04/01/2024 | | $ | 1,480 | | | $ | 1,658 | |
6.875%, 01/15/2028 | | | 638 | | | | 732 | |
5.625%, 04/01/2025 | | | 325 | | | | 349 | |
5.125%, 12/15/2026 (A) | | | 4,261 | | | | 4,458 | |
4.500%, 01/15/2029 (A) | | | 1,315 | | | | 1,340 | |
4.000%, 02/15/2027 (A) | | | 1,131 | | | | 1,169 | |
Cincinnati Bell | | | | | | | | |
8.000%, 10/15/2025 (A) | | | 2,391 | | | | 2,560 | |
7.000%, 07/15/2024 (A) | | | 455 | | | | 470 | |
Cinemark USA | | | | | | | | |
8.750%, 05/01/2025 (A) | | | 191 | | | | 206 | |
Clear Channel International BV | | | | | | | | |
6.625%, 08/01/2025 (A) | | | 2,307 | | | | 2,405 | |
Clear Channel Worldwide Holdings | | | | | | | | |
9.250%, 02/15/2024 | | | 4,125 | | | | 4,120 | |
5.125%, 08/15/2027 (A) | | | 2,930 | | | | 2,959 | |
Consolidated Communications | | | | | | | | |
6.500%, 10/01/2028 (A) | | | 3,958 | | | | 4,290 | |
CSC Holdings LLC | | | | | | | | |
7.500%, 04/01/2028 (A) | | | 2,140 | | | | 2,386 | |
6.500%, 02/01/2029 (A) | | | 695 | | | | 777 | |
5.750%, 01/15/2030 (A) | | | 3,039 | | | | 3,290 | |
5.500%, 05/15/2026 (A) | | | 2,400 | | | | 2,496 | |
4.625%, 12/01/2030 (A) | | | 2,981 | | | | 3,052 | |
3.375%, 02/15/2031 (A) | | | 1,404 | | | | 1,365 | |
Cumulus Media New Holdings | | | | | | | | |
6.750%, 07/01/2026 (A) | | | 7,511 | | | | 7,323 | |
Diamond Sports Group LLC | | | | | | | | |
6.625%, 08/15/2027 (A) | | | 4,245 | | | | 2,434 | |
5.375%, 08/15/2026 (A) | | | 9,170 | | | | 7,107 | |
Digicel | | | | | | | | |
6.750%, 03/01/2023 (A) | | | 1,730 | | | | 1,107 | |
Digicel Group 0.5 | | | | | | | | |
10.000%, 04/01/2024 | | | 588 | | | | 466 | |
Digicel Holdings Bermuda | | | | | | | | |
8.750%, 05/25/2024 (A) | | | 1,363 | | | | 1,387 | |
DISH DBS | | | | | | | | |
7.750%, 07/01/2026 | | | 2,360 | | | | 2,693 | |
7.375%, 07/01/2028 | | | 3,192 | | | | 3,463 | |
5.875%, 11/15/2024 | | | 4,621 | | | | 4,915 | |
5.000%, 03/15/2023 | | | 2,935 | | | | 3,052 | |
DKT Finance ApS | | | | | | | | |
9.375%, 06/17/2023 (A) | | | 2,964 | | | | 3,053 | |
Entercom Media | | | | | | | | |
7.250%, 11/01/2024 (A) | | | 6,372 | | | | 6,117 | |
6.500%, 05/01/2027 (A) | | | 375 | | | | 361 | |
Frontier Communications | | | | | | | | |
11.000%, 09/15/2025 (B) | | | 1,520 | | | | 747 | |
10.500%, 09/15/2022 (B) | | | 1,655 | | | | 815 | |
7.125%, 01/15/2023 (B) | | | 1,595 | | | | 738 | |
6.875%, 01/15/2025 (B) | | | 4,255 | | | | 1,968 | |
| | |
SEI Institutional Investments Trust / Semi-Annual Report / November 30, 2020 | | 147 |
SCHEDULE OF INVESTMENTS (Unaudited)
November 30, 2020
High Yield Bond Fund (Continued)
| | | | | | | | |
| | | |
| Description | | Face Amount
(Thousands) | | Market Value
($ Thousands) |
|
CORPORATE OBLIGATIONS (continued) | |
6.750%, 05/01/2029 (A) | | $ | 803 | | | $ | 831 | |
5.875%, 10/15/2027 (A) | | | 367 | | | | 386 | |
5.000%, 05/01/2028 (A) | | | 1,874 | | | | 1,902 | |
GCI LLC | | | | | | | | |
4.750%, 10/15/2028 (A) | | | 482 | | | | 507 | |
Getty Images | | | | | | | | |
9.750%, 03/01/2027 (A) | | | 2,935 | | | | 3,067 | |
Gray Television | | | | | | | | |
7.000%, 05/15/2027 (A) | | | 2,388 | | | | 2,633 | |
4.750%, 10/15/2030 (A) | | | 1,034 | | | | 1,047 | |
iHeartCommunications (C) | | | | | | | | |
8.375%, 05/01/2027 | | | 4,835 | | | | 5,129 | |
6.375%, 05/01/2026 | | | 156 | | | | 166 | |
5.250%, 08/15/2027 (A) | | | 2,652 | | | | 2,718 | |
4.750%, 01/15/2028 (A) | | | 1,347 | | | | 1,360 | |
Intelsat Jackson Holdings | | | | | | | | |
9.750%, 07/15/2025 (A)(B) | | | 4,037 | | | | 2,866 | |
8.500%, 10/15/2024 (A)(B) | | | 3,082 | | | | 2,173 | |
5.500%, 08/01/2023 (B) | | | 910 | | | | 612 | |
Intelsat Luxembourg | | | | | | | | |
8.125%, 06/01/2023 (B) | | | 1,010 | | | | 44 | |
LCPR Senior Secured Financing DAC | | | | | | | | |
6.750%, 10/15/2027 (A) | | | 5,916 | | | | 6,431 | |
Level 3 Financing | | | | | | | | |
5.375%, 01/15/2024 | | | 550 | | | | 554 | |
5.375%, 05/01/2025 | | | 5,216 | | | | 5,355 | |
4.625%, 09/15/2027 (A) | | | 2,269 | | | | 2,361 | |
4.250%, 07/01/2028 (A) | | | 965 | | | | 996 | |
3.625%, 01/15/2029 (A) | | | 4,396 | | | | 4,401 | |
Live Nation Entertainment | | | | | | | | |
6.500%, 05/15/2027 (A) | | | 373 | | | | 413 | |
5.625%, 03/15/2026 (A) | | | 466 | | | | 471 | |
4.875%, 11/01/2024 (A) | | | 4,520 | | | | 4,486 | |
4.750%, 10/15/2027 (A) | | | 1,818 | | | | 1,793 | |
McGraw-Hill Global Education Holdings LLC | | | | | | | | |
7.875%, 05/15/2024 (A) | | | 3,545 | | | | 3,165 | |
Meredith | | | | | | | | |
6.875%, 02/01/2026 | | | 850 | | | | 845 | |
Midcontinent Communications | | | | | | | | |
5.375%, 08/15/2027 (A) | | | 1,042 | | | | 1,090 | |
MYT Holding LLC | | | | | | | | |
7.500%, 09/25/2025 (A) | | | 422 | | | | 423 | |
Netflix | | | | | | | | |
5.875%, 11/15/2028 | | | 863 | | | | 1,042 | |
5.375%, 11/15/2029 (A) | | | 275 | | | | 328 | |
4.875%, 04/15/2028 | | | 1,862 | | | | 2,132 | |
4.875%, 06/15/2030 (A) | | | 2,657 | | | | 3,076 | |
Nexstar Broadcasting | | | | | | | | |
5.625%, 07/15/2027 (A) | | | 7,352 | | | | 7,839 | |
4.750%, 11/01/2028 (A) | | | 2,510 | | | | 2,583 | |
Photo Holdings Merger Sub | | | | | | | | |
8.500%, 10/01/2026 (A) | | | 905 | | | | 910 | |
| | | | | | | | |
| | | |
| Description | | Face Amount
(Thousands) | | Market Value
($ Thousands) |
|
CORPORATE OBLIGATIONS (continued) | |
Radiate Holdco LLC | | | | | | | | |
6.500%, 09/15/2028 (A) | | $ | 882 | | | $ | 937 | |
4.500%, 09/15/2026 (A) | | | 882 | | | | 917 | |
Sable International Finance | | | | | | | | |
5.750%, 09/07/2027 (A) | | | 3,388 | | | | 3,612 | |
Salem Media Group | | | | | | | | |
6.750%, 06/01/2024 (A) | | | 5,855 | | | | 5,123 | |
Scripps Escrow | | | | | | | | |
5.875%, 07/15/2027 (A) | | | 1,114 | | | | 1,122 | |
Sinclair Television Group | | | | | | | | |
5.625%, 08/01/2024 (A) | | | 750 | | | | 764 | |
5.500%, 03/01/2030 (A) | | | 820 | | | | 821 | |
5.125%, 02/15/2027 (A) | | | 4,180 | | | | 4,107 | |
4.125%, 12/01/2030 (A) | | | 5,875 | | | | 5,882 | |
Sirius XM Radio | | | | | | | | |
5.500%, 07/01/2029 (A) | | | 1,675 | | | | 1,838 | |
5.375%, 07/15/2026 (A) | | | 2,988 | | | | 3,108 | |
5.000%, 08/01/2027 (A) | | | 1,971 | | | | 2,075 | |
4.625%, 07/15/2024 (A) | | | 560 | | | | 580 | |
4.125%, 07/01/2030 (A) | | | 3,992 | | | | 4,177 | |
SoftBank Group | | | | | | | | |
6.000%, VAR USD ICE Swap 11:00 NY 5 Yr+4.226%(D) | | | 950 | | | | 925 | |
5.125%, 09/19/2027 | | | 799 | | | | 833 | |
Sprint | | | | | | | | |
7.875%, 09/15/2023 | | | 2,793 | | | | 3,221 | |
7.625%, 02/15/2025 | | | 7,815 | | | | 9,358 | |
7.625%, 03/01/2026 | | | 2,559 | | | | 3,182 | |
7.250%, 09/15/2021 | | | 2,180 | | | | 2,270 | |
7.125%, 06/15/2024 | | | 1,605 | | | | 1,868 | |
Sprint Capital | | | | | | | | |
8.750%, 03/15/2032 | | | 3,233 | | | | 4,965 | |
TEGNA | | | | | | | | |
4.750%, 03/15/2026 (A) | | | 112 | | | | 119 | |
4.625%, 03/15/2028 (A) | | | 2,684 | | | | 2,741 | |
Telecom Italia | | | | | | | | |
5.303%, 05/30/2024 (A) | | | 520 | | | | 565 | |
Telecom Italia Capital | | | | | | | | |
6.375%, 11/15/2033 | | | 424 | | | | 507 | |
6.000%, 09/30/2034 | | | 2,199 | | | | 2,601 | |
Telenet Finance Luxembourg Notes Sar | | | | | | | | |
5.500%, 03/01/2028 (A) | | | 3,600 | | | | 3,854 | |
Telesat Canada | | | | | | | | |
6.500%, 10/15/2027 (A) | | | 7,629 | | | | 7,858 | |
4.875%, 06/01/2027 (A) | | | 1,793 | | | | 1,824 | |
Terrier Media Buyer | | | | | | | | |
8.875%, 12/15/2027 (A) | | | 7,757 | | | | 8,378 | |
T-Mobile USA | | | | | | | | |
6.500%, 01/15/2026 | | | 2,195 | | | | 2,280 | |
4.750%, 02/01/2028 | | | 4,835 | | | | 5,186 | |
4.375%, 04/15/2040 (A) | | | 88 | | | | 107 | |
3.500%, 04/15/2025 (A) | | | 159 | | | | 175 | |
| | |
148 | | SEI Institutional Investments Trust / Semi-Annual Report / November 30, 2020 |
| | | | | | | | |
| | | |
| Description | | Face Amount
(Thousands) | | Market Value
($ Thousands) |
|
CORPORATE OBLIGATIONS (continued) | |
Townsquare Media | | | | | | | | |
6.500%, 04/01/2023 (A) | | $ | 2,029 | | | $ | 1,968 | |
Trilogy International Partners LLC | | | | | | | | |
8.875%, 05/01/2022 (A) | | | 1,295 | | | | 1,224 | |
TripAdvisor | | | | | | | | |
7.000%, 07/15/2025 (A) | | | 34 | | | | 37 | |
U.S. Cellular | | | | | | | | |
6.700%, 12/15/2033 | | | 2,575 | | | | 3,373 | |
Univision Communications | | | | | | | | |
9.500%, 05/01/2025 (A) | | | 2,480 | | | | 2,747 | |
6.625%, 06/01/2027 (A) | | | 1,395 | | | | 1,489 | |
Urban One | | | | | | | | |
8.750%, 12/15/2022 (A) | | | 9,726 | | | | 9,410 | |
Videotron | | | | | | | | |
5.375%, 06/15/2024 (A) | | | 730 | | | | 811 | |
5.125%, 04/15/2027 (A) | | | 955 | | | | 1,011 | |
Virgin Media Finance | | | | | | | | |
5.000%, 07/15/2030 (A) | | | 779 | | | | 818 | |
Virgin Media Secured Finance | | | | | | | | |
5.500%, 05/15/2029 (A) | | | 1,983 | | | | 2,152 | |
4.500%, 08/15/2030 (A) | | | 757 | | | | 795 | |
Virgin Media Vendor Financing Notes IV DAC | | | | | | | | |
5.000%, 07/15/2028 (A) | | | 2,543 | | | | 2,619 | |
Windstream Escrow LLC | | | | | | | | |
7.750%, 08/15/2028 (A) | | | 6,193 | | | | 6,270 | |
WMG Acquisition | | | | | | | | |
3.000%, 02/15/2031 (A) | | | 749 | | | | 730 | |
Zayo Group Holdings | | | | | | | | |
6.125%, 03/01/2028 (A) | | | 865 | | | | 911 | |
4.000%, 03/01/2027 (A) | | | 1,731 | | | | 1,722 | |
| | | | | | | | |
| | | | | | | 356,447 | |
| | | | | | | | |
|
Consumer Discretionary — 12.9% | |
1011778 BC ULC / New Red Finance Inc | | | | | | | | |
4.375%, 01/15/2028 (A) | | | 898 | | | | 927 | |
4.000%, 10/15/2030 (A) | | | 2,530 | | | | 2,521 | |
3.500%, 02/15/2029 (A) | | | 163 | | | | 163 | |
Abercrombie & Fitch Management | | | | | | | | |
8.750%, 07/15/2025 (A) | | | 1,437 | | | | 1,563 | |
Adelphia Communications (Escrow Security) | | | | | | | | |
10.250%, 06/15/2011 (B)(E) | | | 125 | | | | 1 | |
7.875%, 01/15/2009 (B)(E) | | | 250 | | | | – | |
7.750%, 05/01/2009 (B)(E) | | | 75 | | | | – | |
Adelphia Communications (Escrow Security), Ser B | | | | | | | | |
9.500%, 02/15/2004 (B)(E) | | | 25 | | | | – | |
Adient Global Holdings, Ltd | | | | | | | | |
. 4.875%, 08/15/2026 (A) | | | 690 | | | | 696 | |
Adient US LLC | | | | | | | | |
9.000%, 04/15/2025 (A) | | | 227 | | | | 253 | |
7.000%, 05/15/2026 (A) | | | 540 | | | | 585 | |
| | | | | | | | |
| | | |
| Description | | Face Amount
(Thousands) | | Market Value
($ Thousands) |
|
CORPORATE OBLIGATIONS (continued) | |
American Axle & Manufacturing | | | | | | | | |
6.875%, 07/01/2028 | | $ | 1,584 | | | $ | 1,679 | |
6.500%, 04/01/2027 | | | 1,760 | | | | 1,839 | |
6.250%, 04/01/2025 | | | 720 | | | | 745 | |
6.250%, 03/15/2026 | | | 660 | | | | 675 | |
American Builders & Contractors Supply | | | | | | | | |
4.000%, 01/15/2028 (A) | | | 2,730 | | | | 2,832 | |
American Greetings | | | | | | | | |
8.750%, 04/15/2025 (A) | | | 5,700 | | | | 5,500 | |
Aramark Services | | | | | | | | |
5.000%, 02/01/2028 (A) | | | 745 | | | | 783 | |
Asbury Automotive Group | | | | | | | | |
4.750%, 03/01/2030 | | | 475 | | | | 500 | |
4.500%, 03/01/2028 | | | 2,711 | | | | 2,806 | |
Ashton Woods USA LLC | | | | | | | | |
6.625%, 01/15/2028 (A) | | | 4,021 | | | | 4,152 | |
Aventine (Escrow Security) | | | | | | | | |
0.000%, 10/15/2049 (B)(E)(F) | | | 2,600 | | | | – | |
Bally’s | | | | | | | | |
6.750%, 06/01/2027 (A) | | | 2,070 | | | | 2,163 | |
BorgWarner | | | | | | | | |
5.000%, 10/01/2025 (A) | | | 362 | | | | 424 | |
Boyd Gaming | | | | | | | | |
8.625%, 06/01/2025 (A) | | | 753 | | | | 837 | |
6.000%, 08/15/2026 | | | 530 | | | | 552 | |
Boyne USA | | | | | | | | |
7.250%, 05/01/2025 (A) | | | 370 | | | | 390 | |
Brinker International | | | | | | | | |
3.875%, 05/15/2023 | | | 995 | | | | 985 | |
Brookfield Residential Properties | | | | | | | | |
4.875%, 02/15/2030 (A) | | | 1,081 | | | | 1,068 | |
Burlington Coat Factory Warehouse | | | | | | | | |
6.250%, 04/15/2025 (A) | | | 894 | | | | 950 | |
Caesars Entertainment | | | | | | | | |
8.125%, 07/01/2027 (A) | | | 1,400 | | | | 1,540 | |
6.250%, 07/01/2025 (A) | | | 3,149 | | | | 3,352 | |
Caesars Resort Collection LLC | | | | | | | | |
5.250%, 10/15/2025 (A) | | | 4,475 | | | | 4,475 | |
Carnival | | | | | | | | |
11.500%, 04/01/2023 (A) | | | 5,093 | | | | 5,800 | |
10.500%, 02/01/2026 (A) | | | 1,254 | | | | 1,483 | |
9.875%, 08/01/2027 (A) | | | 585 | | | | 686 | |
Carvana | | | | | | | | |
5.625%, 10/01/2025 (A) | | | 3,295 | | | | 3,311 | |
CD&R Smokey Buyer | | | | | | | | |
6.750%, 07/15/2025 (A) | | | 332 | | | | 356 | |
Cedar Fair | | | | | | | | |
5.500%, 05/01/2025 (A) | | | 285 | | | | 299 | |
5.375%, 06/01/2024 | | | 2,145 | | | | 2,156 | |
5.250%, 07/15/2029 | | | 110 | | | | 113 | |
Cengage Learning | | | | | | | | |
9.500%, 06/15/2024 (A) | | | 5,695 | | | | 5,282 | |
| | |
SEI Institutional Investments Trust / Semi-Annual Report / November 30, 2020 | | 149 |
SCHEDULE OF INVESTMENTS (Unaudited)
November 30, 2020
High Yield Bond Fund (Continued)
| | | | | | | | |
| | | |
| Description | | Face Amount
(Thousands) | | Market Value
($ Thousands) |
|
CORPORATE OBLIGATIONS (continued) | |
Century Communities | | | | | | | | |
6.750%, 06/01/2027 | | $ | 624 | | | $ | 669 | |
5.875%, 07/15/2025 | | | 1,771 | | | | 1,847 | |
Cirsa Finance International Sarl | | | | | | | | |
7.875%, 12/20/2023 (A) | | | 2,124 | | | | 2,113 | |
Claire’s Stores Inc (Escrow Security) | | | | | | | | |
9.000%, 03/15/2019 (B) | | | 1,480 | | | | – | |
Clarios Global | | | | | | | | |
8.500%, 05/15/2027 (A) | | | 5,746 | | | | 6,184 | |
6.750%, 05/15/2025 (A) | | | 2,200 | | | | 2,366 | |
6.250%, 05/15/2026 (A) | | | 2,270 | | | | 2,412 | |
Constellation Merger Sub | | | | | | | | |
8.500%, 09/15/2025 (A) | | | 853 | | | | 744 | |
Cooper-Standard Automotive | | | | | | | | |
13.000%, 06/01/2024 (A) | | | 520 | | | | 589 | |
5.625%, 11/15/2026 (A) | | | 1,485 | | | | 1,198 | |
Core & Main | | | | | | | | |
6.125%, 08/15/2025 (A) | | | 2,772 | | | | 2,841 | |
Core & Main Holdings | | | | | | | | |
8.625%cash/9.375% PIK, 09/15/2024 (A) | | | 2,640 | | | | 2,703 | |
CSC Holdings LLC | | | | | | | | |
5.875%, 09/15/2022 | | | 152 | | | | 162 | |
Dana | | | | | | | | |
5.625%, 06/15/2028 | | | 704 | | | | 759 | |
5.375%, 11/15/2027 | | | 958 | | | | 1,019 | |
Dana Financing Luxembourg Sarl | | | | | | | | |
6.500%, 06/01/2026 (A) | | | 1,245 | | | | 1,303 | |
Diamond Resorts International | | | | | | | | |
10.750%, 09/01/2024 (A) | | | 3,020 | | | | 2,892 | |
eG Global Finance | | | | | | | | |
8.500%, 10/30/2025 (A) | | | 842 | | | | 907 | |
6.750%, 02/07/2025 (A) | | | 4,175 | | | | 4,321 | |
Enterprise Development Authority | | | | | | | | |
12.000%, 07/15/2024 (A) | | | 2,271 | | | | 2,544 | |
ESH Hospitality | | | | | | | | |
4.625%, 10/01/2027 (A) | | | 1,225 | | | | 1,246 | |
Expedia Group Inc | | | | | | | | |
7.000%, 05/01/2025 (A) | | | 169 | | | | 185 | |
6.250%, 05/01/2025 (A) | | | 282 | | | | 322 | |
Ferrellgas | | | | | | | | |
10.000%, 04/15/2025 (A) | | | 559 | | | | 616 | |
Fontainebleau Las Vegas | | | | | | | | |
11.000%, 06/15/2015 (A)(B) | | | 3,481 | | | | – | |
Ford Motor | | | | | | | | |
9.625%, 04/22/2030 | | | 745 | | | | 1,037 | |
9.000%, 04/22/2025 | | | 2,176 | | | | 2,644 | |
8.500%, 04/21/2023 | | | 5,080 | | | | 5,694 | |
Ford Motor Credit LLC | | | | | | | | |
5.596%, 01/07/2022 | | | 1,101 | | | | 1,133 | |
5.584%, 03/18/2024 | | | 105 | | | | 113 | |
5.125%, 06/16/2025 | | | 970 | | | | 1,047 | |
| | | | | | | | |
| | | |
| Description | | Face Amount
(Thousands) | | Market Value
($ Thousands) |
|
CORPORATE OBLIGATIONS (continued) | |
5.113%, 05/03/2029 | | $ | 2,625 | | | $ | 2,841 | |
4.687%, 06/09/2025 | | | 1,245 | | | | 1,323 | |
4.542%, 08/01/2026 | | | 1,481 | | | | 1,553 | |
4.271%, 01/09/2027 | | | 485 | | | | 502 | |
4.140%, 02/15/2023 | | | 395 | | | | 405 | |
4.134%, 08/04/2025 | | | 1,600 | | | | 1,656 | |
4.125%, 08/17/2027 | | | 3,294 | | | | 3,405 | |
4.063%, 11/01/2024 | | | 1,577 | | | | 1,640 | |
4.000%, 11/13/2030 | | | 403 | | | | 406 | |
3.815%, 11/02/2027 | | | 3,425 | | | | 3,450 | |
3.813%, 10/12/2021 | | | 930 | | | | 941 | |
3.810%, 01/09/2024 | | | 225 | | | | 230 | |
3.375%, 11/13/2025 | | | 332 | | | | 335 | |
3.370%, 11/17/2023 | | | 794 | | | | 804 | |
3.350%, 11/01/2022 | | | 265 | | | | 269 | |
3.096%, 05/04/2023 | | | 448 | | | | 451 | |
3.087%, 01/09/2023 | | | 57 | | | | 57 | |
2.979%, 08/03/2022 | | | 1,105 | | | | 1,109 | |
1.104%, VAR ICE LIBOR USD 3 Month+0.880%, 10/12/2021 | | | 1,380 | | | | 1,357 | |
Ford Motor Credit LLC MTN | | | | | | | | |
4.389%, 01/08/2026 | | | 210 | | | | 218 | |
Gap | | | | | | | | |
8.875%, 05/15/2027 (A) | | | 130 | | | | 151 | |
8.625%, 05/15/2025 (A) | | | 2,725 | | | | 3,028 | |
8.375%, 05/15/2023 (A) | | | 455 | | | | 515 | |
General Motors Co | | | | | | | | |
6.800%, 10/01/2027 | | | 139 | | | | 179 | |
6.125%, 10/01/2025 | | | 277 | | | | 334 | |
G-III Apparel Group | | | | | | | | |
7.875%, 08/15/2025 (A) | | | 3,340 | | | | 3,607 | |
Golden Nugget | | | | | | | | |
6.750%, 10/15/2024 (A) | | | 1,195 | | | | 1,168 | |
Group 1 Automotive | | | | | | | | |
4.000%, 08/15/2028 (A) | | | 44 | | | | 45 | |
GrubHub Holdings | | | | | | | | |
5.500%, 07/01/2027 (A) | | | 1,600 | | | | 1,676 | |
Guitar Center | | | | | | | | |
13.000%cash/8.000% PIK, 04/15/2022 (A)(B) | | | 14,901 | | | | 7,152 | |
13.000%, 04/15/2022 (A)(B)(E) | | | 175 | | | | 65 | |
10.000%, 05/15/2022 (A)(B)(E) | | | 95 | | | | 95 | |
Guitar Center Escrow Issuer | | | | | | | | |
9.500%, 10/15/2021 (A)(B) | | | 775 | | | | 760 | |
Hanesbrands | | | | | | | | |
4.875%, 05/15/2026 (A) | | | 370 | | | | 398 | |
4.625%, 05/15/2024 (A) | | | 3,861 | | | | 4,059 | |
Hillman Group | | | | | | | | |
6.375%, 07/15/2022 (A) | | | 5,241 | | | | 5,201 | |
Hilton Domestic Operating | | | | | | | | |
5.750%, 05/01/2028 (A) | | | 171 | | | | 184 | |
5.375%, 05/01/2025 (A) | | | 114 | | | | 121 | |
| | |
150 | | SEI Institutional Investments Trust / Semi-Annual Report / November 30, 2020 |
| | | | | | | | |
| | | |
| Description | | Face Amount
(Thousands) | | Market Value
($ Thousands) |
|
CORPORATE OBLIGATIONS (continued) | |
5.125%, 05/01/2026 | | $ | 3,574 | | | $ | 3,696 | |
4.875%, 01/15/2030 | | | 470 | | | | 507 | |
4.000%, 05/01/2031 (A) | | | 102 | | | | 107 | |
3.750%, 05/01/2029 (A) | | | 171 | | | | 176 | |
Hilton Worldwide Finance LLC | | | | | | | | |
4.875%, 04/01/2027 | | | 148 | | | | 154 | |
4.625%, 04/01/2025 | | | 187 | | | | 191 | |
Houghton Mifflin Harcourt Publishers | | | | | | | | |
9.000%, 02/15/2025 (A) | | | 5,295 | | | | 5,242 | |
Hyatt Hotels | | | | | | | | |
5.750%, 04/23/2030 | | | 135 | | | | 161 | |
5.375%, 04/23/2025 | | | 135 | | | | 151 | |
IHO Verwaltungs GmbH | | | | | | | | |
6.375%cash/7.125% PIK, 05/15/2029 (A) | | | 835 | | | | 893 | |
6.000%cash/6.750% PIK, 05/15/2027 (A) | | | 850 | | | | 895 | |
Inn of the Mountain Gods Resort & Casino | | | | | | | | |
9.250%cash/0% PIK, 11/30/2020 (B)(E) | | | 4,084 | | | | 4,063 | |
International Game Technology | | | | | | | | |
6.500%, 02/15/2025 (A) | | | 635 | | | | 700 | |
6.250%, 01/15/2027 (A) | | | 4,233 | | | | 4,709 | |
5.250%, 01/15/2029 (A) | | | 200 | | | | 212 | |
IRB Holding | | | | | | | | |
7.000%, 06/15/2025 (A) | | | 1,108 | | | | 1,205 | |
6.750%, 02/15/2026 (A) | | | 7,755 | | | | 8,026 | |
Ken Garff Automotive LLC | | | | | | | | |
4.875%, 09/15/2028 (A) | | | 442 | | | | 449 | |
L Brands | | | | | | | | |
9.375%, 07/01/2025 (A) | | | 108 | | | | 132 | |
7.600%, 07/15/2037 | | | 60 | | | | 62 | |
7.500%, 06/15/2029 | | | 542 | | | | 598 | |
6.875%, 07/01/2025 (A) | | | 332 | | | | 359 | |
6.875%, 11/01/2035 | | | 75 | | | | 82 | |
6.750%, 07/01/2036 | | | 2,607 | | | | 2,822 | |
6.625%, 10/01/2030 (A) | | | 2,383 | | | | 2,610 | |
Liberty Interactive LLC | | | | | | | | |
8.250%, 02/01/2030 | | | 6,294 | | | | 6,892 | |
Lions Gate Capital Holdings LLC | | | | | | | | |
6.375%, 02/01/2024 (A) | | | 3,615 | | | | 3,715 | |
Lithia Motors | | | | | | | | |
4.625%, 12/15/2027 (A) | | | 2,350 | | | | 2,497 | |
4.375%, 01/15/2031 (A) | | | 348 | | | | 369 | |
Macy’s | | | | | | | | |
8.375%, 06/15/2025 (A) | | | 4,962 | | | | 5,408 | |
Marriott International Inc/MD | | | | | | | | |
5.750%, 05/01/2025 | | | 175 | | | | 203 | |
4.625%, 06/15/2030 | | | 202 | | | | 233 | |
Marriott Ownership Resorts | | | | | | | | |
6.500%, 09/15/2026 | | | 920 | | | | 966 | |
6.125%, 09/15/2025 (A) | | | 381 | | | | 405 | |
| | | | | | | | |
| | | |
| Description | | Face Amount
(Thousands) | | Market Value
($ Thousands) |
|
CORPORATE OBLIGATIONS (continued) | |
Mattamy Group | | | | | | | | |
4.625%, 03/01/2030 (A) | | $ | 2,872 | | | $ | 3,008 | |
Mattel | | | | | | | | |
6.750%, 12/31/2025 (A) | | | 1,920 | | | | 2,019 | |
5.875%, 12/15/2027 (A) | | | 300 | | | | 331 | |
Melco Resorts Finance | | | | | | | | |
5.250%, 04/26/2026 | | | 1,360 | | | | 1,409 | |
MGM Resorts International | | | | | | | | |
6.750%, 05/01/2025 | | | 4,519 | | | | 4,855 | |
6.000%, 03/15/2023 | | | 2,515 | | | | 2,690 | |
5.750%, 06/15/2025 | | | 1,411 | | | | 1,526 | |
5.500%, 04/15/2027 | | | 2,250 | | | | 2,412 | |
Millennium (Escrow Security) | | | | | | | | |
7.625%, 11/15/2026 (B)(E) | | | 200 | | | | – | |
NCL | | | | | | | | |
12.250%, 05/15/2024 (A) | | | 1,880 | | | | 2,230 | |
Neiman Marcus Group | | | | | | | | |
0.000%, 10/15/2021 | | | 2,835 | | | | 638 | |
Newell Brands | | | | | | | | |
5.875%, 04/01/2036 | | | 130 | | | | 156 | |
4.875%, 06/01/2025 | | | 75 | | | | 83 | |
4.700%, 04/01/2026 | | | 3,150 | | | | 3,394 | |
Nordstrom | | | | | | | | |
8.750%, 05/15/2025 (A) | | | 420 | | | | 470 | |
4.375%, 04/01/2030 | | | 130 | | | | 125 | |
Peninsula Pacific Entertainment LLC | | | | | | | | |
8.500%, 11/15/2027 (A) | | | 4,244 | | | | 4,515 | |
Penn National Gaming | | | | | | | | |
5.625%, 01/15/2027 (A) | | | 2,043 | | | | 2,125 | |
PetSmart | | | | | | | | |
8.875%, 06/01/2025 (A) | | | 370 | | | | 373 | |
7.125%, 03/15/2023 (A) | | | 5,375 | | | | 5,308 | |
5.875%, 06/01/2025 (A) | | | 875 | | | | 888 | |
PM General Purchaser LLC | | | | | | | | |
9.500%, 10/01/2028 (A) | | | 373 | | | | 407 | |
QVC | | | | | | | | |
4.750%, 02/15/2027 | | | 867 | | | | 895 | |
4.450%, 02/15/2025 | | | 1,640 | | | | 1,716 | |
4.375%, 09/01/2028 | | | 442 | | | | 452 | |
Royal Caribbean Cruises | | | | | | | | |
9.125%, 06/15/2023 (A) | | | 1,222 | | | | 1,323 | |
5.250%, 11/15/2022 | | | 1,378 | | | | 1,357 | |
Royal Caribbean Cruises Ltd | | | | | | | | |
11.500%, 06/01/2025 (A) | | | 733 | | | | 861 | |
10.875%, 06/01/2023 (A) | | | 4,251 | | | | 4,809 | |
Scientific Games International | | | | | | | | |
8.625%, 07/01/2025 (A) | | | 1,965 | | | | 2,122 | |
8.250%, 03/15/2026 (A) | | | 2,306 | | | | 2,473 | |
7.250%, 11/15/2029 (A) | | | 745 | | | | 791 | |
7.000%, 05/15/2028 (A) | | | 1,355 | | | | 1,411 | |
SeaWorld Parks & Entertainment | | | | | | | | |
9.500%, 08/01/2025 (A) | | | 3,015 | | | | 3,271 | |
| | |
SEI Institutional Investments Trust / Semi-Annual Report / November 30, 2020 | | 151 |
SCHEDULE OF INVESTMENTS (Unaudited)
November 30, 2020
High Yield Bond Fund (Continued)
| | | | | | | | |
| | | |
| Description | | Face Amount
(Thousands) | | Market Value
($ Thousands) |
|
CORPORATE OBLIGATIONS (continued) | |
Service International | | | | | | | | |
7.500%, 04/01/2027 | | $ | 867 | | | $ | 1,049 | |
5.125%, 06/01/2029 | | | 82 | | | | 91 | |
4.625%, 12/15/2027 | | | 970 | | | | 1,028 | |
3.375%, 08/15/2030 | | | 278 | | | | 285 | |
Shea Homes | | | | | | | | |
4.750%, 02/15/2028 (A) | | | 1,081 | | | | 1,119 | |
4.750%, 04/01/2029 (A) | | | 1,323 | | | | 1,376 | |
Silversea Cruise Finance | | | | | | | | |
7.250%, 02/01/2025 (A) | | | 2,772 | | | | 2,843 | |
Six Flags Entertainment | | | | | | | | |
5.500%, 04/15/2027 (A) | | | 110 | | | | 111 | |
4.875%, 07/31/2024 (A) | | | 6,452 | | | | 6,428 | |
Six Flags Theme Parks | | | | | | | | |
7.000%, 07/01/2025 (A) | | | 1,287 | | | | 1,395 | |
Specialty Building Products Holdings LLC | | | | | | | | |
6.375%, 09/30/2026 (A) | | | 1,600 | | | | 1,664 | |
Speedway Motorsports LLC | | | | | | | | |
4.875%, 11/01/2027 (A) | | | 1,360 | | | | 1,340 | |
SRS Distribution | | | | | | | | |
8.250%, 07/01/2026 (A) | | | 2,249 | | | | 2,384 | |
Staples | | | | | | | | |
10.750%, 04/15/2027 (A) | | | 2,230 | | | | 2,096 | |
7.500%, 04/15/2026 (A) | | | 2,659 | | | | 2,676 | |
Stars Group Holdings BV | | | | | | | | |
7.000%, 07/15/2026 (A) | | | 405 | | | | 428 | |
Station Casinos LLC | | | | | | | | |
5.000%, 10/01/2025 (A) | | | 1,148 | | | | 1,157 | |
4.500%, 02/15/2028 (A) | | | 4,040 | | | | 3,979 | |
Sugarhouse HSP Gaming Prop Mezz LP | | | | | | | | |
5.875%, 05/15/2025 (A) | | | 5,505 | | | | 5,367 | |
Tempur Sealy International | | | | | | | | |
5.625%, 10/15/2023 | | | 480 | | | | 488 | |
5.500%, 06/15/2026 | | | 825 | | | | 859 | |
Tenneco | | | | | | | | |
7.875%, 01/15/2029 (A) | | | 242 | | | | 267 | |
5.375%, 12/15/2024 | | | 415 | | | | 376 | |
5.000%, 07/15/2026 | | | 1,987 | | | | 1,787 | |
Vail Resorts | | | | | | | | |
6.250%, 05/15/2025 (A) | | | 224 | | | | 240 | |
Vista Outdoor | | | | | | | | |
5.875%, 10/01/2023 | | | 1,605 | | | | 1,617 | |
White Capital Buyer LLC | | | | | | | | |
6.875%, 10/15/2028 (A) | | | 188 | | | | 200 | |
William Carter | | | | | | | | |
5.625%, 03/15/2027 (A) | | | 340 | | | | 358 | |
Wolverine Escrow LLC | | | | | | | | |
13.125%, 11/15/2027 (A) | | | 375 | | | | 274 | |
9.000%, 11/15/2026 (A) | | | 970 | | | | 815 | |
Wolverine World Wide | | | | | | | | |
6.375%, 05/15/2025 (A) | | | 901 | | | | 955 | |
| | | | | | | | |
| | | |
| Description | | Face Amount
(Thousands) | | Market Value
($ Thousands) |
|
CORPORATE OBLIGATIONS (continued) | |
WW International | | | | | | | | |
8.625%, 12/01/2025 (A) | | $ | 2,605 | | | $ | 2,719 | |
Wynn Las Vegas LLC | | | | | | | | |
5.500%, 03/01/2025 (A) | | | 2,166 | | | | 2,209 | |
5.250%, 05/15/2027 (A) | | | 635 | | | | 641 | |
4.250%, 05/30/2023 (A) | | | 245 | | | | 246 | |
Wynn Resorts Finance LLC | | | | | | | | |
7.750%, 04/15/2025 (A) | | | 2,825 | | | | 3,047 | |
5.125%, 10/01/2029 (A) | | | 514 | | | | 523 | |
Yum! Brands | | | | | | | | |
7.750%, 04/01/2025 (A) | | | 180 | | | | 199 | |
6.875%, 11/15/2037 | | | 1,840 | | | | 2,318 | |
5.350%, 11/01/2043 | | | 180 | | | | 200 | |
3.625%, 03/15/2031 | | | 1,266 | | | | 1,266 | |
| | | | | | | | |
| | | | | | | 345,495 | |
| | | | | | | | |
|
Consumer Staples — 6.7% | |
AHP Health Partners | | | | | | | | |
9.750%, 07/15/2026 (A) | | | 2,655 | | | | 2,907 | |
Albertsons | | | | | | | | |
5.875%, 02/15/2028 (A) | | | 623 | | | | 673 | |
5.750%, 03/15/2025 | | | 489 | | | | 504 | |
4.875%, 02/15/2030 (A) | | | 285 | | | | 312 | |
4.625%, 01/15/2027 (A) | | | 3,427 | | | | 3,613 | |
3.500%, 02/15/2023 (A) | | | 200 | | | | 205 | |
3.500%, 03/15/2029 (A) | | | 792 | | | | 790 | |
3.250%, 03/15/2026 (A) | | | 792 | | | | 800 | |
Allied Universal Holdco LLC | | | | | | | | |
9.750%, 07/15/2027 (A) | | | 1,151 | | | | 1,277 | |
6.625%, 07/15/2026 (A) | | | 1,564 | | | | 1,681 | |
Ashtead Capital | | | | | | | | |
4.375%, 08/15/2027 (A) | | | 385 | | | | 405 | |
B&G Foods | | | | | | | | |
5.250%, 04/01/2025 | | | 1,170 | | | | 1,214 | |
Bausch Health | | | | | | | | |
9.000%, 12/15/2025 (A) | | | 3,430 | | | | 3,769 | |
7.250%, 05/30/2029 (A) | | | 295 | | | | 326 | |
7.000%, 03/15/2024 (A) | | | 885 | | | | 912 | |
7.000%, 01/15/2028 (A) | | | 1,460 | | | | 1,577 | |
6.250%, 02/15/2029 (A) | | | 6,429 | | | | 6,815 | |
6.125%, 04/15/2025 (A) | | | 3,911 | | | | 4,025 | |
5.250%, 01/30/2030 (A) | | | 5,598 | | | | 5,718 | |
5.250%, 02/15/2031 (A) | | | 3,081 | | | | 3,116 | |
5.000%, 01/30/2028 (A) | | | 1,771 | | | | 1,771 | |
5.000%, 02/15/2029 (A) | | | 879 | | | | 887 | |
Bausch Health Americas | | | | | | | | |
9.250%, 04/01/2026 (A) | | | 365 | | | | 405 | |
8.500%, 01/31/2027 (A) | | | 1,291 | | | | 1,420 | |
Capitol Investment Merger Sub 2 LLC | | | | | | | | |
10.000%, 08/01/2024 (A) | | | 5,510 | | | | 5,868 | |
Central Garden & Pet | | | | | | | | |
5.125%, 02/01/2028 | | | 1,515 | | | | 1,612 | |
| | |
152 | | SEI Institutional Investments Trust / Semi-Annual Report / November 30, 2020 |
| | | | | | | | |
| | | |
| Description | | Face Amount
(Thousands) | | Market Value
($ Thousands) |
|
CORPORATE OBLIGATIONS (continued) | |
4.125%, 10/15/2030 | | $ | 1,655 | | | $ | 1,743 | |
Chobani LLC | | | | | | | | |
7.500%, 04/15/2025 (A) | | | 4,102 | | | | 4,287 | |
4.625%, 11/15/2028 (A) | | | 2,090 | | | | 2,158 | |
Clearwater Seafoods | | | | | | | | |
6.875%, 05/01/2025 (A) | | | 2,106 | | | | 2,201 | |
Coty Inc | | | | | | | | |
6.500%, 04/15/2026 (A) | | | 375 | | | | 366 | |
Dole Food | | | | | | | | |
7.250%, 06/15/2025 (A) | | | 1,761 | | | | 1,783 | |
Edgewell Personal Care | | | | | | | | |
5.500%, 06/01/2028 (A) | | | 1,257 | | | | 1,351 | |
Energizer Holdings | | | | | | | | |
7.750%, 01/15/2027 (A) | | | 2,011 | | | | 2,192 | |
4.750%, 06/15/2028 (A) | | | 536 | | | | 561 | |
4.375%, 03/31/2029 (A) | | | 1,831 | | | | 1,868 | |
Envision Healthcare | | | | | | | | |
8.750%, 10/15/2026 (A) | | | 1,585 | | | | 940 | |
Fresh Market | | | | | | | | |
9.750%, 05/01/2023 (A) | | | 1,764 | | | | 1,729 | |
GEMS MENASA Cayman | | | | | | | | |
7.125%, 07/31/2026 (A) | | | 1,543 | | | | 1,566 | |
Global Medical Response | | | | | | | | |
6.500%, 10/01/2025 (A) | | | 1,937 | | | | 1,995 | |
High Ridge Brands | | | | | | | | |
8.875%, 03/15/2025 (A)(B) | | | 800 | | | | 23 | |
JBS Investments II GmbH | | | | | | | | |
7.000%, 01/15/2026 (A) | | | 2,225 | | | | 2,396 | |
JBS USA LUX | | | | | | | | |
5.750%, 06/15/2025 (A) | | | 135 | | | | 139 | |
5.500%, 01/15/2030 (A) | | | 2,347 | | | | 2,638 | |
Kraft Heinz Foods | | | | | | | | |
5.000%, 07/15/2035 | | | 6,092 | | | | 7,184 | |
4.375%, 06/01/2046 | | | 1,793 | | | | 1,915 | |
4.250%, 03/01/2031 (A) | | | 1,126 | | | | 1,251 | |
3.000%, 06/01/2026 | | | 3,236 | | | | 3,377 | |
Lamb Weston Holdings | | | | | | | | |
4.875%, 11/01/2026 (A) | | | 575 | | | | 598 | |
4.875%, 05/15/2028 (A) | | | 218 | | | | 242 | |
4.625%, 11/01/2024 (A) | | | 2,515 | | | | 2,616 | |
Legacy LifePoint Health LLC | | | | | | | | |
6.750%, 04/15/2025 (A) | | | 612 | | | | 653 | |
4.375%, 02/15/2027 (A) | | | 8,326 | | | | 8,368 | |
LifePoint Health | | | | | | | | |
5.375%, 01/15/2029 (A) | | | 1,143 | | | | 1,143 | |
MPH Acquisition Holdings LLC | | | | | | | | |
5.750%, 11/01/2028 (A) | | | 1,378 | | | | 1,350 | |
New Albertsons | | | | | | | | |
8.700%, 05/01/2030 | | | 2,229 | | | | 2,797 | |
Ortho-Clinical Diagnostics | | | | | | | | |
7.375%, 06/01/2025 (A) | | | 1,300 | | | | 1,391 | |
7.250%, 02/01/2028 (A) | | | 4,064 | | | | 4,328 | |
| | | | | | | | |
| | | |
| Description | | Face Amount
(Thousands) | | Market Value
($ Thousands) |
|
CORPORATE OBLIGATIONS (continued) | |
P&L Development LLC | | | | | | | | |
7.750%, 11/15/2025 (A) | | $ | 1,160 | | | $ | 1,224 | |
Performance Food Group | | | | | | | | |
6.875%, 05/01/2025 (A) | | | 80 | | | | 86 | |
5.500%, 10/15/2027 (A) | | | 565 | | | | 601 | |
Pilgrim’s Pride | | | | | | | | |
5.875%, 09/30/2027 (A) | | | 2,885 | | | | 3,101 | |
Post Holdings | | | | | | | | |
5.750%, 03/01/2027 (A) | | | 1,792 | | | | 1,886 | |
5.625%, 01/15/2028 (A) | | | 1,725 | | | | 1,835 | |
5.500%, 12/15/2029 (A) | | | 857 | | | | 930 | |
4.625%, 04/15/2030 (A) | | | 234 | | | | 244 | |
Prime Security Services Borrower LLC | | | | | | | | |
5.750%, 04/15/2026 (A) | | | 1,663 | | | | 1,804 | |
3.375%, 08/31/2027 (A) | | | 955 | | | | 943 | |
Primo Water Holdings | | | | | | | | |
5.500%, 04/01/2025 (A) | | | 3,509 | | | | 3,627 | |
Radiology Partners | | | | | | | | |
9.250%, 02/01/2028 (A) | | | 2,079 | | | | 2,266 | |
Rite Aid | | | | | | | | |
8.000%, 11/15/2026 (A) | | | 3,945 | | | | 4,004 | |
7.700%, 02/15/2027 | | | 1,620 | | | | 1,353 | |
7.500%, 07/01/2025 (A) | | | 526 | | | | 535 | |
Sabre Global | | | | | | | | |
9.250%, 04/15/2025 (A) | | | 697 | | | | 815 | |
7.375%, 09/01/2025 (A) | | | 999 | | | | 1,076 | |
5.250%, 11/15/2023 (A) | | | 2,042 | | | | 2,055 | |
Sigma Holdco BV | | | | | | | | |
7.875%, 05/15/2026 (A) | | | 5,433 | | | | 5,433 | |
Simmons Foods | | | | | | | | |
5.750%, 11/01/2024 (A) | | | 3,225 | | | | 3,298 | |
Spectrum Brands | | | | | | | | |
5.750%, 07/15/2025 | | | 745 | | | | 769 | |
5.500%, 07/15/2030 (A) | | | 1,303 | | | | 1,420 | |
5.000%, 10/01/2029 (A) | | | 155 | | | | 167 | |
Surgery Center Holdings | | | | | | | | |
6.750%, 07/01/2025 (A) | | | 1,404 | | | | 1,425 | |
Team Health Holdings | | | | | | | | |
6.375%, 02/01/2025 (A) | | | 3,760 | | | | 2,897 | |
TreeHouse Foods | | | | | | | | |
6.000%, 02/15/2024 (A) | | | 1,095 | | | | 1,119 | |
4.000%, 09/01/2028 | | | 65 | | | | 66 | |
US Foods | | | | | | | | |
6.250%, 04/15/2025 (A) | | | 889 | | | | 946 | |
5.875%, 06/15/2024 (A) | | | 1,545 | | | | 1,566 | |
Vector Group | | | | | | | | |
10.500%, 11/01/2026 (A) | | | 6,015 | | | | 6,451 | |
Verscend Escrow | | | | | | | | |
9.750%, 08/15/2026 (A) | | | 1,782 | | | | 1,936 | |
| | |
SEI Institutional Investments Trust / Semi-Annual Report / November 30, 2020 | | 153 |
SCHEDULE OF INVESTMENTS (Unaudited)
November 30, 2020
High Yield Bond Fund (Continued)
| | | | | | | | |
| | | |
| Description | | Face Amount
(Thousands) | | Market Value
($ Thousands) |
|
CORPORATE OBLIGATIONS (continued) | |
West Street Merger Sub | | | | | | | | |
6.375%, 09/01/2025 (A) | | $ | 1,730 | | | $ | 1,775 | |
| | | | | | | | |
| | | | | | | 177,404 | |
| | | | | | | | |
|
Energy — 9.6% | |
Antero Midstream Partners | | | | | | | | |
7.875%, 05/15/2026 (A) | | | 1,473 | | | | 1,477 | |
5.750%, 03/01/2027 (A) | | | 2,186 | | | | 1,992 | |
5.750%, 01/15/2028 (A) | | | 502 | | | | 452 | |
5.375%, 09/15/2024 | | | 1,540 | | | | 1,440 | |
Antero Resources | | | | | | | | |
5.625%, 06/01/2023 | | | 1,020 | | | | 913 | |
5.125%, 12/01/2022 | | | 2,965 | | | | 2,802 | |
Apache | | | | | | | | |
5.100%, 09/01/2040 | | | 2,350 | | | | 2,428 | |
4.875%, 11/15/2027 | | | 1,807 | | | | 1,887 | |
4.625%, 11/15/2025 | | | 737 | | | | 766 | |
4.375%, 10/15/2028 | | | 451 | | | | 460 | |
Archrock Partners | | | | | | | | |
6.250%, 04/01/2028 (A) | | | 2,858 | | | | 2,947 | |
Ascent Resources Utica Holdings LLC | | | | | | | | |
9.000%, 11/01/2027 (A) | | | 1,106 | | | | 1,167 | |
7.000%, 11/01/2026 (A) | | | 1,220 | | | | 1,147 | |
Baytex Energy | | | | | | | | |
8.750%, 04/01/2027 (A) | | | 600 | | | | 282 | |
Blue Racer Midstream LLC | | | | | | | | |
6.625%, 07/15/2026 (A) | | | 250 | | | | 235 | |
6.125%, 11/15/2022 (A) | | | 4,147 | | | | 4,147 | |
Buckeye Partners | | | | | | | | |
4.500%, 03/01/2028 (A) | | | 350 | | | | 350 | |
4.125%, 03/01/2025 (A) | | | 350 | | | | 349 | |
4.125%, 12/01/2027 | | | 480 | | | | 475 | |
Callon Petroleum | | | | | | | | |
8.250%, 07/15/2025 | | | 330 | | | | 130 | |
6.250%, 04/15/2023 | | | 445 | | | | 212 | |
Cenovus Energy | | | | | | | | |
5.375%, 07/15/2025 | | | 612 | | | | 673 | |
Cheniere Corpus Christi Holdings LLC | | | | | | | | |
5.875%, 03/31/2025 | | | 850 | | | | 975 | |
Cheniere Energy | | | | | | | | |
4.625%, 10/15/2028 (A) | | | 1,682 | | | | 1,745 | |
Cheniere Energy Partners | | | | | | | | |
5.625%, 10/01/2026 | | | 3,937 | | | | 4,109 | |
4.500%, 10/01/2029 | | | 10,089 | | | | 10,513 | |
Chesapeake Energy | | | | | | | | |
11.500%, 01/01/2025 (A)(B) | | | 1,373 | | | | 206 | |
7.500%, 10/01/2026 (B) | | | 4,075 | | | | 245 | |
7.000%, 10/01/2024 (B) | | | 1,790 | | | | 107 | |
Citgo Holding | | | | | | | | |
9.250%, 08/01/2024 (A) | | | 2,250 | | | | 2,008 | |
CITGO Petroleum | | | | | | | | |
6.250%, 08/15/2022 (A) | | | 3,184 | | | | 3,108 | |
| | | | | | | | |
| | | |
| Description | | Face Amount
(Thousands) | | Market Value
($ Thousands) |
|
CORPORATE OBLIGATIONS (continued) | |
CNX Midstream Partners | | | | | | | | |
6.500%, 03/15/2026 (A) | | $ | 3,785 | | | $ | 3,842 | |
CNX Resources | | | | | | | | |
7.250%, 03/14/2027 (A) | | | 4,585 | | | | 4,847 | |
6.000%, 01/15/2029 (A) | | | 1,842 | | | | 1,860 | |
Comstock Resources | | | | | | | | |
9.750%, 08/15/2026 | | | 3,640 | | | | 3,849 | |
7.500%, 05/15/2025 (A) | | | 914 | | | | 912 | |
Continental Resources | | | | | | | | |
5.750%, 01/15/2031 (A) | | | 1,014 | | | | 1,088 | |
Crestwood Midstream Partners | | | | | | | | |
6.250%, 04/01/2023 | | | 690 | | | | 693 | |
5.750%, 04/01/2025 | | | 2,905 | | | | 2,883 | |
5.625%, 05/01/2027 (A) | | | 435 | | | | 418 | |
CVR Energy | | | | | | | | |
5.750%, 02/15/2028 (A) | | | 1,350 | | | | 1,131 | |
5.250%, 02/15/2025 (A) | | | 297 | | | | 261 | |
DCP Midstream Operating | | | | | | | | |
8.125%, 08/16/2030 | | | 1,990 | | | | 2,408 | |
5.625%, 07/15/2027 | | | 750 | | | | 812 | |
5.375%, 07/15/2025 | | | 268 | | | | 289 | |
5.125%, 05/15/2029 | | | 896 | | | | 950 | |
Delek Logistics Partners | | | | | | | | |
6.750%, 05/15/2025 | | | 1,462 | | | | 1,345 | |
Devon Energy | | | | | | | | |
7.950%, 04/15/2032 | | | 1,327 | | | | 1,767 | |
Encana, Ser 2004, 110178 | | | | | | | | |
6.500%, 08/15/2034 | | | 105 | | | | 113 | |
Endeavor Energy Resources | | | | | | | | |
6.625%, 07/15/2025 (A) | | | 232 | | | | 247 | |
Energy Transfer | | | | | | | | |
5.500%, 06/01/2027 | | | 2,863 | | | | 2,928 | |
EnLink Midstream LLC | | | | | | | | |
5.375%, 06/01/2029 | | | 7,436 | | | | 7,046 | |
EnLink Midstream Partners | | | | | | | | |
4.850%, 07/15/2026 | | | 140 | | | | 131 | |
4.400%, 04/01/2024 | | | 620 | | | | 598 | |
4.150%, 06/01/2025 | | | 445 | | | | 409 | |
Enviva Partners | | | | | | | | |
6.500%, 01/15/2026 (A) | | | 4,247 | | | | 4,538 | |
EP Energy (Escrow) | | | | | | | | |
0.000%, 05/01/2021 | | | 1,728 | | | | – | |
0.000%, 06/15/2023 | | | 1,185 | | | | – | |
0.000%, 02/15/2025 | | | 1,159 | | | | – | |
EQM Midstream Partners | | | | | | | | |
6.500%, 07/01/2027 (A) | | | 1,116 | | | | 1,230 | |
6.000%, 07/01/2025 (A) | | | 1,445 | | | | 1,539 | |
EQT | | | | | | | | |
8.750%, 02/01/2030 | | | 939 | | | | 1,186 | |
7.875%, 02/01/2025 | | | 4,042 | | | | 4,628 | |
3.900%, 10/01/2027 | | | 230 | | | | 228 | |
| | |
154 | | SEI Institutional Investments Trust / Semi-Annual Report / November 30, 2020 |
| | | | | | | | |
| | | |
| Description | | Face Amount
(Thousands) | | Market Value
($ Thousands) |
|
CORPORATE OBLIGATIONS (continued) | |
Equities | | | | | | | | |
5.000%, 01/15/2029 | | $ | 162 | | | $ | 171 | |
Exterran Energy Solutions | | | | | | | | |
8.125%, 05/01/2025 | | | 3,815 | | | | 3,110 | |
Extraction Oil & Gas | | | | | | | | |
7.375%, 05/15/2024 (A)(B) | | | 6,623 | | | | 1,590 | |
5.625%, 02/01/2026 (A)(B) | | | 4,400 | | | | 1,100 | |
Genesis Energy | | | | | | | | |
7.750%, 02/01/2028 | | | 373 | | | | 343 | |
6.500%, 10/01/2025 | | | 1,476 | | | | 1,358 | |
6.250%, 05/15/2026 | | | 70 | | | | 64 | |
Great Western Petroleum LLC | | | | | | | | |
9.000%, 09/30/2021 (A) | | | 2,974 | | | | 1,695 | |
Gulfport Energy | | | | | | | | |
6.375%, 05/15/2025 (B) | | | 311 | | | | 188 | |
6.375%, 01/15/2026 (B) | | | 780 | | | | 470 | |
6.000%, 10/15/2024 (B) | | | 470 | | | | 283 | |
Hess Midstream Operations | | | | | | | | |
5.625%, 02/15/2026 (A) | | | 3,732 | | | | 3,853 | |
Hilcorp Energy I | | | | | | | | |
6.250%, 11/01/2028 (A) | | | 1,366 | | | | 1,352 | |
5.750%, 10/01/2025 (A) | | | 2,626 | | | | 2,567 | |
5.000%, 12/01/2024 (A) | | | 2,490 | | | | 2,428 | |
Holly Energy Partners | | | | | | | | |
5.000%, 02/01/2028 (A) | | | 295 | | | | 290 | |
Jupiter Resources | | | | | | | | |
13.000%, 01/31/2024 (E) | | | 676 | | | | 608 | |
Laredo Petroleum | | | | | | | | |
10.125%, 01/15/2028 | | | 2,688 | | | | 1,799 | |
9.500%, 01/15/2025 | | | 5,155 | | | | 3,505 | |
Marathon Oil | | | | | | | | |
6.600%, 10/01/2037 | | | 1,183 | | | | 1,400 | |
MEG Energy | | | | | | | | |
7.125%, 02/01/2027 (A) | | | 2,851 | | | | 2,794 | |
7.000%, 03/31/2024 (A) | | | 262 | | | | 263 | |
6.500%, 01/15/2025 (A) | | | 608 | | | | 620 | |
Moss Creek Resources Holdings | | | | | | | | |
10.500%, 05/15/2027 (A) | | | 574 | | | | 399 | |
7.500%, 01/15/2026 (A) | | | 919 | | | | 625 | |
Motiva Enterprises | | | | | | | | |
6.850%, 01/15/2040 (A) | | | 1,713 | | | | 2,035 | |
Nabors Industries | | | | | | | | |
7.250%, 01/15/2026 (A) | | | 245 | | | | 137 | |
5.750%, 02/01/2025 | | | 680 | | | | 249 | |
New Fortress Energy | | | | | | | | |
6.750%, 09/15/2025 (A) | | | 983 | | | | 1,044 | |
NGL Energy Partners | | | | | | | | |
7.500%, 11/01/2023 | | | 890 | | | | 449 | |
6.125%, 03/01/2025 | | | 4,839 | | | | 1,996 | |
Noble Holding International | | | | | | | | |
8.950%, 04/01/2045 (B) | | | 3,100 | | | | 15 | |
7.750%, 01/15/2024 (B) | | | 2,751 | | | | 14 | |
| | | | | | | | |
| | | |
| Description | | Face Amount
(Thousands) | | Market Value
($ Thousands) |
|
CORPORATE OBLIGATIONS (continued) | |
Northern Oil and Gas | | | | | | | | |
8.500%cash/9.500% PIK, 05/15/2023 | | $ | 1,655 | | | $ | 1,394 | |
NRG Energy | | | | | | | | |
12.000%, 09/25/2025 (E) | | | 1,101 | | | | 1,156 | |
NuStar Logistics | | | | | | | | |
6.375%, 10/01/2030 | | | 1,092 | | | | 1,185 | |
6.000%, 06/01/2026 | | | 360 | | | | 379 | |
5.750%, 10/01/2025 | | | 1,092 | | | | 1,149 | |
5.625%, 04/28/2027 | | | 80 | | | | 82 | |
Occidental Petroleum | | | | | | | | |
8.875%, 07/15/2030 | | | 1,856 | | | | 2,095 | |
8.500%, 07/15/2027 | | | 1,900 | | | | 2,109 | |
8.000%, 07/15/2025 | | | 1,072 | | | | 1,176 | |
6.625%, 09/01/2030 | | | 2,310 | | | | 2,413 | |
6.450%, 09/15/2036 | | | 1,425 | | | | 1,393 | |
6.375%, 09/01/2028 | | | 1,966 | | | | 2,004 | |
5.875%, 09/01/2025 | | | 1,176 | | | | 1,188 | |
5.550%, 03/15/2026 | | | 2,855 | | | | 2,834 | |
4.625%, 06/15/2045 | | | 1,875 | | | | 1,556 | |
4.500%, 07/15/2044 | | | 406 | | | | 335 | |
4.400%, 04/15/2046 | | | 155 | | | | 131 | |
3.500%, 08/15/2029 | | | 355 | | | | 311 | |
3.400%, 04/15/2026 | | | 1,277 | | | | 1,156 | |
3.200%, 08/15/2026 | | | 4,728 | | | | 4,184 | |
3.125%, 02/15/2022 | | | 2,594 | | | | 2,587 | |
2.900%, 08/15/2024 | | | 1,089 | | | | 1,016 | |
2.700%, 08/15/2022 | | | 12,979 | | | | 12,788 | |
2.700%, 02/15/2023 | | | 1,843 | | | | 1,775 | |
Ovintiv | | | | | | | | |
8.125%, 09/15/2030 | | | 170 | | | | 196 | |
Parkland | | | | | | | | |
5.875%, 07/15/2027 (A) | | | 1,970 | | | | 2,118 | |
Parsley Energy LLC | | | | | | | | |
5.375%, 01/15/2025 (A) | | | 310 | | | | 319 | |
5.250%, 08/15/2025 (A) | | | 505 | | | | 524 | |
PBF Holding LLC | | | | | | | | |
9.250%, 05/15/2025 (A) | | | 170 | | | | 169 | |
6.000%, 02/15/2028 (A) | | | 325 | | | | 171 | |
PDC Energy | | | | | | | | |
5.750%, 05/15/2026 | | | 3,255 | | | | 3,239 | |
Peabody Energy | | | | | | | | |
6.375%, 03/31/2025 (A) | | | 1,094 | | | | 274 | |
Precision Drilling | | | | | | | | |
7.750%, 12/15/2023 | | | 645 | | | | 519 | |
7.125%, 01/15/2026 (A) | | | 325 | | | | 215 | |
QEP Resources | | | | | | | | |
5.625%, 03/01/2026 | | | 1,151 | | | | 823 | |
Range Resources | | | | | | | | |
4.875%, 05/15/2025 | | | 1,142 | | | | 1,060 | |
Seventy Seven Energy (Escrow Security) | | | | | | | | |
6.500%, 07/15/2022 (B)(E) | | | 395 | | | | – | |
| | |
SEI Institutional Investments Trust / Semi-Annual Report / November 30, 2020 | | 155 |
SCHEDULE OF INVESTMENTS (Unaudited)
November 30, 2020
High Yield Bond Fund (Continued)
| | | | | | | | |
| | | |
| Description | | Face Amount
(Thousands) | | Market Value
($ Thousands) |
|
CORPORATE OBLIGATIONS (continued) | |
Seventy Seven Operating LLC (Escrow Security) | | | | | | | | |
6.625%, 11/15/2019 (B)(E) | | $ | 2,787 | | | $ | – | |
Shelf Drilling Holdings | | | | | | | | |
8.250%, 02/15/2025 (A) | | | 1,365 | | | | 478 | |
SM Energy | | | | | | | | |
6.625%, 01/15/2027 | | | 458 | | | | 257 | |
6.125%, 11/15/2022 | | | 520 | | | | 463 | |
5.625%, 06/01/2025 | | | 405 | | | | 235 | |
5.000%, 01/15/2024 | | | 2,328 | | | | 1,560 | |
Southwestern Energy | | | | | | | | |
7.750%, 10/01/2027 | | | 1,320 | | | | 1,393 | |
7.500%, 04/01/2026 | | | 2,879 | | | | 2,999 | |
6.450%, 01/23/2025 | | | 858 | | | | 875 | |
Summit Midstream Holdings LLC | | | | | | | | |
5.750%, 04/15/2025 | | | 490 | | | | 309 | |
5.500%, 08/15/2022 | | | 2,848 | | | | 2,328 | |
Sunoco | | | | | | | | |
5.875%, 03/15/2028 | | | 2,791 | | | | 2,986 | |
5.500%, 02/15/2026 | | | 2,500 | | | | 2,592 | |
4.500%, 05/15/2029 (A) | | | 902 | | | | 930 | |
Tallgrass Energy Partners | | | | | | | | |
7.500%, 10/01/2025 (A) | | | 875 | | | | 901 | |
6.000%, 03/01/2027 (A) | | | 3,175 | | | | 3,131 | |
5.500%, 09/15/2024 (A) | | | 185 | | | | 183 | |
5.500%, 01/15/2028 (A) | | | 115 | | | | 110 | |
Targa Resources Partners | | | | | | | | |
6.875%, 01/15/2029 | | | 516 | | | | 578 | |
6.500%, 07/15/2027 | | | 6,409 | | | | 6,938 | |
5.875%, 04/15/2026 | | | 685 | | | | 721 | |
5.000%, 01/15/2028 | | | 3,156 | | | | 3,290 | |
4.875%, 02/01/2031 (A) | | | 397 | | | | 422 | |
4.250%, 11/15/2023 | | | 350 | | | | 352 | |
TerraForm Power Operating LLC | | | | | | | | |
4.750%, 01/15/2030 (A) | | | 225 | | | | 244 | |
4.250%, 01/31/2023 (A) | | | 3,153 | | | | 3,256 | |
Transocean | | | | | | | | |
11.500%, 01/30/2027 (A) | | | 1,334 | | | | 680 | |
8.000%, 02/01/2027 (A) | | | 2,645 | | | | 979 | |
7.500%, 04/15/2031 | | | 1,580 | | | | 442 | |
Transocean Guardian | | | | | | | | |
5.875%, 01/15/2024 (A) | | | 2,455 | | | | 1,939 | |
Transocean Pontus | | | | | | | | |
6.125%, 08/01/2025 (A) | | | 3,611 | | | | 3,372 | |
USA Compression Partners | | | | | | | | |
6.875%, 04/01/2026 | | | 3,315 | | | | 3,430 | |
6.875%, 09/01/2027 | | | 2,600 | | | | 2,723 | |
Valaris | | | | | | | | |
5.850%, 01/15/2044 (B) | | | 3,185 | | | | 191 | |
5.400%, 12/01/2042 (B) | | | 545 | | | | 33 | |
4.875%, 06/01/2022 (B) | | | 790 | | | | 50 | |
| | | | | | | | |
| | | |
| Description | | Face Amount
(Thousands) | | Market Value
($ Thousands) |
|
CORPORATE OBLIGATIONS (continued) | |
Vine Oil & Gas | | | | | | | | |
9.750%, 04/15/2023 (A) | | $ | 4,234 | | | $ | 3,408 | |
Western Midstream Operating | | | | | | | | |
5.300%, 02/01/2030 | | | 331 | | | | 354 | |
4.350%, 02/01/2025 | | | 2,304 | | | | 2,299 | |
3.950%, 06/01/2025 | | | 405 | | | | 403 | |
2.074%, VAR ICE LIBOR USD 3 Month+1.850%, 01/13/2023 | | | 500 | | | | 484 | |
WPX Energy | | | | | | | | |
8.250%, 08/01/2023 | | | 566 | | | | 645 | |
5.875%, 06/15/2028 | | | 198 | | | | 213 | |
5.750%, 06/01/2026 | | | 356 | | | | 375 | |
5.250%, 10/15/2027 | | | 1,375 | | | | 1,451 | |
| | | | | | | | |
| | | | | | | 259,762 | |
| | | | | | | | |
|
Financials — 5.9% | |
Acrisure LLC | | | | | | | | |
8.125%, 02/15/2024 (A) | | | 3,492 | | | | 3,667 | |
Advisor Group Holdings | | | | | | | | |
10.750%, 08/01/2027 (A) | | | 2,666 | | | | 2,876 | |
Air Methods | | | | | | | | |
8.000%, 05/15/2025 (A) | | | 5,061 | | | | 4,226 | |
Alliant Holdings Intermediate LLC | | | | | | | | |
6.750%, 10/15/2027 (A) | | | 2,257 | | | | 2,415 | |
Ally Financial | | | | | | | | |
5.750%, 11/20/2025 | | | 650 | | | | 759 | |
AmWINS Group | | | | | | | | |
7.750%, 07/01/2026 (A) | | | 891 | | | | 962 | |
AssuredPartners | | | | | | | | |
7.000%, 08/15/2025 (A) | | | 3,245 | | | | 3,350 | |
Athene Holding | | | | | | | | |
6.150%, 04/03/2030 | | | 1,749 | | | | 2,181 | |
Bank of America | | | | | | | | |
6.100%, VAR ICE LIBOR USD 3 Month+3.898%(D) | | | 887 | | | | 985 | |
5.875%, VAR ICE LIBOR USD 3 Month+2.931%(D) | | | 1,301 | | | | 1,457 | |
Barclays | | | | | | | | |
7.750%, VAR USD Swap Semi 30/360 5 Yr Curr+4.842%(D) | | | 2,760 | | | | 2,967 | |
6.125%, VAR US Treas Yield Curve Rate T Note Const Mat 5 Yr+5.867%(D) | | | 1,250 | | | | 1,344 | |
BGC Partners | | | | | | | | |
3.750%, 10/01/2024 | | | 2,265 | | | | 2,322 | |
Brookfield Property | | | | | | | | |
5.750%, 05/15/2026 (A) | | | 6,941 | | | | 6,386 | |
Citigroup | | | | | | | | |
5.950%, VAR ICE LIBOR USD 3 Month+3.905%(D) | | | 85 | | | | 92 | |
5.000%, VAR United States Secured Overnight Financing Rate+3.813%(D) | | | 5,285 | | | | 5,528 | |
| | |
156 | | SEI Institutional Investments Trust / Semi-Annual Report / November 30, 2020 |
| | | | | | | | |
| | | |
| Description | | Face Amount
(Thousands) | | Market Value
($ Thousands) |
|
CORPORATE OBLIGATIONS (continued) | |
Credit Agricole | | | | | | | | |
6.875%, VAR USD Swap Semi 30/360 5 Yr Curr+4.319%(A)(D) | | $ | 963 | | | $ | 1,065 | |
Donnelley Financial Solutions | | | | | | | | |
8.250%, 10/15/2024 | | | 935 | | | | 993 | |
Freedom Mortgage | | | | | | | | |
8.250%, 04/15/2025 (A) | | | 7,685 | | | | 7,896 | |
8.125%, 11/15/2024 (A) | | | 3,492 | | | | 3,597 | |
7.625%, 05/01/2026 (A) | | | 360 | | | | 367 | |
FS Energy & Power Fund | | | | | | | | |
7.500%, 08/15/2023 (A) | | | 1,950 | | | | 1,843 | |
Genworth Holdings | | | | | | | | |
4.900%, 08/15/2023 | | | 442 | | | | 425 | |
Genworth Mortgage Holdings | | | | | | | | |
6.500%, 08/15/2025 (A) | | | 1,824 | | | | 1,943 | |
HAT Holdings I LLC | | | | | | | | |
6.000%, 04/15/2025 (A) | | | 2,299 | | | | 2,454 | |
3.750%, 09/15/2030 (A) | | | 623 | | | | 637 | |
HUB International | | | | | | | | |
7.000%, 05/01/2026 (A) | | | 1,603 | | | | 1,673 | |
Hunt | | | | | | | | |
6.250%, 02/15/2026 (A) | | | 1,767 | | | | 1,787 | |
Intesa Sanpaolo MTN | | | | | | | | |
5.710%, 01/15/2026 (A) | | | 1,685 | | | | 1,912 | |
Issuer LLC | | | | | | | | |
6.250%, 03/01/2028 (A) | | | 1,299 | | | | 1,306 | |
Jefferies Finance LLC | | | | | | | | |
6.250%, 06/03/2026 (A) | | | 1,388 | | | | 1,462 | |
JPMorgan Chase | | | | | | | | |
5.000%, VAR United States Secured Overnight Financing Rate+3.380%(D) | | | 1,299 | | | | 1,364 | |
4.000%, VAR United States Secured Overnight Financing Rate+2.745%(D) | | | 2,633 | | | | 2,631 | |
Ladder Capital Finance Holdings LLLP | | | | | | | | |
5.250%, 03/15/2022 (A) | | | 3,157 | | | | 3,149 | |
5.250%, 10/01/2025 (A) | | | 345 | | | | 332 | |
4.250%, 02/01/2027 (A) | | | 3,517 | | | | 3,249 | |
LD Holdings Group LLC | | | | | | | | |
6.500%, 11/01/2025 (A) | | | 3,873 | | | | 4,076 | |
Lloyds Banking Group | | | | | | | | |
7.500%, VAR USD Swap Semi 30/360 5 Yr Curr+4.760%(D) | | | 3,250 | | | | 3,583 | |
LPL Holdings | | | | | | | | |
4.625%, 11/15/2027 (A) | | | 3,627 | | | | 3,718 | |
MGM Growth Properties Operating Partnership | | | | | | | | |
5.750%, 02/01/2027 | | | 357 | | | | 398 | |
5.625%, 05/01/2024 | | | 1,335 | | | | 1,432 | |
4.625%, 06/15/2025 (A) | | | 411 | | | | 434 | |
4.500%, 09/01/2026 | | | 2,214 | | | | 2,336 | |
4.500%, 01/15/2028 | | | 175 | | | | 182 | |
| | | | | | | | |
| | | |
| Description | | Face Amount
(Thousands) | | Market Value
($ Thousands) |
|
CORPORATE OBLIGATIONS (continued) | |
3.875%, 02/15/2029 (A) | | $ | 396 | | | $ | 400 | |
Morgan Stanley | | | | | | | | |
5.875%, VAR ICE LIBOR USD 3 Month+4.435%(D) | | | 1,298 | | | | 1,444 | |
5.300%, VAR ICE LIBOR USD 3 Month+3.160%(D) | | | 872 | | | | 903 | |
Nationstar Mortgage Holdings | | | | | | | | |
9.125%, 07/15/2026 (A) | | | 2,985 | | | | 3,205 | |
6.000%, 01/15/2027 (A) | | | 2,312 | | | | 2,397 | |
5.500%, 08/15/2028 (A) | | | 3,865 | | | | 3,981 | |
Navient | | | | | | | | |
7.250%, 09/25/2023 | | | 792 | | | | 863 | |
5.000%, 03/15/2027 | | | 1,097 | | | | 1,086 | |
Navient MTN | | | | | | | | |
5.625%, 08/01/2033 | | | 500 | | | | 469 | |
New Residential Investment | | | | | | | | |
6.250%, 10/15/2025 (A) | | | 5,937 | | | | 5,818 | |
NFP | | | | | | | | |
7.000%, 05/15/2025 (A) | | | 450 | | | | 482 | |
6.875%, 08/15/2028 (A) | | | 2,186 | | | | 2,290 | |
NMI Holdings | | | | | | | | |
7.375%, 06/01/2025 (A) | | | 925 | | | | 1,024 | |
OneMain Finance | | | | | | | | |
7.125%, 03/15/2026 | | | 3,980 | | | | 4,581 | |
6.875%, 03/15/2025 | | | 35 | | | | 40 | |
6.625%, 01/15/2028 | | | 500 | | | | 576 | |
5.375%, 11/15/2029 | | | 1,858 | | | | 2,025 | |
PennyMac Financial Services | | | | | | | | |
5.375%, 10/15/2025 (A) | | | 1,565 | | | | 1,635 | |
PRA Group | | | | | | | | |
7.375%, 09/01/2025 (A) | | | 2,400 | | | | 2,576 | |
Quicken Loans LLC | | | | | | | | |
5.250%, 01/15/2028 (A) | | | 1,166 | | | | 1,233 | |
3.875%, 03/01/2031 (A) | | | 1,025 | | | | 1,038 | |
3.625%, 03/01/2029 (A) | | | 1,025 | | | | 1,019 | |
Radian Group | | | | | | | | |
4.875%, 03/15/2027 | | | 882 | | | | 939 | |
4.500%, 10/01/2024 | | | 1,508 | | | | 1,568 | |
Saracen Development LLC | | | | | | | | |
11.000%cash/3.000% PIK, 10/15/2025 (A)(E) | | | 3,707 | | | | 4,242 | |
SLM | | | | | | | | |
4.200%, 10/29/2025 | | | 996 | | | | 1,043 | |
Starwood Property Trust | | | | | | | | |
5.500%, 11/01/2023 (A) | | | 2,170 | | | | 2,192 | |
4.750%, 03/15/2025 | | | 2,256 | | | | 2,316 | |
Trilogy | | | | | | | | |
10.000%, 01/31/2024 | | | 58 | | | | 59 | |
United Shore Financial Services LLC | | | | | | | | |
5.500%, 11/15/2025 (A) | | | 3,032 | | | | 3,188 | |
| | |
SEI Institutional Investments Trust / Semi-Annual Report / November 30, 2020 | | 157 |
SCHEDULE OF INVESTMENTS (Unaudited)
November 30, 2020
High Yield Bond Fund (Continued)
| | | | | | | | |
| | | |
| Description | | Face Amount
(Thousands) | | Market Value
($ Thousands) |
|
CORPORATE OBLIGATIONS (continued) | |
Voya Financial | | | | | | | | |
4.700%, VAR ICE LIBOR USD 3 Month+2.084%, 01/23/2048 | | $ | 1,183 | | | $ | 1,210 | |
WeWork | | | | | | | | |
7.875%, 05/01/2025 (A) | | | 4,935 | | | | 3,405 | |
| | | | | | | | |
| | | | | | | 157,008 | |
| | | | | | | | |
|
Health Care — 4.1% | |
Acadia Healthcare | | | | | | | | |
5.625%, 02/15/2023 | | | 2,826 | | | | 2,840 | |
5.500%, 07/01/2028 (A) | | | 1,201 | | | | 1,278 | |
5.000%, 04/15/2029 (A) | | | 232 | | | | 244 | |
AMN Healthcare | | | | | | | | |
4.625%, 10/01/2027 (A) | | | 2,262 | | | | 2,364 | |
Avantor Funding | | | | | | | | |
4.625%, 07/15/2028 (A) | | | 483 | | | | 508 | |
Bausch Health | | | | | | | | |
5.875%, 05/15/2023 (A) | | | 9 | | | | 9 | |
Catalent Pharma Solutions | | | | | | | | |
5.000%, 07/15/2027 (A) | | | 726 | | | | 764 | |
Centene | | | | | | | | |
5.375%, 06/01/2026 (A) | | | 730 | | | | 767 | |
4.625%, 12/15/2029 | | | 1,290 | | | | 1,414 | |
4.250%, 12/15/2027 | | | 4,088 | | | | 4,320 | |
3.375%, 02/15/2030 | | | 300 | | | | 314 | |
3.000%, 10/15/2030 | | | 2,638 | | | | 2,777 | |
CHS | | | | | | | | |
8.625%, 01/15/2024 (A) | | | 740 | | | | 770 | |
6.250%, 03/31/2023 | | | 55 | | | | 56 | |
DaVita | | | | | | | | |
4.625%, 06/01/2030 (A) | | | 310 | | | | 326 | |
3.750%, 02/15/2031 (A) | | | 5,249 | | | | 5,229 | |
Emergent BioSolutions | | | | | | | | |
3.875%, 08/15/2028 (A) | | | 4,063 | | | | 4,109 | |
Encompass Health | | | | | | | | |
4.750%, 02/01/2030 | | | 2,257 | | | | 2,402 | |
4.625%, 04/01/2031 | | | 242 | | | | 258 | |
4.500%, 02/01/2028 | | | 2,762 | | | | 2,890 | |
Endo DAC | | | | | | | | |
9.500%, 07/31/2027 (A) | | | 1,968 | | | | 2,166 | |
6.000%, 02/01/2025 (A) | | | 1,058 | | | | 751 | |
6.000%, 06/30/2028 (A) | | | 3,182 | | | | 2,514 | |
Endo Finance LLC | | | | | | | | |
5.750%, 01/15/2022 (A) | | | 1,738 | | | | 1,686 | |
HCA | | | | | | | | |
5.875%, 02/15/2026 | | | 7,520 | | | | 8,657 | |
5.875%, 02/01/2029 | | | 2,467 | | | | 2,949 | |
5.625%, 09/01/2028 | | | 445 | | | | 522 | |
5.375%, 02/01/2025 | | | 6,926 | | | | 7,754 | |
3.500%, 09/01/2030 | | | 2,748 | | | | 2,845 | |
Hill-Rom Holdings | | | | | | | | |
5.000%, 02/15/2025 (A) | | | 1,214 | | | | 1,250 | |
| | | | | | | | |
| | | |
| Description | | Face Amount
(Thousands) | | Market Value
($ Thousands) |
|
CORPORATE OBLIGATIONS (continued) | |
4.375%, 09/15/2027 (A) | | $ | 1,411 | | | $ | 1,471 | |
Hologic | | | | | | | | |
3.250%, 02/15/2029 (A) | | | 417 | | | | 424 | |
Horizon Therapeutics USA | | | | | | | | |
5.500%, 08/01/2027 (A) | | | 1,305 | | | | 1,378 | |
IQVIA | | | | | | | | |
5.000%, 10/15/2026 (A) | | | 1,440 | | | | 1,507 | |
Jaguar Holding II | | | | | | | | |
5.000%, 06/15/2028 (A) | | | 150 | | | | 160 | |
4.625%, 06/15/2025 (A) | | | 152 | | | | 159 | |
Mallinckrodt International Finance | | | | | | | | |
5.625%, 10/15/2023 (A)(B) | | | 850 | | | | 264 | |
5.500%, 04/15/2025 (A)(B) | | | 595 | | | | 184 | |
MEDNAX | | | | | | | | |
6.250%, 01/15/2027 (A) | | | 1,570 | | | | 1,680 | |
Molina Healthcare | | | | | | | | |
4.375%, 06/15/2028 (A) | | | 1,960 | | | | 2,058 | |
3.875%, 11/15/2030 (A) | | | 382 | | | | 403 | |
Par Pharmaceutical | | | | | | | | |
7.500%, 04/01/2027 (A) | | | 3,405 | | | | 3,677 | |
Prestige Brands | | | | | | | | |
6.375%, 03/01/2024 (A) | | | 735 | | | | 753 | |
5.125%, 01/15/2028 (A) | | | 185 | | | | 196 | |
Providence Service | | | | | | | | |
5.875%, 11/15/2025 (A) | | | 1,390 | | | | 1,475 | |
Select Medical | | | | | | | | |
6.250%, 08/15/2026 (A) | | | 1,336 | | | | 1,426 | |
Syneos Health | | | | | | | | |
3.625%, 01/15/2029 (A) | | | 1,105 | | | | 1,113 | |
Tenet Healthcare | | | | | | | | |
7.500%, 04/01/2025 (A) | | | 404 | | | | 442 | |
7.000%, 08/01/2025 | | | 1,520 | | | | 1,570 | |
6.875%, 11/15/2031 | | | 335 | | | | 347 | |
6.750%, 06/15/2023 | | | 830 | | | | 893 | |
6.250%, 02/01/2027 (A) | | | 2,873 | | | | 3,009 | |
6.125%, 10/01/2028 (A) | | | 5,886 | | | | 5,982 | |
5.125%, 05/01/2025 | | | 2,762 | | | | 2,789 | |
5.125%, 11/01/2027 (A) | | | 815 | | | | 850 | |
4.875%, 01/01/2026 (A) | | | 2,367 | | | | 2,438 | |
4.625%, 07/15/2024 | | | 2,095 | | | | 2,132 | |
4.625%, 09/01/2024 (A) | | | 45 | | | | 47 | |
4.625%, 06/15/2028 (A) | | | 3,543 | | | | 3,658 | |
Varex Imaging | | | | | | | | |
7.875%, 10/15/2027 (A) | | | 2,370 | | | | 2,430 | |
| | | | | | | | |
| | | | | | | 109,648 | |
| | | | | | | | |
|
Industrials — 9.4% | |
ACCO Brands | | | | | | | | |
5.250%, 12/15/2024 (A) | | | 740 | | | | 758 | |
ADT Security | | | | | | | | |
4.875%, 07/15/2032 (A) | | | 2,573 | | | | 2,689 | |
| | |
158 | | SEI Institutional Investments Trust / Semi-Annual Report / November 30, 2020 |
| | | | | | | | |
| | | |
| Description | | Face Amount
(Thousands) | | Market Value
($ Thousands) |
|
CORPORATE OBLIGATIONS (continued) | |
Allison Transmission | | | | | | | | |
5.875%, 06/01/2029 (A) | | $ | 355 | | | $ | 396 | |
4.750%, 10/01/2027 (A) | | | 2,184 | | | | 2,311 | |
3.750%, 01/30/2031 (A) | | | 332 | | | | 335 | |
Altera Infrastructure | | | | | | | | |
8.500%, 07/15/2023 (A) | | | 1,612 | | | | 1,335 | |
American Airlines | | | | | | | | |
11.750%, 07/15/2025 (A) | | | 602 | | | | 666 | |
American Airlines Group | | | | | | | | |
5.000%, 06/01/2022 (A) | | | 2,212 | | | | 1,830 | |
3.750%, 03/01/2025 (A) | | | 876 | | | | 582 | |
American Woodmark | | | | | | | | |
4.875%, 03/15/2026 (A) | | | 815 | | | | 833 | |
ARD Finance | | | | | | | | |
6.500%cash/0% PIK, 06/30/2027 (A) | | | 3,812 | | | | 4,017 | |
Ardagh Packaging Finance | | | | | | | | |
6.000%, 02/15/2025 (A) | | | 698 | | | | 721 | |
5.250%, 04/30/2025 (A) | | | 2,581 | | | | 2,720 | |
5.250%, 08/15/2027 (A) | | | 830 | | | | 866 | |
4.125%, 08/15/2026 (A) | | | 900 | | | | 934 | |
ASGN | | | | | | | | |
4.625%, 05/15/2028 (A) | | | 1,796 | | | | 1,868 | |
Avis Budget Car Rental LLC | | | | | | | | |
10.500%, 05/15/2025 (A) | | | 785 | | | | 916 | |
6.375%, 04/01/2024 (A) | | | 2,205 | | | | 2,249 | |
5.250%, 03/15/2025 (A) | | | 470 | | | | 466 | |
Beacon Roofing Supply | | | | | | | | |
4.875%, 11/01/2025 (A) | | | 1,358 | | | | 1,376 | |
Boeing | | | | | | | | |
5.805%, 05/01/2050 | | | 1,769 | | | | 2,339 | |
5.150%, 05/01/2030 | | | 3,538 | | | | 4,171 | |
3.625%, 02/01/2031 | | | 428 | | | | 455 | |
3.250%, 02/01/2028 | | | 456 | | | | 477 | |
Bombardier | | | | | | | | |
8.750%, 12/01/2021 (A) | | | 1,114 | | | | 1,142 | |
7.875%, 04/15/2027 (A) | | | 2,070 | | | | 1,765 | |
7.500%, 12/01/2024 (A) | | | 4,323 | | | | 3,871 | |
7.500%, 03/15/2025 (A) | | | 1,475 | | | | 1,272 | |
6.000%, 10/15/2022 (A) | | | 5,342 | | | | 5,076 | |
Brink’s | | | | | | | | |
5.500%, 07/15/2025 (A) | | | 365 | | | | 390 | |
Builders FirstSource | | | | | | | | |
5.000%, 03/01/2030 (A) | | | 1,297 | | | | 1,398 | |
BWAY Holding Co | | | | | | | | |
7.250%, 04/15/2025 (A) | | | 3,627 | | | | 3,640 | |
5.500%, 04/15/2024 (A) | | | 940 | | | | 952 | |
BWX Technologies | | | | | | | | |
5.375%, 07/15/2026 (A) | | | 3,152 | | | | 3,274 | |
4.125%, 06/30/2028 (A) | | | 607 | | | | 632 | |
Cargo Aircraft Management | | | | | | | | |
4.750%, 02/01/2028 (A) | | | 2,861 | | | | 2,965 | |
| | | | | | | | |
| | | |
| Description | | Face Amount
(Thousands) | | Market Value
($ Thousands) |
|
CORPORATE OBLIGATIONS (continued) | |
Cenveo (Escrow Security) | | | | | | | | |
8.500%, 09/15/2022 (E) | | $ | 10,375 | | | $ | 9 | |
Clark Equipment | | | | | | | | |
5.875%, 06/01/2025 (A) | | | 2,471 | | | | 2,604 | |
Clean Harbors | | | | | | | | |
4.875%, 07/15/2027 (A) | | | 2,979 | | | | 3,155 | |
CP Atlas Buyer | | | | | | | | |
7.000%, 12/01/2028 (A) | | | 2,023 | | | | 2,094 | |
Delta Air Lines | | | | | | | | |
7.375%, 01/15/2026 | | | 1,816 | | | | 2,042 | |
7.000%, 05/01/2025 (A) | | | 4,499 | | | | 5,140 | |
4.750%, 10/20/2028 (A) | | | 3,199 | | | | 3,442 | |
4.500%, 10/20/2025 (A) | | | 3,806 | | | | 4,018 | |
EnerSys | | | | | | | | |
4.375%, 12/15/2027 (A) | | | 892 | | | | 945 | |
EnPro Industries | | | | | | | | |
5.750%, 10/15/2026 | | | 569 | | | | 609 | |
Flex Acquisition | | | | | | | | |
7.875%, 07/15/2026 (A) | | | 1,448 | | | | 1,524 | |
Fortress Transportation & Infrastructure Investors LLC | | | | | | | | |
9.750%, 08/01/2027 (A) | | | 1,500 | | | | 1,702 | |
6.750%, 03/15/2022 (A) | | | 2,000 | | | | 2,014 | |
6.500%, 10/01/2025 (A) | | | 950 | | | | 969 | |
GFL Environmental | | | | | | | | |
8.500%, 05/01/2027 (A) | | | 337 | | | | 372 | |
5.125%, 12/15/2026 (A) | | | 2,069 | | | | 2,183 | |
4.000%, 08/01/2028 (A) | | | 202 | | | | 201 | |
3.750%, 08/01/2025 (A) | | | 1,219 | | | | 1,243 | |
Graham Packaging | | | | | | | | |
7.125%, 08/15/2028 (A) | | | 132 | | | | 141 | |
Granite US Holdings | | | | | | | | |
11.000%, 10/01/2027 (A) | | | 2,715 | | | | 2,986 | |
Griffon | | | | | | | | |
5.750%, 03/01/2028 | | | 690 | | | | 731 | |
H&E Equipment Services | | | | | | | | |
5.625%, 09/01/2025 | | | 3,514 | | | | 3,673 | |
3.875%, 12/15/2028 (A) | | | 3,200 | | | | 3,200 | |
Harsco | | | | | | | | |
5.750%, 07/31/2027 (A) | | | 766 | | | | 810 | |
Herc Holdings | | | | | | | | |
5.500%, 07/15/2027 (A) | | | 3,370 | | | | 3,551 | |
Hertz | | | | | | | | |
7.625%, 06/01/2022 (A)(B) | | | 285 | | | | 274 | |
7.125%, 08/01/2026 (A)(B) | | | 715 | | | | 324 | |
6.000%, 01/15/2028 (A)(B) | | | 520 | | | | 231 | |
5.500%, 10/15/2024 (A)(B) | | | 1,573 | | | | 696 | |
Howmet Aerospace | | | | | | | | |
6.875%, 05/01/2025 | | | 195 | | | | 227 | |
5.900%, 02/01/2027 | | | 1,185 | | | | 1,376 | |
Icahn Enterprises | | | | | | | | |
4.750%, 09/15/2024 | | | 4,455 | | | | 4,589 | |
| | |
SEI Institutional Investments Trust / Semi-Annual Report / November 30, 2020 | | 159 |
SCHEDULE OF INVESTMENTS (Unaudited)
November 30, 2020
High Yield Bond Fund (Continued)
| | | | | | | | |
| | | |
| Description | | Face Amount
(Thousands) | | Market Value
($ Thousands) |
|
CORPORATE OBLIGATIONS (continued) | |
James Hardie International Finance DAC | | | | | | | | |
5.000%, 01/15/2028 (A) | | $ | 2,268 | | | $ | 2,398 | |
4.750%, 01/15/2025 (A) | | | 340 | | | | 348 | |
JELD-WEN | | | | | | | | |
6.250%, 05/15/2025 (A) | | | 235 | | | | 253 | |
4.875%, 12/15/2027 (A) | | | 170 | | | | 179 | |
4.625%, 12/15/2025 (A) | | | 560 | | | | 571 | |
Korn Ferry | | | | | | | | |
4.625%, 12/15/2027 (A) | | | 3,609 | | | | 3,775 | |
LABL Escrow Issuer LLC | | | | | | | | |
10.500%, 07/15/2027 (A) | | | 480 | | | | 532 | |
6.750%, 07/15/2026 (A) | | | 640 | | | | 683 | |
Masonite International | | | | | | | | |
5.750%, 09/15/2026 (A) | | | 57 | | | | 60 | |
5.375%, 02/01/2028 (A) | | | 2,144 | | | | 2,281 | |
MasTec | | | | | | | | |
4.500%, 08/15/2028 (A) | | | 550 | | | | 575 | |
Maxim Crane Works Holdings Capital LLC | | | | | | | | |
10.125%, 08/01/2024 (A) | | | 1,905 | | | | 1,943 | |
Mileage Plus Holdings LLC | | | | | | | | |
6.500%, 06/20/2027 (A) | | | 3,612 | | | | 3,916 | |
Moog | | | | | | | | |
4.250%, 12/15/2027 (A) | | | 2,212 | | | | 2,279 | |
New Enterprise Stone & Lime | | | | | | | | |
6.250%, 03/15/2026 (A) | | | 2,185 | | | | 2,253 | |
Nielsen Finance LLC | | | | | | | | |
5.875%, 10/01/2030 (A) | | | 661 | | | | 726 | |
5.625%, 10/01/2028 (A) | | | 661 | | | | 705 | |
5.000%, 04/15/2022 (A) | | | 420 | | | | 420 | |
Nielsen Luxembourg | | | | | | | | |
5.000%, 02/01/2025 (A) | | | 1,363 | | | | 1,402 | |
PGT Innovations | | | | | | | | |
6.750%, 08/01/2026 (A) | | | 510 | | | | 544 | |
PowerTeam Services LLC | | | | | | | | |
9.033%, 12/04/2025 (A) | | | 1,217 | | | | 1,336 | |
RBS Global | | | | | | | | |
4.875%, 12/15/2025 (A) | | | 2,212 | | | | 2,256 | |
Remington Arms | | | | | | | | |
0.000%, 12/31/2049 (E) | | | 1,885 | | | | – | |
Reynolds Group Issuer | | | | | | | | |
4.000%, 10/15/2027 (A) | | | 1,739 | | | | 1,768 | |
Rolls-Royce | | | | | | | | |
5.750%, 10/15/2027 (A) | | | 3,429 | | | | 3,678 | |
Sensata Technologies | | | | | | | | |
5.625%, 11/01/2024 (A) | | | 200 | | | | 224 | |
5.000%, 10/01/2025 (A) | | | 1,442 | | | | 1,601 | |
4.375%, 02/15/2030 (A) | | | 3,389 | | | | 3,626 | |
3.750%, 02/15/2031 (A) | | | 1,734 | | | | 1,760 | |
Sensata Technologies UK Financing | | | | | | | | |
6.250%, 02/15/2026 (A) | | | 1,895 | | | | 1,966 | |
Signature Aviation US Holdings | | | | | | | | |
4.000%, 03/01/2028 (A) | | | 5,632 | | | | 5,641 | |
| | | | | | | | |
| | | |
| Description | | Face Amount
(Thousands) | | Market Value
($ Thousands) |
|
CORPORATE OBLIGATIONS (continued) | |
Spirit AeroSystems | | | | | | | | |
7.500%, 04/15/2025 (A) | | $ | 440 | | | $ | 471 | |
5.500%, 01/15/2025 (A) | | | 835 | | | | 887 | |
3.950%, 06/15/2023 | | | 2,296 | | | | 2,216 | |
1.050%, VAR ICE LIBOR USD 3 Month+0.800%, 06/15/2021 | | | 2,577 | | | | 2,505 | |
Spirit Loyalty Cayman | | | | | | | | |
8.000%, 09/20/2025 (A) | | | 2,841 | | | | 3,159 | |
SPX FLOW | | | | | | | | |
5.875%, 08/15/2026 (A) | | | 470 | | | | 491 | |
SRM Escrow Issuer LLC | | | | | | | | |
6.000%, 11/01/2028 (A) | | | 1,461 | | | | 1,516 | |
Standard Industries | | | | | | | | |
4.750%, 01/15/2028 (A) | | | 1,295 | | | | 1,365 | |
3.375%, 01/15/2031 (A) | | | 208 | | | | 209 | |
Stericycle | | | | | | | | |
3.875%, 01/15/2029 (A) | | | 1,158 | | | | 1,204 | |
Stevens Holding | | | | | | | | |
6.125%, 10/01/2026 (A) | | | 370 | | | | 401 | |
Summit Materials LLC | | | | | | | | |
5.250%, 01/15/2029 (A) | | | 2,152 | | | | 2,243 | |
5.125%, 06/01/2025 (A) | | | 2,218 | | | | 2,251 | |
Terex | | | | | | | | |
5.625%, 02/01/2025 (A) | | | 905 | | | | 929 | |
Tervita | | | | | | | | |
11.000%, 12/01/2025 (A) | | | 3,893 | | | | 4,040 | |
TransDigm | | | | | | | | |
8.000%, 12/15/2025 (A) | | | 827 | | | | 903 | |
6.250%, 03/15/2026 (A) | | | 6,649 | | | | 7,048 | |
5.500%, 11/15/2027 | | | 3,161 | | | | 3,262 | |
Trident Merger Sub | | | | | | | | |
6.625%, 11/01/2025 (A) | | | 2,914 | | | | 2,914 | |
Trident TPI Holdings | | | | | | | | |
9.250%, 08/01/2024 (A) | | | 2,099 | | | | 2,235 | |
TriMas | | | | | | | | |
4.875%, 10/15/2025 (A) | | | 375 | | | | 383 | |
Triumph Group | | | | | | | | |
8.875%, 06/01/2024 (A) | | | 620 | | | | 684 | |
7.750%, 08/15/2025 | | | 2,765 | | | | 2,406 | |
6.250%, 09/15/2024 (A) | | | 510 | | | | 495 | |
5.250%, 06/01/2022 | | | 1,165 | | | | 1,072 | |
Trivium Packaging Finance BV | | | | | | | | |
8.500%, 08/15/2027 (A) | | | 664 | | | | 719 | |
5.500%, 08/15/2026 (A) | | | 976 | | | | 1,022 | |
Tutor Perini | | | | | | | | |
6.875%, 05/01/2025 (A) | | | 8,173 | | | | 8,194 | |
Uber Technologies | | | | | | | | |
7.500%, 05/15/2025 (A) | | | 903 | | | | 964 | |
United Airlines Holdings | | | | | | | | |
4.875%, 01/15/2025 | | | 1,840 | | | | 1,773 | |
4.250%, 10/01/2022 | | | 1,104 | | | | 1,104 | |
| | |
160 | | SEI Institutional Investments Trust / Semi-Annual Report / November 30, 2020 |
| | | | | | | | |
| | | |
| Description | | Face Amount
(Thousands) | | Market Value
($ Thousands) |
|
CORPORATE OBLIGATIONS (continued) | |
United Rentals North America | | | | | | | | |
5.875%, 09/15/2026 | | $ | 565 | | | $ | 597 | |
5.500%, 05/15/2027 | | | 1,095 | | | | 1,178 | |
3.875%, 02/15/2031 | | | 399 | | | | 417 | |
Univar Solutions USA | | | | | | | | |
5.125%, 12/01/2027 (A) | | | 449 | | | | 474 | |
Vertical Holdco GmbH | | | | | | | | |
7.625%, 07/15/2028 (A) | | | 200 | | | | 214 | |
Wabash National | | | | | | | | |
5.500%, 10/01/2025 (A) | | | 760 | | | | 775 | |
Weekley Homes LLC | | | | | | | | |
4.875%, 09/15/2028 (A) | | | 132 | | | | 138 | |
Welbilt | | | | | | | | |
9.500%, 02/15/2024 | | | 3,080 | | | | 3,165 | |
WESCO Distribution | | | | | | | | |
7.250%, 06/15/2028 (A) | | | 556 | | | | 625 | |
7.125%, 06/15/2025 (A) | | | 556 | | | | 605 | |
Western Global Airlines LLC | | | | | | | | |
10.375%, 08/15/2025 (A) | | | 1,635 | | | | 1,803 | |
XPO Logistics | | | | | | | | |
6.750%, 08/15/2024 (A) | | | 3,070 | | | | 3,253 | |
6.500%, 06/15/2022 (A) | | | 582 | | | | 583 | |
6.250%, 05/01/2025 (A) | | | 275 | | | | 295 | |
6.125%, 09/01/2023 (A) | | | 150 | | | | 153 | |
| | | | | | | | |
| | | | | | | 241,801 | |
| | | | | | | | |
|
Information Technology — 3.0% | |
ACI Worldwide | | | | | | | | |
5.750%, 08/15/2026 (A) | | | 667 | | | | 708 | |
Alliance Data Systems | | | | | | | | |
7.000%, 01/15/2026 (A) | | | 2,000 | | | | 2,040 | |
4.750%, 12/15/2024 (A) | | | 2,426 | | | | 2,326 | |
ams | | | | | | | | |
7.000%, 07/31/2025 (A) | | | 2,218 | | | | 2,451 | |
Ascend Learning LLC | | | | | | | | |
6.875%, 08/01/2025 (A) | | | 928 | | | | 956 | |
Avaya | | | | | | | | |
6.125%, 09/15/2028 (A) | | | 5,437 | | | | 5,736 | |
Black Knight InfoServ LLC | | | | | | | | |
3.625%, 09/01/2028 (A) | | | 726 | | | | 737 | |
Booz Allen Hamilton | | | | | | | | |
3.875%, 09/01/2028 (A) | | | 371 | | | | 383 | |
BY Crown Parent LLC | | | | | | | | |
4.250%, 01/31/2026 (A) | | | 1,957 | | | | 2,011 | |
CDK Global | | | | | | | | |
5.250%, 05/15/2029 (A) | | | 313 | | | | 343 | |
CDW LLC | | | | | | | | |
4.250%, 04/01/2028 | | | 420 | | | | 438 | |
3.250%, 02/15/2029 | | | 270 | | | | 271 | |
Change Healthcare Holdings LLC | | | | | | | | |
5.750%, 03/01/2025 (A) | | | 1,344 | | | | 1,366 | |
| | | | | | | | |
| | | |
| Description | | Face Amount
(Thousands) | | Market Value
($ Thousands) |
|
CORPORATE OBLIGATIONS (continued) | |
CommScope | | | | | | | | |
7.125%, 07/01/2028 (A) | | $ | 225 | | | $ | 240 | |
CommScope Finance LLC | | | | | | | | |
8.250%, 03/01/2027 (A) | | | 3,378 | | | | 3,640 | |
6.000%, 03/01/2026 (A) | | | 970 | | | | 1,023 | |
CommScope Technologies LLC | | | | | | | | |
6.000%, 06/15/2025 (A) | | | 5,685 | | | | 5,825 | |
Dell International LLC | | | | | | | | |
6.200%, 07/15/2030 (A) | | | 135 | | | | 172 | |
Dell International LLC / EMC | | | | | | | | |
6.100%, 07/15/2027 (A) | | | 135 | | | | 166 | |
5.300%, 10/01/2029 (A) | | | 865 | | | | 1,046 | |
Diebold Nixdorf | | | | | | | | |
9.375%, 07/15/2025 (A) | | | 1,631 | | | | 1,790 | |
Entegris | | | | | | | | |
4.625%, 02/10/2026 (A) | | | 895 | | | | 922 | |
4.375%, 04/15/2028 (A) | | | 1,052 | | | | 1,112 | |
Gartner | | | | | | | | |
4.500%, 07/01/2028 (A) | | | 80 | | | | 84 | |
3.750%, 10/01/2030 (A) | | | 188 | | | | 196 | |
Go Daddy Operating LLC | | | | | | | | |
5.250%, 12/01/2027 (A) | | | 2,784 | | | | 2,930 | |
Hughes Satellite Systems | | | | | | | | |
5.250%, 08/01/2026 | | | 1,613 | | | | 1,780 | |
Microchip Technology | | | | | | | | |
4.250%, 09/01/2025 (A) | | | 212 | | | | 222 | |
Monitronics International (Escrow Security) | | | | | | | | |
9.125%, 04/01/2020 (B)(E) | | | 10,706 | | | | – | |
MTS Systems | | | | | | | | |
5.750%, 08/15/2027 (A) | | | 225 | | | | 233 | |
NCR | | | | | | | | |
8.125%, 04/15/2025 (A) | | | 204 | | | | 227 | |
6.125%, 09/01/2029 (A) | | | 735 | | | | 799 | |
5.750%, 09/01/2027 (A) | | | 2,875 | | | | 3,026 | |
5.000%, 10/01/2028 (A) | | | 833 | | | | 862 | |
Nuance Communications | | | | | | | | |
5.625%, 12/15/2026 | | | 173 | | | | 183 | |
ON Semiconductor | | | | | | | | |
3.875%, 09/01/2028 (A) | | | 1,995 | | | | 2,055 | |
Open Text Holdings | | | | | | | | |
4.125%, 02/15/2030 (A) | | | 3,555 | | | | 3,735 | |
Plantronics | | | | | | | | |
5.500%, 05/31/2023 (A) | | | 1,518 | | | | 1,522 | |
Presidio Holdings | | | | | | | | |
8.250%, 02/01/2028 (A) | | | 891 | | | | 967 | |
4.875%, 02/01/2027 (A) | | | 240 | | | | 253 | |
PTC | | | | | | | | |
4.000%, 02/15/2028 (A) | | | 2,012 | | | | 2,095 | |
3.625%, 02/15/2025 (A) | | | 262 | | | | 268 | |
Science Applications International | | | | | | | | |
4.875%, 04/01/2028 (A) | | | 2,317 | | | | 2,444 | |
| | |
SEI Institutional Investments Trust / Semi-Annual Report / November 30, 2020 | | 161 |
SCHEDULE OF INVESTMENTS (Unaudited)
November 30, 2020
High Yield Bond Fund (Continued)
| | | | | | | | |
| | | |
| Description | | Face Amount
(Thousands) | | Market Value
($ Thousands) |
|
CORPORATE OBLIGATIONS (continued) | |
Seagate HDD Cayman | | | | | | | | |
5.750%, 12/01/2034 | | $ | 1,300 | | | $ | 1,534 | |
SS&C Technologies | | | | | | | | |
5.500%, 09/30/2027 (A) | | | 541 | | | | 580 | |
Switch | | | | | | | | |
3.750%, 09/15/2028 (A) | | | 2,377 | | | | 2,412 | |
Tempo Acquisition LLC | | | | | | | | |
5.750%, 06/01/2025 (A) | | | 678 | | | | 722 | |
Unisys | | | | | | | | |
6.875%, 11/01/2027 (A) | | | 1,160 | | | | 1,259 | |
Veritas US | | | | | | | | |
7.500%, 09/01/2025 (A) | | | 5,580 | | | | 5,641 | |
ViaSat | | | | | | | | |
6.500%, 07/15/2028 (A) | | | 3,250 | | | | 3,412 | |
5.625%, 09/15/2025 (A) | | | 1,881 | | | | 1,914 | |
5.625%, 04/15/2027 (A) | | | 1,250 | | | | 1,312 | |
Xerox Holdings | | | | | | | | |
5.500%, 08/15/2028 (A) | | | 442 | | | | 457 | |
5.000%, 08/15/2025 (A) | | | 767 | | | | 798 | |
| | | | | | | | |
| | | | | | | 79,624 | |
| | | | | | | | |
|
Materials — 7.6% | |
Alcoa Nederland Holding | | | | | | | | |
7.000%, 09/30/2026 (A) | | | 415 | | | | 445 | |
6.750%, 09/30/2024 (A) | | | 960 | | | | 995 | |
Alcoa Nederland Holding BV | | | | | | | | |
6.125%, 05/15/2028 (A) | | | 1,927 | | | | 2,127 | |
5.500%, 12/15/2027 (A) | | | 1,529 | | | | 1,656 | |
Allegheny Technologies | | | | | | | | |
7.875%, 08/15/2023 | | | 3,138 | | | | 3,397 | |
5.875%, 12/01/2027 | | | 3,351 | | | | 3,485 | |
ArcelorMittal | | | | | | | | |
4.250%, 07/16/2029 | | | 2,257 | | | | 2,480 | |
Arconic | | | | | | | | |
6.125%, 02/15/2028 (A) | | | 1,002 | | | | 1,087 | |
6.000%, 05/15/2025 (A) | | | 1,039 | | | | 1,118 | |
Ashland LLC | | | | | | | | |
6.875%, 05/15/2043 | | | 1,384 | | | | 1,820 | |
Atotech Alpha 2 BV | | | | | | | | |
8.750%cash/9.500% PIK, 06/01/2023 (A) | | | 2,870 | | | | 2,891 | |
Axalta Coating Systems LLC | | | | | | | | |
4.750%, 06/15/2027 (A) | | | 155 | | | | 163 | |
3.375%, 02/15/2029 (A) | | | 358 | | | | 361 | |
Baffinland Iron Mines | | | | | | | | |
8.750%, 07/15/2026 (A) | | | 8,585 | | | | 9,014 | |
Ball | | | | | | | | |
2.875%, 08/15/2030 | | | 2,165 | | | | 2,154 | |
Berry Global | | | | | | | | |
4.500%, 02/15/2026 (A) | | | 3,548 | | | | 3,637 | |
Berry Global (Escrow Security) | | | | | | | | |
4.875%, 07/15/2026 (A) | | | 2,932 | | | | 3,113 | |
| | | | | | | | |
| | | |
| Description | | Face Amount
(Thousands) | | Market Value
($ Thousands) |
|
CORPORATE OBLIGATIONS (continued) | |
Big River Steel LLC | | | | | | | | |
6.625%, 01/31/2029 (A) | | $ | 426 | | | $ | 452 | |
Boart Longyear Management Pty | | | | | | | | |
10.000%, 12/31/2022 | | | 3,445 | | | | 2,756 | |
Boise Cascade | | | | | | | | |
4.875%, 07/01/2030 (A) | | | 2,380 | | | | 2,582 | |
Carpenter Technology | | | | | | | | |
6.375%, 07/15/2028 | | | 281 | | | | 306 | |
Chemours | | | | | | | | |
7.000%, 05/15/2025 | | | 151 | | | | 156 | |
5.750%, 11/15/2028 (A) | | | 2,684 | | | | 2,728 | |
5.375%, 05/15/2027 | | | 923 | | | | 960 | |
Clearwater Paper | | | | | | | | |
5.375%, 02/01/2025 (A) | | | 1,605 | | | | 1,709 | |
Cleveland-Cliffs | | | | | | | | |
6.750%, 03/15/2026 (A) | | | 3,025 | | | | 3,263 | |
4.875%, 01/15/2024 (A) | | | 1,831 | | | | 1,858 | |
Compass Minerals International | | | | | | | | |
6.750%, 12/01/2027 (A) | | | 1,793 | | | | 1,976 | |
Constellium | | | | | | | | |
6.625%, 03/01/2025 (A) | | | 594 | | | | 613 | |
5.875%, 02/15/2026 (A) | | | 1,807 | | | | 1,859 | |
5.750%, 05/15/2024 (A) | | | 1,398 | | | | 1,426 | |
5.625%, 06/15/2028 (A) | | | 2,520 | | | | 2,709 | |
Cornerstone Chemical | | | | | | | | |
6.750%, 08/15/2024 (A) | | | 8,923 | | | | 8,276 | |
Crown Americas LLC | | | | | | | | |
4.750%, 02/01/2026 | | | 1,324 | | | | 1,374 | |
4.250%, 09/30/2026 | | | 3,127 | | | | 3,369 | |
CVR Partners | | | | | | | | |
9.250%, 06/15/2023 (A) | | | 3,405 | | | | 3,384 | |
Eldorado | | | | | | | | |
9.500%, 06/01/2024 (A) | | | 1,871 | | | | 2,058 | |
Element Solutions | | | | | | | | |
3.875%, 09/01/2028 (A) | | | 3,203 | | | | 3,265 | |
First Quantum Minerals | | | | | | | | |
7.500%, 04/01/2025 (A) | | | 2,930 | | | | 3,044 | |
7.250%, 04/01/2023 (A) | | | 963 | | | | 984 | |
6.875%, 03/01/2026 (A) | | | 2,561 | | | | 2,646 | |
6.875%, 10/15/2027 (A) | | | 2,398 | | | | 2,511 | |
6.500%, 03/01/2024 (A) | | | 2,962 | | | | 3,006 | |
FMG Resources PTY | | | | | | | | |
4.500%, 09/15/2027 (A) | | | 1,729 | | | | 1,896 | |
Forterra Finance LLC | | | | | | | | |
6.500%, 07/15/2025 (A) | | | 285 | | | | 304 | |
Freeport-McMoRan | | | | | | | | |
5.450%, 03/15/2043 | | | 5,756 | | | | 7,170 | |
5.400%, 11/14/2034 | | | 5,083 | | | | 6,297 | |
4.625%, 08/01/2030 | | | 825 | | | | 914 | |
4.375%, 08/01/2028 | | | 1,090 | | | | 1,165 | |
4.125%, 03/01/2028 | | | 1,805 | | | | 1,909 | |
| | |
162 | | SEI Institutional Investments Trust / Semi-Annual Report / November 30, 2020 |
| | | | | | | | |
| | | |
| Description | | Face Amount
(Thousands) | | Market Value
($ Thousands) |
|
CORPORATE OBLIGATIONS (continued) | |
GCP Applied Technologies | | | | | | | | |
5.500%, 04/15/2026 (A) | | $ | 920 | | | $ | 943 | |
Greif | | | | | | | | |
6.500%, 03/01/2027 (A) | | | 580 | | | | 613 | |
Hecla Mining | | | | | | | | |
7.250%, 02/15/2028 | | | 1,360 | | | | 1,465 | |
Hexion | | | | | | | | |
7.875%, 07/15/2027 (A) | | | 3,638 | | | | 3,902 | |
IAMGOLD | | | | | | | | |
5.750%, 10/15/2028 (A) | | | 3,180 | | | | 3,188 | |
INEOS Group Holdings | | | | | | | | |
5.625%, 08/01/2024 (A) | | | 1,805 | | | | 1,837 | |
Innophos Holdings | | | | | | | | |
9.375%, 02/15/2028 (A) | | | 2,800 | | | | 3,073 | |
Kraton Polymers LLC | | | | | | | | |
7.000%, 04/15/2025 (A) | | | 3,252 | | | | 3,358 | |
LSB Industries | | | | | | | | |
9.625%, 05/01/2023 (A) | | | 8,535 | | | | 8,514 | |
Mineral Resources | | | | | | | | |
8.125%, 05/01/2027 (A) | | | 3,845 | | | | 4,245 | |
Mosaic | | | | | | | | |
5.450%, 11/15/2033 | | | 643 | | | | 795 | |
Mountain Province Diamonds | | | | | | | | |
8.000%, 12/15/2022 (A) | | | 4,890 | | | | 4,163 | |
New Gold | | | | | | | | |
7.500%, 07/15/2027 (A) | | | 970 | | | | 1,053 | |
6.375%, 05/15/2025 (A) | | | 1,695 | | | | 1,767 | |
Northwest Acquisitions ULC | | | | | | | | |
7.125%, 11/01/2022 (A)(B) | | | 3,290 | | | | 33 | |
Nouryon Holding BV | | | | | | | | |
8.000%, 10/01/2026 (A) | | | 715 | | | | 766 | |
NOVA Chemicals | | | | | | | | |
5.250%, 08/01/2023 (A) | | | 190 | | | | 191 | |
5.250%, 06/01/2027 (A) | | | 1,020 | | | | 1,063 | |
5.000%, 05/01/2025 (A) | | | 3,127 | | | | 3,236 | |
4.875%, 06/01/2024 (A) | | | 535 | | | | 551 | |
Novelis | | | | | | | | |
5.875%, 09/30/2026 (A) | | | 3,012 | | | | 3,159 | |
4.750%, 01/30/2030 (A) | | | 1,470 | | | | 1,560 | |
OCI | | | | | | | | |
5.250%, 11/01/2024 (A) | | | 1,073 | | | | 1,116 | |
OI European Group BV | | | | | | | | |
4.000%, 03/15/2023 (A) | | | 2,951 | | | | 3,025 | |
Owens-Brockway Glass Container | | | | | | | | |
6.625%, 05/13/2027 (A) | | | 1,945 | | | | 2,105 | |
6.375%, 08/15/2025 (A) | | | 815 | | | | 901 | |
5.875%, 08/15/2023 (A) | | | 1,135 | | | | 1,220 | |
Rain CII Carbon LLC | | | | | | | | |
7.250%, 04/01/2025 (A) | | | 9,350 | | | | 9,280 | |
Reichhold Industries | | | | | | | | |
9.000%, 05/01/2018 (A)(B)(E) | | | 1,056 | | | | – | |
| | | | | | | | |
| | | |
| Description | | Face Amount
(Thousands) | | Market Value
($ Thousands) |
|
CORPORATE OBLIGATIONS (continued) | |
Scotts Miracle-Gro | | | | | | | | |
5.250%, 12/15/2026 | | $ | 165 | | | $ | 176 | |
4.500%, 10/15/2029 | | | 134 | | | | 143 | |
Taseko Mines | | | | | | | | |
8.750%, 06/15/2022 (A) | | | 1,814 | | | | 1,791 | |
Teck Resources | | | | | | | | |
6.125%, 10/01/2035 | | | 1,358 | | | | 1,715 | |
Trinseo Materials Operating SCA | | | | | | | | |
5.375%, 09/01/2025 (A) | | | 975 | | | | 997 | |
Tronox | | | | | | | | |
6.500%, 05/01/2025 (A) | | | 797 | | | | 849 | |
6.500%, 04/15/2026 (A) | | | 640 | | | | 665 | |
Tronox Finance | | | | | | | | |
5.750%, 10/01/2025 (A) | | | 1,999 | | | | 2,066 | |
U.S. Steel | | | | | | | | |
12.000%, 06/01/2025 (A) | | | 336 | | | | 383 | |
Valvoline | | | | | | | | |
4.250%, 02/15/2030 (A) | | | 275 | | | | 289 | |
Venator Finance Sarl | | | | | | | | |
9.500%, 07/01/2025 (A) | | | 1,716 | | | | 1,879 | |
5.750%, 07/15/2025 (A) | | | 3,004 | | | | 2,636 | |
Warrior Met Coal | | | | | | | | |
8.000%, 11/01/2024 (A) | | | 2,530 | | | | 2,530 | |
| | | | | | | | |
| | | | | | | 202,109 | |
| | | | | | | | |
|
Real Estate — 2.0% | |
CoreCivic | | | | | | | | |
4.625%, 05/01/2023 | | | 595 | | | | 559 | |
Diversified Healthcare Trust | | | | | | | | |
9.750%, 06/15/2025 | | | 3,791 | | | | 4,312 | |
Geo Group | | | | | | | | |
5.875%, 10/15/2024 | | | 170 | | | | 134 | |
5.125%, 04/01/2023 | | | 235 | | | | 203 | |
Howard Hughes | | | | | | | | |
5.375%, 08/01/2028 (A) | | | 888 | | | | 945 | |
Iron Mountain | | | | | | | | |
5.250%, 03/15/2028 (A) | | | 2,300 | | | | 2,406 | |
5.250%, 07/15/2030 (A) | | | 830 | | | | 884 | |
5.000%, 07/15/2028 (A) | | | 1,600 | | | | 1,660 | |
4.875%, 09/15/2027 (A) | | | 4,646 | | | | 4,814 | |
4.875%, 09/15/2029 (A) | | | 4,648 | | | | 4,813 | |
4.500%, 02/15/2031 (A) | | | 424 | | | | 433 | |
iStar | | | | | | | | |
4.750%, 10/01/2024 | | | 903 | | | | 903 | |
4.250%, 08/01/2025 | | | 1,783 | | | | 1,734 | |
Lamar Media | | | | | | | | |
4.875%, 01/15/2029 | | | 180 | | | | 190 | |
4.000%, 02/15/2030 | | | 877 | | | | 912 | |
Outfront Media Capital LLC | | | | | | | | |
6.250%, 06/15/2025 (A) | | | 903 | | | | 959 | |
5.000%, 08/15/2027 (A) | | | 766 | | | | 784 | |
| | |
SEI Institutional Investments Trust / Semi-Annual Report / November 30, 2020 | | 163 |
SCHEDULE OF INVESTMENTS (Unaudited)
November 30, 2020
High Yield Bond Fund (Continued)
| | | | | | | | |
| | | |
| Description | | Face Amount
(Thousands) | | Market Value
($ Thousands) |
|
CORPORATE OBLIGATIONS (continued) | |
QualityTech | | | | | | | | |
3.875%, 10/01/2028 (A) | | $ | 990 | | | $ | 1,005 | |
Realogy Group LLC | | | | | | | | |
9.375%, 04/01/2027 (A) | | | 1,766 | | | | 1,934 | |
4.875%, 06/01/2023 (A) | | | 1,699 | | | | 1,729 | |
RHP Hotel Properties | | | | | | | | |
5.000%, 04/15/2023 | | | 1,745 | | | | 1,736 | |
4.750%, 10/15/2027 | | | 2,435 | | | | 2,417 | |
SBA Communications | | | | | | | | |
4.875%, 09/01/2024 | | | 545 | | | | 559 | |
Service Properties Trust | | | | | | | | |
4.950%, 02/15/2027 | | | 2,313 | | | | 2,206 | |
Uniti Group | | | | | | | | |
8.250%, 10/15/2023 | | | 1,787 | | | | 1,789 | |
7.875%, 02/15/2025 (A) | | | 1,313 | | | | 1,395 | |
7.125%, 12/15/2024 (A) | | | 1,210 | | | | 1,183 | |
6.000%, 04/15/2023 (A) | | | 1,975 | | | | 2,017 | |
VICI Properties | | | | | | | | |
4.625%, 12/01/2029 (A) | | | 715 | | | | 762 | |
4.250%, 12/01/2026 (A) | | | 678 | | | | 703 | |
4.125%, 08/15/2030 (A) | | | 1,251 | | | | 1,290 | |
3.750%, 02/15/2027 (A) | | | 885 | | | | 903 | |
3.500%, 02/15/2025 (A) | | | 90 | | | | 92 | |
XHR | | | | | | | | |
6.375%, 08/15/2025 (A) | | | 3,380 | | | | 3,541 | |
| | | | | | | | |
| | | | | | | 51,906 | |
| | | | | | | | |
|
Utilities — 1.6% | |
AES | | | | | | | | |
6.000%, 05/15/2026 | | | 125 | | | | 132 | |
5.500%, 04/15/2025 | | | 565 | | | | 582 | |
AmeriGas Partners | | | | | | | | |
5.875%, 08/20/2026 | | | 235 | | | | 264 | |
5.500%, 05/20/2025 | | | 500 | | | | 549 | |
Calpine | | | | | | | | |
5.000%, 02/01/2031 (A) | | | 548 | | | | 578 | |
4.625%, 02/01/2029 (A) | | | 605 | | | | 625 | |
4.500%, 02/15/2028 (A) | | | 6,967 | | | | 7,193 | |
NextEra Energy Operating Partners | | | | | | | | |
4.250%, 07/15/2024 (A) | | | 2,746 | | | | 2,890 | |
NRG Energy | | | | | | | | |
7.250%, 05/15/2026 | | | 820 | | | | 869 | |
6.625%, 01/15/2027 | | | 2,119 | | | | 2,230 | |
3.625%, 02/15/2031 (A) | | | 1,005 | | | | 1,041 | |
3.375%, 02/15/2029 (A) | | | 1,035 | | | | 1,057 | |
Pacific Gas & Electric | | | | | | | | |
4.750%, 02/15/2044 | | | 520 | | | | 582 | |
4.300%, 03/15/2045 | | | 607 | | | | 652 | |
Pacific Gas and Electric | | | | | | | | |
3.950%, 12/01/2047 | | | 666 | | | | 697 | |
PG&E | | | | | | | | |
5.250%, 07/01/2030 | | | 5,394 | | | | 5,879 | |
| | | | | | | | |
| | | |
| Description | | Face Amount
(Thousands) | | Market Value
($ Thousands) |
|
CORPORATE OBLIGATIONS (continued) | |
5.000%, 07/01/2028 | | $ | 857 | | | $ | 915 | |
Pike | | | | | | | | |
5.500%, 09/01/2028 (A) | | | 1,637 | | | | 1,715 | |
Rockpoint Gas Storage Canada | | | | | | | | |
7.000%, 03/31/2023 (A) | | | 3,412 | | | | 3,280 | |
Talen Energy Supply LLC | | | | | | | | |
7.625%, 06/01/2028 (A) | | | 885 | | | | 932 | |
6.625%, 01/15/2028 (A) | | | 2,120 | | | | 2,168 | |
Vistra Operations LLC | | | | | | | | |
5.625%, 02/15/2027 (A) | | | 825 | | | | 871 | |
5.500%, 09/01/2026 (A) | | | 845 | | | | 884 | |
5.000%, 07/31/2027 (A) | | | 4,115 | | | | 4,352 | |
4.300%, 07/15/2029 (A) | | | 2,839 | | | | 3,168 | |
| | | | | | | | |
| | | | | | | 44,105 | |
| | | | | | | | |
| | |
Total Corporate Obligations
(Cost $1,985,136) ($ Thousands) | | | | | | | 2,025,309 | |
| | | | | | | | |
|
LOAN PARTICIPATIONS — 10.0% | |
Affinity Gaming (fka Affinity Gaming, LLC), Initial Term Loan | | | | | | | | |
9.250%, 01/31/2025 | | | 170 | | | | 155 | |
Affinity Gaming LLC, 1st Lien | | | | | | | | |
4.250%, 07/01/2023 (G) | | | 2,093 | | | | 1,958 | |
AgroFresh, 1st Lien | | | | | | | | |
7.250%, 12/31/2024 | | | 3,309 | | | | 3,265 | |
AI Aqua Merger Sub, Inc., Term Loan B-1, 1st Lien | | | | | | | | |
4.250%, VAR Euribor+4.500%, 12/13/2023 | | | 3,179 | | | | 3,108 | |
Air Medical Group Holdings, Inc., 2018 New Term Loan, 1st Lien | | | | | | | | |
5.250%, VAR LIBOR+3.250%, 03/14/2025 | | | 1,779 | | | | 1,748 | |
Alvogen Pharma, Term Loan | | | | | | | | |
6.250%, 12/31/2023 | | | 2,262 | | | | 2,163 | |
AMC Entertainment Holdings, Inc. (fka AMC Entertainment Inc.), Term B-1 Loan, 1st Lien | | | | | | | | |
3.230%, VAR LIBOR+3.000%, 04/22/2026 (H) | | | 4,304 | | | | 3,242 | |
American Gaming, Term Loan, 1st Lien | | | | | | | | |
14.000%, 02/15/2024 (E) | | | 1,337 | | | | 1,403 | |
American Greetings, Initial Term Loan, 1st Lien | | | | | | | | |
5.500%, VAR LIBOR+4.500%, 04/06/2024 (H) | | | 424 | | | | 417 | |
American Tire Distributors, Inc., Initial Term Loan, 1st Lien | | | | | | | | |
8.500%, VAR LIBOR+6.000%, 09/02/2024 (H) | | | 6,822 | | | | 6,150 | |
| | |
164 | | SEI Institutional Investments Trust / Semi-Annual Report / November 30, 2020 |
| | | | | | | | |
| | | |
| Description | | Face Amount
(Thousands) | | Market Value
($ Thousands) |
|
LOAN PARTICIPATIONS (continued) | |
American Tire Distributors, Initial Term Loan | | | | | | | | |
8.500%, 09/02/2024 | | $ | 113 | | | $ | 102 | |
Aptos, 1st Lien | | | | | | | | |
5.646%, 03/04/2027 (G) | | | 4,098 | | | | 3,904 | |
Aruba Investments, Term Loan, 2nd Lien | | | | | | | | |
8.500%, 10/27/2028 (G)(H) | | | 1,678 | | | | 1,675 | |
Ascend Learning, 1st Lien | | | | | | | | |
4.750%, 07/12/2024 | | | 163 | | | | 163 | |
Ascend Learning, Term Loan, 1st Lien | | | | | | | | |
4.000%, VAR LIBOR+3.250%, 07/12/2024 | | | 252 | | | | 249 | |
Asurion, LLC (fka Asurion Corporation), Second Lien Replacement B-2 Term Loan, 2nd Lien | | | | | | | | |
6.646%, VAR LIBOR+0.500%, 08/04/2025 | | | 3,779 | | | | 3,799 | |
Atotech, Cov-Lite, Term Loan B, 1st Lien | | | | | | | | |
4.000%, 01/31/2024 | | | 3,320 | | | | 3,294 | |
Avianca, Tranche A, 1st Lien | | | | | | | | |
11.000%, 11/10/2021 (E)(H) | | | 1,605 | | | | 1,580 | |
Banijay Group, Term Loan B, 1st Lien | | | | | | | | |
3.888%, 03/01/2025 (H) | | | 70 | | | | 68 | |
Bausch Health Companies Inc., Initial Term Loan, 1st Lien | | | | | | | | |
3.143%, VAR LIBOR+3.000%, 06/02/2025 | | | 799 | | | | 789 | |
BoardRiders Inc., Tranche A Loan, 1st Lien | | | | | | | | |
9.000%, 10/23/2023 (E) | | | 606 | | | | 589 | |
BoardRiders Inc., Tranche B-2 Loan, 1st Lien | | | | | | | | |
10.250%, 04/23/2024 (E) | | | 3,261 | | | | 2,454 | |
Buckeye Partners L.P., Initial Term Loan, 1st Lien | | | | | | | | |
2.899%, 11/01/2026 | | | 363 | | | | 360 | |
BWay Holding Company , Initial Term Loan, 1st Lien | | | | | | | | |
3.480%, VAR LIBOR+3.250%, 04/03/2024 | | | 2,061 | | | | 1,959 | |
Caesars Resort Collection, LLC, Term B-1 Loan, 1st Lien | | | | | | | | |
4.646%, VAR LIBOR+4.500%, 07/21/2025 | | | 4,803 | | | | 4,754 | |
Carestream Health, Extended Loan, 2nd Lien | | | | | | | | |
5.500%, 08/08/2023 (E) | | | 4,045 | | | | 2,953 | |
Carestream, Extended Loan, 1st Lien | | | | | | | | |
7.750%, 05/08/2023 | | | 2,148 | | | | 2,084 | |
CBAC Borrower LLC, Term B Loan, 1st Lien | | | | | | | | |
4.146%, 07/08/2024 (G) | | | 2,637 | | | | 2,378 | |
Cengage Learning, Inc., 2016 Refinancing Term Loan, 1st Lien | | | | | | | | |
5.250%, VAR LIBOR+3.750%, 06/07/2023 | | | 4,553 | | | | 4,225 | |
CenturyLink Inc., Term Loan B, 1st Lien | | | | | | | | |
2.396%, 03/15/2027 | | | 253 | | | | 247 | |
| | | | | | | | |
| | | |
| Description | | Face Amount
(Thousands) | | Market Value
($ Thousands) |
|
LOAN PARTICIPATIONS (continued) | |
Cenveo Corporation, Exit Term Loan, 1st Lien | | | | | | | | |
10.500%, 06/07/2023 (E)(G) | | $ | 2,608 | | | $ | 2,425 | |
CityCenter Holdings, LLC , Term B Loan, 1st Lien | | | | | | | | |
3.000%, VAR LIBOR+2.000%, 04/18/2024 | | | 957 | | | | 921 | |
Claire’s Stores, Term Loan B, 1st Lien | | | | | | | | |
6.807%, 12/18/2026 | | | 2,037 | | | | 1,636 | |
Clarios Global LP, Initial Dollar Term Loan, 1st Lien | | | | | | | | |
3.646%, VAR LIBOR+3.500%, 04/30/2026 | | | 1,118 | | | | 1,105 | |
ConvergeOne Holdings, Corp., Initial Term Loan, 1st Lien | | | | | | | | |
5.146%, 01/04/2026 | | | 4,832 | | | | 4,388 | |
Cornerstone OnDemand, Term Loan | | | | | | | | |
4.396%, 04/22/2027 | | | 295 | | | | 294 | |
Coty Inc., Term Loan B, 1st Lien | | | | | | | | |
2.377%, 04/07/2025 | | | 3,574 | | | | 3,357 | |
CP Atlas Buyer, Inc., Initial Tranche B-1 Term Loan, 1st Lien | | | | | | | | |
5.250%, VAR LIBOR+4.500%, 11/19/2027 (H) | | | 137 | | | | 137 | |
East Valley Tourist Development Authority, Term Loan, 1st Lien | | | | | | | | |
9.000%, VAR LIBOR+3.750%, 03/07/2022 (E) | | | 3,937 | | | | 3,780 | |
Endo Luxembourg Finance Company I, Initial Term Loan, 1st Lien | | | | | | | | |
5.000%, VAR ICE LIBOR USD 3 Month+4.250%, 04/27/2024 | | | 678 | | | | 657 | |
Envision Healthcare Corporation, Initial Term Loan, 1st Lien | | | | | | | | |
3.896%, VAR LIBOR+3.750%, 10/10/2025 | | | 7,041 | | | | 5,722 | |
Epic Crude Services, LP, Term Loan, 1st Lien | | | | | | | | |
5.260%, VAR LIBOR+5.000%, 03/02/2026 | | | 2,983 | | | | 2,076 | |
Epic Y-Grade Services, 1st Lien | | | | | | | | |
7.000%, 06/30/2027 (H) | | | 5,513 | | | | 4,410 | |
eResearchTechnology, Inc., Initial Term Loan, 1st Lien | | | | | | | | |
5.500%, VAR LIBOR+4.500%, 02/04/2027 | | | 2,068 | | | | 2,065 | |
Foresight Energy Operating LLC, Tranche A Term Loan, 1st Lien | | | | | | | | |
9.500%, 06/30/2027 (E) | | | 510 | | | | 517 | |
Gates Global LLC, Initial B-2 Dollar Term Loan, 1st Lien | | | | | | | | |
3.750%, VAR Euribor+3.000%, 04/01/2024 | | | 859 | | | | 850 | |
| | |
SEI Institutional Investments Trust / Semi-Annual Report / November 30, 2020 | | 165 |
SCHEDULE OF INVESTMENTS (Unaudited)
November 30, 2020
High Yield Bond Fund (Continued)
| | | | | | | | |
| | | |
| Description | | Face Amount
(Thousands) | | Market Value
($ Thousands) |
|
LOAN PARTICIPATIONS (continued) | |
Genesis Energy, 1st Lien | | | | | | | | |
4.750%, VAR LIBOR+4.000%, 10/08/2027 (H) | | $ | 509 | | | $ | 507 | |
Getty Images, 1st Lien | | | | | | | | |
4.688%, 02/19/2026 | | | 1,713 | | | | 1,650 | |
GFL Environmental, Incremental Term Loan, 2nd Lien | | | | | | | | |
4.000%, VAR LIBOR+3.250%, 05/30/2025 | | | 556 | | | | 555 | |
Global Medical Response, Inc., 2020 Refinancing Term Loan, 1st Lien | | | | | | | | |
5.750%, VAR LIBOR+4.750%, 09/24/2025 | | | 3,020 | | | | 2,978 | |
Golden Nugget Inc., Term Loan B, 1st Lien | | | | | | | | |
3.250%, VAR LIBOR+2.750%, 10/04/2023 | | | 1,087 | | | | 1,034 | |
Graham Packaging, Cov-Lite, 1st Lien | | | | | | | | |
4.500%, 08/04/2027 | | | 3,694 | | | | 3,688 | |
Green Energy Partners/Stonewall LLC, Term B-1 Conversion Advances, 1st Lien | | | | | | | | |
6.500%, VAR LIBOR+5.500%, 11/13/2021 (E) | | | 717 | | | | 655 | |
Guitar Center | | | | | | | | |
7.000%, 11/21/2021 | | | 666 | | | | 666 | |
Harland Clarke Holdings Corp. (fka Clarke American Corp.), Initial Term Loan, 1st Lien | | | | | | | | |
5.750%, VAR Prime Rate by Country+4.250%, 11/03/2023 | | | 427 | | | | 367 | |
Hercules Achievement, Inc. (Varsity Brands Holding Co., Inc.), Initial Term Loan, 1st Lien | | | | | | | | |
4.500%, 12/16/2024 (G) | | | 483 | | | | 448 | |
Hoya Midco, LLC, Initial Term Loan, 1st Lien | | | | | | | | |
4.500%, VAR LIBOR+1.296%, 06/30/2024 (H) | | | 2,659 | | | | 2,403 | |
iHeartCommunications, Inc. (fka Clear Channel Communications, Inc.), New Term Loan, 1st Lien | | | | | | | | |
3.146%, VAR LIBOR+3.000%, 05/01/2026 | | | 720 | | | | 695 | |
Indivior Finance S.a r.l., 2017 Replacement USD Term Loan, 1st Lien | | | | | | | | |
5.500%, VAR LIBOR+4.250%, 12/19/2022 (E) | | | 865 | | | | 845 | |
Infoblox, Cov-Lite, 2nd Lien | | | | | | | | |
8.000%, VAR LIBOR+7.250%, 10/06/2028 (H) | | | 1,589 | | | | 1,594 | |
Informatica LLC , Dollar 2020 Term Loan, 1st Lien | | | | | | | | |
3.396%, VAR LIBOR+3.250%, 02/25/2027 | | | 148 | | | | 146 | |
| | | | | | | | |
| | | |
| Description | | Face Amount
(Thousands) | | Market Value
($ Thousands) |
|
LOAN PARTICIPATIONS (continued) | |
Insurity Holdings, 1st Lien | | | | | | | | |
4.179%, VAR LIBOR+4.000%, 07/31/2026 (H) | | $ | 1,105 | | | $ | 1,087 | |
IRB Holding Corp., 2020 Replacement Term B Loan, 1st Lien | | | | | | | | |
3.750%, VAR LIBOR+2.750%, 02/05/2025 | | | 454 | | | | 446 | |
IRB Holding Corp., Fourth Amendment Incremental Term Loan, 1st Lien | | | | | | | | |
4.250%, 11/19/2027 (G)(H) | | | 403 | | | | 399 | |
Jaguar Holding Company I, LLC (fka Jaguar Holding Company I), 2018 Term Loan, 1st Lien | | | | | | | | |
3.500%, VAR LIBOR+2.500%, 08/18/2022 | | | 1,038 | | | | 1,035 | |
JC Penney, Delay Draw Term Loan | | | | | | | | |
14.000%, 12/16/2020 (E) | | | 2,946 | | | | 4,861 | |
JC Penney, Term Loan, 1st Lien | | | | | | | | |
5.250%, VAR LIBOR+4.250%, 06/23/2023 (B) | | | 3,751 | | | | 1,039 | |
Knight Energy Services | | | | | | | | |
8.500%, 02/09/2024 (E) | | | 76 | | | | — | |
Kronos Acquisition Intermediate Inc., Initial Loan, 1st Lien | | | | | | | | |
5.000%, VAR LIBOR+4.000%, 05/15/2023 | | | 234 | | | | 234 | |
Kronos Acquisition Intermediate Inc., Initial Loan, 2nd Lien | | | | | | | | |
5.000%, VAR LIBOR+4.000%, 05/15/2023 (H) | | | 148 | | | | 148 | |
Lanai Holdings II, Inc., Initial Term Loan, 1st Lien | | | | | | | | |
5.750%, VAR LIBOR+4.750%, 08/29/2022 | | | 8,015 | | | | 7,629 | |
LANDesk Software, Delayed Draw, Term Loan, 1st Lien | | | | | | | | |
0.000%, 11/22/2027 (G)(H) | | | 827 | | | | 818 | |
LANDesk Software, Term Loan, 1st Lien | | | | | | | | |
5.750%, VAR LIBOR+4.750%, 11/22/2027 (H) | | | 866 | | | | 857 | |
Lifescan Global Corporation, Initial Term Loan, 1st Lien | | | | | | | | |
7.451%, 10/01/2024 | | | 64 | | | | 60 | |
Lifescan Global Corporation, Initial Term Loan, 2nd Lien | | | | | | | | |
6.234%, 10/01/2024 (G) | | | 11,627 | | | | 10,988 | |
Mashantucket (Western) Pequot Tribe, Term B Loan, 1st Lien | | | | | | | | |
8.375%, VAR Euribor+3.250%, 12/31/2020 | | | 11,682 | | | | 11,274 | |
| | |
166 | | SEI Institutional Investments Trust / Semi-Annual Report / November 30, 2020 |
| | | | | | | | |
| | | |
| Description | | Face Amount
(Thousands) | | Market Value
($ Thousands) |
|
LOAN PARTICIPATIONS (continued) | |
Mavenir Systems, Inc., Initial Term Loan, 1st Lien | | | | | | | | |
7.000%, VAR LIBOR+3.250%, 05/08/2025 (E) | | $ | 2,737 | | | $ | 2,716 | |
McGraw-Hill Global Education Holdings, LLC, Term B Loan, 1st Lien | | | | | | | | |
5.000%, 05/04/2022 (G) | | | 5,601 | | | | 5,280 | |
Meredith Corporation, Tranche B-3 Term Loan, 1st Lien | | | | | | | | |
5.250%, 01/31/2025 | | | 494 | | | | 493 | |
Merrill Communications, LLC, Term Loan B (2019), 2nd Lien | | | | | | | | |
6.000%, 10/05/2026 (G) | | | 2,495 | | | | 2,479 | |
MI Windows and Doors, LLC, Initial Term Loan, 1st Lien | | | | | | | | |
6.500%, VAR LIBOR+5.500%, 11/06/2026 | | | 1,219 | | | | 1,217 | |
Mileage Plus Holdings LLC (Mileage Plus Intellectual Property Assets, Ltd.), Initial Term Loan, 1st Lien | | | | | | | | |
6.250%, VAR LIBOR+5.250%, 06/21/2027 | | | 1,460 | | | | 1,503 | |
Misys Limited, Dollar Term Loan, 1st Lien | | | | | | | | |
4.500%, VAR LIBOR+1.317%, 06/13/2024 | | | 2,505 | | | | 2,424 | |
MLN US HoldCo LLC, Term B Loan, 2nd Lien | | | | | | | | |
4.641%, VAR LIBOR+4.500%, 11/30/2025 | | | 1,441 | | | | 1,254 | |
Monitronics International Inc., Term Loan, 1st Lien | | | | | | | | |
7.750%, 03/29/2024 (E) | | | 1,462 | | | | 1,287 | |
Navitas Midstream, 1st Lien | | | | | | | | |
5.500%, 12/13/2024 | | | 1,969 | | | | 1,885 | |
Nestle Skin Health, Term Loan B | | | | | | | | |
4.470%, 10/01/2026 | | | 1,390 | | | | 1,388 | |
New rue21, LLC, Term Loan, 1st Lien | | | | | | | | |
12.500%, VAR LIBOR+6.000%, 09/22/2022 | | | 173 | | | | 168 | |
Nine West Holdings Inc., Term Loan | | | | | | | | |
8.220%, 03/19/2024 | | | 1,196 | | | | 777 | |
Nouryon Finance B.V., Initial Dollar Term Loan, 1st Lien | | | | | | | | |
3.141%, VAR LIBOR+3.000%, 10/01/2025 | | | 940 | | | | 921 | |
Peak 10, Term Loan, 1st Lien | | | | | | | | |
3.720%, VAR LIBOR+3.500%, 08/01/2024 | | | 8,023 | | | | 7,151 | |
PetSmart, Inc., Amended Loan, 1st Lien | | | | | | | | |
5.000%, VAR LIBOR+3.000%, 03/11/2022 | | | 754 | | | | 750 | |
PF Chang’s, 1st Lien | | | | | | | | |
6.396%, 03/01/2026 | | | 1,148 | | | | 984 | |
| | | | | | | | |
| | | |
| Description | | Face Amount
(Thousands) | | Market Value
($ Thousands) |
|
LOAN PARTICIPATIONS (continued) | |
Plantronics, Inc., Initial Term B Loan, 1st Lien | | | | | | | | |
2.646%, VAR LIBOR+2.500%, 07/02/2025 | | $ | 1,766 | | | $ | 1,703 | |
Polymer Additives, Inc., 1st Lien | | | | | | | | |
6.214%, 07/31/2025 (H) | | | 5,931 | | | | 4,676 | |
Polymer Additives, Inc., 2nd Lien | | | | | | | | |
6.166%, 07/31/2025 | | | 2 | | | | 2 | |
Radiate Holdco LLC | | | | | | | | |
4.250%, 09/25/2026 | | | 3,275 | | | | 3,261 | |
Red Lobster Management LLC, Initial Term Loan, 1st Lien | | | | | | | | |
6.250%, 07/28/2021 (G) | | | 3,220 | | | | 3,079 | |
Refinitiv US Holdings Inc., Initial Dollar Term Loan, 1st Lien | | | | | | | | |
3.396%, VAR LIBOR+3.250%, 10/01/2025 | | | 393 | | | | 390 | |
Revlon Consumer Products Corporation, Initial Term B Loan, 1st Lien | | | | | | | | |
4.950%, VAR LIBOR+3.500%, 09/07/2023 | | | 29 | | | | 8 | |
4.250%, VAR LIBOR+3.500%, 09/07/2023 | | | 7,971 | | | | 2,327 | |
Schenectady International Group, Inc., Initial Term Loan, 1st Lien | | | | | | | | |
4.896%, VAR LIBOR+4.750%, 10/15/2025 | | | 6 | | | | 6 | |
Shutterfly, Term Loan B, 1st Lien | | | | | | | | |
7.000%, 09/25/2026 | | | 357 | | | | 346 | |
SIJ LLC, 1st Lien | | | | | | | | |
10.167%, 07/15/2026 (E) | | | 5,230 | | | | 5,178 | |
SkyMiles IP Ltd. (Delta Air Lines, Inc.), Initial Term Loan, 1st Lien | | | | | | | | |
4.750%, VAR LIBOR+3.750%, 10/20/2027 (H) | | | 380 | | | | 388 | |
Sotera Health Holdings, LLC, Initial Term Loan, 1st Lien | | | | | | | | |
5.500%, VAR LIBOR+4.500%, 12/11/2026 | | | 2,559 | | | | 2,556 | |
SP PF Buyer LLC, Term Loan, 1st Lien | | | | | | | | |
4.646%, 12/22/2025 | | | 2,788 | | | | 2,618 | |
Spirit AeroSystems, 1st Lien | | | | | | | | |
6.000%, 01/30/2025 | | | 224 | | | | 225 | |
Staples, Inc., 2019 Refinancing New Term B-1 Loan, 1st Lien | | | | | | | | |
5.214%, VAR LIBOR+5.000%, 04/16/2026 | | | 2,489 | | | | 2,396 | |
Steinway Musical Instruments, Term Loan B, 1st Lien | | | | | | | | |
4.750%, VAR LIBOR+3.750%, 02/14/2025 | | | 1,409 | | | | 1,359 | |
| | |
SEI Institutional Investments Trust / Semi-Annual Report / November 30, 2020 | | 167 |
SCHEDULE OF INVESTMENTS (Unaudited)
November 30, 2020
High Yield Bond Fund (Continued)
| | | | | | | | |
| | | |
| Description | | Face Amount
(Thousands) | | Market Value
($ Thousands) |
|
LOAN PARTICIPATIONS (continued) | |
Syniverse Holdings, Inc., Tranche C Term Loan , 1st Lien | | | | | | | | |
6.000%, VAR LIBOR+3.000%, 03/09/2023 (H) | | $ | 13,240 | | | $ | 11,361 | |
Syniverse, Cov-Lite, 2nd Lien | | | | | | | | |
10.000%, 03/11/2024 | | | 1,407 | | | | 759 | |
Team Health Holdings, Inc., Initial Term Loan, 1st Lien | | | | | | | | |
3.750%, VAR LIBOR+2.750%, 02/06/2024 | | | 11,513 | | | | 10,013 | |
Titan Acquisition Limited, Initial Term Loan, 1st Lien | | | | | | | | |
3.361%, VAR LIBOR+3.000%, 03/28/2025 | | | 1,953 | | | | 1,876 | |
TransDigm Inc., Tranche G Refinancing Term Loan, 1st Lien | | | | | | | | |
2.396%, VAR LIBOR+2.250%, 08/22/2024 | | | 3,250 | | | | 3,150 | |
Traverse Midstream Partners LLC, Advance, 1st Lien | | | | | | | | |
6.500%, VAR LIBOR+5.500%, 09/27/2024 (E) | | | 4,195 | | | | 3,948 | |
Tutor Perini, Term Loan B, 1st Lien | | | | | | | | |
5.750%, 08/18/2027 | | | 3,335 | | | | 3,329 | |
Twin River, Term Loan, 1st Lien | | | | | | | | |
9.000%, 05/11/2026 (E) | | | 1,088 | | | | 1,149 | |
U.S. Renal Care, Inc., Initial Term Loan, 1st Lien | | | | | | | | |
5.146%, VAR LIBOR+4.250%, 06/26/2026 | | | 738 | | | | 731 | |
Uber Technologies, Inc., Term Loan, 1st Lien | | | | | | | | |
5.000%, VAR LIBOR+4.000%, 04/04/2025 | | | 3,252 | | | | 3,245 | |
Valaris | | | | | | | | |
0.000%, 08/17/2021 (E)(H) | | | 1,736 | | | | 1,736 | |
VeriFone Systems, Inc., Initial Term Loan, 1st Lien | | | | | | | | |
4.224%, VAR LIBOR+4.000%, 08/20/2025 | | | 2,734 | | | | 2,588 | |
Vertical Midco GmbH, Facility B (USD), 1st Lien | | | | | | | | |
4.570%, VAR LIBOR+4.250%, 07/30/2027 | | | 431 | | | | 430 | |
Vertiv Group Corporation, Term Loan B, 1st Lien | | | | | | | | |
3.149%, 03/02/2027 | | | 229 | | | | 225 | |
White Cap, Cov-Lite, 1st Lien | | | | | | | | |
4.500%, 10/08/2027 | | | 798 | | | | 790 | |
Wilsonart LLC, Tranche D Term Loan, 1st Lien | | | | | | | | |
4.250%, VAR LIBOR+1.300%, 12/19/2023 | | | 1,209 | | | | 1,197 | |
| | | | | | | | |
| | | |
| Description | | Face Amount
(Thousands) | | Market Value
($ Thousands) |
|
LOAN PARTICIPATIONS (continued) | |
Woodford Express LLC, Term Loan B, 1st Lien 6.000%, VAR LIBOR+5.000%, 01/27/2025 | | $ | 2,800 | | | $ | 1,904 | |
Zayo Group Holdings, Inc., Initial Dollar Term | | | | | | | | |
Loan, 1st Lien 3.146%, VAR LIBOR+3.000%, 03/09/2027 (H) | | | 527 | | | | 518 | |
| | | | | | | | |
| | |
Total Loan Participations
(Cost $272,131) ($ Thousands) | | | | | | | 266,825 | |
| | | | | | | | |
|
ASSET-BACKED SECURITIES — 8.5% | |
|
Other Asset-Backed Securities — 8.5% | |
Airplanes Pass-Through Trust, Ser 2001-1A, Cl A9(J) | | | | | | | | |
0.735%, VAR ICE LIBOR USD 1 Month+0.550%, 03/15/2019 (A) (B)(E) | | | 835 | | | | 30 | |
Apex Credit CLO LLC, Ser 2020-1A, Cl E1 | | | | | | | | |
7.809%, VAR ICE LIBOR USD 3 Month+7.560%, 10/20/2031 (A) | | | 2,215 | | | | 2,038 | |
Ares XXXIV CLO, Ser 2020-2A, Cl FR | | | | | | | | |
8.818%, VAR ICE LIBOR USD 3 Month+8.600%, 04/17/2033 (A)(E) | | | 2,304 | | | | 1,751 | |
B&M CLO, Ser 2014-1A, Cl E | | | | | | | | |
5.980%, VAR ICE LIBOR USD 3 Month+5.750%, 04/16/2026 (A)(E) | | | 2,520 | | | | 1,159 | |
Battalion CLO VII, Ser 2014-7A, Cl SUB | | | | | | | | |
0.000%, 07/17/2028 (A)(E)(I) | | | 4,614 | | | | 1,338 | |
Battalion CLO VIII, Ser 2015-8A, Cl SUB | | | | | | | | |
0.000%, 07/18/2030 (A)(E)(I) | | | 4,378 | | | | 2,189 | |
Battalion CLO X, Ser 2016-10A, Cl SUB | | | | | | | | |
0.000%, 01/24/2029 (A)(E)(I) | | | 6,380 | | | | 3,892 | |
Battalion CLO XI, Ser 2017-11A, Cl SUB | | | | | | | | |
0.000%, 10/24/2029 (A)(E)(I) | | | 10,431 | | | | 7,145 | |
Battalion CLO XII, Ser 2018-12A, Cl SUB | | | | | | | | |
0.000%, 05/17/2031 (A)(E)(I) | | | 8,633 | | | | 6,389 | |
Battalion CLO XIV, Ser 2019-14A | | | | | | | | |
0.000%, 04/20/2032 (E)(I) | | | 6,147 | | | | 3,750 | |
Battalion CLO XVI, Ser 2019-16A, Cl SUB | | | | | | | | |
0.000%, 12/19/2032 (A)(E)(I) | | | 6,023 | | | | 5,150 | |
Battalion CLO, Ser 2018-18 | | | | | | | | |
8.175%, 10/15/2032 (E) | | | 2,467 | | | | 2,430 | |
Benefit Street Partners CLO III, Ser 2013-IIIA, Cl SUB | | | | | | | | |
0.000%, 07/20/2029 (A)(E)(I) | | | 2,640 | | | | 581 | |
Benefit Street Partners CLO IV | | | | | | | | |
0.000%, 07/20/2026 (A)(E)(I)(K) | | | 5 | | | | 875 | |
Benefit Street Partners CLO IX | | | | | | | | |
0.000%, 07/20/2025 (A)(E)(I)(K) | | | 3,363 | | | | 2,152 | |
| | |
168 | | SEI Institutional Investments Trust / Semi-Annual Report / November 30, 2020 |
| | | | | | | | |
| | | |
| Description | | Face Amount
(Thousands) | | Market Value
($ Thousands) |
|
ASSET-BACKED SECURITIES (continued) | |
Benefit Street Partners CLO V | | | | | | | | |
0.000%, 10/20/2026 (A)(E)(I)(K) | | $ | 6,413 | | | $ | 1 | |
Benefit Street Partners CLO V, Ser 2018-5BA | | | | | | | | |
0.000%, 04/20/2031 (E)(I) | | | 10,301 | | | | 4,450 | |
Benefit Street Partners CLO VI, Ser 2015-VIA, Cl SUB | | | | | | | | |
0.000%, 10/18/2029 (A)(E)(I) | | | 9,535 | | | | 2,193 | |
Benefit Street Partners CLO VII, Ser 2015-VIII, Cl SUB | | | | | | | | |
0.000%, 07/18/2027 (E)(I) | | | 9,035 | | | | 2,654 | |
Benefit Street Partners CLO VIII | | | | | | | | |
0.000%, 01/20/2031 (A)(E)(I) | | | 9,000 | | | | 4,230 | |
Benefit Street Partners CLO X, Ser 2016-10A, Cl SUB | | | | | | | | |
0.000%, 01/15/2029 (A)(E)(I) | | | 8,928 | | | | 2,053 | |
Benefit Street Partners CLO XII, Ser 2017— 12A, Cl C | | | | | | | | |
3.287%, VAR ICE LIBOR USD 3 Month+3.050%, 10/15/2030 (A)(E) | | | 1,950 | | | | 1,833 | |
Benefit Street Partners CLO XII, Ser 2017-12A, Cl SUB | | | | | | | | |
0.000%, 10/15/2030 (A)(E)(I) | | | 10,091 | | | | 4,743 | |
Benefit Street Partners CLO XIV, Ser 2018— 14A, Cl SUB | | | | | | | | |
0.000%, 04/20/2031 (A)(E)(I) | | | 6,857 | | | | 3,459 | |
Benefit Street Partners CLO XVIII, Ser 2019— 18A, Cl SUB | | | | | | | | |
0.000%, 10/15/2032 (A)(E)(I) | | | 6,048 | | | | 4,024 | |
Benefit Street Partners CLO XX, Ser 2020— 20A, Cl SUB | | | | | | | | |
0.000%, 07/15/2031 (A)(E)(I) | | | 3,469 | | | | 3,326 | |
Benefit Street Partners CLO XXI, Ser 2020— 21A, Cl E | | | | | | | | |
8.297%, VAR ICE LIBOR USD 3 Month+8.040%, 07/15/2031 (A)(E) | | | 1,531 | | | | 1,538 | |
Benefit Street Partners CLO, Warehouse Note | | | | | | | | |
0.000%, (E)(I)(L) | | | 1,211 | | | | 1,211 | |
Cathedral Lake CLO III, Ser 2015-3A, Cl SUB | | | | | | | | |
0.000%, 01/15/2026 (A)(E)(I) | | | 2,506 | | | | 652 | |
Cathedral Lake V, Ser 2018-5A, Cl SUB | | | | | | | | |
0.000%, 10/21/2030 (A)(E)(I) | | | 5,673 | | | | 2,099 | |
CVP Cascade CLO, Ser 2014-2A, Cl D | | | | | | | | |
5.018%, VAR ICE LIBOR USD 3 Month+4.800%, 07/18/2026 (A) (B)(E) | | | 2,337 | | | | 982 | |
CVP Cascade CLO, Ser 2014-2A, Cl E | | | | | | | | |
6.018%, VAR ICE LIBOR USD 3 Month+5.800%, 07/18/2026 (A)(E) | | | 2,665 | | | | 426 | |
Dryden 75 CLO, Ser 2019-75A, Cl SUB | | | | | | | | |
0.000%, 07/15/2030 (A)(E)(I) | | | 5,115 | | | | 3,376 | |
Figueroa CLO, Ser 2013-2A, Cl SUB | | | | | | | | |
0.000%, 06/20/2027 (A)(E)(I) | | | 3,046 | | | | – | |
| | | | | | | | |
| | | |
| Description | | Face Amount
(Thousands) | | Market Value
($ Thousands) |
|
ASSET-BACKED SECURITIES (continued) | |
Great Lakes CLO, Ser 2014-1A, Cl SUB | | | | | | | | |
0.000%, 10/15/2029 (A)(E)(I) | | $ | 4,940 | | | $ | 1,729 | |
Great Lakes CLO, Ser 2015-1A, Cl SUB | | | | | | | | |
0.000%, 01/16/2030 (A)(E)(I) | | | 6,015 | | | | 2,406 | |
Great Lakes CLO, Ser 2017-1A, Cl ER | | | | | | | | |
7.737%, VAR ICE LIBOR USD 3 Month+7.500%, 10/15/2029 (A)(E) | | | 3,376 | | | | 2,782 | |
Great Lakes CLO, Ser 2017-1A, Cl FR | | | | | | | | |
10.237%, VAR ICE LIBOR USD 3 Month+10.000%, 10/15/2029 (A)(E) | | | 1,972 | | | | 1,562 | |
Great Lakes CLO, Ser 2018-1A, Cl ER | | | | | | | | |
8.000%, VAR ICE LIBOR USD 3 Month+7.360%, 01/16/2030 (A)(E) | | | 4,328 | | | | 3,380 | |
Great Lakes CLO, Ser 2018-1A, Cl FR | | | | | | | | |
11.000%, VAR ICE LIBOR USD 3 Month+10.000%, 01/16/2030 (A) (B)(E) | | | 1,595 | | | | 1,190 | |
IVY Hill Middle Market Credit Fund XII, Ser 2017-12A, Cl D | | | | | | | | |
7.778%, VAR ICE LIBOR USD 3 Month+7.560%, 07/20/2029 (A)(E) | | | 5,687 | | | | 5,043 | |
IVY Hill Middle Market Credit Fund XII, Ser 2017-12A, Cl SUB | | | | | | | | |
0.000%, 07/20/2029 (A)(E)(I) | | | 1,149 | | | | 850 | |
IVY Hill Middle Market Credit Fund XIV, Ser 2018-14A, Cl D | | | | | | | | |
7.288%, VAR ICE LIBOR USD 3 Month+7.070%, 04/18/2030 (A)(E) | | | 2,886 | | | | 2,540 | |
IVY Hill Middle Market Credit Fund XIV, Ser 2018-14A, Cl SUB | | | | | | | | |
0.000%, 04/18/2030 (A)(E)(I) | | | 2,164 | | | | 1,244 | |
JFIN CLO, Ser 2018-1A, Cl BR | | | | | | | | |
2.568%, VAR ICE LIBOR USD 3 Month+2.350%, 07/20/2028 (A)(E) | | | 2,769 | | | | 2,721 | |
Lockwood Grove CLO, Ser 2014-1A, Cl SUB | | | | | | | | |
0.000%, 01/25/2030 (A)(E)(I) | | | 4,865 | | | | 2,189 | |
Lockwood Grove CLO, Ser 2018-1A, Cl ERR | | | | | | | | |
6.065%, VAR ICE LIBOR USD 3 Month+5.850%, 01/25/2030 (A)(E) | | | 3,201 | | | | 2,529 | |
Longfellow Place CLO, Ser 2013-1A | | | | | | | | |
3.237%, 04/15/2029 (E) | | | 2,492 | | | | 2,430 | |
Neuberger Berman CLO XXII, Ser 2016-22A, Cl F | | | | | | | | |
0.100%, 10/17/2030 (A)(E) | | | 161 | | | | 53 | |
Neuberger Berman CLO XXII, Ser 2016-22A, Cl SUB | | | | | | | | |
0.000%, 10/17/2030 (A)(E)(I) | | | 5,235 | | | | 2,827 | |
Neuberger Berman Loan Advisers CLO 36, Ser 2020-36A, Cl INC | | | | | | | | |
0.000%, 04/20/2033 (A)(E)(I) | | | 1,780 | | | | 1,691 | |
Neuberger Berman Loan Advisers CLO 36, Ser 2020-36A, Cl SPIN | | | | | | | | |
0.114%, 04/20/2033 (A)(E)(G) | | | 23 | | | | 21 | |
| | |
SEI Institutional Investments Trust / Semi-Annual Report / November 30, 2020 | | 169 |
SCHEDULE OF INVESTMENTS (Unaudited)
November 30, 2020
High Yield Bond Fund (Continued)
| | | | | | | | |
| | | |
| Description | | Face Amount
(Thousands) | | Market Value
($ Thousands) |
|
ASSET-BACKED SECURITIES (continued) | |
Neuberger Berman Loan Advisers CLO 38 | | | | | | | | |
0.000%, 10/20/2032 (E)(I) | | $ | 5,458 | | | $ | 4,737 | |
Neuberger Berman Loan Advisers CLO 39 | | | | | | | | |
0.000%, 10/20/2032 (I) | | | 8,784 | | | | 7,966 | |
NewStar Berkeley Fund CLO LLC, Ser 2016— 1A, Cl E | | | | | | | | |
7.965%, VAR ICE LIBOR USD 3 Month+7.750%, 10/25/2028 (A)(E) | | | 15,428 | | | | 13,083 | |
NewStar Berkeley Fund CLO LLC, Ser 2016— 1A, Cl SUB | | | | | | | | |
0.000%, 10/25/2028 (A)(E)(I) | | | 21,812 | | | | 6,762 | |
NewStar Clarendon Fund CLO LLC, Ser 2015— 1A, Cl E | | | | | | | | |
6.265%, VAR ICE LIBOR USD 3 Month+6.050%, 01/25/2027 (A)(E) | | | 4,470 | | | | 3,844 | |
NewStar Exeter Fund CLO, Ser 2015-1RA, Cl E | | | | | | | | |
7.418%, VAR ICE LIBOR USD 3 Month+7.200%, 01/20/2027 (A)(E) | | | 5,110 | | | | 4,343 | |
NewStar Fairfield Fund CLO, Ser 2015-2A, Cl SUB | | | | | | | | |
0.000%, 04/20/2030 (A)(E)(I) | | | 9,028 | | | | 3,747 | |
NewStar Fairfield Fund CLO, Ser 2018-2A, Cl DN | | | | | | | | |
7.598%, VAR ICE LIBOR USD 3 Month+7.380%, 04/20/2030 (A)(E) | | | 4,200 | | | | 3,058 | |
OCP CLO, Ser 2017-14A, Cl SUB | | | | | | | | |
0.000%, 11/20/2030 (A)(E)(I) | | | 3,012 | | | | 1,747 | |
OCP CLO, Ser 2020-19A, Cl SUB | | | | | | | | |
0.000%, 07/20/2031 (A)(E)(I) | | | 1,876 | | | | 1,662 | |
Shackleton CLO, Ser 2014-6A, Cl SUB | | | | | | | | |
0.000%, 07/17/2026 (A)(E)(I) | | | 7,965 | | | | 1 | |
Shackleton CLO, Ser 2014-6RA | | | | | | | | |
0.000%, 07/17/2028 (E)(I) | | | 6,412 | | | | 2,180 | |
Shackleton CLO, Ser 2019-14A, Cl SUB | | | | | | | | |
0.000%, 07/20/2030 (A)(E)(I) | | | 3,251 | | | | 1,983 | |
TCP Whitney CLO, Ser 2017-1I, Cl SUB | | | | | | | | |
0.000%, 08/20/2029 (E)(I) | | | 13,119 | | | | 11,181 | |
TCW CLO, Ser 2017-1A, Cl SUB | | | | | | | | |
0.000%, 07/29/2029 (A)(E)(I) | | | 7,377 | | | | 4,574 | |
TCW CLO, Ser 2018-1A, Cl SUB | | | | | | | | |
0.000%, 04/25/2031 (A)(E)(I) | | | 5,509 | | | | 3,730 | |
TCW CLO, Ser 2019-2A, Cl SUB | | | | | | | | |
0.000%, 10/20/2032 (A)(E)(I) | | | 5,959 | | | | 3,992 | |
TCW CLO, Ser 2020-1A, Cl DR | | | | | | | | |
3.931%, VAR ICE LIBOR USD 3 Month+3.700%, 10/20/2031 (A) | | | 1,674 | | | | 1,641 | |
TCW CLO, Warehouse Note, Ser 2020-1 | | | | | | | | |
0.000%, (E)(I)(L) | | | 8,139 | | | | 4,639 | |
Telos CLO, Ser 2018-5A, Cl BR | | | | | | | | |
1.698%, VAR ICE LIBOR USD 3 Month+1.480%, 04/17/2028 (A)(E) | | | 1,624 | | | | 1,571 | |
Venture 35 CLO, Ser 2018-35A, Cl SUB | | | | | | | | |
0.000%, 10/22/2031 (A)(E)(I) | | | 15,819 | | | | 6,644 | |
| | | | | | | | |
| | | |
| Description | | Face Amount
(Thousands) | | Market Value
($ Thousands) |
|
ASSET-BACKED SECURITIES (continued) | |
Venture XXV CLO, Ser 2016-25A, Cl SUB | | | | | | | | |
0.000%, 04/20/2029 (A)(E)(I) | | $ | 2,950 | | | $ | 1,327 | |
Venture XXVI CLO, Ser 2017-26A, Cl SUB | | | | | | | | |
0.000%, 01/20/2029 (A)(E)(I) | | | 2,865 | | | | 888 | |
Venture XXVIII CLO, Ser 2017-28A, Cl SUB | | | | | | | | |
0.000%, 07/20/2030 (A)(E)(I) | | | 5,750 | | | | 2,990 | |
VOYA CLO, Ser 2020-2A | | | | | | | | |
0.000%, 07/31/2031 (E)(I) | | | 7,797 | | | | 7,273 | |
| | | | | | | | |
| | |
Total Asset-Backed Securities
(Cost $218,987) ($ Thousands) | | | | | | | 226,869 | |
| | | | | | | | |
| | |
| | | Shares | | |
|
COMMON STOCK — 1.0% | |
21st Century Oncology *(E) | | | 22,017 | | | | 294 | |
Aquity Equity *(E) | | | 89,545 | | | | 940 | |
Aquity Equity (Escrow Security) *(E) | | | 69,580 | | | | 139 | |
Aspect Software CR1 Inc *(E) | | | 40,500 | | | | — | |
Aspect Software CR2 Inc *(E) | | | 16,397 | | | | — | |
ATD New Holdings Inc *(E) | | | 3,257 | | | | 57 | |
Aurora *(E) | | | 12,989 | | | | — | |
Battalion Oil * | | | 6,488 | | | | 50 | |
Berry Corp | | | 445,831 | | | | 1,712 | |
Cenveo Corp *(E) | | | 66,991 | | | | 904 | |
CHC Group LLC * | | | 28,873 | | | | 22 | |
Claire’s Stores Inc *(E) | | | 858 | | | | 300 | |
Clear Channel Outdoor Holdings Inc, Cl A * | | | 345,144 | | | | 521 | |
CUI Acquisition Corp *(E) | | | 3 | | | | — | |
Cumulus Media Inc, Cl A * | | | 109,292 | | | | 958 | |
Denbury Inc * | | | 20,593 | | | | 462 | |
EP Energy * | | | 25,685 | | | | 604 | |
Foresight * | | | 60,593 | | | | 515 | |
FTS International, Cl A * | | | 118,543 | | | | 2,215 | |
Global Aviation Holdings Inc, Cl A *(E) | | | 101,199 | | | | — | |
Gymboree Corp *(E) | | | 18,542 | | | | 9 | |
Gymboree Holding Corp *(E) | | | 52,848 | | | | 27 | |
Hexion Holdings Corp * | | | 194,188 | | | | 2,278 | |
iHeartMedia Inc *(C) | | | 35,187 | | | | 421 | |
iHeartMedia Inc, Cl A *(C) | | | 119,604 | | | | 1,430 | |
Jupiter Resources *(E) | | | 571,046 | | | | 428 | |
Knight Energy Services LLC *(E)(M) | | | 2,205 | | | | — | |
Medical Card Systems Inc *(E) | | | 395,653 | | | | — | |
Monitronics International Inc *(E) | | | 381,412 | | | | 2,945 | |
MYT Holding LLC *(E) | | | 460,055 | | | | 518 | |
Neiman Marcus Group *(E) | | | 10,950 | | | | 876 | |
Nine West * | | | 163,718 | | | | 164 | |
Oasis Petroleum Inc * | | | 17,789 | | | | 608 | |
Parker Drilling * | | | 143,734 | | | | 433 | |
Quad/Graphics Inc, Cl A | | | 173 | | | | 1 | |
Reichhold Industries *(E) | | | 1,755 | | | | 2,225 | |
Remainco LLC *(E) | | | 39,275 | | | | 47 | |
Remington Outdoor Company Inc *(E) | | | 19,372 | | | | — | |
Rue 21 * | | | 2,551 | | | | 153 | |
| | |
170 | | SEI Institutional Investments Trust / Semi-Annual Report / November 30, 2020 |
| | | | | | | | |
| | | |
| Description | | Shares | | Market Value
($ Thousands) |
|
COMMON STOCK (continued) | |
SandRidge Energy (Escrow Security) (E) | | | 7,605,000 | | | $ | — | |
SandRidge Energy Inc* | | | 10,878 | | | | 29 | |
TE Holdcorp *(E) | | | 67,771 | | | | — | |
Titan Energy LLC * | | | 22,243 | | | | 1 | |
VICI Properties Inc ‡ | | | 121,310 | | | | 3,068 | |
Vistra Corp | | | 46,760 | | | | 873 | |
Whiting Petroleum Corp * | | | 21,292 | | | | 482 | |
Windstream Services *(E) | | | 46,229 | | | | 520 | |
| | | | | | | | |
| | |
Total Common Stock
(Cost $50,688) ($ Thousands) | | | | | | | 27,229 | |
| | | | | | | | |
| | |
| | | Face Amount (Thousands) | | |
|
CONVERTIBLE BONDS — 0.7% | |
Air Canada CV to 65.1337 | | | | | | | | |
4.000%, 07/01/2025 (A) | | $ | 400 | | | | 597 | |
Apollo Commercial Real Estate Finance CV
to 50.2260 | | | | | | | | |
4.750%, 08/23/2022 | | | 443 | | | | 417 | |
Blackstone Mortgage Trust CV to 28.0324 | | | | | | | | |
4.375%, 05/05/2022 | | | 1,331 | | | | 1,320 | |
Cheniere Energy CV to 7.2265 | | | | | | | | |
4.250%, 03/15/2045 | | | 908 | | | | 679 | |
Chesapeake Energy CV to 116.7134 | | | | | | | | |
5.500%, 09/15/2026 (B) | | | 180 | | | | 10 | |
CNX Resources CV to 77.8816 | | | | | | | | |
2.250%, 05/01/2026 (A) | | | 805 | | | | 851 | |
DISH Network CV to 15.3429 | | | | | | | | |
3.375%, 08/15/2026 | | | 2,290 | | | | 2,283 | |
Golar LNG CV to 26.9925 | | | | | | | | |
2.750%, 02/15/2022 | | | 885 | | | | 753 | |
Liberty Media CV to 16.7764 | | | | | | | | |
3.750%, 02/15/2030 | | | 3,482 | | | | 2,646 | |
Liberty Media CV to 22.9469 | | | | | | | | |
4.000%, 11/15/2029 | | | 2,178 | | | | 1,652 | |
MagnaChip Semiconductor CV to 121.1387 | | | | | | | | |
5.000%, 03/01/2021 | | | 500 | | | | 856 | |
MGIC Investment CV to 74.0741 | | | | | | | | |
9.000%, 04/01/2063 (A) | | | 3,480 | | | | 4,576 | |
Royal Caribbean Cruises CV to 13.8672 | | | | | | | | |
4.250%, 06/15/2023 (A) | | | 355 | | | | 488 | |
| | | | | | | | |
| | |
Total Convertible Bonds
(Cost $15,874) ($ Thousands) | | | | | | | 17,128 | |
| | | | | | | | |
| | |
| | | Shares | | |
|
PREFERRED STOCK — 0.5% | |
2020 Mandatory Exchangeable Trust,
6.500%* | | | 901 | | | | 1,596 | |
AMC Entertainment, 0.000% * | | | 1,258 | | | | 5 | |
BoardRiders, 0.000% *(E) | | | 336,591 | | | | 347 | |
Claire’s Stores Inc, 0.000% *(E) | | | 622 | | | | 1,213 | |
| | | | | | | | |
| | | |
| Description | | Shares | | Market Value
($ Thousands) |
|
PREFERRED STOCK (continued) | |
Crestwood Equity Partners, 9.250% (N) | | | 453,690 | | | $ | 3,190 | |
Danaher, 5.000% * | | | 902 | | | | 1,176 | |
FHLMC, 0.000% * | | | 29,819 | | | | 509 | |
FNMA, 0.000% *(G) | | | 43,993 | | | | 766 | |
Ladenburg Thalmann Financial Services, 6.500% | | | 99,400 | | | | 1,605 | |
MYT Holding LLC, 0.000% *(E) | | | 608,423 | | | | 685 | |
Qurate Retail Inc, 8.000% | | | 13,106 | | | | 1,287 | |
TE Holdcorp, 0.000% *(E) | | | 118,617 | | | | — | |
| | | | | | | | |
| | |
Total Preferred Stock
(Cost $11,695) ($ Thousands) | | | | | | | 12,379 | |
| | | | | | | | |
| | |
| | | Face Amount
(Thousands) | | |
|
MUNICIPAL BONDS — 0.2% | |
|
Connecticut — 0.1% | |
Mohegan Tribal Finance Authority, RB
Callable 02/01/2023 @ 100 | | | | | | | | |
7.000%, 02/01/2045 (A) | | $ | 2,940 | | | | 2,903 | |
| | | | | | | | |
|
Puerto Rico — 0.1% | |
Commonwealth of Puerto Rico, Ser A, GO | | | | | | | | |
5.250%, 07/01/2023 (B)(E) | | | 635 | | | | 430 | |
5.125%, 07/01/2037 (B) | | | 465 | | | | 309 | |
5.000%, 07/01/2041 (B) | | | 1,225 | | | | 793 | |
| | | | | | | | |
| | | | | | | 1,532 | |
| | | | | | | | |
| | |
Total Municipal Bonds
(Cost $4,368) ($ Thousands) | | | | | | | 4,435 | |
| | | | | | | | |
| | |
SEI Institutional Investments Trust / Semi-Annual Report / November 30, 2020 | | 171 |
SCHEDULE OF INVESTMENTS (Unaudited)
November 30, 2020
High Yield Bond Fund (Continued)
| | | | | | | | |
| | | |
| Description | | Number of
Warrants | | | Market Value
($ Thousands) | |
|
WARRANTS — 0.0% | |
Carestream, | | | | | | | | |
Strike Price $0 *# | | | 66 | | | $ | – | |
Guitar Center Holdings, Expires 04/16/2025 | | | | | | | | |
Strike Price $0 *(E) | | | 29,435 | | | | – | |
iHeart Communications, Expires 05/01/2039 | | | | | | | | |
Strike Price $0 *(E) | | | 24,100 | | | | 181 | |
Lion Holdings, Expires 12/30/2027 | | | | | | | | |
Strike Price $0 * | | | 2,380 | | | | – | |
Neiman Marcus Group, Expires 09/24/2027 | | | | | | | | |
Strike Price $213 *(E) | | | 6,679 | | | | – | |
Remington Arms, Expires 05/14/2022 | | | | | | | | |
Strike Price $0 *(E) | | | 19,534 | | | | – | |
SandRidge Energy, Expires 10/07/2022 | | | | | | | | |
Strike Price $41 * | | | 14,900 | | | | – | |
SandRidge Energy, Expires 10/07/2022 | | | | | | | | |
Strike Price $42 * | | | 6,273 | | | | – | |
Windstream Services, | | | | | | | | |
| | | | | | | | |
| | | |
| Description | | Number of
Warrants | | | Market Value
($ Thousands) | |
|
WARRANTS (continued) | |
Strike Price $0 *(E)# | | | 50,968 | | | $ | 612 | |
| | | | | | | | |
| | |
Total Warrants
(Cost $951) ($ Thousands) | | | | | | | 793 | |
| | | | | | | | |
| | |
| | | Shares | | | | |
CASH EQUIVALENT — 3.9% | | | | | | | | |
SEI Daily Income Trust, Government Fund, Cl F | | | | | | | | |
0.010%**† | | | 103,553,341 | | | | 103,553 | |
| | | | | | | | |
| | |
Total Cash Equivalent
(Cost $103,553) ($ Thousands) | | | | | | | 103,553 | |
| | | | | | | | |
| | |
Total Investments in Securities — 100.9%
(Cost $2,663,383) ($ Thousands) | | | | | | $ | 2,684,520 | |
| | | | | | | | |
A list of open centrally cleared swap agreements held by the Fund at November 30, 2020 is as follows:
| | | | | | | | | | | | | | | | | | | | | | | | | | | | | | | | |
| |
| Credit Default Swaps | |
| | | | | | | | | |
Reference Entity/ Obligation | | Buy/Sell Protection | | (Pays)/ Receives Rate | | Payment Frequency | | Termination Date | | Notional Amount (Thousands) | | Value (Thousands) | | Upfront Payments/ Receipts (Thousands) | | Net Unrealized Appreciation (Depreciation) (Thousands) |
|
|
|
CDX.NA.HY.33 INDEX | | | Sell | | | | 5.00 | % | | | Quarterly | | | | 12/20/2024 | | | | (1,839 | ) | | $ | 144 | | | $ | (58 | ) | | $ | 202 | |
CDX.NA.HY.34 INDEX | | | Sell | | | | 5.00 | % | | | Quarterly | | | | 06/20/2025 | | | | (2,000 | ) | | | 160 | | | | 2 | | | | 158 | |
| | | | | | | | | | | | | | | | | | | | | | | | | | | | | | | | |
| | | | | | | | | | | | | | | | | | | | | | $ | 304 | | | $ | (56 | ) | | $ | 360 | |
| | | | | | | | | | | | | | | | | | | | | | | | | | | | | | | | |
Percentages are based on Net Assets of $2,661,565 ($ Thousands).
| * | Non-income producing security. |
| ** | The rate reported is the 7-day effective yield as of November 30, 2020. |
| † | Investment in Affiliated Security (see Note 6). |
| ‡ | Real Estate Investment Trust. |
| # | Expiration date not available. |
| (A) | Security exempt from registration under Rule 144A of the Securities Act of 1933. These securities may be resold in transactions exempt from registration normally to qualified institutions. On November 30, 2020, the value of these securities amounted to $1,610,358 ($ Thousands), representing 60.5% of the Net Assets of the Fund. |
| (B) | Security is in default on interest payment. |
| (C) | Security, or a portion thereof, is owned through a holding entity, Bamboo Temple, LLC. |
| (D) | Perpetual security with no stated maturity date. |
| (E) | Level 3 security in accordance with fair value hierarchy. |
| (F) | Securities considered restricted. The total market value of such securities as of November 30, 2020 was $0 ($ Thousands) and represented 0.0% of the Net Assets of the Fund. |
| (G) | Variable or floating rate security, the interest rate of which adjusts periodically based on changes in current interest rates and prepayments on the underlying pool of assets. |
| (H) | Unsettled bank loan. Interest rate may not be available. |
| (I) | No interest rate available. |
| (J) | Security, or a portion thereof, is owned through a holding entity, 717 AEP Leasing, LLC. |
| (K) | Zero coupon security. The rate shown on the Schedule of Investments is the security’s effective yield at the time of purchase. |
| (L) | Warehouse Note—Interest rate and maturity date are unavailable. |
| (M) | Security, or a portion thereof, is owned through a holding entity, Knights Energy Topco, LLC. |
| (N) | Security is a Master Limited Partnership. At November 30, 2020, such securities amounted to $3,190 ($ Thousands), or 0.1% of the Net Assets of the Fund (See Note 2). |
Cl — Class
CLO — Collateralized Loan Obligation
CV — Convertible Security
DAC — Designated Activity Company
FHLMC — Federal Home Loan Mortgage Corporation
FNMA — Federal National Mortgage Association
GO — General Obligation
ICE— Intercontinental Exchange
LIBOR— London Interbank Offered Rate
LLC — Limited Liability Company
LP — Limited Partnership
LLLP — Limited Liability Limited Partnership
Ltd. — Limited
PIK — Payment-In-Kind
Pty — Proprietary
RB — Revenue Bond
Ser — Series
ULC — Unlimited Liability Company
USD — United States Dollar
VAR — Variable Rate
| | |
172 | | SEI Institutional Investments Trust / Semi-Annual Report / November 30, 2020 |
The following is a list of the level of inputs used as of November 30, 2020, in valuing the Fund’s investments and other financial instruments carried at value ($ Thousands):
| | | | | | | | | | | | | | | | |
| | | | | |
| Investments in Securities | | Level 1
($) | | Level 2
($) | | Level 3
($) | | Total ($) |
Corporate Obligations | | | – | | | | 2,015,070 | | | | 10,239 | | | | 2,025,309 | |
Loan Participations | | | – | | | | 228,749 | | | | 38,076 | | | | 266,825 | |
Asset-Backed Securities | | | – | | | | 11,645 | | | | 215,224 | | | | 226,869 | |
Common Stock | | | 16,146 | | | | 854 | | | | 10,229 | | | | 27,229 | |
Convertible Bonds | | | – | | | | 17,128 | | | | – | | | | 17,128 | |
Preferred Stock | | | 5,243 | | | | 4,891 | | | | 2,245 | | | | 12,379 | |
Municipal Bonds | | | – | | | | 4,005 | | | | 430 | | | | 4,435 | |
Warrants | | | – | | | | – | | | | 793 | | | | 793 | |
Cash Equivalent | | | 103,553 | | | | – | | | | – | | | | 103,553 | |
| | | | | | | | | | | | | | | | |
Total Investments in Securities | | | 124,942 | | | | 2,282,342 | | | | 277,236 | | | | 2,684,520 | |
| | | | | | | | | | | | | | | | |
| | | | | | | | | | | | | | | | |
| | | | | |
| Other Financial Instruments | | Level 1 ($) | | Level 2 ($) | | Level 3 ($) | | Total ($) |
Centrally Cleared Swaps | | | | | | | | | | | | | | | | |
Credit Default Swaps*
Unrealized Appreciation | | | – | | | | 360 | | | | – | | | | 360 | |
| | | | | | | | | | | | | | | | |
Total Other Financial Instruments | | | – | | | | 360 | | | | – | | | | 360 | |
| | | | | | | | | | | | | | | | |
* Swap contracts are valued at the unrealized appreciation on the instrument.
The following table depicts purchases and transfers in and/or out of Level 3 investments during the period for investments held as of November 30, 2020 ($ Thousands).
| | | | | | | | | | | | | | | | | | | | | | | | | | | | | | | | |
| | | | | | | | | |
| | | Investments in Corporate Obligations | | Investments in Loan Participations | | Investments in Asset-Backed Securities | | Investments in Common Stock | | Investments in Convertible Bonds | | Investments in Preferred Stock | | Investments in Municipal Bonds | | Investments in Warrants |
Balance as of May 31, 2020 | | $ | 9,408 | | | $ | 31,958 | | | $ | 177,914 | | | $ | 9,163 | | | $ | 30 | | | $ | 1,052 | | | $ | 2,474 | | | $ | 196 | |
Accrued discounts/premiums | | | 123 | | | | 156 | | | | 243 | | | | — | | | | (55 | ) | | | — | | | | — | | | | — | |
Realized gain/(loss) | | | — | | | | (876 | ) | | | 2,567 | | | | 1,045 | | | | (138 | ) | | | — | | | | 177 | | | | — | |
Change in unrealized appreciation/ (depreciation) | | | 1,046 | | | | 5,090 | | | | 40,157 | | | | (594 | ) | | | 163 | | | | 609 | | | | 236 | | | | 597 | |
Purchases | | | 1,218 | | | | 6,980 | | | | 26,241 | | | | 897 | | | | — | | | | 584 | | | | — | | | | — | |
Sales | | | — | | | | (3,818 | ) | | | (31,898 | ) | | | (1,414 | ) | | | — | | | | — | | | | (2,457 | ) | | | — | |
Net transfer into Level 3 | | | 65 | | | | 11,856 | | | | — | | | | 1,132 | | | | — | | | | — | | | | — | | | | — | |
Net transfer out of Level 3 | | | (1,621 | ) | | | (13,270 | ) | | | — | | | | — | | | | — | | | | — | | | | — | | | | — | |
Ending Balance as of November 30, 2020 | | $ | 10,239 | | | $ | 38,076 | | | $ | 215,224 | | | $ | 10,229 | | | $ | — | | | $ | 2,245 | | | $ | 430 | | | $ | 793 | |
Changes in unrealized gains/(losses) included in earnings related to securities still held at reporting date | | $ | 1,003 | | | $ | 5,037 | | | $ | 39,301 | | | $ | 36 | | | $ | (181 | ) | | $ | 609 | | | $ | 65 | | | $ | 763 | |
(1) Of the $276,369 ($ Thousands) in Level 3 securities as of November 30, 2020, $17,373 ($ thousand) or 0.1% of the Net Assets of the Fund are not valued via third party pricing vendors and broker quotes. If significant, the disclosure of the unobservable inputs and the interrelationships and sensitivity between these inputs are required for those Level 3 securities that are not valued by third party pricing vendors or broker quotes. The value of these securities is immaterial and no further disclosure is required.
For the period ended November 30, 2020, there were transfers between Level 2 and Level 3 assets and liabilities. The transfers were due to changes in the availability of observable inputs used to determine fair value.
For more information on valuation inputs, see Note 2 — Significant Accounting Policies in Notes to Financial Statements.
The following is a summary of the Fund’s transactions with affiliates for the period ended November 30, 2020 ($ Thousands):
| | | | | | | | | | | | | | | | | | | | | | | | | | | | | | | | | | | | |
Security
Description | | Value 5/31/2020 | | | Purchases at Cost | | | Proceeds from
Sales | | | Realized Gain/
(Loss) | | | Change in
Unrealized
Appreciation/
(Depreciation) | | | Value
11/30/2020 | | | Shares | | | Income | | | Capital Gains | |
SEI Daily Income Trust, Government Fund, ClF | | $ | 40,088 | | | $ | 552,822 | | | $ | (489,357 | ) | | $ | — | | | $ | — | | | $ | 103,553 | | | | 103,553,341 | | | $ | 5 | | | $ | — | |
| | | | | | | | | | | | | | | | | | | | | | | | | | | | | | | | | | | | |
Amounts designated as “—” are either $0 or have been rounded to $0.
| | |
SEI Institutional Investments Trust / Semi-Annual Report / November 30, 2020 | | 173 |
SCHEDULE OF INVESTMENTS (Unaudited)
November 30, 2020
High Yield Bond Fund (Concluded)
The accompanying notes are an integral part of the financial statements
| | |
174 | | SEI Institutional Investments Trust / Semi-Annual Report / November 30, 2020 |
SCHEDULE OF INVESTMENTS (Unaudited)
November 30, 2020
Long Duration Fund
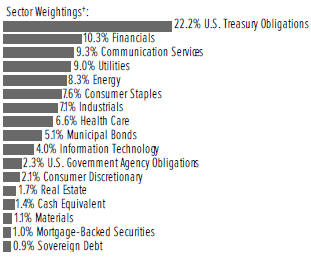
†Percentages based on total investments.
| | | | | | | | |
| | | |
| Description | | Face Amount
(Thousands) | | Market Value
($ Thousands) |
|
CORPORATE OBLIGATIONS — 66.8% | |
|
Communication Services — 9.2% | |
Alphabet | | | | | | | | |
2.250%, 08/15/2060 | | $ | 875 | | | $ | 864 | |
1.900%, 08/15/2040 | | | 500 | | | | 494 | |
America Movil | | | | | | | | |
6.375%, 03/01/2035 | | | 305 | | | | 455 | |
6.125%, 03/30/2040 | | | 595 | | | | 886 | |
4.375%, 04/22/2049 | | | 305 | | | | 398 | |
AT&T Inc | | | | | | | | |
5.150%, 02/15/2050 | | | 1,395 | | | | 1,793 | |
4.800%, 06/15/2044 | | | 2,021 | | | | 2,538 | |
4.650%, 06/01/2044 | | | 308 | | | | 370 | |
4.500%, 05/15/2035 | | | 4,225 | | | | 5,119 | |
4.500%, 03/09/2048 | | | 470 | | | | 574 | |
4.350%, 06/15/2045 | | | 6,456 | | | | 7,611 | |
4.300%, 12/15/2042 | | | 300 | | | | 352 | |
3.850%, 06/01/2060 | | | 365 | | | | 387 | |
3.650%, 06/01/2051 | | | 462 | | | | 489 | |
3.650%, 09/15/2059 (A) | | | 1,571 | | | | 1,592 | |
3.550%, 09/15/2055 (A) | | | 3,171 | | | | 3,250 | |
3.500%, 09/15/2053 (A) | | | 6,061 | | | | 6,183 | |
3.300%, 02/01/2052 | | | 180 | | | | 180 | |
3.100%, 02/01/2043 | | | 485 | | | | 498 | |
Charter Communications Operating LLC | | | | | | | | |
6.484%, 10/23/2045 | | | 2,218 | | | | 3,170 | |
6.384%, 10/23/2035 | | | 2,280 | | | | 3,179 | |
5.750%, 04/01/2048 | | | 1,180 | | | | 1,559 | |
5.375%, 05/01/2047 | | | 977 | | | | 1,239 | |
4.800%, 03/01/2050 | | | 625 | | | | 746 | |
3.850%, 04/01/2061 | | | 645 | | | | 663 | |
3.700%, 04/01/2051 | | | 605 | | | | 632 | |
Comcast | | | | | | | | |
6.400%, 05/15/2038 | | | 794 | | | | 1,236 | |
| | | | | | | | |
| | | |
| Description | | Face Amount
(Thousands) | | Market Value
($ Thousands) |
|
CORPORATE OBLIGATIONS (continued) | |
4.950%, 10/15/2058 | | $ | 203 | | | $ | 309 | |
4.700%, 10/15/2048 | | | 3,422 | | | | 4,856 | |
4.600%, 10/15/2038 | | | 430 | | | | 569 | |
4.600%, 08/15/2045 | | | 835 | | | | 1,128 | |
4.250%, 01/15/2033 | | | 430 | | | | 538 | |
4.049%, 11/01/2052 | | | 1,626 | | | | 2,110 | |
4.000%, 03/01/2048 | | | 465 | | | | 592 | |
3.999%, 11/01/2049 | | | 863 | | | | 1,121 | |
3.969%, 11/01/2047 | | | 2,373 | | | | 2,997 | |
3.900%, 03/01/2038 | | | 1,375 | | | | 1,693 | |
3.750%, 04/01/2040 | | | 2,114 | | | | 2,568 | |
2.650%, 08/15/2062 | | | 325 | | | | 328 | |
Cox Communications | | | | | | | | |
4.700%, 12/15/2042 (A) | | | 353 | | | | 456 | |
Deutsche Telekom International Finance | | | | | | | | |
4.875%, 03/06/2042 (A) | | | 695 | | | | 921 | |
Discovery Communications LLC | | | | | | | | |
5.300%, 05/15/2049 | | | 375 | | | | 485 | |
5.200%, 09/20/2047 | | | 365 | | | | 465 | |
4.650%, 05/15/2050 | | | 540 | | | | 664 | |
4.000%, 09/15/2055 (A) | | | 1,504 | | | | 1,673 | |
Fox | | | | | | | | |
5.576%, 01/25/2049 | | | 1,340 | | | | 1,961 | |
5.476%, 01/25/2039 | | | 755 | | | | 1,048 | |
Interpublic Group | | | | | | | | |
5.400%, 10/01/2048 | | | 218 | | | | 293 | |
Level 3 Financing | | | | | | | | |
3.875%, 11/15/2029 (A) | | | 940 | | | | 1,032 | |
NBCUniversal Media LLC | | | | | | | | |
5.950%, 04/01/2041 | | | 686 | | | | 1,054 | |
Rogers Communications | | | | | | | | |
5.000%, 03/15/2044 | | | 1,077 | | | | 1,463 | |
4.500%, 03/15/2043 | | | 257 | | | | 326 | |
SES GLOBAL Americas Holdings GP | | | | | | | | |
5.300%, 03/25/2044 (A) | | | 1,200 | | | | 1,274 | |
Telefonica Emisiones SAU | | | | | | | | |
5.213%, 03/08/2047 | | | 420 | | | | 535 | |
Time Warner Cable LLC | | | | | | | | |
7.300%, 07/01/2038 | | | 475 | | | | 698 | |
6.750%, 06/15/2039 | | | 475 | | | | 676 | |
6.550%, 05/01/2037 | | | 1,005 | | | | 1,391 | |
5.875%, 11/15/2040 | | | 1,500 | | | | 1,944 | |
5.500%, 09/01/2041 | | | 1,385 | | | | 1,746 | |
4.500%, 09/15/2042 | | | 675 | | | | 779 | |
T-Mobile USA | | | | | | | | |
4.500%, 04/15/2050 (A) | | | 717 | | | | 895 | |
4.375%, 04/15/2040 (A) | | | 650 | | | | 794 | |
3.600%, 11/15/2060 (A) | | | 280 | | | | 298 | |
3.300%, 02/15/2051 (A) | | | 1,955 | | | | 2,048 | |
Verizon Communications Inc | | | | | | | | |
5.012%, 04/15/2049 | | | 33 | | | | 47 | |
5.012%, 08/21/2054 | | | 2,454 | | | | 3,545 | |
| | |
SEI Institutional Investments Trust / Semi-Annual Report / November 30, 2020 | | 175 |
SCHEDULE OF INVESTMENTS (Unaudited)
November 30, 2020
Long Duration Fund (Continued)
| | | | | | | | |
| | | |
| Description | | Face Amount
(Thousands) | | Market Value
($ Thousands) |
|
CORPORATE OBLIGATIONS (continued) | |
4.750%, 11/01/2041 | | $ | 495 | | | $ | 663 | |
4.672%, 03/15/2055 | | | 555 | | | | 766 | |
4.522%, 09/15/2048 | | | 724 | | | | 974 | |
4.500%, 08/10/2033 | | | 3,985 | | | | 5,080 | |
4.400%, 11/01/2034 | | | 900 | | | | 1,138 | |
4.272%, 01/15/2036 | | | 1,265 | | | | 1,589 | |
3.850%, 11/01/2042 | | | 165 | | | | 200 | |
2.987%, 10/30/2056 (A) | | | 2,957 | | | | 3,132 | |
2.650%, 11/20/2040 | | | 170 | | | | 175 | |
ViacomCBS | | | | | | | | |
5.850%, 09/01/2043 | | | 1,825 | | | | 2,498 | |
4.950%, 05/19/2050 | | | 568 | | | | 724 | |
4.850%, 12/15/2034 | | | 1,000 | | | | 1,165 | |
4.600%, 01/15/2045 | | | 310 | | | | 365 | |
Vodafone Group | | | | | | | | |
5.250%, 05/30/2048 | | | 1,486 | | | | 2,034 | |
5.000%, 05/30/2038 | | | 1,245 | | | | 1,622 | |
4.875%, 06/19/2049 | | | 41 | | | | 54 | |
4.375%, 02/19/2043 | | | 865 | | | | 1,066 | |
4.250%, 09/17/2050 | | | 1,140 | | | | 1,396 | |
Walt Disney | | | | | | | | |
7.625%, 11/30/2028 | | | 1 | | | | 1 | |
6.550%, 03/15/2033 | | | 1,200 | | | | 1,772 | |
3.600%, 01/13/2051 | | | 4,745 | | | | 5,638 | |
3.500%, 05/13/2040 | | | 550 | | | | 641 | |
2.750%, 09/01/2049 | | | 447 | | | | 458 | |
| | | | | | | | |
| | | | | | | 126,928 | |
| | | | | | | | |
|
Consumer Discretionary — 2.1% | |
Alimentation Couche-Tard | | | | | | | | |
4.500%, 07/26/2047 (A) | | | 1,075 | | | | 1,331 | |
3.800%, 01/25/2050 (A) | | | 490 | | | | 574 | |
Amazon.com | | | | | | | | |
4.950%, 12/05/2044 | | | 2,029 | | | | 2,997 | |
4.050%, 08/22/2047 | | | 951 | | | | 1,275 | |
2.700%, 06/03/2060 | | | 600 | | | | 660 | |
Aptiv PLC | | | | | | | | |
5.400%, 03/15/2049 | | | 904 | | | | 1,102 | |
General Motors | | | | | | | | |
6.600%, 04/01/2036 | | | 370 | | | | 500 | |
6.250%, 10/02/2043 | | | 200 | | | | 270 | |
5.950%, 04/01/2049 | | | 1,000 | | | | 1,349 | |
5.150%, 04/01/2038 | | | 225 | | | | 268 | |
5.000%, 04/01/2035 | | | 105 | | | | 126 | |
Home Depot | | | | | | | | |
4.250%, 04/01/2046 | | | 925 | | | | 1,230 | |
4.200%, 04/01/2043 | | | 460 | | | | 601 | |
3.900%, 06/15/2047 | | | 607 | | | | 774 | |
3.350%, 04/15/2050 | | | 1,600 | | | | 1,898 | |
2.700%, 04/15/2030 | | | 720 | | | | 800 | |
Lowe’s | | | | | | | | |
5.125%, 04/15/2050 | | | 272 | | | | 399 | |
| | | | | | | | |
| | | |
| Description | | Face Amount
(Thousands) | | Market Value
($ Thousands) |
|
CORPORATE OBLIGATIONS (continued) | |
4.050%, 05/03/2047 | | $ | 735 | | | $ | 904 | |
3.700%, 04/15/2046 | | | 935 | | | | 1,099 | |
3.000%, 10/15/2050 | | | 785 | | | | 843 | |
McDonald’s MTN | | | | | | | | |
4.875%, 12/09/2045 | | | 95 | | | | 130 | |
4.600%, 05/26/2045 | | | 650 | | | | 854 | |
4.450%, 03/01/2047 | | | 1,535 | | | | 1,988 | |
4.450%, 09/01/2048 | | | 50 | | | | 66 | |
3.625%, 09/01/2049 | | | 785 | | | | 921 | |
3.600%, 07/01/2030 | | | 420 | | | | 493 | |
NIKE | | | | | | | | |
3.375%, 03/27/2050 | | | 1,095 | | | | 1,322 | |
3.250%, 03/27/2040 | | | 655 | | | | 767 | |
2.850%, 03/27/2030 | | | 560 | | | | 633 | |
Starbucks | | | | | | | | |
4.500%, 11/15/2048 | | | 310 | | | | 403 | |
4.450%, 08/15/2049 | | | 440 | | | | 572 | |
3.350%, 03/12/2050 | | | 710 | | | | 778 | |
TJX | | | | | | | | |
4.500%, 04/15/2050 | | | 120 | | | | 172 | |
3.875%, 04/15/2030 | | | 525 | | | | 629 | |
| | | | | | | | |
| | | | | | | 28,728 | |
| | | | | | | | |
|
Consumer Staples — 7.5% | |
Advocate Health & Hospitals | | | | | | | | |
4.272%, 08/15/2048 | | | 921 | | | | 1,181 | |
Aetna | | | | | | | | |
4.125%, 11/15/2042 | | | 550 | | | | 653 | |
Alcon Finance | | | | | | | | |
3.800%, 09/23/2049 (A) | | | 750 | | | | 891 | |
Altria Group | | | | | | | | |
5.950%, 02/14/2049 | | | 980 | | | | 1,398 | |
5.800%, 02/14/2039 | | | 185 | | | | 245 | |
5.375%, 01/31/2044 | | | 1,215 | | | | 1,580 | |
4.450%, 05/06/2050 | | | 315 | | | | 371 | |
3.875%, 09/16/2046 | | | 100 | | | | 108 | |
Anheuser-Busch Cos LLC / Anheuser-Busch
InBev Worldwide | | | | | | | | |
4.700%, 02/01/2036 | | | 6,160 | | | | 7,858 | |
Anheuser-Busch InBev Worldwide | | | | | | | | |
5.550%, 01/23/2049 | | | 1,561 | | | | 2,247 | |
4.900%, 02/01/2046 | | | 6,905 | | | | 9,023 | |
4.600%, 04/15/2048 | | | 1,080 | | | | 1,371 | |
4.439%, 10/06/2048 | | | 2,122 | | | | 2,631 | |
4.375%, 04/15/2038 | | | 560 | | | | 693 | |
4.350%, 06/01/2040 | | | 591 | | | | 733 | |
Bacardi | | | | | | | | |
5.300%, 05/15/2048 (A) | | | 480 | | | | 647 | |
BAT Capital | | | | | | | | |
5.282%, 04/02/2050 | | | 245 | | | | 304 | |
4.758%, 09/06/2049 | | | 630 | | | | 726 | |
4.540%, 08/15/2047 | | | 1,980 | | | | 2,237 | |
| | |
176 | | SEI Institutional Investments Trust / Semi-Annual Report / November 30, 2020 |
| | | | | | | | |
| | | |
| Description | | Face Amount
(Thousands) | | | Market Value
($ Thousands) | |
|
CORPORATE OBLIGATIONS (continued) | |
4.390%, 08/15/2037 | | $ | 2,285 | | | $ | 2,572 | |
3.984%, 09/25/2050 | | | 185 | | | | 194 | |
3.734%, 09/25/2040 | | | 750 | | | | 787 | |
BayCare Health System | | | | | | | | |
3.831%, 11/15/2050 | | | 365 | | | | 452 | |
Bayer US Finance II LLC | | | | | | | | |
4.400%, 07/15/2044 (A) | | | 2,580 | | | | 2,991 | |
3.950%, 04/15/2045 (A) | | | 500 | | | | 541 | |
Baylor Scott & White Holdings | | | | | | | | |
4.185%, 11/15/2045 | | | 1,040 | | | | 1,297 | |
Bon Secours Mercy Health | | | | | | | | |
3.205%, 06/01/2050 | | | 450 | | | | 480 | |
Bowdoin College | | | | | | | | |
4.693%, 07/01/2112 | | | 131 | | | | 153 | |
Campbell Soup | | | | | | | | |
4.800%, 03/15/2048 | | | 239 | | | | 317 | |
3.125%, 04/24/2050 | | | 225 | | | | 239 | |
Celgene Corp | | | | | | | | |
5.000%, 08/15/2045 | | | 270 | | | | 341 | |
4.550%, 02/20/2048 | | | 520 | | | | 628 | |
Children’s Hospital Medical Center | | | | | | | | |
2.820%, 11/15/2050 | | | 450 | | | | 452 | |
City of Hope | | | | | | | | |
4.378%, 08/15/2048 | | | 650 | | | | 779 | |
Claremont Mckenna College | | | | | | | | |
3.378%, 01/01/2050 | | | 1,055 | | | | 1,126 | |
Coca-Cola | | | | | | | | |
2.600%, 06/01/2050 | | | 590 | | | | 624 | |
2.500%, 06/01/2040 | | | 690 | | | | 745 | |
2.500%, 03/15/2051 | | | 880 | | | | 915 | |
CommonSpirit Health | | | | | | | | |
4.187%, 10/01/2049 | | | 786 | | | | 871 | |
3.910%, 10/01/2050 | | | 290 | | | | 308 | |
Constellation Brands | | | | | | | | |
4.500%, 05/09/2047 | | | 550 | | | | 700 | |
4.100%, 02/15/2048 | | | 615 | | | | 753 | |
Costco Wholesale | | | | | | | | |
1.600%, 04/20/2030 | | | 915 | | | | 938 | |
Diageo Capital | | | | | | | | |
2.125%, 04/29/2032 | | | 215 | | | | 227 | |
Fomento Economico Mexicano | | | | | | | | |
3.500%, 01/16/2050 | | | 710 | | | | 781 | |
Georgetown University | | | | | | | | |
2.943%, 04/01/2050 | | | 400 | | | | 395 | |
Hackensack Meridian Health | | | | | | | | |
2.875%, 09/01/2050 | | | 370 | | | | 376 | |
Health Care Service, A Mutual Legal Reserve | | | | | | | | |
3.200%, 06/01/2050 (A) | | | 912 | | | | 983 | |
Hershey | | | | | | | | |
3.125%, 11/15/2049 | | | 444 | | | | 505 | |
Johns Hopkins Health System | | | | | | | | |
3.837%, 05/15/2046 | | | 555 | | | | 694 | |
| | | | | | | | |
| | | |
| Description | | Face Amount
(Thousands) | | | Market Value
($ Thousands) | |
|
CORPORATE OBLIGATIONS (continued) | |
Johns Hopkins University | | | | | | | | |
2.813%, 01/01/2060 | | $ | 605 | | | $ | 623 | |
Kaiser Foundation Hospitals | | | | | | | | |
4.150%, 05/01/2047 | | | 590 | | | | 771 | |
3.266%, 11/01/2049 | | | 1,005 | | | | 1,137 | |
Keurig Dr Pepper | | | | | | | | |
5.085%, 05/25/2048 | | | 265 | | | | 370 | |
4.985%, 05/25/2038 | | | 235 | | | | 314 | |
Kraft Heinz Foods | | | | | | | | |
6.875%, 01/26/2039 | | | 865 | | | | 1,203 | |
4.875%, 10/01/2049 (A) | | | 605 | | | | 682 | |
Kroger | | | | | | | | |
5.400%, 01/15/2049 | | | 10 | | | | 15 | |
4.650%, 01/15/2048 | | | 744 | | | | 980 | |
4.450%, 02/01/2047 | | | 1,885 | | | | 2,419 | |
3.950%, 01/15/2050 | | | 387 | | | | 474 | |
Massachusetts Institute of Technology | | | | | | | | |
5.600%, 07/01/2111 | | | 545 | | | | 942 | |
MedStar Health | | | | | | | | |
3.626%, 08/15/2049 | | | 1,780 | | | | 2,012 | |
Memorial Health Services | | | | | | | | |
3.447%, 11/01/2049 | | | 405 | | | | 429 | |
Memorial Sloan-Kettering Cancer Center | | | | | | | | |
4.125%, 07/01/2052 | | | 325 | | | | 426 | |
Methodist Hospital | | | | | | | | |
2.705%, 12/01/2050 | | | 370 | | | | 373 | |
Molson Coors Brewing | | | | | | | | |
4.200%, 07/15/2046 | | | 750 | | | | 868 | |
Mondelez International | | | | | | | | |
1.875%, 10/15/2032 | | | 250 | | | | 255 | |
Nestle Holdings | | | | | | | | |
4.000%, 09/24/2048 (A) | | | 180 | | | | 241 | |
3.900%, 09/24/2038 (A) | | | 815 | | | | 1,047 | |
New York and Presbyterian Hospital | | | | | | | | |
4.763%, 08/01/2116 | | | 309 | | | | 374 | |
3.954%, 08/01/2119 | | | 395 | | | | 441 | |
3.563%, 08/01/2036 | | | 750 | | | | 821 | |
Northwell Healthcare | | | | | | | | |
4.260%, 11/01/2047 | | | 390 | | | | 452 | |
NYU Langone Hospitals | | | | | | | | |
4.428%, 07/01/2042 | | | 2,030 | | | | 2,281 | |
3.380%, 07/01/2055 | | | 645 | | | | 665 | |
Partners Healthcare System | | | | | | | | |
3.342%, 07/01/2060 | | | 2,125 | | | | 2,361 | |
3.192%, 07/01/2049 | | | 85 | | | | 91 | |
PepsiCo | | | | | | | | |
3.625%, 03/19/2050 | | | 675 | | | | 850 | |
3.500%, 03/19/2040 | | | 390 | | | | 475 | |
3.450%, 10/06/2046 | | | 705 | | | | 857 | |
2.875%, 10/15/2049 | | | 105 | | | | 117 | |
Philip Morris International | | | | | | | | |
4.500%, 03/20/2042 | | | 1,665 | | | | 2,130 | |
| | |
SEI Institutional Investments Trust / Semi-Annual Report / November 30, 2020 | | 177 |
SCHEDULE OF INVESTMENTS (Unaudited)
November 30, 2020
Long Duration Fund (Continued)
| | | | | | | | |
| | | |
| Description | | Face Amount
(Thousands) | | Market Value
($ Thousands) |
|
CORPORATE OBLIGATIONS (continued) | |
4.250%, 11/10/2044 | | $ | 230 | | | $ | 286 | |
4.125%, 03/04/2043 | | | 90 | | | | 108 | |
3.875%, 08/21/2042 | | | 795 | | | | 941 | |
Pomona College | | | | | | | | |
2.888%, 01/01/2051 | | | 545 | | | | 572 | |
Procter & Gamble | | | | | | | | |
3.600%, 03/25/2050 | | | 240 | | | | 327 | |
3.550%, 03/25/2040 | | | 380 | | | | 479 | |
Providence St. Joseph Health Obligated Group | | | | | | | | |
3.744%, 10/01/2047 | | | 765 | | | | 899 | |
Reynolds American | | | | | | | | |
5.850%, 08/15/2045 | | | 820 | | | | 1,049 | |
Stanford Health Care | | | | | | | | |
3.795%, 11/15/2048 | | | 731 | | | | 918 | |
Takeda Pharmaceutical | | | | | | | | |
3.175%, 07/09/2050 | | | 857 | | | | 918 | |
3.025%, 07/09/2040 | | | 250 | | | | 265 | |
Tyson Foods | | | | | | | | |
5.100%, 09/28/2048 | | | 245 | | | | 353 | |
University of Chicago | | | | | | | | |
2.761%, 04/01/2045 | | | 440 | | | | 459 | |
University of Southern California | | | | | | | | |
5.250%, 10/01/2111 | | | 1,340 | | | | 2,093 | |
Walgreen | | | | | | | | |
4.400%, 09/15/2042 | | | 475 | | | | 528 | |
Walgreens Boots Alliance | | | | | | | | |
4.800%, 11/18/2044 | | | 1,235 | | | | 1,420 | |
Walmart | | | | | | | | |
4.300%, 04/22/2044 | | | 231 | | | | 313 | |
4.050%, 06/29/2048 | | | 3,540 | | | | 4,867 | |
3.950%, 06/28/2038 | | | 675 | | | | 876 | |
3.625%, 12/15/2047 | | | 95 | | | | 122 | |
2.950%, 09/24/2049 | | | 477 | | | | 555 | |
| | | | | | | | |
| | | | | | | 103,905 | |
| | | | | | | | |
|
Energy — 8.2% | |
BG Energy Capital | | | | | | | | |
5.125%, 10/15/2041 (A) | | | 405 | | | | 542 | |
BP Capital Markets America | | | | | | | | |
3.633%, 04/06/2030 | | | 1,955 | | | | 2,280 | |
3.000%, 02/24/2050 | | | 25 | | | | 26 | |
2.772%, 11/10/2050 | | | 2,030 | | | | 2,024 | |
Burlington Resources LLC | | | | | | | | |
7.200%, 08/15/2031 | | | 20 | | | | 29 | |
5.950%, 10/15/2036 | | | 190 | | | | 266 | |
Canadian Natural Resources MTN | | | | | | | | |
4.950%, 06/01/2047 | | | 350 | | | | 425 | |
Chevron | | | | | | | | |
3.078%, 05/11/2050 | | | 1,084 | | | | 1,209 | |
Columbia Pipeline Group | | | | | | | | |
5.800%, 06/01/2045 | | | 445 | | | | 593 | |
| | | | | | | | |
| | | |
| Description | | Face Amount
(Thousands) | | Market Value
($ Thousands) |
|
CORPORATE OBLIGATIONS (continued) | |
Concho Resources | | | | | | | | |
4.875%, 10/01/2047 | | $ | 545 | | | $ | 725 | |
4.850%, 08/15/2048 | | | 355 | | | | 478 | |
Conoco Funding | | | | | | | | |
7.250%, 10/15/2031 | | | 370 | | | | 547 | |
ConocoPhillips | | | | | | | | |
5.900%, 05/15/2038 | | | 1,628 | | | | 2,321 | |
4.300%, 11/15/2044 | | | 1,475 | | | | 1,854 | |
Devon Energy | | | | | | | | |
7.950%, 04/15/2032 | | | 10 | | | | 13 | |
5.600%, 07/15/2041 | | | 1,250 | | | | 1,460 | |
5.000%, 06/15/2045 | | | 180 | | | | 203 | |
4.750%, 05/15/2042 | | | 1,085 | | | | 1,178 | |
Ecopetrol | | | | | | | | |
5.875%, 05/28/2045 | | | 1,167 | | | | 1,387 | |
El Paso Natural Gas | | | | | | | | |
8.375%, 06/15/2032 | | | 300 | | | | 424 | |
Enbridge Energy Partners | | | | | | | | |
5.500%, 09/15/2040 | | | 400 | | | | 492 | |
Energy Transfer Operating | | | | | | | | |
6.500%, 02/01/2042 | | | 70 | | | | 81 | |
6.250%, 04/15/2049 | | | 510 | | | | 595 | |
6.125%, 12/15/2045 | | | 1,758 | | | | 1,990 | |
5.950%, 10/01/2043 | | | 1,660 | | | | 1,820 | |
5.800%, 06/15/2038 | | | 60 | | | | 66 | |
5.300%, 04/15/2047 | | | 805 | | | | 857 | |
5.250%, 04/15/2029 | | | 155 | | | | 176 | |
5.150%, 02/01/2043 | | | 115 | | | | 118 | |
5.150%, 03/15/2045 | | | 200 | | | | 207 | |
5.000%, 05/15/2050 | | | 612 | | | | 644 | |
4.900%, 03/15/2035 | | | 1,000 | | | | 1,042 | |
3.750%, 05/15/2030 | | | 15 | | | | 16 | |
Energy Transfer Partners | | | | | | | | |
6.625%, 10/15/2036 | | | 115 | | | | 135 | |
6.000%, 06/15/2048 | | | 35 | | | | 40 | |
Eni SpA | | | | | | | | |
5.700%, 10/01/2040 (A) | | | 740 | | | | 902 | |
Enterprise Products Operating LLC | | | | | | | | |
6.650%, 10/15/2034 | | | 1,330 | | | | 1,856 | |
6.125%, 10/15/2039 | | | 420 | | | | 568 | |
5.700%, 02/15/2042 | | | 540 | | | | 720 | |
5.100%, 02/15/2045 | | | 600 | | | | 765 | |
4.950%, 10/15/2054 | | | 545 | | | | 675 | |
4.900%, 05/15/2046 | | | 1,790 | | | | 2,230 | |
4.850%, 03/15/2044 | | | 575 | | | | 704 | |
4.800%, 02/01/2049 | | | 305 | | | | 385 | |
4.250%, 02/15/2048 | | | 355 | | | | 415 | |
4.200%, 01/31/2050 | | | 265 | | | | 309 | |
EOG Resources | | | | | | | | |
4.950%, 04/15/2050 | | | 884 | | | | 1,214 | |
4.375%, 04/15/2030 | | | 520 | | | | 634 | |
| | |
178 | | SEI Institutional Investments Trust / Semi-Annual Report / November 30, 2020 |
| | | | | | | | |
| | | |
| Description | | Face Amount
(Thousands) | | | Market Value
($ Thousands) | |
|
CORPORATE OBLIGATIONS (continued) | |
EQM Midstream Partners | | | | | | | | |
6.500%, 07/15/2048 | | $ | 500 | | | $ | 495 | |
Equinor | | | | | | | | |
6.800%, 01/15/2028 | | | 115 | | | | 153 | |
3.950%, 05/15/2043 | | | 650 | | | | 798 | |
3.625%, 04/06/2040 | | | 2,075 | | | | 2,472 | |
Exxon Mobil | | | | | | | | |
4.327%, 03/19/2050 | | | 875 | | | | 1,130 | |
4.227%, 03/19/2040 | | | 430 | | | | 531 | |
3.452%, 04/15/2051 | | | 4,238 | | | | 4,827 | |
Halliburton | | | | | | | | |
5.000%, 11/15/2045 | | | 35 | | | | 40 | |
Hess | | | | | | | | |
6.000%, 01/15/2040 | | | 45 | | | | 55 | |
5.800%, 04/01/2047 | | | 120 | | | | 148 | |
5.600%, 02/15/2041 | | | 1,560 | | | | 1,833 | |
Kinder Morgan | | | | | | | | |
5.550%, 06/01/2045 | | | 1,185 | | | | 1,500 | |
5.300%, 12/01/2034 | | | 3,131 | | | | 3,774 | |
5.050%, 02/15/2046 | | | 50 | | | | 60 | |
2.000%, 02/15/2031 | | | 160 | | | | 158 | |
Kinder Morgan Energy Partners | | | | | | | | |
6.375%, 03/01/2041 | | | 636 | | | | 821 | |
5.800%, 03/15/2035 | | | 450 | | | | 560 | |
5.000%, 08/15/2042 | | | 700 | | | | 810 | |
Marathon Oil | | | | | | | | |
5.200%, 06/01/2045 | | | 505 | | | | 551 | |
Marathon Petroleum | | | | | | | | |
6.500%, 03/01/2041 | | | 523 | | | | 665 | |
Motiva Enterprises | | | | | | | | |
6.850%, 01/15/2040 (A) | | | 1,415 | | | | 1,681 | |
MPLX | | | | | | | | |
5.500%, 02/15/2049 | | | 1,175 | | | | 1,469 | |
5.200%, 03/01/2047 | | | 165 | | | | 196 | |
4.500%, 04/15/2038 | | | 675 | | | | 749 | |
2.650%, 08/15/2030 | | | 1,055 | | | | 1,068 | |
Noble Energy | | | | | | | | |
5.250%, 11/15/2043 | | | 1,125 | | | | 1,559 | |
5.050%, 11/15/2044 | | | 270 | | | | 369 | |
4.950%, 08/15/2047 | | | 220 | | | | 304 | |
4.200%, 10/15/2049 | | | 275 | | | | 346 | |
Northern Natural Gas | | | | | | | | |
4.300%, 01/15/2049 (A) | | | 275 | | | | 333 | |
Occidental Petroleum | | | | | | | | |
6.139%, 10/10/2036 (B) | | | 3,581 | | | | 1,611 | |
4.500%, 07/15/2044 | | | 375 | | | | 309 | |
4.400%, 08/15/2049 | | | 200 | | | | 163 | |
4.300%, 08/15/2039 | | | 811 | | | | 669 | |
Petroleos Mexicanos | | | | | | | | |
7.690%, 01/23/2050 | | | 160 | | | | 148 | |
6.950%, 01/28/2060 | | | 382 | | | | 327 | |
6.350%, 02/12/2048 | | | 745 | | | | 624 | |
| | | | | | | | |
| | | |
| Description | | Face Amount
(Thousands) | | | Market Value
($ Thousands) | |
|
CORPORATE OBLIGATIONS (continued) | |
Petroleos Mexicanos MTN | | | | | | | | |
6.750%, 09/21/2047 | | $ | 1,555 | | | $ | 1,337 | |
Phillips 66 | | | | | | | | |
5.875%,05/01/2042 | | | 810 | | | | 1,107 | |
4.875%, 11/15/2044 | | | 1,345 | | | | 1,701 | |
Phillips 66 Partners | | | | | | | | |
4.900%, 10/01/2046 | | | 1,064 | | | | 1,145 | |
Plains All American Pipeline | | | | | | | | |
4.900%, 02/15/2045 | | | 500 | | | | 504 | |
Rockies Express Pipeline LLC | | | | | | | | |
6.875%,04/15/2040 (A) | | | 1,135 | | | | 1,203 | |
Sabal Trail Transmission LLC | | | | | | | | |
4.832%,05/01/2048 (A) | | | 725 | | | | 912 | |
4.682%,05/01/2038 (A) | | | 455 | | | | 545 | |
Saudi Arabian Oil MTN | | | | | | | | |
4.375%,04/16/2049 (A) | | | 105 | | | | 128 | |
Shell International Finance BV | | | | | | | | |
6.375%, 12/15/2038 | | | 1,577 | | | | 2,448 | |
5.500%, 03/25/2040 | | | 390 | | | | 563 | |
4.550%, 08/12/2043 | | | 1,485 | | | | 1,962 | |
4.375%, 05/11/2045 | | | 900 | | | | 1,161 | |
4.000%, 05/10/2046 | | | 130 | | | | 161 | |
3.750%, 09/12/2046 | | | 545 | | | | 651 | |
3.125%, 11/07/2049 | | | 435 | | | | 478 | |
Southern Natural Gas | | | | | | | | |
7.350%, 02/15/2031 | | | 1,223 | | | | 1,647 | |
Suncor Energy | | | | | | | | |
6.800%, 05/15/2038 | | | 520 | | | | 702 | |
6.500%, 06/15/2038 | | | 250 | | | | 334 | |
Sunoco Logistics Partners Operations | | | | | | | | |
5.400%, 10/01/2047 | | | 3,495 | | | | 3,749 | |
5.350%, 05/15/2045 | | | 520 | | | | 544 | |
Tennessee Gas Pipeline | | | | | | | | |
7.000%, 10/15/2028 | | | 1,072 | | | | 1,392 | |
Texas Eastern Transmission | | | | | | | | |
7.000%, 07/15/2032 | | | 1,570 | | | | 2,159 | |
4.150%,01/15/2048 (A) | | | 715 | | | | 788 | |
Total Capital International | | | | | | | | |
3.386%, 06/29/2060 | | | 225 | | | | 256 | |
3.127%, 05/29/2050 | | | 1,610 | | | | 1,766 | |
2.986%, 06/29/2041 | | | 430 | | | | 466 | |
TransCanada PipeLines | | | | | | | | |
7.250%, 08/15/2038 | | | 1,070 | | | | 1,630 | |
4.875%, 05/15/2048 | | | 195 | | | | 252 | |
4.750%, 05/15/2038 | | | 780 | | | | 969 | |
4.625%, 03/01/2034 | | | 1,360 | | | | 1,624 | |
Transcanada Trust | | | | | | | | |
5.875%, VAR ICE LIBOR USD 3
Month+4.640%, 08/15/2076 | | | 1,494 | | | | 1,658 | |
Transcontinental Gas Pipe Line LLC | | | | | | | | |
5.400%, 08/15/2041 | | | 1,115 | | | | 1,408 | |
4.600%, 03/15/2048 | | | 536 | | | | 629 | |
| | |
SEI Institutional Investments Trust / Semi-Annual Report / November 30, 2020 | | 179 |
SCHEDULE OF INVESTMENTS (Unaudited)
November 30, 2020
Long Duration Fund (Continued)
| | | | | | | | |
| | | |
| Description | | Face Amount
(Thousands) | | Market Value
($ Thousands) |
|
CORPORATE OBLIGATIONS (continued) | |
4.450%, 08/01/2042 | | $ | 705 | | | $ | 820 | |
Valero Energy | | | | | | | | |
10.500%, 03/15/2039 | | | 1,397 | | | | 2,373 | |
Williams | | | | | | | | |
7.500%, 01/15/2031 | | | 395 | | | | 518 | |
6.300%, 04/15/2040 | | | 550 | | | | 719 | |
5.100%, 09/15/2045 | | | 275 | | | | 332 | |
| | | | | | | | |
| | | | | | | 113,687 | |
| | | | | | | | |
|
Financials — 10.3% | |
AIA Group | | | | | | | | |
3.200%, 09/16/2040 (A) | | | 415 | | | | 443 | |
AIG SunAmerica Global Financing | | | | | | | | |
6.900%, 03/15/2032 (A) | | | 2,042 | | | | 3,091 | |
American International Group | | | | | | | | |
4.750%, 04/01/2048 | | | 105 | | | | 142 | |
4.500%, 07/16/2044 | | | 2,120 | | | | 2,724 | |
4.375%, 06/30/2050 | | | 175 | | | | 227 | |
4.375%, 01/15/2055 | | | 35 | | | | 45 | |
3.875%, 01/15/2035 | | | 1,055 | | | | 1,270 | |
3.400%, 06/30/2030 | | | 30 | | | | 34 | |
Banco Santander | | | | | | | | |
3.490%, 05/28/2030 | | | 265 | | | | 296 | |
Bank of America | | | | | | | | |
6.110%, 01/29/2037 | | | 660 | | | | 970 | |
6.000%, 10/15/2036 | | | 2,950 | | | | 4,337 | |
Bank of America MTN | | | | | | | | |
5.875%, 02/07/2042 | | | 2,445 | | | | 3,773 | |
4.330%, VAR ICE LIBOR USD 3
Month+1.520%, 03/15/2050 | | | 915 | | | | 1,211 | |
4.083%, VAR ICE LIBOR USD 3
Month+3.150%, 03/20/2051 | | | 500 | | | | 637 | |
4.078%, VAR ICE LIBOR USD 3
Month+1.320%, 04/23/2040 | | | 2,555 | | | | 3,159 | |
3.974%, VAR ICE LIBOR USD 3
Month+1.210%, 02/07/2030 | | | 440 | | | | 516 | |
2.884%, VAR ICE LIBOR USD 3
Month+1.190%, 10/22/2030 | | | 945 | | | | 1,034 | |
2.676%, VAR United States Secured Overnight Financing Rate+1.930%, 06/19/2041 | | | 600 | | | | 624 | |
Berkshire Hathaway | | | | | | | | |
4.500%, 02/11/2043 | | | 758 | | | | 1,046 | |
Berkshire Hathaway Finance | | | | | | | | |
4.400%, 05/15/2042 | | | 1,300 | | | | 1,746 | |
4.200%, 08/15/2048 | | | 1,600 | | | | 2,148 | |
Blackstone Holdings Finance LLC | | | | | | | | |
6.250%, 08/15/2042 (A) | | | 1,569 | | | | 2,353 | |
Brighthouse Financial | | | | | | | | |
4.700%, 06/22/2047 | | | 876 | | | | 906 | |
Carlyle Holdings II Finance LLC | | | | | | | | |
5.625%, 03/30/2043 (A) | | | 1,263 | | | | 1,616 | |
| | | | | | | | |
| | | |
| Description | | Face Amount
(Thousands) | | Market Value
($ Thousands) |
|
CORPORATE OBLIGATIONS (continued) | |
Chubb INA Holdings | | | | | | | | |
6.700%, 05/15/2036 | | $ | 627 | | | $ | 982 | |
Cincinnati Financial | | | | | | | | |
6.920%, 05/15/2028 | | | 1,984 | | | | 2,633 | |
Citigroup | | | | | | | | |
6.625%, 06/15/2032 | | | 1,075 | | | | 1,532 | |
4.750%, 05/18/2046 | | | 1,425 | | | | 1,914 | |
4.650%, 07/23/2048 | | | 735 | | | | 1,022 | |
4.281%, VAR ICE LIBOR USD 3
Month+1.839%, 04/24/2048 | | | 1,118 | | | | 1,468 | |
4.125%, 07/25/2028 | | | 530 | | | | 618 | |
2.976%, VAR United States Secured Overnight Financing Rate+1.422%, 11/05/2030 | | | 500 | | | | 547 | |
Commonwealth Bank of Australia MTN | | | | | | | | |
3.743%, 09/12/2039 (A) | | | 415 | | | | 479 | |
Cooperatieve Rabobank UA | | | | | | | | |
5.250%, 08/04/2045 | | | 155 | | | | 223 | |
Empower Finance 2020 | | | | | | | | |
1.776%, 03/17/2031 (A) | | | 140 | | | | 143 | |
Farmers Exchange Capital | | | | | | | | |
7.200%, 07/15/2048 (A) | | | 225 | | | | 297 | |
Farmers Exchange Capital II | | | | | | | | |
6.151%, VAR ICE LIBOR USD 3
Month+3.744%, 11/01/2053 (A) | | | 925 | | | | 1,179 | |
Farmers Exchange Capital III | | | | | | | | |
5.454%, VAR ICE LIBOR USD 3
Month+3.454%, 10/15/2054 (A) | | | 700 | | | | 832 | |
Fifth Third Bancorp | | | | | | | | |
8.250%, 03/01/2038 | | | 286 | | | | 484 | |
First Republic Bank | | | | | | | | |
4.625%, 02/13/2047 | | | 567 | | | | 722 | |
FMR | | | | | | | | |
5.150%, 02/01/2043 (A) | | | 540 | | | | 751 | |
Goldman Sachs Group | | | | | | | | |
6.750%, 10/01/2037 | | | 1,570 | | | | 2,406 | |
6.250%, 02/01/2041 | | | 2,036 | | | | 3,209 | |
4.750%, 10/21/2045 | | | 50 | | | | 70 | |
4.411%, VAR ICE LIBOR USD 3
Month+1.430%, 04/23/2039 | | | 615 | | | | 788 | |
4.017%, VAR ICE LIBOR USD 3
Month+1.373%, 10/31/2038 | | | 3,895 | | | | 4,799 | |
Goldman Sachs Group MTN | | | | | | | | |
4.800%, 07/08/2044 | | | 1,034 | | | | 1,440 | |
Guardian Life Insurance of America | | | | | | | | |
4.875%, 06/19/2064 (A) | | | 1,210 | | | | 1,640 | |
Hartford Financial Services Group | | | | | | | | |
6.625%, 03/30/2040 | | | 440 | | | | 672 | |
HSBC Bank USA | | | | | | | | |
7.000%, 01/15/2039 | | | 485 | | | | 762 | |
HSBC Holdings | | | | | | | | |
6.800%, 06/01/2038 | | | 1,067 | | | | 1,591 | |
6.500%, 09/15/2037 | | | 2,200 | | | | 3,167 | |
| | |
180 | | SEI Institutional Investments Trust / Semi-Annual Report / November 30, 2020 |
| | | | | | | | |
| | | |
| Description | | Face Amount
(Thousands) | | Market Value
($ Thousands) |
|
CORPORATE OBLIGATIONS (continued) | |
4.950%, 03/31/2030 | | $ | 230 | | | $ | 287 | |
Intercontinental Exchange | | | | | | | | |
3.000%, 09/15/2060 | | | 935 | | | | 990 | |
2.650%, 09/15/2040 | | | 450 | | | | 468 | |
JPMorgan Chase | | | | | | | | |
6.400%, 05/15/2038 | | | 150 | | | | 237 | |
5.600%, 07/15/2041 | | | 1,296 | | | | 1,980 | |
4.032%, VAR ICE LIBOR USD 3 Month+1.460%, 07/24/2048 | | | 760 | | | | 977 | |
3.964%, VAR ICE LIBOR USD 3 Month+1.380%, 11/15/2048 | | | 1,465 | | | | 1,867 | |
3.897%, VAR ICE LIBOR USD 3 Month+1.220%, 01/23/2049 | | | 1,955 | | | | 2,487 | |
3.109%, VAR United States Secured Overnight Financing Rate+2.440%, 04/22/2051 | | | 2,025 | | | | 2,262 | |
3.109%, VAR United States Secured Overnight Financing Rate+2.460%, 04/22/2041 | | | 715 | | | | 797 | |
2.956%, VAR United States Secured Overnight Financing Rate+2.515%, 05/13/2031 | | | 420 | | | | 459 | |
2.739%, VAR United States Secured Overnight Financing Rate+1.510%, 10/15/2030 | | | 1,505 | | | | 1,632 | |
KKR Group Finance II LLC | | | | | | | | |
5.500%, 02/01/2043 (A) | | | 1,545 | | | | 2,064 | |
Liberty Mutual Group | | | | | | | | |
3.951%, 10/15/2050 (A) | | | 2,200 | | | | 2,651 | |
3.950%, 05/15/2060 (A) | | | 590 | | | | 704 | |
Lloyds Banking Group | | | | | | | | |
4.344%, 01/09/2048 | | | 391 | | | | 488 | |
3.574%, VAR ICE LIBOR USD 3 Month+1.205%, 11/07/2028 | | | 745 | | | | 836 | |
Markel | | | | | | | | |
4.150%, 09/17/2050 | | | 1,635 | | | | 2,074 | |
Marsh & McLennan | | | | | | | | |
4.750%, 03/15/2039 | | | 909 | | | | 1,230 | |
4.200%, 03/01/2048 | | | 720 | | | | 955 | |
Massachusetts Mutual Life Insurance | | | | | | | | |
3.729%, 10/15/2070 (A) | | | 528 | | | | 589 | |
3.375%, 04/15/2050 (A) | | | 792 | | | | 857 | |
MetLife | | | | | | | | |
5.875%, 02/06/2041 | | | 280 | | | | 432 | |
4.875%, 11/13/2043 | | | 795 | | | | 1,128 | |
4.721%, 12/15/2044 | | | 255 | | | | 352 | |
4.050%, 03/01/2045 | | | 1,481 | | | | 1,906 | |
Mitsubishi UFJ Financial Group | | | | | | | | |
4.153%, 03/07/2039 | | | 340 | | | | 424 | |
Moody’s | | | | | | | | |
4.875%, 12/17/2048 | | | 1,055 | | | | 1,449 | |
Morgan Stanley | | | | | | | | |
4.375%, 01/22/2047 | | | 105 | | | | 145 | |
| | | | | | | | |
| | | |
| Description | | Face Amount
(Thousands) | | Market Value
($ Thousands) |
|
CORPORATE OBLIGATIONS (continued) | |
3.625%, 01/20/2027 | | $ | 370 | | | $ | 423 | |
Morgan Stanley MTN | | | | | | | | |
6.375%, 07/24/2042 | | | 794 | | | | 1,300 | |
5.597%, VAR United States Secured Overnight Financing Rate+4.840%, 03/24/2051 | | | 135 | | | | 218 | |
4.300%, 01/27/2045 | | | 1,000 | | | | 1,358 | |
3.971%, VAR ICE LIBOR USD 3 Month+1.455%, 07/22/2038 | | | 545 | | | | 675 | |
National Rural Utilities Cooperative Finance | | | | | | | | |
4.300%, 03/15/2049 | | | 975 | | | | 1,289 | |
Nationwide Financial Services | | | | | | | | |
3.900%, 11/30/2049 (A) | | | 495 | | | | 540 | |
Nationwide Mutual Insurance | | | | | | | | |
4.950%, 04/22/2044 (A) | | | 125 | | | | 139 | |
4.350%, 04/30/2050 (A) | | | 320 | | | | 375 | |
New York Life Insurance | | | | | | | | |
6.750%, 11/15/2039 (A) | | | 845 | | | | 1,303 | |
5.875%, 05/15/2033 (A) | | | 852 | | | | 1,180 | |
4.450%, 05/15/2069 (A) | | | 950 | | | | 1,286 | |
3.750%, 05/15/2050 (A) | | | 351 | | | | 419 | |
Northwestern Mutual Life Insurance | | | | | | | | |
3.625%, 09/30/2059 (A) | | | 1,008 | | | | 1,160 | |
Pacific LifeCorp | | | | | | | | |
3.350%, 09/15/2050 (A) | | | 1,170 | | | | 1,316 | |
Prudential Financial MTN | | | | | | | | |
5.700%, 12/14/2036 | | | 1,357 | | | | 1,967 | |
Raymond James Financial | | | | | | | | |
4.950%, 07/15/2046 | | | 935 | | | | 1,285 | |
S&P Global | | | | | | | | |
3.250%, 12/01/2049 | | | 250 | | | | 290 | |
Teachers Insurance & Annuity Association of America | | | | | | | | |
3.300%, 05/15/2050 (A) | | | 1,000 | | | | 1,091 | |
Travelers | | | | | | | | |
4.000%, 05/30/2047 | | | 665 | | | | 866 | |
US Bancorp MTN | | | | | | | | |
1.375%, 07/22/2030 | | | 880 | | | | 883 | |
Wells Fargo | | | | | | | | |
5.850%, 02/01/2037 | | | 3,790 | | | | 5,347 | |
5.606%, 01/15/2044 | | | 230 | | | | 329 | |
3.900%, 05/01/2045 | | | 548 | | | | 683 | |
Wells Fargo MTN | | | | | | | | |
5.013%, VAR ICE LIBOR USD 3 Month+4.240%, 04/04/2051 | | | 4,124 | | | | 5,889 | |
4.900%, 11/17/2045 | | | 365 | | | | 488 | |
4.650%, 11/04/2044 | | | 1,370 | | | | 1,767 | |
4.400%, 06/14/2046 | | | 1,175 | | | | 1,490 | |
2.879%, VAR ICE LIBOR USD 3 Month+1.170%, 10/30/2030 | | | 455 | | | | 495 | |
Westpac Banking | | | | | | | | |
4.421%, 07/24/2039 | | | 215 | | | | 279 | |
| | |
SEI Institutional Investments Trust / Semi-Annual Report / November 30, 2020 | | 181 |
SCHEDULE OF INVESTMENTS (Unaudited)
November 30, 2020
Long Duration Fund (Continued)
| | | | | | | | |
| | | |
| Description | | Face Amount
(Thousands) | | Market Value
($ Thousands) |
| |
CORPORATE OBLIGATIONS (continued) | | | | | |
2.963%, 11/16/2040 | | $ | 125 | | | $ | 135 | |
2.668%, VAR US Treas Yield Curve Rate T Note Const Mat 5 Yr+1.750%, 11/15/2035 | | | 220 | | | | 228 | |
Willis North America | | | | | | | | |
3.875%, 09/15/2049 | | | 710 | | | | 875 | |
XLIT | | | | | | | | |
5.250%, 12/15/2043 | | | 587 | | | | 843 | |
| | | | | | | | |
| | | | | | | 141,656 | |
| | | | | | | | |
| | |
Health Care — 6.6% | | | | | | | | |
Abbott Laboratories | | | | | | | | |
4.900%, 11/30/2046 | | | 944 | | | | 1,411 | |
AbbVie Inc | | | | | | | | |
4.875%, 11/14/2048 | | | 905 | | | | 1,233 | |
4.850%, 06/15/2044 | | | 650 | | | | 857 | |
4.700%, 05/14/2045 | | | 1,155 | | | | 1,505 | |
4.550%, 03/15/2035 | | | 2,030 | | | | 2,573 | |
4.500%, 05/14/2035 | | | 1,795 | | | | 2,283 | |
4.450%, 05/14/2046 | | | 800 | | | | 1,015 | |
4.400%, 11/06/2042 | | | 1,939 | | | | 2,439 | |
4.250%, 11/21/2049 | | | 1,531 | | | | 1,934 | |
4.050%, 11/21/2039 | | | 450 | | | | 546 | |
Amgen | | | | | | | | |
4.950%, 10/01/2041 | | | 825 | | | | 1,120 | |
4.663%, 06/15/2051 | | | 1,650 | | | | 2,233 | |
4.400%, 05/01/2045 | | | 2,555 | | | | 3,252 | |
3.150%, 02/21/2040 | | | 886 | | | | 960 | |
Anthem | | | | | | | | |
4.650%, 01/15/2043 | | | 270 | | | | 356 | |
4.650%, 08/15/2044 | | | 305 | | | | 404 | |
4.550%, 03/01/2048 | | | 80 | | | | 108 | |
4.375%, 12/01/2047 | | | 2,888 | | | | 3,782 | |
3.700%, 09/15/2049 | | | 700 | | | | 838 | |
AstraZeneca | | | | | | | | |
6.450%, 09/15/2037 | | | 1,721 | | | | 2,683 | |
Becton Dickinson | | | | | | | | |
3.794%, 05/20/2050 | | | 860 | | | | 1,016 | |
Biogen | | | | | | | | |
5.200%, 09/15/2045 | | | 90 | | | | 120 | |
3.150%, 05/01/2050 | | | 370 | | | | 372 | |
Boston Scientific | | | | | | | | |
4.550%, 03/01/2039 | | | 560 | | | | 718 | |
Bristol-Myers Squibb | | | | | | | | |
4.550%, 02/20/2048 | | | 524 | | | | 734 | |
4.250%, 10/26/2049 | | | 1,490 | | | | 2,018 | |
2.550%, 11/13/2050 | | | 375 | | | | 387 | |
2.350%, 11/13/2040 | | | 110 | | | | 113 | |
Centene Corp | | | | | | | | |
3.000%, 10/15/2030 | | | 1,851 | | | | 1,948 | |
Cigna | | | | | | | | |
4.900%, 12/15/2048 | | | 100 | | | | 138 | |
| | | | | | | | |
| | | |
| Description | | Face Amount
(Thousands) | | Market Value
($ Thousands) |
| |
CORPORATE OBLIGATIONS (continued) | | | | | |
4.800%, 08/15/2038 | | $ | 620 | | | $ | 808 | |
4.800%, 07/15/2046 | | | 1,203 | | | | 1,602 | |
3.875%, 10/15/2047 | | | 750 | | | | 900 | |
3.400%, 03/15/2050 | | | 590 | | | | 667 | |
3.200%, 03/15/2040 | | | 215 | | | | 239 | |
Cleveland Clinic Foundation | | | | | | | | |
4.858%, 01/01/2114 | | | 570 | | | | 801 | |
CVS Health Corp | | | | | | | | |
5.125%, 07/20/2045 | | | 720 | | | | 970 | |
5.050%, 03/25/2048 | | | 5,435 | | | | 7,332 | |
4.780%, 03/25/2038 | | | 2,680 | | | | 3,400 | |
4.250%, 04/01/2050 | | | 283 | | | | 355 | |
4.125%, 04/01/2040 | | | 595 | | | | 710 | |
2.700%, 08/21/2040 | | | 425 | | | | 429 | |
Danaher | | | | | | | | |
2.600%, 10/01/2050 | | | 340 | | | | 358 | |
Gilead Sciences | | | | | | | | |
4.800%, 04/01/2044 | | | 529 | | | | 695 | |
4.750%, 03/01/2046 | | | 5 | | | | 7 | |
4.600%, 09/01/2035 | | | 1,080 | | | | 1,399 | |
4.500%, 02/01/2045 | | | 1,570 | | | | 2,007 | |
GlaxoSmithKline Capital | | | | | | | | |
6.375%, 05/15/2038 | | | 590 | | | | 937 | |
Hartford HealthCare | | | | | | | | |
5.746%, 04/01/2044 | | | 1,200 | | | | 1,555 | |
HCA | | | | | | | | |
5.250%, 06/15/2049 | | | 1,890 | | | | 2,501 | |
Humana | | | | | | | | |
4.950%, 10/01/2044 | | | 740 | | | | 1,002 | |
3.950%, 08/15/2049 | | | 340 | | | | 420 | |
Johnson & Johnson | | | | | | | | |
3.400%, 01/15/2038 | | | 790 | | | | 952 | |
Kaiser Foundation Hospitals | | | | | | | | |
4.875%, 04/01/2042 | | | 185 | | | | 251 | |
Medtronic | | | | | | | | |
4.375%, 03/15/2035 | | | 886 | | | | 1,216 | |
Merck | | | | | | | | |
4.150%, 05/18/2043 | | | 605 | | | | 801 | |
2.450%, 06/24/2050 | | | 530 | | | | 550 | |
2.350%, 06/24/2040 | | | 340 | | | | 355 | |
Mylan | | | | | | | | |
5.250%, 06/15/2046 | | | 315 | | | | 416 | |
Pfizer | | | | | | | | |
4.000%, 12/15/2036 | | | 1,010 | | | | 1,289 | |
2.700%, 05/28/2050 | | | 310 | | | | 330 | |
2.550%, 05/28/2040 | | | 170 | | | | 180 | |
Royalty Pharma | | | | | | | | |
3.300%, 09/02/2040 (A) | | | 500 | | | | 522 | |
Stryker | | | | | | | | |
4.100%, 04/01/2043 | | | 805 | | | | 981 | |
2.900%, 06/15/2050 | | | 195 | | | | 208 | |
| | |
182 | | SEI Institutional Investments Trust / Semi-Annual Report / November 30, 2020 |
| | | | | | | | |
| | | |
| Description | | Face Amount
(Thousands) | | Market Value
($ Thousands) |
CORPORATE OBLIGATIONS (continued) | | | | | |
Thermo Fisher Scientific | | | | | | | | |
4.100%, 08/15/2047 | | $ | 495 | | | $ | 658 | |
UnitedHealth Group | | | | | | | | |
6.875%, 02/15/2038 | | | 885 | | | | 1,458 | |
6.625%, 11/15/2037 | | | 555 | | | | 896 | |
4.625%, 07/15/2035 | | | 730 | | | | 990 | |
4.250%, 04/15/2047 | | | 1,075 | | | | 1,443 | |
4.200%, 01/15/2047 | | | 925 | | | | 1,244 | |
3.875%, 08/15/2059 | | | 345 | | | | 455 | |
3.700%, 08/15/2049 | | | 656 | | | | 831 | |
2.900%, 05/15/2050 | | | 150 | | | | 167 | |
2.750%, 05/15/2040 | | | 145 | | | | 159 | |
Upjohn | | | | | | | | |
4.000%, 06/22/2050 (A) | | | 730 | | | | 833 | |
Viatris | | | | | | | | |
3.850%, 06/22/2040 (A) | | | 935 | | | | 1,057 | |
Wyeth LLC | | | | | | | | |
6.000%, 02/15/2036 | | | 1,800 | | | | 2,673 | |
5.950%, 04/01/2037 | | | 536 | | | | 808 | |
Zoetis | | | | | | | | |
4.450%, 08/20/2048 | | | 205 | | | | 274 | |
3.000%, 05/15/2050 | | | 270 | | | | 295 | |
| | | | | | | | |
| | | | | | | 90,482 | |
| | | | | | | | |
| | |
Industrials — 7.1% | | | | | | | | |
3M | | | | | | | | |
3.250%, 08/26/2049 | | | 610 | | | | 707 | |
3.050%, 04/15/2030 | | | 135 | | | | 154 | |
AerCap Ireland Capital DAC | | | | | | | | |
3.875%, 01/23/2028 | | | 695 | | | | 709 | |
Air Lease | | | | | | | | |
3.250%, 10/01/2029 | | | 255 | | | | 261 | |
Air Lease MTN | | | | | | | | |
3.000%, 02/01/2030 | | | 180 | | | | 180 | |
American Airlines, Pass-Through Trust, Ser 2011-1, Cl A | | | | | |
5.250%, 01/31/2021 | | | 1 | | | | 1 | |
BAE Systems Holdings | | | | | | | | |
4.750%, 10/07/2044 (A) | | | 828 | | | | 1,093 | |
BAE Systems PLC | | | | | | | | |
5.800%, 10/11/2041 (A) | | | 290 | | | | 417 | |
3.000%, 09/15/2050 (A) | | | 850 | | | | 899 | |
Boeing | | | | | | | | |
5.805%, 05/01/2050 | | | 2,731 | | | | 3,612 | |
5.705%, 05/01/2040 | | | 3,780 | | | | 4,779 | |
3.750%, 02/01/2050 | | | 420 | | | | 422 | |
Burlington Northern Santa Fe LLC | | | | | |
6.200%, 08/15/2036 | | | 1,650 | | | | 2,484 | |
6.150%, 05/01/2037 | | | 685 | | | | 1,042 | |
5.750%, 05/01/2040 | | | 185 | | | | 277 | |
5.050%, 03/01/2041 | | | 205 | | | | 288 | |
4.900%, 04/01/2044 | | | 130 | | | | 185 | |
| | | | | | | | |
| | | |
| Description | | Face Amount
(Thousands) | | Market Value
($ Thousands) |
CORPORATE OBLIGATIONS (continued) | | | | | |
4.400%, 03/15/2042 | | $ | 2,340 | | | $ | 3,084 | |
4.125%, 06/15/2047 | | | 800 | | | | 1,081 | |
3.050%, 02/15/2051 | | | 1,520 | | | | 1,757 | |
Canadian National Railway | | | | | | | | |
6.200%, 06/01/2036 | | | 511 | | | | 777 | |
3.650%, 02/03/2048 | | | 575 | | | | 718 | |
2.450%, 05/01/2050 | | | 1,065 | | | | 1,097 | |
Canadian Pacific Railway | | | | | | | | |
6.125%, 09/15/2115 | | | 2,332 | | | | 3,765 | |
Carrier Global | | | | | | | | |
3.577%, 04/05/2050 (A) | | | 285 | | | | 322 | |
3.377%, 04/05/2040 (A) | | | 275 | | | | 303 | |
Caterpillar | | | | | | | | |
3.250%, 09/19/2049 | | | 355 | | | | 420 | |
3.250%, 04/09/2050 | | | 1,090 | | | | 1,290 | |
Continental Airlines, Pass-Through Trust, Ser 2007-1, Cl A | | | | | |
5.983%, 04/19/2022 | | | 3,065 | | | | 3,062 | |
Crane | | | | | | | | |
4.200%, 03/15/2048 | | | 450 | | | | 485 | |
CSX | | | | | | | | |
4.750%, 05/30/2042 | | | 1,420 | | | | 1,871 | |
Deere | | | | | | | | |
3.750%, 04/15/2050 | | | 706 | | | | 919 | |
3.100%, 04/15/2030 | | | 230 | | | | 265 | |
Emerson Electric | | | | | | | | |
2.750%, 10/15/2050 | | | 295 | | | | 316 | |
FedEx | | | | | | | | |
5.100%, 01/15/2044 | | | 125 | | | | 169 | |
4.550%, 04/01/2046 | | | 1,673 | | | | 2,153 | |
4.400%, 01/15/2047 | | | 405 | | | | 510 | |
4.050%, 02/15/2048 | | | 210 | | | | 255 | |
3.900%, 02/01/2035 | | | 700 | | | | 843 | |
GE Capital Funding LLC | | | | | | | | |
4.400%, 05/15/2030 (A) | | | 840 | | | | 968 | |
GE Capital International Funding Unlimited | | | | | |
4.418%, 11/15/2035 | | | 6,086 | | | | 7,016 | |
General Dynamics | | | | | | | | |
4.250%, 04/01/2040 | | | 805 | | | | 1,058 | |
4.250%, 04/01/2050 | | | 155 | | | | 215 | |
General Electric | | | | | | | | |
4.250%, 05/01/2040 | | | 1,140 | | | | 1,298 | |
General Electric MTN | | | | | | | | |
5.875%, 01/14/2038 | | | 4,135 | | | | 5,357 | |
0.701%, VAR ICE LIBOR USD 3 Month+0.480%, 08/15/2036 | | | 1,250 | | | | 872 | |
Johnson Controls International | | | | | | | | |
4.950%, 07/02/2064 | | | 225 | | | | 299 | |
Kansas City Southern | | | | | | | | |
4.200%, 11/15/2069 | | | 453 | | | | 522 | |
Lockheed Martin | | | | | | | | |
4.700%, 05/15/2046 | | | 1,461 | | | | 2,070 | |
| | |
SEI Institutional Investments Trust / Semi-Annual Report / November 30, 2020 | | 183 |
SCHEDULE OF INVESTMENTS (Unaudited)
November 30, 2020
Long Duration Fund (Continued)
| | | | | | | | |
| | | |
| Description | | Face Amount
(Thousands) | | Market Value
($ Thousands) |
| |
CORPORATE OBLIGATIONS (continued) | | | | | |
4.070%, 12/15/2042 | | $ | 600 | | | $ | 781 | |
3.600%, 03/01/2035 | | | 1,085 | | | | 1,340 | |
Norfolk Southern | | | | | | | | |
5.100%, 08/01/2118 | | | 910 | | | | 1,178 | |
4.800%, 08/15/2043 | | | 528 | | | | 659 | |
4.450%, 06/15/2045 | | | 602 | | | | 791 | |
4.050%, 08/15/2052 | | | 664 | | | | 856 | |
3.942%, 11/01/2047 | | | 646 | | | | 801 | |
3.155%, 05/15/2055 | | | 839 | | | | 940 | |
Northrop Grumman | | | | | | | | |
4.750%, 06/01/2043 | | | 1,275 | | | | 1,726 | |
4.030%, 10/15/2047 | | | 345 | | | | 438 | |
3.850%, 04/15/2045 | | | 1,100 | | | | 1,344 | |
Northwest Airlines, Pass-Through Trust, Ser 2001-1, Cl A1 | | | | | |
7.041%, 04/01/2022 | | | 168 | | | | 166 | |
Otis Worldwide | | | | | | | | |
3.362%, 02/15/2050 | | | 100 | | | | 115 | |
Parker-Hannifin | | | | | | | | |
4.000%, 06/14/2049 | | | 450 | | | | 566 | |
Parker-Hannifin MTN | | | | | | | | |
4.450%, 11/21/2044 | | | 405 | | | | 519 | |
Raytheon Technologies | | | | | | | | |
5.700%, 04/15/2040 | | | 1,635 | | | | 2,422 | |
4.625%, 11/16/2048 | | | 105 | | | | 146 | |
4.500%, 06/01/2042 | | | 2,200 | | | | 2,910 | |
4.350%, 04/15/2047 (A) | | | 900 | | | | 1,158 | |
3.750%, 11/01/2046 | | | 49 | | | | 60 | |
Snap-on | | | | | | | | |
3.100%, 05/01/2050 | | | 571 | | | | 645 | |
Trane Technologies Global Holding | | | | | | | | |
4.300%, 02/21/2048 | | | 380 | | | | 483 | |
TTX | | | | | | | | |
4.600%, 02/01/2049 (A) | | | 844 | | | | 1,155 | |
Union Pacific | | | | | | | | |
4.500%, 09/10/2048 | | | 175 | | | | 236 | |
3.839%, 03/20/2060 | | | 2,410 | | | | 2,969 | |
3.799%, 10/01/2051 | | | 555 | | | | 684 | |
3.750%, 02/05/2070 | | | 110 | | | | 131 | |
3.250%, 02/05/2050 | | | 2,356 | | | | 2,704 | |
2.973%, 09/16/2062 (A) | | | 793 | | | | 843 | |
Union Pacific MTN | | | | | | | | |
3.550%, 08/15/2039 | | | 620 | | | | 725 | |
United Airlines Pass-Through Trust, Ser 2019-1, Cl AA | | | | | | | | |
4.150%, 08/25/2031 | | | 398 | | | | 396 | |
United Parcel Service | | | | | | | | |
3.750%, 11/15/2047 | | | 595 | | | | 748 | |
US Airways, Pass-Through Trust, Ser 2010-1, Cl A | | | | | | | | |
6.250%, 04/22/2023 | | | 773 | | | | 723 | |
| | | | | | | | |
| | | |
| Description | | Face Amount
(Thousands) | | Market Value
($ Thousands) |
| |
CORPORATE OBLIGATIONS (continued) | | | | | |
Waste Connections | | | | | | | | |
3.050%, 04/01/2050 | | $ | 450 | | | $ | 490 | |
Waste Management | | | | | | | | |
4.150%, 07/15/2049 | | | 615 | | | | 816 | |
3.900%, 03/01/2035 | | | 360 | | | | 445 | |
WW Grainger | | | | | | | | |
4.600%, 06/15/2045 | | | 340 | | | | 455 | |
4.200%, 05/15/2047 | | | 797 | | | | 1,005 | |
| | | | | | | | |
| | | | | | | 97,216 | |
| | | | | | | | |
| | |
Information Technology — 4.0% | | | | | | | | |
Activision Blizzard | | | | | | | | |
4.500%, 06/15/2047 | | | 295 | | | | 380 | |
Apple | | | | | | | | |
4.650%, 02/23/2046 | | | 1,489 | | | | 2,149 | |
4.500%, 02/23/2036 | | | 660 | | | | 896 | |
4.450%, 05/06/2044 | | | 765 | | | | 1,054 | |
4.375%, 05/13/2045 | | | 2,375 | | | | 3,297 | |
3.850%, 05/04/2043 | | | 145 | | | | 187 | |
3.750%, 09/12/2047 | | | 250 | | | | 318 | |
3.450%, 02/09/2045 | | | 1,455 | | | | 1,785 | |
2.950%, 09/11/2049 | | | 350 | | | | 400 | |
2.550%, 08/20/2060 | | | 985 | | | | 1,017 | |
Applied Materials | | | | | | | | |
4.350%, 04/01/2047 | | | 461 | | | | 638 | |
Broadcom | | | | | | | | |
4.300%, 11/15/2032 | | | 230 | | | | 275 | |
Cisco Systems | | | | | | | | |
5.900%, 02/15/2039 | | | 751 | | | | 1,160 | |
Corning | | | | | | | | |
5.850%, 11/15/2068 | | | 579 | | | | 829 | |
5.450%, 11/15/2079 | | | 925 | | | | 1,271 | |
Deutsche Telekom | | | | | | | | |
3.625%, 01/21/2050 (A) | | | 615 | | | | 716 | |
Fiserv | | | | | | | | |
4.400%, 07/01/2049 | | | 1,140 | | | | 1,512 | |
Intel | | | | | | | | |
4.750%, 03/25/2050 | | | 1,025 | | | | 1,450 | |
3.734%, 12/08/2047 | | | 1,615 | | | | 1,980 | |
3.250%, 11/15/2049 | | | 1,090 | | | | 1,256 | |
Juniper Networks | | | | | | | | |
5.950%, 03/15/2041 | | | 575 | | | | 757 | |
KLA | | | | | | | | |
5.000%, 03/15/2049 | | | 527 | | | | 737 | |
Lam Research | | | | | | | | |
2.875%, 06/15/2050 | | | 557 | | | | 603 | |
Mastercard Inc | | | | | | | | |
3.850%, 03/26/2050 | | | 1,430 | | | | 1,868 | |
3.650%, 06/01/2049 | | | 415 | | | | 519 | |
Microsoft | | | | | | | | |
4.250%, 02/06/2047 | | | 863 | | | | 1,208 | |
4.100%, 02/06/2037 | | | 1,243 | | | | 1,634 | |
| | |
184 | | SEI Institutional Investments Trust / Semi-Annual Report / November 30, 2020 |
| | | | | | | | |
| | | |
| Description | | Face Amount
(Thousands) | | Market Value
($ Thousands) |
| |
CORPORATE OBLIGATIONS (continued) | | | | | |
4.000%, 02/12/2055 | | $ | 744 | | | $ | 1,046 | |
3.950%, 08/08/2056 | | | 718 | | | | 988 | |
3.700%, 08/08/2046 | | | 1,805 | | | | 2,325 | |
3.450%, 08/08/2036 | | | 525 | | | | 650 | |
2.675%, 06/01/2060 | | | 1,217 | | | | 1,337 | |
2.525%, 06/01/2050 | | | 1,672 | | | | 1,801 | |
NVIDIA | | | | | | | | |
3.700%, 04/01/2060 | | | 45 | | | | 58 | |
3.500%, 04/01/2040 | | | 670 | | | | 813 | |
3.500%, 04/01/2050 | | | 1,007 | | | | 1,226 | |
Oracle | | | | | | | | |
4.375%, 05/15/2055 | | | 1,260 | | | | 1,649 | |
4.300%, 07/08/2034 | | | 225 | | | | 287 | |
4.125%, 05/15/2045 | | | 1,180 | | | | 1,453 | |
4.000%, 07/15/2046 | | | 1,490 | | | | 1,818 | |
4.000%, 11/15/2047 | | | 590 | | | | 722 | |
3.900%, 05/15/2035 | | | 40 | | | | 49 | |
3.800%, 11/15/2037 | | | 2,170 | | | | 2,600 | |
3.600%, 04/01/2040 | | | 960 | | | | 1,119 | |
3.600%, 04/01/2050 | | | 1,240 | | | | 1,449 | |
PayPal Holdings | | | | | | | | |
3.250%, 06/01/2050 | | | 495 | | | | 569 | |
Texas Instruments | | | | | | | | |
4.150%, 05/15/2048 | | | 367 | | | | 506 | |
Visa | | | | | | | | |
4.300%, 12/14/2045 | | | 955 | | | | 1,317 | |
4.150%, 12/14/2035 | | | 505 | | | | 658 | |
2.700%, 04/15/2040 | | | 525 | | | | 583 | |
| | | | | | | | |
| | | | | | | 54,919 | |
| | | | | | | | |
| | |
Materials — 1.1% | | | | | | | | |
Air Products and Chemicals | | | | | | | | |
2.700%, 05/15/2040 | | | 220 | | | | 238 | |
Barrick Gold | | | | | | | | |
5.250%, 04/01/2042 | | | 120 | | | | 167 | |
BHP Billiton Finance USA | | | | | | | | |
5.000%, 09/30/2043 | | | 655 | | | | 957 | |
Dow Chemical | | | | | | | | |
3.600%, 11/15/2050 | | | 980 | | | | 1,091 | |
DuPont de Nemours | | | | | | | | |
5.419%, 11/15/2048 | | | 440 | | | | 635 | |
5.319%, 11/15/2038 | | | 985 | | | | 1,344 | |
FMC | | | | | | | | |
4.500%, 10/01/2049 | | | 605 | | | | 768 | |
Glencore Finance Canada | | | | | | | | |
6.000%, 11/15/2041 (A) | | | 1,026 | | | | 1,282 | |
International Flavors & Fragrances | | | | | |
5.000%, 09/26/2048 | | | 1,175 | | | | 1,568 | |
International Paper | | | | | | | | |
5.150%, 05/15/2046 | | | 390 | | | | 550 | |
LYB International Finance III LLC | | | | | |
4.200%, 10/15/2049 | | | 870 | | | | 1,015 | |
| | | | | | | | |
| | | |
| Description | | Face Amount
(Thousands) | | Market Value
($ Thousands) |
| |
CORPORATE OBLIGATIONS (continued) | | | | | |
4.200%, 05/01/2050 | | $ | 265 | | | $ | 308 | |
3.625%, 04/01/2051 | | | 370 | | | | 400 | |
Newmont Goldcorp | | | | | | | | |
6.250%, 10/01/2039 | | | 920 | | | | 1,396 | |
5.875%, 04/01/2035 | | | 185 | | | | 267 | |
Nutrition & Biosciences | | | | | | | | |
3.468%, 12/01/2050 (A) | | | 1,665 | | | | 1,819 | |
3.268%, 11/15/2040 (A) | | | 315 | | | | 340 | |
Sherwin-Williams | | | | | | | | |
3.300%, 05/15/2050 | | | 340 | | | | 385 | |
Vulcan Materials | | | | | | | | |
4.500%, 06/15/2047 | | | 160 | | | | 198 | |
WRKCo | | | | | | | | |
4.200%, 06/01/2032 | | | 470 | | | | 568 | |
| | | | | | | | |
| | | | | | | 15,296 | |
| | | | | | | | |
| | |
Real Estate — 1.7% | | | | | | | | |
Agree | | | | | | | | |
2.900%, 10/01/2030 | | | 395 | | | | 414 | |
American Campus Communities Operating Partnership | | | | | |
2.850%, 02/01/2030 | | | 540 | | | | 557 | |
American Tower | | | | | | | | |
3.100%, 06/15/2050 | | | 190 | | | | 197 | |
AvalonBay Communities MTN | | | | | | | | |
4.350%, 04/15/2048 | | | 80 | | | | 103 | |
Boston Properties | | | | | | | | |
2.900%, 03/15/2030 | | | 325 | | | | 345 | |
CyrusOne | | | | | | | | |
3.450%, 11/15/2029 | | | 1,920 | | | | 2,054 | |
Equinix | | | | | | | | |
2.950%, 09/15/2051 | | | 825 | | | | 851 | |
Essex Portfolio | | | | | | | | |
2.650%, 09/01/2050 | | | 415 | | | | 400 | |
GLP Capital | | | | | | | | |
5.300%, 01/15/2029 | | | 965 | | | | 1,108 | |
4.000%, 01/15/2031 | | | 600 | | | | 649 | |
Healthpeak Properties | | | | | | | | |
6.750%, 02/01/2041 | | | 180 | | | | 264 | |
Hudson Pacific Properties | | | | | | | | |
4.650%, 04/01/2029 | | | 390 | | | | 450 | |
3.250%, 01/15/2030 | | | 355 | | | | 372 | |
National Retail Properties | | | | | | | | |
4.800%, 10/15/2048 | | | 335 | | | | 399 | |
3.100%, 04/15/2050 | | | 470 | | | | 438 | |
Regency Centers | | | | | | | | |
4.650%, 03/15/2049 | | | 635 | | | | 753 | |
4.400%, 02/01/2047 | | | 300 | | | | 341 | |
Simon Property Group | | | | | | | | |
4.750%, 03/15/2042 | | | 45 | | | | 53 | |
Simon Property Group LP | | | | | | | | |
6.750%, 02/01/2040 | | | 634 | | | | 910 | |
| | |
SEI Institutional Investments Trust / Semi-Annual Report / November 30, 2020 | | 185 |
SCHEDULE OF INVESTMENTS (Unaudited)
November 30, 2020
Long Duration Fund (Continued)
| | | | | | | | |
| | | |
| Description | | Face Amount
(Thousands) | | Market Value
($ Thousands) |
| |
CORPORATE OBLIGATIONS (continued) | | | | | |
4.250%, 11/30/2046 | | $ | 85 | | | $ | 96 | |
3.800%, 07/15/2050 | | | 1,490 | | | | 1,606 | |
3.250%, 09/13/2049 | | | 650 | | | | 637 | |
2.650%, 07/15/2030 | | | 670 | | | | 704 | |
Spirit Realty | | | | | | | | |
3.400%, 01/15/2030 | | | 590 | | | | 628 | |
3.200%, 02/15/2031 | | | 960 | | | | 1,004 | |
Ventas Realty | | | | | | | | |
5.700%, 09/30/2043 | | | 2,537 | | | | 3,264 | |
VEREIT Operating Partnership | | | | | | | | |
2.850%, 12/15/2032 | | | 205 | | | | 210 | |
Welltower | | | | | | | | |
5.125%, 03/15/2043 | | | 2,499 | | | | 3,009 | |
4.950%, 09/01/2048 | | | 722 | | | | 928 | |
WP Carey | | | | | | | | |
2.400%, 02/01/2031 | | | 185 | | | | 189 | |
| | | | | | | | |
| | | | | | | 22,933 | |
| | | | | | | | |
| | |
Utilities — 9.0% | | | | | | | | |
AEP Transmission LLC | | | | | | | | |
3.800%, 06/15/2049 | | | 405 | | | | 499 | |
AES | | | | | | | | |
2.450%, 01/15/2031 (A) | | | 425 | | | | 432 | |
Alabama Power | | | | | | | | |
4.300%, 07/15/2048 | | | 745 | | | | 1,002 | |
4.150%, 08/15/2044 | | | 1,045 | | | | 1,321 | |
3.700%, 12/01/2047 | | | 1,061 | | | | 1,300 | |
American Water Capital | | | | | | | | |
4.150%, 06/01/2049 | | | 485 | | | | 639 | |
3.750%, 09/01/2047 | | | 180 | | | | 221 | |
3.450%, 05/01/2050 | | | 1,230 | | | | 1,465 | |
Appalachian Power | | | | | | | | |
4.500%, 03/01/2049 | | | 500 | | | | 645 | |
4.450%, 06/01/2045 | | | 650 | | | | 832 | |
Baltimore Gas & Electric | | | | | | | | |
5.200%, 06/15/2033 | | | 1,238 | | | | 1,535 | |
2.900%, 06/15/2050 | | | 420 | | | | 448 | |
Berkshire Hathaway Energy | | | | | | | | |
6.125%, 04/01/2036 | | | 4,966 | | | | 7,441 | |
Black Hills | | | | | | | | |
4.350%, 05/01/2033 | | | 495 | | | | 594 | |
4.200%, 09/15/2046 | | | 500 | | | | 602 | |
Brooklyn Union Gas | | | | | | | | |
4.273%, 03/15/2048 (A) | | | 710 | | | | 904 | |
CenterPoint Energy Houston Electric LLC | | | | | | | | |
2.900%, 07/01/2050 | | | 335 | | | | 365 | |
CenterPoint Energy Resources | | | | | | | | |
6.250%, 02/01/2037 | | | 791 | | | | 1,057 | |
Cleco Power | | | | | | | | |
6.000%, 12/01/2040 | | | 750 | | | | 1,009 | |
Commonwealth Edison | | | | | | | | |
4.350%, 11/15/2045 | | | 1,530 | | | | 2,022 | |
| | | | | | | | |
| | | |
| Description | | Face Amount
(Thousands) | | Market Value
($ Thousands) |
| |
CORPORATE OBLIGATIONS (continued) | | | | | |
4.000%, 03/01/2048 | | $ | 690 | | | $ | 880 | |
3.700%, 03/01/2045 | | | 600 | | | | 723 | |
3.200%, 11/15/2049 | | | 445 | | | | 500 | |
Connecticut Light & Power | | | | | | | | |
4.000%, 04/01/2048 | | | 500 | | | | 650 | |
Consolidated Edison of New York | | | | | |
6.750%, 04/01/2038 | | | 525 | | | | 825 | |
6.300%, 08/15/2037 | | | 865 | | | | 1,261 | |
4.500%, 05/15/2058 | | | 750 | | | | 1,014 | |
4.450%, 03/15/2044 | | | 245 | | | | 313 | |
3.950%, 04/01/2050 | | | 505 | | | | 627 | |
3.850%, 06/15/2046 | | | 500 | | | | 598 | |
3.700%, 11/15/2059 | | | 600 | | | | 702 | |
Consumers Energy | | | | | | | | |
3.100%, 08/15/2050 | | | 460 | | | | 531 | |
2.500%, 05/01/2060 | | | 300 | | | | 303 | |
Dominion Energy | | | | | | | | |
5.250%, 08/01/2033 | | | 2,830 | | | | 3,643 | |
4.900%, 08/01/2041 | | | 1,785 | | | | 2,347 | |
DTE Electric | | | | | | | | |
4.050%, 05/15/2048 | | | 480 | | | | 632 | |
Duke Energy Carolinas LLC | | | | | | | | |
6.100%, 06/01/2037 | | | 1,690 | | | | 2,532 | |
6.000%, 01/15/2038 | | | 614 | | | | 922 | |
5.300%, 02/15/2040 | | | 1,880 | | | | 2,680 | |
4.250%, 12/15/2041 | | | 1,250 | | | | 1,593 | |
3.200%, 08/15/2049 | | | 20 | | | | 23 | |
Duke Energy Florida LLC | | | | | | | | |
6.350%, 09/15/2037 | | | 450 | | | | 688 | |
1.750%, 06/15/2030 | | | 610 | | | | 627 | |
Duke Energy Indiana LLC | | | | | | | | |
6.350%, 08/15/2038 | | | 310 | | | | 474 | |
4.900%, 07/15/2043 | | | 750 | | | | 1,019 | |
3.750%, 05/15/2046 | | | 845 | | | | 1,017 | |
Duke Energy Ohio | | | | | | | | |
2.125%, 06/01/2030 | | | 315 | | | | 331 | |
Duke Energy Progress LLC | | | | | | | | |
4.375%, 03/30/2044 | | | 2,345 | | | | 3,067 | |
Duquesne Light Holdings | | | | | | | | |
5.900%, 12/01/2021 (A) | | | 750 | | | | 784 | |
Electricite de France | | | | | | | | |
6.000%, 01/22/2114 (A) | | | 495 | | | | 713 | |
5.000%, 09/21/2048 (A) | | | 730 | | | | 977 | |
4.950%, 10/13/2045 (A) | | | 640 | | | | 830 | |
4.750%, 10/13/2035 (A) | | | 245 | | | | 306 | |
Elm Road Generating Station Supercritical | | | | | |
5.848%, 01/19/2041 (A) | | | 2,007 | | | | 2,525 | |
Entergy LLC | | | | | | | | |
3.750%, 06/15/2050 | | | 504 | | | | 600 | |
Entergy Louisiana LLC | | | | | | | | |
4.200%, 04/01/2050 | | | 795 | | | | 1,034 | |
| | |
186 | | SEI Institutional Investments Trust / Semi-Annual Report / November 30, 2020 |
| | | | | | | | |
| | | |
| Description | | Face Amount
(Thousands) | | Market Value
($ Thousands) |
| |
CORPORATE OBLIGATIONS (continued) | | | | | |
Entergy Texas | | | | | | | | |
3.550%, 09/30/2049 | | $ | 475 | | | $ | 546 | |
Evergy Missouri West | | | | | | | | |
8.270%, 11/15/2021 | | | 2,600 | | | | 2,777 | |
Exelon | | | | | | | | |
4.950%, 06/15/2035 | | | 1,260 | | | | 1,603 | |
Exelon Generation LLC | | | | | | | | |
5.600%, 06/15/2042 | | | 1,140 | | | | 1,281 | |
Florida Power & Light | | | | | | | | |
5.960%, 04/01/2039 | | | 980 | | | | 1,490 | |
5.690%, 03/01/2040 | | | 1,201 | | | | 1,792 | |
5.400%, 09/01/2035 | | | 2,315 | | | | 3,347 | |
3.990%, 03/01/2049 | | | 360 | | | | 471 | |
Georgia Power | | | | | | | | |
4.300%, 03/15/2042 | | | 630 | | | | 791 | |
3.700%, 01/30/2050 | | | 1,595 | | | | 1,929 | |
Indianapolis Power & Light | | | | | | | | |
6.050%, 10/01/2036 (A) | | | 1,131 | | | | 1,583 | |
4.700%, 09/01/2045 (A) | | | 280 | | | | 360 | |
Jersey Central Power & Light | | | | | | | | |
6.400%, 05/15/2036 | | | 1,425 | | | | 1,850 | |
KeySpan Gas East | | | | | | | | |
5.819%, 04/01/2041 (A) | | | 1,185 | | | | 1,678 | |
Massachusetts Electric | | | | | | | | |
5.900%, 11/15/2039 (A) | | | 476 | | | | 698 | |
MidAmerican Energy | | | | | | | | |
4.800%, 09/15/2043 | | | 725 | | | | 985 | |
4.400%, 10/15/2044 | | | 950 | | | | 1,249 | |
4.250%, 05/01/2046 | | | 565 | | | | 728 | |
MidAmerican Energy MTN | | | | | | | | |
5.800%, 10/15/2036 | | | 425 | | | | 624 | |
Narragansett Electric | | | | | | | | |
4.170%, 12/10/2042 (A) | | | 1,320 | | | | 1,589 | |
NiSource | | | | | | | | |
5.950%, 06/15/2041 | | | 417 | | | | 596 | |
Northern States Power | | | | | | | | |
5.350%, 11/01/2039 | | | 2,095 | | | | 3,051 | |
3.400%, 08/15/2042 | | | 490 | | | | 573 | |
NSTAR Electric | | | | | | | | |
4.400%, 03/01/2044 | | | 755 | | | | 977 | |
Oglethorpe Power | | | | | | | | |
5.250%, 09/01/2050 | | | 1,051 | | | | 1,322 | |
5.050%, 10/01/2048 | | | 970 | | | | 1,221 | |
Oncor Electric Delivery LLC | | | | | | | | |
5.350%, 10/01/2052 (A) | | | 630 | | | | 973 | |
5.300%, 06/01/2042 | | | 365 | | | | 520 | |
5.250%, 09/30/2040 | | | 1,200 | | | | 1,658 | |
Pacific Gas and Electric | | | | | | | | |
3.500%, 08/01/2050 | | | 675 | | | | 681 | |
3.300%, 08/01/2040 | | | 205 | | | | 206 | |
2.500%, 02/01/2031 | | | 335 | | | | 337 | |
| | | | | | | | |
| | | |
| Description | | Face Amount
(Thousands) | | Market Value
($ Thousands) |
| |
CORPORATE OBLIGATIONS (continued) | | | | | |
PacifiCorp | | | | | | | | |
6.000%, 01/15/2039 | | $ | 555 | | | $ | 832 | |
PECO Energy | | | | | | | | |
3.900%, 03/01/2048 | | | 520 | | | | 660 | |
Piedmont Natural Gas | | | | | | | | |
4.650%, 08/01/2043 | | | 330 | | | | 428 | |
PPL Electric Utilities | | | | | | | | |
4.150%, 06/15/2048 | | | 530 | | | | 693 | |
4.125%, 06/15/2044 | | | 870 | | | | 1,091 | |
Public Service Electric & Gas MTN | | | | | |
4.050%, 05/01/2048 | | | 480 | | | | 630 | |
Public Service of Colorado | | | | | | | | |
6.500%, 08/01/2038 | | | 725 | | | | 1,136 | |
6.250%, 09/01/2037 | | | 750 | | | | 1,149 | |
4.050%, 09/15/2049 | | | 138 | | | | 181 | |
Puget Sound Energy | | | | | | | | |
4.223%, 06/15/2048 | | | 880 | | | | 1,133 | |
San Diego Gas & Electric | | | | | | | | |
3.320%, 04/15/2050 | | | 587 | | | | 660 | |
Sempra Energy | | | | | | | | |
6.000%, 10/15/2039 | | | 865 | | | | 1,237 | |
3.800%, 02/01/2038 | | | 785 | | | | 914 | |
Southern California Edison | | | | | | | | |
6.050%, 03/15/2039 | | | 665 | | | | 904 | |
3.900%, 03/15/2043 | | | 245 | | | | 275 | |
3.650%, 02/01/2050 | | | 120 | | | | 140 | |
Southern California Gas | | | | | | | | |
3.750%, 09/15/2042 | | | 660 | | | | 788 | |
Southern Gas Capital | | | | | | | | |
5.875%, 03/15/2041 | | | 1,568 | | | | 2,226 | |
4.400%, 06/01/2043 | | | 395 | | | | 482 | |
Southwestern Electric Power | | | | | | | | |
6.200%, 03/15/2040 | | | 1,610 | | | | 2,336 | |
Southwestern Public Service | | | | | | | | |
4.400%, 11/15/2048 | | | 550 | | | | 726 | |
Tampa Electric | | | | | | | | |
4.300%, 06/15/2048 | | | 1,070 | | | | 1,371 | |
Virginia Electric & Power | | | | | | | | |
4.450%, 02/15/2044 | | | 750 | | | | 1,020 | |
Wisconsin Public Service | | | | | | | | |
3.300%, 09/01/2049 | | | 175 | | | | 199 | |
| | | | | | | | |
| | | | | | | 123,321 | |
| | | | | | | | |
| | |
Total Corporate Obligations
(Cost $749,987) ($ Thousands) | | | | | | | 919,071 | |
| | | | | | | | |
|
U.S. TREASURY OBLIGATIONS — 22.2% | |
U.S. Treasury Bills | | | | | | | | |
0.180%, 12/03/2020 (B) | | | 5,725 | | | | 5,725 | |
0.147%, 01/07/2021 (B) | | | 2,690 | | | | 2,690 | |
0.124%, 01/21/2021 (B) | | | 4,455 | | | | 4,454 | |
| | |
SEI Institutional Investments Trust / Semi-Annual Report / November 30, 2020 | | 187 |
SCHEDULE OF INVESTMENTS (Unaudited)
November 30, 2020
Long Duration Fund (Continued)
| | | | | | | | |
| | | |
| Description | | Face Amount
(Thousands) | | Market Value
($ Thousands) |
|
U.S. TREASURY OBLIGATIONS (continued) | |
0.120%, 01/14/2021 (B) | | $ | 3,840 | | | $ | 3,840 | |
0.110%, 01/28/2021 (B) | | | 1,075 | | | | 1,075 | |
0.101%, 01/26/2021 (B) | | | 2,825 | | | | 2,825 | |
U.S. Treasury Bonds | | | | | | | | |
3.750%, 08/15/2041 | | | 1,865 | | | | 2,686 | |
3.750%, 11/15/2043 | | | 2,295 | | | | 3,349 | |
3.625%, 08/15/2043 | | | 2,067 | | | | 2,960 | |
3.625%, 02/15/2044 | | | 8,076 | | | | 11,593 | |
3.500%, 02/15/2039 | | | 5,502 | | | | 7,575 | |
3.125%, 11/15/2041 | | | 2,455 | | | | 3,256 | |
3.125%, 02/15/2043 | | | 2,960 | | | | 3,939 | |
3.125%, 08/15/2044 | | | 4,405 | | | | 5,889 | |
3.000%, 11/15/2044 | | | 7,010 | | | | 9,197 | |
3.000%, 05/15/2045 | | | 7,660 | | | | 10,073 | |
3.000%, 05/15/2047 | | | 3,420 | | | | 4,541 | |
3.000%, 02/15/2048 | | | 4,513 | | | | 6,009 | |
2.875%, 11/15/2046 | | | 4,080 | | | | 5,287 | |
2.750%, 08/15/2042 | | | 4,210 | | | | 5,292 | |
2.750%, 11/15/2042 | | | 7,005 | | | | 8,800 | |
2.750%, 11/15/2047 | | | 5,700 | | | | 7,260 | |
2.500%, 05/15/2046 | | | 6,740 | | | | 8,168 | |
2.250%, 08/15/2049 | | | 5,523 | | | | 6,421 | |
1.625%, 11/15/2050 | | | 42,455 | | | | 43,006 | |
1.375%, 11/15/2040 | | | 18,210 | | | | 18,244 | |
1.375%, 08/15/2050 | | | 27,032 | | | | 25,740 | |
1.250%, 05/15/2050 | | | 37,342 | | | | 34,454 | |
1.125%, 05/15/2040 | | | 19,275 | | | | 18,549 | |
1.125%, 08/15/2040 | | | 4,806 | | | | 4,612 | |
U.S. Treasury Inflation-Protected Securities | | | | | | | | |
1.000%, 02/15/2049 | | | 2,773 | | | | 3,886 | |
U.S. Treasury Notes | | | | | | | | |
0.875%, 11/15/2030 | | | 435 | | | | 436 | |
0.625%, 11/30/2027 | | | 9,415 | | | | 9,424 | |
0.625%, 05/15/2030 | | | 3,524 | | | | 3,464 | |
0.625%, 08/15/2030 | | | 2,899 | | | | 2,843 | |
U.S. Treasury STRIPS | | | | | | | | |
3.127%, 08/15/2043 (B) | | | 9,912 | | | | 7,065 | |
| | | | | | | | |
| |
Total U.S. Treasury Obligations
(Cost $283,330) ($ Thousands) | | | | 304,627 | |
| | | | | | | | |
| | |
MUNICIPAL BONDS — 5.1% | | | | | | | | |
California — 2.3% | | | | | | | | |
Bay Area, Toll Authority, Build America Project, RB | | | | | | | | |
6.263%, 04/01/2049 | | | 600 | | | | 1,037 | |
California State University, Ser H, RB | | | | | | | | |
6.548%, 05/15/2048 | | | 1,430 | | | | 2,304 | |
California State, Build America Project, GO | | | | | | | | |
7.500%, 04/01/2034 | | | 3,425 | | | | 5,635 | |
| | | | | | | | |
| | | |
| Description | | Face Amount
(Thousands) | | Market Value
($ Thousands) |
|
MUNICIPAL BONDS (continued) | |
Los Angeles, Community College District, Build America Project, GO | | | | | |
6.750%, 08/01/2049 | | $ | 590 | | | $ | 1,057 | |
Los Angeles, Department of Water & Power, Build America Project, RB | | | | | | | | |
6.008%, 07/01/2039 | | | 3,000 | | | | 4,122 | |
Los Angeles, Unified School District, Build America Project, GO | | | | | | | | |
5.750%, 07/01/2034 | | | 2,235 | | | | 3,079 | |
Los Angeles, Unified School District, Build America Project, Ser RY, GO | | | | | | | | |
6.758%, 07/01/2034 | | | 1,360 | | | | 2,001 | |
Regents of the University of California, Ser N, RB
Callable 11/15/2059 @ 100 | | | | | | | | |
3.256%, 05/15/2060 | | | 1,710 | | | | 1,853 | |
Riverside County, Pension Obligation, RB | | | | | | | | |
3.818%, 02/15/2038 | | | 345 | | | | 381 | |
San Francisco Bay Area, Rapid Transit District, Ser C-1, GO
Callable 08/01/2029 @ 100 | | | | | | | | |
3.000%, 08/01/2050 | | | 275 | | | | 296 | |
San Francisco, City & County Airport, Build America Project, Ser A, AMT, RB
Callable 05/01/2029 @ 100 | | | | | | | | |
5.000%, 05/01/2049 | | | 710 | | | | 871 | |
San Francisco, Public Utilities Commission, Water Revenue, Build America Project,Ser DE, RB | | | | | | | | |
6.000%, 11/01/2040 | | | 3,805 | | | | 5,400 | |
State of California, Build America Project, GO | | | | | | | | |
7.350%, 11/01/2039 | | | 1,645 | | | | 2,724 | |
University of California, Ser AD, RB | | | | | | | | |
4.858%, 05/15/2112 | | | 825 | | | | 1,161 | |
University of California, Ser AP, RB | | | | | | | | |
3.931%, 05/15/2045 | | | 475 | | | | 552 | |
| | | | | | | | |
| | | | | | | 32,473 | |
| | | | | | | | |
| | |
District of Columbia — 0.2% | | | | | | | | |
District of Columbia, Water & Sewer Authority, RB | | | | | | | | |
4.814%, 10/01/2114 | | | 1,505 | | | | 2,216 | |
| | | | | | | | |
| | |
Florida — 0.1% | | | | | | | | |
City of Gainesville, Build America Project, RB | | | | | | | | |
6.024%, 10/01/2040 | | | 650 | | | | 1,010 | |
| | | | | | | | |
| | |
Georgia — 0.1% | | | | | | | | |
Georgia State, Municipal Electric Authority, Build America Project, RB | | | | | | | | |
6.637%, 04/01/2057 | | | 619 | | | | 928 | |
| | | | | | | | |
| | |
188 | | SEI Institutional Investments Trust / Semi-Annual Report / November 30, 2020 |
| | | | | | | | |
| | | |
| Description | | Face Amount
(Thousands) | | Market Value
($ Thousands) |
|
MUNICIPAL BONDS (continued) | |
| | |
Illinois — 0.2% | | | | | | | | |
Greater Chicago, Metropolitan Water Reclamation District, GO | | | | | | | | |
5.720%, 12/01/2038 | | $ | 1,480 | | | $ | 2,098 | |
Illinois State, Finance Authority, RB
Callable 06/01/2022 @ 100 | | | | | | | | |
4.000%, 06/01/2047 | | | 445 | | | | 457 | |
| | | | | | | | |
| | | | | | | 2,555 | |
| | | | | | | | |
| | |
Maryland — 0.0% | | | | | | | | |
Baltimore, Revenue Authority, Water Project, Ser B, RB
Callable 07/01/2030 @ 100 | | | | | | | | |
2.814%, 07/01/2040 | | | 370 | | | | 379 | |
| | | | | | | | |
| | |
Massachusetts — 0.0% | | | | | | | | |
Massachusetts State, Ser C, GO
Callable 03/01/2030 @ 100 | | | | | | | | |
3.000%, 03/01/2048 | | | 415 | | | | 453 | |
| | | | | | | | |
| | |
Michigan — 0.2% | | | | | | | | |
Michigan State University, Build America Project, RB
Callable 02/15/2030 @ 100 | | | | | | | | |
6.173%, 02/15/2050 | | | 2,000 | | | | 2,522 | |
| | | | | | | | |
| | |
Missouri — 0.1% | | | | | | | | |
Missouri State, Health and Education Facilities, RB
Callable 02/15/2057 @ 100 | | | | | | | | |
3.652%, 08/15/2057 | | | 330 | | | | 415 | |
Missouri State, Joint Municipal Electric Utility Commission, Build America Project, Ser A, RB | | | | | | | | |
6.890%, 01/01/2042 | | | 600 | | | | 906 | |
| | | | | | | | |
| | | | | | | 1,321 | |
| | | | | | | | |
| | |
New Jersey — 0.1% | | | | | | | | |
New Jersey State, Turnpike Authority, Build America Project, RB | | | | | | | | |
7.414%, 01/01/2040 | | | 60 | | | | 100 | |
New Jersey State, Turnpike Authority, Ser F, RB | | | | | | | | |
3.729%, 01/01/2036 | | | 1,085 | | | | 1,279 | |
| | | | | | | | |
| | | | | | | 1,379 | |
| | | | | | | | |
| | |
New York — 1.1% | | | | | | | | |
Metropolitan Transportation Authority, Build America Project, RB | | | | | | | | |
6.548%, 11/15/2031 | | | 500 | | | | 592 | |
New York & New Jersey, Port Authority, RB | | | | | | | | |
4.458%, 10/01/2062 | | | 1,240 | | | | 1,615 | |
| | | | | | | | |
| | | |
| Description | | Face Amount
(Thousands) | | Market Value
($ Thousands) |
|
MUNICIPAL BONDS (continued) | |
New York City, Municipal Water Finance Authority, Build America Project, RB | | | | | | | | |
5.440%, 06/15/2043 | | $ | 910 | | | $ | 1,386 | |
New York City, Transitional Finance Authority, Build America Project, RB | | | | | | | | |
5.572%, 11/01/2038 | | | 885 | | | | 1,190 | |
New York City, Transitional Finance Authority, Future Tax Secured Revenue, Build America Project, RB | | | | | | | | |
5.508%, 08/01/2037 | | | 1,000 | | | | 1,357 | |
New York City, Water & Sewer System, RB
Pre-Refunded @ 100 | | | | | | | | |
5.375%, 12/15/2020 (C) | | | 395 | | | | 396 | |
New York City, Water & Sewer System, RB
Callable 12/15/2020 @ 100 | | | | | | | | |
5.375%, 06/15/2043 | | | 205 | | | | 205 | |
New York State, Dormitory Authority, Build America Project, RB | | | | | | | | |
5.289%, 03/15/2033 | | | 1,550 | | | | 1,928 | |
New York State, Dormitory Authority, Build America Project, Ser D, RB | | | | | | | | |
5.500%, 03/15/2030 | | | 2,645 | | | | 3,204 | |
New York State, Dormitory Authority, Ser F, RB | | | | | | | | |
3.110%, 02/15/2039 | | | 1,215 | | | | 1,303 | |
New York State, Urban Development, RB | | | | | | | | |
5.770%, 03/15/2039 | | | 1,470 | | | | 1,882 | |
| | | | | | | | |
| | | | | | | 15,058 | |
| | | | | | | | |
| | |
Ohio — 0.2% | | | | | | | | |
JobsOhio Beverage System, Ser A, RB | | | | | | | | |
2.833%, 01/01/2038 | | | 325 | | | | 350 | |
Ohio State University, Build America Project, GO | | | | | | | | |
4.910%, 06/01/2040 | | | 535 | | | | 747 | |
Ohio State University, Build America Project, Ser A, RB | | | | | | | | |
4.800%, 06/01/2111 | | | 115 | | | | 166 | |
Ohio State, Hospital Facilities Revenue Authority, Cleveland Clinic, RB | | | | | | | | |
2.885%, 01/01/2032 | | | 950 | | | | 1,057 | |
| | | | | | | | |
| | | | | | | 2,320 | |
| | | | | | | | |
| | |
Texas — 0.5% | | | | | | | | |
Grand Parkway, Transportation Corp, Ser E, RB | | | | | | | | |
5.184%, 10/01/2042 | | | 930 | | | | 1,318 | |
North Texas, Tollway Authority, Build America Project, RB | | | | | | | | |
6.718%, 01/01/2049 | | | 490 | | | | 849 | |
North Texas, Tollway Authority, RB
Callable 01/01/2029 @ 100 | | | | | | | | |
3.029%, 01/01/2040 | | | 735 | | | | 757 | |
| | |
SEI Institutional Investments Trust / Semi-Annual Report / November 30, 2020 | | 189 |
SCHEDULE OF INVESTMENTS (Unaudited)
November 30, 2020
Long Duration Fund (Continued)
| | | | | | | | |
| | | |
| Description | | Face Amount
(Thousands) | | Market Value
($ Thousands) |
|
MUNICIPAL BONDS (continued) | |
Permanent University Fund - University of Texas, Ser A, RB | | | | | | | | |
3.500%, 08/15/2050 | | $ | 1,090 | | | $ | 1,382 | |
Permanent University Fund - University of Texas, Ser S, RB
Callable 01/01/2047 @ 100 | | | | | | | | |
3.376%, 07/01/2047 | | | 560 | | | | 674 | |
Texas State, Private Activity Bond Surface Transportation, RB | | | | | | | | |
3.922%, 12/31/2049 | | | 355 | | | | 390 | |
Texas State, Transportation Commission State Highway Fund, Ser B, RB | | | | | | | | |
5.178%, 04/01/2030 | | | 815 | | | | 1,047 | |
University of Texas, RB | | | | | | | | |
5.262%, 07/01/2039 | | | 575 | | | | 840 | |
| | | | | | | | |
| | | | | | | 7,257 | |
| | | | | | | | |
| | |
Total Municipal Bonds
(Cost $57,090) ($ Thousands) | | | | | | | 69,871 | |
| | | | | | | | |
|
U.S. GOVERNMENT AGENCY OBLIGATIONS — 2.3% | |
FNMA | | | | | | | | |
0.875%, 08/05/2030 | | | 1,055 | | | | 1,033 | |
FNMA, PO MTN | | | | | | | | |
0.000%, 05/15/2030 (B) | | | 8,380 | | | | 7,382 | |
Resolution Funding Principal STRIP | | | | | | | | |
4.042%, 04/15/2030 (B) | | | 18,475 | | | | 16,397 | |
1.335%, 01/15/2030 (B) | | | 625 | | | | 556 | |
Tennessee Valley Authority | | | | | | | | |
5.250%, 09/15/2039 | | | 2,290 | | | | 3,460 | |
Tennessee Valley Authority, PO | | | | | | | | |
0.000%, 01/15/2038 (B) | | | 3,700 | | | | 2,607 | |
| | | | | | | | |
| | |
Total U.S. Government Agency Obligations
(Cost $24,701) ($ Thousands) | | | | | | | 31,435 | |
| | | | | | | | |
|
MORTGAGE-BACKED SECURITIES — 1.0% | |
Agency Mortgage-Backed Obligations — 1.0% | |
FHLMC CMO, Ser 2004-2748, Cl ZT | | | | | | | | |
5.500%, 02/15/2024 | | | 356 | | | | 371 | |
FHLMC CMO, Ser 2010-3756, Cl PZ | | | | | | | | |
4.000%, 11/15/2040 | | | 7,454 | | | | 8,220 | |
FHLMC REMIC CMO, Ser 2004-2733, Cl ME | | | | | | | | |
5.000%, 01/15/2034 | | | 83 | | | | 96 | |
FNMA CMO, Ser 2004-12, Cl ZX | | | | | | | | |
6.000%, 03/25/2034 | | | 1,097 | | | | 1,295 | |
FNMA CMO, Ser 2004-80, Cl XZ | | | | | | | | |
5.000%, 11/25/2034 | | | 690 | | | | 816 | |
| | | | | | | | |
| | | |
| Description | | Face Amount
(Thousands) | | Market Value
($ Thousands) |
|
MORTGAGE-BACKED SECURITIES (continued) | |
FNMA REMIC CMO, Ser 2007-68, Cl SC, IO | | | | | | | | |
6.550%, VAR LIBOR USD 1 Month+6.700%, 07/25/2037 | | $ | 18 | | | $ | 3 | |
GNMA ARM | | | | | | | | |
2.875%, VAR US Treas Yield Curve Rate T Note Const Mat 1 Yr+1.500%, 06/20/2032 | | | 33 | | | | 34 | |
GNMA CMO, Ser 2009-8, Cl PS, IO | | | | | | | | |
6.159%, VAR ICE LIBOR USD 1 Month+6.300%, 08/16/2038 | | | 39 | | | | 4 | |
GNMA CMO, Ser 2010-4, Cl NS, IO | | | | | | | | |
6.249%, VAR LIBOR USD 1 Month+6.390%, 01/16/2040 | | | 65 | | | | 14 | |
GNMA CMO, Ser 2011-70, Cl BO, PO | | | | | | | | |
0.000%, 05/20/2041 (B) | | | 2,801 | | | | 2,509 | |
| | | | | | | | |
| | | | | | | 13,362 | |
| | | | | | | | |
|
Non-Agency Mortgage-Backed Obligations — 0.0% | |
Citicorp Residential Mortgage Trust, Ser 2007-1, Cl A5 | | | | | | | | |
5.165%, 03/25/2037 | | | 165 | | | | 170 | |
DSLA Mortgage Loan Trust, Ser 2005-AR2, Cl 2A1A | | | | | | | | |
0.570%, VAR ICE LIBOR USD 1 Month+0.420%, 03/19/2045 | | | 50 | | | | 50 | |
Harborview Mortgage Loan Trust, Ser 2004-8, Cl 2A4A | | | | | | | | |
0.950%, VAR ICE LIBOR USD 1 Month+0.800%, 11/19/2034 | | | 90 | | | | 85 | |
Indymac Index Mortgage Loan Trust, Ser 2004-AR12, Cl A1 | | | | | | | | |
0.930%, VAR ICE LIBOR USD 1 Month+0.780%, 12/25/2034 | | | 67 | | | | 56 | |
Indymac Index Mortgage Loan Trust, Ser 2004-AR5, Cl 2A1B | | | | | | | | |
0.950%, VAR ICE LIBOR USD 1 Month+0.800%, 08/25/2034 | | | 31 | | | | 28 | |
Indymac Index Mortgage Loan Trust, Ser 2004-AR7, Cl A2 | | | | | | | | |
1.010%, VAR ICE LIBOR USD 1 Month+0.860%, 09/25/2034 | | | 12 | | | | 12 | |
RAMP Trust, Ser 2004-SL1, Cl A7 | | | | | | | | |
7.000%, 11/25/2031 | | | 10 | | | | 10 | |
Residential Asset Securitization Trust, Ser 2004-IP2, Cl 2A1 | | | | | | | | |
3.232%, 12/25/2034 (D) | | | 16 | | | | 16 | |
| | |
190 | | SEI Institutional Investments Trust / Semi-Annual Report / November 30, 2020 |
| | | | | | | | |
| | | |
| Description | | Face Amount
(Thousands) | | Market Value
($ Thousands) |
| |
MORTGAGE-BACKED SECURITIES (continued) | | | | | |
WaMu Mortgage Pass-Through Certificates, Ser 2005-AR2, Cl 2A21 | | | | | | | | |
0.810%, VAR ICE LIBOR USD 1 Month+0.660%, 01/25/2045 | | $ | 56 | | | $ | 54 | |
| | | | | | | | |
| | | | | | | 481 | |
| | | | | | | | |
| | |
Total Mortgage-Backed Securities
(Cost $9,779) ($ Thousands) | | | | | | | 13,843 | |
| | | | | | | | |
| | |
SOVEREIGN DEBT – 0.9% | | | | | | | | |
Chile Government International Bond | | | | | | | | |
3.500%, 01/25/2050 | | | 2,075 | | | | 2,363 | |
Colombia Government International Bond | | | | | | | | |
5.625%, 02/26/2044 | | | 595 | | | | 757 | |
3.000%, 01/30/2030 | | | 415 | | | | 432 | |
Israel Government AID Bond | | | | | | | | |
5.500%, 09/18/2033 | | | 1,400 | | | | 2,061 | |
Israel Government International Bond | | | | | | | | |
3.875%, 07/03/2050 | | | 385 | | | | 460 | |
Mexico Government International Bond | | | | | | | | |
5.750%, 10/12/2110 | | | 334 | | | | 418 | |
5.000%, 04/27/2051 | | | 1,005 | | | | 1,211 | |
4.750%, 04/27/2032 | | | 345 | | | | 408 | |
4.500%, 01/31/2050 | | | 1,625 | | | | 1,840 | |
| | | | | | | | |
| | | |
| Description | | Face Amount
(Thousands) | | Market Value
($ Thousands) |
| |
SOVEREIGN DEBT (continued) | | | | | |
3.250%, 04/16/2030 | | $ | 415 | | | $ | 441 | |
Minera Mexico | | | | | | | | |
4.500%, 01/26/2050 (A) | | | 315 | | | | 358 | |
Nacional del Cobre de Chile | | | | | | | | |
4.375%, 02/05/2049 (A) | | | 190 | | | | 231 | |
Panama Government International Bond | | | | | | | | |
3.870%, 07/23/2060 | | | 335 | | | | 390 | |
Philippine Government International Bond | | | | | | | | |
2.950%, 05/05/2045 | | | 400 | | | | 426 | |
Uruguay Government International Bond | | | | | | | | |
5.100%, 06/18/2050 | | | 370 | | | | 508 | |
| | | | | | | | |
| | |
Total Sovereign Debt
(Cost $10,403) ($ Thousands) | | | | | | | 12,304 | |
| | | | | | | | |
| | | Shares | | |
| |
CASH EQUIVALENT — 1.4% | | | | | |
SEI Daily Income Trust, Government Fund, Cl F | | | | | | | | |
0.010%**† | | | 19,873,253 | | | | 19,873 | |
| | | | | | | | |
| | |
Total Cash Equivalent
(Cost $19,873) ($ Thousands) | | | | | | | 19,873 | |
| | | | | | | | |
| | |
Total Investments in Securities — 99.7%
(Cost $1,155,163) ($ Thousands) | | | | | | $ | 1,371,024 | |
| | | | | | | | |
A list of the open futures contracts held by the Fund at November 30, 2020, is as follows:
| | | | | | | | | | | | | | | | | | |
| | | | | | |
Type of Contract | | Number of
Contracts
Long/(Short) | | Expiration
Date | | Notional Amount
(Thousands) | | Value
(Thousands) | | Unrealized
Appreciation
(Depreciation)
(Thousands) |
U.S. 10-Year Treasury Note | | 162 | | | Mar-2021 | | | $ | 22,374 | | | $ | 22,384 | | | $ | 10 | |
U.S. 5-Year Treasury Note | | (48) | | | Apr-2021 | | | | (6,044) | | | | (6,050) | | | | (6) | |
U.S. Long Treasury Bond | | (163) | | | Mar-2021 | | | | (28,338) | | | | (28,510) | | | | (172) | |
U.S. Ultra Long Treasury Bond | | 418 | | | Mar-2021 | | | | 90,520 | | | | 90,301 | | | | (219) | |
Ultra 10-Year U.S. Treasury Note | | (208) | | | Mar-2021 | | | | (32,646) | | | | (32,682) | | | | (36) | |
| | | | | | | | | | |
| | | | | | | | $ | 45,866 | | | $ | 45,443 | | | $ | (423) | |
| | | | | | | | | | |
| | |
SEI Institutional Investments Trust / Semi-Annual Report / November 30, 2020 | | 191 |
SCHEDULE OF INVESTMENTS (Unaudited)
November 30, 2020
Long Duration Fund (Concluded)
| | Percentages are based on Net Assets of $1,375,324 ($ Thousands). |
| ** | The rate reported is the 7-day effective yield as of November 30, 2020. |
| † | Investment in Affiliated Security (see Note 6). |
| (A) | Security exempt from registration under Rule 144A of the Securities Act of 1933. These securities may be resold in transactions exempt from registration normally to qualified institutions. |
| | On November 30, 2020, the value of these securities amounted to $97,676 ($ Thousands), representing 7.1% of the Net Assets of the Fund. |
| (B) | Zero coupon security. The rate shown on the Schedule of Investments is the security’s effective yield at the time of purchase. |
| (C) | Pre-Refunded Securities — The maturity date shown is the pre-refunded date. |
| (D) | Variable or floating rate security, the interest rate of which adjusts periodically based on changes in current interest rates and prepayments on the underlying pool of assets. |
AMT — Alternative Minimum Tax
ARM — Adjustable Rate Mortgage
Cl — Class
CMO — Collateralized Mortgage Obligation
DAC — Designated Activity Company
FHLMC — Federal Home Loan Mortgage Corporation
FNMA — Federal National Mortgage Association
GNMA — Government National Mortgage Association
GO — General Obligation
ICE— Intercontinental Exchange
IO — Interest Only — face amount represents notional amount.
LIBOR— London Interbank Offered Rate
LLC — Limited Liability Company
L.P. — Limited Partnership
MTN — Medium Term Note
PLC — Public Limited Company
PO — Principal Only
RB — Revenue Bond
REMIC — Real Estate Mortgage Investment Conduit
Ser — Series
STRIPS — Separately Traded Registered Interest and Principal Securities
VAR — Variable Rate
The following is a list of the level of inputs used as of November 30, 2020, in valuing the Fund’s investments and other financial instruments carried at value ($ Thousands):
| | | | | | | | | | | | | | | | |
| | | | | |
Investments in
Securities | | Level 1
($) | | Level 2
($) | | Level 3
($) | | Total ($) |
Corporate Obligations | | | – | | | | 919,071 | | | | – | | | | 919,071 | |
U.S. Treasury Obligations | | | – | | | | 304,627 | | | | – | | | | 304,627 | |
Municipal Bonds | | | – | | | | 69,871 | | | | – | | | | 69,871 | |
U.S. Government Agency Obligations | | | – | | | | 31,435 | | | | – | | | | 31,435 | |
Mortgage-Backed Securities | | | – | | | | 13,843 | | | | – | | | | 13,843 | |
Sovereign Debt | | | – | | | | 12,304 | | | | – | | | | 12,304 | |
Cash Equivalent | | | 19,873 | | | | – | | | | – | | | | 19,873 | |
| | | | | | | | | | | | | | | | |
Total Investments in Securities | | | 19,873 | | | | 1,351,151 | | | | – | | | | 1,371,024 | |
| | | | | | | | | | | | | | | | |
| | | | | | | | | | | | | | | | |
| | | | | |
Other Financial
Instruments | | Level 1
($) | | Level 2 ($) | | Level 3 ($) | | Total ($) |
Futures Contracts* | | | | | | | | | | | | | | | | |
Unrealized Appreciation | | | 10 | | | | – | | | | – | | | | 10 | |
Unrealized Depreciation | | | (433) | | | | – | | | | – | | | | (433) | |
| | | | | | | | | | | | | | | | |
Total Other Financial Instruments | | | (423) | | | | – | | | | – | | | | (423) | |
| | | | | | | | | | | | | | | | |
*Futures contracts are valued at the unrealized appreciation (depreciation) on the instrument.
For the period ended November 30, 2020, there were no transfers in or out of Level 3.
For more information on valuation inputs, see Note 2 – Significant Accounting Policies in Notes to Financial Statements.
The following is a summary of the Fund’s transactions with affiliates for the period ended November 30, 2020 ($ Thousands):
| | | | | | | | | | | | | | | | | | |
| | | | | | | | | | |
Security
Description | | Value
5/31/2020 | | Purchases at Cost | | Proceeds from
Sales | | Realized Gain/
(Loss) | | Change in
Unrealized
Appreciation/
(Depreciation) | | Value
11/30/2020 | | Shares | | Income | | Capital
Gains |
SEI Daily Income Trust, Government Fund, Cl F | | $ 9,303 | | $ 171,127 | | $ (160,557) | | $ — | | $ — | | $ 19,873 | | 19,873,253 | | $ 1 | | $ — |
| | | | | | | | | | | | | | | | | | |
Amounts designated as “—” are $0 or have been rounded to $0.
The accompanying notes are an integral part of the financial statements.
| | |
192 | | SEI Institutional Investments Trust / Semi-Annual Report / November 30, 2020 |
SCHEDULE OF INVESTMENTS (Unaudited)
November 30, 2020
Long Duration Credit Fund
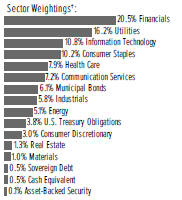
†Percentages based on total investments.
| | | | | | | | |
| | | |
| Description | | Face Amount
(Thousands) | | Market Value
($ Thousands) |
| |
CORPORATE OBLIGATIONS — 88.3% | | | | | |
| |
Communication Services — 7.1% | | | | | |
Alphabet | | | | | | | | |
2.250%, 08/15/2060 | | $ | 8,260 | | | $ | 8,160 | |
1.900%, 08/15/2040 | | | 1,625 | | | | 1,606 | |
America Movil | | | | | | | | |
6.125%, 03/30/2040 | | | 4,845 | | | | 7,213 | |
4.375%, 04/22/2049 | | | 3,135 | | | | 4,087 | |
AT&T Inc | | | | | | | | |
6.350%, 03/15/2040 | | | 50 | | | | 70 | |
4.800%, 06/15/2044 | | | 546 | | | | 686 | |
4.650%, 06/01/2044 | | | 1,100 | | | | 1,322 | |
4.350%, 06/15/2045 | | | 2,919 | | | | 3,441 | |
4.300%, 12/15/2042 | | | 500 | | | | 586 | |
3.500%, 06/01/2041 | | | 935 | | | | 1,015 | |
3.500%, 09/15/2053 (A) | | | 11,497 | | | | 11,729 | |
3.100%, 02/01/2043 | | | 1,410 | | | | 1,449 | |
Charter Communications Operating LLC | | | | | | | | |
6.834%, 10/23/2055 | | | 580 | | | | 874 | |
6.484%, 10/23/2045 | | | 535 | | | | 765 | |
Comcast | | | | | | | | |
6.950%, 08/15/2037 | | | 1,430 | | | | 2,307 | |
6.550%, 07/01/2039 | | | 295 | | | | 469 | |
6.500%, 11/15/2035 | | | 2,096 | | | | 3,256 | |
6.400%, 05/15/2038 | | | 2,237 | | | | 3,483 | |
6.400%, 03/01/2040 | | | 735 | | | | 1,161 | |
5.650%, 06/15/2035 | | | 4,520 | | | | 6,489 | |
4.950%, 10/15/2058 | | | 13,342 | | | | 20,310 | |
4.700%, 10/15/2048 | | | 7,785 | | | | 11,046 | |
4.650%, 07/15/2042 | | | 4,347 | | | | 5,888 | |
4.600%, 10/15/2038 | | | 5,140 | | | | 6,802 | |
4.600%, 08/15/2045 | | | 6,340 | | | | 8,563 | |
4.500%, 01/15/2043 | | | 14,295 | | | | 19,081 | |
4.250%, 01/15/2033 | | | 5,040 | | | | 6,305 | |
4.200%, 08/15/2034 | | | 14,330 | | | | 18,008 | |
| | | | | | | | |
| | | |
| Description | | Face Amount
(Thousands) | | Market Value
($ Thousands) |
| |
CORPORATE OBLIGATIONS (continued) | | | | | |
4.049%, 11/01/2052 | | $ | 16,315 | | | $ | 21,175 | |
4.000%, 03/01/2048 | | | 1,330 | | | | 1,694 | |
3.999%, 11/01/2049 | | | 1,109 | | | | 1,441 | |
3.969%, 11/01/2047 | | | 5,605 | | | | 7,078 | |
3.900%, 03/01/2038 | | | 6,405 | | | | 7,885 | |
3.400%, 04/01/2030 | | | 965 | | | | 1,116 | |
3.400%, 07/15/2046 | | | 9,314 | | | | 10,805 | |
3.250%, 11/01/2039 | | | 670 | | | | 767 | |
2.650%, 08/15/2062 | | | 5,480 | | | | 5,527 | |
Cox Communications | | | | | | | | |
4.800%, 02/01/2035 (A) | | | 1,400 | | | | 1,763 | |
4.700%, 12/15/2042 (A) | | | 880 | | | | 1,137 | |
Level 3 Financing | | | | | | | | |
3.875%, 11/15/2029 (A) | | | 535 | | | | 587 | |
NBCUniversal Media LLC | | | | | | | | |
6.400%, 04/30/2040 | | | 1,785 | | | | 2,819 | |
5.950%, 04/01/2041 | | | 3,575 | | | | 5,492 | |
4.450%, 01/15/2043 | | | 3,155 | | | | 4,187 | |
SES GLOBAL Americas Holdings GP | | | | | | | | |
5.300%, 03/25/2044 (A) | | | 1,550 | | | | 1,646 | |
Tencent Holdings MTN | | | | | | | | |
3.595%, 01/19/2028 (A) | | | 1,455 | | | | 1,602 | |
3.240%, 06/03/2050 (A) | | | 1,180 | | | | 1,231 | |
Time Warner Cable LLC | | | | | | | | |
7.300%, 07/01/2038 | | | 971 | | | | 1,428 | |
5.875%, 11/15/2040 | | | 480 | | | | 622 | |
5.500%, 09/01/2041 | | | 725 | | | | 914 | |
4.500%, 09/15/2042 | | | 500 | | | | 577 | |
Time Warner Entertainment | | | | | | | | |
8.375%, 07/15/2033 | | | 1,709 | | | | 2,665 | |
T-Mobile USA | | | | | | | | |
3.300%, 02/15/2051 (A) | | | 2,635 | | | | 2,761 | |
TWDC Enterprises 18 | | | | | | | | |
4.125%, 12/01/2041 | | | 1,970 | | | | 2,437 | |
TWDC Enterprises 18 MTN | | | | | | | | |
4.125%, 06/01/2044 | | | 2,104 | | | | 2,665 | |
Verizon Communications Inc | | | | | | | | |
5.250%, 03/16/2037 | | | 2,350 | | | | 3,261 | |
5.012%, 04/15/2049 | | | 77 | | | | 109 | |
4.862%, 08/21/2046 | | | 1,130 | | | | 1,556 | |
4.522%, 09/15/2048 | | | 3,155 | | | | 4,246 | |
3.850%, 11/01/2042 | | | 540 | | | | 653 | |
2.987%, 10/30/2056 (A) | | | 2,949 | | | | 3,124 | |
2.650%, 11/20/2040 | | | 2,865 | | | | 2,956 | |
ViacomCBS | | | | | | | | |
5.900%, 10/15/2040 | | | 40 | | | | 53 | |
4.850%, 12/15/2034 | | | 300 | | | | 349 | |
4.600%, 01/15/2045 | | | 650 | | | | 765 | |
Vodafone Group | | | | | | | | |
4.875%, 06/19/2049 | | | 1,960 | | | | 2,567 | |
Walt Disney | | | | | | | | |
6.650%, 11/15/2037 | | | 990 | | | | 1,542 | |
| | |
SEI Institutional Investments Trust / Semi-Annual Report / November 30, 2020 | | 193 |
SCHEDULE OF INVESTMENTS (Unaudited)
November 30, 2020
Long Duration Credit Fund (Continued)
| | | | | | | | |
| | | |
| Description | | Face Amount
(Thousands) | | Market Value
($ Thousands) |
| |
CORPORATE OBLIGATIONS (continued) | | | | | |
6.400%, 12/15/2035 | | $ | 1,743 | | | $ | 2,686 | |
4.750%, 09/15/2044 | | | 175 | | | | 236 | |
4.700%, 03/23/2050 | | | 1,123 | | | | 1,565 | |
4.625%, 03/23/2040 | | | 295 | | | | 390 | |
3.600%, 01/13/2051 | | | 12,879 | | | | 15,302 | |
3.500%, 05/13/2040 | | | 2,195 | | | | 2,557 | |
2.750%, 09/01/2049 | | | 30,991 | | | | 31,738 | |
| | | | | | | | |
| | | | | | | 323,847 | |
| | | | | | | | |
|
Consumer Discretionary — 3.0% | |
Alibaba Group Holding | | | | | | | | |
4.400%, 12/06/2057 | | | 1,750 | | | | 2,367 | |
4.200%, 12/06/2047 | | | 2,542 | | | | 3,251 | |
4.000%, 12/06/2037 | | | 1,583 | | | | 1,900 | |
Alimentation Couche-Tard | | | | | | | | |
4.500%, 07/26/2047 (A) | | | 900 | | | | 1,115 | |
3.800%, 01/25/2050 (A) | | | 2,105 | | | | 2,468 | |
Amazon.com | | | | | | | | |
4.250%, 08/22/2057 | | | 1,895 | | | | 2,695 | |
4.050%, 08/22/2047 | | | 9,384 | | | | 12,581 | |
3.875%, 08/22/2037 | | | 5,014 | | | | 6,348 | |
2.700%, 06/03/2060 | | | 4,300 | | | | 4,731 | |
2.500%, 06/03/2050 | | | 6,535 | | | | 6,910 | |
BMW US Capital LLC | | | | | | | | |
4.150%, 04/09/2030 (A) | | | 1,300 | | | | 1,573 | |
General Motors | | | | | | | | |
6.250%, 10/02/2043 | | | 670 | | | | 904 | |
5.950%, 04/01/2049 | | | 480 | | | | 648 | |
5.150%, 04/01/2038 | | | 735 | | | | 876 | |
5.000%, 04/01/2035 | | | 340 | | | | 408 | |
Grupo Televisa | | | | | | | | |
6.625%, 01/15/2040 | | | 20 | | | | 27 | |
Home Depot | | | | | | | | |
5.950%, 04/01/2041 | | | 1,980 | | | | 3,089 | |
4.500%, 12/06/2048 | | | 7,195 | | | | 10,057 | |
4.400%, 03/15/2045 | | | 5,825 | | | | 7,820 | |
4.250%, 04/01/2046 | | | 10,612 | | | | 14,107 | |
4.200%, 04/01/2043 | | | 3,545 | | | | 4,635 | |
3.900%, 06/15/2047 | | | 14,973 | | | | 19,085 | |
3.350%, 04/15/2050 | | | 2,635 | | | | 3,125 | |
3.300%, 04/15/2040 | | | 2,340 | | | | 2,770 | |
Lowe’s | | | | | | | | |
4.050%, 05/03/2047 | | | 1,065 | | | | 1,310 | |
3.700%, 04/15/2046 | | | 2,041 | | | | 2,398 | |
1.700%, 10/15/2030 | | | 4,315 | | | | 4,337 | |
McDonald’s MTN | | | | | | | | |
3.625%, 09/01/2049 | | | 600 | | | | 704 | |
NIKE | | | | | | | | |
3.625%, 05/01/2043 | | | 1,625 | | | | 1,989 | |
3.375%, 03/27/2050 | | | 3,165 | | | | 3,821 | |
3.250%, 03/27/2040 | | | 1,350 | | | | 1,582 | |
| | | | | | | | |
| | | |
| Description | | Face Amount
(Thousands) | | Market Value
($ Thousands) |
| |
CORPORATE OBLIGATIONS (continued) | | | | | |
Starbucks | | | | | | | | |
3.350%, 03/12/2050 | | $ | 900 | | | $ | 986 | |
TJX | | | | | | | | |
4.500%, 04/15/2050 | | | 1,820 | | | | 2,604 | |
1.600%, 05/15/2031 | | | 3,325 | | | | 3,348 | |
| | | | | | | | |
| | | | | | | 136,569 | |
| | | | | | | | |
|
Consumer Staples — 10.2% | |
Advocate Health & Hospitals | | | | | | | | |
4.272%, 08/15/2048 | | | 2,717 | | | | 3,484 | |
Aetna | | | | | | | | |
4.125%, 11/15/2042 | | | 1,480 | | | | 1,756 | |
Alcon Finance | | | | | | | | |
3.800%, 09/23/2049 (A) | | | 550 | | | | 653 | |
Allina Health System | | | | | | | | |
4.805%, 11/15/2045 | | | 1,666 | | | | 2,164 | |
3.887%, 04/15/2049 | | | 2,554 | | | | 2,982 | |
Altria Group | | | | | | | | |
10.200%, 02/06/2039 | | | 2,501 | | | | 4,280 | |
9.950%, 11/10/2038 | | | 1,665 | | | | 2,789 | |
5.375%, 01/31/2044 | | | 2,300 | | | | 2,991 | |
4.500%, 05/02/2043 | | | 100 | | | | 115 | |
4.450%, 05/06/2050 | | | 1,035 | | | | 1,220 | |
4.250%, 08/09/2042 | | | 575 | | | | 654 | |
3.875%, 09/16/2046 | | | 1,490 | | | | 1,605 | |
Anheuser-Busch InBev Worldwide | | | | | | | | |
8.200%, 01/15/2039 | | | 3,700 | | | | 6,376 | |
8.000%, 11/15/2039 | | | 3,076 | | | | 5,229 | |
4.900%, 02/01/2046 | | | 4,978 | | | | 6,505 | |
4.600%, 04/15/2048 | | | 220 | | | | 279 | |
4.600%, 06/01/2060 | | | 795 | | | | 1,024 | |
4.375%, 04/15/2038 | | | 580 | | | | 718 | |
3.750%, 07/15/2042 | | | 320 | | | | 366 | |
Archer-Daniels-Midland | | | | | | | | |
4.500%, 03/15/2049 | | | 2,106 | | | | 3,041 | |
Ascension Health | | | | | | | | |
4.847%, 11/15/2053 | | | 520 | | | | 783 | |
3.945%, 11/15/2046 | | | 2,276 | | | | 2,904 | |
3.106%, 11/15/2039 | | | 3,100 | | | | 3,402 | |
Banner Health | | | | | | | | |
3.181%, 01/01/2050 | | | 31 | | | | 33 | |
2.913%, 01/01/2051 | | | 520 | | | | 528 | |
Baptist Health South Florida | | | | | | | | |
4.342%, 11/15/2041 | | | 610 | | | | 723 | |
Barnabas Health | | | | | | | | |
4.000%, 07/01/2028 | | | 2,240 | | | | 2,458 | |
BAT Capital | | | | | | | | |
4.906%, 04/02/2030 | | | 3,290 | | | | 3,960 | |
4.540%, 08/15/2047 | | | 1,883 | | | | 2,127 | |
4.390%, 08/15/2037 | | | 9,940 | | | | 11,190 | |
3.984%, 09/25/2050 | | | 600 | | | | 630 | |
| | |
194 | | SEI Institutional Investments Trust / Semi-Annual Report / November 30, 2020 |
| | | | | | | | |
| | | |
| Description | | Face Amount
(Thousands) | | Market Value
($ Thousands) |
| |
CORPORATE OBLIGATIONS (continued) | | | | | |
BayCare Health System | | | | | | | | |
3.831%, 11/15/2050 | | $ | 1,870 | | | $ | 2,316 | |
Bayer US Finance II LLC | | | | | | | | |
4.875%, 06/25/2048 (A) | | | 235 | | | | 302 | |
4.700%, 07/15/2064 (A) | | | 3,530 | | | | 4,089 | |
4.625%, 06/25/2038 (A) | | | 645 | | | | 784 | |
4.400%, 07/15/2044 (A) | | | 2,685 | | | | 3,113 | |
3.950%, 04/15/2045 (A) | | | 2,680 | | | | 2,898 | |
Baylor Scott & White Holdings | | | | | | | | |
4.185%, 11/15/2045 | | | 2,636 | | | | 3,287 | |
3.967%, 11/15/2046 | | | 120 | | | | 144 | |
2.650%, 11/15/2026 | | | 1,235 | | | | 1,332 | |
Bon Secours Mercy Health | | | | | | | | |
3.205%, 06/01/2050 | | | 1,100 | | | | 1,173 | |
Boston University | | | | | | | | |
4.061%, 10/01/2048 | | | 1,800 | | | | 2,276 | |
Bowdoin College | | | | | | | | |
4.693%, 07/01/2112 | | | 370 | | | | 433 | |
Brown University | | | | | | | | |
2.924%, 09/01/2050 | | | 2,198 | | | | 2,455 | |
California Institute of Technology | | | | | | | | |
4.321%, 08/01/2045 | | | 650 | | | | 859 | |
Children’s Health Care | | | | | | | | |
3.448%, 08/15/2049 | | | 815 | | | | 886 | |
Children’s Hospital Medical Center | | | | | | | | |
2.820%, 11/15/2050 | | | 1,180 | | | | 1,186 | |
Children’s Hospital of Philadelphia | | | | | | | | |
2.704%, 07/01/2050 | | | 3,280 | | | | 3,349 | |
City of Hope | | | | | | | | |
5.623%, 11/15/2043 | | | 920 | | | | 1,300 | |
Claremont Mckenna College | | | | | | | | |
3.378%, 01/01/2050 | | | 1,515 | | | | 1,616 | |
Coca-Cola | | | | | | | | |
2.600%, 06/01/2050 | | | 2,640 | | | | 2,794 | |
2.500%, 06/01/2040 | | | 465 | | | | 502 | |
2.500%, 03/15/2051 | | | 3,465 | | | | 3,603 | |
Coca-Cola Femsa | | | | | | | | |
5.250%, 11/26/2043 | | | 3,070 | | | | 4,334 | |
CommonSpirit Health | | | | | | | | |
4.187%, 10/01/2049 | | | 2,925 | | | | 3,241 | |
3.910%, 10/01/2050 | | | 570 | | | | 605 | |
3.817%, 10/01/2049 | | | 3,230 | | | | 3,561 | |
Conagra Brands | | | | | | | | |
5.400%, 11/01/2048 | | | 460 | | | | 664 | |
Dartmouth-Hitchcock Health | | | | | | | | |
4.178%, 08/01/2048 | | | 4,410 | | | | 5,163 | |
Diageo Capital | | | | | | | | |
5.875%, 09/30/2036 | | | 485 | | | | 704 | |
2.125%, 04/29/2032 | | | 675 | | | | 714 | |
Duke University Health System | | | | | | | | |
3.920%, 06/01/2047 | | | 3,995 | | | | 4,918 | |
| | | | | | | | |
| | | |
| Description | | Face Amount
(Thousands) | | Market Value
($ Thousands) |
| |
CORPORATE OBLIGATIONS (continued) | | | | | |
Emory University | | | | | | | | |
2.969%, 09/01/2050 | | $ | 1,660 | | | $ | 1,800 | |
Estee Lauder | | | | | | | | |
3.125%, 12/01/2049 | | | 3,230 | | | | 3,772 | |
Fomento Economico Mexicano | | | | | | | | |
3.500%, 01/16/2050 | | | 3,150 | | | | 3,466 | |
Ford Foundation | | | | | | | | |
3.859%, 06/01/2047 | | | 2,500 | | | | 3,249 | |
Georgetown University | | | | | | | | |
5.215%, 10/01/2118 | | | 2,318 | | | | 3,046 | |
4.315%, 04/01/2049 | | | 2,290 | | | | 2,837 | |
2.943%, 04/01/2050 | | | 1,132 | | | | 1,119 | |
Hackensack Meridian Health | | | | | | | | |
2.875%, 09/01/2050 | | | 1,160 | | | | 1,180 | |
Hartford HealthCare | | | | | | | | |
5.746%, 04/01/2044 | | | 2,130 | | | | 2,760 | |
Health Care Service, A Mutual Legal Reserve | | | | | | | | |
2.200%, 06/01/2030 (A) | | | 1,845 | | | | 1,924 | |
Hershey | | | | | | | | |
3.125%, 11/15/2049 | | | 1,372 | | | | 1,561 | |
Indiana University Health Obligated Group | | | | | | | | |
3.970%, 11/01/2048 | | | 2,410 | | | | 3,027 | |
Johns Hopkins Health System | | | | | | | | |
3.837%, 05/15/2046 | | | 1,020 | | | | 1,274 | |
Johns Hopkins University | | | | | | | | |
4.083%, 07/01/2053 | | | 2,000 | | | | 2,675 | |
2.813%, 01/01/2060 | | | 2,290 | | | | 2,358 | |
Kaiser Foundation Hospitals | | | | | | | | |
4.150%, 05/01/2047 | | | 5,325 | | | | 6,961 | |
3.266%, 11/01/2049 | | | 1,910 | | | | 2,161 | |
Kimberly-Clark | | | | | | | | |
5.300%, 03/01/2041 | | | 555 | | | | 817 | |
3.900%, 05/04/2047 | | | 3,275 | | | | 4,251 | |
2.875%, 02/07/2050 | | | 1,995 | | | | 2,277 | |
Kraft Heinz Foods | | | | | | | | |
7.125%, 08/01/2039 (A) | | | 1,160 | | | | 1,629 | |
6.750%, 03/15/2032 | | | 575 | | | | 769 | |
5.200%, 07/15/2045 | | | 400 | | | | 472 | |
4.875%, 10/01/2049 (A) | | | 470 | | | | 530 | |
4.375%, 06/01/2046 | | | 1,870 | | | | 1,997 | |
Kroger | | | | | | | | |
5.400%, 01/15/2049 | | | 2,371 | | | | 3,447 | |
3.950%, 01/15/2050 | | | 280 | | | | 343 | |
Mars | | | | | | | | |
4.200%, 04/01/2059 (A) | | | 1,485 | | | | 1,957 | |
4.125%, 04/01/2054 (A) | | | 1,385 | | | | 1,832 | |
3.950%, 04/01/2049 (A) | | | 5,430 | | | | 6,893 | |
3.875%, 04/01/2039 (A) | | | 1,650 | | | | 2,016 | |
2.375%, 07/16/2040 (A) | | | 2,000 | | | | 2,057 | |
Massachusetts Institute of Technology | | | | | | | | |
5.600%, 07/01/2111 | | | 3,550 | | | | 6,136 | |
3.959%, 07/01/2038 | | | 1,927 | | | | 2,359 | |
| | |
SEI Institutional Investments Trust / Semi-Annual Report / November 30, 2020 | | 195 |
SCHEDULE OF INVESTMENTS (Unaudited)
November 30, 2020
Long Duration Credit Fund (Continued)
| | | | | | | | |
| | | |
| Description | | Face Amount
(Thousands) | | Market Value
($ Thousands) |
| |
CORPORATE OBLIGATIONS (continued) | | | | | |
2.294%, 07/01/2051 | | $ | 21 | | | $ | 21 | |
MedStar Health | | | | | | | | |
3.626%, 08/15/2049 | | | 2,547 | | | | 2,879 | |
Memorial Health Services | | | | | | | | |
3.447%, 11/01/2049 | | | 3,640 | | | | 3,852 | |
Memorial Sloan-Kettering Cancer Center | | | | | | | | |
4.200%, 07/01/2055 | | | 30 | | | | 40 | |
4.125%, 07/01/2052 | | | 3,085 | | | | 4,041 | |
2.955%, 01/01/2050 | | | 9 | | | | 10 | |
Methodist Hospital | | | | | | | | |
2.705%, 12/01/2050 | | | 1,745 | | | | 1,760 | |
MidMichigan Health | | | | | | | | |
3.409%, 06/01/2050 | | | 3,520 | | | | 3,912 | |
Mount Sinai Hospitals Group | | | | | | | | |
3.737%, 07/01/2049 | | | 2,700 | | | | 2,963 | |
MultiCare Health System | | | | | | | | |
2.803%, 08/15/2050 | | | 755 | | | | 756 | |
Nestle Holdings | | | | | | | | |
4.000%, 09/24/2048 (A) | | | 1,560 | | | | 2,092 | |
3.900%, 09/24/2038 (A) | | | 3,125 | | | | 4,014 | |
New York and Presbyterian Hospital | | | | | | | | |
4.763%, 08/01/2116 | | | 1,705 | | | | 2,064 | |
4.063%, 08/01/2056 | | | 2,300 | | | | 2,906 | |
Northwell Healthcare | | | | | | | | |
4.260%, 11/01/2047 | | | 815 | | | | 945 | |
Northwestern University | | | | | | | | |
3.688%, 12/01/2038 | | | 2,070 | | | | 2,357 | |
Novartis Capital | | | | | | | | |
4.000%, 11/20/2045 | | | 4,325 | | | | 5,651 | |
2.750%, 08/14/2050 | | | 6,634 | | | | 7,282 | |
NY Society for Relief of Ruptured & Crippled Maintaining Hospital Special Surgery | | | | | | | | |
2.667%, 10/01/2050 | | | 980 | | | | 934 | |
NYU Langone Hospitals | | | | | | | | |
5.750%, 07/01/2043 | | | 2,115 | | | | 2,914 | |
4.428%, 07/01/2042 | | | 2,150 | | | | 2,416 | |
4.368%, 07/01/2047 | | | 2,025 | | | | 2,400 | |
3.380%, 07/01/2055 | | | 1,785 | | | | 1,840 | |
OhioHealth | | | | | | | | |
3.042%, 11/15/2050 | | | 2,462 | | | | 2,720 | |
Orlando Health Obligated Group | | | | | | | | |
3.327%, 10/01/2050 | | | 880 | | | | 931 | |
Partners Healthcare System | | | | | | | | |
3.765%, 07/01/2048 | | | 1,000 | | | | 1,177 | |
3.342%, 07/01/2060 | | | 2,015 | | | | 2,239 | |
3.192%, 07/01/2049 | | | 2,260 | | | | 2,411 | |
PeaceHealth Obligated Group | | | | | | | | |
3.218%, 11/15/2050 | | | 5,820 | | | | 6,105 | |
PepsiCo | | | | | | | | |
4.250%, 10/22/2044 | | | 1,000 | | | | 1,315 | |
4.000%, 05/02/2047 | | | 4,823 | | | | 6,181 | |
3.625%, 03/19/2050 | | | 8,203 | | | | 10,325 | |
| | | | | | | | |
| | | |
| Description | | Face Amount
(Thousands) | | Market Value
($ Thousands) |
| |
CORPORATE OBLIGATIONS (continued) | | | | | |
3.500%, 03/19/2040 | | $ | 2,015 | | | $ | 2,456 | |
3.450%, 10/06/2046 | | | 10,379 | | | | 12,623 | |
3.375%, 07/29/2049 | | | 1,685 | | | | 2,048 | |
3.000%, 08/25/2021 | | | 16 | | | | 16 | |
Philip Morris International | | | | | | | | |
4.875%, 11/15/2043 | | | 2,830 | | | | 3,784 | |
4.500%, 03/20/2042 | | | 5,390 | | | | 6,896 | |
4.250%, 11/10/2044 | | | 701 | | | | 873 | |
4.125%, 03/04/2043 | | | 2,286 | | | | 2,735 | |
3.875%, 08/21/2042 | | | 1,235 | | | | 1,461 | |
Pomona College | | | | | | | | |
2.888%, 01/01/2051 | | | 1,445 | | | | 1,517 | |
President & Fellows of Harvard College | | | | | | | | |
3.619%, 10/01/2037 | | | 400 | | | | 474 | |
2.517%, 10/15/2050 | | | 1,760 | | | | 1,850 | |
Princeton University | | | | | | | | |
5.700%, 03/01/2039 | | | 1,449 | | | | 2,191 | |
Procter & Gamble | | | | | | | | |
3.600%, 03/25/2050 | | | 615 | | | | 838 | |
3.550%, 03/25/2040 | | | 1,395 | | | | 1,759 | |
Providence St. Joseph Health Obligated Group | | | | | | | | |
3.744%, 10/01/2047 | | | 1,640 | | | | 1,927 | |
2.532%, 10/01/2029 | | | 2,905 | | | | 3,095 | |
Reynolds American | | | | | | | | |
8.125%, 05/01/2040 | | | 2,390 | | | | 3,501 | |
5.850%, 08/15/2045 | | | 1,995 | | | | 2,553 | |
Rockefeller Foundation | | | | | | | | |
2.492%, 10/01/2050 | | | 3,855 | | | | 3,944 | |
RWJ Barnabas Health | | | | | | | | |
3.949%, 07/01/2046 | | | 50 | | | | 57 | |
3.477%, 07/01/2049 | | | 535 | | | | 594 | |
Sharp HealthCare | | | | | | | | |
2.680%, 08/01/2050 | | | 1,500 | | | | 1,527 | |
Stanford Health Care | | | | | | | | |
3.795%, 11/15/2048 | | | 7,242 | | | | 9,094 | |
Takeda Pharmaceutical | | | | | | | | |
3.375%, 07/09/2060 | | | 1,550 | | | | 1,726 | |
3.175%, 07/09/2050 | | | 2,765 | | | | 2,962 | |
3.025%, 07/09/2040 | | | 1,350 | | | | 1,434 | |
University of Chicago | | | | | | | | |
4.411%, 10/01/2044 | | | 715 | | | | 772 | |
4.003%, 10/01/2053 | | | 2,475 | | | | 3,250 | |
2.761%, 04/01/2045 | | | 4,653 | | | | 4,853 | |
University of Southern California | | | | | | | | |
3.841%, 10/01/2047 | | | 1,655 | | | | 2,046 | |
3.028%, 10/01/2039 | | | 2,300 | | | | 2,494 | |
2.805%, 10/01/2050 | | | 925 | | | | 1,003 | |
Walmart | | | | | | | | |
4.050%, 06/29/2048 | | | 25,749 | | | | 35,403 | |
3.950%, 06/28/2038 | | | 2,510 | | | | 3,258 | |
3.625%, 12/15/2047 | | | 5,280 | | | | 6,782 | |
| | |
196 | | SEI Institutional Investments Trust / Semi-Annual Report / November 30, 2020 |
| | | | | | | | |
| | | |
| Description | | Face Amount
(Thousands) | | Market Value
($ Thousands) |
| |
CORPORATE OBLIGATIONS (continued) | | | | | |
2.950%, 09/24/2049 | | $ | 5,390 | | | $ | 6,270 | |
Willis-Knighton Medical Center | | | | | | | | |
4.813%, 09/01/2048 | | | 2,265 | | | | 2,972 | |
Yale-New Haven Health Services | | | | | | | | |
2.496%, 07/01/2050 | | | 1,000 | | | | 983 | |
| | | | | | | | |
| | | | | | | 461,996 | |
| | | | | | | | |
| | |
Energy — 5.1% | | | | | | | | |
Baker Hughes LLC | | | | | | | | |
4.080%, 12/15/2047 | | | 1,310 | | | | 1,510 | |
BG Energy Capital | | | | | | | | |
5.125%, 10/15/2041 (A) | | | 5,840 | | | | 7,815 | |
BP Capital Markets America | | | | | | | | |
3.937%, 09/21/2028 | | | 2,965 | | | | 3,475 | |
3.000%, 02/24/2050 | | | 3,500 | | | | 3,641 | |
2.772%, 11/10/2050 | | | 3,605 | | | | 3,595 | |
Burlington Resources LLC | | | | | | | | |
5.950%, 10/15/2036 | | | 395 | | | | 553 | |
Chevron | | | | | | | | |
3.078%, 05/11/2050 | | | 1,590 | | | | 1,773 | |
Colonial Enterprises | | | | | | | | |
3.250%, 05/15/2030 (A) | | | 2,905 | | | | 3,253 | |
ConocoPhillips | | | | | | | | |
6.950%, 04/15/2029 | | | 1,938 | | | | 2,702 | |
6.500%, 02/01/2039 | | | 12,863 | | | | 19,682 | |
5.900%, 05/15/2038 | | | 2,400 | | | | 3,422 | |
4.300%, 11/15/2044 | | | 4,720 | | | | 5,933 | |
Devon Energy | | | | | | | | |
7.875%, 09/30/2031 | | | 1,315 | | | | 1,760 | |
Energy Transfer Operating | | | | | | | | |
8.250%, 11/15/2029 | | | 95 | | | | 125 | |
6.500%, 02/01/2042 | | | 150 | | | | 173 | |
6.250%, 04/15/2049 | | | 546 | | | | 637 | |
6.050%, 06/01/2041 | | | 2,225 | | | | 2,473 | |
5.300%, 04/15/2047 | | | 880 | | | | 937 | |
5.150%, 03/15/2045 | | | 75 | | | | 78 | |
5.000%, 05/15/2050 | | | 1,060 | | | | 1,115 | |
4.900%, 03/15/2035 | | | 82 | | | | 85 | |
Eni SpA | | | | | | | | |
5.700%, 10/01/2040 (A) | | | 2,285 | | | | 2,786 | |
EnLink Midstream Partners | | | | | | | | |
5.050%, 04/01/2045 | | | 2,045 | | | | 1,501 | |
Enterprise Products Operating LLC | | | | | | | | |
5.950%, 02/01/2041 | | | 1,092 | | | | 1,499 | |
3.950%, 01/31/2060 | | | 535 | | | | 580 | |
EOG Resources | | | | | | | | |
4.375%, 04/15/2030 | | | 1,695 | | | | 2,067 | |
3.900%, 04/01/2035 | | | 4,997 | | | | 5,829 | |
Equinor | | | | | | | | |
5.100%, 08/17/2040 | | | 1,415 | | | | 1,961 | |
4.800%, 11/08/2043 | | | 2,284 | | | | 3,040 | |
3.700%, 04/06/2050 | | | 1,740 | | | | 2,093 | |
| | | | | | | | |
| | | |
| Description | | Face Amount
(Thousands) | | Market Value
($ Thousands) |
| |
CORPORATE OBLIGATIONS (continued) | | | | | |
3.625%, 04/06/2040 | | $ | 3,345 | | | $ | 3,986 | |
3.250%, 11/18/2049 | | | 1,390 | | | | 1,540 | |
2.375%, 05/22/2030 | | | 1,760 | | | | 1,879 | |
Exxon Mobil | | | | | | | | |
4.327%, 03/19/2050 | | | 3,988 | | | | 5,151 | |
4.227%, 03/19/2040 | | | 3,345 | | | | 4,135 | |
3.567%, 03/06/2045 | | | 5,455 | | | | 6,223 | |
3.452%, 04/15/2051 | | | 11,980 | | | | 13,645 | |
2.995%, 08/16/2039 | | | 2,346 | | | | 2,520 | |
Hess | | | | | | | | |
6.000%, 01/15/2040 | | | 3,630 | | | | 4,414 | |
Kinder Morgan | | | | | | | | |
5.300%, 12/01/2034 | | | 500 | | | | 603 | |
Marathon Petroleum | | | | | | | | |
5.000%, 09/15/2054 | | | 1,030 | | | | 1,126 | |
Motiva Enterprises | | | | | | | | |
6.850%, 01/15/2040 (A) | | | 4,340 | | | | 5,155 | |
MPLX | | | | | | | | |
5.200%, 03/01/2047 | | | 2,910 | | | | 3,461 | |
5.200%, 12/01/2047 | | | 920 | | | | 1,074 | |
4.500%, 04/15/2038 | | | 475 | | | | 527 | |
Noble Energy | | | | | | | | |
6.000%, 03/01/2041 | | | 360 | | | | 528 | |
5.250%, 11/15/2043 | | | 270 | | | | 374 | |
4.200%, 10/15/2049 | | | 1,195 | | | | 1,503 | |
Northern Natural Gas | | | | | | | | |
4.300%, 01/15/2049 (A) | | | 1,530 | | | | 1,852 | |
Occidental Petroleum | | | | | | | | |
4.300%, 08/15/2039 | | | 462 | | | | 381 | |
Petroleos Mexicanos | | | | | | | | |
7.690%, 01/23/2050 | | | 2,785 | | | | 2,569 | |
6.950%, 01/28/2060 | | | 260 | | | | 223 | |
Saudi Arabian Oil | | | | | | | | |
3.500%, 11/24/2070 (A) | | | 1,415 | | | | 1,430 | |
Saudi Arabian Oil MTN | | | | | | | | |
4.375%, 04/16/2049 (A) | | | 340 | | | | 414 | |
Shell International Finance BV | | | | | | | | |
6.375%, 12/15/2038 | | | 6,161 | | | | 9,562 | |
4.550%, 08/12/2043 | | | 3,200 | | | | 4,228 | |
4.375%, 05/11/2045 | | | 4,845 | | | | 6,248 | |
4.000%, 05/10/2046 | | | 7,840 | | | | 9,708 | |
3.750%, 09/12/2046 | | | 10,691 | | | | 12,765 | |
3.625%, 08/21/2042 | | | 2,250 | | | | 2,615 | |
3.250%, 04/06/2050 | | | 1,550 | | | | 1,748 | |
Southern Natural Gas | | | | | | | | |
7.350%, 02/15/2031 | | | 730 | | | | 983 | |
Suncor Energy | | | | | | | | |
5.950%, 12/01/2034 | | | 3,570 | | | | 4,490 | |
Suncor Energy Ventures | | | | | | | | |
6.000%, 04/01/2042 (A) | | | 2,375 | | | | 2,506 | |
Sunoco Logistics Partners Operations | | | | | | | | |
5.400%, 10/01/2047 | | | 1,252 | | | | 1,343 | |
| | |
SEI Institutional Investments Trust / Semi-Annual Report / November 30, 2020 | | 197 |
SCHEDULE OF INVESTMENTS (Unaudited)
November 30, 2020
Long Duration Credit Fund (Continued)
| | | | | | | | |
| | | |
| Description | | Face Amount
(Thousands) | | Market Value
($ Thousands) |
| |
CORPORATE OBLIGATIONS (continued) | | | | | |
Tennessee Gas Pipeline LLC | | | | | | | | |
8.375%, 06/15/2032 | | $ | 2,200 | | | $ | 3,126 | |
Total Capital International | | | | | | | | |
3.386%, 06/29/2060 | | | 1,075 | | | | 1,225 | |
3.127%, 05/29/2050 | | | 10,815 | | | | 11,859 | |
2.986%, 06/29/2041 | | | 1,385 | | | | 1,500 | |
TransCanada PipeLines | | | | | | | | |
7.250%, 08/15/2038 | | | 1,765 | | | | 2,689 | |
6.200%, 10/15/2037 | | | 525 | | | | 733 | |
4.625%, 03/01/2034 | | | 1,965 | | | | 2,346 | |
Williams | | | | | | | | |
6.300%, 04/15/2040 | | | 160 | | | | 209 | |
5.400%, 03/04/2044 | | | 1,000 | | | | 1,203 | |
| | | | | | | | |
| | | | | | | 231,892 | |
| | | | | | | | |
| | |
Financials — 20.3% | | | | | | | | |
AIA Group | | | | | | | | |
3.200%, 09/16/2040 (A) | | | 1,350 | | | | 1,441 | |
AIA Group MTN | | | | | | | | |
4.875%, 03/11/2044 (A) | | | 3,372 | | | | 4,558 | |
AIG SunAmerica Global Financing | | | | | | | | |
6.900%, 03/15/2032 (A) | | | 5,300 | | | | 8,023 | |
Allstate | | | | | | | | |
4.200%, 12/15/2046 | | | 2,525 | | | | 3,331 | |
American International Group | | | | | | | | |
4.750%, 04/01/2048 | | | 375 | | | | 507 | |
4.500%, 07/16/2044 | | | 1,665 | | | | 2,139 | |
4.375%, 06/30/2050 | | | 375 | | | | 487 | |
Apollo Management Holdings | | | | | | | | |
5.000%, 03/15/2048 (A) | | | 2,310 | | | | 2,850 | |
4.872%, 02/15/2029 (A) | | | 1,485 | | | | 1,751 | |
Banco Santander | | | | | | | | |
3.490%, 05/28/2030 | | | 835 | | | | 933 | |
3.306%, 06/27/2029 | | | 1,295 | | | | 1,445 | |
Bank of America | | | | | | | | |
7.750%, 05/14/2038 | | | 1,275 | | | | 2,177 | |
6.110%, 01/29/2037 | | | 1,395 | | | | 2,049 | |
6.000%, 10/15/2036 | | | 3,865 | | | | 5,683 | |
Bank of America MTN | | | | | | | | |
5.875%, 02/07/2042 | | | 12,247 | | | | 18,897 | |
5.000%, 01/21/2044 | | | 2,250 | | | | 3,217 | |
4.330%, VAR ICE LIBOR USD 3 Month+1.520%, 03/15/2050 | | | 12,345 | | | | 16,338 | |
4.244%, VAR ICE LIBOR USD 3 Month+1.814%, 04/24/2038 | | | 7,956 | | | | 9,930 | |
4.083%, VAR ICE LIBOR USD 3 Month+3.150%, 03/20/2051 | | | 9,720 | | | | 12,388 | |
4.078%, VAR ICE LIBOR USD 3 Month+1.320%, 04/23/2040 | | | 10,600 | | | | 13,106 | |
3.970%, VAR ICE LIBOR USD 3 Month+1.070%, 03/05/2029 | | | 15,410 | | | | 17,927 | |
| | | | | | | | |
| | | |
| Description | | Face Amount
(Thousands) | | Market Value
($ Thousands) |
| |
CORPORATE OBLIGATIONS (continued) | | | | | |
2.884%, VAR ICE LIBOR USD 3 Month+1.190%, 10/22/2030 | | $ | 2,065 | | | $ | 2,260 | |
2.676%, VAR United States Secured Overnight Financing Rate+1.930%, 06/19/2041 | | | 9,880 | | | | 10,268 | |
Berkshire Hathaway | | | | | | | | |
4.500%, 02/11/2043 | | | 1,545 | | | | 2,133 | |
Berkshire Hathaway Finance | | | | | | | | |
5.750%, 01/15/2040 | | | 1,875 | | | | 2,927 | |
4.400%, 05/15/2042 | | | 2,250 | | | | 3,021 | |
4.300%, 05/15/2043 | | | 2,265 | | | | 3,002 | |
4.250%, 01/15/2049 | | | 6,065 | | | | 8,217 | |
4.200%, 08/15/2048 | | | 5,170 | | | | 6,941 | |
2.850%, 10/15/2050 | | | 7,861 | | | | 8,601 | |
Blackstone Holdings Finance LLC | | | | | | | | |
6.250%, 08/15/2042 (A) | | | 1,313 | | | | 1,969 | |
5.000%, 06/15/2044 (A) | | | 3,050 | | | | 4,210 | |
Carlyle Holdings II Finance LLC | | | | | | | | |
5.625%, 03/30/2043 (A) | | | 3,818 | | | | 4,884 | |
Chubb INA Holdings | | | | | | | | |
6.700%, 05/15/2036 | | | 4,870 | | | | 7,627 | |
4.350%, 11/03/2045 | | | 6,460 | | | | 8,814 | |
1.375%, 09/15/2030 | | | 5,975 | | | | 5,935 | |
Cincinnati Financial | | | | | | | | |
6.920%, 05/15/2028 | | | 2,518 | | | | 3,342 | |
6.125%, 11/01/2034 | | | 3,553 | | | | 5,026 | |
Citigroup | | | | | | | | |
8.125%, 07/15/2039 | | | 4,070 | | | | 7,376 | |
6.125%, 08/25/2036 | | | 690 | | | | 976 | |
5.316%, VAR United States Secured Overnight Financing Rate+4.548%, 03/26/2041 | | | 3,995 | | | | 5,663 | |
4.650%, 07/30/2045 | | | 1,539 | | | | 2,093 | |
4.650%, 07/23/2048 | | | 12,258 | | | | 17,039 | |
4.281%, VAR ICE LIBOR USD 3 Month+1.839%, 04/24/2048 | | | 979 | | | | 1,286 | |
3.878%, VAR ICE LIBOR USD 3 Month+1.168%, 01/24/2039 | | | 700 | | | | 840 | |
2.976%, VAR United States Secured Overnight Financing Rate+1.422%, 11/05/2030 | | | 1,425 | | | | 1,559 | |
Citigroup Capital III | | | | | | | | |
7.625%, 12/01/2036 | | | 890 | | | | 1,269 | |
CME Group | | | | | | | | |
4.150%, 06/15/2048 | | | 2,544 | | | | 3,496 | |
Commonwealth Bank of Australia | | | | | | | | |
4.316%, 01/10/2048 (A) | | | 2,536 | | | | 3,191 | |
Commonwealth Bank of Australia MTN | | | | | | | | |
3.743%, 09/12/2039 (A) | | | 1,625 | | | | 1,877 | |
Empower Finance 2020 | | | | | | | | |
3.075%, 09/17/2051 (A) | | | 4,135 | | | | 4,630 | |
Farmers Exchange Capital | | | | | | | | |
7.200%, 07/15/2048 (A) | | | 800 | | | | 1,058 | |
| | |
198 | | SEI Institutional Investments Trust / Semi-Annual Report / November 30, 2020 |
| | | | | | | | | | |
| | | |
| Description | | Face Amount
(Thousands) | | Market Value
($ Thousands) |
|
CORPORATE OBLIGATIONS (continued) | |
Farmers Exchange Capital II | | | | | | | | | | |
6.151%, VAR ICE LIBOR USD 3 Month+3.744%, 11/01/2053 (A) | | | $ | 3,890 | | | | $ | 4,958 | |
Farmers Exchange Capital III | | | | | | | | | | |
5.454%, VAR ICE LIBOR USD 3 Month+3.454%, 10/15/2054 (A) | | | | 940 | | | | | 1,117 | |
Fifth Third Bancorp | | | | | | | | | | |
8.250%, 03/01/2038 | | | | 1,885 | | | | | 3,187 | |
FMR | | | | | | | | | | |
5.150%, 02/01/2043 (A) | | | | 260 | | | | | 362 | |
Franklin Resources | | | | | | | | | | |
1.600%, 10/30/2030 | | | | 4,720 | | | | | 4,660 | |
Goldman Sachs Capital I | | | | | | | | | | |
6.345%, 02/15/2034 | | | | 4,645 | | | | | 6,436 | |
Goldman Sachs Group | | | | | | | | | | |
6.750%, 10/01/2037 | | | | 3,118 | | | | | 4,778 | |
6.450%, 05/01/2036 | | | | 930 | | | | | 1,359 | |
6.250%, 02/01/2041 | | | | 6,918 | | | | | 10,904 | |
4.750%, 10/21/2045 | | | | 155 | | | | | 217 | |
4.411%, VAR ICE LIBOR USD 3 Month+1.430%, 04/23/2039 | | | | 9,795 | | | | | 12,554 | |
4.017%, VAR ICE LIBOR USD 3 Month+1.373%, 10/31/2038 | | | | 8,800 | | | | | 10,842 | |
Goldman Sachs Group MTN | | | | | | | | | | |
4.800%, 07/08/2044 | | | | 9,488 | | | | | 13,210 | |
Guardian Life Insurance of America | | | | | | | | | | |
4.875%, 06/19/2064 (A) | | | | 3,430 | | | | | 4,648 | |
3.700%, 01/22/2070 (A) | | | | 1,658 | | | | | 1,828 | |
HSBC Bank PLC | | | | | | | | | | |
7.650%, 05/01/2025 | | | | 2,115 | | | | | 2,629 | |
HSBC Bank USA | | | | | | | | | | |
7.000%, 01/15/2039 | | | | 7,520 | | | | | 11,817 | |
HSBC Holdings | | | | | | | | | | |
6.800%, 06/01/2038 | | | | 6,819 | | | | | 10,166 | |
6.500%, 09/15/2037 | | | | 7,255 | | | | | 10,444 | |
5.250%, 03/14/2044 | | | | 7,730 | | | | | 10,477 | |
4.950%, 03/31/2030 | | | | 1,015 | | | | | 1,265 | |
4.041%, VAR ICE LIBOR USD 3
Month+1.546%, 03/13/2028 | | | | 2,195 | | | | | 2,493 | |
Intercontinental Exchange | | | | | | | | | | |
4.250%, 09/21/2048 | | | | 7,715 | | | | | 9,995 | |
3.000%, 06/15/2050 | | | | 2,510 | | | | | 2,698 | |
3.000%, 09/15/2060 | | | | 3,045 | | | | | 3,224 | |
2.650%, 09/15/2040 | | | | 1,460 | | | | | 1,517 | |
JPMorgan Chase | | | | | | | | | | |
8.750%, 09/01/2030 | | | | 1,075 | | | | | 1,594 | |
6.400%, 05/15/2038 | | | | 11,562 | | | | | 18,293 | |
5.600%, 07/15/2041 | | | | 6,115 | | | | | 9,344 | |
5.500%, 10/15/2040 | | | | 9,315 | | | | | 13,778 | |
5.400%, 01/06/2042 | | | | 8,035 | | | | | 12,050 | |
4.260%, VAR ICE LIBOR USD 3
Month+1.580%, 02/22/2048 | | | | 90 | | | | | 119 | |
| | | | | | | | | | |
| | | |
| Description | | Face Amount
(Thousands) | | Market Value ($ Thousands) |
|
CORPORATE OBLIGATIONS (continued) | |
4.032%, VAR ICE LIBOR USD 3 Month+1.460%, 07/24/2048 | | | $ | 5,145 | | | | $ | 6,617 | |
3.964%, VAR ICE LIBOR USD 3 Month+1.380%, 11/15/2048 | | | | 10,924 | | | | | 13,922 | |
3.897%, VAR ICE LIBOR USD 3 Month+1.220%, 01/23/2049 | | | | 13,505 | | | | | 17,180 | |
3.882%, VAR ICE LIBOR USD 3 Month+1.360%, 07/24/2038 | | | | 16,385 | | | | | 19,970 | |
3.109%, VAR United States Secured Overnight Financing Rate+2.440%, 04/22/2051 | | | | 5,045 | | | | | 5,636 | |
2.739%, VAR United States Secured Overnight Financing Rate+1.510%, 10/15/2030 | | | | 40 | | | | | 43 | |
1.764%, VAR United States Secured Overnight Financing Rate+1.105%, 11/19/2031 | | | | 4,080 | | | | | 4,100 | |
KKR Group Finance II LLC | | | | | | | | | | |
5.500%, 02/01/2043 (A) | | | | 2,248 | | | | | 3,003 | |
KKR Group Finance III LLC | | | | | | | | | | |
5.125%, 06/01/2044 (A) | | | | 3,627 | | | | | 4,655 | |
Marsh & McLennan | | | | | | | | | | |
4.900%, 03/15/2049 | | | | 3,692 | | | | | 5,413 | |
4.200%, 03/01/2048 | | | | 1,905 | | | | | 2,528 | |
2.250%, 11/15/2030 | | | | 4,080 | | | | | 4,359 | |
Massachusetts Mutual Life Insurance | | | | | | | | | | |
4.900%, 04/01/2077 (A) | | | | 530 | | | | | 724 | |
3.729%, 10/15/2070 (A) | | | | 1,975 | | | | | 2,204 | |
3.375%, 04/15/2050 (A) | | | | 1,625 | | | | | 1,759 | |
MassMutual Global Funding II | | | | | | | | | | |
1.550%, 10/09/2030 (A) | | | | 1,490 | | | | | 1,491 | |
MetLife | | | | | | | | | | |
5.875%, 02/06/2041 | | | | 1,675 | | | | | 2,582 | |
5.700%, 06/15/2035 | | | | 9,789 | | | | | 14,430 | |
4.875%, 11/13/2043 | | | | 4,465 | | | | | 6,337 | |
4.721%, 12/15/2044 | | | | 4,430 | | | | | 6,112 | |
Mitsubishi UFJ Financial Group | | | | | | | | | | |
3.751%, 07/18/2039 | | | | 5,540 | | | | | 6,684 | |
Moody’s | | | | | | | | | | |
4.875%, 12/17/2048 | | | | 3,091 | | | | | 4,245 | |
Morgan Stanley | | | | | | | | | | |
4.457%, VAR ICE LIBOR USD 3 Month+1.431%, 04/22/2039 | | | | 4,718 | | | | | 6,180 | |
4.375%, 01/22/2047 | | | | 700 | | | | | 969 | |
Morgan Stanley MTN | | | | | | | | | | |
6.375%, 07/24/2042 | | | | 6,335 | | | | | 10,369 | |
5.597%, VAR United States Secured
Overnight Financing Rate+4.840%, 03/24/2051 | | | | 5,270 | | | | | 8,491 | |
4.300%, 01/27/2045 | | | | 14,800 | | | | | 20,098 | |
3.971%, VAR ICE LIBOR USD 3 Month+1.455%, 07/22/2038 | | | | 7,760 | | | | | 9,608 | |
| | |
SEI Institutional Investments Trust / Semi-Annual Report / November 30, 2020 | | 199 |
SCHEDULE OF INVESTMENTS (Unaudited)
November 30, 2020
Long Duration Credit Fund (Continued)
| | | | | | | | | | |
| | | |
| Description | | Face Amount
(Thousands) | | Market Value ($ Thousands) |
|
CORPORATE OBLIGATIONS (continued) | |
1.615%, VAR ICE LIBOR USD 3 Month+1.400%, 10/24/2023 | | | $ | 1,485 | | | | $ | 1,513 | |
Mutual of Omaha Insurance | | | | | | | | | | |
4.297%, VAR ICE LIBOR USD 3 Month+2.640%, 07/15/2054 (A) | | | | 595 | | | | | 622 | |
National Rural Utilities Cooperative Finance | | | | | | | | | | |
4.400%, 11/01/2048 | | | | 2,655 | | | | | 3,541 | |
4.300%, 03/15/2049 | | | | 4,493 | | | | | 5,941 | |
4.023%, 11/01/2032 | | | | 527 | | | | | 642 | |
Nationwide Mutual Insurance | | | | | | | | | | |
9.375%, 08/15/2039 (A) | | | | 1,260 | | | | | 2,216 | |
4.950%, 04/22/2044 (A) | | | | 700 | | | | | 779 | |
New York Life Insurance | | | | | | | | | | |
6.750%, 11/15/2039 (A) | | | | 2,215 | | | | | 3,415 | |
5.875%, 05/15/2033 (A) | | | | 4,447 | | | | | 6,156 | |
3.750%, 05/15/2050 (A) | | | | 1,814 | | | | | 2,163 | |
Northwestern Mutual Life Insurance | | | | | | | | | | |
3.850%, 09/30/2047 (A) | | | | 4,848 | | | | | 5,771 | |
3.625%, 09/30/2059 (A) | | | | 1,594 | | | | | 1,835 | |
Pacific Life Insurance | | | | | | | | | | |
4.300%, VAR ICE LIBOR USD 3 Month+2.796%, 10/24/2067 (A) | | | | 1,450 | | | | | 1,562 | |
Pacific LifeCorp | | | | | | | | | | |
3.350%, 09/15/2050 (A) | | | | 4,930 | | | | | 5,545 | |
Prudential Financial | | | | | | | | | | |
3.905%, 12/07/2047 | | | | 2,295 | | | | | 2,787 | |
Prudential Financial MTN | | | | | | | | | | |
5.700%, 12/14/2036 | | | | 5,584 | | | | | 8,096 | |
Prudential Insurance of America | | | | | | | | | | |
8.300%, 07/01/2025 (A) | | | | 1,000 | | | | | 1,299 | |
Raymond James Financial | | | | | | | | | | |
4.950%, 07/15/2046 | | | | 1,250 | | | | | 1,717 | |
S&P Global | | | | | | | | | | |
3.250%, 12/01/2049 | | | | 4,971 | | | | | 5,764 | |
Scentre Group Trust 2 | | | | | | | | | | |
5.125%, VAR US Treas Yield Curve Rate
T Note Const Mat 5 Yr+4.685%, 09/24/2080 (A) | | | | 2,170 | | | | | 2,274 | |
4.750%, VAR US Treas Yield Curve Rate
T Note Const Mat 5 Yr+4.379%, 09/24/2080 (A) | | | | 1,105 | | | | | 1,149 | |
Securian Financial Group | | | | | | | | | | |
4.800%, 04/15/2048 (A) | | | | 2,921 | | | | | 3,771 | |
State Street | | | | | | | | | | |
3.031%, VAR United States Secured Overnight Financing Rate+1.490%, 11/01/2034 | | | | 4,435 | | | | | 4,865 | |
Swiss Re Treasury US | | | | | | | | | | |
4.250%, 12/06/2042 (A) | | | | 4,581 | | | | | 5,723 | |
Teachers Insurance & Annuity Association of America | | | | | | | | | | |
4.900%, 09/15/2044 (A) | | | | 2,355 | | | | | 3,157 | |
4.270%, 05/15/2047 (A) | | | | 3,893 | | | | | 4,808 | |
| | | | | | | | | | |
| | | |
| Description | | Face Amount
(Thousands) | | Market Value
($ Thousands) |
|
CORPORATE OBLIGATIONS (continued) | |
3.300%, 05/15/2050 (A) | | | $ | 1,300 | | | | $ | 1,419 | |
Travelers | | | | | | | | | | |
5.350%, 11/01/2040 | | | | 1,565 | | | | | 2,319 | |
4.100%, 03/04/2049 | | | | 4,853 | | | | | 6,407 | |
4.050%, 03/07/2048 | | | | 1,800 | | | | | 2,379 | |
2.550%, 04/27/2050 | | | | 8,045 | | | | | 8,494 | |
Travelers MTN | | | | | | | | | | |
6.250%, 06/15/2037 | | | | 1,205 | | | | | 1,858 | |
Truist Bank | | | | | | | | | | |
2.250%, 03/11/2030 | | | | 1,580 | | | | | 1,653 | |
UBS MTN | | | | | | | | | | |
4.500%, 06/26/2048 (A) | | | | 2,775 | | | | | 3,905 | |
US Bancorp MTN | | | | | | | | | | |
3.000%, 07/30/2029 | | | | 8,865 | | | | | 9,974 | |
1.375%, 07/22/2030 | | | | 2,860 | | | | | 2,870 | |
Validus Holdings | | | | | | | | | | |
8.875%, 01/26/2040 | | | | 2,155 | | | | | 3,559 | |
Wachovia | | | | | | | | | | |
7.500%, 04/15/2035 | | | | 440 | | | | | 664 | |
WEA Finance LLC | | | | | | | | | | |
4.625%, 09/20/2048 (A) | | | | 2,000 | | | | | 2,008 | |
Wells Fargo | | | | | | | | | | |
7.950%, 11/15/2029 | | | | 695 | | | | | 935 | |
6.600%, 01/15/2038 | | | | 8,165 | | | | | 12,519 | |
5.950%, 08/26/2036 | | | | 4,720 | | | | | 6,625 | |
5.950%, 12/15/2036 | | | | 1,062 | | | | | 1,417 | |
5.850%, 02/01/2037 | | | | 14,523 | | | | | 20,490 | |
5.606%, 01/15/2044 | | | | 3,186 | | | | | 4,564 | |
3.900%, 05/01/2045 | | | | 7,974 | | | | | 9,939 | |
3.068%, VAR United States Secured
Overnight Financing Rate+2.530%, 04/30/2041 | | | | 5,145 | | | | | 5,604 | |
Wells Fargo MTN | | | | | | | | | | |
5.013%, VAR ICE LIBOR USD 3 Month+4.240%, 04/04/2051 | | | | 18,153 | | | | | 25,924 | |
4.900%, 11/17/2045 | | | | 2,265 | | | | | 3,029 | |
4.750%, 12/07/2046 | | | | 8,136 | | | | | 10,826 | |
4.650%, 11/04/2044 | | | | 4,200 | | | | | 5,418 | |
4.400%, 06/14/2046 | | | | 6,310 | | | | | 8,003 | |
4.150%, 01/24/2029 | | | | 1,205 | | | | | 1,428 | |
2.879%, VAR ICE LIBOR USD 3 Month+1.170%, 10/30/2030 | | | | 3,595 | | | | | 3,908 | |
2.572%, VAR ICE LIBOR USD 3 Month+1.000%, 02/11/2031 | | | | 415 | | | | | 441 | |
Westpac Banking | | | | | | | | | | |
4.421%, 07/24/2039 | | | | 650 | | | | | 843 | |
2.963%, 11/16/2040 | | | | 415 | | | | | 447 | |
2.668%, VAR US Treas Yield Curve Rate T Note Const Mat 5 Yr+1.750%, 11/15/2035 | | | | 730 | | | | | 755 | |
Willis North America | | | | | | | | | | |
3.875%, 09/15/2049 | | | | 1,025 | | | | | 1,263 | |
| | |
200 | | SEI Institutional Investments Trust / Semi-Annual Report / November 30, 2020 |
| | | | | | | | |
| | | |
| Description | | Face Amount
(Thousands) | | Market Value ($ Thousands) |
|
CORPORATE OBLIGATIONS (continued) | |
XLIT | | | | | | | | |
5.250%, 12/15/2043 | | $ | 805 | | | $ | 1,156 | |
| | | | | | | | |
| | | | | | | 923,533 | |
| | | | | | | | |
| | |
Health Care – 7.9% | | | | | | | | |
Abbott Laboratories | | | | | | | | |
4.900%, 11/30/2046 | | | 4,568 | | | | 6,826 | |
AbbVie Inc | | | | | | | | |
4.875%, 11/14/2048 | | | 1,285 | | | | 1,750 | |
4.850%, 06/15/2044 | | | 625 | | | | 824 | |
4.450%, 05/14/2046 | | | 780 | | | | 990 | |
4.250%, 11/21/2049 | | | 2,035 | | | | 2,571 | |
Amgen | | | | | | | | |
4.663%, 06/15/2051 | | | 829 | | | | 1,122 | |
4.400%, 05/01/2045 | | | 335 | | | | 426 | |
3.150%, 02/21/2040 | | | 540 | | | | 585 | |
2.770%, 09/01/2053 (A) | | | 946 | | | | 937 | |
Anthem | | | | | | | | |
4.650%, 01/15/2043 | | | 250 | | | | 330 | |
4.650%, 08/15/2044 | | | 900 | | | | 1,191 | |
4.375%, 12/01/2047 | | | 1,975 | | | | 2,586 | |
AstraZeneca | | | | | | | | |
4.375%, 11/16/2045 | | | 2,084 | | | | 2,797 | |
Becton Dickinson | | | | | | | | |
3.794%, 05/20/2050 | | | 1,555 | | | | 1,837 | |
Bristol-Myers Squibb | | | | | | | | |
5.000%, 08/15/2045 | | | 2,700 | | | | 3,919 | |
4.625%, 05/15/2044 | | | 780 | | | | 1,064 | |
4.550%, 02/20/2048 | | | 2,103 | | | | 2,946 | |
4.250%, 10/26/2049 | | | 16,579 | | | | 22,457 | |
2.550%, 11/13/2050 | | | 2,185 | | | | 2,257 | |
2.350%, 11/13/2040 | | | 545 | | | | 561 | |
Cigna | | | | | | | | |
4.900%, 12/15/2048 | | | 1,385 | | | | 1,909 | |
4.800%, 08/15/2038 | | | 1,620 | | | | 2,111 | |
3.875%, 10/15/2047 | | | 1,300 | | | | 1,560 | |
Cleveland Clinic Foundation | | | | | | | | |
4.858%, 01/01/2114 | | | 1,443 | | | | 2,027 | |
CVS Health Corp | | | | | | | | |
5.050%, 03/25/2048 | | | 8,439 | | | | 11,384 | |
4.780%, 03/25/2038 | | | 2,335 | | | | 2,963 | |
Eli Lilly | | | | | | | | |
4.150%, 03/15/2059 | | | 288 | | | | 399 | |
3.950%, 03/15/2049 | | | 5,230 | | | | 6,901 | |
Gilead Sciences | | | | | | | | |
4.800%, 04/01/2044 | | | 6,810 | | | | 8,946 | |
4.750%, 03/01/2046 | | | 2,810 | | | | 3,707 | |
4.500%, 02/01/2045 | | | 4,855 | | | | 6,206 | |
GlaxoSmithKline Capital | | | | | | | | |
6.375%, 05/15/2038 | | | 11,439 | | | | 18,171 | |
3.875%, 05/15/2028 | | | 1,580 | | | | 1,878 | |
| | | | | | | | | | |
| | | |
| Description | | Face Amount
(Thousands) | | Market Value ($ Thousands) |
|
CORPORATE OBLIGATIONS (continued) | |
HCA | | | | | | | | | | |
5.250%, 06/15/2049 | | | $ | 2,480 | | | | $ | 3,282 | |
5.125%, 06/15/2039 | | | | 698 | | | | | 898 | |
Humana | | | | | | | | | | |
8.150%, 06/15/2038 | | | | 1,510 | | | | | 2,411 | |
4.625%, 12/01/2042 | | | | 405 | | | | | 522 | |
Johnson & Johnson | | | | | | | | | | |
4.850%, 05/15/2041 | | | | 5,652 | | | | | 8,040 | |
3.700%, 03/01/2046 | | | | 672 | | | | | 865 | |
3.625%, 03/03/2037 | | | | 3,590 | | | | | 4,404 | |
3.400%, 01/15/2038 | | | | 4,510 | | | | | 5,436 | |
2.900%, 01/15/2028 | | | | 1,665 | | | | | 1,876 | |
2.450%, 09/01/2060 | | | | 4,550 | | | | | 4,778 | |
2.250%, 09/01/2050 | | | | 985 | | | | | 1,003 | |
2.100%, 09/01/2040 | | | | 1,335 | | | | | 1,360 | |
Medtronic | | | | | | | | | | |
4.625%, 03/15/2045 | | | | 3,124 | | | | | 4,447 | |
Merck | | | | | | | | | | |
5.750%, 11/15/2036 | | | | 1,200 | | | | | 1,737 | |
4.150%, 05/18/2043 | | | | 3,025 | | | | | 4,005 | |
3.900%, 03/07/2039 | | | | 4,965 | | | | | 6,326 | |
3.700%, 02/10/2045 | | | | 9,550 | | | | | 12,030 | |
3.600%, 09/15/2042 | | | | 1,780 | | | | | 2,216 | |
3.400%, 03/07/2029 | | | | 2,980 | | | | | 3,486 | |
2.450%, 06/24/2050 | | | | 480 | | | | | 498 | |
2.350%, 06/24/2040 | | | | 1,095 | | | | | 1,144 | |
Pfizer | | | | | | | | | | |
5.600%, 09/15/2040 | | | | 808 | | | | | 1,183 | |
4.400%, 05/15/2044 | | | | 3,295 | | | | | 4,429 | |
4.300%, 06/15/2043 | | | | 3,325 | | | | | 4,372 | |
4.200%, 09/15/2048 | | | | 1,500 | | | | | 2,014 | |
4.100%, 09/15/2038 | | | | 3,080 | | | | | 3,935 | |
4.000%, 12/15/2036 | | | | 8,376 | | | | | 10,687 | |
4.000%, 03/15/2049 | | | | 5,616 | | | | | 7,366 | |
2.700%, 05/28/2050 | | | | 2,225 | | | | | 2,372 | |
2.550%, 05/28/2040 | | | | 1,385 | | | | | 1,470 | |
Pharmacia | | | | | | | | | | |
6.600%, 12/01/2028 | | | | 1,145 | | | | | 1,606 | |
Royalty Pharma | | | | | | | | | | |
3.550%, 09/02/2050 (A) | | | | 2,130 | | | | | 2,191 | |
3.300%, 09/02/2040 (A) | | | | 1,050 | | | | | 1,097 | |
Shands Teaching Hospital and Clinics | | | | | | | | | | |
4.741%, 12/01/2042 | | | | 1,750 | | | | | 1,979 | |
Stryker | | | | | | | | | | |
4.625%, 03/15/2046 | | | | 315 | | | | | 420 | |
4.100%, 04/01/2043 | | | | 785 | | | | | 957 | |
Trinity Health | | | | | | | | | | |
4.125%, 12/01/2045 | | | | 2,392 | | | | | 2,831 | |
UnitedHealth Group | | | | | | | | | | |
6.875%, 02/15/2038 | | | | 1,125 | | | | | 1,853 | |
6.625%, 11/15/2037 | | | | 1,160 | | | | | 1,873 | |
6.500%, 06/15/2037 | | | | 1,385 | | | | | 2,207 | |
| | |
SEI Institutional Investments Trust / Semi-Annual Report / November 30, 2020 | | 201 |
SCHEDULE OF INVESTMENTS (Unaudited)
November 30, 2020
Long Duration Credit Fund (Continued)
| | | | | | | | |
| | | |
| Description | | Face Amount
(Thousands) | | Market Value ($ Thousands) |
|
CORPORATE OBLIGATIONS (continued) | |
5.950%, 02/15/2041 | | $ | 1,130 | | | $ | 1,746 | |
5.800%, 03/15/2036 | | | 620 | | | | 918 | |
5.700%, 10/15/2040 | | | 465 | | | | 698 | |
4.750%, 07/15/2045 | | | 7,030 | | | | 10,065 | |
4.625%, 07/15/2035 | | | 1,145 | | | | 1,553 | |
4.450%, 12/15/2048 | | | 15,426 | | | | 21,475 | |
4.375%, 03/15/2042 | | | 30 | | | | 40 | |
4.250%, 03/15/2043 | | | 906 | | | | 1,198 | |
4.250%, 04/15/2047 | | | 6,540 | | | | 8,776 | |
4.250%, 06/15/2048 | | | 3,993 | | | | 5,420 | |
4.200%, 01/15/2047 | | | 4,172 | | | | 5,609 | |
3.950%, 10/15/2042 | | | 1,110 | | | | 1,403 | |
3.875%, 08/15/2059 | | | 5 | | | | 7 | |
3.750%, 10/15/2047 | | | 1,146 | | | | 1,442 | |
3.700%, 08/15/2049 | | | 3,675 | | | | 4,653 | |
3.500%, 08/15/2039 | | | 4,900 | | | | 5,827 | |
3.125%, 05/15/2060 | | | 1,550 | | | | 1,796 | |
2.900%, 05/15/2050 | | | 40 | | | | 45 | |
Wyeth LLC | | | | | | | | |
6.500%, 02/01/2034 | | | 2,485 | | | | 3,937 | |
5.950%, 04/01/2037 | | | 19,729 | | | | 29,737 | |
| | | | | | | | |
| | | | | | | 358,089 | |
| | | | | | | | |
| | |
Industrials – 5.7% | | | | | | | | |
3M | | | | | | | | |
3.700%, 04/15/2050 | | | 1,701 | | | | 2,128 | |
3.250%, 08/26/2049 | | | 2,997 | | | | 3,472 | |
Air Canada, Pass-Through Trust, Ser 2013-1,
Cl A | | | | | | | | |
4.125%, 05/15/2025 (A) | | | 360 | | | | 340 | |
Air Lease | | | | | | | | |
3.250%, 10/01/2029 | | | 380 | | | | 388 | |
Airbus | | | | | | | | |
3.950%, 04/10/2047 (A) | | | 2,500 | | | | 2,854 | |
American Airlines Pass-Through Trust,
Ser 2016-2, Cl AA | | | | | | | | |
3.200%, 06/15/2028 | | | 3,624 | | | | 3,493 | |
BAE Systems | | | | | | | | |
3.000%, 09/15/2050 (A) | | | 1,700 | | | | 1,797 | |
Boeing | | | | | | | | |
5.805%, 05/01/2050 | | | 3,440 | | | | 4,549 | |
5.150%, 05/01/2030 | | | 1,355 | | | | 1,598 | |
Burlington Northern Santa Fe LLC | | | | | | | | |
5.150%, 09/01/2043 | | | 1,665 | | | | 2,422 | |
4.900%, 04/01/2044 | | | 11,441 | | | | 16,282 | |
4.550%, 09/01/2044 | | | 5,465 | | | | 7,627 | |
4.450%, 03/15/2043 | | | 560 | | | | 755 | |
4.400%, 03/15/2042 | | | 2,825 | | | | 3,723 | |
4.375%, 09/01/2042 | | | 325 | | | | 433 | |
4.150%, 04/01/2045 | | | 5,590 | | | | 7,361 | |
4.125%, 06/15/2047 | | | 3,815 | | | | 5,156 | |
4.050%, 06/15/2048 | | | 4,740 | | | | 6,369 | |
| | | | | | | | | | |
| | | |
| Description | | Face Amount
(Thousands) | | Market Value ($ Thousands) |
|
CORPORATE OBLIGATIONS (continued) | |
Canadian National Railway | | | | | | | | | | |
6.200%, 06/01/2036 | | | $ | 6,610 | | | | $ | 10,047 | |
4.500%, 11/07/2043 | | | | 3,800 | | | | | 4,924 | |
3.650%, 02/03/2048 | | | | 1,335 | | | | | 1,668 | |
3.200%, 08/02/2046 | | | | 3,655 | | | | | 4,288 | |
Canadian Pacific Railway | | | | | | | | | | |
6.125%, 09/15/2115 | | | | 1,405 | | | | | 2,268 | |
Caterpillar | | | | | | | | | | |
5.200%, 05/27/2041 | | | | 395 | | | | | 582 | |
4.750%, 05/15/2064 | | | | 910 | | | | | 1,374 | |
3.803%, 08/15/2042 | | | | 3,765 | | | | | 4,821 | |
Crane | | | | | | | | | | |
4.200%, 03/15/2048 | | | | 775 | | | | | 835 | |
Cummins | | | | | | | | | | |
2.600%, 09/01/2050 | | | | 3,535 | | | | | 3,633 | |
Deere | | | | | | | | | | |
3.900%, 06/09/2042 | | | | 3,745 | | | | | 4,819 | |
3.750%, 04/15/2050 | | | | 2,125 | | | | | 2,766 | |
2.875%, 09/07/2049 | | | | 3,855 | | | | | 4,335 | |
Emerson Electric | | | | | | | | | | |
2.750%, 10/15/2050 | | | | 820 | | | | | 879 | |
FedEx | | | | | | | | | | |
4.950%, 10/17/2048 | | | | 2,101 | | | | | 2,841 | |
GE Capital International Funding Unlimited | | | | | | | | | | |
4.418%, 11/15/2035 | | | | 12,767 | | | | | 14,718 | |
General Dynamics | | | | | | | | | | |
4.250%, 04/01/2040 | | | | 1,350 | | | | | 1,774 | |
4.250%, 04/01/2050 | | | | 1,665 | | | | | 2,305 | |
General Electric | | | | | | | | | | |
4.350%, 05/01/2050 | | | | 1,350 | | | | | 1,592 | |
4.250%, 05/01/2040 | | | | 2,225 | | | | | 2,533 | |
4.125%, 10/09/2042 | | | | 550 | | | | | 623 | |
General Electric MTN | | | | | | | | | | |
5.875%, 01/14/2038 | | | | 8,440 | | | | | 10,934 | |
Georgia-Pacific LLC | | | | | | | | | | |
8.875%, 05/15/2031 | | | | 475 | | | | | 756 | |
7.250%, 06/01/2028 | | | | 330 | | | | | 451 | |
Honeywell International | | | | | | | | | | |
2.800%, 06/01/2050 | | | | 1,470 | | | | | 1,642 | |
Lockheed Martin | | | | | | | | | | |
4.700%, 05/15/2046 | | | | 1,000 | | | | | 1,417 | |
4.070%, 12/15/2042 | | | | 4,855 | | | | | 6,318 | |
2.800%, 06/15/2050 | | | | 8,044 | | | | | 8,772 | |
Norfolk Southern | | | | | | | | | | |
5.100%, 08/01/2118 | | | | 1,900 | | | | | 2,459 | |
4.050%, 08/15/2052 | | | | 1,976 | | | | | 2,547 | |
Parker-Hannifin | | | | | | | | | | |
4.100%, 03/01/2047 | | | | 3,704 | | | | | 4,578 | |
4.000%, 06/14/2049 | | | | 2,310 | | | | | 2,905 | |
Parker-Hannifin MTN | | | | | | | | | | |
4.450%, 11/21/2044 | | | | 1,755 | | | | | 2,248 | |
| | |
202 | | SEI Institutional Investments Trust / Semi-Annual Report / November 30, 2020 |
| | | | | | | | |
| | | |
| Description | | Face Amount (Thousands) | | Market Value ($ Thousands) |
|
CORPORATE OBLIGATIONS (continued) | |
Raytheon Technologies | | | | | | | | |
4.700%, 12/15/2041 (A) | | $ | 560 | | | $ | 705 | |
4.625%, 11/16/2048 | | | 785 | | | | 1,088 | |
4.500%, 06/01/2042 | | | 5,280 | | | | 6,983 | |
3.750%, 11/01/2046 | | | 1,039 | | | | 1,263 | |
3.125%, 07/01/2050 | | | 1,340 | | | | 1,510 | |
Rockwell Automation | | | | | | | | |
4.200%, 03/01/2049 | | | 2,500 | | | | 3,384 | |
Snap-on | | | | | | | | |
4.100%, 03/01/2048 | | | 3,896 | | | | 4,950 | |
3.100%, 05/01/2050 | | | 3,485 | | | | 3,939 | |
Stanley Black & Decker | | | | | | | | |
5.200%, 09/01/2040 | | | 280 | | | | 390 | |
TTX | | | | | | | | |
4.600%, 02/01/2049 (A) | | | 3,542 | | | | 4,849 | |
Union Pacific | | | | | | | | |
3.875%, 02/01/2055 | | | 730 | | | | 899 | |
3.839%, 03/20/2060 | | | 2,529 | | | | 3,116 | |
3.250%, 02/05/2050 | | | 2,275 | | | | 2,611 | |
United Airlines Pass-Through Trust, Ser 2019-1, Cl AA | | | | | | | | |
4.150%, 08/25/2031 | | | 1,359 | | | | 1,351 | |
United Parcel Service | | | | | | | | |
7.620%, 04/01/2030 | | | 710 | | | | 1,086 | |
6.200%, 01/15/2038 | | | 3,152 | | | | 4,950 | |
5.300%, 04/01/2050 | | | 2,350 | | | | 3,614 | |
5.200%, 04/01/2040 | | | 725 | | | | 1,039 | |
3.625%, 10/01/2042 | | | 1,535 | | | | 1,836 | |
3.400%, 11/15/2046 | | | 3,925 | | | | 4,751 | |
3.400%, 09/01/2049 | | | 4,470 | | | | 5,535 | |
US Airways, Pass-Through Trust, Ser 2012-1,Cl A | | | | | | | | |
5.900%, 10/01/2024 | | | 1,296 | | | | 1,281 | |
Vinci | | | | | | | | |
3.750%, 04/10/2029 (A) | | | 1,475 | | | | 1,739 | |
Waste Connections | | | | | | | | |
3.050%, 04/01/2050 | | | 1,118 | | | | 1,218 | |
WW Grainger | | | | | | | | |
4.600%, 06/15/2045 | | | 1,328 | | | | 1,776 | |
4.200%, 05/15/2047 | | | 3,329 | | | | 4,197 | |
| | | | | | | | |
| | | | | | | 259,459 | |
| | | | | | | | |
|
Information Technology – 10.7% | |
Apple | | | | | | | | |
4.650%, 02/23/2046 | | | 13,236 | | | | 19,103 | |
4.450%, 05/06/2044 | | | 780 | | | | 1,074 | |
4.375%, 05/13/2045 | | | 15,443 | | | | 21,439 | |
3.850%, 05/04/2043 | | | 3,270 | | | | 4,210 | |
3.850%, 08/04/2046 | | | 18,862 | | | | 24,336 | |
3.750%, 09/12/2047 | | | 7,735 | | | | 9,844 | |
3.750%, 11/13/2047 | | | 2,195 | | | | 2,803 | |
3.450%, 02/09/2045 | | | 8,395 | | | | 10,299 | |
| | | | | | | | | | |
| | | |
| Description | | Face Amount
(Thousands) | | Market Value ($ Thousands) |
|
CORPORATE OBLIGATIONS (continued) | |
2.950%, 09/11/2049 | | | $ | 30 | | | | $ | 34 | |
2.900%, 09/12/2027 | | | | 2,080 | | | | | 2,330 | |
2.650%, 05/11/2050 | | | | 1,585 | | | | | 1,702 | |
2.550%, 08/20/2060 | | | | 730 | | | | | 754 | |
Applied Materials | | | | | | | | | | |
4.350%, 04/01/2047 | | | | 3,649 | | | | | 5,051 | |
2.750%, 06/01/2050 | | | | 1,140 | | | | | 1,246 | |
Cisco Systems | | | | | | | | | | |
5.900%, 02/15/2039 | | | | 5,785 | | | | | 8,933 | |
5.500%, 01/15/2040 | | | | 5,819 | | | | | 8,805 | |
Dell International LLC | | | | | | | | | | |
8.100%, 07/15/2036 (A) | | | | 1,035 | | | | | 1,488 | |
Deutsche Telekom International Finance | | | | | | | | | | |
9.250%, 06/01/2032 | | | | 2,192 | | | | | 3,724 | |
Fiserv | | | | | | | | | | |
4.400%, 07/01/2049 | | | | 500 | | | | | 663 | |
Intel | | | | | | | | | | |
4.950%, 03/25/2060 | | | | 220 | | | | | 334 | |
4.750%, 03/25/2050 | | | | 3,455 | | | | | 4,888 | |
4.600%, 03/25/2040 | | | | 1,485 | | | | | 1,997 | |
4.100%, 05/19/2046 | | | | 3,219 | | | | | 4,165 | |
4.100%, 05/11/2047 | | | | 4,555 | | | | | 5,861 | |
4.000%, 12/15/2032 | | | | 165 | | | | | 207 | |
3.734%, 12/08/2047 | | | | 15,515 | | | | | 19,025 | |
3.250%, 11/15/2049 | | | | 3,825 | | | | | 4,407 | |
International Business Machines | | | | | | | | | | |
4.250%, 05/15/2049 | | | | 4,985 | | | | | 6,628 | |
4.000%, 06/20/2042 | | | | 2,730 | | | | | 3,460 | |
Lam Research | | | | | | | | | | |
2.875%, 06/15/2050 | | | | 6,425 | | | | | 6,961 | |
Mastercard Inc | | | | | | | | | | |
3.950%, 02/26/2048 | | | | 1,530 | | | | | 1,990 | |
3.850%, 03/26/2050 | | | | 8,081 | | | | | 10,556 | |
3.650%, 06/01/2049 | | | | 2,340 | | | | | 2,926 | |
Microsoft | | | | | | | | | | |
4.100%, 02/06/2037 | | | | 7,148 | | | | | 9,393 | |
4.000%, 02/12/2055 | | | | 9,038 | | | | | 12,701 | |
3.700%, 08/08/2046 | | | | 36,508 | | | | | 47,019 | |
3.500%, 02/12/2035 | | | | 1,925 | | | | | 2,397 | |
3.450%, 08/08/2036 | | | | 5,585 | | | | | 6,916 | |
2.675%, 06/01/2060 | | | | 4,465 | | | | | 4,906 | |
2.525%, 06/01/2050 | | | | 34,767 | | | | | 37,442 | |
2.400%, 08/08/2026 | | | | 1,255 | | | | | 1,369 | |
NVIDIA 3.700%, 04/01/2060 | | | | 275 | | | | | 355 | |
3.500%, 04/01/2040 | | | | 3,800 | | | | | 4,612 | |
3.500%, 04/01/2050 | | | | 5,170 | | | | | 6,296 | |
Oracle 4.375%, 05/15/2055 | | | | 3,515 | | | | | 4,599 | |
4.300%, 07/08/2034 | | | | 13,355 | | | | | 17,058 | |
4.125%, 05/15/2045 | | | | 13,910 | | | | | 17,124 | |
4.000%, 07/15/2046 | | | | 16,964 | | | | | 20,703 | |
| | |
SEI Institutional Investments Trust / Semi-Annual Report / November 30, 2020 | | 203 |
SCHEDULE OF INVESTMENTS (Unaudited)
November 30, 2020
Long Duration Credit Fund (Continued)
| | | | | | | | |
| | | |
| Description | | Face Amount (Thousands) | | | Market Value ($ Thousands) | |
|
CORPORATE OBLIGATIONS (continued) | |
4.000%, 11/15/2047 | | $ | 4,420 | | | $ | 5,410 | |
3.900%, 05/15/2035 | | | 1,555 | | | | 1,911 | |
3.850%, 07/15/2036 | | | 470 | | | | 568 | |
3.850%, 04/01/2060 | | | 2,645 | | | | 3,265 | |
3.800%, 11/15/2037 | | | 12,330 | | | | 14,771 | |
3.600%, 04/01/2040 | | | 10,978 | | | | 12,791 | |
3.600%, 04/01/2050 | | | 5,335 | | | | 6,233 | |
2.950%, 04/01/2030 | | | 955 | | | | 1,071 | |
PayPal Holdings | | | | | | | | |
3.250%, 06/01/2050 | | | 1,890 | | | | 2,172 | |
QUALCOMM | | | | | | | | |
4.650%, 05/20/2035 | | | 715 | | | | 961 | |
4.300%, 05/20/2047 | | | 4,065 | | | | 5,490 | |
Texas Instruments | | | | | | | | |
4.150%, 05/15/2048 | | | 7,787 | | | | 10,746 | |
Visa | | | | | | | | |
4.300%, 12/14/2045 | | | 11,135 | | | | 15,351 | |
4.150%, 12/14/2035 | | | 1,300 | | | | 1,693 | |
2.700%, 04/15/2040 | | | 1,115 | | | | 1,237 | |
2.000%, 08/15/2050 | | | 7,219 | | | | 6,895 | |
| | | | | | | | |
| | | | | | | 484,698 | |
| | | | | | | | |
| | |
Materials – 1.0% | | | | | | | | |
Air Liquide Finance | | | | | | | | |
3.500%, 09/27/2046 (A) | | | 1,855 | | | | 2,234 | |
Air Products and Chemicals | | | | | | | | |
2.700%, 05/15/2040 | | | 695 | | | | 753 | |
BHP Billiton Finance USA | | | | | | | | |
6.420%, 03/01/2026 | | | 1,400 | | | | 1,768 | |
5.000%, 09/30/2043 | | | 6,700 | | | | 9,792 | |
Ecolab | | | | | | | | |
5.500%, 12/08/2041 | | | 3,257 | | | | 4,681 | |
International Flavors & Fragrances | | | | | | | | |
5.000%, 09/26/2048 | | | 1,585 | | | | 2,115 | |
International Paper | | | | | | | | |
8.700%, 06/15/2038 | | | 1,000 | | | | 1,617 | |
LYB International Finance III LLC | | | | | | | | |
3.625%, 04/01/2051 | | | 4,255 | | | | 4,602 | |
Nutrition & Biosciences | | | | | | | | |
3.468%, 12/01/2050 (A) | | | 3,215 | | | | 3,512 | |
Rio Tinto Finance USA | | | | | | | | |
5.200%, 11/02/2040 | | | 4,202 | | | | 6,092 | |
4.125%, 08/21/2042 | | | 3,175 | | | | 4,116 | |
Sherwin-Williams | | | | | | | | |
3.300%, 05/15/2050 | | | 295 | | | | 334 | |
Vale | | | | | | | | |
5.625%, 09/11/2042 | | | 840 | | | | 1,095 | |
Vale Canada | | | | | | | | |
7.200%, 09/15/2032 | | | 310 | | | | 413 | |
Vale Overseas | | | | | | | | |
6.875%, 11/21/2036 | | | 1,150 | | | | 1,630 | |
| | | | | | | | |
| | | |
| Description | | Face Amount
(Thousands) | | | Market Value ($ Thousands) | |
|
CORPORATE OBLIGATIONS (continued) | |
6.875%, 11/10/2039 | | $ | 823 | | | $ | 1,186 | |
| | | | | | | | |
| | | | | | | 45,940 | |
| | | | | | | | |
| | |
Real Estate – 1.3% | | | | | | | | |
AvalonBay Communities MTN | | | | | | | | |
4.350%, 04/15/2048 | | | 220 | | | | 283 | |
4.150%, 07/01/2047 | | | 1,200 | | | | 1,505 | |
Brixmor Operating Partnership | | | | | | | | |
4.050%, 07/01/2030 | | | 2,115 | | | | 2,384 | |
Camden Property Trust | | | | | | | | |
3.350%, 11/01/2049 | | | 2,135 | | | | 2,367 | |
Crown Castle Towers LLC | | | | | | | | |
3.663%, 05/15/2025 (A) | | | 2,925 | | | | 3,146 | |
CyrusOne | | | | | | | | |
3.450%, 11/15/2029 | | | 2,800 | | | | 2,995 | |
ERP Operating | | | | | | | | |
4.500%, 06/01/2045 | | | 1,450 | | | | 1,898 | |
4.000%, 08/01/2047 | | | 1,525 | | | | 1,864 | |
GLP Capital | | | | | | | | |
5.750%, 06/01/2028 | | | 5 | | | | 6 | |
5.300%, 01/15/2029 | | | 1,070 | | | | 1,228 | |
4.000%, 01/15/2030 | | | 50 | | | | 54 | |
4.000%, 01/15/2031 | | | 500 | | | | 541 | |
Healthcare Realty Trust | | | | | | | | |
2.400%, 03/15/2030 | | | 205 | | | | 212 | |
National Retail Properties | | | | | | | | |
3.100%, 04/15/2050 | | | 175 | | | | 163 | |
Nationwide Health Properties MTN | | | | | | | | |
6.900%, 10/01/2037 | | | 1,600 | | | | 2,020 | |
Prologis | | | | | | | | |
3.000%, 04/15/2050 | | | 2,775 | | | | 3,075 | |
Realty Income | | | | | | | | |
4.650%, 03/15/2047 | | | 2,655 | | | | 3,575 | |
Regency Centers | | | | | | | | |
4.650%, 03/15/2049 | | | 1,656 | | | | 1,965 | |
4.400%, 02/01/2047 | | | 620 | | | | 705 | |
Simon Property Group LP | | | | | | | | |
6.750%, 02/01/2040 | | | 3,865 | | | | 5,547 | |
4.250%, 11/30/2046 | | | 2,770 | | | | 3,115 | |
3.800%, 07/15/2050 | | | 4,515 | | | | 4,867 | |
3.250%, 09/13/2049 | | | 4,790 | | | | 4,692 | |
2.650%, 07/15/2030 | | | 6,890 | | | | 7,235 | |
Ventas Realty | | | | | | | | |
5.700%, 09/30/2043 | | | 2,007 | | | | 2,582 | |
4.875%, 04/15/2049 | | | 245 | | | | 303 | |
Welltower | | | | | | | | |
5.125%, 03/15/2043 | | | 1,085 | | | | 1,307 | |
4.950%, 09/01/2048 | | | 600 | | | | 771 | |
| | | | | | | | |
| | | | | | | 60,405 | |
| | | | | | | | |
| | |
204 | | SEI Institutional Investments Trust / Semi-Annual Report / November 30, 2020 |
| | | | | | | | | | |
| | | |
| Description | | Face Amount (Thousands) | | Market Value ($ Thousands) |
|
CORPORATE OBLIGATIONS (continued) | |
| | |
Utilities – 16.0% | | | | | | | | | | |
AEP Texas | | | | | | | | | | |
4.150%, 05/01/2049 | | | $ | 2,725 | | | | $ | 3,357 | |
AEP Transmission LLC | | | | | | | | | | |
4.000%, 12/01/2046 | | | | 5,703 | | | | | 7,130 | |
3.800%, 06/15/2049 | | | | 2,575 | | | | | 3,175 | |
3.650%, 04/01/2050 | | | | 1,430 | | | | | 1,744 | |
Alabama Power | | | | | | | | | | |
5.500%, 03/15/2041 | | | | 648 | | | | | 909 | |
5.200%, 06/01/2041 | | | | 155 | | | | | 212 | |
4.300%, 07/15/2048 | | | | 2,300 | | | | | 3,094 | |
4.150%, 08/15/2044 | | | | 135 | | | | | 171 | |
3.850%, 12/01/2042 | | | | 6,767 | | | | | 8,309 | |
Ameren Illinois | | | | | | | | | | |
3.700%, 12/01/2047 | | | | 6,120 | | | | | 7,550 | |
3.250%, 03/15/2050 | | | | 60 | | | | | 69 | |
American Water Capital | | | | | | | | | | |
4.150%, 06/01/2049 | | | | 1,390 | | | | | 1,830 | |
3.750%, 09/01/2047 | | | | 1,950 | | | | | 2,391 | |
3.450%, 05/01/2050 | | | | 20 | | | | | 24 | |
Appalachian Power | | | | | | | | | | |
6.700%, 08/15/2037 | | | | 50 | | | | | 71 | |
5.800%, 10/01/2035 | | | | 125 | | | | | 173 | |
4.600%, 03/30/2021 | | | | 70 | | | | | 70 | |
4.500%, 03/01/2049 | | | | 500 | | | | | 645 | |
Arizona Public Service | | | | | | | | | | |
5.050%, 09/01/2041 | | | | 50 | | | | | 68 | |
4.500%, 04/01/2042 | | | | 12 | | | | | 15 | |
4.350%, 11/15/2045 | | | | 1,735 | | | | | 2,267 | |
Atmos Energy | | | | | | | | | | |
4.125%, 10/15/2044 | | | | 4,005 | | | | | 5,048 | |
4.125%, 03/15/2049 | | | | 3,010 | | | | | 3,889 | |
Avista | | | | | | | | | | |
4.350%, 06/01/2048 | | | | 1,785 | | | | | 2,280 | |
Baltimore Gas & Electric | | | | | | | | | | |
5.200%, 06/15/2033 | | | | 1,525 | | | | | 1,891 | |
3.500%, 08/15/2046 | | | | 4,230 | | | | | 4,942 | |
2.900%, 06/15/2050 | | | | 1,350 | | | | | 1,441 | |
Berkshire Hathaway Energy | | | | | | | | | | |
6.125%, 04/01/2036 | | | | 1,472 | | | | | 2,205 | |
4.450%, 01/15/2049 | | | | 4,860 | | | | | 6,565 | |
4.250%, 10/15/2050 (A) | | | | 5,100 | | | | | 6,649 | |
3.800%, 07/15/2048 | | | | 9,970 | | | | | 12,212 | |
Black Hills | | | | | | | | | | |
4.350%, 05/01/2033 | | | | 75 | | | | | 90 | |
4.200%, 09/15/2046 | | | | 1,135 | | | | | 1,367 | |
3.875%, 10/15/2049 | | | | 30 | | | | | 34 | |
Boston Gas | | | | | | | | | | |
4.487%, 02/15/2042 (A) | | | | 3,472 | | | | | 4,411 | |
Brooklyn Union Gas | | | | | | | | | | |
4.273%, 03/15/2048 (A) | | | | 2,050 | | | | | 2,610 | |
| | | | | | | | | | |
| | | |
| Description | | Face Amount (Thousands) | | Market Value ($ Thousands) |
|
CORPORATE OBLIGATIONS (continued) | |
CenterPoint Energy Houston Electric LLC | | | | | | | | | | |
4.500%, 04/01/2044 | | | $ | 500 | | | | $ | 663 | |
4.250%, 02/01/2049 | | | | 2,260 | | | | | 3,011 | |
3.950%, 03/01/2048 | | | | 500 | | | | | 640 | |
2.900%, 07/01/2050 | | | | 1,090 | | | | | 1,188 | |
CenterPoint Energy Resources | | | | | | | | | | |
6.250%, 02/01/2037 | | | | 1,095 | | | | | 1,463 | |
Cleco Power | | | | | | | | | | |
6.000%, 12/01/2040 | | | | 1,150 | | | | | 1,547 | |
Commonwealth Edison | | | | | | | | | | |
4.700%, 01/15/2044 | | | | 6,023 | | | | | 8,195 | |
4.600%, 08/15/2043 | | | | 2,070 | | | | | 2,781 | |
4.000%, 03/01/2048 | | | | 3,260 | | | | | 4,158 | |
4.000%, 03/01/2049 | | | | 1,480 | | | | | 1,899 | |
3.750%, 08/15/2047 | | | | 6,765 | | | | | 8,324 | |
3.700%, 03/01/2045 | | | | 9,705 | | | | | 11,698 | |
Connecticut Light & Power | | | | | | | | | | |
4.150%, 06/01/2045 | | | | 3,850 | | | | | 4,942 | |
4.000%, 04/01/2048 | | | | 4,827 | | | | | 6,276 | |
Consolidated Edison of New York | | | | | | | | | | |
6.750%, 04/01/2038 | | | | 1,915 | | | | | 3,008 | |
6.200%, 06/15/2036 | | | | 65 | | | | | 93 | |
5.700%, 06/15/2040 | | | | 40 | | | | | 56 | |
5.500%, 12/01/2039 | | | | 75 | | | | | 105 | |
4.650%, 12/01/2048 | | | | 2,060 | | | | | 2,780 | |
4.625%, 12/01/2054 | | | | 2,685 | | | | | 3,642 | |
4.500%, 05/15/2058 | | | | 930 | | | | | 1,258 | |
4.450%, 03/15/2044 | | | | 650 | | | | | 830 | |
4.125%, 05/15/2049 | | | | 770 | | | | | 968 | |
4.000%, 11/15/2057 | | | | 1,915 | | | | | 2,333 | |
3.950%, 03/01/2043 | | | | 5,840 | | | | | 6,982 | |
3.950%, 04/01/2050 | | | | 40 | | | | | 50 | |
3.875%, 06/15/2047 | | | | 6,733 | | | | | 8,059 | |
3.850%, 06/15/2046 | | | | 4,557 | | | | | 5,454 | |
3.700%, 11/15/2059 | | | | 2,350 | | | | | 2,751 | |
3.000%, 12/01/2060 | | | | 505 | | | | | 518 | |
Consumers Energy | | | | | | | | | | |
4.350%, 04/15/2049 | | | | 4,893 | | | | | 6,658 | |
3.500%, 08/01/2051 | | | | 1,505 | | | | | 1,840 | |
3.100%, 08/15/2050 | | | | 830 | | | | | 959 | |
2.500%, 05/01/2060 | | | | 980 | | | | | 989 | |
Dominion Energy | | | | | | | | | | |
5.250%, 08/01/2033 | | | | 20 | | | | | 26 | |
Dominion Energy South Carolina | | | | | | | | | | |
5.100%, 06/01/2065 | | | | 1,705 | | | | | 2,689 | |
DTE Electric | | | | | | | | | | |
3.950%, 06/15/2042 | | | | 80 | | | | | 95 | |
3.900%, 06/01/2021 | | | | 30 | | | | | 30 | |
3.700%, 03/15/2045 | | | | 5,565 | | | | | 6,730 | |
Duke Energy Carolinas LLC | | | | | | | | | | |
6.450%, 10/15/2032 | | | | 110 | | | | | 157 | |
6.100%, 06/01/2037 | | | | 1,910 | | | | | 2,862 | |
| | |
SEI Institutional Investments Trust / Semi-Annual Report / November 30, 2020 | | 205 |
SCHEDULE OF INVESTMENTS (Unaudited)
November 30, 2020
Long Duration Credit Fund (Continued)
| | | | | | | | | | |
| | | |
| Description | | Face Amount
(Thousands) | | Market Value ($ Thousands) |
|
CORPORATE OBLIGATIONS (continued) | |
6.050%, 04/15/2038 | | | $ | 2,285 | | | | $ | 3,456 | |
6.000%, 01/15/2038 | | | | 3,366 | | | | | 5,054 | |
5.300%, 02/15/2040 | | | | 6,675 | | | | | 9,516 | |
4.250%, 12/15/2041 | | | | 2,400 | | | | | 3,058 | |
4.000%, 09/30/2042 | | | | 13,515 | | | | | 16,655 | |
3.875%, 03/15/2046 | | | | 2,170 | | | | | 2,673 | |
3.750%, 06/01/2045 | | | | 200 | | | | | 244 | |
3.700%, 12/01/2047 | | | | 3,360 | | | | | 4,102 | |
Duke Energy Florida LLC | | | | | | | | | | |
6.400%, 06/15/2038 | | | | 2,975 | | | | | 4,636 | |
4.200%, 07/15/2048 | | | | 1,030 | | | | | 1,350 | |
3.400%, 10/01/2046 | | | | 1,505 | | | | | 1,752 | |
Duke Energy Florida Project Finance LLC | | | | | | | | | | |
3.112%, 09/01/2036 | | | | 4,425 | | | | | 4,836 | |
Duke Energy Indiana LLC | | | | | | | | | | |
6.450%, 04/01/2039 | | | | 4,275 | | | | | 6,662 | |
6.350%, 08/15/2038 | | | | 1,935 | | | | | 2,959 | |
4.900%, 07/15/2043 | | | | 960 | | | | | 1,304 | |
3.750%, 05/15/2046 | | | | 1,750 | | | | | 2,107 | |
3.250%, 10/01/2049 | | | | 2,170 | | | | | 2,495 | |
2.750%, 04/01/2050 | | | | 1,927 | | | | | 2,050 | |
Duke Energy Ohio | | | | | | | | | | |
4.300%, 02/01/2049 | | | | 2,120 | | | | | 2,799 | |
2.125%, 06/01/2030 | | | | 1,025 | | | | | 1,077 | |
Duke Energy Progress LLC | | | | | | | | | | |
4.375%, 03/30/2044 | | | | 2,880 | | | | | 3,766 | |
4.200%, 08/15/2045 | | | | 4,400 | | | | | 5,653 | |
4.150%, 12/01/2044 | | | | 1,250 | | | | | 1,591 | |
4.100%, 05/15/2042 | | | | 530 | | | | | 670 | |
4.100%, 03/15/2043 | | | | 860 | | | | | 1,076 | |
3.700%, 10/15/2046 | | | | 650 | | | | | 788 | |
3.600%, 09/15/2047 | | | | 1,850 | | | | | 2,217 | |
East Ohio Gas | | | | | | | | | | |
3.000%, 06/15/2050 (A) | | | | 1,720 | | | | | 1,877 | |
Electricite de France | | | | | | | | | | |
6.000%, 01/22/2114 (A) | | | | 3,237 | | | | | 4,665 | |
5.000%, 09/21/2048 (A) | | | | 2,415 | | | | | 3,233 | |
4.950%, 10/13/2045 (A) | | | | 1,820 | | | | | 2,361 | |
Elm Road Generating Station Supercritical | | | | | | | | | | |
5.848%, 01/19/2041 (A) | | | | 1,000 | | | | | 1,258 | |
Entergy Louisiana LLC | | | | | | | | | | |
4.200%, 09/01/2048 | | | | 2,440 | | | | | 3,177 | |
4.200%, 04/01/2050 | | | | 2,290 | | | | | 2,979 | |
4.000%, 03/15/2033 | | | | 1,580 | | | | | 1,977 | |
2.900%, 03/15/2051 | | | | 2,980 | | | | | 3,235 | |
Essential Utilities | | | | | | | | | | |
4.276%, 05/01/2049 | | | | 1,145 | | | | | 1,458 | |
Evergy Kansas Central | | | | | | | | | | |
3.450%, 04/15/2050 | | | | 1,430 | | | | | 1,676 | |
Evergy Metro | | | | | | | | | | |
5.300%, 10/01/2041 | | | | 150 | | | | | 203 | |
4.200%, 06/15/2047 | | | | 500 | | | | | 632 | |
| | | | | | | | | | |
| | | |
| Description | | Face Amount (Thousands) | | Market Value ($ Thousands) |
|
CORPORATE OBLIGATIONS (continued) | |
4.200%, 03/15/2048 | | | $ | 1,000 | | | | $ | 1,266 | |
Exelon | | | | | | | | | | |
4.950%, 06/15/2035 | | | | 1,760 | | | | | 2,239 | |
Florida Power & Light | | | | | | | | | | |
5.960%, 04/01/2039 | | | | 2,520 | | | | | 3,832 | |
5.690%, 03/01/2040 | | | | 4,978 | | | | | 7,426 | |
5.650%, 02/01/2037 | | | | 1,000 | | | | | 1,436 | |
4.050%, 06/01/2042 | | | | 2,770 | | | | | 3,513 | |
4.050%, 10/01/2044 | | | | 2,715 | | | | | 3,519 | |
3.990%, 03/01/2049 | | | | 1,975 | | | | | 2,584 | |
3.950%, 03/01/2048 | | | | 4,130 | | | | | 5,466 | |
3.800%, 12/15/2042 | | | | 3,935 | | | | | 4,868 | |
3.700%, 12/01/2047 | | | | 600 | | | | | 749 | |
3.150%, 10/01/2049 | | | | 2,375 | | | | | 2,791 | |
Georgia Power | | | | | | | | | | |
4.300%, 03/15/2042 | | | | 6,235 | | | | | 7,825 | |
4.300%, 03/15/2043 | | | | 2,945 | | | | | 3,698 | |
3.700%, 01/30/2050 | | | | 2,545 | | | | | 3,078 | |
Gulf Power | | | | | | | | | | |
4.550%, 10/01/2044 | | | | 700 | | | | | 852 | |
Idaho Power | | | | | | | | | | |
4.200%, 03/01/2048 | | | | 2,010 | | | | | 2,594 | |
Indiana Michigan Power | | | | | | | | | | |
4.550%, 03/15/2046 | | | | 780 | | | | | 1,030 | |
4.250%, 08/15/2048 | | | | 1,340 | | | | | 1,715 | |
Indianapolis Power & Light | | | | | | | | | | |
4.700%, 09/01/2045 (A) | | | | 1,140 | | | | | 1,464 | |
4.650%, 06/01/2043 (A) | | | | 4,165 | | | | | 5,402 | |
International Transmission | | | | | | | | | | |
4.625%, 08/15/2043 | | | | 2,525 | | | | | 3,168 | |
Jersey Central Power & Light | | | | | | | | | | |
6.150%, 06/01/2037 | | | | 775 | | | | | 1,002 | |
John Sevier Combined Cycle Generation | | | | | | | | | | |
4.626%, 01/15/2042 | | | | 4,327 | | | | | 5,486 | |
KeySpan Gas East | | | | | | | | | | |
5.819%, 04/01/2041 (A) | | | | 2,117 | | | | | 2,998 | |
MidAmerican Energy | | | | | | | | | | |
4.800%, 09/15/2043 | | | | 5,260 | | | | | 7,144 | |
4.400%, 10/15/2044 | | | | 7,555 | | | | | 9,932 | |
4.250%, 05/01/2046 | | | | 2,775 | | | | | 3,577 | |
3.950%, 08/01/2047 | | | | 2,055 | | | | | 2,597 | |
3.650%, 08/01/2048 | | | | 3,955 | | | | | 4,856 | |
3.150%, 04/15/2050 | | | | 2,880 | | | | | 3,356 | |
MidAmerican Energy MTN | | | | | | | | | | |
5.800%, 10/15/2036 | | | | 635 | | | | | 932 | |
5.750%, 11/01/2035 | | | | 640 | | | | | 935 | |
Narragansett Electric | | | | | | | | | | |
4.170%, 12/10/2042 (A) | | | | 1,000 | | | | | 1,204 | |
Niagara Mohawk Power | | | | | | | | | | |
4.278%, 10/01/2034 (A) | | | | 4,503 | | | | | 5,610 | |
4.119%, 11/28/2042 (A) | | | | 2,000 | | | | | 2,469 | |
| | |
206 | | SEI Institutional Investments Trust / Semi-Annual Report / November 30, 2020 |
| | | | | | | | |
| | | |
| Description | | Face Amount (Thousands) | | | Market Value ($ Thousands) | |
|
CORPORATE OBLIGATIONS (continued) | |
NiSource | | | | | | | | |
5.950%, 06/15/2041 | | $ | 169 | | | $ | 242 | |
5.800%, 02/01/2042 | | | 900 | | | | 1,260 | |
3.600%, 05/01/2030 | | | 3,890 | | | | 4,510 | |
Northern States Power | | | | | | | | |
6.250%, 06/01/2036 | | | 3,755 | | | | 5,643 | |
6.200%, 07/01/2037 | | | 6,850 | | | | 10,459 | |
3.600%, 05/15/2046 | | | 500 | | | | 612 | |
3.400%, 08/15/2042 | | | 464 | | | | 542 | |
Oglethorpe Power | | | | | | | | |
5.375%, 11/01/2040 | | | 2,390 | | | | 2,999 | |
5.250%, 09/01/2050 | | | 860 | | | | 1,082 | |
4.250%, 04/01/2046 | | | 1,700 | | | | 1,792 | |
4.200%, 12/01/2042 | | | 3,690 | | | | 3,887 | |
Ohio Edison | | | | | | | | |
8.250%, 10/15/2038 | | | 655 | | | | 1,005 | |
Oklahoma Gas & Electric | | | | | | | | |
4.550%, 03/15/2044 | | | 1,395 | | | | 1,724 | |
Oncor Electric Delivery LLC | | | | | | | | |
5.350%, 10/01/2052 (A) | | | 946 | | | | 1,462 | |
5.300%, 06/01/2042 | | | 549 | | | | 782 | |
5.250%, 09/30/2040 | | | 4,606 | | | | 6,363 | |
4.550%, 12/01/2041 | | | 4,575 | | | | 5,953 | |
4.100%, 11/15/2048 | | | 750 | | | | 973 | |
3.800%, 06/01/2049 | | | 4,925 | | | | 6,200 | |
3.700%, 05/15/2050 | | | 2,120 | | | | 2,656 | |
3.100%, 09/15/2049 | | | 95 | | | | 108 | |
Pacific Gas and Electric | | | | | | | | |
3.750%, 08/15/2042 | | | 95 | | | | 95 | |
3.500%, 08/01/2050 | | | 1,325 | | | | 1,336 | |
3.300%, 08/01/2040 | | | 430 | | | | 432 | |
PacifiCorp | | | | | | | | |
6.250%, 10/15/2037 | | | 3,360 | | | | 5,026 | |
6.000%, 01/15/2039 | | | 4,755 | | | | 7,126 | |
4.100%, 02/01/2042 | | | 2,560 | | | | 3,140 | |
3.300%, 03/15/2051 | | | 820 | | | | 951 | |
PECO Energy | | | | | | | | |
4.800%, 10/15/2043 | | | 1,505 | | | | 2,001 | |
3.700%, 09/15/2047 | | | 800 | | | | 991 | |
Pennsylvania Electric | | | | | | | | |
6.150%, 10/01/2038 | | | 100 | | | | 124 | |
Piedmont Natural Gas | | | | | | | | |
4.650%, 08/01/2043 | | | 1,330 | | | | 1,725 | |
3.640%, 11/01/2046 | | | 1,300 | | | | 1,509 | |
Potomac Electric Power | | | | | | | | |
4.950%, 11/15/2043 | | | 950 | | | | 1,246 | |
PPL Electric Utilities | | | | | | | | |
4.750%, 07/15/2043 | | | 3,600 | | | | 4,804 | |
4.125%, 06/15/2044 | | | 1,925 | | | | 2,415 | |
3.950%, 06/01/2047 | | | 3,925 | | | | 4,894 | |
Public Service Electric & Gas MTN | | | | | | | | |
4.050%, 05/01/2048 | | | 2,176 | | | | 2,854 | |
| | | | | | | | |
| | | |
| Description | | Face Amount
(Thousands) | | Market Value ($ Thousands) |
|
CORPORATE OBLIGATIONS (continued) | |
4.000%, 06/01/2044 | | $ | 695 | | | $ | 850 | |
3.800%, 01/01/2043 | | | 2,000 | | | | 2,458 | |
3.800%, 03/01/2046 | | | 2,200 | | | | 2,724 | |
3.650%, 09/01/2042 | | | 1,600 | | | | 1,926 | |
3.600%, 12/01/2047 | | | 4,750 | | | | 5,776 | |
3.200%, 08/01/2049 | | | 4,175 | | | | 4,841 | |
Public Service of Colorado | | | | | | | | |
6.500%, 08/01/2038 | | | 50 | | | | 78 | |
6.250%, 09/01/2037 | | | 1,615 | | | | 2,473 | |
4.750%, 08/15/2041 | | | 50 | | | | 65 | |
4.300%, 03/15/2044 | | | 1,865 | | | | 2,443 | |
4.050%, 09/15/2049 | | | 1,880 | | | | 2,465 | |
3.950%, 03/15/2043 | | | 5,540 | | | | 6,657 | |
3.200%, 03/01/2050 | | | 1,480 | | | | 1,717 | |
Public Service of New Hampshire | | | | | | | | |
3.600%, 07/01/2049 | | | 2,230 | | | | 2,709 | |
Public Service of Oklahoma | | | | | | | | |
4.400%, 02/01/2021 | | | 27 | | | | 27 | |
Puget Sound Energy | | | | | | | | |
5.795%, 03/15/2040 | | | 130 | | | | 187 | |
4.223%, 06/15/2048 | | | 2,470 | | | | 3,180 | |
San Diego Gas & Electric | | | | | | | | |
6.000%, 06/01/2026 | | | 340 | | | | 423 | |
4.100%, 06/15/2049 | | | 2,440 | | | | 3,060 | |
3.750%, 06/01/2047 | | | 2,380 | | | | 2,838 | |
3.320%, 04/15/2050 | | | 5,679 | | | | 6,386 | |
Sempra Energy | | | | | | | | |
4.000%, 02/01/2048 | | | 1,110 | | | | 1,324 | |
Southern California Edison | | | | | | | | |
5.950%, 02/01/2038 | | | 280 | | | | 370 | |
4.650%, 10/01/2043 | | | 2,735 | | | | 3,406 | |
4.125%, 03/01/2048 | | | 6,720 | | | | 8,206 | |
4.050%, 03/15/2042 | | | 5,355 | | | | 6,057 | |
4.000%, 04/01/2047 | | | 3,395 | | | | 4,016 | |
3.650%, 03/01/2028 | | | 3,165 | | | | 3,542 | |
3.650%, 02/01/2050 | | | 1,360 | | | | 1,582 | |
Southern California Gas | | | | | | | | |
4.300%, 01/15/2049 | | | 1,540 | | | | 2,031 | |
4.125%, 06/01/2048 | | | 4,025 | | | | 5,141 | |
3.750%, 09/15/2042 | | | 2,905 | | | | 3,468 | |
2.550%, 02/01/2030 | | | 1,510 | | | | 1,629 | |
Southern Gas Capital | | | | | | | | |
4.400%, 06/01/2043 | | | 825 | | | | 1,007 | |
4.400%, 05/30/2047 | | | 50 | | | | 62 | |
3.950%, 10/01/2046 | | | 490 | | | | 586 | |
Southwest Gas | | | | | | | | |
3.800%, 09/29/2046 | | | 1,065 | | | | 1,207 | |
Southwestern Electric Power | | | | | | | | |
6.200%, 03/15/2040 | | | 1,204 | | | | 1,747 | |
3.850%, 02/01/2048 | | | 3,505 | | | | 4,074 | |
Southwestern Public Service | | | | | | | | |
4.500%, 08/15/2041 | | | 10,725 | | | | 13,779 | |
| | |
SEI Institutional Investments Trust / Semi-Annual Report / November 30, 2020 | | 207 |
SCHEDULE OF INVESTMENTS (Unaudited)
November 30, 2020
Long Duration Credit Fund (Continued)
| | | | | | | | |
| | | |
| Description | | Face Amount (Thousands) | | Market Value ($ Thousands) |
|
CORPORATE OBLIGATIONS (continued) | |
3.700%, 08/15/2047 | | $ | 2,620 | | | $ | 3,109 | |
Tampa Electric | | | | | | | | |
4.350%, 05/15/2044 | | | 1,225 | | | | 1,545 | |
3.625%, 06/15/2050 | | | 4,020 | | | | 4,788 | |
Tucson Electric Power | | | | | | | | |
4.850%, 12/01/2048 | | | 2,380 | | | | 3,186 | |
4.000%, 06/15/2050 | | | 1,275 | | | | 1,579 | |
Virginia Electric & Power | | | | | | | | |
8.875%, 11/15/2038 | | | 1,982 | | | | 3,660 | |
6.350%, 11/30/2037 | | | 920 | | | | 1,380 | |
4.650%, 08/15/2043 | | | 4,010 | | | | 5,486 | |
4.600%, 12/01/2048 | | | 3,310 | | | | 4,774 | |
4.450%, 02/15/2044 | | | 6,250 | | | | 8,497 | |
4.000%, 01/15/2043 | | | 300 | | | | 379 | |
4.000%, 11/15/2046 | | | 1,720 | | | | 2,292 | |
Wisconsin Electric Power | | | | | | | | |
3.650%, 12/15/2042 | | | 2,310 | | | | 2,605 | |
2.950%, 09/15/2021 | | | 3 | | | | 3 | |
Wisconsin Power & Light | | | | | | | | |
4.100%, 10/15/2044 | | | 325 | | | | 391 | |
3.650%, 04/01/2050 | | | 640 | | | | 767 | |
Wisconsin Public Service | | | | | | | | |
4.752%, 11/01/2044 | | | 1,725 | | | | 2,306 | |
Xcel Energy | | | | | | | | |
4.800%, 09/15/2041 | | | 1,707 | | | | 2,166 | |
| | | | | | | | |
| | | | | | | 729,858 | |
| | | | | | | | |
| |
Total Corporate Obligations
(Cost $3,347,553) ($ Thousands) | | | | 4,016,286 | |
| | | | | | | | |
| | |
MUNICIPAL BONDS – 6.0% | | | | | | | | |
| | |
Alabama – 0.0% | | | | | | | | |
Alabama State, Economic Settlement
Authority, Ser B, RB | | | | | | | | |
4.263%, 09/15/2032 | | | 1,010 | | | | 1,202 | |
| | | | | | | | |
| | |
California – 2.7% | | | | | | | | |
Bay Area, Toll Authority, Build America
Project, RB | | | | | |
6.263%, 04/01/2049 | | | 2,545 | | | | 4,399 | |
California State University, Ser B, RB
Callable 05/01/2047 @ 100 | | | | | |
3.899%, 11/01/2047 | | | 2,375 | | | | 2,827 | |
California State, Build America Project, GO | | | | | |
7.625%, 03/01/2040 | | | 1,870 | | | | 3,245 | |
7.600%, 11/01/2040 | | | 410 | | | | 741 | |
7.550%, 04/01/2039 | | | 1,635 | | | | 2,854 | |
7.500%, 04/01/2034 | | | 17,085 | | | | 28,111 | |
7.300%, 10/01/2039 | | | 12,750 | | | | 20,981 | |
| | | | | | | | | | |
| | | |
| Description | | Face Amount
(Thousands) | | Market Value ($ Thousands) |
|
MUNICIPAL BONDS (continued) | |
California State, GO
Callable 04/01/2028 @ 100 | | | | | | | | | | |
4.500%, 04/01/2033 | | | $ | 2,000 | | | | $ | 2,373 | |
East Bay, Municipal Utility District Water System Revenue, RB | | | | | | | | | | |
5.874%, 06/01/2040 | | | | 1,255 | | | | | 1,887 | |
Los Angeles County, Metropolitan Transportation Authority, RB | | | | | | | | | | |
5.735%, 06/01/2039 | | | | 960 | | | | | 1,315 | |
Los Angeles, Community College District, Build America Project, GO | | | | | | | | | | |
6.750%, 08/01/2049 | | | | 1,025 | | | | | 1,837 | |
Los Angeles, Community College District,Ser D, GO | | | | | | | | | | |
6.680%, 08/01/2036 | | | | 500 | | | | | 790 | |
Los Angeles, Department of Airports, RB | | | | | | | | | | |
3.887%, 05/15/2038 | | | | 1,430 | | | | | 1,674 | |
Los Angeles, Department of Water & Power, RB | | | | | | | | | | |
5.716%, 07/01/2039 | | | | 1,510 | | | | | 2,231 | |
Los Angeles, Department of Water & Power, Ser C, RB | | | | | | | | | | |
5.516%, 07/01/2027 | | | | 955 | | | | | 1,205 | |
Los Angeles, Unified School District, Build America Project, GO | | | | | | | | | | |
5.750%, 07/01/2034 | | | | 2,235 | | | | | 3,079 | |
Los Angeles, Unified School District, Build America Project, Ser RY, GO | | | | | | | | | | |
6.758%, 07/01/2034 | | | | 6,000 | | | | | 8,827 | |
Los Angeles, Unified School District, GO | | | | | | | | | | |
5.755%, 07/01/2029 | | | | 1,000 | | | | | 1,271 | |
Regents of the University of California Medical Center, Pooled Revenue, Ser N, RB Callable 11/15/2049 @ 100 | | | | | | | | | | |
3.006%, 05/15/2050 | | | | 2,005 | | | | | 2,148 | |
Regents of the University of California, Ser N, RB Callable 11/15/2059 @ 100 | | | | | | | | | | |
3.256%, 05/15/2060 | | | | 1,995 | | | | | 2,162 | |
San Diego County, Water Authority, Build America Project, RB | | | | | | | | | | |
6.138%, 05/01/2049 | | | | 1,980 | | | | | 3,181 | |
San Francisco Bay Area, Rapid Transit District, Ser C-1, GO Callable 08/01/2029 @ 100 | | | | | | | | | | |
3.000%, 08/01/2050 | | | | 830 | | | | | 894 | |
San Francisco, City & County Airport, Build America Project, Ser A, AMT, RB Callable 05/01/2029 @ 100 | | | | | | | | | | |
5.000%, 05/01/2049 | | | | 1,050 | | | | | 1,288 | |
| | |
208 | | SEI Institutional Investments Trust / Semi-Annual Report / November 30, 2020 |
| | | | | | | | |
| | | |
| Description | | Face Amount
(Thousands) | | | Market Value ($ Thousands) | |
|
MUNICIPAL BONDS (continued) | |
San Francisco, Public Utilities Commission, Water Revenue, Build America Project, Ser DE, RB | | | | | | | | |
6.000%, 11/01/2040 | | $ | 1,000 | | | $ | 1,419 | |
San Francisco, Public Utilities Commission, Water Revenue, Ser E, RB Callable 11/01/2030 @ 100 | | | | | | | | |
2.825%, 11/01/2041 | | | 855 | | | | 875 | |
San Jose, Redevelopment Agency, Ser A-T, TA Callable 08/01/2027 @ 100 | | | | | | | | |
3.375%, 08/01/2034 | | | 1,250 | | | | 1,344 | |
Santa Clara Valley, Transportation Authority, Build America Project, RB | | | | | | | | |
5.876%, 04/01/2032 | | | 1,000 | | | | 1,285 | |
University of California, RB | | | | | | | | |
5.946%, 05/15/2045 | | | 3,000 | | | | 4,340 | |
5.770%, 05/15/2043 | | | 4,850 | | | | 6,975 | |
University of California, Ser AP, RB | | | | | | | | |
3.931%, 05/15/2045 | | | 950 | | | | 1,105 | |
University of California, Ser AQ, RB | | | | | | | | |
4.767%, 05/15/2115 | | | 2,701 | | | | 3,715 | |
University of California, Ser J, RB | | | | | | | | |
4.131%, 05/15/2045 | | | 1,000 | | | | 1,204 | |
| | | | | | | | |
| | |
| | | | | | | 121,582 | |
| | | | | | | | |
| | |
District of Columbia – 0.0% | | | | | | | | |
District of Columbia, Water & Sewer Authority, RB | | | | | | | | |
4.814%, 10/01/2114 | | | 530 | | | | 780 | |
| | | | | | | | |
| | |
Florida – 0.1% | | | | | | | | |
Florida State, Board of Administration Finance, Ser A, RB | | | | | | | | |
2.154%, 07/01/2030 | | | 6,120 | | | | 6,382 | |
| | | | | | | | |
| | |
Georgia – 0.1% | | | | | | | | |
Georgia State, Municipal Electric Authority, Build America Project, RB | | | | | | | | |
7.055%, 04/01/2057 | | | 2,200 | | | | 3,151 | |
6.637%, 04/01/2057 | | | 983 | | | | 1,475 | |
| | | | | | | | |
| | |
| | | | | | | 4,626 | |
| | | | | | | | |
| | |
Illinois – 0.1% | | | | | | | | |
Greater Chicago, Metropolitan Water Reclamation District, GO | | | | | | | | |
5.720%, 12/01/2038 | | | 3,205 | | | | 4,543 | |
| | | | | | | | |
| | |
Kansas – 0.1% | | | | | | | | |
Kansas State, Development Finance Authority, Ser H, RB | | | | | | | | |
4.727%, 04/15/2037 | | | 2,310 | | | | 2,924 | |
| | | | | | | | |
| | | | | | | | |
| | | |
| Description | | Face Amount
(Thousands) | | | Market Value ($ Thousands) | |
|
MUNICIPAL BONDS (continued) | |
Maryland – 0.0% | | | | | | | | |
Baltimore, Revenue Authority, Water Project, Ser B, RB Callable 07/01/2030 @ 100 | | | | | | | | |
2.814%, 07/01/2040 | | $ | 890 | | | $ | 911 | |
| | | | | | | | |
| | |
Massachusetts – 0.2% | | | | | | | | |
Massachusetts State, Build America Project, GO | | | | | | | | |
5.456%, 12/01/2039 | | | 4,085 | | | | 5,763 | |
Massachusetts State, Educational Financing Authority, Ser A, RB | | | | | | | | |
3.105%, 07/01/2030 | | | 1,695 | | | | 1,718 | |
Massachusetts State, Ser C, GO Callable 03/01/2030 @ 100 | | | | | | | | |
3.000%, 03/01/2048 | | | 620 | | | | 676 | |
| | | | | | | | |
| | |
| | | | | | | 8,157 | |
| | | | | | | | |
| | |
Michigan – 0.0% | | | | | | | | |
Michigan State University, Build America Project, RB Callable 02/15/2030 @ 100 | | | | | | | | |
6.173%, 02/15/2050 | | | 850 | | | | 1,072 | |
| | | | | | | | |
| | |
Missouri – 0.1% | | | | | | | | |
Missouri State, Health & Educational Facilities Authority, RB | | | | | | | | |
3.086%, 09/15/2051 | | | 1,555 | | | | 1,741 | |
Missouri State, Health & Educational Facilities Authority, Ser A, RB | | | | | | | | |
3.685%, 02/15/2047 | | | 675 | | | | 826 | |
| | | | | | | | |
| | |
| | | | | | | 2,567 | |
| | | | | | | | |
| | |
New Jersey – 0.2% | | | | | | | | |
New Jersey State, Turnpike Authority, Build America Project, RB | | | | | | | | |
7.414%, 01/01/2040 | | | 985 | | | | 1,650 | |
7.102%, 01/01/2041 | | | 2,460 | | | | 4,009 | |
New Jersey State, Turnpike Authority, Ser F, RB | | | | | | | | |
3.729%, 01/01/2036 | | | 2,000 | | | | 2,357 | |
| | | | | | | | |
| | |
| | | | | | | 8,016 | |
| | | | | | | | |
| | |
New York – 1.0% | | | | | | | | |
Metropolitan Transportation Authority, Build America Project, RB | | | | | | | | |
6.548%, 11/15/2031 | | | 1,210 | | | | 1,433 | |
New York & New Jersey, Port Authority, RB | | | | | | | | |
4.926%, 10/01/2051 | | | 245 | | | | 335 | |
4.458%, 10/01/2062 | | | 4,725 | | | | 6,156 | |
New York & New Jersey, Port Authority, Ser 181, RB | | | | | | | | |
4.960%, 08/01/2046 | | | 500 | | | | 673 | |
| | |
SEI Institutional Investments Trust / Semi-Annual Report / November 30, 2020 | | 209 |
SCHEDULE OF INVESTMENTS (Unaudited)
November 30, 2020
Long Duration Credit Fund (Continued)
| | | | | | | | |
| | | |
| Description | | Face Amount
(Thousands) | | Market Value
($ Thousands) |
|
MUNICIPAL BONDS (continued) | |
New York & New Jersey, Port Authority, Ser 20, RB | | | | | | | | |
4.229%, 10/15/2057 | | $ | 500 | | | $ | 624 | |
New York City, Build America Project, GO | | | | | | | | |
5.985%, 12/01/2036 | | | 1,340 | | | | 1,871 | |
5.206%, 10/01/2031 | | | 750 | | | | 937 | |
New York City, Municipal Water Finance Authority, Build America Project, RB | | | | | | | | |
6.011%, 06/15/2042 | | | 750 | | | | 1,193 | |
5.882%, 06/15/2044 | | | 500 | | | | 800 | |
5.724%, 06/15/2042 | | | 3,720 | | | | 5,727 | |
5.440%, 06/15/2043 | | | 3,000 | | | | 4,571 | |
New York City, Transitional Finance Authority, Build America Project, RB | | | | | | | | |
5.572%, 11/01/2038 | | | 2,475 | | | | 3,329 | |
New York City, Transitional Finance Authority, Future Tax Secured Revenue, RB | | | | | | | | |
5.767%, 08/01/2036 | | | 3,585 | | | | 4,685 | |
5.508%, 08/01/2037 | | | 1,890 | | | | 2,565 | |
5.267%, 05/01/2027 | | | 1,000 | | | | 1,222 | |
New York State, Dormitory Authority, Build America Project, RB | | | | | | | | |
5.289%, 03/15/2033 | | | 2,000 | | | | 2,488 | |
New York State, Dormitory Authority, Ser F, RB | | | | | | | | |
3.110%, 02/15/2039 | | | 4,220 | | | | 4,526 | |
3.057%, 02/15/2034 | | | 265 | | | | 289 | |
New York State, Environmental Facilities, Ser B, RB
Callable 06/15/2029 @ 100 | | | | | | | | |
4.000%, 06/15/2037 | | | 500 | | | | 606 | |
New York State, Urban Development, RB | | | | | | | | |
5.770%, 03/15/2039 | | | 1,970 | | | | 2,522 | |
| | | | | | | | |
| | |
| | | | | | | 46,552 | |
| | | | | | | | |
|
Ohio — 0.2% | |
JobsOhio Beverage System, Ser A, RB | | | | | | | | |
2.833%, 01/01/2038 | | | 460 | | | | 495 | |
Ohio State University, Build America Project, GO | | | | | | | | |
4.910%, 06/01/2040 | | | 2,265 | | | | 3,161 | |
Ohio State University, Ser A, RB | | | | | | | | |
4.048%, 12/01/2056 | | | 4,150 | | | | 5,358 | |
Ohio State, Hospital Facilities Revenue Authority, Cleveland Clinic, RB | | | | | | | | |
3.700%, 01/01/2043 | | | 970 | | | | 1,137 | |
2.885%, 01/01/2032 | | | 295 | | | | 328 | |
| | | | | | | | |
| | |
| | | | | | | 10,479 | |
| | | | | | | | |
| | | | | | | | |
| | | |
| Description | | Face Amount
(Thousands) | | Market Value
($ Thousands) |
|
MUNICIPAL BONDS (continued) | |
|
Pennsylvania — 0.1% | |
Pennsylvania State, Financing Authority, Ser A, RB | | | | | | | | |
4.144%, 06/01/2038 | | $ | 2,865 | | | $ | 3,421 | |
| | | | | | | | |
|
Texas — 0.9% | |
Dallas County, Hospital District, Build America Project, Ser C, GO | | | | | | | | |
5.621%, 08/15/2044 | | | 2,250 | | | | 3,297 | |
Dallas Fort Worth International Airport, Ser A, RB | | | | | | | | |
2.994%, 11/01/2038 | | | 4,095 | | | | 4,252 | |
Grand Parkway, Transportation Corp, Ser E, RB | | | | | | | | |
5.184%, 10/01/2042 | | | 1,350 | | | | 1,913 | |
Houston, GO | | | | | | | | |
3.961%, 03/01/2047 | | | 1,500 | | | | 1,858 | |
North Texas, Tollway Authority, Build America Project, RB | | | | | | | | |
6.718%, 01/01/2049 | | | 1,200 | | | | 2,079 | |
North Texas, Tollway Authority, RB
Callable 01/01/2029 @ 100 | | | | | | | | |
3.079%, 01/01/2042 | | | 1,170 | | | | 1,204 | |
Permanent University Fund - University of Texas, Ser A, RB | | | | | | | | |
3.500%, 08/15/2050 | | | 1,640 | | | | 2,079 | |
Permanent University Fund - University of Texas, Ser S, RB
Callable 01/01/2047 @ 100 | | | | | | | | |
3.376%, 07/01/2047 | | | 2,010 | | | | 2,420 | |
San Antonio, Electric & Gas Systems Revenue, RB | | | | | | | | |
5.808%, 02/01/2041 | | | 3,800 | | | | 5,733 | |
Texas State, Build America Project, GO | | | | | | | | |
5.517%, 04/01/2039 | | | 4,350 | | | | 6,412 | |
Texas State, Build America Project, Ser A, GO | | | | | | | | |
4.631%, 04/01/2033 | | | 1,500 | | | | 1,907 | |
Texas State, Private Activity Bond Surface Transportation, RB | | | | | | | | |
3.922%, 12/31/2049 | | | 1,050 | | | | 1,153 | |
Texas State, Transportation Commission State Highway Fund, Ser B, RB | | | | | | | | |
5.178%, 04/01/2030 | | | 1,000 | | | | 1,284 | |
University of Texas, RB | | | | | | | | |
5.262%, 07/01/2039 | | | 4,540 | | | | 6,634 | |
| | | | | | | | |
| | |
| | | | | | | 42,225 | |
| | | | | | | | |
|
Virginia — 0.0% | |
Virginia Commonwealth University, Health System Authority, Ser A, RB | | | | | | | | |
4.956%, 01/01/2044 | | | 475 | | | | 620 | |
| | | | | | | | |
| | |
210 | | SEI Institutional Investments Trust / Semi-Annual Report / November 30, 2020 |
| | | | | | | | |
| | | |
| Description | | Face Amount
(Thousands) | | Market Value
($ Thousands) |
|
MUNICIPAL BONDS (continued) | |
|
Washington — 0.2% | |
Washington State, Build America Project, GO | | | | | | | | |
5.140%, 08/01/2040 | | $ | 4,495 | | | $ | 6,591 | |
5.040%, 08/01/2031 | | | 1,260 | | | | 1,601 | |
| | | | | | | | |
| | |
| | | | | | | 8,192 | |
| | | | | | | | |
| | |
Total Municipal Bonds
(Cost $236,703) ($ Thousands) | | | | | | | 274,251 | |
| | | | | | | | |
|
U.S. TREASURY OBLIGATIONS — 3.8% | |
U.S. Treasury Bills | | | | | | | | |
0.128%, 01/21/2021 (B) | | | 2,215 | | | | 2,215 | |
0.113%, 01/12/2021 (B) | | | 3,245 | | | | 3,245 | |
0.112%, 01/28/2021 (B) | | | 1,940 | | | | 1,940 | |
U.S. Treasury Bonds | | | | | | | | |
1.625%, 11/15/2050 | | | 13,760 | | | | 13,938 | |
1.375%, 11/15/2040 | | | 11,555 | | | | 11,576 | |
1.375%, 08/15/2050 | | | 56,745 | | | | 54,032 | |
1.250%, 05/15/2050 | | | 51,695 | | | | 47,697 | |
1.125%, 08/15/2040 | | | 7,440 | | | | 7,140 | |
U.S. Treasury Inflation-Protected Securities | | | | | | | | |
1.000%, 02/15/2049 | | | 4,627 | | | | 6,484 | |
U.S. Treasury Notes | | | | | | | | |
0.875%, 11/15/2030 | | | 22,365 | | | | 22,438 | |
| | | | | | | | |
| | |
Total U.S. Treasury Obligations (Cost $170,271) ($ Thousands) | | | | | | | 170,705 | |
| | | | | | | | |
|
SOVEREIGN DEBT — 0.5% | |
Chile Government International Bond | | | | | | | | |
3.500%, 01/25/2050 | | | 10,875 | | | | 12,384 | |
Israel Government International Bond | | | | | | | | |
4.125%, 01/17/2048 | | | 1,515 | | | | 1,939 | |
3.875%, 07/03/2050 | | | 5,400 | | | | 6,452 | |
3.375%, 01/15/2050 | | | 845 | | | | 933 | |
Mexico Government International Bond | | | | | | | | |
5.750%, 10/12/2110 | | | 285 | | | | 356 | |
3.771%, 05/24/2061 | | | 775 | | | | 773 | |
Qatar Government International Bond | | | | | | | | |
4.400%, 04/16/2050 (A) | | | 810 | | | | 1,072 | |
| | | | | | | | |
| | |
Total Sovereign Debt
(Cost $22,081) ($ Thousands) | | | | | | | 23,909 | |
| | | | | | | | |
| | | | | | | | |
| | | |
| Description | | Face Amount
(Thousands) | | Market Value
($ Thousands) |
|
ASSET-BACKED SECURITY — 0.1% | |
|
Other Asset-Backed Securities — 0.1% | |
| | |
American Tower Trust I, Ser 2013-13, Cl 2A | | | | | | | | |
3.070%, 03/15/2048 (A) | | $ | 3,034 | | | $ | 3,096 | |
| | | | | | | | |
Total Asset-Backed Security
(Cost $2,964) ($ Thousands) | | | | | | | 3,096 | |
| | | | | | | | |
| | | Shares | | | | | |
| | | | | | | | |
|
CASH EQUIVALENT — 0.5% | |
SEI Daily Income Trust, Government Fund, Cl F | | | | | | | | |
0.010%**† | | | 22,942,774 | | | | 22,943 | |
| | | | | | | | |
| |
Total Cash Equivalent
(Cost $22,943) ($ Thousands) | | | | 22,943 | |
| | | | | | | | |
| |
Total Investments in Securities – 99.2%
(Cost $3,802,515) ($ Thousands) | | | $ | 4,511,190 | |
| | | | | | | | |
| | |
SEI Institutional Investments Trust / Semi-Annual Report / November 30, 2020 | | 211 |
SCHEDULE OF INVESTMENTS (Unaudited)
November 30, 2020
Long Duration Credit Fund (Concluded)
A list of the open futures contracts held by the Fund at November 30, 2020, is as follows:
| | | | | | | | | | | | | | | | | | | | |
| | | | | | |
Type of
Contract | | Number of
Contracts
Long/(Short) | | | Expiration
Date | | | Notional Amount
(Thousands) | | | Value
(Thousands) | | | Unrealized
Appreciation
(Depreciation)
(Thousands) | |
U.S. 10-Year Treasury Notes | | | 668 | | | | Mar-2021 | | | $ | 92,258 | | | $ | 92,299 | | | $ | 41 | |
U.S. 5-Year Treasury Notes | | | (126 | ) | | | Apr-2021 | | | | (15,864 | ) | | | (15,880 | ) | | | (16 | ) |
U.S. Long Treasury Bond | | | (206 | ) | | | Mar-2021 | | | | (35,813 | ) | | | (36,031 | ) | | | (218 | ) |
U.S. Ultra Long Treasury Bond | | | 93 | | | | Mar-2021 | | | | 19,985 | | | | 20,091 | | | | 106 | |
U.S. Ultra Long Treasury Bond | | | (132 | ) | | | Mar-2021 | | | | (28,485 | ) | | | (28,516 | ) | | | (31 | ) |
Ultra 10-Year U.S. Treasury Notes | | | 192 | | | | Mar-2021 | | | | 30,119 | | | | 30,168 | | | | 49 | |
Ultra 10-Year U.S. Treasury Notes | | | (171 | ) | | | Mar-2021 | | | | (26,830 | ) | | | (26,868 | ) | | | (38 | ) |
| | | | | | | | | | | | |
| | | | | | | | | | $ | 35,370 | | | $ | 35,263 | | | $ | (107 | ) |
| | | | | | | | | | | | |
| | Percentages are based on Net Assets of $4,545,660 ($ Thousands). |
| ** | The rate reported is the 7-day effective yield as of November 30, 2020. |
| † | Investment in Affiliated Security (see Note 6). |
| (A) | Security exempt from registration under Rule 144A of the Securities Act of 1933. These securities may be resold in transactions exempt from registration normally to qualified institutions. On November 30, 2020, the value of these securities amounted to $298,228 ($ Thousands), representing 6.6% of the Net Assets of the Fund. |
| (B) | Zero coupon security. The rate shown on the Schedule of Investments is the security’s effective yield at the time of purchase. |
AMT — Alternative Minimum Tax
Cl — Class
GO — General Obligation
ICE— Intercontinental Exchange
LIBOR— London Interbank Offered Rate
LLC — Limited Liability Company
MTN — Medium Term Note
PLC — Public Limited Company
RB — Revenue Bond
Ser — Series
TA — Tax Allocation
USD — United States Dollar
VAR — Variable Rate
The following is a list of the level of inputs used as of November 30, 2020, in valuing the Fund’s investments and other financial instruments carried at value ($ Thousands):
| | | | | | | | | | | | | | | | |
| | | | | |
| Investments in Securities | | Level 1 ($) | | | Level 2 ($) | | | Level 3 ($) | | | Total ($) | |
Corporate Obligations | | | – | | | | 4,016,286 | | | | – | | | | 4,016,286 | |
Municipal Bonds | | | – | | | | 274,251 | | | | – | | | | 274,251 | |
U.S. Treasury Obligations | | | – | | | | 170,705 | | | | – | | | | 170,705 | |
Sovereign Debt | | | – | | | | 23,909 | | | | – | | | | 23,909 | |
Asset-Backed Security | | | – | | | | 3,096 | | | | – | | | | 3,096 | |
Cash Equivalent | | | 22,943 | | | | – | | | | – | | | | 22,943 | |
| | | | | | | | | | | | | | | | |
Total Investments in Securities | | | 22,943 | | | | 4,488,247 | | | | – | | | | 4,511,190 | |
| | | | | | | | | | | | | | | | |
| | | | | | | | | | | | | | | | |
| | | | | |
| Other Financial Instruments | | Level 1 ($) | | | Level 2 ($) | | | Level 3 ($) | | | Total ($) | |
Futures Contracts* | | | | | | | | | | | | | | | | |
Unrealized Appreciation | | | 196 | | | | – | | | | – | | | | 196 | |
Unrealized Depreciation | | | (303 | ) | | | – | | | | – | | | | (303 | ) |
| | | | | | | | | | | | | | | | |
Total Other Financial Instruments | | | (107 | ) | | | – | | | | – | | | | (107 | ) |
| | | | | | | | | | | | | | | | |
*Futures contracts are valued at the unrealized appreciation (depreciation) on the instrument.
For the period ended November 30, 2020, there were no transfers in or out of Level 3.
For more information on valuation inputs, see Note 2 – Significant Accounting Policies in Notes to Financial Statements.
The following is a summary of the Fund’s transactions with affiliates for the period ended November 30, 2020 ($ Thousands):
| | | | | | | | | | | | | | | | | | |
| | | | | | | | | | |
| Security Description | | Value
5/31/2020 | | Purchases
at Cost | | Proceeds
from Sales | | Realized
Gain
(Loss) | | Change in
Unrealized
Appreciation
(Depreciation) | | Value
11/30/2020 | | Shares | | Income | | Capital Gains |
SEI Daily Income Trust, Government Fund, Cl F | | $24,757 | | $647,098 | | $(648,912) | | $— | | $— | | $22,943 | | 22,942,774 | | $3 | | $— |
| | | | | | | | | | | | | | | | | | |
Amounts designated as “—” are $0 or have been rounded to $0.
The accompanying notes are an integral part of the financial statements.
| | |
212 | | SEI Institutional Investments Trust / Semi-Annual Report / November 30, 2020 |
SCHEDULE OF INVESTMENTS (Unaudited)
November 30, 2020
Ultra Short Duration Bond Fund
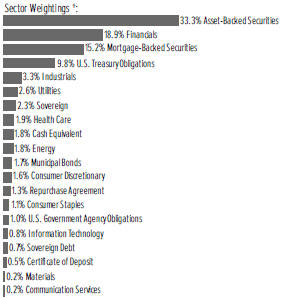
†Percentages based on total investments
| | | | | | | | |
| | | |
| Description | | Face Amount
(Thousands) | | Market Value ($ Thousands) |
|
ASSET-BACKED SECURITIES — 33.9% | |
|
Automotive — 19.6% | |
| | |
American Credit Acceptance Receivables Trust, Ser 2019-3, Cl A | | | | | | | | |
2.440%, 12/12/2022 (A) | | $ | 54 | | | $ | 54 | |
American Credit Acceptance Receivables Trust, Ser 2019-4, Cl A | | | | | | | | |
2.180%, 02/13/2023 (A) | | | 218 | | | | 218 | |
American Credit Acceptance Receivables Trust, Ser 2020-1, Cl A | | | | | | | | |
1.890%, 04/13/2023 (A) | | | 302 | | | | 303 | |
American Credit Acceptance Receivables Trust, Ser 2020-3, Cl A | | | | | | | | |
0.620%, 10/13/2023 (A) | | | 680 | | | | 681 | |
American Credit Acceptance Receivables Trust, Ser 2020-4, Cl A | | | | | | | | |
0.530%, 03/13/2024 (A) | | | 1,150 | | | | 1,150 | |
AmeriCredit Automobile Receivables Trust, Ser 2020-2, Cl A2A | | | | | | | | |
0.600%, 12/18/2023 | | | 640 | | | | 641 | |
AmeriCredit Automobile Receivables Trust, Ser 2020-3, Cl A2 | | | | | | | | |
0.420%, 03/18/2024 | | | 1,785 | | | | 1,786 | |
ARI Fleet Lease Trust, Ser 2018-A, Cl A2 | | | | | | | | |
2.550%, 10/15/2026 (A) | | | 11 | | | | 11 | |
ARI Fleet Lease Trust, Ser 2020-A, Cl A2 | | | | | | | | |
1.770%, 08/15/2028 (A) | | | 865 | | | | 874 | |
BMW Vehicle Owner Trust, Ser 2020-A, Cl A2 | | | | | | | | |
0.390%, 02/27/2023 | | | 635 | | | | 636 | |
| | | | | | | | |
| | |
| Description | | Face Amount
(Thousands) | | Market Value
($ Thousands) |
|
ASSET-BACKED SECURITIES (continued) | |
Canadian Pacer Auto Receivables Trust, Ser 2020-1A, Cl A2A | | | | | | | | |
1.770%, 11/21/2022 (A) | | $ | 674 | | | $ | 678 | |
Carmax Auto Owner Trust, Ser 2019-1, Cl A3 | | | | | | | | |
3.050%, 03/15/2024 | | | 1,047 | | | | 1,069 | |
CarMax Auto Owner Trust, Ser 2019-2, Cl A2A | | | | | | | | |
2.690%, 07/15/2022 | | | 105 | | | | 105 | |
CarMax Auto Owner Trust, Ser 2019-3, Cl A2A | | | | | | | | |
2.210%, 12/15/2022 | | | 206 | | | | 207 | |
Carmax Auto Owner Trust, Ser 2019-4, Cl A2A | | | | | | | | |
2.010%, 03/15/2023 | | | 1,292 | | | | 1,301 | |
CarMax Auto Owner Trust, Ser 2020-1, Cl A2 | | | | | | | | |
1.870%, 04/17/2023 | | | 595 | | | | 599 | |
CarMax Auto Owner Trust, Ser 2020-4, Cl A2 | | | | | | | | |
0.310%, 01/16/2024 | | | 1,265 | | | | 1,265 | |
Carvana Auto Receivables Trust, Ser 2019-4A, Cl A2 | | | | | | | | |
2.200%, 07/15/2022 (A) | | | 127 | | | | 127 | |
Chase Auto Credit Linked Notes, Ser 2020-2, Cl B | | | | | | | | |
0.840%, 02/25/2028 (A) | | | 2,680 | | | | 2,681 | |
Chesapeake Funding II LLC, Ser 2017-2A, Cl A1 | | | | | | | | |
1.990%, 05/15/2029 (A) | | | 31 | | | | 31 | |
Chesapeake Funding II LLC, Ser 2017-3A, Cl A1 | | | | | | | | |
1.910%, 08/15/2029 (A) | | | 58 | | | | 58 | |
Chesapeake Funding II LLC, Ser 2017-3A, Cl A2 | | | | | | | | |
0.481%, VAR ICE LIBOR USD 1 Month+0.340%, 08/15/2029 (A) | | | 151 | | | | 151 | |
Chesapeake Funding II LLC, Ser 2017-4A, Cl A1 | | | | | | | | |
2.120%, 11/15/2029 (A) | | | 123 | | | | 124 | |
Chesapeake Funding II LLC, Ser 2017-4A, Cl A2 | | | | | | | | |
0.451%, VAR ICE LIBOR USD 1 Month+0.310%, 11/15/2029 (A) | | | 504 | | | | 504 | |
Chesapeake Funding II LLC, Ser 2018-2A, Cl A2 | | | | | | | | |
0.511%, VAR ICE LIBOR USD 1 Month+0.370%, 08/15/2030 (A) | | | 372 | | | | 371 | |
Chesapeake Funding II LLC, Ser 2018-3A, Cl A1 | | | | | | | | |
3.390%, 01/15/2031 (A) | | | 425 | | | | 438 | |
Chesapeake Funding II LLC, Ser 2019-2A, Cl A1 | | | | | | | | |
1.950%, 09/15/2031 (A) | | | 1,075 | | | | 1,093 | |
CPS Auto Receivables Trust, Ser 2019-C, Cl A | | | | | | | | |
2.550%, 09/15/2022 (A) | | | 62 | | | | 62 | |
CPS Auto Receivables Trust, Ser 2019-D, Cl A | | | | | | | | |
2.170%, 12/15/2022 (A) | | | 167 | | | | 168 | |
| | |
SEI Institutional Investments Trust / Semi-Annual Report / November 30, 2020 | | 213 |
SCHEDULE OF INVESTMENTS (Unaudited)
November 30, 2020
Ultra Short Duration Bond Fund (Continued)
| | | | | | | | |
| | | |
| Description | | Face Amount
(Thousands) | | Market Value ($ Thousands) |
|
ASSET-BACKED SECURITIES (continued) | |
CPS Auto Receivables Trust, Ser 2020-A, Cl A | | | | | | | | |
2.090%, 05/15/2023 (A) | | $ | 317 | | | $ | 319 | |
CPS Auto Receivables Trust, Ser 2020-C, Cl A | | | | | | | | |
0.630%, 03/15/2024 (A) | | | 764 | | | | 765 | |
Credit Acceptance Auto Loan Trust, Ser 2018-1A, Cl A | | | | | | | | |
3.010%, 02/16/2027 (A) | | | 68 | | | | 68 | |
Credit Acceptance Auto Loan Trust, Ser 2019-3A, Cl A | | | | | | | | |
2.380%, 11/15/2028 (A) | | | 500 | | | | 514 | |
Credit Acceptance Auto Loan Trust, Ser 2020-1A, Cl A | | | | | | | | |
2.010%, 02/15/2029 (A) | | | 885 | | | | 905 | |
Drive Auto Receivables Trust, Ser 2017-3, Cl D | | | | | | | | |
3.530%, 12/15/2023 (A) | | | 635 | | | | 644 | |
Drive Auto Receivables Trust, Ser 2019-4, Cl B | | | | | | | | |
2.230%, 01/16/2024 | | | 870 | | | | 880 | |
Drive Auto Receivables Trust, Ser 2020-1, Cl A3 | | | | | | | | |
2.020%, 11/15/2023 | | | 535 | | | | 541 | |
Drive Auto Receivables Trust, Ser 2020-2, Cl A2A | | | | | | | | |
0.850%, 07/17/2023 | | | 412 | | | | 412 | |
DT Auto Owner Trust, Ser 2018-3A, Cl B | | | | | | | | |
3.560%, 09/15/2022 (A) | | | 242 | | | | 243 | |
DT Auto Owner Trust, Ser 2019-3A, Cl A | | | | | | | | |
2.550%, 08/15/2022 (A) | | | 87 | | | | 87 | |
DT Auto Owner Trust, Ser 2019-4A, Cl A | | | | | | | | |
2.170%, 05/15/2023 (A) | | | 834 | | | | 838 | |
DT Auto Owner Trust, Ser 2020-1A, Cl A | | | | | | | | |
1.940%, 09/15/2023 (A) | | | 219 | | | | 220 | |
DT Auto Owner Trust, Ser 2020-2A, Cl A | | | | | | | | |
1.140%, 01/16/2024 (A) | | | 719 | | | | 722 | |
DT Auto Owner Trust, Ser 2020-2A, Cl B | | | | | | | | |
2.080%, 03/16/2026 (A) | | | 735 | | | | 750 | |
DT Auto Owner Trust, Ser 2020-3A, Cl A | | | | | | | | |
0.540%, 04/15/2024 (A) | | | 1,512 | | | | 1,514 | |
DT Auto Owner Trust, Ser 2020-3A, Cl B | | | | | | | | |
0.910%, 12/16/2024 (A) | | | 1,615 | | | | 1,617 | |
Enterprise Fleet Financing LLC, Ser 2018-2, Cl A2 | | | | | | | | |
3.140%, 02/20/2024 (A) | | | 571 | | | | 575 | |
Enterprise Fleet Financing LLC, Ser 2019-1, Cl A2 | | | | | | | | |
2.980%, 10/20/2024 (A) | | | 675 | | | | 687 | |
Enterprise Fleet Financing LLC, Ser 2019-2, Cl A2 | | | | | | | | |
2.290%, 02/20/2025 (A) | | | 596 | | | | 606 | |
Enterprise Fleet Financing LLC, Ser 2019-3, Cl A2 | | | | | | | | |
2.060%, 05/20/2025 (A) | | | 1,298 | | | | 1,320 | |
| | | | | | | | |
| | | |
| Description | | Face Amount
(Thousands) | | Market Value ($ Thousands) |
|
ASSET-BACKED SECURITIES (continued) | |
Enterprise Fleet Financing LLC, Ser 2020-2, Cl A1 | | | | | | | | |
0.240%, 10/20/2021 (A) | | $ | 1,123 | | | $ | 1,123 | |
Exeter Automobile Receivables Trust, Ser 2019-3A, Cl A | | | | | | | | |
2.590%, 09/15/2022 (A) | | | 16 | | | | 16 | |
Exeter Automobile Receivables Trust, Ser 2019-4A, Cl A | | | | | | | | |
2.180%, 01/17/2023 (A) | | | 160 | | | | 160 | |
Exeter Automobile Receivables Trust, Ser 2019-4A, Cl B | | | | | | | | |
2.300%, 12/15/2023 (A) | | | 1,150 | | | | 1,162 | |
Exeter Automobile Receivables Trust, Ser 2020-1A, Cl A | | | | | | | | |
2.050%, 06/15/2023 (A) | | | 191 | | | | 192 | |
Exeter Automobile Receivables Trust, Ser 2020-3A, Cl A2 | | | | | | | | |
0.460%, 10/17/2022 | | | 1,120 | | | | 1,120 | |
First Investors Auto Owner Trust, Ser 2019-1A, Cl A | | | | | | | | |
2.890%, 03/15/2024 (A) | | | 94 | | | | 95 | |
First Investors Auto Owner Trust, Ser 2019-2A, Cl A | | | | | | | | |
2.210%, 09/16/2024 (A) | | | 411 | | | | 415 | |
Flagship Credit Auto Trust, Ser 2018-3, Cl A | | | | | | | | |
3.070%, 02/15/2023 (A) | | | 70 | | | | 70 | |
Flagship Credit Auto Trust, Ser 2018-4, Cl A | | | | | | | | |
3.410%, 05/15/2023 (A) | | | 220 | | | | 222 | |
Flagship Credit Auto Trust, Ser 2019-1, Cl A | | | | | | | | |
3.110%, 08/15/2023 (A) | | | 133 | | | | 134 | |
Flagship Credit Auto Trust, Ser 2019-2, Cl A | | | | | | | | |
2.830%, 10/16/2023 (A) | | | 448 | | | | 452 | |
Flagship Credit Auto Trust, Ser 2019-4, Cl A | | | | | | | | |
2.170%, 06/17/2024 (A) | | | 456 | | | | 461 | |
Flagship Credit Auto Trust, Ser 2020-1, Cl A | | | | | | | | |
1.900%, 08/15/2024 (A) | | | 552 | | | | 559 | |
Flagship Credit Auto Trust, Ser 2020-3, Cl A | | | | | | | | |
0.700%, 04/15/2025 (A) | | | 287 | | | | 287 | |
Flagship Credit Auto Trust, Ser 2020-4, Cl A | | | | | | | | |
0.530%, 04/15/2025 (A) | | | 1,725 | | | | 1,726 | |
Ford Credit Auto Lease Trust, Ser 2019-A, Cl A4 | | | | | | | | |
2.980%, 06/15/2022 | | | 490 | | | | 497 | |
Ford Credit Auto Lease Trust, Ser 2019-B, Cl A2A | | | | | | | | |
2.280%, 02/15/2022 | | | 185 | | | | 186 | |
Ford Credit Auto Lease Trust, Ser 2019-B, Cl A4 | | | | | | | | |
2.270%, 11/15/2022 | | | 3,000 | | | | 3,056 | |
Ford Credit Auto Lease Trust, Ser 2020-A, Cl A2 | | | | | | | | |
1.800%, 07/15/2022 | | | 436 | | | | 438 | |
| | |
214 | | SEI Institutional Investments Trust / Semi-Annual Report / November 30, 2020 |
| | | | | | | | |
| | | |
| Description | | Face Amount
(Thousands) | | Market Value ($ Thousands) |
|
ASSET-BACKED SECURITIES (continued) | |
Ford Credit Auto Lease Trust, Ser 2020-B, Cl A2A | | | | | | | | |
0.500%, 12/15/2022 | | $ | 730 | | | $ | 731 | |
Ford Credit Auto Owner Trust, Ser 2016-1, Cl A | | | | | | | | |
2.310%, 08/15/2027 (A) | | | 3,200 | | | | 3,213 | |
Ford Credit Auto Owner Trust, Ser 2017-2, Cl A | | | | | | | | |
2.360%, 03/15/2029 (A) | | | 1,400 | | | | 1,447 | |
Ford Credit Auto Owner Trust, Ser 2020-B, Cl A2 | | | | | | | | |
0.500%, 02/15/2023 | | | 2,006 | | | | 2,008 | |
Ford Credit Auto Owner Trust, Ser 2020-C, Cl A2 | | | | | | | | |
0.250%, 10/15/2023 | | | 710 | | | | 710 | |
Foursight Capital Automobile Receivables Trust, Ser 2020-1, Cl A2 | | | | | | | | |
1.970%, 09/15/2023 (A) | | | 504 | | | | 507 | |
GLS Auto Receivables Issuer Trust, Ser 2019-3A, Cl A | | | | | | | | |
2.580%, 07/17/2023 (A) | | | 256 | | | | 258 | |
GLS Auto Receivables Issuer Trust, Ser 2019-4A, Cl A | | | | | | | | |
2.470%, 11/15/2023 (A) | | | 291 | | | | 294 | |
GLS Auto Receivables Issuer Trust, Ser 2020-1A, Cl A | | | | | | | | |
2.170%, 02/15/2024 (A) | | | 395 | | | | 399 | |
GLS Auto Receivables Issuer Trust, Ser 2020-3A, Cl A | | | | | | | | |
0.690%, 10/16/2023 (A) | | | 477 | | | | 477 | |
GLS Auto Receivables Trust, Ser 2018-1A, Cl A | | | | | | | | |
2.820%, 07/15/2022 (A) | | | 39 | | | | 39 | |
GLS Auto Receivables Trust, Ser 2019-2A, Cl A | | | | | | | | |
3.060%, 04/17/2023 (A) | | | 188 | | | | 189 | |
GM Financial Automobile Leasing Trust,Ser 2019-3, Cl A3 | | | | | | | | |
2.030%, 06/20/2022 | | | 700 | | | | 706 | |
GM Financial Automobile Leasing Trust, Ser 2020-2, Cl A2A | | | | | | | | |
0.710%, 10/20/2022 | | | 471 | | | | 472 | |
GM Financial Automobile Leasing Trust, Ser 2020-3, Cl A1 | | | | | | | | |
0.178%, 10/20/2021 | | | 1,104 | | | | 1,104 | |
GM Financial Automobile Leasing Trust, Ser 2020-3, Cl A2A | | | | | | | | |
0.350%, 11/21/2022 | | | 930 | | | | 930 | |
GM Financial Consumer Automobile Receivables Trust, Ser 2018-4, Cl A3 | | | | | | | | |
3.210%, 10/16/2023 | | | 646 | | | | 658 | |
GM Financial Consumer Automobile Receivables Trust, Ser 2020-3, Cl A2 | | | | | | | | |
0.350%, 07/17/2023 | | | 1,415 | | | | 1,416 | |
| | | | | | | | |
| | | |
| Description | | Face Amount
(Thousands) | | Market Value ($ Thousands) |
|
ASSET-BACKED SECURITIES (continued) | |
GM Financial Consumer Automobile Receivables Trust, Ser 2020-4, Cl A2 | | | | | | | | |
0.260%, 11/16/2023 | | $ | 460 | | | $ | 460 | |
Harley-Davidson Motorcycle Trust, Ser 2020-A, Cl A2A | | | | | | | | |
1.830%, 01/17/2023 | | | 681 | | | | 685 | |
Hertz Fleet Lease Funding, Ser 2019-1, Cl A1 | | | | | | | | |
0.598%, VAR ICE LIBOR USD 1 Month+0.470%, 01/10/2033 (A) | | | 579 | | | | 579 | |
Hertz Fleet Lease Funding, Ser 2019-1, Cl A2 | | | | | | | | |
2.700%, 01/10/2033 (A) | | | 648 | | | | 657 | |
Honda Auto Receivables Owner Trust, Ser 2020-2, Cl A2 | | | | | | | | |
0.740%, 11/15/2022 | | | 215 | | | | 216 | |
Hyundai Auto Lease Securitization Trust, Ser 2020-B, Cl A2 | | | | | | | | |
0.360%, 01/17/2023 (A) | | | 1,020 | | | | 1,021 | |
Hyundai Auto Receivables Trust, Ser 2020-A, Cl A2 | | | | | | | | |
1.510%, 04/17/2023 | | | 1,275 | | | | 1,284 | |
JPMorgan Chase Bank, Ser 2020-1, Cl B | | | | | | | | |
0.991%, 01/25/2028 (A) | | | 1,600 | | | | 1,604 | |
Mercedes-Benz Auto Lease Trust, Ser 2019-A, Cl A3 | | | | | | | | |
3.100%, 11/15/2021 | | | 241 | | | | 242 | |
Mercedes-Benz Auto Lease Trust, Ser 2020-A, Cl A2 | | | | | | | | |
1.820%, 03/15/2022 | | | 188 | | | | 189 | |
Mercedes-Benz Auto Lease Trust, Ser 2020-B, Cl A3 | | | | | | | | |
0.400%, 11/15/2023 | | | 1,915 | | | | 1,918 | |
Mercedes-Benz Auto Receivables Trust, Ser 2020-1, Cl A2 | | | | | | | | |
0.460%, 03/15/2023 | | | 1,030 | | | | 1,031 | |
Nissan Auto Lease Trust, Ser 2019-B, Cl A2A | | | | | | | | |
2.270%, 10/15/2021 | | | 223 | | | | 223 | |
Nissan Auto Lease Trust, Ser 2020-A, Cl A2A | | | | | | | | |
1.800%, 05/16/2022 | | | 560 | | | | 563 | |
Nissan Auto Lease Trust, Ser 2020-B, Cl A2 | | | | | | | | |
0.340%, 12/15/2022 | | | 1,205 | | | | 1,206 | |
Nissan Auto Receivables Owner Trust, Ser 2019-C, Cl A3 | | | | | | | | |
1.930%, 07/15/2024 | | | 573 | | | | 585 | |
Nissan Auto Receivables Owner Trust, Ser 2020-B, Cl A2A | | | | | | | | |
0.470%, 10/17/2022 | | | 1,580 | | | | 1,582 | |
Prestige Auto Receivables Trust, Ser 2019-1A, Cl A2 | | | | | | | | |
2.440%, 07/15/2022 (A) | | | 133 | | | | 133 | |
Prestige Auto Receivables Trust, Ser 2020-1A, Cl A2 | | | | | | | | |
0.520%, 02/15/2024 (A) | | | 1,545 | | | | 1,545 | |
| | |
SEI Institutional Investments Trust / Semi-Annual Report / November 30, 2020 | | 215 |
SCHEDULE OF INVESTMENTS (Unaudited)
November 30, 2020
Ultra Short Duration Bond Fund (Continued)
| | | | | | | | |
| | | |
| Description | | Face Amount
(Thousands) | | Market Value
($ Thousands) |
|
ASSET-BACKED SECURITIES (continued) | |
Santander Consumer Auto Receivables Trust, Ser 2020-AA, Cl A | | | | | | | | |
1.370%, 10/15/2024 (A) | | $ | 1,943 | | | $ | 1,960 | |
Santander Consumer Auto Receivables Trust, Ser 2020-BA, Cl A2 | | | | | | | | |
0.380%, 02/15/2023 (A) | | | 1,250 | | | | 1,250 | |
Santander Drive Auto Receivables Trust, Ser 2020-2, Cl A2A | | | | | | | | |
0.620%, 05/15/2023 | | | 914 | | | | 915 | |
Santander Drive Auto Receivables Trust, Ser 2020-3, Cl A2 | | | | | | | | |
0.460%, 09/15/2023 | | | 760 | | | | 760 | |
Santander Drive Auto Receivables Trust, Ser 2020-3, Cl A3 | | | | | | | | |
0.520%, 07/15/2024 | | | 1,500 | | | | 1,503 | |
Santander Drive Auto Receivables Trust, Ser 2020-4, Cl A2 | | | | | | | | |
0.420%, 09/15/2023 | | | 1,495 | | | | 1,495 | |
Santander Retail Auto Lease Trust, Ser 2019-C, Cl A2A | | | | | | | | |
1.890%, 09/20/2022 (A) | | | 780 | | | | 786 | |
Santander Retail Auto Lease Trust, Ser 2020-B, Cl A2 | | | | | | | | |
0.420%, 11/20/2023 (A) | | | 960 | | | | 961 | |
Securitized Term Auto Receivables Trust, Ser 2019-1A, Cl A3 | | | | | | | | |
2.986%, 02/27/2023 (A) | | | 548 | | | | 556 | |
Tesla Auto Lease Trust, Ser 2018-B, Cl A | | | | | | | | |
3.710%, 08/20/2021 | | | 917 | | | | 925 | |
Tesla Auto Lease Trust, Ser 2019-A, Cl A2 | | | | | | | | |
2.130%, 04/20/2022 (A) | | | 1,631 | | | | 1,646 | |
Tesla Auto Lease Trust, Ser 2020-A, Cl A2 | | | | | | | | |
0.550%, 05/22/2023 (A) | | | 1,115 | | | | 1,117 | |
Tidewater Auto Receivables Trust, Ser 2020-AA, Cl A2 | | | | | | | | |
1.390%, 08/15/2024 (A) | | | 1,427 | | | | 1,436 | |
Tidewater Auto Receivables Trust, Ser 2020-AA, Cl B | | | | | | | | |
1.610%, 03/17/2025 (A) | | | 1,005 | | | | 1,016 | |
Toyota Auto Receivables Owner Trust, Ser 2018-B, Cl A3 | | | | | | | | |
2.960%, 09/15/2022 | | | 170 | | | | 171 | |
Toyota Auto Receivables Owner Trust, Ser 2020-B, Cl A2 | | | | | | | | |
1.380%, 12/15/2022 | | | 667 | | | | 671 | |
United Auto Credit Securitization Trust, Ser 2020-1, Cl A | | | | | | | | |
0.850%, 05/10/2022 (A) | | | 284 | | | | 284 | |
Volkswagen Auto Lease Trust, Ser 2019-A, Cl A2A | | | | | | | | |
2.000%, 03/21/2022 | | | 506 | | | | 509 | |
| | | | | | | | |
| | | |
| Description | | Face Amount
(Thousands) | | Market Value
($ Thousands) |
|
ASSET-BACKED SECURITIES (continued) | |
Volkswagen Auto Lease Trust, Ser 2020-A, Cl A2 | | | | | | | | |
0.270%, 04/20/2023 | | $ | 1,945 | | | $ | 1,938 | |
Volkswagen Auto Loan Enhanced Trust, Ser 2020-1, Cl A2A | | | | | | | | |
0.930%, 12/20/2022 | | | 641 | | | | 643 | |
Westlake Automobile Receivables Trust, Ser 2017-2A, Cl D | | | | | | | | |
3.280%, 12/15/2022 (A) | | | 737 | | | | 739 | |
Westlake Automobile Receivables Trust, Ser 2019-2A, Cl A2B | | | | | | | | |
0.611%, VAR ICE LIBOR USD 1 Month+0.470%, 02/15/2023 (A) | | | 351 | | | | 351 | |
Westlake Automobile Receivables Trust, Ser 2019-3A, Cl A2 | | | | | | | | |
2.150%, 02/15/2023 (A) | | | 428 | | | | 431 | |
Westlake Automobile Receivables Trust, Ser 2019-3A, Cl B | | | | | | | | |
2.410%, 10/15/2024 (A) | | | 2,130 | | | | 2,166 | |
Westlake Automobile Receivables Trust, Ser 2020-2A, Cl A2A | | | | | | | | |
0.930%, 02/15/2024 (A) | | | 2,093 | | | | 2,101 | |
Westlake Automobile Receivables Trust, Ser 2020-3A, Cl A2 | | | | | | | | |
0.560%, 05/15/2024 (A) | | | 3,965 | | | | 3,967 | |
Wheels SPV 2 LLC, Ser 2018-1A, Cl A2 | | | | | | | | |
3.060%, 04/20/2027 (A) | | | 35 | | | | 35 | |
Wheels SPV 2 LLC, Ser 2020-1A, Cl A2 | | | | | | | | |
0.510%, 08/20/2029 (A) | | | 505 | | | | 506 | |
World Omni Auto Receivables Trust, Ser 2020-B, Cl A2A | | | | | | | | |
0.550%, 07/17/2023 | | | 3,575 | | | | 3,580 | |
World Omni Auto Receivables Trust, Ser 2020-C, Cl A2 | | | | | | | | |
0.350%, 12/15/2023 | | | 1,665 | | | | 1,666 | |
World Omni Automobile Lease Securitization Trust, Ser 2020-B, Cl A2 | | | | | | | | |
0.320%, 09/15/2023 | | | 400 | | | | 400 | |
World Omni Select Auto Trust, Ser 2018-1A, Cl B | | | | | | | | |
3.680%, 07/15/2023 (A) | | | 465 | | | | 471 | |
World Omni Select Auto Trust, Ser 2019-A, Cl A2A | | | | | | | | |
2.060%, 08/15/2023 | | | 329 | | | | 331 | |
World Omni Select Auto Trust, Ser 2020-A, Cl A2 | | | | | | | | |
0.470%, 06/17/2024 | | | 1,040 | | | | 1,040 | |
| | | | | | | | |
| | |
| | | | | | | 113,591 | |
| | | | | | | | |
|
Credit Cards — 2.0% | |
BA Credit Card Trust, Ser 2018-A1, Cl A1 | | | | | | | | |
2.700%, 07/17/2023 | | | 850 | | | | 854 | |
| | |
216 | | SEI Institutional Investments Trust / Semi-Annual Report / November 30, 2020 |
| | | | | | | | |
| | | |
| Description | | Face Amount
(Thousands) | | Market Value
($ Thousands) |
|
ASSET-BACKED SECURITIES (continued) | |
Capital One Multi-Asset Execution Trust, Ser 2016-A7, Cl A7 | | | | | | | | |
0.651%, VAR ICE LIBOR USD 1 Month+0.510%, 09/16/2024 | | $ | 1,250 | | | $ | 1,255 | |
Capital One Multi-Asset Execution Trust, Ser 2019-A2, Cl A2 | | | | | | | | |
1.720%, 08/15/2024 | | | 310 | | | | 317 | |
Evergreen Credit Card Trust, Ser 2019-2, Cl A | | | | | | | | |
1.900%, 09/16/2024 (A) | | | 535 | | | | 550 | |
Synchrony Card Funding LLC, Ser 2019-A1, Cl A | | | | | | | | |
2.950%, 03/15/2025 | | | 1,690 | | | | 1,747 | |
Synchrony Credit Card Master Note Trust, Ser 2016-2, Cl A | | | | | | | | |
2.210%, 05/15/2024 | | | 3,751 | | | | 3,784 | |
Synchrony Credit Card Master Note Trust, Ser 2018-1, Cl A | | | | | | | | |
2.970%, 03/15/2024 | | | 710 | | | | 716 | |
Trillium Credit Card Trust II, Ser 2019-1A, Cl A | | | | | | | | |
0.626%, VAR ICE LIBOR USD 1 Month+0.480%, 01/26/2024 (A) | | | 1,100 | | | | 1,100 | |
Trillium Credit Card Trust II, Ser 2020-1A, Cl A | | | | | | | | |
0.516%, VAR ICE LIBOR USD 1 Month+0.370%, 12/26/2024 (A) | | | 1,065 | | | | 1,066 | |
| | | | | | | | |
| | |
| | | | | | | 11,389 | |
| | | | | | | | |
|
Mortgage Related Securities — 0.0% | |
| | |
Accredited Mortgage Loan Trust, Ser 2004-4, Cl A1A | | | | | | | | |
0.830%, VAR ICE LIBOR USD 1 Month+0.680%, 01/25/2035 | | | 116 | | | | 116 | |
| | | | | | | | |
|
Other Asset-Backed Securities — 12.3% | |
| | |
Affirm Asset Securitization Trust, Ser 2020-Z1, Cl A 3.460%, | | | | | | | | |
10/15/2024 (A) | | | 353 | | | | 358 | |
Affirm Asset Securitization Trust, Ser 2020-Z2, Cl A | | | | | | | | |
1.900%, 01/15/2025 (A) | | | 900 | | | | 903 | |
Ajax Mortgage Loan Trust, Ser 2017-B, Cl A | | | | | | | | |
3.163%, 09/25/2056 (A)(B) | | | 463 | | | | 463 | |
Ally Master Owner Trust, Ser 2018-2, Cl A | | | | | | | | |
3.290%, 05/15/2023 | | | 2,455 | | | | 2,489 | |
Apidos CLO XII, Ser 2018-12A, Cl AR | | | | | | | | |
1.317%, VAR ICE LIBOR USD 3 Month+1.080%, 04/15/2031 (A) | | | 925 | | | | 916 | |
Atlas Senior Loan Fund IX LLC, Ser 2018-9A, Cl A | | | | | | | | |
1.088%, VAR ICE LIBOR USD 3 Month+0.870%, 04/20/2028 (A) | | | 1,168 | | | | 1,160 | |
| | | | | | | | |
| | | |
| Description | | Face Amount
(Thousands) | | Market Value
($ Thousands) |
|
ASSET-BACKED SECURITIES (continued) | |
Avant Loans Funding Trust, Ser 2019-B, Cl A | | | | | | | | |
2.720%, 10/15/2026 (A) | | $ | 221 | | | $ | 222 | |
Bayview Opportunity Master Fund IVb Trust, Ser 2017-RT6, Cl A | | | | | | | | |
3.500%, 10/28/2057 (A)(B) | | | 411 | | | | 423 | |
Carlyle Global Market Strategies CLO, Ser 2017-2A, Cl AR | | | | | | | | |
1.108%, VAR ICE LIBOR USD 3 Month+0.890%, 01/18/2029 (A) | | | 335 | | | | 332 | |
Carlyle Global Market Strategies CLO, Ser 2018-1A, Cl A1R2 | | | | | | | | |
1.188%, VAR ICE LIBOR USD 3 Month+0.970%, 04/17/2031 (A) | | | 997 | | | | 986 | |
Cloud Pass-Through Trust, Ser 2019-1A, Cl CLOU | | | | | | | | |
3.554%, 12/05/2022 (A)(B) | | | 483 | | | | 490 | |
CNH Equipment Trust, Ser 2019-C, Cl A2 | | | | | | | | |
1.990%, 03/15/2023 | | | 1,487 | | | | 1,496 | |
CNH Equipment Trust, Ser 2020-A, Cl A2 | | | | | | | | |
1.080%, 07/17/2023 | | | 1,070 | | | | 1,074 | |
Cole Park CLO, Ser 2018-1A, Cl AR | | | | | | | | |
1.268%, VAR ICE LIBOR USD 3 Month+1.050%, 10/20/2028 (A) | | | 1,150 | | | | 1,149 | |
Columbia Cent CLO, Ser 2018-27A, Cl A1 | | | | | | | | |
1.365%, VAR ICE LIBOR USD 3 Month+1.150%, 10/25/2028 (A) | | | 720 | | | | 717 | |
Conn’s Receivables Funding LLC, Ser 2020-A, Cl A | | | | | | | | |
1.710%, 06/16/2025 (A) | | | 1,072 | | | | 1,073 | |
Consumer Loan Underlying Bond CLUB Credit Trust, Ser 2020-P1, Cl A | | | | | | | | |
2.260%, 03/15/2028 (A) | | | 623 | | | | 628 | |
Credit-Based Asset Servicing & Securitization LLC, Ser 2005-CB3, Cl M2 | | | | | | | | |
1.080%, VAR ICE LIBOR USD 1 Month+0.930%, 06/25/2035 | | | 32 | | | | 32 | |
Dell Equipment Finance Trust, Ser 2019-1, Cl A2 | | | | | | | | |
2.780%, 08/23/2021 (A) | | | 67 | | | | 67 | |
DLL LLC, Ser 2019-MT3, Cl A2 | | | | | | | | |
2.130%, 01/20/2022 (A) | | | 605 | | | | 607 | |
Ford Credit Floorplan Master Owner Trust A, Ser 2018-3, Cl A1 | | | | | | | | |
3.520%, 10/15/2023 | | | 725 | | | | 745 | |
GreatAmerica Leasing Receivables Funding LLC, Ser 2020-1, Cl A2 | | | | | | | | |
1.760%, 06/15/2022 (A) | | | 913 | | | | 919 | |
Home Partners of America Trust, Ser 2017-1, Cl B | | | | | | | | |
1.486%, VAR ICE LIBOR USD 1 Month+1.350%, 07/17/2034 (A) | | | 1,000 | | | | 999 | |
HPEFS Equipment Trust, Ser 2019-1A, Cl A2 | | | | | | | | |
2.190%, 09/20/2029 (A) | | | 827 | | | | 831 | |
| | |
SEI Institutional Investments Trust / Semi-Annual Report / November 30, 2020 | | 217 |
SCHEDULE OF INVESTMENTS (Unaudited)
November 30, 2020
Ultra Short Duration Bond Fund (Continued)
| | | | | | | | |
| | | |
| Description | | Face Amount
(Thousands) | | Market Value
($ Thousands) |
|
ASSET-BACKED SECURITIES (continued) | |
HPEFS Equipment Trust, Ser 2020-1A, Cl A2 | | | | | | | | |
1.730%, 02/20/2030 (A) | | $ | 435 | | | $ | 438 | |
HPEFS Equipment Trust, Ser 2020-2A, Cl A2 | | | | | | | | |
0.650%, 07/22/2030 (A) | | | 2,875 | | | | 2,880 | |
John Deere Owner Trust, Ser 2019-B, Cl A2 | | | | | | | | |
2.280%, 05/16/2022 | | | 278 | | | | 279 | |
KKR CLO, Ser 2018-21, Cl A | | | | | | | | |
1.237%, VAR ICE LIBOR USD 3 Month+1.000%, 04/15/2031 (A) | | | 775 | | | | 767 | |
Kubota Credit Owner Trust, Ser 2020-1A, Cl A1 | | | | | | | | |
1.500%, 05/17/2021 (A) | | | 15 | | | | 15 | |
Kubota Credit Owner Trust, Ser 2020-2A, Cl A2 | | | | | | | | |
0.410%, 06/15/2023 (A) | | | 545 | | | | 545 | |
Madison Park Funding XII, Ser 2017-12A, Cl AR | | | | | | | | |
1.478%, VAR ICE LIBOR USD 3 Month+1.260%, 07/20/2026 (A) | | | 25 | | | | 25 | |
Madison Park Funding XXX, Ser 2018-30A, Cl A | | | | | | | | |
0.987%, VAR ICE LIBOR USD 3 Month+0.750%, 04/15/2029 (A) | | | 1,350 | | | | 1,336 | |
Magnetite VII, Ser 2018-7A, Cl A1R2 | | | | | | | | |
1.037%, VAR ICE LIBOR USD 3 Month+0.800%, 01/15/2028 (A) | | | 1,250 | | | | 1,241 | |
Magnetite VIII, Ser 2018-8A, Cl AR2 | | | | | | | | |
1.217%, VAR ICE LIBOR USD 3 Month+0.980%, 04/15/2031 (A) | | | 685 | | | | 679 | |
Marlette Funding Trust, Ser 2018-4A, Cl A | | | | | | | | |
3.710%, 12/15/2028 (A) | | | 62 | | | | 62 | |
Marlette Funding Trust, Ser 2019-1A, Cl A | | | | | | | | |
3.440%, 04/16/2029 (A) | | | 310 | | | | 313 | |
Marlette Funding Trust, Ser 2019-2A, Cl A | | | | | | | | |
3.130%, 07/16/2029 (A) | | | 247 | | | | 249 | |
Marlette Funding Trust, Ser 2019-3A, Cl A | | | | | | | | |
2.690%, 09/17/2029 (A) | | | 283 | | | | 285 | |
Marlette Funding Trust, Ser 2019-4A, Cl A | | | | | | | | |
2.390%, 12/17/2029 (A) | | | 471 | | | | 475 | |
Marlette Funding Trust, Ser 2020-1A, Cl A | | | | | | | | |
2.240%, 03/15/2030 (A) | | | 154 | | | | 155 | |
Marlette Funding Trust, Ser 2020-2A, Cl A | | | | | | | | |
1.020%, 09/16/2030 (A) | | | 469 | | | | 470 | |
Mercedes-Benz Master Owner Trust, Ser 2019-AA, Cl A | | | | | | | | |
0.491%, VAR ICE LIBOR USD 1 Month+0.350%, 05/15/2023 (A) | | | 1,405 | | | | 1,407 | |
MetLife Securitization Trust, Ser 2017-1A, Cl A | | | | | | | | |
3.000%, 04/25/2055 (A)(B) | | | 208 | | | | 218 | |
MFA Trust, Ser 2020-NQM1, Cl A1 | | | | | | | | |
1.479%, 03/25/2065 | | | 384 | | | | 386 | |
| | | | | | | | |
| | | |
| Description | | Face Amount
(Thousands) | | Market Value
($ Thousands) |
|
ASSET-BACKED SECURITIES (continued) | |
Mill City Mortgage Loan Trust, Ser 2017-3, Cl A1 | | | | | | | | |
2.750%, 01/25/2061 (A)(B) | | $ | 399 | | | $ | 409 | |
Mill City Mortgage Trust, Ser 2015-2, Cl A2 | | | | | | | | |
3.000%, 09/25/2057 (A)(B) | | | 211 | | | | 213 | |
MMAF Equipment Finance LLC, Ser 2019-A, Cl A2 | | | | | | | | |
2.840%, 01/10/2022 (A) | | | 298 | | | | 299 | |
MMAF Equipment Finance LLC, Ser 2019-B, Cl A2 | | | | | | | | |
2.070%, 10/12/2022 (A) | | | 311 | | | | 313 | |
MMAF Equipment Finance LLC, Ser 2020-BA, Cl A2 | | | | | | | | |
0.380%, 08/14/2023 (A) | | | 1,070 | | | | 1,070 | |
Morgan Stanley Capital 1 Trust, Ser 2012-STAR, Cl A1 | | | | | | | | |
2.084%, 08/05/2034 (A) | | | 78 | | | | 77 | |
Nationstar HECM Loan Trust, Ser 2019-1A, Cl A | | | | | | | | |
2.651%, 06/25/2029 (A)(B) | | | 109 | | | | 109 | |
Nationstar HECM Loan Trust, Ser 2019-2A, Cl A | | | | | | | | |
2.272%, 11/26/2029 (A)(B) | | | 187 | | | | 187 | |
Navient Private Education Refi Loan Trust, Ser 2019-FA, Cl A1 | | | | | | | | |
2.180%, 08/15/2068 (A) | | | 355 | | | | 355 | |
Navient Private Education Refi Loan Trust, Ser 2020-BA, Cl A1 | | | | | | | | |
1.800%, 01/15/2069 (A) | | | 605 | | | | 607 | |
Navient Private Education Refi Loan Trust, Ser 2020-DA, Cl A | | | | | | | | |
1.690%, 05/15/2069 (A) | | | 2,210 | | | | 2,248 | |
Navient Student Loan Trust, Ser 2018-1A, Cl A2 | | | | | | | | |
0.500%, VAR ICE LIBOR USD 1 Month+0.350%, 03/25/2067 (A) | | | 530 | | | | 527 | |
Navient Student Loan Trust, Ser 2019-2A, Cl A1 | | | | | | | | |
0.420%, VAR ICE LIBOR USD 1 Month+0.270%, 02/27/2068 (A) | | | 230 | | | | 230 | |
Navistar Financial Dealer Note Master Owner Trust II, Ser 2019-1, Cl A | | | | | | | | |
0.790%, VAR ICE LIBOR USD 1 Month+0.640%, 05/25/2024 (A) | | | 1,600 | | | | 1,603 | |
New Residential Mortgage LLC, Ser 2018-FNT2, Cl A | | | | | | | | |
3.790%, 07/25/2054 (A) | | | 459 | | | | 456 | |
NextGear Floorplan Master Owner Trust, Ser 2019-1A, Cl A1 | | | | | | | | |
0.791%, VAR ICE LIBOR USD 1 Month+0.650%, 02/15/2024 (A) | | | 1,140 | | | | 1,144 | |
| | |
218 | | SEI Institutional Investments Trust / Semi-Annual Report / November 30, 2020 |
| | | | | | | | |
| | | |
| Description | | Face Amount
(Thousands) | | Market Value
($ Thousands) |
|
ASSET-BACKED SECURITIES (continued) | |
NextGear Floorplan Master Owner Trust, Ser 2020-1A, Cl A1 | | | | | | | | |
0.941%, VAR ICE LIBOR USD 1 Month+0.800%, 02/15/2025 (A) | | $ | 1,830 | | | $ | 1,840 | |
Nissan Master Owner Trust Receivables, Ser 2019-A, Cl A | | | | | | | | |
0.701%, VAR ICE LIBOR USD 1 Month+0.560%, 02/15/2024 | | | 1,075 | | | | 1,080 | |
NRZ Excess Spread-Collateralized Notes, Ser 2018-PLS1, Cl A | | | | | | | | |
3.193%, 01/25/2023 (A) | | | 308 | | | | 308 | |
NRZ Excess Spread-Collateralized Notes, Ser 2018-PLS2, Cl A | | | | | | | | |
3.265%, 02/25/2023 (A) | | | 196 | | | | 196 | |
NYCTL Trust, Ser 2018-A, Cl A 3.220%, | | | | | | | | |
11/10/2031 (A) | | | 227 | | | | 229 | |
NYCTL Trust, Ser 2019-A, Cl A 2.190%, | | | | | | | | |
11/10/2032 (A) | | | 364 | | | | 369 | |
OCP CLO, Ser 2017-8A, Cl A1R | | | | | | | | |
1.068%, VAR ICE LIBOR USD 3 Month+0.850%, 04/17/2027 (A) | | | 143 | | | | 143 | |
OneMain Financial Issuance Trust, Ser 2018-1A, Cl A | | | | | | | | |
3.300%, 03/14/2029 (A) | | | 395 | | | | 399 | |
OneMain Financial Issuance Trust, Ser 2019-1A, Cl A | | | | | | | | |
3.480%, 02/14/2031 (A) | | | 800 | | | | 807 | |
OZLM VII, Ser 2018-7RA, Cl A1R | | | | | | | | |
1.228%, VAR ICE LIBOR USD 3 Month+1.010%, 07/17/2029 (A) | | | 946 | | | | 939 | |
OZLM XII, Ser 2018-12A, Cl A1R | | | | | | | | |
1.264%, VAR ICE LIBOR USD 3 Month+1.050%, 04/30/2027 (A) | | | 552 | | | | 550 | |
Palmer Square CLO, Ser 2018-3A, Cl A2 | | | | | | | | |
1.571%, VAR ICE LIBOR USD 3 Month+1.350%, 08/15/2026 (A) | | | 820 | | | | 815 | |
PFS Financing, Ser 2020-B, Cl A | | | | | | | | |
1.210%, 06/15/2024 (A) | | | 695 | | | | 701 | |
PFS Financing, Ser 2020-F, Cl A | | | | | | | | |
0.930%, 08/15/2024 (A) | | | 2,015 | | | | 2,026 | |
Regional Management Issuance Trust, Ser 2019-1, Cl A | | | | | | | | |
3.050%, 11/15/2028 (A) | | | 175 | | | | 178 | |
SCF Equipment Leasing LLC, Ser 2020-1A, Cl A2 | | | | | | | | |
0.680%, 10/20/2025 (A) | | | 990 | | | | 991 | |
Shackleton CLO, Ser 2018-6RA, Cl A | | | | | | | | |
1.238%, VAR ICE LIBOR USD 3 Month+1.020%, 07/17/2028 (A) | | | 709 | | | | 706 | |
SLM Student Loan Trust, Ser 2007-6, Cl A4 | | | | | | | | |
0.595%, VAR ICE LIBOR USD 3 Month+0.380%, 10/25/2024 | | | 369 | | | | 368 | |
| | | | | | | | |
| | | |
| Description | | Face Amount
(Thousands) | | Market Value
($ Thousands) |
|
ASSET-BACKED SECURITIES (continued) | |
SMB Private Education Loan Trust, Ser 2020-A, Cl A1 | | | | | | | | |
0.441%, VAR ICE LIBOR USD 1 Month+0.300%, 03/15/2027 (A) | | $ | 909 | | | $ | 908 | |
SoFi Consumer Loan Program Trust, Ser 2019-1, Cl A | | | | | | | | |
3.240%, 02/25/2028 (A) | | | 343 | | | | 346 | |
SoFi Consumer Loan Program Trust, Ser 2019-2, Cl A | | | | | | | | |
3.010%, 04/25/2028 (A) | | | 303 | | | | 307 | |
SoFi Consumer Loan Program Trust, Ser 2019-3, Cl A | | | | | | | | |
2.900%, 05/25/2028 (A) | | | 775 | | | | 784 | |
SoFi Consumer Loan Program Trust, Ser 2019-4, Cl A | | | | | | | | |
2.450%, 08/25/2028 (A) | | | 1,300 | | | | 1,314 | |
SoFi Consumer Loan Program Trust, Ser 2020-1, Cl A | | | | | | | | |
2.020%, 01/25/2029 (A) | | | 906 | | | | 916 | |
SoFi Professional Loan Program Trust, Ser 2020-A, Cl A1FX | | | | | | | | |
2.060%, 05/15/2046 (A) | | | 1,338 | | | | 1,349 | |
Symphony CLO XIV, Ser 2019-14A, Cl AR | | | | | | | | |
1.179%, VAR ICE LIBOR USD 3 Month+0.950%, 07/14/2026 (A) | | | 850 | | | | 848 | |
Towd Point Mortgage Trust, Ser 2015-2, Cl 2A11 | | | | | | | | |
3.000%, 11/25/2057 (A)(B) | | | 45 | | | | 45 | |
Towd Point Mortgage Trust, Ser 2015-4, Cl A1B | | | | | | | | |
2.750%, 04/25/2055 (A)(B) | | | 44 | | | | 44 | |
Towd Point Mortgage Trust, Ser 2015-5, Cl A1B | | | | | | | | |
2.750%, 05/25/2055 (A)(B) | | | 58 | | | | 58 | |
Towd Point Mortgage Trust, Ser 2016-1, Cl A1B | | | | | | | | |
2.750%, 02/25/2055 (A)(B) | | | 358 | | | | 363 | |
Towd Point Mortgage Trust, Ser 2016-3, Cl A1 | | | | | | | | |
2.250%, 04/25/2056 (A)(B) | | | 156 | | | | 158 | |
Towd Point Mortgage Trust, Ser 2016-4, Cl A1 | | | | | | | | |
2.250%, 07/25/2056 (A)(B) | | | 288 | | | | 292 | |
Towd Point Mortgage Trust, Ser 2017-1, Cl A1 | | | | | | | | |
2.750%, 10/25/2056 (A)(B) | | | 1,078 | | | | 1,105 | |
Towd Point Mortgage Trust, Ser 2017-2, Cl A1 | | | | | | | | |
2.750%, 04/25/2057 (A)(B) | | | 1,085 | | | | 1,109 | |
Towd Point Mortgage Trust, Ser 2017-4, Cl A1 | | | | | | | | |
2.750%, 06/25/2057 (A)(B) | | | 266 | | | | 276 | |
Towd Point Mortgage Trust, Ser 2017-5, Cl A1 | | | | | | | | |
0.750%, VAR ICE LIBOR USD 1 Month+0.600%, 02/25/2057 (A) | | | 597 | | | | 593 | |
Towd Point Mortgage Trust, Ser 2017-6, Cl A1 | | | | | | | | |
2.750%, 10/25/2057 (A)(B) | | | 212 | | | | 218 | |
| | |
SEI Institutional Investments Trust / Semi-Annual Report / November 30, 2020 | | 219 |
SCHEDULE OF INVESTMENTS (Unaudited)
November 30, 2020
Ultra Short Duration Bond Fund (Continued)
| | | | | | | | |
| | | |
Description | | Face Amount (Thousands) | | Market Value ($ Thousands) |
|
ASSET-BACKED SECURITIES (continued) | |
Towd Point Mortgage Trust, Ser 2019-HY2,Cl A1 | | | | | | | | |
1.150%, VAR ICE LIBOR USD 1 Month+1.000%, 05/25/2058 (A) | | $ | 415 | | | $ | 416 | |
Transportation Finance Equipment Trust,Ser 2019-1, Cl A2 | | | | | | | | |
1.900%, 01/24/2022 (A) | | | 2,119 | | | | 2,129 | |
Tryon Park CLO, Ser 2018-1A, Cl A1SR | | | | | | | | |
1.127%, VAR ICE LIBOR USD 3 Month+0.890%, 04/15/2029 (A) | | | 1,210 | | | | 1,206 | |
Verizon Owner Trust, Ser 2020-A, Cl A1A | | | | | | | | |
1.850%, 07/22/2024 | | | 825 | | | | 845 | |
Verizon Owner Trust, Ser 2020-B, Cl A | | | | | | | | |
0.470%, 02/20/2025 | | | 1,010 | | | | 1,013 | |
Volvo Financial Equipment LLC, Ser 2020-1A,Cl A2 | | | | | | | | |
0.370%, 04/17/2023 (A) | | | 410 | | | | 410 | |
Voya CLO, 2017-1A, Cl A1R | | | | | | | | |
1.118%, VAR ICE LIBOR USD 3 Month+0.900%, 01/18/2029 (A) | | | 420 | | | | 418 | |
Voya CLO, Ser 2017-3A, Cl A1R | | | | | | | | |
0.935%, VAR ICE LIBOR USD 3 Month+0.720%, 07/25/2026 (A) | | | 152 | | | | 152 | |
| | | | | | | | |
| | |
| | | | | | | 71,418 | |
| | | | | | | | |
| | |
Total Asset-Backed Securities (Cost $195,832) ($ Thousands) | | | | | | | 196,514 | |
| | | | | | | | |
|
CORPORATE OBLIGATIONS — 33.8% | |
|
Communication Services — 0.2% | |
Fox | | | | | | | | |
3.666%, 01/25/2022 | | | 120 | | | | 125 | |
NBCUniversal Enterprise | | | | | | | | |
0.625%, VAR ICE LIBOR USD 3 Month+0.400%, 04/01/2021 (A) | | | 900 | | | | 901 | |
| | | | | | | | |
| | | | | | | 1,026 | |
| | | | | | | | |
|
Consumer Discretionary — 1.7% | |
American Honda Finance MTN | | | | | | | | |
0.875%, 07/07/2023 | | | 550 | | | | 556 | |
0.329%, VAR ICE LIBOR USD 3 Month+0.120%, 01/21/2022 | | | 1,000 | | | | 1,000 | |
Daimler Finance North America LLC | | | | | | | | |
0.663%, VAR ICE LIBOR USD 3 Month+0.450%, 02/22/2021 (A) | | | 500 | | | | 500 | |
Ford Motor Credit LLC | | | | | | | | |
1.503%, VAR ICE LIBOR USD 3 Month+1.270%, 03/28/2022 | | | 750 | | | | 740 | |
Hyundai Capital America | | | | | | | | |
1.170%, VAR ICE LIBOR USD 3 Month+0.940%, 07/08/2021 (A) | | | 725 | | | | 726 | |
| | | | | | | | |
| | | |
Description | | Face Amount (Thousands) | | Market Value ($ Thousands) |
|
CORPORATE OBLIGATIONS (continued) | |
Marriott International | | | | | | | | |
0.876%, VAR ICE LIBOR USD 3 Month+0.650%, 03/08/2021 | | $ | 575 | | | $ | 575 | |
0.846%, VAR ICE LIBOR USD 3 Month+0.600%, 12/01/2020 | | | 800 | | | | 800 | |
Nissan Motor Acceptance MTN | | | | | | | | |
1.114%, VAR ICE LIBOR USD 3 Month+0.890%, 01/13/2022 (A) | | | 1,000 | | | | 992 | |
Toyota Motor Credit MTN | | | | | | | | |
1.150%, 05/26/2022 | | | 825 | | | | 835 | |
VF | | | | | | | | |
2.050%, 04/23/2022 | | | 850 | | | | 869 | |
Volkswagen Group of America Finance LLC | | | | | | | | |
2.900%, 05/13/2022 (A) | | | 850 | | | | 877 | |
1.154%, VAR ICE LIBOR USD 3 Month+0.940%, 11/12/2021 (A) | | | 1,150 | | | | 1,158 | |
| | | | | | | | |
| | | | | | | 9,628 | |
| | | | | | | | |
|
Consumer Staples — 1.1% | |
Altria Group | | | | | | | | |
4.750%, 05/05/2021 | | | 1,650 | | | | 1,681 | |
Bayer US Finance II LLC | | | | | | | | |
3.500%, 06/25/2021 (A) | | | 775 | | | | 786 | |
Cargil | | | | | | | | |
l 1.375%, 07/23/2023 (A) | | | 475 | | | | 488 | |
Howard University | | | | | | | | |
2.801%, 10/01/2023 | | | 575 | | | | 597 | |
2.638%, 10/01/2021 | | | 240 | | | | 243 | |
Mondelez International | | | | | | | | |
2.125%, 04/13/2023 | | | 130 | | | | 135 | |
0.625%, 07/01/2022 | | | 700 | | | | 703 | |
OhioHealth | | | | | | | | |
1.119%, 11/15/2021 | | | 455 | | | | 456 | |
Skandinaviska Enskilda Banken | | | | | | | | |
0.550%, 09/01/2023 (A) | | | 425 | | | | 425 | |
Viatris | | | | | | | | |
1.125%, 06/22/2022 (A) | | | 875 | | | | 883 | |
| | | | | | | | |
| | | | | | | 6,397 | |
| | | | | | | | |
|
Energy — 1.9% | |
El Paso Pipeline Partners Operating LLC | | | | | | | | |
5.000%, 10/01/2021 | | | 170 | | | | 174 | |
Kinder Morgan | | | | | | | | |
5.000%, 02/15/2021 (A) | | | 2,000 | | | | 2,011 | |
Kinder Morgan Energy Partners | | | | | | | | |
3.500%, 03/01/2021 | | | 650 | | | | 651 | |
MPLX | | | | | | | | |
1.342%, VAR ICE LIBOR USD 3 Month+1.100%, 09/09/2022 | | | 1,915 | | | | 1,915 | |
Occidental Petroleum | | | | | | | | |
2.600%, 08/13/2021 | | | 350 | | | | 346 | |
| | |
220 | | SEI Institutional Investments Trust / Semi-Annual Report / November 30, 2020 |
| | | | | | | | |
| | | |
Description | | Face Amount (Thousands) | | Market Value ($ Thousands) |
|
CORPORATE OBLIGATIONS (continued) | |
1.163%, VAR ICE LIBOR USD 3 Month+0.950%, 02/08/2021 | | $ | 400 | | | $ | 398 | |
Phillips 66 | | | | | | | | |
3.700%, 04/06/2023 | | | 455 | | | | 487 | |
0.833%, VAR ICE LIBOR USD 3 Month+0.600%, 02/26/2021 | | | 665 | | | | 665 | |
Pioneer Natural Resource | | | | | | | | |
3.450%, 01/15/2021 | | | 1,250 | | | | 1,252 | |
Saudi Arabian | | | | | | | | |
Oil 1.250%, 11/24/2023 (A) | | | 200 | | | | 202 | |
Saudi Arabian Oil MTN | | | | | | | | |
2.750%, 04/16/2022 (A) | | | 2,290 | | | | 2,358 | |
Valero Energy Corp | | | | | | | | |
2.700%, 04/15/2023 | | | 375 | | | | 390 | |
| | | | | | | | |
| | | | | | | 10,849 | |
| | | | | | | | |
| | |
Financials — 18.3% | | | | | | | | |
ABN AMRO Bank MTN | | | | | | | | |
0.628%, VAR ICE LIBOR USD 3 Month+0.410%, 01/19/2021 (A) | | | 950 | | | | 951 | |
AIG Global Funding | | | | | | | | |
0.800%, 07/07/2023 (A) | | | 570 | | | | 576 | |
Aon | | | | | | | | |
2.200%, 11/15/2022 | | | 55 | | | | 57 | |
Assurant | | | | | | | | |
1.483%, VAR ICE LIBOR USD 3 Month+1.250%, 03/26/2021 | | | 127 | | | | 127 | |
Aviation Capital Group LLC | | | | | | | | |
0.884%, VAR ICE LIBOR USD 3 Month+0.670%, 07/30/2021 (A) | | | 945 | | | | 929 | |
Bank of America | | | | | | | | |
0.589%, VAR ICE LIBOR USD 3 Month+0.380%, 01/23/2022 | | | 1,200 | | | | 1,200 | |
Bank of America MTN | | | | | | | | |
1.486%, VAR United States Secured Overnight Financing Rate+1.460%, 05/19/2024 | | | 475 | | | | 485 | |
0.875%, VAR ICE LIBOR USD 3 Month+0.650%, 06/25/2022 | | | 1,900 | | | | 1,906 | |
Bank of Montreal MTN | | | | | | | | |
0.766%, VAR United States Secured Overnight Financing Rate+0.680%, 03/10/2023 | | | 2,165 | | | | 2,180 | |
Bank of New York Mellon MTN | | | | | | | | |
1.950%, 08/23/2022 | | | 375 | | | | 386 | |
Bank of Nova Scotia | | | | | | | | |
0.865%, VAR ICE LIBOR USD 3 Month+0.640%, 03/07/2022 | | | 800 | | | | 805 | |
0.633%, VAR United States Secured Overnight Financing Rate+0.550%, 09/15/2023 | | | 2,725 | | | | 2,736 | |
Barclays Bank | | | | | | | | |
1.700%, 05/12/2022 | | | 350 | | | | 356 | |
| | | | | | | | |
| | | |
Description | | Face Amount (Thousands) | | Market Value ($ Thousands) |
|
CORPORATE OBLIGATIONS (continued) | |
BBVA USA | | | | | | | | |
0.980%, VAR ICE LIBOR USD 3 Month+0.730%, 06/11/2021 | | $ | 875 | | | $ | 878 | |
BPCE | | | | | | | | |
2.650%, 02/03/2021 | | | 725 | | | | 728 | |
BPCE MTN | | | | | | | | |
3.000%, 05/22/2022 (A) | | | 1,799 | | | | 1,865 | |
Canadian Imperial Bank of Commerce | | | | | | | | |
0.884%, VAR United States Secured Overnight Financing Rate+0.800%, 03/17/2023 | | | 700 | | | | 706 | |
0.529%, VAR ICE LIBOR USD 3 Month+0.315%, 02/02/2021 | | | 2,650 | | | | 2,651 | |
Capital One Bank USA | | | | | | | | |
2.014%, VAR United States Secured Overnight Financing Rate+0.616%, 01/27/2023 | | | 575 | | | | 585 | |
Charles Schwab | | | | | | | | |
0.533%, VAR ICE LIBOR USD 3 Month+0.320%, 05/21/2021 | | | 720 | | | | 721 | |
Citibank | | | | | | | | |
0.564%, VAR ICE LIBOR USD 3 Month+0.350%, 02/12/2021 | | | 1,000 | | | | 1,000 | |
Citigroup | | | | | | | | |
1.296%, VAR ICE LIBOR USD 3 Month+1.070%, 12/08/2021 | | | 595 | | | | 600 | |
0.951%, VAR United States Secured Overnight Financing Rate+0.870%, 11/04/2022 | | | 3,130 | | | | 3,143 | |
Citizens Bank | | | | | | | | |
0.941%, VAR ICE LIBOR USD 3 Month+0.720%, 02/14/2022 | | | 800 | | | | 804 | |
Cooperatieve Rabobank UA | | | | | | | | |
3.125%, 04/26/2021 | | | 1,825 | | | | 1,846 | |
1.054%, VAR ICE LIBOR USD 3 Month+0.830%, 01/10/2022 | | | 1,350 | | | | 1,361 | |
0.645%, VAR ICE LIBOR USD 3 Month+0.430%, 04/26/2021 | | | 1,301 | | | | 1,303 | |
Credit Suisse Group Funding Guernsey | | | | | | | | |
3.125%, 12/10/2020 | | | 1,175 | | | | 1,176 | |
Credit Suisse NY | | | | | | | | |
2.100%, 11/12/2021 | | | 915 | | | | 930 | |
0.532%, VAR United States Secured Overnight Financing Rate+0.450%, 02/04/2022 | | | 3,165 | | | | 3,169 | |
Danske Bank | | | | | | | | |
5.000%, 01/12/2022 (A) | | | 850 | | | | 890 | |
3.001%, VAR ICE LIBOR USD 3 Month+1.249%, 09/20/2022 (A) | | | 800 | | | | 814 | |
2.000%, 09/08/2021 (A) | | | 426 | | | | 431 | |
Danske Bank MTN | | | | | | | | |
2.800%, 03/10/2021 (A) | | | 2,400 | | | | 2,415 | |
| | |
SEI Institutional Investments Trust / Semi-Annual Report / November 30, 2020 | | 221 |
SCHEDULE OF INVESTMENTS (Unaudited)
November 30, 2020
Ultra Short Duration Bond Fund (Continued)
| | | | | | | | |
| | | |
| Description | | Face Amount
(Thousands) | | Market Value
($ Thousands) |
|
CORPORATE OBLIGATIONS (continued) | |
Deutsche Bank NY | | | | | | | | |
4.250%, 02/04/2021 | | $ | 1,000 | | | $ | 1,006 | |
1.031%, VAR ICE LIBOR USD 3 Month+0.815%, 01/22/2021 | | | 750 | | | | 750 | |
Fifth Third Bank | | | | | | | | |
0.655%, VAR ICE LIBOR USD 3 Month+0.440%, 07/26/2021 | | | 600 | | | | 601 | |
Fifth Third Bank MTN | | | | | | | | |
1.800%, 01/30/2023 | | | 250 | | | | 257 | |
Goldman Sachs Group | | | | | | | | |
5.750%, 01/24/2022 | | | 5,245 | | | | 5,565 | |
1.325%, VAR ICE LIBOR USD 3 Month+1.110%, 04/26/2022 | | | 900 | | | | 903 | |
0.627%, VAR United States Secured Overnight Financing Rate+0.538%, 11/17/2023 | | | 895 | | | | 897 | |
HSBC Holdings | | | | | | | | |
4.000%, 03/30/2022 | | | 750 | | | | 786 | |
Intercontinental Exchange | | | | | | | | |
0.903%, VAR ICE LIBOR USD 3 Month+0.650%, 06/15/2023 | | | 1,000 | | | | 1,004 | |
Jackson National Life Global Funding | | | | | | | | |
2.250%, 04/29/2021 (A) | | | 525 | | | | 529 | |
0.730%, VAR ICE LIBOR USD 3 Month+0.480%, 06/11/2021 (A) | | | 1,620 | | | | 1,624 | |
KeyBank | | | | | | | | |
1.023%, VAR ICE LIBOR USD 3 Month+0.810%, 11/22/2021 | | | 1,300 | | | | 1,310 | |
0.874%, VAR ICE LIBOR USD 3 Month+0.660%, 02/01/2022 | | | 2,250 | | | | 2,264 | |
Manufacturers & Traders Trust | | | | | | | | |
0.485%, VAR ICE LIBOR USD 3 Month+0.270%, 01/25/2021 | | | 1,950 | | | | 1,951 | |
Marsh & McLennan | | | | | | | | |
3.500%, 12/29/2020 | | | 170 | | | | 170 | |
MassMutual Global Funding II | | | | | | | | |
0.356%, VAR ICE LIBOR USD 3 Month+0.125%, 03/04/2021 (A) | | | 1,000 | | | | 1,000 | |
MassMutual Global Funding II MTN | | | | | | | | |
0.850%, 06/09/2023 (A) | | | 874 | | | | 884 | |
Metropolitan Life Global Funding I | | | | | | | | |
0.900%, 06/08/2023 (A) | | | 575 | | | | 583 | |
Metropolitan Life Global Funding I MTN | | | | | | | | |
0.653%, VAR United States Secured | | | | | | | | |
Overnight Financing Rate+0.570%, 01/13/2023 (A) | | | 825 | | | | 829 | |
Mizuho Financial Group | | | | | | | | |
0.837%, VAR ICE LIBOR USD 3 Month+0.630%, 05/25/2024 | | | 1,200 | | | | 1,202 | |
Morgan Stanley | | | | | | | | |
1.398%, VAR ICE LIBOR USD 3 Month+1.180%, 01/20/2022 | | | 3,300 | | | | 3,305 | |
| | | | | | | | |
| | | |
| Description | | Face Amount
(Thousands) | | Market Value
($ Thousands) |
|
CORPORATE OBLIGATIONS (continued) | |
Morgan Stanley MTN | | | | | | | | |
2.750%, 05/19/2022 | | $ | 2,170 | | | $ | 2,244 | |
0.782%, VAR United States Secured Overnight Financing Rate+0.700%, 01/20/2023 | | | 1,175 | | | | 1,178 | |
MUFG Union Bank | | | | | | | | |
0.825%, VAR ICE LIBOR USD 3 Month+0.600%, 03/07/2022 | | | 1,750 | | | | 1,759 | |
National Australia Bank | | | | | | | | |
1.875%, 12/13/2022 | | | 350 | | | | 361 | |
National Bank of Canada | | | | | | | | |
0.900%, VAR US Treas Yield Curve Rate T Note Const Mat 1 Yr+0.770%, 08/15/2023 | | | 850 | | | | 856 | |
Nationwide Building Society | | | | | | | | |
2.000%, 01/27/2023 (A) | | | 600 | | | | 619 | |
Nordea Bank ABP | | | | | | | | |
1.000%, 06/09/2023 (A) | | | 875 | | | | 887 | |
Pacific Life Global Funding II | | | | | | | | |
0.500%, 09/23/2023 (A) | | | 735 | | | | 735 | |
PNC Bank | | | | | | | | |
1.743%, VAR ICE LIBOR USD 3 Month0.000%, 02/24/2023 | | | 850 | | | | 865 | |
0.530%, VAR ICE LIBOR USD 3 Month+0.325%, 02/24/2023 | | | 2,950 | | | | 2,954 | |
Protective Life Global Funding | | | | | | | | |
1.082%, 06/09/2023 (A) | | | 610 | | | | 620 | |
Royal Bank of Canada MTN | | | | | | | | |
0.683%, VAR ICE LIBOR USD 3 Month+0.470%, 04/29/2022 | | | 2,725 | | | | 2,739 | |
0.604%, VAR ICE LIBOR USD 3 Month+0.390%, 04/30/2021 | | | 810 | | | | 811 | |
0.532%, VAR United States Secured Overnight Financing Rate+0.450%, 10/26/2023 | | | 725 | | | | 726 | |
Santander UK | | | | | | | | |
2.100%, 01/13/2023 | | | 360 | | | | 372 | |
0.845%, VAR ICE LIBOR USD 3 Month+0.620%, 06/01/2021 | | | 850 | | | | 852 | |
Standard Chartered | | | | | | | | |
2.744%, VAR ICE LIBOR USD 3 Month+1.200%, 09/10/2022 (A) | | | 780 | | | | 791 | |
State Street | | | | | | | | |
2.825%, VAR United States Secured Overnight Financing Rate+2.690%, 03/30/2023 | | | 1,265 | | | | 1,306 | |
Svenska Handelsbanken MTN | | | | | | | | |
3.350%, 05/24/2021 | | | 1,460 | | | | 1,481 | |
0.675%, VAR ICE LIBOR USD 3 Month+0.470%, 05/24/2021 | | | 850 | | | | 852 | |
Toronto-Dominion Bank | | | | | | | | |
2.100%, 07/15/2022 (A) | | | 2,000 | | | | 2,057 | |
| | |
222 | | SEI Institutional Investments Trust / Semi-Annual Report / November 30, 2020 |
| | | | | | | | |
| | | |
| Description | | Face Amount
(Thousands) | | Market Value
($ Thousands) |
|
CORPORATE OBLIGATIONS (continued) | |
Toronto-Dominion Bank MTN | | | | | | | | |
0.680%, VAR ICE LIBOR USD 3 Month+0.430%, 06/11/2021 | | $ | 2,961 | | | $ | 2,968 | |
0.562%, VAR United States Secured Overnight Financing Rate+0.480%, 01/27/2023 | | | 2,055 | | | | 2,061 | |
0.534%, VAR United States Secured Overnight Financing Rate+0.450%, 09/28/2023 | | | 725 | | | | 726 | |
UBS/London | | | | | | | | |
1.750%, 04/21/2022 (A) | | | 1,200 | | | | 1,223 | |
UniCredit MTN | | | | | | | | |
6.572%, 01/14/2022 (A) | | | 515 | | | | 545 | |
US Bank | | | | | | | | |
0.530%, VAR ICE LIBOR USD 3 Month+0.310%, 02/04/2021 | | | 1,800 | | | | 1,800 | |
USAA Capital | | | | | | | | |
1.500%, 05/01/2023 (A) | | | 890 | | | | 914 | |
Wells Fargo | | | | | | | | |
2.500%, 03/04/2021 | | | 950 | | | | 955 | |
1.240%, VAR ICE LIBOR USD 3 Month+1.025%, 07/26/2021 | | | 1,799 | | | | 1,810 | |
| | | | | | | | |
| | | | | | | 106,197 | |
| | | | | | | | |
| | |
Health Care — 1.9% | | | | | | | | |
AbbVie | | | | | | | | |
0.691%, VAR ICE LIBOR USD 3 Month+0.460%, 11/19/2021 | | | 2,165 | | | | 2,170 | |
Anthem | | | | | | | | |
2.950%, 12/01/2022 | | | 925 | | | | 969 | |
Bristol-Myers Squibb | | | | | | | | |
3.250%, 02/20/2023 | | | 675 | | | | 716 | |
2.550%, 05/14/2021 | | | 1,600 | | | | 1,617 | |
0.537%, 11/13/2023 | | | 775 | | | | 776 | |
Cigna | | | | | | | | |
0.896%, VAR ICE LIBOR USD 3 Month+0.650%, 09/17/2021 | | | 600 | | | | 600 | |
CVS Health | | | | | | | | |
2.125%, 06/01/2021 | | | 1,400 | | | | 1,410 | |
0.962%, VAR ICE LIBOR USD 3 Month+0.720%, 03/09/2021 | | | 820 | | | | 821 | |
Gilead Sciences | | | | | | | | |
0.370%, VAR ICE LIBOR USD 3 Month+0.150%, 09/17/2021 | | | 1,000 | | | | 1,001 | |
Royalty Pharma | | | | | | | | |
0.750%, 09/02/2023 (A) | | | 650 | | | | 653 | |
Stryker 0.600%, 12/01/2023 | | | 410 | | | | 411 | |
| | | | | | | | |
| | | | | | | 11,144 | |
| | | | | | | | |
| | | | | | | | |
| | | |
| Description | | Face Amount
(Thousands) | | Market Value
($ Thousands) |
|
CORPORATE OBLIGATIONS (continued) | |
| | |
Industrials — 2.8% | | | | | | | | |
AerCap Ireland Capital DAC / AerCap Global Aviation Trust | | | | | | | | |
4.500%, 05/15/2021 | | $ | 1,100 | | | $ | 1,116 | |
Boeing | | | | | | | | |
2.300%, 08/01/2021 | | | 695 | | | | 702 | |
Caterpillar Financial Services MTN | | | | | | | | |
0.505%, VAR ICE LIBOR USD 3 Month+0.280%, 09/07/2021 | | | 2,650 | | | | 2,655 | |
DAE Funding LLC | | | | | | | | |
5.250%, 11/15/2021 (A) | | | 850 | | | | 874 | |
Equifax | | | | | | | | |
1.091%, VAR ICE LIBOR USD 3 Month+0.870%, 08/15/2021 | | | 735 | | | | 738 | |
Honeywell International | | | | | | | | |
0.483%, 08/19/2022 | | | 3,835 | | | | 3,841 | |
John Deere Capital MTN | | | | | | | | |
0.550%, 07/05/2022 | | | 1,425 | | | | 1,432 | |
Otis Worldwide | | | | | | | | |
0.684%, VAR ICE LIBOR USD 3 Month+0.450%, 04/05/2023 | | | 3,390 | | | | 3,391 | |
PACCAR Financial MTN | | | | | | | | |
0.800%, 06/08/2023 | | | 320 | | | | 324 | |
0.466%, VAR ICE LIBOR USD 3 Month+0.260%, 05/10/2021 | | | 400 | | | | 400 | |
Penske Truck Leasing LP | | | | | | | | |
3.650%, 07/29/2021 (A) | | | 575 | | | | 586 | |
Roper Technologies | | | | | | | | |
0.450%, 08/15/2022 | | | 280 | | | | 280 | |
| | | | | | | | |
| | | | | | | 16,339 | |
| | | | | | | | |
| | |
Information Technology — 0.8% | | | | | | | | |
Broadcom | | | | | | | | |
3.125%, 04/15/2021 | | | 1,150 | | | | 1,159 | |
Hewlett Packard Enterprise | | | | | | | | |
4.450%, 10/02/2023 | | | 675 | | | | 743 | |
0.954%, VAR ICE LIBOR USD 3 Month+0.720%, 10/05/2021 | | | 600 | | | | 600 | |
0.929%, VAR ICE LIBOR USD 3 Month+0.680%, 03/12/2021 | | | 1,150 | | | | 1,152 | |
Microchip Technology | | | | | | | | |
3.922%, 06/01/2021 | | | 934 | | | | 949 | |
| | | | | | | | |
| | | | | | | 4,603 | |
| | | | | | | | |
| | |
Materials — 0.2% | | | | | | | | |
LYB International Finance III LLC | | | | | | | | |
1.230%, VAR ICE LIBOR USD 3 Month+1.000%, 10/01/2023 | | | 875 | | | | 876 | |
Nutrition & Biosciences | | | | | | | | |
0.697%, 09/15/2022 (A) | | | 380 | | | | 381 | |
| | | | | | | | |
| | | | | | | 1,257 | |
| | | | | | | | |
| | |
SEI Institutional Investments Trust / Semi-Annual Report / November 30, 2020 | | 223 |
SCHEDULE OF INVESTMENTS (Unaudited)
November 30, 2020
Ultra Short Duration Bond Fund (Continued)
| | | | | | | | |
| | | |
| Description | | Face Amount (Thousands) | | Market Value ($ Thousands) |
|
CORPORATE OBLIGATIONS (continued) | |
|
Sovereign — 2.3% | |
European Investment Bank | | | | | | | | |
0.377%, VAR United States Secured Overnight Financing Rate+0.290%, 06/10/2022 (A) | | $ | 5,595 | | | $ | 5,605 | |
Inter-American Development Bank | | | | | | | | |
0.346%, VAR United States Secured Overnight Financing Rate+0.260%, 09/16/2022 | | | 4,345 | | | | 4,350 | |
Inter-American Development Bank MTN | | | | | | | | |
0.437%, VAR ICE LIBOR USD 3 Month+0.200%, 07/15/2021 | | | 3,273 | | | | 3,277 | |
| | | | | | | | |
| | | | | | | 13,232 | |
| | | | | | | | |
|
Utilities — 2.6% | |
American Electric Power | | | | | | | | |
0.680%, VAR ICE LIBOR USD 3 Month+0.480%, 11/01/2023 | | | 1,875 | | | | 1,877 | |
Consolidated Edison of New York | | | | | | | | |
0.625%, VAR ICE LIBOR USD 3 Month+0.400%, 06/25/2021 | | | 3,195 | | | | 3,201 | |
Dominion Energy | | | | | | | | |
2.715%, –%, 0, 08/15/2021 (C) | | | 155 | | | | 157 | |
2.450%, 01/15/2023 (A) | | | 800 | | | | 832 | |
0.776%, VAR ICE LIBOR USD 3 Month+0.530%, 09/15/2023 | | | 2,560 | | | | 2,564 | |
DTE Energy | | | | | | | | |
0.550%, 11/01/2022 | | | 1,920 | | | | 1,923 | |
Duke Energy Progress LLC | | | | | | | | |
0.400%, VAR ICE LIBOR USD 3 Month+0.180%, 02/18/2022 | | | 1,450 | | | | 1,450 | |
PPL Electric Utilities | | | | | | | | |
0.475%, VAR ICE LIBOR USD 3 Month+0.250%, 09/28/2023 | | | 1,585 | | | | 1,586 | |
Southern California Gas | | | | | | | | |
0.577%, VAR ICE LIBOR USD 3 Month+0.350%, 09/14/2023 | | | 1,705 | | | | 1,706 | |
| | | | | | | | |
| | | | | | | 15,296 | |
| | | | | | | | |
Total Corporate Obligations | | | | | | | | |
(Cost $194,873) ($ Thousands) | | | | | | | 195,968 | |
| | | | | | | | |
|
MORTGAGE-BACKED SECURITIES — 15.5% | |
|
Agency Mortgage-Backed Obligations — 6.2% | |
FDIC Guaranteed Notes Trust, Ser 2010-S4, Cl A | | | | | | | | |
0.860%, VAR LIBOR USD 1 Month+0.720%, 12/04/2020 (A) | | | 778 | | | | 778 | |
FHLMC | | | | | | | | |
2.500%, 08/01/2028 | | | 794 | | | | 830 | |
0.450%, 07/28/2023 to 08/04/2023 | | | 5,675 | | | | 5,671 | |
| | | | | | | | |
| | | |
| Description | | Face Amount (Thousands) | | Market Value
($ Thousands) |
|
MORTGAGE-BACKED SECURITIES (continued) | |
0.375%, 06/08/2022 | | $ | 2,825 | | | $ | 2,825 | |
0.320%, 10/20/2022 | | | 2,850 | | | | 2,849 | |
FHLMC ARM | | | | | | | | |
2.731%, VAR US Treas Yield Curve Rate T Note Const Mat 1 Yr+2.022%, 02/01/2030 | | | 14 | | | | 14 | |
2.160%, VAR US Treas Yield Curve Rate T Note Const Mat 1 Yr+1.901%, 02/01/2022 | | | 1 | | | | 1 | |
FHLMC CMO, Ser 2010-3745, Cl GP | | | | | | | | |
4.000%, 06/15/2039 | | | 183 | | | | 184 | |
FHLMC CMO, Ser 2011-3896, Cl PA | | | | | | | | |
4.000%, 03/15/2040 | | | 90 | | | | 92 | |
FHLMC CMO, Ser 2011-3903, Cl QC | | | | | | | | |
2.250%, 03/15/2041 | | | 123 | | | | 124 | |
FHLMC CMO, Ser 2012-4030, Cl AN | | | | | | | | |
1.750%, 04/15/2027 | | | 751 | | | | 765 | |
FHLMC CMO, Ser 2013-4159, Cl LA | | | | | | | | |
3.500%, 02/15/2040 | | | 875 | | | | 897 | |
FHLMC CMO, Ser 2013-4206, Cl CA | | | | | | | | |
3.000%, 05/15/2037 | | | 384 | | | | 386 | |
FHLMC CMO, Ser 2013-4272, Cl YG | | | | | | | | |
2.000%, 11/15/2026 | | | 82 | | | | 84 | |
FHLMC CMO, Ser 2014-4297, Cl CA | | | | | | | | |
3.000%, 12/15/2030 | | | 611 | | | | 625 | |
FHLMC CMO, Ser 2014-4323, Cl GA | | | | | | | | |
3.000%, 06/15/2040 | | | 181 | | | | 182 | |
FHLMC CMO, Ser 2014-4323, Cl CA | | | | | | | | |
4.000%, 03/15/2040 | | | 99 | | | | 101 | |
FHLMC CMO, Ser 2014-4379, Cl CB | | | | | | | | |
2.250%, 04/15/2033 | | | 898 | | | | 925 | |
FHLMC CMO, Ser 2014-4385, Cl Q | | | | | | | | |
3.000%, 07/15/2039 | | | 845 | | | | 854 | |
FHLMC CMO, Ser 2014-4387, Cl DA | | | | | | | | |
3.000%, 01/15/2032 | | | 600 | | | | 619 | |
FHLMC CMO, Ser 2014-4390, Cl NC | | | | | | | | |
3.000%, 05/15/2039 | | | 368 | | | | 372 | |
FHLMC Multifamily Structured Pass-Through | | | | | | | | |
Certificates, Ser K016, Cl A2 2.968%, 10/25/2021 | | | 593 | | | | 603 | |
FHLMC Multifamily Structured Pass-Through | | | | | | | | |
Certificates, Ser K721, Cl A2 3.090%, 08/25/2022 (B) | | | 1,625 | | | | 1,681 | |
FHLMC Multifamily Structured Pass-Through | | | | | | | | |
Certificates, Ser K020, Cl A1 1.573%, 01/25/2022 | | | 38 | | | | 38 | |
FHLMC Multifamily Structured Pass-Through | | | | | | | | |
Certificates, Ser K037, Cl A1 2.592%, 04/25/2023 | | | 1,282 | | | | 1,314 | |
FNMA | | | | | | | | |
6.000%, 01/01/2027 to 04/01/2040 | | | 144 | | | | 170 | |
5.500%, 12/01/2023 to 12/01/2024 | | | 245 | | | | 253 | |
5.000%, 02/01/2023 to 03/01/2025 | | | 57 | | | | 61 | |
| | |
224 | | SEI Institutional Investments Trust / Semi-Annual Report / November 30, 2020 |
| | | | | | | | |
| | | |
| Description | | Face Amount (Thousands) | | Market Value ($ Thousands) |
|
MORTGAGE-BACKED SECURITIES (continued) | |
3.500%, 09/01/2032 | | $ | 2,808 | | | $ | 2,972 | |
FNMA ARM | | | | | | | | |
3.720%, VAR US Treas Yield Curve Rate T Note Const Mat 1 Yr+2.120%, 11/01/2025 | | | 1 | | | | 1 | |
3.715%, VAR US Treas Yield Curve Rate T Note Const Mat 1 Yr+2.215%, 01/01/2029 | | | 5 | | | | 5 | |
3.604%, VAR US Treas Yield Curve Rate T Note Const Mat 1 Yr+2.282%, 11/01/2023 | | | – | | | | – | |
2.871%, VAR ICE LIBOR USD 6 Month+1.814%, 09/01/2024 | | | 12 | | | | 12 | |
2.770%, VAR ICE LIBOR USD 6 Month+1.772%, 09/01/2024 | | | 6 | | | | 6 | |
2.470%, VAR US Treas Yield Curve Rate T Note Const Mat 1 Yr+2.084%, 05/01/2028 | | | 1 | | | | 1 | |
FNMA CMO, Ser 1993-58, Cl H | | | | | | | | |
5.500%, 04/25/2023 | | | 2 | | | | 2 | |
FNMA CMO, Ser 2001-33, Cl FA | | | | | | | | |
0.600%, VAR ICE LIBOR USD 1 Month+0.450%, 07/25/2031 | | | 5 | | | | 5 | |
FNMA CMO, Ser 2002-64, Cl FG | | | | | | | | |
0.394%, VAR ICE LIBOR USD 1 Month+0.250%, 10/18/2032 | | | 2 | | | | 2 | |
FNMA CMO, Ser 2011-18, Cl LA | | | | | | | | |
4.000%, 08/25/2039 | | | 110 | | | | 111 | |
FNMA CMO, Ser 2011-24, Cl PC | | | | | | | | |
4.000%, 10/25/2039 | | | 7 | | | | 7 | |
FNMA CMO, Ser 2011-87, Cl JA | | | | | | | | |
3.000%, 06/25/2040 | | | 550 | | | | 559 | |
FNMA CMO, Ser 2012-6, Cl E | | | | | | | | |
3.000%, 05/25/2037 | | | 548 | | | | 553 | |
FNMA CMO, Ser 2013-100, Cl CA | | | | | | | | |
4.000%, 03/25/2039 | | | 89 | | | | 90 | |
FNMA CMO, Ser 2013-97, Cl KA | | | | | | | | |
3.000%, 11/25/2031 | | | 104 | | | | 108 | |
FNMA REMICS CMO, Ser 2012-137, Cl UE | | | | | | | | |
1.750%, 09/25/2041 | | | 462 | | | | 469 | |
FNMA REMICS CMO, Ser 2015-46, Cl BA | | | | | | | | |
3.000%, 05/25/2041 | | | 499 | | | | 506 | |
FNMA, Ser 2012-M9, Cl A2 | | | | | | | | |
2.482%, 04/25/2022 | | | 256 | | | | 260 | |
FNMA, Ser 2017-M13, Cl FA | | | | | | | | |
0.550%, VAR LIBOR USD 1 Month+0.400%, 10/25/2024 | | | 199 | | | | 199 | |
FNMA, Ser M4, Cl 1A2 | | | | | | | | |
2.976%, 04/25/2022 (B) | | | 225 | | | | 228 | |
FREMF Mortgage Trust, Ser 2011-K12, Cl B | | | | | | | | |
4.510%, 01/25/2046 (A)(B) | | | 1,435 | | | | 1,434 | |
GNMA CMO, Ser 2010-151, Cl KA | | | | | | | | |
3.000%, 09/16/2039 | | | 95 | | | | 98 | |
| | | | | | | | |
| | | |
| Description | | Face Amount (Thousands) | | Market Value ($ Thousands) |
|
MORTGAGE-BACKED SECURITIES (continued) | |
GNMA CMO, Ser 2011-158, Cl CA | | | | | | | | |
3.000%, 10/20/2026 | | $ | 660 | | | $ | 676 | |
GNMA CMO, Ser 2013-124, Cl CP | | | | | | | | |
2.500%, 06/20/2041 | | | 195 | | | | 197 | |
GNMA CMO, Ser 2013-190, Cl GA | | | | | | | | |
2.500%, 11/20/2038 | | | 1,131 | | | | 1,156 | |
GNMA CMO, Ser 2015-119, Cl TG | | | | | | | | |
1.800%, 05/20/2041 | | | 1,428 | | | | 1,444 | |
GNMA CMO, Ser 2015-56, Cl LB | | | | | | | | |
1.500%, 04/16/2040 | | | 1,005 | | | | 1,015 | |
Mortgage-Linked Amortizing Notes,Ser 2012-1, Cl A10 | | | | | | | | |
2.060%, 01/15/2022 | | | 232 | | | | 236 | |
| | | | | | | | |
| | |
| | | | | | | 35,650 | |
| | | | | | | | |
|
Non-Agency Mortgage-Backed Obligations — 9.3% | |
Angel Oak Mortgage Trust I LLC, Ser 2017-2, Cl A1 | | | | | | | | |
2.478%, 07/25/2047 (A)(B) | | | 75 | | | | 76 | |
Angel Oak Mortgage Trust I LLC, Ser 2018-3, Cl A1 | | | | | | | | |
3.649%, 09/25/2048 (A)(B) | | | 184 | | | | 188 | |
Angel Oak Mortgage Trust I LLC, Ser 2019-1, Cl A1 | | | | | | | | |
3.920%, 11/25/2048 (A)(B) | | | 465 | | | | 476 | |
Angel Oak Mortgage Trust I LLC, Ser 2019-2, Cl A1 | | | | | | | | |
3.628%, 03/25/2049 (A)(B) | | | 706 | | | | 723 | |
Angel Oak Mortgage Trust I LLC, Ser 2019-4, Cl A1 | | | | | | | | |
2.993%, 07/26/2049 (A)(B) | | | 492 | | | | 499 | |
Angel Oak Mortgage Trust LLC, Ser 2017-1, Cl A1 | | | | | | | | |
2.810%, 01/25/2047 (A)(B) | | | 2 | | | | 2 | |
Angel Oak Mortgage Trust LLC, Ser 2017-3, Cl A1 | | | | | | | | |
2.708%, 11/25/2047 (A)(B) | | | 31 | | | | 31 | |
Angel Oak Mortgage Trust, Ser 2020-1, Cl A1 | | | | | | | | |
2.466%, 12/25/2059 (A)(B) | | | 150 | | | | 152 | |
Angel Oak Mortgage Trust, Ser 2020-3, Cl A1 | | | | | | | | |
1.691%, 04/25/2065 (A)(B) | | | 1,261 | | | | 1,270 | |
Angel Oak Mortgage Trust, Ser 2020-4, Cl A1 | | | | | | | | |
1.469%, 06/25/2065 (A)(B) | | | 793 | | | | 797 | |
Arroyo Mortgage Trust, Ser 2019-3, Cl A1 | | | | | | | | |
2.962%, 10/25/2048 (A)(B) | | | 459 | | | | 473 | |
Banc of America Commercial Mortgage Securities Trust, Ser UB10, Cl A2 | | | | | | | | |
2.723%, 07/15/2049 | | | 812 | | | | 821 | |
Banc of America Mortgage Securities, Ser 2005-F, Cl 2A2 | | | | | | | | |
3.093%, 07/25/2035 (B) | | | 74 | | | | 73 | |
| | |
SEI Institutional Investments Trust / Semi-Annual Report / November 30, 2020 | | 225 |
SCHEDULE OF INVESTMENTS (Unaudited)
November 30, 2020
Ultra Short Duration Bond Fund (Continued)
| | | | | | | | |
| | | |
| Description | | Face Amount (Thousands) | | Market Value ($ Thousands) |
|
MORTGAGE-BACKED SECURITIES (continued) | |
Banc of America Mortgage Securities, Ser 2005-J, Cl 2A1 | | | | | | | | |
2.623%, 11/25/2035 (B) | | $ | 9 | | | $ | 9 | |
BANK, Ser BN10, Cl A1 | | | | | | | | |
2.624%, 02/15/2061 | | | 534 | | | | 542 | |
BBCMS Mortgage Trust, Ser C8, Cl A1 | | | | | | | | |
0.601%, 10/15/2053 | | | 936 | | | | 938 | |
Bear Stearns Adjustable Rate Mortgage Trust, Ser 2005-3, Cl 2A1 | | | | | | | | |
3.446%, 06/25/2035 (B) | | | 39 | | | | 39 | |
Bear Stearns Adjustable Rate Mortgage Trust, Ser 2005-6, Cl 3A1 | | | | | | | | |
3.087%, 08/25/2035 (B) | | | 81 | | | | 80 | |
BRAVO Residential Funding Trust, Ser 2020-NQM1, Cl A1 | | | | | | | | |
1.449%, 05/25/2060 (A)(B) | | | 786 | | | | 787 | |
Bunker Hill Loan Depositary Trust, Ser 2019- 1, Cl A1 | | | | | | | | |
3.613%, 10/26/2048 (A) | | | 185 | | | | 193 | |
Bunker Hill Loan Depositary Trust, Ser 2019- 1, Cl A2 | | | | | | | | |
3.817%, 10/26/2048 (A) | | | 786 | | | | 816 | |
Bunker Hill Loan Depositary Trust, Ser 2020- 1, Cl A1 | | | | | | | | |
1.724%, 02/25/2055 (A)(B) | | | 497 | | | | 502 | |
BWAY Mortgage Trust, Ser 2013-1515, Cl A1 | | | | | | | | |
2.809%, 03/10/2033 (A) | | | 424 | | | | 438 | |
BX Commercial Mortgage Trust, Ser 2018- IND, Cl A | | | | | | | | |
0.891%, VAR LIBOR USD 1 Month+0.750%, 11/15/2035 (A) | | | 197 | | | | 197 | |
BX Commercial Mortgage Trust, Ser 2019- XL, Cl B | | | | | | | | |
1.221%, VAR ICE LIBOR USD 1 Month+1.080%, 10/15/2036 (A) | | | 617 | | | | 616 | |
BX Commercial Mortgage Trust, Ser 2019- XL, Cl A | | | | | | | | |
1.061%, VAR ICE LIBOR USD 1 Month+0.920%, 10/15/2036 (A) | | | 949 | | | | 949 | |
CGDBB Commercial Mortgage Trust,Ser 2017-BIOC, Cl A | | | | | | | | |
0.931%, VAR LIBOR USD 1 Month+0.790%, 07/15/2032 (A) | | | 731 | | | | 731 | |
CHC Commercial Mortgage Trust, Ser 2019- CHC, Cl A | | | | | | | | |
1.261%, VAR ICE LIBOR USD 1 Month+1.120%, 06/15/2034 (A) | | | 1,275 | | | | 1,219 | |
CHL Mortgage Pass-Through Trust, Ser 2004- 29, Cl 1A1 | | | | | | | | |
0.690%, VAR ICE LIBOR USD 1 Month+0.540%, 02/25/2035 | | | 14 | | | | 13 | |
CIM Trust, Ser 2017-7, Cl A | | | | | | | | |
3.000%, 04/25/2057 (A)(B) | | | 493 | | | | 504 | |
| | | | | | | | |
| | | |
| Description | | Face Amount (Thousands) | | | Market Value ($ Thousands) | |
|
MORTGAGE-BACKED SECURITIES (continued) | |
Citigroup Commercial Mortgage Trust, Ser 2019-SST2, Cl A | | | | | | | | |
1.061%, VAR LIBOR USD 1 Month+0.920%, 12/15/2036 (A) | | $ | 1,150 | | | $ | 1,150 | |
Citigroup Mortgage Loan Trust, Ser 2004- HYB3, Cl 1A | | | | | | | | |
3.046%, 09/25/2034 (B) | | | 14 | | | | 13 | |
Citigroup Mortgage Loan Trust, Ser 2006- AR2, Cl 1A1 | | | | | | | | |
3.608%, 03/25/2036 (B) | | | 74 | | | | 65 | |
Citigroup Mortgage Loan Trust, Ser 2018- RP2, Cl A1 | | | | | | | | |
3.500%, 02/25/2058 (A)(B) | | | 409 | | | | 434 | |
Citigroup Mortgage Loan Trust, Ser 2019- IMC1, Cl A1 | | | | | | | | |
2.720%, 07/25/2049 (A)(B) | | | 186 | | | | 189 | |
COLT Mortgage Loan Trust, Ser 2019-1, Cl A1 | | | | | | | | |
3.705%, 03/25/2049 (A)(B) | | | 137 | | | | 138 | |
COLT Mortgage Loan Trust, Ser 2019-3, Cl A1 | | | | | | | | |
2.764%, 08/25/2049 (A)(B) | | | 128 | | | | 129 | |
COLT Mortgage Loan Trust, Ser 2020-1, Cl A1 | | | | | | | | |
2.488%, 02/25/2050 (A)(B) | | | 432 | | | | 437 | |
COLT Mortgage Loan Trust, Ser 2020-1R, Cl A1 | | | | | | | | |
1.255%, 09/25/2065 (A)(B) | | | 932 | | | | 933 | |
COLT Mortgage Loan Trust, Ser 2020-2, Cl A1 | | | | | | | | |
1.853%, 03/25/2065 (A)(B) | | | 206 | | | | 208 | |
COLT Mortgage Loan Trust, Ser 2020-2R, Cl A1 | | | | | | | | |
1.325%, 10/26/2065 (A)(B) | | | 804 | | | | 804 | |
COLT Mortgage Loan Trust, Ser 2020-3, Cl A1 | | | | | | | | |
1.506%, 04/27/2065 (A)(B) | | | 516 | | | | 520 | |
COMM Mortgage Trust, Ser 2014-UBS5, Cl A2 | | | | | | | | |
3.031%, 09/10/2047 | | | 53 | | | | 53 | |
COMM Mortgage Trust, Ser CR22, Cl A2 | | | | | | | | |
2.856%, 03/10/2048 | | | 315 | | | | 315 | |
COMM Mortgage Trust, Ser CR23, Cl A2 | | | | | | | | |
2.852%, 05/10/2048 | | | 452 | | | | 454 | |
COMM Mortgage Trust, Ser CR27, Cl A2 | | | | | | | | |
2.223%, 10/10/2048 | | | 94 | | | | 94 | |
COMM Mortgage Trust, Ser LC17, Cl A2 | | | | | | | | |
3.164%, 10/10/2047 | | | 2 | | | | 2 | |
Credit Suisse Mortgage Capital Certificates, Ser 2019-ICE4, Cl A | | | | | | | | |
1.121%, VAR ICE LIBOR USD 1 Month+0.980%, 05/15/2036 (A) | | | 745 | | | | 745 | |
Credit Suisse Mortgage Capital Certificates, Ser 2019-ICE4, Cl B | | | | | | | | |
1.371%, VAR LIBOR USD 1 Month+1.230%, 05/15/2036 (A) | | | 2,180 | | | | 2,177 | |
Deephaven Residential Mortgage Trust, Ser 2017-1A, Cl A1 | | | | | | | | |
2.725%, 12/26/2046 (A)(B) | | | 17 | | | | 17 | |
| | |
226 | | SEI Institutional Investments Trust / Semi-Annual Report / November 30, 2020 |
| | | | | | | | |
| | | |
| Description | | Face Amount (Thousands) | | Market Value ($ Thousands) |
|
MORTGAGE-BACKED SECURITIES (continued) | |
Deephaven Residential Mortgage Trust, | | | | | | | | |
Ser 2017-2A, Cl A1 2.453%, 06/25/2047 (A)(B) | | $ | 55 | | | $ | 55 | |
Deephaven Residential Mortgage Trust, | | | | | | | | |
Ser 2017-3A, Cl A1 2.577%, 10/25/2047 (A)(B) | | | 52 | | | | 53 | |
Deephaven Residential Mortgage Trust, | | | | | | | | |
Ser 2018-1A, Cl A1 2.976%, 12/25/2057 (A)(B) | | | 110 | | | | 110 | |
Deephaven Residential Mortgage Trust, | | | | | | | | |
Ser 2018-2A, Cl A1 3.479%, 04/25/2058 (A)(B) | | | 265 | | | | 270 | |
Deephaven Residential Mortgage Trust, | | | | | | | | |
Ser 2018-3A, Cl A1 3.789%, 08/25/2058 (A)(B) | | | 306 | | | | 308 | |
Deephaven Residential Mortgage Trust, | | | | | | | | |
Ser 2019-3A, Cl A1 2.964%, 07/25/2059 (A)(B) | | | 423 | | | | 429 | |
Deephaven Residential Mortgage Trust, | | | | | | | | |
Ser 2019-4A, Cl A1 2.791%, 10/25/2059 (A)(B) | | | 1,016 | | | | 1,033 | |
Deephaven Residential Mortgage Trust, | | | | | | | | |
Ser 2020-2, Cl A1 1.692%, 05/25/2065 (A) | | | 789 | | | | 793 | |
Ellington Financial Mortgage Trust, Ser 2020-2, Cl A1 | | | | | | | | |
1.178%, 10/25/2065 (A)(B) | | | 257 | | | | 257 | |
FHLMC Structured Agency Credit Risk Debt Notes, Ser 2015-HQ1, Cl M3 | | | | | | | | |
3.950%, VAR ICE LIBOR USD 1 Month+3.800%, 03/25/2025 | | | 88 | | | | 88 | |
Flagstar Mortgage Trust, Ser 2018-5, Cl A7 | | | | | | | | |
4.000%, 09/25/2048 (A)(B) | | | 19 | | | | 19 | |
FNMA Connecticut Avenue Securities, Ser 2016-C03, Cl 2M2 | | | | | | | | |
6.050%, VAR ICE LIBOR USD 1 Month+5.900%, 10/25/2028 | | | 725 | | | | 775 | |
FNMA Connecticut Avenue Securities, Ser 2018-C03, Cl 1EA2 | | | | | | | | |
1.000%, VAR ICE LIBOR USD 1 Month+0.850%, 10/25/2030 | | | 215 | | | | 214 | |
GCAT Trust, Ser 2020-NQM2, Cl A1 | | | | | | | | |
1.555%, 04/25/2065 (A) | | | 456 | | | | 457 | |
GMAC Mortgage Loan Trust, Ser 2005-AR6, Cl 2A1 | | | | | | | | |
3.422%, 11/19/2035 (B) | | | 116 | | | | 110 | |
GS Mortgage Securities Trust, Ser 2012-GC6, Cl A3 | | | | | | | | |
3.482%, 01/10/2045 | | | 1,992 | | | | 2,027 | |
GS Mortgage Securities Trust, Ser 2017- 500K, Cl A | | | | | | | | |
0.841%, VAR LIBOR USD 1 Month+0.700%, 07/15/2032 (A) | | | 665 | | | | 665 | |
| | | | | | | | |
| | | |
| Description | | Face Amount (Thousands) | | Market Value ($ Thousands) |
|
MORTGAGE-BACKED SECURITIES (continued) | |
GS Mortgage Securities Trust, Ser GS2, Cl A2 | | | | | | | | |
2.635%, 05/10/2049 | | $ | 31 | | | $ | 31 | |
GS Mortgage Securities Trust, Ser GS4, Cl A2 | | | | | | | | |
2.905%, 11/10/2049 | | | 1,528 | | | | 1,542 | |
GSR Mortgage Loan Trust, Ser 2005-AR4, Cl 2A1 | | | | | | | | |
3.326%, 07/25/2035 (B) | | | 126 | | | | 92 | |
GSR Mortgage Loan Trust, Ser 2007-AR2, Cl 1A1 | | | | | | | | |
3.625%, 05/25/2037 (B) | | | 118 | | | | 91 | |
Impac CMB Trust, Ser 2004-9, Cl 1A1 | | | | | | | | |
0.910%, VAR ICE LIBOR USD 1 Month+0.760%, 01/25/2035 | | | 33 | | | | 33 | |
Impac CMB Trust, Ser 2005-2, Cl 1A1 | | | | | | | | |
0.670%, VAR ICE LIBOR USD 1 Month+0.520%, 04/25/2035 | | | 39 | | | | 38 | |
Impac CMB Trust, Ser 2005-3, Cl A1 | | | | | | | | |
0.630%, VAR ICE LIBOR USD 1 Month+0.480%, 08/25/2035 | | | 38 | | | | 37 | |
Impac CMB Trust, Ser 2005-5, Cl A1 | | | | | | | | |
0.790%, VAR ICE LIBOR USD 1 Month+0.640%, 08/25/2035 | | | 30 | | | | 30 | |
Impac CMB Trust, Ser 2005-8, Cl 1A | | | | | | | | |
0.670%, VAR ICE LIBOR USD 1 Month+0.520%, 02/25/2036 | | | 100 | | | | 99 | |
JPMorgan Mortgage Trust, Ser 2005-A6, Cl 7A1 | | | | | | | | |
3.099%, 08/25/2035 (B) | | | 39 | | | | 36 | |
JPMorgan Mortgage Trust, Ser 2007-A3, Cl 1A1 | | | | | | | | |
3.598%, 05/25/2037 (B) | | | 73 | | | | 67 | |
JPMorgan Mortgage Trust, Ser 2015-3, Cl A5 | | | | | | | | |
3.500%, 05/25/2045 (A)(B) | | | 36 | | | | 36 | |
JPMorgan Mortgage Trust, Ser 2017-1, Cl A4 | | | | | | | | |
3.500%, 01/25/2047 (A)(B) | | | 668 | | | | 669 | |
JPMorgan Mortgage Trust, Ser 2018-6, Cl 1A3 | | | | | | | | |
3.500%, 12/25/2048 (A)(B) | | | 163 | | | | 164 | |
JPMorgan Mortgage Trust, Ser 2018-7FRB, Cl A2 | | | | | | | | |
0.900%, VAR ICE LIBOR USD 1 Month+0.750%, 04/25/2046 (A) | | | 381 | | | | 380 | |
JPMorgan Mortgage Trust, Ser 2018-9, Cl A5 | | | | | | | | |
4.000%, 02/25/2049 (A)(B) | | | 87 | | | | 87 | |
JPMorgan Mortgage Trust, Ser 2019-5, Cl A4 | | | | | | | | |
4.000%, 11/25/2049 (A)(B) | | | 139 | | | | 139 | |
KNDL Mortgage Trust, Ser 2019-KNSQ, Cl A | | | | | | | | |
0.941%, VAR LIBOR USD 1 Month+0.800%, 05/15/2036 (A) | | | 290 | | | | 289 | |
LSTAR Commercial Mortgage Trust,
Ser 2016-4, Cl A2 | | | | | | | | |
2.579%, 03/10/2049 (A) | | | 2,514 | | | | 2,561 | |
| | |
SEI Institutional Investments Trust / Semi-Annual Report / November 30, 2020 | | 227 |
SCHEDULE OF INVESTMENTS (Unaudited)
November 30, 2020
Ultra Short Duration Bond Fund (Continued)
| | | | | | | | |
| | | |
| Description | | Face Amount (Thousands) | | Market Value ($ Thousands) |
|
MORTGAGE-BACKED SECURITIES (continued) | |
LSTAR Securities Investment, Ser 2019-4, Cl A1 | | | | | | | | |
1.655%, VAR ICE LIBOR USD 1 Month+1.500%, 05/01/2024 (A) | | $ | 609 | | | $ | 600 | |
Merit, Ser HILL, Cl A | | | | | | | | |
1.291%, VAR ICE LIBOR USD 1 Month+1.150%, 08/15/2037 (A) | | | 1,205 | | | | 1,207 | |
Merrill Lynch Mortgage Investors, Ser 2005-A3, Cl A1 | | | | | | | | |
0.690%, VAR ICE LIBOR USD 1 Month+0.540%, 04/25/2035 | | | 2 | | | | 2 | |
Merrill Lynch Mortgage-Backed Securities Trust, Ser 2007-3, Cl 2A1 | | | | | | | | |
3.524%, 06/25/2037 (B) | | | 97 | | | | 75 | |
MFA Trust, Ser 2017-RPL1, Cl A1 | | | | | | | | |
2.588%, 02/25/2057 (A)(B) | | | 98 | | | | 99 | |
Mill City Mortgage Loan Trust, Ser 2018-1, Cl A1 | | | | | | | | |
3.250%, 05/25/2062 (A)(B) | | | 228 | | | | 235 | |
Mill City Mortgage Loan Trust, Ser 2018-2, Cl A1 | | | | | | | | |
3.500%, 05/25/2058 (A)(B) | | | 683 | | | | 711 | |
Morgan Stanley Capital I Trust, Ser 2014- MP, Cl A | | | | | | | | |
3.469%, 08/11/2033 (A) | | | 930 | | | | 942 | |
MortgageIT Trust, Ser 2005-5, Cl A1 | | | | | | | | |
0.670%, VAR ICE LIBOR USD 1 Month+0.520%, 12/25/2035 | | | 99 | | | | 99 | |
MTRO Commercial Mortgage Trust, Ser 2019- | | | | | | | | |
TECH, Cl A 1.041%, VAR LIBOR USD 1 Month+0.900%, 12/15/2033 (A) | | | 775 | | | | 772 | |
New Residential Mortgage LLC, Ser 2018- FNT1, Cl A | | | | | | | | |
3.610%, 05/25/2023 (A) | | | 609 | | | | 610 | |
New Residential Mortgage Loan Trust, Ser 2017-3A, Cl A1 | | | | | | | | |
4.000%, 04/25/2057 (A)(B) | | | 277 | | | | 295 | |
New Residential Mortgage Loan Trust, Ser 2017-6A, Cl A1 | | | | | | | | |
4.000%, 08/27/2057 (A)(B) | | | 656 | | | | 708 | |
New Residential Mortgage Loan Trust, Ser 2018-1A, Cl A1 | | | | | | | | |
4.000%, 09/25/2057 (A)(B) | | | 308 | | | | 333 | |
New Residential Mortgage Loan Trust, Ser 2019-NQM4, Cl A1 | | | | | | | | |
2.492%, 09/25/2059 (A)(B) | | | 282 | | | | 288 | |
New Residential Mortgage Loan Trust, Ser 2020-NQM2, Cl A1 | | | | | | | | |
1.650%, 05/24/2060 (A)(B) | | | 527 | | | | 530 | |
OBX Trust, Ser 2018-1, Cl A2 | | | | | | | | |
0.800%, VAR ICE LIBOR USD 1 Month+0.650%, 06/25/2057 (A) | | | 56 | | | | 56 | |
| | | | | | | | |
| | | |
| Description | | Face Amount (Thousands) | | Market Value ($ Thousands) |
|
MORTGAGE-BACKED SECURITIES (continued) | |
OBX Trust, Ser 2018-EXP2, Cl 2A1A | | | | | | | | |
0.900%, VAR ICE LIBOR USD 1 Month+0.750%, 07/25/2058 (A) | | $ | 321 | | | $ | 320 | |
OBX Trust, Ser 2019-INV1, Cl A8 | | | | | | | | |
4.000%, 11/25/2048 (A)(B) | | | 148 | | | | 148 | |
Paragon Mortgages, Ser 2006-12A, Cl A2C | | | | | | | | |
0.441%, VAR ICE LIBOR USD 3 Month+0.220%, 11/15/2038 (A) | | | 103 | | | | 99 | |
Paragon Mortgages, Ser 2007-15A, Cl A2C | | | | | | | | |
0.470%, VAR ICE LIBOR USD 3 Month+0.220%, 12/15/2039 (A) | | | 234 | | | | 234 | |
Residential Funding Mortgage Securities, Ser 2007-SA3, Cl 2A1 | | | | | | | | |
4.849%, 07/27/2037 (B) | | | 96 | | | | 85 | |
Residential Mortgage Loan Trust, Ser 2020-1, Cl A1 | | | | | | | | |
2.376%, 02/25/2024 (A)(B) | | | 280 | | | | 285 | |
RMF Buyout Issuance Trust, Ser 2020-1, Cl A | | | | | | | | |
2.158%, 02/25/2030 (A)(B) | | | 344 | | | | 345 | |
Sequoia Mortgage Trust, Ser 2004-12, Cl A1 | | | | | | | | |
0.687%, VAR ICE LIBOR USD 1 Month+0.540%, 01/20/2035 | | | 12 | | | | 11 | |
Sequoia Mortgage Trust, Ser 2017-CH2, Cl A10 | | | | | | | | |
4.000%, 12/25/2047 (A)(B) | | | 307 | | | | 308 | |
Sequoia Mortgage Trust, Ser 2018-CH3, Cl A1 | | | | | | | | |
4.500%, 08/25/2048 (A)(B) | | | 243 | | | | 251 | |
Sequoia Mortgage Trust, Ser 2018-CH3, Cl A11 | | | | | | | | |
4.000%, 08/25/2048 (A)(B) | | | 354 | | | | 356 | |
Spruce Hill Mortgage Loan Trust, Ser 2019-SH1, Cl A1 | | | | | | | | |
3.395%, 04/29/2049 (A)(B) | | | 250 | | | | 253 | |
Starwood Mortgage Residential Trust, Ser 2020-1, Cl A1 | | | | | | | | |
2.275%, 02/25/2050 (A)(B) | | | 486 | | | | 497 | |
Starwood Mortgage Residential Trust, Ser 2020-3, Cl A1 | | | | | | | | |
1.486%, 04/25/2065 (A)(B) | | | 295 | | | | 297 | |
UBS-Citigroup Commercial Mortgage Trust, Ser C1, Cl A3 | | | | | | | | |
3.595%, 01/10/2045 | | | 730 | | | | 741 | |
Verus Securitization Trust, Ser 2018-2, Cl A1 | | | | | | | | |
3.677%, 06/01/2058 (A)(B) | | | 289 | | | | 291 | |
Verus Securitization Trust, Ser 2019-1, Cl A1 | | | | | | | | |
3.836%, 02/25/2059 (A)(B) | | | 269 | | | | 272 | |
Verus Securitization Trust, Ser 2019-2, Cl A1 | | | | | | | | |
3.211%, 05/25/2059 (A)(B) | | | 300 | | | | 304 | |
Verus Securitization Trust, Ser 2019-4, Cl A1 | | | | | | | | |
2.642%, 11/25/2059 (A) | | | 482 | | | | 493 | |
Verus Securitization Trust, Ser 2019-INV3, Cl A1 | | | | | | | | |
2.692%, 11/25/2059 (A)(B) | | | 408 | | | | 419 | |
| | |
228 | | SEI Institutional Investments Trust / Semi-Annual Report / November 30, 2020 |
| | | | | | | | |
| | | |
| Description | | Face Amount (Thousands) | | Market Value ($ Thousands) |
|
MORTGAGE-BACKED SECURITIES (continued) | |
Verus Securitization Trust, Ser 2020-1, Cl A1 | | | | | | | | |
2.417%, 01/25/2060 (A) | | $ | 236 | | | $ | 241 | |
Verus Securitization Trust, Ser 2020-4, Cl A1 | | | | | | | | |
1.502%, 05/25/2065 (A) | | | 526 | | | | 529 | |
WaMu Mortgage Pass-Through Certificates, Ser 2006-AR2, Cl 1A1 | | | | | | | | |
3.688%, 03/25/2036 (B) | | | 131 | | | | 126 | |
Wells Fargo Commercial Mortgage Trust, Ser 2012-LC5, Cl AS | | | | | | | | |
3.539%, 10/15/2045 | | | 620 | | | | 643 | |
Wells Fargo Commercial Mortgage Trust, Ser NXS2, Cl A2 | | | | | | | | |
3.020%, 07/15/2058 | | | 738 | | | | 750 | |
Wells Fargo Commercial Mortgage Trust, Ser RC1, Cl A2 | | | | | | | | |
3.118%, 01/15/2060 | | | 834 | | | | 851 | |
WinWater Mortgage Loan Trust, Ser 2015-5,Cl A5 | | | | | | | | |
3.500%, 08/20/2045 (A)(B) | | | 172 | | | | 172 | |
| | | | | | | | |
| | |
| | | | | | | 53,998 | |
| | | | | | | | |
| | |
Total Mortgage-Backed Securities (Cost $89,131) ($ Thousands) | | | | | | | 89,648 | |
| | | | | | | | |
|
U.S. TREASURY OBLIGATIONS — 10.0% | |
U.S. Treasury Bills | | | 8,550 | | | | 8,546 | |
0.169%, 05/20/2021 (C) | | | | | | | | |
0.165%, 04/22/2021 (C) | | | 1,520 | | | | 1,520 | |
0.140%, 08/12/2021 (C) | | | 2,800 | | | | 2,798 | |
0.140%, 10/07/2021 (C) | | | 4,425 | | | | 4,421 | |
U.S. Treasury Notes | | | | | | | | |
1.750%, 09/30/2022 | | | 6,580 | | | | 6,774 | |
1.625%, 12/31/2021 | | | 8,100 | | | | 8,233 | |
1.250%, 10/31/2021 | | | 15,505 | | | | 15,664 | |
1.125%, 07/31/2021 | | | 8,600 | | | | 8,659 | |
0.200%, VAR US Treasury 3 Month Bill Money Market Yield+0.115%, 01/31/2021 | | | 1,450 | | | | 1,450 | |
| | | | | | | | |
| | | | | | | | |
| | |
Total U.S. Treasury Obligations (Cost $57,894) ($ Thousands) | | | | | | | 58,065 | |
| | | | | | | | |
|
MUNICIPAL BONDS — 1.7% | |
|
California — 0.8% | |
Bay Area, Toll Authority, Sub-Ser, RB | | | | | | | | |
2.075%, 04/01/2021 | | | 2,440 | | | | 2,454 | |
California State, Infrastructure & Economic Development Bank, AMT, RB Callable 07/01/2021 @ 100 | | | | | | | | |
0.450%, 01/01/2050 (A)(D) | | | 965 | | | | 965 | |
| | | | | | | | |
| | | |
| Description | | Face Amount (Thousands) | | Market Value ($ Thousands) |
|
MUNICIPAL BONDS (continued) | |
California State, GO Callable 10/01/2021 @ 100 | | | | | | | | |
0.933%, 04/01/2047 (D) | | $ | 1,150 | | | $ | 1,150 | |
University of California, Ser BF, RB | | | | | | | | |
0.455%, 05/15/2022 | | | 230 | | | | 230 | |
| | | | | | | | |
| | |
| | | | | | | 4,799 | |
| | | | | | | | |
|
Florida — 0.1% | |
Florida State, Development Finance Authority, RB | | | | | | | | |
1.645%, 04/01/2021 | | | 405 | | | | 406 | |
| | | | | | | | |
|
Illinois — 0.0% | |
Chicago, Transit Authority, Ser B, RB | | | | | | | | |
1.838%, 12/01/2023 | | | 145 | | | | 147 | |
| | | | | | | | |
|
Nevada — 0.1% | |
Nevada State, Department of Business & Industry, AMT, RB Callable 07/01/2021 @ 100 | | | | | | | | |
0.500%, 01/01/2050 (A)(D) | | | 405 | | | | 405 | |
| | | | | | | | |
|
New York — 0.6% | |
Long Island, Power Authority, Ser C Callable 06/01/2021 @ 100 | | | | | | | | |
0.659%, 03/01/2022 | | | 790 | | | | 789 | |
New York, Transportation Development Authority, RB | | | | | | | | |
1.360%, 12/01/2021 | | | 535 | | | | 535 | |
Port Authority of New York & New Jersey, Ser 208, RB | | | | | | | | |
2.667%, 09/15/2021 | | | 2,380 | | | | 2,421 | |
| | | | | | | | |
| | |
| | | | | | | 3,745 | |
| | | | | | | | |
|
Texas — 0.1% | |
Central Texas, Turnpike System, Ser B, RB | | | | | | | | |
1.980%, 08/15/2042 (D) | | | 375 | | | | 379 | |
City of Houston, Airport System Revenue, Sub-Ser C, RB | | | | | | | | |
0.883%, 07/01/2022 | | | 180 | | | | 180 | |
| | | | | | | | |
| | |
| | | | | | | 559 | |
| | | | | | | | |
| | | | | | | | |
| | |
Total Municipal Bonds
(Cost $10,007) ($ Thousands) | | | | | | | 10,061 | |
|
COMMERCIAL PAPER — 1.4% | |
Arabella Finance LLC | | | | | | | | |
0.418%, 01/04/2021 (C) | | | 2,375 | | | | 2,374 | |
Northwest Natural Gas Company | | | | | | | | |
0.401%, 04/30/2021 (C) | | | 3,000 | | | | 2,997 | |
| | |
SEI Institutional Investments Trust / Semi-Annual Report / November 30, 2020 | | 229 |
SCHEDULE OF INVESTMENTS (Unaudited)
November 30, 2020
Ultra Short Duration Bond Fund (Concluded)
| | | | | | | | |
| | | |
| Description | | Face Amount (Thousands) | | Market Value ($ Thousands) |
|
COMMERCIAL PAPER (continued) | |
Toronto-Dominion Bank | | | | | | | | |
0.110%, 12/03/2020 (C) | | $ | 3,000 | | | $ | 3,000 | |
| | | | | | | | |
| | |
Total Commercial Paper (Cost $8,369) ($ Thousands) | | | | | | | 8,371 | |
| | | | | | | | |
|
U.S. GOVERNMENT AGENCY OBLIGATIONS — 1.0% | |
FFCB | | | | | | | | |
1.900%, 06/24/2021 | | | 2,200 | | | | 2,222 | |
0.530%, 01/18/2022 | | | 3,650 | | | | 3,664 | |
| | | | | | | | |
| |
Total U.S. Government Agency Obligations (Cost $5,868) ($ Thousands) | | | | 5,886 | |
| | | | | | | | |
|
SOVEREIGN DEBT — 0.7% | |
| | |
Province of Quebec Canada | | | | | | | | |
2.375%, 01/31/2022 | | | 4,232 | | | | 4,331 | |
| | | | | | | | |
| | |
Total Sovereign Debt | | | | | | | | |
(Cost $4,276) ($ Thousands) | | | | | | | 4,331 | |
| | | | | | | | |
|
CERTIFICATE OF DEPOSIT — 0.5% | |
Toronto-Dominion Bank | | | | | | | | |
0.220%, 02/25/2021 | | | 3,000 | | | | 3,000 | |
| | | | | | | | |
| | |
Total Certificate of Deposit (Cost $3,000) ($ Thousands) | | | | | | | 3,000 | |
| | | | | | | | |
| | |
| | | Shares | | | | | |
| | | | | | | | |
|
CASH EQUIVALENT — 1.9% | |
SEI Daily Income Trust, Government Fund, Cl F | | | | | | | | |
0.010%**† | | | 10,863,011 | | | | 10,863 | |
| | | | | | | | |
| | |
Total Cash Equivalent (Cost $10,863) ($ Thousands) | | | | | | | 10,863 | |
| | | | | | | | |
| | | | | | | | |
| | | |
| Description | | Face Amount (Thousands) | | Market Value ($ Thousands) |
|
REPURCHASE AGREEMENT — 1.3% | |
BNP Paribas | | | | | | | | |
0.090%, dated on 11/30/20, to be repurchased on 12/01/20, repurchase price $7,400,019 (collateralized by various U.S. Government Agency and Treasury Obligations, 2.385% - 7.625%, 02/15/25 - 07/01/50, ranging in par value from $100 - $18,471,457; with total market value of $7,548,000) (E) | | $ | 7,400 | | | $ | 7,400 | |
| | | | | | | | |
| |
Total Repurchase Agreement (Cost $7,400) ($ Thousands) | | | | 7,400 | |
| | | | | | | | |
| |
Total Investments in Securities — 101.7% (Cost $587,513) ($ Thousands) | | | $ | 590,107 | |
| | | | | | | | |
| | |
230 | | SEI Institutional Investments Trust / Semi-Annual Report / November 30, 2020 |
A list of the open futures contracts held by the Fund at November 30, 2020, is as follows:
| | | | | | | | | | | | | | | | | | | | |
| | | | | | |
Type of Contract | | Number of Contracts Long/(Short) | | | Expiration Date | | | Notional Amount (Thousands) | | | Value (Thousands) | | | Unrealized Appreciation (Depreciation) (Thousands) | |
U.S. 10-Year Treasury Note | | | (38) | | | | Mar-2021 | | | $ | (5,241) | | | $ | (5,251) | | | $ | (10) | |
U.S. 2-Year Treasury Note | | | 154 | | | | Apr-2021 | | | | 34,000 | | | | 34,011 | | | | 11 | |
U.S. 5-Year Treasury Note | | | 15 | | | | Apr-2021 | | | | 1,888 | | | | 1,891 | | | | 3 | |
U.S. Long Treasury Bond | | | (1) | | | | Mar-2021 | | | | (174) | | | | (175) | | | | (1) | |
| | | | | | | | | | | | |
| | | | | | | | | | $ | 30,473 | | | $ | 30,476 | | | $ | 3 | |
| | | | | | | | | | | | |
| | Percentages are based on Net Assets of $580,043 ($ Thousands). |
| ** | The rate reported is the 7-day effective yield as of November 30, 2020. |
| † | Investment in Affiliated Security (see Note 6). |
| (A) | Security exempt from registration under Rule 144A of the Securities Act of 1933. These securities may be resold in transactions exempt from registration normally to qualified institutions. On November 30, 2020, the value of these securities amounted to $217,038 ($ Thousands), representing 37.4% of the Net Assets of the Fund. |
| (B) | Variable or floating rate security, the interest rate of which adjusts periodically based on changes in current interest rates and prepayments on the underlying pool of assets. |
| (C) | Zero coupon security. The rate shown on the Schedule of Investments is the security’s effective yield at the time of purchase. |
| (D) | Variable or floating rate security, the interest rate of which adjusts periodically based on prevailing interest rates. |
| (E) | Tri-Party Repurchase Agreement. |
ARM — Adjustable Rate Mortgage
Cl — Class
CLO — Collateralized Loan Obligation
CMO — Collateralized Mortgage Obligation
DAC — Designated Activity Company
FDIC — Federal Deposit Insurance Corporation
FHLMC — Federal Home Loan Mortgage Corporation
FNMA — Federal National Mortgage Association
FREMF— Freddie Mac Multi-Family
GMAC — General Motors Acceptance Corporation
GNMA — Government National Mortgage Association
GO — General Obligation
ICE— Intercontinental Exchange
LIBOR— London Interbank Offered Rate
LLC — Limited Liability Company
MTN — Medium Term Note
RB — Revenue Bond
USD — United States Dollar
VAR — Variable Rate
The following is a list of the level of inputs used as of November 30, 2020, in valuing the Fund’s investments and other financial instruments carried at value ($ Thousands):
| | | | | | | | | | | | | | | | |
| | | | | |
Investments in
Securities | | Level 1 ($) | | Level 2 ($) | | Level 3 ($) | | Total ($) |
Asset-Backed Securities | | | – | | | | 196,514 | | | | – | | | | 196,514 | |
Corporate Obligations | | | – | | | | 195,968 | | | | – | | | | 195,968 | |
Mortgage-Backed Securities | | | – | | | | 89,648 | | | | – | | | | 89,648 | |
U.S. Treasury Obligations | | | – | | | | 58,065 | | | | – | | | | 58,065 | |
Municipal Bonds | | | – | | | | 10,061 | | | | – | | | | 10,061 | |
Commercial Paper | | | – | | | | 8,371 | | | | – | | | | 8,371 | |
U.S. Government Agency Obligations | | | – | | | | 5,886 | | | | – | | | | 5,886 | |
Sovereign Debt | | | – | | | | 4,331 | | | | – | | | | 4,331 | |
Certificate of Deposit | | | – | | | | 3,000 | | | | – | | | | 3,000 | |
Cash Equivalent | | | 10,863 | | | | – | | | | – | | | | 10,863 | |
Repurchase Agreement | | | – | | | | 7,400 | | | | – | | | | 7,400 | |
| | | | | | | | | | | | | | | | |
Total Investments in Securities | | | 10,863 | | | | 579,244 | | | | – | | | | 590,107 | |
| | | | | | | | | | | | | | | | |
| | | | | | | | | | | | | | | | |
| | | | | |
Other Financial
Instruments | | Level 1 ($) | | Level 2 ($) | | Level 3 ($) | | Total ($) |
Futures Contracts* | | | | | | | | | | | | | | | | |
Unrealized Appreciation | | | 14 | | | | – | | | | – | | | | 14 | |
Unrealized Depreciation | | | (11) | | | | – | | | | – | | | | (11) | |
| | | | | | | | | | | | | | | | |
Total Other Financial Instruments | | | 3 | | | | – | | | | – | | | | 3 | |
| | | | | | | | | | | | | | | | |
*Futures contracts are valued at the unrealized appreciation (depreciation) on the instrument.
For the period ended November 30, 2020, there were no transfers in or out of Level 3.
For more information on valuation inputs, see Note 2 – Significant Accounting Policies in Notes to Financial Statements.
The following is a summary of the Fund’s transactions with affiliates for the period ended November 30, 2020 ($ Thousands):
| | | | | | | | | | | | | | | | | | |
| | | | | | | | | | |
| Security Description | | Value
5/31/2020 | | Purchases
at Cost | | Proceeds from Sales | | Realized
Gain/ (Loss) | | Change in Unrealized Appreciation/ (Depreciation) | | Value 11/30/2020 | | Shares | | Income | | Capital
Gains |
SEI Daily Income Trust, Government Fund, Cl F | | $36,670 | | $117,407 | | $(143,214) | | $ — | | $ — | | $10,863 | | 10,863,011 | | $ 1 | | $ — |
| | | | | | | | | | | | | | | | | | |
Amounts designated as “—” are $0 or have been rounded to $0.
The accompanying notes are an integral part of the financial statements.
| | |
SEI Institutional Investments Trust / Semi-Annual Report / November 30, 2020 | | 231 |
SCHEDULE OF INVESTMENTS (Unaudited)
November 30, 2020
Emerging Markets Debt Fund
Sector Weightings†:
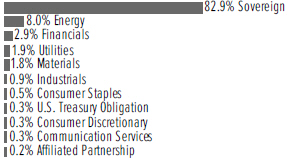
†Percentages based on total investments.
| | | | | | | | | | |
| | | | |
| Description | | | | Face Amount
(Thousands) | | Market Value
($ Thousands) |
|
GLOBAL BONDS — 94.3% | |
| |
Albania — 0.0% | | | | | |
Albania Government International Bond | | | | | | | | | | |
3.500%, 10/09/2025 | | EUR | | | 579 | | | $ | 734 | |
| | | | | | | | | | |
|
Angola — 0.8% | |
Angola Via Avenir II BV MTN | | | | | | | | | | |
10.001%, VAR ICE LIBOR USD 6 Month+7.500%, 07/01/2023 | | $ | | | 5,070 | | | | 4,517 | |
4.757%, VAR ICE LIBOR USD 6 Month+4.500%, 12/07/2023 | | | | | 672 | | | | 598 | |
Angola Via Avenir Issuer II Ireland DAC | | | | | | | | | | |
6.927%, 02/19/2027 | | | | | 3,733 | | | | 2,982 | |
Angolan Government International Bond | | | | | | | | | | |
9.375%, 05/08/2048 | | | | | 3,623 | | | | 3,160 | |
9.375%, 05/08/2048 (A) | | | | | 590 | | | | 515 | |
8.250%, 05/09/2028 | | | | | 1,396 | | | | 1,248 | |
Angolan Government International Bond MTN | | | | | | | | | | |
9.125%, 11/26/2049 (A) | | | | | 1,550 | | | | 1,328 | |
9.125%, 11/26/2049 | | | | | 1,179 | | | | 1,010 | |
8.000%, 11/26/2029 | | | | | 3,279 | | | | 2,860 | |
8.000%, 11/26/2029 (A) | | | | | 959 | | | | 836 | |
| | | | | | | | | | |
| | | | | | | | | 19,054 | |
| | | | | | | | | | |
|
Argentina — 1.4% | |
Adecoagro | | | | | | | | | | |
6.000%, 09/21/2027 (A) | | | | | 960 | | | | 1,003 | |
Argentina Treasury Bond BONCER | | | | | | | | | | |
2.000%, 11/09/2026 | | ARS | | | 138,365 | | | | 769 | |
Argentine Republic Government International Bond | | | | | | | | | | |
2.500%, 2.500%, 07/09/2021, 07/09/2021 (B) | | $ | | | 8,230 | | | | 2,987 | |
2.000%, 2.000%, 07/09/2021, 07/09/2021 (B) | | | | | 9,209 | | | | 3,638 | |
1.125%, 1.130%, 07/09/2021, 07/09/2021 (B) | | | | | 3,324 | | | | 1,183 | |
1.125%, 1.130%, 07/09/2021, 07/09/2021 (B) | | | | | 2,798 | | | | 982 | |
1.000%, 07/09/2029 | | | | | 13,998 | | | | 5,949 | |
| | | | | | | | | | |
| | | |
| Description | | Face Amount
(Thousands) | | Market Value
($ Thousands) |
|
GLOBAL BONDS (continued) | |
0.500%, 0.500%, 07/09/2021, 07/09/2021 (B) | | $ | | | 30,775 | | | $ | 12,018 | |
0.500%, 07/09/2029 | | EUR | | | 13 | | | | 6 | |
0.125%, 07/09/2030 | | | | | 407 | | | | 176 | |
Provincia de Buenos Aires | | | | | | | | | | |
7.875%, 06/15/2027 (F) | | $ | | | 454 | | | | 166 | |
5.375%, 01/20/2023 (F) | | EUR | | | 910 | | | | 357 | |
Provincia de Cordoba | | | | | | | | | | |
7.125%, 06/10/2021 (A) | | $ | | | 709 | | | | 425 | |
Rio Energy | | | | | | | | | | |
6.875%, 02/01/2025 (A) | | | | | 1,522 | | | | 1,062 | |
| | | | | | | | | | |
| | | | | | | | | 30,721 | |
| | | | | | | | | | |
|
Armenia — 0.0% | |
Armenia Government International Bond | | | | | | | | | | |
3.950%, 09/26/2029 | | | | | 1,055 | | | | 1,022 | |
| | | | | | | | | | |
|
Azerbaijan — 0.9% | |
Azerbaijan Government International Bond | | | | | | | | | | |
5.125%, 09/01/2029 | | | | | 2,772 | | | | 3,064 | |
Southern Gas Corridor CJSC | | | | | | | | | | |
6.875%, 03/24/2026 (A) | | | | | 2,102 | | | | 2,517 | |
6.875%, 03/24/2026 | | | | | 5,677 | | | | 6,798 | |
State Oil of the Azerbaijan Republic | | | | | | | | | | |
6.950%, 03/18/2030 | | | | | 3,691 | | | | 4,623 | |
State Oil of the Azerbaijan Republic MTN | | | | | | | | | | |
4.750%, 03/13/2023 | | | | | 2,290 | | | | 2,434 | |
4.750%, 03/13/2023 | | | | | 229 | | | | 243 | |
| | | | | | | | | | |
| | | | | | | | | 19,679 | |
| | | | | | | | | | |
|
Bahrain — 0.7% | |
Bahrain Government International Bond | | | | | | | | | | |
6.125%, 08/01/2023 | | | | | 849 | | | | 910 | |
6.000%, 09/19/2044 | | | | | 402 | | | | 408 | |
5.625%, 09/30/2031 (A) | | | | | 2,176 | | | | 2,274 | |
5.625%, 09/30/2031 | | | | | 1,168 | | | | 1,220 | |
5.450%, 09/16/2032 (A) | | | | | 5,806 | | | | 6,023 | |
5.450%, 09/16/2032 | | | | | 712 | | | | 739 | |
CBB International Sukuk Programme SPC | | | | | | | | | | |
6.250%, 11/14/2024 | | | | | 1,845 | | | | 2,020 | |
3.950%, 09/16/2027 (A) | | | | | 1,071 | | | | 1,097 | |
Oil and Gas Holding BSCC (A) | | | | | | | | | | |
8.375%, 11/07/2028 | | | | | 810 | | | | 933 | |
7.625%, 11/07/2024 | | | | | 1,142 | | | | 1,257 | |
| | | | | | | | | | |
| | | | | | | | | 16,881 | |
| | | | | | | | | | |
|
Belarus — 0.4% | |
Belarus Government International Bond | | | | | | | | | | |
7.625%, 06/29/2027 | | | | | 2,248 | | | | 2,407 | |
6.875%, 02/28/2023 (A) | | | | | 694 | | | | 714 | |
6.200%, 02/28/2030 | | | | | 2,174 | | | | 2,174 | |
5.875%, 02/24/2026 | | | | | 739 | | | | 742 | |
Belarus Ministry of Finance | | | | | | | | | | |
6.378%, 02/24/2031 | | | | | 999 | | | | 1,000 | |
| | |
232 | | SEI Institutional Investments Trust / Semi-Annual Report / November 30, 2020 |
| | | | | | | | | | |
| | | |
| Description | | Face Amount
(Thousands) | | Market Value
($ Thousands) |
|
GLOBAL BONDS (continued) | |
6.378%, 02/24/2031 (A) | | $ | | | 626 | | | $ | 626 | |
5.875%, 02/24/2026 (A) | | | | | 650 | | | | 652 | |
| | | | | | | | | | |
| | | | | | | | | 8,315 | |
| | | | | | | | | | |
|
Belize — 0.0% | |
Belize Government International Bond | | | | | | | | | | |
5.000%, 02/20/2038 | | | | | 1,517 | | | | 702 | |
| | | | | | | | | | |
|
Benin — 0.1% | |
Benin Government International Bond | | | | | | | | | | |
5.750%, 03/26/2026 (A) | | EUR | | | 1,840 | | | | 2,284 | |
| | | | | | | | | | |
|
Bermuda — 0.3% | |
Bermuda Government International Bond | | | | | | | | | | |
4.750%, 02/15/2029 | | $ | | | 1,764 | | | | 2,138 | |
3.717%, 01/25/2027 | | | | | 2,093 | | | | 2,324 | |
3.375%, 08/20/2050 | | | | | 458 | | | | 486 | |
2.375%, 08/20/2030 (A) | | | | | 1,111 | | | | 1,153 | |
2.375%, 08/20/2030 | | | | | 306 | | | | 318 | |
| | | | | | | | | | |
| | | | | | | | | 6,419 | |
| | | | | | | | | | |
|
Brazil — 4.9% | |
Brazil Letras do Tesouro Nacional (C) | | | | | | | | | | |
6.283%, 01/01/2024 | | BRL | | | 38,000 | | | | 5,839 | |
2.575%, 07/01/2021 | | | | | 40,208 | | | | 7,361 | |
Brazil Loan Trust 1 | | | | | | | | | | |
5.477%, 07/24/2023 (A) | | $ | | | 1,451 | | | | 1,502 | |
Brazil Minas SPE via State of Minas Gerais | | | | | | | | | | |
5.333%, 02/15/2028 | | | | | 1,692 | | | | 1,802 | |
5.333%, 02/15/2028 | | | | | 1,362 | | | | 1,450 | |
Brazil Notas do Tesouro Nacional, Ser B | | | | | | | | | | |
6.000%, 05/15/2045 | | BRL | | | 1,442 | | | | 1,140 | |
6.000%, 08/15/2050 | | | | | 2,286 | | | | 1,843 | |
Brazil Notas do Tesouro Nacional, Ser F | | | | | | | | | | |
10.000%, 01/01/2023 | | | | | 120,849 | | | | 24,483 | |
10.000%, 01/01/2025 | | | | | 54,816 | | | | 11,355 | |
10.000%, 01/01/2027 | | | | | 61,650 | | | | 12,872 | |
10.000%, 01/01/2029 | | | | | 50,791 | | | | 10,729 | |
10.000%, 01/01/2031 | | | | | 8,895 | | | | 1,873 | |
Brazilian Government International Bond | | | | | | | | | | |
6.000%, 04/07/2026 | | $ | | | 499 | | | | 592 | |
5.625%, 02/21/2047 | | | | | 928 | | | | 1,095 | |
5.000%, 01/27/2045 | | | | | 3,810 | | | | 4,216 | |
4.625%, 01/13/2028 | | | | | 567 | | | | 630 | |
4.500%, 05/30/2029 | | | | | 965 | | | | 1,065 | |
3.875%, 06/12/2030 | | | | | 5,951 | | | | 6,213 | |
Centrais Eletricas Brasileiras | | | | | | | | | | |
4.625%, 02/04/2030 (A) | | | | | 232 | | | | 241 | |
CSN Inova Ventures | | | | | | | | | | |
6.750%, 01/28/2028 (A) | | | | | 800 | | | | 838 | |
CSN Resources | | | | | | | | | | |
7.625%, 04/17/2026 (A) | | | | | 1,063 | | | | 1,145 | |
| | | | | | | | | | |
| | | |
| Description | | Face Amount
(Thousands) | | Market Value
($ Thousands) |
|
GLOBAL BONDS (continued) | |
Gol Finance | | | | | | | | | | |
7.000%, 01/31/2025 (A)(D) | | $ | | | 1,322 | | | $ | 1,180 | |
JBS Investments II GmbH | | | | | | | | | | |
5.750%, 01/15/2028 (A) | | | | | 644 | | | | 687 | |
Minerva Luxembourg | | | | | | | | | | |
6.500%, 09/20/2026 (A) | | | | | 1,291 | | | | 1,371 | |
MV24 Capital BV | | | | | | | | | | |
6.748%, 06/01/2034 (A) | | | | | 1,235 | | | | 1,336 | |
Petrobras Global Finance BV | | | | | | | | | | |
6.900%, 03/19/2049 | | | | | 3,160 | | | | 3,822 | |
5.750%, 02/01/2029 | | | | | 736 | | | | 851 | |
5.093%, 01/15/2030 | | | | | 309 | | | | 340 | |
Suzano Austria GmbH (A) | | | | | | | | | | |
7.000%, 03/16/2047 | | | | | 572 | | | | 744 | |
6.000%, 01/15/2029 | | | | | 406 | | | | 484 | |
5.000%, 01/15/2030 | | | | | 687 | | | | 776 | |
Vale Overseas Ltd | | | | | | | | | | |
3.750%, 07/08/2030 | | | | | 250 | | | | 275 | |
Votorantim Cimentos International | | | | | | | | | | |
7.250%, 04/05/2041 | | | | | 876 | | | | 1,161 | |
| | | | | | | | | | |
| | | | | | | | | 111,311 | |
| | | | | | | | | | |
|
Cameroon — 0.1% | |
Cameroon International Bond | | | | | | | | | | |
9.500%, 11/19/2025 (A) | | | | | 1,834 | | | | 1,993 | |
| | | | | | | | | | |
|
Canada — 0.0% | |
First Quantum Minerals | | | | | | | | | | |
7.500%, 04/01/2025 (A) | | | | | 528 | | | | 548 | |
| | | | | | | | | | |
|
Cayman Islands — 0.3% | |
Bioceanico Sovereign Certificate Ltd | | | | | | | | | | |
2.501%, 06/05/2034 (C) | | | | | 3,601 | | | | 2,656 | |
Neon Capital MTN | | | | | | | | | | |
1.998%, 01/06/2028 (E) | | JPY | | | 429,141 | | | | 3,196 | |
| | | | | | | | | | |
| | | | | | | | | 5,852 | |
| | | | | | | | | | |
|
Chile — 1.3% | |
Banco de Credito e Inversiones | | | | | | | | | | |
3.500%, 10/12/2027 (A) | | $ | | | 1,691 | | | | 1,850 | |
Bonos de la Tesoreria de la Republica en pesos | | | | | | | | | | |
6.000%, 01/01/2043 | | CLP | | | 1,520,000 | | | | 2,680 | |
4.700%, 09/01/2030 (A) | | | | | 750,000 | | | | 1,135 | |
2.800%, 10/01/2033 (A) | | | | | 1,370,000 | | | | 1,707 | |
Celulosa Arauco y Constitucion | | | | | | | | | | |
5.150%, 01/29/2050 (A) | | $ | | | 811 | | | | 905 | |
Cencosud | | | | | | | | | | |
4.375%, 07/17/2027 (A) | | | | | 2,283 | | | | 2,533 | |
Chile Government International Bond | | | | | | | | | | |
3.500%, 01/25/2050 | | | | | 2,988 | | | | 3,403 | |
2.450%, 01/31/2031 | | | | | 5,592 | | | | 5,928 | |
| | |
SEI Institutional Investments Trust / Semi-Annual Report / November 30, 2020 | | 233 |
SCHEDULE OF INVESTMENTS (Unaudited)
November 30, 2020
Emerging Markets Debt Fund (Continued)
| | | | | | | | | | |
| | | |
| Description | | Face Amount
(Thousands) | | Market Value
($ Thousands) |
|
GLOBAL BONDS (continued) | |
Empresa de Transporte de Pasajeros Metro | | | | | | | | | | |
3.650%, 05/07/2030 (A) | | $ | | | 217 | | | $ | 241 | |
Nacional del Cobre de Chile | | | | | | | | | | |
5.625%, 10/18/2043 | | | | | 629 | | | | 870 | |
4.500%, 09/16/2025 (A)(D) | | | | | 1,556 | | | | 1,772 | |
4.375%, 02/05/2049 (A) | | | | | 2,159 | | | | 2,623 | |
3.750%, 01/15/2031 (A) | | | | | 234 | | | | 264 | |
3.700%, 01/30/2050 (A) | | | | | 794 | | | | 871 | |
3.625%, 08/01/2027 | | | | | 500 | | | | 555 | |
3.625%, 08/01/2027 (A) | | | | | 488 | | | | 541 | |
3.150%, 01/14/2030 (A) | | | | | 522 | | | | 565 | |
3.000%, 09/30/2029 (A) | | | | | 1,365 | | | | 1,461 | |
| | | | | | | | | | |
| | | | | | | | | 29,904 | |
| | | | | | | | | | |
|
China — 2.8% | |
Alibaba Group Holding | | | | | | | | | | |
4.200%, 12/06/2047 | | | | | 456 | | | | 583 | |
Blossom Joy | | | | | | | | | | |
3.100%, VAR US Treas Yield Curve Rate T Note Const Mat 5 Yr+5.799%, 04/21/2169 | | | | | 243 | | | | 243 | |
Charming Light Investments Ltd MTN | | | | | | | | | | |
4.375%, 12/21/2027 | | | | | 1,500 | | | | 1,688 | |
China Government Bond | | | | | | | | | | |
3.390%, 03/16/2050 | | CNY | | | 12,060 | | | | 1,677 | |
3.130%, 11/21/2029 | | | | | 8,560 | | | | 1,287 | |
3.120%, 12/05/2026 | | | | | 12,100 | | | | 1,838 | |
2.850%, 06/04/2027 | | | | | 63,890 | | | | 9,473 | |
2.680%, 05/21/2030 | | | | | 63,550 | | | | 9,197 | |
1.990%, 04/09/2025 | | | | | 85,700 | | | | 12,434 | |
China Government International Bond | | | | | | | | | | |
3.250%, 10/19/2023 | | $ | | | 2,851 | | | | 3,083 | |
1.875%, 12/03/2022 | | | | | 979 | | | | 1,007 | |
0.550%, 10/21/2025 (A) | | | | | 1,700 | | | | 1,697 | |
0.400%, 10/21/2023 (A) | | | | | 3,830 | | | | 3,836 | |
China Minmetals Corp | | | | | | | | | | |
4.450%, VAR US Treas Yield Curve Rate T Note Const Mat 3 Yr+6.070%, 11/13/2168 | | | | | 940 | | | | 946 | |
3.750%, VAR US Treas Yield Curve Rate T Note Const Mat 5 Yr+4.717%, 05/13/2169 | | | | | 3,389 | | | | 3,441 | |
Chinalco Capital Holdings Ltd | | | | | | | | | | |
4.250%, 04/21/2022 | | | | | 900 | | | | 914 | |
4.100%, VAR US Treas Yield Curve Rate T Note Const Mat 5 Yr+5.788%, 03/11/2169 | | | | | 307 | | | | 315 | |
CNAC HK Finbridge Co Ltd | | | | | | | | | | |
5.125%, 03/14/2028 | | | | | 608 | | | | 665 | |
4.625%, 03/14/2023 | | | | | 2 | | | | 2 | |
3.375%, 06/19/2024 | | | | | 230 | | | | 231 | |
Country Garden Holdings | | | | | | | | | | |
4.800%, 08/06/2030 | | | | | 573 | | | | 610 | |
| | | | | | | | | | |
| | | |
| Description | | Face Amount
(Thousands) | | Market Value
($ Thousands) |
|
GLOBAL BONDS (continued) | |
Dianjian Haiyu Ltd | | | | | | | | | | |
4.300%, 12/20/2168 | | $ | | | 205 | | | $ | 210 | |
Dianjian International Finance Ltd | | | | | | | | | | |
4.600%, 07/19/2169 (E) | | | | | 448 | | | | 461 | |
ENN Clean Energy International Investment | | | | | | | | | | |
7.500%, 02/27/2021 | | | | | 550 | | | | 552 | |
Huarong Finance 2017 Co Ltd | | | | | | | | | | |
4.500%, VAR US Treas Yield Curve Rate T Note Const Mat 5 Yr+7.773%, 07/24/2169 | | | | | 2,161 | | | | 2,191 | |
Leader Goal International MTN | | | | | | | | | | |
4.250%, 07/19/2169 (E) | | | | | 263 | | | | 268 | |
Meituan | | | | | | | | | | |
3.050%, 10/28/2030 | | CNY | | | 238 | | | | 247 | |
Minmetals Bounteous Finance BVI | | | | | | | | | | |
3.375%, VAR US Treas Yield Curve Rate T Note Const Mat 5 Yr+5.209%, 09/03/2169 | | $ | | | 1,080 | | | | 1,094 | |
Shimao Group Holdings | | | | | | | | | | |
5.600%, 07/15/2026 | | | | | 555 | | | | 604 | |
Sinopec Group Overseas Development 2018 | | | | | | | | | | |
2.700%, 05/13/2030 | | | | | 196 | | | | 203 | |
Tencent Holdings MTN | | | | | | | | | | |
3.240%, 06/03/2050 (A) | | | | | 620 | | | | 647 | |
Wanda Properties International | | | | | | | | | | |
7.250%, 01/29/2024 | | | | | 608 | | | | 602 | |
| | | | | | | | | | |
| | | | | | | | | 62,246 | |
| | | | | | | | | | |
|
Colombia — 5.9% | |
Colombia Government International Bond | | | | | | | | | | |
9.850%, 06/28/2027 | | COP | | | 7,914,000 | | | | 2,864 | |
9.850%, 06/28/2027 | | | | | 994,000 | | | | 360 | |
8.125%, 05/21/2024 | | $ | | | 821 | | | | 995 | |
7.750%, 04/14/2021 | | COP | | | 3,729,000 | | | | 1,057 | |
7.375%, 09/18/2037 | | $ | | | 734 | | | | 1,053 | |
6.125%, 01/18/2041 | | | | | 2,470 | | | | 3,264 | |
5.625%, 02/26/2044 | | | | | 2,105 | | | | 2,680 | |
5.000%, 06/15/2045 | | | | | 2,296 | | | | 2,761 | |
4.500%, 03/15/2029 | | | | | 2,811 | | | | 3,202 | |
4.375%, 03/21/2023 | | COP | | | 4,586,000 | | | | 1,305 | |
4.000%, 02/26/2024 | | $ | | | 1,285 | | | | 1,380 | |
3.125%, 04/15/2031 | | | | | 8,238 | | | | 8,646 | |
3.000%, 01/30/2030 | | | | | 3,907 | | | | 4,065 | |
Colombian TES | | | | | | | | | | |
10.000%, 07/24/2024 | | COP | | | 9,689,300 | | | | 10,076 | |
7.750%, 09/18/2030 | | | | | 9,555,800 | | | | 6,357 | |
7.500%, 08/26/2026 | | | | | 729,000 | | | | 16,358 | |
7.250%, 10/18/2034 | | | | | 4,881,400 | | | | 7,642 | |
7.000%, 05/04/2022 | | | | | 7,574,600 | | | | 2,245 | |
7.000%, 06/30/2032 | | | | | 2,254,700 | | | | 6,768 | |
6.250%, 11/26/2025 | | | | | 3,335,800 | | | | 10,200 | |
6.000%, 04/28/2028 | | | | | 2,854,100 | | | | 15,687 | |
5.750%, 11/03/2027 | | | | | 447,500 | | | | 14,812 | |
| | |
234 | | SEI Institutional Investments Trust / Semi-Annual Report / November 30, 2020 |
| | | | | | | | | | |
| | | |
| Description | | Face Amount
(Thousands) | | Market Value
($ Thousands) |
|
GLOBAL BONDS (continued) | |
3.000%, 03/25/2033 | | COP | | | 845,500 | | | $ | 676 | |
Ecopetrol | | | | | | | | | | |
7.375%, 09/18/2043 | | $ | | | 377 | | | | 507 | |
6.875%, 04/29/2030 | | | | | 686 | | | | 869 | |
Emgesa ESP | | | | | | | | | | |
8.750%, 01/25/2021 | | COP | | | 940,000 | | | | 264 | |
Empresas Publicas de Medellin ESP (A) | | | | | | | | | | |
8.375%, 11/08/2027 | | | | | 4,600,000 | | | | 1,325 | |
7.625%, 09/10/2024 | | | | | 2,224,000 | | | | 647 | |
7.625%, 09/10/2024 | | | | | 1,827,000 | | | | 532 | |
Financiera de Desarrollo Territorial Findeter | | | | | | | | | | |
7.875%, 08/12/2024 (A) | | | | | 1,408,000 | | | | 424 | |
7.875%, 08/12/2024 | | | | | 1,095,000 | | | | 330 | |
Geopark Ltd | | | | | | | | | | |
6.500%, 09/21/2024 (A) | | $ | | | 729 | | | | 743 | |
Grupo Aval | | | | | | | | | | |
4.375%, 02/04/2030 (A) | | | | | 1,083 | | | | 1,116 | |
Millicom International Cellular | | | | | | | | | | |
6.250%, 03/25/2029 (A) | | | | | 597 | | | | 682 | |
| | | | | | | | | | |
| | | | | | | | | 131,892 | |
| | | | | | | | | | |
|
Costa Rica — 0.5% | |
Costa Rica Government International Bond | | | | | | | | | | |
7.158%, 03/12/2045 | | | | | 6,566 | | | | 5,722 | |
7.158%, 03/12/2045 | | | | | 600 | | | | 523 | |
7.158%, 03/12/2045 (A) | | | | | 225 | | | | 196 | |
7.000%, 04/04/2044 | | | | | 1,860 | | | | 1,603 | |
7.000%, 04/04/2044 | | | | | 780 | | | | 673 | |
6.125%, 02/19/2031 | | | | | 1,547 | | | | 1,365 | |
Instituto Costarricense de Electricidad | | | | | | | | | | |
6.375%, 05/15/2043 | | | | | 290 | | | | 215 | |
| | | | | | | | | | |
| | | | | | | | | 10,297 | |
| | | | | | | | | | |
|
Croatia — 0.1% | |
Croatia Government International Bond | | | | | | | | | | |
6.375%, 03/24/2021 | | | | | 1,895 | | | | 1,928 | |
1.500%, 06/17/2031 | | EUR | | | 900 | | | | 1,158 | |
| | | | | | | | | | |
| | | | | | | | | 3,086 | |
| | | | | | | | | | |
|
Czech Republic — 1.1% | |
Czech Republic Government Bond | | | | | | | | | | |
2.750%, 07/23/2029 | | CZK | | | 123,530 | | | | 6,374 | |
2.400%, 09/17/2025 | | | | | 128,970 | | | | 6,301 | |
2.000%, 10/13/2033 | | | | | 10,500 | | | | 513 | |
1.250%, 02/14/2025 | | | | | 63,250 | | | | 2,937 | |
1.200%, 03/13/2031 | | | | | 58,770 | | | | 2,652 | |
1.000%, 06/26/2026 | | | | | 13,140 | | | | 599 | |
0.950%, 05/15/2030 | | | | | 100,740 | | | | 4,452 | |
| | | | | | | | | | |
| | | | | | | | | 23,828 | |
| | | | | | | | | | |
|
Dominican Republic — 1.4% | |
Dominican Republic Government Bond | | | | | | | | | | |
11.250%, 02/05/2027 | | DOP | | | 20,700 | | | | 401 | |
7.450%, 04/30/2044 (A) | | $ | | | 587 | | | | 723 | |
| | | | | | | | | | |
| | | |
| Description | | Face Amount
(Thousands) | | Market Value
($ Thousands) |
|
GLOBAL BONDS (continued) | |
Dominican Republic International Bond | | | | | | | | | | |
9.750%, 06/05/2026 (A) | | DOP | | | 40,200 | | | $ | 730 | |
8.900%, 02/15/2023 (A) | | | | | 61,250 | | | | 1,074 | |
6.850%, 01/27/2045 | | $ | | | 3,513 | | | | 4,084 | |
6.500%, 02/15/2048 | | | | | 6,158 | | | | 6,903 | |
6.400%, 06/05/2049 | | | | | 1,501 | | | | 1,664 | |
5.875%, 01/30/2060 (A) | | | | | 3,872 | | | | 4,027 | |
5.875%, 01/30/2060 | | | | | 3,598 | | | | 3,742 | |
5.500%, 01/27/2025 | | | | | 720 | | | | 783 | |
4.875%, 09/23/2032 (A) | | | | | 3,788 | | | | 4,053 | |
4.500%, 01/30/2030 (A) | | | | | 3,270 | | | | 3,429 | |
| | | | | | | | | | |
| | | | | | | | | 31,613 | |
| | | | | | | | | | |
|
Ecuador — 0.7% | |
Ecuador Government International Bond | | | | | | | | | | |
8.087%, 07/31/2030 (C) | | | | | 1,613 | | | | 706 | |
6.735%, 07/31/2030 (A)(C) | | | | | 2,674 | | | | 1,170 | |
5.000%, 5.000%, 07/31/2021, 07/31/2021 (A)(B) | | | | | 6,498 | | | | 4,097 | |
5.000%, 5.000%, 07/31/2021, 07/31/2021 (B) | | | | | 500 | | | | 315 | |
1.000%, 1.000%, 07/31/2021, 07/31/2021 (A)(B) | | | | | 13,506 | | | | 7,314 | |
0.500%, 0.500%, 07/31/2021, 07/31/2021 (A)(B) | | | | | 3,854 | | | | 1,886 | |
| | | | | | | | | | |
| | | | | | | | | 15,488 | |
| | | | | | | | | | |
|
Egypt — 2.8% | |
Egypt Government Bond | | | | | | | | | | |
18.000%, 11/06/2028 | | EGP | | | 44,214 | | | | 3,282 | |
17.700%, 08/07/2025 | | | | | 42,975 | | | | 3,061 | |
16.300%, 04/09/2024 | | | | | 21,507 | | | | 1,448 | |
16.100%, 05/07/2029 | | | | | 21,345 | | | | 1,467 | |
14.406%, 07/07/2027 | | | | | 24,826 | | | | 1,580 | |
14.196%, 07/07/2023 | | | | | 30,301 | | | | 1,933 | |
Egypt Government International Bond | | | | | | | | | | |
8.875%, 05/29/2050 (A) | | $ | | | 6,610 | | | | 7,343 | |
8.700%, 03/01/2049 (A) | | | | | 921 | | | | 1,008 | |
8.700%, 03/01/2049 | | | | | 820 | | | | 898 | |
7.903%, 02/21/2048 | | | | | 984 | | | | 1,017 | |
7.625%, 05/29/2032 (A) | | | | | 8,187 | | | | 8,944 | |
7.625%, 05/29/2032 | | | | | 756 | | | | 826 | |
6.588%, 02/21/2028 (A) | | | | | 936 | | | | 1,001 | |
5.250%, 10/06/2025 (A) | | | | | 2,863 | | | | 2,948 | |
Egypt Government International Bond MTN | | | | | | | | | | |
8.500%, 01/31/2047 | | | | | 5,792 | | | | 6,263 | |
8.150%, 11/20/2059 | | | | | 378 | | | | 394 | |
6.375%, 04/11/2031 | | EUR | | | 1,475 | | | | 1,806 | |
6.125%, 01/31/2022 (A) | | $ | | | 524 | | | | 544 | |
5.625%, 04/16/2030 | | EUR | | | 1,262 | | | | 1,517 | |
5.625%, 04/16/2030 (A) | | | | | 169 | | | | 203 | |
4.750%, 04/11/2025 | | | | | 633 | | | | 768 | |
4.750%, 04/16/2026 | | | | | 900 | | | | 1,085 | |
| | |
SEI Institutional Investments Trust / Semi-Annual Report / November 30, 2020 | | 235 |
SCHEDULE OF INVESTMENTS (Unaudited)
November 30, 2020
Emerging Markets Debt Fund (Continued)
| | | | | | | | |
| | | |
| Description | | Face Amount
(Thousands) | | Market Value ($ Thousands) |
|
GLOBAL BONDS (continued) | |
Egypt Treasury Bills (C) | | | | | | | | |
13.474%, 01/05/2021 | | EGP | 112,250 | | | $ | 7,075 | |
13.524%, 04/06/2021 | | | 115,575 | | | | 7,049 | |
| | | | | | | | |
| | | | | | | 63,460 | |
| | | | | | | | |
|
El Salvador — 0.6% | |
El Salvador Government International Bond | | | | | | | | |
9.500%, 07/15/2052 | | $ | 2,665 | | | | 2,524 | |
8.625%, 02/28/2029 | | | 445 | | | | 416 | |
8.250%, 04/10/2032 | | | 3,778 | | | | 3,432 | |
8.250%, 04/10/2032 (A) | | | 1,157 | | | | 1,051 | |
7.750%, 01/24/2023 | | | 3,331 | | | | 3,156 | |
7.650%, 06/15/2035 | | | 484 | | | | 425 | |
7.625%, 02/01/2041 | | | 1,285 | | | | 1,106 | |
7.125%, 01/20/2050 | | | 328 | | | | 273 | |
6.375%, 01/18/2027 | | | 24 | | | | 21 | |
5.875%, 01/30/2025 | | | 2,429 | | | | 2,158 | |
| | | | | | | | |
| | | | | | | 14,562 | |
| | | | | | | | |
| | |
Ethiopia — 0.1% | | | | | | | | |
Federal Democratic Republic of Ethiopia | | | | | | | | |
6.625%, 12/11/2024 (A) | | | 2,013 | | | | 1,975 | |
| | | | | | | | |
| | |
Gabon — 0.1% | | | | | | | | |
Gabon Government International Bond | | | | | | | | |
6.950%, 06/16/2025 (A) | | | 1,502 | | | | 1,521 | |
6.625%, 02/06/2031 | | | 809 | | | | 794 | |
6.375%, 12/12/2024 | | | 1,082 | | | | 1,089 | |
| | | | | | | | |
| | | | | | | 3,404 | |
| | | | | | | | |
| | |
Ghana — 1.2% | | | | | | | | |
Ghana Government Bonds | | | | | | | | |
24.750%, 07/19/2021 | | GHS | – | | | | – | |
19.750%, 03/25/2024 | | | 7,745 | | | | 1,323 | |
19.000%, 11/02/2026 | | | 16,120 | | | | 2,592 | |
Ghana Government International Bond | | | | | | | | |
10.750%, 10/14/2030 | | $ | 3,043 | | | | 3,935 | |
8.950%, 03/26/2051 (A) | | | 4,460 | | | | 4,432 | |
8.950%, 03/26/2051 | | | 200 | | | | 199 | |
8.750%, 03/11/2061 (A) | | | 1,337 | | | | 1,312 | |
8.750%, 03/11/2061 | | | 1,039 | | | | 1,019 | |
8.627%, 06/16/2049 (A) | | | 731 | | | | 713 | |
7.875%, 03/26/2027 (A) | | | 1,740 | | | | 1,824 | |
7.875%, 03/26/2027 | | | 200 | | | | 210 | |
7.875%, 02/11/2035 | | | 2,252 | | | | 2,194 | |
7.875%, 02/11/2035 (A) | | | 1,310 | | | | 1,276 | |
7.625%, 05/16/2029 | | | 1,227 | | | | 1,252 | |
6.375%, 02/11/2027 (A) | | | 3,610 | | | | 3,625 | |
Kosmos Energy | | | | | | | | |
7.125%, 04/04/2026 (A) | | | 246 | | | | 223 | |
Tullow Oil | | | | | | | | |
7.000%, 03/01/2025 (A) | | | 1,051 | | | | 670 | |
| | | | | | | | |
| | | | | | | 26,799 | |
| | | | | | | | |
| | | | | | | | |
| | | |
| Description | | Face Amount
(Thousands) | | Market Value ($ Thousands) |
|
GLOBAL BONDS (continued) | |
Guatemala — 0.3% | | | | | | | | |
Guatemala Government Bond | | | | | | | | |
6.125%, 06/01/2050 | | $ | 1,265 | | | $ | 1,613 | |
5.375%, 04/24/2032 | | | 1,439 | | | | 1,711 | |
4.900%, 06/01/2030 | | | 952 | | | | 1,091 | |
4.500%, 05/03/2026 | | | 1,515 | | | | 1,652 | |
| | | | | | | | |
| | | | | | | 6,067 | |
| | | | | | | | |
| | |
Honduras — 0.1% | | | | | | | | |
Honduras Government International Bond | | | | | | | | |
6.250%, 01/19/2027 | | | 479 | | | | 545 | |
5.625%, 06/24/2030 (A) | | | 1,005 | | | | 1,131 | |
5.625%, 06/24/2030 | | | 411 | | | | 462 | |
| | | | | | | | |
| | | | | | | 2,138 | |
| | | | | | | | |
| | |
Hong Kong — 0.1% | | | | | | | | |
AIA Group | | | | | | | | |
3.200%, 09/16/2040 (A) | | | 200 | | | | 213 | |
NWD | | | | | | | | |
4.125%, 07/18/2029 | | | 1,026 | | | | 1,063 | |
| | | | | | | | |
| | | | | | | 1,276 | |
| | | | | | | | |
| | |
Hungary — 1.6% | | | | | | | | |
Hungary Government Bond | | | | | | | | |
6.750%, 10/22/2028 | | HUF | 762,430 | | | | 3,463 | |
5.500%, 06/24/2025 | | | 1,431,510 | | | | 5,670 | |
3.250%, 10/22/2031 | | | 1,269,540 | | | | 4,643 | |
3.000%, 06/26/2024 | | | 286,840 | | | | 1,017 | |
3.000%, 10/27/2027 | | | 1,913,780 | | | | 6,940 | |
3.000%, 08/21/2030 | | | 794,020 | | | | 2,854 | |
2.750%, 12/22/2026 | | | 1,473,290 | | | | 5,242 | |
2.500%, 10/24/2024 | | | 679,490 | | | | 2,381 | |
Hungary Government International Bond | | | | | | | | |
6.375%, 03/29/2021 | | $ | 3,554 | | | | 3,622 | |
1.750%, 06/05/2035 | | EUR | 366 | | | | 482 | |
1.500%, 11/17/2050 | | | 363 | | | | 430 | |
| | | | | | | | |
| | | | | | | 36,744 | |
| | | | | | | | |
| | |
India — 0.2% | | | | | | | | |
Adani Electricity Mumbai | | | | | | | | |
3.949%, 02/12/2030 (A) | | $ | 720 | | | | 755 | |
Export-Import Bank of India MTN | | | | | | | | |
3.250%, 01/15/2030 (A) | | | 1,630 | | | | 1,738 | |
Network i2i | | | | | | | | |
5.650%, VAR US Treas Yield Curve Rate T Note Const Mat 5 Yr+4.277%, 04/15/2169 (A) | | | 307 | | | | 321 | |
Power Finance MTN | | | | | | | | |
3.950%, 04/23/2030 (A) | | | 786 | | | | 825 | |
Vedanta Resources | | | | | | | | |
6.375%, 07/30/2022 | | | 820 | | | | 611 | |
| | | | | | | | |
| | | | | | | 4,250 | |
| | | | | | | | |
| | |
236 | | SEI Institutional Investments Trust / Semi-Annual Report / November 30, 2020 |
| | | | | | | | |
| | | |
| Description | | Face Amount
(Thousands) | | Market Value ($ Thousands) |
|
GLOBAL BONDS (continued) | |
Indonesia — 7.7% | |
Indonesia Asahan Aluminium Persero | | | | | | | | |
6.757%, 11/15/2048 | | $ | 345 | | | $ | 466 | |
6.757%, 11/15/2048 (A) | | | 322 | | | | 435 | |
6.530%, 11/15/2028 (A) | | | 593 | | | | 739 | |
5.800%, 05/15/2050 (A) | | | 3,460 | | | | 4,281 | |
5.710%, 11/15/2023 (A) | | | 866 | | | | 957 | |
5.450%, 05/15/2030 (A) | | | 1,450 | | | | 1,728 | |
4.750%, 05/15/2025 (A) | | | 2,210 | | | | 2,437 | |
Indonesia Government International Bond | | | | | | | | |
8.500%, 10/12/2035 | | | 3,353 | | | | 5,495 | |
8.500%, 10/12/2035 | | | 400 | | | | 656 | |
7.750%, 01/17/2038 | | | 3,240 | | | | 5,131 | |
5.250%, 01/08/2047 (A) | | | 240 | | | | 323 | |
4.350%, 01/08/2027 | | | 210 | | | | 244 | |
3.500%, 01/11/2028 | | | 3,251 | | | | 3,635 | |
2.850%, 02/14/2030 | | | 2,081 | | | | 2,257 | |
1.400%, 10/30/2031 | | EUR | 1,192 | | | | 1,456 | |
0.900%, 02/14/2027 | | | 585 | | | | 707 | |
Indonesia Government International Bond MTN | | | | | | | | |
5.250%, 01/17/2042 | | $ | 3,410 | | | | 4,460 | |
5.125%, 01/15/2045 | | | 280 | | | | 365 | |
4.625%, 04/15/2043 | | | 1,724 | | | | 2,111 | |
3.750%, 06/14/2028 | | EUR | 372 | | | | 532 | |
Indonesia Treasury Bond | | | | | | | | |
9.000%, 03/15/2029 | | IDR | 9,762,000 | | | | 7,453 | |
8.750%, 05/15/2031 | | | 1,226,000 | | | | 6,739 | |
8.375%, 03/15/2024 | | | 5,878,000 | | | | 8,275 | |
8.375%, 09/15/2026 | | | 3,567,000 | | | | 1,890 | |
8.375%, 03/15/2034 | | | 7,180,000 | | | | 8,619 | |
8.375%, 04/15/2039 | | | 1,042,000 | | | | 8,939 | |
8.250%, 05/15/2029 | | | 2,081,000 | | | | 13,022 | |
8.250%, 06/15/2032 | | | 9,060,000 | | | | 1,498 | |
8.250%, 05/15/2036 | | | 9,122,000 | | | | 8,575 | |
8.125%, 05/15/2024 | | | 2,361,000 | | | | 10,334 | |
7.500%, 08/15/2032 | | | 5,947,000 | | | | 3,464 | |
7.500%, 06/15/2035 | | | 8,110,000 | | | | 2,903 | |
7.500%, 05/15/2038 | | | 596,000 | | | | 5,946 | |
7.500%, 04/15/2040 | | | 9,455,000 | | | | 3,713 | |
7.000%, 05/15/2022 | | | 6,771,000 | | | | 2,721 | |
7.000%, 05/15/2027 | | | 7,421,000 | | | | 5,823 | |
7.000%, 09/15/2030 | | | 1,854,000 | | | | 8,391 | |
6.625%, 05/15/2033 | | | 6,763,000 | | | | 2,593 | |
6.500%, 06/15/2025 | | | 3,801,000 | | | | 3,280 | |
6.500%, 02/15/2031 | | | 6,460,000 | | | | 1,198 | |
6.125%, 05/15/2028 | | | 7,415,000 | | | | 1,238 | |
5.500%, 04/15/2026 | | | 3,000,000 | | | | 3,816 | |
JPMorgan Chase Bank MTN (A) | | | | | | | | |
8.375%, 04/19/2039 | | | 1,563,000 | | | | 126 | |
7.500%, 06/15/2035 | | | 8,592,000 | | | | 2,178 | |
| | | | | | | | |
| | | |
| Description | | Face Amount
(Thousands) | | Market Value ($ Thousands) |
|
GLOBAL BONDS (continued) | |
Medco Bell Pte | | | | | | | | |
6.375%, 01/30/2027 (A) | | $ | 626 | | | $ | 624 | |
Minejesa Capital BV (A) | | | | | | | | |
5.625%, 08/10/2037 | | | 230 | | | | 243 | |
4.625%, 08/10/2030 | | | 786 | | | | 837 | |
Pertamina Persero MTN | | | | | | | | |
6.450%, 05/30/2044 | | | 741 | | | | 1,014 | |
3.650%, 07/30/2029 (A) | | | 1,375 | | | | 1,527 | |
Perusahaan Listrik Negara | | | | | | | | |
1.875%, 11/05/2031 (A) | | EUR | 943 | | | | 1,094 | |
Perusahaan Listrik Negara MTN | | | | | | | | |
6.150%, 05/21/2048 (A) | | $ | 1,015 | | | | 1,347 | |
6.150%, 05/21/2048 | | | 350 | | | | 465 | |
4.375%, 02/05/2050 (A) | | | 355 | | | | 383 | |
Perusahaan Penerbit SBSN Indonesia III | | | | | | | | |
4.325%, 05/28/2025 | | | 3,433 | | | | 3,887 | |
| | | | | | | | |
| | | | | | | 172,570 | |
| | | | | | | | |
| | |
Iraq — 0.1% | | | | | | | | |
Iraq Government International Bond | | | | | | | | |
5.800%, 01/15/2028 | | | 1,973 | | | | 1,811 | |
| | | | | | | | |
| | |
Israel — 0.5% | | | | | | | | |
Bank Leumi Le-Israel | | | | | | | | |
3.275%, VAR US Treas Yield Curve Rate T Note Const Mat 5 Yr+1.631%, 01/29/2031 (A) | | | 592 | | | | 605 | |
Israel Government International Bond | | | | | | | | |
4.500%, 04/03/2120 | | | 5,960 | | | | 7,887 | |
3.875%, 07/03/2050 | | | 1,195 | | | | 1,428 | |
Leviathan Bond (A) | | | | | | | | |
6.750%, 06/30/2030 | | | 550 | | | | 603 | |
6.500%, 06/30/2027 | | | 1,359 | | | | 1,492 | |
| | | | | | | | |
| | | | | | | 12,015 | |
| | | | | | | | |
| | |
Ivory Coast — 0.7% | | | | | | | | |
Ivory Coast Government International Bond | | | | | | | | |
6.875%, 10/17/2040 | | EUR | 1,604 | | | | 2,101 | |
6.625%, 03/22/2048 | | | 1,913 | | | | 2,454 | |
6.625%, 03/22/2048 | | | 333 | | | | 427 | |
5.875%, 10/17/2031 (A) | | | 1,423 | | | | 1,828 | |
5.875%, 10/17/2031 | | | 2,558 | | | | 3,286 | |
5.750%, 12/31/2032 | | $ | 1,455 | | | | 1,457 | |
5.750%, 12/31/2032 | | | 386 | | | | 387 | |
5.250%, 03/22/2030 | | EUR | 173 | | | | 217 | |
5.125%, 06/15/2025 | | | 487 | | | | 638 | |
4.875%, 01/30/2032 | | | 1,927 | | | | 2,296 | |
| | | | | | | | |
| | | | | | | 15,091 | |
| | | | | | | | |
| | |
Jamaica — 0.1% | | | | | | | | |
Jamaica Government International Bond | | | | | | | | |
7.875%, 07/28/2045 | | $ | 1,001 | | | | 1,355 | |
| | | | | | | | |
| | |
SEI Institutional Investments Trust / Semi-Annual Report / November 30, 2020 | | 237 |
SCHEDULE OF INVESTMENTS (Unaudited)
November 30, 2020
Emerging Markets Debt Fund (Continued)
| | | | | | | | |
| | | |
| Description | | Face Amount
(Thousands) | | Market Value ($ Thousands) |
|
GLOBAL BONDS (continued) | |
Jordan — 0.2% | |
Jordan Government International Bond | | | | | | | | |
7.375%, 10/10/2047 (A) | | $ | 341 | | | $ | 379 | |
7.375%, 10/10/2047 | | | 267 | | | | 296 | |
5.850%, 07/07/2030 (A) | | | 2,224 | | | | 2,372 | |
4.950%, 07/07/2025 (A) | | | 1,598 | | | | 1,666 | |
| | | | | | | | |
| | | | | | | 4,713 | |
| | | | | | | | |
| | |
Kazakhstan — 1.2% | | | | | | | | |
Development Bank of Kazakhstan | | | | | | | | |
4.125%, 12/10/2022 | | | 880 | | | | 923 | |
Kazakhstan Government International Bond MTN | | | | | | | | |
6.500%, 07/21/2045 | | | 230 | | | | 371 | |
KazMunayGas National JSC | | | | | | | | |
6.375%, 10/24/2048 (A) | | | 1,057 | | | | 1,501 | |
5.750%, 04/19/2047 (A) | | | 2,960 | | | | 3,904 | |
5.375%, 04/24/2030 | | | 2,592 | | | | 3,178 | |
5.375%, 04/24/2030 | | | 1,605 | | | | 1,968 | |
5.375%, 04/24/2030 (A) | | | 1,295 | | | | 1,587 | |
4.750%, 04/24/2025 (A) | | | 2,299 | | | | 2,598 | |
3.500%, 04/14/2033 (A) | | | 3,925 | | | | 4,265 | |
KazTransGas JSC | | | | | | | | |
4.375%, 09/26/2027 (A) | | | 2,611 | | | | 2,944 | |
4.375%, 09/26/2027 | | | 200 | | | | 225 | |
Tengizchevroil Finance International (A) | | | | | | | | |
3.250%, 08/15/2030 | | | 630 | | | | 657 | |
2.625%, 08/15/2025 | | | 2,358 | | | | 2,439 | |
| | | | | | | | |
| | | | | | | 26,560 | |
| | | | | | | | |
| | |
Kenya — 0.3% | | | | | | | | |
Kenya Government International Bond | | | | | | | | |
8.250%, 02/28/2048 | | | 2,501 | | | | 2,798 | |
8.250%, 02/28/2048 (A) | | | 982 | | | | 1,099 | |
8.000%, 05/22/2032 | | | 834 | | | | 952 | |
7.000%, 05/22/2027 | | | 2,003 | | | | 2,171 | |
| | | | | | | | |
| | | | | | | 7,020 | |
| | | | | | | | |
| | |
Kuwait — 0.1% | | | | | | | | |
Kuwait International Government Bond | | | | | | | | |
3.500%, 03/20/2027 | | | 894 | | | | 1,017 | |
2.750%, 03/20/2022 | | | 646 | | | | 664 | |
Meglobal Canada ULC MTN MTN | | | | | | | | |
5.875%, 05/18/2030 (A) | | | 250 | | | | 304 | |
NBK Tier 1 Financing 2 | | | | | | | | |
4.500%, VAR USD Swap Semi 30/360 6 Yr Curr+2.832%, 05/27/2169 (A) | | | 693 | | | | 693 | |
| | | | | | | | |
| | | | | | | 2,678 | |
| | | | | | | | |
| | |
Lebanon — 0.2% | | | | | | | | |
Lebanon Government International Bond | | | | | | | | |
8.250%, 05/17/2034 (F) | | | 6,312 | | | | 866 | |
8.200%, 05/17/2033 (F) | | | 3,557 | | | | 490 | |
6.750%, 11/29/2027 (F) | | | 1,500 | | | | 206 | |
| | | | | | | | |
| | | |
| Description | | Face Amount
(Thousands) | | Market Value ($ Thousands) |
|
GLOBAL BONDS (continued) | |
6.650%, 04/22/2024 (F) | | $ | 2,000 | | | $ | 275 | |
6.000%, 01/27/2023 (F) | | | 738 | | | | 103 | |
Lebanon Government International Bond MTN | | | | | | | | |
8.250%, 04/12/2021 (F) | | | 1,415 | | | | 205 | |
7.000%, 03/20/2028 (F) | | | 2,543 | | | | 339 | |
6.850%, 05/25/2029 (F) | | | 522 | | | | 72 | |
6.600%, 11/27/2026 (F) | | | 2,890 | | | | 397 | |
6.400%, 05/26/2023 (F) | | | 1,000 | | | | 137 | |
6.100%, 10/04/2022 (F) | | | 2,697 | | | | 384 | |
6.100%, 10/04/2022 (F) | | | 1,143 | | | | 163 | |
| | | | | | | | |
| | | | | | | 3,637 | |
| | | | | | | | |
| | |
Macau — 0.1% | | | | | | | | |
Sands China | | | | | | | | |
5.400%, 08/08/2028 | | | 892 | | | | 1,020 | |
Studio City Finance (A) | | | | | | | | |
6.500%, 01/15/2028 | | | 507 | | | | 535 | |
6.000%, 07/15/2025 | | | 194 | | | | 203 | |
| | | | | | | | |
| | | | | | | 1,758 | |
| | | | | | | | |
| | |
Malaysia — 5.5% | | | | | | | | |
1MDB Energy | | | | | | | | |
5.990%, 05/11/2022 | | | 3,000 | | | | 3,135 | |
1MDB Global Investments Ltd | | | | | | | | |
4.400%, 03/09/2023 | | | 3,800 | | | | 3,829 | |
4.400%, 03/09/2023 | | | 10,100 | | | | 10,176 | |
Gohl Capital | | | | | | | | |
4.250%, 01/24/2027 | | | 1,000 | | | | 1,047 | |
Malaysia Government Bond | | | | | | | | |
5.248%, 09/15/2028 | | MYR | 1,050 | | | | 303 | |
4.935%, 09/30/2043 | | | 2,000 | | | | 565 | |
4.921%, 07/06/2048 | | | 3,873 | | | | 1,075 | |
4.736%, 03/15/2046 | | | 1,052 | | | | 286 | |
4.392%, 04/15/2026 | | | 5,125 | | | | 1,384 | |
4.232%, 06/30/2031 | | | 2,000 | | | | 545 | |
4.181%, 07/15/2024 | | | 22 | | | | 6 | |
4.160%, 07/15/2021 | | | 2,242 | | | | 559 | |
4.059%, 09/30/2024 | | | 17,428 | | | | 4,585 | |
4.048%, 09/30/2021 | | | 900 | | | | 225 | |
3.955%, 09/15/2025 | | | 40,079 | | | | 10,616 | |
3.906%, 07/15/2026 | | | 22,578 | | | | 5,951 | |
3.899%, 11/16/2027 | | | 3,000 | | | | 796 | |
3.885%, 08/15/2029 | | | 46,324 | | | | 12,245 | |
3.828%, 07/05/2034 | | | 38,493 | | | | 9,786 | |
3.800%, 08/17/2023 | | | 42,002 | | | | 10,794 | |
3.795%, 09/30/2022 | | | 4,800 | | | | 1,221 | |
3.757%, 04/20/2023 | | | 25,564 | | | | 6,534 | |
3.757%, 05/22/2040 | | | 1,100 | | | | 271 | |
3.733%, 06/15/2028 | | | 17,936 | | | | 4,714 | |
3.620%, 11/30/2021 | | | 26,756 | | | | 6,700 | |
3.502%, 05/31/2027 | | | 7,247 | | | | 1,875 | |
3.480%, 03/15/2023 | | | 5,058 | | | | 1,284 | |
| | |
238 | | SEI Institutional Investments Trust / Semi-Annual Report / November 30, 2020 |
| | | | | | | | | | |
| | | |
| Description | | Face Amount
(Thousands) | | Market Value
($ Thousands) |
|
GLOBAL BONDS (continued) | |
3.478%, 06/14/2024 | | MYR | | | 11,115 | | | $ | 2,861 | |
3.418%, 08/15/2022 | | | | | 13,665 | | | | 3,445 | |
2.632%, 04/15/2031 | | | | | 5,630 | | | | 1,365 | |
Malaysia Government Investment Issue | | | | | | | | | | |
4.369%, 10/31/2028 | | | | | 2,000 | | | | 545 | |
4.119%, 11/30/2034 | | | | | 6,809 | | | | 1,795 | |
4.070%, 09/30/2026 | | | | | 14,000 | | | | 3,739 | |
Malaysia Sukuk Global | | | | | | | | | | |
3.179%, 04/27/2026 | | $ | | | 2,046 | | | | 2,291 | |
Petronas Capital MTN | | | | | | | | | | |
4.550%, 04/21/2050 (A) | | | | | 778 | | | | 1,046 | |
4.550%, 04/21/2050 | | | | | 755 | | | | 1,015 | |
3.500%, 04/21/2030 (A) | | | | | 3,590 | | | | 4,104 | |
3.500%, 04/21/2030 | | | | | 200 | | | | 229 | |
| | | | | | | | | | |
| | | | | | | | | 122,942 | |
| | | | | | | | | | |
|
Mexico — 8.6% | |
America Movil | | | | | | | | | | |
7.125%, 12/09/2024 | | MXN | | | 23,310 | | | | 1,201 | |
Axtel | | | | | | | | | | |
6.375%, 11/14/2024 (A) | | $ | | | 704 | | | | 736 | |
Banco Mercantil del Norte (A) | | | | | | | | | | |
7.500%, VAR US Treas Yield Curve Rate T Note Const Mat 10 Yr+5.470%, 09/27/2169 | | | | | 623 | | | | 674 | |
6.750%, VAR US Treas Yield Curve Rate T Note Const Mat 5 Yr+4.967%, 09/27/2169 | | | | | 1,569 | | | | 1,653 | |
Banco Nacional de Comercio Exterior SNC | | | | | | | | | | |
3.800%, VAR US Treas Yield Curve Rate T Note Const Mat 5 Yr+3.000%, 08/11/2026 (A) | | | | | 1,794 | | | | 1,792 | |
3.800%, VAR US Treas Yield Curve Rate T Note Const Mat 5 Yr+3.000%, 08/11/2026 | | | | | 176 | | | | 176 | |
Banco Santander Mexico Institucion de Banca Multiple Grupo Financiero Santand | | | | | | | | | | |
5.375%, 04/17/2025 (A) | | | | | 563 | | | | 637 | |
Cemex (A) | | | | | | | | | | |
7.375%, 06/05/2027 | | | | | 782 | | | | 878 | |
5.450%, 11/19/2029 | | | | | 1,000 | | | | 1,095 | |
Cometa Energia | | | | | | | | | | |
6.375%, 04/24/2035 (A) | | | | | 1,231 | | | | 1,419 | |
Comision Federal de Electricidad | | | | | | | | | | |
7.350%, 11/25/2025 | | MXN | | | 52,305 | | | | 2,522 | |
5.750%, 02/14/2042 (A) | | $ | | | 570 | | | | 644 | |
4.750%, 02/23/2027 (A) | | | | | 684 | | | | 770 | |
FEL Energy VI Sarl | | | | | | | | | | |
5.750%, 12/01/2040 (A) | | | | | 437 | | | | 460 | |
Grupo Televisa | | | | | | | | | | |
6.625%, 01/15/2040 | | | | | 866 | | | | 1,186 | |
Industrias Penoles | | | | | | | | | | |
5.650%, 09/12/2049 (A) | | | | | 491 | | | | 613 | |
| | | | | | | | | | |
| | | |
| Description | | Face Amount
(Thousands) | | Market Value
($ Thousands) |
|
GLOBAL BONDS (continued) | |
Mexican Bonos | | | | | | | | | | |
10.000%, 12/05/2024 | | MXN | | | 318,878 | | | $ | 18,801 | |
8.500%, 05/31/2029 | | | | | 93,166 | | | | 5,536 | |
8.500%, 11/18/2038 | | | | | 204,346 | | | | 12,102 | |
8.000%, 11/07/2047 | | | | | 88,721 | | | | 4,960 | |
7.750%, 05/29/2031 | | | | | 197,792 | | | | 11,297 | |
7.750%, 11/23/2034 | | | | | 29,263 | | | | 1,668 | |
7.750%, 11/13/2042 | | | | | 160,063 | | | | 8,767 | |
7.500%, 06/03/2027 | | | | | 251,503 | | | | 13,972 | |
6.500%, 06/09/2022 | | | | | 186,400 | | | | 9,530 | |
5.750%, 03/05/2026 | | | | | 75,293 | | | | 3,849 | |
5.750%, 03/05/2026 | | | | | 6,037 | | | | 309 | |
Mexican Bonos, Ser M20 | | | | | | | | | | |
8.000%, 12/07/2023 | | | | | 132,620 | | | | 7,198 | |
Mexico City Airport Trust | | | | | | | | | | |
5.500%, 07/31/2047 (A) | | $ | | | 1,068 | | | | 1,048 | |
Mexico Government International Bond | | | | | | | | | | |
5.000%, 04/27/2051 | | | | | 796 | | | | 959 | |
4.750%, 04/27/2032 | | | | | 2,843 | | | | 3,362 | |
4.500%, 04/22/2029 | | | | | 886 | | | | 1,022 | |
3.771%, 05/24/2061 | | | | | 5,126 | | | | 5,113 | |
2.659%, 05/24/2031 | | | | | 4,943 | | | | 4,947 | |
Mexico Government International Bond MTN | | | | | | | | | | |
6.050%, 01/11/2040 | | | | | 1,188 | | | | 1,553 | |
5.750%, 10/12/2110 | | | | | 2,460 | | | | 3,078 | |
Minera Mexico | | | | | | | | | | |
4.500%, 01/26/2050 (A) | | | | | 870 | | | | 987 | |
Petroleos Mexicanos | | | | | | | | | | |
9.500%, 09/15/2027 | | | | | 215 | | | | 238 | |
7.690%, 01/23/2050 | | | | | 547 | | | | 505 | |
7.690%, 01/23/2050 | | | | | 877 | | | | 809 | |
7.690%, 01/23/2050 (A) | | | | | 7,764 | | | | 7,163 | |
7.470%, 11/12/2026 | | MXN | | | 260,354 | | | | 10,301 | |
7.190%, 09/12/2024 | | | | | 150,856 | | | | 6,525 | |
6.950%, 01/28/2060 | | $ | | | 2,851 | | | | 2,445 | |
6.950%, 01/28/2060 (A) | | | | | 1,946 | | | | 1,669 | |
6.875%, 10/16/2025 (A) | | | | | 4,890 | | | | 5,110 | |
6.840%, 01/23/2030 (A) | | | | | 534 | | | | 523 | |
6.840%, 01/23/2030 | | | | | 4,598 | | | | 4,505 | |
6.625%, 06/15/2035 | | | | | 7,384 | | | | 6,799 | |
6.500%, 01/23/2029 | | | | | 1,030 | | | | 1,002 | |
6.500%, 01/23/2029 (A) | | | | | 1,111 | | | | 1,081 | |
6.490%, 01/23/2027 (A) | | | | | 515 | | | | 519 | |
5.950%, 01/28/2031 (A) | | | | | 1,354 | | | | 1,261 | |
5.950%, 01/28/2031 | | | | | 1,757 | | | | 1,637 | |
5.950%, 01/28/2031 | | | | | 2,115 | | | | 1,970 | |
5.625%, 01/23/2046 | | | | | 577 | | | | 461 | |
5.350%, 02/12/2028 (A) | | | | | 1,326 | | | | 1,242 | |
Petroleos Mexicanos MTN | | | | | | | | | | |
6.875%, 08/04/2026 | | | | | 270 | | | | 279 | |
6.750%, 09/21/2047 | | | | | 440 | | | | 378 | |
| | |
SEI Institutional Investments Trust / Semi-Annual Report / November 30, 2020 | | 239 |
SCHEDULE OF INVESTMENTS (Unaudited)
November 30, 2020
Emerging Markets Debt Fund (Continued)
| | | | | | | | |
| | | |
| Description | | Face Amount
(Thousands) | | Market Value
($ Thousands) |
|
GLOBAL BONDS (continued) | |
6.750%, 09/21/2047 | | $ | 238 | | | $ | 205 | |
| | | | | | | | |
| | | | | | | 193,141 | |
| | | | | | | | |
|
Mongolia — 0.3% | |
Development Bank of Mongolia LLC | | | | | | | | |
7.250%, 10/23/2023 (A) | | | 1,149 | | | | 1,225 | |
Mongolia Government International Bond | | | | | | | | |
5.625%, 05/01/2023 | | | 2,174 | | | | 2,288 | |
5.125%, 04/07/2026 | | | 546 | | | | 576 | |
Mongolia Government International Bond MTN | | | | | | | | |
8.750%, 03/09/2024 | | | 2,696 | | | | 3,111 | |
5.125%, 12/05/2022 | | | 443 | | | | 459 | |
| | | | | | | | |
| | | | | | | 7,659 | |
| | | | | | | | |
|
Morocco — 0.0% | |
Morocco Government International Bond | | | | | | | | |
5.500%, 12/11/2042 | | | 793 | | | | 986 | |
| | | | | | | | |
|
Mozambique — 0.2% | |
Mozambique International Bond | | | | | | | | |
9.000%, 9.000%, 09/15/2023, 09/15/2023 (A)(B) | | | 4,200 | | | | 3,707 | |
| | | | | | | | |
|
Namibia — 0.0% | |
Namibia International Bond | | | | | | | | |
5.250%, 10/29/2025 | | | 500 | | | | 524 | |
| | | | | | | | |
| | |
Netherlands — 0.0% | | | | | | | | |
IHS Netherlands Holdco BV | | | | | | | | |
8.000%, 09/18/2027 (A) | | | 399 | | | | 429 | |
VEON Holdings BV | | | | | | | | |
3.375%, 11/25/2027 (A) | | | 783 | | | | 801 | |
| | | | | | | | |
| | | | | | | 1,230 | |
| | | | | | | | |
|
Nigeria — 0.7% | |
Nigeria Government International Bond | | | | | | | | |
9.248%, 01/21/2049 | | | 524 | | | | 595 | |
8.747%, 01/21/2031 | | | 3,542 | | | | 4,004 | |
8.747%, 01/21/2031 (A) | | | 423 | | | | 478 | |
7.875%, 02/16/2032 | | | 2,352 | | | | 2,528 | |
7.875%, 02/16/2032 (A) | | | 1,083 | | | | 1,164 | |
7.696%, 02/23/2038 | | | 2,008 | | | | 2,081 | |
7.696%, 02/23/2038 (A) | | | 852 | | | | 883 | |
7.143%, 02/23/2030 | | | 1,065 | | | | 1,119 | |
Nigeria Government International Bond MTN | | | | | | | | |
7.625%, 11/28/2047 (A) | | | 895 | | | | 913 | |
6.500%, 11/28/2027 (A) | | | 1,934 | | | | 2,028 | |
6.500%, 11/28/2027 | | | 70 | | | | 73 | |
| | | | | | | | |
| | | | | | | 15,866 | |
| | | | | | | | |
|
Oman — 0.9% | |
Oman Government International Bond | | | | | | | | |
7.375%, 10/28/2032 (A) | | | 5,015 | | | | 5,256 | |
| | | | | | | | |
| | | |
| Description | | Face Amount
(Thousands) | | Market Value
($ Thousands) |
|
GLOBAL BONDS (continued) | |
6.750%, 10/28/2027 (A) | | $ | 5,564 | | | $ | 5,785 | |
6.750%, 01/17/2048 (A) | | | 1,432 | | | | 1,322 | |
6.750%, 01/17/2048 | | | 6,023 | | | | 5,559 | |
4.750%, 06/15/2026 | | | 1,402 | | | | 1,351 | |
3.625%, 06/15/2021 | | | 1,296 | | | | 1,292 | |
| | | | | | | | |
| | | | | | | 20,565 | |
| | | | | | | | |
|
Pakistan — 0.2% | |
Pakistan Government International Bond | | | | | | | | |
8.250%, 09/30/2025 (A) | | | 335 | | | | 364 | |
7.875%, 03/31/2036 | | | 285 | | | | 292 | |
6.875%, 12/05/2027 (A) | | | 2,134 | | | | 2,198 | |
6.875%, 12/05/2027 | | | 300 | | | | 309 | |
Third Pakistan International Sukuk | | | | | | | | |
5.500%, 10/13/2021 | | | 1,345 | | | | 1,358 | |
| | | | | | | | |
| | | | | | | 4,521 | |
| | | | | | | | |
|
Panama — 1.3% | |
Aeropuerto Internacional de Tocumen | | | | | | | | |
6.000%, 11/18/2048 (A) | | | 938 | | | | 1,072 | |
5.625%, 05/18/2036 | | | 1,481 | | | | 1,670 | |
AES Panama Generation Holdings SRL | | | | | | | | |
4.375%, 05/31/2030 (A) | | | 1,165 | | | | 1,258 | |
Banco Nacional de Panama | | | | | | | | |
2.500%, 08/11/2030 (A) | | | 1,160 | | | | 1,156 | |
Cable Onda | | | | | | | | |
4.500%, 01/30/2030 (A) | | | 227 | | | | 248 | |
Empresa de Transmision Electrica | | | | | | | | |
5.125%, 05/02/2049 (A) | | | 873 | | | | 1,045 | |
Panama Government International Bond | | | | | | | | |
9.375%, 04/01/2029 | | | 1,120 | | | | 1,726 | |
8.125%, 04/28/2034 | | | 699 | | | | 1,037 | |
4.500%, 04/16/2050 | | | 118 | | | | 149 | |
4.500%, 04/01/2056 | | | 5,370 | | | | 6,820 | |
4.000%, 09/22/2024 | | | 1,800 | | | | 1,969 | |
3.870%, 07/23/2060 | | | 4,520 | | | | 5,260 | |
3.750%, 03/16/2025 | | | 2,968 | | | | 3,252 | |
3.160%, 01/23/2030 | | | 738 | | | | 808 | |
2.252%, 09/29/2032 | | | 1,045 | | | | 1,060 | |
| | | | | | | | |
| | | | | | | 28,530 | |
| | | | | | | | |
|
Papua New Guinea — 0.2% | |
Papua New Guinea Government International Bond | | | | | | | | |
8.375%, 10/04/2028 (A) | | | 2,940 | | | | 2,969 | |
8.375%, 10/04/2028 | | | 1,388 | | | | 1,402 | |
| | | | | | | | |
| | | | | | | 4,371 | |
| | | | | | | | |
|
Paraguay — 0.2% | |
Paraguay Government International Bond | | | | | | | | |
6.100%, 08/11/2044 | | | 1,150 | | | | 1,524 | |
5.400%, 03/30/2050 | | | 734 | | | | 915 | |
4.950%, 04/28/2031 | | | 1,286 | | | | 1,524 | |
| | | | | | | | |
| | | | | | | 3,963 | |
| | | | | | | | |
| | |
240 | | SEI Institutional Investments Trust / Semi-Annual Report / November 30, 2020 |
| | | | | | | | | | | | |
| | | | |
| Description | | | | Face Amount
(Thousands) | | Market Value
($ Thousands) |
|
GLOBAL BONDS (continued) | |
|
Peru — 2.9% | |
ABY Transmission Sur | | | | | | | | | | | | |
6.875%, 04/30/2043 (A) | | | | | | $ | 317 | | | $ | 423 | |
Fondo MIVIVIENDA | | | | | | | | | | | | |
7.000%, 02/14/2024 (A) | | | PEN | | | | 5,422 | | | | 1,708 | |
Inkia Energy | | | | | | | | | | | | |
5.875%, 11/09/2027 (A) | | | | | | $ | 487 | | | | 520 | |
Kallpa Generacion SA (A) | | | | | | | | | | | | |
4.875%, 05/24/2026 | | | | | | | 271 | | | | 296 | |
4.125%, 08/16/2027 | | | | | | | 1,542 | | | | 1,653 | |
Nexa Resources | | | | | | | | | | | | |
5.375%, 05/04/2027 (A) | | | | | | | 4,041 | | | | 4,484 | |
Peru Government | | | | | | | | | | | | |
Bond 6.900%, 08/12/2037 | | | PEN | | | | 1,237 | | | | 415 | |
6.150%, 08/12/2032 | | | | | | | 21,502 | | | | 7,044 | |
5.940%, 02/12/2029 | | | | | | | 1,654 | | | | 556 | |
5.350%, 08/12/2040 | | | | | | | 959 | | | | 272 | |
Peruvian Government International Bond | | | | | | | | | | | | |
8.200%, 08/12/2026 | | | | | | | 6,280 | | | | 2,348 | |
8.200%, 08/12/2026 | | | | | | | 3,297 | | | | 1,233 | |
6.950%, 08/12/2031 | | | | | | | 42,027 | | | | 14,685 | |
6.950%, 08/12/2031 | | | | | | | 724 | | | | 253 | |
6.900%, 08/12/2037 | | | | | | | 9,203 | | | | 3,085 | |
6.850%, 02/12/2042 | | | | | | | 882 | | | | 296 | |
6.350%, 08/12/2028 | | | | | | | 5,599 | | | | 1,926 | |
5.700%, 08/12/2024 (A) | | | | | | | 6,317 | | | | 2,057 | |
5.625%, 11/18/2050 | | | | | | $ | 1,394 | | | | 2,129 | |
5.400%, 08/12/2034 | | | PEN | | | | 6,215 | | | | 1,863 | |
3.230%, 07/28/2121 | | | | | | $ | 1,164 | | | | 1,147 | |
2.783%, 01/23/2031 | | | | | | | 4,923 | | | | 5,312 | |
2.780%, 12/01/2060 | | | | | | | 1,595 | | | | 1,577 | |
2.392%, 01/23/2026 | | | | | | | 808 | | | | 850 | |
Petroleos del Peru | | | | | | | | | | | | |
5.625%, 06/19/2047 | | | | | | | 3,233 | | | | 3,888 | |
5.625%, 06/19/2047 (A) | | | | | | | 539 | | | | 648 | |
4.750%, 06/19/2032 (A) | | | | | | | 1,695 | | | | 1,932 | |
4.750%, 06/19/2032 | | | | | | | 3,089 | | | | 3,521 | |
| | | | | | | | | | | | |
| | | | | | | | | | | 66,121 | |
| | | | | | | | | | | | |
|
Philippines — 0.4% | |
Philippine Government International Bond | | | | | | | | | | | | |
4.000%, 01/15/2021 | | | | | | | 247 | | | | 248 | |
3.900%, 11/26/2022 | | | PHP | | | | 52,000 | | | | 1,102 | |
3.750%, 01/14/2029 | | | | | | $ | 3,988 | | | | 4,645 | |
2.950%, 05/05/2045 | | | | | | | 845 | | | | 900 | |
2.457%, 05/05/2030 | | | | | | | 1,565 | | | | 1,689 | |
| | | | | | | | | | | | |
| | | | | | | | | | | 8,584 | |
| | | | | | | | | | | | |
|
Poland — 2.3% | |
Poland Government Bond | | | | | | | | | | | | |
5.750%, 04/25/2029 | | | PLN | | | | 1,539 | | | | 572 | |
3.250%, 07/25/2025 | | | | | | | 12,081 | | | | 3,639 | |
2.750%, 04/25/2028 | | | | | | | 21,101 | | | | 6,357 | |
| | | | | | | | | | | | |
| | | | |
| Description | | | | Face Amount
(Thousands) | | Market Value
($ Thousands) |
|
GLOBAL BONDS (continued) | |
2.750%, 10/25/2029 | | | PLN | | | | 46,843 | | | $ | 14,239 | |
2.500%, 07/25/2026 | | | | | | | 47,889 | | | | 14,084 | |
2.500%, 07/25/2027 | | | | | | | 12,905 | | | | 3,817 | |
1.250%, 10/25/2030 | | | | | | | 20,068 | | | | 5,351 | |
Poland Government International | | | | | | | | | | | | |
Bond 5.000%, 03/23/2022 | | | | | | $ | 3,734 | | | | 3,961 | |
| | | | | | | | | | | | |
| | | | | | | | | | | 52,020 | |
| | | | | | | | | | | | |
|
Qatar — 1.5% | |
Qatar Government International Bond | | | | | | | | | | | | |
5.103%, 04/23/2048 | | | | | | | 1,683 | | | | 2,405 | |
5.103%, 04/23/2048 (A) | | | | | | | 3,485 | | | | 4,979 | |
4.817%, 03/14/2049 (A) | | | | | | | 1,067 | | | | 1,476 | |
4.817%, 03/14/2049 | | | | | | | 4,988 | | | | 6,902 | |
4.400%, 04/16/2050 (A) | | | | | | | 939 | | | | 1,242 | |
4.400%, 04/16/2050 | | | | | | | 509 | | | | 674 | |
4.000%, 03/14/2029 (A) | | | | | | | 2,588 | | | | 3,055 | |
4.000%, 03/14/2029 | | | | | | | 2,402 | | | | 2,836 | |
3.750%, 04/16/2030 (A) | | | | | | | 6,497 | | | | 7,614 | |
3.750%, 04/16/2030 | | | | | | | 516 | | | | 605 | |
3.400%, 04/16/2025 | | | | | | | 993 | | | | 1,092 | |
| | | | | | | | | | | | |
| | | | | | | | | | | 32,880 | |
| | | | | | | | | | | | |
|
Romania — 2.4% | |
Romania Government Bond | | | | | | | | | | | | |
5.850%, 04/26/2023 | | | RON | | | | 2,330 | | | | 614 | |
5.000%, 02/12/2029 | | | | | | | 11,435 | | | | 3,178 | |
4.850%, 04/22/2026 | | | | | | | 17,530 | | | | 4,710 | |
4.750%, 10/11/2034 | | | | | | | 1,205 | | | | 328 | |
4.500%, 06/17/2024 | | | | | | | 11,330 | | | | 2,947 | |
4.400%, 09/25/2023 | | | | | | | 970 | | | | 249 | |
4.250%, 06/28/2023 | | | | | | | 3,930 | | | | 1,003 | |
4.150%, 01/26/2028 | | | | | | | 17,275 | | | | 4,531 | |
4.000%, 10/25/2023 | | | | | | | 4,865 | | | | 1,238 | |
3.700%, 11/25/2024 | | | | | | | 2,455 | | | | 625 | |
3.650%, 07/28/2025 | | | | | | | 35,850 | | | | 9,115 | |
3.650%, 09/24/2031 | | | | | | | 5,685 | | | | 1,421 | |
Romanian Government International Bond | | | | | | | | | | | | |
5.125%, 06/15/2048 | | | | | | $ | 998 | | | | 1,281 | |
4.000%, 02/14/2051 (A) | | | | | | | 3,014 | | | | 3,293 | |
3.000%, 02/14/2031 (A) | | | | | | | 1,918 | | | | 2,049 | |
2.625%, 12/02/2040 (A) | | | EUR | | | | 916 | | | | 1,105 | |
Romanian Government International Bond MTN | | | | | | | | | | | | |
4.625%, 04/03/2049 | | | | | | | 1,677 | | | | 2,623 | |
4.125%, 03/11/2039 | | | | | | | 2,571 | | | | 3,752 | |
3.875%, 10/29/2035 | | | | | | | 432 | | | | 626 | |
3.375%, 01/28/2050 (A) | | | | | | | 1,660 | | | | 2,197 | |
3.375%, 01/28/2050 | | | | | | | 2,537 | | | | 3,358 | |
2.500%, 02/08/2030 (A) | | | | | | | 935 | | | | 1,209 | |
2.124%, 07/16/2031 | | | | | | | 166 | | | | 208 | |
2.000%, 01/28/2032 | | | | | | | 1,376 | | | | S1,709 | |
| | | | | | | | | | | | |
| | | | | | | | | | | 53,369 | |
| | | | | | | | | | | | |
| | |
SEI Institutional Investments Trust / Semi-Annual Report / November 30, 2020 | | 241 |
SCHEDULE OF INVESTMENTS (Unaudited)
November 30, 2020
Emerging Markets Debt Fund (Continued)
| | | | | | | | | | | | |
| | | | |
| Description | | | | | Face Amount (Thousands) | | Market Value ($ Thousands) |
|
GLOBAL BONDS (continued) | |
|
Russia — 5.6% | |
Gazprom OAO Via Gaz Capital | | | | | | | | | | | | |
5.150%, 02/11/2026 (A) | | | | | | $ | 3,647 | | | $ | 4,140 | |
Gazprom PJSC Via Gaz Capital | | | | | | | | | | | | |
4.950%, 02/06/2028 (A) | | | | | | | 901 | | | | 1,025 | |
Gazprom PJSC via Gaz Finance | | | | | | | | | | | | |
4.599%, VAR US Treas Yield Curve Rate T Note Const Mat 5 Yr+4.264%, 01/26/2169 (A) | | | | | | | 1,033 | | | | 1,077 | |
GTLK Europe Capital DAC | | | | | | | | | | | | |
4.949%, 02/18/2026 | | | | | | | 1,336 | | | | 1,394 | |
4.650%, 03/10/2027 | | | | | | | 797 | | | | 811 | |
Rusal Capital DAC | | | | | | | | | | | | |
5.125%, 02/02/2022 | | | | | | | 1,280 | | | | 1,300 | |
Russian Federal Bond - OFZ | | | | | | | | | | | | |
8.500%, 09/17/2031 | | | RUB | | | | 176,075 | | | | 2,770 | |
8.150%, 02/03/2027 | | | | | | | 1,092,284 | | | | 16,331 | |
7.950%, 10/07/2026 | | | | | | | 589,013 | | | | 8,723 | |
7.700%, 03/23/2033 | | | | | | | 632,470 | | | | 9,400 | |
7.700%, 03/16/2039 | | | | | | | 71,598 | | | | 1,085 | |
7.650%, 04/10/2030 | | | | | | | 64,359 | | | | 956 | |
7.250%, 05/10/2034 | | | | | | | 782,371 | | | | 11,243 | |
7.100%, 10/16/2024 | | | | | | | 246,968 | | | | 3,467 | |
7.050%, 01/19/2028 | | | | | | | 1,442,497 | | | | 20,538 | |
7.000%, 08/16/2023 | | | | | | | 340,040 | | | | 4,696 | |
6.900%, 05/23/2029 | | | | | | | 419,591 | | | | 5,945 | |
6.000%, 10/06/2027 | | | | | | | 95,220 | | | | 1,279 | |
Russian Foreign Bond - Eurobond | | | | | | | | | | | | |
7.500%, 03/31/2030 | | | | | | $ | 3 | | | | 3 | |
5.875%, 09/16/2043 | | | | | | | 5,000 | | | | 7,086 | |
5.625%, 04/04/2042 | | | | | | | 2,200 | | | | 3,005 | |
5.100%, 03/28/2035 | | | | | | | 6,800 | | | | 8,572 | |
4.875%, 09/16/2023 | | | | | | | 600 | | | | 659 | |
4.375%, 03/21/2029 | | | | | | | 7,000 | | | | 8,102 | |
4.250%, 06/23/2027 | | | | | | | 800 | | | | 907 | |
SCF Capital Designated Activity | | | | | | | | | | | | |
5.375%, 06/16/2023 (A) | | | | | | | 1,068 | | | | 1,140 | |
Vnesheconombank Via VEB Finance | | | | | | | | | | | | |
6.800%, 11/22/2025 (A) | | | | | | | 600 | | | | 723 | |
6.800%, 11/22/2025 | | | | | | | 240 | | | | 289 | |
| | | | | | | | | | | | |
| | | | | | | | | | | 126,666 | |
| | | | | | | | | | | | |
|
Saudi Arabia — 1.7% | |
Saudi Arabian Oil (A) | | | | | | | | | | | | |
3.500%, 11/24/2070 | | | | | | | 3,618 | | | | 3,657 | |
3.250%, 11/24/2050 | | | | | | | 2,733 | | | | 2,743 | |
1.625%, 11/24/2025 | | | | | | | 1,860 | | | | 1,894 | |
1.250%, 11/24/2023 | | | | | | | 2,050 | | | | 2,073 | |
Saudi Arabian Oil MTN | | | | | | | | | | | | |
4.250%, 04/16/2039 | | | | | | | 4,690 | | | | 5,458 | |
4.250%, 04/16/2039 (A) | | | | | | | 415 | | | | 483 | |
Saudi Government International Bond | | | | | | | | | | | | |
5.250%, 01/16/2050 | | | | | | | 1,240 | | | | 1,702 | |
| | | | | | | | | | | | |
| | | | |
| Description | | | | | Face Amount (Thousands) | | Market Value ($ Thousands) |
|
GLOBAL BONDS (continued) | |
5.250%, 01/16/2050 (A) | | | | | | $ | 75 | | | $ | 103 | |
4.375%, 04/16/2029 (A) | | | | | | | 901 | | | | 1,064 | |
Saudi Government International Bond MTN | | | | | | | | | | | | |
5.000%, 04/17/2049 | | | | | | | 435 | | | | 576 | |
5.000%, 04/17/2049 (A) | | | | | | | 243 | | | | 322 | |
4.500%, 04/17/2030 (A) | | | | | | | 600 | | | | 721 | |
4.500%, 10/26/2046 | | | | | | | 2,571 | | | | 3,153 | |
4.500%, 10/26/2046 (A) | | | | | | | 352 | | | | 432 | |
3.250%, 10/26/2026 (A) | | | | | | | 2,942 | | | | 3,244 | |
3.250%, 10/22/2030 | | | | | | | 2,705 | | | | 2,972 | |
3.250%, 10/22/2030 (A) | | | | | | | 7,052 | | | | 7,748 | |
| | | | | | | | | | | | |
| | | | | | | | | | | 38,345 | |
| | | | | | | | | | | | |
|
Senegal — 0.1% | |
Senegal Government International Bond | | | | | | | | | | | | |
6.750%, 03/13/2048 | | | | | | | 380 | | | | 411 | |
6.250%, 07/30/2024 | | | | | | | 1,080 | | | | 1,178 | |
| | | | | | | | | | | | |
| | | | | | | | | | | 1,589 | |
| | | | | | | | | | | | |
|
Serbia — 0.8% | |
Serbia International Bond | | | | | | | | | | | | |
7.250%, 09/28/2021 | | | | | | | 353 | | | | 372 | |
7.250%, 09/28/2021 | | | | | | | 200 | | | | 211 | |
3.125%, 05/15/2027 | | | EUR | | | | 451 | | | | 602 | |
2.125%, 12/01/2030 (A) | | | | | | $ | 2,569 | | | | 2,528 | |
2.125%, 12/01/2030 | | | | | | | 368 | | | | 362 | |
1.500%, 06/26/2029 | | | EUR | | | | 3,558 | | | | 4,298 | |
Serbia Treasury Bonds | | | | | | | | | | | | |
5.875%, 02/08/2028 | | | RSD | | | | 250,390 | | | | 2,981 | |
4.500%, 01/11/2026 | | | | | | | 310,300 | | | | 3,417 | |
4.500%, 08/20/2032 | | | | | | | 236,320 | | | | 2,498 | |
3.750%, 01/17/2022 | | | | | | | 26,510 | | | | 276 | |
| | | | | | | | | | | | |
| | | | | | | | | | | 17,545 | |
| | | | | | | | | | | | |
|
South Africa — 4.4% | |
Eskom Holdings SOC Ltd | | | | | | | | | | | | |
7.125%, 02/11/2025 | | | | | | $ | 1,220 | | | | 1,247 | |
7.125%, 02/11/2025 (A) | | | | | | | 5,117 | | | | 5,232 | |
Eskom Holdings SOC Ltd MTN | | | | | | | | | | | | |
8.450%, 08/10/2028 (A) | | | | | | | 634 | | | | 680 | |
7.500%, 09/15/2033 | | | ZAR | | | | 52,500 | | | | 2,504 | |
6.750%, 08/06/2023 | | | | | | $ | 3,067 | | | | 3,129 | |
6.750%, 08/06/2023 (A) | | | | | | | 1,503 | | | | 1,533 | |
6.350%, 08/10/2028 (A) | | | | | | | 456 | | | | 497 | |
Liquid Telecommunications Financing PLC | | | | | | | | | | | | |
8.500%, 07/13/2022 (A) | | | | | | | 699 | | | | 714 | |
SASOL Financing USA LLC | | | | | | | | | | | | |
5.875%, 03/27/2024 | | | | | | | 661 | | | | 681 | |
South Africa Government International Bond | | | | | | | | | | | | |
10.500%, 12/21/2026 | | | ZAR | | | | 142,072 | | | | 10,689 | |
9.000%, 01/31/2040 | | | | | | | 79,700 | | | | 4,297 | |
8.875%, 02/28/2035 | | | | | | | 71,187 | | | | 3,988 | |
8.750%, 01/31/2044 | | | | | | | 156,076 | | | | 8,059 | |
8.750%, 02/28/2048 | | | | | | | 281,298 | | | | 14,537 | |
| | |
242 | | SEI Institutional Investments Trust / Semi-Annual Report / November 30, 2020 |
| | | | | | | | | | | | |
| | | | |
| Description | | | | Face Amount (Thousands) | | Market Value
($Thousands) |
|
GLOBAL BONDS (continued) | |
8.500%, 01/31/2037 | | | ZAR | | | | 118,034 | | | $ | 6,202 | |
8.250%, 03/31/2032 | | | | | | | 66,081 | | | | 3,778 | |
8.000%, 01/31/2030 | | | | | | | 70,817 | | | | 4,294 | |
7.750%, 02/28/2023 | | | | | | | 14,049 | | | | 973 | |
7.000%, 02/28/2031 | | | | | | | 100,995 | | | | 5,480 | |
6.500%, 02/28/2041 | | | | | | | 27,919 | | | | 1,159 | |
6.300%, 06/22/2048 | | | | | | $ | 1,706 | | | | 1,747 | |
6.250%, 03/31/2036 | | | ZAR | | | | 99,826 | | | | 4,412 | |
5.875%, 09/16/2025 | | | | | | $ | 326 | | | | 363 | |
5.875%, 06/22/2030 | | | | | | | 199 | | | | 219 | |
5.750%, 09/30/2049 | | | | | | | 7,334 | | | | 7,060 | |
5.650%, 09/27/2047 | | | | | | | 284 | | | | 272 | |
5.000%, 10/12/2046 | | | | | | | 475 | | | | 426 | |
4.850%, 09/27/2027 | | | | | | | 690 | | | | 725 | |
4.850%, 09/30/2029 | | | | | | | 3,111 | | | | 3,199 | |
4.300%, 10/12/2028 | | | | | | | 456 | | | | 459 | |
Transnet SOC MTN | | | | | | | | | | | | |
9.500%, 05/13/2021 (A) | | | ZAR | | | | 8,760 | | | | 571 | |
| | | | | | | | | | | | |
| | | | | | | | | | | 99,126 | |
| | | | | | | | | | | | |
|
South Korea — 0.2% | |
Export-Import Bank of Korea MTN | | | | | | | | | | | | |
8.400%, 11/30/2021 | | | IDR | | | | 5,600,000 | | | | 2,607 | |
Korea International Bond | | | | | | | | | | | | |
1.000%, 09/16/2030 | | | | | | $ | 1,728 | | | | 1,697 | |
| | | | | | | | | | | | |
| | | | | | | | | | | 4,304 | |
| | | | | | | | | | | | |
|
Spain — 0.1% | |
AI Candelaria Spain SLU | | | | | | | | | | | | |
7.500%, 12/15/2028 (A) | | | | | | | 1,825 | | | | 2,044 | |
|
Sri Lanka — 0.7% | |
Sri Lanka Government International Bond | | | | | | | | | | | | |
7.850%, 03/14/2029 | | | | | | | 2,219 | | | | 1,298 | |
7.550%, 03/28/2030 | | | | | | | 3,420 | | | | 2,001 | |
6.850%, 03/14/2024 | | | | | | | 1,445 | | | | 925 | |
6.825%, 07/18/2026 (A) | | | | | | | 1,612 | | | | 975 | |
6.825%, 07/18/2026 | | | | | | | 800 | | | | 484 | |
6.750%, 04/18/2028 | | | | | | | 3,058 | | | | 1,789 | |
6.750%, 04/18/2028 (A) | | | | | | | 7,091 | | | | 4,148 | |
6.350%, 06/28/2024 | | | | | | | 2,006 | | | | 1,284 | |
6.250%, 07/27/2021 (D) | | | | | | | 1,046 | | | | 936 | |
6.200%, 05/11/2027 | | | | | | | 1,794 | | | | 1,049 | |
5.875%, 07/25/2022 (A) | | | | | | | 628 | | | | 462 | |
5.750%, 04/18/2023 (A) | | | | | | | 1,752 | | | | 1,174 | |
5.750%, 04/18/2023 | | | | | | | 322 | | | | 216 | |
| | | | | | | | | | | | |
| | | | | | | | | | | 16,741 | |
| | | | | | | | | | | | |
|
Supranational — 0.4% | |
African Export-Import Bank MTN Bond | | | | | | | | | | | | |
3.994%, 09/21/2029 (A) | | | | | | | 543 | | | | 569 | |
Banque Ouest Africaine de Developpement (A) | | | | | | | | | | | | |
5.000%, 07/27/2027 | | | | | | | 1,274 | | | | 1,391 | |
| | | | | | | | | | | | |
| | | | |
| Description | | | | | Face Amount (Thousands) | | Market Value
($Thousands) |
|
GLOBAL BONDS (continued) | |
4.700%, 10/22/2031 | | | | | | $ | 934 | | | $ | 1,002 | |
European Investment Bank MTN | | | | | | | | | | | | |
8.500%, 09/17/2024 | | | ZAR | | | | 11,350 | | | | 806 | |
Inter-American Development Bank MTN | | | | | | | | | | | | |
7.875%, 03/14/2023 | | | IDR | | | | 3,150,000 | | | | 5,549 | |
| | | | | | | | | | | | |
| | | | | | | | | | | 9,317 | |
| | | | | | | | | | | | |
|
Tanzania — 0.0% | |
AngloGold Ashanti Holdings | | | | | | | | | | | | |
3.750%, 10/01/2030 | | | | | | $ | 323 | | | | 343 | |
| | | | | | | | | | | | |
|
Thailand — 2.7% | |
Thailand Government Bond | | | | | | | | | | | | |
5.670%, 03/13/2028 | | | THB | | | | 3,000 | | | | 130 | |
4.875%, 06/22/2029 | | | | | | | 15,000 | | | | 640 | |
3.775%, 06/25/2032 | | | | | | | 316,175 | | | | 12,896 | |
3.650%, 06/20/2031 | | | | | | | 85,000 | | | | 3,403 | |
3.625%, 06/16/2023 | | | | | | | 34,000 | | | | 1,209 | |
3.400%, 06/17/2036 | | | | | | | 296,187 | | | | 12,049 | |
3.300%, 06/17/2038 | | | | | | | 157,113 | | | | 6,326 | |
2.875%, 12/17/2028 | | | | | | | 134,998 | | | | 5,014 | |
2.875%, 06/17/2046 | | | | | | | 4,865 | | | | 188 | |
2.400%, 12/17/2023 | | | | | | | 167,000 | | | | 5,811 | |
2.125%, 12/17/2026 | | | | | | | 25,000 | | | | 882 | |
1.600%, 12/17/2029 | | | | | | | 111,196 | | | | 3,757 | |
1.600%, 06/17/2035 | | | | | | | 51,336 | | | | 1,685 | |
1.585%, 12/17/2035 | | | | | | | 50,023 | | | | 1,634 | |
1.450%, 12/17/2024 | | | | | | | 124,000 | | | | 4,213 | |
1.250%, 03/12/2028 | | | | | | | 564 | | | | 18 | |
| | | | | | | | | | | | |
| | | | | | | | | | | 59,855 | |
| | | | | | | | | | | | |
|
Trinidad & Tobago — 0.0% | |
Trinidad & Tobago Government International Bond | | | | | | | | | | | | |
4.375%, 01/16/2024 | | | | | | $ | 1,024 | | | | 1,078 | |
| | | | | | | | | | | | |
|
Tunisia — 0.2% | |
Banque Centrale de Tunisie International | | | | | | | | | | | | |
8.250%, 09/19/2027 | | | | | | | 463 | | | | 433 | |
6.375%, 07/15/2026 | | | EUR | | | | 2,262 | | | | 2,439 | |
5.750%, 01/30/2025 | | | | | | $ | 548 | | | | 495 | |
5.625%, 02/17/2024 | | | EUR | | | | 1,077 | | | | 1,169 | |
| | | | | | | | | | | | |
| | | | | | | | | | | 4,536 | |
| | | | | | | | | | | | |
|
Turkey — 2.2% | |
Export Credit Bank of Turkey (A) | | | | | | | | | | | | |
8.250%, 01/24/2024 | | | | | | $ | 327 | | | | 349 | |
6.125%, 05/03/2024 | | | | | | | 831 | | | | 836 | |
5.375%, 10/24/2023 | | | | | | | 1,487 | | | | 1,476 | |
5.000%, 09/23/2021 | | | | | | | 674 | | | | 676 | |
Export Credit Bank of Turkey MTN | | | | | | | | | | | | |
5.375%, 02/08/2021 (A) | | | | | | | 586 | | | | 588 | |
| | |
SEI Institutional Investments Trust / Semi-Annual Report / November 30, 2020 | | 243 |
SCHEDULE OF INVESTMENTS (Unaudited)
November 30, 2020
Emerging Markets Debt Fund (Continued)
| | | | | | | | |
| | | |
| Description | | Face Amount
(Thousands) | | Market Value ($ Thousands) |
|
GLOBAL BONDS (continued) | |
Hazine Mustesarligi Varlik Kiralama | | | | | | | | |
5.180%, 02/21/2022 (A) | | $ | 2,936 | | | $ | 2,971 | |
QNB Finansbank | | | | | | | | |
6.875%, 09/07/2024 (A) | | | 898 | | | | 948 | |
TC Ziraat Bankasi MTN (A) | | | | | | | | |
5.125%, 05/03/2022 | | | 561 | | | | 557 | |
4.750%, 04/29/2021 | | | 756 | | | | 755 | |
Turkey Government Bond | | | | | | | | |
16.200%, 06/14/2023 | | TRY | 10,974 | | | | 1,502 | |
12.200%, 01/18/2023 | | | 9,043 | | | | 1,139 | |
11.000%, 03/02/2022 | | | 6,593 | | | | 812 | |
10.700%, 08/17/2022 | | | 30,802 | | | | 3,761 | |
10.600%, 02/11/2026 | | | 19,572 | | | | 2,393 | |
10.500%, 08/11/2027 | | | 17,688 | | | | 2,121 | |
3.000%, 08/02/2023 | | | 14,482 | | | | 1,880 | |
Turkey Government International Bond | | | | | | | | |
7.250%, 12/23/2023 | | $ | 3,661 | | | | 3,917 | |
6.875%, 03/17/2036 | | | 2,737 | | | | 2,836 | |
6.375%, 10/14/2025 | | | 200 | | | | 210 | |
6.350%, 08/10/2024 | | | 517 | | | | 539 | |
6.125%, 10/24/2028 | | | 2,131 | | | | 2,186 | |
6.000%, 03/25/2027 | | | 840 | | | | 860 | |
6.000%, 01/14/2041 | | | 1,091 | | | | 1,023 | |
5.950%, 01/15/2031 | | | 4,786 | | | | 4,780 | |
5.750%, 03/22/2024 | | | 145 | | | | 148 | |
5.125%, 03/25/2022 | | | 3,863 | | | | 3,920 | |
5.125%, 02/17/2028 | | | 200 | | | | 195 | |
4.875%, 10/09/2026 | | | 847 | | | | 827 | |
4.875%, 04/16/2043 | | | 1,874 | | | | 1,559 | |
Turkiye Garanti Bankasi | | | | | |
6.125%, VAR USD Swap Semi 30/360 5 Yr Curr+4.220%, 05/24/2027 (A) | | | 998 | | | | 958 | |
Turkiye Sise ve Cam Fabrikalari AS | | | | | | | | |
6.950%, 03/14/2026 | | | 725 | | | | 781 | |
Ulker Biskuvi Sanayi | | | | | | | | |
6.950%, 10/30/2025 (A) | | | 1,381 | | | | 1,465 | |
Yapi ve Kredi Bankasi MTN | | | | | | | | |
5.850%, 06/21/2024 (A) | | | 632 | | | | 633 | |
| | | | | | | | |
| | | | 49,601 | |
| | | | | | | | |
| |
Ukraine — 2.2% | | | | | |
NAK Naftogaz Ukraine via Kondor Finance | | | | | | | | |
7.625%, 11/08/2026 (A) | | | 1,334 | | | | 1,338 | |
7.125%, 07/19/2024 | | EUR | 970 | | | | 1,183 | |
Ukraine Government Bond | | | | | | | | |
17.000%, 05/11/2022 | | UAH | 99,987 | | | | 3,760 | |
16.000%, 08/11/2021 | | | 190,780 | | | | 6,918 | |
15.840%, 02/26/2025 | | | 92,615 | | | | 3,642 | |
7.750%, 09/01/2023 | | $ | 459 | | | | 498 | |
Ukraine Government International Bond | | | | | | | | |
15.700%, 01/20/2021 (A) | | UAH | 65,000 | | | | 2,300 | |
9.750%, 11/01/2028 | | $ | 890 | | | | 1,057 | |
9.750%, 11/01/2028 (A) | | | 526 | | | | 625 | |
| | | | | | | | |
| | | |
| Description | | Face Amount (Thousands) | | Market Value ($ Thousands) |
| | |
GLOBAL BONDS (continued) | | | | | | | | |
8.994%, 02/01/2024 | | $ | 1,524 | | | $ | 1,700 | |
7.750%, 09/01/2021 | | | 3,580 | | | | 3,702 | |
7.750%, 09/01/2022 | | | 872 | | | | 927 | |
7.750%, 09/01/2025 (A) | | | 516 | | | | 567 | |
7.750%, 09/01/2025 | | | 1,742 | | | | 1,914 | |
7.750%, 09/01/2026 (A) | | | 3,335 | | | | 3,688 | |
7.750%, 09/01/2026 | | | 1,450 | | | | 1,603 | |
7.750%, 09/01/2027 | | | 924 | | | | 1,023 | |
7.375%, 09/25/2032 | | | 3,668 | | | | 3,927 | |
7.253%, 03/15/2033 (A) | | | 665 | | | | 706 | |
7.253%, 03/15/2033 | | | 636 | | | | 675 | |
6.750%, 06/20/2026 (A) | | EUR | 1,113 | | | | 1,432 | |
6.750%, 06/20/2026 | | | 1,790 | | | | 2,303 | |
4.375%, 01/27/2030 (A) | | | 592 | | | | 659 | |
3.325%, 05/31/2040 (A)(E) | | $ | 3,182 | | | | 3,149 | |
| | | | | | | | |
| | | | | | | 49,296 | |
| | | | | | | | |
| | |
United Arab Emirates — 1.6% | | | | | | | | |
Abu Dhabi Crude Oil Pipeline LLC (A) | | | | | | | | |
4.600%, 11/02/2047 | | | 3,870 | | | | 4,790 | |
3.650%, 11/02/2029 | | | 923 | | | | 1,057 | |
Abu Dhabi Government International Bond (A) | | | | | | | | |
4.125%, 10/11/2047 | | | 369 | | | | 468 | |
3.125%, 09/30/2049 | | | 2,031 | | | | 2,207 | |
Abu Dhabi Government International Bond MTN | | | | | | | | |
3.875%, 04/16/2050 | | | 628 | | | | 779 | |
3.125%, 04/16/2030 | | | 765 | | | | 865 | |
2.700%, 09/02/2070 | | | 942 | | | | 896 | |
2.500%, 04/16/2025 (A) | | | 3,068 | | | | 3,275 | |
Acwa Power Management And Investments One Ltd | | | | | | | | |
5.950%, 12/15/2039 (A) | | | 2,301 | | | | 2,717 | |
DP World MTN (A) | | | | | | | | |
6.850%, 07/02/2037 | | | 557 | | | | 736 | |
5.625%, 09/25/2048 | | | 1,459 | | | | 1,777 | |
4.700%, 09/30/2049 | | | 215 | | | | 238 | |
DP World Salaam | | | | | | | | |
6.000%, VAR US Treas Yield Curve Rate T Note Const Mat 5 Yr+5.750%, 01/01/2169 | | | 383 | | | | 415 | |
Emirate of Dubai Government International Bonds MTN | | | | | | | | |
5.250%, 01/30/2043 | | | 670 | | | | 774 | |
Finance Department Government of Sharjah MTN | | | | | | | | |
4.000%, 07/28/2050 (A) | | | 2,417 | | | | 2,510 | |
Galaxy Pipeline Assets Bidco (A) | | | | | | | | |
3.250%, 09/30/2040 | | | 1,938 | | | | 2,009 | |
2.625%, 03/31/2036 | | | 2,477 | | | | 2,561 | |
MAF Sukuk MTN | | | | | | | | |
3.933%, 02/28/2030 | | | 973 | | | | 1,026 | |
| | |
244 | | SEI Institutional Investments Trust / Semi-Annual Report / November 30, 2020 |
| | | | | | | | |
| | | |
| Description | | Face Amount
(Thousands) | | Market Value ($ Thousands) |
|
GLOBAL BONDS (continued) | |
MDGH - GMTN BV MTN | | | | | | | | |
4.500%, 11/07/2028 (A) | | $ | 1,869 | | | $ | 2,238 | |
3.950%, 05/21/2050 | | | 338 | | | | 403 | |
3.700%, 11/07/2049 (A) | | | 970 | | | | 1,108 | |
2.875%, 11/07/2029 (A) | | | 1,218 | | | | 1,306 | |
Sharjah Sukuk Program MTN | | | | | | | | |
3.854%, 04/03/2026 | | | 1,037 | | | | 1,126 | |
| | | | | | | | |
| | | | | | | 35,281 | |
| | | | | | | | |
| |
United Kingdom — 0.3% | | | | | |
Standard Chartered Bank MTN | | | | | | | | |
8.250%, 05/18/2029 (A) | | IDR | 8,081,000 | | | | 7,076 | |
| | | | | | | | |
| |
United States — 0.4% | | | | | |
JPMorgan Chase Bank MTN | | | | | | | | |
7.000%,
09/18/2030 (A)(E) | | | 7,660,000 | | | | 8,826 | |
| | | | | | | | |
| |
Uruguay — 0.7% | | | | | |
Uruguay Government International Bond | | | | | | | | |
9.875%, 06/20/2022 | | UYU | 56,183 | | | | 1,363 | |
5.100%, 06/18/2050 | | $ | 880 | | | | 1,209 | |
4.975%, 04/20/2055 | | | 646 | | | | 877 | |
4.375%, 10/27/2027 (D) | | | 3,426 | | | | 4,021 | |
4.375%, 12/15/2028 | | UYU | 10,293 | | | | 273 | |
4.375%, 01/23/2031 | | $ | 7,128 | | | | 8,607 | |
| | | | | | | | |
| | | | | | | 16,350 | |
| | | | | | | | |
| |
Uzbekistan — 0.1% | | | | | |
Uzbekistan Government Bond MTN | | | | | | | | |
5.375%, 02/20/2029 | | | 709 | | | | 801 | |
4.750%, 02/20/2024 | | | 531 | | | | 566 | |
3.700%, 11/25/2030 (A) | | | 1,143 | | | | 1,159 | |
3.700%, 11/25/2030 | | | 330 | | | | 335 | |
| | | | | | | | |
| | | | | | | 2,861 | |
| | | | | | | | |
| |
Venezuela — 0.2% | | | | | |
Petroleos de Venezuela | | | | | | | | |
9.750%, 05/17/2035 (F) | | | 3,202 | | | | 107 | |
6.000%, 05/16/2024 (F) | | | 16,821 | | | | 563 | |
6.000%, 05/16/2024 (F) | | | 7,900 | | | | 265 | |
6.000%, 05/16/2024 (F) | | | 1,777 | | | | 60 | |
6.000%, 11/15/2026 (F) | | | 24,577 | | | | 799 | |
5.500%, 04/12/2037 (F) | | | 1,620 | | | | 54 | |
5.375%, 04/12/2027 (F) | | | 7,825 | | | | 274 | |
Venezuela Government International Bond | | | | | | | | |
9.250%, 09/15/2027 (F) | | | 3,400 | | | | 306 | |
9.250%, 05/07/2028 (F) | | | 4,965 | | | | 447 | |
8.250%, 10/13/2024 (F) | | | 4,151 | | | | 374 | |
7.750%, 10/13/2019 (F) | | | 7,816 | | | | 703 | |
| | | | | | | | |
| | | | | | | 3,952 | |
| | | | | | | | |
| | | | | | | | |
| | | |
| Description | | Face Amount (Thousands) | | Market Value ($ Thousands) |
|
GLOBAL BONDS (continued) | |
| |
Vietnam — 0.0% | | | | | |
Mong Duong Finance Holdings BV | | | | | | | | |
5.125%, 05/07/2029 (A) | | $ | 939 | | | $ | 989 | |
| | | | | | | | |
| | |
Zambia — 0.1% | | | | | | | | |
First Quantum Minerals | | | | | | | | |
6.875%, 03/01/2026 (A) | | | 531 | | | | 548 | |
Zambia Government International Bond | | | | | | | | |
5.375%, 09/20/2022 (A)(F) | | | 1,570 | | | | 754 | |
| | | | | | | | |
| | | | | | | 1,302 | |
| | | | | | | | |
| | |
Total Global Bonds | | | | | | | | |
(Cost $2,101,389) ($ Thousands) | | | | | | | 2,121,754 | |
| | | | | | | | |
| |
U.S. TREASURY OBLIGATION — 0.3% | | | | | |
U.S. Treasury Bill | | | | | | | | |
0.169%, 05/20/2021 (C) | | | 7,395 | | | | 7,392 | |
| | | | | | | | |
| | |
Total U.S. Treasury Obligation | | | | | | | | |
(Cost $7,391) ($ Thousands) | | | | | | | 7,392 | |
| | | | | | | | |
| | |
| | | Shares | | | | | |
| | | | | | | | |
| |
AFFILIATED PARTNERSHIP — 0.2% | | | | | |
SEI Liquidity Fund, L.P. | | | | | | | | |
0.070% **†(G) | | | 3,954,055 | | | | 3,955 | |
| | | | | | | | |
| | |
Total Affiliated Partnership | | | | | | | | |
(Cost $3,955) ($ Thousands) | | | | | | | 3,955 | |
| | | | | | | | |
| |
Total Investments in Securities — 94.8% | | | | | |
(Cost $2,112,735) ($ Thousands) | | | | | | $ | 2,133,101 | |
| | | | | | | | |
| | |
SEI Institutional Investments Trust / Semi-Annual Report / November 30, 2020 | | 245 |
SCHEDULE OF INVESTMENTS (Unaudited)
November 30, 2020
Emerging Markets Debt Fund (Continued)
A list of the open futures contracts held by the Fund at November 30, 2020, is as follows:
| | | | | | | | | | | | | | | | | | | | |
| | | | | | |
| Type of Contract | | Number of Contracts Long (Short) | | Expiration Date | | Notional Amount (Thousands) | | Value
(Thousands) | | Unrealized Appreciation (Depreciation) (Thousands) |
Euro-Bund | | | (104 | ) | | | Dec-2020 | | | $ | (21,514 | ) | | $ | (21,802 | ) | | $ | (281 | ) |
Euro-Buxl | | | (29 | ) | | | Dec-2020 | | | | (7,501 | ) | | | (7,858 | ) | | | (335 | ) |
R186 Bond Future | | | 2,215 | | | | Feb-2021 | | | | 15,972 | | | | 16,734 | | | | 17 | |
R2030 Bond Future | | | 645 | | | | Feb-2021 | | | | 3,605 | | | | 3,894 | | | | 105 | |
R2032 Bond Future | | | 1,388 | | | | Feb-2021 | | | | 7,468 | | | | 8,133 | | | | 284 | |
R2035 Bond Future | | | 1,890 | | | | Feb-2021 | | | | 9,979 | | | | 10,954 | | | | 465 | |
R2037 Bond Future | | | 515 | | | | Feb-2021 | | | | 2,438 | | | | 2,693 | | | | 131 | |
R213 Bond Future | | | 602 | | | | Feb-2021 | | | | 3,163 | | | | 3,366 | | | | 75 | |
U.S. 10-Year Treasury Note | | | 159 | | | | Dec-2020 | | | | 22,072 | | | | 22,026 | | | | (46 | ) |
U.S. 10-Year Treasury Note | | | 145 | | | | Mar-2021 | | | | 20,026 | | | | 20,035 | | | | 9 | |
U.S. 10-Year Treasury Note | | | (159 | ) | | | Dec-2020 | | | | (22,020 | ) | | | (22,027 | ) | | | (6 | ) |
U.S. Long Treasury Bond | | | (17 | ) | | | Mar-2021 | | | | (2,971 | ) | | | (2,973 | ) | | | (3 | ) |
U.S. Ultra Long Treasury Bond | | | 49 | | | | Mar-2021 | | | | 10,668 | | | | 10,586 | | | | (82 | ) |
| | | | | | | | | | | | | | | | | | | | |
| | | | | | | | | | $ | 41,385 | | | $ | 43,761 | | | $ | 333 | |
| | | | | | | | | | | | | | | | | | | | |
A list of the open forward foreign currency contracts held by the Fund at November 30, 2020, is as follows:
| | | | | | | | | | | | | | | | | | | | |
| | | | | | | |
| Counterparty | | Settlement Date | | | | | Currency to Deliver (Thousands) | | | | | Currency to Receive (Thousands) | | | Unrealized Appreciation (Depreciation) (Thousands) |
Barclays PLC | | | 12/16/20 | | | USD | | | 4,935 | | | RUB | | | 392,523 | | | $ | 187 | |
Barclays PLC | | | 12/16/20 | | | USD | | | 5,286 | | | KRW | | | 5,935,715 | | | | 75 | |
Barclays PLC | | | 12/17/20 | | | USD | | | 7,779 | | | TRY | | | 64,752 | | | | 454 | |
Barclays PLC | | | 12/16/20 | | | USD | | | 2,370 | | | TRY | | | 18,306 | | | | (41 | ) |
Barclays PLC | | | 12/16/20 | | | MXN | | | 97,198 | | | USD | | | 4,529 | | | | (286 | ) |
Barclays PLC | | | 12/16/20 | | | INR | | | 527,494 | | | USD | | | 7,058 | | | | (59 | ) |
Barclays PLC | | | 12/16/20 | | | IDR | | | 43,795,324 | | | USD | | | 2,906 | | | | (187 | ) |
Barclays PLC | | | 12/17/20 | | | USD | | | 28,200 | | | ZAR | | | 477,957 | | | | 2,620 | |
Citigroup | | | 12/02/20 - 01/05/21 | | | USD | | | 6,400 | | | BRL | | | 36,273 | | | | 335 | |
Citigroup | | | 03/02/21 | | | USD | | | 864 | | | BRL | | | 4,618 | | | | (8 | ) |
Citigroup | | | 12/02/20 - 03/02/21 | | | BRL | | | 47,402 | | | USD | | | 8,520 | | | | (279 | ) |
Citigroup | | | 12/24/20 | | | KRW | | | 369,104 | | | USD | | | 334 | | | | — | |
Citigroup | | | 12/02/20 - 12/07/20 | | | KRW | | | 4,156,812 | | | USD | | | 3,633 | | | | (123 | ) |
Citigroup | | | 12/03/20 - 02/03/21 | | | EUR | | | 15,870 | | | USD | | | 18,791 | | | | (203 | ) |
Citigroup | | | 12/07/20 | | | USD | | | 521 | | | UYU | | | 21,270 | | | | (22 | ) |
Citigroup | | | 12/09/20 - 12/30/20 | | | RON | | | 11,143 | | | EUR | | | 2,279 | | | | (9 | ) |
Citigroup | | | 12/11/20 - 12/16/20 | | | EUR | | | 4,930 | | | HUF | | | 1,789,214 | | | | 62 | |
Citigroup | | | 12/11/20 | | | HUF | | | 1,634,435 | | | EUR | | | 4,470 | | | | (97 | ) |
Citigroup | | | 12/16/20 | | | USD | | | 69 | | | RON | | | 284 | | | | 1 | |
Citigroup | | | 12/16/20 | | | USD | | | 618 | | | PEN | | | 2,216 | | | | (4 | ) |
Citigroup | | | 12/16/20 | | | USD | | | 1,119 | | | COP | | | 4,244,857 | | | | 64 | |
Citigroup | | | 12/16/20 | | | USD | | | 1,461 | | | EUR | | | 1,230 | | | | 11 | |
Citigroup | | | 12/16/20 | | | USD | | | 2,023 | | | IDR | | | 28,872,196 | | | | 17 | |
Citigroup | | | 12/16/20 | | | PLN | | | 4,448 | | | EUR | | | 983 | | | | (10 | ) |
Citigroup | | | 12/16/20 | | | USD | | | 4,883 | | | CZK | | | 110,398 | | | | 140 | |
Citigroup | | | 12/16/20 - 02/26/21 | | | EUR | | | 2,700 | | | PLN | | | 12,150 | | | | 9 | |
Citigroup | | | 12/16/20 | | | EUR | | | 3,072 | | | PLN | | | 13,698 | | | | (21 | ) |
| | |
246 | | SEI Institutional Investments Trust / Semi-Annual Report / November 30, 2020 |
| | | | | | | | | | | | | | | | | | | | |
| | | | | | | |
| Counterparty | | Settlement Date | | | | | Currency to Deliver (Thousands) | | | | | Currency to Receive (Thousands) | | | Unrealized Appreciation (Depreciation) (Thousands) |
Citigroup | | | 12/16/20 | | | USD | | | 6,268 | | | CLP | | | 4,972,619 | | | $ | 218 | |
Citigroup | | | 12/16/20 - 12/18/20 | | | USD | | | 9,122 | | | RUB | | | 689,615 | | | | (122 | ) |
Citigroup | | | 12/16/20 | | | USD | | | 11,632 | | | INR | | | 863,136 | | | | 13 | |
Citigroup | | | 12/16/20 - 12/24/20 | | | USD | | | 12,665 | | | KRW | | | 14,394,319 | | | | 336 | |
Citigroup | | | 12/16/20 | | | USD | | | 19,080 | | | THB | | | 598,955 | | | | 721 | |
Citigroup | | | 12/16/20 | | | RON | | | 20,576 | | | USD | | | 4,956 | | | | (94 | ) |
Citigroup | | | 12/16/20 - 02/05/21 | | | USD | | | 19,162 | | | MXN | | | 409,889 | | | | 1,129 | |
Citigroup | | | 02/05/21 | | | USD | | | 3,028 | | | MXN | | | 61,322 | | | | (7 | ) |
Citigroup | | | 12/16/20 | | | USD | | | 30,844 | | | PLN | | | 117,042 | | | | 393 | |
Citigroup | | | 12/16/20 - 12/21/20 | | | USD | | | 15,904 | | | CNY | | | 108,523 | | | | 562 | |
Citigroup | | | 01/25/21 - 03/17/21 | | | USD | | | 24,385 | | | CNY | | | 160,948 | | | | (46 | ) |
Citigroup | | | 12/16/20 | | | CNY | | | 43,348 | | | USD | | | 6,406 | | | | (172 | ) |
Citigroup | | | 12/16/20 | | | PEN | | | 50,445 | | | USD | | | 14,161 | | | | 174 | |
Citigroup | | | 12/16/20 - 02/05/21 | | | MXN | | | 118,191 | | | USD | | | 5,604 | | | | (242 | ) |
Citigroup | | | 12/16/20 | | | INR | | | 204,387 | | | USD | | | 2,733 | | | | (25 | ) |
Citigroup | | | 12/16/20 | | | HUF | | | 213,140 | | | USD | | | 703 | | | | (7 | ) |
Citigroup | | | 12/16/20 | | | PHP | | | 491,924 | | | USD | | | 10,078 | | | | (145 | ) |
Citigroup | | | 12/16/20 | | | COP | | | 2,458,261 | | | USD | | | 684 | | | | (1 | ) |
Citigroup | | | 12/16/20 - 02/24/21 | | | IDR | | | 72,300,607 | | | USD | | | 4,917 | | | | (172 | ) |
Citigroup | | | 12/17/20 | | | USD | | | 4,327 | | | TRY | | | 35,727 | | | | 216 | |
Citigroup | | | 12/17/20 - 02/05/21 | | | USD | | | 4,976 | | | ZAR | | | 79,315 | | | | 129 | |
Citigroup | | | 02/05/21 | | | USD | | | 582 | | | ZAR | | | 8,955 | | | | (8 | ) |
Citigroup | | | 02/05/21 | | | ZAR | | | 7,991 | | | USD | | | 523 | | | | 10 | |
Citigroup | | | 12/17/20 - 02/05/21 | | | ZAR | | | 233,127 | | | USD | | | 14,560 | | | | (460 | ) |
Citigroup | | | 12/30/20 | | | EUR | | | 1,396 | | | RON | | | 6,826 | | | | 3 | |
Citigroup | | | 12/30/20 | | | EUR | | | 423 | | | RON | | | 2,064 | | | | — | |
Citigroup | | | 01/11/21 | | | EUR | | | 392 | | | CZK | | | 10,258 | | | | (2 | ) |
Citigroup | | | 01/11/21 | | | CZK | | | 8,760 | | | EUR | | | 333 | | | | — | |
Citigroup | | | 05/20/21 | | | EGP | | | 66,383 | | | USD | | | 4,079 | | | | 3 | |
Citigroup | | | 01/27/21 | | | EGP | | | 15,886 | | | USD | | | 926 | | | | (77 | ) |
Citigroup | | | 01/28/21 - 02/04/21 | | | USD | | | 5,503 | | | NGN | | | 2,183,885 | | | | (119 | ) |
Citigroup | | | 01/28/21 - 02/05/21 | | | UAH | | | 431,271 | | | USD | | | 14,735 | | | | (5,568 | ) |
Citigroup | | | 01/28/21 | | | NGN | | | 733,748 | | | USD | | | 1,728 | | | | (83 | ) |
Deutsche Bank | | | 12/16/20 | | | IDR | | | – | | | USD | | | – | | | | — | |
Goldman Sachs | | | 12/02/20 - 03/02/21 | | | USD | | | 16,286 | | | BRL | | | 91,100 | | | | 627 | |
Goldman Sachs | | | 03/02/21 | | | USD | | | 4,029 | | | BRL | | | 21,645 | | | | (17 | ) |
Goldman Sachs | | | 12/03/20 - 01/05/21 | | | EUR | | | 6,443 | | | USD | | | 7,636 | | | | (77 | ) |
Goldman Sachs | | | 12/07/20 | | | USD | | | 937 | | | TRY | | | 7,501 | | | | 20 | |
Goldman Sachs | | | 12/16/20 | | | USD | | | 6,173 | | | TRY | | | 48,147 | | | | (48 | ) |
Goldman Sachs | | | 12/07/20 - 12/16/20 | | | USD | | | 11,322 | | | CNY | | | 77,604 | | | | 455 | |
Goldman Sachs | | | 02/18/21 | | | USD | | | 3,100 | | | CNY | | | 20,461 | | | | (10 | ) |
Goldman Sachs | | | 12/07/20 - 12/16/20 | | | CNY | | | 66,186 | | | USD | | | 9,796 | | | | (250 | ) |
Goldman Sachs | | | 12/08/20 - 12/16/20 | | | TRY | | | 27,876 | | | USD | | | 3,537 | | | | (15 | ) |
Goldman Sachs | | | 12/09/20 | | | RON | | | 4,745 | | | EUR | | | 968 | | | | (6 | ) |
Goldman Sachs | | | 12/09/20 | | | EUR | | | 5,712 | | | RON | | | 27,954 | | | | 28 | |
Goldman Sachs | | | 12/14/20 | | | USD | | | 1,494 | | | THB | | | 45,797 | | | | 20 | |
Goldman Sachs | | | 12/14/20 - 12/16/20 | | | THB | | | 144,879 | | | USD | | | 4,763 | | | | (26 | ) |
Goldman Sachs | | | 12/16/20 | | | USD | | | 333 | | | RON | | | 1,371 | | | | 3 | |
Goldman Sachs | | | 12/16/20 | | | USD | | | 1,184 | | | PEN | | | 4,207 | | | | (17 | ) |
Goldman Sachs | | | 12/16/20 | | | USD | | | 2,026 | | | KRW | | | 2,321,824 | | | | 71 | |
Goldman Sachs | | | 12/16/20 | | | USD | | | 2,247 | | | COP | | | 8,532,375 | | | | 131 | |
| | |
SEI Institutional Investments Trust / Semi-Annual Report / November 30, 2020 | | 247 |
SCHEDULE OF INVESTMENTS (Unaudited)
November 30, 2020
Emerging Markets Debt Fund (Continued)
| | | | | | | | | | | | | | | | | | | | |
| | | | | | | |
| Counterparty | | Settlement Date | | | | | Currency to Deliver
(Thousands) | | | | | Currency to Receive
(Thousands) | | | Unrealized
Appreciation
(Depreciation)
(Thousands) |
Goldman Sachs | | | 12/16/20 | | | USD | | | 2,336 | | | HUF | | | 704,323 | | | $ | 10 | |
Goldman Sachs | | | 12/16/20 | | | USD | | | 1,654 | | | IDR | | | 25,086,608 | | | | 118 | |
Goldman Sachs | | | 02/03/21 | | | USD | | | 1,488 | | | IDR | | | 21,093,905 | | | | (6 | ) |
Goldman Sachs | | | 12/16/20 | | | USD | | | 4,253 | | | CLP | | | 3,277,925 | | | | 23 | |
Goldman Sachs | | | 12/16/20 | | | PEN | | | 1,810 | | | USD | | | 503 | | | | 1 | |
Goldman Sachs | | | 12/16/20 | | | PEN | | | 7,786 | | | USD | | | 2,152 | | | | (8 | ) |
Goldman Sachs | | | 12/16/20 | | | RON | | | 10,055 | | | USD | | | 2,416 | | | | (52 | ) |
Goldman Sachs | |
| 12/16/20 -
02/05/21 |
| | USD | | | 16,138 | | | MXN | | | 345,351 | | | | 923 | |
Goldman Sachs | | | 12/16/20 | | | USD | | | 19,840 | | | CZK | | | 444,894 | | | | 404 | |
Goldman Sachs | | | 12/16/20 | | | HUF | | | 205,437 | | | USD | | | 653 | | | | (31 | ) |
Goldman Sachs | | | 12/16/20 | | | HUF | | | 291,924 | | | EUR | | | 798 | | | | (17 | ) |
Goldman Sachs | | | 12/16/20 | | | RUB | | | 151,909 | | | USD | | | 1,983 | | | | — | |
Goldman Sachs | |
| 12/16/20 -
12/18/20 |
| | RUB | | | 537,844 | | | USD | | | 6,858 | | | | (160 | ) |
Goldman Sachs | | | 12/16/20 | | | CLP | | | 371,340 | | | USD | | | 486 | | | | 1 | |
Goldman Sachs | | | 12/16/20 | | | CLP | | | 2,035,859 | | | USD | | | 2,642 | | | | (14 | ) |
Goldman Sachs | | | 02/03/21 | | | IDR | | | 11,358,682 | | | USD | | | 800 | | | | 2 | |
Goldman Sachs | |
| 12/16/20 -
02/03/21 |
| | IDR | | | 25,870,214 | | | USD | | | 1,714 | | | | (110 | ) |
Goldman Sachs | | | 12/16/20 | | | COP | | | 77,908,001 | | | USD | | | 20,968 | | | | (748 | ) |
Goldman Sachs | | | 12/17/20 | | | ZAR | | | 42,954 | | | USD | | | 2,630 | | | | (140 | ) |
Goldman Sachs | | | 12/18/20 | | | USD | | | 1,283 | | | RUB | | | 101,410 | | | | 40 | |
Goldman Sachs | | | 01/11/21 | | | CZK | | | 10,490 | | | EUR | | | 400 | | | | 2 | |
Goldman Sachs | | | 01/20/21 | | | EUR | | | 3,621 | | | HUF | | | 1,306,980 | | | | 17 | |
Goldman Sachs | | | 01/21/21 | | | EGP | | | 56,931 | | | USD | | | 3,396 | | | | (204 | ) |
Goldman Sachs | | | 02/04/21 | | | USD | | | 464 | | | NGN | | | 187,255 | | | | (4 | ) |
Goldman Sachs | | | 02/05/21 | | | MXN | | | 25,078 | | | USD | | | 1,243 | | | | 7 | |
Goldman Sachs | | | 02/05/21 | | | MXN | | | 25,774 | | | USD | | | 1,210 | | | | (60 | ) |
JPMorgan Chase Bank | | | 12/02/20 | | | BRL | | | 40,873 | | | USD | | | 7,576 | | | | (12 | ) |
JPMorgan Chase Bank | |
| 12/22/20 -
01/14/21 |
| | IDR | | | 79,181,176 | | | USD | | | 5,571 | | | | — | |
JPMorgan Chase Bank | |
| 12/02/20 -
01/20/21 |
| | IDR | | | 550,846,388 | | | USD | | | 38,151 | | | | (727 | ) |
JPMorgan Chase Bank | |
| 12/03/20 -
01/05/21 |
| | USD | | | 20,178 | | | EUR | | | 17,062 | | | | 239 | |
JPMorgan Chase Bank | |
| 12/03/20 -
12/15/20 |
| | EUR | | | 29,627 | | | USD | | | 35,164 | | | | (289 | ) |
JPMorgan Chase Bank | | | 12/07/20 | | | USD | | | 3,383 | | | SGD | | | 4,591 | | | | 44 | |
JPMorgan Chase Bank | | | 12/07/20 | | | USD | | | 3,389 | | | KRW | | | 3,830,445 | | | | 72 | |
JPMorgan Chase Bank | | | 12/07/20 | | | USD | | | 3,408 | | | CNY | | | 22,599 | | | | 24 | |
JPMorgan Chase Bank | | | 02/18/21 | | | USD | | | 4,775 | | | CNY | | | 31,568 | | | | (7 | ) |
JPMorgan Chase Bank | | | 12/07/20 | | | TRY | | | 49,509 | | | USD | | | 5,788 | | | | (530 | ) |
JPMorgan Chase Bank | | | 12/09/20 | | | RON | | | 2,541 | | | EUR | | | 521 | | | | (1 | ) |
JPMorgan Chase Bank | �� |
| 12/09/20 -
01/12/21 |
| | USD | | | 15,085 | | | CNY | | | 100,277 | | | | 121 | |
JPMorgan Chase Bank | | | 12/09/20 | | | USD | | | 2,427 | | | CNY | | | 15,954 | | | | (5 | ) |
JPMorgan Chase Bank | |
| 12/11/20 -
12/14/20 |
| | THB | | | 51,064 | | | USD | | | 1,623 | | | | (65 | ) |
JPMorgan Chase Bank | | | 12/14/20 | | | USD | | | 818 | | | THB | | | 24,682 | | | | (2 | ) |
JPMorgan Chase Bank | | | 12/15/20 | | | JPY | | | 332,280 | | | USD | | | 3,139 | | | | (49 | ) |
JPMorgan Chase Bank | | | 12/16/20 | | | EUR | | | 315 | | | HUF | | | 113,016 | | | | (1 | ) |
JPMorgan Chase Bank | | | 12/16/20 | | | USD | | | 1,804 | | | COP | | | 6,800,468 | | | | 91 | |
JPMorgan Chase Bank | | | 12/16/20 | | | USD | | | 702 | | | PEN | | | 2,536 | | | | 1 | |
JPMorgan Chase Bank | | | 12/16/20 | | | USD | | | 5,631 | | | PEN | | | 20,172 | | | | (38 | ) |
JPMorgan Chase Bank | | | 12/16/20 | | | CLP | | | 2,591,533 | | | USD | | | 3,338 | | | | (43 | ) |
JPMorgan Chase Bank | | | 12/16/20 | | | KRW | | | 12,646,452 | | | USD | | | 10,655 | | | | (769 | ) |
JPMorgan Chase Bank | | | 12/16/20 | | | COP | | | 36,041,566 | | | USD | | | 9,670 | | | | (376 | ) |
JPMorgan Chase Bank | | | 12/17/20 | | | USD | | | 157 | | | CZK | | | 3,521 | | | | 3 | |
| | |
248 | | SEI Institutional Investments Trust / Semi-Annual Report / November 30, 2020 |
| | | | | | | | | | | | | | | | | | | | |
| | | | | | | |
| Counterparty | | Settlement Date | | | | | Currency to Deliver (Thousands) | | | | | Currency to Receive (Thousands) | | | Unrealized Appreciation (Depreciation) (Thousands) |
JPMorgan Chase Bank | | | 12/17/20 | | | USD | | | 6,297 | | | HUF | | | 1,905,979 | | | $ | 54 | |
JPMorgan Chase Bank | | | 12/18/20 | | | USD | | | 246 | | | PEN | | | 893 | | | | 2 | |
JPMorgan Chase Bank | | | 12/18/20 | | | USD | | | 748 | | | PHP | | | 36,144 | | | | 3 | |
JPMorgan Chase Bank | | | 12/18/20 | | | USD | | | 2,075 | | | RUB | | | 162,748 | | | | 48 | |
JPMorgan Chase Bank | | | 12/18/20 | | | USD | | | 2,510 | | | THB | | | 75,798 | | | | (5 | ) |
JPMorgan Chase Bank | | | 12/18/20 | | | USD | | | 2,589 | | | RUB | | | 198,294 | | | | (2 | ) |
JPMorgan Chase Bank | |
| 12/18/20 -
01/12/21 |
| | USD | | | 9,522 | | | CLP | | | 7,222,069 | | | | (96 | ) |
JPMorgan Chase Bank | | | 01/12/21 | | | BRL | | | 31,296 | | | USD | | | 5,864 | | | | 56 | |
JPMorgan Chase Bank | | | 12/18/20 | | | BRL | | | 5,092 | | | USD | | | 941 | | | | (4 | ) |
JPMorgan Chase Bank | | | 12/18/20 | | | RUB | | | 185,546 | | | USD | | | 2,432 | | | | 11 | |
JPMorgan Chase Bank | |
| 12/18/20 -
12/21/20 |
| | RUB | | | 389,914 | | | USD | | | 5,031 | | �� | | (55 | ) |
JPMorgan Chase Bank | | | 12/18/20 | | | CLP | | | 3,920,001 | | | USD | | | 5,106 | | | | (7 | ) |
JPMorgan Chase Bank | | | 12/21/20 | | | USD | | | 637 | | | MYR | | | 2,602 | | | | 2 | |
JPMorgan Chase Bank | | | 12/21/20 | | | USD | | | 2,750 | | | COP | | | 10,019,201 | | | | 43 | |
JPMorgan Chase Bank | | | 12/21/20 | | | USD | | | 5,113 | | | KRW | | | 5,668,246 | | | | 6 | |
JPMorgan Chase Bank | | | 12/21/20 | | | MYR | | | 7,666 | | | USD | | | 1,869 | | | | (13 | ) |
JPMorgan Chase Bank | |
| 12/21/20 -
01/19/21 |
| | USD | | | 10,669 | | | BRL | | | 57,570 | | | | 13 | |
JPMorgan Chase Bank | | | 01/12/21 | | | PEN | | | 11,740 | | | USD | | | 3,280 | | | | 24 | |
JPMorgan Chase Bank | |
| 12/21/20 -
01/11/21 |
| | PEN | | | 5,772 | | | USD | | | 1,587 | | | | (14 | ) |
JPMorgan Chase Bank | | | 12/21/20 | | | COP | | | 15,581,826 | | | USD | | | 4,258 | | | | (85 | ) |
JPMorgan Chase Bank | | | 12/30/20 | | | EUR | | | 5,831 | | | RON | | | 28,669 | | | | 52 | |
JPMorgan Chase Bank | | | 01/12/21 | | | USD | | | 104 | | | IDR | | | 1,487,396 | | | | — | |
JPMorgan Chase Bank | | | 02/17/21 | | | ZAR | | | 4,258 | | | USD | | | 276 | | | | 4 | |
JPMorgan Chase Bank | | | 01/20/21 | | | ZAR | | | 227,214 | | | USD | | | 13,529 | | | | (1,060 | ) |
JPMorgan Chase Bank | | | 02/02/21 | | | USD | | | 7,565 | | | BRL | | | 40,873 | | | | 16 | |
JPMorgan Chase Bank | | | 02/03/21 | | | IDR | | | 51,751,369 | | | USD | | | 3,644 | | | | 10 | |
JPMorgan Chase Bank | |
| 02/03/21 -
02/24/21 |
| | IDR | | | 49,966,982 | | | USD | | | 3,456 | | | | (50 | ) |
JPMorgan Chase Bank | | | 02/05/21 | | | AUD | | | 4,742 | | | USD | | | 3,357 | | | | (139 | ) |
JPMorgan Chase Bank | | | 02/17/21 | | | USD | | | 7,252 | | | ZAR | | | 115,043 | | | | 111 | |
JPMorgan Chase Bank | |
| 02/05/21 -
02/17/21 |
| | USD | | | 2,021 | | | ZAR | | | 30,881 | | | | (43 | ) |
JPMorgan Chase Bank | | | 02/05/21 | | | MXN | | | 19,418 | | | USD | | | 960 | | | | 3 | |
JPMorgan Chase Bank | | | 02/18/21 | | | USD | | | 2,920 | | | MXN | | | 59,883 | | | | 27 | |
JPMorgan Chase Bank | | | 02/18/21 | | | USD | | | 253 | | | MXN | | | 5,102 | | | | (1 | ) |
JPMorgan Chase Bank | | | 02/18/21 | | | USD | | | 7,312 | | | RON | | | 30,245 | | | | 89 | |
JPMorgan Chase Bank | | | 02/18/21 | | | USD | | | 9,822 | | | PLN | | | 37,263 | | | | 128 | |
JPMorgan Chase Bank | | | 02/18/21 | | | PLN | | | 21,917 | | | USD | | | 5,791 | | | | (61 | ) |
JPMorgan Chase Bank | | | 02/18/21 | | | MXN | | | 162,646 | | | USD | | | 7,867 | | | | (137 | ) |
JPMorgan Chase Bank | | | 02/24/21 | | | USD | | | 1,029 | | | IDR | | | 14,675,691 | | | | — | |
JPMorgan Chase Bank | | | 02/26/21 | | | USD | | | 1,009 | | | UAH | | | 29,266 | | | | 360 | |
Merrill Lynch | | | 12/16/20 | | | SGD | | | 21,937 | | | USD | | | 16,035 | | | | (341 | ) |
Merrill Lynch | | | 03/02/21 | | | USD | | | 4,842 | | | BRL | | | 26,024 | | | | (18 | ) |
Morgan Stanley | | | 12/07/20 | | | USD | | | 903 | | | TRY | | | 7,172 | | | | 12 | |
Morgan Stanley | |
| 12/16/20 -
01/20/21 |
| | EUR | | | 1,782 | | | HUF | | | 645,851 | | | | 18 | |
Morgan Stanley | | | 12/16/20 | | | USD | | | 1,758 | | | CLP | | | 1,381,893 | | | | 45 | |
Morgan Stanley | | | 12/16/20 | | | USD | | | 557 | | | CLP | | | 426,106 | | | | (1 | ) |
Morgan Stanley | | | 12/16/20 | | | EUR | | | 997 | | | PLN | | | 4,573 | | | | 28 | |
Morgan Stanley | |
| 12/16/20 -
02/26/21 |
| | EUR | | | 2,003 | | | PLN | | | 8,974 | | | | (4 | ) |
Morgan Stanley | | | 12/16/20 | | | PLN | | | 6,668 | | | EUR | | | 1,464 | | | | (28 | ) |
Morgan Stanley | | | 12/18/20 | | | USD | | | 1,668 | | | RUB | | | 132,028 | | | | 54 | |
Morgan Stanley | | | 12/18/20 | | | RUB | | | 137,873 | | | USD | | | 1,774 | | | | (25 | ) |
| | |
SEI Institutional Investments Trust / Semi-Annual Report / November 30, 2020 | | 249 |
SCHEDULE OF INVESTMENTS (Unaudited)
November 30, 2020
Emerging Markets Debt Fund (Continued)
| | | | | | | | | | | | | | | | | | | | |
| | | | | | | |
| Counterparty | | Settlement Date | | | | | Currency to Deliver (Thousands) | | | | | Currency to Receive (Thousands) | | | Unrealized Appreciation (Depreciation) (Thousands) |
Morgan Stanley | | | 01/11/21 | | | CZK | | | 45,176 | | | EUR | | | 1,680 | | | $ | (45 | ) |
Morgan Stanley | | | 02/05/21 | | | ZAR | | | 71,914 | | | USD | | | 4,461 | | | | (148 | ) |
Morgan Stanley | | | 03/02/21 | | | USD | | | 2,371 | | | BRL | | | 13,367 | | | | 107 | |
Morgan Stanley | | | 03/02/21 | | | USD | | | 1,707 | | | BRL | | | 8,955 | | | | (47 | ) |
Standard Bank | |
| 12/03/20 -
01/05/21 |
| | USD | | | 4,999 | | | EUR | | | 4,249 | | | | 87 | |
Standard Bank | |
| 12/03/20 -
12/16/20 |
| | EUR | | | 12,318 | | | USD | | | 14,627 | | | | (115 | ) |
Standard Bank | | | 12/07/20 | | | SGD | | | 4,564 | | | USD | | | 3,329 | | | | (78 | ) |
Standard Bank | | | 12/16/20 | | | USD | | | 2,382 | | | CZK | | | 55,260 | | | | 132 | |
Standard Bank | | | 12/16/20 | | | MYR | | | 2,389 | | | USD | | | 573 | | | | (13 | ) |
Standard Bank | | | 12/16/20 | | | USD | | | 5,828 | | | KRW | | | 6,542,663 | | | | 82 | |
Standard Bank | | | 12/16/20 | | | USD | | | 6,340 | | | IDR | | | 90,510,004 | | | | 53 | |
Standard Bank | | | 12/16/20 | | | USD | | | 7,014 | | | MYR | | | 29,229 | | | | 160 | |
Standard Bank | | | 12/16/20 | | | MXN | | | 7,380 | | | USD | | | 348 | | | | (17 | ) |
Standard Bank | | | 12/16/20 | | | RUB | | | 25,936 | | | USD | | | 337 | | | | (1 | ) |
Standard Bank | | | 12/16/20 | | | INR | | | 131,256 | | | USD | | | 1,759 | | | | (11 | ) |
Standard Bank | | | 12/16/20 | | | THB | | | 313,367 | | | USD | | | 10,309 | | | | (51 | ) |
Standard Bank | | | 12/16/20 | | | IDR | | | 31,562,538 | | | USD | | | 2,099 | | | | (130 | ) |
Standard Bank | | | 12/17/20 | | | ZAR | | | 1,260 | | | USD | | | 73 | | | | (8 | ) |
Standard Bank | |
| 01/28/21 -
02/04/21 |
| | NGN | | | 1,637,392 | | | USD | | | 3,874 | | | | (161 | ) |
Standard Bank | | | 02/05/21 | | | USD | | | 1,564 | | | ZAR | | | 25,742 | | | | 86 | |
Standard Bank | | | 02/05/21 | | | USD | | | 1,693 | | | AUD | | | 2,371 | | | | 54 | |
Standard Bank | | | 02/09/21 | | | USD | | | 13,632 | | | CNY | | | 90,880 | | | | 102 | |
Standard Bank | | | 02/09/21 | | | TWD | | | 395,655 | | | USD | | | 14,048 | | | | 42 | |
Standard Bank | |
| 02/17/21 -
03/03/21 |
| | GHS | | | 19,947 | | | USD | | | 3,220 | | | | (127 | ) |
Standard Chartered | | | 01/05/21 | | | USD | | | 5,998 | | | BRL | | | 32,905 | | | | 109 | |
Standard Chartered | | | 12/02/20 | | | USD | | | 1,826 | | | BRL | | | 9,755 | | | | (15 | ) |
Standard Chartered | |
| 12/02/20 -
01/05/21 |
| | BRL | | | 14,470 | | | USD | | | 2,715 | | | | 28 | |
Standard Chartered | | | 12/02/20 | | | BRL | | | 19,650 | | | USD | | | 3,567 | | | | (81 | ) |
Standard Chartered | | | 12/11/20 | | | EUR | | | 2,817 | | | HUF | | | 1,010,699 | | | | (3 | ) |
Standard Chartered | | | 12/16/20 | | | PEN | | | 1,156 | | | USD | | | 320 | | | | — | |
Standard Chartered | | | 12/16/20 | | | USD | | | 2,315 | | | CLP | | | 1,770,456 | | | | (6 | ) |
Standard Chartered | | | 12/16/20 | | | HUF | | | 240,119 | | | EUR | | | 661 | | | | (9 | ) |
Standard Chartered | | | 12/16/20 | | | COP | | | 1,343,046 | | | USD | | | 369 | | | | (6 | ) |
Standard Chartered | | | 12/17/20 | | | PHP | | | 16,318 | | | USD | | | 336 | | | | (3 | ) |
Standard Chartered | | | 12/18/20 | | | USD | | | 12,425 | | | RUB | | | 986,238 | | | | 443 | |
Standard Chartered | | | 12/18/20 | | | USD | | | 2,013 | | | RUB | | | 152,036 | | | | (29 | ) |
Standard Chartered | | | 12/18/20 | | | RUB | | | 67,324 | | | USD | | | 870 | | | | (8 | ) |
Standard Chartered | | | 01/13/21 | | | USD | | | 3,473 | | | INR | | | 256,355 | | | | (22 | ) |
Standard Chartered | | | 02/18/21 | | | USD | | | 751 | | | CNY | | | 4,969 | | | | (1 | ) |
Standard Chartered | | | 02/24/21 | | | IDR | | | 15,998,519 | | | USD | | | 1,123 | | | | 1 | |
Standard Chartered | | | 02/24/21 | | | IDR | | | 7,325,077 | | | USD | | | 513 | | | | — | |
State Street | | | 12/03/20 | | | USD | | | 1,133 | | | EUR | | | 962 | | | | 18 | |
State Street | | | 12/03/20 | | | EUR | | | 14,807 | | | USD | | | 17,776 | | | | 64 | |
State Street | |
| 12/03/20 -
02/03/21 |
| | EUR | | | 11,758 | | | USD | | | 13,769 | | | | (319 | ) |
State Street | | | 12/07/20 | | | USD | | | 3,452 | | | SGD | | | 4,634 | | | | 8 | |
State Street | | | 12/16/20 | | | USD | | | 549 | | | COP | | | 2,131,635 | | | | 45 | |
State Street | | | 12/16/20 | | | EUR | | | 1,487 | | | PLN | | | 6,795 | | | | 34 | |
State Street | | | 12/16/20 | | | USD | | | 2,334 | | | INR | | | 173,464 | | | | 6 | |
State Street | | | 12/16/20 | | | USD | | | 2,352 | | | KRW | | | 2,757,276 | | | | 139 | |
State Street | |
| 12/16/20 -
03/02/21 |
| | USD | | | 3,593 | | | BRL | | | 19,109 | | | | (47 | ) |
| | |
250 | | SEI Institutional Investments Trust / Semi-Annual Report / November 30, 2020 |
| | | | | | | | | | | | | | | | | | | | |
| | | | | | | |
| Counterparty | | Settlement Date | | | | | Currency to Deliver (Thousands) | | | | | Currency to Receive (Thousands) | | | Unrealized Appreciation (Depreciation) (Thousands) |
State Street | | | 02/05/21 | | | USD | | | 1,693 | | | AUD | | | 2,372 | | | $ | 55 | |
State Street | | | 02/05/21 | | | USD | | | 2,972 | | | MXN | | | 63,198 | | | | 142 | |
| | | | | | | | | | | | | | | | | | | | |
| | | | | | | | | | | | | | | | | | $ | (2,727 | ) |
| | | | | | | | | | | | | | | | | | | | |
A list of open centrally cleared swap agreements held by the Fund at November 30, 2020, is as follows:
| | | | | | | | | | | | | | | | | | | | | | |
| Interest Rate Swaps | |
| | | | | | | | | |
| Fund Pays | | Fund Receives | | Payment Frequency | | Termination Date | | Currency | | Notional Amount
(Thousands) | | Value
(Thousands) | | Upfront
Payments/
Receipts
(Thousands) | | Net Unrealized Appreciation (Depreciation)
(Thousands) |
| 8.145% | | 28-DAY MXN - TIIE | | Monthly | | 01/28/2021 | | MXN | | 197,867 | | $ | (59 | ) | | $ | – | | | $ | (59 | ) |
| 5.81% | | 1-DAY COP - COLUMBIA IBR | | Quarterly | | 04/03/2029 | | COP | | | | | | | | | | | | | | |
| | OVERNIGHT INTERBANK | | | | | | | | 7,450,804 | | | (292 | ) | | | – | | | | (292 | ) |
| 2.969% FIXED | | 6-MONTH HUF - BUBOR | | Semi-Annually | | 02/08/2029 | | HUF | | 600,000 | | | (115 | ) | | | – | | | | (115 | ) |
| 28-DAY MXN - TIIE | | 7.51% | | Monthly | | 04/20/2027 | | MXN | | 11,913 | | | 78 | | | | – | | | | 78 | |
| 28-DAY MXN - TIIE | | 8.155% | | Monthly | | 12/28/2026 | | MXN | | 21,000 | | | 170 | | | | – | | | | 170 | |
| 28-DAY MXN - TIIE | | 7.72% | | Monthly | | 12/03/2026 | | MXN | | 16,200 | | | 112 | | | | – | | | | 112 | |
| 2.665% | | 7-DAY CHINA FIXING REPO | | Quarterly | | 10/26/2025 | | CNY | | | | | | | | | | | | | | |
| | RATES(CNRR007) | | | | | | | | 25,000 | | | 18 | | | | – | | | | 18 | |
| China 7-Day Reverse Repo Rate | | 2.605% | | Quarterly | | 07/16/2025 | | CNY | | 63,000 | | | (61 | ) | | | – | | | | (61 | ) |
| 0.9925% | | 6-MONTH HUF - BUBOR | | Semi-Annually | | 06/23/2025 | | HUF | | 1,018,345 | | | 6 | | | | – | | | | 6 | |
| 1-DAY-CLP - SINACOFI CHILE | | 1.16% | | Semi-Annually | | 06/23/2025 | | CLP | | | | | | | | | | | | | | |
| INTERBANK RATE AVG | | | | | | | | | | 3,237,689 | | | (79 | ) | | | – | | | | (79 | ) |
| 1-DAY-CLP - SINACOFI CHILE | | 1.36% | | Semi-Annually | | 06/17/2025 | | CLP | | | | | | | | | | | | | | |
| INTERBANK RATE AVG | | | | | | | | | | 2,668,591 | | | (32 | ) | | | – | | | | (32 | ) |
| 0.644% | | 6-MONTH PLN - WIBOR | | Semi-Annually | | 06/09/2025 | | PLN | | 18,906 | | | (18 | ) | | | – | | | | (18 | ) |
| 28-DAY MXN - TIIE | | 6.45% | | Monthly | | 04/01/2025 | | MXN | | 45,932 | | | 146 | | | | – | | | | 146 | |
| 6-MONTH HUF - BUBOR | | 0.725% | | Annually | | 03/25/2025 | | HUF | | 387,151 | | | (15 | ) | | | – | | | | (15 | ) |
| 5.0975% | | INR - MIBOR | | Semi-Annually | | 02/26/2025 | | INR | | 102,239 | | | (45 | ) | | | – | | | | (45 | ) |
| 5.081250% | | INR - MIBOR | | Semi-Annually | | 02/25/2025 | | INR | | 204,478 | | | (89 | ) | | | – | | | | (89 | ) |
| 5.915% | | 1-DAY COP - COLUMBIA IBR | | Quarterly | | 05/15/2029 | | COP | | | | | | | | | | | | | | |
| | OVERNIGHT INTERBANK | | | | | | | | 6,500,000 | | | (273 | ) | | | – | | | | (273 | ) |
| 5.37% | | 1-DAY COP - COLUMBIA IBR | | Quarterly | | 06/21/2029 | | COP | | | | | | | | | | | | | | |
| | OVERNIGHT INTERBANK | | | | | | | | 3,800,000 | | | (115 | ) | | | – | | | | (115 | ) |
| 3-MONTH ZAR - JIBAR | | 8.49% | | Quarterly | | 07/18/2029 | | ZAR | | 60,000 | | | 7 | | | | – | | | | 7 | |
| 6.9225% | | 28-DAY MXN - TIIE | | Monthly | | 08/31/2029 | | MXN | | 58,394 | | | (310 | ) | | | – | | | | (310 | ) |
| 6-MONTH CZK - PRIBOR | | 1.38% | | Annually | | 11/13/2030 | | CZK | | 88,221 | | | 4 | | | | – | | | | 4 | |
| 6-MONTH CZK - PRIBOR | | 1.395% | | Annually | | 11/12/2030 | | CZK | | 88,250 | | | 7 | | | | – | | | | 7 | |
| 1-DAY-CLP - SINACOFI CHILE | | 2.145% | | Semi-Annually | | 08/24/2030 | | CLP | | | | | | | | | | | | | | |
| INTERBANK RATE AVG | | | | | | | | | | 616,282 | | | (41 | ) | | | – | | | | (41 | ) |
| 4.21% | | 1-DAY COP - COLUMBIA IBR | | Quarterly | | 07/08/2030 | | COP | | | | | | | | | | | | | | |
| | OVERNIGHT INTERBANK | | | | | | | | 2,284,149 | | | (8 | ) | | | – | | | | (8 | ) |
| 1% | | 6-MONTH PLN - WIBOR | | Semi-Annually | | 06/12/2030 | | PLN | | 11,257 | | | 26 | | | | – | | | | 26 | |
| 2.33% | | 1-DAY-CLP - SINACOFI CHILE | | Semi-Annually | | 06/05/2030 | | CLP | | | | | | | | | | | | | | |
| | INTERBANK RATE AVG | | | | | | | | 1,146,740 | | | 46 | | | | – | | | | 46 | |
| 4.98% | | 1-DAY COP - COLUMBIA IBR | | Quarterly | | 04/23/2030 | | COP | | | | | | | | | | | | | | |
| | OVERNIGHT INTERBANK | | | | | | | | 1,595,236 | | | (34 | ) | | | – | | | | (34 | ) |
| 6-MONTH HUF - BUBOR | | 1.37% | | Annually | | 02/17/2025 | | HUF | | 360,019 | | | 19 | | | | – | | | | 19 | |
| 5.45% | | 1-DAY COP - COLUMBIA IBR | | Quarterly | | 03/12/2030 | | COP | | | | | | | | | | | | | | |
| | OVERNIGHT INTERBANK | | | | | | | | 2,279,681 | | | (72 | ) | | | – | | | | (72 | ) |
| 1-DAY COP - COLUMBIA IBR | | 5.47% | | Quarterly | | 03/11/2030 | | COP | | | | | | | | | | | | | | |
| OVERNIGHT INTERBANK | | | | | | | | | | 1,499,197 | | | (48 | ) | | | – | | | | (48 | ) |
| 3-MONTH ZAR - JIBAR | | 7.54% | | Quarterly | | 02/28/2030 | | ZAR | | 29,979 | | | (114 | ) | | | – | | | | (114 | ) |
| 6-MONTH PLN - WIBOR | | 1.75% | | Annually | | 02/26/2030 | | PLN | | 16,800 | | | 274 | | | | – | | | | 274 | |
| 1.61% | | 6-MONTH HUF - BUBOR | | Semi-Annually | | 01/17/2030 | | HUF | | 185,000 | | | (7 | ) | | | – | | | | (7 | ) |
| 1.81% | | 6-MONTH CZK - PRIBOR | | Semi-Annually | | 01/17/2030 | | CZK | | 15,000 | | | (42 | ) | | | – | | | | (42 | ) |
| | |
SEI Institutional Investments Trust / Semi-Annual Report / November 30, 2020 | | 251 |
SCHEDULE OF INVESTMENTS (Unaudited)
November 30, 2020
Emerging Markets Debt Fund (Continued)
| | | | | | | | | | | | | | | | | | | | | | | | |
| | | | | | | | | |
| Fund Pays | | Fund Receives | | Payment Frequency | | Termination
Date | | Currency | | Notional Amount
(Thousands) | | Value (Thousands) | | Upfront Payments/ Receipts (Thousands) | | Net Unrealized Appreciation (Depreciation) (Thousands) |
| 1.805% | | 6-MONTH PLN - WIBOR | | Semi-Annually | | 12/17/2029 | | PLN | | | 15,600 | | | $ | (276 | ) | | $ | – | | | $ | (276 | ) |
| 6.82% | | 28-DAY MXN - TIIE | | Monthly | | 09/10/2029 | | MXN | | | 40,855 | | | | (202 | ) | | | – | | | | (202 | ) |
| 5.4% | | 1-DAY COP - COLUMBIA IBR | | Quarterly | | 03/11/2030 | | COP | | | | | | | | | | | | | | | | |
| | OVERNIGHT INTERBANK | | | | | | | | | 2,559,198 | | | | (78 | ) | | | – | | | | (78 | ) |
| 6-MONTH PLN -WIBOR | | 1.635% | | Semi-Annually | | 11/24/2030 | | PLN | | | 15,931 | | | | (6 | ) | | | – | | | | (6 | ) |
| 1-DAY BRL - CETIP | | 6.82% | | Annually | | 01/02/2025 | | BRL | | | 4,671 | | | | 6 | | | | – | | | | 6 | |
| 1-DAY BRL - CETIP | | 6.77% | | Annually | | 01/02/2025 | | BRL | | | 5,570 | | | | 6 | | | | – | | | | 6 | |
| 1-DAY BRL - CETIP | | 5.25% | | Annually | | 01/02/2023 | | BRL | | | 15,387 | | | | 17 | | | | – | | | | 17 | |
| 1-DAY BRL - CETIP | | 11.475% | | Annually | | 01/02/2023 | | BRL | | | 7,562 | | | | 155 | | | | – | | | | 155 | |
| 1-DAY BRL - CETIP | | 9.255% | | Annually | | 01/02/2023 | | BRL | | | 2,474 | | | | 35 | | | | – | | | | 35 | |
| 1-DAY BRL - CETIP | | 6.77% | | Annually | | 01/02/2023 | | BRL | | | 8,540 | | | | 52 | | | | – | | | | 52 | |
| 28-DAY MXN - TIIE | | 6.71% | | Monthly | | 07/07/2022 | | MXN | | | 45,683 | | | | 83 | | | | – | | | | 83 | |
| 6-MONTH HUF -BUBOR | | 0.7675% | | Annually | | 06/23/2022 | | HUF | | | 2,505,212 | | | | 3 | | | | – | | | | 3 | |
| 28-DAY MXN - TIIE | | 6.745% | | Monthly | | 06/23/2022 | | MXN | | | 49,636 | | | | 90 | | | | – | | | | 90 | |
| 28-DAY MXN - TIIE | | 7.705% | | Monthly | | 01/21/2022 | | MXN | | | 6,000 | | | | 11 | | | | – | | | | 11 | |
| 1-DAY BRL - CETIP | | 2.885 FIXED | | Annually | | 01/03/2022 | | BRL | | | 24,057 | | | | (18 | ) | | | – | | | | (18 | ) |
| 1-DAY BRL - CETIP | | 2.99% | | Annually | | 01/03/2022 | | BRL | | | 34,427 | | | | (19 | ) | | | – | | | | (19 | ) |
| 1-DAY BRL - CETIP | | 5.89% | | Annually | | 01/03/2022 | | BRL | | | 36,997 | | | | 180 | | | | – | | | | 180 | |
| 1.960% | | 1-DAY-CLP -SINACOFI CHILE | | Semi-Annually | | 12/12/2021 | | CLP | | | | | | | | | | | | | | | | |
| | INTERBANK RATE AVG | | | | | | | | | 3,489,141 | | | | (68 | ) | | | – | | | | (68 | ) |
| 6-MONTH CZK -PRIBOR | | 2.225% | | Annually | | 11/11/2021 | | CZK | | | 51,000 | | | | 39 | | | | – | | | | 39 | |
| 6-MONTH CZK -PRIBOR | | 2.1% | | Annually | | 09/30/2021 | | CZK | | | 206,802 | | | | 133 | | | | – | | | | 133 | |
| 8.09% | | 28-DAY MXN - TIIE | | Monthly | | 01/28/2021 | | MXN | | | 193,370 | | | | (57 | ) | | | – | | | | (57 | ) |
| 1-DAY BRL - CETIP | | 6.61% | | Annually | | 01/02/2023 | | BRL | | | 6,301 | | | | 35 | | | | – | | | | 35 | |
| 1-DAY BRL - CETIP | | 6.23% | | Annually | | 01/02/2023 | | BRL | | | 7,534 | | | | 33 | | | | – | | | | 33 | |
| 1-DAY BRL - CETIP | | 3.8875% | | Annually | | 01/02/2023 | | BRL | | | 17,361 | | | | (63 | ) | | | – | | | | (63 | ) |
| 28-DAY MXN - TIIE | | 5.55% | | Monthly | | 04/13/2023 | | MXN | | | 66,291 | | | | 80 | | | | – | | | | 80 | |
| 1-DAY BRL - CETIP | | 5.65% | | Annually | | 01/02/2025 | | BRL | | | 17,121 | | | | (93 | ) | | | – | | | | (93 | ) |
| 6-MONTH HUF -BUBOR | | 0.81% | | Annually | | 09/12/2024 | | HUF | | | 100,000 | | | | (2 | ) | | | – | | | | (2 | ) |
| 1.675% | | 6-MONTH CZK - PRIBOR | | Semi-Annually | | 07/17/2024 | | CZK | | | 28,223 | | | | (39 | ) | | | – | | | | (39 | ) |
| 1.64% | | 6-MONTH CZK - PRIBOR | | Semi-Annually | | 06/21/2024 | | CZK | | | 30,000 | | | | (40 | ) | | | – | | | | (40 | ) |
| 28-DAY MXN - TIIE | | 5.47% | | Monthly | | 06/19/2024 | | MXN | | | 221,391 | | | | 22 | | | | – | | | | 22 | |
| 1.7% | | 6-MONTH CZK - PRIBOR | | Semi-Annually | | 06/18/2024 | | CZK | | | 195,000 | | | | (277 | ) | | | – | | | | (277 | ) |
| 6-MONTH PLN - WIBOR | | .65% | | Annually | | 03/26/2024 | | PLN | | | 3,738 | | | | 8 | | | | – | | | | 8 | |
| 1-DAY BRL - CETIP | | 6.455% | | Annually | | 01/02/2025 | | BRL | | | 4,989 | | | | (4 | ) | | | – | | | | (4 | ) |
| 6-MONTH PLN - WIBOR | | .63% | | Annually | | 03/26/2024 | | PLN | | | 4,262 | | | | 9 | | | | – | | | | 9 | |
| 1-DAY BRL - CETIP | | 5.76% | | Annually | | 01/02/2024 | | BRL | | | 12,439 | | | | (13 | ) | | | – | | | | (13 | ) |
| 5.9725% | | 1-DAY BRL - CETIP | | Annually | | 01/02/2024 | | BRL | | | 10,140 | | | | (2 | ) | | | – | | | | (2 | ) |
| 1-DAY BRL - CETIP | | 4.835% | | Annually | | 01/02/2024 | | BRL | | | 30,017 | | | | (165 | ) | | | – | | | | (165 | ) |
| 1-DAY BRL - CETIP | | 5.56% | | Annually | | 01/02/2024 | | BRL | | | 26,364 | | | | (53 | ) | | | – | | | | (53 | ) |
| 1-DAY BRL - CETIP | | 5.715% | | Annually | | 01/02/2024 | | BRL | | | 11,232 | | | | (15 | ) | | | – | | | | (15 | ) |
| 1-DAY BRL - CETIP | | 6.5% | | Annually | | 01/02/2024 | | BRL | | | 6,494 | | | | 15 | | | | – | | | | 15 | |
| 28-DAY MXN - TIIE | | 5.01% | | Monthly | | 11/22/2023 | | MXN | | | 211,565 | | | | 2 | | | | – | | | | 2 | |
| 1.9865% | | 6-MONTH PLN - WIBOR | | Semi-Annually | | 03/25/2024 | | PLN | | | 14,495 | | | | (203 | ) | | | – | | | | (203 | ) |
| 6-MONTH PLN - WIBOR | | 1.709% | | Semi-Annually | | 11/25/2030 | | PLN | | | 13,069 | | | | (7 | ) | | | – | | | | (7 | ) |
| | | | | | | | | | | | | | | | | | | | | | | | |
| | | | | | | | | | | | | | $ | (1,642 | ) | | $ | – | | | $ | (1,642 | ) |
| | | | | | | | | | | | | | | | | | | | | | | | |
| | | | | | | | | | | | | | | | | | | | | | | | | | | | | | | | |
| Credit Default Swap | |
Reference Entity/
Obligation | | Buy/Sell
Protection | | | (Pays)/Receives
Rate | | | Payment
Frequency | | | Termination Date | | | Notional Amount
(Thousands) | | | Value (Thousands) | | | Upfront Payments/ Receipts (Thousands) | | | Net Unrealized (Depreciation) (Thousands) | |
CDX.EM.34.V1 | | | Buy | | | | 1.00 | % | | | Quarterly | | | | 12/20/2025 | | | $ | 15,302 | | | $ | 479 | | | $ | 992 | | | $ | (513 | ) |
| | | | | | | | | | | | | | | | | | | | | | | | | | | | | | | | |
A list of open OTC swap agreements held by the Fund at November 30, 2020, is as follows:
| | |
252 | | SEI Institutional Investments Trust / Semi-Annual Report / November 30, 2020 |
| | | | | | | | | | | | | | | | | | | | | | | | |
| | | | | | | | | | |
| Counterparty | | Fund Pays | | Fund Receives | | Payment Frequency | | Termination Date | | Currency | | Notional Amount
(Thousands) | | Value
(Thousands) | | Upfront Payments (Thousands) | | Net Unrealized Appreciation (Depreciation) (Thousands) |
| Goldman Sachs | | 1-DAY BRL -CETIP | | 12.725% | | Annually | | 01/04/2021 | | BRL | | 13,491 | | $ | 950 | | | $ | – | | | $ | 950 | |
| JPMorgan Chase | | 1-DAY BRL - CETIP | | 10.23% | | Annually | | 01/04/2021 | | BRL | | 250 | | | 9 | | | | – | | | | 9 | |
| JPMorgan Chase | | 1-DAY BRL - CETIP | | 10.04% | | Annually | | 01/04/2021 | | BRL | | 9,579 | | | 334 | | | | – | | | | 334 | |
| JPMorgan Chase | | 1-DAY BRL - CETIP | | 9.61% | | Annually | | 01/04/2021 | | BRL | | 6,884 | | | 215 | | | | – | | | | 215 | |
| JPMorgan Chase | | 1-DAY BRL - CETIP | | 9.275% | | Annually | | 01/04/2021 | | BRL | | 7,587 | | | 215 | | | | – | | | | 215 | |
| JPMorgan Chase | | 1-DAY BRL - CETIP | | 8.87% | | Annually | | 01/04/2021 | | BRL | | 11,980 | | | 303 | | | | – | | | | 303 | |
| Goldman Sachs | | 28-DAY MXN - TIIE | | 5.370% | | Monthly | | 03/17/2021 | | MXN | | 62,000 | | | 8 | | | | – | | | | 8 | |
| | 3-MONTH RUB -MOSCOW | | | | | | | | | | | | | | | | | | | | | | |
| Goldman Sachs | | PRIME OFFERED RATE | | 7.515% | | Annually | | 06/10/2021 | | RUB | | 1,405,247 | | | 560 | | | | – | | | | 560 | |
| JPMorgan Chase | | 1.3775% | | 6-MONTH HUF -BUBOR | | Semi-Annually | | 06/17/2021 | | HUF | | 875,267 | | | (28 | ) | | | – | | | | (28 | ) |
| Goldman Sachs | | 6-MONTH PLN - WIBOR | | 2.208% | | Annually | | 11/16/2021 | | PLN | | 10,048 | | | 53 | | | | – | | | | 53 | |
| Citibank | | 6-MONTH PLN - WIBOR | | 2.431% | | Annually | | 12/14/2021 | | PLN | | 15,500 | | | 191 | | | | – | | | | 191 | |
| | 3-MONTH RUB - MOSCOW | | | | | | | | | | | | | | | | | | | | | | |
| Goldman Sachs | | PRIME OFFERED RATE | | 6.29% | | Quarterly | | 12/14/2021 | | RUB | | 700,000 | | | 122 | | | | – | | | | 122 | |
| Goldman Sachs | | 1.265% | | 6-MONTH HUF - BUBOR | | Semi-Annually | | 01/10/2022 | | HUF | | 2,251,935 | | | (130 | ) | | | – | | | | (130 | ) |
| JPMorgan Chase | | 1.30% | | 6-MONTH HUF - BUBOR | | Semi-Annually | | 04/06/2022 | | HUF | | 400,000 | | | (21 | ) | | | – | | | | (21 | ) |
| | 1-DAY CLP -SINACOFI CHILE | | | | | | | | | | | | | | | | | | | | | | |
| JPMorgan Chase | | INTERBANK RATE AVG | | 3.43% | | Semi-Annually | | 05/10/2022 | | CLP | | 933,434 | | | 53 | | | | – | | | | 53 | |
| Goldman Sachs | | 28-DAY MXN - TIIE | | 5.900% | | Monthly | | 09/12/2022 | | MXN | | 99,662 | | | 129 | | | | – | | | | 129 | |
| Goldman Sachs | | 6-MONTH HUF - BUBOR | | 0.8385% | | Annually | | 09/21/2022 | | HUF | | 783,180 | | | 8 | | | | – | | | | 8 | |
| Goldman Sachs | | 1-DAY BRL - CETIP | | 11.985% | | Annually | | 01/02/2023 | | BRL | | 3,000 | | | 305 | | | | – | | | | 305 | |
| Goldman Sachs | | 1-DAY BRL - CETIP | | 10.89% | | Quarterly | | 01/03/2023 | | BRL | | 6,139 | | | 480 | | | | – | | | | 480 | |
| | 3-MONTH RUB - MOSCOW | | | | | | | | | | | | | | | | | | | | | | |
| Goldman Sachs | | PRIME OFFERED RATE | | 7.072% | | Quarterly | | 04/02/2023 | | RUB | | 1,057,550 | | | 513 | | | | – | | | | 513 | |
| Goldman Sachs | | 28-DAY MXN - TIIE | | 6.355% | | Monthly | | 05/21/2025 | | MXN | | 29,801 | | | 91 | | | | – | | | | 91 | |
| Citibank | | 1.953% | | 3-MONTH MYR -KLIBOR | | Quarterly | | 08/18/2025 | | MYR | | 15,000 | | | 46 | | | | – | | | | 46 | |
| JPMorgan Chase | | 3-MONTH KLIBOR + 0 BPS | | 2.12% | | Quarterly | | 11/12/2025 | | MYR | | 15,800 | | | 21 | | | | – | | | | 21 | |
| Goldman Sachs | | 28-DAY MXN - TIIE | | 6.205% | | Monthly | | 12/08/2025 | | MXN | | 21,174 | | | 60 | | | | – | | | | 60 | |
| Goldman Sachs | | 28-DAY MXN - TIIE | | 6.165% | | Monthly | | 03/05/2026 | | MXN | | 63,199 | | | 175 | | | | – | | | | 175 | |
| JPMorgan Chase | | 28-DAY MXN - TIIE | | 6.13% | | Monthly | | 06/18/2026 | | MXN | | 47,000 | | | 127 | | | | – | | | | 127 | |
| Goldman Sachs | | 28-DAY MXN - TIIE | | 6.381% | | Monthly | | 09/16/2026 | | MXN | | 35,000 | | | 118 | | | | – | | | | 118 | |
| | | | | | | | | | | | | | | | | | | | | | | | |
| | | | | | | | | | | | | | $ | 4,907 | | | $ | – | | | $ | 4,907 | |
| | | | | | | | | | | | | | | | | | | | | | | | |
| | | | | | | | | | | | | | | | | | | | | | | | | | | | | | | | | | | | |
| Cross-Currency Swaps | |
| Counterparty | | Fund Pays | | | Fund Receives | | | Payment
Frequency | | | Termination
Date | | | Currency | | | Notional Amount (Thousands) | | | Value (Thousands) | | | Upfront Payment (Thousands) | | | Net
Unrealized Appreciation (Depreciation) (Thousands) | |
JPMorgan Chase | | | 3-MONTH USD –LIBOR | | | | 11.065 | % | | | Quarterly | | | | 12/07/2025 | | | | TRY | | | | 3,047 | | | $ | 181 | | | $ | – | | | $ | 181 | |
JPMorgan Chase | | | 3-MONTH USD -LIBOR | | | | 12.97 | % | | | Quarterly | | | | 04/07/2026 | | | | TRY | | | | 3,046 | | | | 3 | | | | – | | | | 3 | |
| | | | | | | | | | | | | | | | | | | | | | | | | | | | | | | | | | | | |
| | | | | | | | | | | | | | | | | | | | | | | | | | $ | 184 | | | $ | – | | | $ | 184 | |
| | | | | | | | | | | | | | | | | | | | | | | | | | | | | | | | | | | | |
| | Percentages are based on Net Assets of $2,251,264 ($ Thousands). |
| ** | The rate reported is the 7-day effective yield as of November 30, 2020. |
| † | Investment in Affiliated Security (see Note 6). |
| (A) | Security exempt from registration under Rule 144A of the Securities Act of 1933. These securities may be resold in transactions exempt from registration normally to qualified institutions. On November 30, 2020, the value of these securities amounted to $435,389 ($ Thousands), representing 19.3% of the Net Assets of the Fund. |
| (B) | Step Bonds – Represents the current rate, the step rate, the step date and the final maturity date. |
| (C) | Zero coupon security. The rate shown on the Schedule of Investments is the security’s effective yield at the time of purchase. |
| (D) | Certain securities or partial positions of certain securities are on loan at November 30, 2020 (See Note 12). The total market value of securities on loan at November 30, 2020 was $3,823 ($ Thousands). |
| (E) | Variable or floating rate security, the interest rate of which adjusts periodically based on changes in current interest rates and prepayments on the underlying pool of assets. |
| (F) | Security is in default on interest payment. |
| (G) | This security was purchased with cash collateral held from securities on loan. The total market value of such securities as of November 30, 2020 was $3,955 ($ Thousands). |
AUD — Australian Dollar
BRL — Brazilian Real
BUBOR— Budapest Interbank Offered Rate
CDX — Credit Default Swap Index
CETIP— Central of Custody and Financial Settlement of Securities
CLP — Chilean Peso
CNY — Chinese Yuan Onshore
COP — Colombian Peso
CZK — Czech Koruna
| | |
SEI Institutional Investments Trust / Semi-Annual Report / November 30, 2020 | | 253 |
SCHEDULE OF INVESTMENTS (Unaudited)
November 30, 2020
Emerging Markets Debt Fund (Concluded)
DAC — Designated Activity Company
EGP — Egyptian Pound
EM — Emerging Markets
EUR — Euro
GHS — Ghanaian Cedi
HUF — Hungarian Forint
IBR— Interest Rate Reference Index
ICE— Intercontinental Exchange
IDR — Indonesian Rupiah
INR — Indian Rupee
JIBAR— Johannesburg Interbank Agreed Rate
JPY — Japanese Yen
JSC — Joint-Stock Company
KLIBOR — Kuala Lumpur Interbank Offered Rate
KRW — Korean Won
LIBOR— London Interbank Offered Rate
LLC — Limited Liability Company
L.P. — Limited Partnership
Ltd. — Limited
MIBOR — Mumbai InterBank Overnight Rate
MTN — Medium Term Note
MXN — Mexican Peso
MYR — Malaysian Ringgit
NGN — Nigerian Naira
OTC — Over The Counter
PEN — Peruvian Nuevo Sol
PHP— Philippine Peso
PJSC — Public Joint-Stock Company
PLC — Public Limited Company
PLN — Polish Zloty
PRIBOR— Prague Interbank Offered Rate
RON — Romanian Leu
RSD — Serbian Dinar
RUB — Russian Ruble
SAR— Saudi Riyal
SGD — Singapore Dollar
Ser — Series
THB — Thai Bhat
TIIE — Interbank Equilibrium Interest Rate
TRY — Turkish Lira
TWD — Taiwan Dollar
UAH — Ukrainian Hryvnia
ULC — Unlimited Liability Company
USD — U.S. Dollar
UYU — Uruguayan Peso
WIBOR— Warsaw Interbank Offered Rate
VAR — Variable Rate
ZAR — South African Rand
The following is a list of the level of inputs used as of November 30, 2020, in valuing the Fund’s investments and other financial instruments carried at value ($ Thousands):
| | | | | | | | | | | | | | | | |
| | | | | |
| Investments in Securities | | Level 1
($) | | Level 2 ($) | | Level 3 ($) | | Total ($) |
Global Bonds | | | – | | | | 2,121,754 | | | | – | | | | 2,121,754 | |
U.S. Treasury Obligation | | | – | | | | 7,392 | | | | – | | | | 7,392 | |
Affiliated Partnership | | | – | | | | 3,955 | | | | – | | | | 3,955 | |
| | | | | | | | | | | | | | | | |
Total Investments in Securities | | | – | | | | 2,133,101 | | | | – | | | | 2,133,101 | |
| | | | | | | | | | | | | | | | |
| | | | | | | | | | | | | | | | |
| | | | | |
| Other Financial Instruments | | Level 1
($) | | Level 2
($) | | Level 3
($) | | Total
($) |
Futures Contracts* | | | | | | | | | | | | | | | | |
Unrealized Appreciation | | | 1,086 | | | | – | | | | – | | | | 1,086 | |
Unrealized Depreciation | | | (753) | | | | – | | | | – | | | | (753) | |
Forwards Contracts* | | | | | | | | | | | | | | | | |
Unrealized Appreciation | | | – | | | | 14,596 | | | | – | | | | 14,596 | |
Unrealized Depreciation | | | – | | | | (17,323) | | | | – | | | | (17,323) | |
Centrally Cleared Swaps | | | | | | | | | | | | | | | | |
Interest Rate Swaps* | | | | | | | | | | | | | | | | |
Unrealized Appreciation | | | – | | | | 1,927 | | | | – | | | | 1,927 | |
Unrealized Depreciation | | | – | | | | (3,569) | | | | – | | | | (3,569) | |
Credit Default Swaps* | | | | | | | | | | | | | | | | |
Unrealized Depreciation | | | – | | | | (513) | | | | – | | | | (513) | |
OTC Swaps | | | | | | | | | | | | | | | | |
Interest Rate Swaps* | | | | | | | | | | | | | | | | |
Unrealized Appreciation | | | – | | | | 5,086 | | | | – | | | | 5,086 | |
Unrealized Depreciation | | | – | | | | (179) | | | | – | | | | (179) | |
Cross-Currency Swaps* | | | | | | | | | | | | | | | | |
Unrealized Appreciation | | | – | | | | 184 | | | | – | | | | 184 | |
| | | | | | | | | | | | | | | | |
Total Other Financial Instruments | | | 333 | | | | 209 | | | | – | | | | 542 | |
| | | | | | | | | | | | | | | | |
*Futures contracts, forwards contracts and swap contracts are valued at the unrealized appreciation (depreciation) on the instrument.
For the period ended November 30, 2020, there were no transfers in or out of Level 3.
For more informatin on valuation inputs, see Note 2 – Significant Accounting Policies in Notes to Financial Statements.
The following is a summary of the Fund’s transactions with affiliates for the period ended November 30, 2020 ($ Thousands):
| | | | | | | | | | | | | | | | | | |
| | | | | | | | | | |
| Security Description | | Value 5/31/2020 | | Purchases
at Cost | | Proceeds
from Sales | | Realized
Gain
(Loss) | | Change in Unrealized Appreciation/
(Depreciation) | | Value 11/30/2020 | | Shares | | Income | | Capital
Gains |
SEI Liquidity Fund, L.P. | | $ – | | $8,906 | | $(4,952) | | $1 | | $ – | | $3,955 | | 3,954,055 | | $ – | | $ – |
| | | | | | | | | | | | | | | | | | |
Amounts designated as “—” are $0 or have been rounded to $0.
The accompanying notes are an integral part of the financial statements.
| | |
254 | | SEI Institutional Investments Trust / Semi-Annual Report / November 30, 2020 |
SCHEDULE OF INVESTMENTS (Unaudited)
November 30, 2020
Real Return Fund
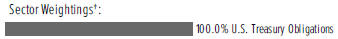
†Percentages based on total investments.
| | | | | | | | |
| | | |
| Description | | Face Amount
(Thousands) | | Market Value ($ Thousands) |
|
U.S. TREASURY OBLIGATIONS – 97.4% | |
U.S. Treasury Inflation-Protected Securities | |
2.375%, 01/15/2025 | | $ | 12,371 | | | $ | 14,301 | |
0.625%, 04/15/2023 | | | 18,913 | | | | 19,752 | |
0.625%, 01/15/2024 | | | 21,216 | | | | 22,528 | |
0.500%, 04/15/2024 | | | 13,404 | | | | 14,213 | |
0.375%, 07/15/2023 | | | 22,086 | | | | 23,177 | |
0.375%, 07/15/2025 | | | 19,709 | | | | 21,359 | |
0.250%, 01/15/2025 | | | 20,578 | | | | 21,922 | |
0.125%, 01/15/2022 | | | 20,452 | | | | 20,739 | |
0.125%, 04/15/2022 | | | 19,519 | | | | 19,830 | |
0.125%, 07/15/2022 | | | 19,441 | | | | 19,924 | |
0.125%, 01/15/2023 | | | 22,744 | | | | 23,427 | |
0.125%, 07/15/2024 | | | 20,475 | | | | 21,659 | |
0.125%, 10/15/2024 | | | 16,180 | | | | 17,138 | |
0.125%, 04/15/2025 | | | 16,195 | | | | 17,196 | |
0.125%, 10/15/2025 | | | 8,778 | | | | 9,421 | |
| | | | | | | | |
| | |
Total U.S. Treasury Obligations
(Cost $275,942) ($ Thousands) | | | | | | | 286,586 | |
| | | | | | | | |
| |
Total Investments in Securities —97.4%
(Cost $275,942) ($ Thousands) | | | $ | 286,586 | |
| | | | | | | | |
Percentages are based on Net Assets of $294,222 ($ Thousands).
As of November 30, 2020, all of the Fund’s investments were considered Level 2, in accordance with the authoritative guidance on fair value measurements and disclosure under U.S. GAAP.
For the period ended November 30, 2020, there were no transfers in or out of Level 3.
For more information on valuation inputs, see Note 2 – Significant Accounting Policies in Notes to Financial Statements.
The accompanying notes are an integral part of the financial statements.
| | |
SEI Institutional Investments Trust / Semi-Annual Report / November 30, 2020 | | 255 |
SCHEDULE OF INVESTMENTS (Unaudited)
November 30, 2020
Limited Duration Bond Fund
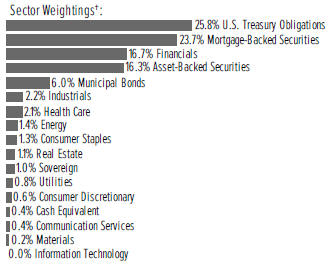
†Percentages are based on total investments.
| | | | | | | | |
| | | |
| Description | | Face Amount
(Thousands) | | Market Value
($ Thousands) |
|
CORPORATE OBLIGATIONS — 28.2% | |
|
Communication Services — 0.4% | |
AT&T | | | | | | | | |
2.300%, 06/01/2027 | | $ | 2,000 | | | $ | 2,125 | |
Sprint Spectrum LLC | | | | | | | | |
4.738%, 03/20/2025 (A) | | | 1,135 | | | | 1,223 | |
3.360%, 09/20/2021 (A) | | | 795 | | | | 803 | |
T-Mobile USA | | | | | | | | |
3.875%, 04/15/2030 (A) | | | 770 | | | | 883 | |
| | | | | | | | |
| | | | | | | 5,034 | |
| | | | | | | | |
|
Consumer Discretionary — 0.6% | |
Alimentation Couche-Tard | | | | | | | | |
3.550%, 07/26/2027 (A) | | | 400 | | | | 448 | |
Daimler Finance North America LLC | | | | | | | | |
1.121%, VAR ICE LIBOR USD 3 Month+0.900%, 02/15/2022 (A) | | | 2,190 | | | | 2,204 | |
Ford Motor Credit LLC | | | | | | | | |
5.750%, 02/01/2021 | | | 1,000 | | | | 1,005 | |
5.596%, 01/07/2022 | | | 9 | | | | 9 | |
1.296%, VAR ICE LIBOR USD 3 Month+1.080%, 08/03/2022 | | | 955 | | | | 929 | |
1.104%, VAR ICE LIBOR USD 3 Month+0.880%, 10/12/2021 | | | 500 | | | | 492 | |
General Motors Financial | | | | | | | | |
4.200%, 03/01/2021 | | | 1,000 | | | | 1,005 | |
4.200%, 11/06/2021 | | | 1,270 | | | | 1,312 | |
3.200%, 07/06/2021 | | | 445 | | | | 450 | |
3.150%, 06/30/2022 | | | 285 | | | | 295 | |
| | | | | | | | |
| | | | | | | 8,149 | |
| | | | | | | | |
| | |
Consumer Staples — 1.3% | | | | | | | | |
BayCare Health System | | | | | | | | |
2.610%, 11/15/2022 | | | 1,190 | | | | 1,239 | |
2.560%, 11/15/2021 | | | 2,595 | | | | 2,645 | |
| | | | | | | | |
| | | |
| Description | | Face Amount
(Thousands) | | Market Value
($ Thousands) |
|
CORPORATE OBLIGATIONS (continued) | |
Bayer US Finance II LLC | | | | | | | | |
3.875%, 12/15/2023 (A) | | $ | 745 | | | $ | 814 | |
3.500%, 06/25/2021 (A) | | | 1,500 | | | | 1,522 | |
Campbell Soup | | | | | | | | |
0.880%, VAR ICE LIBOR USD 3 Month+0.630%, 03/15/2021 | | | 500 | | | | 501 | |
CommonSpirit Health | | | | | | | | |
2.760%, 10/01/2024 | | | 960 | | | | 1,017 | |
Constellation Brands | | | | | | | | |
0.921%, VAR ICE LIBOR USD 3 Month+0.700%, 11/15/2021 | | | 665 | | | | 665 | |
Fresenius Medical Care US Finance II | | | | | | | | |
5.875%, 01/31/2022 (A) | | | 760 | | | | 803 | |
Kraft Heinz Foods | | | | | | | | |
4.000%, 06/15/2023 | | | 2,000 | | | | 2,144 | |
3.950%, 07/15/2025 | | | 1,140 | | | | 1,258 | |
Smithfield Foods | | | | | | | | |
3.350%, 02/01/2022 (A) | | | 590 | | | | 600 | |
Viatris | | | | | | | | |
1.125%, 06/22/2022 (A) | | | 4,575 | | | | 4,616 | |
| | | | | | | | |
| | | | | | | 17,824 | |
| | | | | | | | |
|
Energy — 1.4% | |
BP Capital Markets America | | | | | | | | |
3.633%, 04/06/2030 | | | 770 | | | | 898 | |
Energy Transfer Operating | | | | | | | | |
4.050%, 03/15/2025 | | | 1,000 | | | | 1,075 | |
Kinder Morgan | | | | | | | | |
5.000%, 02/15/2021 (A) | | | 5,000 | | | | 5,026 | |
NGPL PipeCo LLC | | | | | | | | |
4.375%, 08/15/2022 (A) | | | 700 | | | | 728 | |
Petroleos Mexicanos | | | | | | | | |
5.350%, 02/12/2028 | | | 1,200 | | | | 1,124 | |
Saudi Arabian Oil MTN | | | | | | | | |
2.875%, 04/16/2024 (A) | | | 9,270 | | | | 9,794 | |
Sunoco Logistics Partners Operations | | | | | | | | |
4.250%, 04/01/2024 | | | 250 | | | | 268 | |
| | | | | | | | |
| | | | | | | 18,913 | |
| | | | | | | | |
|
Financials — 17.0% | |
Avolon Holdings Funding | | | | | | | | |
3.625%, 05/01/2022 (A) | | | 890 | | | | 903 | |
Bank of America | | | | | | | | |
3.335%, VAR ICE LIBOR USD 3 Month+0.650%, 01/25/2023 | | | 1,000 | | | | 1,034 | |
3.004%, VAR ICE LIBOR USD 3 Month+0.790%, 12/20/2023 | | | 7,175 | | | | 7,534 | |
2.738%, VAR ICE LIBOR USD 3 Month+0.370%, 01/23/2022 | | | 1,455 | | | | 1,460 | |
| | |
256 | | SEI Institutional Investments Trust / Semi-Annual Report / November 30, 2020 |
| | | | | | | | |
| | | |
| Description | | Face Amount (Thousands) | | Market Value ($ Thousands) |
|
CORPORATE OBLIGATIONS (continued) | |
Bank of America MTN | | | | | | | | |
0.810%, VAR United States Secured Overnight Financing Rate+0.740%, 10/24/2024 | | $ | 7,100 | | | $ | 7,129 | |
Bank of Montreal MTN | | | | | | | | |
0.766%, VAR United States Secured Overnight Financing Rate+0.680%, 03/10/2023 | | | 1,970 | | | | 1,984 | |
Citibank | | | | | | | | |
3.400%, 07/23/2021 | | | 250 | | | | 254 | |
Citigroup | | | | | | | | |
3.352%, VAR ICE LIBOR USD 3 Month+0.897%, 04/24/2025 | | | 1,645 | | | | 1,782 | |
2.900%, 12/08/2021 | | | 9,200 | | | | 9,417 | |
2.312%, VAR United States Secured Overnight Financing Rate+0.867%, 11/04/2022 | | | 7,770 | | | | 7,904 | |
Credit Suisse NY | | | | | | | | |
2.800%, 04/08/2022 | | | 5,000 | | | | 5,165 | |
DNB Boligkreditt | | | | | | | | |
2.500%, 03/28/2022 (A) | | | 6,130 | | | | 6,303 | |
Federation des Caisses Desjardins du Quebec | | | | | | | | |
0.450%, 10/07/2023 (A) | | | 6,660 | | | | 6,664 | |
Fifth Third Bancorp | | | | | | | | |
1.625%, 05/05/2023 | | | 6,855 | | | | 7,043 | |
General Electric MTN | | | | | | | | |
0.605%, VAR ICE LIBOR USD 3 Month+0.380%, 05/05/2026 | | | 350 | | | | 334 | |
Goldman Sachs Group | | | | | | | | |
0.627%, VAR United States Secured Overnight Financing Rate+0.538%, 11/17/2023 | | | 8,255 | | | | 8,276 | |
Goldman Sachs Group MTN | | | | | | | | |
2.905%, VAR ICE LIBOR USD 3 Month+0.990%, 07/24/2023 | | | 500 | | | | 520 | |
HSBC Holdings | | | | | | | | |
3.950%, VAR ICE LIBOR USD 3 Month+0.987%, 05/18/2024 | | | 1,870 | | | | 2,015 | |
Intercontinental Exchange | | | | | | | | |
0.903%, VAR ICE LIBOR USD 3 Month+0.650%, 06/15/2023 | | | 1,700 | | | | 1,706 | |
JPMorgan Chase | | | | | | | | |
4.023%, VAR ICE LIBOR USD 3 Month+1.000%, 12/05/2024 | | | 8,660 | | | | 9,535 | |
3.250%, 09/23/2022 | | | 12,000 | | | | 12,632 | |
Lloyds Bank | | | | | | | | |
6.375%, 01/21/2021 | | | 1,250 | | | | 1,260 | |
Lloyds Banking Group | | | | | | | | |
3.870%, VAR US Treas Yield Curve Rate T Note Const Mat 1 Yr+3.500%, 07/09/2025 | | | 180 | | | | 197 | |
| | | | | | | | |
| | | |
| Description | | Face Amount (Thousands) | | Market Value ($ Thousands) |
|
CORPORATE OBLIGATIONS (continued) | |
2.858%, VAR ICE LIBOR USD 3 Month+1.249%, 03/17/2023 | | $ | 305 | | | $ | 314 | |
MassMutual Global Funding II MTN | | | | | | | | |
0.850%, 06/09/2023 (A) | | | 8,800 | | | | 8,899 | |
Morgan Stanley MTN | | | | | | | | |
5.500%, 07/28/2021 | | | 1,800 | | | | 1,860 | |
0.560%, VAR United States Secured Overnight Financing Rate+0.466%, 11/10/2023 | | | 13,260 | | | | 13,271 | |
National Bank of Canada | | | | | | | | |
0.900%, VAR US Treas Yield Curve Rate T Note Const Mat 1 Yr+0.770%, 08/15/2023 | | | 11,485 | | | | 11,566 | |
National Securities Clearing | | | | | | | | |
1.200%, 04/23/2023 (A) | | | 7,290 | | | | 7,429 | |
Nationwide Building Society MTN | | | | | | | | |
3.622%, VAR ICE LIBOR USD 3 Month+1.181%, 04/26/2023 (A) | | | 1,595 | | | | 1,658 | |
Nationwide Mutual Insurance | | | | | | | | |
2.540%, VAR ICE LIBOR USD 3 Month+2.290%, 12/15/2024 (A) | | | 1,000 | | | | 999 | |
New York Life Global Funding | | | | | | | | |
1.100%, 05/05/2023 (A) | | | 4,710 | | | | 4,791 | |
New York Life Global Funding MTN | | | | | | | | |
2.000%, 04/13/2021 (A) | | | 1,000 | | | | 1,006 | |
Pacific Life Global Funding II | | | | | | | | |
0.500%, 09/23/2023 (A) | | | 4,615 | | | | 4,615 | |
Park Aerospace Holdings, 52235879 | | | | | | | | |
5.250%, 08/15/2022 (A) | | | 155 | | | | 162 | |
4.500%, 03/15/2023 (A) | | | 170 | | | | 177 | |
3.625%, 03/15/2021 (A) | | | 250 | | | | 251 | |
PNC Bank | | | | | | | | |
0.530%, VAR ICE LIBOR USD 3 Month+0.325%, 02/24/2023 | | | 9,975 | | | | 9,990 | |
Protective Life Global Funding | | | | | | | | |
1.082%, 06/09/2023 (A) | | | 7,785 | | | | 7,912 | |
Santander UK | | | | | | | | |
3.571%, 01/10/2023 | | | 1,615 | | | | 1,665 | |
3.400%, 06/01/2021 | | | 585 | | | | 594 | |
State Street | | | | | | | | |
2.825%, VAR United States Secured Overnight Financing Rate+2.690%, 03/30/2023 | | | 3,965 | | | | 4,094 | |
Toronto-Dominion Bank | | | | | | | | |
2.100%, 07/15/2022 (A) | | | 7,400 | | | | 7,611 | |
1.450%, 04/03/2023 (A) | | | 2,515 | | | | 2,581 | |
Toronto-Dominion Bank MTN | | | | | | | | |
0.750%, 06/12/2023 | | | 9,290 | | | | 9,366 | |
Truist Financial MTN | | | | | | | | |
2.200%, 03/16/2023 | | | 7,675 | | | | 7,973 | |
| | |
SEI Institutional Investments Trust / Semi-Annual Report / November 30, 2020 | | 257 |
SCHEDULE OF INVESTMENTS (Unaudited)
November 30, 2020
Limited Duration Bond Fund (Continued)
| | | | | | | | |
| | | |
| Description | | Face Amount
(Thousands) | | Market Value ($ Thousands) |
|
CORPORATE OBLIGATIONS (continued) | |
UBS Group | | | | | | | | |
1.008%, VAR US Treas Yield Curve Rate T Note Const Mat 1 Yr+0.830%, 07/30/2024 (A) | | $ | 5,465 | | | $ | 5,505 | |
USAA Capital | | | | | | | | |
1.500%, 05/01/2023 (A) | | | 3,080 | | | | 3,161 | |
Wells Fargo MTN | | | | | | | | |
3.750%, 01/24/2024 | | | 655 | | | | 712 | |
Wells Fargo Bank | | | | | | | | |
3.625%, 10/22/2021 | | | 1,000 | | | | 1,027 | |
2.082%, VAR ICE LIBOR USD 3 Month+0.650%, 09/09/2022 | | | 1,225 | | | | 1,241 | |
Wells Fargo Bank MTN | | | | | | | | |
2.625%, 07/22/2022 | | | 9,580 | | | | 9,926 | |
| | | | | | | | |
| | | | | | | 231,407 | |
| | | | | | | | |
|
Health Care — 2.1% | |
AbbVie | | | | | | | | |
5.000%, 12/15/2021 | | | 500 | | | | 517 | |
3.800%, 03/15/2025 | | | 450 | | | | 503 | |
3.750%, 11/14/2023 | | | 550 | | | | 601 | |
2.150%, 11/19/2021 | | | 8,775 | | | | 8,922 | |
Cigna | | | | | | | | |
0.896%, VAR ICE LIBOR USD 3 Month+0.650%, 09/17/2021 | | | 1,000 | | | | 1,000 | |
Gilead Sciences | | | | | | | | |
0.750%, 09/29/2023 | | | 7,095 | | | | 7,118 | |
0.740%, VAR ICE LIBOR USD 3 Month+0.520%, 09/29/2023 | | | 1,200 | | | | 1,203 | |
Humana | | | | | | | | |
3.850%, 10/01/2024 | | | 1,500 | | | | 1,660 | |
2.500%, 12/15/2020 | | | 855 | | | | 856 | |
Royalty Pharma | | | | | | | | |
0.750%, 09/02/2023 (A) | | | 985 | | | | 989 | |
Stryker | | | | | | | | |
0.600%, 12/01/2023 | | | 5,590 | | | | 5,598 | |
| | | | | | | | |
| | | | | | | 28,967 | |
| | | | | | | | |
|
Industrials — 2.3% | |
AerCap Ireland Capital DAC / AerCap Global Aviation Trust | | | | | | | | |
4.875%, 01/16/2024 | | | 580 | | | | 626 | |
3.950%, 02/01/2022 | | | 1,000 | | | | 1,026 | |
Air Lease | | | | | | | | |
3.500%, 01/15/2022 | | | 690 | | | | 709 | |
American Airlines Pass-Through Trust, Ser 2011-1, Cl A | | | | | | | | |
5.250%, 01/31/2021 | | | 363 | | | | 361 | |
BAE Systems Holdings | | | | | | | | |
2.850%, 12/15/2020 (A) | | | 500 | | | | 501 | |
Caterpillar Financial Services | | | | | | | | |
0.650%, 07/07/2023 | | | 6,745 | | | | 6,792 | |
| | | | | | | | |
| | | |
| Description | | Face Amount
(Thousands) | | Market Value ($ Thousands) |
|
CORPORATE OBLIGATIONS (continued) | |
Delta Air Lines Pass-Through Trust | | | | | | | | |
6.718%, 01/02/2023 | | $ | 292 | | | $ | 295 | |
GE Capital Funding LLC | | | | | | | | |
4.400%, 05/15/2030 (A) | | | 1,190 | | | | 1,371 | |
General Electric MTN | | | | | | | | |
1.237%, VAR ICE LIBOR USD 3 Month+1.000%, 04/15/2023 | | | 2,000 | | | | 1,996 | |
Georgia-Pacific LLC | | | | | | | | |
0.625%, 05/15/2024 (A) | | | 7,115 | | | | 7,120 | |
Honeywell International | | | | | | | | |
0.483%, 08/19/2022 | | | 2,050 | | | | 2,053 | |
IHS Markit | | | | | | | | |
5.000%, 11/01/2022 (A) | | | 1,500 | | | | 1,609 | |
3.625%, 05/01/2024 | | | 430 | | | | 469 | |
Ingersoll-Rand | | | | | | | | |
9.000%, 08/15/2021 | | | 750 | | | | 791 | |
PACCAR Financial MTN | | | | | | | | |
0.800%, 06/08/2023 | | | 5,120 | | | | 5,180 | |
| | | | | | | | |
| | | | | | | 30,899 | |
| | | | | | | | |
|
Information Technology — 0.0% | |
NXP BV | | | | | | | | |
4.625%, 06/01/2023 (A) | | | 620 | | | | 679 | |
| | | | | | | | |
|
Materials — 0.2% | |
Bemis | | | | | | | | |
4.500%, 10/15/2021 | | | 1,590 | | | | 1,630 | |
Nutrition & Biosciences | | | | | | | | |
0.697%, 09/15/2022 (A) | | | 750 | | | | 753 | |
| | | | | | | | |
| | | | | | | 2,383 | |
| | | | | | | | |
|
Real Estate — 1.1% | |
American Campus Communities Operating Partnership | | | | | | | | |
3.750%, 04/15/2023 | | | 1,395 | | | | 1,472 | |
Boston Properties | | | | | | | | |
4.125%, 05/15/2021 | | | 1,000 | | | | 1,007 | |
Camden Property Trust | | | | | | | | |
2.950%, 12/15/2022 | | | 1,490 | | | | 1,553 | |
CyrusOne/CyrusOne Finance | | | | | | | | |
2.900%, 11/15/2024 | | | 1,430 | | | | 1,522 | |
Essex Portfolio | | | | | | | | |
5.200%, 03/15/2021 | | | 1,000 | | | | 1,002 | |
GLP Capital | | | | | | | | |
5.375%, 11/01/2023 | | | 2,803 | | | | 3,021 | |
Healthpeak Properties | | | | | | | | |
4.250%, 11/15/2023 | | | 6 | | | | 7 | |
Highwoods Realty | | | | | | | | |
3.200%, 06/15/2021 | | | 380 | | | | 383 | |
Kilroy Realty | | | | | | | | |
3.450%, 12/15/2024 | | | 395 | | | | 426 | |
| | |
258 | | SEI Institutional Investments Trust / Semi-Annual Report / November 30, 2020 |
| | | | | | | | |
| | | |
| Description | | Face Amount
(Thousands) | | Market Value
($ Thousands) |
| |
CORPORATE OBLIGATIONS (continued) | | | | | |
Kimco Realty | | | | | | | | |
3.400%, 11/01/2022 | | $ | 1,350 | | | $ | 1,419 | |
Realty Income | | | | | | | | |
3.250%, 10/15/2022 | | | 1,000 | | | | 1,046 | |
SL Green Operating Partnership | | | | | | | | |
1.201%, VAR ICE LIBOR USD 3 Month+0.980%, 08/16/2021 | | | 1,395 | | | | 1,386 | |
Welltower | | | | | | | | |
3.750%, 03/15/2023 | | | 500 | | | �� | 531 | |
| | | | | | | | |
| | | | | | | 14,775 | |
| | | | | | | | |
| | |
Sovereign — 1.0% | | | | | | | | |
Inter-American Development Bank MTN | | | | | | | | |
1.750%, 09/14/2022 | | | 13,000 | | | | 13,352 | |
| | | | | | | | |
| | |
Utilities — 0.8% | | | | | | | | |
Dominion Energy | | | | | | | | |
3.300%, 03/15/2025 | | | 1,570 | | | | 1,733 | |
2.450%, 01/15/2023 (A) | | | 500 | | | | 520 | |
0.776%, VAR ICE LIBOR USD 3 Month+0.530%, 09/15/2023 | | | 5,650 | | | | 5,659 | |
DTE Energy | | | | | | | | |
0.550%, 11/01/2022 | | | 3,370 | | | | 3,376 | |
| | | | | | | | |
| | | | | | | 11,288 | |
| | | | | | | | |
| | |
Total Corporate Obligations (Cost $377,499) ($ Thousands) | | | | | | | 383,670 | |
| | | | | | | | |
|
U.S. TREASURY OBLIGATIONS — 26.2% | |
U.S. Treasury Bills | | | | | | | | |
0.181%, 02/23/2021 (B) | | | 2,800 | | | | 2,800 | |
0.118%, 02/09/2021 (B) | | | 1,980 | | | | 1,980 | |
0.101%, 04/01/2021 (B) | | | 2,195 | | | | 2,194 | |
U.S. Treasury Inflation-Protected Securities | | | | | | | | |
0.625%, 04/15/2023 | | | 4,008 | | | | 4,186 | |
0.500%, 04/15/2024 | | | 14,035 | | | | 14,883 | |
U.S. Treasury Notes | | | | | | | | |
1.750%, 09/30/2022 | | | 65,675 | | | | 67,609 | |
1.375%, 10/15/2022 | | | 23,600 | | | | 24,139 | |
0.500%, 03/15/2023 | | | 61,095 | | | | 61,565 | |
0.375%, 11/30/2025 | | | 7,290 | | | | 7,296 | |
0.250%, 11/15/2023 | | | 4,560 | | | | 4,569 | |
0.125%, 09/30/2022 | | | 40,845 | | | | 40,832 | |
0.125%, 10/31/2022 | | | 89,185 | | | | 89,150 | |
0.125%, 11/30/2022 | | | 21,380 | | | | 21,370 | |
0.125%, 05/15/2023 | | | 14,215 | | | | 14,202 | |
| | | | | | | | |
| | |
Total U.S. Treasury Obligations (Cost $353,735) ($ Thousands) | | | | | | | 356,775 | |
| | | | | | | | |
| | | | | | | | |
| | | |
| Description | | Face Amount
(Thousands) | | Market Value
($ Thousands) |
|
MORTGAGE-BACKED SECURITIES — 24.2% | |
|
Agency Mortgage-Backed Obligations — 17.4% | |
FHLMC | | | | | | | | |
4.500%, 09/01/2026 | | $ | 559 | | | $ | 593 | |
4.000%, 03/01/2026 | | | 236 | | | | 251 | |
3.500%, 11/01/2030 | | | 6,463 | | | | 6,991 | |
3.000%, 09/01/2029 | | | 3,894 | | | | 4,075 | |
2.500%, 11/01/2027 to 10/01/2031 | | | 6,262 | | | | 6,528 | |
0.450%, 07/28/2023 | | | 6,805 | | | | 6,806 | |
0.300%, 09/28/2023 to 10/13/2023 | | | 16,535 | | | | 16,529 | |
FHLMC ARM | | | | | | | | |
3.231%, VAR ICE LIBOR USD 12 Month+1.511%, 03/01/2037 | | | 46 | | | | 48 | |
FHLMC CMO, Ser 2004-2761, Cl FT | | | | | | | | |
0.491%, VAR LIBOR USD 1 Month+0.350%, 12/15/2033 | | | 228 | | | | 227 | |
FHLMC CMO, Ser 2005-2922, Cl FE | | | | | | | | |
0.391%, VAR LIBOR USD 1 Month+0.250%, 02/15/2035 | | | 870 | | | | 873 | |
FHLMC CMO, Ser 2005-2990, Cl LK | | | | | | | | |
0.511%, VAR LIBOR USD 1 Month+0.370%, 10/15/2034 | | | 1,072 | | | | 1,075 | |
FHLMC CMO, Ser 2005-3066, Cl PF | | | | | | | | |
0.441%, VAR LIBOR USD 1 Month+0.300%, 04/15/2035 | | | 323 | | | | 323 | |
FHLMC CMO, Ser 2006-3102, Cl FB | | | | | | | | |
0.441%, VAR LIBOR USD 1 Month+0.300%, 01/15/2036 | | | 605 | | | | 606 | |
FHLMC CMO, Ser 2006-3136, Cl KF | | | | | | | | |
0.441%, VAR LIBOR USD 1 Month+0.300%, 04/15/2036 | | | 535 | | | | 536 | |
FHLMC CMO, Ser 2008-3419, Cl FA | | | | | | | | |
0.711%, VAR LIBOR USD 1 Month+0.570%, 08/15/2037 | | | 6 | | | | 6 | |
FHLMC CMO, Ser 2009-3616, Cl FG | | | | | | | | |
0.791%, VAR LIBOR USD 1 Month+0.650%, 03/15/2032 | | | 524 | | | | 531 | |
FHLMC CMO, Ser 2010-3762, Cl FP | | | | | | | | |
0.591%, VAR LIBOR USD 1 Month+0.450%, 03/15/2040 | | | 133 | | | | 134 | |
FHLMC CMO, Ser 2010-3774, Cl EW | | | | | | | | |
3.500%, 12/15/2025 | | | 441 | | | | 464 | |
FHLMC CMO, Ser 2011-3820, Cl GJ | | | | | | | | |
3.500%, 12/15/2039 | | | 216 | | | | 224 | |
FHLMC CMO, Ser 2011-3820, Cl DB | | | | | | | | |
4.000%, 11/15/2038 | | | 622 | | | | 635 | |
FHLMC CMO, Ser 2011-3867, Cl FN | | | | | | | | |
0.491%, VAR LIBOR USD 1 Month+0.350%, 04/15/2040 | | | 108 | | | | 109 | |
FHLMC CMO, Ser 2011-3895, Cl FM | | | | | | | | |
0.491%, VAR LIBOR USD 1 Month+0.350%, 12/15/2040 | | | 700 | | | | 701 | |
| | |
SEI Institutional Investments Trust / Semi-Annual Report / November 30, 2020 | | 259 |
SCHEDULE OF INVESTMENTS (Unaudited)
November 30, 2020
Limited Duration Bond Fund (Continued)
| | | | | | | | |
| | | |
| Description | | Face Amount
(Thousands) | | Market Value
($ Thousands) |
|
MORTGAGE-BACKED SECURITIES (continued) | |
FHLMC CMO, Ser 2011-3940, Cl PF | | | | | | | | |
0.491%, VAR LIBOR USD 1 Month+0.350%, 05/15/2040 | | $ | 802 | | | $ | 803 | |
FHLMC CMO, Ser 2011-3946, Cl FG | | | | | | | | |
0.491%, VAR LIBOR USD 1 Month+0.350%, 10/15/2039 | | | 112 | | | | 112 | |
FHLMC CMO, Ser 2011-3960, Cl JF | | | | | | | | |
0.591%, VAR LIBOR USD 1 Month+0.450%, 04/15/2041 | | | 288 | | | | 289 | |
FHLMC CMO, Ser 2012-4046, Cl PA | | | | | | | | |
2.500%, 05/15/2027 | | | 593 | | | | 614 | |
FHLMC CMO, Ser 2012-4048, Cl GF | | | | | | | | |
0.491%, VAR LIBOR USD 1 Month+0.350%, 10/15/2040 | | | 295 | | | | 295 | |
FHLMC CMO, Ser 2012-4094, Cl BF | | | | | | | | |
0.541%, VAR LIBOR USD 1 Month+0.400%, 08/15/2032 | | | 712 | | | | 711 | |
FHLMC CMO, Ser 2012-4095, Cl FB | | | | | | | | |
0.541%, VAR LIBOR USD 1 Month+0.400%, 04/15/2039 | | | 226 | | | | 226 | |
FHLMC CMO, Ser 2012-4102, Cl LF | | | | | | | | |
0.391%, VAR LIBOR USD 1 Month+0.250%, 01/15/2040 | | | 228 | | | | 228 | |
FHLMC CMO, Ser 2013-4165, Cl TE | | | | | | | | |
1.750%, 12/15/2042 | | | 368 | | | | 374 | |
FHLMC CMO, Ser 2013-4203, Cl DM | | | | | | | | |
3.000%, 04/15/2033 | | | 388 | | | | 412 | |
FHLMC CMO, Ser 2013-4220, Cl KC | | | | | | | | |
1.500%, 05/15/2032 | | | 2,170 | | | | 2,216 | |
FHLMC CMO, Ser 2013-4247, Cl AK | | | | | | | | |
4.500%, 12/15/2042 | | | 241 | | | | 256 | |
FHLMC CMO, Ser 2013-4253, Cl PA | | | | | | | | |
3.500%, 08/15/2041 | | | 450 | | | | 459 | |
FHLMC CMO, Ser 2013-4262, Cl AB | | | | | | | | |
2.500%, 01/15/2031 | | | 851 | | | | 850 | |
FHLMC CMO, Ser 2014-4379, Cl CD | | | | | | | | |
2.500%, 04/15/2033 | | | 536 | | | | 552 | |
FHLMC CMO, Ser 2014-4384, Cl LA | | | | | | | | |
3.500%, 09/15/2040 | | | 655 | | | | 670 | |
FHLMC CMO, Ser 2015-4482, Cl CA | | | | | | | | |
3.000%, 04/15/2034 | | | 599 | | | | 631 | |
FHLMC Multifamily Structured Pass-Through Certificates, Ser J22F, Cl A1 | | | | | | | | |
3.454%, 05/25/2023 | | | 47 | | | | 47 | |
FHLMC Multifamily Structured Pass-Through Certificates, Ser K020, Cl A2 | | | | | | | | |
2.373%, 05/25/2022 | | | 900 | | | | 922 | |
FHLMC Multifamily Structured Pass-Through Certificates, Ser K026, Cl A2 | | | | | | | | |
2.510%, 11/25/2022 | | | 4,708 | | | | 4,871 | |
FHLMC Multifamily Structured Pass-Through Certificates, Ser K027, Cl A2 | | | | | | | | |
2.637%, 01/25/2023 | | | 6,020 | | | | 6,277 | |
| | | | | | | | |
| | | |
| Description | | Face Amount
(Thousands) | | Market Value
($ Thousands) |
|
MORTGAGE-BACKED SECURITIES (continued) | |
FHLMC Multifamily Structured Pass-Through Certificates, Ser K037, Cl A2 | | | | | | | | |
3.490%, 01/25/2024 | | $ | 1,360 | | | $ | 1,475 | |
FHLMC Multifamily Structured Pass-Through Certificates, Ser K037, Cl A1 | | | | | | | | |
2.592%, 04/25/2023 | | | 510 | | | | 523 | |
FHLMC Multifamily Structured Pass-Through Certificates, Ser K038, Cl A1 | | | | | | | | |
2.604%, 10/25/2023 | | | 312 | | | | 319 | |
FHLMC Multifamily Structured Pass-Through Certificates, Ser K046, Cl A1 | | | | | | | | |
2.697%, 01/25/2025 | | | 1,512 | | | | 1,572 | |
FHLMC Multifamily Structured Pass-Through Certificates, Ser K063, Cl A1 | | | | | | | | |
3.045%, 08/25/2026 | | | 3,276 | | | | 3,504 | |
FHLMC Multifamily Structured Pass-Through Certificates, Ser K722, Cl A1 | | | | | | | | |
2.183%, 05/25/2022 | | | 3,707 | | | | 3,775 | |
FHLMC Multifamily Structured Pass-Through Certificates, Ser KF34, Cl A | | | | | | | | |
0.500%, VAR LIBOR USD 1 Month+0.360%, 08/25/2024 | | | 589 | | | | 590 | |
FHLMC Multifamily Structured Pass-Through Certificates, Ser KF37, Cl A | | | | | | | | |
0.500%, VAR ICE LIBOR USD 1 Month+0.360%, 09/25/2027 | | | 374 | | | | 375 | |
FHLMC Multifamily Structured Pass-Through Certificates, Ser KF38, Cl A | | | | | | | | |
0.470%, VAR LIBOR USD 1 Month+0.330%, 09/25/2024 | | | 1,107 | | | | 1,109 | |
FHLMC Multifamily Structured Pass-Through Certificates, Ser KF39, Cl A | | | | | | | | |
0.460%, VAR LIBOR USD 1 Month+0.320%, 11/25/2024 | | | 837 | | | | 838 | |
FHLMC Multifamily Structured Pass-Through Certificates, Ser KF40, Cl A | | | | | | | | |
0.480%, VAR LIBOR USD 1 Month+0.340%, 11/25/2027 | | | 373 | | | | 374 | |
FHLMC Multifamily Structured Pass-Through Certificates, Ser KF43, Cl A | | | | | | | | |
0.380%, VAR ICE LIBOR USD 1 Month+0.240%, 01/25/2028 | | | 782 | | | | 781 | |
FHLMC Multifamily Structured Pass-Through Certificates, Ser KF51, Cl A | | | | | | | | |
0.540%, VAR ICE LIBOR USD 1 Month+0.400%, 08/25/2025 | | | 938 | | | | 940 | |
FHLMC Multifamily Structured Pass-Through Certificates, Ser KJ08, Cl A2 | | | | | | | | |
2.356%, 08/25/2022 | | | 1,420 | | | | 1,445 | |
FHLMC Multifamily Structured Pass-Through Certificates, Ser KJ13, Cl A2 | | | | | | | | |
2.864%, 08/25/2022 | | | 979 | | | | 1,006 | |
| | |
260 | | SEI Institutional Investments Trust / Semi-Annual Report / November 30, 2020 |
| | | | | | | | |
| | | |
| Description | | Face Amount
(Thousands) | | Market Value
($ Thousands) |
|
MORTGAGE-BACKED SECURITIES (continued) | |
FHLMC Multifamily Structured Pass-Through Certificates, Ser KJ24, Cl A1 | | | | | | | | |
2.283%, 05/25/2026 | | $ | 3,720 | | | $ | 3,918 | |
FHLMC Multifamily Structured Pass-Through Certificates, Ser KJ26, Cl A1 | | | | | | | | |
2.135%, 07/25/2025 | | | 4,253 | | | | 4,374 | |
FHLMC Multifamily Structured Pass-Through Certificates, Ser KJ29, Cl A1 | | | | | | | | |
0.735%, 01/25/2026 | | | 1,957 | | | | 1,968 | |
FHLMC Multifamily Structured Pass-Through Certificates, Ser KJ30, Cl A1 | | | | | | | | |
0.526%, 01/25/2025 | | | 1,451 | | | | 1,451 | |
FHLMC Multifamily Structured Pass-Through Certificates, Ser KSMC, Cl A2 | | | | | | | | |
2.615%, 01/25/2023 | | | 1,500 | | | | 1,570 | |
FHLMC Multifamily Structured Pass-Through Certificates, Ser Q004, Cl AFL | | | | | | | | |
1.483%, VAR 12 Month Treas Avg+0.740%, 05/25/2044 | | | 696 | | | | 696 | |
FHLMC REMIC CMO, Ser 2015-4479, Cl HA | | | | | | | | |
3.750%, 05/15/2039 | | | 2,152 | | | | 2,235 | |
FHLMC Whole Loan Securities Trust, Ser 2017-SC02, Cl 2A1 | | | | | | | | |
3.500%, 05/25/2047 | | | 78 | | | | 78 | |
FNMA | | | | | | | | |
6.000%, 02/01/2023 | | | 375 | | | | 388 | |
4.503%, 04/01/2021 (C) | | | 89 | | | | 89 | |
4.500%, 05/01/2024 | | | 267 | | | | 281 | |
4.381%, 06/01/2021 (C) | | | 364 | | | | 365 | |
4.160%, 07/01/2021 | | | 2,695 | | | | 2,731 | |
3.763%, 12/01/2020 (C) | | | 215 | | | | 215 | |
3.500%, 10/01/2031 | | | 476 | | | | 520 | |
3.430%, 10/01/2023 | | | 1,348 | | | | 1,432 | |
3.000%, 10/01/2027 to 08/01/2035 | | | 3,364 | | | | 3,529 | |
2.918%, 01/01/2026 (C) | | | 2,025 | | | | 2,192 | |
2.500%, 12/01/2027 to 11/01/2034 | | | 8,714 | | | | 9,077 | |
2.240%, 12/01/2022 | | | 9,414 | | | | 9,649 | |
1.870%, 07/01/2021 | | | 1,649 | | | | 1,652 | |
FNMA ACES, Ser 2016-M11, Cl AL | | | | | | | | |
2.944%, 07/25/2039 | | | 1,069 | | | | 1,088 | |
FNMA CMO, Ser 2004-94, Cl HF | | | | | | | | |
0.450%, VAR LIBOR USD 1 Month+0.300%, 10/25/2034 | | | 115 | | | | 115 | |
FNMA CMO, Ser 2005-83, Cl FP | | | | | | | | |
0.480%, VAR LIBOR USD 1 Month+0.330%, 10/25/2035 | | | 948 | | | | 951 | |
FNMA CMO, Ser 2006-31, Cl FP | | | | | | | | |
0.450%, VAR LIBOR USD 1 Month+0.300%, 05/25/2036 | | | 169 | | | | 169 | |
FNMA CMO, Ser 2006-56, Cl FE | | | | | | | | |
0.580%, VAR LIBOR USD 1 Month+0.430%, 07/25/2036 | | | 794 | | | | 800 | |
| | | | | | | | |
| | | |
| Description | | Face Amount
(Thousands) | | Market Value
($ Thousands) |
|
MORTGAGE-BACKED SECURITIES (continued) | |
FNMA CMO, Ser 2007-98, Cl FD | | | | | | | | |
0.600%, VAR LIBOR USD 1 Month+0.450%, 06/25/2037 | | $ | 405 | | | $ | 408 | |
FNMA CMO, Ser 2008-24, Cl PF | | | | | | | | |
0.800%, VAR LIBOR USD 1 Month+0.650%, 02/25/2038 | | | 271 | | | | 273 | |
FNMA CMO, Ser 2010-43, Cl VF | | | | | | | | |
0.700%, VAR LIBOR USD 1 Month+0.550%, 05/25/2040 | | | 648 | | | | 654 | |
FNMA CMO, Ser 2011-115, Cl MB | | | | | | | | |
2.500%, 11/25/2026 | | | 439 | | | | 455 | |
FNMA CMO, Ser 2012-111, Cl NF | | | | | | | | |
0.500%, VAR LIBOR USD 1 Month+0.350%, 05/25/2042 | | | 951 | | | | 953 | |
FNMA CMO, Ser 2012-20, Cl BD | | | | | | | | |
2.000%, 01/25/2031 | | | 2,306 | | | | 2,368 | |
FNMA CMO, Ser 2012-54, Cl CF | | | | | | | | |
0.850%, VAR LIBOR USD 1 Month+0.700%, 05/25/2042 | | | 333 | | | | 338 | |
FNMA CMO, Ser 2012-93, Cl GF | | | | | | | | |
0.400%, VAR LIBOR USD 1 Month+0.250%, 07/25/2040 | | | 162 | | | | 162 | |
FNMA CMO, Ser 2012-98, Cl MA | | | | | | | | |
2.000%, 08/25/2031 | | | 7,127 | | | | 7,322 | |
FNMA CMO, Ser 2013-104, Cl JA | | | | | | | | |
3.000%, 12/25/2030 | | | 244 | | | | 248 | |
FNMA CMO, Ser 2013-116, Cl CB | | | | | | | | |
2.500%, 04/25/2033 | | | 603 | | | | 624 | |
FNMA CMO, Ser 2013-53, Cl CL | | | | | | | | |
3.000%, 06/25/2037 | | | 205 | | | | 205 | |
FNMA CMO, Ser 2013-6, Cl MC | | | | | | | | |
2.000%, 02/25/2040 | | | 316 | | | | 320 | |
FNMA CMO, Ser 2013-85, Cl AG | | | | | | | | |
2.500%, 08/25/2028 | | | 683 | | | | 712 | |
FNMA CMO, Ser 2014-30, Cl KD | | | | | | | | |
2.500%, 05/25/2033 | | | 1,285 | | | | 1,337 | |
FNMA CMO, Ser 2014-33, Cl AH | | | | | | | | |
3.000%, 06/25/2029 | | | 617 | | | | 643 | |
FNMA CMO, Ser 2016-48, Cl UF | | | | | | | | |
0.550%, VAR LIBOR USD 1 Month+0.400%, 08/25/2046 | | | 342 | | | | 344 | |
FNMA CMO, Ser 2020-10, Cl FA | | | | | | | | |
0.650%, VAR ICE LIBOR USD 1 Month+0.500%, 03/25/2050 | | | 3,399 | | | | 3,430 | |
FNMA REMIC CMO, Ser 2019-79, Cl FA | | | | | | | | |
0.650%, VAR ICE LIBOR USD 1 Month+0.500%, 01/25/2050 | | | 868 | | | | 876 | |
FNMA, Ser 2012-M9, Cl A2 | | | | | | | | |
2.482%, 04/25/2022 | | | 1,164 | | | | 1,182 | |
FNMA, Ser 2014-M2, Cl ASV2 | | | | | | | | |
2.777%, 06/25/2021 (C) | | | 43 | | | | 43 | |
FNMA, Ser 2017-M14, Cl A1 | | | | | | | | |
2.971%, 11/25/2027 (C) | | | 1,545 | | | | 1,653 | |
| | |
SEI Institutional Investments Trust / Semi-Annual Report / November 30, 2020 | | 261 |
SCHEDULE OF INVESTMENTS (Unaudited)
November 30, 2020
Limited Duration Bond Fund (Continued)
| | | | | | | | |
| | | |
| Description | | Face Amount
(Thousands) | | Market Value
($ Thousands) |
|
MORTGAGE-BACKED SECURITIES (continued) | |
FREMF Mortgage Trust, Ser 2011-K11, Cl B | | | | | | | | |
4.570%, 12/25/2048 (A)(C) | | $ | 1,525 | | | $ | 1,524 | |
FREMF Mortgage Trust, Ser 2011-K12, Cl B | | | | | | | | |
4.510%, 01/25/2046 (A)(C) | | | 5,605 | | | | 5,602 | |
FREMF Mortgage Trust, Ser K22, Cl B | | | | | | | | |
3.811%, 08/25/2045 (A)(C) | | | 2,480 | | | | 2,597 | |
FREMF Mortgage Trust, Ser K24, Cl B | | | | | | | | |
3.627%, 11/25/2045 (A)(C) | | | 2,580 | | | | 2,705 | |
FREMF Mortgage Trust, Ser K35, Cl B | | | | | | | | |
4.069%, 12/25/2046 (A)(C) | | | 2,015 | | | | 2,170 | |
GNMA | | | | | | | | |
3.000%, 01/20/2027 to 02/20/2030 | | | 3,051 | | | | 3,201 | |
GNMA ARM | | | | | | | | |
3.000%, VAR US Treas Yield Curve Rate T Note Const Mat 1 Yr+1.500%, 02/20/2041 | | | 140 | | | | 146 | |
GNMA CMO, Ser 2007-1, Cl F | | | | | | | | |
0.447%, VAR LIBOR USD 1 Month+0.300%, 01/20/2037 | | | 565 | | | | 565 | |
GNMA CMO, Ser 2010-158, Cl HA | | | | | | | | |
3.500%, 10/20/2039 | | | 200 | | | | 204 | |
GNMA CMO, Ser 2010-98, Cl QF | | | | | | | | |
0.547%, VAR LIBOR USD 1 Month+0.400%, 01/20/2040 | | | 931 | | | | 933 | |
GNMA CMO, Ser 2011-151, Cl BF | | | | | | | | |
0.497%, VAR LIBOR USD 1 Month+0.350%, 04/20/2041 | | | 556 | | | | 557 | |
GNMA CMO, Ser 2012-77, Cl FM | | | | | | | | |
0.811%, VAR LIBOR USD 1 Month+0.670%, 11/16/2039 | | | 916 | | | | 923 | |
GNMA CMO, Ser 2013-12, Cl AB | | | | | | | | |
1.826%, 11/16/2052 | | | 1,089 | | | | 1,105 | |
GNMA CMO, Ser 2013-124, Cl CP | | | | | | | | |
2.500%, 06/20/2041 | | | 541 | | | | 546 | |
GNMA CMO, Ser 2014-20, Cl MU | | | | | | | | |
3.000%, 07/20/2042 | | | 4,294 | | | | 4,468 | |
GNMA CMO, Ser 2015-45, Cl AG | | | | | | | | |
2.500%, 02/16/2041 | | | 1,137 | | | | 1,153 | |
GNMA TBA | | | | | | | | |
2.500%, 05/09/2026 | | | 22,775 | | | | 24,000 | |
2.000%, 12/15/2050 to 01/15/2051 | | | 7,825 | | | | 8,179 | |
GNMA, Ser 2008-92, Cl E | | | | | | | | |
5.556%, 03/16/2044 (C) | | | 761 | | | | 788 | |
GNMA, Ser 2010-159, Cl D | | | | | | | | |
4.291%, 09/16/2044 (C) | | | 1,559 | | | | 1,594 | |
UMBS TBA | | | | | | | | |
2.500%, 12/01/2042 to 01/01/2043 | | | 3,825 | | | | 4,003 | |
| | | | | | | | |
| | | |
| Description | | Face Amount
(Thousands) | | Market Value
($ Thousands) |
|
MORTGAGE-BACKED SECURITIES (continued) | |
2.000%, 12/15/2050 to 01/15/2051 | | $ | 4,050 | | | $ | 4,204 | |
| | | | | | | | |
| | |
| | | | | | | 235,956 | |
| | | | | | | | |
|
Mortgage Related Securities — 0.9% | |
ABFC Trust, Ser 2005-HE2, Cl M3 | | | | | | | | |
0.930%, VAR ICE LIBOR USD 1 Month+0.780%, 06/25/2035 | | | 790 | | | | 791 | |
Centex Home Equity Loan Trust, Ser 2006-A, Cl M1 | | | | | | | | |
0.450%, VAR ICE LIBOR USD 1 Month+0.300%, 06/25/2036 | | | 2,140 | | | | 2,120 | |
Citigroup Mortgage Loan Trust, Ser 2006-WFH3, Cl M1 | | | | | | | | |
0.585%, VAR ICE LIBOR USD 1 Month+0.435%, 10/25/2036 | | | 71 | | | | 71 | |
Citigroup Mortgage Loan Trust, Ser 2007-WFH3, Cl A3 | | | | | | | | |
0.400%, VAR ICE LIBOR USD 1 Month+0.250%, 06/25/2037 | | | 820 | | | | 816 | |
GSAA Home Equity Trust, Ser 2005-MTR1, Cl A4 | | | | | | | | |
0.890%, VAR ICE LIBOR USD 1 Month+0.740%, 10/25/2035 | | | 1,868 | | | | 1,862 | |
GSAA Home Equity Trust, Ser 2007-8, Cl A3 | | | | | | | | |
0.600%, VAR ICE LIBOR USD 1 Month+0.450%, 08/25/2037 | | | 1,448 | | | | 1,432 | |
GSAA Trust, Ser 2005-10, Cl M4 | | | | | | | | |
1.125%, VAR ICE LIBOR USD 1 Month+0.975%, 06/25/2035 | | | 1,425 | | | | 1,463 | |
Nationstar Home Equity Loan Trust, Ser 2007-A, Cl AV4 | | | | | | | | |
0.380%, VAR ICE LIBOR USD 1 Month+0.230%, 03/25/2037 | | | 923 | | | | 912 | |
Option One Mortgage Loan Trust, Ser 2005-4, Cl M1 | | | | | | | | |
0.810%, VAR ICE LIBOR USD 1 Month+0.660%, 11/25/2035 | | | 629 | | | | 629 | |
Option One Mortgage Loan Trust, Ser 2006-1, Cl 1A1 | | | | | | | | |
0.370%, VAR ICE LIBOR USD 1 Month+0.220%, 01/25/2036 | | | 328 | | | | 325 | |
RASC Trust, Ser 2006-KS6, Cl A4 | | | | | | | | |
0.400%, VAR ICE LIBOR USD 1 Month+0.250%, 08/25/2036 | | | 1,365 | | | | 1,355 | |
Terwin Mortgage Trust, Ser 2006-3, Cl 1A2 | | | | | | | | |
0.610%, VAR ICE LIBOR USD 1 Month+0.460%, 04/25/2037 (A) | | | 785 | | | | 779 | |
| | | | | | | | |
| | |
| | | | | | | 12,555 | |
| | | | | | | | |
|
Non-Agency Mortgage-Backed Obligations — 5.9% | |
Agate Bay Mortgage Trust, Ser 2015-5, Cl A5 | | | | | | | | |
3.500%, 07/25/2045 (A)(C) | | | 392 | | | | 394 | |
| | |
262 | | SEI Institutional Investments Trust / Semi-Annual Report / November 30, 2020 |
| | | | | | | | |
| | | |
| Description | | Face Amount
(Thousands) | | Market Value
($ Thousands) |
|
MORTGAGE-BACKED SECURITIES (continued) | |
BANK, Ser BN28, Cl A1 | | | | | | | | |
0.628%, 03/15/2063 | | $ | 591 | | | $ | 592 | |
BBCMS Mortgage Trust, Ser C7, Cl A1 | | | | | | | | |
1.079%, 04/15/2053 | | | 1,413 | | | | 1,419 | |
BBCMS Trust, Ser 2013-TYSN, Cl A2 | | | | | | | | |
3.756%, 09/05/2032 (A) | | | 3,291 | | | | 3,282 | |
BCAP LLC Trust, Ser 2015-RR5, Cl 1A3 | | | | | | | | |
0.349%, 08/26/2036 (A)(C) | | | 220 | | | | 218 | |
Benchmark Mortgage Trust, Ser B19, Cl A1 | | | | | | | | |
0.628%, 09/15/2053 | | | 733 | | | | 735 | |
BX Commercial Mortgage Trust, Ser 2018-IND, Cl A | | | | | | | | |
0.891%, VAR ICE LIBOR USD 1 Month+0.750%, 11/15/2035 (A) | | | 1,213 | | | | 1,212 | |
BX Commercial Mortgage Trust, Ser 2019-XL, Cl B | | | | | | | | |
1.221%, VAR ICE LIBOR USD 1 Month+1.080%, 10/15/2036 (A) | | | 2,473 | | | | 2,468 | |
BX Commercial Mortgage Trust, Ser 2020-BXLP, Cl A | | | | | | | | |
0.941%, VAR ICE LIBOR USD 1 Month+0.800%, 12/15/2036 (A) | | | 999 | | | | 998 | |
CHC Commercial Mortgage Trust, Ser 2019-CHC, Cl A | | | | | | | | |
1.261%, VAR ICE LIBOR USD 1 Month+1.120%, 06/15/2034 (A) | | | 2,949 | | | | 2,821 | |
Citigroup Commercial Mortgage Trust, Ser 2015-GC31, Cl AAB | | | | | | | | |
3.431%, 06/10/2048 | | | 1,758 | | | | 1,860 | |
COMM Mortgage Trust, Ser 2012-CR2, Cl A4 | | | | | | | | |
3.147%, 08/15/2045 | | | 1,000 | | | | 1,032 | |
COMM Mortgage Trust, Ser 2013-CR11, Cl ASB | | | | | | | | |
3.660%, 08/10/2050 | | | 263 | | | | 274 | |
COMM Mortgage Trust, Ser 2013-LC6, Cl ASB | | | | | | | | |
2.478%, 01/10/2046 | | | 1,084 | | | | 1,102 | |
COMM Mortgage Trust, Ser 2014-UBS5, Cl A2 | | | | | | | | |
3.031%, 09/10/2047 | | | 299 | | | | 299 | |
COMM Mortgage Trust, Ser 2014-UBS6, Cl ASB | | | | | | | | |
3.387%, 12/10/2047 | | | 1,638 | | | | 1,725 | |
Commercial Mortgage Trust, Ser 2013-CR9, Cl ASB | | | | | | | | |
3.834%, 07/10/2045 | | | 815 | | | | 845 | |
Core Mortgage Trust, Ser 2019-CORE, Cl A | | | | | | | | |
1.021%, VAR ICE LIBOR USD 1 Month+0.880%, 12/15/2031 (A) | | | 500 | | | | 498 | |
Credit Suisse Commercial Mortgage Securities, Ser 2019-SKLZ, Cl A | | | | | | | | |
1.391%, VAR ICE LIBOR USD 1 Month+1.250%, 01/15/2034 (A) | | | 2,925 | | | | 2,835 | |
| | | | | | | | |
| | | |
| Description | | Face Amount
(Thousands) | | Market Value
($ Thousands) |
|
MORTGAGE-BACKED SECURITIES (continued) | |
Credit Suisse Mortgage Capital Certificates, Ser 2019-ICE4, Cl B | | | | | | | | |
1.371%, VAR ICE LIBOR USD 1 Month+1.230%, 05/15/2036 (A) | | $ | 5,520 | | | $ | 5,513 | |
Credit Suisse Mortgage Capital Certificates, Ser 2019-ICE4, Cl A | | | | | | | | |
1.121%, VAR ICE LIBOR USD 1 Month+0.980%, 05/15/2036 (A) | | | 2,925 | | | | 2,926 | |
CSAIL Commercial Mortgage Trust, Ser 2016-C5, Cl ASB | | | | | | | | |
3.533%, 11/15/2048 | | | 53 | | | | 57 | |
DBCG Mortgage Trust, Ser 2017-BBG, Cl A | | | | | | | | |
0.841%, VAR ICE LIBOR USD 1 Month+0.700%, 06/15/2034 (A) | | | 2,400 | | | | 2,382 | |
DBRR Trust, Ser 2011-LC2, Cl A4A | | | | | | | | |
4.537%, 07/12/2044 (A)(C) | | | 1,528 | | | | 1,535 | |
DBUBS Mortgage Trust, Ser 2011-LC2A, Cl A1FL | | | | | | | | |
1.491%, VAR ICE LIBOR USD 1 Month+1.350%, 07/12/2044 (A) | | | 104 | | | | 104 | |
Flagstar Mortgage Trust, Ser 2018-5, Cl A7 | | | | | | | | |
4.000%, 09/25/2048 (A)(C) | | | 32 | | | | 32 | |
Gosforth Funding, Ser 2018-1A, Cl A1 | | | | | | | | |
0.657%, VAR ICE LIBOR USD 3 Month+0.450%, 08/25/2060 (A) | | | 443 | | | | 443 | |
GS Mortgage Securities II, Ser 2018-GS10, Cl A1 | | | | | | | | |
3.199%, 07/10/2051 | | | 1,104 | | | | 1,132 | |
GS Mortgage Securities Trust, Ser 2011-GC5, Cl A3 | | | | | | | | |
3.817%, 08/10/2044 | | | 850 | | | | 851 | |
GS Mortgage Securities Trust, Ser 2012-GC6, Cl A3 | | | | | | | | |
3.482%, 01/10/2045 | | | 1,305 | | | | 1,328 | |
GS Mortgage Securities Trust, Ser 2013-GC13, Cl AAB | | | | | | | | |
3.719%, 07/10/2046 (C) | | | 524 | | | | 542 | |
GS Mortgage Securities Trust, Ser 2013-GC14, Cl AAB | | | | | | | | |
3.817%, 08/10/2046 | | | 683 | | | | 707 | |
GS Mortgage-Backed Securities Trust, Ser 2018-RPL1, Cl A1A | | | | | | | | |
3.750%, 10/25/2057 (A) | | | 1,498 | | | | 1,595 | |
JPMorgan Chase Commercial Mortgage Securities Trust, Ser 2011-C5, Cl A3 | | | | | | | | |
4.171%, 08/15/2046 | | | 696 | | | | 706 | |
JPMorgan Chase Commercial Mortgage Securities Trust, Ser 2013-LC11, Cl ASB | | | | | | | | |
2.554%, 04/15/2046 | | | 1,013 | | | | 1,035 | |
JPMorgan Chase Commercial Mortgage Securities Trust, Ser 2017-1, Cl A5 | | | | | | | | |
3.500%, 01/25/2047 (A)(C) | | | 774 | | | | 775 | |
| | |
SEI Institutional Investments Trust / Semi-Annual Report / November 30, 2020 | | 263 |
SCHEDULE OF INVESTMENTS (Unaudited)
November 30, 2020
Limited Duration Bond Fund (Continued)
| | | | | | | | |
| | | |
| Description | | Face Amount
(Thousands) | | Market Value
($ Thousands) |
|
MORTGAGE-BACKED SECURITIES (continued) | |
JPMorgan Mortgage Trust, Ser 2015-3, Cl A5 | | | | | | | | |
3.500%, 05/25/2045 (A)(C) | | $ | 39 | | | $ | 39 | |
JPMorgan Mortgage Trust, Ser 2017-1, Cl A4 | | | | | | | | |
3.500%, 01/25/2047 (A)(C) | | | 644 | | | | 645 | |
JPMorgan Mortgage Trust, Ser 2017-2, Cl A5 | | | | | | | | |
3.500%, 05/25/2047 (A)(C) | | | 902 | | | | 911 | |
JPMorgan Mortgage Trust, Ser 2017-4, Cl A6 | | | | | | | | |
3.000%, 11/25/2048 (A)(C) | | | 390 | | | | 391 | |
JPMBB Commercial Mortgage Securities Trust, Ser 2013-C17, Cl ASB | | | | | | | | |
3.705%, 01/15/2047 | | | 251 | | | | 262 | |
JPMBB Commercial Mortgage Securities Trust, Ser 2014-C21, Cl ASB | | | | | | | | |
3.428%, 08/15/2047 | | | 764 | | | | 794 | |
JPMorgan Chase Commercial Mortgage Securities Trust, Ser 2012-C8, Cl ASB | | | | | | | | |
2.379%, 10/15/2045 | | | 525 | | | | 533 | |
LSTAR Commercial Mortgage Trust, Ser 2016-4, Cl A2 | | | | | | | | |
2.579%, 03/10/2049 (A) | | | 6,207 | | | | 6,324 | |
Merrill Lynch Mortgage Investors Trust, Ser 2004-A, Cl A1 | | | | | | | | |
0.610%, VAR ICE LIBOR USD 1 Month+0.460%, 04/25/2029 | | | 377 | | | | 368 | |
Morgan Stanley Bank of America Merrill Lynch Trust, Ser 2013-C13, Cl ASB | | | | | | | | |
3.557%, 11/15/2046 | | | 283 | | | | 294 | |
Morgan Stanley Bank of America Merrill Lynch Trust, Ser 2013-C7, Cl A4 | | | | | | | | |
2.918%, 02/15/2046 | | | 830 | | | | 862 | |
Morgan Stanley Bank of America Merrill Lynch Trust, Ser 2014-C15, Cl A3 | | | | | | | | |
3.773%, 04/15/2047 | | | 375 | | | | 405 | |
Morgan Stanley Bank of America Merrill Lynch Trust, Ser 2015-C26, Cl ASB | | | | | | | | |
3.323%, 10/15/2048 | | | 767 | | | | 809 | |
Morgan Stanley Capital I Trust, Ser 2011-C3, Cl A4 | | | | | | | | |
4.118%, 07/15/2049 | | | 1,164 | | | | 1,177 | |
Morgan Stanley Capital I Trust, Ser 2014-CPT, Cl A | | | | | | | | |
3.350%, 07/13/2029 (A) | | | 2,375 | | | | 2,398 | |
Morgan Stanley Capital I Trust, Ser 2014-MP, Cl A | | | | | | | | |
3.469%, 08/11/2033 (A) | | | 390 | | | | 395 | |
SBALR Commercial Mortgage Trust, Ser 2020-RR1, Cl A1 | | | | | | | | |
2.025%, 02/13/2053 (A) | | | 1,312 | | | | 1,341 | |
Sequoia Mortgage Trust, Ser 2017-4, Cl A4 | | | | | | | | |
3.500%, 07/25/2047 (A)(C) | | | 96 | | | | 96 | |
Sequoia Mortgage Trust, Ser 2017-CH1, Cl A11 | | | | | | | | |
3.500%, 08/25/2047 (A)(C) | | | 382 | | | | 384 | |
| | | | | | | | |
| | | |
| Description | | Face Amount
(Thousands) | | Market Value
($ Thousands) |
|
MORTGAGE-BACKED SECURITIES (continued) | |
Sequoia Mortgage Trust, Ser 2018-CH1, Cl A10 | | | | | | | | |
4.000%, 02/25/2048 (A)(C) | | $ | 492 | | | $ | 495 | |
UBS Commercial Mortgage Trust, Ser 2018-C11, Cl A1 | | | | | | | | |
3.211%, 06/15/2051 | | | 298 | | | | 303 | |
UBS Commercial Mortgage Trust, Ser 2019-C16, Cl A1 | | | | | | | | |
2.739%, 04/15/2052 | | | 1,818 | | | | 1,867 | |
WaMu Mortgage Pass-Through Certificates, Ser 2005-AR15, Cl A1A1 | | | | | | | | |
0.410%, VAR ICE LIBOR USD 1 Month+0.260%, 11/25/2045 | | | 1,392 | | | | 1,363 | |
Wells Fargo Commercial Mortgage Trust, Ser 2016-C34, Cl A2 | | | | | | | | |
2.603%, 06/15/2049 | | | 2,155 | | | | 2,163 | |
Wells Fargo Commercial Mortgage Trust, Ser 2016-C35, Cl A2 | | | | | | | | |
2.495%, 07/15/2048 | | | 1,085 | | | | 1,090 | |
Wells Fargo Commercial Mortgage Trust, Ser 2016-C36, Cl A2 | | | | | | | | |
2.504%, 11/15/2059 | | | 770 | | | | 776 | |
Wells Fargo Commercial Mortgage Trust, Ser 2016-LC24, Cl A2 | | | | | | | | |
2.501%, 10/15/2049 | | | 799 | | | | 806 | |
Wells Fargo Commercial Mortgage Trust, Ser 2016-NXS5, Cl A2 | | | | | | | | |
2.711%, 01/15/2059 | | | 117 | | | | 117 | |
Wells Fargo Commercial Mortgage Trust, Ser 2020-C56, Cl A1 | | | | | | | | |
1.341%, 06/15/2053 | | | 1,927 | | | | 1,942 | |
Wells Fargo Commercial Mortgage Trust, Ser C57, Cl A1 | | | | | | | | |
0.903%, 08/15/2053 | | | 2,422 | | | | 2,430 | |
Wells Fargo Commercial Mortgage Trust, Ser LC16, Cl A4 | | | | | | | | |
3.548%, 08/15/2050 | | | 1,734 | | | | 1,841 | |
| | | | | | | | |
| | |
| | | | | | | 79,893 | |
| | | | | | | | |
| | |
Total Mortgage-Backed Securities (Cost $325,962) ($ Thousands) | | | | | | | 328,404 | |
| | | | | | | | |
|
ASSET-BACKED SECURITIES — 16.7% | |
|
Automotive — 6.9% | |
| | |
ARI Fleet Lease Trust, Ser 2020-A, Cl B | | | | | | | | |
2.060%, 11/15/2028 (A) | | | 1,075 | | | | 1,102 | |
CarMax Auto Owner Trust, Ser 2018-2, Cl A3 | | | | | | | | |
2.980%, 01/17/2023 | | | 602 | | | | 609 | |
CarMax Auto Owner Trust, Ser 2020-1, Cl A3 | | | | | | | | |
1.890%, 12/16/2024 | | | 2,510 | | | | 2,572 | |
| | |
264 | | SEI Institutional Investments Trust / Semi-Annual Report / November 30, 2020 |
| | | | | | | | |
| | | |
| Description | | Face Amount
(Thousands) | | Market Value
($ Thousands) |
|
ASSET-BACKED SECURITIES (continued) | |
Chase Auto Credit Linked Notes, Ser 2020-2, Cl B | | | | | | | | |
0.840%, 02/25/2028 (A) | | $ | 1,750 | | | $ | 1,751 | |
Chesapeake Funding II LLC, Ser 2017-4A, Cl B | | | | | | | | |
2.590%, 11/15/2029 (A) | | | 4,395 | | | | 4,435 | |
Chesapeake Funding II LLC, Ser 2019-1A, Cl A1 | | | | | | | | |
2.940%, 04/15/2031 (A) | | | 3,777 | | | | 3,850 | |
CPS Auto Receivables Trust, Ser 2020-B, Cl A | | | | | | | | |
1.150%, 07/17/2023 (A) | | | 3,211 | | | | 3,219 | |
Credit Acceptance Auto Loan Trust, Ser 2018-1A, Cl A | | | | | | | | |
3.010%, 02/16/2027 (A) | | | 172 | | | | 172 | |
Credit Acceptance Auto Loan Trust, Ser 2019-3A, Cl A | | | | | | | | |
2.380%, 11/15/2028 (A) | | | 2,350 | | | | 2,414 | |
Credit Acceptance Auto Loan Trust, Ser 2019-3A, Cl B | | | | | | | | |
2.860%, 01/16/2029 (A) | | | 500 | | | | 520 | |
Drive Auto Receivables Trust, Ser 2019-2, Cl B | | | | | | | | |
3.170%, 11/15/2023 | | | 2,203 | | | | 2,220 | |
Drive Auto Receivables Trust, Ser 2019-4, Cl B | | | | | | | | |
2.230%, 01/16/2024 | | | 3,825 | | | | 3,869 | |
DT Auto Owner Trust, Ser 2019-4A, Cl B | | | | | | | | |
2.360%, 01/16/2024 (A) | | | 3,260 | | | | 3,304 | |
DT Auto Owner Trust, Ser 2020-2A, Cl A | | | | | | | | |
1.140%, 01/16/2024 (A) | | | 2,224 | | | | 2,233 | |
DT Auto Owner Trust, Ser 2020-2A, Cl B | | | | | | | | |
2.080%, 03/16/2026 (A) | | | 2,285 | | | | 2,332 | |
Enterprise Fleet Financing LLC, Ser 2019-1, Cl A2 | | | | | | | | |
2.980%, 10/20/2024 (A) | | | 849 | | | | 864 | |
Ford Credit Auto Owner Trust, Ser 2017-2, Cl A | | | | | | | | |
2.360%, 03/15/2029 (A) | | | 4,385 | | | | 4,532 | |
GM Financial Automobile Leasing Trust,Ser 2020-3, Cl B | | | | | | | | |
0.760%, 10/21/2024 | | | 300 | | | | 301 | |
GM Financial Consumer Automobile Receivables Trust, Ser 2018-1, Cl B | | | | | | | | |
2.570%, 07/17/2023 | | | 1,400 | | | | 1,424 | |
Harley-Davidson Motorcycle Trust, Ser 2020-A, Cl A3 | | | | | | | | |
1.870%, 10/15/2024 | | | 4,805 | | | | 4,884 | |
JPMorgan Chase Bank, Ser 2020-1, Cl B | | | | | | | | |
0.991%, 01/25/2028 (A) | | | 5,000 | | | | 5,012 | |
Prestige Auto Receivables Trust, Ser 2019-1A, Cl A2 | | | | | | | | |
2.440%, 07/15/2022 (A) | | | 288 | | | | 289 | |
| | | | | | | | |
| | | |
| Description | | Face Amount
(Thousands) | | Market Value
($ Thousands) |
|
ASSET-BACKED SECURITIES (continued) | |
Prestige Auto Receivables Trust, Ser 2020-1A, Cl B | | | | | | | | |
0.770%, 10/15/2024 (A) | | $ | 8,425 | | | $ | 8,434 | |
Santander Consumer Auto Receivables Trust, Ser 2020-AA, Cl A | | | | | | | | |
1.370%, 10/15/2024 (A) | | | 4,484 | | | | 4,524 | |
Santander Consumer Auto Receivables Trust, Ser 2020-BA, Cl B | | | | | | | | |
0.770%, 12/15/2025 (A) | | | 2,710 | | | | 2,711 | |
Santander Retail Auto Lease Trust, Ser 2020-A, Cl B | | | | | | | | |
1.880%, 03/20/2024 (A) | | | 750 | | | | 768 | |
Tesla Auto Lease Trust, Ser 2020-A, Cl A3 | | | | | | | | |
0.680%, 12/20/2023 (A) | | | 4,080 | | | | 4,102 | |
Tidewater Auto Receivables Trust, Ser 2020-AA, Cl A2 | | | | | | | | |
1.390%, 08/15/2024 (A) | | | 6,262 | | | | 6,300 | |
Tidewater Auto Receivables Trust, Ser 2020-AA, Cl B | | | | | | | | |
1.610%, 03/17/2025 (A) | | | 3,600 | | | | 3,638 | |
Westlake Automobile Receivables Trust, Ser 2020-3A, Cl B | | | | | | | | |
0.780%, 11/17/2025 (A) | | | 5,060 | | | | 5,066 | |
Wheels SPV 2 LLC, Ser 2020-1A, Cl A3 | | | | | | | | |
0.620%, 08/20/2029 (A) | | | 4,110 | | | | 4,108 | |
World Omni Select Auto Trust, Ser 2018-1A,Cl B | | | | | | | | |
3.680%, 07/15/2023 (A) | | | 1,660 | | | | 1,682 | |
| | | | | | | | |
| | | | | | | 93,241 | |
| | | | | | | | |
|
Credit Cards — 0.6% | |
Citibank Credit Card Issuance Trust, Ser 2018-A6, Cl A6 | | | | | | | | |
3.210%, 12/07/2024 | | | 3,200 | | | | 3,388 | |
Evergreen Credit Card Trust, Ser 2019-2, Cl A | | | | | | | | |
1.900%, 09/16/2024 (A) | | | 3,795 | | | | 3,902 | |
Master Credit Card Trust II, Ser 2020-1A, Cl A | | | | | | | | |
1.990%, 09/21/2024 (A) | | | 500 | | | | 518 | |
| | | | | | | | |
| | | | | | | 7,808 | |
| | | | | | | | |
|
Mortgage Related Securities — 0.1% | |
| | |
Centex Home Equity Loan Trust, Ser 2006-A, Cl AV4 | | | | | | | | |
0.400%, VAR ICE LIBOR USD 1 Month+0.250%, 06/25/2036 | | | 424 | | | | 424 | |
New Century Home Equity Loan Trust, Ser 2005-4, Cl M2 | | | | | | | | |
0.915%, VAR ICE LIBOR USD 1 Month+0.765%, 09/25/2035 | | | 600 | | | | 602 | |
| | | | | | | | |
| | | | | | | 1,026 | |
| | | | | | | | |
| | |
SEI Institutional Investments Trust / Semi-Annual Report / November 30, 2020 | | 265 |
SCHEDULE OF INVESTMENTS (Unaudited)
November 30, 2020
Limited Duration Bond Fund (Continued)
| | | | | | | | |
| | | |
| Description | | Face Amount
(Thousands) | | Market Value
($ Thousands) |
| |
ASSET-BACKED SECURITIES (continued) | | | | | |
| |
Other Asset-Backed Securities — 9.1% | | | | | |
| | |
Aegis Asset-Backed Securities Trust, Ser 2005-5, Cl 2A | | | | | | | | |
0.650%, VAR ICE LIBOR USD 1 Month+0.500%, 12/25/2035 | | $ | 317 | | | $ | 316 | |
Ameriquest Asset-Backed Pass-Through Certificates, Ser 2004-R12, Cl M1 | | | | | | | | |
1.005%, VAR ICE LIBOR USD 1 Month+0.855%, 01/25/2035 | | | 496 | | | | 499 | |
Ameriquest Asset-Backed Pass-Through Certificates, Ser 2004-R2, Cl A4 | | | | | | | | |
0.930%, VAR ICE LIBOR USD 1 Month+0.780%, 04/25/2034 | | | 323 | | | | 323 | |
Barings CLO, Ser 2018-3A, Cl A1 | | | | | | | | |
1.168%, VAR ICE LIBOR USD 3 Month+0.950%, 07/20/2029 (A) | | | 800 | | | | 798 | |
Bear Stearns Asset Backed Securities I Trust, Ser 2005-HE11, Cl M2 | | | | | | | | |
0.825%, VAR ICE LIBOR USD 1 Month+0.675%, 11/25/2035 | | | 790 | | | | 787 | |
Bravo Mortgage Asset Trust, Ser 2006-1A, Cl A2 | | | | | | | | |
0.390%, VAR ICE LIBOR USD 1 Month+0.240%, 07/25/2036 (A) | | | 292 | | | | 291 | |
CIT Mortgage Loan Trust, Ser 2007-1, Cl 1A | | | | | | | | |
1.500%, VAR ICE LIBOR USD 1 Month+1.350%, 10/25/2037 (A) | | | 591 | | | | 593 | |
CNH Equipment Trust, Ser 2017-B, Cl A4 | | | | | | | | |
2.170%, 04/17/2023 | | | 1,275 | | | | 1,287 | |
CNH Equipment Trust, Ser 2020-A, Cl A3 | | | | | | | | |
1.160%, 06/16/2025 | | | 8,835 | | | | 8,960 | |
Countrywide Asset-Backed Certificates, Ser 2004-12, Cl MV4 | | | | | | | | |
1.575%, VAR ICE LIBOR USD 1 Month+1.425%, 03/25/2035 | | | 82 | | | | 82 | |
Countrywide Asset-Backed Certificates, Ser 2006-BC4, Cl 2A3 | | | | | | | | |
0.630%, VAR ICE LIBOR USD 1 Month+0.480%, 11/25/2036 | | | 2,705 | | | | 2,657 | |
Credit-Based Asset Servicing & Securitization LLC, Ser 2005-CB3, Cl M3 | | | | | | | | |
1.125%, VAR ICE LIBOR USD 1 Month+0.975%, 06/25/2035 | | | 1,000 | | | | 987 | |
Dell Equipment Finance Trust, Ser 2019-1, Cl A2 | | | | | | | | |
2.780%, 08/23/2021 (A) | | | 352 | | | | 353 | |
EFS Volunteer No. 3 LLC, Ser 2012-1, Cl A3 | | | | | | | | |
1.150%, VAR ICE LIBOR USD 1 Month+1.000%, 04/25/2033 (A) | | | 577 | | | | 574 | |
| | | | | | | | |
| | | |
| Description | | Face Amount
(Thousands) | | Market Value
($ Thousands) |
| |
ASSET-BACKED SECURITIES (continued) | | | | | |
Encore Credit Receivables Trust, Ser 2005-2, Cl M2 | | | | | | | | |
0.840%, VAR ICE LIBOR USD 1 Month+0.690%, 11/25/2035 | | $ | 17 | | | $ | 17 | |
Flatiron CLO, Ser 2017-1A, Cl AR | | | | | | | | |
1.127%, VAR ICE LIBOR USD 3 Month+0.890%, 04/15/2027 (A) | | | 613 | | | | 611 | |
Ford Credit Floorplan Master Owner Trust A, Ser 2017-3, Cl A | | | | | | | | |
2.480%, 09/15/2024 | | | 6,690 | | | | 6,938 | |
Ford Credit Floorplan Master Owner Trust A, Ser 2018-3, Cl A1 | | | | | | | | |
3.520%, 10/15/2023 | | | 2,255 | | | | 2,318 | |
Ford Credit Floorplan Master Owner Trust A, Ser 2020-1, Cl A1 | | | | | | | | |
0.700%, 09/15/2025 | | | 7,775 | | | | 7,813 | |
GSAMP Trust, Ser 2006-HE3, Cl A2C | | | | | | | | |
0.470%, VAR ICE LIBOR USD 1 Month+0.320%, 05/25/2046 | | | 1,525 | | | | 1,514 | |
Hilton Grand Vacations Trust, Ser 2020-AA, Cl A | | | | | | | | |
2.740%, 02/25/2039 (A) | | | 3,149 | | | | 3,278 | |
HPEFS Equipment Trust, Ser 2019-1A, Cl B | | | | | | | | |
2.320%, 09/20/2029 (A) | | | 3,475 | | | | 3,533 | |
HSI Asset Securitization Trust, Ser 2006-OPT1, Cl M1 | | | | | | | | |
0.510%, VAR ICE LIBOR USD 1 Month+0.360%, 12/25/2035 | | | 3,168 | | | | 3,094 | |
JFIN CLO, Ser 2017-2A, Cl A1AR | | | | | | | | |
1.388%, VAR ICE LIBOR USD 3 Month+1.170%, 07/20/2026 (A) | | | 360 | | | | 360 | |
Kubota Credit Owner Trust, Ser 2020-1A, Cl A1 | | | | | | | | |
1.500%, 05/17/2021 (A) | | | 58 | | | | 58 | |
Magnetite XVI, Ser 2018-16A, Cl AR | | | | | | | | |
1.018%, VAR ICE LIBOR USD 3 Month+0.800%, 01/18/2028 (A) | | | 740 | | | | 735 | |
Mill City Mortgage Trust, Ser 2015-2, Cl A2 | | | | | | | | |
3.000%, 09/25/2057 (A)(C) | | | 1,181 | | | | 1,193 | |
MMAF Equipment Finance LLC, Ser 2020-A, Cl A2 | | | | | | | | |
0.740%, 04/09/2024 (A) | | | 3,720 | | | | 3,732 | |
MMAF Equipment Finance LLC, Ser 2020-BA, Cl A3 | | | | | | | | |
0.490%, 08/14/2025 (A) | | | 7,970 | | | | 7,966 | |
Nationstar HECM Loan Trust, Ser 2006-B, Cl AV4 | | | | | | | | |
0.430%, VAR ICE LIBOR USD 1 Month+0.280%, 09/25/2036 | | | 1,525 | | | | 1,519 | |
Navient Private Education Refi Loan Trust, Ser 2019-GA, Cl A | | | | | | | | |
2.400%, 10/15/2068 (A) | | | 1,125 | | | | 1,152 | |
| | |
266 | | SEI Institutional Investments Trust / Semi-Annual Report / November 30, 2020 |
| | | | | | | | |
| | | |
| Description | | Face Amount
(Thousands) | | Market Value
($ Thousands) |
| |
ASSET-BACKED SECURITIES (continued) | | | | | |
Navient Private Education Refi Loan Trust, Ser 2020-DA, Cl A | | | | | | | | |
1.690%, 05/15/2069 (A) | | $ | 5,765 | | | $ | 5,863 | |
Navient Private Education Refi Loan Trust, Ser 2020-FA, Cl A | | | | | | | | |
1.220%, 07/15/2069 (A) | | | 399 | | | | 401 | |
Navient Private Education Refi Loan Trust, Ser 2020-HA, Cl A | | | | | | | | |
1.310%, 01/15/2069 (A) | | | 4,800 | | | | 4,837 | |
Navient Student Loan Trust, Ser 2015-2, Cl A3 | | | | | | | | |
0.720%, VAR ICE LIBOR USD 1 Month+0.570%, 11/26/2040 | | | 931 | | | | 915 | |
Navient Student Loan Trust, Ser 2016-3A, Cl A2 | | | | | | | | |
1.000%, VAR ICE LIBOR USD 1 Month+0.850%, 06/25/2065 (A) | | | 32 | | | | 32 | |
Navient Student Loan Trust, Ser 2017-1A, Cl A2 | | | | | | | | |
0.900%, VAR ICE LIBOR USD 1 Month+0.750%, 07/26/2066 (A) | | | 353 | | | | 353 | |
Navient Student Loan Trust, Ser 2017-2A, Cl A | | | | | | | | |
1.200%, VAR ICE LIBOR USD 1 Month+1.050%, 12/27/2066 (A) | | | 730 | | | | 730 | |
Navient Student Loan Trust, Ser 2017-3A, Cl A2 | | | | | | | | |
0.750%, VAR ICE LIBOR USD 1 Month+0.600%, 07/26/2066 (A) | | | 1,492 | | | | 1,491 | |
Navient Student Loan Trust, Ser 2018-3A, Cl A2 | | | | | | | | |
0.570%, VAR ICE LIBOR USD 1 Month+0.420%, 03/25/2067 (A) | | | 856 | | | | 854 | |
Nelnet Student Loan Trust, Ser 2012-5A, Cl A | | | | | | | | |
0.750%, VAR ICE LIBOR USD 1 Month+0.600%, 10/27/2036 (A) | | | 368 | | | | 363 | |
Palmer Square CLO, Ser 2018-1A, Cl A1 | | | | | | | | |
1.248%, VAR ICE LIBOR USD 3 Month+1.030%, 04/18/2031 (A) | | | 500 | | | | 496 | |
Palmer Square Loan Funding, Ser 2020-2A, Cl A1 | | | | | | | | |
1.218%, VAR ICE LIBOR USD 3 Month+1.000%, 04/20/2028 (A) | | | 932 | | | | 924 | |
Park Place Securities Asset-Backed Pass- Through Certificates, Ser 2005-WCW3, Cl M1 | | | | | | | | |
0.870%, VAR ICE LIBOR USD 1 Month+0.720%, 08/25/2035 | | | 1,764 | | | | 1,772 | |
PFS Financing, Ser 2018-B, Cl A | | | | | | | | |
2.890%, 02/15/2023 (A) | | | 3,800 | | | | 3,812 | |
PFS Financing, Ser 2020-B, Cl A | | | | | | | | |
1.210%, 06/15/2024 (A) | | | 3,490 | | | | 3,521 | |
PHEAA Student Loan Trust, Ser 2016-1A, Cl A | | | | | | | | |
1.300%, VAR ICE LIBOR USD 1 Month+1.150%, 09/25/2065 (A) | | | 1,573 | | | | 1,578 | |
| | | | | | | | |
| | | |
| Description | | Face Amount
(Thousands) | | Market Value
($ Thousands) |
| |
ASSET-BACKED SECURITIES (continued) | | | | | |
RAMP Series Trust, Ser 2006-NC2, Cl A3 | | | | | | | | |
0.730%, VAR ICE LIBOR USD 1 Month+0.580%, 02/25/2036 | | $ | 1,628 | | | $ | 1,615 | |
RAMP Series Trust, Ser 2006-RZ4, Cl A3 | | | | | | | | |
0.420%, VAR ICE LIBOR USD 1 Month+0.270%, 10/25/2036 | | | 1,269 | | | | 1,257 | |
Riserva CLO, Ser 2019-3A, Cl AR | | | | | | | | |
1.358%, VAR ICE LIBOR USD 3 Month+1.140%, 10/18/2028 (A) | | | 1,000 | | | | 997 | |
SLC Student Loan Trust, Ser 2005-3, Cl A3 | | | | | | | | |
0.370%, VAR ICE LIBOR USD 3 Month+0.120%, 06/15/2029 | | | 1,140 | | | | 1,131 | |
SLC Student Loan Trust, Ser 2007-1, Cl A4 | | | | | | | | |
0.281%, VAR ICE LIBOR USD 3 Month+0.060%, 05/15/2029 | | | 1,066 | | | | 1,044 | |
SLM Student Loan Trust, Ser 2003-10A, Cl A3 | | | | | | | | |
0.720%, VAR ICE LIBOR USD 3 Month+0.470%, 12/15/2027 (A) | | | 1,055 | | | | 1,055 | |
SLM Student Loan Trust, Ser 2003-11, Cl A6 | | | | | | | | |
0.800%, VAR ICE LIBOR USD 3 Month+0.550%, 12/15/2025 (A) | | | 547 | | | | 546 | |
SLM Student Loan Trust, Ser 2004-1, Cl A4 | | | | | | | | |
0.475%, VAR ICE LIBOR USD 3 Month+0.260%, 10/27/2025 | | | 639 | | | | 635 | |
SLM Student Loan Trust, Ser 2005-4, Cl A3 | | | | | | | | |
0.335%, VAR ICE LIBOR USD 3 Month+0.120%, 01/25/2027 | | | 1,162 | | | | 1,152 | |
SLM Student Loan Trust, Ser 2005-5, Cl A4 | | | | | | | | |
0.355%, VAR ICE LIBOR USD 3 Month+0.140%, 10/25/2028 | | | 940 | | | | 934 | |
SLM Student Loan Trust, Ser 2006-5, Cl A5 | | | | | | | | |
0.325%, VAR ICE LIBOR USD 3 Month+0.110%, 01/25/2027 | | | 105 | | | | 105 | |
SLM Student Loan Trust, Ser 2006-8, Cl A5 | | | | | | | | |
0.325%, VAR ICE LIBOR USD 3 Month+0.110%, 01/27/2025 | | | 243 | | | | 242 | |
SLM Student Loan Trust, Ser 2006-9, Cl A5 | | | | | | | | |
0.315%, VAR ICE LIBOR USD 3 Month+0.100%, 01/26/2026 | | | 64 | | | | 64 | |
SLM Student Loan Trust, Ser 2007-6, Cl A4 | | | | | | | | |
0.595%, VAR ICE LIBOR USD 3 Month+0.380%, 10/25/2024 | | | 609 | | | | 608 | |
SLM Student Loan Trust, Ser 2011-2, Cl A1 | | | | | | | | |
0.750%, VAR ICE LIBOR USD 1 Month+0.600%, 11/25/2027 | | | 322 | | | | 322 | |
SLM Student Loan Trust, Ser 2012-2, Cl A | | | | | | | | |
0.850%, VAR ICE LIBOR USD 1 Month+0.700%, 01/25/2029 | | | 997 | | | | 946 | |
SLM Student Loan Trust, Ser 2013-2, Cl A | | | | | | | | |
0.600%, VAR ICE LIBOR USD 1 Month+0.450%, 06/25/2043 | | | 1,220 | | | | 1,190 | |
| | |
SEI Institutional Investments Trust / Semi-Annual Report / November 30, 2020 | | 267 |
SCHEDULE OF INVESTMENTS (Unaudited)
November 30, 2020
Limited Duration Bond Fund (Continued)
| | | | | | | | |
| | | |
| Description | | Face Amount
(Thousands) | | Market Value
($ Thousands) |
| |
ASSET-BACKED SECURITIES (continued) | | | | | |
SLM Student Loan Trust, Ser 2013-4, Cl A | | | | | | | | |
0.700%, VAR ICE LIBOR USD 1 Month+0.550%, 06/25/2043 | | $ | 1,289 | | | $ | 1,264 | |
SoFi Consumer Loan Program Trust, Ser 2019-3, Cl A | | | | | | | | |
2.900%, 05/25/2028 (A) | | | 1,998 | | | | 2,021 | |
Structured Asset Investment Loan Trust, Ser 2005-3, Cl M2 | | | | | | | | |
0.810%, VAR ICE LIBOR USD 1 Month+0.660%, 04/25/2035 | | | 114 | | | | 115 | |
Structured Asset Securities Mortgage Loan Trust, Ser 2005-WF2, Cl M1 | | | | | | | | |
0.720%, VAR ICE LIBOR USD 1 Month+0.570%, 05/25/2035 | | | 500 | | | | 497 | |
Structured Asset Securities Mortgage Loan Trust, Ser 2006-WF3, Cl M1 | | | | | | | | |
0.400%, VAR ICE LIBOR USD 1 Month+0.250%, 09/25/2036 | | | 1,619 | | | | 1,603 | |
Towd Point Mortgage Trust, Ser 2019-HY2, Cl A1 | | | | | | | | |
1.150%, VAR ICE LIBOR USD 1 Month+1.000%, 05/25/2058 (A) | | | 1,467 | | | | 1,470 | |
Transportation Finance Equipment Trust, Ser 2019-1, Cl A3 | | | | | | | | |
1.850%, 04/24/2023 (A) | | | 5,095 | | | | 5,170 | |
Treman Park CLO, Ser 2018-1A, Cl ARR | | | | | | | | |
1.288%, VAR ICE LIBOR USD 3 Month+1.070%, 10/20/2028 (A) | | | 1,100 | | | | 1,098 | |
Voya CLO, Ser 2018-2A, Cl AR | | | | | | | | |
1.179%, VAR ICE LIBOR USD 3 Month+0.970%, 07/23/2027 (A) | | | 2,899 | | | | 2,894 | |
Wells Fargo Home Equity Trust, Ser 2006-1, Cl M3 | | | | | | | | |
0.645%, VAR ICE LIBOR USD 1 Month+0.495%, 05/25/2036 | | | 1,978 | | | | 1,938 | |
| | | | | | | | |
| | | | | | | 124,193 | |
| | | | | | | | |
| | |
Total Asset-Backed Securities (Cost $224,176) ($ Thousands) | | | | | | | 226,268 | |
| | | | | | | | |
| | |
MUNICIPAL BONDS — 6.1% | | | | | | | | |
| | |
Arizona — 0.3% | | | | | | | | |
Phoenix, Civic Improvement, RB | | | | | | | | |
2.107%, 07/01/2021 | | | 3,500 | | | | 3,519 | |
| | | | | | | | |
| | |
California — 1.4% | | | | | | | | |
Bay Area, Toll Authority, Sub-Ser, RB | | | | | | | | |
2.128%, 04/01/2022 | | | 4,525 | | | | 4,627 | |
2.075%, 04/01/2021 | | | 4,000 | | | | 4,023 | |
Riverside County, Pension Obligation, RB | | | | | | | | |
2.363%, 02/15/2023 | | | 2,855 | | | | 2,961 | |
| | | | | | | | |
| | | |
| Description | | Face Amount
(Thousands) | | Market Value
($ Thousands) |
| |
MUNICIPAL BONDS (continued) | | | | | |
San Francisco Bay Area, Rapid Transit District Sales Tax Revenue, Ser B, RB | | | | | | | | |
2.537%, 07/01/2022 | | $ | 3,355 | | | $ | 3,459 | |
Upper Santa Clara Valley, Joint Powers Authority, Ser B, RB | | | | | | | | |
0.525%, 08/01/2022 | | | 3,500 | | | | 3,503 | |
| | | | | | | | |
| | |
| | | | | | | 18,573 | |
| | | | | | | | |
| | |
Colorado — 0.3% | | | | | | | | |
Denver, Airport System Revenue, Ser C, RB | | | | | | | | |
1.115%, 11/15/2024 | | | 2,440 | | | | 2,445 | |
0.877%, 11/15/2023 | | | 2,350 | | | | 2,353 | |
| | | | | | | | |
| | |
| | | | | | | 4,798 | |
| | | | | | | | |
| | |
Florida — 0.2% | | | | | | | | |
Miami-Dade County, Aviation Revenue, Ser D, RB | | | | | | | | |
2.124%, 10/01/2021 | | | 2,335 | | | | 2,344 | |
| | | | | | | | |
| | |
Hawaii — 0.2% | | | | | | | | |
Honolulu, Wastewater System Revenue, Ser A, RB | | | | | | | | |
2.000%, 07/01/2022 | | | 3,000 | | | | 3,069 | |
| | | | | | | | |
| | |
Michigan — 0.3% | | | | | | | | |
Michigan, Finance Authority, RB | | | | | | | | |
0.487%, 10/01/2023 | | | 4,460 | | | | 4,462 | |
| | | | | | | | |
| | |
New York — 1.9% | | | | | | | | |
Long Island, Power Authority, Ser C, RB Callable 06/01/2022 @ 100 | | | | | | | | |
0.764%, 03/01/2023 | | | 3,610 | | | | 3,597 | |
New York City, Transitional Finance Authority, Building Aid Revenue, Sub-Ser, RB | | | | | | | | |
3.310%, 07/15/2022 | | | 5,195 | | | | 5,436 | |
New York City, Transitional Finance Authority, Future Tax Secured Revenue, Ser A3, RB | | | | | | | | |
2.710%, 08/01/2023 | | | 5,095 | | | | 5,355 | |
New York City, Transitional Finance Authority, Future Tax Secured Revenue, Ser B-2, RB | | | | | | | | |
2.310%, 11/01/2026 | | | 820 | | | | 875 | |
New York State, Dormitory Authority, Ser A, RB Callable 03/15/2025 @ 100 | | | | | | | | |
4.000%, 03/15/2032 | | | 850 | | | | 951 | |
New York State, Dormitory Authority, Ser D, RB | | | | | | | | |
5.000%, 03/15/2024 | | | 950 | | | | 1,077 | |
New York State, Urban Development, RB | | | | | | | | |
0.622%, 03/15/2023 | | | 8,785 | | | | 8,822 | |
| | | | | | | | |
| | |
| | | | | | | 26,113 | |
| | | | | | | | |
| | |
268 | | SEI Institutional Investments Trust / Semi-Annual Report / November 30, 2020 |
| | | | | | | | |
| | | |
| Description | | Face Amount
(Thousands) | | Market Value
($ Thousands) |
|
MUNICIPAL BONDS (continued) | |
|
Pennsylvania — 0.3% | |
Pennsylvania State University, Ser D, RB | | | | | | | | |
1.353%, 09/01/2023 | | $ | 1,870 | | | $ | 1,910 | |
1.140%, 09/01/2022 | | | 2,515 | | | | 2,545 | |
| | | | | | | | |
| | |
| | | | | | | 4,455 | |
| | | | | | | | |
| |
South Carolina — 0.4% | | | | | |
South Carolina, Public Service Authority, Ser D, RB | | | | | | | | |
2.388%, 12/01/2023 | | | 5,362 | | | | 5,604 | |
| | | | | | | | |
|
Texas — 0.7% | |
Dallas Fort Worth, International Airport, Ser A, RB | | | | | | | | |
1.939%, 11/01/2023 | | | 3,500 | | | | 3,622 | |
Houston, Airport System Revenue, Sub-Ser C, RB | | | | | | | | |
1.054%, 07/01/2023 | | | 3,160 | | | | 3,165 | |
| | | | | | | | |
| | | |
| Description | | Face Amount
(Thousands) | | Market Value
($ Thousands) |
|
MUNICIPAL BONDS (continued) | |
Houston, Utility System Revenue, Ser B, RB | | | | | | | | |
3.428%, 05/15/2023 | | $ | 2,225 | | | $ | 2,377 | |
| | | | | | | | |
| | |
| | | | | | | 9,164 | |
| | | | | | | | |
| | |
Washington — 0.1% | | | | | | | | |
Franklin County, Ser B, RB | | | | | | | | |
1.980%, 09/01/2021 | | | 1,000 | | | | 1,006 | |
| | | | | | | | |
Total Municipal Bonds
(Cost $82,089) ($ Thousands) | | | | 83,107 | |
| | | | | | | | |
| | |
| | | Shares | | |
| | |
CASH EQUIVALENT — 0.4% | | | | | | | | |
SEI Daily Income Trust, Government Fund, Cl F | | | | | | | | |
0.010%**† | | | 5,857,855 | | | | 5,858 | |
| | | | | | | | |
Total Cash Equivalent
(Cost $5,858) ($ Thousands) | | | | 5,858 | |
| | | | | | | | |
Total Investments in Securities — 101.8%
(Cost $1,369,319) ($ Thousands) | | | $ | 1,384,082 | |
| | | | | | | | |
A list of the open futures contracts held by the Fund at November 30, 2020, is as follows:
| | | | | | | | | | | | | | | | | | | | |
| | | | | | |
| Type of Contract | | Number of
Contracts
Long/(Short) | | | Expiration
Date | | | Notional Amount
(Thousands) | | | Value
(Thousands) | | | Unrealized
Appreciation
(Depreciation)
(Thousands) | |
U.S. 2-Year Treasury Note | | | 24 | | | | Apr-2021 | | | $ | 5,299 | | | $ | 5,300 | | | $ | 1 | |
U.S. 5-Year Treasury Note | | | (59 | ) | | | Apr-2021 | | | | (7,428 | ) | | | (7,436 | ) | | | (8 | ) |
Ultra 10-Year U.S. Treasury Note | | | (35 | ) | | | Mar-2021 | | | | (5,495 | ) | | | (5,499 | ) | | | (4 | ) |
| | | | | | | | | | | | |
| | | | | | | | | | $ | (7,624 | ) | | $ | (7,635 | ) | | $ | (11 | ) |
| | | | | | | | | | | | |
| | Percentages are based on Net Assets of $1,359,550 ($ Thousands). |
| ** | The rate reported is the 7-day effective yield as of November 30, 2020. |
| † | Investment in Affiliated Security (see Note 6). |
| (A) | Security exempt from registration under Rule 144A of the Securities Act of 1933. These securities may be resold in transactions exempt from registration normally to qualified institutions. On November 30, 2020, the value of these securities amounted to $319,974 ($ Thousands), representing 23.5% of the Net Assets of the Fund. |
| (B) | Zero coupon security. The rate shown on the Schedule of Investments is the security’s effective yield at the time of purchase. |
| (C) | Variable or floating rate security, the interest rate of which adjusts periodically based on changes in current interest rates and prepayments on the underlying pool of assets. |
ACES — Altern+ative Credit Enhancement Structure
ARM — Adjustable Rate Mortgage
Cl — Class
CLO — Collateralized Loan Obligation
CMO — Collateralized Mortgage Obligation
DAC — Designated Activity Company
FHLMC — Federal Home Loan Mortgage Corporation
FNMA — Federal National Mortgage Association
FREMF— Freddie Mac Multi-Family
GNMA — Government National Mortgage Association
ICE— Intercontinental Exchange
LIBOR— London Interbank Offered Rate
LLC — Limited Liability Company
L.P. — Limited Partnership
MTN — Medium Term Note
RB — Revenue Bond
REMIC — Real Estate Mortgage Investment Conduit
Ser — Series
TBA — To Be Announced
UMBS — Uniform Mortgage Backed Securities
VAR — Variable Rate
| | |
SEI Institutional Investments Trust / Semi-Annual Report / November 30, 2020 | | 269 |
SCHEDULE OF INVESTMENTS (Unaudited)
November 30, 2020
Limited Duration Bond Fund (Concluded)
The following is a list of the level of inputs used as of November 30, 2020, in valuing the Fund’s investments and other financial instruments carried at value ($ Thousands):
| | | | | | | | | | | | | | | | |
| | | | | |
| Investments in Securities | | Level 1
($) | | | Level 2
($) | | | Level 3
($) | | | Total
($) | |
Corporate Obligations | | | – | | | | 383,670 | | | | – | | | | 383,670 | |
U.S. Treasury Obligations | | | – | | | | 356,775 | | | | – | | | | 356,775 | |
Mortgage-Backed Securities | | | – | | | | 328,404 | | | | – | | | | 328,404 | |
Asset-Backed Securities | | | – | | | | 226,268 | | | | – | | | | 226,268 | |
Municipal Bonds | | | – | | | | 83,107 | | | | – | | | | 83,107 | |
Cash Equivalent | | | 5,858 | | | | – | | | | – | | | | 5,858 | |
| | | | | | | | | | | | | | | | |
Total Investments in Securities | | | 5,858 | | | | 1,378,224 | | | | – | | | | 1,384,082 | |
| | | | | | | | | | | | | | | | |
| | | | | | | | | | | | | | | | |
| | | | | |
| Other Financial Instruments | | Level 1
($) | | | Level 2
($) | | | Level 3
($) | | | Total
($) | |
Futures Contracts* | | | | | | | | | | | | | | | | |
Unrealized Appreciation | | | 1 | | | | – | | | | – | | | | 1 | |
Unrealized Depreciation | | | (12) | | | | – | | | | – | | | | (12) | |
| | | | | | | | | | | | | | | | |
Total Other Financial Instruments | | | (11) | | | | – | | | | – | | | | (11) | |
| | | | | | | | | | | | | | | | |
*Futures contracts are valued at the unrealized appreciation/depreciation on the instruments.
For the period ended November 30, 2020, there were no transfers in or out of Level 3.
For more information on valuation inputs, see Note 2 – Significant Accounting Policies in Notes to Financial Statements.
The following is a summary of the Fund’s transactions with affiliates for the period ended November 30, 2020 ($ Thousands):
| | | | | | | | | | | | | | | | | | |
| | | | | | | | | | |
| Security Description | | Value
5/31/2020 | | Purchases
at Cost | | Proceeds from
Sales | | Realized Gain/
(Loss) | | Change in
Unrealized
Appreciation/
(Depreciation) | | Value
11/30/2020 | | Shares | | Income | | Capital
Gains |
SEI Daily Income Trust, Government Fund, Cl F | | $ 23,060 | | $ 539,775 | | $ (556,977) | | $ — | | $ — | | $ 5,858 | | 5,857,855 | | $ 2 | | $ — |
| | | | | | | | | | | | | | | | | | |
Amounts designated as “—” are $0 or have been rounded to $0.
The accompanying notes are an integral part of the financial statements.
| | |
270 | | SEI Institutional Investments Trust / Semi-Annual Report / November 30, 2020 |
SUMMARY SCHEDULE OF INVESTMENTS (Unaudited)
November 30, 2020
Intermediate Duration Credit Fund
Sector Weightings†:
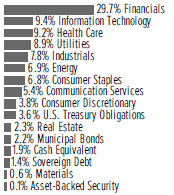
†Percentages are based on total investments.
| | | | | | | | |
| | | |
| Description | | Face Amount
(Thousands) | | Market Value
($ Thousands) |
|
CORPORATE OBLIGATIONS — 88.5% | |
|
Communication Services — 5.9% | |
Alphabet | | | | | | | | |
1.900%, 08/15/2040 | | $ | 3,620 | | | $ | 3,577 | |
America Movil | | | | | | | | |
6.125%, 03/30/2040 | | | 645 | | | | 960 | |
3.125%, 07/16/2022 | | | 12,265 | | | | 12,762 | |
AT&T | | | | | | | | |
8.750%, 11/15/2031 | | | 1,150 | | | | 1,726 | |
6.800%, 05/15/2036 | | | 2,915 | | | | 3,978 | |
4.900%, 08/15/2037 | | | 3,040 | | | | 3,814 | |
3.650%, 06/01/2051 | | | 3,295 | | | | 3,485 | |
3.650%, 09/15/2059 (A) | | | 1,996 | | | | 2,023 | |
3.500%, 06/01/2041 | | | 890 | | | | 967 | |
3.500%, 09/15/2053 (A) | | | 2,835 | | | | 2,892 | |
3.372%, 11/27/2022 (A)(B) | | | 6,000 | | | | 5,937 | |
2.250%, 02/01/2032 | | | 2,430 | | | | 2,452 | |
Charter Communications Operating LLC / Charter Communications Operating Capital | | | | | | | | |
4.908%, 07/23/2025 | | | 115 | | | | 133 | |
4.464%, 07/23/2022 | | | 50 | | | | 53 | |
Comcast | | | | | | | | |
6.450%, 03/15/2037 | | | 3,764 | | | | 5,779 | |
5.650%, 06/15/2035 | | | 260 | | | | 373 | |
4.950%, 10/15/2058 | | | 2,370 | | | | 3,608 | |
4.700%, 10/15/2048 | | | 5,891 | | | | 8,359 | |
4.600%, 10/15/2038 | | | 4,556 | | | | 6,030 | |
4.200%, 08/15/2034 | | | 7,700 | | | | 9,676 | |
4.049%, 11/01/2052 | | | 1,800 | | | | 2,336 | |
3.969%, 11/01/2047 | | | 3,193 | | | | 4,032 | |
3.950%, 10/15/2025 | | | 4,090 | | | | 4,689 | |
3.900%, 03/01/2038 | | | 1,305 | | | | 1,607 | |
3.700%, 04/15/2024 | | | 165 | | | | 182 | |
3.600%, 03/01/2024 | | | 920 | | | | 1,011 | |
3.400%, 04/01/2030 | | | 4,400 | | | | 5,087 | |
3.400%, 07/15/2046 | | | 1,060 | | | | 1,230 | |
| | | | | | | | |
| | | |
| Description | | Face Amount
(Thousands) | | Market Value
($ Thousands) |
|
CORPORATE OBLIGATIONS (continued) | |
3.375%, 02/15/2025 | | $ | 8,100 | | | $ | 8,935 | |
3.375%, 08/15/2025 | | | 2,290 | | | | 2,550 | |
3.150%, 03/01/2026 | | | 3,250 | | | | 3,623 | |
3.150%, 02/15/2028 | | | 780 | | | | 879 | |
3.100%, 04/01/2025 | | | 1,870 | | | | 2,057 | |
Comcast Cable Communications Holdings | | | | | | | | |
9.455%, 11/15/2022 | | | 3,850 | | | | 4,532 | |
Cox Communications | | | | | | | | |
6.450%, 12/01/2036 (A) | | | 2,610 | | | | 3,673 | |
Discovery Communications LLC | | | | | | | | |
5.000%, 09/20/2037 | | | 1,310 | | | | 1,659 | |
2.950%, 03/20/2023 | | | 2,362 | | | | 2,490 | |
NBCUniversal Media LLC | | | | | | | | |
6.400%, 04/30/2040 | | | 2,555 | | | | 4,034 | |
5.950%, 04/01/2041 | | | 1,669 | | | | 2,564 | |
Sprint Spectrum LLC | | | | | | | | |
5.152%, 03/20/2028 (A) | | | 6,735 | | | | 7,808 | |
4.738%, 03/20/2025 (A) | | | 6,525 | | | | 7,031 | |
3.360%, 09/20/2021 (A) | | | 557 | | | | 562 | |
Time Warner Cable LLC | | | | | | | | |
6.550%, 05/01/2037 | | | 2,145 | | | | 2,968 | |
4.500%, 09/15/2042 | | | 585 | | | | 675 | |
T-Mobile USA | | | | | | | | |
3.500%, 04/15/2025 (A) | | | 3,290 | | | | 3,630 | |
2.050%, 02/15/2028 (A) | | | 4,220 | | | | 4,336 | |
Verizon Communications | | | | | | | | |
7.750%, 12/01/2030 | | | 1,750 | | | | 2,702 | |
4.862%, 08/21/2046 | | | 1,032 | | | | 1,421 | |
4.522%, 09/15/2048 | | | 3,701 | | | | 4,980 | |
3.850%, 11/01/2042 | | | 555 | | | | 671 | |
2.650%, 11/20/2040 | | | 3,330 | | | | 3,436 | |
1.750%, 01/20/2031 | | | 3,728 | | | | 3,771 | |
Verizon Communications Inc | | | | | | | | |
5.012%, 04/15/2049 | | | 217 | | | | 308 | |
2.987%, 10/30/2056 (A) | | | 4,170 | | | | 4,417 | |
ViacomCBS | | | | | | | | |
6.875%, 04/30/2036 | | | 2,760 | | | | 3,939 | |
4.750%, 05/15/2025 | | | 3,700 | | | | 4,287 | |
Walt Disney | | | | | | | | |
6.400%, 12/15/2035 | | | 2,915 | | | | 4,492 | |
3.600%, 01/13/2051 | | | 3,675 | | | | 4,366 | |
2.750%, 09/01/2049 | | | 5,418 | | | | 5,549 | |
2.650%, 01/13/2031 | | | 1,910 | | | | 2,081 | |
| | | | | | | | |
| | | | | | | 209,184 | |
| | | | | | | | |
|
Consumer Discretionary — 4.3% | |
Air Canada Pass-Through Trust, Ser 2015-1, Cl A | | | | | | | | |
3.600%, 03/15/2027 (A) | | | 3,644 | | | | 3,467 | |
Alibaba Group Holding | | | | | | | | |
2.800%, 06/06/2023 | | | 2,060 | | | | 2,168 | |
| | |
SEI Institutional Investments Trust / Semi-Annual Report / November 30, 2020 | | 271 |
SCHEDULE OF INVESTMENTS (Unaudited)
November 30, 2020
Intermediate Duration Credit Fund (Continued)
| | | | | | | | |
| | | |
| Description | | Face Amount
(Thousands) | | Market Value
($ Thousands) |
|
CORPORATE OBLIGATIONS (continued) | |
Amazon.com | | | | | | | | |
3.875%, 08/22/2037 | | $ | 4,295 | | | $ | 5,438 | |
2.800%, 08/22/2024 | | | 2,800 | | | | 3,031 | |
American Honda Finance | | | | | | | | |
1.950%, 05/20/2022 | | | 12,280 | | | | 12,571 | |
American Honda Finance MTN | | | | | | | | |
0.400%, 10/21/2022 | | | 4,678 | | | | 4,684 | |
BMW US Capital LLC | | | | | | | | |
4.150%, 04/09/2030 (A) | | | 3,300 | | | | 3,994 | |
2.800%, 04/11/2026 (A) | | | 3,630 | | | | 3,916 | |
British Airways 2020-1 Class A Pass Through Trust | | | | | | | | |
4.250%, 11/15/2032 (A) | | | 2,585 | | | | 2,682 | |
Ferguson Finance | | | | | | | | |
4.500%, 10/24/2028 (A) | | | 1,717 | | | | 2,060 | |
3.250%, 06/02/2030 (A) | | | 4,865 | | | | 5,389 | |
Ford Motor Credit LLC | | | | | | | | |
4.271%, 01/09/2027 | | | 4,515 | | | | 4,674 | |
3.813%, 10/12/2021 | | | 6,270 | | | | 6,346 | |
General Motors | | | | | | | | |
6.250%, 10/02/2043 | | | 570 | | | | 769 | |
5.950%, 04/01/2049 | | | 265 | | | | 357 | |
5.150%, 04/01/2038 | | | 875 | | | | 1,043 | |
5.000%, 04/01/2035 | | | 395 | | | | 473 | |
General Motors Financial | | | | | | | | |
3.550%, 07/08/2022 | | | 4,770 | | | | 4,984 | |
1.700%, 08/18/2023 | | | 6,800 | | | | 6,947 | |
Home Depot | | | | | | | | |
5.875%, 12/16/2036 | | | 4,344 | | | | 6,610 | |
4.500%, 12/06/2048 | | | 1,875 | | | | 2,621 | |
4.400%, 03/15/2045 | | | 840 | | | | 1,128 | |
4.250%, 04/01/2046 | | | 400 | | | | 532 | |
3.900%, 06/15/2047 | | | 1,505 | | | | 1,918 | |
3.500%, 09/15/2056 | | | 2,895 | | | | 3,550 | |
3.350%, 09/15/2025 | | | 620 | | | | 699 | |
3.350%, 04/15/2050 | | | 735 | | | | 872 | |
3.300%, 04/15/2040 | | | 830 | | | | 983 | |
2.800%, 09/14/2027 | | | 3,120 | | | | 3,473 | |
2.700%, 04/15/2030 | | | 9,255 | | | | 10,284 | |
Hyundai Capital America | | | | | | | | |
2.375%, 10/15/2027 (A) | | | 2,725 | | | | 2,811 | |
1.250%, 09/18/2023 (A) | | | 4,610 | | | | 4,643 | |
Kohl’s | | | | | | | | |
5.550%, 07/17/2045 | | | 3,160 | | | | 3,096 | |
Lowe’s | | | | | | | | |
1.700%, 10/15/2030 | | | 5,010 | | | | 5,035 | |
1.300%, 04/15/2028 | | | 3,000 | | | | 3,001 | |
McDonald’s MTN | | | | | | | | |
2.125%, 03/01/2030 | | | 2,900 | | | | 3,051 | |
NIKE | | | | | | | | |
3.250%, 03/27/2040 | | | 750 | | | | 879 | |
| | | | | | | | |
| | | |
| Description | | Face Amount
(Thousands) | | Market Value
($ Thousands) |
|
CORPORATE OBLIGATIONS (continued) | |
QVC | | | | | | | | |
4.850%, 04/01/2024 | | $ | 1,060 | | | $ | 1,116 | |
Target | | | | | | | | |
2.500%, 04/15/2026 | | | 1,810 | | | | 1,993 | |
TJX | | | | | | | | |
1.600%, 05/15/2031 | | | 3,835 | | | | 3,861 | |
Volkswagen Group of America Finance LLC | | | | | | | | |
1.250%, 11/24/2025 (A) | | | 6,775 | | | | 6,782 | |
0.875%, 11/22/2023 (A) | | | 6,915 | | | | 6,929 | |
| | | | | | | | |
| | | | | | | 150,860 | |
| | | | | | | | |
|
Consumer Staples — 9.6% | |
Advocate Health & Hospitals | | | | | | | | |
4.272%, 08/15/2048 | | | 2,984 | | | | 3,827 | |
2.211%, 06/15/2030 | | | 3,670 | | | | 3,834 | |
Altria Group | | | | | | | | |
9.950%, 11/10/2038 | | | 1,708 | | | | 2,861 | |
5.950%, 02/14/2049 | | | 570 | | | | 813 | |
5.800%, 02/14/2039 | | | 260 | | | | 344 | |
5.375%, 01/31/2044 | | | 1,595 | | | | 2,074 | |
4.500%, 05/02/2043 | | | 375 | | | | 432 | |
3.400%, 05/06/2030 | | | 845 | | | | 939 | |
Anheuser-Busch Cos LLC / Anheuser-Busch InBev Worldwide | | | | | | | | |
4.700%, 02/01/2036 | | | 2,706 | | | | 3,452 | |
Anheuser-Busch InBev Worldwide | | | | | | | | |
8.000%, 11/15/2039 | | | 7,409 | | | | 12,595 | |
4.900%, 02/01/2046 | | | 250 | | | | 327 | |
4.750%, 01/23/2029 | | | 5,220 | | | | 6,414 | |
4.375%, 04/15/2038 | | | 664 | | | | 822 | |
Archer-Daniels-Midland | | | | | | | | |
4.500%, 03/15/2049 | | | 4,605 | | | | 6,649 | |
Ascension Health | | | | | | | | |
3.945%, 11/15/2046 | | | 4,194 | | | | 5,352 | |
3.106%, 11/15/2039 | | | 1,610 | | | | 1,767 | |
2.532%, 11/15/2029 | | | 3,500 | | | | 3,798 | |
BAT Capital | | | | | | | | |
4.906%, 04/02/2030 | | | 7,210 | | | | 8,677 | |
4.390%, 08/15/2037 | | | 2,998 | | | | 3,375 | |
3.215%, 09/06/2026 | | | 775 | | | | 845 | |
2.259%, 03/25/2028 | | | 4,745 | | | | 4,889 | |
Bayer US Finance II LLC | | | | | | | | |
4.700%, 07/15/2064 (A) | | | 3,685 | | | | 4,269 | |
3.500%, 06/25/2021 (A) | | | 5,000 | | | | 5,074 | |
Bayer US Finance LLC | | | | | | | | |
3.375%, 10/08/2024 (A) | | | 1,820 | | | | 1,982 | |
Blue Cross & Blue Shield of Minnesota | | | | | | | | |
3.790%, 05/01/2025 (A) | | | 2,086 | | | | 2,269 | |
Bon Secours Mercy Health | | | | | | | | |
3.464%, 06/01/2030 | | | 1,930 | | | | 2,201 | |
2.095%, 06/01/2031 | | | 1,430 | | | | 1,442 | |
| | |
272 | | SEI Institutional Investments Trust / Semi-Annual Report / November 30, 2020 |
| | | | | | | | |
| | | |
| Description | | Face Amount
(Thousands) | | Market Value
($ Thousands) |
|
CORPORATE OBLIGATIONS (continued) | |
Bowdoin College | | | | | | | | |
4.693%, 07/01/2112 | | $ | 378 | | | $ | 442 | |
Bunge Finance | | | | | | | | |
1.630%, 08/17/2025 | | | 1,910 | | | | 1,950 | |
Coca-Cola | | | | | | | | |
2.500%, 06/01/2040 | | | 2,525 | | | | 2,727 | |
1.000%, 03/15/2028 | | | 2,355 | | | | 2,356 | |
CommonSpirit Health | | | | | | | | |
4.187%, 10/01/2049 | | | 2,925 | | | | 3,241 | |
Conagra Brands | | | | | | | | |
1.375%, 11/01/2027 | | | 3,605 | | | | 3,638 | |
Costco Wholesale | | | | | | | | |
1.600%, 04/20/2030 | | | 3,000 | | | | 3,076 | |
CVS Pass-Through Trust | | | | | | | | |
8.353%, 07/10/2031 (A) | | | 1,980 | | | | 2,621 | |
7.507%, 01/10/2032 (A) | | | 1,371 | | | | 1,694 | |
6.036%, 12/10/2028 | | | 2,640 | | | | 3,005 | |
Diageo Capital | | | | | | | | |
2.125%, 04/29/2032 | | | 775 | | | | 820 | |
Georgetown University | | | | | | | | |
4.315%, 04/01/2049 | | | 2,429 | | | | 3,009 | |
Health Care Service, A Mutual Legal Reserve | | | | | | | | |
3.200%, 06/01/2050 (A) | | | 3,025 | | | | 3,260 | |
2.200%, 06/01/2030 (A) | | | 4,515 | | | | 4,707 | |
1.500%, 06/01/2025 (A) | | | 4,585 | | | | 4,704 | |
Hershey | | | | | | | | |
3.100%, 05/15/2021 | | | 4,805 | | | | 4,866 | |
2.300%, 08/15/2026 | | | 3,985 | | | | 4,302 | |
Kaiser Foundation Hospitals | | | | | | | | |
4.150%, 05/01/2047 | | | 2,830 | | | | 3,699 | |
3.150%, 05/01/2027 | | | 2,005 | | | | 2,238 | |
Kimberly-Clark | | | | | | | | |
3.200%, 04/25/2029 | | | 5,080 | | | | 5,873 | |
Kroger | | | | | | | | |
3.850%, 08/01/2023 | | | 2,700 | | | | 2,919 | |
Land O’ Lakes | | | | | | | | |
6.000%, 11/15/2022 (A) | | | 640 | | | | 679 | |
Mars | | | | | | | | |
4.200%, 04/01/2059 (A) | | | 1,520 | | | | 2,003 | |
3.600%, 04/01/2034 (A) | | | 1,790 | | | | 2,155 | |
3.200%, 04/01/2030 (A) | | | 2,435 | | | | 2,821 | |
2.700%, 04/01/2025 (A) | | | 7,530 | | | | 8,156 | |
2.375%, 07/16/2040 (A) | | | 5,086 | | | | 5,230 | |
Massachusetts Institute of Technology | | | | | | | | |
5.600%, 07/01/2111 | | | 3,235 | | | | 5,591 | |
Memorial Health Services | | | | | | | | |
3.447%, 11/01/2049 | | | 1,680 | | | | 1,778 | |
Mondelez International | | | | | | | | |
2.125%, 04/13/2023 | | | 1,515 | | | | 1,572 | |
MultiCare Health System | | | | | | | | |
2.803%, 08/15/2050 | | | 4,370 | | | | 4,374 | |
| | | | | | | | |
| | | |
| Description | | Face Amount
(Thousands) | | Market Value
($ Thousands) |
|
CORPORATE OBLIGATIONS (continued) | |
Nestle Holdings | | | | | | | | |
4.000%, 09/24/2048 (A) | | $ | 1,445 | | | $ | 1,951 | |
3.500%, 09/24/2025 (A) | | | 6,130 | | | | 6,896 | |
New York and Presbyterian Hospital | | | | | | | | |
4.763%, 08/01/2116 | | | 1,395 | | | | 1,689 | |
1.651%, 08/01/2030 | | | 2,487 | | | | 2,490 | |
Northwell Healthcare | | | | | | | | |
4.260%, 11/01/2047 | | | 1,915 | | | | 2,220 | |
Northwestern University | | | | | | | | |
4.643%, 12/01/2044 | | | 100 | | | | 133 | |
3.662%, 12/01/2057 | | | 1,920 | | | | 2,338 | |
Novartis Capital | | | | | | | | |
3.000%, 11/20/2025 | | | 4,115 | | | | 4,564 | |
2.750%, 08/14/2050 | | | 5,386 | | | | 5,912 | |
NY Society for Relief of Ruptured & Crippled Maintaining Hospital Special Surgery | | | | | | | | |
2.667%, 10/01/2050 | | | 5,210 | | | | 4,968 | |
Orlando Health Obligated Group | | | | | | | | |
3.327%, 10/01/2050 | | | 720 | | | | 762 | |
PeaceHealth Obligated Group | | | | | | | | |
3.218%, 11/15/2050 | | | 3,600 | | | | 3,776 | |
PepsiCo | | | | | | | | |
3.625%, 03/19/2050 | | | 605 | | | | 761 | |
3.450%, 10/06/2046 | | | 2,386 | | | | 2,902 | |
3.375%, 07/29/2049 | | | 3,384 | | | | 4,112 | |
2.625%, 03/19/2027 | | | 2,075 | | | | 2,284 | |
2.375%, 10/06/2026 | | | 3,920 | | | | 4,270 | |
1.625%, 05/01/2030 | | | 1,335 | | | | 1,374 | |
Philip Morris International | | | | | | | | |
4.500%, 03/20/2042 | | | 2,830 | | | | 3,621 | |
4.375%, 11/15/2041 | | | 2,207 | | | | 2,784 | |
3.875%, 08/21/2042 | | | 3,460 | | | | 4,094 | |
2.500%, 11/02/2022 | | | 4,640 | | | | 4,828 | |
2.375%, 08/17/2022 | | | 3,045 | | | | 3,145 | |
Providence St. Joseph Health Obligated Group | | | | | | | | |
2.532%, 10/01/2029 | | | 9,800 | | | | 10,440 | |
Reynolds American | | | | | | | | |
8.125%, 05/01/2040 | | | 980 | | | | 1,435 | |
7.250%, 06/15/2037 | | | 2,870 | | | | 3,953 | |
4.450%, 06/12/2025 | | | 1,575 | | | | 1,796 | |
Roche Holdings | | | | | | | | |
2.625%, 05/15/2026 (A) | | | 3,145 | | | | 3,446 | |
Rockefeller Foundation | | | | | | | | |
2.492%, 10/01/2050 | | | 3,140 | | | | 3,212 | |
RWJ Barnabas Health | | | | | | | | |
3.477%, 07/01/2049 | | | 4,000 | | | | 4,445 | |
SSM Health Care | | | | | | | | |
3.688%, 06/01/2023 | | | 7,331 | | | | 7,842 | |
Stanford Health Care | | | | | | | | |
3.310%, 08/15/2030 | | | 990 | | | | 1,126 | |
| | |
SEI Institutional Investments Trust / Semi-Annual Report / November 30, 2020 | | 273 |
SCHEDULE OF INVESTMENTS (Unaudited)
November 30, 2020
Intermediate Duration Credit Fund (Continued)
| | | | | | | | |
| | | |
| Description | | Face Amount
(Thousands) | | Market Value
($ Thousands) |
|
CORPORATE OBLIGATIONS (continued) | |
Takeda Pharmaceutical | | | | | | | | |
3.175%, 07/09/2050 | | $ | 4,450 | | | $ | 4,766 | |
2.050%, 03/31/2030 | | | 3,352 | | | | 3,417 | |
Unilever Capital | | | | | | | | |
2.125%, 09/06/2029 | | | 2,840 | | | | 3,045 | |
University of Southern California | | | | | | | | |
5.250%, 10/01/2111 | | | 3,250 | | | | 5,076 | |
2.805%, 10/01/2050 | | | 194 | | | | 210 | |
Walmart | | | | | | | | |
4.050%, 06/29/2048 | | | 5,284 | | | | 7,265 | |
2.950%, 09/24/2049 | | | 3,905 | | | | 4,543 | |
2.550%, 04/11/2023 | | | 7,590 | | | | 7,949 | |
2.375%, 09/24/2029 | | | 6,015 | | | | 6,622 | |
2.350%, 12/15/2022 | | | 4,655 | | | | 4,848 | |
| | | | | | | | |
| | | | | | | 348,139 | |
| | | | | | | | |
| | |
Energy — 6.8% | | | | | | | | |
BP Capital Markets | | | | | | | | |
3.723%, 11/28/2028 | | | 2,159 | | | | 2,491 | |
3.279%, 09/19/2027 | | | 1,825 | | | | 2,039 | |
BP Capital Markets America | | | | | | | | |
3.937%, 09/21/2028 | | | 2,205 | | | | 2,584 | |
3.216%, 11/28/2023 | | | 5,420 | | | | 5,820 | |
3.000%, 02/24/2050 | | | 920 | | | | 957 | |
2.772%, 11/10/2050 | | | 2,940 | | | | 2,932 | |
2.520%, 09/19/2022 | | | 4,430 | | | | 4,591 | |
Cameron LNG LLC | | | | | | | | |
2.902%, 07/15/2031 (A) | | | 478 | | | | 525 | |
Cheniere Corpus Christi Holdings LLC | | | | | | | | |
5.125%, 06/30/2027 | | | 2,120 | | | | 2,460 | |
Chevron | | | | | | | | |
2.895%, 03/03/2024 | | | 4,000 | | | | 4,281 | |
2.236%, 05/11/2030 | | | 7,687 | | | | 8,264 | |
Colonial Enterprises | | | | | | | | |
3.250%, 05/15/2030 (A) | | | 3,325 | | | | 3,724 | |
ConocoPhillips | | | | | | | | |
6.500%, 02/01/2039 | | | 3,065 | | | | 4,690 | |
1.121%, VAR ICE LIBOR USD 3 Month+0.900%, 05/15/2022 | | | 3,955 | | | | 3,983 | |
Diamondback Energy | | | | | | | | |
4.750%, 05/31/2025 | | | 1,225 | | | | 1,366 | |
2.875%, 12/01/2024 | | | 1,675 | | | | 1,746 | |
Energy Transfer Operating | | | | | | | | |
5.200%, 02/01/2022 | | | 4,940 | | | | 5,127 | |
Eni Spa | | | | | | | | |
4.000%, 09/12/2023 (A) | | | 6,800 | | | | 7,400 | |
Enterprise Products Operating LLC | | | | | | | | |
3.900%, 02/15/2024 | | | 4,250 | | | | 4,659 | |
EOG Resources | | | | | | | | |
4.375%, 04/15/2030 | | | 1,915 | | | | 2,336 | |
Equinor | | | | | | | | |
3.700%, 04/06/2050 | | | 1,385 | | | | 1,666 | |
| | | | | | | | |
| | | |
| Description | | Face Amount
(Thousands) | | Market Value
($ Thousands) |
|
CORPORATE OBLIGATIONS (continued) | |
2.875%, 04/06/2025 | | $ | 3,480 | | | $ | 3,782 | |
2.375%, 05/22/2030 | | | 2,035 | | | | 2,173 | |
1.750%, 01/22/2026 | | | 1,950 | | | | 2,039 | |
Exxon Mobil | | | | | | | | |
4.327%, 03/19/2050 | | | 4,660 | | | | 6,019 | |
4.227%, 03/19/2040 | | | 3,900 | | | | 4,821 | |
3.452%, 04/15/2051 | | | 3,500 | | | | 3,986 | |
3.043%, 03/01/2026 | | | 1,985 | | | | 2,195 | |
2.995%, 08/16/2039 | | | 2,830 | | | | 3,039 | |
1.571%, 04/15/2023 | | | 6,890 | | | | 7,086 | |
Galaxy Pipeline Assets Bidco | | | | | | | | |
2.625%, 03/31/2036 (A) | | | 2,555 | | | | 2,641 | |
1.750%, 09/30/2027 (A) | | | 2,125 | | | | 2,137 | |
Hess | | | | | | | | |
6.000%, 01/15/2040 | | | 2,630 | | | | 3,198 | |
5.800%, 04/01/2047 | | | 420 | | | | 517 | |
4.300%, 04/01/2027 | | | 3,155 | | | | 3,403 | |
HollyFrontier | | | | | | | | |
2.625%, 10/01/2023 | | | 2,375 | | | | 2,394 | |
Kinder Morgan | | | | | | | | |
5.550%, 06/01/2045 | | | 2,055 | | | | 2,602 | |
Marathon Petroleum | | | | | | | | |
4.700%, 05/01/2025 | | | 2,865 | | | | 3,251 | |
4.500%, 05/01/2023 | | | 4,085 | | | | 4,415 | |
MPLX | | | | | | | | |
5.200%, 03/01/2047 | | | 1,060 | | | | 1,261 | |
5.200%, 12/01/2047 | | | 455 | | | | 531 | |
4.875%, 12/01/2024 | | | 1,660 | | | | 1,881 | |
4.800%, 02/15/2029 | | | 2,120 | | | | 2,493 | |
4.500%, 07/15/2023 | | | 1,350 | | | | 1,464 | |
1.342%, VAR ICE LIBOR USD 3 Month+1.100%, 09/09/2022 | | | 3,290 | | | | 3,290 | |
Noble Energy | | | | | | | | |
5.250%, 11/15/2043 | | | 135 | | | | 187 | |
4.200%, 10/15/2049 | | | 575 | | | | 723 | |
Northern Natural Gas | | | | | | | | |
4.250%, 06/01/2021 (A) | | | 720 | | | | 727 | |
Phillips 66 | | | | | | | | |
3.850%, 04/09/2025 | | | 935 | | | | 1,046 | |
Sabal Trail Transmission LLC | | | | | | | | |
4.246%, 05/01/2028 (A) | | | 3,415 | | | | 3,870 | |
Sabine Pass Liquefaction LLC | | | | | | | | |
5.750%, 05/15/2024 | | | 650 | | | | 740 | |
5.000%, 03/15/2027 | | | 2,905 | | | | 3,364 | |
Saudi Arabian Oil | | | | | | | | |
1.625%, 11/24/2025 (A) | | | 1,810 | | | | 1,843 | |
1.250%, 11/24/2023 (A) | | | 2,190 | | | | 2,214 | |
Saudi Arabian Oil MTN | | | | | | | | |
4.375%, 04/16/2049 (A) | | | 355 | | | | 432 | |
2.750%, 04/16/2022 (A) | | | 2,985 | | | | 3,073 | |
Schlumberger Finance Canada | | | | | | | | |
1.400%, 09/17/2025 | | | 2,565 | | | | 2,619 | |
| | |
274 | | SEI Institutional Investments Trust / Semi-Annual Report / November 30, 2020 |
| | | | | | | | |
| | | |
| Description | | Face Amount
(Thousands) | | Market Value
($ Thousands) |
|
CORPORATE OBLIGATIONS (continued) | |
Schlumberger Holdings | | | | | | | | |
3.900%, 05/17/2028 (A) | | $ | 2,444 | | | $ | 2,720 | |
Shell International Finance BV | | | | | | | | |
6.375%, 12/15/2038 | | | 1,465 | | | | 2,274 | |
4.125%, 05/11/2035 | | | 4,275 | | | | 5,339 | |
4.000%, 05/10/2046 | | | 3,115 | | | | 3,857 | |
3.750%, 09/12/2046 | | | 2,600 | | | | 3,104 | |
3.400%, 08/12/2023 | | | 5,525 | | | | 5,978 | |
2.500%, 09/12/2026 | | | 315 | | | | 344 | |
2.375%, 11/07/2029 | | | 2,715 | | | | 2,915 | |
Spectra Energy Partners | | | | | | | | |
3.375%, 10/15/2026 | | | 1,835 | | | | 2,036 | |
Suncor Energy | | | | | | | | |
3.100%, 05/15/2025 | | | 3,535 | | | | 3,847 | |
Suncor Energy Ventures | | | | | | | | |
4.500%, 04/01/2022 (A) | | | 1,950 | | | | 2,029 | |
Sunoco Logistics Partners Operations | | | | | | | | |
4.000%, 10/01/2027 | | | 1,265 | | | | 1,361 | |
Tennessee Gas Pipeline LLC | | | | | | | | |
8.375%, 06/15/2032 | | | 3,265 | | | | 4,640 | |
2.900%, 03/01/2030 (A) | | | 4,230 | | | | 4,463 | |
Total Capital | | | | | | | | |
3.883%, 10/11/2028 | | | 5,330 | | | | 6,357 | |
Total Capital International | | | | | | | | |
3.386%, 06/29/2060 | | | 1,250 | | | | 1,424 | |
3.127%, 05/29/2050 | | | 2,980 | | | | 3,268 | |
2.986%, 06/29/2041 | | | 250 | | | | 271 | |
TransCanada PipeLines | | | | | | | | |
3.750%, 10/16/2023 | | | 5,000 | | | | 5,410 | |
Valero Energy | | | | | | | | |
2.850%, 04/15/2025 | | | 2,255 | | | | 2,370 | |
1.200%, 03/15/2024 | | | 5,325 | | | | 5,333 | |
Williams Partners | | | | | | | | |
5.800%, 11/15/2043 | | | 745 | | | | 940 | |
| | | | | | | | |
| | | | | | | 235,377 | |
| | | | | | | | |
| | |
Financials — 29.0% | | | | | | | | |
AIA Group | | | | | | | | |
3.600%, 04/09/2029 (A) | | | 9,500 | | | | 10,753 | |
3.200%, 09/16/2040 (A) | | | 1,540 | | | | 1,644 | |
AIG SunAmerica Global Financing | | | | | | | | |
6.900%, 03/15/2032 (A) | | | 1,436 | | | | 2,174 | |
American Express | | | | | | | | |
3.700%, 11/05/2021 | | | 10,570 | | | | 10,870 | |
3.700%, 08/03/2023 | | | 4,810 | | | | 5,222 | |
2.500%, 08/01/2022 | | | 15,971 | | | | 16,516 | |
American International Group | | | | | | | | |
4.750%, 04/01/2048 | | | 565 | | | | 764 | |
4.500%, 07/16/2044 | | | 1,915 | | | | 2,461 | |
4.375%, 06/30/2050 | | | 435 | | | | 565 | |
4.375%, 01/15/2055 | | | 140 | | | | 180 | |
| | | | | | | | |
| | | |
| Description | | Face Amount
(Thousands) | | Market Value
($ Thousands) |
|
CORPORATE OBLIGATIONS (continued) | |
Ameriprise Financial | | | | | | | | |
4.000%, 10/15/2023 | | $ | 2,450 | | | $ | 2,699 | |
Apollo Management Holdings | | | | | | | | |
5.000%, 03/15/2048 (A) | | | 2,575 | | | | 3,177 | |
4.400%, 05/27/2026 (A) | | | 1,140 | | | | 1,325 | |
4.000%, 05/30/2024 (A) | | | 6,353 | | | | 7,000 | |
Athene Global Funding | | | | | | | | |
3.000%, 07/01/2022 (A) | | | 2,610 | | | | 2,694 | |
2.950%, 11/12/2026 (A) | | | 4,960 | | | | 5,263 | |
Athene Holding | | | | | | | | |
4.125%, 01/12/2028 | | | 860 | | | | 953 | |
Aviation Capital Group LLC | | | | | | | | |
2.875%, 01/20/2022 (A) | | | 2,055 | | | | 2,090 | |
Banco Bilbao Vizcaya Argentaria | | | | | | | | |
1.125%, 09/18/2025 | | | 3,815 | | | | 3,829 | |
Banco Santander | | | | | | | | |
3.125%, 02/23/2023 | | | 3,230 | | | | 3,403 | |
2.746%, 05/28/2025 | | | 3,905 | | | | 4,157 | |
2.706%, 06/27/2024 | | | 6,975 | | | | 7,426 | |
Banco Santander Mexico Institucion de Banca Multiple Grupo Financiero Santand | | | | | | | | |
5.375%, 04/17/2025 (A) | | | 3,880 | | | | 4,388 | |
Bank of America | | | | | | | | |
6.000%, 10/15/2036 | | | 440 | | | | 647 | |
3.366%, VAR ICE LIBOR USD 3 Month+0.810%, 01/23/2026 | | | 12,335 | | | | 13,528 | |
3.004%, VAR ICE LIBOR USD 3 Month+0.790%, 12/20/2023 | | | 6,152 | | | | 6,460 | |
Bank of America MTN | | | | | | | | |
4.450%, 03/03/2026 | | | 900 | | | | 1,051 | |
4.330%, VAR ICE LIBOR USD 3 Month+1.520%, 03/15/2050 | | | 1,430 | | | | 1,893 | |
4.271%, VAR ICE LIBOR USD 3 Month+1.310%, 07/23/2029 | | | 9,960 | | | | 11,850 | |
4.183%, 11/25/2027 | | | 6,880 | | | | 7,951 | |
4.083%, VAR ICE LIBOR USD 3 Month+3.150%, 03/20/2051 | | | 7,465 | | | | 9,514 | |
4.000%, 01/22/2025 | | | 1,300 | | | | 1,458 | |
3.970%, VAR ICE LIBOR USD 3 Month+1.070%, 03/05/2029 | | | 1,195 | | | | 1,390 | |
3.705%, VAR ICE LIBOR USD 3 Month+1.512%, 04/24/2028 | | | 13,945 | | | | 15,918 | |
3.593%, VAR ICE LIBOR USD 3 Month+1.370%, 07/21/2028 | | | 55 | | | | 62 | |
3.458%, VAR ICE LIBOR USD 3 Month+0.970%, 03/15/2025 | | | 9,500 | | | | 10,303 | |
3.248%, 10/21/2027 | | | 3,990 | | | | 4,436 | |
2.884%, VAR ICE LIBOR USD 3 Month+1.190%, 10/22/2030 | | | 5,995 | | | | 6,561 | |
2.676%, VAR United States Secured Overnight Financing Rate+1.930%, 06/19/2041 | | | 6,025 | | | | 6,262 | |
| | |
SEI Institutional Investments Trust / Semi-Annual Report / November 30, 2020 | | 275 |
SCHEDULE OF INVESTMENTS (Unaudited)
November 30, 2020
Intermediate Duration Credit Fund (Continued)
| | | | | | | | |
| | | |
| Description | | Face Amount
(Thousands) | | Market Value
($ Thousands) |
|
CORPORATE OBLIGATIONS (continued) | |
Bank of Montreal MTN | | | | | | | | |
3.300%, 02/05/2024 | | $ | 4,490 | | | $ | 4,864 | |
1.900%, 08/27/2021 | | | 4,875 | | | | 4,935 | |
Bank of New York Mellon MTN | | | | | | | | |
3.450%, 08/11/2023 | | | 6,755 | | | | 7,307 | |
2.450%, 08/17/2026 | | | 645 | | | | 701 | |
Bank of Nova Scotia | | | | | | | | |
4.900%, VAR US Treas Yield Curve Rate T Note Const Mat 5 Yr+4.551%(C) | | | 3,930 | | | | 4,214 | |
Barclays | | | | | | | | |
4.610%, VAR ICE LIBOR USD 3 Month+1.400%, 02/15/2023 | | | 2,745 | | | | 2,872 | |
3.932%, VAR ICE LIBOR USD 3 Month+1.610%, 05/07/2025 | | | 4,330 | | | | 4,717 | |
Berkshire Hathaway | | | | | | | | |
3.125%, 03/15/2026 | | | 1,978 | | | | 2,220 | |
Berkshire Hathaway Finance | | | | | | | | |
4.250%, 01/15/2049 | | | 90 | | | | 122 | |
2.850%, 10/15/2050 | | | 4,855 | | | | 5,312 | |
1.450%, 10/15/2030 | | | 4,000 | | | | 4,057 | |
Blackstone | | | | | | | | |
3.625%, 01/15/2026 (A) | | | 3,105 | | | | 3,177 | |
Blackstone Holdings Finance LLC | | | | | | | | |
5.000%, 06/15/2044 (A) | | | 738 | | | | 1,019 | |
4.750%, 02/15/2023 (A) | | | 2,014 | | | | 2,195 | |
4.450%, 07/15/2045 (A) | | | 1,534 | | | | 1,985 | |
3.150%, 10/02/2027 (A) | | | 1,878 | | | | 2,093 | |
BNP Paribas | | | | | | | | |
2.219%, VAR United States Secured Overnight Financing Rate+2.074%, 06/09/2026 (A) | | | 3,925 | | | | 4,087 | |
BPCE | | | | | | | | |
1.652%, VAR United States Secured Overnight Financing Rate+1.520%, 10/06/2026 (A) | | | 6,925 | | | | 7,030 | |
Brown & Brown | | | | | | | | |
2.375%, 03/15/2031 | | | 1,635 | | | | 1,703 | |
Canadian Imperial Bank of Commerce | | | | | | | | |
0.950%, 10/23/2025 | | | 3,400 | | | | 3,423 | |
Capital One Financial | | | | | | | | |
3.650%, 05/11/2027 | | | 4,523 | | | | 5,133 | |
3.300%, 10/30/2024 | | | 4,618 | | | | 5,018 | |
Carlyle Finance Subsidiary LLC | | | | | | | | |
3.500%, 09/19/2029 (A) | | | 2,697 | | | | 2,980 | |
Carlyle Holdings Finance LLC | | | | | | | | |
3.875%, 02/01/2023 (A) | | | 861 | | | | 916 | |
CDP Financial | | | | | | | | |
5.600%, 11/25/2039 (A) | | | 700 | | | | 1,011 | |
Charles Schwab | | | | | | | | |
2.650%, 01/25/2023 | | | 8,646 | | | | 9,062 | |
Chubb INA Holdings | | | | | | | | |
4.350%, 11/03/2045 | | | 1,138 | | | | 1,553 | |
| | | | | | | | |
| | | |
| Description | | Face Amount
(Thousands) | | Market Value
($ Thousands) |
|
CORPORATE OBLIGATIONS (continued) | |
2.875%, 11/03/2022 | | $ | 1,965 | | | $ | 2,052 | |
1.375%, 09/15/2030 | | | 6,790 | | | | 6,744 | |
Cincinnati Financial | | | | | | | | |
6.920%, 05/15/2028 | | | 845 | | | | 1,122 | |
6.125%, 11/01/2034 | | | 2,882 | | | | 4,077 | |
Citadel | | | | | | | | |
4.875%, 01/15/2027 (A) | | | 3,820 | | | | 4,160 | |
Citigroup | | | | | | | | |
8.125%, 07/15/2039 | | | 2,969 | | | | 5,381 | |
5.500%, 09/13/2025 | | | 880 | | | | 1,059 | |
5.316%, VAR United States Secured Overnight Financing Rate+4.548%, 03/26/2041 | | | 4,970 | | | | 7,045 | |
4.750%, 05/18/2046 | | | 1,040 | | | | 1,397 | |
4.650%, 07/23/2048 | | | 3,288 | | | | 4,570 | |
4.450%, 09/29/2027 | | | 180 | | | | 211 | |
4.281%, VAR ICE LIBOR USD 3 Month+1.839%, 04/24/2048 | | | 2,918 | | | | 3,832 | |
3.400%, 05/01/2026 | | | 6,375 | | | | 7,126 | |
2.900%, 12/08/2021 | | | 4,200 | | | | 4,299 | |
CME Group | | | | | | | | |
4.150%, 06/15/2048 | | | 1,989 | | | | 2,734 | |
Cooperatieve Rabobank UA | | | | | | | | |
4.625%, 12/01/2023 | | | 3,005 | | | | 3,345 | |
3.875%, 09/26/2023 (A) | | | 3,000 | | | | 3,279 | |
1.093%, VAR ICE LIBOR USD 3 Month+0.860%, 09/26/2023 (A) | | | 6,790 | | | | 6,874 | |
Credit Agricole MTN | | | | | | | | |
3.750%, 04/24/2023 (A) | | | 4,640 | | | | 4,991 | |
Credit Suisse Group | | | | | | | | |
2.193%, VAR United States Secured Overnight Financing Rate+2.044%, 06/05/2026 (A) | | | 6,540 | | | | 6,807 | |
Credit Suisse NY | | | | | | | | |
3.000%, 10/29/2021 | | | 3,760 | | | | 3,852 | |
Empower Finance 2020 | | | | | | | | |
3.075%, 09/17/2051 (A) | | | 5,955 | | | | 6,668 | |
Equitable Financial Life Global Funding | | | | | | | | |
1.400%, 07/07/2025 (A) | | | 1,473 | | | | 1,510 | |
1.400%, 08/27/2027 (A) | | | 1,973 | | | | 1,975 | |
Equitable Holdings | | | | | | | | |
3.900%, 04/20/2023 | | | 2,440 | | | | 2,634 | |
Farmers Exchange Capital III | | | | | | | | |
5.454%, VAR ICE LIBOR USD 3 Month+3.454%, 10/15/2054 (A) | | | 1,640 | | | | 1,949 | |
Fifth Third Bancorp | | | | | | | | |
2.550%, 05/05/2027 | | | 1,920 | | | | 2,073 | |
Fifth Third Bank | | | | | | | | |
2.875%, 10/01/2021 | | | 3,570 | | | | 3,639 | |
First Republic Bank | | | | | | | | |
2.500%, 06/06/2022 | | | 1,718 | | | | 1,770 | |
| | |
276 | | SEI Institutional Investments Trust / Semi-Annual Report / November 30, 2020 |
| | | | | | | | |
| | | |
| Description | | Face Amount
(Thousands) | | Market Value ($ Thousands) |
| |
CORPORATE OBLIGATIONS (continued) | | | | | |
1.912%, VAR United States Secured Overnight Financing Rate+0.620%, 02/12/2024 | | $ | 2,800 | | | $ | 2,884 | |
Five Corners Funding Trust | | | | | | | | |
4.419%, 11/15/2023 (A) | | | 4,190 | | | | 4,662 | |
Franklin Resources | | | | | | | | |
1.600%, 10/30/2030 | | | 5,455 | | | | 5,386 | |
Goldman Sachs Capital I | | | | | | | | |
6.345%, 02/15/2034 | | | 2,010 | | | | 2,785 | |
Goldman Sachs Group | | | | | | | | |
6.750%, 10/01/2037 | | | 405 | | | | 621 | |
6.450%, 05/01/2036 | | | 630 | | | | 920 | |
4.750%, 10/21/2045 | | | 180 | | | | 252 | |
4.411%, VAR ICE LIBOR USD 3 Month+1.430%, 04/23/2039 | | | 940 | | | | 1,205 | |
4.017%, VAR ICE LIBOR USD 3 Month+1.373%, 10/31/2038 | | | 1,502 | | | | 1,851 | |
3.850%, 01/26/2027 | | | 140 | | | | 160 | |
3.800%, 03/15/2030 | | | 2,545 | | | | 2,981 | |
3.500%, 01/23/2025 | | | 2,265 | | | | 2,489 | |
3.500%, 11/16/2026 | | | 4,613 | | | | 5,172 | |
3.272%, VAR ICE LIBOR USD 3 Month+1.201%, 09/29/2025 | | | 9,475 | | | | 10,331 | |
2.908%, VAR ICE LIBOR USD 3 Month+1.053%, 06/05/2023 | | | 1,045 | | | | 1,084 | |
2.876%, VAR ICE LIBOR USD 3 Month+0.821%, 10/31/2022 | | | 4,463 | | | | 4,560 | |
2.600%, 02/07/2030 | | | 1,435 | | | | 1,551 | |
1.391%, VAR ICE LIBOR USD 3 Month+1.170%, 05/15/2026 | | | 1,125 | | | | 1,144 | |
Goldman Sachs Group MTN | | | | | | | | |
4.800%, 07/08/2044 | | | 6,330 | | | | 8,813 | |
2.905%, VAR ICE LIBOR USD 3 Month+0.990%, 07/24/2023 | | | 4,145 | | | | 4,310 | |
Guardian Life Global Funding | | | | | | | | |
1.100%, 06/23/2025 (A) | | | 1,800 | | | | 1,821 | |
HSBC Bank PLC | | | | | | | | |
7.650%, 05/01/2025 | | | 2,880 | | | | 3,580 | |
HSBC Bank USA | | | | | | | | |
7.000%, 01/15/2039 | | | 6,726 | | | | 10,569 | |
HSBC Holdings | | | | | | | | |
4.950%, 03/31/2030 | | | 2,285 | | | | 2,847 | |
4.041%, VAR ICE LIBOR USD 3 Month+1.546%, 03/13/2028 | | | 11,362 | | | | 12,902 | |
3.262%, VAR ICE LIBOR USD 3 Month+1.055%, 03/13/2023 | | | 8,800 | | | | 9,101 | |
ING Bank | | | | | | | | |
5.800%, 09/25/2023 (A) | | | 298 | | | | 337 | |
ING Groep | | | | | | | | |
4.625%, 01/06/2026 (A) | | | 3,445 | | | | 4,047 | |
4.100%, 10/02/2023 | | | 3,950 | | | | 4,346 | |
3.550%, 04/09/2024 | | | 4,460 | | | | 4,866 | |
| | | | | | | | |
| | | |
| Description | | Face Amount
(Thousands) | | Market Value ($ Thousands) |
| |
CORPORATE OBLIGATIONS (continued) | | | | | |
Intercontinental Exchange | | | | | | | | |
4.250%, 09/21/2048 | | $ | 4,417 | | | $ | 5,722 | |
3.000%, 06/15/2050 | | | 1,650 | | | | 1,773 | |
1.850%, 09/15/2032 | | | 8,245 | | | | 8,328 | |
International Bank for Reconstruction & Development MTN | | | | | | | | |
1.625%, 03/09/2021 | | | 4,705 | | | | 4,724 | |
JPMorgan Chase | | | | | | | | |
8.750%, 09/01/2030 | | | 1,291 | | | | 1,915 | |
7.750%, 07/15/2025 | | | 1,690 | | | | 2,190 | |
6.400%, 05/15/2038 | | | 2,612 | | | | 4,133 | |
5.500%, 10/15/2040 | | | 1,000 | | | | 1,479 | |
4.260%, VAR ICE LIBOR USD 3 Month+1.580%, 02/22/2048 | | | 1,290 | | | | 1,700 | |
3.964%, VAR ICE LIBOR USD 3 Month+1.380%, 11/15/2048 | | | 50 | | | | 64 | |
3.897%, VAR ICE LIBOR USD 3 Month+1.220%, 01/23/2049 | | | 4,840 | | | | 6,157 | |
3.875%, 09/10/2024 | | | 2,115 | | | | 2,359 | |
3.509%, VAR ICE LIBOR USD 3 Month+0.945%, 01/23/2029 | | | 15,247 | | | | 17,281 | |
3.250%, 09/23/2022 | | | 3,704 | | | | 3,899 | |
3.220%, VAR ICE LIBOR USD 3 Month+1.155%, 03/01/2025 | | | 2,275 | | | | 2,459 | |
3.200%, 01/25/2023 | | | 3,400 | | | | 3,603 | |
3.200%, 06/15/2026 | | | 17,020 | | | | 19,018 | |
3.109%, VAR United States Secured Overnight Financing Rate+2.440%, 04/22/2051 | | | 465 | | | | 519 | |
2.700%, 05/18/2023 | | | 3,815 | | | | 4,017 | |
2.522%, VAR United States Secured Overnight Financing Rate+2.040%, 04/22/2031 | | | 8,778 | | | | 9,426 | |
0.760%, VAR ICE LIBOR USD 3 Month+0.550%, 02/01/2027 | | | 1,630 | | | | 1,516 | |
KKR Group Finance III LLC | | | | | | | | |
5.125%, 06/01/2044 (A) | | | 4,703 | | | | 6,036 | |
KKR Group Finance VIII LLC | | | | | | | | |
3.500%, 08/25/2050 (A) | | | 1,275 | | | | 1,386 | |
Korea Development Bank MTN | | | | | | | | |
1.750%, 02/18/2025 | | | 5,905 | | | | 6,134 | |
Kreditanstalt fuer Wiederaufbau | | | | | | | | |
2.500%, 02/15/2022 | | | 24,730 | | | | 25,415 | |
2.125%, 01/17/2023 | | | 3,320 | | | | 3,454 | |
Lincoln National | | | | | | | | |
3.400%, 01/15/2031 | | | 3,100 | | | | 3,534 | |
Lloyds Banking Group | | | | | | | | |
2.438%, VAR US Treas Yield Curve Rate T Note Const Mat 1 Yr+1.000%, 02/05/2026 | | | 4,500 | | | | 4,734 | |
Macquarie Group | | | | | | | | |
3.189%, VAR ICE LIBOR USD 3 Month+1.023%, 11/28/2023 (A) | | | 7,108 | | | | 7,424 | |
| | |
SEI Institutional Investments Trust / Semi-Annual Report / November 30, 2020 | | 277 |
SCHEDULE OF INVESTMENTS (Unaudited)
November 30, 2020
Intermediate Duration Credit Fund (Continued)
| | | | | | | | |
| | | |
| Description | | Face Amount
(Thousands) | | Market Value
($ Thousands) |
|
CORPORATE OBLIGATIONS (continued) | |
Marsh & McLennan | | | | | | | | |
2.250%, 11/15/2030 | | $ | 4,665 | | | $ | 4,984 | |
Massachusetts Mutual Life Insurance | | | | | | | | |
3.375%, 04/15/2050 (A) | | | 1,153 | | | | 1,248 | |
Mercury General | | | | | | | | |
4.400%, 03/15/2027 | | | 4,805 | | | | 5,274 | |
MetLife | | | | | | | | |
4.050%, 03/01/2045 | | | 1,250 | | | | 1,609 | |
Metropolitan Life Global Funding I MTN | | | | | | | | |
3.600%, 01/11/2024 (A) | | | 5,765 | | | | 6,280 | |
2.400%, 06/17/2022 (A) | | | 6,924 | | | | 7,148 | |
Mitsubishi UFJ Financial Group | | | | | | | | |
3.195%, 07/18/2029 | | | 1,820 | | | | 2,046 | |
Moody’s | | | | | | | | |
2.550%, 08/18/2060 | | | 2,136 | | | | 2,013 | |
Morgan Stanley | | | | | | | | |
3.625%, 01/20/2027 | | | 8,990 | | | | 10,274 | |
Morgan Stanley MTN | | | | | | | | |
6.375%, 07/24/2042 | | | 2,080 | | | | 3,405 | |
5.597%, VAR United States Secured Overnight Financing Rate+4.840%, 03/24/2051 | | | 5,865 | | | | 9,450 | |
4.300%, 01/27/2045 | | | 4,450 | | | | 6,043 | |
3.971%, VAR ICE LIBOR USD 3 Month+1.455%, 07/22/2038 | | | 2,720 | | | | 3,368 | |
3.875%, 04/29/2024 | | | 4,860 | | | | 5,374 | |
3.750%, 02/25/2023 | | | 10,122 | | | | 10,851 | |
2.699%, VAR United States Secured Overnight Financing Rate+1.143%, 01/22/2031 | | | 700 | | | | 761 | |
2.500%, 04/21/2021 | | | 3,850 | | | | 3,882 | |
MUFG Americas Holdings | | | | | | | | |
3.000%, 02/10/2025 | | | 2,975 | | | | 3,234 | |
Mutual of Omaha Insurance | | | | | | | | |
4.297%, VAR ICE LIBOR USD 3 Month+2.640%, 07/15/2054 (A) | | | 1,475 | | | | 1,542 | |
Nasdaq | | | | | | | | |
3.250%, 04/28/2050 | | | 2,225 | | | | 2,441 | |
National Rural Utilities Cooperative Finance | | | | | | | | |
4.750%, VAR ICE LIBOR USD 3 Month+2.910%, 04/30/2043 | | | 2,056 | | | | 2,165 | |
4.400%, 11/01/2048 | | | 4,190 | | | | 5,588 | |
4.300%, 03/15/2049 | | | 2,638 | | | | 3,488 | |
4.023%, 11/01/2032 | | | 395 | | | | 481 | |
Nationwide Mutual Insurance | | | | | | | | |
9.375%, 08/15/2039 (A) | | | 1,360 | | | | 2,392 | |
4.350%, 04/30/2050 (A) | | | 3,471 | | | | 4,064 | |
Natwest Group | | | | | | | | |
3.498%, VAR ICE LIBOR USD 3 Month+1.480%, 05/15/2023 | | | 4,175 | | | | 4,342 | |
New York Life Global Funding | | | | | | | | |
3.250%, 08/06/2021 (A) | | | 5,090 | | | | 5,195 | |
| | | | | | | | |
| | | |
| Description | | Face Amount
(Thousands) | | Market Value
($ Thousands) |
|
CORPORATE OBLIGATIONS (continued) | |
New York Life Global Funding MTN | | | | | | | | |
2.000%, 04/13/2021 (A) | | $ | 5,000 | | | $ | 5,032 | |
New York Life Insurance | | | | | | | | |
3.750%, 05/15/2050 (A) | | | 1,420 | | | | 1,693 | |
Pacific Life Global Funding II | | | | | | | | |
1.200%, 06/24/2025 (A) | | | 1,350 | | | | 1,371 | |
Pacific Life Insurance | | | | | | | | |
4.300%, VAR ICE LIBOR USD 3 Month+2.796%, 10/24/2067 (A) | | | 1,455 | | | | 1,567 | |
Pacific LifeCorp | | | | | | | | |
3.350%, 09/15/2050 (A) | | | 2,120 | | | | 2,385 | |
Peachtree Corners Funding Trust | | | | | | | | |
3.976%, 02/15/2025 (A) | | | 4,431 | | | | 4,907 | |
PNC Bank | | | | | | | | |
3.300%, 10/30/2024 | | | 1,840 | | | | 2,026 | |
PNC Financial Services Group | | | | | | | | |
2.600%, 07/23/2026 | | | 7,740 | | | | 8,480 | |
Pricoa Global Funding I | | | | | | | | |
3.450%, 09/01/2023 (A) | | | 4,850 | | | | 5,237 | |
Principal Life Global Funding II | | | | | | | | |
2.375%, 11/21/2021 (A) | | | 3,000 | | | | 3,063 | |
1.500%, 08/27/2030 (A) | | | 3,374 | | | | 3,322 | |
1.250%, 06/23/2025 (A) | | | 1,350 | | | | 1,380 | |
Prudential | | | | | | | | |
3.125%, 04/14/2030 | | | 2,008 | | | | 2,290 | |
Prudential Financial MTN | | | | | | | | |
5.700%, 12/14/2036 | | | 1,660 | | | | 2,407 | |
1.500%, 03/10/2026 | | | 4,945 | | | | 5,094 | |
Royal Bank of Canada MTN | | | | | | | | |
0.500%, 10/26/2023 | | | 4,347 | | | | 4,362 | |
S&P Global | | | | | | | | |
3.250%, 12/01/2049 | | | 4,115 | | | | 4,771 | |
Scentre Group Trust 1 | | | | | | | | |
4.375%, 05/28/2030 (A) | | | 3,380 | | | | 3,849 | |
3.625%, 01/28/2026 (A) | | | 4,545 | | | | 4,933 | |
Scentre Group Trust 2 | | | | | | | | |
4.750%, VAR US Treas Yield Curve Rate T Note Const Mat 5 Yr+4.379%, 09/24/2080 (A) | | | 6,270 | | | | 6,521 | |
Securian Financial Group | | | | | | | | |
4.800%, 04/15/2048 (A) | | | 1,938 | | | | 2,502 | |
Standard Chartered | | | | | | | | |
4.247%, VAR ICE LIBOR USD 3 Month+1.150%, 01/20/2023 (A) | | | 4,602 | | | | 4,783 | |
State Street | | | | | | | | |
3.031%, VAR United States Secured Overnight Financing Rate+1.490%, 11/01/2034 | | | 4,980 | | | | 5,463 | |
Sumitomo Mitsui Financial Group | | | | | | | | |
2.448%, 09/27/2024 | | | 2,750 | | | | 2,914 | |
Sumitomo Mitsui Trust Bank | | | | | | | | |
0.800%, 09/12/2023 (A) | | | 6,300 | | | | 6,338 | |
| | |
278 | | SEI Institutional Investments Trust / Semi-Annual Report / November 30, 2020 |
| | | | | | | | |
| | | |
| Description | | Face Amount
(Thousands) | | Market Value
($ Thousands) |
|
CORPORATE OBLIGATIONS (continued) | |
Travelers | | | | | | | | |
3.750%, 05/15/2046 | | $ | 1,505 | | | $ | 1,886 | |
2.550%, 04/27/2050 | | | 1,125 | | | | 1,188 | |
Truist Bank | | | | | | | | |
3.800%, 10/30/2026 | | | 1,780 | | | | 2,051 | |
3.200%, 04/01/2024 | | | 6,315 | | | | 6,847 | |
2.250%, 03/11/2030 | | | 1,620 | | | | 1,695 | |
Truist Financial | | | | | | | | |
4.000%, 05/01/2025 | | | 7,740 | | | | 8,779 | |
Truist Financial MTN | | | | | | | | |
3.050%, 06/20/2022 | | | 11,435 | | | | 11,887 | |
2.850%, 10/26/2024 | | | 2,365 | | | | 2,558 | |
UBS MTN | | | | | | | | |
4.500%, 06/26/2048 (A) | | | 3,075 | | | | 4,327 | |
UBS Group | | | | | | | | |
4.125%, 09/24/2025 (A) | | | 1,265 | | | | 1,447 | |
3.491%, 05/23/2023 (A) | | | 3,885 | | | | 4,046 | |
1.008%, VAR US Treas Yield Curve Rate T Note Const Mat 1 Yr+0.830%, 07/30/2024 (A) | | | 2,700 | | | | 2,719 | |
US Bancorp | | | | | | | | |
3.375%, 02/05/2024 | | | 5,740 | | | | 6,224 | |
US Bancorp MTN | | | | | | | | |
3.000%, 07/30/2029 | | | 10,540 | | | | 11,858 | |
2.950%, 07/15/2022 | | | 2,110 | | | | 2,197 | |
1.375%, 07/22/2030 | | | 3,230 | | | | 3,241 | |
Validus Holdings | | | | | | | | |
8.875%, 01/26/2040 | | | 1,760 | | | | 2,907 | |
Wells Fargo | | | | | | | | |
5.950%, 12/15/2036 | | | 975 | | | | 1,301 | |
5.606%, 01/15/2044 | | | 3,421 | | | | 4,901 | |
3.069%, 01/24/2023 | | | 6,395 | | | | 6,579 | |
3.068%, VAR United States Secured Overnight Financing Rate+2.530%, 04/30/2041 | | | 7,570 | | | | 8,246 | |
3.000%, 04/22/2026 | | | 8,965 | | | | 9,843 | |
Wells Fargo MTN | | | | | | | | |
5.013%, VAR ICE LIBOR USD 3 Month+4.240%, 04/04/2051 | | | 575 | | | | 821 | |
4.900%, 11/17/2045 | | | 1,415 | | | | 1,892 | |
4.750%, 12/07/2046 | | | 2,718 | | | | 3,617 | |
4.400%, 06/14/2046 | | | 3,285 | | | | 4,166 | |
4.300%, 07/22/2027 | | | 939 | | | | 1,095 | |
3.584%, VAR ICE LIBOR USD 3 Month+1.310%, 05/22/2028 | | | 6,541 | | | | 7,394 | |
3.196%, VAR ICE LIBOR USD 3 Month+1.170%, 06/17/2027 | | | 8,425 | | | | 9,300 | |
2.879%, VAR ICE LIBOR USD 3 Month+1.170%, 10/30/2030 | | | 4,300 | | | | 4,674 | |
2.393%, VAR United States Secured Overnight Financing Rate+2.100%, 06/02/2028 | | | 8,120 | | | | 8,570 | |
| | | | | | | | |
| | | |
| Description | | Face Amount
(Thousands) | | Market Value
($ Thousands) |
|
CORPORATE OBLIGATIONS (continued) | |
2.164%, VAR ICE LIBOR USD 3 Month+0.750%, 02/11/2026 | | $ | 6,755 | | | $ | 7,068 | |
Westpac Banking | | | | | | | | |
2.963%, 11/16/2040 | | | 485 | | | | 522 | |
2.668%, VAR US Treas Yield Curve Rate T Note Const Mat 5 Yr+1.750%, 11/15/2035 | | | 4,035 | | | | 4,171 | |
| | | | | | | | |
| | | | | | | 1,053,343 | |
| | | | | | | | |
|
Health Care — 5.4% | |
AbbVie | | | | | | | | |
2.150%, 11/19/2021 | | | 12,845 | | | | 13,060 | |
AstraZeneca | | | | | | | | |
3.375%, 11/16/2025 | | | 1,308 | | | | 1,473 | |
Baxter International | | | | | | | | |
1.730%, 04/01/2031 (A) | | | 3,565 | | | | 3,609 | |
Bristol-Myers Squibb | | | | | | | | |
5.000%, 08/15/2045 | | | 1,900 | | | | 2,758 | |
4.550%, 02/20/2048 | | | 255 | | | | 357 | |
3.400%, 07/26/2029 | | | 4,405 | | | | 5,148 | |
3.200%, 06/15/2026 | | | 1,355 | | | | 1,522 | |
2.900%, 07/26/2024 | | | 4,240 | | | | 4,570 | |
2.550%, 11/13/2050 | | | 2,530 | | | | 2,613 | |
2.350%, 11/13/2040 | | | 630 | | | | 649 | |
0.537%, 11/13/2023 | | | 5,059 | | | | 5,067 | |
Cigna | | | | | | | | |
4.125%, 11/15/2025 | | | 2,154 | | | | 2,479 | |
2.400%, 03/15/2030 | | | 2,655 | | | | 2,826 | |
CommonSpirit Health | | | | | | | | |
4.350%, 11/01/2042 | | | 1,680 | | | | 1,949 | |
CVS Health | | | | | | | | |
4.100%, 03/25/2025 | | | 1,297 | | | | 1,469 | |
3.700%, 03/09/2023 | | | 3,504 | | | | 3,749 | |
3.000%, 08/15/2026 | | | 2,105 | | | | 2,314 | |
1.750%, 08/21/2030 | | | 5,065 | | | | 5,047 | |
DH Europe Finance II Sarl | | | | | | | | |
2.050%, 11/15/2022 | | | 3,635 | | | | 3,754 | |
Eli Lilly | | | | | | | | |
3.375%, 03/15/2029 | | | 3,155 | | | | 3,672 | |
Gilead Sciences | | | | | | | | |
4.800%, 04/01/2044 | | | 1,300 | | | | 1,708 | |
4.750%, 03/01/2046 | | | 1,625 | | | | 2,144 | |
3.250%, 09/01/2022 | | | 5,765 | | | | 6,024 | |
GlaxoSmithKline Capital | | | | | | | | |
3.875%, 05/15/2028 | | | 2,040 | | | | 2,425 | |
Johnson & Johnson | | | | | | | | |
2.900%, 01/15/2028 | | | 2,435 | | | | 2,744 | |
2.625%, 01/15/2025 | | | 1,660 | | | | 1,801 | |
1.300%, 09/01/2030 | | | 5,355 | | | | 5,376 | |
McKesson | | | | | | | | |
0.900%, 12/03/2025 | | | 2,000 | | | | 1,999 | |
| | |
SEI Institutional Investments Trust / Semi-Annual Report / November 30, 2020 | | 279 |
SCHEDULE OF INVESTMENTS (Unaudited)
November 30, 2020
Intermediate Duration Credit Fund (Continued)
| | | | | | | | |
| | | |
| Description | | Face Amount
(Thousands) | | Market Value
($ Thousands) |
|
CORPORATE OBLIGATIONS (continued) | |
Medtronic | | | | | | | | |
4.625%, 03/15/2045 | | $ | 931 | | | $ | 1,325 | |
4.375%, 03/15/2035 | | | 1,732 | | | | 2,376 | |
Merck | | | | | | | | |
3.900%, 03/07/2039 | | | 3,065 | | | | 3,905 | |
3.600%, 09/15/2042 | | | 2,000 | | | | 2,490 | |
3.400%, 03/07/2029 | | | 2,385 | | | | 2,790 | |
2.450%, 06/24/2050 | | | 570 | | | | 591 | |
2.350%, 02/10/2022 | | | 3,630 | | | | 3,718 | |
2.350%, 06/24/2040 | | | 1,270 | | | | 1,327 | |
Pfizer | | | | | | | | |
4.000%, 03/15/2049 | | | 815 | | | | 1,069 | |
3.000%, 12/15/2026 | | | 2,065 | | | | 2,332 | |
2.800%, 03/11/2022 | | | 7,950 | | | | 8,203 | |
2.625%, 04/01/2030 | | | 9,926 | | | | 11,038 | |
2.550%, 05/28/2040 | | | 1,090 | | | | 1,157 | |
Pharmacia | | | | | | | | |
6.600%, 12/01/2028 | | | 1,000 | | | | 1,403 | |
Royalty Pharma | | | | | | | | |
2.200%, 09/02/2030 (A) | | | 3,950 | | | | 3,996 | |
1.750%, 09/02/2027 (A) | | | 1,700 | | | | 1,726 | |
UnitedHealth Group | | | | | | | | |
6.875%, 02/15/2038 | | | 2,370 | | | | 3,904 | |
6.500%, 06/15/2037 | | | 1,645 | | | | 2,621 | |
4.750%, 07/15/2045 | | | 890 | | | | 1,274 | |
4.625%, 07/15/2035 | | | 5,440 | | | | 7,380 | |
4.200%, 01/15/2047 | | | 1,432 | | | | 1,925 | |
3.875%, 12/15/2028 | | | 1,835 | | | | 2,213 | |
3.850%, 06/15/2028 | | | 1,275 | | | | 1,519 | |
3.750%, 07/15/2025 | | | 3,700 | | | | 4,215 | |
3.700%, 12/15/2025 | | | 1,705 | | | | 1,951 | |
3.700%, 08/15/2049 | | | 420 | | | | 532 | |
3.500%, 02/15/2024 | | | 6,745 | | | | 7,392 | |
2.750%, 05/15/2040 | | | 2,075 | | | | 2,274 | |
2.375%, 10/15/2022 | | | 4,245 | | | | 4,411 | |
2.000%, 05/15/2030 | | | 2,300 | | | | 2,445 | |
Wyeth LLC | | | | | | | | |
6.000%, 02/15/2036 | | | 1,400 | | | | 2,079 | |
5.950%, 04/01/2037 | | | 3,700 | | | | 5,577 | |
| | | | | | | | |
| | | | | | | 193,464 | |
| | | | | | | | |
|
Industrials — 7.4% | |
Air Lease | | | | | | | | |
3.875%, 07/03/2023 | | | 4,406 | | | | 4,667 | |
Airbus | | | | | | | | |
3.950%, 04/10/2047 (A) | | | 2,800 | | | | 3,196 | |
American Airlines Pass-Through Trust,Ser 2013-1, Cl A | | | | | | | | |
4.000%, 07/15/2025 | | | 899 | | | | 722 | |
BAE Systems | | | | | | | | |
1.900%, 02/15/2031 (A) | | | 1,971 | | | | 1,984 | |
| | | | | | | | |
| | | |
| Description | | Face Amount
(Thousands) | | Market Value
($ Thousands) |
|
CORPORATE OBLIGATIONS (continued) | |
BAE Systems Holdings | | | | | | | | |
3.800%, 10/07/2024 (A) | | $ | 1,700 | | | $ | 1,894 | |
BAE Systems PLC | | | | | | | | |
5.800%, 10/11/2041 (A) | | | 1,940 | | | | 2,789 | |
3.400%, 04/15/2030 (A) | | | 2,307 | | | | 2,608 | |
Boeing | | | | | | | | |
5.150%, 05/01/2030 | | | 8,840 | | | | 10,423 | |
3.100%, 05/01/2026 | | | 3,710 | | | | 3,857 | |
2.700%, 05/01/2022 | | | 3,420 | | | | 3,497 | |
1.875%, 06/15/2023 | | | 2,900 | | | | 2,929 | |
Burlington Northern Santa Fe LLC | | | | | | | | |
6.150%, 05/01/2037 | | | 2,590 | | | | 3,940 | |
4.900%, 04/01/2044 | | | 2,563 | | | | 3,648 | |
4.550%, 09/01/2044 | | | 4,695 | | | | 6,552 | |
4.375%, 09/01/2042 | | | 335 | | | | 446 | |
4.150%, 04/01/2045 | | | 2,905 | | | | 3,825 | |
Caterpillar | | | | | | | | |
3.803%, 08/15/2042 | | | 1,420 | | | | 1,818 | |
3.400%, 05/15/2024 | | | 3,050 | | | | 3,333 | |
Caterpillar Financial Services MTN | | | | | | | | |
3.150%, 09/07/2021 | | | 3,340 | | | | 3,413 | |
2.950%, 02/26/2022 | | | 5,725 | | | | 5,913 | |
2.550%, 11/29/2022 | | | 8,075 | | | | 8,423 | |
CCL Industries | | | | | | | | |
3.050%, 06/01/2030 (A) | | | 3,435 | | | | 3,738 | |
Continental Airlines Pass-Through Trust, Ser 2012-1, Cl A | | | | | | | | |
4.150%, 04/11/2024 | | | 2,511 | | | | 2,473 | |
Continental Airlines Pass-Through Trust, Ser 2012-2, Cl A | | | | | | | | |
4.000%, 10/29/2024 | | | 3,396 | | | | 3,342 | |
CSX | | | | | | | | |
3.350%, 09/15/2049 | | | 4,726 | | | | 5,467 | |
Deere | | | | | | | | |
3.750%, 04/15/2050 | | | 205 | | | | 267 | |
3.100%, 04/15/2030 | | | 4,033 | | | | 4,643 | |
Delta Air Lines Pass-Through Trust, Ser 2015-1, Cl A | | | | | | | | |
3.875%, 07/30/2027 | | | 1,231 | | | | 1,175 | |
Delta Air Lines Pass-Through Trust, Ser 2019-1, Cl A | | | | | | | | |
3.404%, 04/25/2024 | | | 2,800 | | | | 2,736 | |
Delta Air Lines Pass-Through Trust, Ser 2020-1, Cl AA | | | | | | | | |
2.000%, 06/10/2028 | | | 3,200 | | | | 3,170 | |
Emerson Electric | | | | | | | | |
1.800%, 10/15/2027 | | | 6,393 | | | | 6,720 | |
Equifax | | | | | | | | |
2.600%, 12/15/2025 | | | 1,885 | | | | 2,040 | |
GE Capital International Funding Unlimited | | | | | | | | |
4.418%, 11/15/2035 | | | 13,457 | | | | 15,513 | |
| | |
280 | | SEI Institutional Investments Trust / Semi-Annual Report / November 30, 2020 |
| | | | | | | | |
| | | |
| Description | | Face Amount
(Thousands) | | Market Value
($ Thousands) |
|
CORPORATE OBLIGATIONS (continued) | |
General Dynamics | | | | | | | | |
4.250%, 04/01/2040 | | $ | 880 | | | $ | 1,157 | |
1.875%, 08/15/2023 | | | 2,495 | | | | 2,593 | |
General Electric | | | | | | | | |
4.250%, 05/01/2040 | | | 3,085 | | | | 3,511 | |
3.625%, 05/01/2030 | | | 7,110 | | | | 7,976 | |
3.450%, 05/01/2027 | | | 2,025 | | | | 2,228 | |
General Electric MTN | | | | | | | | |
5.875%, 01/14/2038 | | | 790 | | | | 1,024 | |
John Deere Capital | | | | | | | | |
3.650%, 10/12/2023 | | | 4,902 | | | | 5,369 | |
John Deere Capital MTN | | | | | | | | |
3.450%, 06/07/2023 | | | 4,761 | | | | 5,125 | |
3.125%, 09/10/2021 | | | 2,670 | | | | 2,730 | |
2.950%, 04/01/2022 | | | 5,720 | | | | 5,926 | |
2.800%, 03/04/2021 | | | 1,850 | | | | 1,862 | |
2.800%, 07/18/2029 | | | 4,220 | | | | 4,743 | |
2.650%, 06/24/2024 | | | 4,525 | | | | 4,856 | |
2.650%, 06/10/2026 | | | 325 | | | | 356 | |
0.400%, 10/10/2023 | | | 10,540 | | | | 10,565 | |
Lockheed Martin | | | | | | | | |
2.800%, 06/15/2050 | | | 1,645 | | | | 1,794 | |
Norfolk Southern | | | | | | | | |
3.800%, 08/01/2028 | | | 3,180 | | | | 3,721 | |
Northrop Grumman | | | | | | | | |
2.930%, 01/15/2025 | | | 4,590 | | | | 4,986 | |
PACCAR Financial MTN | | | | | | | | |
1.650%, 08/11/2021 | | | 1,200 | | | | 1,211 | |
Penske Truck Leasing LP | | | | | | | | |
4.000%, 07/15/2025 (A) | | | 2,904 | | | | 3,286 | |
3.450%, 07/01/2024 (A) | | | 5,540 | | | | 6,039 | |
Penske Truck Leasing/PTL Finance | | | | | | | | |
3.950%, 03/10/2025 (A) | | | 2,752 | | | | 3,069 | |
Raytheon Technologies | | | | | | | | |
4.500%, 06/01/2042 | | | 2,300 | | | | 3,042 | |
2.500%, 12/15/2022 (A) | | | 6,237 | | | | 6,460 | |
Ryder System MTN | | | | | | | | |
4.625%, 06/01/2025 | | | 4,800 | | | | 5,532 | |
Siemens
Financieringsmaatschappij | | | | | | | | |
1.700%, 09/15/2021 (A) | | | 3,930 | | | | 3,975 | |
SMBC Aviation Capital Finance DAC | | | | | | | | |
3.000%, 07/15/2022 (A) | | | 2,035 | | | | 2,085 | |
Snap-on | | | | | | | | |
4.100%, 03/01/2048 | | | 570 | | | | 724 | |
3.100%, 05/01/2050 | | | 5,459 | | | | 6,171 | |
Southwest Airlines Pass-Through Trust, Ser 2007-1 | | | | | | | | |
6.150%, 08/01/2022 | | | 314 | | | | 329 | |
TTX | | | | | | | | |
4.600%, 02/01/2049 (A) | | | 2,100 | | | | 2,875 | |
TTX MTN | | | | | | | | |
3.600%, 01/15/2025 (A) | | | 3,243 | | | | 3,603 | |
| | | | | | | | |
| | | |
| Description | | Face Amount
(Thousands) | | Market Value
($ Thousands) |
|
CORPORATE OBLIGATIONS (continued) | |
United Airlines Pass-Through Trust, Ser 2019- 1, Cl AA | | | | | | | | |
4.150%, 08/25/2031 | | $ | 1,450 | | | $ | 1,442 | |
United Parcel Service | | | | | | | | |
5.300%, 04/01/2050 | | | 3,026 | | | | 4,653 | |
US Airways Pass-Through Trust, Ser 2012-2,Cl A | | | | | | | | |
4.625%, 06/03/2025 | | | – | | | | – | |
Verisk Analytics | | | | | | | | |
3.625%, 05/15/2050 | | | 2,930 | | | | 3,437 | |
WW Grainger | | | | | | | | |
4.600%, 06/15/2045 | | | 419 | | | | 560 | |
4.200%, 05/15/2047 | | | 2,510 | | | | 3,164 | |
| | | | | | | | |
| | | | | | | 263,340 | |
| | | | | | | | |
|
Information Technology — 8.2% | |
Adobe | | | | | | | | |
1.700%, 02/01/2023 | | | 12,255 | | | | 12,638 | |
Apple | | | | | | | | |
4.650%, 02/23/2046 | | | 5,810 | | | | 8,385 | |
4.500%, 02/23/2036 | | | 2,385 | | | | 3,239 | |
4.375%, 05/13/2045 | | | 515 | | | | 715 | |
3.850%, 08/04/2046 | | | 7,140 | | | | 9,212 | |
3.350%, 02/09/2027 | | | 3,810 | | | | 4,339 | |
3.250%, 02/23/2026 | | | 19,690 | | | | 22,072 | |
3.000%, 02/09/2024 | | | 3,800 | | | | 4,086 | |
2.850%, 05/11/2024 | | | 1,055 | | | | 1,134 | |
2.650%, 05/11/2050 | | | 3,395 | | | | 3,645 | |
Applied Materials | | | | | | | | |
3.900%, 10/01/2025 | | | 3,155 | | | | 3,629 | |
2.750%, 06/01/2050 | | | 1,580 | | | | 1,727 | |
Broadcom | | | | | | | | |
4.150%, 11/15/2030 | | | 970 | | | | 1,127 | |
3.150%, 11/15/2025 | | | 2,365 | | | | 2,570 | |
2.650%, 01/15/2023 | | | 3,066 | | | | 3,194 | |
Cisco Systems | | | | | | | | |
5.900%, 02/15/2039 | | | 2,007 | | | | 3,099 | |
2.200%, 09/20/2023 | | | 4,055 | | | | 4,249 | |
Corning | | | | | | | | |
7.250%, 08/15/2036 | | | 1,844 | | | | 2,355 | |
Dell International LLC | | | | | | | | |
8.100%, 07/15/2036 (A) | | | 645 | | | | 927 | |
Genpact Luxembourg Sarl | | | | | | | | |
3.700%, 04/01/2022 | | | 3,310 | | | | 3,379 | |
3.375%, 12/01/2024 | | | 3,580 | | | | 3,909 | |
Intel | | | | | | | | |
4.950%, 03/25/2060 | | | 1,775 | | | | 2,695 | |
4.600%, 03/25/2040 | | | 1,905 | | | | 2,562 | |
4.000%, 12/15/2032 | | | 4,300 | | | | 5,383 | |
3.734%, 12/08/2047 | | | 2,511 | | | | 3,079 | |
3.250%, 11/15/2049 | | | 3,045 | | | | 3,508 | |
2.875%, 05/11/2024 | | | 5,830 | | | | 6,284 | |
| | |
SEI Institutional Investments Trust / Semi-Annual Report / November 30, 2020 | | 281 |
SCHEDULE OF INVESTMENTS (Unaudited)
November 30, 2020
Intermediate Duration Credit Fund (Continued)
| | | | | | | | |
| | | |
| Description | | Face Amount
(Thousands) | | Market Value
($ Thousands) |
|
CORPORATE OBLIGATIONS (continued) | |
International Business Machines | | | | | | | | |
4.150%, 05/15/2039 | | $ | 2,325 | | | $ | 2,977 | |
3.300%, 05/15/2026 | | | 1,805 | | | | 2,037 | |
Intuit | | | | | | | | |
1.350%, 07/15/2027 | | | 2,989 | | | | 3,045 | |
Lam Research | | | | | | | | |
1.900%, 06/15/2030 | | | 7,050 | | | | 7,335 | |
Mastercard | | | | | | | | |
3.850%, 03/26/2050 | | | 2,915 | | | | 3,808 | |
2.950%, 06/01/2029 | | | 2,420 | | | | 2,741 | |
Mastercard Inc | | | | | | | | |
3.300%, 03/26/2027 | | | 2,560 | | | | 2,919 | |
Microsoft | | | | | | | | |
4.100%, 02/06/2037 | | | 5,275 | | | | 6,932 | |
4.000%, 02/12/2055 | | | 1,100 | | | | 1,546 | |
3.700%, 08/08/2046 | | | 9,099 | | | | 11,719 | |
3.500%, 02/12/2035 | | | 1,225 | | | | 1,525 | |
3.450%, 08/08/2036 | | | 245 | | | | 303 | |
2.875%, 02/06/2024 | | | 1,900 | | | | 2,039 | |
2.675%, 06/01/2060 | | | 1,078 | | | | 1,185 | |
2.525%, 06/01/2050 | | | 7,160 | | | | 7,711 | |
2.400%, 08/08/2026 | | | 11,215 | | | | 12,229 | |
NXP BV | | | | | | | | |
4.875%, 03/01/2024 (A) | | | 3,252 | | | | 3,667 | |
Oracle | | | | | | | | |
4.300%, 07/08/2034 | | | 2,835 | | | | 3,621 | |
4.125%, 05/15/2045 | | | 325 | | | | 400 | |
4.000%, 07/15/2046 | | | 8,820 | | | | 10,764 | |
3.850%, 07/15/2036 | | | 470 | | | | 568 | |
3.800%, 11/15/2037 | | | 3,395 | | | | 4,067 | |
3.600%, 04/01/2040 | | | 8,005 | | | | 9,327 | |
3.600%, 04/01/2050 | | | 1,900 | | | | 2,220 | |
2.950%, 05/15/2025 | | | 2,160 | | | | 2,360 | |
2.950%, 04/01/2030 | | | 9,310 | | | | 10,437 | |
2.650%, 07/15/2026 | | | 5,610 | | | | 6,121 | |
2.500%, 05/15/2022 | | | 4,700 | | | | 4,832 | |
2.400%, 09/15/2023 | | | 3,840 | | | | 4,039 | |
QUALCOMM | | | | | | | | |
4.300%, 05/20/2047 | | | 3,006 | | | | 4,060 | |
1.300%, 05/20/2028 (A) | | | 5,677 | | | | 5,700 | |
Texas Instruments | | | | | | | | |
4.150%, 05/15/2048 | | | 3,734 | | | | 5,153 | |
3.875%, 03/15/2039 | | | 180 | | | | 227 | |
2.250%, 09/04/2029 | | | 15,700 | | | | 17,036 | |
1.375%, 03/12/2025 | | | 4,015 | | | | 4,149 | |
Visa | | | | | | | | |
4.150%, 12/14/2035 | | | 1,125 | | | | 1,465 | |
2.700%, 04/15/2040 | | | 670 | | | | 743 | |
| | | | | | | | |
| | | | | | | 294,148 | |
| | | | | | | | |
| | | | | | | | |
| | | |
| Description | | Face Amount
(Thousands) | | Market Value
($ Thousands) |
|
CORPORATE OBLIGATIONS (continued) | |
|
Materials — 1.0% | |
Air Products and Chemicals | | | | | | | | |
1.850%, 05/15/2027 | | $ | 2,860 | | | $ | 3,015 | |
Barrick North America Finance LLC | | | | | | | | |
5.750%, 05/01/2043 | | | 610 | | | | 899 | |
BHP Billiton Finance USA | | | | | | | | |
6.420%, 03/01/2026 | | | 1,510 | | | | 1,907 | |
5.000%, 09/30/2043 | | | 1,400 | | | | 2,046 | |
Ecolab | | | | | | | | |
4.800%, 03/24/2030 | | | 892 | | | | 1,142 | |
1.300%, 01/30/2031 | | | 3,495 | | | | 3,477 | |
Linde | | | | | | | | |
3.200%, 01/30/2026 | | | 2,315 | | | | 2,587 | |
LYB International Finance III LLC | | | | | | | | |
3.625%, 04/01/2051 | | | 2,485 | | | | 2,687 | |
Nacional del Cobre de Chile | | | | | | | | |
4.250%, 07/17/2042 (A) | | | 2,100 | | | | 2,430 | |
Newcrest Finance Pty | | | | | | | | |
3.250%, 05/13/2030 (A) | | | 2,440 | | | | 2,689 | |
Nutrition & Biosciences | | | | | | | | |
3.468%, 12/01/2050 (A) | | | 3,725 | | | | 4,069 | |
1.230%, 10/01/2025 (A) | | | 4,205 | | | | 4,258 | |
Rio Tinto Finance USA | | | | | | | | |
5.200%, 11/02/2040 | | | 1,185 | | | | 1,718 | |
| | | | | | | | |
| | | | | | | 32,924 | |
| | | | | | | | |
|
Real Estate — 2.5% | |
Agree | | | | | | | | |
2.900%, 10/01/2030 | | | 1,295 | | | | 1,358 | |
AvalonBay Communities MTN | | | | | | | | |
3.350%, 05/15/2027 | | | 2,980 | | | | 3,333 | |
2.950%, 05/11/2026 | | | 2,182 | | | | 2,398 | |
Boston Properties | | | | | | | | |
4.500%, 12/01/2028 | | | 2,630 | | | | 3,137 | |
Brixmor Operating Partnership | | | | | | | | |
4.050%, 07/01/2030 | | | 2,500 | | | | 2,818 | |
Crown Castle Towers LLC | | | | | | | | |
3.663%, 05/15/2025 (A) | | | 3,600 | | | | 3,871 | |
Healthpeak Properties | | | | | | | | |
4.250%, 11/15/2023 | | | 1,970 | | | | 2,157 | |
3.250%, 07/15/2026 | | | 1,940 | | | | 2,163 | |
Kimco Realty | | | | | | | | |
3.300%, 02/01/2025 | | | 2,045 | | | | 2,239 | |
2.700%, 03/01/2024 | | | 1,890 | | | | 1,995 | |
Newmark Group | | | | | | | | |
6.125%, 11/15/2023 | | | 3,140 | | | | 3,407 | |
Regency Centers | | | | | | | | |
4.650%, 03/15/2049 | | | 260 | | | | 308 | |
4.400%, 02/01/2047 | | | 1,455 | | | | 1,655 | |
Sabra Health Care | | | | | | | | |
4.800%, 06/01/2024 | | | 940 | | | | 1,001 | |
3.900%, 10/15/2029 | | | 4,275 | | | | 4,427 | |
| | |
282 | | SEI Institutional Investments Trust / Semi-Annual Report / November 30, 2020 |
| | | | | | | | |
| | | |
| Description | | Face Amount
(Thousands) | | Market Value
($ Thousands) |
|
CORPORATE OBLIGATIONS (continued) | |
Simon Property Group | | | | | | | | |
4.750%, 03/15/2042 | | $ | 205 | | | $ | 244 | |
3.800%, 07/15/2050 | | | 8,050 | | | | 8,678 | |
3.500%, 09/01/2025 | | | 1,920 | | | | 2,115 | |
3.375%, 10/01/2024 | | | 5,488 | | | | 5,939 | |
2.450%, 09/13/2029 | | | 5,620 | | | | 5,750 | |
Simon Property Group LP | | | | | | | | |
6.750%, 02/01/2040 | | | 470 | | | | 675 | |
4.250%, 11/30/2046 | | | 2,179 | | | | 2,450 | |
3.250%, 09/13/2049 | | | 3,085 | | | | 3,022 | |
2.650%, 07/15/2030 | | | 4,455 | | | | 4,678 | |
Ventas Realty | | | | | | | | |
4.400%, 01/15/2029 | | | 5,598 | | | | 6,516 | |
3.125%, 06/15/2023 | | | 1,595 | | | | 1,677 | |
Vornado Realty | | | | | | | | |
3.500%, 01/15/2025 | | | 3,895 | | | | 4,091 | |
Welltower | | | | | | | | |
4.950%, 09/01/2048 | | | 2,632 | | | | 3,382 | |
WP Carey | | | | | | | | |
4.600%, 04/01/2024 | | | 2,670 | | | | 2,960 | |
| | | | | | | | |
| | | | | | | 88,444 | |
| | | | | | | | |
|
Telecommunication Services — 0.1% | |
Cox Communications | | | | | | | | |
1.800%, 10/01/2030 (A) | | | 3,600 | | | | 3,614 | |
| | | | | | | | |
| | |
Utilities — 8.3% | | | | | | | | |
AEP Texas | | | | | | | | |
3.450%, 01/15/2050 | | | 2,695 | | | | 3,075 | |
Alabama Power | | | | | | | | |
3.850%, 12/01/2042 | | | 600 | | | | 737 | |
3.700%, 12/01/2047 | | | 2,800 | | | | 3,430 | |
2.450%, 03/30/2022 | | | 2,545 | | | | 2,612 | |
1.450%, 09/15/2030 | | | 3,416 | | | | 3,480 | |
Ameren Illinois | | | | | | | | |
4.500%, 03/15/2049 | | | 7,345 | | | | 9,999 | |
2.700%, 09/01/2022 | | | 2,000 | | | | 2,070 | |
Atmos Energy | | | | | | | | |
4.125%, 03/15/2049 | | | 3,545 | | | | 4,580 | |
Baltimore Gas & Electric | | | | | | | | |
2.900%, 06/15/2050 | | | 791 | | | | 844 | |
Berkshire Hathaway Energy | | | | | | | | |
4.450%, 01/15/2049 | | | 210 | | | | 284 | |
4.250%, 10/15/2050 (A) | | | 2,890 | | | | 3,768 | |
3.800%, 07/15/2048 | | | 1,065 | | | | 1,304 | |
3.250%, 04/15/2028 | | | 1,720 | | | | 1,952 | |
CenterPoint Energy Houston Electric LLC | | | | | | | | |
4.500%, 04/01/2044 | | | 2,215 | | | | 2,935 | |
2.900%, 07/01/2050 | | | 665 | | | | 725 | |
Cleco Corporate Holdings LLC | | | | | | | | |
3.375%, 09/15/2029 | | | 1,620 | | | | 1,659 | |
| | | | | | | | |
| | | |
| Description | | Face Amount
(Thousands) | | Market Value
($ Thousands) |
| |
CORPORATE OBLIGATIONS (continued) | | | | | |
CMS Energy | | | | | | | | |
3.000%, 05/15/2026 | | $ | 4,285 | | | $ | 4,720 | |
Commonwealth Edison | | | | | | | | |
4.700%, 01/15/2044 | | | 2,000 | | | | 2,721 | |
4.000%, 03/01/2048 | | | 3,635 | | | | 4,636 | |
3.200%, 11/15/2049 | | | 1,425 | | | | 1,601 | |
3.000%, 03/01/2050 | | | 2,940 | | | | 3,236 | |
2.550%, 06/15/2026 | | | 4,665 | | | | 5,087 | |
Consolidated Edison of New York | | | | | | | | |
3.875%, 06/15/2047 | | | 3,000 | | | | 3,591 | |
3.800%, 05/15/2028 | | | 5,765 | | | | 6,720 | |
Consumers Energy | | | | | | | | |
3.500%, 08/01/2051 | | | 500 | | | | 611 | |
Dominion Energy | | | | | | | | |
3.375%, 04/01/2030 | | | 545 | | | | 623 | |
Dominion Energy Gas Holdings LLC | | | | | | | | |
2.500%, 11/15/2024 | | | 2,410 | | | | 2,570 | |
Dominion Energy South Carolina | | | | | | | | |
4.600%, 06/15/2043 | | | 1,000 | | | | 1,332 | |
4.250%, 08/15/2028 | | | 5,318 | | | | 6,040 | |
Duke Energy Carolinas LLC | | | | | | | | |
5.300%, 02/15/2040 | | | 1,700 | | | | 2,424 | |
3.900%, 06/15/2021 | | | 235 | | | | 237 | |
3.875%, 03/15/2046 | | | 3,800 | | | | 4,680 | |
3.350%, 05/15/2022 | | | 11,290 | | | | 11,802 | |
Duke Energy Florida LLC | | | | | | | | |
3.100%, 08/15/2021 | | | 4,530 | | | | 4,587 | |
Duke Energy Indiana LLC | | | | | | | | |
6.350%, 08/15/2038 | | | 235 | | | | 359 | |
4.900%, 07/15/2043 | | | 240 | | | | 326 | |
Duke Energy Ohio | | | | | | | | |
2.125%, 06/01/2030 | | | 1,190 | | | | 1,250 | |
Duke Energy Progress LLC | | | | | | | | |
4.200%, 08/15/2045 | | | 2,310 | | | | 2,968 | |
4.100%, 05/15/2042 | | | 966 | | | | 1,221 | |
East Ohio Gas | | | | | | | | |
3.000%, 06/15/2050 (A) | | | 1,000 | | | | 1,091 | |
2.000%, 06/15/2030 (A) | | | 2,370 | | | | 2,463 | |
Electricite de France | | | | | | | | |
4.950%, 10/13/2045 (A) | | | 2,015 | | | | 2,614 | |
4.750%, 10/13/2035 (A) | | | 900 | | | | 1,123 | |
Entergy Louisiana LLC | | | | | | | | |
4.200%, 09/01/2048 | | | 4,565 | | | | 5,943 | |
Entergy Mississippi LLC | | | | | | | | |
2.850%, 06/01/2028 | | | 3,670 | | | | 4,056 | |
Essential Utilities | | | | | | | | |
4.276%, 05/01/2049 | | | 1,275 | | | | 1,623 | |
Evergy | | | | | | | | |
5.292%, 06/15/2022 | | | 1,190 | | | | 1,261 | |
Eversource Energy | | | | | | | | |
3.800%, 12/01/2023 | | | 2,905 | | | | 3,183 | |
2.900%, 10/01/2024 | | | 4,515 | | | | 4,874 | |
| | |
SEI Institutional Investments Trust / Semi-Annual Report / November 30, 2020 | | 283 |
SCHEDULE OF INVESTMENTS (Unaudited)
November 30, 2020
Intermediate Duration Credit Fund (Continued)
| | | | | | | | |
| | | |
| Description | | Face Amount
(Thousands) | | Market Value
($ Thousands) |
|
CORPORATE OBLIGATIONS (continued) | |
2.750%, 03/15/2022 | | $ | 1,270 | | | $ | 1,305 | |
Florida Power & Light | | | | | | | | |
5.960%, 04/01/2039 | | | 140 | | | | 213 | |
5.690%, 03/01/2040 | | | 1,621 | | | | 2,418 | |
4.125%, 02/01/2042 | | | 3,395 | | | | 4,346 | |
2.850%, 04/01/2025 | | | 2,515 | | | | 2,738 | |
Georgia Power | | | | | | | | |
4.300%, 03/15/2043 | | | 3,970 | | | | 4,985 | |
3.700%, 01/30/2050 | | | 2,920 | | | | 3,531 | |
Idaho Power | | | | | | | | |
4.200%, 03/01/2048 | | | 2,315 | | | | 2,988 | |
Indiana Michigan Power | | | | | | | | |
4.250%, 08/15/2048 | | | 525 | | | | 672 | |
Indianapolis Power & Light | | | | | | | | |
4.700%, 09/01/2045 (A) | | | 825 | | | | 1,059 | |
4.050%, 05/01/2046 (A) | | | 60 | | | | 74 | |
Kentucky Utilities | | | | | | | | |
5.125%, 11/01/2040 | | | 155 | | | | 212 | |
Korea Gas MTN | | | | | | | | |
2.750%, 07/20/2022 (A) | | | 4,490 | | | | 4,642 | |
Massachusetts Electric | | | | | | | | |
1.729%, 11/24/2030 (A) | | | 1,300 | | | | 1,310 | |
MidAmerican Energy | | | | | | | | |
3.150%, 04/15/2050 | | | 2,700 | | | | 3,146 | |
Niagara Mohawk Power | | | | | | | | |
4.278%, 10/01/2034 (A) | | | 1,959 | | | | 2,441 | |
3.508%, 10/01/2024 (A) | | | 130 | | | | 142 | |
NiSource | | | | | | | | |
0.950%, 08/15/2025 | | | 5,035 | | | | 5,028 | |
Northern States Power | | | | | | | | |
7.125%, 07/01/2025 | | | 3,220 | | | | 4,104 | |
NSTAR Electric | | | | | | | | |
3.250%, 05/15/2029 | | | 2,684 | | | | 3,085 | |
Oglethorpe Power | | | | | | | | |
5.375%, 11/01/2040 | | | 1,535 | | | | 1,926 | |
4.250%, 04/01/2046 | | | 1,150 | | | | 1,212 | |
4.200%, 12/01/2042 | | | 170 | | | | 179 | |
Ohio Power | | | | | | | | |
2.600%, 04/01/2030 | | | 3,565 | | | | 3,910 | |
Oncor Electric Delivery | | | | | | | | |
7.500%, 09/01/2038 | | | 100 | | | | 164 | |
Oncor Electric Delivery LLC | | | | | | | | |
5.350%, 10/01/2052 (A) | | | 1,934 | | | | 2,988 | |
5.300%, 06/01/2042 | | | 1,151 | | | | 1,639 | |
3.750%, 04/01/2045 | | | 3,435 | | | | 4,164 | |
3.700%, 05/15/2050 | | | 770 | | | | 965 | |
Pacific Gas and Electric | | | | | | | | |
1.750%, 06/16/2022 | | | 4,370 | | | | 4,377 | |
PacifiCorp | | | | | | | | |
6.250%, 10/15/2037 | | | 2,195 | | | | 3,284 | |
6.000%, 01/15/2039 | | | 4,275 | | | | 6,407 | |
2.950%, 06/01/2023 | | | 4,940 | | | | 5,217 | |
| | | | | | | | |
| | | |
| Description | | Face Amount
(Thousands) | | Market Value
($ Thousands) |
|
CORPORATE OBLIGATIONS (continued) | |
PPL Electric Utilities | | | | | | | | |
4.150%, 06/15/2048 | | $ | 2,400 | | | $ | 3,137 | |
3.950%, 06/01/2047 | | | 1,802 | | | | 2,247 | |
Public Service Electric & Gas MTN | | | | | | | | |
4.050%, 05/01/2048 | | | 2,792 | | | | 3,662 | |
3.250%, 09/01/2023 | | | 1,450 | | | | 1,558 | |
Public Service Electric and Gas MTN | | | | | | | | |
3.700%, 05/01/2028 | | | 1,180 | | | | 1,379 | |
Public Service of Colorado | | | | | | | | |
6.250%, 09/01/2037 | | | 210 | | | | 322 | |
3.200%, 03/01/2050 | | | 1,575 | | | | 1,827 | |
Public Service of New Hampshire | | | | | | | | |
3.600%, 07/01/2049 | | | 6,760 | | | | 8,212 | |
Public Service of Oklahoma | | | | | | | | |
6.625%, 11/15/2037 | | | 960 | | | | 1,397 | |
San Diego Gas & Electric | | | | | | | | |
4.500%, 08/15/2040 | | | 2,025 | | | | 2,540 | |
3.600%, 09/01/2023 | | | 1,224 | | | | 1,321 | |
3.320%, 04/15/2050 | | | 400 | | | | 450 | |
3.000%, 08/15/2021 | | | 3,840 | | | | 3,913 | |
Sempra Energy | | | | | | | | |
4.000%, 02/01/2048 | | | 480 | | | | 573 | |
3.800%, 02/01/2038 | | | 1,160 | | | | 1,351 | |
3.400%, 02/01/2028 | | | 1,715 | | | | 1,917 | |
2.900%, 02/01/2023 | | | 4,129 | | | | 4,329 | |
Southern California Edison | | | | | | | | |
3.875%, 06/01/2021 | | | 8,795 | | | | 8,873 | |
2.850%, 08/01/2029 | | | 2,555 | | | | 2,765 | |
Southern California Gas | | | | | | | | |
5.125%, 11/15/2040 | | | 10 | | | | 14 | |
4.300%, 01/15/2049 | | | 1,045 | | | | 1,378 | |
3.750%, 09/15/2042 | | | 180 | | | | 215 | |
2.550%, 02/01/2030 | | | 4,515 | | | | 4,870 | |
Tampa Electric | | | | | | | | |
3.625%, 06/15/2050 | | | 4,580 | | | | 5,455 | |
Union Electric | | | | | | | | |
4.000%, 04/01/2048 | | | 1,040 | | | | 1,324 | |
3.900%, 09/15/2042 | | | 80 | | | | 98 | |
Wisconsin Power & Light | | | | | | | | |
3.650%, 04/01/2050 | | | 40 | | | | 48 | |
3.050%, 10/15/2027 | | | 2,300 | | | | 2,560 | |
Wisconsin Power and Light | | | | | | | | |
6.375%, 08/15/2037 | | | 50 | | | | 72 | |
Wisconsin Public Service | | | | | | | | |
3.300%, 09/01/2049 | | | 2,475 | | | | 2,811 | |
| | | | | | | | |
| | | | | | | 300,516 | |
| | | | | | | | |
| | |
Total Corporate Obligations | | | | | | | | |
(Cost $2,869,427) ($ Thousands) | | | | | | | 3,173,353 | |
| | | | | | | | |
| | |
284 | | SEI Institutional Investments Trust / Semi-Annual Report / November 30, 2020 |
| | | | | | | | |
| | | |
| Description | | Face Amount
(Thousands) | | Market Value
($ Thousands) |
|
U.S. TREASURY OBLIGATIONS — 4.5% | |
U.S. Treasury Bonds | | | | | | | | |
1.375%, 11/15/2040 | | $ | 2,940 | | | $ | 2,945 | |
1.375%, 08/15/2050 | | | 17,285 | | | | 16,459 | |
1.250%, 05/15/2050 | | | 29,480 | | | | 27,200 | |
1.125%, 08/15/2040 | | | 4,441 | | | | 4,262 | |
U.S. Treasury Notes | | | | | | | | |
0.875%, 11/15/2030 | | | 19,785 | | | | 19,850 | |
0.625%, 11/30/2027 | | | 9,665 | | | | 9,674 | |
0.625%, 08/15/2030 | | | 2,016 | | | | 1,977 | |
0.500%, 10/31/2027 | | | 29,075 | | | | 28,861 | |
0.375%, 11/30/2025 | | | 21,705 | | | | 21,722 | |
0.250%, 11/15/2023 | | | 17,610 | | | | 17,644 | |
0.250%, 10/31/2025 | | | 1,680 | | | | 1,672 | |
0.125%, 07/31/2022 | | | 4,295 | | | | 4,294 | |
0.125%, 10/31/2022 | | | 4,845 | | | | 4,843 | |
| | | | | | | | |
| | |
Total U.S. Treasury Obligations
(Cost $160,957) ($ Thousands) | | | | | | | 161,403 | |
| | | | | | | | |
|
MUNICIPAL BONDS — 3.1% | |
| | |
California — 0.9% | | | | | | | | |
Bay Area, Toll Authority, RB | | | | | | | | |
2.574%, 04/01/2031 | | | 3,300 | | | | 3,551 | |
2.425%, 04/01/2026 | | | 1,400 | | | | 1,503 | |
California State University, RB | | | | | | | | |
5.770%, 05/15/2043 | | | 1,505 | | | | 2,164 | |
California State University, Ser D, RB | | | | | | | | |
1.490%, 11/01/2028 | | | 2,580 | | | | 2,568 | |
California State University, Ser H, RB | | | | | | | | |
6.548%, 05/15/2048 | | | 120 | | | | 193 | |
California State, Build America Project, GO | | | | | | | | |
7.600%, 11/01/2040 | | | 560 | | | | 1,012 | |
7.550%, 04/01/2039 | | | 2,205 | | | | 3,849 | |
7.500%, 04/01/2034 | | | 5,125 | | | | 8,432 | |
California State, Health Facilities Financing Authority, RB | | | | | | | | |
1.679%, 06/01/2028 | | | 4,975 | | | | 5,015 | |
Los Angeles, Community College District, GO | | | | | | | | |
1.606%, 08/01/2028 | | | 4,780 | | | | 4,903 | |
Los Angeles, Unified School District, Build America Project, Ser RY, GO | | | | | | | | |
6.758%, 07/01/2034 | | | 1,070 | | | | 1,574 | |
| | | | | | | | |
| | | | | | | 34,764 | |
| | | | | | | | |
| | |
Colorado — 0.1% | | | | | | | | |
City & County of Denver, Airport System Revenue, Ser C, RB | | | | | | | | |
2.037%, 11/15/2028 | | | 4,000 | | | | 4,035 | |
| | | | | | | | |
| | | | | | | | |
| | | |
| Description | | Face Amount
(Thousands) | | Market Value
($ Thousands) |
|
MUNICIPAL BONDS (continued) | |
| |
Florida — 0.2% | | | | | |
Florida State, Board of Administration Finance, Ser A, RB | | | | | | | | |
1.705%, 07/01/2027 | | $ | 7,520 | | | $ | 7,731 | |
| | | | | | | | |
|
Georgia — 0.2% | |
Georgia State, Municipal Electric Authority, Build America Project, RB | | | | | | | | |
7.055%, 04/01/2057 | | | 2,706 | | | | 3,876 | |
6.637%, 04/01/2057 | | | 2,411 | | | | 3,617 | |
| | | | | | | | |
| | |
| | | | | | | 7,493 | |
| | | | | | | | |
|
Illinois — 0.1% | |
Greater Chicago, Metropolitan Water Reclamation District, GO | | | | | | | | |
5.720%, 12/01/2038 | | | 2,580 | | | | 3,657 | |
| | | | | | | | |
| |
Kansas — 0.1% | | | | | |
Kansas State, Development Finance Authority, Ser H, RB | | | | | | | | |
4.727%, 04/15/2037 | | | 1,455 | | | | 1,842 | |
| | | | | | | | |
| |
Massachusetts — 0.1% | | | | | |
Massachusetts State, Build America Project, GO | | | | | | | | |
4.910%, 05/01/2029 | | | 100 | | | | 128 | |
Massachusetts State, Build America Project, RB | | | | | | | | |
5.731%, 06/01/2040 | | | 80 | | | | 116 | |
Massachusetts State, Educational Financing Authority, Ser A, RB | | | | | | | | |
2.925%, 07/01/2028 | | | 2,550 | | | | 2,573 | |
| | | | | | | | |
| | |
| | | | | | | 2,817 | |
| | | | | | | | |
| |
Michigan — 0.2% | | | | | |
Michigan State, Finance Authority, RB | | | | | | | | |
3.084%, 12/01/2034 | | | 1,685 | | | | 1,818 | |
Michigan State, Finance Authority, RB Callable 03/01/2026 @ 100 | | | | | | | | |
2.671%, 09/01/2049 (D) | | | 4,600 | | | | 4,830 | |
| | | | | | | | |
| | |
| | | | | | | 6,648 | |
| | | | | | | | |
| |
New Jersey — 0.2% | | | | | |
New Jersey State, Transportation Trust Fund Authority, Ser C, RB | | | | | | | | |
5.754%, 12/15/2028 | | | 2,300 | | | | 2,604 | |
New Jersey State, Turnpike Authority, Build America Project, RB | | | | | | | | |
7.102%, 01/01/2041 | | | 2,500 | | | | 4,074 | |
| | | | | | | | |
| | |
| | | | | | | 6,678 | |
| | | | | | | | |
|
| |
| | |
SEI Institutional Investments Trust / Semi-Annual Report / November 30, 2020 | | 285 |
SCHEDULE OF INVESTMENTS (Unaudited)
November 30, 2020
Intermediate Duration Credit Fund (Concluded)
| | | | | | | | |
| | | |
| Description | | Face Amount
(Thousands) | | Market Value
($ Thousands) |
|
MUNICIPAL BONDS (continued) | |
| | |
New York — 0.8% | | | | | | | | |
New York & New Jersey, Port Authority, RB | | | | | | | | |
4.926%, 10/01/2051 | | $ | 165 | | | $ | 226 | |
4.458%, 10/01/2062 | | | 195 | | | | 254 | |
New York & New Jersey, Port Authority, Ser 181, RB | | | | | | | | |
4.960%, 08/01/2046 | | | 1,280 | | | | 1,722 | |
New York & New Jersey, Port Authority, Ser AAA, RB | | | | | | | | |
1.086%, 07/01/2023 | | | 2,225 | | | | 2,250 | |
New York City, Transitional Finance Authority Future Tax Secured Revenue, Sub-Ser, RB | | | | | | | | |
3.480%, 08/01/2026 | | | 2,100 | | | | 2,373 | |
New York State, Dormitory Authority, Ser F, RB | | | | | | | | |
3.110%, 02/15/2039 | | | 2,435 | | | | 2,611 | |
New York State, Thruway Authority, Ser M, RB | | | | | | | | |
2.900%, 01/01/2035 | | | 4,150 | | | | 4,508 | |
New York State, Urban Development, RB | | | | | | | | |
5.770%, 03/15/2039 | | | 8,225 | | | | 10,529 | |
| | | | | | | | |
| | |
| | | | | | | 24,473 | |
| | | | | | | | |
|
Oregon — 0.1% | |
Oregon State, School Boards Association, Ser B, GO, NATL | | | | | | | | |
5.550%, 06/30/2028 | | | 4,000 | | | | 4,896 | |
| | | | | | | | |
|
Texas — 0.1% | |
City of Houston, Airport System Revenue, Sub-Ser C, RB | | | | | | | | |
2.085%, 07/01/2028 | | | 2,320 | | | | 2,332 | |
Grand Parkway, Transportation Corp, Ser E, RB | | | | | | | | |
5.184%, 10/01/2042 | | | 530 | | | | 751 | |
North Texas, Tollway Authority, Build America Project, RB | | | | | | | | |
6.718%, 01/01/2049 | | | 810 | | | | 1,403 | |
Texas State, Build America Project, GO | | | | | | | | |
5.517%, 04/01/2039 | | | 540 | | | | 796 | |
Texas State, Dallas Area, Rapid Transit, RB | | | | | | | | |
1.147%, 12/01/2026 | | | 1,200 | | | | 1,206 | |
Texas State, Private Activity Bond Surface Transportation, RB | | | | | | | | |
3.922%, 12/31/2049 | | | 1,120 | | | | 1,230 | |
| | | | | | | | |
| | | | | | | 7,718 | |
| | | | | | | | |
| | |
Total Municipal Bonds
(Cost $103,877) ($ Thousands) | | | | | | | 112,752 | |
| | | | | | | | |
| | | | | | | | |
| | | |
| Description | | Face Amount
(Thousands) | | Market Value
($ Thousands) |
| |
SOVEREIGN DEBT — 1.3% | | | | | |
| | |
Chile Government International Bond | | | | | | | | |
3.500%, 01/25/2050 | | $ | 6,515 | | | $ | 7,419 | |
European Bank for Reconstruction & Development MTN | | | | | | | | |
2.125%, 03/07/2022 | | | 3,060 | | | | 3,133 | |
European Investment Bank | | | | | | | | |
2.250%, 03/15/2022 | | | 3,695 | | | | 3,793 | |
1.375%, 09/06/2022 | | | 2,790 | | | | 2,848 | |
Export-Import Bank of Korea | | | | | | | | |
2.750%, 01/25/2022 | | | 3,320 | | | | 3,407 | |
Israel Government International Bond | | | | | | | | |
3.875%, 07/03/2050 | | | 1,405 | | | | 1,679 | |
Japan Bank for International Cooperation | | | | | | | | |
1.750%, 01/23/2023 | | | 7,830 | | | | 8,061 | |
Mexico Government International Bond | | | | | | | | |
3.771%, 05/24/2061 | | | 3,025 | | | | 3,018 | |
2.659%, 05/24/2031 | | | 2,595 | | | | 2,597 | |
Province of Quebec Canada | | | | | | | | |
6.350%, 01/30/2026 | | | 270 | | | | 341 | |
2.500%, 04/09/2024 | | | 8,670 | | | | 9,271 | |
| | | | | | | | |
| | |
Total Sovereign Debt
(Cost $43,412) ($ Thousands) | | | | | | | 45,567 | |
| | | | | | | | |
|
ASSET-BACKED SECURITY — 0.1% | |
| |
Other Asset-Backed Securities — 0.1% | | | | | |
American Tower Trust I, Ser 2013-13, Cl 2A | | | | | | | | |
3.070%, 03/15/2048 (A) | | | 3,285 | | | | 3,353 | |
| | | | | | | | |
| | |
Total Asset-Backed Security (Cost $3,281) ($ Thousands) | | | | | | | 3,353 | |
| | | | | | | | |
| | |
| | | Shares | | |
| |
CASH EQUIVALENT — 2.0% | | | | | |
SEI Daily Income Trust, Government Fund, Cl F | | | | | | | | |
0.010%**† | | | 70,535,447 | | | | 70,535 | |
| | | | | | | | |
| | |
Total Cash Equivalent
(Cost $70,535) ($ Thousands) | | | | | | | 70,535 | |
| | | | | | | | |
| | |
Total Investments in Securities
— 99.5% (Cost $3,251,489) ($ Thousands) | | | | | | $ | 3,566,963 | |
| | | | | | | | |
| | |
286 | | SEI Institutional Investments Trust / Semi-Annual Report / November 30, 2020 |
A list of the open futures contracts held by the Fund at November 30, 2020, is as follows:
| | | | | | | | | | | | | | | | | | | | |
| | | | | | |
| Type of Contract | | Number of Contracts Short | | | Expiration Date | | | Notional Amount (Thousands) | | | Value (Thousands) | | | Unrealized Depreciation (Thousands) | |
Ultra 10-Year U.S. Treasury Note | | | (133 | ) | | | Mar-2021 | | | $ | (20,831 | ) | | $ | (20,898 | ) | | $ | (67 | ) |
| | | | | | | | | | | | | | | | | | | | |
| | Percentages are based on Net Assets of $3,583,718 ($ Thousands). |
| ** | The rate reported is the 7-day effective yield as of November 30, 2020. |
| † | Investment in Affiliated Security (see Note 6). |
| (A) | Security exempt from registration under Rule 144A of the Securities Act of 1933. These securities may be resold in transactions exempt from registration normally to qualified institutions. |
| | On November 30, 2020, the value of these securities amounted to $532,140 ($ Thousands), representing 14.8% of the Net Assets of the Fund. |
| (B) | Zero coupon security. The rate shown on the Schedule of Investments is the security’s effective yield at the time of purchase. |
| (C) | Perpetual security with no stated maturity date. |
| (D) | Variable or floating rate security, the interest rate of which adjusts periodically based on prevailing interest rates. |
Cl — Class
DAC — Designated Activity Company
GO — General Obligation
ICE— Intercontinental Exchange
LIBOR— London Interbank Offered Rate
LLC — Limited Liability Company
LP — Limited Partnership
MTN — Medium Term Note
PLC — Public Limited Company
RB — Revenue Bond
Ser — Series
USD — United States Dollar
VAR — Variable Rate
The following is a list of the level of inputs used as of November 30, 2020, in valuing the Fund’s investments and other financial instruments carried at value ($ Thousands):
| | | | | | | | | | | | | | | | |
| Investments in Securities | | Level 1 ($) | | Level 2
($) | | Level 3
($) | | Total ($) |
Corporate Obligations | | | – | | | | 3,173,353 | | | | – | | | | 3,173,353 | |
U.S. Treasury Obligations | | | – | | | | 161,403 | | | | – | | | | 161,403 | |
Municipal Bonds | | | – | | | | 112,752 | | | | – | | | | 112,752 | |
Sovereign Debt | | | – | | | | 45,567 | | | | – | | | | 45,567 | |
Asset-Backed Security | | | – | | | | 3,353 | | | | – | | | | 3,353 | |
Cash Equivalent | | | 70,535 | | | | – | | | | – | | | | 70,535 | |
| | | | | | | | | | | | | | | | |
Total Investments in Securities | | | 70,535 | | | | 3,496,428 | | | | – | | | | 3,566,963 | |
| | | | | | | | | | | | | | | | |
| | | | | | | | | | | | | | | | |
| Other Financial Instruments | | Level 1
($) | | Level 2
($) | | Level 3
($) | | Total ($) |
Futures Contracts* | | | | | | | | | | | | | | | | |
Unrealized Depreciation | | | (67) | | | | – | | | | – | | | | (67) | |
| | | | | | | | | | | | | | | | |
Total Other Financial Instruments | | | (67) | | | | – | | | | – | | | | (67) | |
| | | | | | | | | | | | | | | | |
* Futures contracts are valued at the unrealized depreciation on the instrument.
For the period ended November 30, 2020, there were no transfers in or out of Level 3.
For more information on valuation inputs, see Note 2 — Significant Accounting Policies in Notes to Financial Statements.
The following is a summary of the Fund’s transactions with affiliates for the period ended November 30, 2020 ($ Thousands):
| | | | | | | | | | | | | | | | | | |
| | | | | | | | | | |
| Security Description | | Value
5/31/2020 | | Purchases
at Cost | | Proceeds
from Sales | | Realized Gain
(Loss) | | Change in
Unrealized
Appreciation
(Depreciation) | | Value
11/30/2020 | | Shares | | Income | | Capital Gains |
SEI Daily Income Trust, Government Fund, Cl F | | $ 63,112 | | $ 595,817 | | $ (588,394) | | $ — | | $ — | | $ 70,535 | | 70,535,447 | | $ 5 | | $ — |
| | | | | | | | | | | | | | | | | | |
Amounts designated as “—” are either $0 or have been rounded to $0.
The accompanying notes are an integral part of the financial statements.
| | |
SEI Institutional Investments Trust / Semi-Annual Report / November 30, 2020 | | 287 |
CONSOLIDATED SUMMARY SCHEDULE OF INVESTMENTS (Unaudited)
November 30, 2020
Dynamic Asset Allocation Fund
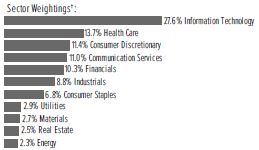
†Percentages are based on total investments.
| | | | | | | | | | | | |
| | | | |
| Description | | Percentage of
Net Assets (%) | | Shares | | Market Value
($ Thousands) |
| |
COMMON STOCK — 91.0% | | | | | |
| |
Communication Services — 10.0% | | | | | |
Alphabet Inc, Cl A * | | | 1.6 | % | | | 18,245 | | | $ | 32,009 | |
Alphabet Inc, Cl C * | | | 1.6 | | | | 17,822 | | | | 31,380 | |
AT&T Inc | | | 0.6 | | | | 432,819 | | | | 12,444 | |
Comcast Corp, Cl A | | | 0.7 | | | | 277,000 | | | | 13,916 | |
Facebook Inc, Cl A * | | | 2.0 | | | | 146,200 | | | | 40,493 | |
Netflix Inc * | | | 0.7 | | | | 26,800 | | | | 13,151 | |
Verizon Communications Inc | | | 0.8 | | | | 251,900 | | | | 15,217 | |
Walt Disney Co/The | | | 0.8 | | | | 109,777 | | | | 16,248 | |
Other Securities | | | 1.2 | | | | | | | | 26,521 | |
| | | | | | | | | | | | |
| | | | | | | | | | | 201,379 | |
| | | | | | | | | | | | |
| |
Consumer Discretionary — 10.3% | | | | | |
Amazon.com Inc * | | | 4.1 | | | | 25,900 | | | | 82,052 | |
Home Depot Inc/The | | | 0.9 | | | | 65,532 | | | | 18,179 | |
McDonald’s Corp | | | 0.5 | | | | 45,300 | | | | 9,850 | |
NIKE Inc, Cl B | | | 0.5 | | | | 75,900 | | | | 10,224 | |
Other Securities | | | 4.3 | | | | | | | | 86,831 | |
| | | | | | | | | | | | |
| | | | | | | | | | | 207,136 | |
| | | | | | | | | | | | |
| |
Consumer Staples — 6.2% | | | | | |
Coca-Cola Co/The | | | 0.6 | | | | 234,800 | | | | 12,116 | |
Costco Wholesale Corp | | | 0.5 | | | | 26,900 | | | | 10,539 | |
PepsiCo Inc | | | 0.6 | | | | 84,062 | | | | 12,124 | |
Procter & Gamble Co/The | | | 1.0 | | | | 151,536 | | | | 21,044 | |
Walmart Inc | | | 0.6 | | | | 84,565 | | | | 12,921 | |
Other Securities | | | 2.9 | | | | | | | | 55,493 | |
| | | | | | | | | | | | |
| | | | | | | | | | | 124,237 | |
| | | | | | | | | | | | |
| |
Energy — 2.1% | | | | | |
Chevron Corp | | | 0.5 | | | | 117,282 | | | | 10,225 | |
Exxon Mobil Corp | | | 0.5 | | | | 256,800 | | | | 9,792 | |
Other Securities | | | 1.1 | | | | | | | | 21,992 | |
| | | | | | | | | | | | |
| | | | | | | | | | | 42,009 | |
| | | | | | | | | | | | |
| |
Financials — 9.4% | | | | | |
Bank of America Corp | | | 0.7 | | | | 463,200 | | | | 13,044 | |
Berkshire Hathaway Inc, Cl B * | | | 1.4 | | | | 120,500 | | | | 27,584 | |
JPMorgan Chase & Co | | | 1.1 | | | | 185,300 | | | | 21,843 | |
Other Securities | | | 6.2 | | | | | | | | 126,205 | |
| | | | | | | | | | | | |
| | | | | | | | | | | 188,676 | |
| | | | | | | | | | | | |
| | | | | | | | | | | | |
| | | | |
| Description | | Percentage of
Net Assets (%) | | Shares | | Market Value
($ Thousands) |
| |
COMMON STOCK (continued) | | | | | |
| |
Health Care — 12.5% | | | | | |
Abbott Laboratories | | | 0.6 | % | | | 107,539 | | | $ | 11,638 | |
AbbVie Inc | | | 0.6 | | | | 107,153 | | | | 11,206 | |
Amgen Inc | | | 0.4 | | | | 35,600 | | | | 7,905 | |
Bristol-Myers Squibb Co | | | 0.4 | | | | 137,500 | | | | 8,580 | |
Danaher Corp | | | 0.4 | | | | 38,400 | | | | 8,626 | |
Johnson & Johnson | | | 1.2 | | | | 160,000 | | | | 23,149 | |
Medtronic PLC | | | 0.5 | | | | 81,955 | | | | 9,318 | |
Merck & Co Inc | | | 0.6 | | | | 153,600 | | | | 12,348 | |
Pfizer Inc | | | 0.6 | | | | 337,596 | | | | 12,933 | |
Thermo Fisher Scientific Inc | | | 0.6 | | | | 24,100 | | | | 11,206 | |
UnitedHealth Group Inc | | | 1.0 | | | | 57,800 | | | | 19,440 | |
Other Securities | | | 5.6 | | | | | | | | 113,578 | |
| | | | | | | | | | | | |
| | | | | | | | | | | 249,927 | |
| | | | | | | | | | | | |
| |
Industrials — 8.0% | | | | | |
Honeywell International Inc | | | 0.4 | | | | 42,700 | | | | 8,707 | |
Union Pacific Corp | | | 0.4 | | | | 41,400 | | | | 8,449 | |
Other Securities | | | 7.2 | | | | | | | | 142,950 | |
| | | | | | | | | | | | |
| | | | | | | | | | | 160,106 | |
| | | | | | | | | | | | |
| |
Information Technology — 25.1% | | | | | |
Accenture PLC, Cl A | | | 0.5 | | | | 38,700 | | | | 9,640 | |
Adobe Inc * | | | 0.7 | | | | 29,200 | | | | 13,971 | |
Apple Inc | | | 5.8 | | | | 977,800 | | | | 116,407 | |
Broadcom Inc | | | 0.5 | | | | 24,493 | | | | 9,836 | |
Cisco Systems Inc | | | 0.6 | | | | 257,100 | | | | 11,060 | |
Intel Corp | | | 0.6 | | | | 258,300 | | | | 12,489 | |
Mastercard Inc, Cl A | | | 0.9 | | | | 53,700 | | | | 18,071 | |
Microsoft Corp | | | 4.9 | | | | 460,300 | | | | 98,536 | |
NVIDIA Corp | | | 1.0 | | | | 37,500 | | | | 20,102 | |
PayPal Holdings Inc * | | | 0.8 | | | | 71,300 | | | | 15,267 | |
QUALCOMM Inc | | | 0.5 | | | | 68,800 | | | | 10,125 | |
salesforce.com* | | | 0.7 | | | | 55,300 | | | | 13,593 | |
Texas Instruments Inc | | | 0.4 | | | | 55,600 | | | | 8,966 | |
Visa Inc, Cl A | | | 1.1 | | | | 102,500 | | | | 21,561 | |
Other Securities | | | 6.1 | | | | | | | | 124,334 | |
| | | | | | | | | | | | |
| | | | | | | | | | | 503,958 | |
| | | | | | | | | | | | |
| |
Materials — 2.5% | | | | | |
Linde PLC | | | 0.4 | | | | 32,041 | | | | 8,216 | |
Other Securities | | | 2.1 | | | | | | | | 41,405 | |
| | | | | | | | | | | | |
| | | | | | | | | | | 49,621 | |
| | | | | | | | | | | | |
| |
Real Estate — 2.3% | | | | | |
Other Securities ‡ | | | 2.3 | | | | | | | | 46,057 | |
| | | | | | | | | | | | |
| |
Utilities — 2.6% | | | | | |
NextEra Energy Inc | | | 0.4 | | | | 119,100 | | | | 8,765 | |
Other Securities | | | 2.2 | | | | | | | | 44,322 | |
| | | | | | | | | | | | |
| | | | | | | | | | | 53,087 | |
| | | | | | | | | | | | |
| |
Total Common Stock
(Cost $749,354) ($ Thousands) | | | | 1,826,193 | |
| | | | | | | | | | | | |
| |
Total Investments in Securities — 91.0%
(Cost $749,354)($ Thousands) | | | $ | 1,826,193 | |
| | | | | | | | | | | | |
| | |
288 | | SEI Institutional Investments Trust / Semi-Annual Report / November 30, 2020 |
| | | | | | | | |
| | | |
| Description | | Contracts | | | Market Value ($ Thousands) |
|
PURCHASED SWAPTIONS * — 1.2% | |
Total Purchased Swaptions (A) | | | | | | | | |
(Cost $15,467) ($ Thousands) | | | 2,742,237,893 | | | $ | 23,193 | |
| | | | | | | | |
A list of the open OTC swaption contracts held by the Fund at November 30, 2020, is as follows:
| | | | | | | | | | | | | | | | | | | | |
| | | | | | |
| Description | | Counterparty | | | Number of Contracts/
Notional Amount | | Exercise Price | | Expiration Date | | Value
(Thousands) |
| | | | | |
PURCHASED SWAPTIONS — 1.2% | | | | | | | | | | | | | | | | | | | | |
| | | | | |
Call Swaptions | | | | | | | | | | | | | | | | | | | | |
CMS One Look* | | | Bank of America Merill Lynch | | | | 2,550,870,000 | | | | $0.14 | | | | 07/17/2021 | | | $ | 14,571 | |
CMS One Look* | | | Bank of America Merill Lynch | | | | 191,367,893 | | | | $2.00 | | | | 08/19/2023 | | | | 8,622 | |
| | | | | | | | | | | | | | | | | | | | |
Total Purchased Swaptions | | | | | | | 2,742,237,893 | | | | | | | | | | | $ | 23,193 | |
| | | | | | | | | | | | | | | | | | | | |
A list of the open futures contracts held by the Fund at November 30, 2020, is as follows:
| | | | | | | | | | | | | | | | | | | | |
| | | | | | |
| Type of Contract | | Number of
Contracts Long | | Expiration
Date | | Notional Amount
(Thousands) | | Value
(Thousands) | | Unrealized
Appreciation (Thousands) |
S&P 500 Index E-MINI^ | | | 1,001 | | | | Dec-2020 | | | $ | 167,306 | | | $ | 181,341 | | | $ | 14,035 | |
| | | | | | | | | | | | | | | | | | | | |
A list of the open forward foreign currency contracts held by the Fund at November 30, 2020, is as follows:
| | | | | | | | | | | | | | | | | | | | | | | | |
| | | | | | | |
| Counterparty | | Settlement Date | | | | | | Currency to Deliver
(Thousands) | | | | | | Currency to Receive
(Thousands) | | | Unrealized
Appreciation (Depreciation) (Thousands) | |
Bank of America | | | 01/11/21 | | | | USD | | | | 28,699 | | | | SAR | | | | 107,802 | | | $ | 42 | |
Bank of America | | | 01/11/21 | | | | SAR | | | | 486,018 | | | | USD | | | | 129,470 | | | | (107 | ) |
| | | | | | | | | | | | | | | | | | | | | | | | |
| | | | | | | | | | | | | | | | | | | | | | $ | (65 | ) |
| | | | | | | | | | | | | | | | | | | | | | | | |
A list of OTC swap agreements held by the fund at November 30, 2020, is as follows:
| | | | | | | | | | | | | | | | | | | | | | | | | | | | | | | | | | | | | | | | |
| Total Return Swaps | |
| | | | | | | | | | | |
| Counterparty | | Reference Entity/ Obligation | | | Fund Pays | | | Fund
Receives | | | Payment Frequency | | | Termination Date | | | Currency | | | Notional Amount (Thousands) | | | Value (Thousands) | | | Upfront Payments/ Receipts (Thousands) | | | Net Unrealized Depreciation (Thousands) | |
BNP Paribas^ | |
| Bloomberg Gold SubIndex
Total Return |
| |
| US T-BILL HIGH
DISCOUNT RATE +
7 BPS |
| |
| INDEX
RETURN |
| | | Quarterly | | | | 03/17/2021 | | | | USD | | | | (122,730) | | | $ | (11,056 | ) | | $ | – | | | $ | (11,056 | ) |
BNP Paribas^ | |
| Bloomberg Gold SubIndex
Total Return |
| |
| US T-BILL HIGH
DISCOUNT RATE +
7 BPS |
| |
| INDEX
RETURN |
| | | Quarterly | | | | 04/05/2021 | | | | USD | | | | (84,502) | | | | (6,415 | ) | | | – | | | | (6,415 | ) |
| | | | | | | | | | | | | | | | | | | | | | | | | | | | | | | | |
| | | | | | | | | | | | | | | | | | | | | | | | | | | | | | $ | (17,471 | ) | | $ | – | | | $ | (17,471 | ) |
| | | | | | | | | | | | | | | | | | | | | | | | | | | | | | | | |
Percentages are based on a Net Assets of $2,006,136 ($ Thousands).
| * | Non-income producing security. |
| ‡ | Real Estate Investment Trust. |
| (A) | Refer to table below for details on Swaption Contracts. |
| ^ | Security, or a portion thereof, is held by DAA Commodity Strategy Subsidiary, Ltd. as of November 30, 2020. |
| | |
SEI Institutional Investments Trust / Semi-Annual Report / November 30, 2020 | | 289 |
CONSOLIDATED SUMMARY SCHEDULE OF INVESTMENTS (Unaudited)
November 30, 2020
Dynamic Asset Allocation Fund (Concluded)
Cl — Class
Ltd. — Limited
OTC — Over The Counter
PLC — Public Limited Company
S&P— Standard & Poor’s
SAR— Saudi Riyal
USD — U.S. Dollar
The Summary Schedule of Investments does not reflect the complete portfolio holdings. It includes the Fund’s 50 largest holdings and each investment of any issuer that exceeds 1% of the Fund’s net assets. “Other Securities” represent all issues not required to be disclosed under the rules adopted by the U.S. Securities and Exchange Commission (“SEC”). In certain instances, securities for which footnotes listed above may otherwise apply are included in the Other Securities caption. The complete schedule of portfolio holdings is available (i) without charge, upon request, by calling (800) 342-5734; and (ii) on the SEC’s website at http://www.sec.gov.
The following is a list of the level of inputs used as of November 30, 2020, in valuing the Fund’s investments and other financial instruments carried at value ($ Thousands):
| | | | | | | | | | | | | | | | |
| | | | | |
| Investments in Securities | | Level 1
($) | | Level 2
($) | | Level 3
($) | | Total ($) |
Common Stock | | | 1,826,193 | | | | – | | | | – | | | | 1,826,193 | |
| | | | | | | | | | | | | | | | |
Total Investments in Securities | | | 1,826,193 | | | | – | | | | – | | | | 1,826,193 | |
| | | | | | | | | | | | | | | | |
| | | | | | | | | | | | | | | | |
| | | | | |
| Other Financial Instruments | | Level 1 ($) | | Level 2 ($) | | Level 3 ($) | | Total ($) |
Purchased Swaptions | | | – | | | | 23,193 | | | | – | | | | 23,193 | |
Futures Contracts* | | | | | | | | | | | | | | | | |
Unrealized Appreciation | | | 14,035 | | | | – | | | | – | | | | 14,035 | |
Forwards Contracts* | | | | | | | | | | | | | | | | |
Unrealized Appreciation | | | – | | | | 42 | | | | – | | | | 42 | |
Unrealized Depreciation | | | – | | | | (107) | | | | – | | | | (107) | |
OTC Swaps | | | | | | | | | | | | | | | | |
Total Return Swaps*
Unrealized Depreciation | | | – | | | | (17,471) | | | | – | | | | (17,471) | |
| | | | | | | | | | | | | | | | |
Total Other Financial Instruments | | | 14,035 | | | | 5,657 | | | | – | | | | 19,692 | |
| | | | | | | | | | | | | | | | |
* Futures contracts, forwards contracts, and swap contracts are valued at the unrealized appreciation
(depreciation) on the instrument.
For the period ended November 30, 2020, there were no transfers in or out of Level 3.
For more information on valuation inputs, see Note 2 – Significant Accounting Policies in Notes to Financial Statements.
Amounts designated as “—” are $0 or have been rounded to $0.
The accompanying notes are an integral part of the financial statements.
| | |
290 | | SEI Institutional Investments Trust / Semi-Annual Report / November 30, 2020 |
CONSOLIDATED SCHEDULE OF INVESTMENTS (Unaudited)
November 30, 2020
Multi-Asset Real Return Fund
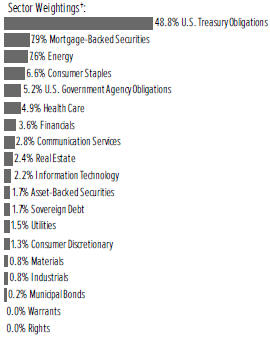
†Percentages are based on total investments.
| | | | | | | | |
| | | |
| Description | | Face Amount (Thousands) | | Market Value ($ Thousands) |
|
U.S. TREASURY OBLIGATIONS — 63.2% | |
U.S. Treasury Bills ^ (A) | | | | | | | | |
0.110%, 04/08/2021 | | $ | 500 | | | $ | 500 | |
0.101%, 02/25/2021 | | | 70,500 | | | | 70,485 | |
0.095%, 01/07/2021 | | | 500 | | | | 500 | |
0.080%, 12/29/2020 | | | 500 | | | | 500 | |
0.080%, 01/26/2021 | | | 100 | | | | 100 | |
U.S. Treasury Inflation-Protected Securities | | | | | | | | |
2.375%, 01/15/2025 | | | 27,609 | | | | 31,918 | |
2.000%, 01/15/2026 | | | 12,871 | | | | 15,102 | |
0.625%, 07/15/2021 (G) | | | 16,293 | | | | 16,470 | |
0.625%, 04/15/2023 | | | 29,482 | | | | 30,790 | |
0.625%, 01/15/2024 (G) | | | 21,875 | | | | 23,228 | |
0.625%, 01/15/2026 | | | 10,450 | | | | 11,495 | |
0.500%, 04/15/2024 | | | 5,511 | | | | 5,844 | |
0.375%, 07/15/2023 (G) | | | 28,973 | | | | 30,404 | |
0.375%, 07/15/2025 (G) | | | 62,944 | | | | 68,213 | |
0.250%, 01/15/2025 | | | 8,066 | | | | 8,593 | |
0.125%, 01/15/2022 | | | 10,580 | | | | 10,728 | |
0.125%, 04/15/2022 | | | 4,375 | | | | 4,445 | |
0.125%, 07/15/2022 (G) | | | 37,688 | | | | 38,624 | |
0.125%, 01/15/2023 (G) | | | 25,243 | | | | 26,001 | |
0.125%, 07/15/2024 (G) | | | 15,982 | | | | 16,906 | |
0.125%, 10/15/2024 (G) | | | 33,529 | | | | 35,513 | |
0.125%, 07/15/2026 | | | 19,272 | | | | 20,873 | |
U.S. Treasury Notes ^ | | | | | | | | |
0.385%, VAR US Treasury 3 Month Bill Money Market Yield+0.300%, 10/31/2021 | | | 5,300 | | | | 5,314 | |
| | | | | | | | |
| | | |
| Description | | Face Amount (Thousands) | | Market Value ($ Thousands) |
|
U.S. TREASURY OBLIGATIONS (continued) | |
0.199%, VAR US Treasury 3 Month Bill Money Market Yield+0.114%, 04/30/2022 | | $ | 4,100 | | | $ | 4,104 | |
0.140%, VAR US Treasury 3 Month Bill Money Market Yield+0.055%, 07/31/2022 | | | 7,600 | | | | 7,601 | |
0.140%, VAR US Treasury 3 Month Bill Money Market Yield+0.055%, 10/31/2022 | | | 1,900 | | | | 1,900 | |
| | | | | | | | |
| | |
Total U.S. Treasury Obligations
(Cost $468,744) ($ Thousands) | | | | | | | 486,151 | |
| | | | | | | | |
| | |
| | | Shares | | |
| | |
COMMON STOCK — 30.5% | | | | | | | | |
|
Communication Services — 2.3% | |
Activision Blizzard Inc | | | 4,306 | | | | 342 | |
Alphabet Inc, Cl A * | | | 903 | | | | 1,584 | |
Alphabet Inc, Cl C * | | | 944 | | | | 1,662 | |
Anterix Inc * | | | 1,171 | | | | 35 | |
AT&T Inc (H) | | | 84,958 | | | | 2,442 | |
ATN International Inc | | | 1,025 | | | | 50 | |
CenturyLink Inc | | | 11,891 | | | | 124 | |
Cinemark Holdings Inc | | | 2,300 | | | | 36 | |
Electronic Arts Inc | | | 1,888 | | | | 241 | |
Facebook Inc, Cl A * | | | 8,034 | | | | 2,225 | |
GCI Liberty Inc * | | | 1,600 | | | | 146 | |
Iridium Communications Inc * | | | 3,479 | | | | 112 | |
Liberty Media Corp-Liberty Braves, Cl C * | | | 7,800 | | | | 195 | |
Liberty Media Corp-Liberty Formula One, Cl C * | | | 2,100 | | | | 88 | |
Live Nation Entertainment Inc * | | | 700 | | | | 46 | |
Madison Square Garden Entertainment Corp * | | | 1,322 | | | | 101 | |
Madison Square Garden Sports Corp, Cl A * | | | 1,127 | | | | 191 | |
Match Group Inc * | | | 231 | | | | 32 | |
Netflix Inc * | | | 2,728 | | | | 1,339 | |
Roku Inc, Cl A * | | | 549 | | | | 161 | |
Shenandoah Telecommunications Co | | | 500 | | | | 22 | |
Spok Holdings Inc | | | 3,900 | | | | 38 | |
Spotify Technology SA * | | | 783 | | | | 228 | |
Take-Two Interactive Software Inc * | | | 900 | | | | 162 | |
Telephone and Data Systems Inc | | | 1,478 | | | | 28 | |
T-Mobile US Inc * | | | 5,767 | | | | 767 | |
Twitter Inc * | | | 2,103 | | | | 98 | |
United States Cellular Corp * | | | 600 | | | | 19 | |
Verizon Communications Inc | | | 46,216 | | | | 2,792 | |
ViacomCBS Inc, Cl B | | | 2,444 | | | | 86 | |
Vonage Holdings Corp * | | | 4,800 | | | | 62 | |
Walt Disney Co/The | | | 12,347 | | | | 1,827 | |
| | |
SEI Institutional Investments Trust / Semi-Annual Report / November 30, 2020 | | 291 |
CONSOLIDATED SCHEDULE OF INVESTMENTS (Unaudited)
November 30, 2020
Multi-Asset Real Return Fund (Continued)
| | | | | | | | |
| | | |
| Description | | Shares | | Market Value ($ Thousands) |
|
COMMON STOCK (continued) | |
Zynga Inc, Cl A * | | | 3,709 | | | $ | 31 | |
| | | | | | | | |
| | |
| | | | | | | 17,312 | |
| | | | | | | | |
|
Consumer Discretionary — 0.0% | |
Pinterest Inc, Cl A * | | | 979 | | | | 69 | |
World Fuel Services Corp | | | 6,860 | | | | 195 | |
| | | | | | | | |
| | |
| | | | | | | 264 | |
| | | | | | | | |
|
Consumer Staples — 7.4% | |
Altria Group Inc (H) | | | 48,789 | | | | 1,943 | |
Andersons Inc | | | 1,600 | | | | 36 | |
Archer-Daniels-Midland Co | | | 15,284 | | | | 761 | |
B&G Foods Inc, Cl A | | | 971 | | | | 27 | |
BellRing Brands, Cl A * | | | 700 | | | | 14 | |
Beyond Meat Inc * | | | 1,100 | | | | 154 | |
BJ’s Wholesale Club Holdings Inc * | | | 2,900 | | | | 119 | |
Boston Beer Co Inc/The, Cl A * | | | 50 | | | | 47 | |
Brown-Forman Corp, Cl A | | | 1,099 | | | | 81 | |
Brown-Forman Corp, Cl B | | | 4,029 | | | | 325 | |
Bunge Ltd | | | 5,244 | | | | 309 | |
Calavo Growers Inc | | | 956 | | | | 69 | |
Cal-Maine Foods Inc * | | | 1,050 | | | | 41 | |
Campbell Soup Co | | | 4,802 | | | | 240 | |
Casey’s General Stores Inc | | | 1,203 | | | | 219 | |
Central Garden & Pet Co, Cl A * | | | 1,500 | | | | 55 | |
Church & Dwight Co Inc | | | 6,662 | | | | 585 | |
Clorox Co/The | | | 3,158 | | | | 641 | |
Coca-Cola Co/The (H) | | | 98,440 | | | | 5,080 | |
Coca-Cola Consolidated Inc | | | 100 | | | | 26 | |
Colgate-Palmolive Co | | | 22,413 | | | | 1,919 | |
Conagra Brands Inc | | | 12,706 | | | | 465 | |
Constellation Brands Inc, Cl A | | | 4,028 | | | | 829 | |
Costco Wholesale Corp (H) | | | 11,602 | | | | 4,545 | |
Coty Inc, Cl A | | | 5,168 | | | | 37 | |
Darling Ingredients Inc * | | | 3,464 | | | | 167 | |
Edgewell Personal Care Co | | | 1,766 | | | | 61 | |
Energizer Holdings Inc | | | 2,087 | | | | 87 | |
Estee Lauder Cos Inc/The, Cl A | | | 5,736 | | | | 1,407 | |
Flowers Foods Inc | | | 6,713 | | | | 149 | |
Fresh Del Monte Produce Inc | | | 1,211 | | | | 31 | |
Freshpet Inc * | | | 400 | | | | 55 | |
General Mills Inc | | | 15,456 | | | | 940 | |
Grocery Outlet Holding Corp * | | | 1,900 | | | | 73 | |
Hain Celestial Group Inc/The * | | | 3,266 | | | | 126 | |
Herbalife Nutrition Ltd * | | | 3,212 | | | | 154 | |
Hershey Co/The | | | 4,299 | | | | 636 | |
Hormel Foods Corp | | | 8,209 | | | | 387 | |
Hostess Brands Inc, Cl A * | | | 3,430 | | | | 46 | |
Ingles Markets Inc, Cl A | | | 447 | | | | 17 | |
Ingredion Inc | | | 2,685 | | | | 207 | |
Inter Parfums Inc | | | 900 | | | | 49 | |
J & J Snack Foods Corp | | | 953 | | | | 139 | |
J M Smucker Co/The | | | 3,427 | | | | 402 | |
| | | | | | | | |
| | | |
| Description | | Shares | | Market Value ($ Thousands) |
|
COMMON STOCK (continued) | |
John B Sanfilippo & Son Inc | | | 400 | | | $ | 30 | |
Kellogg Co | | | 6,908 | | | | 441 | |
Keurig Dr Pepper Inc | | | 9,334 | | | | 284 | |
Kimberly-Clark Corp | | | 9,115 | | | | 1,270 | |
Kraft Heinz Co/The | | | 16,644 | | | | 548 | |
Kroger Co/The | | | 20,771 | | | | 685 | |
Lamb Weston Holdings Inc | | | 4,009 | | | | 290 | |
Lancaster Colony Corp | | | 1,050 | | | | 178 | |
McCormick & Co Inc/MD | | | 3,271 | | | | 612 | |
Medifast Inc | | | 146 | | | | 30 | |
Molson Coors Beverage Co, Cl B | | | 5,165 | | | | 238 | |
Mondelez International Inc, Cl A | | | 35,820 | | | | 2,058 | |
Monster Beverage Corp * | | | 9,662 | | | | 819 | |
Nu Skin Enterprises Inc, Cl A | | | 957 | | | | 49 | |
PepsiCo Inc (H) | | | 34,670 | | | | 5,000 | |
Performance Food Group Co * | | | 4,005 | | | | 174 | |
Philip Morris International Inc (H) | | | 39,715 | | | | 3,008 | |
Pilgrim’s Pride Corp * | | | 1,222 | | | | 23 | |
Post Holdings Inc * | | | 2,245 | | | | 212 | |
PriceSmart Inc | | | 2,647 | | | | 215 | |
Primo Water | | | 3,775 | | | | 57 | |
Procter & Gamble Co/The (H) | | | 60,866 | | | | 8,452 | |
Reynolds Consumer Products Inc | | | 1,300 | | | | 39 | |
Sanderson Farms Inc | | | 599 | | | | 82 | |
Seaboard Corp | | | 30 | | | | 96 | |
Simply Good Foods Co * | | | 1,700 | | | | 37 | |
Spectrum Brands Holdings Inc | | | 2,168 | | | | 145 | |
Sprouts Farmers Market Inc * | | | 3,001 | | | | 64 | |
Sysco Corp | | | 13,254 | | | | 945 | |
Tootsie Roll Industries Inc | | | 1,721 | | | | 53 | |
TreeHouse Foods Inc * | | | 1,079 | | | | 44 | |
Tyson Foods Inc, Cl A (H) | | | 8,000 | | | | 522 | |
Universal Corp/VA | | | 878 | | | | 40 | |
US Foods Holding Corp * | | | 6,064 | | | | 191 | |
USANA Health Sciences Inc * | | | 500 | | | | 38 | |
Vector Group Ltd | | | 5,319 | | | | 60 | |
Village Super Market Inc, Cl A | | | 2,944 | | | | 68 | |
Walgreens Boots Alliance Inc | | | 22,450 | | | | 853 | |
Walmart Inc (H) | | | 34,453 | | | | 5,264 | |
WD-40 Co | | | 539 | | | | 137 | |
Weis Markets Inc | | | 1,300 | | | | 62 | |
| | | | | | | | |
| | |
| | | | | | | 57,113 | |
| | | | | | | | |
|
Energy — 8.4% | |
Antero Midstream Corp | | | 29,000 | | | | 196 | |
Antero Resources Corp * | | | 10,353 | | | | 40 | |
Apache Corp | | | 29,708 | | | | 383 | |
Arch Resources Inc | | | 1,100 | | | | 37 | |
Archrock Inc | | | 8,900 | | | | 69 | |
Baker Hughes Co, Cl A | | | 53,392 | | | | 1,000 | |
Berry Corp | | | 3,147 | | | | 12 | |
Bonanza Creek Energy Inc * | | | 1,800 | | | | 40 | |
Brigham Minerals Inc, Cl A | | | 5,417 | | | | 56 | |
| | |
292 | | SEI Institutional Investments Trust / Semi-Annual Report / November 30, 2020 |
| | | | | | | | |
| | | |
| Description | | Shares | | Market Value ($ Thousands) |
| | |
COMMON STOCK (continued) | | | | | | | | |
Cabot Oil & Gas Corp, Cl A | | | 36,348 | | | $ | 637 | |
Cactus Inc, Cl A | | | 2,200 | | | | 51 | |
ChampionX Corp * | | | 14,162 | | | | 168 | |
Cheniere Energy Inc * | | | 20,538 | | | | 1,164 | |
Chevron Corp (H) | | | 160,741 | | | | 14,013 | |
Cimarex Energy Co | | | 8,161 | | | | 293 | |
Clean Energy Fuels Corp * | | | 20,000 | | | | 91 | |
CNX Resources Corp * | | | 14,740 | | | | 139 | |
Concho Resources Inc | | | 17,127 | | | | 984 | |
ConocoPhillips (H) | | | 93,213 | | | | 3,688 | |
Continental Resources Inc/OK | | | 6,817 | | | | 105 | |
CVR Energy Inc | | | 2,300 | | | | 33 | |
Delek US Holdings Inc | | | 3,082 | | | | 41 | |
Devon Energy Corp | | | 33,666 | | | | 471 | |
DHT Holdings Inc | | | 2,900 | | | | 15 | |
Diamondback Energy Inc | | | 15,406 | | | | 616 | |
DMC Global Inc | | | 1,000 | | | | 41 | |
Dril-Quip Inc * | | | 3,912 | | | | 111 | |
EOG Resources Inc | | | 50,306 | | | | 2,358 | |
EQT Corp | | | 21,809 | | | | 325 | |
Equitrans Midstream Corp | | | 36,803 | | | | 300 | |
Evolution Petroleum Corp | | | 10,002 | | | | 30 | |
Exxon Mobil Corp (H) | | | 360,747 | | | | 13,755 | |
Falcon Minerals Corp | | | 15,200 | | | | 35 | |
Frank’s International NV * | | | 12,500 | | | | 28 | |
Frontline Ltd/Bermuda | | | 13,414 | | | | 84 | |
Golar LNG Ltd | | | 5,023 | | | | 46 | |
Goodrich Petroleum Corp * | | | 1,184 | | | | 14 | |
Halliburton Co | | | 68,732 | | | | 1,140 | |
Helix Energy Solutions Group Inc * | | | 5,788 | | | | 22 | |
Helmerich & Payne Inc | | | 9,839 | | | | 224 | |
Hess Corp | | | 24,200 | | | | 1,142 | |
HollyFrontier Corp | | | 13,447 | | | | 315 | |
Kinder Morgan Inc | | | 168,309 | | | | 2,420 | |
Kosmos Energy Ltd | | | 25,916 | | | | 46 | |
Liberty Oilfield Services Inc, Cl A | | | 7,330 | | | | 68 | |
Magnolia Oil & Gas Corp * | | | 6,491 | | | | 41 | |
Marathon Oil Corp | | | 60,140 | | | | 356 | |
Marathon Petroleum Corp (H) | | | 54,276 | | | | 2,110 | |
Matador Resources Co * | | | 7,300 | | | | 74 | |
Murphy Oil Corp | | | 11,077 | | | | 111 | |
National Oilwell Varco Inc | | | 31,749 | | | | 389 | |
NextDecade Corp * | | | 11,600 | | | | 28 | |
NexTier Oilfield Solutions Inc * | | | 8,900 | | | | 25 | |
Nordic American Tankers Ltd | | | 4,800 | | | | 15 | |
Occidental Petroleum Corp | | | 69,419 | | | | 1,094 | |
Oceaneering International Inc * | | | 3,123 | | | | 19 | |
ONEOK Inc | | | 33,612 | | | | 1,206 | |
Ovintiv Inc | | | 18,530 | | | | 236 | |
Par Pacific Holdings Inc * | | | 7,205 | | | | 82 | |
Parsley Energy Inc, Cl A | | | 26,842 | | | | 336 | |
Patterson-UTI Energy Inc | | | 10,365 | | | | 45 | |
| | | | | | | | |
| | | |
| Description | | Shares | | Market Value ($ Thousands) |
| | |
COMMON STOCK (continued) | | | | | | | | |
PBF Energy Inc, Cl A | | | 4,880 | | | $ | 35 | |
PDC Energy Inc * | | | 8,772 | | | | 147 | |
Peabody Energy Corp | | | 16,200 | | | | 22 | |
Phillips 66 | | | 36,075 | | | | 2,185 | |
Pioneer Natural Resources Co | | | 14,480 | | | | 1,456 | |
PrimeEnergy Resources Corp * | | | 150 | | | | 9 | |
ProPetro Holding Corp * | | | 1,806 | | | | 10 | |
Range Resources Corp | | | 19,873 | | | | 145 | |
Renewable Energy Group Inc * | | | 3,500 | | | | 203 | |
REX American Resources Corp * | | | 293 | | | | 23 | |
Schlumberger NV | | | 114,106 | | | | 2,372 | |
Scorpio Tankers Inc | | | 2,741 | | | | 32 | |
SFL Corp Ltd | | | 5,417 | | | | 37 | |
Southwestern Energy Co * | | | 49,678 | | | | 155 | |
Targa Resources Corp | | | 20,738 | | | | 487 | |
Tellurian Inc * | | | 36,000 | | | | 54 | |
Transocean Ltd * (H) | | | 30,154 | | | | 56 | |
Valero Energy Corp (H) | | | 34,104 | | | | 1,834 | |
Williams Cos Inc/The | | | 102,687 | | | | 2,154 | |
WPX Energy Inc * | | | 27,761 | | | | 198 | |
| | | | | | | | |
| | |
| | | | | | | 64,627 | |
| | | | | | | | |
| | |
Health Care — 5.8% | | | | | | | | |
10X Genomics Inc, Cl A * | | | 478 | | | | 73 | |
Abbott Laboratories | | | 14,586 | | | | 1,579 | |
AbbVie Inc | | | 15,423 | | | | 1,613 | |
ABIOMED Inc * | | | 426 | | | | 117 | |
Acadia Healthcare Co Inc * | | | 1,045 | | | | 44 | |
ACADIA Pharmaceuticals Inc * | | | 900 | | | | 51 | |
Acceleron Pharma Inc * | | | 400 | | | | 47 | |
Adaptive Biotechnologies Corp * | | | 954 | | | | 46 | |
Agilent Technologies Inc | | | 2,882 | | | | 337 | |
Agios Pharmaceuticals Inc * | | | 700 | | | | 32 | |
Alexion Pharmaceuticals Inc * | | | 2,259 | | | | 276 | |
Align Technology Inc * | | | 669 | | | | 322 | |
Alkermes PLC * | | | 2,389 | | | | 44 | |
Allscripts Healthcare Solutions Inc * | | | 4,242 | | | | 58 | |
Alnylam Pharmaceuticals Inc * | | | 1,127 | | | | 146 | |
Amedisys Inc * | | | 200 | | | | 49 | |
AmerisourceBergen Corp, Cl A | | | 1,738 | | | | 179 | |
Amgen Inc (H) | | | 5,423 | | | | 1,204 | |
Amicus Therapeutics Inc * | | | 2,977 | | | | 68 | |
Amphastar Pharmaceuticals Inc * | | | 3,807 | | | | 68 | |
ANI Pharmaceuticals Inc * | | | 1,900 | | | | 56 | |
Anthem Inc | | | 2,276 | | | | 709 | |
Arena Pharmaceuticals Inc * | | | 1,059 | | | | 70 | |
Arrowhead Pharmaceuticals Inc * | | | 274 | | | | 17 | |
Atrion Corp | | | 100 | | | | 60 | |
Avanos Medical Inc * | | | 2,842 | | | | 120 | |
Avantor Inc * | | | 2,294 | | | | 63 | |
Baxter International Inc (H) | | | 5,359 | | | | 408 | |
Becton Dickinson and Co | | | 2,422 | | | | 569 | |
Biogen Inc * | | | 1,659 | | | | 398 | |
| | |
SEI Institutional Investments Trust / Semi-Annual Report / November 30, 2020 | | 293 |
CONSOLIDATED SCHEDULE OF INVESTMENTS (Unaudited)
November 30, 2020
Multi-Asset Real Return Fund (Continued)
| | | | | | | | |
| | | |
| Description | | Shares | | Market Value
($ Thousands) |
|
COMMON STOCK (continued) | |
BioMarin Pharmaceutical Inc * | | | 2,052 | | | $ | 162 | |
Bio-Rad Laboratories Inc, Cl A * | | | 198 | | | | 107 | |
Bio-Techne Corp | | | 442 | | | | 134 | |
BioTelemetry Inc * | | | 800 | | | | 44 | |
Bluebird Bio Inc * | | | 603 | | | | 27 | |
Blueprint Medicines Corp * | | | 560 | | | | 61 | |
Boston Scientific Corp * | | | 12,837 | | | | 426 | |
Bridgebio Pharma * | | | 2,450 | | | | 123 | |
Bristol-Myers Squibb Co | | | 19,700 | | | | 1,229 | |
Bruker Corp | | | 976 | | | | 49 | |
Cantel Medical Corp | | | 1,696 | | | | 101 | |
Cardinal Health Inc | | | 3,681 | | | | 201 | |
Cardiovascular Systems Inc * | | | 244 | | | | 8 | |
Catalent Inc * | | | 1,471 | | | | 141 | |
Centene Corp * | | | 4,657 | | | | 287 | |
Cerner Corp | | | 3,347 | | | | 250 | |
Change Healthcare Inc * | | | 1,000 | | | | 17 | |
Charles River Laboratories International Inc * | | | 547 | | | | 128 | |
Chemed Corp | | | 150 | | | | 72 | |
Cigna Corp | | | 3,366 | | | | 704 | |
CONMED Corp | | | 400 | | | | 41 | |
Cooper Cos Inc/The | | | 628 | | | | 211 | |
CorVel Corp * | | | 200 | | | | 18 | |
Covetrus Inc * | | | 1,665 | | | | 45 | |
CVS Health Corp | | | 12,712 | | | | 862 | |
Danaher Corp | | | 5,154 | | | | 1,158 | |
DaVita Inc * | | | 962 | | | | 106 | |
DENTSPLY SIRONA Inc | | | 3,348 | | | | 170 | |
DexCom Inc * | | | 683 | | | | 218 | |
Edwards Lifesciences Corp * | | | 4,410 | | | | 370 | |
Elanco Animal Health Inc * | | | 5,600 | | | | 171 | |
Eli Lilly and Co | | | 7,142 | | | | 1,040 | |
Enanta Pharmaceuticals Inc * | | | 1,000 | | | | 41 | |
Encompass Health Corp | | | 1,522 | | | | 123 | |
Ensign Group Inc/The | | | 361 | | | | 26 | |
Envista Holdings Corp * | | | 1,600 | | | | 48 | |
Exact Sciences Corp * | | | 1,161 | | | | 141 | |
Exelixis Inc * | | | 2,196 | | | | 42 | |
FibroGen Inc * | | | 1,214 | | | | 50 | |
Gilead Sciences Inc (H) | | | 12,133 | | | | 736 | |
Global Blood Therapeutics Inc * | | | 700 | | | | 32 | |
Globus Medical Inc, Cl A * | | | 800 | | | | 48 | |
Guardant Health Inc * | | | 466 | | | | 56 | |
Haemonetics Corp * | | | 672 | | | | 76 | |
Halozyme Therapeutics Inc * | | | 1,232 | | | | 48 | |
HCA Healthcare Inc | | | 2,349 | | | | 353 | |
Health Catalyst Inc * | | | 2,700 | | | | 96 | |
HealthEquity Inc * | | | 500 | | | | 36 | |
HealthStream Inc * | | | 8,500 | | | | 159 | |
Henry Schein Inc * | | | 1,703 | | | | 110 | |
Hill-Rom Holdings Inc | | | 537 | | | | 51 | |
| | | | | | | | |
| | | |
| Description | | Shares | | Market Value
($ Thousands) |
|
COMMON STOCK (continued) | |
HMS Holdings Corp * | | | 1,600 | | | $ | 50 | |
Hologic Inc * | | | 2,418 | | | | 167 | |
Horizon Therapeutics PLC * | | | 1,472 | | | | 104 | |
Humana Inc | | | 1,106 | | | | 443 | |
ICU Medical Inc * | | | 426 | | | | 80 | |
IDEXX Laboratories Inc * | | | 682 | | | | 314 | |
Illumina Inc * | | | 1,290 | | | | 416 | |
Incyte Corp * | | | 1,845 | | | | 156 | |
Innoviva Inc * | | | 2,700 | | | | 28 | |
Insmed Inc * | | | 745 | | | | 29 | |
Insulet Corp * | | | 490 | | | | 126 | |
Integer Holdings Corp * | | | 400 | | | | 29 | |
Integra LifeSciences Holdings Corp * | | | 672 | | | | 37 | |
Intuitive Surgical Inc * | | | 1,013 | | | | 735 | |
Invitae Corp * | | | 652 | | | | 32 | |
Ionis Pharmaceuticals Inc * | | | 1,124 | | | | 57 | |
Iovance Biotherapeutics Inc * | | | 1,400 | | | | 54 | |
IQVIA Holdings Inc * | | | 2,082 | | | | 352 | |
Ironwood Pharmaceuticals Inc, Cl A * | | | 2,400 | | | | 28 | |
Jazz Pharmaceuticals PLC * | | | 1,031 | | | | 145 | |
Johnson & Johnson (H) | | | 23,071 | | | | 3,338 | |
Laboratory Corp of America Holdings * | | | 1,089 | | | | 218 | |
LHC Group Inc * | | | 400 | | | | 79 | |
Ligand Pharmaceuticals Inc * | | | 222 | | | | 19 | |
LivaNova PLC * | | | 543 | | | | 29 | |
Luminex Corp | | | 1,000 | | | | 24 | |
Masimo Corp * | | | 508 | | | | 129 | |
McKesson Corp | | | 1,577 | | | | 284 | |
MEDNAX Inc * | | | 1,367 | | | | 28 | |
Medpace Holdings Inc * | | | 300 | | | | 39 | |
Medtronic PLC | | | 12,186 | | | | 1,386 | |
Merck & Co Inc | | | 22,359 | | | | 1,797 | |
Merit Medical Systems Inc * | | | 500 | | | | 28 | |
Mesa Laboratories Inc | | | 98 | | | | 27 | |
Mettler-Toledo International Inc * | | | 201 | | | | 231 | |
Mirati Therapeutics Inc * | | | 134 | | | | 32 | |
Moderna Inc * | | | 2,791 | | | | 426 | |
Molina Healthcare Inc * | | | 562 | | | | 115 | |
Natera Inc * | | | 559 | | | | 49 | |
National HealthCare Corp | | | 586 | | | | 36 | |
Natus Medical Inc * | | | 1,200 | | | | 25 | |
Nektar Therapeutics, Cl A * | | | 2,316 | | | | 38 | |
Neogen Corp * | | | 997 | | | | 74 | |
NeoGenomics Inc * | | | 878 | | | | 42 | |
Neurocrine Biosciences Inc * | | | 913 | | | | 87 | |
Nevro Corp * | | | 100 | | | | 16 | |
NextGen Healthcare Inc * | | | 6,684 | | | | 119 | |
Novavax Inc * | | | 232 | | | | 32 | �� |
Novocure Ltd * | | | 1,200 | | | | 151 | |
NuVasive Inc * | | | 500 | | | | 23 | |
Omnicell Inc * | | | 550 | | | | 58 | |
Orthofix Medical Inc * | | | 3,528 | | | | 130 | |
| | |
294 | | SEI Institutional Investments Trust / Semi-Annual Report / November 30, 2020 |
| | | | | | | | |
| | | |
| Description | | Shares | | Market Value
($ Thousands) |
|
COMMON STOCK (continued) | |
Pacira BioSciences Inc * | | | 700 | | | $ | 42 | |
Patterson Cos Inc | | | 2,178 | | | | 60 | |
Penumbra Inc * | | | 350 | | | | 78 | |
PerkinElmer Inc | | | 1,078 | | | | 143 | |
Perrigo Co PLC | | | 1,329 | | | | 64 | |
Pfizer Inc | | | 49,179 | | | | 1,884 | |
Phibro Animal Health Corp, Cl A | | | 1,500 | | | | 28 | |
PRA Health Sciences Inc * | | | 1,002 | | | | 112 | |
Premier Inc, Cl A | | | 500 | | | | 18 | |
Prestige Consumer Healthcare Inc * | | | 600 | | | | 21 | |
Providence Service Corp/The * | | | 195 | | | | 26 | |
PTC Therapeutics Inc * | | | 700 | | | | 44 | |
QIAGEN NV * | | | 2,606 | | | | 126 | |
Quest Diagnostics Inc | | | 1,341 | | | | 166 | |
Quidel Corp * | | | 200 | | | | 39 | |
Regeneron Pharmaceuticals Inc * | | | 780 | | | | 403 | |
Repligen Corp * | | | 512 | | | | 97 | |
ResMed Inc | | | 1,457 | | | | 305 | |
Sage Therapeutics Inc * | | | 803 | | | | 60 | |
Sarepta Therapeutics Inc * | | | 511 | | | | 72 | |
Seagen Inc * | | | 948 | | | | 161 | |
STAAR Surgical Co * | | | 220 | | | | 16 | |
STERIS PLC | | | 783 | | | | 152 | |
Stryker Corp | | | 3,384 | | | | 790 | |
Supernus Pharmaceuticals Inc * | | | 4,363 | | | | 93 | |
Syneos Health Inc, Cl A * | | | 427 | | | | 28 | |
Tandem Diabetes Care Inc * | | | 400 | | | | 38 | |
Teladoc Health Inc * | | | 739 | | | | 147 | |
Teleflex Inc | | | 473 | | | | 181 | |
Thermo Fisher Scientific Inc | | | 3,379 | | | | 1,571 | |
Ultragenyx Pharmaceutical Inc * | | | 424 | | | | 50 | |
United Therapeutics Corp * | | | 439 | | | | 58 | |
UnitedHealth Group Inc (H) | | | 7,819 | | | | 2,630 | |
Universal Health Services Inc, Cl B | | | 1,102 | | | | 144 | |
US Physical Therapy Inc | | | 674 | | | | 72 | |
Varex Imaging Corp * | | | 1,200 | | | | 20 | |
Varian Medical Systems Inc * | | | 1,030 | | | | 179 | |
Veeva Systems Inc, Cl A * | | | 930 | | | | 257 | |
Vertex Pharmaceuticals Inc * | | | 2,320 | | | | 528 | |
Viatris Inc, Cl W * | | | 14,505 | | | | 244 | |
Waters Corp * | | | 776 | | | | 180 | |
West Pharmaceutical Services Inc | | | 630 | | | | 173 | |
Xencor Inc * | | | 2,891 | | | | 122 | |
Zimmer Biomet Holdings Inc | | | 2,160 | | | | 322 | |
Zoetis Inc, Cl A | | | 3,954 | | | | 634 | |
| | | | | | | | |
| | | | | | | 44,845 | |
| | | | | | | | |
|
Industrials — 0.0% | |
SEACOR Holdings Inc * | | | 1,100 | | | | 37 | |
| | | | | | | | |
|
Information Technology — 1.9% | |
Accenture PLC, Cl A | | | 1,474 | | | | 367 | |
ACI Worldwide Inc * | | | 1,708 | | | | 56 | |
| | | | | | | | |
| | | |
| Description | | Shares | | Market Value
($ Thousands) |
|
COMMON STOCK (continued) | |
Adobe Inc * | | | 1,012 | | | $ | 484 | |
Amdocs Ltd | | | 1,847 | | | | 122 | |
ANSYS Inc * | | | 146 | | | | 49 | |
Aspen Technology Inc * | | | 424 | | | | 57 | |
Atlassian Corp PLC, Cl A * | | | 500 | | | | 112 | |
Autodesk Inc * | | | 537 | | | | 151 | |
Automatic Data Processing Inc | | | 1,482 | | | | 258 | |
Black Knight Inc * | | | 300 | | | | 28 | |
Blackbaud Inc | | | 800 | | | | 44 | |
Bottomline Technologies DE Inc * | | | 683 | | | | 31 | |
Broadridge Financial Solutions Inc | | | 300 | | | | 44 | |
Cadence Design Systems Inc * | | | 1,018 | | | | 118 | |
Cass Information Systems Inc | | | 3,200 | | | | 136 | |
CDK Global Inc | | | 935 | | | | 45 | |
Citrix Systems Inc | | | 200 | | | | 25 | |
Cognizant Technology Solutions Corp, Cl A | | | 2,247 | | | | 176 | |
CommVault Systems Inc * | | | 1,100 | | | | 53 | |
CSG Systems International Inc | | | 634 | | | | 28 | |
Datadog Inc, Cl A * | | | 225 | | | | 22 | |
DocuSign Inc, Cl A * | | | 500 | | | | 114 | |
Ebix Inc | | | 4,000 | | | | 136 | |
EPAM Systems Inc * | | | 98 | | | | 32 | |
Euronet Worldwide Inc * | | | 373 | | | | 50 | |
Fidelity National Information Services Inc | | | 1,252 | | | | 186 | |
Fiserv Inc * | | | 1,539 | | | | 177 | |
FleetCor Technologies Inc * | | | 195 | | | | 52 | |
Fortinet Inc * | | | 350 | | | | 43 | |
Gartner Inc * | | | 400 | | | | 61 | |
Genpact Ltd | | | 600 | | | | 24 | |
Global Payments Inc | | | 926 | | | | 181 | |
Guidewire Software Inc * | | | 400 | | | | 49 | |
International Business Machines Corp | | | 2,931 | | | | 362 | |
Intuit Inc | | | 936 | | | | 330 | |
Jack Henry & Associates Inc | | | 349 | | | | 56 | |
KBR Inc | | | 6,300 | | | | 175 | |
Manhattan Associates Inc * | | | 586 | | | | 60 | |
ManTech International Corp/VA, Cl A | | | 244 | | | | 19 | |
Mastercard Inc, Cl A | | | 2,182 | | | | 734 | |
MAXIMUS Inc | | | 500 | | | | 36 | |
Microsoft Corp (H) | | | 19,402 | | | | 4,153 | |
MicroStrategy Inc, Cl A * | | | 1,495 | | | | 512 | |
NortonLifeLock Inc | | | 1,294 | | | | 24 | |
Nuance Communications Inc * | | | 1,074 | | | | 46 | |
Oracle Corp | | | 5,230 | | | | 302 | |
PagerDuty Inc * | | | 1,435 | | | | 49 | |
Palo Alto Networks Inc * | | | 194 | | | | 57 | |
Paychex Inc | | | 1,625 | | | | 151 | |
Paycom Software Inc * | | | 49 | | | | 20 | |
PayPal Holdings Inc * | | | 2,605 | | | | 558 | |
Pegasystems Inc | | | 430 | | | | 56 | |
Perspecta Inc | | | 5,685 | | | | 127 | |
Progress Software Corp | | | 878 | | | | 35 | |
| | |
SEI Institutional Investments Trust / Semi-Annual Report / November 30, 2020 | | 295 |
CONSOLIDATED SCHEDULE OF INVESTMENTS (Unaudited)
November 30, 2020
Multi-Asset Real Return Fund (Continued)
| | | | | | | | |
| | | |
| Description | | Shares | | Market Value
($ Thousands) |
|
COMMON STOCK (continued) | |
Proofpoint Inc * | | | 100 | | | $ | 10 | |
PTC Inc * | | | 500 | | | | 54 | |
QAD Inc, Cl A | | | 3,823 | | | | 219 | |
Qualys Inc * | | | 146 | | | | 14 | |
salesforce.com Inc * | | | 2,018 | | | | 496 | |
ServiceNow Inc * | | | 388 | | | | 207 | |
Slack Technologies Inc, Cl A * | | | 1,386 | | | | 59 | |
Splunk Inc * | | | 442 | | | | 90 | |
Square Inc, Cl A * | | | 1,030 | | | | 217 | |
SS&C Technologies Holdings Inc | | | 540 | | | | 37 | |
Synopsys Inc * | | | 539 | | | | 123 | |
Teradata Corp * | | | 1,100 | | | | 24 | |
Trade Desk Inc/The, Cl A * | | | 100 | | | | 90 | |
Twilio Inc, Cl A * | | | 200 | | | | 64 | |
Verint Systems Inc * | | | 500 | | | | 29 | |
Visa Inc, Cl A | | | 4,444 | | | | 935 | |
VMware Inc, Cl A * | | | 80 | | | | 11 | |
Western Union Co/The | | | 2,483 | | | | 56 | |
WEX Inc * | | | 200 | | | | 35 | |
Workday Inc, Cl A * | | | 449 | | | | 101 | |
Xperi Holding Corp | | | 7,792 | | | | 149 | |
Zoom Video Communications Inc, Cl A * | | | 448 | | | | 214 | |
| | | | | | | | |
| | |
| | | | | | | 14,607 | |
| | | | | | | | |
|
Real Estate — 3.1% | |
Acadia Realty Trust ‡ | | | 3,573 | | | | 51 | |
Agree Realty Corp ‡ | | | 800 | | | | 53 | |
Alexander & Baldwin Inc ‡ | | | 2,532 | | | | 40 | |
Alexander’s Inc ‡ | | | 400 | | | | 109 | |
Alexandria Real Estate Equities Inc ‡ | | | 2,018 | | | | 330 | |
American Assets Trust Inc ‡ | | | 1,565 | | | | 45 | |
American Campus Communities Inc ‡ | | | 3,730 | | | | 148 | |
American Finance Trust Inc ‡ | | | 1,562 | | | | 12 | |
American Homes 4 Rent, Cl A ‡ | | | 5,206 | | | | 149 | |
American Tower Corp, Cl A ‡ | | | 7,246 | | | | 1,675 | |
Americold Realty Trust ‡ | | | 3,300 | | | | 113 | |
Apartment Investment and Management | | | | | | | | |
Co, Cl A ‡ | | | 3,347 | | | | 102 | |
Apple Hospitality Inc ‡ | | | 9,386 | | | | 124 | |
AvalonBay Communities Inc ‡ | | | 3,263 | | | | 544 | |
Boston Properties Inc ‡ | | | 3,395 | | | | 333 | |
Brandywine Realty Trust ‡ | | | 5,779 | | | | 64 | |
Brixmor Property Group Inc ‡ | | | 7,963 | | | | 122 | |
Brookfield Property Inc, Cl A ‡ | | | 600 | | | | 9 | |
Camden Property Trust ‡ | | | 2,407 | | | | 238 | |
CareTrust ‡ | | | 2,400 | | | | 47 | |
CBRE Group Inc, Cl A * | | | 7,191 | | | | 440 | |
Colony Capital Inc ‡ | | | 1,134 | | | | 5 | |
Columbia Property Trust Inc ‡ | | | 3,472 | | | | 49 | |
CoreCivic Inc ‡ | | | 3,873 | | | | 27 | |
CoreSite Realty Corp ‡ | | | 614 | | | | 77 | |
Corporate Office Properties Trust ‡ | | | 3,473 | | | | 92 | |
Cousins Properties Inc ‡ | | | 2,755 | | | | 92 | |
| | | | | | | | |
| | | |
| Description | | Shares | | Market Value
($ Thousands) |
|
COMMON STOCK (continued) | |
Crown Castle International Corp ‡ | | | 6,595 | | | $ | 1,105 | |
CubeSmart ‡ | | | 5,619 | | | | 183 | |
Cushman & Wakefield PLC * | | | 4,462 | | | | 66 | |
CyrusOne Inc ‡ | | | 1,664 | | | | 116 | |
Digital Realty Trust Inc ‡ | | | 4,053 | | | | 546 | |
Douglas Emmett Inc ‡ | | | 4,131 | | | | 128 | |
Duke Realty Corp ‡ | | | 6,263 | | | | 238 | |
EastGroup Properties Inc ‡ | | | 683 | | | | 93 | |
Empire State Realty Trust Inc, Cl A ‡ | | | 4,809 | | | | 44 | |
EPR Properties ‡ | | | 1,947 | | | | 70 | |
Equinix Inc ‡ | | | 1,299 | | | | 906 | |
Equity Commonwealth ‡ | | | 3,781 | | | | 100 | |
Equity LifeStyle Properties Inc ‡ | | | 3,460 | | | | 203 | |
Equity Residential ‡ | | | 7,867 | | | | 456 | |
Essential Properties Realty Trust Inc ‡ | | | 1,598 | | | | 33 | |
Essex Property Trust Inc ‡ | | | 1,474 | | | | 362 | |
Extra Space Storage Inc ‡ | | | 2,885 | | | | 325 | |
Federal Realty Investment Trust ‡ | | | 2,121 | | | | 185 | |
First Industrial Realty Trust Inc ‡ | | | 2,670 | | | | 112 | |
Forestar Group Inc * | | | 7,200 | | | | 140 | |
Four Corners Property Trust Inc ‡ | | | 2,200 | | | | 62 | |
Franklin Street Properties Corp ‡ | | | 7,900 | | | | 37 | |
Gaming and Leisure Properties Inc ‡ | | | 4,860 | | | | 202 | |
GEO Group Inc/The ‡ | | | 3,953 | | | | 37 | |
Getty Realty Corp ‡ | | | 1,300 | | | | 37 | |
Global Net Lease Inc ‡ | | | 3,953 | | | | 66 | |
Healthcare Realty Trust Inc ‡ | | | 4,096 | | | | 121 | |
Healthcare Trust of America Inc, Cl A ‡ | | | 6,049 | | | | 157 | |
Healthpeak Properties Inc ‡ | | | 11,115 | | | | 321 | |
Highwoods Properties Inc ‡ | | | 3,149 | | | | 121 | |
Host Hotels & Resorts Inc ‡ | | | 13,406 | | | | 188 | |
Howard Hughes Corp/The * | | | 2,891 | | | | 210 | |
Hudson Pacific Properties Inc ‡ | | | 4,118 | | | | 107 | |
Industrial Logistics Properties Trust ‡ | | | 1,400 | | | | 30 | |
Invitation Homes Inc ‡ | | | 9,857 | | | | 282 | |
Iron Mountain Inc ‡ | | | 5,801 | | | | 160 | |
JBG SMITH Properties ‡ | | | 3,450 | | | | 106 | |
Jones Lang LaSalle Inc | | | 1,295 | | | | 171 | |
Kennedy-Wilson Holdings Inc | | | 4,115 | | | | 66 | |
Kilroy Realty Corp ‡ | | | 2,414 | | | | 148 | |
Kimco Realty Corp ‡ | | | 10,743 | | | | 155 | |
Kite Realty Group Trust ‡ | | | 3,300 | | | | 48 | |
Lamar Advertising Co, Cl A ‡ | | | 2,216 | | | | 176 | |
Lexington Realty Trust, Cl B ‡ | | | 5,231 | | | | 53 | |
Life Storage Inc ‡ | | | 983 | | | | 108 | |
LTC Properties Inc ‡ | | | 1,415 | | | | 52 | |
Macerich Co ‡ | | | 1,103 | | | | 11 | |
Mack-Cali Realty Corp ‡ | | | 2,976 | | | | 41 | |
Marcus & Millichap Inc * | | | 600 | | | | 21 | |
Medical Properties Trust Inc ‡ | | | 7,942 | | | | 154 | |
Mid-America Apartment Communities Inc ‡ | | | 2,326 | | | | 293 | |
| | |
296 | | SEI Institutional Investments Trust / Semi-Annual Report / November 30, 2020 |
| | | | | | | | |
| | | |
| Description | | Shares | | Market Value
($ Thousands) |
| | |
COMMON STOCK (continued) | | | | | | | | |
Monmouth Real Estate Investment Corp, Cl A ‡ | | | 2,294 | | | $ | 34 | |
National Health Investors Inc ‡ | | | 1,459 | | | | 94 | |
National Retail Properties Inc ‡ | | | 4,295 | | | | 162 | |
National Storage Affiliates Trust ‡ | | | 1,757 | | | | 60 | |
Newmark Group Inc, Cl A | | | 13,741 | | | | 96 | |
Office Properties Income Trust ‡ | | | 446 | | | | 10 | |
Omega Healthcare Investors Inc ‡ | | | 5,026 | | | | 177 | |
Outfront Media Inc ‡ | | | 4,825 | | | | 91 | |
Paramount Group Inc ‡ | | | 6,293 | | | | 58 | |
Park Hotels & Resorts Inc ‡ | | | 6,531 | | | | 107 | |
Pebblebrook Hotel Trust ‡ | | | 2,847 | | | | 53 | |
Physicians Realty Trust ‡ | | | 3,113 | | | | 54 | |
Piedmont Office Realty Trust Inc, Cl A ‡ | | | 3,834 | | | | 60 | |
PotlatchDeltic Corp ‡ | | | 2,059 | | | | 96 | |
Prologis Inc ‡ | | | 11,520 | | | | 1,153 | |
PS Business Parks Inc ‡ | | | 998 | | | | 132 | |
Public Storage ‡ | | | 3,130 | | | | 703 | |
QTS Realty Trust Inc, Cl A ‡ | | | 398 | | | | 24 | |
Rayonier Inc ‡ | | | 4,419 | | | | 124 | |
Realty Income Corp ‡ | | | 7,042 | | | | 422 | |
Redfin Corp * | | | 491 | | | | 23 | |
Regency Centers Corp ‡ | | | 4,278 | | | | 195 | |
Retail Opportunity Investments Corp ‡ | | | 5,111 | | | | 66 | |
Retail Properties of America Inc, Cl A ‡ | | | 7,610 | | | | 62 | |
Rexford Industrial Realty Inc ‡ | | | 2,072 | | | | 99 | |
RLJ Lodging Trust ‡ | | | 4,589 | | | | 57 | |
Ryman Hospitality Properties Inc ‡ | | | 928 | | | | 60 | |
Sabra Health Care Inc ‡ | | | 5,761 | | | | 95 | |
Saul Centers Inc ‡ | | | 866 | | | | 27 | |
SBA Communications Corp, Cl A ‡ | | | 1,834 | | | | 527 | |
Service Properties Trust ‡ | | | 2,782 | | | | 33 | |
Simon Property Group Inc ‡ | | | 6,545 | | | | 540 | |
SITE Centers Corp ‡ | | | 4,565 | | | | 46 | |
SL Green Realty Corp ‡ | | | 1,688 | | | | 98 | |
Spirit Realty Capital Inc ‡ | | | 3,178 | | | | 117 | |
St Joe Co/The | | | 10,733 | | | | 354 | |
STAG Industrial Inc ‡ | | | 3,222 | | | | 96 | |
STORE Capital Corp ‡ | | | 5,145 | | | | 168 | |
Sun Communities Inc ‡ | | | 1,748 | | | | 243 | |
Sunstone Hotel Investors Inc ‡ | | | 5,594 | | | | 59 | |
Tanger Factory Outlet Centers Inc ‡ | | | 2,977 | | | | 28 | |
Taubman Centers Inc ‡ | | | 586 | | | | 25 | |
Terreno Realty Corp ‡ | | | 1,022 | | | | 59 | |
UDR Inc ‡ | | | 6,235 | | | | 240 | |
Uniti Group Inc ‡ | | | 4,338 | | | | 45 | |
Universal Health Realty Income Trust ‡ | | | 400 | | | | 24 | |
Urban Edge Properties ‡ | | | 2,952 | | | | 38 | |
Ventas Inc ‡ | | | 7,594 | | | | 364 | |
VEREIT Inc ‡ | | | 19,153 | | | | 136 | |
VICI Properties Inc ‡ | | | 7,800 | | | | 197 | |
Vornado Realty Trust ‡ | | | 5,084 | | | | 198 | |
| | | | | | | | |
| | | |
| Description | | Shares | | Market Value
($ Thousands) |
| | |
COMMON STOCK (continued) | | | | | | | | |
Washington Real Estate Investment Trust ‡ | | | 2,522 | | | $ | 59 | |
Weingarten Realty Investors ‡ | | | 3,014 | | | | 63 | |
Welltower Inc ‡ | | | 8,197 | | | | 516 | |
Weyerhaeuser Co ‡ | | | 12,507 | | | | 363 | |
WP Carey Inc ‡ | | | 4,021 | | | | 278 | |
Xenia Hotels & Resorts Inc ‡ | | | 2,172 | | | | 31 | |
| | | | | | | | |
| | |
| | | | | | | 23,581 | |
| | | | | | | | |
| | |
Utilities — 1.6% | | | | | | | | |
AES Corp/The | | | 7,758 | | | | 159 | |
ALLETE Inc | | | 2,450 | | | | 138 | |
Alliant Energy Corp | | | 3,542 | | | | 186 | |
Ameren Corp | | | 2,387 | | | | 186 | |
American Electric Power Co Inc | | | 4,896 | | | | 416 | |
American States Water Co | | | 500 | | | | 37 | |
American Water Works Co Inc | | | 1,101 | | | | 169 | |
Atmos Energy Corp | | | 1,127 | | | | 108 | |
Avangrid Inc | | | 2,300 | | | | 107 | |
Avista Corp | | | 1,600 | | | | 60 | |
Black Hills Corp | | | 1,600 | | | | 97 | |
Brookfield Infrastructure, Cl A | | | 2,745 | | | | 183 | |
Brookfield Renewable Partners (B) | | | 572 | | | | 36 | |
California Water Service Group | | | 1,300 | | | | 64 | |
CenterPoint Energy Inc | | | 6,802 | | | | 158 | |
Chesapeake Utilities Corp | | | 500 | | | | 52 | |
Clearway Energy Inc, Cl C | | | 1,281 | | | | 37 | |
CMS Energy Corp | | | 2,676 | | | | 165 | |
Consolidated Edison Inc | | | 4,368 | | | | 333 | |
Dominion Energy Inc | | | 7,918 | | | | 621 | |
DTE Energy Co | | | 2,438 | | | | 307 | |
Duke Energy Corp | | | 7,276 | | | | 674 | |
Edison International | | | 4,887 | | | | 300 | |
Entergy Corp | | | 2,699 | | | | 294 | |
Essential Utilities Inc | | | 2,297 | | | | 104 | |
Evergy Inc | | | 2,414 | | | | 134 | |
Eversource Energy | | | 3,233 | | | | 283 | |
Exelon Corp | | | 10,979 | | | | 451 | |
FirstEnergy Corp | | | 6,734 | | | | 179 | |
Hawaiian Electric Industries Inc | | | 2,950 | | | | 106 | |
IDACORP Inc | | | 1,500 | | | | 136 | |
MDU Resources Group Inc | | | 4,955 | | | | 124 | |
MGE Energy Inc | | | 1,700 | | | | 117 | |
Middlesex Water Co | | | 700 | | | | 48 | |
National Fuel Gas Co | | | 1,363 | | | | 56 | |
New Jersey Resources Corp | | | 1,828 | | | | 60 | |
NextEra Energy Inc | | | 18,236 | | | | 1,342 | |
NiSource Inc | | | 4,054 | | | | 98 | |
Northwest Natural Holding Co | | | 600 | | | | 29 | |
NorthWestern Corp | | | 1,599 | | | | 93 | |
NRG Energy Inc | | | 3,295 | | | | 108 | |
OGE Energy Corp | | | 5,685 | | | | 184 | |
ONE Gas Inc | | | 1,106 | | | | 88 | |
Ormat Technologies Inc | | | 800 | | | | 63 | |
| | |
SEI Institutional Investments Trust / Semi-Annual Report / November 30, 2020 | | 297 |
CONSOLIDATED SCHEDULE OF INVESTMENTS (Unaudited)
November 30, 2020
Multi-Asset Real Return Fund (Continued)
| | | | | | | | |
| | | |
| Description | | Shares | | Market Value
($ Thousands) |
|
COMMON STOCK (continued) | |
Otter Tail Corp | | | 6,571 | | | $ | 262 | |
PG&E Corp * | | | 3,975 | | | | 50 | |
Pinnacle West Capital Corp | | | 2,026 | | | | 166 | |
PNM Resources Inc | | | 2,648 | | | | 130 | |
Portland General Electric Co | | | 2,324 | | | | 96 | |
PPL Corp | | | 8,954 | | | | 254 | |
Public Service Enterprise Group Inc | | | 5,652 | | | | 329 | |
Sempra Energy | | | 3,381 | | | | 431 | |
SJW Group | | | 800 | | | | 52 | |
South Jersey Industries Inc | | | 1,000 | | | | 23 | |
Southern Co/The | | | 10,836 | | | | 648 | |
Southwest Gas Holdings Inc | | | 1,024 | | | | 66 | |
Spire Inc | | | 1,106 | | | | 71 | |
UGI Corp | | | 2,953 | | | | 105 | |
Unitil Corp | | | 500 | | | | 20 | |
Vistra Corp | | | 6,845 | | | | 128 | |
WEC Energy Group Inc | | | 3,313 | | | | 315 | |
Xcel Energy Inc | | | 5,232 | | | | 352 | |
| | | | | | | | |
| | | | | | | 12,188 | |
| | | | | | | | |
Total Common Stock
(Cost $196,189) ($ Thousands) | | | | | | | 234,574 | |
| | | | | | | | |
| | |
| | | Face Amount
(Thousands) | | |
|
CORPORATE OBLIGATIONS — 14.2% | |
|
Communication Services — 1.3% | |
AT&T Inc | | | | | | | | |
3.500%, 09/15/2053 (C) | | $ | 450 | | | | 459 | |
2.750%, 06/01/2031 | | | 200 | | | | 213 | |
Baidu | | | | | | | | |
3.425%, 04/07/2030 | | | 201 | | | | 223 | |
Cable One | | | | | | | | |
4.000%, 11/15/2030 (C) | | | 375 | | | | 390 | |
CCO Holdings LLC | | | | | | | | |
5.000%, 02/01/2028 (C) | | | 599 | | | | 631 | |
4.000%, 03/01/2023 (C) | | | 596 | | | | 600 | |
CenturyLink Inc | | | | | | | | |
4.500%, 01/15/2029 (C) | | | 669 | | | | 682 | |
Cox Communications | | | | | | | | |
2.950%, 06/30/2023 (C) | | | 173 | | | | 182 | |
CSC Holdings LLC | | | | | | | | |
6.750%, 11/15/2021 | | | 125 | | | | 131 | |
Globo Comunicacao e Participacoes | | | | | | | | |
4.875%, 01/22/2030 (C) | | | 415 | | | | 432 | |
Interpublic Group of Cos Inc/The | | | | | | | | |
4.750%, 03/30/2030 | | | 520 | | | | 637 | |
Tencent Holdings MTN | | | | | | | | |
3.240%, 06/03/2050 (C) | | | 412 | | | | 430 | |
1.810%, 01/26/2026 (C) | | | 621 | | | | 634 | |
Time Warner Cable LLC | | | | | | | | |
4.500%, 09/15/2042 | | | 245 | | | | 283 | |
4.125%, 02/15/2021 | | | 65 | | | | 65 | |
| | | | | | | | | | | | |
| | | | |
| Description | | | | Face Amount
(Thousands) | | Market Value
($ Thousands) |
|
CORPORATE OBLIGATIONS (continued) | |
Verizon Communications Inc | | | | | | | | | | | | |
4.862%, 08/21/2046 | | | | | | $ | 465 | | | $ | 640 | |
3.000%, 03/22/2027 | | | | | | | 241 | | | | 268 | |
ViacomCBS Inc | | | | | | | | | | | | |
4.950%, 01/15/2031 | | | | | | | 214 | | | | 266 | |
4.200%, 05/19/2032 | | | | | | | 135 | | | | 160 | |
Vodafone Group | | | | | | | | | | | | |
3.750%, 01/16/2024 | | | | | | | 1,694 | | | | 1,853 | |
Weibo | | | | | | | | | | | | |
3.375%, 07/08/2030 | | | | | | | 913 | | | | 930 | |
| | | | | | | | | | | | |
| | | | | | | | | | | 10,109 | |
| | | | | | | | | | | | |
|
Consumer Discretionary — 1.7% | |
1011778 BC ULC / New Red Finance | | | | | | | | | | | | |
3.500%, 02/15/2029 (C) | | | | | | | 785 | | | | 784 | |
AutoNation | | | | | | | | | | | | |
4.750%, 06/01/2030 | | | | | | | 142 | | | | 171 | |
Booking Holdings Inc | | | | | | | | | | | | |
4.625%, 04/13/2030 | | | | | | | 1,042 | | | | 1,282 | |
Clarios Global | | | | | | | | | | | | |
4.375%, 05/15/2026 (C) | | | EUR | | | | 161 | | | | 199 | |
Expedia Group Inc | | | | | | | | | | | | |
6.250%, 05/01/2025 (C) | | | | | | $ | 53 | | | | 61 | |
General Motors Co | | | | | | | | | | | | |
6.800%, 10/01/2027 | | | | | | | 194 | | | | 250 | |
6.125%, 10/01/2025 | | | | | | | 138 | | | | 166 | |
General Motors Financial | | | | | | | | | | | | |
5.100%, 01/17/2024 | | | | | | | 936 | | | | 1,046 | |
Harley-Davidson Financial Services | | | | | | | | | | | | |
3.350%, 06/08/2025 (C) | | | | | | | 1,246 | | | | 1,338 | |
Hilton Domestic Operating | | | | | | | | | | | | |
4.000%, 05/01/2031 (C) | | | | | | | 1,043 | | | | 1,095 | |
International Game Technology | | | | | | | | | | | | |
6.250%, 02/15/2022 (C) | | | | | | | 219 | | | | 225 | |
Las Vegas Sands Corp | | | | | | | | | | | | |
3.200%, 08/08/2024 | | | | | | | 334 | | | | 349 | |
2.900%, 06/25/2025 | | | | | | | 572 | | | | 588 | |
Lear | | | | | | | | | | | | |
3.800%, 09/15/2027 | | | | | | | 110 | | | | 121 | |
3.500%, 05/30/2030 | | | | | | | 356 | | | | 384 | |
Marriott International Inc/MD | | | | | | | | | | | | |
5.750%, 05/01/2025 | | | | | | | 67 | | | | 78 | |
Nissan Motor | | | | | | | | | | | | |
4.345%, 09/17/2027 (C) | | | | | | | 1,034 | | | | 1,113 | |
Ralph Lauren Corp | | | | | | | | | | | | |
2.950%, 06/15/2030 | | | | | | | 1,230 | | | | 1,304 | |
Ross Stores | | | | | | | | | | | | |
4.700%, 04/15/2027 | | | | | | | 946 | | | | 1,116 | |
Royal Caribbean Cruises Ltd | | | | | | | | | | | | |
11.500%, 06/01/2025 (C) | | | | | | | 503 | | | | 591 | |
10.875%, 06/01/2023 (C) | | | | | | | 279 | | | | 316 | |
| | |
298 | | SEI Institutional Investments Trust / Semi-Annual Report / November 30, 2020 |
| | | | | | | | |
| | | |
| Description | | Face Amount (Thousands) | | Market Value ($ Thousands) |
|
CORPORATE OBLIGATIONS (continued) | |
Volkswagen Group of America Finance LLC | | | | | | | | |
2.900%, 05/13/2022 (C) | | $ | 462 | | | $ | 477 | |
| | | | | | | | |
| | | | | | | 13,054 | |
| | | | | | | | |
|
Consumer Staples — 1.2% | |
Albertsons | | | | | | | | |
3.500%, 02/15/2023 (C) | | | 873 | | | | 895 | |
Altria Group | | | | | | | | |
4.800%, 02/14/2029 | | | 160 | | | | 192 | |
3.400%, 05/06/2030 | | | 850 | | | | 944 | |
Anheuser-Busch InBev Worldwide | | | | | | | | |
4.600%, 06/01/2060 | | | 435 | | | | 560 | |
Banner Health | | | | | | | | |
1.897%,01/01/2031 | | | 250 | | | | 252 | |
Baptist Healthcare System Obligated Group | | | | | | | | |
3.540%, 08/15/2050 | | | 599 | | | | 649 | |
BAT Capital | | | | | | | | |
4.700%, 04/02/2027 | | | 545 | | | | 638 | |
2.726%, 03/25/2031 | | | 504 | | | | 518 | |
2.259%, 03/25/2028 | | | 1,268 | | | | 1,306 | |
BRF GmbH | | | | | | | | |
4.350%, 09/29/2026 | | | 200 | | | | 209 | |
Coca-Cola Femsa | | | | | | | | |
2.750%, 01/22/2030 | | | 347 | | | | 375 | |
1.850%, 09/01/2032 | | | 308 | | | | 311 | |
CommonSpirit Health | | | | | | | | |
1.547%, 10/01/2025 | | | 390 | | | | 396 | |
Kimberly-Clark de Mexico | | | | | | | | |
2.431%, 07/01/2031 (C) | | | 292 | | | | 301 | |
Spectrum Brands | | | | | | | | |
5.750%, 07/15/2025 | | | 685 | | | | 707 | |
Sutter Health | | | | | | | | |
1.321%, 08/15/2025 | | | 610 | | | | 617 | |
Virgolino de Oliveira Finance | | | | | | | | |
10.500%, 01/28/2018 (C)(D) | | | 500 | | | | 5 | |
| | | | | | | | |
| | | | | | | 8,875 | |
| | | | | | | | |
|
Energy — 1.4% | |
Baker Hughes LLC | | | | | | | | |
3.337%, 12/15/2027 | | | 569 | | | | 627 | |
BP Capital Markets America | | | | | | | | |
3.194%, 04/06/2025 | | | 542 | | | | 595 | |
Cenovus Energy | | | | | | | | |
4.250%,04/15/2027 | | | 36 | | | | 38 | |
Energy Transfer Operating | | | | | | | | |
5.200%, 02/01/2022 | | | 465 | | | | 483 | |
4.650%, 06/01/2021 | | | 85 | | | | 86 | |
3.750%, 05/15/2030 | | | 1,684 | | | | 1,742 | |
Eni | | | | | | | | |
4.250%, 05/09/2029 (C) | | | 950 | | | | 1,107 | |
Exxon Mobil Corp | | | | | | | | |
2.992%, 03/19/2025 | | | 645 | | | | 704 | |
| | | | | | | | |
| | | |
| Description | | Face Amount
(Thousands) | | Market Value
($ Thousands) |
|
CORPORATE OBLIGATIONS (continued) | |
Husky Energy | | | | | | | | |
4.400%, 04/15/2029 | | $ | 1,712 | | | $ | 1,832 | |
Kinder Morgan Energy Partners | | | | | | | | |
4.150%, 03/01/2022 | | | 48 | | | | 50 | |
Marathon Petroleum Corp | | | | | | | | |
5.125%, 03/01/2021 | | | 47 | | | | 48 | |
5.125%, 12/15/2026 | | | 216 | | | | 253 | |
Oleoducto Central | | | | | | | | |
4.000%, 07/14/2027 (C) | | | 235 | | | | 254 | |
ONEOK Inc | | | | | | | | |
6.350%, 01/15/2031 | | | 138 | | | | 170 | |
4.000%, 07/13/2027 | | | 717 | | | | 776 | |
Petroleos Mexicanos | | | | | | | | |
6.840%, 01/23/2030 | | | 198 | | | | 194 | |
Petroleos Mexicanos MTN | | | | | | | | |
6.750%, 09/21/2047 | | | 410 | | | | 353 | |
Saudi Arabian Oil | | | | | | | | |
2.250%, 11/24/2030 (C) | | | 322 | | | | 326 | |
Tengizchevroil Finance International | | | | | | | | |
3.250%, 08/15/2030 (C) | | | 255 | | | | 266 | |
Transocean Poseidon | | | | | | | | |
6.875%, 02/01/2027 (C) | | | 313 | | | | 263 | |
Valero Energy Corp | | | | | | | | |
2.700%, 04/15/2023 | | | 479 | | | | 498 | |
Williams Cos Inc/The | | | | | | | | |
3.900%, 01/15/2025 | | | 176 | | | | 194 | |
| | | | | | | | |
| | | | | | | 10,859 | |
| | | | | | | | |
|
Financials — 4.7% | |
ABN AMRO Bank | | | | | | | | |
4.750%, 07/28/2025 (C) | | | 200 | | | | 229 | |
AIB Group MTN | | | | | | | | |
4.750%, 10/12/2023 (C) | | | 325 | | | | 357 | |
Aircastle | | | | | | | | |
5.250%, 08/11/2025 (C) | | | 367 | | | | 388 | |
5.000%, 04/01/2023 | | | 36 | | | | 37 | |
4.400%, 09/25/2023 | | | 428 | | | | 440 | |
4.250%, 06/15/2026 | | | 31 | | | | 32 | |
4.125%, 05/01/2024 | | | 172 | | | | 177 | |
Alfa | | | | | | | | |
5.250%, 03/25/2024 (C) | | | 814 | | | | 891 | |
Alleghany | | | | | | | | |
3.625%, 05/15/2030 | | | 894 | | | | 1,010 | |
American Express | | | | | | | | |
3.535%, VAR ICE LIBOR USD 3 Month+3.285%(E) | | | 364 | | | | 354 | |
Australia & New Zealand Banking Group | | | | | | | | |
4.400%, 05/19/2026 (C) | | | 400 | | | | 460 | |
Aviation Capital Group LLC | | | | | | | | |
5.500%, 12/15/2024 (C) | | | 432 | | | | 462 | |
4.875%, 10/01/2025 (C) | | | 175 | | | | 179 | |
4.375%, 01/30/2024 (C) | | | 152 | | | | 157 | |
| | |
SEI Institutional Investments Trust / Semi-Annual Report / November 30, 2020 | | 299 |
CONSOLIDATED SCHEDULE OF INVESTMENTS (Unaudited)
November 30, 2020
Multi-Asset Real Return Fund (Continued)
| | | | | | | | |
| | | |
| Description | | Face Amount (Thousands) | | Market Value ($ Thousands) |
|
CORPORATE OBLIGATIONS (continued) | |
4.125%, 08/01/2025 (C) | | $ | 6 | | | $ | 6 | |
3.875%, 05/01/2023 (C) | | | 376 | | | | 384 | |
3.500%, 11/01/2027 (C) | | | 157 | | | | 150 | |
2.875%, 01/20/2022 (C) | | | 72 | | | | 73 | |
Banco de Credito del Peru MTN | | | | | | | | |
3.125%, VAR US Treas Yield Curve Rate T Note Const Mat 5 Yr+3.000%, 07/01/2030 (C) | | | 728 | | | | 737 | |
Banco Santander | | | | | | | | |
5.179%, 11/19/2025 | | | 1,200 | | | | 1,392 | |
Banco Santander Mexico Institucion de Banca Multiple Grupo Financiero Santand | | | | | | | | |
5.375%, 04/17/2025 (C) | | | 358 | | | | 405 | |
Bank of America MTN | | | | | | | | |
3.124%, VAR ICE LIBOR USD 3 Month+1.160%, 01/20/2023 | | | 1,225 | | | | 1,262 | |
Bank of New York Mellon | | | | | | | | |
4.700%, VAR US Treas Yield Curve Rate T Note Const Mat 5 Yr+4.358%(E) | | | 192 | | | | 210 | |
Barclays | | | | | | | | |
3.684%, 01/10/2023 | | | 755 | | | | 779 | |
BNP Paribas MTN | | | | | | | | |
4.375%, 05/12/2026 (C) | | | 700 | | | | 801 | |
Capital One Financial | | | | | | | | |
2.600%, 05/11/2023 | | | 398 | | | | 417 | |
Charles Schwab | | | | | | | | |
5.375%, VAR US Treas Yield Curve Rate T Note Const Mat 5 Yr+4.971%(E) | | | 397 | | | | 443 | |
Citigroup | | | | | | | | |
5.950%, VAR ICE LIBOR USD 3 Month+4.068%(E) | | | 232 | | | | 244 | |
4.699%, VAR ICE LIBOR USD 3 Month+4.478%(E) | | | 398 | | | | 399 | |
4.316%, VAR ICE LIBOR USD 3 Month+4.095%(E) | | | 320 | | | | 319 | |
3.875%, 03/26/2025 | | | 421 | | | | 470 | |
Commonwealth Bank of Australia | | | | | | | | |
4.500%, 12/09/2025 (C) | | | 402 | | | | 460 | |
Cooperatieve Rabobank | | | | | | | | |
UA 4.375%, 08/04/2025 | | | 425 | | | | 486 | |
Credit Suisse Group | | | | | | | | |
7.500%, VAR USD Swap Semi 30/360 5 Yr Curr+4.598%(C)(E) | | | 200 | | | | 223 | |
7.500%, VAR USD Swap Semi 30/360 5 Yr Curr+4.600%(E) | | | 749 | | | | 815 | |
6.375%, VAR US Treas Yield Curve Rate T Note Const Mat 5 Yr+4.822%(C)(E) | | | 300 | | | | 334 | |
Danske Bank | | | | | | | | |
3.244%, VAR ICE LIBOR USD 3 Month+1.591%, 12/20/2025 (C) | | | 577 | | | | 617 | |
| | | | | | | | |
| | | |
| Description | | Face Amount (Thousands) | | Market Value ($ Thousands) |
|
CORPORATE OBLIGATIONS (continued) | |
Deutsche Bank NY | | | | | | | | |
3.961%, VAR United States Secured Overnight Financing Rate+2.581%, 11/26/2025 | | $ | 295 | | | $ | 319 | |
2.129%, VAR United States Secured Overnight Financing Rate+1.870%, 11/24/2026 | | | 330 | | | | 334 | |
Discover Financial Services | | | | | | | | |
6.125%, VAR US Treas Yield Curve Rate T Note Const Mat 5 Yr+5.783%(E) | | | 1,248 | | | | 1,376 | |
Fifth Third Bancorp | | | | | | | | |
4.500%, VAR US Treas Yield Curve Rate T Note Const Mat 5 Yr+4.215%(E) | | | 236 | | | | 245 | |
Financiera de Desarrollo | | | | | | | | |
2.400%, 09/28/2027 (C) | | | 1,045 | | | | 1,061 | |
Goldman Sachs Group MTN | | | | | | | | |
1.824%, VAR ICE LIBOR USD 3 Month+1.600%, 11/29/2023 | | | 660 | | | | 682 | |
HSBC Holdings | | | | | | | | |
4.292%, VAR ICE LIBOR USD 3 Month+1.348%, 09/12/2026 | | | 260 | | | | 294 | |
4.041%, VAR ICE LIBOR USD 3 Month+1.546%, 03/13/2028 | | | 592 | | | | 672 | |
ING Groep | | | | | | | | |
6.875%, VAR USD Swap Semi 30/360 5 Yr Curr+5.124%(E) | | | 725 | | | | 760 | |
3.550%, 04/09/2024 | | | 1,000 | | | | 1,091 | |
JPMorgan Chase | | | | | | | | |
2.083%, VAR United States Secured Overnight Financing Rate+1.850%, 04/22/2026 | | | 679 | | | | 712 | |
MetLife | | | | | | | | |
5.700%, 06/15/2035 | | | 65 | | | | 96 | |
Morgan Stanley | | | | | | | | |
4.047%, VAR ICE LIBOR USD 3 Month+3.810%(E) | | | 160 | | | | 159 | |
Morgan Stanley MTN | | | | | | | | |
5.000%, 11/24/2025 | | | 154 | | | | 183 | |
4.350%, 09/08/2026 | | | 286 | | | | 336 | |
3.591%, VAR ICE LIBOR USD 3 Month+1.340%, 07/22/2028 | | | 457 | | | | 520 | |
Nationwide Building Society | | | | | | | | |
4.000%, 09/14/2026 (C) | | | 510 | | | | 571 | |
Nationwide Financial Services | | | | | | | | |
5.375%, 03/25/2021 (C) | | | 320 | | | | 324 | |
Natwest Group | | | | | | | | |
8.625%, VAR USD Swap Semi 30/360 5 Yr Curr+7.598%(E) | | | 560 | | | | 583 | |
Navient | | | | | | | | |
6.625%, 07/26/2021 | | | 560 | | | | 573 | |
Navient MTN | | | | | | | | |
7.250%, 01/25/2022 | | | 15 | | | | 16 | |
| | |
300 | | SEI Institutional Investments Trust / Semi-Annual Report / November 30, 2020 |
| | | | | | | | |
| | | |
Description | | Face Amount (Thousands) | | Market Value ($ Thousands) |
|
CORPORATE OBLIGATIONS (continued) | |
Santander Holdings USA | | | | | | | | |
4.400%, 07/13/2027 | | $ | 351 | | | $ | 398 | |
SLM | | | | | | | | |
4.200%, 10/29/2025 | | | 677 | | | | 709 | |
Standard Chartered | | | | | | | | |
7.500%, VAR USD Swap Semi 30/360 5 Yr Curr+6.301%(E) | | | 385 | | | | 401 | |
1.724%, VAR ICE LIBOR USD 3
Month+1.510%(C)(E) | | | 400 | | | | 381 | |
State Street | | | | | | | | |
2.901%, VAR United States Secured Overnight Financing Rate+2.600%, 03/30/2026 (C) | | | 61 | | | | 66 | |
Synchrony Financial | | | | | | | | |
4.500%, 07/23/2025 | | | 931 | | | | 1,047 | |
Truist Financial | | | | | | | | |
5.100%, VAR US Treas Yield Curve Rate T Note Const Mat 10 Yr+4.349%(E) | | | 792 | | | | 895 | |
UBS Group | | | | | | | | |
7.125%, VAR USSW5YF+5.883%(E) | | | 1,806 | | | | 1,860 | |
UniCredit | | | | | | | | |
2.569%, VAR US Treas Yield Curve Rate T Note Const Mat 1 Yr+2.300%, 09/22/2026 (C) | | | 1,265 | | | | 1,287 | |
US Bancorp | | | | | | | | |
5.300%, VAR ICE LIBOR USD 3 Month+2.914%(E) | | | 408 | | | | 456 | |
Voya Financial | | | | | | | | |
5.650%, VAR ICE LIBOR USD 3 Month+3.580%, 05/15/2053 | | | 258 | | | | 272 | |
Wells Fargo | | | | | | | | |
2.188%, VAR United States Secured Overnight Financing Rate+2.000%, 04/30/2026 | | | 420 | | | | 440 | |
Wells Fargo MTN | | | | | | | | |
4.300%, 07/22/2027 | | | 325 | | | | 379 | |
| | | | | | | | |
| | | | | | | 36,097 | |
| | | | | | | | |
|
Health Care — 0.5% | |
AbbVie Inc | | | | | | | | |
4.875%, 11/14/2048 | | | 259 | | | | 353 | |
Baxalta | | | | | | | | |
3.600%, 06/23/2022 | | | 222 | | | | 231 | |
Centene Corp | | | | | | | | |
4.250%, 12/15/2027 | | | 159 | | | | 168 | |
Cigna Corp | | | | | | | | |
4.375%, 10/15/2028 | | | 384 | | | | 462 | |
4.125%, 11/15/2025 | | | 288 | | | | 331 | |
3.750%, 07/15/2023 | | | 152 | | | | 165 | |
CVS Health Corp | | | | | | | | |
5.050%, 03/25/2048 | | | 495 | | | | 668 | |
Molina Healthcare Inc | | | | | | | | |
3.875%, 11/15/2030 (C) | | | 962 | | | | 1,015 | |
| | | | | | | | |
| | | |
| Description | | Face Amount (Thousands) | | Market Value
($ Thousands) |
|
CORPORATE OBLIGATIONS (continued) | |
Royalty Pharma | | | | | | | | |
1.750%, 09/02/2027 (C) | | $ | 143 | | | $ | 145 | |
Utah Acquisition Sub | | | | | | | | |
3.950%, 06/15/2026 | | | 478 | | | | 546 | |
| | | | | | | | |
| | | | | | | 4,084 | |
| | | | | | | | |
| | |
Industrials — 1.0% | | | | | | | | |
AerCap Ireland Capital DAC | | | | | | | | |
6.500%, 07/15/2025 | | | 187 | | | | 216 | |
4.450%, 04/03/2026 | | | 156 | | | | 168 | |
4.125%, 07/03/2023 | | | 249 | | | | 264 | |
3.300%, 01/23/2023 | | | 249 | | | | 257 | |
Air Lease | | | | | | | | |
3.875%, 07/03/2023 | | | 71 | | | | 75 | |
Air Lease MTN | | | | | | | | |
4.250%, 02/01/2024 | | | 283 | | | | 304 | |
2.875%, 01/15/2026 | | | 236 | | | | 245 | |
Allison Transmission | | | | | | | | |
3.750%, 01/30/2031 (C) | | | 1,056 | | | | 1,065 | |
Delta Air Lines | | | | | | | | |
4.750%, 10/20/2028 (C) | | | 450 | | | | 484 | |
4.500%, 10/20/2025 (C) | | | 388 | | | | 409 | |
Embraer Netherlands Finance BV | | | | | | | | |
6.950%, 01/17/2028 (C) | | | 242 | | | | 269 | |
5.400%, 02/01/2027 | | | 575 | | | | 608 | |
Empresa de Transporte de Pasajeros Metro | | | | | | | | |
3.650%, 05/07/2030 (C) | | | 200 | | | | 223 | |
ENA Master Trust | | | | | | | | |
4.000%, 05/19/2048 (C) | | | 269 | | | | 280 | |
GE Capital European Funding Unlimited MTN | | | | | | | | |
4.625%, 02/22/2027 | | EUR | 100 | | | | 147 | |
H&E Equipment Services | | | | | | | | |
3.875%, 12/15/2028 (C) | | $ | 765 | | | | 765 | |
Lima Metro Line 2 Finance | | | | | | | | |
5.875%, 07/05/2034 | | | 250 | | | | 302 | |
4.350%, 04/05/2036 (C) | | | 228 | | | | 251 | |
Odebrecht Finance | | | | | | | | |
7.125%, 06/26/2042 (C)(D) | | | 371 | | | | 16 | |
5.250%, 06/27/2029 (C)(D) | | | 369 | | | | 12 | |
Rumo Luxembourg Sarl | | | | | | | | |
5.875%, 01/18/2025 (C) | | | 431 | | | | 456 | |
Southwest Airlines | | | | | | | | |
5.250%, 05/04/2025 | | | 496 | | | | 566 | |
TransDigm | | | | | | | | |
6.250%, 03/15/2026 (C) | | | 448 | | | | 475 | |
Westinghouse Air Brake Technologies | | | | | | | | |
3.200%, 06/15/2025 | | | 134 | | | | 144 | |
| | | | | | | | |
| | | | | | | 8,001 | |
| | | | | | | | |
|
Information Technology — 0.9% | |
Analog Devices | | | | | | | | |
2.950%, 04/01/2025 | | | 69 | | | | 75 | |
| | |
SEI Institutional Investments Trust / Semi-Annual Report / November 30, 2020 | | 301 |
CONSOLIDATED SCHEDULE OF INVESTMENTS (Unaudited)
November 30, 2020
Multi-Asset Real Return Fund (Continued)
| | | | | | | | |
| | | |
| Description | | Face Amount (Thousands) | | Market Value ($ Thousands) |
|
CORPORATE OBLIGATIONS (continued) | |
Broadcom Corp / Broadcom Cayman Finance Ltd | | | | | | | | |
3.500%, 01/15/2028 | | $ | 169 | | | $ | 186 | |
Broadcom Inc | | | | | | | | |
5.000%, 04/15/2030 | | | 235 | | | | 285 | |
4.150%, 11/15/2030 | | | 818 | | | | 950 | |
4.110%, 09/15/2028 | | | 696 | | | | 797 | |
Dell International LLC | | | | | | | | |
6.020%, 06/15/2026 (C) | | | 313 | | | | 380 | |
5.450%, 06/15/2023 (C) | | | 128 | | | | 141 | |
Infor | | | | | | | | |
1.750%, 07/15/2025 (C) | | | 323 | | | | 335 | |
Mastercard Inc | | | | | | | | |
3.850%, 03/26/2050 | | | 504 | | | | 659 | |
3.300%, 03/26/2027 | | | 355 | | | | 405 | |
Micron Technology | | | | | | | | |
4.185%, 02/15/2027 | | | 1,146 | | | | 1,323 | |
NXP BV | | | | | | | | |
2.700%, 05/01/2025 (C) | | | 103 | | | | 111 | |
Oracle Corp | | | | | | | | |
2.500%, 04/01/2025 | | | 816 | | | | 875 | |
Seagate HDD Cayman | | | | | | | | |
4.091%, 06/01/2029 (C) | | | 171 | | | | 189 | |
| | | | | | | | |
| | | | | | | 6,711 | |
| | | | | | | | |
|
Materials — 1.1% | |
Alpek | | | | | | | | |
4.250%, 09/18/2029 (C) | | | 375 | | | | 401 | |
Axalta Coating Systems LLC | | | | | | | | |
3.375%, 02/15/2029 (C) | | | 628 | | | | 633 | |
Braskem Netherlands Finance BV | | | | | | | | |
4.500%, 01/31/2030 (C) | | | 420 | | | | 424 | |
Celulosa Arauco y Constitucion | | | | | | | | |
4.200%, 01/29/2030 (C) | | | 404 | | | | 446 | |
DuPont de Nemours Inc | | | | | | | | |
4.493%, 11/15/2025 | | | 710 | | | | 830 | |
4.205%, 11/15/2023 | | | 710 | | | | 782 | |
Fresnillo | | | | | | | | |
4.250%, 10/02/2050 (C) | | | 1,274 | | | | 1,361 | |
GUSAP III | | | | | | | | |
4.250%, 01/21/2030 (C) | | | 750 | | | | 821 | |
Indonesia Asahan Aluminium Persero | | | | | | | | |
4.750%, 05/15/2025 (C) | | | 330 | | | | 364 | |
Industrias Penoles | | | | | | | | |
4.750%, 08/06/2050 (C) | | | 287 | | | | 318 | |
Ingevity | | | | | | | | |
3.875%, 11/01/2028 (C) | | | 516 | | | | 522 | |
Inversiones CMPC | | | | | | | | |
4.375%, 05/15/2023 | | | 237 | | | | 253 | |
Nacional del Cobre de Chile | | | | | | | | |
3.750%, 01/15/2031 (C) | | | 201 | | | | 226 | |
3.150%, 01/14/2030 (C) | | | 485 | | | | 525 | |
| | | | | | | | |
| | | |
| Description | | Face Amount
(Thousands) | | Market Value
($ Thousands) |
|
CORPORATE OBLIGATIONS (continued) | |
Nutrition & Biosciences | | | | | | | | |
1.832%, 10/15/2027 (C) | | $ | 220 | | | $ | 225 | |
Suzano Austria GmbH | | | | | | | | |
3.750%, 01/15/2031 | | | 163 | | | | 172 | |
| | | | | | | | |
| | | | | | | 8,303 | |
| | | | | | | | |
| | |
Real Estate — 0.0% | | | | | | | | |
Host Hotels & Resorts Inc | | | | | | | | |
3.750%, 10/15/2023 | | | 13 | | | | 14 | |
Rexford Industrial Realty Inc | | | | | | | | |
2.125%, 12/01/2030 | | | 188 | | | | 189 | |
Welltower Inc | | | | | | | | |
4.000%, 06/01/2025 | | | 136 | | | | 153 | |
| | | | | | | | |
| | | | | | | 356 | |
| | | | | | | | |
| | |
Utilities — 0.4% | | | | | | | | |
AES Panama Generation Holdings SRL | | | | | | | | |
4.375%, 05/31/2030 (C) | | | 297 | | | | 321 | |
Enel Chile | | | | | | | | |
4.875%, 06/12/2028 | | | 689 | | | | 803 | |
Israel Electric | | | | | | | | |
5.000%, 11/12/2024 (C) | | | 581 | | | | 657 | |
Kentucky Utilities | | | | | | | | |
3.300%, 06/01/2050 | | | 365 | | | | 416 | |
NextEra Energy Capital Holdings | | | | | | | | |
2.750%, 05/01/2025 | | | 166 | | | | 180 | |
Star Energy Geothermal Darajat II | | | | | | | | |
4.850%, 10/14/2038 (C) | | | 529 | | | | 573 | |
Terraform Global Operating LLC | | | | | | | | |
6.125%, 03/01/2026 (C) | | | 77 | | | | 79 | |
| | | | | | | | |
| | | | | | | 3,029 | |
| | | | | | | | |
| | |
Total Corporate Obligations (Cost $103,751) ($ Thousands) | | | | | | | 109,478 | |
| | | | | | | | |
|
MORTGAGE-BACKED SECURITIES — 10.2% | |
|
Agency Mortgage-Backed Obligations — 1.6% | |
FHLMC CMO, Ser 2016-4585, Cl DS, IO | | | | | | | | |
5.859%, VAR ICE LIBOR USD 1 Month+6.000%,
05/15/2046 | | | 1,089 | | | | 262 | |
FHLMC CMO, Ser 2017-4693, Cl SL, IO | | | | | | | | |
6.009%, VAR ICE LIBOR USD 1 Month+6.150%,
06/15/2047 | | | 1,746 | | | | 398 | |
FHLMC CMO, Ser 2017-4719, Cl JS, IO | | | | | | | | |
6.009%, VAR ICE LIBOR USD 1 Month+6.150%,
09/15/2047 | | | 1,670 | | | | 283 | |
FHLMC CMO, Ser 2017-4727, Cl SA, IO | | | | | | | | |
6.059%, VAR ICE LIBOR USD 1 Month+6.200%,
11/15/2047 | | | 1,896 | | | | 383 | |
| | |
302 | | SEI Institutional Investments Trust / Semi-Annual Report / November 30, 2020 |
| | | | | | | | |
| | | |
| Description | | Face Amount
(Thousands) | | Market Value
($ Thousands) |
|
MORTGAGE-BACKED SECURITIES (continued) | |
FHLMC CMO, Ser 2020-4954, Cl SL, IO | | | | | | | | |
5.900%, VAR ICE LIBOR USD 1 Month+6.050%, 02/25/2050 | | $ | 2,308 | | | $ | 412 | |
FHLMC CMO, Ser 2020-4976, Cl MI, IO | | | | | | | | |
4.500%, 05/25/2050 | | | 3,456 | | | | 550 | |
FHLMC CMO, Ser 2020-4981, Cl HS, IO | | | | | | | | |
5.950%, VAR ICE LIBOR USD 1 Month+6.100%, 06/25/2050 | | | 4,879 | | | | 915 | |
FHLMC CMO, Ser 2020-5015, Cl BI, IO | | | | | | | | |
4.000%, 09/25/2050 | | | 2,765 | | | | 443 | |
FHLMC CMO, Ser 2020-5018, Cl EI, IO | | | | | | | | |
4.000%, 10/25/2050 | | | 2,247 | | | | 313 | |
FNMA CMO, Ser 2011-131, Cl ST, IO | | | | | | | | |
6.390%, VAR ICE LIBOR USD 1 Month+6.540%, 12/25/2041 | | | 817 | | | | 180 | |
FNMA CMO, Ser 2014-17, Cl SA, IO | | | | | | | | |
5.900%, VAR ICE LIBOR USD 1 Month+6.050%, 04/25/2044 | | | 2,328 | | | | 590 | |
FNMA CMO, Ser 2014-78, Cl SE, IO | | | | | | | | |
5.950%, VAR ICE LIBOR USD 1 Month+6.100%, 12/25/2044 | | | 1,429 | | | | 283 | |
FNMA CMO, Ser 2016-77, Cl DS, IO | | | | | | | | |
5.850%, VAR ICE LIBOR USD 1 Month+6.000%, 10/25/2046 | | | 1,382 | | | | 277 | |
FNMA CMO, Ser 2017-62, Cl AS, IO | | | | | | | | |
6.000%, VAR ICE LIBOR USD 1 Month+6.150%, 08/25/2047 | | | 1,752 | | | | 327 | |
FNMA CMO, Ser 2017-81, Cl SA, IO | | | | | | | | |
6.050%, VAR ICE LIBOR USD 1 Month+6.200%, 10/25/2047 | | | 1,801 | | | | 402 | |
FNMA CMO, Ser 2020-26, Cl GS, IO | | | | | | | | |
5.850%, VAR ICE LIBOR USD 1 Month+6.000%, 05/25/2050 | | | 2,384 | | | | 418 | |
FNMA CMO, Ser 2020-89, Cl KI, IO | | | | | | | | |
4.000%,12/25/2050 | | | 5,435 | | | | 853 | |
GNMA CMO, Ser 2017-122, Cl SA, IO | | | | | | | | |
6.054%, VAR ICE LIBOR USD 1 Month+6.200%, 08/20/2047 | | | 1,333 | | | | 277 | |
UMBS TBA | | | | | | | | |
1.500%,12/14/2050 | | | 4,270 | | | | 4,319 | |
| | | | | | | | |
| | |
| | | | | | | 11,885 | |
| | | | | | | | |
|
Non-Agency Mortgage-Backed Obligations — 8.6% | |
Alternative Loan Trust, Ser 2005-20CB, Cl 3A6 | | | | | | | | |
5.500%, 07/25/2035 | | | 54 | | | | 49 | |
Alternative Loan Trust, Ser 2006-24CB, Cl A16 | | | | | | | | |
5.750%, 08/25/2036 | | | 260 | | | | 210 | |
Alternative Loan Trust, Ser 2006-28CB, Cl A14 | | | | | | | | |
6.250%, 10/25/2036 | | | 192 | | | | 143 | |
| | | | | | | | |
| | | |
| Description | | Face Amount
(Thousands) | | Market Value
($ Thousands) |
|
MORTGAGE-BACKED SECURITIES (continued) | |
Alternative Loan Trust, Ser 2006-J1, Cl 1A13 | | | | | | | | |
5.500%, 02/25/2036 | | $ | 120 | | | $ | 111 | |
Ashford Hospitality Trust, Ser 2018-ASHF, Cl A | | | | | | | | |
1.041%, VAR ICE LIBOR USD 1 Month+0.900%, 04/15/2035 (C) | | | 758 | | | | 725 | |
Ashford Hospitality Trust, Ser 2018-KEYS, Cl A | | | | | | | | |
1.141%, VAR ICE LIBOR USD 1 Month+1.000%, 06/15/2035 (C) | | | 1,000 | | | | 952 | |
BAMLL Commercial Mortgage Securities Trust, Ser 2013-WBRK, Cl D | | | | | | | | |
3.652%, 03/10/2037 (C)(F) | | | 395 | | | | 352 | |
BAMLL Commercial Mortgage Securities Trust, Ser 2017-SCH, Cl AF | | | | | | | | |
1.141%, VAR ICE LIBOR USD 1 Month+1.000%, 11/15/2033 (C) | | | 1,535 | | | | 1,460 | |
BBCMS Mortgage Trust, Ser 2020-BID, Cl A | | | | | | | | |
2.281%, VAR ICE LIBOR USD 1 Month+2.140%, 10/15/2037 (C) | | | 710 | | | | 709 | |
Bellemeade Re, Ser 2018-3A, Cl M1B | | | | | | | | |
2.000%, VAR ICE LIBOR USD 1 Month+1.850%, 10/25/2028 (C) | | | 311 | | | | 311 | |
Bellemeade Re, Ser 2019-1A, Cl M1B | | | | | | | | |
1.900%, VAR ICE LIBOR USD 1 Month+1.750%, 03/25/2029 (C) | | | 720 | | | | 720 | |
Bellemeade Re, Ser 2019-2A, Cl M1C | | | | | | | | |
2.150%, VAR ICE LIBOR USD 1 Month+2.000%, 04/25/2029 (C) | | | 516 | | | | 511 | |
Bellemeade Re, Ser 2019-3A, Cl M1B | | | | | | | | |
1.750%, VAR ICE LIBOR USD 1 Month+1.600%, 07/25/2029 (C) | | | 507 | | | | 503 | |
Bellemeade Re, Ser 2019-3A, Cl M1C | | | | | | | | |
2.100%, VAR ICE LIBOR USD 1 Month+1.950%, 07/25/2029 (C) | | | 366 | | | | 357 | |
Bellemeade Re, Ser 2019-4A, Cl M1B | | | | | | | | |
2.150%, VAR ICE LIBOR USD 1 Month+2.000%, 10/25/2029 (C) | | | 730 | | | | 725 | |
Bellemeade Re, Ser 2020-2A, Cl M1B | | | | | | | | |
3.350%, VAR ICE LIBOR USD 1 Month+3.200%, 08/26/2030 (C) | | | 380 | | | | 384 | |
Bellemeade Re, Ser 2020-3A, Cl M1B | | | | | | | | |
3.000%, VAR ICE LIBOR USD 1 Month+2.850%, 10/25/2030 (C) | | | 240 | | | | 241 | |
BHMS, Ser 2018-ATLS, Cl A | | | | | | | | |
1.391%, VAR ICE LIBOR USD 1 Month+1.250%, 07/15/2035 (C) | | | 762 | | | | 738 | |
Braemar Hotels & Resorts Trust, Ser 2018-PRME, Cl A | | | | | | | | |
0.961%, VAR ICE LIBOR USD 1 Month+0.820%, 06/15/2035 (C) | | | 750 | | | | 720 | |
BX Trust, Ser 2018-EXCL, Cl A | | | | | | | | |
1.229%, VAR ICE LIBOR USD 1 Month+1.088%, 09/15/2037 (C) | | | 862 | | | | 797 | |
| | |
SEI Institutional Investments Trust / Semi-Annual Report / November 30, 2020 | | 303 |
CONSOLIDATED SCHEDULE OF INVESTMENTS (Unaudited)
November 30, 2020
Multi-Asset Real Return Fund (Continued)
| | | | | | | | |
| | | |
| Description | | Face Amount
(Thousands) | | Market Value
($ Thousands) |
|
MORTGAGE-BACKED SECURITIES (continued) | |
CFCRE Commercial Mortgage Trust, Ser 2016-C4, Cl A4 | | | | | | | | |
3.283%,05/10/2058 | | $ | 625 | | | $ | 676 | |
CGRBS Commercial Mortgage Trust, Ser 2013-VN05, Cl A | | | | | | | | |
3.369%,03/13/2035 (C) | | | 285 | | | | 300 | |
Chase Mortgage Finance Trust, Ser 2007-S5, Cl 1A17 | | | | | | | | |
6.000%,07/25/2037 | | | 88 | | | | 63 | |
Chase Mortgage Reference Notes, Ser 2019-CL1, Cl M3 | | | | | | | | |
2.250%, VAR ICE LIBOR USD 1 Month+2.100%, 04/25/2047 (C) | | | 202 | | | | 203 | |
CHL Mortgage Pass-Through Trust, Ser 2006-10, Cl 1A8 | | | | | | | | |
6.000%,05/25/2036 | | | 122 | | | | 91 | |
CHL Mortgage Pass-Through Trust, Ser 2006-13, Cl 1A19 | | | | | | | | |
6.250%,09/25/2036 | | | 60 | | | | 40 | |
Citigroup Commercial Mortgage Trust, Ser 2013-GC11, Cl D | | | | | | | | |
4.563%,04/10/2046 (C)(F) | | | 250 | | | | 240 | |
Citigroup Commercial Mortgage Trust, Ser 2015-GC27, Cl A5 | | | | | | | | |
3.137%,02/10/2048 | | | 779 | | | | 836 | |
Citigroup Commercial Mortgage Trust,Ser 2015-GC35, Cl A4 | | | | | | | | |
3.818%,11/10/2048 | | | 390 | | | | 436 | |
Citigroup Commercial Mortgage Trust, Ser 2016-GC36, Cl A5 | | | | | | | | |
3.616%,02/10/2049 | | | 950 | | | | 1,057 | |
Citigroup Commercial Mortgage Trust, Ser 2017-P8, Cl AS | | | | | | | | |
3.789%,09/15/2050 (F) | | | 392 | | | | 443 | |
CLNY Trust, Ser 2019-IKPR, Cl D | | | | | | | | |
2.166%, VAR ICE LIBOR USD 1 Month+2.025%, 11/15/2038 (C) | | | 750 | | | | 682 | |
COMM Mortgage Trust, Ser 2010-C1, Cl D | | | | | | | | |
5.985%,07/10/2046 (C)(F) | | | 690 | | | | 552 | |
COMM Mortgage Trust, Ser 2013-CR12, Cl A4 | | | | | | | | |
4.046%,10/10/2046 | | | 920 | | | | 996 | |
COMM Mortgage Trust, Ser 2013-SFS, Cl A1 | | | | | | | | |
1.873%,04/12/2035 (C) | | | 449 | | | | 445 | |
COMM Mortgage Trust, Ser 2015-3BP, Cl A | | | | | | | | |
3.178%,02/10/2035 (C) | | | 200 | | | | 215 | |
COMM Mortgage Trust, Ser 2015-CR24, Cl A5 | | | | | | | | |
3.696%,08/10/2048 | | | 490 | | | | 546 | |
COMM Mortgage Trust, Ser 2015-DC1, Cl A5 | | | | | | | | |
3.350%,02/10/2048 | | | 700 | | | | 758 | |
Connecticut Avenue Securities Trust, Ser 2018-R07, Cl 1M2 | | | | | | | | |
2.550%, VAR ICE LIBOR USD 1 Month+2.400%, 04/25/2031 (C) | | | 287 | | | | 285 | |
| | | | | | | | |
| | | |
| Description | | Face Amount
(Thousands) | | Market Value
($ Thousands) |
|
MORTGAGE-BACKED SECURITIES (continued) | |
Connecticut Avenue Securities Trust, Ser 2019-R02, Cl 1M2 | | | | | | | | |
2.450%, VAR ICE LIBOR USD 1 Month+2.300%, 08/25/2031 (C) | | $ | 202 | | | $ | 201 | |
Connecticut Avenue Securities Trust, Ser 2019-R03, Cl 1M2 | | | | | | | | |
2.300%, VAR ICE LIBOR USD 1 Month+2.150%, 09/25/2031 (C) | | | 105 | | | | 104 | |
Connecticut Avenue Securities Trust, Ser 2019-R04, Cl 2M2 | | | | | | | | |
2.250%, VAR ICE LIBOR USD 1 Month+2.100%, 06/25/2039 (C) | | | 358 | | | | 357 | |
Connecticut Avenue Securities Trust, Ser 2019-R05, Cl 1M2 | | | | | | | | |
2.150%, VAR ICE LIBOR USD 1 Month+2.000%, 07/25/2039 (C) | | | 204 | | | | 204 | |
Connecticut Avenue Securities Trust, Ser 2019-R06, Cl 2M2 | | | | | | | | |
2.250%, VAR ICE LIBOR USD 1 Month+2.100%, 09/25/2039 (C) | | | 474 | | | | 472 | |
Connecticut Avenue Securities Trust, Ser 2019-R07, Cl 1M2 | | | | | | | | |
2.250%, VAR ICE LIBOR USD 1 Month+2.100%, 10/25/2039 (C) | | | 809 | | | | 805 | |
CSAIL Commercial Mortgage Trust, Ser 2015-C2, Cl A4 | | | | | | | | |
3.504%,06/15/2057 | | | 421 | | | | 462 | |
CSAIL Commercial Mortgage Trust, Ser 2015-C3, Cl A4 | | | | | | | | |
3.718%,08/15/2048 | | | 401 | | | | 444 | |
CSAIL Commercial Mortgage Trust, Ser 2015-C4, Cl A4 | | | | | | | | |
3.808%,11/15/2048 | | | 1,070 | | | | 1,197 | |
DBWF Mortgage Trust, Ser 2018-GLKS, Cl A | | | | | | | | |
1.179%, VAR ICE LIBOR USD 1 Month+1.030%, 12/19/2030 (C) | | | 798 | | | | 782 | |
Deutsche Alt-A Securities Mortgage Loan Trust, Ser 2006-AR4, Cl A2 | | | | | | | | |
0.530%, VAR ICE LIBOR USD 1 Month+0.380%, 12/25/2036 | | | 173 | | | | 89 | |
Eagle Re, Ser 2020-1, Cl M1A | | | | | | | | |
1.050%, VAR ICE LIBOR USD 1 Month+0.900%, 01/25/2030 (C) | | | 820 | | | | 817 | |
FHLMC STACR Remic Trust, Ser 2020-DNA1, Cl M2 | | | | | | | | |
1.850%, VAR ICE LIBOR USD 1 Month+1.700%, 01/25/2050 (C) | | | 725 | | | | 718 | |
FHLMC STACR Remic Trust, Ser 2020-DNA5, Cl M2 | | | | | | | | |
2.888%, VAR SOFR30A+2.800%, 10/25/2050 (C) | | | 710 | | | | 714 | |
| | |
304 | | SEI Institutional Investments Trust / Semi-Annual Report / November 30, 2020 |
| | | | | | | | |
| | | |
| Description | | Face Amount
(Thousands) | | Market Value
($ Thousands) |
|
MORTGAGE-BACKED SECURITIES (continued) | |
FHLMC STACR Trust, Ser 2019-DNA3, Cl M2 | | | | | | | | |
2.200%, VAR ICE LIBOR USD 1 Month+2.050%, 07/25/2049 (C) | | $ | 56 | | | $ | 56 | |
FHLMC STACR Trust, Ser 2019-DNA4, Cl M2 | | | | | | | | |
2.100%, VAR ICE LIBOR USD 1 Month+1.950%, 10/25/2049 (C) | | | 609 | | | | 605 | |
FHLMC STACR Trust, Ser 2019-FTR2, Cl M2 | | | | | | | | |
2.300%, VAR ICE LIBOR USD 1 Month+2.150%, 11/25/2048 (C) | | | 403 | | | | 383 | |
FHLMC STACR Trust, Ser 2019-HQA3, Cl M2 | | | | | | | | |
2.000%, VAR ICE LIBOR USD 1 Month+1.850%, 09/25/2049 (C) | | | 348 | | | | 342 | |
FHLMC Structured Agency Credit Risk Debt Notes, Ser 2017-DNA3, Cl M2 | | | | | | | | |
2.650%, VAR ICE LIBOR USD 1 Month+2.500%, 03/25/2030 | | | 705 | | | | 714 | |
FHLMC Structured Agency Credit Risk Debt Notes, Ser 2017-HQA2, Cl M2B | | | | | | | | |
2.800%, VAR ICE LIBOR USD 1 Month+2.650%, 12/25/2029 | | | 630 | | | | 619 | |
FHLMC Structured Agency Credit Risk Debt Notes, Ser 2017-HQA3, Cl M2 | | | | | | | | |
2.500%, VAR ICE LIBOR USD 1 Month+2.350%, 04/25/2030 | | | 652 | | | | 660 | |
First Horizon Alternative Mortgage Securities Trust, Ser 2006-FA3, Cl A9 | | | | | | | | |
6.000%,07/25/2036 | | | 51 | | | | 35 | |
FNMA Connecticut Avenue Securities, Ser 2014-C04, Cl 1M2 | | | | | | | | |
5.050%, VAR ICE LIBOR USD 1 Month+4.900%, 11/25/2024 | | | 256 | | | | 262 | |
FNMA Connecticut Avenue Securities, Ser 2015-C01, Cl 2M2 | | | | | | | | |
4.700%, VAR ICE LIBOR USD 1 Month+4.550%, 02/25/2025 | | | 78 | | | | 79 | |
FNMA Connecticut Avenue Securities, Ser 2015-C01, Cl 1M2 | | | | | | | | |
4.450%, VAR ICE LIBOR USD 1 Month+4.300%, 02/25/2025 | | | 482 | | | | 491 | |
FNMA Connecticut Avenue Securities, Ser 2015-C02, Cl 2M2 | | | | | | | | |
4.150%, VAR ICE LIBOR USD 1 Month+4.000%, 05/25/2025 | | | 106 | | | | 107 | |
FNMA Connecticut Avenue Securities, Ser 2015-C02, Cl 1M2 | | | | | | | | |
4.150%, VAR ICE LIBOR USD 1 Month+4.000%, 05/25/2025 | | | 303 | | | | 308 | |
FNMA Connecticut Avenue Securities, Ser 2015-C03, Cl 1M2 | | | | | | | | |
5.150%, VAR ICE LIBOR USD 1 Month+5.000%, 07/25/2025 | | | 278 | | | | 285 | |
| | | | | | | | |
| | | |
| Description | | Face Amount
(Thousands) | | Market Value
($ Thousands) |
|
MORTGAGE-BACKED SECURITIES (continued) | |
FNMA Connecticut Avenue Securities, Ser 2015-C03, Cl 2M2 | | | | | | | | |
5.150%, VAR ICE LIBOR USD 1 Month+5.000%, 07/25/2025 | | $ | 187 | | | $ | 192 | |
FNMA Connecticut Avenue Securities, Ser 2015-C04, Cl 1M2 | | | | | | | | |
5.850%, VAR ICE LIBOR USD 1 Month+5.700%, 04/25/2028 | | | 101 | | | | 108 | |
FNMA Connecticut Avenue Securities, Ser 2016-C05, Cl 2M2 | | | | | | | | |
4.600%, VAR ICE LIBOR USD 1 Month+4.450%, 01/25/2029 | | | 486 | | | | 504 | |
FNMA Connecticut Avenue Securities, Ser 2016-C06, Cl 1M2 | | | | | | | | |
4.400%, VAR ICE LIBOR USD 1 Month+4.250%, 04/25/2029 | | | 192 | | | | 201 | |
FNMA Connecticut Avenue Securities, Ser 2016-C07, Cl 2M2 | | | | | | | | |
4.500%, VAR ICE LIBOR USD 1 Month+4.350%, 05/25/2029 | | | 485 | | | | 503 | |
FNMA Connecticut Avenue Securities, Ser 2017-C01, Cl 1M2 | | | | | | | | |
3.700%, VAR ICE LIBOR USD 1 Month+3.550%, 07/25/2029 | | | 478 | | | | 491 | |
FNMA Connecticut Avenue Securities, Ser 2017-C02, Cl 2M2C | | | | | | | | |
3.800%, VAR ICE LIBOR USD 1 Month+3.650%, 09/25/2029 | | | 698 | | | | 699 | |
FNMA Connecticut Avenue Securities, Ser 2017-C03, Cl 1M2 | | | | | | | | |
3.150%, VAR ICE LIBOR USD 1 Month+3.000%, 10/25/2029 | | | 411 | | | | 415 | |
GS Mortgage Securities Trust, Ser 2011-GC5, Cl D | | | | | | | | |
5.555%,08/10/2044 (C)(F) | | | 80 | | | | 67 | |
GS Mortgage Securities Trust, Ser 2013-G1, Cl A2 | | | | | | | | |
3.557%,04/10/2031 (C)(F) | | | 1,485 | | | | 1,471 | |
GS Mortgage Securities Trust, Ser 2013-G1, Cl A1 | | | | | | | | |
2.059%,04/10/2031 (C) | | | 63 | | | | 64 | |
GS Mortgage Securities Trust, Ser 2014-GC18, Cl D | | | | | | | | |
5.155%,01/10/2047 (C)(F) | | | 431 | | | | 122 | |
GS Mortgage Securities Trust, Ser 2014-GC22, Cl A5 | | | | | | | | |
3.862%,06/10/2047 | | | 767 | | | | 835 | |
GS Mortgage Securities Trust, Ser 2018-GS9, Cl A4 | | | | | | | | |
3.992%,03/10/2051 (F) | | | 1,400 | | | | 1,623 | |
| | |
SEI Institutional Investments Trust / Semi-Annual Report / November 30, 2020 | | 305 |
CONSOLIDATED SCHEDULE OF INVESTMENTS (Unaudited)
November 30, 2020
Multi-Asset Real Return Fund (Continued)
| | | | | | | | |
| | | |
| Description | | Face Amount
(Thousands) | | Market Value
($ Thousands) |
|
MORTGAGE-BACKED SECURITIES (continued) | |
GS Mortgage Securities Trust, Ser 2019-BOCA, Cl A | | | | | | | | |
1.341%, VAR ICE LIBOR USD 1 Month+1.200%, 06/15/2038 (C) | | $ | 1,039 | | | $ | 1,024 | |
GS Mortgage Securities Trust, Ser 2019-SMP, Cl A | | | | | | | | |
1.291%, VAR ICE LIBOR USD 1 Month+1.150%, 08/15/2032 (C) | | | 860 | | | | 841 | |
HFX, Ser 2017-1A, Cl A3 | | | | | | | | |
3.647%,03/15/2035 | | | 800 | | | | 858 | |
Home Re, Ser 2020-1, Cl M1B | | | | | | | | |
3.400%, VAR ICE LIBOR USD 1 Month+3.250%, 10/25/2030 (C) | | | 585 | | | | 590 | |
HomeBanc Mortgage Trust, Ser 2005-1, Cl A1 1 | | | | | | | | |
0.650%, VAR ICE LIBOR USD Month+0.500%, 03/25/2035 | | | 43 | | | | 39 | |
JPMBB Commercial Mortgage Securities Trust, Ser 2014-C21, Cl A5 | | | | | | | | |
3.775%,08/15/2047 | | | 955 | | | | 1,044 | |
JPMBB Commercial Mortgage Securities Trust, Ser 2014-C22, Cl XA, IO | | | | | | | | |
0.983%,09/15/2047 (F) | | | 16,160 | | | | 419 | |
JPMBB Commercial Mortgage Securities Trust, Ser 2015-C30, Cl A5 | | | | | | | | |
3.822%,07/15/2048 | | | 485 | | | | 544 | |
JPMBB Commercial Mortgage Securities Trust, Ser 2015-C31, Cl A3 | | | | | | | | |
3.801%,08/15/2048 | | | 845 | | | | 945 | |
JPMCC Commercial Mortgage Securities Trust, Ser 2017-JP7, Cl XA, IO | | | | | | | | |
1.203%,09/15/2050 (F) | | | 6,836 | | | | 343 | |
JPMorgan Chase Commercial Mortgage Securities Trust, Ser 2012-C8, Cl AS | | | | | | | | |
3.424%,10/15/2045 (C) | | | 1,200 | | | | 1,236 | |
JPMorgan Chase Commercial Mortgage Securities Trust, Ser 2014-C20, Cl A5 | | | | | | | | |
3.805%,07/15/2047 | | | 900 | | | | 981 | |
JPMorgan Chase Commercial Mortgage Securities Trust, Ser 2020-NNN, Cl EFL | | | | | | | | |
1.991%, VAR ICE LIBOR USD 1 Month+1.850%, 01/16/2037 (C) | | | 99 | | | | 91 | |
LB-UBS Commercial Mortgage Trust, Ser 2006-C6, Cl AJ | | | | | | | | |
5.452%,09/15/2039 (F) | | | 143 | | | | 83 | |
LSTAR Commercial Mortgage Trust, Ser 2016-4, Cl A2 | | | | | | | | |
2.579%,03/10/2049 (C) | | | 572 | | | | 582 | |
Morgan Stanley Bank of America Merrill Lynch Trust, Ser 2014-C16, Cl A5 | | | | | | | | |
3.892%,06/15/2047 | | | 950 | | | | 1,033 | |
Morgan Stanley Capital I Trust, Ser 2011-C1,Cl D | | | | | | | | |
5.795%,09/15/2047 (C)(F) | | | 110 | | | | 110 | |
| | | | | | | | |
| | | |
| Description | | Face Amount
(Thousands) | | Market Value
($ Thousands) |
|
MORTGAGE-BACKED SECURITIES (continued) | |
Morgan Stanley Capital I Trust, Ser 2015-XLF2, Cl SNMA | | | | | | | | |
2.091%, VAR ICE LIBOR USD 1 Month+1.950%, 11/15/2026 (C) | | $ | 114 | | | $ | 96 | |
Morgan Stanley Capital I Trust, Ser 2016-UB12, Cl A4 | | | | | | | | |
3.596%,12/15/2049 | | | 755 | | | | 842 | |
Mortgage Insurance-Linked Notes, Ser 2019- 1, Cl M1 | | | | | | | | |
2.050%, VAR ICE LIBOR USD 1 Month+1.900%, 11/26/2029 (C) | | | 603 | | | | 600 | |
Natixis Commercial Mortgage Securities Trust, Ser 2018-850T, Cl A | | | | | | | | |
0.924%, VAR ICE LIBOR USD 1 Month+0.784%, 07/15/2033 (C) | | | 480 | | | | 474 | |
Natixis Commercial Mortgage Securities Trust, Ser 2019-MILE, Cl A | | | | | | | | |
1.641%, VAR ICE LIBOR USD 1 Month+1.500%, 07/15/2036 (C) | | | 346 | | | | 344 | |
Oaktown Re V, Ser 2020-2A, Cl M1B | | | | | | | | |
3.750%, VAR ICE LIBOR USD 1 Month+3.600%, 10/25/2030 (C) | | | 1,071 | | | | 1,080 | |
PMT Credit Risk Transfer Trust, Ser 2019-1R,Cl A | | | | | | | | |
2.147%, VAR ICE LIBOR USD 1 Month+2.000%, 03/27/2024 (C) | | | 215 | | | | 196 | |
PMT Credit Risk Transfer Trust, Ser 2019-2R, Cl A | | | | | | | | |
2.897%, VAR ICE LIBOR USD 1 Month+2.750%, 05/27/2023 (C) | | | 391 | | | | 377 | |
PMT Credit Risk Transfer Trust, Ser 2019-3R, Cl A | | | | | | | | |
2.847%, VAR ICE LIBOR USD 1 Month+2.700%, 10/27/2022 (C) | | | 139 | | | | 134 | |
PMT Credit Risk Transfer Trust, Ser 2020-1R, Cl A | | | | | | | | |
2.497%, VAR ICE LIBOR USD 1 Month+2.350%, 02/27/2023 (C) | | | 437 | | | | 423 | |
Radnor Re, Ser 2019-1, Cl M1B | | | | | | | | |
2.100%, VAR ICE LIBOR USD 1 Month+1.950%, 02/25/2029 (C) | | | 404 | | | | 405 | |
Radnor Re, Ser 2019-2, Cl M1B | | | | | | | | |
1.900%, VAR ICE LIBOR USD 1 Month+1.750%, 06/25/2029 (C) | | | 530 | | | | 528 | |
Radnor Re, Ser 2020-1, Cl M1A | | | | | | | | |
1.100%, VAR ICE LIBOR USD 1 Month+0.950%, 02/25/2030 (C) | | | 311 | | | | 310 | |
Radnor Re, Ser 2020-2, Cl M1C | | | | | | | | |
4.750%, VAR ICE LIBOR USD 1 Month+4.600%, 10/25/2030 (C) | | | 426 | | | | 433 | |
| | |
306 | | SEI Institutional Investments Trust / Semi-Annual Report / November 30, 2020 |
| | | | | | | | |
| | | |
Description | | Face Amount (Thousands) | | Market Value ($ Thousands) |
|
MORTGAGE-BACKED SECURITIES (continued) | |
Starwood Retail Property Trust, Ser 2014- STAR, Cl A | | | | | | | | |
1.611%, VAR ICE LIBOR USD 1 Month+1.470%, 11/15/2027 (C) | | $ | 1,081 | | | $ | 783 | |
Traingle Re, Ser 2020-1, Cl M1B | | | | | | | | |
4.050%, VAR ICE LIBOR USD 1 Month+3.900%, 10/25/2030 (C) | | | 1,231 | | | | 1,240 | |
UBS Commercial Mortgage Trust, Ser 2017-C1, Cl A4 | | | | | | | | |
3.544%,11/15/2050 (F) | | | 1,070 | | | | 1,214 | |
UBS Commercial Mortgage Trust, Ser 2018-C10, Cl A4 | | | | | | | | |
4.313%,05/15/2051 | | | 1,000 | | | | 1,170 | |
UBS Commercial Mortgage Trust, Ser 2018-C8, Cl A4 | | | | | | | | |
3.983%,02/15/2051 | | | 855 | | | | 984 | |
UBS Commercial Mortgage Trust, Ser 2018-C9, Cl A4 | | | | | | | | |
4.117%,03/15/2051 (F) | | | 1,500 | | | | 1,732 | |
UBS-Barclays Commercial Mortgage Trust, Ser 2012-C4, Cl A5 | | | | | | | | |
2.850%,12/10/2045 | | | 194 | | | | 201 | |
Wells Fargo Commercial Mortgage Trust, Ser 2015-SG1, Cl C | | | | | | | | |
4.611%,09/15/2048 (F) | | | 527 | | | | 456 | |
Wells Fargo Commercial Mortgage Trust, Ser 2016-LC25, Cl C | | | | | | | | |
4.564%,12/15/2059 (F) | | | 370 | | | | 363 | |
Wells Fargo Commercial Mortgage Trust, Ser 2016-NXS6, Cl C | | | | | | | | |
4.459%,11/15/2049 (F) | | | 620 | | | | 606 | |
Wells Fargo Commercial Mortgage Trust, Ser 2018-C43, Cl A4 | | | | | | | | |
4.012%,03/15/2051 (F) | | | 750 | | | | 876 | |
Wells Fargo Commercial Mortgage Trust, Ser 2018-C48, Cl A5 | | | | | | | | |
4.302%,01/15/2052 | | | 103 | | | | 122 | |
Wells Fargo Credit Risk Transfer Securities
Trust, Ser 2015-WF1, Cl 2M2 | | | | | | | | |
5.650%, VAR ICE LIBOR USD 1 Month+5.500%, 11/25/2025 (C) | | | 74 | | | | 59 | |
Wells Fargo Credit Risk Transfer Securities
Trust, Ser 2015-WF1, Cl 1M2 | | | | | | | | |
5.400%, VAR ICE LIBOR USD 1 Month+5.250%, 11/25/2025 (C) | | | 246 | | | | 194 | |
| | | | | | | | |
| | | | | | | 66,194 | |
| | | | | | | | |
Total Mortgage-Backed Securities (Cost $76,673) ($ Thousands) | | | | 78,079 | |
| | | | | | | | |
| | | | | | | | |
| | | |
Description | | Face Amount (Thousands) | | Market Value ($ Thousands) |
|
U.S. GOVERNMENT AGENCY OBLIGATIONS ^ — 6.8% | |
FFCB | | | | | | | | |
0.505%, VAR US Treasury 3 Month Bill Money Market Yield+0.420%, 11/07/2022 | | $ | 1,200 | | | $ | 1,208 | |
0.460%, VAR United States Secured Overnight Financing Rate+0.380%, 05/08/2023 | | | 7,400 | | | | 7,451 | |
0.390%, VAR United States Secured Overnight Financing Rate+0.310%, 11/07/2022 | | | 2,500 | | | | 2,511 | |
0.355%, VAR US Treasury 3 Month Bill Money Market Yield+0.270%, 05/16/2022 | | | 3,000 | | | | 3,008 | |
0.340%, 12/02/2022 | | | 400 | | | | 400 | |
0.215%, VAR United States Secured Overnight Financing Rate+0.135%, 11/06/2023 | | | 2,000 | | | | 1,999 | |
0.170%, VAR United States Secured Overnight Financing Rate+0.090%, 09/23/2022 | | | 500 | | | | 500 | |
FHLB DN | | | | | | | | |
0.110%, 03/03/2021 (A) | | | 2,000 | | | | 2,000 | |
FHLMC | | | | | | | | |
0.600%, 07/29/2024 | | | 1,000 | | | | 1,001 | |
0.450%, 05/26/2023 | | | 1,000 | | | | 1,001 | |
0.450%, 07/28/2023 | | | 2,000 | | | | 2,000 | |
0.375%, 05/05/2023 | | | 1,000 | | | | 1,005 | |
0.375%, 07/21/2025 | | | 1,400 | | | | 1,396 | |
0.350%, 01/27/2023 | | | 1,200 | | | | 1,201 | |
FHLMC MTN | | | | | | | | |
0.270%, VAR United States Secured Overnight Financing Rate+0.190%, 06/02/2022 | | | 1,000 | | | | 1,002 | |
0.230%, VAR United States Secured Overnight Financing Rate+0.150%, 03/04/2022 | | | 2,000 | | | | 2,002 | |
0.225%, VAR United States Secured Overnight Financing Rate+0.145%, 12/09/2021 | | | 1,500 | | | | 1,502 | |
0.210%, VAR United States Secured Overnight Financing Rate+0.130%, 08/05/2022 | | | 2,500 | | | | 2,502 | |
| | |
SEI Institutional Investments Trust / Semi-Annual Report / November 30, 2020 | | 307 |
CONSOLIDATED SCHEDULE OF INVESTMENTS (Unaudited)
November 30, 2020
Multi-Asset Real Return Fund (Continued)
| | | | | | | | |
| | | |
Description | | Face Amount (Thousands) | | Market Value ($ Thousands) |
|
U.S. GOVERNMENT AGENCY OBLIGATIONS (continued) | |
FNMA | | | | | | | | |
0.625%, 04/22/2025 | | $ | 1,300 | | | $ | 1,315 | |
0.500%, 06/17/2025 | | | 1,500 | | | | 1,505 | |
0.470%, VAR United States Secured Overnight Financing Rate+0.390%, 04/15/2022 | | | 2,100 | | | | 2,110 | |
0.440%, VAR United States Secured Overnight Financing Rate+0.360%, 01/20/2022 | | | 2,300 | | | | 2,309 | |
0.430%, VAR United States Secured Overnight Financing Rate+0.350%, 04/07/2022 | | | 3,800 | | | | 3,815 | |
0.400%, VAR United States Secured Overnight Financing Rate+0.320%, 10/22/2021 | | | 1,800 | | | | 1,804 | |
0.380%, VAR United States Secured Overnight Financing Rate+0.300%, 01/27/2022 | | | 1,700 | | | | 1,705 | |
0.250%, 05/22/2023 | | | 1,500 | | | | 1,501 | |
0.250%, 07/10/2023 | | | 1,100 | | | | 1,100 | |
0.250%, 11/27/2023 | | | 100 | | | | 100 | |
0.190%, VAR United States Secured Overnight Financing Rate+0.110%, 03/04/2022 | | | 1,000 | | | | 1,001 | |
| | | | | | | | |
Total U.S. Government Agency Obligations
(Cost $51,799) ($ Thousands) | | | | 51,954 | |
| | | | | | | | |
|
ASSET-BACKED SECURITIES — 2.2% | |
| |
Automotive — 0.8% | | | | | |
Avis Budget Rental Car Funding AESOP LLC, Ser 2016-1A, Cl A | | | | | | | | |
2.990%, 06/20/2022 (C) | | | 438 | | | | 441 | |
Avis Budget Rental Car Funding AESOP LLC, Ser 2018-1A, Cl A | | | | | | | | |
3.700%, 09/20/2024 (C) | | | 1,000 | | | | 1,052 | |
Avis Budget Rental Car Funding AESOP LLC, Ser 2018-2A, Cl A | | | | | | | | |
4.000%, 03/20/2025 (C) | | | 1,100 | | | | 1,181 | |
Exeter Automobile Receivables Trust, Ser 2019-3A, Cl B | | | | | | | | |
2.580%, 08/15/2023 (C) | | | 1,000 | | | | 1,007 | |
First Investors Auto Owner Trust, Ser 2020-1A, Cl A | | | | | | | | |
1.490%, 01/15/2025 (C) | | | 433 | | | | 437 | |
Flagship Credit Auto Trust, Ser 2016-2, Cl D | | | | | | | | |
8.560%, 11/15/2023 (C) | | | 365 | | | | 373 | |
Flagship Credit Auto Trust, Ser 2016-4, Cl D | | | | | | | | |
3.890%, 11/15/2022 (C) | | | 375 | | | | 382 | |
Flagship Credit Auto Trust, Ser 2018-3, Cl B | | | | | | | | |
3.590%, 12/16/2024 (C) | | | 705 | | | | 718 | |
| | | | | | | | |
| | | |
Description | | Face Amount (Thousands) | | Market Value ($ Thousands) |
|
ASSET-BACKED SECURITIES (continued) | |
Hertz Vehicle Financing II, Ser 2015-3A, Cl A | | | | | | | | |
2.670%, 09/25/2021 (C) | | $ | 96 | | | $ | 97 | |
Hertz Vehicle Financing II, Ser 2017-1A, Cl A | | | | | | | | |
2.960%, 10/25/2021 (C) | | | 196 | | | | 196 | |
Hertz Vehicle Financing II, Ser 2018-1A, Cl A | | | | | | | | |
3.290%, 02/25/2024 (C) | | | 315 | | | | 315 | |
Hertz Vehicle Financing II, Ser 2019-1A, Cl A | | | | | | | | |
3.710%, 03/25/2023 (C) | | | 247 | | | | 248 | |
Hertz Vehicle Financing II, Ser 2019-2A, Cl A | | | | | | | | |
3.420%, 05/25/2025 (C) | | | 155 | | | | 155 | |
| | | | | | | | |
| | | | | | | 6,602 | |
| | | | | | | | |
| |
Credit Cards — 0.4% | | | | | |
World Financial Network Credit Card Master Trust, Ser 2018-A, Cl A | | | | | | | | |
3.070%, 12/16/2024 | | | 1,435 | | | | 1,443 | |
World Financial Network Credit Card Master Trust, Ser 2018-B, Cl M | | | | | | | | |
3.810%, 07/15/2025 | | | 715 | | | | 723 | |
World Financial Network Credit Card Master Trust, Ser 2019-B, Cl M | | | | | | | | |
3.040%, 04/15/2026 | | | 830 | | | | 855 | |
| | | | | | | | |
| | | | | | | 3,021 | |
| | | | | | | | |
| |
Other Asset-Backed Securities — 1.0% | | | | | |
Affirm Asset Securitization Trust, Ser 2020-A, Cl A | | | | | | | | |
2.100%, 02/18/2025 (C) | | | 531 | | | | 534 | |
Dryden 77 CLO, Ser 2020-77A, Cl A | | | | | | | | |
2.224%, VAR ICE LIBOR USD 3 Month+2.000%, 05/20/2031 (C) | | | 500 | | | | 501 | |
Dryden 78 CLO, Ser 2020-78A, Cl C | | | | | | | | |
2.168%, VAR ICE LIBOR USD 3 Month+1.950%, 04/17/2033 (C) | | | 660 | | | | 644 | |
Dryden 78 CLO, Ser 2020-78A, Cl D | | | | | | | | |
3.218%, VAR ICE LIBOR USD 3 Month+3.000%, 04/17/2033 (C) | | | 340 | | | | 330 | |
Elevation CLO, Ser 2020-11A, Cl C | | | | | | | | |
2.437%, VAR ICE LIBOR USD 3 Month+2.200%, 04/15/2033 (C) | | | 580 | | | | 566 | |
Goldentree Loan Management US CLO 7, Ser 2020-7A, Cl A | | | | | | | | |
2.118%, VAR ICE LIBOR USD 3 Month+1.900%, 04/20/2031 (C) | | | 733 | | | | 736 | |
Hardee’s Funding LLC, Ser 2018-1A, Cl A23 | | | | | | | | |
5.710%, 06/20/2048 (C) | | | 379 | | | | 413 | |
Hardee’s Funding LLC, Ser 2020-1A, Cl A2 | | | | | | | | |
3.981%, 12/20/2050 (C) | | | 266 | | | | 267 | |
Kayne CLO 7, Ser 2020-7A, Cl C | | | | | | | | |
2.218%, VAR ICE LIBOR USD 3 Month+2.000%, 04/17/2033 (C) | | | 300 | | | | 294 | |
| | |
308 | | SEI Institutional Investments Trust / Semi-Annual Report / November 30, 2020 |
| | | | | | | | |
| | | |
Description | | Face Amount (Thousands) | | Market Value ($ Thousands) |
|
ASSET-BACKED SECURITIES (continued) | |
Magnetite XXVI, Ser 2020-26A, Cl A | | | | | | | | |
1.987%, VAR ICE LIBOR USD 3 Month+1.750%, 07/15/2030 (C) | | $ | 988 | | | $ | 990 | |
Marlette Funding Trust, Ser 2018-4A, Cl A | | | | | | | | |
3.710%, 12/15/2028 (C) | | | 50 | | | | 51 | |
Marlette Funding Trust, Ser 2020-1A, Cl A | | | | | | | | |
2.240%, 03/15/2030 (C) | | | 116 | | | | 117 | |
OCP CLO, Ser 2020-18A, Cl A | | | | | | | | |
2.018%, VAR ICE LIBOR USD 3 Month+1.800%, 04/20/2030 (C) | | | 727 | | | | 728 | |
Prosper Marketplace Issuance Trust, Ser 2019-3A, Cl A | | | | | | | | |
3.190%, 07/15/2025 (C) | | | 82 | | | | 82 | |
SoFi Consumer Loan Program LLC, Ser 2017-2, Cl A | | | | | | | | |
3.280%, 02/25/2026 (C) | | | 4 | | | | 3 | |
SoFi Consumer Loan Program LLC, Ser 2017-5, Cl A2 | | | | | | | | |
2.780%, 09/25/2026 (C) | | | 205 | | | | 206 | |
SoFi Consumer Loan Program LLC, Ser 2017-6, Cl A2 | | | | | | | | |
2.820%, 11/25/2026 (C) | | | 203 | | | | 204 | |
SoFi Consumer Loan Program Trust, Ser 2018-3, Cl A2 | | | | | | | | |
3.670%, 08/25/2027 (C) | | | 181 | | | | 182 | |
Upstart Securitization Trust, Ser 2020-3, Cl A | | | | | | | | |
1.702%, 11/20/2030 (C) | | | 456 | | | | 458 | |
Voya CLO, Ser 2019-1A, Cl DR | | | | | | | | |
3.087%, VAR ICE LIBOR USD 3 Month+2.850%, 04/15/2031 (C) | | | 265 | | | | 248 | |
| | | | | | | | |
| | | | | | | 7,554 | |
| | | | | | | | |
Total Asset-Backed Securities
(Cost $17,006) ($ Thousands) | | | | 17,177 | |
| | | | | | | | |
| |
SOVEREIGN DEBT — 2.2% | | | | | |
Abu Dhabi Government International Bond MTN | | | | | | | | |
3.875%, 04/16/2050 (C) | | | 412 | | | | 511 | |
2.500%, 04/16/2025 (C) | | | 468 | | | | 499 | |
1.700%, 03/02/2031 (C) | | | 581 | | | | 582 | |
Canadian Government Real Return Bond | | | | | | | | |
0.500%, 12/01/2050 | | | CAD 3,229 | | | | 3,138 | |
Colombia Government International Bond | | | | | | | | |
3.125%, 04/15/2031 | | $ | 213 | | | | 224 | |
Dominican Republic International Bond | | | | | | | | |
4.875%, 09/23/2032 (C) | | | 871 | | | | 932 | |
Egypt Government International Bond MTN | | | | | | | | |
6.125%, 01/31/2022 (C) | | | 251 | | | | 261 | |
Israel Government International Bond | | | | | | | | |
3.875%, 07/03/2050 | | | 495 | | | | 591 | |
| | | | | | | | |
| | | |
Description | | Face Amount (Thousands) | | Market Value ($ Thousands) |
|
SOVEREIGN DEBT (continued) | |
Japanese Government CPI Linked Bond | | | | | | | | |
0.100%, 03/10/2027 | | | JPY 415,330 | | | $ | 3,985 | |
Malaysia Government International Bond | | | | | | | | |
3.882%, 03/10/2022 | | | MYR 5,183 | | | | 1,308 | |
Mexico Government International Bond | | | | | | | | |
3.900%, 04/27/2025 | | $ | 550 | | | | 609 | |
Qatar Government International Bond | | | | | | | | |
3.400%, 04/16/2025 (C) | | | 294 | | | | 323 | |
Saudi Government International Bond MTN | | | | | | | | |
2.900%, 10/22/2025 (C) | | | 539 | | | | 579 | |
South Africa Government International Bond | | | | | | | | |
8.000%, 01/31/2030 | | | ZAR 55,312 | | | | 3,354 | |
Uruguay Government International Bond | | | | | | | | |
4.375%, 01/23/2031 | | $ | 180 | | | | 217 | |
| | | | | | | | |
Total Sovereign Debt
(Cost $15,722) ($ Thousands) | | | | 17,113 | |
| | | | | | | | |
| |
MUNICIPAL BONDS — 0.2% | | | | | |
| |
California — 0.1% | | | | | |
California State, Build America Bonds, GO | | | | | | | | |
5.700%, 11/01/2021 | | | 620 | | | | 650 | |
| | | | | | | | |
| |
New York — 0.0% | | | | | |
New York & New Jersey, Port Authority, Ser AAA, RB | | | | | | | | |
1.086%, 07/01/2023 | | | 490 | | | | 496 | |
| | | | | | | | |
| |
West Virginia — 0.1% | | | | | |
Tobacco Settlement Finance Authority, RB Callable 12/01/2030 @ 100 | | | | | | | | |
3.000%, 06/01/2035 | | | 580 | | | | 582 | |
| | | | | | | | |
Total Municipal Bonds
(Cost $1,719) ($ Thousands) | | | | 1,728 | |
| | | | | | | | |
| | |
| |
| Number of
Warrants |
| | | | |
| | |
WARRANTS — 0.0% | | | | | | | | |
Occidental Petroleum Corp, Expires 08/06/2027 Strike Price $22 * | | | 6,339 | | | | 33 | |
| | | | | | | | |
Total Warrants
(Cost $—) ($ Thousands) | | | | | | | 33 | |
| | | | | | | | |
| | |
SEI Institutional Investments Trust / Semi-Annual Report / November 30, 2020 | | 309 |
CONSOLIDATED SCHEDULE OF INVESTMENTS (Unaudited)
November 30, 2020
Multi-Asset Real Return Fund (Continued)
| | | | | | | | |
| | | |
Description | | Number of Rights | | Market Value ($ Thousands) |
| |
RIGHTS — 0.0% | | | | | |
Bristol-Myers Squibb Co *‡‡ | | | 8,919 | | | $ | 10 | |
| | | | | | | | |
Total Rights | | | | | | | | |
(Cost $19) ($ Thousands) | | | | | | | 10 | |
| | | | | | | | |
Total Investments in Securities — 129.5% | | | | | | | | |
(Cost $931,622) ($ Thousands) | | | | | | $ | 996,297 | |
| | | | | | | | |
| | |
| | | Shares | | | | | |
|
COMMON STOCK SOLD SHORT— (14.0)% | |
| |
Communication Services — (0.7)% | | | | | |
Altice USA Inc, Cl A * | | | (3,500 | ) | | | (119 | ) |
Cable One Inc | | | (100 | ) | | | (198 | ) |
Cardlytics Inc* | | | (600 | ) | | | (71 | ) |
Charter Communications Inc, Cl A * | | | (2,086 | ) | | | (1,360 | ) |
Comcast Corp, Cl A | | | (51,511 | ) | | | (2,588 | ) |
DISH Network Corp, Cl A * | | | (1,952 | ) | | | (70 | ) |
EverQuote Inc, Cl A * | | | (700 | ) | | | (26 | ) |
Interpublic Group of Cos Inc/The | | | (2,635 | ) | | | (59 | ) |
Liberty Broadband Corp, Cl A * | | | (442 | ) | | | (69 | ) |
Liberty Broadband Corp, Cl C * | | | (1,225 | ) | | | (193 | ) |
New York Times Co/The, Cl A | | | (2,400 | ) | | | (103 | ) |
News Corp | | | (732 | ) | | | (13 | ) |
News Corp, Cl A | | | (5,500 | ) | | | (97 | ) |
Nexstar Media Group Inc, Cl A | | | (146 | ) | | | (15 | ) |
Omnicom Group Inc | | | (759 | ) | | | (48 | ) |
Shutterstock Inc | | | (500 | ) | | | (34 | ) |
Sirius XM Holdings Inc | | | (14,000 | ) | | | (91 | ) |
Stamps.com Inc* | | | (400 | ) | | | (75 | ) |
TechTarget Inc* | | | (1,366 | ) | | | (72 | ) |
ViacomCBS Inc, Cl B | | | (5,880 | ) | | | (208 | ) |
| | | | | | | | |
| | | | | | | (5,509 | ) |
| | | | | | | | |
| |
Consumer Discretionary — (9.2)% | | | | | |
1-800-Flowers.com Inc, Cl A * | | | (900 | ) | | | (21 | ) |
Acushnet Holdings Corp | | | (600 | ) | | | (23 | ) |
Adient PLC * | | | (6,029 | ) | | | (189 | ) |
Adtalem Global Education Inc* | | | (253 | ) | | | (7 | ) |
Advance Auto Parts Inc | | | (471 | ) | | | (70 | ) |
Amazon.com Inc* | | | (1,724 | ) | | | (5,462 | ) |
American Axle & Manufacturing Holdings | | | | | | | | |
Inc* | | | (6,843 | ) | | | (54 | ) |
Aptiv PLC | | | (11,811 | ) | | | (1,402 | ) |
Aramark | | | (4,658 | ) | | | (163 | ) |
Aspen Group Inc/CO * | | | (4,615 | ) | | | (56 | ) |
At Home Group Inc* | | | (1,900 | ) | | | (36 | ) |
AutoZone Inc* | | | (139 | ) | | | (158 | ) |
Best Buy Co Inc | | | (2,211 | ) | | | (241 | ) |
Bloomin’ Brands Inc | | | (3,500 | ) | | | (61 | ) |
Booking Holdings Inc* | | | (376 | ) | | | (763 | ) |
BorgWarner Inc | | | (12,290 | ) | | | (477 | ) |
| | | | | | | | |
| | | |
Description | | Shares | | Market Value ($ Thousands) |
|
COMMON STOCK SOLD SHORT (continued) | |
Boyd Gaming Corp | | | (2,019 | ) | | $ | (78 | ) |
Bright Horizons Family Solutions Inc* | | | (1,610 | ) | | | (274 | ) |
Brinker International Inc | | | (859 | ) | | | (43 | ) |
Brunswick Corp/DE | | | (3,409 | ) | | | (254 | ) |
Burlington Stores Inc* | | | (637 | ) | | | (139 | ) |
Caesars Entertainment * | | | (4,001 | ) | | | (273 | ) |
Callaway Golf Co | | | (4,967 | ) | | | (106 | ) |
Camping World Holdings Inc, Cl A | | | (1,300 | ) | | | (40 | ) |
Capri Holdings Ltd * | | | (4,862 | ) | | | (172 | ) |
CarMax Inc* | | | (1,556 | ) | | | (145 | ) |
Carnival Corp, Cl A | | | (11,789 | ) | | | (236 | ) |
CarParts.com Inc* | | | (2,229 | ) | | | (34 | ) |
Carter’s Inc | | | (678 | ) | | | (60 | ) |
Carvana Co, Cl A * | | | (488 | ) | | | (122 | ) |
Cavco Industries Inc* | | | (44 | ) | | | (8 | ) |
Century Communities Inc* | | | (2,059 | ) | | | (92 | ) |
Chegg Inc* | | | (4,500 | ) | | | (351 | ) |
Chipotle Mexican Grill Inc, Cl A * | | | (709 | ) | | | (914 | ) |
Choice Hotels International Inc | | | (902 | ) | | | (90 | ) |
Churchill Downs Inc | | | (1,154 | ) | | | (208 | ) |
Cooper Tire & Rubber Co | | | (5,592 | ) | | | (222 | ) |
Cooper-Standard Holdings Inc* | | | (900 | ) | | | (31 | ) |
Crocs Inc* | | | (3,186 | ) | | | (188 | ) |
Dana Inc | | | (10,039 | ) | | | (169 | ) |
Darden Restaurants Inc | | | (3,398 | ) | | | (367 | ) |
Deckers Outdoor Corp * | | | (1,176 | ) | | | (299 | ) |
Dollar General Corp | | | (2,181 | ) | | | (477 | ) |
Dollar Tree Inc* | | | (1,573 | ) | | | (172 | ) |
Domino’s Pizza Inc | | | (1,143 | ) | | | (449 | ) |
Dorman Products Inc* | | | (2,948 | ) | | | (272 | ) |
DR Horton Inc | | | (13,068 | ) | | | (974 | ) |
Dunkin’ Brands Group Inc | | | (2,059 | ) | | | (219 | ) |
eBay Inc | | | (6,496 | ) | | | (328 | ) |
Envela* | | | (4,403 | ) | | | (20 | ) |
Etsy Inc* | | | (1,300 | ) | | | (209 | ) |
Expedia Group Inc | | | (1,026 | ) | | | (128 | ) |
Five Below Inc* | | | (200 | ) | | | (31 | ) |
Floor & Decor Holdings Inc, Cl A * | | | (1,100 | ) | | | (88 | ) |
Ford Motor Co | | | (153,078 | ) | | | (1,390 | ) |
Fox Factory Holding Corp * | | | (1,278 | ) | | | (112 | ) |
frontdoor Inc* | | | (100 | ) | | | (5 | ) |
Gap Inc/The | | | (1,900 | ) | | | (40 | ) |
Garmin Ltd | | | (5,652 | ) | | | (660 | ) |
General Motors Co | | | (49,183 | ) | | | (2,156 | ) |
Gentex Corp | | | (18,269 | ) | | | (596 | ) |
Gentherm Inc* | | | (3,154 | ) | | | (179 | ) |
Genuine Parts Co | | | (2,442 | ) | | | (240 | ) |
Goodyear Tire & Rubber Co/The | | | (17,339 | ) | | | (181 | ) |
GoPro Inc, Cl A * | | | (8,151 | ) | | | (57 | ) |
Grand Canyon Education Inc* | | | (455 | ) | | | (38 | ) |
Grubhub Inc* | | | (968 | ) | | | (68 | ) |
H&R Block Inc | | | (803 | ) | | | (15 | ) |
| | |
310 | | SEI Institutional Investments Trust / Semi-Annual Report / November 30, 2020 |
| | | | | | | | |
| | | |
| Description | | Shares | | Market Value
($ Thousands) |
|
COMMON STOCK SOLD SHORT (continued) | |
Hanesbrands Inc | | | (11,702 | ) | | $ | (166 | ) |
Harley-Davidson Inc | | | (5,684 | ) | | | (229 | ) |
Hasbro Inc | | | (3,985 | ) | | | (371 | ) |
Helen of Troy Ltd * | | | (1,024 | ) | | | (207 | ) |
Hilton Grand Vacations Inc * | | | (1,700 | ) | | | (47 | ) |
Hilton Worldwide Holdings Inc | | | (7,632 | ) | | | (791 | ) |
Home Depot Inc/The | | | (8,179 | ) | | | (2,269 | ) |
Installed Building Products Inc * | | | (1,322 | ) | | | (131 | ) |
iRobot Corp * | | | (953 | ) | | | (75 | ) |
Jack in the Box Inc | | | (587 | ) | | | (54 | ) |
Johnson Outdoors Inc, Cl A | | | (195 | ) | | | (16 | ) |
K12 Inc * | | | (1,600 | ) | | | (37 | ) |
KB Home | | | (4,265 | ) | | | (150 | ) |
Kontoor Brands Inc | | | (1,600 | ) | | | (67 | ) |
L Brands Inc | | | (2,033 | ) | | | (79 | ) |
Las Vegas Sands Corp | | | (9,420 | ) | | | (525 | ) |
Laureate Education Inc, Cl A * | | | (900 | ) | | | (13 | ) |
La-Z-Boy Inc, Cl Z | | | (359 | ) | | | (13 | ) |
LCI Industries | | | (2,113 | ) | | | (266 | ) |
Lear Corp | | | (4,255 | ) | | | (608 | ) |
Leggett & Platt Inc | | | (4,644 | ) | | | (200 | ) |
Lennar Corp, Cl A | | | (10,654 | ) | | | (808 | ) |
Lennar Corp, Cl B | | | (601 | ) | | | (36 | ) |
LGI Homes Inc * | | | (1,028 | ) | | | (111 | ) |
Lifetime Brands Inc | | | (2,206 | ) | | | (30 | ) |
Lithia Motors Inc, Cl A | | | (200 | ) | | | (58 | ) |
LKQ Corp * | | | (6,052 | ) | | | (213 | ) |
Lowe’s Cos Inc | | | (6,088 | ) | | | (949 | ) |
Lululemon Athletica Inc * | | | (4,127 | ) | | | (1,528 | ) |
M/I Homes Inc * | | | (1,562 | ) | | | (71 | ) |
Magnite Inc * | | | (4,000 | ) | | | (76 | ) |
Malibu Boats Inc, Cl A * | | | (1,000 | ) | | | (57 | ) |
Marriott International Inc/MD, Cl A | | | (7,156 | ) | | | (908 | ) |
Marriott Vacations Worldwide Corp | | | (989 | ) | | | (126 | ) |
Mattel Inc * | | | (10,187 | ) | | | (158 | ) |
McDonald’s Corp | | | (19,350 | ) | | | (4,207 | ) |
MDC Holdings Inc | | | (2,287 | ) | | | (110 | ) |
Meritage Homes Corp * | | | (1,797 | ) | | | (162 | ) |
MGM Resorts International | | | (14,889 | ) | | | (421 | ) |
Mohawk Industries Inc * | | | (1,677 | ) | | | (211 | ) |
Motorcar Parts of America Inc * | | | (6,471 | ) | | | (130 | ) |
Nautilus Inc * | | | (2,300 | ) | | | (49 | ) |
Newell Brands Inc | | | (15,510 | ) | | | (330 | ) |
NIKE Inc, Cl B | | | (42,429 | ) | | | (5,715 | ) |
Norwegian Cruise Line Holdings Ltd * | | | (7,453 | ) | | | (170 | ) |
NVR Inc * | | | (122 | ) | | | (488 | ) |
Ollie’s Bargain Outlet Holdings Inc * | | | (478 | ) | | | (42 | ) |
O’Reilly Automotive Inc * | | | (536 | ) | | | (237 | ) |
Overstock.com Inc * | | | (600 | ) | | | (40 | ) |
Papa John’s International Inc | | | (1,462 | ) | | | (117 | ) |
Peloton Interactive Inc, Cl A * | | | (4,239 | ) | | | (493 | ) |
Penn National Gaming Inc * | | | (4,131 | ) | | | (289 | ) |
| | | | | | | | |
| | | |
| Description | | Shares | | Market Value
($ Thousands) |
|
COMMON STOCK SOLD SHORT (continued) | |
Perdoceo Education Corp * | | | (634 | ) | | $ | (7 | ) |
Planet Fitness Inc, Cl A * | | | (2,401 | ) | | | (175 | ) |
Polaris Inc | | | (2,214 | ) | | | (213 | ) |
Pool Corp | | | (350 | ) | | | (121 | ) |
PulteGroup Inc | | | (10,642 | ) | | | (464 | ) |
Purple Innovation Inc, Cl A * | | | (2,500 | ) | | | (75 | ) |
PVH Corp | | | (2,144 | ) | | | (170 | ) |
Qurate Retail Inc | | | (1,600 | ) | | | (17 | ) |
Ralph Lauren Corp, Cl A | | | (1,273 | ) | | | (109 | ) |
RH * | | | (200 | ) | | | (91 | ) |
Ross Stores Inc | | | (2,428 | ) | | | (261 | ) |
Royal Caribbean Cruises Ltd | | | (4,694 | ) | | | (370 | ) |
Scientific Games Corp, Cl A * | | | (3,138 | ) | | | (117 | ) |
Service Corp International/US | | | (4,924 | ) | | | (239 | ) |
Shake Shack Inc, Cl A * | | | (800 | ) | | | (65 | ) |
Six Flags Entertainment Corp | | | (594 | ) | | | (18 | ) |
Skechers USA Inc, Cl A * | | | (4,367 | ) | | | (146 | ) |
Skyline Champion Corp * | | | (2,050 | ) | | | (63 | ) |
Smith & Wesson Brands Inc | | | (2,001 | ) | | | (32 | ) |
Sonos Inc * | | | (4,804 | ) | | | (107 | ) |
Standard Motor Products Inc | | | (3,705 | ) | | | (171 | ) |
Starbucks Corp | | | (29,537 | ) | | | (2,895 | ) |
Stitch Fix Inc, Cl A * | | | (390 | ) | | | (16 | ) |
Stoneridge Inc * | | | (1,370 | ) | | | (37 | ) |
Strategic Education Inc | | | (289 | ) | | | (27 | ) |
Tapestry Inc | | | (9,886 | ) | | | (280 | ) |
Target Corp | | | (4,435 | ) | | | (796 | ) |
Taylor Morrison Home Corp, Cl A * | | | (5,059 | ) | | | (128 | ) |
Tempur Sealy International Inc * | | | (8,356 | ) | | | (210 | ) |
Tenneco Inc, Cl A * | | | (8,974 | ) | | | (96 | ) |
Terminix Global Holdings | | | (2,596 | ) | | | (127 | ) |
Tesla Inc * | | | (13,510 | ) | | | (7,668 | ) |
Texas Roadhouse Inc, Cl A | | | (1,072 | ) | | | (81 | ) |
Thor Industries Inc | | | (3,533 | ) | | | (341 | ) |
Tiffany & Co | | | (1,030 | ) | | | (135 | ) |
TJX Cos Inc/The | | | (9,317 | ) | | | (592 | ) |
Toll Brothers Inc | | | (4,558 | ) | | | (216 | ) |
TopBuild Corp * | | | (1,618 | ) | | | (282 | ) |
Tractor Supply Co | | | (683 | ) | | | (96 | ) |
TRI Pointe Group Inc* | | | (5,980 | ) | | | (105 | ) |
Tupperware Brands Corp | | | (3,000 | ) | | | (101 | ) |
Turtle Beach Corp * | | | (2,100 | ) | | | (39 | ) |
Ulta Beauty Inc * | | | (374 | ) | | | (103 | ) |
Under Armour Inc, Cl A * | | | (6,175 | ) | | | (102 | ) |
Under Armour Inc, Cl C * | | | (5,941 | ) | | | (86 | ) |
Vail Resorts Inc | | | (948 | ) | | | (261 | ) |
VF Corp | | | (10,523 | ) | | | (878 | ) |
Vista Outdoor Inc * | | | (4,460 | ) | | | (92 | ) |
Visteon Corp * | | | (3,229 | ) | | | (390 | ) |
Waitr Holdings Inc* | | | (8,900 | ) | | | (30 | ) |
Wayfair Inc, Cl A * | | | (624 | ) | | | (159 | ) |
Wendy’s Co/The | | | (3,972 | ) | | | (87 | ) |
| | |
SEI Institutional Investments Trust / Semi-Annual Report / November 30, 2020 | | 311 |
SUMMARY SCHEDULE OF INVESTMENTS (Unaudited)
November 30, 2020
Multi-Asset Real Return Fund (Continued)
| | | | | | | | |
| | | |
| Description | | Shares | | Market Value
($ Thousands) |
|
COMMON STOCK SOLD SHORT (continued) | |
Whirlpool Corp | | | (2,245 | ) | | $ | (437 | ) |
Williams-Sonoma Inc | | | (1,271 | ) | | | (139 | ) |
Wingstop Inc | | | (900 | ) | | | (115 | ) |
Winnebago Industries Inc | | | (2,997 | ) | | | (159 | ) |
Wolverine World Wide Inc | | | (1,854 | ) | | | (53 | ) |
Workhorse Group Inc * | | | (7,300 | ) | | | (185 | ) |
WW International Inc * | | | (1,300 | ) | | | (38 | ) |
Wyndham Destinations Inc | | | (2,152 | ) | | | (90 | ) |
Wyndham Hotels & Resorts Inc | | | (2,805 | ) | | | (161 | ) |
Wynn Resorts Ltd | | | (2,329 | ) | | | (234 | ) |
XPEL Inc * | | | (4,982 | ) | | | (189 | ) |
YETI Holdings Inc * | | | (3,431 | ) | | | (217 | ) |
Yum China Holdings Inc | | | (9,296 | ) | | | (524 | ) |
Yum! Brands Inc | | | (7,896 | ) | | | (835 | ) |
| | | | | | | | |
| | |
| | | | | | | (70,719 | ) |
| | | | | | | | |
| | |
Energy — (0.0)% | | | | | | | | |
Murphy USA Inc | | | (100 | ) | | | (13 | ) |
| | | | | | | | |
| | |
Financials — (0.0)% | | | | | | | | |
Sturm Ruger & Co Inc | | | (301 | ) | | | (17 | ) |
| | | | | | | | |
|
Information Technology — (2.4)% | |
Advanced Micro Devices Inc* | | | (6,054 | ) | | | (561 | ) |
Amphenol Corp, Cl A | | | (2,252 | ) | | | (295 | ) |
Analog Devices Inc | | | (1,215 | ) | | | (169 | ) |
Apple Inc | | | (48,224 | ) | | | (5,741 | ) |
Applied Materials Inc | | | (5,005 | ) | | | (413 | ) |
Arista Networks Inc * | | | (556 | ) | | | (151 | ) |
Arrow Electronics Inc * | | | (898 | ) | | | (82 | ) |
Avid Technology Inc * | | | (1,600 | ) | | | (19 | ) |
Broadcom Inc | | | (1,847 | ) | | | (742 | ) |
Calix Inc * | | | (2,900 | ) | | | (69 | ) |
CDW Corp/DE | | | (1,302 | ) | | | (170 | ) |
Ciena Corp * | | | (1,000 | ) | | | (45 | ) |
Cisco Systems Inc | | | (21,918 | ) | | | (943 | ) |
Cognex Corp | | | (1,000 | ) | | | (75 | ) |
Corning Inc | | | (5,111 | ) | | | (191 | ) |
CyberOptics Corp * | | | (1,220 | ) | | | (33 | ) |
Dell Technologies Inc, Cl C * | | | (1,466 | ) | | | (101 | ) |
Enphase Energy Inc * | | | (671 | ) | | | (92 | ) |
Entegris Inc | | | (500 | ) | | | (46 | ) |
ePlus Inc * | | | (100 | ) | | | (8 | ) |
F5 Networks Inc * | | | (403 | ) | | | (66 | ) |
Fabrinet * | | | (510 | ) | | | (35 | ) |
Hewlett Packard Enterprise Co | | | (10,145 | ) | | | (112 | ) |
HP Inc | | | (10,543 | ) | | | (231 | ) |
II-VI Inc * | | | (1,618 | ) | | | (109 | ) |
Infinera Corp * | | | (6,900 | ) | | | (58 | ) |
Inphi Corp * | | | (300 | ) | | | (47 | ) |
| | | | | | | | |
| | | |
| Description | | Shares | | Market Value
($ Thousands) |
|
COMMON STOCK SOLD SHORT (continued) | |
Intel Corp | | | (19,528 | ) | | $ | (944 | ) |
Intellicheck * | | | (5,222 | ) | | | (51 | ) |
Jabil Inc | | | (1,478 | ) | | | (57 | ) |
Juniper Networks Inc | | | (566 | ) | | | (12 | ) |
Keysight Technologies Inc * | | | (1,447 | ) | | | (174 | ) |
KLA Corp | | | (778 | ) | | | (196 | ) |
Lam Research Corp | | | (998 | ) | | | (452 | ) |
Lumentum Holdings Inc * | | | (600 | ) | | | (52 | ) |
Marvell Technology Group Ltd | | | (3,364 | ) | | | (156 | ) |
Microchip Technology Inc | | | (1,053 | ) | | | (142 | ) |
Micron Technology Inc * | | | (6,493 | ) | | | (416 | ) |
MKS Instruments Inc | | | (424 | ) | | | (59 | ) |
Monolithic Power Systems Inc | | | (378 | ) | | | (121 | ) |
Motorola Solutions Inc | | | (1,103 | ) | | | (189 | ) |
NetApp Inc | | | (2,167 | ) | | | (116 | ) |
Novanta Inc * | | | (100 | ) | | | (12 | ) |
NVIDIA Corp | | | (2,924 | ) | | | (1,567 | ) |
ON Semiconductor Corp * | | | (577 | ) | | | (17 | ) |
PAR Technology Corp * | | | (2,206 | ) | | | (119 | ) |
PC Connection Inc | | | (100 | ) | | | (5 | ) |
Pure Storage Inc, Cl A * | | | (3,412 | ) | | | (62 | ) |
Qorvo Inc * | | | (439 | ) | | | (69 | ) |
QUALCOMM Inc | | | (6,105 | ) | | | (898 | ) |
Quantum * | | | (10,300 | ) | | | (59 | ) |
Ribbon Communications Inc * | | | (5,812 | ) | | | (40 | ) |
Skyworks Solutions Inc | | | (1,057 | ) | | | (149 | ) |
SolarEdge Technologies Inc * | | | (393 | ) | | | (109 | ) |
Super Micro Computer Inc * | | | (3,448 | ) | | | (97 | ) |
SYNNEX Corp | | | (500 | ) | | | (80 | ) |
Teradyne Inc | | | (1,471 | ) | | | (162 | ) |
Texas Instruments Inc | | | (4,945 | ) | | | (797 | ) |
Trimble Inc * | | | (976 | ) | | | (58 | ) |
Ubiquiti Inc | | | (339 | ) | | | (84 | ) |
Universal Display Corp | | | (146 | ) | | | (33 | ) |
Western Digital Corp | | | (2,383 | ) | | | (107 | ) |
Xerox Holdings Corp | | | (1,001 | ) | | | (22 | ) |
Xilinx Inc | | | (904 | ) | | | (132 | ) |
Zebra Technologies Corp, Cl A * | | | (539 | ) | | | (204 | ) |
| | | | | | | | |
| | |
| | | | | | | (18,623 | ) |
| | | | | | | | |
| | |
Materials — (1.7)% | | | | | | | | |
Air Products and Chemicals Inc | | | (3,844 | ) | | | (1,077 | ) |
Albemarle Corp | | | (2,060 | ) | | | (280 | ) |
Alcoa Corp * | | | (3,400 | ) | | | (68 | ) |
Amcor PLC | | | (21,232 | ) | | | (241 | ) |
Avery Dennison Corp | | | (1,232 | ) | | | (184 | ) |
Axalta Coating Systems Ltd * | | | (773 | ) | | | (22 | ) |
Ball Corp | | | (4,274 | ) | | | (410 | ) |
Berry Global Group Inc * | | | (2,098 | ) | | | (111 | ) |
Celanese Corp, Cl A | | | (971 | ) | | | (126 | ) |
CF Industries Holdings Inc | | | (559 | ) | | | (21 | ) |
Chemours Co/The | | | (3,800 | ) | | | (92 | ) |
| | |
312 | | SEI Institutional Investments Trust / Semi-Annual Report / November 30, 2020 |
| | | | | | | | |
| | | |
| Description | | Shares | | Market Value
($ Thousands) |
|
COMMON STOCK SOLD SHORT (continued) | |
Cleveland-Cliffs Inc | | | (9,900 | ) | | $ | (109 | ) |
Commercial Metals Co | | | (1,269 | ) | | | (25 | ) |
Corteva Inc | | | (11,853 | ) | | | (454 | ) |
Crown Holdings Inc * | | | (1,737 | ) | | | (164 | ) |
Dow Inc | | | (10,230 | ) | | | (542 | ) |
DuPont de Nemours Inc | | | (9,617 | ) | | | (610 | ) |
Eastman Chemical Co | | | (1,470 | ) | | | (143 | ) |
Ecolab Inc | | | (3,910 | ) | | | (869 | ) |
Element Solutions Inc | | | (800 | ) | | | (11 | ) |
FMC Corp | | | (2,067 | ) | | | (240 | ) |
Freeport-McMoRan Inc, Cl B | | | (21,827 | ) | | | (511 | ) |
Graphic Packaging Holding Co | | | (2,440 | ) | | | (37 | ) |
Hecla Mining Co | | | (12,005 | ) | | | (57 | ) |
Huntsman Corp | | | (1,269 | ) | | | (31 | ) |
International Flavors & Fragrances Inc | | | (1,618 | ) | | | (181 | ) |
International Paper Co | | | (5,764 | ) | | | (285 | ) |
Linde PLC | | | (8,239 | ) | | | (2,113 | ) |
Louisiana-Pacific Corp | | | (1,074 | ) | | | (37 | ) |
LyondellBasell Industries NV, Cl A | | | (1,541 | ) | | | (131 | ) |
Martin Marietta Materials Inc | | | (537 | ) | | | (143 | ) |
Mosaic Co/The | | | (2,561 | ) | | | (56 | ) |
Newmont Corp | | | (11,038 | ) | | | (649 | ) |
Nucor Corp | | | (3,367 | ) | | | (181 | ) |
Packaging Corp of America | | | (1,698 | ) | | | (221 | ) |
PPG Industries Inc | | | (3,410 | ) | | | (501 | ) |
Reliance Steel & Aluminum Co | | | (281 | ) | | | (33 | ) |
RPM International Inc | | | (2,164 | ) | | | (190 | ) |
Scotts Miracle-Gro Co/The, Cl A | | | (900 | ) | | | (158 | ) |
Sealed Air Corp | | | (148 | ) | | | (7 | ) |
Sherwin-Williams Co/The | | | (1,252 | ) | | | (936 | ) |
Sonoco Products Co | | | (488 | ) | | | (28 | ) |
Southern Copper Corp | | | (1,025 | ) | | | (61 | ) |
Steel Dynamics Inc | | | (2,646 | ) | | | (96 | ) |
United States Steel Corp | | | (900 | ) | | | (13 | ) |
Vulcan Materials Co | | | (1,235 | ) | | | (173 | ) |
Westrock Co | | | (4,294 | ) | | | (181 | ) |
| | | | | | | | |
| | |
| | | | | | | (12,809 | ) |
| | | | | | | | |
Total Common Stock Sold Short | | | | | | | | |
(Proceeds $84,278) ($ Thousands) | | | | | | | (107,690 | ) |
| | | | | | | | |
|
PREFERRED STOCK SOLD SHORT— (0.0)% | |
|
Consumer Discretionary — (0.0)% | |
Qurate Retail Inc | | | (48 | ) | | | (5 | ) |
| | | | | | | | |
| | |
Industrials — (0.0)% | | | | | | | | |
WESCO International, 10.625% | | | (64 | ) | | | (2 | ) |
| | | | | | | | |
| | | | | | | | |
| | | |
| Description | | | | Market Value
($ Thousands) |
|
PREFERRED STOCK SOLD SHORT (continued) | |
| |
Total Preferred Stock Sold Short | | | | | |
(Proceeds $5) ($ Thousands) | | | | | | $ | (7 | ) |
| | | | | | | | |
| | |
Total Investments Sold Short — (14.0)% | | | | | | | | |
(Proceeds $84,283) ($ Thousands) | | | | | | $ | (107,697 | ) |
| | | | | | | | |
| | | Contracts | | | | | |
| |
PURCHASED OPTIONS* — 0.2% | | | | | |
Total Purchased Options (I) | | | | | | | | |
(Cost $1,005) ($ Thousands) | | | 356 | | | | 1,211 | |
| | | | | | | | |
| |
WRITTEN OPTIONS* — (0.0)% | | | | | |
| | |
Total Written Options (I) | | | | | | | | |
(Premiums Received $352) ($ Thousands) | | | (183 | ) | | | (300 | ) |
| | | | | | | | |
| |
WRITTEN SWAPTION* — (0.0)% | | | | | |
Total Written Swaption (J) | | | | | | | | |
(Premiums Received $478) ($ Thousands) | | | (21,400,000 | ) | | | (15 | ) |
| | | | | | | | |
| | |
SEI Institutional Investments Trust / Semi-Annual Report / November 30, 2020 | | 313 |
CONSOLIDATED SCHEDULE OF INVESTMENTS (Unaudited)
November 30, 2020
Multi-Asset Real Return Fund (Continued)
A list of the open exchange traded options contracts held by the Fund at November 30, 2020, is as follows:
| | | | | | | | | | | | | | | | | | | | |
| | | | | |
| Description | | Number of Contracts | | | Notional Amount (Thousands) † | | | Exercise Price | | | Expiration Date | | | Value (Thousands) | |
| | | | |
PURCHASED OPTIONS *^ — 0.0% | | | | | | | | | | | | | | | | | |
| | | | | |
Put Options | | | | | | | | | | | | | | | | | | | | |
March 2021, WTI Crude Oil | | | 60 | | | $ | 67 | | | | $25.00 | | | | 2/20/2021 | | | $ | 9 | |
| | | | | | | | | | | | | | | | | | | | |
| | | | | |
Call Options | | | | | | | | | | | | | | | | | | | | |
January 2021, Natural Gas | | | 81 | | | | 223 | | | | 3.60 | | | | 12/19/2020 | | | | 33 | |
July 2021, Corn | | | 75 | | | | 260 | | | | 320.00 | | | | 6/19/2021 | | | | 416 | |
March 2021, LME Lead | | | 90 | | | | 117 | | | | 1,950.00 | | | | 3/20/2021 | | | | 373 | |
March 2021, Soybean | | | 50 | | | | 338 | | | | 1,020.00 | | | | 2/20/2021 | | | | 380 | |
| | | | | | | | | | | | | | | | | | | | |
| | | | | | | 938 | | | | | | | | | | | | 1,202 | |
| | | | | | | | | | | | | | | | | | | | |
| | | | | | | | | | | | | | | | | | | | |
Total Purchased Options | | | | | | | 1,005 | | | | | | | | | | | | 1,211 | |
| | | | | | | | | | | | | | | | | | | | |
| | | | |
WRITTEN OPTIONS *^ — 0.0% | | | | | | | | | | | | | | | | | |
| | | | | |
Put Options | | | | | | | | | | | | | | | | | | | | |
March 2021, Natural Gas | | | (47) | | | | (173) | | | | 2.85 | | | | 02/20/21 | | | | (162) | |
March 2021, WTI Crude Oil | | | (60) | | | | (35) | | | | 20.00 | | | | 02/20/21 | | | | (6) | |
| | | | | | | | | | | | | | | | | | | | |
| | | | | | | (208) | | | | | | | | | | | | (168) | |
| | | | | | | | | | | | | | | | | | | | |
| | | | | | | | | | | | | | | | | | | | |
| | | | | |
Call Options | | | | | | | | | | | | | | | | | | | | |
January 2021, Natural Gas | | | (3) | | | | (7) | | | | 4.00 | | | | 12/19/20 | | | | (1) | |
July 2021, WTI Crude Oil | | | (30) | | | | (98) | | | | 49.00 | | | | 06/19/21 | | | | (105) | |
June 2021, Crude Oil | | | (18) | | | | (26) | | | | 60.00 | | | | 04/17/21 | | | | (16) | |
March 2021, Soybean | | | (25) | | | | (13) | | | | 1,340.00 | | | | 02/20/21 | | | | (10) | |
| | | | | | | | | | | | | | | | | | | | |
| | | | | | | (144) | | | | | | | | | | | | (132) | |
| | | | | | | | | | | | | | | | | | | | |
Total Written Options | | | | | | $ | (352) | | | | | | | | | | | $ | (300) | |
| | | | | | | | | | | | | | | | | | | | |
† Represents cost.
A list of open OTC swaption contracts held by the Fund at November 30, 2020, is as follows:
| | | | | | | | | | | | | | | | | | | | |
| | | | | |
| Description | | Counterparty | | | Number of Contracts/ Notional Amount | | | Exercise Price | | | Expiration Date | | | Value (Thousands) | |
| | | | |
WRITTEN SWAPTION — (0.0)% | | | | | | | | | | | | | | | | | |
| | | | | |
Put Swaption | | | | | | | | | | | | | | | | | | | | |
CDX.NA.5Y* | | | Bank of America | | | | (21,400,000) | | | | $0.01 | | | | 12/19/2020 | | | $ | (15) | |
| | | | | | | | | | | | | | | | | | | | |
A list of the open futures contracts held by the Fund at November 30, 2020, is as follows:
| | | | | | | | | | | | | | | | | | | | |
| | | | | | |
| Type of Contract | | Number of Contracts Long (Short) | | | Expiration Date | | | Notional Amount (Thousands) | | | Value (Thousands) | | | Unrealized Appreciation (Depreciation) (Thousands) | |
Brent Crude^ | | | 217 | | | | Feb-2021 | | | $ | 9,249 | | | $ | 10,405 | | | $ | 1,156 | |
Brent Crude^ | | | (76) | | | | May-2021 | | | | (3,234) | | | | (3,659) | | | | (425) | |
Canadian 10-Year Bond | | | (92) | | | | Mar-2021 | | | | (10,498) | | | | (10,567) | | | | (26) | |
| | |
314 | | SEI Institutional Investments Trust / Semi-Annual Report / November 30, 2020 |
| | | | | | | | | | | | | | | | | | | | | | | | | |
| | | | | | |
| Type of Contract | | Number of Contracts Long (Short) | | Expiration Date | | Notional Amount (Thousands) | | Value (Thousands) | | Unrealized Appreciation (Depreciation) (Thousands) |
Coffee C^ | | | | (27) | | | | | Mar-2021 | | | | $ | (1,246 | ) | | | $ | (1,248 | ) | | | $ | (2 | ) |
Coffee C^ | | | | 43 | | | | | Mar-2021 | | | | | 1,794 | | | | | 1,988 | | | | | 194 | |
Copper^ | | | | 179 | | | | | Apr-2021 | | | | | 13,927 | | | | | 15,385 | | | | | 1,458 | |
Corn^ | | | | 2 | | | | | Sep-2021 | | | | | 41 | | | | | 41 | | | | | – | |
Corn^ | | | | 67 | | | | | Mar-2021 | | | | | 1,434 | | | | | 1,427 | | | | | (7 | ) |
Cotton No. 2^ | | | | (56) | | | | | Mar-2021 | | | | | (1,987 | ) | | | | (2,020 | ) | | | | (33 | ) |
Cotton No. 2^ | | | | 32 | | | | | Mar-2021 | | | | | 1,137 | | | | | 1,155 | | | | | 18 | |
Euro-Buxl | | | | (34) | | | | | Dec-2020 | | | | | (8,991 | ) | | | | (9,213 | ) | | | | (116 | ) |
Feeder Cattle^ | | | | 11 | | | | | Jan-2021 | | | | | 766 | | | | | 776 | | | | | 10 | |
Gasoline^ | | | | 23 | | | | | Jan-2021 | | | | | 1,126 | | | | | 1,199 | | | | | 73 | |
Gasoline^ | | | | (17) | | | | | Mar-2021 | | | | | (847 | ) | | | | (907 | ) | | | | (60 | ) |
Gasoline^ | | | | (27) | | | | | Jan-2021 | | | | | (1,314 | ) | | | | (1,408 | ) | | | | (94 | ) |
Gold^ | | | | 71 | | | | | Feb-2021 | | | | | 13,239 | | | | | 12,645 | | | | | (594 | ) |
Gold^ | | | | 49 | | | | | May-2021 | | | | | 9,199 | | | | | 8,746 | | | | | (453 | ) |
Heating Oil^ | | | | 19 | | | | | Jan-2021 | | | | | 1,055 | | | | | 1,094 | | | | | 39 | |
Japanese 10-Year Government Bond E-MINI | | | | (25) | | | | | Dec-2020 | | | | | (3,565 | ) | | | | (3,644 | ) | | | | (10 | ) |
KC HRW Wheat^ | | | | 39 | | | | | Mar-2021 | | | | | 1,095 | | | | | 1,067 | | | | | (28 | ) |
KC HRW Wheat^ | | | | (22) | | | | | Mar-2021 | | | | | (618 | ) | | | | (602 | ) | | | | 16 | |
Lean Hogs^ | | | | 38 | | | | | Feb-2021 | | | | | 1,016 | | | | | 1,042 | | | | | 26 | |
Lean Hogs^ | | | | 10 | | | | | Apr-2021 | | | | | 297 | | | | | 286 | | | | | (11 | ) |
Lean Hogs^ | | | | (95) | | | | | Feb-2021 | | | | | (2,530 | ) | | | | (2,606 | ) | | | | (76 | ) |
Live Cattle^ | | | | (26) | | | | | Mar-2021 | | | | | (1,176 | ) | | | | (1,174 | ) | | | | 2 | |
Live Cattle^ | | | | 54 | | | | | Mar-2021 | | | | | 2,482 | | | | | 2,438 | | | | | (44 | ) |
LME Lead^ | | | | 9 | | | | | Jun-2021 | | | | | 456 | | | | | 469 | | | | | 13 | |
LME Lead^ | | | | 21 | | | | | Jan-2021 | | | | | 1,000 | | | | | 1,086 | | | | | 86 | |
LME Nickel^ | | | | 25 | | | | | Jan-2021 | | | | | 2,245 | | | | | 2,402 | | | | | 157 | |
LME Nickel^ | | | | (8) | | | | | Mar-2021 | | | | | (766 | ) | | | | (770 | ) | | | | (4 | ) |
LME Primary Aluminum^ | | | | 85 | | | | | Jun-2021 | | | | | 4,120 | | | | | 4,356 | | | | | 236 | |
LME Primary Aluminum^ | | | | 20 | | | | | Jan-2021 | | | | | 915 | | | | | 1,022 | | | | | 107 | |
LME Zinc^ | | | | 10 | | | | | Jan-2021 | | | | | 606 | | | | | 696 | | | | | 90 | |
LME Zinc^ | | | | 47 | | | | | Mar-2021 | | | | | 3,114 | | | | | 3,283 | | | | | 169 | |
Long Gilt 10-Year Bond | | | | (105) | | | | | Apr-2021 | | | | | (18,849 | ) | | | | (18,811 | ) | | | | (4 | ) |
Low Sulphur Gasoil^ | | | | 32 | | | | | Jan-2021 | | | | | 1,120 | | | | | 1,248 | | | | | 128 | |
Low Sulphur Gasoil^ | | | | (21) | | | | | Jan-2021 | | | | | (764 | ) | | | | (819 | ) | | | | (55 | ) |
MSCI EAFE Index | | | | (120) | | | | | Dec-2020 | | | | | (11,574 | ) | | | | (12,198 | ) | | | | (624 | ) |
Natural Gas^ | | | | 113 | | | | | Feb-2022 | | | | | 3,375 | | | | | 3,284 | | | | | (91 | ) |
Natural Gas^ | | | | 442 | | | | | Jan-2021 | | | | | 13,530 | | | | | 12,739 | | | | | (791 | ) |
Natural Gas^ | | | | (113) | | | | | Apr-2022 | | | | | (2,916 | ) | | | | (2,843 | ) | | | | 73 | |
NY Harbor ULSD^ | | | | 52 | | | | | Jan-2021 | | | | | 2,984 | | | | | 2,995 | | | | | 11 | |
NYMEX Cocoa^ | | | | (4) | | | | | Mar-2021 | | | | | (101 | ) | | | | (109 | ) | | | | (8 | ) |
Platinum^ | | | | 1 | | | | | Jan-2021 | | | | | 48 | | | | | 48 | | | | | – | |
Red Wheat^ | | | | 26 | | | | | Mar-2021 | | | | | 743 | | | | | 719 | | | | | (24 | ) |
S&P 500 Index E-MINI | | | | (131) | | | | | Dec-2020 | | | | | (22,277 | ) | | | | (23,732 | ) | | | | (1,455 | ) |
Silver^ | | | | 34 | | | | | Apr-2021 | | | | | 4,179 | | | | | 3,841 | | | | | (338 | ) |
Soybean^ | | | | 33 | | | | | May-2021 | | | | | 1,591 | | | | | 1,927 | | | | | 336 | |
Soybean^ | | | | 30 | | | | | Nov-2021 | | | | | 1,557 | | | | | 1,563 | | | | | 6 | |
Soybean^ | | | | 92 | | | | | Jan-2021 | | | | | 5,072 | | | | | 5,375 | | | | | 303 | |
Soybean Meal^ | | | | 33 | | | | | Mar-2021 | | | | | 1,092 | | | | | 1,284 | | | | | 192 | |
Soybean Meal^ | | | | 119 | | | | | Jan-2021 | | | | | 4,262 | | | | | 4,647 | | | | | 385 | |
Soybean Oil^ | | | | 46 | | | | | Dec-2021 | | | | | 948 | | | | | 965 | | | | | 17 | |
Soybean Oil^ | | | | 96 | | | | | Mar-2021 | | | | | 1,935 | | | | | 2,147 | | | | | 212 | |
Soybean Oil^ | | | | 106 | | | | | Jan-2021 | | | | | 2,124 | | | | | 2,384 | | | | | 260 | |
Sugar No. 11^ | | | | 165 | | | | | Mar-2021 | | | | | 2,442 | | | | | 2,682 | | | | | 240 | |
U.S. 2-Year Treasury Notes | | | | 33 | | | | | Apr-2021 | | | | | 7,285 | | | | | 7,288 | | | | | 3 | |
U.S. 5-Year Treasury Notes | | | | (177) | | | | | Apr-2021 | | | | | (22,280 | ) | | | | (22,307 | ) | | | | (27 | ) |
U.S. 10-Year Treasury Notes | | | | (145) | | | | | Mar-2021 | | | | | (19,999 | ) | | | | (20,035 | ) | | | | (36 | ) |
U.S. Ultra Long Treasury Bond | | | | (31) | | | | | Mar-2021 | | | | | (6,749 | ) | | | | (6,697 | ) | | | | 52 | |
| | |
SEI Institutional Investments Trust / Semi-Annual Report / November 30, 2020 | | 315 |
CONSOLIDATED SCHEDULE OF INVESTMENTS (Unaudited)
November 30, 2020
Multi-Asset Real Return Fund (Continued)
| | | | | | | | | | | | | | | | | | | | |
| | | | | | |
| Type of Contract | | Number of Contracts Long (Short) | | | Expiration Date | | | Notonal Amount (Thousands) | | | Value (Thousands) | | | Unrealized Appreciation (Depreciation) (Thousands) | |
Ultra 10-Year U.S. Treasury Notes | | | (40 | ) | | | Mar-2021 | | | $ | (6,289) | | | $ | (6,285) | | | $ | 4 | |
Wheat^ | | | (32 | ) | | | Mar-2021 | | | | (959) | | | | (936) | | | | 23 | |
Wheat^ | | | 73 | | | | Mar-2021 | | | | 2,200 | | | | 2,135 | | | | (65) | |
WTI Crude Oil^ | | | (170 | ) | | | Dec-2020 | | | | (7,060) | | | | (7,708) | | | | (648) | |
WTI Crude Oil^ | | | (95 | ) | | | Feb-2021 | | | | (3,822) | | | | (4,337) | | | | (515) | |
WTI Crude Oil^ | | | 223 | | | | May-2021 | | | | 9,456 | | | | 10,207 | | | | 751 | |
WTI Crude Oil^ | | | 98 | | | | Dec-2020 | | | | 4,010 | | | | 4,443 | | | | 433 | |
| | | | | | | | | | | | | | | | | | | | |
| | | | | | | | | | $ | (20,145) | | | $ | (19,706) | | | $ | 615 | |
| | | | | | | | | | | | | | | | | | | | |
A list of the open forward foreign currency contracts held by the Fund at November 30, 2020, is as follows:
| | | | | | | | | | | | | | | | | | | | | | | | |
| | | | | | | |
| Counterparty | | Settlement Date | | | | | | Currency to Deliver
(Thousands) | | | | | | Currency to Receive
(Thousands) | | | Unrealized
Appreciation
(Depreciation)
(Thousands) | |
Bank of America | | | 12/10/20 | | | | USD | | | | 3,292 | | | | CAD | | | | 4,328 | | | $ | 48 | |
Bank of America | | | 12/10/20 | | | | CAD | | | | 3,888 | | | | USD | | | | 2,959 | | | | (42) | |
Bank of America | | | 12/22/20 | | | | USD | | | | 4,327 | | | | NZD | | | | 6,322 | | | | 116 | |
Bank of America | | | 01/12/21 | | | | AUD | | | | 4,329 | | | | USD | | | | 3,098 | | | | (93) | |
Barclays PLC | | | 12/11/20 | | | | JPY | | | | 190,966 | | | | USD | | | | 1,840 | | | | 8 | |
Barclays PLC | | | 12/17/20 | | | | USD | | | | 8,782 | | | | CNY | | | | 58,121 | | | | 35 | |
BNP Paribas | | | 12/10/20 | | | | CAD | | | | 30,212 | | | | USD | | | | 22,744 | | | | (573) | |
Brown Brothers Harriman | | | 12/11/20 | | | | JPY | | | | 35,755 | | | | USD | | | | 341 | | | | (2) | |
Brown Brothers Harriman | | | 12/18/20 | | | | EUR | | | | 413 | | | | USD | | | | 490 | | | | (4) | |
Brown Brothers Harriman | | | 12/18/20 | | | | USD | | | | 1,336 | | | | EUR | | | | 1,128 | | | | 13 | |
Brown Brothers Harriman | | | 12/22/20 | | | | USD | | | | 304 | | | | NZD | | | | 449 | | | | 11 | |
Brown Brothers Harriman | | | 01/12/21 | | | | USD | | | | 873 | | | | AUD | | | | 1,194 | | | | 7 | |
Brown Brothers Harriman | | | 01/15/21 | | | | USD | | | | 1,273 | | | | SEK | | | | 10,969 | | | | 11 | |
Brown Brothers Harriman | | | 01/21/21 | | | | GBP | | | | 204 | | | | USD | | | | 270 | | | | (2) | |
Citigroup | | | 12/10/20 | | | | USD | | | | 1,535 | | | | CAD | | | | 2,007 | | | | 14 | |
Citigroup | | | 12/11/20 | | | | USD | | | | 15,343 | | | | JPY | | | | 1,617,437 | | | | 174 | |
Citigroup | | | 12/17/20 | | | | CNY | | | | 57,896 | | | | USD | | | | 8,615 | | | | (168) | |
Citigroup | | | 12/22/20 | | | | USD | | | | 443 | | | | NZD | | | | 637 | | | | 5 | |
Citigroup | | | 12/22/20 | | | | NZD | | | | 13,050 | | | | USD | | | | 8,651 | | | | (519) | |
Citigroup | | | 01/12/21 | | | | USD | | | | 3,381 | | | | AUD | | | | 4,719 | | | | 97 | |
Citigroup | | | 01/14/21 | | | | USD | | | | 8,669 | | | | KRW | | | | 9,861,006 | | | | 233 | |
Goldman Sachs | | | 01/12/21 | | | | USD | | | | 8,504 | | | | AUD | | | | 12,066 | | | | 389 | |
Goldman Sachs | | | 01/22/21 | | | | USD | | | | 4,282 | | | | RUB | | | | 330,073 | | | | 12 | |
Goldman Sachs | | | 01/22/21 | | | | RUB | | | | 30,893 | | | | USD | | | | 403 | | | | 1 | |
JPMorgan Chase Bank | | | 12/18/20 | | | | USD | | | | 15,127 | | | | EUR | | | | 12,864 | | | | 271 | |
JPMorgan Chase Bank | | | 01/15/21 | | | | SEK | | | | 94,659 | | | | USD | | | | 10,743 | | | | (343) | |
Morgan Stanley | | | 01/12/21 | | | | AUD | | | | 24,353 | | | | USD | | | | 17,385 | | | | (564) | |
Morgan Stanley | | | 03/25/21 | | | | MYR | | | | 5,636 | | | | USD | | | | 1,352 | | | | (32) | |
Standard Bank | | | 12/18/20 | | | | EUR | | | | 1,264 | | | | USD | | | | 1,499 | | | | (14) | |
Standard Bank | | | 01/14/21 | | | | KRW | | | | 9,931,784 | | | | USD | | | | 8,903 | | | | (63) | |
UBS | | | 02/04/21 | | | | ZAR | | | | 53,797 | | | | USD | | | | 3,473 | | | | 26 | |
| | | | | | | | | | | | | | | | | | | | | | | | |
| | | | | | | | | | | | | | | | | | | | | | $ | (948) | |
| | | | | | | | | | | | | | | | | | | | | | | | |
| | |
316 | | SEI Institutional Investments Trust / Semi-Annual Report / November 30, 2020 |
A list of the open centrally cleared swap agreements held by the Fund at November 30, 2020, is as follows:
| | | | | | | | | | | | | | | | | | | | | | | | | | | | | | | | |
| |
| Credit Default Swaps | |
| | | | | | | | | |
| Reference Entity/ Obligation | | Buy/Sell Protection | | | (Pays)/ Receives Rate | | | Payment Frequency | | | Termination
Date | | | Notional
Amount (Thousands) | | | Value (Thousands) | | | Upfront Payments/ Receipts (Thousands) | | | Net Unrealized Depreciation (Thousands) | |
Malaysia Senior | | | Buy | | | | 1.00% | | | | Quarterly | | | | 12/20/2025 | | | | 36,970 | | | $ | (1,177) | | | $ | (931) | | | $ | (246) | |
CDX.NAIGS.34V1 | | | Buy | | | | 1.00% | | | | Quarterly | | | | 06/20/2025 | | | | 80,645 | | | | (1,314) | | | | (248) | | | | (1,066) | |
People’s Republic of China | | | Buy | | | | 1.00% | | | | Quarterly | | | | 06/20/2025 | | | | 20,500 | | | | (683) | | | | (442) | | | | (241) | |
| | | | | | | | | | | | | | | | | | | | | | | | | | | | | | | | |
| | | | | | | | | | | | | | | | | | | | | | $ | (3,174) | | | $ | (1,621) | | | $ | (1,553) | |
| | | | | | | | | | | | | | | | | | | | | | | | | | | | | | | | |
| | | | | | | | | | | | | | | | | | | | | | | | | | | | | | | | |
| |
| Interest Rate Swaps | |
| | | | | | | | | |
| Fund Pays | | Fund Receives | | | Payment Frequency | | | Termination
Date | | | Currency | | | Notional Amount (Thousands) | | | Value (Thousands) | | | Upfront
Payments/ Receipts (Thousands) | | | Net Unrealized Appreciation (Depreciation) (Thousands) | |
3-MONTH SEK - STIBOR | | | -0.165% | | | | Annually | | | | 08/30/2024 | | | | SEK | | | | 170,000 | | | $ | (147) | | | $ | – | | | $ | (147 | ) |
2.631% | | | 3-MONTH USD - LIBOR | | | | Quarterly | | | | 11/10/2035 | | | | USD | | | | 1,300 | | | | (288) | | | | – | | | | (288 | ) |
1.593% | | | 3-MONTH USD - LIBOR | | | | Quarterly | | | | 09/27/2029 | | | | USD | | | | 2,440 | | | | (180) | | | | – | | | | (180 | ) |
2.1495% | | | 3-MONTH USD - LIBOR | | | | Quarterly | | | | 06/04/2029 | | | | USD | | | | 5,145 | | | | (656) | | | | – | | | | (656 | ) |
2.3545 | | | 3-MONTH USD - LIBOR | | | | Quarterly | | | | 07/12/2027 | | | | USD | | | | 720 | | | | (90) | | | | – | | | | (90 | ) |
0.5575% | | | 3-MONTH USD - LIBOR | | | | Quarterly | | | | 06/05/2027 | | | | USD | | | | 15,050 | | | | (17) | | | | – | | | | (17 | ) |
2.44 | | | 3-MONTH USD - LIBOR | | | | Quarterly | | | | 04/04/2027 | | | | USD | | | | 3,640 | | | | (443) | | | | – | | | | (443 | ) |
1.67 | | | 3-MONTH USD - LIBOR | | | | Quarterly | | | | 11/09/2026 | | | | USD | | | | 1,230 | | | | (84) | | | | – | | | | (84 | ) |
1.66 | | | 3-MONTH USD - LIBOR | | | | Quarterly | | | | 11/08/2026 | | | | USD | | | | 1,040 | | | | (70) | | | | – | | | | (70 | ) |
1.487 | | | 3-MONTH USD - LIBOR | | | | Quarterly | | | | 10/04/2026 | | | | USD | | | | 7,010 | | | | (412) | | | | – | | | | (412 | ) |
3-MONTH CAD - CDOR | | | 0.698% | | | | Semi-Annually | | | | 08/07/2025 | | | | CAD | | | | 48,520 | | | | (163) | | | | – | | | | (163 | ) |
2.293% | | | 3-MONTH USD - LIBOR | | | | Quarterly | | | | 08/04/2025 | | | | USD | | | | 1,833 | | | | (175) | | | | – | | | | (175 | ) |
2.4875% | | | 3-MONTH USD - LIBOR | | | | Quarterly | | | | 06/09/2025 | | | | USD | | | | 1,240 | | | | (132) | | | | – | | | | (132 | ) |
USD @ 0.512% | | | USD/LIBOR/3M/T3750/0.00000 | | | | Quarterly | | | | 06/09/2025 | | | | USD | | | | 85,300 | | | | (654) | | | | – | | | | (654 | ) |
1.9905 | | | 3-MONTH USD - LIBOR | | | | Quarterly | | | | 04/21/2025 | | | | USD | | | | 2,040 | | | | (149) | | | | – | | | | (149 | ) |
0.9575 | | | 3-MONTH CAD - CDOR | | | | Semi-Annually | | | | 03/24/2025 | | | | CAD | | | | 27,036 | | | | 182 | | | | – | | | | 182 | |
EUR/EURIBOR/6M/T248/0.00000 | | | -0.043% | | | | Annually | | | | 11/10/2050 | | | | EUR | | | | 2,900 | | | | (39) | | | | – | | | | (39 | ) |
0.022% | | | EUR/EURIBOR/6M/T248/0.00000 | | | | Semi-Annually | | | | 11/10/2050 | | | | EUR | | | | 2,900 | | | | (30) | | | | 23 | | | | (53 | ) |
| | | | | | | | | | | | | | | | | | | | | | | | | | | | | | | | |
| | | | | | | | | | | | | | | | | | | | | | $ | (3,547) | | | $ | 23 | | | $ | (3,570 | ) |
| | | | | | | | | | | | | | | | | | | | | | | | | | | | | | | | |
A list of the open OTC swap agreements held by the Fund at November 30, 2020 is as follows:
| | | | | | | | | | | | | | | | | | | | | | | | |
| |
| Credit Default Swaps | |
| | | | | | | | | | |
| Counterparty | | Reference Entity/
Obligation | | Buy/Sell
Protection | | (Pays)/Receives
Rate | | Payment Frequency | | Termination Date | | Notional Amount (Thousands) | | Value (Thousands) | | | Upfront Payments/ Receipts (Thousands) | | | Net Unrealized Appreciation (Depreciation) (Thousands) | |
Credit Suisse | | CMBX.NA.A.6 Index | | Sell | | 2.00% | | Monthly | | 05/11/2063 | | $(1,125) | | $ | (105 | ) | | $ | (24 | ) | | $ | (81 | ) |
Deutsche Bank | | CMBX.NA.BBB.6 Index | | Sell | | 3.00% | | Monthly | | 05/11/2049 | | (136) | | | (39 | ) | | | (10 | ) | | | (29 | ) |
Credit Suisse | | CMBX.NA.BBB.6 Index | | Sell | | 3.00% | | Quarterly | | 12/31/2049 | | (233) | | | (67 | ) | | | (10 | ) | | | (57 | ) |
Credit Suisse | | CMBX.NA.BBB.6 Index | | Sell | | 3.00% | | Monthly | | 12/31/2049 | | (778) | | | (225 | ) | | | (51 | ) | | | (174 | ) |
Credit Suisse | | CMBX.NA.BBB.6 Index | | Sell | | 3.00% | | Monthly | | 12/31/2049 | | (162) | | | (47 | ) | | | (11 | ) | | | (36 | ) |
Deutsche Bank | | CMBX.NA.BBB.6 Index | | Sell | | 3.00% | | Monthly | | 12/31/2049 | | (29) | | | (8 | ) | | | (2 | ) | | | (6 | ) |
Deutsche Bank | | CMBX.NA.BBB.6 Index | | Sell | | 3.00% | | Monthly | | 12/31/2049 | | (172) | | | (50 | ) | | | (20 | ) | | | (30 | ) |
Goldman Sachs | | CMBX.NA.BBB.6 Index | | Sell | | 3.00% | | Monthly | | 12/31/2049 | | (565) | | | (163 | ) | | | (41 | ) | | | (122 | ) |
Goldman Sachs | | CMBX.NA.BBB.6 Index | | Sell | | 3.00% | | Monthly | | 12/31/2049 | | (217) | | | (63 | ) | | | (14 | ) | | | (49 | ) |
Goldman Sachs | | CMBX.NA.BBB.6 Index | | Sell | | 3.00% | | Quarterly | | 05/11/2063 | | (55) | | | (16 | ) | | | (6 | ) | | | (10 | ) |
JPMorgan Chase | | CMBX.NA.BBB.6 Index | | Sell | | 3.00% | | Monthly | | 05/11/2063 | | (143) | | | (41 | ) | | | (14 | ) | | | (27 | ) |
Goldman Sachs | | CMBX.NA.BBB.6 Index | | Sell | | 3.00% | | Quarterly | | 05/11/2063 | | (900) | | | (258 | ) | | | (116 | ) | | | (142 | ) |
Goldman Sachs | | CMBX.NA.BBB.6 Index | | Sell | | 3.00% | | Monthly | | 05/11/2063 | | (16) | | | (5 | ) | | | (2 | ) | | | (3 | ) |
| | |
SEI Institutional Investments Trust / Semi-Annual Report / November 30, 2020 | | 317 |
CONSOLIDATED SCHEDULE OF INVESTMENTS (Unaudited)
November 30, 2020
Multi-Asset Real Return Fund (Continued)
| | | | | | | | | | | | | | | | | | | | | | | | |
| | | | | | | | | | |
| Counterparty | | Reference Entity/
Obligation | | Buy/Sell
Protection | | (Pays)/Receives
Rate | | Payment Frequency | | Termination Date | | Notional Amount (Thousands) | | Value (Thousands) | | | Upfront Payments/ Receipts (Thousands) | | | Net Unrealized Appreciation (Depreciation) (Thousands) | |
Goldman Sachs | | CMBX.NA.BBB.6 Index | | Sell | | 3.00% | | Monthly | | 05/11/2063 | | $(254) | | $ | (73 | ) | | $ | (41 | ) | | $ | (32 | ) |
Goldman Sachs | | CMBX.NA.BBB.6 Index | | Sell | | 3.00% | | Monthly | | 05/11/2063 | | (182) | | | (53 | ) | | | (29 | ) | | | (24 | ) |
Goldman Sachs | | CMBX.NA.BBB.6 Index | | Sell | | 3.00% | | Monthly | | 05/11/2063 | | (163) | | | (47 | ) | | | (25 | ) | | | (22 | ) |
Goldman Sachs | | CMBX.NA.BBB.6 Index | | Sell | | 3.00% | | Monthly | | 05/11/2063 | | (165) | | | (48 | ) | | | (19 | ) | | | (29 | ) |
Goldman Sachs | | CMBX.NA.BBB.6 Index | | Sell | | 3.00% | | Monthly | | 05/11/2063 | | (289) | | | (84 | ) | | | (38 | ) | | | (46 | ) |
Goldman Sachs | | CMBX.NA.BBB.6 Index | | Sell | | 3.00% | | Monthly | | 05/11/2063 | | (190) | | | (55 | ) | | | (20 | ) | | | (35 | ) |
Credit Suisse | | CMBX.NA.BBB.6 Index | | Sell | | 3.00% | | Monthly | | 05/11/2063 | | (143) | | | (41 | ) | | | (9 | ) | | | (32 | ) |
Credit Suisse | | CMBX.NA.BBB.6 Index | | Sell | | 3.00% | | Monthly | | 05/11/2063 | | (965) | | | (279 | ) | | | (140 | ) | | | (139 | ) |
Goldman Sachs | | CMBX.NA.BBB.6 Index | | Sell | | 3.00% | | Monthly | | 05/11/2063 | | (28) | | | (8 | ) | | | (3 | ) | | | (5 | ) |
Goldman Sachs | | CMBX.NA.BBB.6 Index | | Sell | | 3.00% | | Monthly | | 05/11/2063 | | (14) | | | (4 | ) | | | (1 | ) | | | (3 | ) |
Citibank | | CMBX.NA.BBB.6 Index | | Sell | | 3.00% | | Monthly | | 05/11/2063 | | (223) | | | (65 | ) | | | (29 | ) | | | (36 | ) |
Citibank | | CMBX.NA.BBB.6 Index | | Sell | | 3.00% | | Monthly | | 05/11/2063 | | (165) | | | (48 | ) | | | (22 | ) | | | (26 | ) |
Citibank | | CMBX.NA.BBB.6 Index | | Sell | | 3.00% | | Monthly | | 05/11/2063 | | (38) | | | (11 | ) | | | (6 | ) | | | (5 | ) |
Citibank | | CMBX.NA.BBB.6 Index | | Sell | | 3.00% | | Monthly | | 05/11/2063 | | (33) | | | (10 | ) | | | (5 | ) | | | (5 | ) |
Citibank | | CMBX.NA.BBB.6 Index | | Sell | | 3.00% | | Monthly | | 05/11/2063 | | (226) | | | (65 | ) | | | (33 | ) | | | (32 | ) |
Goldman Sachs | | CMBX.NA.BBB.6 Index | | Sell | | 3.00% | | Monthly | | 05/11/2063 | | (166) | | | (48 | ) | | | (14 | ) | | | (34 | ) |
Goldman Sachs | | CMBX.NA.BBB.6 Index | | Sell | | 3.00% | | Monthly | | 05/11/2063 | | (750) | | | (217 | ) | | | (58 | ) | | | (159 | ) |
Deutsche Bank | | CMBX.NA.BBB.6 Index | | Sell | | 3.00% | | Monthly | | 05/11/2063 | | (73) | | | (21 | ) | | | (8 | ) | | | (13 | ) |
Deutsche Bank | | CMBX.NA.BBB.6 Index | | Sell | | 3.00% | | Monthly | | 05/11/2063 | | (100) | | | (29 | ) | | | (11 | ) | | | (18 | ) |
Deutsche Bank | | CMBX.NA.BBB.6 Index | | Sell | | 3.00% | | Monthly | | 05/11/2063 | | (100) | | | (29 | ) | | | (11 | ) | | | (18 | ) |
Deutsche Bank | | CMBX.NA.BBB.6 Index | | Sell | | 3.00% | | Monthly | | 05/11/2063 | | (28) | | | (8 | ) | | | (3 | ) | | | (5 | ) |
JPMorgan Chase | | CMBX.NA.BBB.6 Index | | Sell | | 3.00% | | Monthly | | 05/11/2063 | | (34) | | | (10 | ) | | | (3 | ) | | | (7 | ) |
Credit Suisse | | CMBX.NA.BBB.6 Index | | Sell | | 3.00% | | Monthly | | 05/11/2063 | | (243) | | | (70 | ) | | | (35 | ) | | | (35 | ) |
Goldman Sachs | | CMBX.NA.BBB.6 Index | | Sell | | 3.00% | | Monthly | | 05/11/2063 | | (28) | | | (8 | ) | | | (3 | ) | | | (5 | ) |
Citibank | | CMBX.NA.BBB.6 Index | | Sell | | 3.00% | | Monthly | | 05/11/2063 | | (118) | | | (34 | ) | | | (12 | ) | | | (22 | ) |
JPMorgan Chase | | CMBX.NA.BBB-.6 Index | | Sell | | 3.00% | | Monthly | | 05/11/2063 | | (185) | | | (53 | ) | | | (23 | ) | | | (30 | ) |
Citibank | | CMBX.NA.BBB-.6 Index | | Sell | | 3.00% | | Monthly | | 05/11/2063 | | (253) | | | (73 | ) | | | (32 | ) | | | (41 | ) |
Citibank | | CMBX.NA.BBB-.6 Index | | Sell | | 3.00% | | Quarterly | | 05/11/2063 | | (360) | | | (103 | ) | | | (45 | ) | | | (58 | ) |
Citibank | | CMBX.NA.BBB-.6 Index | | Sell | | 3.00% | | Quarterly | | 05/11/2063 | | (257) | | | (74 | ) | | | (32 | ) | | | (42 | ) |
Citibank | | CMBX.NA.BBB-.6 Index | | Sell | | 3.00% | | Quarterly | | 05/11/2063 | | (73) | | | (21 | ) | | | (8 | ) | | | (13 | ) |
JPMorgan Chase | | CMBX.NA.BBB-.6 Index | | Sell | | 3.00% | | Monthly | | 05/11/2063 | | (35) | | | (10 | ) | | | (3 | ) | | | (7 | ) |
Citibank | | CMBX.NA.BBB-.6 Index | | Sell | | 3.00% | | Monthly | | 05/11/2063 | | (263) | | | (76 | ) | | | (29 | ) | | | (47 | ) |
Citibank | | CMBX.NA.BBB-.6 Index | | Sell | | 3.00% | | Monthly | | 05/11/2063 | | (711) | | | (205 | ) | | | (78 | ) | | | (127 | ) |
Citibank | | CMBX.NA.BBB-.6 Index | | Sell | | 3.00% | | Monthly | | 05/11/2063 | | (509) | | | (147 | ) | | | (57 | ) | | | (90 | ) |
Citibank | | CMBX.NA.BBB-.6 Index | | Sell | | 3.00% | | Monthly | | 05/11/2063 | | (355) | | | (103 | ) | | | (40 | ) | | | (63 | ) |
Citibank | | CMBX.NA.BBB-.6 Index | | Sell | | 3.00% | | Monthly | | 05/11/2063 | | (150) | | | (43 | ) | | | (18 | ) | | | (25 | ) |
Citibank | | CMBX.NA.BBB-.6 Index | | Sell | | 3.00% | | Monthly | | 05/11/2063 | | (500) | | | (144 | ) | | | (59 | ) | | | (85 | ) |
Citibank | | CMBX.NA.BBB-.6 Index | | Sell | | 3.00% | | Quarterly | | 05/11/2063 | | (224) | | | (64 | ) | | | (28 | ) | | | (36 | ) |
JPMorgan Chase | | CMBX.NA.BBB-.6 Index | | Sell | | 3.00% | | Monthly | | 05/11/2063 | | (535) | | | (155 | ) | | | (64 | ) | | | (91 | ) |
Credit Suisse | | CMBX.NA.BBB-.6 Index | | Sell | | 3.00% | | Monthly | | 05/11/2063 | | (108) | | | (31 | ) | | | (13 | ) | | | (18 | ) |
Credit Suisse | | CMBX.NA.BBB-.6 Index | | Sell | | 3.00% | | Monthly | | 05/11/2063 | | (4) | | | (1 | ) | | | (1 | ) | | | – | |
Goldman Sachs | | CMBX.NA.BBB-.6 Index | | Sell | | 3.00% | | Monthly | | 05/11/2063 | | (20) | | | (6 | ) | | | (3 | ) | | | (3 | ) |
JPMorgan Chase | | CMBX.NA.BBB-.6 Index | | Sell | | 3.00% | | Quarterly | | 05/11/2063 | | (91) | | | (26 | ) | | | (11 | ) | | | (15 | ) |
Citibank | | CMBX.NA.BBB-.6 Index | | Sell | | 3.00% | | Monthly | | 05/11/2063 | | (53) | | | (15 | ) | | | (7 | ) | | | (8 | ) |
Citibank | | CMBX.NA.BBB-.6 Index | | Sell | | 3.00% | | Monthly | | 05/11/2063 | | (711) | | | (205 | ) | | | (76 | ) | | | (129 | ) |
Morgan Stanley | | CMBX.NA.BBB-.9 | | Buy | | 3.00% | | Monthly | | 09/17/2058 | | 531 | | | 96 | | | | 109 | | | | (13 | ) |
Morgan Stanley | | CMBX.NA.BBB-.9 | | Buy | | 3.00% | | Monthly | | 09/17/2058 | | 266 | | | 48 | | | | 52 | | | | (4 | ) |
Citibank | | CMBX.NA.BBB-.9 | | Buy | | 3.00% | | Monthly | | 09/17/2058 | | 531 | | | 97 | | | | 108 | | | | (11 | ) |
Citibank | | CMBX.NA.BBB-.9 | | Buy | | 3.00% | | Monthly | | 09/17/2058 | | 2,255 | | | 411 | | | | 461 | | | | (50 | ) |
Citibank | | CMBX.NA.BBB-.9 | | Buy | | 3.00% | | Monthly | | 09/17/2058 | | 1,127 | | | 205 | | | | 226 | | | | (21 | ) |
Citibank | | CMBX.NA.BBB-.9 | | Buy | | 3.00% | | Monthly | | 09/17/2058 | | 451 | | | 82 | | | | 90 | | | | (8 | ) |
Citibank | | CMBX.NA.BBB-.9 Index | | Buy | | 3.00% | | Monthly | | 09/17/2058 | | 509 | | | 93 | | | | 40 | | | | 53 | |
Citibank | | CMBX.NA.BBB-.9 Index | | Buy | | 3.00% | | Monthly | | 09/17/2058 | | 1,018 | | | 185 | | | | 72 | | | | 113 | |
Citibank | | CMBX.NA.BBB-.9 Index | | Buy | | 3.00% | | Monthly | | 09/17/2058 | | 1,255 | | | 229 | | | | 86 | | | | 143 | |
Citibank | | CMBX.NA.BBB-.9 Index | | Buy | | 3.00% | | Quarterly | | 09/17/2058 | | 264 | | | 47 | | | | 18 | | | | 29 | |
Citibank | | CMBX.NA.BBB-.9 Index | | Buy | | 3.00% | | Quarterly | | 09/17/2058 | | 265 | | | 48 | | | | 18 | | | | 30 | |
| | |
318 | | SEI Institutional Investments Trust / Semi-Annual Report / November 30, 2020 |
| | | | | | | | | | | | | | | | | | | | | | | | | | | | | | | | | | | | |
| | | | | | | | | | |
| Counterparty | | Reference Entity/
Obligation | | | Buy/Sell Protection | | | (Pays)/Receives Rate | | | Payment
Frequency | | | Termination
Date | | | Notional
Amount
(Thousands) | | | Value (Thousands) | | | Upfront
Payments/
Receipts (Thousands) | | | Net Unrealized
Appreciation
(Depreciation)
(Thousands) | |
Citibank | |
| CMBX.NA.BBB-.9
Index |
| | | Buy | | | | 3.00% | | | | Monthly | | | | 09/17/2058 | | | $ | 1,018 | | | $ | 185 | | | $ | 75 | | | $ | 110 | |
Citibank | |
| CMBX.NA.BBB-.9
Index |
| | | Buy | | | | 3.00% | | | | Monthly | | | | 09/17/2058 | | | | 251 | | | | 46 | | | | 17 | | | | 29 | |
Goldman Sachs | | | CMBX-BBB-557874 | | | | Buy | | | | 3.00% | | | | Monthly | | | | 09/17/2058 | | | | 498 | | | | 91 | | | | 87 | | | | 4 | |
Citibank | | | CMBX-BBB-560152 | | | | Buy | | | | 3.00% | | | | Monthly | | | | 09/17/2058 | | | | 532 | | | | 97 | | | | 108 | | | | (11 | ) |
Citibank | | | CMBX-BBB-561625 | | | | Buy | | | | 3.00% | | | | Monthly | | | | 09/17/2058 | | | | 436 | | | | 79 | | | | 90 | | | | (11 | ) |
JPMorgan Chase | | | CMBX-BBB-562055 | | | | Buy | | | | 3.00% | | | | Monthly | | | | 09/17/2058 | | | | 232 | | | | 42 | | | | 47 | | | | (5 | ) |
| | | | | | | | | | | | | | | | | | | | | | | | | | | | | | | | | | | | |
| | | | | | | | | | | | | | | | | | | | | | | | | | $ | (1,926 | ) | | $ | 178 | | | $ | (2,104 | ) |
| | | | | | | | | | | | | | | | | | | | | | | | | | | | | | | | | | | | |
| | | | | | | | | | | | | | | | | | | | | | | | | | |
| | | | | | | | | |
| | | | | | | Total Return Swaps | | | | | | | | | | |
| | | | | | | | | | | |
| Counterparty | | Reference Entity/
Obligation | | Fund Pays | | Fund Receives | | Payment
Frequency | | Termination
Date | | Currency | | Notional
Amount (Thousands) | | Value (Thousands) | | Upfront
Payments/
Receipts (Thousands) | | Net Unrealized Appreciation (Depreciation)
(Thousands) |
Barclays PLC | | IBOXHY-TRS-560853 | | INDEX RETURN | | USD-3Month LIBOR | | Quarterly | | 12/20/2020 | | USD | | 15,328 | | $ | (822 | ) | | $ | 3 | | | $ | (825 | ) |
Macquarie Bank | | Bloomberg Commodity
Index Total Return^ | | US T-BILL HIGH
DISCOUNT RATE +
9 BPS | | INDEX RETURN | | Monthly | | 12/17/2020 | | USD | | (12,734) | | | 293 | | | | – | | | | 293 | |
Macquarie Bank | | Macquarie Commodity
Product 251E^ | | 0.33% | | INDEX RETURN | | Monthly | | 12/02/2020 | | USD | | (2,361) | | | (25 | ) | | | – | | | | (25 | ) |
Merrill Lynch | | Bloomberg Commodity
2 Month Total Return^ | | US T-BILL HIGH
DISCOUNT RATE +
12 BPS | | INDEX RETURN | | Monthly | | 12/17/2020 | | USD | | (1,577) | | | 41 | | | | – | | | | 41 | |
Merrill Lynch | | BofA Merrill Lynch
3-Month U.S. Treasury
Commodity
MLBXCS3E^ | | rate plus 23 BPS | | INDEX RETURN | | Monthly | | 12/02/2020 | | USD | | (3,155) | | | (52 | ) | | | – | | | | (52 | ) |
Societe Generale | | Bloomberg Commodity
2 Month Total Return^ | | US T-BILL HIGH
DISCOUNT RATE +
14 BPS | | INDEX RETURN | | Monthly | | 12/17/2020 | | USD | | (1,719) | | | 44 | | | | – | | | | 44 | |
Societe Generale | | Bloomberg Commodity
Index Total Return^ | | US T-BILL HIGH
DISCOUNT RATE +
11 BPS | | INDEX RETURN | | Monthly | | 12/17/2020 | | USD | | (11,211) | | | 259 | | | | – | | | | 259 | |
Societe Generale | | Bloomberg Commodity
Index Total Return^ | | US T-BILL HIGH
DISCOUNT RATE +
11 BPS | | INDEX RETURN | | Monthly | | 12/17/2020 | | USD | | (6,863) | | | 158 | | | | – | | | | 158 | |
Societe Generale | | Societe Generale
Commodities Custom
Alpha 061^ | | 0.35% | | INDEX RETURN | | Monthly | | 12/02/2020 | | USD | | (3,282) | | | (37 | ) | | | – | | | | (37 | ) |
| | | | | | | | | | | | | | | | | | | | | | | | | | |
| | | | | | | | | | | | | | | | $ | (141 | ) | | $ | 3 | | | $ | (144 | ) |
| | | | | | | | | | | | | | | | | | | | | | | | | | |
As of November 30, 2020, the Reverse Repurchase Agreements held by the Fund are listed below:
| | | | | | | | | | | | | | | | |
| | | | | |
Principal Amount ($ Thousands) | | Counterparty | | Rate | | Maturity | | Value ($ Thousands) |
$(16,748) | | | Chase Securities | | | | 0.20 | % | | | Open Ended | | | | $(16,748) | |
(37,508) | | | Chase Securities | | | | 0.18 | % | | | Open Ended | | | | (37,508) | |
(14,695) | | | Chase Securities | | | | 0.16 | % | | | Open Ended | | | | (14,695) | |
(25,492) | | | Chase Securities | | | | 0.14 | % | | | Open Ended | | | | (25,492) | |
(141,213) | | | HSBC | | | | 0.11 | % | | | Open Ended | | | | (141,213) | |
| | | | | | | | | | | | | | | | |
| | | | | | | | | | | | | | | $(235,656) | |
| | | | | | | | | | | | | | | | |
| | Percentages are based on Net Assets of $769,391 ($ Thousands). |
| * | Security, or a portion thereof, is held by the MARR Commodity Strategy Subsidiary, Ltd. as of November 30, 2020. |
| * | Non-income producing security. |
| ‡ | Real Estate Investment Trust. |
| ‡‡ | Expiration date not available. |
| (A) | Zero coupon security. The rate shown on the Schedule of Investments is the security’s effective yield at the time of purchase. |
| (B) | Security is a Master Limited Partnership. At November 30, 2020, such securities amounted to $36 ($ Thousands), or 0.0% of the Net Assets of the Fund (See Note 2). |
| (C) | Security exempt from registration under Rule 144A of the Securities Act of 1933. These securities may be resold in transactions exempt from registration normally to qualified institutions. On November 30, 2020, the value of these securities amounted to $91,739 ($ Thousands), representing 11.9% of the Net Assets of the Fund. |
| (D) | Security is in default on interest payment. |
| (E) | Perpetual security with no stated maturity date. |
| (F) | Variable or floating rate security, the interest rate of which adjusts periodically based on changes in current interest rates and prepayments on the underlying pool of assets. |
| (G) | Security, or a portion thereof, has been pledged as collateral on reverse repurchase agreements. |
| (H) | Security, or a portion thereof, has been pledged as collateral on securities sold short. |
| (I) | Refer to table below for details on Options Contracts. |
| (J) | Refer to table below for details on Swaption Contracts. |
AUD – Australian Dollar
BPS – Basis Points
CAD – Canadian Dollar
CDOR – Canadian Dollar Offered Rate
Cl – Class
| | |
SEI Institutional Investments Trust / Semi-Annual Report / November 30, 2020 | | 319 |
CONSOLIDATED SCHEDULE OF INVESTMENTS (Unaudited)
November 30, 2020
Multi-Asset Real Fund (Concluded)
CMBX – Commercial Mortgage-Backed Index
CMO – Collateralized Mortgage Obligation
CNY – Chinese Yuan CPI – Consumer Price Index DAC – Designated Activity Company
DN – Discount Note
EAFE – Europe, Australasia and Far East EUR – Euro
EURIBOR – Euro Interbank Offered Rate FFCB – Federal Farm Credit Bank FHLB – Federal Home Loan Bank FHLMC – Federal Home Loan Mortgage Corporation
FNMA – Federal National Mortgage Association
GNMA – Government National Mortgage Association GBP – British Pound
GO – Government Obligation
HRW – Hard Red Winter
ICE– Intercontinental Exchange
IO – Interest Only – face amount represents notional amount.
JPY – Japanese Yen
KRW – Korean Won
LIBOR– London Interbank Offered Rate
LLC – Limited Liability Company
LME – London Metal Exchange
Ltd – Limited
MSCI – Morgan Stanley Capital International
MTN – Medium Term Note
MYR – Malaysian Ringgit
NYMEX – New York Mercantile Exchange
NZD – New Zealand Dollar
PLC – Public Limited Company RB – Revenue Bond
RUB – Russian Ruble
S&P– Standard & Poor’s SEK – Swedish Krona Ser – Series
STIBOR– Stockholm Interbank Offered Rate
ULSD – Ultra-Low Sulfur Diesel USD – U.S. Dollar
VAR – Variable Rate
WTI – West Texas Intermediate
ZAR – South African Rand
The following is a list of the level of inputs used as of November 30, 2020, in valuing the Fund’s investments and other financial instruments carried at value ($ Thousands):
| | | | | | | | | | | | | | | | |
| | | | | |
| Investments in Securities | | Level 1 ($) | | | Level 2 ($) | | Level 3
($) | | | Total ($) |
U.S. Treasury Obligations | | | – | | | | 486,151 | | | | – | | | | 486,151 | |
Common Stock | | | 234,574 | | | | – | | | | – | | | | 234,574 | |
Corporate Obligations | | | – | | | | 109,478 | | | | – | | | | 109,478 | |
Mortgage-Backed Securities | | | – | | | | 78,079 | | | | – | | | | 78,079 | |
U.S. Government Agency Obligations | | | – | | | | 51,954 | | | | – | | | | 51,954 | |
Asset-Backed Securities | | | – | | | | 17,177 | | | | – | | | | 17,177 | |
Sovereign Debt | | | – | | | | 17,113 | | | | – | | | | 17,113 | |
Municipal Bonds | | | – | | | | 1,728 | | | | – | | | | 1,728 | |
Warrants | | | – | | | | 33 | | | | – | | | | 33 | |
Rights | | | 10 | | | | – | | | | – | | | | 10 | |
| | | | | | | | | | | | | | | | |
Total Investments in Securities | | | 234,584 | | | | 761,713 | | | | – | | | | 996,297 | |
| | | | | | | | | | | | | | | | |
Securities Sold Short | | | | | | | | | | | | | | | | |
Common Stock | | | (107,690) | | | | – | | | | – | | | | (107,690) | |
Preferred Stock | | | (5) | | | | (2) | | | | – | | | | (7) | |
| | | | | | | | | | | | | | | | |
Total Securities Sold Short | | | (107,695) | | | | (2) | | | | – | | | | (107,697) | |
| | | | | | | | | | | | | | | | |
| | | | | | | | | | | | | | | | |
| | | | | |
| Other Financial Instruments | | Level 1
($) | | | Level 2
($) | | Level 3
($) | | | Total ($) |
Purchased Options | | | 1,211 | | | | – | | | | – | | | | 1,211 | |
Written Options | | | (300) | | | | – | | | | – | | | | (300) | |
Written Swaption | | | – | | | | (15) | | | | – | | | | (15) | |
Futures Contracts* | | | | | | | | | | | | | | | | |
Unrealized Appreciation | | | 7,279 | | | | – | | | | – | | | | 7,279 | |
Unrealized Depreciation | | | (6,664) | | | | – | | | | – | | | | (6,664) | |
Forwards Contracts* | | | | | | | | | | | | | | | | |
Unrealized Appreciation | | | – | | | | 1,471 | | | | – | | | | 1,471 | |
Unrealized Depreciation | | | – | | | | (2,419) | | | | – | | | | (2,419) | |
Centrally Cleared Swaps | | | | | | | | | | | | | | | | |
Credit Default Swaps* | | | | | | | | | | | | | | | | |
Unrealized Depreciation | | | – | | | | (1,553) | | | | – | | | | (1,553) | |
Interest Rate Swaps* | | | | | | | | | | | | | | | | |
Unrealized Appreciation | | | – | | | | 182 | | | | – | | | | 182 | |
Unrealized Depreciation | | | – | | | | (3,752) | | | | – | | | | (3,752) | |
OTC Swaps | | | | | | | | | | | | | | | | |
Credit Default Swaps* | | | | | | | | | | | | | | | | |
Unrealized Appreciation | | | – | | | | 511 | | | | – | | | | 511 | |
Unrealized Depreciation | | | – | | | | (2,615) | | | | – | | | | (2,615) | |
Total Return Swaps* | | | | | | | | | | | | | | | | |
Unrealized Appreciation | | | – | | | | 795 | | | | – | | | | 795 | |
Unrealized Depreciation | | | – | | | | (939) | | | | – | | | | (939) | |
Reverse Repurchase Agreements | | | – | | | | (235,656) | | | | – | | | | (235,656) | |
| | | | | | | | | | | | | | | | |
Total Other Financial Instruments | | | 1,526 | | | | (243,990) | | | | – | | | | (242,464) | |
| | | | | | | | | | | | | | | | |
* Futures contracts, forwards contracts and swap contracts are valued at the unrealized appreciation
(depreciation) on the instrument.
For the period ended November 30, 2020, there were no transfers in or out of Level 3.
For more information on valuation inputs, see Note 2 – Significant Accounting Policies in Notes to
Financial Statements.
Amounts designated as “–” are $0 or have been rounded to $0.
The accompanying notes are an integral part of the financial statements.
| | |
320 | | SEI Institutional Investments Trust / Semi-Annual Report / November 30, 2020 |
(This page intentionally left blank)
SCHEDULE OF ASSETS AND LIABILITIES ($ Thousands)
November 30, 2020 (Unaudited)
| | | | | | | | |
| | | Large Cap Fund | | | Large Cap Disciplined
Equity Fund | |
Assets: | | | | | | | | |
Investments, at value † | | $ | 1,019,955 | * | | $ | 1,378,027 | * |
Affiliated investments, at value †† | | | 18,224 | | | | 84,203 | |
Cash and cash equivalents | | | – | | | | 48,928 | |
Cash pledged as collateral on futures contracts | | | 339 | | | | 3,072 | |
Receivable for fund shares sold | | | 48 | | | | 73 | |
Receivable for investment securities sold | | | 25,996 | | | | 32,155 | |
Dividends and interest receivable | | | 1,921 | | | | 2,311 | |
Foreign tax reclaim receivable | | | 28 | | | | 9 | |
Prepaid expenses | | | 13 | | | | 19 | |
Total Assets | | | 1,066,524 | | | | 1,548,797 | |
| Liabilities: | | | | | | |
Payable upon return on securities loaned | | | 7,163 | | | | 48 | |
Payable for investment securities purchased | | | 22,794 | | | | 31,615 | |
Payable for fund shares redeemed | | | 489 | | | | 549 | |
Payable for variation margin on futures contracts | | | 25 | | | | 177 | |
Swap contracts, at value †††† | | | – | | | | 975 | |
Foreign currency payable to custodian, at value ††† | | | – | | | | – | |
Investment advisory fees payable | | | 137 | | | | 194 | |
Trustees fees payable | | | 5 | | | | 8 | |
CCO fees payable | | | 2 | | | | 3 | |
Accrued expense payable | | | 25 | | | | 36 | |
Total Liabilities | | | 30,640 | | | | 33,605 | |
Net Assets | | $ | 1,035,884 | | | $ | 1,515,192 | |
† Cost of investments | | $ | 767,761 | | | $ | 1,040,901 | |
†† Cost of affiliated investments | | | 18,221 | | | | 84,204 | |
††† Cost of foreign currency | | | – | | | | – | |
* Includes market value of securities on loan | | | 6,912 | | | | 83 | |
Net Assets: | | | | | | | | |
Paid-in Capital — (unlimited authorization — no par value) | | $ | 713,170 | | | $ | 1,057,690 | |
Total distributable earnings | | | 322,714 | | | | 457,502 | |
| Net Assets | | $1,035,884 | | | $1,515,192 | |
Net Asset Value, Offering and Redemption Price Per Share — Class A | | $ | 16.47 | | | $ | 11.44 | |
| | |
| ($1,035,884,399 ÷
62,886,106 shares) |
| |
| ($1,515,191,680 ÷
132,437,494 shares) |
|
|
Amounts designated as “—” are $0 or have been rounded to $0.
The accompanying notes are an integral part of the financial statements.
| | |
322 | | SEI Institutional Investments Trust / Semi-Annual Report / November 30, 2020 |
| | | | | | | | | | | | | | | | | | | | | | | | | | |
| | | | | | | |
| Large Cap Index Fund | | | S&P 500 Index Fund | | | Extended Market Index
Fund | | | Small Cap Fund | | | Small Cap II Fund | | | Small/Mid Cap Equity
Fund | | | U.S. Equity Factor Allocation Fund | |
| $ | 2,053,290 | * | | $ | 5,457,339 | * | | $ | 1,615,967 | * | | $ | 276,130 | * | | $ | 388,436 | * | | $ | 1,052,090* | | | $ | 1,049,033 | |
| | 21,392 | | | | 89,132 | | | | 131,091 | | | | 17,162 | | | | 36,664 | | | | 103,344 | | | | 8,324 | |
| | 78 | | | | 211 | | | | 1 | | | | – | | | | – | | | | – | | | | 5,918 | |
| | 1,184 | | | | 6,420 | | | | 859 | | | | – | | | | – | | | | – | | | | 660 | |
| | – | | | | 12,234 | | | | – | | | | 8 | | | | – | | | | 63 | | | | 136 | |
| | 5,367 | | | | 7,031 | | | | 15,164 | | | | 688 | | | | 2,429 | | | | 14,480 | | | | – | |
| | 2,919 | | | | 8,255 | | | | 1,162 | | | | 477 | | | | 553 | | | | 1,681 | | | | 2,096 | |
| | 11 | | | | 30 | | | | – | | | | – | | | | 1 | | | | 4 | | | | 9 | |
| | 24 | | | | 59 | | | | 16 | | | | 3 | | | | 4 | | | | 12 | | | | 10 | |
| | 2,084,265 | | | | 5,580,711 | | | | 1,764,260 | | | | 294,468 | | | | 428,087 | | | | 1,171,674 | | | | 1,066,186 | |
| | 14,174 | | | | 13,796 | | | | 129,103 | | | | 13,427 | | | | 28,502 | | | | 75,091 | | | | – | |
| | – | | | | 9,744 | | | | – | | | | 993 | | | | 2,587 | | | | 4,856 | | | | 541 | |
| | 2,144 | | | | 3,985 | | | | 6,282 | | | | 582 | | | | 935 | | | | 2,686 | | | | 2,069 | |
| | 104 | | | | 356 | | | | 225 | | | | – | | | | – | | | | – | | | | 33 | |
| | – | | | | – | | | | – | | | | – | | | | – | | | | – | | | | – | |
| | – | | | | – | | | | 2 | | | | – | | | | – | | | | – | | | | – | |
| | 17 | | | | 45 | | | | 38 | | | | 93 | | | | 130 | | | | 341 | | | | – | |
| | 10 | | | | 27 | | | | 7 | | | | 1 | | | | 2 | | | | 5 | | | | 5 | |
| | 4 | | | | 11 | | | | 3 | | | | – | | | | 1 | | | | 2 | | | | 2 | |
| | 356 | | | | 963 | | | | 222 | | | | 6 | | | | 8 | | | | 26 | | | | 24 | |
| | 16,809 | | | | 28,927 | | | | 135,882 | | | | 15,102 | | | | 32,165 | | | | 83,007 | | | | 2,674 | |
| $ | 2,067,456 | | | $ | 5,551,784 | | | $ | 1,628,378 | | | $ | 279,366 | | | $ | 395,922 | | | $ | 1,088,667 | | | $ | 1,063,512 | |
| $ | 664,044 | | | $ | 3,070,259 | | | $ | 1,023,672 | | | $ | 235,408 | | | $ | 314,181 | | | $ | 856,292 | | | $ | 839,135 | |
| | 21,152 | | | | 89,136 | | | | 130,598 | | | | 17,159 | | | | 36,657 | | | | 103,334 | | | | 8,324 | |
| | – | | | | – | | | | (2 | ) | | | – | | | | – | | | | – | | | | – | |
| | 13,867 | | | | 13,405 | | | | 126,421 | | | | 12,914 | | | | 27,057 | | | | 72,156 | | | | – | |
| $ | 661,306 | | | $ | 3,124,611 | | | $ | 1,026,989 | | | $ | 224,664 | | | $ | 324,806 | | | $ | 849,328 | | | $ | 864,431 | |
| | 1,406,150 | | | | 2,427,173 | | | | 601,389 | | | | 54,702 | | | | 71,116 | | | | 239,339 | | | | 199,081 | |
| $ | 2,067,456 | | | $ | 5,551,784 | | | $ | 1,628,378 | | | $ | 279,366 | | | $ | 395,922 | | | $ | 1,088,667 | | | $ | 1,063,512 | |
| $ | 198.13 | | | $ | 19.20 | | | $ | 19.63 | | | $ | 15.20 | | | $ | 11.81 | | | $ | 11.49 | | | $ | 12.52 | |
| ($2,067,456,053 ÷
10,434,949 shares) |
| |
| ($5,551,784,391 ÷
289,107,659 shares) |
| |
| ($1,628,377,861 ÷
82,939,327 shares) |
| |
| ($279,365,794 ÷
18,376,545 shares) |
| |
| ($395,921,590 ÷
33,521,479 shares) |
| |
| ($1,088,667,140 ÷
94,767,706 shares) |
| |
| ($1,063,512,242 ÷
84,913,622 shares) |
|
|
| | |
SEI Institutional Investments Trust / Semi-Annual Report / November 30, 2020 | | 323 |
STATEMENTS OF ASSETS AND LIABILITIES ($ Thousands)
November 30, 2020 (Unaudited)
| | | | | | | | |
| | | |
| | | U.S. Managed Volatility Fund | | | Global Managed Volatility Fund | |
Assets: | | | | | | | | |
Investments, at value † | | $ | 1,302,765 | * | | $ | 2,837,856 | * |
Affiliated investments, at value †† | | | 60,354 | | | | 60,433 | |
Repurchase agreements† | | | – | | | | – | |
Cash and cash equivalents | | | – | | | | 5,552 | |
Cash pledged as collateral on swap contracts | | | – | | | | – | |
Cash pledged as collateral on futures contracts | | | 900 | | | | 3,009 | |
Foreign currency, at value ††† | | | 6 | | | | 25,586 | |
Receivable for fund shares sold | | | 660 | | | | 4,248 | |
Receivable for investment securities sold | | | 4,476 | | | | 3,157 | |
Dividends and interest receivable | | | 3,425 | | | | 8,030 | |
Foreign tax reclaim receivable | | | 7 | | | | 4,397 | |
Unrealized gain on forward foreign currency contracts | | | – | | | | 71 | |
Unrealized gain on foreign spot currency contracts | | | – | | | | – | |
Options purchased, at value ††††† | | | – | | | | – | |
Receivable for variation margin on futures contracts | | | – | | | | 8 | |
Receivable for variation margin on swap contracts | | | – | | | | – | |
Prepaid expenses | | | 16 | | | | 37 | |
Total Assets | | | 1,372,609 | | | | 2,952,384 | |
Liabilities: | | | | | | | | |
Payable upon return on securities loaned | | | 37,740 | | | | 10,256 | |
Payable for investment securities purchased | | | 3,917 | | | | 2,768 | |
Payable for fund shares redeemed | | | 2,228 | | | | 6,020 | |
Payable for variation margin on futures contracts | | | 50 | | | | 211 | |
Income distribution payable | | | – | | | | – | |
Options written, at value ††††† | | | – | | | | – | |
Payable to custodian | | | – | | | | – | |
Unrealized loss on foreign currency spot contracts | | | – | | | | – | |
Unrealized loss on forward foreign currency contracts | | | – | | | | 7,313 | |
Investment advisory fees payable | | | 193 | | | | 519 | |
Trustees fees payable | | | 7 | | | | 15 | |
CCO fees payable | | | 3 | | | | 6 | |
Unfunded bank loans | | | – | | | | – | |
Accrued expense payable | | | 33 | | | | 110 | |
Accrued foreign capital gains tax on appreciated securities | | | – | | | | – | |
Total Liabilities | | | 44,171 | | | | 27,218 | |
Net Assets | | $ | 1,328,438 | | | $ | 2,925,166 | |
† Cost of investments | | $ | 1,075,279 | | | $ | 2,630,654 | |
†† Cost of affiliated investments | | | 60,353 | | | | 60,433 | |
††† Cost of foreign currency | | | 6 | | | | 25,169 | |
††††† Cost (Premiums received) | | | – | | | | – | |
* Includes market value of securities on loan | | | 36,640 | | | | 9,761 | |
Net Assets: | | | | | | | | |
Paid-in Capital — (unlimited authorization — no par value) | | $ | 1,092,931 | | | $ | 2,693,201 | |
Total distributable earnings (loss) | | | 235,507 | | | | 231,965 | |
Net Assets | | $ | 1,328,438 | �� | | $ | 2,925,166 | |
Net Asset Value, Offering and Redemption Price Per Share — Class A | | | $13.25 | | | | $11.77 | |
| | |
| ($1,328,437,777 ÷
100,293,803 shares) |
| |
| ($2,925,166,154 ÷
248,454,476 shares) |
|
Amounts designated as “—” are $0 or have been rounded to $0.
The accompanying notes are an integral part of the financial statements.
| | |
324 | | SEI Institutional Investments Trust / Semi-Annual Report / November 30, 2020 |
| | | | | | | | | | | | | | | | | | | | | | | | | | |
| | | | | | | |
World Equity Ex-US Fund | | | Screened
World Equity Ex-US Fund | | | World Select
Equity Fund | | | Emerging Markets Equity Fund | | | Opportunistic
Income Fund | | | Core Fixed
Income Fund | | | High Yield
Bond Fund | |
| $ | 9,318,661 | * | | $ | 106,572 | | | $ | 474,837 | | | $ | 1,182,106 | | | $ | 975,398 | | | $ | 8,473,607* | | | $ | 2,580,967 | |
| | 187,522 | | | | 2,522 | | | | 14,731 | | | | 7,553 | | | | 43,348 | | | | 464,844 | | | | 103,553 | |
| | – | | | | – | | | | – | | | | – | | | | 6,900 | | | | – | | | | – | |
| | 253,039 | | | | 2,443 | | | | 11,522 | | | | 10,542 | | | | – | | | | – | | | | – | |
| | – | | | | – | | | | – | | | | – | | | | – | | | | 6,316 | | | | 1,046 | |
| | 10,299 | | | | 260 | | | | 9,319 | | | | 714 | | | | 213 | | | | 4,367 | | | | – | |
| | 8,077 | | | | 444 | | | | 1,172 | | | | 5,550 | | | | – | | | | 2,728 | | | | 2 | |
| | 6,351 | | | | – | | | | – | | | | 1,750 | | | | 74 | | | | 30,132 | | | | 646 | |
| | 25,417 | | | | 231 | | | | 510 | | | | 7,589 | | | | 30,064 | | | | 763,840 | | | | 14,074 | |
| | 11,754 | | | | 117 | | | | 996 | | | | 794 | | | | 2,175 | | | | 28,316 | | | | 33,239 | |
| | 18,219 | | | | 246 | | | | 649 | | | | 26 | | | | 10 | | | | 508 | | | | 107 | |
| | 1,080 | | | | 4 | | | | 2,136 | | | | – | | | | – | | | | 1,125 | | | | – | |
| | – | | | | – | | | | 25 | | | | – | | | | – | | | | – | | | | – | |
| | – | | | | – | | | | 7 | | | | – | | | | – | | | | 133 | | | | – | |
| | 57 | | | | – | | | | 986 | | | | – | | | | 1 | | | | 210 | | | | – | |
| | – | | | | – | | | | – | | | | – | | | | – | | | | 169 | | | | 1 | |
| | 114 | | | | 1 | | | | 6 | | | | 14 | | | | 13 | | | | 102 | | | | 31 | |
| | 9,840,590 | | | | 112,840 | | | | 516,896 | | | | 1,216,638 | | | | 1,058,196 | | | | 9,776,397 | | | | 2,733,666 | |
| | 93,111 | | | | – | | | | – | | | | – | | | | – | | | | 9,934 | | | | – | |
| | 33,771 | | | | 193 | | | | 521 | | | | 5,987 | | | | 44,289 | | | | 1,569,425 | | | | 67,833 | |
| | 15,846 | | | | 45 | | | | 219 | | | | 1,714 | | | | 2 | | | | 1,012 | | | | 1,336 | |
| | 1,192 | | | | 34 | | | | 515 | | | | 222 | | | | 8 | | | | 223 | | | | – | |
| | – | | | | – | | | | – | | | | – | | | | – | | | | 600 | | | | 357 | |
| | – | | | | – | | | | – | | | | – | | | | – | | | | 233 | | | | – | |
| | – | | | | – | | | | – | | | | – | | | | 31,527 | | | | 14,709 | | | | 1,897 | |
| | – | | | | – | | | | – | | | | 1 | | | | – | | | | – | | | | – | |
| | 3,823 | | | | 9 | | | | 2,272 | | | | – | | | | – | | | | 268 | | | | – | |
| | 2,093 | | | | 21 | | | | 118 | | | | 516 | | | | 170 | | | | 636 | | | | 580 | |
| | 48 | | | | 1 | | | | 2 | | | | 6 | | | | 5 | | | | 43 | | | | 13 | |
| | 20 | | | | – | | | | 1 | | | | 3 | | | | 2 | | | | 18 | | | | 6 | |
| | – | | | | – | | | | – | | | | – | | | | – | | | | – | | | | 14 | |
| | 418 | | | | 28 | | | | 111 | | | | 277 | | | | 30 | | | | 195 | | | | 65 | |
| | 3,423 | | | | 82 | | | | 110 | | | | 1,987 | | | | – | | | | – | | | | – | |
| | 153,745 | | | | 413 | | | | 3,869 | | | | 10,713 | | | | 76,033 | | | | 1,597,296 | | | | 72,101 | |
| $ | 9,686,845 | | | $ | 112,427 | | | $ | 513,027 | | | $ | 1,205,925 | | | $ | 982,163 | | | $ | 8,179,101 | | | $ | 2,661,565 | |
| $ | 7,006,619 | | | $ | 83,047 | | | $ | 416,754 | | | $ | 897,132 | | | $ | 989,727 | | | $ | 8,138,996 | | | $ | 2,559,830 | |
| | 187,505 | | | | 2,522 | | | | 14,731 | | | | 7,553 | | | | 43,348 | | | | 464,842 | | | | 103,553 | |
| | 8,034 | | | | 442 | | | | 1,164 | | | | 5,441 | | | | – | | | | 2,598 | | | | – | |
| | – | | | | – | | | | 44 | | | | – | | | | – | | | | (38 | ) | | | – | |
| | 88,627 | | | | – | | | | – | | | | – | | | | – | | | | 9,808 | | | | – | |
| $ | 7,224,492 | | | $ | 86,726 | | | $ | 515,558 | | | $ | 967,403 | | | $ | 1,010,821 | | | $ | 7,563,664 | | | $ | 2,903,890 | |
| | 2,462,353 | | | | 25,701 | | | | (2,531 | ) | | | 238,522 | | | | (28,658 | ) | | | 615,437 | | | | (242,325 | ) |
| $ | 9,686,845 | | | $ | 112,427 | | | $ | 513,027 | | | $ | 1,205,925 | | | $ | 982,163 | | | $ | 8,179,101 | | | $ | 2,661,565 | |
| | $14.46 | | | | $12.49 | | | | $10.64 | | | | $10.77 | | | | $8.12 | | | | $11.19 | | | | $8.48 | |
| ($9,686,844,583 ÷
669,694,837 shares) |
| |
| ($112,427,111 ÷
8,999,283 shares) |
| |
| ($513,026,620 ÷
48,232,920 shares) |
| |
| ($1,205,925,186 ÷
111,952,939 shares) |
| |
| ($982,163,378 ÷
121,018,186 shares) |
| |
| ($8,179,100,901 ÷
731,209,259 shares) |
| |
| ($2,661,565,084 ÷
314,042,320 shares) |
|
| | |
SEI Institutional Investments Trust / Semi-Annual Report / November 30, 2020 | | 325 |
STATEMENTS OF ASSETS AND LIABILITIES / CONSOLIDATED STATEMENTS OF ASSETS AND LIABILITIES ($ Thousands)
November 30, 2020 (Unaudited)
| | | | | | | | |
| | | |
| | | Long Duration Fund | | | Long Duration Credit
Fund | |
Assets: | | | | | | | | |
Investments, at value † | | $ | 1,351,151 | | | $ | 4,488,247 | |
Affiliated investments, at value †† | | | 19,873 | | | | 22,943 | |
Repurchase agreements† | | | – | | | | – | |
Cash and cash equivalents | | | – | | | | 1,016 | |
Deposits from counterparty | | | – | | | | – | |
Cash pledged as collateral on swap contracts | | | – | | | | – | |
Cash pledged as collateral on futures contracts | | | 3,060 | | | | 1,691 | |
Foreign currency, at value ††† | | | – | | | | – | |
Receivable for fund shares sold | | | 542 | | | | 563 | |
Dividends and interest receivable | | | 9,281 | | | | 38,234 | |
Receivable for investment securities sold | | | 8,774 | | | | 2,181 | |
Foreign tax reclaim receivable | | | 47 | | | | 757 | |
Receivable for variation margin on futures contracts | | | 37 | | | | 31 | |
Unrealized gain on forward foreign currency contracts | | | – | | | | – | |
Unrealized gain on foreign spot currency contracts | | | – | | | | – | |
Swap contracts, at value †††† | | | – | | | | – | |
Options purchased, at value ††††† | | | – | | | | – | |
Swaptions purchased, at value †††††† | | | – | | | | – | |
Receivable for variation margin on swap contracts | | | – | | | | – | |
Prepaid expenses | | | 18 | | | | 56 | |
Total Assets | | | 1,392,783 | | | | 4,555,719 | |
Liabilities: | | | | | | | | |
Payable upon return on securities loaned | | | – | | | | – | |
Payable for investment securities purchased | | | 17,026 | | | | 8,467 | |
Payable for fund shares redeemed | | | 221 | | | | 951 | |
Payable to custodian | | | 14 | | | | – | |
Payable for variation margin on futures contracts | | | 4 | | | | 21 | |
Income distribution payable | | | 2 | | | | – | |
Payable for securities sold short@ | | | – | | | | – | |
Swap contracts, at value †††† | | | – | | | | – | |
Options written, at value ††††† | | | – | | | | – | |
Swaptions written, at value ††††† † | | | – | | | | – | |
Reverse repurchase agreements | | | – | | | | – | |
Payable for variation margin on swap contracts | | | – | | | | – | |
Unrealized loss on forward foreign currency contracts | | | – | | | | – | |
Investment advisory fees payable | | | 143 | | | | 474 | |
Trustees fees payable | | | 7 | | | | 23 | |
CCO fees payable | | | 3 | | | | 10 | |
Accrued expense payable | | | 39 | | | | 113 | |
Total Liabilities | | | 17,459 | | | | 10,059 | |
Net Assets | | $ | 1,375,324 | | | $ | 4,545,660 | |
† Cost of investments | | $ | 1,135,290 | | | $ | 3,779,572 | |
†† Cost of affiliated investments | | | 19,873 | | | | 22,943 | |
††† Cost of foreign currency | | | – | | | | – | |
†††† Cost (Premiums received) | | | – | | | | – | |
††††† Cost (Premiums received) | | | – | | | | – | |
†††††† Cost (Premiums received) | | | – | | | | – | |
@Proceeds from securities sold short | | | – | | | | – | |
* Includes market value of securities on loan | | | – | | | | – | |
Net Assets: | | | | | | | | |
Paid-in Capital — (unlimited authorization — no par value) | | $ | 1,071,402 | | | $ | 3,648,841 | |
Total distributable earnings (loss) | | | 303,922 | | | | 896,819 | |
Net Assets | | $ | 1,375,324 | | | $ | 4,545,660 | |
Net Asset Value, Offering and Redemption Price Per Share — Class A | | | $10.07 | | | | $12.63 | |
| | |
| ($1,375,324,350 ÷
136,626,417 shares) |
| |
| ($4,545,660,176 ÷
359,911,436 shares) |
|
Amounts designated as “—” are $0 or have been rounded to $0.
The accompanying notes are an integral part of the financial statements.
| | |
326 | | SEI Institutional Investments Trust / Annual Report / November 30, 2020 |
| | | | | | | | | | | | | | | | | | | | | | | | | | |
| | | | | | | |
Ultra Short
Duration Bond Fund | | | Emerging
Markets Debt Fund | | | Real Return
Fund | | | Limited Duration
Bond Fund | | | Intermediate
Duration Credit Fund | | | Dynamic Asset Allocation Fund | | | Multi-Asset
Real Return
Fund | |
| $ | 571,844 | | | $ | 2,129,146 | * | | $ | 286,586 | | | $ | 1,378,224 | | | $ | 3,496,428 | | | $ | 1,826,193 | | | $ | 996,297 | |
| | 10,863 | | | | 3,955 | | | | – | | | | 5,858 | | | | 70,535 | | | | – | | | | – | |
| | 7,400 | | | | – | | | | – | | | | – | | | | – | | | | – | | | | – | |
| | – | | | | 84,150 | | | | 1,998 | | | | 1,903 | | | | 60 | | | | 170,958 | | | | 103,297 | |
| | – | | | | 854 | | | | – | | | | – | | | | – | | | | – | | | | 747 | |
| | – | | | | 4,220 | | | | – | | | | – | | | | – | | | | – | | | | 3,349 | |
| | 76 | | | | 2,123 | | | | – | | | | 382 | | | | – | | | | 12,012 | | | | 11,544 | |
| | – | | | | 15,447 | | | | – | | | | – | | | | – | | | | – | | | | 72 | |
| | 25 | | | | 1,370 | | | | 5,343 | | | | 12,253 | | | | 466 | | | | 173 | | | | 4,413 | |
| | 1,103 | | | | 31,440 | | | | 313 | | | | 3,302 | | | | 24,119 | | | | 2,768 | | | | 2,802 | |
| | – | | | | 16,254 | | | | – | | | | 13,318 | | | | 1,592 | | | | – | | | | 150 | |
| | 14 | | | | – | | | | – | | | | 46 | | | | – | | | | 47 | | | | 21 | |
| | 6 | | | | 59 | | | | – | | | | 1 | | | | 2 | | | | – | | | | 1,136 | |
| | – | | | | 14,596 | | | | – | | | | – | | | | – | | | | 42 | | | | 1,471 | |
| | – | | | | 18 | | | | – | | | | – | | | | – | | | | – | | | | – | |
| | – | | | | 5,270 | | | | – | | | | – | | | | – | | | | – | | | | 2,876 | |
| | – | | | | – | | | | – | | | | – | | | | – | | | | – | | | | 1,211 | |
| | – | | | | – | | | | – | | | | – | | | | – | | | | 23,193 | | | | – | |
| | – | | | | 149 | | | | – | | | | – | | | | – | | | | – | | | | 23 | |
| | 7 | | | | 28 | | | | 4 | | | | 17 | | | | 45 | | | | 23 | | | | 10 | |
| | 591,338 | | | | 2,309,079 | | | | 294,244 | | | | 1,415,304 | | | | 3,593,247 | | | | 2,035,409 | | | | 1,129,419 | |
| | – | | | | 3,954 | | | | – | | | | – | | | | – | | | | – | | | | – | |
| | 11,139 | | | | 33,882 | | | | – | | | | 55,416 | | | | 9,042 | | | | 8,516 | | | | 7,496 | |
| | 50 | | | | 1,326 | | | | 12 | | | | 133 | | | | – | | | | 2,352 | | | | 19 | |
| | 41 | | | | – | | | | – | | | | – | | | | – | | | | – | | | | – | |
| | – | | | | 79 | | | | – | | | | 2 | | | | – | | | | 666 | | | | 1,139 | |
| | 1 | | | | – | | | | – | | | | 57 | | | | – | | | | – | | | | – | |
| | – | | | | – | | | | – | | | | – | | | | – | | | | – | | | | 107,697 | |
| | – | | | | 179 | | | | – | | | | – | | | | – | | | | 17,471 | | | | 4,943 | |
| | – | | | | – | | | | – | | | | – | | | | – | | | | – | | | | 300 | |
| | – | | | | – | | | | – | | | | – | | | | – | | | | – | | | | 15 | |
| | – | | | | – | | | | – | | | | – | | | | – | | | | – | | | | 235,656 | |
| | – | | | | 155 | | | | – | | | | – | | | | – | | | | – | | | | 173 | |
| | – | | | | 17,323 | | | | – | | | | – | | | | – | | | | 107 | | | | 2,419 | |
| | 47 | | | | 656 | | | | – | | | | 100 | | | | 378 | | | | 97 | | | | 119 | |
| | 3 | | | | 12 | | | | 1 | | | | 7 | | | | 19 | | | | 10 | | | | 4 | |
| | 1 | | | | 5 | | | | 1 | | | | 3 | | | | 8 | | | | 4 | | | | 2 | |
| | 13 | | | | 244 | | | | 8 | | | | 36 | | | | 82 | | | | 50 | | | | 46 | |
| | 11,295 | | | | 57,815 | | | | 22 | | | | 55,754 | | | | 9,529 | | | | 29,273 | | | | 360,028 | |
| $ | 580,043 | | | $ | 2,251,264 | | | $ | 294,222 | | | $ | 1,359,550 | | | $ | 3,583,718 | | | $ | 2,006,136 | | | $ | 769,391 | |
| $ | 576,650 | | | $ | 2,108,780 | | | $ | 275,942 | | | $ | 1,363,461 | | | $ | 3,180,954 | | | $ | 749,354 | | | $ | 931,622 | |
| | 10,863 | | | | 3,955 | | | | – | | | | 5,858 | | | | 70,535 | | | | – | | | | – | |
| | – | | | | 15,181 | | | | – | | | | – | | | | – | | | | – | | | | 70 | |
| | – | | | | – | | | | – | | | | – | | | | – | | | | – | | | | 181 | |
| | – | | | | – | | | | – | | | | – | | | | – | | | | – | | | | 653 | |
| | – | | | | – | | | | – | | | | – | | | | – | | | | 15,467 | | | | (478 | ) |
| | – | | | | – | | | | – | | | | – | | | | – | | | | – | | | | 84,283 | |
| | – | | | | 3,823 | | | | – | | | | – | | | | – | | | | – | | | | – | |
| $ | 581,472 | | | $ | 2,295,204 | | | $ | 287,750 | | | $ | 1,331,386 | | | $ | 3,191,657 | | | $ | 694,349 | | | $ | 911,453 | |
| | (1,429 | ) | | | (43,940 | ) | | | 6,472 | | | | 28,164 | | | | 392,061 | | | | 1,311,787 | | | | (142,062 | ) |
| $ | 580,043 | | | $ | 2,251,264 | | | $ | 294,222 | | | $ | 1,359,550 | | | $ | 3,583,718 | | | $ | 2,006,136 | | | $ | 769,391 | |
| | $10.03 | | | | $10.23 | | | | $9.92 | | | | $10.20 | | | | $11.28 | | | | $23.26 | | | | $7.69 | |
| ($580,043,254 ÷
57,816,568 shares) |
| |
| ($2,251,263,947 ÷
220,087,662 shares) |
| |
| ($294,222,057 ÷
29,644,862 shares) |
| |
| ($1,359,550,382 ÷
133,313,132 shares) |
| |
| ($3,583,717,968 ÷
317,786,948 shares) |
| |
| ($2,006,135,522 ÷
86,250,277 shares) |
| |
| ($769,390,663 ÷
100,103,652 shares) |
|
| | |
SEI Institutional Investments Trust / Annual Report / November 30, 2020 | | 327 |
STATEMENTS OF OPERATIONS ($ Thousands)
For the six month period ended November 30, 2020 (Unaudited)
| | | | | | | | |
| | | |
| | | Large Cap Fund | | | Large Cap Disciplined Equity Fund | |
Investment Income: | | | | | | | | |
Dividends | | $ | 10,180 | | | $ | 13,228 | |
Income from affiliated investments(1) | | | 1 | | | | 4 | |
Interest income | | | – | | | | – | |
Security lending income — net(1)(2) | | | 74 | | | | 7 | |
Less: foreign taxes withheld | | | (38 | ) | | | (30 | ) |
Total Investment Income | | | 10,217 | | | | 13,209 | |
Expenses: | | | | | | | | |
Investment advisory fees | | | 1,989 | | | | 2,897 | |
Administration fees | | | 249 | | | | 362 | |
Trustees’ fees | | | 10 | | | | 15 | |
Chief compliance officer fees | | | 3 | | | | 4 | |
Custodian/wire agent fees | | | 21 | | | | 32 | |
Professional fees | | | 18 | | | | 27 | |
Printing fees | | | 5 | | | | 7 | |
Registration fees | | | 5 | | | | 9 | |
Licensing fees | | | – | | | | – | |
Other expenses | | | 30 | | | | 45 | |
Total Expenses | | | 2,330 | | | | 3,398 | |
Less: | | | | | | | | |
Waiver of investment advisory fees | | | (1,194 | ) | | | (1,738 | ) |
Waiver of administration fees | | | (249 | ) | | | (362 | ) |
Net Expenses | | | 887 | | | | 1,298 | |
| Net Investment Income | | 9,330 | | | 11,911 | |
Net Realized Gain (Loss) on: | | | | | | | | |
Investments | | | 63,085 | | | | 151,459 | |
Affiliated investments | | | 3 | | | | 1 | |
Futures contracts | | | 2,736 | | | | 4,791 | |
Swap contracts | | | – | | | | (2,882 | ) |
Net Change in Unrealized Appreciation (Depreciation) on: | | | | | | | | |
Investments | | | 100,894 | | | | 83,244 | |
Affiliated investments | | | (8 | ) | | | (5 | ) |
Futures contracts | | | (242 | ) | | | 2,499 | |
Swap contracts | | | – | | | | (975 | ) |
Foreign currency translation of other assets and liabilities denominated in foreign currencies | | | – | | | | 1 | |
Net Increase in Net Assets Resulting from Operations | | $ | 175,798 | | | $ | 250,044 | |
(1) See Note 6 in the Notes to Financial Statements.
(2) Income is from the investment of collateral in an affiliated security.
Amounts designated as “—” are $0 or have been rounded to $0.
The accompanying notes are an integral part of the financial statements.
| | |
328 | | SEI Institutional Investments Trust / Semi-Annual Report / November 30, 2020 |
| | | | | | | | | | | | | | | | | | | | | | | | | | |
Large Cap Index Fund | | | S&P 500 Index Fund | | | Extended Market Index Fund | | | Small Cap Fund | | | Small Cap II Fund | | | Small/Mid Cap Equity Fund | | | U.S. Equity Factor Allocation Fund | |
| | | | | | |
| $ | 15,390 | | | $ | 40,786 | | | $ | 7,492 | | | $ | 2,092 | | | $ | 2,419 | | | $ | 7,278 | | | $ | 8,627 | |
| | 3 | | | | 7 | | | | 13 | | | | – | | | | 1 | | | | 3 | | | | 1 | |
| | – | | | | – | | | | – | | | | 5 | | | | – | | | | – | | | | – | |
| | 38 | | | | 50 | | | | 495 | | | | 62 | | | | 129 | | | | 269 | | | | – | |
| | – | | | | – | | | | (8 | ) | | | (3 | ) | | | (7 | ) | | | (26 | ) | | | – | |
| | 15,431 | | | | 40,843 | | | | 7,992 | | | | 2,156 | | | | 2,542 | | | | 7,524 | | | | 8,628 | |
| | | | | | |
| | 476 | | | | 733 | | | | 822 | | | | 812 | | | | 1,134 | | | | 3,187 | | | | 1,101 | |
| | 476 | | | | 1,222 | | | | 342 | | | | 62 | | | | 87 | | | | 245 | | | | 220 | |
| | 19 | | | | 48 | | | | 13 | | | | 2 | | | | 3 | | | | 10 | | | | 9 | |
| | 5 | | | | 13 | | | | 3 | | | | 1 | | | | 1 | | | | 3 | | | | 2 | |
| | 40 | | | | 99 | | | | 27 | | | | 5 | | | | 7 | | | | 20 | | | | 9 | |
| | 35 | | | | 89 | | | | 24 | | | | 5 | | | | 6 | | | | 18 | | | | 16 | |
| | 9 | | | | 22 | | | | 6 | | | | 1 | | | | 2 | | | | 5 | | | | 4 | |
| | 9 | | | | 23 | | | | 6 | | | | 2 | | | | 2 | | | | 5 | | | | 4 | |
| | – | | | | 284 | | | | – | | | | – | | | | – | | | | – | | | | – | |
| | 141 | | | | 140 | | | | 101 | | | | 8 | | | | 10 | | | | 28 | | | | 25 | |
| | 1,210 | | | | 2,673 | | | | 1,344 | | | | 898 | | | | 1,252 | | | | 3,521 | | | | 1,390 | |
| | | | | | |
| | (381 | ) | | | (489 | ) | | | (616 | ) | | | (285 | ) | | | (416 | ) | | | (1,275 | ) | | | (1,101 | ) |
| | (476 | ) | | | (1,222 | ) | | | (342 | ) | | | (62 | ) | | | (87 | ) | | | (245 | ) | | | (220 | ) |
| | 353 | | | | 962 | | | | 386 | | | | 551 | | | | 749 | | | | 2,001 | | | | 69 | |
| | 15,078 | | | | 39,881 | | | | 7,606 | | | | 1,605 | | | | 1,793 | | | | 5,523 | | | | 8,559 | |
| | | | | | |
| | 3,115 | | | | (12,894 | ) | | | (3,442 | ) | | | 19,049 | | | | 34,372 | | | | 54,094 | | | | (7,347 | ) |
| | 2 | | | | 12 | | | | (24 | ) | | | – | | | | – | | | | 8 | | | | – | |
| | 2,247 | | | | 21,111 | | | | 2,247 | | | | 19 | | | | 469 | | | | 569 | | | | 4,226 | |
| | – | | | | – | | | | – | | | | 2 | | | | – | | | | – | | | | – | |
| | | | | | |
| | 359,768 | | | | 843,373 | | | | 429,431 | | | | 42,045 | | | | 64,279 | | | | 164,083 | | | | 153,344 | |
| | (19 | ) | | | (19 | ) | | | (67 | ) | | | (5 | ) | | | (12 | ) | | | (43 | ) | | | – | |
| | (372 | ) | | | (4,600 | ) | | | 1,334 | | | | – | | | | – | | | | (360 | ) | | | (2,103 | ) |
| | – | | | | – | | | | – | | | | – | | | | – | | | | – | | | | – | |
| | – | | | | – | | | | – | | | | – | | | | – | | | | – | | | | – | |
| $ | 379,819 | | | $ | 886,864 | | | $ | 437,085 | | | $ | 62,715 | | | $ | 100,901 | | | $ | 223,874 | | | $ | 156,679 | |
| | |
SEI Institutional Investments Trust / Semi-Annual Report / November 30, 2020 | | 329 |
STATEMENTS OF OPERATIONS ($ Thousands)
For the six month period ended November 30, 2020 (Unaudited)
| | | | | | | | | | | | |
| | | U.S. Managed Volatility Fund | | | Global Managed Volatility Fund | | | World Equity Ex-US Fund | |
Investment Income: | | | | | | | | | | | | |
Dividends | | $ | 15,643 | | | $ | 38,523 | | | $ | 90,218 | |
Income from affiliated investments(1) | | | 2 | | | | 3 | | | | 6 | |
Interest income | | | 5 | | | | (5 | ) | | | 2 | |
Security lending income — net(1)(2) | | | 55 | | | | – | | | | 1,216 | |
Less: foreign taxes withheld | | | (119 | ) | | | (1,655 | ) | | | (8,914 | ) |
Total Investment Income | | | 15,586 | | | | 36,866 | | | | 82,528 | |
Expenses: | | | | | | | | | | | | |
Investment advisory fees | | | 4,090 | | | | 9,210 | | | | 24,657 | |
Administration fees | | | 315 | | | | 708 | | | | 2,242 | |
Trustees’ fees | | | 13 | | | | 29 | | | | 91 | |
Chief compliance officer fees | | | 3 | | | | 8 | | | | 24 | |
Custodian/wire agent fees | | | 28 | | | | 99 | | | | 463 | |
Professional fees | | | 24 | | | | 54 | | | | 165 | |
Registration fees | | | 7 | | | | 14 | | | | 44 | |
Printing fees | | | 6 | | | | 13 | | | | 42 | |
Other expenses | | | 40 | | | | 86 | | | | 267 | |
Total Expenses | | | 4,526 | | | | 10,221 | | | | 27,995 | |
Less: | | | | | | | | | | | | |
Waiver of investment advisory fees | | | (2,958 | ) | | | (6,093 | ) | | | (12,553 | ) |
Waiver of administration fees | | | (315 | ) | | | (708 | ) | | | (2,242 | ) |
Fees paid indirectly(1) | | | – | | | | – | | | | (34 | ) |
Net Expenses | | | 1,253 | | | | 3,420 | | | | 13,166 | |
Net Investment Income | | | 14,333 | | | | 33,446 | | | | 69,362 | |
Net Realized Gain (Loss) on: | | | | | | | | | | | | |
Investments | | | 29,946 | | | | 4,679 | | | | 283,475 | |
Affiliated investments | | | – | | | | – | | | | (13 | ) |
Futures contracts | | | 2,496 | | | | 6,263 | | | | 21,550 | |
Foreign currency transactions | | | 22 | | | | 1,000 | | | | 5,644 | |
Foreign forward currency contracts | | | – | | | | (28,678 | ) | | | (12,028 | ) |
Purchased and written options | | | – | | | | – | | | | – | |
Purchased and written swaptions | | | – | | | | – | | | | – | |
Swap contracts | | | – | | | | – | | | | – | |
Net Change in Unrealized Appreciation (Depreciation) on: | | | | | | | | | | | | |
Investments | | | 75,317 | | | | 207,971 | | | | 1,541,284 | |
Affiliated investments | | | (4 | ) | | | – | | | | (26 | ) |
Futures contracts | | | (578 | ) | | | 81 | | | | (2,055 | ) |
Purchased and written options | | | – | | | | – | | | | – | |
Purchased and written swaptions | | | – | | | | – | | | | – | |
Swap contracts | | | – | | | | – | | | | – | |
Foreign capital gains tax on appreciated securities | | | – | | | | – | | | | (3,423 | ) |
Foreign currency translation of other assets and liabilities denominated in foreign currencies | | | (2 | ) | | | 652 | | | | 7,929 | |
Foreign forward currency contracts | | | – | | | | (2,354 | ) | | | 5 | |
Net Increase in Net Assets Resulting from Operations | | $ | 121,530 | | | $ | 223,060 | | | $ | 1,911,704 | |
(1) See Note 6 in the Notes to Financial Statements.
(2) Income is from the investment of collateral in an affiliated security.
Amounts designated as “—” are $0 or have been rounded to $0.
The accompanying notes are an integral part of the financial statements.
| | |
330 | | SEI Institutional Investments Trust / Semi-Annual Report / November 30, 2020 |
| | | | | | | | | | | | | | | | | | | | | | |
| | | | | | |
Screened World Equity Ex-US Fund | | | World Select Equity Fund | | | Emerging Markets Equity Fund | | | Opportunistic Income Fund | | | Core Fixed Income Fund | | | High Yield Bond Fund | |
| | | | | |
| $ | 1,346 | | | $ | 5,463 | | | $ | 17,332 | | | | – | | | | – | | | $ | 1,264 | |
| | – | | | | 1 | | | | 1 | | | | 3 | | | | 40 | | | | 5 | |
| | – | | | | – | | | | – | | | | 15,610 | | | | 78,789 | | | | 83,779 | |
| | – | | | | – | | | | – | | | | – | | | | 1 | | | | – | |
| | (113 | ) | | | (338 | ) | | | (1,638 | ) | | | (1 | ) | | | (77 | ) | | | – | |
| | 1,233 | | | | 5,126 | | | | 15,695 | | | | 15,612 | | | | 78,753 | | | | 85,048 | |
| | | | | |
| | 338 | | | | 1,304 | | | | 5,910 | | | | 2,232 | | | | 11,774 | | | | 6,045 | |
| | 26 | | | | 119 | | | | 281 | | | | 248 | | | | 1,787 | | | | 620 | |
| | 1 | | | | 5 | | | | 11 | | | | 10 | | | | 82 | | | | 25 | |
| | – | | | | 1 | | | | 3 | | | | 3 | | | | 21 | | | | 7 | |
| | 53 | | | | 170 | | | | 335 | | | | 23 | | | | 175 | | | | 53 | |
| | 2 | | | | 9 | | | | 21 | | | | 19 | | | | 150 | | | | 46 | |
| | 1 | | | | 3 | | | | 6 | | | | 6 | | | | 39 | | | | 13 | |
| | 1 | | | | 2 | | | | 5 | | | | 5 | | | | 37 | | | | 12 | |
| | 3 | | | | 16 | | | | 34 | | | | 32 | | | | 239 | | | | 75 | |
| | 425 | | | | 1,629 | | | | 6,606 | | | | 2,578 | | | | 14,304 | | | | 6,896 | |
| | | | | |
| | (210 | ) | | | (569 | ) | | | (2,890 | ) | | | (1,182 | ) | | | (7,849 | ) | | | (2,697 | ) |
| | (26 | ) | | | (119 | ) | | | (281 | ) | | | (248 | ) | | | (1,787 | ) | | | (620 | ) |
| | – | | | | – | | | | – | | | | – | | | | – | | | | – | |
| | 189 | | | | 941 | | | | 3,435 | | | | 1,148 | | | | 4,668 | | | | 3,579 | |
| | 1,044 | | | | 4,185 | | | | 12,260 | | | | 14,464 | | | | 74,085 | | | | 81,469 | |
| | | | | |
| | 8,126 | | | | 1,903 | | | | 23,997 | | | | 1,463 | | | | 100,750 | | | | (5,155 | ) |
| | – | | | | – | | | | – | | | | – | | | | (5 | ) | | | – | |
| | 256 | | | | 6,180 | | | | 4,689 | | | | (31 | ) | | | 278 | | | | – | |
| | 58 | | | | 5,164 | | | | (151 | ) | | | – | | | | 138 | | | | – | |
| | (118 | ) | | | 261 | | | | – | | | | – | | | | (272 | ) | | | – | |
| | – | | | | (1,510 | ) | | | – | | | | – | | | | 859 | | | | – | |
| | – | | | | – | | | | – | | | | – | | | | 631 | | | | – | |
| | – | | | | – | | | | – | | | | – | | | | (20,532 | ) | | | 106 | |
| | | | | |
| | 13,232 | | | | 81,943 | | | | 241,615 | | | | 28,441 | | | | 62,764 | | | | 228,634 | |
| | – | | | | – | | | | – | | | | – | | | | 2 | | | | – | |
| | (27 | ) | | | (948 | ) | | | (207 | ) | | | (35 | ) | | | (2,866 | ) | | | – | |
| | – | | | | (61 | ) | | | – | | | | – | | | | (402 | ) | | | – | |
| | – | | | | – | | | | – | | | | – | | | | (633 | ) | | | – | |
| | – | | | | – | | | | – | | | | – | | | | 28,104 | | | | 358 | |
| | (82 | ) | | | (65 | ) | | | (1,456 | ) | | | – | | | | – | | | | – | |
| | | | | |
| | 15 | | | | (10 | ) | | | 155 | | | | – | | | | 61 | | | | 6 | |
| | 22 | | | | (412 | ) | | | – | | | | – | | | | 941 | | | | – | |
| $ | 22,526 | | | $ | 96,630 | | | $ | 280,902 | | | $ | 44,302 | | | $ | 243,903 | | | $ | 305,418 | |
| | |
SEI Institutional Investments Trust / Semi-Annual Report / November 30, 2020 | | 331 |
STATEMENTS OF OPERATIONS / CONSOLIDATED STATEMENTS OF OPERATIONS ($ Thousands)
For the six month period ended November 30, 2020 (Unaudited)
| | | | | | | | | | | | |
| | | | |
| | | Long Duration Fund | | | Long Duration Credit Fund | | | Ultra Short Duration Bond Fund | |
Investment Income: | | | | | | | | | | | | |
Dividends | | $ | – | | | $ | – | | | $ | – | |
Income from affiliated investments(1) | | | 1 | | | | 3 | | | | 1 | |
Interest income | | | 21,375 | | | | 68,974 | | | | 4,012 | |
Less: foreign taxes withheld | | | – | | | | – | | | | – | |
Total Investment Income | | | 21,376 | | | | 68,977 | | | | 4,013 | |
Expenses: | | | | | | | | | | | | |
Investment advisory fees | | | 2,012 | | | | 6,464 | | | | 431 | |
Administration fees | | | 335 | | | | 1,077 | | | | 144 | |
Trustees’ fees | | | 14 | | | | 45 | | | | 6 | |
Chief compliance officer fees | | | 4 | | | | 12 | | | | 2 | |
Custodian/wire agent fees | | | 31 | | | | 96 | | | | 12 | |
Professional fees | | | 26 | | | | 83 | | | | 11 | |
Registration fees | | | 7 | | | | 22 | | | | 3 | |
Printing fees | | | 6 | | | | 20 | | | | 3 | |
Interest expense on reverse repurchase agreements | | | – | | | | – | | | | – | |
Dividend expense on securities sold short | | | – | | | | – | | | | – | |
Other expenses | | | 43 | | | | 133 | | | | 17 | |
Total Expenses | | | 2,478 | | | | 7,952 | | | | 629 | |
Less: | | | | | | | | | | | | |
Waiver of investment advisory fees | | | (1,140 | ) | | | (3,663 | ) | | | (144 | ) |
Waiver of administration fees | | | (335 | ) | | | (1,077 | ) | | | (144 | ) |
Net Expenses | | | 1,003 | | | | 3,212 | | | | 341 | |
Net Investment Income | | | 20,373 | | | | 65,765 | | | | 3,672 | |
Net Realized Gain (Loss) on: | | | | | | | | | | | | |
Investments | | | 30,754 | | | | 81,537 | | | | 228 | |
Securities sold short | | | – | | | | – | | | | – | |
Affiliated investments | | | – | | | | – | | | | – | |
Futures contracts | | | 105 | | | | 506 | | | | 3 | |
Foreign currency transactions | | | – | | | | – | | | | – | |
Foreign forward currency contracts | | | – | | | | – | | | | – | |
Purchased and written options | | | – | | | | – | | | | – | |
Purchased and written swaptions | | | – | | | | – | | | | – | |
Swap contracts | | | – | | | | – | | | | – | |
Net Change in Unrealized Appreciation (Depreciation) on: | | | | | |
Investments | | | 37,281 | | | | 164,418 | | | | 2,708 | |
Securities sold short | | | – | | | | – | | | | – | |
Futures contracts | | | (117 | ) | | | (191 | ) | | | 4 | |
Purchased and written options | | | – | | | | – | | | | – | |
Purchased and written swaptions | | | – | | | | – | | | | – | |
Swap contracts | | | – | | | | – | | | | – | |
Foreign currency translation of other assets and liabilities denominated in foreign currencies | | | – | | | | – | | | | – | |
Foreign forward currency contracts | | | – | | | | – | | | | – | |
Net Increase in Net Assets Resulting from Operations | | $ | 88,396 | | | $ | 312,035 | | | $ | 6,615 | |
(1) See Note 6 in the Notes to Financial Statements.
Amounts designated as “—” are $0 or have been rounded to $0.
The accompanying notes are an integral part of the financial statements.
| | |
332 | | SEI Institutional Investments Trust / Semi-Annual Report / November 30, 2020 |
| | | | | | | | | | | | | | | | | | | | | | |
| | | | | | |
Emerging Markets Debt Fund | | | Real Return Fund | | | Limited Duration Bond Fund | | | Intermediate Duration Credit Fund | | | Dynamic Asset Allocation Fund | | | Multi-Asset Real Return Fund | |
| | | | | |
| $ | – | | | $ | – | | | $ | – | | | $ | – | | | $ | 14,274 | | | $ | 3,004 | |
| | – | | | | – | | | | 2 | | | | 5 | | | | – | | | | – | |
| | 57,069 | | | | 2,421 | | | | 10,238 | | | | 48,626 | | | | 8 | | | | 7,489 | |
| | (1,232 | ) | | | – | | | | – | | | | – | | | | (4 | ) | | | – | |
| | 55,837 | | | | 2,421 | | | | 10,240 | | | | 48,631 | | | | 14,278 | | | | 10,493 | |
| | | | | |
| | 9,228 | | | | 318 | | | | 1,653 | | | | 4,307 | | | | 5,599 | | | | 2,089 | |
| | 543 | | | | 72 | | | | 331 | | | | 861 | | | | 467 | | | | 190 | |
| | 22 | | | | 3 | | | | 14 | | | | 36 | | | | 19 | | | | 8 | |
| | 6 | | | | 1 | | | | 4 | | | | 9 | | | | 5 | | | | 2 | |
| | 298 | | | | 2 | | | | 30 | | | | 77 | | | | 20 | | | | 26 | |
| | 41 | | | | 6 | | | | 26 | | | | 66 | | | | 35 | | | | 15 | |
| | 11 | | | | 2 | | | | 7 | | | | 16 | | | | 10 | | | | 5 | |
| | 10 | | | | 1 | | | | 6 | | | | 16 | | | | 9 | | | | 4 | |
| | – | | | | – | | | | – | | | | – | | | | – | | | | 150 | |
| | – | | | | – | | | | – | | | | – | | | | – | | | | 638 | |
| | 67 | | | | 10 | | | | 42 | | | | 106 | | | | 57 | | | | 25 | |
| | 10,226 | | | | 415 | | | | 2,113 | | | | 5,494 | | | | 6,221 | | | | 3,152 | |
| | | | | |
| | (5,320 | ) | | | (318 | ) | | | (1,058 | ) | | | (2,067 | ) | | | (5,039 | ) | | | (1,393 | ) |
| | (543 | ) | | | (72 | ) | | | (331 | ) | | | (861 | ) | | | (467 | ) | | | (190 | ) |
| | 4,363 | | | | 25 | | | | 724 | | | | 2,566 | | | | 715 | | | | 1,569 | |
| | 51,474 | | | | 2,396 | | | | 9,516 | | | | 46,065 | | | | 13,563 | | | | 8,924 | |
| | | | | |
| | 10,708 | | | | 1,935 | | | | 8,201 | | | | 38,672 | | | | 28,041 | | | | 18,191 | |
| | – | | | | – | | | | – | | | | – | | | | – | | | | (14,633 | ) |
| | 1 | | | | – | | | | – | | | | – | | | | – | | | | – | |
| | 1,894 | | | | – | | | | 15 | | | | 49 | | | | 25,202 | | | | 9,373 | |
| | (8,372 | ) | | | – | | | | – | | | | – | | | | (10 | ) | | | 118 | |
| | (4,586 | ) | | | – | | | | – | | | | – | | | | – | | | | (835 | ) |
| | (376 | ) | | | – | | | | – | | | | – | | | | (3,912 | ) | | | (1,353 | ) |
| | – | | | | – | | | | – | | | | – | | | | – | | | | 492 | |
| | (3,695 | ) | | | – | | | | – | | | | – | | | | 34,680 | | | | 632 | |
| | | | | |
| | 156,874 | | | | 4,700 | | | | 343 | | | | 83,507 | | | | 266,517 | | | | 21,523 | |
| | – | | | | – | | | | – | | | | – | | | | – | | | | (17,259 | ) |
| | (2,015 | ) | | | – | | | | 32 | | | | (36 | ) | | | 5,529 | | | | 5,760 | |
| | 347 | | | | – | | | | – | | | | – | | | | 1,873 | | | | 357 | |
| | – | | | | – | | | | – | | | | – | | | | 3,553 | | | | 257 | |
| | 816 | | | | – | | | | – | | | | – | | | | (35,317 | ) | | | 2,472 | |
| | | | | |
| | 1,721 | | | | – | | | | – | | | | – | | | | 1 | | | | 7 | |
| | 2,061 | | | | – | | | | – | | | | – | | | | (272 | ) | | | (777 | ) |
| $ | 206,852 | | | $ | 9,031 | | | $ | 18,107 | | | $ | 168,257 | | | $ | 339,448 | | | $ | 33,249 | |
| | |
SEI Institutional Investments Trust / Semi-Annual Report / November 30, 2020 | | 333 |
STATEMENTS OF CHANGES IN NET ASSETS ($ Thousands)
For the six month period ended November 30, 2020 (Unaudited) and the year ended May 31, 2020
| | | | | | | | | | | | | | | | |
| | | |
| | | Large Cap Fund | | | Large Cap Disciplined Equity Fund | |
| | | | | |
| | | 06/01/20 to
11/30/20 | | | 06/01/19 to
05/31/20 | | | 06/01/20 to
11/30/20 | | | 06/01/19 to
05/31/20 | |
Operations: | | | | | | | | | | | | | | | | |
Net investment income | | $ | 9,330 | | | $ | 20,633 | | | $ | 11,911 | | | $ | 31,554 | |
Net realized gain (loss) from investments, securities sold short, futures contracts, options, swaptions and swap contracts | | | 65,824 | | | | 47,040 | | | | 153,369 | | | | 70,665 | |
Net change in unrealized appreciation (depreciation) on investments, securities sold short, futures contracts, options and swap contracts | | | 100,644 | | | | 6,649 | | | | 84,763 | | | | 69,320 | |
Net change in unrealized appreciation on foreign currency transactions and foreign forward currency contracts | | | — | | | | — | | | | 1 | | | | 2 | |
Net Increase (Decrease) in Net Assets Resulting from Operations | | | 175,798 | | | | 74,322 | | | | 250,044 | | | | 171,541 | |
Distributions: | | | | | | | | | | | | | | | | |
Class A | | | (8,331 | ) | | | (110,934 | ) | | | (6,474 | ) | | | (216,133 | ) |
Total Distributions | | | (8,331 | ) | | | (110,934 | ) | | | (6,474 | ) | | | (216,133 | ) |
Capital Share Transactions:(1) | | | | | | | | | | | | | | | | |
Class A: | | | | | | | | | | | | | | | | |
Proceeds from shares issued | | | 36,983 | | | | 118,737 | | | | 67,984 | | | | 107,747 | |
Reinvestment of dividends & distributions | | | 8,216 | | | | 110,081 | | | | 6,281 | | | | 210,412 | |
Cost of shares redeemed | | | (117,868 | ) | | | (341,250 | ) | | | (182,712 | ) | | | (896,549 | ) |
Net Increase (Decrease) from Class A Transactions | | | (72,669 | ) | | | (112,432 | ) | | | (108,447 | ) | | | (578,390 | ) |
Net Increase (Decrease) in Net Assets | | | 94,798 | | | | (149,044 | ) | | | 135,123 | | | | (622,982 | ) |
Net Assets | | | | | | | | | | | | | | | | |
Beginning of Period | | | 941,086 | | | | 1,090,130 | | | | 1,380,069 | | | | 2,003,051 | |
End of Period | | $ | 1,035,884 | | | $ | 941,086 | | | $ | 1,515,192 | | | $ | 1,380,069 | |
(1) See Note 7 in the Notes to Financial Statements for additional information.
Amounts designated as “—” are $0 or have been rounded to $0.
The accompanying notes are an integral part of the financial statements.
| | |
334 | | SEI Institutional Investments Trust / Semi-Annual Report / November 30, 2020 |
| | | | | | | | | | | | | | | | | | | | | | | | | | | | | | | | | | | | | | |
| | | | | |
| Large Cap Index Fund | | | S&P 500 Index Fund | | | Extended Market Index Fund | | | Small Cap Fund | | | Small Cap II Fund | |
| | | | | | | | | | |
06/01/20 to
11/30/20 | | | 06/01/19 to
05/31/20 | | | 06/01/20 to
11/30/20 | | | 06/01/19 to
05/31/20 | | | 06/01/20 to
11/30/20 | | | 06/01/19 to
05/31/20 | | | 06/01/20 to
11/30/20 | | | 06/01/19 to
05/31/20 | | | 06/01/20 to
11/30/20 | | | 06/01/19 to
05/31/20 | |
| | | | | | | | | | | | | | | | | | | | | | | | | | | | | | | | | | | | | | |
| | | | | | | | | |
| $ | 15,078 | | | $ | 30,874 | | | $ | 39,881 | | | $ | 84,818 | | | $ | 7,606 | | | $ | 14,998 | | | $ | 1,605 | | | $ | 2,891 | | | $ | 1,793 | | | $ | 3,007 | |
| | | | | | | | | |
| | 5,364 | | | | 134,758 | | | | 8,229 | | | | 84,519 | | | | (1,219 | ) | | | 39,942 | | | | 19,070 | | | | 5,777 | | | | 34,841 | | | | (19,389 | ) |
| | | | | | | | | |
| | 359,377 | | | | 53,773 | | | | 838,754 | | | | 433,475 | | | | 430,698 | | | | (2,527 | ) | | | 42,040 | | | | (19,016 | ) | | | 64,267 | | | | 6,174 | |
| | | | | | | | | |
| | — | | | | — | | | | — | | | | — | | | | — | | | | — | | | | — | | | | — | | | | — | | | | — | |
| | 379,819 | | | | 219,405 | | | | 886,864 | | | | 602,812 | | | | 437,085 | | | | 52,413 | | | | 62,715 | | | | (10,348 | ) | | | 100,901 | | | | (10,208 | ) |
| | | | | | | | | | | | | | | | | | | | | | | | | | | | | | | | | | | | | | |
| | (13,991 | ) | | | (279,415 | ) | | | (35,900 | ) | | | (148,745 | ) | | | (5,918 | ) | | | (47,496 | ) | | | (903 | ) | | | (15,719 | ) | | | (1,183 | ) | | | (17,082 | ) |
| | (13,991 | ) | | | (279,415 | ) | | | (35,900 | ) | | | (148,745 | ) | | | (5,918 | ) | | | (47,496 | ) | | | (903 | ) | | | (15,719 | ) | | | (1,183 | ) | | | (17,082 | ) |
| | | | | | | | | | | | | | | | | | | | | | | | | | | | | | | | | | | | | | |
| | | | | | | | | | | | | | | | | | | | | | | | | | | | | | | | | | | | | | |
| | 88,166 | | | | 409,306 | | | | 773,299 | | | | 1,564,221 | | | | 189,036 | | | | 443,373 | | | | 8,255 | | | | 40,161 | | | | 20,307 | | | | 67,651 | |
| | 12,028 | | | | 270,466 | | | | 35,089 | | | | 145,170 | | | | 5,786 | | | | 46,311 | | | | 858 | | | | 14,930 | | | | 1,158 | | | | 16,795 | |
| | (149,030 | ) | | | (505,335 | ) | | | (385,188 | ) | | | (1,861,520 | ) | | | (174,275 | ) | | | (255,773 | ) | | | (20,459 | ) | | | (67,136 | ) | | | (38,211 | ) | | | (81,319 | ) |
| | (48,836 | ) | | | 174,437 | | | | 423,200 | | | | (152,129 | ) | | | 20,547 | | | | 233,911 | | | | (11,346 | ) | | | (12,045 | ) | | | (16,746 | ) | | | 3,127 | |
| | 316,992 | | | | 114,427 | | | | 1,274,164 | | | | 301,938 | | | | 451,714 | | | | 238,828 | | | | 50,466 | | | | (38,112 | ) | | | 82,972 | | | | (24,163 | ) |
| | | | | | | | | | | | | | | | | | | | | | | | | | | | | | | | | | | | | | |
| | 1,750,464 | | | | 1,636,037 | | | | 4,277,620 | | | | 3,975,682 | | | | 1,176,664 | | | | 937,836 | | | | 228,900 | | | | 267,012 | | | | 312,950 | | | | 337,113 | |
| $ | 2,067,456 | | | $ | 1,750,464 | | | $ | 5,551,784 | | | $ | 4,277,620 | | | $ | 1,628,378 | | | $ | 1,176,664 | | | $ | 279,366 | | | $ | 228,900 | | | $ | 395,922 | | | $ | 312,950 | |
| | |
SEI Institutional Investments Trust / Semi-Annual Report / November 30, 2020 | | 335 |
STATEMENTS OF CHANGES IN NET ASSETS ($ Thousands)
For the six month period ended November 30, 2020 (Unaudited) and the year ended May 31, 2020
| | | | | | | | | | | | | | | | | | | | | | | | |
| | | Small/Mid Cap Equity Fund | | | U.S. Equity Factor Allocation Fund | | | U.S. Managed Volatility Fund | |
| | | | | | | |
| | | 06/01/20 to
11/30/20 | | | 06/01/19 to
05/31/20 | | | 06/01/20 to
11/30/20 | | | 06/01/19 to
05/31/20 | | | 06/01/20 to
11/30/20 | | | 06/01/19 to
05/31/20 | |
Operations: | | | | | | | | | | | | | | | | | | | | | | | | |
Net investment income | | $ | 5,523 | | | $ | 13,132 | | | $ | 8,559 | | | $ | 15,924 | | | $ | 14,333 | | | $ | 30,951 | |
Net realized gain (loss) from investments, securities sold short, futures contracts, options, swaptions and swap contracts | | | 54,671 | | | | 32,042 | | | | (3,121 | ) | | | 2,506 | | | | 32,442 | | | | (7,512 | ) |
Net realized gain (loss) on foreign currency transactions and forward currency contracts | | | — | | | | — | | | | — | | | | — | | | | 22 | | | | 11 | |
Net change in unrealized appreciation (depreciation) on investments, securities sold short, futures contracts, options and swap contracts | | | 163,680 | | | | (22,602 | ) | | | 151,241 | | | | 48,314 | | | | 74,735 | | | | (22,417 | ) |
Net change in unrealized appreciation (depreciation) on foreign currency transactions and foreign forward currency contracts | | | — | | | | — | | | | — | | | | — | | | | (2 | ) | | | 9 | |
Net change in foreign capital gains tax on appreciated securities | | | — | | | | — | | | | — | | | | — | | | | — | | | | — | |
Net Increase (Decrease) in Net Assets Resulting from Operations | | | 223,874 | | | | 22,572 | | | | 156,679 | | | | 66,744 | | | | 121,530 | | | | 1,042 | |
Distributions: | | | | | | | | | | | | | | | | | | | | | | | | |
Class A | | | (4,911 | ) | | | (77,127 | ) | | | (7,168 | ) | | | (17,282 | ) | | | (12,306 | ) | | | (80,536 | ) |
Total Distributions | | | (4,911 | ) | | | (77,127 | ) | | | (7,168 | ) | | | (17,282 | ) | | | (12,306 | ) | | | (80,536 | ) |
Capital Share Transactions:(1) | | | | | | | | | | | | | | | | | | | | | | | | |
Class A: | | | | | | | | | | | | | | | | | | | | | | | | |
Proceeds from shares issued | | | 63,301 | | | | 143,384 | | | | 203,279 | | | | 70,322 | | | | 83,670 | | | | 338,375 | |
Reinvestment of dividends & distributions | | | 4,473 | | | | 75,572 | | | | 6,969 | | | | 16,547 | | | | 11,986 | | | | 78,150 | |
Cost of shares redeemed | | | (77,092 | ) | | | (463,911 | ) | | | (52,442 | ) | | | (253,316 | ) | | | (93,122 | ) | | | (301,924 | ) |
Net Increase (Decrease) from Class A Transactions | | | (9,318 | ) | | | (244,955 | ) | | | 157,806 | | | | (166,447 | ) | | | 2,534 | | | | 114,601 | |
Net Increase (Decrease) in Net Assets | | | 209,645 | | | | (299,510 | ) | | | 307,317 | | | | (116,985 | ) | | | 111,758 | | | | 35,107 | |
Net Assets | | | | | | | | | | | | | | | | | | | | | | | | |
Beginning of Period | | | 879,022 | | | | 1,178,532 | | | | 756,195 | | | | 873,180 | | | | 1,216,680 | | | | 1,181,573 | |
End of Period | | $ | 1,088,667 | | | $ | 879,022 | | | $ | 1,063,512 | | | $ | 756,195 | | | $ | 1,328,438 | | | $ | 1,216,680 | |
(1) See Note 7 in the Notes to Financial Statements for additional information.
Amounts designated as “—” are $0 or have been rounded to $0.
The accompanying notes are an integral part of the financial statements.
| | |
336 | | SEI Institutional Investments Trust / Semi-Annual Report / November 30, 2020 |
| | | | | | | | | | | | | | | | | | | | | | | | | | | | | | |
| Global Managed Volatility Fund | | | World Equity Ex-US Fund | | | Screened World Equity Ex-US Fund | | | World Select Equity Fund | |
06/01/20 to
11/30/20 | | | 06/01/19 to
05/31/20 | | | 06/01/20 to
11/30/20 | | | 06/01/19 to
05/31/20 | | | 06/01/20 to
11/30/20 | | | 06/01/19 to
05/31/20 | | | 06/01/20 to
11/30/20 | | | 06/01/19 to
05/31/20 | |
| | | | | | | | | | | | | | | | | | | | | | | | | | | | | | |
| $ | 33,446 | | | $ | 68,696 | | | $ | 69,362 | | | $ | 152,302 | | | $ | 1,044 | | | $ | 1,912 | | | $ | 4,185 | | | $ | 14,008 | |
| | | | | | | |
| | 10,942 | | | | (5,424 | ) | | | 305,012 | | | | (109,035 | ) | | | 8,382 | | | | (4,803 | ) | | | 6,573 | | | | (46,222 | ) |
| | | | | | | |
| | (27,678) | | | | 15,296 | | | | (6,384 | ) | | | 2,563 | | | | (60 | ) | | | (20 | ) | | | 5,425 | | | | 2,011 | |
| | | | | | | |
| | 208,052 | | | | (89,917 | ) | | | 1,539,203 | | | | (3,474 | ) | | | 13,205 | | | | 3,739 | | | | 80,934 | | | | 30,148 | |
| | | | | | | |
| | (1,702) | | | | (3,640 | ) | | | 7,934 | | | | (3,561 | ) | | | 37 | | | | (27 | ) | | | (422 | ) | | | 1,048 | |
| | — | | | | — | | | | (3,423 | ) | | | 223 | | | | (82 | ) | | | — | | | | (65 | ) | | | — | |
| | 223,060 | | | | (14,989 | ) | | | 1,911,704 | | | | 39,018 | | | | 22,526 | | | | 801 | | | | 96,630 | | | | 993 | |
| | | | | | | | | | | | | | | | | | | | | | | | | | | | | | |
| | — | | | | (130,679 | ) | | | — | | | | (222,407 | ) | | | — | | | | (3,025 | ) | | | — | | | | (23,564 | ) |
| | — | | | | (130,679 | ) | | | — | | | | (222,407 | ) | | | — | | | | (3,025 | ) | | | — | | | | (23,564 | ) |
| | | | | | | | | | | | | | | | | | | | | | | | | | | | | | |
| | | | | | | | | | | | | | | | | | | | | | | | | | | | | | |
| | 154,124 | | | | 754,519 | | | | 370,329 | | | | 1,256,886 | | | | 2,590 | | | | 9,100 | | | | 10,483 | | | | 62,075 | |
| | — | | | | 126,013 | | | | — | | | | 216,678 | | | | — | | | | 1,716 | | | | — | | | | 23,564 | |
| | (190,843) | | | | (486,870 | ) | | | (710,502 | ) | | | (1,502,133 | ) | | | (13,856 | ) | | | (6,394 | ) | | | (70,382 | ) | | | (571,949 | ) |
| | (36,719) | | | | 393,662 | | | | (340,173 | ) | | | (28,569 | ) | | | (11,266 | ) | | | 4,422 | | | | (59,899 | ) | | | (486,310 | ) |
| | 186,341 | | | | 247,994 | | | | 1,571,531 | | | | (211,958 | ) | | | 11,260 | | | | 2,198 | | | | 36,731 | | | | (508,881 | ) |
| | | | | | | | | | | | | | | | | | | | | | | | | | | | | | |
| | 2,738,825 | | | | 2,490,831 | | | | 8,115,314 | | | | 8,327,272 | | | | 101,167 | | | | 98,969 | | | | 476,296 | | | | 985,177 | |
| $ | 2,925,166 | | | $ | 2,738,825 | | | $ | 9,686,845 | | | $ | 8,115,314 | | | $ | 112,427 | | | $ | 101,167 | | | $ | 513,027 | | | $ | 476,296 | |
| | |
SEI Institutional Investments Trust / Semi-Annual Report / November 30, 2020 | | 337 |
STATEMENTS OF CHANGES IN NET ASSETS ($ Thousands)
For the six month period ended November 30, 2020 (Unaudited) and the year ended May 31, 2020
| | | | | | | | | | | | | | | | | | | | | | | | |
| | | Emerging Markets Equity Fund | | | Opportunistic Income Fund | | | Core Fixed Income Fund | |
| | | | | | | |
| | | 06/01/20 to
11/30/20 | | | 06/01/19 to
05/31/20 | | | 06/01/20 to
11/30/20 | | | 06/01/19 to
05/31/20 | | | 06/01/20 to
11/30/20 | | | 06/01/19 to
05/31/20 | |
Operations: | | | | | | | | | | | | | | | | | | | | | | | | |
Net investment income | | $ | 12,260 | | | $ | 18,158 | | | $ | 14,464 | | | $ | 44,980 | | | $ | 74,085 | | | $ | 204,912 | |
Net realized gain (loss) from investments, securities sold short, futures contracts, options, swaptions and swap contracts | | | 28,686 | | | | (47,111 | ) | | | 1,432 | | | | (10,109 | ) | | | 81,981 | | | | 402,455 | |
Net realized loss on foreign currency transactions and forward currency contracts | | | (151 | ) | | | (634 | ) | | | — | | | | (8 | ) | | | (134 | ) | | | (6,139 | ) |
Net change in unrealized appreciation (depreciation) on investments, securities sold short, futures contracts, options and swap contracts | | | 241,408 | | | | (22,567 | ) | | | 28,406 | | | | (38,601 | ) | | | 86,969 | | | | 94,318 | |
Net change in unrealized appreciation (depreciation) on foreign currency transactions and foreign forward currency contracts | | | 155 | | | | (26 | ) | | | — | | | | 6 | | | | 1,002 | | | | 417 | |
Net change in foreign capital gains tax on appreciated securities | | | (1,456 | ) | | | (110 | ) | | | — | | | | — | | | | — | | | | — | |
Net Increase (Decrease) in Net Assets Resulting from Operations | | | 280,902 | | | | (52,290 | ) | | | 44,302 | | | | (3,732 | ) | | | 243,903 | | | | 695,963 | |
Distributions: | | | | | | | | | | | | | | | | | | | | | | | | |
Class A | | | — | | | | (21,069 | ) | | | (13,657 | ) | | | (50,855 | ) | | | (85,474 | ) | | | (296,077 | ) |
Total Distributions | | | — | | | | (21,069 | ) | | | (13,657 | ) | | | (50,855 | ) | | | (85,474 | ) | | | (296,077 | ) |
Capital Share Transactions:(1) | | | | | | | | | | | | | | | | | | | | | | | | |
Class A: | | | | | | | | | | | | | | | | | | | | | | | | |
Proceeds from shares issued | | | 33,069 | | | | 267,987 | | | | 49,713 | | | | 106,467 | | | | 1,208,449 | | | | 1,712,793 | † |
Reinvestment of dividends & distributions | | | — | | | | 20,086 | | | | 13,492 | | | | 49,450 | | | | 80,815 | | | | 286,522 | |
Cost of shares redeemed | | | (116,809 | ) | | | (213,856 | ) | | | (87,153 | ) | | | (514,785 | ) | | | (744,222 | ) | | | (1,975,916 | ) |
Net Increase (Decrease) from Class A Transactions | | | (83,740 | ) | | | 74,217 | | | | (23,948 | ) | | | (358,868 | ) | | | 545,042 | | | | 23,399 | |
Net Increase (Decrease) in Net Assets | | | 197,162 | | | | 858 | | | | 6,697 | | | | (413,455 | ) | | | 703,471 | | | | 423,285 | |
Net Assets | | | | | | | | | | | | | | | | | | | | | | | | |
Beginning of Period | | | 1,008,763 | | | | 1,007,905 | | | | 975,466 | | | | 1,388,921 | | | | 7,475,630 | | | | 7,052,345 | |
End of Period | | $ | 1,205,925 | | | $ | 1,008,763 | | | $ | 982,163 | | | $ | 975,466 | | | $ | 8,179,101 | | | $ | 7,475,630 | |
† Includes subscriptions as a result of an in-kind transfer of securities (see Note 11).
(1) See Note 7 in the Notes to Financial Statements for additional information.
Amounts designated as “—” are $0 or have been rounded to $0.
The accompanying notes are an integral part of the financial statements.
| | |
338 | | SEI Institutional Investments Trust / Semi-Annual Report / November 30, 2020 |
| | | | | | | | | | | | | | | | | | | | | | | | | | | | | | |
| High Yield Bond Fund | | | Long Duration Fund | | | Long Duration Credit Fund | | | Ultra Short Duration Bond Fund | |
06/01/20 to
11/30/20 | | | 06/01/19 to
05/31/20 | | | 06/01/20 to
11/30/20 | | | 06/01/19 to
05/31/20 | | | 06/01/20 to
11/30/20 | | | 06/01/19 to
05/31/20 | | | 06/01/20 to
11/30/20 | | | 06/01/19 to
05/31/20 | |
| | | | | | | |
| | $ 81,469 | | | $ | 163,448 | | | $ | 20,373 | | | $ | 48,594 | | | $ | 65,765 | | | $ | 141,665 | | | $ | 3,672 | | | $ | 11,604 | |
| | | | | | | |
| | (5,049) | | | | (62,254 | ) | | | 30,859 | | | | 150,698 | | | | 82,043 | | | | 181,225 | | | | 231 | | | | 827 | |
| | | | | | | |
| | — | | | | (7 | ) | | | — | | | | — | | | | — | | | | — | | | | — | | | | — | |
| | | | | | | |
| | 228,992 | | | | (177,547 | ) | | | 37,164 | | | | 64,358 | | | | 164,227 | | | | 359,512 | | | | 2,712 | | | | (1,467 | ) |
| | | | | | | |
| | 6 | | | | 3 | | | | — | | | | — | | | | — | | | | — | | | | — | | | | — | |
| | — | | | | — | | | | — | | | | — | | | | — | | | | — | | | | — | | | | — | |
| | 305,418 | | | | (76,357 | ) | | | 88,396 | | | | 263,650 | | | | 312,035 | | | | 682,402 | | | | 6,615 | | | | 10,964 | |
| | | | | | | |
| | (80,076) | | | | (184,908 | ) | | | (20,349 | ) | | | (113,633 | ) | | | (65,784 | ) | | | (153,072 | ) | | | (3,940 | ) | | | (11,653 | ) |
| | (80,076) | | | | (184,908 | ) | | | (20,349 | ) | | | (113,633 | ) | | | (65,784 | ) | | | (153,072 | ) | | | (3,940 | ) | | | (11,653 | ) |
| | | | | | | |
| | 206,824 | | | | 316,490 | | | | 32,444 | | | | 81,546 | | | | 410,140 | † | | | 403,108 | | | | 77,187 | | | | 284,602 | |
| | 77,205 | | | | 180,534 | | | | 20,304 | | | | 113,613 | | | | 65,732 | | | | 153,024 | | | | 3,869 | | | | 11,573 | |
| | (148,127) | | | | (616,948 | ) | | | (43,204 | ) | | | (475,260 | ) | | | (243,361 | ) | | | (987,123 | ) | | | (84,650 | ) | | | (160,843 | ) |
| | 135,902 | | | | (119,924 | ) | | | 9,544 | | | | (280,101 | ) | | | 232,511 | | | | (430,991 | ) | | | (3,594 | ) | | | 135,332 | |
| | 361,244 | | | | (381,189 | ) | | | 77,591 | | | | (130,084 | ) | | | 478,762 | | | | 98,339 | | | | (919 | ) | | | 134,643 | |
| | | | | | | |
| | 2,300,321 | | | | 2,681,510 | | | | 1,297,733 | | | | 1,427,817 | | | | 4,066,898 | | | | 3,968,559 | | | | 580,962 | | | | 446,319 | |
| | $2,661,565 | | | $ | 2,300,321 | | | $ | 1,375,324 | | | $ | 1,297,733 | | | $ | 4,545,660 | | | $ | 4,066,898 | | | $ | 580,043 | | | $ | 580,962 | |
| | |
SEI Institutional Investments Trust / Semi-Annual Report / November 30, 2020 | | 339 |
STATEMENTS OF CHANGES IN NET ASSETS / CONSOLIDATED STATEMENTS OF CHANGES IN NET ASSETS ($ Thousands)
For the six month period ended November 30, 2020 (Unaudited) and the year ended May 31, 2020
| | | | | | | | | | | | | | | | |
| | | Emerging Markets Debt Fund | | Real Return Fund |
| | | 06/01/20 to
11/30/20 | | 06/01/19 to
05/31/20 | | 06/01/20 to
11/30/20 | | 06/01/19 to
05/31/20 |
Operations: | | | | | | | | | | | | | | | | |
Net investment income | | $ | 51,474 | | | $ | 115,529 | | | $ | 2,396 | | | $ | 5,739 | |
Net realized gain (loss) from investments, securities sold short, futures contracts, options, swaptions and swap contracts | | | 8,532 | | | | 12,673 | | | | 1,935 | | | | (390 | ) |
Net realized gain (loss) on foreign currency transactions and forward currency contracts | | | (12,958 | ) | | | (71,902 | ) | | | — | | | | — | |
Net change in unrealized appreciation (depreciation) on investments, securities sold short, futures contracts, options and swap contracts | | | 156,022 | | | | (35,379 | ) | | | 4,700 | | | | 4,459 | |
Net change in unrealized appreciation (depreciation) on foreign currency transactions and foreign forward currency contracts | | | 3,782 | | | | (2,508 | ) | | | — | | | | — | |
Net Increase (Decrease) in Net Assets Resulting from Operations | | | 206,852 | | | | 18,413 | | | | 9,031 | | | | 9,808 | |
Distributions: | | | | | | | | | | | | | | | | |
Class A | | | (18,111 | ) | | | (75,714 | ) | | | (1,621 | ) | | | (7,386 | ) |
Total Distributions | | | (18,111 | ) | | | (75,714 | ) | | | (1,621 | ) | | | (7,386 | ) |
Capital Share Transactions:(1) | | | | | | | | | | | | | | | | |
Class A: | | | | | | | | | | | | | | | | |
Proceeds from shares issued | | | 139,239 | | | | 313,438 | | | | 39,374 | | | | 97,438 | |
Reinvestment of dividends & distributions | | | 17,373 | | | | 73,796 | | | | 1,508 | | | | 6,671 | |
Cost of shares redeemed | | | (158,235 | ) | | | (511,053 | ) | | | (51,307 | ) | | | (91,098 | ) |
Net Increase (Decrease) from Class A Transactions | | | (1,623 | ) | | | (123,819 | ) | | | (10,425 | ) | | | 13,011 | |
Net Increase (Decrease) in Net Assets | | | 187,118 | | | | (181,120 | ) | | | (3,015 | ) | | | 15,433 | |
Net Assets | | | | | | | | | | | | | | | | |
Beginning of Period | | | 2,064,146 | | | | 2,245,266 | | | | 297,237 | | | | 281,804 | |
End of Period | | $ | 2,251,264 | | | $ | 2,064,146 | | | $ | 294,222 | | | $ | 297,237 | |
† Includes subscriptions as a result of an in-kind transfer of securities (see Note 11).
(1) See Note 7 in the Notes to Financial Statements for additional information.
Amounts designated as “—” are $0 or have been rounded to $0.
The accompanying notes are an integral part of the financial statements.
| | |
340 | | SEI Institutional Investments Trust / Semi-Annual Report / November 30, 2020 |
| | | | | | | | | | | | | | | | | | | | | | | | | | | | | | |
| Limited Duration Bond Fund | | | Intermediate Duration Credit Fund | | | Dynamic Asset Allocation Fund | | | Multi-Asset Real Return Fund | |
06/01/20 to
11/30/20 | | | 06/01/19 to
05/31/20 | | | 06/01/20 to
11/30/20 | | | 06/01/19 to
05/31/20 | | | 06/01/20 to
11/30/20 | | | 06/01/19 to
05/31/20 | | | 06/01/20 to
11/30/20 | | | 06/01/19 to
05/31/20 | |
| | | | | | | |
| $ | 9,516 | | | $ | 32,478 | | | $ | 46,065 | | | $ | 92,887 | | | $ | 13,563 | | | $ | 36,714 | | | $ | 8,924 | | | $ | 20,066 | |
| | | | | | | |
| | 8,216 | | | | 14,216 | | | | 38,721 | | | | 73,736 | | | | 84,011 | | | | 305,034 | | | | 12,702 | | | | (59,409 | ) |
| | — | | | | — | | | | — | | | | — | | | | (10 | ) | | | 15,857 | | | | (717 | ) | | | 40 | |
| | | | | | | |
| | 375 | | | | 7,633 | | | | 83,471 | | | | 159,567 | | | | 242,155 | | | | (98,485 | ) | | | 13,110 | | | | 4,511 | |
| | | | | | | |
| | — | | | | — | | | | — | | | | — | | | | (271 | ) | | | (12,148 | ) | | | (770 | ) | | | (258 | ) |
| | 18,107 | | | | 54,327 | | | | 168,257 | | | | 326,190 | | | | 339,448 | | | | 246,972 | | | | 33,249 | | | | (35,050 | ) |
| | | | | | | |
| | (9,954) | | | | (32,944 | ) | | | (46,108 | ) | | | (92,984 | ) | | | — | | | | (242,435 | ) | | | — | | | | (19,163 | ) |
| | (9,954) | | | | (32,944 | ) | | | (46,108 | ) | | | (92,984 | ) | | | — | | | | (242,435 | ) | | | — | | | | (19,163 | ) |
| | | | | | | |
| | 157,119 | | | | 287,161 | | | | 354,203 | † | | | 509,067 | | | | 104,428 | | | | 198,962 | | | | 39,344 | | | | 142,862 | |
| | 9,742 | | | | 32,164 | | | | 45,851 | | | | 92,935 | | | | — | | | | 234,959 | | | | — | | | | 18,449 | |
| | (100,161) | | | | (589,958 | ) | | | (261,733 | ) | | | (566,218 | ) | | | (160,444 | ) | | | (1,007,562 | ) | | | (57,393 | ) | | | (264,427 | ) |
| | 66,700 | | | | (270,633 | ) | | | 138,321 | | | | 35,784 | | | | (56,016 | ) | | | (573,641 | ) | | | (18,049 | ) | | | (103,116 | ) |
| | 74,853 | | | | (249,250 | ) | | | 260,470 | | | | 268,990 | | | | 283,432 | | | | (569,104 | ) | | | 15,200 | | | | (157,329 | ) |
| | | | | | | |
| | 1,284,697 | | | | 1,533,947 | | | | 3,323,248 | | | | 3,054,258 | | | | 1,722,704 | | | | 2,291,808 | | | | 754,191 | | | | 911,520 | |
| $ | 1,359,550 | | | $ | 1,284,697 | | | $ | 3,583,718 | | | $ | 3,323,248 | | | $ | 2,006,136 | | | $ | 1,722,704 | | | $ | 769,391 | | | $ | 754,191 | |
| | |
SEI Institutional Investments Trust / Semi-Annual Report / November 30, 2020 | | 341 |
CONSOLIDATED STATEMENT OF CASH FLOWS ($ Thousands)
For the six month period ended November 30, 2020 (Unaudited)
| | | | |
| | | Multi-Asset Real Return
Fund | |
Cash Flows from Operating Activities: | | | | |
| |
Net Increase in Net Assets from Operations | | $ | 33,249 | |
| |
Adjustments to Reconcile Net Increase in Net Assets Resulting from Operations to Net Cash Provided by Operating Activities: | | | | |
| |
Purchase of investment securities | | | (332,047 | ) |
| |
Proceeds from disposition of investment securities | | | 365,800 | |
| |
Purchased options/swaptions and purchases to cover written options/swaptions | | | (741 | ) |
| |
Proceeds from sale of options/swaptions and expired options/swaptions | | | 175 | |
| |
Purchases to cover securities sold short | | | (52,338 | ) |
| |
Proceeds from securities sold short | | | 24,392 | |
| |
Amortization (Accretion of Market Discount) | | | (2,512 | ) |
| |
Net Realized Gain (Loss) on: | | | | |
| |
Investments | | | (18,191 | ) |
| |
Options/Swaptions | | | 861 | |
| |
Securities sold short | | | 14,633 | |
| |
Net Change in Unrealized (Appreciation) Depreciation on: | | | | |
| |
Investments | | | (21,523 | ) |
| |
Options/Swaptions | | | (614 | ) |
| |
Securities sold short | | | 17,259 | |
| |
Changes in Assets: | | | | |
| |
Cash pledged as collateral on futures contracts | | | (362 | ) |
| |
Cash pledged as collateral on swap contracts | | | 1,049 | |
| |
Dividends and interest receivable | | | (145 | ) |
| |
Receivable for investment securities sold | | | 597 | |
| |
Receivable for variation margin | | | 2,011 | |
| |
Unrealized gain on forward foreign currency contracts | | | (1,398 | ) |
| |
Swap contracts, at value | | | (1,604 | ) |
| |
Due from broker | | | (747 | ) |
| |
Prepaid expenses | | | (5 | ) |
| |
Changes in Liabilities: | | | | |
| |
Payable for investment securities purchased | | | 4,550 | |
| |
Payable for variation margin | | | (1,120 | ) |
| |
Swap contracts, at value | | | (2,834 | ) |
| |
Unrealized gain on forward foreign currency contracts | | | 2,175 | |
| |
Unrealized gain on spot currency contracts | | | (3 | ) |
| |
Investment advisory fees payable | | | 4 | |
| |
Due to broker | | | (1,303 | ) |
| |
Accrued expenses payable | | | (77 | ) |
| | |
Net Cash Provided by Operating Activities | | | 29,191 | |
Cash Flows from Financing Activities | | | | |
| |
Reverse repurchase agreements | | | (3,587 | ) |
| |
Proceeds from shares issued | | | 37,522 | |
| |
Cost of shares redeemed | | | (63,611 | ) |
| | |
Net Cash Used in Financing Activities | | | (29,676 | ) |
| |
Net Change in Cash, Restricted Cash, and Foreign Currency | | | (485 | ) |
| |
Cash, Restricted Cash, and Foreign Currency at Beginning of Period | | $ | 103,854 | |
| | |
Cash, Restricted Cash, and Foreign Currency at End of Period | | $ | 103,369 | |
Supplemental Disclosure of Cash Flow Information | | | | |
| |
Interest paid | | $ | 150 | |
The accompanying notes are an integral part of the financial statements.
| | |
342 | | SEI Institutional Investments Trust / Semi-Annual Report / November 30, 2020 |
FINANCIAL HIGHLIGHTS
For the period ended November 30, 2020 (Unaudited) and the years or period ended May 31, (unless otherwise indicated) For a share outstanding throughout each period
| | | | | | | | | | | | | | | | | | | | | | | | | | | | | | | | | | | | | | | | | | | | | | | | | | | | | | | | | | | | |
| | | Net Asset
Value,
Beginning of
Period | | | Net
Investment
Income
(Loss)(1) | | | Net Realized
and Unrealized
Gains (Losses) on
Investments(1) | | | Total
from
Operations | | | Dividends
from
Net
Investment
Income | | | Distributions
from Net
Realized
Capital
Gains | | | Total
Dividends
and
Distributions | | | Net Asset
Value,
End
of Period | | | Total
Return† | | | Net Assets
End of Period
($ Thousands) | | | Ratio of Net Expenses
to Average Net Assets | | | Ratio of Expenses
to Average Net
Assets (Excluding
Fees Paid Indirectly
and Including
Waivers) | | | Ratio of Expenses
to Average
Net Assets
(Excluding Fees Paid Indirectly
and Waivers) | | | Ratio of Net
Investment
Income (Loss)
to Average
Net Assets | | | Portfolio
Turnover
Rate† | |
Large Cap Fund | | | | | | | | | | | | | | | | | | | | | | | | | | | | | | | | | | | | | | | | | | | | | | | | | |
Class A | | | | | | | | | | | | | | | | | | | | | | | | | | | | | | | | | | | | | | | | | | | | | | | | | | | | | | | | | | | | |
2020@ | | $ | 13.95 | | | $ | 0.14 | | | $ | 2.51 | | | $ | 2.65 | | | $ | (0.13 | ) | | $ | — | | | $ | (0.13 | ) | | $ | 16.47 | | | | 19.08 | % | | $ | 1,035,884 | | | | 0.18% | | | | 0.18% | | | | 0.47% | | | | 1.87% | | | | 47% | |
2020 | | | 14.73 | | | | 0.30 | | | | 0.66 | | | | 0.96 | | | | (0.29 | ) | | | (1.45 | ) | | | (1.74 | ) | | | 13.95 | | | | 5.78 | | | | 941,086 | | | | 0.18 | | | | 0.18 | | | | 0.47 | | | | 2.02 | | | | 76 | |
2019 | | | 18.93 | | | | 0.32 | | | | (0.28 | ) | | | 0.04 | | | | (0.31 | ) | | | (3.93 | ) | | | (4.24 | ) | | | 14.73 | | | | 1.49 | | | | 1,090,130 | | | | 0.19 | | | | 0.19 | | | | 0.47 | | | | 1.87 | | | | 102 | |
2018 | | | 20.42 | | | | 0.33 | | | | 2.63 | | | | 2.96 | | | | (0.39 | ) | | | (4.06 | ) | | | (4.45 | ) | | | 18.93 | | | | 15.00 | | | | 1,368,392 | | | | 0.20 | | | | 0.20 | | | | 0.47 | | | | 1.64 | | | | 68 | |
2017 | | | 18.90 | | | | 0.29 | | | | 2.19 | | | | 2.48 | | | | (0.25 | ) | | | (0.71 | ) | | | (0.96 | ) | | | 20.42 | | | | 13.44 | | | | 2,019,282 | | | | 0.20 | | | | 0.20 | | | | 0.47 | | | | 1.49 | | | | 97 | |
2016 | | | 22.89 | | | | 0.33 | | | | (0.96 | ) | | | (0.63 | ) | | | (0.32 | ) | | | (3.04 | ) | | | (3.36 | ) | | | 18.90 | | | | (2.41 | ) | | | 2,086,522 | | | | 0.20(2) | | | | 0.20(2) | | | | 0.47(2) | | | | 1.60 | | | | 73 | |
Large Cap Disciplined Equity Fund | | | | | | | | | | | | | | | | | | | | | | | | | | | | | | | | | | | | | | | | | | | | | | | | | |
Class A | | | | | | | | | | | | | | | | | | | | | | | | | | | | | | | | | | | | | | | | | | | | | | | | | | | | | | | | | | | | |
2020@ | | $ | 9.71 | | | $ | 0.09 | | | $ | 1.69 | | | $ | 1.78 | | | $ | (0.05 | ) | | $ | — | | | $ | (0.05 | ) | | $ | 11.44 | | | | 18.36 | % | | $ | 1,515,192 | | | | 0.18% | | | | 0.18% | | | | 0.47% | | | | 1.64% | | | | 77% | |
2020 | | | 10.27 | | | | 0.19 | | | | 0.65 | | | | 0.84 | | | | (0.26 | ) | | | (1.14 | ) | | | (1.40 | ) | | | 9.71 | | | | 7.23 | | | | 1,380,069 | | | | 0.18 | | | | 0.18 | | | | 0.47 | | | | 1.83 | | | | 139 | |
2019 | | | 13.58 | | | | 0.22 | | | | (0.39 | ) | | | (0.17 | ) | | | (0.22 | ) | | | (2.92 | ) | | | (3.14 | ) | | | 10.27 | | | | (0.14 | ) | | | 2,003,051 | | | | 0.19 | | | | 0.19 | | | | 0.47 | | | | 1.80 | | | | 125 | |
2018 | | | 13.87 | | | | 0.24 | | | | 1.43 | | | | 1.67 | | | | (0.25 | ) | | | (1.71 | ) | | | (1.96 | ) | | | 13.58 | | | | 12.43 | | | | 3,033,957 | | | | 0.19 | | | | 0.19 | | | | 0.47 | | | | 1.71 | | | | 134 | |
2017 | | | 12.57 | | | | 0.23 | | | | 1.75 | | | | 1.98 | | | | (0.24 | ) | | | (0.44 | ) | | | (0.68 | ) | | | 13.87 | | | | 16.23 | | | | 3,715,731 | | | | 0.19 | | | | 0.19 | | | | 0.47 | | | | 1.74 | | | | 104 | |
2016 | | | 14.38 | | | | 0.24 | | | | (0.14 | ) | | | 0.10 | | | | (0.25 | ) | | | (1.66 | ) | | | (1.91 | ) | | | 12.57 | | | | 1.34 | | | | 3,592,226 | | | | 0.19(2) | | | | 0.19(2) | | | | 0.47(2) | | | | 1.82 | | | | 102 | |
Large Cap Index Fund | | | | | | | | | | | | | | | | | | | | | | | | | | | | | | | | | | | | | | | | | | | | | | | | | |
Class A | | | | | | | | | | | | | | | | | | | | | | | | | | | | | | | | | | | | | | | | | | | | | | | | | | | | | | | | | | | | |
2020@ | | $ | 163.61 | | | $ | 1.43 | | | $ | 34.42 | | | $ | 35.85 | | | $ | (1.33 | ) | | $ | — | | | $ | (1.33 | ) | | $ | 198.13 | | | | 22.01 | % | | $ | 2,067,456 | | | | 0.04% | | | | 0.04% | | | | 0.13% | | | | 1.58% | | | | 8% | |
2020 | | | 173.92 | | | | 3.26 | | | | 19.13 | | | | 22.39 | | | | (3.34 | ) | | | (29.36 | ) | | | (32.70 | ) | | | 163.61 | | | | 12.48 | | | | 1,750,464 | | | | 0.04 | | | | 0.04 | | | | 0.13 | | | | 1.87 | | | | 32 | |
2019 | | | 200.41 | | | | 4.18 | | | | 0.70 | | | | 4.88 | | | | (4.27 | ) | | | (27.10 | ) | | | (31.37 | ) | | | 173.92 | | | | 3.43 | | | | 1,636,037 | | | | 0.04 | | | | 0.04 | | | | 0.13 | | | | 2.19 | | | | 16 | |
2018 | | | 182.82 | | | | 3.63 | | | | 22.56 | | | | 26.19 | | | | (4.13 | ) | | | (4.47 | ) | | | (8.60 | ) | | | 200.41 | | | | 14.53 | | | | 1,989,617 | | | | 0.03 | | | | 0.03 | | | | 0.12 | | | | 1.87 | | | | 16 | |
2017 | | | 160.22 | | | | 3.30 | | | | 24.18 | | | | 27.48 | | | | (2.83 | ) | | | (2.05 | ) | | | (4.88 | ) | | | 182.82 | | | | 17.44 | | | | 2,354,169 | | | | 0.03 | | | | 0.03 | | | | 0.24 | | | | 1.94 | | | | 12 | |
2016 | | | 169.36 | | | | 3.26 | | | | (2.45 | ) | | | 0.81 | | | | (3.32 | ) | | | (6.63 | ) | | | (9.95 | ) | | | 160.22 | | | | 0.76 | | | | 2,061,670 | | | | 0.03(2) | | | | 0.03(2) | | | | 0.25(2) | | | | 2.06 | | | | 18 | |
S&P 500 Index Fund | | | | | | | | | | | | | | | | | | | | | | | | | | | | | | | | | | | | | | | | | | | | | | | | | |
Class A | | | | | | | | | | | | | | | | | | | | | | | | | | | | | | | | | | | | | | | | | | | | | | | | | | | | | | | | | | | | |
2020@ | | $ | 16.13 | | | $ | 0.14 | | | $ | 3.06 | | | $ | 3.20 | | | $ | (0.13 | ) | | $ | — | | | $ | (0.13 | ) | | $ | 19.20 | | | | 19.93 | % | | $ | 5,551,784 | | | | 0.04% | | | | 0.04% | | | | 0.11% | | | | 1.63% | | | | 7% | |
2020 | | | 14.78 | | | | 0.31 | | | | 1.57 | | | | 1.88 | | | | (0.31 | ) | | | (0.22 | ) | | | (0.53 | ) | | | 16.13 | | | | 12.77 | | | | 4,277,620 | | | | 0.05 | | | | 0.05 | | | | 0.12 | | | | 1.94 | | | | 34 | |
2019 | | | 14.92 | | | | 0.34 | | | | 0.19 | | | | 0.53 | | | | (0.34 | ) | | | (0.33 | ) | | | (0.67 | ) | | | 14.78 | | | | 3.77 | | | | 3,975,682 | | | | 0.05 | | | | 0.05 | | | | 0.12 | | | | 2.23 | | | | 21 | |
2018 | | | 13.39 | | | | 0.28 | | | | 1.62 | | | | 1.90 | | | | (0.30 | ) | | | (0.07 | ) | | | (0.37 | ) | | | 14.92 | | | | 14.36 | | | | 4,258,172 | | | | 0.05 | | | | 0.05 | | | | 0.12 | | | | 1.92 | | | | 25 | |
2017 | | | 11.60 | | | | 0.24 | | | | 1.76 | | | | 2.00 | | | | (0.21 | ) | | | — | | | | (0.21 | ) | | | 13.39 | | | | 17.42 | | | | 4,100,863 | | | | 0.06 | | | | 0.06 | | | | 0.12 | | | | 1.98 | | | | 8 | |
2016 | | | 11.69 | | | | 0.24 | | | | (0.06 | ) | | | 0.18 | | | | (0.24 | ) | | | (0.03 | ) | | | (0.27 | ) | | | 11.60 | | | | 1.66 | | | | 3,384,560 | | | | 0.05(2) | | | | 0.05(2) | | | | 0.12(2) | | | | 2.11 | | | | 13 | |
Extended Market Index Fund | | | | | | | | | | | | | | | | | | | | | | | | | | | | | | | | | | | | | | | | | | | | | | | | | |
Class A | | | | | | | | | | | | | | | | | | | | | | | | | | | | | | | | | | | | | | | | | | | | | | | | | | | | | | | | | | | | |
2020@ | | $ | 14.47 | | | $ | 0.09 | | | $ | 5.14 | | | $ | 5.23 | | | $ | (0.07 | ) | | $ | — | | | $ | (0.07 | ) | | $ | 19.63 | | | | 36.25 | % | | $ | 1,628,378 | | | | 0.06% | | | | 0.06% | | | | 0.20% | | | | 1.11% | | | | 34% | |
2020 | | | 14.52 | | | | 0.20 | | | | 0.39 | | | | 0.59 | | | | (0.20 | ) | | | (0.44 | ) | | | (0.64 | ) | | | 14.47 | | | | 3.88 | | | | 1,176,664 | | | | 0.06 | | | | 0.06 | | | | 0.20 | | | | 1.35 | | | | 56 | |
2019 | | | 15.94 | | | | 0.23 | | | | (0.80 | ) | | | (0.57 | ) | | | (0.23 | ) | | | (0.62 | ) | | | (0.85 | ) | | | 14.52 | | | | (3.29 | ) | | | 937,836 | | | | 0.06 | | | | 0.06 | | | | 0.20 | | | | 1.51 | | | | 46 | |
2018 | | | 14.16 | | | | 0.19 | | | | 2.39 | | | | 2.58 | | | | (0.21 | ) | | | (0.59 | ) | | | (0.80 | ) | | | 15.94 | | | | 18.58 | | | | 996,135 | | | | 0.06 | | | | 0.06 | | | | 0.20 | | | | 1.27 | | | | 64 | |
2017 | | | 12.30 | | | | 0.19 | | | | 2.13 | | | | 2.32 | | | | (0.19 | ) | | | (0.27 | ) | | | (0.46 | ) | | | 14.16 | | | | 19.03 | | | | 917,907 | | | | 0.06 | | | | 0.06 | | | | 0.19 | | | | 1.43 | | | | 20 | |
2016 | | | 13.69 | | | | 0.18 | | | | (0.98 | ) | | | (0.80 | ) | | | (0.18 | ) | | | (0.41 | ) | | | (0.59 | ) | | | 12.30 | | | | (5.66 | ) | | | 714,258 | | | | 0.07(2) | | | | 0.07(2) | | | | 0.20(2) | | | | 1.49 | | | | 27 | |
Small Cap Fund | | | | | | | | | | | | | | | | | | | | | | | | | | | | | | | | | | | | | | | | | | | | | | | | | |
Class A | | | | | | | | | | | | | | | | | | | | | | | | | | | | | | | | | | | | | | | | | | | | | | | | | | | | | | | | | | | | |
2020@ | | $ | 11.91 | | | $ | 0.08 | | | $ | 3.26 | | | $ | 3.34 | | | $ | (0.05 | ) | | $ | — | | | $ | (0.05 | ) | | $ | 15.20 | | | | 28.09 | % | | $ | 279,366 | | | | 0.44% | | | | 0.44% | | | | 0.72% | | | | 1.28% | | | | 59% | |
2020 | | | 13.66 | | | | 0.16 | | | | (0.99 | ) | | | (0.83 | ) | | | (0.19 | ) | | | (0.73 | ) | | | (0.92 | ) | | | 11.91 | | | | (7.04 | ) | | | 228,900 | | | | 0.45 | | | | 0.45 | | | | 0.72 | | | | 1.16 | | | | 127 | |
2019 | | | 18.76 | | | | 0.18 | | | | (1.81 | ) | | | (1.63 | ) | | | (0.16 | ) | | | (3.31 | ) | | | (3.47 | ) | | | 13.66 | | | | (7.71 | ) | | | 267,012 | | | | 0.44 | | | | 0.44 | | | | 0.72 | | | | 1.09 | | | | 109 | |
2018 | | | 17.83 | | | | 0.12 | | | | 2.64 | | | | 2.76 | | | | (0.12 | ) | | | (1.71 | ) | | | (1.83 | ) | | | 18.76 | | | | 16.30 | | | | 375,607 | | | | 0.43 | | | | 0.43 | | | | 0.72 | | | | 0.68 | | | | 115 | |
2017 | | | 15.99 | | | | 0.13 | | | | 2.33 | | | | 2.46 | | | | (0.15 | ) | | | (0.47 | ) | | | (0.62 | ) | | | 17.83 | | | | 15.40 | | | | 513,528 | | | | 0.44 | | | | 0.44 | | | | 0.72 | | | | 0.77 | | | | 114 | |
2016 | | | 19.06 | | | | 0.17 | | | | (1.18 | ) | | | (1.01 | ) | | | (0.19 | ) | | | (1.87 | ) | | | (2.06 | ) | | | 15.99 | | | | (4.99 | ) | | | 502,222 | | | | 0.46(2) | | | | 0.46(2) | | | | 0.72(2) | | | | 0.99 | | | | 115 | |
| † | Returns and portfolio turnover rates are for the period indicated and have not been annualized. Returns do not reflect the deduction of taxes the shareholder would pay on fund distributions or redemption of fund shares. |
| (1) | Per share net investment income and net realized and unrealized gains (losses) calculated using average shares. |
| (2) | The expense ratio includes proxy expenses outside the cap. |
| @ | For the six-month period ended November 30, 2020. All ratios for the period have been annualized. |
Amounts designated as “—” are $0.
The accompanying notes are an integral part of the financial statements.
| | |
SEI Institutional Investments Trust / Semi-Annual Report / November 30, 2020 | | 343 |
FINANCIAL HIGHLIGHTS
For the period ended November 30, 2020 (Unaudited) and the years or period ended May 31, (unless otherwise indicated) For a share outstanding throughout each period
| | | | | | | | | | | | | | | | | | | | | | | | | | | | | | | | | | | | | | | | | | | | | | | | | | | | | | | | | | | | |
| | | Net Asset Value, Beginning of Period | | | Net Investment Income
(Loss)(1) | | | Net Realized and Unrealized Gains (Losses) on
Investments(1) | | | Total from
Operations | | | Dividends from Net Investment
Income | | | Distributions from Net Realized Capital Gains | | | Total
Dividends and Distributions | | | Net Asset
Value, End of Period | | | Total
Return† | | | Net Assets End of Period ($ Thousands) | | | Ratio of Net Expenses
to Average Net Assets | | | Ratio of Expenses to Average Net Assets (Excluding Fees Paid Indirectly
and Including
Waivers) | | | Ratio of Expenses to Average Net Assets
(Excluding Fees
Paid Indirectly
and Waivers) | | | Ratio of Net Investment Income (Loss)
to Average Net Assets | | | Portfolio
Turnover
Rate† | |
Small Cap II Fund | |
Class A | |
2020@ | | $ | 8.95 | | | $ | 0.05 | | | $ | 2.84 | | | $ | 2.89 | | | $ | (0.03) | | | $ | — | | | $ | (0.03) | | | $ | 11.81 | | | | 32.40 | % | | $ | 395,922 | | | | 0.43 | % | | | 0.43 | % | | | 0.72 | % | | | 1.02 | % | | | 69 | % |
2020 | | | 9.93 | | | | 0.09 | | | | (0.54) | | | | (0.45) | | | | (0.10) | | | | (0.43) | | | | (0.53) | | | | 8.95 | | | | (5.20) | | | | 312,950 | | | | 0.44 | | | | 0.44 | | | | 0.72 | | | | 0.92 | | | | 136 | |
2019 | | | 13.22 | | | | 0.09 | | | | (1.14) | | | | (1.05) | | | | (0.08) | | | | (2.16) | | | | (2.24) | | | | 9.93 | | | | (6.98) | | | | 337,113 | | | | 0.43 | | | | 0.43 | | | | 0.72 | | | | 0.73 | | | | 129 | |
2018 | | | 12.65 | | | | 0.08 | | | | 2.27 | | | | 2.35 | | | | (0.08) | | | | (1.70) | | | | (1.78) | | | | 13.22 | | | | 19.97 | | | | 442,285 | | | | 0.42 | | | | 0.42 | | | | 0.72 | | | | 0.60 | | | | 127 | |
2017 | | | 11.14 | | | | 0.07 | | | | 1.52 | | | | 1.59 | | | | (0.08) | | | | —^ | | | | (0.08) | | | | 12.65 | | | | 14.27 | | | | 462,730 | | | | 0.43 | | | | 0.43 | | | | 0.72 | | | | 0.61 | | | | 111 | |
2016 | | | 12.95 | | | | 0.08 | | | | (0.89) | | | | (0.81) | | | | (0.08) | | | | (0.92) | | | | (1.00) | | | | 11.14 | | | | (6.07) | | | | 455,742 | | | | 0.45 | (2) | | | 0.45 | (2) | | | 0.72 | (2) | | | 0.70 | | | | 134 | |
Small/Mid Cap Equity Fund | |
Class A | |
2020@ | | $ | 9.23 | | | $ | 0.06 | | | $ | 2.25 | | | $ | 2.31 | | | $ | (0.05) | | | $ | — | | | $ | (0.05) | | | $ | 11.49 | | | | 25.13 | % | | $ | 1,088,667 | | | | 0.41 | % | | | 0.41 | % | | | 0.72 | % | | | 1.12 | % | | | 48 | % |
2020 | | | 10.27 | | | | 0.13 | | | | (0.43) | | | | (0.30) | | | | (0.11) | | | | (0.63) | | | | (0.74) | | | | 9.23 | | | | (3.80) | | | | 879,022 | | | | 0.41 | | | | 0.41 | | | | 0.72 | | | | 1.24 | | | | 111 | |
2019 | | | 13.63 | | | | 0.14 | | | | (1.17) | | | | (1.03) | | | | (0.10) | | | | (2.23) | | | | (2.33) | | | | 10.27 | | | | (6.58) | | | | 1,178,532 | | | | 0.42 | | | | 0.42 | | | | 0.72 | | | | 1.18 | | | | 116 | |
2018 | | | 13.19 | | | | 0.10 | | | | 1.97 | | | | 2.07 | | | | (0.14) | | | | (1.49) | | | | (1.63) | | | | 13.63 | | | | 16.52 | | | | 1,596,828 | | | | 0.42 | | | | 0.42 | | | | 0.72 | | | | 0.76 | | | | 107 | |
2017 | | | 11.98 | | | | 0.10 | | | | 1.75 | | | | 1.85 | | | | (0.11) | | | | (0.53) | | | | (0.64) | | | | 13.19 | | | | 15.53 | | | | 1,730,233 | | | | 0.44 | | | | 0.44 | | | | 0.72 | | | | 0.80 | | | | 84 | |
2016 | | | 14.89 | | | | 0.12 | | | | (0.99) | | | | (0.87) | | | | (0.13) | | | | (1.91) | | | | (2.04) | | | | 11.98 | | | | (5.33) | | | | 1,642,784 | | | | 0.46 | (2) | | | 0.46 | (2) | | | 0.72 | (2) | | | 0.93 | | | | 104 | |
U.S. Equity Factor Allocation Fund | |
Class A | |
2020@ | | $ | 10.67 | | | $ | 0.11 | | | $ | 1.83 | | | $ | 1.94 | | | $ | (0.09) | | | $ | — | | | $ | (0.09) | | | $ | 12.52 | | | | 18.31 | % | | $ | 1,063,512 | | | | 0.02 | % | | | 0.02 | % | | | 0.31 | % | | | 1.94 | % | | | 24 | % |
2020 | | | 10.18 | | | | 0.22 | | | | 0.51 | | | | 0.73 | | | | (0.24) | | | | — | | | | (0.24) | | | | 10.67 | | | | 7.21 | | | | 756,195 | | | | 0.02 | | | | 0.02 | | | | 0.32 | | | | 2.03 | | | | 39 | |
2019 | | | 10.17 | �� | | | 0.23 | | | | (0.05) | | | | 0.18 | | | | (0.17) | | | | — | | | | (0.17) | | | | 10.18 | | | | 1.74 | | | | 873,180 | | | | 0.02 | | | | 0.02 | | | | 0.32 | | | | 2.18 | | | | 43 | |
2018(3) | | | 10.00 | | | | 0.03 | | | | 0.14 | | | | 0.17 | | | | — | | | | — | | | | — | | | | 10.17 | | | | 1.70 | | | | 255,550 | | | | 0.04 | | | | 0.04 | | | | 0.34 | | | | 2.66 | | | | – | |
U.S. Managed Volatility Fund | |
Class A | |
2020@ | | $ | 12.17 | | | $ | 0.14 | | | $ | 1.06 | | | $ | 1.20 | | | $ | (0.12) | | | $ | — | | | $ | (0.12) | | | $ | 13.25 | | | | 9.96 | % | | $ | 1,328,438 | | | | 0.20 | % | | | 0.20 | % | | | 0.72 | % | | | 2.27 | % | | | 31 | % |
2020 | | | 13.01 | | | | 0.33 | | | | (0.29) | | | | 0.04 | | | | (0.31) | | | | (0.57) | | | | (0.88) | | | | 12.17 | | | | (0.31) | | | | 1,216,680 | | | | 0.20 | | | | 0.20 | | | | 0.72 | | | | 2.48 | | | | 58 | |
2019 | | | 14.34 | | | | 0.36 | | | | 0.56 | | | | 0.92 | | | | (0.36) | | | | (1.89) | | | | (2.25) | | | | 13.01 | | | | 7.10 | | | | 1,181,573 | | | | 0.20 | | | | 0.20 | | | | 0.72 | | | | 2.56 | | | | 39 | |
2018 | | | 14.83 | | | | 0.34 | | | | 0.82 | | | | 1.16 | | | | (0.39) | | | | (1.26) | | | | (1.65) | | | | 14.34 | | | | 7.81 | | | | 1,287,447 | | | | 0.23 | | | | 0.23 | | | | 0.72 | | | | 2.31 | | | | 58 | |
2017 | | | 13.92 | | | | 0.34 | | | | 1.54 | | | | 1.88 | | | | (0.30) | | | | (0.67) | | | | (0.97) | | | | 14.83 | | | | 13.93 | | | | 1,481,081 | | | | 0.24 | | | | 0.24 | | | | 0.72 | | | | 2.38 | | | | 40 | |
2016 | | | 14.64 | | | | 0.34 | | | | 0.13 | | | | 0.47 | | | | (0.35) | | | | (0.84) | | | | (1.19) | | | | 13.92 | | | | 3.71 | | | | 1,524,568 | | | | 0.24 | (2) | | | 0.24 | (2) | | | 0.72 | (2) | | | 2.47 | | | | 62 | |
Global Managed Volatility Fund | |
Class A | |
2020@ | | $ | 10.88 | | | $ | 0.13 | | | $ | 0.76 | | | $ | 0.89 | | | $ | — | | | $ | — | | | $ | — | | | $ | 11.77 | | | | 8.18 | % | | $ | 2,925,166 | | | | 0.24 | % | | | 0.24 | % | | | 0.72 | % | | | 2.35 | % | | | 26 | % |
2020 | | | 11.53 | | | | 0.30 | | | | (0.35) | | | | (0.05) | | | | (0.40) | | | | (0.20) | | | | (0.60) | | | | 10.88 | | | | (1.08) | | | | 2,738,825 | | | | 0.24 | | | | 0.24 | | | | 0.72 | | | | 2.57 | | | | 47 | |
2019 | | | 12.05 | | | | 0.35 | | | | (0.02) | | | | 0.33 | | | | (0.44) | | | | (0.41) | | | | (0.85) | | | | 11.53 | | | | 3.14 | | | | 2,490,831 | | | | 0.24 | | | | 0.24 | | | | 0.72 | | | | 2.88 | | | | 42 | |
2018 | | | 11.72 | | | | 0.32 | | | | 0.55 | | | | 0.87 | | | | (0.27) | | | | (0.27) | | | | (0.54) | | | | 12.05 | | | | 7.41 | | | | 2,256,778 | | | | 0.24 | | | | 0.24 | | | | 0.72 | | | | 2.68 | | | | 37 | |
2017 | | | 10.78 | | | | 0.31 | | | | 1.10 | | | | 1.41 | | | | (0.26) | | | | (0.21) | | | | (0.47) | | | | 11.72 | | | | 13.50 | | | | 1,633,683 | | | | 0.25 | | | | 0.25 | | | | 0.73 | | | | 2.80 | | | | 36 | |
2016(4) | | | 10.00 | | | | 0.12 | | | | 0.66 | | | | 0.78 | | | | — | | | | — | | | | — | | | | 10.78 | | | | 7.80 | | | | 1,061,014 | | | | 0.26 | (2) | | | 0.26 | (2) | | | 0.73 | (2) | | | 3.34 | | | | 42 | |
World Equity Ex-US Fund | |
Class A | |
2020@ | | $ | 11.67 | | | $ | 0.10 | | | $ | 2.69 | | | $ | 2.79 | | | $ | — | | | $ | — | | | $ | — | | | $ | 14.46 | | | | 23.91 | % | | $ | 9,686,845 | | | | 0.29 | % | | | 0.29 | % | | | 0.62 | % | | | 1.54 | % | | | 36 | % |
2020 | | | 12.08 | | | | 0.22 | | | | (0.30) | | | | (0.08) | | | | (0.33) | | | | — | | | | (0.33) | | | | 11.67 | | | | (1.00) | | | | 8,115,314 | | | | 0.31 | | | | 0.31 | | | | 0.62 | | | | 1.80 | | | | 92 | |
2019 | | | 13.78 | | | | 0.29 | | | | (1.35) | | | | (1.06) | | | | (0.28) | | | | (0.36) | | | | (0.64) | | | | 12.08 | | | | (7.34) | | | | 8,327,272 | | | | 0.31 | | | | 0.31 | | | | 0.62 | | | | 2.25 | | | | 75 | |
2018 | | | 12.63 | | | | 0.28 | | | | 1.19 | | | | 1.47 | | | | (0.28) | | | | (0.04) | | | | (0.32) | | | | 13.78 | | | | 11.60 | | | | 8,559,023 | | | | 0.32 | | | | 0.32 | | | | 0.62 | | | | 2.03 | | | | 75 | |
2017 | | | 10.80 | | | | 0.25 | | | | 1.80 | | | | 2.05 | | | | (0.22) | | | | — | | | | (0.22) | | | | 12.63 | | | | 19.28 | | | | 8,174,354 | | | | 0.32 | | | | 0.32 | | | | 0.62 | | | | 2.20 | | | | 71 | |
2016 | | | 12.68 | | | | 0.23 | | | | (1.83) | | | | (1.60) | | | | (0.23) | | | | (0.05) | | | | (0.28) | | | | 10.80 | | | | (12.60) | | | | 6,923,937 | | | | 0.33 | (2) | | | 0.33 | (2) | | | 0.63 | (2) | | | 2.11 | | | | 50 | |
| † | Returns and portfolio turnover rates are for the period indicated and have not been annualized. Returns do not reflect the deduction of taxes the shareholder would pay on fund distributions or redemption of fund shares. |
| ^ | Amount represents less than $0.005. |
| (1) | Per share net investment income and net realized and unrealized gains (losses) calculated using average shares. |
| (2) | The expense ratio includes proxy expenses outside the cap. |
| (3) | Commenced operations on April 26, 2018. All ratios for the period have been annualized. |
| (4) | Commenced operations on January 29, 2016. All ratios for the period have been annualized. |
| @ | For the six-month period ended November 30, 2020. All ratios for the period have been annualized. |
Amounts designated as “—” are $0.
The accompanying notes are an integral part of the financial statements.
| | |
344 | | SEI Institutional Investments Trust / Semi-Annual Report / November 30, 2020 |
FINANCIAL HIGHLIGHTS
For the period ended November 30, 2020 (Unaudited) and the years or period ended May 31, (unless otherwise indicated) For a share outstanding throughout each period
| | | | | | | | | | | | | | | | | | | | | | | | | | | | | | | | | | | | | | | | | | | | | | | | | | | | | | | | | | | | |
| | | Net Asset Value, Beginning of
Period | | | Net Investment
Income
(Loss)(1) | | | Net Realized and Unrealized
Gains (Losses) on
Investments(1) | | | Total from
Operations | | | Dividends
from Net
Investment
Income | | | Distributions
from Net
Realized
Capital
Gains | | | Total Dividends
and Distributions | | | Net Asset Value,
End of Period | | | Total Return† | | | Net Assets End of Period
($ Thousands) | | | Ratio of Net
Expenses
to Average
Net Assets | | | Ratio of Expenses
to Average Net
Assets (Excluding
Fees Paid Indirectly
and Including
Waivers) | | | Ratio of Expenses
to Average Net Assets
(Excluding Fees
Paid Indirectly
and Waivers) | | | Ratio of Net
Investment
Income (Loss)
to Average
Net Assets | | | Portfolio
Turnover
Rate† | |
Screened World Equity Ex-US Fund | |
Class A | |
2020@ | | $ | 10.05 | | | $ | 0.10 | | | $ | 2.34 | | | $ | 2.44 | | | $ | — | | | $ | — | | | $ | — | | | $ | 12.49 | | | | 24.28 | % | | $ | 112,427 | | | | 0.36 | % | | | 0.36 | % | | | 0.81 | % | | | 1.67 | % | | | 44 | % |
2020 | | | 10.31 | | | | 0.22 | | | | (0.16) | | | | 0.06 | | | | (0.32) | (2) | | | — | | | | (0.32) | | | | 10.05 | | | | 0.17 | | | | 101,167 | | | | 0.35 | | | | 0.35 | | | | 0.81 | | | | 2.03 | | | | 77 | |
2019 | | | 11.48 | | | | 0.24 | | | | (1.03) | | | | (0.79) | | | | (0.21) | | | | (0.17) | | | | (0.38) | | | | 10.31 | | | | (6.57) | | | | 98,969 | | | | 0.33 | | | | 0.33 | | | | 0.79 | | | | 2.22 | | | | 52 | |
2018 | | | 10.36 | | | | 0.22 | | | | 1.15 | | | | 1.37 | | | | (0.25) | | | | — | | | | (0.25) | | | | 11.48 | | | | 13.24 | | | | 111,582 | | | | 0.36 | | | | 0.36 | | | | 0.80 | | | | 1.95 | | | | 56 | |
2017 | | | 8.50 | | | | 0.19 | | | | 1.82 | | | | 2.01 | | | | (0.15) | | | | — | | | | (0.15) | | | | 10.36 | | | | 23.99 | | | | 105,426 | | | | 0.35 | | | | 0.35 | | | | 0.79 | | | | 2.03 | | | | 52 | |
2016 | | | 9.52 | | | | 0.17 | | | | (1.01) | | | | (0.84) | | | | (0.18) | | | | — | | | | (0.18) | | | | 8.50 | | | | (8.78) | | | | 82,836 | | | | 0.35 | (3) | | | 0.35 | (3) | | | 0.79 | (3) | | | 2.01 | | | | 41 | |
World Select Equity Fund | |
Class A | |
2020@ | | $ | 8.69 | | | $ | 0.08 | | | $ | 1.87 | | | $ | 1.95 | | | $ | — | | | $ | — | | | $ | — | | | $ | 10.64 | | | | 22.44 | % | | $ | 513,027 | | | | 0.40 | % | | | 0.40 | % | | | 0.69 | % | | | 1.76 | % | | | 29 | % |
2020 | | | 9.38 | | | | 0.21 | | | | (0.51) | | | | (0.30) | | | | (0.39) | | | | — | | | | (0.39) | | | | 8.69 | | | | (3.86) | | | | 476,296 | | | | 0.37 | | | | 0.37 | | | | 0.69 | | | | 2.20 | | | | 66 | |
2019 | | | 11.30 | | | | 0.23 | | | | (1.26) | | | | (1.03) | | | | (0.31) | | | | (0.58) | | | | (0.89) | | | | 9.38 | | | | (8.81) | | | | 985,177 | | | | 0.31 | | | | 0.31 | | | | 0.65 | | | | 2.18 | | | | 93 | |
2018(4) | | | 10.00 | | | | 0.18 | | | | 1.30 | | | | 1.48 | | | | (0.08) | | | | (0.10) | | | | (0.18) | | | | 11.30 | | | | 14.88 | | | | 1,239,095 | | | | 0.30 | | | | 0.30 | | | | 0.63 | | | | 1.82 | | | | 68 | |
Emerging Markets Equity Fund | |
Class A | |
2020@ | | $ | 8.37 | | | $ | 0.11 | | | $ | 2.29 | | | $ | 2.40 | | | $ | — | | | $ | — | | | $ | — | | | $ | 10.77 | | | | 28.67 | % | | $ | 1,205,925 | | | | 0.61 | % | | | 0.61 | % | | | 1.17 | % | | | 2.17 | % | | | 37 | % |
2020 | | | 8.99 | | | | 0.16 | | | | (0.59) | | | | (0.43) | | | | (0.19) | | | | — | | | | (0.19) | | | | 8.37 | | | | (5.14) | | | | 1,008,763 | | | | 0.63 | | | | 0.63 | | | | 1.19 | | | | 1.71 | | | | 59 | |
2019 | | | 11.21 | | | | 0.19 | | | | (1.43) | | | | (1.24) | | | | (0.19) | | | | (0.79) | | | | (0.98) | | | | 8.99 | | | | (10.59) | | | | 1,007,905 | | | | 0.66 | | | | 0.66 | | | | 1.20 | | | | 1.91 | | | | 59 | |
2018 | | | 10.25 | | | | 0.19 | | | | 1.08 | | | | 1.27 | | | | (0.22) | | | | (0.09) | | | | (0.31) | | | | 11.21 | | | | 12.37 | | | | 1,094,294 | | | | 0.63 | | | | 0.63 | | | | 1.17 | | | | 1.70 | | | | 97 | |
2017 | | | 8.61 | | | | 0.14 | | | | 1.69 | | | | 1.83 | | | | (0.19) | | | | — | | | | (0.19) | | | | 10.25 | | | | 21.62 | | | | 1,250,465 | | | | 0.65 | | | | 0.65 | | | | 1.19 | | | | 1.51 | | | | 84 | |
2016 | | | 10.01 | | | | 0.14 | | | | (1.40) | | | | (1.26) | | | | (0.12) | | | | (0.02) | | | | (0.14) | | | | 8.61 | | | | (12.53) | | | | 935,399 | | | | 0.70 | (3) | | | 0.70 | (3) | | | 1.24 | (3) | | | 1.67 | | | | 105 | |
Opportunistic Income Fund | |
Class A | |
2020@ | | $ | 7.87 | | | $ | 0.12 | | | $ | 0.24 | | | $ | 0.36 | | | $ | (0.11) | | | $ | — | | | $ | (0.11) | | | $ | 8.12 | | | | 4.62 | % | | $ | 982,163 | | | | 0.23 | % | | | 0.23 | % | | | 0.52 | % | | | 2.91 | % | | | 31 | % |
2020 | | | 8.24 | | | | 0.31 | | | | (0.33) | | | | (0.02) | | | | (0.35) | | | | — | | | | (0.35) | | | | 7.87 | | | | (0.22) | | | | 975,466 | | | | 0.24 | | | | 0.24 | | | | 0.52 | | | | 3.81 | | | | 36 | |
2019 | | | 8.23 | | | | 0.34 | | | | (0.03) | | | | 0.31 | | | | (0.30) | | | | — | | | | (0.30) | | | | 8.24 | | | | 3.90 | | | | 1,388,921 | | | | 0.24 | | | | 0.24 | | | | 0.52 | | | | 4.14 | | | | 26 | |
2018 | | | 8.29 | | | | 0.27 | | | | — | | | | 0.27 | | | | (0.33) | | | | — | | | | (0.33) | | | | 8.23 | | | | 3.36 | | | | 1,850,589 | | | | 0.24 | | | | 0.24 | | | | 0.52 | | | | 3.25 | | | | 45 | |
2017 | | | 8.11 | | | | 0.23 | | | | 0.14 | | | | 0.37 | | | | (0.19) | | | | — | | | | (0.19) | | | | 8.29 | | | | 4.57 | | | | 2,204,029 | | | | 0.26 | | | | 0.26 | | | | 0.52 | | | | 2.83 | | | | 37 | |
2016 | | | 8.25 | | | | 0.22 | | | | (0.15) | | | | 0.07 | | | | (0.21) | | | | — | | | | (0.21) | | | | 8.11 | | | | 0.93 | | | | 2,129,669 | | | | 0.26 | (3) | | | 0.26 | (3) | | | 0.52 | (3) | | | 2.67 | | | | 35 | |
Core Fixed Income Fund | |
Class A | |
2020@ | | $ | 10.96 | | | $ | 0.10 | | | $ | 0.25 | | | $ | 0.35 | | | $ | (0.12) | | | $ | — | | | $ | (0.12) | | | $ | 11.19 | | | | 3.22 | % | | $ | 8,179,101 | | | | 0.12 | % | | | 0.12 | % | | | 0.36 | % | | | 1.88 | % | | | 164 | % |
2020 | | | 10.35 | | | | 0.29 | | | | 0.74 | | | | 1.03 | | | | (0.31) | | | | (0.11) | | | | (0.42) | | | | 10.96 | | | | 10.18 | | | | 7,475,630 | | | | 0.12 | | | | 0.12 | | | | 0.37 | | | | 2.77 | | | | 369 | |
2019 | | | 10.03 | | | | 0.33 | | | | 0.33 | | | | 0.66 | | | | (0.34) | | | | — | | | | (0.34) | | | | 10.35 | | | | 6.72 | | | | 7,052,345 | | | | 0.12 | | | | 0.12 | | | | 0.37 | | | | 3.26 | | | | 368 | |
2018 | | | 10.31 | | | | 0.27 | | | | (0.25) | | | | 0.02 | | | | (0.30) | | | | — | | | | (0.30) | | | | 10.03 | | | | 0.18 | | | | 6,586,334 | | | | 0.12 | | | | 0.12 | | | | 0.37 | | | | 2.67 | | | | 388 | |
2017 | | | 10.44 | | | | 0.27 | | | | (0.02) | | | | 0.25 | | | | (0.27) | | | | (0.11) | | | | (0.38) | | | | 10.31 | | | | 2.51 | | | | 5,771,305 | | | | 0.12 | | | | 0.12 | | | | 0.37 | | | | 2.57 | | | | 343 | |
2016 | | | 10.62 | | | | 0.28 | | | | 0.02 | | | | 0.30 | | | | (0.28) | | | | (0.20) | | | | (0.48) | | | | 10.44 | | | | 2.97 | | | | 5,264,859 | | | | 0.13 | (3) | | | 0.13 | (3) | | | 0.37 | (3) | | | 2.66 | | | | 364 | |
High Yield Bond Fund | |
Class A | |
2020@ | | $ | 7.74 | | | $ | 0.27 | | | $ | 0.73 | | | $ | 1.00 | | | $ | (0.26) | | | $ | — | | | $ | (0.26) | | | $ | 8.48 | | | | 13.15 | % | | $ | 2,661,565 | | | | 0.29 | % | | | 0.29 | % | | | 0.55 | % | | | 6.55 | % | | | 38 | % |
2020 | | | 8.65 | | | | 0.54 | | | | (0.84) | | | | (0.30) | | | | (0.54) | | | | (0.07) | | | | (0.61) | | | | 7.74 | | | | (3.73) | | | | 2,300,321 | | | | 0.29 | | | | 0.29 | | | | 0.56 | | | | 6.48 | | | | 80 | |
2019 | | | 8.81 | | | | 0.55 | | | | (0.10) | | | | 0.45 | | | | (0.55) | | | | (0.06) | | | | (0.61) | | | | 8.65 | | | | 5.32 | | | | 2,681,510 | | | | 0.29 | | | | 0.29 | | | | 0.56 | | | | 6.31 | | | | 60 | |
2018 | | | 9.13 | | | | 0.57 | | | | (0.25) | | | | 0.32 | | | | (0.56) | | | | (0.08) | | | | (0.64) | | | | 8.81 | | | | 3.59 | | | | 2,903,499 | | | | 0.29 | | | | 0.29 | | | | 0.55 | | | | 6.29 | | | | 59 | |
2017 | | | 8.53 | | | | 0.59 | | | | 0.66 | | | | 1.25 | | | | (0.58) | | | | (0.07) | | | | (0.65) | | | | 9.13 | | | | 15.05 | | | | 2,940,816 | | | | 0.30 | | | | 0.30 | | | | 0.55 | | | | 6.61 | | | | 65 | |
2016 | | | 9.41 | | | | 0.58 | | | | (0.81) | | | | (0.23) | | | | (0.58) | | | | (0.07) | | | | (0.65) | | | | 8.53 | | | | (2.17) | | | | 2,639,919 | | | | 0.30 | (3) | | | 0.30 | (3) | | | 0.56 | (3) | | | 6.81 | | | | 50 | |
| † | Returns and portfolio turnover rates are for the period indicated and have not been annualized. Returns do not reflect the deduction of taxes the shareholder would pay on fund distributions or redemption of fund shares. |
| (1) | Per share net investment income and net realized and unrealized gains (losses) calculated using average shares. |
| (2) | Includes a return of capital of $0.06 per share. |
| (3) | The expense ratio includes proxy expenses outside the cap. |
| (4) | Commenced operations on June 30, 2017. All ratios for the period have been annualized. |
| @ | For the six-month period ended November 30, 2020. All ratios for the period have been annualized. |
Amounts designated as “—” are $0.
The accompanying notes are an integral part of the financial statements.
| | |
SEI Institutional Investments Trust / Semi-Annual Report / November 30, 2020 | | 345 |
FINANCIAL HIGHLIGHTS
For the period ended November 30, 2020 (Unaudited) and the years or period ended May 31, (unless otherwise indicated) For a share outstanding throughout each period
| | | | | | | | | | | | | | | | | | | | | | | | | | | | | | | | | | | | | | | | | | | | | | | | | | | | | | | | | | | | |
| | | Net Asset
Value,
Beginning of
Period | | | Net Investment
Income
(Loss)(1) | | | Net Realized
and Unrealized
Gains (Losses) on
Investments(1) | | | Total from
Operations | | | Dividends
from Net
Investment
Income | | | Distributions
from Net
Realized
Capital
Gains | | | Total Dividends
and Distributions | | | Net Asset Value, End of Period | | | Total Return† | | | Net Assets
End of Period
($ Thousands) | | | Ratio of Net
Expenses
to Average
Net Assets | | | Ratio of Expenses
to Average Net
Assets (Excluding
Fees Paid Indirectly
and Including
Waivers) | | | Ratio of Expenses
to Average Net Assets
(Excluding Fees
Paid Indirectly
and Waivers) | | | Ratio of Net
Investment
Income (Loss)
to Average
Net Assets | | | Portfolio
Turnover
Rate† | |
Long Duration Fund | |
Class A | |
2020@ | | $ | 9.57 | | | $ | 0.15 | | | $ | 0.50 | | | $ | 0.65 | | | $ | (0.15) | | | $ | — | | | $ | (0.15) | | | $ | 10.07 | | | | 6.83 | % | | $ | 1,375,324 | | | | 0.15 | % | | | 0.15 | % | | | 0.37 | % | | | 3.03 | % | | | 49 | % |
2020 | | | 8.59 | | | | 0.31 | | | | 1.41 | | | | 1.72 | | | | (0.31) | | | | (0.43) | | | | (0.74) | | | | 9.57 | | | | 20.85 | | | | 1,297,733 | | | | 0.15 | | | | 0.15 | | | | 0.37 | | | | 3.46 | | | | 109 | |
2019 | | | 8.17 | | | | 0.33 | | | | 0.47 | | | | 0.80 | | | | (0.33) | | | | (0.05) | | | | (0.38) | | | | 8.59 | | | | 10.21 | | | | 1,427,817 | | | | 0.15 | | | | 0.15 | | | | 0.37 | | | | 4.05 | | | | 102 | |
2018 | | | 8.47 | | | | 0.33 | | | | (0.24) | | | | 0.09 | | | | (0.33) | | | | (0.06) | | | | (0.39) | | | | 8.17 | | | | 0.92 | | | | 1,965,417 | | | | 0.15 | | | | 0.15 | | | | 0.37 | | | | 3.88 | | | | 104 | |
2017 | | | 8.68 | | | | 0.34 | | | | 0.02 | | | | 0.36 | | | | (0.34) | | | | (0.23) | | | | (0.57) | | | | 8.47 | | | | 4.41 | | | | 2,160,286 | | | | 0.15 | | | | 0.15 | | | | 0.37 | | | | 3.94 | | | | 76 | |
2016 | | | 8.92 | | | | 0.36 | | | | 0.14 | | | | 0.50 | | | | (0.36) | | | | (0.38) | | | | (0.74) | | | | 8.68 | | | | 6.19 | | | | 2,775,237 | | | | 0.15 | (2) | | | 0.15 | (2) | | | 0.37 | (2) | | | 4.23 | | | | 72 | |
Long Duration Credit Fund | |
Class A | |
2020@ | | $ | 11.90 | | | $ | 0.19 | | | $ | 0.73 | | | $ | 0.92 | | | $ | (0.19) | | | $ | — | | | $ | (0.19) | | | $ | 12.63 | | | | 7.76 | % | | $ | 4,545,660 | | | | 0.15 | % | | | 0.15 | % | | | 0.37 | % | | | 3.04 | % | | | 24 | % |
2020 | | | 10.42 | | | | 0.39 | | | | 1.51 | | | | 1.90 | | | | (0.39) | | | | (0.03) | | | | (0.42) | | | | 11.90 | | | | 18.47 | | | | 4,066,898 | | | | 0.15 | | | | 0.15 | | | | 0.37 | | | | 3.44 | | | | 74 | |
2019 | | | 9.92 | | | | 0.39 | | | | 0.51 | | | | 0.90 | | | | (0.39) | | | | (0.01) | | | | (0.40) | | | | 10.42 | | | | 9.50 | | | | 3,968,559 | | | | 0.15 | | | | 0.15 | | | | 0.37 | | | | 4.03 | | | | 77 | |
2018 | | | 10.31 | | | | 0.39 | | | | (0.32) | | | | 0.07 | | | | (0.39) | | | | (0.07) | | | | (0.46) | | | | 9.92 | | | | 0.64 | | | | 3,856,709 | | | | 0.15 | | | | 0.15 | | | | 0.37 | | | | 3.81 | | | | 79 | |
2017 | | | 10.26 | | | | 0.40 | | | | 0.07 | | | | 0.47 | | | | (0.40) | | | | (0.02) | | | | (0.42) | | | | 10.31 | | | | 4.63 | | | | 3,612,106 | | | | 0.15 | | | | 0.15 | | | | 0.37 | | | | 3.87 | | | | 68 | |
2016 | | | 10.18 | | | | 0.41 | | | | 0.30 | | | | 0.71 | | | | (0.41) | | | | (0.22) | | | | (0.63) | | | | 10.26 | | | | 7.37 | | | | 3,333,806 | | | | 0.15 | (2) | | | 0.15 | (2) | | | 0.37 | (2) | | | 4.15 | | | | 74 | |
Ultra Short Duration Bond Fund | |
Class A | |
2020@ | | $ | 9.99 | | | $ | 0.06 | | | $ | 0.05 | | | $ | 0.11 | | | $ | (0.07) | | | $ | — | | | $ | (0.07) | | | $ | 10.03 | | | | 1.09 | % | | $ | 580,043 | | | | 0.12 | % | | | 0.12 | % | | | 0.22 | % | | | 1.28 | % | | | 33 | % |
2020 | | | 10.00 | | | | 0.25 | | | | (0.01) | | | | 0.24 | | | | (0.25) | | | | — | | | | (0.25) | | | | 9.99 | | | | 2.45 | | | | 580,962 | | | | 0.12 | | | | 0.12 | | | | 0.22 | | | | 2.50 | | | | 81 | |
2019 | | | 9.97 | | | | 0.27 | | | | 0.04 | | | | 0.31 | | | | (0.28) | | | | — | | | | (0.28) | | | | 10.00 | | | | 3.12 | | | | 446,319 | | | | 0.12 | | | | 0.12 | | | | 0.22 | | | | 2.74 | | | | 75 | |
2018 | | | 10.00 | | | | 0.19 | | | | (0.02) | | | | 0.17 | | | | (0.20) | | | | — | | | | (0.20) | | | | 9.97 | | | | 1.70 | | | | 482,897 | | | | 0.12 | | | | 0.12 | | | | 0.22 | | | | 1.94 | | | | 90 | |
2017 | | | 9.98 | | | | 0.14 | | | | 0.03 | | | | 0.17 | | | | (0.15) | | | | — | | | | (0.15) | | | | 10.00 | | | | 1.76 | | | | 486,747 | | | | 0.12 | | | | 0.12 | | | | 0.22 | | | | 1.42 | | | | 93 | |
2016 | | | 10.01 | | | | 0.11 | | | | (0.01) | | | | 0.10 | | | | (0.13) | | | | — | | | | (0.13) | | | | 9.98 | | | | 1.01 | | | | 535,629 | | | | 0.12 | (2) | | | 0.12 | (2) | | | 0.22 | (2) | | | 1.08 | | | | 103 | |
Emerging Markets Debt Fund | |
Class A | |
2020@ | | $ | 9.37 | | | $ | 0.23 | | | $ | 0.71 | | | $ | 0.94 | | | $ | (0.08) | | | $ | — | | | $ | (0.08) | | | $ | 10.23 | | | | 10.10 | % | | $ | 2,251,264 | | | | 0.40 | % | | | 0.40 | % | | | 0.94 | % | | | 4.73 | % | | | 41 | % |
2020 | | | 9.66 | | | | 0.51 | | | | (0.46) | | | | 0.05 | | | | (0.34) | | | | — | | | | (0.34) | | | | 9.37 | | | | 0.28 | | | | 2,064,146 | | | | 0.42 | | | | 0.42 | | | | 0.96 | | | | 5.25 | | | | 90 | |
2019 | | | 9.66 | | | | 0.57 | | | | (0.41) | | | | 0.16 | | | | (0.16) | | | | — | | | | (0.16) | | | | 9.66 | | | | 1.63 | | | | 2,245,266 | | | | 0.42 | | | | 0.42 | | | | 0.95 | | | | 6.11 | | | | 96 | |
2018 | | | 10.17 | | | | 0.61 | | | | (0.46) | | | | 0.15 | | | | (0.66) | | | | — | | | | (0.66) | | | | 9.66 | | | | 1.22 | | | | 2,277,309 | | | | 0.42 | | | | 0.42 | | | | 0.94 | | | | 5.87 | | | | 83 | |
2017 | | | 9.39 | | | | 0.58 | | | | 0.53 | | | | 1.11 | | | | (0.33) | | | | — | | | | (0.33) | | | | 10.17 | | | | 12.19 | | | | 2,211,664 | | | | 0.43 | | | | 0.43 | | | | 0.94 | | | | 5.89 | | | | 82 | |
2016 | | | 9.65 | | | | 0.56 | | | | (0.73) | | | | (0.17) | | | | (0.09) | | | | — | | | | (0.09) | | | | 9.39 | | | | (1.77) | | | | 1,935,751 | | | | 0.43 | (2) | | | 0.43 | (2) | | | 0.95 | (2) | | | 6.19 | | | | 77 | |
Real Return Fund | |
Class A | |
2020@ | | $ | 9.68 | | | $ | 0.08 | | | $ | 0.22 | | | $ | 0.30 | | | $ | (0.06) | | | $ | — | | | $ | (0.06) | | | $ | 9.92 | | | | 3.07 | % | | $ | 294,222 | | | | 0.02 | % | | | 0.02 | % | | | 0.29 | % | | | 1.66 | % | | | 18 | % |
2020 | | | 9.60 | | | | 0.19 | | | | 0.13 | | | | 0.32 | | | | (0.24) | | | | — | | | | (0.24) | | | | 9.68 | | | | 3.44 | | | | 297,237 | | | | 0.02 | | | | 0.02 | | | | 0.29 | | | | 1.94 | | | | 49 | |
2019 | | | 9.51 | | | | 0.20 | | | | 0.06 | | | | 0.26 | | | | (0.17) | | | | — | | | | (0.17) | | | | 9.60 | | | | 2.83 | | | | 281,804 | | | | 0.02 | | | | 0.02 | | | | 0.29 | | | | 2.15 | | | | 40 | |
2018 | | | 9.65 | | | | 0.22 | | | | (0.18) | | | | 0.04 | | | | (0.18) | | | | — | | | | (0.18) | | | | 9.51 | | | | 0.48 | | | | 170,843 | | | | 0.08 | (3) | | | 0.08 | (3) | | | 0.29 | (3) | | | 2.27 | | | | 55 | |
2017 | | | 9.64 | | | | 0.21 | | | | (0.04) | | | | 0.17 | | | | (0.16) | | | | — | | | | (0.16) | | | | 9.65 | | | | 1.76 | | | | 160,138 | | | | 0.08 | | | | 0.08 | | | | 0.29 | | | | 2.17 | | | | 47 | |
2016 | | | 9.59 | | | | 0.08 | | | | (0.03) | | | | 0.05 | | | | — | | | | — | | | | — | | | | 9.64 | | | | 0.52 | | | | 149,972 | | | | 0.08 | (2) | | | 0.08 | (2) | | | 0.29 | (2) | | | 0.87 | | | | 80 | |
| † | Returns and portfolio turnover rates are for the period indicated and have not been annualized. Returns do not reflect the deduction of taxes the shareholder would pay on fund distributions or redemption of fund shares. |
| (1) | Per share net investment income and net realized and unrealized gains (losses) calculated using average shares. |
| (2) | The expense ratio includes proxy expenses outside the cap. |
| (3) | The expense ratio includes interest expense on reverse repurchase agreements and dividend expense on securities sold short. Had this expense been excluded, the ratios would have been 0.08%, 0.08%, and 0.29%, respectively. |
| @ | For the six-month period ended November 30, 2020. All ratios for the period have been annualized. |
Amounts designated as “—” are $0.
The accompanying notes are an integral part of the financial statements.
| | |
346 | | SEI Institutional Investments Trust / Semi-Annual Report / November 30, 2020 |
FINANCIAL HIGHLIGHTS / CONSOLIDATED FINANCIAL HIGHLIGHTS
For the period ended November 30, 2020 (Unaudited) and the years or period ended May 31, (unless otherwise indicated) For a share outstanding throughout each period
| | | | | | | | | | | | | | | | | | | | | | | | | | | | | | | | | | | | | | | | | | | | | | | | | | |
| | | Net Asset Value,
Beginning of
Period | | | Net Investment
Income
(Loss)(1) | | | Net Realized
and Unrealized
Gains (Losses) on
Investments(1) | | | Total from
Operations | | | Dividends
from Net
Investment
Income | | | Distributions
from Net
Realized
Capital
Gains | | | Total Dividends
and Distributions | | | Net Asset Value, End of Period | | | Total Return† | | | Net Assets
End of Period
($ Thousands) | | | Ratio of Net
Expenses
to Average
Net Assets | | Ratio of Expenses
to Average Net
Assets (Excluding
Fees Paid Indirectly
and Including
Waivers) | | Ratio of Expenses
to Average Net Assets
(Excluding Fees
Paid Indirectly
and Waivers) | | Ratio of Net
Investment
Income (Loss)
to Average
Net Assets | | Portfolio
Turnover
Rate† |
Limited Duration Bond Fund |
Class A |
2020@ | | $ | 10.13 | | | $ | 0.07 | | | $ | 0.08 | | | $ | 0.15 | | | $ | (0.08) | | | $ | — | | | $ | (0.08) | | | $ | 10.20 | | | | 1.45 | % | | $ | 1,359,550 | | | 0.11% | | 0.11% | | 0.32% | | 1.44% | | 72% |
2020 | | | 9.96 | | | | 0.23 | | | | 0.18 | | | | 0.41 | | | | (0.24) | | | | — | | | | (0.24) | | | | 10.13 | | | | 4.14 | | | | 1,284,697 | | | 0.11 | | 0.11 | | 0.32 | | 2.35 | | 146 |
2019 | | | 9.87 | | | | 0.26 | | | | 0.09 | | | | 0.35 | | | | (0.26) | | | | — | | | | (0.26) | | | | 9.96 | | | | 3.59 | | | | 1,533,947 | | | 0.11 | | 0.11 | | 0.32 | | 2.63 | | 155 |
2018 | | | 9.97 | | | | 0.18 | | | | (0.10) | | | | 0.08 | | | | (0.18) | | | | — | | | | (0.18) | | | | 9.87 | | | | 0.81 | | | | 1,397,610 | | | 0.11 | | 0.11 | | 0.32 | | 1.79 | | 150 |
2017 | | | 10.00 | | | | 0.14 | | | | (0.02) | | | | 0.12 | | | | (0.15) | | | | —^ | | | | (0.15) | | | | 9.97 | | | | 1.21 | | | | 1,347,212 | | | 0.11 | | 0.11 | | 0.32 | | 1.42 | | 92 |
2016 | | | 10.01 | | | | 0.12 | | | | 0.01 | | | | 0.13 | | | | (0.13) | | | | (0.01) | | | | (0.14) | | | | 10.00 | | | | 1.26 | | | | 1,156,258 | | | 0.12 | | 0.12 | | 0.32 | | 1.25 | | 134 |
Intermediate Duration Credit Fund |
Class A |
2020@ | | $ | 10.88 | | | $ | 0.15 | | | $ | 0.40 | | | $ | 0.55 | | | $ | (0.15) | | | $ | — | | | $ | (0.15) | | | $ | 11.28 | | | | 5.07 | % | | $ | 3,583,718 | | | 0.15% | | 0.15% | | 0.32% | | 2.67% | | 41% |
2020 | | | 10.10 | | | | 0.32 | | | | 0.78 | | | | 1.10 | | | | (0.32) | | | | — | | | | (0.32) | | | | 10.88 | | | | 10.99 | | | | 3,323,248 | | | 0.15 | | 0.15 | | 0.32 | | 3.01 | | 134 |
2019 | | | 9.75 | | | | 0.32 | | | | 0.35 | | | | 0.67 | | | | (0.32) | | | | — | | | | (0.32) | | | | 10.10 | | | | 7.00 | | | | 3,054,258 | | | 0.15 | | 0.15 | | 0.32 | | 3.25 | | 122 |
2018 | | | 10.02 | | | | 0.29 | | | | (0.27) | | | | 0.02 | | | | (0.29) | | | | — | | | | (0.29) | | | | 9.75 | | | | 0.14 | | | | 2,675,195 | | | 0.15 | | 0.15 | | 0.32 | | 2.87 | | 155 |
2017 | | | 9.96 | | | | 0.27 | | | | 0.06 | | | | 0.33 | | | | (0.27) | | | | — | | | | (0.27) | | | | 10.02 | | | | 3.38 | | | | 1,688,561 | | | 0.15 | | 0.15 | | 0.32 | | 2.72 | | 151 |
2016 | | | 9.82 | | | | 0.26 | | | | 0.14 | | | | 0.40 | | | | (0.26) | | | | — | | | | (0.26) | | | | 9.96 | | | | 4.16 | | | | 1,440,434 | | | 0.15 | | 0.15 | | 0.32 | | 2.66 | | 181 |
Dynamic Asset Allocation Fund |
Class A |
2020@ | | $ | 19.41 | | | $ | 0.16 | | | $ | 3.69 | | | $ | 3.85 | | | $ | — | | | $ | — | | | $ | — | | | $ | 23.26 | | | | 19.84 | % | | $ | 2,006,136 | | | 0.08% | | 0.08% | | 0.67% | | 1.45% | | 5% |
2020 | | | 19.62 | | | | 0.37 | | | | 2.02 | | | | 2.39 | | | | (0.61) | | | | (1.99) | | | | (2.60) | | | | 19.41 | | | | 11.85 | | | | 1,722,704 | | | 0.08 | | 0.08 | | 0.67 | | 1.83 | | 10 |
2019 | | | 19.83 | | | | 0.40 | | | | (0.27) | | | | 0.13 | | | | (0.13) | | | | (0.21) | | | | (0.34) | | | | 19.62 | | | | 0.75 | | | | 2,291,808 | | | 0.08 | | 0.08 | | 0.67 | | 1.98 | | 5 |
2018 | | | 18.57 | | | | 0.36 | | | | 1.65 | | | | 2.01 | | | | (0.50) | | | | (0.25) | | | | (0.75) | | | | 19.83 | | | | 10.83 | | | | 2,503,365 | | | 0.07 | | 0.07 | | 0.66 | | 1.85 | | 12 |
2017 | | | 15.83 | | | | 0.34 | | | | 2.67 | | | | 3.01 | | | | (0.27) | | | | — | | | | (0.27) | | | | 18.57 | | | | 19.17 | | | | 2,474,189 | | | 0.08 | | 0.08 | | 0.66 | | 2.00 | | 8 |
2016 | | | 16.97 | | | | 0.33 | | | | (0.41) | | | | (0.08) | | | | (0.91) | | | | (0.15) | | | | (1.06) | | | | 15.83 | | | | (0.32) | | | | 2,079,154 | | | 0.08 | | 0.08 | | 0.67 | | 2.08 | | 12 |
Multi-Asset Real Return Fund |
Class A |
2020@ | | $ | 7.36 | | | $ | 0.09 | | | $ | 0.24 | | | $ | 0.33 | | | $ | — | | | $ | — | | | $ | — | | | $ | 7.69 | | | | 4.48 | % | | $ | 769,391 | | | 0.41%(2) | | 0.41%(2) | | 0.83%(2) | | 2.34% | | 27% |
2020 | | | 7.78 | | | | 0.17 | | | | (0.42) | | | | (0.25) | | | | (0.17) | | | | — | | | | (0.17) | | | | 7.36 | | | | (3.38) | | | | 754,191 | | | 0.88(2) | | 0.88(2) | | 1.30(2) | | 2.26 | | 53 |
2019 | | | 8.06 | | | | 0.19 | | | | (0.20) | | | | (0.01) | | | | (0.27) | | | | — | | | | (0.27) | | | | 7.78 | | | | 0.03 | | | | 911,520 | | | 1.00(3) | | 1.00(3) | | 1.43(3) | | 2.36 | | 22 |
2018 | | | 8.07 | | | | 0.18 | | | | (0.06) | | | | 0.12 | | | | (0.13) | | | | — | | | | (0.13) | | | | 8.06 | | | | 1.45 | | | | 979,909 | | | 0.72(2) | | 0.72(2) | | 1.14(2) | | 2.23 | | 22 |
2017 | | | 8.28 | | | | 0.17 | | | | (0.24) | | | | (0.07) | | | | (0.14) | | | | — | | | | (0.14) | | | | 8.07 | | | | (0.85) | | | | 766,218 | | | 0.53(4) | | 0.53(4) | | 0.90(4) | | 2.02 | | 58 |
2016 | | | 8.64 | | | | 0.10 | | | | (0.38) | | | | (0.28) | | | | (0.08) | | | | — | | | | (0.08) | | | | 8.28 | | | | (3.19) | | | | 733,029 | | | 0.54(5) | | 0.54(5) | | 0.90(5) | | 1.17 | | 91 |
| † | Returns and portfolio turnover rates are for the period indicated and have not been annualized. Returns do not reflect the deduction of taxes the shareholder would pay on fund distributions or redemption of fund shares. |
| ^ | Amount represents less than $0.005. |
| (1) | Per share net investment income and net realized and unrealized gains (losses) calculated using average shares. |
| (2) | The expense ratio includes interest expense on reverse repurchase agreements and dividend expense on securities sold short. Had this expense been excluded, the ratios would have been 0.20%, 0.20% and 0.62%, respectively. |
| (3) | The expense ratio includes interest expense on reverse repurchase agreements and dividend expense on securities sold short. Had this expense been excluded, the ratios would have been 0.19%, 0.19% and 0.62%, respectively. |
| (4) | The expense ratio includes interest expense on reverse repurchase agreements and dividend expense on securities sold short. Had this expense been excluded, the ratios would have been 0.25%, 0.25% and 0.62%, respectively |
| (5) | The expense ratio includes interest expense on reverse repurchase agreements and dividend expense on securities sold short. Had this expense been excluded, the ratios would have been 0.31%, 0.31% and 0.67%, respectively. |
| @ | For the six-month period ended November 30, 2020. All ratios for the period have been annualized. |
Amounts designated as “—” are $0.
The accompanying notes are an integral part of the financial statements.
| | |
SEI Institutional Investments Trust / Semi-Annual Report / November 30, 2020 | | 347 |
NOTES TO FINANCIAL STATEMENTS / CONSOLIDATED NOTES TO FINANCIAL STATEMENTS
November 30, 2020 (Unaudited)
1. ORGANIZATION
SEI Institutional Investments Trust (the “Trust”) was organized as a Massachusetts business trust under a Declaration of Trust dated March 1, 1995. The Trust commenced operations on June 14, 1996.
The Trust is registered under the Investment Company Act of 1940, as amended, as an open-end investment company with 27 registered funds: Large Cap, Large Cap Disciplined Equity, Large Cap Index, S&P 500 Index, Extended Market Index, Small Cap, Small Cap II, Small/Mid Cap Equity, U.S. Equity Factor Allocation, U.S. Managed Volatility, Global Managed Volatility, World Equity Ex-US, Screened World Equity Ex-US, World Select Equity, Emerging Markets Equity, Opportunistic Income, Core Fixed Income, High Yield Bond, Long Duration, Long Duration Credit, Ultra Short Duration Bond, Emerging Markets Debt, Real Return, Limited Duration Bond, Intermediate Duration Credit, Dynamic Asset Allocation and Multi-Asset Real Return (each a “Fund,” collectively, the “Funds”) each of which are diversified Funds with the exception of the Emerging Markets Debt and Multi-Asset Real Return Funds. The Trust is registered to offer Class A shares of all Funds. The assets of each Fund are segregated, and a shareholder’s interest is limited to the Fund in which shares are held. The Trust’s prospectus provides a description of each Fund’s investment goals, principal strategies and risks.
The DAA Commodity Strategy Subsidiary, Ltd. and the MARR Commodity Strategy Subsidiary, Ltd. (the “Subsidiaries”) are wholly-owned subsidiaries of the Dynamic Asset Allocation and Multi-Asset Real Return Funds, respectively. The Subsidiaries are organized under the laws of the Cayman Islands as an exempt limited company. Information regarding the Dynamic Asset Allocation and Multi-Asset Real Return Funds and their respective subsidiary has been consolidated on the Consolidated Summary Schedule of Investments, Consolidated Schedule of Investments, Consolidated Statements of Assets and Liabilities, Consolidated Statements of Operations, Consolidated Statements of Changes in Net Assets, Consolidated Statement of Cash Flows of Multi-Asset Real Return Fund and Consolidated Financial Highlights.
2. SIGNIFICANT ACCOUNTING POLICIES
The following are significant accounting policies, which are consistently followed in the preparation of its financial statements by the Funds. The Funds are investment companies that apply the accounting and reporting guidance issued in Topic 946 by the U.S. Financial Accounting Standards Board (“FASB”).
Use of Estimates — The preparation of financial statements, in conformity with U.S. GAAP requires management to make estimates and assumptions that affect the reported amount of assets and liabilities and disclosure of contingent assets and liabilities as of the date of the financial statements and the reported amounts of increases and decreases in net assets from operations during the reporting period. Actual results could differ from those estimates.
Security Valuation — Securities listed on a securities exchange, market or automated quotation system for which quotations are readily available (other than securities traded on National Association of Securities Dealers Automated Quotations (“NASDAQ”) or as otherwise noted below) are valued at the last quoted sale price on an exchange or market (foreign or domestic) on which the securities are traded, or, if there is no such reported sale, at the most recent quoted bid price. The Funds value securities traded on NASDAQ at the NASDAQ Official Closing Price. If available, debt securities, swaps (which are not centrally cleared), bank loans or collateralized debt obligations (including collateralized loan obligations), such as those held by the Funds, are priced based upon valuations provided by independent, third-party pricing agents. Such values generally reflect the last reported sales price if the security is actively traded. The third-party pricing agents may also value debt securities at an evaluated bid price by employing methodologies that utilize actual market transactions, broker-supplied valuations or other methodologies designed to identify the market value for such securities. Redeemable securities issued by open-end investment companies are valued at the investment company’s applicable net asset value, with the exception of ETFs, which are priced as equity securities. The prices of foreign securities are reported in local currency and converted to U.S. dollars using currency exchange rates. If a security’s price cannot be obtained, as noted above, the Funds will value the securities using a bid price from at least one independent broker. If such prices are not readily available or cannot be valued using the methodologies described above, the Funds will value the security using the Funds’ Fair Value Pricing Policies and Procedures (“Fair Value Procedures”), as described below.
On the first day a new debt security purchase is recorded, if a price is not available from a third-party pricing agent or an independent broker, the security may be valued at its purchase price. Each day thereafter, the debt security will be valued according to the Funds’ Fair Value Procedures until a price from an independent source can be secured. Securities held by a Fund with remaining maturities of 60 days or less may be valued by the amortized cost method, which involves valuing
| | |
348 | | SEI Institutional Investments Trust / Semi-Annual Report / November 30, 2020 |
a security at its cost on the date of purchase and thereafter (absent unusual circumstances) assuming a constant amortization to maturity of any discount or premium, regardless of the impact of fluctuations in general market rates of interest on the value of the instrument. While this method provides certainty in valuation, it may result in periods during which value, as determined by this method, is higher or lower than the price a Fund would receive if it sold the instrument. Further, the value of securities in the Fund can be expected to vary inversely with changes in prevailing interest rates. Should existing credit, liquidity or interest rate conditions in the relevant markets and issuer-specific circumstances suggest that amortized cost does not approximate fair value, then the amortized cost method may not be used.
Options and warrants are valued at the last quoted sales price. If there is no such reported sale on the valuation date, long positions are valued at the most recent bid price, and short positions are valued at the most recent ask price.
Futures and swaps cleared through a central clearing house (“centrally cleared swaps”) are valued at the settlement price established each day by the board of exchange on which they are traded. The daily settlement prices for financial futures and centrally cleared swaps are provided by an independent source. On days when there is excessive volume, market volatility or the future or centrally cleared swap does not end trading by the time a Fund calculates its Net Asset Value (“NAV”), the settlement price may not be available at the time at which the Fund calculates its NAV. On such days, the best available price (which is typically the last sales price) may be used to value a Fund’s futures or centrally cleared swaps position.
Foreign currency forward contracts are valued at the current day’s interpolated foreign exchange rate, as calculated using the current day’s spot rate, and the thirty, sixty, ninety and one-hundred eighty day forward rates provided by an independent source.
Prices for most securities held by a Fund are provided daily by third-party independent pricing agents. SEI Investments Management Corporation (“SIMC”) or a Sub-Adviser (“Sub-Adviser”), as applicable, reasonably believes that prices provided by independent pricing agents are reliable. However, there can be no assurance that such pricing service’s prices will be reliable. SIMC or a Sub-Adviser, as applicable, will continuously monitor the reliability of prices obtained from any pricing service and shall promptly notify the Funds’ administrator if it believes that a particular pricing service is no longer a reliable source of prices. The Funds’ administrator, in turn, will notify the Fair Value Pricing Committee
(the “Committee”) if it receives such notification from SIMC or a Sub-Adviser, as applicable, or if the Funds’ administrator reasonably believes that a particular pricing service is no longer a reliable source for prices.
The Funds’ Fair Value Procedures provide that any change in a primary pricing agent or a pricing methodology requires prior approval by the Board of Trustees (“Board”) or its designated sub-committee. However, when the change would not materially affect valuation of a Fund’s net assets or involve a material departure in pricing methodology from that of the Fund’s existing pricing agent or pricing methodology, approval may be obtained at the next regularly scheduled meeting of the Board.
Securities for which market prices are not readily available, for which market prices are determined to be unreliable, or which cannot be valued using the methodologies described above are valued in accordance with the Fair Value Procedures established by the Board. The Funds’ Fair Value Procedures are implemented through the Committee designated by the Board. The Committee is currently composed of two members of the Board, as well as representatives from SIMC and its affiliates. Some of the more common reasons that may necessitate that a security be valued using Fair Value Procedures include: (i) the security’s trading has been halted or suspended, (ii) the security has been delisted from a national exchange, (iii) the security’s primary trading market is temporarily closed at a time when under normal conditions it would be open, or (iv) the security’s primary pricing source is not able or willing to provide a price. When a security is valued in accordance with the Fair Value Procedures, the Committee will determine the value after taking into consideration relevant information reasonably available to the Committee. Examples of factors the Committee may consider include: (i) the facts giving rise to the need to fair value, (ii) the last trade price, (iii) the performance of the market or the issuer’s industry, (iv) the liquidity of the security, (v) the size of the holding in a Fund, or (vi) any other appropriate information.
The determination of a security’s fair value price often involves the consideration of a number of subjective factors, and is therefore subject to the unavoidable risk that the value assigned to a security may be higher or lower than the security’s value would be if a reliable market quotation for the security was readily available.
For securities that principally trade on a foreign market or exchange, a significant gap in time can exist between the time of a particular security’s last trade and the time at which a Fund calculates its NAV. The closing prices of such securities may no longer reflect their market value at the time a Fund calculates NAV if an event that
| | |
SEI Institutional Investments Trust / Semi-Annual Report / November 30, 2020 | | 349 |
NOTES TO FINANCIAL STATEMENTS / CONSOLIDATED NOTES TO FINANCIAL STATEMENTS (Continued)
November 30, 2020 (Unaudited)
could materially affect the value of those securities (a “Significant Event”), including substantial fluctuations in domestic or foreign markets or occurrences not tied directly to the securities markets, such as natural disasters, armed conflicts or significant governmental actions, has occurred between the time of the security’s last close and the time that the Fund calculates NAV. A Fund may invest in securities that are primarily listed on foreign exchanges that trade on weekends or other days when the Fund does not price its shares. As a result, the NAV of the Fund’s shares may change on days when shareholders will not be able to purchase or redeem Fund shares.
A Significant Event may relate to a single issuer or to an entire market sector. If SIMC or a Sub-Adviser becomes aware of a Significant Event that has occurred with respect to a security or group of securities after the closing of the exchange or market on which the security or securities principally trade, but before the time at which the Funds calculate NAV, it may request that a Committee meeting be called. In addition, the Funds use several processes, with respect to certain securities to monitor the pricing data supplied by various sources, including price comparisons and price movements. Any identified discrepancies are researched and subject to the procedures described above.
The U.S. Managed Volatility, Global Managed Volatility, World Equity Ex-US, Screened World Equity Ex-US, World Select Equity, Emerging Markets Equity, Opportunistic Income, Core Fixed Income, High Yield Bond, Emerging Markets Debt and Multi-Asset Real Return Funds that hold international securities also use a third-party fair valuation vendor. The vendor provides a fair value for foreign securities held by the Funds based on certain factors and methodologies (involving, generally, tracking valuation correlations between the U.S. market and each non-U.S. security). Values from the fair value vendor are applied in the event that there is a movement in the U.S. market that exceeds a specific threshold that has been established by the Committee. The Committee has also established a “confidence interval” which is used to determine the level of historical correlation between the value of a specific foreign security and movements in the U.S. market before a particular security will be fair valued when the threshold is exceeded. In the event that the threshold established by the Committee is exceeded on a specific day, these Funds will value the non-U.S. securities in their portfolios that exceed the applicable “confidence interval” based upon the adjusted prices provided by the fair valuation vendor.
In accordance with U.S. GAAP, fair value is defined as the price that a Fund would receive upon selling an investment in an orderly transaction to an independent
buyer in the principal or most advantageous market of the investment. A three tier hierarchy has been established to maximize the use of observable and minimize the use of unobservable inputs and to establish classification of fair value measurements for disclosure purposes. Inputs refer broadly to the assumptions that market participants would use in pricing an asset. Inputs may be observable or unobservable. Observable inputs are inputs that reflect the assumptions market participants would use in pricing the asset or liability based on market data obtained from sources independent of the reporting entity. Unobservable inputs are inputs that reflect the reporting entity’s own assumptions about the assumptions market participants would use in pricing the asset or liability based on the best information available in the circumstances.
The three-tier hierarchy of inputs is summarized in the three broad Levels listed below:
Level 1 — quoted prices in active markets for identical investments
Level 2 — other significant observable inputs (including quoted prices for similar investments, interest rates, prepayment speeds, credit risks, etc.)
Level 3 — significant unobservable inputs (including the Fund’s own assumptions in determining the fair value of investments)
Investments are classified within the level of the lowest significant input considered in determining fair value. Investments classified within Level 3 whose fair value measurement considers several inputs may include Level 1 or Level 2 inputs as components of the overall fair value measurement.
Debt securities are valued in accordance with the evaluated bid price supplied by the pricing service and generally categorized as Level 2 in the hierarchy. Other securities that are categorized as Level 2 in the hierarchy include, but are not limited to, preferred stocks, bank loans, warrants, swaps and forward contracts. The Fund may use a systematic fair valuation model provided by an independent pricing service to value foreign equity securities in order to adjust for stale pricing, which may occur between the close of certain foreign exchanges and the New York Stock Exchange. These are generally categorized as Level 2 in the hierarchy.
When independent prices are unavailable or unreliable, debt securities and swaps may be valued utilizing pricing matrices which consider similar factors that would be used by independent pricing services. These are generally categorized as Level 2 in the hierarchy but may be Level 3 depending on the circumstances. For certain collateralized debt obligations, corporate
| | |
350 | | SEI Institutional Investments Trust / Semi-Annual Report / November 30, 2020 |
obligations, mortgage backed securities, auction rate preferred securities and loan participations where observable inputs are limited, assumptions about market activity and risk are used and are categorized as Level 3 in the hierarchy.
The valuation techniques used by the Funds to measure fair value during the period ended November 30, 2020 maximized the use of observable inputs and minimized the use of unobservable inputs. For details of the investment classification, reference the Summary Schedules of Investments/Schedules of Investments.
For the period ended November 30, 2020, there have been no significant changes to the Trust’s fair valuation methodologies.
Security Transactions and Investment Income — Security transactions are recorded on the trade date. Costs used in determining net realized capital gains and losses on the sale of securities are on the basis of specific identification. Dividend income and expense is recognized on the ex-dividend date, and interest income and expense is recognized using the accrual basis of accounting. Income from payment-in-kind securities is recorded daily based on the effective interest method of accrual.
Distributions received on securities that represent a return of capital or capital gain are recorded as a reduction of cost of investments and/or as a realized gain. The Trust estimates the components of distributions received that may be considered nontaxable distributions or capital gain distributions.
Amortization and accretion is calculated using the scientific interest method, which approximates the effective interest method over the holding period of the security. Amortization of premiums and discounts is included in interest income. Consent fees and amendment income received from Bank Loans is recorded as interest income in the accompanying Statement of Operations.
For Treasury Inflation-Protected Securities, the principal amount is adjusted daily to keep pace with inflation. Interest is accrued based on the adjusted principal amount. The adjustments to principal due to inflation are reflected as increases or decreases to interest in the accompanying Statements of Operations. Such adjustments may have a significant impact on a Fund’s distributions.
Cash and Cash Equivalents — Idle cash and currency balances may be swept into various overnight sweep accounts and are classified as cash and cash equivalents on the Statement of Assets and Liabilities/ Consolidated Statement of Assets and Liabilities and
Consolidated Statement of Cash Flows. These amounts, at times, may exceed United States federally insured limits. Amounts swept are available on the next business day.
Cash Equivalents, as shown on the Summary Schedule of Investments or Schedule of Investments, are classified as Investments on the Statements of Assets and Liabilities.
Repurchase Agreements — Securities pledged as collateral for repurchase agreements are held by each Fund’s custodian bank until the repurchase date of the repurchase agreement. The Funds may also invest in tri-party repurchase agreements. Securities held as collateral for tri-party repurchase agreements are maintained by the broker’s custodian bank in a segregated account until the repurchase date of the repurchase agreement. Provisions of the repurchase agreements and the Trust’s policies require that the market value of the collateral, including accrued interest thereon, is sufficient in the event of default by the counterparty. If the counterparty defaults and the value of the collateral declines, or if the counterparty enters into an insolvency proceeding, realization of the collateral by the Funds may be delayed or limited.
Reverse Repurchase Agreements — To the extent consistent with its Investment Objective and Strategies, a Fund may enter into reverse repurchase agreements. A reverse repurchase agreement involves the sale of portfolio assets together with an agreement to repurchase the same assets later at a fixed price. Assets are then segregated to cover the requirements to repurchase the assets. The segregated assets may consist of cash, U.S. Government securities, or other liquid securities at least equal in value to the obligations under the reverse repurchase agreements. In the event the buyer of securities under a reverse repurchase agreement files for bankruptcy or becomes insolvent, a Fund’s use of the proceeds under the reverse repurchase agreement may be restricted pending a determination by the other party, or its trustee or receiver, whether to enforce the obligation to repurchase the securities. Refer to each Fund’s Schedule of Investments, Summary Schedule of Investments, Consolidated Summary Schedule of Investments or Consolidated Schedule of Investments for details regarding open reverse repurchase agreements as of November 30, 2020, if applicable.
Expenses — Expenses that are directly related to a Fund are charged directly to that Fund. Other operating expenses of the Funds are prorated to the Funds on the basis of relative net assets.
| | |
SEI Institutional Investments Trust / Semi-Annual Report / November 30, 2020 | | 351 |
NOTES TO FINANCIAL STATEMENTS / CONSOLIDATED NOTES TO FINANCIAL STATEMENTS (Continued)
November 30, 2020 (Unaudited)
Commodity-Linked Investments — To the extent consistent with its Investment Objective and Strategies, the Dynamic Asset Allocation and Multi-Asset Real Return Funds may invest in commodity investments to provide exposure to the investment returns of the commodities markets. Commodity investments include notes with interest payments that are tied to an underlying commodity or commodity index, ETFs or other exchange-traded products that are tied to the performance of a commodity or commodity index or other types of commodities or commodity indices. The Dynamic Asset Allocation and Multi-Asset Real Return Funds may also invest in equity securities of issuers in commodity-related industries.
The Dynamic Asset Allocation and Multi-Asset Real Return Funds may also seek to gain exposure to the commodity markets, in whole or in part, through investments in a wholly owned Subsidiary. The Subsidiary, unlike the Fund, may invest to a significant extent directly in commodities and in equity-linked securities and commodity-linked derivative instruments, including options, futures contracts, swaps, options on futures contracts and commodity-linked structured notes. The Subsidiary may also invest in other instruments in which the Fund is permitted to invest, either as investments or to serve as margin or collateral for its derivative positions. A Fund may invest up to 25% of its total assets in its Subsidiary.
In order for a Fund to qualify as a regulated investment company under Subchapter M of the Code, the Fund must derive at least 90% of its gross income each taxable year from qualifying income. The status of certain commodity-linked derivative instruments as qualifying income has been addressed in Revenue Ruling 2006-1 and Revenue Ruling 2006-31 which provide that income from certain commodity-linked derivative instruments in which the Fund invests will not be considered qualifying income. To the extent the Dynamic Asset Allocation and Multi-Asset Real Return Funds invest in such instruments directly, each Fund will seek to restrict its income from commodity-linked derivative instruments that do not generate qualifying income, such as commodity-linked swaps, to a maximum of 10% of its gross income (when combined with its other investments that produce non-qualifying income).
Foreign Currency Translation — The books and records of the Funds investing in international securities are maintained in U.S. dollars on the following basis:
(I) market value of investment securities, assets and liabilities at the current rate of exchange; and
(II) purchases and sales of investment securities, income and expenses at the relevant rates of exchange prevailing on the respective dates of such transactions.
The Funds do not isolate that portion of gains and losses on investments that is due to changes in the foreign exchange rates from that which is due to changes in market prices of investments.
The Funds report certain foreign-currency-related transactions as components of realized gains for financial reporting purposes, whereas such components are treated as ordinary income for Federal income tax purposes.
Forward Foreign Currency Contracts — To the extent consistent with its Investment Objective and Strategies, a Fund may enter into forward foreign currency contracts as hedges against either specific transactions, fund positions or anticipated fund positions. A Fund may also engage in currency transactions to enhance that Fund’s returns. All commitments are marked-to-market daily at the applicable foreign exchange rate, and any resulting unrealized gains or losses are recorded currently. A Fund realizes gains and losses at the time forward contracts are extinguished. Unrealized gains or losses on outstanding positions in forward foreign currency contracts held at the close of the period are recognized as ordinary income or loss for Federal income tax purposes.
A Fund could be exposed to risk if the counterparties to the contracts are unable to meet the terms of the contract and from unanticipated movements in the value of a foreign currency relative to the U.S. dollar.
Finally, the risk exists that losses could exceed amounts disclosed on the Statements of Assets and Liabilities or Consolidated Statements of Assets and Liabilities. Refer to each Fund’s Schedule of Investments, Summary Schedule of Investments, Consolidated Schedule of Investments or Consolidated Summary Schedule of Investments for details regarding open forward foreign currency contracts as of November 30, 2020, if applicable.
Futures Contracts — To the extent consistent with its Investment Objective and Strategies, a Fund may use futures contracts for tactical hedging purposes as well as to enhance the Fund’s returns. In addition, fixed income funds will utilize futures contracts to help manage duration and yield curve exposure. These Funds’ investments in futures contracts are designed to enable the Funds to more closely approximate the performance of their benchmark indices. Initial margin deposits of cash or securities are made upon entering into futures contracts. The contracts are marked-to-market daily and the resulting changes in value are accounted for as unrealized gains and losses. Variation margin payments are paid or received, depending upon whether unrealized gains or losses are incurred. When
| | |
352 | | SEI Institutional Investments Trust / Semi-Annual Report / November 30, 2020 |
contracts are closed, the Funds record a realized gain or loss equal to the difference between the proceeds from (or cost of) the closing transaction and the amount invested in the contract.
Risks of entering into futures contracts include the possibility that there will be an imperfect price correlation between the futures and the underlying securities. Second, it is possible that a lack of liquidity for futures contracts could exist in the secondary market, resulting in an inability to close a position prior to its maturity date. Third, futures contracts involve the risk that a Fund could lose more than the original margin deposit required to initiate a futures transaction.
Finally, the risk exists that losses could exceed amounts disclosed on the Statements of Assets and Liabilities or Consolidated Statements of Assets and Liabilities. Refer to each Fund’s Schedule of Investments, Summary Schedule of Investments, Consolidated Summary Schedule of Investments or Consolidated Schedule of Investments for details regarding open futures contracts as of November 30, 2020, if applicable.
Master Limited Partnerships — Investments in units of master limited partnerships (“MLPs”) involve risks that differ from an investment in common stock. Holders of the units of master limited partnerships have more limited control and limited rights to vote on matters affecting the partnership. There are also certain tax risks associated with an investment in units of master limited partnerships. In addition, conflicts of interest may exist between common unit holders, subordinated unit holders and the general partner of a master limited partnership, including a conflict arising as a result of incentive distribution payments. The benefit a Fund derives from investment in MLP units is largely dependent on the MLPs being treated as partnerships and not as corporations for federal income tax purposes. If an MLP were classified as a corporation for federal income tax purposes, there would be reduction in the after-tax return to a Fund of distributions from the MLP, likely causing a reduction in the value of a Fund’s shares. MLP entities are typically focused in the energy, natural resources and real estate sectors of the economy. A downturn in the energy, natural resources or real estate sectors of the economy could have an adverse impact on a Fund. At times, the performance of securities of companies in the energy, natural resources and real estate sectors of the economy may lag the performance of other sectors or the broader market as a whole. Refer to each Fund’s Schedule of Investments or Consolidated Summary Schedule of Investments for details regarding Master Limited Partnerships, if applicable.
Options/Swaptions Writing/Purchasing — To the extent consistent with its Investment Objective and Strategies, a Fund may invest in financial options/swaptions contracts for the purpose of hedging its existing portfolio securities, or securities that a Fund intends to purchase, against fluctuations in fair market value caused by changes in prevailing market interest rates. A Fund may also invest in financial option/swaption contracts to enhance its returns. When the Fund writes or purchases an option/swaption, an amount equal to the premium received or paid by the Fund is recorded as a liability or an asset and is subsequently adjusted to the current market value of the option/swaption written or purchased. Premiums received or paid from writing or purchasing options/swaptions which expire unexercised are treated by the Fund on the expiration date as realized gains or losses. The difference between the premium and the amount paid or received on effecting a closing purchase or sale transaction, including brokerage commissions, is also treated as a realized gain or loss. If an option/swaption is exercised, the premium paid or received is added to the cost of the purchase or proceeds from the sale in determining whether the Fund has realized a gain or a loss. The World Select Equity, Core Fixed Income, Dynamic Asset Allocation and Multi-Asset Real Return Funds had options/swaption contracts as of November 30, 2020, as disclosed in the Funds’ Schedule of Investments or Consolidated Summary Schedule of Investments. The risk in writing a call option/swaption is a Fund may give up the opportunity for profit if the market price of the security increases. The risk in writing a put option/swaption is a Fund may incur a loss if the market price of the security decreases and the option/swaption is exercised. The risk in purchasing an option/swaption is a Fund may pay a premium whether or not the option/swaption is exercised. The Funds also have the additional risk of being unable to enter into a closing transaction at an acceptable price if a liquid secondary market does not exist. Option/swaption contracts also involve the risk that they may not work as intended due to unanticipated developments in market conditions or other causes.
Finally, the risk exists that losses on written options could exceed amounts disclosed on the Statements of Assets and Liabilities. Refer to each Fund’s Schedule of Investments or Consolidated Summary Schedule of Investments for details regarding open option/swaption contracts as of November 30, 2020, if applicable.
| | |
SEI Institutional Investments Trust / Semi-Annual Report / November 30, 2020 | | 353 |
NOTES TO FINANCIAL STATEMENTS / CONSOLIDATED NOTES TO FINANCIAL STATEMENTS (Continued)
November 30, 2020 (Unaudited)
Securities Sold Short—To the extent consistent with its Investment Objective and Strategies, a Fund may engage in short sales. Short sales are transactions under which a Fund sells a security it does not own. To complete such a transaction, a Fund must borrow the security to make delivery to the buyer. A Fund then is obligated to replace the security borrowed by purchasing the security at the market price at the time of the replacement. The price at such time may be more or less than the price at which the security was sold by a Fund. Until the security is replaced, a Fund is required to pay the lender amounts equal to any dividends or interest that accrue during the period of the loan. Dividends and interest are shown as an expense for financial reporting purposes. To borrow the security, a Fund also may be required to pay a premium, which would decrease proceeds of the security sold. The proceeds of the short sale are retained by the broker, to the extent necessary to meet margin requirements, until the short position is closed out. A gain, limited to the price at which a Fund sold the security short, or a loss, unlimited in size, will be recognized upon the close of a short sale.
Until a Fund closes its short position or replaces the borrowed security, the Fund will: (i) earmark on the books of the Fund or place in a segregated account cash or liquid securities at such a level that the amount earmarked or deposited in the segregated account plus the amount deposited with the broker as collateral will equal the current value of the security sold short; or (ii) otherwise “cover” the Fund’s short position as required by the 1940 Act. Refer to each Fund’s Schedule of Investments, Summary Schedule of Investments, Consolidated Summary Schedule of Investments or Consolidated Schedule of Investments for details regarding securities sold short as of November 30, 2020, if applicable.
Swap Agreements — To the extent consistent with its Investment Objective and Strategies, a Fund may invest in swap contracts as an efficient means to synthetically obtain exposure to securities or baskets of securities and to manage a Fund’s interest rate duration and yield curve exposure. Swap contracts may also be used to mitigate a Fund’s overall level of risk and/or a Fund’s risk to particular types of securities, currencies or market segments. Interest rate swaps may further be used to manage a Fund’s yield spread sensitivity. A Fund may buy credit default swaps in an attempt to manage credit risk where a Fund has credit exposure to an issuer, and a Fund may sell credit default swaps to more efficiently gain credit exposure to a security or basket of securities. A swap agreement is a two-party contract under which an agreement is made to exchange returns from predetermined investments or instruments, including
a particular interest rate, foreign currency, or “basket” of securities representing a particular index. Swap agreements are privately negotiated in the over-the-counter market (“OTC swaps”) or may be executed in a multilateral or other trade facility platform, such as a registered commodities exchange (“Centrally Cleared swaps”). Interest rate swaps involve the exchange by a Fund with another party of their respective commitments to pay or receive interest (e.g., an exchange of floating rate payments for fixed rate payments) with respect to a notional amount of principal. Credit-default swaps involve periodic payments by a Fund or counterparty based on a specified rate multiplied by a notional amount assigned to an underlying debt instrument or group of debt instruments in exchange for the assumption of credit risk on the same instruments. In the event of a credit event, usually in the form of a credit rating downgrade, the party receiving periodic payments (i.e. floating rate payer) must pay the other party (i.e. fixed rate payer) an amount equal to the recovery rate used to settle the contracts. The recovery rate is a function of how many credit default swap investors wish to deliver the security or receive the security. The recovery rate is determined through an auction process. Total return swaps allow an investor to benefit from the cash flow without ever actually owning the underlying security. The receiver must pay any decline in value to the payer at the end of the total return swap. However, the investor does not need to make a payment if there is no decline in price. Payments can be made on various indices, bonds (i.e. mortgage backed securities, bank debt and corporate), loans or commodities. The value of a total return swap is equal to the change in value of the underlying asset versus the accrued income payment based on LIBOR or some other form of indices on the notional amount. Interest rate swaps involve the exchange by a Fund with another party of their respective commitments to pay or receive interest (e.g., an exchange of floating rate payments for fixed rate payments) with respect to a notional amount of principal to manage a Fund’s exposure to interest rates. Payments received or made are recorded as realized gains or loss. A Fund could be exposed to credit or market risk due to unfavorable changes in the fluctuation of interest rates or if the counterparty defaults on its obligation to perform. Risk of loss may exceed amounts recognized on the Statements of Assets and Liabilities or Consolidated Statements of Assets and Liabilities. Interest rate swap contracts outstanding at period end, if any, are listed after a Fund’s portfolio. In connection with swap agreements securities may be set aside as collateral by a Fund’s custodian.
Swaps are marked-to-market daily based upon quotations from market makers and the resulting
| | |
354 | | SEI Institutional Investments Trust / Semi-Annual Report / November 30, 2020 |
changes in market values, if any, are recorded as an unrealized gain or loss on the Statements of Operations or Consolidated Statements of Operations. Net payments of interest are recorded as realized gains or losses. Daily changes in valuation of Centrally Cleared swaps, if any, are recorded as a receivable or payable for the change in value as appropriate (“variation margin”) on the Statements of Assets and Liabilities or Consolidated Statements of Assets and Liabilities.
Entering into swap agreements involves, to varying degrees, elements of credit and market risk in excess of the amounts recognized on the Statements of Assets and Liabilities or Consolidated Statements of Assets and Liabilities. Such risks involve the possibility that there will be no liquid market for these agreements, that the counterparty to the agreement may default on its obligation to perform and that there may be unfavorable changes in the fluctuation of interest rates. Risks also arise from potential losses from adverse market movements.
This risk is mitigated by having a master netting arrangement between a Fund and the counterparty and by having the counterparty post collateral to cover a Fund’s exposure to the counterparty. See Note 3 for further details. Refer to each Fund’s Schedule of Investments, Summary Schedule of Investments, Consolidated Summary Schedule of Investments or Consolidated Schedule of Investments for details regarding open swap agreements as of November 30, 2020, if applicable.
Forward Treasury Commitments — To the extent consistent with its Investment Objective and Strategies, a Fund may invest in commitments to purchase U.S. Treasury securities on an extended settlement basis. Such transactions involve the commitment to purchase a security with payment and delivery taking place in the future, sometimes a month or more after the transaction date. The Funds account for such transactions as purchases and sales and record an unrealized gain or loss each day equal to the difference between the cost of the purchase commitment and the current market value. Realized gains or losses are recorded upon closure or settlement of such commitments. No interest is earned prior to settlement of the transaction. These instruments are subject to market fluctuation due to changes in interest rates and the market value at the time of settlement could be higher or lower than the purchase price. A Fund may incur losses due to changes in the value of the underlying treasury securities from interest rate fluctuations or as a result of counterparty nonperformance.
Delayed Delivery Transactions — To the extent consistent with its Investment Objective and Strategies, a Fund may purchase or sell securities on a when-issued or delayed delivery basis. These transactions involve a commitment by the Fund to purchase or sell securities for a predetermined price or yield, with payment and delivery taking place beyond the customary settlement period. When purchasing a security on a delayed delivery basis, the Fund assumes the rights and risks of ownership of the security, including the risk of price and yield fluctuations, and takes such fluctuations into account when determining its net asset value. The Funds may dispose of or renegotiate a delayed delivery transaction after it is entered into, and may sell when-issued securities before they are delivered, which may result in a capital gain or loss. When the Fund has sold a security on a delayed delivery basis, the Fund does not participate in future gains and losses with respect to the security.
Participation Notes (P-Notes) — To the extent consistent with its Investment Objective and Strategies, a Fund may acquire P-Notes issued by participating banks or broker-dealers. P-Notes are participation interest notes that are designed to offer a return linked to a particular underlying equity, debt, currency or market. The P-Notes in which the Fund may invest will typically have a maturity of one year. When purchasing a P-Note, the posting of margin is not required because the full cost of the P-Note (plus commission) is paid at the time of purchase. When the P-Note matures, the issuer will pay to, or receive from, the purchaser the difference between the minimal value of the underlying instrument at the time of purchase and that instrument’s value at maturity. Investments in P-Notes involve the same risks associated with a direct investment in the underlying foreign companies of foreign securities markets that they seek to replicate.
In addition, there can be no assurance that the trading price of P-Notes will equal the underlying value of the foreign companies or foreign securities markets that they seek to replicate. The holder of a participation note that is linked to a particular underlying security is entitled to receive any dividends paid in connection with an underlying security or instrument. However, the holder of a participation note does not receive voting rights as it would if it directly owned the underlying security or instrument. P-Notes are generally traded over-the-counter. P-Notes constitute general unsecured contractual obligations of the banks or broker-dealers that issue them and the counterparty. There is also counterparty risk associated with these investments because the Fund is relying on the creditworthiness of such counterparty and has no rights under a participation note against the issuer of the underlying
| | |
SEI Institutional Investments Trust / Semi-Annual Report / November 30, 2020 | | 355 |
NOTES TO FINANCIAL STATEMENTS / CONSOLIDATED NOTES TO FINANCIAL STATEMENTS (Continued)
November 30, 2020 (Unaudited)
security. In addition, the Fund will incur transaction costs as a result of investments in P-Notes.
Loan Participations and Brady Bonds — To the extent consistent with its Investment Objective and Strategies, a Fund may invest in Loan Participations. Loan Participations include fixed and floating rate loans that are privately negotiated between a corporate borrower and one or more financial institutions, including, but not limited to, term loans, revolvers, and other instruments issued in the bank loan market. Each Fund may acquire interests in loans directly (by way of assignment from the selling institution) or indirectly (by way of the purchase of a participation interest from the selling institution). Under a bank loan assignment, a Fund generally will succeed to all the rights and obligations of an assigning lending institution and becomes a lender under the loan agreement with the relevant borrower in connection with that loan. Under bank loan participation, the Fund generally will have a contractual relationship only with the lender, not with the relevant borrower. As a result, a Fund generally will have the right to receive payments of principal, interest, and any fees to which it is entitled only from the lender selling the participation and only upon receipt by the lender of the payments from the relevant borrower. The Fund may not directly benefit from the collateral supporting the debt obligation in which it has purchased the participation. As a result, a Fund will assume the credit risk of both the borrower and the institution selling the participation to the Fund. The interest rate indicated in the Fund’s Schedule of Investments is the rate in effect at November 30, 2020. Pursuant to the terms of certain loan agreements, the Funds may hold unfunded commitments in loan participations which are disclosed on the Statement of Assets and Liabilities. Unfunded commitments represent the remaining obligation of the Fund to the borrower. At any point in time, up to the maturity date of the issue, the borrower may demand the unfunded portion. Unfunded amounts, if any, are marked to market and any unrealized gains or losses are recorded in the Statement of Assets and Liabilities. The Funds disclosed consent fees and amendment income in the Statement of Operations as “Interest income”.
Certain debt obligations, customarily referred to as “Brady Bonds,” are created through the exchange of existing commercial bank loans to foreign entities for new obligations in connection with debt restructuring under a plan introduced by former U.S. Secretary of the Treasury Nicholas F. Brady. Brady Bonds have only been issued since 1989, and, accordingly, do not have a long payment history. They are issued by governments
that may have previously defaulted on the loans being restructured by the Brady Bonds, so they are subject to the risk of default by the issuer. They may be fully or partially collateralized or uncollateralized and issued in various currencies.
Collateralized Debt Obligations — To the extent consistent with its Investment Objective and Strategies, a Fund may invest in collateralized debt obligations (“CDOs”), which include collateralized loan obligations (“CLOs”) and other similarly structured securities. CLOs are a type of asset-backed securities. A CLO is a trust typically collateralized by a pool of loans, which may include, among others, domestic and foreign senior secured loans, senior unsecured loans, and subordinate corporate loans, including loans that may be rated below investment grade or equivalent unrated loans. CDOs may charge management fees and administrative expenses.
Dividends and Distributions to Shareholders — Dividends from net investment income are declared and paid to shareholders quarterly for the Large Cap, Large Cap Disciplined Equity, Large Cap Index, S&P 500 Index, Extended Market Index, Small Cap, Small Cap II, Small/Mid Cap Equity, U.S. Equity Factor Allocation, U.S. Managed Volatility, Opportunistic Income, Emerging Markets Debt and Real Return Funds; declared daily and paid monthly for the Core Fixed Income, High Yield Bond, Long Duration, Long Duration Credit, Ultra Short Duration Bond and Intermediate Duration Credit Funds; declared and paid at least annually for the Global Managed Volatility, World Equity Ex-US, Screened World Equity Ex-US, World Select Equity, Emerging Markets Equity, Limited Duration Bond, Dynamic Asset Allocation and Multi-Asset Real Return Funds. Dividends and distributions are recorded on the ex-dividend date. Any net realized capital gains will be distributed at least annually by the Funds.
Investments in Real Estate Investment Trusts (“REITs”) — With respect to the Funds, with the exception of the World Equity Ex-US, Screened World Equity Ex-US and Real Return Funds, dividend income is recorded based on the income included in distributions received from the REIT investments using published REIT reclassifications including some management estimates when actual amounts are not available. Distributions received in excess of this estimated amount are recorded as a reduction of the cost of investments or reclassified to capital gains. The actual amounts of income, return of capital, and capital gains are only determined by each REIT after its fiscal year-end, and may differ from the estimated amounts.
Restricted Securities — As of November 30, 2020, the following Fund owned private placement investments that were purchased through private offerings or acquired through initial public offerings and cannot be sold without
| | |
356 | | SEI Institutional Investments Trust / Semi-Annual Report / November 30, 2020 |
prior registration under the Securities Act of 1933 or pursuant to an exemption therefrom. In addition, this Fund has generally agreed to further restrictions on the disposition of certain holdings as set forth in various agreements entered into in connection with the purchase of these private placement investments. The acquisition dates of these investments, the enforceable right to acquire these private placement investments, along with the cost and values at November 30, 2020, were as follows:
| | | | | | | | | | | | | | | | | | | | | | | | |
| | | | | | | |
| | | Face Amount ($ Thousands) | | | Acquisition Date | | | Right to Acquire Date | | | Cost ($ Thousands) | | | Market Value ($ Thousands) | | | % of Net Assets | |
| | | | | | |
High Yield Bond Fund | | | | | | | | | | | | | | | | | | | | | | | | |
Aventine (Escrow Security) | | | 2,600 | | | | 11/30/2010 | | | | 11/30/2010 | | | $ | 0 | | | $ | 0 | | | | 0.00 | % |
| | | | | | | | | | | | | | | | | | | | | | | | |
Investment in Subsidiary — The Dynamic Asset Allocation and Multi-Asset Real Return Funds may invest in their own Subsidiary. By investing in its Subsidiary, each Fund is indirectly exposed to the risks associated with the Subsidiary’s investments. The commodity-related instruments held by a Subsidiary are generally similar to those that are permitted to be held by the applicable Fund and are subject to the same risks that apply to similar investments if held directly by the Fund. A Subsidiary, however, is not registered under the 1940 Act and will not be subject to all of the investor protections of the 1940 Act. Thus, the Dynamic Asset Allocation and Multi-Asset Real Return Funds, as investors in their own Subsidiary, will not have all of the protections offered to investors in registered investment companies.
However, each Fund wholly owns and controls its respective Subsidiary, and the Funds and the Subsidiaries are all managed by SIMC, making it unlikely that the Subsidiary will take action contrary to the interests of the applicable Fund or its shareholders. While a Subsidiary has its own Board of Directors (“Board”) that is responsible for overseeing the operations of such Subsidiary, the respective Fund’s Board has oversight responsibility for the investment activities of the Fund, including its investment in the respective Subsidiary, and the Fund’s role as the sole shareholder of such Subsidiary. It is not currently expected that shares of the Subsidiary will be sold or offered to investors other than the respective Fund.
Changes in the laws of the United States and/or the Cayman Islands or governmental interpretation of such laws, under which the Fund and the Subsidiary, respectively, are organized, could result in the inability of the Fund and/or its respective Subsidiary to operate as intended and could negatively affect the Fund and its shareholders. For example, Cayman Islands law does not currently impose any income, corporate or capital gains tax, estate duty, inheritance tax, gift tax or withholding tax on the Subsidiaries. If Cayman Islands law changes such that the Subsidiaries must pay Cayman Islands governmental authority taxes, Fund shareholders would likely suffer decreased investment return.
3. CREDIT DERIVATIVES
A Fund may use credit default swaps to reduce risk where a Fund has exposure to the issuer, or to take an active long or short position with respect to the likelihood of an event of default. The reference obligation of the swap can be a single issuer, a “basket” of issuers, or an index. The underlying referenced assets are corporate debt, sovereign debt and asset backed securities.
The buyer of a credit default swap is generally obligated to pay the seller a periodic stream of payments over the term of the contract in return for a contingent payment upon the occurrence of a credit event with respect to an underlying reference obligation. Generally, a credit event for corporate or sovereign reference obligations means bankruptcy, failure to pay, obligation acceleration, repudiation/moratorium or restructuring. For credit default swaps on asset-backed securities, a credit event may be triggered by events such as failure to pay principal, maturity extension, rating downgrade or write-down.
If a Fund is a seller of protection, and a credit event occurs, as defined under the terms of that particular swap agreement, a Fund will generally either (i) pay to the buyer an amount equal to the notional amount of the swap and take delivery of the referenced obligation, other deliverable obligations, or underlying securities comprising a referenced index or (ii) pay a net settlement amount in the form of cash or securities equal to the notional amount of the swap less the recovery value of the referenced obligation or underlying securities comprising a referenced index.
If a Fund is a buyer of protection and a credit event occurs, as defined under the terms of that particular swap agreement, a Fund will either (i) receive from the seller of protection an amount equal to the notional amount of the swap and deliver the referenced obligation, other deliverable obligations or underlying securities comprising the referenced index or (ii) receive a net settlement amount in the form of cash or securities equal to the notional amount of the swap less the recovery value of the referenced obligation
| | |
SEI Institutional Investments Trust / Semi-Annual Report / November 30, 2020 | | 357 |
NOTES TO FINANCIAL STATEMENTS / CONSOLIDATED NOTES TO FINANCIAL STATEMENTS (Continued)
November 30, 2020 (Unaudited)
or underlying securities comprising the referenced index. Recovery values are assumed by market makers considering either industry standard recovery rates or entity specific factors and considerations until a credit event occurs. If a credit event has occurred, the recovery
value is determined by a facilitated auction whereby a minimum number of allowable broker bids, together with a specified valuation method, are used to calculate the settlement value.
As of November 30, 2020, the Multi-Asset Real Return Fund is the buyer (“receiving protection”) on a total notional amount of $149.6 million. Additionally, the Core Fixed Income, High Yield Bond, and Multi-Asset Real Return Funds are the sellers (“providing protection”) on a total notional amount of $254 million, $3.8 million and $14.6 million, respectively. The notional amounts of the swaps are not recorded in the financial statements; however the notional amounts approximate the maximum potential amount of future payments that the Fund could be required to make if the Fund was the seller of protection and a credit event were to occur. Those credit default swaps (“CDS”) for which the Fund is providing protection at balance sheet date are summarized as follows:
| | | | | | | | | | | | | | | | | | | | |
| |
| Core Fixed Income Fund | |
| | | |
| Written Credit Derivative Contracts | | Single Name CDS | | | CDS Index | | | | |
| | | | | | |
| Reference Asset | | Corp US$ | | | Sovereign US$ | | | ABS US$ | | | Corp US$ | | | Total | |
| | | | | |
Fair value of written credit derivatives | | $ | — | | | $ | — | | | $ | — | | | $ | 4,262,820 | | | $ | 4,262,820 | |
| | | | | |
Maximum potential amount of future payments | | | — | | | | — | | | | — | | | | 253,865,000 | | | | 253,865,000 | |
| | | | | |
Recourse provisions with the third parties any amounts paid under the credit derivative (including any purchased credit protection)(1) | | | — | | | | — | | | | — | | | | — | | | | — | |
| | | | | |
Collateral held by the Fund or other third parties which the Fund can obtain upon occurrence of triggering event | | | — | | | | — | | | | — | | | | — | | | | — | |
| (1) | Potential recoveries would include purchased credit derivatives to the extent they offset written credit derivatives which have an identical underlying, or a netting arrangement or credit support annex with the counterparty. There may be other potential recoveries from recourse provisions where agreements cover multiple derivative arrangements but those amounts have not been included. |
| | | | | | | | | | | | | | | | | | | | | | | | |
| |
| Maximum Potential Amount of Future Payments by Contract Term | |
| | | | | | | |
| | | 0-6 Months | | | 6-12 Months | | | 1-5 Years | | | 5-10 Years | | | >10 Years | | | Total | |
| | | | | | |
Current credit spread* on underlying
(in basis points) | | | | | | | | | | | | | | | | | | | | | | | | |
| | | | | | |
0-100 | | $ | — | | | $ | — | | | $ | 229,898,000 | | | $ | 23,967,000 | | | $ | — | | | $ | 253,865,000 | |
| | | | | | |
Greater than 100 | | | — | | | | — | | | | — | | | | — | | | | — | | | | — | |
| | | | | | | |
| Total | | $ | — | | | $ | — | | | $ | 229,898,000 | | | $ | 23,967,000 | | | $ | — | | | $ | 253,865,000 | |
| * | The credit spread on the underlying asset is generally indicative of the current status of the underlying risk of the Fund having to perform. The spread also reflects the cost of buying/selling protection and may include upfront payments required to be made to enter into a contract. Higher credit spreads with a shorter contract term is indicative of a higher likelihood of performance by the Fund. |
| | | | | | | | | | | | | | | | | | | | |
| |
| High Yield Bond Fund | |
| | | |
| Written Credit Derivative Contracts | | Single Name CDS | | | CDS Index | | | | |
| | | | | | |
| Reference Asset | | Corp US$ | | | Sovereign US$ | | | ABS US$ | | | Corp US$ | | | Total | |
| | | | | |
Fair value of written credit derivatives | | $ | — | | | $ | — | | | $ | — | | | $ | 303,871 | | | $ | 303,871 | |
| | | | | |
Maximum potential amount of future payments | | | — | | | | — | | | | — | | | | 3,839,000 | | | | 3,839,000 | |
| | | | | |
Recourse provisions with the third parties any amounts paid under the credit derivative (including any purchased credit protection)(1) | | | — | | | | — | | | | — | | | | — | | | | — | |
| | | | | |
Collateral held by the Fund or other third parties which the Fund can obtain upon occurrence of triggering event | | | — | | | | — | | | | — | | | | — | | | | — | |
| (1) | Potential recoveries would include purchased credit derivatives to the extent they offset written credit derivatives which have an identical underlying, or a netting arrangement or credit support annex with the counterparty. There may be other potential recoveries from recourse provisions where agreements cover multiple derivative arrangements but those amounts have not been included. |
| | | | | | | | | | | | | | | | | | | | | | | | |
| |
| Maximum Potential Amount of Future Payments by Contract Term | |
| | | | | | | |
| | | 0-6 Months | | | 6-12 Months | | | 1-5 Years | | | 5-10 Years | | | >10 Years | | | Total | |
| | | | | | |
Current credit spread* on underlying
(in basis points) | | | | | | | | | | | | | | | | | | | | | | | | |
| | | | | | |
0-200 | | $ | — | | | $ | — | | | $ | — | | | $ | — | | | $ | — | | | $ | — | |
| | | | | | |
201-300 | | | — | | | | — | | | | 3,839,000 | | | | — | | | | — | | | | 3,839,000 | |
| | | | | | |
Greater than 300 | | | — | | | | — | | | | — | | | | — | | | | — | | | | — | |
| | | | | | | |
| Total | | $ | — | | | $ | — | | | $ | 3,839,000 | | | $ | — | | | $ | — | | | $ | 3,839,000 | |
| * | The credit spread on the underlying asset is generally indicative of the current status of the underlying risk of the Fund having to perform. The spread also reflects the cost of buying/selling protection and may include upfront payments required to be made to enter into a contract. Higher credit spreads with a shorter contract term is indicative of a higher likelihood of performance by the Fund. |
| | |
358 | | SEI Institutional Investments Trust / Semi-Annual Report / November 30, 2020 |
| | | | | | | | | | | | | | | | | | | | |
| |
| Multi-Asset Real Return Fund | |
| | | |
| Written Credit Derivative Contracts | | Single Name CDS | | | CDS Index | | | | |
| | | | | | |
| Reference Asset | | Corp US$ | | | Sovereign US$ | | | ABS US$ | | | Corp US$ | | | Total | |
| | | | | |
Fair value of written credit derivatives | | $ | — | | | $ | — | | | $ | (4,007,611 | ) | | $ | — | | | $ | (4,007,611 | ) |
| | | | | |
Maximum potential amount of future payments | | | — | | | | — | | | | 14,646,000 | | | | — | | | | 14,646,000 | |
| | | | | |
Recourse provisions with the third parties any amounts paid under the credit derivative (including any purchased credit protection)(1) | | | — | | | | — | | | | — | | | | — | | | | — | |
| | | | | |
Collateral held by the Fund or other third parties which the Fund can obtain upon occurrence of triggering event | | | — | | | | — | | | | — | | | | — | | | | — | |
| (1) | Potential recoveries would include purchased credit derivatives to the extent they offset written credit derivatives which have an identical underlying, or a netting arrangement or credit support annex with the counterparty. There may be other potential recoveries from recourse provisions where agreements cover multiple derivative arrangements but those amounts have not been included. |
| | | | | | | | | | | | | | | | | | | | | | | | |
| |
| Maximum Potential Amount of Future Payments by Contract Term | |
| | | | | | | |
| | | 0-6 Months | | | 6-12 Months | | | 1-5 Years | | | 5-10 Years | | | >10 Years | | | Total | |
| | | | | | |
Current credit spread* on underlying
(in basis points) | | | | | | | | | | | | | | | | | | | | | | | | |
| | | | | | |
0-400 | | $ | — | | | $ | — | | | $ | — | | | $ | — | | | $ | — | | | $ | — | |
| | | | | | |
Greater than 400 | | | — | | | | — | | | | — | | | | — | | | | 14,646,000 | | | | 14,646,000 | |
| Total | | $ | — | | | $ | — | | | $ | — | | | $ | — | | | $ | 14,646,000 | | | $ | 14,646,000 | |
| * | The credit spread on the underlying asset is generally indicative of the current status of the underlying risk of the Fund having to perform. The spread also reflects the cost of buying/selling protection and may include upfront payments required to be made to enter into a contract. Higher credit spreads with a shorter contract term is indicative of a higher likelihood of performance by the Fund. |
The credit spread disclosed above for each reference obligation where the Fund is the seller of protection is a representation of the current payment/performance risk of the swap.
4. DERIVATIVE TRANSACTIONS
The following tables include only Funds that had exposure to more than one type of risk on derivatives held throughout the year. For Funds that held derivatives throughout the period with only one type of risk exposure, additional information can be found on the Schedule of Investments, Consolidated Summary Schedule of Investments or Consolidated Schedule of Investments and the Statements of Operations or Consolidated Statements of Operations.
The fair value of derivative instruments as of November 30, 2020 was as follows ($ Thousands):
| | | | | | | | | | | | |
| | | | | |
| | | Asset Derivatives | | | | | Liability Derivatives | | | |
| | | | | |
| | | Statements of Assets and Liabilities/ Consolidated Statement of Assets and Liabilities Location | | Fair Value | | | Statements of Assets and Liabilities/ Consolidated Statement of Assets and Liabilities Location | | Fair
Value | |
| |
| Large Cap Disciplined Equity Fund | | | | |
| | | | |
Equity contracts | | Net Assets — Unrealized appreciation on futures contracts | | $ | 2,842 | * | | Net Assets — Unrealized depreciation on futures contracts | | $ | — | * |
| | | | |
| | Net Assets — Unrealized appreciation on swap contracts | | | 389 | † | | Net Assets — Unrealized depreciation on swap contracts | | | 1,364 | † |
| | | | |
| | | | | | | | | | | | |
| | | | |
| Total derivatives not accounted for as hedging instruments | | | | $ | 3,231 | | | | | $ | 1,364 | |
| | | | |
| | | | | | | | | | | | |
| |
| Global Managed Volatility Fund | | | | |
| | | | |
Equity contracts | | Net Assets — Unrealized appreciation on futures contracts | | $ | 1,673 | * | | Net Assets — Unrealized depreciation on futures contracts | | $ | 4 | * |
| | | | |
Foreign exchange contracts | | Unrealized gain on forward foreign currency contracts | | | 71 | | | Unrealized loss on forward foreign currency contracts | | | 7,313 | |
| | | | |
| | | | | | | | | | | | |
| | | | |
| Total derivatives not accounted for as hedging instruments | | | | $ | 1,744 | | | | | $ | 7,317 | |
| | | | |
| | | | | | | | | | | | |
| |
| World Equity Ex-US Fund | | | | |
| | | | |
Equity contracts | | Net Assets — Unrealized appreciation on futures contracts | | $ | 3,134 | * | | Net Assets — Unrealized depreciation on futures contracts | | $ | 46 | * |
| | | | |
Foreign exchange contracts | | Unrealized gain on forward foreign currency contracts | | | 1,080 | | | Unrealized loss on forward foreign currency contracts | | | 3,823 | |
| | | | |
| | | | | | | | | | | | |
| | | | |
| Total derivatives not accounted for as hedging instruments | | | | $ | 4,214 | | | | | $ | 3,869 | |
| | | | |
| | | | | | | | | | | | |
| | |
SEI Institutional Investments Trust / Semi-Annual Report / November 30, 2020 | | 359 |
NOTES TO FINANCIAL STATEMENTS / CONSOLIDATED NOTES TO FINANCIAL STATEMENTS (Continued)
November 30, 2020 (Unaudited)
| | | | | | | | | | | | |
| | | | | |
| | | Asset Derivatives | | | | | Liability Derivatives | | | |
| | | | | |
| | | Statements of Assets and Liabilities/ Consolidated Statement of Assets and Liabilities Location | | Fair Value | | | Statements of Assets and Liabilities/ Consolidated Statement of Assets and Liabilities Location | | Fair Value | |
| |
| Screened World Select Equity Ex-US Fund | | | | |
| | | | |
Equity contracts | | Net Assets — Unrealized
appreciation on futures
contracts | | $ | 23 | * | | Net Assets — Unrealized
depreciation on futures
contracts | | $ | 10 | * |
| | | | |
Foreign exchange contracts | | Unrealized gain on
forward foreign currency
contracts | | | 4 | | | Unrealized loss on
forward foreign currency
contracts | | | 9 | |
| | | | |
| | | | | | | | | | | | |
| | | |
| Total derivatives not accounted for as hedging instruments | | $ | 27 | | | | | $ | 19 | |
| | | | |
| | | | | | | | | | | | |
| |
| World Select Equity Fund | | | | |
| | | | |
Equity contracts | | Net Assets — Unrealized
appreciation on futures
contracts | | $ | 5,506 | * | | Net Assets — Unrealized
depreciation on futures
contracts | | $ | 3,941 | * |
| | | | |
Foreign exchange contracts | | Unrealized gain on
forward foreign currency
contracts | | | 2,136 | | | Unrealized loss on
forward foreign currency
contracts | | | 2,272 | |
| | | | |
| | Options purchased, at
value | | | 7 | | | Options written, at value | | | — | |
| | | | |
| | | | | | | | | | | | |
| | | |
| Total derivatives not accounted for as hedging instruments | | $ | 7,649 | | | | | $ | 6,213 | |
| | | | |
| | | | | | | | | | | | |
| |
| Core Fixed Income Fund | | | | |
| | | | |
Interest rate contracts | | Net Assets — Unrealized
appreciation on futures
contracts | | $ | 1,306 | * | | Net Assets — Unrealized
depreciation on futures
contracts | | $ | 3,574 | * |
| | | | |
| | Net Assets — Unrealized
appreciation on swap
contracts | | | 3,965 | † | | Net Assets — Unrealized
depreciation on swap
contracts | | | 36 | † |
| | | | |
| | Options purchased, at
value | | | 133 | | | Options written, at value | | | 233 | |
| | | | |
Credit contracts | | Net Assets — Unrealized
appreciation on swap
contracts | | | 4,455 | † | | Net Assets — Unrealized
depreciation on swap
contracts | | | 265 | † |
| | | | |
Foreign exchange contracts | | Unrealized gain on
forward foreign currency
contracts | | | 1,125 | | | Unrealized loss on
forward foreign currency
contracts | | | 268 | |
| | | | |
| | | | | | | | | | | | |
| | | |
| Total derivatives not accounted for as hedging instruments | | $ | 10,984 | | | | | $ | 4,376 | |
| | | | |
| | | | | | | | | | | | |
| |
| Emerging Markets Debt Fund | | | | |
| | | | |
Interest rate contracts | | Net Assets — Unrealized
appreciation on swaps
contracts | | $ | 7,013 | † | | Net Assets — Unrealized
depreciation on swap
contracts | | $ | 3,748 | † |
| | | | |
| | Net Assets — Unrealized
appreciation on future
contracts | | | 1,086 | * | | Net Assets — Unrealized
depreciation on future
contracts | | | 753 | * |
| | | | |
Credit contracts | | Net Assets — Unrealized
appreciation on swap
contracts | | | — | † | | Net Assets — Unrealized
depreciation on swap
contracts | | | 513 | † |
| | | | |
Foreign exchange contracts | | Unrealized gain on
forward foreign currency
contracts | | | 14,596 | | | Unrealized loss on
forward foreign currency
contracts | | | 17,323 | |
| | | | |
| | Net Assets — Unrealized
appreciation on swap
contracts | | | 184 | | | Net Assets — Unrealized
depreciation on swap
contracts | | | — | |
| | | | |
| | | | | | | | | | | | |
| | | |
| Total derivatives not accounted for as hedging instruments | | $ | 22,879 | | | | | $ | 22,337 | |
| | | | |
| | | | | | | | | | | | |
| |
| Dynamic Asset Allocation Fund | | | | |
| | | | |
Interest rate contracts | | Swaptions purchased, at
value | | $ | 23,193 | | | Swaptions written, at
value | | $ | — | |
| | | | |
Commodity contracts | | Net Assets — Unrealized
appreciation on swap
contracts | | | — | † | | Net Assets — Unrealized
depreciation on swap
contracts | | | 17,471 | † |
| | | | |
Equity contracts | | Net Assets — Unrealized
appreciation on futures
contracts | | | 14,035 | * | | Net Assets — Unrealized
depreciation on futures
contracts | | | — | * |
| | | | |
Foreign exchange contracts | | Unrealized gain on
forward foreign currency
contracts | | | 42 | | | Unrealized loss on
forward foreign currency
contracts | | | 107 | |
| | | | |
| | | | | | | | | | | | |
| | | |
| Total derivatives not accounted for as hedging instruments | | $ | 37,270 | | | | | $ | 17,578 | |
| | | | |
| | | | | | | | | | | | |
| | |
360 | | SEI Institutional Investments Trust / Semi-Annual Report / November 30, 2020 |
| | | | | | | | | | | | |
| | | | | |
| | | Asset Derivatives | | | | | Liability Derivatives | | | |
| | | | | |
| | | Statements of Assets and Liabilities/ Consolidated Statement of Assets and Liabilities Location | | Fair Value | | | Statements of Assets and Liabilities/ Consolidated Statement of Assets and Liabilities Location | | Fair Value | |
| |
| Multi-Asset Real Return Fund | | | | |
| | | | |
Interest rate contracts | | Net Assets — Unrealized appreciation
on futures contracts | | | $ 59 | * | | Net Assets — Unrealized depreciation
on futures contracts | | | $ 219 | * |
| | | | |
| | Net Assets — Unrealized appreciation
on swap contracts | | | 182 | † | | Net Assets — Unrealized depreciation
on swap contracts | | | 4,577 | † |
| | | | |
Equity contracts | | Net Assets — Unrealized appreciation
on futures contracts | | | — | * | | Net Assets — Unrealized depreciation
on futures contracts | | | 2,079 | * |
| | | | |
Credit contracts | | Net Assets — Unrealized appreciation
on swaps contracts | | | 511 | † | | Net Assets — Unrealized depreciation
on swaps contracts | | | 4,168 | † |
| | | | |
Commodity contracts | | Net Assets — Unrealized appreciation
on futures contracts | | | 7,220 | * | | Net Assets — Unrealized depreciation
on futures contracts | | | 4,366 | * |
| | | | |
| | Net Assets — Unrealized appreciation
on swap contracts | | | 795 | † | | Net Assets — Unrealized depreciation
on swap contracts | | | 114 | † |
| | | | |
| | Options purchased, at value | | | 1,211 | | | Options written, at value | | | 300 | |
| | | | |
| | Swaptions purchased, at value | | | — | | | Swaptions written, at value | | | 15 | |
| | | | |
Foreign exchange contracts | | Unrealized gain on forward foreign
currency contracts | | | 1,471 | | | Unrealized loss on forward foreign
currency contracts | | | 2,419 | |
| | | | | | | | | | | | |
| | | |
Total derivatives not accounted for as hedging instruments | | | $11,449 | | | | | | $18,257 | |
| | | | | | | | | | | | |
| * | Includes cumulative appreciation/depreciation of futures contracts as reported in the Schedules of Investments, Consolidated Summary Schedule of Investments or Consolidated Schedule of Investments. Only current day’s variation margin is reported within the Statements of Assets and Liabilities or Consolidated Statements of Assets and Liabilities. |
| † | Includes cumulative appreciation/depreciation of swap contracts as reported in the Schedules of Investments, Consolidated Summary Schedule of Investments or Consolidated Schedule of Investments. Market Value is reported within the Statements of Assets and Liabilities or Consolidated Statements of Assets and Liabilities for swap contracts that have paid premiums. |
The effect of derivative instruments on the Statements of Operations or Consolidated Statements of Operations for the period ended November 30, 2020.
Amount of realized gain or (loss) on derivatives recognized in income ($ Thousands):
| | | | | | | | | | | | | | | | | | | | | | | | |
| | | | | | | |
| Derivatives Not Accounted for as Hedging Instruments | | Swaptions | | | Options | | | Futures | | | Forward Currency Contracts | | | Swaps | | | Total | |
| | | | | | |
| Large Cap Disciplined Equity Fund | | | | | | | | | | | | | | | | | | | | | | | | |
Equity contracts | | | $— | | | | $— | | | | $ 4,791 | | | | $— | | | | $— | | | | $4,791 | |
Credit contracts | | | — | | | | — | | | | — | | | | — | | | | (2,882 | ) | | | (2,882 | ) |
Total | | | $— | | | | $— | | | | $ 4,791 | | | | $— | | | | $(2,882 | ) | | | $1,909 | |
| | | | | | |
| Global Managed Volatility Fund | | | | | | | | | | | | | | | | | | | | | | | | |
Foreign exchange contracts | | | $— | | | | $— | | | | $— | | | | $(28,678 | ) | | | $— | | | | $(28,678 | ) |
Equity contracts | | | — | | | | — | | | | 6,263 | | | | — | | | | — | | | | 6,263 | |
Total | | | $— | | | | $— | | | | $6,263 | | | | $(28,678 | ) | | | $— | | | | $(22,415 | ) |
| | | | | | |
| World Equity Ex-US Fund | | | | | | | | | | | | | | | | | | | | | | | | |
Foreign exchange contracts | | | $— | | | | $— | | | | $— | | | | $(12,028 | ) | | | $— | | | | $(12,028 | ) |
Equity contracts | | | — | | | | — | | | | 21,550 | | | | — | | | | — | | | | 21,550 | |
Total | | | $— | | | | $— | | | | $21,550 | | | | $(12,028 | ) | | | $— | | | | $9,522 | |
| | | | | | |
| Screened World Select Equity Ex-US Fund | | | | | | | | | | | | | | | | | | | | | | | | |
Interest rate contracts | | | $— | | | | $— | | | | $— | | | | $(118 | ) | | | $— | | | | $(118 | ) |
Equity contracts | | | — | | | | — | | | | 256 | | | | — | | | | — | | | | 256 | |
Total | | | $— | | | | $— | | | | $256 | | | | $(118 | ) | | | $— | | | | $138 | |
| | | | | | |
| World Select Equity Fund | | | | | | | | | | | | | | | | | | | | | | | | |
Foreign exchange contracts | | | $— | | | | $(1,510 | ) | | | $— | | | | $261 | | | | $— | | | | $(1,249 | ) |
Equity contracts | | | — | | | | — | | | | 6,180 | | | | — | | | | — | | | | 6,180 | |
Total | | | $— | | | | $(1,510 | ) | | | $6,180 | | | | $261 | | | | $— | | | | $4,931 | |
| | |
SEI Institutional Investments Trust / Semi-Annual Report / November 30, 2020 | | 361 |
NOTES TO FINANCIAL STATEMENTS / CONSOLIDATED NOTES TO FINANCIAL STATEMENTS (Continued)
November 30, 2020 (Unaudited)
| | | | | | | | | | | | | | | | | | | | | | | | |
| | | | | | | |
| Derivatives Not Accounted for as Hedging Instruments | | Swaptions | | | Options | | | Futures | | | Forward Currency Contracts | | | Swaps | | | Total | |
| | | | | | |
| Core Fixed Income Fund | | | | | | | | | | | | | | | | | | | | | | | | |
Interest rate contracts | | | $379 | | | | $859 | | | | $278 | | | | $— | | | | $(22,335 | ) | | | $(20,819 | ) |
Foreign exchange contracts | | | — | | | | — | | | | — | | | | (272 | ) | | | — | | | | (272 | ) |
Credit contracts | | | 252 | | | | — | | | | — | | | | — | | | | 1,803 | | | | 2,055 | |
Total | | | $631 | | | | $859 | | | | $278 | | | | $(272 | ) | | | $(20,532 | ) | | | $(19,036 | ) |
| | | | | | |
| Emerging Markets Debt Fund | | | | | | | | | | | | | | | | | | | | | | | | |
Interest rate contracts | | | $— | | | | $— | | | | $1,894 | | | | $— | | | | $(992 | ) | | | $902 | |
Foreign exchange contracts | | | — | | | | (376 | ) | | | — | | | | (4,586 | ) | | | 42 | | | | (4,920 | ) |
Credit contracts | | | — | | | | — | | | | — | | | | — | | | | (2,745 | ) | | | (2,745 | ) |
Total | | | $— | | | | $(376 | ) | | | $1,894 | | | | $(4,586 | ) | | | $(3,695 | ) | | | $(6,763 | ) |
| | | | | | |
| Dynamic Asset Allocation Fund | | | | | | | | | | | | | | | | | | | | | | | | |
Interest rate contracts | | | $— | | | | $(3,912 | ) | | | $— | | | | $— | | | | $— | | | | $(3,912 | ) |
Equity contracts | | | — | | | | — | | | | 25,202 | | | | — | | | | — | | | | 25,202 | |
Commodity contracts | | | — | | | | — | | | | — | | | | — | | | | 34,680 | | | | 34,680 | |
Total | | | $— | | | | $(3,912 | ) | | | $25,202 | | | | $— | | | | $34,680 | | | | $55,970 | |
| | | | | | |
| Multi-Asset Real Return Fund | | | | | | | | | | | | | | | | | | | | | | | | |
Interest rate contracts | | | $492 | | | | $— | | | | $988 | | | | $— | | | | $(1,424 | ) | | | $56 | |
Foreign exchange contracts | | | — | | | | — | | | | — | | | | (835 | ) | | | — | | | | (835 | ) |
Credit contracts | | | — | | | | — | | | | — | | | | — | | | | (3,270 | ) | | | (3,270 | ) |
Equity contracts | | | — | | | | — | | | | (10,144 | ) | | | — | | | | — | | | | (10,144 | ) |
Commodity contracts | | | — | | | | (1,353 | ) | | | 18,529 | | | | — | | | | 5,326 | | | | 22,502 | |
Total | | | $492 | | | | $(1,353 | ) | | | $9,373 | | | | $(835 | ) | | | $632 | | | | $8,309 | |
Change in unrealized appreciation or (depreciation) on derivatives recognized in income ($ Thousands):
| | | | | | | | | | | | | | | | | | | | | | | | |
| | | | | | | |
| Derivatives Not Accounted for as Hedging Instruments | | Swaptions | | | Options | | | Futures | | | Forward Currency Contracts | | | Swaps | | | Total | |
| | | | | | |
| Large Cap Disciplined Equity Fund | | | | | | | | | | | | | | | | | | | | | | | | |
Equity contracts | | | $— | | | | $— | | | | $2,499 | | | | $— | | | | $— | | | | $2,499 | |
Credit contracts | | | — | | | | — | | | | — | | | | — | | | | (975 | ) | | | (975 | ) |
Total | | | $— | | | | $— | | | | $2,499 | | | | $— | | | | $(975 | ) | | | $1,524 | |
| | | | | | |
| Global Managed Volatility Fund | | | | | | | | | | | | | | | | | | | | | | | | |
Foreign exchange contracts | | | $— | | | | $— | | | | $— | | | | $(2,354 | ) | | | $— | | | | $(2,354 | ) |
Equity contracts | | | — | | | | — | | | | 81 | | | | — | | | | — | | | | 81 | |
Total | | | $— | | | | $— | | | | $81 | | | | $(2,354 | ) | | | $— | | | | $(2,273 | ) |
| | | | | | |
| World Equity Ex-US Fund | | | | | | | | | | | | | | | | | | | | | | | | |
Foreign exchange contracts | | | $— | | | | $— | | | | $— | | | | $5 | | | | $— | | | | $5 | |
Equity contracts | | | — | | | | — | | | | (2,055 | ) | | | — | | | | — | | | | (2,055 | ) |
Total | | | $— | | | | $— | | | | $(2,055 | ) | | | $5 | | | | $— | | | | $(2,050 | ) |
| | | | | | |
| Screened World Select Equity Ex-US Fund | | | | | | | | | | | | | | | | | | | | | | | | |
Foreign exchange contracts | | | $— | | | | $— | | | | $— | | | | $22 | | | | $— | | | | $22 | |
Equity contracts | | | — | | | | — | | | | (27 | ) | | | — | | | | — | | | | (27 | ) |
Total | | | $— | | | | $— | | | | $(27) | | | | $22 | | | | $— | | | | $(5 | ) |
| | | | | | |
| World Select Equity Fund | | | | | | | | | | | | | | | | | | | | | | | | |
Foreign exchange contracts | | | $— | | | | $(61 | ) | | | $— | | | | $(412 | ) | | | $— | | | | $(473 | ) |
Equity contracts | | | — | | | | — | | | | (948 | ) | | | — | | | | — | | | | (948 | ) |
Total | | | $— | | | | $(61 | ) | | | $(948 | ) | | | $(412 | ) | | | $— | | | | $(1,421 | ) |
| | | | | | |
| Core Fixed Income Fund | | | | | | | | | | | | | | | | | | | | | | | | |
Interest rate contracts | | | $(381) | | | | $(402 | ) | | | $(2,866 | ) | | | $— | | | | $27,211 | | | | $23,562 | |
Foreign exchange contracts | | | — | | | | — | | | | — | | | | 941 | | | | — | | | | 941 | |
Credit contracts | | | (252 | ) | | | — | | | | — | | | | — | | | | 893 | | | | 641 | |
Total | | | $(633 | ) | | | $(402 | ) | | | $(2,866 | ) | | | $941 | | | | $28,104 | | | | $25,144 | |
| | | | | | |
| Emerging Markets Debt Fund | | | | | | | | | | | | | | | | | | | | | | | | |
Interest rate contracts | | | $— | | | | $— | | | | $(2,015 | ) | | | $— | | | | $(950 | ) | | | $(2,965 | ) |
Foreign exchange contracts | | | — | | | | 347 | | | | — | | | | 2,061 | | | | 280 | | | | 2,688 | |
Credit contracts | | | — | | | | — | | | | — | | | | — | | | | 1,486 | | | | 1,486 | |
Total | | | $— | | | | $347 | | | | $(2,015 | ) | | | $2,061 | | | | $816 | | | | $1,209 | |
| | |
362 | | SEI Institutional Investments Trust / Semi-Annual Report / November 30, 2020 |
| | | | | | | | | | | | | | | | | | | | | | | | |
| | | | | | | |
| Derivatives Not Accounted for as Hedging Instruments | | Swaptions | | | Options | | | Futures | | | Forward Currency Contracts | | | Swaps | | | Total | |
| | | | | | |
| Dynamic Asset Allocation Fund | | | | | | | | | | | | | | | | | | | | | | | | |
Foreign exchange contracts | | | $— | | | | $1,873 | | | | $— | | | | $(272 | ) | | | $— | | | | $1,601 | |
Equity contracts | | | 3,553 | | | | — | | | | 5,529 | | | | — | | | | — | | | | 9,082 | |
Commodity contracts | | | — | | | | — | | | | — | | | | — | | | | (35,317 | ) | | | (35,317 | ) |
Total | | | $3,553 | | | | $1,873 | | | | $5,529 | | | | $(272 | ) | | | $(35,317 | ) | | | $(24,634 | ) |
| | | | | | |
| Multi-Asset Real Return Fund | | | | | | | | | | | | | | | | | | | | | | | | |
Interest rate contracts | | | $257 | | | | $— | | | | $116 | | | | $— | | | | $(865 | ) | | | $(492 | ) |
Foreign exchange contracts | | | — | | | | — | | | | — | | | | (777 | ) | | | — | | | | (777 | ) |
Credit contracts | | | — | | | | — | | | | — | | | | — | | | | 2,747 | | | | 2,747 | |
Equity contracts | | | — | | | | — | | | | 4,548 | | | | — | | | | — | | | | 4,548 | |
Commodity contracts | | | — | | | | 357 | | | | 1,096 | | | | — | | | | 590 | | | | 2,043 | |
Total | | | $257 | | | | $357 | | | | $5,760 | | | | $(777 | ) | | | $2,472 | | | | $8,069 | |
The following table discloses the volume of the Funds’ futures contracts, option contracts, forward foreign currency contracts and swap contracts activity during the period ended November 30, 2020 ($ Thousands):
| | | | | | | | | | | | | | | | | | | | |
| | | | | |
| | | Large Cap Fund | | | Large Cap Disciplined
Equity Fund | | | Large Cap Index Fund | | | S&P 500 Index Fund | | | Extended Market
Index Fund | |
| | | | | |
Futures Contracts: | | | | | | | | | | | | | | | | | | | | |
| | | | | |
Commodity Contracts | | | | | | | | | | | | | | | | | | | | |
Average Notional Balance Long | | $ | – | | | $ | 58,297 | | | $ | – | | | $ | – | | | $ | – | |
Ending Notional Balance Long | | | – | | | | 58,297 | | | | – | | | | – | | | | – | |
| | | | | |
Equity Contracts | | | | | | | | | | | | | | | | | | | | |
Average Notional Balance Long | | | 9,568 | | | | 29,227 | | | | 13,568 | | | | 84,827 | | | | 9,055 | |
Ending Notional Balance Long | | | 4,987 | | | | 44,984 | | | | 16,421 | | | | 88,452 | | | | 10,520 | |
| | | | | |
Swaps: | | | | | | | | | | | | | | | | | | | | |
| | | | | |
Equity Contracts | | | | | | | | | | | | | | | | | | | | |
Average Notional Balance Long | | | – | | | | 69,713 | | | | – | | | | – | | | | – | |
Ending Notional Balance Long | | | – | | | | 74,541 | | | | – | | | | – | | | | – | |
| | | | | |
| | | U.S. Equity Factor
Allocation Fund | | | U.S. Managed
Volatility Fund | | | | | | | | | | |
| | | | | |
Futures Contracts: | | | | | | | | | | | | | | | | | | | | |
| | | | | |
Equity Contracts | | | | | | | | | | | | | | | | | | | | |
Average Notional Balance Long | | $ | 6,716 | | | $ | 14,913 | | | | | | | | | | | | | |
Ending Notional Balance Long | | | 8,206 | | | | 13,177 | | | | | | | | | | | | | |
| | | | | |
| | | Global Managed
Volatility Fund | | | World Equity Ex-US
Fund | | | Screened World
Equity Ex-US Fund | | | World Select Equity
Fund | | | | |
| | | | | |
Futures Contracts: | | | | | | | | | | | | | | | | | | | | |
| | | | | |
Equity Contracts | | | | | | | | | | | | | | | | | | | | |
Average Notional Balance Long | | $ | 20,619 | | | $ | 70,776 | | | $ | 1,977 | | | $ | 72,320 | | | | | |
Average Notional Balance Short | | | – | | | | – | | | | – | | | | 45,189 | | | | | |
Ending Notional Balance Long | | | 33,777 | | | | 97,894 | | | | 2,796 | | | | 75,458 | | | | | |
Ending Notional Balance Short | | | – | | | | – | | | | – | | | | 46,026 | | | | | |
| | | | | |
Forward Foreign Currency Contracts: | | | | | | | | | | | | | | | | | | | | |
Average Notional Balance Long | | | – | | | | 498,955 | | | | 2,850 | | | | 327,670 | | | | | |
Average Notional Balance Short | | | – | | | | 501,475 | | | | 2,893 | | | | 327,539 | | | | | |
Ending Notional Balance Long | | | – | | | | 696,321 | | | | 1,406 | | | | 333,107 | | | | | |
Ending Notional Balance Short | | | – | | | | 699,063 | | | | 1,411 | | | | 333,244 | | | | | |
| | | | | |
Options/Swaptions: | | | | | | | | | | | | | | | | | | | | |
| | | | | |
Currency | | | | | | | | | | | | | | | | | | | | |
Average Notional Balance Long† | | | – | | | | – | | | | – | | | | 51 | | | | | |
Ending Notional Balance Long† | | | – | | | | – | | | | – | | | | 44 | | | | | |
| | |
SEI Institutional Investments Trust / Semi-Annual Report / November 30, 2020 | | 363 |
NOTES TO FINANCIAL STATEMENTS / CONSOLIDATED NOTES TO FINANCIAL STATEMENTS (Continued)
November 30, 2020 (Unaudited)
| | | | | | | | | | | | | | | | | | | | |
| | | | | |
| | | Emerging Markets
Equity Fund | | | Opportunistic Income
Fund | | | Core Fixed Income
Fund | | | High Yield Bond Fund | | | | |
| | | | | |
Futures Contracts: | | | | | | | | | | | | | | | | | | | | |
| | | | | |
Equity Contracts | | | | | | | | | | | | | | | | | | | | |
Average Notional Balance Long | | $ | 15,694 | | | $ | – | | | $ | – | | | $ | – | | | | | |
Ending Notional Balance Long | | | 8,576 | | | | – | | | | – | | | | – | | | | | |
| | | | | |
Interest Contracts | | | | | | | | | | | | | | | | | | | | |
Average Notional Balance Long | | | – | | | | – | | | | 1,179,937 | | | | – | | | | | |
Average Notional Balance Short | | | – | | | | 33,538 | | | | 1,914,281 | | | | – | | | | | |
Ending Notional Balance Long | | | – | | | | – | | | | 1,033,462 | | | | – | | | | | |
Ending Notional Balance Short | | | – | | | | 53,687 | | | | 2,129,824 | | | | – | | | | | |
| | | | | |
Forward Foreign Currency Contracts: | | | | | | | | | | | | | | | | | | | | |
Average Notional Balance Long | | | 506 | | | | – | | | | 90,453 | | | | – | | | | | |
Average Notional Balance Short | | | 506 | | | | – | | | | 89,585 | | | | – | | | | | |
Ending Notional Balance Long | | | 595 | | | | – | | | | 95,392 | | | | – | | | | | |
Ending Notional Balance Short | | | 594 | | | | – | | | | 93,679 | | | | – | | | | | |
| | | | | |
Swaps: | | | | | | | | | | | | | | | | | | | | |
| | | | | |
Credit Contracts | | | | | | | | | | | | | | | | | | | | |
Average Notional Balance Short | | | – | | | | – | | | | 510,685 | | | | 3,839 | | | | | |
Ending Notional Balance Short | | | – | | | | – | | | | 507,730 | | | | 3,839 | | | | | |
| | | | | |
Interest Contracts | | | | | | | | | | | | | | | | | | | | |
Average Notional Balance | | | – | | | | – | | | | 264,857 | | | | – | | | | | |
Ending Notional Balance | | | – | | | | – | | | | 261,406 | | | | – | | | | | |
| | | | | |
Options/Swaptions: | | | | | | | | | | | | | | | | | | | | |
| | | | | |
Interest | | | | | | | | | | | | | | | | | | | | |
Average Notional Balance Long† | | | – | | | | – | | | | 1,227 | | | | – | | | | | |
Average Notional Balance Short† | | | – | | | | – | | | | 1,260 | | | | – | | | | | |
Ending Notional Balance Long† | | | – | | | | – | | | | 636 | | | | – | | | | | |
Ending Notional Balance Short† | | | – | | | | – | | | | 710 | | | | – | | | | | |
| | | | | |
| | | Long Duration Fund | | | Long Duration Credit
Fund | | | Ultra Short Duration
Bond Fund | | | Emerging Markets
Debt Fund | | | | |
| | | | | |
Futures Contracts: | | | | | | | | | | | | | | | | | | | | |
| | | | | |
Equity Contracts | | | | | | | | | | | | | | | | | | | | |
Average Notional Balance Long | | $ | – | | | $ | – | | | $ | 35,894 | | | $ | – | | | | | |
Average Notional Balance Short | | | – | | | | – | | | | 5,436 | | | | – | | | | | |
Ending Notional Balance Long | | | – | | | | – | | | | 35,888 | | | | – | | | | | |
Ending Notional Balance Short | | | – | | | | – | | | | 5,415 | | | | – | | | | | |
Interest Contracts | | | | | | | | | | | | | | | | | | | | |
Average Notional Balance Long | | | 117,607 | | | | 143,012 | | | | – | | | | 85,012 | | | | | |
Average Notional Balance Short | | | 67,415 | | | | 100,802 | | | | – | | | | 43,836 | | | | | |
Ending Notional Balance Long | | | 112,894 | | | | 142,362 | | | | – | | | | 95,391 | | | | | |
Ending Notional Balance Short | | | 67,027 | | | | 106,992 | | | | – | | | | 54,006 | | | | | |
| | | | | |
Forward Foreign Currency Contracts: | | | | | | | | | | | | | | | | | | | | |
Average Notional Balance Long | | | – | | | | – | | | | – | | | | 506 | | | | | |
Average Notional Balance Short | | | – | | | | – | | | | – | | | | 506 | | | | | |
Ending Notional Balance Long | | | – | | | | – | | | | – | | | | 595 | | | | | |
Ending Notional Balance Short | | | – | | | | – | | | | – | | | | 594 | | | | | |
| | | | | |
Swaps: | | | | | | | | | | | | | | | | | | | | |
| | | | | |
Credit Contracts | | | | | | | | | | | | | | | | | | | | |
Average Notional Balance Long | | | – | | | | – | | | | – | | | | 15,783 | | | | | |
Ending Notional Balance Long | | | – | | | | – | | | | – | | | | 15,302 | | | | | |
| | | | | |
Options/Swaptions: | | | | | | | | | | | | | | | | | | | | |
| | | | | |
Currency | | | | | | | | | | | | | | | | | | | | |
Average Notional Balance Long† | | | – | | | | – | | | | – | | | | 188 | | | | | |
| | | | | |
| | | Limited Duration
Bond Fund | | | Intermediate Duration
Credit Fund | | | Dynamic Asset
Allocation Fund | | | Multi-Asset Real
Return Fund | | | | |
| | | | | |
Futures Contracts: | | | | | | | | | | | | | | | | | | | | |
| | | | | |
Commodity Contracts | | | | | | | | | | | | | | | | | | | | |
Average Notional Balance Long | | $ | – | | | $ | – | | | $ | – | | | $ | 123,243 | | | | | |
| | |
364 | | SEI Institutional Investments Trust / Semi-Annual Report / November 30, 2020 |
| | | | | | | | | | | | | | | | | | | | |
| | | | | |
| | | Limited Duration
Bond Fund | | | Intermediate Duration
Credit Fund | | | Dynamic Asset
Allocation Fund | | | Multi-Asset Real
Return Fund | | | | |
| | | | | |
Futures Contracts: (continued) | | | | | | | | | | | | | | | | | | | | |
Average Notional Balance Short | | | – | | | | – | | | | – | | | | 21,850 | | | | | |
Ending Notional Balance Long | | | – | | | | – | | | | – | | | | 132,980 | | | | | |
Ending Notional Balance Short | | | – | | | | – | | | | – | | | | 29,339 | | | | | |
| | | | | |
Equity Contracts | | | | | | | | | | | | | | | | | | | | |
Average Notional Balance Long | | | – | | | | – | | | | 154,662 | | | | – | | | | | |
Average Notional Balance Short | | | – | | | | – | | | | – | | | | 31,074 | | | | | |
Ending Notional Balance Long | | | – | | | | – | | | | 167,306 | | | | – | | | | | |
Ending Notional Balance Short | | | – | | | | – | | | | – | | | | 33,850 | | | | | |
| | | | | |
Interest Contracts | | | | | | | | | | | | | | | | | | | | |
Average Notional Balance Long | | | 5,632 | | | | 4,674 | | | | – | | | | 12,258 | | | | | |
Average Notional Balance Short | | | 10,326 | | | | 21,238 | | | | – | | | | 103,664 | | | | | |
Ending Notional Balance Long | | | 5,299 | | | | – | | | | – | | | | 7,285 | | | | | |
Ending Notional Balance Short | | | 12,923 | | | | 20,831 | | | | – | | | | 97,220 | | | | | |
| | | | | |
Forward Foreign Currency Contracts: | | | | | | | | | | | | | | | | | | | | |
Average Notional Balance Long | | | – | | | | – | | | | 151,920 | | | | 125,410 | | | | | |
Average Notional Balance Short | | | – | | | | – | | | | 151,958 | | | | 125,961 | | | | | |
Ending Notional Balance Long | | | – | | | | – | | | | 158,211 | | | | 171,673 | | | | | |
Ending Notional Balance Short | | | – | | | | – | | | | 158,275 | | | | 172,621 | | | | | |
| | | | | |
Swaps: | | | | | | | | | | | | | | | | | | | | |
| | | | | |
Total Return Basket Swaps | | | | | | | | | | | | | | | | | | | | |
Average Notional Balance Long | | | – | | | | – | | | | 199,199 | | | | – | | | | | |
Ending Notional Balance Long | | | – | | | | – | | | | 207,232 | | | | – | | | | | |
| | | | | |
Total Return Contracts | | | | | | | | | | | | | | | | | | | | |
Average Notional Balance Short | | | – | | | | – | | | | – | | | | 23,070 | | | | | |
Ending Notional Balance Short | | | – | | | | – | | | | – | | | | 15,380 | | | | | |
| | | | | |
Credit Contracts | | | | | | | | | | | | | | | | | | | | |
Average Notional Balance Long | | | – | | | | – | | | | – | | | | 165,619 | | | | | |
Average Notional Balance Short | | | – | | | | – | | | | – | | | | 24,853 | | | | | |
Ending Notional Balance Long | | | – | | | | – | | | | – | | | | 149,554 | | | | | |
Ending Notional Balance Short | | | – | | | | – | | | | – | | | | 14,646 | | | | | |
| | | | | |
Interest Contracts | | | | | | | | | | | | | | | | | | | | |
Average Notional Balance | | | – | | | | – | | | | – | | | | 209,400 | | | | | |
Ending Notional Balance | | | – | | | | – | | | | – | | | | 213,113 | | | | | |
Commodity Contracts | | | | | | | | | | | | | | | | | | | | |
Average Notional Balance Long | | | – | | | | – | | | | – | | | | 42,187 | | | | | |
Ending Notional Balance Long | | | – | | | | – | | | | – | | | | 43,263 | | | | | |
| | | | | |
Options/Swaptions: | | | | | | | | | | | | | | | | | | | | |
| | | | | |
Commodity | | | | | | | | | | | | | | | | | | | | |
Average Notional Balance Long† | | | – | | | | – | | | | – | | | | 1,286 | | | | | |
Average Notional Balance Short† | | | – | | | | – | | | | – | | | | 410 | | | | | |
Ending Notional Balance Long† | | | – | | | | – | | | | – | | | | 1,005 | | | | | |
Ending Notional Balance Short† | | | – | | | | – | | | | – | | | | 352 | | | | | |
| | | | | |
Interest | | | | | | | | | | | | | | | | | | | | |
Average Notional Balance Long† | | | – | | | | – | | | | 15,467 | | | | 327 | | | | | |
Average Notional Balance Short† | | | – | | | | – | | | | – | | | | 306 | | | | | |
Ending Notional Balance Long† | | | – | | | | – | | | | 15,467 | | | | 654 | | | | | |
Ending Notional Balance Short† | | | – | | | | – | | | | – | | | | 611 | | | | | |
| | | | | |
Credit | | | | | | | | | | | | | | | | | | | | |
Average Notional Balance Long† | | | – | | | | – | | | | – | | | | 707 | | | | | |
Ending Notional Balance Long† | | | – | | | | – | | | | – | | | | 478 | | | | | |
| | |
SEI Institutional Investments Trust / Semi-Annual Report / November 30, 2020 | | 365 |
NOTES TO FINANCIAL STATEMENTS / CONSOLIDATED NOTES TO FINANCIAL STATEMENTS (Continued)
November 30, 2020 (Unaudited)
A Fund is subject to various netting arrangements with select counterparties (“Master Agreements”). Master Agreements govern the terms of certain transactions, and reduce the counterparty risk associated with relevant transactions by specifying credit protection mechanisms and providing standardization that improves legal certainty. Since different types of transactions have different mechanics and are sometimes traded out of different legal entities of a particular counterparty organization, each type of transaction may be covered by a different Master Agreement, resulting in the need for multiple agreements with a single counterparty. As the Master Agreements are specific to unique operations of different asset types, they allow a Fund to close out and net its total exposure to a specific counterparty entity in the event of a default with respect to all the transactions governed under a single agreement with a specific counterparty entity.
Master Agreements can also help limit counterparty risk by specifying collateral posting arrangements at pre-arranged exposure levels. Under the Master Agreements, collateral is routinely transferred if the total net exposure to certain transactions (net of existing collateral already in place) governed under the relevant Master Agreement with a counterparty in a given account exceeds a specified threshold, which typically ranges from zero to $250,000 depending on the counterparty and the type of Master Agreement. United States Treasury Securities and U.S. dollar cash are generally the preferred forms of collateral. Securities and cash pledged as collateral are reflected as assets on the Statements of Assets and Liabilities/Consolidated Statements of Assets and Liabilities as either a component of investments at value (securities) or deposits due from counterparties (cash). Cash collateral received is not typically held in a segregated account and as such is reflected as a liability on the
Statements of Assets and Liabilities/Consolidated Statements of Assets and Liabilities as deposits due to counterparties. The market value of any securities received as collateral is not reflected as a component of net asset value. A Fund’s overall exposure to counterparty risk can change substantially within a short period, as it is affected by each transaction subject to the relevant Master Agreement.
Customer Account Agreements and related addendums govern exchange traded derivatives transactions such as futures, options on futures, and centrally cleared swaps. Exchange traded derivative transactions require posting of initial margin as determined by each relevant clearing agency which is segregated at a broker account registered with the Commodities Futures Trading
Commission (“CFTC”), or the applicable regulator. In the US, counterparty risk is significantly reduced as creditors of the futures broker do not have claim to Fund assets in the segregated account. Additionally, portability of exposure in the event of default further reduces risk to the Funds. Variation margin, or changes in market value, are exchanged daily, but may not be netted between futures and cleared OTC derivatives. Refer to each Funds Statement of Assets and Liabilities or Consolidated Statement of Assets and Liabilities for market value and variation margin of exchange-traded or centrally cleared financial derivative instruments.
Securities with an aggregate market value of $— ($ Thousands) have been pledged and $88,181 ($ Thousands) in cash has been pledged as collateral for exchange-traded and centrally cleared derivative instruments as of November 30, 2020.
The table below summarizes the collateral pledged by Fund:
| | | | | | | | | | | | |
| | | | |
| | | Securities at Aggregate Market Value ($ Thousands) | | Cash ($ Thousands) | | Total ($ Thousands) | |
Large Cap Fund | | | $– | | | | $339 | | | | $339 | |
Large Cap Disciplined Equity Fund | | | – | | | | 3,072 | | | | 3,072 | |
Large Cap Index Fund | | | – | | | | 1,184 | | | | 1,184 | |
S&P 500 Index Fund | | | – | | | | 6,420 | | | | 6,420 | |
Extended Market Index Fund | | | – | | | | 859 | | | | 859 | |
U.S. Equity Factor Allocation Fund | | | – | | | | 660 | | | | 660 | |
U.S. Managed Volatility Fund | | | – | | | | 900 | | | | 900 | |
Global Managed Volatility Fund | | | – | | | | 3,009 | | | | 3,009 | |
World Equity Ex-US Fund | | | – | | | | 10,299 | | | | 10,299 | |
Screened World Equity Ex-US Fund | | | – | | | | 260 | | | | 260 | |
World Select Equity Fund | | | – | | | | 9,319 | | | | 9,319 | |
Emerging Markets Equity Fund | | | – | | | | 714 | | | | 714 | |
Opportunistic Income Fund | | | – | | | | 213 | | | | 213 | |
Core Fixed Income Fund | | | – | | | | 10,683 | | | | 10,683 | |
High Yield Bond Fund | | | – | | | | 1,046 | | | | 1,046 | |
Long Duration Fund | | | – | | | | 3,060 | | | | 3,060 | |
Long Duration Credit Fund | | | – | | | | 1,691 | | | | 1,691 | |
Ultra Short Duration Bond Fund | | | – | | | | 76 | | | | 76 | |
Emerging Markets Debt Fund | | | – | | | | 6,343 | | | | 6,343 | |
Limited Duration Bond Fund | | | – | | | | 382 | | | | 382 | |
Dynamic Asset Allocation Fund | | | – | | | | 12,012 | | | | 12,012 | |
Multi-Asset Real Return Fund | | | – | | | | 15,640 | | | | 15,640 | |
| | | | | | | | | | | | |
Total | | | $– | | | | $88,181 | | | | $88,181 | |
| | | | | | | | | | | | |
International Swaps and Derivatives Association, Inc. Master Agreements and Credit Support Annexes (“ISDA Master Agreements”) govern OTC financial derivative transactions entered into by a Fund and select counterparties. ISDA Master Agreements maintain provisions for general obligations, representations, agreements, collateral and events of default or termination. Events of termination include conditions that may entitle counterparties to elect to terminate early and
| | |
366 | | SEI Institutional Investments Trust / Semi-Annual Report / November 30, 2020 |
cause settlement of all outstanding transactions under the applicable ISDA Master Agreement.
Any election to terminate early could be material to the financial statements. In limited circumstances, the ISDA Master Agreement may contain additional provisions
that add additional counterparty protection beyond coverage of existing daily exposure if the counterparty has a decline in credit quality below a predefined level. These amounts, if any, may be segregated with a third party custodian.
The following is a summary by derivative type of the market value of OTC financial derivative instruments and collateral (received) pledged as of November 30, 2020 ($ Thousands):
| | | | | | | | | | | | | | | | | | | | | | | | | | | | | | | | | | | | | | | | | | | | | | | | | | | | |
| | | Financial Derivative Assets | | | | | | Financial Derivative Liabilities | | | | | | | | | | |
Large Cap Disciplined Equity Fund | | Forward Foreign Currency Contracts | | | Purchased Options and Swaptions | | | Swap Agreements | | | Total Over the Counter | | | | | | Forward Foreign Currency Contracts | | | Written Options and Swaptions | | | Swap Agreements | | | Reverse Repurchase Agreements | | | Total Over
the Counter | | | Net Market Value of OTC Derivatives | | | Collateral (Received) Pledged(1) | | | Net Exposures(2) | |
BAML | | | $ — | | | | $ — | | | | $ — | | | | $ — | | | | | | | | $ — | | | | $ — | | | | $ 975 | | | | $ — | | | | $ 975 | | | | $(975 | ) | | | $— | | | | $(975 | ) |
Total Over the Counter | | | $ — | | | | $ — | | | | $ — | | | | $ — | | | | | | | | $ — | | | | $ — | | | | $ 975 | | | | $ — | | | | $ 975 | | | | | | | | | | | | | |
| | | | | | |
| | | Financial Derivative Assets | | | | | | Financial Derivative Liabilities | | | | | | | | | | |
Global Managed
Volatility Fund | | Forward Foreign Currency Contracts | | | Purchased Options and Swaptions | | | Swap Agreements | | | Total Over
the Counter | | | | | | Forward Foreign Currency Contracts | | | Written Options and Swaptions | | | Swap Agreements | | | Reverse Repurchase Agreements | | | Total Over
the Counter | | | Net Market Value of OTC Derivatives | | | Collateral (Received) Pledged(1) | | | Net Exposures(2) | |
Brown Brothers Harriman | | | $ 71 | | | | $ — | | | | $ — | | | | $71 | | | | | | | | $ 7,313 | | | | $ — | | | | $ — | | | | $ — | | | | $ 7,313 | | | | $(7,242 | ) | | | $ — | | | | $(7,242 | ) |
Total Over the
Counter | | | $ 71 | | | | $ — | | | | $ — | | | | $ 71 | | | | | | | | $ 7,313 | | | | $ — | | | | $ — | | | | $ — | | | | $ 7,313 | | | | | | | | | | | | | |
| | | | | | |
| | | Financial Derivative Assets | | | | | | Financial Derivative Liabilities | | | | | | | | | | |
World Equity Ex-US
Fund | | Forward Foreign Currency Contracts | | | Purchased Options and Swaptions | | | Swap Agreements | | | Total Over the Counter | | | | | | Forward Foreign Currency Contracts | | | Written Options and Swaptions | | | Swap Agreements | | | Reverse Repurchase Agreements | | | Total Over
the Counter | | | Net Market Value of OTC Derivatives | | | Collateral (Received) Pledged(1) | | | Net Exposures(2) | |
Bank of America | | | $ 16 | | | | $ — | | | | $ — | | | | $ 16 | | | | | | | | $ — | | | | $ — | | | | $ — | | | | $ — | | | | $ — | | | | $ 16 | | | | $— | | | | $ 16 | |
Barclays PLC | | | 31 | | | | — | | | | — | | | | 31 | | | | | | | | — | | | | — | | | | — | | | | — | | | | — | | | | 31 | | | | — | | | | 31 | |
Citigroup | | | 178 | | | | — | | | | — | | | | 178 | | | | | | | | 1,057 | | | | — | | | | — | | | | — | | | | 1,057 | | | | (879 | ) | | | — | | | | (879 | ) |
Credit Suisse | | | — | | | | — | | | | — | | | | — | | | | | | | | 99 | | | | — | | | | — | | | | — | | | | 99 | | | | (99 | ) | | | — | | | | (99 | ) |
Goldman Sachs | | | 403 | | | | — | | | | — | | | | 403 | | | | | | | | 32 | | | | — | | | | — | | | | — | | | | 32 | | | | 371 | | | | — | | | | 371 | |
HSBC | | | — | | | | — | | | | — | | | | — | | | | | | | | 145 | | | | — | | | | — | | | | — | | | | 145 | | | | (145 | ) | | | — | | | | (145 | ) |
JPMorgan Chase Bank | | | 157 | | | | — | | | | — | | | | 157 | | | | | | | | 16 | | | | — | | | | — | | | | — | | | | 16 | | | | 141 | | | | — | | | | 141 | |
Morgan Stanley | | | 171 | | | | — | | | | — | | | | 171 | | | | | | | | 429 | | | | — | | | | — | | | | — | | | | 429 | | | | (258 | ) | | | — | | | | (258 | ) |
RBS | | | 124 | | | | — | | | | — | | | | 124 | | | | | | | | 2,029 | | | | — | | | | — | | | | — | | | | 2,029 | | | | (1,905 | ) | | | — | | | | (1,905 | ) |
Standard Bank | | | — | | | | — | | | | — | | | | — | | | | | | | | 16 | | | | — | | | | — | | | | — | | | | 16 | | | | (16 | ) | | | — | | | | (16 | ) |
Total Over the
Counter | | | $ 1,080 | | | | $ — | | | | $ — | | | | $ 1,080 | | | | | | | | $ 3,823 | | | | $ — | | | | $ — | | | | $ — | | | | $ 3,823 | | | | | | | | | | | | | |
| | | | | | |
| | | Financial Derivative Assets | | | | | | Financial Derivative Liabilities | | | | | | | | | | |
Screened World Select Equity
Ex-US Fund | | Forward Foreign Currency Contracts | | | Purchased Options and Swaptions | | | Swap Agreements | | | Total Over the Counter | | | | | | Forward Foreign Currency Contracts | | | Written Options and Swaptions | | | Swap Agreements | | | Reverse Repurchase Agreements | | | Total Over
the Counter | | | Net Market Value of OTC Derivatives | | | Collateral (Received) Pledged(1) | | | Net Exposures(2) | |
Brown Brothers Harriman | | | $4 | | | | $ — | | | | $ — | | | | $ 4 | | | | | | | | $ 9 | | | | $ — | | | | $ — | | | | $ — | | | | $ 9 | | | | $(5 | ) | | | $— | | | | $(5 | ) |
Total Over the Counter | | | $4 | | | | $ — | | | | $ — | | | | $ 4 | | | | | | | | $ 9 | | | | $ — | | | | $ — | | | | $ — | | | | $ 9 | | | | | | | | | | | | | |
| | | | | | |
| | | Financial Derivative Assets | | | | | | Financial Derivative Liabilities | | | | | | | | | | |
World Select Equity
Fund | | Forward Foreign Currency Contracts | | | Purchased Options and Swaptions | | | Swap Agreements | | | Total Over the Counter | | | | | | Forward Foreign Currency Contracts | | | Written Options and Swaptions | | | Swap Agreements | | | Reverse Repurchase Agreements | | | Total Over
the Counter | | | Net Market Value of OTC Derivatives | | | Collateral (Received) Pledged(1) | | | Net Exposures(2) | |
Brown Brothers Harriman | | | $ 2,136 | | | | $ — | | | | $ — | | | | $ 2,136 | | | | | | | | $ 2,272 | | | | $ — | | | | $ — | | | | $ — | | | | $ 2,272 | | | | $ (136 | ) | | | $ — | | | | $ (136 | ) |
Total Over the Counter | | | $ 2,136 | | | | $ — | | | | $ — | | | | $ 2,136 | | | | | | | | $ 2,272 | | | | $ — | | | | $ — | | | | $ — | | | | $ 2,272 | | | | | | | | | | | | | |
| | |
SEI Institutional Investments Trust / Semi-Annual Report / November 30, 2020 | | 367 |
NOTES TO FINANCIAL STATEMENTS / CONSOLIDATED NOTES TO FINANCIAL STATEMENTS (Continued)
November 30, 2020 (Unaudited)
| | | | | | | | | | | | | | | | | | | | | | | | | | | | | | | | | | | | | | | | | | | | | | | | | | | | | | | | |
| | | Financial Derivative Assets | | | | | | Financial Derivative Liabilities | | | | | | | | | | | | | |
| Core Fixed Income Fund | | Forward Foreign Currency Contracts | | | Purchased Options and Swaptions | | | Swap Agreements | | | Total Over the Counter | | | | | | Forward Foreign Currency Contracts | | | Written Options and Swaptions | | | Swap Agreements | | | Reverse Repurchase Agreements | | | Total Over
the Counter | | | | | | Net Market Value of OTC Derivatives | | | Collateral
(Received)
Pledged(1) | | | Net
Exposures(2) | |
BNP Paribas | | $ | — | | | $ | — | | | $ | — | | | $ | — | | | | | | | $ | 88 | | | $ | — | | | $ | — | | | $ | — | | | $ | 88 | | | | | | | $ | (88 | ) | | $ | — | | | $ | (88 | ) |
Citigroup | | | 884 | | | | — | | | | — | | | | 884 | | | | | | | | 49 | | | | — | | | | — | | | | — | | | | 49 | | | | | | | | 835 | | | | — | | | | 835 | |
Goldman Sachs | | | 241 | | | | — | | | | — | | | | 241 | | | | | | | | 131 | | | | — | | | | — | | | | — | | | | 131 | | | | | | | | 110 | | | | — | | | | 110 | |
Total Over the Counter | | $ | 1,125 | | | $ | — | | | $ | — | | | $ | 1,125 | | | | | | | $ | 268 | | | $ | — | | | $ | — | | | $ | — | | | $ | 268 | | | | | | | | | | | | | | | | | |
| | | | | | | | | | | | | | | | | | | | | | | | | | | | | | | | | | | | | | | | | | | | | | | | | | | | | | | | |
| | | Financial Derivative Assets | | | | | | Financial Derivative Liabilities | | | | | | | | | | | | | |
Emerging Markets
Debt Fund | | Forward Foreign Currency Contracts | | | Purchased Options and Swaptions | | | Swap Agreements | | | Total Over the Counter | | | | | | Forward Foreign Currency Contracts | | | Written Options and Swaptions | | | Swap Agreements | | | Reverse Repurchase Agreements | | | Total Over
the Counter | | | | | | Net Market Value of OTC Derivatives | | | Collateral
(Received)
Pledged(1) | | | Net
Exposures(2) | |
Barclays PLC | | $ | 3,336 | | | $ | — | | | $ | — | | | $ | 3,336 | | | | | | | $ | 573 | | | $ | — | | | $ | — | | | $ | — | | | $ | 573 | | | | | | | $ | 2,763 | | | $
|
— |
| | $ | 2,763 | |
Citibank | | | — | | | | — | | | | 237 | | | | 237 | | | | | | | | — | | | | — | | | | — | | | | — | | | | — | | | | | | | | 237 | | | | — | | | | 237 | |
Citigroup | | | 4,546 | | | | — | | | | — | | | | 4,546 | | | | | | | | 8,126 | | | | — | | | | — | | | | — | | | | 8,126 | | | | | | | | (3,580 | ) | | | — | | | | (3,580 | ) |
Goldman Sachs | | | 2,903 | | | | — | | | | 3,572 | | | | 6,475 | | | | | | | | 2,020 | | | | — | | | | 130 | | | | — | | | | 2,150 | | | | | | | | 4,455 | | | | — | | | | 4,455 | |
JPMorgan Chase Bank | | | 1,657 | | | | — | | | | 1,461 | | | | 3,118 | | | | | | | | 4,686 | | | | — | | | | 49 | | | | — | | | | 4,735 | | | | | | | | (1,617 | ) | | | — | | | | (1,617 | ) |
Merrill Lynch | | | — | | | | — | | | | — | | | | — | | | | | | | | 359 | | | | — | | | | — | | | | — | | | | 359 | | | | | | | | (359 | ) | | | — | | | | (359 | ) |
Morgan Stanley | | | 264 | | | | — | | | | — | | | | 264 | | | | | | | | 298 | | | | — | | | | — | | | | — | | | | 298 | | | | | | | | (34 | ) | | | — | | | | (34 | ) |
Standard Bank | | | 798 | | | | — | | | | — | | | | 798 | | | | | | | | 712 | | | | — | | | | — | | | | — | | | | 712 | | | | | | | | 86 | | | | — | | | | 86 | |
Standard Chartered | | | 581 | | | | — | | | | — | | | | 581 | | | | | | | | 183 | | | | — | | | | — | | | | — | | | | 183 | | | | | | | | 398 | | | | — | | | | 398 | |
State Street | | | 511 | | | | — | | | | — | | | | 511 | | | | | | | | 366 | | | | — | | | | — | | | | — | | | | 366 | | | | | | | | 145 | | | | — | | | | 145 | |
Total Over the Counter | | $ | 14,596 | | | $ | — | | | $ | 5,270 | | | $ | 19,866 | | | | | | | $ | 17,323 | | | $ | — | | | $ | 179 | | | $ | — | | | $ | 19,981 | | | | | | | | | | | | | | | | | |
| | | | | | | | | | | | | | | | | | | | | | | | | | | | | | | | | | | | | | | | | | | | | | | | | | | | | | | | |
| | | Financial Derivative Assets | | | | | | Financial Derivative Liabilities | | | | | | | | | | | | | |
Dynamic Asset Allocation Fund | | Forward Foreign Currency Contracts | | | Purchased Options and Swaptions | | | Swap Agreements | | | Total Over the Counter | | | | | | Forward Foreign Currency Contracts | | | Written Options and Swaptions | | | Swap Agreements | | | Reverse Repurchase Agreements | | | Total Over the Counter | | | | | | Net Market Value of OTC Derivatives | | | Collateral
(Received)
Pledged(1) | | | Net
Exposures(2) | |
Bank of America | | $ | 42 | | | $ | 23,193 | | | $ | — | | | $ | 23,235 | | | | | | | $ | 107 | | | $ | — | | | $ | — | | | $ | — | | | $ | 107 | | | | | | | $ | 23,128 | | | $ | — | | | $ | 23,128 | |
BNP Paribas | | | — | | | | — | | | | — | | | | — | | | | | | | | — | | | | — | | | | 17,471 | | | | — | | | | 17,471 | | | | | | | | (17,471 | ) | | | — | | | | (17,471 | ) |
Total Over the Counter | | $ | 42 | | | $ | 23,193 | | | $ | — | | | $ | 23,235 | | | | | | | $ | 107 | | | $ | — | | | $
|
17,471 |
| | $ | — | | | $ | 17,578 | | | | | | | | | | | | | | | | | |
| | | | | | | | | | | | | | | | | | | | | | | | | | | | | | | | | | | | | | | | | | | | | | | | | | | | | | | | |
| | | Financial Derivative Assets | | | | | | Financial Derivative Liabilities | | | | | | | | | | | | | |
Multi-Asset Real
Return Fund | | Forward Foreign Currency Contracts | | | Purchased Options and Swaptions | | | Swap Agreements | | | Total
Over the Counter | | | | | | Forward Foreign Currency Contracts | | | Written Options and Swaptions | | | Swap Agreements | | | Reverse Repurchase Agreements | | | Total Over the Counter | | | | | | Net Market Value of OTC Derivatives | | | Collateral
(Received)
Pledged(1) | | | Net
Exposures(2) | |
Bank of America | | $ | 164 | | | $ | — | | | $ | — | | | $ | 164 | | | | | | | $ | 135 | | | $ | 15 | | | $ | — | | | $ | — | | | $ | 150 | | | | | | | $ | 14 | | | $ | — | | | $ | 14 | |
Barclays PLC | | | 43 | | | | — | | | | — | | | | 43 | | | | | | | | — | | | | — | | | | 822 | | | | — | | | | 822 | | | | | | | | (779 | ) | | | 779 | | | | — | |
BNP Paribas | | | — | | | | — | | | | — | | | | — | | | | | | | | 573 | | | | — | | | | — | | | | — | | | | 573 | | | | | | | | (573 | ) | | | — | | | | (573 | ) |
Brown Brothers Harriman | | | 42 | | | | — | | | | — | | | | 42 | | | | | | | | 8 | | | | — | | | | — | | | | — | | | | 8 | | | | | | | | 34 | | | | — | | | | 34 | |
Chase Securities | | | — | | | | — | | | | — | | | | — | | | | | | | | — | | | | — | | | | — | | | | 94,443 | | | | 94,443 | | | | | | | | (94,443 | ) | | | 94,443 | | | | — | |
Citigroup | | | 523 | | | | — | | | | 1,804 | | | | 2,327 | | | | | | | | 687 | | | | — | | | | 1,506 | | | | — | | | | 2,193 | | | | | | | | 134 | | | | — | | | | 134 | |
Credit Suisse | | | — | | | | — | | | | — | | | | — | | | | | | | | — | | | | — | | | | 866 | | | | — | | | | 866 | | | | | | | | (866 | ) | | | — | | | | (866 | ) |
Deutsche Bank | | | — | | | | — | | | | — | | | | — | | | | | | | | — | | | | — | | | | 184 | | | | — | | | | 184 | | | | | | | | (184 | ) | | | — | | | | (184 | ) |
Goldman Sachs | | | 402 | | | | — | | | | 91 | | | | 493 | | | | | | | | — | | | | — | | | | 1,156 | | | | — | | | | 1,156 | | | | | | | | (663 | ) | | | — | | | | (663 | ) |
HSBC | | | — | | | | — | | | | — | | | | — | | | | | | | | — | | | | — | | | | — | | | | 141,213 | | | | 141,213 | | | | | | | | (141,213 | ) | | | 141,213 | | | | — | |
JPMorgan Chase | | | 271 | | | | — | | | | 42 | | | | 313 | | | | | | | | 343 | | | | — | | | | 295 | | | | — | | | | 638 | | | | | | | | (325 | ) | | | — | | | | (325 | ) |
Macquarie Bank | | | — | | | | — | | | | 293 | | | | 293 | | | | | | | | — | | | | — | | | | 25 | | | | — | | | | 25 | | | | | | | | 268 | | | | — | | | | 268 | |
Merrill Lynch | | | — | | | | — | | | | 41 | | | | 41 | | | | | | | | — | | | | — | | | | 52 | | | | — | | | | 52 | | | | | | | | (11 | ) | | | — | | | | (11 | ) |
Morgan Stanley | | | — | | | | — | | | | 144 | | | | 144 | | | | | | | | 596 | | | | — | | | | — | | | | — | | | | 596 | | | | | | | | (452 | ) | | | — | | | | (452 | ) |
Societe Generale | | | — | | | | — | | | | 461 | | | | 461 | | | | | | | | — | | | | — | | | | 37 | | | | — | | | | 37 | | | | | | | | 424 | | | | — | | | | 424 | |
Standard Bank | | | — | | | | — | | | | — | | | | — | | | | | | | | 77 | | | | — | | | | — | | | | — | | | | 77 | | | | | | | | (77 | ) | | | — | | | | (77 | ) |
UBS | | | 26 | | | | — | | | | — | | | | 26 | | | | | | | | — | | | | — | | | | — | | | | — | | | | — | | | | | | | | 26 | | | | — | | | | 26 | |
Total Over the Counter | | $ | 1,471 | | | $ | — | | | $ | 2,876 | | | $ | 4,347 | | | | | | | $ | 2,419 | | | $ | 15 | | | $ | 4,943 | | | $ | 235,656 | | | $ | 243,033 | | | | | | | | | | | | | | | | | |
| (1) | Excess collateral pledged is not shown for financial reporting purposes. |
| (2) | Net Exposures represents the net receivable/(payable) that would be due from/to the counterparty in the event of default. Exposure from OTC financial derivative instruments can only be netted across transactions governed under the same master agreement with the same legal entity. |
| | |
368 | | SEI Institutional Investments Trust / Semi-Annual Report / November 30, 2020 |
5. BASIS FOR CONSOLIDATION FOR THE DYNAMIC ASSET ALLOCATION AND MULTI-ASSET REAL RETURN FUNDS
The Consolidated Summary Schedule of Investments, Consolidated Schedule of Investments, Consolidated Statements of Assets and Liabilities, Consolidated Statements of Operations, Consolidated Statements of Changes in Net Assets, Consolidated Statement of Cash Flows, and the Consolidated Financial Highlights of the Dynamic Asset Allocation and Multi-Asset Real Return Funds include the accounts of their respective Subsidiaries. All intercompany accounts and transactions have been eliminated in consolidation for the Funds. The Subsidiaries have a fiscal year end of May 31 for financial statement consolidation purposes and a nonconforming tax year end of April 30.
The Subsidiaries are classified as controlled foreign corporations under the Internal Revenue Code of 1986 (“IRC”). The Subsidiaries taxable income is included in the calculation of the Funds’ taxable income. Net losses of the Subsidiaries are not deductible by the Funds either in the current period or carried forward to future periods.
The Dynamic Asset Allocation and Multi-Asset Real Return Funds may invest up to 25% of their total assets in their respective Subsidiary.
A summary of the Funds’ investments in the Subsidiaries are as follows:
| | | | | | | | | | | | |
| | | | |
| | | Inception Date of Subsidiary | | Subsidiary Net Assets at November 30, 2020 ($ Thousands) | | % of Total Net Assets at November 30, 2020 |
Dynamic Asset Allocation | | | | | | | | | | | | |
Commodity Strategy Subsidiary, Ltd. | | | January 28, 2014 | | | $ | 153,777 | | | | 7.67% | |
Multi-Asset Real Return | | | | | | | | | | | | |
Commodity Strategy Subsidiary, Ltd. | | | June 27, 2013 | | | $ | 155,352 | | | | 20.19% | |
6. INVESTMENT ADVISORY, ADMINISTRATION AND DISTRIBUTION AGREEMENTS, INVESTMENT SUBADVISORY AGREEMENTS AND OTHER TRANSACTIONS WITH AFFILIATES
Investment Advisory, Administration and Distribution Agreements — SEI Investments Global Funds Services (the “Administrator”) serves as administrator to the Funds. The Administrator provides certain administrative and shareholder servicing for an annual fee of 0.05%
of the average daily net assets of each Fund. For the period ended November 30, 2020, the Administrator has voluntarily agreed to waive all of its fee. The Funds’ Administrator may discontinue all or part of these voluntary waivers at any time.
SIMC serves as investment adviser (the “Adviser”) to each Fund. In connection with serving as Adviser, SIMC is entitled to a fee that is calculated daily and paid monthly, based on the average daily net assets of each Fund. SIMC plans to voluntarily waive a portion of its fees in order to keep investment advisory fees at a specified level. The Funds’ Adviser may discontinue all or part of these voluntary waivers at any time. Accordingly, the advisory fee and voluntary expense limitations for each Fund are as follows:
| | | | | | | | |
| | | |
| | | Advisory
Fees | | Investment Advisory Fees After Fee Waivers |
Large Cap Fund | | | 0.40% | | | | 0.16% | |
Large Cap Disciplined Equity Fund | | | 0.40 | | | | 0.16 | |
Large Cap Index Fund | | | 0.05 | | | | 0.01 | |
S&P 500 Index Fund | | | 0.03 | | | | 0.01 | |
Extended Market Index Fund | | | 0.12 | | | | 0.03 | |
Small Cap Fund | | | 0.65 | | | | 0.42 | |
Small Cap II Fund | | | 0.65 | | | | 0.41 | |
Small/Mid Cap Equity Fund | | | 0.65 | | | | 0.39 | |
U.S. Equity Factor Allocation Fund | | | 0.25 | | | | 0.00 | |
U.S. Managed Volatility Fund | | | 0.65 | | | | 0.18 | |
Global Managed Volatility Fund | | | 0.65 | | | | 0.22 | |
World Equity Ex-US Fund | | | 0.55 | | | | 0.27 | |
Screened World Equity Ex-US Fund | | | 0.65 | | | | 0.25 | |
World Select Equity Fund | | | 0.55 | | | | 0.31 | |
Emerging Markets Equity Fund(1) | | | 1.05 | | | | 0.54 | |
Opportunistic Income Fund | | | 0.45 | | | | 0.21 | |
Core Fixed Income Fund | | | 0.30 | | | | 0.10 | |
High Yield Bond Fund | | | 0.4875 | | | | 0.27 | |
Long Duration Fund | | | 0.30 | | | | 0.13 | |
Long Duration Credit Fund | | | 0.30 | | | | 0.13 | |
Ultra Short Duration Bond Fund | | | 0.15 | | | | 0.10 | |
Emerging Markets Debt Fund | | | 0.85 | | | | 0.36 | |
Real Return Fund | | | 0.22 | | | | 0.00 | |
Limited Duration Bond Fund | | | 0.25 | | | | 0.09 | |
Intermediate Duration Credit Fund | | | 0.25 | | | | 0.13 | |
Dynamic Asset Allocation Fund | | | 0.60 | | | | 0.06 | |
Multi-Asset Real Return Fund | | | 0.55 | | | | 0.18 | |
| (1) | Effective September 30, 2020, SIMC, the Fund’s investment adviser, has contractually agreed to waive or reduce its management fee for a period of one year as necessary to keep the management fee paid by the Fund during the fiscal year from exceeding 0.95%. This fee waiver agreement shall remain in effect until September 30, 2021 and, unless earlier terminated, shall be automatically renewed for successive one-year periods thereafter. The agreement may be amended or terminated only with the consent of the Board of Trustees. |
| | |
SEI Institutional Investments Trust / Semi-Annual Report / November 30, 2020 | | 369 |
NOTES TO FINANCIAL STATEMENTS / CONSOLIDATED NOTES TO FINANCIAL STATEMENTS (Continued)
November 30, 2020 (Unaudited)
As of November 30, 2020, SIMC has entered into investment sub-advisory agreements with the following parties and pays the sub-advisers out of the fee that it receives from the Funds:
Investment Sub-Adviser
Large Cap Fund
Acadian Asset Management LLC
Coho Partners, Ltd.
Fred Alger Management, Inc.
LSV Asset Management*
Mar Vista Investment Partners, LLC
Schafer Cullen Capital Management, Inc.
Large Cap Disciplined Equity Fund
Acadian Asset Management LLC
Ceredex Value Advisors, LLC
Coho Partners, Ltd.
Mackenzie Investments Corporation
QMA, LLC
Large Cap Index Fund
SSGA Funds Management, Inc.
S&P 500 Index Fund
SSGA Funds Management, Inc.
Extended Market Index Fund
SSGA Funds Management, Inc.
Small Cap Fund
Axiom International Investors, LLC
EAM Investors, LLC
Los Angeles Capital Management and Equity Research,
Inc.
LSV Asset Management*
Martingale Asset Management L.P.
Small Cap II Fund
ArrowMark Colorado Holdings, LLC
Copeland Capital Management, LLC
EAM Investors, LLC
LMCG Investments, LLC
Los Angeles Capital Management and Equity Research,
Inc.
Snow Capital Management, L.P.
Small/Mid Cap Equity Fund
ArrowMark Colorado Holdings, LLC
Axiom International Investors, LLC
Cardinal Capital Management, LLC
Copeland Capital Management, LLC
Jackson Creek Investment Advisory, LLC
LSV Asset Management*
U.S. Managed Volatility Fund
LSV Asset Management*
Wells Capital Management, Inc.
Global Managed Volatility Fund
Acadian Asset Management, LLC
LSV Asset Management*
Wells Capital Management, Inc.
World Equity Ex-US Fund
Acadian Asset Management, LLC
AllianceBernstein, L.P.
Baillie Gifford Overseas Ltd.
J O Hambro Capital Management Limited
McKinley Capital Management, LLC
Wells Capital Management, Inc.
Screened World Equity Ex-US Fund
Acadian Asset Management LLC
Baillie Gifford Overseas Ltd.
McKinley Capital Management, LLC
Wells Capital Management, Inc.
World Select Equity Fund
AS Trigon Asset Management
Fiera Capital Inc.
Fondmaeglerselskabet Maj Invest A/S
INTECH Investment Management LLC
LSV Asset Management*
Mackenzie Investments
Metropole Gestion SA
Poplar Forest Capital LLC
Rhicon Currency Management Pte Ltd.
Sompo Japan Nipponkoa Asset Management Co., Ltd.
Towle & Co.
Emerging Markets Equity Fund
AllianceBernstein L.P.
Causeway Capital Management LLC
J O Hambro Capital Management Limited
KBI Global Investors (North America) Ltd.
RWC Asset Advisor (US) LLC
WCM Investment Management
Opportunistic Income Fund
Ares Management, LLC
Manulife Investment Management (US), LLC
Schroder Investment Management North America, Inc.
Wellington Management Company, LLP
Core Fixed Income Fund
Jennison Associates LLC
MetLife Investment Management, LLC
Metropolitan West Asset Management, LLC
Wells Capital Management, Inc.
Western Asset Management Company
Wester Asset Management Company Limited
High Yield Bond Fund
Ares Management, LLC
Benefit Street Partners, LLC
Brigade Capital Management, LP
J.P. Morgan Investment Management, Inc.
T. Rowe Price Associates, Inc.
Long Duration Fund
Income Research & Management
Jennison Associates LLC
Legal & General Investment Management Americas, Inc.
Metropolitan West Asset Management LLC
| | |
370 | | SEI Institutional Investments Trust / Semi-Annual Report / November 30, 2020 |
Long Duration Credit Fund
Income Research & Management
Jennison Associates LLC
Legal & General Investment Management America, Inc.
MetLife Investment Management, LLC
Metropolitan West Asset Management LLC
Ultra Short Duration Bond Fund
MetLife Investment Management, LLC
Wellington Management Company, LLP
Emerging Markets Debt Fund
Colchester Global Investors Limited
Marathon Asset Management L.P.
Ninety One UK Limited
Neuberger Berman Investment Advisers, LLC
Stone Harbor Investment Partners, L.P.
Limited Duration Bond Fund
MetLife Investment Management, LLC
Metropolitan West Asset Management LLC
Intermediate Duration Credit Fund
Income Research & Management
Legal & General Investment Management America, Inc.
MetLife Investment Management, LLC
Dynamic Asset Allocation Fund
SSGA Funds Management, Inc.
Multi-Asset Real Return Fund
AllianceBernstein L.P.
Columbia Management Investments
Credit Suisse Asset Management, LLC
QS Investors, LLC
* Affiliated
SEI Investments Distribution Co. (the “Distributor”), a wholly owned subsidiary of SEI Investments Company (“SEI”), serves as each Fund’s Distributor pursuant to a Distribution Agreement with the Trust.
Other — The Distribution Agreement between the Distributor and the Trust provides that the Distributor may receive compensation on fund transactions effected for the Trust in accordance with Securities and Exchange Commission (“SEC”) rules. Accordingly, it is expected that fund transactions may result in brokerage commissions being paid to the Distributor. The SEC rules require that such commissions not exceed usual and customary commissions.
Such commissions for the period ended November 30, 2020, were as follows ($ Thousands):
| | | | |
U.S. Equity Factor Allocation Fund | | | 51 | |
World Equity Ex-US Fund | | | 12 | |
World Select Equity Fund | | | 3 | |
Payments to Affiliates — Certain officers and/or trustees of the Trust are also officers and/or Directors of the Distributor, the Adviser and/or the Administrator.
The Trust pays each unaffiliated Trustee an annual fee for attendance at quarterly and interim meetings.
Compensation of officers and affiliated Trustees of the Trust is paid by the Distributor or Administrator. A portion of the services provided by the Chief Compliance Officer (“CCO”) and his staff, whom are employees of the Administrator, are paid for by the Trust as incurred. The services include regulatory oversight of the Trust’s Adviser, sub-advisers and service providers as required by SEC regulations. LSV Asset Management (partially-owned subsidiary of SIMC) serves as a sub-adviser to the Large Cap, Small Cap, Small/Mid Cap Equity, U.S. Managed Volatility, Global Managed Volatility and Intermediate Duration Credit Funds. For this service, LSV Asset Management is entitled to receive a fee from SIMC. Such fees for the period ended November 30, 2020, were as follows ($ Thousands):
| | | | |
Large Cap Fund | | | $144 | |
Small Cap Fund | | | 171 | |
Small/Mid Cap Equity Fund | | | 461 | |
Global Managed Volatility Fund | | | 1,768 | |
U.S. Managed Volatility Fund | | | 901 | |
World Select Equity Fund | | | 39 | |
Fees Paid Indirectly — The Funds may direct certain fund trades to the Distributor who pays a portion of each Fund’s expenses. Accordingly, the expenses reduced, which were used to pay third party expenses, can be found on the Statements of Operations or Consolidated Statement of Operations and the effect on each Fund’s expense ratio, as a percentage of each Fund’s average daily net assets for the period ended November 30, 2020, can be found on the Financial Highlights or Consolidated Financial Highlights.
Investment in Affiliated Security — The Funds may invest in the SEI Daily Income Trust (“SDIT”) Government Fund, an affiliated money market fund to manage excess cash or to serve as margin or collateral for derivative positions. Additionally, the Funds may invest the cash collateral from the securities lending program in the SEI Liquidity Fund, L.P.
A Fund may purchase companies with which it is affiliated to the extent these companies are represented in its benchmark index.
Interfund Lending — The SEC has granted an exemption that permits the Trust to participate in an interfund lending program (“The Program”) with existing or future investment companies registered under the 1940 Act that are advised by SIMC (the “SEI Funds”). The Program allows the SEI Funds to lend money to and borrow money from each other for temporary or emergency
| | |
SEI Institutional Investments Trust / Semi-Annual Report / November 30, 2020 | | 371 |
NOTES TO FINANCIAL STATEMENTS / CONSOLIDATED NOTES TO FINANCIAL STATEMENTS (Continued)
November 30, 2020 (Unaudited)
purposes. Participation in The Program is voluntary for both borrowing and lending funds.
Interfund loans may be made only when the rate of interest to be charged is more favorable to the lending fund than an investment in overnight repurchase agreements (“Repo Rate”), and more favorable to the borrowing fund than the rate of interest that would be charged by a bank for short-term borrowings (“Bank
Loan Rate”). The Bank Loan Rate will be determined using a formula annually reviewed by the SEI Funds’ Board of Trustees. The interest rate imposed on inter-fund loans is the average of the Repo Rate and the Bank Loan Rate.
As of and during the six month period ended November 30, 2020, the Trust did not participate in the program.
7. CAPITAL SHARE TRANSACTIONS
Capital share transactions for the Funds were as follows (Thousands):
| | | | | | | | | | | | | | | | | | | | | | | | | | | | |
| | | | |
| | | Large Cap Fund | | | Large Cap Disciplined
Equity Fund | | | Large Cap Index Fund | | S&P 500 Index Fund |
| | | | | | | | | |
| | | 6/1/2020 to 11/30/2020
(Unaudited) | | | 6/1/2019 to 5/31/2020 | | | 6/1/2020 to 11/30/2020
(Unaudited) | | | 6/1/2019 to
5/31/2020 | | | 6/1/2020 to 11/30/2020 (Unaudited) | | | 6/1/2019 to
5/31/2020 | | 6/1/2020 to 11/30/2020
(Unaudited) | | | 6/1/2019 to
5/31/2020 |
| | | | | | | | |
Class A: | | | | | | | | | | | | | | | | | | | | | | | | | | | | |
Shares Issued | | | 2,476 | | | | 8,333 | | | | 6,487 | | | | 11,247 | | | | 488 | | | 2,492 | | | 43,568 | | | 99,518 |
Shares Issued in Lieu of Dividends and Distributions | | | 560 | | | | 7,268 | | | | 597 | | | | 19,706 | | | | 69 | | | 1,589 | | | 2,041 | | | 9,053 |
Shares Redeemed | | | (7,617 | ) | | | (22,129 | ) | | | (16,838 | ) | | | (83,861 | ) | | | (821 | ) | | (2,789) | | | (21,717 | ) | | (112,404) |
Total Increase (Decrease) in Net Assets Derived from Class A Transactions | | | (4,581 | ) | | | (6,528 | ) | | | (9,754 | ) | | | (52,908 | ) | | | (264 | ) | | 1,292 | | | 23,892 | | | (3,833) |
| | | | |
| | | Extended Market Index
Fund | | | Small Cap Fund | | | Small Cap II Fund | | Small/Mid Cap Equity Fund |
| | | | | | | | | |
| | | 6/1/2020 to 11/30/2020
(Unaudited) | | | 6/1/2019 to 5/31/2020 | | | 6/1/2020 to 11/30/2020
(Unaudited) | | | 6/1/2019 to
5/31/2020 | | | 6/1/2020 to 11/30/2020 (Unaudited) | | | 6/1/2019 to
5/31/2020 | | 6/1/2020 to 11/30/2020
(Unaudited) | | | 6/1/2019 to
5/31/2020 |
| | | | | | | | |
Class A: | | | | | | | | | | | | | | | | | | | | | | | | | | | | |
Shares Issued | | | 11,550 | | | | 30,732 | | | | 632 | | | | 3,402 | | | | 2,043 | | | 7,323 | | | 6,506 | | | 16,185 |
Shares Issued in Lieu of Dividends and Distributions | | | 356 | | | | 3,050 | | | | 66 | | | | 1,067 | | | | 118 | | | 1,625 | | | 457 | | | 7,102 |
Shares Redeemed | | | (10,281 | ) | | | (17,062 | ) | | | (1,534 | ) | | | (4,799 | ) | | | (3,590 | ) | | (7,934) | | | (7,410 | ) | | (42,836) |
Total Increase (Decrease) in Net Assets Derived from Class A Transactions | | | 1,625 | | | | 16,720 | | | | (836 | ) | | | (330 | ) | | | (1,429 | ) | | 1,014 | | | (447 | ) | | (19,549) |
| | | | |
| | | U.S. Equity Factor
Allocation Fund | | | U.S. Managed Volatility
Fund | | | Global Managed Volatility
Fund | | World Equity Ex-US Fund |
| | | | | | | | | |
| | | 6/1/2020 to 11/30/2020
(Unaudited) | | | 6/1/2019 to 5/31/2020 | | | 6/1/2020 to 11/30/2020
(Unaudited) | | | 6/1/2019 to
5/31/2020 | | | 6/1/2020 to 11/30/2020 (Unaudited) | | | 6/1/2019 to
5/31/2020 | | 6/1/2020 to 11/30/2020
(Unaudited) | | | 6/1/2019 to
5/31/2020 |
| | | | | | | | |
Class A: | | | | | | | | | | | | | | | | | | | | | | | | | | | | |
Shares Issued | | | 17,890 | | | | 6,875 | | | | 6,749 | | | | 25,783 | | | | 13,805 | | | 66,064 | | | 28,357 | | | 108,154 |
Shares Issued in Lieu of Dividends and Distributions | | | 619 | | | | 1,565 | | | | 974 | | | | 5,791 | | | | — | | | 10,106 | | | — | | | 16,182 |
Shares Redeemed | | | (4,461 | ) | | | (23,348 | ) | | | (7,397 | ) | | | (22,403 | ) | | | (16,985 | ) | | (40,527) | | | (53,936 | ) | | (118,366) |
Total Increase (Decrease) in Net Assets Derived from Class A Transactions | | | 14,048 | | | | (14,908 | ) | | | 326 | | | | 9,171 | | | | (3,180 | ) | | 35,643 | | | (25,579 | ) | | 5,970 |
| | | | |
| | | Screened World Equity
Ex-US Fund | | | World Select Equity Fund | | | Emerging Markets Equity
Fund | | Opportunistic Income
Fund |
| | | | | | | | | |
| | | 6/1/2020 to 11/30/2020
(Unaudited) | | | 6/1/2019 to 5/31/2020 | | | 6/1/2020 to 11/30/2020
(Unaudited) | | | 6/1/2019 to
5/31/2020 | | | 6/1/2020 to 11/30/2020 (Unaudited) | | | 6/1/2019 to
5/31/2020 | | 6/1/2020 to 11/30/2020
(Unaudited) | | | 6/1/2019 to
5/31/2020 |
| | | | | | | | |
Class A: | | | | | | | | | | | | | | | | | | | | | | | | | | | | |
Shares Issued | | | 221 | | | | 915 | | | | 1,116 | | | | 7,611 | | | | 3,414 | | | 30,204 | | | 6,203 | | | 13,099 |
Shares Issued in Lieu of Dividends and Distributions | | | — | | | | 149 | | | | — | | | | 2,286 | | | | — | | | 2,023 | | | 1,694 | | | 6,172 |
Shares Redeemed | | | (1,288 | ) | | | (595 | ) | | | (7,695 | ) | | | (60,153 | ) | | | (12,043 | ) | | (23,703) | | | (10,849 | ) | | (63,916) |
Total Increase (Decrease) in Net Assets Derived from Class A Transactions | | | (1,067 | ) | | | 469 | | | | (6,579 | ) | | | (50,256 | ) | | | (8,629 | ) | | 8,524 | | | (2,952 | ) | | (44,645) |
| | |
372 | | SEI Institutional Investments Trust / Semi-Annual Report / November 30, 2020 |
| | | | | | | | | | | | | | | | | | | | | | | | | | | | | | |
| | | | |
| | | Core Fixed Income Fund | | | High Yield Bond Fund | | | Long Duration Fund | | | Long Duration Credit Fund |
| | | | | | | | | |
| | | 6/1/2020 to 11/30/2020 (Unaudited) | | | 6/1/2019 to 5/31/2020 | | | 6/1/2020 to 11/30/2020 (Unaudited) | | | 6/1/2019 to 5/31/2020 | | | 6/1/2020 to 11/30/2020
(Unaudited) | | | 6/1/2019 to
5/31/2020 | | | 6/1/2020 to 11/30/2020 (Unaudited) | | | 6/1/2019 to 5/31/2020 |
| | | | | | | | |
Class A: | | | | | | | | | | | | | | | | | | | | | | | | | | | | | | |
Shares Issued | | | 69,373 | | | | 160,830 | † | | | 25,482 | | | | 38,424 | | | | 3,279 | | | | 8,898 | | | | 32,802 | | | 34,641 |
Shares Issued in Lieu of Dividends and Distributions | | | 7,258 | | | | 27,006 | | | | 9,496 | | | | 21,532 | | | | 2,049 | | | | 12,603 | | | | 5,311 | | | 13,470 |
Shares Redeemed | | | (27,655 | ) | | | (187,134 | ) | | | (18,260 | ) | | | (72,748 | ) | | | (4,353 | ) | | | (52,117 | ) | | | (19,869 | ) | | (87,404) |
Total Increase (Decrease) in Net Assets Derived from Class A Transactions | | | 48,976 | | | | 702 | | | | 16,718 | | | | (12,792 | ) | | | 975 | | | | (30,616 | ) | | | 18,244 | | | (39,293) |
| | | | |
| | | Ultra Short Duration Bond
Fund | | | Emerging Markets Debt Fund | | | Real Return Fund | | | Limited Duration Bond Fund |
| | | | | | | | | |
| | | 6/1/2020 to 11/30/2020 (Unaudited) | | | 6/1/2019 to 5/31/2020 | | | 6/1/2020 to 11/30/2020 (Unaudited) | | | 6/1/2019 to 5/31/2020 | | | 6/1/2020 to 11/30/2020
(Unaudited) | | | 6/1/2019 to
5/31/2020 | | | 6/1/2020 to 11/30/2020 (Unaudited) | | | 6/1/2019 to 5/31/2020 |
| | | | | | | | |
Class A: | | | | | | | | | | | | | | | | | | | | | | | | | | | | | | |
Shares Issued | | | 7,695 | | | | 28,567 | | | | 14,156 | | | | 32,675 | | | | 3,991 | | | | 10,154 | | | | 15,418 | | | 28,664 |
Shares Issued in Lieu of Dividends and Distributions | | | 386 | | | | 1,160 | | | | 1,778 | | | | 7,325 | | | | 153 | | | | 699 | | | | 956 | | | 3,212 |
Shares Redeemed | | | (8,444 | ) | | | (16,196 | ) | | | (16,062 | ) | | | (52,289 | ) | | | (5,212 | ) | | | (9,504 | ) | | | (9,836 | ) | | (59,045) |
Total Increase (Decrease) in Net Assets Derived from Class A Transactions | | | (363 | ) | | | 13,531 | | | | (128 | ) | | | (12,289 | ) | | | (1,068 | ) | | | 1,349 | | | | 6,538 | | | (27,169) |
| | | | |
| | | Intermediate Duration Credit Fund | | | Dynamic Asset Allocation
Fund | | | Multi-Asset Real Return
Fund | | | |
| | | | | | | | | |
| | | 6/1/2020 to 11/30/2020 (Unaudited) | | | 6/1/2019 to 5/31/2020 | | | 6/1/2020 to 11/30/2020 (Unaudited) | | | 6/1/2019 to 5/31/2020 | | | 6/1/2020 to 11/30/2020
(Unaudited) | | | 6/1/2019 to
5/31/2020 | | | | | | |
| | | | | | | | |
Class A: | | | | | | | | | | | | | | | | | | | | | | | | | | | | | | |
Shares Issued | | | 31,759 | | | | 48,596 | | | | 4,886 | | | | 10,494 | | | | 5,213 | | | | 18,326 | | | | | | | |
Shares Issued in Lieu of Dividends and Distributions | | | 4,107 | | | | 8,802 | | | | — | | | | 11,538 | | | | — | | | | 2,347 | | | | | | | |
Shares Redeemed | | | (23,502 | ) | | | (54,319 | ) | | | (7,408 | ) | | | (50,072 | ) | | | (7,604 | ) | | | (35,354 | ) | | | | | | |
Total Increase (Decrease) in Net Assets Derived from Class A Transactions | | | 12,364 | | | | 3,079 | | | | (2,522 | ) | | | (28,040 | ) | | | (2,391 | ) | | | (14,681 | ) | | | | | | |
† Includes subscriptions as a result of an in-kind transfer of securities (see Note 11).
8. INVESTMENT TRANSACTIONS
The cost of security purchases and proceeds from the sale and maturities of securities other than temporary cash investments, during the period ended November 30, 2020, were as follows:
| | | | | | | | | | | | |
| | | | |
| | | U.S. Gov’t
($ Thousands) | | Other
($ Thousands) | | Total
($ Thousands) |
Large Cap Fund | | | | | |
Purchases | | $ | — | | | $ | 457,429 | | | $ | 457,429 | |
Sales | | | — | | | | 539,167 | | | | 539,167 | |
Large Cap Disciplined Equity Fund | | | | | |
Purchases | | | — | | | | 1,039,480 | | | | 1,039,480 | |
Sales | | | — | | | | 1,265,151 | | | | 1,265,151 | |
Large Cap Index Fund | | | | | | | | | |
Purchases | | | — | | | | 145,244 | | | | 145,244 | |
Sales | | | — | | | | 207,542 | | | | 207,542 | |
S&P 500 Index Fund | | | | | | | | | |
Purchases | | | — | | | | 723,009 | | | | 723,009 | |
Sales | | | — | | | | 324,410 | | | | 324,410 | |
Extended Market Index Fund | | | | | |
Purchases | | | — | | | | 516,284 | | | | 516,284 | |
Sales | | | — | | | | 525,356 | | | | 525,356 | |
| | | | | | | | | | | | |
| | | | |
| | | U.S. Gov’t
($ Thousands) | | Other
($ Thousands) | | Total
($ Thousands) |
Small Cap Fund | | | | | |
Purchases | | $ | — | | | $ | 151,623 | | | $ | 151,623 | |
Sales | | | — | | | | 167,423 | | | | 167,423 | |
Small Cap II Fund | | | | | |
Purchases | | | — | | | | 260,251 | | | | 260,251 | |
Sales | | | — | | | | 287,104 | | | | 287,104 | |
Small/Mid Cap Equity Fund | | | | | |
Purchases | | | — | | | | 499,423 | | | | 499,423 | |
Sales | | | — | | | | 573,414 | | | | 573,414 | |
U.S. Equity Factor Allocation Fund | | | | | |
Purchases | | | — | | | | 380,052 | | | | 380,052 | |
Sales | | | — | | | | 211,972 | | | | 211,972 | |
U.S. Managed Volatility Fund | | | | | |
Purchases | | | — | | | | 412,158 | | | | 412,158 | |
Sales | | | — | | | | 385,487 | | | | 385,487 | |
Global Managed Volatility Fund | | | | | |
Purchases | | | — | | | | 716,306 | | | | 716,306 | |
Sales | | | — | | | | 751,009 | | | | 751,009 | |
World Equity Ex-US Fund | | | | | |
Purchases | | | — | | | | 3,101,724 | | | | 3,101,724 | |
Sales | | | — | | | | 3,331,105 | | | | 3,331,105 | |
Screened World Equity Ex-US Fund | | | | | |
Purchases | | | — | | | | 78,779 | | | | 78,779 | |
Sales | | | — | | | | 75,802 | | | | 75,802 | |
| | |
SEI Institutional Investments Trust / Semi-Annual Report / November 30, 2020 | | 373 |
NOTES TO FINANCIAL STATEMENTS / CONSOLIDATED NOTES TO FINANCIAL STATEMENTS (Continued)
November 30, 2020 (Unaudited)
| | | | | | | | | | | | |
| | | | |
| | | U.S. Gov’t
($ Thousands) | | Other
($ Thousands) | | Total
($ Thousands) |
World Select Equity Fund | | | | | |
Purchases | | $ | — | | | $ | 126,852 | | | $ | 126,852 | |
Sales | | | — | | | | 174,263 | | | | 174,263 | |
Emerging Markets Equity Fund | | | | | |
Purchases | | | — | | | | 393,769 | | | | 393,769 | |
Sales | | | — | | | | 442,513 | | | | 442,513 | |
Opportunistic Income Fund | | | | | |
Purchases | | | 41,207 | | | | 178,920 | | | | 220,127 | |
Sales | | | 14,946 | | | | 180,139 | | | | 195,085 | |
Core Fixed Income Fund | | | | | |
Purchases | | | 11,499,400 | | | | 1,531,518 | | | | 13,030,918 | |
Sales | | | 10,768,443 | | | | 1,577,080 | | | | 12,345,523 | |
High Yield Bond Fund | | | | | |
Purchases | | | — | | | | 878,121 | | | | 878,121 | |
Sales | | | — | | | | 821,398 | | | | 821,398 | |
Long Duration Fund | | | | | |
Purchases | | | 533,503 | | | | 101,137 | | | | 634,640 | |
Sales | | | 470,763 | | | | 172,573 | | | | 643,336 | |
Long Duration Credit Fund | | | | | |
Purchases | | | 607,734 | | | | 606,779 | | | | 1,214,513 | |
Sales | | | 514,335 | | | | 496,930 | | | | 1,011,265 | |
Ultra Short Duration Bond Fund | | | | | |
Purchases | | | — | | | | 132,345 | | | | 132,345 | |
Sales | | | — | | | | 108,142 | | | | 108,142 | |
Emerging Markets Debt Fund | | | | | |
Purchases | | | — | | | | 815,212 | | | | 815,212 | |
Sales | | | — | | | | 809,480 | | | | 809,480 | |
Real Return Fund | | | | | |
Purchases | | | 53,079 | | | | — | | | | 53,079 | |
Sales | | | 69,835 | | | | — | | | | 69,835 | |
Limited Duration Bond Fund | | | | | |
Purchases | | | 647,563 | | | | 302,117 | | | | 949,680 | |
Sales | | | 536,718 | | | | 322,052 | | | | 858,770 | |
Intermediate Duration Credit Fund | | | | | |
Purchases | | | 867,844 | | | | 633,818 | | | | 1,501,662 | |
Sales | | | 822,350 | | | | 544,542 | | | | 1,366,892 | |
Dynamic Asset Allocation Fund | | | | | |
Purchases | | | — | | | | 92,112 | | | | 92,112 | |
Sales | | | — | | | | 100,632 | | | | 100,632 | |
Multi-Asset Real Return Fund | | | | | |
Purchases | | | 88,455 | | | | 125,647 | | | | 214,102 | |
Sales | | | 147,925 | | | | 120,516 | | | | 268,441 | |
(1) Includes 17a-7 related transactions of $(51) (thousands).
9. FEDERAL TAX INFORMATION
It is each Fund’s intention to qualify for or continue to qualify as a regulated investment company under
Subchapter M of the Internal Revenue Code and distribute all of its taxable income (including net capital gains). Accordingly, no provision for Federal income taxes is required.
The Dynamic Asset Allocation and Multi-Asset Real Return Funds have each requested private letter rulings from the Internal Revenue Service (“IRS”) concluding that the income generated from their investment in their respective Subsidiaries, each of which invests in commodity-linked derivatives, will be “qualifying income” for regulated investment company (“RIC”) qualification purposes, regardless of whether actual distributions are made to the Funds by the respective Subsidiary.
In July 2011, the IRS suspended the issuance of private letter rulings regarding the investment by RICs into controlled foreign corporations which principally invest in commodities, such as the Subsidiaries, indicating that it was reconsidering its policies surrounding the issuance of these rulings. The Dynamic Asset Allocation and Multi-Asset Real Return Funds have secured an opinion of counsel based on customary representations that actual distributions made to the Funds should be treated as “qualifying income”. The Treasury released a proposed regulation in October of 2016 stating that income inclusion from a controlled foreign corporation is treated as dividends i.e. qualifying income only to the extent that the Funds received cash distributions from the subsidiary. The distribution requirement is consistent with the Funds’ policy. The Treasury released a final regulation in March 2019 reversing its position on the proposed regulation by removing the cash distribution requirement. As a conservative measure, the Funds will continue to follow their existing distribution policy.
Dividends from net investment income and distributions from net realized capital gains are determined in accordance with U.S. Federal income tax regulations, which may differ from those amounts determined under U.S. GAAP. These book/tax differences are either temporary or permanent in nature. To the extent these differences are permanent, they are charged or credited to paid-in capital or distributable earnings (loss), as appropriate, in the period that the differences arise.
The tax character of dividends and distributions paid during the last two years or periods ended May 31, were as follows:
| | | | | | | | | | | | | | | | | | | | |
| | | | | | Ordinary Income
($ Thousands) | | | Long-term
Capital Gain
($ Thousands) | | | Distributions
($ Thousands) | | | Total
($ Thousands) | |
Large Cap Fund | | | | | | | | | | | | | | | | | | | | |
| | | 2020 | | | $ | 27,498 | | | $ | 83,436 | | | $ | — | | | $ | 110,934 | |
| | | 2019 | | | | 83,505 | | | | 215,389 | | | | — | | | | 298,894 | |
| | |
374 | | SEI Institutional Investments Trust / Semi-Annual Report / November 30, 2020 |
| | | | | | | | | | | | | | | | | | | | |
| | | | | | Ordinary
Income
($ Thousands) | | | Long-term
Capital Gain
($ Thousands) | | | Distributions
($ Thousands) | | | Total
($ Thousands) | |
Large Cap Disciplined Equity Fund | | | | | | | | | | | | | | | | | | | | |
| | | 2020 | | | $ | 31,591 | | | $ | 184,542 | | | $ | — | | | $ | 216,133 | |
| | | 2019 | | | | 108,507 | | | | 459,588 | | | | — | | | | 568,095 | |
Large Cap Index Fund | | | | | | | | | | | | | | | | | | | | |
| | | 2020 | | | | 34,032 | | | | 245,383 | | | | — | | | | 279,415 | |
| | | 2019 | | | | 45,210 | | | | 237,665 | | | | — | | | | 282,875 | |
S&P 500 Index Fund | | | | | | | | | | | | | | | | | | | | |
| | | 2020 | | | | 94,971 | | | | 53,774 | | | | — | | | | 148,745 | |
| | | 2019 | | | | 92,740 | | | | 86,825 | | | | — | | | | 179,565 | |
Extended Market Index Fund | | | | | | | | | | | | | | | | | | | | |
| | | 2020 | | | | 16,646 | | | | 30,850 | | | | — | | | | 47,496 | |
| | | 2019 | | | | 22,120 | | | | 30,849 | | | | — | | | | 52,969 | |
Small Cap Fund | | | | | | | | | | | | | | | | | | | | |
| | | 2020 | | | | 3,445 | | | | 12,274 | | | | — | | | | 15,719 | |
| | | 2019 | | | | 16,389 | | | | 45,815 | | | | — | | | | 62,204 | |
Small Cap II Fund | | | | | | | | | | | | | | | | | | | | |
| | | 2020 | | | | 3,438 | | | | 13,644 | | | | — | | | | 17,082 | |
| | | 2019 | | | | 17,362 | | | | 53,128 | | | | — | | | | 70,490 | |
Small/Mid Cap Equity Fund | | | | | | | | | | | | | | | | | | | | |
| | | 2020 | | | | 10,942 | | | | 66,185 | | | | — | | | | 77,127 | |
| | | 2019 | | | | 48,058 | | | | 195,949 | | | | — | | | | 244,007 | |
U.S. Equity Factor Allocation Fund | | | | | | | | | | | | | | | | | | | | |
| | | 2020 | | | | 17,282 | | | | — | | | | — | | | | 17,282 | |
| | | 2019 | | | | 9,556 | | | | — | | | | — | | | | 9,556 | |
U.S. Managed Volatility Fund | | | | | | | | | | | | | | | | | | | | |
| | | 2020 | | | | 30,031 | | | | 50,505 | | | | — | | | | 80,536 | |
| | | 2019 | | | | 52,640 | | | | 146,324 | | | | — | | | | 198,964 | |
Global Managed Volatility Fund | | | | | | | | | | | | | | | | | | | | |
| | | 2020 | | | | 90,508 | | | | 40,171 | | | | — | | | | 130,679 | |
| | | 2019 | | | | 95,851 | | | | 63,221 | | | | — | | | | 159,072 | |
World Equity Ex-US Fund | | | | | | | | | | | | | | | | | | | | |
| | | 2020 | | | | 222,407 | | | | — | | | | — | | | | 222,407 | |
| | | 2019 | | | | 181,960 | | | | 223,055 | | | | — | | | | 405,015 | |
Screened World Equity Ex-US Fund | | | | | | | | | | | | | | | | | | | | |
| | | 2020 | | | | 3,025 | | | | — | | | | — | | | | 3,025 | |
| | | 2019 | | | | 3,880 | | | | — | | | | — | | | | 3,880 | |
World Select Equity Fund | | | | | | | | | | | | | | | | | | | | |
| | | 2020 | | | | 23,564 | | | | — | | | | — | | | | 23,564 | |
| | | 2019 | | | | 68,984 | | | | 28,083 | | | | — | | | | 97,067 | |
Emerging Markets Equity Fund | | | | | | | | | | | | | | | | | | | | |
| | | 2020 | | | | 21,069 | | | | — | | | | — | | | | 21,069 | |
| | | 2019 | | | | 41,349 | | | | 55,510 | | | | — | | | | 96,859 | |
Opportunistic Income Fund | | | | | | | | | | | | | | | | | | | | |
| | | 2020 | | | | 50,855 | | | | — | | | | — | | | | 50,855 | |
| | | 2019 | | | | 60,320 | | | | — | | | | — | | | | 60,320 | |
Core Fixed Income Fund | | | | | | | | | | | | | | | | | | | | |
| | | 2020 | | | | 296,077 | | | | — | | | | — | | | | 296,077 | |
| | | 2019 | | | | 222,818 | | | | — | | | | — | | | | 222,818 | |
High Yield Bond Fund | | | | | | | | | | | | | | | | | | | | |
| | | 2020 | | | | 184,908 | | | | — | | | | — | | | | 184,908 | |
| | | 2019 | | | | 197,603 | | | | — | | | | — | | | | 197,603 | |
Long Duration Fund | | | | | | | | | | | | | | | | | | | | |
| | | 2020 | | | | 89,826 | | | | 23,807 | | | | — | | | | 113,633 | |
| | | 2019 | | | | 77,501 | | | | 6,378 | | | | — | | | | 83,879 | |
| | |
SEI Institutional Investments Trust / Semi-Annual Report / November 30, 2020 | | 375 |
NOTES TO FINANCIAL STATEMENTS / CONSOLIDATED NOTES TO FINANCIAL STATEMENTS (Continued)
November 30, 2020 (Unaudited)
| | | | | | | | | | | | | | | | | | | | |
| | | | | | |
| | | | | | Ordinary
Income
($ Thousands) | | | Long-term
Capital Gain
($ Thousands) | | | Distributions
($ Thousands) | | | Total
($ Thousands) | |
Long Duration Credit Fund | | | | | | | | | | | | | | | | | | | | |
| | | 2020 | | | $ | 153,072 | | | $ | — | | | $ | — | | | $ | 153,072 | |
| | | 2019 | | | | 159,278 | | | | 3,070 | | | | — | | | | 162,348 | |
Ultra Short Duration Bond Fund | | | | | | | | | | | | | | | | | | | | |
| | | 2020 | | | | 11,653 | | | | — | | | | — | | | | 11,653 | |
| | | 2019 | | | | 12,835 | | | | — | | | | — | | | | 12,835 | |
Emerging Markets Debt Fund | | | | | | | | | | | | | | | | | | | | |
| | | 2020 | | | | 75,714 | | | | — | | | | — | | | | 75,714 | |
| | | 2019 | | | | 36,600 | | | | — | | | | — | | | | 36,600 | |
Real Return Fund | | | | | | | | | | | | | | | | | | | | |
| | | 2020 | | | | 7,386 | | | | — | | | | — | | | | 7,386 | |
| | | 2019 | | | | 4,593 | | | | — | | | | — | | | | 4,593 | |
Limited Duration Bond Fund | | | | | | | | | | | | | | | | | | | | |
| | | 2020 | | | | 32,944 | | | | — | | | | — | | | | 32,944 | |
| | | 2019 | | | | 39,239 | | | | — | | | | — | | | | 39,239 | |
Intermediate Duration Credit Fund | | | | | | | | | | | | | | | | | | | | |
| | | 2020 | | | | 92,984 | | | | — | | | | — | | | | 92,984 | |
| | | 2019 | | | | 92,910 | | | | — | | | | — | | | | 92,910 | |
Dynamic Asset Allocation Fund | | | | | | | | | | | | | | | | | | | | |
| | | 2020 | | | | 58,738 | | | | 183,697 | | | | — | | | | 242,435 | |
| | | 2019 | | | | 15,590 | | | | 25,215 | | | | — | | | | 40,805 | |
Multi-Asset Real Return Fund | | | | | | | | | | | | | | | | | | | | |
| | | 2020 | | | | 19,163 | | | | — | | | | — | | | | 19,163 | |
| | | 2019 | | | | 31,060 | | | | — | | | | — | | | | 31,060 | |
As of May 31, 2020, the components of distributable earnings (accumulated losses) were as follows:
| | | | | | | | | | | | | | | | | | | | | | | | | | | | | | | | |
| | | | | | | | | |
| | | Undistributed
Ordinary
Income
($ Thousands) | | | Undistributed
Long-Term
Capital Gain
($ Thousands) | | | Capital Loss Carryforwards
($ Thousands) | | | Post- October
Losses
($ Thousands) | | | Late Year
Ordinary
Losses
($ Thousands) | | | Unrealized Appreciation (Depreciation)
($ Thousands) | | | Other
Temporary
Differences
($ Thousands) | | | Total
Distributable
Earnings (Accumulated
Losses)
($ Thousands) | |
Large Cap Fund | | $ | 2,924 | | | $ | 24,914 | | | | — | | | $ | (9,359 | ) | | $ | — | | | $ | 136,770 | | | $ | (2 | ) | | $ | 155,247 | |
Large Cap Disciplined Equity Fund | | | — | | | | 3,509 | | | | — | | | | — | | | | — | | | | 210,429 | | | | (6 | ) | | | 213,932 | |
Large Cap Index Fund | | | 5,881 | | | | 21,791 | | | | — | | | | — | | | | — | | | | 1,012,652 | | | | (2 | ) | | | 1,040,322 | |
S&P 500 Index Fund | | | 48,879 | | | | 73,160 | | | | — | | | | — | | | | — | | | | 1,454,170 | | | | — | | | | 1,576,209 | |
Extended Market Index Fund | | | 4,877 | | | | 28,047 | | | | — | | | | — | | | | — | | | | 137,294 | | | | 4 | | | | 170,222 | |
Small Cap Fund | | | 535 | | | | — | | | | — | | | | (2,391 | ) | | | — | | | | (5,254 | ) | | | — | | | | (7,110 | ) |
Small Cap II Fund | | | 321 | | | | — | | | | (8,024 | ) | | | (18,798 | ) | | | — | | | | (2,101 | ) | | | — | | | | (28,602 | ) |
Small/Mid Cap Equity Fund | | | 2,766 | | | | 8,595 | | | | — | | | | — | | | | — | | | | 9,015 | | | | — | | | | 20,376 | |
U.S. Equity Factor Allocation Fund | | | 2,061 | | | | — | | | | (381 | ) | | | (3,392 | ) | | | — | | | | 51,282 | | | | — | | | | 49,570 | |
U.S. Managed Volatility Fund | | | 2,991 | | | | — | | | | — | | | | (23,586 | ) | | | — | | | | 146,878 | | | | — | | | | 126,283 | |
Global Managed Volatility Fund | | | 38,115 | | | | — | | | | — | | | | (21,946 | ) | | | — | | | | (7,262 | ) | | | (2 | ) | | | 8,905 | |
World Equity Ex-US Fund | | | 62,621 | | | | — | | | | (87,587 | ) | | | (80,409 | ) | | | — | | | | 656,024 | | | | — | | | | 550,649 | |
Screened World Equity Ex-US Fund | | | — | | | | — | | | | (563 | ) | | | (5,232 | ) | | | (191 | ) | | | 9,161 | | | | — | | | | 3,175 | |
World Select Equity Fund | | | 6,458 | | | | — | | | | (43,841 | ) | | | (20,772 | ) | | | — | | | | (41,006 | ) | | | — | | | | (99,161 | ) |
Emerging Markets Equity Fund | | | 6,479 | | | | — | | | | (52,910 | ) | | | (26,593 | ) | | | — | | | | 30,643 | | | | 1 | | | | (42,380 | ) |
Opportunistic Income Fund | | | 12,832 | | | | — | | | | (23,836 | ) | | | (12,358 | ) | | | — | | | | (35,748 | ) | | | (193 | ) | | | (59,303 | ) |
Core Fixed Income Fund | | | 211,315 | | | | 42,349 | | | | — | | | | — | | | | — | | | | 244,740 | | | | (41,396 | ) | | | 457,008 | |
High Yield Bond Fund | | | 36,816 | | | | — | | | | (125,226 | ) | | | (39,148 | ) | | | — | | | | (326,830 | ) | | | (13,279 | ) | | | (467,667 | ) |
Long Duration Fund | | | 78,188 | | | | 17,444 | | | | — | | | | — | | | | — | | | | 175,037 | | | | (34,794 | ) | | | 235,875 | |
Long Duration Credit Fund | | | 100,712 | | | | 26,893 | | | | — | | | | — | | | | — | | | | 537,739 | | | | (14,776 | ) | | | 650,568 | |
Ultra Short Duration Bond Fund | | | 546 | | | | — | | | | (3,728 | ) | | | — | | | | — | | | | (114 | ) | | | (808 | ) | | | (4,104 | ) |
Emerging Markets Debt Fund | | | — | | | | — | | | | (30,875 | ) | | | (2,214 | ) | | | (10,938 | ) | | | (153,990 | ) | | | (34,664 | ) | | | (232,681 | ) |
Real Return Fund | | | 391 | | | | — | | | | (5,658 | ) | | | (129 | ) | | | — | | | | 5,516 | | | | (1,058 | ) | | | (938 | ) |
Limited Duration Bond Fund | | | 7,212 | | | | — | | | | — | | | | — | | | | — | | | | 14,376 | | | | (1,577 | ) | | | 20,011 | |
Intermediate Duration Credit Fund | | | 40,856 | | | | — | | | | — | | | | — | | | | — | | | | 229,496 | | | | (440 | ) | | | 269,912 | |
| | |
376 | | SEI Institutional Investments Trust / Semi-Annual Report / November 30, 2020 |
| | | | | | | | | | | | | | | | | | | | | | | | | | | | | | | | |
| | | | | | | | | |
| | | Undistributed
Ordinary
Income
($ Thousands) | | | Undistributed
Long-Term
Capital Gain
($ Thousands) | | | Capital Loss Carryforwards
($ Thousands) | | | Post- October
Losses
($ Thousands) | | | Late Year
Ordinary
Losses
($ Thousands) | | | Unrealized Appreciation (Depreciation)
($ Thousands) | | | Other
Temporary
Differences
($ Thousands) | | | Total
Distributable
Earnings (Accumulated
Losses)
($ Thousands) | |
Dynamic Asset Allocation Fund | | $ | 16,987 | | | $ | 160,631 | | | $ | — | | | $ | — | | | $ | — | | | $ | 794,721 | | | $ | — | | | $ | 972,339 | |
Multi-Asset Real Return Fund | | | 3,734 | | | | — | | | | (45,198 | ) | | | — | | | | — | | | | (122,791 | ) | | | (11,056 | ) | | | (175,311 | ) |
Post-October losses represent losses realized on investment transactions from November 1, 2019 through May 31, 2020 that, in accordance with Federal income tax regulations, the Funds may elect to defer and treat as having arisen in the following fiscal year. Other temporary differences are primarily consist of straddle loss deferrals and dividend payable.
During the year ended May 31, 2020, the U.S. Equity Factor Allocation Fund, Core Fixed Income Fund, Long Duration Credit Fund, Ultra Short Duration Bond Fund, Intermediate Duration Credit Fund, Real Return Fund, and Limited Duration Bond Fund utilized capital loss carryforwards to offset capital gains of $10,796 ($ Thousands), $32,004 ($ Thousands), $19,451 ($ Thousands), $665 ($ Thousands), $29,086 ($ Thousands), $22 ($ Thousands), and $7,618 ($ Thousands), respectively.
The Funds have capital losses carried forward as follows:
| | | | | | | | | | | | |
| | | | |
| | | Short-Term
Loss
($ Thousands) | | Long-Term
Loss
($ Thousands) | | Total*
($ Thousands) |
Small Cap II Fund | | | 8,024 | | | | – | | | | 8,024 | |
U.S. Equity Factor Allocation Fund | | | 381 | | | | – | | | | 381 | |
World Equity Ex-US Fund | | | 87,587 | | | | – | | | | 87,587 | |
Screened World Equity Ex-US Fund | | | 563 | | | | – | | | | 563 | |
World Select Equity Fund | | | 35,224 | | | | 8,617 | | | | 43,841 | |
Emerging Markets Equity Fund | | | 44,248 | | | | 8,662 | | | | 52,910 | |
Opportunistic Income Fund | | | 759 | | | | 23,077 | | | | 23,836 | |
High Yield Bond Fund | | | 3,263 | | | | 121,963 | | | | 125,226 | |
Ultra Short Duration Bond Fund | | | 951 | | | | 2,777 | | | | 3,728 | |
Emerging Markets Debt Fund | | | 21,210 | | | | 9,665 | | | | 30,875 | |
Real Return Fund | | | 525 | | | | 5,133 | | | | 5,658 | |
Multi-Asset Real Return Fund | | | 21,796 | | | | 23,402 | | | | 45,198 | |
*This table should be used in conjunction with the capital loss carryforwards table
For Federal income tax purposes, the cost of investments owned at November 30, 2020, and the net realized gains or losses on investments sold for the period were not materially different from amounts reported for financial reporting purposes. These differences are primarily due to investments in partnerships, passive foreign investment companies, defaulted bond and wash sales which cannot be used for Federal income tax purposes in the current year and have been deferred for use in future years. The aggregate gross unrealized appreciation and depreciation on total investments held by the Funds at November 30, 2020, was as follows:
| | | | | | | | | | | | | | | | |
| | | | | |
| | | Federal Tax Cost
($ Thousands) | | Appreciated
Securities
($ Thousands) | | Depreciated
Securities
($ Thousands) | | Net Unrealized Appreciation (Depreciation)
($ Thousands) |
Large Cap Fund | | $ | 785,982 | | | $ | 279,880 | | | $ | (27,683 | ) | | $ | 252,197 | |
Large Cap Disciplined Equity Fund | | | 1,125,105 | | | | 347,194 | | | | (10,069 | ) | | | 337,125 | |
Large Cap Index Fund | | | 685,196 | | | | 1,414,161 | | | | (24,675 | ) | | | 1,389,486 | |
S&P 500 Index Fund | | | 3,159,395 | | | | 2,539,864 | | | | (152,788 | ) | | | 2,387,076 | |
Extended Market Index Fund | | | 1,154,270 | | | | 685,233 | | | | (92,445 | ) | | | 592,788 | |
Small Cap Fund | | | 252,567 | | | | 59,939 | | | | (19,214 | ) | | | 40,725 | |
Small Cap II Fund | | | 350,838 | | | | 86,030 | | | | (11,768 | ) | | | 74,262 | |
Small/Mid Cap Equity Fund | | | 959,626 | | | | 252,725 | | | | (56,917 | ) | | | 195,808 | |
U.S. Equity Factor Allocation Fund | | | 847,459 | | | | 220,826 | | | | (10,928 | ) | | | 209,898 | |
U.S. Managed Volatility Fund | | | 1,135,632 | | | | 267,334 | | | | (39,847 | ) | | | 227,487 | |
Global Managed Volatility Fund | | | 2,691,087 | | | | 341,276 | | | | (134,074 | ) | | | 207,202 | |
World Equity Ex-US Fund | | | 7,194,124 | | | | 2,447,879 | | | | (135,820 | ) | | | 2,312,059 | |
Screened World Equity Ex-US Fund | | | 85,569 | | | | 25,224 | | | | (1,699 | ) | | | 23,525 | |
World Select Equity Fund | | | 431,485 | | | | 86,598 | | | | (28,515 | ) | | | 58,083 | |
Emerging Markets Equity Fund | | | 904,685 | | | | 333,462 | | | | (48,488 | ) | | | 284,974 | |
Opportunistic Income Fund | | | 1,033,075 | | | | 9,816 | | | | (17,245 | ) | | | (7,429 | ) |
Core Fixed Income Fund | | | 8,603,838 | | | | 371,463 | | | | (36,850 | ) | | | 334,613 | |
High Yield Bond Fund | | | 2,663,383 | | | | 156,209 | | | | (135,072 | ) | | | 21,137 | |
Long Duration Fund | | | 1,155,163 | | | | 221,012 | | | | (5,151 | ) | | | 215,861 | |
Long Duration Credit Fund | | | 3,802,515 | | | | 719,397 | | | | (10,722 | ) | | | 708,675 | |
Ultra Short Duration Bond Fund | | | 587,513 | | | | 2,957 | | | | (363 | ) | | | 2,594 | |
Emerging Markets Debt Fund | | | 2,112,735 | | | | 138,099 | | | | (117,733 | ) | | | 20,366 | |
Real Return Fund | | | 275,942 | | | | 10,644 | | | | — | | | | 10,644 | |
Limited Duration Bond Fund | | | 1,369,319 | | | | 15,719 | | | | (956 | ) | | | 14,763 | |
Intermediate Duration Credit Fund | | | 3,251,489 | | | | 318,654 | | | | (3,180 | ) | | | 315,474 | |
Dynamic Asset Allocation Fund | | | 749,354 | | | | 1,126,810 | | | | (49,971 | ) | | | 1,076,839 | |
| | |
SEI Institutional Investments Trust / Semi-Annual Report / November 30, 2020 | | 377 |
NOTES TO FINANCIAL STATEMENTS / CONSOLIDATED NOTES TO FINANCIAL STATEMENTS (Continued)
November 30, 2020 (Unaudited)
| | | | | | | | | | | | | | | | |
| | | | | |
| | | Federal Tax
Cost
($ Thousands) | | Appreciated
Securities
($ Thousands) | | Depreciated
Securities
($ Thousands) | | Net
Unrealized Appreciation (Depreciation)
($ Thousands) |
Multi-Asset Real Return Fund | | $ | 931,622 | | | $ | 79,220 | | | $ | (14,545 | ) | | $ | 64,675 | |
Management has analyzed the Funds’ tax positions taken on Federal income tax returns for all open tax years and has concluded that as of November 30, 2020, no provision for income tax would be required in the Funds’ financial statements. The Funds’ Federal and state income and Federal excise tax returns for tax years for which the applicable statutes of limitations have not expired are subject to examination by the Internal Revenue Service and state departments of revenue.
10. CONCENTRATION/RISKS
In the normal course of business, the Trust enters into contracts that provide general indemnifications by the Trust to the counterparty to the contract. The Trust’s maximum exposure under these arrangements is dependent on future claims that may be made against the Trust and, therefore, cannot be estimated; however, Management believes that, based on experience, the risk of loss from such claims is considered remote.
The market values of the Core Fixed Income, High Yield Bond, Long Duration, Long Duration Credit, Ultra Short Duration Bond, Limited Duration Bond, Intermediate Duration Credit and Multi-Asset Real Return Funds’ investments will change in response to interest rate changes and other factors. During periods of falling interest rates, the values of fixed income securities generally rise. Conversely, during periods of rising interest rates, the values of such securities generally decline. Changes by recognized rating agencies in the ratings of any fixed income security and in the ability of an issuer to make payments of interest and principal may also affect the value of these investments.
The World Equity Ex-US, Screened World Equity Ex-US, World Select Equity, Emerging Markets Equity and Emerging Markets Debt Funds concentrate their investments in securities of foreign issuers in various countries. These investments may involve certain considerations and risks not typically associated with investments in the United States, as a result of, among other factors, the possibility of future political and economic developments and the level of governmental supervision and regulation of securities markets in the respective countries.
The following descriptions provide additional information about some of the risks of investing in the Funds:
American Depositary Receipts (ADRs) Risk — ADRs are certificates evidencing ownership of shares of a foreign
issuer that are issued by depositary banks and generally trade on an established market. ADRs are subject to many of the risks associated with investing directly in foreign securities, including, among other things, political, social and economic developments abroad, currency movements and different legal, regulatory and tax environments.
Asset-Backed Securities Risk — Payment of principal and interest on asset-backed securities is dependent largely on the cash flows generated by the assets backing the securities. Securitization trusts generally do not have any assets or sources of funds other than receivables and related property they own, and asset-backed securities are generally not insured or guaranteed by the related sponsor or any other entity. Asset-backed securities may be more illiquid than more conventional types of fixed income securities that the Fund may acquire.
Bank Loans Risk—With respect to bank loans, the Fund will assume the credit risk of both the borrower and the lender that is selling the participation. The Fund may also have difficulty disposing of bank loans because, in certain cases, the market for such instruments is not highly liquid.
Below Investment Grade Securities (Junk Bonds) Risk — Fixed income securities rated below investment grade (junk bonds) involve greater risks of default or downgrade and are generally more volatile than investment grade securities because the prospect for repayment of principal and interest of many of these securities is speculative. Because these securities typically offer a higher rate of return to compensate investors for these risks, they are sometimes referred to as “high yield bonds,” but there is no guarantee that an investment in these securities will result in a high rate of return.
Collateralized Debt Obligations (CDOs) and Collateralized Loan Obligations (CLOs) Risk — CDOs and CLOs are securities backed by an underlying portfolio of debt and loan obligations, respectively. CDOs and CLOs issue classes or “tranches” that vary in risk and yield and may experience substantial losses due to actual defaults, decrease in market value due to collateral defaults and removal of subordinate tranches, market anticipation of defaults and investor aversion to CDO and CLO securities as a class. The risks of investing in CDOs and CLOs depend largely on the tranche invested in and the type of the underlying debts and loans in the tranche of the CDO or CLO, respectively, in which the Fund invests. CDOs and CLOs also carry risks including, but not limited to, interest rate risk and credit risk, which are described below. For example, a liquidity crisis in the global credit markets could cause substantial
| | |
378 | | SEI Institutional Investments Trust / Semi-Annual Report / November 30, 2020 |
fluctuations in prices for leveraged loans and high-yield debt securities and limited liquidity for such instruments. When the Fund invests in CDOs or CLOs, in addition to directly bearing the expenses associated with its own operations, it may bear a pro rata portion of the CDO’s or CLO’s expenses.
Commercial Paper Risk — Commercial paper is a short-term obligation with a maturity generally ranging from one to 270 days and is issued by U.S. or foreign companies or other entities in order to finance their current operations. Such investments are unsecured and usually discounted from their value at maturity. The value of commercial paper may be affected by changes in the credit rating or financial condition of the issuing entities and will tend to fall when interest rates rise and rise when interest rates fall. Asset-backed commercial paper may be issued by structured investment vehicles or other conduits that are organized to issue the commercial paper and to purchase trade receivables or other financial assets. The repayment of asset-backed commercial paper depends primarily on the cash collections received from such an issuer’s underlying asset portfolio and the issuer’s ability to issue new asset-backed commercial paper.
Commodity Investments and Derivatives Risk — Commodity investments and derivatives may be more volatile and less liquid than direct investments in the underlying commodities themselves. Commodity related equity returns can also be affected by the issuer’s financial structure or the performance of unrelated businesses. The value of a commodity investment or a derivative investment in commodities is typically based upon the price movements of a physical commodity, a commodity futures contract or commodity index or some other readily measurable economic variable that is dependent upon changes in the value of commodities or the commodities markets. The value of these securities will rise or fall in response to changes in the underlying commodity or related benchmark or investment, changes in interest rates or factors affecting a particular industry or commodity, such as natural disasters, weather and U.S. and international economic, political and regulatory developments.
Commodity-Linked Securities Risk — Investments in commodity-linked securities may be more volatile and less liquid than direct investments in the underlying commodities themselves. Commodity-related equity returns can also be affected by the issuer’s financial structure or the performance of unrelated businesses.
Convertible and Preferred Securities Risk — Convertible and preferred securities have many of the same characteristics as stocks, including many of the same risks. In addition, convertible bonds may be
more sensitive to changes in interest rates than stocks. Convertible bonds may also have credit ratings below investment grade, meaning that they carry a higher risk of failure by the issuer to pay principal and/or interest when due.
Corporate Fixed Income Securities Risk — Corporate fixed income securities respond to economic developments, especially changes in interest rates, as well as perceptions of the creditworthiness and business prospects of individual issuers.
Credit Risk — The risk that the issuer of a security or the counterparty to a contract will default or otherwise become unable to honor a financial obligation.
Currency Risk — Currency risk is the risk that foreign currencies will decline in value relative to the U.S. dollar or, in the case of hedging positions, that the U.S. dollar will decline in value relative to the currency hedged. Due to the Fund’s active positions in currencies, it will be subject to the risk that currency exchange rates may fluctuate in response to, among other things, changes in interest rates, intervention (or failure to intervene) by U.S. or foreign governments, central banks or supranational entities, or by the imposition of currency controls or other political developments in the United States or abroad.
Depositary Receipts Risk — Depositary receipts, such as American Depositary Receipts, are certificates evidencing ownership of shares of a foreign issuer that are issued by depositary banks and generally trade on an established market. Depositary receipts are subject to many of the risks associated with investing directly in foreign securities, including, among other things, political, social and economic developments abroad, currency movements and different legal, regulatory, tax, accounting and audit environments.
Derivatives Risk — The Fund’s use of futures contracts and swaps is subject to leverage risk, correlation risk, liquidity risk and market risk. Leverage risk and liquidity risk are described below. Many over-the-counter (OTC) derivative instruments will not have liquidity beyond the counterparty to the instrument. Market risk is the risk that the market value of an investment may move up and down, sometimes rapidly and unpredictably. Correlation risk is the risk that changes in the value of the derivative may not correlate perfectly with the underlying asset, rate or index. The Fund’s use of swaps is also subject to credit risk and valuation risk. Credit risk is described above. Valuation risk is the risk that the derivative may be difficult to value and/or valued incorrectly. Each of these risks could cause the Fund to lose more than the principal amount invested in a derivative instrument. Some derivatives have the potential for unlimited loss, regardless of the size of the Fund’s initial investment.
| | |
SEI Institutional Investments Trust / Semi-Annual Report / November 30, 2020 | | 379 |
NOTES TO FINANCIAL STATEMENTS / CONSOLIDATED NOTES TO FINANCIAL STATEMENTS (Continued)
November 30, 2020 (Unaudited)
The other parties to certain derivative contracts present the same types of credit risk as issuers of fixed income securities. The Fund’s use of derivatives may also increase the amount of taxes payable by shareholders. Both U.S. and non-U.S. regulators are in the process of adopting and implementing regulations governing derivatives markets, the ultimate impact of which remains unclear.
Duration Risk — The longer-term securities in which the Fund may invest are more volatile. A portfolio with a longer average portfolio duration is more sensitive to changes in interest rates than a portfolio with a shorter average portfolio duration.
Economic Risks of Global Health Events — Global health events and pandemics, such as COVID-19, have the ability to affect—quickly, drastically and substantially the economies of many nations, states, individual companies and the markets in general and can cause disruptions that cannot necessarily be foreseen. The spread of COVID-19 around the world in 2020 resulted in a substantial number of nations implementing social distancing measures, quarantines, and the shutdown of non-essential businesses and governmental services. Further, it has caused significant volatility in U.S. and international markets. The impact of the outbreak may be short term or may last for an extended period of time.
Equity Market Risk — The risk that the market value of a security may move up and down, sometimes rapidly and unpredictably. Market risk may affect a single issuer, an industry, a sector or the equity or bond market as a whole. Equity markets may decline significantly in response to adverse issuer, political, regulatory, market, economic or other developments that may cause broad changes in market value, public perceptions concerning these developments, and adverse investor sentiment or publicity. Similarly, environmental and public health risks, such as natural disasters, epidemics, pandemics or widespread fear that such events may occur, may impact markets adversely and cause market volatility in both the short- and long-term.
Exchange-Traded Funds (ETFs) Risk — The risks of owning shares of an ETF generally reflect the risks of owning the underlying securities the ETF is designed to track, although lack of liquidity in an ETF could result in its value being more volatile than the underlying portfolio securities. When the Fund invests in an ETF, in addition to directly bearing the expenses associated with its own operations, it will bear a pro rata portion of the ETF’s expenses.
Exchange-Traded Notes Risk — The value of an ETN is subject to the credit risk of the issuer. There may not be an active trading market available for some ETNs.
Additionally, trading of ETNs may be halted or the ETN may be delisted by the listing exchange.
Extension Risk — The risk that rising interest rates may extend the duration of a fixed income security, typically reducing the security’s value.
Fixed Income Market Risk — The prices of the Fund’s fixed income securities respond to economic developments, particularly interest rate changes, as well as to perceptions about the creditworthiness of individual issuers, including governments and their agencies. Generally, the Fund’s fixed income securities will decrease in value if interest rates rise and vice versa. In a low interest rate environment, risks associated with rising rates are heightened. Declines in dealer market-making capacity as a result of structural or regulatory changes could decrease liquidity and/or increase volatility in the fixed income markets. Markets for fixed income securities may decline significantly in response to adverse issuer, political, regulatory, market, economic or other developments that may cause broad changes in market value, public perceptions concerning these developments, and adverse investor sentiment or publicity. Similarly, environmental and public health risks, such as natural disasters, epidemics, pandemics or widespread fear that such events may occur, may impact markets adversely and cause market volatility in both the short- and long-term. In response to these events, the Fund’s value may fluctuate and/or the Fund may experience increased redemptions from shareholders, which may impact the Fund’s liquidity or force the Fund to sell securities into a declining or illiquid market.
Foreign Investment/Emerging and Frontier Markets Risk — The risk that non-U.S. securities may be subject to additional price volatility, illiquidity and decreases in value due to, among other things, political, social and economic developments abroad, government ownership or control of portions of the private sector or certain companies, trade barriers and currency movements, exchange controls and managed adjustments in relative currency values, and different or new and unsettled securities and tax markets, laws and regulations. These additional risks may be heightened with respect to emerging market countries because political turmoil and rapid changes in economic conditions are more likely to occur in these countries. These risks may be magnified further with respect to “frontier market countries,” which are a subset of emerging market countries with even smaller national economies.
Foreign Issuer Risk — The risk that issuers in foreign countries face political and economic events unique to
| | |
380 | | SEI Institutional Investments Trust / Semi-Annual Report / November 30, 2020 |
those countries. These events will not necessarily affect the U.S. economy or similar issuer located in the U.S.
Foreign Sovereign Debt Securities Risk — The risk that non-U.S. securities may be subject to additional price volatility, illiquidity and decreases in value due to, among other things, political, social and economic developments abroad, government ownership or control of portions of the private sector or certain companies, trade barriers and currency movements, exchange controls and managed adjustments in relative currency values, and different or new and unsettled securities and tax markets, laws and regulations. These additional risks may be heightened with respect to emerging market countries because political turmoil and rapid changes in economic conditions are more likely to occur in these countries. These risks may be magnified further with respect to “frontier market countries,” which are a subset of emerging market countries with even smaller national economies. Investments in emerging markets are subject to the added risk that information in emerging markets investments may be unreliable or outdated due to differences in regulatory, accounting or auditing and financial record keeping standards, or because less information about emerging markets investments is publicly available. In addition, the rights and remedies associated with emerging markets investments may be different than investments in developed markets. A lack of reliable information, rights and remedies increase the risks of investing in emerging markets in comparison to more developed markets.
Inflation Protected Securities Risk — The value of inflation protected securities, including TIPS, generally will fluctuate in response to changes in “real” interest rates, generally decreasing when real interest rates rise and increasing when real interest rates fall. Real interest rates represent nominal (or stated) interest rates reduced by the expected impact of inflation. In addition, interest payments on inflation-indexed securities will generally vary up or down along with the rate of inflation.
Interest Rate Risk — The risk that a rise in interest rates will cause a fall in the value of fixed income securities, including U.S. Government securities, in which a Fund invests. A low interest rate environment may present greater interest rate risk, because there may be a greater likelihood of rates increasing and rates may increase more rapidly.
Investment Company Risk — When the Fund invests in an investment company, including closed-end funds and ETFs, in addition to directly bearing the expenses associated with its own operations, it will bear a pro rata portion of the investment company’s expenses. Further, while the risks of owning shares of an investment company generally reflect the risks of owning the
underlying investments of the investment company, the Fund may be subject to additional or different risks than if the Fund had invested directly in the underlying investments. For example, the lack of liquidity in an ETF could result in its value being more volatile than that of the underlying portfolio securities. Closed-end investment companies issue a fixed number of shares that trade on a stock exchange or over-the-counter at a premium or a discount to their net asset value. As a result, a closed-end fund’s share price fluctuates based on what another investor is willing to pay rather than on the market value of the securities in the fund.
Investment in the Subsidiary Risk — The Subsidiary is not registered under the Investment Company Act of 1940, as amended (“the 1940 Act”), and, unless otherwise noted in this prospectus, is not subject to all of the investor protections of the 1940 Act. Thus, the Fund, as an investor in the Subsidiary, will not have all of the protections offered to investors in registered investment companies. In addition, changes in the laws of the United States and/or the Cayman Islands, under which the Fund and the Subsidiary, respectively, are organized, could result in the inability of the Fund and/or the Subsidiary to operate as intended and could negatively affect the Fund and its shareholders.
Investment Style Risk — The risk that large capitalization securities may underperform other segments of the equity markets or the equity markets as a whole.
Large Capitalization Risk — The risk that larger, more established companies may be unable to respond quickly to new competitive challenges such as changes in technology and consumer tastes. Larger companies also may not be able to attain the high growth rates of successful smaller companies.
Leverage Risk — The Funds’ use of derivatives may result in the Funds’ total investment exposure substantially exceeding the value of its portfolio securities and the Funds’ investment returns depending substantially on the performance of securities that the Funds may not directly own. The use of leverage can amplify the effects of market volatility on the Funds’ share price and may also cause the Funds to liquidate portfolio positions when it would not be advantageous to do so in order to satisfy its obligations. The Funds’ use of leverage may result in a heightened risk of investment loss.
Liquidity Risk — The risk that certain securities may be difficult or impossible to sell at the time and the price that the Fund would like. The Fund may have to lower the price of the security, sell other securities instead or forego an investment opportunity, any of which
| | |
SEI Institutional Investments Trust / Semi-Annual Report / November 30, 2020 | | 381 |
NOTES TO FINANCIAL STATEMENTS / CONSOLIDATED NOTES TO FINANCIAL STATEMENTS (Continued)
November 30, 2020 (Unaudited)
could have a negative effect on Fund management or performance.
Market Risk — The risk that the market value of a security may move up and down, sometimes rapidly and unpredictably. Market risk may affect a single issuer, an industry, a sector or the equity or bond market as a whole. The prices of the Fund’s fixed income securities respond to economic developments, particularly interest rate changes, as well as to perceptions about the creditworthiness of individual issuers, including governments and their agencies. Generally, the Fund’s fixed income securities will decrease in value if interest rates rise and vice versa. In a low interest rate environment, risks associated with rising rates are heightened. Declines in dealer market-making capacity as a result of structural or regulatory changes could decrease liquidity and/or increase volatility in the fixed income markets. Markets for fixed income securities may decline significantly in response to adverse issuer, political, regulatory, market, economic or other developments that may cause broad changes in market value, public perceptions concerning these developments, and adverse investor sentiment or publicity. Similarly, environmental and public health risks, such as natural disasters, epidemics, pandemics or widespread fear that such events may occur, may impact markets adversely and cause market volatility in both the short- and long-term. In response to these events, the Fund’s value may fluctuate and/or the Fund may experience increased redemptions from shareholders, which may impact the Fund’s liquidity or force the Fund to sell securities into a declining or illiquid market.
Mortgage-Backed Securities Risk — Mortgage-backed securities are affected significantly by the rate of prepayments and modifications of the mortgage loans backing those securities, as well as by other factors such as borrower defaults, delinquencies, realized or liquidation losses and other shortfalls. Mortgage-backed securities are particularly sensitive to prepayment risk, which is described below, given that the term to maturity for mortgage loans is generally substantially longer than the expected lives of those securities; however, the timing and amount of prepayments cannot be accurately predicted. The timing of changes in the rate of prepayments of the mortgage loans may significantly affect the Fund’s actual yield to maturity on any mortgage-backed securities, even if the average rate of principal payments is consistent with the Fund’s expectation. Along with prepayment risk, mortgage-backed securities are significantly affected by interest rate risk, which is described above. In a low interest rate environment, mortgage loan prepayments would generally be expected to increase due to factors such as refinancings and loan modifications at lower
interest rates. In contrast, if prevailing interest rates rise, prepayments of mortgage loans would generally be expected to decline and therefore extend the weighted average lives of mortgage-backed securities held or acquired by the Fund.
Mortgage Dollar Rolls Risk — Mortgage dollar rolls are transactions in which the Fund sells securities (usually mortgage-backed securities) and simultaneously contracts to repurchase substantially similar, but not identical, securities on a specified future date. If the broker-dealer to whom the Fund sells the security becomes insolvent, the Fund’s right to repurchase the security may be restricted. Other risks involved in entering into mortgage dollar rolls include the risk that the value of the security may change adversely over the term of the mortgage dollar roll and that the security the Fund is required to repurchase may be worth less than the security that the Fund originally held.
Municipal Securities Risk — Municipal securities, like other fixed income securities, rise and fall in value in response to economic and market factors, primarily changes in interest rates, and actual or perceived credit quality. Rising interest rates will generally cause municipal securities to decline in value. Longer-term securities respond more sharply to interest rate changes than do shorter-term securities. A municipal security will also lose value if, due to rating downgrades or other factors, there are concerns about the issuer’s current or future ability to make principal or interest payments. State and local governments rely on taxes and, to some extent, revenues from private projects financed by municipal securities, to pay interest and principal on municipal debt. Poor statewide or local economic results or changing political sentiments may reduce tax revenues and increase the expenses of municipal issuers, making it more difficult for them to repay principal and to make interest payments on securities owned by the Fund. Actual or perceived erosion of the creditworthiness of municipal issuers may reduce the value of the Fund’s holdings. As a result, the Fund will be more susceptible to factors that adversely affect issuers of municipal obligations than a mutual fund that does not have as great a concentration in municipal obligations.
Non-Diversified Risk — The Emerging Markets Debt and Multi-Asset Real Return Funds are non-diversified, which means that they may invest in the securities of relatively few issuers. As a result, the Funds may be more susceptible to a single adverse economic or political occurrence affecting one or more of these
| | |
382 | | SEI Institutional Investments Trust / Semi-Annual Report / November 30, 2020 |
issuers and may experience increased volatility due to its investments in those securities.
Opportunity Risk — The risk of missing out on an investment opportunity because the assets necessary to take advantage of it are tied up in other investments.
Participation Notes (P-Notes) Risk — P-Notes are participation interest notes that are issued by banks or broker-dealers and are designed to offer a return linked to a particular underlying equity, debt, currency or market. When purchasing a P-Note, the posting of margin is not required because the full cost of the P-Note (plus commission) is paid at the time of purchase. When the P-Note matures, the issuer will pay to, or receive from, the purchaser the difference between the minimal value of the underlying instrument at the time of purchase and that instrument’s value at maturity. Investments in P-Notes involve the same risks associated with a direct investment in the underlying foreign companies or foreign securities markets that they seek to replicate.
Portfolio Turnover Risk — Due to its investment strategy, the Fund may buy and sell securities frequently. This may result in higher transaction costs and additional capital gains tax liabilities, which may affect the Fund’s performance.
Prepayment Risk — The risk that, in a declining interest rate environment, fixed income securities with stated interest rates may have the principal paid earlier than expected, requiring the Fund to invest the proceeds at generally lower interest rates.
Private Placements Risk — Investment in privately placed securities may be less liquid than in publicly traded securities. Although these securities may be resold in privately negotiated transactions, the prices realized from these sales could be less than those originally paid by the Fund or less than what may be considered the fair value of such securities. Further, companies whose securities are not publicly traded may not be subject to the disclosure and other investor protection requirements that might be applicable if their securities were publicly traded.
Quantitative Investing Risk — A quantitative investment style generally involves the use of computers to implement a systematic or rules-based approach to selecting investments based on specific measurable factors. Due to the significant role technology plays in such strategies, they carry the risk of unintended or unrecognized issues or flaws in the design, coding, implementation or maintenance of the computer
programs or technology used in the development and implementation of the quantitative strategy.
Real Estate Industry Risk — Securities of companies principally engaged in the real estate industry may be subject to the risks associated with direct ownership of real estate. Risks commonly associated with the direct ownership of real estate include fluctuations in the value of underlying properties, defaults by borrowers or tenants, changes in interest rates and risks related to general or local economic conditions.
Redemption Risk — The Funds may experience periods of heavy redemptions that could cause the Funds to liquidate its assets at inopportune times or at a loss or depressed value, particularly during periods of declining or illiquid markets.
REITs Risk — REITs are trusts that invest primarily in commercial real estate or real estate-related loans. The Fund’s investments in REITs will be subject to the risks associated with the direct ownership of real estate. Risks commonly associated with the direct ownership of real estate include fluctuations in the value of underlying properties, defaults by borrowers or tenants, changes in interest rates and risks related to general or local economic conditions. Some REITs may have limited diversification and may be subject to risks inherent in financing a limited number of properties.
Repurchase Agreements and Reverse Repurchase Agreements Risk — In the event of the insolvency of the counterparty to a repurchase agreement or reverse repurchase agreement, recovery of the repurchase price owed to the Fund or, in the case of a reverse repurchase agreement, the securities sold by the Fund, may be delayed. Because reverse repurchase agreements may be considered to be the practical equivalent of borrowing funds, they constitute a form of leverage. If the Fund reinvests the proceeds of a reverse repurchase agreement at a rate lower than the cost of the agreement, entering into the agreement will lower the Fund’s yield.
Sampling Risk — The Fund may not fully replicate the benchmark index and may hold securities not included in the index. As a result, the Fund may not track the return of its benchmark index as well as it would have if the Fund purchased all of the securities in its benchmark index.
Short Sales Risk — A short sale involves the sale of a security that the Fund does not own in the expectation of purchasing the same security (or a security exchangeable therefore) at a later date at a lower price. Short sales expose the Fund to the risk that it will be required to buy the security sold short (also known as “covering” the short position) at a time when the security has appreciated in value, thus resulting in a loss to the
| | |
SEI Institutional Investments Trust / Semi-Annual Report / November 30, 2020 | | 383 |
NOTES TO FINANCIAL STATEMENTS / CONSOLIDATED NOTES TO FINANCIAL STATEMENTS (Continued)
November 30, 2020 (Unaudited)
Fund. Investment in short sales may also cause the Fund to incur expenses related to borrowing securities. Reinvesting proceeds received from short selling may create leverage, which can amplify the effects of market volatility on the Fund’s share price. In addition, shorting a future contract may require posting only a margin that may amount to less than the notional exposure of the contract. Such a practice may exacerbate the loss in a case of adverse price action.
Small and Medium Capitalization Risk — Small and medium capitalization companies in which the Fund may invest may be more vulnerable to adverse business or economic events than larger, more established companies. In particular, small and medium capitalization companies may have limited product lines, markets and financial resources and may depend upon a relatively small management group. Therefore, small and medium capitalization stocks may be more volatile than those of larger companies. Small and medium capitalization stocks may be traded over-the-counter (OTC). OTC stocks may trade less frequently and in smaller volume than exchange listed stocks and may have more price volatility than that of exchange-listed stocks.
Social Investment Criteria Risk — The Fund’s portfolio is subject to certain social investment criteria. As a result, the Sub-Advisers may avoid purchasing certain securities for social reasons when it is otherwise economically advantageous to purchase those securities or may sell certain securities for social reasons when it is otherwise economically advantageous to hold those securities. In general, the application of the Fund’s social investment criteria may affect the Fund’s exposure to certain industries, sectors and geographic areas, which may affect the financial performance of the Fund, positively or negatively, depending on whether these industries or sectors are in or out of favor.
Tax Risk — The Fund may gain most of its exposure to the commodities markets through its investment in the Subsidiary, which invests in commodity investments and derivative instruments. To the extent the Fund invests in such instruments directly, it will seek to restrict its income from commodity-linked derivative instruments that do not generate qualifying income, such as commodity-linked swaps, to a maximum of 10% of its gross income (when combined with its other investments that produce non-qualifying income) to comply with certain qualifying income tests necessary for the Fund to qualify as a regulated investment company under Subchapter M of the Internal Revenue Code of 1986, as amended. The tax treatment of certain commodity-linked derivative instruments may be affected by future regulatory or legislative changes that could affect the
character, timing
and/or amount of the Fund’s taxable income or gains and distributions.
Tracking Error Risk — The risk that the Fund’s performance may vary substantially from the performance of the benchmark index it tracks as a result of cash flows, Fund expenses, imperfect correlation between the Fund’s investments and the index’s components and other factors.
U.S. Government Securities Risk — Although U.S. Government securities are considered to be among the safest investments, they are still subject to the credit risk of the U.S. Government and are not guaranteed against price movements due to changing interest rates. Obligations issued by some U.S. Government agencies are backed by the U.S. Treasury, while others are backed solely by the ability of the agency to borrow from the U.S. Treasury or by the agency’s own resources. No assurance can be given that the U.S. Government will provide financial support to its agencies and instrumentalities if it is not obligated by law to do so.
Warrants Risk — Warrants are instruments that entitle the holder to buy an equity security at a specific price for a specific period of time. Warrants may be more speculative than other types of investments. The price of a warrant may be more volatile than the price of its underlying security, and a warrant may offer greater potential for capital appreciation as well as capital loss. A warrant ceases to have value if it is not exercised prior to its expiration date.
Please refer to each Fund’s current prospectus for additional disclosure regarding the risks associated with investing in the Funds. The foregoing is not intended to be a complete discussion of the risks associated with the investment strategies of the Funds.
11. IN-KIND TRANSFERS OF SECURITIES
During the year ended May 31, 2020 and the period ended November 30, 2020, the Core Fixed Income Fund, Long Duration Credit Fund and Intermediate Duration Credit Fund issued/(redeemed) shares of beneficial interest in exchange for securities. These securities were transferred at their current value on the date of such transactions.
| | | | | | | | | | | | |
| | | | |
| | | Shares Issued (Thousands) | | | Value ($ Thousands) | | | Gain ($ Thousands) | |
Core Fixed Income Fund | |
04/30/2020 | | | 49,845 | | | $ | 55,437 | | | $ | — | |
Long Duration Credit Fund | |
09/18/2020 | | | 5,500 | | | | 68,088 | | | | — | |
Intermediate Duration Credit Fund | |
09/18/2020 | | | 3,984 | | | | 44,539 | | | | — | |
| | |
384 | | SEI Institutional Investments Trust / Semi-Annual Report / November 30, 2020 |
12. SECURITIES LENDING
To the extent consistent with its Investment Objective and Strategies, a Fund may lend portfolio securities to brokers, dealers and other financial organizations that meet capital and other credit requirements or other criteria established by the Trust’s Board of Trustees. These loans may not exceed 33 1/3% of the total asset value of the Fund including the loan collateral). No Fund will lend portfolio securities to its Adviser, sub-adviser or their affiliates unless it has applied for and received specific authority to do so from the SEC. Loans of portfolio securities will be fully collateralized by cash. Collateral will be maintained in an amount equal to at least 100% of the current market value of the loaned securities by marking-to-market daily, although the borrower will be required to deliver collateral between 102% and 105% of the market value of borrowed securities for domestic and foreign securities, respectively. However, due to market fluctuations during the day, the value of securities loaned on a particular day may, during the course of the day, exceed the value of collateral. On each business day, the amount of collateral is adjusted based on the prior day’s market fluctuations and the current day’s lending activity.
Income from lending activity is determined by the amount of interest earned on collateral, less any amounts payable to the borrowers of the securities and the lending agent. Lending securities involves certain risks, including the risk that the Fund may be delayed or prevented from recovering the collateral if the borrower fails to return the securities.
Cash collateral received in connection with securities lending is invested in short-term investments by the lending agent. These investments may include the SEI Liquidity Fund, L.P., and the Fund bears all of the gains and losses on such investment. There is no guarantee that these investments will not lose value.
The following is a summary of securities lending agreements held by certain Funds which would
be subject to offset as of November 30, 2020 ($ Thousands):
| | | | | | | | | | | | |
| | | | |
| Fund | | Securities Loaned at Value | | | Cash Collateral Received(1) | | | Net Amount | |
Large Cap Fund | | $ | 6,912 | | | $ | 6,912 | | | $ | - | |
Large Cap Disciplined Equity Fund | | | 83 | | | | 83 | | | | - | |
Large Cap Index Fund | | | 13,867 | | | | 13,867 | | | | - | |
S&P 500 Index Fund | | | 13,405 | | | | 13,405 | | | | - | |
Extended Market Index Fund | | | 126,421 | | | | 126,421 | | | | - | |
Small Cap Fund | | | 12,914 | | | | 12,914 | | | | - | |
Small Cap II Fund | | | 27,057 | | | | 27,057 | | | | - | |
Small/Mid Cap Equity Fund | | | 72,156 | | | | 72,156 | | | | - | |
U.S. Managed Volatility Fund | | | 36,640 | | | | 36,640 | | | | - | |
Global Managed Volatility Fund | | | 9,761 | | | | 9,761 | | | | - | |
World Equity Ex-US Fund | | | 88,627 | | | | 88,627 | | | | - | |
Core Fixed Income Fund | | | 9,808 | | | | 9,808 | | | | - | |
Emerging Markets Debt Fund | | | 3,823 | | | | 3,823 | | | | - | |
| (1) | Excess collateral received in connection with the above securities lending transactions is not shown for financial reporting purposes. See each Fund’s Summary Schedule of Investments or Schedule of Investments for the total collateral received. |
13. CONCENTRATION OF SHAREHOLDERS
SEI Private Trust Company (“SPTC”) and SIMC are subsidiaries of SEI Investments Company. As of November 30, 2020, SPTC held of record the following:
| | | | |
| | |
| Fund | | % Held |
Large Cap Fund | | | 47.13% | |
Large Cap Disciplined Equity Fund | | | 56.84% | |
Large Cap Index Fund | | | 61.97% | |
S&P 500 Index Fund | | | 61.54% | |
Extended Market Index Fund | | | 62.36% | |
Small Cap Fund | | | 42.93% | |
Small Cap II Fund | | | 38.47% | |
Small/Mid Cap Equity Fund | | | 53.43% | |
U.S. Equity Factor Allocation Fund | | | 58.05% | |
U.S. Managed Volatility Fund | | | 46.72% | |
Global Managed Volatility Fund | | | 52.12% | |
World Equity Ex-US Fund | | | 60.70% | |
Screened World Equity Ex-US Fund | | | 100.00% | |
World Select Equity Fund | | | 85.48% | |
Emerging Markets Equity Fund | | | 59.13% | |
Opportunistic Income Fund | | | 70.67% | |
Core Fixed Income Fund | | | 59.59% | |
High Yield Bond Fund | | | 53.44% | |
Long Duration Fund | | | 73.25% | |
Long Duration Credit Fund | | | 34.70% | |
Ultra Short Duration Bond Fund | | | 53.49% | |
Emerging Markets Debt Fund | | | 59.27% | |
Real Return Fund | | | 65.65% | |
Limited Duration Bond Fund | | | 63.10% | |
Intermediate Duration Credit Fund | | | 55.79% | |
Dynamic Asset Allocation Fund | | | 62.41% | |
Multi-Asset Real Return Fund | | | 60.30% | |
SPTC is not a direct service provider to the Funds. However, SPTC performs a key role in the comprehensive investment solution that SEI provides
| | |
SEI Institutional Investments Trust / Semi-Annual Report / November 30, 2020 | | 385 |
NOTES TO FINANCIAL STATEMENTS / CONSOLIDATED NOTES TO FINANCIAL STATEMENTS (Concluded)
November 30, 2020 (Unaudited)
to investors. SPTC holds the vast majority of shares in the Funds as custodian for shareholders that are clients of the advisors and financial planners. SPTC maintains accounts at SEI Institutional Transfer Agency (“SITA”), and operates in an omnibus fund account environment.
14. REGULATORY MATTERS
In July 2017, the Financial Conduct Authority, the United Kingdom’s financial regulatory body, announced that after 2021 it will cease its active encouragement of banks to provide the quotations needed to sustain LIBOR. That announcement suggests that LIBOR very likely will cease to be published after that time. Various financial industry groups have begun planning for that transition, whether through marketwide protocols, fallback contractual provisions, bespoke negotiations or amendments or otherwise, but there are obstacles to converting certain securities and transactions to a new benchmark. Transition planning is at an early stage, and neither the effect of the transition process nor its ultimate success can yet be known. The transition process might lead to increased volatility and illiquidity in markets for instruments whose terms currently include LIBOR. It could also lead to a reduction in the value of some LIBOR-based investments and reduce the effectiveness of new hedges placed against existing LIBOR-based investments. While some LIBOR-based instruments may contemplate a scenario where LIBOR is no longer available by providing for an alternative rate-setting methodology and/or increased costs for certain LIBOR-related instruments or financing transactions, not all may have such provisions and there may be significant uncertainty regarding the effectiveness of any such alternative methodologies, resulting in prolonged adverse market conditions for the Fund. Because the usefulness of LIBOR as a benchmark could deteriorate during the transition period, these effects could occur prior to the end of 2021. There also remains uncertainty and risk regarding the willingness and ability of issuers to include enhanced provisions in new and existing contracts or instruments. All of the aforementioned may adversely affect the Fund’s performance or NAV.
15. NEW ACCOUNTING PRONOUNCEMENTS
In August 2018, the FASB issued Accounting Standards Update (“ASU”) 2018-13, Fair Value Measurement (Topic 820). The new guidance includes additions and modifications to disclosures requirements for fair value measurements. For public entities, the amendments are effective for financial statements issued for fiscal years beginning after December 15, 2019, and interim periods within those fiscal years. Management elected to early adopt the removal and modifications of certain disclosures and delay the adoption of additional disclosures until the effective date.
16. SUBSEQUENT EVENTS
Management has evaluated the need for disclosures and/or adjustments resulting from subsequent events through the date the financial statements were issued. Based on this evaluation, no disclosure and/or adjustments were required to the financial statements as of November 30, 2020.
| | |
386 | | SEI Institutional Investments Trust / Semi-Annual Report / November 30, 2020 |
DISCLOSURE OF FUND EXPENSES (Unaudited)
November 30, 2020
All mutual funds have operating expenses. As a shareholder of a fund, your investment is affected by these ongoing costs, which include (among others) costs for portfolio management, administrative services, and shareholder reports like this one. It is important for you to understand the impact of these costs on your investment returns.
Operating expenses such as these are deducted from the fund’s gross income and directly reduce your final investment return. These expenses are expressed as a percentage of the fund’s average net assets; this percentage is known as the fund’s expense ratio.
The following examples use the expense ratio and are intended to help you understand the ongoing costs (in dollars) of investing in your fund and to compare these costs with those of other mutual funds. The examples are based on an investment of $1,000 made at the beginning of the period shown and held for the entire period (June 1, 2020 through November 30, 2020).
The table on this page illustrates your fund’s costs in two ways:
• Actual fund return. This section helps you to estimate the actual expenses after fee waivers that your Fund incurred over the period. The “Expenses Paid During Period” column shows the actual dollar expense cost incurred by a $1,000 investment in the Fund, and the “Ending Account Value” number is derived from deducting that expense cost from the Fund’s gross investment return.
You can use this information, together with the actual amount you invested in the Fund, to estimate the expenses you paid over that period. Simply divide your actual account value by $1,000 to arrive at a ratio (for example, an $8,600 account value divided by $1,000 = 8.6), then multiply that ratio by the number shown for your Fund under “Expenses Paid During Period.”
• Hypothetical 5% return. This section helps you compare your Fund’s costs with those of other mutual funds. It assumes that the fund had an annual 5% return before expenses during the year, but that the expense ratio (Column 3) for the period is unchanged. This example is useful in making comparisons because the Securities and Exchange Commission requires all mutual funds to make this 5% calculation. You can assess your Fund’s comparative cost by comparing the hypothetical result for your Fund in the “Expenses Paid During Period” column with those that appear in the same charts in the shareholder reports for other funds.
NOTE: Because the return is set at 5% for comparison purposes — NOT your Fund’s actual return — the account values shown may not apply to your specific investment.
| | | | | | | | | | | | | | | | |
| | | | |
| | | Beginning
Account
Value
6/1/20 | | | Ending
Account
Value
11/30/20 | | | Annualized
Expense
Ratios | | | Expenses
Paid
During
Period* | |
| | | |
| Large Cap Fund | | | | | | | |
Actual Fund Return | |
| | | | |
Class A Shares | | $ | 1,000.00 | | | $ | 1,190.80 | | | | 0.18 | % | | $ | 0.99 | |
Hypothetical 5% Return | |
| | | | |
Class A Shares | | $ | 1,000.00 | | | $ | 1,024.17 | | | | 0.18 | % | | $ | 0.91 | |
| | | |
| Large Cap Disciplined Equity Fund | | | | | | | |
Actual Fund Return | |
| | | | |
Class A Shares | | $ | 1,000.00 | | | $ | 1,183.60 | | | | 0.18 | % | | $ | 0.99 | |
Hypothetical 5% Return | |
| | | | |
Class A Shares | | $ | 1,000.00 | | | $ | 1,024.17 | | | | 0.18 | % | | $ | 0.91 | |
| | | |
| Large Cap Index Fund | | | | | | | |
Actual Fund Return | |
| | | | |
Class A Shares | | $ | 1,000.00 | | | $ | 1,220.10 | | | | 0.04 | % | | $ | 0.22 | |
Hypothetical 5% Return | |
| | | | |
Class A Shares | | $ | 1,000.00 | | | $ | 1,024.87 | | | | 0.04 | % | | $ | 0.20 | |
| | | |
| S&P 500 Index Fund | | | | | | | |
Actual Fund Return | |
| | | | |
Class A Shares | | $ | 1,000.00 | | | $ | 1,199.30 | | | | 0.04 | % | | $ | 0.22 | |
Hypothetical 5% Return | |
| | | | |
Class A Shares | | $ | 1,000.00 | | | $ | 1,024.87 | | | | 0.04 | % | | $ | 0.20 | |
| | | | | | | | | | | | | | | | |
| | | | |
| | | Beginning
Account
Value
6/1/20 | | | Ending
Account
Value
11/30/20 | | | Annualized
Expense
Ratios | | | Expenses
Paid
During
Period* | |
| | | |
| Extended Market Index Fund | | | | | | | |
Actual Fund Return | |
| | | | |
Class A Shares | | $ | 1,000.00 | | | $ | 1,362.50 | | | | 0.06 | % | | $ | 0.36 | |
Hypothetical 5% Return | |
| | | | |
Class A Shares | | $ | 1,000.00 | | | $ | 1,024.77 | | | | 0.06 | % | | $ | 0.30 | |
| | | |
| Small Cap Fund | | | | | | | |
Actual Fund Return | |
| | | | |
Class A Shares | | $ | 1,000.00 | | | $ | 1,280.90 | | | | 0.44 | % | | $ | 2.52 | |
Hypothetical 5% Return | |
| | | | |
Class A Shares | | $ | 1,000.00 | | | $ | 1,022.86 | | | | 0.44 | % | | $ | 2.23 | |
| | | |
| Small Cap II Fund | | | | | | | |
Actual Fund Return | |
| | | | |
Class A Shares | | $ | 1,000.00 | | | $ | 1,324.00 | | | | 0.43 | % | | $ | 2.51 | |
Hypothetical 5% Return | |
| | | | |
Class A Shares | | $ | 1,000.00 | | | $ | 1,022.91 | | | | 0.43 | % | | $ | 2.18 | |
| | | |
| Small/Mid Cap Equity Fund | | | | | | | |
Actual Fund Return | |
| | | | |
Class A Shares | | $ | 1,000.00 | | | $ | 1,251.30 | | | | 0.41 | % | | $ | 2.31 | |
Hypothetical 5% Return | |
| | | | |
Class A Shares | | $ | 1,000.00 | | | $ | 1,023.01 | | | | 0.41 | % | | $ | 2.08 | |
| | |
SEI Institutional Investments Trust / Semi-Annual Report / November 30, 2020 | | 387 |
DISCLOSURE OF FUND EXPENSES (Unaudited) (Concluded)
November 30, 2020
| | | | | | | | | | | | | | | | |
| | | | |
| | | Beginning
Account
Value
6/1/20 | | | Ending
Account
Value
11/30/20 | | | Annualized
Expense
Ratios | | | Expenses
Paid
During
Period* | |
| | | |
| U.S. Equity Factor Allocation Fund | | | | | | | |
Actual Fund Return | | | | | | | | | |
| | | | |
Class A Shares | | $ | 1,000.00 | | | $ | 1,183.10 | | | | 0.02 | % | | $ | 0.11 | |
Hypothetical 5% Return | | | | | | | | | |
| | | | |
Class A Shares | | $ | 1,000.00 | | | $ | 1,024.97 | | | | 0.02 | % | | $ | 0.10 | |
| | | |
| U.S. Managed Volatility Fund | | | | | | | |
Actual Fund Return | | | | | | | | | |
| | | | |
Class A Shares | | $ | 1,000.00 | | | $ | 1,099.60 | | | | 0.20 | % | | $ | 1.05 | |
Hypothetical 5% Return | | | | | | | | | |
| | | | |
Class A Shares | | $ | 1,000.00 | | | $ | 1,024.07 | | | | 0.20 | % | | $ | 1.01 | |
| | | |
| Global Managed Volatility Fund | | | | | | | |
Actual Fund Return | | | | | | | | | |
| | | | |
Class A Shares | | $ | 1,000.00 | | | $ | 1,081.80 | | | | 0.24 | % | | $ | 1.25 | |
Hypothetical 5% Return | | | | | | | | | |
| | | | |
Class A Shares | | $ | 1,000.00 | | | $ | 1,023.87 | | | | 0.24 | % | | $ | 1.22 | |
| | | |
| World Equity Ex-US Fund | | | | | | | |
Actual Fund Return | | | | | | | | | |
| | | | |
Class A Shares | | $ | 1,000.00 | | | $ | 1,239.10 | | | | 0.29 | % | | $ | 1.63 | |
Hypothetical 5% Return | | | | | | | | | |
| | | | |
Class A Shares | | $ | 1,000.00 | | | $ | 1,023.61 | | | | 0.29 | % | | $ | 1.48 | |
| | | |
| Screened World Equity Ex-US Fund | | | | | | | |
Actual Fund Return | | | | | | | | | |
| | | | |
Class A Shares | | $ | 1,000.00 | | | $ | 1,242.80 | | | | 0.36 | % | | $ | 2.02 | |
Hypothetical 5% Return | | | | | | | | | |
| | | | |
Class A Shares | | $ | 1,000.00 | | | $ | 1,023.26 | | | | 0.36 | % | | $ | 1.83 | |
| | | |
| World Select Equity Fund | | | | | | | |
Actual Fund Return | | | | | | | | | |
| | | | |
Class A Shares | | $ | 1,000.00 | | | $ | 1,224.40 | | | | 0.40 | % | | $ | 2.23 | |
Hypothetical 5% Return | | | | | | | | | |
| | | | |
Class A Shares | | $ | 1,000.00 | | | $ | 1,023.06 | | | | 0.40 | % | | $ | 2.03 | |
| | | |
| Emerging Markets Equity Fund | | | | | | | |
Actual Fund Return | | | | | | | | | |
| | | | |
Class A Shares | | $ | 1,000.00 | | | $ | 1,286.70 | | | | 0.61 | % | | $ | 3.50 | |
Hypothetical 5% Return | | | | | | | | | |
| | | | |
Class A Shares | | $ | 1,000.00 | | | $ | 1,022.01 | | | | 0.61 | % | | $ | 3.09 | |
| | | |
| Opportunistic Income Fund | | | | | | | |
Actual Fund Return | | | | | | | | | |
| | | | |
Class A Shares | | $ | 1,000.00 | | | $ | 1,046.20 | | | | 0.23 | % | | $ | 1.18 | |
Hypothetical 5% Return | | | | | | | | | |
| | | | |
Class A Shares | | $ | 1,000.00 | | | $ | 1,023.92 | | | | 0.23 | % | | $ | 1.17 | |
| | | |
| Core Fixed Income Fund | | | | | | | |
Actual Fund Return | | | | | | | | | |
| | | | |
Class A Shares | | $ | 1,000.00 | | | $ | 1,032.20 | | | | 0.12 | % | | $ | 0.61 | |
Hypothetical 5% Return | | | | | | | | | |
| | | | |
Class A Shares | | $ | 1,000.00 | | | $ | 1,024.47 | | | | 0.12 | % | | $ | 0.61 | |
| | | |
| High Yield Bond Fund | | | | | | | |
Actual Fund Return | | | | | | | | | |
| | | | |
Class A Shares | | $ | 1,000.00 | | | $ | 1,131.50 | | | | 0.29 | % | | $ | 1.53 | |
Hypothetical 5% Return | | | | | | | | | |
| | | | |
Class A Shares | | $ | 1,000.00 | | | $ | 1,023.63 | | | | 0.29 | % | | $ | 1.45 | |
| | | | | | | | | | | | | | | | |
| | | | |
| | | Beginning
Account
Value
6/1/20 | | | Ending
Account
Value
11/30/20 | | | Annualized
Expense
Ratios | | | Expenses
Paid
During
Period* | |
| | | |
| Long Duration Fund | | | | | | | |
Actual Fund Return | | | | | | | | | |
| | | | |
Class A Shares | | $ | 1,000.00 | | | $ | 1,068.30 | | | | 0.15 | % | | $ | 0.78 | |
Hypothetical 5% Return | | | | | | | | | |
| | | | |
Class A Shares | | $ | 1,000.00 | | | $ | 1,024.32 | | | | 0.15 | % | | $ | 0.76 | |
| | | |
| Long Duration Credit Fund | | | | | | | |
Actual Fund Return | | | | | | | | | |
| | | | |
Class A Shares | | $ | 1,000.00 | | | $ | 1,077.60 | | | | 0.15 | % | | $ | 0.78 | |
Hypothetical 5% Return | | | | | | | | | |
| | | | |
Class A Shares | | $ | 1,000.00 | | | $ | 1,024.32 | | | | 0.15 | % | | $ | 0.76 | |
| | | |
| Ultra Short Duration Bond Fund | | | | | | | |
Actual Fund Return | | | | | | | | | |
| | | | |
Class A Shares | | $ | 1,000.00 | | | $ | 1,010.90 | | | | 0.12 | % | | $ | 0.60 | |
Hypothetical 5% Return | | | | | | | | | |
| | | | |
Class A Shares | | $ | 1,000.00 | | | $ | 1,024.47 | | | | 0.12 | % | | $ | 0.61 | |
| | | |
| Emerging Markets Debt Fund | | | | | | | |
Actual Fund Return | | | | | | | | | |
| | | | |
Class A Shares | | $ | 1,000.00 | | | $ | 1,101.00 | | | | 0.40 | % | | $ | 2.10 | |
Hypothetical 5% Return | | | | | | | | | |
| | | | |
Class A Shares | | $ | 1,000.00 | | | $ | 1,023.07 | | | | 0.40 | % | | $ | 2.02 | |
| | | |
| Real Return Fund | | | | | | | |
Actual Fund Return | | | | | | | | | |
| | | | |
Class A Shares | | $ | 1,000.00 | | | $ | 1,030.70 | | | | 0.02 | % | | $ | 0.10 | |
Hypothetical 5% Return | | | | | | | | | |
| | | | |
Class A Shares | | $ | 1,000.00 | | | $ | 1,024.97 | | | | 0.02 | % | | $ | 0.10 | |
| | | |
| Limited Duration Bond Fund | | | | | | | |
Actual Fund Return | | | | | | | | | |
| | | | |
Class A Shares | | $ | 1,000.00 | | | $ | 1,014.50 | | | | 0.11 | % | | $ | 0.56 | |
Hypothetical 5% Return | | | | | | | | | |
| | | | |
Class A Shares | | $ | 1,000.00 | | | $ | 1,024.52 | | | | 0.11 | % | | $ | 0.56 | |
| | | |
| Intermediate Duration Credit Fund | | | | | | | |
Actual Fund Return | | | | | | | | | |
| | | | |
Class A Shares | | $ | 1,000.00 | | | $ | 1,050.70 | | | | 0.15 | % | | $ | 0.76 | |
Hypothetical 5% Return | | | | | | | | | |
| | | | |
Class A Shares | | $ | 1,000.00 | | | $ | 1,024.33 | | | | 0.15 | % | | $ | 0.75 | |
| | | |
| Dynamic Asset Allocation Fund | | | | | | | |
Actual Fund Return | | | | | | | | | |
| | | | |
Class A Shares | | $ | 1,000.00 | | | $ | 1,198.40 | | | | 0.08 | % | | $ | 0.44 | |
Hypothetical 5% Return | | | | | | | | | |
| | | | |
Class A Shares | | $ | 1,000.00 | | | $ | 1,024.67 | | | | 0.08 | % | | $ | 0.41 | |
| | | |
| Multi-Asset Real Return Fund | | | | | | | |
Actual Fund Return | | | | | | | | | |
| | | | |
Class A Shares | | $ | 1,000.00 | | | $ | 1,044.80 | | | | 0.41 | % | | $ | 2.10 | |
Hypothetical 5% Return | | | | | | | | | |
| | | | |
Class A Shares | | $ | 1,000.00 | | | $ | 1,023.01 | | | | 0.41 | % | | $ | 2.08 | |
| * | Expenses are equal to the Fund’s annualized expense ratio, including dividend expense, if applicable, multiplied by the average account value over the period, multiplied by 183/365 (to reflect the one-half year period shown). |
| | |
388 | | SEI Institutional Investments Trust / Semi-Annual Report / November 30, 2020 |
BOARD OF TRUSTEES CONSIDERATIONS IN APPROVING THE ADVISORY AND SUB-ADVISORY AGREEMENT (Unaudited)
SEI Institutional Investments Trust (the “Trust”) and SEI Investments Management Corporation (“SIMC”) have entered into an investment advisory agreement (the “Advisory Agreement”), pursuant to which SIMC provides investment advisory services to the series of the Trust (the “Funds”). Pursuant to separate sub-advisory agreements with SIMC (the “Sub-Advisory Agreements” and, together with the Advisory Agreement, the “Investment Advisory Agreements”), and under the supervision of SIMC and the Trust’s Board of Trustees (each member, a “Trustee” and, collectively, the “Trustees” or the “Board”), the sub-advisers (each, a “Sub-Adviser” and collectively, the “Sub-Advisers”) provide security selection and certain other advisory services with respect to all or a discrete portion of the assets of the Funds. The Sub-Advisers are also responsible for managing their employees who provide services to the Funds. The Sub-Advisers are selected based primarily upon the research and recommendations of SIMC, which evaluates quantitatively and qualitatively the Sub-Advisers’ skills and investment results in managing assets for specific asset classes, investment styles and strategies.
The Investment Company Act of 1940, as amended (the “1940 Act”), requires that the initial approval of a Fund’s Investment Advisory Agreements be specifically approved by the vote of a majority of the outstanding shareholders of the Funds and the vote of a majority of the Trustees who are not parties to the Investment Advisory Agreements or “interested persons” of any party (the “Independent Trustees”) cast in person (or otherwise, as consistent with applicable laws, regulations and related guidance and relief) at a meeting called for such purpose. In addition, the 1940 Act requires that the continuation or renewal of any Investment Advisory Agreement be approved at least annually (after an initial period of up to two years), which also requires the vote of a majority of the Board, including a majority of the Independent Trustees. In the case of the initial approval of a Sub-Advisory Agreement, only the approval of a majority of the Board, including a majority of the Independent Trustees, is required, pursuant to an exemptive order that has been granted to the Trust by the Securities and Exchange Commission. In connection with their consideration of such initial approvals and renewals, the Funds’ Trustees must request and evaluate, and SIMC and the Sub-Advisers are required to furnish, such information as may be reasonably necessary to evaluate the terms of the Investment Advisory Agreements. In addition, the Securities and Exchange Commission takes the position that, as part of their fiduciary duties with respect to a mutual fund’s fees, mutual fund boards are required to evaluate the material factors applicable to a decision to approve an Investment Advisory Agreement.
Consistent with these responsibilities, the Board calls and holds meetings each year to consider whether to approve new and/or renew existing Investment Advisory Agreements between the Trust and SIMC and SIMC and the Sub-Advisers with respect to the Funds of the Trust. In preparation for these meetings, the Board requests and reviews a wide variety of materials provided by SIMC and the Sub-Advisers, including information about SIMC’s and the Sub-Advisers’ affiliates, personnel and operations and the services provided pursuant to the Investment Advisory Agreements. The Board also receives data from third parties. This information is provided in addition to the detailed information about the Funds that the Board reviews during the course of each year, including information that relates to Fund operations and Fund performance. The Trustees also receive a memorandum from counsel regarding the responsibilities of Trustees in connection with their consideration of whether to approve the Trust’s Investment Advisory Agreements. Finally, the Independent Trustees receive advice from independent counsel to the Independent Trustees, meet in executive sessions outside the presence of Fund management and participate in question and answer sessions with representatives of SIMC and the Sub-Advisers.
Specifically, during the first half of the Trust’s fiscal year, the Board requested and received written materials from SIMC and certain of the Sub-Advisers regarding: (i) the quality of each Sub-Adviser’s investment management and other services; (ii) each Sub-Adviser’s investment management personnel; (iii) each Sub-Adviser’s operations and financial condition; (iv) each Sub-Adviser’s brokerage practices (including any soft dollar arrangements) and investment strategies; (v) the level of the sub-advisory fees that SIMC pays each Sub-Adviser, compared with fees each charge to comparable accounts; (vi) the level of each Sub-Adviser’s profitability from their Fund-related operations; (vii) each Sub-Adviser’s compliance program, including a description of material compliance matters and material compliance violations; (viii) each Sub-Adviser’s policies on and compliance procedures for personal securities transactions; (ix) each Sub-Adviser’s expertise and resources in domestic and/or international financial markets; and (x) the Funds’ performance over various periods of time.
Certain Sub-Advisory Agreements were either initially approved or, if the Sub-Advisory Agreement was already in effect (unless operating under an initial two-year term), renewed at meetings of the Board held during the course of the Trust’s fiscal year on June 22-24, 2020, September 14-16, 2020 and November 12, 2020. In each case, the Board’s approval (or renewal) was based on its consideration and evaluation of the factors described above, as
| | |
SEI Institutional Investments Trust / Semi-Annual Report / November 30, 2020 | | 389 |
BOARD OF TRUSTEES CONSIDERATIONS IN APPROVING THE ADVISORY AND SUB-ADVISORY AGREEMENT (Unaudited) (Concluded)
discussed at the meetings and at prior meetings. The following discusses some, but not all, of the factors that were considered by the Board in connection with its assessment of the Sub-Advisory Agreements.
Nature, Extent and Quality of Services. The Board considered the nature, extent and quality of the services provided by the Sub-Advisers to the Funds and the resources of the Sub-Advisers and their affiliates dedicated to the Funds. In this regard, the Trustees evaluated, among other things, each Sub-Adviser’s personnel, experience, track record and compliance program. Following evaluation, the Board concluded that, within the context of its full deliberations, the nature, extent and quality of services provided by the Sub-Advisers to the Funds and the resources of the Sub-Advisers and their affiliates dedicated to the Funds were sufficient to support the initial approval or renewal of the Sub-Advisory Agreements.
Performance. In determining whether to approve or renew the Sub-Advisory Agreements, the Trustees considered the Funds’ performance relative to their peer groups and appropriate indexes/benchmarks. The Trustees reviewed performance information for each Fund, noting that they receive performance reports that permit them to monitor each Fund’s performance at board meetings throughout the year. Based on the materials considered and discussed at the meetings, the Trustees found Fund performance satisfactory, or, where performance was materially below the benchmark and/or peer group, the Trustees were satisfied with the reasons provided to explain such performance. In connection with the approval or renewal of the Sub-Advisory Agreements, the Board considered the performance of each Sub-Adviser relative to appropriate indexes/benchmarks. Following evaluation, the Board concluded that, within the context of its full deliberations, the performance of each Sub-Adviser was sufficient to support approval or renewal of the Sub-Advisory Agreement.
Fees. With respect to the Funds’ expenses under the Sub-Advisory Agreements, the Trustees considered the rate of compensation called for by the Sub-Advisory Agreements and the Funds’ net operating expense ratios in comparison to those of the Funds’ respective peer groups. Based on the materials considered and discussion at the meetings, the Trustees further determined that fees were either shown to be below the peer average in the comparative fee analysis, or that there was a reasonable basis for the fee level. When considering fees paid to Sub-Advisers, the Board took into account the fact that the Sub-Advisers are compensated by SIMC and not by the Funds directly, and that such compensation with respect to any unaffiliated Sub-Adviser reflects an arms-length negotiation between the Sub-Adviser and SIMC. Following evaluation, the Board concluded that, within the context of its full deliberations, the expenses of the Funds are reasonable and supported approval or renewal of the Sub-Advisory Agreements. The Board also considered whether the Sub-Advisers and their affiliates may have realized other benefits from their relationship with the Funds, such as any research and brokerage services received under soft dollar arrangements.
Profitability. With regard to profitability, the Trustees considered compensation flowing to the Sub-Advisers and their affiliates, directly or indirectly. The Trustees considered whether the levels of compensation and profitability were reasonable. As with the fee levels, when considering the profitability of the Sub-Advisers, the Board took into account the fact that compensation with respect to any unaffiliated Sub-Adviser reflects an arms-length negotiation between the Sub-Adviser and SIMC. In connection with the approval or renewal of each Sub-Advisory Agreement, the Board also took into consideration the impact that the fees paid to the Sub-Adviser have on SIMC’s advisory fee margin and profitability. Based on this evaluation, the Board concluded that, within the context of its full deliberations, the profitability of each of the Sub-Advisers is reasonable and supported renewal of the Sub-Advisory Agreements.
Economies of Scale. The Trustees considered whether any economies of scale were being realized by the Sub-Advisers in connection with the Fund as Fund assets grow, and, if so, whether the benefits of such economies of scale were passed along to the Funds or Funds’ shareholders through a graduated investment advisory fee schedule or other means. The Trustees recognized that economies of scale are difficult to identify and quantify and are rarely identifiable on a fund-by-fund basis. Based on this evaluation, the Board determined that the sub-advisory fees were reasonable in light of the information that was provided by the Sub-Advisers with respect to economies of scale.
Based on the Trustees’ deliberation and their evaluation of the information described above, the Board, including all of the Independent Trustees, with the assistance of Fund counsel and Independent Trustees’ counsel, unanimously approved the approval or renewal, as applicable, of the Sub-Advisory Agreements and concluded that the compensation under the Sub-Advisory Agreements is fair and reasonable in light of such services and expenses and such other matters as the Trustees considered to be relevant in the exercise of their reasonable judgment. In
| | |
390 | | SEI Institutional Investments Trust / Semi-Annual Report / November 30, 2020 |
the course of its deliberations, the Board did not identify any particular factor (or conclusion with respect thereto) or single piece of information that was all-important, controlling or determinative of its decision, but considered all of the factors together, and each Trustee may have attributed different weights to the various factors (and conclusions with respect thereto) and information.
| | |
SEI Institutional Investments Trust / Semi-Annual Report / November 30, 2020 | | 391 |
(This page intentionally left blank)
SEI Institutional Investments Trust / Semi-Annual Report / November 30, 2020
Robert A. Nesher, Chairman
Trustees
William M. Doran
George J. Sullivan, Jr.
Nina Lesavoy
James M. Williams
Mitchell A. Johnson
Hubert L. Harris, Jr.
Susan C. Cote
James B. Taylor
Christine Reynolds
Officers
Robert A. Nesher
President and Chief Executive Officer
Peter A. Rodriguez
Controller and Chief Financial Officer
Glenn R. Kurdziel
Assistant Controller
Russell Emery
Chief Compliance Officer
Timothy D. Barto
Vice President, Secretary
Aaron Buser
Vice President, Assistant Secretary
David F. McCann
Vice President, Assistant Secretary
Stephen G. MacRae
Vice President
Bridget E. Sudall
Anti-Money Laundering Compliance Officer Privacy Officer
Investment Adviser
SEI Investments Management Corporation
Administrator
SEI Investments Global Funds Services
Distributor
SEI Investments Distribution Co.
Legal Counsel
Morgan, Lewis & Bockius LLP
Independent Registered Public Accounting Firm
KPMG LLP
This report and the financial statements contained herein are submitted for the general information of the shareholders of the Trust and must be preceded or accompanied by a current prospectus. Shares of the Funds are not deposits or obligations of, or guaranteed or endorsed by, any bank. The shares are not federally insured by the Federal Deposit Insurance Corporation (FDIC), the Federal Reserve Board, or any other government agency. Investment in the shares involves risk, including the possible loss of principal.
For more information call
1 800 DIAL SEI
(1 800 342 5734)

1 Freedom Valley Drive, P.O. Box 1100, Oaks, PA 19456
SEI-F-120 (11/20)
Not applicable for semi-annual report.
| Item 3. | Audit Committee Financial Expert. |
Not applicable for semi-annual report.
| Item 4. | Principal Accountant Fees and Services. |
Not applicable for semi-annual report.
| Item 5. | Audit Committee of Listed Registrants. |
Not applicable for semi-annual report.
(a) The Schedules of Investments in securities of unaffiliated issuers as of the close of the reporting period for the Large Cap Fund, Large Cap Disciplined Equity Fund, Large Cap Index Fund, S&P 500 Index Fund, Extended Market Index Fund, Small Cap Fund, Small Cap II Fund, Small/Mid Cap Equity Fund, U.S. Equity Factor Allocation Fund, U.S. Managed Volatility Fund, Global Managed Volatility Fund, World Equity Ex-US Fund, Screened World Equity Ex-US Fund, World Select Equity Fund and Emerging Markets Equity Fund and the Consolidated Schedule of Investments in securities of unaffiliated issuers as of the close of the reporting period for the Dynamic Asset Allocation Fund are listed below. The Schedule of Investments in securities of unaffiliated issuers as of the close of the reporting period for the Opportunistic Income Fund, Core Fixed Income Fund, High Yield Bond Fund, Long Duration Fund, Long Duration Credit Fund, Ultra Short Duration Bond Fund, Emerging Markets Debt Fund, Real Return Fund, Limited Duration Bond Fund and Intermediate Duration Credit Fund and the Consolidated Schedule of Investments in securities of unaffiliated issuers as of the close of the reporting period for the Multi-Asset Real Return Fund are included as part of the report to shareholders filed under Item 1 of this form.
SCHEDULE OF INVESTMENTS (Unaudited)
November 30, 2020
Large Cap Fund (Continued)
| | | | | | | | |
| | | |
| Description | | Shares | | Market Value ($ Thousands) |
COMMON STOCK — 98.4% | |
| |
Communication Services — 7.1% | | | | | |
Activision Blizzard Inc | | | 14,025 | | | $ | 1,115 | |
Alphabet Inc, Cl A * | | | 2,676 | | | | 4,695 | |
Alphabet Inc, Cl C * | | | 7,828 | | | | 13,783 | |
AT&T Inc | | | 257,690 | | | | 7,409 | |
BCE Inc (A) | | | 110,930 | | | | 4,810 | |
Comcast Corp, Cl A | | | 143,672 | | | | 7,218 | |
Facebook Inc, Cl A * | | | 49,808 | | | | 13,795 | |
Interpublic Group of Cos Inc/The | | | 34,851 | | | | 777 | |
Netflix Inc * | | | 2,914 | | | | 1,430 | |
News Corp, Cl A | | | 12,002 | | | | 212 | |
Omnicom Group Inc | | | 6,723 | | | | 423 | |
Roku Inc, Cl A * | | | 1,646 | | | | 483 | |
Shutterstock Inc | | | 600 | | | | 41 | |
Take-Two Interactive Software Inc * | | | 600 | | | | 108 | |
TEGNA Inc | | | 83,946 | | | | 1,210 | |
T-Mobile US Inc * | | | 36,382 | | | | 4,837 | |
Twitter Inc * | | | 4,000 | | | | 186 | |
Upwork Inc * | | | 3,772 | | | | 123 | |
Verizon Communications Inc | | | 131,799 | | | | 7,962 | |
ViacomCBS Inc, Cl B | | | 29,156 | | | | 1,029 | |
Walt Disney Co/The | | | 11,062 | | | | 1,637 | |
Zillow Group Inc, Cl C * | | | 2,200 | | | | 237 | |
ZoomInfo Technologies Inc, Cl A * | | | 2,400 | | | | 123 | |
| | |
| | | | | | | 73,643 | |
| |
Consumer Discretionary — 12.4% | | | | | |
Acushnet Holdings Corp | | | 3,400 | | | | 128 | |
Alibaba Group Holding Ltd ADR * | | | 13,429 | | | | 3,537 | |
Amazon.com Inc * | | | 8,870 | | | | 28,101 | |
Beacon Roofing Supply Inc * | | | 1,644 | | | | 60 | |
Best Buy Co Inc | | | 14,300 | | | | 1,556 | |
Big Lots Inc (A) | | | 17,400 | | | | 899 | |
Booking Holdings Inc * | | | 278 | | | | 564 | |
Carter’s Inc | | | 30,206 | | | | 2,688 | |
Cooper Tire & Rubber Co | | | 32,100 | | | | 1,275 | |
Deckers Outdoor Corp * | | | 600 | | | | 153 | |
Dick’s Sporting Goods Inc | | | 2,500 | | | | 142 | |
Dillard’s Inc, Cl A (A) | | | 15,300 | | | | 715 | |
Dollar General Corp | | | 21,039 | | | | 4,599 | |
Dollar Tree Inc * | | | 1,212 | | | | 132 | |
DraftKings Inc, Cl A *(A) | | | 29,073 | | | | 1,522 | |
eBay Inc | | | 29,900 | | | | 1,508 | |
Floor & Decor Holdings Inc, Cl A * | | | 3,913 | | | | 313 | |
Foot Locker Inc | | | 50,700 | | | | 1,896 | |
Ford Motor Co | | | 304,228 | | | | 2,762 | |
Gap Inc/The | | | 1,500 | | | | 31 | |
General Motors Co | | | 73,500 | | | | 3,222 | |
Genuine Parts Co | | | 57,000 | | | | 5,607 | |
Goodyear Tire & Rubber Co/The | | | 77,400 | | | | 806 | |
Harley-Davidson Inc | | | 25,500 | | | | 1,027 | |
Home Depot Inc/The | | | 4,700 | | | | 1,304 | |
KB Home | | | 37,600 | | | | 1,324 | |
| | | | | | | | |
| | | |
| Description | | Shares | | Market Value ($ Thousands) |
COMMON STOCK (continued) | |
Kohl’s Corp | | | 29,500 | | | $ | 950 | |
L Brands Inc | | | 3,089 | | | | 120 | |
Las Vegas Sands Corp | | | 25,377 | | | | 1,414 | |
Lear Corp | | | 10,200 | | | | 1,458 | |
Lithia Motors Inc, Cl A | | | 3,099 | | | | 897 | |
Lowe’s Cos Inc | | | 61,674 | | | | 9,610 | |
Macy’s Inc (A) | | | 53,200 | | | | 543 | |
Magnite Inc * | | | 2,990 | | | | 57 | |
Mattel Inc * | | | 8,700 | | | | 135 | |
McDonald’s Corp | | | 6,300 | | | | 1,370 | |
MercadoLibre Inc * | | | 1,005 | | | | 1,561 | |
Mohawk Industries Inc * | | | 500 | | | | 63 | |
NIKE Inc, Cl B | | | 52,767 | | | | 7,108 | |
O’Reilly Automotive Inc * | | | 5,566 | | | | 2,463 | |
Pinterest Inc, Cl A * | | | 30,821 | | | | 2,158 | |
Pool Corp | | | 1,300 | | | | 450 | |
PulteGroup Inc | | | 41,300 | | | | 1,802 | |
Ross Stores Inc | | | 56,398 | | | | 6,064 | |
Royal Caribbean Cruises Ltd | | | 9,200 | | | | 725 | |
Service Corp International/US | | | 2,300 | | | | 112 | |
Sonos Inc * | | | 8,724 | | | | 194 | |
Starbucks Corp | | | 47,584 | | | | 4,664 | |
Steven Madden Ltd | | | 81 | | | | 3 | |
Tapestry Inc | | | 1,900 | | | | 54 | |
Target Corp | | | 62,218 | | | | 11,170 | |
Tempur Sealy International Inc * | | | 20,400 | | | | 514 | |
Tesla Inc * | | | 2,800 | | | | 1,589 | |
TJX Cos Inc/The | | | 13,850 | | | | 880 | |
Vail Resorts Inc | | | 2,876 | | | | 793 | |
VF Corp | | | 3,100 | | | | 259 | |
Whirlpool Corp | | | 12,900 | | | | 2,510 | |
Wyndham Destinations Inc | | | 31,800 | | | | 1,338 | |
YETI Holdings Inc * | | | 1,955 | | | | 123 | |
Yum China Holdings Inc | | | 2,982 | | | | 168 | |
| | |
| | | | | | | 129,190 | |
| |
Consumer Staples — 8.2% | | | | | |
Altria Group Inc | | | 117,500 | | | | 4,680 | |
Bunge Ltd | | | 2,324 | | | | 137 | |
Clorox Co/The | | | 2,300 | | | | 467 | |
Coca-Cola Co/The | | | 103,855 | | | | 5,359 | |
Colgate-Palmolive Co | | | 45,843 | | | | 3,926 | |
Conagra Brands Inc | | | 134,866 | | | | 4,931 | |
Costco Wholesale Corp | | | 4,986 | | | | 1,953 | |
Diageo PLC ADR | | | 21,500 | | | | 3,331 | |
Estee Lauder Cos Inc/The, Cl A | | | 647 | | | | 159 | |
Herbalife Nutrition Ltd * | | | 2,603 | | | | 125 | |
J M Smucker Co/The | | | 46,918 | | | | 5,499 | |
Kimberly-Clark Corp | | | 32,800 | | | | 4,569 | |
Kroger Co/The | | | 246,130 | | | | 8,122 | |
Molson Coors Beverage Co, Cl B | | | 24,900 | | | | 1,145 | |
Nu Skin Enterprises Inc, Cl A | | | 2,200 | | | | 113 | |
PepsiCo Inc | | | 38,802 | | | | 5,597 | |
| | |
| SEI Institutional Investments Trust / Semi-Annual Report / November 30, 2020 | | 1 |
SCHEDULE OF INVESTMENTS (Unaudited)
November 30, 2020
Large Cap Fund (Continued)
| | | | | | | | |
| | | |
| Description | | Shares | | Market Value ($ Thousands) |
COMMON STOCK (continued) | |
Philip Morris International Inc | | | 123,785 | | | $ | 9,377 | |
Procter & Gamble Co/The | | | 16,153 | | | | 2,243 | |
Spectrum Brands Holdings Inc | | | 915 | | | | 61 | |
Sysco Corp | | | 52,984 | | | | 3,777 | |
Tyson Foods Inc, Cl A | | | 33,000 | | | | 2,152 | |
Unilever PLC ADR | | | 204,931 | | | | 12,513 | |
US Foods Holding Corp * | | | 52,712 | | | | 1,659 | |
Walgreens Boots Alliance Inc | | | 98,900 | | | | 3,759 | |
| | |
| | | | | | | 85,654 | |
| | |
Energy — 2.2% | | | | | | | | |
Baker Hughes Co, Cl A | | | 12,354 | | | | 231 | |
ChampionX Corp * | | | 18,945 | | | | 225 | |
Chevron Corp | | | 93,948 | | | | 8,190 | |
ConocoPhillips | | | 90,900 | | | | 3,596 | |
Devon Energy Corp | | | 81,200 | | | | 1,136 | |
Exxon Mobil Corp | | | 93,400 | | | | 3,561 | |
Marathon Petroleum Corp | | | 39,000 | | | | 1,516 | |
National Oilwell Varco Inc | | | 3,423 | | | | 42 | |
Ovintiv Inc | | | 680 | | | | 9 | |
Phillips 66 | | | 28,400 | | | | 1,721 | |
Schlumberger NV | | | 19,172 | | | | 399 | |
Sunnova Energy International Inc * | | | 5,586 | | | | 226 | |
Targa Resources Corp | | | 5,913 | | | | 139 | |
Valero Energy Corp | | | 32,800 | | | | 1,764 | |
Western Midstream Partners LP (B) | | | 7,145 | | | | 92 | |
| | |
| | | | | | | 22,847 | |
| | |
Financials — 14.9% | | | | | | | | |
Aflac Inc | | | 126,899 | | | | 5,575 | |
Allstate Corp/The | | | 25,800 | | | | 2,641 | |
Ally Financial Inc | | | 92,900 | | | | 2,754 | |
American Express Co | | | 2,000 | | | | 237 | |
American Financial Group Inc/OH | | | 700 | | | | 63 | |
Ameriprise Financial Inc | | | 17,700 | | | | 3,279 | |
Ameris Bancorp | | | 3,300 | | | | 112 | |
Annaly Capital Management Inc ‡ | | | 121,900 | | | | 975 | |
Assurant Inc | | | 1,392 | | | | 180 | |
Bank of America Corp | | | 325,400 | | | | 9,163 | |
Berkshire Hathaway Inc, Cl B * | | | 46,470 | | | | 10,637 | |
BlackRock Inc, Cl A | | | 2,068 | | | | 1,444 | |
Capital One Financial Corp | | | 14,800 | | | | 1,267 | |
Charles Schwab Corp/The | | | 103,566 | | | | 5,052 | |
Chimera Investment Corp ‡ | | | 27,500 | | | | 282 | |
Chubb Ltd | | | 40,761 | | | | 6,026 | |
Citigroup Inc | | | 145,000 | | | | 7,985 | |
Citizens Financial Group Inc | | | 80,300 | | | | 2,623 | |
CME Group Inc, Cl A | | | 5,484 | | | | 960 | |
CNA Financial Corp | | | 13,500 | | | | 466 | |
Discover Financial Services | | | 22,500 | | | | 1,714 | |
Eastern Bankshares Inc * | | | 23,100 | | | | 342 | |
Everest Re Group Ltd | | | 6,100 | | | | 1,387 | |
Fifth Third Bancorp | | | 64,200 | | | | 1,627 | |
| | | | | | | | |
| | | |
| Description | | Shares | | Market Value ($ Thousands) |
COMMON STOCK (continued) | |
First Republic Bank/CA | | | 54,668 | | | $ | 7,083 | |
FirstCash Inc | | | 1,100 | | | | 71 | |
Globe Life Inc | | | 4,046 | | | | 377 | |
Goldman Sachs Group Inc/The | | | 7,900 | | | | 1,821 | |
Hartford Financial Services Group Inc/The | | | 27,552 | | | | 1,218 | |
Hilltop Holdings Inc | | | 3,700 | | | | 89 | |
Houlihan Lokey Inc, Cl A | | | 960 | | | | 62 | |
JPMorgan Chase & Co | | | 92,685 | | | | 10,926 | |
KeyCorp | | | 74,100 | | | | 1,146 | |
Lazard Ltd, Cl A (B) | | | 6,021 | | | | 225 | |
Lincoln National Corp | | | 42,100 | | | | 1,988 | |
M&T Bank Corp | | | 7,600 | | | | 885 | |
Markel Corp * | | | 6,307 | | | | 6,142 | |
Marsh & McLennan Cos Inc | | | 32,407 | | | | 3,715 | |
MetLife Inc | | | 49,135 | | | | 2,269 | |
MGIC Investment Corp | | | 82,300 | | | | 984 | |
Moody’s Corp | | | 20,154 | | | | 5,690 | |
Morgan Stanley | | | 166,512 | | | | 10,295 | |
Navient Corp | | | 86,700 | | | | 812 | |
Nelnet Inc, Cl A | | | 800 | | | | 54 | |
OneMain Holdings Inc, Cl A | | | 4,112 | | | | 160 | |
PNC Financial Services Group Inc/The | | | 7,400 | | | | 1,022 | |
PROG Holdings Inc | | | 700 | | | | 44 | |
Prudential Financial Inc | | | 19,300 | | | | 1,459 | |
Radian Group Inc | | | 52,200 | | | | 986 | |
Regions Financial Corp | | | 150,100 | | | | 2,292 | |
S&P Global Inc | | | 5,712 | | | | 2,009 | |
South State Corp | | | 5,028 | | | | 334 | |
Starwood Property Trust Inc ‡ | | | 43,400 | | | | 779 | |
State Street Corp | | | 90,286 | | | | 6,363 | |
Synchrony Financial | | | 11,395 | | | | 347 | |
Travelers Cos Inc/The | | | 20,650 | | | | 2,677 | |
Truist Financial Corp | | | 91,500 | | | | 4,247 | |
Umpqua Holdings Corp | | | 19,700 | | | | 274 | |
Unum Group | | | 38,400 | | | | 854 | |
US Bancorp | | | 173,814 | | | | 7,511 | |
Virtu Financial Inc, Cl A | | | 1,843 | | | | 42 | |
Wells Fargo & Co | | | 17,049 | | | | 466 | |
| | |
| | | | | | | 154,509 | |
| | |
Health Care — 14.5% | | | | | | | | |
1Life Healthcare Inc * | | | 3,600 | | | | 118 | |
Abbott Laboratories | | | 10,100 | | | | 1,093 | |
AbbVie Inc | | | 21,200 | | | | 2,217 | |
Acadia Healthcare Co Inc * | | | 7,400 | | | | 314 | |
ACADIA Pharmaceuticals Inc * | | | 3,910 | | | | 222 | |
Alexion Pharmaceuticals Inc * | | | 16,610 | | | | 2,028 | |
Align Technology Inc * | | | 1,314 | | | | 632 | |
Amedisys Inc * | | | 1,200 | | | | 294 | |
AmerisourceBergen Corp, Cl A | | | 41,531 | | | | 4,282 | |
Amgen Inc | | | 33,880 | | | | 7,523 | |
AMN Healthcare Services Inc * | | | 4,900 | | | | 319 | |
Anthem Inc | | | 300 | | | | 94 | |
| | |
| 2 | | SEI Institutional Investments Trust / Semi-Annual Report / November 30, 2020 |
SCHEDULE OF INVESTMENTS (Unaudited)
November 30, 2020
Large Cap Fund (Continued)
| | | | | | | | |
| | | |
| Description | | Shares | | Market Value ($ Thousands) |
COMMON STOCK (continued) | |
Biogen Inc * | | | 7,900 | | | $ | 1,897 | |
Boston Scientific Corp * | | | 17,892 | | | | 593 | |
Bristol-Myers Squibb Co | | | 63,400 | | | | 3,956 | |
Cardinal Health Inc | | | 29,900 | | | | 1,632 | |
CareDx Inc * | | | 1,800 | | | | 103 | |
Change Healthcare Inc * | | | 9,102 | | | | 156 | |
Chemed Corp | | | 600 | | | | 287 | |
CVS Health Corp | | | 140,113 | | | | 9,498 | |
Danaher Corp | | | 19,499 | | | | 4,380 | |
DexCom Inc * | | | 1,115 | | | | 356 | |
Eli Lilly and Co | | | 24,400 | | | | 3,554 | |
Encompass Health Corp | | | 2,500 | | | | 202 | |
Ensign Group Inc/The | | | 1,978 | | | | 142 | |
Exact Sciences Corp * | | | 1,100 | | | | 133 | |
Gilead Sciences Inc | | | 48,331 | | | | 2,932 | |
Guardant Health Inc * | | | 6,100 | | | | 739 | |
HCA Healthcare Inc | | | 20,000 | | | | 3,002 | |
Humana Inc | | | 225 | | | | 90 | |
IDEXX Laboratories Inc * | | | 400 | | | | 184 | |
Johnson & Johnson | | | 128,854 | | | | 18,643 | |
Laboratory Corp of America Holdings * | | | 5,500 | | | | 1,099 | |
LHC Group Inc * | | | 2,000 | | | | 393 | |
McKesson Corp | | | 15,800 | | | | 2,843 | |
Medtronic PLC | | | 82,267 | | | | 9,354 | |
Merck & Co Inc | | | 151,048 | | | | 12,143 | |
Mettler-Toledo International Inc * | | | 4,036 | | | | 4,642 | |
Novartis AG ADR (A) | | | 59,600 | | | | 5,414 | |
Oak Street Health Inc * | | | 500 | | | | 24 | |
PerkinElmer Inc | | | 2,100 | | | | 279 | |
Perrigo Co PLC | | | 90,050 | | | | 4,342 | |
Pfizer Inc | | | 285,445 | | | | 10,935 | |
Quest Diagnostics Inc | | | 32,012 | | | | 3,969 | |
Quidel Corp * | | | 300 | | | | 59 | |
Regeneron Pharmaceuticals Inc * | | | 1,500 | | | | 774 | |
Repligen Corp * | | | 1,200 | | | | 228 | |
Seagen Inc * | | | 800 | | | | 136 | |
Select Medical Holdings Corp * | | | 3,300 | | | | 80 | |
STERIS PLC | | | 500 | | | | 97 | |
Teleflex Inc | | | 16,063 | | | | 6,148 | |
Thermo Fisher Scientific Inc | | | 3,200 | | | | 1,488 | |
UnitedHealth Group Inc | | | 31,543 | | | | 10,609 | |
Universal Health Services Inc, Cl B | | | 12,600 | | | | 1,645 | |
Vertex Pharmaceuticals Inc * | | | 4,423 | | | | 1,007 | |
Viatris Inc, Cl W * | | | 19,338 | | | | 325 | |
Zoetis Inc, Cl A | | | 3,940 | | | | 632 | |
| | |
| | | | | | | 150,280 | |
| | |
Industrials — 9.0% | | | | | | | | |
3M Co | | | 35,550 | | | | 6,141 | |
Acuity Brands Inc | | | 2,130 | | | | 253 | |
AGCO Corp | | | 21,600 | | | | 1,998 | |
Allison Transmission Holdings Inc, Cl A | | | 40,300 | | | | 1,654 | |
American Airlines Group Inc (A) | | | 42,100 | | | | 595 | |
| | | | | | | | |
| | | |
| Description | | Shares | | Market Value ($ Thousands) |
COMMON STOCK (continued) | |
ASGN Inc * | | | 488 | | | $ | 38 | |
Boeing Co/The | | | 900 | | | | 190 | |
Carrier Global Corp | | | 16,125 | | | | 614 | |
Cintas Corp | | | 3,304 | | | | 1,174 | |
Copart Inc * | | | 3,700 | | | | 427 | |
CoStar Group Inc * | | | 375 | | | | 341 | |
Cummins Inc | | | 14,223 | | | | 3,288 | |
Deere & Co | | | 5,900 | | | | 1,544 | |
Delta Air Lines Inc | | | 40,300 | | | | 1,622 | |
Eaton Corp PLC | | | 1,800 | | | | 218 | |
FedEx Corp | | | 868 | | | | 249 | |
Fortive Corp | | | 62,022 | | | | 4,350 | |
Generac Holdings Inc * | | | 800 | | | | 172 | |
General Dynamics Corp | | | 20,900 | | | | 3,121 | |
General Electric Co | | | 59,565 | | | | 606 | |
HD Supply Holdings Inc * | | | 18,700 | | | | 1,043 | |
Herman Miller Inc | | | 5,800 | | | | 207 | |
Honeywell International Inc | | | 35,725 | | | | 7,285 | |
Howmet Aerospace Inc | | | 15,807 | | | | 371 | |
Hubbell Inc, Cl B | | | 1,400 | | | | 226 | |
Huntington Ingalls Industries Inc | | | 7,900 | | | | 1,265 | |
Illinois Tool Works Inc | | | 6,755 | | | | 1,426 | |
Insperity Inc | | | 380 | | | | 32 | |
Johnson Controls International PLC | | | 130,036 | | | | 5,987 | |
KAR Auction Services Inc | | | 12,685 | | | | 229 | |
Korn Ferry | | | 7,411 | | | | 297 | |
ManpowerGroup Inc | | | 20,300 | | | | 1,759 | |
Matson Inc | | | 3,200 | | | | 186 | |
Old Dominion Freight Line Inc | | | 1,453 | | | | 295 | |
Oshkosh Corp | | | 20,000 | | | | 1,610 | |
Otis Worldwide Corp | | | 1,237 | | | | 83 | |
PACCAR Inc | | | 13,748 | | | | 1,197 | |
Parker-Hannifin Corp | | | 1,996 | | | | 533 | |
Raytheon Technologies Corp | | | 77,230 | | | | 5,539 | |
Regal Beloit Corp | | | 3,400 | | | | 405 | |
Roper Technologies Inc | | | 9,151 | | | | 3,907 | |
Sensata Technologies Holding PLC * | | | 9,700 | | | | 474 | |
Siemens AG ADR | | | 66,500 | | | | 4,440 | |
Snap-on Inc | | | 2,660 | | | | 468 | |
Stanley Black & Decker Inc | | | 16,166 | | | | 2,980 | |
Textron Inc | | | 41,500 | | | | 1,872 | |
Toro Co/The | | | 1,225 | | | | 111 | |
TransDigm Group Inc | | | 9,871 | | | | 5,717 | |
Uber Technologies Inc * | | | 24,922 | | | | 1,238 | |
Union Pacific Corp | | | 6,917 | | | | 1,412 | |
United Airlines Holdings Inc * | | | 32,900 | | | | 1,482 | |
United Parcel Service Inc, Cl B | | | 25,725 | | | | 4,401 | |
United Rentals Inc * | | | 4,100 | | | | 931 | |
Watsco Inc | | | 400 | | | | 91 | |
| | |
| SEI Institutional Investments Trust / Semi-Annual Report / November 30, 2020 | | 3 |
SCHEDULE OF INVESTMENTS (Unaudited)
November 30, 2020
Large Cap Fund (Continued)
| | | | | | | | |
| | | |
| Description | | Shares | | Market Value ($ Thousands) |
COMMON STOCK (continued) | | | | | | | | |
WW Grainger Inc | | | 11,282 | | | $ | 4,719 | |
| | |
| | | | | | | 92,813 | |
| | |
Information Technology — 21.8% | | | | | | | | |
Accenture PLC, Cl A | | | 3,756 | | | | 936 | |
Adobe Inc * | | | 31,084 | | | | 14,873 | |
Advanced Energy Industries Inc * | | | 2,200 | | | | 212 | |
Advanced Micro Devices Inc * | | | 30,868 | | | | 2,860 | |
Amdocs Ltd | | | 1,781 | | | | 117 | |
Amkor Technology Inc | | | 5,367 | | | | 79 | |
Amphenol Corp, Cl A | | | 28,442 | | | | 3,720 | |
Anaplan Inc * | | | 4,023 | | | | 282 | |
Apple Inc | | | 254,104 | | | | 30,251 | |
Applied Materials Inc | | | 93,378 | | | | 7,702 | |
Arrow Electronics Inc * | | | 12,200 | | | | 1,118 | |
Automatic Data Processing Inc | | | 23,419 | | | | 4,072 | |
Black Knight Inc * | | | 4,800 | | | | 440 | |
Box Inc, Cl A * | | | 3,700 | | | | 69 | |
Broadcom Inc | | | 14,550 | | | | 5,843 | |
Brooks Automation Inc | | | 1,360 | | | | 99 | |
Cadence Design Systems Inc * | | | 2,100 | | | | 244 | |
CDK Global Inc | | | 1,600 | | | | 77 | |
Cisco Systems Inc | | | 149,124 | | | | 6,415 | |
Cloudflare Inc, Cl A * | | | 1,100 | | | | 83 | |
Cognizant Technology Solutions Corp, Cl A | | | 3,600 | | | | 281 | |
Corning Inc | | | 24,600 | | | | 921 | |
Dell Technologies Inc, Cl C * | | | 21,600 | | | | 1,491 | |
DocuSign Inc, Cl A * | | | 500 | | | | 114 | |
Duck Creek Technologies Inc * | | | 4,245 | | | | 169 | |
DXC Technology Co | | | 28,400 | | | | 622 | |
Entegris Inc | | | 933 | | | | 86 | |
EPAM Systems Inc * | | | 2,100 | | | | 677 | |
Euronet Worldwide Inc * | | | 800 | | | | 108 | |
ExlService Holdings Inc * | | | 1,416 | | | | 118 | |
Fair Isaac Corp * | | | 348 | | | | 165 | |
Fidelity National Information Services Inc | | | 13,867 | | | | 2,058 | |
Fiserv Inc * | | | 18,017 | | | | 2,075 | |
Five9 Inc * | | | 1,934 | | | | 300 | |
Flex Ltd * | | | 10,707 | | | | 174 | |
Gartner Inc * | | | 3,632 | | | | 552 | |
Global Payments Inc | | | 24,088 | | | | 4,702 | |
GoDaddy Inc, Cl A * | | | 606 | | | | 48 | |
Hewlett Packard Enterprise Co | | | 120,200 | | | | 1,327 | |
HP Inc | | | 83,709 | | | | 1,836 | |
Intel Corp | | | 210,006 | | | | 10,154 | |
International Business Machines Corp | | | 14,400 | | | | 1,779 | |
Intuit Inc | | | 29,284 | | | | 10,309 | |
Jabil Inc | | | 6,200 | | | | 237 | |
Lam Research Corp | | | 1,594 | | | | 722 | |
Littelfuse Inc | | | 1,600 | | | | 385 | |
LiveRamp Holdings Inc * | | | 842 | | | | 49 | |
Marvell Technology Group Ltd | | | 1,433 | | | | 66 | |
Microchip Technology Inc | | | 93,473 | | | | 12,562 | |
| | | | | | | | |
| | | |
| Description | | Shares | | Market Value ($ Thousands) |
COMMON STOCK (continued) | | | | | | | | |
Micron Technology Inc * | | | 18,700 | | | $ | 1,198 | |
Microsoft Corp | | | 133,106 | | | | 28,494 | |
NCR Corp * | | | 29,400 | | | | 814 | |
NVIDIA Corp | | | 5,670 | | | | 3,039 | |
NXP Semiconductors NV | | | 17,822 | | | | 2,823 | |
Okta Inc, Cl A * | | | 846 | | | | 207 | |
ON Semiconductor Corp * | | | 40,100 | | | | 1,153 | |
Oracle Corp | | | 44,800 | | | | 2,586 | |
Palo Alto Networks Inc * | | | 614 | | | | 180 | |
Paychex Inc | | | 2,115 | | | | 197 | |
PayPal Holdings Inc * | | | 28,846 | | | | 6,176 | |
Qorvo Inc * | | | 4,400 | | | | 689 | |
QUALCOMM Inc | | | 34,923 | | | | 5,140 | |
RingCentral Inc, Cl A * | | | 3,146 | | | | 935 | |
Rogers Corp * | | | 216 | | | | 32 | |
salesforce.com * | | | 44,301 | | | | 10,889 | |
SAP SE ADR | | | 32,253 | | | | 3,908 | |
Seagate Technology PLC | | | 27,700 | | | | 1,629 | |
Shift4 Payments Inc, Cl A * | | | 1,400 | | | | 86 | |
Skyworks Solutions Inc | | | 563 | | | | 79 | |
Snap Inc, Cl A * | | | 1,452 | | | | 64 | |
Square Inc, Cl A * | | | 1,388 | | | | 293 | |
Synopsys Inc * | | | 2,100 | | | | 478 | |
TE Connectivity Ltd | | | 8,300 | | | | 946 | |
Tenable Holdings Inc * | | | 4,900 | | | | 176 | |
Teradyne Inc | | | 2,245 | | | | 248 | |
Texas Instruments Inc | | | 2,924 | | | | 471 | |
Trade Desk Inc/The, Cl A * | | | 182 | | | | 164 | |
TTEC Holdings Inc | | | 3,977 | | | | 269 | |
Visa Inc, Cl A | | | 62,556 | | | | 13,159 | |
Vishay Intertechnology Inc | | | 46,100 | | | | 892 | |
Vontier Corp * | | | 26,310 | | | | 873 | |
Western Union Co/The | | | 57,712 | | | | 1,302 | |
Workday Inc, Cl A * | | | 2,148 | | | | 483 | |
Workiva Inc, Cl A * | | | 3,972 | | | | 298 | |
Xerox Holdings Corp | | | 46,300 | | | | 1,014 | |
Zendesk Inc * | | | 1,015 | | | | 135 | |
Zoom Video Communications Inc, Cl A * | | | 900 | | | | 431 | |
| | |
| | | | | | | 225,529 | |
| | |
Materials — 4.0% | | | | | | | | |
Air Products and Chemicals Inc | | | 11,210 | | | | 3,140 | |
Alcoa Corp * | | | 7,973 | | | | 159 | |
Avery Dennison Corp | | | 2,300 | | | | 343 | |
Ball Corp | | | 2,638 | | | | 253 | |
Berry Global Group Inc * | | | 19,500 | | | | 1,034 | |
Celanese Corp, Cl A | | | 14,200 | | | | 1,836 | |
Chemours Co/The | | | 46,300 | | | | 1,126 | |
Crown Holdings Inc * | | | 850 | | | | 80 | |
Dow Inc | | | 58,051 | | | | 3,077 | |
Eastman Chemical Co | | | 28,200 | | | | 2,747 | |
Ecolab Inc | | | 13,156 | | | | 2,923 | |
Huntsman Corp | | | 77,300 | | | | 1,915 | |
| | |
| 4 | | SEI Institutional Investments Trust / Semi-Annual Report / November 30, 2020 |
SCHEDULE OF INVESTMENTS (Unaudited)
November 30, 2020
Large Cap Fund (Continued)
| | | | | | | | |
| | | |
| Description | | Shares | | Market Value ($ Thousands) |
COMMON STOCK (continued) | | | | | | | | |
Ingevity Corp * | | | 10,801 | | | $ | 719 | |
International Paper Co | | | 26,600 | | | | 1,316 | |
Linde PLC | | | 13,832 | | | | 3,547 | |
Louisiana-Pacific Corp | | | 7,000 | | | | 240 | |
LyondellBasell Industries NV, Cl A | | | 28,700 | | | | 2,442 | |
Nucor Corp | | | 2,440 | | | | 131 | |
O-I Glass Inc, Cl I | | | 65,000 | | | | 736 | |
Packaging Corp of America | | | 909 | | | | 118 | |
Reliance Steel & Aluminum Co | | | 16,010 | | | | 1,886 | |
RPM International Inc | | | 34,919 | | | | 3,073 | |
Sherwin-Williams Co/The | | | 5,115 | | | | 3,824 | |
Southern Copper Corp | | | 19,451 | | | | 1,155 | |
Steel Dynamics Inc | | | 43,884 | | | | 1,589 | |
Valvoline Inc | | | 3,900 | | | | 89 | |
Westrock Co | | | 41,474 | | | | 1,751 | |
Worthington Industries Inc | | | 900 | | | | 47 | |
| | |
| | | | | | | 41,296 | |
| | |
Real Estate — 2.3% | | | | | | | | |
American Tower Corp, Cl A ‡ | | | 29,404 | | | | 6,798 | |
Brixmor Property Group Inc ‡ | | | 56,000 | | | | 855 | |
Broadstone Net Lease Inc, Cl A ‡ | | | 9,963 | | | | 176 | |
Crown Castle International Corp ‡ | | | 10,030 | | | | 1,681 | |
Cushman & Wakefield PLC * | | | 9,900 | | | | 147 | |
eXp World Holdings Inc * | | | 1,456 | | | | 78 | |
Gaming and Leisure Properties Inc ‡ | | | 42,328 | | | | 1,758 | |
Healthcare Trust of America Inc, Cl A ‡ | | | 13,936 | | | | 363 | |
Healthpeak Properties Inc ‡ | | | 132,636 | | | | 3,828 | |
Jones Lang LaSalle Inc | | | 2,319 | | | | 307 | |
Kimco Realty Corp ‡ | | | 13,752 | | | | 199 | |
Lamar Advertising Co, Cl A ‡ | | | 584 | | | | 46 | |
Lexington Realty Trust, Cl B ‡ | | | 200 | | | | 2 | |
Redfin Corp * | | | 585 | | | | 28 | |
Service Properties Trust ‡ | | | 37,100 | | | | 440 | |
VEREIT Inc ‡ | | | 230,521 | | | | 1,634 | |
Welltower Inc ‡ | | | 60,700 | | | | 3,823 | |
Weyerhaeuser Co ‡ | | | 31,962 | | | | 928 | |
Xenia Hotels & Resorts Inc ‡ | | | 42,100 | | | | 593 | |
| | |
| | | | | | | 23,684 | |
| | |
Utilities — 2.0% | | | | | | | | |
AES Corp/The | | | 13,300 | | | | 272 | |
| | | | | | | | |
| | | |
| Description | | Shares | | Market Value ($ Thousands) |
COMMON STOCK (continued) | | | | | | | | |
American Electric Power Co Inc | | | 4,348 | | | $ | 369 | |
American Water Works Co Inc | | | 1,400 | | | | 215 | |
Black Hills Corp | | | 1,400 | | | | 85 | |
Brookfield Renewable Corp, Cl A | | | 10,900 | | | | 863 | |
California Water Service Group | | | 2,246 | | | | 111 | |
Duke Energy Corp | | | 30,300 | | | | 2,808 | |
Evergy Inc | | | 35,100 | | | | 1,945 | |
Exelon Corp | | | 62,400 | | | | 2,563 | |
MDU Resources Group Inc | | | 86,850 | | | | 2,166 | |
NextEra Energy Inc | | | 87,800 | | | | 6,461 | |
NextEra Energy Partners LP | | | 2,935 | | | | 186 | |
Ormat Technologies Inc | | | 1,412 | | | | 111 | |
Public Service Enterprise Group Inc | | | 9,200 | | | | 536 | |
UGI Corp | | | 19,250 | | | | 683 | |
Vistra Corp | | | 42,000 | | | | 785 | |
WEC Energy Group Inc | | | 3,700 | | | | 351 | |
| | |
| | | | | | | 20,510 | |
| | |
Total Common Stock
(Cost $767,761) ($ Thousands) | | | | | | | 1,019,955 | |
| |
AFFILIATED PARTNERSHIP — 0.7% | | | | | |
SEI Liquidity Fund, L.P. 0.070% **† (C) | | | 7,164,678 | | | | 7,168 | |
| |
Total Affiliated Partnership
(Cost $7,165) ($ Thousands) | | | | 7,168 | |
| | |
CASH EQUIVALENT — 1.1% | | | | | | | | |
SEI Daily Income Trust, Government Fund,
Cl F
0.010% **† | | | 11,056,298 | | | | 11,056 | |
| |
Total Cash Equivalent
(Cost $11,056) ($ Thousands) | | | | 11,056 | |
| |
Total Investments in Securities — 100.2%
(Cost $785,982) ($ Thousands) | | | $ | 1,038,179 | |
| | | | | | | | |
A list of the open futures contracts held by the Fund at November 30, 2020, is as follows:
| | | | | | | | | | | | | | | | | | |
| | | | | | |
Type of Contract | | Number of Contracts Long/(Short) | | Expiration Date | | | Notional Amount (Thousands) | | | Value (Thousands) | | | Unrealized Appreciation (Depreciation) (Thousands) | |
S&P 500 Index E-MINI | | 25 | | | Dec-2020 | | | | $ 4,544 | | | | $ 4,529 | | | $ | (15) | |
S&P Mid Cap 400 Index E-MINI | | 2 | | | Dec-2020 | | | | 443 | | | | 434 | | | | (9) | |
| | | | | | | | | | |
| | | | | | | | | $ 4,987 | | | | $ 4,963 | | | $ | (24) | |
| | | | | | | | | | |
| | |
| SEI Institutional Investments Trust / Semi-Annual Report / November 30, 2020 | | 5 |
SCHEDULE OF INVESTMENTS (Unaudited)
November 30, 2020
Large Cap Fund (Continued)
| | Percentages are based on Net Assets of $1,035,884 ($ Thousands). |
| * | Non-income producing security. |
| ** | The rate reported is the 7-day effective yield as of November 30, 2020. |
| † | Investment in Affiliated Security (See Note 6). |
| ‡ | Real Estate Investment Trust. |
| (A) | Certain securities or partial positions of certain securities are on loan at November 30, 2020 (See Note 12). The total market value of securities on loan at November 30, 2020 was $6,912 ($ Thousands). |
| (B) | Security is a Master Limited Partnership. At November 30, 2020, such securities amounted to $317 ($ Thousands), or 0.0% of the Net Assets of the Fund (See Note 2). |
| (C) | This security was purchased with cash collateral held from securities on loan (See Note 12). The total market value of such securities as of November 30, 2020 was $7,168 ($ Thousands). |
ADR — American Depositary Receipt
Cl — Class
L.P. — Limited Partnership
Ltd. — Limited
PLC — Public Limited Company
S&P— Standard & Poor’s
The following is a list of the level of inputs used as of November 30, 2020, in valuing the Fund’s investments and other financial instruments carried at value ($ Thousands):
| | | | | | | | | | | | | | | | |
| Investments in Securities | | Level 1 ($) | | | Level 2 ($) | | | Level 3 ($) | | | Total ($) | |
Common Stock | | | 1,019,955 | | | | – | | | | – | | | | 1,019,955 | |
Affiliated Partnership | | | – | | | | 7,168 | | | | – | | | | 7,168 | |
Cash Equivalent | | | 11,056 | | | | – | | | | – | | | | 11,056 | |
| | | | | | | | | | | | | | | | |
Total Investments in Securities | | | 1,031,011 | | | | 7,168 | | | | – | | | | 1,038,179 | |
| | | | | | | | | | | | | | | | |
| | | | | | | | | | | | | | | | |
| Other Financial Instruments | | Level 1 ($) | | | Level 2 ($) | | | Level 3 ($) | | | Total ($) | |
Futures Contracts* | | | | | | | | | | | | | | | | |
Unrealized Depreciation | | | (24) | | | | – | | | | – | | | | (24) | |
| | | | | | | | | | | | | | | | |
Total Other Financial Instruments | | | (24) | | | | – | | | | – | | | | (24) | |
| | | | | | | | | | | | | | | | |
* Futures contracts are valued at the unrealized depreciation on the instrument.
For the period ended November 30, 2020, there were no transfers in or out of Level 3.
For more information on valuation inputs, see Note 2 – Significant Accounting Policies in Notes to Financial Statements.
The following is a summary of the Fund’s transactions with affiliates for the period ended November 30, 2020 ($ Thousands):
| | | | | | | | | | | | | | | | | | |
Security
Description | | Value
5/31/2020 | | Purchases at Cost | | Proceeds from Sales | | Realized Gain/ (Loss) | | Change in Unrealized Appreciation/ (Depreciation) | | Value 11/30/2020 | | Shares | | Income | | Capital Gains |
SEI Liquidity Fund, L.P. | | $ 28,649 | | $ 69,284 | | $ (90,760) | | $ 3 | | $ (8) | | $ 7,168 | | 7,164,678 | | $ 74 | | $ — |
SEI Daily Income Trust, Government Fund, Cl F | | 12,188 | | 164,034 | | (165,166) | | — | | — | | 11,056 | | 11,056,298 | | 1 | | — |
| | | | | | | | | | | | | | | | | | |
Totals | | $ 40,837 | | $233,318 | | $ (255,926) | | $ 3 | | $ (8) | | $ 18,224 | | | | $ 75 | | $ — |
| | | | | | | | | | | | | | | | | | |
Amounts designated as “—” are $0 or have been rounded to $0.
The accompanying notes are an integral part of the financial statements.
| | |
| 6 | | SEI Institutional Investments Trust / Semi-Annual Report / November 30, 2020 |
SCHEDULE OF INVESTMENTS (Unaudited)
November 30, 2020
Large Cap Disciplined Equity Fund (Continued)
| | | | | | | | |
| | | |
| Description | | Shares | | Market Value ($ Thousands) |
COMMON STOCK — 90.9% | |
| |
Communication Services — 6.9% | | | | | |
Activision Blizzard Inc | | | 84,820 | | | $ | 6,742 | |
Alphabet Inc, Cl A * | | | 10,774 | | | | 18,902 | |
Alphabet Inc, Cl C * | | | 3,761 | | | | 6,622 | |
Altice USA Inc, Cl A * | | | 63,300 | | | | 2,147 | |
AT&T Inc | | | 154,300 | | | | 4,436 | |
Comcast Corp, Cl A | | | 60,200 | | | | 3,024 | |
Electronic Arts Inc | | | 19,800 | | | | 2,530 | |
Facebook Inc, Cl A * | | | 106,421 | | | | 29,476 | |
Interpublic Group of Cos Inc/The | | | 77,603 | | | | 1,729 | |
Netflix Inc * | | | 2,690 | | | | 1,320 | |
News Corp, Cl A | | | 62,412 | | | | 1,102 | |
Omnicom Group Inc | | | 19,799 | | | | 1,247 | |
Roku Inc, Cl A * | | | 2,214 | | | | 650 | |
Take-Two Interactive Software Inc * | | | 16,000 | | | | 2,888 | |
Twitter Inc * | | | 5,600 | | | | 260 | |
Verizon Communications Inc | | | 273,583 | | | | 16,527 | |
Walt Disney Co/The * | | | 26,815 | | | | 3,969 | |
Warner Music Group, Cl A | | | 2,800 | | | | 83 | |
Zillow Group Inc, Cl C * | | | 2,600 | | | | 280 | |
ZoomInfo Technologies Inc, Cl A * | | | 4,500 | | | | 231 | |
| | |
| | | | | | | 104,165 | |
| |
Consumer Discretionary — 8.7% | | | | | |
Amazon.com Inc * | | | 10,800 | | | | 34,215 | |
American Outdoor Brands Inc * | | | 2,950 | | | | 41 | |
AutoNation Inc * | | | 30,600 | | | | 1,876 | |
Big Lots Inc | | | 4,200 | | | | 217 | |
BorgWarner Inc (A) | | | 201,607 | | | | 7,832 | |
Chewy Inc, Cl A * | | | 6,600 | | | | 512 | |
Darden Restaurants Inc | | | 11,200 | | | | 1,209 | |
Deckers Outdoor Corp * | | | 1,178 | | | | 300 | |
Dick’s Sporting Goods Inc | | | 1,888 | | | | 107 | |
Dollar General Corp | | | 23,595 | | | | 5,157 | |
Dollar Tree Inc * | | | 14,083 | | | | 1,538 | |
DR Horton Inc | | | 6,000 | | | | 447 | |
eBay Inc | | | 77,200 | | | | 3,893 | |
Floor & Decor Holdings Inc, Cl A * | | | 7,677 | | | | 615 | |
Ford Motor Co * | | | 287,412 | | | | 2,610 | |
Gap Inc/The | | | 4,300 | | | | 90 | |
General Motors Co * | | | 127,500 | | | | 5,590 | |
Home Depot Inc/The | | | 35,078 | | | | 9,731 | |
L Brands Inc * | | | 6,289 | | | | 244 | |
Leggett & Platt Inc | | | 102,486 | | | | 4,417 | |
Lennar Corp, Cl A | | | 5,900 | | | | 448 | |
Lithia Motors Inc, Cl A | | | 438 | | | | 127 | |
LKQ Corp * | | | 47,200 | | | | 1,662 | |
Lowe’s Cos Inc | | | 68,176 | | | | 10,623 | |
M/I Homes Inc * | | | 9,900 | | | | 450 | |
McDonald’s Corp | | | 26,100 | | | | 5,675 | |
Mohawk Industries Inc * | | | 1,500 | | | | 189 | |
Newell Brands Inc | | | 2,134 | | | | 45 | |
NIKE Inc, Cl B | | | 32,400 | | | | 4,364 | |
| | | | | | | | |
| | | |
| Description | | Shares | | Market Value ($ Thousands) |
COMMON STOCK (continued) | |
O’Reilly Automotive Inc * | | | 4,500 | | | $ | 1,991 | |
Penn National Gaming Inc * | | | 19,100 | | | | 1,337 | |
Pinterest Inc, Cl A * | | | 8,500 | | | | 595 | |
Pool Corp | | | 3,100 | | | | 1,073 | |
Ross Stores Inc * | | | 63,816 | | | | 6,862 | |
Service Corp International/US | | | 3,380 | | | | 164 | |
Smith & Wesson Brands Inc | | | 20,800 | | | | 328 | |
Sonic Automotive Inc, Cl A (A) | | | 3,800 | | | | 153 | |
Starbucks Corp | | | 2,700 | | | | 265 | |
Tapestry Inc * | | | 6,400 | | | | 181 | |
Target Corp | | | 55,833 | | | | 10,024 | |
Tempur Sealy International Inc * | | | 28,841 | | | | 727 | |
TJX Cos Inc/The | | | 33,064 | | | | 2,100 | |
VF Corp | | | 10,300 | | | | 859 | |
World Fuel Services Corp | | | 7,800 | | | | 222 | |
YETI Holdings Inc * | | | 4,516 | | | | 285 | |
| | |
| | | | | | | 131,390 | |
| |
Consumer Staples — 7.7% | | | | | |
Altria Group Inc | | | 217,962 | | | | 8,681 | |
Archer-Daniels-Midland Co | | | 42,500 | | | | 2,115 | |
Bunge Ltd | | | 3,300 | | | | 194 | |
Clorox Co/The | | | 2,600 | | | | 528 | |
Coca-Cola Co/The | | | 180,768 | | | | 9,328 | |
Coca-Cola European Partners PLC | | | 154,508 | | | | 6,903 | |
Colgate-Palmolive Co | | | 27,700 | | | | 2,372 | |
Conagra Brands Inc | | | 138,093 | | | | 5,049 | |
Costco Wholesale Corp | | | 18,193 | | | | 7,127 | |
Estee Lauder Cos Inc/The, Cl A | | | 5,775 | | | | 1,417 | |
General Mills Inc | | | 58,100 | | | | 3,534 | |
Herbalife Nutrition Ltd * | | | 47,238 | | | | 2,263 | |
J M Smucker Co/The | | | 28,632 | | | | 3,356 | |
Keurig Dr Pepper Inc | | | 33,800 | | | | 1,029 | |
Kraft Heinz Co/The | | | 68,200 | | | | 2,247 | |
Kroger Co/The | | | 240,882 | | | | 7,949 | |
Monster Beverage Corp * | | | 22,400 | | | | 1,899 | |
PepsiCo Inc | | | 40,856 | | | | 5,893 | |
Philip Morris International Inc | | | 50,599 | | | | 3,833 | |
Procter & Gamble Co/The | | | 132,918 | | | | 18,458 | |
Sysco Corp | | | 137,455 | | | | 9,799 | |
Unilever PLC ADR | | | 72,851 | | | | 4,448 | |
Walmart Inc | | | 57,500 | | | | 8,785 | |
| | |
| | | | | | | 117,207 | |
| |
Energy — 1.6% | | | | | |
Baker Hughes Co, Cl A | | | 51,758 | | | | 969 | |
Chevron Corp | | | 66,562 | | | | 5,803 | |
Cimarex Energy Co | | | 23,600 | | | | 849 | |
EOG Resources Inc | | | 31,100 | | | | 1,458 | |
Exxon Mobil Corp | | | 123,600 | | | | 4,713 | |
Kinder Morgan Inc | | | 173,300 | | | | 2,492 | |
Marathon Petroleum Corp | | | 121,782 | | | | 4,735 | |
Pioneer Natural Resources Co | | | 500 | | | | 50 | |
| | |
| SEI Institutional Investments Trust / Semi-Annual Report / November 30, 2020 | | 1 |
SCHEDULE OF INVESTMENTS (Unaudited)
November 30, 2020
Large Cap Disciplined Equity Fund (Continued)
| | | | | | | | |
| | | |
| Description | | Shares | | Market Value ($ Thousands) |
COMMON STOCK (continued) | |
Schlumberger NV | | | 76,642 | | | $ | 1,593 | |
Targa Resources Corp | | | 7,213 | | | | 170 | |
TechnipFMC PLC | | | 105,800 | | | | 879 | |
Western Midstream Partners LP (B) | | | 19,176 | | | | 247 | |
| | |
| | | | | | | 23,958 | |
| |
Financials — 10.8% | | | | | |
Affiliated Managers Group Inc | | | 9,600 | | | | 836 | |
Aflac Inc | | | 171,329 | | | | 7,526 | |
Allstate Corp/The | | | 48,200 | | | | 4,933 | |
Ally Financial | | | 35,800 | | | | 1,062 | |
American Express Co | | | 5,900 | | | | 700 | |
American Financial Group Inc/OH | | | 6,300 | | | | 563 | |
American International Group Inc | | | 3,400 | | | | 131 | |
Ameriprise Financial Inc | | | 15,000 | | | | 2,779 | |
Annaly Capital Management Inc ‡ | | | 189,100 | | | | 1,513 | |
Assurant Inc | | | 1,885 | | | | 243 | |
Bank of America Corp | | | 677,110 | | | | 19,067 | |
Bank of New York Mellon Corp/The | | | 14,300 | | | | 559 | |
Berkshire Hathaway Inc, Cl B * | | | 37,711 | | | | 8,632 | |
BlackRock Inc, Cl A | | | 4,965 | | | | 3,467 | |
Brighthouse Financial Inc * | | | 33,900 | | | | 1,190 | |
Capital One Financial Corp | | | 155,984 | | | | 13,358 | |
Cboe Global Markets Inc | | | 19,300 | | | | 1,763 | |
Charles Schwab Corp/The | | | 14,607 | | | | 713 | |
Chubb Ltd | | | 5,453 | | | | 806 | |
Citigroup Inc | | | 159,000 | | | | 8,756 | |
Citizens Financial Group Inc | | | 83,100 | | | | 2,714 | |
Comerica Inc | | | 50,400 | | | | 2,480 | |
Discover Financial Services | | | 10,000 | | | | 762 | |
Federated Hermes Inc, Cl B | | | 32,700 | | | | 878 | |
Globe Life Inc | | | 9,982 | | | | 929 | |
Goldman Sachs Group Inc/The | | | 14,000 | | | | 3,228 | |
Great Western Bancorp Inc | | | 21,300 | | | | 350 | |
Hartford Financial Services Group Inc/The | | | 9,700 | | | | 429 | |
Huntington Bancshares Inc/OH | | | 7,995 | | | | 97 | |
JPMorgan Chase & Co | | | 112,569 | | | | 13,270 | |
M&T Bank Corp | | | 16,100 | | | | 1,876 | |
Marsh & McLennan Cos Inc | | | 48,350 | | | | 5,543 | |
MetLife Inc | | | 143,942 | | | | 6,646 | |
Morgan Stanley | | | 51,603 | | | | 3,191 | |
Old Republic International Corp | | | 44,500 | | | | 797 | |
OneMain Holdings Inc, Cl A | | | 28,479 | | | | 1,110 | |
PacWest Bancorp | | | 31,700 | | | | 737 | |
Pinnacle Financial Partners Inc | | | 10,000 | | | | 542 | |
Popular Inc | | | 28,600 | | | | 1,388 | |
Raymond James Financial Inc | | | 4,600 | | | | 418 | |
Regions Financial Corp | | | 144,600 | | | | 2,208 | |
S&P Global Inc | | | 359 | | | | 126 | |
Starwood Property Trust Inc ‡ | | | 32,300 | | | | 579 | |
State Street Corp | | | 74,367 | | | | 5,241 | |
Synchrony Financial | | | 100,556 | | | | 3,064 | |
TPG RE Finance Trust Inc | | | 57,100 | | | | 592 | |
| | | | | | | | |
| | | |
| Description | | Shares | | Market Value ($ Thousands) |
COMMON STOCK (continued) | |
Travelers Cos Inc/The | | | 53,425 | | | $ | 6,927 | |
US Bancorp | | | 133,604 | | | | 5,773 | |
Wells Fargo & Co | | | 186,933 | | | | 5,113 | |
Willis Towers Watson PLC | | | 42,601 | | | | 8,869 | |
| | |
| | | | | | | 164,474 | |
| |
Health Care — 14.4% | | | | | |
Abbott Laboratories | | | 69,600 | | | | 7,532 | |
AbbVie Inc | | | 67,700 | | | | 7,080 | |
Agilent Technologies Inc | | | 25,591 | | | | 2,992 | |
Alexion Pharmaceuticals Inc * | | | 6,000 | | | | 733 | |
Align Technology Inc * | | | 600 | | | | 289 | |
Amedisys Inc * | | | 2,797 | | | | 685 | |
AmerisourceBergen Corp, Cl A | | | 53,319 | | | | 5,498 | |
Amgen Inc | | | 41,264 | | | | 9,162 | |
Anthem Inc | | | 2,100 | | | | 654 | |
Becton Dickinson and Co | | | 66,180 | | | | 15,542 | |
Biogen Inc * | | | 9,137 | | | | 2,194 | |
Boston Scientific Corp * | | | 23,500 | | | | 779 | |
Bristol-Myers Squibb Co | | | 68,400 | | | | 4,268 | |
Change Healthcare Inc * | | | 26,981 | | | | 462 | |
Chemed Corp | | | 1,600 | | | | 765 | |
Cigna Corp | | | 12,500 | | | | 2,614 | |
CVS Health Corp | | | 148,365 | | | | 10,058 | |
Danaher Corp | | | 30,800 | | | | 6,919 | |
Eli Lilly and Co | | | 15,445 | | | | 2,249 | |
Encompass Health Corp | | | 6,800 | | | | 548 | |
Envista Holdings Corp * | | | 15,900 | | | | 473 | |
Exact Sciences Corp * | | | 1,100 | | | | 133 | |
Gilead Sciences Inc | | | 99,215 | | | | 6,019 | |
HCA Healthcare Inc * | | | 19,337 | | | | 2,903 | |
Hologic Inc * | | | 4,500 | | | | 311 | |
Horizon Therapeutics PLC * | | | 14,100 | | | | 993 | |
Humana Inc | | | 25,234 | | | | 10,107 | |
IDEXX Laboratories Inc * | | | 1,900 | | | | 876 | |
Jazz Pharmaceuticals PLC * | | | 17,000 | | | | 2,392 | |
Johnson & Johnson | | | 131,429 | | | | 19,015 | |
LHC Group Inc * | | | 4,900 | | | | 962 | |
McKesson Corp | | | 3,100 | | | | 558 | |
Medpace Holdings Inc * | | | 1,100 | | | | 141 | |
Medtronic PLC | | | 113,190 | | | | 12,870 | |
Merck & Co Inc | | | 246,040 | | | | 19,779 | |
Mettler-Toledo International Inc * | | | 24 | | | | 28 | |
Oak Street Health Inc * | | | 2,726 | | | | 129 | |
PerkinElmer Inc | | | 7,700 | | | | 1,024 | |
Pfizer Inc | | | 228,900 | | | | 8,769 | |
Quest Diagnostics Inc | | | 3,600 | | | | 446 | |
Regeneron Pharmaceuticals Inc * | | | 1,700 | | | | 877 | |
Repligen Corp * | | | 1,800 | | | | 341 | |
ResMed Inc | | | 3,700 | | | | 775 | |
Seagen Inc * | | | 4,800 | | | | 817 | |
STERIS PLC | | | 2,400 | | | | 465 | |
Thermo Fisher Scientific Inc | | | 16,200 | | | | 7,533 | |
| | |
| 2 | | SEI Institutional Investments Trust / Semi-Annual Report / November 30, 2020 |
SCHEDULE OF INVESTMENTS (Unaudited)
November 30, 2020
Large Cap Disciplined Equity Fund (Continued)
| | | | | | | | |
| | | |
| Description | | Shares | | Market Value ($ Thousands) |
COMMON STOCK (continued) | |
United Therapeutics Corp * | | | 6,700 | | | $ | 889 | |
UnitedHealth Group Inc | | | 66,058 | | | | 22,218 | |
Universal Health Services Inc, Cl B * | | | 3,400 | | | | 444 | |
Vertex Pharmaceuticals Inc * | | | 2,400 | | | | 547 | |
Viatris Inc, Cl W * | | | 26,317 | | | | 443 | |
West Pharmaceutical Services Inc | | | 4,500 | | | | 1,238 | |
Zimmer Biomet Holdings Inc | | | 55,315 | | | | 8,249 | |
Zoetis Inc, Cl A | | | 23,909 | | | | 3,834 | |
| | |
| | | | | | | 217,621 | |
| |
Industrials — 10.6% | | | | | |
3M Co | | | 38,600 | | | | 6,667 | |
Acuity Brands Inc | | | 6,600 | | | | 784 | |
AGCO Corp | | | 14,800 | | | | 1,369 | |
Allison Transmission Holdings Inc, Cl A | | | 51,300 | | | | 2,106 | |
Altra Industrial Motion Corp | | | 10,100 | | | | 573 | |
AMETEK Inc | | | 71,662 | | | | 8,494 | |
Atkore International Group Inc * | | | 35,200 | | | | 1,372 | |
Barrett Business Services Inc | | | 2,700 | | | | 180 | |
Boeing Co/The * | | | 1,407 | | | | 296 | |
BWX Technologies Inc | | | 8,700 | | | | 495 | |
Carrier Global Corp | | | 31,270 | | | | 1,190 | |
Caterpillar Inc | | | 1,200 | | | | 208 | |
Copart Inc * | | | 11,500 | | | | 1,328 | |
Crane Co | | | 17,600 | | | | 1,224 | |
CSX Corp | | | 69,919 | | | | 6,296 | |
Cummins Inc | | | 11,994 | | | | 2,773 | |
Deere & Co | | | 20,400 | | | | 5,337 | |
Eaton Corp PLC | | | 18,900 | | | | 2,289 | |
EMCOR Group Inc | | | 7,100 | | | | 612 | |
Emerson Electric Co | | | 102,323 | | | | 7,860 | |
FedEx Corp | | | 2,860 | | | | 820 | |
Gates Industrial Corp PLC * | | | 32,800 | | | | 423 | |
General Electric Co | | | 117,089 | | | | 1,192 | |
GMS Inc * | | | 22,900 | | | | 715 | |
Herman Miller Inc | | | 16,700 | | | | 595 | |
Honeywell International Inc | | | 54,070 | | | | 11,026 | |
Howmet Aerospace Inc * | | | 31,010 | | | | 728 | |
Hubbell Inc, Cl B | | | 2,900 | | | | 469 | |
IAA Inc * | | | 1,988 | | | | 119 | |
Illinois Tool Works Inc | | | 14,670 | | | | 3,097 | |
JB Hunt Transport Services Inc | | | 46,318 | | | | 6,266 | |
Johnson Controls International PLC | | | 8,572 | | | | 395 | |
Kforce Inc | | | 5,300 | | | | 218 | |
L3Harris Technologies Inc | | | 30,250 | | | | 5,808 | |
Landstar System Inc | | | 1,100 | | | | 145 | |
Lockheed Martin Corp | | | 8,300 | | | | 3,030 | |
ManpowerGroup Inc | | | 26,394 | | | | 2,287 | |
Masco Corp | | | 39,000 | | | | 2,093 | |
Nielsen Holdings PLC | | | 43,100 | | | | 697 | |
Nordson Corp | | | 25,717 | | | | 5,241 | |
Northrop Grumman Corp | | | 8,100 | | | | 2,448 | |
Old Dominion Freight Line Inc | | | 4,588 | | | | 933 | |
| | | | | | | | |
| | | |
| Description | | Shares | | Market Value ($ Thousands) |
COMMON STOCK (continued) | |
Oshkosh Corp | | | 5,600 | | | $ | 451 | |
Otis Worldwide Corp | | | 63,194 | | | | 4,230 | |
Owens Corning | | | 33,900 | | | | 2,470 | |
PACCAR Inc | | | 49,025 | | | | 4,268 | |
Parker-Hannifin Corp | | | 4,300 | | | | 1,149 | |
Pentair PLC | | | 5,700 | | | | 295 | |
Quanta Services Inc | | | 11,300 | | | | 772 | |
Raytheon Technologies Corp | | | 168,513 | | | | 12,086 | |
Regal Beloit Corp | | | 13,500 | | | | 1,607 | |
Rexnord Corp | | | 39,800 | | | | 1,493 | |
Rockwell Automation Inc | | | 17,421 | | | | 4,452 | |
Sensata Technologies Holding PLC * | | | 23,100 | | | | 1,128 | |
SPX Corp * | | | 800 | | | | 41 | |
Standex International Corp | | | 1,700 | | | | 128 | |
Stanley Black & Decker Inc | | | 64,883 | | | | 11,959 | |
Toro Co/The | | | 2,759 | | | | 250 | |
TransDigm Group Inc * | | | 1,727 | | | | 1,000 | |
UFP Industries Inc | | | 24,500 | | | | 1,314 | |
United Parcel Service Inc, Cl B | | | 15,839 | | | | 2,710 | |
United Rentals Inc * | | | 12,400 | | | | 2,815 | |
Werner Enterprises Inc | | | 25,400 | | | | 1,016 | |
WW Grainger Inc | | | 12,850 | | | | 5,375 | |
| | |
| | | | | | | 161,207 | |
| |
Information Technology — 22.0% | | | | | |
Accenture PLC, Cl A | | | 29,484 | | | | 7,344 | |
Adobe Inc * | | | 21,553 | | | | 10,312 | |
Amdocs Ltd | | | 20,442 | | | | 1,345 | |
Anaplan Inc * | | | 6,562 | | | | 459 | |
Apple Inc | | | 598,443 | | | | 71,245 | |
Applied Materials Inc | | | 62,019 | | | | 5,115 | |
Arrow Electronics Inc * | | | 7,900 | | | | 724 | |
Autodesk Inc * | | | 16,900 | | | | 4,736 | |
Automatic Data Processing Inc | | | 38,060 | | | | 6,618 | |
Black Knight Inc * | | | 11,580 | | | | 1,061 | |
Booz Allen Hamilton Holding Corp, Cl A | | | 9,200 | | | | 799 | |
Broadcom Inc | | | 24,390 | | | | 9,795 | |
Brooks Automation Inc | | | 3,759 | | | | 274 | |
CACI International Inc, Cl A * | | | 6,700 | | | | 1,590 | |
Cadence Design Systems Inc * | | | 5,600 | | | | 651 | |
CDK Global Inc | | | 2,800 | | | | 134 | |
Cisco Systems Inc | | | 197,982 | | | | 8,517 | |
Cognizant Technology Solutions Corp, Cl A | | | 50,900 | | | | 3,977 | |
Dell Technologies Inc, Cl C * | | | 12,500 | | | | 863 | |
Duck Creek Technologies Inc * | | | 10,343 | | | | 411 | |
Entegris Inc | | | 1,292 | | | | 120 | |
EPAM Systems Inc * | | | 5,617 | | | | 1,811 | |
Euronet Worldwide Inc * | | | 3,000 | | | | 403 | |
Fair Isaac Corp * | | | 483 | | | | 228 | |
Flex Ltd * | | | 14,144 | | | | 229 | |
Gartner Inc * | | | 9,040 | | | | 1,374 | |
Genpact Ltd | | | 8,000 | | | | 325 | |
Global Payments Inc | | | 59,800 | | | | 11,672 | |
| | |
| SEI Institutional Investments Trust / Semi-Annual Report / November 30, 2020 | | 3 |
SCHEDULE OF INVESTMENTS (Unaudited)
November 30, 2020
Large Cap Disciplined Equity Fund (Continued)
| | | | | | | | |
| | | |
| Description | | Shares | | Market Value ($ Thousands) |
COMMON STOCK (continued) | |
GoDaddy Inc, Cl A * | | | 32,967 | | | $ | 2,622 | |
Hewlett Packard Enterprise Co | | | 53,700 | | | | 593 | |
Intel Corp | | | 124,583 | | | | 6,024 | |
International Business Machines Corp | | | 34,900 | | | | 4,311 | |
Intuit Inc | | | 18,334 | | | | 6,454 | |
Jabil Inc | | | 22,900 | | | | 875 | |
KBR Inc | | | 31,900 | | | | 886 | |
KLA Corp | | | 24,057 | | | | 6,062 | |
Lam Research Corp | | | 13,836 | | | | 6,263 | |
Leidos Holdings Inc | | | 900 | | | | 91 | |
Littelfuse Inc | | | 4,200 | | | | 1,010 | |
Mastercard Inc, Cl A | | | 11,753 | | | | 3,955 | |
Microchip Technology Inc | | | 41,798 | | | | 5,617 | |
Micron Technology Inc * | | | 25,200 | | | | 1,615 | |
Microsoft Corp | | | 321,796 | | | | 68,887 | |
MKS Instruments Inc | | | 7,700 | | | | 1,062 | |
Motorola Solutions Inc | | | 44,077 | | | | 7,561 | |
NortonLifeLock Inc | | | 21,400 | | | | 390 | |
NVIDIA Corp | | | 15,958 | | | | 8,554 | |
Oracle Corp | | | 128,574 | | | | 7,421 | |
Paychex Inc | | | 7,468 | | | | 696 | |
PayPal Holdings Inc * | | | 19,056 | | | | 4,080 | |
Qorvo Inc * | | | 10,579 | | | | 1,658 | |
QUALCOMM Inc | | | 106,812 | | | | 15,719 | |
salesforce.com inc * | | | 6,768 | | | | 1,663 | |
Semtech Corp * | | | 3,600 | | | | 243 | |
ServiceNow Inc * | | | 2,934 | | | | 1,568 | |
Skyworks Solutions Inc | | | 1,853 | | | | 262 | |
Snap Inc, Cl A * | | | 2,000 | | | | 89 | |
Sykes Enterprises Inc * | | | 6,500 | | | | 245 | |
Synopsys Inc * | | | 3,800 | | | | 865 | |
TE Connectivity Ltd | | | 19,599 | | | | 2,234 | |
Teradyne Inc | | | 21,137 | | | | 2,332 | |
Texas Instruments Inc | | | 36,128 | | | | 5,826 | |
Visa Inc, Cl A | | | 11,700 | | | | 2,461 | |
VMware Inc, Cl A * | | | 4,900 | | | | 685 | |
Western Union Co/The | | | 13,320 | | | | 301 | |
Workday Inc, Cl A * | | | 2,402 | | | | 540 | |
| | |
| | | | | | | 333,852 | |
| |
Materials — 3.1% | | | | | |
Air Products and Chemicals Inc | | | 33,969 | | | | 9,516 | |
AptarGroup Inc | | | 38,103 | | | | 4,813 | |
Avery Dennison Corp | | | 32,273 | | | | 4,820 | |
Axalta Coating Systems Ltd * | | | 18,200 | | | | 521 | |
Ball Corp | | | 7,107 | | | | 682 | |
Boise Cascade Co | | | 4,200 | | | | 182 | |
Corteva Inc | | | 46,700 | | | | 1,789 | |
Crown Holdings Inc * | | | 1,234 | | | | 116 | |
Dow Inc | | | 67,549 | | | | 3,581 | |
Huntsman Corp | | | 60,500 | | | | 1,499 | |
International Paper Co | | | 9,700 | | | | 480 | |
LyondellBasell Industries NV, Cl A | | | 11,500 | | | | 979 | |
| | | | | | | | |
| | | |
| Description | | Shares | | Market Value ($ Thousands) |
COMMON STOCK (continued) | |
Newmont Corp | | | 41,700 | | | $ | 2,453 | |
Nucor Corp | | | 22,289 | | | | 1,197 | |
Packaging Corp of America | | | 2,715 | | | | 353 | |
PPG Industries Inc | | | 2,200 | | | | 323 | |
Reliance Steel & Aluminum Co | | | 8,291 | | | | 977 | |
RPM International Inc | | | 3,500 | | | | 308 | |
Sherwin-Williams Co/The | | | 7,000 | | | | 5,233 | |
Steel Dynamics Inc | | | 78,983 | | | | 2,860 | |
Vulcan Materials Co | | | 30,541 | | | | 4,265 | |
Westrock Co | | | 6,765 | | | | 285 | |
| | |
| | | | | | | 47,232 | |
| |
Real Estate — 2.3% | | | | | |
American Homes 4 Rent, Cl A ‡ | | | 147,255 | | | | 4,229 | |
American Tower Corp, Cl A ‡ | | | 1,300 | | | | 301 | |
Apple Hospitality Inc *‡ | | | 14,500 | | | | 192 | |
Columbia Property Trust Inc ‡ | | | 11,300 | | | | 158 | |
CoreCivic Inc *‡ | | | 50,000 | | | | 354 | |
Crown Castle International Corp ‡ | | | 69,103 | | | | 11,580 | |
EastGroup Properties Inc ‡ | | | 6,100 | | | | 832 | |
Equinix Inc ‡ | | | 1,100 | | | | 768 | |
Extra Space Storage Inc ‡ | | | 17,700 | | | | 1,995 | |
Franklin Street Properties Corp ‡ | | | 19,300 | | | | 89 | |
Gaming and Leisure Properties Inc ‡ | | | 50,394 | | | | 2,093 | |
Healthcare Trust of America Inc, Cl A ‡ | | | 14,164 | | | | 369 | |
Healthpeak Properties Inc ‡ | | | 24,856 | | | | 717 | |
Invitation Homes Inc ‡ | | | 76,100 | | | | 2,175 | |
Kimco Realty Corp ‡ | | | 9,400 | | | | 136 | |
Lamar Advertising Co, Cl A ‡ | | | 2,700 | | | | 215 | |
Life Storage Inc ‡ | | | 7,800 | | | | 856 | |
MGM Growth Properties LLC, Cl A ‡ | | | 30,400 | | | | 929 | |
PotlatchDeltic Corp ‡ | | | 3,700 | | | | 172 | |
SBA Communications Corp, Cl A ‡ | | | 3,311 | | | | 951 | |
VEREIT Inc ‡ | | | 74,800 | | | | 530 | |
Weyerhaeuser Co ‡ | | | 170,200 | | | | 4,943 | |
| | |
| | | | | | | 34,584 | |
| |
Utilities — 2.8% | | | | | |
AES Corp/The | | | 265,700 | | | | 5,431 | |
American Electric Power Co Inc | | | 15,900 | | | | 1,350 | |
American Water Works Co Inc | | | 7,100 | | | | 1,089 | |
Atmos Energy Corp | | | 1,999 | | | | 192 | |
Avangrid Inc | | | 33,400 | | | | 1,554 | |
Dominion Energy Inc | | | 16,466 | | | | 1,292 | |
Duke Energy Corp | | | 22,600 | | | | 2,094 | |
Entergy Corp | | | 6,700 | | | | 729 | |
Eversource Energy | | | 2,900 | | | | 254 | |
Exelon Corp | | | 73,100 | | | | 3,002 | |
MDU Resources Group Inc | | | 5,400 | | | | 135 | |
National Fuel Gas Co | | | 21,100 | | | | 869 | |
NextEra Energy Inc | | | 118,061 | | | | 8,688 | |
NRG Energy Inc | | | 48,000 | | | | 1,572 | |
PPL Corp | | | 98,200 | | | | 2,791 | |
| | |
| 4 | | SEI Institutional Investments Trust / Semi-Annual Report / November 30, 2020 |
SCHEDULE OF INVESTMENTS (Unaudited)
November 30, 2020
Large Cap Disciplined Equity Fund (Continued)
| | | | | | | | |
| | | |
| Description | | Shares | | Market Value ($ Thousands) |
COMMON STOCK (continued) | | | | | | | | |
Public Service Enterprise Group Inc | | | 36,000 | | | $ | 2,098 | |
Sempra Energy | | | 19,000 | | | | 2,422 | |
Southern Co/The | | | 40,600 | | | | 2,430 | |
UGI Corp | | | 48,400 | | | | 1,717 | |
Vistra Corp | | | 76,800 | | | | 1,435 | |
WEC Energy Group Inc | | | 11,300 | | | | 1,073 | |
| | |
| | | | | | | 42,217 | |
| | |
Total Common Stock
(Cost $1,040,781) ($ Thousands) | | | | | | | 1,377,907 | |
| | |
| | | Face Amount
(Thousands) | | |
| |
U.S. TREASURY OBLIGATION — 0.0% | | | | | |
U.S. Treasury Bills 0.060%, 12/17/2020 | | $ | 120 | | | | 120 | |
| |
Total U.S. Treasury Obligation
(Cost $120) ($ Thousands) | | | | 120 | |
| | | | | | | | |
| | | |
| Description | | Shares | | Market Value ($ Thousands) |
AFFILIATED PARTNERSHIP — 0.0% | | | | | |
SEI Liquidity Fund, L.P. 0.070% **†(C) | | | 49,583 | | | $ | 48 | |
| |
Total Affiliated Partnership
(Cost $49) ($ Thousands) | | | | 48 | |
| | |
CASH EQUIVALENT — 5.6% | | | | | | | | |
SEI Daily Income Trust, Government Fund, Cl F
0.010%**† | | | 84,155,071 | | | | 84,155 | |
| |
Total Cash Equivalent
(Cost $84,155) ($ Thousands) | | | | 84,155 | |
| |
Total Investments in Securities — 96.5%
(Cost $1,125,105) ($ Thousands) | | | $ | 1,462,230 | |
| | | | | | | | |
A list of the open futures contracts held by the Fund at November 30, 2020, is as follows:
| | | | | | | | | | | | | | | | | | |
| | | | | | |
Type of Contract | | Number of Contracts Long | | Expiration Date | | | Notional Amount (Thousands) | | | Value (Thousands) | | | Unrealized Appreciation (Thousands) | |
S&P 500 Index E-MINI | | 264 | | | Dec-2020 | | | $ | 44,984 | | | $ | 47,826 | | | $ | 2,842 | |
| | | | | | | | | | | | | | | | | | |
A list of the open OTC Swap agreement held by the Fund at November 30, 2020, is as follows:
| | | | | | | | | | | | | | | | | | | | | | | | | | | | |
| |
| Total Return Swaps | |
| Counterparty | | Reference Entity/
Obligation | | Fund Pays | | Fund
Receives | | Payment
Frequency | | Termination Date | | | Currency | | | Notional
Amount
(Thousands) | | Value (Thousands) | | Net Unrealized
(Depreciation)
(Thousands) |
BAML | | United States Custom Basket of Securities | | 1 Month + 0.15% | | Asset
Return | | Monthly | | | 02/28/2022 | | | | USD | | | $ | 73,541 | | | $ | (975 | ) | | $ | (975 | ) |
| | | | | | | | | | | | | | | | | | | | | | | | | | | | |
The following table represents the individual stock exposures comprising the Net Long Custom Basket Total Return Swaps as of November 30, 2020:
United States Custom Basket of Long Securities
| | | | | | | | | | | | | | | | | | | | |
| Shares | | Description | | Currency | | Notional
Amount
(Thousands) | | | Net Unrealized
Appreciation
(Depreciation) (Thousands) | | | Fair Value
(Thousands) | | | Percentage Value of
Underlying Investment | |
| 21,700 | | AGCO CORP | | USD | | $ | 2,095 | | | $ | (84 | ) | | $ | (84 | ) | | | (21.59 | )% |
| 1,186 | | ALIGN TECHNOLOGY INC | | USD | | | 542 | | | | 28 | | | | 28 | | | | 7.20 | |
| 13,700 | | ALEXION PHARM | | USD | | | 1,751 | | | | (78 | ) | | | (78 | ) | | | (20.05 | ) |
| 4,000 | | AMEDISYS INC | | USD | | | 978 | | | | 1 | | | | 1 | | | | 0.26 | |
| 16,300 | | AMERICAN HOMES 4 RENT- A | | USD | | | 484 | | | | (16 | ) | | | (16 | ) | | | (4.11 | ) |
| 16,300 | | AMERIPRISE FINANCIAL INC | | USD | | | 3,031 | | | | 4 | | | | 4 | | | | 1.03 | |
| 5,178 | | AMAZON.COM INC | | USD | | | 16,213 | | | | 188 | | | | 188 | | | | 48.33 | |
| 4,416 | | BIO-RAD LABORATORIES-A | | USD | | | 2,637 | | | | (260 | ) | | | (260 | ) | | | (66.84 | ) |
| | |
| SEI Institutional Investments Trust / Semi-Annual Report / November 30, 2020 | | 5 |
SCHEDULE OF INVESTMENTS (Unaudited)
November 30, 2020
Large Cap Disciplined Equity Fund (Continued)
| | | | | | | | | | | | | | | | | | | | |
| Shares | | Description | | Currency | | Notional
Amount
(Thousands) | | | Net Unrealized
Appreciation
(Depreciation)
(Thousands) | | | Fair Value
(Thousands) | | | Percentage
Value of
Underlying
Investment | |
| 57,700 | | BJ’S WHOLESALE C | | USD | | $ | 2,425 | | | $ | (61 | ) | | $ | (61 | ) | | | (15.68 | )% |
| 1,133 | | BOOKING HOLDINGS INC | | USD | | | 2,390 | | | | (92 | ) | | | (92 | ) | | | (23.65 | ) |
| — | | BLUEPRINT MEDICINES CORP | | USD | | | — | | | | 3 | | | | 3 | | | | 0.77 | |
| 4,619 | | BERKSHIRE HATH-B | | USD | | | 1,077 | | | | (20 | ) | | | (20 | ) | | | (5.14 | ) |
| 72,700 | | CONAGRA BRANDS INC | | USD | | | 2,656 | | | | 21 | | | | 21 | | | | 5.40 | |
| 19,700 | | CBRE GROUP INC - A | | USD | | | 1,180 | | | | 24 | | | | 24 | | | | 6.17 | |
| 24,600 | | CHURCH & DWIGHT CO INC | | USD | | | 2,164 | | | | 1 | | | | 1 | | | | 0.26 | |
| 5,973 | | CHARTER COMMUN-A | | USD | | | 3,831 | | | | 62 | | | | 62 | | | | 15.94 | |
| 122,100 | | CENTERPOINT ENERGY INC | | USD | | | 3,063 | | | | (214 | ) | | | (214 | ) | | | (55.01 | ) |
| 11,500 | | CITRIX SYSTEMS INC | | USD | | | 1,363 | | | | 62 | | | | 62 | | | | 15.94 | |
| 10,100 | | CUBESMART | | USD | | | 330 | | | | (2 | ) | | | (2 | ) | | | (0.51 | ) |
| 17,600 | | DROPBOX INC-CLASS A | | USD | | | 329 | | | | 22 | | | | 22 | | | | 5.66 | |
| — | | DISH NETWORK CORP-A | | USD | | | — | | | | (16 | ) | | | (16 | ) | | | (4.11 | ) |
| 7,700 | | DOLBY LABORATO-A | | USD | | | 685 | | | | (2 | ) | | | (2 | ) | | | (0.51 | ) |
| 384 | | DOMINO’S PIZZA INC | | USD | | | 148 | | | | 3 | | | | 3 | | | | 0.77 | |
| 21,400 | | ELECTRONIC ARTS INC | | USD | | | 2,538 | | | | 195 | | | | 195 | | | | 50.13 | |
| 18,500 | | EURONET WORLDWIDE INC | | USD | | | 2,371 | | | | 125 | | | | 125 | | | | 32.13 | |
| 87,900 | | EQUITABLE HOLDINGS INC | | USD | | | 2,161 | | | | 84 | | | | 84 | | | | 21.59 | |
| 32,800 | | EXELIXIS INC | | USD | | | 642 | | | | (14 | ) | | | (14 | ) | | | (3.60 | ) |
| 13,500 | | DIAMONDBACK ENERGY INC | | USD | | | 543 | | | | (4 | ) | | | (4 | ) | | | (1.03 | ) |
| — | | FIRSTENERGY CORP | | USD | | | — | | | | 5 | | | | 5 | | | | 1.29 | |
| 1,658 | | FAIR ISAAC CORP | | USD | | | 785 | | | | (1 | ) | | | (1 | ) | | | (0.26 | ) |
| 21,000 | | FORTINET INC | | USD | | | 2,451 | | | | 136 | | | | 136 | | | | 34.96 | |
| 10,500 | | GILEAD SCIENCES INC | | USD | | | 641 | | | | (5 | ) | | | (5 | ) | | | (1.29 | ) |
| 35,600 | | GAMING AND LEISU | | USD | | | 1,486 | | | | 9 | | | | 9 | | | | 2.31 | |
| 6,077 | | ALPHABET INC-CL A | | USD | | | 10,781 | | | | (122 | ) | | | (122 | ) | | | (31.36 | ) |
| 160,900 | | HUNTINGTON BANCSHARES INC | | USD | | | 1,936 | | | | 8 | | | | 8 | | | | 2.06 | |
| — | | HD SUPPLY HOLDINGS INC | | USD | | | — | | | | — | | | | — | | | | — | |
| 17,800 | | HOLLYFRONTIER CORP | | USD | | | 430 | | | | (8 | ) | | | (8 | ) | | | (2.06 | ) |
| 16,500 | | HARTFORD FINL SV | | USD | | | 765 | | | | (30 | ) | | | (30 | ) | | | (7.71 | ) |
| 6,307 | | HUMANA INC | | USD | | | 2,703 | | | | (177 | ) | | | (177 | ) | | | (45.50 | ) |
| 19,700 | | HOWMET AEROSPACE INC | | USD | | | 457 | | | | 5 | | | | 5 | | | | 1.29 | |
| 1,007 | | ILLUMINA INC | | USD | | | 299 | | | | 25 | | | | 25 | | | | 6.43 | |
| 36,300 | | KNIGHT-SWIFT TRA | | USD | | | 1,515 | | | | (17 | ) | | | (17 | ) | | | (4.37 | ) |
| 2,900 | | COCA-COLA CO/THE | | USD | | | 156 | | | | (5 | ) | | | (5 | ) | | | (1.29 | ) |
| 74,500 | | KROGER CO | | USD | | | 2,406 | | | | 65 | | | | 65 | | | | 16.71 | |
| 6,500 | | LITHIA MOTORS INC-CL A | | USD | | | 1,729 | | | | 153 | | | | 153 | | | | 39.33 | |
| 19,500 | | LAMAR ADVERTISING CO-A | | USD | | | 1,500 | | | | 52 | | | | 52 | | | | 13.37 | |
| 116,500 | | LIBERTY GLOBAL PLC- C | | USD | | | 2,546 | | | | (25 | ) | | | (25 | ) | | | (6.43 | ) |
| 2,000 | | LHC GROUP INC | | USD | | | 421 | | | | (29 | ) | | | (29 | ) | | | (7.46 | ) |
| 29,800 | | LKQ CORP | | USD | | | 1,097 | | | | (47 | ) | | | (47 | ) | | | (12.08 | ) |
| 6,100 | | LOWE’S COS INC | | USD | | | 988 | | | | (37 | ) | | | (37 | ) | | | (9.51 | ) |
| — | | LATTICE SEMICOND | | USD | | | — | | | | 5 | | | | 5 | | | | 1.29 | |
| 42,300 | | MASCO CORP | | USD | | | 2,339 | | | | (69 | ) | | | (69 | ) | | | (17.74 | ) |
| 17,800 | | MCKESSON CORP | | USD | | | 3,269 | | | | (60 | ) | | | (60 | ) | | | (15.42 | ) |
| 26,400 | | MARSH & MCLENNAN COS | | USD | | | 3,053 | | | | (28 | ) | | | (28 | ) | | | (7.20 | ) |
| 95,900 | | MOSAIC CO/THE | | USD | | | 1,801 | | | | 305 | | | | 305 | | | | 78.41 | |
| 400 | | MONOLITHIC POWER | | USD | | | 121 | | | | 7 | | | | 7 | | | | 1.80 | |
| 52,997 | | NEXTERA ENERGY INC | | USD | | | 4,121 | | | | (203 | ) | | | (203 | ) | | | (52.19 | ) |
| 17,700 | | NEXTERA ENERGY PARTNERS LP | | USD | | | 1,149 | | | | (26 | ) | | | (26 | ) | | | (6.68 | ) |
| 12,300 | | NIKE INC -CL B | | USD | | | 1,600 | | | | 56 | | | | 56 | | | | 14.40 | |
| 91,800 | | NOV INC | | USD | | | 1,105 | | | | 20 | | | | 20 | | | | 5.14 | |
| — | | NOVAVAX INC | | USD | | | — | | | | (13 | ) | | | (13 | ) | | | (3.34 | ) |
| 68,700 | | NEWS CORP - CLASS A | | USD | | | 1,195 | | | | 18 | | | | 18 | | | | 4.63 | |
| 67,000 | | NY COMM BANCORP | | USD | | | 604 | | | | 57 | | | | 57 | | | | 14.65 | |
| 2,400 | | OKTA INC | | USD | | | 535 | | | | 53 | | | | 53 | | | | 13.62 | |
| 4,200 | | PALO ALTO NETWORKS INC | | USD | | | 1,170 | | �� | | 65 | | | | 65 | | | | 16.71 | |
| | |
| 6 | | SEI Institutional Investments Trust / Semi-Annual Report / November 30, 2020 |
SCHEDULE OF INVESTMENTS (Unaudited)
November 30, 2020
Large Cap Disciplined Equity Fund (Continued)
| | | | | | | | | | | | | | | | | | | | | | |
| Shares | | Description | | Currency | | | Notional
Amount
(Thousands) | | | Net Unrealized
Appreciation
(Depreciation)
(Thousands) | | | Fair Value
(Thousands) | | | Percentage Value of
Underlying Investment | |
| 6,300 | | PERFORMANCE FOOD GROUP CO | | | USD | | | $ | 275 | | | $ | (2 | ) | | $ | (2 | ) | | | (0.51 | )% |
| 19,300 | | PULTEGROUP INC | | | USD | | | | 827 | | | | 14 | | | | 14 | | | | 3.60 | |
| 20,200 | | PERKINELMER INC | | | USD | | | | 2,693 | | | | (7 | ) | | | (7 | ) | | | (1.80 | ) |
| — | | PLUG POWER INC | | | USD | | | | — | | | | 43 | | | | 43 | | | | 11.05 | |
| 4,821 | | POOL CORP | | | USD | | | | 1,643 | | | | 16 | | | | 16 | | | | 4.11 | |
| — | | PLURALSIGHT INC - A | | | USD | | | | — | | | | 35 | | | | 35 | | | | 9.00 | |
| 28,500 | | QUANTA SERVICES INC | | | USD | | | | 1,976 | | | | (29 | ) | | | (29 | ) | | | (7.46 | ) |
| 1,300 | | PAYPAL HOLDINGS INC | | | USD | | | | 250 | | | | 29 | | | | 29 | | | | 7.46 | |
| 2,945 | | REGENERON PHARMACEUTICALS | | | USD | | | | 1,647 | | | | (128 | ) | | | (128 | ) | | | (32.90 | ) |
| — | | RH | | | USD | | | | — | | | | 35 | | | | 35 | | | | 9.00 | |
| 16,000 | | RELIANCE STEEL & ALUMINUM | | | USD | | | | 1,933 | | | | (39 | ) | | | (39 | ) | | | (10.03 | ) |
| 1,616 | | SBA COMMUNICATIONS CORP | | | USD | | | | 477 | | | | (13 | ) | | | (13 | ) | | | (3.34 | ) |
| 6,600 | | SITEONE LANDSCAP | | | USD | | | | 893 | | | | 28 | | | | 28 | | | | 7.20 | |
| 27,000 | | SCHNEIDER NATL-B | | | USD | | | | 594 | | | | 24 | | | | 24 | | | | 6.17 | |
| 14,400 | | SYNNEX CORP | | | USD | | | | 2,268 | | | | 40 | | | | 40 | | | | 10.28 | |
| — | | SOUTH STATE CORP | | | USD | | | | — | | | | (1 | ) | | | (1 | ) | | | (0.26 | ) |
| 2,090 | | THERMO FISHER | | | USD | | | | 1,005 | | | | (34 | ) | | | (34 | ) | | | (8.74 | ) |
| 1,200 | | T ROWE PRICE GROUP INC | | | USD | | | | 173 | | | | (1 | ) | | | (1 | ) | | | (0.26 | ) |
| 8,500 | | UNIVERSAL HLTH-B | | | USD | | | | 1,130 | | | | (20 | ) | | | (20 | ) | | | (5.14 | ) |
| 1,000 | | UNITED PARCEL-B | | | USD | | | | 168 | | | | 4 | | | | 4 | | | | 1.03 | |
| 1,200 | | UNITED RENTALS INC | | | USD | | | | 261 | | | | 19 | | | | 19 | | | | 4.88 | |
| 5,400 | | MARRIOTT VACATIONS WORLD | | | USD | | | | 704 | | | | (16 | ) | | | (16 | ) | | | (4.11 | ) |
| 109,200 | | WELLS FARGO & CO | | | USD | | | | 2,719 | | | | 276 | | | | 276 | | | | 70.95 | |
| 15,800 | | WP CAREY INC | | | USD | | | | 1,134 | | | | (40 | ) | | | (40 | ) | | | (10.28 | ) |
| 49,500 | | WEYERHAEUSER CO | | | USD | | | | 1,453 | | | | (16 | ) | | | (16 | ) | | | (4.11 | ) |
| 3,300 | | XPO LOGISTICS INC | | | USD | | | | 351 | | | | 1 | | | | 1 | | | | 0.26 | |
| 14,300 | | XEROX HOLDINGS CORP | | | USD | | | | 325 | | | | (12 | ) | | | (12 | ) | | | (3.10 | ) |
| 6,900 | | ZENDESK INC | | | USD | | | | 845 | | | | 81 | | | | 81 | | | | 20.79 | |
| | | | | | | | | | |
| | | | | | | | $ | 140,525 | | | $ | 389 | | | $ | 389 | | | | 100.00 | % |
| | | | | | | | | | |
The following table represents the individual stock exposures comprising the Net Short Custom Basket Total Return Swaps as of November 30, 2020:
United States Custom Basket of Short Securities
| | | | | | | | | | | | | | | | | | | | |
| Shares | | Description | | Currency | | Notional
Amount
(Thousands) | | | Net Unrealized
Appreciation
(Depreciation)
(Thousands) | | | Fair Value
(Thousands) | | | Percentage Value of
Underlying Investment | |
| (74,300) | | AMERICAN AIRLINE | | USD | | $ | (954 | ) | | $ | (96 | ) | | $ | (96 | ) | | | 7.04 | % |
| (22,300) | | ADAPTIVE BIOTECHNOLOGIES | | USD | | | (1,041 | ) | | | (34 | ) | | | (34 | ) | | | 2.49 | |
| (91,800) | | ADT INC | | USD | | | (695 | ) | | | (44 | ) | | | (44 | ) | | | 3.23 | |
| (20,100) | | AEROJET ROCKETDY | | USD | | | (747 | ) | | | (6 | ) | | | (6 | ) | | | 0.44 | |
| (14,200) | | ALLOGENE THERAPEUTICS INC | | USD | | | (469 | ) | | | 28 | | | | 28 | | | | -2.05 | |
| (3,200) | | ALLAKOS INC | | USD | | | (320 | ) | | | (22 | ) | | | (22 | ) | | | 1.61 | |
| (10,500) | | APELLIS PHARMACE | | USD | | | (496 | ) | | | 1 | | | | 1 | | | | -0.07 | |
| (11,500) | | ARROWHEAD PHARMA | | USD | | | (794 | ) | | | 75 | | | | 75 | | | | -5.50 | |
| (9,200) | | ATMOS ENERGY CORP | | USD | | | (932 | ) | | | 44 | | | | 44 | | | | -3.23 | |
| (10,500) | | AMERICAN STATES WATER CO | | USD | | | (831 | ) | | | 52 | | | | 52 | | | | -3.81 | |
| (10,300) | | BRIDGEBIO PHARMA INC | | USD | | | (457 | ) | | | (61 | ) | | | (61 | ) | | | 4.47 | |
| (1,200) | | BRIGHT HORIZONS FAMILY SOLUT | | USD | | | (204 | ) | | | — | | | | — | | | | 0.00 | |
| (5,900) | | BIOHAVEN PHARMAC | | USD | | | (568 | ) | | | 43 | | | | 43 | | | | -3.15 | |
| (11,300) | | BILL.COM HOLDINGS INC | | USD | | | (1,090 | ) | | | (297 | ) | | | (297 | ) | | | 21.77 | |
| (19,500) | | BLACKBAUD INC | | USD | | | (1,020 | ) | | | (55 | ) | | | (55 | ) | | | 4.03 | |
| (11,300) | | BLUEBIRD BIO INC | | USD | | | (524 | ) | | | 26 | | | | 26 | | | | -1.91 | |
| (13,800) | | BANK OF HAWAII CORP | | USD | | | (1,039 | ) | | | (4 | ) | | | (4 | ) | | | 0.29 | |
| (12,900) | | BOK FINANCIAL CORPORATION | | USD | | | (912 | ) | | | 41 | | | | 41 | | | | -3.01 | |
| (25,400) | | BLACKSTONE MOR-A | | USD | | | (660 | ) | | | — | | | | — | | | | 0.00 | |
| | |
| SEI Institutional Investments Trust / Semi-Annual Report / November 30, 2020 | | 7 |
SCHEDULE OF INVESTMENTS (Unaudited)
November 30, 2020
Large Cap Disciplined Equity Fund (Continued)
| | | | | | | | | | | | | | | | | | | | |
| Shares | | Description | | Currency | | Notional
Amount
(Thousands) | | | Net Unrealized
Appreciation
(Depreciation)
(Thousands) | | | Fair Value
(Thousands) | | | Percentage Value of
Underlying Investment | |
| (13,700) | | COMMUNITY BANK SYSTEM INC | | USD | | $ | (909 | ) | | $ | 56 | | | $ | 56 | | | | -4.11 | % |
| (12,100) | | CHEGG INC | | USD | | | (822 | ) | | | (121 | ) | | | (121 | ) | | | 8.87 | |
| (44,000) | | CLEVELAND-CLIFFS INC | | USD | | | (466 | ) | | | (19 | ) | | | (19 | ) | | | 1.39 | |
| (9,700) | | DECIPHERA PHARMA | | USD | | | (642 | ) | | | 42 | | | | 42 | | | | -3.08 | |
| (5,000) | | DENALI THERAPEUTICS INC | | USD | | | (320 | ) | | | 16 | | | | 16 | | | | -1.17 | |
| (2,400) | | EDISON INTERNATIONAL | | USD | | | (156 | ) | | | 9 | | | | 9 | | | | -0.66 | |
| (19,100) | | EQUITY COMMONWEALTH | | USD | | | (515 | ) | | | 8 | | | | 8 | | | | -0.59 | |
| (2,000) | | ELASTIC NV | | USD | | | (203 | ) | | | (44 | ) | | | (44 | ) | | | 3.23 | |
| (13,400) | | FATE THERAPEUTICS INC | | USD | | | (708 | ) | | | (76 | ) | | | (76 | ) | | | 5.57 | |
| (50,800) | | FIRST HAWAIIAN INC | | USD | | | (1,135 | ) | | | 9 | | | | 9 | | | | -0.66 | |
| (14,100) | | FOX FACTORY HOLDING CORP | | USD | | | (1,156 | ) | | | (75 | ) | | | (75 | ) | | | 5.50 | |
| (8,100) | | FASTLY INC - CLASS A | | USD | | | (639 | ) | | | (48 | ) | | | (48 | ) | | | 3.52 | |
| (11,500) | | GATX CORP | | USD | | | (940 | ) | | | 22 | | | | 22 | | | | -1.61 | |
| (20,100) | | GLACIER BANCORP INC | | USD | | | (887 | ) | | | 67 | | | | 67 | | | | -4.91 | |
| (1,669) | | GRAHAM HOLDING-B | | USD | | | (754 | ) | | | 7 | | | | 7 | | | | -0.51 | |
| (6,500) | | GOOSEHEAD INSU-A | | USD | | | (807 | ) | | | 7 | | | | 7 | | | | -0.51 | |
| (14,400) | | HOWARD HUGHES CORP/THE | | USD | | | (1,026 | ) | | | (21 | ) | | | (21 | ) | | | 1.54 | |
| (41,300) | | HOME BANCSHARES INC | | USD | | | (815 | ) | | | 45 | | | | 45 | | | | -3.30 | |
| (88,800) | | H&R BLOCK INC | | USD | | | (1,565 | ) | | | (105 | ) | | | (105 | ) | | | 7.70 | |
| (2,300) | | IDACORP INC | | USD | | | (217 | ) | | | 9 | | | | 9 | | | | -0.66 | |
| (6,000) | | IMMUNOVANT INC | | USD | | | (316 | ) | | | 21 | | | | 21 | | | | -1.54 | |
| (18,300) | | INSMED INC | | USD | | | (671 | ) | | | (43 | ) | | | (43 | ) | | | 3.15 | |
| (3,400) | | INSPIRE MEDICAL | | USD | | | (591 | ) | | | (40 | ) | | | (40 | ) | | | 2.93 | |
| (73,700) | | JETBLUE AIRWAYS CORP | | USD | | | (1,090 | ) | | | (22 | ) | | | (22 | ) | | | 1.61 | |
| (4,500) | | KINSALE CAPITAL GROUP INC | | USD | | | (1,006 | ) | | | (75 | ) | | | (75 | ) | | | 5.50 | |
| (4,100) | | QUAKER CHEMICAL CORP | | USD | | | (1,060 | ) | | | 47 | | | | 47 | | | | -3.45 | |
| (10,800) | | OPEN LENDING CORP - CL A | | USD | | | (325 | ) | | | 21 | | | | 21 | | | | -1.54 | |
| (170,800) | | Lumen Technologies | | USD | | | (1,720 | ) | | | (108 | ) | | | (108 | ) | | | 7.92 | |
| (21,800) | | LIVE NATION ENTE | | USD | | | (1,489 | ) | | | 58 | | | | 58 | | | | -4.25 | |
| (8,600) | | MERCURY SYSTEMS INC | | USD | | | (591 | ) | | | (22 | ) | | | (22 | ) | | | 1.61 | |
| (700) | | MIRATI THERAPEUTICS INC | | USD | | | (160 | ) | | | (6 | ) | | | (6 | ) | | | 0.44 | |
| (4,600) | | NEW FORTRESS ENERGY INC | | USD | | | (172 | ) | | | (27 | ) | | | (27 | ) | | | 1.98 | |
| (28,500) | | NEW JERSEY RESOURCES CORP | | USD | | | (1,066 | ) | | | 125 | | | | 125 | | | | -9.16 | |
| (8,500) | | NIKOLA CORP | | USD | | | (186 | ) | | | 12 | | | | 12 | | | | -0.88 | |
| (88,900) | | NEW RESIDENT | | USD | | | (767 | ) | | | (56 | ) | | | (56 | ) | | | 4.11 | |
| (8,200) | | NUTANIX INC - A | | USD | | | (219 | ) | | | (6 | ) | | | (6 | ) | | | 0.44 | |
| (10,800) | | ONEOK INC | | USD | | | (349 | ) | | | (38 | ) | | | (38 | ) | | | 2.79 | |
| (8,600) | | 1LIFE HEALTHCARE INC | | USD | | | (282 | ) | | | — | | | | — | | | | 0.00 | |
| (2,200) | | ORMAT TECHNOLOGIES INC | | USD | | | (180 | ) | | | 6 | | | | 6 | | | | -0.44 | |
| (41,100) | | OWL ROCK CAPITAL CORP | | USD | | | (559 | ) | | | 3 | | | | 3 | | | | -0.22 | |
| (152,200) | | P G & E CORP | | USD | | | (1,756 | ) | | | (177 | ) | | | (177 | ) | | | 12.98 | |
| (8,700) | | PENNYMAC FINANCI | | USD | | | (495 | ) | | | (7 | ) | | | (7 | ) | | | 0.51 | |
| (84,000) | | PARK HOTELS & RESORTS INC | | USD | | | (1,216 | ) | | | (155 | ) | | | (155 | ) | | | 11.36 | |
| (19,500) | | PINNACLE FINL | | USD | | | (1,081 | ) | | | 22 | | | | 22 | | | | -1.61 | |
| (8,100) | | REATA PHARMACE-A | | USD | | | (1,380 | ) | | | 143 | | | | 143 | | | | -10.48 | |
| (5,400) | | ROYAL GOLD INC | | USD | | | (617 | ) | | | 20 | | | | 20 | | | | -1.47 | |
| (9,300) | | ROCKET COS INC-CLASS A | | USD | | | (211 | ) | | | 18 | | | | 18 | | | | -1.32 | |
| (4,700) | | ROKU INC | | USD | | | (1,094 | ) | | | (286 | ) | | | (286 | ) | | | 20.97 | |
| (33,484) | | ROOT INC/OH -CLASS A | | USD | | | (573 | ) | | | (20 | ) | | | (20 | ) | | | 1.47 | |
| (55,300) | | SABRE CORP | | USD | | | (544 | ) | | | (79 | ) | | | (79 | ) | | | 5.79 | |
| (9,500) | | SAGE THERAPEUTICS INC | | USD | | | (698 | ) | | | (6 | ) | | | (6 | ) | | | 0.44 | |
| (113) | | SEABOARD CORP | | USD | | | (361 | ) | | | (1 | ) | | | (1 | ) | | | 0.07 | |
| (5,100) | | SVB FINANCIAL GROUP | | USD | | | (1,809 | ) | | | 50 | | | | 50 | | | | -3.67 | |
| (1,300) | | SNOWFLAKE INC-CLASS A | | USD | | | (314 | ) | | | (109 | ) | | | (109 | ) | | | 7.99 | |
| (25,700) | | SPIRIT AEROSYS-A | | USD | | | (832 | ) | | | (42 | ) | | | (42 | ) | | | 3.08 | |
| (42,200) | | SUNPOWER CORP | | USD | | | (833 | ) | | | (103 | ) | | | (103 | ) | | | 7.55 | |
| | |
| 8 | | SEI Institutional Investments Trust / Semi-Annual Report / November 30, 2020 |
SCHEDULE OF INVESTMENTS (Unaudited)
November 30, 2020
Large Cap Disciplined Equity Fund (Continued)
| | | | | | | | | | | | | | | | | | | | |
| Shares | | Description | | Currency | | Notional
Amount
(Thousands) | | | Net Unrealized
Appreciation
(Depreciation)
(Thousands) | | | Fair Value
(Thousands) | | | Percentage Value of
Underlying Investment | |
| (16,600) | | SPIRE INC | | USD | | $ | (1,058 | ) | | $ | (3 | ) | | $ | (3 | ) | | | 0.22 | % |
| (3,500) | | STAMPS.COM INC | | USD | | | (633 | ) | | | (23 | ) | | | (23 | ) | | | 1.69 | |
| (2,200) | | SPRINGWORKS THER | | USD | | | (152 | ) | | | 8 | | | | 8 | | | | -0.59 | |
| (13,800) | | SOUTHWEST GAS HO | | USD | | | (972 | ) | | | 77 | | | | 77 | | | | -5.65 | |
| (4,100) | | TEXAS CAPITAL BA | | USD | | | (233 | ) | | | 4 | | | | 4 | | | | -0.29 | |
| (6,300) | | TCF FINANCIAL CORP | | USD | | | (212 | ) | | | (2 | ) | | | (2 | ) | | | 0.15 | |
| (4,200) | | THOR INDUSTRIES INC | | USD | | | (373 | ) | | | (32 | ) | | | (32 | ) | | | 2.35 | |
| (9,200) | | TAYLOR MORRISON HOME CORP | | USD | | | (228 | ) | | | (5 | ) | | | (5 | ) | | | 0.37 | |
| (10,200) | | TOOTSIE ROLL INDS | | USD | | | (331 | ) | | | 15 | | | | 15 | | | | -1.10 | |
| (3,400) | | TRUPANION INC | | USD | | | (306 | ) | | | (38 | ) | | | (38 | ) | | | 2.79 | |
| (1,800) | | TWIST BIOSCIENCE CORP | | USD | | | (188 | ) | | | (14 | ) | | | (14 | ) | | | 1.03 | |
| (3,568) | | UNITED AIRLINES | | USD | | | (146 | ) | | | (41 | ) | | | (41 | ) | | | 3.01 | |
| (75,000) | | UMPQUA HOLDINGS CORP | | USD | | | (1,091 | ) | | | 34 | | | | 34 | | | | -2.49 | |
| (7,400) | | VIR BIOTECHNOLOGY INC | | USD | | | (198 | ) | | | (38 | ) | | | (38 | ) | | | 2.79 | |
| (20,300) | | VORNADO REALTY TRUST | | USD | | | (811 | ) | | | 10 | | | | 10 | | | | -0.73 | |
| (3,900) | | VROOM INC | | USD | | | (131 | ) | | | (9 | ) | | | (9 | ) | | | 0.66 | |
| (12,600) | | VERTIV HOLDINGS CO | | USD | | | (230 | ) | | | (6 | ) | | | (6 | ) | | | 0.44 | |
| (11,600) | | VIASAT INC | | USD | | | (425 | ) | | | 31 | | | | 31 | | | | -2.27 | |
| (78,200) | | Vistra Corp. | | USD | | | (1,548 | ) | | | 87 | | | | 87 | | | | -6.38 | |
| (15,200) | | VIVINT SMART HOME INC | | USD | | | (310 | ) | | | (25 | ) | | | (25 | ) | | | 1.82 | |
| (29,700) | | ESSENTIAL UTILITIES INC | | USD | | | (1,360 | ) | | | 9 | | | | 9 | | | | -0.67 | |
| | | | | | | | |
| | | | | | | $ (65,984) | | | $ (1,364) | | | $ (1,364) | | | 100.00% | |
| | | | | | | | |
Percentages are based on a Net Assets of $1,515,192 ($ Thousands).
| * | Non-income producing security. |
| ** | The rate reported is the 7-day effective yield as of November 30, 2020. |
| ‡ | Real Estate Investment Trust. |
| † | Investment in Affiliated Security (see Note 6). |
| (A) | Certain securities or partial positions of certain securities are on loan at November 30, 2020 (see Note 12). The total market value of securities on loan at November 30, 2020, was $83 ($ Thousands). |
| (B) | Security is a Master Limited Partnership. At November 30, 2020, such securities amounted to $247 ($ Thousands), or 0.0% of Net Assets (see Note 2). |
| (C) | This security was purchased with cash collateral held from securities on loan (see Note 12). The total market value of such securities as of November 30, 2020 was $48 ($ Thousands). |
ADR — American Depositary Receipt
Cl — Class
L.P. — Limited Partnership
Ltd. — Limited
MSCI — Morgan Stanley Capital International
PLC — Public Limited Company
REIT — Real Estate investment Trust
S&P— Standard & Poor’s
SPX — Standard & Poor’s 500 Index
The following is a list of the level of inputs used as of November 30, 2020, in valuing the Fund’s investments carried at value ($ Thousands):
| | | | | | | | | | | | | | | | |
| | | | | |
| Investments in Securities | | Level 1 ($) | | | Level 2 ($) | | | Level 3 ($) | | | Total ($) | |
Common Stock | | | 1,377,907 | | | | — | | | | — | | | | 1,377,907 | |
U.S. Treasury Obligation | | | — | | | | 120 | | | | — | | | | 120 | |
Affiliated Partnership | | | — | | | | 48 | | | | — | | | | 48 | |
Cash Equivalent | | | 84,155 | | | | — | | | | — | | | | 84,155 | |
| | | | | | | | | | | | | | | | |
Total Investments in Securities | | | 1,462,062 | | | | 168 | | | | — | | | | 1,462,230 | |
| | | | | | | | | | | | | | | | |
| | | | |
| | | | | | | | | | | | | |
| | | | | |
| Other Financial Instruments | | Level 1 ($) | | | Level 2 ($) | | | Level 3 ($) | | | Total ($) | |
Futures Contracts* | | | | | | | | | | | | | | | | |
Unrealized Appreciation | | | 2,842 | | | | — | | | | — | | | | 2,842 | |
Total Return Swaps* | | | | | | | | | | | | | | | | |
Unrealized Depreciation | | | — | | | | (975 | ) | | | — | | | | (975 | ) |
| | | | | | | | | | | | | | | | |
Total Other Financial Instruments | | | 2,842 | | | | (975 | ) | | | — | | | | 1,867 | |
| | | | | | | | | | | | | | | | |
* Futures contracts are valued at the unrealized appreciation on the instrument.
For the period ended November 30, 2020, there were no transfers in or out of Level 3.
For more information on valuation inputs, see Note 2 – Significant Accounting Policies in Notes to Financial Statements.
| | |
| SEI Institutional Investments Trust / Semi-Annual Report / November 30, 2020 | | 9 |
SCHEDULE OF INVESTMENTS (Unaudited)
November 30, 2020
Large Cap Disciplined Equity Fund (Continued)
The following is a summary of the Fund’s transactions with affiliates for the period ended November 30, 2020 ($ Thousands):
| | | | | | | | | | | | | | | | | | |
| | | | | | | | | | |
Security
Description | | Value 5/31/2020 | | Purchases at Cost | | Proceeds from
Sales | | Realized Gain/
(Loss) | | Change in
Unrealized
Appreciation/
(Depreciation) | | Value
11/30/2020 | | Shares | | Income | | Capital Gains |
SEI Liquidity Fund, L.P. | | $22,577 | | $60,460 | | $(82,985) | | $1 | | $(5) | | $48 | | 49,583 | | $7 | | $— |
SEI Daily Income Trust, Government Fund, Cl F | | 37,160 | | 326,427 | | (279,432) | | — | | — | | 84,155 | | 84,155,071 | | 4 | | — |
| | | | | | | | | | | | | | | | | | |
Totals | | $59,737 | | $386,887 | | $(362,417) | | $1 | | $(5) | | $84,203 | | | | $11 | | $— |
| | | | | | | | | | | | | | | | | | |
Amounts designated as “—” are $0 or have been rounded to $ 0.
The accompanying notes are an integral part of the financial statements.
| | |
| 10 | | SEI Institutional Investments Trust / Semi-Annual Report / November 30, 2020 |
SCHEDULE OF INVESTMENTS (Unaudited)
November 30, 2020
Large Cap Index Fund (Continued)
| | | | | | | | |
| | | |
| Description | | Shares | | Market Value ($ Thousands) |
COMMON STOCK — 99.3% | |
| |
Communication Services — 10.3% | | | | | |
Activision Blizzard Inc | | | 46,356 | | | $ | 3,684 | |
Alphabet Inc, Cl A * | | | 18,129 | | | | 31,805 | |
Alphabet Inc, Cl C * | | | 17,899 | | | | 31,515 | |
Altice USA Inc, Cl A *(A) | | | 18,500 | | | | 627 | |
AT&T Inc | | | 425,785 | | | | 12,241 | |
Cable One Inc | | | 357 | | | | 707 | |
CenturyLink Inc | | | 62,106 | | | | 649 | |
Charter Communications Inc, Cl A * | | | 8,797 | | | | 5,735 | |
Comcast Corp, Cl A | | | 273,150 | | | | 13,723 | |
Discovery Inc, Cl A *(A) | | | 8,000 | | | | 215 | |
Discovery Inc, Cl C * | | | 23,300 | | | | 560 | |
DISH Network Corp, Cl A * | | | 15,226 | | | | 546 | |
Electronic Arts Inc | | | 17,365 | | | | 2,219 | |
Facebook Inc, Cl A * | | | 144,900 | | | | 40,133 | |
Fox Corp | | | 31,527 | | | | 905 | |
GCI Liberty Inc * | | | 4,949 | | | | 451 | |
IAC/InterActiveCorp * | | | 4,532 | | | | 643 | |
Interpublic Group of Cos Inc/The | | | 23,275 | | | | 518 | |
John Wiley & Sons Inc, Cl A | | | 3,842 | | | | 133 | |
Liberty Broadband Corp, Cl A * | | | 1,280 | | | | 201 | |
Liberty Broadband Corp, Cl C * | | | 7,008 | | | | 1,103 | |
Liberty Media Corp-Liberty Formula One, Cl A * | | | 1,600 | | | | 60 | |
Liberty Media Corp-Liberty Formula One, Cl C * | | | 12,200 | | | | 510 | |
Liberty Media Corp-Liberty SiriusXM, Cl A * | | | 4,020 | | | | 165 | |
Liberty Media Corp-Liberty SiriusXM, Cl C * | | | 9,721 | | | | 399 | |
Lions Gate Entertainment Corp, Cl A *(A) | | | 4,900 | | | | 48 | |
Lions Gate Entertainment Corp, Cl B * | | | 10,883 | | | | 98 | |
Live Nation Entertainment Inc * | | | 7,300 | | | | 479 | |
Madison Square Garden Entertainment Corp * | | | 1,086 | | | | 82 | |
Madison Square Garden Sports Corp, Cl A * | | | 1,086 | | | | 184 | |
Match Group Inc * | | | 13,296 | | | | 1,851 | |
Netflix Inc * | | | 25,700 | | | | 12,611 | |
New York Times Co/The, Cl A (A) | | | 8,800 | | | | 378 | |
News Corp | | | 10,800 | | | | 192 | |
News Corp, Cl A | | | 25,546 | | | | 451 | |
Nexstar Media Group Inc, Cl A | | | 2,400 | | | | 253 | |
Omnicom Group Inc | | | 12,744 | | | | 803 | |
Roku Inc, Cl A * | | | 6,200 | | | | 1,820 | |
Sirius XM Holdings Inc (A) | | | 79,600 | | | | 517 | |
Spotify Technology SA * | | | 8,100 | | | | 2,360 | |
Take-Two Interactive Software Inc * | | | 7,300 | | | | 1,318 | |
Telephone and Data Systems Inc | | | 4,280 | | | | 81 | |
T-Mobile US Inc * | | | 33,892 | | | | 4,506 | |
TripAdvisor Inc * | | | 5,767 | | | | 150 | |
Twitter Inc * | | | 45,560 | | | | 2,119 | |
United States Cellular Corp * | | | 831 | | | | 26 | |
Verizon Communications Inc | | | 250,676 | | | | 15,143 | |
ViacomCBS Inc | | | 715 | | | | 26 | |
| | | | | | | | |
| | | |
| Description | | Shares | | Market Value ($ Thousands) |
COMMON STOCK (continued) | |
ViacomCBS Inc, Cl B | | | 32,786 | | | $ | 1,157 | |
Walt Disney Co/The * | | | 108,950 | | | | 16,126 | |
World Wrestling Entertainment Inc, Cl A | | | 2,200 | | | | 95 | |
Zillow Group Inc, Cl A * | | | 2,643 | | | | 292 | |
Zillow Group Inc, Cl C * | | | 8,286 | | | | 893 | |
Zynga Inc, Cl A * | | | 50,500 | | | | 417 | |
| | |
| | | | | | | 213,923 | |
| |
Consumer Discretionary — 12.2% | | | | | |
Advance Auto Parts Inc | | | 3,508 | | | | 518 | |
Amazon.com Inc * | | | 25,489 | | | | 80,750 | |
Aptiv PLC * | | | 16,900 | | | | 2,006 | |
Aramark | | | 15,300 | | | | 535 | |
AutoNation Inc * | | | 3,032 | | | | 186 | |
AutoZone Inc * | | | 1,307 | | | | 1,487 | |
Best Buy Co Inc | | | 13,347 | | | | 1,452 | |
Booking Holdings Inc * | | | 2,432 | | | | 4,933 | |
BorgWarner Inc | | | 12,764 | | | | 496 | |
Bright Horizons Family Solutions Inc * | | | 3,600 | | | | 612 | |
Brunswick Corp/DE | | | 3,500 | | | | 261 | |
Burlington Stores Inc * | | | 3,700 | | | | 809 | |
Capri Holdings Ltd * | | | 7,300 | | | | 258 | |
CarMax Inc * | | | 9,760 | | | | 912 | |
Carnival Corp, Cl A * | | | 23,300 | | | | 466 | |
Carter’s Inc * | | | 3,300 | | | | 294 | |
Carvana Co, Cl A *(A) | | | 3,400 | | | | 851 | |
Chegg Inc * | | | 7,400 | | | | 577 | |
Chipotle Mexican Grill Inc, Cl A * | | | 1,619 | | | | 2,088 | |
Choice Hotels International Inc * | | | 1,884 | | | | 188 | |
Columbia Sportswear Co * | | | 2,300 | | | | 188 | |
Darden Restaurants Inc | | | 6,922 | | | | 747 | |
Dick’s Sporting Goods Inc | | | 5,458 | | | | 310 | |
Dollar General Corp | | | 15,500 | | | | 3,388 | |
Dollar Tree Inc * | | | 13,234 | | | | 1,446 | |
Domino’s Pizza Inc | | | 2,400 | | | | 942 | |
DR Horton Inc | | | 20,368 | | | | 1,517 | |
Dunkin’ Brands Group Inc | | | 5,500 | | | | 585 | |
eBay Inc | | | 41,011 | | | | 2,068 | |
Etsy Inc * | | | 6,700 | | | | 1,077 | |
Expedia Group Inc * | | | 7,822 | | | | 974 | |
Extended Stay America Inc | | | 7,600 | | | | 104 | |
Five Below Inc * | | | 3,000 | | | | 469 | |
Floor & Decor Holdings Inc, Cl A * | | | 4,800 | | | | 384 | |
Foot Locker Inc | | | 5,869 | | | | 220 | |
Ford Motor Co * | | | 237,284 | | | | 2,155 | |
frontdoor Inc * | | | 4,700 | | | | 222 | |
Gap Inc/The | | | 15,021 | | | | 315 | |
Garmin Ltd | | | 8,700 | | | | 1,016 | |
General Motors Co * | | | 72,600 | | | | 3,183 | |
Gentex Corp | | | 12,864 | | | | 419 | |
Genuine Parts Co | | | 9,511 | | | | 936 | |
Graham Holdings Co, Cl B | | | 157 | | | | 70 | |
Grand Canyon Education Inc * | | | 2,300 | | | | 192 | |
| | |
| SEI Institutional Investments Trust / Semi-Annual Report / November 30, 2020 | | 1 |
SCHEDULE OF INVESTMENTS (Unaudited)
November 30, 2020
Large Cap Index Fund (Continued)
| | | | | | | | |
| | | |
| Description | | Shares | | Market Value ($ Thousands) |
COMMON STOCK (continued) | |
Grubhub Inc * | | | 4,800 | | | $ | 338 | |
H&R Block Inc | | | 11,725 | | | | 220 | |
Hanesbrands Inc | | | 19,972 | | | | 284 | |
Harley-Davidson Inc | | | 10,003 | | | | 403 | |
Hasbro Inc | | | 7,067 | | | | 657 | |
Hilton Worldwide Holdings Inc * | | | 16,633 | | | | 1,724 | |
Home Depot Inc/The | | | 65,015 | | | | 18,036 | |
Hyatt Hotels Corp, Cl A * | | | 2,600 | | | | 187 | |
Kohl’s Corp * | | | 10,319 | | | | 332 | |
L Brands Inc * | | | 11,357 | | | | 441 | |
Las Vegas Sands Corp * | | | 21,893 | | | | 1,220 | |
Lear Corp | | | 3,600 | | | | 515 | |
Leggett & Platt Inc | | | 7,212 | | | | 311 | |
Lennar Corp, Cl A | | | 16,790 | | | | 1,274 | |
Lennar Corp, Cl B | | | 1,713 | | | | 104 | |
LKQ Corp * | | | 18,400 | | | | 648 | |
Lowe’s Cos Inc | | | 45,710 | | | | 7,123 | |
Lululemon Athletica Inc * | | | 7,000 | | | | 2,592 | |
Marriott International Inc/MD, Cl A * | | | 16,294 | | | | 2,067 | |
Mattel Inc * | | | 19,842 | | | | 307 | |
McDonald’s Corp | | | 45,280 | | | | 9,846 | |
MGM Resorts International | | | 29,739 | | | | 840 | |
Mohawk Industries Inc * | | | 2,766 | | | | 348 | |
Newell Brands Inc | | | 27,193 | | | | 578 | |
NIKE Inc, Cl B | | | 73,568 | | | | 9,910 | |
Nordstrom Inc *(A) | | | 6,912 | | | | 179 | |
Norwegian Cruise Line Holdings Ltd *(A) | | | 12,400 | | | | 284 | |
NVR Inc * | | | 184 | | | | 735 | |
Ollie’s Bargain Outlet Holdings Inc *(A) | | | 2,800 | | | | 247 | |
O’Reilly Automotive Inc * | | | 4,440 | | | | 1,964 | |
Peloton Interactive Inc, Cl A * | | | 6,000 | | | | 698 | |
Penske Automotive Group Inc | | | 1,800 | | | | 99 | |
Pinterest Inc, Cl A * | | | 24,700 | | | | 1,729 | |
Planet Fitness Inc, Cl A * | | | 4,700 | | | | 343 | |
Polaris Inc | | | 2,700 | | | | 259 | |
Pool Corp | | | 2,500 | | | | 865 | |
PulteGroup Inc | | | 16,145 | | | | 704 | |
PVH Corp * | | | 3,300 | | | | 262 | |
Qurate Retail Inc * | | | 28,230 | | | | 296 | |
Ralph Lauren Corp, Cl A * | | | 3,180 | | | | 273 | |
Ross Stores Inc * | | | 20,176 | | | | 2,169 | |
Royal Caribbean Cruises Ltd * | | | 10,000 | | | | 788 | |
Service Corp International/US | | | 10,894 | | | | 530 | |
Six Flags Entertainment Corp * | | | 3,500 | | | | 108 | |
Skechers USA Inc, Cl A * | | | 8,500 | | | | 284 | |
Starbucks Corp | | | 69,312 | | | | 6,794 | |
Tapestry Inc * | | | 13,967 | | | | 396 | |
Target Corp | | | 30,185 | | | | 5,419 | |
Tempur Sealy International Inc * | | | 6,800 | | | | 171 | |
Terminix Global Holdings * | | | 6,200 | | | | 304 | |
Tesla Inc * | | | 44,685 | | | | 25,363 | |
Thor Industries Inc (A) | | | 3,300 | | | | 318 | |
| | | | | | | | |
| | | |
| Description | | Shares | | Market Value ($ Thousands) |
COMMON STOCK (continued) | |
Tiffany & Co | | | 7,125 | | | $ | 937 | |
TJX Cos Inc/The | | | 73,616 | | | | 4,675 | |
Toll Brothers Inc | | | 8,751 | | | | 414 | |
Tractor Supply Co | | | 7,400 | | | | 1,042 | |
Ulta Beauty Inc * | | | 3,152 | | | | 868 | |
Under Armour Inc, Cl A * | | | 10,700 | | | | 177 | |
Under Armour Inc, Cl C * | | | 8,821 | | | | 128 | |
Vail Resorts Inc * | | | 2,100 | | | | 579 | |
VF Corp | | | 19,968 | | | | 1,665 | |
Wayfair Inc, Cl A *(A) | | | 3,800 | | | | 967 | |
Wendy’s Co/The | | | 13,075 | | | | 288 | |
Whirlpool Corp | | | 3,716 | | | | 723 | |
Williams-Sonoma Inc | | | 5,162 | | | | 565 | |
Wyndham Destinations Inc | | | 4,768 | | | | 201 | |
Wyndham Hotels & Resorts Inc | | | 5,768 | | | | 332 | |
Wynn Resorts Ltd * | | | 5,196 | | | | 522 | |
Yum China Holdings Inc | | | 22,448 | | | | 1,266 | |
Yum! Brands Inc | | | 18,348 | | | | 1,9412 | |
| | |
| | | | | | | 251,783 | |
| |
Consumer Staples — 6.2% | | | | | |
Altria Group Inc | | | 114,340 | | | | 4,554 | |
Archer-Daniels-Midland Co | | | 34,479 | | | | 1,716 | |
Beyond Meat Inc *(A) | | | 2,700 | | | | 378 | |
Boston Beer Co Inc/The, Cl A *(A) | | | 500 | | | | 465 | |
Brown-Forman Corp, Cl A | | | 2,200 | | | | 162 | |
Brown-Forman Corp, Cl B | | | 9,817 | | | | 792 | |
Bunge Ltd | | | 8,800 | | | | 518 | |
Campbell Soup Co | | | 8,978 | | | | 449 | |
Casey’s General Stores Inc | | | 1,900 | | | | 345 | |
Church & Dwight Co Inc | | | 15,314 | | | | 1,344 | |
Clorox Co/The (A) | | | 7,103 | | | | 1,442 | |
Coca-Cola Co/The | | | 230,740 | | | | 11,906 | |
Colgate-Palmolive Co | | | 50,150 | | | | 4,295 | |
Conagra Brands Inc | | | 28,376 | | | | 1,037 | |
Constellation Brands Inc, Cl A | | | 9,331 | | | | 1,921 | |
Costco Wholesale Corp | | | 26,581 | | | | 10,414 | |
Coty Inc, Cl A * | | | 14,922 | | | | 107 | |
Energizer Holdings Inc (A) | | | 2,941 | | | | 123 | |
Estee Lauder Cos Inc/The, Cl A | | | 13,808 | | | | 3,387 | |
Flowers Foods Inc | | | 10,325 | | | | 229 | |
General Mills Inc | | | 36,692 | | | | 2,232 | |
Grocery Outlet Holding Corp * | | | 3,800 | | | | 147 | |
Hain Celestial Group Inc/The * | | | 3,300 | | | | 127 | |
Herbalife Nutrition Ltd * | | | 6,500 | | | | 311 | |
Hershey Co/The | | | 9,298 | | | | 1,375 | |
Hormel Foods Corp (A) | | | 16,756 | | | | 791 | |
Ingredion Inc | | | 4,100 | | | | 316 | |
J M Smucker Co/The | | | 6,311 | | | | 740 | |
Kellogg Co | | | 15,403 | | | | 984 | |
Keurig Dr Pepper Inc | | | 21,000 | | | | 640 | |
Kimberly-Clark Corp | | | 20,718 | | | | 2,886 | |
Kraft Heinz Co/The | | | 39,402 | | | | 1,298 | |
| | |
| 2 | | SEI Institutional Investments Trust / Semi-Annual Report / November 30, 2020 |
SCHEDULE OF INVESTMENTS (Unaudited)
November 30, 2020
Large Cap Index Fund (Continued)
| | | | | | | | |
| | | |
| Description | | Shares | | Market Value ($ Thousands) |
COMMON STOCK (continued) | |
Kroger Co/The | | | 48,646 | | | $ | 1,605 | |
Lamb Weston Holdings Inc | | | 8,362 | | | | 605 | |
McCormick & Co Inc/MD | | | 7,693 | | | | 1,438 | |
Molson Coors Beverage Co, Cl B * | | | 11,962 | | | | 550 | |
Mondelez International Inc, Cl A | | | 86,806 | | | | 4,987 | |
Monster Beverage Corp * | | | 22,987 | | | | 1,949 | |
Nu Skin Enterprises Inc, Cl A | | | 3,900 | | | | 201 | |
PepsiCo Inc | | | 82,852 | | | | 11,950 | |
Philip Morris International Inc | | | 93,568 | | | | 7,088 | |
Pilgrim’s Pride Corp * | | | 400 | | | | 8 | |
Post Holdings Inc * | | | 3,800 | | | | 359 | |
Procter & Gamble Co/The | | | 147,254 | | | | 20,449 | |
Reynolds Consumer Products Inc | | | 5,200 | | | | 158 | |
Seaboard Corp | | | 16 | | | | 51 | |
Spectrum Brands Holdings Inc | | | 2,918 | | | | 195 | |
Sprouts Farmers Market Inc * | | | 9,000 | | | | 191 | |
Sysco Corp | | | 28,348 | | | | 2,021 | |
TreeHouse Foods Inc * | | | 3,000 | | | | 123 | |
Tyson Foods Inc, Cl A | | | 18,565 | | | | 1,211 | |
US Foods Holding Corp * | | | 13,000 | | | | 409 | |
Walgreens Boots Alliance Inc | | | 42,825 | | | | 1,628 | |
Walmart Inc | | | 83,179 | | | | 12,709 | |
| | |
| | | | | | | 127,316 | |
| |
Energy — 2.1% | | | | | |
Antero Midstream Corp | | | 10,700 | | | | 72 | |
Apache Corp | | | 21,559 | | | | 278 | |
Baker Hughes Co, Cl A | | | 38,040 | | | | 712 | |
Cabot Oil & Gas Corp, Cl A | | | 23,700 | | | | 415 | |
Cheniere Energy Inc * | | | 13,600 | | | | 771 | |
Chevron Corp | | | 115,498 | | | | 10,069 | |
Cimarex Energy Co | | | 6,900 | | | | 248 | |
Concho Resources Inc | | | 13,424 | | | | 772 | |
ConocoPhillips | | | 65,976 | | | | 2,610 | |
Continental Resources Inc/OK * | | | 5,300 | | | | 81 | |
Devon Energy Corp | | | 20,413 | | | | 286 | |
Diamondback Energy Inc | | | 8,717 | | | | 348 | |
EOG Resources Inc | | | 35,090 | | | | 1,645 | |
EQT Corp * | | | 11,619 | | | | 173 | |
Equitrans Midstream Corp | | | 16,495 | | | | 135 | |
Exxon Mobil Corp | | | 255,138 | | | | 9,729 | |
Halliburton Co | | | 51,036 | | | | 847 | |
Helmerich & Payne Inc | | | 6,550 | | | | 149 | |
Hess Corp | | | 18,512 | | | | 873 | |
HollyFrontier Corp | | | 7,026 | | | | 164 | |
Kinder Morgan Inc | | | 125,122 | | | | 1,799 | |
Marathon Oil Corp | | | 48,376 | | | | 286 | |
Marathon Petroleum Corp | | | 38,419 | | | | 1,494 | |
Murphy Oil Corp | | | 5,354 | | | | 54 | |
National Oilwell Varco Inc * | | | 23,180 | | | | 284 | |
Occidental Petroleum Corp | | | 49,819 | | | | 785 | |
ONEOK Inc | | | 24,558 | | | | 881 | |
Parsley Energy Inc, Cl A | | | 17,300 | | | | 217 | |
| | | | | | | | |
| | | |
| Description | | Shares | | Market Value ($ Thousands) |
COMMON STOCK (continued) | |
Phillips 66 | | | 26,288 | | | $ | 1,593 | |
Pioneer Natural Resources Co | | | 10,844 | | | | 1,091 | |
Schlumberger NV | | | 82,255 | | | | 1,710 | |
Targa Resources Corp | | | 14,800 | | | | 348 | |
Valero Energy Corp | | | 22,636 | | | | 1,217 | |
Williams Cos Inc/The | | | 69,796 | | | | 1,464 | |
WPX Energy Inc * | | | 23,648 | | | | 168 | |
| | |
| | | | | | | 43,768 | |
| |
Financials — 10.3% | | | | | |
Affiliated Managers Group Inc | | | 3,220 | | | | 281 | |
Aflac Inc | | | 41,012 | | | | 1,802 | |
AGNC Investment Corp ‡ | | | 34,059 | | | | 520 | |
Alleghany Corp * | | | 999 | | | | 575 | |
Allstate Corp/The | | | 18,925 | | | | 1,937 | |
Ally Financial Inc | | | 23,500 | | | | 697 | |
American Express Co | | | 40,234 | | | | 4,771 | |
American Financial Group Inc/OH | | | 4,114 | | | | 368 | |
American International Group Inc | | | 51,923 | | | | 1,996 | |
American National Group Inc | | | 822 | | | | 70 | |
Ameriprise Financial Inc | | | 7,680 | | | | 1,423 | |
Annaly Capital Management Inc ‡ | | | 86,211 | | | | 690 | |
Aon PLC, Cl A | | | 13,878 | | | | 2,843 | |
Apollo Global Management Inc, Cl A | | | 10,500 | | | | 458 | |
Arch Capital Group Ltd * | | | 22,600 | | | | 728 | |
Ares Management Corp, Cl A | | | 6,000 | | | | 270 | |
Arthur J Gallagher & Co | | | 11,104 | | | | 1,282 | |
Associated Banc-Corp | | | 7,284 | | | | 112 | |
Assurant Inc | | | 4,193 | | | | 541 | |
Assured Guaranty Ltd | | | 4,700 | | | | 142 | |
Athene Holding Ltd, Cl A * | | | 9,400 | | | | 417 | |
Axis Capital Holdings Ltd | | | 4,800 | | | | 241 | |
Bank of America Corp | | | 462,063 | | | | 13,012 | |
Bank of Hawaii Corp | | | 2,282 | | | | 171 | |
Bank of New York Mellon Corp/The | | | 48,309 | | | | 1,890 | |
Bank OZK | | | 6,400 | | | | 179 | |
Berkshire Hathaway Inc, Cl B * | | | 115,600 | | | | 26,462 | |
BlackRock Inc, Cl A | | | 8,985 | | | | 6,275 | |
BOK Financial Corp | | | 2,475 | | | | 166 | |
Brighthouse Financial Inc * | | | 7,728 | | | | 271 | |
Brown & Brown Inc | | | 13,948 | | | | 628 | |
Capital One Financial Corp | | | 27,725 | | | | 2,374 | |
Carlyle Group Inc/The | | | 7,100 | | | | 202 | |
Cboe Global Markets Inc | | | 6,600 | | | | 603 | |
Charles Schwab Corp/The | | | 84,381 | | | | 4,116 | |
Chubb Ltd | | | 26,891 | | | | 3,975 | |
Cincinnati Financial Corp | | | 8,986 | | | | 686 | |
Citigroup Inc | | | 123,504 | | | | 6,801 | |
Citizens Financial Group Inc | | | 26,700 | | | | 872 | |
CME Group Inc, Cl A | | | 21,570 | | | | 3,775 | |
CNA Financial Corp | | | 3,100 | | | | 107 | |
Comerica Inc | | | 8,953 | | | | 441 | |
Commerce Bancshares Inc/MO | | | 7,191 | | | | 474 | |
| | |
| SEI Institutional Investments Trust / Semi-Annual Report / November 30, 2020 | | 3 |
SCHEDULE OF INVESTMENTS (Unaudited)
November 30, 2020
Large Cap Index Fund (Continued)
| | | | | | | | |
| | | |
| Description | | Shares | | Market Value ($ Thousands) |
COMMON STOCK (continued) | |
Credit Acceptance Corp *(A) | | | 500 | | | $ | 149 | |
Cullen/Frost Bankers Inc | | | 3,568 | | | | 299 | |
Discover Financial Services | | | 18,889 | | | | 1,439 | |
East West Bancorp Inc | | | 9,000 | | | | 384 | |
Eaton Vance Corp | | | 6,010 | | | | 403 | |
Equitable Holdings Inc | | | 26,200 | | | | 665 | |
Erie Indemnity Co, Cl A | | | 1,419 | | | | 320 | |
Evercore Inc, Cl A | | | 3,100 | | | | 282 | |
Everest Re Group Ltd | | | 2,500 | | | | 568 | |
FactSet Research Systems Inc | | | 2,300 | | | | 768 | |
Fidelity National Financial Inc | | | 15,152 | | | | 545 | |
Fifth Third Bancorp | | | 43,082 | | | | 1,092 | |
First American Financial Corp | | | 6,900 | | | | 334 | |
First Citizens BancShares Inc/NC, Cl A | | | 500 | | | | 264 | |
First Hawaiian Inc | | | 8,000 | | | | 175 | |
First Horizon Corp | | | 32,956 | | | | 403 | |
First Republic Bank/CA | | | 10,700 | | | | 1,386 | |
FNB Corp/PA | | | 17,100 | | | | 151 | |
Franklin Resources Inc (A) | | | 19,649 | | | | 432 | |
Globe Life Inc | | | 6,487 | | | | 604 | |
Goldman Sachs Group Inc/The | | | 20,175 | | | | 4,652 | |
Hanover Insurance Group Inc/The | | | 2,493 | | | | 280 | |
Hartford Financial Services Group Inc/The | | | 23,710 | | | | 1,048 | |
Huntington Bancshares Inc/OH | | | 55,134 | | | | 666 | |
Interactive Brokers Group Inc, Cl A | | | 5,600 | | | | 295 | |
Intercontinental Exchange Inc | | | 33,200 | | | | 3,503 | |
Invesco Ltd | | | 16,800 | | | | 273 | |
Jefferies Financial Group Inc | | | 16,706 | | | | 380 | |
JPMorgan Chase & Co | | | 182,934 | | | | 21,564 | |
Kemper Corp | | | 3,300 | | | | 247 | |
KeyCorp | | | 59,751 | | | | 924 | |
KKR & Co Inc | | | 32,700 | | | | 1,240 | |
Lazard Ltd, Cl A (B) | | | 6,900 | | | | 258 | |
LendingTree Inc * | | | 400 | | | | 102 | |
Lincoln National Corp | | | 11,688 | | | | 552 | |
Loews Corp | | | 15,936 | | | | 668 | |
LPL Financial Holdings Inc | | | 4,800 | | | | 436 | |
M&T Bank Corp | | | 8,557 | | | | 997 | |
Markel Corp * | | | 790 | | | | 769 | |
MarketAxess Holdings Inc | | | 2,100 | | | | 1,132 | |
Marsh & McLennan Cos Inc | | | 29,965 | | | | 3,435 | |
Mercury General Corp | | | 2,396 | | | | 107 | |
MetLife Inc | | | 44,609 | | | | 2,060 | |
MGIC Investment Corp | | | 18,900 | | | | 226 | |
Moody’s Corp | | | 10,027 | | | | 2,831 | |
Morgan Stanley | | | 80,609 | | | | 4,984 | |
Morningstar Inc | | | 1,000 | | | | 200 | |
MSCI Inc, Cl A | | | 4,700 | | | | 1,924 | |
Nasdaq Inc | | | 7,000 | | | | 896 | |
New Residential Investment Corp ‡ | | | 24,100 | | | | 223 | |
New York Community Bancorp Inc | | | 33,272 | | | | 322 | |
Northern Trust Corp | | | 11,505 | | | | 1,071 | |
| | | | | | | | |
| | | |
| Description | | Shares | | Market Value ($ Thousands) |
COMMON STOCK (continued) | |
Old Republic International Corp | | | 17,490 | | | $ | 313 | |
OneMain Holdings Inc, Cl A | | | 4,700 | | | | 183 | |
PacWest Bancorp | | | 8,200 | | | | 191 | |
People’s United Financial Inc | | | 24,934 | | | | 309 | |
Pinnacle Financial Partners Inc | | | 4,100 | | | | 222 | |
PNC Financial Services Group Inc/The | | | 26,022 | | | | 3,593 | |
Popular Inc | | | 5,853 | | | | 284 | |
Primerica Inc | | | 2,300 | | | | 300 | |
Principal Financial Group Inc | | | 16,308 | | | | 812 | |
Progressive Corp/The | | | 35,480 | | | | 3,091 | |
Prosperity Bancshares Inc | | | 6,000 | | | | 377 | |
Prudential Financial Inc | | | 23,663 | | | | 1,789 | |
Raymond James Financial Inc | | | 7,221 | | | | 657 | |
Regions Financial Corp | | | 59,487 | | | | 908 | |
Reinsurance Group of America Inc, Cl A | | | 4,699 | | | | 542 | |
RenaissanceRe Holdings Ltd | | | 2,600 | | | | 428 | |
Rocket, Cl A *(A) | | | 10,200 | | | | 211 | |
S&P Global Inc | | | 14,756 | | | | 5,191 | |
Santander Consumer USA Holdings Inc *(A) | | | 4,900 | | | | 108 | |
SEI Investments Co † | | | 6,742 | | | | 356 | |
Signature Bank/New York NY | | | 3,100 | | | | 348 | |
SLM Corp | | | 25,914 | | | | 275 | |
Starwood Property Trust Inc ‡ | | | 14,100 | | | | 253 | |
State Street Corp | | | 21,379 | | | | 1,507 | |
Sterling Bancorp/DE | | | 9,300 | | | | 149 | |
SVB Financial Group * | | | 3,200 | | | | 1,104 | |
Synchrony Financial | | | 36,018 | | | | 1,097 | |
Synovus Financial Corp | | | 7,896 | | | | 249 | |
T Rowe Price Group Inc | | | 14,130 | | | | 2,026 | |
TCF Financial Corp | | | 7,076 | | | | 238 | |
TFS Financial Corp | | | 6,200 | | | | 107 | |
Tradeweb Markets Inc, Cl A | | | 5,000 | | | | 298 | |
Travelers Cos Inc/The | | | 15,375 | | | | 1,993 | |
Truist Financial Corp | | | 82,063 | | | | 3,809 | |
Umpqua Holdings Corp | | | 15,800 | | | | 219 | |
Unum Group | | | 11,905 | | | | 265 | |
US Bancorp | | | 83,497 | | | | 3,608 | |
Virtu Financial Inc, Cl A | | | 2,600 | | | | 59 | |
Voya Financial Inc | | | 8,500 | | | | 490 | |
W R Berkley Corp | | | 8,121 | | | | 529 | |
Webster Financial Corp | | | 5,600 | | | | 212 | |
Wells Fargo & Co | | | 224,766 | | | | 6,147 | |
Western Alliance Bancorp | | | 6,500 | | | | 333 | |
White Mountains Insurance Group Ltd | | | 179 | | | | 172 | |
Willis Towers Watson PLC | | | 7,362 | | | | 1,533 | |
Wintrust Financial Corp | | | 2,000 | | | | 109 | |
Zions Bancorp NA | | | 7,802 | | | | 301 | |
| | |
| | | | | | | 211,867 | |
| |
Health Care — 13.5% | | | | | |
10X Genomics Inc, Cl A * | | | 3,300 | | | | 505 | |
Abbott Laboratories | | | 105,137 | | | | 11,378 | |
AbbVie Inc | | | 106,301 | | | | 11,117 | |
| | |
| 4 | | SEI Institutional Investments Trust / Semi-Annual Report / November 30, 2020 |
SCHEDULE OF INVESTMENTS (Unaudited)
November 30, 2020
Large Cap Index Fund (Continued)
| | | | | | | | |
| | | |
| Description | | Shares | | Market Value ($ Thousands) |
COMMON STOCK (continued) | |
ABIOMED Inc * | | | 2,800 | | | $ | 768 | |
Acadia Healthcare Co Inc * | | | 7,100 | | | | 301 | |
ACADIA Pharmaceuticals Inc * | | | 6,700 | | | | 380 | |
Acceleron Pharma Inc * | | | 2,800 | | | | 331 | |
Adaptive Biotechnologies Corp * | | | 5,800 | | | | 280 | |
Agilent Technologies Inc | | | 19,064 | | | | 2,229 | |
Agios Pharmaceuticals Inc * | | | 3,700 | | | | 171 | |
Alexion Pharmaceuticals Inc * | | | 13,700 | | | | 1,673 | |
Align Technology Inc * | | | 4,600 | | | | 2,214 | |
Alkermes PLC * | | | 9,200 | | | | 168 | |
Alnylam Pharmaceuticals Inc * | | | 6,300 | | | | 818 | |
Amedisys Inc * | | | 1,900 | | | | 465 | |
AmerisourceBergen Corp, Cl A | | | 8,624 | | | | 889 | |
Amgen Inc | | | 35,758 | | | | 7,940 | |
Anthem Inc | | | 15,531 | | | | 4,838 | |
Avantor Inc * | | | 25,300 | | | | 690 | |
Baxter International Inc | | | 30,615 | | | | 2,329 | |
Becton Dickinson and Co | | | 16,370 | | | | 3,844 | |
Biogen Inc * | | | 9,200 | | | | 2,210 | |
BioMarin Pharmaceutical Inc * | | | 10,600 | | | | 834 | |
Bio-Rad Laboratories Inc, Cl A * | | | 1,300 | | | | 700 | |
Bio-Techne Corp | | | 2,541 | | | | 771 | |
Bluebird Bio Inc * | | | 3,800 | | | | 168 | |
Boston Scientific Corp * | | | 84,239 | | | | 2,793 | |
Bristol-Myers Squibb Co | | | 136,419 | | | | 8,513 | |
Bruker Corp | | | 5,700 | | | | 288 | |
Cardinal Health Inc | | | 17,329 | | | | 946 | |
Catalent Inc * | | | 9,800 | | | | 942 | |
Centene Corp * | | | 33,658 | | | | 2,075 | |
Cerner Corp | | | 18,796 | | | | 1,407 | |
Change Healthcare Inc * | | | 20,808 | | | | 356 | |
Charles River Laboratories International Inc * | | | 3,143 | | | | 737 | |
Chemed Corp | | | 1,100 | | | | 526 | |
Cigna Corp | | | 22,202 | | | | 4,643 | |
Cooper Cos Inc/The | | | 2,904 | | | | 973 | |
CVS Health Corp | | | 79,499 | | | | 5,389 | |
Danaher Corp | | | 38,102 | | | | 8,559 | |
DaVita Inc * | | | 6,885 | | | | 756 | |
DENTSPLY SIRONA Inc | | | 13,366 | | | | 680 | |
DexCom Inc * | | | 5,800 | | | | 1,854 | |
Edwards Lifesciences Corp * | | | 36,184 | | | | 3,035 | |
Elanco Animal Health Inc * | | | 21,137 | | | | 647 | |
Eli Lilly and Co | | | 50,671 | | | | 7,380 | |
Encompass Health Corp | | | 5,800 | | | | 467 | |
Envista Holdings Corp * | | | 8,100 | | | | 241 | |
Exact Sciences Corp * | | | 8,700 | | | | 1,053 | |
Exelixis Inc * | | | 21,900 | | | | 420 | |
Gilead Sciences Inc | | | 77,134 | | | | 4,680 | |
Global Blood Therapeutics Inc * | | | 3,600 | | | | 165 | |
Globus Medical Inc, Cl A * | | | 4,500 | | | | 270 | |
Guardant Health Inc * | | | 4,600 | | | | 557 | |
| | | | | | | | |
| | | |
| Description | | Shares | | Market Value ($ Thousands) |
COMMON STOCK (continued) | |
Haemonetics Corp * | | | 3,100 | | | $ | 350 | |
HCA Healthcare Inc * | | | 16,200 | | | | 2,432 | |
Henry Schein Inc * | | | 8,868 | | | | 570 | |
Hill-Rom Holdings Inc | | | 4,124 | | | | 391 | |
Hologic Inc * | | | 15,400 | | | | 1,065 | |
Horizon Therapeutics PLC * | | | 10,600 | | | | 747 | |
Humana Inc | | | 7,875 | | | | 3,154 | |
ICU Medical Inc * | | | 1,200 | | | | 226 | |
IDEXX Laboratories Inc * | | | 5,104 | | | | 2,353 | |
Illumina Inc * | | | 8,905 | | | | 2,868 | |
Incyte Corp * | | | 12,100 | | | | 1,023 | |
Insulet Corp * | | | 3,600 | | | | 928 | |
Integra LifeSciences Holdings Corp * | | | 3,000 | | | | 164 | |
Intuitive Surgical Inc * | | | 7,071 | | | | 5,134 | |
Ionis Pharmaceuticals Inc * | | | 8,300 | | | | 419 | |
Iovance Biotherapeutics Inc * | | | 8,300 | | | | 322 | |
IQVIA Holdings Inc * | | | 10,913 | | | | 1,844 | |
Jazz Pharmaceuticals PLC * | | | 3,100 | | | | 436 | |
Johnson & Johnson | | | 159,009 | | | | 23,005 | |
Laboratory Corp of America Holdings * | | | 5,690 | | | | 1,137 | |
Masimo Corp * | | | 3,100 | | | | 789 | |
McKesson Corp | | | 10,370 | | | | 1,866 | |
Medtronic PLC | | | 80,826 | | | | 9,190 | |
Merck & Co Inc | | | 150,843 | | | | 12,126 | |
Mettler-Toledo International Inc * | | | 1,436 | | | | 1,651 | |
Moderna Inc * | | | 16,500 | | | | 2,520 | |
Molina Healthcare Inc * | | | 3,400 | | | | 694 | |
Nektar Therapeutics, Cl A * | | | 8,700 | | | | 143 | |
Neurocrine Biosciences Inc * | | | 5,400 | | | | 513 | |
Novocure Ltd * | | | 6,100 | | | | 766 | |
Penumbra Inc *(A) | | | 2,300 | | | | 510 | |
PerkinElmer Inc | | | 6,534 | | | | 869 | |
Perrigo Co PLC | | | 7,800 | | | | 376 | |
Pfizer Inc | | | 331,922 | | | | 12,716 | |
PPD Inc * | | | 10,500 | | | | 368 | |
PRA Health Sciences Inc * | | | 3,900 | | | | 438 | |
Premier Inc, Cl A | | | 4,400 | | | | 156 | |
QIAGEN NV * | | | 14,740 | | | | 711 | |
Quest Diagnostics Inc | | | 8,244 | | | | 1,022 | |
Quidel Corp * | | | 2,300 | | | | 449 | |
Reata Pharmaceuticals Inc, Cl A * | | | 1,500 | | | | 229 | |
Regeneron Pharmaceuticals Inc * | | | 5,800 | | | | 2,993 | |
Repligen Corp * | | | 3,200 | | | | 607 | |
ResMed Inc | | | 9,182 | | | | 1,925 | |
Royalty Pharma, Cl A | | | 7,600 | | | | 324 | |
Sage Therapeutics Inc * | | | 3,100 | | | | 230 | |
Sarepta Therapeutics Inc * | | | 3,900 | | | | 549 | |
Seagen Inc * | | | 6,900 | | | | 1,175 | |
STERIS PLC | | | 4,900 | | | | 950 | |
Stryker Corp | | | 21,004 | | | | 4,902 | |
Syneos Health Inc, Cl A * | | | 3,800 | | | | 250 | |
Tandem Diabetes Care Inc * | | | 3,600 | | | | 338 | |
| | |
| SEI Institutional Investments Trust / Semi-Annual Report / November 30, 2020 | | 5 |
SCHEDULE OF INVESTMENTS (Unaudited)
November 30, 2020
Large Cap Index Fund (Continued)
| | | | | | | | |
| | | |
| Description | | Shares | | Market Value ($ Thousands) |
COMMON STOCK (continued) | |
Teladoc Health Inc *(A) | | | 6,453 | | | $ | 1,283 | |
Teleflex Inc | | | 2,740 | | | | 1,049 | |
Thermo Fisher Scientific Inc | | | 23,525 | | | | 10,939 | |
United Therapeutics Corp * | | | 2,400 | | | | 318 | |
UnitedHealth Group Inc | | | 57,020 | | | | 19,178 | |
Universal Health Services Inc, Cl B * | | | 4,876 | | | | 637 | |
Varian Medical Systems Inc * | | | 5,630 | | | | 980 | |
Veeva Systems Inc, Cl A * | | | 7,700 | | | | 2,132 | |
Vertex Pharmaceuticals Inc * | | | 15,600 | | | | 3,553 | |
Viatris Inc, Cl W * | | | 72,822 | | | | 1,225 | |
Waters Corp * | | | 3,946 | | | | 916 | |
West Pharmaceutical Services Inc | | | 4,400 | | | | 1,211 | |
Zimmer Biomet Holdings Inc | | | 12,225 | | | | 1,823 | |
Zoetis Inc, Cl A | | | 29,244 | | | | 4,689 | |
| | |
| | | | | | | 279,209 | |
| |
Industrials — 9.0% | | | | | |
3M Co | | | 33,633 | | | | 5,809 | |
A O Smith Corp | | | 7,600 | | | | 428 | |
Acuity Brands Inc | | | 1,900 | | | | 226 | |
ADT Inc | | | 6,700 | | | | 52 | |
AECOM * | | | 10,116 | | | | 525 | |
AGCO Corp | | | 3,700 | | | | 342 | |
Air Lease Corp, Cl A | | | 5,300 | | | | 194 | |
Alaska Air Group Inc * | | | 5,900 | | | | 301 | |
Allegion plc | | | 5,766 | | | | 658 | |
Allison Transmission Holdings Inc, Cl A | | | 6,300 | | | | 259 | |
AMERCO * | | | 600 | | | | 249 | |
American Airlines Group Inc *(A) | | | 38,200 | | | | 540 | |
AMETEK Inc | | | 12,928 | | | | 1,532 | |
Armstrong World Industries Inc | | | 2,900 | | | | 223 | |
Axon Enterprise Inc * | | | 3,800 | | | | 478 | |
Boeing Co/The * | | | 31,991 | | | | 6,741 | |
BWX Technologies Inc | | | 6,750 | | | | 384 | |
Carlisle Cos Inc | | | 3,566 | | | | 516 | |
Carrier Global Corp | | | 51,078 | | | | 1,945 | |
Caterpillar Inc | | | 32,888 | | | | 5,709 | |
CH Robinson Worldwide Inc | | | 8,986 | | | | 844 | |
Cintas Corp | | | 5,557 | | | | 1,974 | |
Clean Harbors Inc * | | | 3,400 | | | | 246 | |
Colfax Corp * | | | 4,700 | | | | 170 | |
Copa Holdings SA, Cl A * | | | 1,300 | | | | 104 | |
Copart Inc * | | | 12,136 | | | | 1,401 | |
CoreLogic Inc/United States | | | 4,584 | | | | 355 | |
CoStar Group Inc * | | | 2,300 | | | | 2,094 | |
Crane Co | | | 2,600 | | | | 181 | |
CSX Corp | | | 46,796 | | | | 4,214 | |
Cummins Inc | | | 9,012 | | | | 2,083 | |
Curtiss-Wright Corp | | | 2,000 | | | | 231 | |
Deere & Co | | | 17,119 | | | | 4,479 | |
Delta Air Lines Inc * | | | 38,500 | | | | 1,550 | |
Donaldson Co Inc | | | 7,844 | | | | 418 | |
Dover Corp | | | 8,357 | | | | 1,020 | |
| | | | | | | | |
| | | |
| Description | | Shares | | Market Value ($ Thousands) |
COMMON STOCK (continued) | |
Dun & Bradstreet Holdings * | | | 5,200 | | | $ | 139 | |
Eaton Corp PLC | | | 24,616 | | | | 2,981 | |
Emerson Electric Co | | | 36,510 | | | | 2,805 | |
Equifax Inc | | | 6,956 | | | | 1,161 | |
Expeditors International of Washington Inc | | | 10,048 | | | | 898 | |
Fastenal Co | | | 33,048 | | | | 1,634 | |
FedEx Corp | | | 14,744 | | | | 4,225 | |
Flowserve Corp | | | 8,100 | | | | 276 | |
Fortive Corp | | | 17,253 | | | | 1,210 | |
Fortune Brands Home & Security Inc | | | 8,420 | | | | 703 | |
FTI Consulting Inc * | | | 2,200 | | | | 231 | |
Gates Industrial Corp PLC * | | | 2,800 | | | | 36 | |
Generac Holdings Inc * | | | 3,700 | | | | 798 | |
General Dynamics Corp | | | 14,672 | | | | 2,191 | |
General Electric Co | | | 512,206 | | | | 5,214 | |
Graco Inc | | | 11,272 | | | | 764 | |
GrafTech International Ltd | | | 3,700 | | | | 29 | |
HD Supply Holdings Inc * | | | 10,800 | | | | 602 | |
HEICO Corp | | | 2,210 | | | | 273 | |
HEICO Corp, Cl A | | | 3,821 | | | | 423 | |
Hexcel Corp * | | | 5,600 | | | | 277 | |
Honeywell International Inc | | | 42,190 | | | | 8,603 | |
Howmet Aerospace Inc * | | | 23,267 | | | | 546 | |
Hubbell Inc, Cl B | | | 3,792 | | | | 613 | |
Huntington Ingalls Industries Inc | | | 2,437 | | | | 390 | |
IAA Inc * | | | 8,100 | | | | 485 | |
IDEX Corp | | | 4,293 | | | | 829 | |
IHS Markit Ltd | | | 23,700 | | | | 2,357 | |
Illinois Tool Works Inc | | | 19,380 | | | | 4,091 | |
Ingersoll Rand Inc * | | | 23,365 | | | | 1,034 | |
ITT Inc | | | 5,051 | | | | 367 | |
Jacobs Engineering Group Inc | | | 7,984 | | | | 861 | |
JB Hunt Transport Services Inc | | | 4,852 | | | | 656 | |
JetBlue Airways Corp * | | | 11,900 | | | | 180 | |
Johnson Controls International PLC | | | 42,866 | | | | 1,974 | |
Kansas City Southern | | | 5,900 | | | | 1,098 | |
Kirby Corp * | | | 3,500 | | | | 177 | |
Knight-Swift Transportation Holdings Inc, Cl A | | | 6,900 | | | | 285 | |
L3Harris Technologies Inc | | | 13,234 | | | | 2,541 | |
Landstar System Inc | | | 2,365 | | | | 311 | |
Lennox International Inc | | | 2,100 | | | | 604 | |
Lincoln Electric Holdings Inc | | | 3,800 | | | | 437 | |
Lockheed Martin Corp | | | 14,873 | | | | 5,429 | |
Lyft Inc, Cl A * | | | 14,100 | | | | 538 | |
Macquarie Infrastructure Corp * | | | 4,500 | | | | 146 | |
ManpowerGroup Inc | | | 2,984 | | | | 259 | |
Masco Corp | | | 16,079 | | | | 863 | |
Mercury Systems Inc * | | | 3,300 | | | | 235 | |
Middleby Corp/The * | | | 2,600 | | | | 354 | |
MSA Safety Inc (A) | | | 2,200 | | | | 329 | |
MSC Industrial Direct Co Inc, Cl A | | | 2,720 | | | | 227 | |
| | |
| 6 | | SEI Institutional Investments Trust / Semi-Annual Report / November 30, 2020 |
SCHEDULE OF INVESTMENTS (Unaudited)
November 30, 2020
Large Cap Index Fund (Continued)
| | | | | | | | |
| | | |
| Description | | Shares | | Market Value ($ Thousands) |
COMMON STOCK (continued) | |
Nielsen Holdings PLC | | | 23,200 | | | $ | 375 | |
Nordson Corp | | | 3,100 | | | | 632 | |
Norfolk Southern Corp | | | 15,133 | | | | 3,587 | |
Northrop Grumman Corp | | | 9,478 | | | | 2,865 | |
nVent Electric PLC | | | 7,173 | | | | 165 | |
Old Dominion Freight Line Inc | | | 6,000 | | | | 1,220 | |
Oshkosh Corp | | | 4,359 | | | | 351 | |
Otis Worldwide Corp | | | 25,539 | | | | 1,710 | |
Owens Corning | | | 6,200 | | | | 452 | |
PACCAR Inc | | | 20,370 | | | | 1,773 | |
Parker-Hannifin Corp | | | 7,704 | | | | 2,059 | |
Pentair PLC | | | 8,873 | | | | 460 | |
Quanta Services Inc | | | 7,900 | | | | 540 | |
Raytheon Technologies Corp | | | 84,462 | | | | 6,058 | |
Regal Beloit Corp | | | 2,500 | | | | 298 | |
Republic Services Inc, Cl A | | | 12,442 | | | | 1,203 | |
Robert Half International Inc | | | 7,376 | | | | 473 | |
Rockwell Automation Inc | | | 6,904 | | | | 1,764 | |
Rollins Inc | | | 9,225 | | | | 527 | |
Roper Technologies Inc | | | 6,300 | | | | 2,690 | |
Ryder System Inc | | | 2,706 | | | | 160 | |
Schneider National Inc, Cl B | | | 3,000 | | | | 63 | |
Sensata Technologies Holding PLC * | | | 10,100 | | | | 493 | |
Snap-on Inc | | | 3,791 | | | | 667 | |
Southwest Airlines Co * | | | 36,220 | | | | 1,678 | |
Spirit AeroSystems Holdings Inc, Cl A | | | 4,800 | | | | 163 | |
Stanley Black & Decker Inc | | | 9,193 | | | | 1,694 | |
Stericycle Inc * | | | 5,926 | | | | 417 | |
Teledyne Technologies Inc * | | | 2,400 | | | | 907 | |
Textron Inc | | | 13,422 | | | | 605 | |
Timken Co/The | | | 3,769 | | | | 277 | |
Toro Co/The | | | 6,340 | | | | 575 | |
Trane Technologies PLC | | | 13,700 | | | | 2,003 | |
TransDigm Group Inc * | | | 3,193 | | | | 1,849 | |
TransUnion | | | 11,200 | | | | 1,020 | |
Trex Co Inc * | | | 7,000 | | | | 524 | |
Trinity Industries Inc | | | 4,800 | | | | 110 | |
Uber Technologies Inc * | | | 83,800 | | | | 4,162 | |
Union Pacific Corp | | | 40,932 | | | | 8,353 | |
United Airlines Holdings Inc * | | | 19,400 | | | | 874 | |
United Parcel Service Inc, Cl B | | | 42,941 | | | | 7,346 | |
United Rentals Inc * | | | 3,900 | | | | 885 | |
Univar Solutions Inc * | | | 10,400 | | | | 186 | |
Valmont Industries Inc | | | 800 | | | | 130 | |
Verisk Analytics Inc, Cl A | | | 9,600 | | | | 1,904 | |
Vertiv Holdings Co, Cl A | | | 12,300 | | | | 230 | |
Virgin Galactic Holdings Inc *(A) | | | 3,700 | | | | 98 | |
Waste Management Inc | | | 24,794 | | | | 2,954 | |
Watsco Inc | | | 1,900 | | | | 432 | |
Westinghouse Air Brake Technologies Corp | | | 12,137 | | | | 890 | |
Woodward Inc | | | 3,000 | | | | 335 | |
WW Grainger Inc | | | 2,887 | | | | 1,208 | |
| | | | | | | | |
| | | |
| Description | | Shares | | Market Value ($ Thousands) |
COMMON STOCK (continued) | |
XPO Logistics Inc * | | | 4,900 | | | $ | 523 | |
Xylem Inc/NY | | | 11,802 | | | | 1,133 | |
| | |
| | | | | | | 186,214 | |
| |
Information Technology — 27.3% | | | | | |
2U Inc * | | | 4,100 | | | | 132 | |
Accenture PLC, Cl A | | | 38,400 | | | | 9,565 | |
Adobe Inc * | | | 28,702 | | | | 13,733 | |
Advanced Micro Devices Inc * | | | 69,000 | | | | 6,394 | |
Akamai Technologies Inc * | | | 9,718 | | | | 1,006 | |
Alliance Data Systems Corp | | | 2,612 | | | | 191 | |
Alteryx Inc, Cl A * | | | 3,800 | | | | 455 | |
Amdocs Ltd | | | 8,500 | | | | 559 | |
Amphenol Corp, Cl A | | | 17,484 | | | | 2,287 | |
Analog Devices Inc | | | 22,279 | | | | 3,099 | |
Anaplan Inc * | | | 8,000 | | | | 560 | |
ANSYS Inc * | | | 5,400 | | | | 1,825 | |
Apple Inc | | | 970,700 | | | | 115,562 | |
Applied Materials Inc | | | 54,755 | | | | 4,516 | |
Arista Networks Inc * | | | 3,700 | | | | 1,002 | |
Arrow Electronics Inc * | | | 4,689 | | | | 430 | |
Aspen Technology Inc * | | | 3,800 | | | | 511 | |
Atlassian Corp PLC, Cl A * | | | 7,500 | | | | 1,688 | |
Autodesk Inc * | | | 12,937 | | | | 3,625 | |
Automatic Data Processing Inc | | | 26,392 | | | | 4,589 | |
Avalara Inc * | | | 4,700 | | | | 807 | |
Avnet Inc | | | 3,810 | | | | 116 | |
Bill.com Holdings Inc * | | | 2,400 | | | | 294 | |
Black Knight Inc * | | | 9,700 | | | | 889 | |
Booz Allen Hamilton Holding Corp, Cl A | | | 8,600 | | | | 746 | |
Broadcom Inc | | | 23,532 | | | | 9,450 | |
Broadridge Financial Solutions Inc | | | 7,573 | | | | 1,112 | |
CACI International Inc, Cl A * | | | 1,300 | | | | 308 | |
Cadence Design Systems Inc * | | | 16,963 | | | | 1,973 | |
CDK Global Inc | | | 7,597 | | | | 364 | |
CDW Corp/DE | | | 8,700 | | | | 1,135 | |
Ceridian HCM Holding Inc * | | | 5,700 | | | | 550 | |
Ciena Corp * | | | 8,600 | | | | 385 | |
Cirrus Logic Inc * | | | 3,600 | | | | 288 | |
Cisco Systems Inc | | | 256,327 | | | | 11,027 | |
Citrix Systems Inc | | | 7,387 | | | | 915 | |
Cloudflare Inc, Cl A * | | | 6,700 | | | | 503 | |
Cognex Corp | | | 9,200 | | | | 691 | |
Cognizant Technology Solutions Corp, Cl A | | | 31,376 | | | | 2,451 | |
Coherent Inc * | | | 1,900 | | | | 231 | |
CommScope Holding Co Inc * | | | 13,300 | | | | 158 | |
Corning Inc | | | 45,058 | | | | 1,686 | |
Coupa Software Inc * | | | 4,200 | | | | 1,381 | |
Cree Inc *(A) | | | 5,800 | | | | 524 | |
Crowdstrike Holdings Inc, Cl A * | | | 8,500 | | | | 1,303 | |
Datadog Inc, Cl A * | | | 9,400 | | | | 930 | |
Dell Technologies Inc, Cl C * | | | 15,142 | | | | 1,045 | |
DocuSign Inc, Cl A * | | | 10,400 | | | | 2,370 | |
| | |
| SEI Institutional Investments Trust / Semi-Annual Report / November 30, 2020 | | 7 |
SCHEDULE OF INVESTMENTS (Unaudited)
November 30, 2020
Large Cap Index Fund (Continued)
| | | | | | | | |
| | | |
| Description | | Shares | | Market Value ($ Thousands) |
COMMON STOCK (continued) | |
Dolby Laboratories Inc, Cl A | | | 2,643 | | | $ | 234 | |
Dropbox Inc, Cl A * | | | 11,400 | | | | 228 | |
DXC Technology Co * | | | 15,736 | | | | 345 | |
Dynatrace Inc * | | | 11,000 | | | | 418 | |
EchoStar Corp, Cl A * | | | 3,332 | | | | 79 | |
Elastic NV * | | | 4,100 | | | | 508 | |
Enphase Energy Inc * | | | 6,500 | | | | 888 | |
Entegris Inc | | | 7,300 | | | | 676 | |
EPAM Systems Inc * | | | 3,500 | | | | 1,128 | |
Euronet Worldwide Inc * | | | 2,400 | | | | 323 | |
Everbridge Inc * | | | 2,100 | | | | 267 | |
F5 Networks Inc * | | | 3,638 | | | | 592 | |
Fair Isaac Corp * | | | 1,700 | | | | 804 | |
Fastly Inc, Cl A *(A) | | | 4,500 | | | | 381 | |
Fidelity National Information Services Inc | | | 37,548 | | | | 5,572 | |
FireEye Inc * | | | 6,400 | | | | 96 | |
First Solar Inc * | | | 5,100 | | | | 476 | |
Fiserv Inc * | | | 34,274 | | | | 3,948 | |
Five9 Inc * | | | 3,800 | | | | 590 | |
FleetCor Technologies Inc * | | | 5,000 | | | | 1,326 | |
FLIR Systems Inc | | | 9,700 | | | | 371 | |
Fortinet Inc * | | | 8,400 | | | | 1,035 | |
Gartner Inc * | | | 5,100 | | | | 775 | |
Genpact Ltd | | | 11,400 | | | | 463 | |
Global Payments Inc | | | 17,752 | | | | 3,465 | |
Globant SA * | | | 2,200 | | | | 415 | |
GoDaddy Inc, Cl A * | | | 10,600 | | | | 843 | |
Guidewire Software Inc * | | | 5,700 | | | | 698 | |
Hewlett Packard Enterprise Co | | | 79,670 | | | | 880 | |
HP Inc | | | 86,170 | | | | 1,890 | |
HubSpot Inc * | | | 2,200 | | | | 868 | |
Inphi Corp * | | | 2,900 | | | | 450 | |
Intel Corp | | | 252,958 | | | | 12,231 | |
International Business Machines Corp | | | 53,398 | | | | 6,596 | |
Intuit Inc | | | 15,352 | | | | 5,404 | |
IPG Photonics Corp * | | | 1,700 | | | | 352 | |
Jabil Inc | | | 9,274 | | | | 354 | |
Jack Henry & Associates Inc | | | 4,400 | | | | 708 | |
Juniper Networks Inc | | | 22,925 | | | | 499 | |
Keysight Technologies Inc * | | | 10,932 | | | | 1,312 | |
KLA Corp | | | 9,109 | | | | 2,295 | |
Lam Research Corp | | | 8,752 | | | | 3,962 | |
Leidos Holdings Inc | | | 8,873 | | | | 893 | |
Littelfuse Inc | | | 1,000 | | | | 241 | |
Lumentum Holdings Inc * | | | 4,600 | | | | 397 | |
Manhattan Associates Inc * | | | 3,700 | | | | 378 | |
Marvell Technology Group Ltd | | | 37,802 | | | | 1,750 | |
Mastercard Inc, Cl A | | | 53,400 | | | | 17,970 | |
Maxim Integrated Products Inc * | | | 15,800 | | | | 1,312 | |
Medallia Inc * | | | 6,000 | | | | 210 | |
Microchip Technology Inc | | | 15,215 | | | | 2,045 | |
Micron Technology Inc * | | | 67,516 | | | | 4,327 | |
| | | | | | | | |
| | | |
| Description | | Shares | | Market Value ($ Thousands) |
COMMON STOCK (continued) | |
Microsoft Corp | | | 450,300 | | | $ | 96,396 | |
MKS Instruments Inc | | | 3,200 | | | | 442 | |
MongoDB Inc, Cl A *(A) | | | 2,600 | | | | 747 | |
Monolithic Power Systems Inc | | | 2,400 | | | | 768 | |
Motorola Solutions Inc | | | 10,414 | | | | 1,786 | |
National Instruments Corp | | | 6,604 | | | | 247 | |
NCR Corp * | | | 5,189 | | | | 144 | |
NetApp Inc | | | 12,555 | | | | 669 | |
New Relic Inc * | | | 2,400 | | | | 143 | |
NortonLifeLock Inc | | | 34,548 | | | | 630 | |
Nuance Communications Inc * | | | 18,100 | | | | 781 | |
Nutanix Inc, Cl A * | | | 8,200 | | | | 225 | |
NVIDIA Corp | | | 35,656 | | | | 19,114 | |
Okta Inc, Cl A * | | | 7,100 | | | | 1,740 | |
ON Semiconductor Corp * | | | 22,400 | | | | 644 | |
Oracle Corp | | | 116,620 | | | | 6,731 | |
PagerDuty Inc * | | | 300 | | | | 10 | |
Palo Alto Networks Inc * | | | 5,300 | | | | 1,558 | |
Paychex Inc | | | 19,407 | | | | 1,808 | |
Paycom Software Inc * | | | 3,000 | | | | 1,251 | |
Paylocity Holding Corp * | | | 1,600 | | | | 315 | |
PayPal Holdings Inc * | | | 70,211 | | | | 15,034 | |
Pegasystems Inc | | | 2,900 | | | | 380 | |
Pluralsight Inc, Cl A * | | | 3,400 | | | | 56 | |
Proofpoint Inc * | | | 2,800 | | | | 290 | |
PTC Inc * | | | 6,300 | | | | 679 | |
Pure Storage Inc, Cl A * | | | 12,600 | | | | 230 | |
Qorvo Inc * | | | 7,200 | | | | 1,128 | |
QUALCOMM Inc | | | 67,759 | | | | 9,972 | |
RealPage Inc * | | | 5,400 | | | | 373 | |
RingCentral Inc, Cl A * | | | 4,400 | | | | 1,307 | |
Sabre Corp * | | | 12,900 | | | | 145 | |
salesforce.com Inc * | | | 52,184 | | | | 12,827 | |
Science Applications International Corp | | | 3,600 | | | | 333 | |
ServiceNow Inc * | | | 11,400 | | | | 6,094 | |
Skyworks Solutions Inc | | | 10,100 | | | | 1,426 | |
Slack Technologies Inc, Cl A *(A) | | | 23,000 | | | | 986 | |
Smartsheet Inc, Cl A * | | | 6,700 | | | | 389 | |
SolarEdge Technologies Inc * | | | 3,000 | | | | 834 | |
SolarWinds Corp *(A) | | | 1,600 | | | | 37 | |
Splunk Inc * | | | 10,000 | | | | 2,042 | |
Square Inc, Cl A * | | | 22,400 | | | | 4,725 | |
SS&C Technologies Holdings Inc | | | 13,100 | | | | 902 | |
StoneCo Ltd, Cl A * | | | 9,500 | | | | 696 | |
Switch Inc, Cl A | | | 2,400 | | | | 38 | |
SYNNEX Corp * | | | 2,200 | | | | 353 | |
Synopsys Inc * | | | 9,282 | | | | 2,112 | |
Teradata Corp * | | | 7,889 | | | | 173 | |
Teradyne Inc | | | 10,463 | | | | 1,154 | |
Texas Instruments Inc | | | 55,308 | | | | 8,918 | |
Trade Desk Inc/The, Cl A * | | | 2,400 | | | | 2,163 | |
Trimble Inc * | | | 15,728 | | | | 942 | |
| | |
| 8 | | SEI Institutional Investments Trust / Semi-Annual Report / November 30, 2020 |
SCHEDULE OF INVESTMENTS (Unaudited)
November 30, 2020
Large Cap Index Fund (Continued)
| | | | | | | | |
| | | |
| Description | | Shares | | Market Value ($ Thousands) |
COMMON STOCK (continued) | |
Twilio Inc, Cl A * | | | 8,100 | | | $ | 2,593 | |
Tyler Technologies Inc * | | | 2,300 | | | | 983 | |
Ubiquiti Inc | | | 500 | | | | 124 | |
Universal Display Corp | | | 2,400 | | | | 550 | |
VeriSign Inc * | | | 6,285 | | | | 1,261 | |
ViaSat Inc * | | | 3,000 | | | | 102 | |
Visa Inc, Cl A | | | 102,000 | | | | 21,456 | |
VMware Inc, Cl A *(A) | | | 4,500 | | | | 629 | |
Vontier Corp * | | | 6,901 | | | | 229 | |
Western Digital Corp * | | | 18,096 | | | | 812 | |
Western Union Co/The | | | 25,228 | | | | 569 | |
WEX Inc * | | | 2,600 | | | | 450 | |
Workday Inc, Cl A * | | | 10,600 | | | | 2,383 | |
Xerox Holdings Corp | | | 7,999 | | | | 175 | |
Xilinx Inc | | | 14,757 | | | | 2,148 | |
Zebra Technologies Corp, Cl A * | | | 3,125 | | | | 1,183 | |
Zendesk Inc * | | | 7,600 | | | | 1,015 | |
Zoom Video Communications Inc, Cl A * | | | 9,900 | | | | 4,736 | |
Zscaler Inc * | | | 4,200 | | | | 654 | |
| | |
| | | | | | | 564,568 | |
| |
Materials — 2.7% | | | | | |
Air Products and Chemicals Inc | | | 13,094 | | | | 3,668 | |
Albemarle Corp | | | 6,973 | | | | 948 | |
Amcor PLC | | | 98,500 | | | | 1,116 | |
AptarGroup Inc | | | 3,500 | | | | 442 | |
Ardagh Group SA, Cl A | | | 1,200 | | | | 21 | |
Ashland Global Holdings Inc | | | 3,376 | | | | 254 | |
Avery Dennison Corp | | | 4,710 | | | | 703 | |
Axalta Coating Systems Ltd * | | | 8,800 | | | | 252 | |
Ball Corp | | | 19,400 | | | | 1,863 | |
Berry Global Group Inc * | | | 8,500 | | | | 451 | |
Cabot Corp | | | 4,273 | | | | 177 | |
Celanese Corp, Cl A | | | 7,283 | | | | 942 | |
CF Industries Holdings Inc | | | 12,630 | | | | 471 | |
Chemours Co/The | | | 12,700 | | | | 309 | |
Corteva Inc | | | 46,676 | | | | 1,789 | |
Crown Holdings Inc * | | | 8,251 | | | | 778 | |
Dow Inc | | | 44,976 | | | | 2,384 | |
DuPont de Nemours Inc | | | 42,876 | | | | 2,720 | |
Eagle Materials Inc * | | | 2,100 | | | | 191 | |
Eastman Chemical Co | | | 8,028 | | | | 782 | |
Ecolab Inc | | | 15,255 | | | | 3,389 | |
Element Solutions Inc | | | 16,800 | | | | 232 | |
FMC Corp | | | 7,620 | | | | 884 | |
Freeport-McMoRan Inc, Cl B * | | | 81,924 | | | | 1,916 | |
Graphic Packaging Holding Co | | | 15,300 | | | | 234 | |
Huntsman Corp | | | 8,729 | | | | 216 | |
International Flavors & Fragrances Inc (A) | | | 6,291 | | | | 705 | |
International Paper Co | | | 23,055 | | | | 1,141 | |
Linde PLC | | | 31,625 | | | | 8,109 | |
LyondellBasell Industries NV, Cl A | | | 15,460 | | | | 1,316 | |
Martin Marietta Materials Inc | | | 3,663 | | | | 973 | |
| | | | | | | | |
| | | |
| Description | | Shares | | Market Value ($ Thousands) |
COMMON STOCK (continued) | |
Mosaic Co/The | | | 22,478 | | | $ | 494 | |
NewMarket Corp | | | 300 | | | | 111 | |
Newmont Corp | | | 49,333 | | | | 2,902 | |
Nucor Corp | | | 17,890 | | | | 961 | |
Olin Corp | | | 12,700 | | | | 278 | |
Packaging Corp of America | | | 5,499 | | | | 715 | |
PPG Industries Inc | | | 13,546 | | | | 1,988 | |
Reliance Steel & Aluminum Co | | | 3,700 | | | | 436 | |
Royal Gold Inc | | | 4,600 | | | | 508 | |
RPM International Inc | | | 7,669 | | | | 675 | |
Scotts Miracle-Gro Co/The, Cl A | | | 2,306 | | | | 405 | |
Sealed Air Corp | | | 8,568 | | | | 386 | |
Sherwin-Williams Co/The | | | 5,037 | | | | 3,766 | |
Silgan Holdings Inc | | | 3,808 | | | | 129 | |
Sonoco Products Co | | | 5,746 | | | | 334 | |
Southern Copper Corp | | | 5,768 | | | | 342 | |
Steel Dynamics Inc | | | 11,900 | | | | 431 | |
Valvoline Inc | | | 11,204 | | | | 255 | |
Vulcan Materials Co | | | 7,757 | | | | 1,083 | |
W R Grace & Co | | | 2,000 | | | | 109 | |
Westlake Chemical Corp | | | 2,000 | | | | 150 | |
Westrock Co | | | 17,345 | | | | 732 | |
| | |
| | | | | | | 56,566 | |
| |
Real Estate — 3.0% | | | | | |
Alexandria Real Estate Equities Inc ‡ | | | 7,600 | | | | 1,244 | |
American Campus Communities Inc ‡ | | | 8,000 | | | | 318 | |
American Homes 4 Rent, Cl A ‡ | | | 16,800 | | | | 482 | |
American Tower Corp, Cl A ‡ | | | 27,022 | | | | 6,247 | |
Americold Realty Trust ‡ | | | 10,500 | | | | 358 | |
Apartment Investment and Management Co, Cl A ‡ | | | 9,503 | | | | 288 | |
Apple Hospitality Inc *‡ | | | 6,900 | | | | 91 | |
AvalonBay Communities Inc ‡ | | | 8,341 | | | | 1,390 | |
Boston Properties Inc ‡ | | | 9,584 | | | | 941 | |
Brandywine Realty Trust ‡ | | | 15,600 | | | | 174 | |
Brixmor Property Group Inc ‡ | | | 17,300 | | | | 264 | |
Brookfield Property Inc, Cl A ‡(A) | | | 6,465 | | | | 101 | |
Camden Property Trust ‡ | | | 5,847 | | | | 578 | |
CBRE Group Inc, Cl A * | | | 19,617 | | | | 1,199 | |
CoreSite Realty Corp ‡ | | | 2,100 | | | | 263 | |
Corporate Office Properties Trust ‡ | | | 4,600 | | | | 123 | |
Cousins Properties Inc ‡ | | | 7,900 | | | | 264 | |
Crown Castle International Corp ‡ | | | 24,996 | | | | 4,189 | |
CubeSmart ‡ | | | 10,700 | | | | 348 | |
CyrusOne Inc ‡ | | | 6,900 | | | | 482 | |
Digital Realty Trust Inc ‡ | | | 15,796 | | | | 2,129 | |
Douglas Emmett Inc ‡ | | | 9,200 | | | | 285 | |
Duke Realty Corp ‡ | | | 24,309 | | | | 925 | |
Empire State Realty Trust Inc, Cl A *‡ | | | 12,600 | | | | 114 | |
EPR Properties *‡ | | | 4,500 | | | | 162 | |
Equinix Inc ‡ | | | 5,442 | | | | 3,797 | |
Equity Commonwealth *‡ | | | 8,825 | | | | 234 | |
| | |
| SEI Institutional Investments Trust / Semi-Annual Report / November 30, 2020 | | 9 |
SCHEDULE OF INVESTMENTS (Unaudited)
November 30, 2020
Large Cap Index Fund (Continued)
| | | | | | | | |
| | | |
| Description | | Shares | | Market Value ($ Thousands) |
COMMON STOCK (continued) | |
Equity LifeStyle Properties Inc ‡ | | | 12,100 | | | $ | 709 | |
Equity Residential ‡ | | | 21,877 | | | | 1,267 | |
Essex Property Trust Inc ‡ | | | 3,854 | | | | 948 | |
Extra Space Storage Inc ‡ | | | 7,500 | | | | 845 | |
Federal Realty Investment Trust ‡ | | | 3,996 | | | | 349 | |
First Industrial Realty Trust Inc ‡ | | | 7,700 | | | | 322 | |
Gaming and Leisure Properties Inc ‡ | | | 12,801 | | | | 532 | |
Healthcare Trust of America Inc, Cl A ‡ | | | 11,800 | | | | 307 | |
Healthpeak Properties Inc ‡ | | | 33,474 | | | | 966 | |
Highwoods Properties Inc ‡ | | | 5,400 | | | | 207 | |
Host Hotels & Resorts Inc *‡ | | | 43,040 | | | | 604 | |
Howard Hughes Corp/The * | | | 2,773 | | | | 202 | |
Hudson Pacific Properties Inc ‡ | | | 9,100 | | | | 237 | |
Invitation Homes Inc ‡ | | | 31,400 | | | | 897 | |
Iron Mountain Inc ‡(A) | | | 19,403 | | | | 534 | |
JBG SMITH Properties ‡ | | | 8,518 | | | | 262 | |
Jones Lang LaSalle Inc * | | | 3,300 | | | | 437 | |
Kilroy Realty Corp ‡ | | | 7,700 | | | | 471 | |
Kimco Realty Corp ‡ | | | 22,344 | | | | 323 | |
Lamar Advertising Co, Cl A ‡ | | | 4,740 | | | | 377 | |
Life Storage Inc ‡ | | | 3,100 | | | | 340 | |
Medical Properties Trust Inc ‡ | | | 34,900 | | | | 677 | |
Mid-America Apartment Communities Inc ‡ | | | 6,950 | | | | 877 | |
National Retail Properties Inc ‡ | | | 9,300 | | | | 351 | |
Omega Healthcare Investors Inc ‡ | | | 11,700 | | | | 412 | |
Outfront Media Inc *‡ | | | 6,580 | | | | 125 | |
Paramount Group Inc ‡ | | | 11,600 | | | | 107 | |
Park Hotels & Resorts Inc *‡ | | | 14,488 | | | | 236 | |
Prologis Inc ‡ | | | 43,944 | | | | 4,397 | |
Public Storage ‡ | | | 8,868 | | | | 1,991 | |
Rayonier Inc ‡ | | | 7,504 | | | | 211 | |
Realty Income Corp ‡ | | | 21,200 | | | | 1,271 | |
Regency Centers Corp ‡ | | | 9,658 | | | | 440 | |
Rexford Industrial Realty Inc ‡ | | | 7,100 | | | | 340 | |
SBA Communications Corp, Cl A ‡ | | | 6,500 | | | | 1,867 | |
Simon Property Group Inc ‡ | | | 18,281 | | | | 1,509 | |
SL Green Realty Corp ‡ | | | 5,268 | | | | 305 | |
Spirit Realty Capital Inc ‡ | | | 4,120 | | | | 152 | |
STORE Capital Corp ‡ | | | 10,600 | | | | 345 | |
Sun Communities Inc ‡ | | | 6,000 | | | | 834 | |
Taubman Centers Inc *‡ | | | 3,300 | | | | 141 | |
UDR Inc ‡ | | | 16,093 | | | | 619 | |
Ventas Inc ‡ | | | 21,192 | | | | 1,015 | |
VEREIT Inc ‡ | | | 63,400 | | | | 450 | |
VICI Properties Inc ‡ | | | 36,800 | | | | 931 | |
Vornado Realty Trust ‡ | | | 9,936 | | | | 387 | |
Weingarten Realty Investors ‡ | | | 6,767 | | | | 142 | |
Welltower Inc ‡ | | | 26,483 | | | | 1,668 | |
Weyerhaeuser Co ‡ | | | 43,446 | | | | 1,262 | |
| | | | | | | | |
| | | |
| Description | | Shares | | Market Value ($ Thousands) |
COMMON STOCK (continued) | | | | | | | | |
WP Carey Inc ‡ | | | 9,700 | | | $ | 671 | |
| | |
| | | | | | | 61,859 | |
| |
Utilities — 2.7% | | | | | |
AES Corp/The | | | 37,624 | | | | 769 | |
Alliant Energy Corp | | | 15,952 | | | | 839 | |
Ameren Corp | | | 14,490 | | | | 1,127 | |
American Electric Power Co Inc | | | 30,050 | | | | 2,551 | |
American Water Works Co Inc | | | 11,600 | | | | 1,779 | |
Atmos Energy Corp | | | 7,991 | | | | 766 | |
Avangrid Inc | | | 3,094 | | | | 144 | |
CenterPoint Energy Inc | | | 30,115 | | | | 698 | |
CMS Energy Corp | | | 17,642 | | | | 1,086 | |
Consolidated Edison Inc | | | 21,316 | | | | 1,625 | |
Dominion Energy Inc | | | 49,370 | | | | 3,875 | |
DTE Energy Co | | | 12,064 | | | | 1,518 | |
Duke Energy Corp | | | 43,616 | | | | 4,041 | |
Edison International | | | 22,679 | | | | 1,392 | |
Entergy Corp | | | 12,898 | | | | 1,404 | |
Essential Utilities Inc | | | 12,046 | | | | 545 | |
Evergy Inc | | | 13,149 | | | | 729 | |
Eversource Energy | | | 20,808 | | | | 1,821 | |
Exelon Corp | | | 58,876 | | | | 2,418 | |
FirstEnergy Corp | | | 34,827 | | | | 925 | |
Hawaiian Electric Industries Inc | | | 7,546 | | | | 270 | |
IDACORP Inc | | | 2,700 | | | | 245 | |
MDU Resources Group Inc | | | 10,421 | | | | 260 | |
National Fuel Gas Co | | | 4,789 | | | | 197 | |
NextEra Energy Inc | | | 118,692 | | | | 8,735 | |
NiSource Inc | | | 23,421 | | | | 567 | |
NRG Energy Inc | | | 15,100 | | | | 494 | |
OGE Energy Corp | | | 10,036 | | | | 325 | |
PG&E Corp * | | | 69,118 | | | | 878 | |
Pinnacle West Capital Corp | | | 6,992 | | | | 572 | |
PPL Corp | | | 50,026 | | | | 1,422 | |
Public Service Enterprise Group Inc | | | 30,552 | | | | 1,781 | |
Sempra Energy | | | 18,023 | | | | 2,298 | |
Southern Co/The | | | 63,903 | | | | 3,825 | |
UGI Corp | | | 11,725 | | | | 416 | |
Vistra Corp | | | 25,100 | | | | 469 | |
WEC Energy Group Inc | | | 18,057 | | | | 1,714 | |
Xcel Energy Inc | | | 30,481 | | | | 2,053 | |
| | |
| | | | | | | 56,573 | |
| | |
Total Common Stock (Cost $664,160) ($ Thousands) | | | | | | | 2,053,646 | |
| | |
| 10 | | SEI Institutional Investments Trust / Semi-Annual Report / November 30, 2020 |
SCHEDULE OF INVESTMENTS (Unaudited)
November 30, 2020
Large Cap Index Fund (Continued)
| | | | | | | | |
| | | |
| Description | | Shares | | | Market Value ($ Thousands) | |
| |
AFFILIATED PARTNERSHIP — 0.7% | | | | | |
SEI Liquidity Fund, L.P. 0.070% **†(C) | | | 14,178,074 | | | $ | 14,178 | |
| |
Total Affiliated Partnership
(Cost $14,178) ($ Thousands) | | | | 14,178 | |
| | |
CASH EQUIVALENT — 0.3% | | | | | | | | |
SEI Daily Income Trust, Government Fund, Cl F
0.010%**† | | | 6,858,192 | | | | 6,858 | |
| |
Total Cash Equivalent
(Cost $6,858) ($ Thousands) | | | | 6,858 | |
| |
Total Investments in Securities — 100.3%
(Cost $685,196) ($ Thousands) | | | $ | 2,074,682 | |
| | | | | | | | |
A list of the open futures contracts held by the Fund at November 30, 2020, is as follows:
| | | | | | | | | | | | | | | | | | |
| | | | | | |
| Type of Contract | | Number of Contracts Long | | Expiration Date | | | Notional Amount (Thousands) | | | Value (Thousands) | | | Unrealized Appreciation (Thousands) | |
S&P 500 Index E-MINI | | 84 | | | Dec-2020 | | | | $ 13,974 | | | | $ 15,217 | | | $ | 1,243 | |
S&P Mid Cap 400 Index E-MINI | | 13 | | | Dec-2020 | | | | 2,447 | | | | 2,819 | | | | 372 | |
| | | | | | | | | | |
| | | | | | | | | $ 16,421 | | | | $ 18,036 | | | $ | 1,615 | |
| | | | | | | | | | |
Percentages are based on a Net Assets of $2,067,456 ($ Thousands).
| * | Non-income producing security. |
| ** | The rate reported is the 7-day effective yield as of November 30, 2020. |
| ‡ | Real Estate Investment Trust. |
| † | Investment in Affiliated Security (see Note 6). |
| (A) | Certain securities or partial positions of certain securities are on loan at November 30, 2020 (see Note 12). The total market value of securities on loan at November 30, 2020, was $13,867 ($ Thousands). |
| (B) | Security is a Master Limited Partnership. At November 30, 2020, such securities amounted to $258 ($ Thousands), or 0.0% of Net Assets of the Fund (see Note 2). |
| (C) | This security was purchased with cash collateral held from securities on loan (see Note 12). The total market value of such securities as of November 30, 2020 was $14,178 ($ Thousands). |
Cl — Class
L.P. — Limited Partnership
PLC — Public Limited Company
S&P — Standard & Poor’s
The following is a list of the level of inputs used as of November 30, 2020, in valuing the Fund’s investments and other financial instruments carried at value ($ Thousands):
| | | | | | | | | | | | | | | | |
| Investments in Securities | | Level 1
($) | | | Level 2
($) | | | Level 3
($) | | | Total ($) | |
Common Stock | | | 2,053,646 | | | | – | | | | – | | | | 2,053,646 | |
Affiliated Partnership | | | – | | | | 14,178 | | | | – | | | | 14,178 | |
Cash Equivalent | | | 6,858 | | | | – | | | | – | | | | 6,858 | |
| | | | | | | | | | | | | | | | |
Total Investments in Securities | | | 2,060,504 | | | | 14,178 | | | | – | | | | 2,074,682 | |
| | | | | | | | | | | | | | | | |
| | | | | | | | | | | | | | | | |
| Other Financial Instruments | | Level 1 ($) | | | Level 2
($) | | | Level 3
($) | | | Total ($) | |
Futures Contracts* | | | | | | | | | | | | | | | | |
Unrealized Appreciation | | | 1,615 | | | | – | | | | – | | | | 1,615 | |
| | | | | | | | | | | | | | | | |
Total Other Financial Instruments | | | 1,615 | | | | – | | | | – | | | | 1,615 | |
| | | | | | | | | | | | | | | | |
* Futures contracts are valued at the unrealized appreciation on the instrument.
For the period ended November 30, 2020, there were no transfers in or out of Level 3.
For more information on valuation inputs, see Note 2 – Significant Accounting Policies in Notes to Financial Statements.
| | |
| SEI Institutional Investments Trust / Semi-Annual Report / November 30, 2020 | | 11 |
SCHEDULE OF INVESTMENTS (Unaudited)
November 30, 2020
Large Cap Index Fund (Continued)
The following is a summary of the Fund’s transactions with affiliates for the period ended November 30, 2020 ($ Thousands):
| | | | | | | | | | | | | | | | | | |
Security Description | | Value 5/31/2020 | | Purchases at Cost | | Proceeds from Sales | | Realized Gain/ (Loss) | | Change in Unrealized
Appreciation/ (Depreciation) | | Value
11/30/2020 | | Shares | | Income | | Capital Gains |
SEI Investment Co. | | $ 366 | | $— | | $ — | | $ — | | $ (10) | | $ 356 | | 6,742 | | $2 | | $ — |
SEI Liquidity Fund, L.P. | | 27,289 | | 69,416 | | (82,520) | | 2 | | (9) | | 14,178 | | 14,178,074 | | 38 | | — |
SEI Daily Income Trust, Government Fund, Cl F | | 6,854 | | 100,020 | | (100,016) | | — | | — | | 6,858 | | 6,858,192 | | 1 | | — |
| | | | | | | | | | | | | | | | | | |
Totals | | $ 34,509 | | $169,436 | | $ (182,536) | | $ 2 | | $ (19) | | $ 21,392 | | | | $ 41 | | $ — |
| | | | | | | | | | | | | | | | | | |
Amounts designated as “—” are $0 or have been rounded to $0.
The accompanying notes are an integral part of the financial statements.
| | |
| 12 | | SEI Institutional Investments Trust / Semi-Annual Report / November 30, 2020 |
SCHEDULE OF INVESTMENTS (Unaudited)
November 30, 2020
S&P 500 Index Fund (Continued)
| | | | | | | | |
| | | |
| Description | | Shares | | Market Value
($ Thousands) |
COMMON STOCK — 98.3% | | | | | | | | |
| |
Communication Services — 10.8% | | | | | |
Activision Blizzard Inc | | | 139,500 | | | $ | 11,087 | |
Alphabet Inc, Cl A * | | | 54,641 | | | | 95,862 | |
Alphabet Inc, Cl C * | | | 53,363 | | | | 93,958 | |
AT&T Inc | | | 1,292,791 | | | | 37,168 | |
CenturyLink Inc | | | 174,974 | | | | 1,828 | |
Charter Communications Inc, Cl A * | | | 27,100 | | | | 17,669 | |
Comcast Corp, Cl A | | | 827,248 | | | | 41,561 | |
Discovery Inc, Cl A *(A) | | | 27,000 | | | | 726 | |
Discovery Inc, Cl C * | | | 53,645 | | | | 1,289 | |
DISH Network Corp, Cl A * | | | 45,768 | | | | 1,642 | |
Electronic Arts Inc | | | 52,500 | | | | 6,707 | |
Facebook Inc, Cl A * | | | 436,978 | | | | 121,030 | |
Fox Corp | | | 94,557 | | | | 2,713 | |
Interpublic Group of Cos Inc/The | | | 70,000 | | | | 1,560 | |
Live Nation Entertainment Inc * | | | 24,800 | | | | 1,628 | |
Netflix Inc * | | | 79,979 | | | | 39,246 | |
News Corp | | | 19,000 | | | | 338 | |
News Corp, Cl A | | | 70,383 | | | | 1,242 | |
Omnicom Group Inc | | | 39,700 | | | | 2,501 | |
Take-Two Interactive Software Inc * | | | 20,900 | | | | 3,773 | |
T-Mobile US Inc * | | | 106,100 | | | | 14,105 | |
Twitter Inc * | | | 143,900 | | | | 6,693 | |
Verizon Communications Inc | | | 751,052 | | | | 45,371 | |
ViacomCBS Inc, Cl B | | | 103,281 | | | | 3,644 | |
Walt Disney Co/The * | | | 328,019 | | | | 48,550 | |
| | |
| | | | | | | 601,891 | |
|
Consumer Discretionary — 11.1% | |
Advance Auto Parts Inc | | | 12,300 | | | | 1,817 | |
Amazon.com Inc * | | | 77,360 | | | | 245,080 | |
Aptiv PLC * | | | 49,300 | | | | 5,852 | |
AutoZone Inc * | | | 4,245 | | | | 4,829 | |
Best Buy Co Inc | | | 41,987 | | | | 4,568 | |
Booking Holdings Inc * | | | 7,484 | | | | 15,181 | |
BorgWarner Inc | | | 44,600 | | | | 1,733 | |
CarMax Inc * | | | 29,000 | | | | 2,711 | |
Carnival Corp, Cl A * | | | 96,500 | | | | 1,928 | |
Chipotle Mexican Grill Inc, Cl A * | | | 5,120 | | | | 6,602 | |
Darden Restaurants Inc | | | 22,995 | | | | 2,483 | |
Dollar General Corp | | | 45,000 | | | | 9,836 | |
Dollar Tree Inc * | | | 43,369 | | | | 4,738 | |
Domino’s Pizza Inc | | | 7,200 | | | | 2,826 | |
DR Horton Inc | | | 60,591 | | | | 4,514 | |
eBay Inc | | | 120,883 | | | | 6,096 | |
Etsy Inc * | | | 22,000 | | | | 3,535 | |
Expedia Group Inc * | | | 24,995 | | | | 3,112 | |
Ford Motor Co * | | | 711,343 | | | | 6,459 | |
Gap Inc/The | | | 39,800 | | | | 834 | |
Garmin Ltd | | | 27,395 | | | | 3,199 | |
General Motors Co * | | | 228,587 | | | | 10,021 | |
Genuine Parts Co | | | 25,600 | | | | 2,518 | |
Hanesbrands Inc | | | 60,200 | | | | 855 | |
| | | | | | | | |
| | | |
| Description | | Shares | | Market Value
($ Thousands) |
COMMON STOCK (continued) | | | | | | | | |
Hasbro Inc | | | 22,595 | | | $ | 2,102 | |
Hilton Worldwide Holdings Inc * | | | 50,500 | | | | 5,233 | |
Home Depot Inc/The | | | 195,387 | | | | 54,202 | |
L Brands Inc * | | | 41,100 | | | | 1,595 | |
Las Vegas Sands Corp * | | | 59,000 | | | | 3,287 | |
Leggett & Platt Inc | | | 23,295 | | | | 1,004 | |
Lennar Corp, Cl A | | | 50,391 | | | | 3,823 | |
LKQ Corp * | | | 51,100 | | | | 1,800 | |
Lowe’s Cos Inc | | | 137,687 | | | | 21,454 | |
Marriott International Inc/MD, Cl A * | | | 47,836 | | | | 6,069 | |
McDonald’s Corp | | | 134,887 | | | | 29,330 | |
MGM Resorts International | | | 74,700 | | | | 2,110 | |
Mohawk Industries Inc * | | | 10,300 | | | | 1,296 | |
Newell Brands Inc | | | 65,790 | | | | 1,399 | |
NIKE Inc, Cl B | | | 226,582 | | | | 30,521 | |
Norwegian Cruise Line Holdings Ltd *(A) | | | 59,700 | | | | 1,365 | |
NVR Inc * | | | 630 | | | | 2,518 | |
O’Reilly Automotive Inc * | | | 13,500 | | | | 5,973 | |
Pool Corp | | | 7,300 | | | | 2,527 | |
PulteGroup Inc | | | 49,483 | | | | 2,159 | |
PVH Corp * | | | 13,500 | | | | 1,073 | |
Ralph Lauren Corp, Cl A * | | | 9,395 | | | | 806 | |
Ross Stores Inc * | | | 64,700 | | | | 6,956 | |
Royal Caribbean Cruises Ltd * | | | 33,000 | | | | 2,601 | |
Starbucks Corp | | | 212,882 | | | | 20,867 | |
Tapestry Inc * | | | 48,291 | | | | 1,368 | |
Target Corp | | | 90,691 | | | | 16,282 | |
Tiffany & Co | | | 19,995 | | | | 2,629 | |
TJX Cos Inc/The | | | 218,682 | | | | 13,888 | |
Tractor Supply Co | | | 21,300 | | | | 2,999 | |
Ulta Beauty Inc * | | | 10,000 | | | | 2,754 | |
Under Armour Inc, Cl A * | | | 30,995 | | | | 514 | |
Under Armour Inc, Cl C * | | | 30,332 | | | | 441 | |
VF Corp | | | 58,291 | | | | 4,861 | |
Whirlpool Corp | | | 11,000 | | | | 2,141 | |
Wynn Resorts Ltd * | | | 17,100 | | | | 1,719 | |
Yum! Brands Inc | | | 54,900 | | | | 5,808 | |
| | |
| | | | | | | 618,801 | |
|
Consumer Staples — 6.7% | |
Altria Group Inc | | | 336,383 | | | | 13,398 | |
Archer-Daniels-Midland Co | | | 101,191 | | | | 5,036 | |
Brown-Forman Corp, Cl B | | | 32,490 | | | | 2,621 | |
Campbell Soup Co | | | 37,591 | | | | 1,880 | |
Church & Dwight Co Inc | | | 45,100 | | | | 3,958 | |
Clorox Co/The (A) | | | 23,000 | | | | 4,668 | |
Coca-Cola Co/The | | | 701,457 | | | | 36,195 | |
Colgate-Palmolive Co | | | 156,391 | | | | 13,393 | |
Conagra Brands Inc | | | 89,487 | | | | 3,272 | |
Constellation Brands Inc, Cl A | | | 30,600 | | | | 6,299 | |
Costco Wholesale Corp | | | 80,300 | | | | 31,459 | |
Estee Lauder Cos Inc/The, Cl A | | | 40,900 | | | | 10,034 | |
General Mills Inc | | | 110,996 | | | | 6,751 | |
| | |
| SEI Institutional Investments Trust / Semi-Annual Report / November 30, 2020 | | 1 |
SCHEDULE OF INVESTMENTS (Unaudited)
November 30, 2020
S&P 500 Index Fund (Continued)
| | | | | | | | |
| | | |
| Description | | Shares | | Market Value
($ Thousands) |
| |
COMMON STOCK (continued) | | | | | |
Hershey Co/The | | | 26,900 | | | $ | 3,978 | |
Hormel Foods Corp (A) | | | 51,592 | | | | 2,434 | |
J M Smucker Co/The | | | 21,095 | | | | 2,472 | |
Kellogg Co | | | 46,500 | | | | 2,972 | |
Kimberly-Clark Corp | | | 61,596 | | | | 8,581 | |
Kraft Heinz Co/The | | | 118,491 | | | | 3,903 | |
Kroger Co/The | | | 142,282 | | | | 4,695 | |
Lamb Weston Holdings Inc | | | 26,000 | | | | 1,882 | |
McCormick & Co Inc/MD | | | 22,595 | | | | 4,225 | |
Molson Coors Beverage Co, Cl B * | | | 32,895 | | | | 1,513 | |
Mondelez International Inc, Cl A | | | 258,578 | | | | 14,855 | |
Monster Beverage Corp * | | | 67,431 | | | | 5,717 | |
PepsiCo Inc | | | 251,278 | | | | 36,242 | |
Philip Morris International Inc | | | 283,078 | | | | 21,443 | |
Procter & Gamble Co/The | | | 452,667 | | | | 62,862 | |
Sysco Corp | | | 92,400 | | | | 6,587 | |
Tyson Foods Inc, Cl A | | | 52,587 | | | | 3,429 | |
Walgreens Boots Alliance Inc | | | 129,387 | | | | 4,918 | |
Walmart Inc | | | 251,983 | | | | 38,501 | |
| | |
| | | | | | | 370,173 | |
|
Energy — 2.3% | |
Apache Corp | | | 66,600 | | | | 858 | |
Baker Hughes Co, Cl A | | | 122,000 | | | | 2,284 | |
Cabot Oil & Gas Corp, Cl A | | | 74,487 | | | | 1,305 | |
Chevron Corp | | | 348,901 | | | | 30,417 | |
Concho Resources Inc | | | 34,600 | | | | 1,989 | |
ConocoPhillips | | | 194,783 | | | | 7,706 | |
Devon Energy Corp | | | 73,200 | | | | 1,024 | |
Diamondback Energy Inc | | | 29,900 | | | | 1,195 | |
EOG Resources Inc | | | 106,691 | | | | 5,002 | |
Exxon Mobil Corp | | | 766,300 | | | | 29,219 | |
Halliburton Co | | | 155,391 | | | | 2,578 | |
Hess Corp | | | 50,700 | | | | 2,392 | |
HollyFrontier Corp | | | 29,300 | | | | 685 | |
Kinder Morgan Inc | | | 354,683 | | | | 5,100 | |
Marathon Oil Corp | | | 152,000 | | | | 900 | |
Marathon Petroleum Corp | | | 116,711 | | | | 4,538 | |
National Oilwell Varco Inc * | | | 66,400 | | | | 814 | |
Occidental Petroleum Corp | | | 152,724 | | | | 2,407 | |
ONEOK Inc | | | 81,891 | | | | 2,937 | |
Phillips 66 | | | 79,596 | | | | 4,822 | |
Pioneer Natural Resources Co | | | 30,296 | | | | 3,047 | |
Schlumberger NV | | | 252,866 | | | | 5,257 | |
TechnipFMC PLC | | | 82,800 | | | | 688 | |
Valero Energy Corp | | | 74,500 | | | | 4,006 | |
Williams Cos Inc/The | | | 221,096 | | | | 4,639 | |
| | |
| | | | | | | 125,809 | |
|
Financials — 10.2% | |
Aflac Inc | | | 120,882 | | | | 5,310 | |
Allstate Corp/The | | | 56,800 | | | | 5,813 | |
American Express Co | | | 118,887 | | | | 14,099 | |
| | | | | | | | |
| | | |
| Description | | Shares | | Market Value
($ Thousands) |
| |
COMMON STOCK (continued) | | | | | |
American International Group Inc | | | 157,078 | | | $ | 6,038 | |
Ameriprise Financial Inc | | | 22,000 | | | | 4,075 | |
Aon PLC, Cl A | | | 42,000 | | | | 8,605 | |
Arthur J Gallagher & Co | | | 35,000 | | | | 4,039 | |
Assurant Inc | | | 10,395 | | | | 1,342 | |
Bank of America Corp | | | 1,383,483 | | | | 38,959 | |
Bank of New York Mellon Corp/The | | | 148,287 | | | | 5,801 | |
Berkshire Hathaway Inc, Cl B * | | | 360,328 | | | | 82,483 | |
BlackRock Inc, Cl A | | | 25,696 | | | | 17,945 | |
Capital One Financial Corp | | | 82,996 | | | | 7,108 | |
Cboe Global Markets Inc | | | 20,200 | | | | 1,845 | |
Charles Schwab Corp/The | | | 270,191 | | | | 13,180 | |
Chubb Ltd | | | 81,947 | | | | 12,114 | |
Cincinnati Financial Corp | | | 27,696 | | | | 2,115 | |
Citigroup Inc | | | 378,357 | | | | 20,836 | |
Citizens Financial Group Inc | | | 78,800 | | | | 2,574 | |
CME Group Inc, Cl A | | | 65,495 | | | | 11,464 | |
Comerica Inc | | | 24,191 | | | | 1,190 | |
Discover Financial Services | | | 56,100 | | | | 4,273 | |
Everest Re Group Ltd | | | 7,500 | | | | 1,705 | |
Fifth Third Bancorp | | | 130,700 | | | | 3,312 | |
First Republic Bank/CA | | | 31,500 | | | | 4,081 | |
Franklin Resources Inc | | | 48,095 | | | | 1,058 | |
Globe Life Inc | | | 17,546 | | | | 1,633 | |
Goldman Sachs Group Inc/The | | | 62,291 | | | | 14,363 | |
Hartford Financial Services Group Inc/The | | | 63,900 | | | | 2,824 | |
Huntington Bancshares Inc/OH | | | 188,561 | | | | 2,278 | |
Intercontinental Exchange Inc | | | 101,500 | | | | 10,709 | |
Invesco Ltd | | | 64,500 | | | | 1,047 | |
JPMorgan Chase & Co | | | 554,057 | | | | 65,312 | |
KeyCorp | | | 180,700 | | | | 2,794 | |
Lincoln National Corp | | | 32,000 | | | | 1,511 | |
Loews Corp | | | 42,087 | | | | 1,764 | |
M&T Bank Corp | | | 23,723 | | | | 2,763 | |
MarketAxess Holdings Inc | | | 7,000 | | | | 3,774 | |
Marsh & McLennan Cos Inc | | | 91,591 | | | | 10,500 | |
MetLife Inc | | | 140,387 | | | | 6,482 | |
Moody’s Corp | | | 29,300 | | | | 8,273 | |
Morgan Stanley | | | 259,253 | | | | 16,030 | |
MSCI Inc, Cl A | | | 15,300 | | | | 6,264 | |
Nasdaq Inc | | | 21,200 | | | | 2,713 | |
Northern Trust Corp | | | 37,196 | | | | 3,464 | |
People’s United Financial Inc | | | 73,000 | | | | 905 | |
PNC Financial Services Group Inc/The | | | 76,991 | | | | 10,630 | |
Principal Financial Group Inc | | | 47,191 | | | | 2,350 | |
Progressive Corp/The | | | 105,783 | | | | 9,215 | |
Prudential Financial Inc | | | 71,900 | | | | 5,437 | |
Raymond James Financial Inc | | | 22,700 | | | | 2,065 | |
Regions Financial Corp | | | 177,900 | | | | 2,716 | |
S&P Global Inc | | | 43,600 | | | | 15,338 | |
State Street Corp | | | 64,300 | | | | 4,532 | |
SVB Financial Group * | | | 9,200 | | | | 3,173 | |
| | |
| 2 | | SEI Institutional Investments Trust / Semi-Annual Report / November 30, 2020 |
SCHEDULE OF INVESTMENTS (Unaudited)
November 30, 2020
S&P 500 Index Fund (Continued)
| | | | | | | | |
| | | |
| Description | | Shares | | Market Value
($ Thousands) |
| |
COMMON STOCK (continued) | | | | | |
Synchrony Financial | | | 100,221 | | | $ | 3,054 | |
T Rowe Price Group Inc | | | 41,300 | | | | 5,923 | |
Travelers Cos Inc/The | | | 46,096 | | | | 5,976 | |
Truist Financial Corp | | | 243,692 | | | | 11,312 | |
Unum Group | | | 34,591 | | | | 769 | |
US Bancorp | | | 247,883 | | | | 10,711 | |
W R Berkley Corp | | | 26,300 | | | | 1,713 | |
Wells Fargo & Co | | | 748,648 | | | | 20,475 | |
Willis Towers Watson PLC | | | 23,445 | | | | 4,881 | |
Zions Bancorp NA | | | 28,400 | | | | 1,096 | |
| | |
| | | | | | | 568,133 | |
|
Health Care — 13.4% | |
Abbott Laboratories | | | 321,248 | | | | 34,766 | |
AbbVie Inc | | | 319,913 | | | | 33,456 | |
ABIOMED Inc * | | | 8,400 | | | | 2,302 | |
Agilent Technologies Inc | | | 56,091 | | | | 6,557 | |
Alexion Pharmaceuticals Inc * | | | 40,100 | | | | 4,897 | |
Align Technology Inc * | | | 13,100 | | | | 6,305 | |
AmerisourceBergen Corp, Cl A | | | 26,196 | | | | 2,701 | |
Amgen Inc | | | 106,691 | | | | 23,690 | |
Anthem Inc | | | 45,696 | | | | 14,235 | |
Baxter International Inc | | | 91,829 | | | | 6,985 | |
Becton Dickinson and Co | | | 52,339 | | | | 12,291 | |
Biogen Inc * | | | 28,500 | | | | 6,845 | |
Bio-Rad Laboratories Inc, Cl A * | | | 3,800 | | | | 2,046 | |
Boston Scientific Corp * | | | 258,400 | | | | 8,566 | |
Bristol-Myers Squibb Co | | | 408,370 | | | | 25,482 | |
Cardinal Health Inc | | | 53,796 | | | | 2,937 | |
Catalent Inc * | | | 30,200 | | | | 2,903 | |
Centene Corp * | | | 105,264 | | | | 6,490 | |
Cerner Corp | | | 55,800 | | | | 4,176 | |
Cigna Corp | | | 66,707 | | | | 13,951 | |
Cooper Cos Inc/The | | | 8,800 | | | | 2,950 | |
CVS Health Corp | | | 237,757 | | | | 16,118 | |
Danaher Corp | | | 114,400 | | | | 25,698 | |
DaVita Inc * | | | 13,695 | | | | 1,504 | |
DENTSPLY SIRONA Inc | | | 40,391 | | | | 2,056 | |
DexCom Inc * | | | 17,400 | | | | 5,562 | |
Edwards Lifesciences Corp * | | | 112,300 | | | | 9,421 | |
Eli Lilly and Co | | | 144,545 | | | | 21,053 | |
Gilead Sciences Inc | | | 226,978 | | | | 13,771 | |
HCA Healthcare Inc * | | | 47,895 | | | | 7,190 | |
Henry Schein Inc * | | | 26,700 | | | | 1,717 | |
Hologic Inc * | | | 47,600 | | | | 3,291 | |
Humana Inc | | | 23,896 | | | | 9,571 | |
IDEXX Laboratories Inc * | | | 15,500 | | | | 7,145 | |
Illumina Inc * | | | 26,500 | | | | 8,535 | |
Incyte Corp * | | | 34,100 | | | | 2,883 | |
Intuitive Surgical Inc * | | | 21,300 | | | | 15,465 | |
IQVIA Holdings Inc * | | | 34,800 | | | | 5,881 | |
Johnson & Johnson | | | 478,670 | | | | 69,254 | |
Laboratory Corp of America Holdings * | | | 17,800 | | | | 3,557 | |
| | | | | | | | |
| | | |
| Description | | Shares | | Market Value
($ Thousands) |
| |
COMMON STOCK (continued) | | | | | |
McKesson Corp | | | 29,560 | | | $ | 5,318 | |
Medtronic PLC | | | 243,561 | | | | 27,693 | |
Merck & Co Inc | | | 458,970 | | | | 36,897 | |
Mettler-Toledo International Inc * | | | 4,400 | | | | 5,060 | |
PerkinElmer Inc | | | 19,900 | | | | 2,647 | |
Perrigo Co PLC | | | 23,596 | | | | 1,138 | |
Pfizer Inc | | | 1,008,235 | | | | 38,625 | |
Quest Diagnostics Inc | | | 23,900 | | | | 2,963 | |
Regeneron Pharmaceuticals Inc * | | | 18,900 | | | | 9,753 | |
ResMed Inc | | | 26,400 | | | | 5,533 | |
STERIS PLC | | | 15,600 | | | | 3,023 | |
Stryker Corp | | | 59,596 | | | | 13,910 | |
Teleflex Inc | | | 8,600 | | | | 3,292 | |
Thermo Fisher Scientific Inc | | | 71,791 | | | | 33,381 | |
UnitedHealth Group Inc | | | 172,487 | | | | 58,014 | |
Universal Health Services Inc, Cl B * | | | 13,700 | | | | 1,789 | |
Varian Medical Systems Inc * | | | 16,295 | | | | 2,835 | |
Vertex Pharmaceuticals Inc * | | | 47,100 | | | | 10,727 | |
Viatris Inc, Cl W * | | | 218,005 | | | | 3,667 | |
Waters Corp * | | | 11,500 | | | | 2,668 | |
West Pharmaceutical Services Inc | | | 13,500 | | | | 3,715 | |
Zimmer Biomet Holdings Inc | | | 37,695 | | | | 5,621 | |
Zoetis Inc, Cl A | | | 86,300 | | | | 13,841 | |
| | |
| | | | | | | 746,313 | |
|
Industrials — 8.6% | |
3M Co | | | 104,691 | | | | 18,083 | |
A O Smith Corp | | | 25,400 | | | | 1,430 | |
Alaska Air Group Inc * | | | 21,400 | | | | 1,091 | |
Allegion plc | | | 16,396 | | | | 1,870 | |
American Airlines Group Inc *(A) | | | 97,291 | | | | 1,375 | |
AMETEK Inc | | | 42,100 | | | | 4,990 | |
Boeing Co/The * | | | 96,391 | | | | 20,311 | |
Carrier Global Corp | | | 149,085 | | | | 5,676 | |
Caterpillar Inc | | | 98,391 | | | | 17,080 | |
CH Robinson Worldwide Inc (A) | | | 23,995 | | | | 2,255 | |
Cintas Corp | | | 15,795 | | | | 5,612 | |
Copart Inc * | | | 37,700 | | | | 4,352 | |
CSX Corp | | | 138,478 | | | | 12,470 | |
Cummins Inc | | | 26,896 | | | | 6,217 | |
Deere & Co | | | 56,896 | | | | 14,885 | |
Delta Air Lines Inc * | | | 116,487 | | | | 4,689 | |
Dover Corp | | | 26,400 | | | | 3,222 | |
Eaton Corp PLC | | | 72,595 | | | | 8,792 | |
Emerson Electric Co | | | 108,491 | | | | 8,334 | |
Equifax Inc | | | 22,195 | | | | 3,704 | |
Expeditors International of Washington Inc | | | 30,791 | | | | 2,752 | |
Fastenal Co | | | 104,582 | | | | 5,172 | |
FedEx Corp | | | 43,600 | | | | 12,495 | |
Flowserve Corp | | | 22,100 | | | | 753 | |
Fortive Corp | | | 61,425 | | | | 4,308 | |
Fortune Brands Home & Security Inc | | | 24,500 | | | | 2,046 | |
General Dynamics Corp | | | 42,196 | | | | 6,302 | |
| | |
| SEI Institutional Investments Trust / Semi-Annual Report / November 30, 2020 | | 3 |
SCHEDULE OF INVESTMENTS (Unaudited)
November 30, 2020
S&P 500 Index Fund (Continued)
| | | | | | | | |
| | | |
| Description | | Shares | | Market Value
($ Thousands) |
| |
COMMON STOCK (continued) | | | | | |
General Electric Co | | | 1,589,588 | | | $ | 16,182 | |
Honeywell International Inc | | | 127,787 | | | | 26,058 | |
Howmet Aerospace Inc * | | | 69,066 | | | | 1,620 | |
Huntington Ingalls Industries Inc | | | 7,700 | | | | 1,233 | |
IDEX Corp | | | 13,400 | | | | 2,588 | |
IHS Markit Ltd | | | 68,000 | | | | 6,763 | |
Illinois Tool Works Inc | | | 51,995 | | | | 10,976 | |
Ingersoll Rand Inc * | | | 68,227 | | | | 3,020 | |
Jacobs Engineering Group Inc | | | 24,096 | | | | 2,599 | |
JB Hunt Transport Services Inc | | | 14,900 | | | | 2,016 | |
Johnson Controls International PLC | | | 135,346 | | | | 6,231 | |
Kansas City Southern | | | 16,900 | | | | 3,146 | |
L3Harris Technologies Inc | | | 39,260 | | | | 7,538 | |
Lockheed Martin Corp | | | 44,656 | | | | 16,299 | |
Masco Corp | | | 46,400 | | | | 2,490 | |
Nielsen Holdings PLC | | | 62,600 | | | | 1,012 | |
Norfolk Southern Corp | | | 46,096 | | | | 10,926 | |
Northrop Grumman Corp | | | 28,096 | | | | 8,492 | |
Old Dominion Freight Line Inc | | | 17,600 | | | | 3,579 | |
Otis Worldwide Corp | | | 74,192 | | | | 4,966 | |
PACCAR Inc | | | 63,000 | | | | 5,485 | |
Parker-Hannifin Corp | | | 23,100 | | | | 6,174 | |
Pentair PLC | | | 28,900 | | | | 1,498 | |
Quanta Services Inc | | | 25,900 | | | | 1,770 | |
Raytheon Technologies Corp | | | 277,608 | | | | 19,910 | |
Republic Services Inc, Cl A | | | 38,600 | | | | 3,733 | |
Robert Half International Inc | | | 21,695 | | | | 1,392 | |
Rockwell Automation Inc | | | 21,096 | | | | 5,391 | |
Rollins Inc | | | 27,600 | | | | 1,578 | |
Roper Technologies Inc | | | 19,000 | | | | 8,113 | |
Snap-on Inc | | | 10,200 | | | | 1,794 | |
Southwest Airlines Co * | | | 107,587 | | | | 4,986 | |
Stanley Black & Decker Inc | | | 29,095 | | | | 5,363 | |
Teledyne Technologies Inc * | | | 6,800 | | | | 2,570 | |
Textron Inc | | | 40,491 | | | | 1,826 | |
Trane Technologies PLC | | | 43,596 | | | | 6,375 | |
TransDigm Group Inc * | | | 9,900 | | | | 5,734 | |
Union Pacific Corp | | | 122,987 | | | | 25,099 | |
United Airlines Holdings Inc * | | | 53,800 | | | | 2,424 | |
United Parcel Service Inc, Cl B | | | 128,787 | | | | 22,032 | |
United Rentals Inc * | | | 13,300 | | | | 3,019 | |
Verisk Analytics Inc, Cl A | | | 29,500 | | | | 5,850 | |
Waste Management Inc | | | 70,500 | | | | 8,399 | |
Westinghouse Air Brake Technologies Corp | | | 31,953 | | | | 2,342 | |
WW Grainger Inc | | | 8,300 | | | | 3,472 | |
Xylem Inc/NY | | | 33,200 | | | | 3,186 | |
| | |
| | | | | | | 477,515 | |
|
Information Technology — 27.1% | |
Accenture PLC, Cl A | | | 115,296 | | | | 28,719 | |
Adobe Inc * | | | 87,095 | | | | 41,672 | |
Advanced Micro Devices Inc * | | | 213,300 | | | | 19,764 | |
Akamai Technologies Inc * | | | 29,796 | | | | 3,084 | |
| | | | | | | | |
| | | |
| Description | | Shares | | Market Value
($ Thousands) |
| |
COMMON STOCK (continued) | | | | | |
Amphenol Corp, Cl A | | | 54,291 | | | $ | 7,102 | |
Analog Devices Inc | | | 67,106 | | | | 9,333 | |
ANSYS Inc * | | | 15,700 | | | | 5,308 | |
Apple Inc | | | 2,920,984 | | | | 347,743 | |
Applied Materials Inc | | | 165,300 | | | | 13,634 | |
Arista Networks Inc * | | | 10,100 | | | | 2,734 | |
Autodesk Inc * | | | 39,800 | | | | 11,153 | |
Automatic Data Processing Inc | | | 77,791 | | | | 13,526 | |
Broadcom Inc | | | 73,159 | | | | 29,379 | |
Broadridge Financial Solutions Inc | | | 21,200 | | | | 3,114 | |
Cadence Design Systems Inc * | | | 50,800 | | | | 5,908 | |
CDW Corp/DE | | | 25,500 | | | | 3,328 | |
Cisco Systems Inc | | | 767,343 | | | | 33,011 | |
Citrix Systems Inc | | | 22,600 | | | | 2,801 | |
Cognizant Technology Solutions Corp, Cl A | | | 98,495 | | | | 7,695 | |
Corning Inc | | | 138,670 | | | | 5,189 | |
DXC Technology Co * | | | 43,552 | | | | 954 | |
F5 Networks Inc * | | | 10,800 | | | | 1,758 | |
Fidelity National Information Services Inc | | | 112,600 | | | | 16,711 | |
Fiserv Inc * | | | 100,500 | | | | 11,576 | |
FleetCor Technologies Inc * | | | 15,400 | | | | 4,084 | |
FLIR Systems Inc | | | 25,300 | | | | 967 | |
Fortinet Inc * | | | 24,000 | | | | 2,958 | |
Gartner Inc * | | | 15,800 | | | | 2,402 | |
Global Payments Inc | | | 54,272 | | | | 10,593 | |
Hewlett Packard Enterprise Co | | | 238,174 | | | | 2,629 | |
HP Inc | | | 249,274 | | | | 5,467 | |
Intel Corp | | | 771,652 | | | | 37,309 | |
International Business Machines Corp | | | 161,851 | | | | 19,992 | |
Intuit Inc | | | 47,600 | | | | 16,756 | |
IPG Photonics Corp * | | | 6,800 | | | | 1,408 | |
Jack Henry & Associates Inc | | | 14,200 | | | | 2,284 | |
Juniper Networks Inc | | | 62,300 | | | | 1,356 | |
Keysight Technologies Inc * | | | 33,500 | | | | 4,021 | |
KLA Corp | | | 28,300 | | | | 7,131 | |
Lam Research Corp | | | 26,395 | | | | 11,948 | |
Leidos Holdings Inc | | | 23,700 | | | | 2,387 | |
Mastercard Inc, Cl A | | | 160,347 | | | | 53,958 | |
Maxim Integrated Products Inc * | | | 48,900 | | | | 4,061 | |
Microchip Technology Inc | | | 45,996 | | | | 6,181 | |
Micron Technology Inc * | | | 201,600 | | | | 12,921 | |
Microsoft Corp | | | 1,375,004 | | | | 294,347 | |
Motorola Solutions Inc | | | 30,888 | | | | 5,298 | |
NetApp Inc | | | 41,391 | | | | 2,207 | |
NortonLifeLock Inc | | | 108,900 | | | | 1,985 | |
NVIDIA Corp | | | 111,983 | | | | 60,030 | |
Oracle Corp | | | 351,365 | | | | 20,281 | |
Paychex Inc | | | 58,387 | | | | 5,439 | |
Paycom Software Inc * | | | 9,000 | | | | 3,754 | |
PayPal Holdings Inc * | | | 212,883 | | | | 45,583 | |
Qorvo Inc * | | | 21,000 | | | | 3,290 | |
QUALCOMM Inc | | | 204,478 | | | | 30,093 | |
| | |
| 4 | | SEI Institutional Investments Trust / Semi-Annual Report / November 30, 2020 |
SCHEDULE OF INVESTMENTS (Unaudited)
November 30, 2020
S&P 500 Index Fund (Continued)
| | | | | | | | |
| | | |
| Description | | Shares | | Market Value
($ Thousands) |
| |
COMMON STOCK (continued) | | | | | |
salesforce.com Inc * | | | 165,191 | | | $ | 40,604 | |
Seagate Technology PLC | | | 41,400 | | | | 2,435 | |
ServiceNow Inc * | | | 34,700 | | | | 18,549 | |
Skyworks Solutions Inc | | | 30,596 | | | | 4,319 | |
Synopsys Inc * | | | 27,600 | | | | 6,279 | |
TE Connectivity Ltd | | | 59,991 | | | | 6,837 | |
Teradyne Inc | | | 30,600 | | | | 3,376 | |
Texas Instruments Inc | | | 165,983 | | | | 26,765 | |
Tyler Technologies Inc * | | | 7,400 | | | | 3,164 | |
VeriSign Inc * | | | 18,500 | | | | 3,713 | |
Visa Inc, Cl A | | | 306,570 | | | | 64,487 | |
Vontier Corp * | | | 24,570 | | | | 815 | |
Western Digital Corp * | | | 55,831 | | | | 2,506 | |
Western Union Co/The | | | 76,678 | | | | 1,730 | |
Xerox Holdings Corp | | | 34,850 | | | | 763 | |
Xilinx Inc | | | 44,500 | | | | 6,477 | |
Zebra Technologies Corp, Cl A * | | | 9,800 | | | | 3,709 | |
| | |
| | | | | | | 1,504,844 | |
|
Materials — 2.7% | |
Air Products and Chemicals Inc | | | 39,900 | | | | 11,178 | |
Albemarle Corp | | | 18,800 | | | | 2,556 | |
Amcor PLC | | | 287,162 | | | | 3,253 | |
Avery Dennison Corp | | | 14,800 | | | | 2,210 | |
Ball Corp | | | 59,492 | | | | 5,712 | |
Celanese Corp, Cl A | | | 21,800 | | | | 2,819 | |
CF Industries Holdings Inc | | | 40,300 | | | | 1,503 | |
Corteva Inc | | | 137,231 | | | | 5,259 | |
Dow Inc | | | 134,565 | | | | 7,133 | |
DuPont de Nemours Inc | | | 133,131 | | | | 8,446 | |
Eastman Chemical Co | | | 24,096 | | | | 2,347 | |
Ecolab Inc | | | 45,015 | | | | 10,000 | |
FMC Corp | | | 23,900 | | | | 2,773 | |
Freeport-McMoRan Inc, Cl B * | | | 264,700 | | | | 6,191 | |
International Flavors & Fragrances Inc (A) | | | 18,900 | | | | 2,119 | |
International Paper Co | | | 70,296 | | | | 3,478 | |
Linde PLC | | | 95,660 | | | | 24,529 | |
LyondellBasell Industries NV, Cl A | | | 46,956 | | | | 3,996 | |
Martin Marietta Materials Inc | | | 11,500 | | | | 3,055 | |
Mosaic Co/The | | | 62,791 | | | | 1,379 | |
Newmont Corp | | | 145,083 | | | | 8,534 | |
Nucor Corp | | | 53,787 | | | | 2,888 | |
Packaging Corp of America | | | 17,300 | | | | 2,249 | |
PPG Industries Inc | | | 42,900 | | | | 6,296 | |
Sealed Air Corp | | | 27,400 | | | | 1,235 | |
Sherwin-Williams Co/The | | | 14,900 | | | | 11,140 | |
Vulcan Materials Co | | | 24,300 | | | | 3,393 | |
Westrock Co | | | 45,882 | | | | 1,937 | |
| | |
| | | | | | | 147,608 | |
|
Real Estate — 2.5% | |
Alexandria Real Estate Equities Inc ‡ | | | 21,300 | | | | 3,487 | |
American Tower Corp, Cl A ‡ | | | 80,800 | | | | 18,681 | |
| | | | | | | | |
| | | |
| Description | | Shares | | Market Value
($ Thousands) |
| |
COMMON STOCK (continued) | | | | | |
Apartment Investment and Management | | | | | | | | |
Co, Cl A ‡ | | | 25,711 | | | $ | 780 | |
AvalonBay Communities Inc ‡ | | | 25,800 | | | | 4,298 | |
Boston Properties Inc ‡ | | | 25,800 | | | | 2,533 | |
CBRE Group Inc, Cl A * | | | 61,791 | | | | 3,778 | |
Crown Castle International Corp ‡ | | | 75,796 | | | | 12,701 | |
Digital Realty Trust Inc ‡ | | | 48,800 | | | | 6,576 | |
Duke Realty Corp ‡ | | | 68,200 | | | | 2,596 | |
Equinix Inc ‡ | | | 16,057 | | | | 11,204 | |
Equity Residential ‡ | | | 61,296 | | | | 3,550 | |
Essex Property Trust Inc ‡ | | | 12,000 | | | | 2,951 | |
Extra Space Storage Inc ‡ | | | 23,800 | | | | 2,683 | |
Federal Realty Investment Trust ‡ | | | 12,100 | | | | 1,055 | |
Healthpeak Properties Inc ‡ | | | 98,200 | | | | 2,834 | |
Host Hotels & Resorts Inc *‡ | | | 124,174 | | | | 1,742 | |
Iron Mountain Inc ‡(A) | | | 49,801 | | | | 1,370 | |
Kimco Realty Corp ‡ | | | 82,187 | | | | 1,187 | |
Mid-America Apartment Communities Inc ‡ | | | 21,000 | | | | 2,649 | |
Prologis Inc ‡ | | | 134,799 | | | | 13,487 | |
Public Storage ‡ | | | 27,595 | | | | 6,194 | |
Realty Income Corp ‡ | | | 63,300 | | | | 3,796 | |
Regency Centers Corp ‡ | | | 29,400 | | | | 1,340 | |
SBA Communications Corp, Cl A ‡ | | | 20,300 | | | | 5,830 | |
Simon Property Group Inc ‡ | | | 59,696 | | | | 4,929 | |
SL Green Realty Corp ‡(A) | | | 12,700 | | | | 735 | |
UDR Inc ‡ | | | 52,000 | | | | 2,000 | |
Ventas Inc ‡ | | | 68,400 | | | | 3,277 | |
Vornado Realty Trust ‡ | | | 26,896 | | | | 1,047 | |
Welltower Inc ‡ | | | 76,500 | | | | 4,818 | |
Weyerhaeuser Co ‡ | | | 136,845 | | | | 3,974 | |
| | |
| | | | | | | 138,082 | |
|
Utilities — 2.9% | |
AES Corp/The | | | 123,100 | | | | 2,516 | |
Alliant Energy Corp | | | 44,200 | | | | 2,325 | |
Ameren Corp | | | 45,391 | | | | 3,530 | |
American Electric Power Co Inc | | | 90,100 | | | | 7,649 | |
American Water Works Co Inc | | | 33,000 | | | | 5,062 | |
Atmos Energy Corp | | | 21,800 | | | | 2,090 | |
CenterPoint Energy Inc | | | 96,583 | | | | 2,240 | |
CMS Energy Corp | | | 52,591 | | | | 3,236 | |
Consolidated Edison Inc | | | 61,000 | | | | 4,651 | |
Dominion Energy Inc | | | 151,685 | | | | 11,906 | |
DTE Energy Co | | | 35,200 | | | | 4,429 | |
Duke Energy Corp | | | 134,191 | | | | 12,434 | |
Edison International | | | 69,096 | | | | 4,240 | |
Entergy Corp | | | 36,600 | | | | 3,984 | |
Evergy Inc | | | 42,000 | | | | 2,327 | |
Eversource Energy | | | 62,400 | | | | 5,461 | |
Exelon Corp | | | 177,091 | | | | 7,273 | |
FirstEnergy Corp | | | 96,887 | | | | 2,573 | |
NextEra Energy Inc | | | 354,900 | | | | 26,117 | |
NiSource Inc | | | 67,287 | | | | 1,628 | |
| | |
| SEI Institutional Investments Trust / Semi-Annual Report / November 30, 2020 | | 5 |
SCHEDULE OF INVESTMENTS (Unaudited)
November 30, 2020
S&P 500 Index Fund (Continued)
| | | | | | | | |
| | | |
| Description | | Shares | | Market Value
($ Thousands) |
| | |
COMMON STOCK (continued) | | | | | | | | |
NRG Energy Inc | | | 42,787 | | | $ | 1,401 | |
Pinnacle West Capital Corp | | | 21,000 | | | | 1,719 | |
PPL Corp | | | 140,400 | | | | 3,990 | |
Public Service Enterprise Group Inc | | | 92,100 | | | | 5,368 | |
Sempra Energy | | | 52,595 | | | | 6,705 | |
Southern Co/The | | | 191,000 | | | | 11,431 | |
WEC Energy Group Inc | | | 57,431 | | | | 5,453 | |
Xcel Energy Inc | | | 95,483 | | | | 6,432 | |
| | |
| | | | | | | 158,170 | |
| | |
Total Common Stock
(Cost $3,070,259) ($ Thousands) | | | | | | | 5,457,339 | |
| | | | | | | | |
| | | |
| Description | | Shares | | Market Value
($ Thousands) |
| |
AFFILIATED PARTNERSHIP — 0.2% | | | | | |
SEI Liquidity Fund, L.P.
0.070% **†(B) | | | 13,811,270 | | | $ | 13,806 | |
| | |
Total Affiliated Partnership
(Cost $13,810) ($ Thousands) | | | | | | | 13,806 | |
| | |
CASH EQUIVALENT — 1.4% | | | | | | | | |
SEI Daily Income Trust, Government Fund, Cl F
0.010%**† | | | 75,326,229 | | | | 75,326 | |
| | |
Total Cash Equivalent
(Cost $75,326) ($ Thousands) | | | | | | | 75,326 | |
| | |
Total Investments in Securities — 99.9%
(Cost $3,159,395) ($ Thousands) | | | | | | $ | 5,546,471 | |
| | | | | | | | |
A list of the open futures contracts held by the Fund at November 30, 2020, is as follows:
| | | | | | | | | | | | | | | | | | | | |
Type of Contract | | Number of
Contracts
Long | | | Expiration
Date | | | Notional Amount
(Thousands) | | | Value
(Thousands) | | | Unrealized Appreciation (Thousands) | |
S&P 500 Index E-MINI | | | 535 | | | | Dec-2020 | | | $ | 88,452 | | | $ | 96,921 | | | $ | 8,469 | |
| | | | | | | | | | | | |
| | Percentages are based on a Net Assets of $5,551,784 ($ Thousands). |
| * | Non-income producing security. |
| ** | The rate reported is the 7-day effective yield as of November 30, 2020. |
| ‡ | Real Estate Investment Trust. |
| † | Investment in Affiliated Security (see Note 6). |
| (A) | Certain securities or partial positions of certain securities are on loan at November 30, 2020 (see Note 12). The total market value of securities on loan at November 30, 2020, was $13,405 ($ Thousands). |
| (B) | This security was purchased with cash collateral held from securities on loan (see Note 12). The total market value of such securities as of November 30, 2020 was $13,806 ($ Thousands). |
Cl — Class
L.P. — Limited Partnership
PLC — Public Limited Company
S&P — Standard & Poor’s
The following is a list of the level of inputs used as of November 30, 2020, in valuing the Fund’s investments and other financial instruments carried at value ($ Thousands):
| | | | | | | | | | | | | | | | |
| | | | | |
| Investments in Securities | | Level 1
($) | | | Level 2
($) | | | Level 3
($) | | | Total
($) | |
Common Stock | | | 5,457,339 | | | | – | | | | – | | | | 5,457,339 | |
Affiliated Partnership | | | – | | | | 13,806 | | | | – | | | | 13,806 | |
Cash Equivalent | | | 75,326 | | | | – | | | | – | | | | 75,326 | |
| | | | | | | | | | | | | | | | |
Total Investments in Securities | | | 5,532,665 | | | | 13,806 | | | | – | | | | 5,546,471 | |
| | | | | | | | | | | | | | | | |
| | | | | | | | | | | | | | | | |
| Other Financial Instruments | | Level 1
($) | | | Level 2
($) | | | Level 3 ($) | | | Total
($) | |
Futures Contracts* | | | | | | | | | | | | | | | | |
Unrealized Appreciation | | | 8,469 | | | | – | | | | – | | | | 8,469 | |
| | | | | | | | | | | | | | | | |
Total Other Financial Instruments | | | 8,469 | | | | – | | | | – | | | | 8,469 | |
| | | | | | | | | | | | | | | | |
* Futures contracts are valued at the unrealized appreciation on the instrument.
For the period ended November 30, 2020, there were no transfers in or out of Level 3.
For more information on valuation inputs, see Note 2 – Significant Accounting Policies in Notes to Financial Statements.
| | |
| 6 | | SEI Institutional Investments Trust / Semi-Annual Report / November 30, 2020 |
SCHEDULE OF INVESTMENTS (Unaudited)
November 30, 2020
S&P 500 Index Fund (Continued)
The following is a summary of the Fund’s transactions with affiliates for the period ended November 30, 2020 ($ Thousands):
| | | | | | | | | | | | | | | | | | |
| Security Description | | Value
5/31/2020 | | Purchases at
Cost | | Proceeds from
Sales | | Realized Gain/
(Loss) | | Change in
Unrealized
Appreciation/
(Depreciation) | | Value
11/30/2020 | | Shares | | Income | | Capital
Gains |
SEI Liquidity Fund, L.P. | | $ 49,600 | | $ 96,031 | | $ (131,818) | | $ 12 | | $ (19) | | $ 13,806 | | 13,811,270 | | $ 50 | | $ — |
SEI Daily Income Trust, Government Fund, Cl F | | 66,287 | | 550,211 | | (541,172) | | — | | — | | 75,326 | | 75,326,229 | | 7 | | — |
| | | | | | | | | | | | | | | | | | |
Totals | | $ 115,887 | | $ 646,242 | | $ (672,990) | | $ 12 | | $ (19) | | $ 89,132 | | | | $ 57 | | $ — |
| | | | | | | | | | | | | | | | | | |
Amounts designated as “—” are $0 or have been rounded to $0.
The accompanying notes are an integral part of the financial statements.
| | |
| SEI Institutional Investments Trust / Semi-Annual Report / November 30, 2020 | | 7 |
SCHEDULE OF INVESTMENTS (Unaudited)
November 30, 2020
Extended Market Index Fund (Continued)
| | | | | | | | |
| | | |
| Description | | Shares | | Market Value ($ Thousands) |
COMMON STOCK — 99.4% | | | | | | | | |
| | |
Communication Services — 4.6% | | | | | | | | |
Altice USA Inc, Cl A *(A) | | | 74,500 | | | $ | 2,527 | |
AMC Entertainment Holdings Inc, Cl A (A) | | | 11,994 | | | | 51 | |
AMC Networks Inc, Cl A *(A) | | | 9,160 | | | | 302 | |
Anterix Inc * | | | 4,500 | | | | 135 | |
ATN International Inc | | | 2,267 | | | | 111 | |
Boingo Wireless Inc * | | | 9,200 | | | | 130 | |
Boston Omaha Corp, Cl A * | | | 4,300 | | | | 100 | |
Cable One Inc | | | 1,300 | | | | 2,575 | |
Cardlytics Inc *(A) | | | 6,100 | | | | 724 | |
Cargurus Inc, Cl A * | | | 21,300 | | | | 534 | |
Cars.com Inc *(A) | | | 15,200 | | | | 170 | |
Cincinnati Bell Inc * | | | 16,504 | | | | 251 | |
Cinemark Holdings Inc (A) | | | 26,640 | | | | 412 | |
Cogent Communications Holdings Inc | | | 10,804 | | | | 628 | |
comScore Inc * | | | 20,100 | | | | 51 | |
Consolidated Communications Holdings Inc * | | | 13,612 | | | | 76 | |
Daily Journal Corp * | | | 300 | | | | 81 | |
DHI Group Inc * | | | 16,900 | | | | 32 | |
Emerald Holding Inc | | | 5,700 | | | | 24 | |
Entercom Communications Corp, Cl A | | | 56,182 | | | | 137 | |
Entravision Communications Corp, Cl A | | | 14,200 | | | | 41 | |
Eros International PLC * | | | 59,700 | | | | 127 | |
Eventbrite Inc, Cl A *(A) | | | 11,200 | | | | 188 | |
EverQuote Inc, Cl A * | | | 2,900 | | | | 109 | |
EW Scripps Co/The, Cl A | | | 13,896 | | | | 177 | |
Fluent Inc * | | | 18,300 | | | | 63 | |
Gannett Co Inc | | | 55,187 | | | | 157 | |
GCI Liberty Inc * | | | 23,647 | | | | 2,155 | |
Glu Mobile Inc * | | | 37,600 | | | | 380 | |
Gogo Inc *(A) | | | 13,900 | | | | 146 | |
Gray Television Inc * | | | 21,200 | | | | 374 | |
Hemisphere Media Group Inc, Cl A * | | | 3,500 | | | | 38 | |
IAC/InterActiveCorp * | | | 18,021 | | | | 2,559 | |
IDT Corp, Cl B * | | | 5,700 | | | | 68 | |
iHeartMedia Inc, Cl A * | | | 14,200 | | | | 170 | |
IMAX Corp * | | | 11,800 | | | | 175 | |
Iridium Communications Inc * | | | 30,646 | | | | 983 | |
John Wiley & Sons Inc, Cl A | | | 11,872 | | | | 410 | |
Liberty Broadband Corp, Cl A * | | | 6,783 | | | | 1,063 | |
Liberty Broadband Corp, Cl C * | | | 25,868 | | | | 4,070 | |
Liberty Latin America Ltd, Cl A * | | | 8,300 | | | | 94 | |
Liberty Latin America Ltd, Cl C * | | | 32,262 | | | | 365 | |
Liberty Media Corp-Liberty Braves, Cl A * | | | 1,803 | | | | 45 | |
Liberty Media Corp-Liberty Braves, Cl C * | | | 10,465 | | | | 262 | |
Liberty Media Corp-Liberty Formula One, Cl A * | | | 7,308 | | | | 276 | |
Liberty Media Corp-Liberty Formula One, Cl C * | | | 47,242 | | | | 1,974 | |
Liberty Media Corp-Liberty SiriusXM, Cl A * | | | 19,835 | | | | 812 | |
Liberty Media Corp-Liberty SiriusXM, Cl C * | | | 45,422 | | | | 1,863 | |
| | | | | | | | |
| | | |
| Description | | Shares | | Market Value ($ Thousands) |
COMMON STOCK (continued) | | | | | | | | |
Liberty TripAdvisor Holdings Inc, Cl A * | | | 13,392 | | | $ | 37 | |
Lions Gate Entertainment Corp, Cl A *(A) | | | 21,655 | | | | 211 | |
Lions Gate Entertainment Corp, Cl B * | | | 35,975 | | | | 323 | |
LiveXLive Media Inc *(A) | | | 5,200 | | | | 13 | |
Loral Space & Communications Inc | | | 2,700 | | | | 62 | |
Madison Square Garden Entertainment Corp * | | | 4,979 | | | | 378 | |
Madison Square Garden Sports Corp, Cl A * | | | 4,479 | | | | 759 | |
Marcus Corp/The | | | 4,061 | | | | 48 | |
Match Group Inc * | | | 54,636 | | | | 7,606 | |
Meredith Corp | | | 9,244 | | | | 188 | |
MSG Networks Inc *(A) | | | 11,940 | | | | 145 | |
National CineMedia Inc | | | 15,007 | | | | 51 | |
New York Times Co/The, Cl A (A) | | | 42,482 | | | | 1,823 | |
Nexstar Media Group Inc, Cl A | | | 10,944 | | | | 1,152 | |
Ooma Inc * | | | 6,900 | | | | 108 | |
ORBCOMM Inc * | | | 12,086 | | | | 69 | |
QuinStreet Inc * | | | 9,586 | | | | 171 | |
Roku Inc, Cl A * | | | 26,400 | | | | 7,750 | |
Saga Communications Inc, Cl A | | | 593 | | | | 13 | |
Scholastic Corp | | | 8,067 | | | | 191 | |
Shenandoah Telecommunications Co | | | 12,404 | | | | 551 | |
Shutterstock Inc | | | 5,797 | | | | 399 | |
Sinclair Broadcast Group Inc, Cl A (A) | | | 7,811 | | | | 213 | |
Sirius XM Holdings Inc (A) | | | 280,381 | | | | 1,820 | |
Spok Holdings Inc | | | 4,132 | | | | 41 | |
Spotify Technology SA * | | | 32,800 | | | | 9,557 | |
Stamps.com Inc * | | | 4,155 | | | | 779 | |
TechTarget Inc * | | | 4,700 | | | | 247 | |
TEGNA Inc | | | 52,100 | | | | 751 | |
Telephone and Data Systems Inc | | | 24,555 | | | | 466 | |
Tribune Publishing Co | | | 4,100 | | | | 50 | |
TripAdvisor Inc * | | | 25,200 | | | | 658 | |
TrueCar Inc * | | | 22,900 | | | | 93 | |
United States Cellular Corp * | | | 2,952 | | | | 93 | |
Upwork Inc * | | | 20,900 | | | | 684 | |
Vonage Holdings Corp * | | | 54,520 | | | | 701 | |
WideOpenWest Inc * | | | 5,500 | | | | 45 | |
World Wrestling Entertainment Inc, Cl A | | | 10,534 | | | | 453 | |
Yelp Inc, Cl A * | | | 17,198 | | | | 549 | |
Zillow Group Inc, Cl A * | | | 15,191 | | | | 1,676 | |
Zillow Group Inc, Cl C * | | | 34,482 | | | | 3,717 | |
Zynga Inc, Cl A * | | | 231,174 | | | | 1,907 | |
| | | | | | | | |
| | |
| | | | | | | 74,743 | |
| | | | | | | | |
| | |
Consumer Discretionary — 16.8% | | | | | | | | |
1-800-Flowers.com Inc, Cl A * | | | 7,300 | | | | 171 | |
Abercrombie & Fitch Co, Cl A | | | 14,600 | | | | 303 | |
Accel Entertainment Inc, Cl A * | | | 10,000 | | | | 104 | |
Acushnet Holdings Corp | | | 8,600 | | | | 324 | |
Adient PLC * | | | 23,000 | | | | 720 | |
Adtalem Global Education Inc * | | | 12,881 | | | | 369 | |
| | |
| SEI Institutional Investments Trust / Semi-Annual Report / November 30, 2020 | | 1 |
SCHEDULE OF INVESTMENTS (Unaudited)
November 30, 2020
Extended Market Index Fund (Continued)
| | | | | | | | |
| | | |
| Description | | Shares | | Market Value ($ Thousands) |
| | |
COMMON STOCK (continued) | | | | | | | | |
American Axle & Manufacturing Holdings Inc * | | | 34,398 | | | $ | 274 | |
American Eagle Outfitters Inc (A) | | | 39,222 | | | | 706 | |
American Outdoor Brands Inc * | | | 3,095 | | | | 43 | |
American Public Education Inc * | | | 2,727 | | | | 85 | |
America’s Car-Mart Inc/TX * | | | 1,750 | | | | 183 | |
Aramark | | | 54,500 | | | | 1,907 | |
Asbury Automotive Group Inc *(A) | | | 4,498 | | | | 507 | |
Aspen Group Inc/CO * | | | 9,800 | | | | 119 | |
At Home Group Inc * | | | 15,600 | | | | 295 | |
AutoNation Inc * | | | 15,400 | | | | 944 | |
Bally’s Corp | | | 5,528 | | | | 246 | |
Beacon Roofing Supply Inc * | | | 13,170 | | | | 479 | |
Beazer Homes USA Inc * | | | 7,161 | | | | 106 | |
Bed Bath & Beyond Inc (A) | | | 31,600 | | | | 662 | |
Big Lots Inc (A) | | | 10,846 | | | | 560 | |
Biglari Holdings Inc, Cl B * | | | 182 | | | | 20 | |
BJ’s Restaurants Inc | | | 4,642 | | | | 153 | |
Bloomin’ Brands Inc | | | 21,550 | | | | 377 | |
Bluegreen Vacations Corp | | | 1,700 | | | | 11 | |
Bluegreen Vacations Holding, Cl A | | | 2,520 | | | | 32 | |
Boot Barn Holdings Inc * | | | 7,200 | | | | 297 | |
Boyd Gaming Corp | | | 20,645 | | | | 795 | |
Bright Horizons Family Solutions Inc * | | | 14,435 | | | | 2,456 | |
Brinker International Inc | | | 12,882 | | | | 645 | |
Brunswick Corp/DE | | | 20,883 | | | | 1,559 | |
Buckle Inc/The (A) | | | 8,851 | | | | 237 | |
Burlington Stores Inc * | | | 16,000 | | | | 3,497 | |
Caesars Entertainment *(A) | | | 41,970 | | | | 2,859 | |
Caleres Inc | | | 8,576 | | | | 101 | |
Callaway Golf Co | | | 21,906 | | | | 465 | |
Camping World Holdings Inc, Cl A | | | 7,000 | | | | 215 | |
Capri Holdings Ltd * | | | 37,700 | | | | 1,334 | |
CarParts.com Inc * | | | 6,200 | | | | 93 | |
Carriage Services Inc, Cl A | | | 6,006 | | | | 163 | |
Carrols Restaurant Group Inc * | | | 7,900 | | | | 54 | |
Carter’s Inc | | | 10,970 | | | | 976 | |
Carvana Co, Cl A *(A) | | | 13,500 | | | | 3,378 | |
Cato Corp/The, Cl A | | | 6,296 | | | | 51 | |
Cavco Industries Inc * | | | 2,231 | | | | 402 | |
Century Casinos Inc * | | | 4,000 | | | | 24 | |
Century Communities Inc * | | | 7,800 | | | | 347 | |
Cheesecake Factory Inc/The (A) | | | 9,323 | | | | 349 | |
Chegg Inc * | | | 29,000 | | | | 2,260 | |
Chico’s FAS Inc | | | 58,751 | | | | 89 | |
Children’s Place Inc/The (A) | | | 3,433 | | | | 148 | |
Choice Hotels International Inc | | | 9,177 | | | | 914 | |
Churchill Downs Inc | | | 8,931 | | | | 1,607 | |
Chuy’s Holdings Inc * | | | 2,335 | | | | 55 | |
Citi Trends Inc | | | 3,097 | | | | 105 | |
Clarus Corp | | | 5,121 | | | | 74 | |
Collectors Universe Inc | | | 1,800 | | | | 139 | |
| | | | | | | | |
| | | |
| Description | | Shares | | Market Value ($ Thousands) |
| | |
COMMON STOCK (continued) | | | | | | | | |
Columbia Sportswear Co | | | 6,844 | | | $ | 561 | |
Conn’s Inc * | | | 3,909 | | | | 43 | |
Container Store Group Inc/The * | | | 1,600 | | | | 15 | |
Cooper Tire & Rubber Co | | | 13,832 | | | | 550 | |
Cooper-Standard Holdings Inc * | | | 3,300 | | | | 112 | |
Core-Mark Holding Co Inc | | | 12,836 | | | | 400 | |
Cracker Barrel Old Country Store Inc | | | 5,744 | | | | 802 | |
Crocs Inc * | | | 15,803 | | | | 931 | |
Dana Inc | | | 35,698 | | | | 601 | |
Dave & Buster’s Entertainment Inc (A) | | | 7,900 | | | | 200 | |
Deckers Outdoor Corp * | | | 6,904 | | | | 1,758 | |
Del Taco Restaurants Inc * | | | 4,500 | | | | 40 | |
Denny’s Corp * | | | 14,463 | | | | 166 | |
Designer Brands Inc, Cl A | | | 12,192 | | | | 96 | |
Dick’s Sporting Goods Inc | | | 14,835 | | | | 843 | |
Dillard’s Inc, Cl A (A) | | | 2,562 | | | | 120 | |
Dine Brands Global Inc | | | 4,372 | | | | 275 | |
Dorman Products Inc * | | | 6,740 | | | | 623 | |
Duluth Holdings Inc, Cl B * | | | 2,900 | | | | 43 | |
Dunkin’ Brands Group Inc | | | 19,930 | | | | 2,119 | |
El Pollo Loco Holdings Inc * | | | 3,900 | | | | 61 | |
Escalade Inc | | | 2,500 | | | | 48 | |
Ethan Allen Interiors Inc | | | 5,276 | | | | 96 | |
Everi Holdings Inc * | | | 28,600 | | | | 304 | |
Express Inc *(A) | | | 14,962 | | | | 23 | |
Extended Stay America Inc | | | 42,200 | | | | 579 | |
Fiesta Restaurant Group Inc * | | | 2,905 | | | | 34 | |
Five Below Inc * | | | 13,005 | | | | 2,034 | |
Floor & Decor Holdings Inc, Cl A * | | | 24,500 | | | | 1,962 | |
Foot Locker Inc | | | 25,200 | | | | 942 | |
Fossil Group Inc * | | | 8,500 | | | | 90 | |
Fox Factory Holding Corp * | | | 9,600 | | | | 838 | |
Franchise Group | | | 4,600 | | | | 123 | |
frontdoor Inc * | | | 20,950 | | | | 992 | |
Funko Inc, Cl A *(A) | | | 4,400 | | | | 39 | |
Gaia Inc, Cl A * | | | 2,200 | | | | 22 | |
GameStop Corp, Cl A *(A) | | | 20,300 | | | | 336 | |
Genesco Inc * | | | 4,069 | | | | 128 | |
Gentex Corp | | | 58,490 | | | | 1,907 | |
Gentherm Inc * | | | 7,748 | | | | 441 | |
G-III Apparel Group Ltd * | | | 10,906 | | | | 222 | |
Golden Entertainment Inc * | | | 2,100 | | | | 35 | |
Goodyear Tire & Rubber Co/The | | | 55,400 | | | | 577 | |
GoPro Inc, Cl A * | | | 33,500 | | | | 234 | |
Graham Holdings Co, Cl B | | | 1,100 | | | | 492 | |
Grand Canyon Education Inc * | | | 12,715 | | | | 1,061 | |
Green Brick Partners Inc * | | | 6,200 | | | | 135 | |
Greenlane Holdings Inc, Cl A * | | | 2,400 | | | | 10 | |
Group 1 Automotive Inc (A) | | | 4,735 | | | | 563 | |
Groupon, Cl A * | | | 5,457 | | | | 165 | |
GrowGeneration Corp *(A) | | | 8,700 | | | | 306 | |
Grubhub Inc * | | | 22,400 | | | | 1,576 | |
| | |
| 2 | | SEI Institutional Investments Trust / Semi-Annual Report / November 30, 2020 |
SCHEDULE OF INVESTMENTS (Unaudited)
November 30, 2020
Extended Market Index Fund (Continued)
| | | | | | | | |
| | | |
| Description | | Shares | | Market Value ($ Thousands) |
| | |
COMMON STOCK (continued) | | | | | | | | |
Guess? Inc (A) | | | 11,317 | | | $ | 190 | |
H&R Block Inc | | | 52,600 | | | | 989 | |
Hamilton Beach Brands Holding Co, Cl A | | | 2,010 | | | | 38 | |
Harley-Davidson Inc | | | 39,500 | | | | 1,591 | |
Haverty Furniture Cos Inc | | | 4,363 | | | | 119 | |
Helen of Troy Ltd * | | | 6,648 | | | | 1,343 | |
Hibbett Sports Inc * | | | 4,012 | | | | 165 | |
Hilton Grand Vacations Inc * | | | 20,470 | | | | 568 | |
Hooker Furniture Corp | | | 2,700 | | | | 82 | |
Houghton Mifflin Harcourt Co * | | | 18,000 | | | | 54 | |
Hudson Ltd, Cl A * | | | 7,500 | | | | 58 | |
Hyatt Hotels Corp, Cl A (A) | | | 8,327 | | | | 599 | |
Installed Building Products Inc * | | | 6,500 | | | | 642 | |
International Game Technology PLC | | | 21,600 | | | | 272 | |
iRobot Corp *(A) | | | 6,402 | | | | 502 | |
Jack in the Box Inc (A) | | | 5,421 | | | | 499 | |
Johnson Outdoors Inc, Cl A | | | 1,400 | | | | 117 | |
K12 Inc * | | | 9,488 | | | | 221 | |
KB Home | | | 23,685 | | | | 834 | |
Kohl’s Corp | | | 36,700 | | | | 1,182 | |
Kontoor Brands Inc | | | 11,600 | | | | 483 | |
Kura Sushi USA Inc, Cl A * | | | 800 | | | | 13 | |
Lands’ End Inc * | | | 4,362 | | | | 109 | |
Laureate Education Inc, Cl A * | | | 28,100 | | | | 399 | |
La-Z-Boy Inc, Cl Z | | | 12,226 | | | | 453 | |
LCI Industries | | | 5,749 | | | | 723 | |
Lear Corp | | | 14,571 | | | | 2,083 | |
Legacy Housing Corp * | | | 1,400 | | | | 21 | |
LGI Homes Inc *(A) | | | 6,000 | | | | 648 | |
Lifetime Brands Inc | | | 3,300 | | | | 44 | |
Lindblad Expeditions Holdings Inc * | | | 4,100 | | | | 52 | |
Liquidity Services Inc * | | | 2,222 | | | | 21 | |
Lithia Motors Inc, Cl A | | | 6,489 | | | | 1,877 | |
Lovesac Co/The * | | | 2,200 | | | | 70 | |
Lululemon Athletica Inc * | | | 28,000 | | | | 10,366 | |
Lumber Liquidators Holdings Inc * | | | 6,926 | | | | 200 | |
M/I Homes Inc * | | | 8,294 | | | | 377 | |
Macy’s Inc (A) | | | 79,400 | | | | 811 | |
Magnite Inc *(A) | | | 22,438 | | | | 426 | |
Malibu Boats Inc, Cl A * | | | 4,600 | | | | 262 | |
Marine Products Corp | | | 1,800 | | | | 28 | |
MarineMax Inc * | | | 3,996 | | | | 131 | |
Marriott Vacations Worldwide Corp | | | 9,372 | | | | 1,193 | |
MasterCraft Boat Holdings Inc * | | | 5,000 | | | | 108 | |
Mattel Inc * | | | 82,100 | | | | 1,272 | |
MDC Holdings Inc | | | 14,415 | | | | 696 | |
Meritage Homes Corp * | | | 9,311 | | | | 839 | |
Michaels Cos Inc/The *(A) | | | 22,100 | | | | 219 | |
Modine Manufacturing Co * | | | 9,874 | | | | 108 | |
Monarch Casino & Resort Inc * | | | 3,500 | | | | 193 | |
Monro Inc | | | 7,828 | | | | 368 | |
Motorcar Parts of America Inc *(A) | | | 3,700 | | | | 74 | |
| | | | | | | | |
| | | |
| Description | | Shares | | Market Value ($ Thousands) |
| | |
COMMON STOCK (continued) | | | | | | | | |
Movado Group Inc | | | 2,720 | | | $ | 46 | |
Nathan’s Famous Inc | | | 900 | | | | 51 | |
National Vision Holdings Inc * | | | 19,100 | | | | 818 | |
Nautilus Inc * | | | 7,000 | | | | 148 | |
Noodles & Co, Cl A * | | | 11,000 | | | | 87 | |
Nordstrom Inc (A) | | | 27,700 | | | | 718 | |
Office Depot Inc | | | 14,511 | | | | 416 | |
Ollie’s Bargain Outlet Holdings Inc *(A) | | | 13,100 | | | | 1,154 | |
OneSpaWorld Holdings Ltd | | | 12,400 | | | | 110 | |
Overstock.com Inc *(A) | | | 11,700 | | | | 790 | |
Oxford Industries Inc | | | 4,254 | | | | 237 | |
Papa John’s International Inc | | | 9,142 | | | | 735 | |
Peloton Interactive Inc, Cl A * | | | 24,100 | | | | 2,804 | |
Penn National Gaming Inc * | | | 38,473 | | | | 2,693 | |
Penske Automotive Group Inc | | | 7,288 | | | | 401 | |
Perdoceo Education Corp * | | | 16,254 | | | | 184 | |
PetMed Express Inc (A) | | | 3,796 | | | | 117 | |
Pinterest Inc, Cl A * | | | 100,400 | | | | 7,030 | |
Planet Fitness Inc, Cl A * | | | 21,200 | | | | 1,547 | |
PlayAGS Inc * | | | 8,100 | | | | 40 | |
Polaris Inc | | | 15,307 | | | | 1,469 | |
Purple Innovation Inc, Cl A * | | | 8,000 | | | | 239 | |
Quotient Technology Inc * | | | 21,000 | | | | 156 | |
Qurate Retail Inc | | | 90,922 | | | | 952 | |
RCI Hospitality Holdings Inc | | | 2,800 | | | | 83 | |
RealReal Inc/The * | | | 17,400 | | | | 241 | |
Red Robin Gourmet Burgers Inc * | | | 2,967 | | | | 60 | |
Red Rock Resorts Inc, Cl A | | | 18,400 | | | | 400 | |
Regis Corp * | | | 6,527 | | | | 55 | |
Rent-A-Center Inc/TX, Cl A | | | 13,040 | | | | 441 | |
RH *(A) | | | 3,711 | | | | 1,682 | |
Rocky Brands Inc | | | 2,500 | | | | 72 | |
Ruth’s Hospitality Group Inc | | | 5,172 | | | | 81 | |
Sally Beauty Holdings Inc * | | | 30,691 | | | | 353 | |
Scientific Games Corp, Cl A * | | | 14,862 | | | | 554 | |
SeaWorld Entertainment Inc *(A) | | | 10,500 | | | | 293 | |
Service Corp International/US | | | 41,089 | | | | 1,999 | |
Shake Shack Inc, Cl A * | | | 9,600 | | | | 784 | |
Shoe Carnival Inc | | | 2,076 | | | | 76 | |
Signet Jewelers Ltd (A) | | | 11,400 | | | | 345 | |
Six Flags Entertainment Corp | | | 19,758 | | | | 607 | |
Skechers USA Inc, Cl A * | | | 35,546 | | | | 1,190 | |
Skyline Champion Corp * | | | 12,400 | | | | 381 | |
Sleep Number Corp *(A) | | | 6,909 | | | | 479 | |
Smith & Wesson Brands Inc | | | 12,383 | | | | 195 | |
Sonic Automotive Inc, Cl A | | | 5,064 | | | | 204 | |
Sonos Inc * | | | 18,600 | | | | 414 | |
Sportsman’s Warehouse Holdings Inc * | | | 9,400 | | | | 131 | |
Standard Motor Products Inc | | | 5,766 | | | | 267 | |
Steven Madden Ltd | | | 19,551 | | | | 615 | |
Stitch Fix Inc, Cl A * | | | 15,900 | | | | 644 | |
Stoneridge Inc * | | | 5,930 | | | | 159 | |
| | |
| SEI Institutional Investments Trust / Semi-Annual Report / November 30, 2020 | | 3 |
SCHEDULE OF INVESTMENTS (Unaudited)
November 30, 2020
Extended Market Index Fund (Continued)
| | | | | | | | |
| | | |
| Description | | Shares | | Market Value ($ Thousands) |
| | |
COMMON STOCK (continued) | | | | | | | | |
Strategic Education Inc | | | 6,687 | | | $ | 628 | |
Superior Group of Cos Inc | | | 2,000 | | | | 43 | |
Target Hospitality Corp * | | | 12,300 | | | | 19 | |
Taylor Morrison Home Corp, Cl A * | | | 32,360 | | | | 818 | |
Tempur Sealy International Inc * | | | 48,892 | | | | 1,232 | |
Tenneco Inc, Cl A * | | | 11,263 | | | | 120 | |
Terminix Global Holdings | | | 31,100 | | | | 1,525 | |
Tesla Inc * | | | 183,495 | | | | 104,152 | |
Texas Roadhouse Inc, Cl A | | | 17,366 | | | | 1,316 | |
Thor Industries Inc (A) | | | 14,590 | | | | 1,408 | |
Tilly’s Inc, Cl A | | | 10,343 | | | | 94 | |
Toll Brothers Inc | | | 30,539 | | | | 1,446 | |
TopBuild Corp * | | | 8,700 | | | | 1,516 | |
TRI Pointe Group Inc * | | | 35,073 | | | | 613 | |
Tupperware Brands Corp | | | 9,624 | | | | 324 | |
Turtle Beach Corp * | | | 4,000 | | | | 75 | |
Unifi Inc * | | | 2,480 | | | | 38 | |
Universal Electronics Inc * | | | 3,887 | | | | 205 | |
Universal Technical Institute * | | | 8,800 | | | | 58 | |
Urban Outfitters Inc * | | | 15,800 | | | | 433 | |
Vail Resorts Inc | | | 10,012 | | | | 2,762 | |
Vera Bradley Inc * | | | 2,470 | | | | 21 | |
Vista Outdoor Inc * | | | 12,288 | | | | 253 | |
Visteon Corp * | | | 6,465 | | | | 781 | |
Vivint Smart Home * | | | 16,600 | | | | 366 | |
Vroom Inc *(A) | | | 7,300 | | | | 262 | |
Waitr Holdings Inc * | | | 19,000 | | | | 63 | |
Wayfair Inc, Cl A *(A) | | | 16,200 | | | | 4,121 | |
Wendy’s Co/The | | | 44,975 | | | | 989 | |
Weyco Group Inc | | | 263 | | | | 5 | |
Williams-Sonoma Inc | | | 18,337 | | | | 2,007 | |
Wingstop Inc | | | 8,000 | | | | 1,018 | |
Winmark Corp | | | 1,091 | | | | 196 | |
Winnebago Industries Inc | | | 7,235 | | | | 383 | |
Wolverine World Wide Inc | | | 20,896 | | | | 603 | |
Workhorse Group Inc *(A) | | | 25,800 | | | | 655 | |
World Fuel Services Corp | | | 14,841 | | | | 422 | |
WW International Inc * | | | 12,174 | | | | 359 | |
Wyndham Destinations Inc | | | 20,100 | | | | 845 | |
Wyndham Hotels & Resorts Inc | | | 22,800 | | | | 1,311 | |
XPEL Inc * | | | 4,000 | | | | 151 | |
YETI Holdings Inc * | | | 21,300 | | | | 1,346 | |
Yum China Holdings Inc | | | 99,100 | | | | 5,587 | |
Zumiez Inc * | | | 3,903 | | | | 145 | |
| | | | | | | | |
| | |
| | | | | | | 273,254 | |
| | | | | | | | |
| | |
Consumer Staples — 2.6% | | | | | | | | |
Albertsons Cos Inc (A) | | | 15,900 | | | | 255 | |
Alico Inc | | | 143 | | | | 4 | |
Andersons Inc | | | 8,999 | | | | 205 | |
B&G Foods Inc, Cl A (A) | | | 16,611 | | | | 460 | |
BellRing Brands, Cl A * | | | 9,500 | | | | 194 | |
Beyond Meat Inc *(A) | | | 13,400 | | | | 1,875 | |
| | | | | | | | |
| | | |
| Description | | Shares | | Market Value ($ Thousands) |
| | |
COMMON STOCK (continued) | | | | | | | | |
BJ’s Wholesale Club Holdings Inc * | | | 35,900 | | | $ | 1,472 | |
Boston Beer Co Inc/The, Cl A *(A) | | | 2,283 | | | | 2,125 | |
Bridgford Foods Corp * | | | 400 | | | | 7 | |
Bunge Ltd | | | 32,843 | | | | 1,934 | |
Calavo Growers Inc | | | 4,426 | | | | 317 | |
Cal-Maine Foods Inc * | | | 8,128 | | | | 318 | |
Casey’s General Stores Inc | | | 9,659 | | | | 1,755 | |
CBIZ Inc * | | | 11,445 | | | | 277 | |
Celsius Holdings Inc * | | | 6,900 | | | | 223 | |
Central Garden & Pet Co, Cl A * | | | 12,129 | | | | 456 | |
Chefs’ Warehouse Inc/The *(A) | | | 6,121 | | | | 141 | |
Cimpress PLC *(A) | | | 4,199 | | | | 376 | |
Coca-Cola Consolidated Inc | | | 1,189 | | | | 311 | |
Coty Inc, Cl A | | | 57,800 | | | | 416 | |
Darling Ingredients Inc * | | | 38,657 | | | | 1,866 | |
Deluxe Corp | | | 10,154 | | | | 261 | |
Edgewell Personal Care Co | | | 13,345 | | | | 464 | |
elf Beauty Inc * | | | 14,600 | | | | 317 | |
Energizer Holdings Inc (A) | | | 14,845 | | | | 622 | |
Farmer Bros Co * | | | 900 | | | | 4 | |
Flowers Foods Inc | | | 51,708 | | | | 1,147 | |
Fresh Del Monte Produce Inc | | | 8,981 | | | | 228 | |
Freshpet Inc * | | | 9,500 | | | | 1,300 | |
Grocery Outlet Holding Corp *(A) | | | 19,300 | | | | 745 | |
Hain Celestial Group Inc/The * | | | 20,360 | | | | 784 | |
Herbalife Nutrition Ltd * | | | 24,044 | | | | 1,152 | |
HF Foods Group Inc *(A) | | | 9,900 | | | | 77 | |
Hostess Brands Inc, Cl A * | | | 31,800 | | | | 431 | |
Ingles Markets Inc, Cl A | | | 3,545 | | | | 133 | |
Ingredion Inc | | | 17,665 | | | | 1,363 | |
Inter Parfums Inc | | | 3,806 | | | | 207 | |
J & J Snack Foods Corp | | | 3,564 | | | | 518 | |
John B Sanfilippo & Son Inc | | | 2,619 | | | | 194 | |
Keurig Dr Pepper Inc | | | 113,000 | | | | 3,441 | |
Lancaster Colony Corp | | | 4,529 | | | | 767 | |
Landec Corp * | | | 4,693 | | | | 49 | |
Lifevantage Corp * | | | 4,700 | | | | 50 | |
Limoneira Co | | | 6,495 | | | | 95 | |
Medifast Inc | | | 2,964 | | | | 605 | |
MGP Ingredients Inc (A) | | | 2,300 | | | | 100 | |
National Beverage Corp *(A) | | | 2,352 | | | | 231 | |
Natural Grocers by Vitamin Cottage Inc | | | 1,085 | | | | 16 | |
Nature’s Sunshine Products Inc * | | | 437 | | | | 5 | |
NewAge *(A) | | | 15,700 | | | | 54 | |
Nu Skin Enterprises Inc, Cl A | | | 12,705 | | | | 654 | |
Oil-Dri Corp of America | | | 1,010 | | | | 35 | |
Performance Food Group Co * | | | 32,100 | | | | 1,392 | |
Pilgrim’s Pride Corp * | | | 14,207 | | | | 269 | |
Post Holdings Inc * | | | 16,769 | | | | 1,584 | |
PriceSmart Inc | | | 5,423 | | | | 441 | |
Primo Water | | | 37,100 | | | | 558 | |
Revlon Inc, Cl A *(A) | | | 2,920 | | | | 38 | |
| | |
| 4 | | SEI Institutional Investments Trust / Semi-Annual Report / November 30, 2020 |
SCHEDULE OF INVESTMENTS (Unaudited)
November 30, 2020
Extended Market Index Fund (Continued)
| | | | | | | | |
| | | |
| Description | | Shares | | Market Value ($ Thousands) |
| | |
COMMON STOCK (continued) | | | | | | | | |
Reynolds Consumer Products Inc | | | 11,600 | | | $ | 352 | |
Rite Aid Corp *(A) | | | 13,411 | | | | 177 | |
Sanderson Farms Inc | | | 4,741 | | | | 648 | |
Seaboard Corp | | | 57 | | | | 183 | |
Seneca Foods Corp, Cl A * | | | 2,462 | | | | 103 | |
Simply Good Foods Co * | | | 21,200 | | | | 461 | |
SpartanNash Co | | | 7,336 | | | | 138 | |
Spectrum Brands Holdings Inc | | | 10,087 | | | | 674 | |
Sprouts Farmers Market Inc * | | | 30,400 | | | | 644 | |
Tootsie Roll Industries Inc (A) | | | 3,508 | | | | 109 | |
TreeHouse Foods Inc * | | | 13,309 | | | | 547 | |
Turning Point Brands Inc | | | 1,500 | | | | 59 | |
United Natural Foods Inc *(A) | | | 12,698 | | | | 219 | |
Universal Corp/VA | | | 5,545 | | | | 252 | |
US Foods Holding Corp * | | | 52,000 | | | | 1,637 | |
USANA Health Sciences Inc *(A) | | | 3,432 | | | | 258 | |
Vector Group Ltd | | | 30,491 | | | | 343 | |
Village Super Market Inc, Cl A | | | 1,962 | | | | 45 | |
Vital Farms Inc *(A) | | | 4,100 | | | | 121 | |
WD-40 Co (A) | | | 3,386 | | | | 861 | |
Weis Markets Inc | | | 1,704 | | | | 81 | |
| | | | | | | | |
| | |
| | | | | | | 43,230 | |
| | | | | | | | |
| | |
Energy — 1.7% | | | | | | | | |
Antero Midstream Corp | | | 69,200 | | | | 466 | |
Antero Resources Corp *(A) | | | 74,800 | | | | 293 | |
Arch Resources Inc | | | 3,500 | | | | 117 | |
Archrock Inc | | | 40,283 | | | | 313 | |
Ardmore Shipping Corp | | | 2,100 | | | | 7 | |
Berry Corp | | | 10,500 | | | | 40 | |
Bonanza Creek Energy Inc * | | | 4,100 | | | | 90 | |
Brigham Minerals Inc, Cl A | | | 5,600 | | | | 58 | |
Bristow Group * | | | 697 | | | | 15 | |
Cactus Inc, Cl A | | | 12,400 | | | | 288 | |
ChampionX Corp * | | | 47,600 | | | | 565 | |
Cheniere Energy Inc * | | | 56,965 | | | | 3,229 | |
Cimarex Energy Co | | | 24,000 | | | | 863 | |
Clean Energy Fuels Corp * | | | 20,388 | | | | 93 | |
CNX Resources Corp * | | | 49,100 | | | | 462 | |
Comstock Resources Inc * | | | 3,700 | | | | 18 | |
CONSOL Energy Inc * | | | 5,075 | | | | 27 | |
Contango Oil & Gas Co * | | | 21,300 | | | | 36 | |
Continental Resources Inc/OK | | | 20,396 | | | | 314 | |
CVR Energy Inc | | | 7,097 | | | | 100 | |
Delek US Holdings Inc | | | 17,446 | | | | 232 | |
DHT Holdings Inc | | | 26,500 | | | | 135 | |
DMC Global Inc (A) | | | 3,400 | | | | 139 | |
Dorian LPG Ltd * | | | 6,747 | | | | 74 | |
Dril-Quip Inc * | | | 10,287 | | | | 292 | |
Earthstone Energy Inc, Cl A * | | | 8,700 | | | | 33 | |
Energy Fuels Inc/Canada *(A) | | | 65,400 | | | | 136 | |
EQT Corp | | | 68,300 | | | | 1,016 | |
Equitrans Midstream Corp | | | 109,200 | | | | 891 | |
| | | | | | | | |
| | | |
| Description | | Shares | | Market Value ($ Thousands) |
| | |
COMMON STOCK (continued) | | | | | | | | |
Evolution Petroleum Corp | | | 4,027 | | | $ | 12 | |
Exterran Corp * | | | 7,541 | | | | 32 | |
Falcon Minerals Corp | | | 13,800 | | | | 32 | |
Frank’s International NV * | | | 20,900 | | | | 47 | |
Frontline Ltd/Bermuda (A) | | | 28,000 | | | | 175 | |
Golar LNG Ltd | | | 22,402 | | | | 204 | |
Goodrich Petroleum Corp * | | | 2,200 | | | | 25 | |
Green Plains Inc * | | | 7,690 | | | | 114 | |
Helix Energy Solutions Group Inc * | | | 47,369 | | | | 178 | |
Helmerich & Payne Inc | | | 28,000 | | | | 638 | |
Kosmos Energy Ltd | | | 81,275 | | | | 143 | |
Liberty Oilfield Services Inc, Cl A | | | 10,800 | | | | 100 | |
Magnolia Oil & Gas Corp *(A) | | | 39,700 | | | | 248 | |
Matador Resources Co * | | | 25,400 | | | | 259 | |
Matrix Service Co * | | | 4,781 | | | | 46 | |
MRC Global Inc * | | | 18,112 | | | | 105 | |
Murphy Oil Corp (A) | | | 36,100 | | | | 363 | |
Murphy USA Inc | | | 7,500 | | | | 961 | |
Nabors Industries Ltd (A) | | | 1,391 | | | | 73 | |
NACCO Industries Inc, Cl A | | | 1,005 | | | | 27 | |
National Energy Services Reunited Corp * | | | 11,400 | | | | 100 | |
Newpark Resources Inc * | | | 18,020 | | | | 27 | |
NextDecade Corp * | | | 3,000 | | | | 7 | |
NexTier Oilfield Solutions Inc * | | | 56,839 | | | | 159 | |
Nordic American Tankers Ltd | | | 34,377 | | | | 110 | |
Oceaneering International Inc * | | | 20,846 | | | | 127 | |
Oil States International Inc * | | | 16,699 | | | | 74 | |
Overseas Shipholding Group Inc, Cl A * | | | 8,900 | | | | 18 | |
Ovintiv Inc | | | 62,200 | | | | 794 | |
Par Pacific Holdings Inc * | | | 6,786 | | | | 77 | |
Parsley Energy Inc, Cl A | | | 71,423 | | | | 895 | |
Patterson-UTI Energy Inc | | | 55,822 | | | | 241 | |
PBF Energy Inc, Cl A | | | 28,477 | | | | 207 | |
PDC Energy Inc * | | | 24,377 | | | | 408 | |
Peabody Energy Corp | | | 15,500 | | | | 21 | |
Penn Virginia Corp * | | | 2,900 | | | | 26 | |
Plug Power Inc *(A) | | | 94,100 | | | | 2,483 | |
PrimeEnergy Resources Corp * | | | 100 | | | | 6 | |
ProPetro Holding Corp * | | | 16,000 | | | | 92 | |
Range Resources Corp | | | 59,900 | | | | 437 | |
Renewable Energy Group Inc * | | | 10,100 | | | | 587 | |
REX American Resources Corp * | | | 1,300 | | | | 102 | |
RPC Inc *(A) | | | 10,999 | | | | 34 | |
Scorpio Tankers Inc (A) | | | 10,813 | | | | 125 | |
Select Energy Services Inc, Cl A * | | | 12,200 | | | | 52 | |
SFL Corp Ltd | | | 19,676 | | | | 133 | |
SM Energy Co | | | 37,713 | | | | 160 | |
Solaris Oilfield Infrastructure Inc, Cl A | | | 5,400 | | | | 36 | |
Southwestern Energy Co * | | | 174,271 | | | | 542 | |
Sunnova Energy International Inc * | | | 11,300 | | | | 458 | |
Sunrun Inc *(A) | | | 37,210 | | | | 2,384 | |
Talos Energy Inc * | | | 4,900 | | | | 42 | |
| | |
| SEI Institutional Investments Trust / Semi-Annual Report / November 30, 2020 | | 5 |
SCHEDULE OF INVESTMENTS (Unaudited)
November 30, 2020
Extended Market Index Fund (Continued)
| | | | | | | | |
| | | |
| Description | | Shares | | Market Value ($ Thousands) |
| | |
COMMON STOCK (continued) | | | | | | | | |
Targa Resources Corp | | | 56,259 | | | $ | 1,322 | |
Tellurian Inc *(A) | | | 21,300 | | | | 32 | |
Tidewater Inc * | | | 9,800 | | | | 93 | |
Transocean Ltd *(A) | | | 138,034 | | | | 255 | |
Uranium Energy Corp * | | | 103,800 | | | | 110 | |
US Silica Holdings Inc | | | 15,626 | | | | 67 | |
W&T Offshore Inc *(A) | | | 15,938 | | | | 31 | |
Whiting Petroleum * | | | 288 | | | | 7 | |
WPX Energy Inc * | | | 98,000 | | | | 698 | |
| | | | | | | | |
| | |
| | | | | | | 27,703 | |
| | | | | | | | |
| | |
Financials — 11.4% | | | | | | | | |
1st Constitution Bancorp | | | 2,100 | | | | 34 | |
1st Source Corp | | | 4,158 | | | | 155 | |
ACNB Corp | | | 900 | | | | 22 | |
Affiliated Managers Group Inc | | | 11,200 | | | | 976 | |
AGNC Investment Corp ‡ | | | 132,421 | | | | 2,023 | |
Alerus Financial Corp | | | 6,700 | | | | 161 | |
Alleghany Corp | | | 3,367 | | | | 1,937 | |
Allegiance Bancshares Inc | | | 5,500 | | | | 174 | |
Ally Financial Inc | | | 91,200 | | | | 2,704 | |
Altabancorp | | | 2,500 | | | | 69 | |
Amalgamated Bank, Cl A | | | 5,800 | | | | 74 | |
Ambac Financial Group Inc * | | | 12,500 | | | | 183 | |
Amerant Bancorp Inc, Cl A * | | | 7,100 | | | | 105 | |
American Equity Investment Life Holding Co | | | 21,578 | | | | 567 | |
American Financial Group Inc/OH | | | 17,453 | | | | 1,560 | |
American National Bankshares Inc | | | 4,106 | | | | 107 | |
American National Group Inc | | | 2,231 | | | | 189 | |
Ameris Bancorp | | | 15,162 | | | | 516 | |
AMERISAFE Inc | | | 4,533 | | | | 248 | |
Ames National Corp | | | 1,097 | | | | 24 | |
Annaly Capital Management Inc ‡ | | | 358,159 | | | | 2,865 | |
Anworth Mortgage Asset Corp | | | 20,368 | | | | 44 | |
Apollo Commercial Real Estate Finance Inc | | | 36,619 | | | | 395 | |
Apollo Global Management Inc, Cl A | | | 44,400 | | | | 1,937 | |
Arbor Realty Trust Inc ‡(A) | | | 24,500 | | | | 326 | |
Arch Capital Group Ltd * | | | 96,408 | | | | 3,104 | |
Ares Commercial Real Estate Corp | | | 4,800 | | | | 53 | |
Ares Management Corp, Cl A | | | 23,200 | | | | 1,045 | |
Argo Group International Holdings Ltd | | | 8,416 | | | | 330 | |
Arlington Asset Investment Corp, Cl A | | | 3,412 | | | | 11 | |
ARMOUR Residential Inc ‡ | | | 14,724 | | | | 156 | |
Arrow Financial Corp | | | 2,387 | | | | 71 | |
Artisan Partners Asset Management Inc, Cl A | | | 12,600 | | | | 567 | |
Assetmark Financial Holdings * | | | 3,900 | | | | 93 | |
Associated Banc-Corp | | | 37,536 | | | | 575 | |
Associated Capital Group Inc | | | 500 | | | | 19 | |
Assured Guaranty Ltd | | | 20,087 | | | | 605 | |
Athene Holding Ltd, Cl A * | | | 27,300 | | | | 1,211 | |
Atlantic Capital Bancshares Inc * | | | 4,300 | | | | 60 | |
Atlantic Union Bankshares Corp | | | 18,982 | | | | 568 | |
Axis Capital Holdings Ltd | | | 19,368 | | | | 971 | |
| | | | | | | | |
| | | |
| Description | | Shares | | Market Value ($ Thousands) |
| | |
COMMON STOCK (continued) | | | | | | | | |
Axos Financial Inc *(A) | | | 15,136 | | | $ | 507 | |
B Riley Financial Inc | | | 6,900 | | | | 249 | |
Banc of California Inc | | | 8,800 | | | | 117 | |
BancFirst Corp | | | 3,650 | | | | 198 | |
Banco Latinoamericano de Comercio Exterior SA, Cl E | | | 5,312 | | | | 78 | |
Bancorp Inc/The * | | | 10,004 | | | | 118 | |
BancorpSouth Bank | | | 25,582 | | | | 649 | |
Bank First Corp (A) | | | 1,900 | | | | 131 | |
Bank of Commerce Holdings | | | 5,900 | | | | 56 | |
Bank of Hawaii Corp | | | 9,424 | | | | 706 | |
Bank of Marin Bancorp | | | 3,614 | | | | 125 | |
Bank of NT Butterfield & Son Ltd/The | | | 12,400 | | | | 393 | |
Bank of Princeton/The | | | 1,400 | | | | 33 | |
Bank OZK (A) | | | 28,970 | | | | 810 | |
Bank7 Corp | | | 900 | | | | 11 | |
BankFinancial Corp | | | 4,897 | | | | 40 | |
BankUnited Inc | | | 21,496 | | | | 613 | |
Bankwell Financial Group Inc | | | 300 | | | | 6 | |
Banner Corp | | | 8,151 | | | | 337 | |
Bar Harbor Bankshares | | | 2,850 | | | | 66 | |
BayCom Corp * | | | 2,800 | | | | 40 | |
BCB Bancorp Inc | | | 4,800 | | | | 49 | |
Berkshire Hills Bancorp Inc | | | 9,991 | | | | 164 | |
BGC Partners Inc, Cl A | | | 72,536 | | | | 300 | |
Blackstone Mortgage Trust Inc, Cl A ‡ | | | 32,800 | | | | 852 | |
Blucora Inc * | | | 10,529 | | | | 137 | |
BOK Financial Corp | | | 7,682 | | | | 514 | |
Boston Private Financial Holdings Inc | | | 17,215 | | | | 123 | |
Bridge Bancorp Inc | | | 3,412 | | | | 76 | |
Bridgewater Bancshares Inc * | | | 6,100 | | | | 72 | |
Brighthouse Financial Inc * | | | 23,500 | | | | 825 | |
Brightsphere Investment Group Inc | | | 15,300 | | | | 271 | |
Broadmark Realty Capital | | | 30,500 | | | | 310 | |
Brookline Bancorp Inc | | | 21,974 | | | | 250 | |
Brown & Brown Inc | | | 58,252 | | | | 2,623 | |
BRP Group Inc, Cl A * | | | 10,600 | | | | 312 | |
Bryn Mawr Bank Corp | | | 4,522 | | | | 135 | |
Business First Bancshares Inc | | | 1,800 | | | | 34 | |
Byline Bancorp Inc | | | 3,200 | | | | 49 | |
C&F Financial Corp | | | 300 | | | | 11 | |
Cadence BanCorp, Cl A | | | 32,314 | | | | 450 | |
Cambridge Bancorp | | | 2,700 | | | | 183 | |
Camden National Corp | | | 3,058 | | | | 105 | |
Cannae Holdings Inc * | | | 21,462 | | | | 846 | |
Capital Bancorp Inc * | | | 1,900 | | | | 23 | |
Capital City Bank Group Inc | | | 2,861 | | | | 65 | |
Capitol Federal Financial Inc | | | 33,387 | | | | 411 | |
Capstar Financial Holdings Inc | | | 6,400 | | | | 77 | |
Capstead Mortgage Corp ‡ | | | 18,718 | | | | 105 | |
Carlyle Group Inc/The | | | 27,800 | | | | 790 | |
Carter Bankshares Inc | | | 7,100 | | | | 67 | |
| | |
| 6 | | SEI Institutional Investments Trust / Semi-Annual Report / November 30, 2020 |
SCHEDULE OF INVESTMENTS (Unaudited)
November 30, 2020
Extended Market Index Fund (Continued)
| | | | | | | | |
| | | |
| Description | | Shares | | Market Value ($ Thousands) |
| | |
COMMON STOCK (continued) | | | | | | | | |
Cathay General Bancorp | | | 18,715 | | | $ | 529 | |
CBTX Inc | | | 3,600 | | | | 79 | |
Central Pacific Financial Corp | | | 6,810 | | | | 112 | |
Central Valley Community Bancorp | | | 1,500 | | | | 21 | |
Century Bancorp Inc/MA, Cl A | | | 300 | | | | 22 | |
Chemung Financial Corp | | | 900 | | | | 30 | |
Cherry Hill Mortgage Investment Corp | | | 5,813 | | | | 53 | |
Chimera Investment Corp ‡ | | | 44,565 | | | | 457 | |
ChoiceOne Financial Services | | | 4,000 | | | | 119 | |
CIT Group Inc | | | 23,461 | | | | 786 | |
Citizens & Northern Corp | | | 1,840 | | | | 33 | |
Citizens Inc/TX, Cl A * | | | 7,833 | | | | 50 | |
City Holding Co | | | 3,885 | | | | 255 | |
Civista Bancshares Inc | | | 1,900 | | | | 32 | |
CNA Financial Corp | | | 6,675 | | | | 230 | |
CNB Financial Corp/PA | | | 2,048 | | | | 40 | |
CNO Financial Group Inc | | | 36,525 | | | | 777 | |
Coastal Financial * | | | 1,900 | | | | 37 | |
Codorus Valley Bancorp Inc | | | 1,944 | | | | 33 | |
Cohen & Steers Inc | | | 5,536 | | | | 392 | |
Colony Bankcorp Inc | | | 1,800 | | | | 26 | |
Colony Credit Real Estate Inc ‡ | | | 16,100 | | | | 117 | |
Columbia Banking System Inc | | | 18,229 | | | | 576 | |
Columbia Financial Inc * | | | 14,900 | | | | 214 | |
Commerce Bancshares Inc/MO | | | 26,427 | | | | 1,743 | |
Community Bank System Inc | | | 14,251 | | | | 887 | |
Community Bankers Trust Corp | | | 7,400 | | | | 48 | |
Community Financial Corp/The | | | 1,200 | | | | 33 | |
Community Trust Bancorp Inc | | | 3,393 | | | | 115 | |
ConnectOne Bancorp Inc | | | 6,383 | | | | 113 | |
Cowen Inc, Cl A | | | 8,030 | | | | 192 | |
Crawford & Co, Cl A | | | 5,700 | | | | 42 | |
Credit Acceptance Corp *(A) | | | 2,412 | | | | 720 | |
CrossFirst Bankshares Inc * | | | 11,500 | | | | 105 | |
CryoPort Inc *(A) | | | 8,000 | | | | 389 | |
Cullen/Frost Bankers Inc | | | 13,105 | | | | 1,100 | |
Curo Group Holdings Corp | | | 2,300 | | | | 20 | |
Customers Bancorp Inc * | | | 7,470 | | | | 126 | |
CVB Financial Corp | | | 30,679 | | | | 583 | |
Diamond Hill Investment Group Inc | | | 554 | | | | 76 | |
Diamond S Shipping Inc * | | | 8,600 | | | | 59 | |
Dime Community Bancshares Inc | | | 5,583 | | | | 81 | |
Donegal Group Inc, Cl A | | | 2,500 | | | | 35 | |
Dynex Capital Inc | | | 5,597 | | | | 99 | |
Eagle Bancorp Inc | | | 8,906 | | | | 328 | |
East West Bancorp Inc | | | 33,266 | | | | 1,421 | |
Eaton Vance Corp | | | 26,725 | | | | 1,790 | |
eHealth Inc * | | | 5,874 | | | | 446 | |
Ellington Financial Inc | | | 8,300 | | | | 120 | |
Employers Holdings Inc | | | 7,074 | | | | 216 | |
Encore Capital Group Inc * | | | 7,975 | | | | 272 | |
Enova International Inc * | | | 10,266 | | | | 215 | |
| | | | | | | | |
| | | |
| Description | | Shares | | Market Value ($ Thousands) |
| | |
COMMON STOCK (continued) | | | | | | | | |
Enstar Group Ltd * | | | 2,751 | | | $ | 521 | |
Enterprise Bancorp Inc/MA | | | 1,148 | | | | 30 | |
Enterprise Financial Services Corp | | | 6,749 | | | | 230 | |
Equitable Holdings Inc | | | 99,100 | | | | 2,515 | |
Equity Bancshares Inc, Cl A * | | | 5,300 | | | | 107 | |
Erie Indemnity Co, Cl A | | | 6,587 | | | | 1,486 | |
Esquire Financial Holdings Inc * | | | 1,500 | | | | 28 | |
ESSA Bancorp Inc | | | 2,300 | | | | 36 | |
Essent Group Ltd | | | 29,200 | | | | 1,281 | |
Evans Bancorp Inc | | | 1,700 | | | | 46 | |
Evercore Inc, Cl A | | | 10,876 | | | | 989 | |
EZCORP Inc, Cl A * | | | 7,457 | | | | 38 | |
FactSet Research Systems Inc | | | 9,286 | | | | 3,099 | |
Farmers & Merchants Bancorp Inc/Archbold OH | | | 1,800 | | | | 41 | |
Farmers National Banc Corp | | | 4,900 | | | | 61 | |
FB Financial Corp | | | 7,502 | | | | 239 | |
FBL Financial Group Inc, Cl A | | | 1,682 | | | | 87 | |
Federal Agricultural Mortgage Corp, Cl C | | | 1,988 | | | | 135 | |
Federated Hermes Inc, Cl B | | | 22,970 | | | | 616 | |
FedNat Holding Co | | | 1,300 | | | | 7 | |
Fidelity D&D Bancorp Inc | | | 700 | | | | 41 | |
Fidelity National Financial Inc | | | 66,066 | | | | 2,378 | |
Financial Institutions Inc | | | 3,243 | | | | 65 | |
First American Financial Corp | | | 28,472 | | | | 1,379 | |
First Bancorp Inc/The | | | 3,052 | | | | 74 | |
First BanCorp/Puerto Rico | | | 55,116 | | | | 438 | |
First Bancorp/Southern Pines NC | | | 6,545 | | | | 205 | |
First Bancshares Inc/The | | | 7,100 | | | | 194 | |
First Bank | | | 5,700 | | | | 53 | |
First Busey Corp | | | 12,392 | | | | 248 | |
First Business Financial Services Inc | | | 1,000 | | | | 19 | |
First Capital Inc | | | 1,100 | | | | 73 | |
First Choice Bancorp | | | 2,600 | | | | 43 | |
First Citizens BancShares Inc/NC, Cl A | | | 1,691 | | | | 894 | |
First Commonwealth Financial Corp | | | 22,901 | | | | 221 | |
First Community Bankshares Inc | | | 4,442 | | | | 94 | |
First Financial Bancorp | | | 23,033 | | | | 370 | |
First Financial Bankshares Inc | | | 30,012 | | | | 1,003 | |
First Financial Corp/IN | | | 4,012 | | | | 152 | |
First Foundation Inc | | | 10,600 | | | | 188 | |
First Guaranty Bancshares Inc | | | 1,200 | | | | 20 | |
First Hawaiian Inc | | | 30,600 | | | | 671 | |
First Horizon Corp | | | 129,325 | | | | 1,580 | |
First Internet Bancorp | | | 1,100 | | | | 28 | |
First Interstate BancSystem Inc, Cl A | | | 12,391 | | | | 471 | |
First Merchants Corp | | | 14,018 | | | | 467 | |
First Mid Bancshares Inc | | | 2,100 | | | | 63 | |
First Midwest Bancorp Inc/IL | | | 27,242 | | | | 381 | |
First Northwest Bancorp | | | 3,500 | | | | 53 | |
First of Long Island Corp/The | | | 4,995 | | | | 84 | |
FirstCash Inc | | | 9,620 | | | | 618 | |
| | |
| SEI Institutional Investments Trust / Semi-Annual Report / November 30, 2020 | | 7 |
SCHEDULE OF INVESTMENTS (Unaudited)
November 30, 2020
Extended Market Index Fund (Continued)
| | | | | | | | |
| | | |
| Description | | Shares | | Market Value ($ Thousands) |
| | |
COMMON STOCK (continued) | | | | | | | | |
Flagstar Bancorp Inc | | | 12,500 | | | $ | 438 | |
Flushing Financial Corp | | | 6,070 | | | | 86 | |
FNB Corp/PA | | | 76,989 | | | | 680 | |
FNCB Bancorp Inc | | | 4,100 | | | | 28 | |
Focus Financial Partners Inc, Cl A * | | | 6,500 | | | | 257 | |
Franklin Financial Services Corp | | | 1,000 | | | | 28 | |
FS Bancorp Inc | | | 1,300 | | | | 70 | |
Fulton Financial Corp | | | 38,112 | | | | 470 | |
FVCBankcorp Inc * | | | 5,300 | | | | 69 | |
GAMCO Investors Inc, Cl A | | | 1,931 | | | | 28 | |
Genworth Financial Inc, Cl A * | | | 124,800 | | | | 567 | |
German American Bancorp Inc | | | 7,066 | | | | 226 | |
Glacier Bancorp Inc | | | 23,580 | | | | 961 | |
GoHealth, Cl A *(A) | | | 15,000 | | | | 158 | |
Goosehead Insurance Inc, Cl A | | | 3,100 | | | | 382 | |
Granite Point Mortgage Trust Inc | | | 10,941 | | | | 101 | |
Great Ajax Corp | | | 3,002 | | | | 30 | |
Great Southern Bancorp Inc | | | 2,499 | | | | 115 | |
Great Western Bancorp Inc | | | 14,800 | | | | 243 | |
Green Dot Corp, Cl A * | | | 12,455 | | | | 667 | |
Greene County Bancorp Inc | | | 800 | | | | 20 | |
Greenhill & Co Inc | | | 2,071 | | | | 27 | |
Greenlight Capital Re Ltd, Cl A * | | | 6,409 | | | | 49 | |
Guaranty Bancshares Inc/TX | | | 3,000 | | | | 86 | |
GWG Holdings Inc * | | | 400 | | | | 3 | |
Hamilton Lane Inc, Cl A | | | 8,500 | | | | 594 | |
Hancock Whitney Corp | | | 20,614 | | | | 579 | |
Hanmi Financial Corp | | | 5,678 | | | | 55 | |
Hanover Insurance Group Inc/The | | | 9,417 | | | | 1,058 | |
HarborOne Bancorp Inc | | | 7,720 | | | | 76 | |
Hawthorn Bancshares Inc | | | 1,456 | | | | 32 | |
HBT Financial Inc | | | 2,200 | | | | 31 | |
HCI Group Inc (A) | | | 1,115 | | | | 58 | |
Heartland Financial USA Inc | | | 7,775 | | | | 303 | |
Heritage Commerce Corp | | | 17,800 | | | | 150 | |
Heritage Financial Corp/WA | | | 8,071 | | | | 188 | |
Heritage Insurance Holdings Inc | | | 3,800 | | | | 39 | |
Hilltop Holdings Inc | | | 18,000 | | | | 434 | |
Hingham Institution For Savings The | | | 300 | | | | 66 | |
Home Bancorp Inc | | | 1,200 | | | | 34 | |
Home BancShares Inc/AR | | | 39,032 | | | | 723 | |
HomeStreet Inc | | | 4,372 | | | | 141 | |
HomeTrust Bancshares Inc | | | 4,102 | | | | 70 | |
Hope Bancorp Inc | | | 26,995 | | | | 256 | |
Horace Mann Educators Corp | | | 9,814 | | | | 392 | |
Horizon Bancorp Inc/IN | | | 11,625 | | | | 166 | |
Houlihan Lokey Inc, Cl A | | | 13,800 | | | | 894 | |
Howard Bancorp Inc * | | | 2,500 | | | | 31 | |
Independence Holding Co | | | 1,700 | | | | 67 | |
Independent Bank Corp | | | 7,786 | | | | 527 | |
Independent Bank Corp/MI | | | 5,400 | | | | 92 | |
Independent Bank Group Inc | | | 8,402 | | | | 471 | |
| | | | | | | | |
| | | |
| Description | | Shares | | Market Value ($ Thousands) |
| | |
COMMON STOCK (continued) | | | | | | | | |
Interactive Brokers Group Inc, Cl A | | | 17,727 | | | $ | 935 | |
International Bancshares Corp | | | 14,350 | | | | 465 | |
International Seaways Inc | | | 5,366 | | | | 91 | |
Invesco Mortgage Capital Inc (A) | | | 55,095 | | | | 183 | |
Investar Holding Corp | | | 1,700 | | | | 28 | |
Investors Bancorp Inc (A) | | | 51,843 | | | | 502 | |
Investors Title Co | | | 400 | | | | 68 | |
James River Group Holdings Ltd | | | 7,200 | | | | 328 | |
Jefferies Financial Group Inc | | | 53,800 | | | | 1,223 | |
Kearny Financial Corp/MD | | | 17,129 | | | | 169 | |
Kemper Corp | | | 14,573 | | | | 1,092 | |
Kinsale Capital Group Inc | | | 5,600 | | | | 1,345 | |
KKR & Co Inc | | | 131,500 | | | | 4,988 | |
KKR Real Estate Finance Trust Inc | | | 5,800 | | | | 106 | |
Ladder Capital Corp, Cl A ‡ | | | 25,162 | | | | 229 | |
Lakeland Bancorp Inc | | | 14,893 | | | | 179 | |
Lakeland Financial Corp | | | 5,757 | | | | 292 | |
Lazard Ltd, Cl A (B) | | | 24,131 | | | | 901 | |
LCNB Corp | | | 2,500 | | | | 37 | |
Lemonade *(A) | | | 4,400 | | | | 305 | |
LendingClub Corp * | | | 17,800 | | | | 142 | |
LendingTree Inc * | | | 2,700 | | | | 690 | |
Level One Bancorp Inc | | | 1,200 | | | | 23 | |
Live Oak Bancshares Inc | | | 6,500 | | | | 267 | |
LPL Financial Holdings Inc | | | 20,562 | | | | 1,866 | |
Luther Burbank Corp | | | 4,422 | | | | 43 | |
Macatawa Bank Corp | | | 5,200 | | | | 40 | |
Mackinac Financial Corp | | | 2,200 | | | | 27 | |
MainStreet Bancshares Inc * | | | 1,700 | | | | 28 | |
Markel Corp * | | | 3,273 | | | | 3,187 | |
Marlin Business Services Corp | | | 1,822 | | | | 19 | |
MBIA Inc * | | | 21,782 | | | | 139 | |
Mercantile Bank Corp | | | 3,557 | | | | 88 | |
Merchants Bancorp/IN | | | 3,100 | | | | 83 | |
Mercury General Corp | | | 6,578 | | | | 293 | |
Meridian Bancorp Inc | | | 12,127 | | | | 165 | |
Meta Financial Group Inc | | | 9,100 | | | | 301 | |
Metrocity Bankshares Inc (A) | | | 3,800 | | | | 53 | |
Metropolitan Bank Holding Corp * | | | 1,300 | | | | 43 | |
MFA Financial Inc ‡ | | | 112,497 | | | | 416 | |
MGIC Investment Corp | | | 80,618 | | | | 964 | |
Mid Penn Bancorp Inc | | | 2,400 | | | | 56 | |
Midland States Bancorp Inc | | | 5,600 | | | | 95 | |
MidWestOne Financial Group Inc | | | 2,369 | | | | 55 | |
MMA Capital Holdings Inc * | | | 1,200 | | | | 30 | |
Moelis & Co, Cl A | | | 14,800 | | | | 581 | |
Morningstar Inc | | | 5,420 | | | | 1,085 | |
Mr Cooper Group Inc * | | | 22,071 | | | | 588 | |
MVB Financial Corp | | | 3,200 | | | | 64 | |
National Bank Holdings Corp, Cl A | | | 7,500 | | | | 241 | |
National Bankshares Inc | | | 1,036 | | | | 31 | |
National General Holdings Corp | | | 18,000 | | | | 613 | |
| | |
| 8 | | SEI Institutional Investments Trust / Semi-Annual Report / November 30, 2020 |
SCHEDULE OF INVESTMENTS (Unaudited)
November 30, 2020
Extended Market Index Fund (Continued)
| | | | | | | | |
| | | |
| Description | | Shares | | Market Value ($ Thousands) |
| | |
COMMON STOCK (continued) | | | | | | | | |
National Western Life Group Inc, Cl A | | | 510 | | | $ | 95 | |
Navient Corp | | | 48,100 | | | | 451 | |
NBT Bancorp Inc | | | 10,108 | | | | 303 | |
Nelnet Inc, Cl A | | | 4,531 | | | | 308 | |
New Residential Investment Corp ‡ | | | 98,950 | | | | 916 | |
New York Community Bancorp Inc | | | 103,339 | | | | 1,001 | |
New York Mortgage Trust Inc ‡ | | | 90,238 | | | | 317 | |
NI Holdings Inc * | | | 2,300 | | | | 39 | |
Nicolet Bankshares Inc * | | | 2,000 | | | | 133 | |
NMI Holdings Inc, Cl A * | | | 23,700 | | | | 519 | |
Northeast Bank | | | 2,600 | | | | 57 | |
Northfield Bancorp Inc | | | 8,705 | | | | 97 | |
Northrim BanCorp Inc | | | 1,300 | | | | 41 | |
Northwest Bancshares Inc | | | 25,179 | | | | 298 | |
Norwood Financial Corp | | | 2,000 | | | | 54 | |
Oak Valley Bancorp | | | 1,600 | | | | 29 | |
OceanFirst Financial Corp | | | 12,468 | | | | 197 | |
OFG Bancorp | | | 10,925 | | | | 183 | |
Ohio Valley Banc Corp | | | 1,000 | | | | 23 | |
Old National Bancorp/IN | | | 38,894 | | | | 616 | |
Old Republic International Corp | | | 75,344 | | | | 1,350 | |
Old Second Bancorp Inc | | | 8,600 | | | | 83 | |
OneMain Holdings Inc, Cl A | | | 16,100 | | | | 628 | |
OP Bancorp | | | 3,200 | | | | 23 | |
Oportun Financial Corp * | | | 1,700 | | | | 29 | |
Oppenheimer Holdings Inc, Cl A | | | 2,164 | | | | 64 | |
Orchid Island Capital Inc, Cl A ‡(A) | | | 20,900 | | | | 112 | |
Origin Bancorp Inc | | | 6,200 | | | | 159 | |
Orrstown Financial Services Inc | | | 3,700 | | | | 60 | |
Pacific Premier Bancorp Inc | | | 20,636 | | | | 595 | |
PacWest Bancorp | | | 27,912 | | | | 649 | |
Palomar Holdings Inc, Cl A * | | | 5,600 | | | | 370 | |
Park National Corp (A) | | | 3,905 | | | | 395 | |
Parke Bancorp Inc | | | 1,636 | | | | 24 | |
PCB Bancorp | | | 4,600 | | | | 50 | |
PCSB Financial Corp | | | 4,700 | | | | 72 | |
PDL Community Bancorp * | | | 2,000 | | | | 22 | |
Peapack-Gladstone Financial Corp | | | 6,154 | | | | 135 | |
Penns Woods Bancorp Inc | | | 978 | | | | 25 | |
PennyMac Financial Services Inc | | | 11,000 | | | | 634 | |
PennyMac Mortgage Investment Trust ‡ | | | 22,663 | | | | 388 | |
Peoples Bancorp Inc/OH | | | 3,010 | | | | 75 | |
Peoples Bancorp of North Carolina Inc | | | 1,100 | | | | 27 | |
Peoples Financial Services Corp | | | 900 | | | | 34 | |
Pinnacle Financial Partners Inc | | | 17,627 | | | | 955 | |
Pioneer Bancorp * | | | 2,700 | | | | 28 | |
Piper Sandler Cos | | | 3,977 | | | | 367 | |
PJT Partners Inc | | | 6,000 | | | | 416 | |
Popular Inc | | | 20,756 | | | | 1,007 | |
PRA Group Inc * | | | 11,858 | | | | 494 | |
Preferred Bank/Los Angeles CA | | | 3,037 | | | | 112 | |
Premier Financial Bancorp Inc | | | 625 | | | | 8 | |
| | | | | | | | |
| | | |
| Description | | Shares | | Market Value ($ Thousands) |
| | |
COMMON STOCK (continued) | | | | | | | | |
Premier Financial Corp | | | 8,976 | | | $ | 186 | |
Primerica Inc | | | 9,429 | | | | 1,228 | |
ProAssurance Corp | | | 15,225 | | | | 242 | |
PROG Holdings Inc | | | 17,916 | | | | 1,127 | |
ProSight Global Inc * | | | 2,100 | | | | 27 | |
Prosperity Bancshares Inc | | | 23,635 | | | | 1,485 | |
Protective Insurance Corp | | | 1,481 | | | | 21 | |
Provident Bancorp Inc | | | 2,100 | | | | 21 | |
Provident Financial Holdings Inc | | | 1,400 | | | | 20 | |
Provident Financial Services Inc | | | 20,378 | | | | 319 | |
Prudential Bancorp Inc | | | 2,100 | | | | 27 | |
Pzena Investment Management Inc, Cl A | | | 6,300 | | | | 42 | |
QCR Holdings Inc | | | 4,800 | | | | 167 | |
Radian Group Inc | | | 45,548 | | | | 860 | |
RBB Bancorp | | | 2,600 | | | | 39 | |
Ready Capital Corp | | | 6,294 | | | | 81 | |
Red River Bancshares Inc | | | 1,200 | | | | 60 | |
Redwood Trust Inc ‡ | | | 27,405 | | | | 237 | |
Regional Management Corp | | | 2,800 | | | | 75 | |
Reinsurance Group of America Inc, Cl A | | | 16,416 | | | | 1,892 | |
Reliant Bancorp Inc | | | 1,900 | | | | 34 | |
RenaissanceRe Holdings Ltd | | | 13,106 | | | | 2,158 | |
Renasant Corp | | | 13,160 | | | | 406 | |
Republic Bancorp Inc/KY, Cl A | | | 1,298 | | | | 46 | |
Republic First Bancorp Inc * | | | 9,800 | | | | 31 | |
Richmond Mutual BanCorp Inc | | | 4,500 | | | | 56 | |
Riverview Bancorp Inc | | | 5,100 | | | | 27 | |
RLI Corp (A) | | | 9,182 | | | | 879 | |
Rocket, Cl A *(A) | | | 26,600 | | | | 551 | |
S&T Bancorp Inc | | | 8,332 | | | | 187 | |
Safeguard Scientifics Inc | | | 3,396 | | | | 22 | |
Safety Insurance Group Inc | | | 4,031 | | | | 287 | |
Sandy Spring Bancorp Inc | | | 13,510 | | | | 398 | |
Santander Consumer USA Holdings Inc (A) | | | 18,000 | | | | 398 | |
Sculptor Capital Management Inc, Cl A | | | 5,700 | | | | 80 | |
Seacoast Banking Corp of Florida * | | | 12,398 | | | | 313 | |
SEI Investments Co.† | | | 30,319 | | | | 1,599 | |
Select Bancorp Inc * | | | 5,700 | | | | 52 | |
Selective Insurance Group Inc | | | 13,584 | | | | 840 | |
Selectquote * | | | 10,500 | | | | 225 | |
ServisFirst Bancshares Inc | | | 12,700 | | | | 480 | |
Shore Bancshares Inc | | | 3,000 | | | | 42 | |
Siebert Financial Corp * | | | 1,800 | | | | 6 | |
Sierra Bancorp | | | 2,978 | | | | 66 | |
Signature Bank/New York NY | | | 13,770 | | | | 1,545 | |
Silvercrest Asset Management Group Inc, Cl A | | | 2,100 | | | | 28 | |
Silvergate Capital Corp, Cl A * | | | 800 | | | | 28 | |
Simmons First National Corp, Cl A | | | 26,748 | | | | 522 | |
SLM Corp | | | 89,400 | | | | 949 | |
SmartFinancial Inc | | | 2,200 | | | | 39 | |
South Plains Financial Inc | | | 2,400 | | | | 42 | |
| | |
| SEI Institutional Investments Trust / Semi-Annual Report / November 30, 2020 | | 9 |
SCHEDULE OF INVESTMENTS (Unaudited)
November 30, 2020
Extended Market Index Fund (Continued)
| | | | | | | | |
| | | |
| Description | | Shares | | Market Value ($ Thousands) |
| | |
COMMON STOCK (continued) | | | | | | | | |
South State Corp | | | 16,836 | | | $ | 1,119 | |
Southern First Bancshares Inc * | | | 1,491 | | | | 48 | |
Southern Missouri Bancorp Inc | | | 1,900 | | | | 57 | |
Southern National Bancorp of Virginia Inc | | | 6,000 | | | | 66 | |
Southside Bancshares Inc | | | 8,762 | | | | 258 | |
Spirit of Texas Bancshares Inc | | | 4,600 | | | | 72 | |
Starwood Property Trust Inc ‡ | | | 72,680 | | | | 1,304 | |
State Auto Financial Corp | | | 3,690 | | | | 55 | |
Sterling Bancorp | | | 4,000 | | | | 16 | |
Sterling Bancorp/DE | | | 46,315 | | | | 740 | |
Stewart Information Services Corp | | | 6,841 | | | | 286 | |
Stifel Financial Corp | | | 15,582 | | | | 1,080 | |
Stock Yards Bancorp Inc | | | 4,702 | | | | 187 | |
StoneX Group * | | | 3,268 | | | | 201 | |
Sturm Ruger & Co Inc | | | 3,542 | | | | 217 | |
Summit Financial Group Inc | | | 1,700 | | | | 36 | |
Synovus Financial Corp | | | 36,392 | | | | 1,149 | |
TCF Financial Corp | | | 37,180 | | | | 1,249 | |
Territorial Bancorp Inc | | | 773 | | | | 17 | |
Texas Capital Bancshares Inc * | | | 12,723 | | | | 711 | |
TFS Financial Corp | | | 12,343 | | | | 212 | |
Third Point Reinsurance Ltd * | | | 17,500 | | | | 167 | |
Timberland Bancorp Inc/WA | | | 2,400 | | | | 57 | |
Tiptree Inc | | | 9,700 | | | | 49 | |
Tompkins Financial Corp | | | 3,905 | | | | 248 | |
Towne Bank/Portsmouth VA | | | 15,967 | | | | 347 | |
TPG RE Finance Trust Inc | | | 14,400 | | | | 149 | |
Tradeweb Markets Inc, Cl A | | | 22,200 | | | | 1,324 | |
TriCo Bancshares | | | 6,909 | | | | 226 | |
TriState Capital Holdings Inc * | | | 6,500 | | | | 97 | |
Triumph Bancorp Inc * | | | 4,500 | | | | 205 | |
Trupanion Inc * | | | 8,300 | | | | 841 | |
TrustCo Bank Corp NY | | | 21,626 | | | | 131 | |
Trustmark Corp | | | 14,939 | | | | 371 | |
Two Harbors Investment Corp ‡ | | | 64,742 | | | | 404 | |
UMB Financial Corp | | | 10,245 | | | | 697 | |
Umpqua Holdings Corp | | | 52,531 | | | | 730 | |
United Bankshares Inc/WV | | | 29,856 | | | | 874 | |
United Community Banks Inc/GA | | | 17,474 | | | | 418 | |
United Fire Group Inc | | | 6,771 | | | | 148 | |
United Insurance Holdings Corp | | | 1,900 | | | | 8 | |
United Security Bancshares/Fresno CA | | | 3,200 | | | | 23 | |
Unity Bancorp Inc | | | 2,800 | | | | 49 | |
Universal Insurance Holdings Inc | | | 9,000 | | | | 126 | |
Univest Financial Corp | | | 8,915 | | | | 163 | |
Valley National Bancorp | | | 94,568 | | | | 864 | |
Value Line Inc | | | 300 | | | | 8 | |
Veritex Holdings Inc | | | 12,539 | | | | 272 | |
Virtu Financial Inc, Cl A | | | 14,400 | | | | 328 | |
Virtus Investment Partners Inc | | | 2,200 | | | | 394 | |
Voya Financial Inc | | | 29,900 | | | | 1,723 | |
Waddell & Reed Financial Inc, Cl A (A) | | | 16,402 | | | | 270 | |
| | | | | | | | |
| | | |
| Description | | Shares | | Market Value ($ Thousands) |
| | |
COMMON STOCK (continued) | | | | | | | | |
Walker & Dunlop Inc | | | 7,523 | | | $ | 602 | |
Washington Federal Inc | | | 17,936 | | | | 419 | |
Washington Trust Bancorp Inc | | | 3,870 | | | | 152 | |
Waterstone Financial Inc | | | 4,000 | | | | 70 | |
Watford Holdings Ltd * | | | 5,900 | | | | 205 | |
Webster Financial Corp | | | 22,551 | | | | 853 | |
WesBanco Inc | | | 16,609 | | | | 476 | |
West BanCorp Inc | | | 3,785 | | | | 73 | |
Westamerica BanCorp | | | 6,155 | | | | 339 | |
Western Alliance Bancorp | | | 23,161 | | | | 1,187 | |
Western Asset Mortgage Capital Corp ‡ | | | 18,144 | | | | 56 | |
Western New England Bancorp Inc | | | 5,000 | | | | 33 | |
Westwood Holdings Group Inc | | | 1,828 | | | | 22 | |
White Mountains Insurance Group Ltd | | | 762 | | | | 732 | |
Wintrust Financial Corp | | | 13,649 | | | | 744 | |
WisdomTree Investments Inc | | | 34,575 | | | | 148 | |
World Acceptance Corp * | | | 1,676 | | | | 189 | |
WSFS Financial Corp | | | 12,143 | | | | 463 | |
| | | | | | | | |
| | |
| | | | | | | 185,111 | |
| | | | | | | | |
| | |
Health Care — 15.0% | | | | | | | | |
10X Genomics Inc, Cl A * | | | 13,700 | | | | 2,098 | |
1Life Healthcare Inc * | | | 21,700 | | | | 713 | |
89bio Inc * | | | 700 | | | | 19 | |
Abeona Therapeutics Inc * | | | 7,000 | | | | 11 | |
Acadia Healthcare Co Inc * | | | 20,587 | | | | 874 | |
ACADIA Pharmaceuticals Inc * | | | 26,000 | | | | 1,473 | |
Accelerate Diagnostics Inc * | | | 4,900 | | | | 38 | |
Acceleron Pharma Inc * | | | 13,600 | | | | 1,606 | |
Accolade *(A) | | | 4,600 | | | | 239 | |
Accuray Inc *(A) | | | 14,863 | | | | 66 | |
Acutus Medical * | | | 4,100 | | | | 117 | |
AdaptHealth Corp, Cl A * | | | 8,700 | | | | 260 | |
Adaptive Biotechnologies Corp * | | | 20,500 | | | | 989 | |
Addus HomeCare Corp * | | | 3,600 | | | | 357 | |
ADMA Biologics Inc *(A) | | | 15,400 | | | | 31 | |
Adverum Biotechnologies Inc * | | | 17,400 | | | | 236 | |
Aeglea BioTherapeutics Inc, Cl Savings Shares * | | | 9,300 | | | | 80 | |
Aerie Pharmaceuticals Inc * | | | 11,900 | | | | 148 | |
Affimed NV * | | | 19,500 | | | | 104 | |
Agenus Inc * | | | 33,000 | | | | 122 | |
Agile Therapeutics * | | | 16,200 | | | | 46 | |
Agios Pharmaceuticals Inc * | | | 15,600 | | | | 723 | |
Akebia Therapeutics Inc * | | | 30,985 | | | | 103 | |
Akero Therapeutics Inc * | | | 3,000 | | | | 86 | |
Akouos *(A) | | | 6,000 | | | | 124 | |
Albireo Pharma Inc * | | | 4,800 | | | | 179 | |
Alector Inc * | | | 11,000 | | | | 144 | |
Alkermes PLC * | | | 37,653 | | | | 688 | |
Allakos Inc *(A) | | | 5,800 | | | | 621 | |
Allogene Therapeutics Inc * | | | 15,100 | | | | 469 | |
Allovir *(A) | | | 6,800 | | | | 269 | |
| | |
| 10 | | SEI Institutional Investments Trust / Semi-Annual Report / November 30, 2020 |
SCHEDULE OF INVESTMENTS (Unaudited)
November 30, 2020
Extended Market Index Fund (Continued)
| | | | | | | | |
| | | |
| Description | | Shares | | Market Value ($ Thousands) |
| | |
COMMON STOCK (continued) | | | | | | | | |
Allscripts Healthcare Solutions Inc * | | | 37,453 | | | $ | 512 | |
Alnylam Pharmaceuticals Inc * | | | 27,989 | | | | 3,636 | |
Alphatec Holdings Inc * | | | 12,300 | | | | 129 | |
ALX Oncology Holdings * | | | 1,200 | | | | 92 | |
Amedisys Inc * | | | 7,771 | | | | 1,902 | |
American Renal Associates Holdings Inc * | | | 1,700 | | | | 19 | |
Amicus Therapeutics Inc * | | | 60,300 | | | | 1,380 | |
AMN Healthcare Services Inc * | | | 10,909 | | | | 711 | |
Amneal Pharmaceuticals Inc * | | | 23,588 | | | | 93 | |
Amphastar Pharmaceuticals Inc * | | | 7,300 | | | | 130 | |
AnaptysBio Inc * | | | 4,800 | | | | 124 | |
Anavex Life Sciences Corp * | | | 10,300 | | | | 55 | |
AngioDynamics Inc * | | | 7,370 | | | | 105 | |
ANI Pharmaceuticals Inc * | | | 2,500 | | | | 74 | |
Anika Therapeutics Inc * | | | 3,070 | | | | 116 | |
Annexon * | | | 6,200 | | | | 150 | |
Antares Pharma Inc * | | | 60,900 | | | | 190 | |
Apellis Pharmaceuticals Inc * | | | 16,300 | | | | 768 | |
Apollo Medical Holdings Inc * | | | 8,300 | | | | 151 | |
Applied Molecular Transport *(A) | | | 4,900 | | | | 152 | |
Applied Therapeutics Inc * | | | 3,200 | | | | 74 | |
Aprea Therapeutics Inc * | | | 1,600 | | | | 40 | |
Apyx Medical Corp * | | | 14,200 | | | | 109 | |
Aravive Inc * | | | 2,900 | | | | 17 | |
Arcturus Therapeutics Holdings Inc * | | | 3,100 | | | | 284 | |
Arcus Biosciences Inc * | | | 13,200 | | | | 359 | |
Arcutis Biotherapeutics Inc * | | | 2,500 | | | | 68 | |
Ardelyx Inc * | | | 16,000 | | | | 101 | |
Arena Pharmaceuticals Inc * | | | 14,565 | | | | 959 | |
Arrowhead Pharmaceuticals Inc *(A) | | | 24,000 | | | | 1,501 | |
Arvinas Inc * | | | 7,000 | | | | 169 | |
Aspira Women’s Health *(A) | | | 11,200 | | | | 54 | |
Assembly Biosciences Inc * | | | 8,400 | | | | 48 | |
Atara Biotherapeutics Inc *(A) | | | 21,800 | | | | 506 | |
Athenex Inc *(A) | | | 14,700 | | | | 200 | |
Athersys Inc *(A) | | | 50,000 | | | | 93 | |
Atreca Inc, Cl A * | | | 7,200 | | | | 112 | |
AtriCure Inc * | | | 12,320 | | | | 536 | |
Atrion Corp | | | 330 | | | | 198 | |
Avalon GloboCare Corp *(A) | | | 5,200 | | | | 7 | |
Avanos Medical Inc * | | | 12,200 | | | | 517 | |
Avantor Inc * | | | 125,200 | | | | 3,415 | |
Avid Bioservices Inc * | | | 18,600 | | | | 170 | |
Avidity Biosciences Inc * | | | 5,900 | | | | 177 | |
Avrobio Inc * | | | 7,400 | | | | 102 | |
Axcella Health Inc * | | | 1,900 | | | | 11 | |
Axogen Inc * | | | 6,100 | | | | 87 | |
Axonics Modulation Technologies Inc *(A) | | | 7,200 | | | | 316 | |
Axsome Therapeutics Inc *(A) | | | 6,500 | | | | 471 | |
Beam Therapeutics Inc *(A) | | | 7,000 | | | | 350 | |
Berkeley Lights * | | | 3,300 | | | | 273 | |
Beyondspring Inc * | | | 4,400 | | | | 49 | |
| | | | | | | | |
| | | |
| Description | | Shares | | Market Value ($ Thousands) |
| | |
COMMON STOCK (continued) | | | | | | | | |
BioCryst Pharmaceuticals Inc *(A) | | | 52,000 | | | $ | 266 | |
BioDelivery Sciences International Inc * | | | 35,600 | | | | 135 | |
Biohaven Pharmaceutical Holding Co Ltd * | | | 11,200 | | | | 996 | |
BioLife Solutions Inc * | | | 1,700 | | | | 61 | |
BioMarin Pharmaceutical Inc * | | | 44,346 | | | | 3,490 | |
BioSig Technologies Inc *(A) | | | 3,800 | | | | 18 | |
BioSpecifics Technologies Corp * | | | 1,400 | | | | 124 | |
Bio-Techne Corp | | | 9,325 | | | | 2,828 | |
BioTelemetry Inc *(A) | | | 8,000 | | | | 443 | |
Bioxcel Therapeutics Inc * | | | 2,500 | | | | 110 | |
Black Diamond Therapeutics Inc * | | | 2,900 | | | | 97 | |
Bluebird Bio Inc * | | | 18,100 | | | | 798 | |
Blueprint Medicines Corp * | | | 13,700 | | | | 1,481 | |
BrainStorm Cell Therapeutics *(A) | | | 6,300 | | | | 35 | |
Bridgebio Pharma *(A) | | | 18,200 | | | | 914 | |
Brookdale Senior Living Inc, Cl A * | | | 60,509 | | | | 257 | |
Bruker Corp | | | 24,532 | | | | 1,242 | |
Cabaletta Bio Inc * | | | 1,600 | | | | 24 | |
Calithera Biosciences Inc * | | | 22,500 | | | | 110 | |
Calyxt Inc *(A) | | | 2,200 | | | | 8 | |
Cantel Medical Corp | | | 8,877 | | | | 528 | |
Cara Therapeutics Inc * | | | 9,400 | | | | 138 | |
Cardiovascular Systems Inc * | | | 11,725 | | | | 404 | |
CareDx Inc * | | | 10,600 | | | | 606 | |
CASI Pharmaceuticals Inc * | | | 9,300 | | | | 23 | |
Castle Biosciences Inc * | | | 4,000 | | | | 190 | |
Catalyst Pharmaceuticals Inc * | | | 23,400 | | | | 86 | |
Cellular Biomedicine Group Inc * | | | 4,200 | | | | 77 | |
CEL-SCI Corp *(A) | | | 9,900 | | | | 124 | |
Cerecor Inc * | | | 5,300 | | | | 13 | |
Cerus Corp * | | | 38,497 | | | | 256 | |
Change Healthcare Inc * | | | 56,200 | | | | 963 | |
Charles River Laboratories International Inc * | | | 11,806 | | | | 2,769 | |
Checkpoint Therapeutics Inc * | | | 5,900 | | | | 14 | |
Chemed Corp | | | 4,045 | | | | 1,935 | |
ChemoCentryx Inc * | | | 13,500 | | | | 745 | |
Chiasma Inc * | | | 11,600 | | | | 50 | |
Chimerix Inc * | | | 7,900 | | | | 30 | |
Chinook Therapeutics * | | | 1,560 | | | | 22 | |
ChromaDex Corp * | | | 9,900 | | | | 49 | |
Clovis Oncology Inc * | | | 17,166 | | | | 84 | |
Codexis Inc * | | | 11,400 | | | | 211 | |
Co-Diagnostics Inc *(A) | | | 6,200 | | | | 73 | |
Coherus Biosciences Inc * | | | 14,800 | | | | 273 | |
Collegium Pharmaceutical Inc * | | | 6,400 | | | | 118 | |
Community Health Systems Inc * | | | 21,729 | | | | 178 | |
Concert Pharmaceuticals Inc * | | | 3,900 | | | | 44 | |
CONMED Corp | | | 6,608 | | | | 673 | |
Constellation Pharmaceuticals Inc * | | | 6,400 | | | | 162 | |
Corbus Pharmaceuticals Holdings Inc *(A) | | | 15,800 | | | | 19 | |
Corcept Therapeutics Inc *(A) | | | 25,200 | | | | 571 | |
| | |
| SEI Institutional Investments Trust / Semi-Annual Report / November 30, 2020 | | 11 |
SCHEDULE OF INVESTMENTS (Unaudited)
November 30, 2020
Extended Market Index Fund (Continued)
| | | | | | | | |
| | | |
| Description | | Shares | | Market Value ($ Thousands) |
| | |
COMMON STOCK (continued) | | | | | | | | |
CorMedix Inc * | | | 8,600 | | | $ | 77 | |
Cortexyme Inc * | | | 3,700 | | | | 180 | |
CorVel Corp * | | | 2,334 | | | | 209 | |
Covetrus Inc * | | | 26,700 | | | | 721 | |
Crinetics Pharmaceuticals Inc * | | | 6,400 | | | | 86 | |
Cross Country Healthcare Inc * | | | 9,179 | | | | 80 | |
CryoLife Inc * | | | 8,545 | | | | 178 | |
Cue Biopharma Inc * | | | 6,900 | | | | 97 | |
Cutera Inc * | | | 2,900 | | | | 73 | |
Cyclerion Therapeutics Inc * | | | 2,425 | | | | 7 | |
Cymabay Therapeutics Inc * | | | 11,300 | | | | 85 | |
Cytokinetics Inc * | | | 15,800 | | | | 265 | |
CytomX Therapeutics Inc * | | | 15,800 | | | | 119 | |
CytoSorbents Corp * | | | 5,500 | | | | 46 | |
Deciphera Pharmaceuticals Inc * | | | 8,900 | | | | 550 | |
Denali Therapeutics Inc * | | | 14,500 | | | | 884 | |
Dicerna Pharmaceuticals Inc * | | | 15,500 | | | | 392 | |
Durect Corp * | | | 47,000 | | | | 87 | |
Dyadic International * | | | 4,600 | | | | 27 | |
Dynavax Technologies Corp, Cl A *(A) | | | 21,289 | | | | 108 | |
Eagle Pharmaceuticals Inc/DE * | | | 2,700 | | | | 123 | |
Editas Medicine Inc *(A) | | | 17,500 | | | | 535 | |
Eidos Therapeutics Inc * | | | 3,100 | | | | 285 | |
Eiger BioPharmaceuticals Inc * | | | 5,600 | | | | 51 | |
Elanco Animal Health Inc * | | | 99,200 | | | | 3,035 | |
Eloxx Pharmaceuticals Inc * | | | 4,100 | | | | 12 | |
Emergent BioSolutions Inc * | | | 11,784 | | | | 965 | |
Enanta Pharmaceuticals Inc * | | | 4,700 | | | | 194 | |
Encompass Health Corp | | | 23,441 | | | | 1,889 | |
Endo International PLC * | | | 64,300 | | | | 327 | |
Enochian Biosciences Inc *(A) | | | 3,300 | | | | 10 | |
Ensign Group Inc/The | | | 12,936 | | | | 930 | |
Envista Holdings Corp * | | | 37,400 | | | | 1,112 | |
Enzo Biochem Inc * | | | 10,000 | | | | 22 | |
Epizyme Inc * | | | 19,800 | | | | 272 | |
Esperion Therapeutics Inc *(A) | | | 6,200 | | | | 176 | |
Evelo Biosciences Inc * | | | 3,300 | | | | 17 | |
Evofem Biosciences Inc * | | | 7,034 | | | | 16 | |
Evolent Health Inc, Cl A * | | | 23,000 | | | | 334 | |
Evolus Inc * | | | 4,600 | | | | 17 | |
Exact Sciences Corp * | | | 37,180 | | | | 4,501 | |
Exagen Inc * | | | 800 | | | | 12 | |
Exelixis Inc * | | | 79,000 | | | | 1,514 | |
Fate Therapeutics Inc *(A) | | | 16,300 | | | | 953 | |
Fennec Pharmaceuticals * | | | 5,100 | | | | 40 | |
FibroGen Inc * | | | 22,400 | | | | 925 | |
Five Prime Therapeutics Inc * | | | 5,300 | | | | 100 | |
Flexion Therapeutics Inc * | | | 6,800 | | | | 73 | |
Fluidigm Corp * | | | 18,053 | | | | 113 | |
Forma Therapeutics Holdings * | | | 5,300 | | | | 232 | |
Fortress Biotech *(A) | | | 32,300 | | | | 89 | |
Frequency Therapeutics Inc *(A) | | | 6,700 | | | | 192 | |
| | | | | | | | |
| | | |
| Description | | Shares | | Market Value ($ Thousands) |
| | |
COMMON STOCK (continued) | | | | | | | | |
Fulcrum Therapeutics Inc * | | | 1,100 | | | $ | 13 | |
Fulgent Genetics Inc *(A) | | | 2,900 | | | | 130 | |
G1 Therapeutics Inc *(A) | | | 8,400 | | | | 153 | |
Galectin Therapeutics Inc *(A) | | | 9,600 | | | | 25 | |
Galera Therapeutics Inc * | | | 400 | | | | 4 | |
Generation Bio * | | | 5,000 | | | | 241 | |
GenMark Diagnostics Inc * | | | 16,100 | | | | 215 | |
Geron Corp *(A) | | | 103,570 | | | | 193 | |
Glaukos Corp *(A) | | | 10,049 | | | | 678 | |
Global Blood Therapeutics Inc *(A) | | | 15,001 | | | | 689 | |
Globus Medical Inc, Cl A * | | | 17,400 | | | | 1,045 | |
GlycoMimetics Inc * | | | 6,500 | | | | 24 | |
Gossamer Bio Inc * | | | 10,600 | | | | 94 | |
Gritstone Oncology Inc *(A) | | | 9,800 | | | | 30 | |
Guardant Health Inc * | | | 20,200 | | | | 2,447 | |
Haemonetics Corp * | | | 13,247 | | | | 1,495 | |
Halozyme Therapeutics Inc * | | | 32,458 | | | | 1,269 | |
Hanger Inc * | | | 10,000 | | | | 227 | |
Harpoon Therapeutics Inc * | | | 1,800 | | | | 27 | |
Health Catalyst Inc *(A) | | | 10,000 | | | | 357 | |
HealthEquity Inc * | | | 18,100 | | | | 1,298 | |
HealthStream Inc * | | | 5,964 | | | | 111 | |
Heron Therapeutics Inc * | | | 20,900 | | | | 362 | |
Heska Corp * | | | 1,500 | | | | 188 | |
Hill-Rom Holdings Inc | | | 17,501 | | | | 1,660 | |
HMS Holdings Corp * | | | 20,731 | | | | 651 | |
Homology Medicines Inc * | | | 9,200 | | | | 91 | |
Hookipa Pharma Inc * | | | 2,400 | | | | 28 | |
Horizon Therapeutics PLC * | | | 47,300 | | | | 3,331 | |
iCAD Inc * | | | 4,800 | | | | 48 | |
ICU Medical Inc * | | | 5,327 | | | | 1,005 | |
IGM Biosciences Inc * | | | 1,200 | | | | 80 | |
IMARA *(A) | | | 1,200 | | | | 31 | |
ImmunoGen Inc * | | | 55,252 | | | | 301 | |
Immunovant Inc * | | | 10,200 | | | | 502 | |
Inari Medical * | | | 2,700 | | | | 187 | |
InfuSystem Holdings Inc * | | | 3,400 | | | | 54 | |
Innoviva Inc * | | | 14,009 | | | | 146 | |
Inogen Inc * | | | 4,900 | | | | 172 | |
Inovalon Holdings Inc, Cl A * | | | 18,000 | | | | 336 | |
Inovio Pharmaceuticals Inc *(A) | | | 42,500 | | | | 519 | |
Insmed Inc * | | | 27,100 | | | | 1,057 | |
Inspire Medical Systems Inc * | | | 6,100 | | | | 1,133 | |
Insulet Corp * | | | 16,121 | | | | 4,155 | |
Integer Holdings Corp * | | | 8,530 | | | | 615 | |
Integra LifeSciences Holdings Corp * | | | 16,604 | | | | 909 | |
Intellia Therapeutics Inc *(A) | | | 10,300 | | | | 405 | |
Intercept Pharmaceuticals Inc *(A) | | | 5,876 | | | | 209 | |
Intersect ENT Inc * | | | 9,600 | | | | 184 | |
Intra-Cellular Therapies Inc, Cl A * | | | 18,300 | | | | 433 | |
IntriCon Corp * | | | 1,200 | | | | 21 | |
Invacare Corp | | | 6,889 | | | | 59 | |
| | |
| 12 | | SEI Institutional Investments Trust / Semi-Annual Report / November 30, 2020 |
SCHEDULE OF INVESTMENTS (Unaudited)
November 30, 2020
Extended Market Index Fund (Continued)
| | | | | | | | |
| | | |
| Description | | Shares | | Market Value ($ Thousands) |
| | |
COMMON STOCK (continued) | | | | | | | | |
Invitae Corp *(A) | | | 30,400 | | | $ | 1,509 | |
Ionis Pharmaceuticals Inc * | | | 34,094 | | | | 1,723 | |
Iovance Biotherapeutics Inc * | | | 33,900 | | | | 1,316 | |
iRadimed Corp * | | | 1,100 | | | | 27 | |
iRhythm Technologies Inc * | | | 7,100 | | | | 1,736 | |
Ironwood Pharmaceuticals Inc, Cl A * | | | 44,054 | | | | 508 | |
iTeos Therapeutics * | | | 4,600 | | | | 123 | |
IVERIC bio * | | | 10,700 | | | | 73 | |
Jazz Pharmaceuticals PLC * | | | 14,100 | | | | 1,984 | |
Joint Corp/The * | | | 5,500 | | | | 138 | |
Jounce Therapeutics Inc * | | | 1,600 | | | | 11 | |
Kadmon Holdings Inc * | | | 38,300 | | | | 167 | |
Kala Pharmaceuticals Inc *(A) | | | 9,400 | | | | 70 | |
Kaleido Biosciences Inc *(A) | | | 2,700 | | | | 21 | |
KalVista Pharmaceuticals Inc * | | | 4,700 | | | | 88 | |
Karuna Therapeutics Inc *(A) | | | 3,700 | | | | 369 | |
Karyopharm Therapeutics Inc * | | | 16,200 | | | | 275 | |
Keros Therapeutics * | | | 1,700 | | | | 129 | |
Kezar Life Sciences Inc * | | | 4,800 | | | | 32 | |
Kindred Biosciences Inc * | | | 4,400 | | | | 17 | |
Kiniksa Pharmaceuticals Ltd, Cl A * | | | 3,400 | | | | 63 | |
Kodiak Sciences Inc *(A) | | | 7,800 | | | | 1,066 | |
Krystal Biotech Inc * | | | 3,100 | | | | 170 | |
Kura Oncology Inc * | | | 11,800 | | | | 428 | |
La Jolla Pharmaceutical Co * | | | 3,000 | | | | 15 | |
Lannett Co Inc * | | | 5,200 | | | | 32 | |
Lantheus Holdings Inc * | | | 16,800 | | | | 221 | |
LeMaitre Vascular Inc (A) | | | 3,200 | | | | 126 | |
LENSAR | | | 3,558 | | | | 31 | |
Lexicon Pharmaceuticals Inc *(A) | | | 9,305 | | | | 14 | |
LHC Group Inc * | | | 7,947 | | | | 1,560 | |
Ligand Pharmaceuticals Inc *(A) | | | 3,928 | | | | 331 | |
Liquidia Technologies Inc *(A) | | | 3,200 | | | | 9 | |
LivaNova PLC * | | | 12,000 | | | | 634 | |
LogicBio Therapeutics Inc * | | | 2,000 | | | | 14 | |
Luminex Corp | | | 10,255 | | | | 243 | |
MacroGenics Inc * | | | 12,600 | | | | 291 | |
Madrigal Pharmaceuticals Inc * | | | 1,900 | | | | 222 | |
Magellan Health Inc * | | | 5,740 | | | | 454 | |
Magenta Therapeutics Inc * | | | 7,300 | | | | 52 | |
MannKind Corp * | | | 50,700 | | | | 151 | |
Marinus Pharmaceuticals Inc *(A) | | | 5,050 | | | | 80 | |
Marker Therapeutics Inc * | | | 11,600 | | | | 20 | |
Masimo Corp * | | | 11,793 | | | | 3,001 | |
MediciNova Inc *(A) | | | 5,900 | | | | 35 | |
MEDNAX Inc * | | | 21,156 | | | | 427 | |
Medpace Holdings Inc * | | | 6,500 | | | | 834 | |
MEI Pharma Inc * | | | 16,900 | | | | 49 | |
MeiraGTx Holdings PLC * | | | 4,500 | | | | 64 | |
Meridian Bioscience Inc * | | | 10,041 | | | | 190 | |
Merit Medical Systems Inc * | | | 12,875 | | | | 709 | |
Mersana Therapeutics Inc * | | | 15,600 | | | | 398 | |
| | | | | | | | |
| | | |
| Description | | Shares | | Market Value ($ Thousands) |
| | |
COMMON STOCK (continued) | | | | | | | | |
Mesa Laboratories Inc (A) | | | 1,400 | | | $ | 380 | |
Minerva Neurosciences Inc * | | | 3,700 | | | | 14 | |
Mirati Therapeutics Inc * | | | 9,800 | | | | 2,331 | |
Mirum Pharmaceuticals Inc * | | | 600 | | | | 14 | |
Misonix Inc * | | | 1,900 | | | | 27 | |
Moderna Inc *(A) | | | 71,200 | | | | 10,875 | |
Molecular Templates Inc * | | | 6,300 | | | | 56 | |
Molina Healthcare Inc * | | | 14,736 | | | | 3,008 | |
Morphic Holding Inc * | | | 3,300 | | | | 104 | |
Mustang Bio Inc * | | | 6,700 | | | | 25 | |
Myriad Genetics Inc * | | | 16,326 | | | | 286 | |
NanoString Technologies Inc * | | | 8,500 | | | | 422 | |
NantKwest Inc *(A) | | | 6,800 | | | | 65 | |
Natera Inc * | | | 16,500 | | | | 1,456 | |
National HealthCare Corp | | | 2,994 | | | | 186 | |
National Research Corp, Cl A | | | 3,212 | | | | 165 | |
Natus Medical Inc * | | | 10,158 | | | | 213 | |
Nektar Therapeutics, Cl A * | | | 48,000 | | | | 787 | |
Neogen Corp * | | | 14,306 | | | | 1,062 | |
NeoGenomics Inc * | | | 26,000 | | | | 1,237 | |
Neoleukin Therapeutics Inc * | | | 7,000 | | | | 89 | |
Neurocrine Biosciences Inc * | | | 22,600 | | | | 2,146 | |
Nevro Corp * | | | 8,800 | | | | 1,419 | |
NextCure Inc * | | | 3,400 | | | | 34 | |
NextGen Healthcare Inc * | | | 11,815 | | | | 210 | |
NGM Biopharmaceuticals Inc * | | | 5,800 | | | | 137 | |
Nkarta * | | | 5,800 | | | | 193 | |
Novavax Inc *(A) | | | 15,962 | | | | 2,227 | |
Novocure Ltd * | | | 24,400 | | | | 3,066 | |
Nurix Therapeutics *(A) | | | 4,700 | | | | 200 | |
NuVasive Inc * | | | 12,178 | | | | 564 | |
Oak Street Health Inc *(A) | | | 5,700 | | | | 269 | |
Ocular Therapeutix Inc * | | | 18,400 | | | | 322 | |
Odonate Therapeutics Inc * | | | 3,000 | | | | 45 | |
Omeros Corp *(A) | | | 16,700 | | | | 194 | |
Omnicell Inc * | | | 10,112 | | | | 1,060 | |
Oncocyte Corp * | | | 5,200 | | | | 10 | |
Ontrak Inc * | | | 1,700 | | | | 84 | |
OPKO Health Inc *(A) | | | 93,184 | | | | 432 | |
OptimizeRx Corp * | | | 5,900 | | | | 156 | |
Optinose Inc * | | | 3,100 | | | | 13 | |
Option Care Health Inc * | | | 16,227 | | | | 256 | |
OraSure Technologies Inc * | | | 19,939 | | | | 239 | |
Organogenesis Holdings Inc, Cl A * | | | 2,600 | | | | 13 | |
ORIC Pharmaceuticals * | | | 2,100 | | | | 71 | |
Orthofix Medical Inc * | | | 3,940 | | | | 145 | |
OrthoPediatrics Corp * | | | 2,800 | | | | 128 | |
Osmotica Pharmaceuticals PLC * | | | 1,900 | | | | 12 | |
Ovid therapeutics * | | | 10,200 | | | | 70 | |
Owens & Minor Inc | | | 14,139 | | | | 364 | |
Oyster Point Pharma Inc * | | | 1,400 | | | | 31 | |
Pacific Biosciences of California Inc * | | | 37,100 | | | | 587 | |
| | |
| SEI Institutional Investments Trust / Semi-Annual Report / November 30, 2020 | | 13 |
SCHEDULE OF INVESTMENTS (Unaudited)
November 30, 2020
Extended Market Index Fund (Continued)
| | | | | | | | |
| | | |
| Description | | Shares | | Market Value ($ Thousands) |
| | |
COMMON STOCK (continued) | | | | | | | | |
Pacira BioSciences Inc *(A) | | | 10,545 | | | $ | 639 | |
Paratek Pharmaceuticals Inc * | | | 3,300 | | | | 20 | |
Passage Bio * | | | 3,200 | | | | 66 | |
Patterson Cos Inc (A) | | | 19,700 | | | | 547 | |
PDL BioPharma Inc * | | | 46,900 | | | | 119 | |
Pennant Group Inc/The * | | | 6,468 | | | | 328 | |
Penumbra Inc *(A) | | | 8,600 | | | | 1,908 | |
Personalis Inc * | | | 4,700 | | | | 129 | |
PetIQ Inc, Cl A * | | | 4,700 | | | | 135 | |
PhaseBio Pharmaceuticals Inc *(A) | | | 3,300 | | | | 13 | |
Phathom Pharmaceuticals Inc * | | | 2,600 | | | | 111 | |
Phibro Animal Health Corp, Cl A | | | 3,700 | | | | 70 | |
Phreesia Inc * | | | 8,900 | | | | 393 | |
Pieris Pharmaceuticals Inc * | | | 12,800 | | | | 37 | |
Pliant Therapeutics *(A) | | | 4,700 | | | | 129 | |
PPD Inc * | | | 37,300 | | | | 1,306 | |
PRA Health Sciences Inc * | | | 16,500 | | | | 1,851 | |
Precigen Inc *(A) | | | 11,400 | | | | 90 | |
Precision BioSciences Inc * | | | 8,600 | | | | 107 | |
Premier Inc, Cl A | | | 14,100 | | | | 499 | |
Prestige Consumer Healthcare Inc * | | | 11,979 | | | | 426 | |
Prevail Therapeutics Inc * | | | 1,800 | | | | 19 | |
Progyny Inc * | | | 6,300 | | | | 224 | |
Protagonist Therapeutics Inc * | | | 7,400 | | | | 179 | |
Prothena Corp PLC * | | | 7,600 | | | | 86 | |
Provention Bio * | | | 10,100 | | | | 151 | |
Providence Service Corp/The * | | | 2,458 | | | | 334 | |
PTC Therapeutics Inc * | | | 15,600 | | | | 976 | |
Pulse Biosciences Inc *(A) | | | 2,289 | | | | 34 | |
Puma Biotechnology Inc * | | | 6,700 | | | | 75 | |
QIAGEN NV * | | | 56,183 | | | | 2,711 | |
Quanterix Corp * | | | 6,300 | | | | 272 | |
Quidel Corp * | | | 9,212 | | | | 1,797 | |
Quotient * | | | 14,400 | | | | 100 | |
R1 RCM Inc * | | | 24,700 | | | | 501 | |
Radius Health Inc * | | | 11,400 | | | | 180 | |
RadNet Inc * | | | 11,000 | | | | 205 | |
RAPT Therapeutics * | | | 2,600 | | | | 56 | |
Reata Pharmaceuticals Inc, Cl A *(A) | | | 5,700 | | | | 871 | |
Recro Pharma Inc * | | | 8,300 | | | | 20 | |
REGENXBIO Inc * | | | 9,300 | | | | 324 | |
Relay Therapeutics *(A) | | | 9,500 | | | | 506 | |
Relmada Therapeutics Inc * | | | 3,300 | | | | 117 | |
Repligen Corp * | | | 12,722 | | | | 2,413 | |
Replimune Group Inc * | | | 4,100 | | | | 212 | |
Repro-Med Systems Inc * | | | 5,800 | | | | 26 | |
Revance Therapeutics Inc * | | | 17,500 | | | | 422 | |
REVOLUTION Medicines Inc * | | | 11,700 | | | | 510 | |
Rhythm Pharmaceuticals Inc * | | | 7,500 | | | | 232 | |
Rigel Pharmaceuticals Inc * | | | 37,059 | | | | 112 | |
Rocket Pharmaceuticals Inc * | | | 9,800 | | | | 303 | |
Rockwell Medical Inc * | | | 10,000 | | | | 11 | |
| | | | | | | | |
| | | |
| Description | | Shares | | Market Value ($ Thousands) |
| | |
COMMON STOCK (continued) | | | | | | | | |
Royalty Pharma, Cl A | | | 22,900 | | | $ | 976 | |
Rubius Therapeutics Inc *(A) | | | 4,600 | | | | 29 | |
Sage Therapeutics Inc * | | | 13,900 | | | | 1,030 | |
Sangamo Therapeutics Inc *(A) | | | 28,370 | | | | 283 | |
Sarepta Therapeutics Inc * | | | 18,400 | | | | 2,592 | |
Satsuma Pharmaceuticals Inc * | | | 1,100 | | | | 5 | |
Savara Inc * | | | 4,800 | | | | 6 | |
Scholar Rock Holding Corp * | | | 5,200 | | | | 259 | |
Schrodinger Inc/United States * | | | 8,400 | | | | 584 | |
Seagen Inc * | | | 30,000 | | | | 5,109 | |
SeaSpine Holdings Corp * | | | 3,900 | | | | 55 | |
Select Medical Holdings Corp * | | | 24,765 | | | | 597 | |
Selecta Biosciences Inc *(A) | | | 16,100 | | | | 54 | |
Seres Therapeutics Inc * | | | 12,900 | | | | 356 | |
Shockwave Medical Inc *(A) | | | 8,000 | | | | 783 | |
SI-BONE Inc * | | | 5,900 | | | | 137 | |
Sientra Inc *(A) | | | 4,500 | | | | 23 | |
SIGA Technologies Inc * | | | 10,000 | | | | 69 | |
Silk Road Medical Inc *(A) | | | 7,600 | | | | 436 | |
Simulations Plus Inc | | | 3,900 | | | | 218 | |
Solid Biosciences Inc * | | | 1,700 | | | | 6 | |
Soliton Inc * | | | 1,300 | | | | 12 | |
Sorrento Therapeutics Inc *(A) | | | 62,400 | | | | 512 | |
Spectrum Pharmaceuticals Inc * | | | 45,379 | | | | 214 | |
Spero Therapeutics Inc * | | | 3,110 | | | | 52 | |
SpringWorks Therapeutics Inc * | | | 5,000 | | | | 327 | |
STAAR Surgical Co * | | | 10,678 | | | | 761 | |
Stereotaxis Inc * | | | 10,500 | | | | 45 | |
Stoke Therapeutics Inc * | | | 3,000 | | | | 156 | |
Strongbridge Biopharma PLC * | | | 8,700 | | | | 24 | |
Supernus Pharmaceuticals Inc * | | | 10,600 | | | | 226 | |
Surgalign Holdings * | | | 6,918 | | | | 16 | |
Surgery Partners Inc * | | | 3,500 | | | | 86 | |
Surmodics Inc * | | | 2,444 | | | | 92 | |
Sutro Biopharma Inc * | | | 2,600 | | | | 44 | |
Syndax Pharmaceuticals Inc * | | | 6,400 | | | | 148 | |
Syneos Health Inc, Cl A * | | | 16,100 | | | | 1,060 | |
Syros Pharmaceuticals Inc * | | | 12,700 | | | | 104 | |
Tabula Rasa HealthCare Inc *(A) | | | 5,000 | | | | 172 | |
Tactile Systems Technology Inc * | | | 4,900 | | | | 211 | |
Tandem Diabetes Care Inc * | | | 15,500 | | | | 1,455 | |
TCR2 Therapeutics Inc * | | | 3,900 | | | | 106 | |
Teladoc Health Inc *(A) | | | 25,424 | | | | 5,054 | |
Tenet Healthcare Corp * | | | 24,200 | | | | 761 | |
TG Therapeutics Inc *(A) | | | 30,200 | | | | 886 | |
TherapeuticsMD Inc *(A) | | | 50,700 | | | | 68 | |
Theravance Biopharma Inc *(A) | | | 12,845 | | | | 213 | |
Tivity Health Inc *(A) | | | 9,768 | | | | 180 | |
Translate Bio Inc *(A) | | | 21,100 | | | | 469 | |
TransMedics Group Inc * | | | 9,600 | | | | 143 | |
Travere Therapeutics Inc * | | | 8,900 | | | | 204 | |
Tricida Inc * | | | 5,700 | | | | 42 | |
| | |
| 14 | | SEI Institutional Investments Trust / Semi-Annual Report / November 30, 2020 |
SCHEDULE OF INVESTMENTS (Unaudited)
November 30, 2020
Extended Market Index Fund (Continued)
| | | | | | | | |
| | | |
| Description | | Shares | | Market Value ($ Thousands) |
| | |
COMMON STOCK (continued) | | | | | | | | |
Triple-S Management Corp, Cl B * | | | 5,850 | | | $ | 131 | |
Turning Point Therapeutics Inc * | | | 9,300 | | | | 990 | |
Twist Bioscience Corp * | | | 7,500 | | | | 838 | |
Tyme Technologies Inc *(A) | | | 58,300 | | | | 61 | |
Ultragenyx Pharmaceutical Inc * | | | 14,200 | | | | 1,683 | |
United Therapeutics Corp * | | | 11,464 | | | | 1,521 | |
UNITY Biotechnology Inc *(A) | | | 5,800 | | | | 35 | |
UroGen Pharma Ltd *(A) | | | 5,300 | | | | 110 | |
US Physical Therapy Inc | | | 2,726 | | | | 290 | |
Utah Medical Products Inc | | | 1,300 | | | | 112 | |
Vanda Pharmaceuticals Inc * | | | 15,600 | | | | 190 | |
Vapotherm Inc * | | | 4,900 | | | | 123 | |
Varex Imaging Corp * | | | 11,900 | | | | 199 | |
Vaxart *(A) | | | 9,900 | | | | 79 | |
Vaxcyte * | | | 5,800 | | | | 186 | |
VBI Vaccines Inc * | | | 36,900 | | | | 126 | |
Veeva Systems Inc, Cl A * | | | 32,900 | | | | 9,109 | |
Veracyte Inc * | | | 12,600 | | | | 687 | |
Verastem Inc *(A) | | | 38,800 | | | | 78 | |
Vericel Corp * | | | 11,200 | | | | 286 | |
Verrica Pharmaceuticals Inc *(A) | | | 4,500 | | | | 41 | |
Viela Bio Inc * | | | 4,700 | | | | 180 | |
Viemed Healthcare Inc * | | | 8,200 | | | | 80 | |
ViewRay Inc *(A) | | | 47,200 | | | | 181 | |
Viking Therapeutics Inc *(A) | | | 21,500 | | | | 138 | |
Vir Biotechnology Inc *(A) | | | 15,200 | | | | 485 | |
Voyager Therapeutics Inc * | | | 6,900 | | | | 57 | |
VYNE Therapeutics *(A) | | | 25,400 | | | | 43 | |
WaVe Life Sciences Ltd * | | | 4,000 | | | | 35 | |
X4 Pharmaceuticals Inc * | | | 4,100 | | | | 27 | |
XBiotech Inc *(A) | | | 4,339 | | | | 83 | |
Xencor Inc * | | | 13,500 | | | | 571 | |
Xeris Pharmaceuticals Inc * | | | 7,900 | | | | 34 | |
Y-mAbs Therapeutics Inc * | | | 6,400 | | | | 326 | |
Zentalis Pharmaceuticals * | | | 2,500 | | | | 127 | |
ZIOPHARM Oncology Inc *(A) | | | 64,346 | | | | 180 | |
Zogenix Inc * | | | 13,200 | | | | 283 | |
Zynex Inc *(A) | | | 3,800 | | | | 53 | |
| | | | | | | | |
| | |
| | | | | | | 242,593 | |
| | | | | | | | |
| | |
Industrials — 12.1% | | | | | | | | |
AAON Inc | | | 10,850 | | | | 707 | |
AAR Corp | | | 7,429 | | | | 211 | |
ABM Industries Inc | | | 17,055 | | | | 657 | |
Acacia Research Corp * | | | 8,749 | | | | 32 | |
ACCO Brands Corp | | | 22,029 | | | | 169 | |
Acuity Brands Inc | | | 9,300 | | | | 1,104 | |
ADT Inc | | | 45,100 | | | | 350 | |
Advanced Drainage Systems Inc | | | 14,900 | | | | 1,039 | |
AECOM * | | | 36,448 | | | | 1,891 | |
Aegion Corp, Cl A * | | | 8,903 | | | | 153 | |
Aerojet Rocketdyne Holdings Inc * | | | 17,379 | | | | 650 | |
AeroVironment Inc * | | | 5,125 | | | | 438 | |
| | | | | | | | |
| | | |
| Description | | Shares | | Market Value ($ Thousands) |
| | |
COMMON STOCK (continued) | | | | | | | | |
AGCO Corp | | | 16,323 | | | $ | 1,510 | |
Air Lease Corp, Cl A | | | 25,331 | | | | 926 | |
Air Transport Services Group Inc * | | | 14,036 | | | | 431 | |
Alamo Group Inc | | | 2,135 | | | | 290 | |
Albany International Corp, Cl A | | | 6,898 | | | | 473 | |
Allegiant Travel Co, Cl A | | | 3,350 | | | | 570 | |
Allied Motion Technologies Inc | | | 1,300 | | | | 53 | |
Allison Transmission Holdings Inc, Cl A | | | 26,476 | | | | 1,087 | |
Alpha Pro Tech Ltd *(A) | | | 6,700 | | | | 85 | |
Altra Industrial Motion Corp | | | 15,289 | | | | 868 | |
AMERCO | | | 2,200 | | | | 911 | |
Ameresco Inc, Cl A * | | | 8,079 | | | | 360 | |
American Superconductor Corp * | | | 7,200 | | | | 143 | |
American Woodmark Corp * | | | 3,984 | | | | 349 | |
API Group * | | | 33,200 | | | | 515 | |
Apogee Enterprises Inc | | | 6,011 | | | | 158 | |
Applied Industrial Technologies Inc | | | 8,861 | | | | 695 | |
ArcBest Corp | | | 5,590 | | | | 234 | |
Arcosa Inc | | | 12,613 | | | | 654 | |
Argan Inc | | | 2,979 | | | | 137 | |
Armstrong World Industries Inc | | | 11,377 | | | | 877 | |
ASGN Inc * | | | 12,369 | | | | 967 | |
Astec Industries Inc | | | 6,263 | | | | 363 | |
Astronics Corp * | | | 3,874 | | | | 44 | |
Astronics Corp, Cl B * | | | 2,395 | | | | 27 | |
Atkore International Group Inc * | | | 11,500 | | | | 448 | |
Atlas Air Worldwide Holdings Inc * | | | 7,269 | | | | 406 | |
Avis Budget Group Inc *(A) | | | 13,960 | | | | 491 | |
Axon Enterprise Inc * | | | 15,169 | | | | 1,907 | |
AZEK Co Inc/The, Cl A * | | | 11,800 | | | | 421 | |
AZZ Inc | | | 7,396 | | | | 330 | |
Barnes Group Inc | | | 11,852 | | | | 545 | |
Barrett Business Services Inc | | | 1,634 | | | | 109 | |
BG Staffing Inc | | | 3,400 | | | | 43 | |
Bloom Energy Corp, Cl A *(A) | | | 21,500 | | | | 527 | |
Blue Bird Corp * | | | 4,392 | | | | 72 | |
BMC Stock Holdings Inc * | | | 16,900 | | | | 827 | |
Brady Corp, Cl A | | | 11,527 | | | | 509 | |
BrightView Holdings Inc * | | | 15,000 | | | | 205 | |
Brink’s Co/The (A) | | | 11,906 | | | | 799 | |
Builders FirstSource Inc * | | | 28,170 | | | | 1,054 | |
BWX Technologies Inc | | | 25,024 | | | | 1,423 | |
Caesarstone Ltd (A) | | | 4,600 | | | | 55 | |
CAI International Inc | | | 5,072 | | | | 161 | |
Carlisle Cos Inc | | | 14,077 | | | | 2,039 | |
Casella Waste Systems Inc, Cl A * | | | 10,991 | | | | 661 | |
CECO Environmental Corp * | | | 5,647 | | | | 42 | |
Chart Industries Inc * | | | 9,672 | | | | 1,000 | |
CIRCOR International Inc * | | | 3,715 | | | | 123 | |
Clean Harbors Inc * | | | 12,276 | | | | 888 | |
Colfax Corp * | | | 24,689 | | | | 891 | |
Columbus McKinnon Corp/NY | | | 5,065 | | | | 191 | |
| | |
| SEI Institutional Investments Trust / Semi-Annual Report / November 30, 2020 | | 15 |
SCHEDULE OF INVESTMENTS (Unaudited)
November 30, 2020
Extended Market Index Fund (Continued)
| | | | | | | | |
| | | |
| Description | | Shares | | Market Value ($ Thousands) |
| | |
COMMON STOCK (continued) | | | | | | | | |
Comfort Systems USA Inc | | | 9,691 | | | $ | 488 | |
CompX International Inc | | | 400 | | | | 6 | |
Concrete Pumping Holdings Inc * | | | 3,900 | | | | 15 | |
Construction Partners Inc, Cl A * | | | 4,200 | | | | 110 | |
Copa Holdings SA, Cl A | | | 7,028 | | | | 560 | |
CoreLogic Inc/United States | | | 18,983 | | | | 1,471 | |
Cornerstone Building Brands Inc * | | | 6,048 | | | | 53 | |
Costamare Inc | | | 18,000 | | | | 129 | |
CoStar Group Inc * | | | 9,763 | | | | 8,890 | |
Covanta Holding Corp | | | 27,058 | | | | 336 | |
Covenant Logistics Group Inc, Cl A * | | | 3,300 | | | | 61 | |
CRA International Inc | | | 2,105 | | | | 97 | |
Crane Co | | | 11,629 | | | | 809 | |
CSW Industrials Inc | | | 4,000 | | | | 429 | |
Cubic Corp | | | 7,189 | | | | 421 | |
Curtiss-Wright Corp | | | 9,778 | | | | 1,127 | |
Daseke Inc * | | | 7,700 | | | | 52 | |
Donaldson Co Inc | | | 33,246 | | | | 1,770 | |
Douglas Dynamics Inc | | | 6,122 | | | | 239 | |
Ducommun Inc * | | | 3,700 | | | | 184 | |
Dun & Bradstreet Holdings * | | | 23,900 | | | | 641 | |
DXP Enterprises Inc/TX * | | | 4,162 | | | | 88 | |
Dycom Industries Inc * | | | 8,107 | | | | 510 | |
Eagle Bulk Shipping | | | 1,314 | | | | 24 | |
Eastern Co/The | | | 1,300 | | | | 29 | |
Echo Global Logistics Inc * | | | 6,286 | | | | 178 | |
EMCOR Group Inc | | | 13,587 | | | | 1,171 | |
Encore Wire Corp | | | 4,403 | | | | 227 | |
Energy Recovery Inc * | | | 10,200 | | | | 109 | |
Enerpac Tool Group Corp, Cl A | | | 14,842 | | | | 332 | |
EnerSys | | | 10,083 | | | | 825 | |
Ennis Inc | | | 5,288 | | | | 86 | |
EnPro Industries Inc | | | 4,868 | | | | 345 | |
ESCO Technologies Inc | | | 6,077 | | | | 601 | |
EVI Industries Inc *(A) | | | 1,100 | | | | 37 | |
Evoqua Water Technologies Corp * | | | 25,700 | | | | 671 | |
Exponent Inc | | | 12,572 | | | | 1,044 | |
Federal Signal Corp | | | 15,647 | | | | 486 | |
Fluor Corp | | | 31,200 | | | | 539 | |
Forrester Research Inc * | | | 1,564 | | | | 65 | |
Forward Air Corp | | | 7,418 | | | | 542 | |
Foundation Building Materials Inc * | | | 5,300 | | | | 102 | |
Franklin Covey Co * | | | 3,304 | | | | 73 | |
Franklin Electric Co Inc | | | 11,781 | | | | 796 | |
FTI Consulting Inc * | | | 8,768 | | | | 921 | |
FuelCell Energy *(A) | | | 50,500 | | | | 515 | |
Gates Industrial Corp PLC * | | | 8,400 | | | | 108 | |
GATX Corp (A) | | | 8,252 | | | | 658 | |
Genco Shipping & Trading Ltd | | | 3,700 | | | | 28 | |
Gencor Industries Inc * | | | 2,200 | | | | 27 | |
Generac Holdings Inc * | | | 14,945 | | | | 3,222 | |
General Finance Corp * | | | 2,800 | | | | 23 | |
| | | | | | | | |
| | | |
| Description | | Shares | | Market Value ($ Thousands) |
| | |
COMMON STOCK (continued) | | | | | | | | |
Gibraltar Industries Inc * | | | 8,760 | | | $ | 573 | |
GMS Inc * | | | 12,500 | | | | 390 | |
Gorman-Rupp Co/The | | | 4,077 | | | | 134 | |
GP Strategies Corp * | | | 2,500 | | | | 29 | |
Graco Inc | | | 41,405 | | | | 2,805 | |
GrafTech International Ltd | | | 11,400 | | | | 90 | |
Graham Corp | | | 796 | | | | 13 | |
Granite Construction Inc | | | 12,634 | | | | 311 | |
Great Lakes Dredge & Dock Corp * | | | 17,880 | | | | 202 | |
Greenbrier Cos Inc/The | | | 7,123 | | | | 238 | |
Griffon Corp | | | 9,137 | | | | 190 | |
H&E Equipment Services Inc | | | 7,525 | | | | 202 | |
Harsco Corp * | | | 20,828 | | | | 353 | |
Hawaiian Holdings Inc | | | 12,480 | | | | 253 | |
HD Supply Holdings Inc * | | | 39,100 | | | | 2,181 | |
Healthcare Services Group Inc | | | 17,739 | | | | 420 | |
Heartland Express Inc | | | 9,772 | | | | 181 | |
HEICO Corp | | | 11,818 | | | | 1,460 | |
HEICO Corp, Cl A | | | 18,582 | | | | 2,058 | |
Heidrick & Struggles International Inc | | | 4,552 | | | | 119 | |
Helios Technologies Inc | | | 6,577 | | | | 324 | |
Herc Holdings Inc * | | | 5,667 | | | | 325 | |
Heritage-Crystal Clean Inc * | | | 5,100 | | | | 98 | |
Herman Miller Inc | | | 13,443 | | | | 479 | |
Hexcel Corp | | | 19,898 | | | | 985 | |
Hillenbrand Inc | | | 18,380 | | | | 689 | |
HNI Corp | | | 11,249 | | | | 410 | |
Hub Group Inc, Cl A * | | | 7,862 | | | | 429 | |
Hubbell Inc, Cl B | | | 12,889 | | | | 2,083 | |
Hurco Cos Inc | | | 1,235 | | | | 37 | |
Huron Consulting Group Inc * | | | 5,411 | | | | 238 | |
Hyster-Yale Materials Handling Inc | | | 2,002 | | | | 110 | |
IAA Inc * | | | 32,829 | | | | 1,967 | |
ICF International Inc | | | 4,768 | | | | 345 | |
IES Holdings Inc * | | | 3,000 | | | | 111 | |
Insperity Inc | | | 8,924 | | | | 763 | |
Insteel Industries Inc | | | 2,941 | | | | 68 | |
Interface Inc, Cl A | | | 14,045 | | | | 117 | |
ITT Inc | | | 22,763 | | | | 1,653 | |
JELD-WEN Holding Inc * | | | 17,800 | | | | 431 | |
JetBlue Airways Corp * | | | 63,281 | | | | 955 | |
John Bean Technologies Corp | | | 7,431 | | | | 822 | |
Kadant Inc | | | 2,725 | | | | 349 | |
Kaman Corp | | | 6,573 | | | | 344 | |
KAR Auction Services Inc | | | 31,829 | | | | 575 | |
Kelly Services Inc, Cl A | | | 6,795 | | | | 139 | |
Kennametal Inc | | | 19,714 | | | | 690 | |
Kforce Inc | | | 4,537 | | | | 186 | |
Kimball International Inc, Cl B | | | 7,025 | | | | 77 | |
Kirby Corp * | | | 14,326 | | | | 725 | |
Knight-Swift Transportation Holdings Inc, Cl A | | | 32,927 | | | | 1,360 | |
| | |
| 16 | | SEI Institutional Investments Trust / Semi-Annual Report / November 30, 2020 |
SCHEDULE OF INVESTMENTS (Unaudited)
November 30, 2020
Extended Market Index Fund (Continued)
| | | | | | | | |
| | | |
| Description | | Shares | | Market Value ($ Thousands) |
| | |
COMMON STOCK (continued) | | | | | | | | |
Knoll Inc | | | 11,763 | | | $ | 161 | |
Korn Ferry | | | 14,558 | | | | 583 | |
Kratos Defense & Security Solutions Inc * | | | 29,016 | | | | 614 | |
Landstar System Inc | | | 10,044 | | | | 1,320 | |
Lawson Products Inc/DE * | | | 1,800 | | | | 85 | |
LB Foster Co, Cl A * | | | 1,900 | | | | 28 | |
Lennox International Inc | | | 8,529 | | | | 2,455 | |
Lincoln Electric Holdings Inc | | | 15,033 | | | | 1,729 | |
Lindsay Corp | | | 2,527 | | | | 293 | |
Luxfer Holdings PLC | | | 7,600 | | | | 114 | |
Lydall Inc * | | | 3,632 | | | | 100 | |
Lyft Inc, Cl A * | | | 59,000 | | | | 2,252 | |
Macquarie Infrastructure Corp | | | 17,500 | | | | 566 | |
Manitowoc Co Inc/The * | | | 5,987 | | | | 67 | |
ManpowerGroup Inc | | | 13,756 | | | | 1,192 | |
Marten Transport Ltd | | | 14,229 | | | | 251 | |
Masonite International Corp * | | | 6,900 | | | | 690 | |
MasTec Inc * | | | 13,962 | | | | 792 | |
Matson Inc | | | 11,152 | | | | 648 | |
Matthews International Corp, Cl A | | | 6,813 | | | | 182 | |
Maxar Technologies Inc (A) | | | 14,300 | | | | 398 | |
Mayville Engineering Co Inc * | | | 1,500 | | | | 17 | |
McGrath RentCorp | | | 5,948 | | | | 379 | |
Mercury Systems Inc * | | | 13,823 | | | | 984 | |
Meritor Inc * | | | 17,795 | | | | 470 | |
Mesa Air Group Inc * | | | 7,700 | | | | 49 | |
Middleby Corp/The * | | | 13,525 | | | | 1,839 | |
Miller Industries Inc/TN | | | 2,311 | | | | 77 | |
Mistras Group Inc * | | | 2,697 | | | | 14 | |
Montrose Environmental Group * | | | 4,900 | | | | 134 | |
Moog Inc, Cl A | | | 7,824 | | | | 605 | |
MSA Safety Inc (A) | | | 9,644 | | | | 1,441 | |
MSC Industrial Direct Co Inc, Cl A | | | 10,703 | | | | 892 | |
Mueller Industries Inc | | | 14,508 | | | | 475 | |
Mueller Water Products Inc, Cl A | | | 41,012 | | | | 487 | |
MYR Group Inc * | | | 4,079 | | | | 209 | |
National Presto Industries Inc | | | 1,091 | | | | 93 | |
Navistar International Corp * | | | 12,791 | | | | 566 | |
NL Industries Inc | | | 2,000 | | | | 9 | |
NN Inc * | | | 5,587 | | | | 35 | |
Nordson Corp | | | 14,412 | | | | 2,937 | |
Northwest Pipe Co * | | | 2,600 | | | | 75 | |
NOW Inc * | | | 21,600 | | | | 121 | |
NV5 Global Inc * | | | 2,700 | | | | 197 | |
nVent Electric PLC | | | 37,100 | | | | 853 | |
Omega Flex Inc | | | 600 | | | | 85 | |
Oshkosh Corp | | | 17,817 | | | | 1,434 | |
Owens Corning | | | 27,860 | | | | 2,030 | |
PAE Inc * | | | 14,000 | | | | 135 | |
PAM Transportation Services Inc * | | | 500 | | | | 23 | |
Park Aerospace Corp | | | 5,082 | | | | 65 | |
Park-Ohio Holdings Corp | | | 1,118 | | | | 31 | |
| | | | | | | | |
| | | |
| Description | | Shares | | Market Value ($ Thousands) |
| | |
COMMON STOCK (continued) | | | | | | | | |
Patrick Industries Inc | | | 5,225 | | | $ | 329 | |
PGT Innovations Inc * | | | 16,500 | | | | 307 | |
Powell Industries Inc | | | 1,364 | | | | 35 | |
Preformed Line Products Co | | | 90 | | | | 5 | |
Primoris Services Corp | | | 13,047 | | | | 316 | |
Proto Labs Inc * | | | 7,099 | | | | 981 | |
Quad/Graphics Inc, Cl A | | | 6,862 | | | | 21 | |
Quanex Building Products Corp | | | 6,965 | | | | 143 | |
Radiant Logistics Inc * | | | 12,400 | | | | 73 | |
Raven Industries Inc | | | 8,655 | | | | 218 | |
RBC Bearings Inc * | | | 5,895 | | | | 995 | |
Regal Beloit Corp | | | 10,225 | | | | 1,217 | |
Resideo Technologies Inc * | | | 31,100 | | | | 575 | |
Resources Connection Inc | | | 9,581 | | | | 116 | |
REV Group Inc | | | 8,400 | | | | 78 | |
Rexnord Corp | | | 32,526 | | | | 1,220 | |
Rush Enterprises Inc, Cl A | | | 11,098 | | | | 425 | |
Rush Enterprises Inc, Cl B | | | 2,700 | | | | 92 | |
Ryder System Inc | | | 12,400 | | | | 734 | |
Safe Bulkers Inc * | | | 12,300 | | | | 15 | |
Saia Inc * | | | 6,592 | | | | 1,151 | |
Schneider National Inc, Cl B | | | 15,600 | | | | 326 | |
Scorpio Bulkers Inc | | | 1,591 | | | | 27 | |
SEACOR Holdings Inc * | | | 3,374 | | | | 112 | |
Sensata Technologies Holding PLC * | | | 36,600 | | | | 1,787 | |
Shyft Group Inc/The | | | 6,500 | | | | 169 | |
Simpson Manufacturing Co Inc | | | 11,543 | | | | 1,061 | |
SiteOne Landscape Supply Inc * | | | 11,100 | | | | 1,533 | |
SkyWest Inc | | | 11,322 | | | | 486 | |
SP Plus Corp * | | | 7,098 | | | | 202 | |
Spirit AeroSystems Holdings Inc, Cl A | | | 25,075 | | | | 853 | |
Spirit Airlines Inc *(A) | | | 24,047 | | | | 544 | |
SPX Corp * | | | 10,194 | | | | 522 | |
SPX FLOW Inc * | | | 11,794 | | | | 632 | |
Standex International Corp | | | 2,429 | | | | 183 | |
Steelcase Inc, Cl A | | | 22,857 | | | | 278 | |
Stericycle Inc * | | | 24,000 | | | | 1,691 | |
Sterling Construction Co Inc * | | | 8,700 | | | | 139 | |
Systemax Inc | | | 1,400 | | | | 43 | |
Team Inc * | | | 5,757 | | | | 50 | |
Tennant Co | | | 4,638 | | | | 311 | |
Terex Corp | | | 14,170 | | | | 439 | |
Tetra Tech Inc | | | 12,642 | | | | 1,508 | |
Textainer Group Holdings Ltd * | | | 12,553 | | | | 231 | |
Thermon Group Holdings Inc * | | | 6,882 | | | | 97 | |
Timken Co/The | | | 15,809 | | | | 1,161 | |
Titan Machinery Inc * | | | 3,312 | | | | 61 | |
Toro Co/The | | | 25,700 | | | | 2,331 | |
TPI Composites Inc * | | | 7,500 | | | | 302 | |
Transcat Inc * | | | 3,400 | | | | 108 | |
TransUnion | | | 46,800 | | | | 4,263 | |
Trex Co Inc * | | | 27,560 | | | | 2,062 | |
| | |
| SEI Institutional Investments Trust / Semi-Annual Report / November 30, 2020 | | 17 |
SCHEDULE OF INVESTMENTS (Unaudited)
November 30, 2020
Extended Market Index Fund (Continued)
| | | | | | | | |
| | | |
| Description | | Shares | | Market Value ($ Thousands) |
COMMON STOCK (continued) | | | | | | | | |
TriMas Corp * | | | 9,876 | | | $ | 264 | |
TriNet Group Inc * | | | 9,800 | | | | 735 | |
Trinity Industries Inc (A) | | | 21,742 | | | | 497 | |
Triton International Ltd/Bermuda | | | 13,284 | | | | 601 | |
Triumph Group Inc | | | 13,296 | | | | 175 | |
TrueBlue Inc * | | | 8,328 | | | | 159 | |
Tutor Perini Corp * | | | 8,051 | | | | 109 | |
Uber Technologies Inc * | | | 343,800 | | | | 17,073 | |
UFP Industries Inc | | | 16,465 | | | | 883 | |
UniFirst Corp/MA | | | 3,640 | | | | 673 | |
Univar Solutions Inc * | | | 40,250 | | | | 720 | |
Universal Logistics Holdings Inc | | | 700 | | | | 15 | |
US Ecology Inc | | | 6,440 | | | | 218 | |
US Xpress Enterprises Inc, Cl A * | | | 5,300 | | | | 40 | |
Valmont Industries Inc | | | 5,014 | | | | 817 | |
Vectrus Inc * | | | 2,679 | | | | 128 | |
Veritiv Corp * | | | 2,000 | | | | 37 | |
Vertiv Holdings Co, Cl A | | | 57,600 | | | | 1,078 | |
Viad Corp | | | 4,271 | | | | 128 | |
Vicor Corp * | | | 4,200 | | | | 344 | |
Virgin Galactic Holdings Inc *(A) | | | 14,400 | | | | 383 | |
VSE Corp | | | 2,000 | | | | 68 | |
Wabash National Corp | | | 11,741 | | | | 208 | |
Watsco Inc | | | 8,459 | | | | 1,923 | |
Watts Water Technologies Inc, Cl A | | | 7,056 | | | | 827 | |
Welbilt Inc * | | | 31,050 | | | | 293 | |
Werner Enterprises Inc | | | 14,890 | | | | 595 | |
WESCO International Inc * | | | 12,365 | | | | 806 | |
Willdan Group Inc * | | | 1,300 | | | | 51 | |
Willis Lease Finance Corp * | | | 1,000 | | | | 32 | |
WillScot Mobile Mini Holdings, Cl A * | | | 39,211 | | | | 843 | |
Woodward Inc | | | 13,142 | | | | 1,470 | |
XPO Logistics Inc * | | | 21,790 | | | | 2,325 | |
| | | | | | | | |
| | |
| | | | | | | 197,008 | |
| | | | | | | | |
| | |
Information Technology — 23.4% | | | | | | | | |
2U Inc *(A) | | | 16,400 | | | | 530 | |
3D Systems Corp *(A) | | | 35,847 | | | | 328 | |
8x8 Inc * | | | 27,614 | | | | 546 | |
A10 Networks Inc * | | | 9,800 | | | | 78 | |
Acacia Communications Inc * | | | 9,900 | | | | 690 | |
ACI Worldwide Inc * | | | 26,912 | | | | 877 | |
ADTRAN Inc | | | 9,897 | | | | 125 | |
Advanced Energy Industries Inc * | | | 8,819 | | | | 851 | |
Agilysys Inc * | | | 5,200 | | | | 194 | |
Akoustis Technologies Inc *(A) | | | 8,400 | | | | 64 | |
Alarm.com Holdings Inc * | | | 13,000 | | | | 987 | |
Alliance Data Systems Corp | | | 12,800 | | | | 936 | |
Alpha & Omega Semiconductor Ltd * | | | 5,600 | | | | 139 | |
Altair Engineering Inc, Cl A * | | | 11,600 | | | | 625 | |
Alteryx Inc, Cl A * | | | 13,800 | | | | 1,654 | |
Ambarella Inc * | | | 9,200 | | | | 719 | |
Amdocs Ltd | | | 31,668 | | | | 2,084 | |
| | | | | | | | |
| | | |
| Description | | Shares | | Market Value ($ Thousands) |
COMMON STOCK (continued) | | | | | | | | |
American Software Inc/GA, Cl A | | | 8,672 | | | $ | 142 | |
Amkor Technology Inc | | | 20,913 | | | | 308 | |
Anaplan Inc * | | | 31,200 | | | | 2,184 | |
Appfolio Inc, Cl A * | | | 3,800 | | | | 619 | |
Appian Corp, Cl A *(A) | | | 8,200 | | | | 1,148 | |
Applied Optoelectronics Inc *(A) | | | 3,800 | | | | 32 | |
Arlo Technologies Inc * | | | 13,252 | | | | 70 | |
Arrow Electronics Inc * | | | 20,125 | | | | 1,844 | |
Aspen Technology Inc * | | | 16,167 | | | | 2,174 | |
Atlassian Corp PLC, Cl A * | | | 31,800 | | | | 7,157 | |
Avalara Inc * | | | 20,200 | | | | 3,469 | |
Avaya Holdings Corp * | | | 25,100 | | | | 467 | |
Avid Technology Inc * | | | 5,000 | | | | 61 | |
Avnet Inc | | | 23,399 | | | | 710 | |
Axcelis Technologies Inc * | | | 9,350 | | | | 252 | |
AXT Inc * | | | 6,600 | | | | 64 | |
Badger Meter Inc | | | 7,424 | | | | 612 | |
Bandwidth Inc, Cl A *(A) | | | 5,100 | | | | 774 | |
Bel Fuse Inc, Cl B | | | 888 | | | | 13 | |
Belden Inc | | | 11,723 | | | | 451 | |
Benchmark Electronics Inc | | | 9,930 | | | | 241 | |
Benefitfocus Inc * | | | 5,300 | | | | 76 | |
BigCommerce Holdings Inc *(A) | | | 2,900 | | | | 234 | |
Bill.com Holdings Inc * | | | 13,100 | | | | 1,608 | |
Black Knight Inc * | | | 37,137 | | | | 3,402 | |
Blackbaud Inc | | | 11,955 | | | | 659 | |
Blackline Inc * | | | 12,800 | | | | 1,573 | |
Booz Allen Hamilton Holding Corp, Cl A | | | 34,365 | | | | 2,983 | |
Bottomline Technologies DE Inc * | | | 9,971 | | | | 455 | |
Box Inc, Cl A * | | | 35,000 | | | | 654 | |
Brightcove Inc * | | | 6,800 | | | | 114 | |
Brooks Automation Inc | | | 16,803 | | | | 1,226 | |
CACI International Inc, Cl A * | | | 6,232 | | | | 1,479 | |
CalAmp Corp * | | | 8,156 | | | | 74 | |
Calix Inc * | | | 11,045 | | | | 262 | |
Cambium Networks Corp * | | | 1,000 | | | | 27 | |
Cardtronics PLC * | | | 8,885 | | | | 216 | |
Casa Systems Inc * | | | 2,800 | | | | 15 | |
Cass Information Systems Inc | | | 3,154 | | | | 134 | |
CDK Global Inc | | | 32,100 | | | | 1,538 | |
Cerence Inc * | | | 8,110 | | | | 736 | |
Ceridian HCM Holding Inc * | | | 26,200 | | | | 2,526 | |
CEVA Inc * | | | 5,138 | | | | 202 | |
ChannelAdvisor Corp * | | | 5,900 | | | | 87 | |
Ciena Corp * | | | 39,986 | | | | 1,791 | |
Cirrus Logic Inc * | | | 13,795 | | | | 1,105 | |
Clearfield Inc * | | | 1,400 | | | | 33 | |
Cloudera Inc * | | | 48,668 | | | | 568 | |
Cloudflare Inc, Cl A *(A) | | | 26,400 | | | | 1,982 | |
CMC Materials Inc | | | 6,805 | | | | 1,050 | |
Cognex Corp | | | 40,716 | | | | 3,059 | |
Coherent Inc * | | | 5,753 | | | | 701 | |
| | |
| 18 | | SEI Institutional Investments Trust / Semi-Annual Report / November 30, 2020 |
SCHEDULE OF INVESTMENTS (Unaudited)
November 30, 2020
Extended Market Index Fund (Continued)
| | | | | | | | |
| | | |
| Description | | Shares | | Market Value ($ Thousands) |
| | |
COMMON STOCK (continued) | | | | | | | | |
Cohu Inc | | | 12,236 | | | $ | 347 | |
CommScope Holding Co Inc * | | | 48,900 | | | | 579 | |
CommVault Systems Inc * | | | 11,684 | | | | 558 | |
Computer Programs and Systems Inc | | | 1,702 | | | | 48 | |
Comtech Telecommunications Corp | | | 4,332 | | | | 83 | |
Conduent Inc * | | | 39,300 | | | | 166 | |
Cornerstone OnDemand Inc * | | | 16,799 | | | | 742 | |
Coupa Software Inc * | | | 16,400 | | | | 5,394 | |
Cree Inc *(A) | | | 26,423 | | | | 2,388 | |
Crowdstrike Holdings Inc, Cl A * | | | 37,500 | | | | 5,748 | |
CSG Systems International Inc | | | 9,117 | | | | 395 | |
CTS Corp | | | 10,445 | | | | 318 | |
CyberOptics Corp * | | | 1,700 | | | | 45 | |
Daktronics Inc | | | 4,580 | | | | 21 | |
Datadog Inc, Cl A * | | | 38,000 | | | | 3,759 | |
Dell Technologies Inc, Cl C * | | | 61,972 | | | | 4,278 | |
Diebold Nixdorf Inc * | | | 14,133 | | | | 134 | |
Digi International Inc * | | | 11,801 | | | | 203 | |
Digimarc Corp *(A) | | | 2,076 | | | | 87 | |
Digital Turbine Inc * | | | 19,600 | | | | 882 | |
Diodes Inc * | | | 10,642 | | | | 723 | |
DocuSign Inc, Cl A * | | | 44,000 | | | | 10,027 | |
Dolby Laboratories Inc, Cl A | | | 14,704 | | | | 1,301 | |
Domo Inc, Cl B * | | | 8,000 | | | | 304 | |
Donnelley Financial Solutions Inc * | | | 4,957 | | | | 81 | |
Dropbox Inc, Cl A * | | | 62,200 | | | | 1,242 | |
DSP Group Inc * | | | 7,900 | | | | 133 | |
Duck Creek Technologies Inc * | | | 5,000 | | | | 199 | |
Dynatrace Inc * | | | 47,700 | | | | 1,814 | |
DZS * | | | 1,900 | | | | 24 | |
Ebix Inc (A) | | | 4,825 | | | | 164 | |
EchoStar Corp, Cl A * | | | 13,503 | | | | 321 | |
eGain Corp * | | | 4,900 | | | | 56 | |
Elastic NV * | | | 17,000 | | | | 2,105 | |
Endurance International Group Holdings Inc * | | | 9,100 | | | | 86 | |
Enphase Energy Inc * | | | 26,500 | | | | 3,619 | |
Entegris Inc | | | 32,808 | | | | 3,039 | |
Envestnet Inc * | | | 13,552 | | | | 1,088 | |
EPAM Systems Inc * | | | 13,100 | | | | 4,223 | |
ePlus Inc * | | | 3,288 | | | | 277 | |
Euronet Worldwide Inc * | | | 11,888 | | | | 1,598 | |
Everbridge Inc *(A) | | | 9,200 | | | | 1,168 | |
EVERTEC Inc | | | 15,100 | | | | 561 | |
Evo Payments Inc, Cl A * | | | 10,400 | | | | 261 | |
ExlService Holdings Inc * | | | 8,023 | | | | 668 | |
Extreme Networks Inc * | | | 41,487 | | | | 233 | |
Fabrinet * | | | 9,515 | | | | 650 | |
Fair Isaac Corp * | | | 6,891 | | | | 3,258 | |
FARO Technologies Inc * | | | 4,508 | | | | 298 | |
Fastly Inc, Cl A *(A) | | | 20,600 | | | | 1,746 | |
FireEye Inc *(A) | | | 51,000 | | | | 767 | |
| | | | | | | | |
| | | |
| Description | | Shares | | Market Value ($ Thousands) |
| | |
COMMON STOCK (continued) | | | | | | | | |
First Solar Inc * | | | 22,400 | | | $ | 2,093 | |
Fitbit Inc, Cl A * | | | 58,100 | | | | 417 | |
Five9 Inc * | | | 15,000 | | | | 2,328 | |
FormFactor Inc * | | | 18,019 | | | | 739 | |
Genpact Ltd | | | 48,850 | | | | 1,986 | |
Globant SA * | | | 10,100 | | | | 1,906 | |
GoDaddy Inc, Cl A * | | | 40,800 | | | | 3,245 | |
GreenSky, Cl A * | | | 14,700 | | | | 63 | |
GSI Technology Inc * | | | 3,800 | | | | 25 | |
GTT Communications Inc *(A) | | | 9,500 | | | | 43 | |
GTY Technology Holdings Inc * | | | 11,200 | | | | 40 | |
Guidewire Software Inc * | | | 19,969 | | | | 2,446 | |
Hackett Group Inc/The | | | 3,300 | | | | 46 | |
Harmonic Inc * | | | 20,694 | | | | 135 | |
HubSpot Inc * | | | 10,200 | | | | 4,022 | |
I3 Verticals Inc, Cl A * | | | 3,600 | | | | 100 | |
Ichor Holdings Ltd * | | | 4,100 | | | | 131 | |
II-VI Inc * | | | 23,839 | | | | 1,613 | |
Immersion Corp * | | | 3,567 | | | | 31 | |
Impinj Inc * | | | 3,600 | | | | 150 | |
Infinera Corp * | | | 36,984 | | | | 313 | |
Information Services Group Inc * | | | 8,600 | | | | 26 | |
Inphi Corp * | | | 11,462 | | | | 1,778 | |
Inseego Corp *(A) | | | 21,400 | | | | 213 | |
Insight Enterprises Inc * | | | 9,198 | | | | 657 | |
Intelligent Systems Corp *(A) | | | 2,700 | | | | 106 | |
InterDigital Inc | | | 6,930 | | | | 415 | |
International Money Express Inc * | | | 4,600 | | | | 72 | |
Iteris Inc * | | | 12,600 | | | | 61 | |
Itron Inc * | | | 9,611 | | | | 756 | |
J2 Global Inc * | | | 10,957 | | | | 982 | |
Jabil Inc | | | 36,500 | | | | 1,395 | |
Jamf Holding * | | | 6,800 | | | | 216 | |
KBR Inc | | | 33,845 | | | | 940 | |
Kimball Electronics Inc * | | | 9,293 | | | | 143 | |
Knowles Corp * | | | 20,300 | | | | 345 | |
KVH Industries Inc * | | | 1,997 | | | | 21 | |
Lattice Semiconductor Corp * | | | 31,262 | | | | 1,308 | |
Limelight Networks Inc * | | | 27,600 | | | | 122 | |
Littelfuse Inc | | | 5,631 | | | | 1,354 | |
LivePerson Inc *(A) | | | 14,291 | | | | 835 | |
LiveRamp Holdings Inc * | | | 16,074 | | | | 940 | |
Lumentum Holdings Inc * | | | 19,670 | | | | 1,699 | |
MACOM Technology Solutions Holdings Inc * | | | 12,425 | | | | 555 | |
Manhattan Associates Inc * | | | 15,780 | | | | 1,613 | |
ManTech International Corp/VA, Cl A | | | 6,422 | | | | 494 | |
Marvell Technology Group Ltd | | | 163,357 | | | | 7,562 | |
Maxeon Solar Technologies *(A) | | | 2,142 | | | | 52 | |
MAXIMUS Inc | | | 16,216 | | | | 1,164 | |
MaxLinear Inc, Cl A * | | | 15,544 | | | | 486 | |
Medallia Inc *(A) | | | 22,000 | | | | 770 | |
Methode Electronics Inc | | | 8,684 | | | | 304 | |
| | |
| SEI Institutional Investments Trust / Semi-Annual Report / November 30, 2020 | | 19 |
SCHEDULE OF INVESTMENTS (Unaudited)
November 30, 2020
Extended Market Index Fund (Continued)
| | | | | | | | |
| | | |
| Description | | Shares | | Market Value ($ Thousands) |
| | |
COMMON STOCK (continued) | | | | | | | | |
MicroStrategy Inc, Cl A * | | | 1,553 | | | $ | 532 | |
Mimecast * | | | 13,400 | | | | 603 | |
Mitek Systems Inc * | | | 15,100 | | | | 178 | |
MKS Instruments Inc | | | 12,923 | | | | 1,783 | |
MobileIron Inc * | | | 34,400 | | | | 242 | |
Model N Inc��* | | | 7,600 | | | | 262 | |
MoneyGram International Inc * | | | 18,900 | | | | 128 | |
MongoDB Inc, Cl A *(A) | | | 12,300 | | | | 3,534 | |
Monolithic Power Systems Inc | | | 10,751 | | | | 3,440 | |
MTS Systems Corp | | | 4,389 | | | | 154 | |
Napco Security Technologies Inc * | | | 4,200 | | | | 128 | |
National Instruments Corp | | | 32,567 | | | | 1,219 | |
nCino *(A) | | | 4,700 | | | | 383 | |
NCR Corp * | | | 30,383 | | | | 841 | |
NeoPhotonics Corp * | | | 7,500 | | | | 60 | |
NETGEAR Inc * | | | 6,692 | | | | 213 | |
NetScout Systems Inc * | | | 19,058 | | | | 446 | |
New Relic Inc * | | | 11,800 | | | | 705 | |
NIC Inc | | | 17,522 | | | | 411 | |
nLight Inc * | | | 6,800 | | | | 204 | |
Novanta Inc * | | | 8,162 | | | | 979 | |
Nuance Communications Inc * | | | 68,781 | | | | 2,967 | |
Nutanix Inc, Cl A * | | | 48,700 | | | | 1,334 | |
NVE Corp | | | 694 | | | | 36 | |
Okta Inc, Cl A * | | | 28,500 | | | | 6,984 | |
ON Semiconductor Corp * | | | 99,200 | | | | 2,852 | |
OneSpan Inc * | | | 7,554 | | | | 149 | |
Onto Innovation Inc * | | | 11,272 | | | | 498 | |
OSI Systems Inc * | | | 4,068 | | | | 358 | |
PagerDuty Inc *(A) | | | 16,400 | | | | 564 | |
Palo Alto Networks Inc * | | | 23,633 | | | | 6,946 | |
PAR Technology Corp * | | | 4,100 | | | | 221 | |
Parsons Corp * | | | 5,100 | | | | 167 | |
Paylocity Holding Corp * | | | 8,200 | | | | 1,612 | |
Paysign Inc * | | | 10,100 | | | | 49 | |
PC Connection Inc | | | 2,231 | | | | 102 | |
PDF Solutions Inc * | | | 10,053 | | | | 222 | |
Pegasystems Inc | | | 10,436 | | | | 1,366 | |
Perficient Inc * | | | 9,000 | | | | 410 | |
Perspecta Inc | | | 33,100 | | | | 742 | |
Photronics Inc * | | | 13,129 | | | | 152 | |
Ping Identity Holding Corp * | | | 11,100 | | | | 250 | |
Pitney Bowes Inc | | | 41,300 | | | | 235 | |
Plantronics Inc | | | 7,169 | | | | 196 | |
Plexus Corp * | | | 6,928 | | | | 518 | |
Pluralsight Inc, Cl A * | | | 29,600 | | | | 485 | |
Power Integrations Inc | | | 15,878 | | | | 1,134 | |
Priority Technology Holdings Inc * | | | 1,600 | | | | 8 | |
Progress Software Corp | | | 11,658 | | | | 467 | |
Proofpoint Inc * | | | 14,900 | | | | 1,542 | |
PROS Holdings Inc * | | | 10,799 | | | | 463 | |
PTC Inc * | | | 26,190 | | | | 2,825 | |
| | | | | | | | |
| | | |
| Description | | Shares | | Market Value ($ Thousands) |
| | |
COMMON STOCK (continued) | | | | | | | | |
Pure Storage Inc, Cl A *(A) | | | 57,100 | | | $ | 1,043 | |
Q2 Holdings Inc * | | | 13,100 | | | | 1,485 | |
QAD Inc, Cl A | | | 2,900 | | | | 166 | |
Qualys Inc *(A) | | | 8,100 | | | | 770 | |
Rackspace Technology *(A) | | | 11,700 | | | | 210 | |
Rambus Inc * | | | 29,910 | | | | 470 | |
Rapid7 Inc * | | | 12,400 | | | | 929 | |
RealPage Inc * | | | 20,946 | | | | 1,445 | |
Repay Holdings, Cl A * | | | 17,400 | | | | 420 | |
Ribbon Communications Inc * | | | 13,520 | | | | 93 | |
Rimini Street Inc * | | | 4,900 | | | | 21 | |
RingCentral Inc, Cl A * | | | 19,200 | | | | 5,703 | |
Rogers Corp * | | | 4,393 | | | | 645 | |
Sabre Corp | | | 65,600 | | | | 738 | |
Sailpoint Technologies Holdings Inc * | | | 23,600 | | | | 1,099 | |
Sanmina Corp * | | | 16,966 | | | | 540 | |
Sapiens International Corp NV | | | 6,100 | | | | 182 | |
ScanSource Inc * | | | 7,196 | | | | 181 | |
Science Applications International Corp | | | 13,676 | | | | 1,266 | |
SecureWorks Corp, Cl A * | | | 2,000 | | | | 23 | |
Semtech Corp * | | | 15,675 | | | | 1,058 | |
ShotSpotter Inc * | | | 1,400 | | | | 46 | |
Silicon Laboratories Inc * | | | 10,482 | | | | 1,229 | |
SiTime Corp * | | | 1,500 | | | | 130 | |
Slack Technologies Inc, Cl A *(A) | | | 93,100 | | | | 3,992 | |
SMART Global Holdings Inc * | | | 4,500 | | | | 138 | |
Smartsheet Inc, Cl A * | | | 25,900 | | | | 1,503 | |
SolarEdge Technologies Inc * | | | 12,000 | | | | 3,336 | |
SolarWinds Corp *(A) | | | 12,100 | | | | 277 | |
Splunk Inc * | | | 39,884 | | | | 8,144 | |
Sprout Social Inc, Cl A * | | | 8,500 | | | | 437 | |
SPS Commerce Inc * | | | 8,458 | | | | 872 | |
Square Inc, Cl A * | | | 91,300 | | | | 19,261 | |
SS&C Technologies Holdings Inc | | | 55,218 | | | | 3,804 | |
StarTek Inc * | | | 4,000 | | | | 31 | |
StoneCo Ltd, Cl A * | | | 43,800 | | | | 3,207 | |
SunPower Corp, Cl A *(A) | | | 17,136 | | | | 380 | |
Super Micro Computer Inc *(A) | | | 10,600 | | | | 299 | |
SVMK Inc * | | | 33,900 | | | | 721 | |
Switch Inc, Cl A | | | 24,700 | | | | 390 | |
Sykes Enterprises Inc * | | | 9,311 | | | | 350 | |
Synaptics Inc * | | | 8,687 | | | | 675 | |
Synchronoss Technologies Inc * | | | 14,400 | | | | 43 | |
SYNNEX Corp | | | 10,281 | | | | 1,648 | |
Telenav Inc * | | | 3,400 | | | | 16 | |
Tenable Holdings Inc * | | | 18,600 | | | | 670 | |
Teradata Corp *(A) | | | 26,200 | | | | 575 | |
Trade Desk Inc/The, Cl A * | | | 10,300 | | | | 9,281 | |
Trimble Inc * | | | 61,820 | | | | 3,701 | |
TTEC Holdings Inc | | | 5,527 | | | | 374 | |
TTM Technologies Inc * | | | 31,387 | | | | 410 | |
Tucows Inc, Cl A *(A) | | | 1,800 | | | | 131 | |
| | |
| 20 | | SEI Institutional Investments Trust / Semi-Annual Report / November 30, 2020 |
SCHEDULE OF INVESTMENTS (Unaudited)
November 30, 2020
Extended Market Index Fund (Continued)
| | | | | | | | |
| | | |
| Description | | Shares | | Market Value ($ Thousands) |
| | |
COMMON STOCK (continued) | | | | | | | | |
Twilio Inc, Cl A * | | | 33,816 | | | $ | 10,824 | |
Ubiquiti Inc (A) | | | 2,400 | | | | 595 | |
Ultra Clean Holdings Inc * | | | 11,052 | | | | 350 | |
Unisys Corp * | | | 16,883 | | | | 246 | |
Universal Display Corp | | | 10,408 | | | | 2,384 | |
Upland Software Inc * | | | 5,700 | | | | 261 | |
Varonis Systems Inc * | | | 7,200 | | | | 869 | |
Veeco Instruments Inc * | | | 9,910 | | | | 165 | |
Verint Systems Inc * | | | 15,250 | | | | 869 | |
Veritone *(A) | | | 5,500 | | | | 146 | |
Verra Mobility Corp, Cl A * | | | 30,500 | | | | 372 | |
ViaSat Inc * | | | 13,356 | | | | 454 | |
Viavi Solutions Inc * | | | 57,400 | | | | 777 | |
VirnetX Holding Corp (A) | | | 20,442 | | | | 111 | |
Virtusa Corp * | | | 6,949 | | | | 348 | |
Vishay Intertechnology Inc | | | 30,417 | | | | 589 | |
Vishay Precision Group Inc * | | | 3,164 | | | | 93 | |
VMware Inc, Cl A *(A) | | | 19,417 | | | | 2,716 | |
Vocera Communications Inc * | | | 6,142 | | | | 208 | |
WEX Inc * | | | 10,676 | | | | 1,850 | |
Workday Inc, Cl A * | | | 42,289 | | | | 9,506 | |
Workiva Inc, Cl A * | | | 9,100 | | | | 682 | |
Wrap Technologies Inc * | | | 2,000 | | | | 12 | |
Xperi Holding Corp | | | 30,450 | | | | 581 | |
Yext Inc *(A) | | | 25,100 | | | | 477 | |
Zendesk Inc * | | | 28,300 | | | | 3,778 | |
Zix Corp * | | | 11,213 | | | | 81 | |
Zoom Video Communications Inc, Cl A * | | | 41,300 | | | | 19,756 | |
Zscaler Inc * | | | 17,400 | | | | 2,710 | |
Zuora Inc, Cl A * | | | 20,500 | | | | 233 | |
| | | | | | | | |
| | |
| | | | | | | 381,153 | |
| | | | | | | | |
| | |
Materials — 3.4% | | | | | | | | |
Advanced Emissions Solutions Inc (A) | | | 7,300 | | | | 41 | |
AdvanSix Inc * | | | 5,900 | | | | 105 | |
Alcoa Corp * | | | 46,200 | | | | 919 | |
Allegheny Technologies Inc * | | | 32,100 | | | | 433 | |
American Vanguard Corp | | | 8,099 | | | | 123 | |
Amyris Inc *(A) | | | 14,400 | | | | 42 | |
AptarGroup Inc | | | 15,266 | | | | 1,928 | |
Arconic Corp * | | | 24,700 | | | | 680 | |
Ardagh Group SA, Cl A | | | 5,500 | | | | 98 | |
Ashland Global Holdings Inc | | | 13,408 | | | | 1,008 | |
Avient Corp | | | 23,032 | | | | 842 | |
Axalta Coating Systems Ltd * | | | 55,600 | | | | 1,591 | |
Balchem Corp | | | 7,688 | | | | 797 | |
Berry Global Group Inc * | | | 34,741 | | | | 1,841 | |
Boise Cascade Co | | | 10,770 | | | | 466 | |
Cabot Corp | | | 14,632 | | | | 606 | |
Caledonia Mining Corp PLC | | | 3,400 | | | | 49 | |
Carpenter Technology Corp | | | 11,501 | | | | 281 | |
Century Aluminum Co * | | | 8,259 | | | | 84 | |
Chase Corp | | | 2,200 | | | | 233 | |
| | | | | | | | |
| | | |
| Description | | Shares | | Market Value ($ Thousands) |
| | |
COMMON STOCK (continued) | | | | | | | | |
Chemours Co/The | | | 40,500 | | | $ | 985 | |
Clearwater Paper Corp * | | | 2,951 | | | | 103 | |
Cleveland-Cliffs Inc (A) | | | 95,860 | | | | 1,055 | |
Coeur Mining Inc * | | | 54,061 | | | | 383 | |
Commercial Metals Co | | | 28,241 | | | | 562 | |
Compass Minerals International Inc | | | 8,640 | | | | 540 | |
Crown Holdings Inc * | | | 32,535 | | | | 3,066 | |
Domtar Corp | | | 14,050 | | | | 423 | |
Eagle Materials Inc | | | 10,383 | | | | 945 | |
Element Solutions Inc | | | 52,100 | | | | 720 | |
Ferro Corp * | | | 16,305 | | | | 233 | |
Forterra Inc * | | | 5,600 | | | | 104 | |
FutureFuel Corp | | | 3,876 | | | | 47 | |
GCP Applied Technologies Inc * | | | 13,824 | | | | 325 | |
Glatfelter | | | 14,571 | | | | 234 | |
Gold Resource Corp | | | 12,400 | | | | 37 | |
Graphic Packaging Holding Co | | | 65,017 | | | | 996 | |
Greif Inc, Cl A | | | 7,219 | | | | 351 | |
Greif Inc, Cl B | | | 1,300 | | | | 64 | |
Hawkins Inc | | | 1,773 | | | | 89 | |
Haynes International Inc | | | 2,823 | | | | 60 | |
HB Fuller Co | | | 13,033 | | | | 682 | |
Hecla Mining Co | | | 129,768 | | | | 620 | |
Huntsman Corp | | | 53,124 | | | | 1,316 | |
Ingevity Corp * | | | 10,100 | | | | 673 | |
Innospec Inc | | | 6,113 | | | | 503 | |
Intrepid Potash * | | | 1,960 | | | | 25 | |
Kaiser Aluminum Corp | | | 3,754 | | | | 293 | |
Koppers Holdings Inc * | | | 4,473 | | | | 121 | |
Kraton Corp * | | | 7,080 | | | | 191 | |
Kronos Worldwide Inc | | | 3,484 | | | | 48 | |
Livent Corp * | | | 39,700 | | | | 602 | |
Louisiana-Pacific Corp | | | 25,842 | | | | 885 | |
Marrone Bio Innovations * | | | 12,500 | | | | 15 | |
Materion Corp | | | 5,074 | | | | 296 | |
Minerals Technologies Inc | | | 8,924 | | | | 541 | |
Myers Industries Inc | | | 7,018 | | | | 119 | |
Neenah Inc | | | 3,393 | | | | 165 | |
NewMarket Corp | | | 1,697 | | | | 628 | |
Novagold Resources Inc * | | | 55,300 | | | | 551 | |
O-I Glass Inc, Cl I | | | 36,900 | | | | 418 | |
Olin Corp | | | 34,016 | | | | 745 | |
Olympic Steel Inc | | | 1,927 | | | | 29 | |
Orion Engineered Carbons SA | | | 14,400 | | | | 224 | |
PQ Group Holdings Inc * | | | 12,200 | | | | 156 | |
Quaker Chemical Corp | | | 3,434 | | | | 848 | |
Ranpak Holdings Corp, Cl A * | | | 6,900 | | | | 78 | |
Rayonier Advanced Materials Inc * | | | 9,817 | | | | 64 | |
Reliance Steel & Aluminum Co | | | 16,538 | | | | 1,948 | |
Royal Gold Inc | | | 17,002 | | | | 1,878 | |
RPM International Inc | | | 31,588 | | | | 2,780 | |
Ryerson Holding Corp * | | | 1,400 | | | | 15 | |
| | |
| SEI Institutional Investments Trust / Semi-Annual Report / November 30, 2020 | | 21 |
SCHEDULE OF INVESTMENTS (Unaudited)
November 30, 2020
Extended Market Index Fund (Continued)
| | | | | | | | |
| | | |
| Description | | Shares | | Market Value ($ Thousands) |
| | |
COMMON STOCK (continued) | | | | | | | | |
Schnitzer Steel Industries Inc, Cl A | | | 4,656 | | | $ | 119 | |
Schweitzer-Mauduit International Inc | | | 8,338 | | | | 290 | |
Scotts Miracle-Gro Co/The, Cl A | | | 9,559 | | | | 1,680 | |
Sensient Technologies Corp | | | 9,635 | | | | 691 | |
Silgan Holdings Inc | | | 20,060 | | | | 678 | |
Sonoco Products Co | | | 26,421 | | | | 1,534 | |
Southern Copper Corp | | | 19,529 | | | | 1,159 | |
Steel Dynamics Inc | | | 47,637 | | | | 1,725 | |
Stepan Co | | | 5,125 | | | | 595 | |
Summit Materials Inc, Cl A * | | | 28,906 | | | | 549 | |
SunCoke Energy Inc | | | 14,846 | | | | 67 | |
TimkenSteel Corp * | | | 7,904 | | | | 37 | |
Trecora Resources * | | | 2,517 | | | | 17 | |
Tredegar Corp | | | 5,341 | | | | 84 | |
Trinseo SA | | | 8,600 | | | | 327 | |
Tronox Holdings PLC | | | 19,200 | | | | 243 | |
UFP Technologies Inc * | | | 1,800 | | | | 79 | |
United States Lime & Minerals Inc | | | 400 | | | | 44 | |
United States Steel Corp (A) | | | 60,800 | | | | 863 | |
US Concrete Inc * | | | 3,000 | | | | 106 | |
Valvoline Inc | | | 49,636 | | | | 1,131 | |
Verso Corp | | | 6,500 | | | | 70 | |
W R Grace & Co | | | 14,224 | | | | 778 | |
Warrior Met Coal Inc | | | 12,600 | | | | 220 | |
Westlake Chemical Corp | | | 9,110 | | | | 685 | |
Worthington Industries Inc | | | 10,202 | | | | 528 | |
| | | | | | | | |
| | |
| | | | | | | 55,245 | |
| | | | | | | | |
| | |
Real Estate — 6.3% | | | | | | | | |
Acadia Realty Trust ‡ | | | 20,139 | | | | 286 | |
Agree Realty Corp ‡ | | | 12,247 | | | | 807 | |
Alexander & Baldwin Inc ‡ | | | 16,191 | | | | 253 | |
Alexander’s Inc ‡ | | | 488 | | | | 133 | |
Altisource Portfolio Solutions SA * | | | 1,700 | | | | 22 | |
American Assets Trust Inc ‡ | | | 12,491 | | | | 358 | |
American Campus Communities Inc ‡ | | | 36,162 | | | | 1,439 | |
American Finance Trust Inc ‡ | | | 26,000 | | | | 192 | |
American Homes 4 Rent, Cl A ‡ | | | 67,600 | | | | 1,942 | |
American Realty Investors Inc * | | | 600 | | | | 6 | |
Americold Realty Trust ‡(A) | | | 53,000 | | | | 1,809 | |
Apple Hospitality Inc ‡ | | | 52,500 | | | | 696 | |
Armada Hoffler Properties Inc ‡ | | | 13,800 | | | | 146 | |
Bluerock Residential Growth Inc, Cl A ‡ | | | 5,800 | | | | 59 | |
Brandywine Realty Trust ‡ | | | 44,739 | | | | 498 | |
Brixmor Property Group Inc ‡ | | | 70,900 | | | | 1,083 | |
Brookfield Property Inc, Cl A ‡(A) | | | 13,600 | | | | 213 | |
BRT Apartments Corp ‡ | | | 2,400 | | | | 31 | |
Camden Property Trust ‡ | | | 24,438 | | | | 2,415 | |
CareTrust ‡ | | | 22,653 | | | | 440 | |
CatchMark Timber Trust Inc, Cl A ‡ | | | 7,800 | | | | 75 | |
Chatham Lodging Trust ‡ | | | 13,735 | | | | 151 | |
CIM Commercial Trust Corp ‡ | | | 300 | | | | 4 | |
City Office REIT Inc ‡ | | | 11,000 | | | | 97 | |
| | | | | | | | |
| | | |
| Description | | Shares | | Market Value ($ Thousands) |
| | |
COMMON STOCK (continued) | | | | | | | | |
Clipper Realty Inc ‡ | | | 3,500 | | | $ | 22 | |
Colony Capital Inc ‡(A) | | | 109,394 | | | | 473 | |
Columbia Property Trust Inc ‡ | | | 30,000 | | | | 419 | |
Community Healthcare Trust Inc ‡ | | | 5,400 | | | | 244 | |
CoreCivic Inc ‡ | | | 30,902 | | | | 219 | |
CorEnergy Infrastructure Trust Inc ‡ | | | 2,140 | | | | 13 | |
CorePoint Lodging Inc ‡ | | | 8,250 | | | | 54 | |
CoreSite Realty Corp ‡ | | | 9,573 | | | | 1,200 | |
Corporate Office Properties Trust ‡ | | | 26,930 | | | | 717 | |
Cousins Properties Inc ‡ | | | 39,245 | | | | 1,311 | |
CTO Realty Growth Inc | | | 500 | | | | 20 | |
CubeSmart ‡ | | | 50,622 | | | | 1,647 | |
Cushman & Wakefield PLC *(A) | | | 29,800 | | | | 444 | |
CyrusOne Inc ‡ | | | 30,229 | | | | 2,113 | |
DiamondRock Hospitality Co ‡ | | | 51,907 | | | | 390 | |
Diversified Healthcare Trust ‡ | | | 55,107 | | | | 243 | |
Douglas Emmett Inc ‡ | | | 40,985 | | | | 1,269 | |
Easterly Government Properties Inc ‡ | | | 18,000 | | | | 390 | |
EastGroup Properties Inc ‡ | | | 10,185 | | | | 1,389 | |
Empire State Realty Trust Inc, Cl A ‡ | | | 36,700 | | | | 332 | |
EPR Properties ‡ | | | 18,751 | | | | 675 | |
Equity Commonwealth ‡ | | | 27,344 | | | | 725 | |
Equity LifeStyle Properties Inc ‡ | | | 42,764 | | | | 2,506 | |
Essential Properties Realty Trust Inc ‡ | | | 21,700 | | | | 446 | |
eXp World Holdings Inc * | | | 5,000 | | | | 267 | |
Farmland Partners Inc ‡ | | | 9,000 | | | | 72 | |
First Industrial Realty Trust Inc ‡ | | | 33,253 | | | | 1,393 | |
Forestar Group Inc * | | | 7,667 | | | | 149 | |
Four Corners Property Trust Inc ‡ | | | 14,919 | | | | 418 | |
Franklin Street Properties Corp ‡ | | | 34,896 | | | | 162 | |
Front Yard Residential Corp ‡ | | | 11,300 | | | | 184 | |
FRP Holdings Inc * | | | 838 | | | | 38 | |
Gaming and Leisure Properties Inc ‡ | | | 50,104 | | | | 2,081 | |
GEO Group Inc/The ‡(A) | | | 30,685 | | | | 290 | |
Getty Realty Corp ‡ | | | 9,189 | | | | 261 | |
Gladstone Commercial Corp ‡ | | | 8,919 | | | | 161 | |
Gladstone Land Corp ‡ | | | 6,000 | | | | 87 | |
Global Medical REIT Inc ‡ | | | 8,900 | | | | 122 | |
Global Net Lease Inc ‡ | | | 22,333 | | | | 373 | |
Griffin Industrial Realty Inc | | | 200 | | | | 14 | |
Hannon Armstrong Sustainable Infrastructure Capital Inc ‡ | | | 18,800 | | | | 1,028 | |
Healthcare Realty Trust Inc ‡ | | | 36,655 | | | | 1,081 | |
Healthcare Trust of America Inc, Cl A ‡(A) | | | 57,150 | | | | 1,488 | |
Hersha Hospitality Trust, Cl A ‡ | | | 9,019 | | | | 73 | |
Highwoods Properties Inc ‡ | | | 23,468 | | | | 899 | |
Howard Hughes Corp/The * | | | 9,817 | | | | 714 | |
Hudson Pacific Properties Inc ‡ | | | 35,870 | | | | 933 | |
Independence Realty Trust Inc ‡(A) | | | 20,300 | | | | 261 | |
Industrial Logistics Properties Trust ‡ | | | 15,409 | | | | 335 | |
Innovative Industrial Properties Inc, Cl A ‡(A) | | | 5,800 | | | | 891 | |
Investors Real Estate Trust ‡ | | | 2,403 | | | | 167 | |
| | |
| 22 | | SEI Institutional Investments Trust / Semi-Annual Report / November 30, 2020 |
SCHEDULE OF INVESTMENTS (Unaudited)
November 30, 2020
Extended Market Index Fund (Continued)
| | | | | | | | |
| | | |
| Description | | Shares | | Market Value ($ Thousands) |
| | |
COMMON STOCK (continued) | | | | | | | | |
Invitation Homes Inc ‡ | | | 137,981 | | | $ | 3,944 | |
iStar Inc ‡ | | | 16,418 | | | | 232 | |
JBG SMITH Properties ‡ | | | 29,100 | | | | 895 | |
Jones Lang LaSalle Inc | | | 12,247 | | | | 1,620 | |
Kennedy-Wilson Holdings Inc | | | 31,129 | | | | 497 | |
Kilroy Realty Corp ‡ | | | 30,043 | | | | 1,837 | |
Kite Realty Group Trust ‡ | | | 21,955 | | | | 316 | |
Lamar Advertising Co, Cl A ‡ | | | 21,297 | | | | 1,695 | |
Lexington Realty Trust, Cl B ‡ | | | 73,890 | | | | 754 | |
Life Storage Inc ‡ | | | 12,293 | | | | 1,349 | |
LTC Properties Inc ‡ | | | 9,217 | | | | 341 | |
Macerich Co ‡(A) | | | 35,545 | | | | 355 | |
Mack-Cali Realty Corp ‡ | | | 21,667 | | | | 296 | |
Marcus & Millichap Inc * | | | 5,100 | | | | 183 | |
Maui Land & Pineapple Co Inc * | | | 1,600 | | | | 20 | |
Medical Properties Trust Inc ‡ | | | 130,462 | | | | 2,531 | |
Monmouth Real Estate Investment Corp, Cl A ‡ | | | 22,546 | | | | 334 | |
National Health Investors Inc ‡ | | | 10,564 | | | | 683 | |
National Retail Properties Inc ‡ | | | 44,743 | | | | 1,687 | |
National Storage Affiliates Trust ‡ | | | 15,200 | | | | 517 | |
New Senior Investment Group Inc ‡ | | | 16,600 | | | | 92 | |
Newmark Group Inc, Cl A | | | 34,005 | | | | 239 | |
NexPoint Residential Trust Inc ‡ | | | 4,900 | | | | 217 | |
Office Properties Income Trust ‡ | | | 12,691 | | | | 290 | |
Omega Healthcare Investors Inc ‡ | | | 58,657 | | | | 2,066 | |
One Liberty Properties Inc ‡ | | | 2,562 | | | | 46 | |
Outfront Media Inc ‡ | | | 33,609 | | | | 637 | |
Paramount Group Inc ‡ | | | 45,200 | | | | 418 | |
Park Hotels & Resorts Inc ‡ | | | 56,259 | | | | 918 | |
Pebblebrook Hotel Trust ‡ | | | 32,325 | | | | 598 | |
Physicians Realty Trust ‡ | | | 55,500 | | | | 963 | |
Piedmont Office Realty Trust Inc, Cl A ‡ | | | 33,066 | | | | 517 | |
Plymouth Industrial REIT Inc ‡ | | | 8,200 | | | | 108 | |
PotlatchDeltic Corp ‡ | | | 15,412 | | | | 717 | |
Preferred Apartment Communities Inc, Cl A ‡ | | | 11,600 | | | | 91 | |
PS Business Parks Inc ‡ | | | 4,928 | | | | 650 | |
QTS Realty Trust Inc, Cl A ‡(A) | | | 16,300 | | | | 968 | |
Rafael Holdings Inc, Cl B *‡ | | | 4,000 | | | | 86 | |
Rayonier Inc ‡ | | | 32,653 | | | | 920 | |
RE/MAX Holdings Inc, Cl A | | | 3,200 | | | | 100 | |
Realogy Holdings Corp * | | | 24,502 | | | | 302 | |
Redfin Corp * | | | 25,500 | | | | 1,221 | |
Retail Opportunity Investments Corp ‡ | | | 29,259 | | | | 380 | |
Retail Properties of America Inc, Cl A ‡ | | | 48,903 | | | | 396 | |
Retail Value Inc ‡ | | | 3,148 | | | | 49 | |
Rexford Industrial Realty Inc ‡ | | | 32,400 | | | | 1,553 | |
RLJ Lodging Trust ‡ | | | 40,154 | | | | 495 | |
RMR Group Inc/The, Cl A | | | 4,170 | | | | 154 | |
RPT Realty ‡ | | | 16,337 | | | | 120 | |
Ryman Hospitality Properties Inc ‡ | | | 11,360 | | | | 729 | |
Sabra Health Care Inc ‡ | | | 48,820 | | | | 805 | |
| | | | | | | | |
| | | |
| Description | | Shares | | Market Value ($ Thousands) |
| | |
COMMON STOCK (continued) | | | | | | | | |
Safehold Inc ‡ | | | 5,200 | | | $ | 354 | |
Saul Centers Inc ‡ | | | 2,144 | | | | 67 | |
Seritage Growth Properties ‡(A) | | | 7,500 | | | | 123 | |
Service Properties Trust ‡ | | | 38,741 | | | | 459 | |
SITE Centers Corp ‡ | | | 36,607 | | | | 369 | |
Spirit Realty Capital Inc ‡ | | | 24,913 | | | | 918 | |
St Joe Co/The | | | 8,100 | | | | 267 | |
STAG Industrial Inc ‡ | | | 39,456 | | | | 1,175 | |
STORE Capital Corp ‡ | | | 55,300 | | | | 1,801 | |
Stratus Properties Inc * | | | 1,900 | | | | 46 | |
Summit Hotel Properties Inc ‡ | | | 32,729 | | | | 284 | |
Sun Communities Inc ‡ | | | 23,421 | | | | 3,256 | |
Sunstone Hotel Investors Inc ‡ | | | 51,038 | | | | 536 | |
Tanger Factory Outlet Centers Inc ‡(A) | | | 23,549 | | | | 223 | |
Taubman Centers Inc ‡ | | | 14,487 | | | | 619 | |
Tejon Ranch Co * | | | 6,376 | | | | 91 | |
Terreno Realty Corp ‡ | | | 15,463 | | | | 896 | |
Transcontinental Realty Investors Inc * | | | 300 | | | | 8 | |
UMH Properties Inc ‡ | | | 11,000 | | | | 158 | |
Uniti Group Inc ‡ | | | 43,760 | | | | 450 | |
Universal Health Realty Income Trust ‡ | | | 3,116 | | | | 188 | |
Urban Edge Properties ‡ | | | 29,600 | | | | 384 | |
Urstadt Biddle Properties Inc, Cl A ‡ | | | 6,156 | | | | 86 | |
VEREIT Inc ‡ | | | 281,000 | | | | 1,992 | |
VICI Properties Inc ‡ | | | 131,200 | | | | 3,318 | |
Washington Real Estate Investment Trust ‡ | | | 20,713 | | | | 481 | |
Weingarten Realty Investors ‡ | | | 28,368 | | | | 593 | |
Whitestone, Cl B ‡ | | | 7,077 | | | | 53 | |
WP Carey Inc ‡ | | | 42,700 | | | | 2,955 | |
Xenia Hotels & Resorts Inc ‡ | | | 25,700 | | | | 362 | |
| | | | | | | | |
| | |
| | | | | | | 103,801 | |
| | | | | | | | |
| | |
Utilities — 2.1% | | | | | | | | |
ALLETE Inc | | | 12,370 | | | | 696 | |
American States Water Co | | | 8,774 | | | | 648 | |
Artesian Resources Corp, Cl A | | | 2,184 | | | | 81 | |
Atlantic Power Corp * | | | 12,421 | | | | 26 | |
Avangrid Inc | | | 15,850 | | | | 738 | |
Avista Corp | | | 16,652 | | | | 625 | |
Black Hills Corp | | | 15,502 | | | | 943 | |
Brookfield Infrastructure, Cl A | | | 7,700 | | | | 513 | |
Brookfield Renewable Corp, Cl A | | | 16,342 | | | | 1,293 | |
Cadiz Inc *(A) | | | 4,300 | | | | 43 | |
California Water Service Group | | | 11,541 | | | | 571 | |
Chesapeake Utilities Corp | | | 3,815 | | | | 397 | |
Clearway Energy Inc, Cl A | | | 7,000 | | | | 190 | |
Clearway Energy Inc, Cl C | | | 22,600 | | | | 661 | |
Consolidated Water Co Ltd | | | 3,000 | | | | 33 | |
Essential Utilities Inc | | | 53,837 | | | | 2,438 | |
Genie Energy Ltd, Cl B | | | 3,400 | | | | 28 | |
Global Water Resources Inc | | | 2,800 | | | | 36 | |
Hawaiian Electric Industries Inc | | | 25,058 | | | | 898 | |
IDACORP Inc | | | 12,024 | | | | 1,089 | |
| | |
| SEI Institutional Investments Trust / Semi-Annual Report / November 30, 2020 | | 23 |
SCHEDULE OF INVESTMENTS (Unaudited)
November 30, 2020
Extended Market Index Fund (Continued)
| | | | | | | | |
| | | |
| Description | | Shares | | Market Value ($ Thousands) |
| | |
COMMON STOCK (continued) | | | | | | | | |
MDU Resources Group Inc | | | 52,732 | | | $ | 1,315 | |
MGE Energy Inc | | | 8,114 | | | | 557 | |
Middlesex Water Co | | | 4,001 | | | | 274 | |
National Fuel Gas Co | | | 21,288 | | | | 876 | |
New Jersey Resources Corp | | | 24,694 | | | | 816 | |
Northwest Natural Holding Co | | | 7,776 | | | | 373 | |
NorthWestern Corp | | | 12,046 | | | | 699 | |
OGE Energy Corp | | | 52,476 | | | | 1,700 | |
ONE Gas Inc | | | 12,100 | | | | 958 | |
Ormat Technologies Inc (A) | | | 9,934 | | | | 783 | |
Otter Tail Corp | | | 9,546 | | | | 380 | |
PG&E Corp * | | | 318,700 | | | | 4,047 | |
PICO Holdings Inc * | | | 4,621 | | | | 40 | |
PNM Resources Inc | | | 18,617 | | | | 914 | |
Portland General Electric Co | | | 21,400 | | | | 886 | |
Pure Cycle Corp * | | | 5,900 | | | | 56 | |
RGC Resources Inc | | | 3,412 | | | | 83 | |
SJW Group | | | 6,264 | | | | 411 | |
South Jersey Industries Inc (A) | | | 28,196 | | | | 649 | |
Southwest Gas Holdings Inc | | | 13,041 | | | | 838 | |
Spark Energy Inc, Cl A | | | 2,000 | | | | 19 | |
Spire Inc | | | 11,903 | | | | 761 | |
UGI Corp | | | 54,296 | | | | 1,926 | |
Unitil Corp | | | 3,058 | | | | 125 | |
Vistra Corp | | | 116,768 | | | | 2,181 | |
York Water Co/The | | | 2,352 | | | | 106 | |
| | | | | | | | |
| | |
| | | | | | | 33,720 | |
| | | | | | | | |
| | |
Total Common Stock
(Cost $1,024,802) ($ Thousands) | | | | | | | 1,617,561 | |
| | | | | | | | |
| | |
| | | Number
of Rights | | |
| | |
RIGHTS — 0.0% | | | | | | | | |
| | |
Corium International CVR *‡‡ | | | 6,300 | | | | 3 | |
| | |
NewStar Financial Inc CVR *‡‡(C) | | | 3,393 | | | | 2 | |
| | |
Media General Inc CVR *‡‡(C) | | | 20,200 | | | | — | |
| | |
Tobira Therapeutics CVR *‡‡(C) | | | 2,300 | | | | — | |
| | | | | | | | |
| | |
Total Rights
(Cost $3) ($ Thousands) | | | | | | | 5 | |
| | | | | | | | |
| | |
| | | Number
of Warrants | | |
|
WARRANTS — 0.0% | |
Whiting Petroleum, Expires 12/31/2025 | | | | | | | | |
Strike Price * | | | 1,692 | | | | — | |
| | | | | | | | |
| | |
Total Warrants
(Cost $—) ($ Thousands) | | | | | | | — | |
| | | | | | | | |
| | | | | | | | |
| | | |
| Description | | Shares | | Market Value
($ Thousands) |
| | |
AFFILIATED PARTNERSHIP — 7.9% | | | | | | | | |
SEI Liquidity Fund, L.P.
0.070% **†(D) | | | 129,101,211 | | | $ | 129,129 | |
| | | | | | | | |
| | |
Total Affiliated Partnership (Cost $129,102) ($ Thousands) | | | | | | | 129,129 | |
| | | | | | | | |
| | |
CASH EQUIVALENT — 0.0% | | | | | | | | |
SEI Daily Income Trust, Government Fund, Cl F
0.010%**† | | | 363,054 | | | | 363 | |
| | | | | | | | |
| | |
Total Cash Equivalent
(Cost $363) ($ Thousands) | | | | | | | 363 | |
| | | | | | | | |
| |
Total Investments in Securities — 107.3%
(Cost $1,154,270) ($ Thousands) | | | $ | 1,747,058 | |
| | | | | | | | |
| | |
| 24 | | SEI Institutional Investments Trust / Semi-Annual Report / November 30, 2020 |
SCHEDULE OF INVESTMENTS (Unaudited)
November 30, 2020
Extended Market Index Fund (Continued)
A list of the open futures contracts held by the Fund at November 30, 2020 is as follows:
| | | | | | | | | | | | | | | | | | | | |
| Type of Contract | | Number of Contracts
Long | | | Expiration
Date | | | Notional Amount
(Thousands) | | | Value
(Thousands) | | | Unrealized
Appreciation
(Thousands) | |
Russell 2000 Index E-MINI | | | 76 | | | | Dec-2020 | | | | $ 5,624 | | | | $ 6,916 | | | | $ 1,292 | |
S&P Mid Cap 400 Index E-MINI | | | 27 | | | | Dec-2020 | | | | 4,896 | | | | 5,855 | | | | 959 | |
| | | | | | | | | | | | |
| | | | | |
| | | | | | | | | | | $ 10,520 | | | | $ 12,771 | | | | $ 2,251 | |
| | | | | | | | | | | | |
| | Percentages are based on Net Assets of $1,628,378 ($ Thousands). |
| * | Non-income producing security. |
| ** | The rate reported is the 7-day effective yield as of November 30, 2020. |
| † | Investment in Affiliated Security (see Note 5). |
| ‡ | Real Estate Investment Trust. |
| ‡‡ | Expiration date not available. |
| (A) | Certain securities or partial positions of certain securities are on loan at November 30, 2020 (See Note 12). The total market value of securities on loan at November 30, 2020 was $126,421 ($ Thousands). |
| (B) | Security is a Master Limited Partnership. At November 30, 2020, such securities amounted to $901 ($ Thousands), or 0.1% of the Net Assets of the Fund (see Note 2). |
| (C) | Level 3 security in accordance with fair value hierarchy. |
| (D) | This security was purchased with cash collateral held from securities on loan. The total market value of such securities as of November 30, 2020 was $129,129 ($ Thousands). |
CBT — Chicago Board of Trade
Cl — Class
CVR — Contingent Value Rights
LME — London Metal Exchange
L.P. — Limited Partnership
Ltd. — Limited
PLC — Public Limited Company
REIT — Real Estate investment Trust
S&P— Standard & Poor’s
Ser — Series
SPX — Standard & Poor’s 500 Index
TRAN – Tax Revenue Anticipation Note
The following is a list of the level of inputs used as of November 30, 2020, in valuing the Fund’s investments and other financial instruments carried a value ($ Thousands):
| | | | | | | | | | | | | | | | |
| | | | | |
| Investments in Securities | | Level 1 ($) | | | Level 2 ($) | | | Level 3 ($)(1) | | | Total ($) | |
Common Stock | | | 1,617,561 | | | | – | | | | – | | | | 1,617,561 | |
Rights | | | 3 | | | | – | | | | 2 | | | | 5 | |
Warrants | | | – | | | | – | | | | – | | | | – | |
Affiliated Partnership | | | – | | | | 129,129 | | | | – | | | | 129,129 | |
Cash Equivalent | | | 363 | | | | – | | | | – | | | | 363 | |
| | | | | | | | | | | | | | | | |
Total Investments in Securities | | | 1,617,927 | | | | 129,129 | | | | 2 | | | | 1,747,058 | |
| | | | | | | | | | | | | | | | |
| | | | | | | | | | | | | | | | |
Other Financial
Instruments | | Level 1
($) | | | Level 2
($) | | | Level 3
($) | | | Total
($) | |
Futures Contracts* | | | | | | | | | | | | | | | | |
Unrealized Appreciation | | | 2,251 | | | | – | | | | – | | | | 2,251 | |
| | | | | | | | | | | | | | | | |
Total Other Financial Instruments | | | 2,251 | | | | – | | | | – | | | | 2,251 | |
| | | | | | | | | | | | | | | | |
(1) A reconciliation of Level 3 instruments is presented when the Fund has a significant amount of Level 3 investments at the beginning and/or end of the year in relation to the net assets. Management has concluded that Level 3 investments are not material in relation to net assets.
* Futures contracts are value at the unrealized appreciation on the instrument.
For the period ended November 30, 2020, there were no transfers in or out of Level 3.
For more information on valuation inputs, see Note 2 — Significant Accounting Policies in Notes to Financial Statements.
The following is a summary of the Fund’s transactions with affiliates for the period ended November 30, 2020 ($ Thousands):
| | | | | | | | | | | | | | | | | | |
| Security Description | | Value
5/31/2020 | | Purchases
at Cost | | Proceeds from
Sales | | Realized Gain/
(Loss) | | Change in
Unrealized
Appreciation/ (Depreciation) | | Value
11/30/2020 | | Shares | | Income | | Capital
Gains |
SEI Investments Co | | $ 1,828 | | $ 140 | | $ (328) | | $ (20) | | $ (21) | | $ 1,599 | | 30,319 | | $ 12 | | $ — |
SEI Liquidity Fund, L.P. | | 155,062 | | 294,693 | | (320,576) | | (4) | | (46) | | 129,129 | | 129,101,211 | | 495 | | — |
SEI Daily Income Trust, Government Fund, Cl F | | — | | 123,257 | | (122,894) | | — | | — | | 363 | | 363,054 | | 1 | | — |
| | | | | | | | | | | | | | | | | | |
Totals | | $ 156,890 | | $ 418,090 | | $ (443,798) | | $ (24) | | $ (67) | | $ 131,091 | | | | $ 508 | | $ — |
| | | | | | | | | | | | | | | | | | |
Amounts designated as “—” are $0 or have been rounded to $0.
The accompanying notes are an integral part of the financial statements.
| | |
| SEI Institutional Investments Trust / Semi-Annual Report / November 30, 2020 | | 25 |
SCHEDULE OF INVESTMENTS (Unaudited)
November 30, 2020
Small Cap Fund (Continued)
| | | | | | | | |
| | | |
| Description | | Shares | | Market Value
($ Thousands) |
COMMON STOCK — 98.9% | | | | | | | | |
| | |
Communication Services — 2.4% | | | | | | | | |
AMC Networks Inc, Cl A *(A) | | | 9,100 | | | $ | 300 | |
Anterix Inc * | | | 1,400 | | | | 42 | |
ATN International Inc | | | 1,100 | | | | 54 | |
Boingo Wireless Inc * | | | 10,910 | | | | 154 | |
Boston Omaha Corp, Cl A * | | | 4,867 | | | | 113 | |
Cable One Inc | | | 180 | | | | 357 | |
Cardlytics Inc *(A) | | | 2,270 | | | | 269 | |
Cars.com Inc * | | | 17,570 | | | | 196 | |
Cogent Communications Holdings | | | 3,100 | | | | 180 | |
comScore Inc * | | | 33,013 | | | | 84 | |
Consolidated Communications Holdings Inc * | | | 53,650 | | | | 300 | |
|
DHI Group Inc * | | | 37,500 | | | | 72 | |
Entercom Communications Corp, Cl A | | | 54,900 | | | | 133 | |
EverQuote Inc, Cl A *(A) | | | 3,985 | | | | 150 | |
Gray Television Inc * | | | 22,600 | | | | 399 | |
Iridium Communications Inc * | | | 8,200 | | | | 263 | |
MSG Networks Inc *(A) | | | 43,643 | | | | 530 | |
New York Times Co/The, Cl A | | | 4,900 | | | | 210 | |
Ooma Inc * | | | 12,990 | | | | 203 | |
QuinStreet Inc * | | | 13,876 | | | | 248 | |
Shenandoah Telecommunications Co | | | 3,600 | | | | 160 | |
Shutterstock Inc | | | 5,159 | | | | 355 | |
Stamps.com Inc * | | | 1,000 | | | | 188 | |
TechTarget Inc * | | | 6,447 | | | | 339 | |
Tribune Publishing Co | | | 2,100 | | | | 25 | |
TrueCar Inc * | | | 66,251 | | | | 270 | |
United States Cellular Corp * | | | 1,500 | | | | 47 | |
Upwork Inc * | | | 7,677 | | | | 251 | |
WideOpenWest Inc * | | | 57,700 | | | | 473 | |
Zynga Inc, Cl A * | | | 31,100 | | | | 257 | |
| | |
| | | | | | | 6,622 | |
| | |
Consumer Discretionary — 12.6% | | | | | | | | |
1-800-Flowers.com Inc, Cl A * | | | 2,900 | | | | 68 | |
American Axle & Manufacturing Holdings Inc * | | | 46,000 | | | | 366 | |
|
American Outdoor Brands Inc * | | | 1,009 | | | | 14 | |
American Public Education Inc * | | | 17,878 | | | | 555 | |
America’s Car-Mart Inc/TX * | | | 3,506 | | | | 366 | |
Bally’s Corp | | | 5,903 | | | | 262 | |
Beazer Homes USA Inc * | | | 30,966 | | | | 459 | |
Big Lots Inc (A) | | | 7,300 | | | | 377 | |
Biglari Holdings Inc, Cl B * | | | 544 | | | | 61 | |
Bright Horizons Family Solutions Inc * | | | 2,200 | | | | 374 | |
Buckle Inc/The | | | 9,062 | | | | 243 | |
CarParts.com Inc *(A) | | | 34,899 | | | | 526 | |
Carriage Services Inc, Cl A | | | 22,833 | | | | 621 | |
Cato Corp/The, Cl A | | | 21,220 | | | | 171 | |
Churchill Downs Inc | | | 1,875 | | | | 337 | |
Chuy’s Holdings Inc * | | | 13,734 | | | | 325 | |
Citi Trends Inc | | | 4,862 | | | | 165 | |
| | | | | | | | |
| | | |
| Description | | Shares | | Market Value
($ Thousands) |
COMMON STOCK (continued) | | | | | | | | |
Cooper Tire & Rubber Co | | | 9,600 | | | $ | 381 | |
Core-Mark Holding Co Inc | | | 2,600 | | | | 81 | |
Dana Inc | | | 35,100 | | | | 591 | |
Dave & Buster’s Entertainment Inc (A) | | | 9,600 | | | | 243 | |
Deckers Outdoor Corp * | | | 950 | | | | 242 | |
Del Taco Restaurants Inc * | | | 11,340 | | | | 100 | |
Dick’s Sporting Goods Inc | | | 8,505 | | | | 483 | |
El Pollo Loco Holdings Inc * | | | 28,504 | | | | 447 | |
Ethan Allen Interiors Inc | | | 47,440 | | | | 867 | |
Fiesta Restaurant Group Inc * | | | 10,650 | | | | 125 | |
Floor & Decor Holdings Inc, Cl A * | | | 2,181 | | | | 175 | |
Genesco Inc * | | | 9,800 | | | | 307 | |
Gentex Corp | | | 6,704 | | | | 219 | |
G-III Apparel Group Ltd * | | | 14,700 | | | | 299 | |
Graham Holdings Co, Cl B | | | 800 | | | | 358 | |
Green Brick Partners Inc * | | | 36,741 | | | | 800 | |
Group 1 Automotive Inc (A) | | | 7,618 | | | | 905 | |
GrowGeneration Corp *(A) | | | 6,564 | | | | 231 | |
Hamilton Beach Brands Holding Co, Cl A | | | 3,089 | | | | 58 | |
Hanesbrands Inc | | | 36,700 | | | | 521 | |
Haverty Furniture Cos Inc (A) | | | 38,906 | | | | 1,059 | |
Helen of Troy Ltd * | | | 1,600 | | | | 323 | |
Hibbett Sports Inc * | | | 19,315 | | | | 795 | |
Hooker Furniture Corp | | | 16,972 | | | | 514 | |
Johnson Outdoors Inc, Cl A | | | 5,939 | | | | 497 | |
Lands’ End Inc * | | | 2,998 | | | | 75 | |
La-Z-Boy Inc, Cl Z | | | 15,500 | | | | 574 | |
Lithia Motors Inc, Cl A | | | 610 | | | | 176 | |
Lovesac Co/The *(A) | | | 12,040 | | | | 384 | |
M/I Homes Inc * | | | 10,000 | | | | 454 | |
Magnite Inc * | | | 15,692 | | | | 298 | |
Marine Products Corp | | | 4,730 | | | | 73 | |
MDC Holdings Inc | | | 13,600 | | | | 656 | |
Meritage Homes Corp * | | | 5,200 | | | | 469 | |
Modine Manufacturing Co * | | | 57,760 | | | | 631 | |
Noodles & Co, Cl A * | | | 14,310 | | | | 114 | |
Nordstrom Inc (A) | | | 11,400 | | | | 296 | |
NVR Inc * | | | 10 | | | | 40 | |
Office Depot Inc | | | 13,020 | | | | 373 | |
Ollie’s Bargain Outlet Holdings Inc * | | | 2,800 | | | | 247 | |
Penn National Gaming Inc * | | | 4,004 | | | | 280 | |
Perdoceo Education Corp * | | | 22,359 | | | | 254 | |
Pool Corp | | | 1,100 | | | | 381 | |
Purple Innovation Inc, Cl A * | | | 6,556 | | | | 195 | |
Qurate Retail Inc | | | 33,500 | | | | 351 | |
Rent-A-Center Inc/TX, Cl A | | | 17,100 | | | | 578 | |
RH *(A) | | | 826 | | | | 374 | |
Sally Beauty Holdings Inc * | | | 31,900 | | | | 367 | |
Scientific Games Corp, Cl A * | | | 5,703 | | | | 213 | |
Service Corp International/US | | | 700 | | | | 34 | |
Shoe Carnival Inc (A) | | | 7,200 | | | | 263 | |
Signet Jewelers Ltd | | | 4,900 | | | | 148 | |
| | |
SEI Institutional Investments Trust / Semi-Annual Report / November 30, 2020 | | 1 |
SCHEDULE OF INVESTMENTS (Unaudited)
November 30, 2020
Small Cap Fund (Continued)
| | | | | | | | |
| | | |
| Description | | Shares | | Market Value
($ Thousands) |
| | |
COMMON STOCK (continued) | | | | | | | | |
Sleep Number Corp *(A) | | | 8,400 | | | $ | 583 | |
Smith & Wesson Brands Inc | | | 4,039 | | | | 64 | |
Sonic Automotive Inc, Cl A (A) | | | 10,800 | | | | 436 | |
Sonos Inc * | | | 10,163 | | | | 226 | |
Sportsman’s Warehouse Holdings Inc * | | | 15,448 | | | | 215 | |
Standard Motor Products Inc | | | 2,000 | | | | 93 | |
Stitch Fix Inc, Cl A * | | | 5,546 | | | | 225 | |
Superior Group of Cos Inc | | | 7,161 | | | | 156 | |
Texas Roadhouse Inc, Cl A | | | 3,902 | | | | 296 | |
Tilly’s Inc, Cl A | | | 35,010 | | | | 320 | |
TopBuild Corp * | | | 10,825 | | | | 1,886 | |
TRI Pointe Group Inc * | | | 24,200 | | | | 423 | |
Tupperware Brands Corp | | | 15,280 | | | | 514 | |
Turtle Beach Corp * | | | 5,090 | | | | 95 | |
Vera Bradley Inc * | | | 9,517 | | | | 81 | |
Vista Outdoor Inc * | | | 12,990 | | | | 268 | |
Visteon Corp * | | | 5,905 | | | | 714 | |
VOXX International Corp, Cl A * | | | 3,840 | | | | 49 | |
Waitr Holdings Inc * | | | 39,170 | | | | 130 | |
Weyco Group Inc | | | 4,200 | | | | 75 | |
Williams-Sonoma Inc | | | 7,404 | | | | 811 | |
Wingstop Inc | | | 10,450 | | | | 1,330 | |
Winmark Corp | | | 2,675 | | | | 482 | |
World Fuel Services Corp | | | 16,800 | | | | 477 | |
XPEL Inc * | | | 10,897 | | | | 413 | |
YETI Holdings Inc * | | | 3,497 | | | | 221 | |
Zumiez Inc * | | | 9,248 | | | | 343 | |
| | |
| | | | | | | 35,135 | |
| | |
Consumer Staples — 5.7% | | | | | | | | |
Albertsons Cos Inc | | | 4,700 | | | | 75 | |
BJ’s Wholesale Club Holdings Inc * | | | 6,700 | | | | 275 | |
Boston Beer Co Inc/The, Cl A * | | | 250 | | | | 233 | |
Bunge Ltd | | | 8,400 | | | | 495 | |
Cal-Maine Foods Inc * | | | 2,700 | | | | 106 | |
Casey’s General Stores Inc | | | 1,600 | | | | 291 | |
CBIZ Inc * | | | 6,400 | | | | 155 | |
Celsius Holdings Inc * | | | 6,325 | | | | 204 | |
Central Garden & Pet Co, Cl A * | | | 14,520 | | | | 569 | |
Chefs’ Warehouse Inc/The * | | | 9,802 | | | | 226 | |
Coca-Cola Consolidated Inc | | | 400 | | | | 105 | |
Darling Ingredients Inc * | | | 3,919 | | | | 189 | |
Deluxe Corp | | | 7,700 | | | | 198 | |
Edgewell Personal Care Co | | | 13,600 | | | | 472 | |
elf Beauty Inc * | | | 14,336 | | | | 312 | |
Flowers Foods Inc | | | 12,800 | | | | 284 | |
Fresh Del Monte Produce Inc | | | 3,000 | | | | 76 | |
Freshpet Inc * | | | 18,137 | | | | 2,483 | |
Grocery Outlet Holding Corp * | | | 5,000 | | | | 193 | |
Hostess Brands Inc, Cl A * | | | 8,700 | | | | 118 | |
Ingles Markets Inc, Cl A | | | 14,420 | | | | 542 | |
Ingredion Inc | | | 10,300 | | | | 795 | |
J & J Snack Foods Corp | | | 1,200 | | | | 174 | |
| | | | | | | | |
| | | |
| Description | | Shares | | Market Value
($ Thousands) |
| | | | | | | | |
| | |
COMMON STOCK (continued) | | | | | | | | |
John B Sanfilippo & Son Inc | | | 1,000 | | | $ | 74 | |
Lamb Weston Holdings Inc | | | 1,300 | | | | 94 | |
Lancaster Colony Corp | | | 1,300 | | | | 220 | |
Landec Corp * | | | 13,805 | | | | 143 | |
Lifevantage Corp * | | | 25,379 | | | | 270 | |
Medifast Inc | | | 1,208 | | | | 247 | |
MGP Ingredients Inc | | | 1,540 | | | | 67 | |
Natural Grocers by Vitamin Cottage Inc | | | 28,134 | | | | 410 | |
Nu Skin Enterprises Inc, Cl A | | | 5,400 | | | | 278 | |
Post Holdings Inc * | | | 2,900 | | | | 274 | |
PriceSmart Inc | | | 1,900 | | | | 154 | |
Seaboard Corp | | | 12 | | | | 38 | |
Seneca Foods Corp, Cl A * | | | 700 | | | | 29 | |
SpartanNash Co | | | 26,362 | | | | 498 | |
Sprouts Farmers Market Inc * | | | 26,500 | | | | 561 | |
Tootsie Roll Industries Inc (A) | | | 19,274 | | | | 597 | |
Turning Point Brands Inc | | | 13,900 | | | | 542 | |
United Natural Foods Inc * | | | 7,220 | | | | 125 | |
Universal Corp/VA | | | 10,900 | | | | 496 | |
USANA Health Sciences Inc * | | | 1,100 | | | | 83 | |
Utz Brands Inc (A) | | | 10,545 | | | | 213 | |
Village Super Market Inc, Cl A | | | 21,722 | | | | 503 | |
Vital Farms Inc * | | | 1,291 | | | | 38 | |
WD-40 Co | | | 3,461 | | | | 880 | |
Weis Markets Inc | | | 11,847 | | | | 564 | |
| | |
| | | | | | | 15,968 | |
| | |
Energy — 1.3% | | | | | | | | |
Arch Resources Inc | | | 6,200 | | | | 207 | |
Berry Corp | | | 16,930 | | | | 65 | |
Bonanza Creek Energy Inc * | | | 16,588 | | | | 366 | |
Delek US Holdings Inc | | | 7,800 | | | | 104 | |
DHT Holdings Inc | | | 53,200 | | | | 272 | |
MRC Global Inc * | | | 34,720 | | | | 201 | |
Murphy USA Inc | | | 500 | | | | 64 | |
National Energy Services Reunited Corp * | | | 12,730 | | | | 111 | |
New Fortress Energy Inc, Cl A (A) | | | 4,293 | | | | 185 | |
NexTier Oilfield Solutions Inc * | | | 30,628 | | | | 86 | |
PBF Energy Inc, Cl A | | | 19,200 | | | | 140 | |
PDC Energy Inc * | | | 10,159 | | | | 170 | |
Plug Power Inc *(A) | | | 13,652 | | | | 360 | |
Renewable Energy Group Inc * | | | 2,745 | | | | 160 | |
Select Energy Services Inc, Cl A * | | | 6,648 | | | | 28 | |
Solaris Oilfield Infrastructure Inc, Cl A | | | 9,710 | | | | 65 | |
Southwestern Energy Co * | | | 110,400 | | | | 343 | |
Sunnova Energy International Inc * | | | 7,335 | | | | 297 | |
Sunrun Inc * | | | 2,899 | | | | 186 | |
Talos Energy Inc * | | | 6,290 | | | | 54 | |
Tidewater Inc * | | | 3,721 | | | | 35 | |
VAALCO Energy Inc * | | | 68,300 | | | | 109 | |
| | |
| 2 | | SEI Institutional Investments Trust / Semi-Annual Report / November 30, 2020 |
SCHEDULE OF INVESTMENTS (Unaudited)
November 30, 2020
Small Cap Fund (Continued)
| | | | | | | | |
| | | |
| Description | | Shares | | Market Value
($ Thousands) |
| | |
COMMON STOCK (continued) | | | | | | | | |
W&T Offshore Inc *(A) | | | 70,900 | | | $ | 139 | |
| | |
| | | | | | | 3,747 | |
| | |
Financials — 17.2% | | | | | | | | |
1st Source Corp | | | 1,400 | | | | 52 | |
Alleghany Corp | | | 450 | | | | 259 | |
Altabancorp | | | 1,300 | | | | 36 | |
Amalgamated Bank, Cl A | | | 12,056 | | | | 153 | |
A-Mark Precious Metals Inc | | | 1,672 | | | | 51 | |
American Equity Investment Life Holding Co | | | 21,000 | | | | 552 | |
American Financial Group Inc/OH | | | 1,300 | | | | 116 | |
American National Group Inc | | | 3,900 | | | | 331 | |
AMERISAFE Inc | | | 1,600 | | | | 88 | |
Anworth Mortgage Asset Corp | | | 33,554 | | | | 72 | |
Apollo Commercial Real Estate Finance Inc | | | 18,100 | | | | 195 | |
Apollo Investment Corp | | | 21,366 | | | | 232 | |
Arbor Realty Trust Inc ‡ | | | 22,000 | | | | 293 | |
Arrow Financial Corp | | | 1,033 | | | | 31 | |
Artisan Partners Asset Management Inc, Cl A | | | 5,100 | | | | 230 | |
Associated Banc-Corp | | | 38,000 | | | | 582 | |
Assurant Inc | | | 2,400 | | | | 310 | |
Assured Guaranty Ltd | | | 11,200 | | | | 337 | |
Atlantic Capital Bancshares Inc * | | | 8,585 | | | | 121 | |
Axis Capital Holdings Ltd | | | 2,300 | | | | 115 | |
B Riley Financial Inc | | | 3,933 | | | | 142 | |
Banco Latinoamericano de Comercio Exterior SA, Cl E | | | 7,710 | | | | 114 | |
|
Bancorp Inc/The * | | | 24,523 | | | | 289 | |
Bank of Marin Bancorp | | | 7,150 | | | | 248 | |
BankUnited Inc | | | 19,100 | | | | 545 | |
Berkshire Hills Bancorp Inc | | | 10,300 | | | | 169 | |
BlackRock Capital Investment Corp | | | 46,599 | | | | 137 | |
Bridgewater Bancshares Inc * | | | 8,803 | | | | 104 | |
Brightsphere Investment Group Inc | | | 36,000 | | | | 637 | |
Brookline Bancorp Inc | | | 7,000 | | | | 80 | |
Brown & Brown Inc | | | 6,400 | | | | 288 | |
BRP Group Inc, Cl A * | | | 14,168 | | | | 417 | |
Cadence BanCorp, Cl A | | | 10,295 | | | | 144 | |
Camden National Corp | | | 11,800 | | | | 405 | |
Capital Bancorp Inc * | | | 675 | | | | 8 | |
Capital City Bank Group Inc | | | 1,600 | | | | 36 | |
Capstead Mortgage Corp ‡ | | | 7,002 | | | | 39 | |
Carter Bankshares Inc | | | 12,180 | | | | 114 | |
Cathay General Bancorp | | | 18,900 | | | | 534 | |
Central Pacific Financial Corp | | | 9,520 | | | | 156 | |
CIT Group Inc | | | 9,700 | | | | 325 | |
CNO Financial Group Inc | | | 57,500 | | | | 1,224 | |
Columbia Financial Inc * | | | 4,300 | | | | 62 | |
Community Trust Bancorp Inc | | | 7,300 | | | | 247 | |
Crawford & Co, Cl A | | | 19,750 | | | | 145 | |
CryoPort Inc *(A) | | | 16,595 | | | | 807 | |
Curo Group Holdings Corp | | | 11,370 | | | | 98 | |
Customers Bancorp Inc * | | | 23,734 | | | | 401 | |
| | | | | | | | |
| | | |
| Description | | Shares | | Market Value
($ Thousands) |
| | |
COMMON STOCK (continued) | | | | | | | | |
Diamond Hill Investment Group Inc | | | 300 | | | $ | 41 | |
Dime Community Bancshares Inc | | | 5,300 | | | | 77 | |
Donegal Group Inc, Cl A | | | 9,051 | | | | 127 | |
Dynex Capital Inc | | | 18,859 | | | | 332 | |
Employers Holdings Inc | | | 2,700 | | | | 82 | |
Enova International Inc * | | | 5,120 | | | | 107 | |
Erie Indemnity Co, Cl A | | | 1,100 | | | | 248 | |
Everest Re Group Ltd | | | 1,200 | | | | 273 | |
Exantas Capital Corp ‡ | | | 27,900 | | | | 97 | |
EZCORP Inc, Cl A * | | | 36,610 | | | | 186 | |
FactSet Research Systems Inc | | | 300 | | | | 100 | |
Farmers National Banc Corp | | | 15,030 | | | | 188 | |
FB Financial Corp | | | 9,600 | | | | 306 | |
Federal Agricultural Mortgage Corp, Cl C | | | 7,700 | | | | 521 | |
Federated Hermes Inc, Cl B | | | 21,200 | | | | 569 | |
Financial Institutions Inc | | | 10,110 | | | | 202 | |
First American Financial Corp | | | 3,000 | | | | 145 | |
First Bancshares Inc/The | | | 4,437 | | | | 121 | |
First Busey Corp | | | 21,900 | | | | 438 | |
First Business Financial Services Inc | | | 9,400 | | | | 178 | |
First Commonwealth Financial Corp | | | 44,900 | | | | 434 | |
First Community Bankshares Inc | | | 12,140 | | | | 256 | |
First Financial Bankshares Inc | | | 23,335 | | | | 780 | |
First Financial Corp/IN | | | 4,610 | | | | 175 | |
First Horizon Corp | | | 79,500 | | | | 972 | |
First of Long Island Corp/The | | | 7,605 | | | | 128 | |
Flagstar Bancorp Inc | | | 11,300 | | | | 396 | |
Flushing Financial Corp | | | 22,861 | | | | 325 | |
FNB Corp/PA | | | 59,300 | | | | 524 | |
FS KKR Capital Corp (A) | | | 21,950 | | | | 391 | |
Fulton Financial Corp | | | 25,500 | | | | 314 | |
Goosehead Insurance Inc, Cl A | | | 1,560 | | | | 192 | |
Granite Point Mortgage Trust Inc | | | 21,697 | | | | 201 | |
Great Southern Bancorp Inc | | | 1,100 | | | | 51 | |
Great Western Bancorp Inc | | | 17,500 | | | | 288 | |
Greenhill & Co Inc | | | 10,570 | | | | 138 | |
Greenlight Capital Re Ltd, Cl A * | | | 11,570 | | | | 89 | |
Hamilton Lane Inc, Cl A | | | 20,575 | | | | 1,438 | |
Hancock Whitney Corp | | | 12,300 | | | | 346 | |
Hanmi Financial Corp | | | 28,430 | | | | 277 | |
Hanover Insurance Group Inc/The | | | 7,500 | | | | 843 | |
HarborOne Bancorp Inc | | | 41,220 | | | | 404 | |
HBT Financial Inc | | | 13,070 | | | | 183 | |
HCI Group Inc | | | 6,668 | | | | 348 | |
Heritage Commerce Corp | | | 10,572 | | | | 89 | |
Heritage Insurance Holdings Inc | | | 26,820 | | | | 277 | |
Hilltop Holdings Inc | | | 17,000 | | | | 410 | |
HomeStreet Inc | | | 8,400 | | | | 272 | |
HomeTrust Bancshares Inc | | | 8,890 | | | | 151 | |
Hope Bancorp Inc | �� | | 59,400 | | | | 563 | |
Houlihan Lokey Inc, Cl A | | | 2,000 | | | | 130 | |
Independent Bank Corp/MI | | | 33,460 | | | | 569 | |
| | |
| SEI Institutional Investments Trust / Semi-Annual Report / November 30, 2020 | | 3 |
SCHEDULE OF INVESTMENTS (Unaudited)
November 30, 2020
Small Cap Fund (Continued)
| | | | | | | | |
| | | |
| Description | | Shares | | Market Value
($ Thousands) |
| | |
COMMON STOCK (continued) | | | | | | | | |
International Bancshares Corp | | | 17,200 | | | $ | 557 | |
International Seaways Inc | | | 2,500 | | | | 42 | |
Invesco Mortgage Capital Inc (A) | | | 29,090 | | | | 97 | |
James River Group Holdings Ltd | | | 2,200 | | | | 100 | |
Kinsale Capital Group Inc | | | 7,356 | | | | 1,767 | |
Ladder Capital Corp, Cl A ‡ | | | 9,600 | | | | 88 | |
Lakeland Bancorp Inc | | | 20,700 | | | | 249 | |
Macatawa Bank Corp | | | 17,975 | | | | 139 | |
Mercantile Bank Corp | | | 16,480 | | | | 409 | |
Merchants Bancorp/IN | | | 1,500 | | | | 40 | |
Mercury General Corp | | | 11,100 | | | | 494 | |
Meridian Bancorp Inc | | | 5,000 | | | | 68 | |
MidWestOne Financial Group Inc | | | 1,000 | | | | 23 | |
Morningstar Inc | | | 1,400 | | | | 280 | |
Mr Cooper Group Inc * | | | 8,905 | | | | 237 | |
National General Holdings Corp | | | 1,332 | | | | 45 | |
New Mountain Finance Corp | | | 22,600 | | | | 271 | |
New Residential Investment Corp ‡ | | | 31,400 | | | | 291 | |
New York Mortgage Trust Inc ‡ | | | 57,400 | | | | 202 | |
Nicolet Bankshares Inc * | | | 800 | | | | 53 | |
Northwest Bancshares Inc | | | 7,400 | | | | 88 | |
OceanFirst Financial Corp | | | 4,800 | | | | 76 | |
OFG Bancorp | | | 21,400 | | | | 358 | |
Old National Bancorp/IN | | | 14,400 | | | | 228 | |
Old Republic International Corp | | | 13,300 | | | | 238 | |
Oportun Financial Corp * | | | 6,693 | | | | 113 | |
Oppenheimer Holdings Inc, Cl A | | | 5,080 | | | | 150 | |
Palomar Holdings Inc, Cl A * | | | 3,155 | | | | 209 | |
PCSB Financial Corp | | | 13,413 | | | | 205 | |
Peapack-Gladstone Financial Corp | | | 6,633 | | | | 146 | |
PennantPark Investment Corp | | | 55,400 | | | | 249 | |
PennyMac Financial Services Inc | | | 2,671 | | | | 154 | |
PennyMac Mortgage Investment Trust ‡ | | | 16,000 | | | | 274 | |
Peoples Bancorp Inc/OH | | | 18,900 | | | | 472 | |
Piper Sandler Cos | | | 400 | | | | 37 | |
PJT Partners Inc | | | 2,200 | | | | 152 | |
Popular Inc | | | 9,300 | | | | 451 | |
Premier Financial Corp | | | 4,754 | | | | 98 | |
Professional Holding Corp, Cl A * | | | 4,436 | | | | 63 | |
PROG Holdings Inc | | | 4,300 | | | | 271 | |
Prospect Capital Corp | | | 52,800 | | | | 282 | |
Provident Bancorp Inc | | | 8,263 | | | | 83 | |
Pzena Investment Management Inc, Cl A | | | 14,384 | | | | 96 | |
QCR Holdings Inc | | | 1,500 | | | | 52 | |
RBB Bancorp | | | 12,350 | | | | 183 | |
Ready Capital Corp | | | 13,464 | | | | 174 | |
Regional Management Corp | | | 11,372 | | | | 304 | |
Reliant Bancorp Inc | | | 2,030 | | | | 36 | |
RenaissanceRe Holdings Ltd | | | 1,800 | | | | 296 | |
Republic Bancorp Inc/KY, Cl A | | | 8,000 | | | | 282 | |
Richmond Mutual BanCorp Inc | | | 7,251 | | | | 91 | |
RLI Corp | | | 2,100 | | | | 201 | |
| | | | | | | | |
| | | |
| Description | | Shares | | Market Value
($ Thousands) |
| | |
COMMON STOCK (continued) | | | | | | | | |
Safeguard Scientifics Inc | | | 31,040 | | | $ | 199 | |
Safety Insurance Group Inc | | | 1,100 | | | | 78 | |
Selective Insurance Group Inc | | | 2,200 | | | | 136 | |
Sierra Bancorp | | | 1,600 | | | | 35 | |
Simmons First National Corp, Cl A | | | 32,600 | | | | 636 | |
Sixth Street Specialty Lending Inc (A) | | | 29,800 | | | | 614 | |
Stewart Information Services Corp | | | 2,200 | | | | 92 | |
Stifel Financial Corp | | | 10,545 | | | | 731 | |
Sturm Ruger & Co Inc | | | 2,100 | | | | 129 | |
Synovus Financial Corp | | | 33,400 | | | | 1,054 | |
TCF Financial Corp | | | 12,400 | | | | 417 | |
Towne Bank/Portsmouth VA | | | 2,800 | | | | 61 | |
Trean Insurance Group Inc * | | | 2,228 | | | | 32 | |
TriCo Bancshares | | | 2,600 | | | | 85 | |
TriState Capital Holdings Inc * | | | 8,010 | | | | 119 | |
Trupanion Inc * | | | 1,774 | | | | 180 | |
TrustCo Bank Corp NY | | | 9,700 | | | | 59 | |
United Community Banks Inc/GA | | | 26,900 | | | | 643 | |
United Fire Group Inc | | | 2,000 | | | | 44 | |
Universal Insurance Holdings Inc (A) | | | 11,400 | | | | 159 | |
Univest Financial Corp | | | 22,860 | | | | 419 | |
Veritex Holdings Inc | | | 10,800 | | | | 234 | |
Walker & Dunlop Inc | | | 10,400 | | | | 832 | |
Washington Trust Bancorp Inc | | | 1,300 | | | | 51 | |
Waterstone Financial Inc | | | 35,329 | | | | 621 | |
Westwood Holdings Group Inc | | | 2,010 | | | | 24 | |
White Mountains Insurance Group Ltd | | | 200 | | | | 192 | |
WisdomTree Investments Inc | | | 23,890 | | | | 102 | |
WSFS Financial Corp | | | 1,800 | | | | 69 | |
| | |
| | | | | | | 47,974 | |
| | |
Health Care — 15.8% | | | | | | | | |
Abeona Therapeutics Inc * | | | 43,889 | | | | 71 | |
Acceleron Pharma Inc * | | | 1,600 | | | | 189 | |
Accuray Inc * | | | 38,433 | | | | 171 | |
Addus HomeCare Corp * | | | 11,100 | | | | 1,102 | |
Affimed NV * | | | 82,682 | | | | 442 | |
Agenus Inc * | | | 65,299 | | | | 242 | |
Akero Therapeutics Inc * | | | 1,500 | | | | 43 | |
Albireo Pharma Inc * | | | 4,910 | | | | 183 | |
Alphatec Holdings Inc * | | | 27,732 | | | | 291 | |
American Renal Associates Holdings Inc * | | | 11,539 | | | | 132 | |
Amicus Therapeutics Inc * | | | 15,443 | | | | 354 | |
Amphastar Pharmaceuticals Inc * | | | 3,800 | | | | 68 | |
AnaptysBio Inc * | | | 1,994 | | | | 51 | |
Anika Therapeutics Inc * | | | 7,364 | | | | 278 | |
Antares Pharma Inc * | | | 49,710 | | | | 155 | |
Applied Therapeutics Inc * | | | 1,400 | | | | 32 | |
Apyx Medical Corp * | | | 15,108 | | | | 116 | |
Arcturus Therapeutics Holdings Inc * | | | 2,303 | | | | 211 | |
Arcus Biosciences Inc * | | | 2,100 | | | | 57 | |
Ardelyx Inc * | | | 11,218 | | | | 71 | |
Arrowhead Pharmaceuticals Inc * | | | 3,914 | | | | 245 | |
| | |
| 4 | | SEI Institutional Investments Trust / Semi-Annual Report / November 30, 2020 |
SCHEDULE OF INVESTMENTS (Unaudited)
November 30, 2020
Small Cap Fund (Continued)
| | | | | | | | |
| | | |
| Description | | Shares | | Market Value
($ Thousands) |
| | |
COMMON STOCK (continued) | | | | | | | | |
Assembly Biosciences Inc * | | | 3,000 | | | $ | 17 | |
Atreca Inc, Cl A * | | | 8,201 | | | | 127 | |
AtriCure Inc * | | | 3,000 | | | | 130 | |
Atrion Corp | | | 100 | | | | 60 | |
Avid Bioservices Inc * | | | 52,626 | | | | 480 | |
Avidity Biosciences Inc * | | | 16,900 | | | | 506 | |
Axonics Modulation Technologies Inc * | | | 3,336 | | | | 146 | |
BioDelivery Sciences International Inc * | | | 153,500 | | | | 583 | |
Biohaven Pharmaceutical Holding Co Ltd * | | | 2,148 | | | | 191 | |
Bio-Rad Laboratories Inc, Cl A * | | | 450 | | | | 242 | |
BioSpecifics Technologies Corp * | | | 700 | | | | 62 | |
Bio-Techne Corp | | | 1,000 | | | | 303 | |
Blueprint Medicines Corp * | | | 2,798 | | | | 302 | |
Bruker Corp | | | 1,000 | | | | 51 | |
Cardiff Oncology Inc * | | | 11,394 | | | | 282 | |
CareDx Inc * | | | 4,650 | | | | 266 | |
Castle Biosciences Inc * | | | 6,695 | | | | 318 | |
Catalent Inc * | | | 3,900 | | | | 375 | |
Catalyst Pharmaceuticals Inc * | | | 58,445 | | | | 214 | |
Cellular Biomedicine Group Inc * | | | 1,700 | | | | 31 | |
Charles River Laboratories International Inc * | | | 700 | | | | 164 | |
|
Chemed Corp | | | 700 | | | | 335 | |
Chiasma Inc * | | | 28,505 | | | | 122 | |
ChromaDex Corp * | | | 5,600 | | | | 28 | |
Collegium Pharmaceutical Inc * | | | 3,300 | | | | 61 | |
Concert Pharmaceuticals Inc * | | | 3,500 | | | | 40 | |
CorVel Corp * | | | 900 | | | | 81 | |
Cross Country Healthcare Inc * | | | 17,460 | | | | 152 | |
CryoLife Inc * | | | 2,400 | | | | 50 | |
Cutera Inc * | | | 13,782 | | | | 345 | |
CytomX Therapeutics Inc * | | | 16,826 | | | | 127 | |
CytoSorbents Corp * | | | 16,292 | | | | 137 | |
Denali Therapeutics Inc * | | | 4,961 | | | | 303 | |
Eagle Pharmaceuticals Inc/DE * | | | 5,343 | | | | 243 | |
Eidos Therapeutics Inc * | | | 1,200 | | | | 111 | |
Eiger BioPharmaceuticals Inc * | | | 7,770 | | | | 71 | |
Electromed Inc * | | | 15,440 | | | | 156 | |
Encompass Health Corp | | | 4,500 | | | | 363 | |
Ensign Group Inc/The | | | 28,501 | | | | 2,048 | |
Enzo Biochem Inc * | | | 64,403 | | | | 140 | |
Evolent Health Inc, Cl A * | | | 18,508 | | | | 269 | |
Fate Therapeutics Inc * | | | 4,933 | | | | 288 | |
Five Prime Therapeutics Inc * | | | 9,514 | | | | 179 | |
Flexion Therapeutics Inc * | | | 2,720 | | | | 29 | |
Fulcrum Therapeutics Inc * | | | 522 | | | | 6 | |
Fulgent Genetics Inc *(A) | | | 2,440 | | | | 110 | |
G1 Therapeutics Inc * | | | 21,568 | | | | 394 | |
Globus Medical Inc, Cl A * | | | 3,800 | | | | 228 | |
Haemonetics Corp * | | | 1,900 | | | | 214 | |
Halozyme Therapeutics Inc * | | | 27,893 | | | | 1,091 | |
Harpoon Therapeutics Inc * | | | 4,349 | | | | 65 | |
| | | | | | | | |
| | | |
| Description | | Shares | | Market Value
($ Thousands) |
| | |
COMMON STOCK (continued) | | | | | | | | |
HealthStream Inc * | | | 4,400 | | | $ | 82 | |
Heska Corp * | | | 2,630 | | | | 329 | |
Hill-Rom Holdings Inc | | | 3,000 | | | | 285 | |
Homology Medicines Inc * | | | 3,500 | | | | 34 | |
Immunovant Inc * | | | 4,821 | | | | 237 | |
Innoviva Inc * | | | 43,200 | | | | 452 | |
Inovalon Holdings Inc, Cl A * | | | 6,400 | | | | 120 | |
Insmed Inc * | | | 6,107 | | | | 238 | |
Inspire Medical Systems Inc * | | | 1,680 | | | | 312 | |
Integer Holdings Corp * | | | 1,100 | | | | 79 | |
Integra LifeSciences Holdings Corp * | | | 3,400 | | | | 186 | |
Intersect ENT Inc * | | | 8,250 | | | | 158 | |
Invacare Corp | | | 13,670 | | | | 117 | |
Invitae Corp * | | | 5,371 | | | | 267 | |
iRadimed Corp * | | | 4,949 | | | | 121 | |
iRhythm Technologies Inc * | | | 868 | | | | 212 | |
Jazz Pharmaceuticals PLC * | | | 2,400 | | | | 338 | |
Joint Corp/The * | | | 10,918 | | | | 274 | |
Kindred Biosciences Inc * | | | 18,631 | | | | 73 | |
Kiniksa Pharmaceuticals Ltd, Cl A * | | | 6,783 | | | | 127 | |
Kodiak Sciences Inc * | | | 2,122 | | | | 290 | |
Krystal Biotech Inc * | | | 1,200 | | | | 66 | |
Kura Oncology Inc * | | | 5,613 | | | | 204 | |
Lannett Co Inc * | | | 22,679 | | | | 140 | |
Lantheus Holdings Inc * | | | 26,780 | | | | 352 | |
LeMaitre Vascular Inc | | | 4,345 | | | | 171 | |
Marinus Pharmaceuticals Inc *(A) | | | 10,896 | | | | 173 | |
Masimo Corp * | | | 1,100 | | | | 280 | |
MEDNAX Inc * | | | 21,200 | | | | 428 | |
Medpace Holdings Inc * | | | 700 | | | | 90 | |
MeiraGTx Holdings PLC * | | | 13,280 | | | | 187 | |
Meridian Bioscience Inc * | | | 7,634 | | | | 144 | |
Mesa Laboratories Inc | | | 400 | | | | 109 | |
Mirati Therapeutics Inc * | | | 1,616 | | | | 384 | |
Mustang Bio Inc * | | | 24,791 | | | | 92 | |
NanoString Technologies Inc * | | | 4,246 | | | | 211 | |
Natera Inc * | | | 27,523 | | | | 2,429 | |
National HealthCare Corp | | | 1,400 | | | | 87 | |
National Research Corp, Cl A | | | 1,100 | | | | 56 | |
Natus Medical Inc * | | | 4,300 | | | | 90 | |
Neogen Corp * | | | 3,100 | | | | 230 | |
Neoleukin Therapeutics Inc * | | | 2,830 | | | | 36 | |
Neurocrine Biosciences Inc * | | | 500 | | | | 48 | |
NextGen Healthcare Inc * | | | 5,200 | | | | 92 | |
NGM Biopharmaceuticals Inc * | | | 2,500 | | | | 59 | |
Ocular Therapeutix Inc * | | | 12,992 | | | | 227 | |
Omnicell Inc * | | | 4,288 | | | | 450 | |
Orthofix Medical Inc * | | | 2,200 | | | | 81 | |
OrthoPediatrics Corp * | | | 1,100 | | | | 50 | |
Owens & Minor Inc | | | 19,135 | | | | 493 | |
Oyster Point Pharma Inc * | | | 3,118 | | | | 68 | |
Patterson Cos Inc (A) | | | 11,000 | | | | 305 | |
| | |
| SEI Institutional Investments Trust / Semi-Annual Report / November 30, 2020 | | 5 |
SCHEDULE OF INVESTMENTS (Unaudited)
November 30, 2020
Small Cap Fund (Continued)
| | | | | | | | |
| | | |
| Description | | Shares | | Market Value
($ Thousands) |
| | |
COMMON STOCK (continued) | | | | | | | | |
Penumbra Inc *(A) | | | 776 | | | $ | 172 | |
Perrigo Co PLC | | | 5,400 | | | | 260 | |
Personalis Inc * | | | 6,492 | | | | 179 | |
Phibro Animal Health Corp, Cl A | | | 2,300 | | | | 43 | |
Pieris Pharmaceuticals Inc * | | | 30,339 | | | | 89 | |
PRA Health Sciences Inc * | | | 1,300 | | | | 146 | |
Precision BioSciences Inc * | | | 12,172 | | | | 152 | |
Prestige Consumer Healthcare Inc * | | | 16,779 | | | | 597 | |
Prevail Therapeutics Inc * | | | 6,860 | | | | 70 | |
Progyny Inc *(A) | | | 29,759 | | | | 1,056 | |
Protagonist Therapeutics Inc * | | | 12,499 | | | | 302 | |
Prothena Corp PLC * | | | 12,580 | | | | 142 | |
Providence Service Corp/The * | | | 2,795 | | | | 380 | |
QIAGEN NV * | | | 3,100 | | | | 150 | |
Quidel Corp * | | | 979 | | | | 191 | |
R1 RCM Inc * | | | 11,891 | | | | 241 | |
Relmada Therapeutics Inc * | | | 1,400 | | | | 50 | |
Repligen Corp * | | | 12,881 | | | | 2,443 | |
Replimune Group Inc * | | | 4,594 | | | | 237 | |
Revance Therapeutics Inc * | | | 500 | | | | 12 | |
Rhythm Pharmaceuticals Inc * | | | 3,400 | | | | 105 | |
Rigel Pharmaceuticals Inc * | | | 180,193 | | | | 546 | |
Scholar Rock Holding Corp * | | | 5,404 | | | | 269 | |
Seagen Inc * | | | 500 | | | | 85 | |
SeaSpine Holdings Corp * | | | 2,700 | | | | 38 | |
Select Medical Holdings Corp * | | | 20,000 | | | | 482 | |
Seres Therapeutics Inc * | | | 5,556 | | | | 153 | |
Shockwave Medical Inc * | | | 3,262 | | | | 319 | |
SIGA Technologies Inc * | | | 37,916 | | | | 263 | |
Silk Road Medical Inc * | | | 5,795 | | | | 332 | |
Simulations Plus Inc | | | 2,500 | | | | 140 | |
SOC Telemed Inc *(A) | | | 14,450 | | | | 117 | |
Spectrum Pharmaceuticals Inc * | | | 18,260 | | | | 86 | |
Spero Therapeutics Inc * | | | 6,570 | | | | 109 | |
STAAR Surgical Co * | | | 4,995 | | | | 356 | |
STERIS PLC | | | 1,400 | | | | 271 | |
Stoke Therapeutics Inc * | | | 1,400 | | | | 73 | |
Surmodics Inc * | | | 3,666 | | | | 137 | |
Sutro Biopharma Inc * | | | 6,777 | | | | 116 | |
Syros Pharmaceuticals Inc * | | | 19,316 | | | | 157 | |
Tenet Healthcare Corp * | | | 10,000 | | | | 314 | |
TG Therapeutics Inc * | | | 6,952 | | | | 204 | |
Translate Bio Inc * | | | 4,100 | | | | 91 | |
Travere Therapeutics Inc * | | | 4,200 | | | | 96 | |
Turning Point Therapeutics Inc * | | | 1,739 | | | | 185 | |
Twist Bioscience Corp * | | | 4,026 | | | | 450 | |
Ultragenyx Pharmaceutical Inc * | | | 2,346 | | | | 278 | |
United Therapeutics Corp * | | | 6,800 | | | | 902 | |
Utah Medical Products Inc | | | 1,179 | | | | 102 | |
Veracyte Inc * | | | 5,089 | | | | 277 | |
Vericel Corp * | | | 12,315 | | | | 315 | |
Viemed Healthcare Inc * | | | 13,071 | | | | 127 | |
| | | | | | | | |
| | | |
| Description | | Shares | | Market Value
($ Thousands) |
| | |
COMMON STOCK (continued) | | | | | | | | |
Voyager Therapeutics Inc * | | | 20,022 | | | $ | 167 | |
West Pharmaceutical Services Inc | | | 900 | | | | 248 | |
Y-mAbs Therapeutics Inc * | | | 2,200 | | | | 112 | |
| | |
| | | | | | | 44,237 | |
| | |
Industrials — 17.4% | | | | | | | | |
ACCO Brands Corp | | | 49,600 | | | | 380 | |
Advanced Drainage Systems Inc | | | 2,338 | | | | 163 | |
AGCO Corp | | | 2,371 | | | | 219 | |
Air Lease Corp, Cl A | | | 10,400 | | | | 380 | |
Air Transport Services Group Inc * | | | 59,341 | | | | 1,824 | |
Alaska Air Group Inc | | | 7,945 | | | | 405 | |
Allied Motion Technologies Inc | | | 1,500 | | | | 61 | |
Altra Industrial Motion Corp | | | 29,691 | | | | 1,685 | |
Ameresco Inc, Cl A * | | | 4,082 | | | | 182 | |
American Superconductor Corp * | | | 22,447 | | | | 446 | |
American Woodmark Corp * | | | 3,200 | | | | 280 | |
Apogee Enterprises Inc | | | 19,000 | | | | 499 | |
Applied Industrial Technologies Inc | | | 1,500 | | | | 118 | |
ArcBest Corp | | | 11,200 | | | | 469 | |
Atkore International Group Inc * | | | 20,100 | | | | 783 | |
Atlas Air Worldwide Holdings Inc * | | | 8,800 | | | | 491 | |
Barrett Business Services Inc | | | 700 | | | | 47 | |
Bloom Energy Corp, Cl A * | | | 9,134 | | | | 224 | |
Builders FirstSource Inc * | | | 24,965 | | | | 934 | |
CAI International Inc | | | 8,805 | | | | 279 | |
Casella Waste Systems Inc, Cl A * | | | 3,400 | | | | 205 | |
CECO Environmental Corp * | | | 18,571 | | | | 137 | |
Chart Industries Inc * | | | 2,642 | | | | 273 | |
Clean Harbors Inc * | | | 3,200 | | | | 232 | |
Cornerstone Building Brands Inc * | | | 29,842 | | | | 261 | |
Covenant Logistics Group Inc, Cl A * | | | 17,616 | | | | 326 | |
CRA International Inc | | | 18,352 | | | | 841 | |
Crane Co | | | 9,600 | | | | 667 | |
CSW Industrials Inc | | | 1,500 | | | | 161 | |
Curtiss-Wright Corp | | | 4,300 | | | | 496 | |
Ducommun Inc * | | | 7,215 | | | | 359 | |
DXP Enterprises Inc/TX * | | | 12,221 | | | | 257 | |
Echo Global Logistics Inc * | | | 8,400 | | | | 238 | |
EMCOR Group Inc | | | 5,000 | | | | 431 | |
Energy Recovery Inc * | | | 40,939 | | | | 437 | |
Ennis Inc | | | 34,540 | | | | 566 | |
Exponent Inc | | | 27,495 | | | | 2,282 | |
Federal Signal Corp | | | 27,320 | | | | 848 | |
Forrester Research Inc * | | | 1,800 | | | | 74 | |
Forward Air Corp | | | 2,300 | | | | 168 | |
Foundation Building Materials Inc * | | | 17,690 | | | | 340 | |
Franklin Covey Co * | | | 8,260 | | | | 181 | |
FTI Consulting Inc * | | | 2,300 | | | | 242 | |
Generac Holdings Inc * | | | 10,143 | | | | 2,187 | |
GMS Inc * | | | 10,500 | | | | 328 | |
Great Lakes Dredge & Dock Corp * | | | 14,930 | | | | 169 | |
Hawaiian Holdings Inc | | | 22,200 | | | | 450 | |
| | |
| 6 | | SEI Institutional Investments Trust / Semi-Annual Report / November 30, 2020 |
SCHEDULE OF INVESTMENTS (Unaudited)
November 30, 2020
Small Cap Fund (Continued)
| | | | | | | | |
| | | |
| Description | | Shares | | Market Value
($ Thousands) |
| | |
COMMON STOCK (continued) | | | | | | | | |
Heartland Express Inc | | | 4,400 | | | $ | 81 | |
Heidrick & Struggles International Inc | | | 13,376 | | | | 349 | |
Heritage-Crystal Clean Inc * | | | 2,000 | | | | 39 | |
Herman Miller Inc | | | 13,400 | | | | 478 | |
Hub Group Inc, Cl A * | | | 2,700 | | | | 147 | |
Hubbell Inc, Cl B | | | 1,800 | | | | 291 | |
Huron Consulting Group Inc * | | | 2,200 | | | | 97 | |
Hyster-Yale Materials Handling Inc | | | 6,900 | | | | 380 | |
IAA Inc * | | | 3,718 | | | | 223 | |
ICF International Inc | | | 1,500 | | | | 109 | |
IES Holdings Inc * | | | 1,200 | | | | 44 | |
Insteel Industries Inc | | | 3,582 | | | | 83 | |
Interface Inc, Cl A | | | 27,300 | | | | 228 | |
JetBlue Airways Corp * | | | 30,300 | | | | 457 | |
John Bean Technologies Corp | | | 6,640 | | | | 734 | |
Kadant Inc | | | 600 | | | | 77 | |
Kelly Services Inc, Cl A | | | 18,800 | | | | 385 | |
Kforce Inc | | | 10,800 | | | | 443 | |
Kimball International Inc, Cl B | | | 8,000 | | | | 87 | |
Knoll Inc | | | 18,300 | | | | 250 | |
Landstar System Inc | | | 2,000 | | | | 263 | |
Marten Transport Ltd | | | 5,600 | | | | 99 | |
MasTec Inc * | | | 10,300 | | | | 584 | |
Matson Inc | | | 4,273 | | | | 248 | |
Mercury Systems Inc * | | | 7,220 | | | | 514 | |
Meritor Inc * | | | 24,400 | | | | 644 | |
Miller Industries Inc/TN | | | 6,397 | | | | 214 | |
MSA Safety Inc (A) | | | 7,465 | | | | 1,116 | |
MYR Group Inc * | | | 9,050 | | | | 463 | |
National Presto Industries Inc | | | 500 | | | | 43 | |
Northwest Pipe Co * | | | 10,110 | | | | 291 | |
Orion Energy Systems Inc * | | | 8,710 | | | | 90 | |
Park Aerospace Corp | | | 26,732 | | | | 340 | |
Park-Ohio Holdings Corp | | | 7,900 | | | | 222 | |
Powell Industries Inc | | | 15,347 | | | | 396 | |
Primoris Services Corp | | | 24,100 | | | | 584 | |
Quad/Graphics Inc, Cl A | | | 21,039 | | | | 65 | |
Quanex Building Products Corp | | | 14,431 | | | | 297 | |
Quanta Services Inc | | | 3,593 | | | | 246 | |
Radiant Logistics Inc * | | | 4,900 | | | | 29 | |
RBC Bearings Inc * | | | 3,550 | | | | 599 | |
Regal Beloit Corp | | | 1,860 | | | | 221 | |
Resources Connection Inc | | | 31,100 | | | | 377 | |
Rush Enterprises Inc, Cl A | | | 5,100 | | | | 195 | |
Saia Inc * | | | 2,971 | | | | 519 | |
Schneider National Inc, Cl B | | | 4,900 | | | | 102 | |
Shyft Group Inc/The | | | 13,329 | | | | 346 | |
SkyWest Inc | | | 8,900 | | | | 382 | |
SP Plus Corp * | | | 3,484 | | | | 99 | |
Standex International Corp | | | 1,200 | | | | 91 | |
Steelcase Inc, Cl A | | | 34,700 | | | | 422 | |
Stericycle Inc * | | | 3,900 | | | | 275 | |
| | | | | | | | |
| | | |
| Description | | Shares | | Market Value
($ Thousands) |
| | |
COMMON STOCK (continued) | | | | | | | | |
Sterling Construction Co Inc * | | | 8,960 | | | $ | 143 | |
Systemax Inc | | | 17,192 | | | | 529 | |
Terex Corp | | | 6,700 | | | | 208 | |
Tetra Tech Inc | | | 5,880 | | | | 701 | |
Textainer Group Holdings Ltd * | | | 14,650 | | | | 270 | |
Timken Co/The | | | 3,016 | | | | 221 | |
Toro Co/The | | | 300 | | | | 27 | |
Trex Co Inc * | | | 30,243 | | | | 2,263 | |
TriMas Corp * | | | 4,400 | | | | 118 | |
Triton International Ltd/Bermuda | | | 22,602 | | | | 1,023 | |
TrueBlue Inc * | | | 2,800 | | | | 53 | |
Tutor Perini Corp * | | | 18,993 | | | | 257 | |
UniFirst Corp/MA | | | 900 | | | | 166 | |
Universal Logistics Holdings Inc | | | 24,240 | | | | 521 | |
US Xpress Enterprises Inc, Cl A * | | | 8,010 | | | | 60 | |
Vectrus Inc * | | | 3,382 | | | | 161 | |
Veritiv Corp * | | | 5,420 | | | | 101 | |
Vertiv Holdings Co, Cl A | | | 76,660 | | | | 1,434 | |
Vicor Corp * | | | 2,010 | | | | 165 | |
Wabash National Corp (A) | | | 37,532 | | | | 664 | |
Werner Enterprises Inc | | | 4,500 | | | | 180 | |
WESCO International Inc * | | | 10,100 | | | | 659 | |
Willdan Group Inc * | | | 3,870 | | | | 150 | |
| | |
| | | | | | | 48,457 | |
| | |
Information Technology — 16.2% | | | | | | | | |
A10 Networks Inc * | | | 79,141 | | | | 632 | |
Agilysys Inc * | | | 13,914 | | | | 520 | |
Alliance Data Systems Corp | | | 3,111 | | | | 228 | |
Amdocs Ltd | | | 5,200 | | | | 342 | |
American Software Inc/GA, Cl A | | | 19,626 | | | | 322 | |
Amkor Technology Inc | | | 49,700 | | | | 733 | |
Appian Corp, Cl A * | | | 1,764 | | | | 247 | |
Aspen Technology Inc * | | | 2,200 | | | | 296 | |
Avalara Inc * | | | 13,140 | | | | 2,257 | |
Avaya Holdings Corp * | | | 17,907 | | | | 333 | |
Avid Technology Inc * | | | 21,960 | | | | 267 | |
Axcelis Technologies Inc * | | | 3,100 | | | | 84 | |
Bandwidth Inc, Cl A * | | | 1,400 | | | | 212 | |
Bel Fuse Inc, Cl B | | | 10,088 | | | | 148 | |
Benchmark Electronics Inc | | | 17,900 | | | | 435 | |
Bill.com Holdings Inc * | | | 1,493 | | | | 183 | |
Blackline Inc * | | | 2,881 | | | | 354 | |
Brightcove Inc * | | | 49,032 | | | | 819 | |
Calix Inc * | | | 9,739 | | | | 231 | |
Casa Systems Inc * | | | 36,817 | | | | 195 | |
Cass Information Systems Inc | | | 1,900 | | | | 81 | |
CDK Global Inc | | | 2,500 | | | | 120 | |
Cerence Inc * | | | 2,742 | | | | 249 | |
ChannelAdvisor Corp * | | | 11,156 | | | | 165 | |
Ciena Corp * | | | 7,000 | | | | 314 | |
Cirrus Logic Inc * | | | 3,600 | | | | 288 | |
Cohu Inc | | | 8,001 | | | | 227 | |
| | |
| SEI Institutional Investments Trust / Semi-Annual Report / November 30, 2020 | | 7 |
SCHEDULE OF INVESTMENTS (Unaudited)
November 30, 2020
Small Cap Fund (Continued)
| | | | | | | | |
| | | |
| Description | | Shares | | Market Value
($ Thousands) |
| | |
COMMON STOCK (continued) | | | | | | | | |
CommVault Systems Inc * | | | 3,600 | | | $ | 172 | |
Computer Programs and Systems Inc | | | 7,860 | | | | 223 | |
Comtech Telecommunications Corp | | | 19,224 | | | | 366 | |
Cree Inc * | | | 2,586 | | | | 234 | |
CSG Systems International Inc | | | 15,200 | | | | 659 | |
CyberOptics Corp * | | | 6,841 | | | | 183 | |
Digi International Inc * | | | 10,243 | | | | 176 | |
Digital Turbine Inc * | | | 12,256 | | | | 551 | |
Diodes Inc * | | | 8,200 | | | | 557 | |
DocuSign Inc, Cl A * | | | 600 | | | | 137 | |
Dolby Laboratories Inc, Cl A | | | 3,082 | | | | 273 | |
DSP Group Inc * | | | 23,211 | | | | 391 | |
Ebix Inc (A) | | | 11,600 | | | | 395 | |
EchoStar Corp, Cl A * | | | 4,300 | | | | 102 | |
eGain Corp * | | | 14,084 | | | | 160 | |
Endurance International Group Holdings Inc * | | | 20,220 | | | | 192 | |
|
Entegris Inc | | | 1,761 | | | | 163 | |
EPAM Systems Inc * | | | 600 | | | | 193 | |
Everbridge Inc * | | | 650 | | | | 82 | |
EVERTEC Inc | | | 5,400 | | | | 201 | |
ExlService Holdings Inc * | | | 3,000 | | | | 250 | |
Fair Isaac Corp * | | | 800 | | | | 378 | |
Genasys Inc * | | | 23,787 | | | | 168 | |
Genpact Ltd | | | 9,000 | | | | 366 | |
Globant SA * | | | 1,600 | | | | 302 | |
GSI Technology Inc * | | | 16,772 | | | | 111 | |
Hackett Group Inc/The | | | 28,730 | | | | 405 | |
Harmonic Inc * | | | 29,643 | | | | 194 | |
I3 Verticals Inc, Cl A * | | | 1,700 | | | | 47 | |
Ichor Holdings Ltd * | | | 8,837 | | | | 282 | |
II-VI Inc * | | | 5,162 | | | | 349 | |
Insight Enterprises Inc * | | | 8,600 | | | | 615 | |
Intelligent Systems Corp * | | | 900 | | | | 35 | |
International Money Express Inc * | | | 35,189 | | | | 554 | |
J2 Global Inc * | | | 3,600 | | | | 323 | |
Kimball Electronics Inc * | | | 4,566 | | | | 70 | |
Leidos Holdings Inc | | | 700 | | | | 70 | |
Littelfuse Inc | | | 6,096 | | | | 1,466 | |
LivePerson Inc *(A) | | | 19,035 | | | | 1,112 | |
ManTech International Corp/VA, Cl A | | | 2,400 | | | | 185 | |
MAXIMUS Inc | | | 4,200 | | | | 302 | |
Methode Electronics Inc | | | 18,200 | | | | 637 | |
MicroStrategy Inc, Cl A * | | | 900 | | | | 308 | |
Mitek Systems Inc * | | | 34,864 | | | | 411 | |
MobileIron Inc * | | | 40,196 | | | | 283 | |
Model N Inc * | | | 3,700 | | | | 127 | |
Monolithic Power Systems Inc | | | 7,587 | | | | 2,428 | |
Napco Security Technologies Inc * | | | 8,761 | | | | 267 | |
National Instruments Corp | | | 4,000 | | | | 150 | |
NeoPhotonics Corp * | | | 66,597 | | | | 537 | |
NIC Inc | | | 8,700 | | | | 204 | |
| | | | | | | | |
| | | |
| Description | | Shares | | Market Value
($ Thousands) |
| | |
COMMON STOCK (continued) | | | | | | | | |
nLight Inc * | | | 11,426 | | | $ | 343 | |
Nova Measuring Instruments Ltd *(A) | | | 14,705 | | | | 949 | |
Novanta Inc * | | | 9,389 | | | | 1,126 | |
Nuance Communications Inc * | | | 8,441 | | | | 364 | |
NVE Corp | | | 600 | | | | 31 | |
OSI Systems Inc * | | | 1,100 | | | | 97 | |
PC Connection Inc | | | 2,200 | | | | 100 | |
PDF Solutions Inc * | | | 10,360 | | | | 229 | |
Pegasystems Inc | | | 500 | | | | 65 | |
Perficient Inc * | | | 4,200 | | | | 191 | |
Photronics Inc * | | | 6,900 | | | | 80 | |
Power Integrations Inc | | | 8,530 | | | | 609 | |
Progress Software Corp | | | 4,100 | | | | 164 | |
QAD Inc, Cl A | | | 3,410 | | | | 195 | |
Qualys Inc * | | | 300 | | | | 28 | |
Rambus Inc * | | | 9,200 | | | | 145 | |
RealPage Inc * | | | 2,800 | | | | 193 | |
Ribbon Communications Inc * | | | 26,775 | | | | 184 | |
Rimini Street Inc * | | | 20,680 | | | | 90 | |
RingCentral Inc, Cl A * | | | 697 | | | | 207 | |
Rogers Corp * | | | 1,480 | | | | 217 | |
Sailpoint Technologies Holdings Inc * | | | 6,625 | | | | 308 | |
Sanmina Corp * | | | 14,000 | | | | 445 | |
Sapiens International Corp NV | | | 2,500 | | | | 75 | |
ScanSource Inc * | | | 9,300 | | | | 233 | |
Science Applications International Corp | | | 3,400 | | | | 315 | |
SecureWorks Corp, Cl A * | | | 35,173 | | | | 397 | |
Silicon Laboratories Inc * | | | 10,580 | | | | 1,240 | |
SiTime Corp * | | | 1,970 | | | | 171 | |
SMART Global Holdings Inc * | �� | | 18,688 | | | | 574 | |
Sprout Social Inc, Cl A * | | | 5,815 | | | | 299 | |
SPS Commerce Inc * | | | 5,043 | | | | 520 | |
SunPower Corp, Cl A *(A) | | | 10,677 | | | | 237 | |
Sykes Enterprises Inc * | | | 16,400 | | | | 617 | |
Telenav Inc * | | | 69,306 | | | | 329 | |
TTEC Holdings Inc | | | 4,979 | | | | 337 | |
TTM Technologies Inc * | | | 18,900 | | | | 247 | |
Tucows Inc, Cl A * | | | 900 | | | | 65 | |
Tyler Technologies Inc * | | | 600 | | | | 257 | |
Ultra Clean Holdings Inc * | | | 12,700 | | | | 402 | |
Upland Software Inc * | | | 1,200 | | | | 55 | |
Varonis Systems Inc * | | | 1,267 | | | | 153 | |
Veeco Instruments Inc * | | | 10,306 | | | | 171 | |
Verint Systems Inc * | | | 1,800 | | | | 103 | |
Viavi Solutions Inc * | | | 41,775 | | | | 566 | |
Vishay Intertechnology Inc | | | 23,300 | | | | 451 | |
Vishay Precision Group Inc * | | | 11,109 | | | | 325 | |
Vocera Communications Inc * | | | 1,900 | | | | 64 | |
WNS Holdings Ltd ADR * | | | 16,860 | | | | 1,187 | |
Workiva Inc, Cl A * | | | 3,466 | | | | 260 | |
Xperi Holding Corp | | | 11,900 | | | | 227 | |
| | |
| 8 | | SEI Institutional Investments Trust / Semi-Annual Report / November 30, 2020 |
SCHEDULE OF INVESTMENTS (Unaudited)
November 30, 2020
Small Cap Fund (Continued)
| | | | | | | | |
| | | |
| Description | | Shares | | Market Value
($ Thousands) |
COMMON STOCK (continued) | | | | | | | | |
Zix Corp * | | | 37,990 | | | $ | 274 | |
| | |
| | | | | | | 45,139 | |
| | |
Materials — 3.6% | | | | | | | | |
AdvanSix Inc * | | | 13,000 | | | | 231 | |
American Vanguard Corp | | | 8,310 | | | | 126 | |
AptarGroup Inc | | | 1,300 | | | | 164 | |
Balchem Corp | | | 2,300 | | | | 239 | |
Cabot Corp | | | 9,000 | | | | 373 | |
Century Aluminum Co * | | | 30,547 | | | | 310 | |
Chase Corp | | | 700 | | | | 74 | |
Clearwater Paper Corp * | | | 3,860 | | | | 135 | |
Commercial Metals Co | | | 19,700 | | | | 392 | |
Domtar Corp | | | 7,600 | | | | 229 | |
Element Solutions Inc | | | 16,122 | | | | 223 | |
Forterra Inc * | | | 31,058 | | | | 576 | |
Gold Resource Corp | | | 31,560 | | | | 94 | |
Greif Inc, Cl A | | | 21,600 | | | | 1,050 | |
Hawkins Inc | | | 2,700 | | | | 136 | |
Koppers Holdings Inc * | | | 28,349 | | | | 767 | |
Kronos Worldwide Inc | | | 12,500 | | | | 172 | |
Livent Corp * | | | 13,731 | | | | 208 | |
Materion Corp | | | 2,100 | | | | 122 | |
Myers Industries Inc | | | 32,177 | | | | 547 | |
NewMarket Corp | | | 400 | | | | 148 | |
Novagold Resources Inc * | | | 22,600 | | | | 225 | |
O-I Glass Inc, Cl I | | | 19,700 | | | | 223 | |
Ranpak Holdings Corp, Cl A * | | | 8,040 | | | | 91 | |
Resolute Forest Products Inc * | | | 48,200 | | | | 264 | |
Royal Gold Inc | | | 3,000 | | | | 331 | |
Ryerson Holding Corp * | | | 17,402 | | | | 187 | |
Schnitzer Steel Industries Inc, Cl A | | | 15,750 | | | | 404 | |
Schweitzer-Mauduit International Inc | | | 8,200 | | | | 285 | |
Scotts Miracle-Gro Co/The, Cl A | | | 860 | | | | 151 | |
Silgan Holdings Inc | | | 10,900 | | | | 368 | |
Stepan Co | | | 600 | | | | 70 | |
Tredegar Corp | | | 25,700 | | | | 406 | |
Trinseo SA | | | 6,500 | | | | 247 | |
UFP Technologies Inc * | | | 900 | | | | 40 | |
US Concrete Inc * | | | 8,626 | | | | 306 | |
Verso Corp | | | 17,153 | | | | 185 | |
| | |
| | | | | | | 10,099 | |
| | |
Real Estate — 4.2% | | | | | | | | |
Alexander’s Inc ‡ | | | 200 | | | | 55 | |
American Assets Trust Inc ‡ | | | 11,400 | | | | 327 | |
Americold Realty Trust ‡ | | | 9,440 | | | | 322 | |
Ashford Hospitality Trust Inc ‡ | | | 5,150 | | | | 14 | |
Camden Property Trust ‡ | | | 3,200 | | | | 316 | |
CatchMark Timber Trust Inc, Cl A ‡ | | | 6,100 | | | | 58 | |
Cedar Realty Trust Inc ‡(A) | | | 20,167 | | | | 160 | |
Chatham Lodging Trust ‡ | | | 19,300 | | | | 212 | |
Community Healthcare Trust Inc ‡ | | | 1,900 | | | | 86 | |
| | | | | | | | |
| | | |
| Description | | Shares | | Market Value
($ Thousands) |
COMMON STOCK (continued) | | | | | | | | |
CoreCivic Inc ‡ | | | 22,000 | | | $ | 156 | |
CorEnergy Infrastructure Trust Inc ‡(A) | | | 10,900 | | | | 65 | |
CTO Realty Growth Inc | | | 1,513 | | | | 62 | |
DiamondRock Hospitality Co ‡ | | | 31,700 | | | | 238 | |
EastGroup Properties Inc ‡ | | | 2,100 | | | | 286 | |
Equity Commonwealth ‡ | | | 8,400 | | | | 223 | |
Equity LifeStyle Properties Inc ‡ | | | 6,000 | | | | 352 | |
Franklin Street Properties Corp ‡ | | | 45,400 | | | | 211 | |
FRP Holdings Inc * | | | 700 | | | | 32 | |
Getty Realty Corp ‡ | | | 4,300 | | | | 122 | |
Gladstone Commercial Corp ‡ | | | 5,100 | | | | 92 | |
Gladstone Land Corp ‡ | | | 2,500 | | | | 36 | |
Global Medical REIT Inc ‡ | | | 17,100 | | | | 234 | |
Global Net Lease Inc ‡ | | | 18,300 | | | | 305 | |
Hannon Armstrong Sustainable
Infrastructure Capital Inc ‡ | | | 3,973 | | | | 217 | |
|
Healthcare Realty Trust Inc ‡ | | | 2,000 | | | | 59 | |
Hersha Hospitality Trust, Cl A ‡ | | | 11,300 | | | | 92 | |
Highwoods Properties Inc ‡ | | | 1,700 | | | | 65 | |
Independence Realty Trust Inc ‡ | | | 9,700 | | | | 125 | |
Industrial Logistics Properties Trust ‡ | | | 22,400 | | | | 487 | |
Investors Real Estate Trust ‡ | | | 1,440 | | | | 100 | |
Kite Realty Group Trust ‡ | | | 26,500 | | | | 382 | |
Life Storage Inc ‡ | | | 2,300 | | | | 252 | |
Monmouth Real Estate Investment Corp, Cl A ‡ | | | 9,300 | | | | 138 | |
|
National Health Investors Inc ‡ | | | 5,300 | | | | 343 | |
National Storage Affiliates Trust ‡ | | | 5,200 | | | | 177 | |
NexPoint Residential Trust Inc ‡ | | | 1,900 | | | | 84 | |
Office Properties Income Trust ‡ | | | 13,400 | | | | 306 | |
One Liberty Properties Inc ‡ | | | 2,132 | | | | 38 | |
Outfront Media Inc ‡ | | | 12,300 | | | | 233 | |
Piedmont Office Realty Trust Inc, Cl A ‡ | | | 11,400 | | | | 178 | |
Plymouth Industrial REIT Inc ‡ | | | 2,000 | | | | 26 | |
Preferred Apartment Communities Inc, Cl A ‡ | | | 15,000 | | | | 117 | |
PS Business Parks Inc ‡ | | | 1,500 | | | | 198 | |
RE/MAX Holdings Inc, Cl A | | | 5,926 | | | | 185 | |
Realogy Holdings Corp * | | | 16,700 | | | | 206 | |
Retail Value Inc ‡ | | | 9,994 | | | | 154 | |
Rexford Industrial Realty Inc ‡ | | | 23,258 | | | | 1,114 | |
RMR Group Inc/The, Cl A | | | 1,800 | | | | 67 | |
Ryman Hospitality Properties Inc ‡ | | | 4,184 | | | | 269 | |
Sabra Health Care ‡ | | | 32,000 | | | | 527 | |
Safehold Inc ‡ | | | 1,200 | | | | 82 | |
Service Properties Trust ‡ | | | 21,900 | | | | 260 | |
SITE Centers Corp ‡ | | | 30,000 | | | | 303 | |
Summit Hotel Properties Inc ‡ | | | 28,200 | | | | 245 | |
Sun Communities Inc ‡ | | | 2,000 | | | | 278 | |
Tanger Factory Outlet Centers Inc ‡(A) | | | 17,600 | | | | 166 | |
Tejon Ranch Co * | | | 6,660 | | | | 95 | |
Terreno Realty Corp ‡ | | | 500 | | | | 29 | |
| | |
| SEI Institutional Investments Trust / Semi-Annual Report / November 30, 2020 | | 9 |
SCHEDULE OF INVESTMENTS (Unaudited)
November 30, 2020
Small Cap Fund (Continued)
| | | | | | | | |
| | | |
| Description | | Shares | | Market Value
($ Thousands) |
COMMON STOCK (continued) | | | | | | | | |
UMH Properties Inc ‡ | | | 7,718 | | | $ | 111 | |
| | |
| | | | | | | 11,672 | |
| | |
Utilities — 2.5% | | | | | | | | |
ALLETE Inc | | | 3,400 | | | | 191 | |
American States Water Co | | | 2,800 | | | | 207 | |
Artesian Resources Corp, Cl A | | | 5,465 | | | | 202 | |
Atlantic Power Corp * | | | 100,260 | | | | 207 | |
Atmos Energy Corp | | | 2,300 | | | | 221 | |
Black Hills Corp | | | 4,100 | | | | 249 | |
Cadiz Inc * | | | 3,000 | | | | 30 | |
California Water Service Group | | | 2,600 | | | | 129 | |
Chesapeake Utilities Corp | | | 1,500 | | | | 156 | |
Consolidated Water Co Ltd | | | 18,908 | | | | 207 | |
Genie Energy Ltd, Cl B | | | 35,641 | | | | 296 | |
Hawaiian Electric Industries Inc | | | 7,000 | | | | 251 | |
IDACORP Inc | | | 2,900 | | | | 263 | |
MDU Resources Group Inc | | | 18,400 | | | | 459 | |
Middlesex Water Co | | | 1,700 | | | | 116 | |
National Fuel Gas Co | | | 24,500 | | | | 1,009 | |
NorthWestern Corp | | | 3,900 | | | | 226 | |
NRG Energy Inc | | | 7,800 | | | | 255 | |
OGE Energy Corp | | | 4,600 | | | | 149 | |
ONE Gas Inc | | | 3,300 | | | | 261 | |
Ormat Technologies Inc | | | 3,300 | | | | 260 | |
PICO Holdings Inc * | | | 8,153 | | | | 71 | |
Pinnacle West Capital Corp | | | 4,000 | | | | 327 | |
PNM Resources Inc | | | 1,000 | | | | 49 | |
Portland General Electric Co | | | 6,000 | | | | 248 | |
Pure Cycle Corp * | | | 42,169 | | | | 402 | |
Southwest Gas Holdings Inc | | | 1,400 | | | | 90 | |
Spark Energy Inc, Cl A | | | 6,935 | | | | 64 | |
Spire Inc | | | 3,800 | | | | 243 | |
UGI Corp | | | 2,100 | | | | 75 | |
Unitil Corp | | | 2,200 | | | | 90 | |
York Water Co/The | | | 1,700 | | | | 77 | |
| | |
| | | | | | | 7,080 | |
| | |
Total Common Stock
(Cost $235,408) ($ Thousands) | | | | | | | 276,130 | |
| | |
| | | Number of Rights | | |
| | |
RIGHTS — 0.0% | | | | | | | | |
Media General Inc CVR *‡‡(B) | | | 1,155 | | | | – | |
| | |
Total Rights
(Cost $—) ($ Thousands) | | | | | | | – | |
| | | | | | | | |
| | | |
| Description | | Shares | | Market Value
($ Thousands) |
AFFILIATED PARTNERSHIP — 4.8% | | | | | |
SEI Liquidity Fund, L.P.
0.070% **† (C) | | | 13,427,347 | | | $ | 13,430 | |
| | |
Total Affiliated Partnership
(Cost $13,427) ($ Thousands) | | | | | | | 13,430 | |
| |
CASH EQUIVALENT — 1.3% | | | | | |
SEI Daily Income Trust, Government Fund, Cl F
0.010%**† | | | 3,732,394 | | | | 3,732 | |
Total Cash Equivalent
(Cost $3,732) ($ Thousands) | | | | | | | 3,732 | |
| | |
Total Investments in Securities — 105.0%
(Cost $252,567) ($ Thousands) | | | | | | $ | 293,292 | |
| | | | | | | | |
| | Percentages are based on Net Assets of $279,366 ($ Thousands). |
| * | Non-income producing security. |
| ** | The rate reported is the 7-day effective yield as of November 30, 2020. |
| † | Investment in Affiliated Security (See Note 6). |
| ‡ | Real Estate Investment Trust. |
| ‡‡ | Expiration date not available. |
| (A) | Certain securities or partial positions of certain securities are on loan at November 30, 2020 (See Note 12). The total market value of securities on loan at November 30, 2020 was $12,914 ($ Thousands). |
| (B) | Level 3 security in accordance with fair value hierarchy. |
| (C) | This security was purchased with cash collateral held from securities on loan (See Note 12). The total market value of such securities as of November 30, 2020 was $13,430 ($ Thousands). |
ADR — American Depositary Receipt
Cl — Class
CVR — Contingent Value Rights
L.P. — Limited Partnership
Ltd. — Limited
PLC — Public Limited Company
REIT — Real Estate investment Trust
The following is a list of the level of inputs used as of November 30, 2020, in valuing the Fund’s investments ($ Thousands):
| | | | | | | | | | | | | | | | |
| Investments in Securities | | Level 1
($) | | | Level 2
($) | | | Level 3
($) | | | Total ($) | |
Common Stock | | | 276,130 | | | | – | | | | – | | | | 276,130 | |
Rights | | | – | | | | – | | | | –^ | | | | – | |
Affiliated Partnership | | | – | | | | 13,430 | | | | – | | | | 13,430 | |
Cash Equivalent | | | 3,732 | | | | – | | | | – | | | | 3,732 | |
| | | | | | | | | | | | | | | | |
Total Investments in Securities | | | 279,862 | | | | 13,430 | | | | – | | | | 293,292 | |
| | | | | | | | | | | | | | | | |
(1) A reconciliation of Level 3 instruments is presented when the Fund has a significant amount of Level 3 investments at the beginning and/or end of the period in relation to net assets. Management has concluded that Level 3 investments are not material in relation to net assets.
^ Securities market value less than $500.
For the period ended November 30, 2020, there were no transfers in or out of Level 3.
| | |
| 10 | | SEI Institutional Investments Trust / Semi-Annual Report / November 30, 2020 |
SCHEDULE OF INVESTMENTS (Unaudited)
November 30, 2020
Small Cap Fund (Continued)
For more information on valuation inputs, see Note 2 – Significant Accounting Policies in Notes to Financial Statements.
The following is a summary of the Fund’s transactions with affiliates for the period ended November 30, 2020 ($ Thousands):
| | | | | | | | | | | | | | | | | | | | | | | | | | | | | | | | | | | | |
| Security Description | | Value
5/31/2020 | | Purchases
at Cost | | Proceeds
from Sales | | Realized
Gain/(Loss) | | Change in
Unrealized
Appreciation/
(Depreciation) | | Value
11/30/2020 | | Shares | | Income | | Capital
Gains |
SEI Liquidity Fund, L.P. | | | $19,356 | | | | $ 34,288 | | | | $ (40,209) | | | | $— | | | | $(5) | | | | $13,430 | | | | 13,427,347 | | | | $62 | | | | $— | |
SEI Daily Income Trust, Government Fund, Cl F | | | 2,845 | | | | 35,903 | | | | (35,016 | ) | | | — | | | | — | | | | 3,732 | | | | 3,732,394 | | | | — | | | | — | |
| | | | | | | | | | | | | | | | | | | | | | | | | | | | | | | | | | | | |
Totals | | | $22,201 | | | | $70,191 | | | | $(75,225) | | | | $— | | | | $(5) | | | | $17,162 | | | | | | | | $62 | | | | $— | |
| | | | | | | | | | | | | | | | | | | | | | | | | | | | | | | | | | | | |
Amounts designated as “—” are $0 or have been rounded to $0.
The accompanying notes are an integral part of the financial statements.
| | |
| SEI Institutional Investments Trust / Semi-Annual Report / November 30, 2020 | | 11 |
SCHEDULE OF INVESTMENTS (Unaudited)
November 30, 2020
Small Cap II Fund (Continued)
| | | | | | | | |
| | | |
| Description | | Shares | | Market Value
($ Thousands) |
COMMON STOCK — 98.1% | | | | | | | | |
| | |
Communication Services — 3.2% | | | | | | | | |
Boingo Wireless Inc * | | | 12,930 | | | $ | 183 | |
Boston Omaha Corp, Cl A * | | | 4,686 | | | | 109 | |
Cable One Inc | | | 403 | | | | 798 | |
Cardlytics Inc *(A) | | | 5,470 | | | | 649 | |
Cars.com Inc * | | | 19,890 | | | | 222 | |
Cinemark Holdings Inc (A) | | | 100,978 | | | | 1,560 | |
Cogent Communications Holdings Inc | | | 21,545 | | | | 1,253 | |
comScore Inc * | | | 33,390 | | | | 85 | |
Consolidated Communications Holdings Inc | | | 58,699 | | | | 329 | |
Lions Gate Entertainment Corp, Cl A * | | | 197,222 | | | | 1,921 | |
MSG Networks Inc * | | | 21,885 | | | | 266 | |
Nexstar Media Group Inc, Cl A | | | 7,698 | | | | 810 | |
Ooma Inc * | | | 11,570 | | | | 181 | |
QuinStreet Inc * | | | 13,986 | | | | 249 | |
Shutterstock Inc | | | 18,603 | | | | 1,279 | |
TechTarget Inc * | | | 12,827 | | | | 673 | |
TEGNA Inc | | | 79,366 | | | | 1,144 | |
TrueCar Inc * | | | 69,636 | | | | 284 | |
Upwork Inc * | | | 18,497 | | | | 605 | |
| | |
| | | | | | | 12,600 | |
| | |
Consumer Discretionary — 12.9% | | | | | | | | |
Advance Auto Parts Inc | | | 4,481 | | | | 662 | |
American Axle & Manufacturing Holdings Inc * | | | 14,780 | | | | 118 | |
American Eagle Outfitters Inc (A) | | | 176,250 | | | | 3,171 | |
American Outdoor Brands Inc * | | | 1,285 | | | | 18 | |
American Public Education Inc * | | | 19,804 | | | | 615 | |
America’s Car-Mart Inc/TX * | | | 3,306 | | | | 345 | |
Bally’s Corp | | | 14,225 | | | | 632 | |
Beazer Homes USA Inc * | | | 34,980 | | | | 518 | |
Bloomin’ Brands Inc | | | 64,094 | | | | 1,122 | |
Brinker International Inc | | | 8,276 | | | | 415 | |
Brunswick Corp/DE | | | 12,055 | | | | 900 | |
Buckle Inc/The (A) | | | 10,309 | | | | 276 | |
Callaway Golf Co | | | 23,461 | | | | 499 | |
CarParts.com Inc *(A) | | | 40,448 | | | | 610 | |
Carriage Services Inc, Cl A | | | 23,319 | | | | 635 | |
Carter’s Inc | | | 8,735 | | | | 777 | |
Cato Corp/The, Cl A | | | 24,450 | | | | 197 | |
Churchill Downs Inc | | | 4,524 | | | | 814 | |
Chuy’s Holdings Inc * | | | 15,557 | | | | 369 | |
Citi Trends Inc | | | 5,633 | | | | 191 | |
Clarus Corp | | | 26,647 | | | | 384 | |
Cooper-Standard Holdings Inc * | | | 9,665 | | | | 328 | |
Core-Mark Holding Co Inc | | | 26,890 | | | | 839 | |
Dave & Buster’s Entertainment Inc (A) | | | 42,108 | | | | 1,066 | |
Deckers Outdoor Corp * | | | 2,292 | | | | 584 | |
Del Taco Restaurants Inc * | | | 12,490 | | | | 111 | |
Domino’s Pizza Inc | | | 1,992 | | | | 782 | |
El Pollo Loco Holdings Inc * | | | 33,575 | | | | 526 | |
Ethan Allen Interiors Inc | | | 33,130 | | | | 605 | |
| | | | | | | | |
| | | |
| Description | | Shares | | Market Value
($ Thousands) |
COMMON STOCK (continued) | | | | | | | | |
Fiesta Restaurant Group Inc * | | | 12,950 | | | $ | 152 | |
Floor & Decor Holdings Inc, Cl A * | | | 5,256 | | | | 421 | |
Fox Factory Holding Corp * | | | 1,876 | | | | 164 | |
Gentex Corp | | | 16,153 | | | | 526 | |
Grand Canyon Education Inc * | | | 2,740 | | | | 229 | |
Green Brick Partners Inc * | | | 54,812 | | | | 1,193 | |
Group 1 Automotive Inc (A) | | | 4,141 | | | | 492 | |
GrowGeneration Corp *(A) | | | 15,818 | | | | 556 | |
Hamilton Beach Brands Holding Co, Cl A | | | 3,312 | | | | 62 | |
Hanesbrands Inc | | | 22,683 | | | | 322 | |
Haverty Furniture Cos Inc | | | 23,382 | | | | 636 | |
Hibbett Sports Inc * | | | 6,773 | | | | 279 | |
Hooker Furniture Corp | | | 18,242 | | | | 552 | |
Johnson Outdoors Inc, Cl A | | | 6,277 | | | | 525 | |
KB Home | | | 11,601 | | | | 408 | |
Lands’ End Inc * | | | 5,292 | | | | 132 | |
Lithia Motors Inc, Cl A | | | 1,474 | | | | 426 | |
Lovesac Co/The *(A) | | | 13,460 | | | | 429 | |
Magnite Inc * | | | 37,810 | | | | 718 | |
Malibu Boats Inc, Cl A * | | | 4,883 | | | | 278 | |
Marine Products Corp | | | 4,790 | | | | 74 | |
Modine Manufacturing Co * | | | 336,570 | | | | 3,675 | |
Monro Inc | | | 15,859 | | | | 746 | |
Noodles & Co, Cl A * | | | 17,000 | | | | 135 | |
Norwegian Cruise Line Holdings Ltd *(A) | | | 56,632 | | | | 1,295 | |
Oxford Industries Inc | | | 8,395 | | | | 468 | |
Penn National Gaming Inc * | | | 9,648 | | | | 675 | |
PlayAGS Inc * | | | 50,482 | | | | 248 | |
Pool Corp | | | 2,370 | | | | 820 | |
Purple Innovation Inc, Cl A * | | | 14,414 | | | | 430 | |
RH *(A) | | | 1,990 | | | | 902 | |
Sally Beauty Holdings Inc * | | | 65,051 | | | | 748 | |
Scientific Games Corp, Cl A * | | | 13,759 | | | | 513 | |
Shift Technologies *(A) | | | 27,621 | | | | 259 | |
Skechers USA Inc, Cl A * | | | 33,551 | | | | 1,123 | |
Smith & Wesson Brands Inc | | | 5,143 | | | | 81 | |
Sonos Inc * | | | 24,489 | | | | 545 | |
Sportsman’s Warehouse Holdings Inc * | | | 17,470 | | | | 243 | |
Steven Madden Ltd | | | 23,357 | | | | 735 | |
Stitch Fix Inc, Cl A * | | | 13,364 | | | | 541 | |
Superior Group of Cos Inc | | | 8,290 | | | | 180 | |
Taylor Morrison Home Corp, Cl A * | | | 49,691 | | | | 1,256 | |
Texas Roadhouse Inc, Cl A | | | 16,211 | | | | 1,229 | |
Tilly’s Inc, Cl A | | | 40,010 | | | | 365 | |
TopBuild Corp * | | | 2,543 | | | | 443 | |
Tractor Supply Co | | | 6,227 | | | | 877 | |
Tupperware Brands Corp | | | 15,130 | | | | 509 | |
Turtle Beach Corp * | | | 5,280 | | | | 99 | |
Urban Outfitters Inc * | | | 51,751 | | | | 1,417 | |
Vera Bradley Inc * | | | 9,494 | | | | 81 | |
Vista Outdoor Inc * | | | 44,081 | | | | 909 | |
VOXX International Corp, Cl A * | | | 3,980 | | | | 51 | |
| | |
| SEI Institutional Investments Trust / Semi-Annual Report / November 30, 2020 | | 1 |
SCHEDULE OF INVESTMENTS (Unaudited)
November 30, 2020
Small Cap II Fund (Continued)
| | | | | | | | |
| | | |
| Description | | Shares | | Market Value
($ Thousands) |
COMMON STOCK (continued) | | | | | | | | |
Waitr Holdings Inc * | | | 42,850 | | | $ | 142 | |
Weyco Group Inc | | | 5,330 | | | | 96 | |
Williams-Sonoma Inc | | | 3,632 | | | | 398 | |
Wingstop Inc | | | 2,157 | | | | 275 | |
Winmark Corp | | | 2,529 | | | | 455 | |
XPEL Inc * | | | 12,008 | | | | 455 | |
YETI Holdings Inc * | | | 8,438 | | | | 533 | |
Zumiez Inc * | | | 10,677 | | | | 396 | |
| | |
| | | | | | | 51,031 | |
| | |
Consumer Staples — 5.4% | | | | | | | | |
BJ’s Wholesale Club Holdings Inc * | | | 22,459 | | | | 921 | |
Calavo Growers Inc | | | 10,160 | | | | 728 | |
Cal-Maine Foods Inc | | | 15,887 | | | | 622 | |
Casey’s General Stores Inc | | | 4,279 | | | | 777 | |
Celsius Holdings Inc *(A) | | | 15,240 | | | | 492 | |
Central Garden & Pet Co, Cl A * | | | 12,294 | | | | 492 | |
Chefs’ Warehouse Inc/The * | | | 23,617 | | | | 544 | |
Cimpress PLC *(A) | | | 3,800 | | | | 341 | |
Darling Ingredients Inc * | | | 9,444 | | | | 456 | |
elf Beauty Inc * | | | 16,828 | | | | 366 | |
Energizer Holdings Inc | | | 12,496 | | | | 523 | |
Freshpet Inc * | | | 5,501 | | | | 753 | |
Hain Celestial Group Inc/The * | | | 21,303 | | | | 820 | |
Hostess Brands Inc, Cl A * | | | 76,945 | | | | 1,043 | |
Ingles Markets Inc, Cl A | | | 5,490 | | | | 206 | |
Ingredion Inc | | | 16,194 | | | | 1,249 | |
J & J Snack Foods Corp | | | 5,193 | | | | 755 | |
Lamb Weston Holdings Inc | | | 9,499 | | | | 688 | |
Landec Corp * | | | 12,319 | | | | 128 | |
Lifevantage Corp * | | | 30,672 | | | | 326 | |
Medifast Inc | | | 2,911 | | | | 594 | |
MGP Ingredients Inc (A) | | | 15,441 | | | | 673 | |
Natural Grocers by Vitamin Cottage Inc | | | 32,339 | | | | 471 | |
Pilgrim’s Pride Corp * | | | 57,782 | | | | 1,092 | |
Sanderson Farms Inc | | | 8,225 | | | | 1,125 | |
SpartanNash Co | | | 5,816 | | | | 110 | |
Spectrum Brands Holdings Inc | | | 10,795 | | | | 721 | |
Tootsie Roll Industries Inc (A) | | | 16,796 | | | | 520 | |
TreeHouse Foods Inc * | | | 39,748 | | | | 1,635 | |
Turning Point Brands Inc | | | 15,210 | | | | 594 | |
United Natural Foods Inc * | | | 8,200 | | | | 141 | |
Utz Brands Inc (A) | | | 25,439 | | | | 513 | |
Village Super Market Inc, Cl A | | | 13,739 | | | | 318 | |
Vital Farms Inc * | | | 1,087 | | | | 32 | |
Weis Markets Inc | | | 11,871 | | | | 565 | |
| | |
| | | | | | | 21,334 | |
| | |
Energy — 3.4% | | | | | | | | |
Berry Corp | | | 20,570 | | | | 79 | |
Bonanza Creek Energy Inc * | | | 5,217 | | | | 115 | |
Cabot Oil & Gas Corp, Cl A | | | 72,125 | | | | 1,264 | |
Cimarex Energy Co | | | 58,159 | | | | 2,091 | |
| | | | | | | | |
| | | |
| Description | | Shares | | Market Value
($ Thousands) |
COMMON STOCK (continued) | | | | | | | | |
Delek US Holdings Inc | | | 148,955 | | | $ | 1,980 | |
Diamondback Energy Inc | | | 6,563 | | | | 262 | |
DMC Global Inc (A) | | | 11,958 | | | | 488 | |
Evolution Petroleum Corp | | | 47,368 | | | | 144 | |
MRC Global Inc * | | | 35,440 | | | | 205 | |
Murphy USA Inc | | | 14,963 | | | | 1,918 | |
National Energy Services Reunited Corp * | | | 13,460 | | | | 118 | |
NCS Multistage Holdings Inc * | | | 59,209 | | | | 60 | |
New Fortress Energy Inc, Cl A (A) | | | 10,347 | | | | 446 | |
NexTier Oilfield Solutions Inc * | | | 37,907 | | | | 106 | |
Parsley Energy Inc, Cl A | | | 46,295 | | | | 580 | |
PDC Energy Inc * | | | 25,663 | | | | 429 | |
Plug Power Inc *(A) | | | 32,894 | | | | 868 | |
Renewable Energy Group Inc * | | | 6,614 | | | | 384 | |
RigNet Inc * | | | 42,899 | | | | 231 | |
Select Energy Services Inc, Cl A * | | | 40,681 | | | | 172 | |
Solaris Oilfield Infrastructure Inc, Cl A | | | 11,800 | | | | 79 | |
Sunnova Energy International Inc * | | | 17,699 | | | | 717 | |
Sunrun Inc * | | | 6,986 | | | | 448 | |
Talos Energy Inc * | | | 6,300 | | | | 54 | |
Tidewater Inc * | | | 8,491 | | | | 81 | |
| | |
| | | | | | | 13,319 | |
| | |
Financials — 17.6% | | | | | | | | |
Affiliated Managers Group Inc | | | 5,827 | | | | 508 | |
Amalgamated Bank, Cl A | | | 13,720 | | | | 175 | |
A-Mark Precious Metals Inc | | | 1,671 | | | | 51 | |
American Equity Investment Life Holding Co | | | 31,087 | | | | 817 | |
Anworth Mortgage Asset Corp | | | 36,437 | | | | 78 | |
Argo Group International Holdings Ltd | | | 56,631 | | | | 2,219 | |
Artisan Partners Asset Management Inc, Cl A | | | 12,305 | | | | 554 | |
Atlantic Capital Bancshares Inc * | | | 9,661 | | | | 136 | |
B Riley Financial Inc | | | 5,224 | | | | 189 | |
Banco Latinoamericano de Comercio Exterior SA, Cl E | | | 6,740 | | | | 100 | |
Bancorp Inc/The * | | | 24,707 | | | | 292 | |
Bank of Marin Bancorp | | | 6,490 | | | | 225 | |
Bank of NT Butterfield & Son Ltd/The | | | 46,218 | | | | 1,463 | |
Bank OZK | | | 28,858 | | | | 807 | |
BankUnited Inc | | | 147,707 | | | | 4,211 | |
Blackstone Mortgage Trust Inc, Cl A ‡ | | | 42,831 | | | | 1,113 | |
Bridgewater Bancshares Inc * | | | 11,187 | | | | 132 | |
BRP Group Inc, Cl A * | | | 24,988 | | | | 736 | |
Capstead Mortgage Corp ‡ | | | 11,170 | | | | 63 | |
Carter Bankshares Inc | | | 14,975 | | | | 140 | |
Central Pacific Financial Corp | | | 9,730 | | | | 159 | |
CNO Financial Group Inc | | | 163,400 | | | | 3,477 | |
Cohen & Steers Inc | | | 14,264 | | | | 1,009 | |
Crawford & Co, Cl A | | | 24,180 | | | | 178 | |
Curo Group Holdings Corp | | | 12,570 | | | | 109 | |
Customers Bancorp Inc * | | | 12,231 | | | | 207 | |
Donegal Group Inc, Cl A | | | 10,560 | | | | 148 | |
Dynex Capital Inc (A) | | | 52,069 | | | | 917 | |
| | |
| 2 | | SEI Institutional Investments Trust / Semi-Annual Report / November 30, 2020 |
SCHEDULE OF INVESTMENTS (Unaudited)
November 30, 2020
Small Cap II Fund (Continued)
| | | | | | | | |
| | | |
| Description | | Shares | | Market Value
($ Thousands) |
COMMON STOCK (continued) | | | | | | | | |
Enova International Inc * | | | 3,700 | | | $ | 77 | |
ESSA Bancorp Inc | | | 5,750 | | | | 91 | |
EZCORP Inc, Cl A * | | | 42,500 | | | | 216 | |
FactSet Research Systems Inc | | | 2,728 | | | | 910 | |
Farmers National Banc Corp | | | 13,160 | | | | 165 | |
First Bancshares Inc/The | | | 3,308 | | | | 91 | |
First Commonwealth Financial Corp | | | 149,129 | | | | 1,442 | |
First Community Bankshares Inc | | | 11,860 | | | | 250 | |
First Financial Corp/IN | | | 3,860 | | | | 146 | |
First Horizon Corp | | | 450,950 | | | | 5,511 | |
First of Long Island Corp/The | | | 8,291 | | | | 139 | |
Flushing Financial Corp | | | 18,150 | | | | 258 | |
FNB Corp/PA | | | 470,832 | | | | 4,157 | |
Foley Trasimene Acquisition * | | | 28,668 | | | | 311 | |
Globe Life Inc | | | 6,979 | | | | 650 | |
Goosehead Insurance Inc, Cl A | | | 3,760 | | | | 463 | |
Granite Point Mortgage Trust Inc | | | 25,171 | | | | 233 | |
Greenhill & Co Inc | | | 11,923 | | | | 155 | |
Greenlight Capital Re Ltd, Cl A * | | | 12,610 | | | | 97 | |
Hanmi Financial Corp | | | 8,000 | | | | 78 | |
Hanover Insurance Group Inc/The | | | 12,987 | | | | 1,459 | |
HarborOne Bancorp Inc | | | 45,950 | | | | 451 | |
HBT Financial Inc | | | 16,370 | | | | 229 | |
HCI Group Inc | | | 7,072 | | | | 369 | |
Hercules Capital | | | 96,786 | | | | 1,291 | |
Heritage Commerce Corp | | | 12,566 | | | | 106 | |
Heritage Insurance Holdings Inc | | | 11,840 | | | | 122 | |
Home BancShares Inc/AR | | | 44,467 | | | | 823 | |
HomeTrust Bancshares Inc | | | 9,480 | | | | 161 | |
Independent Bank Corp/MI | | | 5,620 | | | | 96 | |
Jaws Acquisition Corp, Cl A * | | | 44,018 | | | | 503 | |
Kemper Corp | | | 11,487 | | | | 861 | |
Kinsale Capital Group Inc | | | 2,728 | | | | 655 | |
Lincoln National Corp | | | 57,340 | | | | 2,707 | |
Macatawa Bank Corp | | | 23,766 | | | | 184 | |
MarketAxess Holdings Inc | | | 1,568 | | | | 845 | |
Mercantile Bank Corp | | | 4,473 | | | | 111 | |
MGIC Investment Corp | | | 140,245 | | | | 1,677 | |
Morningstar Inc | | | 3,011 | | | | 603 | |
Mr Cooper Group Inc * | | | 21,484 | | | | 573 | |
OFG Bancorp | | | 71,015 | | | | 1,190 | |
Oportun Financial Corp * | | | 6,586 | | | | 111 | |
Oppenheimer Holdings Inc, Cl A | | | 6,320 | | | | 186 | |
PCSB Financial Corp | | | 12,810 | | | | 196 | |
Peapack-Gladstone Financial Corp | | | 7,134 | | | | 157 | |
PennantPark Investment Corp | | | 42,756 | | | | 192 | |
PennyMac Financial Services Inc | | | 6,435 | | | | 371 | |
Peoples Bancorp Inc/OH | | | 18,930 | | | | 473 | |
Pinnacle Financial Partners Inc | | | 30,432 | | | | 1,648 | |
Professional Holding Corp, Cl A * | | | 6,126 | | | | 87 | |
PROG Holdings Inc | | | 16,680 | | | | 1,050 | |
Prosperity Bancshares Inc | | | 11,941 | | | | 750 | |
| | | | | | | | |
| | | |
| Description | | Shares | | Market Value
($ Thousands) |
COMMON STOCK (continued) | | | | | | | | |
Provident Bancorp Inc | | | 10,665 | | | $ | 108 | |
Pzena Investment Management Inc, Cl A | | | 19,866 | | | | 132 | |
RBB Bancorp | | | 12,920 | | | | 192 | |
Ready Capital Corp | | | 13,848 | | | | 179 | |
Regional Management Corp | | | 4,249 | | | | 114 | |
Reliant Bancorp Inc | | | 780 | | | | 14 | |
Richmond Mutual BanCorp Inc | | | 8,117 | | | | 102 | |
Safeguard Scientifics Inc | | | 35,402 | | | | 227 | |
Sterling Bancorp/DE | | | 101,446 | | | | 1,621 | |
TCF Financial Corp | | | 102,028 | | | | 3,428 | |
Trean Insurance Group Inc * | | | 2,228 | | | | 32 | |
TriState Capital Holdings Inc * | | | 7,497 | | | | 112 | |
Trupanion Inc * | | | 4,276 | | | | 433 | |
TS Innovation Acquisitions * | | | 25,706 | | | | 260 | |
Umpqua Holdings Corp | | | 243,590 | | | | 3,383 | |
Univest Financial Corp | | | 61,114 | | | | 1,119 | |
Waterstone Financial Inc | | | 35,304 | | | | 620 | |
Western Alliance Bancorp | | | 27,409 | | | | 1,405 | |
WisdomTree Investments Inc | | | 104,679 | | | | 448 | |
| | |
| | | | | | | 69,819 | |
| | |
Health Care — 15.5% | | | | | | | | |
Abeona Therapeutics Inc * | | | 48,969 | | | | 79 | |
Accelerate Diagnostics Inc * | | | 8,230 | | | | 64 | |
Accuray Inc * | | | 42,740 | | | | 191 | |
Affimed NV * | | | 95,948 | | | | 512 | |
Agenus Inc * | | | 72,460 | | | | 268 | |
Albireo Pharma Inc * | | | 11,083 | | | | 412 | |
Alphatec Holdings Inc * | | | 56,120 | | | | 589 | |
American Renal Associates Holdings Inc * | | | 14,435 | | | | 165 | |
Amicus Therapeutics Inc * | | | 37,207 | | | | 852 | |
AMN Healthcare Services Inc * | | | 33,071 | | | | 2,155 | |
AnaptysBio Inc * | | | 2,366 | | | | 61 | |
Anika Therapeutics Inc * | | | 8,555 | | | | 323 | |
Antares Pharma Inc * | | | 50,750 | | | | 158 | |
Apyx Medical Corp * | | | 16,054 | | | | 123 | |
Arcturus Therapeutics Holdings Inc * | | | 5,550 | | | | 509 | |
Ardelyx Inc * | | | 12,578 | | | | 79 | |
Argenx SE ADR * | | | 814 | | | | 233 | |
Arrowhead Pharmaceuticals Inc * | | | 9,432 | | | | 590 | |
Arvinas Inc * | | | 3,821 | | | | 92 | |
Atreca Inc, Cl A * | | | 5,651 | | | | 88 | |
Avid Bioservices Inc * | | | 59,884 | | | | 546 | |
Avidity Biosciences Inc * | | | 18,438 | | | | 552 | |
Axogen Inc * | | | 19,680 | | | | 281 | |
Axonics Modulation Technologies Inc *(A) | | | 8,040 | | | | 353 | |
BioDelivery Sciences International Inc * | | | 147,884 | | | | 562 | |
Biohaven Pharmaceutical Holding Co Ltd * | | | 5,184 | | | | 461 | |
BioSpecifics Technologies Corp * | | | 2,544 | | | | 225 | |
BioTelemetry Inc *(A) | | | 15,779 | | | | 874 | |
Blueprint Medicines Corp * | | | 6,752 | | | | 730 | |
C4 Therapeutics * | | | 2,030 | | | | 69 | |
Cardiff Oncology Inc * | | | 27,453 | | | | 678 | |
| | |
| SEI Institutional Investments Trust / Semi-Annual Report / November 30, 2020 | | 3 |
SCHEDULE OF INVESTMENTS (Unaudited)
November 30, 2020
Small Cap II Fund (Continued)
| | | | | | | | |
| | | |
| Description | | Shares | | Market Value
($ Thousands) |
COMMON STOCK (continued) | | | | | | | | |
Cardiovascular Systems Inc * | | | 7,882 | | | $ | 272 | |
CareDx Inc * | | | 20,276 | | | | 1,159 | |
Castle Biosciences Inc * | | | 10,957 | | | | 521 | |
Catalyst Pharmaceuticals Inc * | | | 66,544 | | | | 244 | |
Chemed Corp | | | 1,738 | | | | 831 | |
Chiasma Inc * | | | 31,865 | | | | 136 | |
Cross Country Healthcare Inc * | | | 20,480 | | | | 178 | |
CryoLife Inc * | | | 7,281 | | | | 152 | |
Cutera Inc * | | | 15,752 | | | | 394 | |
CytomX Therapeutics Inc * | | | 10,504 | | | | 79 | |
CytoSorbents Corp * | | | 18,887 | | | | 158 | |
Deciphera Pharmaceuticals Inc * | | | 4,216 | | | | 261 | |
Denali Therapeutics Inc * | | | 11,953 | | | | 729 | |
Eagle Pharmaceuticals Inc/DE * | | | 5,040 | | | | 229 | |
Eiger BioPharmaceuticals Inc * | | | 8,400 | | | | 77 | |
Electromed Inc * | | | 17,190 | | | | 173 | |
Encompass Health Corp | | | 10,142 | | | | 817 | |
Ensign Group Inc/The | | | 28,077 | | | | 2,018 | |
Envista Holdings Corp * | | | 41,663 | | | | 1,239 | |
Enzo Biochem Inc * | | | 73,049 | | | | 159 | |
Evolent Health Inc, Cl A * | | | 20,959 | | | | 305 | |
Fate Therapeutics Inc *(A) | | | 11,900 | | | | 696 | |
Five Prime Therapeutics Inc * | | | 22,924 | | | | 431 | |
Flexion Therapeutics Inc * | | | 2,427 | | | | 26 | |
Fulcrum Therapeutics Inc * | | | 4,160 | | | | 48 | |
Fulgent Genetics Inc *(A) | | | 2,350 | | | | 106 | |
G1 Therapeutics Inc * | | | 25,020 | | | | 457 | |
Halozyme Therapeutics Inc * | | | 14,665 | | | | 573 | |
Harpoon Therapeutics Inc * | | | 5,488 | | | | 82 | |
HealthEquity Inc * | | | 7,663 | | | | 549 | |
Heron Therapeutics Inc * | | | 15,941 | | | | 276 | |
Heska Corp * | | | 2,370 | | | | 296 | |
Immunovant Inc * | | | 11,633 | | | | 572 | |
Inhibrx *(A) | | | 9,445 | | | | 260 | |
Insmed Inc * | | | 14,715 | | | | 574 | |
Inspire Medical Systems Inc * | | | 4,077 | | | | 757 | |
Integra LifeSciences Holdings Corp * | | | 43,232 | | | | 2,366 | |
Intersect ENT Inc * | | | 9,605 | | | | 184 | |
Invacare Corp | | | 15,310 | | | | 131 | |
Invitae Corp *(A) | | | 12,958 | | | | 643 | |
iRadimed Corp * | | | 6,146 | | | | 151 | |
iRhythm Technologies Inc * | | | 2,092 | | | | 512 | |
Joint Corp/The * | | | 12,582 | | | | 316 | |
Kindred Biosciences Inc * | | | 20,826 | | | | 81 | |
Kiniksa Pharmaceuticals Ltd, Cl A *(A) | | | 12,111 | | | | 226 | |
Kodiak Sciences Inc *(A) | | | 7,687 | | | | 1,051 | |
Kura Oncology Inc * | | | 13,524 | | | | 491 | |
Lannett Co Inc * | | | 4,290 | | | | 26 | |
Lantheus Holdings Inc * | | | 15,910 | | | | 209 | |
LeMaitre Vascular Inc (A) | | | 10,481 | | | | 413 | |
Luminex Corp | | | 28,929 | | | | 687 | |
Lyra Therapeutics * | | | 6,234 | | | | 77 | |
| | | | | | | | |
| | | |
| Description | | Shares | | Market Value
($ Thousands) |
COMMON STOCK (continued) | | | | | | | | |
Marinus Pharmaceuticals Inc *(A) | | | 11,321 | | | $ | 180 | |
MEDNAX Inc * | | | 15,637 | | | | 316 | |
MeiraGTx Holdings PLC * | | | 14,573 | | | | 206 | |
Meridian Bioscience Inc | | | 8,159 | | | | 154 | |
Merit Medical Systems Inc * | | | 14,015 | | | | 772 | |
Metacrine * | | | 10,183 | | | | 81 | |
Mirati Therapeutics Inc * | | | 3,900 | | | | 928 | |
Mustang Bio Inc * | | | 27,967 | | | | 103 | |
NanoString Technologies Inc * | | | 10,244 | | | | 509 | |
Natera Inc * | | | 9,658 | | | | 853 | |
Neoleukin Therapeutics Inc * | | | 2,600 | | | | 33 | |
Nevro Corp * | | | 997 | | | | 161 | |
NextCure Inc * | | | 4,516 | | | | 46 | |
NuVasive Inc * | | | 13,145 | | | | 609 | |
Ocular Therapeutix Inc * | | | 31,306 | | | | 548 | |
Olema Pharmaceuticals * | | | 4,472 | | | | 228 | |
Omnicell Inc * | | | 10,626 | | | | 1,114 | |
Ontrak Inc * | | | 3,086 | | | | 153 | |
ORIC Pharmaceuticals * | | | 7,733 | | | | 262 | |
Owens & Minor Inc | | | 31,815 | | | | 820 | |
Oyster Point Pharma Inc * | | | 3,235 | | | | 71 | |
Penumbra Inc *(A) | | | 1,870 | | | | 415 | |
Personalis Inc * | | | 2,786 | | | | 77 | |
Pieris Pharmaceuticals Inc * | | | 36,568 | | | | 107 | |
PMV Pharmaceuticals * | | | 4,070 | | | | 143 | |
Precision BioSciences Inc * | | | 27,196 | | | | 339 | |
Prestige Consumer Healthcare Inc * | | | 29,192 | | | | 1,038 | |
Prevail Therapeutics Inc * | | | 7,782 | | | | 80 | |
Protagonist Therapeutics Inc * | | | 14,029 | | | | 339 | |
Prothena Corp PLC * | | | 12,085 | | | | 137 | |
Providence Service Corp/The * | | | 4,086 | | | | 555 | |
Pulmonx * | | | 4,794 | | | | 260 | |
Quest Diagnostics Inc | | | 6,305 | | | | 782 | |
Quidel Corp * | | | 2,912 | | | | 568 | |
R1 RCM Inc * | | | 28,685 | | | | 582 | |
Relay Therapeutics * | | | 4,303 | | | | 229 | |
Renalytix AI ADR * | | | 5,346 | | | | 72 | |
Repligen Corp * | | | 2,135 | | | | 405 | |
Replimune Group Inc * | | | 11,071 | | | | 572 | |
Revance Therapeutics Inc *(A) | | | 10,210 | | | | 246 | |
Rigel Pharmaceuticals Inc * | | | 211,870 | | | | 642 | |
Scholar Rock Holding Corp * | | | 13,010 | | | | 648 | |
Seres Therapeutics Inc * | | | 13,387 | | | | 370 | |
Shockwave Medical Inc *(A) | | | 7,870 | | | | 770 | |
SIGA Technologies Inc * | | | 35,769 | | | | 248 | |
Spectrum Pharmaceuticals Inc * | | | 15,650 | | | | 74 | |
Spero Therapeutics Inc *(A) | | | 5,227 | | | | 87 | |
SpringWorks Therapeutics Inc * | | | 5,056 | | | | 331 | |
STERIS PLC | | | 5,185 | | | | 1,005 | |
Surmodics Inc * | | | 3,790 | | | | 142 | |
Sutro Biopharma Inc * | | | 6,747 | | | | 115 | |
Syneos Health Inc, Cl A * | | | 8,440 | | | | 556 | |
| | |
| 4 | | SEI Institutional Investments Trust / Semi-Annual Report / November 30, 2020 |
SCHEDULE OF INVESTMENTS (Unaudited)
November 30, 2020
Small Cap II Fund (Continued)
| | | | | | | | |
| | | |
| Description | | Shares | | Market Value
($ Thousands) |
COMMON STOCK (continued) | | | | | | | | |
Syros Pharmaceuticals Inc * | | | 22,197 | | | $ | 181 | |
TCR2 Therapeutics Inc * | | | 16,955 | | | | 462 | |
TG Therapeutics Inc *(A) | | | 16,775 | | | | 492 | |
Turning Point Therapeutics Inc * | | | 4,190 | | | | 446 | |
Twist Bioscience Corp * | | | 5,845 | | | | 653 | |
Ultragenyx Pharmaceutical Inc * | | | 5,662 | | | | 671 | |
Utah Medical Products Inc | | | 822 | | | | 71 | |
Veracyte Inc * | | | 24,458 | | | | 1,333 | |
Vericel Corp * | | | 13,546 | | | | 346 | |
Viela Bio Inc * | | | 3,628 | | | | 139 | |
Viemed Healthcare Inc * | | | 10,656 | | | | 104 | |
Viking Therapeutics Inc *(A) | | | 33,098 | | | | 213 | |
Voyager Therapeutics Inc * | | | 22,026 | | | | 183 | |
Xeris Pharmaceuticals Inc * | | | 31,005 | | | | 135 | |
| | |
| | | | | | | 61,782 | |
| | |
Industrials — 16.4% | | | | | | | | |
ABM Industries Inc | | | 33,879 | | | | 1,304 | |
ACCO Brands Corp | | | 276,834 | | | | 2,121 | |
Advanced Drainage Systems Inc | | | 5,633 | | | | 393 | |
AGCO Corp | | | 5,714 | | | | 529 | |
Air Transport Services Group Inc * | | | 18,098 | | | | 556 | |
Alaska Air Group Inc | | | 10,952 | | | | 558 | |
Allied Motion Technologies Inc | | | 1,900 | | | | 77 | |
Altra Industrial Motion Corp | | | 32,377 | | | | 1,838 | |
Ameresco Inc, Cl A * | | | 9,836 | | | | 438 | |
American Superconductor Corp * | | | 25,823 | | | | 513 | |
Atlas Air Worldwide Holdings Inc * | | | 8,827 | | | | 493 | |
Bloom Energy Corp, Cl A * | | | 22,010 | | | | 540 | |
Builders FirstSource Inc * | | | 17,528 | | | | 656 | |
BWX Technologies Inc | | | 33,761 | | | | 1,920 | |
CAI International Inc | | | 9,903 | | | | 313 | |
CECO Environmental Corp * | | | 20,732 | | | | 153 | |
Chart Industries Inc * | | | 6,365 | | | | 658 | |
CIRCOR International Inc * | | | 19,041 | | | | 630 | |
Clean Harbors Inc * | | | 27,012 | | | | 1,955 | |
Cornerstone Building Brands Inc * | | | 31,918 | | | | 279 | |
Covenant Logistics Group Inc, Cl A * | | | 19,316 | | | | 357 | |
CRA International Inc | | | 10,128 | | | | 464 | |
Ducommun Inc * | | | 8,170 | | | | 406 | |
DXP Enterprises Inc/TX * | | | 14,661 | | | | 309 | |
Echo Global Logistics Inc * | | | 28,073 | | | | 797 | |
EMCOR Group Inc | | | 6,671 | | | | 575 | |
Energy Recovery Inc * | | | 45,601 | | | | 487 | |
Enerpac Tool Group Corp, Cl A | | | 27,888 | | | | 624 | |
Ennis Inc | | | 23,530 | | | | 385 | |
EnPro Industries Inc | | | 12,413 | | | | 879 | |
Exponent Inc | | | 6,476 | | | | 538 | |
Forrester Research Inc | | | 10,541 | | | | 436 | |
Forward Air Corp (A) | | | 6,066 | | | | 443 | |
Foundation Building Materials Inc * | | | 17,388 | | | | 335 | |
Franklin Covey Co * | | | 9,200 | | | | 202 | |
Generac Holdings Inc * | | | 1,749 | | | | 377 | |
| | | | | | | | |
| | | |
| Description | | Shares | | Market Value
($ Thousands) |
COMMON STOCK (continued) | | | | | | | | |
Graham Corp | | | 13,531 | | | $ | 214 | |
Great Lakes Dredge & Dock Corp * | | | 16,640 | | | | 188 | |
Harsco Corp * | | | 43,617 | | | | 739 | |
Heartland Express Inc | | | 8,221 | | | | 152 | |
Heidrick & Struggles International Inc | | | 15,236 | | | | 398 | |
Heritage-Crystal Clean Inc * | | | 44,030 | | | | 848 | |
Hexcel Corp | | | 16,611 | | | | 823 | |
Hillenbrand Inc | | | 12,087 | | | | 453 | |
Hudson Technologies Inc * | | | 95,821 | | | | 128 | |
Huntington Ingalls Industries Inc | | | 4,864 | | | | 779 | |
Huron Consulting Group Inc * | | | 19,901 | | | | 877 | |
IAA Inc * | | | 8,958 | | | | 537 | |
Insteel Industries Inc | | | 3,766 | | | | 87 | |
ITT Inc | | | 20,639 | | | | 1,499 | |
JetBlue Airways Corp * | | | 164,485 | | | | 2,482 | |
John Bean Technologies Corp | | | 4,418 | | | | 488 | |
Kelly Services Inc, Cl A | | | 22,364 | | | | 458 | |
Kennametal Inc | | | 5,208 | | | | 182 | |
Kimball International Inc, Cl B | | | 10,620 | | | | 116 | |
Kirby Corp * | | | 9,909 | | | | 501 | |
Korn Ferry | | | 21,950 | | | | 879 | |
Landstar System Inc | | | 4,467 | | | | 587 | |
Masonite International Corp * | | | 13,656 | | | | 1,366 | |
Matson Inc | | | 21,498 | | | | 1,250 | |
Middleby Corp/The * | | | 3,787 | | | | 515 | |
Miller Industries Inc/TN | | | 6,199 | | | | 207 | |
Montrose Environmental Group * | | | 7,139 | | | | 196 | |
MSC Industrial Direct Co Inc, Cl A | | | 12,236 | | | | 1,019 | |
MYR Group Inc * | | | 7,456 | | | | 381 | |
Nordson Corp | | | 3,218 | | | | 656 | |
Northwest Pipe Co * | | | 12,122 | | | | 349 | |
nVent Electric PLC | | | 30,234 | | | | 695 | |
Orion Energy Systems Inc * | | | 9,790 | | | | 101 | |
Park Aerospace Corp | | | 28,739 | | | | 366 | |
Powell Industries Inc | | | 15,959 | | | | 412 | |
Quanex Building Products Corp | | | 16,638 | | | | 343 | |
Quanta Services Inc | | | 8,658 | | | | 592 | |
Regal Beloit Corp | | | 13,378 | | | | 1,593 | |
Resources Connection Inc | | | 29,280 | | | | 355 | |
Ritchie Bros Auctioneers Inc | | | 14,963 | | | | 1,074 | |
Saia Inc * | | | 2,827 | | | | 493 | |
Shyft Group Inc/The | | | 15,791 | | | | 409 | |
Snap-on Inc | | | 5,067 | | | | 891 | |
SP Plus Corp * | | | 13,450 | | | | 383 | |
SPX FLOW Inc * | | | 9,312 | | | | 499 | |
Standex International Corp | | | 12,261 | | | | 925 | |
Sterling Construction Co Inc * | | | 10,044 | | | | 161 | |
Systemax Inc | | | 15,665 | | | | 482 | |
Team Inc *(A) | | | 66,184 | | | | 576 | |
Tennant Co | | | 7,347 | | | | 493 | |
Tetra Tech Inc | | | 14,708 | | | | 1,754 | |
Textainer Group Holdings Ltd * | | | 15,610 | | | | 288 | |
| | |
| SEI Institutional Investments Trust / Semi-Annual Report / November 30, 2020 | | 5 |
SCHEDULE OF INVESTMENTS (Unaudited)
November 30, 2020
Small Cap II Fund (Continued)
| | | | | | | | |
| | | |
| Description | | Shares | | Market Value
($ Thousands) |
COMMON STOCK (continued) | | | | | | | | |
Timken Co/The | | | 7,268 | | | $ | 534 | |
Toro Co/The | | | 8,556 | | | | 776 | |
TriNet Group Inc * | | | 11,546 | | | | 866 | |
Triton International Ltd/Bermuda | | | 12,054 | | | | 546 | |
TrueBlue Inc * | | | 26,079 | | | | 498 | |
Tutor Perini Corp * | | | 20,934 | | | | 283 | |
UniFirst Corp/MA | | | 3,656 | | | | 676 | |
Universal Logistics Holdings Inc | | | 10,600 | | | | 228 | |
US Xpress Enterprises Inc, Cl A * | | | 9,010 | | | | 68 | |
Vectrus Inc * | | | 3,992 | | | | 190 | |
Veritiv Corp * | | | 7,003 | | | | 130 | |
Vicor Corp * | | | 4,851 | | | | 398 | |
Wabash National Corp | | | 22,730 | | | | 402 | |
WESCO International Inc * | | | 48,725 | | | | 3,178 | |
Willdan Group Inc * | | | 3,970 | | | | 154 | |
| | |
| | | | | | | 64,704 | |
| | |
Information Technology — 13.6% | | | | | | | | |
2U Inc *(A) | | | 18,681 | | | | 604 | |
8x8 Inc * | | | 12,923 | | | | 255 | |
A10 Networks Inc * | | | 83,431 | | | | 666 | |
Actua Corp *(B)(C) | | | 39,640 | | | | 2 | |
Agilysys Inc * | | | 13,240 | | | | 495 | |
Allegro MicroSystems * | | | 8,525 | | | | 204 | |
Alliance Data Systems Corp | | | 7,497 | | | | 548 | |
American Software Inc/GA, Cl A | | | 16,839 | | | | 276 | |
Appian Corp, Cl A *(A) | | | 4,251 | | | | 595 | |
Asure Software Inc * | | | 24,114 | | | | 187 | |
AudioCodes Ltd | | | 21,045 | | | | 589 | |
Avid Technology Inc * | | | 26,610 | | | | 323 | |
Badger Meter Inc | | | 10,845 | | | | 894 | |
Belden Inc | | | 8,359 | | | | 322 | |
Benefitfocus Inc * | | | 37,517 | | | | 540 | |
Bill.com Holdings Inc * | | | 3,603 | | | | 442 | |
Blackline Inc * | | | 6,942 | | | | 853 | |
Brightcove Inc * | | | 48,305 | | | | 807 | |
Broadridge Financial Solutions Inc | | | 4,877 | | | | 716 | |
CACI International Inc, Cl A * | | | 4,706 | | | | 1,117 | |
Calix Inc * | | | 23,497 | | | | 556 | |
Casa Systems Inc * | | | 36,239 | | | | 192 | |
Cerence Inc *(A) | | | 8,206 | | | | 745 | |
ChannelAdvisor Corp * | | | 19,908 | | | | 294 | |
CMC Materials Inc | | | 5,422 | | | | 837 | |
Cognex Corp | | | 10,183 | | | | 765 | |
Cohu Inc | | | 19,278 | | | | 547 | |
Computer Programs and Systems Inc | | | 6,446 | | | | 183 | |
Comtech Telecommunications Corp | | | 9,690 | | | | 185 | |
Cree Inc * | | | 6,231 | | | | 563 | |
CTS Corp | | | 16,101 | | | | 490 | |
CyberOptics Corp * | | | 7,763 | | | | 208 | |
Digi International Inc * | | | 10,809 | | | | 185 | |
Digital Turbine Inc * | | | 19,311 | | | | 869 | |
Diodes Inc * | | | 9,897 | | | | 673 | |
| | | | | | | | |
| | | |
| Description | | Shares | | Market Value
($ Thousands) |
COMMON STOCK (continued) | | | | | | | | |
Dolby Laboratories Inc, Cl A | | | 6,220 | | | $ | 550 | |
DSP Group Inc * | | | 22,962 | | | | 386 | |
eGain Corp * | | | 18,847 | | | | 214 | |
Endurance International Group Holdings Inc * | | | 20,690 | | | | 196 | |
Entegris Inc | | | 4,243 | | | | 393 | |
ExlService Holdings Inc * | | | 13,952 | | | | 1,162 | |
Genasys Inc * | | | 25,217 | | | | 179 | |
GSI Technology Inc * | | | 19,399 | | | | 129 | |
Hackett Group Inc/The | | | 29,390 | | | | 414 | |
Harmonic Inc * | | | 119,257 | | | | 779 | |
Ichor Holdings Ltd * | | | 10,120 | | | | 323 | |
II-VI Inc * | | | 18,494 | | | | 1,251 | |
International Money Express Inc * | | | 46,304 | | | | 729 | |
J2 Global Inc | | | 28,698 | | | | 2,572 | |
Jack Henry & Associates Inc | | | 4,213 | | | | 678 | |
Kimball Electronics Inc * | | | 1,030 | | | | 16 | |
Littelfuse Inc | | | 3,468 | | | | 834 | |
LivePerson Inc *(A) | | | 6,881 | | | | 402 | |
MACOM Technology Solutions Holdings Inc * | | | 20,226 | | | | 904 | |
ManTech International Corp/VA, Cl A | | | 19,157 | | | | 1,475 | |
MAXIMUS Inc | | | 9,080 | | | | 652 | |
Mimecast * | | | 4,960 | | | | 223 | |
Mitek Systems Inc * | | | 35,677 | | | | 420 | |
MobileIron Inc * | | | 44,913 | | | | 316 | |
Model N Inc * | | | 8,739 | | | | 301 | |
Napco Security Technologies Inc * | | | 10,228 | | | | 312 | |
NCR Corp * | | | 86,575 | | | | 2,395 | |
NEOGAMES * | | | 4,290 | | | | 94 | |
NeoPhotonics Corp * | | | 75,624 | | | | 610 | |
nLight Inc * | | | 22,555 | | | | 677 | |
Nuance Communications Inc * | | | 11,184 | | | | 482 | |
PDF Solutions Inc * | | | 10,464 | | | | 231 | |
Ping Identity Holding Corp * | | | 5,700 | | | | 128 | |
Pluralsight Inc, Cl A * | | | 28,662 | | | | 469 | |
Power Integrations Inc | | | 23,329 | | | | 1,665 | |
QAD Inc, Cl A | | | 5,556 | | | | 319 | |
Ribbon Communications Inc * | | | 26,249 | | | | 180 | |
Rimini Street Inc * | | | 19,780 | | | | 86 | |
Rogers Corp * | | | 9,537 | | | | 1,401 | |
Sailpoint Technologies Holdings Inc * | | | 15,983 | | | | 744 | |
SecureWorks Corp, Cl A * | | | 38,167 | | | | 431 | |
SiTime Corp * | | | 4,746 | | | | 413 | |
SMART Global Holdings Inc * | | | 12,407 | | | | 381 | |
Sprout Social Inc, Cl A * | | | 6,487 | | | | 333 | |
SPS Commerce Inc * | | | 5,171 | | | | 533 | |
SunPower Corp, Cl A *(A) | | | 25,727 | | | | 570 | |
Super Micro Computer Inc * | | | 92,479 | | | | 2,609 | |
SVMK Inc * | | | 9,414 | | | | 200 | |
Telenav Inc * | | | 73,303 | | | | 348 | |
TTEC Holdings Inc | | | 8,142 | | | | 551 | |
Universal Display Corp | | | 4,208 | | | | 964 | |
| | |
| 6 | | SEI Institutional Investments Trust / Semi-Annual Report / November 30, 2020 |
SCHEDULE OF INVESTMENTS (Unaudited)
November 30, 2020
Small Cap II Fund (Continued)
| | | | | | | | |
| | | |
| Description | | Shares | | Market Value
($ Thousands) |
COMMON STOCK (continued) | | | | | | | | |
Upland Software Inc * | | | 3,683 | | | $ | 169 | |
Varonis Systems Inc * | | | 3,053 | | | | 368 | |
Veeco Instruments Inc * | | | 11,125 | | | | 185 | |
Viavi Solutions Inc * | | | 85,235 | | | | 1,155 | |
Vocera Communications Inc * | | | 11,717 | | | | 396 | |
Workiva Inc, Cl A * | | | 10,421 | | | | 781 | |
Zix Corp * | | | 44,790 | | | | 322 | |
Zuora Inc, Cl A * | | | 19,398 | | | | 221 | |
| | |
| | | | | | | 53,948 | |
| | |
Materials — 5.2% | | | | | | | | |
American Vanguard Corp | | | 8,000 | | | | 121 | |
B2Gold Corp (A) | | | 220,370 | | | | 1,230 | |
Cabot Corp | | | 9,870 | | | | 409 | |
Century Aluminum Co * | | | 120,405 | | | | 1,222 | |
Clearwater Paper Corp * | | | 4,190 | | | | 146 | |
Commercial Metals Co | | | 142,450 | | | | 2,836 | |
Domtar Corp | | | 32,506 | | | | 978 | |
Element Solutions Inc | | | 38,846 | | | | 537 | |
Forterra Inc * | | | 34,760 | | | | 645 | |
Gold Resource Corp | | | 180,628 | | | | 538 | |
Hawkins Inc | | | 1,520 | | | | 76 | |
Ingevity Corp * | | | 11,331 | | | | 754 | |
Innospec Inc | | | 8,054 | | | | 663 | |
Koppers Holdings Inc * | | | 15,987 | | | | 433 | |
Livent Corp *(A) | | | 107,365 | | | | 1,629 | |
Myers Industries Inc | | | 19,255 | | | | 327 | |
O-I Glass Inc, Cl I | | | 69,162 | | | | 783 | |
Olin Corp | | | 27,015 | | | | 591 | |
Quaker Chemical Corp | | | 4,161 | | | | 1,028 | |
Ranpak Holdings Corp, Cl A * | | | 75,264 | | | | 851 | |
Ryerson Holding Corp * | | | 18,601 | | | | 200 | |
Schnitzer Steel Industries Inc, Cl A | | | 10,350 | | | | 265 | |
Scotts Miracle-Gro Co/The, Cl A | | | 2,078 | | | | 365 | |
Sensient Technologies Corp | | | 5,786 | | | | 415 | |
Silgan Holdings Inc | | | 17,418 | | | | 589 | |
US Concrete Inc * | | | 8,524 | | | | 302 | |
Valvoline Inc | | | 47,468 | | | | 1,082 | |
Verso Corp | | | 21,543 | | | | 233 | |
W R Grace & Co | | | 21,447 | | | | 1,174 | |
| | |
| | | | | | | 20,422 | |
| | |
Real Estate — 2.5% | | | | | | | | |
Alexandria Real Estate Equities Inc ‡ | | | 5,053 | | | | 827 | |
American Campus Communities Inc ‡ | | | 20,408 | | | | 812 | |
Americold Realty Trust ‡ | | | 19,388 | | | | 662 | |
Columbia Property Trust Inc ‡ | | | 57,895 | | | | 809 | |
Corporate Office Properties Trust ‡ | | | 26,232 | | | | 699 | |
CTO Realty Growth Inc | | | 1,660 | | | | 68 | |
Global Medical REIT Inc ‡ | | | 13,420 | | | | 184 | |
Hannon Armstrong Sustainable | | | | | | | | |
Infrastructure Capital Inc ‡ | | | 9,572 | | | | 523 | |
Innovative Industrial Properties Inc, Cl A ‡(A) | | | 5,003 | | | | 769 | |
| | | | | | | | |
| | | |
| Description | | Shares | | Market Value
($ Thousands) |
COMMON STOCK (continued) | | | | | | | | |
Kennedy-Wilson Holdings Inc | | | 39,454 | | | $ | 630 | |
Lexington Realty Trust, Cl B ‡ | | | 56,405 | | | | 576 | |
Newmark Group Inc, Cl A | | | 134,575 | | | | 945 | |
NexPoint Residential Trust Inc ‡ | | | 16,292 | | | | 722 | |
QTS Realty Trust Inc, Cl A ‡ | | | 11,311 | | | | 672 | |
RE/MAX Holdings Inc, Cl A | | | 5,371 | | | | 168 | |
Retail Value Inc ‡ | | | 11,790 | | | | 182 | |
Ryman Hospitality Properties Inc ‡ | | | 10,081 | | | | 647 | |
Tejon Ranch Co * | | | 7,490 | | | | 107 | |
UMH Properties Inc ‡ | | | 3,250 | | | | 47 | |
| | |
| | | | | | | 10,049 | |
| | |
Utilities — 2.4% | | | | | | | | |
Algonquin Power & Utilities Corp | | | 44,677 | | | | 701 | |
American States Water Co | | | 7,646 | | | | 564 | |
Artesian Resources Corp, Cl A | | | 5,222 | | | | 193 | |
Atlantic Power Corp * | | | 122,240 | | | | 252 | |
Black Hills Corp | | | 12,189 | | | | 741 | |
Consolidated Water Co Ltd | | | 23,240 | | | | 255 | |
Genie Energy Ltd, Cl B | | | 41,308 | | | | 343 | |
Hawaiian Electric Industries Inc | | | 11,612 | | | | 416 | |
IDACORP Inc | | | 12,705 | | | | 1,151 | |
PICO Holdings Inc * | | | 8,650 | | | | 75 | |
Portland General Electric Co | | | 62,105 | | | | 2,570 | |
Pure Cycle Corp * | | | 48,649 | | | | 464 | |
Spark Energy Inc, Cl A | | | 8,640 | | | | 80 | |
Spire Inc | | | 13,851 | | | | 886 | |
UGI Corp | | | 20,763 | | | | 737 | |
| | |
| | | | | | | 9,428 | |
Total Common Stock
(Cost $314,181) ($ Thousands) | | | | | | | 388,436 | |
| | |
| | | Number of
Rights | | |
| | |
RIGHTS* — 0.0% | | | | | | | | |
Media General Inc CVR *‡‡(B)(C) | | | 3,306 | | | | – | |
| | |
Total Rights
(Cost $—) ($ Thousands) | | | | | | | – | |
| | |
| | | Shares | | |
| | |
AFFILIATED PARTNERSHIP — 7.2% | | | | | | | | |
SEI Liquidity Fund, L.P.
0.070% **†(D) | | | 28,500,233 | | | | 28,508 | |
| | |
Total Affiliated Partnership
(Cost $28,501) ($ Thousands) | | | | | | | 28,508 | |
| | |
| SEI Institutional Investments Trust / Semi-Annual Report / November 30, 2020 | | 7 |
SCHEDULE OF INVESTMENTS (Unaudited)
November 30, 2020
Small Cap II Fund (Continued)
| | | | | | | | |
| | | |
| Description | | Shares | | Market Value
($ Thousands) |
CASH EQUIVALENT — 2.1% | | | | | | | | |
SEI Daily Income Trust, Government Fund, Cl F
0.010%**† | | | 8,156,082 | | | $ | 8,156 | |
Total Cash Equivalent
(Cost $8,156) ($ Thousands) | | | | | | | 8,156 | |
| | |
Total Investments in Securities — 107.4%
(Cost $350,838) ($ Thousands) | | | | | | $ | 425,100 | |
| | | | | | | | |
| | Percentages are based on Net Assets of $395,922 ($ Thousands). |
| * | Non-income producing security. |
| ** | The rate reported is the 7-day effective yield as of November 30, 2020. |
| † | Investment in Affiliated Security (see Note 6). |
| ‡ | Real Estate Investment Trust. |
| ‡‡ | Expiration date not available. |
| (A) | Certain securities or partial positions of certain securities are on loan at November 30, 2020 (See Note 12). The total market value of securities on loan at November 30, 2020 was $27,057 ($ Thousands). |
| (B) | Security fair valued using methods determined in good faith by the Valuation Committee of the Board of Trustees. The total market value of such securities as of November 30, 2020 was $2 ($ Thousands) and represented 0.0% of the Net Assets of the Fund. |
| (C) | Level 3 security in accordance with fair value hierarchy. |
| (D) | This security was purchased with cash collateral held from securities on loan (see Note 12). The total market value of such securities as of November 30, 2020 was $28,508 ($ Thousands). |
ADR — American Depositary Receipt
Cl — Class
CVR — Contingent Value Rights
L.P. — Limited Partnership
Ltd. — Limited
PLC — Public Limited Company
SPX — Standard & Poor’s 500 Index
The following is a list of the level of inputs used as of November 30, 2020, in valuing the Fund’s investments carried at value ($ Thousands):
| | | | | | | | | | | | | | | | |
| | | | | |
| Investments in Securities | | Level 1
($) | | | Level 2
($) | | | Level 3
($)(1) | | | Total ($) | |
Common Stock | | | 388,434 | | | | – | | | | 2 | | | | 388,436 | |
Rights | | | – | | | | – | | | | –^ | | | | – | |
Affiliated Partnership | | | – | | | | 28,508 | | | | – | | | | 28,508 | |
Cash Equivalent | | | 8,156 | | | | – | | | | – | | | | 8,156 | |
| | | | | | | | | | | | | | | | |
| | | | |
Total Investments in Securities | | | 396,590 | | | | 28,508 | | | | 2 | | | | 425,100 | |
| | | | | | | | | | | | | | | | |
(1) A reconciliation of Level 3 instruments is presented when the Fund has a significant amount of Level 3 investments at the beginning and/or end of the period in relation to net assets. Management has concluded that Level 3 investments are not material in relation to net assets.
^ Securities market value less than $500.
For the period ended November 30, 2020, there were no transfers in or out of Level 3.
For more information on valuation inputs, see Note 2 – Significant Accounting Policies in Notes to Financial Statements.
The following is a summary of the Fund’s transactions with affiliates for the period ended November 30, 2020 ($ Thousands):
| | | | | | | | | | | | | | | | | | | | | | | | | | | | | | | | | | | | |
| Security Description | | Value
5/31/2020 | | Purchases
at Cost | | Proceeds
from Sales | | Realized
Gain/
(Loss) | | Change in
Unrealized
Appreciation/
(Depreciation) | | Value
11/30/2020 | | Shares | | Income | | Capital
Gains |
SEI Liquidity Fund, L.P. | | $ | 40,682 | | | $ | 86,261 | | | $ | (98,423) | | | $ | — | | | | $(12) | | | $ | 28,508 | | | | 28,500,233 | | | $ | 129 | | | $ | — | |
SEI Daily Income Trust, Government Fund, Cl F | | | 8,951 | | | | 76,071 | | | | (76,866 | ) | | | — | | | | — | | | | 8,156 | | | | 8,156,082 | | | | 1 | | | | — | |
| | | | | | | | | | | | | | | | | | | | | | | | | | | | | | | | | | | | |
Totals | | $ | 49,633 | | | $ | 162,332 | | | $ | (175,290) | | | $ | — | | | | $(12) | | | $ | 49,633 | | | | | | | $ | 130 | | | $ | — | |
| | | | | | | | | | | | | | | | | | | | | | | | | | | | | | | | | | | | |
Amounts designated as “—” are $0 or have been rounded to $0.
The accompanying notes are an integral part of the financial statements.
| | |
| 8 | | SEI Institutional Investments Trust / Semi-Annual Report / November 30, 2020 |
SCHEDULE OF INVESTMENTS (Unaudited)
November 30, 2020
Small/Mid Cap Equity Fund (Continued)
| | | | | | | | |
| | | |
| Description | | Shares | | Market Value
($ Thousands) |
COMMON STOCK — 96.6% | | | | | | | | |
| | |
Communication Services — 2.7% | | | | | | | | |
AMC Networks Inc, Cl A *(A) | | | 33,600 | | | $ | 1,108 | |
Cable One Inc | | | 1,743 | | | | 3,452 | |
Cargurus Inc, Cl A * | | | 23,306 | | | | 584 | |
Cars.com Inc * | | | 51,100 | | | | 571 | |
CenturyLink Inc | | | 68,600 | | | | 717 | |
Cogent Communications Holdings Inc | | | 52,711 | | | | 3,064 | |
Entercom Communications Corp, Cl A | | | 173,700 | | | | 422 | |
EverQuote Inc, Cl A *(A) | | | 13,030 | | | | 491 | |
Glu Mobile Inc * | | | 105,700 | | | | 1,069 | |
Gray Television Inc * | | | 11,200 | | | | 198 | |
Meredith Corp | | | 48,500 | | | | 987 | |
Nexstar Media Group Inc, Cl A | | | 94,631 | | | | 9,960 | |
Shutterstock Inc | | | 43,240 | | | | 2,973 | |
TechTarget Inc * | | | 16,400 | | | | 861 | |
TEGNA Inc | | | 72,400 | | | | 1,043 | |
ViacomCBS Inc, Cl B | | | 56,500 | | | | 1,993 | |
| | |
| | | | | | | 29,493 | |
| | |
Consumer Discretionary — 11.2% | | | | | | | | |
Advance Auto Parts Inc | | | 19,933 | | | | 2,944 | |
American Axle & Manufacturing Holdings Inc * | | | 90,600 | | | | 721 | |
Asbury Automotive Group Inc *(A) | | | 7,390 | | | | 833 | |
Beacon Roofing Supply Inc * | | | 25,300 | | | | 921 | |
Big Lots Inc (A) | | | 52,100 | | | | 2,692 | |
Bloomin’ Brands Inc | | | 65,198 | | | | 1,141 | |
BorgWarner Inc | | | 34,400 | | | | 1,336 | |
Brinker International Inc | | | 33,400 | | | | 1,674 | |
Brunswick Corp/DE | | | 55,159 | | | | 4,117 | |
Capri Holdings Ltd * | | | 31,200 | | | | 1,104 | |
Carter’s Inc | | | 12,190 | | | | 1,085 | |
Cooper Tire & Rubber Co | | | 50,500 | | | | 2,006 | |
Core-Mark Holding Co Inc | | | 115,498 | | | | 3,602 | |
Deckers Outdoor Corp * | | | 3,746 | | | | 954 | |
Dick’s Sporting Goods Inc | | | 65,820 | | | | 3,739 | |
Dillard’s Inc, Cl A (A) | | | 20,600 | | | | 963 | |
Dine Brands Global Inc | | | 14,000 | | | | 882 | |
Domino’s Pizza Inc | | | 8,830 | | | | 3,466 | |
El Pollo Loco Holdings Inc * | | | 48,500 | | | | 760 | |
Ethan Allen Interiors Inc | | | 42,200 | | | | 771 | |
Foot Locker Inc | | | 47,100 | | | | 1,761 | |
Fox Factory Holding Corp * | | | 7,907 | | | | 690 | |
frontdoor Inc * | | | 46,958 | | | | 2,223 | |
Goodyear Tire & Rubber Co/The | | | 69,900 | | | | 728 | |
Grand Canyon Education Inc * | | | 11,279 | | | | 942 | |
Green Brick Partners Inc * | | | 27,996 | | | | 610 | |
Group 1 Automotive Inc (A) | | | 22,327 | | | | 2,653 | |
Hanesbrands Inc | | | 235,661 | | | | 3,346 | |
Harley-Davidson Inc | | | 42,300 | | | | 1,704 | |
Haverty Furniture Cos Inc (A) | | | 52,200 | | | | 1,421 | |
Helen of Troy Ltd * | | | 6,050 | | | | 1,222 | |
Jack in the Box Inc (A) | | | 9,840 | | | | 905 | |
| | | | | | | | |
| | | |
| Description | | Shares | | Market Value
($ Thousands) |
COMMON STOCK (continued) | | | | | | | | |
KB Home | | | 49,013 | | | $ | 1,725 | |
Kohl’s Corp | | | 36,700 | | | | 1,182 | |
La-Z-Boy Inc, Cl Z | | | 26,600 | | | | 985 | |
Lear Corp | | | 9,400 | | | | 1,344 | |
Lithia Motors Inc, Cl A | | | 19,052 | | | | 5,512 | |
Malibu Boats Inc, Cl A * | | | 22,900 | | | | 1,305 | |
MarineMax Inc * | | | 25,700 | | | | 844 | |
MDC Holdings Inc | | | 25,900 | | | | 1,250 | |
Meritage Homes Corp * | | | 7,900 | | | | 712 | |
Monro Inc | | | 71,785 | | | | 3,375 | |
Office Depot Inc | | | 43,718 | | | | 1,253 | |
Papa John’s International Inc | | | 8,980 | | | | 722 | |
Perdoceo Education Corp * | | | 35,100 | | | | 398 | |
Polaris Inc | | | 10,232 | | | | 982 | |
Pool Corp | | | 10,292 | | | | 3,562 | |
PulteGroup Inc | | | 40,500 | | | | 1,767 | |
PVH Corp | | | 18,800 | | | | 1,494 | |
Rent-A-Center Inc/TX, Cl A | | | 47,433 | | | | 1,604 | |
Sally Beauty Holdings Inc * | | | 247,656 | | | | 2,848 | |
Skechers USA Inc, Cl A * | | | 112,457 | | | | 3,764 | |
Sleep Number Corp *(A) | | | 12,300 | | | | 854 | |
Sonic Automotive Inc, Cl A (A) | | | 27,700 | | | | 1,119 | |
Sportsman’s Warehouse Holdings Inc * | | | 62,359 | | | | 869 | |
Taylor Morrison Home Corp, Cl A * | | | 38,159 | | | | 965 | |
Toll Brothers Inc | | | 48,700 | | | | 2,306 | |
TopBuild Corp * | | | 31,965 | | | | 5,569 | |
Tractor Supply Co | | | 27,694 | | | | 3,900 | |
TRI Pointe Group Inc * | | | 14,880 | | | | 260 | |
Visteon Corp * | | | 19,314 | | | | 2,334 | |
Vroom Inc *(A) | | | 45,336 | | | | 1,626 | |
Whirlpool Corp | | | 14,500 | | | | 2,822 | |
Williams-Sonoma Inc | | | 11,200 | | | | 1,226 | |
Wingstop Inc | | | 43,304 | | | | 5,513 | |
World Fuel Services Corp | | | 15,900 | | | | 452 | |
Wyndham Destinations Inc | | | 34,500 | | | | 1,451 | |
| | |
| | | | | | | 121,810 | |
| | |
Consumer Staples — 3.9% | | | | | | | | |
B&G Foods Inc, Cl A (A) | | | 30,416 | | | | 842 | |
Calavo Growers Inc (A) | | | 45,319 | | | | 3,246 | |
Casey’s General Stores Inc | | | 18,926 | | | | 3,439 | |
Cimpress PLC *(A) | | | 15,376 | | | | 1,378 | |
Deluxe Corp | | | 35,400 | | | | 911 | |
Freshpet Inc * | | | 51,861 | | | | 7,099 | |
Hostess Brands Inc, Cl A *(A) | | | 353,072 | | | | 4,784 | |
Ingles Markets Inc, Cl A | | | 23,000 | | | | 865 | |
Ingredion Inc | | | 18,200 | | | | 1,404 | |
J & J Snack Foods Corp | | | 23,519 | | | | 3,419 | |
J M Smucker Co/The | | | 15,400 | | | | 1,805 | |
Lamb Weston Holdings Inc | | | 43,333 | | | | 3,136 | |
Molson Coors Beverage Co, Cl B | | | 33,900 | | | | 1,559 | |
National Beverage Corp *(A) | | | 10,905 | | | | 1,069 | |
Performance Food Group Co * | | | 18,780 | | | | 815 | |
| | |
| SEI Institutional Investments Trust / Semi-Annual Report / November 30, 2020 | | 1 |
SCHEDULE OF INVESTMENTS (Unaudited)
November 30, 2020
Small/Mid Cap Equity Fund (Continued)
| | | | | | | | |
| | | |
| Description | | Shares | | Market Value
($ Thousands) |
| | |
COMMON STOCK (continued) | | | | | | | | |
SpartanNash Co | | | 79,900 | | | $ | 1,509 | |
Sprouts Farmers Market Inc * | | | 25,500 | | | | 540 | |
Turning Point Brands Inc | | | 22,100 | | | | 862 | |
Universal Corp/VA | | | 23,000 | | | | 1,047 | |
WD-40 Co | | | 8,375 | | | | 2,130 | |
Weis Markets Inc (A) | | | 12,900 | | | | 614 | |
| | |
| | | | | | | 42,473 | |
| | |
Energy — 1.3% | | | | | | | | |
Arch Resources Inc | | | 16,200 | | | | 542 | |
Cabot Oil & Gas Corp, Cl A | | | 185,863 | | | | 3,256 | |
Cactus Inc, Cl A | | | 15,960 | | | | 370 | |
Diamondback Energy Inc | | | 27,726 | | | | 1,108 | |
HollyFrontier Corp | | | 41,500 | | | | 971 | |
Magnolia Oil & Gas Corp *(A) | | | 122,862 | | | | 768 | |
Matador Resources Co * | | | 88,800 | | | | 904 | |
Murphy USA Inc | | | 5,810 | | | | 745 | |
Parsley Energy Inc, Cl A | | | 143,028 | | | | 1,792 | |
Rattler Midstream LP (B) | | | 142,458 | | | | 1,181 | |
Southwestern Energy Co * | | | 270,000 | | | | 840 | |
Viper Energy Partners LP (B) | | | 93,016 | | | | 1,042 | |
W&T Offshore Inc *(A) | | | 185,500 | | | | 363 | |
| | |
| | | | | | | 13,882 | |
| | |
Financials — 14.6% | | | | | | | | |
AG Mortgage Investment Trust Inc ‡(A) | | | 61,500 | | | | 196 | |
Ally Financial Inc | | | 58,900 | | | | 1,746 | |
American Equity Investment Life Holding Co | | | 28,100 | | | | 738 | |
American Financial Group Inc/OH | | | 23,270 | | | | 2,081 | |
Ameriprise Financial Inc | | | 9,800 | | | | 1,815 | |
Annaly Capital Management Inc ‡ | | | 114,200 | | | | 914 | |
Ares Capital Corp | | | 46,600 | | | | 768 | |
Artisan Partners Asset Management Inc, Cl A | | | 22,800 | | | | 1,026 | |
Ashford Inc * | | | 239 | | | | 2 | |
Associated Banc-Corp | | | 124,500 | | | | 1,907 | |
Assured Guaranty Ltd | | | 37,800 | | | | 1,139 | |
Axos Financial Inc * | | | 27,600 | | | | 925 | |
Banco Latinoamericano de Comercio Exterior SA, Cl E | | | 30,600 | | | | 452 | |
BancorpSouth Bank | | | 36,400 | | | | 923 | |
Bank OZK | | | 170,992 | | | | 4,781 | |
BankUnited Inc | | | 37,100 | | | | 1,058 | |
BGC Partners Inc, Cl A | | | 802,419 | | | | 3,322 | |
Chimera Investment Corp ‡ | | | 61,200 | | | | 628 | |
CIT Group Inc | | | 41,200 | | | | 1,380 | |
Citizens Financial Group Inc | | | 47,600 | | | | 1,555 | |
CNA Financial Corp | | | 28,700 | | | | 990 | |
CNO Financial Group Inc | | | 79,400 | | | | 1,690 | |
Cohen & Steers Inc | | | 62,216 | | | | 4,403 | |
Columbia Banking System Inc | | | 140,580 | | | | 4,444 | |
Cowen Inc, Cl A | | | 44,700 | | | | 1,071 | |
CryoPort Inc *(A) | | | 54,285 | | | | 2,641 | |
Equitable Holdings Inc | | | 49,900 | | | | 1,266 | |
| | | | | | | | |
| | | |
| Description | | Shares | | Market Value
($ Thousands) |
| | |
COMMON STOCK (continued) | | | | | | | | |
Essent Group Ltd | | | 26,400 | | | $ | 1,158 | |
Everest Re Group Ltd | | | 4,800 | | | | 1,091 | |
FactSet Research Systems Inc | | | 12,035 | | | | 4,017 | |
Federated Hermes Inc, Cl B | | | 28,600 | | | | 768 | |
Fifth Third Bancorp | | | 54,100 | | | | 1,371 | |
First American Financial Corp | | | 28,700 | | | | 1,390 | |
First Financial Bankshares Inc | | | 102,235 | | | | 3,417 | |
First Horizon Corp | | | 156,900 | | | | 1,917 | |
First Merchants Corp | | | 72,197 | | | | 2,406 | |
Flagstar Bancorp Inc | | | 22,890 | | | | 802 | |
Flushing Financial Corp | | | 36,700 | | | | 521 | |
FNB Corp/PA | | | 102,600 | | | | 906 | |
Focus Financial Partners Inc, Cl A * | | | 19,993 | | | | 792 | |
FS KKR Capital Corp (A) | | | 47,600 | | | | 848 | |
Fulton Financial Corp | | | 68,700 | | | | 846 | |
Globe Life Inc | | | 31,458 | | | | 2,929 | |
Hamilton Lane Inc, Cl A | | | 67,300 | | | | 4,703 | |
Hancock Whitney Corp | | | 29,700 | | | | 834 | |
Hanmi Financial Corp | | | 62,800 | | | | 612 | |
Hilltop Holdings Inc | | | 32,173 | | | | 775 | |
Home BancShares Inc/AR | | | 197,685 | | | | 3,659 | |
HomeStreet Inc | | | 28,600 | | | | 925 | |
Investors Bancorp Inc | | | 92,600 | | | | 896 | |
Jaws Acquisition Corp, Cl A *(A) | | | 181,138 | | | | 2,070 | |
KeyCorp | | | 78,400 | | | | 1,212 | |
Kinsale Capital Group Inc | | | 16,430 | | | | 3,946 | |
Lincoln National Corp | | | 33,400 | | | | 1,577 | |
LPL Financial Holdings Inc | | | 24,902 | | | | 2,260 | |
MarketAxess Holdings Inc | | | 6,815 | | | | 3,675 | |
Meta Financial Group Inc | | | 39,514 | | | | 1,308 | |
MFA Financial Inc ‡ | | | 165,000 | | | | 611 | |
MGIC Investment Corp | | | 111,400 | | | | 1,332 | |
Morningstar Inc | | | 13,255 | | | | 2,652 | |
Mr Cooper Group Inc * | | | 33,301 | | | | 888 | |
Navient Corp | | | 92,300 | | | | 865 | |
New Residential Investment Corp ‡ | | | 67,700 | | | | 627 | |
Oaktree Specialty Lending Corp | | | 218,200 | | | | 1,224 | |
OFG Bancorp | | | 42,300 | | | | 709 | |
Old National Bancorp/IN | | | 49,602 | | | | 785 | |
Pacific Premier Bancorp Inc | | | 87,676 | | | | 2,527 | |
PacWest Bancorp | | | 276,999 | | | | 6,443 | |
Palomar Holdings, Cl A * | | | 5,740 | | | | 379 | |
PennyMac Financial Services Inc | | | 15,990 | | | | 922 | |
Piper Sandler Cos | | | 9,700 | | | | 894 | |
PJT Partners Inc | | | 11,800 | | | | 818 | |
Popular Inc | | | 29,100 | | | | 1,412 | |
Preferred Bank/Los Angeles CA | | | 14,000 | | | | 515 | |
PROG Holdings Inc | | | 75,008 | | | | 4,720 | |
Prospect Capital Corp | | | 159,000 | | | | 849 | |
Prosperity Bancshares Inc | | | 53,717 | | | | 3,375 | |
Radian Group Inc | | | 40,700 | | | | 768 | |
Regions Financial Corp | | | 88,600 | | | | 1,353 | |
| | |
| 2 | | SEI Institutional Investments Trust / Semi-Annual Report / November 30, 2020 |
SCHEDULE OF INVESTMENTS (Unaudited)
November 30, 2020
Small/Mid Cap Equity Fund (Continued)
| | | | | | | | |
| | | |
| Description | | Shares | | Market Value
($ Thousands) |
| | |
COMMON STOCK (continued) | | | | | | | | |
Reinsurance Group of America Inc, Cl A | | | 8,100 | | | $ | 934 | |
Republic Bancorp Inc/KY, Cl A | | | 23,300 | | | | 822 | |
ServisFirst Bancshares Inc | | | 21,000 | | | | 793 | |
Starwood Property Trust Inc ‡ | | | 291,542 | | | | 5,230 | |
Stewart Information Services Corp | | | 23,000 | | | | 963 | |
Stifel Financial Corp | | | 50,005 | | | | 3,465 | |
Synovus Financial Corp | | | 32,000 | | | | 1,010 | |
TCF Financial Corp | | | 20,800 | | | | 699 | |
Trustmark Corp | | | 34,000 | | | | 844 | |
United Community Banks Inc/GA | | | 126,300 | | | | 3,020 | |
Universal Insurance Holdings Inc (A) | | | 27,000 | | | | 377 | |
Unum Group | | | 68,500 | | | | 1,523 | |
Veritex Holdings Inc | | | 38,800 | | | | 842 | |
Voya Financial Inc | | | 24,900 | | | | 1,435 | |
Waddell & Reed Financial Inc, Cl A (A) | | | 46,900 | | | | 772 | |
Walker & Dunlop Inc | | | 11,213 | | | | 897 | |
WisdomTree Investments Inc (A) | | | 281,685 | | | | 1,206 | |
Zions Bancorp NA | | | 54,400 | | | | 2,099 | |
| | |
| | | | | | | 159,091 | |
| | |
Health Care — 14.0% | | | | | | | | |
ABIOMED Inc * | | | 3,444 | | | | 944 | |
AdaptHealth Corp, Cl A * | | | 29,700 | | | | 887 | |
Addus HomeCare Corp * | | | 42,121 | | | | 4,180 | |
Agios Pharmaceuticals Inc * | | | 19,722 | | | | 914 | |
Allakos Inc * | | | 6,310 | | | | 675 | |
AMN Healthcare Services Inc * | | | 23,902 | | | | 1,557 | |
Axogen Inc * | | | 82,246 | | | | 1,175 | |
BioTelemetry Inc *(A) | | | 75,118 | | | | 4,162 | |
Blueprint Medicines Corp * | | | 8,000 | | | | 865 | |
CareDx Inc * | | | 15,300 | | | | 875 | |
Change Healthcare Inc * | | | 302,250 | | | | 5,178 | |
Chemed Corp | | | 7,695 | | | | 3,680 | |
Collegium Pharmaceutical Inc * | | | 45,300 | | | | 838 | |
Cooper Cos Inc/The | | | 4,828 | | | | 1,618 | |
Covetrus Inc * | | | 34,900 | | | | 943 | |
CytomX Therapeutics Inc * | | | 75,900 | | | | 571 | |
DaVita Inc * | | | 15,100 | | | | 1,659 | |
Deciphera Pharmaceuticals Inc * | | | 30,884 | | | | 1,909 | |
Emergent BioSolutions Inc * | | | 7,500 | | | | 614 | |
Encompass Health Corp | | | 45,377 | | | | 3,656 | |
Ensign Group Inc/The | | | 181,333 | | | | 13,032 | |
Exact Sciences Corp * | | | 8,636 | | | | 1,045 | |
Halozyme Therapeutics Inc * | | | 98,240 | | | | 3,841 | |
HealthEquity Inc * | | | 31,367 | | | | 2,249 | |
Heron Therapeutics Inc *(A) | | | 68,309 | | | | 1,184 | |
Hologic Inc * | | | 31,118 | | | | 2,151 | |
Innoviva Inc *(A) | | | 147,800 | | | | 1,545 | |
Integra LifeSciences Holdings Corp * | | | 12,101 | | | | 662 | |
Intersect ENT Inc * | | | 41,650 | | | | 797 | |
Ironwood Pharmaceuticals Inc, Cl A * | | | 79,700 | | | | 918 | |
Jazz Pharmaceuticals PLC * | | | 23,965 | | | | 3,372 | |
Kodiak Sciences Inc *(A) | | | 10,529 | | | | 1,439 | |
| | | | | | | | |
| | | |
| Description | | Shares | | Market Value
($ Thousands) |
| | |
COMMON STOCK (continued) | | | | | | | | |
Lannett Co Inc *(A) | | | 35,947 | | | $ | 221 | |
Lantheus Holdings Inc * | | | 30,700 | | | | 404 | |
LeMaitre Vascular Inc | | | 31,054 | | | | 1,223 | |
Ligand Pharmaceuticals Inc *(A) | | | 52,692 | | | | 4,446 | |
Luminex Corp | | | 129,219 | | | | 3,066 | |
Masimo Corp * | | | 2,551 | | | | 649 | |
MEDNAX Inc * | | | 98,359 | | | | 1,988 | |
Meridian Bioscience Inc * | | | 46,800 | | | | 885 | |
Merit Medical Systems Inc * | | | 61,518 | | | | 3,388 | |
Molina Healthcare Inc * | | | 5,750 | | | | 1,174 | |
Natera Inc * | | | 87,815 | | | | 7,751 | |
Neurocrine Biosciences Inc * | | | 10,239 | | | | 972 | |
Nevro Corp * | | | 4,177 | | | | 674 | |
NextGen Healthcare Inc * | | | 56,600 | | | | 1,004 | |
Omnicell Inc * | | | 14,008 | | | | 1,469 | |
Ontrak Inc *(A) | | | 12,439 | | | | 618 | |
Option Care Health Inc * | | | 64,800 | | | | 1,021 | |
Pennant Group Inc/The * | | | 22,100 | | | | 1,120 | |
Precision BioSciences Inc * | | | 26,912 | | | | 336 | |
Prestige Consumer Healthcare Inc * | | | 15,591 | | | | 555 | |
Progyny Inc *(A) | | | 97,350 | | | | 3,455 | |
Quest Diagnostics Inc | | | 28,066 | | | | 3,480 | |
Quidel Corp * | | | 15,945 | | | | 3,110 | |
Radius Health Inc * | | | 58,000 | | | | 915 | |
Repligen Corp * | | | 41,772 | | | | 7,923 | |
Revance Therapeutics Inc * | | | 40,117 | | | | 968 | |
Sangamo Therapeutics Inc *(A) | | | 74,500 | | | | 744 | |
Select Medical Holdings Corp * | | | 30,998 | | | | 747 | |
Silk Road Medical Inc * | | | 18,950 | | | | 1,086 | |
SOC Telemed Inc *(A) | | | 47,270 | | | | 381 | |
Sotera Health Co * | | | 43,238 | | | | 1,170 | |
SpringWorks Therapeutics Inc *(A) | | | 9,964 | | | | 652 | |
STAAR Surgical Co * | | | 16,350 | | | | 1,165 | |
STERIS PLC | | | 43,677 | | | | 8,465 | |
Syneos Health Inc, Cl A * | | | 110,519 | | | | 7,277 | |
Tenet Healthcare Corp * | | | 26,019 | | | | 818 | |
Translate Bio Inc * | | | 57,500 | | | | 1,278 | |
Travere Therapeutics Inc * | | | 40,900 | | | | 938 | |
United Therapeutics Corp * | | | 10,800 | | | | 1,432 | |
Universal Health Services Inc, Cl B | | | 13,300 | | | | 1,737 | |
Vanda Pharmaceuticals Inc * | | | 69,300 | | | | 846 | |
Viking Therapeutics Inc *(A) | | | 98,331 | | | | 632 | |
Xencor Inc * | | | 20,000 | | | | 846 | |
| | |
| | | | | | | 152,164 | |
| | |
Industrials — 18.3% | | | | | | | | |
ABM Industries Inc | | | 157,499 | | | | 6,064 | |
Acuity Brands Inc | | | 2,250 | | | | 267 | |
AGCO Corp | | | 20,900 | | | | 1,933 | |
Air Transport Services Group Inc * | | | 203,328 | | | | 6,250 | |
Alamo Group Inc | | | 6,400 | | | | 869 | |
Allison Transmission Holdings Inc, Cl A | | | 26,500 | | | | 1,088 | |
Altra Industrial Motion Corp | | | 99,205 | | | | 5,631 | |
| | |
| SEI Institutional Investments Trust / Semi-Annual Report / November 30, 2020 | | 3 |
SCHEDULE OF INVESTMENTS (Unaudited)
November 30, 2020
Small/Mid Cap Equity Fund (Continued)
| | | | | | | | |
| | | |
| Description | | Shares | | Market Value
($ Thousands) |
| | |
COMMON STOCK (continued) | | | | | | | | |
American Woodmark Corp * | | | 9,130 | | | $ | 799 | |
Apogee Enterprises Inc | | | 31,100 | | | | 816 | |
ArcBest Corp | | | 28,600 | | | | 1,199 | |
ASGN Inc * | | | 12,300 | | | | 962 | |
Atkore International Group Inc * | | | 40,000 | | | | 1,559 | |
Atlas Air Worldwide Holdings Inc * | | | 13,526 | | | | 755 | |
Builders FirstSource Inc * | | | 24,630 | | | | 921 | |
BWX Technologies Inc | | | 141,161 | | | | 8,029 | |
CH Robinson Worldwide Inc | | | 15,406 | | | | 1,448 | |
Clean Harbors Inc * | | | 33,494 | | | | 2,424 | |
Colfax Corp * | | | 152,533 | | | | 5,503 | |
EMCOR Group Inc | | | 10,700 | | | | 922 | |
Ennis Inc | | | 45,100 | | | | 738 | |
Exponent Inc | | | 107,946 | | | | 8,961 | |
Federal Signal Corp | | | 89,400 | | | | 2,774 | |
Forward Air Corp | | | 25,408 | | | | 1,857 | |
Generac Holdings Inc * | | | 42,525 | | | | 9,168 | |
Heartland Express Inc | | | 30,864 | | | | 570 | |
Hillenbrand Inc | | | 25,000 | | | | 937 | |
Huntington Ingalls Industries Inc | | | 29,142 | | | | 4,668 | |
Interface Inc, Cl A | | | 78,400 | | | | 654 | |
JELD-WEN Holding Inc * | | | 35,600 | | | | 861 | |
JetBlue Airways Corp * | | | 89,300 | | | | 1,348 | |
John Bean Technologies Corp | | | 39,651 | | | | 4,384 | |
Kaman Corp | | | 60,086 | | | | 3,142 | |
KAR Auction Services Inc | | | 266,765 | | | | 4,815 | |
Kennametal Inc | | | 23,462 | | | | 821 | |
Kirby Corp * | | | 40,562 | | | | 2,052 | |
Landstar System Inc | | | 19,608 | | | | 2,577 | |
ManpowerGroup Inc | | | 17,800 | | | | 1,542 | |
Masonite International Corp * | | | 8,960 | | | | 896 | |
MasTec Inc * | | | 16,400 | | | | 930 | |
Matson Inc | | | 60,455 | | | | 3,514 | |
Mercury Systems Inc * | | | 23,625 | | | | 1,683 | |
Meritor Inc * | | | 72,100 | | | | 1,903 | |
Middleby Corp/The * | | | 15,483 | | | | 2,106 | |
MSA Safety Inc (A) | | | 16,570 | | | | 2,476 | |
MSC Industrial Direct Co Inc, Cl A | | | 53,454 | | | | 4,454 | |
Nordson Corp | | | 13,952 | | | | 2,844 | |
NV5 Global Inc * | | | 11,900 | | | | 870 | |
Oshkosh Corp | | | 13,200 | | | | 1,063 | |
Owens Corning | | | 18,500 | | | | 1,348 | |
Patrick Industries Inc | | | 16,441 | | | | 1,036 | |
Primoris Services Corp | | | 44,100 | | | | 1,069 | |
Quad/Graphics Inc, Cl A (A) | | | 86,600 | | | | 269 | |
Quanta Services Inc | | | 14,300 | | | | 977 | |
RBC Bearings Inc * | | | 11,620 | | | | 1,962 | |
Regal Beloit Corp | | | 7,900 | | | | 940 | |
Ritchie Bros Auctioneers Inc | | | 62,603 | | | | 4,496 | |
Sensata Technologies Holding PLC * | | | 75,207 | | | | 3,672 | |
SiteOne Landscape Supply Inc * | | | 7,324 | | | | 1,011 | |
SkyWest Inc | | | 26,700 | | | | 1,146 | |
| | | | | | | | |
| | | |
| Description | | Shares | | Market Value
($ Thousands) |
| | |
COMMON STOCK (continued) | | | | | | | | |
Snap-on Inc | | | 33,722 | | | $ | 5,930 | |
SPX Corp * | | | 16,800 | | | | 861 | |
Steelcase Inc, Cl A | | | 69,700 | | | | 847 | |
Teledyne Technologies Inc * | | | 8,720 | | | | 3,296 | |
Tennant Co | | | 25,562 | | | | 1,717 | |
Terex Corp | | | 33,100 | | | | 1,026 | |
Tetra Tech Inc | | | 31,951 | | | | 3,810 | |
Textron Inc | | | 28,200 | | | | 1,272 | |
Timken Co/The | | | 22,300 | | | | 1,638 | |
Toro Co/The | | | 37,408 | | | | 3,393 | |
Trex Co Inc * | | | 98,930 | | | | 7,402 | |
TriNet Group Inc * | | | 61,035 | | | | 4,578 | |
Trinity Industries Inc (A) | | | 125,392 | | | | 2,865 | |
Triton International Ltd/Bermuda | | | 64,400 | | | | 2,915 | |
UFP Industries Inc | | | 13,800 | | | | 740 | |
UniFirst Corp/MA | | | 16,353 | | | | 3,023 | |
United Rentals Inc * | | | 14,000 | | | | 3,178 | |
Vectrus Inc * | | | 12,800 | | | | 610 | |
Vertiv Holdings Co, Cl A | | | 250,775 | | | | 4,692 | |
Werner Enterprises Inc | | | 18,000 | | | | 720 | |
WESCO International Inc * | | | 16,900 | | | | 1,102 | |
Woodward Inc | | | 10,593 | | | | 1,185 | |
XPO Logistics Inc * | | | 24,354 | | | | 2,598 | |
| | |
| | | | | | | 199,371 | |
| | |
Information Technology — 17.2% | | | | | | | | |
2U Inc *(A) | | | 77,787 | | | | 2,513 | |
8x8 Inc * | | | 45,544 | | | | 900 | |
ACI Worldwide Inc * | | | 190,691 | | | | 6,213 | |
Advanced Energy Industries Inc * | | | 10,090 | | | | 973 | |
Amdocs Ltd | | | 17,500 | | | | 1,152 | |
Amkor Technology Inc | | | 194,161 | | | | 2,862 | |
Arrow Electronics Inc * | | | 18,900 | | | | 1,732 | |
AudioCodes Ltd (A) | | | 94,296 | | | | 2,637 | |
Avalara Inc * | | | 42,985 | | | | 7,383 | |
Badger Meter Inc | | | 48,252 | | | | 3,978 | |
Bandwidth Inc, Cl A * | | | 6,408 | | | | 973 | |
Belden Inc | | | 49,532 | | | | 1,906 | |
Box Inc, Cl A * | | | 43,700 | | | | 817 | |
Broadridge Financial Solutions Inc | | | 21,663 | | | | 3,182 | |
Calix Inc * | | | 35,579 | | | | 842 | |
CDK Global Inc | | | 22,200 | | | | 1,063 | |
ChannelAdvisor Corp * | | | 32,834 | | | | 484 | |
Ciena Corp * | | | 34,500 | | | | 1,546 | |
Cirrus Logic Inc * | | | 5,800 | | | | 465 | |
Cloudera Inc *(A) | | | 80,689 | | | | 942 | |
CMC Materials Inc | | | 23,581 | | | | 3,638 | |
Cognex Corp | | | 44,163 | | | | 3,318 | |
Digital Turbine Inc * | | | 24,360 | | | | 1,096 | |
Diodes Inc * | | | 19,196 | | | | 1,305 | |
Dolby Laboratories Inc, Cl A | | | 5,166 | | | | 457 | |
Donnelley Financial Solutions Inc * | | | 5,407 | | | | 88 | |
Ebix Inc (A) | | | 33,600 | | | | 1,143 | |
| | |
| 4 | | SEI Institutional Investments Trust / Semi-Annual Report / November 30, 2020 |
SCHEDULE OF INVESTMENTS (Unaudited)
November 30, 2020
Small/Mid Cap Equity Fund (Continued)
| | | | | | | | |
| | | |
| Description | | Shares | | Market Value
($ Thousands) |
| | |
COMMON STOCK (continued) | | | | | | | | |
Euronet Worldwide Inc * | | | 35,044 | | | $ | 4,711 | |
Everbridge Inc *(A) | | | 4,109 | | | | 522 | |
EVERTEC Inc | | | 7,440 | | | | 277 | |
FireEye Inc *(A) | | | 99,154 | | | | 1,490 | |
FormFactor Inc * | | | 27,600 | | | | 1,132 | |
Gartner Inc * | | | 11,844 | | | | 1,800 | |
Insight Enterprises Inc * | | | 26,900 | | | | 1,923 | |
Itron Inc * | | | 5,474 | | | | 430 | |
J2 Global Inc * | | | 158,479 | | | | 14,201 | |
Jabil Inc | | | 59,600 | | | | 2,278 | |
Jack Henry & Associates Inc | | | 18,306 | | | | 2,945 | |
Littelfuse Inc | | | 35,292 | | | | 8,489 | |
LivePerson Inc *(A) | | | 52,930 | | | | 3,092 | |
Lumentum Holdings Inc * | | | 7,537 | | | | 651 | |
ManTech International Corp/VA, Cl A | | | 53,677 | | | | 4,131 | |
MAXIMUS Inc | | | 40,534 | | | | 2,911 | |
Monolithic Power Systems Inc | | | 20,891 | | | | 6,684 | |
MTS Systems Corp | | | 23,830 | | | | 835 | |
NCR Corp * | | | 41,300 | | | | 1,143 | |
New Relic Inc * | | | 23,184 | | | | 1,385 | |
Nova Measuring Instruments Ltd *(A) | | | 48,105 | | | | 3,105 | |
Novanta Inc * | | | 30,715 | | | | 3,685 | |
Nuance Communications Inc * | | | 45,445 | | | | 1,960 | |
ON Semiconductor Corp * | | | 173,597 | | | | 4,991 | |
OSI Systems Inc * | | | 100 | | | | 9 | |
Perficient Inc * | | | 21,400 | | | | 974 | |
Pitney Bowes Inc | | | 103,400 | | | | 589 | |
Pluralsight Inc, Cl A * | | | 118,743 | | | | 1,945 | |
Power Integrations Inc | | | 57,675 | | | | 4,117 | |
Proofpoint Inc * | | | 18,548 | | | | 1,919 | |
RingCentral Inc, Cl A * | | | 2,280 | | | | 677 | |
Sanmina Corp * | | | 58,700 | | | | 1,867 | |
Seagate Technology PLC | | | 34,800 | | | | 2,047 | |
Silicon Laboratories Inc * | | | 34,605 | | | | 4,056 | |
Silicon Motion Technology Corp ADR | | | 120,143 | | | | 4,767 | |
SolarWinds Corp *(A) | | | 142,620 | | | | 3,263 | |
SS&C Technologies Holdings Inc | | | 13,309 | | | | 917 | |
Sumo Logic Inc * | | | 18,780 | | | | 492 | |
Sykes Enterprises Inc * | | | 24,400 | | | | 918 | |
SYNNEX Corp | | | 9,965 | | | | 1,597 | |
Tenable Holdings Inc * | | | 23,900 | | | | 861 | |
Teradyne Inc | | | 12,200 | | | | 1,346 | |
Trimble Inc * | | | 29,407 | | | | 1,761 | |
TTEC Holdings Inc | | | 16,178 | | | | 1,095 | |
TTM Technologies Inc * | | | 68,500 | | | | 895 | |
Ultra Clean Holdings Inc * | | | 65,531 | | | | 2,073 | |
Universal Display Corp | | | 18,481 | | | | 4,233 | |
Verint Systems Inc * | | | 86,825 | | | | 4,946 | |
Viavi Solutions Inc * | | | 136,660 | | | | 1,851 | |
Vishay Intertechnology Inc | | | 93,000 | | | | 1,800 | |
Vocera Communications Inc * | | | 25,000 | | | | 846 | |
Western Union Co/The | | | 43,200 | | | | 975 | |
| | | | | | | | |
| | | |
| Description | | Shares | | Market Value
($ Thousands) |
| | |
COMMON STOCK (continued) | | | | | | | | |
Wix.com Ltd * | | | 2,498 | | | $ | 638 | |
WNS Holdings Ltd ADR * | | | 55,160 | | | | 3,884 | |
Workiva Inc, Cl A * | | | 12,305 | | | | 923 | |
Xerox Holdings Corp | | | 43,900 | | | | 961 | |
| | |
| | | | | | | 187,621 | |
| | |
Materials — 5.1% | | | | | | | | |
Ashland Global Holdings Inc | | | 50,458 | | | | 3,793 | |
Axalta Coating Systems Ltd * | | | 157,269 | | | | 4,499 | |
Berry Global Group Inc * | | | 30,300 | | | | 1,606 | |
Boise Cascade Co | | | 17,550 | | | | 759 | |
Cabot Corp | | | 41,400 | | | | 1,714 | |
Celanese Corp, Cl A | | | 7,200 | | | | 931 | |
Chemours Co/The | | | 52,200 | | | | 1,270 | |
Clearwater Paper Corp * | | | 26,500 | | | | 925 | |
Domtar Corp | | | 36,200 | | | | 1,090 | |
Eastman Chemical Co | | | 24,100 | | | | 2,347 | |
FMC Corp | | | 75,726 | | | | 8,785 | |
Forterra Inc * | | | 56,474 | | | | 1,048 | |
Graphic Packaging Holding Co | | | 65,198 | | | | 999 | |
Huntsman Corp | | | 48,000 | | | | 1,189 | |
Koppers Holdings Inc * | | | 30,800 | | | | 834 | |
O-I Glass Inc, Cl I | | | 89,400 | | | | 1,012 | |
Quaker Chemical Corp | | | 18,103 | | | | 4,471 | |
Reliance Steel & Aluminum Co | | | 12,800 | | | | 1,508 | |
Schweitzer-Mauduit International Inc | | | 20,200 | | | | 703 | |
Silgan Holdings Inc | | | 243,983 | | | | 8,247 | |
Steel Dynamics Inc | | | 69,300 | | | | 2,509 | |
Trinseo SA | | | 19,900 | | | | 756 | |
US Concrete Inc * | | | 29,504 | | | | 1,047 | |
Westrock Co | | | 49,900 | | | | 2,106 | |
Worthington Industries Inc | | | 17,240 | | | | 892 | |
| | |
| | | | | | | 55,040 | |
| | |
Real Estate — 6.5% | | | | | | | | |
Alexandria Real Estate Equities Inc ‡ | | | 22,306 | | | | 3,652 | |
Americold Realty Trust ‡(A) | | | 120,084 | | | | 4,098 | |
Braemar Hotels & Resorts Inc ‡ | | | 3,000 | | | | 12 | |
Brandywine Realty Trust ‡ | | | 80,600 | | | | 897 | |
Brixmor Property Group Inc ‡ | | | 115,600 | | | | 1,765 | |
Chatham Lodging Trust ‡ | | | 53,400 | | | | 588 | |
City Office REIT Inc ‡ | | | 72,700 | | | | 638 | |
Community Healthcare Trust Inc ‡ | | | 17,800 | | | | 804 | |
CoreCivic Inc ‡ | | | 62,100 | | | | 440 | |
DiamondRock Hospitality Co ‡ | | | 122,500 | | | | 921 | |
Diversified Healthcare Trust ‡ | | | 151,600 | | | | 669 | |
EastGroup Properties Inc ‡ | | | 6,814 | | | | 929 | |
Franklin Street Properties Corp ‡ | | | 150,900 | | | | 700 | |
Gaming and Leisure Properties Inc ‡ | | | 161,747 | | | | 6,719 | |
GEO Group Inc/The ‡(A) | | | 38,900 | | | | 368 | |
Global Medical REIT Inc ‡ | | | 60,566 | | | | 829 | |
Healthcare Realty Trust Inc ‡ | | | 21,700 | | | | 640 | |
Howard Hughes Corp/The * | | | 47,663 | | | | 3,467 | |
| | |
| SEI Institutional Investments Trust / Semi-Annual Report / November 30, 2020 | | 5 |
SCHEDULE OF INVESTMENTS (Unaudited)
November 30, 2020
Small/Mid Cap Equity Fund (Continued)
| | | | | | | | |
| | | |
| Description | | Shares | | Market Value
($ Thousands) |
| | |
COMMON STOCK (continued) | | | | | | | | |
Industrial Logistics Properties Trust ‡ | | | 35,900 | | | $ | 780 | |
Innovative Industrial Properties Inc, Cl A ‡(A) | | | 28,389 | | | | 4,362 | |
Invitation Homes Inc ‡ | | | 49,083 | | | | 1,403 | |
Kennedy-Wilson Holdings Inc | | | 174,311 | | | | 2,785 | |
Kite Realty Group Trust ‡ | | | 70,700 | | | | 1,018 | |
Lexington Realty Trust, Cl B ‡ | | | 400 | | | | 4 | |
Medical Properties Trust Inc ‡ | | | 363,229 | | | | 7,047 | |
Newmark Group Inc, Cl A | | | 231,396 | | | | 1,624 | |
NexPoint Residential Trust Inc ‡ | | | 70,015 | | | | 3,102 | |
Office Properties Income Trust ‡(A) | | | 45,400 | | | | 1,037 | |
Omega Healthcare Investors Inc ‡ | | | 29,900 | | | | 1,053 | |
Outfront Media Inc ‡ | | | 38,100 | | | | 722 | |
Piedmont Office Realty Trust Inc, Cl A ‡ | | | 55,300 | | | | 864 | |
PotlatchDeltic Corp ‡ | | | 18,300 | | | | 852 | |
QTS Realty Trust Inc, Cl A ‡ | | | 50,626 | | | | 3,008 | |
RE/MAX Holdings Inc, Cl A | | | 24,000 | | | | 751 | |
Realogy Holdings Corp * | | | 69,400 | | | | 854 | |
Redfin Corp * | | | 18,413 | | | | 882 | |
Retail Properties of America Inc, Cl A ‡ | | | 96,000 | | | | 778 | |
Retail Value Inc ‡ | | | 6,050 | | | | 93 | |
Rexford Industrial Realty Inc ‡ | | | 93,381 | | | | 4,475 | |
RPT Realty ‡ | | | 65,300 | | | | 479 | |
Sabra Health Care Inc ‡ | | | 60,000 | | | | 989 | |
Service Properties Trust ‡ | | | 48,500 | | | | 575 | |
SITE Centers Corp ‡ | | | 56,700 | | | | 572 | |
Tanger Factory Outlet Centers Inc ‡(A) | | | 65,700 | | | | 621 | |
VEREIT Inc ‡ | | | 188,300 | | | | 1,335 | |
Xenia Hotels & Resorts Inc ‡ | | | 46,100 | | | | 650 | |
| | |
| | | | | | | 70,851 | |
| | |
Utilities — 1.8% | | | | | | | | |
AES Corp/The | | | 31,300 | | | | 640 | |
Algonquin Power & Utilities Corp (A) | | | 201,305 | | | | 3,156 | |
American States Water Co | | | 33,538 | | | | 2,476 | |
Chesapeake Utilities Corp | | | 8,725 | | | | 908 | |
MDU Resources Group Inc | | | 38,900 | | | | 970 | |
Middlesex Water Co | | | 11,695 | | | | 801 | |
National Fuel Gas Co | | | 28,600 | | | | 1,177 | |
NRG Energy Inc | | | 74,600 | | | | 2,443 | |
Otter Tail Corp | | | 19,600 | | | | 781 | |
Portland General Electric Co | | | 20,000 | | | | 828 | |
South Jersey Industries Inc | | | 38,600 | | | | 889 | |
UGI Corp | | | 92,431 | | | | 3,279 | |
Vistra Corp | | | 104,200 | | | | 1,946 | |
| | |
| | | | | | | 20,294 | |
| | |
Total Common Stock
(Cost $856,292) ($ Thousands) | | | | | | | 1,052,090 | |
| | | | | | | | |
| | | |
| Description | | Shares | | Market Value
($ Thousands) |
| | |
AFFILIATED PARTNERSHIP — 6.9% | | | | | | | | |
SEI Liquidity Fund, L.P.
0.070% **† (C) | | | 75,095,493 | | | $ | 75,105 | |
| | |
Total Affiliated Partnership
(Cost $75,095) ($ Thousands) | | | | | | | 75,105 | |
| | |
CASH EQUIVALENT — 2.6% | | | | | | | | |
SEI Daily Income Trust, Government Fund, Cl F
0.010%**† | | | 28,238,588 | | | | 28,239 | |
| | |
Total Cash Equivalent
(Cost $28,239) ($ Thousands) | | | | | | | 28,239 | |
| | |
Total Investments in Securities — 106.1%
(Cost $959,626) ($ Thousands) | | | | | | $ | 1,155,434 | |
| | | | | | | | |
| | Percentages are based on Net Assets of $1,088,667 ($ Thousands). |
| * | Non-income producing security. |
| ** | Rate shown is the 7-day effective yield as of November 30, 2020. |
| † | Investment in Affiliated Security (See Note 6). |
| ‡ | Real Estate Investment Trust. |
| (A) | Certain securities or partial positions of certain securities are on loan at November 30, 2020 (see Note 12). The total market value of securities on loan at November 30, 2020 was $72,156 ($ Thousands). |
| (B) | Security is a Master Limited Partnership. At November 30, 2020, such securities amounted to $2,223 ($ Thousands), or 0.2% of the net assets of the Fund (See Note 2). |
| (C) | This security was purchased with cash collateral held from securities on loan (See Note 12). The total market value of such securities as of November 30, 2020 was $75,105 ($ Thousands). |
ADR — American Depositary Receipt
Cl — Class
L.P. — Limited Partnership
Ltd. — Limited
PLC — Public Limited Company
REIT — Real Estate investment Trust
| | |
| 6 | | SEI Institutional Investments Trust / Semi-Annual Report / November 30, 2020 |
SCHEDULE OF INVESTMENTS (Unaudited)
November 30, 2020
Small/Mid Cap Equity Fund (Continued)
The following is a list of the level of inputs used as of November 30, 2020, in valuing the Fund’s investments carried at value ($ Thousands):
| | | | | | | | | | | | | | | | |
| | | | | |
Investments in
Securities | | Level 1 ($) | | | Level 2
($) | | | Level 3
($) | | | Total ($) | |
Common Stock | | | 1,052,090 | | | | – | | | | – | | | | 1,052,090 | |
Affiliated Partnership | | | – | | | | 75,105 | | | | – | | | | 75,105 | |
Cash Equivalent | | | 28,239 | | | | – | | | | – | | | | 28,239 | |
| | | | | | | | | | | | | | | | |
Total Investments in Securities | | | 1,080,329 | | | | 75,105 | | | | – | | | | 1,155,434 | |
| | | | | | | | | | | | | | | | |
For the period ended November 30, 2020, there were no transfers in or out of Level 3.
For more information on valuation inputs, see Note 2 – Significant Accounting Policies in Notes to Financial Statements.
The following is a summary of the Fund’s transactions with affiliates for the period ended November 30, 2020 ($ Thousands):
| | | | | | | | | | | | | | | | | | | | | | | | | | | | | | | | | | | | |
| Security Description | | Value
5/31/2020 | | Purchases
at Cost | | Proceeds
from Sales | | Realized Gain/
(Loss) | | Change in
Unrealized
Appreciation/
(Depreciation) | | Value
11/30/2020 | | Shares | | Income | | Capital
Gains |
SEI Liquidity Fund, L.P. | | | $140,805 | | | | $ 176,844 | | | | $(242,509) | | | | $8 | | | | $(43) | | | | $75,105 | | | | 75,095,493 | | | | $269 | | | | $— | |
SEI Daily Income Trust, Government Fund, Cl F | | | 49,188 | | | | 168,814 | | | | (189,763 | ) | | | — | | | | — | | | | 28,239 | | | | 28,238,588 | | | | 3 | | | | — | |
| | | | | | | | | | | | | | | | | | | | | | | | | | | | | | | | | | | | |
Totals | | | $189,993 | | | | $345,658 | | | | $(432,272) | | | | $8 | | | | $(43) | | | | $103,344 | | | | | | | | $272 | | | | $— | |
| | | | | | | | | | | | | | | | | | | | | | | | | | | | | | | | | | | | |
Amounts designated as “—” are $0 or have been rounded to $0.
The accompanying notes are an integral part of the financial statements.
| | |
| SEI Institutional Investments Trust / Semi-Annual Report / November 30, 2020 | | 7 |
SCHEDULE OF INVESTMENTS (Unaudited)
November 30, 2020
U.S. Equity Factor Allocation Fund (Continued)
| | | | | | | | |
| | | |
| Description | | Shares | | Market Value
($ Thousands) |
COMMON STOCK — 98.6% | |
|
Communication Services — 7.4% | |
Alphabet Inc, Cl A * | | | 7,902 | | | $ | 13,863 | |
Alphabet Inc, Cl C * | | | 7,851 | | | | 13,824 | |
AMC Networks Inc, Cl A * | | | 30,694 | | | | 1,012 | |
AT&T Inc | | | 212,926 | | | | 6,122 | |
ATN International Inc | | | 719 | | | | 35 | |
Cargurus Inc, Cl A * | | | 7,321 | | | | 183 | |
CenturyLink Inc | | | 19,753 | | | | 206 | |
Comcast Corp, Cl A | | | 100,209 | | | | 5,035 | |
Consolidated Communications Holdings Inc * | | | 10,629 | | | | 60 | |
Discovery Inc, Cl A * | | | 6,900 | | | | 186 | |
Discovery Inc, Cl C * | | | 261,037 | | | | 6,270 | |
Electronic Arts Inc | | | 7,900 | | | | 1,009 | |
Facebook Inc, Cl A * | | | 44,292 | | | | 12,267 | |
Gogo Inc * | | | 8,343 | | | | 88 | |
John Wiley & Sons Inc, Cl A | | | 13,164 | | | | 455 | |
Liberty Latin America Ltd, Cl A * | | | 6,970 | | | | 79 | |
Liberty Media Corp-Liberty SiriusXM, Cl A * | | | 9,340 | | | | 382 | |
Lions Gate Entertainment Corp, Cl A * | | | 7,929 | | | | 77 | |
Lions Gate Entertainment Corp, Cl B * | | | 36,902 | | | | 331 | |
Match Group Inc * | | | 5,977 | | | | 832 | |
MSG Networks Inc * | | | 31,839 | | | | 387 | |
News Corp | | | 31,883 | | | | 568 | |
News Corp, Cl A | | | 121,455 | | | | 2,144 | |
Omnicom Group Inc | | | 90,683 | | | | 5,713 | |
Sirius XM Holdings Inc | | | 124,401 | | | | 807 | |
Stamps.com Inc * | | | 859 | | | | 161 | |
TechTarget Inc * | | | 3,411 | | | | 179 | |
Verizon Communications Inc | | | 101,880 | | | | 6,155 | |
| | |
| | | | | | | 78,430 | |
|
Consumer Discretionary — 13.9% | |
1-800-Flowers.com Inc, Cl A * | | | 7,870 | | | | 184 | |
Acushnet Holdings Corp | | | 1,213 | | | | 46 | |
Amazon.com Inc * | | | 6,296 | | | | 19,946 | |
American Public Education Inc * | | | 12,859 | | | | 399 | |
AutoNation Inc * | | | 47,154 | | | | 2,890 | |
AutoZone Inc * | | | 2,996 | | | | 3,408 | |
Best Buy Co Inc | | | 87,488 | | | | 9,519 | |
Big Lots Inc | | | 35,328 | | | | 1,825 | |
Booking Holdings Inc * | | | 2,079 | | | | 4,217 | |
Brinker International Inc | | | 6,549 | | | | 328 | |
Buckle Inc/The | | | 4,380 | | | | 117 | |
Chuy’s Holdings Inc * | | | 2,469 | | | | 58 | |
Collectors Universe Inc | | | 1,396 | | | | 108 | |
Cooper Tire & Rubber Co | | | 16,159 | | | | 642 | |
Core-Mark Holding Co Inc | | | 6,656 | | | | 208 | |
Crocs Inc * | | | 9,215 | | | | 543 | |
Deckers Outdoor Corp * | | | 12,841 | | | | 3,269 | |
Dick’s Sporting Goods Inc | | | 9,277 | | | | 527 | |
Dollar General Corp | | | 3,464 | | | | 757 | |
Domino’s Pizza Inc | | | 4,551 | | | | 1,787 | |
| | | | | | | | |
| | | |
| Description | | Shares | | Market Value
($ Thousands) |
COMMON STOCK (continued) | |
eBay Inc | | | 272,139 | | | $ | 13,724 | |
Ethan Allen Interiors Inc | | | 3,424 | | | | 63 | |
Ford Motor Co | | | 86,588 | | | | 786 | |
Fox Factory Holding Corp * | | | 2,147 | | | | 187 | |
Garmin Ltd | | | 5,367 | | | | 627 | |
General Motors Co | | | 31,665 | | | | 1,388 | |
Genesco Inc * | | | 2,125 | | | | 67 | |
Genuine Parts Co | | | 12,481 | | | | 1,228 | |
GoPro Inc, Cl A * | | | 19,432 | | | | 136 | |
Graham Holdings Co, Cl B | | | 1,100 | | | | 492 | |
Group 1 Automotive Inc | | | 2,602 | | | | 309 | |
Hanesbrands Inc | | | 52,137 | | | | 740 | |
Haverty Furniture Cos Inc | | | 13,347 | | | | 363 | |
Hibbett Sports Inc * | | | 15,456 | | | | 636 | |
Home Depot Inc/The | | | 11,596 | | | | 3,217 | |
Johnson Outdoors Inc, Cl A | | | 785 | | | | 66 | |
La-Z-Boy Inc, Cl Z | | | 35,500 | | | | 1,315 | |
Lennar Corp, Cl A | | | 69,097 | | | | 5,242 | |
Lennar Corp, Cl B | | | 12,480 | | | | 758 | |
Lithia Motors Inc, Cl A | | | 3,256 | | | | 942 | |
Lowe’s Cos Inc | | | 12,503 | | | | 1,948 | |
Lululemon Athletica Inc * | | | 5,396 | | | | 1,998 | |
Lumber Liquidators Holdings Inc * | | | 4,294 | | | | 124 | |
Meritage Homes Corp * | | | 16,058 | | | | 1,448 | |
Michaels Cos Inc/The * | | | 11,058 | | | | 109 | |
Nautilus Inc * | | | 4,402 | | | | 93 | |
NIKE Inc, Cl B | | | 18,789 | | | | 2,531 | |
NVR Inc * | | | 196 | | | | 783 | |
Ollie’s Bargain Outlet Holdings Inc * | | | 3,543 | | | | 312 | |
Papa John’s International Inc | | | 3,650 | | | | 293 | |
Penn National Gaming Inc * | | | 4,509 | | | | 316 | |
Perdoceo Education Corp * | | | 22,191 | | | | 252 | |
PetMed Express Inc | | | 2,952 | | | | 91 | |
Pinterest Inc, Cl A * | | | 52,656 | | | | 3,687 | |
Pool Corp | | | 4,287 | | | | 1,484 | |
PulteGroup Inc | | | 93,966 | | | | 4,100 | |
Qurate Retail Inc | | | 306,024 | | | | 3,204 | |
Rent-A-Center Inc/TX, Cl A | | | 45,300 | | | | 1,532 | |
RH * | | | 2,330 | | | | 1,056 | |
Shoe Carnival Inc | | | 1,343 | | | | 49 | |
Sonic Automotive Inc, Cl A | | | 3,502 | | | | 141 | |
Sportsman’s Warehouse Holdings Inc * | | | 40,567 | | | | 565 | |
Starbucks Corp | | | 24,108 | | | | 2,363 | |
Target Corp | | | 90,077 | | | | 16,172 | |
Tesla Inc * | | | 5,634 | | | | 3,198 | |
TJX Cos Inc/The | | | 37,364 | | | | 2,373 | |
Toll Brothers Inc | | | 26,950 | | | | 1,276 | |
Tractor Supply Co | | | 16,368 | | | | 2,305 | |
TRI Pointe Group Inc * | | | 39,332 | | | | 687 | |
Tupperware Brands Corp | | | 3,113 | | | | 105 | |
Vista Outdoor Inc * | | | 8,696 | | | | 179 | |
Williams-Sonoma Inc | | | 38,579 | | | | 4,223 | |
| | |
| SEI Institutional Investments Trust / Semi-Annual Report / November 30, 2020 | | 1 |
SCHEDULE OF INVESTMENTS (Unaudited)
November 30, 2020
U.S. Equity Factor Allocation Fund (Continued)
| | | | | | | | |
| | | |
| Description | | Shares | | Market Value
($ Thousands) |
|
COMMON STOCK (continued) | |
Wingstop Inc | | | 4,395 | | | $ | 559 | |
Winmark Corp | | | 2,676 | | | | 482 | |
XPEL Inc * | | | 2,469 | | | | 93 | |
Yum China Holdings Inc | | | 28,627 | | | | 1,614 | |
Yum! Brands Inc | | | 23,494 | | | | 2,486 | |
| | |
| | | | | | | 147,295 | |
|
Consumer Staples — 10.9% | |
Altria Group Inc | | | 49,652 | | | | 1,978 | |
Archer-Daniels-Midland Co | | | 41,009 | | | | 2,041 | |
B&G Foods Inc, Cl A | | | 7,837 | | | | 217 | |
Boston Beer Co Inc/The, Cl A * | | | 762 | | | | 709 | |
Brown-Forman Corp, Cl A | | | 11,795 | | | | 870 | |
Brown-Forman Corp, Cl B | | | 20,000 | | | | 1,613 | |
Bunge Ltd | | | 53,027 | | | | 3,123 | |
Casey’s General Stores Inc | | | 3,867 | | | | 703 | |
Celsius Holdings Inc * | | | 5,153 | | | | 166 | |
Central Garden & Pet Co, Cl A * | | | 6,442 | | | | 242 | |
Church & Dwight Co Inc | | | 22,695 | | | | 1,992 | |
Clorox Co/The | | | 29,316 | | | | 5,950 | |
Colgate-Palmolive Co | | | 75,155 | | | | 6,436 | |
Costco Wholesale Corp | | | 8,129 | | | | 3,185 | |
Estee Lauder Cos Inc/The, Cl A | | | 9,947 | | | | 2,440 | |
Flowers Foods Inc | | | 80,157 | | | | 1,779 | |
Freshpet Inc * | | | 5,742 | | | | 786 | |
General Mills Inc | | | 9,719 | | | | 591 | |
Hain Celestial Group Inc/The * | | | 4,778 | | | | 184 | |
Hershey Co/The | | | 20,505 | | | | 3,032 | |
Ingles Markets Inc, Cl A | | | 13,216 | | | | 497 | |
Ingredion Inc | | | 2,069 | | | | 160 | |
J M Smucker Co/The | | | 12,014 | | | | 1,408 | |
Kellogg Co | | | 27,692 | | | | 1,770 | |
Keurig Dr Pepper Inc | | | 24,990 | | | | 761 | |
Kimberly-Clark Corp | | | 13,727 | | | | 1,912 | |
Kroger Co/The | | | 355,262 | | | | 11,724 | |
Lancaster Colony Corp | | | 1,198 | | | | 203 | |
Medifast Inc | | | 5,574 | | | | 1,138 | |
Monster Beverage Corp * | | | 47,586 | | | | 4,034 | |
Nu Skin Enterprises Inc, Cl A | | | 7,623 | | | | 393 | |
PepsiCo Inc | | | 36,600 | | | | 5,279 | |
Performance Food Group Co * | | | 9,440 | | | | 409 | |
Philip Morris International Inc | | | 60,980 | | | | 4,619 | |
Procter & Gamble Co/The | | | 135,054 | | | | 18,755 | |
SpartanNash Co | | | 30,904 | | | | 583 | |
Sprouts Farmers Market Inc * | | | 112,330 | | | | 2,378 | |
Sysco Corp | | | 6,065 | | | | 432 | |
Turning Point Brands Inc | | | 1,400 | | | | 55 | |
United Natural Foods Inc * | | | 8,234 | | | | 142 | |
Universal Corp/VA | | | 5,230 | | | | 238 | |
USANA Health Sciences Inc * | | | 10,865 | | | | 817 | |
Vector Group Ltd | | | 131,653 | | | | 1,480 | |
Walgreens Boots Alliance Inc | | | 47,937 | | | | 1,822 | |
Walmart Inc | | | 110,376 | | | | 16,864 | |
| | | | | | | | |
| | | |
| Description | | Shares | | Market Value
($ Thousands) |
|
COMMON STOCK (continued) | |
WD-40 Co | | | 1,377 | | | $ | 350 | |
Weis Markets Inc | | | 2,216 | | | | 105 | |
| | |
| | | | | | | 116,365 | |
|
Energy — 0.5% | |
Bonanza Creek Energy Inc * | | | 2,791 | | | | 62 | |
Cabot Oil & Gas Corp, Cl A | | | 43,989 | | | | 771 | |
Cactus Inc, Cl A | | | 5,656 | | | | 131 | |
DHT Holdings Inc | | | 101,957 | | | | 521 | |
Dorian LPG Ltd * | | | 30,100 | | | | 329 | |
Frontline Ltd/Bermuda | | | 17,500 | | | | 109 | |
Murphy USA Inc | | | 8,505 | | | | 1,090 | |
Nordic American Tankers Ltd | | | 21,794 | | | | 70 | |
Plug Power Inc * | | | 48,366 | | | | 1,276 | |
Range Resources Corp | | | 31,886 | | | | 233 | |
Renewable Energy Group Inc * | | | 6,293 | | | | 366 | |
Southwestern Energy Co * | | | 79,469 | | | | 247 | |
| | |
| | | | | | | 5,205 | |
|
Financials — 9.1% | |
Aflac Inc | | | 35,671 | | | | 1,567 | |
Alleghany Corp | | | 1,521 | | | | 875 | |
Allstate Corp/The | | | 21,160 | | | | 2,166 | |
American Equity Investment Life Holding Co | | | 13,527 | | | | 355 | |
Ameriprise Financial Inc | | | 1,018 | | | | 189 | |
Arrow Financial Corp | | | 1,982 | | | | 59 | |
Artisan Partners Asset Management Inc, Cl A | | | 19,717 | | | | 887 | |
Axis Capital Holdings Ltd | | | 25,720 | | | | 1,289 | |
Bank First Corp | | | 859 | | | | 59 | |
Bank of America Corp | | | 6,924 | | | | 195 | |
Bank of New York Mellon Corp/The | | | 302,332 | | | | 11,827 | |
Bank OZK | | | 18,359 | | | | 513 | |
Bridge Bancorp Inc | | | 2,232 | | | | 50 | |
Brighthouse Financial Inc * | | | 12,807 | | | | 450 | |
Brightsphere Investment Group Inc | | | 9,274 | | | | 164 | |
Bryn Mawr Bank Corp | | | 2,899 | | | | 86 | |
Cannae Holdings Inc * | | | 12,586 | | | | 496 | |
CBTX Inc | | | 2,475 | | | | 54 | |
Citigroup Inc | | | 169,996 | | | | 9,362 | |
Cohen & Steers Inc | | | 3,322 | | | | 235 | |
Cowen Inc, Cl A | | | 21,273 | | | | 510 | |
Curo Group Holdings Corp | | | 14,504 | | | | 125 | |
Diamond Hill Investment Group Inc | | | 477 | | | | 65 | |
Encore Capital Group Inc * | | | 1,303 | | | | 44 | |
Enova International Inc * | | | 31,819 | | | | 665 | |
Enstar Group Ltd * | | | 1,820 | | | | 345 | |
Equitable Holdings Inc | | | 20,511 | | | | 521 | |
Everest Re Group Ltd | | | 4,335 | | | | 985 | |
Federated Hermes Inc, Cl B | | | 43,873 | | | | 1,178 | |
Fidelity National Financial Inc | | | 33,784 | | | | 1,216 | |
Fifth Third Bancorp | | | 34,855 | | | | 883 | |
First of Long Island Corp/The | | | 3,397 | | | | 57 | |
First Republic Bank/CA | | | 3,705 | | | | 480 | |
| | |
| 2 | | SEI Institutional Investments Trust / Semi-Annual Report / November 30, 2020 |
SCHEDULE OF INVESTMENTS (Unaudited)
November 30, 2020
U.S. Equity Factor Allocation Fund (Continued)
| | | | | | | | |
| | | |
| Description | | Shares | | Market Value
($ Thousands) |
|
COMMON STOCK (continued) | |
Flagstar Bancorp Inc | | | 5,261 | | | $ | 184 | |
Focus Financial Partners Inc, Cl A * | | | 4,617 | | | | 183 | |
Green Dot Corp, Cl A * | | | 7,623 | | | | 408 | |
Hanover Insurance Group Inc/The | | | 3,948 | | | | 444 | |
Hartford Financial Services Group Inc/The | | | 29,270 | | | | 1,294 | |
Hilltop Holdings Inc | | | 10,780 | | | | 260 | |
JPMorgan Chase & Co | | | 30,164 | | | | 3,556 | |
Kinsale Capital Group Inc | | | 3,077 | | | | 739 | |
Live Oak Bancshares Inc | | | 4,187 | | | | 172 | |
LPL Financial Holdings Inc | | | 7,173 | | | | 651 | |
MetLife Inc | | | 6,804 | | | | 314 | |
MGIC Investment Corp | | | 31,558 | | | | 377 | |
Mr Cooper Group Inc * | | | 22,013 | | | | 587 | |
Navient Corp | | | 25,618 | | | | 240 | |
Nelnet Inc, Cl A | | | 2,600 | | | | 177 | |
New York Community Bancorp Inc | | | 67,246 | | | | 652 | |
Pacific Premier Bancorp Inc | | | 2,936 | | | | 85 | |
PennyMac Financial Services Inc | | | 6,054 | | | | 349 | |
PJT Partners Inc | | | 3,436 | | | | 238 | |
PRA Group Inc * | | | 6,685 | | | | 278 | |
Preferred Bank/Los Angeles CA | | | 2,034 | | | | 75 | |
Principal Financial Group Inc | | | 55,171 | | | | 2,747 | |
Prosperity Bancshares Inc | | | 1,288 | | | | 81 | |
Prudential Financial Inc | | | 60,815 | | | | 4,599 | |
QCR Holdings Inc | | | 2,170 | | | | 76 | |
Radian Group Inc | | | 24,285 | | | | 459 | |
S&P Global Inc | | | 10,659 | | | | 3,750 | |
Signature Bank/New York NY | | | 5,818 | | | | 653 | |
SLM Corp | | | 113,758 | | | | 1,207 | |
State Street Corp | | | 29,146 | | | | 2,054 | |
Stewart Information Services Corp | | | 4,672 | | | | 196 | |
StoneX Group * | | | 2,362 | | | | 146 | |
Sturm Ruger & Co Inc | | | 13,347 | | | | 817 | |
SVB Financial Group * | | | 4,377 | | | | 1,509 | |
Synchrony Financial | | | 215,034 | | | | 6,552 | |
T Rowe Price Group Inc | | | 108,328 | | | | 15,535 | |
Third Point Reinsurance Ltd * | | | 16,261 | | | | 155 | |
Travelers Cos Inc/The | | | 14,317 | | | | 1,856 | |
Unum Group | | | 22,017 | | | | 489 | |
Virtu Financial Inc, Cl A | | | 7,730 | | | | 176 | |
Voya Financial Inc | | | 38,537 | | | | 2,221 | |
W R Berkley Corp | | | 14,875 | | | | 969 | |
Waddell & Reed Financial Inc, Cl A | | | 51,028 | | | | 840 | |
Watford Holdings Ltd * | | | 2,577 | | | | 89 | |
| | |
| | | | | | | 96,391 | |
|
Health Care — 14.3% | |
Agilent Technologies Inc | | | 19,200 | | | | 2,244 | |
Alexion Pharmaceuticals Inc * | | | 7,844 | | | | 958 | |
AmerisourceBergen Corp, Cl A | | | 62,096 | | | | 6,403 | |
Amgen Inc | | | 47,110 | | | | 10,460 | |
Amicus Therapeutics Inc * | | | 14,453 | | | | 331 | |
Antares Pharma Inc * | | | 24,221 | | | | 76 | |
| | | | | | | | |
| | | |
| Description | | Shares | | Market Value
($ Thousands) |
|
COMMON STOCK (continued) | |
Avanos Medical Inc * | | | 7,121 | | | $ | 302 | |
Avantor Inc * | | | 2,752 | | | | 75 | |
Biogen Inc * | | | 21,821 | | | | 5,241 | |
Bristol-Myers Squibb Co | | | 84,508 | | | | 5,273 | |
Cardinal Health Inc | | | 102,730 | | | | 5,608 | |
Catalent Inc * | | | 14,757 | | | | 1,419 | |
Catalyst Pharmaceuticals Inc * | | | 18,905 | | | | 69 | |
Centene Corp * | | | 5,019 | | | | 309 | |
Cerner Corp | | | 51,053 | | | | 3,821 | |
Chemed Corp | | | 1,652 | | | | 790 | |
Co-Diagnostics Inc * | | | 3,200 | | | | 38 | |
Community Health Systems Inc * | | | 12,776 | | | | 105 | |
Corcept Therapeutics Inc * | | | 4,403 | | | | 100 | |
CVS Health Corp | | | 28,180 | | | | 1,910 | |
DaVita Inc * | | | 84,652 | | | | 9,299 | |
Edwards Lifesciences Corp * | | | 1,323 | | | | 111 | |
Eli Lilly and Co | | | 3,867 | | | | 563 | |
Ensign Group Inc/The | | | 7,623 | | | | 548 | |
Fulgent Genetics Inc * | | | 1,437 | | | | 65 | |
Gilead Sciences Inc | | | 57,472 | | | | 3,487 | |
Haemonetics Corp * | | | 3,207 | | | | 362 | |
HCA Healthcare Inc | | | 14,900 | | | | 2,237 | |
Henry Schein Inc * | | | 15,753 | | | | 1,013 | |
Horizon Therapeutics PLC * | | | 11,875 | | | | 837 | |
Humana Inc | | | 14,672 | | | | 5,876 | |
IDEXX Laboratories Inc * | | | 1,924 | | | | 887 | |
Inovalon Holdings Inc, Cl A * | | | 10,834 | | | | 202 | |
iRhythm Technologies Inc * | | | 3,006 | | | | 735 | |
Jazz Pharmaceuticals PLC * | | | 13,829 | | | | 1,946 | |
Johnson & Johnson | | | 51,146 | | | | 7,400 | |
Laboratory Corp of America Holdings * | | | 9,834 | | | | 1,965 | |
Ligand Pharmaceuticals Inc * | | | 2,147 | | | | 181 | |
McKesson Corp | | | 59,336 | | | | 10,675 | |
Medpace Holdings Inc * | | | 4,029 | | | | 517 | |
Medtronic PLC | | | 47,440 | | | | 5,394 | |
Merck & Co Inc | | | 172,154 | | | | 13,839 | |
Meridian Bioscience Inc * | | | 2,300 | | | | 43 | |
Merit Medical Systems Inc * | | | 7,086 | | | | 390 | |
Mettler-Toledo International Inc * | | | 2,199 | | | | 2,529 | |
Moderna Inc * | | | 1,020 | | | | 156 | |
Novavax Inc * | | | 1,181 | | | | 165 | |
Novocure Ltd * | | | 5,526 | | | | 694 | |
Ocular Therapeutix Inc * | | | 7,730 | | | | 135 | |
Ontrak Inc * | | | 1,181 | | | | 59 | |
Owens & Minor Inc | | | 9,430 | | | | 243 | |
Pacira BioSciences Inc * | | | 1,503 | | | | 91 | |
Pennant Group Inc/The * | | | 3,554 | | | | 180 | |
Pfizer Inc | | | 178,928 | | | | 6,855 | |
Providence Service Corp/The * | | | 1,820 | | | | 247 | |
Quidel Corp * | | | 5,547 | | | | 1,082 | |
R1 RCM Inc * | | | 15,889 | | | | 322 | |
Regeneron Pharmaceuticals Inc * | | | 7,411 | | | | 3,824 | |
| | |
| SEI Institutional Investments Trust / Semi-Annual Report / November 30, 2020 | | 3 |
SCHEDULE OF INVESTMENTS (Unaudited)
November 30, 2020
U.S. Equity Factor Allocation Fund (Continued)
| | | | | | | | |
| | | |
| Description | | Shares | | Market Value
($ Thousands) |
|
COMMON STOCK (continued) | |
ResMed Inc | | | 537 | | | $ | 113 | |
SIGA Technologies Inc * | | | 7,888 | | | | 55 | |
STAAR Surgical Co * | | | 3,167 | | | | 226 | |
Surgery Partners Inc * | | | 2,791 | | | | 68 | |
Surmodics Inc * | | | 1,994 | | | | 75 | |
Travere Therapeutics Inc * | | | 6,281 | | | | 144 | |
Triple-S Management Corp, Cl B * | | | 2,836 | | | | 63 | |
United Therapeutics Corp * | | | 35,353 | | | | 4,689 | |
UnitedHealth Group Inc | | | 28,824 | | | | 9,695 | |
Universal Health Services Inc, Cl B | | | 4,552 | | | | 594 | |
Veeva Systems Inc, Cl A * | | | 3,584 | | | | 992 | |
Vertex Pharmaceuticals Inc * | | | 9,361 | | | | 2,132 | |
Viatris Inc, Cl W * | | | 22,201 | | | | 373 | |
Waters Corp * | | | 6,633 | | | | 1,539 | |
Zoetis Inc, Cl A | | | 3,640 | | | | 584 | |
| | |
| | | | | | | 152,028 | |
|
Industrials — 9.5% | |
3M Co | | | 12,665 | | | | 2,188 | |
Aerojet Rocketdyne Holdings Inc * | | | 530 | | | | 20 | |
Altra Industrial Motion Corp | | | 9,126 | | | | 518 | |
Ameresco Inc, Cl A * | | | 3,650 | | | | 163 | |
ArcBest Corp | | | 6,654 | | | | 279 | |
Arcosa Inc | | | 3,404 | | | | 177 | |
Atlas Air Worldwide Holdings Inc * | | | 3,865 | | | | 216 | |
Bloom Energy Corp, Cl A * | | | 3,000 | | | | 74 | |
BMC Stock Holdings Inc * | | | 18,010 | | | | 881 | |
CAI International Inc | | | 2,461 | | | | 78 | |
Carlisle Cos Inc | | | 5,939 | | | | 860 | |
CH Robinson Worldwide Inc | | | 14,376 | | | | 1,351 | |
Cintas Corp | | | 8,163 | | | | 2,900 | |
CSW Industrials Inc | | | 3,563 | | | | 382 | |
Cummins Inc | | | 752 | | | | 174 | |
Deere & Co | | | 18,506 | | | | 4,842 | |
Echo Global Logistics Inc * | | | 3,865 | | | | 110 | |
EMCOR Group Inc | | | 16,476 | | | | 1,420 | |
Emerson Electric Co | | | 4,436 | | | | 341 | |
Ennis Inc | | | 6,866 | | | | 112 | |
ESCO Technologies Inc | | | 3,758 | | | | 372 | |
Evoqua Water Technologies Corp * | | | 11,488 | | | | 300 | |
Expeditors International of Washington Inc | | | 78,664 | | | | 7,030 | |
FedEx Corp | | | 15,667 | | | | 4,490 | |
Forrester Research Inc * | | | 1,610 | | | | 67 | |
Foundation Building Materials Inc * | | | 2,900 | | | | 56 | |
FTI Consulting Inc * | | | 1,130 | | | | 119 | |
Generac Holdings Inc * | | | 8,906 | | | | 1,920 | |
Gibraltar Industries Inc * | | | 4,878 | | | | 319 | |
GMS Inc * | | | 4,730 | | | | 148 | |
Great Lakes Dredge & Dock Corp * | | | 17,920 | | | | 202 | |
Harsco Corp * | | | 11,595 | | | | 197 | |
Herc Holdings Inc * | | | 3,637 | | | | 208 | |
Honeywell International Inc | | | 41,808 | | | | 8,525 | |
Hubbell Inc, Cl B | | | 5,903 | | | | 954 | |
| | | | | | | | |
| | | |
| Description | | Shares | | Market Value
($ Thousands) |
|
COMMON STOCK (continued) | |
IDEX Corp | | | 8,003 | | | $ | 1,546 | |
Illinois Tool Works Inc | | | 13,208 | | | | 2,788 | |
Johnson Controls International PLC | | | 61,076 | | | | 2,812 | |
Kadant Inc | | | 1,235 | | | | 158 | |
Kforce Inc | | | 18,511 | | | | 760 | |
Kimball International Inc, Cl B | | | 4,930 | | | | 54 | |
L3Harris Technologies Inc | | | 10,984 | | | | 2,109 | |
Landstar System Inc | | | 15,617 | | | | 2,052 | |
Lennox International Inc | | | 1,652 | | | | 475 | |
Lockheed Martin Corp | | | 8,420 | | | | 3,073 | |
ManpowerGroup Inc | | | 17,662 | | | | 1,530 | |
Marten Transport Ltd | | | 8,052 | | | | 142 | |
Masco Corp | | | 68,904 | | | | 3,698 | |
Masonite International Corp * | | | 3,486 | | | | 349 | |
MSC Industrial Direct Co Inc, Cl A | | | 4,949 | | | | 412 | |
Mueller Industries Inc | | | 8,374 | | | | 274 | |
MYR Group Inc * | | | 2,470 | | | | 126 | |
Northrop Grumman Corp | | | 8,482 | | | | 2,564 | |
Northwest Pipe Co * | | | 1,394 | | | | 40 | |
Omega Flex Inc | | | 433 | | | | 61 | |
PACCAR Inc | | | 121,193 | | | | 10,551 | |
PAE Inc * | | | 8,842 | | | | 85 | |
Primoris Services Corp | | | 22,722 | | | | 551 | |
Quanta Services Inc | | | 10,487 | | | | 717 | |
Republic Services Inc, Cl A | | | 23,058 | | | | 2,230 | |
Robert Half International Inc | | | 101,424 | | | | 6,509 | |
Rockwell Automation Inc | | | 5,244 | | | | 1,340 | |
Rollins Inc | | | 16,357 | | | | 935 | |
Rush Enterprises Inc, Cl A | | | 32,244 | | | | 1,236 | |
Schneider National Inc, Cl B | | | 21,624 | | | | 452 | |
Shyft Group Inc/The | | | 4,993 | | | | 129 | |
Simpson Manufacturing Co Inc | | | 17,246 | | | | 1,585 | |
Snap-on Inc | | | 5,891 | | | | 1,036 | |
SPX Corp * | | | 6,335 | | | | 325 | |
SPX FLOW Inc * | | | 1,176 | | | | 63 | |
Steelcase Inc, Cl A | | | 22,682 | | | | 276 | |
Textainer Group Holdings Ltd * | | | 7,731 | | | | 142 | |
TPI Composites Inc * | | | 4,348 | | | | 175 | |
TransUnion | | | 1,278 | | | | 116 | |
TriNet Group Inc * | | | 12,860 | | | | 964 | |
TrueBlue Inc * | | | 6,276 | | | | 120 | |
Tutor Perini Corp * | | | 6,012 | | | | 81 | |
UniFirst Corp/MA | | | 1,521 | | | | 281 | |
Vicor Corp * | | | 2,684 | | | | 220 | |
Waste Management Inc | | | 19,773 | | | | 2,356 | |
Werner Enterprises Inc | | | 17,302 | | | | 692 | |
WW Grainger Inc | | | 1,018 | | | | 426 | |
| | |
| | | | | | | 100,609 | |
|
Information Technology — 28.4% | |
Accenture PLC, Cl A | | | 47,368 | | | | 11,799 | |
Adobe Inc * | | | 4,901 | | | | 2,345 | |
Amdocs Ltd | | | 56,751 | | | | 3,735 | |
| | |
| 4 | | SEI Institutional Investments Trust / Semi-Annual Report / November 30, 2020 |
SCHEDULE OF INVESTMENTS (Unaudited)
November 30, 2020
U.S. Equity Factor Allocation Fund (Continued)
| | | | | | | | |
| | | |
| Description | | Shares | | Market Value
($ Thousands) |
|
COMMON STOCK (continued) | |
Amkor Technology Inc | | | 14,900 | | | $ | 220 | |
Amphenol Corp, Cl A | | | 16,105 | | | | 2,107 | |
Apple Inc | | | 390,948 | | | | 46,542 | |
Arlo Technologies Inc * | | | 11,702 | | | | 62 | |
Arrow Electronics Inc * | | | 69,520 | | | | 6,371 | |
Automatic Data Processing Inc | | | 9,176 | | | | 1,596 | |
Avnet Inc | | | 27,919 | | | | 847 | |
Booz Allen Hamilton Holding Corp, Cl A | | | 14,980 | | | | 1,300 | |
Box Inc, Cl A * | | | 15,889 | | | | 297 | |
CACI International Inc, Cl A * | | | 7,753 | | | | 1,840 | |
Cadence Design Systems Inc * | | | 37,356 | | | | 4,344 | |
Calix Inc * | | | 7,086 | | | | 168 | |
ChannelAdvisor Corp * | | | 3,874 | | | | 57 | |
Ciena Corp * | | | 22,828 | | | | 1,023 | |
Cirrus Logic Inc * | | | 4,087 | | | | 327 | |
Cisco Systems Inc | | | 260,716 | | | | 11,216 | |
Citrix Systems Inc | | | 27,239 | | | | 3,375 | |
Cloudera Inc * | | | 30,437 | | | | 355 | |
Cognizant Technology Solutions Corp, Cl A | | | 150,143 | | | | 11,731 | |
Cree Inc * | | | 8,804 | | | | 796 | |
Crowdstrike Holdings Inc, Cl A * | | | 7,129 | | | | 1,093 | |
CSG Systems International Inc | | | 8,636 | | | | 375 | |
Diebold Nixdorf Inc * | | | 10,521 | | | | 100 | |
Digital Turbine Inc * | | | 11,551 | | | | 520 | |
Dolby Laboratories Inc, Cl A | | | 26,948 | | | | 2,384 | |
Dropbox Inc, Cl A * | | | 31,693 | | | | 633 | |
EchoStar Corp, Cl A * | | | 13,164 | | | | 313 | |
eGain Corp * | | | 3,142 | | | | 36 | |
Endurance International Group Holdings Inc * | | | 9,300 | | | | 88 | |
Enphase Energy Inc * | | | 7,931 | | | | 1,083 | |
EPAM Systems Inc * | | | 8,039 | | | | 2,591 | |
EVERTEC Inc | | | 8,945 | | | | 332 | |
F5 Networks Inc * | | | 6,800 | | | | 1,107 | |
FormFactor Inc * | | | 4,939 | | | | 202 | |
Fortinet Inc * | | | 36,914 | | | | 4,549 | |
Genpact Ltd | | | 20,244 | | | | 823 | |
Hewlett Packard Enterprise Co | | | 257,258 | | | | 2,840 | |
HP Inc | | | 434,530 | | | | 9,529 | |
Inseego Corp * | | | 10,199 | | | | 101 | |
Intel Corp | | | 264,586 | | | | 12,793 | |
International Business Machines Corp | | | 25,427 | | | | 3,141 | |
Intuit Inc | | | 40,967 | | | | 14,421 | |
Jabil Inc | | | 48,567 | | | | 1,856 | |
Jack Henry & Associates Inc | | | 8,450 | | | | 1,359 | |
Juniper Networks Inc | | | 16,693 | | | | 363 | |
KLA Corp | | | 1,797 | | | | 453 | |
Lam Research Corp | | | 7,641 | | | | 3,459 | |
Lattice Semiconductor Corp * | | | 16,875 | | | | 706 | |
Leidos Holdings Inc | | | 16,824 | | | | 1,694 | |
Limelight Networks Inc * | | | 17,500 | | | | 78 | |
Manhattan Associates Inc * | | | 644 | | | | 66 | |
| | | | | | | | |
| | | |
| Description | | Shares | | Market Value
($ Thousands) |
|
COMMON STOCK (continued) | |
Mastercard Inc, Cl A | | | 6,231 | | | $ | 2,097 | |
MAXIMUS Inc | | | 3,255 | | | | 234 | |
Microsoft Corp | | | 235,113 | | | | 50,331 | |
MicroStrategy Inc, Cl A * | | | 6,108 | | | | 2,094 | |
Monolithic Power Systems Inc | | | 6,501 | | | | 2,080 | |
Motorola Solutions Inc | | | 11,639 | | | | 1,996 | |
NETGEAR Inc * | | | 27,712 | | | | 881 | |
NortonLifeLock Inc | | | 126,792 | | | | 2,311 | |
Nuance Communications Inc * | | | 161,580 | | | | 6,969 | |
Okta Inc, Cl A * | | | 6,284 | | | | 1,540 | |
ON Semiconductor Corp * | | | 7,259 | | | | 209 | |
OneSpan Inc * | | | 5,046 | | | | 100 | |
Oracle Corp | | | 234,695 | | | | 13,547 | |
PagerDuty Inc * | | | 7,623 | | | | 262 | |
PayPal Holdings Inc * | | | 17,955 | | | | 3,845 | |
Perficient Inc * | | | 4,723 | | | | 215 | |
Plantronics Inc | | | 5,046 | | | | 138 | |
Progress Software Corp | | | 15,461 | | | | 620 | |
Qorvo Inc * | | | 16,859 | | | | 2,641 | |
QUALCOMM Inc | | | 2,963 | | | | 436 | |
Sailpoint Technologies Holdings Inc * | | | 13,098 | | | | 610 | |
Sanmina Corp * | | | 21,583 | | | | 687 | |
Skyworks Solutions Inc | | | 8,841 | | | | 1,248 | |
SPS Commerce Inc * | | | 4,933 | | | | 508 | |
Sykes Enterprises Inc * | | | 14,209 | | | | 535 | |
Synaptics Inc * | | | 15,946 | | | | 1,240 | |
SYNNEX Corp | | | 12,643 | | | | 2,027 | |
Teradyne Inc | | | 24,681 | | | | 2,723 | |
Texas Instruments Inc | | | 13,783 | | | | 2,222 | |
Trade Desk Inc/The, Cl A * | | | 1,808 | | | | 1,629 | |
TTEC Holdings Inc | | | 5,055 | | | | 342 | |
Ultra Clean Holdings Inc * | | | 5,690 | | | | 180 | |
Verint Systems Inc * | | | 20,570 | | | | 1,172 | |
VeriSign Inc * | | | 11,953 | | | | 2,399 | |
VirnetX Holding Corp | | | 58,762 | | | | 318 | |
Visa Inc, Cl A | | | 23,371 | | | | 4,916 | |
Western Union Co/The | | | 173,337 | | | | 3,910 | |
Xerox Holdings Corp | | | 54,174 | | | | 1,186 | |
Zebra Technologies Corp, Cl A * | | | 1,062 | | | | 402 | |
| | |
| | | | | | | 302,341 | |
|
Materials — 2.7% | |
Air Products and Chemicals Inc | | | 2,489 | | | | 697 | |
Avery Dennison Corp | | | 8,946 | | | | 1,336 | |
Avient Corp | | | 13,803 | | | | 505 | |
Boise Cascade Co | | | 14,927 | | | | 646 | |
Chase Corp | | | 1,074 | | | | 114 | |
Clearwater Paper Corp * | | | 2,362 | | | | 83 | |
Coeur Mining Inc * | | | 13,205 | | | | 94 | |
Commercial Metals Co | | | 44,187 | | | | 880 | |
Dow Inc | | | 24,400 | | | | 1,293 | |
FMC Corp | | | 451 | | | | 52 | |
Freeport-McMoRan Inc, Cl B | | | 25,459 | | | | 596 | |
| | |
| SEI Institutional Investments Trust / Semi-Annual Report / November 30, 2020 | | 5 |
SCHEDULE OF INVESTMENTS (Unaudited)
November 30, 2020
U.S. Equity Factor Allocation Fund (Continued)
| | | | | | | | |
| | | |
| Description | | Shares | | Market Value
($ Thousands) |
|
COMMON STOCK (continued) | |
Graphic Packaging Holding Co | | | 30,155 | | | $ | 462 | |
Hawkins Inc | | | 1,396 | | | | 70 | |
Hecla Mining Co | | | 58,189 | | | | 278 | |
Linde PLC | | | 14,458 | | | | 3,707 | |
Myers Industries Inc | | | 5,368 | | | | 91 | |
NewMarket Corp | | | 2,708 | | | | 1,001 | |
Newmont Corp | | | 13,366 | | | | 786 | |
Nucor Corp | | | 48,359 | | | | 2,597 | |
PPG Industries Inc | | | 46,855 | | | | 6,877 | |
Reliance Steel & Aluminum Co | | | 33,060 | | | | 3,895 | |
Schnitzer Steel Industries Inc, Cl A | | | 2,899 | | | | 74 | |
Scotts Miracle-Gro Co/The, Cl A | | | 6,030 | | | | 1,060 | |
Sealed Air Corp | | | 11,853 | | | | 534 | |
Sensient Technologies Corp | | | 4,091 | | | | 293 | |
Silgan Holdings Inc | | | 12,881 | | | | 435 | |
Sonoco Products Co | | | 10,178 | | | | 591 | |
Stepan Co | | | 3,221 | | | | 374 | |
Worthington Industries Inc | | | 5,475 | | | | 283 | |
| | |
| | | | | | | 29,704 | |
|
Real Estate — 1.0% | |
Alexandria Real Estate Equities Inc ‡ | | | 5,504 | | | | 901 | |
Community Healthcare Trust Inc ‡ | | | 3,113 | | | | 141 | |
Easterly Government Properties Inc ‡ | | | 11,083 | | | | 240 | |
EastGroup Properties Inc ‡ | | | 3,359 | | | | 458 | |
Equity Commonwealth ‡ | | | 18,632 | | | | 494 | |
Innovative Industrial Properties Inc, Cl A ‡ | | | 789 | | | | 121 | |
Invitation Homes Inc ‡ | | | 79,894 | | | | 2,283 | |
iStar Inc ‡ | | | 6,773 | | | | 95 | |
Jones Lang LaSalle Inc | | | 8,240 | | | | 1,090 | |
Lexington Realty Trust, Cl B ‡ | | | 22,646 | | | | 231 | |
PotlatchDeltic Corp ‡ | | | 9,770 | | | | 455 | |
Prologis Inc ‡ | | | 25,440 | | | | 2,545 | |
Public Storage ‡ | | | 491 | | | | 110 | |
RE/MAX Holdings Inc, Cl A | | | 2,657 | | | | 83 | |
Redfin Corp * | | | 14,483 | | | | 694 | |
RMR Group Inc/The, Cl A | | | 2,941 | | | | 109 | |
Safehold Inc ‡ | | | 2,594 | | | | 177 | |
STAG Industrial Inc ‡ | | | 12,078 | | | | 360 | |
| | |
| | | | | | | 10,587 | |
| | |
Utilities — 0.9% | | | | | | | | |
AES Corp/The | | | 35,516 | | | | 726 | |
Exelon Corp | | | 159,948 | | | | 6,569 | |
Sempra Energy | | | 10,038 | | | | 1,280 | |
Vistra Corp | | | 80,459 | | | | 1,503 | |
| | |
| | | | | | | 10,078 | |
| | |
Total Common Stock (Cost $839,135) ($ Thousands) | | | | | | | 1,049,033 | |
| | | | | | | | |
| | | |
| Description | | Number of
Warrants | | Market Value
($ Thousands) |
| | |
WARRANT — 0.0% | | | | | | | | |
Occidental Petroleum Corp, Expires 08/06/2027
Strike Price $22 * | | | 1 | | | $ | – | |
| | | | | | | | |
| | |
Total Warrant
(Cost $—) ($ Thousands) | | | | | | | – | |
| | | | | | | | |
| | |
| | | Shares | | |
|
CASH EQUIVALENT — 0.8% | |
SEI Daily Income Trust, Government Fund, Cl F
0.010%**† | | | 8,324,263 | | | | 8,324 | |
| | | | | | | | |
| |
Total Cash Equivalent
(Cost $8,324) ($ Thousands) | | | | 8,324 | |
| | | | | | | | |
| |
Total Investments in Securities — 99.4%
(Cost $847,459) ($ Thousands) | | | $ | 1,057,357 | |
| | | | | | | | |
| | |
| 6 | | SEI Institutional Investments Trust / Semi-Annual Report / November 30, 2020 |
SCHEDULE OF INVESTMENTS (Unaudited)
November 30, 2020
U.S. Equity Factor Allocation Fund (Continued)
A list of the open futures contracts held by the Fund at November 30, 2020, is as follows:
| | | | | | | | | | | | | | | | | | | | | | |
| Type of Contract | | Number of
Contracts Long | | | | | Expiration
Date | | | Notional Amount
(Thousands) | | | Value
(Thousands) | | | Unrealized
Appreciation (Thousands) | |
| S&P 500 Index E-MINI | | | 48 | | | | | | Dec-2020 | | | $ | 8,206 | | | $ | 8,696 | | | $ | 490 | |
| | | | | | | | | | | | | | | | | | | | | | |
| | Percentages are based on Net Assets of $1,063,512 ($ Thousands). |
| * | Non-income producing security. |
| ** | The rate reported is the 7-day effective yield as of November 30, 2020. |
| † | Investment in Affiliated Security (see Note 6). |
| ‡ | Real Estate Investment Trust. |
Cl — Class
Ltd. — Limited
PLC — Public Limited Company
S&P— Standard & Poor’s
The following is a list of the level of inputs used as of November 30, 2020, in valuing the Fund’s investments and other financial instruments carried at value ($ Thousands):
| | | | | | | | | | | | | | | | |
| Investments in Securities | | Level 1 ($) | | | Level 2
($) | | | Level 3
($) | | | Total ($) | |
Common Stock | | | 1,049,033 | | | | – | | | | – | | | | 1,049,033 | |
Warrant | | | – | | | | – | | | | – | | | | – | |
Cash Equivalent | | | 8,324 | | | | – | | | | – | | | | 8,324 | |
| | | | | | | | | | | | | | | | |
Total Investments in Securities | | | 1,057,357 | | | | – | | | | – | | | | 1,057,357 | |
| | | | | | | | | | | | | | | | |
| | | | |
| | | | | | | | | | | | | | | | |
Other Financial
Instruments | | Level 1 ($) | | | Level 2
($) | | | Level 3
($) | | | Total ($) | |
Futures Contracts* | | | | | | | | | | | | | | | | |
Unrealized Appreciation | | | 490 | | | | – | | | | – | | | | 490 | |
| | | | | | | | | | | | | | | | |
Total Other Financial Instruments | | | 490 | | | | – | | | | – | | | | 490 | |
| | | | | | | | | | | | | | | | |
*Futures contracts are valued at the unrealized appreciation on the instrument.
For the period ended November 30, 2020, there were no transfers in or out of Level 3.
For more information on valuation inputs, see Note 2 — Significant Accounting Policies in Notes to Financial Statements.
The following is a summary of the Fund’s transactions with affiliates for the period ended November 30, 2020 ($ Thousands):
| | | | | | | | | | | | | | | | | | |
| Security Description | | Value 5/31/2020 | | Purchases at
Cost | | Proceeds from
Sales | | Realized Gain/
(Loss) | | Change in
Unrealized
Appreciation/
(Depreciation) | | Value
11/30/2020 | | Shares | | Income | | Capital Gains |
SEI Daily Income Trust, Government Fund, Cl F | | $15,622 | | $45,929 | | $(53,227) | | $— | | $— | | $8,324 | | 8,324,263 | | $1 | | $— |
| | | | | | | | | | | | | | | | | | |
Amounts designated as “—” are either $0 or have been rounded to $0.
The accompanying notes are an integral part of the financial statements.
| | |
| SEI Institutional Investments Trust / Semi-Annual Report / November 30, 2020 | | 7 |
SCHEDULE OF INVESTMENTS (Unaudited)
November 30, 2020
U.S. Managed Volatility Fund (Continued)
| | | | | | | | |
| | | |
| Description | | Shares | | Market Value
($ Thousands) |
COMMON STOCK — 98.1% | | | | | | | | |
| | |
Communication Services — 9.5% | | | | | | | | |
Activision Blizzard Inc | | | 59,251 | | | $ | 4,709 | |
AT&T Inc | | | 727,100 | | | | 20,904 | |
BCE Inc | | | 57,600 | | | | 2,502 | |
Cargurus Inc, Cl A * | | | 10,625 | | | | 266 | |
China Mobile Ltd ADR (A) | | | 87,300 | | | | 2,606 | |
Cogeco Communications Inc | | | 13,400 | | | | 972 | |
Comcast Corp, Cl A | | | 389,200 | | | | 19,553 | |
Discovery Inc, Cl C * | | | 48,845 | | | | 1,173 | |
Electronic Arts Inc | | | 29,888 | | | | 3,818 | |
EverQuote Inc, Cl A *(A) | | | 4,650 | | | | 175 | |
Facebook Inc, Cl A * | | | 14,484 | | | | 4,012 | |
John Wiley & Sons Inc, Cl A | | | 22,331 | | | | 771 | |
Madison Square Garden Sports Corp, Cl A * | | | 8,634 | | | | 1,463 | |
New York Times Co/The, Cl A (A) | | | 54,157 | | | | 2,324 | |
Nippon Telegraph & Telephone Corp ADR | | | 173,800 | | | | 4,109 | |
Omnicom Group Inc | | | 116,900 | | | | 7,365 | |
Ooma Inc * | | | 13,623 | | | | 213 | |
Shenandoah Telecommunications Co | | | 1,110 | | | | 49 | |
Shutterstock Inc | | | 7,046 | | | | 485 | |
SK Telecom Co Ltd ADR | | | 172,800 | | | | 4,062 | |
Spok Holdings Inc | | | 7,330 | | | | 72 | |
Spotify Technology SA * | | | 12,710 | | | | 3,703 | |
Take-Two Interactive Software Inc * | | | 26,449 | | | | 4,774 | |
TechTarget Inc * | | | 8,798 | | | | 462 | |
TrueCar Inc * | | | 14,186 | | | | 58 | |
United States Cellular Corp * | | | 7,108 | | | | 223 | |
Upwork Inc * | | | 15,955 | | | | 522 | |
Verizon Communications Inc | | | 520,653 | | | | 31,453 | |
Zynga Inc, Cl A *(A) | | | 362,925 | | | | 2,994 | |
| | |
| | | | | | | 125,792 | |
| | |
Consumer Discretionary — 9.8% | | | | | | | | |
1-800-Flowers.com Inc, Cl A * | | | 2,064 | | | | 48 | |
Amazon.com Inc * | | | 760 | | | | 2,408 | |
Aspen Group Inc/CO * | | | 13,224 | | | | 161 | |
AutoZone Inc * | | | 13,000 | | | | 14,790 | |
Canadian Tire Corp Ltd, Cl A | | | 51,400 | | | | 6,583 | |
Chegg Inc * | | | 36,083 | | | | 2,812 | |
Chipotle Mexican Grill Inc, Cl A * | | | 3,539 | | | | 4,563 | |
Collectors Universe Inc | | | 7,366 | | | | 568 | |
Domino’s Pizza Inc | | | 12,598 | | | | 4,946 | |
Dorman Products Inc * | | | 4,690 | | | | 433 | |
DR Horton Inc | | | 74,800 | | | | 5,573 | |
eBay Inc | | | 364,700 | | | | 18,392 | |
Etsy Inc * | | | 4,184 | | | | 672 | |
frontdoor Inc * | | | 19,063 | | | | 902 | |
Gaia Inc, Cl A * | | | 2,452 | | | | 25 | |
Garmin Ltd | | | 29,676 | | | | 3,465 | |
Grand Canyon Education Inc * | | | 40,617 | | | | 3,390 | |
GrowGeneration Corp *(A) | | | 16,422 | | | | 578 | |
Johnson Outdoors Inc, Cl A | | | 1,183 | | | | 99 | |
K12 Inc * | | | 8,418 | | | | 196 | |
| | | | | | | | |
| | | |
| Description | | Shares | | Market Value
($ Thousands) |
COMMON STOCK (continued) | | | | | | | | |
Lakeland Industries Inc * | | | 11,405 | | | $ | 226 | |
Lululemon Athletica Inc * | | | 12,037 | | | | 4,456 | |
NIKE Inc, Cl B | | | 11,870 | | | | 1,599 | |
Ollie’s Bargain Outlet Holdings Inc *(A) | | | 42,876 | | | | 3,776 | |
Papa John’s International Inc | | | 4,495 | | | | 361 | |
Perdoceo Education Corp * | | | 6,775 | | | | 77 | |
Pool Corp | | | 8,602 | | | | 2,977 | |
PulteGroup Inc | | | 84,400 | | | | 3,682 | |
Purple Innovation Inc, Cl A * | | | 8,021 | | | | 239 | |
Smith & Wesson Brands Inc | | | 1,174 | | | | 19 | |
Target Corp | | | 198,600 | | | | 35,654 | |
Toyota Motor Corp ADR (A) | | | 48,000 | | | | 6,454 | |
| | |
| | | | | | | 130,124 | |
| | |
Consumer Staples — 17.2% | | | | | | | | |
Altria Group Inc | | | 226,400 | | | | 9,018 | |
B&G Foods Inc, Cl A (A) | | | 4,620 | | | | 128 | |
Beyond Meat Inc *(A) | | | 19,089 | | | | 2,671 | |
BJ’s Wholesale Club Holdings Inc * | | | 12,704 | | | | 521 | |
Boston Beer Co Inc/The, Cl A *(A) | | | 4,288 | | | | 3,991 | |
Bunge Ltd | | | 22,932 | | | | 1,350 | |
Campbell Soup Co (A) | | | 94,351 | | | | 4,719 | |
Casey’s General Stores Inc | | | 11,426 | | | | 2,076 | |
Celsius Holdings Inc * | | | 14,069 | | | | 454 | |
Central Garden & Pet Co, Cl A * | | | 989 | | | | 40 | |
Church & Dwight Co Inc | | | 71,463 | | | | 6,272 | |
Clorox Co/The (A) | | | 29,209 | | | | 5,928 | |
Coca-Cola Consolidated Inc | | | 437 | | | | 114 | |
Colgate-Palmolive Co | | | 66,875 | | | | 5,727 | |
Conagra Brands Inc | | | 33,587 | | | | 1,228 | |
Costco Wholesale Corp | | | 17,007 | | | | 6,663 | |
Estee Lauder Cos Inc/The, Cl A | | | 23,261 | | | | 5,706 | |
Flowers Foods Inc | | | 170,496 | | | | 3,783 | |
Freshpet Inc * | | | 3,846 | | | | 526 | |
General Mills Inc | | | 306,217 | | | | 18,624 | |
Hain Celestial Group Inc/The * | | | 5,843 | | | | 225 | |
Hershey Co/The | | | 38,133 | | | | 5,639 | |
Hormel Foods Corp (A) | | | 142,001 | | | | 6,700 | |
Hostess Brands Inc, Cl A * | | | 49,099 | | | | 665 | |
Ingredion Inc | | | 46,100 | | | | 3,557 | |
J & J Snack Foods Corp | | | 2,184 | | | | 318 | |
J M Smucker Co/The | | | 173,270 | | | | 20,307 | |
John B Sanfilippo & Son Inc | | | 8,421 | | | | 625 | |
Kellogg Co | | | 163,728 | | | | 10,464 | |
Kimberly-Clark Corp | | | 72,600 | | | | 10,114 | |
Kraft Heinz Co/The | | | 165,500 | | | | 5,452 | |
Kroger Co/The | | | 620,574 | | | | 20,479 | |
Lancaster Colony Corp | | | 2,679 | | | | 454 | |
McCormick & Co Inc/MD | | | 26,567 | | | | 4,968 | |
Medifast Inc | | | 2,297 | | | | 469 | |
MGP Ingredients Inc (A) | | | 10,018 | | | | 437 | |
Mondelez International Inc, Cl A | | | 31,056 | | | | 1,784 | |
Monster Beverage Corp * | | | 27,028 | | | | 2,291 | |
| | |
| SEI Institutional Investments Trust / Semi-Annual Report / November 30, 2020 | | 1 |
SCHEDULE OF INVESTMENTS (Unaudited)
November 30, 2020
U.S. Managed Volatility Fund (Continued)
| | | | | | | | |
| | | |
| Description | | Shares | | Market Value
($ Thousands) |
| | |
COMMON STOCK (continued) | | | | | | | | |
National Beverage Corp *(A) | | | 4,014 | | | $ | 393 | |
Natural Grocers by Vitamin Cottage Inc | | | 18,266 | | | | 266 | |
PepsiCo Inc | | | 41,318 | | | | 5,959 | |
PriceSmart Inc | | | 2,400 | | | | 195 | |
Procter & Gamble Co/The | | | 40,315 | | | | 5,599 | |
Tootsie Roll Industries Inc (A) | | | 17,840 | | | | 553 | |
Tyson Foods Inc, Cl A | | | 223,400 | | | | 14,566 | |
Universal Corp/VA | | | 7,484 | | | | 341 | |
USANA Health Sciences Inc *(A) | | | 6,053 | | | | 455 | |
Village Super Market Inc, Cl A | | | 1,361 | | | | 32 | |
Walgreens Boots Alliance Inc | | | 85,300 | | | | 3,242 | |
Walmart Inc | | | 139,744 | | | | 21,351 | |
WD-40 Co (A) | | | 2,411 | | | | 613 | |
Weis Markets Inc | | | 12,349 | | | | 588 | |
| | |
| | | | | | | 228,640 | |
| | |
Energy — 0.7% | | | | | | | | |
Antero Midstream Corp | | | 85,730 | | | | 578 | |
Cabot Oil & Gas Corp, Cl A | | | 196,372 | | | | 3,440 | |
Frontline Ltd/Bermuda (A) | | | 21,393 | | | | 134 | |
Murphy USA Inc | | | 4,124 | | | | 529 | |
Phillips 66 | | | 78,100 | | | | 4,731 | |
Renewable Energy Group Inc * | | | 730 | | | | 42 | |
| | |
| | | | | | | 9,454 | |
| | |
Financials — 11.9% | | | | | | | | |
Aflac Inc | | | 258,600 | | | | 11,360 | |
Alerus Financial Corp | | | 4,560 | | | | 110 | |
Allstate Corp/The | | | 177,400 | | | | 18,157 | |
American Financial Group Inc/OH | | | 133,500 | | | | 11,936 | |
American National Group Inc | | | 6,185 | | | | 524 | |
Annaly Capital Management Inc ‡ | | | 902,000 | | | | 7,216 | |
Assured Guaranty Ltd | | | 99,900 | | | | 3,010 | |
Bank of New York Mellon Corp/The | | | 155,100 | | | | 6,068 | |
Berkshire Hathaway Inc, Cl B * | | | 116,400 | | | | 26,645 | |
Canadian Imperial Bank of Commerce | | | 79,400 | | | | 6,708 | |
Columbia Financial Inc * | | | 14,761 | | | | 212 | |
Commerce Bancshares Inc/MO | | | 10,555 | | | | 696 | |
Community Bank System Inc | | | 3,257 | | | | 203 | |
Community Bankers Trust Corp | | | 8,924 | | | | 58 | |
Crawford & Co, Cl A | | | 4,403 | | | | 32 | |
CryoPort Inc * | | | 4,096 | | | | 199 | |
Donegal Group Inc, Cl A | | | 9,196 | | | | 129 | |
eHealth Inc * | | | 2,922 | | | | 222 | |
Employers Holdings Inc | | | 5,079 | | | | 155 | |
Everest Re Group Ltd | | | 14,000 | | | | 3,183 | |
First Financial Bankshares Inc | | | 7,390 | | | | 247 | |
Goosehead Insurance Inc, Cl A | | | 3,117 | | | | 384 | |
HarborOne Bancorp Inc | | | 43,681 | | | | 429 | |
Hartford Financial Services Group Inc/The | | | 104,800 | | | | 4,632 | |
Horace Mann Educators Corp | | | 503 | | | | 20 | |
Houlihan Lokey Inc, Cl A | | | 6,471 | | | | 419 | |
Investors Bancorp Inc (A) | | | 423,000 | | | | 4,095 | |
| | | | | | | | |
| | | |
| Description | | Shares | | Market Value
($ Thousands) |
| | |
COMMON STOCK (continued) | | | | | | | | |
JPMorgan Chase & Co | | | 57,600 | | | $ | 6,790 | |
Kearny Financial Corp/MD | | | 12,056 | | | | 119 | |
Kinsale Capital Group Inc | | | 2,832 | | | | 680 | |
KKR Real Estate Finance Trust Inc | | | 23,775 | | | | 433 | |
Live Oak Bancshares Inc | | | 8,886 | | | | 365 | |
Loblaw Cos Ltd | | | 76,100 | | | | 3,770 | |
MarketAxess Holdings Inc | | | 8,689 | | | | 4,685 | |
Mercury General Corp | | | 23,518 | | | | 1,046 | |
Morningstar Inc | | | 8,276 | | | | 1,656 | |
National Bank Holdings Corp, Cl A | | | 7,929 | | | | 255 | |
National Bank of Canada | | | 122,700 | | | | 6,812 | |
NI Holdings Inc * | | | 2,526 | | | | 43 | |
Nicolet Bankshares Inc * | | | 814 | | | | 54 | |
Northeast Bank | | | 5,104 | | | | 111 | |
Orrstown Financial Services Inc | | | 1,329 | | | | 21 | |
PCSB Financial Corp | | | 14,107 | | | | 216 | |
PennyMac Financial Services Inc | | | 9,485 | | | | 547 | |
Progressive Corp/The | | | 46,378 | | | | 4,040 | |
Reliant Bancorp Inc | | | 1,441 | | | | 26 | |
Safeguard Scientifics Inc | | | 5,957 | | | | 38 | |
Safety Insurance Group Inc | | | 3,728 | | | | 266 | |
Starwood Property Trust Inc ‡ | | | 265,500 | | | | 4,763 | |
Stewart Information Services Corp | | | 13,696 | | | | 573 | |
Sturm Ruger & Co Inc | | | 12,690 | | | | 777 | |
TFS Financial Corp | | | 12,246 | | | | 211 | |
Timberland Bancorp Inc/WA | | | 1,060 | | | | 25 | |
Tradeweb Markets Inc, Cl A | | | 47,206 | | | | 2,816 | |
US Bancorp | | | 158,300 | | | | 6,840 | |
Virtu Financial Inc, Cl A | | | 34,860 | | | | 795 | |
Waterstone Financial Inc | | | 6,724 | | | | 118 | |
White Mountains Insurance Group Ltd | | | 1,637 | | | | 1,572 | |
| | |
| | | | | | | 157,512 | |
| | |
Health Care — 14.7% | | | | | | | | |
AbbVie Inc | | | 71,100 | | | | 7,435 | |
AdaptHealth Corp, Cl A * | | | 7,069 | | | | 211 | |
Agilent Technologies Inc | | | 18,536 | | | | 2,167 | |
Amgen Inc | | | 50,100 | | | | 11,124 | |
Amphastar Pharmaceuticals Inc *(A) | | | 13,694 | | | | 243 | |
BioDelivery Sciences International Inc * | | | 15,740 | | | | 60 | |
Bristol-Myers Squibb Co | | | 374,270 | | | | 23,354 | |
Cassava Sciences Inc *(A) | | | 15,709 | | | | 121 | |
Catabasis Pharmaceuticals Inc * | | | 11,364 | | | | 19 | |
Cerner Corp | | | 19,039 | | | | 1,425 | |
Chemed Corp | | | 5,395 | | | | 2,580 | |
Co-Diagnostics Inc *(A) | | | 9,400 | | | | 110 | |
Coherus Biosciences Inc * | | | 8,952 | | | | 165 | |
Collegium Pharmaceutical Inc * | | | 2,788 | | | | 52 | |
CVS Health Corp | | | 197,400 | | | | 13,382 | |
Eli Lilly and Co | | | 32,020 | | | | 4,664 | |
Fulgent Genetics Inc *(A) | | | 1,345 | | | | 60 | |
GenMark Diagnostics Inc * | | | 12,637 | | | | 169 | |
Gilead Sciences Inc | | | 167,200 | | | | 10,144 | |
| | |
| 2 | | SEI Institutional Investments Trust / Semi-Annual Report / November 30, 2020 |
SCHEDULE OF INVESTMENTS (Unaudited)
November 30, 2020
U.S. Managed Volatility Fund (Continued)
| | | | | | | | |
| | | |
| Description | | Shares | | Market Value
($ Thousands) |
| | |
COMMON STOCK (continued) | | | | | | | | |
Halozyme Therapeutics Inc * | | | 13,857 | | | $ | 542 | |
Harrow Health Inc * | | | 11,644 | | | | 67 | |
HCA Healthcare Inc | | | 37,200 | | | | 5,584 | |
HealthStream Inc * | | | 7,186 | | | | 134 | |
HMS Holdings Corp * | | | 11,424 | | | | 359 | |
IDEXX Laboratories Inc * | | | 9,535 | | | | 4,395 | |
Incyte Corp * | | | 24,927 | | | | 2,107 | |
InfuSystem Holdings Inc * | | | 1,993 | | | | 32 | |
Johnson & Johnson | | | 209,423 | | | | 30,299 | |
Joint Corp/The * | | | 14,123 | | | | 355 | |
LeMaitre Vascular Inc | | | 703 | | | | 28 | |
Luminex Corp | | | 11,674 | | | | 277 | |
Masimo Corp * | | | 7,990 | | | | 2,033 | |
Merck & Co Inc | | | 380,442 | | | | 30,584 | |
Mettler-Toledo International Inc * | | | 2,985 | | | | 3,433 | |
National HealthCare Corp | | | 1,687 | | | | 105 | |
Neogen Corp * | | | 3,622 | | | | 269 | |
Orthofix Medical Inc * | | | 1,597 | | | | 59 | |
Pacira BioSciences Inc * | | | 7,765 | | | | 470 | |
Pfizer Inc | | | 481,800 | | | | 18,458 | |
Premier Inc, Cl A | | | 3,666 | | | | 130 | |
Prestige Consumer Healthcare Inc * | | | 5,898 | | | | 210 | |
Providence Service Corp/The * | | | 1,706 | | | | 232 | |
Regeneron Pharmaceuticals Inc * | | | 8,800 | | | | 4,541 | |
Relmada Therapeutics Inc * | | | 4,252 | | | | 151 | |
Repro-Med Systems Inc * | | | 30,708 | | | | 138 | |
SeaSpine Holdings Corp * | | | 6,486 | | | | 92 | |
SIGA Technologies Inc * | | | 38,405 | | | | 266 | |
Simulations Plus Inc | | | 4,319 | | | | 242 | |
Stereotaxis Inc * | | | 28,993 | | | | 125 | |
Tandem Diabetes Care Inc * | | | 482 | | | | 45 | |
Translate Bio Inc * | | | 2,299 | | | | 51 | |
Universal Health Services Inc, Cl B | | | 38,900 | | | | 5,080 | |
Vapotherm Inc * | | | 1,664 | | | | 42 | |
Viatris Inc, Cl W * | | | 59,781 | | | | 1,006 | |
Viemed Healthcare Inc * | | | 26,284 | | | | 256 | |
West Pharmaceutical Services Inc | | | 18,527 | | | | 5,098 | |
XBiotech Inc *(A) | | | 11,134 | | | | 212 | |
| | |
| | | | | | | 194,992 | |
| | |
Industrials — 8.6% | | | | | | | | |
3M Co | | | 64,300 | | | | 11,107 | |
Allison Transmission Holdings Inc, Cl A | | | 179,500 | | | | 7,368 | |
BWX Technologies Inc | | | 14,359 | | | | 817 | |
Carlisle Cos Inc | | | 9,425 | | | | 1,365 | |
Carrier Global Corp | | | 59,100 | | | | 2,250 | |
CH Robinson Worldwide Inc | | | 65,154 | | | | 6,123 | |
Cintas Corp | | | 4,819 | | | | 1,712 | |
CoStar Group Inc * | | | 5,973 | | | | 5,439 | |
CSW Industrials Inc | | | 3,305 | | | | 355 | |
Cummins Inc | | | 33,700 | | | | 7,791 | |
Expeditors International of Washington Inc | | | 52,146 | | | | 4,660 | |
Fastenal Co | | | 131,436 | | | | 6,499 | |
| | | | | | | | |
| | | |
| Description | | Shares | | Market Value
($ Thousands) |
| | |
COMMON STOCK (continued) | | | | | | | | |
Federal Signal Corp | | | 4,960 | | | $ | 154 | |
Gencor Industries Inc * | | | 2,685 | | | | 32 | |
General Dynamics Corp | | | 35,700 | | | | 5,332 | |
Graco Inc | | | 1,091 | | | | 74 | |
Heartland Express Inc | | | 11,533 | | | | 213 | |
Huntington Ingalls Industries Inc | | | 27,000 | | | | 4,325 | |
Lockheed Martin Corp | | | 11,200 | | | | 4,088 | |
Miller Industries Inc/TN | | | 2,452 | | | | 82 | |
Northrop Grumman Corp | | | 19,300 | | | | 5,834 | |
Old Dominion Freight Line Inc | | | 15,980 | | | | 3,250 | |
Orion Energy Systems Inc * | | | 9,057 | | | | 93 | |
Otis Worldwide Corp | | | 29,550 | | | | 1,978 | |
PAE Inc * | | | 4,188 | | | | 40 | |
Proto Labs Inc *(A) | | | 1,903 | | | | 263 | |
Red Violet Inc * | | | 9,203 | | | | 246 | |
Republic Services Inc, Cl A | | | 91,300 | | | | 8,831 | |
Resources Connection Inc | | | 2,055 | | | | 25 | |
Robert Half International Inc | | | 31,911 | | | | 2,048 | |
Rollins Inc | | | 44,220 | | | | 2,528 | |
Snap-on Inc | | | 34,600 | | | | 6,084 | |
Toro Co/The | | | 23,085 | | | | 2,094 | |
Waste Management Inc | | | 72,800 | | | | 8,673 | |
Watsco Inc | | | 11,567 | | | | 2,630 | |
Werner Enterprises Inc | | | 7,324 | | | | 293 | |
| | |
| | | | | | | 114,696 | |
| | |
Information Technology — 14.7% | | | | | | | | |
A10 Networks Inc * | | | 10,558 | | | | 84 | |
Acacia Communications Inc * | | | 14,624 | | | | 1,019 | |
Amdocs Ltd | | | 393,545 | | | | 25,899 | |
Arista Networks Inc * | | | 12,054 | | | | 3,263 | |
Bandwidth Inc, Cl A * | | | 2,232 | | | | 339 | |
Black Knight Inc * | | | 22,655 | | | | 2,076 | |
Blackline Inc * | | | 3,451 | | | | 424 | |
Booz Allen Hamilton Holding Corp, Cl A | | | 29,052 | | | | 2,521 | |
Box Inc, Cl A * | | | 20,989 | | | | 392 | |
Brightcove Inc * | | | 9,568 | | | | 160 | |
CACI International Inc, Cl A * | | | 21,400 | | | | 5,078 | |
Calix Inc * | | | 13,529 | | | | 320 | |
Canon Inc ADR (A) | | | 94,900 | | | | 1,683 | |
Cisco Systems Inc | | | 371,300 | | | | 15,973 | |
CommVault Systems Inc * | | | 8,506 | | | | 406 | |
CSG Systems International Inc | | | 110,476 | | | | 4,792 | |
DocuSign Inc, Cl A * | | | 14,780 | | | | 3,368 | |
Dropbox Inc, Cl A * | | | 85,655 | | | | 1,711 | |
F5 Networks Inc * | | | 89,233 | | | | 14,528 | |
GSI Technology Inc * | | | 2,600 | | | | 17 | |
Intel Corp | | | 458,300 | | | | 22,159 | |
Intelligent Systems Corp *(A) | | | 3,455 | | | | 136 | |
International Business Machines Corp | | | 127,800 | | | | 15,786 | |
Intevac Inc * | | | 10,954 | | | | 66 | |
Jack Henry & Associates Inc | | | 24,722 | | | | 3,977 | |
Juniper Networks Inc | | | 495,700 | | | | 10,791 | |
| | |
| SEI Institutional Investments Trust / Semi-Annual Report / November 30, 2020 | | 3 |
SCHEDULE OF INVESTMENTS (Unaudited)
November 30, 2020
U.S. Managed Volatility Fund (Continued)
| | | | | | | | |
| | | |
| Description | | Shares | | Market Value
($ Thousands) |
| | |
COMMON STOCK (continued) | | | | | | | | |
MAXIMUS Inc | | | 4,099 | | | $ | 294 | |
MicroStrategy Inc, Cl A * | | | 1,960 | | | | 672 | |
Mitek Systems Inc * | | | 26,325 | | | | 310 | |
MobileIron Inc * | | | 33,085 | | | | 233 | |
Napco Security Technologies Inc * | | | 3,703 | | | | 113 | |
NETGEAR Inc * | | | 10,568 | | | | 336 | |
NIC Inc | | | 14,166 | | | | 332 | |
Oracle Corp | | | 508,500 | | | | 29,351 | |
Parsons Corp *(A) | | | 9,201 | | | | 301 | |
Progress Software Corp | | | 7,786 | | | | 312 | |
Qualys Inc *(A) | | | 2,914 | | | | 277 | |
Seagate Technology PLC | | | 17,900 | | | | 1,053 | |
ServiceNow Inc * | | | 8,026 | | | | 4,290 | |
ShotSpotter Inc * | | | 690 | | | | 23 | |
SPS Commerce Inc * | | | 3,248 | | | | 335 | |
Telenav Inc * | | | 4,022 | | | | 19 | |
Tucows Inc, Cl A * | | | 1,337 | | | | 97 | |
Vocera Communications Inc * | | | 7,882 | | | | 267 | |
Western Union Co/The | | | 627,600 | | | | 14,159 | |
Zoom Video Communications Inc, Cl A * | | | 6,478 | | | | 3,099 | |
Zscaler Inc * | | | 18,847 | | | | 2,935 | |
| | |
| | | | | | | 195,776 | |
| | |
Materials — 3.8% | | | | | | | | |
AptarGroup Inc | | | 38,510 | | | | 4,865 | |
Balchem Corp | | | 4,152 | | | | 430 | |
Berry Global Group Inc * | | | 149,797 | | | | 7,939 | |
Gold Resource Corp | | | 39,528 | | | | 118 | |
Linde PLC | | | 21,526 | | | | 5,520 | |
NewMarket Corp | | | 9,167 | | | | 3,390 | |
Newmont Corp | | | 22,200 | | | | 1,306 | |
Novagold Resources Inc * | | | 16,798 | | | | 167 | |
Ranpak Holdings Corp, Cl A * | | | 12,166 | | | | 138 | |
Royal Gold Inc | | | 15,122 | | | | 1,671 | |
Sealed Air Corp | | | 95,500 | | | | 4,303 | |
Sensient Technologies Corp | | | 4,743 | | | | 340 | |
Sherwin-Williams Co/The | | | 8,768 | | | | 6,555 | |
Silgan Holdings Inc | | | 181,300 | | | | 6,128 | |
Sonoco Products Co | | | 127,100 | | | | 7,379 | |
Stepan Co | | | 2,144 | | | | 249 | |
| | |
| | | | | | | 50,498 | |
| | |
Real Estate — 1.7% | | | | | | | | |
Americold Realty Trust ‡ | | | 23,076 | | | | 787 | |
Brandywine Realty Trust ‡ | | | 270,500 | | | | 3,011 | |
Easterly Government Properties Inc ‡ | | | 7,059 | | | | 153 | |
eXp World Holdings Inc * | | | 5,021 | | | | 268 | |
Forestar Group Inc * | | | 3,395 | | | | 66 | |
Gladstone Land Corp ‡ | | | 6,871 | | | | 100 | |
Innovative Industrial Properties Inc, Cl A ‡ | | | 3,205 | | | | 492 | |
Iron Mountain Inc ‡(A) | | | 160,400 | | | | 4,411 | |
Jones Lang LaSalle Inc | | | 9,666 | | | | 1,279 | |
Maui Land & Pineapple Co Inc * | | | 1,950 | | | | 24 | |
| | | | | | | | |
| | | |
| Description | | Shares | | Market Value
($ Thousands) |
| | |
COMMON STOCK (continued) | | | | | | | | |
Piedmont Office Realty Trust Inc, Cl A ‡ | | | 226,600 | | | $ | 3,542 | |
PS Business Parks Inc ‡ | | | 2,024 | | | | 267 | |
St Joe Co/The | | | 16,892 | | | | 557 | |
Terreno Realty Corp ‡ | | | 7,511 | | | | 435 | |
VEREIT Inc ‡ | | | 914,100 | | | | 6,481 | |
| | |
| | | | | | | 21,873 | |
| | |
Utilities — 5.5% | | | | | | | | |
American States Water Co | | | 8,188 | | | | 604 | |
Artesian Resources Corp, Cl A | | | 1,536 | | | | 57 | |
Atlantic Power Corp * | | | 55,839 | | | | 115 | |
Cadiz Inc *(A) | | | 29,367 | | | | 295 | |
California Water Service Group | | | 4,643 | | | | 230 | |
Consolidated Water Co Ltd | | | 1,660 | | | | 18 | |
DTE Energy Co | | | 51,600 | | | | 6,492 | |
Entergy Corp | | | 150,600 | | | | 16,393 | |
Evergy Inc | | | 258,200 | | | | 14,307 | |
Exelon Corp | | | 476,400 | | | | 19,566 | |
Genie Energy Ltd, Cl B | | | 13,329 | | | | 111 | |
Global Water Resources Inc | | | 3,483 | | | | 45 | |
Hawaiian Electric Industries Inc | | | 65,574 | | | | 2,349 | |
MDU Resources Group Inc | | | 62,578 | | | | 1,561 | |
MGE Energy Inc | | | 1,472 | | | | 101 | |
National Fuel Gas Co | | | 19,080 | | | | 785 | |
NextEra Energy Inc | | | 44,668 | | | | 3,287 | |
Northwest Natural Holding Co | | | 1,651 | | | | 79 | |
ONE Gas Inc | | | 2,247 | | | | 178 | |
Public Service Enterprise Group Inc | | | 105,700 | | | | 6,160 | |
Pure Cycle Corp * | | | 11,847 | | | | 113 | |
Southwest Gas Holdings Inc | | | 1,351 | | | | 87 | |
Spark Energy Inc, Cl A | | | 4,577 | | | | 42 | |
Spire Inc | | | 4,609 | | | | 295 | |
Vistra Corp | | | 7,398 | | | | 138 | |
| | |
| | | | | | | 73,408 | |
| | |
Total Common Stock
(Cost $1,075,279) ($ Thousands) | | | | | | | 1,302,765 | |
| |
AFFILIATED PARTNERSHIP — 2.8% | | | | | |
SEI Liquidity Fund, L.P.
0.070% **† (B) | | | 37,731,208 | | | | 37,738 | |
| | |
Total Affiliated Partnership
(Cost $37,737) ($ Thousands) | | | | | | | 37,738 | |
| | |
CASH EQUIVALENT — 1.7% | | | | | | | | |
SEI Daily Income Trust, Government Fund, Cl F
0.010%**† | | | 22,615,933 | | | | 22,616 | |
| | |
| 4 | | SEI Institutional Investments Trust / Semi-Annual Report / November 30, 2020 |
SCHEDULE OF INVESTMENTS (Unaudited)
November 30, 2020
U.S. Managed Volatility Fund (Continued)
| | | | | | | | |
| | | |
| Description | | Shares | | | Market Value ($ Thousands) | |
| |
CASH EQUIVALENT (continued) | | | | | |
Total Cash Equivalent
(Cost $22,616) ($ Thousands) | | | | | | $ | 22,616 | |
| | | | | | | | |
Total Investments in Securities — 102.6%
(Cost $1,135,632) ($ Thousands) | | | $ | 1,363,119 | |
| | | | | | | | |
A list of the open futures contracts held by the Fund at November 30, 2020, is as follows:
| | | | | | | | | | | | | | | | | | | | |
Type of
Contract | | Number of
Contracts
Long | | | Expiration
Date | | | Notional Amount
(Thousands) | | | Value
(Thousands) | | | Unrealized
Appreciation
(Thousands) | |
S&P 500 Index E-MINI | | | 75 | | | | Dec-2020 | | | $ | 13,177 | | | $ | 13,587 | | | $ | 410 | |
| | | | | | | | | | | | | | | | | | | | |
| | Percentages are based on Net Assets of $1,328,438 ($ Thousands). |
| * | Non-income producing security. |
| ** | The rate reported is the 7-day effective yield as of November 30, 2020. |
| † | Investment in Affiliated Security (See Note 6). |
| ‡ | Real Estate Investment Trust. |
| (A) | Certain securities or partial positions of certain securities are on loan at November 30, 2020 (See Note 12). The total market value of securities on loan at November 30, 2020 was $36,640 ($ Thousands). |
| (B) | This security was purchased with cash collateral held from securities on loan (See Note 12). The total market value of such securities as of November 30, 2020 was $37,738 ($ Thousands). |
ADR — American Depositary Receipt
Cl — Class
L.P. — Limited Partnership
Ltd. — Limited
PLC — Public Limited Company
The following is a list of the level of inputs used as of November 30, 2020, in valuing the Fund’s investments and other financial instruments carried at value ($ Thousands):
| | | | | | | | | | | | | | | | |
| | | | | |
Investments in
Securities | | Level 1 ($) | | | Level 2 ($) | | | Level 3 ($) | | | Total ($) | |
Common Stock | | | 1,302,765 | | | | – | | | | – | | | | 1,302,765 | |
Affiliated Partnership | | | – | | | | 37,738 | | | | – | | | | 37,738 | |
Cash Equivalent | | | 22,616 | | | | – | | | | – | | | | 22,616 | |
| | | | | | | | | | | | | | | | |
| | | | |
Total Investments in Securities | | | 1,325,381 | | | | 37,738 | | | | – | | | | 1,363,119 | |
| | | | | | | | | | | | | | | | |
| | | | | | | | | | | | | | | | |
| | | | | |
| Other Financial Instruments | | Level 1
($) | | | Level 2
($) | | | Level 3
($) | | | Total
($) | |
Futures Contracts* | | | | | | | | | | | | | | | | |
Unrealized Appreciation | | | 410 | | | | – | | | | – | | | | 410 | |
| | | | | | | | | | | | | | | | |
| | | | |
Total Other Financial Instruments | | | 410 | | | | – | | | | – | | | | 410 | |
| | | | | | | | | | | | | | | | |
| * | Futures contracts are valued at the unrealized appreciation on the instrument. |
For the period ended November 30, 2020, there were no transfers in or out of Level 3.
For more information on valuation inputs, see Note 2 – Significant Accounting Policies in Notes to Financial Statements.
The following is a summary of the Fund’s transactions with affiliates for the period ended November 30, 2020 ($ Thousands):
| | | | | | | | | | | | | | | | | | | | | | | | | | | | | | | | | | | | |
| Security Description | | Value
5/31/2019 | | | Purchases
at Cost | | | Proceeds
from Sales | | | Realized
Gain (Loss) | | | Change in
Unrealized
Appreciation
(Depreciation) | | | Value
11/30/2019 | | | Shares | | | Income | | | Capital
Gains | |
SEI Liquidity Fund, L.P. | | $ | 19,825 | | | $ | 92,031 | | | $ | (74,114 | ) | | $ | — | | | $ | (4 | ) | | $ | 37,738 | | | | 37,731,208 | | | $ | 55 | | | $ | — | |
SEI Daily Income Trust, Government Fund, Cl F | | | 39,061 | | | | 126,803 | | | | (143,248 | ) | | | — | | | | — | | | | 22,616 | | | | 22,615,933 | | | | 2 | | | | — | |
| | | | | | | | | | | | | | | | | | | | | | | | | | | | | | | | | | | | |
Totals | | $ | 58,886 | | | $ | 218,834 | | | $ | (217,362 | ) | | $ | — | | | $ | (4 | ) | | $ | 60,354 | | | | | | | $ | 57 | | | $ | — | |
| | | | | | | | | | | | | | | | | | | | | | | | | | | | | | | | | | | | |
Amounts designated as “—” are $0 or have been rounded to $0.
The accompanying notes are an integral part of the financial statements.
| | |
| SEI Institutional Investments Trust / Semi-Annual Report / November 30, 2020 | | 5 |
SCHEDULE OF INVESTMENTS (Unaudited)
November 30, 2020
Global Managed Volatility Fund (Continued)
| | | | | | | | |
| | | |
| Description | | Shares | | Market Value
($ Thousands) |
COMMON STOCK — 96.7% | | | | | | | | |
| | |
Australia — 1.3% | | | | | | | | |
AGL Energy Ltd | | | 1,205,000 | | | $ | 11,987 | |
Coca-Cola Amatil Ltd | | | 165,200 | | | | 1,540 | |
Coles Group Ltd | | | 558,057 | | | | 7,344 | |
Evolution Mining Ltd | | | 1,409,622 | | | | 5,162 | |
Newcrest Mining Ltd | | | 502,843 | | | | 9,978 | |
Regis Resources Ltd | | | 692,879 | | | | 1,884 | |
| | |
| | | | | | | 37,895 | |
| | |
Austria — 0.0% | | | | | | | | |
Agrana Beteiligungs AG | | | 7,360 | | | | 147 | |
Flughafen Wien AG | | | 3,245 | | | | 105 | |
Oberbank AG | | | 175 | | | | 17 | |
Telekom Austria AG, Cl A | | | 38,558 | | | | 284 | |
| | |
| | | | | | | 553 | |
| | |
Belgium — 0.5% | | | | | | | | |
Ageas SA/NV | | | 111,600 | | | | 5,502 | |
Etablissements Franz Colruyt NV | | | 137,342 | | | | 8,218 | |
| | |
| | | | | | | 13,720 | |
| | |
Canada — 3.8% | | | | | | | | |
Alimentation Couche-Tard Inc, Cl B | | | 40,800 | | | | 1,358 | |
B2Gold Corp | | | 504,472 | | | | 2,818 | |
Bank of Montreal | | | 72,700 | | | | 5,236 | |
Bank of Nova Scotia/The | | | 106,000 | | | | 5,169 | |
Barrick Gold Corp | | | 194,700 | | | | 4,479 | |
BCE Inc | | | 74,600 | | | | 3,241 | |
Canadian Tire Corp Ltd, Cl A (A) | | | 83,400 | | | | 10,681 | |
Centerra Gold Inc | | | 389,400 | | | | 3,810 | |
Dundee Precious Metals Inc | | | 16,135 | | | | 106 | |
Empire Co Ltd, Cl A | | | 159,800 | | | | 4,382 | |
George Weston Ltd | | | 72,013 | | | | 5,341 | |
Great-West Lifeco Inc | | | 172,100 | | | | 4,012 | |
Hydro One Ltd | | | 132,800 | | | | 3,105 | |
Kinross Gold Corp | | | 308,200 | | | | 2,200 | |
Kirkland Lake Gold Ltd | | | 30,000 | | | | 1,232 | |
Loblaw Cos Ltd | | | 289,651 | | | | 14,350 | |
Metro Inc/CN, Cl A | | | 72,700 | | | | 3,347 | |
National Bank of Canada | | | 71,400 | | | | 3,964 | |
North West Co Inc/The | | | 21,300 | | | | 552 | |
Osisko Gold Royalties Ltd | | | 108,782 | | | | 1,184 | |
Power Corp of Canada | | | 246,540 | | | | 5,563 | |
Roxgold Inc * | | | 295,172 | | | | 376 | |
TELUS Corp | | | 631,600 | | | | 12,209 | |
Torex Gold Resources Inc * | | | 127,986 | | | | 1,770 | |
Toronto-Dominion Bank/The | | | 168,700 | | | | 9,019 | |
Wheaton Precious Metals Corp | | | 8,200 | | | | 317 | |
| | |
| | | | | | | 109,821 | |
| | |
Denmark — 0.5% | | | | | | | | |
Carlsberg AS, Cl B | | | 5,330 | | | | 795 | |
Coloplast A/S, Cl B | | | 47,820 | | | | 7,159 | |
Novo Nordisk A/S, Cl B | | | 118,937 | | | | 8,022 | |
| | | | | | | | |
| | | |
| Description | | Shares | | Market Value
($ Thousands) |
COMMON STOCK (continued) | | | | | | | | |
Schouw & Co A/S | | | 1,955 | | | $ | 191 | |
| | |
| | | | | | | 16,167 | |
| | |
Finland — 0.1% | | | | | | | | |
Aspo Oyj | | | 27 | | | | – | |
Kesko Oyj, Cl B | | | 64,581 | | | | 1,699 | |
Olvi Oyj, Cl A | | | 1,167 | | | | 67 | |
Orion Oyj, Cl B | | | 46,662 | | | | 2,203 | |
| | |
| | | | | | | 3,969 | |
| | |
France — 1.8% | | | | | | | | |
BioMerieux | | | 14,830 | | | | 2,143 | |
Boiron SA | | | 56 | | | | 3 | |
Carrefour SA | | | 7,074 | | | | 116 | |
Danone SA | | | 63,190 | | | | 4,071 | |
Eurofins Scientific | | | 13,820 | | | | 1,125 | |
Fountaine Pajot SA | | | 345 | | | | 29 | |
Orange SA | | | 502,262 | | | | 6,362 | |
Sanofi | | | 237,112 | | | | 24,027 | |
Sartorius Stedim Biotech | | | 5,341 | | | | 1,936 | |
SEB SA | | | 7,121 | | | | 1,271 | |
Societe BIC SA | | | 77,200 | | | | 4,595 | |
TOTAL SE | | | 133,400 | | | | 5,717 | |
| | |
| | | | | | | 51,395 | |
| | |
Germany — 1.4% | | | | | | | | |
Allianz SE | | | 24,800 | | | | 5,864 | |
Bayerische Motoren Werke AG | | | 45,600 | | | | 3,984 | |
Deutsche Telekom AG | | | 1,204,297 | | | | 21,774 | |
Henkel | | | 11,427 | | | | 1,106 | |
Knorr-Bremse AG | | | 44,322 | | | | 5,688 | |
McKesson Europe AG | | | 1,563 | | | | 48 | |
Scout24 AG | | | 12,605 | | | | 967 | |
Wuestenrot & Wuerttembergische AG | | | 2,239 | | | | 46 | |
Zalando * | | | 5,949 | | | | 603 | |
| | |
| | | | | | | 40,080 | |
| | |
Hong Kong — 0.9% | | | | | | | | |
Chinney Investments Ltd | | | 88,000 | | | | 19 | |
CITIC Telecom International Holdings Ltd | | | 412,000 | | | | 137 | |
CK Hutchison Holdings Ltd | | | 449,500 | | | | 3,262 | |
CK Infrastructure Holdings Ltd | | | 151,425 | | | | 775 | |
CLP Holdings Ltd | | | 671,680 | | | | 6,307 | |
Fountain SET Holdings Ltd | | | 386,000 | | | | 45 | |
HK Electric Investments & HK Electric Investments Ltd | | | 2,671,521 | | | | 2,688 | |
HKT Trust & HKT Ltd | | | 4,444,686 | | | | 5,814 | |
Langham Hospitality Investments and Langham Hospitality Investments Ltd | | | 450,500 | | | | 62 | |
PCCW Ltd | | | 1,852,000 | | | | 1,125 | |
Power Assets Holdings Ltd | | | 58,000 | | | | 305 | |
Regal Hotels International Holdings Ltd | | | 98,000 | | | | 34 | |
Sun Hung Kai Properties Ltd | | | 239,000 | | | | 3,191 | |
Transport International Holdings Ltd | | | 13,200 | | | | 26 | |
| | |
| SEI Institutional Investments Trust / Semi-Annual Report / November 30, 2020 | | 1 |
SCHEDULE OF INVESTMENTS (Unaudited)
November 30, 2020
Global Managed Volatility Fund (Continued)
| | | | | | | | |
| | | |
| Description | | Shares | | Market Value
($ Thousands) |
| | |
COMMON STOCK (continued) | | | | | | | | |
VTech Holdings Ltd | | | 35,300 | | | $ | 272 | |
WH Group Ltd | | | 4,215,000 | | | | 3,442 | |
Yue Yuen Industrial Holdings Ltd | | | 22 | | | | – | |
| | |
| | | | | | | 27,504 | |
| | |
Israel — 0.7% | | | | | | | | |
Bank Leumi Le-Israel BM | | | 1,041,944 | | | | 5,858 | |
Bezeq The Israeli Telecommunication Corp Ltd * | | | 556,347 | | | | 602 | |
Freshmarket Ltd | | | 23,543 | | | | 90 | |
Isracard Ltd | | | 1 | | | | – | |
Malam—Team Ltd | | | 239 | | | | 50 | |
Mizrahi Tefahot Bank Ltd | | | 348,198 | | | | 7,444 | |
Neto ME Holdings Ltd | | | 1,148 | | | | 53 | |
Nice Ltd * | | | 1,890 | | | | 455 | |
Rami Levy Chain Stores Hashikma Marketing 2006 Ltd | | | 13,597 | | | | 906 | |
Shufersal Ltd | | | 350,226 | | | | 2,735 | |
Strauss Group Ltd | | | 34,839 | | | | 1,069 | |
Victory Supermarket Chain Ltd | | | 1,785 | | | | 39 | |
| | |
| | | | | | | 19,301 | |
| | |
Italy — 0.8% | | | | | | | | |
A2A SpA | | | 1,020,552 | | | | 1,560 | |
ACEA SpA | | | 4,161 | | | | 88 | |
DiaSorin SpA | | | 5,723 | | | | 1,209 | |
Enel SpA | | | 1,513,300 | | | | 15,151 | |
Hera SpA | | | 692,174 | | | | 2,534 | |
Iren SpA | | | 885,046 | | | | 2,380 | |
Orsero SpA * | | | 7,137 | | | | 55 | |
| | |
| | | | | | | 22,977 | |
| | |
Japan — 9.3% | | | | | | | | |
Aeon Hokkaido Corp | | | 18,800 | | | | 172 | |
Ahjikan Co Ltd | | | 5,308 | | | | 40 | |
Anabuki Kosan Inc | | | 1,600 | | | | 26 | |
Aozora Bank Ltd | | | 85,300 | | | | 1,550 | |
Araya Industrial Co Ltd | | | 3,800 | | | | 42 | |
Arcs Co Ltd | | | 29,200 | | | | 611 | |
Astellas Pharma Inc | | | 792,200 | | | | 11,271 | |
Atsugi Co Ltd | | | 21,950 | | | | 111 | |
Axial Retailing | | | 1,200 | | | | 55 | |
Belc Co Ltd | | | 3,000 | | | | 176 | |
Biofermin Pharmaceutical Co Ltd | | | 1,300 | | | | 30 | |
Calbee | | | 7,000 | | | | 207 | |
Can Do Co Ltd | | | 25,316 | | | | 447 | |
Canon Inc | | | 243,300 | | | | 4,325 | |
Cawachi Ltd | | | 3,300 | | | | 95 | |
C’BON COSMETICS Co Ltd | | | 3,200 | | | | 61 | |
Choushimaru Co Ltd | | | 11,394 | | | | 110 | |
Chugoku Electric Power Co Inc/The | | | 133,708 | | | | 1,702 | |
Cosmos Pharmaceutical Corp | | | 26,400 | | | | 4,557 | |
Create Medic Co Ltd | | | 2,784 | | | | 26 | |
Create SD Holdings Co Ltd | | | 2,000 | | | | 71 | |
| | | | | | | | |
| | | |
| Description | | Shares | | Market Value
($ Thousands) |
| | |
COMMON STOCK (continued) | | | | | | | | |
Daiohs Corp | | | 2,700 | | | $ | 24 | |
DCM Holdings Co Ltd | | | 125,300 | | | | 1,425 | |
DyDo Group Holdings Inc | | | 15,396 | | | | 824 | |
Earth Corp | | | 10,600 | | | | 625 | |
Ebara Foods Industry Inc | | | 1,600 | | | | 37 | |
ESTELLE Holdings Co Ltd | | | 6,000 | | | | 36 | |
Fujicco Co Ltd | | | 3,600 | | | | 68 | |
FUJIFILM Holdings Corp | | | 116,500 | | | | 6,284 | |
Fujiya Co Ltd | | | 9,400 | | | | 213 | |
Hakudo Co Ltd | | | 2,100 | | | | 29 | |
Heiwado Co Ltd | | | 11,900 | | | | 242 | |
Hitachi Ltd | | | 525 | | | | 20 | |
Hokuto Corp | | | 17,900 | | | | 354 | |
ITOCHU Corp | | | 440,400 | | | | 11,650 | |
Itochu-Shokuhin Co Ltd | | | 953 | | | | 51 | |
Itoham Yonekyu Holdings Inc | | | 31,400 | | | | 197 | |
Japan Post Holdings Co Ltd | | | 358,600 | | | | 2,657 | |
Japan Tobacco Inc | | | 919,200 | | | | 18,688 | |
J-Oil Mills Inc | | | 700 | | | | 24 | |
JXTG Holdings | | | 1,100,600 | | | | 3,784 | |
Kaken Pharmaceutical | | | 12,100 | | | | 442 | |
Kakiyasu Honten Co Ltd | | | 7,053 | | | | 170 | |
Kameda Seika Co Ltd | | | 1,000 | | | | 47 | |
Kamigumi | | | 68,700 | | | | 1,189 | |
Kato Sangyo Co Ltd | | | 16,200 | | | | 537 | |
KDDI Corp | | | 828,700 | | | | 23,703 | |
Kewpie Corp | | | 15,200 | | | | 317 | |
King Jim Co Ltd | | | 7,400 | | | | 64 | |
Kobe Bussan | | | 20,800 | | | | 726 | |
Kohnan Shoji Co Ltd | | | 138,458 | | | | 4,289 | |
K’s Holdings Corp | | | 304,700 | | | | 3,705 | |
Kuraray Co Ltd | | | 165,400 | | | | 1,643 | |
Kyokuyo Co Ltd | | | 14,100 | | | | 378 | |
KYORIN Holdings Inc | | | 24,100 | | | | 434 | |
Lawson Inc | | | 9,900 | | | | 449 | |
Life Corp | | | 18,200 | | | | 643 | |
Lion Corp | | | 126,200 | | | | 2,987 | |
McDonald’s Holdings Co Japan Ltd | | | 15,700 | | | | 763 | |
Medipal Holdings Corp | | | 78,800 | | | | 1,483 | |
MEIJI Holdings Co Ltd | | | 13,300 | | | | 941 | |
Ministop Co Ltd | | | 15,600 | | | | 202 | |
Mitsubishi Shokuhin Co Ltd | | | 6,500 | | | | 172 | |
Miyoshi Oil & Fat Co Ltd | | | 10,118 | | | | 120 | |
Mizuho Financial Group Inc | | | 646,850 | | | | 8,235 | |
Mochida Pharmaceutical Co Ltd | | | 14,000 | | | | 538 | |
Morozoff Ltd | | | 611 | | | | 36 | |
MS&AD Insurance Group Holdings Inc | | | 11,600 | | | | 338 | |
Natori Co Ltd | | | 1,800 | | | | 34 | |
Nexon Co Ltd | | | 32,600 | | | | 986 | |
Nihon Chouzai Co Ltd | | | 3,800 | | | | 55 | |
Nintendo Co Ltd | | | 29,000 | | | | 16,481 | |
Nippon Beet Sugar Manufacturing Co Ltd | | | 3,000 | | | | 46 | |
| | |
| 2 | | SEI Institutional Investments Trust / Semi-Annual Report / November 30, 2020 |
SCHEDULE OF INVESTMENTS (Unaudited)
November 30, 2020
Global Managed Volatility Fund (Continued)
| | | | | | | | |
| | | |
| Description | | Shares | | Market Value
($ Thousands) |
| | |
COMMON STOCK (continued) | | | | | | | | |
Nippon Flour Mills Co Ltd | | | 225,242 | | | $ | 3,514 | |
Nippon Kanzai Co Ltd | | | 7,694 | | | | 153 | |
Nippon Telegraph & Telephone Corp | | | 1,206,700 | | | | 28,526 | |
Nipro | | | 41,700 | | | | 448 | |
Nisshin Oillio Group Ltd/The | | | 4,849 | | | | 135 | |
Nissin Foods Holdings Co Ltd | | | 18,500 | | | | 1,529 | |
Nissui Pharmaceutical Co Ltd | | | 11,900 | | | | 113 | |
NJS Co Ltd | | | 3,200 | | | | 60 | |
Okinawa Cellular Telephone Co | | | 3,311 | | | | 138 | |
Okinawa Electric Power Co Inc/The | | | 38,902 | | | | 541 | |
Okuwa Co Ltd | | | 13,500 | | | | 173 | |
Oracle Corp Japan | | | 44,654 | | | | 4,955 | |
OUG Holdings Inc | | | 3,200 | | | | 87 | |
Prima Meat Packers Ltd | | | 4,000 | | | | 111 | |
San-A Co Ltd, Cl A | | | 4,800 | | | | 186 | |
Sekisui Chemical Co Ltd | | | 254,100 | | | | 4,394 | |
Senko Group Holdings Co Ltd | | | 429,100 | | | | 3,992 | |
Seven & i Holdings Co Ltd | | | 116,500 | | | | 3,701 | |
Showa Sangyo Co Ltd | | | 12,200 | | | | 370 | |
SKY Perfect JSAT Holdings Inc | | | 401,200 | | | | 1,820 | |
SoftBank Corp | | | 1,958,300 | | | | 24,123 | |
SPK | | | 2,200 | | | | 26 | |
ST Corp | | | 3,700 | | | | 72 | |
Sugi Holdings Co Ltd | | | 41,500 | | | | 2,758 | |
Sundrug Co Ltd | | | 112,400 | | | | 4,721 | |
Takihyo Co Ltd | | | 2,800 | | | | 50 | |
Teijin Ltd | | | 327,300 | | | | 5,600 | |
Toho Holdings Co Ltd | | | 20,900 | | | | 381 | |
Tokyo Electric Power Co Holdings Inc * | | | 172,200 | | | | 449 | |
Toyo Suisan Kaisha Ltd | | | 42,200 | | | | 2,076 | |
Toyota Motor Corp | | | 163,300 | | | | 10,961 | |
Trend Micro | | | 32,700 | | | | 1,778 | |
Tsuruha Holdings Inc | | | 45,200 | | | | 6,623 | |
Unicafe Inc | | | 9,700 | | | | 107 | |
Unicharm Corp | | | 66,600 | | | | 3,234 | |
United Super Markets Holdings Inc | | | 67,500 | | | | 700 | |
Valor Holdings Co Ltd | | | 16,500 | | | | 410 | |
Vital KSK Holdings Inc | | | 32,600 | | | | 269 | |
Welcia Holdings Co Ltd | | | 103,200 | | | | 4,152 | |
Wowow Inc | | | 4,776 | | | | 130 | |
Yamaguchi Financial Group Inc | | | 365,000 | | | | 2,282 | |
Yaoko Co Ltd | | | 6,500 | | | | 445 | |
Zaoh Co Ltd | | | 2,000 | | | | 25 | |
ZERIA Pharmaceutical Co Ltd | | | 2,000 | | | | 36 | |
| | |
| | | | | | | 271,424 | |
| | |
Netherlands — 1.5% | | | | | | | | |
Adyen NV * | | | 1,846 | | | | 3,538 | |
Koninklijke Ahold Delhaize NV | | | 1,093,213 | | | | 31,372 | |
NN Group NV | | | 137,300 | | | | 5,592 | |
Signify NV | | | 78,500 | | | | 3,333 | |
| | |
| | | | | | | 43,835 | |
| | | | | | | | |
| | | |
| Description | | Shares | | Market Value
($ Thousands) |
| | |
COMMON STOCK (continued) | | | | | | | | |
| | |
New Zealand — 0.4% | | | | | | | | |
Argosy Property Ltd ‡ | | | 313,788 | | | $ | 329 | |
Chorus Ltd | | | 32,562 | | | | 188 | |
Contact Energy Ltd | | | 260,726 | | | | 1,429 | |
EBOS Group Ltd | | | 14,634 | | | | 256 | |
Fisher & Paykel Healthcare Corp Ltd | | | 61,513 | | | | 1,553 | |
Genesis Energy Ltd | | | 325,661 | | | | 739 | |
Goodman Property Trust ‡ | | | 311,977 | | | | 526 | |
Investore Property Ltd ‡ | | | 188 | | | | – | |
Mainfreight Ltd | | | 9,621 | | | | 422 | |
Mercury NZ Ltd | | | 219,680 | | | | 926 | |
Property for Industry Ltd ‡ | | | 49,229 | | | | 100 | |
Sanford Ltd/NZ | | | 8,999 | | | | 32 | |
Spark New Zealand Ltd | | | 1,151,309 | | | | 3,690 | |
Stride Property Group | | | 85,010 | | | | 133 | |
Trustpower Ltd | | | 12,723 | | | | 66 | |
| | |
| | | | | | | 10,389 | |
| | |
Norway — 0.7% | | | | | | | | |
Orkla ASA | | | 1,384,689 | | | | 13,321 | |
Sparebanken More | | | 56 | | | | 2 | |
Telenor ASA | | | 434,824 | | | | 7,435 | |
| | |
| | | | | | | 20,758 | |
| | |
Portugal — 0.0% | | | | | | | | |
Jeronimo Martins SGPS SA | | | 12,386 | | | | 213 | |
REN—Redes Energeticas Nacionais SGPS SA | | | 264,138 | | | | 725 | |
| | |
| | | | | | | 938 | |
| | |
Singapore — 0.9% | | | | | | | | |
Dairy Farm International Holdings Ltd | | | 20,800 | | | | 85 | |
DBS Group Holdings Ltd | | | 330,900 | | | | 6,225 | |
Haw Par | | | 5,700 | | | | 43 | |
Oversea-Chinese Banking Corp Ltd | | | 704,300 | | | | 5,299 | |
Sheng Siong Group Ltd | | | 1,279,833 | | | | 1,490 | |
Singapore Exchange Ltd | | | 368,194 | | | | 2,443 | |
United Overseas Bank Ltd | | | 616,700 | | | | 10,362 | |
Venture Corp Ltd | | | 72,575 | | | | 1,020 | |
| | |
| | | | | | | 26,967 | |
| | |
Spain — 1.0% | | | | | | | | |
Ebro Foods SA | | | 106,366 | | | | 2,529 | |
Endesa SA | | | 380,556 | | | | 10,912 | |
Iberdrola SA | | | 1,127,050 | | | | 15,430 | |
Red Electrica Corp SA | | | 85,594 | | | | 1,754 | |
| | |
| | | | | | | 30,625 | |
| | |
Sweden — 0.9% | | | | | | | | |
Axfood AB | | | 308,008 | | | | 7,025 | |
Essity AB, Cl B | | | 58,372 | | | | 1,856 | |
Evolution Gaming Group AB | | | 66,494 | | | | 5,702 | |
ICA Gruppen AB | | | 234,458 | | | | 11,370 | |
Swedish Match AB | | | 11,297 | | | | 913 | |
| | |
| | | | | | | 26,866 | |
| | |
| SEI Institutional Investments Trust / Semi-Annual Report / November 30, 2020 | | 3 |
SCHEDULE OF INVESTMENTS (Unaudited)
November 30, 2020
Global Managed Volatility Fund (Continued)
| | | | | | | | |
| | | |
| Description | | Shares | | Market Value ($ Thousands) |
| | |
COMMON STOCK (continued) | | | | | | | | |
| | |
Switzerland — 4.4% | | | | | | | | |
Allreal Holding AG | | | 12,752 | | | $ | 2,702 | |
Basellandschaftliche Kantonalbank | | | 74 | | | | 76 | |
BKW AG | | | 9,657 | | | | 1,001 | |
Crealogix Holding AG | | | 301 | | | | 39 | |
Emmi AG | | | 752 | | | | 723 | |
EMS-Chemie Holding AG | | | 229 | | | | 210 | |
Helvetia Holding AG | | | 34,800 | | | | 3,431 | |
Intershop Holding AG | | | 291 | | | | 187 | |
Investis Holding SA | | | 813 | | | | 80 | |
Logitech International SA | | | 65,545 | | | | 5,820 | |
Mobimo Holding AG | | | 241 | | | | 70 | |
Nestle SA | | | 80,941 | | | | 9,046 | |
Novartis AG | | | 287,233 | | | | 26,103 | |
Novavest Real Estate AG | | | 1,207 | | | | 58 | |
Orior AG | | | 5,554 | | | | 450 | |
PSP Swiss Property AG | | | 19,986 | | | | 2,444 | |
Roche Holding AG | | | 121,074 | | | | 39,995 | |
Schindler Holding AG | | | 14,837 | | | | 4,037 | |
Sonova Holding AG | | | 19,975 | | | | 4,967 | |
Swiss Life Holding AG | | | 15,700 | | | | 7,037 | |
Swisscom AG | | | 17,514 | | | | 9,286 | |
TX Group AG | | | 1,293 | | | | 101 | |
Zurich Insurance Group AG | | | 24,400 | | | | 9,943 | |
| | |
| | | | | | | 127,806 | |
| | |
United Kingdom — 3.8% | | | | | | | | |
3i Group PLC | | | 396,800 | | | | 5,671 | |
AEW UK REIT PLC ‡ | | | 47,922 | | | | 48 | |
Amino Technologies PLC | | | 28,544 | | | | 44 | |
BAE Systems PLC | | | 1,526,300 | | | | 10,270 | |
British American Tobacco PLC | | | 274,000 | | | | 9,655 | |
Britvic PLC | | | 210,590 | | | | 2,304 | |
BT Group PLC, Cl A | | | 2,303,600 | | | | 3,592 | |
GlaxoSmithKline PLC | | | 1,455,383 | | | | 26,619 | |
Hikma Pharmaceuticals PLC | | | 30,436 | | | | 1,060 | |
Hummingbird Resources PLC * | | | 82,842 | | | | 33 | |
Imperial Brands PLC | | | 682,300 | | | | 12,397 | |
J Sainsbury PLC | | | 2,514,039 | | | | 7,085 | |
Liberty Global PLC * | | | 284,090 | | | | 6,148 | |
Pan African Resources PLC | | | 144,024 | | | | 38 | |
ScS Group PLC | | | 12,552 | | | | 31 | |
Tate & Lyle PLC | | | 1,094,755 | | | | 9,322 | |
Unilever PLC | | | 106,048 | | | | 6,472 | |
Wm Morrison Supermarkets PLC | | | 4,452,164 | | | | 10,690 | |
| | |
| | | | | | | 111,479 | |
| | |
United States — 62.0% | | | | | | | | |
| | |
Communication Services — 5.5% | | | | | | | | |
Activision Blizzard Inc | | | 61,266 | | | | 4,869 | |
AT&T Inc | | | 1,291,361 | | | | 37,127 | |
ATN International Inc | | | 3,739 | | | | 183 | |
BCE Inc | | | 228,183 | | | | 9,894 | |
| | | | | | | | |
| | | |
| Description | | Shares | | Market Value ($ Thousands) |
| | |
COMMON STOCK (continued) | | | | | | | | |
Comcast Corp, Cl A | | | 595,741 | | | $ | 29,930 | |
Electronic Arts Inc | | | 2,749 | | | | 351 | |
Facebook Inc, Cl A * | | | 21,970 | | | | 6,085 | |
Fox Corp | | | 177,685 | | | | 5,093 | |
John Wiley & Sons Inc, Cl A | | | 33,618 | | | | 1,161 | |
New York Times Co/The, Cl A | | | 6,367 | | | | 273 | |
News Corp, Cl A | | | 122,608 | | | | 2,164 | |
Omnicom Group Inc | | | 88,629 | | | | 5,584 | |
Scholastic Corp | | | 48,941 | | | | 1,161 | |
Take-Two Interactive Software Inc * | | | 27,626 | | | | 4,987 | |
Telephone and Data Systems Inc | | | 67,700 | | | | 1,285 | |
Verizon Communications Inc | | | 878,128 | | | | 53,048 | |
| | |
| | | | | | | 163,195 | |
| | |
Consumer Discretionary — 5.5% | | | | | | | | |
Acushnet Holdings Corp | | | 25,701 | | | | 969 | |
Amazon.com Inc * | | | 1,065 | | | | 3,374 | |
AutoZone Inc * | | | 11,900 | | | | 13,538 | |
Dollar General Corp | | | 79,177 | | | | 17,306 | |
Dollar Tree Inc * | | | 51,012 | | | | 5,573 | |
Domino’s Pizza Inc | | | 17,774 | | | | 6,978 | |
DR Horton Inc | | | 101,300 | | | | 7,547 | |
eBay Inc | | | 423,300 | | | | 21,347 | |
Ford Motor Co | | | 403,300 | | | | 3,662 | |
General Motors Co | | | 153,400 | | | | 6,725 | |
Genuine Parts Co | | | 39,684 | | | | 3,904 | |
Graham Holdings Co, Cl B | | | 1,154 | | | | 516 | |
Haverty Furniture Cos Inc | | | 8,342 | | | | 227 | |
Johnson Outdoors Inc, Cl A | | | 2,338 | | | | 195 | |
Lowe’s Cos Inc | | | 10,640 | | | | 1,658 | |
Lululemon Athletica Inc * | | | 13,841 | | | | 5,124 | |
Pool Corp | | | 3,293 | | | | 1,140 | |
PulteGroup Inc | | | 121,800 | | | | 5,314 | |
Target Corp | | | 318,782 | | | | 57,231 | |
Tractor Supply Co | | | 7,641 | | | | 1,076 | |
| | |
| | | | | | | 163,404 | |
| | |
Consumer Staples — 11.4% | | | | | | | | |
Altria Group Inc | | | 321,200 | | | | 12,793 | |
Archer-Daniels-Midland Co | | | 36,457 | | | | 1,814 | |
Bunge Ltd | | | 40,766 | | | | 2,401 | |
Campbell Soup Co | | | 146,552 | | | | 7,331 | |
Casey’s General Stores Inc | | | 48,528 | | | | 8,817 | |
Central Garden & Pet Co, Cl A * | | | 26,119 | | | | 964 | |
Church & Dwight Co Inc | | | 182,208 | | | | 15,992 | |
Clorox Co/The | | | 85,054 | | | | 17,263 | |
Coca-Cola Co/The | | | 19,893 | | | | 1,026 | |
Colgate-Palmolive Co | | | 189,074 | | | | 16,192 | |
Conagra Brands Inc | | | 72,100 | | | | 2,636 | |
Costco Wholesale Corp | | | 56,376 | | | | 22,086 | |
Flowers Foods Inc | | | 157,439 | | | | 3,494 | |
General Mills Inc | | | 446,568 | | | | 27,160 | |
Herbalife Nutrition Ltd * | | | 12,681 | | | | 608 | |
| | |
| 4 | | SEI Institutional Investments Trust / Semi-Annual Report / November 30, 2020 |
SCHEDULE OF INVESTMENTS (Unaudited)
November 30, 2020
Global Managed Volatility Fund (Continued)
| | | | | | | | |
| | | |
| Description | | Shares | | Market Value ($ Thousands) |
| | |
COMMON STOCK (continued) | | | | | | | | |
Hershey Co/The | | | 15,053 | | | $ | 2,226 | |
Hormel Foods Corp | | | 78,512 | | | | 3,704 | |
Ingles Markets Inc, Cl A | | | 2,749 | | | | 103 | |
Ingredion Inc | | | 77,200 | | | | 5,956 | |
Inter Parfums Inc | | | 1,674 | | | | 91 | |
J & J Snack Foods Corp | | | 1,061 | | | | 154 | |
J M Smucker Co/The | | | 154,913 | | | | 18,156 | |
John B Sanfilippo & Son Inc | | | 13,699 | | | | 1,017 | |
Kellogg Co | | | 231,352 | | | | 14,786 | |
Kimberly-Clark Corp | | | 116,573 | | | | 16,240 | |
Kroger Co/The | | | 984,727 | | | | 32,496 | |
Lancaster Colony Corp | | | 11,509 | | | | 1,949 | |
McCormick & Co Inc/MD | | | 17,814 | | | | 3,331 | |
Molson Coors Beverage Co, Cl B | | | 118,300 | | | | 5,442 | |
PepsiCo Inc | | | 58,560 | | | | 8,446 | |
Procter & Gamble Co/The | | | 86,802 | | | | 12,054 | |
Reynolds Consumer Products Inc | | | 25,429 | | | | 772 | |
Sprouts Farmers Market Inc * | | | 66,726 | | | | 1,413 | |
Tyson Foods Inc, Cl A | | | 190,700 | | | | 12,434 | |
USANA Health Sciences Inc * | | | 37,440 | | | | 2,815 | |
Village Super Market Inc, Cl A | | | 1,724 | | | | 40 | |
Walgreens Boots Alliance Inc | | | 282,880 | | | | 10,752 | |
Walmart Inc | | | 207,367 | | | | 31,684 | |
WD-40 Co | | | 14,678 | | | | 3,733 | |
Weis Markets Inc | | | 11,531 | | | | 549 | |
| | |
| | | | | | | 330,920 | |
| | |
Energy — 0.2% | | | | | | | | |
Phillips 66 | | | 103,300 | | | | 6,258 | |
| | |
Financials — 4.8% | | | | | | | | |
1st Source Corp | | | 3,670 | | | | 137 | |
Aflac Inc | | | 173,000 | | | | 7,600 | |
Allstate Corp/The | | | 218,900 | | | | 22,404 | |
American Financial Group Inc/OH | | | 56,600 | | | | 5,061 | |
Annaly Capital Management Inc ‡ | | | 540,500 | | | | 4,324 | |
Ares Capital Corp | | | 210,500 | | | | 3,469 | |
Axis Capital Holdings Ltd | | | 132,900 | | | | 6,660 | |
Bank of New York Mellon Corp/The | | | 268,100 | | | | 10,488 | |
BankFinancial Corp | | | 18,693 | | | | 151 | |
Bankwell Financial Group Inc | | | 909 | | | | 17 | |
BayCom Corp * | | | 3,168 | | | | 46 | |
Berkshire Hathaway Inc, Cl B * | | | 99,400 | | | | 22,754 | |
BlackRock TCP Capital Corp | | | 82,133 | | | | 973 | |
Bridgewater Bancshares Inc * | | | 2,320 | | | | 27 | |
Camden National Corp | | | 2,985 | | | | 103 | |
Cboe Global Markets Inc | | | 48,759 | | | | 4,453 | |
CBTX Inc | | | 4,594 | | | | 101 | |
Central Pacific Financial Corp | | | 43,600 | | | | 715 | |
Chimera Investment Corp ‡ | | | 142,200 | | | | 1,459 | |
Columbia Financial Inc * | | | 15,773 | | | | 227 | |
Commerce Bancshares Inc/MO | | | 558 | | | | 37 | |
Community Trust Bancorp Inc | | | 1,332 | | | | 45 | |
| | | | | | | | |
| | | |
| Description | | Shares | | Market Value ($ Thousands) |
| | |
COMMON STOCK (continued) | | | | | | | | |
Everest Re Group Ltd | | | 26,600 | | | $ | 6,047 | |
Fidus Investment Corp | | | 12,648 | | | | 179 | |
Flagstar Bancorp Inc | | | 31,174 | | | | 1,092 | |
Great Southern Bancorp Inc | | | 3,590 | | | | 165 | |
HarborOne Bancorp Inc | | | 75,205 | | | | 738 | |
Hartford Financial Services Group Inc/The | | | 209,700 | | | | 9,269 | |
HomeTrust Bancshares Inc | | | 15,505 | | | | 264 | |
Independent Bank Corp/MI | | | 17,477 | | | | 297 | |
JPMorgan Chase & Co | | | 58,300 | | | | 6,872 | |
Kearny Financial Corp/MD | | | 35,436 | | | | 350 | |
Lakeland Bancorp Inc | | | 12,295 | | | | 148 | |
Macatawa Bank Corp | | | 2,501 | | | | 19 | |
Mercantile Bank Corp | | | 3,028 | | | | 75 | |
Meridian Bancorp Inc | | | 18,859 | | | | 257 | |
National Bank Holdings Corp, Cl A | | | 12,380 | | | | 398 | |
New Mountain Finance Corp | | | 1,132 | | | | 14 | |
Northwest Bancshares Inc | | | 75,969 | | | | 899 | |
Oaktree Strategic Income Corp | | | 199 | | | | 2 | |
PCB Bancorp | | | 1,470 | | | | 16 | |
PCSB Financial Corp | | | 8,024 | | | | 123 | |
PNC Financial Services Group Inc/The | | | 38,500 | | | | 5,316 | |
Progressive Corp/The | | | 26,496 | | | | 2,308 | |
Provident Financial Holdings Inc | | | 9,453 | | | | 136 | |
Sixth Street Specialty Lending Inc | | | 23,637 | | | | 487 | |
Solar Capital Ltd | | | 9,799 | | | | 173 | |
Solar Senior Capital Ltd | | | 4,923 | | | | 73 | |
Starwood Property Trust Inc ‡ | | | 103,300 | | | | 1,853 | |
Stellus Capital Investment Corp | | | 100 | | | | 1 | |
Stock Yards Bancorp Inc | | | 4,062 | | | | 162 | |
Territorial Bancorp Inc | | | 2,474 | | | | 55 | |
Travelers Cos Inc/The | | | 66,600 | | | | 8,635 | |
TriCo Bancshares | | | 1,777 | | | | 58 | |
Trustmark Corp | | | 44,240 | | | | 1,098 | |
Washington Federal Inc | | | 24,770 | | | | 579 | |
Waterstone Financial Inc | | | 85,537 | | | | 1,502 | |
Westamerica BanCorp | | | 6,717 | | | | 370 | |
| | |
| | | | | | | 141,281 | |
| | |
Health Care — 13.4% | | | | | | | | |
AbbVie Inc | | | 64,197 | | | | 6,714 | |
Agilent Technologies Inc | | | 16,343 | | | | 1,910 | |
Amgen Inc | | | 110,740 | | | | 24,589 | |
Biogen Inc * | | | 29,057 | | | | 6,979 | |
Bio-Rad Laboratories Inc, Cl A * | | | 19,334 | | | | 10,411 | |
Bristol-Myers Squibb Co | | | 374,111 | | | | 23,345 | |
Bruker Corp | | | 11,302 | | | | 572 | |
Cerner Corp | | | 102,826 | | | | 7,695 | |
Chemed Corp | | | 25,668 | | | | 12,276 | |
CVS Health Corp | | | 206,035 | | | | 13,967 | |
Danaher Corp | | | 1,039 | | | | 233 | |
DaVita Inc * | | | 37,833 | | | | 4,156 | |
DexCom Inc * | | | 6,178 | | | | 1,975 | |
Eagle Pharmaceuticals Inc/DE * | | | 3,911 | | | | 178 | |
| | |
| SEI Institutional Investments Trust / Semi-Annual Report / November 30, 2020 | | 5 |
SCHEDULE OF INVESTMENTS (Unaudited)
November 30, 2020
Global Managed Volatility Fund (Continued)
| | | | | | | | |
| | | |
| Description | | Shares | | Market Value ($ Thousands) |
| | |
COMMON STOCK (continued) | | | | | | | | |
Eli Lilly and Co | | | 57,925 | | | $ | 8,437 | |
Enanta Pharmaceuticals Inc * | | | 9,594 | | | | 395 | |
Encompass Health Corp | | | 102,056 | | | | 8,224 | |
Gilead Sciences Inc | | | 279,665 | | | | 16,967 | |
HCA Healthcare Inc | | | 49,900 | | | | 7,490 | |
HealthStream Inc * | | | 8,152 | | | | 152 | |
Henry Schein Inc * | | | 35,877 | | | | 2,307 | |
Hill-Rom Holdings Inc | | | 1,324 | | | | 126 | |
Hologic Inc * | | | 20,360 | | | | 1,407 | |
Humana Inc | | | 16,437 | | | | 6,583 | |
IDEXX Laboratories Inc * | | | 3,746 | | | | 1,727 | |
Johnson & Johnson | | | 307,401 | | | | 44,475 | |
Luminex Corp | | | 21,286 | | | | 505 | |
Masimo Corp * | | | 8,106 | | | | 2,063 | |
Merck & Co Inc | | | 485,703 | | | | 39,046 | |
Mettler-Toledo International Inc * | | | 5,946 | | | | 6,838 | |
National HealthCare Corp | | | 17,703 | | | | 1,101 | |
Orthofix Medical Inc * | | | 18,249 | | | | 671 | |
PerkinElmer Inc | | | 100,388 | | | | 13,352 | |
Pfizer Inc | | | 838,519 | | | | 32,124 | |
Phibro Animal Health Corp, Cl A | | | 15,960 | | | | 301 | |
Prestige Consumer Healthcare Inc * | | | 46,889 | | | | 1,668 | |
Quest Diagnostics Inc | | | 39,624 | | | | 4,913 | |
Regeneron Pharmaceuticals Inc * | | | 16,278 | | | | 8,400 | |
STERIS PLC | | | 19,318 | | | | 3,744 | |
Taro Pharmaceutical Industries Ltd * | | | 7,891 | | | | 557 | |
Thermo Fisher Scientific Inc | | | 18,496 | | | | 8,600 | |
United Therapeutics Corp * | | | 54,101 | | | | 7,176 | |
Universal Health Services Inc, Cl B | | | 135,970 | | | | 17,755 | |
Vertex Pharmaceuticals Inc * | | | 38,561 | | | | 8,782 | |
Viatris Inc, Cl W * | | | 104,042 | | | | 1,750 | |
Waters Corp * | | | 18,980 | | | | 4,404 | |
West Pharmaceutical Services Inc | | | 26,244 | | | | 7,221 | |
| | |
| | | | | | | 384,261 | |
| | |
Industrials — 3.9% | | | | | | | | |
Allison Transmission Holdings Inc, Cl A | | | 162,700 | | | | 6,679 | |
Brady Corp, Cl A | | | 26,676 | | | | 1,179 | |
Carrier Global Corp | | | 50,300 | | | | 1,915 | |
CH Robinson Worldwide Inc | | | 57,501 | | | | 5,403 | |
Ennis Inc | | | 18,070 | | | | 296 | |
Expeditors International of Washington Inc | | | 113,097 | | | | 10,107 | |
General Dynamics Corp | | | 61,300 | | | | 9,155 | |
HD Supply Holdings Inc * | | | 167,100 | | | | 9,321 | |
JB Hunt Transport Services Inc | | | 46,588 | | | | 6,302 | |
Knight-Swift Transportation Holdings Inc, Cl A | | | 147,408 | | | | 6,086 | |
Lennox International Inc | | | 4,026 | | | | 1,159 | |
Lockheed Martin Corp | | | 49,010 | | | | 17,889 | |
Northrop Grumman Corp | | | 63,734 | | | | 19,264 | |
Old Dominion Freight Line Inc | | | 3,667 | | | | 746 | |
Otis Worldwide Corp | | | 25,150 | | | | 1,684 | |
Regal Beloit Corp | | | 4,262 | | | | 507 | |
Republic Services Inc, Cl A | | | 74,000 | | | | 7,157 | |
| | | | | | | | |
| | | |
| Description | | Shares | | Market Value ($ Thousands) |
| | |
COMMON STOCK (continued) | | | | | | | | |
Robert Half International Inc | | | 48,155 | | | $ | 3,091 | |
TrueBlue Inc * | | | 24,911 | | | | 476 | |
United Parcel Service Inc, Cl B | | | 12,124 | | | | 2,074 | |
Waste Management Inc | | | 59,500 | | | | 7,088 | |
| | |
| | | | | | | 117,578 | |
| | |
Information Technology — 10.9% | | | | | | | | |
ADTRAN Inc | | | 29,365 | | | | 371 | |
Akamai Technologies Inc * | | | 2,320 | | | | 240 | |
Amdocs Ltd | | | 449,470 | | | | 29,580 | |
Apple Inc | | | 44,554 | | | | 5,304 | |
Arista Networks Inc * | | | 13,795 | | | | 3,734 | |
Booz Allen Hamilton Holding Corp, Cl A | | | 26,224 | | | | 2,276 | |
CACI International Inc, Cl A * | | | 43,800 | | | | 10,393 | |
Calix Inc * | | | 46,092 | | | | 1,091 | |
CDK Global Inc | | | 146,358 | | | | 7,011 | |
Check Point Software Technologies Ltd * | | | 117,621 | | | | 13,842 | |
Ciena Corp * | | | 80,140 | | | | 3,590 | |
Cisco Systems Inc | | | 613,332 | | | | 26,386 | |
Citrix Systems Inc | | | 109,882 | | | | 13,617 | |
Cognizant Technology Solutions Corp, Cl A | | | 156,400 | | | | 12,220 | |
CommVault Systems Inc * | | | 27,388 | | | | 1,308 | |
Computer Programs and Systems Inc | | | 18,023 | | | | 512 | |
Comtech Telecommunications Corp | | | 17 | | | | – | |
CSG Systems International Inc | | | 58,119 | | | | 2,521 | |
DSP Group Inc * | | | 2,459 | | | | 41 | |
EchoStar Corp, Cl A * | | | 47,819 | | | | 1,137 | |
F5 Networks Inc * | | | 101,961 | | | | 16,600 | |
Intel Corp | | | 463,300 | | | | 22,401 | |
InterDigital Inc | | | 3,776 | | | | 226 | |
International Business Machines Corp | | | 165,800 | | | | 20,480 | |
Intuit Inc | | | 25,764 | | | | 9,069 | |
J2 Global Inc * | | | 46,902 | | | | 4,203 | |
Juniper Networks Inc | | | 539,761 | | | | 11,751 | |
MAXIMUS Inc | | | 13,508 | | | | 970 | |
Microsoft Corp | | | 38,492 | | | | 8,240 | |
MicroStrategy Inc, Cl A * | | | 4,005 | | | | 1,373 | |
Motorola Solutions Inc | | | 29,750 | | | | 5,103 | |
NetApp Inc | | | 39,786 | | | | 2,121 | |
NETGEAR Inc * | | | 25,458 | | | | 810 | |
NetScout Systems Inc * | | | 76,833 | | | | 1,799 | |
NortonLifeLock Inc | | | 182,954 | | | | 3,335 | |
Oracle Corp | | | 756,020 | | | | 43,637 | |
Progress Software Corp | | | 51,558 | | | | 2,067 | |
QAD Inc, Cl A | | | 5,217 | | | | 299 | |
Radware Ltd * | | | 51,445 | | | | 1,297 | |
ScanSource Inc * | | | 955 | | | | 24 | |
Silicom Ltd * | | | 2,397 | | | | 93 | |
SPS Commerce Inc * | | | 888 | | | | 92 | |
Sykes Enterprises Inc * | | | 95,054 | | | | 3,577 | |
Teradyne Inc | | | 48,853 | | | | 5,390 | |
Ubiquiti Inc | | | 1,588 | | | | 394 | |
VeriSign Inc * | | | 19,657 | | | | 3,946 | |
| | |
| 6 | | SEI Institutional Investments Trust / Semi-Annual Report / November 30, 2020 |
SCHEDULE OF INVESTMENTS (Unaudited)
November 30, 2020
Global Managed Volatility Fund (Continued)
| | | | | | | | |
| | | |
| Description | | Shares | | Market Value ($ Thousands) |
COMMON STOCK (continued) | | | | | | | | |
Viavi Solutions Inc * | | | 133,291 | | | $ | 1,805 | |
Western Union Co/The | | | 420,100 | | | | 9,477 | |
Zoom Video Communications Inc, Cl A * | | | 9,057 | | | | 4,332 | |
| | |
| | | | | | | 320,085 | |
| | |
Materials — 2.5% | | | | | | | | |
AptarGroup Inc | | | 8,349 | | | | 1,055 | |
Kaiser Aluminum Corp | | | 16,279 | | | | 1,269 | |
Materion Corp | | | 35,732 | | | | 2,083 | |
NewMarket Corp | | | 23,220 | | | | 8,586 | |
Newmont Corp | | | 439,203 | | | | 25,834 | |
Reliance Steel & Aluminum Co | | | 62,551 | | | | 7,368 | |
Royal Gold Inc | | | 73,852 | | | | 8,158 | |
Sealed Air Corp | | | 220,200 | | | | 9,922 | |
Silgan Holdings Inc | | | 242,689 | | | | 8,203 | |
| | |
| | | | | | | 72,478 | |
| | |
Real Estate — 0.8% | | | | | | | | |
Brandywine Realty Trust ‡ | | | 425,400 | | | | 4,735 | |
National Health Investors Inc ‡ | | | 106,100 | | | | 6,860 | |
Piedmont Office Realty Trust Inc, Cl A ‡ | | | 192,900 | | | | 3,015 | |
VEREIT Inc ‡ | | | 1,157,900 | | | | 8,209 | |
| | |
| | | | | | | 22,819 | |
| | |
Utilities — 3.1% | | | | | | | | |
Alliant Energy Corp | | | 96,570 | | | | 5,080 | |
American Electric Power Co Inc | | | 51,106 | | | | 4,338 | |
Avista Corp | | | 13,035 | | | | 489 | |
Consolidated Edison Inc | | | 51,280 | | | | 3,910 | |
Entergy Corp | | | 123,800 | | | | 13,476 | |
Evergy Inc | | | 171,600 | | | | 9,508 | |
Exelon Corp | | | 504,000 | | | | 20,699 | |
Hawaiian Electric Industries Inc | | | 114,206 | | | | 4,092 | |
MDU Resources Group Inc | | | 19,759 | | | | 493 | |
National Fuel Gas Co | | | 213,900 | | | | 8,806 | |
Otter Tail Corp | | | 3,124 | | | | 124 | |
PPL Corp | | | 80,249 | | | | 2,281 | |
Public Service Enterprise Group Inc | | | 262,900 | | | | 15,322 | |
Star Group LP (B) | | | 3,247 | | | | 31 | |
Xcel Energy Inc | | | 45,774 | | | | 3,083 | |
| | |
| | | | | | | 91,732 | |
| | | | | | | 1,814,011 | |
| | |
Total Common Stock
(Cost $2,622,211) ($ Thousands) | | | | | | | 2,828,480 | |
| | | | | | | | |
| | | |
| Description | | Shares | | Market Value ($ Thousands) |
COMMON STOCK (continued) | | | | | | | | |
| | |
PREFERRED STOCK — 0.3% | | | | | | | | |
Germany — 0.3% | | | | | | | | |
FUCHS PETROLUB (C) | | | 3,864 | | | $ | 222 | |
Henkel AG & Co KGaA (C) | | | 84,806 | | | | 9,154 | |
| | |
| | | | | | | 9,376 | |
| | |
Total Preferred Stock (Cost $8,443) ($ Thousands) | | | | | | | 9,376 | |
| | |
| | | Number of
Rights | | |
| | |
RIGHTS — 0.0% | | | | | | | | |
| | |
Switzerland — 0.0% | | | | | | | | |
Novavest Real Estate, Expires 12/18/2020 | | | 1,207 | | | | – | |
| | |
Total Rights
(Cost $—) ($ Thousands) | | | | | | | – | |
| | |
| | | Shares | | |
| | |
AFFILIATED PARTNERSHIP — 0.4% | | | | | | | | |
SEI Liquidity Fund, L.P.
0.070% **†(D) | | | 10,248,915 | | | | 10,253 | |
| | |
Total Affiliated Partnership
(Cost $10,253) ($ Thousands) | | | | | | | 10,253 | |
| | |
CASH EQUIVALENT — 1.7% | | | | | | | | |
SEI Daily Income Trust, Government Fund, Cl F 0.010% **† | | | 50,179,553 | | | | 50,180 | |
| | |
Total Cash Equivalent
(Cost $50,180) ($ Thousands) | | | | | | | 50,180 | |
| | |
Total Investments — 99.1%
(Cost $2,691,087) ($ Thousands) | | | | | | $ | 2,898,289 | |
| | | | | | | | |
A list of the open futures contracts held by the Fund at November 30, 2020, is as follows:
| | | | | | | | | | | | | | | | | | | | |
| Type of Contract | | Number of
Contracts Long | | | Expiration
Date | | | Notional Amount
(Thousands) | | | Value
(Thousands) | | | Unrealized Appreciation
(Depreciation) (Thousands) | |
Euro STOXX 50 | | | 102 | | | | Dec-2020 | | | $ | 3,881 | | | $ | 4,277 | | | $ | 325 | |
FTSE 100 Index | | | 22 | | | | Dec-2020 | | | | 1,735 | | | | 1,848 | | | | 84 | |
Hang Seng Index | | | 3 | | | | Jan-2021 | | | | 515 | | | | 511 | | | | (4 | ) |
S&P 500 Index E-MINI | | | 137 | | | | Dec-2020 | | | | 23,666 | | | | 24,819 | | | | 1,153 | |
SPI 200 Index | | | 9 | | | | Dec-2020 | | | | 1,073 | | | | 1,083 | | | | 1 | |
TOPIX Index | | | 18 | | | | Dec-2020 | | | | 2,907 | | | | 3,030 | | | | 110 | |
| | | | | | | | | | | | | | | | | | | | |
| | | | | | | | | | $ | 33,777 | | | $ | 35,568 | | | $ | 1,669 | |
| | | | | | | | | | | | | | | | | | | | |
| | |
| SEI Institutional Investments Trust / Semi-Annual Report / November 30, 2020 | | 7 |
SCHEDULE OF INVESTMENTS (Unaudited)
November 30, 2020
Global Managed Volatility Fund (Continued)
A list of the open forward foreign currency contracts held by the Fund at November 30, 2020, is as follows:
| | | | | | | | | | | | | | | | | | |
| Counterparty | | Settlement Date | | | | Currency to Deliver
(Thousands) | | | | Currency to Receive
(Thousands) | | Unrealized
Appreciation
(Depreciation)
(Thousands) |
Brown Brothers Harriman | | 12/14/20 | | USD | | | 131 | | | NZD | | | 189 | | | $ | 2 | |
Brown Brothers Harriman | | 12/14/20 | | USD | | | 69 | | | NZD | | | 99 | | | | — | |
Brown Brothers Harriman | | 12/14/20 | | USD | | | 228 | | | DKK | | | 1,426 | | | | 2 | |
Brown Brothers Harriman | | 12/14/20 | | USD | | | 214 | | | SGD | | | 288 | | | | 1 | |
Brown Brothers Harriman | | 12/14/20 | | USD | | | 95 | | | SGD | | | 127 | | | | — | |
Brown Brothers Harriman | | 12/14/20 | | USD | | | 218 | | | SEK | | | 1,876 | | | | 1 | |
Brown Brothers Harriman | | 12/14/20 | | USD | | | 98 | | | SEK | | | 836 | | | | (1 | ) |
Brown Brothers Harriman | | 12/14/20 | | USD | | | 213 | | | HKD | | | 1,650 | | | | — | |
Brown Brothers Harriman | | 12/14/20 | | USD | | | 163 | | | HKD | | | 1,266 | | | | — | |
Brown Brothers Harriman | | 12/14/20 | | USD | | | 313 | | | NOK | | | 2,814 | | | | 4 | |
Brown Brothers Harriman | | 12/14/20 | | USD | | | 97 | | | NOK | | | 852 | | | | — | |
Brown Brothers Harriman | | 12/14/20 | | USD | | | 609 | | | AUD | | | 834 | | | | 6 | |
Brown Brothers Harriman | | 12/14/20 | | USD | | | 401 | | | AUD | | | 541 | | | | (2 | ) |
Brown Brothers Harriman | | 12/14/20 | | USD | | | 1,401 | | | CAD | | | 1,829 | | | | 11 | |
Brown Brothers Harriman | | 12/14/20 | | USD | | | 1,464 | | | GBP | | | 1,103 | | | | 9 | |
Brown Brothers Harriman | | 12/14/20 | | USD | | | 1,072 | | | CHF | | | 977 | | | | 8 | |
Brown Brothers Harriman | | 12/14/20 | | USD | | | 634 | | | CHF | | | 573 | | | | (1 | ) |
Brown Brothers Harriman | | 12/14/20 | | USD | | | 2,716 | | | EUR | | | 2,286 | | | | 20 | |
Brown Brothers Harriman | | 12/14/20 | | USD | | | 1,472 | | | JPY | | | 153,972 | | | | 5 | |
Brown Brothers Harriman | | 12/14/20 | | USD | | | 3,228 | | | JPY | | | 335,172 | | | | (13 | ) |
Brown Brothers Harriman | | 12/14/20 | | NZD | | | 9,045 | | | USD | | | 6,215 | | | | (142 | ) |
Brown Brothers Harriman | | 12/14/20 | | SGD | | | 17,498 | | | USD | | | 12,964 | | | | (99 | ) |
Brown Brothers Harriman | | 12/14/20 | | GBP | | | 438 | | | USD | | | 586 | | | | 1 | |
Brown Brothers Harriman | | 12/14/20 | | GBP | | | 40,450 | | | USD | | | 53,400 | | | | (613 | ) |
Brown Brothers Harriman | | 12/14/20 | | AUD | | | 47,218 | | | USD | | | 34,299 | | | | (496 | ) |
Brown Brothers Harriman | | 12/14/20 | | DKK | | | 59,013 | | | USD | | | 9,324 | | | | (165 | ) |
Brown Brothers Harriman | | 12/14/20 | | CHF | | | 61,061 | | | USD | | | 66,542 | | | | (957 | ) |
Brown Brothers Harriman | | 12/14/20 | | CAD | | | 78,776 | | | USD | | | 60,262 | | | | (540 | ) |
Brown Brothers Harriman | | 12/14/20 | | EUR | | | 94,782 | | | USD | | | 111,520 | | | | (1,912 | ) |
Brown Brothers Harriman | | 12/14/20 | | NOK | | | 100,852 | | | USD | | | 11,103 | | | | (288 | ) |
Brown Brothers Harriman | | 12/14/20 | | HKD | | | 1,603 | | | USD | | | 207 | | | | — | |
Brown Brothers Harriman | | 12/14/20 | | HKD | | | 118,481 | | | USD | | | 15,282 | | | | (2 | ) |
Brown Brothers Harriman | | 12/14/20 | | SEK | | | 265 | | | USD | | | 31 | | | | — | |
Brown Brothers Harriman | | 12/14/20 | | SEK | | | 128,558 | | | USD | | | 14,852 | | | | (192 | ) |
Brown Brothers Harriman | | 12/14/20 | | JPY | | | 76,420 | | | USD | | | 734 | | | | 1 | |
Brown Brothers Harriman | | 12/14/20 | | JPY | | | 15,214,554 | | | USD | | | 144,084 | | | | (1,890 | ) |
| | | | | | | | | | | | | | | | | | |
| | | | | | | | | | | | | | | | $ | (7,242 | ) |
| | | | | | | | | | | | | | | | | | |
| | Percentages are based on a Net Assets of $2,925,166 ($ Thousands). |
| * | Non-income producing security. |
| ** | The rate reported is the 7-day effective yield as of November 30, 2020. |
| ‡ | Real Estate Investment Trust. |
| † | Investment in Affiliated Security (see Note 6). |
| (A) | Certain securities or partial positions of certain securities are on loan at November 30, 2020 (see Note 12). The total market value of securities on loan at November 30, 2020, was $9,761 ($ Thousands). |
| (B) | Security is a Master Limited Partnership. At November 30, 2020, such securities amounted to $31 ($ Thousands), or 0.00% of Net Assets of the Fund (see Note 2). |
| (C) | There is currently no rate available. |
| | |
| 8 | | SEI Institutional Investments Trust / Semi-Annual Report / November 30, 2020 |
SCHEDULE OF INVESTMENTS (Unaudited)
November 30, 2020
Global Managed Volatility Fund (Continued)
| (D) | This security was purchased with cash collateral held from securities on loan (see Note 12). The total market value of such securities as of November 30, 2020 was $10,253 ($ Thousands). |
AUD — Australian Dollar
CAD — Canadian Dollar
CHF — Swiss Franc
Cl — Class
DKK — Danish Krone
EUR — Euro
FTSE— Financial Times Stock Exchange
GBP — British Pound Sterling
HKD — Hong Kong Dollar
JPY — Japanese Yen
L.P. — Limited Partnership
Ltd. — Limited
NOK — Norwegian Krone
NZD — New Zealand Dollar
PLC — Public Limited Company
REIT — Real Estate investment Trust
S&P— Standard & Poor’s
SEK — Swedish Krona
SGD — Singapore Dollar
SPI — Share Price Index
TOPIX — Tokyo Price Index
USD — United States Dollar
The following is a list of the level of inputs used as of May 31, 2020, in valuing the Fund’s investments and other financial instruments carried at value ($ Thousands):
| | | | | | | | | | | | | | | | |
| | | | | |
| Investments in Securities | | Level 1 ($) | | | Level 2
($) | | | Level 3
($) | | | Total ($) | |
Common Stock | | | 2,828,304 | | | | 176 | | | | – | | | | 2,828,480 | |
Preferred Stock | | | 9,376 | | | | – | | | | – | | | | 9,376 | |
Right | | | – | | | | – | | | | – | | | | – | |
Affiliated Partnership | | | – | | | | 10,253 | | | | – | | | | 10,253 | |
Cash Equivalent | | | 50,180 | | | | – | | | | – | | | | 50,180 | |
| | | | | | | | | | | | | | | | |
Total Investments in Securities | | | 2,887,860 | | | | 10,429 | | | | – | | | | 2,898,289 | |
| | | | | | | | | | | | | | | | |
| | | | | | | | | | | | | | | | |
Other Financial
Instruments | | Level 1 ($) | | | Level 2
($) | | | Level 3
($) | | | Total ($) | |
Futures Contracts* | | | | | | | | | | | | | | | | |
Unrealized Appreciation | | | 1,673 | | | | – | | | | – | | | | 1,673 | |
Unrealized Depreciation | | | (4) | | | | – | | | | – | | | | (4) | |
Forwards Contracts* | | | | | | | | | | | | | | | | |
Unrealized Appreciation | | | – | | | | 71 | | | | – | | | | 71 | |
Unrealized Depreciation | | | – | | | | (7,313) | | | | – | | | | (7,313) | |
| | | | | | | | | | | | | | | | |
Total Other Financial Instruments | | | 1,669 | | | | (7,242) | | | | – | | | | (5,573) | |
| | | | | | | | | | | | | | | | |
* Futures contracts and forwards contracts are valued at the unrealized appreciation (depreciation) on the instrument.
For the period ended November 30, 2020, there were no transfers in or out of Level 3.
For more information on valuation inputs, see Note 2 — Significant Accounting Policies in Notes to Financial Statements.
| | |
| SEI Institutional Investments Trust / Semi-Annual Report / November 30, 2020 | | 9 |
SCHEDULE OF INVESTMENTS (Unaudited)
November 30, 2020
Global Managed Volatility Fund (Continued)
The following is a summary of the Fund’s transactions with affiliates for the period ended November 30, 2020 ($ Thousands):
| | | | | | | | | | | | | | | | | | |
| Security Description | | Value 5/31/2020 | | Purchases at Cost | | Proceeds from
Sales | | Realized Gain/
(Loss) | | Change in
Unrealized
Appreciation/
(Depreciation) | | Value
11/30/2020 | | Shares | | Income | | Capital Gains |
SEI Liquidity Fund, L.P. | | $— | | $61,071 | | $(50,818) | | $— | | $— | | $10,253 | | 10,248,915 | | $— | | $— |
SEI Daily Income Trust, Government Fund, Cl F | | 36,578 | | 168,442 | | (154,840) | | — | | — | | 50,180 | | 50,179,553 | | 3 | | — |
| | | | | | | | | | | | | | | | | | |
Totals | | $36,578 | | $229,513 | | $(205,658) | | $— | | $— | | $60,433 | | | | $3 | | $— |
| | | | | | | | | | | | | | | | | | |
Amounts designated as “–” are either $0 or have been rounded to $0.
The accompanying notes are an integral part of the financial statements.
| | |
| 10 | | SEI Institutional Investments Trust / Semi-Annual Report / November 30, 2020 |
SCHEDULE OF INVESTMENTS (Unaudited)
November 30, 2020
World Equity Ex-US Fund (Continued)
| | | | | | | | |
| | | |
| Description | | Shares | | Market Value
($ Thousands) |
FOREIGN COMMON STOCK — 91.3% | | | | | | | | |
| | |
Australia — 4.8% | | | | | | | | |
a2 Milk Co Ltd * | | | 4,590,476 | | | $ | 46,746 | |
Adelaide Brighton Ltd | | | 655,381 | | | | 1,492 | |
ASX Ltd | | | 710,802 | | | | 40,387 | |
BGP Holdings *(A) | | | 239,898 | | | | – | |
BHP Group Ltd | | | 117,812 | | | | 3,305 | |
BlueScope Steel Ltd | | | 4,013,344 | | | | 50,569 | |
Boral Ltd | | | 794,511 | | | | 2,874 | |
Cochlear Ltd | | | 74,052 | | | | 12,027 | |
CSL Ltd | | | 77,652 | | | | 17,015 | |
Evolution Mining Ltd | | | 741,269 | | | | 2,715 | |
Fisher & Paykel Healthcare | | | 53,155 | | | | 1,314 | |
Fortescue Metals Group Ltd | | | 2,427,506 | | | | 32,608 | |
Harvey Norman Holdings Ltd | | | 250,789 | | | | 852 | |
Iluka Resources Ltd | | | 131,956 | | | | 519 | |
JB Hi-Fi Ltd | | | 57,517 | | | | 1,937 | |
Kogan.com Ltd | | | 77,419 | | | | 936 | |
Macquarie Group Ltd | | | 105,170 | | | | 10,746 | |
Mineral Resources Ltd | | | 465,417 | | | | 11,087 | |
Netwealth Group Ltd | | | 112,731 | | | | 1,398 | |
Newcrest Mining Ltd | | | 2,210,348 | | | | 43,861 | |
Northern Star Resources Ltd | | | 555,285 | | | | 5,160 | |
Orora Ltd | | | 848,711 | | | | 1,657 | |
OZ Minerals Ltd | | | 140,290 | | | | 1,687 | |
Perseus Mining Ltd * | | | 1,011,941 | | | | 828 | |
Qantas Airways Ltd | | | 13,878,374 | | | | 55,017 | |
Redbubble Ltd * | | | 282,815 | | | | 1,084 | |
Rio Tinto Ltd | | | 297,980 | | | | 22,264 | |
South32 Ltd | | | 10,255,407 | | | | 18,136 | |
Suncorp Group Ltd | | | 5,039,650 | | | | 37,469 | |
Westpac Banking Corp | | | 2,653,370 | | | | 39,357 | |
| | | | | | | 465,047 | |
| | |
Austria — 0.0% | | | | | | | | |
Andritz | | | 21,659 | | | | 916 | |
Raiffeisen Bank International AG | | | 81,545 | | | | 1,566 | |
| | | | | | | 2,482 | |
| | |
Belgium — 0.6% | | | | | | | | |
Ageas SA/NV | | | 20,028 | | | | 987 | |
Colruyt SA | | | 23,065 | | | | 1,380 | |
KBC Group NV | | | 508,831 | | | | 35,546 | |
Solvay SA | | | 60,630 | | | | 6,951 | |
Umicore SA | | | 204,799 | | | | 9,204 | |
| | | | | | | 54,068 | |
| | |
Brazil — 0.7% | | | | | | | | |
B3 SA - Brasil Bolsa Balcao | | | 4,313,631 | | | | 44,953 | |
Cyrela Brazil Realty SA Empreendimentos e Participacoes | | | 204,900 | | | | 1,024 | |
JBS SA | | | 609,900 | | | | 2,621 | |
Marfrig Global Foods SA * | | | 321,700 | | | | 875 | |
Porto Seguro SA | | | 47,600 | | | | 426 | |
| | | | | | | | |
| | | |
| Description | | Shares | | Market Value
($ Thousands) |
FOREIGN COMMON STOCK (continued) | | | | | |
YDUQS Participacoes SA | | | 3,581,800 | | | $ | 21,852 | |
| | | | | | | 71,751 | |
| | |
Canada — 2.3% | | | | | | | | |
Agnico Eagle Mines Ltd | | | 222,728 | | | | 14,628 | |
BRP Inc | | | 212,167 | | | | 12,130 | |
Canfor Corp * | | | 97,899 | | | | 1,435 | |
Constellation Software Inc/Canada | | | 15,212 | | | | 18,879 | |
Empire Co Ltd, Cl A | | | 341,400 | | | | 9,363 | |
Enghouse Systems Ltd | | | 34,400 | | | | 1,778 | |
Home Capital Group Inc, Cl B * | | | 672,300 | | | | 15,299 | |
iA Financial Corp Inc | | | 82,701 | | | | 3,629 | |
Interfor Corp * | | | 48,800 | | | | 735 | |
Lundin Mining Corp | | | 5,702,829 | | | | 45,679 | |
Nutrien Ltd | | | 87,000 | | | | 4,303 | |
Open Text Corp | | | 413,498 | | | | 18,293 | |
Quebecor Inc, Cl B | | | 482,620 | | | | 12,044 | |
Real Matters Inc * | | | 107,000 | | | | 1,582 | |
Sun Life Financial Inc | | | 246,900 | | | | 10,988 | |
TMX Group Ltd | | | 436,308 | | | | 43,025 | |
Viemed Healthcare Inc * | | | 18,200 | | | | 179 | |
West Fraser Timber Co Ltd | | | 109,100 | | | | 6,054 | |
| | | | | | | 220,023 | |
| | |
China — 2.0% | | | | | | | | |
Alibaba Group Holding Ltd ADR * | | | 54,209 | | | | 14,277 | |
Autohome Inc ADR | | | 24,915 | | | | 2,352 | |
Baidu Inc ADR ADR * | | | 116,943 | | | | 16,254 | |
BYD Co Ltd, Cl H | | | 159,000 | | | | 3,735 | |
China Communications Services Corp Ltd, Cl H | | | 3,178,000 | | | | 1,697 | |
China Conch Venture Holdings Ltd | | | 862,500 | | | | 4,094 | |
China Construction Bank Corp, Cl H | | | 6,515,000 | | | | 5,110 | |
China Mobile Ltd | | | 664,500 | | | | 3,977 | |
China National Building Material Co Ltd, Cl H | | | 3,314,000 | | | | 4,352 | |
China Telecom Corp Ltd, Cl H | | | 9,116,000 | | | | 2,751 | |
Great Wall Motor Co Ltd, Cl H | | | 1,350,000 | | | | 2,734 | |
LONGi Green Energy Technology Co Ltd, Cl A | | | 1,149,200 | | | | 11,994 | |
Midea Group Co Ltd, Cl A | | | 2,945,884 | | | | 38,870 | |
Momo Inc ADR | | | 74,947 | | | | 1,078 | |
Oppein Home Group Inc, Cl A | | | 1,437,056 | | | | 27,854 | |
Ping An Insurance Group Co of China Ltd, Cl H | | | 1,652,500 | | | | 19,397 | |
Tencent Music Entertainment Group ADR * | | | 851,392 | | | | 14,269 | |
Vipshop Holdings Ltd ADR * | | | 122,775 | | | | 3,136 | |
Weichai Power Co Ltd, Cl H | | | 8,078,000 | | | | 16,484 | |
| | | | | | | 194,415 | |
| | |
Denmark — 3.7% | | | | | | | | |
AP Moller - Maersk A/S, Cl B | | | 10,247 | | | | 20,972 | |
Chr Hansen Holding A/S | | | 98,012 | | | | 9,523 | |
Coloplast A/S, Cl B | | | 32,730 | | | | 4,900 | |
Danske Bank A/S | | | 3,044,600 | | | | 50,323 | |
DSV PANALPINA A/S | | | 170,949 | | | | 27,050 | |
| | |
| SEI Institutional Investments Trust / Semi-Annual Report / November 30, 2020 | | 1 |
SCHEDULE OF INVESTMENTS (Unaudited)
November 30, 2020
World Equity Ex-US Fund (Continued)
| | | | | | | | |
| | | |
| Description | | Shares | | Market Value
($ Thousands) |
| |
FOREIGN COMMON STOCK (continued) | | | | | |
Genmab A/S * | | | 42,276 | | | $ | 16,265 | |
GN Store Nord A/S | | | 100,215 | | | | 8,181 | |
H Lundbeck A/S | | | 68,199 | | | | 2,092 | |
Novo Nordisk A/S, Cl B | | | 589,118 | | | | 39,735 | |
Novozymes A/S, Cl B | | | 263,085 | | | | 15,090 | |
Orsted A/S | | | 271,576 | | | | 49,056 | |
Pandora A/S | | | 373,345 | | | | 37,500 | |
Rockwool International A/S, Cl B | | | 9,655 | | | | 3,538 | |
Royal Unibrew A/S | | | 53,670 | | | | 5,627 | |
Vestas Wind Systems A/S | | | 330,006 | | | | 67,645 | |
| | | | | | | 357,497 | |
| | |
Finland — 0.9% | | | | | | | | |
Kone OYJ, Cl B | | | 465,825 | | | | 39,184 | |
Konecranes OYJ, Cl A | | | 21,911 | | | | 749 | |
Neste OYJ | | | 171,790 | | | | 11,545 | |
Nokia Corp ADR (B) | | | 526,362 | | | | 2,121 | |
Orion OYJ, Cl B | | | 261,102 | | | | 12,325 | |
Outotec OYJ | | | 766,390 | | | | 6,876 | |
Sampo OYJ, Cl A | | | 149,010 | | | | 6,458 | |
Sanoma OYJ | | | 27,718 | | | | 404 | |
Stora Enso OYJ, Cl R | | | 261,226 | | | | 4,428 | |
Valmet OYJ | | | 49,818 | | | | 1,264 | |
| | | | | | | 85,354 | |
| | |
France — 5.5% | | | | | | | | |
Airbus SE | | | 38,430 | | | | 4,033 | |
Alstom SA | | | 774,774 | | | | 41,427 | |
Atos SE | | | 341,760 | | | | 31,430 | |
BNP Paribas SA | | | 256,930 | | | | 13,205 | |
Cie de Saint-Gobain | | | 1,217,514 | | | | 57,993 | |
Criteo SA ADR ADR * | | | 113,015 | | | | 2,189 | |
Danone SA | | | 160,186 | | | | 10,321 | |
Dassault Systemes SE | | | 67,644 | | | | 12,546 | |
Edenred | | | 333,017 | | | | 19,093 | |
Eurofins Scientific | | | 12,950 | | | | 1,054 | |
Euronext NV | | | 429,269 | | | | 45,701 | |
Faurecia SE | | | 611,217 | | | | 30,488 | |
Ipsen SA | | | 35,045 | | | | 3,389 | |
Legrand SA | | | 70,315 | | | | 5,970 | |
L’Oreal SA | | | 138,822 | | | | 50,947 | |
Orange SA | | | 2,742,925 | | | | 34,747 | |
Peugeot SA | | | 2,031,652 | | | | 48,034 | |
Remy Cointreau SA | | | 27,665 | | | | 4,931 | |
Sanofi | | | 868,773 | | | | 88,033 | |
Sartorius Stedim Biotech | | | 7,824 | | | | 2,836 | |
Schneider Electric SE | | | 78,025 | | | | 10,887 | |
Ubisoft Entertainment SA * | | | 182,533 | | | | 17,420 | |
| | | | | | | 536,674 | |
| | |
Germany — 5.6% | | | | | | | | |
Allianz SE | | | 196,458 | | | | 46,451 | |
Aroundtown SA | | | 5,008,276 | | | | 34,855 | |
Bayerische Motoren Werke AG | | | 240,223 | | | | 20,988 | |
| | | | | | | | |
| | | |
| Description | | Shares | | Market Value
($ Thousands) |
| |
FOREIGN COMMON STOCK (continued) | | | | | |
DaimlerChrysler AG | | | 22,593 | | | $ | 1,526 | |
Deutsche Bank AG | | | 360,380 | | | | 4,028 | |
Deutsche Boerse AG | | | 412,164 | | | | 68,901 | |
Deutsche Post AG | | | 212,650 | | | | 10,302 | |
Evonik Industries AG | | | 1,007,342 | | | | 30,498 | |
HelloFresh SE * | | | 186,679 | | | | 11,004 | |
METRO AG | | | 1,196,493 | | | | 10,963 | |
Muenchener Rueckversicherungs- Gesellschaft AG in Muenchen | | | 158,330 | | | | 44,243 | |
Puma SE | | | 39,152 | | | | 3,904 | |
QIAGEN NV * | | | 32,415 | | | | 1,567 | |
Rational AG | | | 19,339 | | | | 17,234 | |
Rheinmetall AG | | | 720,131 | | | | 64,228 | |
SAP SE | | | 577,469 | | | | 70,445 | |
Scout24 AG | | | 403,314 | | | | 30,925 | |
Siemens AG | | | 198,523 | | | | 26,597 | |
Siemens Energy AG * | | | 99,262 | | | | 2,957 | |
TeamViewer AG * | | | 823,750 | | | | 39,346 | |
VERBIO Vereinigte BioEnergie AG * | | | 25,244 | | | | 785 | |
Wacker Chemie AG | | | 3,804 | | | | 476 | |
zooplus AG * | | | 4,372 | | | | 827 | |
| | | | | | | 543,050 | |
| | |
Greece — 0.0% | | | | | | | | |
Hellenic Telecommunications Organization SA | | | 267,185 | | | | 4,465 | |
| | |
Hong Kong — 7.3% | | | | | | | | |
AIA Group Ltd | | | 3,327,200 | | | | 36,459 | |
Alibaba Group Holding Ltd * | | | 2,494,080 | | | | 84,096 | |
Alibaba Health Information Technology Ltd * | | | 1,650,000 | | | | 4,853 | |
Anhui Conch Cement Co Ltd, Cl H | | | 3,618,000 | | | | 23,148 | |
Brilliance China Automotive Holdings Ltd | | | 1,094,000 | | | | 974 | |
Chaoda Modern Agriculture Holdings Ltd * | | | 52,790 | | | | – | |
China Aoyuan Group Ltd | | | 1,878,321 | | | | 1,955 | |
China Lesso Group Holdings Ltd | | | 1,216,000 | | | | 2,171 | |
China Resources Cement Holdings Ltd | | | 5,980,000 | | | | 7,436 | |
China Resources Gas Group Ltd | | | 3,852,000 | | | | 18,558 | |
CITIC Ltd | | | 1,244,000 | | | | 972 | |
Country Garden Services Holdings Co Ltd | | | 1,816,283 | | | | 10,168 | |
Dongyue Group Ltd | | | 3,708,000 | | | | 1,932 | |
Galaxy Entertainment Group | | | 3,508,000 | | | | 26,697 | |
Guangzhou Automobile Group Co Ltd, Cl H | | | 18,348,000 | | | | 19,738 | |
Hengan International Group Co Ltd | | | 1,007,000 | | | | 6,949 | |
Hong Kong Exchanges & Clearing Ltd | | | 1,295,432 | | | | 64,400 | |
Industrial & Commercial Bank of China Ltd, Cl H | | | 33,067,000 | | | | 20,985 | |
Kingboard Holdings Ltd | | | 162,500 | | | | 623 | |
Kunlun Energy Co Ltd | | | 21,564,000 | | | | 16,244 | |
Lee & Man Paper Manufacturing Ltd | | | 2,233,243 | | | | 1,815 | |
Lenovo Group Ltd | | | 738,000 | | | | 526 | |
Logan Property Holdings Co Ltd | | | 840,368 | | | | 1,407 | |
Meituan Dianping, Cl B * | | | 792,000 | | | | 29,627 | |
| | |
| 2 | | SEI Institutional Investments Trust / Semi-Annual Report / November 30, 2020 |
SCHEDULE OF INVESTMENTS (Unaudited)
November 30, 2020
World Equity Ex-US Fund (Continued)
| | | | | | | | |
| | | |
| Description | | Shares | | Market Value
($ Thousands) |
| |
FOREIGN COMMON STOCK (continued) | | | | | |
NetDragon Websoft Holdings Ltd | | | 423,000 | | | $ | 930 | |
Nine Dragons Paper Holdings Ltd | | | 5,643,000 | | | | 7,410 | |
Ping An Healthcare and Technology Co Ltd * | | | 1,061,500 | | | | 12,987 | |
Poly Property Group Co Ltd | | | 496,718 | | | | 154 | |
Powerlong Real Estate Holdings Ltd | | | 501,000 | | | | 362 | |
Road King Infrastructure Ltd | | | 169,968 | | | | 228 | |
Samsonite International SA | | | 21,565,800 | | | | 34,828 | |
Shanghai Pharmaceuticals Holding Co Ltd, Cl H | | | 33,263,300 | | | | 56,293 | |
Techtronic Industries Co Ltd | | | 305,000 | | | | 3,909 | |
Tencent Holdings Ltd | | | 646,300 | | | | 46,935 | |
Tingyi Cayman Islands Holding Corp | | | 3,128,000 | | | | 5,278 | |
Topsports International Holdings | | | 29,690,000 | | | | 44,195 | |
Vinda International Holdings Ltd | | | 242,000 | | | | 691 | |
WH Group Ltd | | | 44,025,500 | | | | 35,947 | |
Xinyi Glass Holdings Ltd | | | 20,352,000 | | | | 45,679 | |
Yuexiu Property Co Ltd | | | 4,465,954 | | | | 928 | |
Zhongsheng Group Holdings Ltd | | | 2,994,500 | | | | 22,481 | |
Zoomlion Heavy Industry Science and Technology Co Ltd | | | 7,122,124 | | | | 7,432 | |
| | | | | | | 708,400 | |
| | |
India — 1.7% | | | | | | | | |
Grasim Industries Ltd | | | 60,762 | | | | 716 | |
HCL Technologies Ltd | | | 1,252,350 | | | | 13,880 | |
HDFC Bank Ltd ADR * | | | 196,260 | | | | 13,542 | |
Hero MotoCorp Ltd | | | 85,890 | | | | 3,595 | |
Housing Development Finance Corp Ltd | | | 811,966 | | | | 24,602 | |
ICICI Bank Ltd | | | 2,882,964 | | | | 18,285 | |
ICICI Lombard General Insurance Co Ltd * | | | 84,174 | | | | 1,645 | |
Mindtree Ltd | | | 175,219 | | | | 3,359 | |
Mphasis Ltd | | | 41,876 | | | | 746 | |
Power Grid Corp of India Ltd | | | 7,489,613 | | | | 19,388 | |
Tata Elxsi Ltd | | | 47,921 | | | | 1,027 | |
Tech Mahindra Ltd | | | 4,730,873 | | | | 55,956 | |
Wipro Ltd | | | 838,305 | | | | 3,970 | |
WNS Holdings Ltd ADR ADR * | | | 3,069 | | | | 216 | |
| | | | | | | 160,927 | |
| | |
Ireland — 1.8% | | | | | | | | |
Bank of Ireland Group PLC | | | 9,243,315 | | | | 29,168 | |
CRH PLC | | | 867,092 | | | | 34,023 | |
ICON PLC * | | | 412,160 | | | | 80,322 | |
Ryanair Holdings PLC ADR * | | | 260,534 | | | | 27,036 | |
| | | | | | | 170,549 | |
| | |
Israel — 0.7% | | | | | | | | |
Bank Hapoalim BM * | | | 2,704,140 | | | | 17,731 | |
Bank Leumi Le-Israel BM | | | 5,320,899 | | | | 29,913 | |
Bezeq The Israeli Telecommunication Corp Ltd * | | | 1,313,637 | | | | 1,420 | |
Isracard Ltd | | | 18 | | | | – | |
Israel Discount Bank Ltd, Cl A | | | 1,453,485 | | | | 4,926 | |
Nice Ltd * | | | 7,363 | | | | 1,772 | |
| | | | | | | | |
| | | |
| Description | | Shares | | Market Value
($ Thousands) |
| |
FOREIGN COMMON STOCK (continued) | | | | | |
Nice Ltd ADR *(B) | | | 39,759 | | | $ | 9,690 | |
| | | | | | | 65,452 | |
| | |
Italy — 1.4% | | | | | | | | |
Azimut Holding SpA | | | 82,380 | | | | 1,741 | |
Banca Generali SpA * | | | 71,495 | | | | 2,381 | |
Banca Mediolanum SpA | | | 598,982 | | | | 5,449 | |
De’Longhi SPA | | | 23,496 | | | | 822 | |
DiaSorin SpA | | | 14,203 | | | | 3,000 | |
Enel SpA | | | 3,229,930 | | | | 32,339 | |
EXOR NV | | | 223,217 | | | | 15,588 | |
Ferrari NV | | | 10,148 | | | | 2,146 | |
FinecoBank Banca Fineco | | | 381,536 | | | | 5,995 | |
Hera SpA | | | 1,723,307 | | | | 6,308 | |
Intesa Sanpaolo SpA | | | 865,620 | | | | 1,994 | |
Mediobanca Banca di Credito Finanziario SpA * | | | 2,604,430 | | | | 23,284 | |
Prysmian SpA | | | 848,136 | | | | 27,829 | |
Recordati SpA | | | 186,760 | | | | 9,971 | |
| | | | | | | 138,847 | |
| | |
Japan — 14.6% | | | | | | | | |
AEON Financial Service Co | | | 150,300 | | | | 1,640 | |
Alps Alpine Co Ltd | | | 3,139,800 | | | | 39,385 | |
Anritsu Corp | | | 1,965,800 | | | | 44,849 | |
Capcom Co Ltd | | | 284,600 | | | | 16,048 | |
COLOPL Inc | | | 57,300 | | | | 502 | |
Daifuku Co Ltd | | | 68,600 | | | | 7,960 | |
Daikin Industries Ltd | | | 35,900 | | | | 8,147 | |
Daito Trust Construction Co Ltd | | | 25,400 | | | | 2,494 | |
Daiwa Securities Group Inc | | | 10,846,600 | | | | 47,235 | |
Denso Corp | | | 280,400 | | | | 13,254 | |
Dip Corp | | | 612,400 | | | | 14,295 | |
FANUC Corp | | | 99,000 | | | | 24,082 | |
Fuji Electric Co Ltd | | | 793,900 | | | | 28,246 | |
Fujitsu Ltd | | | 209,700 | | | | 29,170 | |
Goldcrest Co Ltd | | | 35,153 | | | | 474 | |
Hitachi Ltd | | | 1,749,000 | | | | 66,522 | |
Japan Exchange Group Inc | | | 1,003,900 | | | | 24,872 | |
Japan Post Holdings Co Ltd | | | 76,900 | | | | 570 | |
Kao Corp | | | 564,700 | | | | 42,284 | |
KDDI Corp | | | 952,900 | | | | 27,255 | |
Kobayashi Pharmaceutical Co Ltd | | | 414,374 | | | | 49,872 | |
Konami Holdings Corp | | | 424,500 | | | | 22,268 | |
K’s Holdings Corp | | | 132,500 | | | | 1,611 | |
Mitsubishi Electric Corp | | | 77,000 | | | | 1,132 | |
Mitsubishi UFJ Financial Group Inc | | | 14,265,000 | | | | 61,356 | |
Mitsui & Co Ltd | | | 621,200 | | | | 10,604 | |
Mixi Inc | | | 250,300 | | | | 6,843 | |
Morinaga & Co Ltd/Japan | | | 273,000 | | | | 9,975 | |
MS&AD Insurance Group Holdings Inc | | | 27,100 | | | | 789 | |
Nichirei Corp | | | 659,600 | | | | 17,927 | |
Nidec Corp | | | 336,600 | | | | 42,949 | |
| | |
| SEI Institutional Investments Trust / Semi-Annual Report / November 30, 2020 | | 3 |
SCHEDULE OF INVESTMENTS (Unaudited)
November 30, 2020
World Equity Ex-US Fund (Continued)
| | | | | | | | |
| | | |
| Description | | Shares | | Market Value
($ Thousands) |
| |
FOREIGN COMMON STOCK (continued) | | | | | |
Nihon Unisys Ltd | | | 86,600 | | | $ | 3,206 | |
Nintendo Co Ltd | | | 118,300 | | | | 67,230 | |
Nippon Shinyaku Co Ltd | | | 234,100 | | | | 16,748 | |
Nippon Steel Corp | | | 233,300 | | | | 2,856 | |
Nippon Telegraph & Telephone Corp | | | 2,113,200 | | | | 49,955 | |
Nishimatsuya Chain Ltd | | | 32,900 | | | | 496 | |
Nissan Tokyo Sales Holdings Co Ltd | | | 86,600 | | | | 208 | |
Nitori Holdings Co Ltd | | | 10,900 | | | | 2,324 | |
Nomura Holdings Inc | | | 170,200 | | | | 855 | |
Olympus Corp | | | 400,300 | | | | 8,662 | |
ORIX Corp | | | 1,124,100 | | | | 16,742 | |
Otsuka Holdings Co Ltd | | | 17,000 | | | | 692 | |
PeptiDream Inc * | | | 1,001,200 | | | | 51,080 | |
Rakuten Inc | | | 4,099,900 | | | | 45,963 | |
Recruit Holdings Co Ltd | | | 1,316,200 | | | | 55,538 | |
SBI Holdings Inc/Japan | | | 1,857,915 | | | | 50,423 | |
SCREEN Holdings Co Ltd | | | 483,800 | | | | 32,292 | |
Seria Co Ltd | | | 20,100 | | | | 708 | |
Shimamura Co Ltd | | | 25,300 | | | | 2,620 | |
Shimano Inc | | | 86,500 | | | | 20,523 | |
Shiseido Co Ltd | | | 186,300 | | | | 13,150 | |
SMC Corp/Japan | | | 38,700 | | | | 24,614 | |
Sompo Holdings Inc | | | 12,000 | | | | 462 | |
Sony Corp | | | 585,400 | | | | 54,478 | |
Square Enix Holdings Co Ltd | | | 27,900 | | | | 1,715 | |
Suzuki Motor Corp | | | 599,200 | | | | 32,202 | |
Takeda Pharmaceutical Co Ltd | | | 1,320,900 | | | | 47,440 | |
Terumo Corp | | | 1,155,500 | | | | 45,954 | |
TIS Inc | | | 531,100 | | | | 10,584 | |
Toho Holdings Co Ltd | | | 48,300 | | | | 882 | |
Tokio Marine Holdings Inc | | | 197,500 | | | | 9,830 | |
Tokyo Electric Power Co Holdings Inc * | | | 1,829,900 | | | | 4,773 | |
Tosoh Corp | | | 2,085,300 | | | | 32,917 | |
Toyota Tsusho Corp | | | 358,200 | | | | 12,401 | |
UT Group Co Ltd | | | 824,100 | | | | 26,041 | |
ZOZO Inc | | | 90,100 | | | | 2,250 | |
| | | | | | | 1,413,424 | |
| | |
Malaysia — 0.0% | | | | | | | | |
Hong Leong Financial Group | | | 123,020 | | | | 495 | |
Public Bank Bhd | | | 117,600 | | | | 503 | |
| | | | | | | 998 | |
| | |
Mexico — 0.0% | | | | | | | | |
Grupo Televisa SA ADR | | | 212,317 | | | | 1,703 | |
Orbia Advance Corp SAB de CV | | | 280,435 | | | | 580 | |
Qualitas Controladora SAB de CV | | | 80,382 | | | | 392 | |
| | | | | | | 2,675 | |
| | |
Netherlands — 5.8% | | | | | | | | |
Adyen NV * | | | 7,283 | | | | 13,957 | |
AerCap Holdings NV * | | | 1,343,580 | | | | 49,390 | |
Akzo Nobel NV | | | 66,930 | | | | 7,130 | |
ASML Holding NV | | | 187,897 | | | | 81,780 | |
| | | | | | | | |
| | | |
| Description | | Shares | | Market Value
($ Thousands) |
| |
FOREIGN COMMON STOCK (continued) | | | | | |
ASR Nederland NV | | | 283,755 | | | $ | 10,617 | |
Galapagos NV * | | | 4,564 | | | | 563 | |
Heineken Holding NV | | | 143,713 | | | | 13,315 | |
IMCD NV | | | 125,470 | | | | 15,744 | |
Koninklijke Ahold Delhaize NV | | | 1,079,813 | | | | 30,987 | |
Koninklijke DSM NV | | | 276,839 | | | | 45,468 | |
Koninklijke Philips NV | | | 941,095 | | | | 48,812 | |
NN Group NV | | | 2,602,176 | | | | 105,988 | |
OCI NV * | | | 1,687,062 | | | | 29,444 | |
PostNL NV | | | 472,766 | | | | 1,620 | |
Prosus NV | | | 591,814 | | | | 64,308 | |
Randstad NV | | | 293,434 | | | | 18,252 | |
TKH Group NV | | | 1,695 | | | | 80 | |
Wolters Kluwer NV | | | 288,787 | | | | 24,285 | |
| | | | | | | 561,740 | |
| | |
New Zealand — 0.1% | | | | | | | | |
Fisher & Paykel Healthcare Corp Ltd | | | 394,907 | | | | 9,969 | |
Fletcher Building Ltd * | | | 148,660 | | | | 592 | |
| | | | | | | 10,561 | |
| | |
Norway — 1.3% | | | | | | | | |
DNB ASA * | | | 3,705,459 | | | | 67,423 | |
LINK Mobility Group Holding * | | | 7,264,263 | | | | 41,010 | |
Salmar ASA | | | 362,450 | | | | 19,951 | |
| | | | | | | 128,384 | |
| | |
Poland — 0.1% | | | | | | | | |
Dino Polska SA * | | | 60,220 | | | | 4,052 | |
Powszechna Kasa Oszczednosci Bank Polski SA | | | 220,335 | | | | 1,552 | |
Santander Bank Polska SA | | | 5,440 | | | | 253 | |
| | | | | | | 5,857 | |
| | |
Portugal — 0.4% | | | | | | | | |
EDP - Energias de Portugal SA | | | 7,104,250 | | | | 37,970 | |
| | |
Russia — 1.0% | | | | | | | | |
Magnit PJSC GDR | | | 461,710 | | | | 6,967 | |
MMC Norilsk Nickel PJSC ADR | | | 273,475 | | | | 7,627 | |
Mobile TeleSystems PJSC ADR | | | 5,740,066 | | | | 49,537 | |
X5 Retail Group NV GDR | | | 819,850 | | | | 29,433 | |
| | | | | | | 93,564 | |
| | |
Saudi Arabia — 0.0% | | | | | | | | |
Al-Etihad Cooperative Insurance | | | 74,765 | | | | 507 | |
Arabian Cement | | | 55,852 | | | | 479 | |
City Cement Co | | | 153,187 | | | | 952 | |
| | | | | | | 1,938 | |
| | |
Singapore — 0.1% | | | | | | | | |
Jardine Cycle & Carriage Ltd | | | 129,100 | | | | 1,870 | |
United Overseas Bank Ltd | | | 521,002 | | | | 8,754 | |
| | | | | | | 10,624 | |
| | |
| 4 | | SEI Institutional Investments Trust / Semi-Annual Report / November 30, 2020 |
SCHEDULE OF INVESTMENTS (Unaudited)
November 30, 2020
World Equity Ex-US Fund (Continued)
| | | | | | | | |
| | | |
| Description | | Shares | | Market Value
($ Thousands) |
| |
FOREIGN COMMON STOCK (continued) | | | | | |
| | |
South Africa — 0.1% | | | | | | | | |
Discovery Ltd | | | 1,394,705 | | | $ | 11,103 | |
Telkom SA SOC Ltd | | | 472,559 | | | | 957 | |
| | | | | | | 12,060 | |
| | |
South Korea — 6.7% | | | | | | | | |
BNK Financial Group Inc | | | 642,597 | | | | 3,269 | |
Coway Co Ltd | | | 775,287 | | | | 48,624 | |
Daelim Industrial Co Ltd | | | 64,253 | | | | 4,645 | |
DGB Financial Group Inc | | | 154,853 | | | | 1,022 | |
Hana Financial Group Inc | | | 2,086,412 | | | | 63,825 | |
Hanwha Aerospace Co Ltd * | | | 72,254 | | | | 1,724 | |
KB Financial Group Inc | | | 901,720 | | | | 36,955 | |
Kia Motors Corp | | | 510,764 | | | | 26,680 | |
KIWOOM Securities Co Ltd | | | 11,434 | | | | 1,281 | |
KT Corp | | | 88,068 | | | | 1,930 | |
KT Corp SP ADR | | | 718,938 | | | | 7,779 | |
LG Display Co Ltd | | | 521,031 | | | | 7,181 | |
LG Electronics Inc | | | 237,021 | | | | 18,314 | |
LG Uplus Corp | | | 203,689 | | | | 2,200 | |
NAVER Corp | | | 272,034 | | | | 68,221 | |
NHN Corp * | | | 23,347 | | | | 1,540 | |
Samsung Electronics Co Ltd | | | 3,663,763 | | | | 220,842 | |
Samsung SDI Co Ltd | | | 25,150 | | | | 12,114 | |
Samsung Securities Co Ltd | | | 40,217 | | | | 1,434 | |
SK Hynix Inc | | | 1,036,695 | | | | 91,345 | |
SK Telecom Co Ltd | | | 122,920 | | | | 26,382 | |
| | | | | | | 647,307 | |
| | |
Spain — 1.5% | | | | | | | | |
Amadeus IT Group SA, Cl A | | | 351,722 | | | | 24,175 | |
Bankinter SA | | | 494,465 | | | | 2,454 | |
Cellnex Telecom SA | | | 109,760 | | | | 6,943 | |
Grifols SA | | | 225,145 | | | | 6,396 | |
Grifols SA ADR | | | 171,725 | | | | 3,182 | |
Industria de Diseno Textil SA | | | 397,739 | | | | 13,251 | |
Pharma Mar SA | | | 22,348 | | | | 2,585 | |
Repsol SA | | | 2,297,593 | | | | 22,146 | |
Siemens Gamesa Renewable Energy SA | | | 1,691,505 | | | | 60,560 | |
| | | | | | | 141,692 | |
| | |
Sweden — 1.8% | | | | | | | | |
Atlas Copco AB, Cl B | | | 503,948 | | | | 22,322 | |
Atlas Copco AB, Cl A | | | 134,820 | | | | 6,815 | |
Betsson AB | | | 277,327 | | | | 2,404 | |
Electrolux AB, Cl B | | | 610,605 | | | | 14,683 | |
Embracer Group AB, Cl B * | | | 271,900 | | | | 5,537 | |
Epiroc AB, Cl B | | | 1,031,034 | | | | 16,437 | |
Epiroc AB, Cl A | | | 153,069 | | | | 2,551 | |
Essity AB, Cl B | | | 380,461 | | | | 12,099 | |
Evolution Gaming Group AB | | | 61,040 | | | | 5,235 | |
Getinge AB, Cl B | | | 182,055 | | | | 3,900 | |
Husqvarna AB, Cl B | | | 803,122 | | | | 8,578 | |
Kinnevik AB | | | 305,745 | | | | 15,268 | |
| | | | | | | | |
| | | |
| Description | | Shares | | Market Value
($ Thousands) |
| |
FOREIGN COMMON STOCK (continued) | | | | | |
NCC AB, Cl B | | | 25,840 | | | $ | 447 | |
Paradox Interactive AB | | | 17,438 | | | | 538 | |
SKF AB, Cl B | | | 138,333 | | | | 3,417 | |
Swedish Match AB | | | 316,328 | | | | 25,558 | |
Telefonaktiebolaget LM Ericsson, Cl B | | | 117,473 | | | | 1,441 | |
Telia Co AB | | | 1,432,910 | | | | 6,094 | |
Volvo AB, Cl B | | | 1,017,519 | | | | 23,183 | |
| | | | | | | 176,507 | |
| | |
Switzerland — 5.0% | | | | | | | | |
Cie Financiere Richemont SA, Cl A | | | 152,832 | | | | 12,743 | |
Credit Suisse Group AG | | | 1,375,572 | | | | 17,443 | |
Geberit AG | | | 12,490 | | | | 7,547 | |
Idorsia Ltd *(B) | | | 1,647,203 | | | | 49,200 | |
Kuehne + Nagel International AG | | | 76,134 | | | | 17,299 | |
LafargeHolcim Ltd | | | 1,279,460 | | | | 67,358 | |
Logitech International SA | | | 89,857 | | | | 7,978 | |
Lonza Group AG | | | 10,700 | | | | 6,732 | |
Nestle SA | | | 295,826 | | | | 33,063 | |
Novartis AG | | | 946,442 | | | | 86,009 | |
Roche Holding AG | | | 433,747 | | | | 143,281 | |
Schindler Holding AG | | | 5,349 | | | | 1,465 | |
Sonova Holding AG | | | 4,566 | | | | 1,135 | |
Tecan Group AG | | | 3,513 | | | | 1,545 | |
Temenos AG | | | 94,563 | | | | 11,991 | |
UBS Group AG | | | 1,249,427 | | | | 17,790 | |
| | | | | | | 482,579 | |
| | |
Taiwan — 3.1% | | | | | | | | |
Acer Inc | | | 1,972,000 | | | | 1,602 | |
ASROCK Inc | | | 319,000 | | | | 1,869 | |
Asustek Computer Inc | | | 385,000 | | | | 3,363 | |
Cathay Financial Holding Co Ltd | | | 1,098,000 | | | | 1,556 | |
Chicony Electronics Co Ltd | | | 173,000 | | | | 518 | |
Compal Electronics Inc | | | 2,491,000 | | | | 1,687 | |
FocalTech Systems Co Ltd | | | 1,043,865 | | | | 2,439 | |
Fubon Financial Holding Co Ltd | | | 1,247,000 | | | | 1,938 | |
General Interface Solution Holding Ltd | | | 1,213,000 | | | | 4,830 | |
Gigabyte Technology Ltd | | | 1,444,000 | | | | 3,977 | |
Holtek Semiconductor Inc | | | 272,000 | | | | 685 | |
Hon Hai Precision Industry Co Ltd | | | 9,181,000 | | | | 26,510 | |
Huaku Development Co Ltd | | | 215,000 | | | | 665 | |
Innolux Corp, Cl A | | | 7,998,544 | | | | 2,820 | |
International Games System Co Ltd | | | 135,000 | | | | 3,211 | |
Inventec Corp | | | 2,453,000 | | | | 2,005 | |
Kindom Development Co Ltd | | | 1,468,131 | | | | 1,937 | |
Lite-On Technology Corp | | | 2,218,000 | | | | 3,739 | |
MediaTek Inc | | | 1,766,964 | | | | 43,643 | |
Nien Made Enterprise Co Ltd | | | 92,000 | | | | 1,086 | |
Pegatron Corp | | | 4,404,000 | | | | 10,090 | |
Pou Chen Corp | | | 2,745,000 | | | | 3,010 | |
Quanta Computer Inc | | | 242,000 | | | | 654 | |
Radiant Opto-Electronics Corp | | | 467,000 | | | | 1,901 | |
| | |
| SEI Institutional Investments Trust / Semi-Annual Report / November 30, 2020 | | 5 |
SCHEDULE OF INVESTMENTS (Unaudited)
November 30, 2020
World Equity Ex-US Fund (Continued)
| | | | | | | | |
| | | |
| Description | | Shares | | Market Value
($ Thousands) |
| |
FOREIGN COMMON STOCK (continued) | | | | | |
Realtek Semiconductor Corp | | | 221,000 | | | $ | 2,877 | |
Simplo Technology Co Ltd | | | 2,231,000 | | | | 25,948 | |
Synnex Technology International Corp | | | 492,000 | | | | 768 | |
Taiwan Semiconductor Manufacturing Co Ltd | | | 6,427,000 | | | | 108,347 | |
TPK Holding Co Ltd | | | 15,000 | | | | 25 | |
Wistron Corp | | | 9,600,000 | | | | 10,054 | |
Yuanta Financial Holding Co Ltd | | | 24,004,184 | | | | 16,086 | |
Zhen Ding Technology Holding Ltd | | | 3,063,000 | | | | 13,272 | |
| | | | | | | 303,112 | |
| | |
Thailand — 0.4% | | | | | | | | |
Kasikornbank PCL | | | 874,300 | | | | 3,179 | |
Krung Thai Bank PCL Ltd | | | 1,217,800 | | | | 431 | |
Siam Commercial Bank PCL/The | | | 12,299,500 | | | | 34,764 | |
Thai Union Group PCL | | | 2,224,700 | | | | 1,110 | |
| | | | | | | 39,484 | |
| | |
Turkey — 0.3% | | | | | | | | |
Akbank T.A.S. | | | 3,616,737 | | | | 2,783 | |
Arcelik AS | | | 2,208,036 | | | | 7,695 | |
BIM Birlesik Magazalar AS | | | 153,904 | | | | 1,377 | |
Dogus Otomotiv Servis ve Ticaret AS | | | 562,290 | | | | 1,919 | |
Haci Omer Sabanci Holding AS | | | 1,115,278 | | | | 1,375 | |
KOC Holding AS | | | 1,624,649 | | | | 3,664 | |
Migros Ticaret AS * | | | 48,308 | | | | 261 | |
Tofas Turk Otomobil Fabrikasi AS | | | 315,432 | | | | 1,149 | |
Turk Traktor ve Ziraat Makineleri AS | | | 56,883 | | | | 996 | |
Turkiye Is Bankasi AS, Cl C | | | 4,782,985 | | | | 3,980 | |
Vestel Elektronik Sanayi ve Ticaret AS * | | | 232,342 | | | | 594 | |
Yapi ve Kredi Bankasi AS * | | | 7,755,529 | | | | 2,836 | |
| | | | | | | 28,629 | |
| | |
United Kingdom — 10.0% | | | | | | | | |
Accenture PLC, Cl A | | | 209,369 | | | | 52,152 | |
Anglo American PLC | | | 51,982 | | | | 1,536 | |
Aptiv PLC | | | 421,574 | | | | 50,041 | |
AstraZeneca PLC | | | 46,630 | | | | 4,859 | |
Atlassian Corp PLC, Cl A * | | | 268,158 | | | | 60,349 | |
Avast PLC | | | 4,019,700 | | | | 27,262 | |
BHP Group PLC | | | 285,920 | | | | 6,484 | |
Blue Prism Group PLC *(B) | | | 1,323,602 | | | | 25,251 | |
British American Tobacco PLC | | | 990,692 | | | | 34,910 | |
Burberry Group PLC | | | 434,553 | | | | 10,031 | |
ConvaTec Group PLC | | | 19,040,479 | | | | 52,568 | |
Drax Group PLC | | | 293,935 | | | | 1,289 | |
Dunelm Group PLC | | | 21,376 | | | | 348 | |
Evraz PLC | | | 879,231 | | | | 4,534 | |
Experian PLC | | | 802,265 | | | | 28,340 | |
Ferguson PLC | | | 11,869 | | | | 1,335 | |
Ferrexpo PLC | | | 2,429,432 | | | | 6,883 | |
Flutter Entertainment PLC | | | 34,920 | | | | 6,389 | |
Fresnillo PLC | | | 689,844 | | | | 9,693 | |
GlaxoSmithKline PLC | | | 1,966,400 | | | | 35,966 | |
Greencore Group PLC | | | 10,613,527 | | | | 16,593 | |
| | | | | | | | |
| | | |
| Description | | Shares | | Market Value
($ Thousands) |
| |
FOREIGN COMMON STOCK (continued) | | | | | |
GVC Holdings PLC | | | 1,969,150 | | | $ | 27,222 | |
Hargreaves Lansdown PLC | | | 694,249 | | | | 13,254 | |
Inchcape PLC | | | 197,358 | | | | 1,577 | |
Indivior PLC * | | | 1,052,904 | | | | 1,421 | |
Investec PLC (B) | | | 875,600 | | | | 2,170 | |
JD Sports Fashion PLC | | | 276,744 | | | | 2,868 | |
John Wood Group PLC | | | 7,002,800 | | | | 27,860 | |
Just Eat Takeaway.com NV * | | | 126,525 | | | | 13,446 | |
Just Group PLC * | | | 311,466 | | | | 233 | |
Kingfisher PLC | | | 10,903,012 | | | | 39,825 | |
Kingspan Group PLC | | | 250,554 | | | | 21,924 | |
Legal & General Group PLC | | | 713,340 | | | | 2,407 | |
Linde PLC | | | 187,912 | | | | 48,081 | |
London Stock Exchange Group PLC | | | 42,000 | | | | 4,545 | |
Man Group PLC/Jersey | | | 18,993,736 | | | | 29,846 | |
Medtronic PLC | | | 422,000 | | | | 47,981 | |
Ninety One PLC * | | | 337,765 | | | | 951 | |
OTP Bank Nyrt | | | 769,288 | | | | 30,573 | |
Pagegroup PLC | | | 123,008 | | | | 681 | |
Persimmon PLC | | | 663,710 | | | | 23,534 | |
Plus500 Ltd | | | 29,055 | | | | 603 | |
Prudential PLC | | | 1,128,993 | | | | 17,627 | |
QinetiQ Group PLC | | | 613,423 | | | | 2,403 | |
Rio Tinto PLC | | | 402,588 | | | | 25,981 | |
Rio Tinto PLC ADR (B) | | | 68,668 | | | | 4,461 | |
Royal Dutch Shell PLC, Cl A | | | 2,014,336 | | | | 34,635 | |
Royal Mail PLC | | | 706,947 | | | | 2,904 | |
Sensata Technologies Holding PLC * | | | 225,370 | | | | 11,005 | |
Smiths Group PLC | | | 2,458,281 | | | | 47,883 | |
St James’s Place PLC | | | 137,823 | | | | 1,877 | |
Tesco PLC | | | 8,551,310 | | | | 25,915 | |
THG Holdings Ltd * | | | 927,759 | | | | 7,788 | |
Whitbread PLC | | | 159,130 | | | | 6,439 | |
| | | | | | | 966,733 | |
| | |
Total Foreign Common Stock
(Cost $6,684,861) ($ Thousands) | | | | | | | 8,844,839 | |
| | |
COMMON STOCK — 4.6% | | | | | | | | |
| | |
United States — 4.6% | | | | | | | | |
360 DigiTech Inc ADR * | | | 115,810 | | | | 1,436 | |
Berry Global Group Inc * | | | 570,581 | | | | 30,241 | |
Check Point Software Technologies Ltd * | | | 462,233 | | | | 54,396 | |
Copa Holdings SA, Cl A (B) | | | 117,219 | | | | 9,342 | |
Credicorp Ltd | | | 49,932 | | | | 7,685 | |
Fiverr International Ltd *(B) | | | 16,890 | | | | 3,384 | |
Gentex Corp | | | 868,477 | | | | 28,312 | |
Hollysys Automation Technologies Ltd | | | 1,153,583 | | | | 14,547 | |
IHS Markit Ltd | | | 608,689 | | | | 60,540 | |
KE Holdings Inc ADR * | | | 96,477 | | | | 6,303 | |
MercadoLibre Inc * | | | 50,111 | | | | 77,839 | |
Nomad Foods Ltd * | | | 2,677,134 | | | | 64,653 | |
| | |
| 6 | | SEI Institutional Investments Trust / Semi-Annual Report / November 30, 2020 |
SCHEDULE OF INVESTMENTS (Unaudited)
November 30, 2020
World Equity Ex-US Fund (Continued)
| | | | | | | | |
| | | |
| Description | | Shares | | Market Value
($ Thousands) |
COMMON STOCK (continued) | | | | | | | | |
NXP Semiconductors NV | | | 126,262 | | | $ | 20,002 | |
Ritchie Bros Auctioneers Inc | | | 179,020 | | | | 12,856 | |
Spotify Technology SA * | | | 66,429 | | | | 19,355 | |
XP Inc, Cl A * | | | 971,796 | | | | 39,853 | |
| | | | | | | 450,744 | |
| | |
Total Common Stock
(Cost $294,756) ($ Thousands) | | | | | | | 450,744 | |
| | |
PREFERRED STOCK — 0.2% | | | | | | | | |
| | |
Brazil — 0.1% | | | | | | | | |
Cia de Transmissao de Energia Eletrica Paulista (C) | | | 244,200 | | | | 1,232 | |
Itau Unibanco Holding SA ADR (C) | | | 898,705 | | | | 4,808 | |
| | | | | | | 6,040 | |
| | |
Germany — 0.1% | | | | | | | | |
Volkswagen (C) | | | 85,745 | | | | 14,497 | |
| | |
Spain — 0.0% | | | | | | | | |
Grifols SA (C) | | | 135,639 | | | | 2,531 | |
| | |
Total Preferred Stock
(Cost $27,002) ($ Thousands) | | | | | | | 23,068 | |
| | |
| | | Number
of Warrants | | |
| | |
WARRANT — 0.0% | | | | | | | | |
| | |
Switzerland — 0.0% | | | | | | | | |
Cie Financiere Richemont, Expires 11/27/2023 * | | | 74,658 | | | | 10 | |
| | | | | | | | |
| | | |
| Description | | Number
of Warrants | | Market Value
($ Thousands) |
WARRANT (continued) | | | | | | | | |
| | |
Total Warrant
(Cost $—) ($ Thousands) | | | | | | $ | 10 | |
| | |
| | | Number
of Rights | | |
| | |
RIGHT — 0.0% | | | | | | | | |
| | |
Taiwan — 0.0% | | | | | | | | |
Simplo Technology Co Ltd *‡‡(A) | | | 23,368 | | | | – | |
| | |
Total Right
(Cost $—) ($ Thousands) | | | | | | | – | |
| | |
| | | Shares | | |
| | |
AFFILIATED PARTNERSHIP — 1.0% | | | | | | | | |
SEI Liquidity Fund, L.P.
0.070% **†(D) | | | 93,112,091 | | | | 93,131 | |
| | |
Total Affiliated Partnership
(Cost $93,114) ($ Thousands) | | | | | | | 93,131 | |
| | |
CASH EQUIVALENT — 1.0% | | | | | | | | |
SEI Daily Income Trust, Government Fund, Cl F
0.010%**† | | | 94,391,178 | | | | 94,391 | |
| | |
Total Cash Equivalent
(Cost $94,391) ($ Thousands) | | | | | | | 94,391 | |
| |
Total Investments in Securities — 98.1%
(Cost $7,194,124) ($ Thousands) | | | $ | 9,506,183 | |
| | | | | | | | |
A list of the open futures contracts held by the Fund at November 30, 2020, is as follows:
| | | | | | | | | | | | | | | | | | | | |
| Type of Contract | | Number of
Contracts Long | | | Expiration
Date | | | Notional Amount
(Thousands) | | Value
(Thousands) | | Unrealized Appreciation
(Depreciation) (Thousands) |
Euro STOXX 50 | | | 824 | | | | Dec-2020 | | | $ | 33,198 | | | $ | 34,548 | | | $ | 952 | |
FTSE 100 Index | | | 155 | | | | Dec-2020 | | | | 12,585 | | | | 13,021 | | | | 239 | |
Hang Seng Index | | | 38 | | | | Jan-2021 | | | | 6,525 | | | | 6,478 | | | | (46 | ) |
S&P TSX 60 Index | | | 74 | | | | Dec-2020 | | | | 11,146 | | | | 11,684 | | | | 525 | |
SPI 200 Index | | | 69 | | | | Dec-2020 | | | | 7,921 | | | | 8,299 | | | | 291 | |
TOPIX Index | | | 166 | | | | Dec-2020 | | | | 26,519 | | | | 27,947 | | | | 1,127 | |
| | | | | | | | | | | | | | | | | | | | |
| | | | | | | | | | $ | 97,894 | | | $ | 101,977 | | | $ | 3,088 | |
| | | | | | | | | | | | | | | | | | | | |
| | |
| SEI Institutional Investments Trust / Semi-Annual Report / November 30, 2020 | | 7 |
SCHEDULE OF INVESTMENTS (Unaudited)
November 30, 2020
World Equity Ex-US Fund (Continued)
A list of the open forward foreign currency contracts held by the Fund at November 30, 2020, is as follows:
| | | | | | | | | | | | | | | | | | | | | | | | |
| Counterparty | | Settlement Date | | | | | | Currency to Deliver
(Thousands) | | | | | | Currency to Receive
(Thousands) | | | Unrealized
Appreciation
(Depreciation)
(Thousands) |
Bank of America | | | 03/15/21 | | | | USD | | | | 1,396 | | | | EUR | | | | 1,178 | | | $ | 16 | |
Barclays PLC | | | 01/14/21 | | | | KRW | | | | 27,624,370 | | | | USD | | | | 24,945 | | | | 7 | |
Barclays PLC | | | 03/15/21 | | | | GBP | | | | 7,972 | | | | USD | | | | 10,675 | | | | 24 | |
Citigroup | | | 01/05/21 | | | | USD | | | | 7,364 | | | | BRL | | | | 39,296 | | | | (70 | ) |
Citigroup | | | 01/14/21 | | | | KRW | | | | 2,635,226 | | | | USD | | | | 2,377 | | | | (2 | ) |
Citigroup | | | 03/15/21 | | | | USD | | | | 50,857 | | | | CHF | | | | 46,034 | | | | 178 | |
Citigroup | | | 03/15/21 | | | | USD | | | | 63,493 | | | | CNY | | | | 420,580 | | | | (85 | ) |
Citigroup | | | 03/15/21 | | | | EUR | | | | 125,929 | | | | USD | | | | 150,129 | | | | (900 | ) |
Credit Suisse First Boston | | | 03/15/21 | | | | USD | | | | 39,719 | | | | SEK | | | | 338,056 | | | | (99 | ) |
Goldman Sachs | | | 01/22/21 | | | | RUB | | | | 493,981 | | | | USD | | | | 6,481 | | | | 54 | |
Goldman Sachs | | | 03/15/21 | | | | USD | | | | 90,739 | | | | CAD | | | | 117,967 | | | | 349 | |
Goldman Sachs | | | 03/16/21 | | | | USD | | | | 8,579 | | | | MXN | | | | 174,153 | | | | (32 | ) |
HSBC | | | 03/15/21 | | | | ILS | | | | 82,232 | | | | USD | | | | 24,773 | | | | (145 | ) |
JPMorgan Chase Bank | | | 03/15/21 | | | | USD | | | | 9,924 | | | | EUR | | | | 8,405 | | | | 157 | |
JPMorgan Chase Bank | | | 03/15/21 | | | | USD | | | | 25,077 | | | | CNY | | | | 166,232 | | | | (16 | ) |
Morgan Stanley | | | 02/18/21 | | | | GBP | | | | 26,639 | | | | USD | | | | 35,158 | | | | (429 | ) |
Morgan Stanley | | | 02/18/21 | | | | USD | | | | 35,416 | | | | GBP | | | | 26,639 | | | | 170 | |
Morgan Stanley | | | 03/15/21 | | | | HKD | | | | 152,846 | | | | USD | | | | 19,721 | | | | 1 | |
RBS | | | 03/15/21 | | | | USD | | | | 9,649 | | | | EUR | | | | 8,149 | | | | 124 | |
RBS | | | 03/15/21 | | | | EUR | | | | 61,960 | | | | USD | | | | 72,281 | | | | (2,029 | ) |
Standard Bank | | | 01/15/21 | | | | USD | | | | 6,891 | | | | INR | | | | 510,750 | | | | (16 | ) |
| | | | | | | | | | | | | | | | | | | | | | | | |
| | | | | | | | | | | | | | | | | | | | | | $ | (2,743 | ) |
| | | | | | | | | | | | | | | | | | | | | | | | |
| | Percentages are based on Net Assets of $9,686,845 ($ Thousands). |
| * | Non-income producing security. |
| ** | The rate reported is the 7-day effective yield as of November 30, 2020. |
| † | Investment in Affiliated Security (see Note 6). |
| ‡‡ | Expiration date not available. |
| (A) | Level 3 security in accordance with fair value hierarchy. |
| (B) | Certain securities or partial positions of certain securities are on loan at November 30, 2020. The total market value of securities on loan at November 30, 2020 was $88,627 ($ Thousands). (C) There is currently no rate available. |
| (D) | This security was purchased with cash collateral held from securities on loan. The total market value of such securities as of November 30, 2020 was $93,131 ($ Thousands). |
ADR — American Depositary Receipt
BRL — Brazilian Real
CAD — Canadian Dollar
CHF — Swiss Franc
Cl — Class
CNY — Chinese Yuan Onshore
EUR — Euro
FTSE— Financial Times and Stock Exchange
GBP — British Pound Sterling
HKD — Hong Kong Dollar
INR — Indian Rupee
ILS — Israeli New Sheckels
KRW — Korean Won
L.P. — Limited Partnership
Ltd. — Limited
MXN — Mexican Peso
PJSC — Public Joint-Stock Company
PLC — Public Limited Company
RUB — Russian Ruble
S&P— Standard & Poor’s
SEK — Swedish Krona
SPI — Share Price Index
TOPIX- Tokyo Price Index
TSX — Toronto Stock Exchange
USD — U.S. Dollar
| | |
| 8 | | SEI Institutional Investments Trust / Semi-Annual Report / November 30, 2020 |
SCHEDULE OF INVESTMENTS (Unaudited)
November 30, 2020
World Equity Ex-US Fund (Continued)
The following is a list of the level of inputs used as of November 30, 2020, in valuing the Fund’s investments and other financial instruments carried at value ($ Thousands):
| | | | | | | | | | | | | | | | |
| | | | | |
| Investments in Securities | | Level 1 ($) | | Level 2 ($) | | Level 3
($)(1) | | Total ($) |
Foreign Common Stock | | | 8,806,554 | | | | 38,285 | | | | – | | | | 8,844,839 | |
Common Stock | | | 450,744 | | | | – | | | | – | | | | 450,744 | |
Preferred Stock | | | 20,537 | | | | 2,531 | | | | – | | | | 23,068 | |
Warrant | | | – | | | | 10 | | | | – | | | | 10 | |
Right | | | – | | | | – | | | | –^ | | | | – | |
Affiliated Partnership | | | – | | | | 93,131 | | | | – | | | | 93,131 | |
Cash Equivalent | | | 94,391 | | | | – | | | | – | | | | 94,391 | |
| | | | | | | | | | | | | | | | |
Total Investments in Securities | | | 9,372,226 | | | | 133,957 | | | | – | | | | 9,506,183 | |
| | | | | | | | | | | | | | | | |
| | | | | | | | | | | | | | | | |
| Other Financial Instruments | | Level 1 ($) | | Level 2
($) | | Level 3
($) | | Total ($) |
Futures Contracts* | | | | | | | | | | | | | | | | |
Unrealized Appreciation | | | 3,134 | | | | – | | | | – | | | | 3,134 | |
Unrealized Depreciation | | | (46 | ) | | | – | | | | – | | | | (46 | ) |
Forwards Contracts* | | | | | | | | | | | | | | | | |
Unrealized Appreciation | | | – | | | | 1,080 | | | | – | | | | 1,080 | |
Unrealized Depreciation | | | – | | | | (3,823 | ) | | | – | | | | (3,823 | ) |
| | | | | | | | | | | | | | | | |
Total Other Financial Instruments | | | 3,088 | | | | (2,743 | ) | | | – | | | | 345 | |
| | | | | | | | | | | | | | | | |
(1) A reconciliation of Level 3 investments is presented when the Fund has a significant amount of Level 3 investments at the beginning and/or end of the period in relation to net assets. Management has concluded that Level 3 investments are not material in relation to net assets.
^ Securities market value less than $500.
*Futures contracts and forward contracts are valued at the unrealized appreciation (depreciation) on the instrument.
For the period ended November 30, 2020, there were no transfers in or out of Level 3.
For more information on valuation inputs, see Note 2 – Significant Accounting Policies in Notes to Financial Statements.
The following is a summary of the Fund’s transactions with affiliates for the period ended November 30, 2020 ($ Thousands):
| | | | | | | | | | | | | | | | | | |
| | | | | | | | | | |
| Security Description | | Value 5/31/2020 | | Purchases at
Cost | | Proceeds from
Sales | | Realized Gain/
(Loss) | | Change in
Unrealized
Appreciation/
(Depreciation) | | Value
11/30/2020 | | Shares | | Income | | Capital Gains |
SEI Liquidity Fund, L.P. | | $73,249 | | $495,049 | | $(475,128) | | $(13) | | $(26) | | $93,131 | | 93,112,091 | | $1,216 | | $— |
SEI Daily Income Trust, Government Fund,
Cl F | | 156,154 | | 460,187 | | (521,950) | | — | | — | | 94,391 | | 94,391,178 | | 6 | | — |
| | | | | | | | | | | | | | | | | | |
Totals | | $229,403 | | $955,236 | | $(997,078) | | $(13) | | $(26) | | $187,522 | | | | $1,222 | | $— |
| | | | | | | | | | | | | | | | | | |
Amounts designated as “—” are $0 or have been rounded to $0.
The accompanying notes are an integral part of the financial statements.
| | |
| SEI Institutional Investments Trust / Semi-Annual Report / November 30, 2020 | | 9 |
SCHEDULE OF INVESTMENTS (Unaudited)
November 30, 2020
Screened World Equity Ex-US Fund (Continued)
| | | | | | | | |
| | | |
| Description | | Shares | | Market Value ($ Thousands) |
| | |
COMMON STOCK — 94.5% | | | | | | | | |
Australia — 4.6% | | | | | | | | |
a2 Milk Co Ltd * | | | 27,614 | | | $ | 281 | |
Australian Vintage | | | 21,642 | | | | 10 | |
Beacon Lighting Group | | | 19,110 | | | | 19 | |
BGP Holdings * | | | 4,500 | | | | – | |
BHP Group Ltd | | | 16,495 | | | | 463 | |
BlueScope Steel Ltd | | | 30,042 | | | | 379 | |
Champion Iron Ltd * | | | 13,677 | | | | 45 | |
Cochlear Ltd * | | | 700 | | | | 114 | |
CSL Ltd | | | 735 | | | | 161 | |
Fortescue Metals Group Ltd | | | 66,393 | | | | 892 | |
Kogan.com Ltd | | | 2,678 | | | | 32 | |
Macquarie Group Ltd | | | 3,270 | | | | 334 | |
Midway Ltd * | | | 9,210 | | | | 7 | |
Netwealth Group Ltd | | | 7,426 | | | | 92 | |
Newcrest Mining Ltd | | | 10,705 | | | | 212 | |
Northern Star Resources Ltd | | | 17,265 | | | | 160 | |
Objective Corporation | | | 5,361 | | | | 51 | |
OM Holdings Ltd | | | 41,402 | | | | 10 | |
Qantas Airways Ltd * | | | 241,331 | | | | 957 | |
Redbubble Ltd * | | | 4,943 | | | | 19 | |
Rio Tinto Ltd | | | 6,011 | | | | 449 | |
Sandfire Resources Ltd | | | 6,052 | | | | 19 | |
Sigma Healthcare * | | | 182,929 | | | | 76 | |
South32 Ltd | | | 227,319 | | | | 402 | |
Wagners Holding * | | | 14,266 | | | | 18 | |
| | |
| | | | | | | 5,202 | |
| | |
Austria — 0.3% | | | | | | | | |
Andritz | | | 2,906 | | | | 123 | |
Kapsch TrafficCom AG * | | | 3,881 | | | | 58 | |
Palfinger | | | 2,459 | | | | 74 | |
Strabag SE | | | 889 | | | | 28 | |
| | |
| | | | | | | 283 | |
| | |
Belgium — 0.6% | | | | | | | | |
bpost SA * | | | 8,147 | | | | 99 | |
Solvay SA | | | 1,880 | | | | 215 | |
UCB SA | | | 2,286 | | | | 245 | |
Umicore SA | | | 1,907 | | | | 86 | |
| | |
| | | | | | | 645 | |
| | |
Brazil — 0.3% | | | | | | | | |
JBS SA | | | 50,600 | | | | 218 | |
Kepler Weber | | | 2,400 | | | | 17 | |
Porto Seguro SA | | | 4,700 | | | | 42 | |
| | |
| | | | | | | 277 | |
| | |
Canada — 2.4% | | | | | | | | |
5N Plus * | | | 5,200 | | | | 10 | |
Absolute Software Corp | | | 35,900 | | | | 370 | |
BRP Inc | | | 5,352 | | | | 306 | |
Cascades | | | 6,400 | | | | 72 | |
Cervus Equipment Corp | | | 1,900 | | | | 18 | |
| | | | | | | | |
| | | |
| Description | | Shares | | Market Value ($ Thousands) |
| | |
COMMON STOCK (continued) | | | | | | | | |
Cogeco Inc | | | 1,831 | | | $ | 112 | |
Constellation Software Inc/Canada | | | 93 | | | | 116 | |
Corus Entertainment Inc, Cl B | | | 2,817 | | | | 9 | |
Hardwoods Distribution | | | 400 | | | | 8 | |
Home Capital Group Inc, Cl B * | | | 14,600 | | | | 332 | |
KE Holdings Inc ADR * | | | 984 | | | | 64 | |
Linamar Corp | | | 1,200 | | | | 55 | |
Lundin Mining Corp | | | 98,300 | | | | 787 | |
Melcor Developments Ltd | | | 1,800 | | | | 11 | |
Nutrien Ltd | | | 2,700 | | | | 134 | |
Pollard Banknote | | | 700 | | | | 14 | |
Real Matters Inc * | | | 14,000 | | | | 207 | |
Sun Life Financial Inc | | | 800 | | | | 36 | |
| | |
| | | | | | | 2,661 | |
| | |
China — 3.3% | | | | | | | | |
Alibaba Group Holding Ltd ADR * | | | 2,160 | | | | 569 | |
Baidu Inc ADR * | | | 2,666 | | | | 370 | |
BYD Co Ltd, Cl H | | | 11,000 | | | | 258 | |
China Conch Venture Holdings Ltd | | | 27,000 | | | | 128 | |
China Construction Bank Corp, Cl H | | | 681,000 | | | | 534 | |
China Mobile Ltd | | | 33,500 | | | | 201 | |
LONGi Green Energy Technology Co Ltd, Cl A | | | 20,000 | | | | 209 | |
Midea Group Co Ltd, Cl A | | | 50,300 | | | | 664 | |
Oppein Home Group Inc, Cl A | | | 24,663 | | | | 478 | |
Ping An Insurance Group Co of China Ltd, Cl H | | | 15,500 | | | | 182 | |
Tencent Music Entertainment Group ADR * | | | 7,867 | | | | 132 | |
| | |
| | | | | | | 3,725 | |
| | |
Denmark — 3.8% | | | | | | | | |
AP Moller - Maersk A/S, Cl B | | | 266 | | | | 544 | |
Chr Hansen Holding A/S * | | | 919 | | | | 89 | |
Coloplast A/S, Cl B | | | 1,020 | | | | 153 | |
Danske Bank A/S * | | | 51,934 | | | | 858 | |
DSV PANALPINA A/S | | | 2,731 | | | | 432 | |
Genmab A/S * | | | 936 | | | | 360 | |
Nilfisk Holding * | | | 1,974 | | | | 43 | |
North Media AS | | | 6,655 | | | | 87 | |
Novo Nordisk A/S, Cl B | | | 15,787 | | | | 1,065 | |
Novozymes A/S, Cl B | | | 2,458 | | | | 141 | |
Royal Unibrew A/S | | | 1,670 | | | | 175 | |
TCM Group A/S | | | 439 | | | | 9 | |
Vestas Wind Systems A/S | | | 1,430 | | | | 293 | |
| | |
| | | | | | | 4,249 | |
| | |
Finland — 1.3% | | | | | | | | |
Alma Media Oyj | | | 3,430 | | | | 33 | |
Aspo Oyj | | | 1,598 | | | | 13 | |
Digia Oyj | | | 1,726 | | | | 13 | |
Harvia Oyj | | | 2,645 | | | | 66 | |
Kone Oyj, Cl B | | | 4,252 | | | | 358 | |
Neste Oyj | | | 5,350 | | | | 360 | |
Oriola Oyj | | | 1,404 | | | | 3 | |
| | |
| SEI Institutional Investments Trust / Semi-Annual Report / November 30, 2020 | | 1 |
SCHEDULE OF INVESTMENTS (Unaudited)
November 30, 2020
Screened World Equity Ex-US Fund (Continued)
| | | | | | | | |
| | | |
| Description | | Shares | | Market Value ($ Thousands) |
| | |
COMMON STOCK (continued) | | | | | | | | |
Orion Oyj, Cl B | | | 1,287 | | | $ | 61 | |
Outotec OYJ | | | 23,835 | | | | 214 | |
Rapala VMC Oyj * | | | 5,629 | | | | 27 | |
Sampo OYJ, Cl A | | | 4,630 | | | | 201 | |
Scanfil Oyj | | | 3,934 | | | | 27 | |
Verkkokauppa.com | | | 7,619 | | | | 54 | |
| | |
| | | | | | | 1,430 | |
| | |
France — 4.2% | | | | | | | | |
Airbus SE * | | | 1,190 | | | | 125 | |
BNP Paribas SA * | | | 7,990 | | | | 411 | |
Burelle SA | | | 67 | | | | 65 | |
Cie de Saint-Gobain * | | | 20,787 | | | | 990 | |
Criteo SA ADR ADR * | | | 4,451 | | | | 86 | |
Danone SA | | | 1,517 | | | | 98 | |
Dassault Systemes SE | | | 641 | | | | 119 | |
Edenred | | | 3,139 | | | | 180 | |
Groupe Guillin | | | 950 | | | | 26 | |
Guerbet | | | 1,548 | | | | 60 | |
Legrand SA | | | 661 | | | | 56 | |
Peugeot SA * | | | 15,425 | | | | 365 | |
Remy Cointreau SA | | | 850 | | | | 151 | |
Sanofi | | | 11,056 | | | | 1,120 | |
Schneider Electric SE | | | 2,430 | | | | 339 | |
Somfy SA | | | 392 | | | | 62 | |
Ubisoft Entertainment SA * | | | 3,584 | | | | 342 | |
Vetoquinol SA | | | 206 | | | | 20 | |
Virbac SA * | | | 258 | | | | 67 | |
| | |
| | | | | | | 4,682 | |
| | |
Germany — 5.4% | | | | | | | | |
Allianz SE | | | 1,728 | | | | 409 | |
AlzChem Group | | | 437 | | | | 10 | |
Bayer AG | | | 4,551 | | | | 263 | |
Bayerische Motoren Werke AG | | | 5,664 | | | | 495 | |
CECONOMY * | | | 8,986 | | | | 44 | |
Centrotec SE * | | | 4,974 | | | | 89 | |
DaimlerChrysler AG | | | 8,982 | | | | 607 | |
Deutsche Bank AG * | | | 3,615 | | | | 40 | |
Deutsche Boerse AG | | | 1,513 | | | | 253 | |
Deutsche Post AG | | | 5,440 | | | | 264 | |
HelloFresh SE * | | | 4,805 | | | | 283 | |
METRO AG | | | 23,996 | | | | 220 | |
Muenchener Rueckversicherungs— Gesellschaft AG in Muenchen | | | 3,124 | | | | 873 | |
Paul Hartmann AG | | | 32 | | | | 13 | |
Rational AG | | | 182 | | | | 162 | |
Rheinmetall AG | | | 12,280 | | | | 1,095 | |
SAP SE | | | 5,047 | | | | 616 | |
Schaltbau Holding * | | | 378 | | | | 14 | |
Scout24 AG | | | 3,794 | | | | 291 | |
USU Software AG | | | 1,041 | | | | 29 | |
| | | | | | | | |
| | | |
| Description | | Shares | | Market Value ($ Thousands) |
| | |
COMMON STOCK (continued) | | | | | | | | |
zooplus AG * | | | 265 | | | $ | 50 | |
| | |
| | | | | | | 6,120 | |
| | |
Greece — 0.2% | | | | | | | | |
Athens Water Supply & Sewage Co SA | | | 3,509 | | | | 29 | |
Hellenic Telecommunications Organization SA | | | 8,310 | | | | 139 | |
Thrace Plastics | | | 2,431 | | | | 9 | |
| | |
| | | | | | | 177 | |
| | |
Hong Kong — 7.8% | | | | | | | | |
361 Degrees International Ltd * | | | 81,000 | | | | 10 | |
AIA Group Ltd | | | 48,400 | | | | 531 | |
Alibaba Group Holding Ltd * | | | 45,400 | | | | 1,531 | |
Alibaba Health Information Technology Ltd * | | | 52,000 | | | | 153 | |
Build King Holdings Ltd | | | 269,107 | | | | 35 | |
Chaowei Power Holdings Ltd | | | 334,000 | | | | 140 | |
China Resources Cement Holdings Ltd | | | 120,000 | | | | 149 | |
CRCC High-Tech Equipment Corp Ltd, Cl H | | | 105,500 | | | | 11 | |
Eagle Nice International Holdings | | | 22,000 | | | | 12 | |
Goodbaby International Holdings * | | | 215,000 | | | | 28 | |
Henan Jinma Energy Co Ltd, Cl H | | | 57,365 | | | | 20 | |
Hong Kong Exchanges & Clearing Ltd | | | 3,000 | | | | 149 | |
Industrial & Commercial Bank of China Ltd, Cl H | | | 1,059,000 | | | | 672 | |
Johnson Electric Holdings | | | 19,000 | | | | 45 | |
Lee & Man Paper Manufacturing Ltd | | | 131,000 | | | | 106 | |
Left Field Printing Group Ltd | | | 9,386 | | | | 1 | |
Lion Rock Group Ltd | | | 150,180 | | | | 14 | |
Meituan, Cl B * | | | 12,800 | | | | 479 | |
Modern Land China Co Ltd | | | 98,000 | | | | 13 | |
PAX Global Technology Ltd | | | 137,000 | | | | 85 | |
Pico Far East Holdings | | | 164,000 | | | | 30 | |
Ping An Healthcare and Technology Co Ltd * | | | 9,900 | | | | 121 | |
Samsonite International SA * | | | 371,400 | | | | 600 | |
Shandong Chenming Paper Holdings Ltd, Cl H | | | 325,000 | | | | 167 | |
Shanghai Pharmaceuticals Holding Co Ltd, Cl H | | | 423,500 | | | | 717 | |
Techtronic Industries Co Ltd | | | 23,500 | | | | 301 | |
Tencent Holdings Ltd | | | 11,900 | | | | 864 | |
Texwinca Holdings Ltd | | | 662,000 | | | | 132 | |
Time Watch Investments Ltd * | | | 292,000 | | | | 30 | |
TK Group Holdings | | | 30,000 | | | | 9 | |
Topsports International Holdings | | | 507,000 | | | | 755 | |
Xinyi Glass Holdings Ltd | | | 394,000 | | | | 885 | |
Xiwang Special Steel * | | | 274,000 | | | | 16 | |
| | |
| | | | | | | 8,811 | |
| | |
India — 2.6% | | | | | | | | |
eClerx Services Ltd | | | 11,904 | | | | 116 | |
Ganesha Ecosphere Ltd | | | 5,398 | | | | 24 | |
GHCL | | | 8,116 | | | | 19 | |
HCL Technologies Ltd | | | 27,526 | | | | 305 | |
| | |
| 2 | | SEI Institutional Investments Trust / Semi-Annual Report / November 30, 2020 |
SCHEDULE OF INVESTMENTS (Unaudited)
November 30, 2020
Screened World Equity Ex-US Fund (Continued)
| | | | | | | | |
| | | |
| Description | | Shares | | Market Value ($ Thousands) |
| | |
COMMON STOCK (continued) | | | | | | | | |
HDFC Bank Ltd ADR * | | | 6,100 | | | $ | 421 | |
Housing Development Finance Corp Ltd | | | 7,680 | | | | 233 | |
ICICI Lombard General Insurance Co Ltd * | | | 794 | | | | 15 | |
Kirloskar Brothers | | | 19,133 | | | | 36 | |
KPR Mill | | | 2,830 | | | | 31 | |
LG Balakrishnan & Bros | | | 4,092 | | | | 14 | |
NIIT Ltd | | | 58,426 | | | | 139 | |
Redington India Ltd | | | 70,486 | | | | 125 | |
Tata Consultancy Services Ltd | | | 5,113 | | | | 184 | |
Tech Mahindra Ltd | | | 84,476 | | | | 999 | |
Time Technoplast | | | 20,803 | | | | 13 | |
TVS Srichakra | | | 993 | | | | 21 | |
Welspun Corp Ltd | | | 88,147 | | | | 141 | |
Wipro ADR | | | 7,733 | | | | 40 | |
Wipro Ltd | | | 1,743 | | | | 8 | |
| | |
| | | | | | | 2,884 | |
| | |
Indonesia — 0.1% | | | | | | | | |
Adira Dinamika Multi Finance Tbk PT | | | 25,000 | | | | 15 | |
Mandala Multifinance Tbk PT | | | 319,700 | | | | 25 | |
Mitrabara Adiperdana Tbk PT | | | 127,534 | | | | 25 | |
| | |
| | | | | | | 65 | |
| | |
Ireland — 1.4% | | | | | | | | |
CRH PLC | | | 16,181 | | | | 635 | |
ICON PLC * | | | 3,669 | | | | 715 | |
Ryanair Holdings PLC ADR * | | | 2,448 | | | | 254 | |
| | |
| | | | | | | 1,604 | |
| | |
Israel — 0.5% | | | | | | | | |
Nice Ltd ADR * | | | 2,311 | | | | 563 | |
| | |
Italy — 0.9% | | | | | | | | |
De’Longhi SPA | | | 1,974 | | | | 69 | |
Digital Bros SpA | | | 2,304 | | | | 47 | |
Emak * | | | 16,630 | | | | 19 | |
EXOR NV | | | 4,832 | | | | 337 | |
FinecoBank Banca Fineco * | | | 3,596 | | | | 57 | |
FNM * | | | 14,519 | | | | 10 | |
Prysmian SpA | | | 14,466 | | | | 475 | |
| | |
| | | | | | | 1,014 | |
| | |
Japan — 11.1% | | | | | | | | |
AEON Financial Service Co | | | 2,100 | | | | 23 | |
Ainavo Holdings Co Ltd | | | 5,054 | | | | 46 | |
Alps Alpine Co Ltd | | | 53,900 | | | | 676 | |
Capcom Co Ltd | | | 2,000 | | | | 113 | |
Daifuku Co Ltd | | | 2,100 | | | | 244 | |
Daikin Industries Ltd | | | 1,100 | | | | 250 | |
Daiwa Securities Group Inc | | | 189,700 | | | | 826 | |
Denso Corp | | | 2,600 | | | | 123 | |
Falco SD Holdings | | | 1,200 | | | | 18 | |
FANUC Corp | | | 1,500 | | | | 365 | |
Fujitsu Ltd | | | 5,500 | | | | 765 | |
Hitachi Ltd | | | 30,000 | | | | 1,141 | |
| | | | | | | | |
| | | |
| Description | | Shares | | Market Value ($ Thousands) |
| | |
COMMON STOCK (continued) | | | | | | | | |
Hokuriku Gas Co Ltd | | | 500 | | | $ | 15 | |
Japan Exchange Group Inc | | | 16,300 | | | | 404 | |
Kanefusa Corp | | | 2,300 | | | | 14 | |
KDDI Corp | | | 24,500 | | | | 701 | |
Koike Sanso Kogyo Co Ltd | | | 400 | | | | 9 | |
Marubeni Corp | | | 57,200 | | | | 334 | |
MS&AD Insurance Group Holdings Inc | | | 12,500 | | | | 364 | |
Nidec Corp | | | 4,400 | | | | 561 | |
Nintendo Co Ltd | | | 1,800 | | | | 1,023 | |
Nippon Steel Corp * | | | 7,300 | | | | 89 | |
Nippon Telegraph & Telephone Corp | | | 28,040 | | | | 663 | |
Nitori Holdings Co Ltd | | | 1,400 | | | | 298 | |
NJS Co Ltd | | | 1,900 | | | | 36 | |
Nomura Holdings Inc | | | 10,200 | | | | 51 | |
Okinawa Cellular Telephone Co | | | 700 | | | | 29 | |
Olympus Corp * | | | 12,500 | | | | 271 | |
Otsuka Holdings Co Ltd | | | 600 | | | | 24 | |
Panasonic Corp | | | 32,500 | | | | 347 | |
Persol Holdings Co Ltd | | | 3,000 | | | | 55 | |
Recruit Holdings Co Ltd | | | 3,800 | | | | 160 | |
Shimano Inc | | | 800 | | | | 190 | |
Shiseido Co Ltd | | | 1,800 | | | | 127 | |
SHL-Japan Ltd | | | 400 | | | | 9 | |
SMC Corp/Japan | | | 400 | | | | 254 | |
Sony Corp | | | 4,400 | | | | 409 | |
Square Enix Holdings Co Ltd | | | 1,800 | | | | 111 | |
Takeda Pharmaceutical Co Ltd | | | 22,600 | | | | 812 | |
Techno Medica Co Ltd | | | 500 | | | | 7 | |
Tokio Marine Holdings Inc | | | 6,100 | | | | 304 | |
Toyota Tsusho Corp | | | 3,300 | | | | 114 | |
Tsubakimoto Kogyo Co Ltd | | | 2,100 | | | | 73 | |
ZOZO Inc | | | 1,000 | | | | 25 | |
| | |
| | | | | | | 12,473 | |
| | |
Malaysia — 0.6% | | | | | | | | |
Allianz Malaysia Bhd | | | 19,700 | | | | 66 | |
Hai-O Enterprise, Cl O * | | | 17,000 | | | | 8 | |
Hong Leong Bank Bhd | | | 25,100 | | | | 106 | |
Kenanga Investment Bank Bhd | | | 298,800 | | | | 67 | |
Lii Hen Industries Bhd | | | 106,148 | | | | 112 | |
Magni-Tech Industries Bhd | | | 111,733 | | | | 66 | |
Malaysian Pacific Industries Bhd | | | 6,369 | | | | 39 | |
MKH Bhd | | | 110,100 | | | | 39 | |
RHB Bank Bhd | | | 151,300 | | | | 191 | |
| | |
| | | | | | | 694 | |
| | |
Mexico — 0.0% | | | | | | | | |
Cia Minera Autlan SAB de CV * | | | 3,088 | | | | 2 | |
Kimberly-Clark de Mexico SAB de CV ADR | | | 1,805 | | | | 14 | |
| | |
| | | | | | | 16 | |
| | |
Netherlands — 5.8% | | | | | | | | |
Adyen NV * | | | 137 | | | | 263 | |
Akzo Nobel NV | | | 2,080 | | | | 222 | |
| | |
| SEI Institutional Investments Trust / Semi-Annual Report / November 30, 20120 | | 3 |
SCHEDULE OF INVESTMENTS (Unaudited)
November 30, 2020
Screened World Equity Ex-US Fund (Continued)
| | | | | | | | |
| | | |
| Description | | Shares | | Market Value ($ Thousands) |
| | |
COMMON STOCK (continued) | | | | | | | | |
Amsterdam Commodities NV | | | 1,721 | | | $ | 44 | |
ASML Holding NV | | | 1,225 | | | | 533 | |
Brunel International * | | | 3,087 | | | | 27 | |
Galapagos NV * | | | 1,476 | | | | 182 | |
Heineken Holding NV | | | 1,339 | | | | 124 | |
Hunter Douglas * | | | 357 | | | | 23 | |
IMCD NV | | | 1,199 | | | | 150 | |
Koninklijke Ahold Delhaize NV | | | 24,230 | | | | 695 | |
Koninklijke Philips NV * | | | 29,952 | | | | 1,554 | |
NN Group NV | | | 36,856 | | | | 1,501 | |
OCI NV * | | | 29,135 | | | | 508 | |
Prosus NV * | | | 1,091 | | | | 119 | |
SNS Reaal * | | | 1,762 | | | | – | |
Wolters Kluwer NV | | | 6,220 | | | | 523 | |
| | |
| | | | | | | 6,468 | |
| | |
New Zealand — 0.3% | | | | | | | | |
Eroad Ltd * | | | 5,372 | | | | 17 | |
Fisher & Paykel Healthcare Corp Ltd | | | 6,597 | | | | 167 | |
Fletcher Building Ltd * | | | 7,487 | | | | 30 | |
NZX Ltd | | | 11,151 | | | | 14 | |
Pushpay Holdings * | | | 70,244 | | | | 86 | |
Skellerup Holdings | | | 13,632 | | | | 30 | |
| | |
| | | | | | | 344 | |
| | |
Norway — 1.2% | | | | | | | | |
DNB ASA * | | | 71,364 | | | | 1,299 | |
SpareBank 1 BV | | | 2,882 | | | | 13 | |
Sparebanken Sor * | | | 1,278 | | | | 16 | |
Veidekke * | | | 2,072 | | | | 31 | |
| | |
| | | | | | | 1,359 | |
| | |
Peru — 0.0% | | | | | | | | |
Empresa Siderurgica del Peru SAA | | | 36,299 | | | | 9 | |
| | |
Philippines — 0.0% | | | | | | | | |
LT Group Inc | | | 88,800 | | | | 24 | |
| | |
Poland — 0.4% | | | | | | | | |
Amica SA | | | 2,913 | | | | 114 | |
Budimex SA | | | 494 | | | | 36 | |
ComArch SA | | | 299 | | | | 15 | |
Dino Polska SA * | | | 1,870 | | | | 126 | |
ING Bank Slaski * | | | 742 | | | | 30 | |
Lubelski Wegiel Bogdanka SA * | | | 11,696 | | | | 58 | |
Polimex-Mostostal * | | | 13,173 | | | | 8 | |
Zespol Elektrowni Patnow Adamow Konin SA * | | | 1,621 | | | | 4 | |
| | |
| | | | | | | 391 | |
| | |
Portugal — 0.0% | | | | | | | | |
CTT-Correios de Portugal * | | | 9,602 | | | | 28 | |
| | |
Qatar — 0.1% | | | | | | | | |
Ooredoo QPSC | | | 78,390 | | | | 146 | |
| | | | | | | | |
| | | |
| Description | | Shares | | Market Value ($ Thousands) |
| | |
COMMON STOCK (continued) | | | | | | | | |
| | |
Russia — 1.1% | | | | | | | | |
Magnit PJSC GDR | | | 4,360 | | | $ | 66 | |
MMC Norilsk Nickel PJSC ADR | | | 2,628 | | | | 73 | |
Mobile TeleSystems PJSC ADR | | | 97,849 | | | | 845 | |
Sberbank of Russia PJSC ADR | | | 22,376 | | | | 297 | |
| | |
| | | | | | | 1,281 | |
| | |
Singapore — 0.9% | | | | | | | | |
Boustead Singapore Ltd | | | 64,765 | | | | 38 | |
Delfi Ltd | | | 19,900 | | | | 10 | |
Dutech Holdings Ltd | | | 31,100 | | | | 6 | |
Great Eastern Holdings Ltd | | | 2,700 | | | | 40 | |
Jardine Cycle & Carriage Ltd | | | 16,200 | | | | 235 | |
Keppel Corp Ltd | | | 115,900 | | | | 438 | |
Penguin International Ltd | | | 12,199 | | | | 4 | |
Riverstone Holdings Ltd/Singapore | | | 29,408 | | | | 29 | |
Sing Investments & Finance Ltd | | | 21,700 | | | | 21 | |
Sunningdale Tech Ltd | | | 45,000 | | | | 51 | |
Tiong Seng Holdings Ltd | | | 7,037 | | | | 1 | |
United Overseas Bank Ltd | | | 4,774 | | | | 80 | |
| | |
| | | | | | | 953 | |
| | |
South Africa — 0.3% | | | | | | | | |
Blue Label Telecoms * | | | 289,784 | | | | 74 | |
Combined Motor Holdings Ltd | | | 9,481 | | | | 9 | |
Discovery Ltd | | | 12,993 | | | | 103 | |
Kumba Iron Ore Ltd | | | 2,690 | | | | 92 | |
Metair Investments Ltd * | | | 11,852 | | | | 13 | |
MiX Telematics Ltd ADR | | | 1,301 | | | | 13 | |
Ninety One | | | 17,004 | | | | 47 | |
| | |
| | | | | | | 351 | |
| | |
South Korea — 6.4% | | | | | | | | |
Aekyung Petrochemical Co Ltd | | | 12,329 | | | | 105 | |
Coway Co Ltd * | | | 14,795 | | | | 928 | |
DTR Automotive | | | 749 | | | | 16 | |
Fursys Inc | | | 377 | | | | 10 | |
Hana Financial Group Inc | | | 30,934 | | | | 946 | |
Kia Motors Corp | | | 5,960 | | | | 311 | |
KPX Chemical | | | 281 | | | | 13 | |
KT Skylife Co Ltd | | | 4,735 | | | | 38 | |
LG Electronics Inc | | | 6,623 | | | | 512 | |
LG Hausys Ltd | | | 2,513 | | | | 172 | |
LG International Corp | | | 11,692 | | | | 202 | |
Maeil Holdings Co Ltd | | | 6,313 | | | | 50 | |
NAVER Corp | | | 1,278 | | | | 321 | |
Samsung Electronics Co Ltd | | | 31,109 | | | | 1,875 | |
Samsung Electronics Co Ltd GDR | | | 885 | | | | 1,340 | |
Samsung SDI Co Ltd | | | 780 | | | | 376 | |
Tongyang Life Insurance Co Ltd | | | 2,795 | | | | 9 | |
| | |
| | | | | | | 7,224 | |
| | |
Spain — 0.9% | | | | | | | | |
Amadeus IT Group SA, Cl A | | | 5,863 | | | | 403 | |
| | |
| 4 | | SEI Institutional Investments Trust / Semi-Annual Report / November 30, 2020 |
SCHEDULE OF INVESTMENTS (Unaudited)
November 30, 2020
Screened World Equity Ex-US Fund (Continued)
| | | | | | | | |
| | | |
| Description | | Shares | | Market Value ($ Thousands) |
| | |
COMMON STOCK (continued) | | | | | | | | |
Bankinter SA | | | 4,644 | | | $ | 23 | |
Cellnex Telecom SA * | | | 3,415 | | | | 216 | |
Cia de Distribucion Integral Logista Holdings SA | | | 6,568 | | | | 121 | |
Elecnor | | | 1,054 | | | | 12 | |
Grifols SA | | | 2,173 | | | | 62 | |
Grifols SA ADR | | | 3,080 | | | | 57 | |
Industria de Diseno Textil SA | | | 3,711 | | | | 123 | |
| | |
| | | | | | | 1,017 | |
| | |
Sweden — 3.6% | | | | | | | | |
Atlas Copco AB, Cl A | | | 4,190 | | | | 212 | |
Atlas Copco AB, Cl B | | | 4,725 | | | | 209 | |
Corem Property Group AB, Cl B | | | 6,583 | | | | 15 | |
Doro AB * | | | 2,733 | | | | 14 | |
Embracer Group AB, Cl B * | | | 8,450 | | | | 172 | |
Epiroc AB, Cl A | | | 18,610 | | | | 310 | |
Epiroc AB, Cl B | | | 9,592 | | | | 153 | |
Essity AB, Cl B | | | 11,954 | | | | 380 | |
Evolution Gaming Group AB | | | 1,900 | | | | 163 | |
Ferronordic | | | 1,510 | | | | 27 | |
Getinge AB, Cl B | | | 6,507 | | | | 139 | |
Kambi Group PLC * | | | 2,077 | | | | 80 | |
Kinnevik AB * | | | 7,386 | | | | 369 | |
Sandvik AB * | | | 376 | | | | 9 | |
SKF AB, Cl B | | | 7,529 | | | | 186 | |
Swedish Match AB | | | 8,970 | | | | 725 | |
Telefonaktiebolaget LM Ericsson, Cl B | | | 1,281 | | | | 16 | |
Telia Co AB | | | 44,555 | | | | 190 | |
Volati * | | | 3,076 | | | | 32 | |
Volvo AB, Cl B * | | | 29,287 | | | | 667 | |
| | |
| | | | | | | 4,068 | |
| | |
Switzerland — 5.9% | | | | | | | | |
Cie Financiere Richemont SA, Cl A | | | 1,437 | | | | 120 | |
Credit Suisse Group AG | | | 32,304 | | | | 409 | |
Geberit AG | | | 390 | | | | 236 | |
Julius Baer Group | | | 875 | | | | 51 | |
Kuehne + Nagel International AG | | | 624 | | | | 142 | |
LafargeHolcim Ltd | | | 22,022 | | | | 1,159 | |
Logitech International SA | | | 3,607 | | | | 320 | |
Lonza Group AG | | | 330 | | | | 208 | |
Nestle SA | | | 4,858 | | | | 543 | |
Novartis AG | | | 19,873 | | | | 1,806 | |
Roche Holding AG | | | 3,245 | | | | 1,072 | |
Temenos AG | | | 883 | | | | 112 | |
UBS Group AG | | | 32,183 | | | | 458 | |
Zehnder Group | | | 889 | | | | 49 | |
| | |
| | | | | | | 6,685 | |
| | |
Taiwan — 2.3% | | | | | | | | |
Acer Inc | | | 83,000 | | | | 67 | |
Coretronic Corp | | | 68,000 | | | | 84 | |
Hon Hai Precision Industry Co Ltd | | | 242,000 | | | | 699 | |
| | | | | | | | |
| | | |
| Description | | Shares | | Market Value ($ Thousands) |
| | |
COMMON STOCK (continued) | | | | | | | | |
Hsing TA Cement Co | | | 14,600 | | | $ | 10 | |
IEI Integration Corp | | | 48,000 | | | | 81 | |
Silicon Motion Technology Corp ADR | | | 3,256 | | | | 129 | |
Taiwan Semiconductor Manufacturing Co Ltd | | | 66,000 | | | | 1,112 | |
Wistron Corp | | | 118,000 | | | | 124 | |
X-Legend Entertainment Co Ltd * | | | 22,000 | | | | 58 | |
Yuanta Financial Holding Co Ltd | | | 368,160 | | | | 247 | |
| | |
| | | | | | | 2,611 | |
| | |
Thailand — 0.6% | | | | | | | | |
Siam Commercial Bank PCL/The | | | 246,500 | | | | 697 | |
| | |
| | | | | | | 697 | |
| | |
Turkey — 1.0% | | | | | | | | |
Akbank T.A.S. * | | | 22,859 | | | | 18 | |
AvivaSA Emeklilik ve Hayat AS * | | | 25,715 | | | | 46 | |
Coca-Cola Icecek AS * | | | 36,173 | | | | 259 | |
Haci Omer Sabanci Holding AS | | | 200,106 | | | | 247 | |
KOC Holding AS | | | 50,741 | | | | 114 | |
Tofas Turk Otomobil Fabrikasi AS | | | 5,325 | | | | 19 | |
Turk Traktor ve Ziraat Makineleri AS | | | 10,087 | | | | 177 | |
Turk Tuborg Bira ve Malt Sanayii * | | | 9,106 | | | | 20 | |
Turkcell Iletisim Hizmetleri AS | | | 28,347 | | | | 54 | |
Turkiye Garanti Bankasi AS * | | | 189,897 | | | | 212 | |
| | |
| | | | | | | 1,166 | |
| | |
United Kingdom — 7.7% | | | | | | | | |
AstraZeneca PLC | | | 1,450 | | | | 151 | |
Atlassian Corp PLC, Cl A * | | | 2,146 | | | | 483 | |
BHP Group PLC | | | 8,900 | | | | 202 | |
Burberry Group PLC * | | | 4,160 | | | | 96 | |
Computacenter PLC | | | 1,190 | | | | 35 | |
ConvaTec Group PLC | | | 224,770 | | | | 621 | |
Evraz PLC | | | 34,681 | | | | 179 | |
Exillon Energy PLC * | | | 4,819 | | | | 3 | |
Experian PLC | | | 13,210 | | | | 467 | |
Ferrexpo PLC | | | 16,544 | | | | 47 | |
Fiat Chrysler Automobiles NV * | | | 4,000 | | | | 63 | |
Finsbury Food Group * | | | 17,831 | | | | 18 | |
Flutter Entertainment PLC * | | | 1,090 | | | | 199 | |
Fresnillo PLC | | | 11,758 | | | | 165 | |
Frontier Developments PLC * | | | 1,313 | | | | 43 | |
Greencore Group PLC * | | | 194,796 | | | | 305 | |
H&T Group PLC | | | 4,868 | | | | 17 | |
Hargreaves Lansdown PLC | | | 6,503 | | | | 124 | |
Impellam Group PLC * | | | 3,091 | | | | 10 | |
Indivior PLC * | | | 17,994 | | | | 24 | |
John Wood Group PLC * | | | 119,744 | | | | 476 | |
Judges Scientific PLC | | | 1,706 | | | | 134 | |
Just Eat Takeaway.com NV * | | | 1,206 | | | | 128 | |
Just Group PLC * | | | 154,296 | | | | 115 | |
Keystone Law Group | | | 2,516 | | | | 16 | |
Kingfisher PLC * | | | 181,771 | | | | 664 | |
Kingspan Group PLC * | | | 2,368 | | | | 207 | |
| | |
| SEI Institutional Investments Trust / Semi-Annual Report / November 30, 2020 | | 5 |
SCHEDULE OF INVESTMENTS (Unaudited)
November 30, 2020
Screened World Equity Ex-US Fund (Continued)
| | | | | | | | |
| | | |
| Description | | Shares | | Market Value ($ Thousands) |
| | |
COMMON STOCK (continued) | | | | | | | | |
Legal & General Group PLC | | | 82,614 | | | $ | 279 | |
London Stock Exchange Group PLC | | | 1,310 | | | | 142 | |
Man Group PLC/Jersey | | | 333,530 | | | | 524 | |
NWF Group PLC | | | 12,655 | | | | 34 | |
OTP Bank Nyrt * | | | 5,290 | | | | 210 | |
Pagegroup PLC * | | | 2,389 | | | | 13 | |
Plus500 Ltd | | | 3,536 | | | | 73 | |
Prudential PLC | | | 10,703 | | | | 167 | |
Rio Tinto PLC | | | 2,953 | | | | 191 | |
Rio Tinto PLC ADR | | | 5,359 | | | | 348 | |
Sensata Technologies Holding PLC * | | | 6,733 | | | | 329 | |
Smiths Group PLC | | | 51,883 | | | | 1,011 | |
St James’s Place PLC | | | 1,304 | | | | 18 | |
Team17 Group PLC * | | | 11,281 | | | | 122 | |
Vertu Motors PLC * | | | 30,896 | | | | 13 | |
Whitbread PLC * | | | 4,950 | | | | 200 | |
| | |
| | | | | | | 8,666 | |
| | |
United States — 4.6% | | | | | | | | |
Berry Global Group Inc * | | | 8,479 | | | | 449 | |
Check Point Software Technologies Ltd * | | | 11,984 | | | | 1,410 | |
Copa Holdings SA, Cl A * | | | 1,109 | | | | 88 | |
Credicorp Ltd | | | 464 | | | | 71 | |
Fiverr International Ltd * | | | 339 | | | | 68 | |
Gentex Corp | | | 11,107 | | | | 362 | |
Hollysys Automation Technologies Ltd | | | 20,967 | | | | 265 | |
MercadoLibre Inc * | | | 601 | | | | 933 | |
Nomad Foods Ltd * | | | 45,991 | | | | 1,111 | |
Resolute Forest Products Inc * | | | 29,125 | | | | 160 | |
Ritchie Bros Auctioneers Inc | | | 1,651 | | | | 119 | |
Spotify Technology SA * | | | 624 | | | | 182 | |
| | |
| | | | | | | 5,218 | |
| | |
Total Common Stock
(Cost $82,701) ($ Thousands) | | | | | | | 106,281 | |
| | |
PREFERRED STOCK — 0.3% | | | | | | | | |
| | |
Brazil — 0.1% | | | | | | | | |
Itau Unibanco Holding SA ADR (A) | | | 9,158 | | | | 49 | |
| | |
Germany — 0.2% | | | | | | | | |
Draegerwerk AG & Co KGaA (A) | | | 254 | | | | 20 | |
Einhell Germany AG (A) | | | 125 | | | | 12 | |
KSB SE & Co KGaA (A) | | | 237 | | | | 62 | |
Schaeffler (A) | | | 19,779 | | | | 148 | |
| | |
| | | | | | | 242 | |
| | |
Total Preferred Stock
(Cost $346) ($ Thousands) | | | | | | | 291 | |
| | | | | | | | |
| | | |
| Description | | Number of Warrants | | Market Value ($ Thousands) |
| | |
WARRANTS — 0.0% | | | | | | | | |
| | |
Switzerland — 0.0% | | | | | | | | |
Cie Financiere Richemont, Expires 11/27/2023 * | | | 702 | | | $ | – | |
| |
Total Warrants
(Cost $—) ($ Thousands) | | | | – | |
| | |
| | | Shares | | | | | |
| | |
CASH EQUIVALENT — 2.2% | | | | | | | | |
SEI Daily Income Trust, Government Fund, CI F | | | | | | | | |
0.010%**† | | | 2,521,893 | | | | 2,522 | |
| | |
Total Cash Equivalent
(Cost $2,522) ($ Thousands) | | | | | | | 2,522 | |
| |
Total Investments in Securities — 97.0%
(Cost $85,569) ($ Thousands) | | | $ | 109,094 | |
| | | | | | | | |
| | |
| 6 | | SEI Institutional Investments Trust / Semi-Annual Report / November 30, 2020 |
SCHEDULE OF INVESTMENTS (Unaudited)
November 30, 2020
Screened World Equity Ex-US Fund (Continued)
A list of the open futures contracts held by the Fund at November 30, 2020, is as follows:
| | | | | | | | | | | | | | | | | | | | |
Type of Contract | | Number of
Contracts
Long | | | Expiration
Date | | | Notional Amount
(Thousands) | | | Value
(Thousands) | | | Unrealized
Appreciation
(Depreciation)
(Thousands) | |
Euro STOXX 50 | | | 22 | | | | Dec-2020 | | | $ | 889 | | | $ | 922 | | | $ | 23 | |
FTSE 100 Index | | | 4 | | | | Dec-2020 | | | | 339 | | | | 336 | | | | (4) | |
Hang Seng Index | | | 1 | | | | Jan-2021 | | | | 173 | | | | 170 | | | | (2) | |
S&P TSX 60 Index | | | 2 | | | | Dec-2020 | | | | 316 | | | | 316 | | | | (1) | |
SPI 200 Index | | | 2 | | | | Dec-2020 | | | | 238 | | | | 241 | | | | – | |
TOPIX Index | | | 5 | | | | Dec-2020 | | | | 841 | | | | 842 | | | | (3) | |
| | | | | | | | | | | | | | | | | | | | |
| | | | | | | | | | $ | 2,796 | | | $ | 2,827 | | | $ | 13 | |
| | | | | | | | | | | | | | | | | | | | |
A list of the open forward foreign currency contracts held by the Fund at November 30, 2020, is as follows:
| | | | | | | | | | | | | | | | | | | | | | | | |
| Counterparty | | Settlement
Date | | | | | | Currency to
Deliver (Thousands) | | | | | | Currency to
Receive
(Thousands) | | | Unrealized Appreciation (Depreciation) (Thousands) |
Brown Brothers Harriman | | | 02/18/21 | | | | GBP | | | | 530 | | | | USD | | | | 699 | | | $ | (9 | ) |
Brown Brothers Harriman | | | 02/18/21 | | | | USD | | | | 704 | | | | GBP | | | | 530 | | | | 4 | |
| | | | | |
| | | | | | | | | | | | | | | | | | | | | | $ | (5 | ) |
| | | | | |
Percentages are based on Net Assets of $112,427 ($ Thousands).
| * | Non-income producing security. |
| ** | The rate reported is the 7-day effective yield as of November 30, 2020. |
| † | Investment in Affiliated Security (see Note 6). |
| (A) | There is currently no rate available. |
ADR — American Depositary Receipt
Cl — Class
FTSE— Financial Times Stock Exchange
GBP — British Pound Sterling
GDR — Global Depositary Receipt
Ltd. — Limited
PJSC — Public Joint-Stock Company
PLC — Public Limited Company
S&P— Standard & Poor’s
SPI — Share Price Index
TOPIX - Tokyo Price Index
TSX — Toronto Stock Exchange
USD — United States Dollar
The following is a list of the level of inputs used as of November 30, 2020, in valuing the Fund’s investments and other financial instruments carried at value ($ Thousands):
| | | | | | | | | | | | | | | | |
| Investments in Securities | | Level 1 ($) | | | Level 2 ($) | | | Level 3 ($) | | | Total ($) | |
Common Stock | | | 103,834 | | | | 2,447 | | | | – | | | | 106,281 | |
Preferred Stock | | | 291 | | | | – | | | | – | | | | 291 | |
Warrants | | | – | | | | – | | | | – | | | | – | |
Cash Equivalent | | | 2,522 | | | | – | | | | – | | | | 2,522 | |
| | | | | | | | | | | | | | | | |
Total Investments in Securities | | | 106,647 | | | | 2,447 | | | | – | | | | 109,094 | |
| | | | | | | | | | | | | | | | |
| | | | | | | | | | | | | | | | | |
| Other Financial Instruments | | Level 1 ($) | | | Level 2 ($) | | | Level 3 ($) | | | Total ($) | |
Futures Contracts* | | | | | | | | | | | | | | | | |
Unrealized Appreciation | | | 23 | | | | – | | | | – | | | | 23 | |
Unrealized Depreciation | | | (10) | | | | – | | | | – | | | | (10) | |
Forwards Contracts* | | | | | | | | | | | | | | | | |
Unrealized Appreciation | | | – | | | | 4 | | | | – | | | | 4 | |
Unrealized Depreciation | | | – | | | | (9) | | | | – | | | | (9) | |
| | | | | | | | | | | | | | | | |
Total Other Financial Instruments | | | 13 | | | | (5) | | | | – | | | | 8 | |
| | | | | | | | | | | | | | | | |
For the period ended November 30, 2020, there were no transfers in or out of Level 3.
For more information on valuation inputs, see Note 2 – Significant Accounting Policies in Notes to Financial Statements.
The following is a summary of the Fund’s transactions with affiliates for the period ended November 30, 2020 ($ Thousands):
| | | | | | | | | | | | | | | | | | |
| | | | | | | | | | |
| Security Description | | Value 5/31/2020 | | Purchases
at Cost | | Proceeds
from Sales | | Realized
Gain/ (Loss) | | Change in Unrealized Appreciation/ (Depreciation) | | Value 11/30/2020 | | Shares | | Income | | Capital
Gains |
SEI Daily Income Trust, Government Fund, Cl F | | $ 1,456 | | $ 5,501, | | $ (4,435) | | $ — | | $ — | | $ 2,522 | | 2,521,893 | | $ — | | $ — |
| | | | | | | | | | | | | | | | | | |
Amounts designated as “—” are $0 or have been rounded to $0. The accompanying notes are an integral part of the financial statements.
| | |
| SEI Institutional Investments Trust / Semi-Annual Report / November 30, 2020 | | 7 |
SCHEDULE OF INVESTMENTS (Unaudited)
November 30, 2020
World Select Equity Fund (Continued)
| | | | | | | | |
| | | |
| Description | | Shares | | Market Value
($ Thousands) |
COMMON STOCK — 92.1% | | | | | | | | |
| | |
Argentina — 0.0% | | | | | | | | |
Banco Macro SA ADR * | | | 7,336 | | | $ | 117 | |
| | |
Australia — 0.4% | | | | | | | | |
AGL Energy Ltd | | | 32,700 | | | | 325 | |
Ampol Ltd | | | 805 | | | | 18 | |
Brambles Ltd | | | 22,719 | | | | 184 | |
Fortescue Metals Group Ltd | | | 58,371 | | | | 784 | |
JB Hi-Fi Ltd | | | 2,527 | | | | 85 | |
Sonic Healthcare Ltd | | | 761 | | | | 19 | |
Telstra Corp Ltd | | | 57,574 | | | | 130 | |
TPG Telecom Ltd * | | | 4,148 | | | | 23 | |
Treasury Wine Estates Ltd | | | 9,568 | | | | 61 | |
Wesfarmers Ltd | | | 1,103 | | | | 40 | |
WiseTech Global Ltd | | | 1,700 | | | | 39 | |
Woolworths Group Ltd | | | 2,091 | | | | 57 | |
| | |
| | | | | | | 1,765 | |
| | |
Austria — 0.2% | | | | | | | | |
IMMOFINANZ AG | | | 32,679 | | | | 611 | |
Mayr Melnhof Karton AG | | | 1,400 | | | | 247 | |
Raiffeisen Bank International AG | | | 11,926 | | | | 229 | |
Vienna Insurance Group AG Wiener Versicherung Gruppe | | | 6,500 | | | | 155 | |
| | |
| | | | | | | 1,242 | |
| | |
Belgium — 0.1% | | | | | | | | |
Ageas SA/NV | | | 6,100 | | | | 301 | |
Anheuser-Busch InBev SA/NV | | | 150 | | | | 10 | |
D’ieteren SA/NV | | | 513 | | | | 36 | |
Etablissements Franz Colruyt NV | | | 3,300 | | | | 197 | |
| | |
| | | | | | | 544 | |
| | |
Brazil — 0.3% | | | | | | | | |
B3 SA - Brasil Bolsa Balcao | | | 6,400 | | | | 67 | |
Banco do Brasil SA | | | 38,300 | | | | 242 | |
Klabin SA | | | 6,800 | | | | 31 | |
Marfrig Global Foods SA * | | | 13,471 | | | | 37 | |
Petrobras Distribuidora SA | | | 9,700 | | | | 37 | |
Vale SA ADR, Cl B | | | 68,800 | | | | 1,002 | |
Valid Solucoes e Servicos de Seguranca em Meios de Pagamento e Identificacao SA * | | | 91,421 | | | | 164 | |
WEG SA | | | 8,110 | | | | 112 | |
| | |
| | | | | | | 1,692 | |
| | |
Canada — 1.5% | | | | | | | | |
Alimentation Couche-Tard Inc, Cl B | | | 68,244 | | | | 2,271 | |
AltaGas Ltd | | | 3,852 | | | | 55 | |
CAE Inc | | | 2,482 | | | | 60 | |
Canaccord Genuity Group Inc | | | 1,828 | | | | 13 | |
Canadian Imperial Bank of Commerce | | | 3,100 | | | | 262 | |
Canadian National Railway Co | | | 14,980 | | | | 1,572 | |
Canadian Natural Resources Ltd | | | 5,831 | | | | 133 | |
Canadian Pacific Railway Ltd | | | 614 | | | | 199 | |
Canadian Tire Corp Ltd, Cl A | | | 5,400 | | | | 692 | |
| | | | | | | | |
| | | |
| Description | | Shares | | Market Value
($ Thousands) |
COMMON STOCK (continued) | | | | | | | | |
CI Financial Corp | | | 1,571 | | | $ | 20 | |
Cogeco Communications Inc | | | 326 | | | | 24 | |
Crescent Point Energy Corp | | | 10,054 | | | | 18 | |
DREAM Unlimited Corp, Cl A | | | 672 | | | | 10 | |
Enbridge Inc | | | 9,479 | | | | 297 | |
Intact Financial Corp | | | 838 | | | | 94 | |
Loblaw Cos Ltd | | | 5,400 | | | | 268 | |
Manulife Financial Corp | | | 21,910 | | | | 374 | |
National Bank of Canada | | | 888 | | | | 49 | |
North West Co Inc/The | | | 838 | | | | 22 | |
Parkland Corp/Canada | | | 2,007 | | | | 62 | |
Quebecor Inc, Cl B | | | 813 | | | | 20 | |
Richelieu Hardware Ltd | | | 1,062 | | | | 31 | |
Rogers Communications Inc, Cl B | | | 7,731 | | | | 365 | |
Shaw Communications Inc, Cl B | | | 7,303 | | | | 127 | |
Sleep Country Canada Holdings Inc | | | 845 | | | | 16 | |
Stantec Inc | | | 2,489 | | | | 75 | |
Sun Life Financial Inc | | | 1,381 | | | | 61 | |
TELUS Corp | | | 14,100 | | | | 273 | |
Toronto-Dominion Bank/The | | | 3,200 | | | | 171 | |
| | |
| | | | | | | 7,634 | |
| | |
China — 2.3% | | | | | | | | |
Alibaba Group Holding Ltd ADR * | | | 14,573 | | | | 3,838 | |
Anhui Conch Cement Co Ltd, Cl A | | | 1,135 | | | | 10 | |
Bank of Communications Co Ltd, Cl H | | | 296,000 | | | | 164 | |
Bank of Jiangsu Co Ltd, Cl A | | | 774,500 | | | | 733 | |
Bilibili Inc ADR * | | | 452 | | | | 28 | |
BOE Technology Group Co Ltd, Cl A | | | 44,800 | | | | 18 | |
China Construction Bank Corp, Cl H | | | 1,245,000 | | | | 976 | |
China Medical System Holdings Ltd | | | 12,000 | | | | 12 | |
China Mobile Ltd | | | 184,500 | | | | 1,104 | |
China National Building Material Co Ltd, Cl H | | | 242,000 | | | | 318 | |
China Petroleum & Chemical Corp, Cl H | | | 24,471 | | | | 11 | |
China Telecom Corp Ltd, Cl H | | | 1,224,000 | | | | 369 | |
COSCO SHIPPING Holdings Co Ltd, Cl A * | | | 9,000 | | | | 14 | |
Dongfeng Motor Group Co Ltd, Cl H | | | 24,000 | | | | 25 | |
Focus Media Information Technology Co Ltd, Cl A | | | 63,300 | | | | 93 | |
Great Wall Motor Co Ltd, Cl H | | | 392,500 | | | | 795 | |
HUYA Inc ADR * | | | 655 | | | | 13 | |
JD.com Inc ADR * | | | 11,344 | | | | 968 | |
Jiangsu Hengli Hydraulic Co Ltd, Cl A | | | 1,480 | | | | 21 | |
Li Ning Co Ltd | | | 27,443 | | | | 149 | |
Momo Inc ADR | | | 1,702 | | | | 25 | |
NetEase Inc ADR | | | 1,029 | | | | 93 | |
NIO Inc ADR * | | | 1,477 | | | | 75 | |
PICC Property & Casualty Co Ltd | | | 258,000 | | | | 213 | |
Pinduoduo Inc ADR * | | | 496 | | | | 69 | |
RiseSun Real Estate Development Co Ltd, Cl A | | | 46,100 | | | | 51 | |
Shaanxi Coal Industry Co Ltd, Cl A | | | 258,300 | | | | 410 | |
| | |
| SEI Institutional Investments Trust / Semi-Annual Report / November 30, 2020 | | 1 |
SCHEDULE OF INVESTMENTS (Unaudited)
November 30, 2020
World Select Equity Fund (Continued)
| | | | | | | | |
| | | |
| Description | | Shares | | Market Value
($ Thousands) |
| | |
COMMON STOCK (continued) | | | | | | | | |
Shanghai Bairun Investment Holding Group Co Ltd, Cl A | | | 20,698 | | | $ | 241 | |
Shanghai Liangxin Electrical Co Ltd, Cl A | | | 9,700 | | | | 35 | |
Shanxi Xinghuacun Fen Wine Factory Co Ltd, Cl A | | | 500 | | | | 18 | |
TAL Education Group ADR * | | | 612 | | | | 43 | |
Vipshop Holdings Ltd ADR * | | | 578 | | | | 15 | |
Weichai Power Co Ltd, Cl H | | | 38,846 | | | | 79 | |
Weifu High-Technology Group Co Ltd, Cl B | | | 60,900 | | | | 119 | |
Xiamen Xiangyu Co Ltd, Cl A | | | 272,686 | | | | 264 | |
Xinyuan Real Estate Co Ltd ADR | | | 15,400 | | | | 39 | |
Yealink Network Technology Corp Ltd, Cl A | | | 900 | | | | 9 | |
Zai Lab Ltd ADR * | | | 1,104 | | | | 122 | |
ZTO Express Cayman Inc ADR | | | 806 | | | | 23 | |
| | | | | | | 11,602 | |
| | |
Croatia — 0.1% | | | | | | | | |
Atlantic Grupa dd | | | 1,250 | | | | 269 | |
Hrvatski Telekom dd | | | 8,914 | | | | 255 | |
| | | | | | | 524 | |
| | |
Czech Republic — 0.2% | | | | | | | | |
CEZ AS | | | 16,250 | | | | 345 | |
Komercni banka as | | | 14,520 | | | | 389 | |
| | | | | | | 734 | |
| | |
Denmark — 0.2% | | | | | | | | |
Novo Nordisk A/S, Cl B | | | 9,910 | | | | 669 | |
Pandora A/S | | | 910 | | | | 91 | |
Scandinavian Tobacco Group A/S | | | 26,000 | | | | 401 | |
| | | | | | | 1,161 | |
| | |
Egypt — 0.0% | | | | | | | | |
Eastern Co SAE | | | 20,567 | | | | 14 | |
Oriental Weavers | | | 118,598 | | | | 55 | |
Palm Hills Developments SAE * | | | 1,500,261 | | | | 134 | |
| | | | | | | 203 | |
| | |
Estonia — 0.1% | | | | | | | | |
Tallinna Kaubamaja Grupp AS | | | 21,000 | | | | 222 | |
| | |
Finland — 0.7% | | | | | | | | |
Elisa Oyj, Cl A | | | 2,171 | | | | 117 | |
Kone Oyj, Cl B | | | 1,205 | | | | 102 | |
Metsa Board Oyj | | | 4,309 | | | | 39 | |
Neste Oyj | | | 623 | | | | 42 | |
Nokia Oyj | | | 348,973 | | | | 1,397 | |
Orion Oyj, Cl B | | | 1,469 | | | | 69 | |
Stora Enso Oyj, Cl R | | | 92,630 | | | | 1,570 | |
Tokmanni Group Corp | | | 722 | | | | 13 | |
UPM-Kymmene Oyj | | | 2,293 | | | | 76 | |
Uponor Oyj | | | 1,074 | | | | 22 | |
| | | | | | | 3,447 | |
| | |
France — 3.8% | | | | | | | | |
Alstom SA | | | 15,483 | | | | 828 | |
| | | | | | | | |
| | | |
| Description | | Shares | | Market Value
($ Thousands) |
| | |
COMMON STOCK (continued) | | | | | | | | |
Atos SE | | | 11,980 | | | $ | 1,102 | |
AXA SA | | | 74,850 | | | | 1,765 | |
BNP Paribas SA | | | 56,694 | | | | 2,914 | |
Bureau Veritas SA | | | 30,609 | | | | 792 | |
Carrefour SA | | | 87,089 | | | | 1,430 | |
Cie de Saint-Gobain | | | 39,084 | | | | 1,862 | |
Danone SA | | | 138 | | | | 9 | |
Gaztransport Et Technigaz SA | | | 456 | | | | 45 | |
Publicis Groupe SA | | | 36,328 | | | | 1,655 | |
Safran SA | | | 9,900 | | | | 1,448 | |
Sanofi | | | 4,100 | | | | 415 | |
Schneider Electric SE | | | 330 | | | | 46 | |
SES SA, Cl A | | | 3,880 | | | | 36 | |
Societe BIC SA | | | 3,400 | | | | 202 | |
Societe Generale SA | | | 61,727 | | | | 1,232 | |
Suez SA | | | 5,007 | | | | 97 | |
Television Francaise 1 | | | 801 | | | | 6 | |
TOTAL SE | | | 41,490 | | | | 1,778 | |
Valeo SA | | | 46,900 | | | | 1,825 | |
Veolia Environnement SA | | | 2,054 | | | | 47 | |
Vivendi SA | | | 1,320 | | | | 40 | |
| | | | | | | 19,574 | |
| | |
Germany — 3.3% | | | | | | | | |
Allianz SE | | | 16,438 | | | | 3,887 | |
Aurubis AG | | | 733 | | | | 56 | |
BASF SE | | | 28,870 | | | | 2,118 | |
Bayerische Motoren Werke AG | | | 19,643 | | | | 1,716 | |
Brenntag AG | | | 2,173 | | | | 166 | |
Continental AG | | | 10,778 | | | | 1,472 | |
Covestro AG | | | 24,940 | | | | 1,395 | |
Deutsche Post AG | | | 4,000 | | | | 194 | |
Deutsche Telekom AG | | | 29,911 | | | | 541 | |
Draegerwerk AG & Co KGaA | | | 110 | | | | 8 | |
E.ON SE | | | 30,173 | | | | 328 | |
Hannover Rueck SE | | | 884 | | | | 148 | |
HeidelbergCement AG | | | 30,845 | | | | 2,197 | |
HOCHTIEF AG | | | 2,500 | | | | 242 | |
Hornbach Holding AG & Co KGaA | | | 207 | | | | 22 | |
MTU Aero Engines AG | | | 8,915 | | | | 2,111 | |
RWE AG | | | 8,099 | | | | 337 | |
Scout24 AG | | | 275 | | | | 21 | |
Siemens Energy AG * | | | 1,019 | | | | 30 | |
Telefonica Deutschland Holding AG | | | 24,932 | | | | 69 | |
| | | | | | | 17,058 | |
| | |
Greece — 0.1% | | | | | | | | |
Aegean Airlines SA * | | | 25,000 | | | | 135 | |
Fourlis Holdings SA * | | | 22,206 | | | | 107 | |
JUMBO SA | | | 12,000 | | | | 215 | |
National Bank of Greece SA * | | | 62,000 | | | | 113 | |
| | | | | | | 570 | |
| | |
| 2 | | SEI Institutional Investments Trust / Semi-Annual Report / November 30, 2020 |
SCHEDULE OF INVESTMENTS (Unaudited)
November 30, 2020
World Select Equity Fund (Continued)
| | | | | | | | |
| | | |
| Description | | Shares | | Market Value
($ Thousands) |
| | |
COMMON STOCK (continued) | | | | | | | | |
| | |
Hong Kong — 2.1% | | | | | | | | |
Agile Group Holdings Ltd | | | 326,000 | | | $ | 471 | |
Alibaba Health Information Technology Ltd * | | | 18,000 | | | | 53 | |
A-Living Smart City Services Co Ltd, Cl H | | | 13,080 | | | | 55 | |
Anhui Conch Cement Co Ltd, Cl H | | | 27,930 | | | | 179 | |
ANTA Sports Products Ltd | | | 1,000 | | | | 14 | |
BAIC Motor Corp Ltd, Cl H | | | 197,000 | | | | 74 | |
BOC Aviation Ltd | | | 3,400 | | | | 30 | |
Bosideng International Holdings Ltd | | | 54,000 | | | | 24 | |
China Everbright Environment Group Ltd | | | 67,000 | | | | 37 | |
China Hongqiao Group Ltd | | | 33,500 | | | | 29 | |
China Jinmao Holdings Group Ltd | | | 26,000 | | | | 13 | |
China Lesso Group Holdings Ltd | | | 13,000 | | | | 23 | |
China Merchants Land Ltd | | | 826,000 | | | | 125 | |
China Overseas Grand Oceans Group Ltd | | | 73,056 | | | | 44 | |
China Reinsurance Group Corp, Cl H | | | 560,000 | | | | 59 | |
China Resources Cement Holdings Ltd | | | 56,330 | | | | 70 | |
China Resources Gas Group Ltd | | | 2,000 | | | | 10 | |
China Resources Power Holdings Co Ltd | | | 596,446 | | | | 634 | |
China State Construction International Holdings Ltd | | | 28,000 | | | | 18 | |
China Unicom Hong Kong Ltd | | | 32,000 | | | | 19 | |
CK Infrastructure Holdings Ltd | | | 9,000 | | | | 46 | |
CNOOC Ltd | | | 65,000 | | | | 68 | |
Country Garden Services Holdings Co Ltd | | | 188,627 | | | | 1,056 | |
Dali Foods Group Co Ltd | | | 30,500 | | | | 19 | |
Far East Horizon Ltd | | | 29,000 | | | | 31 | |
Fuyao Glass Industry Group Co Ltd, Cl H | | | 117,600 | | | | 563 | |
GF Securities Co Ltd, Cl H | | | 53,000 | | | | 74 | |
Haitian International Holdings Ltd | | | 9,000 | | | | 24 | |
Hengan International Group Co Ltd | | | 5,500 | | | | 38 | |
HK Electric Investments & HK Electric Investments Ltd | | | 36,000 | | | | 36 | |
Industrial & Commercial Bank of China Ltd, Cl H | | | 857,002 | | | | 544 | |
Kaisa Group Holdings Ltd | | | 40,000 | | | | 21 | |
Kingboard Holdings Ltd | | | 7,000 | | | | 27 | |
Kingboard Laminates Holdings Ltd | | | 100,500 | | | | 163 | |
KWG Group Holdings Ltd | | | 506,500 | | | | 693 | |
Lenovo Group Ltd | | | 62,000 | | | | 44 | |
Longfor Group Holdings Ltd | | | 4,000 | | | | 26 | |
Man Wah Holdings Ltd | | | 15,300 | | | | 28 | |
Meituan, Cl B * | | | 15,300 | | | | 572 | |
Nine Dragons Paper Holdings Ltd | | | 19,000 | | | | 25 | |
PCCW Ltd | | | 36,000 | | | | 22 | |
PetroChina Co Ltd, Cl H | | | 858,000 | | | | 273 | |
Postal Savings Bank of China Co Ltd, Cl H | | | 63,000 | | | | 36 | |
Power Assets Holdings Ltd | | | 14,000 | | | | 74 | |
Shenzhen Expressway Co Ltd, Cl H | | | 138,000 | | | | 138 | |
Shenzhen International Holdings Ltd | | | 10,000 | | | | 16 | |
Shimao Group Holdings Ltd | | | 16,000 | | | | 60 | |
Sinotruk Hong Kong Ltd | | | 184,000 | | | | 457 | |
| | | | | | | | |
| | | |
| Description | | Shares | | Market Value
($ Thousands) |
| | |
COMMON STOCK (continued) | | | | | | | | |
Sun Hung Kai Properties Ltd | | | 5,000 | | | $ | 67 | |
Sunny Optical Technology Group Co Ltd | | | 2,000 | | | | 39 | |
Tencent Holdings Ltd | | | 33,990 | | | | 2,468 | |
Tingyi Cayman Islands Holding Corp | | | 350,000 | | | | 590 | |
Uni-President China Holdings Ltd | | | 18,000 | | | | 16 | |
Xinyi Solar Holdings Ltd | | | 38,000 | | | | 69 | |
Yuexiu Property Co Ltd | | | 88,000 | | | | 18 | |
ZhongAn Online P&C Insurance Co Ltd, Cl H * | | | 6,100 | | | | 29 | |
Zhongsheng Group Holdings Ltd | | | 15,008 | | | | 113 | |
| | | | | | | 10,564 | |
| | |
Hungary — 0.3% | | | | | | | | |
Magyar Telekom Telecommunications PLC | | | 696,632 | | | | 901 | |
MOL Hungarian Oil & Gas PLC | | | 35,000 | | | | 235 | |
Richter Gedeon Nyrt | | | 17,664 | | | | 419 | |
| | | | | | | 1,555 | |
| | |
India — 1.0% | | | | | | | | |
Apollo Tyres Ltd | | | 5,170 | | | | 13 | |
Aurobindo Pharma Ltd | | | 31,911 | | | | 375 | |
Bajaj Auto Ltd | | | 412 | | | | 18 | |
Bharat Forge Ltd | | | 2,848 | | | | 19 | |
Coromandel International Ltd | | | 1,439 | | | | 16 | |
Dr Reddy’s Laboratories Ltd | | | 5,592 | | | | 365 | |
Granules India Ltd | | | 82,645 | | | | 463 | |
HCL Technologies Ltd | | | 15,747 | | | | 175 | |
Infosys Ltd ADR | | | 12,900 | | | | 196 | |
ITC Ltd | | | 18,565 | | | | 48 | |
Jubilant Foodworks Ltd | | | 784 | | | | 26 | |
Karur Vysya Bank Ltd/The * | | | 48,577 | | | | 25 | |
Mphasis Ltd | | | 22,400 | | | | 399 | |
Nestle India Ltd | | | 554 | | | | 133 | |
Oil & Natural Gas Corp Ltd | | | 538,564 | | | | 570 | |
Oil India Ltd | | | 123,468 | | | | 160 | |
Petronet LNG Ltd | | | 5,765 | | | | 20 | |
Power Finance Corp Ltd | | | 292,987 | | | | 427 | |
Power Grid Corp of India Ltd | | | 15,743 | | | | 41 | |
REC Ltd | | | 295,967 | | | | 486 | |
Redington India Ltd | | | 35,838 | | | | 63 | |
Tata Consultancy Services Ltd | | | 2,776 | | | | 100 | |
Tata Steel Ltd | | | 6,467 | | | | 50 | |
Tech Mahindra Ltd | | | 7,489 | | | | 89 | |
Titan Co Ltd | | | 2,960 | | | | 54 | |
Torrent Pharmaceuticals Ltd | | | 694 | | | | 25 | |
UltraTech Cement Ltd | | | 1,345 | | | | 87 | |
Vedanta Ltd | | | 515,090 | | | | 840 | |
| | | | | | | 5,283 | |
| | |
Indonesia — 0.1% | | | | | | | | |
Aneka Tambang Tbk | | | 177,598 | | | | 14 | |
Erajaya Swasembada Tbk PT * | | | 1,141,586 | | | | 139 | |
Indofood CBP Sukses Makmur Tbk PT | | | 26,400 | | | | 19 | |
Indofood Sukses Makmur Tbk PT | | | 126,800 | | | | 64 | |
| | |
| SEI Institutional Investments Trust / Semi-Annual Report / November 30, 2020 | | 3 |
SCHEDULE OF INVESTMENTS (Unaudited)
November 30, 2020
World Select Equity Fund (Continued)
| | | | | | | | |
| | | |
| Description | | Shares | | Market Value
($ Thousands) |
| | |
COMMON STOCK (continued) | | | | | | | | |
Indosat Tbk PT * | | | 635,200 | | | $ | 99 | |
| | | | | | | 335 | |
| | |
Ireland — 0.0% | | | | | | | | |
Flutter Entertainment PLC | | | 230 | | | | 43 | |
| | |
Italy — 1.2% | | | | | | | | |
Assicurazioni Generali SpA * | | | 13,725 | | | | 235 | |
Enel SpA | | | 233,177 | | | | 2,335 | |
Hera SpA | | | 41,200 | | | | 151 | |
Intesa Sanpaolo SpA | | | 976,543 | | | | 2,249 | |
Sesa SpA | | | 172 | | | | 17 | |
Telecom Italia SpA/Milano | | | 138,376 | | | | 68 | |
UniCredit SpA | | | 107,631 | | | | 1,113 | |
UnipolSai Assicurazioni SpA | | | 29,308 | | | | 78 | |
| | | | | | | 6,246 | |
| | |
Japan — 11.9% | | | | | | | | |
AEON REIT Investment Corp ‡ | | | 160 | | | | 187 | |
AGC Inc | | | 15,200 | | | | 507 | |
Aichi Steel Corp | | | 3,700 | | | | 90 | |
Aisin Seiki Co Ltd | | | 8,000 | | | | 237 | |
Aoyama Trading Co Ltd | | | 23,200 | | | | 99 | |
Aozora Bank Ltd | | | 12,100 | | | | 220 | |
Asahi Kasei Corp | | | 2,100 | | | | 19 | |
Canon Inc | | | 6,300 | | | | 112 | |
Central Japan Railway Co | | | 10,700 | | | | 1,365 | |
Chugai Pharmaceutical Co Ltd | | | 9,087 | | | | 440 | |
Citizen Watch Co Ltd | | | 148,500 | | | | 392 | |
Cosel Co Ltd | | | 10,600 | | | | 112 | |
Credit Saison Co Ltd | | | 80,200 | | | | 919 | |
Daibiru Corp | | | 23,600 | | | | 304 | |
Daicel Corp | | | 3,500 | | | | 25 | |
Daido Steel Co Ltd | | | 1,400 | | | | 58 | |
Dai-ichi Life Holdings Inc | | | 84,200 | | | | 1,328 | |
Daito Trust Construction Co Ltd | | | 17,001 | | | | 1,669 | |
Daiwa House Industry Co Ltd | | | 700 | | | | 21 | |
DCM Holdings Co Ltd | | | 18,900 | | | | 215 | |
East Japan Railway Co | | | 26,000 | | | | 1,618 | |
Eizo Corp | | | 7,600 | | | | 265 | |
Exedy Corp | | | 11,900 | | | | 141 | |
FANUC Corp | | | 5,000 | | | | 1,216 | |
Fuji Media Holdings Inc | | | 38,000 | | | | 396 | |
FUJIFILM Holdings Corp | | | 2,700 | | | | 146 | |
Fujitsu Ltd | | | 2,056 | | | | 286 | |
H.U. Group Holdings Inc | | | 15,200 | | | | 412 | |
Hachijuni Bank Ltd/The | | | 30,200 | | | | 107 | |
Hirogin Holdings Inc | | | 38,000 | | | | 212 | |
Hitachi Ltd | | | 11,300 | | | | 430 | |
Hokuetsu Corp | | | 60,900 | | | | 205 | |
Honda Motor Co Ltd | | | 77,565 | | | | 2,136 | |
ITOCHU Corp | | | 7,000 | | | | 185 | |
Itochu Enex Co Ltd | | | 27,200 | | | | 261 | |
J Front Retailing Co Ltd | | | 65,800 | | | | 528 | |
| | | | | | | | |
| | | |
| Description | | Shares | | Market Value
($ Thousands) |
| | |
COMMON STOCK (continued) | | | | | | | | |
Japan Lifeline Co Ltd | | | 46,400 | | | $ | 640 | |
Japan Tobacco Inc | | | 102,300 | | | | 2,080 | |
JFE Holdings Inc | | | 95,500 | | | | 876 | |
JGC Holdings Corp | | | 97,600 | | | | 875 | |
JSR Corp | | | 2,300 | | | | 64 | |
Kajima Corp | | | 76,600 | | | | 1,009 | |
Kandenko Co Ltd | | | 16,100 | | | | 123 | |
KDDI Corp | | | 69,300 | | | | 1,982 | |
Kirin Holdings Co Ltd | | | 49,600 | | | | 1,081 | |
Komatsu Ltd | | | 59,100 | | | | 1,440 | |
Komeri Co Ltd | | | 11,100 | | | | 302 | |
K’s Holdings Corp | | | 31,300 | | | | 381 | |
Kuraray Co Ltd | | | 19,000 | | | | 189 | |
KYORIN Holdings Inc | | | 22,900 | | | | 412 | |
Lasertec Corp | | | 1,454 | | | | 153 | |
Life Corp | | | 339 | | | | 12 | |
Lixil Corp | | | 3,500 | | | | 84 | |
Macnica Fuji Electronics Holdings Inc | | | 958 | | | | 19 | |
Marui Group Co Ltd | | | 2,500 | | | | 46 | |
Mitsubishi Corp | | | 14,100 | | | | 329 | |
Mitsubishi Estate Co Ltd | | | 116,500 | | | | 2,015 | |
Mitsubishi Gas Chemical Co Inc | | | 1,200 | | | | 25 | |
Mitsubishi Heavy Industries Ltd | | | 14,400 | | | | 325 | |
Mitsubishi UFJ Financial Group Inc | | | 178,500 | | | | 768 | |
Mitsubishi UFJ Lease & Finance Co Ltd | | | 43,200 | | | | 198 | |
Mizuho Financial Group Inc | | | 16,550 | | | | 211 | |
NEC Networks & System Integration Corp | | | 1,607 | | | | 28 | |
Nexon Co Ltd | | | 600 | | | | 18 | |
NGK Insulators Ltd | | | 2,800 | | | | 45 | |
NH Foods Ltd | | | 9,700 | | | | 414 | |
Nippon Express Co Ltd | | | 3,200 | | | | 214 | |
Nippon Steel Corp | | | 133,700 | | | | 1,637 | |
Nippon Telegraph & Telephone Corp | | | 164,808 | | | | 3,896 | |
Nippon Television Holdings Inc | | | 68,300 | | | | 745 | |
Nippon Yusen KK | | | 47,600 | | | | 1,039 | |
Nishi-Nippon Financial Holdings Inc | | | 17,400 | | | | 121 | |
Nissan Motor Co Ltd | | | 76,100 | | | | 359 | |
NOK Corp | | | 45,500 | | | | 503 | |
Nomura Holdings Inc | | | 131,400 | | | | 660 | |
Nomura Real Estate Holdings Inc | | | 15,700 | | | | 340 | |
Nomura Research Institute Ltd | | | 726 | | | | 25 | |
North Pacific Bank Ltd | | | 42,200 | | | | 94 | |
NSK Ltd | | | 14,400 | | | | 117 | |
Obayashi Corp | | | 45,600 | | | | 402 | |
Okuwa Co Ltd | | | 587 | | | | 7 | |
Organo Corp | | | 133 | | | | 8 | |
ORIX Corp | | | 8,400 | | | | 125 | |
Osaka Gas Co Ltd | | | 36,300 | | | | 698 | |
Panasonic Corp | | | 6,900 | | | | 74 | |
Park24 Co Ltd | | | 12,600 | | | | 188 | |
Persol Holdings Co Ltd | | | 14,300 | | | | 262 | |
San-Ai Oil Co Ltd | | | 1,264 | | | | 14 | |
| | |
| 4 | | SEI Institutional Investments Trust / Semi-Annual Report / November 30, 2020 |
SCHEDULE OF INVESTMENTS (Unaudited)
November 30, 2020
World Select Equity Fund (Continued)
| | | | | | | | |
| | | |
| Description | | Shares | | Market Value
($ Thousands) |
| | |
COMMON STOCK (continued) | | | | | | | | |
Sawai Pharmaceutical Co Ltd | | | 13,000 | | | $ | 588 | |
SBI Holdings Inc/Japan | | | 2,200 | | | | 60 | |
SCSK Corp | | | 600 | | | | 36 | |
Sega Sammy Holdings Inc | | | 1,400 | | | | 20 | |
Seiko Epson Corp | | | 89,700 | | | | 1,339 | |
Seven & i Holdings Co Ltd | | | 17,200 | | | | 546 | |
Shimizu Corp | | | 8,400 | | | | 64 | |
Sony Corp | | | 27,000 | | | | 2,513 | |
Sumitomo Corp | | | 1,200 | | | | 15 | |
Sumitomo Electric Industries Ltd | | | 133,700 | | | | 1,531 | |
Sumitomo Mitsui Financial Group Inc | | | 52,700 | | | | 1,532 | |
Sumitomo Mitsui Trust Holdings Inc | | | 42,100 | | | | 1,232 | |
Sumitomo Rubber Industries Ltd | | | 19,000 | | | | 168 | |
Takashimaya Co Ltd | | | 57,300 | | | | 441 | |
Takeda Pharmaceutical Co Ltd | | | 39,700 | | | | 1,426 | |
Teijin Ltd | | | 18,100 | | | | 310 | |
Tocalo Co Ltd | | | 1,359 | | | | 16 | |
Toho Holdings Co Ltd | | | 28,000 | | | | 511 | |
Tokyo Gas Co Ltd | | | 59,200 | | | | 1,331 | |
Tokyo Ohka Kogyo Co Ltd | | | 249 | | | | 16 | |
Toray Industries Inc | | | 91,800 | | | | 498 | |
Torii Pharmaceutical Co Ltd | | | 267 | | | | 8 | |
Toyota Motor Corp | | | 4,482 | | | | 301 | |
Toyota Tsusho Corp | | | 900 | | | | 31 | |
Tsukui Holdings Corp | | | 34,900 | | | | 193 | |
United Arrows Ltd | | | 14,700 | | | | 206 | |
Wacoal Holdings Corp | | | 9,300 | | | | 178 | |
Welcia Holdings Co Ltd | | | 2,106 | | | | 85 | |
Xebio Holdings Co Ltd | | | 19,100 | | | | 139 | |
Yamada Holdings Co Ltd | | | 259,700 | | | | 1,235 | |
Yaoko Co Ltd | | | 374 | | | | 26 | |
| | | | | | | 61,130 | |
| | |
Luxembourg — 0.4% | | | | | | | | |
Trinseo SA | | | 50,890 | | | | 1,933 | |
| | |
Malaysia — 0.3% | | | | | | | | |
AMMB Holdings Bhd | | | 24,300 | | | | 20 | |
HAP Seng Consolidated Bhd | | | 10,300 | | | | 21 | |
Hartalega Holdings Bhd | | | 118,800 | | | | 420 | |
Hong Leong Bank Bhd | | | 11,300 | | | | 48 | |
Kossan Rubber Industries | | | 87,200 | | | | 133 | |
MMC Corp Bhd | | | 609,413 | | | | 138 | |
Nestle Malaysia Bhd | | | 1,074 | | | | 35 | |
Petronas Dagangan Bhd | | | 4,500 | | | | 23 | |
RHB Bank Bhd | | | 164,900 | | | | 208 | |
Supermax Corp Bhd * | | | 61,278 | | | | 137 | |
Telekom Malaysia Bhd | | | 16,000 | | | | 20 | |
Tenaga Nasional Bhd | | | 34,600 | | | | 85 | |
Top Glove Corp Bhd | | | 79,500 | | | | 139 | |
| | | | | | | 1,427 | |
| | |
Mexico — 0.1% | | | | | | | | |
Alpek SAB de CV, Cl A | | | 126,278 | | | | 112 | |
| | | | | | | | |
| | | |
| Description | | Shares | | Market Value
($ Thousands) |
| | |
COMMON STOCK (continued) | | | | | | | | |
Banco Santander Mexico SA ADR | | | 31,886 | | | $ | 167 | |
Becle SAB de CV | | | 8,742 | | | | 20 | |
Gruma SAB de CV, Cl B | | | 2,385 | | | | 26 | |
Grupo Comercial Chedraui SA de CV | | | 39,000 | | | | 55 | |
Kimberly-Clark de Mexico SAB de CV, Cl A | | | 32,255 | | | | 51 | |
Wal-Mart de Mexico SAB de CV | | | 3,229 | | | | 9 | |
| | | | | | | 440 | |
| | |
Netherlands — 1.6% | | | | | | | | |
Altice Europe NV * | | | 3,336 | | | | 18 | |
Arcadis NV | | | 1,580 | | | | 48 | |
ArcelorMittal SA | | | 110,500 | | | | 2,029 | |
ASM International NV | | | 336 | | | | 60 | |
CNH Industrial NV | | | 205,500 | | | | 2,236 | |
Koninklijke Ahold Delhaize NV | | | 95,762 | | | | 2,748 | |
Koninklijke Vopak NV | | | 650 | | | | 34 | |
NN Group NV | | | 5,900 | | | | 240 | |
Signify NV | | | 22,903 | | | | 973 | |
| | | | | | | 8,386 | |
| | |
Nigeria — 0.0% | | | | | | | | |
Zenith Bank PLC | | | 2,032,323 | | | | 126 | |
| | |
Norway — 0.1% | | | | | | | | |
Austevoll Seafood ASA | | | 21,700 | | | | 198 | |
Europris ASA | | | 3,090 | | | | 17 | |
Fjordkraft Holding ASA | | | 1,539 | | | | 15 | |
| | | | | | | 230 | |
| | |
Pakistan — 0.0% | | | | | | | | |
Kot Addu Power Co Ltd | | | 399,000 | | | | 70 | |
Nishat Mills Ltd | | | 190,100 | | | | 109 | |
| | | | | | | 179 | |
| | |
Philippines — 0.1% | | | | | | | | |
DMCI Holdings Inc | | | 1,824,900 | | | | 213 | |
First Philippine Holdings Corp | | | 22,040 | | | | 30 | |
Globe Telecom Inc | | | 395 | | | | 16 | |
International Container Terminal Services Inc | | | 14,590 | | | | 36 | |
PLDT Inc | | | 11,973 | | | | 327 | |
| | | | | | | 622 | |
| | |
Poland — 1.4% | | | | | | | | |
Bank Handlowy w Warszawie SA * | | | 37,721 | | | | 342 | |
Bank Millennium SA * | | | 245,000 | | | | 183 | |
Bank Polska Kasa Opieki SA | | | 101,906 | | | | 1,543 | |
Budimex SA | | | 220 | | | | 16 | |
CCC SA | | | 33,703 | | | | 561 | |
Cyfrowy Polsat SA | | | 4,524 | | | | 32 | |
Eurocash SA | | | 50,000 | | | | 190 | |
Globe Trade Centre SA | | | 31,044 | | | | 57 | |
Grupa Kety SA | | | 3,390 | | | | 418 | |
Grupa Lotos SA | | | 26,980 | | | | 250 | |
Powszechna Kasa Oszczednosci Bank Polski SA | | | 232,641 | | | | 1,639 | |
| | |
| SEI Institutional Investments Trust / Semi-Annual Report / November 30, 2020 | | 5 |
SCHEDULE OF INVESTMENTS (Unaudited)
November 30, 2020
World Select Equity Fund (Continued)
| | | | | | | | |
| | | |
| Description | | Shares | | Market Value
($ Thousands) |
| | |
COMMON STOCK (continued) | | | | | | | | |
Powszechny Zaklad Ubezpieczen SA | | | 213,582 | | | $ | 1,432 | |
Stalexport Autostrady SA | | | 217,207 | | | | 186 | |
VRG SA * | | | 174,696 | | | | 113 | |
| | | | | | | 6,962 | |
| | |
Portugal — 0.0% | | | | | | | | |
EDP - Energias de Portugal SA | | | 38,127 | | | | 204 | |
| | |
Qatar — 0.0% | | | | | | | | |
Masraf Al Rayan QSC | | | 30,098 | | | | 35 | |
Qatar Islamic Bank SAQ | | | 5,333 | | | | 25 | |
| | | | | | | 60 | |
| | |
Romania — 0.3% | | | | | | | | |
BRD-Groupe Societe Generale SA | | | 152,118 | | | | 498 | |
Fondul Proprietatea SA | | | 1,717,255 | | | | 551 | |
OMV Petrom SA | | | 8,079,528 | | | | 707 | |
| | | | | | | 1,756 | |
| | |
Russia — 1.0% | | | | | | | | |
Detsky Mir PJSC | | | 243,030 | | | | 446 | |
Federal Grid Co Unified Energy System PJSC | | | 11,340,000 | | | | 30 | |
Gazprom PJSC | | | 60,000 | | | | 143 | |
Inter RAO UES PJSC | | | 1,500,000 | | | | 101 | |
LUKOIL PJSC ADR | | | 979 | | | | 64 | |
Magnit PJSC | | | 7,934 | | | | 513 | |
Magnitogorsk Iron & Steel Works PJSC | | | 246,400 | | | | 135 | |
MMC Norilsk Nickel PJSC | | | 3,691 | | | | 1,035 | |
Mobile TeleSystems PJSC ADR | | | 6,224 | | | | 54 | |
Rosneft Oil Co PJSC GDR | | | 40,000 | | | | 232 | |
Sberbank of Russia PJSC | | | 255,930 | | | | 835 | |
Severstal PAO | | | 45,369 | | | | 664 | |
United Co RUSAL International PJSC * | | | 1,064,140 | | | | 524 | |
X5 Retail Group NV GDR | | | 14,423 | | | | 517 | |
| | | | | | | 5,293 | |
| | |
Saudi Arabia — 0.2% | | | | | | | | |
Al Rajhi Bank | | | 886 | | | | 18 | |
Bank AlBilad | | | 2,652 | | | | 19 | |
Bank Al-Jazira | | | 27,492 | | | | 101 | |
Banque Saudi Fransi | | | 2,286 | | | | 20 | |
City Cement Co | | | 9,066 | | | | 56 | |
Etihad Etisalat Co * | | | 7,111 | | | | 56 | |
Jarir Marketing Co | | | 1,344 | | | | 63 | |
National Medical Care Co | | | 10,187 | | | | 147 | |
Sahara International Petrochemical Co * | | | 5,893 | | | | 27 | |
Saudi Cement Co | | | 1,250 | | | | 19 | |
Saudi Industrial Investment Group | | | 2,883 | | | | 20 | |
Southern Province Cement Co | | | 3,721 | | | | 75 | |
United Electronics Co | | | 6,063 | | | | 129 | |
Zamil Industrial Investment Co * | | | 15,995 | | | | 95 | |
| | | | | | | 845 | |
| | |
Singapore — 0.1% | | | | | | | | |
Best World International Ltd | | | 24,994 | | | | 25 | |
| | | | | | | | |
| | | |
| Description | | Shares | | Market Value
($ Thousands) |
| | |
COMMON STOCK (continued) | | | | | | | | |
DBS Group Holdings Ltd | | | 12,900 | | | $ | 243 | |
Keppel Infrastructure Trust | | | 77,748 | | | | 32 | |
Sheng Siong Group Ltd | | | 14,441 | | | | 17 | |
Singapore Telecommunications Ltd | | | 82,700 | | | | 147 | |
United Overseas Bank Ltd | | | 7,700 | | | | 129 | |
Venture Corp Ltd | | | 3,800 | | | | 54 | |
| | | | | | | 647 | |
| | |
Slovenia — 0.4% | | | | | | | | |
Krka dd Novo mesto | | | 8,705 | | | | 920 | |
Luka Koper | | | 21,153 | | | | 476 | |
Telekom Slovenije DD | | | 10,347 | | | | 552 | |
| | | | | | | 1,948 | |
| | |
South Africa — 0.5% | | | | | | | | |
Anglo American Platinum Ltd | | | 256 | | | | 19 | |
Aspen Pharmacare Holdings Ltd | | | 2,034 | | | | 16 | |
Barloworld Ltd | | | 61,993 | | | | 281 | |
Clicks Group Ltd | | | 1,060 | | | | 16 | |
DataTec Ltd * | | | 20,620 | | | | 34 | |
Exxaro Resources Ltd | | | 3,167 | | | | 24 | |
Kumba Iron Ore Ltd | | | 15,398 | | | | 524 | |
MTN Group Ltd | | | 194,061 | | | | 831 | |
Naspers Ltd, Cl N | | | 1,164 | | | | 235 | |
Old Mutual Ltd | | | 294,559 | | | | 223 | |
Remgro Ltd | | | 3,306 | | | | 20 | |
Sanlam Ltd | | | 10,272 | | | | 37 | |
Telkom SA SOC Ltd | | | 177,441 | | | | 359 | |
| | | | | | | 2,619 | |
| | |
South Korea — 2.4% | | | | | | | | |
Chongkundang Holdings Corp | | | 1,129 | | | | 113 | |
Coway Co Ltd | | | 773 | | | | 48 | |
E-MART Inc | | | 5,362 | | | | 746 | |
Gene Bio Tech Co Ltd | | | 2,593 | | | | 14 | |
Hana Financial Group Inc | | | 27,477 | | | | 841 | |
INTOPS Co Ltd | | | 12,276 | | | | 250 | |
JB Financial Group Co Ltd | | | 12,343 | | | | 61 | |
KB Financial Group Inc | | | 21,708 | | | | 890 | |
Kia Motors Corp | | | 17,566 | | | | 918 | |
Korea Zinc Co Ltd | | | 125 | | | | 43 | |
KT&G Corp | | | 4,100 | | | | 306 | |
LG Corp | | | 317 | | | | 20 | |
LG Display Co Ltd | | | 7,333 | | | | 101 | |
LG Electronics Inc | | | 10,070 | | | | 778 | |
LOTTE Himart Co Ltd | | | 8,523 | | | | 242 | |
Mirae Asset Daewoo Co Ltd | | | 2,107 | | | | 18 | |
NAVER Corp | | | 464 | | | | 116 | |
Pharma Research Products Co Ltd | | | 1,536 | | | | 82 | |
POSCO ADR | | | 11,110 | | | | 593 | |
Samsung Electronics Co Ltd | | | 34,913 | | | | 2,104 | |
Samsung Electronics Co Ltd GDR | | | 2,121 | | | | 3,196 | |
Samsung Life Insurance Co Ltd | | | 636 | | | | 41 | |
Seegene Inc | | | 74 | | | | 13 | |
| | |
| 6 | | SEI Institutional Investments Trust / Semi-Annual Report / November 30, 2020 |
SCHEDULE OF INVESTMENTS (Unaudited)
November 30, 2020
World Select Equity Fund (Continued)
| | | | | | | | |
| | | |
| Description | | Shares | | Market Value
($ Thousands) |
| | |
COMMON STOCK (continued) | | | | | | | | |
SK Telecom Co Ltd | | | 1,700 | | | $ | 365 | |
Soulbrain Holdings Co Ltd | | | 8,800 | | | | 343 | |
Yuhan Corp | | | 694 | | | | 40 | |
| | | | | | | 12,282 | |
| | |
Spain — 0.5% | | | | | | | | |
Banco Santander SA | | | 700,786 | | | | 2,027 | |
Ebro Foods SA | | | 13,300 | | | | 316 | |
Endesa SA | | | 7,200 | | | | 206 | |
Siemens Gamesa Renewable Energy SA | | | 2,900 | | | | 104 | |
Viscofan SA | | | 873 | | | | 62 | |
| | | | | | | 2,715 | |
| | |
Sweden — 0.8% | | | | | | | | |
Atlas Copco AB, Cl A | | | 3,757 | | | | 190 | |
Autoliv Inc | | | 11,443 | | | | 1,026 | |
Axfood AB | | | 1,342 | | | | 31 | |
Evolution Gaming Group AB | | | 2,157 | | | | 185 | |
Fortnox AB | | | 838 | | | | 36 | |
Hennes & Mauritz AB, Cl B | | | 4,872 | | | | 103 | |
Husqvarna AB, Cl B | | | 2,812 | | | | 30 | |
Kinnevik AB | | | 1,430 | | | | 71 | |
Mycronic AB | | | 1,467 | | | | 39 | |
Sandvik AB | | | 69,476 | | | | 1,563 | |
Skanska AB, Cl B | | | 6,964 | | | | 166 | |
Swedish Match AB | | | 4,220 | | | | 341 | |
Tele2 AB, Cl B | | | 7,344 | | | | 95 | |
Telia Co AB | | | 9,605 | | | | 41 | |
| | | | | | | 3,917 | |
| | |
Switzerland — 0.8% | | | | | | | | |
ABB Ltd | | | 4,917 | | | | 130 | |
Adecco Group AG | | | 1,942 | | | | 118 | |
Baloise Holding AG | | | 532 | | | | 92 | |
Cie Financiere Richemont SA, Cl A | | | 3,362 | | | | 280 | |
Clariant AG | | | 1,086 | | | | 22 | |
Credit Suisse Group AG | | | 138,828 | | | | 1,761 | |
Geberit AG | | | 283 | | | | 171 | |
Intershop Holding AG | | | 30 | | | | 19 | |
Kuehne + Nagel International AG | | | 497 | | | | 113 | |
LafargeHolcim Ltd | | | 212 | | | | 11 | |
LEM Holding SA | | | 20 | | | | 37 | |
Novartis AG | | | 2,115 | | | | 192 | |
Partners Group Holding AG | | | 242 | | | | 261 | |
Roche Holding AG | | | 2,239 | | | | 740 | |
Swiss Life Holding AG | | | 600 | | | | 269 | |
Swiss Re AG | | | 730 | | | | 67 | |
| | | | | | | 4,283 | |
| | |
Taiwan — 2.2% | | | | | | | | |
Acer Inc | | | 62,000 | | | | 50 | |
Asustek Computer Inc | | | 4,000 | | | | 35 | |
AU Optronics Corp | | | 639,009 | | | | 273 | |
Avita Corp | | | 36,000 | | | | 166 | |
| | | | | | | | |
| | | |
| Description | | Shares | | Market Value
($ Thousands) |
| | |
COMMON STOCK (continued) | | | | | | | | |
Chailease Holding Co Ltd | | | 13,520 | | | $ | 74 | |
Chicony Electronics Co Ltd | | | 86,558 | | | | 259 | |
Chunghwa Telecom Co Ltd | | | 40,000 | | | | 152 | |
Evergreen Marine Corp Taiwan Ltd * | | | 50,013 | | | | 43 | |
Everlight Electronics Co Ltd | | | 76,000 | | | | 99 | |
Feng Hsin Steel Co Ltd | | | 9,549 | | | | 20 | |
Fubon Financial Holding Co Ltd | | | 419,000 | | | | 651 | |
Ginko International Co Ltd | | | 7,000 | | | | 37 | |
Goldsun Building Materials Co Ltd | | | 21,959 | | | | 21 | |
Highwealth Construction Corp | | | 11,000 | | | | 17 | |
Hon Hai Precision Industry Co Ltd | | | 54,000 | | | | 156 | |
Innolux Corp, Cl A | | | 2,194,000 | | | | 774 | |
Kinsus Interconnect Technology Corp | | | 91,000 | | | | 290 | |
Lien Hwa Industrial Holdings Corp | | | 17,497 | | | | 25 | |
Nan Ya Plastics Corp | | | 23,000 | | | | 52 | |
Nien Made Enterprise Co Ltd | | | 1,000 | | | | 12 | |
Novatek Microelectronics Corp | | | 52,000 | | | | 545 | |
Pacific Hospital Supply Co Ltd | | | 11,000 | | | | 27 | |
Pegatron Corp | | | 135,027 | | | | 309 | |
Pegavision Corp | | | 26,000 | | | | 233 | |
Pixart Imaging Inc | | | 2,726 | | | | 19 | |
Pou Chen Corp | | | 204,000 | | | | 224 | |
Quanta Computer Inc | | | 229,010 | | | | 619 | |
Realtek Semiconductor Corp | | | 56,130 | | | | 731 | |
Rossmax International Ltd | | | 52,000 | | | | 35 | |
Simplo Technology Co Ltd | | | 3,753 | | | | 44 | |
SinoPac Financial Holdings Co Ltd | | | 573,000 | | | | 223 | |
Taiwan Cement Corp | | | 26,250 | | | | 40 | |
Taiwan Semiconductor Manufacturing Co Ltd | | | 192,020 | | | | 3,237 | |
United Microelectronics Corp | | | 836,000 | | | | 1,188 | |
Wistron Corp | | | 41,483 | | | | 43 | |
WPG Holdings Ltd | | | 26,000 | | | | 39 | |
Yuanta Financial Holding Co Ltd | | | 495,040 | | | | 332 | |
| | | | | | | 11,094 | |
| | |
Thailand — 0.1% | | | | | | | | |
Bangkok Bank PCL | | | 44,900 | | | | 175 | |
Kiatnakin Phatra Bank PCL | | | 109,100 | | | | 179 | |
Krungthai Card PCL | | | 15,000 | | | | 25 | |
SC Asset Corp PCL | | | 208,300 | | | | 19 | |
Srisawad Corp PCL | | | 9,100 | | | | 17 | |
| | | | | | | 415 | |
| | |
Turkey — 0.3% | | | | | | | | |
Anadolu Efes Biracilik Ve Malt Sanayii AS | | | 187,425 | | | | 502 | |
BIM Birlesik Magazalar AS | | | 14,634 | | | | 131 | |
Enerjisa Enerji AS | | | 5,986 | | | | 8 | |
KOC Holding AS | | | 190,000 | | | | 429 | |
Koza Altin Isletmeleri AS * | | | 20,000 | | | | 190 | |
Turkiye Garanti Bankasi AS | | | 238,000 | | | | 266 | |
| | | | | | | 1,526 | |
| | |
United Arab Emirates — 0.0% | | | | | | | | |
Dubai Islamic Bank PJSC | | | 26,509 | | | | 32 | |
| | |
| SEI Institutional Investments Trust / Semi-Annual Report / November 30, 2020 | | 7 |
SCHEDULE OF INVESTMENTS (Unaudited)
November 30, 2020
World Select Equity Fund (Continued)
| | | | | | | | |
| | | |
| Description | | Shares | | Market Value
($ Thousands) |
|
COMMON STOCK (continued) | |
Emaar Properties PJSC | | | 171,036 | | | $ | 148 | |
| | | | | | | 180 | |
|
United Kingdom — 4.8% | |
Adient PLC * | | | 75,030 | | | | 2,348 | |
Admiral Group PLC | | | 893 | | | | 34 | |
AstraZeneca PLC | | | 16,756 | | | | 1,746 | |
BAE Systems PLC | | | 53,600 | | | | 361 | |
BP PLC | | | 487,182 | | | | 1,611 | |
British American Tobacco PLC | | | 7,200 | | | | 254 | |
Dunelm Group PLC | | | 3,665 | | | | 59 | |
Evraz PLC | | | 55,000 | | | | 284 | |
Frasers Group PLC * | | | 4,300 | | | | 24 | |
Games Workshop Group PLC | | | 755 | | | | 99 | |
GlaxoSmithKline PLC | | | 37,600 | | | | 688 | |
Globaltrans Investment PLC GDR | | | 71,000 | | | | 406 | |
GVC Holdings PLC | | | 1,704 | | | | 24 | |
Halyk Savings Bank of Kazakhstan JSC GDR | | | 22,265 | | | | 264 | |
Imperial Brands PLC | | | 15,900 | | | | 289 | |
Informa PLC | | | 184,836 | | | | 1,308 | |
Intermediate Capital Group PLC | | | 4,765 | | | | 104 | |
International Consolidated Airlines Group SA | | | 357,672 | | | | 736 | |
Linde PLC | | | 5,249 | | | | 1,346 | |
M&G PLC | | | 14,573 | | | | 36 | |
MD Medical Group Investments PLC GDR | | | 43,000 | | | | 236 | |
Meggitt PLC | | | 344,652 | | | | 1,801 | |
NAC Kazatomprom JSC GDR | | | 14,000 | | | | 198 | |
Next PLC | | | 21,599 | | | | 1,889 | |
Nova Ljubljanska Banka dd GDR * | | | 17,800 | | | | 196 | |
OTP Bank Nyrt | | | 985 | | | | 39 | |
Pearson PLC | | | 222,741 | | | | 1,924 | |
Pets at Home Group PLC | | | 2,121 | | | | 12 | |
Reckitt Benckiser Group PLC | | | 3,151 | | | | 277 | |
Rightmove PLC | | | 23,230 | | | | 194 | |
Royal Dutch Shell PLC, Cl A | | | 75,240 | | | | 1,295 | |
Sage Group PLC/The | | | 1,833 | | | | 15 | |
Smiths Group PLC | | | 66,161 | | | | 1,289 | |
Standard Life Aberdeen PLC | | | 14,868 | | | | 54 | |
Stock Spirits Group PLC | | | 65,680 | | | | 207 | |
Tate & Lyle PLC | | | 33,300 | | | | 283 | |
Telecom Plus PLC | | | 830 | | | | 16 | |
Tesco PLC | | | 15,199 | | | | 46 | |
Travis Perkins PLC | | | 56,655 | | | | 970 | |
Vodafone Group PLC | | | 55,834 | | | | 92 | |
Wm Morrison Supermarkets PLC | | | 69,300 | | | | 166 | |
WPP PLC | | | 135,247 | | | | 1,310 | |
| | | | | | | 24,530 | |
|
United States — 43.8% | |
|
Communication Services — 2.3% | |
Alphabet Inc, Cl A * | | | 1,416 | | | | 2,484 | |
Alphabet Inc, Cl C * | | | 129 | | | | 227 | |
AMC Networks Inc, Cl A * | | | 3,900 | | | | 128 | |
| | | | | | | | |
| | | |
| Description | | Shares | | Market Value
($ Thousands) |
|
COMMON STOCK (continued) | |
AT&T Inc | | | 112,584 | | | $ | 3,237 | |
CenturyLink Inc | | | 157,770 | | | | 1,649 | |
Comcast Corp, Cl A | | | 15,900 | | | | 799 | |
Facebook Inc, Cl A * | | | 1,631 | | | | 452 | |
Gray Television Inc * | | | 2,129 | | | | 38 | |
Interpublic Group of Cos Inc/The | | | 7,476 | | | | 166 | |
Take-Two Interactive Software Inc * | | | 211 | | | | 38 | |
Verizon Communications Inc | | | 16,200 | | | | 979 | |
ViacomCBS Inc, Cl B | | | 45,700 | | | | 1,612 | |
Yelp Inc, Cl A * | | | 1,084 | | | | 35 | |
Zillow Group Inc, Cl C * | | | 2,012 | | | | 217 | |
| | |
| | | | | | | 12,061 | |
|
Consumer Discretionary — 8.7% | |
Advance Auto Parts Inc | | | 17,700 | | | | 2,614 | |
Amazon.com Inc * | | | 271 | | | | 859 | |
AutoZone Inc * | | | 2,236 | | | | 2,544 | |
Beazer Homes USA Inc * | | | 101,620 | | | | 1,505 | |
Best Buy Co Inc | | | 4,607 | | | | 501 | |
Buckle Inc/The | | | 619 | | | | 17 | |
Carnival Corp, Cl A | | | 38,230 | | | | 764 | |
Chipotle Mexican Grill Inc, Cl A * | | | 364 | | | | 469 | |
Crocs Inc * | | | 601 | | | | 35 | |
Dana Inc | | | 119,240 | | | | 2,008 | |
Darden Restaurants Inc | | | 879 | | | | 95 | |
Designer Brands Inc, Cl A | | | 202,510 | | | | 1,600 | |
DR Horton Inc | | | 4,400 | | | | 328 | |
eBay Inc | | | 10,300 | | | | 519 | |
Foot Locker Inc | | | 36,480 | | | | 1,364 | |
Ford Motor Co | | | 27,700 | | | | 252 | |
Garmin Ltd | | | 3,085 | | | | 360 | |
General Motors Co | | | 31,671 | | | | 1,388 | |
Gentex Corp | | | 52,127 | | | | 1,699 | |
Goodyear Tire & Rubber Co/The | | | 136,070 | | | | 1,418 | |
Group 1 Automotive Inc | | | 14,970 | | | | 1,779 | |
Hasbro Inc | | | 1,726 | | | | 161 | |
Lowe’s Cos Inc | | | 19,459 | | | | 3,032 | |
Lululemon Athletica Inc * | | | 1,109 | | | | 411 | |
M/I Homes Inc * | | | 29,130 | | | | 1,324 | |
McDonald’s Corp | | | 788 | | | | 171 | |
MercadoLibre Inc * | | | 36 | | | | 56 | |
Newell Brands Inc | | | 96,280 | | | | 2,047 | |
NIKE Inc, Cl B | | | 14,502 | | | | 1,953 | |
NVR Inc * | | | 61 | | | | 244 | |
O’Reilly Automotive Inc * | | | 1,810 | | | | 801 | |
Perdoceo Education Corp * | | | 1,001 | | | | 11 | |
PulteGroup Inc | | | 3,905 | | | | 170 | |
PVH Corp | | | 20,560 | | | | 1,634 | |
Rent-A-Center Inc/TX, Cl A | | | 1,644 | | | | 56 | |
Ruth’s Hospitality Group Inc | | | 560 | | | | 9 | |
Sleep Number Corp * | | | 670 | | | | 46 | |
Sonic Automotive Inc, Cl A | | | 524 | | | | 21 | |
Tapestry Inc | | | 72,700 | | | | 2,059 | |
| | |
| 8 | | SEI Institutional Investments Trust / Semi-Annual Report / November 30, 2020 |
SCHEDULE OF INVESTMENTS (Unaudited)
November 30, 2020
World Select Equity Fund (Continued)
| | | | | | | | |
| | | |
| Description | | Shares | | Market Value
($ Thousands) |
|
COMMON STOCK (continued) | |
Target Corp | | | 13,102 | | | $ | 2,352 | |
Taylor Morrison Home Corp, Cl A * | | | 82,640 | | | | 2,089 | |
Tenneco Inc, Cl A * | | | 999 | | | | 11 | |
TJX Cos Inc/The | | | 20,217 | | | | 1,284 | |
TopBuild Corp * | | | 344 | | | | 60 | |
Tractor Supply Co | | | 7,018 | | | | 988 | |
VF Corp | | | 1,604 | | | | 134 | |
Whirlpool Corp | | | 6,565 | | | | 1,278 | |
| | |
| | | | | | | 44,520 | |
|
Consumer Staples — 2.5% | |
Altria Group Inc | | | 7,900 | | | | 315 | |
Archer-Daniels-Midland Co | | | 8,474 | | | | 422 | |
Bunge Ltd | | | 912 | | | | 54 | |
Campbell Soup Co | | | 2,025 | | | | 101 | |
Colgate-Palmolive Co | | | 12,877 | | | | 1,103 | |
Conagra Brands Inc | | | 48,577 | | | | 1,776 | |
General Mills Inc | | | 11,701 | | | | 711 | |
Hain Celestial Group Inc/The * | | | 1,023 | | | | 39 | |
J M Smucker Co/The | | | 4,300 | | | | 504 | |
Kellogg Co | | | 7,664 | | | | 490 | |
Kimberly-Clark Corp | | | 3,453 | | | | 481 | |
Kraft Heinz Co/The | | | 10,869 | | | | 358 | |
Kroger Co/The | | | 24,152 | | | | 797 | |
Lamb Weston Holdings Inc | | | 1,143 | | | | 83 | |
Medifast Inc | | | 124 | | | | 25 | |
PepsiCo Inc | | | 12,358 | | | | 1,782 | |
Procter & Gamble Co/The | | | 5,018 | | | | 697 | |
Sprouts Farmers Market Inc * | | | 1,422 | | | | 30 | |
Sysco Corp | | | 31,601 | | | | 2,253 | |
Tyson Foods Inc, Cl A | | | 3,100 | | | | 202 | |
USANA Health Sciences Inc * | | | 304 | | | | 23 | |
Walgreens Boots Alliance Inc | | | 2,800 | | | | 106 | |
Walmart Inc | | | 4,043 | | | | 618 | |
| | |
| | | | | | | 12,970 | |
|
Energy — 1.2% | |
Apache Corp | | | 970 | | | | 12 | |
Baker Hughes Co, Cl A | | | 33,500 | | | | 627 | |
Cactus Inc, Cl A | | | 790 | | | | 18 | |
Chevron Corp | | | 28,600 | | | | 2,494 | |
Dril-Quip Inc * | | | 731 | | | | 21 | |
Halliburton Co | | | 5,002 | | | | 83 | |
HollyFrontier Corp | | | 62,920 | | | | 1,472 | |
Murphy Oil Corp | | | 121,000 | | | | 1,217 | |
Murphy USA Inc | | | 193 | | | | 25 | |
Phillips 66 | | | 2,700 | | | | 164 | |
Valero Energy Corp | | | 804 | | | | 43 | |
| | |
| | | | | | | 6,176 | |
|
Financials — 8.4% | |
Aflac Inc | | | 62,094 | | | | 2,728 | |
Allstate Corp/The | | | 5,400 | | | | 553 | |
Ally Financial Inc | | | 151,930 | | | | 4,505 | |
| | | | | | | | |
| | | |
| Description | | Shares | | Market Value
($ Thousands) |
|
COMMON STOCK (continued) | |
American Express Co | | | 20,219 | | | $ | 2,398 | |
American Financial Group Inc/OH | | | 2,500 | | | | 224 | |
American International Group Inc | | | 74,000 | | | | 2,845 | |
Annaly Capital Management Inc ‡ | | | 24,700 | | | | 198 | |
Apollo Global Management Inc, Cl A | | | 2,500 | | | | 109 | |
Artisan Partners Asset Management Inc, Cl A | | | 1,112 | | | | 50 | |
Axis Capital Holdings Ltd | | | 4,800 | | | | 240 | |
Bank of America Corp | | | 40,500 | | | | 1,140 | |
Berkshire Hathaway Inc, Cl B * | | | 2,800 | | | | 641 | |
BlackRock Inc, Cl A | | | 1,108 | | | | 774 | |
Blackstone Group Inc/The, Cl A | | | 5,673 | | | | 338 | |
Brightsphere Investment Group Inc | | | 1,622 | | | | 29 | |
Carlyle Group Inc/The | | | 962 | | | | 27 | |
CME Group Inc, Cl A | | | 6,211 | | | | 1,087 | |
CNA Financial Corp | | | 17,760 | | | | 613 | |
Cohen & Steers Inc | | | 517 | | | | 37 | |
Equitable Holdings Inc | | | 113,239 | | | | 2,874 | |
Everest Re Group Ltd | | | 1,000 | | | | 227 | |
FactSet Research Systems Inc | | | 3,648 | | | | 1,218 | |
Federated Hermes Inc, Cl B | | | 2,072 | | | | 56 | |
Goldman Sachs Group Inc/The | | | 2,942 | | | | 678 | |
Hartford Financial Services Group Inc/The | | | 4,700 | | | | 208 | |
Investors Bancorp Inc | | | 23,800 | | | | 230 | |
Janus Henderson Group PLC | | | 3,790 | | | | 108 | |
JPMorgan Chase & Co | | | 2,400 | | | | 283 | |
Lincoln National Corp | | | 30,700 | | | | 1,450 | |
Moody’s Corp | | | 11,501 | | | | 3,247 | |
Morgan Stanley | | | 40,893 | | | | 2,528 | |
Mr Cooper Group Inc * | | | 1,438 | | | | 38 | |
MSCI Inc, Cl A | | | 4,463 | | | | 1,827 | |
OneMain Holdings Inc, Cl A | | | 878 | | | | 34 | |
PRA Group Inc * | | | 806 | | | | 34 | |
Progressive Corp/The | | | 38,669 | | | | 3,368 | |
S&P Global Inc | | | 1,499 | | | | 527 | |
Starwood Property Trust Inc ‡ | | | 4,171 | | | | 75 | |
Synchrony Financial | | | 5,318 | | | | 162 | |
T Rowe Price Group Inc | | | 2,528 | | | | 362 | |
Travelers Cos Inc/The | | | 1,800 | | | | 233 | |
US Bancorp | | | 62,185 | | | | 2,687 | |
Victory Capital Holdings Inc, Cl A | | | 422 | | | | 9 | |
Wells Fargo & Co | | | 84,000 | | | | 2,297 | |
| | |
| | | | | | | 43,296 | |
|
Health Care — 4.9% | |
AbbVie Inc | | | 5,941 | | | | 621 | |
Amedisys Inc * | | | 288 | | | | 70 | |
AmerisourceBergen Corp, Cl A | | | 24,400 | | | | 2,516 | |
Amgen Inc | | | 2,200 | | | | 489 | |
Becton Dickinson and Co | | | 6,401 | | | | 1,503 | |
Bristol-Myers Squibb Co | | | 23,348 | | | | 1,457 | |
Cardinal Health Inc | | | 4,026 | | | | 220 | |
Chemed Corp | | | 363 | | | | 174 | |
CVS Health Corp | | | 29,100 | | | | 1,973 | |
| | |
| SEI Institutional Investments Trust / Semi-Annual Report / November 30, 2020 | | 9 |
SCHEDULE OF INVESTMENTS (Unaudited)
November 30, 2020
World Select Equity Fund (Continued)
| | | | | | | | |
| | | |
| Description | | Shares | | Market Value
($ Thousands) |
|
COMMON STOCK (continued) | |
Danaher Corp | | | 2,220 | | | $ | 499 | |
DaVita Inc * | | | 1,839 | | | | 202 | |
DexCom Inc * | | | 880 | | | | 281 | |
Eli Lilly and Co | | | 10,743 | | | | 1,565 | |
Gilead Sciences Inc | | | 3,900 | | | | 237 | |
HCA Healthcare Inc | | | 1,200 | | | | 180 | |
Humana Inc | | | 33 | | | | 13 | |
IDEXX Laboratories Inc * | | | 454 | | | | 209 | |
Johnson & Johnson | | | 16,065 | | | | 2,324 | |
McKesson Corp | | | 1,429 | | | | 257 | |
Medpace Holdings Inc * | | | 538 | | | | 69 | |
Merck & Co Inc | | | 43,603 | | | | 3,505 | |
Mettler-Toledo International Inc * | | | 1,089 | | | | 1,252 | |
PerkinElmer Inc | | | 1,256 | | | | 167 | |
Pfizer Inc | | | 13,700 | | | | 525 | |
ResMed Inc | | | 2,003 | | | | 420 | |
Thermo Fisher Scientific Inc | | | 62 | | | | 29 | |
UnitedHealth Group Inc | | | 12,418 | | | | 4,177 | |
Vertex Pharmaceuticals Inc * | | | 166 | | | | 38 | |
Viatris Inc, Cl W * | | | 1,699 | | | | 28 | |
Zoetis Inc, Cl A | | | 130 | | | | 21 | |
| | |
| | | | | | | 25,021 | |
|
Industrials — 5.4% | |
3M Co | | | 1,098 | | | | 190 | |
AAR Corp | | | 8,030 | | | | 228 | |
Alaska Air Group Inc | | | 14,680 | | | | 748 | |
Allison Transmission Holdings Inc, Cl A | | | 8,000 | | | | 328 | |
Altra Industrial Motion Corp | | | 231 | | | | 13 | |
Astec Industries Inc | | | 293 | | | | 17 | |
Atlas Air Worldwide Holdings Inc * | | | 31,080 | | | | 1,735 | |
BMC Stock Holdings Inc * | | | 1,407 | | | | 69 | |
Carrier Global Corp | | | 31,701 | | | | 1,207 | |
Copart Inc * | | | 2,047 | | | | 236 | |
Curtiss-Wright Corp | | | 6,000 | | | | 691 | |
Eaton Corp PLC | | | 360 | | | | 43 | |
Expeditors International of Washington Inc | | | 262 | | | | 23 | |
Fastenal Co | | | 7,781 | | | | 385 | |
Fluor Corp | | | 138,670 | | | | 2,395 | |
Generac Holdings Inc * | | | 1,459 | | | | 314 | |
General Dynamics Corp | | | 1,700 | | | | 254 | |
Graco Inc | | | 23,056 | | | | 1,562 | |
Greenbrier Cos Inc/The | | | 42,100 | | | | 1,405 | |
HD Supply Holdings Inc * | | | 4,500 | | | | 251 | |
Johnson Controls International PLC | | | 2,763 | | | | 127 | |
Lockheed Martin Corp | | | 647 | | | | 236 | |
Manitowoc Co Inc/The * | | | 91,270 | | | | 1,014 | |
Meritor Inc * | | | 69,249 | | | | 1,828 | |
Middleby Corp/The * | | | 7,865 | | | | 1,070 | |
Northrop Grumman Corp | | | 500 | | | | 151 | |
Old Dominion Freight Line Inc | | | 394 | | | | 80 | |
Otis Worldwide Corp | | | 15,646 | | | | 1,047 | |
Parker-Hannifin Corp | | | 8,283 | | | | 2,214 | |
| | | | | | | | |
| | | |
| Description | | Shares | | Market Value
($ Thousands) |
|
COMMON STOCK (continued) | |
Robert Half International Inc | | | 13,910 | | | $ | 893 | |
Rockwell Automation Inc | | | 734 | | | | 188 | |
Saia Inc * | | | 520 | | | | 91 | |
Stanley Black & Decker Inc | | | 6,200 | | | | 1,143 | |
TransDigm Group Inc | | | 511 | | | | 296 | |
Union Pacific Corp | | | 13,059 | | | | 2,665 | |
United Parcel Service Inc, Cl B | | | 3,770 | | | | 645 | |
Wabash National Corp | | | 81,110 | | | | 1,434 | |
WW Grainger Inc | | | 815 | | | | 341 | |
| | |
| | | | | | | 27,557 | |
|
Information Technology — 6.9% | |
Accenture PLC, Cl A | | | 177 | | | | 44 | |
Advanced Micro Devices Inc * | | | 8,105 | | | | 751 | |
Akamai Technologies Inc * | | | 498 | | | | 52 | |
Amdocs Ltd | | | 10,800 | | | | 711 | |
Amkor Technology Inc | | | 2,059 | | | | 30 | |
Amphenol Corp, Cl A | | | 3,765 | | | | 493 | |
Analog Devices Inc | | | 9,950 | | | | 1,384 | |
Apple Inc | | | 16,405 | | | | 1,953 | |
Arista Networks Inc * | | | 242 | | | | 66 | |
Automatic Data Processing Inc | | | 265 | | | | 46 | |
Broadcom Inc | | | 593 | | | | 238 | |
CACI International Inc, Cl A * | | | 1,568 | | | | 372 | |
Cadence Design Systems Inc * | | | 514 | | | | 60 | |
CDK Global Inc | | | 3,600 | | | | 172 | |
CDW Corp/DE | | | 335 | | | | 44 | |
Check Point Software Technologies Ltd * | | | 2,891 | | | | 340 | |
Cisco Systems Inc | | | 29,410 | | | | 1,265 | |
Citrix Systems Inc | | | 144 | | | | 18 | |
Cognizant Technology Solutions Corp, Cl A | | | 4,100 | | | | 320 | |
Corning Inc | | | 8,474 | | | | 317 | |
Dell Technologies Inc, Cl C * | | | 19,880 | | | | 1,372 | |
DocuSign Inc, Cl A * | | | 1,330 | | | | 303 | |
DXC Technology Co | | | 155,810 | | | | 3,414 | |
Fair Isaac Corp * | | | 550 | | | | 260 | |
Fortinet Inc * | | | 334 | | | | 41 | |
Globant SA * | | | 92 | | | | 17 | |
HP Inc | | | 24,375 | | | | 535 | |
Intel Corp | | | 68,880 | | | | 3,330 | |
International Business Machines Corp | | | 29,032 | | | | 3,586 | |
Intuit Inc | | | 1,423 | | | | 501 | |
Juniper Networks Inc | | | 8,449 | | | | 184 | |
KLA Corp | | | 194 | | | | 49 | |
Lam Research Corp | | | 919 | | | | 416 | |
Lattice Semiconductor Corp * | | | 377 | | | | 16 | |
Leidos Holdings Inc | | | 1,432 | | | | 144 | |
Manhattan Associates Inc * | | | 141 | | | | 14 | |
Mastercard Inc, Cl A | | | 6,963 | | | | 2,343 | |
Microsoft Corp | | | 16,641 | | | | 3,562 | |
MongoDB Inc, Cl A * | | | 81 | | | | 23 | |
NortonLifeLock Inc | | | 11,949 | | | | 218 | |
Oracle Corp | | | 39,681 | | | | 2,290 | |
| | |
| 10 | | SEI Institutional Investments Trust / Semi-Annual Report / November 30, 2020 |
SCHEDULE OF INVESTMENTS (Unaudited)
November 30, 2020
World Select Equity Fund (Continued)
| | | | | | | | |
| | | |
| Description | | Shares | | Market Value
($ Thousands) |
|
COMMON STOCK (continued) | |
Palo Alto Networks Inc * | | | 720 | | | $ | 212 | |
Perficient Inc * | | | 670 | | | | 31 | |
QUALCOMM Inc | | | 11,731 | | | | 1,727 | |
RingCentral Inc, Cl A * | | | 100 | | | | 30 | |
Seagate Technology PLC | | | 3,020 | | | | 178 | |
Splunk Inc * | | | 1,250 | | | | 255 | |
Teradyne Inc | | | 3,556 | | | | 392 | |
Trade Desk Inc/The, Cl A * | | | 339 | | | | 306 | |
TTEC Holdings Inc | | | 376 | | | | 25 | |
Twilio Inc, Cl A * | | | 877 | | | | 281 | |
VeriSign Inc * | | | 788 | | | | 158 | |
Western Union Co/The | | | 21,205 | | | | 478 | |
Zebra Technologies Corp, Cl A * | | | 218 | | | | 83 | |
| | |
| | | | | | | 35,450 | |
|
Materials — 2.6% | |
AdvanSix Inc * | | | 96,990 | | | | 1,724 | |
Boise Cascade Co | | | 859 | | | | 37 | |
Commercial Metals Co | | | 2,347 | | | | 47 | |
Ecolab Inc | | | 3,962 | | | | 880 | |
Huntsman Corp | | | 70,910 | | | | 1,756 | |
International Flavors & Fragrances Inc | | | 847 | | | | 95 | |
Nucor Corp | | | 45,000 | | | | 2,417 | |
Packaging Corp of America | | | 19,885 | | | | 2,585 | |
Reliance Steel & Aluminum Co | | | 10,442 | | | | 1,230 | |
Scotts Miracle-Gro Co/The, Cl A | | | 389 | | | | 68 | |
Sealed Air Corp | | | 6,400 | | | | 288 | |
Sherwin-Williams Co/The | | | 2,676 | | | | 2,001 | |
Silgan Holdings Inc | | | 6,400 | | | | 216 | |
Tredegar Corp | | | 612 | | | | 10 | |
| | |
| | | | | | | 13,354 | |
|
Real Estate — 0.4% | |
Brandywine Realty Trust ‡ | | | 10,000 | | | | 111 | |
Brixmor Property Group Inc ‡ | | | 83,500 | | | | 1,275 | |
Medical Properties Trust Inc ‡ | | | 3,263 | | | | 63 | |
Mid-America Apartment Communities Inc ‡ | | | 510 | | | | 65 | |
National Health Investors Inc ‡ | | | 1,500 | | | | 97 | |
VEREIT Inc ‡ | | | 14,000 | | | | 99 | |
Weyerhaeuser Co ‡ | | | 5,615 | | | | 163 | |
| | |
| | | | | | | 1,873 | |
|
Utilities — 0.5% | |
Edison International | | | 4,183 | | | | 257 | |
Entergy Corp | | | 4,400 | | | | 479 | |
Evergy Inc | | | 3,000 | | | | 166 | |
Exelon Corp | | | 14,800 | | | | 608 | |
National Fuel Gas Co | | | 17,500 | | | | 720 | |
Public Service Enterprise Group Inc | | | 7,100 | | | | 414 | |
| | |
| | | | | | | 2,644 | |
| | | | | | | 224,922 | |
| | | | | | | | |
| | | |
| Description | | Shares | | Market Value
($ Thousands) |
|
COMMON STOCK (continued) | |
Total Common Stock
(Cost $414,599) ($ Thousands) | | | $ | 472,786 | |
|
PREFERRED STOCK — 0.4% | |
|
Brazil — 0.1% | |
Banco do Estado do Rio Grande do Sul SA (A) | | | 180,601 | | | | 447 | |
Cia Paranaense de Energia (A) | | | 1,900 | | | | 24 | |
Petroleo Brasileiro SA (A) | | | 50,900 | | | | 236 | |
| | | | | | | 707 | |
|
Germany — 0.2% | |
Volkswagen AG (A) | | | 5,446 | | | | 921 | |
|
Russia — 0.1% | |
Surgutneftegas PJSC (A) | | | 600,000 | | | | 311 | |
|
South Korea — 0.0% | |
Samsung Electronics Co Ltd (A) | | | 437 | | | | 24 | |
| |
Total Preferred Stock
(Cost $2,155) ($ Thousands) | | | | 1,963 | |
| | |
| | | Number of
Rights | | |
|
RIGHTS — 0.0% | |
|
Hong Kong — 0.0% | |
KWG Group Holdings Ltd *‡‡ | | | 467 | | | | – | |
Shimao Group Holdings Ltd *‡‡ | | | 140 | | | | – | |
|
Spain — 0.0% | |
Banco Santander SA *‡‡ | | | 700,786 | | | | 88 | |
|
Taiwan — 0.0% | |
Rossmax International Ltd, Expires 12/04/2020 * | | | 1,768 | | | | – | |
| |
Total Rights
(Cost $—) ($ Thousands) | | | | 88 | |
| | |
| | | Shares | | |
|
CASH EQUIVALENT — 2.9% | |
SEI Daily Income Trust, Government Fund, Cl F
0.010%**† | | | 14,730,889 | | | | 14,731 | |
| |
Total Cash Equivalent
(Cost $14,731) ($ Thousands) | | | | 14,731 | |
| |
Total Investments in Securities — 95.4% (Cost $431,485) ($ Thousands) | | | $ | 489,568 | |
| | | | | | | | |
| | |
| SEI Institutional Investments Trust / Semi-Annual Report / November 30, 2020 | | 11 |
SCHEDULE OF INVESTMENTS (Unaudited)
November 30, 2020
World Select Equity Fund (Continued)
| | | | | | | | |
| | | |
| Description | | Contracts | | Market Value
($ Thousands) |
|
PURCHASED OPTION** — 0.0% | |
| | |
Total Purchased Option (B)
(Cost $44) ($ Thousands) | | | 25,190,520 | | | $ | 7 | |
| | | | | | | | |
A list of the open centrally cleared options contracts held by the Fund at November 30, 2020, is as follows:
| | | | | | | | | | | | | | | | | | | | |
| Description | | Number of Contracts | | | Notional Amount
(Thousands) † | | | Exercise Price | | | Expiration Date | | | Value (Thousands) | |
| | | | | |
PURCHASED OPTION — 0.0% | | | | | | | | | | | | | | | | | | | | |
| | | | | |
Call Options | | | | | | | | | | | | | | | | | | | | |
December 2020, AUD Call USD Put* | | | 25,190,520 | | | $ | 44 | | | | $0.74 | | | | 12/1/2020 | | | $ | 7 | |
| | | | | | | | | | | | | | | | | | | | |
| | | | | |
Total Purchased Option | | | | | | | 44 | | | | | | | | | | | $ | 7 | |
| | | | | | | | | | | | | | | | | | | | |
A list of the open futures contracts held by the Fund at November 30, 2020, is as follows:
| | | | | | | | | | | | | | | | | | | | |
| Type of Contract | | Number of
Contracts Long
(Short) | | | Expiration
Date | | | Notional Amount
(Thousands) | | Value
(Thousands) | | Unrealized Appreciation
(Depreciation) (Thousands) |
Euro STOXX 50 | | | (2) | | | | Dec-2020 | | | $ | (84 | ) | | $ | (84 | ) | | $ | – | |
Hang Seng Index | | | 19 | | | | Jan-2021 | | | | 3,262 | | | | 3,239 | | | | (23 | ) |
MSCI Emerging Markets | | | (409) | | | | Dec-2020 | | | | (22,797 | ) | | | (24,587 | ) | | | (1,790 | ) |
MSCI Singapore Index | | | 41 | | | | Jan-2021 | | | | 1,004 | | | | 982 | | | | (23 | ) |
OMX Stockholm 30 | | | 26 | | | | Dec-2020 | | | | 582 | | | | 582 | | | | (3 | ) |
S&P 500 Index E-MINI | | | 331 | | | | Dec-2020 | | | | 55,573 | | | | 59,964 | | | | 4,391 | |
S&P TSX 60 Index | | | 62 | | | | Dec-2020 | | | | 9,096 | | | | 9,790 | | | | 541 | |
SPI 200 Index | | | 55 | | | | Dec-2020 | | | | 5,941 | | | | 6,615 | | | | 574 | |
TOPIX Index | | | (152) | | | | Dec-2020 | | | | (23,145 | ) | | | (25,590 | ) | | | (2,102 | ) |
| | | | | | | | | | | | | | | | | | | | |
| | | | | | | | | | $ | 29,432 | | | $ | 30,911 | | | $ | 1,565 | |
| | | | | | | | | | | | | | | | | | | | |
A list of the open forward foreign currency contracts held by the Fund at November 30, 2020, is as follows:
| | | | | | | | | | | | | | | | | | | | | | | | |
| Counterparty | | Settlement Date | | | | | | Currency to Deliver (Thousands) | | | | | | Currency to Receive
(Thousands) | | | Unrealized
Appreciation
(Depreciation)
(Thousands) |
Brown Brothers Harriman | | | 12/14/20 | | | | NZD | | | | 4 | | | | USD | | | | 3 | | | $ | — | |
Brown Brothers Harriman | | | 12/14/20 | | | | NZD | | | | 37 | | | | USD | | | | 25 | | | | (1 | ) |
Brown Brothers Harriman | | | 12/14/20 | | | | USD | | | | 427 | | | | NZD | | | | 622 | | | | 10 | |
Brown Brothers Harriman | | | 12/14/20 | | | | USD | | | | 0 | | | | NZD | | | | 0 | | | | — | |
Brown Brothers Harriman | | | 12/14/20 | | | | USD | | | | 807 | | | | NOK | | | | 7,324 | | | | 20 | |
Brown Brothers Harriman | | | 12/14/20 | | | | USD | | | | 2 | | | | NOK | | | | 14 | | | | — | |
Brown Brothers Harriman | | | 12/14/20 | | | | SGD | | | | 12 | | | | USD | | | | 9 | | | | — | |
Brown Brothers Harriman | | | 12/14/20 | | | | SGD | | | | 852 | | | | USD | | | | 631 | | | | (5 | ) |
Brown Brothers Harriman | | | 12/14/20 | | | | USD | | | | 1,503 | | | | SGD | | | | 2,028 | | | | 11 | |
Brown Brothers Harriman | | | 12/14/20 | | | | USD | | | | 3 | | | | SGD | | | | 4 | | | | — | |
Brown Brothers Harriman | | | 12/14/20 | | | | NOK | | | | 43 | | | | USD | | | | 5 | | | | — | |
Brown Brothers Harriman | | | 12/14/20 | | | | NOK | | | | 2,395 | | | | USD | | | | 264 | | | | (7 | ) |
| | |
| | |
| 12 | | SEI Institutional Investments Trust / Semi-Annual Report / November 30, 2020 |
SCHEDULE OF INVESTMENTS (Unaudited)
November 30, 2020
World Select Equity Fund (Continued)
| | | | | | | | | | | | | | | | | | | | | | | | |
| Counterparty | | Settlement Date | | | | | | Currency to Deliver (Thousands) | | | | | | Currency to Receive
(Thousands) | | | Unrealized
Appreciation
(Depreciation)
(Thousands) |
Brown Brothers Harriman | | | 12/14/20 | | | | AUD | | | | 80 | | | | USD | | | | 59 | | | $ | — | |
Brown Brothers Harriman | | | 12/14/20 | | | | AUD | | | | 2,796 | | | | USD | | | | 2,031 | | | | (29 | ) |
Brown Brothers Harriman | | | 12/14/20 | | | | HKD | | | | 363 | | | | USD | | | | 47 | | | | — | |
Brown Brothers Harriman | | | 12/14/20 | | | | HKD | | | | 3,001 | | | | USD | | | | 387 | | | | — | |
Brown Brothers Harriman | | | 12/14/20 | | | | USD | | | | 3,602 | | | | DKK | | | | 22,784 | | | | 62 | |
Brown Brothers Harriman | | | 12/14/20 | | | | USD | | | | 4,674 | | | | HKD | | | | 36,235 | | | | 1 | |
Brown Brothers Harriman | | | 12/14/20 | | | | USD | | | | 134 | | | | HKD | | | | 1,040 | | | | — | |
Brown Brothers Harriman | | | 12/14/20 | | | | USD | | | | 4,733 | | | | SEK | | | | 40,956 | | | | 59 | |
Brown Brothers Harriman | | | 12/14/20 | | | | USD | | | | 95 | | | | SEK | | | | 809 | | | | — | |
Brown Brothers Harriman | | | 12/14/20 | | | | CHF | | | | 83 | | | | USD | | | | 92 | | | | — | |
Brown Brothers Harriman | | | 12/14/20 | | | | CHF | | | | 5,492 | | | | USD | | | | 5,988 | | | | (82 | ) |
Brown Brothers Harriman | | | 12/14/20 | | | | DKK | | | | 9,016 | | | | USD | | | | 1,425 | | | | (24 | ) |
Brown Brothers Harriman | | | 12/14/20 | | | | USD | | | | 9,694 | | | | AUD | | | | 13,340 | | | | 136 | |
Brown Brothers Harriman | | | 12/14/20 | | | | USD | | | �� | 15 | | | | AUD | | | | 21 | | | | — | |
Brown Brothers Harriman | | | 12/14/20 | | | | CAD | | | | 10,429 | | | | USD | | | | 7,978 | | | | (71 | ) |
Brown Brothers Harriman | | | 12/14/20 | | | | USD | | | | 15,043 | | | | CAD | | | | 19,663 | | | | 132 | |
Brown Brothers Harriman | | | 12/14/20 | | | | USD | | | | 15,174 | | | | CHF | | | | 13,920 | | | | 212 | |
Brown Brothers Harriman | | | 12/14/20 | | | | USD | | | | 47 | | | | CHF | | | | 43 | | | | — | |
Brown Brothers Harriman | | | 12/14/20 | | | | GBP | | | | 500 | | | | USD | | | | 669 | | | | 2 | |
Brown Brothers Harriman | | | 12/14/20 | | | | GBP | | | | 15,094 | | | | USD | | | | 19,931 | | | | (224 | ) |
Brown Brothers Harriman | | | 12/14/20 | | | | USD | | | | 20,209 | | | | GBP | | | | 15,305 | | | | 227 | |
Brown Brothers Harriman | | | 12/14/20 | | | | USD | | | | 562 | | | | GBP | | | | 420 | | | | (1 | ) |
Brown Brothers Harriman | | | 12/14/20 | | | | SEK | | | | 759 | | | | USD | | | | 89 | | | | — | |
Brown Brothers Harriman | | | 12/14/20 | | | | SEK | | | | 25,968 | | | | USD | | | | 3,000 | | | | (38 | ) |
Brown Brothers Harriman | | | 12/14/20 | | | | USD | | | | 36,866 | | | | JPY | | | | 3,891,305 | | | | 465 | |
Brown Brothers Harriman | | | 12/14/20 | | | | USD | | | | 1,740 | | | | JPY | | | | 180,908 | | | | (4 | ) |
Brown Brothers Harriman | | | 12/14/20 | | | | USD | | | | 48,732 | | | | EUR | | | | 41,385 | | | | 794 | |
Brown Brothers Harriman | | | 12/14/20 | | | | EUR | | | | 50,439 | | | | USD | | | | 59,387 | | | | (973 | ) |
Brown Brothers Harriman | | | 12/14/20 | | | | JPY | | | | 165,918 | | | | USD | | | | 1,597 | | | | 5 | |
Brown Brothers Harriman | | | 12/14/20 | | | | JPY | | | | 6,680,222 | | | | USD | | | | 63,275 | | | | (813 | ) |
| | | | | | | | | | | | | | | | | | | | | | | | |
| | | | | | | | | | | | | | | | | | | | | | $ | (136 | ) |
| | | | | | | | | | | | | | | | | | | | | | | | |
| | Percentages are based on Net Assets of $513,027 ($ Thousands). |
| * | Non-income producing security. |
| ** | The rate reported is the 7-day effective yield as of November 30, 2020. |
| † | Investment in Affiliated Security (see Note 6). |
| ‡ | Real Estate Investment Trust. |
| ‡‡ | Expiration date not available. |
| (A) | There is currently no rate available. |
| (B) | Refer to table below for details on Options Contracts. |
ADR — American Depositary Receipt
AUD — Australian Dollar
CAD — Canadian Dollar
CHF — Swiss Franc
Cl — Class
DKK — Danish Krone
EUR — Euro
GBP — British Pound Sterling
GDR — Global Depositary Receipt
HKD — Hong Kong Dollar
JPY — Japanese Yen
JSC — Joint-Stock Company
Ltd. — Limited
MSCI — Morgan Stanley Capital International
NOK — Norwegian Krone
NZD — New Zealand Dollar
OMX — Offset Market Exchange
PJSC — Public Joint-Stock Company
PLC — Public Limited Company
REIT — Real Estate investment Trust
S&P— Standard & Poor’s
SGD — Singapore Dollar
SEK — Swedish Krona
SPI — Share Price Index
TOPIX- Tokyo Price Index
TSX — Toronto Stock Exchange
USD — U.S. Dollar
| | |
| SEI Institutional Investments Trust / Semi-Annual Report / November 30, 2020 | | 13 |
SCHEDULE OF INVESTMENTS (Unaudited)
November 30, 2020
World Select Equity Fund (Continued)
The following is a list of the level of inputs used as of November 30, 2020, in valuing the Fund’s investments and other financial instruments carried at value ($ Thousands):
| | | | | | | | | | | | | | | | |
| | | | | |
| Investments in Securities | | Level 1
($) | | | Level 2
($) | | | Level 3
($)(1) | | | Total
($) | |
Common Stock | | | 471,899 | | | | 862 | | | | 25 | | | | 472,786 | |
Preferred Stock | | | 1,963 | | | | – | | | | – | | | | 1,963 | |
Rights | | | 88 | | | | – | | | | – | | | | 88 | |
Cash Equivalent | | | 14,731 | | | | – | | | | – | | | | 14,731 | |
| | | | | | | | | | | | | | | | |
| | | | |
Total Investments in Securities | | | 488,681 | | | | 862 | | | | 25 | | | | 489,568 | |
| | | | | | | | | | | | | | | | |
| | | | | | | | | | | | | | | | |
| Other Financial Instruments | | Level 1
($) | | | Level 2
($) | | | Level 3
($) | | | Total
($) | |
Purchased Options | | | 7 | | | | – | | | | – | | | | 7 | |
Futures Contracts* | | | | | | | | | | | | | | | | |
Unrealized Appreciation | | | 5,506 | | | | – | | | | – | | | | 5,506 | |
Unrealized Depreciation | | | (3,941) | | | | – | | | | – | | | | (3,941) | |
Forwards Contracts* | | | | | | | | | | | | | | | | |
Unrealized Appreciation | | | – | | | | 2,136 | | | | – | | | | 2,136 | |
Unrealized Depreciation | | | – | | | | (2,272) | | | | – | | | | (2,272) | |
| | | | | | | | | | | | | | | | |
Total Other Financial Instruments | | | 1,572 | | | | (136) | | | | – | | | | 1,436 | |
| | | | | | | | | | | | | | | | |
* Futures contracts and forward contracts are valued at the unrealized appreciation (depreciation) on the instrument.
For the period ended November 30, 2020, there were transfers in or out of Level 3.
For more information on valuation inputs, see Note 2 – Significant Accounting Policies in Notes to Financial Statements.
The following is a summary of the Fund’s transactions with affiliates for the period ended November 30, 2020 ($ Thousands):
| | | | | | | | | | | | | | | | | | |
| Security Description | | Value
5/31/2020 | | Purchases
at Cost | | Proceeds from
Sales | | Realized Gain/
(Loss) | | Change in
Unrealized
Appreciation/
(Depreciation) | | Value
11/30/2020 | | Shares | | Income | | Capital Gains |
SEI Daily Income Trust, Government Fund, Cl F | | $3,966 | | $53,805 | | $(43,040) | | $- | | $- | | $14,731 | | $14,730,889 | | $1 | | $- |
| | | | | | | | | | | | | | | | | | |
Amounts designated as “–” are either $0 or have been rounded to $0.
The accompanying notes are an integral part of the financial statements.
| | |
| 14 | | SEI Institutional Investments Trust / Semi-Annual Report / November 30, 2020 |
SCHEDULE OF INVESTMENTS (Unaudited)
November 30, 2020
Emerging Markets Equity Fund (Continued)
| | | | | | | | |
| | | |
| Description | | Shares | | Market Value
($ Thousands) |
COMMON STOCK — 95.0% | | | | | | | | |
| | |
Argentina — 0.1% | | | | | | | | |
Cablevision Holding SA GDR | | | 76,426 | | | $ | 184 | |
Corp America Airports SA * | | | 266,076 | | | | 836 | |
IRSA Propiedades Comerciales SA ADR | | | 1,698 | | | | 17 | |
| | |
| | | | | | | 1,037 | |
| | |
Bangladesh — 0.4% | | | | | | | | |
BRAC Bank Ltd | | | 6,138,360 | | | | 3,330 | |
GrameenPhone Ltd | | | 143,460 | | | | 540 | |
Square Pharmaceuticals Ltd | | | 540,210 | | | | 1,171 | |
| | |
| | | | | | | 5,041 | |
| | |
Brazil — 3.6% | | | | | | | | |
Ambev SA | | | 443,800 | | | | 1,164 | |
B2W Cia Digital * | | | 3,800 | | | | 50 | |
B3 SA - Brasil Bolsa Balcao | | | 36,000 | | | | 375 | |
Banco do Brasil SA | | | 429,854 | | | | 2,723 | |
Banco Santander Brasil SA | | | 298,900 | | | | 2,188 | |
CCR SA | | | 233,600 | | | | 566 | |
Cia Brasileira de Distribuicao | | | 101,610 | | | | 1,291 | |
Cia Energetica de Minas Gerais ADR | | | 465,602 | | | | 1,127 | |
Cosan SA | | | 129,400 | | | | 1,887 | |
CPFL Energia SA | | | 37,900 | | | | 218 | |
Cyrela Brazil Realty SA Empreendimentos e Participacoes | | | 307,000 | | | | 1,534 | |
Engie Brasil Energia SA | | | 23,300 | | | | 185 | |
Gerdau SA ADR | | | 389,463 | | | | 1,640 | |
Grupo SBF SA * | | | 185,900 | | | | 921 | |
Hapvida Participacoes e Investimentos SA | | | 912,000 | | | | 2,411 | |
Hypera SA | | | 121,100 | | | | 718 | |
JBS SA | | | 627,600 | | | | 2,697 | |
Lojas Quero Quero S/A * | | | 612,300 | | | | 1,842 | |
Lojas Renner SA | | | 315,260 | | | | 2,627 | |
Minerva SA/Brazil | | | 239,468 | | | | 446 | |
Movida Participacoes SA | | | 430,407 | | | | 1,574 | |
Notre Dame Intermedica Participacoes SA | | | 215,700 | | | | 2,743 | |
Petroleo Brasileiro SA ADR, Cl A | | | 302,613 | | | | 2,799 | |
Qualicorp Consultoria e Corretora de Seguros SA | | | 204,900 | | | | 1,267 | |
Sul America SA | | | 174,012 | | | | 1,372 | |
TOTVS SA | | | 167,794 | | | | 854 | |
Vale SA ADR, Cl B | | | 377,135 | | | | 5,491 | |
YDUQS Participacoes SA | | | 184,600 | | | | 1,126 | |
| | |
| | | | | | | 43,836 | |
| | |
Canada — 1.2% | | | | | | | | |
Dundee Precious Metals Inc | | | 301,167 | | | | 1,975 | |
Endeavour Mining Corp * | | | 31,692 | | | | 749 | |
ERO Copper Corp * | | | 33,648 | | | | 579 | |
First Quantum Minerals Ltd | | | 362,530 | | | | 5,156 | |
Gran Tierra Energy Inc * | | | 1,180,670 | | | | 337 | |
Lithium Americas Corp * | | | 167,211 | | | | 1,889 | |
| | | | | | | | |
| | | |
| Description | | Shares | | Market Value
($ Thousands) |
COMMON STOCK (continued) | | | | | | | | |
Parex Resources Inc * | | | 227,755 | | | $ | 3,128 | |
| | | | | | | 13,813 | |
Chile — 0.8% | | | | | | | | |
Antofagasta PLC | | | 33,400 | | | | 559 | |
Banco Santander Chile | | | 11,253,730 | | | | 485 | |
Falabella SA | | | 159,989 | | | | 544 | |
Parque Arauco SA | | | 97,152 | | | | 150 | |
Plaza SA | | | 136,870 | | | | 223 | |
SMU SA | | | 4,073,721 | | | | 616 | |
Sociedad Quimica y Minera de Chile SA ADR | | | 112,867 | | | | 5,313 | |
Vina Concha y Toro SA | | | 1,326,815 | | | | 2,273 | |
| | |
| | | | | | | 10,163 | |
| | |
China — 15.0% | | | | | | | | |
Alibaba Group Holding Ltd ADR * | | | 150,610 | | | | 39,665 | |
Autobio Diagnostics Co Ltd, Cl A | | | 89,784 | | | | 1,978 | |
Baidu Inc ADR * | | | 34,194 | | | | 4,753 | |
BYD Co Ltd, Cl H | | | 76,000 | | | | 1,785 | |
By-health Co Ltd, Cl A | | | 552,700 | | | | 2,108 | |
Changzhou Xingyu Automotive Lighting Systems Co Ltd, Cl A | | | 72,100 | | | | 2,085 | |
China Communications Construction Co Ltd, Cl H | | | 1,211,000 | | | | 628 | |
China Construction Bank Corp, Cl H | | | 21,954,000 | | | | 17,218 | |
China Life Insurance Co Ltd, Cl H | | | 1,091,000 | | | | 2,474 | |
China Medical System Holdings Ltd | | | 2,084,000 | | | | 2,129 | |
China Mobile Ltd | | | 598,500 | | | | 3,582 | |
China Mobile Ltd ADR | | | 48,173 | | | | 1,438 | |
China National Medicines Corp Ltd, Cl A | | | 214,147 | | | | 1,454 | |
China Railway Construction Corp Ltd, Cl H | | | 918,000 | | | | 606 | |
Chongqing Fuling Zhacai Group Co Ltd, Cl A | | | 297,898 | | | | 1,720 | |
Chongqing Zhifei Biological Products Co Ltd, Cl A | | | 186,600 | | | | 3,541 | |
Country Garden Holdings Co Ltd | | | 1,280,619 | | | | 1,691 | |
Daqin Railway Co Ltd, Cl A | | | 1,133,145 | | | | 1,167 | |
Dongfeng Motor Group Co Ltd, Cl H | | | 1,370,000 | | | | 1,410 | |
Fosun International Ltd | | | 1,833,500 | | | | 2,649 | |
Guangzhou R&F Properties Co Ltd | | | 1,655,600 | | | | 2,157 | |
Hangzhou Robam Appliances Co Ltd, Cl A | | | 451,384 | | | | 2,741 | |
Huadong Medicine Co Ltd, Cl A | | | 195,200 | | | | 820 | |
Hundsun Technologies Inc, Cl A | | | 164,900 | | | | 2,215 | |
JD.com Inc ADR * | | | 83,846 | | | | 7,156 | |
Kingdee International Software Group Co Ltd | | | 915,000 | | | | 3,193 | |
Kweichow Moutai Co Ltd, Cl A | | | 23,975 | | | | 6,243 | |
Laobaixing Pharmacy Chain JSC, Cl A | | | 120,142 | | | | 1,313 | |
Li Ning Co Ltd | | | 578,500 | | | | 3,134 | |
NetEase Inc ADR | | | 118,084 | | | | 10,671 | |
New Oriental Education & Technology Group Inc ADR * | | | 16,368 | | | | 2,698 | |
Ping An Insurance Group Co of China Ltd, Cl H | | | 950,000 | | | | 11,151 | |
| | |
| SEI Institutional Investments Trust / Semi-Annual Report / November 30, 2020 | | 1 |
SCHEDULE OF INVESTMENTS (Unaudited)
November 30, 2020
Emerging Markets Equity Fund (Continued)
| | | | | | | | |
| | | |
| Description | | Shares | | Market Value
($ Thousands) |
| | |
COMMON STOCK (continued) | | | | | | | | |
Shanghai Yuyuan Tourist Mart Group Co Ltd, Cl A | | | 2,525,844 | | | $ | 3,469 | |
Shenzhen Megmeet Electrical Co Ltd, Cl A | | | 185,600 | | | | 988 | |
Shenzhou International Group Holdings Ltd | | | 309,000 | | | | 5,230 | |
Skshu Paint Co Ltd, Cl A | | | 86,044 | | | | 1,799 | |
Tongwei Co Ltd, Cl A | | | 211,395 | | | | 989 | |
Vipshop Holdings Ltd ADR * | | | 43,870 | | | | 1,120 | |
Wuhu Sanqi Interactive Entertainment Network Technology Group Co Ltd, Cl A | | | 1,655,400 | | | | 6,572 | |
Wuliangye Yibin Co Ltd, Cl A | | | 154,715 | | | | 5,970 | |
Xtep International Holdings Ltd | | | 2,011,500 | | | | 856 | |
Yunnan Baiyao Group Co Ltd, Cl A | | | 98,500 | | | | 1,426 | |
Zhejiang Expressway Co Ltd, Cl H | | | 2,900,000 | | | | 2,065 | �� |
Zhejiang Supor Co Ltd, Cl A | | | 73,211 | | | | 777 | |
Zhejiang Weixing New Building Materials Co Ltd, Cl A | | | 636,448 | | | | 1,826 | |
| | | | | | | 180,660 | |
| | |
Colombia — 0.3% | | | | | | | | |
Bancolombia SA ADR, Cl R | | | 20,440 | | | | 622 | |
Canacol Energy Ltd | | | 430,406 | | | | 1,337 | |
Corp Financiera Colombiana SA * | | | 679 | | | | 6 | |
Ecopetrol SA ADR | | | 42,210 | | | | 486 | |
Grupo de Inversiones Suramericana SA | | | 80,484 | | | | 488 | |
Grupo Nutresa SA | | | 108,440 | | | | 696 | |
| | | | | | | 3,635 | |
| | |
Czech Republic — 0.1% | | | | | | | | |
Moneta Money Bank AS | | | 526,685 | | | | 1,574 | |
| | |
Egypt — 0.4% | | | | | | | | |
Cleopatra Hospital * | | | 2,000,000 | | | | 604 | |
Commercial International Bank Egypt SAE | | | 265,402 | | | | 1,053 | |
Commercial International Bank Egypt SAE GDR | | | 350,211 | | | | 1,341 | |
Egyptian Financial Group-Hermes Holding Co* | | | 254,800 | | | | 224 | |
Palm Hills Developments SAE * | | | 14,824,649 | | | | 1,323 | |
| | | | | | | 4,545 | |
| | |
Germany — 0.3% | | | | | | | | |
Delivery Hero SE * | | | 20,689 | | | | 2,506 | |
Global Fashion Group SA * | | | 101,564 | | | | 981 | |
| | | | | | | 3,487 | |
| | |
Ghana — 0.0% | | | | | | | | |
Scancom PLC | | | 1,623,950 | | | | 170 | |
| | |
Greece — 0.3% | | | | | | | | |
National Bank of Greece SA * | | | 1,705,867 | | | | 3,096 | |
OPAP SA | | | 49,936 | | | | 564 | |
| | | | | | | 3,660 | |
| | |
Hong Kong — 10.7% | | | | | | | | |
Agile Group Holdings Ltd | | | 594,000 | | | | 858 | |
Agricultural Bank of China Ltd, Cl H | | | 8,159,000 | | | | 3,094 | |
| | | | | | | | |
| | | |
| Description | | Shares | | Market Value
($ Thousands) |
| | |
COMMON STOCK (continued) | | | | | | | | |
AIA Group Ltd | | | 626,240 | | | $ | 6,862 | |
Anhui Conch Cement Co Ltd, Cl H | | | 936,500 | | | | 5,992 | |
AsiaInfo Technologies Ltd | | | 718,000 | | | | 1,087 | |
Bank of China Ltd, Cl H | | | 7,314,000 | | | | 2,585 | |
Beijing Enterprises Holdings Ltd | | | 676,500 | | | | 2,190 | |
Bosideng International Holdings Ltd | | | 3,708,000 | | | | 1,626 | |
China Education Group Holdings Ltd | | | 1,407,000 | | | | 2,810 | |
China Lesso Group Holdings Ltd | | | 1,430,000 | | | | 2,553 | |
China Mengniu Dairy Co Ltd | | | 1,003,000 | | | | 5,072 | |
China Overseas Grand Oceans Group Ltd | | | 2,121,000 | | | | 1,264 | |
China Yongda Automobiles Services Holdings Ltd | | | 1,478,000 | | | | 2,524 | |
China Yuhua Education Corp Ltd | | | 1,394,000 | | | | 1,315 | |
CNOOC Ltd | | | 2,109,000 | | | | 2,212 | |
Dali Foods Group Co Ltd | | | 2,114,500 | | | | 1,309 | |
Geely Automobile Holdings Ltd | | | 259,000 | | | | 720 | |
Industrial & Commercial Bank of China Ltd, Cl H | | | 6,010,000 | | | | 3,814 | |
Kingboard Laminates Holdings Ltd | | | 1,447,000 | | | | 2,341 | |
KWG Group Holdings Ltd | | | 964,500 | | | | 1,319 | |
KWG Living Group Holdings Ltd * | | | 482,000 | | | | 373 | |
Lee & Man Paper Manufacturing Ltd | | | 1,917,000 | | | | 1,558 | |
Lenovo Group Ltd | | | 1,304,000 | | | | 930 | |
Logan Group Co Ltd | | | 2,237,000 | | | | 3,745 | |
Luye Pharma Group Ltd | | | 1,676,500 | | | | 978 | |
Meituan, Cl B * | | | 201,100 | | | | 7,523 | |
Sany Heavy Equipment International Holdings Co Ltd | | | 2,293,000 | | | | 1,331 | |
Shanghai Pharmaceuticals Holding Co Ltd, Cl H | | | 1,446,700 | | | | 2,448 | |
Shimao Group Holdings Ltd | | | 294,500 | | | | 1,098 | |
Sinotrans Ltd, Cl H | | | 6,489,000 | | | | 2,302 | |
Sinotruk Hong Kong Ltd | | | 690,000 | | | | 1,712 | |
SITC International Holdings Co Ltd | | | 1,425,000 | | | | 2,739 | |
Sunac China Holdings Ltd | | | 355,000 | | | | 1,360 | |
Sunac Services Holdings Ltd * | | | 11,876 | | | | 18 | |
Techtronic Industries Co Ltd | | | 364,500 | | | | 4,671 | |
Tencent Holdings Ltd | | | 368,581 | | | | 26,767 | |
TravelSky Technology Ltd, Cl H | | | 1,113,000 | | | | 2,524 | |
Vinda International Holdings Ltd | | | 334,000 | | | | 954 | |
WuXi AppTec Co Ltd, Cl H | | | 271,820 | | | | 4,067 | |
Wuxi Biologics Cayman Inc * | | | 54,000 | | | | 527 | |
Xiaomi Corp, Cl B * | | | 202,200 | | | | 691 | |
Xinyi Energy Holdings Ltd | | | 1,958,000 | | | | 1,129 | |
Zhongsheng Group Holdings Ltd | | | 937,000 | | | | 7,034 | |
Zhou Hei Ya International Holdings Co Ltd | | | 1,488,000 | | | | 1,363 | |
| | | | | | | 129,389 | |
| | |
Hungary — 0.4% | | | | | | | | |
Magyar Telekom Telecommunications PLC | | | 387,640 | | | | 501 | |
Richter Gedeon Nyrt | | | 180,356 | | | | 4,281 | |
| | | | | | | 4,782 | |
| | |
| 2 | | SEI Institutional Investments Trust / Semi-Annual Report / November 30, 2020 |
SCHEDULE OF INVESTMENTS (Unaudited)
November 30, 2020
Emerging Markets Equity Fund (Continued)
| | | | | | | | |
| | | |
| Description | | Shares | | Market Value
($ Thousands) |
COMMON STOCK (continued) | | | | | | | | |
| | |
India — 7.5% | | | | | | | | |
Asian Paints Ltd | | | 53,005 | | | $ | 1,582 | |
Aurobindo Pharma Ltd | | | 194,740 | | | | 2,289 | |
Avenue Supermarts Ltd, Cl A * | | | 51,960 | | | | 1,598 | |
Bajaj Auto Ltd | | | 46,464 | | | | 1,979 | |
Bata India Ltd | | | 77,031 | | | | 1,632 | |
Britannia Industries Ltd | | | 21,356 | | | | 1,051 | |
City Union Bank Ltd | | | 503,948 | | | | 1,261 | |
Divi’s Laboratories Ltd | | | 89,175 | | | | 4,352 | |
Dixon Technologies India Ltd | | | 11,877 | | | | 1,906 | |
Dr Lal PathLabs Ltd | | | 62,875 | | | | 1,942 | |
Dr Reddy’s Laboratories Ltd | | | 38,375 | | | | 2,505 | |
Godrej Properties Ltd * | | | 127,171 | | | | 1,995 | |
HCL Technologies Ltd | | | 227,154 | | | | 2,518 | |
HDFC Bank Ltd ADR * | | | 99,269 | | | | 6,850 | |
Hero MotoCorp Ltd | | | 55,519 | | | | 2,324 | |
Hindalco Industries Ltd | | | 1,030,230 | | | | 3,118 | |
Hindustan Unilever Ltd | | | 72,778 | | | | 2,103 | |
ICICI Bank Ltd ADR | | | 269,309 | | | | 3,463 | |
Info Edge India Ltd | | | 40,282 | | | | 2,329 | |
Infosys Ltd | | | 298,524 | | | | 4,465 | |
Infosys Ltd ADR | | | 284,206 | | | | 4,326 | |
Ipca Laboratories Ltd | | | 73,253 | | | | 2,153 | |
ITC Ltd | | | 229,893 | | | | 599 | |
Jubilant Foodworks Ltd | | | 34,366 | | | | 1,161 | |
Kotak Mahindra Bank Ltd * | | | 170,045 | | | | 4,357 | |
Multi Commodity Exchange of India Ltd | | | 25,026 | | | | 545 | |
Persistent Systems Ltd | | | 74,007 | | | | 1,190 | |
Petronet LNG Ltd | | | 1,005,068 | | | | 3,403 | |
REC Ltd | | | 658,934 | | | | 1,082 | |
Reliance Industries Ltd | | | 196,922 | | | | 5,122 | |
Shriram Transport Finance Co Ltd | | | 134,637 | | | | 1,936 | |
State Bank of India | | | 449,801 | | | | 1,479 | |
Tata Consultancy Services Ltd | | | 51,517 | | | | 1,855 | |
Tata Consumer Products Ltd | | | 112,752 | | | | 818 | |
Varun Beverages Ltd | | | 119,679 | | | | 1,407 | |
WNS Holdings Ltd ADR * | | | 100,877 | | | | 7,103 | |
Zee Entertainment Enterprises Ltd | | | 422,431 | | | | 1,098 | |
| | | | | | | 90,896 | |
| | |
Indonesia — 2.2% | | | | | | | | |
Ace Hardware Indonesia Tbk PT | | | 6,817,600 | | | | 765 | |
Astra International Tbk PT | | | 1,954,000 | | | | 733 | |
Bank Central Asia Tbk PT | | | 1,393,300 | | | | 3,061 | |
Bank Negara Indonesia Persero Tbk PT | | | 1,811,000 | | | | 770 | |
Bank Rakyat Indonesia Persero Tbk PT | | | 10,558,600 | | | | 3,058 | |
Bank Tabungan Negara Persero Tbk PT | | | 9,729,300 | | | | 1,134 | |
Bumi Serpong Damai Tbk PT * | | | 13,302,400 | | | | 989 | |
Ciputra Development Tbk PT | | | 15,215,300 | | | | 997 | |
Indofood Sukses Makmur Tbk PT | | | 3,714,900 | | | | 1,868 | |
Link Net Tbk PT | | | 2,915,000 | | | | 500 | |
Malindo Feedmill Tbk PT * | | | 3,961,500 | | | | 182 | |
Matahari Department Store Tbk PT | | | 1,558,800 | | | | 140 | |
| | | | | | | | |
| | | |
| Description | | Shares | | Market Value
($ Thousands) |
COMMON STOCK (continued) | | | | | | | | |
Media Nusantara Citra Tbk PT * | | | 7,246,700 | | | $ | 521 | |
Medikaloka Hermina Tbk PT | | | 11,480,000 | | | | 3,171 | |
Merdeka Copper Gold Tbk PT * | | | 12,607,700 | | | | 1,732 | |
Pakuwon Jati Tbk PT | | | 75,033,584 | | | | 2,657 | |
Pan Brothers Tbk PT | | | 3,957,400 | | | | 64 | |
Tiga Pilar Sejahtera Food Tbk * | | | 6,565,800 | | | | 132 | |
Ultrajaya Milk Industry & Trading Co Tbk PT | | | 31,400,000 | | | | 3,580 | |
United Tractors Tbk PT | | | 364,500 | | | | 594 | |
| | | | | | | 26,648 | |
| | |
Ivory Coast — 0.1% | | | | | | | | |
Sonatel SA | | | 32,578 | | | | 665 | |
| | |
Kenya — 0.4% | | | | | | | | |
ARM Cement Ltd * | | | 10 | | | | – | |
East African Breweries Ltd | | | 868,992 | | | | 1,208 | |
Equity Group Holdings PLC/Kenya | | | 7,653,143 | | | | 2,405 | |
Safaricom PLC | | | 5,706,820 | | | | 1,695 | |
| | | | | | | 5,308 | |
| | |
Malaysia — 0.8% | | | | | | | | |
Fraser & Neave Holdings Bhd | | | 72,100 | | | | 574 | |
Malayan Banking Bhd | | | 678,269 | | | | 1,315 | |
MR DIY Group M Bhd | | | 3,506,500 | | | | 2,264 | |
PPB Group Bhd | | | 278,700 | | | | 1,272 | |
TIME dotCom Bhd | | | 408,200 | | | | 1,373 | |
Top Glove Corp Bhd | | | 1,389,400 | | | | 2,428 | |
VS Industry Bhd | | | 1,381,300 | | | | 797 | |
| | | | | | | 10,023 | |
| | |
Mauritius — 0.1% | | | | | | | | |
MCB Group Ltd * | | | 100,910 | | | | 608 | |
| | |
Mexico — 1.7% | | | | | | | | |
Bolsa Mexicana de Valores SAB de CV | | | 420,688 | | | | 953 | |
Corp Inmobiliaria Vesta SAB de CV | | | 926,800 | | | | 1,665 | |
Genomma Lab Internacional SAB de CV, Cl B * | | | 1,079,224 | | | | 1,060 | |
Gruma SAB de CV, Cl B | | | 68,300 | | | | 757 | |
Grupo Aeroportuario del Centro Norte SAB de CV, Cl B | | | 322,889 | | | | 1,883 | |
Grupo Aeroportuario del Sureste SAB de CV ADR * | | | 17,416 | | | | 2,604 | |
Grupo Aeroportuario del Sureste SAB de CV, Cl B * | | | 27,585 | | | | 412 | |
Grupo Financiero Banorte SAB de CV, Cl O * | | | 626,321 | | | | 3,127 | |
Grupo Mexico SAB de CV, Ser B | | | 710,600 | | | | 2,591 | |
Kimberly-Clark de Mexico SAB de CV, Cl A | | | 431,556 | | | | 686 | |
Promotora y Operadora de Infraestructura SAB de CV | | | 52,700 | | | | 423 | |
Wal-Mart de Mexico SAB de CV | | | 1,850,551 | | | | 4,884 | |
| | | | | | | 21,045 | |
| | |
Morocco — 0.3% | | | | | | | | |
Attijariwafa Bank * | | | 18,750 | | | | 846 | |
Label Vie | | | 6,226 | | | | 2,158 | |
| | |
| SEI Institutional Investments Trust / Semi-Annual Report / November 30, 2020 | | 3 |
SCHEDULE OF INVESTMENTS (Unaudited)
November 30, 2020
Emerging Markets Equity Fund (Continued)
| | | | | | | | |
| | | |
| Description | | Shares | | Market Value
($ Thousands) |
| | |
COMMON STOCK (continued) | | | | | | | | |
Societe d’Exploitation des Ports | | | 38,140 | | | $ | 823 | |
| | | | | | | 3,827 | |
| | |
Nigeria — 0.4% | | | | | | | | |
Guaranty Trust Bank PLC | | | 4,577,704 | | | | 394 | |
Zenith Bank PLC | | | 63,514,510 | | | | 3,952 | |
| | | | | | | 4,346 | |
| | |
Oman — 0.0% | | | | | | | | |
Bank Muscat SAOG | | | 367,181 | | | | 370 | |
| | |
Pakistan — 0.2% | | | | | | | | |
United Bank Ltd/Pakistan | | | 3,224,955 | | | | 2,438 | |
| | |
Peru — 0.3% | | | | | | | | |
Alicorp SAA | | | 512,528 | | | | 1,009 | |
Cementos Pacasmayo SAA | | | 531,678 | | | | 873 | |
Cia de Minas Buenaventura SAA ADR * | | | 39,400 | | | | 437 | |
Ferreycorp SAA | | | 1,298,960 | | | | 608 | |
InRetail Peru Corp | | | 28,180 | | | | 1,000 | |
| | | | | | | 3,927 | |
| | |
Philippines — 3.6% | | | | | | | | |
AllHome Corp * | | | 17,413,000 | | | | 3,094 | |
Alliance Global Group Inc | | | 11,598,710 | | | | 2,362 | |
Altus Property Ventures Inc * | | | 160,437 | | | | 50 | |
Ayala Corp | | | 375,259 | | | | 6,455 | |
Ayala Land Inc | | | 2,540,300 | | | | 2,000 | |
Bank of the Philippine Islands | | | 1,572,390 | | | | 2,719 | |
BDO Unibank Inc | | | 1,448,824 | | | | 3,106 | |
Cebu Air Inc * | | | 670,040 | | | | 657 | |
East West Banking Corp * | | | 2,254,500 | | | | 546 | |
Emperador Inc | | | 2,082,300 | | | | 437 | |
GT Capital Holdings Inc | | | 423,650 | | | | 5,130 | |
International Container Terminal Services Inc | | | 509,730 | | | | 1,237 | |
Jollibee Foods Corp | | | 328,270 | | | | 1,290 | |
Megaworld Corp | | | 15,174,000 | | | | 1,212 | |
Metropolitan Bank & Trust Co | | | 1,034,120 | | | | 1,030 | |
Robinsons Land Corp | | | 16,594,032 | | | | 5,754 | |
Robinsons Retail Holdings Inc | | | 1,824,690 | | | | 2,586 | |
Security Bank Corp | | | 93,130 | | | | 242 | |
Universal Robina Corp | | | 583,820 | | | | 1,728 | |
Wilcon Depot Inc | | | 4,390,600 | | | | 1,647 | |
| | | | | | | 43,282 | |
| | |
Poland — 0.7% | | | | | | | | |
Bank Polska Kasa Opieki SA | | | 104,558 | | | | 1,583 | |
Cyfrowy Polsat SA | | | 156,766 | | | | 1,117 | |
Dino Polska SA * | | | 55,934 | | | | 3,763 | |
Kernel Holding SA | | | 152,020 | | | | 1,963 | |
Polski Koncern Naftowy ORLEN SA | | | 27,547 | | | | 407 | |
| | | | | | | 8,833 | |
| | |
Qatar — 0.2% | | | | | | | | |
Commercial Bank PSQC/The | | | 258,460 | | | | 309 | |
Ooredoo QPSC | | | 594,537 | | | | 1,104 | |
| | | | | | | | |
| | | |
| Description | | Shares | | Market Value
($ Thousands) |
| | |
COMMON STOCK (continued) | | | | | | | | |
Qatar National Bank QPSC | | | 101,190 | | | $ | 492 | |
Qatar Navigation QSC | | | 178,580 | | | | 312 | |
| | | | | | | 2,217 | |
Romania — 0.2% | | | | | | | | |
Banca Transilvania SA | | | 4,466,269 | | | | 2,416 | |
Russia — 3.1% | | | | | | | | |
Gazprom PJSC ADR | | | 690,225 | | | | 3,209 | |
Globaltrans Investment PLC GDR | | | 191,414 | | | | 1,097 | |
LUKOIL PJSC ADR | | | 102,433 | | | | 6,711 | |
Mail.Ru Group Ltd GDR * | | | 73,162 | | | | 2,111 | |
MMC Norilsk Nickel PJSC ADR | | | 104,821 | | | | 2,923 | |
Mobile TeleSystems PJSC ADR | | | 31,036 | | | | 268 | |
Moscow Exchange MICEX-RTS PJSC * | | | 1,331,960 | | | | 2,663 | |
Sberbank of Russia PJSC ADR | | | 506,098 | | | | 6,734 | |
Sistema PJSFC GDR | | | 221,310 | | | | 1,772 | |
X5 Retail Group NV GDR | | | 22,671 | | | | 814 | |
Yandex NV, Cl A * | | | 138,529 | | | | 9,553 | |
| | | | | | | 37,855 | |
Saudi Arabia — 0.7% | | | | | | | | |
Al Rajhi Bank | | | 88,290 | | | | 1,761 | |
Arab National Bank | | | 120,951 | | | | 658 | |
National Commercial Bank | | | 115,756 | | | | 1,304 | |
Riyad Bank | | | 77,347 | | | | 429 | |
Saudi Arabian Fertilizer Co | | | 23,787 | | | | 520 | |
Saudi British Bank/The | | | 83,253 | | | | 603 | |
Saudi Telecom Co | | | 54,315 | | | | 1,561 | |
United Electronics Co | | | 56,528 | | | | 1,206 | |
| | | | | | | 8,042 | |
South Africa — 2.9% | | | | | | | | |
Absa Group Ltd | | | 277,922 | | | | 1,979 | |
African Rainbow Minerals Ltd | | | 111,951 | | | | 1,735 | |
Aspen Pharmacare Holdings Ltd | | | 100,986 | | | | 806 | |
Bidvest Group Ltd/The | | | 35,112 | | | | 370 | |
Capitec Bank Holdings Ltd | | | 28,355 | | | | 2,374 | |
Clicks Group Ltd | | | 120,163 | | | | 1,823 | |
Exxaro Resources Ltd | | | 37,981 | | | | 293 | |
Gold Fields Ltd ADR | | | 91,566 | | | | 798 | |
Impala Platinum Holdings Ltd | | | 213,109 | | | | 2,241 | |
Kumba Iron Ore Ltd | | | 28,579 | | | | 973 | |
Life Healthcare Group Holdings Ltd | | | 310,271 | | | | 317 | |
Mediclinic International PLC | | | 180,583 | | | | 678 | |
Mr Price Group Ltd | | | 320,060 | | | | 3,365 | |
Naspers Ltd, Cl N | | | 55,448 | | | | 11,210 | |
Northam Platinum Ltd * | | | 88,705 | | | | 1,010 | |
Old Mutual Ltd | | | 1,444,546 | | | | 1,091 | |
Shoprite Holdings Ltd | | | 47,811 | | | | 395 | |
Sibanye Stillwater Ltd | | | 792,848 | | | | 2,638 | |
Standard Bank Group Ltd | | | 129,358 | | | | 1,012 | |
| | | | | | | 35,108 | |
| | |
| 4 | | SEI Institutional Investments Trust / Semi-Annual Report / November 30, 2020 |
SCHEDULE OF INVESTMENTS (Unaudited)
November 30, 2020
Emerging Markets Equity Fund (Continued)
| | | | | | | | |
| | | |
| Description | | Shares | | Market Value
($ Thousands) |
COMMON STOCK (continued) | | | | | | | | |
South Korea — 10.1% | | | | | | | | |
BGF retail Co Ltd | | | 11,442 | | | $ | 1,298 | |
Celltrion Inc * | | | 4,657 | | | | 1,431 | |
Chunbo Co Ltd | | | 6,038 | | | | 977 | |
CJ ENM Co Ltd | | | 59,851 | | | | 7,205 | |
Daelim Industrial Co Ltd | | | 10,750 | | | | 777 | |
DB HiTek Co Ltd | | | 44,704 | | | | 1,432 | |
DGB Financial Group Inc | | | 232,108 | | | | 1,531 | |
Doosan Bobcat Inc | | | 25,801 | | | | 701 | |
Douzone Bizon Co Ltd | | | 43,210 | | | | 4,120 | |
Duk San Neolux Co Ltd * | | | 50,535 | | | | 1,441 | |
Ecopro Co Ltd | | | 11,904 | | | | 489 | |
E-MART Inc | | | 11,897 | | | | 1,656 | |
Eugene Technology Co Ltd | | | 54,916 | | | | 1,663 | |
Hana Financial Group Inc | | | 100,122 | | | | 3,063 | |
Hankook Tire & Technology Co Ltd | | | 37,973 | | | | 1,122 | |
Hanwha Corp | | | 46,199 | | | | 1,077 | |
Hanwha Solutions Corp | | | 36,537 | | | | 1,577 | |
Hugel Inc * | | | 9,596 | | | | 1,714 | |
Hyundai Marine & Fire Insurance Co Ltd | | | 62,654 | | | | 1,263 | |
Iljin Materials Co Ltd | | | 19,966 | | | | 844 | |
KB Financial Group Inc | | | 144,847 | | | | 5,936 | |
Kia Motors Corp | | | 76,131 | | | | 3,977 | |
KINX Inc | | | 15,877 | | | | 1,042 | |
Koh Young Technology Inc | | | 25,180 | | | | 2,132 | |
Korea Zinc Co Ltd | | | 4,569 | | | | 1,565 | |
LG Corp | | | 31,113 | | | | 1,985 | |
LG Electronics Inc | | | 15,341 | | | | 1,185 | |
LG Household & Health Care Ltd | | | 1,815 | | | | 2,483 | |
Mando Corp | | | 48,627 | | | | 2,131 | |
NAVER Corp | | | 13,215 | | | | 3,314 | |
NCSoft Corp | | | 8,369 | | | | 6,126 | |
NICE Information Service Co Ltd | | | 65,323 | | | | 1,263 | |
Pan Ocean Co Ltd * | | | 325,205 | | | | 1,249 | |
Park Systems Corp | | | 17,800 | | | | 1,187 | |
POSCO | | | 8,374 | | | | 1,771 | |
POSCO ADR | | | 31,885 | | | | 1,701 | |
PSK Inc | | | 57,063 | | | | 1,903 | |
Samsung C&T Corp | | | 9,295 | | | | 1,012 | |
Samsung Electro-Mechanics Co Ltd | | | 9,987 | | | | 1,408 | |
Samsung Electronics Co Ltd | | | 553,987 | | | | 33,393 | |
SK Hynix Inc | | | 42,968 | | | | 3,786 | |
SK Telecom Co Ltd | | | 6,334 | | | | 1,359 | |
SKC Co Ltd | | | 15,808 | | | | 1,281 | |
Webcash Corp | | | 20,703 | | | | 1,396 | |
WONIK IPS Co Ltd | | | 40,157 | | | | 1,446 | |
| | | | | | | 121,412 | |
| | |
Sri Lanka — 0.1% | | | | | | | | |
John Keells Holdings PLC | | | 1,938,965 | | | | 1,547 | |
| | |
Taiwan — 12.0% | | | | | | | | |
Accton Technology Corp | | | 490,000 | | | | 4,109 | |
| | | | | | | | |
| | | |
| Description | | Shares | | Market Value
($ Thousands) |
| | |
COMMON STOCK (continued) | | | | | | | | |
Airtac International Group | | | 121,000 | | | $ | 3,524 | |
Asia Cement Corp | | | 1,517,000 | | | | 2,305 | |
ASMedia Technology Inc | | | 26,000 | | | | 1,501 | |
Chailease Holding Co Ltd | | | 1,089,448 | | | | 5,963 | |
Chicony Power Technology Co Ltd | | | 648,000 | | | | 1,530 | |
Chilisin Electronics Corp | | | 280,000 | | | | 1,297 | |
Compeq Manufacturing Co Ltd | | | 466,000 | | | | 786 | |
Delta Electronics Inc | | | 849,000 | | | | 6,687 | |
Elan Microelectronics Corp | | | 337,000 | | | | 1,561 | |
FLEXium Interconnect Inc | | | 238,000 | | | | 1,002 | |
Fubon Financial Holding Co Ltd | | | 2,893,000 | | | | 4,496 | |
Global PMX Co Ltd | | | 258,000 | | | | 1,742 | |
Gourmet Master Co Ltd | | | 138,000 | | | | 692 | |
Grand Pacific Petrochemical | | | 2,033,000 | | | | 1,669 | |
Hon Hai Precision Industry Co Ltd | | | 1,521,912 | | | | 4,394 | |
Kindom Development Co Ltd | | | 680,000 | | | | 897 | |
King Yuan Electronics Co Ltd | | | 700,000 | | | | 869 | |
King’s Town Bank Co Ltd | | | 900,000 | | | | 1,206 | |
Lite-On Technology Corp | | | 891,862 | | | | 1,504 | |
MediaTek Inc | | | 178,357 | | | | 4,405 | |
Merida Industry Co Ltd | | | 154,000 | | | | 1,351 | |
Micro-Star International Co Ltd | | | 513,000 | | | | 2,250 | |
Novatek Microelectronics Corp | | | 65,000 | | | | 682 | |
Pan Jit International Inc | | | 1,061,000 | | | | 1,660 | |
Parade Technologies Ltd | | | 45,000 | | | | 1,634 | |
Pegatron Corp | | | 588,000 | | | | 1,347 | |
Pegavision Corp | | | 95,000 | | | | 852 | |
Powertech Technology Inc | | | 434,000 | | | | 1,401 | |
Realtek Semiconductor Corp | | | 129,000 | | | | 1,679 | |
Silergy Corp | | | 73,947 | | | | 5,760 | |
Taishin Financial Holding Co Ltd | | | 1,366,000 | | | | 640 | |
Taiwan Semiconductor Manufacturing Co Ltd | | | 1,125,000 | | | | 18,966 | |
Taiwan Semiconductor Manufacturing Co | | | | | | | | |
Ltd ADR | | | 459,588 | | | | 44,589 | |
Unimicron Technology Corp | | | 477,000 | | | | 1,504 | |
United Microelectronics Corp | | | 1,084,000 | | | | 1,540 | |
Universal Microwave Technology Inc | | | 2 | | | | – | |
Voltronic Power Technology Corp | | | 42,950 | | | | 1,317 | |
Win Semiconductors Corp | | | 109,000 | | | | 1,281 | |
Yeong Guan Energy Technology Group Co Ltd | | | 423,000 | | | | 1,325 | |
Yuanta Financial Holding Co Ltd | | | 3,489,400 | | | | 2,338 | |
| | | | | | | 144,255 | |
| | |
Thailand — 3.2% | | | | | | | | |
Advanced Info Service PCL | | | 299,900 | | | | 1,740 | |
Airports of Thailand PCL | | | 801,700 | | | | 1,696 | |
Bangkok Dusit Medical Services PCL, Cl F | | | 2,560,600 | | | | 1,820 | |
Charoen Pokphand Foods PCL | | | 2,018,700 | | | | 1,918 | |
CP ALL PCL | | | 1,045,600 | | | | 2,091 | |
Home Product Center PCL | | | 14,760,445 | | | | 7,173 | |
Intouch Holdings PCL, Cl F | | | 785,600 | | | | 1,441 | |
JMT Network Services PCL | | | 1,665,200 | | | | 1,844 | |
Kasikornbank PCL | | | 185,200 | | | | 673 | |
| | |
| SEI Institutional Investments Trust / Semi-Annual Report / November 30, 2020 | | 5 |
SCHEDULE OF INVESTMENTS (Unaudited)
November 30, 2020
Emerging Markets Equity Fund (Continued)
| | | | | | | | |
| | | |
| Description | | Shares | | Market Value
($ Thousands) |
| | |
COMMON STOCK (continued) | | | | | | | | |
Kasikornbank PCL NVDR | | | 933,800 | | | $ | 3,396 | |
Minor International PCL NVDR | | | 5,062,457 | | | | 4,150 | |
PTT PCL | | | 1,350,900 | | | | 1,786 | |
Siam Cement PCL/The | | | 45,300 | | | | 560 | |
Sri Trang Agro-Industry PCL | | | 1,840,600 | | | | 1,628 | |
Thanachart Capital PCL | | | 256,098 | | | | 288 | |
Tisco Financial Group PCL | | | 528,700 | | | | 1,372 | |
TOA Paint Thailand PCL | | | 1,904,500 | | | | 2,330 | |
VGI PCL | | | 8,095,100 | | | | 2,061 | |
| | | | | | | 37,967 | |
| | |
Turkey — 0.3% | | | | | | | | |
Ford Otomotiv Sanayi AS | | | 36,917 | | | | 509 | |
Haci Omer Sabanci Holding AS | | | 640,798 | | | | 790 | |
Tekfen Holding AS | | | 268,755 | | | | 500 | |
Turkcell Iletisim Hizmetleri AS | | | 758,032 | | | | 1,434 | |
| | | | | | | 3,233 | |
| | |
United Arab Emirates — 1.0% | | | | | | | | |
Aldar Properties PJSC | | | 4,270,322 | | | | 3,534 | |
Emaar Development PJSC | | | 4,791,415 | | | | 3,548 | |
Emaar Properties PJSC | | | 6,093,155 | | | | 5,275 | |
| | | | | | | 12,357 | |
| | |
United Kingdom — 4.2% | | | | | | | | |
AB Ignitis Grupe GDR | | | 90,914 | | | | 2,121 | |
ADES International Holding PLC * | | | 40,990 | | | | 379 | |
Avast PLC | | | 167,612 | | | | 1,137 | |
Bank of Georgia Group PLC | | | 42,990 | | | | 643 | |
Energean PLC * | | | 153,642 | | | | 1,472 | |
Georgia Capital PLC * | | | 10,196 | | | | 66 | |
Halyk Savings Bank of Kazakhstan JSC GDR | | | 580,564 | | | | 6,880 | |
Hochschild Mining PLC | | | 1,160,964 | | | | 3,295 | |
Investec PLC | | | 326,803 | | | | 810 | |
Kaspi.KZ JSC GDR | | | 37,350 | | | | 1,905 | |
KAZ Minerals PLC | | | 206,051 | | | | 1,763 | |
MHP SE GDR | | | 81,450 | | | | 497 | |
NAC Kazatomprom JSC GDR | | | 400,789 | | | | 5,671 | |
Network International Holdings PLC | | | 159,200 | | | | 570 | |
Nova Ljubljanska Banka dd GDR * | | | 382,226 | | | | 4,206 | |
OTP Bank Nyrt | | | 39,370 | | | | 1,565 | |
Polymetal International PLC | | | 92,878 | | | | 1,937 | |
Polyus PJSC GDR | | | 11,819 | | | | 1,122 | |
SEPLAT Petroleum Development Co Plc | | | 1,763,008 | | | | 1,341 | |
TBC Bank Group PLC | | | 14,830 | | | | 237 | |
Tullow Oil PLC | | | 1,090,179 | | | | 405 | |
Vivo Energy PLC | | | 6,310,306 | | | | 7,127 | |
VTB Bank PJSC GDR | | | 425,016 | | | | 396 | |
Wizz Air Holdings PLC * | | | 91,076 | | | | 5,474 | |
| | | | | | | 51,019 | |
| | |
United States — 2.6% | | | | | | | | |
Credicorp Ltd | | | 40,242 | | | | 6,194 | |
EPAM Systems Inc * | | | 14,525 | | | | 4,682 | |
| | | | | | | | |
| | | |
| Description | | Shares | | Market Value
($ Thousands) |
| | |
COMMON STOCK (continued) | | | | | | | | |
Globant SA * | | | 12,365 | | | $ | 2,333 | |
Intercorp Financial Services Inc | | | 113,097 | | | | 3,393 | |
Livent Corp * | | | 65,875 | | | | 999 | |
MercadoLibre Inc * | | | 5,481 | | | | 8,514 | |
Southern Copper Corp | | | 9,676 | | | | 575 | |
XP Inc, Cl A * | | | 34,123 | | | | 1,399 | |
Yum China Holdings Inc | | | 46,745 | | | | 2,635 | |
| | | | | | | 30,724 | |
| | |
Vietnam — 2.5% | | | | | | | | |
Binh Minh Plastics JSC | | | 169,850 | | | | 447 | |
FPT Corp | | | 670,202 | | | | 1,604 | |
Gemadept Corp | | | 487,470 | | | | 586 | |
Ho Chi Minh City Development Joint Stock | | | | | | | | |
Commercial Bank * | | | 2,166,178 | | | | 2,059 | |
Hoa Phat Group JSC | | | 2,113,722 | | | | 3,242 | |
Khang Dien House Trading and Investment | | | | | | | | |
JSC | | | 468,770 | | | | 542 | |
Military Commercial Joint Stock Bank * | | | 6,531,653 | | | | 5,744 | |
Refrigeration Electrical Engineering Corp | | | 61,290 | | | | 129 | |
Vietnam Dairy Products JSC | | | 958,024 | | | | 4,479 | |
Vietnam Engine & Agricultural Machinery | | | | | | | | |
Corp | | | 608,930 | | | | 1,274 | |
Vietnam Prosperity JSC Bank * | | | 1,987,341 | | | | 2,301 | |
Vietnam Technological & Commercial Joint | | | | | | | | |
Stock Bank * | | | 2,706,270 | | | | 2,818 | |
Vincom Retail JSC * | | | 3,239,259 | | | | 3,947 | |
Vinhomes JSC * | | | 181,607 | | | | 648 | |
| | | | | | | 29,820 | |
| | |
Total Common Stock
(Cost $869,641) ($ Thousands) | | | | | | | 1,145,980 | |
| | |
PREFERRED STOCK — 1.5% | | | | | | | | |
| | |
Brazil — 0.6% | | | | | | | | |
Banco Bradesco SA (A) | | | 285,015 | | | | 1,293 | |
Centrais Eletricas Brasileiras SA (A) | | | 70,100 | | | | 418 | |
Cia Paranaense de Energia (A) | | | 154,200 | | | | 1,966 | |
Itausa SA (A) | | | 1,639,017 | | | | 3,232 | |
Petroleo Brasileiro SA (A) | | | 54,300 | | | | 251 | |
| | | | | | | 7,160 | |
| | |
Chile — 0.1% | | | | | | | | |
Embotelladora Andina SA (A) | | | 215,173 | | | | 484 | |
| | |
Colombia — 0.2% | | | | | | | | |
Banco Davivienda SA (A) | | | 330,314 | | | | 2,614 | |
| | |
South Korea — 0.6% | | | | | | | | |
Hyundai Motor Co (A) | | | 32,565 | | | | 2,472 | |
LG Chem Ltd (A) | | | 7,271 | | | | 2,342 | |
Samsung Electronics Co Ltd (A) | | | 50,103 | | | | 2,767 | |
| | | | | | | 7,581 | |
| | |
| 6 | | SEI Institutional Investments Trust / Semi-Annual Report / November 30, 2020 |
SCHEDULE OF INVESTMENTS (Unaudited)
November 30, 2020
Emerging Markets Equity Fund (Continued)
| | | | | | | | |
| | | |
| Description | | | | Market Value
($ Thousands) |
| | |
PREFERRED STOCK (continued) | | | | | | | | |
| | |
Total Preferred Stock
(Cost $15,399) ($ Thousands) | | | | | | $ | 17,839 | |
| | |
| | | Number of
Warrants | | |
| | |
WARRANTS — 1.3% | | | | | | | | |
| | |
India — 0.1% | | | | | | | | |
Voltas, Expires 05/28/2020 * | | | 159,533 | | | | 1,726 | |
| | |
Luxembourg — 0.2% | | | | | | | | |
Emirates NBD Bank PJSC, Expires 01/03/2022 * | | | 631,588 | | | | 1,860 | |
| | |
Thailand — 0.0% | | | | | | | | |
JMT Network Services, Expires 02/19/2021 * | | | 170,598 | | | | – | |
Minor International PCL, Expires 07/31/2023 * | | | 121,175 | | | | 32 | |
Minor International PCL, Expires 09/30/2021 * | | | 159,221 | | | | 3 | |
Minor International PCL, Expires 09/30/2021 * | | | 40,200 | | | | 1 | |
| | | | | | | 36 | |
| | |
United States — 0.8% | | | | | | | | |
Citigroup, Expires 02/19/2021 * | | | 279,755 | | | | 1,723 | |
FPT Corp, Expires 03/31/2021 * | | | 2,586,532 | | | | 6,130 | |
Shandong Pharmaceutical Glass Co Ltd, Expires 02/19/2020 * | | | 315,432 | | | | 2,094 | |
| | | | | | | 9,947 | |
| | |
Vietnam — 0.2% | | | | | | | | |
Mobile World Investment, Expires 03/31/2021 * | | | 370,086 | | | | 1,836 | |
| | |
Total Warrants
(Cost $9,762) ($ Thousands) | | | | | | | 15,405 | |
| | |
| | | Shares | | |
| | |
EXCHANGE TRADED FUND — 0.3% | | | | | | | | |
| | |
United States — 0.3% | | | | | | | | |
iShares Core MSCI Emerging Markets | | | 48,940 | | | | 2,869 | |
| | |
Total Exchange Traded Fund
(Cost $2,330) ($ Thousands) | | | | | | | 2,869 | |
| | |
| | | Number of
Rights | | |
| | |
RIGHTS — 0.0% | | | | | | | | |
| | |
Hong Kong — 0.0% | | | | | | | | |
KWG Group Holdings Ltd *‡‡ | | | 36,411 | | | | – | |
| | | | | | | | |
| | | |
| Description | | Number of
Rights | | Market Value
($ Thousands) |
| | |
RIGHTS (continued) | | | | | | | | |
| | |
Taiwan — 0.0% | | | | | | | | |
Hiwin Technologies, Expires 12/18/2020 * | | | 3,310 | | | $ | 13 | |
Total Rights
(Cost $—) ($ Thousands) | | | | | | | 13 | |
| | |
| | | Shares | | |
| | |
CASH EQUIVALENT — 0.6% | | | | | | | | |
SEI Daily Income Trust, Government Fund, Cl F
0.010%**† | | | 7,552,959 | | | | 7,553 | |
| | |
Total Cash Equivalent
(Cost $7,553) ($ Thousands) | | | | | | | 7,553 | |
| | |
Total Investments in Securities — 98.7%
(Cost $904,685) ($ Thousands) | | | | | | $ | 1,189,659 | |
| | | | | | | | |
| | |
| SEI Institutional Investments Trust / Semi-Annual Report / November 30, 2020 | | 7 |
SCHEDULE OF INVESTMENTS (Unaudited)
November 30, 2020
Emerging Markets Equity Fund (Continued)
A list of the open futures contracts held by the Fund at November 30, 2020, is as follows:
| | | | | | | | | | | | | | | | | | | | |
| Type of Contract | | Number of
Contracts Long | | | Expiration
Date | | | Notional Amount
(Thousands) | | | Value
(Thousands) | | | Unrealized Appreciation (Thousands) | |
MSCI Emerging Markets | | | 144 | | | | Dec-2020 | | | $ | 8,576 | | | $ | 8,656 | | | $ | 80 | |
| | | | | | | | | | | | | | | | | | | | |
| | Percentages are based on Net Assets of $1,205,925 ($ Thousands). |
| * | Non-income producing security. |
| ** | The rate reported is the 7-day effective yield as of November 30, 2020. |
| † | Investment in Affiliated Security. |
| ‡‡ | Expiration date not available. |
| (A) | There is currently no rate available. |
ADR — American Depositary Receipt
Cl — Class
GDR — Global Depositary Receipt
JSC — Joint-Stock Company
Ltd — Limited
MSCI —Morgan Stanley Capital International
NVDR — Non-Voting Depositary Receipt
PCL — Public Company Limited
PJSC — Public Joint-Stock Company
PLC — Public Limited Company
Ser — Series
The following is a list of the level of inputs used as of November 30, 2020, in valuing the Fund’s investments and other financial instruments carried at value ($ Thousands).
| | | | | | | | | | | | | | | | |
| Investments in Securities | | Level 1 ($) | | | Level 2
($) | | | Level 3
($) | | | Total ($) | |
Common Stock | | | 1,001,783 | | | | 144,197 | | | | – | | | | 1,145,980 | |
Preferred Stock | | | 17,839 | | | | – | | | | – | | | | 17,839 | |
Warrants | | | 11,807 | | | | 3,598 | | | | – | | | | 15,405 | |
Exchange Traded Fund | | | 2,869 | | | | – | | | | – | | | | 2,869 | |
Rights | | | 13 | | | | – | | | | – | | | | 13 | |
Cash Equivalent | | | 7,553 | | | | – | | | | – | | | | 7,553 | |
| | | | | | | | | | | | | | | | |
Total Investments in Securities | | | 1,041,864 | | | | 147,795 | | | | – | | | | 1,189,659 | |
| | | | | | | | | | | | | | | | |
| | | | | | | | | | | | | | | | |
Other Financial
Instruments | | Level 1 ($) | | | Level 2 ($) | | | Level 3 ($) | | | Total ($) | |
Futures Contracts* | | | | | | | | | | | | | | | | |
Unrealized Appreciation | | | 80 | | | | – | | | | – | | | | 80 | |
| | | | | | | | | | | | | | | | |
Total Other Financial Instruments | | | 80 | | | | – | | | | – | | | | 80 | |
| | | | | | | | | | | | | | | | |
*Futures contracts are valued at the unrealized appreciation on the instrument.
For the period ended November 30, 2020, there were transfers in or out of Level 3.
For more information on valuation inputs, see Note 2 – Significant Accounting Policies in Notes to Financial Statements.
The following is a summary the of Fund’s transactions with affiliates for the period ended November 30, 2020 ($ Thousands).
| | | | | | | | | | | | | | | | | | |
| Security Description | | Value
5/31/2020 | | Purchases
at Cost | | Proceeds from
Sales | | Realized Gain
(Loss) | | Change in
Unrealized
Appreciation
(Depreciation) | | Value
11/30/2020 | | Shares | | Income | | Capital Gains |
SEI Daily Income Trust, Government Fund, Cl F | | $18,307 | | $89,417 | | $(100,171) | | $— | | $— | | $7,553 | | 7,552,959 | | $1 | | $— |
| | | | | | | | | | | | | | | | | | |
Amounts designated as “—” are $0 or have been rounded to $0.
The accompanying notes are an integral part of the financial statements.
| | |
| 8 | | SEI Institutional Investments Trust / Semi-Annual Report / November 30, 2020 |
CONSOLIDATED SCHEDULE OF INVESTMENTS (Unaudited)
November 30, 2020
Dynamic Asset Allocation Fund (Continued)
| | | | | | | | |
| | | |
| Description | | Shares | | Market Value
($ Thousands) |
COMMON STOCK — 91.0% | |
|
Communication Services — 10.0% | |
Activision Blizzard Inc | | | 47,100 | | | $ | 3,744 | |
Alphabet Inc, Cl A * | | | 18,245 | | | | 32,009 | |
Alphabet Inc, Cl C * | | | 17,822 | | | | 31,380 | |
AT&T Inc | | | 432,819 | | | | 12,444 | |
CenturyLink Inc | | | 58,115 | | | | 607 | |
Charter Communications Inc, Cl A * | | | 9,100 | | | | 5,933 | |
Comcast Corp, Cl A | | | 277,000 | | | | 13,916 | |
Discovery Inc, Cl A * | | | 9,900 | | | | 267 | |
Discovery Inc, Cl C * | | | 19,219 | | | | 462 | |
DISH Network Corp, Cl A * | | | 14,501 | | | | 520 | |
Electronic Arts Inc | | | 17,700 | | | | 2,261 | |
Facebook Inc, Cl A * | | | 146,200 | | | | 40,493 | |
Fox Corp | | | 30,466 | | | | 874 | |
Interpublic Group of Cos Inc/The | | | 23,400 | | | | 521 | |
Live Nation Entertainment Inc * | | | 8,400 | | | | 551 | |
Netflix Inc * | | | 26,800 | | | | 13,151 | |
News Corp | | | 6,400 | | | | 114 | |
News Corp, Cl A | | | 24,400 | | | | 431 | |
Omnicom Group Inc | | | 12,700 | | | | 800 | |
Take-Two Interactive Software Inc * | | | 7,100 | | | | 1,282 | |
T-Mobile US Inc * | | | 35,565 | | | | 4,728 | |
Twitter Inc * | | | 48,000 | | | | 2,232 | |
Verizon Communications Inc | | | 251,900 | | | | 15,217 | |
ViacomCBS Inc, Cl B | | | 33,840 | | | | 1,194 | |
Walt Disney Co/The | | | 109,777 | | | | 16,248 | |
| | |
| | | | | | | 201,379 | |
|
Consumer Discretionary — 10.3% | |
Advance Auto Parts Inc | | | 4,200 | | | | 620 | |
Amazon.com Inc * | | | 25,900 | | | | 82,052 | |
Aptiv PLC | | | 16,300 | | | | 1,935 | |
AutoZone Inc * | | | 1,400 | | | | 1,593 | |
Best Buy Co Inc | | | 13,900 | | | | 1,513 | |
Booking Holdings Inc * | | | 2,500 | | | | 5,071 | |
BorgWarner Inc | | | 15,000 | | | | 583 | |
CarMax Inc * | | | 9,800 | | | | 916 | |
Carnival Corp, Cl A | | | 32,500 | | | | 649 | |
Chipotle Mexican Grill Inc, Cl A * | | | 1,700 | | | | 2,192 | |
Darden Restaurants Inc | | | 8,000 | | | | 864 | |
Dollar General Corp | | | 15,200 | | | | 3,322 | |
Dollar Tree Inc * | | | 14,384 | | | | 1,571 | |
Domino’s Pizza Inc | | | 2,400 | | | | 942 | |
DR Horton Inc | | | 20,400 | | | | 1,520 | |
eBay Inc | | | 40,800 | | | | 2,058 | |
Etsy Inc * | | | 7,200 | | | | 1,157 | |
Expedia Group Inc | | | 8,300 | | | | 1,033 | |
Ford Motor Co | | | 239,900 | | | | 2,178 | |
Gap Inc/The | | | 11,600 | | | | 243 | |
Garmin Ltd | | | 8,900 | | | | 1,039 | |
General Motors Co | | | 77,100 | | | | 3,380 | |
Genuine Parts Co | | | 8,951 | | | | 881 | |
Hanesbrands Inc | | | 21,500 | | | | 305 | |
| | | | | | | | |
| | | |
| Description | | Shares | | Market Value
($ Thousands) |
COMMON STOCK (continued) | |
Hasbro Inc | | | 7,600 | | | $ | 707 | |
Hilton Worldwide Holdings Inc | | | 16,800 | | | | 1,741 | |
Home Depot Inc/The | | | 65,532 | | | | 18,179 | |
L Brands Inc | | | 14,700 | | | | 571 | |
Las Vegas Sands Corp | | | 20,300 | | | | 1,131 | |
Leggett & Platt Inc | | | 7,700 | | | | 332 | |
Lennar Corp, Cl A | | | 16,600 | | | | 1,259 | |
LKQ Corp * | | | 16,600 | | | | 585 | |
Lowe’s Cos Inc | | | 46,069 | | | | 7,178 | |
Marriott International Inc/MD, Cl A | | | 16,020 | | | | 2,032 | |
McDonald’s Corp | | | 45,300 | | | | 9,850 | |
MGM Resorts International | | | 24,400 | | | | 689 | |
Mohawk Industries Inc * | | | 3,528 | | | | 444 | |
Newell Brands Inc | | | 22,799 | | | | 485 | |
NIKE Inc, Cl B | | | 75,900 | | | | 10,224 | |
Norwegian Cruise Line Holdings Ltd * | | | 18,000 | | | | 412 | |
NVR Inc * | | | 210 | | | | 839 | |
O’Reilly Automotive Inc * | | | 4,500 | | | | 1,991 | |
Pool Corp | | | 2,500 | | | | 865 | |
PulteGroup Inc | | | 16,800 | | | | 733 | |
PVH Corp | | | 4,200 | | | | 334 | |
Ralph Lauren Corp, Cl A | | | 2,800 | | | | 240 | |
Ross Stores Inc | | | 21,600 | | | | 2,322 | |
Royal Caribbean Cruises Ltd | | | 10,500 | | | | 828 | |
Starbucks Corp | | | 71,100 | | | | 6,969 | |
Tapestry Inc | | | 16,400 | | | | 464 | |
Target Corp | | | 30,400 | | | | 5,458 | |
Tiffany & Co | | | 6,700 | | | | 881 | |
TJX Cos Inc/The | | | 73,200 | | | | 4,649 | |
Tractor Supply Co | | | 7,000 | | | | 986 | |
Ulta Beauty Inc * | | | 3,500 | | | | 964 | |
Under Armour Inc, Cl A * | | | 10,300 | | | | 171 | |
Under Armour Inc, Cl C * | | | 10,636 | | | | 155 | |
VF Corp | | | 19,324 | | | | 1,612 | |
Whirlpool Corp | | | 3,700 | | | | 720 | |
Wynn Resorts Ltd | | | 5,900 | | | | 593 | |
Yum! Brands Inc | | | 18,200 | | | | 1,926 | |
| | |
| | | | | | | 207,136 | |
|
Consumer Staples — 6.2% | |
Altria Group Inc | | | 113,600 | | | | 4,525 | |
Archer-Daniels-Midland Co | | | 34,100 | | | | 1,697 | |
Brown-Forman Corp, Cl B | | | 10,925 | | | | 881 | |
Campbell Soup Co | | | 12,700 | | | | 635 | |
Church & Dwight Co Inc | | | 15,300 | | | | 1,343 | |
Clorox Co/The | | | 7,800 | | | | 1,583 | |
Coca-Cola Co/The | | | 234,800 | | | | 12,116 | |
Colgate-Palmolive Co | | | 52,400 | | | | 4,488 | |
Conagra Brands Inc | | | 29,400 | | | | 1,075 | |
Constellation Brands Inc, Cl A | | | 10,300 | | | | 2,120 | |
Costco Wholesale Corp | | | 26,900 | | | | 10,539 | |
Estee Lauder Cos Inc/The, Cl A | | | 13,800 | | | | 3,385 | |
General Mills Inc | | | 37,400 | | | | 2,275 | |
| | |
| SEI Institutional Investments Trust / Semi-Annual Report / November 30, 2020 | | 1 |
CONSOLIDATED SCHEDULE OF INVESTMENTS (Unaudited)
November 30, 2020
Dynamic Asset Allocation Fund (Continued)
| | | | | | | | |
| | | |
| Description | | Shares | | Market Value
($ Thousands) |
|
COMMON STOCK (continued) | |
Hershey Co/The | | | 8,900 | | | $ | 1,316 | |
Hormel Foods Corp | | | 17,500 | | | | 826 | |
J M Smucker Co/The | | | 6,782 | | | | 795 | |
Kellogg Co | | | 15,800 | | | | 1,010 | |
Kimberly-Clark Corp | | | 20,900 | | | | 2,911 | |
Kraft Heinz Co/The | | | 39,966 | | | | 1,317 | |
Kroger Co/The | | | 47,200 | | | | 1,558 | |
Lamb Weston Holdings Inc | | | 9,000 | | | | 651 | |
McCormick & Co Inc/MD | | | 7,500 | | | | 1,402 | |
Molson Coors Beverage Co, Cl B | | | 11,500 | | | | 529 | |
Mondelez International Inc, Cl A | | | 87,300 | | | | 5,015 | |
Monster Beverage Corp * | | | 22,520 | | | | 1,909 | |
PepsiCo Inc | | | 84,062 | | | | 12,124 | |
Philip Morris International Inc | | | 94,900 | | | | 7,189 | |
Procter & Gamble Co/The | | | 151,536 | | | | 21,044 | |
Sysco Corp | | | 31,200 | | | | 2,224 | |
Tyson Foods Inc, Cl A | | | 17,700 | | | | 1,154 | |
Walgreens Boots Alliance Inc | | | 44,200 | | | | 1,680 | |
Walmart Inc | | | 84,565 | | | | 12,921 | |
| | |
| | | | | | | 124,237 | |
|
Energy — 2.1% | |
Apache Corp | | | 22,200 | | | | 286 | |
Baker Hughes Co, Cl A | | | 39,700 | | | | 743 | |
Cabot Oil & Gas Corp, Cl A | | | 24,600 | | | | 431 | |
Chevron Corp | | | 117,282 | | | | 10,225 | |
Concho Resources Inc | | | 12,000 | | | | 690 | |
ConocoPhillips | | | 65,700 | | | | 2,599 | |
Devon Energy Corp | | | 21,600 | | | | 302 | |
Diamondback Energy Inc | | | 9,700 | | | | 387 | |
EOG Resources Inc | | | 35,800 | | | | 1,678 | |
Exxon Mobil Corp | | | 256,800 | | | | 9,792 | |
Halliburton Co | | | 52,000 | | | | 863 | |
Hess Corp | | | 17,000 | | | | 802 | |
HollyFrontier Corp | | | 8,800 | | | | 206 | |
Kinder Morgan Inc | | | 119,577 | | | | 1,719 | |
Marathon Oil Corp | | | 47,100 | | | | 279 | |
Marathon Petroleum Corp | | | 39,111 | | | | 1,521 | |
National Oilwell Varco Inc | | | 24,300 | | | | 298 | |
Occidental Petroleum Corp | | | 49,728 | | | | 784 | |
ONEOK Inc | | | 27,600 | | | | 990 | |
Phillips 66 | | | 26,300 | | | | 1,593 | |
Pioneer Natural Resources Co | | | 9,900 | | | | 996 | |
Schlumberger NV | | | 85,237 | | | | 1,772 | |
TechnipFMC PLC | | | 23,600 | | | | 196 | |
Valero Energy Corp | | | 24,500 | | | | 1,317 | |
Williams Cos Inc/The | | | 73,400 | | | | 1,540 | |
| | |
| | | | | | | 42,009 | |
|
Financials — 9.4% | |
Aflac Inc | | | 40,300 | | | | 1,770 | |
Allstate Corp/The | | | 19,200 | | | | 1,965 | |
American Express Co | | | 39,800 | | | | 4,720 | |
| | | | | | | | |
| | | |
| Description | | Shares | | Market Value
($ Thousands) |
|
COMMON STOCK (continued) | |
American International Group Inc | | | 52,100 | | | $ | 2,003 | |
Ameriprise Financial Inc | | | 7,300 | | | | 1,352 | |
Aon PLC, Cl A | | | 14,200 | | | | 2,909 | |
Arthur J Gallagher & Co | | | 11,500 | | | | 1,327 | |
Assurant Inc | | | 3,700 | | | | 478 | |
Bank of America Corp | | | 463,200 | | | | 13,044 | |
Bank of New York Mellon Corp/The | | | 49,200 | | | | 1,925 | |
Berkshire Hathaway Inc, Cl B * | | | 120,500 | | | | 27,584 | |
BlackRock Inc, Cl A | | | 8,641 | | | | 6,034 | |
Capital One Financial Corp | | | 27,700 | | | | 2,372 | |
Cboe Global Markets Inc | | | 6,800 | | | | 621 | |
Charles Schwab Corp/The | | | 90,000 | | | | 4,390 | |
Chubb Ltd | | | 27,326 | | | | 4,040 | |
Cincinnati Financial Corp | | | 9,400 | | | | 718 | |
Citigroup Inc | | | 126,300 | | | | 6,955 | |
Citizens Financial Group Inc | | | 25,500 | | | | 833 | |
CME Group Inc, Cl A | | | 21,900 | | | | 3,833 | |
Comerica Inc | | | 8,700 | | | | 428 | |
Discover Financial Services | | | 18,500 | | | | 1,409 | |
Everest Re Group Ltd | | | 2,500 | | | | 568 | |
Fifth Third Bancorp | | | 42,800 | | | | 1,085 | |
First Republic Bank/CA | | | 10,400 | | | | 1,347 | |
Franklin Resources Inc | | | 15,400 | | | | 339 | |
Globe Life Inc | | | 6,100 | | | | 568 | |
Goldman Sachs Group Inc/The | | | 21,000 | | | | 4,842 | |
Hartford Financial Services Group Inc/The | | | 21,550 | | | | 952 | |
Huntington Bancshares Inc/OH | | | 61,300 | | | | 740 | |
Intercontinental Exchange Inc | | | 34,245 | | | | 3,613 | |
Invesco Ltd | | | 21,800 | | | | 354 | |
JPMorgan Chase & Co | | | 185,300 | | | | 21,843 | |
KeyCorp | | | 58,699 | | | | 907 | |
Lincoln National Corp | | | 10,600 | | | | 501 | |
Loews Corp | | | 14,300 | | | | 599 | |
M&T Bank Corp | | | 7,621 | | | | 888 | |
MarketAxess Holdings Inc | | | 2,300 | | | | 1,240 | |
Marsh & McLennan Cos Inc | | | 30,900 | | | | 3,542 | |
MetLife Inc | | | 46,800 | | | | 2,161 | |
Moody’s Corp | | | 9,847 | | | | 2,780 | |
Morgan Stanley | | | 87,165 | | | | 5,389 | |
MSCI Inc, Cl A | | | 5,100 | | | | 2,088 | |
Nasdaq Inc | | | 6,900 | | | | 883 | |
Northern Trust Corp | | | 12,700 | | | | 1,183 | |
People’s United Financial Inc | | | 24,300 | | | | 301 | |
PNC Financial Services Group Inc/The | | | 26,000 | | | | 3,590 | |
Principal Financial Group Inc | | | 15,800 | | | | 787 | |
Progressive Corp/The | | | 35,800 | | | | 3,119 | |
Prudential Financial Inc | | | 23,900 | | | | 1,807 | |
Raymond James Financial Inc | | | 7,600 | | | | 691 | |
Regions Financial Corp | | | 59,300 | | | | 906 | |
S&P Global Inc | | | 14,700 | | | | 5,171 | |
SVB Financial Group * | | | 3,200 | | | | 1,104 | |
Synchrony Financial | | | 32,511 | | | | 991 | |
| | |
| 2 | | SEI Institutional Investments Trust / Semi-Annual Report / November 30, 2020 |
CONSOLIDATED SCHEDULE OF INVESTMENTS (Unaudited)
November 30, 2020
Dynamic Asset Allocation Fund (Continued)
| | | | | | | | |
| | | |
| Description | | Shares | | Market Value
($ Thousands) |
|
COMMON STOCK (continued) | |
T Rowe Price Group Inc | | | 13,800 | | | $ | 1,979 | |
Travelers Cos Inc/The | | | 15,500 | | | | 2,010 | |
Truist Financial Corp | | | 82,382 | | | | 3,824 | |
Unum Group | | | 11,600 | | | | 258 | |
US Bancorp | | | 83,800 | | | | 3,621 | |
W R Berkley Corp | | | 8,300 | | | | 541 | |
Wells Fargo & Co | | | 250,400 | | | | 6,849 | |
Willis Towers Watson PLC | | | 7,795 | | | | 1,623 | |
Zions Bancorp NA | | | 9,900 | | | | 382 | |
| | |
| | | | | | | 188,676 | |
|
Health Care — 12.5% | |
Abbott Laboratories | | | 107,539 | | | | 11,638 | |
AbbVie Inc | | | 107,153 | | | | 11,206 | |
ABIOMED Inc * | | | 2,700 | | | | 740 | |
Agilent Technologies Inc | | | 18,600 | | | | 2,174 | |
Alexion Pharmaceuticals Inc * | | | 13,200 | | | | 1,612 | |
Align Technology Inc * | | | 4,400 | | | | 2,118 | |
AmerisourceBergen Corp, Cl A | | | 8,961 | | | | 924 | |
Amgen Inc | | | 35,600 | | | | 7,905 | |
Anthem Inc | | | 15,200 | | | | 4,735 | |
Baxter International Inc | | | 30,938 | | | | 2,353 | |
Becton Dickinson and Co | | | 17,737 | | | | 4,165 | |
Biogen Inc * | | | 9,600 | | | | 2,306 | |
Bio-Rad Laboratories Inc, Cl A * | | | 1,300 | | | | 700 | |
Boston Scientific Corp * | | | 87,400 | | | | 2,897 | |
Bristol-Myers Squibb Co | | | 137,500 | | | | 8,580 | |
Cardinal Health Inc | | | 17,500 | | | | 955 | |
Catalent Inc * | | | 9,900 | | | | 952 | |
Centene Corp * | | | 35,530 | | | | 2,190 | |
Cerner Corp | | | 18,500 | | | | 1,384 | |
Cigna Corp | | | 22,381 | | | | 4,681 | |
Cooper Cos Inc/The | | | 3,000 | | | | 1,006 | |
CVS Health Corp | | | 79,943 | | | | 5,419 | |
Danaher Corp | | | 38,400 | | | | 8,626 | |
DaVita Inc * | | | 4,600 | | | | 505 | |
DENTSPLY SIRONA Inc | | | 13,000 | | | | 662 | |
DexCom Inc * | | | 5,900 | | | | 1,886 | |
Edwards Lifesciences Corp * | | | 38,000 | | | | 3,188 | |
Eli Lilly and Co | | | 48,367 | | | | 7,045 | |
Gilead Sciences Inc | | | 76,056 | | | | 4,614 | |
HCA Healthcare Inc | | | 15,900 | | | | 2,387 | |
Henry Schein Inc * | | | 9,000 | | | | 579 | |
Hologic Inc * | | | 16,100 | | | | 1,113 | |
Humana Inc | | | 8,100 | | | | 3,244 | |
IDEXX Laboratories Inc * | | | 5,200 | | | | 2,397 | |
Illumina Inc * | | | 8,900 | | | | 2,867 | |
Incyte Corp * | | | 11,500 | | | | 972 | |
Intuitive Surgical Inc * | | | 7,100 | | | | 5,155 | |
IQVIA Holdings Inc * | | | 11,700 | | | | 1,977 | |
Johnson & Johnson | | | 160,000 | | | | 23,149 | |
Laboratory Corp of America Holdings * | | | 5,854 | | | | 1,170 | |
McKesson Corp | | | 9,736 | | | | 1,751 | |
| | | | | | | | |
| | | |
| Description | | Shares | | Market Value
($ Thousands) |
|
COMMON STOCK (continued) | |
Medtronic PLC | | | 81,955 | | | $ | 9,318 | |
Merck & Co Inc | | | 153,600 | | | | 12,348 | |
Mettler-Toledo International Inc * | | | 1,400 | | | | 1,610 | |
PerkinElmer Inc | | | 6,700 | | | | 891 | |
Perrigo Co PLC | | | 8,600 | | | | 415 | |
Pfizer Inc | | | 337,596 | | | | 12,933 | |
Quest Diagnostics Inc | | | 8,000 | | | | 992 | |
Regeneron Pharmaceuticals Inc * | | | 6,400 | | | | 3,303 | |
ResMed Inc | | | 8,800 | | | | 1,844 | |
STERIS PLC | | | 5,200 | | | | 1,008 | |
Stryker Corp | | | 19,800 | | | | 4,621 | |
Teleflex Inc | | | 2,800 | | | | 1,072 | |
Thermo Fisher Scientific Inc | | | 24,100 | | | | 11,206 | |
UnitedHealth Group Inc | | | 57,800 | | | | 19,440 | |
Universal Health Services Inc, Cl B | | | 4,600 | | | | 601 | |
Varian Medical Systems Inc * | | | 5,500 | | | | 957 | |
Vertex Pharmaceuticals Inc * | | | 15,900 | | | | 3,621 | |
Viatris Inc, Cl W * | | | 73,874 | | | | 1,243 | |
Waters Corp * | | | 3,700 | | | | 858 | |
West Pharmaceutical Services Inc | | | 4,400 | | | | 1,211 | |
Zimmer Biomet Holdings Inc | | | 12,700 | | | | 1,894 | |
Zoetis Inc, Cl A | | | 28,767 | | | | 4,614 | |
| | |
| | | | | | | 249,927 | |
|
Industrials — 8.0% | |
3M Co | | | 34,900 | | | | 6,028 | |
A O Smith Corp | | | 8,200 | | | | 462 | |
Alaska Air Group Inc | | | 7,100 | | | | 362 | |
Allegion plc | | | 5,733 | | | | 654 | |
American Airlines Group Inc | | | 32,500 | | | | 459 | |
AMETEK Inc | | | 13,900 | | | | 1,648 | |
Boeing Co/The | | | 32,300 | | | | 6,806 | |
Carrier Global Corp | | | 49,279 | | | | 1,876 | |
Caterpillar Inc | | | 32,800 | | | | 5,694 | |
CH Robinson Worldwide Inc | | | 8,400 | | | | 789 | |
Cintas Corp | | | 5,300 | | | | 1,883 | |
Copart Inc * | | | 12,400 | | | | 1,432 | |
CSX Corp | | | 46,700 | | | | 4,205 | |
Cummins Inc | | | 9,000 | | | | 2,081 | |
Deere & Co | | | 19,100 | | | | 4,997 | |
Delta Air Lines Inc | | | 39,300 | | | | 1,582 | |
Dover Corp | | | 8,600 | | | | 1,049 | |
Eaton Corp PLC | | | 24,501 | | | | 2,967 | |
Emerson Electric Co | | | 36,600 | | | | 2,812 | |
Equifax Inc | | | 7,300 | | | | 1,218 | |
Expeditors International of Washington Inc | | | 10,200 | | | | 912 | |
Fastenal Co | | | 35,300 | | | | 1,746 | |
FedEx Corp | | | 14,649 | | | | 4,198 | |
Flowserve Corp | | | 8,400 | | | | 286 | |
Fortive Corp | | | 20,724 | | | | 1,453 | |
Fortune Brands Home & Security Inc | | | 8,300 | | | | 693 | |
General Dynamics Corp | | | 14,200 | | | | 2,121 | |
General Electric Co | | | 534,592 | | | | 5,442 | |
| | |
| SEI Institutional Investments Trust / Semi-Annual Report / November 30, 2020 | | 3 |
CONSOLIDATED SCHEDULE OF INVESTMENTS (Unaudited)
November 30, 2020
Dynamic Asset Allocation Fund (Continued)
| | | | | | | | |
| | | |
| Description | | Shares | | Market Value
($ Thousands) |
|
COMMON STOCK (continued) | |
Honeywell International Inc | | | 42,700 | | | $ | 8,707 | |
Howmet Aerospace Inc | | | 22,966 | | | | 539 | |
Huntington Ingalls Industries Inc | | | 2,500 | | | | 400 | |
IDEX Corp | | | 4,700 | | | | 908 | |
IHS Markit Ltd | | | 22,700 | | | | 2,258 | |
Illinois Tool Works Inc | | | 17,556 | | | | 3,706 | |
Ingersoll Rand Inc * | | | 23,030 | | | | 1,020 | |
Jacobs Engineering Group Inc | | | 7,800 | | | | 841 | |
JB Hunt Transport Services Inc | | | 5,200 | | | | 703 | |
Johnson Controls International PLC | | | 45,003 | | | | 2,072 | |
Kansas City Southern | | | 5,700 | | | | 1,061 | |
L3Harris Technologies Inc | | | 13,210 | | | | 2,536 | |
Lockheed Martin Corp | | | 15,024 | | | | 5,484 | |
Masco Corp | | | 15,700 | | | | 843 | |
Nielsen Holdings PLC | | | 21,100 | | | | 341 | |
Norfolk Southern Corp | | | 15,600 | | | | 3,698 | |
Northrop Grumman Corp | | | 9,500 | | | | 2,871 | |
Old Dominion Freight Line Inc | | | 5,800 | | | | 1,180 | |
Otis Worldwide Corp | | | 24,989 | | | | 1,673 | |
PACCAR Inc | | | 21,200 | | | | 1,846 | |
Parker-Hannifin Corp | | | 7,800 | | | | 2,085 | |
Pentair PLC | | | 10,546 | | | | 547 | |
Quanta Services Inc | | | 8,200 | | | | 560 | |
Raytheon Technologies Corp | | | 92,871 | | | | 6,661 | |
Republic Services Inc, Cl A | | | 12,700 | | | | 1,228 | |
Robert Half International Inc | | | 7,000 | | | | 449 | |
Rockwell Automation Inc | | | 7,000 | | | | 1,789 | |
Rollins Inc | | | 8,750 | | | | 500 | |
Roper Technologies Inc | | | 6,400 | | | | 2,733 | |
Snap-on Inc | | | 3,300 | | | | 580 | |
Southwest Airlines Co | | | 36,300 | | | | 1,682 | |
Stanley Black & Decker Inc | | | 9,800 | | | | 1,806 | |
Teledyne Technologies Inc * | | | 2,200 | | | | 831 | |
Textron Inc | | | 13,900 | | | | 627 | |
Trane Technologies PLC | | | 14,500 | | | | 2,121 | |
TransDigm Group Inc | | | 3,300 | | | | 1,911 | |
Union Pacific Corp | | | 41,400 | | | | 8,449 | |
United Airlines Holdings Inc * | | | 18,100 | | | | 815 | |
United Parcel Service Inc, Cl B | | | 43,100 | | | | 7,373 | |
United Rentals Inc * | | | 4,300 | | | | 976 | |
Verisk Analytics Inc, Cl A | | | 10,000 | | | | 1,983 | |
Waste Management Inc | | | 23,800 | | | | 2,835 | |
Westinghouse Air Brake Technologies Corp | | | 11,172 | | | | 819 | |
WW Grainger Inc | | | 2,700 | | | | 1,129 | |
Xylem Inc/NY | | | 11,200 | | | | 1,075 | |
| | |
| | | | | | | 160,106 | |
|
Information Technology — 25.1% | |
Accenture PLC, Cl A | | | 38,700 | | | | 9,640 | |
Adobe Inc * | | | 29,200 | | | | 13,971 | |
Advanced Micro Devices Inc * | | | 71,200 | | | | 6,597 | |
Akamai Technologies Inc * | | | 9,700 | | | | 1,004 | |
Amphenol Corp, Cl A | | | 18,300 | | | | 2,394 | |
| | | | | | | | |
| | | |
| Description | | Shares | | Market Value
($ Thousands) |
|
COMMON STOCK (continued) | |
Analog Devices Inc | | | 15,193 | | | $ | 2,113 | |
ANSYS Inc * | | | 5,200 | | | | 1,758 | |
Apple Inc | | | 977,800 | | | | 116,407 | |
Applied Materials Inc | | | 55,500 | | | | 4,578 | |
Arista Networks Inc * | | | 3,300 | | | | 893 | |
Autodesk Inc * | | | 13,400 | | | | 3,755 | |
Automatic Data Processing Inc | | | 26,100 | | | | 4,538 | |
Broadcom Inc | | | 24,493 | | | | 9,836 | |
Broadridge Financial Solutions Inc | | | 6,900 | | | | 1,013 | |
Cadence Design Systems Inc * | | | 17,100 | | | | 1,989 | |
CDW Corp/DE | | | 8,600 | | | | 1,122 | |
Cisco Systems Inc | | | 257,100 | | | | 11,060 | |
Citrix Systems Inc | | | 7,600 | | | | 942 | |
Cognizant Technology Solutions Corp, Cl A | | | 33,200 | | | | 2,594 | |
Corning Inc | | | 46,800 | | | | 1,751 | |
DXC Technology Co | | | 15,238 | | | | 334 | |
F5 Networks Inc * | | | 3,800 | | | | 619 | |
Fidelity National Information Services Inc | | | 37,600 | | | | 5,580 | |
Fiserv Inc * | | | 34,000 | | | | 3,916 | |
FleetCor Technologies Inc * | | | 5,200 | | | | 1,379 | |
FLIR Systems Inc | | | 8,000 | | | | 306 | |
Fortinet Inc * | | | 8,100 | | | | 998 | |
Gartner Inc * | | | 5,500 | | | | 836 | |
Global Payments Inc | | | 18,272 | | | | 3,567 | |
Hewlett Packard Enterprise Co | | | 76,700 | | | | 847 | |
HP Inc | | | 84,200 | | | | 1,847 | |
Intel Corp | | | 258,300 | | | | 12,489 | |
International Business Machines Corp | | | 54,158 | | | | 6,690 | |
Intuit Inc | | | 15,900 | | | | 5,597 | |
IPG Photonics Corp * | | | 2,100 | | | | 435 | |
Jack Henry & Associates Inc | | | 4,600 | | | | 740 | |
Juniper Networks Inc | | | 20,400 | | | | 444 | |
Keysight Technologies Inc * | | | 11,300 | | | | 1,356 | |
KLA Corp | | | 9,423 | | | | 2,374 | |
Lam Research Corp | | | 8,887 | | | | 4,023 | |
Leidos Holdings Inc | | | 8,100 | | | | 816 | |
Mastercard Inc, Cl A | | | 53,700 | | | | 18,071 | |
Maxim Integrated Products Inc | | | 28,716 | | | | 2,385 | |
Microchip Technology Inc | | | 15,500 | | | | 2,083 | |
Micron Technology Inc * | | | 67,900 | | | | 4,352 | |
Microsoft Corp | | | 460,300 | | | | 98,536 | |
Motorola Solutions Inc | | | 10,467 | | | | 1,795 | |
NetApp Inc | | | 13,500 | | | | 720 | |
NortonLifeLock Inc | | | 36,700 | | | | 669 | |
NVIDIA Corp | | | 37,500 | | | | 20,102 | |
Oracle Corp | | | 117,900 | | | | 6,805 | |
Paychex Inc | | | 19,700 | | | | 1,835 | |
Paycom Software Inc * | | | 3,000 | | | | 1,251 | |
PayPal Holdings Inc * | | | 71,300 | | | | 15,267 | |
Qorvo Inc * | | | 6,900 | | | | 1,081 | |
QUALCOMM Inc | | | 68,800 | | | | 10,125 | |
salesforce.com * | | | 55,300 | | | | 13,593 | |
| | |
| 4 | | SEI Institutional Investments Trust / Semi-Annual Report / November 30, 2020 |
CONSOLIDATED SCHEDULE OF INVESTMENTS (Unaudited)
November 30, 2020
Dynamic Asset Allocation Fund (Continued)
| | | | | | | | |
| | | |
| Description | | Shares | | Market Value
($ Thousands) |
|
COMMON STOCK (continued) | |
Seagate Technology PLC | | | 13,300 | | | $ | 782 | |
ServiceNow Inc * | | | 11,700 | | | | 6,254 | |
Skyworks Solutions Inc | | | 10,300 | | | | 1,454 | |
Synopsys Inc * | | | 9,300 | | | | 2,116 | |
TE Connectivity Ltd | | | 20,200 | | | | 2,302 | |
Teradyne Inc | | | 10,000 | | | | 1,103 | |
Texas Instruments Inc | | | 55,600 | | | | 8,966 | |
Tyler Technologies Inc * | | | 2,500 | | | | 1,069 | |
VeriSign Inc * | | | 6,100 | | | | 1,224 | |
Visa Inc, Cl A | | | 102,500 | | | | 21,561 | |
Vontier Corp * | | | 8,289 | | | | 275 | |
Western Digital Corp | | | 18,403 | | | | 826 | |
Western Union Co/The | | | 25,900 | | | | 584 | |
Xerox Holdings Corp | | | 10,075 | | | | 221 | |
Xilinx Inc | | | 14,800 | | | | 2,154 | |
Zebra Technologies Corp, Cl A * | | | 3,300 | | | | 1,249 | |
| | |
| | | | | | | 503,958 | |
|
Materials — 2.5% | |
Air Products and Chemicals Inc | | | 13,500 | | | | 3,782 | |
Albemarle Corp | | | 6,400 | | | | 870 | |
Amcor PLC | | | 94,388 | | | | 1,069 | |
Avery Dennison Corp | | | 5,100 | | | | 762 | |
Ball Corp | | | 20,100 | | | | 1,930 | |
Celanese Corp, Cl A | | | 7,200 | | | | 931 | |
CF Industries Holdings Inc | | | 13,200 | | | | 492 | |
Corteva Inc | | | 45,205 | | | | 1,732 | |
Dow Inc | | | 45,371 | | | | 2,405 | |
DuPont de Nemours Inc | | | 44,905 | | | | 2,849 | |
Eastman Chemical Co | | | 8,300 | | | | 809 | |
Ecolab Inc | | | 15,175 | | | | 3,371 | |
FMC Corp | | | 8,000 | | | | 928 | |
Freeport-McMoRan Inc, Cl B | | | 89,300 | | | | 2,089 | |
International Flavors & Fragrances Inc | | | 6,700 | | | | 751 | |
International Paper Co | | | 24,300 | | | | 1,202 | |
Linde PLC | | | 32,041 | | | | 8,216 | |
LyondellBasell Industries NV, Cl A | | | 15,700 | | | | 1,336 | |
Martin Marietta Materials Inc | | | 3,700 | | | | 983 | |
Mosaic Co/The | | | 20,100 | | | | 441 | |
Newmont Corp | | | 49,100 | | | | 2,888 | |
Nucor Corp | | | 18,100 | | | | 972 | |
Packaging Corp of America | | | 5,800 | | | | 754 | |
PPG Industries Inc | | | 14,500 | | | | 2,128 | |
Sealed Air Corp | | | 8,900 | | | | 401 | |
Sherwin-Williams Co/The | | | 4,975 | | | | 3,720 | |
Vulcan Materials Co | | | 8,200 | | | | 1,145 | |
Westrock Co | | | 15,741 | | | | 665 | |
| | |
| | | | | | | 49,621 | |
|
Real Estate — 2.3% | |
Alexandria Real Estate Equities Inc ‡ | | | 7,100 | | | | 1,163 | |
American Tower Corp, Cl A ‡ | | | 27,047 | | | | 6,253 | |
| | | | | | | | |
| | | |
| Description | | Shares | | Market Value
($ Thousands) |
|
COMMON STOCK (continued) | |
Apartment Investment and Management Co, Cl A ‡ | | | 8,907 | | | $ | 270 | |
AvalonBay Communities Inc ‡ | | | 8,500 | | | | 1,416 | |
Boston Properties Inc ‡ | | | 8,800 | | | | 864 | |
CBRE Group Inc, Cl A * | | | 20,200 | | | | 1,235 | |
Crown Castle International Corp ‡ | | | 25,500 | | | | 4,273 | |
Digital Realty Trust Inc ‡ | | | 16,500 | | | | 2,223 | |
Duke Realty Corp ‡ | | | 22,100 | | | | 841 | |
Equinix Inc ‡ | | | 5,357 | | | | 3,738 | |
Equity Residential ‡ | | | 21,200 | | | | 1,228 | |
Essex Property Trust Inc ‡ | | | 4,000 | | | | 984 | |
Extra Space Storage Inc ‡ | | | 7,700 | | | | 868 | |
Federal Realty Investment Trust ‡ | | | 4,300 | | | | 375 | |
Four Corners Property Trust Inc ‡ | | | 1 | | | | — | |
Healthpeak Properties Inc ‡ | | | 32,300 | | | | 932 | |
Host Hotels & Resorts Inc ‡ | | | 44,085 | | | | 619 | |
Iron Mountain Inc ‡ | | | 17,571 | | | | 483 | |
Kimco Realty Corp ‡ | | | 26,600 | | | | 384 | |
Mid-America Apartment Communities Inc ‡ | | | 6,800 | | | | 858 | |
Prologis Inc ‡ | | | 44,798 | | | | 4,482 | |
Public Storage ‡ | | | 9,300 | | | | 2,088 | |
Realty Income Corp ‡ | | | 21,200 | | | | 1,271 | |
Regency Centers Corp ‡ | | | 9,300 | | | | 424 | |
SBA Communications Corp, Cl A ‡ | | | 6,700 | | | | 1,924 | |
Simon Property Group Inc ‡ | | | 18,400 | | | | 1,519 | |
SL Green Realty Corp ‡ | | | 4,700 | | | | 272 | |
UDR Inc ‡ | | | 18,300 | | | | 704 | |
Ventas Inc ‡ | | | 22,700 | | | | 1,088 | |
Vornado Realty Trust ‡ | | | 10,000 | | | | 389 | |
Welltower Inc ‡ | | | 25,200 | | | | 1,587 | |
Weyerhaeuser Co ‡ | | | 44,827 | | | | 1,302 | |
| | |
| | | | | | | 46,057 | |
|
Utilities — 2.6% | |
AES Corp/The | | | 39,800 | | | | 813 | |
Alliant Energy Corp | | | 14,900 | | | | 784 | |
Ameren Corp | | | 14,900 | | | | 1,159 | |
American Electric Power Co Inc | | | 30,400 | | | | 2,581 | |
American Water Works Co Inc | | | 11,100 | | | | 1,702 | |
Atmos Energy Corp | | | 7,400 | | | | 710 | |
CenterPoint Energy Inc | | | 32,500 | | | | 754 | |
CMS Energy Corp | | | 17,800 | | | | 1,095 | |
Consolidated Edison Inc | | | 20,200 | | | | 1,540 | |
Dominion Energy Inc | | | 51,332 | | | | 4,029 | |
DTE Energy Co | | | 11,600 | | | | 1,459 | |
Duke Energy Corp | | | 44,930 | | | | 4,163 | |
Edison International | | | 22,800 | | | | 1,399 | |
Entergy Corp | | | 12,100 | | | | 1,317 | |
Evergy Inc | | | 13,999 | | | | 776 | |
Eversource Energy | | | 21,000 | | | | 1,838 | |
Exelon Corp | | | 59,700 | | | | 2,452 | |
FirstEnergy Corp | | | 32,900 | | | | 874 | |
NextEra Energy Inc | | | 119,100 | | | | 8,765 | |
| | |
| SEI Institutional Investments Trust / Semi-Annual Report / November 30, 2020 | | 5 |
CONSOLIDATED SCHEDULE OF INVESTMENTS (Unaudited)
November 30, 2020
Dynamic Asset Allocation Fund (Continued)
| | | | | | | | |
| | | |
| Description | | Shares | | Market Value
($ Thousands) |
|
COMMON STOCK (continued) | |
NiSource Inc | | | 23,000 | | | $ | 557 | |
NRG Energy Inc | | | 15,300 | | | | 501 | |
Pinnacle West Capital Corp | | | 6,900 | | | | 565 | |
PPL Corp | | | 46,400 | | | | 1,319 | |
Public Service Enterprise Group Inc | | | 31,100 | | | | 1,812 | |
Sempra Energy | | | 17,700 | | | | 2,256 | |
Southern Co/The | | | 64,500 | | | | 3,860 | |
WEC Energy Group Inc | | | 19,362 | | | | 1,838 | |
| | | | | | | | |
| | | |
| Description | | Shares | | Market Value
($ Thousands) |
|
COMMON STOCK (continued) | |
Xcel Energy Inc | | | 32,200 | | | $ | 2,169 | |
| | |
| | | | | | | 53,087 | |
Total Common Stock
(Cost $749,354) ($ Thousands) | | | | 1,826,193 | |
| |
Total Investments in Securities — 91.0% (Cost $749,354) ($ Thousands) | | | $ | 1,826,193 | |
| | | | | | | | |
| | |
| | | Contracts | | |
|
PURCHASED SWAPTIONS* — 1.2% | |
| | |
Total Purchased Swaptions (A) (Cost $15,467) ($ Thousands) | | | 2,742,237,893 | | | $ | 23,193 | |
| | | | | | | | |
A list of the open OTC swaption contracts held by the Fund at November 30, 2020, is as follows:
| | | | | | | | | | | | | | | | | | |
| | | | | |
| Description | | Counterparty | | Number of Contracts/
Notional Amount | | | Exercise Price | | | Expiration Date | | | Value
(Thousands) | |
|
PURCHASED SWAPTIONS — 1.2% | |
| | | | | |
Call Swaptions | | | | | | | | | | | | | | | | | | |
CMS One Look* | | Bank of America Merill Lynch | | | 2,550,870,000 | | | | $0.14 | | | | 07/17/2021 | | | $ | 14,571 | |
CMS One Look* | | Bank of America Merill Lynch | | | 191,367,893 | | | | $2.00 | | | | 08/19/2023 | | | | 8,622 | |
| | | | | | | | | | | | | | | | | | |
Total Purchased Swaptions | | | | | 2,742,237,893 | | | | | | | | | | | $ | 23,193 | |
| | | | | | | | | | | | | | | | | | |
A list of the open futures contracts held by the Fund at November 30, 2020, is as follows:
| | | | | | | | | | | | | | | | | | | | |
| | | | | | |
| Type of Contract | | Number of
Contracts Long | | | Expiration
Date | | | Notional Amount
(Thousands) | | | Value
(Thousands) | | | Unrealized
Appreciation (Thousands) | |
S&P 500 Index E-MINI^ | | | 1,001 | | | | Dec-2020 | | | $ | 167,306 | | | $ | 181,341 | | | $ | 14,035 | |
| | | | | | | | | | | | | | | | | | | | |
A list of the open forward foreign currency contracts held by the Fund at November 30, 2020, is as follows:
| | | | | | | | | | | | | | | | | | | | | | | | |
| | | | | | | |
| Counterparty | | Settlement Date | | | | | | Currency to Deliver
(Thousands) | | | | | | Currency to Receive
(Thousands) | | | Unrealized
Appreciation
(Depreciation)
(Thousands) |
| | | | | | |
Bank of America | | | 01/11/21 | | | | USD | | | | 28,699 | | | | SAR | | | | 107,802 | | | $ | 42 | |
| | | | | | |
Bank of America | | | 01/11/21 | | | | SAR | | | | 486,018 | | | | USD | | | | 129,470 | | | | (107 | ) |
| | | | | | | | | | | | | | | | | | | | | | | | |
| | | | | | |
| | | | | | | | | | | | | | | | | | | | | | $ | (65 | ) |
| | | | | | | | | | | | | | | | | | | | | | | | |
| | |
| 6 | | SEI Institutional Investments Trust / Semi-Annual Report / November 30, 2020 |
CONSOLIDATED SCHEDULE OF INVESTMENTS (Unaudited)
November 30, 2020
Dynamic Asset Allocation Fund (Continued)
A list of OTC swap agreements held by the fund at November 30, 2020, is as follows:
| | | | | | | | | | | | | | | | | | | | | | | | | | | | | | | | | | | | | | | | |
| |
| Total Return Swaps | |
| | | | | | | | | | | |
| Counterparty | | Reference Entity/
Obligation | | | Fund Pays | | | Fund Receives | | | Payment
Frequency | | | Termination
Date | | | Currency | | | Notional
Amount
(Thousands) | | | Value
(Thousands) | | Upfront
Payments/
Receipts
(Thousands) | | Net Unrealized
(Depreciation)
(Thousands) |
BNP Paribas^ | |
| Bloomberg
Gold
SubIndex
Total
Return |
| |
| US T-BILL
HIGH
DISCOUNT
RATE + 7
BPS |
| |
| INDEX
RETURN |
| | | Quarterly | | | | 03/17/2021 | | | | USD | | | | (122,730) | | | $ | (11,056 | ) | | $ | – | | | $ | (11,056 | ) |
BNP Paribas^ | |
| Bloomberg
Gold
SubIndex
Total
Return |
| |
| US T-BILL
HIGH
DISCOUNT
RATE + 7
BPS |
| |
| INDEX
RETURN |
| | | Quarterly | | | | 04/05/2021 | | | | USD | | | | (84,502) | | | | (6,415 | ) | | | – | | | | (6,415 | ) |
| | | | | | | | | | | | | | | | | | | | | | | | | | | | | | | | |
| | | | | | | | | | | | | | | | | | | | | | | | | | | | | | $ | (17,471 | ) | | $ | – | | | $ | (17,471 | ) |
| | | | | | | | | | | | | | | | | | | | | | | | | | | | | | | | |
| | Percentages are based on Net Assets of $2,006,136 ($ Thousands). |
| * | Non-income producing security. |
| ‡ | Real Estate Investment Trust. |
| (A) | Refer to table below for details on Swaption Contracts. |
| ^ | Security, or a portion thereof, is held by DAA Commodity Strategy Subsidiary, Ltd. as of November 30, 2020. |
Cl — Class
Ltd. — Limited
OTC — Over The Counter
PLC — Public Limited Company
S&P— Standard & Poor’s
SAR— Saudi Riyal
USD — U.S. Dollar
The following is a list of the level of inputs used as of November 30, 2020, in valuing the Fund’s investments and other financial instruments carried at value ($ Thousands):
| | | | | | | | | | | | | | | | |
| | | | | |
| Investments in Securities | | Level 1 ($) | | Level 2 ($) | | Level 3
($) | | Total ($) |
Common Stock | | | 1,826,193 | | | | – | | | | – | | | | 1,826,193 | |
| | | | | | | | | | | | | | | | |
| | | | |
Total Investments in Securities | | | 1,826,193 | | | | – | | | | – | | | | 1,826,193 | |
| | | | | | | | | | | | | | | | |
| | | | | | | | | | | | | | | | |
| | | | | |
| Other Financial Instruments | | Level 1 ($) | | Level 2 ($) | | Level 3 ($) | | Total ($) |
Purchased Swaptions | | | – | | | | 23,193 | | | | – | | | | 23,193 | |
Futures Contracts* | | | | | | | | | | | | | | | | |
Unrealized Appreciation | | | 14,035 | | | | – | | | | – | | | | 14,035 | |
Forwards Contracts* | | | | | | | | | | | | | | | | |
Unrealized Appreciation | | | – | | | | 42 | | | | – | | | | 42 | |
Unrealized Depreciation | | | – | | | | (107 | ) | | | – | | | | (107 | ) |
OTC Swaps | | | | | | | | | | | | | | | | |
Total Return Swaps* | | | | | | | | | | | | | | | | |
Unrealized Depreciation | | | – | | | | (17,471 | ) | | | – | | | | (17,471 | ) |
| | | | | | | | | | | | | | | | |
| | | | |
Total Other Financial Instruments | | | 14,035 | | | | 5,657 | | | | – | | | | 19,692 | |
| | | | | | | | | | | | | | | | |
* Futures contracts, forwards contracts, and swap contracts are valued at the unrealized appreciation (depreciation) on the instrument.
For the period ended November 30, 2020, there were no transfers in or out of Level 3.
For more information on valuation inputs, see Note 2 – Significant Accounting Policies in Notes to Financial Statements.
Amounts designated as “—” are $0 or have been rounded to $0.
The accompanying notes are an integral part of the financial statements.
| | |
| SEI Institutional Investments Trust / Semi-Annual Report / November 30, 2020 | | 7 |
(b) In accordance with Section 13(c) of the Investment Company Act of 1940 the Screened World Equity Ex-US Fund did not hold any divested securities during the six-months ended November 30, 2020.
| Item 7. | Disclosure of Proxy Voting Policies and Procedures for Closed-End Management Investment Companies. |
Not applicable.
| Item 8. | Portfolio Managers of Closed-End Management Investment Companies. |
Not applicable.
| Item 9. | Purchases of Equity Securities by Closed-End Management Company and Affiliated Purchasers. |
Not applicable.
| Item 10. | Submission of Matters to a Vote of Security Holders. |
There have been no material changes to the procedures by which shareholders may recommend nominees to the Registrant’s Board of Trustees (the “Board”). The Registrant has a standing Governance Committee (the “Committee”) currently consisting of the Independent Trustees. The Committee is responsible for evaluating and recommending nominees for election to the Board. Pursuant to the Committee’s Charter, adopted on June 18, 2004, as amended, the Committee will review all shareholder recommendations for nominations to fill vacancies on the Board if such recommendations are submitted in writing and addressed to the Committee at the Registrant’s office.
| Item 11. | Controls and Procedures. |
(a) The Registrant’s principal executive and principal financial officers, or persons performing similar functions, have concluded that the Registrant’s disclosure controls and procedures (as defined in Rule 30a-3(c) under the Investment Company Act of 1940 (the “1940 Act”)) are effective, based on the evaluation of these controls and procedures required by Rule 30a-3(b) under the 1940 Act and Rules 13a-15(b) or 15d-15(b) under the Securities Exchange Act of 1934 as of a date within 90 days of the filing date of this report.
(b) There were no changes in the Registrant’s internal control over financial reporting (as defined in Rule 30a-3(d) under the 1940 Act) that occurred during the period covered by this report that have materially affected, or are reasonably likely to materially affect, the Registrant’s internal control over financial reporting.
| Item 12. | Disclosure of Securities Lending Activities for Closed-End Management Investment Companies. |
Not applicable.
(a)(1) Not applicable for semi-annual report.
(a)(2) A separate certification for the principal executive officer and the principal financial officer of the Registrant as required by Rule 30a-2(a) under the Investment Company Act of 1940, are filed herewith.
(b) Officer certifications as required by Rule 30a-2(b) under the Investment Company Act of 1940, as amended also accompany this filing as exhibits.
SIGNATURES
Pursuant to the requirements of the Securities Exchange Act of 1934 and the Investment Company Act of 1940, the Registrant has duly caused this report to be signed on its behalf by the undersigned, thereunto duly authorized.
| | | | | | |
| | | | SEI Institutional Investments Trust |
| | | |
| By | | | | | | /s/ Robert A. Nesher |
| | | | | | Robert A. Nesher, President & CEO |
| | | |
| Date: February 8, 2021 | | | | | | |
Pursuant to the requirements of the Securities Exchange Act of 1934 and the Investment Company Act of 1940, this report has been signed below by the following persons on behalf of the Registrant and in the capacities and on the dates indicated.
| | | | | | |
| By | | | | | | /s/ Robert A. Nesher |
| | | | | | Robert A. Nesher, President & CEO |
| | | |
| Date: February 8, 2021 | | | | | | |
| | | |
| By | | | | | | /s/ Peter A. Rodriguez |
| | | | | | Peter A. Rodriguez, Controller & CFO |
| | | |
| Date: February 8, 2021 | | | | | | |