|
Exhibit 99.2 
|
Exhibit 99.2
Analytical Insights into Starboard’s Proposed Transactions as Requested by and for the Benefit of Shareholders
September 2014
Forward-Looking Statement
These materials may contain forward-looking statements concerning the Company’s expectations, goals or objectives. Forward-looking statements in this communication that are not historical facts, including without limitation statements concerning our future economic performance, plans or objectives and expectations regarding the performance of the Company following the sale of Red Lobster and related matters, are made under the Safe Harbor provisions of the Private Securities Litigation Reform Act of 1995. Any forward-looking statements speak only as of the date on which such statements are made, and we undertake no obligation to update such statements to reflect events or circumstances arising after such date except as required by law. We wish to caution investors not to place undue reliance on any such forward-looking statements. By their nature, forward-looking statements involve risks and uncertainties that could cause actual results to materially differ from those anticipated in the statements. The most significant of these uncertainties are described in Darden’s Form 10-K, Form 10-Q and Form 8-K reports (including all amendments to those reports). These risks and uncertainties include the ability to achieve Darden’s strategic plan to enhance shareholder value including realizing the expected benefits from the sale of Red Lobster, actions of activist investors and the cost and disruption of responding to those actions, including any proxy contest for the election of directors at our annual meeting, food safety and food-borne illness concerns, litigation, unfavorable publicity, risks relating to public policy changes and federal, state and local regulation of our business including health care reform, labor and insurance costs, technology failures, failure to execute a business continuity plan following a disaster, health concerns including virus outbreaks, intense competition, failure to drive sales growth, our plans to expand our smaller brands Bahama Breeze, Seasons 52 and Eddie V’s, a lack of suitable new restaurant locations, higher-than-anticipated costs to open, close, relocate or remodel restaurants, a failure to execute innovative marketing tactics and increased advertising and marketing costs, a failure to develop and recruit effective leaders, a failure to address cost pressures, shortages or interruptions in the delivery of food and other products, adverse weather conditions and natural disasters, volatility in the market value of derivatives, economic factors specific to the restaurant industry and general macroeconomic factors including unemployment and interest rates, disruptions in the financial markets, risks of doing business with franchisees and vendors in foreign markets, failure to protect our service marks or other intellectual property, impairment in the carrying value of our goodwill or other intangible assets, a failure of our internal controls over financial reporting, or changes in accounting standards, an inability or failure to manage the accelerated impact of social media and other factors and uncertainties discussed from time to time in reports filed by Darden with the Securities and Exchange Commission.
2
Important Additional Information
The Company, its directors and certain of its executive officers are participants in the solicitation of proxies from stockholders in connection with the Company’s 2014 annual meeting of stockholders (the “Annual Meeting”). Information regarding the names and interests of such participants in the Company’s proxy solicitation is set forth in the Company’s definitive proxy statement, filed with the SEC on September 9, 2014. Additional information can be found in the Company’s Annual Report on Form 10-K for the year ended May 25, 2014, filed with the SEC on July 18, 2013. These documents are available free of charge at the SEC’s website at www.sec.gov.
The Company will be mailing its definitive proxy statement and proxy card to the stockholders entitled to vote at the Annual Meeting. WE URGE INVESTORS TO READ ANY PROXY STATEMENT (INCLUDING ANY SUPPLEMENTS THERETO) AND ANY OTHER RELEVANT DOCUMENTS THAT THE COMPANY MAY FILE WITH THE SEC CAREFULLY AND IN THEIR ENTIRETY WHEN THEY BECOME AVAILABLE BECAUSE THEY WILL CONTAIN IMPORTANT INFORMATION. Stockholders will be able to obtain, free of charge, copies of any proxy statement and any other documents filed by the Company with the SEC in connection with the proxy solicitation at the SEC’s website at www.sec.gov. In addition, copies will also be available at no charge at the Investors section of the Company’s website at http://investor.darden.com/investors/investor-relations/default.aspx.
3
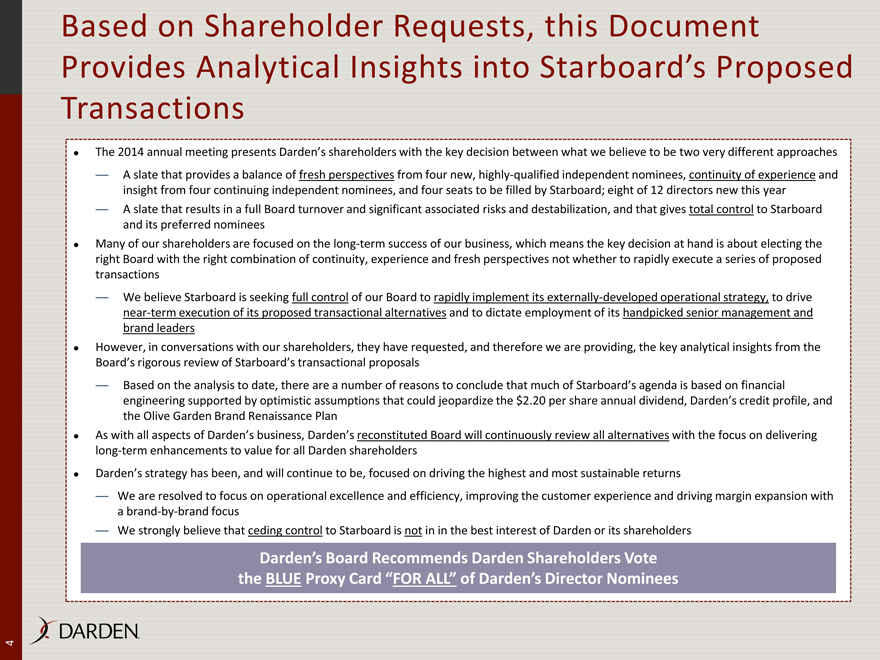
Based on Shareholder Requests, this Document Provides Analytical Insights into Starboard’s Proposed Transactions
The 2014 annual meeting presents Darden’s shareholders with the key decision between what we believe to be two very different approaches
A slate that provides a balance of fresh perspectives from four new, highly-qualified independent nominees, continuity of experience and insight from four continuing independent nominees, and four seats to be filled by Starboard; eight of 12 directors new this year
A slate that results in a full Board turnover and significant associated risks and destabilization, and that gives total control to Starboard and its preferred nominees
Many of our shareholders are focused on the long-term success of our business, which means the key decision at hand is about electing the right Board with the right combination of continuity, experience and fresh perspectives not whether to rapidly execute a series of proposed transactions
We believe Starboard is seeking full control of our Board to rapidly implement its externally-developed operational strategy, to drive near-term execution of its proposed transactional alternatives and to dictate employment of its handpicked senior management and brand leaders
However, in conversations with our shareholders, they have requested, and therefore we are providing, the key analytical insights from the Board’s rigorous review of Starboard’s transactional proposals
Based on the analysis to date, there are a number of reasons to conclude that much of Starboard’s agenda is based on financial engineering supported by optimistic assumptions that could jeopardize the $2.20 per share annual dividend, Darden’s credit profile, and the Olive Garden Brand Renaissance Plan
As with all aspects of Darden’s business, Darden’s reconstituted Board will continuously review all alternatives with the focus on delivering long-term enhancements to value for all Darden shareholders
Darden’s strategy has been, and will continue to be, focused on driving the highest and most sustainable returns
We are resolved to focus on operational excellence and efficiency, improving the customer experience and driving margin expansion with a brand-by-brand focus
We strongly believe that ceding control to Starboard is not in in the best interest of Darden or its shareholders
Darden’s Board Recommends Darden Shareholders Vote
the BLUE Proxy Card “FOR ALL” of Darden’s Director Nominees
4
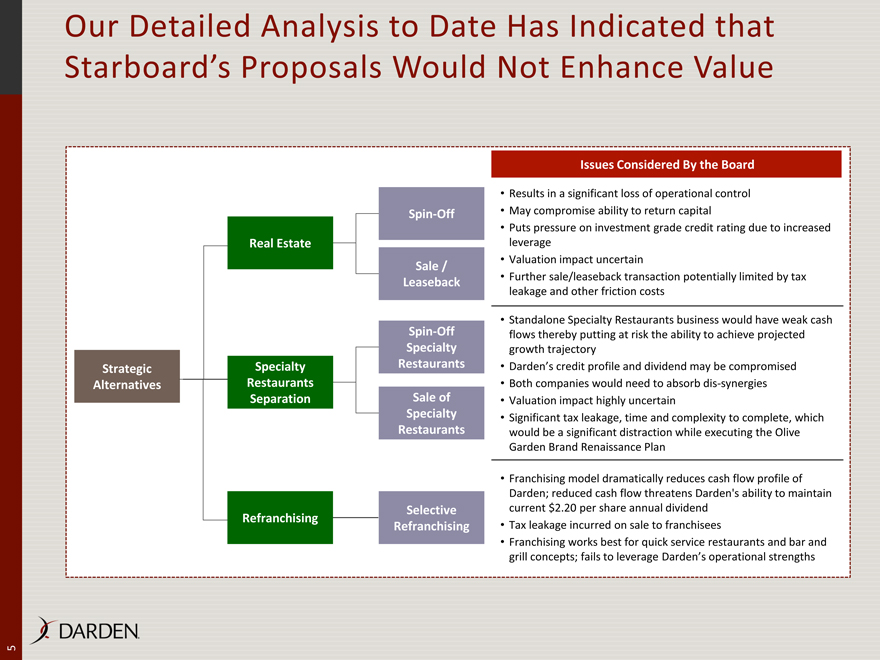
Our Detailed Analysis to Date Has Indicated that Starboard’s Proposals Would Not Enhance Value
Strategic Alternatives Real Estate
Specialty Restaurants Separation
Refranchising Spin-Off
Sale / Leaseback Spin-Off
Specialty Restaurants
Sale of Specialty Restaurants
Selective Refranchising
Issues Considered By the Board
Results in a significant loss of operational control
May compromise ability to return capital
Puts pressure on investment grade credit rating due to increased leverage
Valuation impact uncertain
Further sale/leaseback transaction potentially limited by tax leakage and other friction costs
Standalone Specialty Restaurants business would have weak cash flows thereby putting at risk the ability to achieve projected growth trajectory
Darden’s credit profile and dividend may be compromised
Both companies would need to absorb dis-synergies
Valuation impact highly uncertain
Significant tax leakage, time and complexity to complete, which would be a significant distraction while executing the Olive Garden Brand Renaissance Plan
Franchising model dramatically reduces cash flow profile of Darden; reduced cash flow threatens Darden’s ability to maintain current $2.20 per share annual dividend
Tax leakage incurred on sale to franchisees
Franchising works best for quick service restaurants and bar and grill concepts; fails to leverage Darden’s operational strengths
5
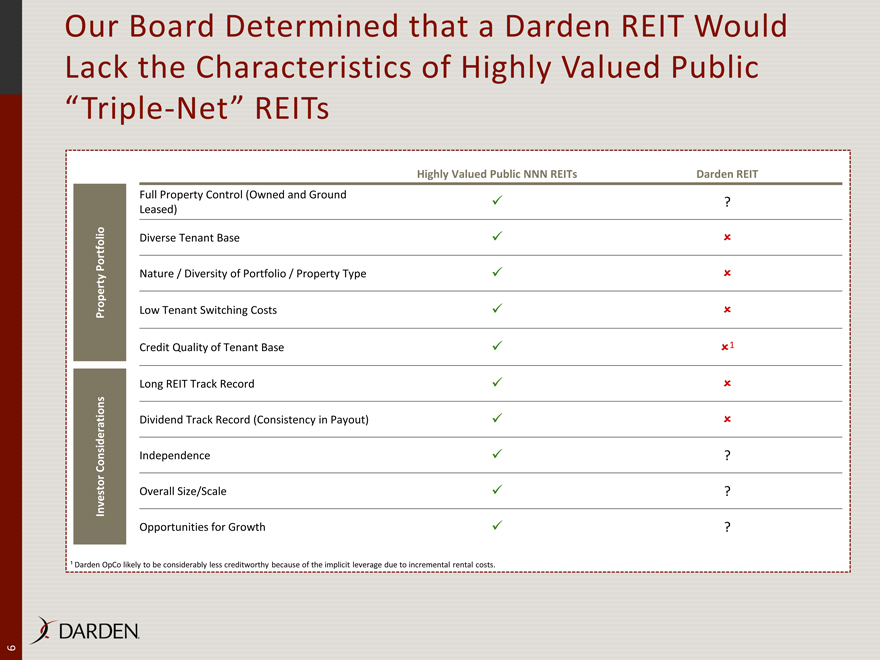
Our Board Determined that a Darden REIT Would Lack the Characteristics of Highly Valued Public “Triple-Net” REITs
Highly Valued Public NNN REITs
Darden REIT
Property Portfolio
Investor Considerations
Full Property Control (Owned and Ground Leased) ?
Diverse Tenant Base
Nature / Diversity of Portfolio / Property Type
Low Tenant Switching Costs
Credit Quality of Tenant Base 1
Long REIT Track Record
Dividend Track Record (Consistency in Payout)
Independence ?
Overall Size/Scale ?
Opportunities for Growth ?
1 Darden OpCo likely to be considerably less creditworthy because of the implicit leverage due to incremental rental costs.
6
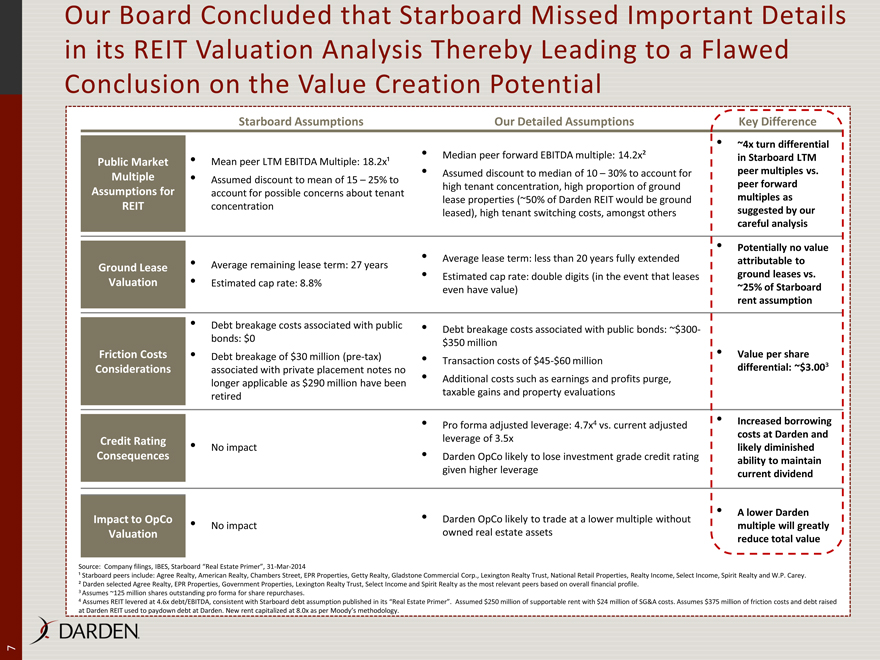
Our Board Concluded that Starboard Missed Important Details in its REIT Valuation Analysis Thereby Leading to a Flawed Conclusion on the Value Creation Potential
Starboard Assumptions
Our Detailed Assumptions
Key Difference
Public Market Multiple Assumptions for REIT
Ground Lease Valuation
Friction Costs Considerations
Credit Rating Consequences
Impact to OpCo Valuation
Mean peer LTM EBITDA Multiple: 18.2x1
Assumed discount to mean of 15 – 25% to account for possible concerns about tenant concentration
Average remaining lease term: 27 years
Estimated cap rate: 8.8%
Debt breakage costs associated with public bonds: $0
Debt breakage of $30 million (pre-tax) associated with private placement notes no longer applicable as $290 million have been retired
No impact
No impact
Median peer forward EBITDA multiple: 14.2x2
Assumed discount to median of 10 – 30% to account for high tenant concentration, high proportion of ground lease properties (~50% of Darden REIT would be ground leased), high tenant switching costs, amongst others
Average lease term: less than 20 years fully extended
Estimated cap rate: double digits (in the event that leases even have value)
Debt breakage costs associated with public bonds: ~$300-$350 million
Transaction costs of $45-$60 million
Additional costs such as earnings and profits purge, taxable gains and property evaluations
Pro forma adjusted leverage: 4.7x4 vs. current adjusted leverage of 3.5x
Darden OpCo likely to lose investment grade credit rating given higher leverage
Darden OpCo likely to trade at a lower multiple without owned real estate assets
~4x turn differential in Starboard LTM peer multiples vs. peer forward multiples as suggested by our careful analysis
Potentially no value attributable to ground leases vs. ~25% of Starboard rent assumption
Value per share differential: ~$3.00³
Increased borrowing costs at Darden and likely diminished ability to maintain current dividend
A lower Darden multiple will greatly reduce total value
Source: Company filings, IBES, Starboard “Real Estate Primer”, 31-Mar-2014
1 Starboard peers include: Agree Realty, American Realty, Chambers Street, EPR Properties, Getty Realty, Gladstone Commercial Corp., Lexington Realty Trust, National Retail Properties, Realty Income, Select Income, Spirit Realty and W.P. Carey.
2 Darden selected Agree Realty, EPR Properties, Government Properties, Lexington Realty Trust, Select Income and Spirit Realty as the most relevant peers based on overall financial profile.
3 Assumes ~125 million shares outstanding pro forma for share repurchases.
4 Assumes REIT levered at 4.6x debt/EBITDA, consistent with Starboard debt assumption published in its “Real Estate Primer”. Assumed $250 million of supportable rent with $24 million of SG&A costs. Assumes $375 million of friction costs and debt raised at Darden REIT used to paydown debt at Darden. New rent capitalized at 8.0x as per Moody’s methodology.
7
Our Board’s Rigorous Analysis Indicated that the Formation of a Darden REIT Could Be Subject to Significant Valuation Risks and Impose Meaningful Friction Costs for Darden
Starboard Inaccurately Uses Inflated LTM Multiples…
Starboard Asserted
Potential Multiples Based On Our Careful Analysis
Midpoint of 15 – 25% Discount to Peer Average
10 – 30% discount to peers would imply a range of
13 – 10x2
18.2 x 14.6x 14.2x 11.5x
Starboard REIT Peers LTM
Average (1)
Starboard Valuation Multiple for Darden REIT
Appropriate Peers Forward Median (2)
Darden REIT Valuation Multiple Range
REIT Transaction Could Be Destabilizing for Credit Rating…
2015E Adjusted Leverage (3)
3.5x ~1x 4.7x 4.6x
Darden Darden OpCo PF for REIT Spin
Darden REIT
Adjusted leverage increases due to incremental rent burden
Increased adjusted leverage likely to trigger credit rating downgrade at Darden OpCo
…And a Darden REIT Would Not Be Best-in-Class
35% 100% 13% 100% 3% 54% 57% 100%
% Non-IG
Tenants
% Share of Top Tenant
Ground Leases as a % of Total Portfolio
Largest Single Property Type as a % of Total
Peer Median (2) Darden REIT
...And Starboard Appears to Ignore
Value Destructive Friction Costs
Issue
Low
High
Breakage Costs
Transaction Expenses
Other
Make-whole payment for existing debt complex
$300mm
$350mm
Refinancing expenses
Fees for tax, legal, financial, other advisory
45mm
60mm
Taxable gains, transfer taxes and property tax reassessments
Costs associated with purging the tax “earnings and profits”
Ongoing SG&A costs of a second public company
+
+
Source: Public filings, Starboard “Real Estate Primer”, 31-Mar-2014
(1) Starboard peers are Agree Realty, American Realty, Chambers Street, EPR Properties, Getty Realty, Gladstone Commercial, Lexington Realty Trust, National Retail Properties, Realty Income, Select Income REIT, Spirit Realty and W.P. Carey.
(2) Darden peers assumes Agree Realty, EPR Properties, Spirit Realty, Government Properties, Select Income and Lexington Realty Trust as of 2-Sep-2014. We have assumed a wider range than Starboard’s discount range due to inherent uncertainty.
(3) Assumes REIT levered at 4.6x debt/EBITDA, consistent with Starboard debt assumption published in its “Real Estate Primer”. Assumed $250 million of supportable rent with $24 million of SG&A costs. Assumes $375 million of friction costs and debt raised at Darden REIT used to paydown debt at Darden. New rent capitalized at 8.0x as per Moody’s methodology.
8
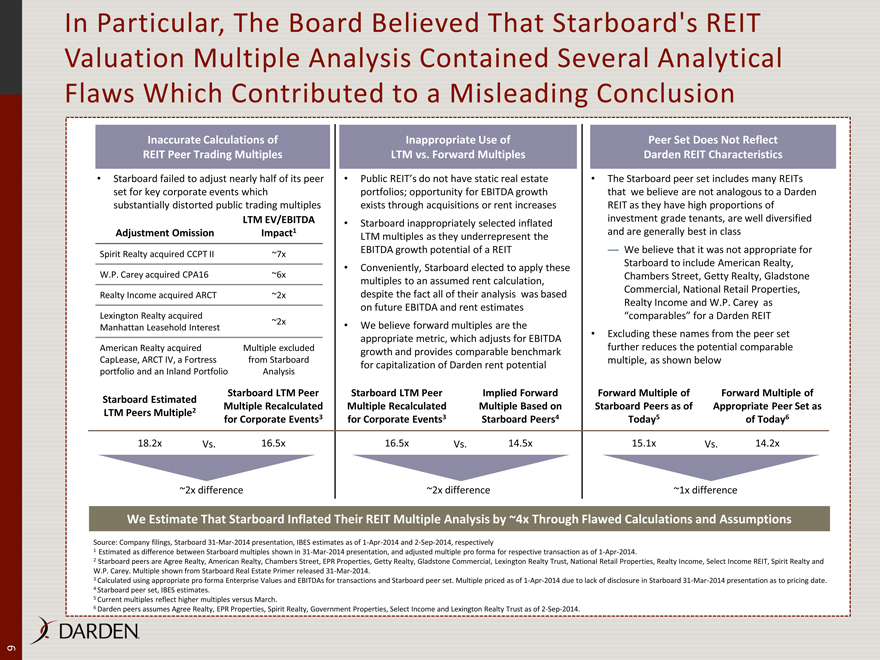
In Particular, The Board Believed That Starboard’s REIT Valuation Multiple Analysis Contained Several Analytical Flaws Which Contributed to a Misleading Conclusion
Inaccurate Calculations of
REIT Peer Trading Multiples
Starboard failed to adjust nearly half of its peer set for key corporate events which substantially distorted public trading multiples
Adjustment Omission
LTM EV/EBITDA Impact1
Spirit Realty acquired CCPT II
~7x
W.P. Carey acquired CPA16
~6x
Realty Income acquired ARCT
~2x
Lexington Realty acquired Manhattan Leasehold Interest
~2x
American Realty acquired CapLease, ARCT IV, a Fortress portfolio and an Inland Portfolio
Multiple excluded from Starboard Analysis
Starboard Estimated LTM Peers Multiple2
Starboard LTM Peer Multiple Recalculated for Corporate Events3
18.2x
Vs.
16.5x
~2x difference
Inappropriate Use of
LTM vs. Forward Multiples
Public REIT’s do not have static real estate portfolios; opportunity for EBITDA growth exists through acquisitions or rent increases
Starboard inappropriately selected inflated LTM multiples as they underrepresent the EBITDA growth potential of a REIT
Conveniently, Starboard elected to apply these multiples to an assumed rent calculation, despite the fact all of their analysis was based on future EBITDA and rent estimates
We believe forward multiples are the appropriate metric, which adjusts for EBITDA growth and provides comparable benchmark for capitalization of Darden rent potential
Starboard LTM Peer Multiple Recalculated for Corporate Events3
Implied Forward Multiple Based on Starboard Peers4
16.5x
Vs.
14.5x
~2x difference
Peer Set Does Not Reflect
Darden REIT Characteristics
The Starboard peer set includes many REITs that we believe are not analogous to a Darden REIT as they have high proportions of investment grade tenants, are well diversified and are generally best in class
We believe that it was not appropriate for Starboard to include American Realty, Chambers Street, Getty Realty, Gladstone Commercial, National Retail Properties, Realty Income and W.P. Carey as “comparables” for a Darden REIT
Excluding these names from the peer set further reduces the potential comparable multiple, as shown below
Forward Multiple of Starboard Peers as of Today5
Forward Multiple of Appropriate Peer Set as of Today6
15.1x
Vs.
14.2x
~1x difference
We Estimate That Starboard Inflated Their REIT Multiple Analysis by ~4x Through Flawed Calculations and Assumptions
Source: Company filings, Starboard 31-Mar-2014 presentation, IBES estimates as of 1-Apr-2014 and 2-Sep-2014, respectively
1 Estimated as difference between Starboard multiples shown in 31-Mar-2014 presentation, and adjusted multiple pro forma for respective transaction as of 1-Apr-2014.
2 Starboard peers are Agree Realty, American Realty, Chambers Street, EPR Properties, Getty Realty, Gladstone Commercial, Lexington Realty Trust, National Retail Properties, Realty Income, Select Income REIT, Spirit Realty and W.P. Carey. Multiple shown from Starboard Real Estate Primer released 31-Mar-2014.
3 Calculated using appropriate pro forma Enterprise Values and EBITDAs for transactions and Starboard peer set. Multiple priced as of 1-Apr-2014 due to lack of disclosure in Starboard 31-Mar-2014 presentation as to pricing date.
4 Starboard peer set, IBES estimates.
5 Current multiples reflect higher multiples versus March.
6 Darden peers assumes Agree Realty, EPR Properties, Spirit Realty, Government Properties, Select Income and Lexington Realty Trust as of 2-Sep-2014.
9
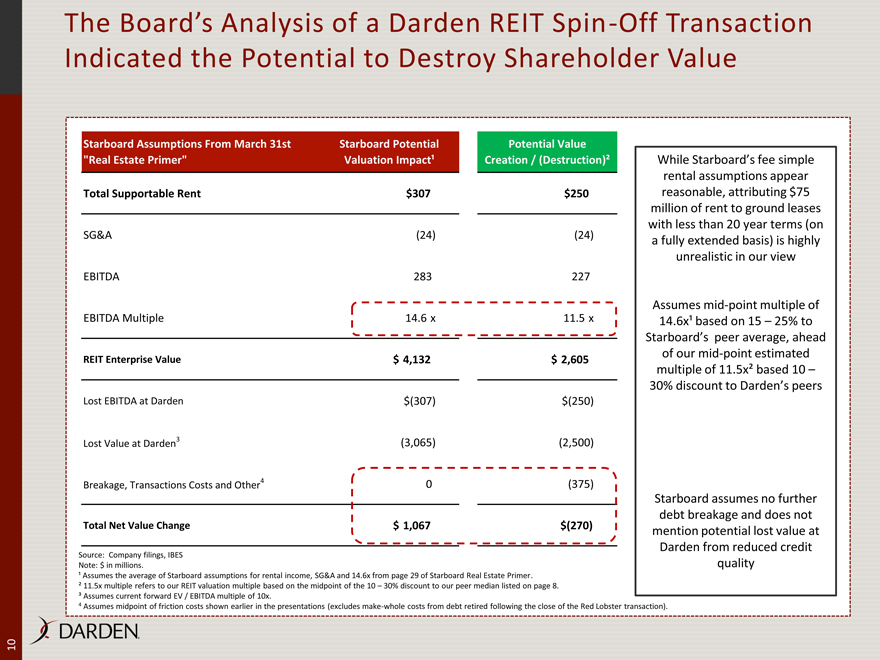
The Board’s Analysis of a Darden REIT Spin-Off Transaction Indicated the Potential to Destroy Shareholder Value
Starboard Assumptions From March 31st “Real Estate Primer”
Starboard Potential Valuation Impact¹
Potential Value Creation / (Destruction)²
Total Supportable Rent $307 $250
SG&A (24) (24) EBITDA 283 227 EBITDA Multiple 14.6 x 11.5 x
REIT Enterprise Value $ 4,132 $ 2,605
Lost EBITDA at Darden $(307) $(250)
3 (3,065) (2,500)
Lost Value at Darden
4 0 (375)
Breakage, Transactions Costs and Other
Total Net Value Change $ 1,067 $(270)
Source: Company filings, IBES
Note: $ in millions.
1 Assumes the average of Starboard assumptions for rental income, SG&A and 14.6x from page 29 of Starboard Real Estate Primer.
2 11.5x multiple refers to our REIT valuation multiple based on the midpoint of the 10 – 30% discount to our peer median listed on page 8.
3 Assumes current forward EV / EBITDA multiple of 10x.
4 Assumes midpoint of friction costs shown earlier in the presentations (excludes make-whole costs from debt retired following the close of the Red Lobster transaction).
While Starboard’s fee simple rental assumptions appear reasonable, attributing $75 million of rent to ground leases with less than 20 year terms (on a fully extended basis) is highly unrealistic in our view
Assumes mid-point multiple of 14.6x¹ based on 15 – 25% to Starboard’s peer average, ahead of our mid-point estimated multiple of 11.5x² based 10 – 30% discount to Darden’s peers
Starboard assumes no further debt breakage and does not mention potential lost value at Darden from reduced credit quality
10
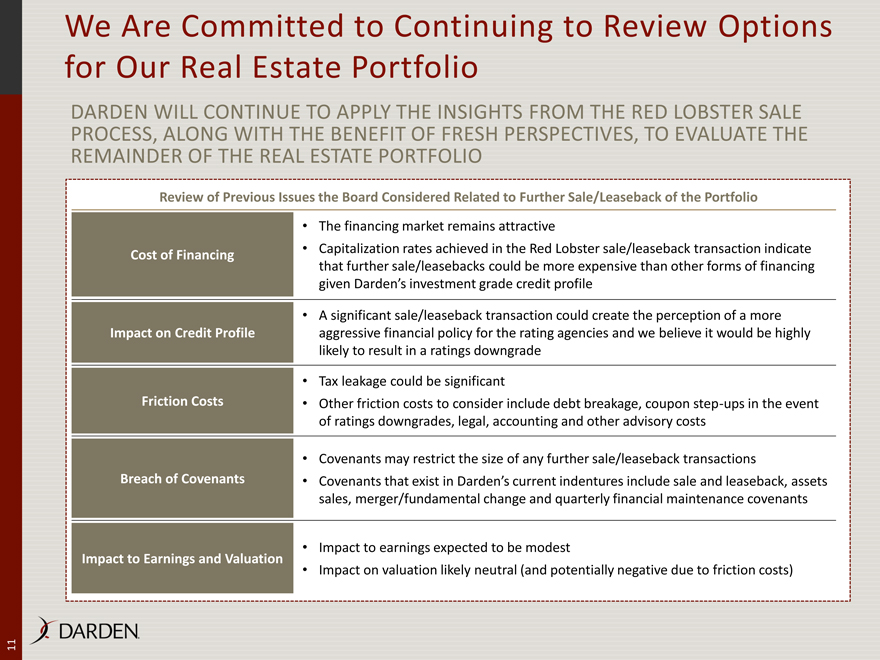
We Are Committed to Continuing to Review Options for Our Real Estate Portfolio
Darden WILL Continue TO apply THE insights from the red lobster sale process, Along WITH THE BENEFIT OF FRESH PERSPECTIVES, to evaluate the remainder of the real estate portfolio
Review of Previous Issues the Board Considered Related to Further Sale/Leaseback of the Portfolio
Cost of Financing
The financing market remains attractive
Capitalization rates achieved in the Red Lobster sale/leaseback transaction indicate that further sale/leasebacks could be more expensive than other forms of financing given Darden’s investment grade credit profile
Impact on Credit Profile
A significant sale/leaseback transaction could create the perception of a more aggressive financial policy for the rating agencies and we believe it would be highly likely to result in a ratings downgrade
Friction Costs
Tax leakage could be significant
Other friction costs to consider include debt breakage, coupon step-ups in the event of ratings downgrades, legal, accounting and other advisory costs
Breach of Covenants
Covenants may restrict the size of any further sale/leaseback transactions
Covenants that exist in Darden’s current indentures include sale and leaseback, assets sales, merger/fundamental change and quarterly financial maintenance covenants
Impact to Earnings and Valuation
Impact to earnings expected to be modest
Impact on valuation likely neutral (and potentially negative due to friction costs)
11
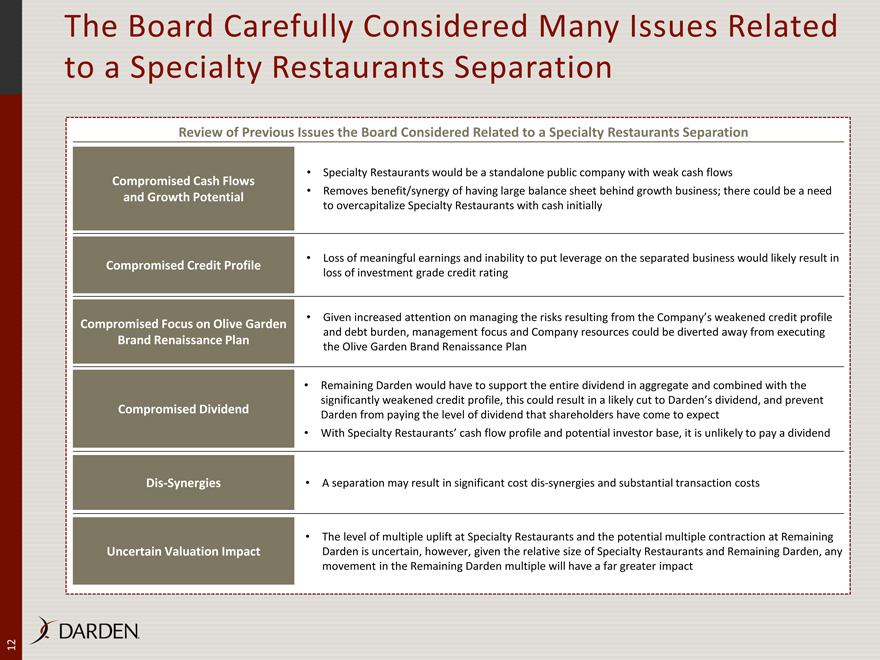
The Board Carefully Considered Many Issues Related to a Specialty Restaurants Separation Review of Previous Issues the Board Considered Related to a Specialty Restaurants Separation
Compromised Cash Flows
and Growth Potential
Specialty Restaurants would be a standalone public company with weak cash flows
Removes benefit/synergy of having large balance sheet behind growth business; there could be a need to overcapitalize Specialty Restaurants with cash initially
Compromised Credit Profile
Loss of meaningful earnings and inability to put leverage on the separated business would likely result in loss of investment grade credit rating
Compromised Focus on Olive Garden Brand Renaissance Plan
Given increased attention on managing the risks resulting from the Company’s weakened credit profile and debt burden, management focus and Company resources could be diverted away from executing the Olive Garden Brand Renaissance Plan
Compromised Dividend
Remaining Darden would have to support the entire dividend in aggregate and combined with the significantly weakened credit profile, this could result in a likely cut to Darden’s dividend, and prevent Darden from paying the level of dividend that shareholders have come to expect
With Specialty Restaurants’ cash flow profile and potential investor base, it is unlikely to pay a dividend
Dis-Synergies
A separation may result in significant cost dis-synergies and substantial transaction costs
Uncertain Valuation Impact
The level of multiple uplift at Specialty Restaurants and the potential multiple contraction at Remaining Darden is uncertain, however, given the relative size of Specialty Restaurants and Remaining Darden, any movement in the Remaining Darden multiple will have a far greater impact
12
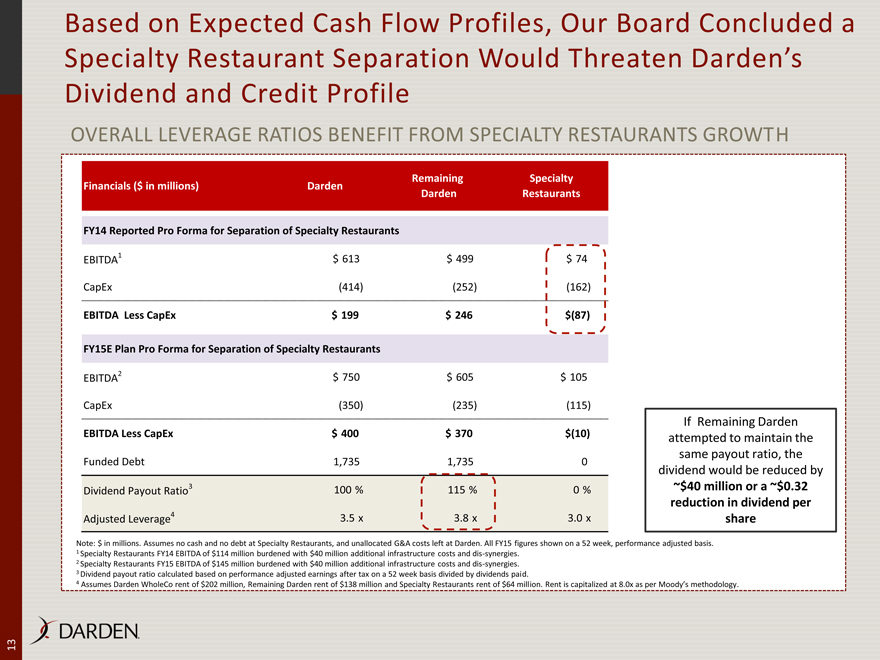
Based on Expected Cash Flow Profiles, Our Board Concluded a Specialty Restaurant Separation Would Threaten Darden’s Dividend and Credit Profile
Overall leverage ratios benefit from Specialty Restaurants growth
Remaining Specialty Financials ($ in millions) Darden Darden Restaurants
FY14 Reported Pro Forma for Separation of Specialty Restaurants
EBITDA1 $613 $499 $74
CapEx (414) (252) (162)
EBITDA Less CapEx $ 199 $ 246 $(87)
FY15E Plan Pro Forma for Separation of Specialty Restaurants
EBITDA2 $ 750 $ 605 $ 105
CapEx (350) (235) (115)
EBITDA Less CapEx $ 400 $ 370 $(10)
Funded Debt 1,735 1,735 0
Dividend Payout Ratio3 100 % 115 % 0 %
Adjusted Leverage4 3.5 x 3.8 x 3.0 x
Note: $ in millions. Assumes no cash and no debt at Specialty Restaurants, and unallocated G&A costs left at Darden. All FY15 figures shown on a 52 week, performance adjusted basis.
1 Specialty Restaurants FY14 EBITDA of $114 million burdened with $40 million additional infrastructure costs and dis-synergies.
2 Specialty Restaurants FY15 EBITDA of $145 million burdened with $40 million additional infrastructure costs and dis-synergies.
3 Dividend payout ratio calculated based on performance adjusted earnings after tax on a 52 week basis divided by dividends paid.
4 Assumes Darden WholeCo rent of $202 million, Remaining Darden rent of $138 million and Specialty Restaurants rent of $64 million. Rent is capitalized at 8.0x as per Moody’s methodology.
If Remaining Darden attempted to maintain the same payout ratio, the dividend would be reduced by ~$40 million or a ~$0.32 reduction in dividend per share
13
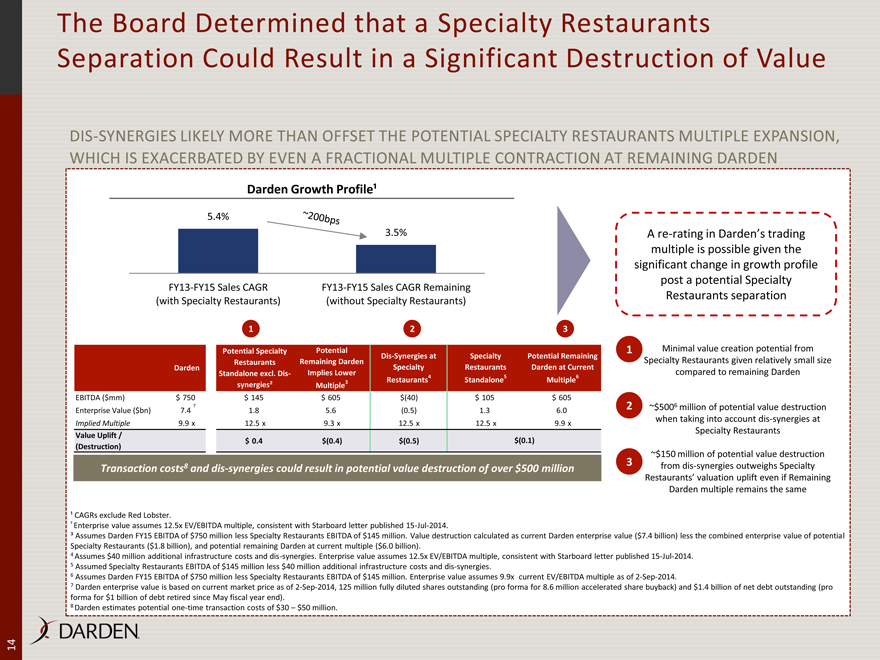
The Board Determined that a Specialty Restaurants Separation Could Result in a Significant Destruction of Value
DIS-SYNERGIES LIKELY MORE THAN OFFSET THE POTENTIAL SPECIALTY RESTAURANTS MULTIPLE EXPANSION, WHICH IS EXACERBATED BY EVEN A FRACTIONAL MULTIPLE CONTRACTION AT REMAINING DARDEN
Darden Growth Profile¹
5.4%
~200bps
3.5%
FY13-FY15 Sales CAGR FY13-FY15 Sales CAGR Remaining (with Specialty Restaurants) (without Specialty Restaurants)
1 2 3
Potential Specialty Potential Dis-Synergies at Specialty Potential Remaining Restaurants Remaining Darden Darden Standalone excl. Dis- Implies Lower Specialty Restaurants Darden at Current Restaurants4 Standalone5 Multiple6 synergies² Multiple3
EBITDA ($mm) $ 750 $ 145 $ 605 $(40) $ 105 $ 605 Enterprise Value ($bn) 7.4 7 1.8 5.6 (0.5) 1.3 6.0 Implied Multiple 9.9 x 12.5 x 9.3 x 12.5 x 12.5 x 9.9 x
Value Uplift /
(Destruction) $ 0.4 $(0.4) $(0.5) $(0.1)
Transaction costs8 and dis-synergies could result in potential value destruction of over $500 million
1 CAGRs exclude Red Lobster.
2 Enterprise value assumes 12.5x EV/EBITDA multiple, consistent with Starboard letter published 15-Jul-2014.
3 Assumes Darden FY15 EBITDA of $750 million less Specialty Restaurants EBITDA of $145 million. Value destruction calculated as current Darden enterprise value ($7.4 billion) less the combined enterprise value of potential Specialty Restaurants ($1.8 billion), and potential remaining Darden at current multiple ($6.0 billion).
4 Assumes $40 million additional infrastructure costs and dis-synergies. Enterprise value assumes 12.5x EV/EBITDA multiple, consistent with Starboard letter published 15-Jul-2014.
5 Assumed Specialty Restaurants EBITDA of $145 million less $40 million additional infrastructure costs and dis-synergies.
6 Assumes Darden FY15 EBITDA of $750 million less Specialty Restaurants EBITDA of $145 million. Enterprise value assumes 9.9x current EV/EBITDA multiple as of 2-Sep-2014.
7 Darden enterprise value is based on current market price as of 2-Sep-2014, 125 million fully diluted shares outstanding (pro forma for 8.6 million accelerated share buyback) and $1.4 billion of net debt outstanding (pro forma for $1 billion of debt retired since May fiscal year end).
8 Darden estimates potential one-time transaction costs of $30 – $50 million.
A re-rating in Darden’s trading multiple is possible given the significant change in growth profile post a potential Specialty Restaurants separation
1 Minimal value creation potential from Specialty Restaurants given relatively small size compared to remaining Darden
2 ~$5006 million of potential value destruction when taking into account dis-synergies at Specialty Restaurants
3 ~$150 million of potential value destruction from dis-synergies outweighs Specialty Restaurants’ valuation uplift even if Remaining Darden multiple remains the same
14
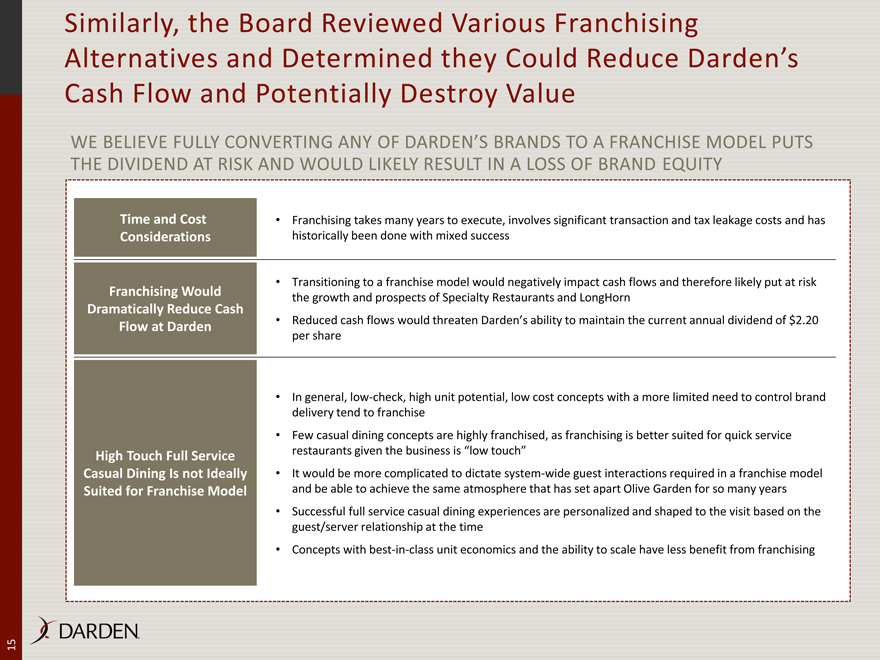
Similarly, the Board Reviewed Various Franchising Alternatives and Determined they Could Reduce Darden’s Cash Flow and Potentially Destroy Value
We believe fully converting any of Darden’s brands to a franchise model puts the dividend at risk and Would likely result in a loss of brand equity
Time and Cost Considerations
Franchising takes many years to execute, involves significant transaction and tax leakage costs and has historically been done with mixed success
Franchising Would Dramatically Reduce Cash Flow at Darden
Transitioning to a franchise model would negatively impact cash flows and therefore likely put at risk the growth and prospects of Specialty Restaurants and LongHorn
Reduced cash flows would threaten Darden’s ability to maintain the current annual dividend of $2.20 per share
High Touch Full Service Casual Dining Is not Ideally Suited for Franchise Model
In general, low-check, high unit potential, low cost concepts with a more limited need to control brand delivery tend to franchise
Few casual dining concepts are highly franchised, as franchising is better suited for quick service restaurants given the business is “low touch”
It would be more complicated to dictate system-wide guest interactions required in a franchise model and be able to achieve the same atmosphere that has set apart Olive Garden for so many years
Successful full service casual dining experiences are personalized and shaped to the visit based on the guest/server relationship at the time
Concepts with best-in-class unit economics and the ability to scale have less benefit from franchising
15
VII. Appendix
16
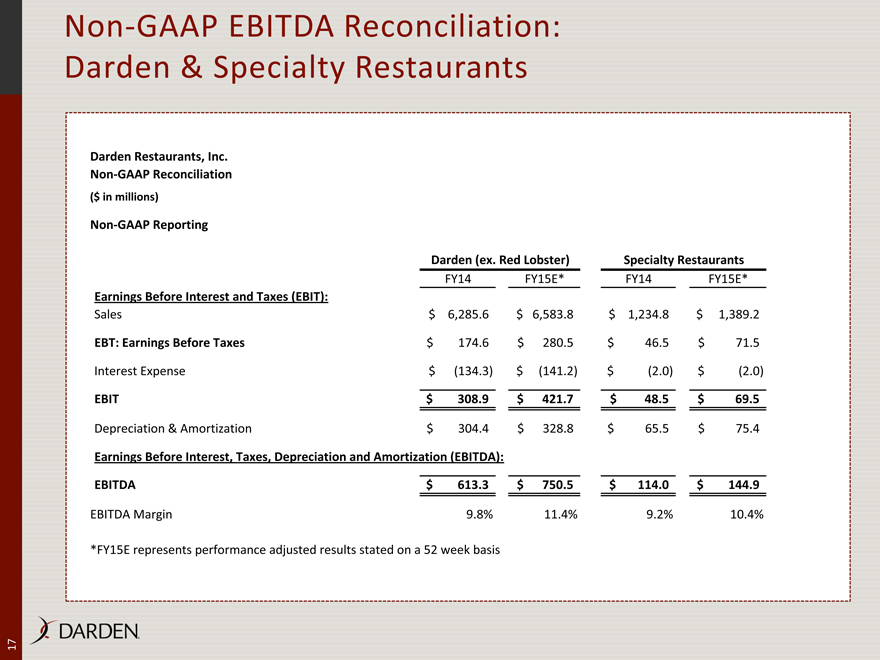
Non-GAAP EBITDA Reconciliation:
Darden & Specialty Restaurants
Darden Restaurants, Inc. Non-GAAP Reconciliation
($ in millions)
Non-GAAP Reporting
Darden (ex. Red Lobster) Specialty Restaurants
FY14 FY15E* FY14 FY15E*
Earnings Before Interest and Taxes (EBIT):
Sales $ 6,285.6 $ 6,583.8 $ 1,234.8 $ 1,389.2
EBT: Earnings Before Taxes $ 174.6 $ 280.5 $ 46.5 $ 71.5
Interest Expense $ (134.3) $ (141.2) $ (2.0) $ (2.0)
EBIT $ 308.9 $ 421.7 $ 48.5 $ 69.5
Depreciation & Amortization $ 304.4 $ 328.8 $ 65.5 $ 75.4
Earnings Before Interest, Taxes, Depreciation and Amortization (EBITDA):
EBITDA $ 613.3 $ 750.5 $ 114.0 $ 144.9
EBITDA Margin 9.8% 11.4% 9.2% 10.4%
*FY15E represents performance adjusted results stated on a 52 week basis
17
DARDEN