Issuer Free Writing Prospectus
Filed Pursuant to Rule 433
September 15, 2014
Registration Statement No. 333-198711
| Israel Chemicals Ltd. Common Stock Offering September 2014 |
| Safe Harbor All statements in this communication, other than those relating to historical facts, are “forward-looking statements.” These forward-looking statements and projections are not guarantees of future performance and are subject to a number of assumptions, risks, projections and uncertainties, many of which are beyond our control, which could cause actual results to differ materially from such statements or projections. Important factors that could cause actual results to differ materially from our expectations include, among others: loss or impairment of business licenses or mining permits or concessions; natural disasters; failure to raise the water level in evaporation Pond 5 in the Dead Sea; accidents or disruptions at our seaport shipping facilities or regulatory restrictions affecting our ability to export our products overseas; labor disputes, slowdowns and strikes involving our employees; currency rate fluctuations; rising interest rates; general market, political or economic conditions in the countries in which we operate; pension and health insurance liabilities; price increases or shortages with respect to our principal raw materials; volatility of supply and demand and the impact of competition; changes to laws or regulations (including environmental protection and safety and tax laws or regulations), or the application or interpretation of such laws or regulations; government examinations or investigations; the difference between actual reserves and our reserve estimates; failure to integrate or realize expected benefits from acquisitions and joint ventures; volatility or crises in the financial markets; cyclicality of our businesses; changes in demand for our fertilizer products due to a decline in agricultural product prices, lack of available credit, weather conditions, government policies or other factors beyond our control; decreases in demand for bromine-based products and other industrial products; litigation, arbitration and regulatory proceedings; and war or acts of terror. More detailed information about factors that may affect our performance may be found in “Risk Factors” in the prospectus for this offering. Forward-looking statements and projections represent our views and are given only as of the date of this communication and we disclaim any obligation to update or revise them, whether as a result of new information, future events or otherwise, except as required by law. This presentation includes certain non-GAAP financial measures as defined by SEC rules. As required by Regulation G, we have provided a reconciliation of those measures to the most directly comparable GAAP measures, which is available in the Appendix. We have filed a registration statement (including a prospectus) with the U.S. Securities and Exchange Commission (the “SEC”) for the offering to which this communication relates. Before you invest, you should read the prospectus in that registration statement and the other documents we have filed with the SEC for more complete information about us and this offering. You may get these documents for free by visiting EDGAR on the SEC website at www.sec.gov. Alternatively, you may obtain a preliminary prospectus from Morgan Stanley, Attention: Prospectus Department, 180 Varick Street, 2nd Floor, New York, NY 10014. 2 |
| Offering Summary 3 Issuer Israel Chemicals Ltd. (TASE: ICL) Listing: Ticker NYSE: ICL Shares Offered 62.0MM Offering Size $459MM, based on ICL share price of $7.41, as of September 12, 2014 Over-Allotment Option 10% Offering Structure 100% secondary Israel Corp. Is selling 36.2MM ordinary shares. Additionally, Israel Corp. expects to enter into forward sale agreements for 36.2MM additional shares, 25.8MM of which are part of the offering Use of Proceeds ICL will not receive any proceeds from this offering Israel Corp. Pro Forma Ownership 47.5%; 47.0% upon exercise of Greenshoe Lock-Up Provision 180 days after closing for the selling shareholder and ICL* Active Bookrunners Morgan Stanley, Barclays Expected Pricing Week of September 22, 2014 *Subject to exceptions disclosed in the registration statement related to the forward sale agreements, Israel Corporation’s margin loans, acquisitions by ICL under certain circumstances, and other customary exceptions, in each case subject to the terms and conditions of the lock-ups |
| Today’s Presenters 4 Stefan Borgas President & CEO Avi Doitchman Executive VP, CFO & Strategy Limor Gruber Head of Investor Relations |
| Introduction to ICL |

| Our Unique Business Model Resources Segment Our Expertise End Market (% ICL Sales) Our Specialty Minerals Negev Desert U.K. / Spain Mines Dead Sea Fertilizers Industrial Products Performance Products Potash Bromine Polysulphate (Polyhalite) Potash Phosphate Magnesium Agriculture 58% Processed Food 8% Engineered Materials 31% Potential New Geographies Potash Phosphate 6 |
|
|
| Why Invest in ICL? 7 2 Fully Integrated and Diversified Value Chain 1 Unique Portfolio of Mineral Assets 4 Strong Cash Flow Generation and Return of Capital to Shareholders 3 Leading Positions in Concentrated Global Markets with Strong Fundamentals 6 Growth Opportunities Across our Value Chain 5 Annual Run-Rate Cost Reductions and Efficiency Improvements of $350MM by the End of 2016 |

| ICL at a Glance 8 ICL is a leading global specialty minerals company that operates a unique integrated business model to fulfil essential needs in three key end markets: Agriculture, Engineered Materials and Processed Food Utilizes sophisticated processing and product formulation technologies to produce downstream / value-added products Operates low-cost, geographically advantaged assets ~50% of production and ~95% of sales outside of Israel LTM dividend yield: 7.9% (including special dividend) (2)(3) Company Snapshot Key Statistics (3) Our Business Segments US$Bn Market Capitalization 9.4 Net Debt 2.7 Enterprise Value 12.1 1H 2014A 2013A Revenue 3.1 6.3 EBITDA 0.7 1.6 % Margin 22% 25% Fertilizers: One of the world's largest producers of potash, phosphate-based fertilizers and specialty fertilizers Performance Products: Produces, markets and sells a broad range of downstream phosphate-based food additives and advanced additives Industrial Products: Extracts bromine and magnesium from the Dead Sea and produces and markets bromine, magnesium and phosphorus compounds Our Business Mix and End Markets (1) Potash Fertilizers & Phosphates Industrial Products Performance Products Processed Food Engineered Materials Agriculture (Bulk and Specialty Fertilizers) Fertilizers Segment Business Mix (Based on 2013 EBITDA) End Markets (Based on 2013 Revenue) Other Excludes adjusted EBITDA attributable to Other and eliminations; Does not sum to 100% due to rounding Dividend yield calculated as total dividends paid over the last twelve months divided by current market capitalization Market data as of September 12, 2014; Net debt calculated as total debt less cash, cash equivalents and short term investments |
| Our World Class Mineral Assets 9 Resources Our Specialty Minerals Negev Desert U.K. / Spain Mines Dead Sea Potash Bromine Phosphate Magnesium Potash Phosphate Potential New Geographies Polysulphate (Polyhalite) Potash |
| ICL’s largest and lowest cost potash asset Near-infinite resource life Ability to stockpile more than one full year of potash outdoors Close to ports and key end markets (key advantage vs. peers) Potentially subject to new tax and royalty regime in Israel as of 2017 Potash – Our Low Cost Dead Sea Reserves 10 Near-Infinite Low Cost Source of Potash ICL – Dead Sea c. 2/3 of ICL’s effective capacity Key Initiatives Potash Cash Cost Curve – FOB $ / Tonne, Excluding Royalties ICL – Dead Sea Cost Potash volume Cost reduction initiatives Process improvement and reduction of production costs Increase annual production capacity of potash processing plants by 0.3-0.5 million tonnes by YE2014 Continue to leverage synergies across portfolio and maintain market share Source: CRU Potash Cost Report 2013 Edition (December 2012), McKinsey & Company, ICL estimates |
| Global Potash Assets to Support Growth 11 ICL – SPAIN Potential to increase ICL’s total capacity by at least 2 million tonnes in the next decade, while reducing costs Assets close to ports and key end markets, reducing time to market and all-in costs ICL – U.K. Cost reduction initiatives Cost reduction initiatives Potash Cash Cost Curve – FOB $ / Tonne, Excluding Royalties* ICL – AFRICA (Option Value: Increase stake only if returns attractive for ICL shareholders) Allana Potash (Ethiopia) 16.4% Equity investment; Option to increase to 37% 1 million tonnes offtake agreement Attractive economics Production expected within less than 5 years The first potash mine in Africa Iberpotash (Spain) Close to Port of Barcelona – access to South East Asian and Brazilian markets Facility consolidation- maintaining capacity, reducing costs per tonne Potential future debottlenecking opportunity Evaluate brownfield expansion based on improved cost position Cleveland Potash (UK) Close to Teesside Port – access to Northern Europe Increase annual polysulphate production from 130,000 to 600,000 tonnes to capitalize on demand and reduce costs per ton (capex: £38MM) Improve capacity utilization while reducing costs per tonne Cost Potash volume *Source: CRU Potash Cost Report 2013 Edition (December 2012), McKinsey & Company, ICL estimates |

| World’s Largest Elemental Bromine Producer The Dead Sea integrated operations provide the highest concentration of Bromine which supports its world leading cost position Access to Largest and Richest Known Source of Bromine Grams/Liter ICL’s leading market position Other China Chemtura Albemarle ICL 2013 Estimated Production Capacity China’s reserves are depleting ICL owns the largest fleet of isotanks in the world 12 Source: ICL estimates, MarketsandMarkets |
| Looking to create a phosphate franchise outside Israel – potentially in an emerging market 3 Open Pit Mines Phosphate used in phosphate fertilizers, compound and specialty fertilizers as well as food additives Potential Production Capacity (bulk products): Phosphate rock: ~4.5 million tonnes Phosphoric acid: ~600 thousand tonnes Phosphate – A Complementary Mineral Asset Restored Mine 13 Phosphate Volume 2 3 1 ICL Located Within Sectors 2 & 3 Cost Phosphate Cost Curve (abstract model)* *Source: CRU Phosphate Rock Cost Report, 2014 Edition (January 2014), ICL estimates Important initiatives in our phosphate business are: Cost reduction at Rotem Expansion of sources of rock and phosphoric acid capacity Expansion of our geographic presence Market development in technical end markets Efforts to obtain new franchise in Barir field |

| Our Integrated Value Chain 14 Segment Our Expertise Fertilizers Industrial Products Performance Products |
| Integrated Value Chains Provide Significant Synergies and Logistics Advantages 15 The Negev Desert (in Israel) Phosphate Fertilizers Fertilizer Grade Phosphoric Acid Food Grade Phosphoric Acid Salt (NaCl) Phosphate Salts Pure Magnesium Magnesium Alloys Compound Fertilizers Salt (NaCl) Potash Specialty Fertilizers Chlorine based Biocides Bromine Compounds Magnesium Chloride Solution Magnesium Chloride Raw Materials Potash Potash Mines in the UK & Spain Sylvanite Crude Magnesium Fertilizers Industrial Products Performance Products DSM Product Sold End Brine Elemental Bromine Phosphate Rock Chlorine Elemental Phosphorus Special Grade Acid OPFRs & Others Magnesia Products (MgO) Source Major Intermediate & Finished Products Food Hygiene Wildfire Extinguishers Food Additives Phosphorus ( Penta) Sulfide Alumina & Magnesia Based Polysulphate Carnallite PCL3 POCL3 The Dead Sea (in Israel) |

| We Do Business in 3 Key Markets 16 End Market (% ICL Sales) Agriculture 58% Processed Food 8% Engineered Materials 31% |
| Leading Positions in Our Markets 17 Potash #2 in Western Europe; #3 in India; #4 in China and Brazil PK Fertilizers #1 in Western Europe Specialty Fertilizers #1 Worldwide in MAP / MKP Soluble Agriculture Fertilizers; #1 in the United States in Controlled-Release Fertilizers; #2 (tied) in Europe in Controlled-Release Fertilizers Specialty Phosphates Top 2 Worldwide Elemental Bromine #1 Worldwide Phosphorus-Based Flame Retardants #1 Worldwide Forest Fire Retardants #1 Worldwide Phosphate-Based Food Additives Top 3 Worldwide End-Markets Product Rank Agriculture Processed Food Engineered Materials Source: ICL estimates, see “Presentation of Financial and Other Information” in the prospectus |
| ICL Well-Positioned in Growing Potash Markets 18 Key ICL Markets Projected Growth (CAGR 2013 – 2018) 2013 Total Imports (Mt) ICL Market Share (2013) 15% 13% 22% #4 #4 #3 Brazil China India ICL Has Leading Positions in Growing Markets Source: China Fertilizers Imp. & Exp. Data, Beijing Orient Agribusiness Consultant, Sindicato da Industria de Adubose Correctivos Agricolas no Estado de Sao Paulo Source: Fertecon Potash Outlook Feb. 2014 Source: China Fertilizers Imp. & Exp. Data, Beijing Orient Agribusiness Consultant, Sindicato da Industria de Adubose Correctivos Agricolas no Estado de Sao Paulo, CRU Potassium Chloride Market Outlook Feb. 2014 Significant Upside in ICL Markets Nutrient Usage, Kg per Ha Crop Yield Tonnes, per Ha Source: USDA, IFA Potash Demand Growth Potential (Corn Example) Key ICL Initiatives India – Potash for Life Grassroots initiatives to prove efficacy of potash ICL initiative in 9 states and 30 districts -- 720 demonstration plots/year 15-35% average increase in yields Success stories demonstrate benefit-to- cost ratios between 13:1 and 43:1 Potash for Africa Joint project with the Ethiopian government in 30 districts -- 600 demonstration plots/year Minimal incremental demand can result in material ICL growth Only ~250,000 tonnes of incremental shipments required to grow at 5% p.a. Phosphate Potash Yield (Kg/Ha) |

| Food: Leverage Leadership in Phosphate Food Additives for Texture and Stability 19 Strong technology platform & know-how provides preferred solutions for customers Distinctive texture and stability solutions for the meat, bakery and dairy industries Bakery Expand applications development and commercial footprint in emerging markets Enhance technology platform for texture and stability solutions Assess M&A options to expand ingredients portfolio in a targeted manner Generated ~$500MM in Revenue in 2013 Dairy Meat/Poultry/ Seafood Bakery and Cereals Lower Fat & Sugar Lower Sodium Beverages Know How Platform for Texture and Stability Expand from Phosphate Ingredients to Growth in Texture and Stability Integrated Solutions |

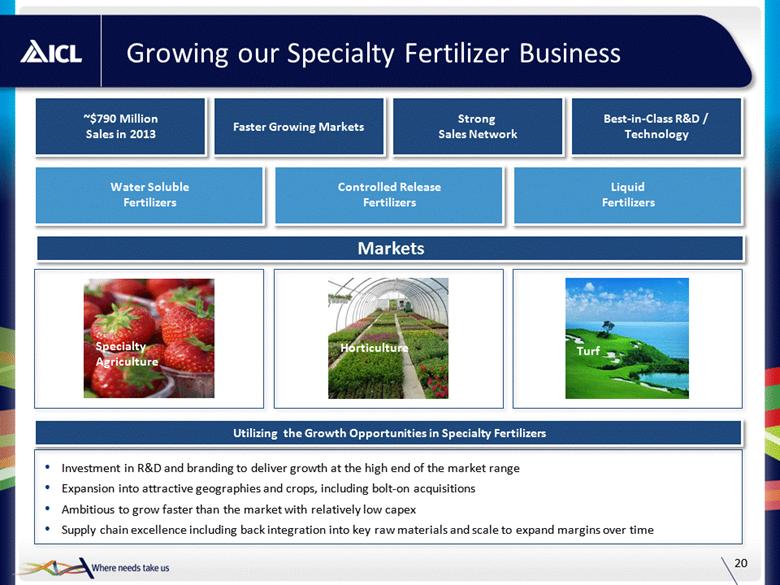
| Growing our Specialty Fertilizer Business 20 Horticulture Turf Specialty Agriculture Water Soluble Fertilizers Controlled Release Fertilizers Liquid Fertilizers Investment in R&D and branding to deliver growth at the high end of the market range Expansion into attractive geographies and crops, including bolt-on acquisitions Ambitious to grow faster than the market with relatively low capex Supply chain excellence including back integration into key raw materials and scale to expand margins over time Utilizing the Growth Opportunities in Specialty Fertilizers Markets |
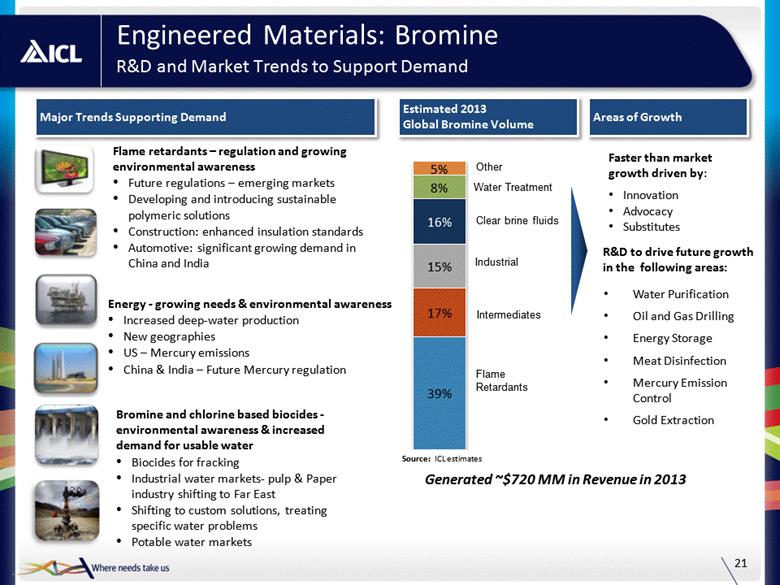
| Engineered Materials: Bromine R&D and Market Trends to Support Demand 21 Source: ICL estimates Major Trends Supporting Demand Faster than market growth driven by: Innovation Advocacy Substitutes Estimated 2013 Global Bromine Volume Areas of Growth Water Purification Oil and Gas Drilling Energy Storage Meat Disinfection Mercury Emission Control Gold Extraction R&D to drive future growth in the following areas: Flame retardants – regulation and growing environmental awareness Future regulations – emerging markets Developing and introducing sustainable polymeric solutions Construction: enhanced insulation standards Automotive: significant growing demand in China and India Energy - growing needs & environmental awareness Increased deep-water production New geographies US – Mercury emissions China & India – Future Mercury regulation Bromine and chlorine based biocides - environmental awareness & increased demand for usable water Biocides for fracking Industrial water markets- pulp & Paper industry shifting to Far East Shifting to custom solutions, treating specific water problems Potable water markets Generated ~$720 MM in Revenue in 2013 |
| Engineered Materials: Phosphorous & Phosphates Leading Positions in Market Segments 22 Strong technology platform & know-how provides preferred solutions for customers in key Engineered Materials end markets: Paints & coatings , metal treatment, oil additives, semiconductors, construction and cleaners As the only true global player in all regions, we continue our expansion of global presence with focus on emerging markets Have expanded global presence over last several years via acquisitions Drive differentiated offerings via increased innovation and additional targeted M&A Generated ~$940 MM in Revenue in 2013 Purified & specialty phosphoric acid Technical and specialty phosphates Wildfire Safety P2S5 for lubricants, motor oils and insecticides Phosphorous flame retardants Phosphorous industrial solutions Leadership Positions in Key End Markets Leading Positions in Industrial Phosphates, Specialty Phosphoric Acids, Wild Land Fire Fighting & P2S5 |

| Financial Overview Industry Leading Cash Returns |
| Consistently Strong Operating Cash Flow 24 (US$Bn) Adjusted EBITDA and Operating Cash Flow Operating Cash Flow Adjusted EBITDA By Segment Average Cash Flow Conversion: 81% (1) (US$MM) FY2010 FY2011 FY2012 FY2013 Fertilizers Potash 938 1,288 1,107 841 Fertilizer and Phosphates 147 313 264 257 Industrial Products 258 348 279 225 Performance Products 225 231 222 242 Operating Cash Flow adjusted for one-time $108 million taxes paid due to Trapped Earnings Law Average of 2010 – 2013 Operating Cash Flow divided by Adjusted EBITDA (2) |
| Average of Specialty Chemical Peers (4) Industry-Leading Returns Through Disciplined Use of Capital 25 Average: 18% Average: 33% 2010 – 2013 Average (%) Return on Invested Capital (2) Free Cash Flow Conversion (1) Average of Specialty Chemical Peers (4) (3) Free cash flow conversion calculated as free cash flow divided by EBITDA (calculated as operating income plus depreciation & amortization); Free cash flow calculated as cash flow from operations less capex and cash acquisitions ROIC defined as after-tax operating income (assuming effective tax rate) divided by invested capital (net debt plus shareholder equity plus minority interest) Based on May year end Includes: Albemarle, Innophos and Rockwood 2010 – 2013 (%) ICL asset base requires minimal maintenance capital Peers have over-invested in growth capital (capex and M&A); ICL has been disciplined Source: Company filings, filings of competitors Source: Company filings, filings of competitors |
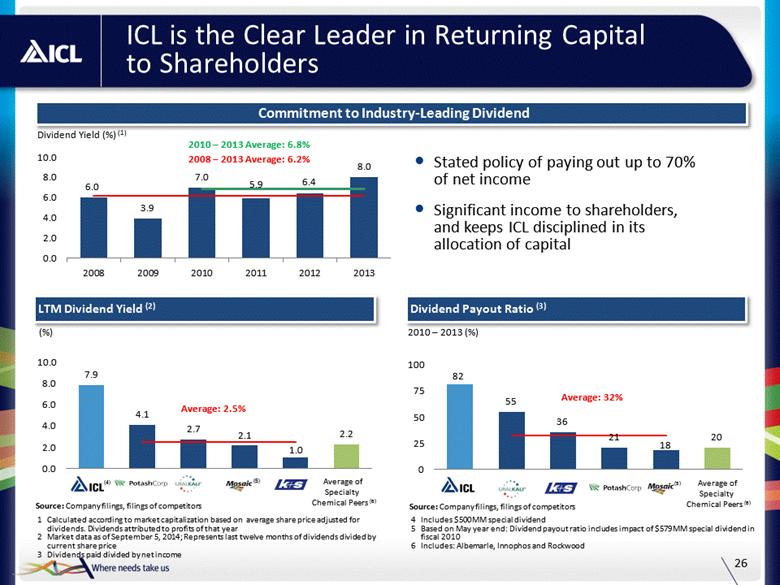
| Includes $500MM special dividend Based on May year end: Dividend payout ratio includes impact of $579MM special dividend in fiscal 2010 Includes: Albemarle, Innophos and Rockwood ICL is the Clear Leader in Returning Capital to Shareholders 26 Calculated according to market capitalization based on average share price adjusted for dividends. Dividends attributed to profits of that year Market data as of September 5, 2014; Represents last twelve months of dividends divided by current share price Dividends paid divided by net income Commitment to Industry-Leading Dividend (%) Average: 32% Average: 2.5% Dividend Payout Ratio (3) LTM Dividend Yield (2) (5) (5) Average of Specialty Chemical Peers (6) Average of Specialty Chemical Peers (6) 2010 – 2013 (%) (4) Stated policy of paying out up to 70% of net income Significant income to shareholders, and keeps ICL disciplined in its allocation of capital 2008 – 2013 Average: 6.2% Dividend Yield (%) (1) 2010 – 2013 Average: 6.8% Source: Company filings, filings of competitors Source: Company filings, filings of competitors |
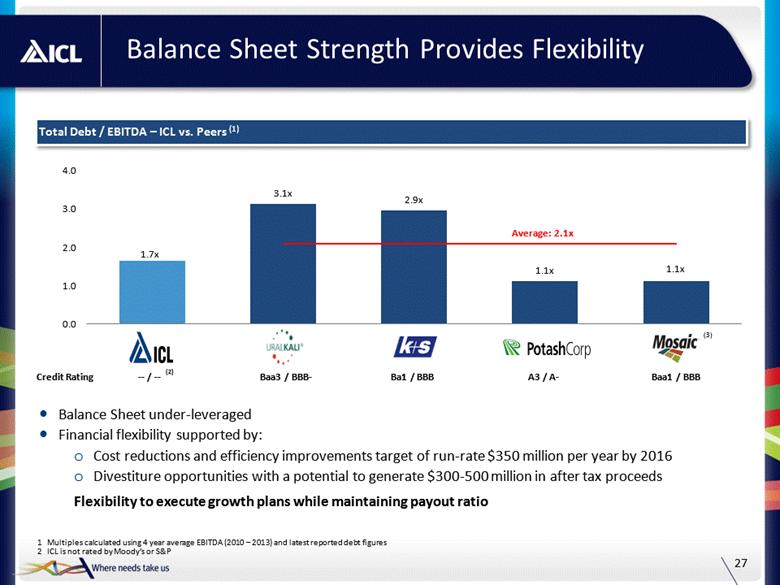
| Balance Sheet Strength Provides Flexibility 27 Multiples calculated using 4 year average EBITDA (2010 – 2013) and latest reported debt figures ICL is not rated by Moody’s or S&P Balance Sheet under-leveraged Financial flexibility supported by: Cost reductions and efficiency improvements target of run-rate $350 million per year by 2016 Divestiture opportunities with a potential to generate $300-500 million in after tax proceeds Flexibility to execute growth plans while maintaining payout ratio Average: 2.1x Total Debt / EBITDA – ICL vs. Peers (1) (3) Baa1 / BBB A3 / A- Ba1 / BBB Baa3 / BBB- -- / -- Credit Rating (2) |
| Future Priorities |

| Implications of the Natural Resources Committee 29 Legal Actions Operational Business Measures: Cost Cutting Acceleration, Revaluating Certain Product Lines ICL’s Actions Based on 2013 financial performance pro forma for statutory tax rate of 26.5% for comparability purposes. See “Recent Developments” in the prospectus Preliminary Sheshinski II recommendations, including additional royalties for bromine downstream products, imply a net impact to ICL’s bottom line of ~$160MM (1) Every 10% change in potash prices impacts net income by ~$45MM Changes to the potash tax system will not come into effect prior to January 2017 Advocacy: Government Lobbying, Challenge Committee’s Assessments Strategic Business Measures: Cancellation of $0.75Bn and Review of $1.00Bn of Investments, Shifting Investments Outside of Israel |

| Annual Run-Rate Cost Reductions and Efficiency Improvements of $350MM by the End of 2016 30 Simplification and interfaces New ways of working Best practices exchange Skill building Specific investment projects (e.g., potash, phosphate) Sources of Improvement Procurement Energy R&D Pricing Overall USD Millions/Year Mineral Cost Efficiency Initiative: 2016 EBITDA Impact (Run-Rate) Based on $350MM, cost reductions and efficiency improvements assumed statutory 26.5% tax rate (excludes impact of new natural resources tax), 1.3Bn shares outstanding and a discount rate of 10% Above closing share price of $7.41 on 9/12/14; calculated as NPV per share ($1.99) divided by the closing share price ($7.41) Net present value of $2.57Bn, or $1.99 per share (1) Implies value creation potential of 27% per share (2) |

| Our Future Priorities 31 “One ICL” Harmonize IT systems and management processes, share best practices Identify and reward top performing employees Grow Our Core Businesses Seek and evaluate opportunities with a potential to double our phosphate scale Expand our potash minerals assets and outperform potash market growth by educating emerging market farmers on the benefits of potash Continue to pursue high-return “bolt-on” M&A opportunities in phosphates, food additives and specialty fertilizers Drive demand growth through innovation in downstream bromine and phosphate-based products Expected to increase R&D by 30% by 2019 Improve Our Cost Position by $350MM by 2016 (1) Streamline potash and phosphate operations to reduce cost per tonne Implement efficiency improvements across our global processes Grow Shareholder Returns Committed to a dividend pay-out ratio of up to 70% Maintain commitment to return of capital to shareholders Optimize best-in-class ROIC and free cash flow generation Maintain Strong Flexible Balance Sheet Run-rate reduction based on 2013 Maintain investment grade credit metrics Maintain current level of capex while substituting maintenance capex with growth capex Divestitures of non-core assets should contribute $300-500 million 1 |
| Offering Provides Unique Investment Opportunity 32 Market Capitalization ($Bn) (9/12/2014) 9.4 28.5 17.3 Total Shareholder Return (1) January 2005 to Sheshinski 417% 341% 228% LTM Dividend Yield 8% 4% 2% Expansion Capex and Potash Production Growth Cumulative Capex on Capacity Expansions ($Bn) (2) 0.65 7.9 3.2 Expansion Capex / Market Capitalization 7% 27% 18% % Increase in Potash Production 2007 - 2013 2% (15%) (12%) Capital Efficiency Free Cash Flow Conversion (3) 40% 34% 28% ROIC (4) 26% 18% 18% Key Shareholders Israel Corp: 52% Potash Corp: 14% None Cargill Trusts: 19% ICL provides leverage to attractive valuation catalysts relative to peers Long-term share performance Recovery from short-term uncertainties (Sheshinski, Gaza, etc.) Higher dividend yield provides ‘value support’ Disciplined approach to capital allocation Cost reductions and efficiency improvements ($350MM p.a) 1 2 3 4 USD share price plus dividends Expansion and growth capex from 2008 – 2013 2010 to 2013 performance; Free cash flow conversion calculated as free cash flow divided by EBITDA; Free cash flow calculated as cash flow from operations less capex and cash acquisitions 2010 to 2013 performance; ROIC defined as after-tax operating income (assuming effective tax rate) divided by invested capital (net debt plus shareholder equity plus minority interest) Current Israel Corp. ownership prior to the offering Financial metrics are based on May year end (5) (6) (6) (6) 5 |

| Why Invest in ICL? 33 2 Fully Integrated and Diversified Value Chain 1 Unique Portfolio of Mineral Assets 4 Strong Cash Flow Generation and Return of Capital to Shareholders 3 Leading Positions in Concentrated Global Markets with Strong Fundamentals 6 Growth Opportunities Across our Value Chain 5 Annual Run-Rate Cost Reductions and Efficiency Improvements of $350MM by the End of 2016 |
| Appendix |

| Israel Corp. Organizational Structure and Proposed Strategic Separation Under Consideration(1)(2)(3) 35 52% 37% 100% 50% 32% 30% 100% Specialty Minerals and Engineered Materials Companies to be included in the newly formed entity On June 26th 2013, Israel Corp (TASE:ILCO) announced it would examine a strategic action to split the Company's holdings Israel Corp. estimates the process to be concluded by the end of 2014 Following the strategic separation, Israel Corp.’s debt will remain at Israel Corp. ICL dividend has been the main source of liquidity for Israel Corp. Refining and Petrochemicals Global Power Generation Company with Assets in LatAm and Israel Renewable Energy International Automotive Company Based in China Notes For full details, please refer to the immediate report filed June 26, 2013, of which the Hebrew is the binding version, in addition to the section “Examination of Change in the Corporation’s Holdings” in the Company’s 2014 Director’s Report This slide includes forward-looking information, as defined in the Securities Law. The Split Plan, in its final determined format, may not materialize in whole or in part, or may materialize in a different format than the one under consideration, in a different time frame than expected and in a different manner than anticipated. Factors which may influence on this are, among others, un-fulfillment of various conditions, including in connection with various regulators and other bodies, which approval is required Shareholding percentages for all companies are as of August 28, 2014. TowerJazz shareholding percentage assumes the conversion of bank held capital notes held by banks Container Shipping Semiconductor Manufacturer |

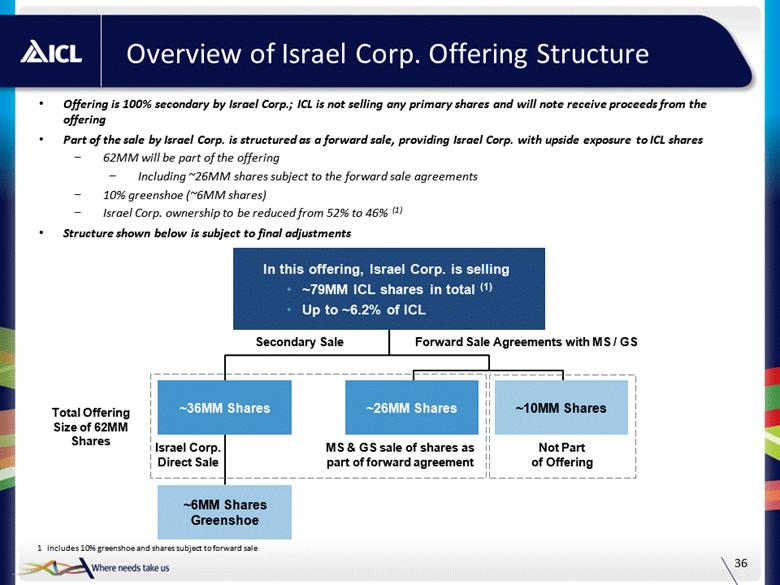
| Overview of Israel Corp. Offering Structure 36 In this offering, Israel Corp. is selling ~79MM ICL shares in total (1) Up to ~6.2% of ICL Offering is 100% secondary by Israel Corp.; ICL is not selling any primary shares and will note receive proceeds from the offering Part of the sale by Israel Corp. is structured as a forward sale, providing Israel Corp. with upside exposure to ICL shares 62MM will be part of the offering Including ~26MM shares subject to the forward sale agreements 10% greenshoe (~6MM shares) Israel Corp. ownership to be reduced from 52% to 46% (1) Structure shown below is subject to final adjustments Secondary Sale Forward Sale Agreements with MS / GS Includes 10% greenshoe and shares subject to forward sale ~26MM Shares ~6MM Shares Greenshoe ~36MM Shares ~10MM Shares Israel Corp. Direct Sale MS & GS sale of shares as part of forward agreement Not Part of Offering Total Offering Size of 62MM Shares |
| Update on Discussed Tax Increases and Royalty Arbitration 37 Sheshinski II Committee was mandated by the Finance Ministry to review royalty and tax policy for natural resource companies Released draft recommendations on May 18, 2014 Additionally, on May 19, 2014, an arbitrator ruled that ICL must pay royalties on downstream products manufactured from the Dead Sea Minerals As a result, ICL made a $135MM post-tax provision recorded in 2Q 2014 for the arbitration award (for 2000 through 2013) and will be subject to higher future royalties Royalties Potash royalties will fall to 5% from current level of 5% on first 1.5MM tonnes, and 10% thereafter Bromine and magnesium royalties remain at 5% Phosphate royalties will increase from 2% to 5% Downstream products manufactured with minerals from the Dead Sea will incur a 5% royalty Some changes will be implemented on the calculation method Natural Resource Tax After the deduction of an amount equal to an 11% return on the net book value of ICL’s fixed assets, incremental operating profits will be taxed at 42% The tax will be implemented on the operating profit of each company that utilizes natural resources in Israel Corporate Tax Profits will be taxed at statutory tax level (expected to be 26.5%) Timing Recommendations are preliminary Any new royalty rate or tax on Dead Sea works will require legislation. Potash tax system will not come into effect prior to January 2017 Royalties and taxes on bromine and phosphate may be imposed prior to 2017 |

| Highly Attractive Fertilizer Fundamentals 38 Population Is Growing Arable Land Is Declining Yield Growth Required to Meet World’s Food Needs Meat Consumption and Fertilizer Use Source: FAO Pop (Bn) MM Tonnes of Meat and Nutrient Tonnes Arable Land per Capita (Hectares) Grain Production (Indexed to 100) Fertilizer Consumption World Crop Production in 2005 – 2007 Crop Rotation World Crop Production in 2050 Increase in Yields Expansion of Arable Land +9% +14% +77% Source: U.S. Census Bureau, United Nations Source: USDA, meat includes beef, veal, swine, broiler and turkey Source: FAO |
| ICL Market Share and Market Growth 39 Global Potash Demand 2011 – 2020E 2013 Global Potash Capacity (Mt) Source: Equity Research Long-term Growth Drivers Population growth Increased standards of living and protein consumption Declining arable land per capita Former BPC 31% Canpotex 34% ICL 8% RoW 27% Potash Corp Mosaic Co Agrium Uralkali Belaruskali K+S China Other Source: Equity Research Potash Price Forecast to 2020 $/Tonne MM Mt KCL Source: Fertecon |
| Israel based on average from Dead Sea to Port of Eilat and Ashdod; Germany based on Werra to Port of Hamburg and Bremerhaven; Canada based on Saskatchewan to Port of Vancouver; Russia based on Starobin to Port of Klaipeda; Spain based on Cabanasas Mine to Port of Barcelona; UK based on Cleveland Potash, Saltburn-by-the-Sea to Teesport Commerce Park Advantageous Potash Assets Locations 40 ICL Has Shorter and Lower Cost Shipping Routes to Emerging Markets Destination (Days) Destination ($/tonne) Country of Departure Mine-to-Port (km) (1) China India Brazil China India Brazil Israel ~200 23 11 22 27 18 23 UK ~30 34 22 20 40 32 23 Spain ~85 27 15 17 42 31 23 Germany ~350 34 23 20 38 31 22 Russia / Belarus ~600 39 27 25 31 31 25 Canada West Coast ~1,700 35 47 43 22 35 40 Clear Service Advantage to Developed and Emerging Markets Low plant gate-to-port costs and ocean freight costs with faster time to markets Europe China Brazil India US Israel Source: ICL estimates, Netpas |
| History of Productive M&A 41 Acquired Company Date Country Business Area Allana Potash (16%) 2014 Canada (Africa) Potash Auxquimia 2014 Spain Fire Safety Hagesued 2014 Germany Food Eclean 2013 China Anti Germ Knapsack 2013 Germany P2S5 Tiami 2012 Sweden Water Solutions X-Calibur Plant Health Company 2012 U.S. Specialty Fertilizers Remaining 50% of Nutrisi 2011 Belgium Specialty Fertilizers Remaining 50% of TBT 2011 Israel Flame Retardants Halox 2011 U.S. Advanced Additives Cozmocel 2011 Mexico Food Chimtec 2011 Poland Anti Germ Fuentes 2011 Spain Specialty Fertilizers Everris (Scotts Miracle Gro Professional Products) 2011 U.S. Specialty Fertilizers Summary of ICL M&A A total of ~$640MM of M&A spending since 2011 |
| Adjusted EBITDA Reconciliation 42 The table below reconciles Adjusted EBITDA to the IFRS measure, income to Company shareholders: Six Months Ended June 30, Year Ended December 31, ($MM) 1H 2014 1H 2013 2013 2012 2011 2010 Income to Company Shareholders 199 622 819 1,300 1,498 1,025 Depreciation and Amortization 177 164 348 323 316 254 Finance Expenses, Net 69 18 27 61 78 60 Taxes on Income 63 123 280 218 333 262 Unusual Items, net (1) 174 - 95 44 - 10 Adjusted EBITDA 682 926 1,568 1,945 2,225 1,611 Unusual expense in the first half of 2014 includes approximately $23 million of costs caused by the strike at our Rotem subsidiary and approximately $149 million (before interest expenses and tax) in respect of a provision relating to prior periods due to the royalties arbitration decision. Unusual expense in 2013 includes $60 million of early retirement expense at our Rotem subsidiary in Israel from an early retirement program and a $25 million increase in a waste removal provision and $10 million asset write-down in our Industrial Products segment. Unusual expense in 2012 includes $33 million of early retirement expense at Rotem and $22 million of early retirement expense in our Industrial Products segment, offset by $11 million of unusual income due to a VAT refund. Unusual expense in 2010 includes an expense relating to a malfunction at our sulfuric acid plant. |
| Free Cash Flow Conversion Reconciliation 43 Year Ended December 31, ($MM) 2013 2012 2011 2010 Total Cash Flow from Operations 1,127 1,727 1,359 1,566 5,779 Capital Expenditures(1) (890) (724) (984) (334) (2,931) Free Cash Flow 237 1,004 375 1,047 2,848 Operating Income 1,101 1,554 1,878 1,319 5,852 Depreciation and Amortization 348 323 316 217 1,203 EBITDA 1,449 1,876 2,194 1,536 7,055 Free Cash Flow Conversion(2) 16.4% 53.5% 17.1% 80.2% 40.4% Includes cash acquisitions Free cash flow conversion calculated as free cash flow divided by EBITDA; Free cash flow calculated as cash flow from operations less capex and cash acquisitions |
| Return on Invested Capital Reconciliation 44 Year Ended December 31, ($MM) 2013 2012 2011 2010 Average Operating Income 1,101 1,554 1,878 1,319 Effective Tax Rate 25.5% 14.3% 18.6% 20.6% After-Tax Operating Income 821 1,331 1,529 1,047 Total Debt 2,029 1,697 1,694 1,421 Minority Interest 25 23 28 21 Shareholder’s Equity 3,654 3,365 3,062 2,623 Less: Cash (188) (206) (238) (355) Invested Capital 5,519 4,880 4,546 3,710 Return on Invested Capital (1) 14.9% 27.3% 33.6% 25.5% 26.0% ROIC defined as after-tax operating income (assuming effective tax rate) divided by invested capital (net debt plus shareholder equity plus minority interest) |