UNITED STATES
SECURITIES AND EXCHANGE COMMISSION
Washington, D.C. 20549
FORM 6-K
REPORT OF FOREIGN PRIVATE ISSUER PURSUANT TO RULE 13a-16 OR 15d-16 UNDER
THE SECURITIES EXCHANGE ACT OF 1934
For the month of November 2019
Commission File Number: 001-13742
ISRAEL CHEMICALS LTD.
(Exact name of registrant as specified in its charter)
Israel Chemicals Ltd.
Millennium Tower
23 Aranha Street
P.O. Box 20245
Tel Aviv, 61202 Israel
(972-3) 684-4400
(Address of principal executive office)
Indicate by check mark whether the registrant files or will file annual reports under cover of Form 20-F or Form 40-F:
Form 20-F ☒ Form 40-F ☐
Indicate by check mark if the registrant is submitting the Form 6-K in paper as permitted by Regulation S-T Rule 101(b)(1):
Yes ☐ No ☒
Indicate by check mark if the registrant is submitting the Form 6-K in paper as permitted by Regulation S-T Rule 101(b)(7):
Yes ☐ No ☒
ISRAEL CHEMICALS LTD.
| 1. | Q3 2019 Investor Presentation |
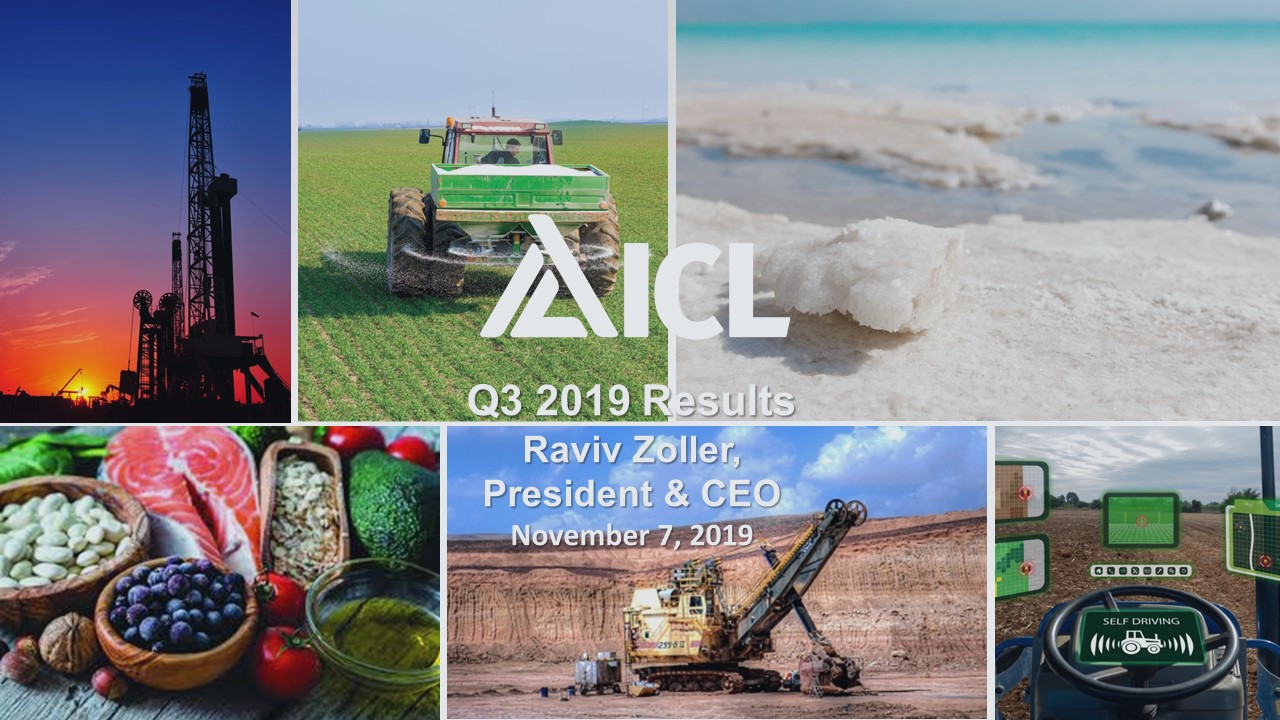
Q3 2019 ResultsRaviv Zoller, President & CEONovember 7, 2019
Disclaimer and Safe Harbor for Forward-Looking Statements The information contained herein in this presentation or delivered or to be delivered to you during our presentation does not constitute an offer, expressed or implied, or a recommendation to do any transaction in Israel Chemicals Ltd. (“ICL” or “Company”) securities or in any securities of its affiliates or subsidiaries. This presentation and/or other oral or written statements made by ICL during its presentation or from time to time, may contain forward-looking statements within the meaning of the United States Private Securities Litigation Reform Act of 1995 and other applicable securities laws. Whenever words such as "believe," "expect," "anticipate," "intend," "plan," "estimate", “predict” or similar expressions are used, the Company is making forward-looking statements. Such forward-looking statements may include, but are not limited to, those that discuss strategies, goals, financial outlooks, corporate initiatives, existing or new products, existing or new markets, operating efficiencies, or other non-historical matters. Because such statements deal with future events and are based on ICL’s current expectations, they could be impacted or be subject to various risks and uncertainties, including those discussed in the "Risk Factors" section and elsewhere in our Annual Report on Form 20-F for the year ended December 31, 2018, and in subsequent filings with the Tel Aviv Securities Exchange (TASE) and/or the U.S. Securities and Exchange Commission (SEC). Therefore actual results, performance or achievements of the Company could differ materially from those described in or implied by such forward-looking statements. Although the Company believes that the expectations reflected in such forward-looking statements are based on reasonable assumptions, it can provide no assurance that expectations will be achieved. Except as otherwise required by law, ICL disclaims any intention or obligation to update or revise any forward-looking statements, which speak only as of the date hereof, whether as a result of new information, future events or circumstances or otherwise. Readers, listeners and viewers are cautioned to consider these risks and uncertainties and to not place undue reliance on such information.Certain market and/or industry data used in this presentation were obtained from internal estimates and studies, where appropriate, as well as from market research and publicly available information. Such information may include data obtained from sources believed to be reliable, however ICL disclaims the accuracy and completeness of such information which is not guaranteed. Internal estimates and studies, which we believe to be reliable, have not been independently verified. We cannot assure that such data is accurate or complete. Included in this presentation are certain non-GAAP financial measures, such as sales excluding divested businesses, adjusted operating income, adjusted operating income excluding divested businesses, adjusted EBITDA excluding divested businesses, Adjusted net income excluding divested businesses, adjusted EPS excluding divested businesses and free cash flow, designed to complement the financial information presented in accordance with IFRS because management believes such measures are useful to investors. These non-GAAP financial measures should be considered only as supplemental to, and not superior to, financial measures provided in accordance with IFRS. Please refer to our Q3 2019 press release for the quarter ended September 30, 2019 and the appendix to this presentation for a reconciliation of the non-GAAP financial measures included in this presentation to the most directly comparable financial measures prepared in accordance with IFRS. 2 Important Legal Notes
3 Q3 2019 Highlights Solid results with record cash generationSales of $1,325 million were 3% lower than Q3 2018, mainly due to delays in the signing of potash supply contracts in AsiaOperating income was slightly higher at $201 million EPS of $0.10, in line with Q3 2018Adjusted EBITDA was up by 4% to $307 million. YTD adjusted EBITDA increased by 18%6-year record quarterly operating cash flow of $368 million, 88% higher compared to Q3 2018. YTD operating cash flow almost doubled to $780 millionA dividend of ¢5 per share, reflecting a dividend yield(1) of more than 4%Important strategic milestones achieved by Industrial Products and Phosphate Solutions divisions, supporting ICL's future growth LTM dividend yield
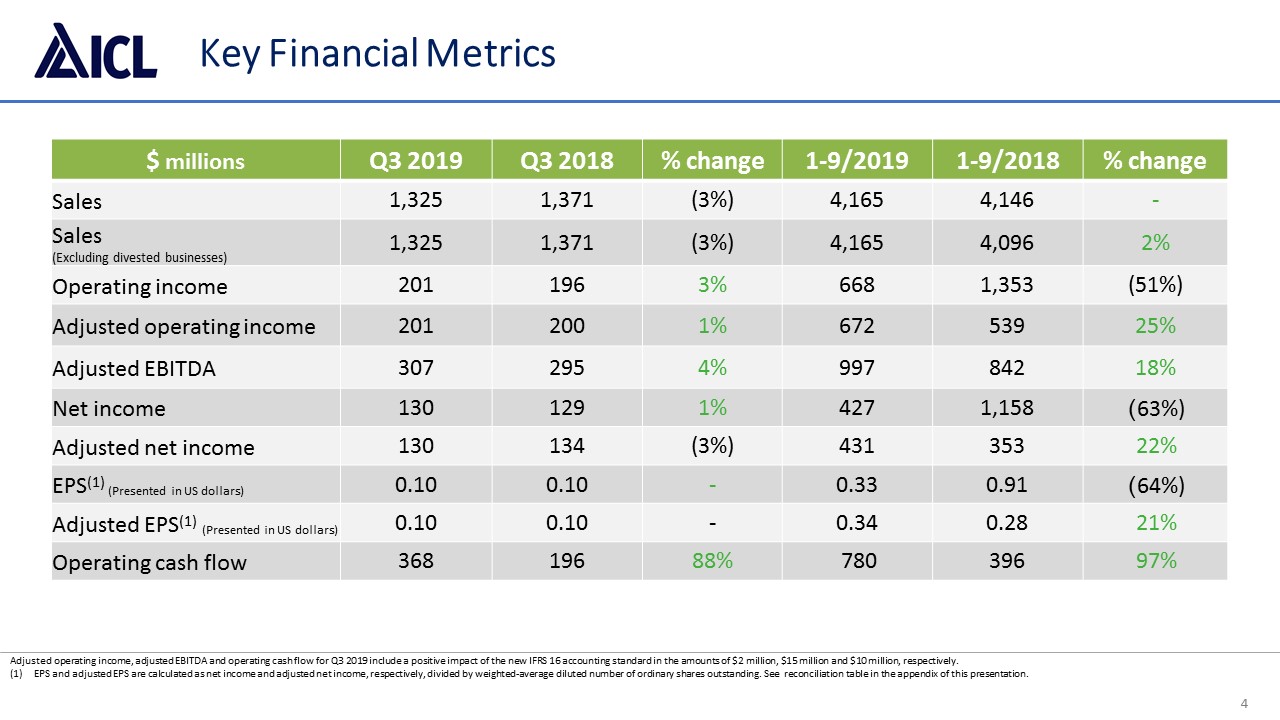
Adjusted operating income, adjusted EBITDA and operating cash flow for Q3 2019 include a positive impact of the new IFRS 16 accounting standard in the amounts of $2 million, $15 million and $10 million, respectively.EPS and adjusted EPS are calculated as net income and adjusted net income, respectively, divided by weighted-average diluted number of ordinary shares outstanding. See reconciliation table in the appendix of this presentation. 4 Key Financial Metrics $ millions Q3 2019 Q3 2018 % change 1-9/2019 1-9/2018 % change Sales 1,325 1,371 (3%) 4,165 4,146 - Sales(Excluding divested businesses) 1,325 1,371 (3%) 4,165 4,096 2% Operating income 201 196 3% 668 1,353 (51%) Adjusted operating income 201 200 1% 672 539 25% Adjusted EBITDA 307 295 4% 997 842 18% Net income 130 129 1% 427 1,158 63%)) Adjusted net income 130 134 (3%) 431 353 22% EPS(1) (Presented in US dollars) 0.10 0.10 - 0.33 0.91 64%)) Adjusted EPS(1) (Presented in US dollars) 0.10 0.10 - 0.34 0.28 21% Operating cash flow 368 196 88% 780 396 97%
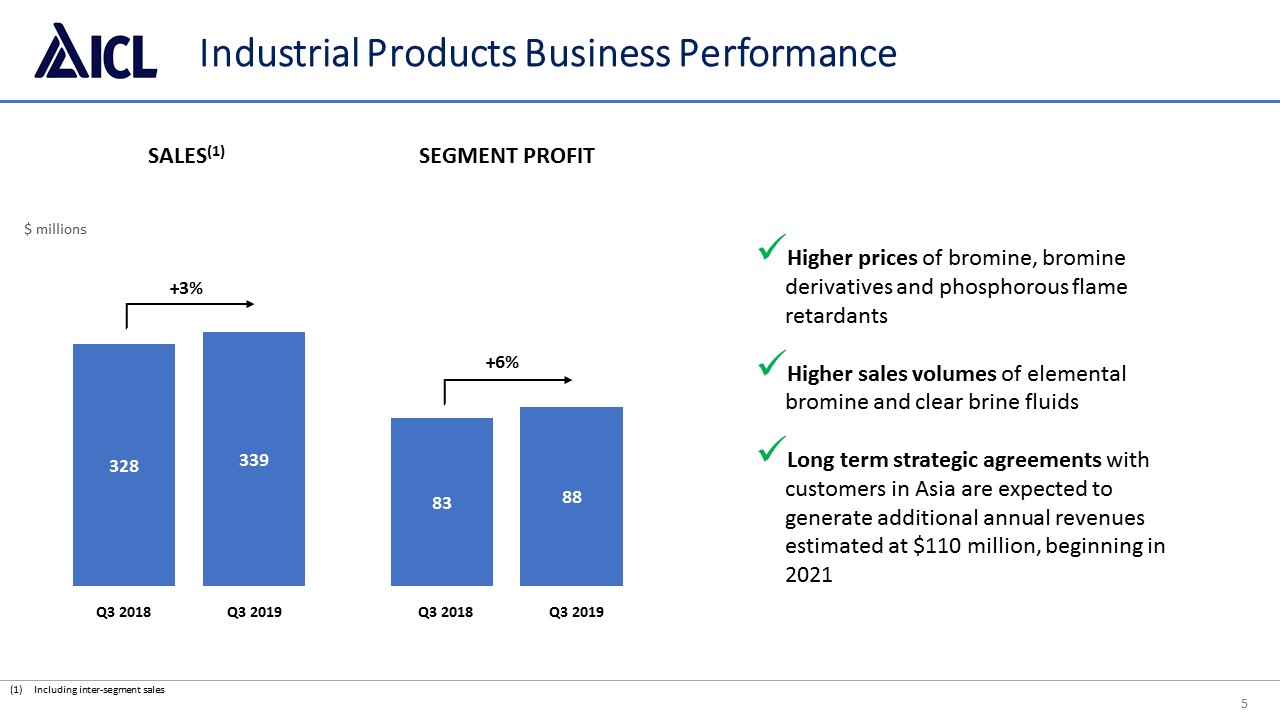
5 Higher prices of bromine, bromine derivatives and phosphorous flame retardantsHigher sales volumes of elemental bromine and clear brine fluidsLong term strategic agreements with customers in Asia are expected to generate additional annual revenues estimated at $110 million, beginning in 2021 Including inter-segment sales Industrial Products Business Performance SALES(1) $ millions +3% +6% Q3 2018 Q3 2018 Q3 2019 Q3 2019 SEGMENT PROFIT
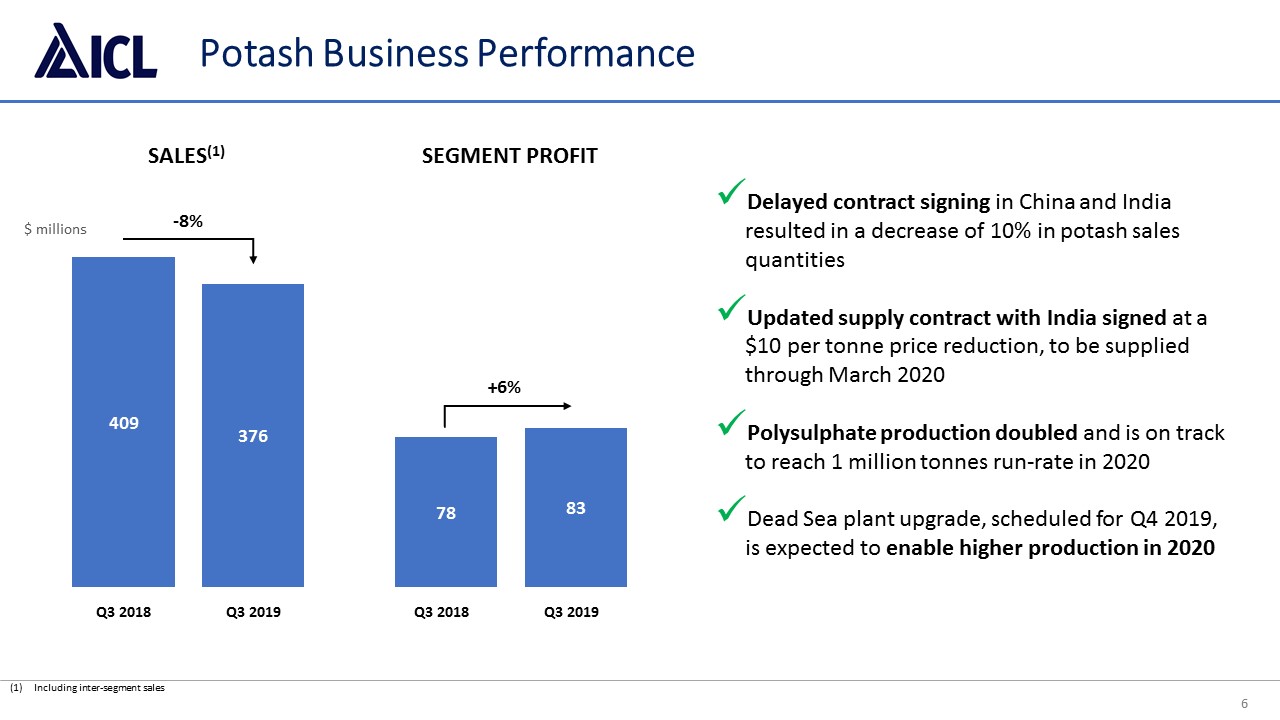
6 Including inter-segment sales Potash Business Performance SALES(1) $ millions -8% +6% Q3 2018 Q3 2018 Q3 2019 Q3 2019 Delayed contract signing in China and India resulted in a decrease of 10% in potash sales quantitiesUpdated supply contract with India signed at a $10 per tonne price reduction, to be supplied through March 2020 Polysulphate production doubled and is on track to reach 1 million tonnes run-rate in 2020Dead Sea plant upgrade, scheduled for Q4 2019, is expected to enable higher production in 2020 SEGMENT PROFIT
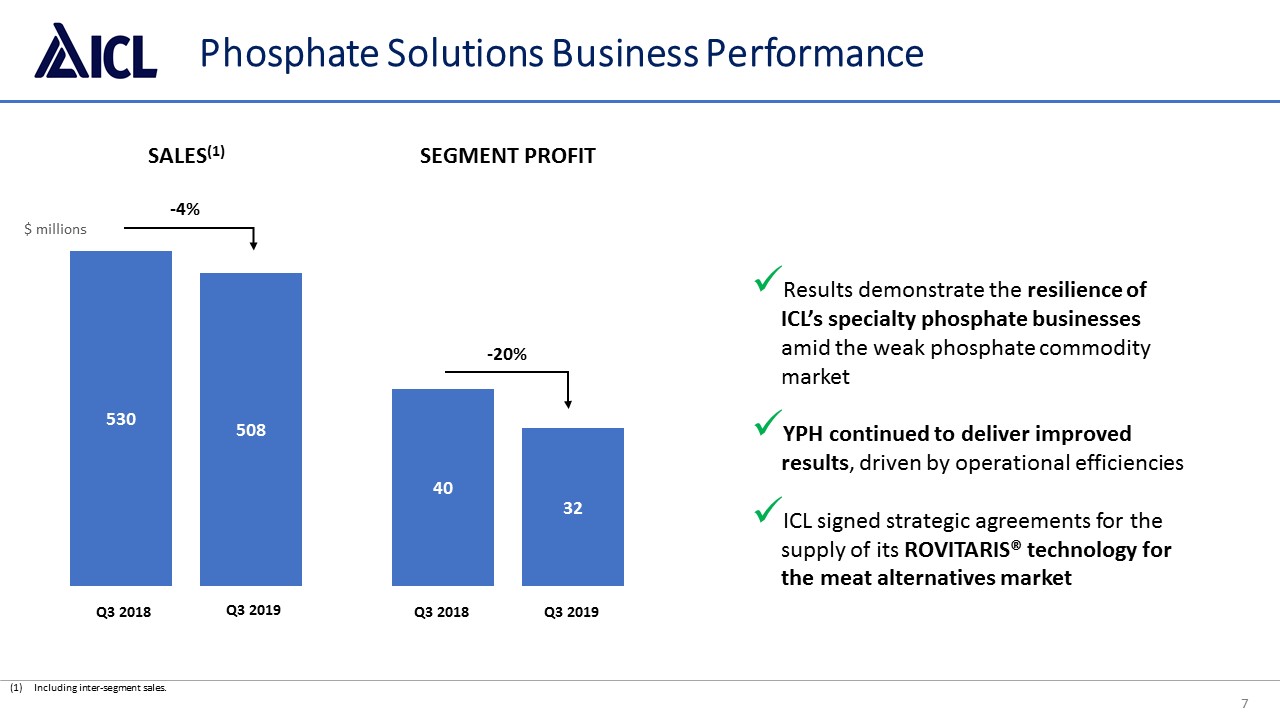
7 Including inter-segment sales. Phosphate Solutions Business Performance SALES(1) SEGMENT PROFIT $ millions -4% Q3 2018 Q3 2018 Q3 2019 Q3 2019 Results demonstrate the resilience of ICL’s specialty phosphate businesses amid the weak phosphate commodity market YPH continued to deliver improved results, driven by operational efficienciesICL signed strategic agreements for the supply of its ROVITARIS® technology for the meat alternatives market -20%
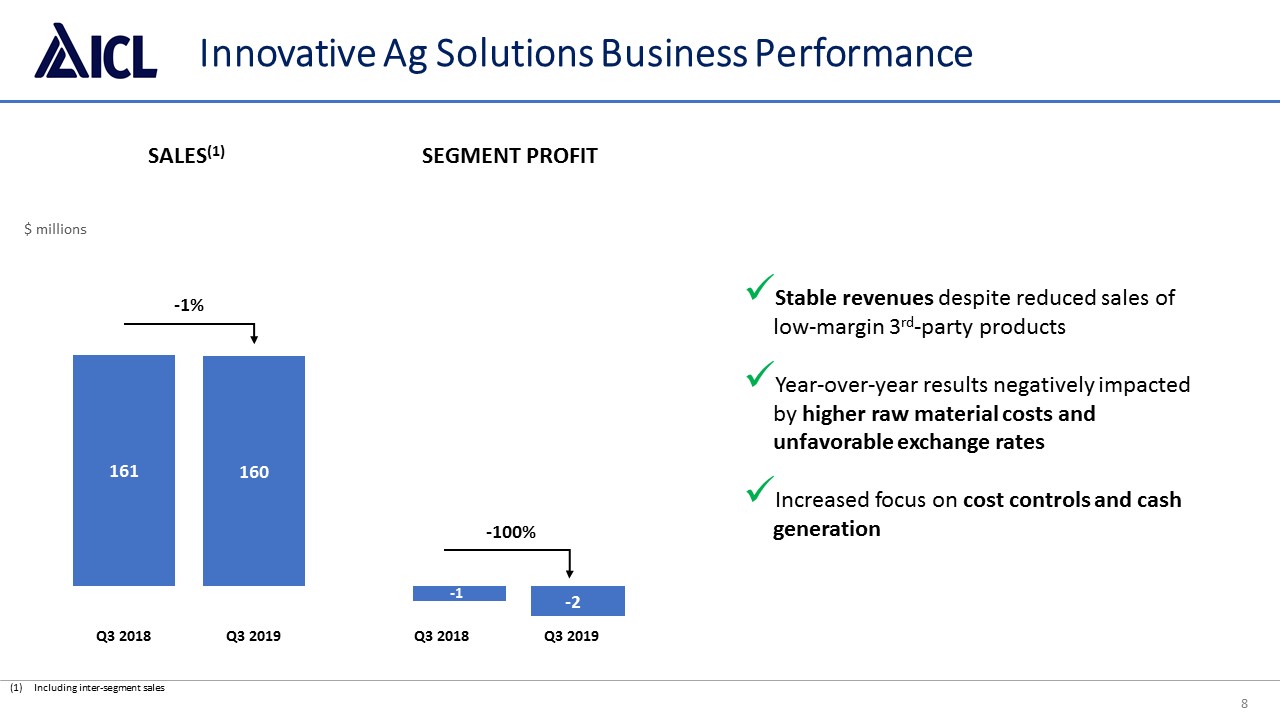
8 Including inter-segment sales Innovative Ag Solutions Business Performance SALES(1) $ millions -1% -100% Q3 2018 Q3 2018 Q3 2019 Q3 2019 Stable revenues despite reduced sales of low-margin 3rd-party productsYear-over-year results negatively impacted by higher raw material costs and unfavorable exchange rates Increased focus on cost controls and cash generation SEGMENT PROFIT
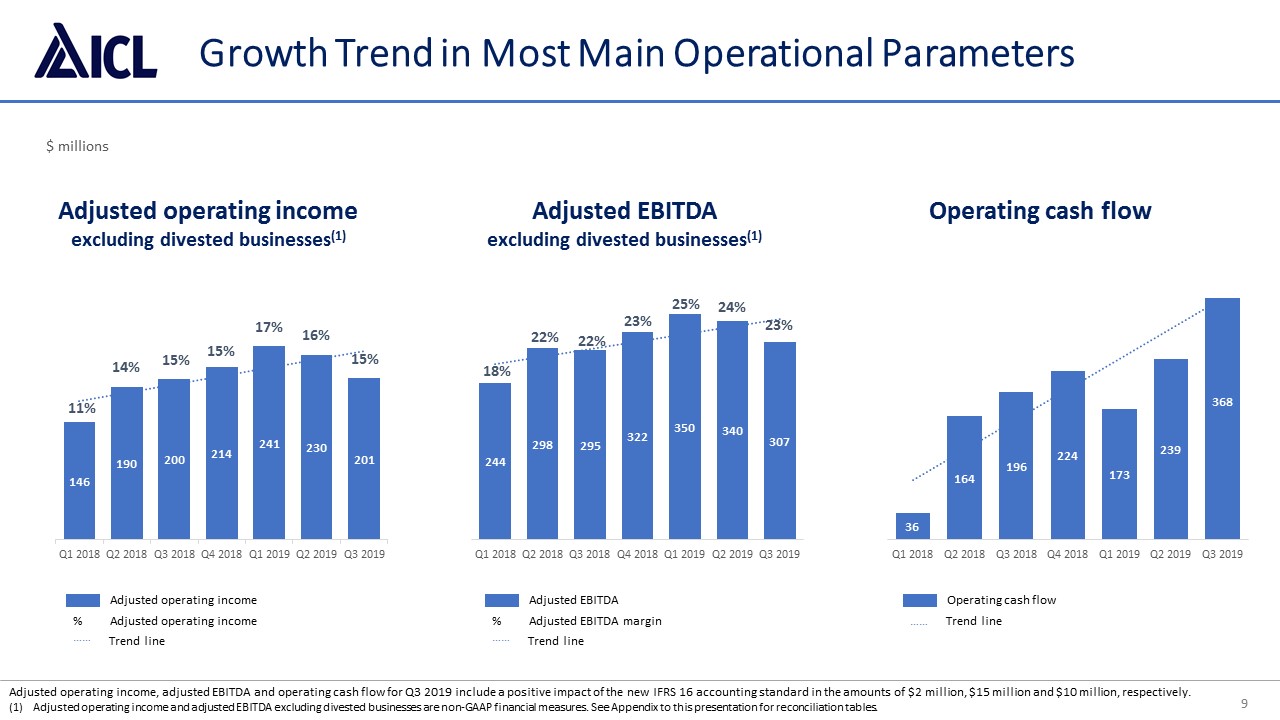
9 Growth Trend in Most Main Operational Parameters Adjusted operating income, adjusted EBITDA and operating cash flow for Q3 2019 include a positive impact of the new IFRS 16 accounting standard in the amounts of $2 million, $15 million and $10 million, respectively.Adjusted operating income and adjusted EBITDA excluding divested businesses are non-GAAP financial measures. See Appendix to this presentation for reconciliation tables. $ millions Adjusted operating incomeexcluding divested businesses(1) Adjusted EBITDAexcluding divested businesses(1) Operating cash flow Adjusted operating income Adjusted operating income % Trend line …… Adjusted EBITDA Adjusted EBITDA margin % Trend line …… Operating cash flow Trend line ……
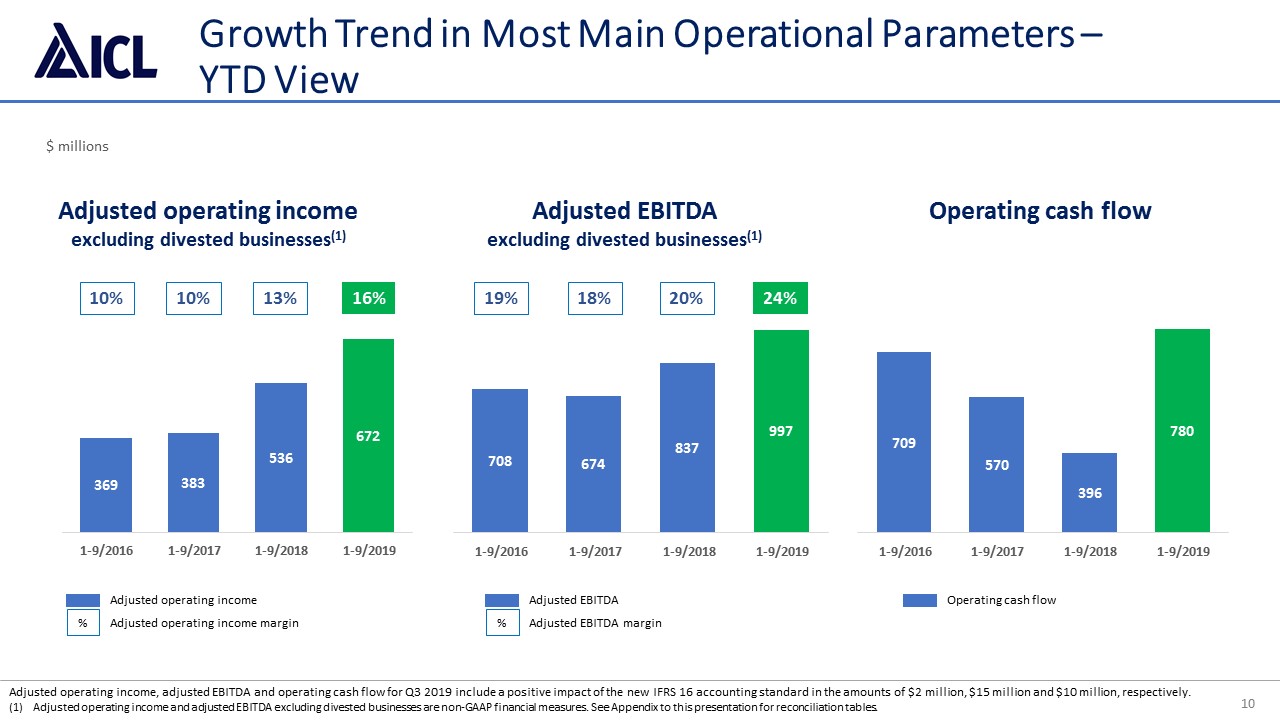
10 Growth Trend in Most Main Operational Parameters – YTD View Adjusted operating income, adjusted EBITDA and operating cash flow for Q3 2019 include a positive impact of the new IFRS 16 accounting standard in the amounts of $2 million, $15 million and $10 million, respectively.Adjusted operating income and adjusted EBITDA excluding divested businesses are non-GAAP financial measures. See Appendix to this presentation for reconciliation tables. $ millions Adjusted operating incomeexcluding divested businesses(1) Adjusted EBITDAexcluding divested businesses(1) Operating cash flow Adjusted operating income Adjusted operating income margin % Adjusted EBITDA Adjusted EBITDA margin % Operating cash flow 16% 13% 24% 20% 10% 18% 10% 19%

Kobi Altman, CFO
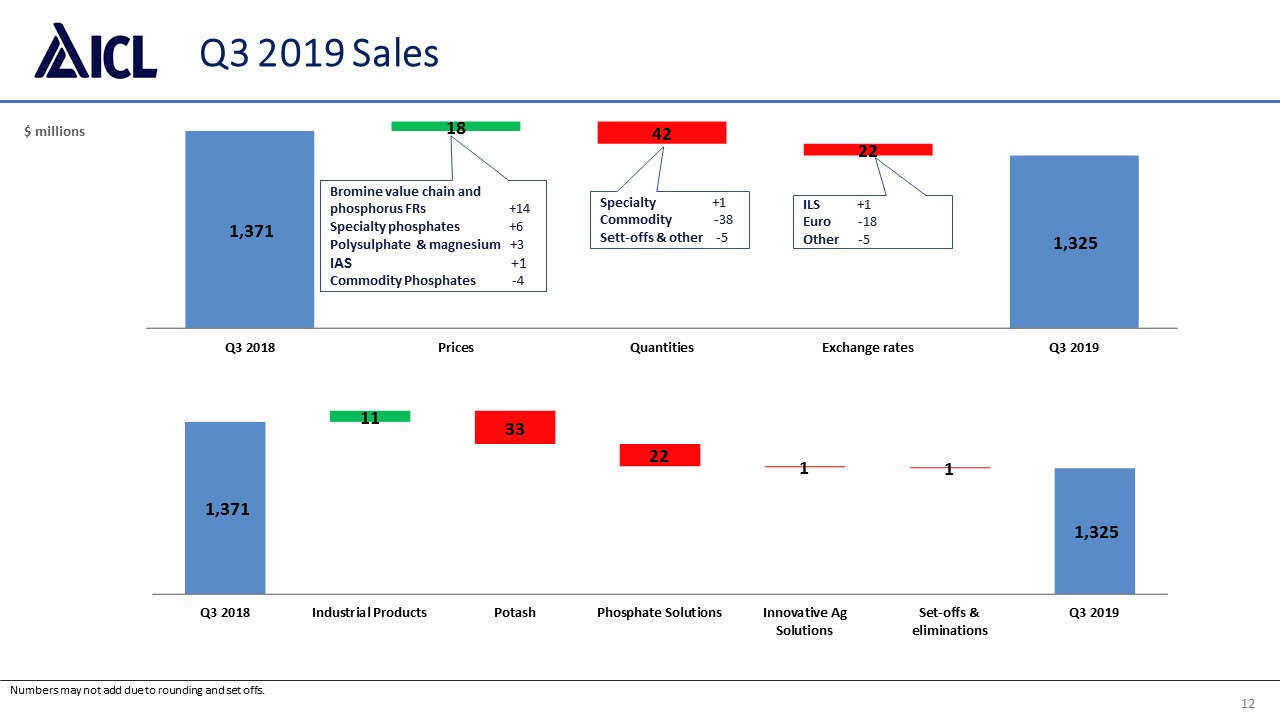
12 Q3 2019 Sales Numbers may not add due to rounding and set offs. $ millions Bromine value chain and phosphorus FRs +14Specialty phosphates +6Polysulphate & magnesium +3IAS +1Commodity Phosphates -4 Specialty +1Commodity -38Sett-offs & other -5 ILS +1Euro -18Other -5
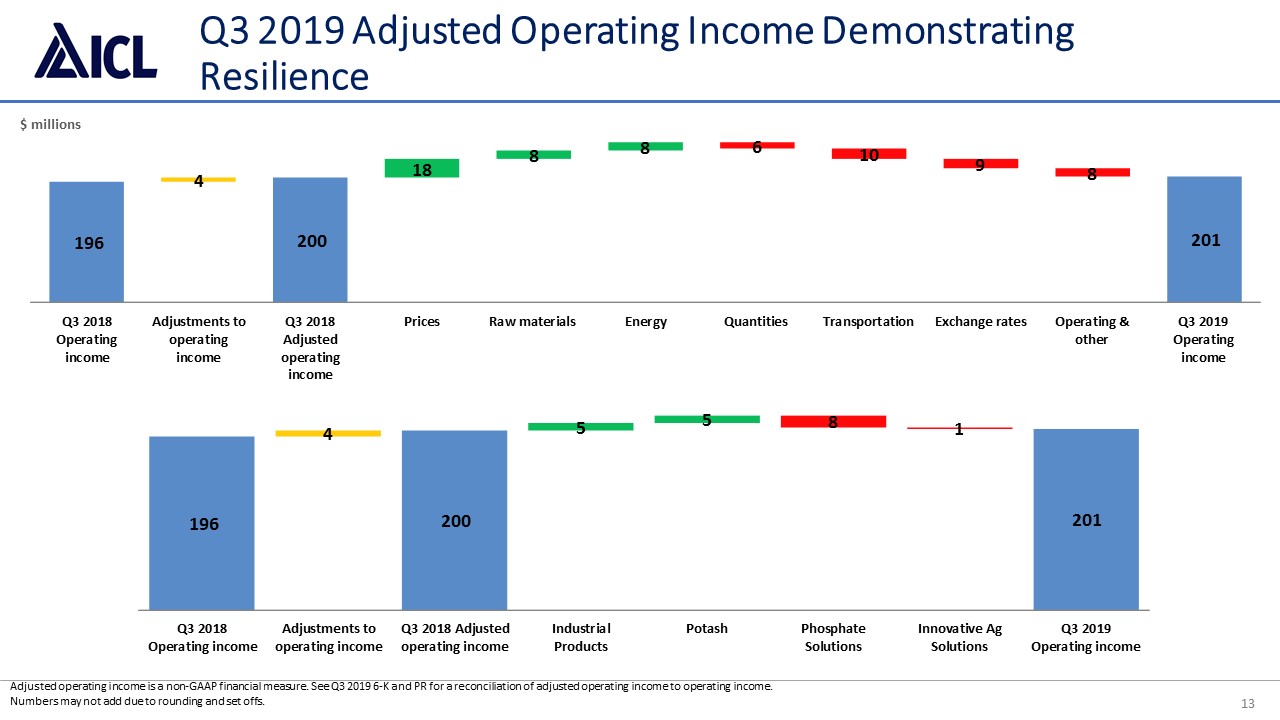
13 Q3 2019 Adjusted Operating Income Demonstrating Resilience Adjusted operating income is a non-GAAP financial measure. See Q3 2019 6-K and PR for a reconciliation of adjusted operating income to operating income. Numbers may not add due to rounding and set offs. $ millions
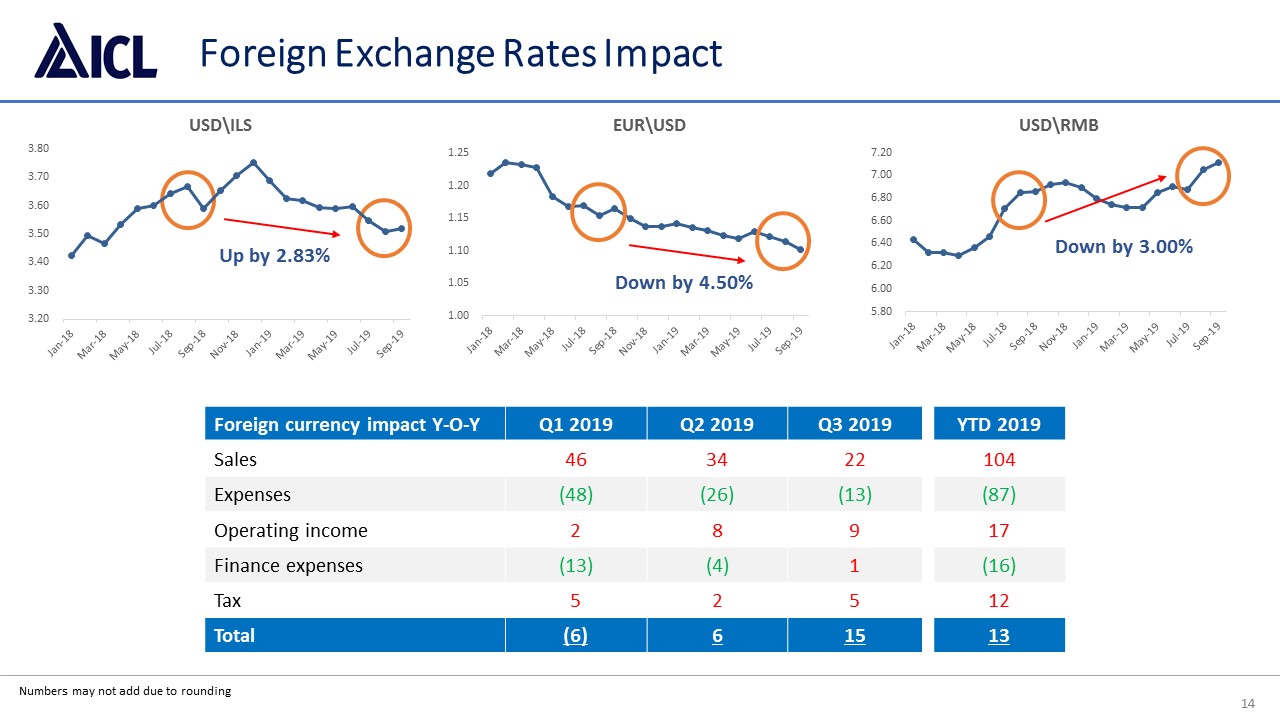
14 Foreign Exchange Rates Impact Foreign currency impact Y-O-Y Q1 2019 Q2 2019 Q3 2019 Sales 46 34 22 Expenses (48) (26) (13) Operating income 2 8 9 Finance expenses (13) (4) 1 Tax 5 2 5 Total (6) 6 15 Numbers may not add due to rounding Up by 2.83% Down by 4.50% Down by 3.00% YTD 2019 104 (87) 17 (16) 12 13
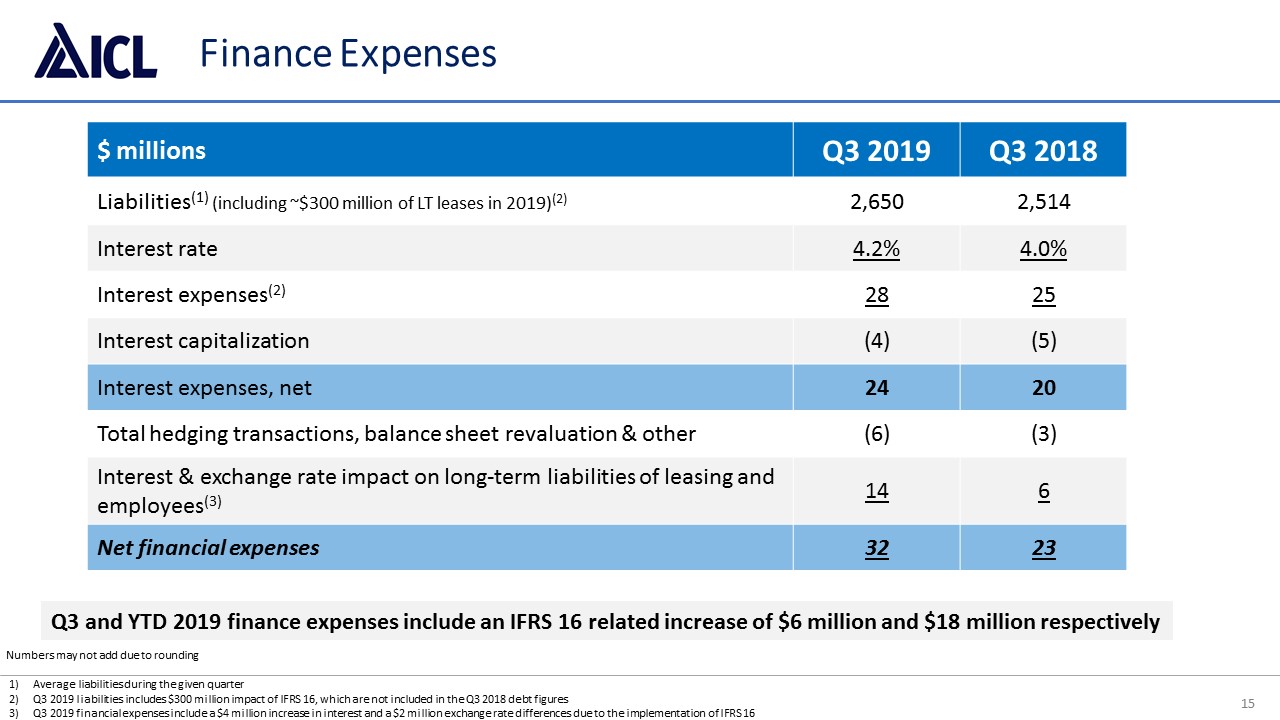
15 Finance Expenses $ millions Q3 2019 Q3 2018 Liabilities(1) (including ~$300 million of LT leases in 2019)(2) 2,650 2,514 Interest rate 4.2% 4.0% Interest expenses(2) 28 25 Interest capitalization (4) (5) Interest expenses, net 24 20 Total hedging transactions, balance sheet revaluation & other (6) (3) Interest & exchange rate impact on long-term liabilities of leasing and employees(3) 14 6 Net financial expenses 32 23 Average liabilities during the given quarterQ3 2019 liabilities includes $300 million impact of IFRS 16, which are not included in the Q3 2018 debt figuresQ3 2019 financial expenses include a $4 million increase in interest and a $2 million exchange rate differences due to the implementation of IFRS 16 Numbers may not add due to rounding Q3 and YTD 2019 finance expenses include an IFRS 16 related increase of $6 million and $18 million respectively
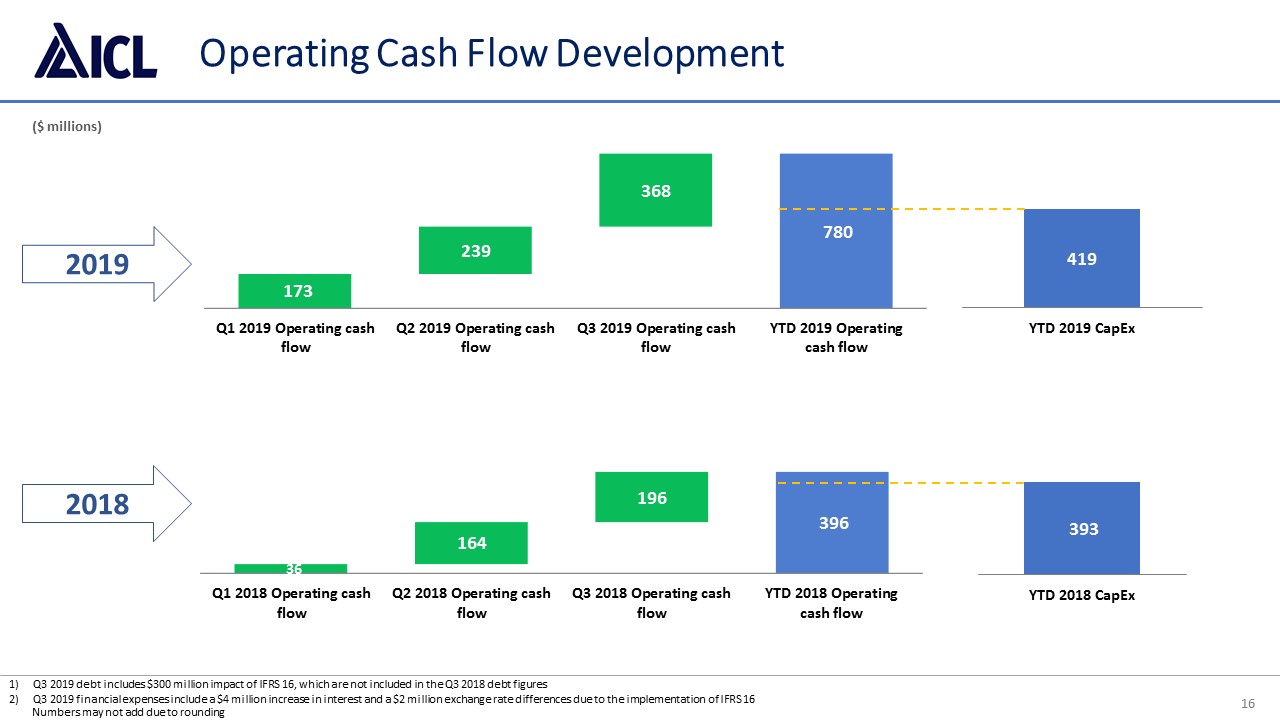
16 Operating Cash Flow Development Q3 2019 debt includes $300 million impact of IFRS 16, which are not included in the Q3 2018 debt figuresQ3 2019 financial expenses include a $4 million increase in interest and a $2 million exchange rate differences due to the implementation of IFRS 16 Numbers may not add due to rounding ($ millions) 2019 2018
16 Operating Cash Flow Development Q3 2019 debt includes $300 million impact of IFRS 16, which are not included in the Q3 2018 debt figuresQ3 2019 financial expenses include a $4 million increase in interest and a $2 million exchange rate differences due to the implementation of IFRS 16 Numbers may not add due to rounding ($ millions) 2019 2018
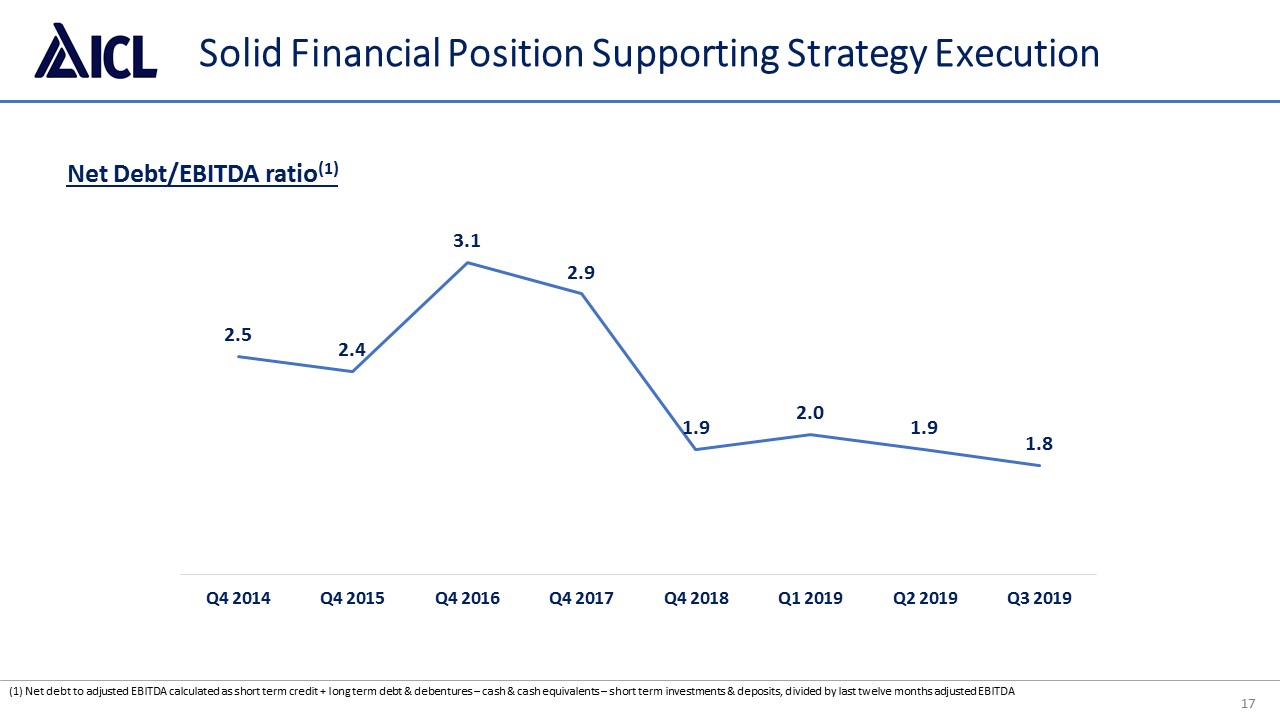
17 Solid Financial Position Supporting Strategy Execution (1) Net debt to adjusted EBITDA calculated as short term credit + long term debt & debentures – cash & cash equivalents – short term investments & deposits, divided by last twelve months adjusted EBITDA Net Debt/EBITDA ratio(1)
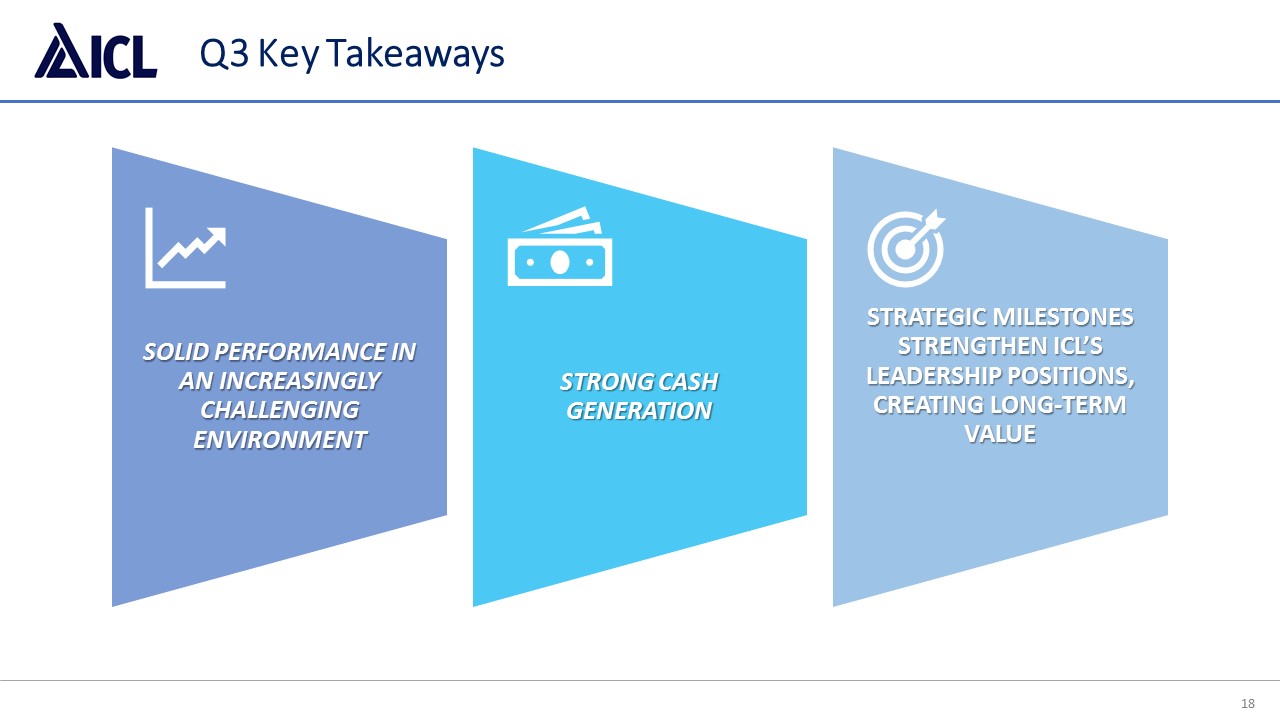
18 Q3 Key Takeaways
THANK YOU 19
APPENDIX 20
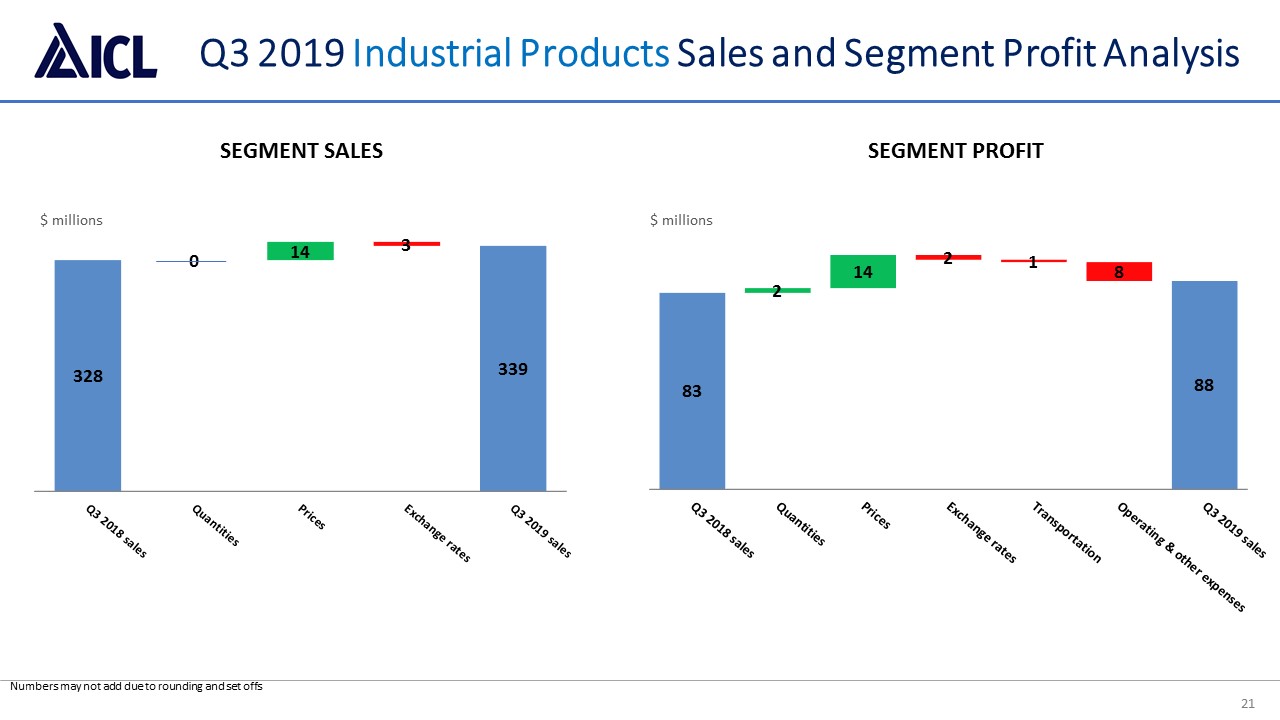
21 Q3 2019 Industrial Products Sales and Segment Profit Analysis SEGMENT SALES SEGMENT PROFIT Numbers may not add due to rounding and set offs $ millions $ millions
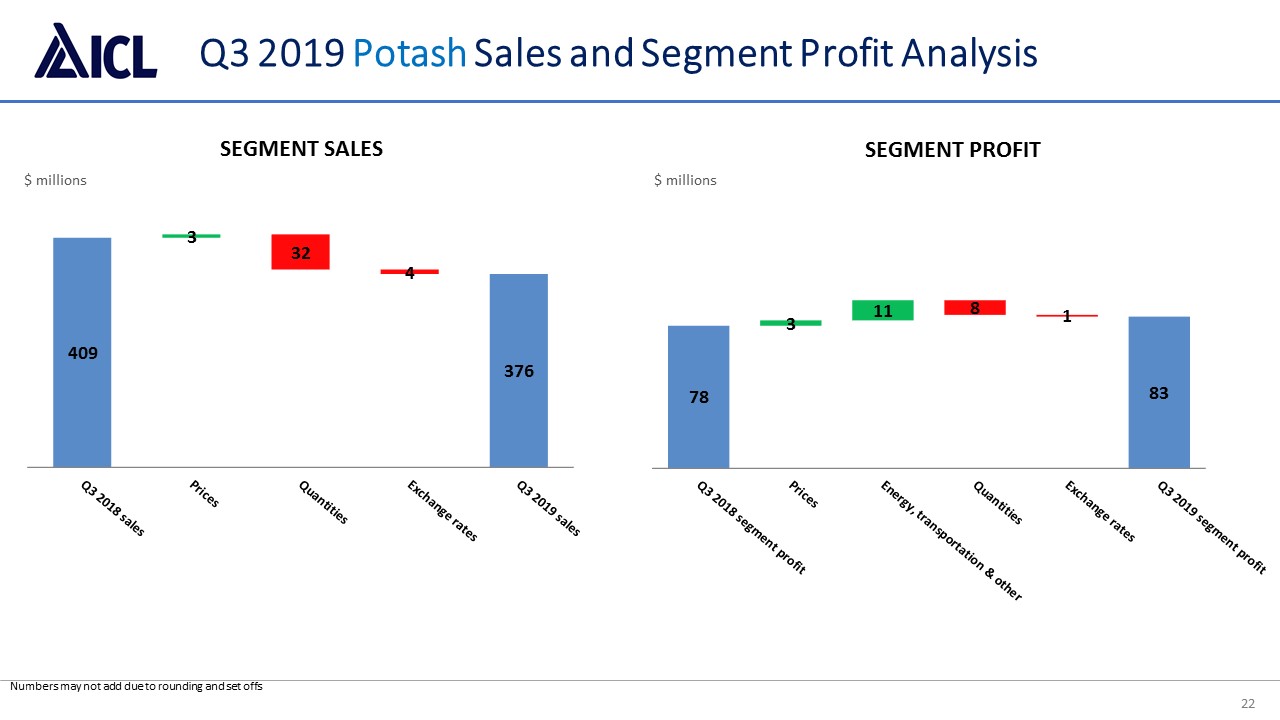
22 Q3 2019 Potash Sales and Segment Profit Analysis SEGMENT SALES SEGMENT PROFIT $ millions $ millions Numbers may not add due to rounding and set offs
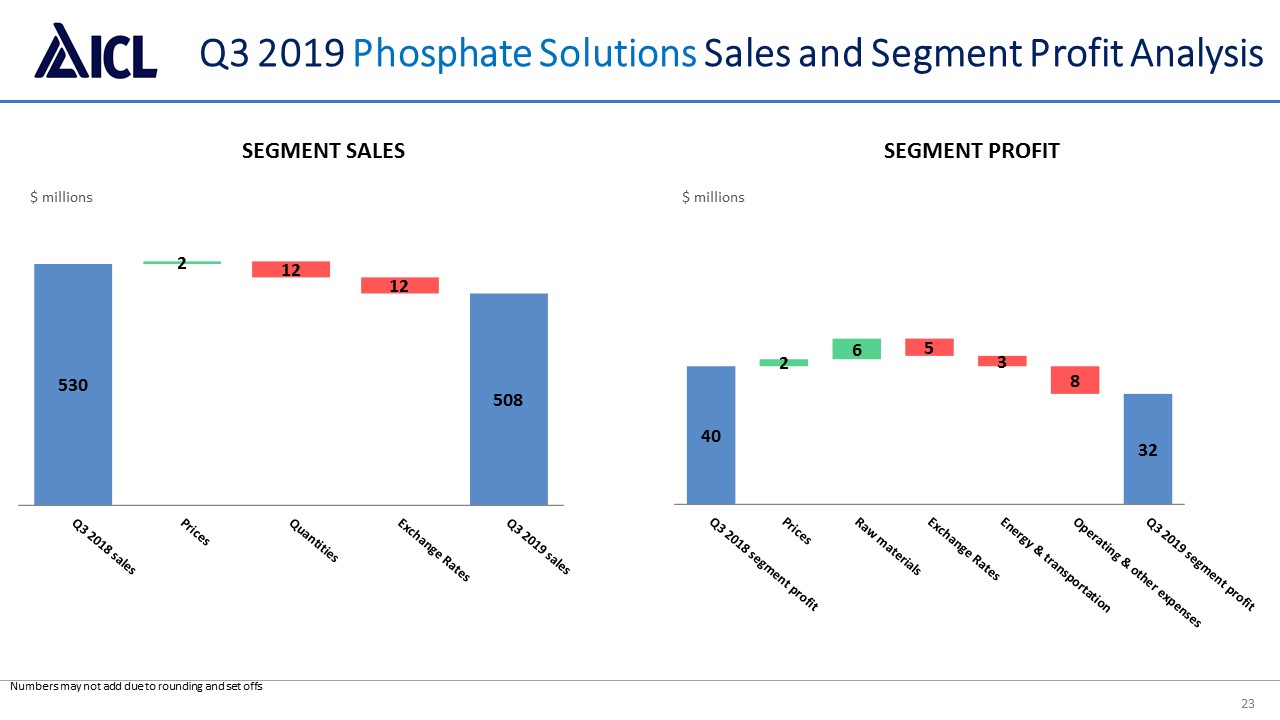
23 Q3 2019 Phosphate Solutions Sales and Segment Profit Analysis SEGMENT SALES SEGMENT PROFIT $ millions $ millions Numbers may not add due to rounding and set offs
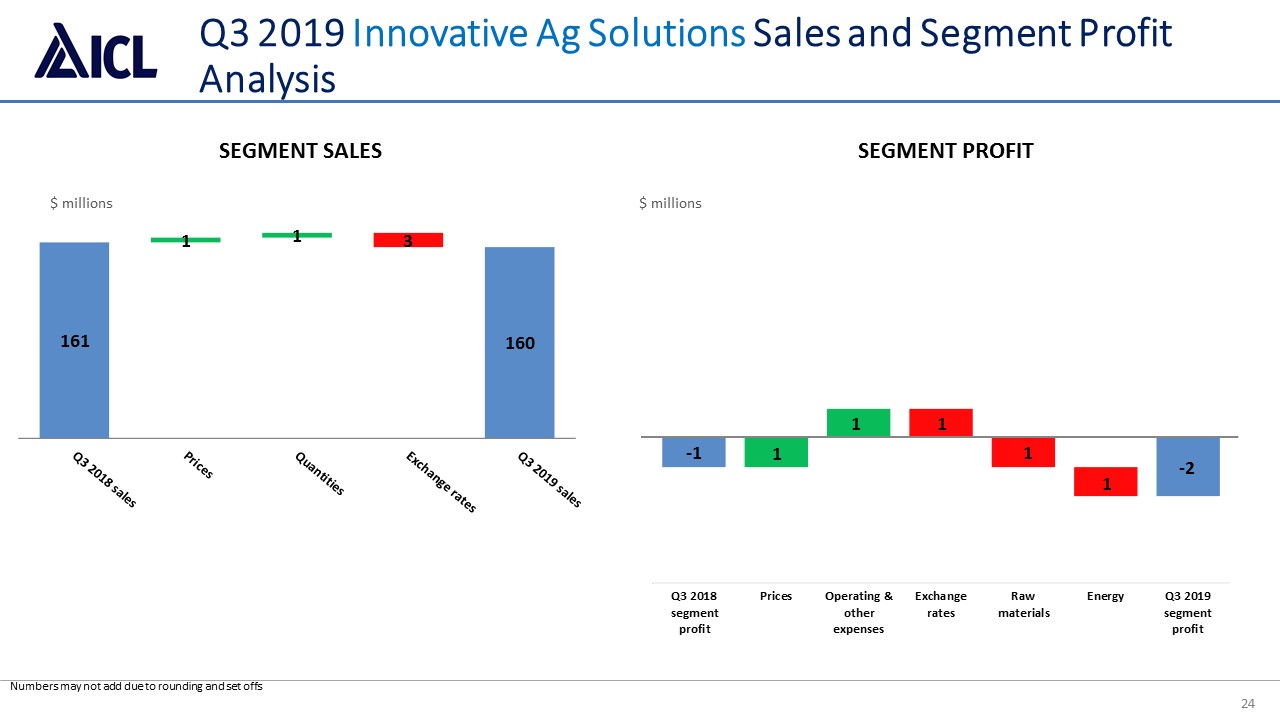
24 Q3 2019 Innovative Ag Solutions Sales and Segment Profit Analysis SEGMENT SALES SEGMENT PROFIT $ millions $ millions Numbers may not add due to rounding and set offs 1 1 1 1 1
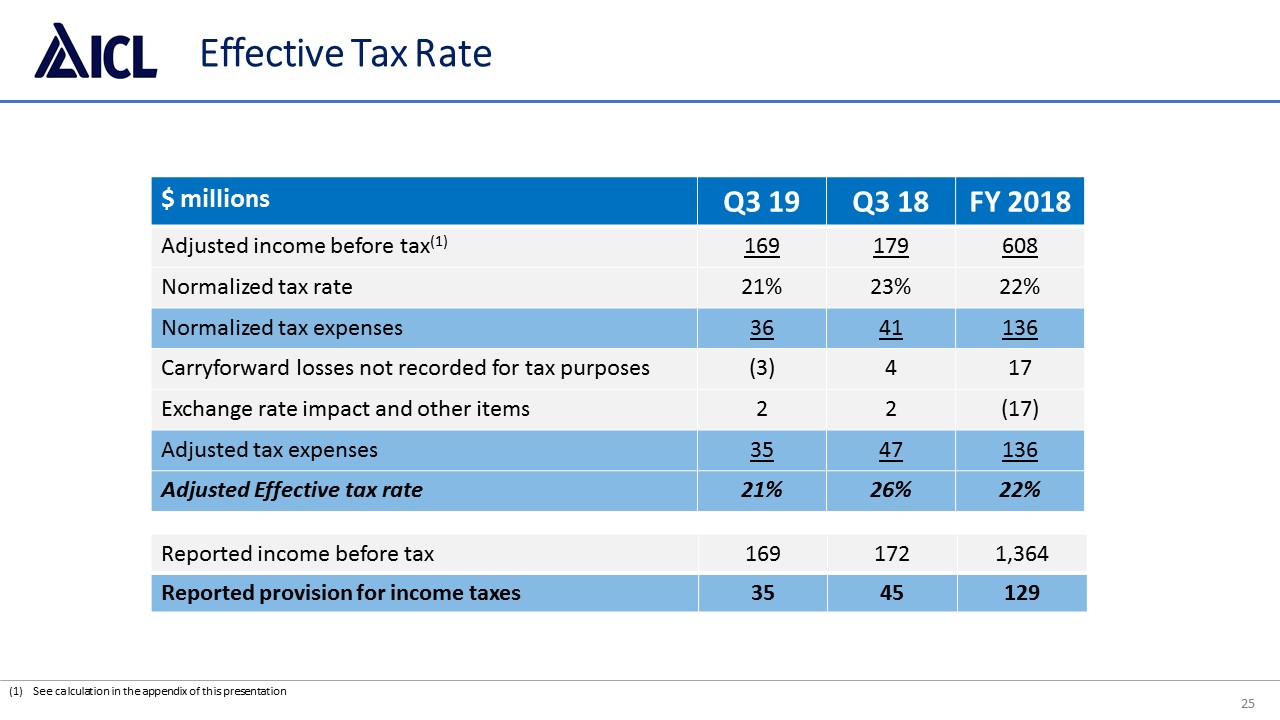
25 Effective Tax Rate $ millions Q3 19 Q3 18 FY 2018 Adjusted income before tax(1) 169 179 608 Normalized tax rate 21% 23% 22% Normalized tax expenses 36 41 136 Carryforward losses not recorded for tax purposes (3) 4 17 Exchange rate impact and other items 2 2 (17) Adjusted tax expenses 35 47 136 Adjusted Effective tax rate 21% 26% 22% See calculation in the appendix of this presentation Reported income before tax 169 172 1,364 Reported provision for income taxes 35 45 129
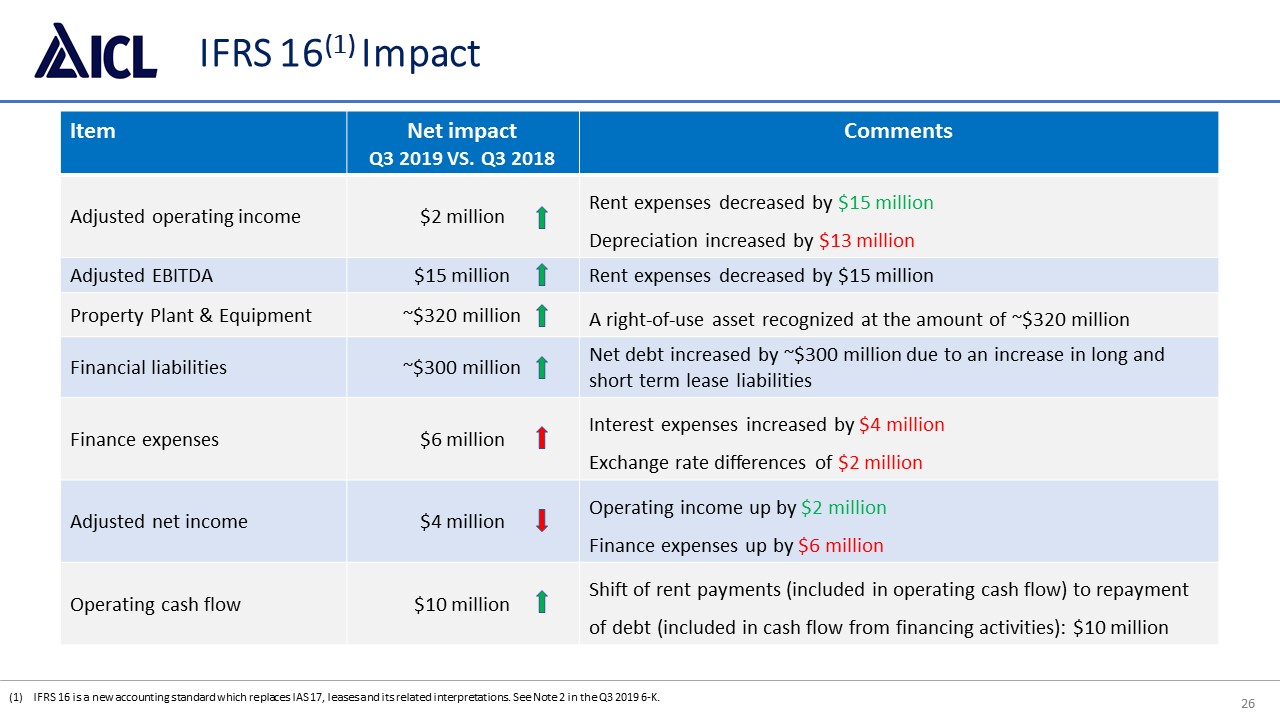
26 IFRS 16(1) Impact Item Net impactQ3 2019 VS. Q3 2018 Comments Adjusted operating income $2 million Rent expenses decreased by $15 millionDepreciation increased by $13 million Adjusted EBITDA $15 million Rent expenses decreased by $15 million Property Plant & Equipment ~$320 million A right-of-use asset recognized at the amount of ~$320 million Financial liabilities ~$300 million Net debt increased by ~$300 million due to an increase in long and short term lease liabilities Finance expenses $6 million Interest expenses increased by $4 millionExchange rate differences of $2 million Adjusted net income $4 million Operating income up by $2 millionFinance expenses up by $6 million Operating cash flow $10 million Shift of rent payments (included in operating cash flow) to repayment of debt (included in cash flow from financing activities): $10 million IFRS 16 is a new accounting standard which replaces IAS 17, leases and its related interpretations. See Note 2 in the Q3 2019 6-K.
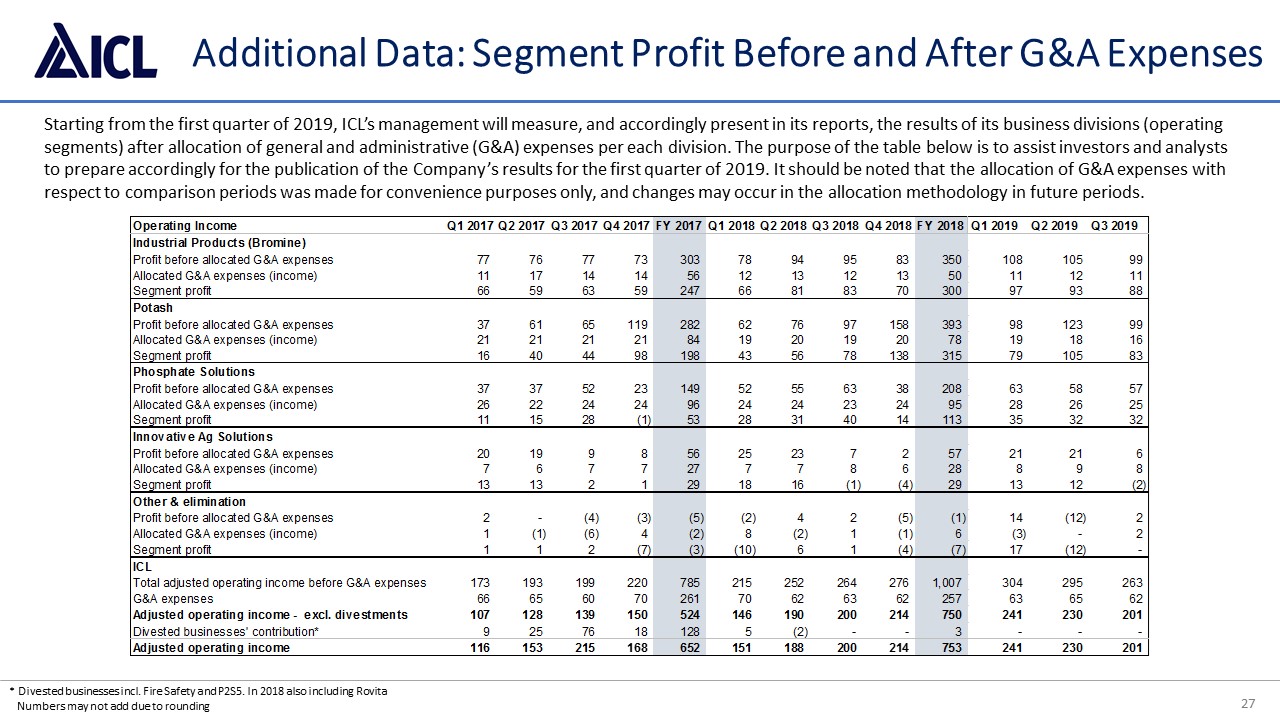
27 Additional Data: Segment Profit Before and After G&A Expenses * Divested businesses incl. Fire Safety and P2S5. In 2018 also including Rovita Numbers may not add due to rounding Starting from the first quarter of 2019, ICL’s management will measure, and accordingly present in its reports, the results of its business divisions (operating segments) after allocation of general and administrative (G&A) expenses per each division. The purpose of the table below is to assist investors and analysts to prepare accordingly for the publication of the Company’s results for the first quarter of 2019. It should be noted that the allocation of G&A expenses with respect to comparison periods was made for convenience purposes only, and changes may occur in the allocation methodology in future periods.
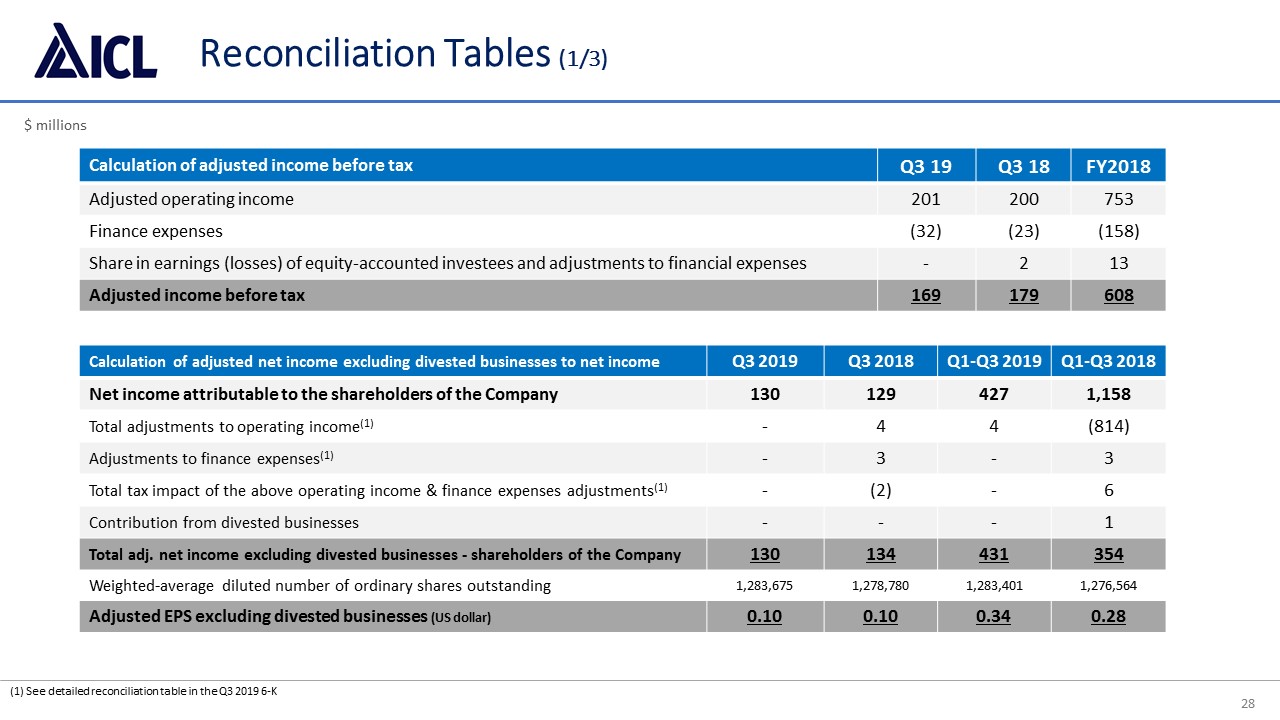
28 Reconciliation Tables (1/3) Calculation of adjusted income before tax Q3 19 Q3 18 FY2018 Adjusted operating income 201 200 753 Finance expenses (32) (23) (158) Share in earnings (losses) of equity-accounted investees and adjustments to financial expenses - 2 13 Adjusted income before tax 169 179 608 (1) See detailed reconciliation table in the Q3 2019 6-K Calculation of adjusted net income excluding divested businesses to net income Q3 2019 Q3 2018 Q1-Q3 2019 Q1-Q3 2018 Net income attributable to the shareholders of the Company 130 129 427 1,158 Total adjustments to operating income(1) - 4 4 (814) Adjustments to finance expenses(1) - 3 - 3 Total tax impact of the above operating income & finance expenses adjustments(1) - (2) - 6 Contribution from divested businesses - - - 1 Total adj. net income excluding divested businesses - shareholders of the Company 130 134 431 354 Weighted-average diluted number of ordinary shares outstanding 1,283,675 1,278,780 1,283,401 1,276,564 Adjusted EPS excluding divested businesses (US dollar) 0.10 0.10 0.34 0.28 $ millions
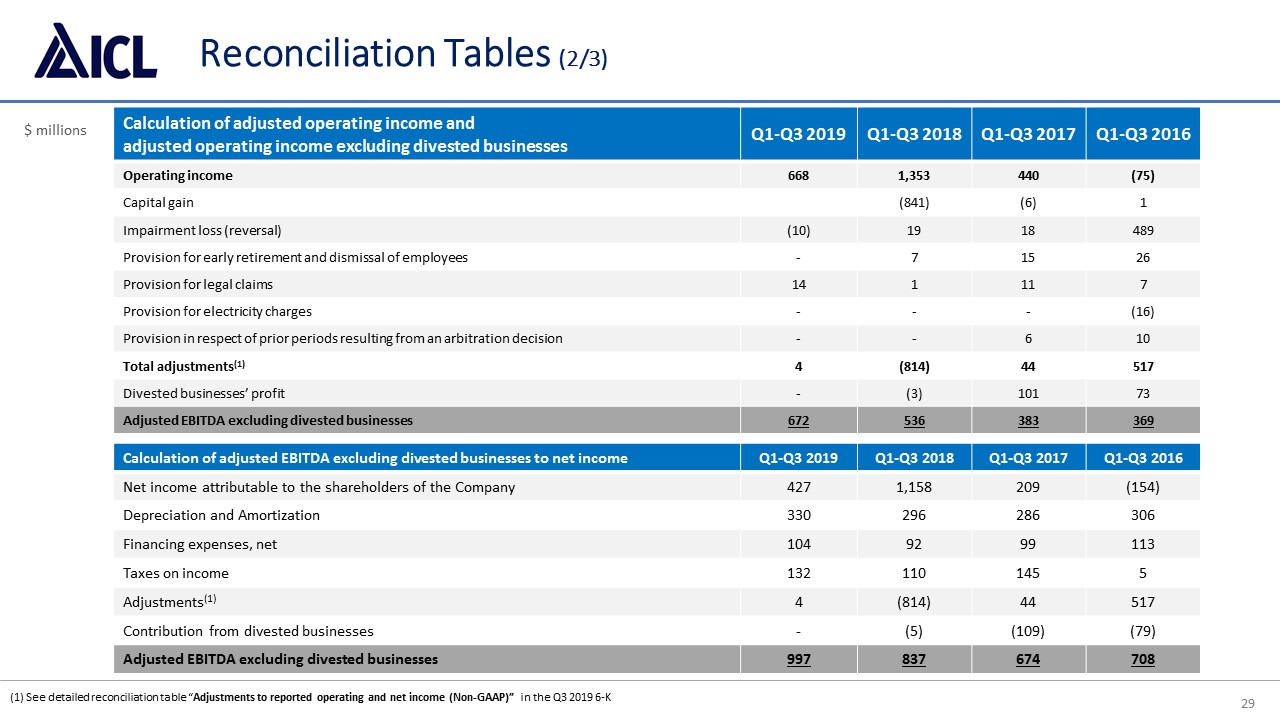
29 Reconciliation Tables (2/3) (1) See detailed reconciliation table “Adjustments to reported operating and net income (Non-GAAP)” in the Q3 2019 6-K Calculation of adjusted EBITDA excluding divested businesses to net income Q1-Q3 2019 Q1-Q3 2018 Q1-Q3 2017 Q1-Q3 2016 Net income attributable to the shareholders of the Company 427 1,158 209 (154) Depreciation and Amortization 330 296 286 306 Financing expenses, net 104 92 99 113 Taxes on income 132 110 145 5 Adjustments(1) 4 (814) 44 517 Contribution from divested businesses - (5) (109) (79) Adjusted EBITDA excluding divested businesses 997 837 674 708 Calculation of adjusted operating income and adjusted operating income excluding divested businesses Q1-Q3 2019 Q1-Q3 2018 Q1-Q3 2017 Q1-Q3 2016 Operating income 668 1,353 440 (75) Capital gain (841) (6) 1 Impairment loss (reversal) (10) 19 18 489 Provision for early retirement and dismissal of employees - 7 15 26 Provision for legal claims 14 1 11 7 Provision for electricity charges - - - (16) Provision in respect of prior periods resulting from an arbitration decision - - 6 10 Total adjustments(1) 4 (814) 44 517 Divested businesses’ profit - (3) 101 73 Adjusted EBITDA excluding divested businesses 672 536 383 369 $ millions
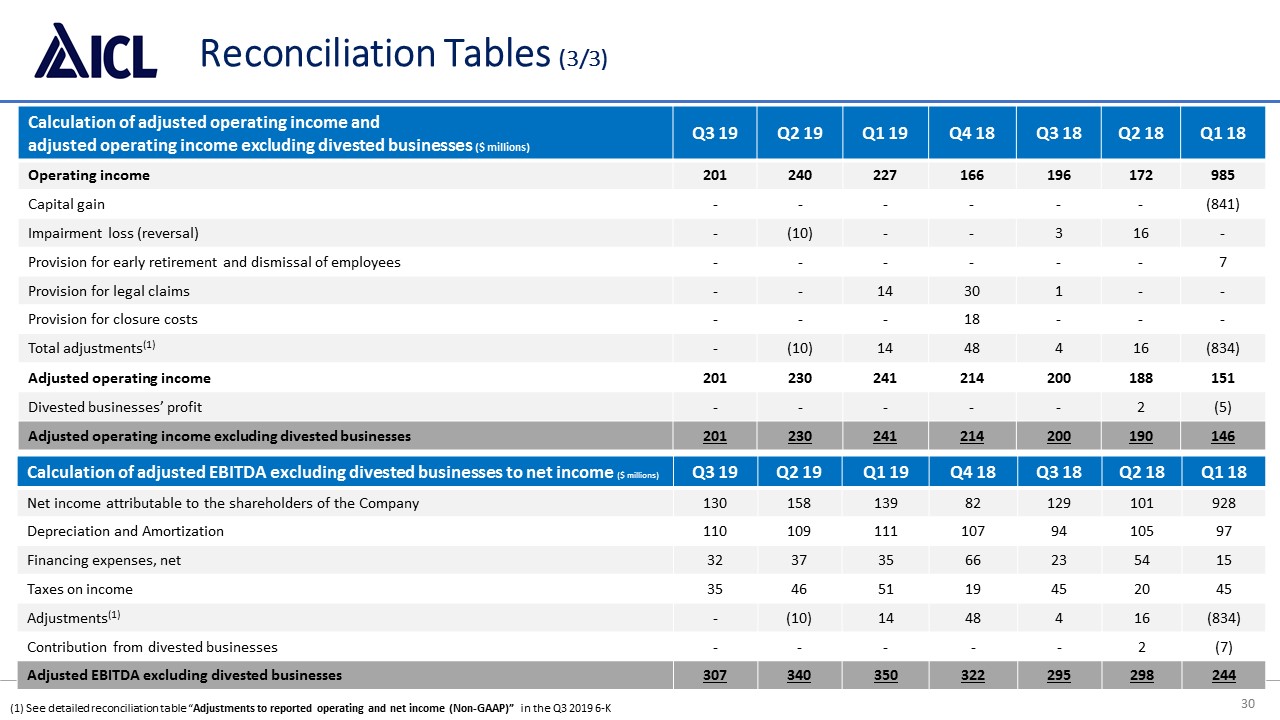
30 Reconciliation Tables (3/3) (1) See detailed reconciliation table “Adjustments to reported operating and net income (Non-GAAP)” in the Q3 2019 6-K Calculation of adjusted operating income and adjusted operating income excluding divested businesses ($ millions) Q3 19 Q2 19 Q1 19 Q4 18 Q3 18 Q2 18 Q1 18 Operating income 201 240 227 166 196 172 985 Capital gain - - - - - - (841) Impairment loss (reversal) - (10) - - 3 16 - Provision for early retirement and dismissal of employees - - - - - - 7 Provision for legal claims - - 14 30 1 - - Provision for closure costs - - - 18 - - - Total adjustments(1) - (10) 14 48 4 16 (834) Adjusted operating income 201 230 241 214 200 188 151 Divested businesses’ profit - - - - - 2 (5) Adjusted operating income excluding divested businesses 201 230 241 214 200 190 146 Calculation of adjusted EBITDA excluding divested businesses to net income ($ millions) Q3 19 Q2 19 Q1 19 Q4 18 Q3 18 Q2 18 Q1 18 Net income attributable to the shareholders of the Company 130 158 139 82 129 101 928 Depreciation and Amortization 110 109 111 107 94 105 97 Financing expenses, net 32 37 35 66 23 54 15 Taxes on income 35 46 51 19 45 20 45 Adjustments(1) - (10) 14 48 4 16 (834) Contribution from divested businesses - - - - - 2 (7) Adjusted EBITDA excluding divested businesses 307 340 350 322 295 298 244
31 Non-GAAP Financial Measures We disclose in this Quarterly Report non-IFRS financial measures titled sales excluding divested businesses, adjusted operating income, adjusted operating income excluding divested businesses, adjusted net income attributable to the Company’s shareholders excluding divested businesses, adjusted EBITDA excluding divested businesses, adjusted EPS excluding divested businesses and free cash flow. Our management uses sales excluding divested businesses, adjusted operating income, adjusted operating income excluding divested businesses, adjusted net income attributable to the Company’s shareholders excluding divested businesses and adjusted EBITDA excluding divested businesses to facilitate operating performance comparisons from period to period and present free cash flow to facilitate a review of our cash flows in periods. We calculate our sales excluding divested businesses by adjusting our sales to exclude results of the divested Fire Safety and Oil Additives business (divested in Q1 2018) and Rovita business (divested in Q3 2018). We calculate our adjusted operating income by adjusting our operating income to add certain items, as set forth above and in the reconciliation table “Adjustments to reported operating and net income”. Certain of these items may recur. We calculate our adjusted net income attributable to the Company’s shareholders by adjusting our adjusted operating income excluding divested businesses, net income attributable to the Company’s shareholders to add certain items, as set forth above and in the reconciliation table “Adjustments to reported operating and net income (Non-GAAP)” in the accompanying press release, excluding the total tax impact of such adjustments and adjustments attributable to the non-controlling interests. We calculate our adjusted operating income excluding divested businesses by excluding the results of the divested Fire Safety and Oil Additives business (divested in Q1 2018) and Rovita business (divested in Q3 2018). We calculate our adjusted EBITDA by adding back to the net income attributable to the Company’s shareholders the depreciation and amortization, financing expenses, net, taxes on income and the items presented in the reconciliation table “Adjustments to reported operating and net income” in the accompanying press release which were adjusted for in calculating the adjusted operating income excluding divested businesses and adjusted net income attributable to the Company’s shareholders. Adjusted EPS excluding divested businesses is calculated as adjusted net income excluding divested businesses divided by weighted-average diluted number of ordinary shares outstanding as provided in the reconciliation table under “Calculation of Adjusted EPS”. We calculate our free cash flow as our cash flows from operating activities net of our purchase of property, plant, equipment and intangible assets, and adding Proceeds from sale of property, plant and equipment and dividends from equity-accounted investees during such period as presented in the reconciliation table under “Calculation of free cash flow”. You should not view sales excluding divested businesses, adjusted operating income, adjusted operating income excluding divested businesses, adjusted net income attributable to the Company’s shareholders excluding divested businesses, adjusted EPS excluding divested businesses or adjusted EBITDA excluding divested businesses as a substitute for operating income or net income attributable to the Company’s shareholders determined in accordance with IFRS, adjusted EPS excluding divested businesses as a substitute for EPS or free cash flow as a substitute for sales, cash flows from operating activities and cash flows used in investing activities, and you should note that our definitions of adjusted operating income, adjusted net income attributable to the Company’s shareholders, adjusted EBITDA excluding divested businesses and free cash flow may differ from those used by other companies. However, we believe sales excluding divested businesses, adjusted operating income, adjusted operating income excluding divested businesses, adjusted net income attributable to the Company’s shareholders excluding divested businesses, adjusted EBITDA excluding divested businesses, adjusted EPS excluding divested businesses and free cash flow provide useful information to both management and investors by excluding certain expenses that management believes are not indicative of our ongoing operations , in particular the divested Fire Safety and Oil Additives business (divested in Q1 2018) and the Rovita business (divested in July 2018), as we no longer own these businesses. In particular for free cash flow, we adjust our Capex to include any Proceeds from sale of property, plant and equipment because we believe such amounts offset the impact of our purchase of property, plant, equipment and intangible assets. We further adjust free cash flow to add Dividends from equity-accounted investees because receipt of such dividends affects our residual cash flow. Free cash flow does not reflect adjustment for additional items that may impact our residual cash flow for discretionary expenditures, such as adjustments for charges relating to acquisitions, servicing debt obligations, changes in our deposit account balances that relate to our investing activities and other non-discretionary expenditures. Our management uses these non-IFRS measures to evaluate the Company's business strategies and management's performance. We believe that these non-IFRS measures provide useful information to investors because they improve the comparability of the financial results between periods and provide for greater transparency of key measures used to evaluate our performance.We present a discussion in the period-to-period comparisons of the primary drivers of changes in the company’s results of operations. This discussion is based in part on management’s best estimates of the impact of the main trends in its businesses. We have based the following discussion on our financial statements. You should read the following discussion together with our financial statements.

THANK YOU visit us at www.icl-group.com 32
SIGNATURE
Pursuant to the requirements of the Securities Exchange Act of 1934, the registrant has duly caused this report to be signed on its behalf by the undersigned, thereunto duly authorized.
| Israel Chemicals Ltd. | ||||
| By: | /s/ Kobi Altman | |||
| Name: | Kobi Altman | |||
| Title: | Chief Financial Officer | |||
| Israel Chemicals Ltd. | ||||
| By: | /s/ Aya Landman | |||
| Name: | Aya Landman | |||
| Title: | Global Company Secretary | |||
Date: November 7, 2019
THANK YOU visit us at www.icl-group.com 32