UNITED STATES
SECURITIES AND EXCHANGE COMMISSION
Washington, D.C. 20549
FORM 6-K
REPORT OF FOREIGN PRIVATE ISSUER PURSUANT TO RULE 13a-16 OR 15d-16 UNDER
THE SECURITIES EXCHANGE ACT OF 1934
For the month of July 2021
Commission File Number: 001-13742
ICL GROUP LTD.
(Exact name of registrant as specified in its charter)
ICL Group Ltd.
Millennium Tower
23 Aranha Street
P.O. Box 20245
Tel Aviv, 61202 Israel
(972-3) 684-4400
(Address of principal executive office)
Indicate by check mark whether the registrant files or will file annual reports under cover of Form 20-F or Form 40-F:
| Form 20-F ☒ Form 40-F ☐ |
Indicate by check mark if the registrant is submitting the Form 6-K in paper as permitted by Regulation S-T Rule 101(b)(1):
| Yes ☐ No ☒ |
Indicate by check mark if the registrant is submitting the Form 6-K in paper as permitted by Regulation S-T Rule 101(b)(7):
| Yes ☐ No ☒ |
ICL GROUP LTD.
| 1. | Q2 2021 Investor Presentation |
Second Quarter 2021 Financial Results Raviv Zoller July 28, 2021 President and CEO
Important legal notes 2 Disclaimer and safe harbor for forward-looking statements The information contained herein in this presentation or delivered or to be delivered to you during this presentation does not constitute an offer, expressed or implied, or a recommendation to do any transaction in ICL Group Ltd. (ICL Group or company) securities or in any securities of its affiliates or subsidiaries.This presentation and/or other oral or written statements made by ICL Group during its presentation or from time to time, may contain forward-looking statements within the meaning of the United States Private Securities Litigation Reform Act of 1995 and other applicable securities laws. Whenever words such as "believe," "expect," "anticipate," "intend," "plan," "estimate", “predict” or similar expressions are used, the company is making forward-looking statements. Such forward-looking statements may include, but are not limited to, its 2021 guidance, those that discuss strategies, goals, financial outlooks, corporate initiatives, existing or new products, existing or new markets, operating efficiencies, or other non-historical matters.Because such statements deal with future events and are based on ICL Group’s current expectations, they could be impacted or be subjected to various risks and uncertainties, including those discussed in the "Risk Factors" section and elsewhere in the company’s Annual Report on Form 20-F for the year ended December 31, 2020, and in subsequent filings with the Tel Aviv Stock Exchange (TASE) and/or the U.S. Securities and Exchange Commission (SEC). Therefore, actual results, performance or achievements of the company could differ materially from those described in or implied by such forward-looking statements.Although the company believes the expectations reflected in such forward-looking statements are based on reasonable assumptions, it can provide no assurance expectations will be achieved. Except as otherwise required by law, ICL Group disclaims any intention or obligation to update or revise any forward-looking statements, which speak only as of the date hereof, whether as a result of new information, future events or circumstances or otherwise. Readers, listeners and viewers are cautioned to consider these risks and uncertainties and to not place undue reliance on such information. Certain market and/or industry data used in this presentation were obtained from internal estimates and studies, where appropriate, as well as from market research and publicly available information. Such information may include data obtained from sources believed to be reliable, however, ICL Group disclaims the accuracy and completeness of such information, which is not guaranteed. Internal estimates and studies, which the company believes to be reliable, have not been independently verified. The company cannot assure such data is accurate or complete.Included in this presentation are certain non-GAAP financial measures, such as adjusted operating income, adjusted operating income margin, adjusted EBITDA, adjusted EBITDA margin, adjusted net income, adjusted EPS, segment EBITDA, segment EBITDA margin and free cash flow, designed to complement the financial information presented in accordance with IFRS because management believes such measures are useful to investors. Please note other companies may calculate similarly titled non‑GAAP financial measures differently than ICL Group and definitions of these measures may differ from those used by other companies or such companies may use other measures to evaluate their performance, which may reduce the usefulness of our non-GAAP financial measures as tools for comparison. These non-GAAP financial measures should be considered only as supplemental to, and not superior to, financial measures provided in accordance with IFRS. Please refer to the company’s second quarter 2021 press release for the period ended June 30, 2021, and the appendix to this presentation for a reconciliation of the non-GAAP financial measures included in this presentation to the most directly comparable financial measures prepared in accordance with IFRS.

3 2Q’21 Highlights Innovative Ag Solutions Phosphate Solutions Potash Industrial Products Record quarter driven by increased demand for specialty products Successful completion of Dead Sea annual maintenance and ramp project in Spain Record breaking quarter, with strength in specialty food and industrial products Sales growth across all product lines, with higher prices and volumes All divisions contributed to strong quarterly results
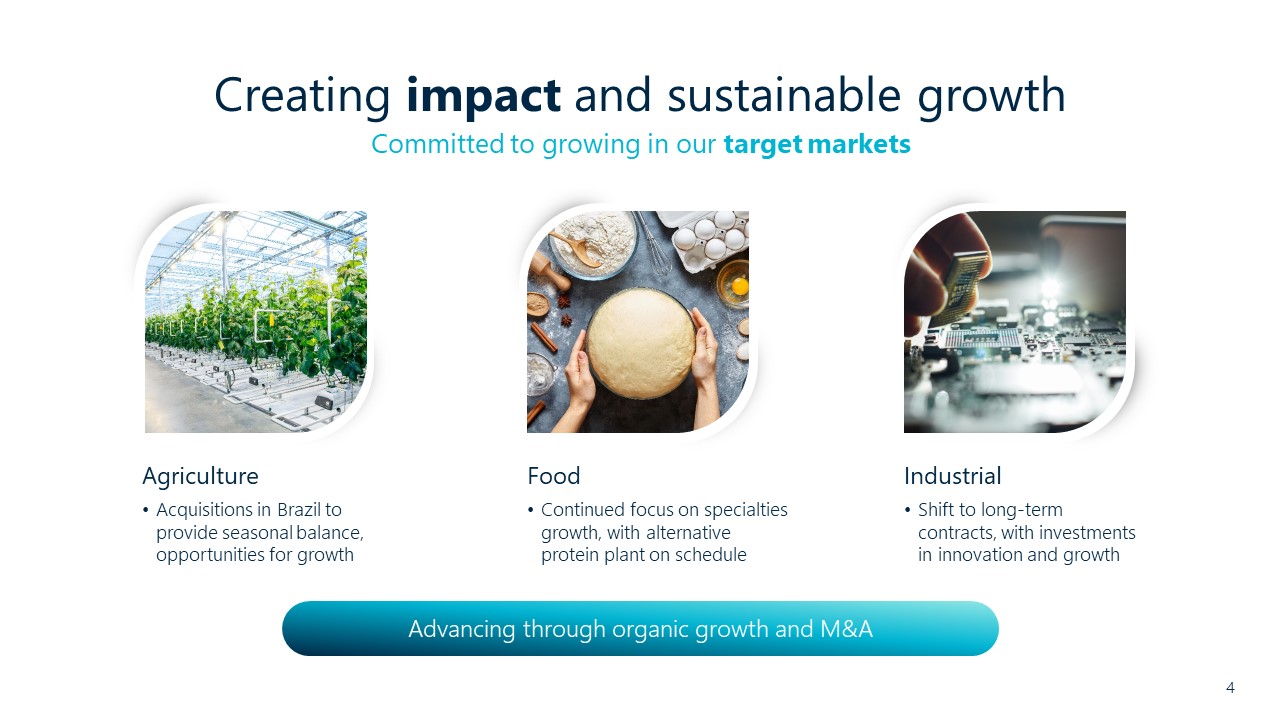
Industrial Agriculture Food 4 Creating impact and sustainable growth Committed to growing in our target markets Shift to long-term contracts, with investments in innovation and growth Acquisitions in Brazil to provide seasonal balance, opportunities for growth Continued focus on specialties growth, with alternative protein plant on schedule Advancing through organic growth and M&A
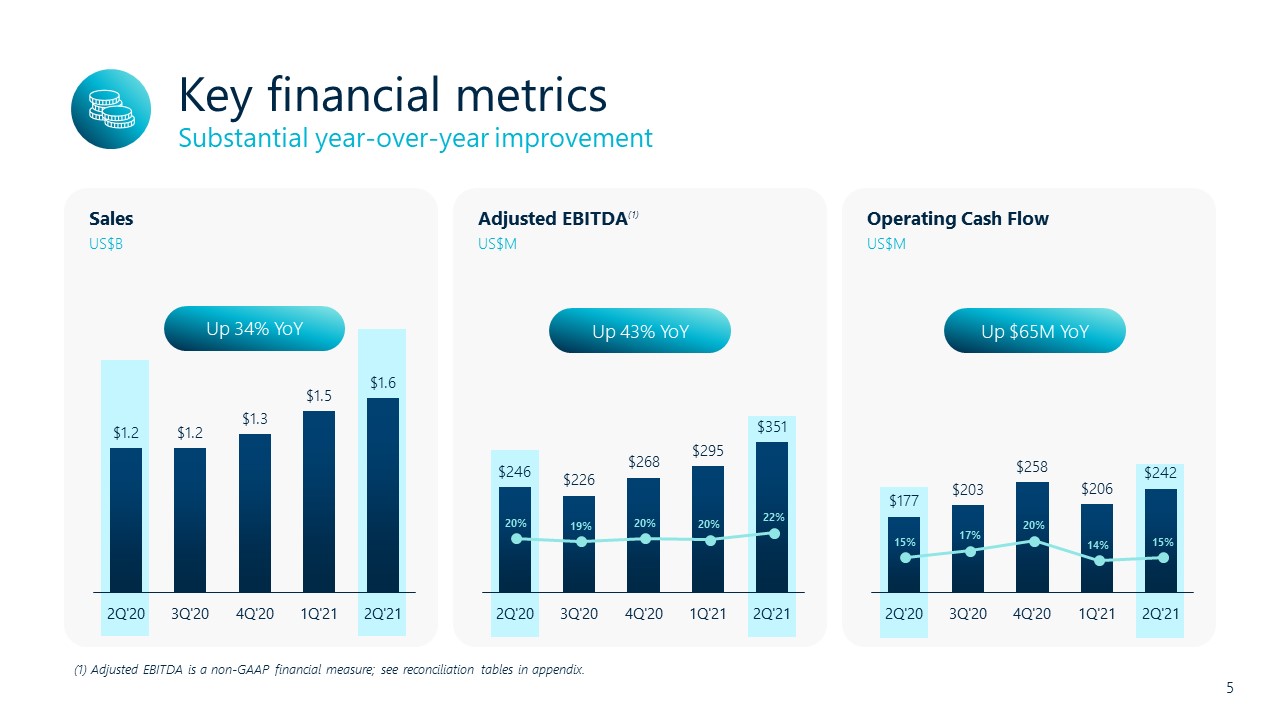
Key financial metrics 5 Substantial year-over-year improvement (1) Adjusted EBITDA is a non-GAAP financial measure; see reconciliation tables in appendix. Operating Cash Flow Adjusted EBITDA(1) Sales US$M US$M US$B Up 34% YoY Up 43% YoY Up $65M YoY

Second quarter 2021 6 Key financial highlights (1) Adjusted operating income and margin, adjusted net income, adjusted EBITDA and margin, and adjusted EPS are non-GAAP financial measures; see reconciliation tables in appendix. US$M 2Q’21 2Q’20 YoY Change Sales $1,617 $1,203 34% Gross profit $570 $320 78% Gross margin 35.3% 26.6% 870 bps Operating income $243 ($169) n/m Adjusted operating income(1) $236 $128 84% Adjusted operating margin 14.6% 10.6% 400 bps Net income, attributable $140 ($168) n/m Adjusted net income, attributable(1) $135 $72 88% Adjusted EBITDA(1) $351 $246 43% Adjusted EBITDA margin 21.7% 20.4% 130 bps Diluted earnings per share 11¢ (13¢) n/m Adjusted diluted EPS(1) 11¢ 6¢ 83% Dividend per share 5.26¢ 2.80¢ 88% Operating cash flow $242 $177 37%
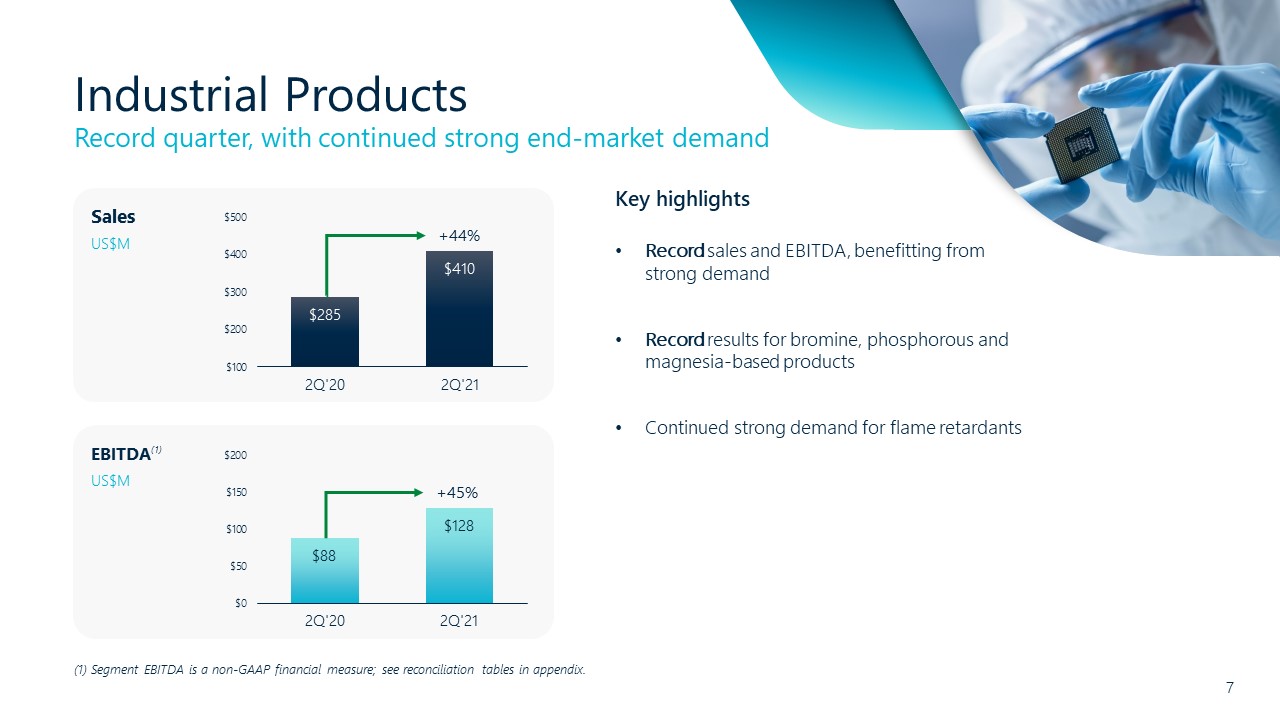
Industrial Products 7 Record quarter, with continued strong end-market demand Sales US$M EBITDA(1) US$M Key highlights Record sales and EBITDA, benefitting from strong demand Record results for bromine, phosphorous and magnesia-based productsContinued strong demand for flame retardants +45% +44% (1) Segment EBITDA is a non-GAAP financial measure; see reconciliation tables in appendix.

Potash 8 Continued good environment, with additional upside expected Sales US$M EBITDA(1) US$M Key highlights Dead Sea: successful one-week maintenance shutdown in early April, with ~80 projects completedICL Iberia: ramp project finalized, with production ramping up Good environment continued in second quarter – significant impact expected in second half +6% +21% (1) Segment EBITDA is a non-GAAP financial measure; see reconciliation tables in appendix.

Phosphate Solutions 9 Sales US$M EBITDA(1) US$M Key highlights Record results for specialties, commodities and YPH joint ventureSpecialties: food and industrial saw strong demand and higher prices across most regions and industriesPhosphate fertilizers: sales up, especially in U.S. and Brazil, where prices surged – as did raw material costs +123% +42% (1) Segment EBITDA is a non-GAAP financial measure; see reconciliation tables in appendix. Record quarter, with strong demand for specialties

Innovative Ag Solutions 10 All products showed year-over-year growth (1) Segment EBITDA is a non-GAAP financial measure; see reconciliation tables in appendix. Sales US$M EBITDA(1) US$M Key highlights All product lines showed sales growth, due to higher prices and volumes Record turf and ornamental sales, with all geographies improving and new markets doing especially well Completed acquisition of Compass Minerals South American Plant Nutrition business on July 1 – ahead of original schedule +23% +21%
Key takeaways 11 Specialties provide balanced long-term growth Consistently seeing strength in all businesses, with adjusted EBITDA improvement across all divisionsFocusing on long-term partnerships with customers in Industrial ProductsCompletion of Potash capacity increasesDriving Phosphate Specialties growth through focus on food Capitalizing on new opportunities for Innovative Ag Solutions in BrazilStrong cash generation funding investments and acquisitionsCommitted to meeting 2025 leadership goals in sustainable agriculture, food and industrial solutions

Second Quarter 2021 Financial Results Kobi Altman CFO

Financial strength 13 Continued growth in cash flow (1) Free cash flow is a non-GAAP financial measure; see reconciliation tables in appendix.Note: Liquidity is comprised of available credit facilities, cash and equivalents, and short-term investments and deposits. Operating cash flow of $242M vs. $177M in 2Q’20Up $105M YoY in 1H’21Free cash flow(1) of $94M vs. $20M in 2Q’20Up $105M YoY in 1H’21Net debt to adjusted EBITDA improved to 2.1 timesInvestment grade debt ratings reaffirmed S&P senior unsecured rating BBB-Fitch senior unsecured rating at BBB-Liquidity of ~$1.2B availableFunded Compass Minerals acquisition in July Highlights for 2Q’21

Pricing across mineral value chain 14 Commodity price upcycle Sources: GMOP and phosphoric acid - CRU Fertilizer Week, as of 6.30.21; Supramax - Simpson Spence Young (SSY), as of July 2021; Sulfur - CRU, as of 7.15.21. GMOP FOB NOLA US$/ton Phosphoric acid CFR contract India US$/ton Sulfur Bulk FOB Middle East Spot US$/ton Supramax Timecharter Average US$/day
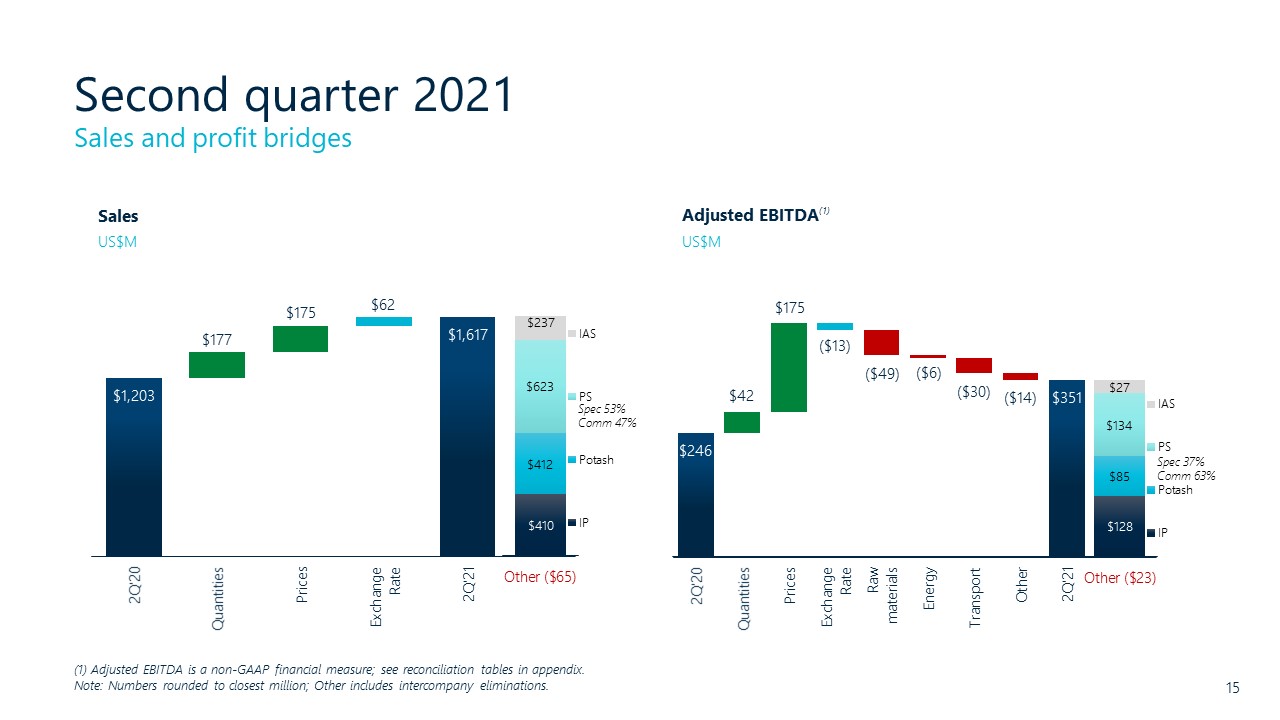
Second quarter 2021 15 Sales and profit bridges (1) Adjusted EBITDA is a non-GAAP financial measure; see reconciliation tables in appendix.Note: Numbers rounded to closest million; Other includes intercompany eliminations. Sales US$M Adjusted EBITDA(1) US$M Spec 37%Comm 63% Spec 53%Comm 47%
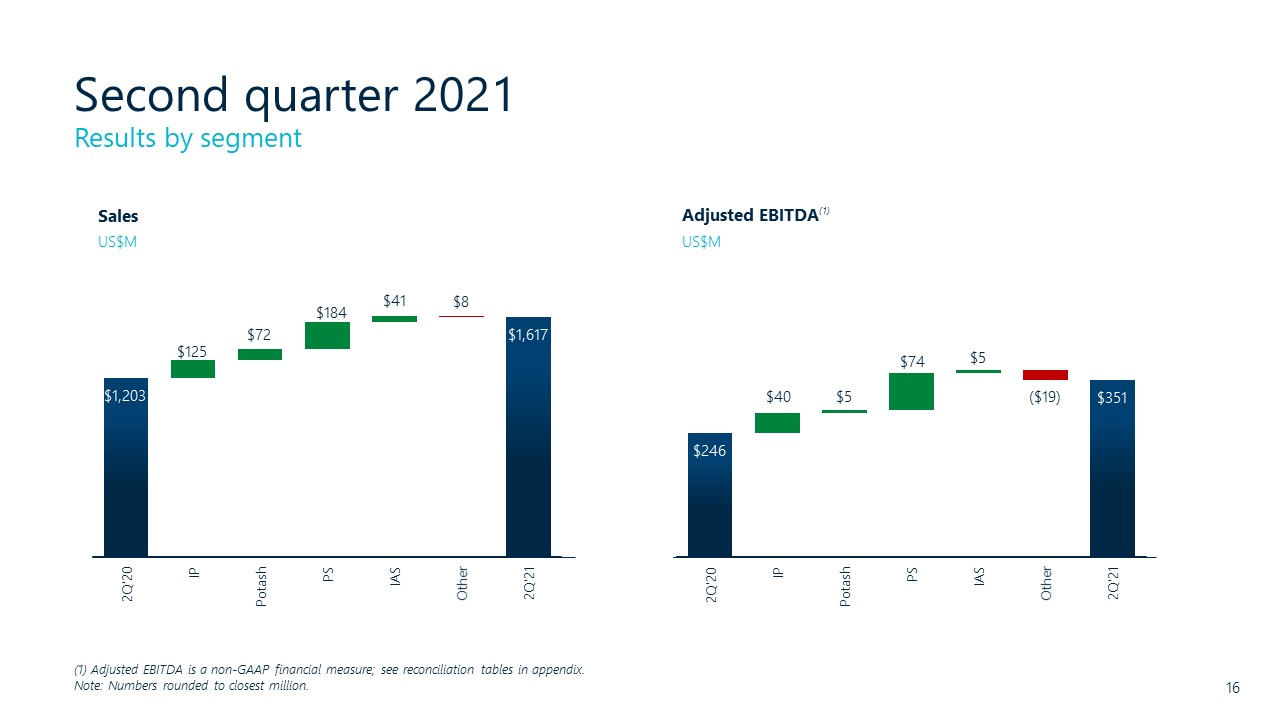
Second quarter 2021 16 Results by segment Sales US$M Adjusted EBITDA(1) US$M (1) Adjusted EBITDA is a non-GAAP financial measure; see reconciliation tables in appendix.Note: Numbers rounded to closest million.

Guidance 17 Full year 2021 (1) See guidance and non-GAAP financial measures in appendix. Note: Adjusted EBITDA is a non-GAAP measure, see appendix for calculation. Expect adjusted EBITDA range of $1,315 million to $1,375 million(1) Follows another quarter of strong resultsIncludes South American Plant Nutrition acquisition Raising expectations

Sustainability 18 Significant reduction(1) with continued progress Included for 3rd straight year Highest Platinum+ ranking for 3rd consecutive year A Industry leading member for 4th straight year Certified 1st sustainable European underground mining company Rated A- for 2nd straight year Leadership through creative solutions for the world’s challenges Included in index series Emissions Bloomberg 2021 GEI MAALA Bloomberg ESG Index ICL Iberia Carbon Disclosure Project FTSE4Good (1) Significant emission reductions in NOx (-1.6%), SOx (-36%), PM (-43%) and GHGs (-10%) from 2018 to 2020. Adopting framework for 2021 reporting TCFD/SASB Disclosure .
Thank you Contact Peggy.ReillyTharp@icl-group.com for more information on ICLView our interactive data tool at https://investors.icl-group.com/interactive-data-tool/default.aspx
Appendix Second Quarter 2021 Financial Results

Results of operations 21 Second quarter and first half 2021 Industrial ProductsUS$M 2Q’21 2Q’20 1H’21 1H’20 Segment sales $410 $285 $808 $649 Sales to external customers $406 $281 $800 $642 Sales to internal customers $4 $4 $8 $7 Segment profit $114 $70 $219 $173 Depreciation and amortization $14 $18 $31 $35 Capital expenditures $14 $24 $31 $45 Segment EBITDA $128 $88 $250 $208 Phosphate SolutionsUS$M 2Q’21 2Q’20 1H’21 1H’20 Segment sales $623 $439 $1,168 $941 Sales to external customers $599 $421 $1,124 $904 Sales to internal customers $24 $18 $44 $37 Segment profit $77 $8 $117 $17 Depreciation and amortization $57 $52 $111 $101 Capital expenditures $68 $63 $119 $124 Segment EBITDA $134 $60 $228 $118 PotashUS$M 2Q’21 2Q’20 1H’21 1H’20 Segment sales $412 $340 $797 $654 Sales to external customers $296 $253 $550 $479 Sales to internal customers $27 $24 $49 $47 Other and eliminations $89 $63 $198 $128 Segment profit $43 $38 $72 $52 Depreciation and amortization $42 $42 $79 $81 Capital expenditures $72 $55 $137 $116 Segment EBITDA $85 $80 $151 $133 Innovative Ag SolutionsUS$M 2Q’21 2Q’20 1H’21 1H’20 Segment sales $237 $196 $478 $395 Sales to external customers $235 $193 $473 $389 Sales to internal customers $2 $3 $5 $6 Segment profit $20 $15 $42 $29 Depreciation and amortization $7 $7 $14 $12 Capital expenditures $5 $4 $*9 $7 Segment EBITDA $27 $22 $56 $41 Note: Segment EBITDA is a non-GAAP financial measure; see reconciliation tables.*Not including capital expenditures as part of business combination. For further information see Note 3 to the Company’s Interim Financial Statements in the 2021 6-K Report.
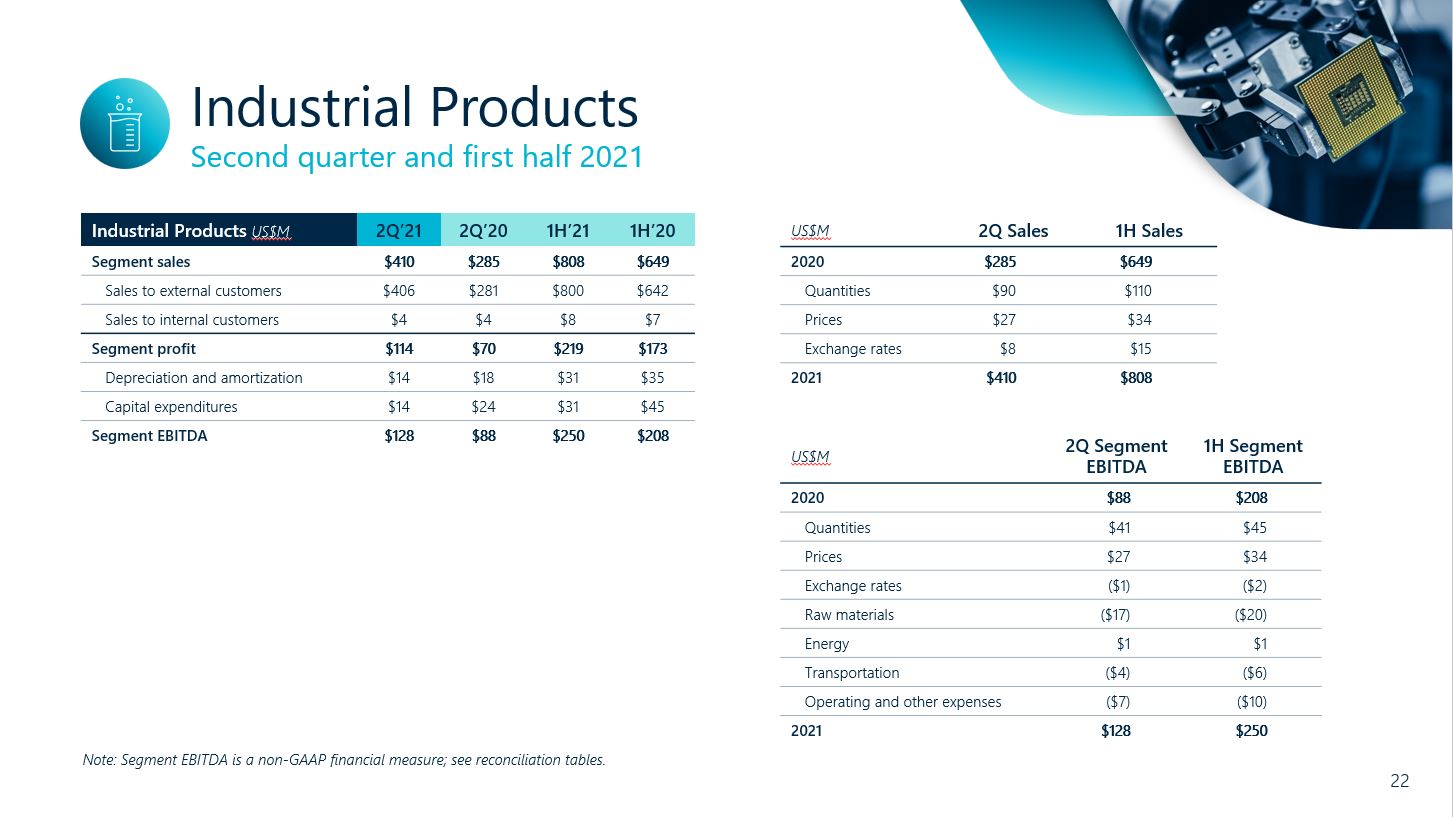
Industrial Products 22 Second quarter and first half 2021 US$M 2Q Sales 1H Sales 2020 $285 $649 Quantities $90 $110 Prices $27 $34 Exchange rates $8 $15 2021 $410 $808 US$M 2Q Segment EBITDA 1H Segment EBITDA 2020 $88 $208 Quantities $41 $45 Prices $27 $34 Exchange rates $(1) $(2) Raw materials ($17) ($20) Energy $1 $1 Transportation ($4) ($6) Operating and other expenses ($7) ($10) 2021 $128 $250 Note: Segment EBITDA is a non-GAAP financial measure; see reconciliation tables. Industrial Products US$M 2Q’21 2Q’20 1H’21 1H’20 Segment sales $410 $285 $808 $649 Sales to external customers $406 $281 $800 $642 Sales to internal customers $4 $4 $8 $7 Segment profit $114 $70 $219 $173 Depreciation and amortization $14 $18 $31 $35 Capital expenditures $14 $24 $31 $45 Segment EBITDA $128 $88 $250 $208
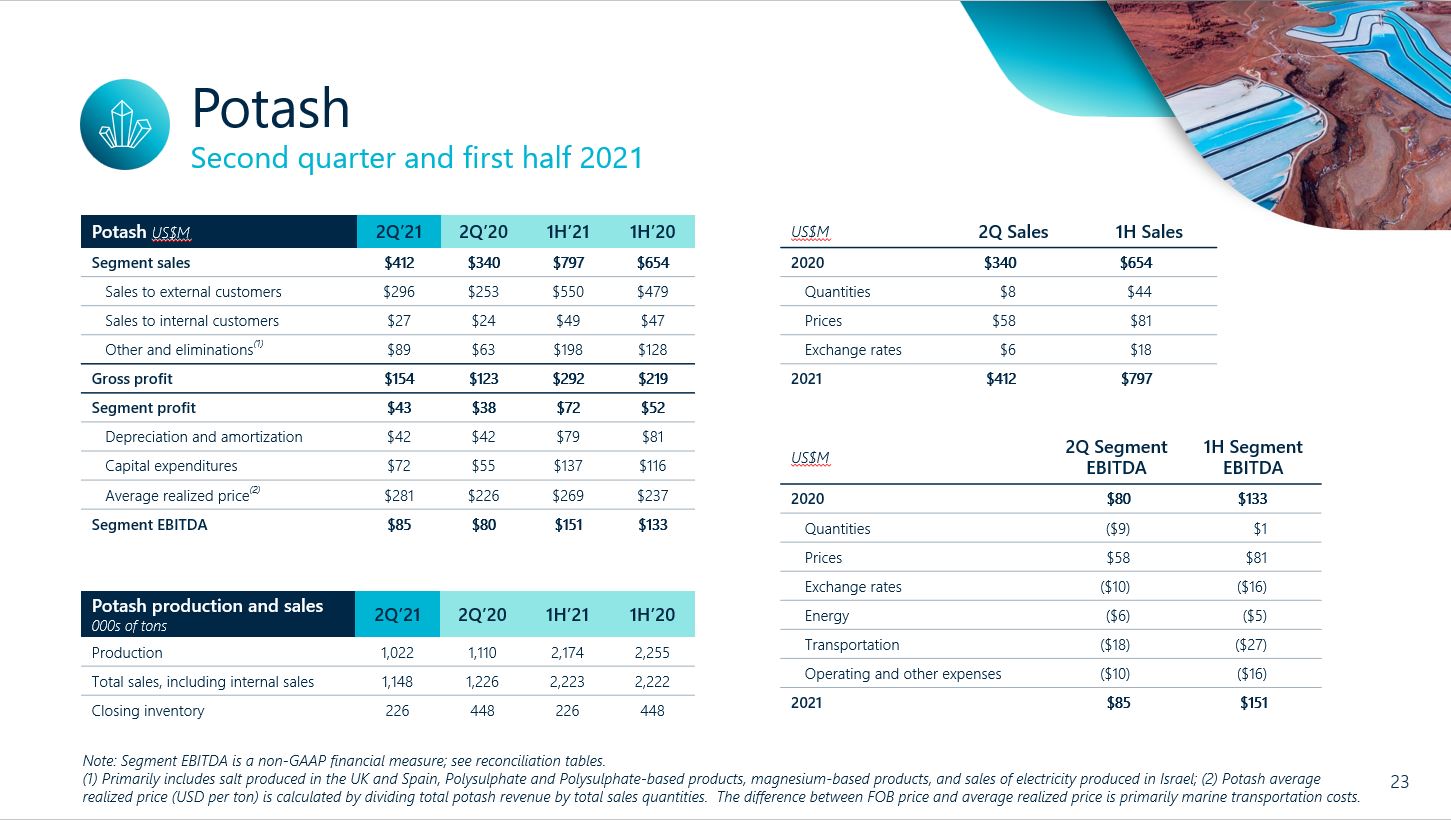
Potash 23 Second quarter and first half 2021 Note: Segment EBITDA is a non-GAAP financial measure; see reconciliation tables.(1) Primarily includes salt produced in the UK and Spain, Polysulphate and Polysulphate-based products, magnesium-based products, and sales of electricity produced in Israel; (2) Potash average realized price (USD per ton) is calculated by dividing total potash revenue by total sales quantities. The difference between FOB price and average realized price is primarily marine transportation costs. Potash US$M 2Q’21 2Q’20 1H’21 1H’20 Segment sales $412 $340 $797 $654 Sales to external customers $296 $253 $550 $479 Sales to internal customers $27 $24 $49 $47 Other and eliminations(1) $89 $63 $198 $128 Gross profit $154 $123 $292 $219 Segment profit $43 $38 $72 $52 Depreciation and amortization $42 $42 $79 $81 Capital expenditures $72 $55 $137 $116 Average realized price(2) $281 $226 $269 $237 Segment EBITDA $85 $80 $151 $133 Potash production and sales000s of tons 2Q’21 2Q’20 1H’21 1H’20 Production 1,022 1,110 2,174 2,255 Total sales, including internal sales 1,148 1,226 2,223 2,222 Closing inventory 226 448 226 448 US$M 2Q Sales 1H Sales 2020 $340 $654 Quantities $8 $44 Prices $58 $81 Exchange rates $6 $18 2021 $412 $797 US$M 2Q Segment EBITDA 1H Segment EBITDA 2020 $80 $133 Quantities ($9) $1 Prices $58 $81 Exchange rates ($10) ($16) Energy $(6) ($5) Transportation ($18) ($27) Operating and other expenses ($10) ($16) 2021 $85 $151
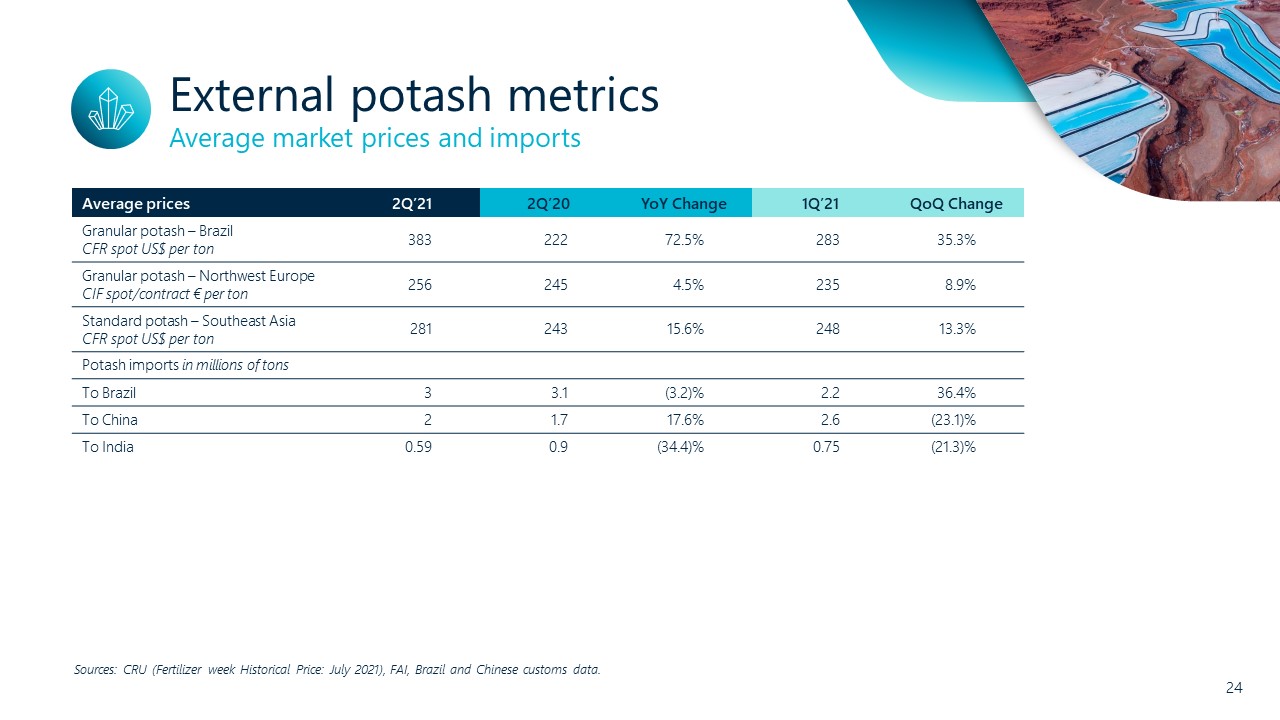
External potash metrics 24 Average market prices and imports Sources: CRU (Fertilizer week Historical Price: July 2021), FAI, Brazil and Chinese customs data. Average prices 2Q’21 2Q’20 YoY Change 1Q’21 QoQ Change Granular potash – BrazilCFR spot US$ per ton 383 222 72.5% 283 35.3% Granular potash – Northwest EuropeCIF spot/contract € per ton 256 245 4.5% 235 8.9% Standard potash – Southeast AsiaCFR spot US$ per ton 281 243 15.6% 248 13.3% Potash imports in millions of tons To Brazil 3 3.1 (3.2)% 2.2 36.4% To China 2 1.7 17.6% 2.6 (23.1)% To India 0.59 0.9 (34.4)% 0.75 (21.3)%
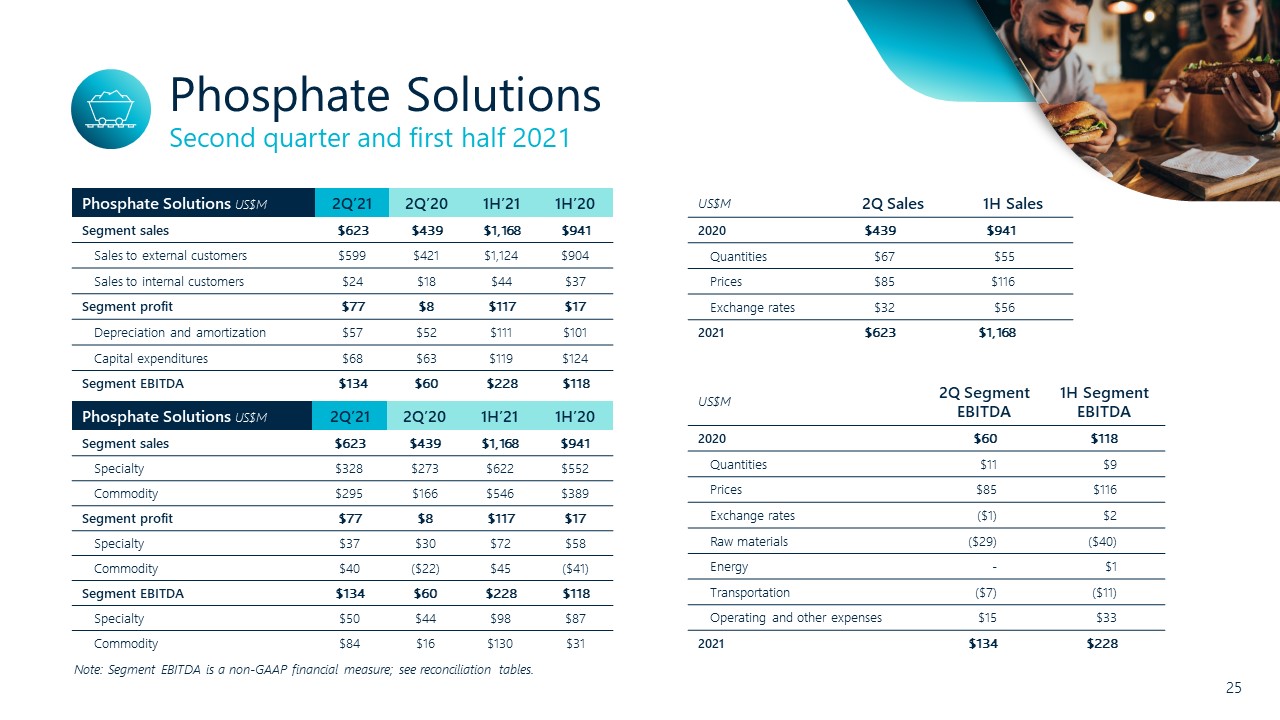
Phosphate Solutions 25 Second quarter and first half 2021 Phosphate Solutions US$M 2Q’21 2Q’20 1H’21 1H’20 Segment sales $623 $439 $1,168 $941 Specialty $328 $273 $622 $552 Commodity $295 $166 $546 $389 Segment profit $77 $8 $117 $17 Specialty $37 $30 $72 $58 Commodity $40 ($22) $45 ($41) Segment EBITDA $134 $60 $228 $118 Specialty $50 $44 $98 $87 Commodity $84 $16 $130 $31 Note: Segment EBITDA is a non-GAAP financial measure; see reconciliation tables. Phosphate Solutions US$M 2Q’21 2Q’20 1H’21 1H’20 Segment sales $623 $439 $1,168 $941 Sales to external customers $599 $421 $1,124 $904 Sales to internal customers $24 $18 $44 $37 Segment profit $77 $8 $117 $17 Depreciation and amortization $57 $52 $111 $101 Capital expenditures $68 $63 $119 $124 Segment EBITDA $134 $60 $228 $118 US$M 2Q Sales 1H Sales 2020 $439 $941 Quantities $67 $55 Prices $85 $116 Exchange rates $32 $56 2021 $623 $1,168 US$M 2Q Segment EBITDA 1H Segment EBITDA 2020 $60 $118 Quantities $11 $9 Prices $85 $116 Exchange rates ($1) $2 Raw materials ($29) ($40) Energy - $1 Transportation ($7) ($11) Operating and other expenses $15 $33 2021 $134 $228
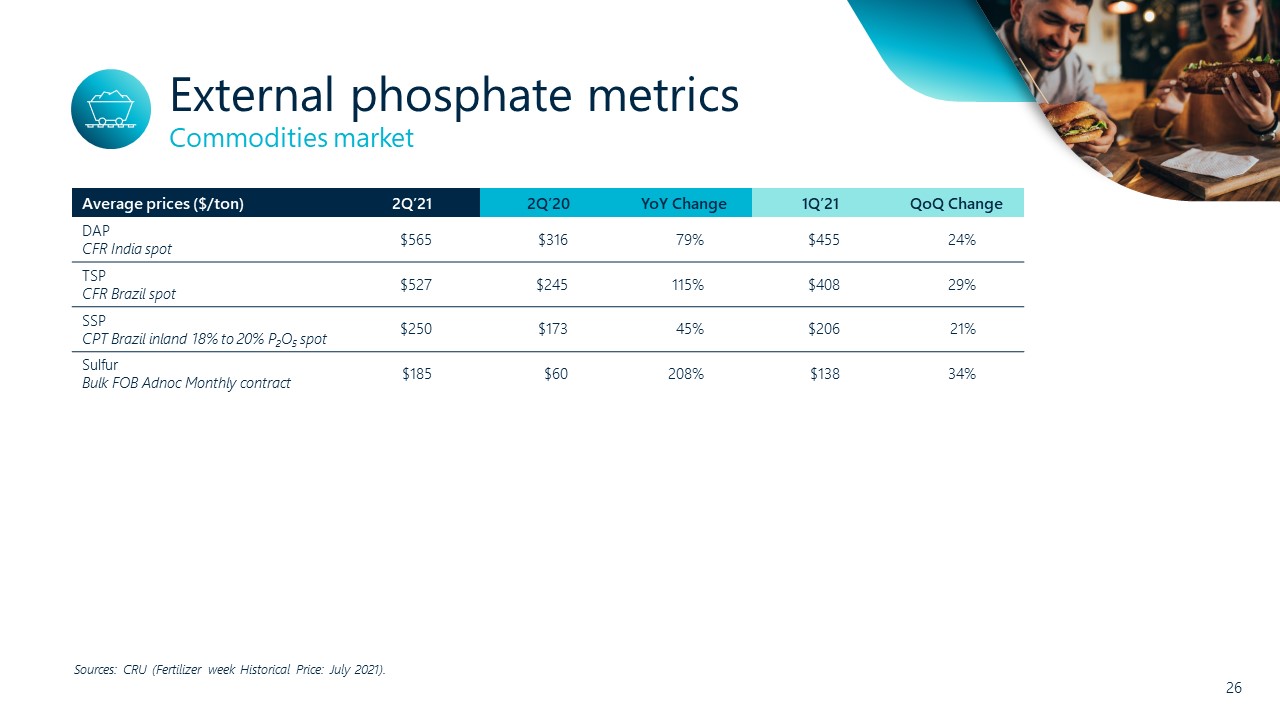
External phosphate metrics 26 Commodities market Average prices ($/ton) 2Q’21 2Q’20 YoY Change 1Q’21 QoQ Change DAPCFR India spot $565 $316 79% $455 24% TSPCFR Brazil spot $527 $245 115% $408 29% SSPCPT Brazil inland 18% to 20% P2O5 spot $250 $173 45% $206 21% SulfurBulk FOB Adnoc Monthly contract $185 $60 208% $138 34% Sources: CRU (Fertilizer week Historical Price: July 2021).
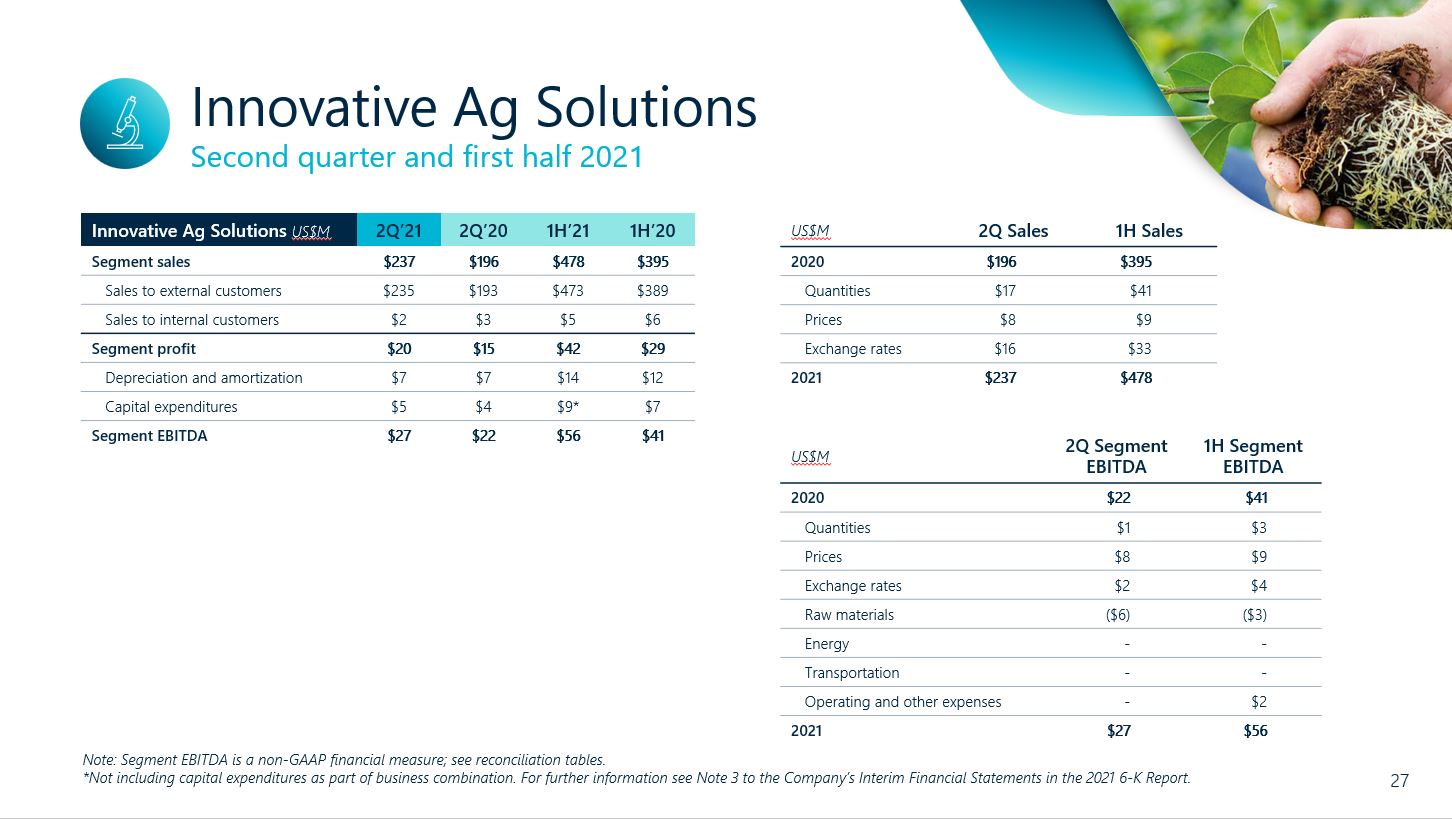
Innovative Ag Solutions 27 Second quarter and first half 2021 Note: Segment EBITDA is a non-GAAP financial measure; see reconciliation tables.*Not including capital expenditures as part of business combination. For further information see Note 3 to the Company’s Interim Financial Statements in the 2021 6-K Report. US$M 2Q Sales 1H Sales 2020 $196 $395 Quantities $17 $41 Prices $8 $9 Exchange rates $16 $33 2021 $237 $478 US$M 2Q Segment EBITDA 1H Segment EBITDA 2020 $22 $41 Quantities $1 $3 Prices $8 $9 Exchange rates $2 $4 Raw materials ($6) ($3) Energy - - Transportation - - Operating and other expenses - $2 2021 $27 $56 Innovative Ag Solutions US$M 2Q’21 2Q’20 1H’21 1H’20 Segment sales $237 $196 $478 $395 Sales to external customers $235 $193 $473 $389 Sales to internal customers $2 $3 $5 $6 Segment profit $20 $15 $42 $29 Depreciation and amortization $7 $7 $14 $12 Capital expenditures $5 $4 *$9 $7 Segment EBITDA $27 $22 $56 $41

Consolidated results analysis 28 Second quarter 2021 US$M Sales Expenses Operating Income EBITDA Notes: 2Q’20 $1,203 ($1,372) ($169) Total adjustments Q2 2020* - $297 $297 Adjusted Q2 2020 figures $1,203 ($1,075) $128 $246 Quantities $177 ($135) $42 $42 Positive – higher sales volumes of bromine- and phosphorus-based flame retardants, bromine-based industrial solutions, mainly clear brine fluids, as well as acids, phosphate fertilizers and phosphate-based food additives and saltsNegative – decreased sales volumes of potash Prices $175 - $175 $175 Positive – phosphate fertilizers, potash, elemental bromine, and bromine- and phosphorus-based flame retardants Exchange rates $62 ($75) ($13) ($13) Negative – appreciation of avg. exchange rate of Israeli shekel and British Pound vs. U.S. dollar Positive – appreciation of euro and Chinese yuan against the U.S. dollar Raw materials - ($49) ($49) ($49) Negative – higher prices of sulfur and raw materials used to produce flame retardants Energy - ($6) ($6) ($6) Negative – increased electricity prices Transportation - ($30) ($30) ($30) Negative – higher marine transportation rates Operating and other expenses - ($11) ($11) ($14) Negative – decreased production of potash and increased royalties from higher selling prices.Positive – increased production from Rotem Israel and YPH joint venture; Rotem efficiency plan implemented in 2020 Adjusted Q2 2021 figures $1,617 ($1,381) $236 $351 Total adjustments Q2 2021* - $7 $7 2Q’21 $1,617 ($1,374) $243 * See “Adjustments to reported Operating and Net income (Non-GAAP)” in the 2021 6-K report.

Consolidated results analysis 29 First half 2021 US$M Sales Expenses Operating Income EBITDA Notes: 1H’20 $2,522 ($2,559) ($37) Total adjustments YTD 2020* - $297 $297 Adjusted YTD 2020 figures $2,522 ($2,262) $260 $496 Quantities $245 ($192) $53 $53 Positive – higher sales volumes of bromine- and phosphorus-based flame retardants, bromine-based industrial solutions,, as well as Innovative Ag-Solutions products, acids, phosphate fertilizers and phosphate-based food additives Prices $236 - $236 $236 Positive – phosphate fertilizers, potash, elemental bromine, and bromine- and phosphorus-based flame retardants Exchange rates $124 ($142) ($18) ($18) Negative – appreciation of avg. exchange rate of Israeli shekel & British Pound vs. U.S. dollar Positive – appreciation of euro and Chinese yuan against the U.S. dollar Raw materials - ($62) ($62) ($62) Negative – higher prices of sulfur and raw materials used to produce flame retardants Energy - ($3) ($3) ($3) Transportation - ($44) ($44) ($44) Negative – higher marine transportation rates Operating and other expenses - ($1) ($1) ($12) Negative – decreased production of potash and increased royalties from higher selling pricesPositive – increased production from Rotem Israel and YPH joint venture. Rotem efficiency plan implemented in 2020 Adjusted YTD 2021 figures $3,127 ($2,706) $421 $646 Total adjustments YTD 2021* - $7 $7 1H’21 $3,127 ($2,699) $428 * See “Adjustments to reported Operating and Net income (Non-GAAP)” in the 2021 6-K report.

Sales by geographic location 30 Second quarter 2021 SalesUS$M Industrial Products Potash Phosphate Solutions Innovative Ag Solutions Other Activities Reconciliations Consolidated 2Q’21 2Q’20 2Q’21 2Q’20 2Q’21 2Q’20 2Q’21 2Q’20 2Q’21 2Q’20 2Q’21 2Q’20 2Q’21 2Q’20 Europe $142 $99 $96 $84 $185 $154 $113 $89 $6 $7 ($23) ($17) $519 $416 Asia $148 $98 $128 $132 $150 $93 $39 $36 - - ($3) ($4) $462 $355 North America $87 $66 $32 $14 $125 $83 $28 $26 - $1 ($1) ($2) $271 $188 South America $22 $6 $112 $64 $116 $62 $12 $4 - - - - $262 $136 Rest of world $11 $16 $44 $46 $47 $47 $45 $41 $1 $1 ($45) ($43) $103 $108 Total $410 $285 $412 $340 $623 $439 $237 $196 $7 $9 ($72) ($66) $1,617 $1,203

Finance expenses 31 Second quarter and first half 2021 (1) Average liabilities during given quarter.(2) Other for 2Q’21 includes $6 million, due to shekel revaluation vs. U.S. dollar.Note: Numbers may not add, due to rounding and set-offs. US$M 2Q’21 2Q’20 1H’21 1H’20 Average net debt(1) $2,800 $2,800 $2,800 $2,700 Weighted average interest rate 3.8% 3.9% 3.8% 4.0% Interest expenses $26 $27 $53 $54 Interest capitalization ($5) ($6) ($11) ($12) Interest expenses, net $21 $21 $42 $42 Total hedging and balance sheet revaluation ($2) ($6) $10 $32 Interest and exchange rate impact on LT liabilities of leasing and employees and other(2) $11 $16 ($2) $9 Net financial expenses $30 $31 $50 $83

Adjusted effective tax rate 32 Second quarter and first half 2021 (1) See reconciliation table.Note: Numbers may not add, due to rounding and set-offs. US$M 2Q’21 2Q’20 1H’21 1H’20 Adjusted income before tax(1) $207 $98 $372 $179 Normalized tax rate 25% 20% 23% 21% Normalized tax expenses $52 $20 $86 $37 Carryforward losses for which deferred taxes were not recognized and other $1 $1 $4 $7 Exchange rate impact $9 $3 ($5) - Adjusted tax expenses $62 $24 $85 $44 Effective tax rate 30% 25% 23% 25% Tax adjustments $2 ($57) $2 ($57) Reported provision for income taxes $64 ($33) $87 ($13)
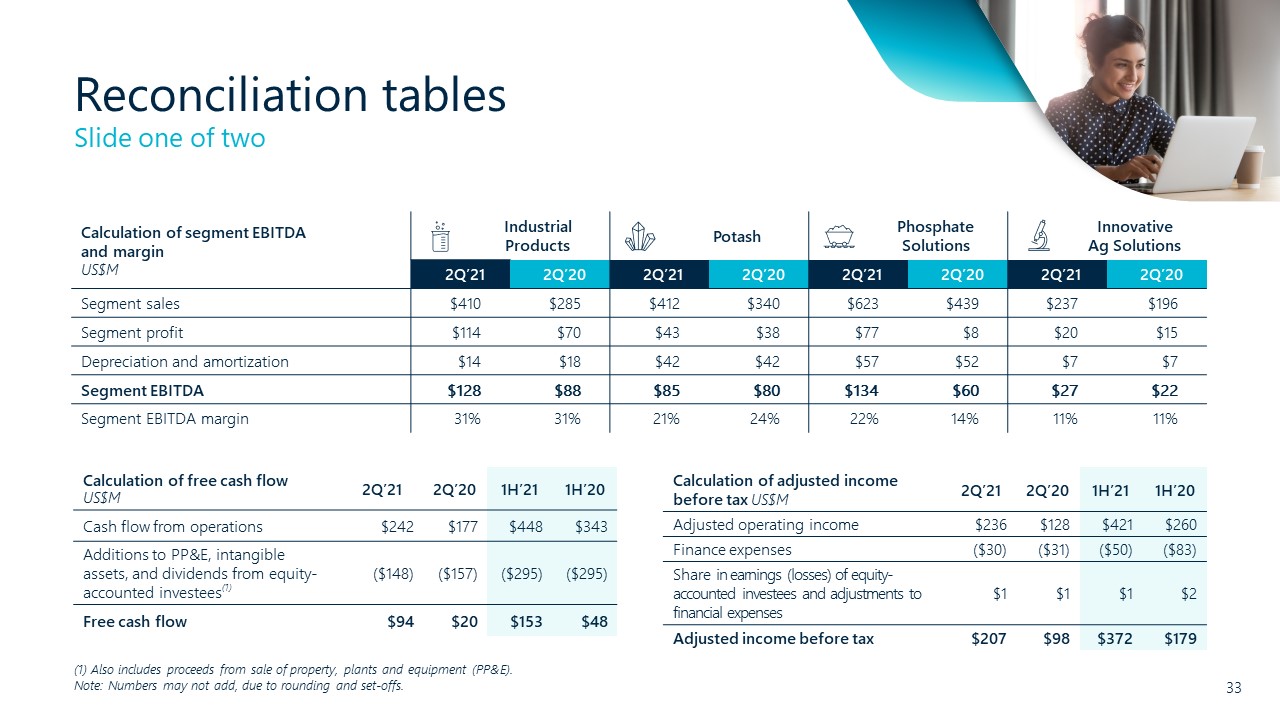
Reconciliation tables 33 Slide one of two (1) Also includes proceeds from sale of property, plants and equipment (PP&E).Note: Numbers may not add, due to rounding and set-offs. Calculation of segment EBITDA and marginUS$M Industrial Products Potash Phosphate Solutions Innovative Ag Solutions 2Q’21 2Q’20 2Q’21 2Q’20 2Q’21 2Q’20 2Q’21 2Q’20 Segment sales $410 $285 $412 $340 $623 $439 $237 $196 Segment profit $114 $70 $43 $38 $77 $8 $20 $15 Depreciation and amortization $14 $18 $42 $42 $57 $52 $7 $7 Segment EBITDA $128 $88 $85 $80 $134 $60 $27 $22 Segment EBITDA margin 31% 31% 21% 24% 22% 14% 11% 11% Calculation of free cash flow US$M 2Q’21 2Q’20 1H’21 1H’20 Cash flow from operations $242 $177 $448 $343 Additions to PP&E, intangible assets, and dividends from equity-accounted investees(1) ($148) ($157) ($295) ($295) Free cash flow $94 $20 $153 $48 Calculation of adjusted income before tax US$M 2Q’21 2Q’20 1H’21 1H’20 Adjusted operating income $236 $128 $421 $260 Finance expenses ($30) ($31) ($50) ($83) Share in earnings (losses) of equity-accounted investees and adjustments to financial expenses $1 $1 $1 $2 Adjusted income before tax $207 $98 $372 $179

Reconciliation tables 34 Slide two of two (1) See detailed reconciliation table – adjustments to reported operating and net income (non-GAAP) – in corresponding quarters’ earnings release.(2) Quarterly net debt to EBITDA ratio was calculated by dividing net debt by past four quarters adjusted EBITDA.Note: Numbers may not add, due to rounding and set-offs. Calculation of adjusted EBITDA US$M 2Q’21 1Q’21 4Q’20 3Q’20 2Q’20 FY’20 FY’19 FY’18 Net income attributable to shareholders of the company $140 $135 $65 $54 ($168) $11 $475 $1,240 Financing expenses, net $30 $20 $46 $29 $31 $158 $129 $158 Taxes on income $64 $23 $24 $14 ($33) $25 $147 $129 Minority and equity profit, net $9 $7 $4 $3 $1 $8 $5 ($8) Operating income $243 $185 $139 $100 ($169) $202 $756 $1,519 Minority and equity profit, net ($9) ($7) ($4) ($3) ($1) ($8) ($5) $8 Depreciation and amortization $124 $117 $129 $123 $119 $489 $443 $403 Adjustments(1) ($7) - $4 $6 $297 $307 $4 ($766) Adjusted EBITDA $351 $295 $268 $226 $246 $990 $1,198 $1,164 Net debt to EBITDA(2) US$M 2Q’21 Net debt $2,432 EBITDA $1,140 Net debt to EBITDA 2.1
Guidance and non-GAAP financial measures 35 GuidanceThe company only provides guidance on a non-GAAP basis. We do not provide a reconciliation of forward-looking adjusted EBITDA (non-GAAP) to GAAP net income (loss), due to the inherent difficulty in forecasting and quantifying certain amounts necessary for such a reconciliation, in particular because special items, such as restructuring, litigation and other matters, used to calculate projected net income (loss) vary dramatically based on actual events, the company is not able to forecast on a GAAP basis with reasonable certainty all deductions needed in order to provide a GAAP calculation of projected net income (loss) at this time. The amount of these deductions may be material and, therefore, could result in projected GAAP net income (loss) being materially less than projected adjusted EBITDA (non-GAAP). Our guidance speaks only as of the date hereof. We undertake no obligation to update any of these forward-looking statements to reflect events or circumstances after the date of this presentation or to reflect actual outcomes, unless required by law.Non-GAAP financial measuresWe disclose in this presentation non-IFRS financial measures titled: adjusted operating income, adjusted net income attributable to the company’s shareholders, adjusted EBITDA, adjusted EPS, segment EBITDA, segment EBITDA margin and free cash flow. Our management uses such non-GAAP measures to facilitate operating performance comparisons from period to period and presents free cash flow to facilitate a review of our cash flows. We calculate our adjusted operating income by adjusting our operating income to add certain items, as set forth in the reconciliation table “Adjustments to reported operating and net income.” Certain of these items may recur. We calculate our adjusted net income attributable to the company’s shareholders by adjusting our adjusted operating income, net income attributable to the company’s shareholders to add certain items, as set forth in the reconciliation table “Adjustments to reported operating and net income (Non-GAAP)” in our quarterly earnings release, excluding the total tax impact of such adjustments. We calculate our adjusted EBITDA by adding depreciation and amortization back to adjusted operating income. Adjusted EPS is calculated as adjusted net income divided by weighted-average diluted number of ordinary shares outstanding as provided in the reconciliation table under “Calculation of adjusted EPS.” We calculate our segment EBITDA by adding back to our segment profit the depreciation and amortization for each segment. We calculate our segment EBITDA margin by dividing segment EBITDA by revenue. We calculate our free cash flow as our cash flows from operating activities net of our purchase of property, plant, equipment and intangible assets, and adding proceeds from the sale of property, plant and equipment, and dividends from equity-accounted investees during such period as presented in the reconciliation table under “Calculation of free cash flow.” You should not view adjusted operating income, adjusted net income attributable to the company’s shareholders, adjusted EPS or adjusted EBITDA as a substitute for operating income or net income attributable to the company’s shareholders determined in accordance with IFRS, adjusted EPS as a substitute for EPS, or free cash flow as a substitute for cash flows from operating activities and cash flows used in investing activities, and you should note that our definitions of adjusted operating income, adjusted net income attributable to the company’s shareholders, adjusted EBITDA and free cash flow may differ from those used by other companies. However, we believe such non-GAAP measures provide useful information to both management and investors by excluding certain expenses management believes are not indicative of our ongoing operations. In particular, for free cash flow, we adjust our CAPEX to include any proceeds from the sale of property, plant and equipment because we believe such amounts offset the impact of our purchase of property, plant, equipment and intangible assets. We further adjust free cash flow to add dividends from equity-accounted investees because receipt of such dividends affects our residual cash flow. Free cash flow does not reflect adjustment for additional items that may impact our residual cash flow for discretionary expenditures, such as adjustments for charges relating to acquisitions, servicing debt obligations, changes in our deposit account balances that relate to our investing activities and other non-discretionary expenditures. Our management uses these non-IFRS measures to evaluate the company's business strategies and management's performance. We believe these non-IFRS measures provide useful information to investors because they improve the comparability of the financial results between periods and provide for greater transparency of key measures used to evaluate our performance. We present a discussion in the period-to-period comparisons of the primary drivers of changes in the company’s results of operations. This discussion is based, in part, on management’s best estimates of the impact of the main trends in its businesses. We have based the preceding discussion on our financial statements. You should read the preceding discussion together with our financial statements.
SIGNATURE
Pursuant to the requirements of the Securities Exchange Act of 1934, the registrant has duly caused this report to be signed on its behalf by the undersigned, thereunto duly authorized.
| ICL Group Ltd. | |||
| By: | /s/ Kobi Altman | ||
| Name: | Kobi Altman | ||
| Title: | Chief Financial Officer | ||
| ICL Group Ltd. | |||
| By: | /s/ Aya Landman | ||
| Name: | Aya Landman | ||
| Title: | VP, Company Secretary & Global Compliance | ||
Date: July 28, 2021