Exhibit 99.2
Outerwall Inc. 2013 Fourth Quarter and Full Year Earnings
Prepared Remarks from CEO J. Scott Di Valerio and CFO Galen C. Smith
February 6, 2014
Outerwall Inc. issued a press release today, February 6, 2014, announcing financial results for the 2013 fourth quarter and full year ended December 31, 2013. These prepared remarks provide additional information related to the company’s 2013 fourth quarter and full year operating and financial performance and 2014 first quarter and full year guidance. The prepared remarks also include supplementary slides in Appendix B.
CEO J. Scott Di Valerio and CFO Galen C. Smith will host a conference call today at 2:00 p.m. PST to answer questions related to the company’s business performance, financial results and guidance.
The Q4 press release, prepared remarks and conference call webcast are available on the Investor Relations section of Outerwall’s website at ir.outerwall.com.
Safe Harbor for Forward-Looking Statements
Certain statements in this press release are “forward-looking statements” within the meaning of the Private Securities Litigation Reform Act of 1995. The words “believe,” “estimate,” “expect,” “intend,” “will,” “anticipate,” “goals,” variations of such words, and similar expressions identify forward-looking statements, but their absence does not mean that the statement is not forward-looking. The forward-looking statements in this release include statements regarding Outerwall Inc.’s anticipated growth and future operating results, including 2014 first quarter and full year results, as well as stock repurchases, including the announced tender offer, bank loans, potential cost savings and tax benefits, leadership transitions and timing and integration of such leadership changes. Forward-looking statements are not guarantees of future performance and actual results may vary materially from the results expressed or implied in such statements. Differences may result from actions taken by Outerwall Inc. or its subsidiaries, as well as from risks and uncertainties beyond Outerwall Inc.’s control. Such risks and uncertainties include, but are not limited to,
| • | competition from other entertainment providers, |
| • | individual personnel decisions, |
| • | the ability to achieve the strategic and financial objectives for our entry into new businesses, includingecoATM, SAMPLEit and Redbox Instant™ by Verizon, |
| • | our ability to complete the tender offer, the occurrence of any conditions to completing the tender offer,and our decision to waive the occurrence of any condition to completing the tender offer, |
| • | our ability to repurchase stock and the availability of an open trading window, |
| • | the achievement of anticipated cost savings and tax benefits, |
| • | results of our restructuring and cost initiatives, including discontinuation of affected new ventures andworkforce reduction, |
| • | the termination, non-renewal or renegotiation on materially adverse terms of our contracts with oursignificant retailers and suppliers, |
| • | payment of increased fees to retailers, suppliers and other third-party providers, including financialservice providers, |
| • | the timing of new DVD releases and the inability to receive delivery of DVDs on the date of theirinitial release to the general public, or shortly thereafter, or in sufficient quantity, for homeentertainment viewing, |
| • | the effective management of our content library, |
| • | the ability to attract new retailers, penetrate new markets and distribution channels and react to changing consumer demands, |
| • | the ability to adequately protect our intellectual property, and |
| • | the application of substantial federal, state, local and foreign laws and regulations specific to our business. |
The foregoing list of risks and uncertainties is illustrative, but by no means exhaustive. For more information on factors that may affect future performance, please review “Risk Factors” described in our most recent Annual Report on Form 10-K filed with the Securities and Exchange Commission and other documents filed therewith. These forward-looking statements reflect Outerwall Inc.’s expectations as of the date of this press release. Outerwall Inc. undertakes no obligation to update the information provided herein.
©2014 Outerwall Inc. All Rights Reserved. These materials may not be reproduced, altered or distributed without the express written consent of Outerwall Inc.
Outerwall Inc. 2013 Fourth Quarter and Full Year Earnings
Prepared Remarks from CEO J. Scott Di Valerio and CFO Galen C. Smith
February 6, 2014
Important Information Regarding the Expected Tender Offer
These prepared remarks are for informational purposes only and are neither an offer to buy nor the solicitation of an offer to sell any shares of Outerwall’s common stock. The expected tender offer described in these prepared remarks has not yet commenced, and there can be no assurances that Outerwall will commence the tender offer on the terms and conditions described in these prepared remarks or at all. If Outerwall commences the tender offer, the tender offer will be made solely by an Offer to Purchase, the Letter of Transmittal and related materials, as they may be amended or supplemented. Stockholders should read Outerwall’s commencement tender offer statement on Schedule TO expected to be filed with the SEC in connection with the tender offer, which will include as exhibits the Offer to Purchase, the Letter of Transmittal and related materials, as well as any amendments or supplements to the Schedule TO when they become available, because they will contain important information. If Outerwall commences the tender offer, each of these documents will be filed with the SEC, and, when available, stockholders may obtain them for free from the SEC at its website (www.sec.gov) or from the Company’s information agent in connection with the tender offer.
Use of Non-GAAP Financial Measures
Non-GAAP measures may be provided as a complement to results provided in accordance with United States generally accepted accounting principles (“GAAP”).
We use the following non-GAAP financial measures to evaluate our financial results:
| • | Core adjusted EBITDA from continuing operations; |
| • | Core diluted earnings per share (“EPS”) from continuing operations; and |
| • | Free cash flow. |
These measures, the definitions of which are presented in Appendix A, are non-GAAP because they exclude certain amounts which are included in the most directly comparable measure calculated and presented in accordance with GAAP. Our non-GAAP financial measures are not meant to be considered in isolation or as a substitute for our GAAP financial measures and may not be comparable with similarly titled measures of other companies.
Core and Non-Core Results
We distinguish our core activities, those associated with our primary operations which we directly control, from non-core activities. Non-core activities are primarily nonrecurring events or events we do not directly control. Our non-core adjustments include i) restructuring costs associated with actions to reduce costs in our continuing operations primarily through workforce reductions across the Company, ii) acquisition costs primarily related to the NCR Asset Acquisition and acquisition of ecoATM, iii) compensation expense for rights to receive cash issued in conjunction with our acquisition of ecoATM and attributable to post-combination services as they are fixed amount acquisition related awards and not indicative of the directly controllable future business results, iv) income or loss from equity method investments, which represents our share of income or loss from entities we do not consolidate or control and the impact of the gain on re-measurement of our previously held equity interest in ecoATM upon acquisition, v) a gain on the grant of a license to use certain Redbox trademarks to Redbox Instant™ by Verizon, vi) benefits from release of indemnification reserves upon settlement of the Sigue Note and vii) a tax benefit related to the recognition of a worthless stock deduction in a corporate subsidiary (“Non-Core Adjustments”).
We believe investors should consider our core results because they are more indicative of our ongoing performance and trends, are more consistent with how management evaluates our operational results and trends, provide meaningful supplemental information to investors through the exclusion of certain expenses which are either non-recurring or may not be indicative of our directly controllable business operating results, allow for greater transparency in assessing our performance, help investors better analyze the results of our business and assist in forecasting future periods.
Additional information and reconciliations of the non-GAAP financial measures are included in Appendix A.
Page 2
©2014 Outerwall Inc. All Rights Reserved. These materials may not be reproduced, altered or distributed without the express written consent of Outerwall Inc.
Outerwall Inc. 2013 Fourth Quarter and Full Year Earnings
Prepared Remarks from CEO J. Scott Di Valerio and CFO Galen C. Smith
February 6, 2014
2013 Highlights: Managing Our Business for Enhanced Profitability and Free Cash Flow, Driving Value for Shareholders
2013 Consolidated Results1
A summary of Outerwall Inc.’s consolidated results for the year ended December 31, 2013, follows (in millions, except per share data):
| 2013 | 2012 | Change (%) | ||||||||||
Consolidated revenue | $ | 2,306.6 | $ | 2,199.9 | 4.9 | % | ||||||
Net income | $ | 174.8 | $ | 150.2 | 16.4 | % | ||||||
Income from continuing operations | $ | 208.1 | $ | 160.5 | 29.7 | % | ||||||
Core adjusted EBITDA from continuing operations2 | $ | 491.7 | $ | 486.2 | 1.1 | % | ||||||
Diluted EPS from continuing operations | $ | 7.33 | $ | 4.99 | 46.9 | % | ||||||
Core diluted EPS from continuing operations2 | $ | 5.92 | $ | 5.15 | 15.0 | % | ||||||
Net cash provided by operating activities | $ | 324.1 | $ | 463.9 | (30.1 | )% | ||||||
Free cash flow2 | $ | 166.4 | $ | 255.9 | (35.0 | )% | ||||||
Our achievements in 2013 include:
| • | Generating over $2.3 billion in revenue and $491.7 million in core adjusted EBITDA from continuing operations |
| • | Driving Redbox revenue of over $1.97 billion from over 775 million rentals |
| • | Surpassing $300 million in annual revenue in the Coinstar business for the first time |
| • | Completing the acquisition of ecoATM in our New Ventures segment, providing a strong growth opportunity that leverages our core competencies in scaling and managing kiosk businesses |
| • | Producing $166 million of free cash flow (FCF), including approximately $142 million in Q4 |
| • | Repurchasing approximately $195 million of our common stock, representing approximately 3.3 million shares and over 100% of FCF |
| • | Enhancing our company’s capital structure, enabling us to move toward our target net leverage ratio3 of 1.75x to 2.25x. We accomplished this by raising $350 million through an offering of senior unsecured notes in March, and additional debt capacity of $350 million in December, which included a $200 million term loan and an additional $150 million of capacity under the revolving line of credit |
2013 results reflect several factors related to Q4 including:
| • | A reduction in expected bonus of approximately $3.3 million; |
| 1 | The year over year comparisons we make will be 2013 versus 2012 and the quarter over quarter comparisons will be Q4 2013 versus Q4 2012 |
| 2 | Additional information and reconciliations of non-GAAP financial measures are included in Appendix A |
| 3 | Net leverage ratio is defined as total outstanding debt, including capital leases, less domestic cash and cash equivalents, then divided by core adjusted EBITDA from continuing operations |
Page 3
©2014 Outerwall Inc. All Rights Reserved. These materials may not be reproduced, altered or distributed without the express written consent of Outerwall Inc.
Outerwall Inc. 2013 Fourth Quarter and Full Year Earnings
Prepared Remarks from CEO J. Scott Di Valerio and CFO Galen C. Smith
February 6, 2014
| • | Approximately $7.0 million related to higher than expected benefit from the change in amortization for content costs in the Redbox business that was implemented in Q2, which is expected to reverse in Q1; and, |
| • | Approximately $2.2 million in cost reductions driven by greater efficiencies in shared services. |
In addition, the exited three New Ventures concepts were classified as discontinued operations and as a result, we recorded associated one-time impairment and restructuring charges of $29.5 million. We also recognized a one-time net tax benefit of $16.7 million associated with a worthless stock deduction.
We continue to enhance shareholder value by:
| • | Streamlining New Ventures portfolio to ensure investments provide highest risk-adjusted returns |
| • | Discontinued three concepts, Rubi™, Crisp Market™ and Star Studio™ |
| • | Underscored our commitment to invest in scaling the ecoATM business, which provides the potential for another meaningful pillar in our automated retail platform, as well as to a limited investment in our SAMPLEit™ concept based on the potential we see in the business |
| • | Realigning our businesses to drive greater profitability and FCF |
| • | Cost reduction initiatives, including a workforce reduction of 8.5% across the organization, which are expected to generate $22 million of annualized savings beginning in the first quarter of 2014 |
| • | Enhancing our capital allocation strategy, optimizing leverage and FCF to increase shareholder returns |
| • | Committed to return 75%-100% of FCF to shareholders, initially through share repurchases |
| • | Announced the Board of Directors approval of a new share repurchase authorization of $500 million, bringing the total current authorization to approximately $650 million |
| • | Announced our intent to purchase $350 million of Outerwall’s common stock through a modified “Dutch auction” tender offer |
Additional Full Year Metrics
| • | Total net interest expense was $32.8 million, up 110% year over year primarily due to interest expense associated with the Senior Unsecured Notes issued in March and losses from the early extinguishment of our Convertible Notes for the notes repurchased during the year; net interest expense included $25.3 million of cash interest expense and $5.8 million of non-cash interest expense |
Page 4
©2014 Outerwall Inc. All Rights Reserved. These materials may not be reproduced, altered or distributed without the express written consent of Outerwall Inc.
Outerwall Inc. 2013 Fourth Quarter and Full Year Earnings
Prepared Remarks from CEO J. Scott Di Valerio and CFO Galen C. Smith
February 6, 2014
| • | Effective tax rate from continuing operations was 14.2%. The lower tax rate was due to several factors, including a $16.7 million tax benefit reported in Q4 related to the recognition of a worthless stock deduction related to a corporate subsidiary; $24.3 million tax benefit related to the non-taxable gain upon the re-measurement of our previously held equity interest in ecoATM; and the discrete one-time tax benefit of $17.8 million reported in the second quarter related to the sale of a subsidiary |
| • | $24.8 million cash payment in Q4 from Sigue Corporation for full payment of the Sigue Note related to the sale of the Money Transfer Business completed in 2011 and associated interest |
| • | Ending cash and cash equivalents of $371.4 million, including $85.5 million identified for settling our payable to retailer partners in relation to our Coinstar kiosks. Of the total, $199.0 million in cash and equivalents was held in financial institutions domestically |
| • | Total outstanding debt of $766.9 million including capital leases |
| • | Net leverage ratio of 1.2x |
Q4 Consolidated Results
A summary of Outerwall Inc.’s consolidated results for Q4 follows (in millions, except per share data):
| 2013 Q4 | 2012 Q4 | Change (%) | ||||||||||
Consolidated revenue | $ | 593.7 | $ | 563.1 | 5.4 | % | ||||||
Net income | $ | 22.7 | $ | 22.9 | (0.9 | )% | ||||||
Income from continuing operations | $ | 42.9 | $ | 25.5 | 68.2 | % | ||||||
Core adjusted EBITDA from continuing operations | $ | 137.3 | $ | 105.5 | 30.1 | % | ||||||
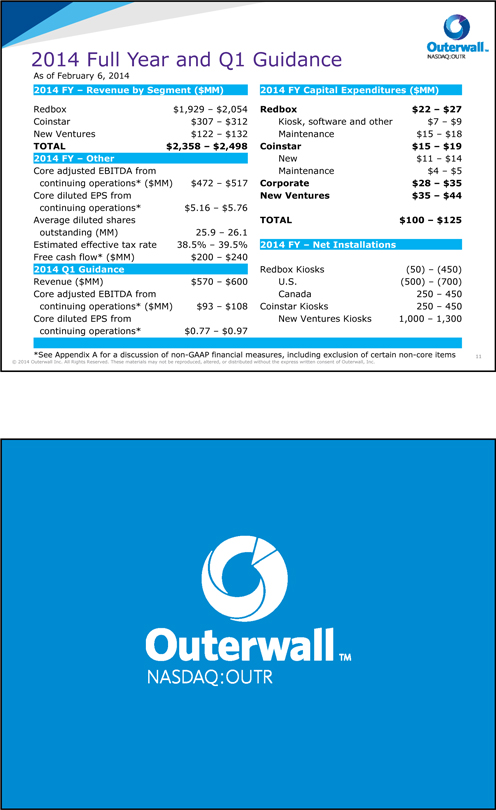
Diluted EPS from continuing operations | $ | 1.55 | $ | 0.83 | 86.7 | % | ||||||
Core diluted EPS from continuing operations | $ | 1.68 | $ | 1.01 | 66.3 | % | ||||||
Net cash provided by operating activities | $ | 191.7 | $ | 152.2 | 26.0 | % | ||||||
Free cash flow | $ | 142.6 | $ | 77.3 | 84.5 | % | ||||||
Q4 results include the impact of the factors discussed following the summary of full year results above.
Capital Returns
Consistent with our focus on delivering enhanced shareholder value and allocating capital to the highest return opportunities, we repurchased 3.3 million shares in 2013 at an average price of $58.98.
In Q4, we repurchased $100 million of Outerwall common stock through an accelerated repurchase program, representing approximately 1.5 million shares at an average price of $66.06.
Page 5
©2014 Outerwall Inc. All Rights Reserved. These materials may not be reproduced, altered or distributed without the express written consent of Outerwall Inc.
Outerwall Inc. 2013 Fourth Quarter and Full Year Earnings
Prepared Remarks from CEO J. Scott Di Valerio and CFO Galen C. Smith
February 6, 2014
During January 2014, we repurchased an additional $50 million of Outerwall common stock through a 10b5-1 plan, representing 736,000 shares at an average price of $67.93.
Given current valuations, we continue to believe share repurchases deliver a compelling capital return for excess capital. Today we announced that our Board approved an increase to our share repurchase authorization of $500 million and our intent to purchase $350 million of Outerwall’s common stock via a modified “Dutch auction” tender offer. We anticipate launching the tender February 7, 2014, at a 5-20% premium over today’s last reported sale price. The tender offer expresses our confidence in Outerwall’s business and long-term growth potential.
Capital Structure
In December, we closed on an additional $350 million of borrowing capacity under the accordion feature of our senior secured credit facility comprised of a $200 million term loan and $150 million of incremental revolver capacity. We plan to use a portion of the proceeds to fund the tender for common stock we announced today. This borrowing will enable us to move towards our target net leverage ratio.
Capital Expenditures
We discuss our CAPEX on an accrual basis rather than a cash basis; we believe this better aligns the reported CAPEX to activities during the quarter driving the expenditures. In Q4, our total investment in CAPEX was $36.6 million, bringing the total for 2013 to $140.8 million on an accrual basis.
A breakdown of CAPEX by category is included in the table that follows.
| In millions | New | Maintenance | Other | TOTAL | ||||||||||||
Redbox | $ | 4.3 | $ | 2.6 | $ | 2.1 | $ | 9.0 | ||||||||
Coinstar | 2.8 | 1.1 | — | 3.9 | ||||||||||||
New Ventures | 14.9 | — | — | 14.9 | ||||||||||||
Corporate | — | — | 8.8 | 8.8 | ||||||||||||
TOTAL | $ | 22.0 | $ | 3.7 | $ | 10.9 | $ | 36.6 | ||||||||
In Q4 Redbox continued to focus on maximizing productivity through network optimization, installing approximately 360 gross new kiosks and removing approximately 270 kiosks in the U.S. In Canada, we installed approximately 350 kiosks, bringing total active kiosks to approximately 1,100 at the end of 2013. Maintenance CAPEX included routine kiosk-related maintenance and the completion of our Vertical Merchandise Zone (VMZ) retrofit project, which included approximately 36,000 retrofitted kiosks in 2013, bringing the total to approximately 39,500. Other was primarily related to continued software development for the digital platform, operational efficiencies and marketing initiatives.
Page 6
©2014 Outerwall Inc. All Rights Reserved. These materials may not be reproduced, altered or distributed without the express written consent of Outerwall Inc.
Outerwall Inc. 2013 Fourth Quarter and Full Year Earnings
Prepared Remarks from CEO J. Scott Di Valerio and CFO Galen C. Smith
February 6, 2014
Coinstar is also focused on network optimization and completed approximately 100 net new kiosk installations. We also invested in routine maintenance to upgrade components on existing kiosks.
New Ventures CAPEX is primarily related to approximately 80 new ecoATM kiosk installations and additions related to our discontinued concepts prior to the decision to exit three concepts announced on December 10.
Corporate CAPEX includes primarily investments in software and hardware to support our business.
Redbox
Redbox Q4 Results Summary
• Revenue | $ | 496.4 million | ||
• Rentals | 192.0 million | |||
• Net revenue per rental | $ | 2.58 | ||
• Segment operating income | $ | 111.3 million | ||
• Segment operating margin | 22.4 | % | ||
• Gross margin | 58.5 | % | ||
• Unique credit cards renting in quarter | 40.3 million | |||
Redbox Strategy
We offer entertainment at a great value and have built a loyal customer base that generated over 775 million rentals in 2013, driving strong returns for our retail and studio partners. During the year, we focused on understanding our consumers’ rental cycles and providing the right level of content at their local kiosks. We continued to build out our Customer Relationship Management, or CRM platform, enabling us to more effectively track traffic and rental patterns and use that information to drive rentals through personalized recommendations. In addition, we increased the capacity and available inventory in the majority of our kiosks through the VMZ project, and will utilize this functionality to enhance our ability to provide the right inventory at the right location in 2014. We also continued to expand our Blu-ray content reaching a high of 14.2% of disc rentals this quarter.
Redbox Segment Operating Results
In Q4 Redbox revenue was $496.4 million, up 1.7%, compared with Q4 2012. During the quarter, we generated 192.0 million rentals, up 2.2% year over year, with net revenue per rental, or average check, of $2.58, a 0.4% increase from Q4 2012. Rents per kiosk grew 1.1% year over year and revenue per kiosk grew 2.1%.
Page 7
©2014 Outerwall Inc. All Rights Reserved. These materials may not be reproduced, altered or distributed without the express written consent of Outerwall Inc.
Outerwall Inc. 2013 Fourth Quarter and Full Year Earnings
Prepared Remarks from CEO J. Scott Di Valerio and CFO Galen C. Smith
February 6, 2014
November was an exceptional month and tied with December 2012 as Redbox’s second highest rental month, supported by strong content with a great variety of titles fromWhite House DowntoGrown-ups 2, despite following a weak October release schedule. The titles released in December did not perform as well as we expected. We believe December was partially pressured by a shortened holiday period due to a late Thanksgiving, which led to a lower-than-expected seasonal lift in December.
The business improved promotion efficiency throughout the quarter with CRM strategies, including utilizing Adaptive Email, which provides customized offers only to customers who are renting out of cycle, and average check increased 4.8% from Q3 2013.
Single night rentals, a key component impacting net revenue per rental, trended up consistently throughout most of 2013, putting pressure on revenue. We believe two main factors drive this trend: increased customer frequency and customer response to promotions. In Q4 2013, the percentage of single night rentals decreased 1.4 percentage points sequentially from Q3 as we utilized our CRM platform to decrease broad range discounts and focus on customers out of rental cycle.
Gross margin in Q4 2013 was 58.5%, up 4.6 percentage points from Q4 2012. During the quarter we adjusted our purchases to better align content with our revised revenue expectations, while in 2012 we bought additional content to bring back customers following the Olympics. We also received a greater than expected benefit in Q4 from lower content amortization as a result of the change we made in Q2 2013, which was approximately $7.0 million or 1.4 percentage points. This benefit is expected to reverse in Q1 as we recognize amortization on that content.
Same store sales were up 0.9% for the quarter, driven by an increase in November same store sales of 8.5% that reflected the strong slate as well as continued mix shift to Blu-ray.
Record Blu-ray Rentals and Revenue
Blu-ray reached record levels at 14.2% of disc rentals and 16.3% of revenue in Q4, up from 10.7% and 12.5% respectively in 2012. Blu-ray performance in Q4 was driven by continued growth in demand across many genres. Top-performing titles in the quarter includedWhite House Down,After Earth,The Heat, andThis is the End.Iron Man 3 andWorld War Z, which were released in the back half of September, also made strong contributions to Q4 Blu-ray rentals. Over 28% of customers who rented from us in Q4 rented a Blu-ray disc at least once.4
| 4 | Source: Redbox internal data |
Page 8
©2014 Outerwall Inc. All Rights Reserved. These materials may not be reproduced, altered or distributed without the express written consent of Outerwall Inc.
Outerwall Inc. 2013 Fourth Quarter and Full Year Earnings
Prepared Remarks from CEO J. Scott Di Valerio and CFO Galen C. Smith
February 6, 2014
Blu-ray remains an important component of our growth strategy, and we expect continued growth in this format through Blu-ray upsell, currently available online and through our mobile app. We plan to add this feature to the kiosk in 2014 to make it easy for our customers to rent and watch movies in the best format available today. Further, our efforts will be aided by increased Blu-ray device penetration—more than 72 million U.S. homes5 and 55% of Redbox customers6 now own Blu-ray compatible devices—and early success of the new Blu-ray-enabled Xbox One console is bringing Blu-ray into even more homes.
Video Games Continue to Perform Well
Video games continued to perform well in Q4, accounting for 2.7% of rentals, down slightly from 3.0% of rentals in Q4 2012, and 6.1% of revenue, down year over year by 0.7 percentage points. Redbox performance was impacted by weakness in the Wii platform and the increased number of Xbox 360 games needing multiple-discs to play. Game publishers continue to support games for PS3 and Xbox 360, but at a slower pace of new releases and with less prominent franchises compared with a year ago. In addition, publishers have shifted Wii platform support to WiiU and next generation. As the video game industry transitions to new consoles, the price of current generation consoles will drop further, enabling new, price-sensitive consumers to enter the marketplace. Redbox is a great entry point for value conscious consumers who want to try new games before they purchase them, and we will continue to offer a mix of games across different consoles.
Redbox Key Initiatives
Customer Strategy:40.3 million total credit cards rented with Redbox in Q4 representing a 1.7% year over year increase and customer frequency grew 2% versus Q4 2012. We were able to achieve these growth numbers while utilizing 25% less promotional dollars than a year ago.
Our High Frequency Renters or HFRs, which are defined as consumers who visit the kiosk at least 4 times in the quarter, represented over 25% of our total customer base in Q4. In addition, their rental frequency increased 2.5% year over year, despite lower promotional levels. This positive change in frequency led to a sequential increase of 3% in the average revenue per HFR for the quarter. We will continue to focus on opportunities to both grow this segment as well as the average revenue per HFR.
Redbox Instant™ by Verizon:Redbox Instant by Verizon continued to expand service availability in Q4, launching on Xbox One, PS3/PS4, Kindle Fire, and Windows Phone 8, delivering upon our goal to be on the devices that people want to use today. Redbox Instant continues to see increased customer acquisition levels and service engagement, with month over month increases in average time spent viewing content through streaming. In Q4, digital rentals also increased due in part to the expansion of
| 5 | Digital Entertainment Group year-end 2013 Home Entertainment Report, Jan. 7, 2014 |
| 6 | New Media Measures Q3 survey results; “Redbox customers” are those who report having rented from a Redbox kiosk in the past three months; 44% of total respondents reported owning a Blu-ray capable device |
Page 9
©2014 Outerwall Inc. All Rights Reserved. These materials may not be reproduced, altered or distributed without the express written consent of Outerwall Inc.
Outerwall Inc. 2013 Fourth Quarter and Full Year Earnings
Prepared Remarks from CEO J. Scott Di Valerio and CFO Galen C. Smith
February 6, 2014
the service to more over-the-top devices and gaming consoles. Redbox Instant continues to work with both parent companies and additional partners to promote the service via web digital, CRM, in-store, and kiosk programs, including a presence at Verizon sponsored NFL stadiums, on FiOS TV, and on Redbox kiosks.
Canada:We ended the year with nearly 1,100 installed kiosks in Canada, including approximately 350 installed in Q4. Aided awareness of the Redbox brand in Canada reached 64% in December, up from 58% in August. Redbox priorities for Canada in 2014 include customer acquisition through increased marketing and continuing to build out the kiosk network. We are concentrating installs in key geographies to create the same network effect of Rent and Return Anywhere we currently have in the U.S., which potential customers in Canada have said is one of the most compelling reasons to try Redbox.
Vertical Merchandising Zone Enhancement (VMZ):We completed the last of the VMZ retrofits in October, enabling us to provide more content to consumers longer, generating incremental rentals at roughly the same product cost. In 2014, the VMZ enhancement will allow for smarter rebalancing to ensure content is available in the right quantities at the right locations, further enhancing rental performance and improving profitability.
Coinstar
Coinstar Q4 Results Summary
• Revenue | $ | 80.7 million | ||
• Average transaction | $ | 43.82 | ||
• Same store sales growth | 5.9 | % | ||
• Segment operating income | $ | 30.8 million | ||
• Segment operating margin | 38.2 | % | ||
Coinstar Segment Operating Results
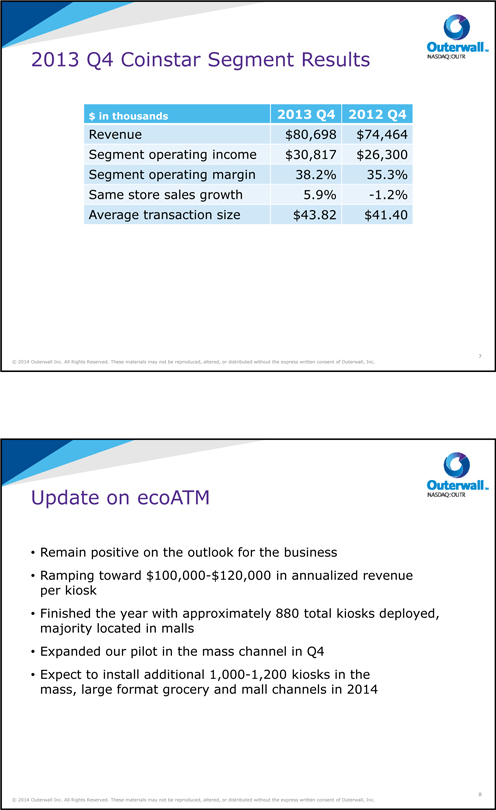
Coinstar segment revenue increased 8.4% year over year, reaching $80.7 million in Q4, and pushing Coinstar’s full year revenue above $300 million for the first time. The results reflect the price increase implemented on October 1, 2013, which raised the fee to 10.9% from 9.8% for all grocery locations in the U.S. Average transaction increased 5.8% to $43.82, while transactions were down approximately 1.1% year over year.
The installed base of kiosks ended the year at 20,900, compared with 20,300 in the previous year. The increase was primarily due to installs for TD Canada Trust, Loblaws and gift card exchange.
Page 10
©2014 Outerwall Inc. All Rights Reserved. These materials may not be reproduced, altered or distributed without the express written consent of Outerwall Inc.
Outerwall Inc. 2013 Fourth Quarter and Full Year Earnings
Prepared Remarks from CEO J. Scott Di Valerio and CFO Galen C. Smith
February 6, 2014
Same stores sales (SSS) grew 5.9% in Q4, up from (1.2)% in Q4 2012, driving SSS growth for the year to 1.4%. SSS were up primarily due to the price increase. To date, there has been no material impact to our U.S. coin volumes as a result of the price increase.
Coinstar segment operating income was $30.8 million, an increase of 17.2% over Q4 2012, and segment operating margin was 38.2%, up 2.9 percentage points year over year from 35.3%. Segment operating income increased primarily due to the U.S. price increase and cost reductions driven by efficiencies implemented across our field organization.
New Ventures
Following the shutdown of several New Ventures concepts in 2013, our focus is on scaling ecoATM, which provides consumers with the ability to instantly monetize their mobile phones, tablets and mp3 players for cash. We also will continue to make a limited investment in SAMPLEit, which is a unique concept that gives consumers an opportunity to try beauty and personal care products before they buy.
New Ventures Segment Operating Results
New Ventures reported segment revenue of $16.6 million in Q4, compared with $0.3 million in Q4 2012. The year over year increase in revenue is attributable primarily to the ecoATM business, which was acquired in July 2013. Segment operating loss was $7.4 million, compared with a loss of $3.1 million in Q4 2012, with the change reflecting investments to support growth at ecoATM.
ecoATM
We completed several key milestones for the ecoATM business in Q4 and remain enthusiastic about the outlook for the business. We finished the year with approximately 880 total kiosks deployed. The majority of our kiosks are in malls; however, in Q4 we expanded our pilot in the mass channel and believe that will be a substantial piece of our future growth. The kiosks are ramping toward the $100,000 to $120,000 in annualized revenue per kiosk that we previously shared. However, in Q4 we saw performance slightly below that level as the average sales price we received on devices declined from Q3 levels – largely due to uncertainty of locked iPhones. We deployed a software solution during the quarter that we believe will limit our exposure to these phones in the future.
We continue to invest in ecoATM, mainly in the areas of infrastructure and compliance. ecoATM has developed an industry leading process for capturing the required data to sell phones on the secondary market. This technology is a competitive advantage and as such we will continue to make significant investments in this technology, which allows us to provide law enforcement information they require and provides our consumers a safe and convenient way to trade in their device for cash.
Page 11
©2014 Outerwall Inc. All Rights Reserved. These materials may not be reproduced, altered or distributed without the express written consent of Outerwall Inc.
Outerwall Inc. 2013 Fourth Quarter and Full Year Earnings
Prepared Remarks from CEO J. Scott Di Valerio and CFO Galen C. Smith
February 6, 2014
As we look forward in Q1 we are seeing the impact of the locked iPhone challenge in Q4 settle, and average sales price return to anticipated levels. We expect to install an additional 1,000 to 1,200 kiosks in 2014 among several different channels including mass, large format grocery and mall.
Q4 Initiatives: Discontinued Operations, Restructuring, Cost Alignment
During the fourth quarter of 2013, after completing a comprehensive operational review, we decided to execute a restructuring plan intended to, among other things, better align our cost structure with revenue growth in our core businesses. As part of the restructuring plan, we discontinued three concepts, as mentioned above, which were previously included in our New Ventures operating segment.
In Q4, the loss from discontinued operations included the following expenses in connection with the restructuring:
| • | $0.9 million of severance expense; |
| • | $1.4 million related to other shut-down costs; and |
| • | Impairment expense of $27.2 million. |
We anticipate the remaining shut-down expenses to be incurred in Q1 to be approximately $0.5 million.
Also as part of the restructuring plan, we implemented actions to reduce costs in our continuing operations primarily through workforce reductions across the company. The closure of the three concepts and the workforce reductions are expected to be substantially complete by the end of the first quarter of 2014. In addition to the three concepts discontinued during the fourth quarter, we discontinued our concept Orango during the third quarter of 2013. The results of these four discontinued concepts and associated impairment and restructuring charges were recorded within loss from discontinued operations, net of tax on our income statement.
Non-Core Results
During Q4, the pre-tax loss from non-core results totaled $29.7 million, compared with a pre-tax loss of $9.3 million in Q4 2012 primarily driven by higher equity investment losses, expense associated with rights to receive cash payments issued upon the acquisition of ecoATM in 2013 and restructuring costs. We did not make a capital contribution to Redbox Instant by Verizon in Q4. Our share of the total start-up losses for the joint venture was $21.4 million for the quarter. In addition to this, we recognized a worthless stock deduction in a corporate subsidiary of $16.7 million included as a component of non-core results.
Page 12
©2014 Outerwall Inc. All Rights Reserved. These materials may not be reproduced, altered or distributed without the express written consent of Outerwall Inc.
Outerwall Inc. 2013 Fourth Quarter and Full Year Earnings
Prepared Remarks from CEO J. Scott Di Valerio and CFO Galen C. Smith
February 6, 2014
2014 Q1 Consolidated Guidance
Beginning in 2015, we plan to provide only annual guidance instead of both annual and quarterly guidance. As Redbox has matured and moved from a period of significant kiosk installs into a new phase of network optimization, results will be driven much more by the timing and type of content released as opposed to kiosk growth.
For Redbox in 2014, we remain focused on further optimizing the network, growing rentals system-wide, and maximizing profitability through content management and operational efficiencies. This will be done by repositioning underperforming kiosks to new, attractive locations, leveraging the CRM system to drive frequency and re-engage lapsed customers, and continuing to migrate consumers to Blu-ray rentals while continually refining our purchasing to ensure it is in line with consumer demand. As a result, we expect rentals and revenue per kiosk to be up year over year.
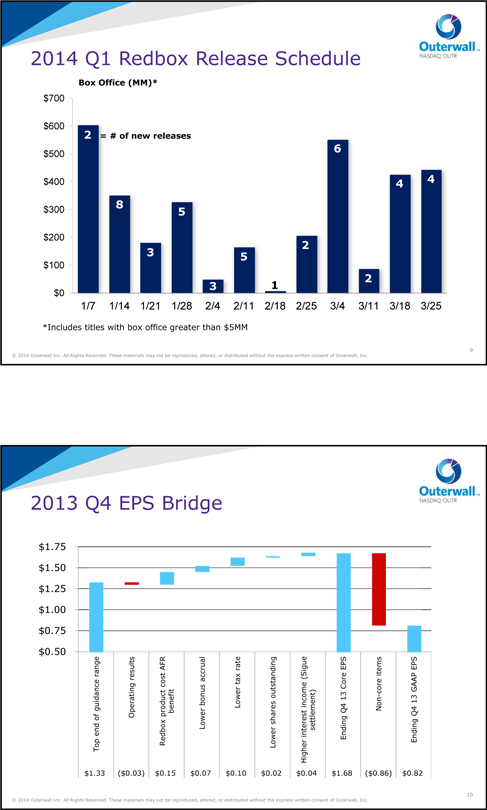
Q1 2014 has an estimated total box office of $3.4 billion, up 20% vs. last year, including 45 titles with a box office greater than or equal to $5 million, compared with 41 titles in Q1 2013. While the beginning and end of the quarter compare favorably to last year, with January and March combining for 27% more box office, we expect February box office to be 15% less than it was in 2013. The Q1 2014 schedule includes 12 titles over $100 million, one more than in 2013.
The breakdown for Redbox kiosks by month is:
| • | 18 theatrical titles in January with total box office of approximately $1.5 billion, including 6 titles, spanning four genres some of which are not as rental-friendly as others, with box office over $100 million. |
| • | 11 theatrical titles in February with total box office of approximately $430 million. Thor, the only February title over $100 million, accounts for over 45% of the expected box office for February titles. |
| • | 16 theatrical titles in March with total box office of approximately $1.5 billion, including 4 titles with box office over $100 million. Each week in March is expected to have almost $100 million combined box office and three of the four weeks are expected to have over $400 million combined box office. |
While winter months bring strong seasonality and we have an abundance of diverse product to start the quarter, there is less momentum in Q1 from December titles compared with previous years and product strength dips considerably in February, when we will have to compete with the Winter Olympics for our customer’s entertainment hours. Based on the release schedule and the competition of the Winter Olympics, we believe the impact on the quarter will be a 5 million reduction in rentals. As we head into March we expect to leverage the steady stream of compelling theatrical product and any Oscars-related
Page 13
©2014 Outerwall Inc. All Rights Reserved. These materials may not be reproduced, altered or distributed without the express written consent of Outerwall Inc.
Outerwall Inc. 2013 Fourth Quarter and Full Year Earnings
Prepared Remarks from CEO J. Scott Di Valerio and CFO Galen C. Smith
February 6, 2014
buzz to bring customers back to the kiosks. We expect Blu-ray rentals to represent approximately 14% to 15% of rentals in Q1, as we capitalize on the increase in Blu-ray player penetration and continue to build on the strong Blu-ray rental activity we achieved in Q4 2013. For 2014 we expect Blu-ray rentals to represent approximately 14% to 17% of rentals.
We expect video game rentals will represent approximately 3.0% to 4.0% of Redbox revenue in Q1, reflecting lower demand for Wii product and the continued shift to new platforms along with the growth of Blu-ray.
As previously discussed, Redbox content costs in Q1 will be negatively impacted by the unwinding of the $7.0 million amortization benefit experienced in Q4 2013. Guidance also includes the impact of the price increase taken in our Coinstar business in Q4 2013. Finally, we plan to invest in Q1 in the build-out of ecoATM which will negatively impact results in the quarter but provide a strong return for investors long-term.
2014 Q1 consolidated guidance is as follows:
| • | Consolidated revenue between $570 and $600 million |
| • | Core adjusted EBITDA from continuing operations between $93 and $108 million |
| • | Core diluted EPS from continuing operations between $0.77 and $0.97 |
2014 Full Year Consolidated Guidance
For the full year, there are several factors that will impact core adjusted EBITDA from continuing operations and core diluted EPS from continuing operations. For core adjusted EBITDA from continuing operations we expect to benefit from the restructuring changes we made in Q4 2013, which are expected to provide $22.0 million in benefit. Compensation expense, which includes a full bonus target for 2014 compared with reduced bonuses in 2013, will partially offset the savings from the discontinuation of certain New Ventures, which were included in our 2013 actuals as the costs were moved to discontinued operations, and we do not expect any additional savings in 2014. Finally, we received several one-time benefits in 2013, including an accrued liability reversal in Q1 2013 and a refined content amortization methodology in Q2 2013, which we do not expect to benefit from in 2014. In addition to these items, core diluted EPS from continuing operations will be negatively impacted by amortization of the intangibles related to the ecoATM purchase price accounting, a higher expected tax rate of 39% relative to a tax rate of 29.7% in 2013, and reduced interest income as the note receivable for Sique has been paid off. Finally, while we have included the benefit from shares repurchased in Q1 2014, we have not included the benefit from any additional share repurchases we may complete including the tender offer announced today.
Page 14
©2014 Outerwall Inc. All Rights Reserved. These materials may not be reproduced, altered or distributed without the express written consent of Outerwall Inc.
Outerwall Inc. 2013 Fourth Quarter and Full Year Earnings
Prepared Remarks from CEO J. Scott Di Valerio and CFO Galen C. Smith
February 6, 2014
We expect revenue, core adjusted EBITDA from continuing operations and core diluted EPS from continuing operations to be higher in the second half of 2014 than the first half of 2014. As noted above, several one-time items in the first half of 2013 are not expected to reoccur. Additionally, the Winter Olympics are expected to depress rentals in Q1 2014 but not have a lasting impact on the rest of the year. The second half of the year should benefit from improved revenue and profitability at Redbox, particularly in Q3, as we have adjusted the promotional strategy that was utilized in 2013. We expect ecoATM to continue to ramp throughout the year as we more than double the total number of installed kiosks that we had at the end of 2013.
For the 2014 full year we expect:
| • | Consolidated revenue between $2.358 and $2.498 billion |
| • | Core adjusted EBITDA from continuing operations between $472 and $517 million; and |
| • | Core diluted EPS from continuing operations between $5.16 and $5.76. |
For 2014 we expect capital expenditures of $100 to $125 million, including:
| • | Redbox – $22 to $27 million |
| • | Kiosk, Other – $7 to $9 million, including 250 - 450 installs in Canada |
| • | Maintenance – $15 to $18 million, which includes a one-time upgrade of our kiosks of $10 to $12 million |
| • | Coinstar – $15 to $19 million |
| • | New – $11 to $14 million for planned installs and software |
| • | Maintenance – $4 to $5 million |
| • | New Ventures – $35 to $44 million, primarily for new ecoATM installs |
| • | Corporate – $28 to $35 million |
| • | Infrastructure – $20 to $25 million |
| • | Maintenance – $8 to $10 million |
For 2014 we expect free cash flow in the range of $200 million to $240 million, which reflects our expectations for higher core adjusted EBITDA from continuing operations, flat CAPEX and higher cash taxes along with other working capital items.
We estimate an effective tax rate of 38.5% to 39.5%, which is up from 2013, and cash taxes in the range of $105 million to $115 million, including a refund from 2013 of $24 million received in January.
For the year, we expect average diluted shares in the range of 25.9 million to 26.1 million, which includes the benefit of the 736,000 shares purchased in January 2014 but does not include the benefit for any other expected share repurchases throughout 2014 including the tender offer announced today.
Page 15
©2014 Outerwall Inc. All Rights Reserved. These materials may not be reproduced, altered or distributed without the express written consent of Outerwall Inc.
Outerwall Inc. 2013 Fourth Quarter and Full Year Earnings
Prepared Remarks from CEO J. Scott Di Valerio and CFO Galen C. Smith
February 6, 2014
We expect to make a capital contribution to Redbox Instant by Verizon in the range of $10.0 million to $11.0 million in Q1.
We have provided a summary of 2014 full year and Q1 guidance in Appendix B.
Summary
Outerwall delivered a strong finish in 2013, with results that underscore the value of our core brands, as Redbox alone generated over $1.97 billion in revenue from over 775 million rentals and Coinstar surpassed $300 million in annual revenue for the first time in its history. Additionally in 2013 we completed the acquisition of ecoATM, adding a compelling opportunity to our automated retail portfolio. As we move into 2014, we have selected a new leader for Redbox, and transitioned two high caliber senior executives to lead Coinstar and ecoATM – and all of them share our commitment to drive value creation as they manage the businesses.
We also continue to execute on our commitment to optimize our capital allocation strategy to increase shareholder returns. In 2013 we repurchased approximately 3.3 million shares and today announced our intent to repurchase $350 million of our common stock via a modified “Dutch auction” tender offer.
All of our announcements today reflect our confidence in Outerwall’s business and long-term growth potential and our ability to continue driving value creation for our customers, partners, employees, and shareholders.
Page 16
©2014 Outerwall Inc. All Rights Reserved. These materials may not be reproduced, altered or distributed without the express written consent of Outerwall Inc.
Outerwall Inc. 2013 Fourth Quarter and Full Year Earnings
Prepared Remarks from CEO J. Scott Di Valerio and CFO Galen C. Smith
February 6, 2014
APPENDIX A
Use of Non-GAAP Financial Measures
Non-GAAP measures may be provided as a complement to results provided in accordance with United States generally accepted accounting principles (“GAAP”).
We use the following non-GAAP financial measures to evaluate our financial results:
| • | Core adjusted EBITDA from continuing operations; |
| • | Core diluted earnings per share (“EPS”) from continuing operations; and |
| • | Free cash flow. |
These measures, the definitions of which are presented below, are non-GAAP because they exclude certain amounts which are included in the most directly comparable measure calculated and presented in accordance with GAAP. Our non-GAAP financial measures are not meant to be considered in isolation or as a substitute for our GAAP financial measures and may not be comparable with similarly titled measures of other companies.
Core and Non-Core Results
We distinguish our core activities, those associated with our primary operations which we directly control, from non-core activities. Non-core activities are primarily nonrecurring events or events we do not directly control. Our non-core adjustments include i) restructuring costs associated with actions to reduce costs in our continuing operations primarily through workforce reductions across the Company, ii) acquisition costs primarily related to the NCR Asset Acquisition and acquisition of ecoATM, iii) compensation expense for rights to receive cash issued in conjunction with our acquisition of ecoATM and attributable to post-combination services as they are fixed amount acquisition related awards and not indicative of the directly controllable future business results, iv) income or loss from equity method investments, which represents our share of income or loss from entities we do not consolidate or control and the impact of the gain on re-measurement of our previously held equity interest in ecoATM upon acquisition, v) a gain on the grant of a license to use certain Redbox trademarks to Redbox Instant™ by Verizon, vi) benefits from release of indemnification reserves upon settlement of the Sigue Note and vii) a tax benefit related to the recognition of a worthless stock deduction in a corporate subsidiary (“Non-Core Adjustments”).
We believe investors should consider our core results because they are more indicative of our ongoing performance and trends, are more consistent with how management evaluates our operational results and trends, provide meaningful supplemental information to investors through the exclusion of certain expenses which are either non-recurring or may not be indicative of our directly controllable business operating results, allow for greater transparency in assessing our performance, help investors better analyze the results of our business and assist in forecasting future periods.
Page 17
©2014 Outerwall Inc. All Rights Reserved. These materials may not be reproduced, altered or distributed without the express written consent of Outerwall Inc.
Outerwall Inc. 2013 Fourth Quarter and Full Year Earnings
Prepared Remarks from CEO J. Scott Di Valerio and CFO Galen C. Smith
February 6, 2014
Core Adjusted EBITDA from continuing operations
Our non-GAAP financial measure core adjusted EBITDA from continuing operations is defined as earnings from continuing operations before depreciation, amortization and other; interest expense, net; income taxes; share-based payments expense; and Non-Core Adjustments.
A reconciliation of core adjusted EBITDA from continuing operations to net income from continuing operations, the most comparable GAAP financial measure, is presented in the following table:
| Three Months Ended | Twelve Months Ended | |||||||||||||||
| December 31, | December 31, | |||||||||||||||
| Dollars in thousands | 2013 | 2012 | 2013 | 2012 | ||||||||||||
Income from continuing operations | $ | 42,876 | $ | 25,535 | $ | 208,091 | $ | 160,452 | ||||||||
Depreciation, amortization and other | 52,853 | 47,496 | 203,094 | 184,405 | ||||||||||||
Interest expense, net | 6,848 | 4,615 | 32,801 | 15,648 | ||||||||||||
Income tax benefit (expense) | (289 | ) | 12,404 | 34,477 | 97,941 | |||||||||||
Share-based payments expense(1) | 5,377 | 6,218 | 16,831 | 19,362 | ||||||||||||
|
|
|
|
|
|
|
| |||||||||
Adjusted EBITDA from continuing operations | 107,665 | 96,268 | 495,294 | 477,808 | ||||||||||||
Non-Core Adjustments: | ||||||||||||||||
Restructuring costs | 4,495 | — | 4,495 | — | ||||||||||||
Acquisition costs | — | — | 5,669 | 3,235 | ||||||||||||
Rights to receive cash issued in connection with the acquisition of ecoATM | 6,364 | — | 8,664 | — | ||||||||||||
Loss from equity method investments | 21,352 | 9,278 | 48,448 | 24,684 | ||||||||||||
Sigue indemnification reserve releases | (2,542 | ) | — | (2,542 | ) | — | ||||||||||
Gain on previously held equity interest on ecoATM | — | — | (68,376 | ) | — | |||||||||||
Gain on formation of Redbox Instant by Verizon | — | — | — | (19,500 | ) | |||||||||||
|
|
|
|
|
|
|
| |||||||||
Core adjusted EBITDA from continuing operations | $ | 137,334 | $ | 105,546 | $ | 491,652 | $ | 486,227 | ||||||||
|
|
|
|
|
|
|
| |||||||||
| (1) | Includes both non-cash share-based compensation for executives, non-employee directors and employees as well as share-based payments for content arrangements. |
Page 18
©2014 Outerwall Inc. All Rights Reserved. These materials may not be reproduced, altered or distributed without the express written consent of Outerwall Inc.
Outerwall Inc. 2013 Fourth Quarter and Full Year Earnings
Prepared Remarks from CEO J. Scott Di Valerio and CFO Galen C. Smith
February 6, 2014
Core Diluted EPS from continuing operations
Our non-GAAP financial measure core diluted EPS from continuing operations is defined as diluted earnings per share from continuing operations excluding Non-Core Adjustments, net of applicable taxes.
A reconciliation of core diluted EPS from continuing operation to diluted EPS from continuing operations, the most comparable GAAP financial measure, is presented in the following table:
| Three Months Ended | Twelve Months Ended | |||||||||||||||
| December 31, | December 31, | |||||||||||||||
| 2013 | 2012 | 2013 | 2012 | |||||||||||||
Diluted EPS from continuing operations | $ | 1.55 | $ | 0.83 | $ | 7.33 | $ | 4.99 | ||||||||
Non-Core Adjustments, net of tax:(1) | ||||||||||||||||
Restructuring costs | 0.10 | — | 0.10 | — | ||||||||||||
Acquisition costs | 0.02 | — | 0.17 | 0.06 | ||||||||||||
Rights to receive cash issued in connection with the acquisition of ecoATM | 0.20 | — | 0.25 | — | ||||||||||||
Loss from equity method investments | 0.47 | 0.18 | 1.04 | 0.47 | ||||||||||||
Sigue indemnification reserve releases | (0.06 | ) | — | (0.05 | ) | — | ||||||||||
Gain on previously held equity interest on ecoATM | — | — | (2.33 | ) | — | |||||||||||
Gain on formation of Redbox Instant by Verizon | — | — | — | (0.37 | ) | |||||||||||
Tax benefit of worthless stock deduction | (0.60 | ) | — | (0.59 | ) | — | ||||||||||
|
|
|
|
|
|
|
| |||||||||
Core diluted EPS from continuing operations | $ | 1.68 | $ | 1.01 | $ | 5.92 | $ | 5.15 | ||||||||
|
|
|
|
|
|
|
| |||||||||
| (1) | Non-Core Adjustments are presented after-tax using the applicable effective tax rate for the respective periods. |
Free Cash Flow
Our non-GAAP financial measure free cash flow is defined as net cash provided by operating activities after capital expenditures. We believe free cash flow is an important non-GAAP measure as it provides additional information to users of the financial statements regarding our ability to service, incur or pay down indebtedness and repurchase our securities.
A reconciliation of free cash flow to net cash provided by operating activities, the most comparable GAAP financial measure, is presented in the following table:
| Three Months Ended | Twelve Months Ended | |||||||||||||||
| December 31, | December 31, | |||||||||||||||
| Dollars in thousands | 2013 | 2012 | 2013 | 2012 | ||||||||||||
Net cash provided by operating activities | $ | 191,700 | $ | 152,212 | $ | 324,091 | $ | 463,906 | ||||||||
Purchase of property and equipment | (49,053 | ) | (74,873 | ) | (157,669 | ) | (208,054 | ) | ||||||||
|
|
|
|
|
|
|
| |||||||||
Free cash flow | $ | 142,647 | $ | 77,339 | $ | 166,422 | $ | 255,852 | ||||||||
|
|
|
|
|
|
|
| |||||||||
Page 19
©2014 Outerwall Inc. All Rights Reserved. These materials may not be reproduced, altered or distributed without the express written consent of Outerwall Inc.
NASDAQ:OUTR
Appendix B
2013 Q4 Prepared Remarks
February 6, 2014
Safe Harbor for Forward-Looking Statements
Various remarks that we may make about future expectations, plans and prospects for thecompany constitute forward-looking statements for purposes of thesafe harbor provisions under the Private Securities Litigation Reform Act of 1995. Actual results may differ materially from those indicated by these forward-looking statements as a result of various factors, including those discussed in our most recent Annual Report on Form 10-K and subsequent Quarterly Reports on Form 10-Q filed with the Securities and Exchange Commission. Outerwall Inc. assumes no obligation and does not intend to update these forward-looking statements.
Reconciliation of GAAP and Non-GAAP Financial Measures
This presentation contains references to both GAAP and non-GAAP financial measures. Reconciliations between GAAP and non-GAAP financial measures and definitions of non-GAAP financial measures are available in Appendix A to the 2013 Q4 and Full Year prepared remarks and in the fourth quarter and full year earnings press release dated February 6, 2014, which is posted on the Investor Relations section of Outerwall’s website at ir.outerwall.com.
© 2014 Outerwall Inc. All Rights Reserved. These materials may not be reproduced, altered, or distributed without the express written consent of Outerwall, Inc.
2
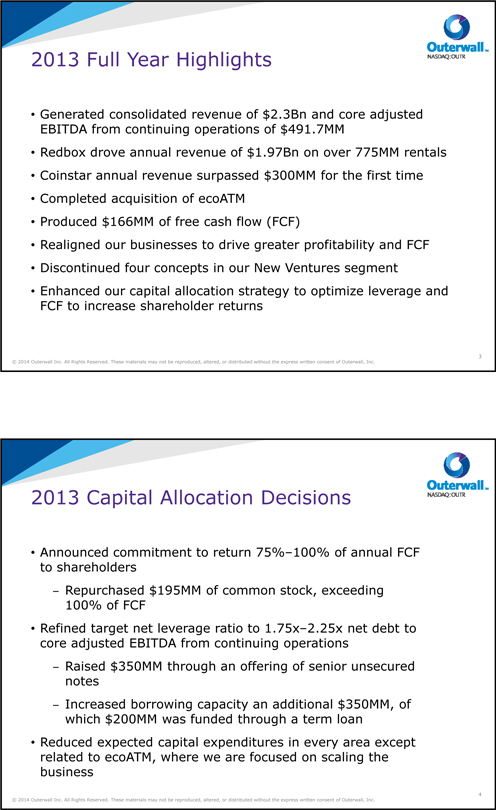
2013 Full Year Highlights
Generated consolidated revenue of $2.3Bn and core adjusted EBITDA from continuing operations of $491.7MM
Redbox drove annual revenue of $1.97Bn on over 775MM rentals
Coinstar annual revenue surpassed $300MM for the first time
Completed acquisition of ecoATM
Produced $166MM of free cash flow (FCF)
Realigned our businesses to drive greater profitability and FCF
Discontinued four concepts in our New Ventures segment
Enhanced our capital allocation strategy to optimize leverage and FCF to increase shareholder returns
© 2014 Outerwall Inc. All Rights Reserved. These materials may not be reproduced, altered, or distributed without the express written consent of Outerwall, Inc.
3
2013 Capital Allocation Decisions
Announced commitment to return 75%–100% of annual FCF to shareholders
Repurchased $195MM of common stock, exceeding 100% of FCF
Refined target net leverage ratio to 1.75x–2.25x net debt to core adjusted EBITDA from continuing operations
Raised $350MM through an offering of senior unsecured notes
Increased borrowing capacity an additional $350MM, of which $200MM was funded through a term loan
Reduced expected capital expenditures in every area except related to ecoATM, where we are focused on scaling the business
© 2014 Outerwall Inc. All Rights Reserved. These materials may not be reproduced, altered, or distributed without the express written consent of Outerwall, Inc.
4
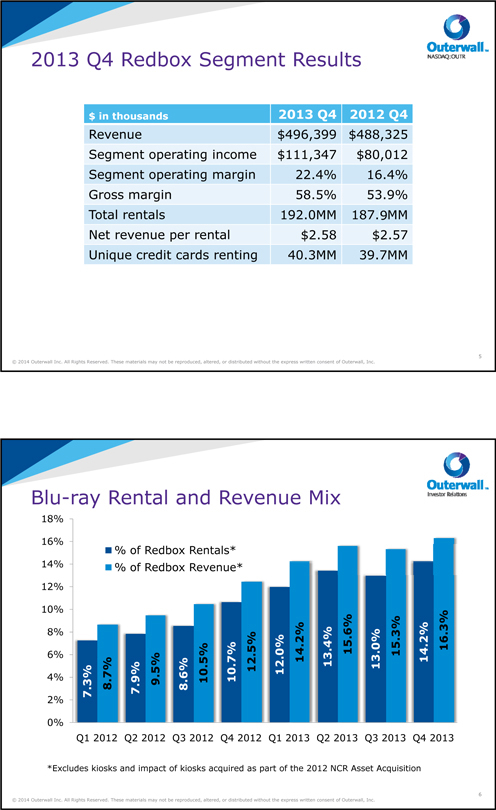
2013 Q4 Redbox Segment Results
$ in thousands 2013 Q4 2012 Q4
Revenue $496,399 $488,325
Segment operating income $111,347 $80,012
Segment operating margin 22.4% 16.4%
Gross margin 58.5% 53.9%
Total rentals 192.0MM 187.9MM
Net revenue per rental $2.58 $2.57
Unique credit cards renting 40.3MM 39.7MM
© 2014 Outerwall Inc. All Rights Reserved. These materials may not be reproduced, altered, or distributed without the express written consent of Outerwall, Inc.
5
Blu-ray Rental and Revenue Mix
18%
16%
% of Redbox Rentals*
14%% of Redbox Revenue*
12%
10%
8%
6%
4% 7.3% 8.7% 7.9% 9.5% 8.6% 10.5% 10.7% 12.5% 12.0% 14.2% 13.4% 15.6% 13.0% 15.3% 14.2% 16.3%
2%
0%
Q1 2012 Q2 2012 Q3 2012 Q4 2012 Q1 2013 Q2 2013 Q3 2013 Q4 2013
*Excludes kiosks and impact of kiosks acquired as part of the 2012 NCR Asset Acquisition
© 2014 Outerwall Inc. All Rights Reserved. These materials may not be reproduced, altered, or distributed without the express written consent of Outerwall, Inc.
6
2013 Q4 Coinstar Segment Results
$ in thousands 2013 Q4 2012 Q4
Revenue $80,698 $74,464
Segment operating income $30,817 $26,300
Segment operating margin 38.2% 35.3%
Same store sales growth 5.9% -1.2%
Average transaction size $43.82 $41.40
© 2014 Outerwall Inc. All Rights Reserved. These materials may not be reproduced, altered, or distributed without the express written consent of Outerwall, Inc.
7
Update on ecoATM
Remain positive on the outlook for the business
Ramping toward $100,000-$120,000 in annualized revenue per kiosk
Finished the year with approximately 880 total kiosks deployed, majority located in malls
Expanded our pilot in the mass channel in Q4
Expect to install additional 1,000-1,200 kiosks in the mass, large format grocery and mall channels in 2014
© 2014 Outerwall Inc. All Rights Reserved. These materials may not be reproduced, altered, or distributed without the express written consent of Outerwall, Inc.
8
2014 Q1 Redbox Release Schedule
Box Office (MM)*
$700
$600
2 = # of new releases
$500 6
$400 4
4
$300 8 5
$200
2
$100 3 5
$0 3 1 2
1/7 1/14 1/21 1/28 2/4 2/11 2/18 2/25 3/4 3/11 3/18 3/25
*Includes titles with box office greater than $5MM
© 2014 Outerwall Inc. All Rights Reserved. These materials may not be reproduced, altered, or distributed without the express written consent of Outerwall, Inc.
9
2013 Q4 EPS Bridge
$ 1.75
$ 1.50
$ 1.25
$ 1.00
$ 0.75
$ 0.50
range results cost AFR accrual tax rate(Sigue Core EPS items EPS
outstanding 13-13
guidance Operating product benefit bonus Lower income settlement) Non core GAAP
Q4 Q4
end of Redbox Lower Lower shares interest Ending Ending
Top Higher
$ 1.33($0.03) $0.15 $0.07 $0.10 $0.02 $0.04 $1.68($0.86) $0.82
© 2014 Outerwall Inc. All Rights Reserved. These materials may not be reproduced, altered, or distributed without the express written consent of Outerwall, Inc.
10
2014 Full Year and Q1 Guidance
As of February 6, 2014
2014 FY – Revenue by Segment ($MM) 2014 FY Capital Expenditures ($MM)
Redbox $1,929 – $2,054 Redbox $22 – $27
Coinstar $307 – $312 Kiosk, software and other $7 – $9
New Ventures $122 – $132 Maintenance $15 – $18
TOTAL $2,358 – $2,498 Coinstar $15 – $19
2014 FY – Other New $11 – $14
Core adjusted EBITDA from Maintenance $4 – $5
continuing operations* ($MM) $472 – $517 Corporate $28 – $35
Core diluted EPS from New Ventures $35 – $44
continuing operations* $5.16 – $5.76
Average diluted shares TOTAL $100 – $125
outstanding (MM) 25.9 – 26.1
Estimated effective tax rate 38.5% – 39.5% 2014 FY – Net Installations
Free cash flow* ($MM) $200 – $240
2014 Q1 Guidance Redbox Kiosks(50) – (450)
Revenue ($MM) $570 – $600 U.S.(500) – (700)
Core adjusted EBITDA from Canada 250 – 450
continuing operations* ($MM) $93 – $108 Coinstar Kiosks 250 – 450
Core diluted EPS from New Ventures Kiosks 1,000 – 1,300
continuing operations* $0.77 – $0.97
*See Appendix A for a discussion of non-GAAP financial measures, including exclusion of certain non-core items
© 2014 Outerwall Inc. All Rights Reserved. These materials may not be reproduced, altered, or distributed without the express written consent of Outerwall, Inc.
11