Exhibit 99.2

Outerwall Inc. 2014 Third Quarter Earnings
Prepared Remarks
October 30, 2014
Today, October 30, 2014, Outerwall Inc. issued a press release announcing financial results for the third quarter of 2014. The following prepared remarks provide additional information related to the company’s 2014 third quarter operating and financial performance as well as 2014 fourth quarter and full year guidance. The prepared remarks also include supplementary slides.
The company will host a conference call today at 2:30 p.m. PDT to discuss 2014 third quarter results and 2014 fourth quarter and full year guidance.
The 2014 third quarter earnings press release, prepared remarks and conference call webcast are available on the Investor Relations section of Outerwall’s website at ir.outerwall.com.
Safe Harbor for Forward-Looking Statements
Certain statements in these prepared remarks are “forward-looking statements” within the meaning of the Private Securities Litigation Reform Act of 1995. The words “believe,” “estimate,” “expect,” “intend,” “will,” “anticipate,” “goals,” variations of such words, and similar expressions identify forward-looking statements, but their absence does not mean that the statement is not forward-looking. The forward-looking statements in this release include statements regarding Outerwall Inc.’s anticipated growth and future operating results, including 2014 fourth quarter and full year results. Forward-looking statements are not guarantees of future performance and actual results may vary materially from the results expressed or implied in such statements. Differences may result from actions taken by Outerwall Inc. or its subsidiaries, as well as from risks and uncertainties beyond Outerwall Inc.’s control. Such risks and uncertainties include, but are not limited to,
| | • | | competition from other entertainment providers, |
| | • | | the ability to achieve the strategic and financial objectives for our entry into new businesses, including ecoATM, SAMPLEit and Redbox Instant™ by Verizon, |
| | • | | our ability to repurchase stock and the availability of an open trading window, |
| | • | | the termination, non-renewal or renegotiation on materially adverse terms of our contracts with our significant retailers and suppliers, |
| | • | | payment of increased fees to retailers, suppliers and other third-party providers, including financial service providers, |
| | • | | the timing of new DVD releases and the inability to receive delivery of DVDs on the date of their initial release to the general public, or shortly thereafter, or in sufficient quantity, for home entertainment viewing, |
| | • | | the effective management of our content library, |
| | • | | the timing of the release slate and the relative attractiveness of titles in a particular quarter or year, |
| | • | | the ability to attract new retailers, penetrate new markets and distribution channels and react to changing consumer demands, |
| | • | | the ability to generate sufficient cash flow to timely and fully service indebtedness and adhere to certain covenants and restrictions, |
| | • | | the ability to adequately protect our intellectual property, and |
| | • | | the application of substantial federal, state, local and foreign laws and regulations specific to our business. |
The foregoing list of risks and uncertainties is illustrative, but by no means exhaustive. For more information on factors that may affect future performance, please review “Risk Factors” described in our most recent Annual Report on Form 10-K and any subsequent Quarterly Reports on Form 10-Q filed with the Securities and Exchange Commission. These forward-looking statements reflect Outerwall Inc.’s expectations as of the date of these prepared remarks. Outerwall Inc. undertakes no obligation to update the information provided herein.
©2014 Outerwall Inc. All Rights Reserved. These materials may not be reproduced, altered or distributed without the express written consent of Outerwall Inc.
| | |
Outerwall Inc. 2014 Third Quarter Earnings Prepared Remarks October 30, 2014 | | |
Non-GAAP Financial Measures
Non-GAAP measures may be provided as a complement to results provided in accordance with United States generally accepted accounting principles (“GAAP”).
We use the following non-GAAP financial measures to evaluate our financial results:
| | • | | Core adjusted EBITDA from continuing operations; |
| | • | | Core diluted earnings per share (“EPS”) from continuing operations; |
| | • | | Net debt and net leverage ratio. |
These measures, the definitions of which are presented in Appendix A, are non-GAAP because they exclude certain amounts which are included in the most directly comparable measure calculated and presented in accordance with GAAP. Our non-GAAP financial measures are not meant to be considered in isolation or as a substitute for our GAAP financial measures and may not be comparable with similarly titled measures of other companies.
Core and Non-Core Results
We distinguish our core activities, those associated with our primary operations which we directly control, fromnon-core activities. Non-core activities are primarily nonrecurring events or events we do not directly control. Ournon-core adjustments for the periods presented include i) restructuring costs associated with actions to reduce costs in our continuing operations primarily through workforce reductions across the Company, ii) acquisition costs primarily related to the acquisition of ecoATM, iii) compensation expense for rights to receive cash issued in conjunction with our acquisition of ecoATM and attributable to post-combination services as they are fixed amount acquisition related awards and not indicative of the directly controllable future business results, iv) income or loss from equity method investments, which represents our share of income or loss from entities we do not consolidate or control and includes the impacts of the gain on re-measurement of our previously held equity interest in ecoATM upon acquisition, and v) tax benefits related to a net operating loss adjustment and the recognition of a worthless stock deduction in a corporate subsidiary (“Non-Core Adjustments”).
We believe investors should consider our core results because they are more indicative of our ongoing performance and trends, are more consistent with how management evaluates our operational results and trends, provide meaningful supplemental information to investors through the exclusion of certain expenses which are either nonrecurring or may not be indicative of our directly controllable business operating results, allow for greater transparency in assessing our performance, help investors better analyze the results of our business and assist in forecasting future periods.
Page 2
©2014 Outerwall Inc. All Rights Reserved. These materials may not be reproduced, altered or distributed without the express written consent of Outerwall Inc.
| | |
Outerwall Inc. 2014 Third Quarter Earnings Prepared Remarks October 30, 2014 | | |
Q3 2014 CONSOLIDATED RESULTS
Highlights1
For year-over-year comparisons of Q3 2014 GAAP results, note that in Q3 2013 we completed the acquisition of ecoATM, and, as a result, recognized a pretax gain on there-measurement of our previously held 23% equity interest in ecoATM. This non-core item benefitted Q3 2013 income from continuing operations in the amount of $68.4 million and Q3 2013 diluted EPS from continuing operations by $2.36.
| | | | | | | | | | | | |
(In millions, except per share data) | | Q3 2014 | | | Q3 2013 | | | Change (%) | |
GAAP Results | | | | | | | | | | | | |
Consolidated revenue | | $ | 552.9 | | | $ | 586.5 | | | | (5.7 | )% |
Income from continuing operations | | $ | 17.9 | | | $ | 86.8 | | | | (79.4 | )% |
Net income | | $ | 17.9 | | | $ | 82.7 | | | | (78.4 | )% |
Diluted EPS from continuing operations | | $ | 0.93 | | | $ | 3.10 | | | | (70.0 | )% |
Net cash provided by operating activities | | $ | 49.6 | | | $ | 60.9 | | | | (18.6 | )% |
Core Results2 | | | | | | | | | | | | |
Core adjusted EBITDA from continuing operations | | $ | 111.6 | | | $ | 114.3 | | | | (2.3 | )% |
Core diluted EPS from continuing operations | | $ | 1.44 | | | $ | 1.12 | | | | 28.6 | % |
Free cash flow | | $ | 30.3 | | | $ | 21.8 | | | | 38.9 | % |
Highlights from Q3 2014 include:
| | • | | Managed the business for profitability as demonstrated by solid core adjusted EBITDA from continuing operations despite lower revenue that was driven primarily by soft flow-through from the second quarter of 2014 and the unfavorable timing of releases in the third quarter of 2014 |
| | • | | Consolidated general and administrative (G&A) expense improved 21.6% compared with Q3 2013 as a result of our ongoing focus on expense management initiatives in our shared services organization and across all lines of business |
| | • | | Increased segment operating margins in Redbox and Coinstar businesses both year-over-year and sequentially |
| | • | | Extended the existing content agreement with Universal and recently signed a new content agreement with Lionsgate |
| | • | | Installed more than 530 net new ecoATM™ kiosks during the quarter, bringing total ecoATM kiosks to 1,510 at September 30, 2014; signed several new ecoATM installation agreements with retail partners |
| | • | | Generated $30.3 million in free cash flow, bringing the year-to-date total to $134.7 million |
| | • | | Repurchased approximately 1.2 million shares of our common stock for $70.6 million |
| | • | | Settled all outstanding conversions and made the final principal and interest payments on our 4% Senior Convertible Notes that matured on September 2, 2014 |
G&A expenses in Q3 2014 also reflect a shift in the timing of expenses as certain initiatives and new hires moved from Q3 to Q4.
| 1 | Year-over-year comparisons are Q3 2014 versus Q3 2013 unless we note otherwise |
| 2 | Additional information on core and non-core results and reconciliations of non-GAAP financial measures are included in Appendix A |
Page 3
©2014 Outerwall Inc. All Rights Reserved. These materials may not be reproduced, altered or distributed without the express written consent of Outerwall Inc.
| | |
Outerwall Inc. 2014 Third Quarter Earnings Prepared Remarks October 30, 2014 | | |
Update on Redbox Instant™ by Verizon
On October 22, 2014, the company announced that Redbox withdrew as a member of the Redbox Instant by Verizon joint venture (JV). As part of the withdrawal agreement, we received a cash payment of $16.8 million and will make no further capital contributions to wind down the business. As a result, inclusive of the $16.8 million, over the course of the JV, we received $70.5 million in cash from payments for services and kiosk nights while investing $77.0 million in capital contributions, including $14.0 million in Q3 2014. In addition, we realized approximately $29.9 million in cash tax savings through deductions related to our share of the JV’s losses over the course of the venture. We do not expect a material net financial impact as a result of settling all outstanding amounts related to the JV, including expense reimbursements, in Q4 2014.
Additional Q3 Consolidated Metrics
| | | | | | |
Metric | | Amount | | | Comment |
Total net interest expense | | $ | 12.5MM | | | Includes $0.9MM in noncash interest expense |
| | |
Core effective tax rate | | | 37.7% | | | |
| | |
Cash and cash equivalents | | $ | 184.9MM | | | Includes $71.7MM payable to retailer partners; additionally, $26.0MM of total cash was held in financial institutions domestically |
| | |
Total principal value of outstanding debt, including capital leases | | $ | 1.03Bn | | | |
| | |
Net leverage ratio3 | | | 2.10x | | | Target range of 1.75x – 2.25x |
Capital Structure
On September 2, 2014, the company’s remaining outstanding 4.0% Convertible Senior Notes (Convertible Notes) matured. During Q3, we settled all outstanding conversions and made the final principal and interest payments on our Convertible Notes for a total of $33.4 million in cash and 248,944 shares.
| 3 | Our non-GAAP financial measure net leverage ratio is defined as net debt divided by core adjusted EBITDA from continuing operations for the last twelve months. Additional information and reconciliations of non-GAAP financial measures are included in Appendix A |
Page 4
©2014 Outerwall Inc. All Rights Reserved. These materials may not be reproduced, altered or distributed without the express written consent of Outerwall Inc.
| | |
Outerwall Inc. 2014 Third Quarter Earnings Prepared Remarks October 30, 2014 | | |
Capital Allocation
During Q3, we repurchased approximately 1.2 million shares of our common stock at an average price of $59.52. At September 30, 2014, there was approximately $162.9 million remaining under the company’s stock repurchase authorization.
We remain committed to returning 75%-100% of free cash flow to shareholders. Year-to-date through September 30, 2014, we returned $191.4 million to shareholders through share repurchases, not including $350 million purchased as part of the tender offer earlier this year. Given current valuations and our confidence in the business, we believe that share repurchases continue to provide a compelling capital return. We are focused on directing capital to what we believe will produce the highest returns, including investing in the business.
Capital Expenditures
We discuss our capital expenditures (CAPEX) on an accrual basis as we believe this methodology better aligns the reported CAPEX to activities during the quarter driving the expenditures. In Q3, our total investment in CAPEX was $23.5 million, bringing the year-to-date total to $71.5 million. The following is a breakdown of CAPEX by category for Q3:
| | | | | | | | | | | | | | | | |
(In millions) | | New | | | Maintenance | | | Other | | | Q3 TOTAL | |
Redbox | | $ | 0.7 | | | $ | 0.8 | | | $ | — | | | $ | 1.5 | |
Coinstar | | | 4.5 | | | | 1.2 | | | | — | | | | 5.7 | |
New Ventures | | | 13.5 | | | | — | | | | — | | | | 13.5 | |
Corporate | | | — | | | | — | | | | 2.8 | | | | 2.8 | |
Q3 TOTAL | | $ | 18.7 | | | $ | 2.0 | | | $ | 2.8 | | | $ | 23.5 | |
CAPEX investments in Q3 included:
| | • | | Redbox maintenance CAPEX that was lower than recent quarters as significant routine maintenance was conducted in Q1 and Q2 during implementation of a one-time system upgrade throughout the entire kiosk network |
| | • | | Coinstar investments in Coinstar™ Exchange kiosks planned for deployment in Q4 2014 |
| | • | | New Ventures investments in ecoATM kiosks installed in Q3 and planned for deployment in Q4 2014 |
Page 5
©2014 Outerwall Inc. All Rights Reserved. These materials may not be reproduced, altered or distributed without the express written consent of Outerwall Inc.
| | |
Outerwall Inc. 2014 Third Quarter Earnings Prepared Remarks October 30, 2014 | | |
Q3 2014 SEGMENT OPERATING RESULTS
Redbox
Q3 Key Metrics
| | | | | | | | |
Category | | Q3 2014 | | | Q3 2013 | |
Revenue | | $ | 438.0MM | | | $ | 491.7MM | |
Rentals | | | 172.2MM | | | | 199.5MM | |
Net revenue per rental | | $ | 2.54 | | | $ | 2.46 | |
Same store sales growth (decline) | | | (11.8 | )% | | | 2.1 | % |
Gross margin | | | 56.8 | % | | | 57.1 | % |
Segment operating income | | $ | 85.7MM | | | $ | 91.0MM | |
Segment operating margin | | | 19.6 | % | | | 18.5 | % |
Unique credit cards renting in quarter | | | 38.7MM | | | | 42.0MM | |
Total kiosks (at quarter end) | | | 43,790 | | | | 43,600 | |
U.S. kiosks | | | 42,400 | | | | 42,860 | |
Canada kiosks | | | 1,390 | | | | 740 | |
Total locations (at quarter end) | | | 36,210 | | | | 36,000 | |
U.S. locations | | | 34,820 | | | | 35,260 | |
Canada locations | | | 1,390 | | | | 740 | |
Blu-ray | | | | | | | | |
Blu-ray as percentage of rentals | | | 15.1 | % | | | 13.0 | % |
Blu-ray as percentage of Redbox revenue | | | 17.6 | % | | | 15.3 | % |
Redbox Segment Operating Results
Redbox results in Q3 2014 reflect our focus on cost management to offset lower revenue driven primarily by weaker content year-over-year. While Q3 2014 total box office was approximately 8% higher than Q3 2013, if the releases on the last day of the quarter are excluded, Q3 box office would have declined by approximately 3%. As we expected, rentals also were impacted by soft flow-through from Q2 2014 releases and an unfavorable mix of content. As noted in our Q2 2014 prepared remarks, June 2014 had an 83% lower box office and nine fewer titles than June 2013, resulting in 46% fewer rentals of June titles during Q3 2014 compared with Q3 2013.
As a result, Redbox revenue decreased 10.9% year-over-year to $438.0 million in Q3 2014. Also, total rentals decreased 13.7% year-over-year to 172.2 million in Q3 2014. The year-over-year decrease in same store sales primarily reflects the decline in revenue. However, average check increased 3.3% to $2.54, reflecting the following factors:
| | • | | a continued shift to Blu-ray, which represented 15.1% of rentals and 17.6% of revenue in Q3, significantly above the 13.0% of rentals and 15.3% of revenue Blu-ray reached in Q3 2013; and |
| | • | | a continued stabilization of single night rentals, which decreased 80 basis points year-over-year to 58.5% in Q3 2014. |
Page 6
©2014 Outerwall Inc. All Rights Reserved. These materials may not be reproduced, altered or distributed without the express written consent of Outerwall Inc.
| | |
Outerwall Inc. 2014 Third Quarter Earnings Prepared Remarks October 30, 2014 | | |
The improvement in single-night rentals was primarily driven by more targeted and efficient promotional activity leveraging our investment in CRM. Overall, marketing promotional spend decreased by 5.8% in Q3 2014 compared with Q3 2013.
As we expected, rentals and revenue per kiosk were down year-over-year due to the weaker mix of content in the quarter and softer flow-through from June releases. However, we continue to expect Q4 2014 rentals per kiosk to be higher than Q3 2014 and Q4 2013 based on the stronger titles expected during the holiday season.
Consistent with the year-over-year content-driven rental decline, unique credit cards renting during Q3 2014 decreased by 7.7% to 38.7 million compared with Q3 2013. However, despite the weaker content, unique credit cards renting in Q3 increased approximately 50 basis points from Q2 2014. High frequency renters represented 52.1% of revenue in Q3 2014, a decline from Q3 2013 but a slight increase sequentially compared with Q2 2014.
Redbox customer engagement remains strong as email subscribers and app downloads increasedyear-over-year by 16.0% and 19.8%, respectively. Also, email open rates increased by 15.9%.
We recently announced the national launch of Redbox Play Pass, a new loyalty program. The launch comes after a successful beta program, and we expect it to help drive further consumer engagement and frequency of visits.
In Q3 2014, Redbox segment operating income was $85.7 million, a decrease of 5.8% compared with Q3 2013. However, segment operating margin increased 110 basis points to 19.6% compared with Q3 2013 mainly due to our continued focus on managing G&A expenses and direct operating costs. Direct operating costs are primarily variable costs that decrease with lower revenue. While gross margin decreased 30 basis points year-over-year to 56.8%, it improved by 50 basis points sequentially from Q2 2014 as we continued to adjust product purchase levels to align with the weaker content.
Video Games Rentals and Revenue
| | | | | | | | |
Video Games Performance | | Q3 2014 | | | Q3 2013 | |
Percentage of rentals | | | 2.1 | % | | | 1.9 | % |
Percentage of Redbox revenue | | | 4.4 | % | | | 4.4 | % |
Video games rentals increased as a percentage of revenue in Q3 2014 compared with Q3 2013 despite a slate of three fewer titles as the game industry shifts to next generation platforms. Game publishers continue to strongly support the Xbox 360 and PS3 platforms which are the bulk of our current offering and consumer demand. In addition, we are testing video game rentals for next generation platforms, including Xbox One and Playstation 4, in approximately 5,000 kiosks and plan to expand more broadly in 2015, as demand from our consumers for the next generation platforms increases.
Page 7
©2014 Outerwall Inc. All Rights Reserved. These materials may not be reproduced, altered or distributed without the express written consent of Outerwall Inc.
| | |
Outerwall Inc. 2014 Third Quarter Earnings Prepared Remarks October 30, 2014 | | |
Kiosk Optimization
To improve efficiency and productivity, we are removing kiosks that underperform our revenue expectations in their respective channels. In Q3 2014, we removed a net 150 Redbox® kiosks in the U.S. Our goal is to recapture rentals from removed kiosks in the remaining network through targeted marketing that keeps customers engaged, while lowering content and servicing costs due to a smaller installed base. We expect to remove 150 to 200 additional kiosks in the U.S. in Q4 2014.
Canada
We installed approximately 40 net new Redbox kiosks in Canada in Q3, bringing total Canadian installations to 1,390. We expect to add 50 to 100 kiosks in Q4 2014. Our focus in Canada is on driving brand awareness and growing our customer base at existing locations through new marketing programs and partnerships with retailers.
Price Testing
We periodically conduct price testing to learn more about how pricing impacts our business. In Q3, we began several in-market tests to evaluate increased pricing for both standard definition DVD (SD) and Blu-ray (BD) formats. We are testing three pricing structures across 11 markets: $1.35 SD / $1.50 BD; $1.35 SD / $1.75 BD; and $1.50 SD / $2.00 BD. All of these price points continue to support our consumer promise of providing the best value in the marketplace for new release content. From a financial perspective, we expect any price increase to help offset the expected secular decline in the physical rental market.
Studio Contracts
We continue to focus on strengthening our studio relationships. In Q3 2014, we extended our distribution agreement with Universal Studios, and this week we announced a new agreement with Lionsgate. Our studio partnership strategy includes establishing shorter-term contracts that provide greater flexibility to meet the future needs of the industry and the business, including capitalizing on the large-scale consumer demand for quality new release content from Redbox.
Page 8
©2014 Outerwall Inc. All Rights Reserved. These materials may not be reproduced, altered or distributed without the express written consent of Outerwall Inc.
| | |
Outerwall Inc. 2014 Third Quarter Earnings Prepared Remarks October 30, 2014 | | |
Coinstar
Q3 Key Metrics
| | | | | | | | |
Category | | Q3 2014 | | | Q3 2013 | |
Revenue | | $ | 85.1MM | | | $ | 79.6MM | |
Average transaction | | $ | 41.92 | | | $ | 41.25 | |
Transactions | | | 19.6MM | | | | 20.6MM | |
Same store sales growth | | | 5.8 | % | | | 0.4 | % |
Segment operating income | | $ | 33.4MM | | | $ | 27.6MM | |
Segment operating margin | | | 39.3 | % | | | 34.7 | % |
Kiosks (at quarter end) | | | 21,210 | | | | 20,800 | |
Locations (at quarter end) | | | 20,220 | | | | 20,500 | |
Coinstar Segment Operating Results
Coinstar revenue increased $5.5 million, or 6.9%, year-over-year primarily due to the price increase implemented in the U. S. in October 20134. Additional factors impacting revenue include higher volume in the U.K. due to an increase in the U.K. kiosk base, a price increase implemented across all grocery retail locations in the U.K. effective August 1, 20145, and an increase in the number of Coinstar™ Exchange kiosks. The growth in same store sales was also due to the U.S. and U.K. price increases.
Average transaction size continued to increase in Q3, while overall transactions continue to decline. The decline in transactions is the result of larger pours and less frequent visits, and a decrease in the U.S. kiosk base as a result of our optimization efforts.
Coinstar segment operating income increased $5.8 million, or 20.9%, compared with Q3 2013, and segment operating margin was 39.3%, an increase of 460 basis points year-over-year. The increases in segment operating income and margin reflect the increase in revenue as well as continued efforts to manage costs and increase productivity in the business, including leveraging existing Coinstar field teams in servicing the Coinstar Exchange kiosks.
| 4 | On October 1, 2013, the coin voucher product transaction fee was raised to 10.9% from 9.8% for all U.S. grocery retail locations |
| 5 | On August 1, 2014, the coin voucher product transaction fee was raised to 9.9% from 8.9% for all U.K. grocery retail locations |
Page 9
©2014 Outerwall Inc. All Rights Reserved. These materials may not be reproduced, altered or distributed without the express written consent of Outerwall Inc.
| | |
Outerwall Inc. 2014 Third Quarter Earnings Prepared Remarks October 30, 2014 | | |
New Ventures
Q3 Key Metrics
| | | | | | | | |
Category | | Q3 2014 | | | Q3 2013 | |
Revenue | | $ | 29.7MM | | | $ | 15.2MM | |
Segment operating loss | | $ | 4.4MM | | | $ | 5.4MM | |
Total kiosks | | | 1,550 | | | | 820 | |
ecoATM kiosks | | | 1,510 | | | | 810 | |
New Ventures Segment Operating Results
New Ventures segment operating results primarily reflect the operations and performance of ecoATM. The majority of segment revenue and its year-over-year increase are due to an increased number of installed ecoATM kiosks and the continued ramping of kiosks that were deployed in 2014. The mobile device recycling industry has quickly become a crowded environment, with consumers having multiple options on where they can recycle their devices, including ecoATM kiosks, carrier and brick and mortar stores and online retailers. However, ecoATM is differentiated from other options for mobile device recycling due to its ability to offer instant cash as well as its compliance programs. Carrier and brick and mortar stores are offering several different programs that can be restrictive or confusing to the consumer about what the incentive is, how to obtain the incentive (e.g., mailing in your device) and where the incentive can be used (e.g., as a store credit to buy accessories).
We are focused on scaling ecoATM, and the increase in New Ventures direct operating expense reflects the investments necessary to support and grow this business, a kiosk base that nearly doubledyear-over-year, and our limited investment in SAMPLEit. Direct operating expense was $27.0 million in Q3 2014, and includes expenses primarily related to acquiring, transporting and processing mobile devices at ecoATM, servicing the kiosks, and payments to retailers. As deployed ecoATM kiosks ramp, and we install additional kiosks, we expect our servicing costs to increase, offset in part by increased productivity in certain fixed costs that support a larger kiosk base.
The year-over-year decrease in segment operating loss was primarily due to $4.0 million in acquisition costs for ecoATM that were recorded in Q3 2013 and are included in G&A expense. However, direct operating costs increased year-over-year as we continue to invest in building the teams and infrastructure needed to scale the ecoATM business and support our ongoing testing of SAMPLEit.
In Q3 2014, we signed new ecoATM installation agreements with several retail partners, primarily in the grocery channel. ecoATM now has agreements with six of the top seven grocers in the U.S. During the quarter, we installed more than 530 net new ecoATM kiosks and believe we are on track to reach our target of 1,000 to 1,100 net new kiosk installations in 2014. Due to the ramping timeframe and our 30-day compliance hold, we do not expect the Q4 installs to materially impact our revenue during Q4 2014.
Page 10
©2014 Outerwall Inc. All Rights Reserved. These materials may not be reproduced, altered or distributed without the express written consent of Outerwall Inc.
| | |
Outerwall Inc. 2014 Third Quarter Earnings Prepared Remarks October 30, 2014 | | |
Non-Core Results
In Q3 2014, total pretax non-core expenses were $14.6 million, including approximately $3.3 million in rights to receive cash issued in connection with the acquisition of ecoATM, and an approximately $11.4 million loss from equity method investments.
In Q3, we made a capital contribution of $14.0 million to the joint venture (JV), bringing the total capital contributions over the course of the JV to $77.0 million. As noted above, we signed an agreement with Verizon to withdraw from the JV and received a cash payment of $16.8 million. We will make no further capital contributions to wind down the business. As a result, over the course of the JV we will have received $70.5 million in cash from payments for services and kiosk nights while investing $77.0 million in capital contributions. In addition, we realized approximately $29.9 million in cash tax savings through deductions related to our share of the JV’s losses over the course of the venture. We do not expect a material net financial impact in Q4 2014.
Guidance
As a reminder, beginning in 2015, we will provide annual guidance only. We believe annual guidance is a more relevant measurement of the business given our stage of growth, and full-year results better capture the varying seasonal patterns for each of our businesses.
There are several factors influencing our current expectations for Q4 and full year 2014:
| | • | | the shift of costs related to key initiatives and hiring from Q3 to Q4; |
| | • | | lapping the price increase in our Coinstar business for U. S. retail grocery locations; |
| | • | | Q3 share repurchases; and |
| | • | | a lower average selling price for devices in our ecoATM business as a result of the iPhone® 6 launch and the timing of ecoATM kiosk installations. |
We remain focused on aligning costs and capital expenditures with revenue growth opportunities and are managing the business to maximize profitability and cash flow in our core businesses while investing in our future to generate shareholder value.
Q4 2014 Guidance
We expect Redbox Q4 2014 rentals and revenue to be in line with prior year results. We expect strong demand in November and December driven by typical holiday seasonality and increased box office compared with Q4 2013. Comedies with broad consumer appeal, such as22 Jump StreetandTammy,are expected to perform well in Q4.
Page 11
©2014 Outerwall Inc. All Rights Reserved. These materials may not be reproduced, altered or distributed without the express written consent of Outerwall Inc.
| | |
Outerwall Inc. 2014 Third Quarter Earnings Prepared Remarks October 30, 2014 | | |
While the expected Q4 box office of $3.5 billion is 22% higher than Q4 2013, the weaker content in September and early October is expected to partially reduce the impact of the pick-up in November and December when content is stronger. In fact, box office for the last four months of 2014 is flat compared with 2013, which is a key factor in our expectations for rentals and revenue to be in line with Q3 2013 results. Further, our actions and the improvements we have made over the past year, including rebalancing, implementing the vertical merchandising zone and leveraging our CRM system, will help offset the expected secular decline in the physical rental market. We continue to expect Q4 2014 rentals per kiosk to be higher than Q3 2014 and Q4 2013 based on the stronger titles expected during the 2014 holiday season and the lower kiosk count as we continue to optimize our network by removing underperforming kiosks.
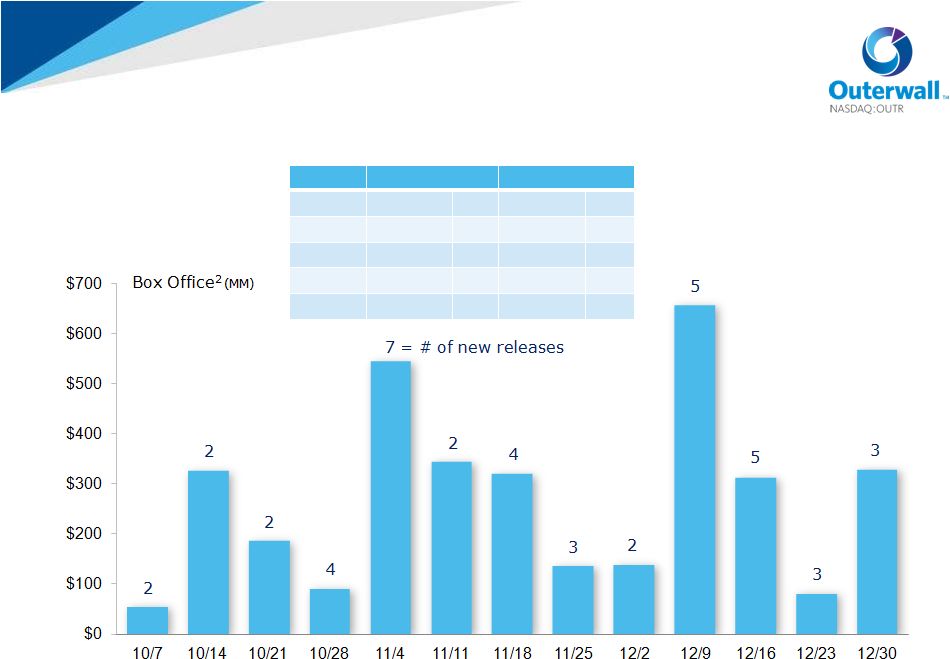
A breakdown of content for Redbox kiosks by month follows:
| | | | | | | | | | | | | | | | |
| | | Q4 2014 | | | Q4 2013 | |
(2014 data estimated) | | Box Office* | | | Titles | | | Box Office* | | | Titles | |
TOTAL | | $ | 3.52Bn | | | | 44 | | | $ | 2.88Bn | | | | 34 | |
October | | $ | 660MM | | | | 10 | | | $ | 658MM | | | | 6 | |
November | | $ | 1.34Bn | | | | 16 | | | $ | 1.02Bn | | | | 12 | |
December | | $ | 1.52Bn | | | | 18 | | | $ | 1.20Bn | | | | 16 | |
| * | Includes titles with total North American box office greater than $5MM |
Blu-ray rentals are expected to represent 15% to 17% of rentals in Q4 2014 compared with 14.2% in Q4 2013, driven by increased device penetration, customer experience enhancements, Blu-ray upsell and targeted marketing efforts.
2014 Q4 consolidated guidance follows:
| | • | | Consolidated revenue between $575MM and $605MM |
| | • | | Core adjusted EBITDA from continuing operations between $123MM and $138MM |
| | • | | Core diluted EPS from continuing operations between $1.85 and $2.15 |
| | • | | For the quarter, we expect average diluted shares in the range of 18.5MM to 18.6MM |
2014 Full-Year Guidance
For the full-year 2014, we have narrowed our ranges and currently expect:
| | • | | Consolidated revenue between $2.277Bn and $2.307Bn |
| | • | | Core adjusted EBITDA from continuing operations between $462MM and $477MM |
| | • | | Core diluted EPS from continuing operations between $5.98 and $6.28 |
| | • | | Free cash flow in the range of $210MM to $240MM |
| | • | | We estimate an effective tax rate of 37.0% to 39.0% |
| | • | | For the year, we expect average diluted shares in the range of 20.6MM to 20.7MM |
Page 12
©2014 Outerwall Inc. All Rights Reserved. These materials may not be reproduced, altered or distributed without the express written consent of Outerwall Inc.
| | |
Outerwall Inc. 2014 Third Quarter Earnings Prepared Remarks October 30, 2014 | | |
Summary
Our performance in Q3 demonstrates our commitment to managing the business for profitability. Our continued focus on managing costs across the organization resulted in increased operating margins year-over-year and sequential growth.
We are focused on optimizing our core Redbox and Coinstar businesses – both strong brands that deliver great value to consumers and retailers. Our studio relationships remain strong and we recently signed Redbox content agreements with Universal and Lionsgate.
We continue to invest in scaling ecoATM and in Q3 signed kiosk installation agreements with several retail partners. We also installed more than 530 ecoATM kiosks in Q3, bringing the total to 1,510 at the end of the quarter.
We are pleased with the progress we made in Q3 and are committed to delivering value to our customers, partners and shareholders.
Page 13
©2014 Outerwall Inc. All Rights Reserved. These materials may not be reproduced, altered or distributed without the express written consent of Outerwall Inc.
| | |
Outerwall Inc. 2014 Third Quarter Earnings Prepared Remarks October 30, 2014 | | |
Appendix A
Non-GAAP Financial Measures
Non-GAAP measures may be provided as a complement to results provided in accordance with United States generally accepted accounting principles (“GAAP”).
We use the following non-GAAP financial measures to evaluate our financial results:
| | • | | Core adjusted EBITDA from continuing operations; |
| | • | | Core diluted earnings per share (“EPS”) from continuing operations; |
| | • | | Net debt and net leverage ratio. |
These measures, the definitions of which are presented below, are non-GAAP because they exclude certain amounts which are included in the most directly comparable measure calculated and presented in accordance with GAAP. Our non-GAAP financial measures are not meant to be considered in isolation or as a substitute for our GAAP financial measures and may not be comparable with similarly titled measures of other companies.
Core and Non-Core Results
We distinguish our core activities, those associated with our primary operations which we directly control, fromnon-core activities. Non-core activities are primarily nonrecurring events or events we do not directly control. Ournon-core adjustments for the periods presented include i) restructuring costs associated with actions to reduce costs in our continuing operations primarily through workforce reductions across the Company, ii) acquisition costs primarily related to the acquisition of ecoATM, iii) compensation expense for rights to receive cash issued in conjunction with our acquisition of ecoATM and attributable to post-combination services as they are fixed amount acquisition related awards and not indicative of the directly controllable future business results, iv) income or loss from equity method investments, which represents our share of income or loss from entities we do not consolidate or control and includes the impacts of the gain on re-measurement of our previously held equity interest in ecoATM upon acquisition, and v) tax benefits related to a net operating loss adjustment and the recognition of a worthless stock deduction in a corporate subsidiary (“Non-Core Adjustments”).
We believe investors should consider our core results because they are more indicative of our ongoing performance and trends, are more consistent with how management evaluates our operational results and trends, provide meaningful supplemental information to investors through the exclusion of certain expenses which are either nonrecurring or may not be indicative of our directly controllable business operating results, allow for greater transparency in assessing our performance, help investors better analyze the results of our business and assist in forecasting future periods.
Page 14
©2014 Outerwall Inc. All Rights Reserved. These materials may not be reproduced, altered or distributed without the express written consent of Outerwall Inc.
| | |
Outerwall Inc. 2014 Third Quarter Earnings Prepared Remarks October 30, 2014 | | |
Core Adjusted EBITDA from continuing operations
Our non-GAAP financial measure core adjusted EBITDA from continuing operations is defined as earnings from continuing operations before depreciation, amortization and other; interest expense, net; income taxes; share-based payments expense; and Non-Core Adjustments.
A reconciliation of core adjusted EBITDA from continuing operations to net income from continuing operations, the most comparable GAAP financial measure, is presented in the following table:
| | | | | | | | | | | | | | | | |
| | | Three Months Ended
September 30, | | | Nine Months Ended
September 30, | |
| Dollars in thousands | | 2014 | | | 2013 | | | 2014 | | | 2013 | |
Net income from continuing operations | | $ | 17,890 | | | $ | 86,795 | | | $ | 63,586 | | | $ | 165,215 | |
Depreciation, amortization and other | | | 51,567 | | | | 52,436 | | | | 157,537 | | | | 150,241 | |
Interest expense, net | | | 12,463 | | | | 8,402 | | | | 35,037 | | | | 25,953 | |
Income taxes | | | 11,841 | | | | 15,529 | | | | 31,454 | | | | 34,766 | |
Share-based payments expense(1) | | | 3,249 | | | | 2,774 | | | | 10,093 | | | | 11,454 | |
| | | | | | | | | | | | | | | | |
Adjusted EBITDA from continuing operations | | | 97,010 | | | | 165,936 | | | | 297,707 | | | | 387,629 | |
Non-Core Adjustments: | | | | | | | | | | | | | | | | |
Restructuring costs | | | — | | | | — | | | | 469 | | | | — | |
Acquisition costs | | | — | | | | 4,003 | | | | — | | | | 5,669 | |
Rights to receive cash issued in connection with the acquisition of ecoATM | | | 3,274 | | | | 2,300 | | | | 10,033 | | | | 2,300 | |
Loss from equity method investments | | | 11,352 | | | | 10,442 | | | | 31,261 | | | | 27,096 | |
Gain on previously held equity interest in ecoATM | | | — | | | | (68,376 | ) | | | — | | | | (68,376 | ) |
| | | | | | | | | | | | | | | | |
Core adjusted EBITDA from continuing operations | | $ | 111,636 | | | $ | 114,305 | | | $ | 339,470 | | | $ | 354,318 | |
| | | | | | | | | | | | | | | | |
| (1) | Includes both non-cash share-based compensation for executives, non-employee directors and employees as well as share-based payments for content arrangements. |
Page 15
©2014 Outerwall Inc. All Rights Reserved. These materials may not be reproduced, altered or distributed without the express written consent of Outerwall Inc.
| | |
Outerwall Inc. 2014 Third Quarter Earnings Prepared Remarks October 30, 2014 | | |
Core Diluted EPS from continuing operations
Our non-GAAP financial measure core diluted EPS from continuing operations is defined as diluted earnings per share from continuing operations excluding Non-Core Adjustments, net of applicable taxes.
A reconciliation of core diluted EPS from continuing operations to diluted EPS from continuing operations, the most comparable GAAP financial measure, is presented in the following table:
| | | | | | | | | | | | | | | | |
| | | Three Months Ended
September 30, | | | Nine Months Ended
September 30, | |
| | | 2014 | | | 2013 | | | 2014 | | | 2013 | |
Diluted EPS from continuing operations | | $ | 0.93 | | | $ | 3.10 | | | $ | 2.98 | | | $ | 5.78 | |
Non-Core Adjustments, net of tax:(1) | | | | | | | | | | | | | | | | |
Restructuring costs | | | — | | | | — | | | | 0.01 | | | | — | |
Acquisition costs | | | — | | | | 0.09 | | | | — | | | | 0.14 | |
Rights to receive cash issued in connection with the acquisition of ecoATM | | | 0.14 | | | | 0.06 | | | | 0.37 | | | | 0.06 | |
Loss from equity method investments | | | 0.36 | | | | 0.23 | | | | 0.89 | | | | 0.58 | |
Gain on previously held equity interest on ecoATM | | | — | | | | (2.36 | ) | | | — | | | | (2.32 | ) |
Tax benefit from net operating loss adjustment | | | — | | | | — | | | | (0.04 | ) | | | — | |
Tax (benefit) expense of worthless stock deduction | | | 0.01 | | | | — | | | | (0.10 | ) | | | — | |
| | | | | | | | | | | | | | | | |
Core diluted EPS from continuing operations | | $ | 1.44 | | | $ | 1.12 | | | $ | 4.11 | | | $ | 4.24 | |
| | | | | | | | | | | | | | | | |
| (1) | Non-Core Adjustments are presented after-tax using the applicable effective tax rate for the respective periods. |
Free Cash Flow
Our non-GAAP financial measure free cash flow is defined as net cash provided by operating activities after capital expenditures. We believe free cash flow is an important non-GAAP measure as it provides additional information to users of the financial statements regarding our ability to service, incur or pay down indebtedness and repurchase our securities.
A reconciliation of free cash flow to net cash provided by operating activities, the most comparable GAAP financial measure, is presented in the following table:
| | | | | | | | | | | | | | | | |
| | | Three Months Ended
September 30, | | | Nine Months Ended
September 30, | |
| Dollars in thousands | | 2014 | | | 2013 | | | 2014 | | | 2013 | |
Net cash provided by operating activities | | $ | 49,627 | | | $ | 60,943 | | | $ | 207,047 | | | $ | 147,121 | |
Purchase of property and equipment | | | (19,295 | ) | | | (39,102 | ) | | | (72,311 | ) | | | (123,346 | ) |
| | | | | | | | | | | | | | | | |
Free cash flow | | $ | 30,332 | | | $ | 21,841 | | | $ | 134,736 | | | $ | 23,775 | |
| | | | | | | | | | | | | | | | |
Page 16
©2014 Outerwall Inc. All Rights Reserved. These materials may not be reproduced, altered or distributed without the express written consent of Outerwall Inc.
| | |
Outerwall Inc. 2014 Third Quarter Earnings Prepared Remarks October 30, 2014 | | |
Net Debt and Net Leverage Ratio
Our non-GAAP financial measure net debt is defined as the total face value of outstanding debt, including capital leases, less cash and cash equivalents held in financial institutions domestically. Our non-GAAP financial measure net leverage ratio is defined as net debt divided by core adjusted EBITDA from continuing operations for the last twelve months (LTM). We believe net debt and net leverage ratio are important non-GAAP measures because they:
| | • | | are used to assess the degree of leverage by management; |
| | • | | provide additional information to users of the financial statements regarding our ability to service, incur or pay down indebtedness and repurchase our securities as well as additional information about our capital structure; and |
| | • | | are reported quarterly to support covenant compliance under our credit agreement. |
A reconciliation of net debt to total outstanding debt including capital leases, the most comparable GAAP financial measure, is presented in the following table:
| | | | | | | | |
| Dollars in thousands | | September 30,
2014 | | | December 31,
2013 | |
Senior unsecured notes(1) | | $ | 650,000 | | | $ | 350,000 | |
Term loans(1) | | | 148,125 | | | | 344,375 | |
Revolving line of credit | | | 210,000 | | | | — | |
Convertible debt(2) | | | — | | | | 51,148 | |
Capital leases | | | 18,051 | | | | 21,361 | |
| | | | | | | | |
Total principal value of outstanding debt including capital leases | | | 1,026,176 | | | | 766,884 | |
Less domestic cash and cash equivalents held in financial institutions | | | (26,003 | ) | | | (199,027 | ) |
| | | | | | | | |
Net debt | | | 1,000,173 | | | | 567,857 | |
LTM Core adjusted EBITDA from continuing operations(3) | | $ | 476,804 | | | $ | 491,652 | |
| | | | | | | | |
Net leverage ratio | | | 2.10 | | | | 1.15 | |
| (1) | The senior unsecured notes on our Consolidated Balance Sheets as of September 30, 2014 and December 31, 2013 included $8.9 million and $5.3 million in associated debt discount, respectively. The Term loan on our Consolidated Balance Sheets as of September 30, 2014 included $0.4 million in associated debt discount. There was no associated debt discount with the Term loans as of December 31, 2013. |
| (2) | The convertible debt balance on our Consolidated Balance Sheet as of December 31, 2013 included $1.4 million in associated debt discount. |
| (3) | LTM Core Adjusted EBITDA from continuing operations for the twelve months ended September 30, 2014 and December 31, 2013 was determined as follows: |
| | | | |
| Dollars in thousands | | | |
Core adjusted EBITDA from continuing operations for the nine months ended September 30, 2014 | | $ | 339,470 | |
Add: Core adjusted EBITDA from continuing operations for the twelve months ended December 31, 2013(A) | | | 491,652 | |
Less: Core adjusted EBITDA from continuing operations for the nine months ended September 30, 2013 | | | (354,318 | ) |
| | | | |
LTM Core adjusted EBITDA from continuing operations for the twelve months ended September 30, 2014 | | $ | 476,804 | |
| | | | |
| (A) | Core adjusted EBITDA from continuing operations for the twelve months ended December 31, 2013 is obtained from our Annual Report on Form 10-K for the period ended December 31, 2013, where it is reconciled to net income from continuing operations, the most comparable GAAP financial measure, and represents the LTM core adjusted EBITDA from continuing operations we use in our calculation of net leverage ratio as of December 31, 2013. |
Page 17
©2014 Outerwall Inc. All Rights Reserved. These materials may not be reproduced, altered or distributed without the express written consent of Outerwall Inc.
|
Supplementary Slides 2014 Q3 Prepared Remarks October 30, 2014 |
|
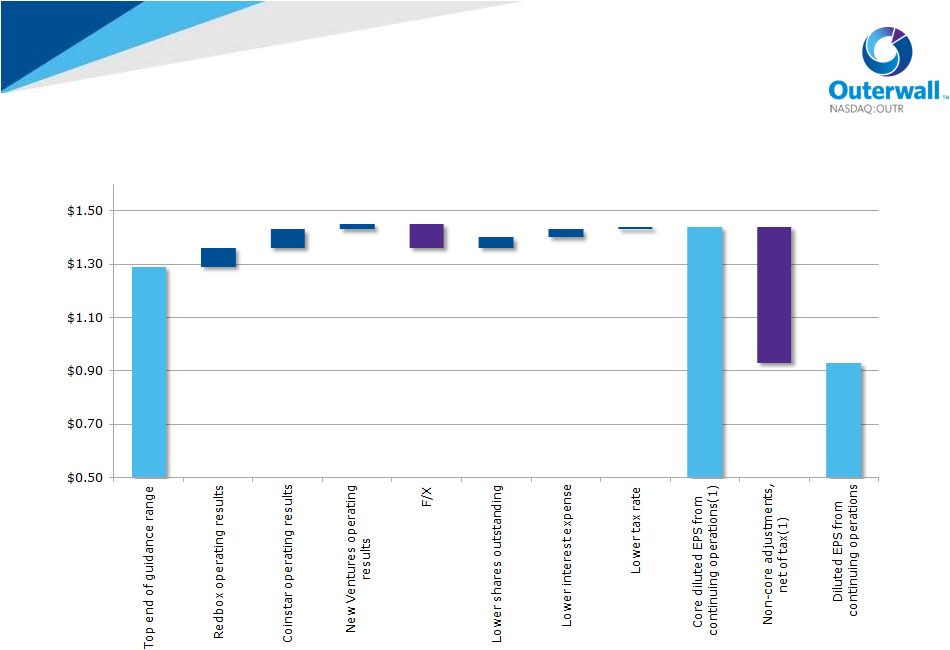
© 2014 Outerwall Inc. All Rights Reserved. These materials may not be reproduced, altered, or distributed without the express written consent of Outerwall Inc. S – 2 2014 Q3 EPS Bridge Actual results versus previous guidance (1) Refer to Appendix A for a discussion of Non-GAAP Financial Measures and Core and Non-Core Results $1.29 $0.07 $0.07 $(0.09) $0.04 $0.03 $0.01 $1.44 $(0.51) $0.93 $0.02 |
|
© 2014 Outerwall Inc. All Rights Reserved. These materials may not be reproduced, altered, or distributed without the express written consent of Outerwall Inc. S – 3 2014 Q4 Redbox Release Schedule 1 Q4 2014 data estimated 2 Includes titles with total North American box office greater than $5MM Q4 2014 Q4 2013 Box Office Titles Box Office Titles Total $3.52Bn 44 $2.88Bn 34 October $660MM 10 $658MM 6 November $1.34Bn 16 $1.02Bn 12 December $1.52Bn 18 $1.20Bn 16 As of October 30, 2014 1 2 2 |
|
© 2014 Outerwall Inc. All Rights Reserved. These materials may not be reproduced, altered, or distributed without the express written consent of Outerwall Inc. S – 4 2014 Full-Year and Q4 Guidance 2014 FY – Revenue by Segment ($MM) 2014 FY Capital Expenditures ($MM) Redbox $1,868 – $1,890 Redbox $24 – $27 Coinstar $312 – $315 Kiosk, software and other $8 – $9 New Ventures $97 – $102 Maintenance $16 – $18 TOTAL $2,277 – $2,307 Coinstar $17 – $19 2014 FY – Other New $13 – $14 Core adjusted EBITDA from Maintenance $4 – $5 continuing operations ($MM) $462 – $477 New Ventures $41 – $44 Core diluted EPS from Corporate $18 – $20 continuing operations $5.98 – $6.28 Average diluted shares TOTAL $100 – $110 outstanding (MM) 20.6 – 20.7 Estimated effective tax rate 37% – 39% 2014 FY – Net Installations Free cash flow ($MM) $210 – $240 2014 Q4 Guidance Redbox Kiosks (400) – (100) Revenue ($MM) $575 – $605 U.S. (700) – (500) Core adjusted EBITDA from Canada 300 – 400 continuing operations ($MM) $123 – $138 Coinstar Kiosks 300 – 400 Core diluted EPS from New Ventures Kiosks 1,000 – 1,200 continuing operations $1.85 – $2.15 Average diluted shares outstanding (MM) 18.5 – 18.6 See Appendix A for a discussion of Non-GAAP Financial Measures and Core and Non-Core Results Excludes the impact of any future share repurchases for the remainder of 2014 As of October 30, 2014 1 1,2 2 1 1 1,2 2 1 2 |