Exhibit 99.2
Outerwall Inc. 2014 Fourth Quarter and Full Year Earnings
Prepared Remarks
February 5, 2015
Today, February 5, 2015, Outerwall Inc. issued a press release announcing financial results for the 2014 fourth quarter and full year. The following prepared remarks provide additional information related to the company’s operating and financial performance as well as full year 2015 guidance. The prepared remarks also include supplementary slides.
The company will host a conference call today at 2:30 p.m. PST to discuss 2014 fourth quarter and full year results and full year 2015 guidance.
The 2014 fourth quarter earnings press release, prepared remarks and conference call webcast are available on the Investor Relations section of Outerwall’s website at ir.outerwall.com.
Safe Harbor for Forward-Looking Statements
Certain statements in this press release are “forward-looking statements” within the meaning of the Private Securities Litigation Reform Act of 1995. The words “believe,” “estimate,” “expect,” “intend,” “will,” “anticipate,” “goals,” variations of such words, and similar expressions identify forward-looking statements, but their absence does not mean that the statement is not forward-looking. The forward-looking statements in this release include statements regarding Outerwall Inc.’s anticipated growth and future operating results, including 2015 full year results. Forward-looking statements are not guarantees of future performance and actual results may vary materially from the results expressed or implied in such statements. Differences may result from actions taken by Outerwall Inc. or its subsidiaries, as well as from risks and uncertainties beyond Outerwall Inc.’s control. Such risks and uncertainties include, but are not limited to,
| | • | | competition from other entertainment providers, |
| | • | | the ability to achieve the strategic and financial objectives for our entry into new businesses, including ecoATM and SAMPLEit, |
| | • | | our ability to repurchase stock and the availability of an open trading window, |
| | • | | our declaration and payment of dividends, including our board’s discretion to change the dividend policy, |
| | • | | the termination, non-renewal or renegotiation on materially adverse terms of our contracts with our significant retailers and suppliers, |
| | • | | payment of increased fees to retailers, suppliers and other third-party providers, including financial service providers, |
| | • | | the timing of new DVD releases and the inability to receive delivery of DVDs on the date of their initial release to the general public, or shortly thereafter, or in sufficient quantity, for home entertainment viewing, |
| | • | | the effective management of our content library, |
| | • | | the timing of the release slate and the relative attractiveness of titles in a particular quarter or year, |
| | • | | the ability to attract new retailers, penetrate new markets and distribution channels and react to changing consumer demands, |
| | • | | the ability to generate sufficient cash flow to timely and fully service indebtedness and adhere to certain covenants and restrictions, |
| | • | | the ability to adequately protect our intellectual property, and |
| | • | | the application of substantial federal, state, local and foreign laws and regulations specific to our business. |
The foregoing list of risks and uncertainties is illustrative, but by no means exhaustive. For more information on factors that may affect future performance, please review “Risk Factors” described in our most recent Annual Report on Form10-K and any subsequent Quarterly Reports on Form 10-Q filed with the Securities and Exchange Commission. These forward-looking statements reflect Outerwall Inc.’s expectations as of the date of this press release. Outerwall Inc. undertakes no obligation to update the information provided herein.
©2015 Outerwall Inc. All Rights Reserved. These materials may not be reproduced, altered or distributed without the express written consent of Outerwall Inc.
Outerwall Inc. 2014 Fourth Quarter and Full Year Earnings
Prepared Remarks
February 5, 2015
Non-GAAP Financial Measures
Non-GAAP measures may be provided as a complement to results provided in accordance with United States generally accepted accounting principles (“GAAP”).
We use the following non-GAAP financial measures to evaluate our financial results:
| | • | | Core adjusted EBITDA from continuing operations; |
| | • | | Core diluted earnings per share (“EPS”) from continuing operations; |
| | • | | Net debt and net leverage ratio. |
These measures, the definitions of which are presented in Appendix A, are non-GAAP because they exclude certain amounts which are included in the most directly comparable measure calculated and presented in accordance with GAAP. Our non-GAAP financial measures are not meant to be considered in isolation or as a substitute for our GAAP financial measures and may not be comparable with similarly titled measures of other companies.
Core and Non-Core Results
We distinguish our core activities, those associated with our primary operations which we directly control, from non-core activities. Non-core activities are primarily nonrecurring events or events we do not directly control. Our non-core adjustments for the periods presented include, but not limited to, i) restructuring costs associated with actions to reduce costs in our continuing operations primarily through workforce reductions across the Company, ii) acquisition costs primarily related to the acquisition of ecoATM, iii) compensation expense for rights to receive cash issued in conjunction with our acquisition of ecoATM and attributable to post-combination services as they are fixed amount acquisition related awards and not indicative of the directly controllable future business results, iv) income or loss from equity method investments, which represents our share of income or loss from entities we do not consolidate or control and includes the impacts of the gain on re-measurement of our previously held equity interest in ecoATM upon acquisition, v) benefits from release of indemnification reserves upon settlement of the Sigue Note and vi) tax benefits related to a net operating loss adjustment and the recognition of a worthless stock deduction in a corporate subsidiary (“Non-Core Adjustments”).
We believe investors should consider our core results because they are more indicative of our ongoing performance and trends, are more consistent with how management evaluates our operational results and trends, provide meaningful supplemental information to investors through the exclusion of certain expenses which are either nonrecurring or may not be indicative of our directly controllable business operating results, allow for greater transparency in assessing our performance, help investors better analyze the results of our business and assist in forecasting future periods.
©2015 Outerwall Inc. All Rights Reserved. These materials may not be reproduced, altered or distributed without the express written consent of Outerwall Inc.
Page 2
Outerwall Inc. 2014 Fourth Quarter and Full Year Earnings
Prepared Remarks
February 5, 2015
Overview
Our Q4 and full-year 2014 financial results demonstrate our execution of our strategy to optimize our core businesses, scale ecoATM and leverage our existing platforms to achieve operational efficiencies across the company.
On January 20, 2015, our board of directors named Nora Denzel interim chief executive officer. Even with this change in leadership, our commitment to executing our strategy to drive profitability and cash flow and returning capital to shareholders has not changed.
Further demonstrating our commitment to delivering returns to shareholders and our confidence in ourlong-term outlook, today we announced that our board declared our first-ever quarterly dividend of $0.30 per share and authorized an additional $250.0 million in share repurchases, bringing the total available for repurchases to approximately $413.7 million.
2014 Consolidated Results
The year-over-year comparisons we make in these prepared remarks will be 2014 versus 2013 and the quarter-over-quarter comparisons will be Q4 2014 versus Q4 2013 unless otherwise noted.
Outerwall’s consolidated results for the year ended December 31, 2014:
| | | | | | | | | | | | |
| | | Year Ended December 31, | | | Change | |
(In millions, except per share data) | | 2014 | | | 2013 | | | % | |
GAAP Results | | | | | | | | | | | | |
Consolidated revenue | | $ | 2,303.0 | | | $ | 2,306.6 | | | | (0.2 | )% |
Income from continuing operations | | $ | 107.4 | | | $ | 208.1 | | | | (48.4 | )% |
Net income | | $ | 106.6 | | | $ | 174.8 | | | | (39.0 | )% |
Diluted EPS from continuing operations | | $ | 5.19 | | | $ | 7.33 | | | | (29.2 | )% |
Net cash provided by operating activities | | $ | 338.4 | | | $ | 327.8 | | | | 3.2 | % |
Core Results1 | | | | | | | | | | | | |
Core adjusted EBITDA from continuing operations | | $ | 480.5 | | | $ | 491.7 | | | | (2.3 | )% |
Core diluted EPS from continuing operations | | $ | 6.43 | | | $ | 5.92 | | | | 8.6 | % |
Free cash flow | | $ | 240.4 | | | $ | 166.4 | | | | 44.5 | % |
Highlights from full-year 2014 include:
| | • | | Managed the business for profitability while making investments in our future as demonstrated by solid core adjusted EBITDA from continuing operations of $480.5 million despite a decline in revenue at Redbox due to a challenging release schedule for much of 2014 |
| | • | | Redbox achieved its 4 billionth cumulative rental in November 2014 |
| | • | | Extended existing content agreements with Sony, Paramount and Universal and signed a new agreement with Lionsgate |
| | • | | Installed more than 1,000 ecoATM kiosks during the year, bringing total ecoATM kiosks to 1,890 at December 31, 2014 |
| 1 | Additional information on core and non-core results and reconciliations of non-GAAP financial measures are included in Appendix A |
©2015 Outerwall Inc. All Rights Reserved. These materials may not be reproduced, altered or distributed without the express written consent of Outerwall Inc.
Page 3
Outerwall Inc. 2014 Fourth Quarter and Full Year Earnings
Prepared Remarks
February 5, 2015
| | • | | Consolidated general and administrative (G&A) expense improved 13.6% year-over-year primarily as a result of our ongoing focus on expense management |
| | • | | Core diluted EPS from continuing operations increased 8.6% year-over-year |
| | • | | Generated $240.4 million in free cash flow during 2014 up from $166.4 million in 2013 |
| | • | | Repurchased 7.9 million shares of our common stock at an average price of $68.31 per share for $541.4 million |
For comparison purposes, Q4 2013 included a one-time tax benefit of $16.7 million associated with a worthless stock deduction.
Q4 Consolidated Results
Outerwall’s year-over-year comparisons of Q4 2014 results:
| | | | | | | | | | | | |
| | | Three Months Ended
December 31, | | | Change | |
(In millions, except per share data) | | 2014 | | | 2013 | | | % | |
GAAP Results | | | | | | | | | | | | |
Consolidated revenue | | $ | 600.6 | | | $ | 593.7 | | | | 1.2 | % |
Income from continuing operations | | $ | 43.8 | | | $ | 42.9 | | | | 2.2 | % |
Net income | | $ | 43.8 | | | $ | 22.7 | | | | 93.2 | % |
Diluted EPS from continuing operations | | $ | 2.35 | | | $ | 1.55 | | | | 51.6 | % |
Net cash provided by operating activities | | $ | 131.3 | | | $ | 180.7 | | | | (27.3 | )% |
Core Results2 | | | | | | | | | | | | |
Core adjusted EBITDA from continuing operations | | $ | 141.0 | | | $ | 137.3 | | | | 2.7 | % |
Core diluted EPS from continuing operations | | $ | 2.44 | | | $ | 1.68 | | | | 45.2 | % |
Free cash flow | | $ | 105.7 | | | $ | 142.6 | | | | (25.9 | )% |
Highlights from Q4 2014 include:
| | • | | Successfully implemented Redbox price increases in December 2014 for movies and early January 2015 for video games |
| | • | | Week of December 29, 2014, marked the highest rental week in Redbox history, led by strong new release titles |
| | • | | Installed approximately 380 net new ecoATM kiosks in the quarter |
| | • | | Consolidated revenue increased 1.2% compared with Q4 2013 primarily reflecting an increase in New Ventures segment revenue as we continued to scale ecoATM |
| | • | | Consolidated G&A expense improved 20.9% compared with Q4 2013, primarily as a result of our ongoing focus on expense management |
| | • | | Core adjusted EBITDA from continuing operations increased 2.7% compared with Q4 2013 primarily due to an improvement in G&A expense |
| | • | | Core diluted EPS from continuing operations increased 45.2% compared with Q4 2013, primarily reflecting share repurchases throughout the year |
| 2 | Additional information on core and non-core results and reconciliations of non-GAAP financial measures are included in Appendix A |
©2015 Outerwall Inc. All Rights Reserved. These materials may not be reproduced, altered or distributed without the express written consent of Outerwall Inc.
Page 4
Outerwall Inc. 2014 Fourth Quarter and Full Year Earnings
Prepared Remarks
February 5, 2015
Additional Q4 2014 Consolidated Metrics
| | | | |
Metric | | Amount | | Comment |
Total net interest expense | | $12.6MM | | Includes $0.7MM in noncash interest expense |
Core effective tax rate | | 37.6% | | |
Cash and cash equivalents | | $242.7MM | | Includes $81.7MM payable to retailer partners; additionally, $66.5MM of total cash was held in financial institutions domestically |
Total principal value of outstanding debt, including capital leases | | $971.6MM | | |
Net leverage ratio* | | 1.88x | | Target range of 1.75x - 2.25x |
| * | Our non-GAAP financial measure net leverage ratio is defined as net debt divided by core adjusted EBITDA from continuing operations for the last twelve months. Additional information and reconciliations of non-GAAP financial measures are included in Appendix A |
Capital Allocation
We remain committed to returning 75% to 100% of annual free cash flow to shareholders.
During 2014, we repurchased 2.6 million shares of our common stock at an average price of $64.77 per share for $170.6 million, in addition to the 5.3 million shares purchased at a price of $70.07 per share for $370.8 million through a tender offer in the first quarter of 2014.
As of December 31, 2014, there was approximately $163.7 million in authority remaining under our stock repurchase program. On February 3, 2015, our board of directors authorized an additional $250.0 million in share repurchases, bringing the total available for repurchases to approximately $413.7 million.
On February 3, 2015, our board of directors initiated a new quarterly dividend policy and declared a quarterly cash dividend of $0.30 per share to be paid on March 18, 2015, to all stockholders of record as of the close of business on March 3, 2015. This is the first cash dividend paid to stockholders in the company’s history. Future quarterly dividend payments will be subject to approval by our board of directors.
These decisions further underscore our confidence in our business and future cash flows. We remain focused on deploying capital to those activities that we believe will produce the highest returns, including disciplined investments in the business.
©2015 Outerwall Inc. All Rights Reserved. These materials may not be reproduced, altered or distributed without the express written consent of Outerwall Inc.
Page 5
Outerwall Inc. 2014 Fourth Quarter and Full Year Earnings
Prepared Remarks
February 5, 2015
Capital Expenditures
We discuss our capital expenditures (CAPEX) on an accrual basis as we believe this methodology better aligns the reported CAPEX to activities during the quarter driving the expenditures. In Q4, our total investment in CAPEX was $28.0 million, bringing the total for the year to $99.5 million. The following is a breakdown of CAPEX by category for Q4:
| | | | | | | | | | | | | | | | |
| (In-millions) | | New | | | Maintenance | | | Other | | | TOTAL | |
Redbox | | $ | 0.5 | | | $ | 1.6 | | | $ | 0.3 | | | $ | 2.4 | |
Coinstar | | | 2.6 | | | | 0.8 | | | | — | | | | 3.4 | |
New Ventures | | | 18.6 | | | | — | | | | — | | | | 18.6 | |
Corporate | | | — | | | | — | | | | 3.6 | | | | 3.6 | |
TOTAL | | $ | 21.7 | | | $ | 2.4 | | | $ | 3.9 | | | $ | 28.0 | |
CAPEX in Q4 reflects investments in ecoATM kiosks to scale the business and corporate investments in technology and equipment.
©2015 Outerwall Inc. All Rights Reserved. These materials may not be reproduced, altered or distributed without the express written consent of Outerwall Inc.
Page 6
Outerwall Inc. 2014 Fourth Quarter and Full Year Earnings
Prepared Remarks
February 5, 2015
Q4 2014 SEGMENT OPERATING RESULTS
Redbox
Q4 Key Metrics
| | | | | | | | |
Category | | Q4 2014 | | | Q4 2013 | |
Revenue | | $ | 494.0 | MM | | $ | 496.4 | MM |
Rentals | | | 181.3 | MM | | | 192.0 | MM |
Net revenue per rental | | $ | 2.72 | | | $ | 2.58 | |
Same store sales growth (decline) | | | (1.3 | )% | | | 0.9 | % |
Gross margin | | | 57.5 | % | | | 58.5 | % |
Segment operating income | | $ | 121.3 | MM | | $ | 111. | 3MM |
Segment operating margin | | | 24.6 | % | | | 22.4 | % |
Unique credit cards renting in quarter | | | 39.1 | MM | | | 40.3 | MM |
Total kiosks (at quarter end) | | | 43,680 | | | | 44,000 | |
U.S. kiosks | | | 42,280 | | | | 42,900 | |
Canada kiosks | | | 1,400 | | | | 1,100 | |
Total locations (at quarter end) | | | 36,140 | | | | 36,400 | |
U.S. locations | | | 34,740 | | | | 35,300 | |
Canada locations | | | 1,400 | | | | 1,100 | |
Blu-ray | | | | | | | | |
Blu-ray as percentage of rentals | | | 15.3 | % | | | 14.2 | % |
Blu-ray as percentage of Redbox revenue | | | 18.4 | % | | | 16.3 | % |
Price Increase Implemented in Q4 2014
Following several months of testing three pricing structures across multiple markets, on December 2, 2014, we increased prices for daily DVD and Blu-ray rentals in the U.S. to $1.50 and $2.00, respectively. Price test results indicated that these price points would yield the greatest positive revenue impact and provide the highest overall margin benefit despite a resulting decrease in demand, particularly from the mostprice-sensitive customers. The new pricing maintains our consumer promise of providing the best value in the marketplace for new release content and will help offset the secular decline in the physical rental market.
The benefit from the price increase to revenue in December 2014 was greater than we expected due to the robust content slate and holiday seasonality that attracted customers and lessened the impact of increased price on rental demand. In fact, the week of December 29 marked the highest rental week in Redbox history, led by strong new release titlesThe Equalizer andDawn of the Planet of the Apes.
We expect the impact of the price increase to vary as demand changes during periods of stronger and weaker release schedules and seasonality. Also, our more price-sensitive customers may change their rental habits over time in response to the new prices, which could have an impact on total rentals or nights out.
©2015 Outerwall Inc. All Rights Reserved. These materials may not be reproduced, altered or distributed without the express written consent of Outerwall Inc.
Page 7
Outerwall Inc. 2014 Fourth Quarter and Full Year Earnings
Prepared Remarks
February 5, 2015
Segment Operating Results
The benefit of the price increase in December helped offset lower demand from weaker content in September and early October that negatively impacted rentals at the beginning of Q4 2014.
While Q4 2014 rentals decreased 5.6% to 181.3 million compared with 192.0 million in Q4 2013, Redbox revenue of $494.0 million in Q4 2014 was relatively flat compared with Q4 2013. The year-over-year decline in rentals in Q4 2014 was primarily due to the underperformance of certain movie and video game titles earlier in the quarter, moderately lower demand from price-sensitive customers following the December price increase, and an impact from secular decline.
The top performing titles in Q4 2014 included the comedies22 Jump Street andNeighbors. While Q4 box office was 23% greater than box office in Q4 2013, weaker content in September and early October offset the stronger content in November and December. September box office was 46% below the prior year and resulted in 13% fewer rentals of September titles during Q4 2014 compared with Q4 2013.
Unique credit cards renting in Q4 2014 were 39.1 million, a decrease of 3.0% year-over-year. However, unique credit cards renting increased 1% sequentially from Q3 2014. Similarly, high frequency renters, customers that rent four or more titles per quarter, represented 54.0% of revenue in Q4 2014, a decline from 57.2% in Q4 2013, but an increase sequentially compared with 52.1% in Q3 2014.
In November 2014, we launched Redbox Play Pass, our new loyalty program, which quickly scaled to 1.5 million members by year-end. During Q4, members who participated in Redbox Play Pass exhibited an increase in rentals and frequency. We expect Redbox Play Pass to drive continued improvement in customer engagement and rental frequency based on a year-long, in-market test. In addition, we continue to expand the Redbox digital network of consumer touch points with substantial year-over-year growth across all categories in Q4, including 39 million email subscribers, 22% growth; 6 million text club members, 49% growth; and 27.7 million apps downloaded, 16% growth.
Average check of $2.72 increased 5.4% compared with Q4 2013 and 7.1% sequentially compared with Q3 2014, primarily as a result of the price increase and the continued shift to Blu-ray in Q4. Blu-ray represented 15.3% of rentals and 18.4% of revenue in Q4, increasing from 14.2% of rentals and 16.3% of revenue in Q4 2013 due to larger quantities of Blu-ray titles in the kiosks, targeted marketing, and Blu-ray upsell online and at the kiosk. The top performing Blu-ray titles in Q4 wereTransformers: Age of Extinctionand22 Jump Street.
Single-night rentals represented 58.1% of total rentals, an increase of only 20 basis points year-over-year as our more targeted and efficient promotional activity helped offset the impact of the December movie price increase.
In Q4 2014, Redbox segment operating income increased 8.9% year-over-year to $121.3 million and segment operating margin increased 220 basis points to 24.6%, primarily reflecting a decrease in direct operating and G&A expenses. Direct operating expenses in Q4 2014 included a one-time adjustment of $5.6 million related to personal property taxes due to a reduction of the estimated liability. Gross margin in Q4 decreased 100 basis points year-over-year to 57.5%, mainly due to product and studio mix, but improved 70 basis points sequentially compared with Q3 2014.
©2015 Outerwall Inc. All Rights Reserved. These materials may not be reproduced, altered or distributed without the express written consent of Outerwall Inc.
Page 8
Outerwall Inc. 2014 Fourth Quarter and Full Year Earnings
Prepared Remarks
February 5, 2015
Video Games Rentals and Revenue
| | | | | | | | |
Video Games Performance | | Q4 2014 | | | Q4 2013 | |
Percentage of rentals | | | 2.6 | % | | | 2.7 | % |
Percentage of Redbox revenue | | | 5.7 | % | | | 6.1 | % |
In Q4 2014, video games rentals and revenue declined compared with Q4 2013 as we purchased less game content due to an anticipated decline in Wii platform rentals and consumer transition to new generation platforms. In addition, certain key titles that underperformed at sell-through also underperformed as rentals. We continue to test video game rentals for new generation platforms, including Xbox One and Playstation 4, in 5,000 kiosks. Also, we plan to expand new generation titles more broadly in 2015 as demand from our consumers for the new platforms increases.
Kiosk Optimization
We continue to optimize our network as we collaborate with our retail partners to improve kiosk productivity at existing locations and remove unproductive kiosks that underperform our revenue expectations for kiosks in their respective channels. Our goal is to recapture rentals from removed kiosks in the remaining network through targeted marketing that keeps customers engaged, while lowering content and servicing costs due to a smaller installed base.
Canada
In January 2015, we made the decision to shut down our Redbox operations in Canada due to its continued negative impact on Redbox’s financial results. While the offering built good momentum throughout 2014 with the support of our retail partners, it did not reach our targeted level of performance. As a result, we recognized additional expense, net of tax, of $1.5 million in Q4 2014 related to accelerated recognition of content library and capitalized install costs on property and equipment. The remaining value of the content library and capitalized install costs will be amortized over an expected three month wind-down period. We anticipate using the Canadian kiosks in the U.S. as replacement kiosks as needed. Following the final shutdown of the operations in Canada, we expect Redbox Canada results will be reported as a discontinued operation.
Studio Agreements
As previously announced, during Q4 2014, we extended our agreement with Paramount under the existing terms and signed a new agreement with Lionsgate that created value for both parties. We are in active discussions with Warner Brothers and working to find an agreement that reflects our mutual interests in satisfying consumers and adding value to the home entertainment category. Our studio partnership strategy includes establishing shorter-term contracts that provide greater flexibility to meet the future needs of the industry and the business, including capitalizing on the large-scale consumer demand for quality new release content from Redbox.
©2015 Outerwall Inc. All Rights Reserved. These materials may not be reproduced, altered or distributed without the express written consent of Outerwall Inc.
Page 9
Outerwall Inc. 2014 Fourth Quarter and Full Year Earnings
Prepared Remarks
February 5, 2015
Coinstar
Q4 Key Metrics
| | | | | | | | |
Category | | Q4 2014 | | | Q4 2013 | |
Revenue | | $ | 81.9 | MM | | $ | 80.7 | MM |
Average transaction | | $ | 44.45 | | | $ | 43.82 | |
Transactions | | $ | 17.9 | MM | | $ | 18.5 | MM |
Same store sales (SSS) growth | | | 3.3 | % | | | 5.9 | % |
Segment operating income | | $ | 33.6 | MM | | $ | 30.8 | MM |
Segment operating margin | | | 41.0 | % | | | 38.2 | % |
Kiosks (at quarter end) | | | 21,340 | | | | 20,900 | |
Locations (at quarter end) | | | 20,250 | | | | 20,600 | |
Coinstar Segment Operating Results
Coinstar revenue increased $1.2 million, or 1.5%, compared with Q4 2013 primarily due to growth in the number of installed Coinstar Exchange kiosks, a price increase implemented across all grocery retail locations in the U.K. effective August 1, 20143, and higher volume in the U.K. due to an increase in the U.K. kiosk base.
Average transaction size continued to increase in Q4, while the number of transactions declined. The decline in transactions is the result of larger pours and less frequent visits, and a decrease in the U.S. kiosk base as a result of our optimization efforts that include removing or relocating underperforming kiosks, achieving optimal market density, and leveraging efficiencies in coin handling and field operations.
Coinstar segment operating income increased $2.7 million, or 8.9%, compared with Q4 2013, and segment operating margin was 41.0%, an increase of 280 basis points year-over-year. The increases in segment operating income and margin reflect an increase in revenue and our continued focus on managing costs and increasing productivity in the business.
| 3 | On August 1, 2014, the coin voucher product transaction fee was raised to 9.9% from 8.9% for all U.K. grocery retail locations |
©2015 Outerwall Inc. All Rights Reserved. These materials may not be reproduced, altered or distributed without the express written consent of Outerwall Inc.
Page 10
Outerwall Inc. 2014 Fourth Quarter and Full Year Earnings
Prepared Remarks
February 5, 2015
New Ventures
Q4 2014 Key Metrics
| | | | | | | | |
Category | | Q4 2014 | | | Q4 2013 | |
Revenue | | $ | 24.7 | MM | | $ | 16.6 | MM |
Segment operating loss | | $ | 12.2 | MM | | $ | 7.4 | MM |
Total kiosks | | | 1,980 | | | | 900 | |
ecoATM kiosks | | | 1,890 | | | | 880 | |
New Ventures Segment Operating Results
New Ventures segment operating results primarily reflect the operations and performance of ecoATM. Beginning in Q1 2015, we expect to report ecoATM results as a separate segment.
We installed approximately 430 kiosks in Q4 2014, bringing the total number of New Ventures kiosks, including ecoATM and SAMPLEit, to 1,980 at December 31, 2014. We installed approximately 380 net new ecoATM kiosks during the quarter, primarily in the grocery channel, ending the year with 1,890 ecoATM kiosks. Relative to our mall and mass merchant channels, sites in the grocery channel typically are smaller in overall square footage and have less foot traffic. As a result, we expect ecoATM kiosks in the grocery channel to ramp slower than our mall and mass merchant kiosks.
New Ventures segment revenue in Q4 2014 grew 48.9% compared with Q4 2013 primarily due to the increased number of installed ecoATM kiosks and continued ramping of kiosks that were deployed in 2014. New Ventures segment revenue decreased sequentially from $29.7 million in Q3 2014 primarily due to seasonality, a lower mix of high value devices and a lower average selling price in the secondary market. Additionally, the highly successful launch of the iPhone 6/6+ in September 2014 caused a significant increase in device trade-ins that lowered resale values in the secondary market to below historical levels.
In 2013 and 2014, Q3 was our best quarter from a seasonality perspective. During Q4 2014, there was a substantial increase in carrier promotions that resulted in lower device collections and a decrease in the average selling price of devices in the secondary market. Similar to what we saw in Q4 2014, as we move into Q1 2015, we expect less promotional advertising by the carriers and our average selling price to start to trend upward.
New Ventures direct operating expense was $28.9 million in Q4 2014 compared with $16.6 million in Q4 2013. This year-over-year increase primarily reflects the necessary investments to support and grow ecoATM and our investment in SAMPLEit. Expenses include acquiring, transporting and processing mobile devices at ecoATM, servicing kiosks and payments to retailers.
Sequentially, New Ventures direct operating expense increased from $27.0 million in Q3 2014 primarily due to the fixed costs per kiosk associated with additional ecoATM installations, continued investments necessary to scale and grow ecoATM, and our ongoing investment in SAMPLEit. As a percentage of revenue, in Q4 direct operating expense was higher than Q3 2014 due to lower than expected Q4 revenue.
©2015 Outerwall Inc. All Rights Reserved. These materials may not be reproduced, altered or distributed without the express written consent of Outerwall Inc.
Page 11
Outerwall Inc. 2014 Fourth Quarter and Full Year Earnings
Prepared Remarks
February 5, 2015
In 2015, our marketing focus will be on increasing the performance of our existing kiosks by better understanding our core customer. We will use this insight to drive higher collections of devices throughin-store promotions and continuous marketing to customers in our key demographic segments. We also plan on accelerating the ramp time of new installs in our mass merchant channel with our kiosk jumpstart program that uses regular marketing support to build awareness.
Non-Core Results
In Q4 2014, total pretax non-core expenses were $710,000 including $3.2 million in expense in rights to receive cash issued in connection with the acquisition of ecoATM offset by $2.5 million in income from equity method investments related to our withdrawal from the Redbox Instant™ by Verizon joint venture during Q4.
Guidance
As previously communicated, beginning this year, we are providing annual guidance only and expect to update our annual guidance as appropriate when we report financial results each quarter.
There are several factors that influence our 2015 expectations, including the impact of pricing, the timing and number of net kiosk installations, the new release schedule and strength of content, and our ability to further align costs with revenue.
For the full-year 2015, we expect:
| | • | | consolidated revenue in the range of $2.314 billion to $2.464 billion, |
| | • | | core adjusted EBITDA from continuing operations of between $467 million and $512 million, and |
| | • | | core diluted earnings per share between $6.71 and $7.71 for the full-year 2015, which does not reflect any share repurchases we may complete during the year. |
In 2015, there are several factors influencing Redbox revenue that we expect will help partially offset the secular decline in the physical rental market and the underlying risk in the content slate, including the recently implemented price increase, continued product mix shift to Blu-ray and games, and benefits resulting from investments in customer experience and marketing programs. We also expect that revenue will be impacted by a lower box office for titles releasing at Redbox in 2015 compared with 2014.
Our 2015 guidance also incorporates anticipated lower rental demand and shorter average rental duration as a result of the price increase that partially offset the increase in consumer price per night. We will continue to monitor the impact of the price increases on consumer rental behavior and revenue through varying product strength and seasonality throughout the year.
Redbox continues to offer the best value in home entertainment, and we continue to build stronger, more personalized relationships with our consumers via web, email and mobile marketing tools. The price increase will support investments in several initiatives to enhance customer experience and drive engagement, including enhanced merchandising tools that offer title recommendations, more personalized interfaces at the kiosk and on digital platforms, and enhancements to our Redbox Play Pass loyalty program.
©2015 Outerwall Inc. All Rights Reserved. These materials may not be reproduced, altered or distributed without the express written consent of Outerwall Inc.
Page 12
Outerwall Inc. 2014 Fourth Quarter and Full Year Earnings
Prepared Remarks
February 5, 2015
Rental demand in 2015 is estimated to decline compared with 2014 primarily due to the price increase, lower box office and secular decline, but is expected to be partially offset by new marketing initiatives and investments in customer experience as described above.
Our 2015 guidance is based on our expectation that the box office of titles releasing at Redbox in 2015 will decrease from 2014 with fewer titles driven by the 16% decline in theatrical box office in the second half of 2014 compared with 2013. Q1 2015 box office for Redbox releases is expected to be 31% below Q1 2014 with eight fewer theatrical titles releasing during the quarter, offsetting the benefit of the price increase. We expect content strength to improve in Q2 2015 as the 2014 slate was particularly weak, bringing the first half of 2015 box office down low double-digits compared with 2014.
While it is hard to predict how theatrical releases will perform and studio slates will evolve throughout the course of the year, our assumptions include a box office estimate for the second half of 2015 that is flat to slightly down compared with 2014. Consistent with historical patterns, we expect stronger seasonality in the first and fourth quarters of 2015.
We also expect that our continued focus on operational efficiencies and network optimization will drive additional profit growth for Redbox in 2015. We continue to collaborate with our retail partners to improve kiosk productivity at existing locations and remove unproductive kiosks. We expect to remove 1,000 to 1,900 U.S. kiosks in 2015, helping to improve revenue per kiosk growth, while lowering content and servicing costs due to a smaller installed base.
Our revenue guidance excludes revenue for Redbox Canada as we expect that once it is shut down, its results will be reported as a discontinued operation reducing the negative impact in 2015 and prior periods.
In our Coinstar segment, we expect revenue to be flat compared with 2014. Note that 2014 revenue in the Coinstar segment benefited from a U.S. price increase that was implemented in October 2013.
In 2015, we will continue to invest in growing and scaling ecoATM. We expect New Ventures segment revenue to be in the range of between $166 million to $181 million and an increase of 600 to 1,200 net new kiosks in 2015. The lower installs in 2015 compared with 2014 is partially driven by our focus on the ecoATM business moving to segment operating breakeven in the first half of the year based on the current timing of expected installs. Beginning in Q1 2015, we expect to report ecoATM as a separate segment.
We expect free cash flow in 2015 to be in the range of between $205 million and $245 million, due to slightly higher CAPEX, an increase in cash taxes, and working capital. The company remains committed to our current policy of returning 75% to 100% of annual FCF to shareholders, which includes share repurchases and quarterly cash dividend payments.
Other factors impacting our 2015 annual guidance include:
| | • | | higher incentive compensation expense in 2015 compared with reduced incentive compensation for 2014, and |
| | • | | $5.6 million related to a Redbox personal property tax accrual that was reversed in 2014 and will not recur in 2015. |
©2015 Outerwall Inc. All Rights Reserved. These materials may not be reproduced, altered or distributed without the express written consent of Outerwall Inc.
Page 13
Outerwall Inc. 2014 Fourth Quarter and Full Year Earnings
Prepared Remarks
February 5, 2015
Summary
We accomplished much in 2014 despite challenging market dynamics, and our actions pave the way for 2015 and beyond. In 2014, we successfully implemented a Redbox price increase and extended existing and signed new content agreements with our studio partners. We signed several new ecoATM retail partner agreements as we continued to ramp and scale the business. Also, as part of our strategy, G&A improved as we continued to leverage our existing platforms to achieve operational efficiencies across the company and align costs with revenue. Finally, we delivered on our commitment to return capital to shareholders through share repurchases.
Our position as a leader in automated retail will allow us to continue to provide consumers with compelling products and services that create value for our partners and shareholders alike to ensure we deliver sustainable, long-term growth for the company.
©2015 Outerwall Inc. All Rights Reserved. These materials may not be reproduced, altered or distributed without the express written consent of Outerwall Inc.
Page 14
Outerwall Inc. 2014 Fourth Quarter and Full Year Earnings
Prepared Remarks
February 5, 2015
Appendix A
Non-GAAP Financial Measures
Non-GAAP measures may be provided as a complement to results provided in accordance with United States generally accepted accounting principles (“GAAP”).
We use the following non-GAAP financial measures to evaluate our financial results:
| | • | | Core adjusted EBITDA from continuing operations; |
| | • | | Core diluted earnings per share (“EPS”) from continuing operations; |
| | • | | Net debt and net leverage ratio. |
These measures, the definitions of which are presented below, are non-GAAP because they exclude certain amounts which are included in the most directly comparable measure calculated and presented in accordance with GAAP. Our non-GAAP financial measures are not meant to be considered in isolation or as a substitute for our GAAP financial measures and may not be comparable with similarly titled measures of other companies.
Core and Non-Core Results
We distinguish our core activities, those associated with our primary operations which we directly control, from non-core activities. Non-core activities are primarily nonrecurring events or events we do not directly control. Our non-core adjustments for the periods presented include, but not limited to, i) restructuring costs associated with actions to reduce costs in our continuing operations primarily through workforce reductions across the Company, ii) acquisition costs primarily related to the acquisition of ecoATM, iii) compensation expense for rights to receive cash issued in conjunction with our acquisition of ecoATM and attributable to post-combination services as they are fixed amount acquisition related awards and not indicative of the directly controllable future business results, iv) income or loss from equity method investments, which represents our share of income or loss from entities we do not consolidate or control and includes the impacts of the gain on re-measurement of our previously held equity interest in ecoATM upon acquisition, v) benefits from release of indemnification reserves upon settlement of the Sigue Note and vi) tax benefits related to a net operating loss adjustment and the recognition of a worthless stock deduction in a corporate subsidiary (“Non-Core Adjustments”).
We believe investors should consider our core results because they are more indicative of our ongoing performance and trends, are more consistent with how management evaluates our operational results and trends, provide meaningful supplemental information to investors through the exclusion of certain expenses which are either nonrecurring or may not be indicative of our directly controllable business operating results, allow for greater transparency in assessing our performance, help investors better analyze the results of our business and assist in forecasting future periods.
©2015 Outerwall Inc. All Rights Reserved. These materials may not be reproduced, altered or distributed without the express written consent of Outerwall Inc.
Page 15
Outerwall Inc. 2014 Fourth Quarter and Full Year Earnings
Prepared Remarks
February 5, 2015
Core Adjusted EBITDA from continuing operations
Our non-GAAP financial measure core adjusted EBITDA from continuing operations is defined as earnings from continuing operations before depreciation, amortization and other; interest expense, net; income taxes; share-based payments expense; and Non-Core Adjustments.
A reconciliation of core adjusted EBITDA from continuing operations to net income from continuing operations, the most comparable GAAP financial measure, is presented in the following table:
| | | | | | | | | | | | | | | | |
| | | Three Months Ended | | | Year Ended | |
| | | December 31, | | | December 31, | |
| Dollars in thousands | | 2014 | | | 2013 | | | 2014 | | | 2013 | |
Net income from continuing operations | | $ | 43,800 | | | $ | 42,876 | | | $ | 107,386 | | | $ | 208,091 | |
Depreciation, amortization and other | | | 52,333 | | | | 52,853 | | | | 209,870 | | | | 203,094 | |
Interest expense, net | | | 12,599 | | | | 6,848 | | | | 47,636 | | | | 32,801 | |
Income tax expense (benefit) | | | 28,294 | | | | (289 | ) | | | 59,748 | | | | 34,477 | |
Share-based payments expense(1) | | | 3,291 | | | | 5,377 | | | | 13,384 | | | | 16,831 | |
| | | | | | | | | | | | | | | | |
Adjusted EBITDA from continuing operations | | | 140,317 | | | | 107,665 | | | | 438,024 | | | | 495,294 | |
Non-Core Adjustments: | | | | | | | | | | | | | | | | |
Restructuring costs | | | — | | | | 4,495 | | | | 469 | | | | 4,495 | |
Acquisition costs | | | — | | | | — | | | | — | | | | 5,669 | |
Rights to receive cash issued in connection with the acquisition of ecoATM | | | 3,237 | | | | 6,364 | | | | 13,270 | | | | 8,664 | |
(Income) loss from equity method investments, net | | | (2,527 | ) | | | 21,352 | | | | 28,734 | | | | 48,448 | |
Sigue indemnification reserve releases | | | — | | | | (2,542 | ) | | | — | | | | (2,542 | ) |
Gain on previously held equity interest in ecoATM | | | — | | | | — | | | | — | | | | (68,376 | ) |
| | | | | | | | | | | | | | | | |
Core adjusted EBITDA from continuing operations | | $ | 141,027 | | | $ | 137,334 | | | $ | 480,497 | | | $ | 491,652 | |
| | | | | | | | | | | | | | | | |
| (1) | Includes both non-cash share-based compensation for executives, non-employee directors and employees as well as share-based payments for content arrangements. |
©2015 Outerwall Inc. All Rights Reserved. These materials may not be reproduced, altered or distributed without the express written consent of Outerwall Inc.
Page 16
Outerwall Inc. 2014 Fourth Quarter and Full Year Earnings
Prepared Remarks
February 5, 2015
Core Diluted EPS from continuing operations
Our non-GAAP financial measure core diluted EPS from continuing operations is defined as diluted earnings per share from continuing operations excluding Non-Core Adjustments, net of applicable taxes.
A reconciliation of core diluted EPS from continuing operations to diluted EPS from continuing operations, the most comparable GAAP financial measure, is presented in the following table:
| | | | | | | | | | | | | | | | |
| | | Three Months Ended | | | Year Ended | |
| | December 31, | | | December 31, | |
| | | 2014 | | | 2013 | | | 2014 | | | 2013 | |
Diluted EPS from continuing operations | | $ | 2.35 | | | $ | 1.55 | | | $ | 5.19 | | | $ | 7.33 | |
Non-Core Adjustments, net of tax:(1) | | | | | | | | | | | | | | | | |
Restructuring costs | | | — | | | | 0.10 | | | | 0.01 | | | | 0.10 | |
Acquisition costs | | | — | | | | 0.02 | | | | — | | | | 0.17 | |
Rights to receive cash issued in connection with the acquisition of ecoATM | | | 0.17 | | | | 0.20 | | | | 0.53 | | | | 0.25 | |
(Income) loss from equity method investments, net | | | (0.08 | ) | | | 0.47 | | | | 0.85 | | | | 1.04 | |
Sigue indemnification reserve releases | | | — | | | | (0.06 | ) | | | — | | | | (0.05 | ) |
Gain on previously held equity interest on ecoATM | | | — | | | | — | | | | — | | | | (2.33 | ) |
Tax benefit from net operating loss adjustment | | | — | | | | — | | | | (0.05 | ) | | | — | |
Tax benefit of worthless stock deduction | | | — | | | | (0.60 | ) | | | (0.10 | ) | | | (0.59 | ) |
| | | | | | | | | | | | | | | | |
Core diluted EPS from continuing operations | | $ | 2.44 | | | $ | 1.68 | | | $ | 6.43 | | | $ | 5.92 | |
| | | | | | | | | | | | | | | | |
| (1) | Non-Core Adjustments are presented after-tax using the applicable effective tax rate for the respective periods. |
Free Cash Flow
Our non-GAAP financial measure free cash flow is defined as net cash provided by operating activities after capital expenditures. We believe free cash flow is an important non-GAAP measure as it provides additional information to users of the financial statements regarding our ability to service, incur or pay down indebtedness and repurchase our securities. A reconciliation of free cash flow to net cash provided by operating activities, the most comparable GAAP financial measure, is presented in the following table:
| | | | | | | | | | | | | | | | |
| | | Three Months Ended | | | Year Ended | |
| | | December 31, | | | December 31, | |
| Dollars in thousands | | 2014 | | | 2013 | | | 2014 | | | 2013 | |
Net cash provided by operating activities | | $ | 131,304 | | | $ | 180,713 | | | $ | 338,351 | | | $ | 327,834 | |
Purchase of property and equipment | | | (25,613 | ) | | | (38,066 | ) | | | (97,924 | ) | | | (161,412 | ) |
| | | | | | | | | | | | | | | | |
Free cash flow | | $ | 105,691 | | | $ | 142,647 | | | $ | 240,427 | | | $ | 166,422 | |
| | | | | | | | | | | | | | | | |
©2015 Outerwall Inc. All Rights Reserved. These materials may not be reproduced, altered or distributed without the express written consent of Outerwall Inc.
Page 17
Outerwall Inc. 2014 Fourth Quarter and Full Year Earnings
Prepared Remarks
February 5, 2015
Net Debt and Net Leverage Ratio
Our non-GAAP financial measure net debt is defined as the total face value of outstanding debt, including capital leases, less cash and cash equivalents held in financial institutions domestically. Our non-GAAP financial measure net leverage ratio is defined as net debt divided by core adjusted EBITDA from continuing operations for the last twelve months (LTM). We believe net debt and net leverage ratio are important non-GAAP measures because they:
| | • | | are used to assess the degree of leverage by management; |
| | • | | provide additional information to users of the financial statements regarding our ability to service, incur or pay down indebtedness and repurchase our securities as well as additional information about our capital structure; and |
| | • | | are reported quarterly to support covenant compliance under our credit agreement. |
A reconciliation of net debt to total outstanding debt including capital leases, the most comparable GAAP financial measure, is presented in the following table:
| | | | | | | | |
| | | December 31, | |
| Dollars in thousands | | 2014 | | | 2013 | |
Senior unsecured notes(1) | | $ | 650,000 | | | $ | 350,000 | |
Term loans(1) | | | 146,250 | | | | 344,375 | |
Revolving line of credit | | | 160,000 | | | | — | |
Convertible debt(2) | | | — | | | | 51,148 | |
Capital leases | | | 15,391 | | | | 21,361 | |
| | | | | | | | |
Total principal value of outstanding debt including capital leases | | | 971,641 | | | | 766,884 | |
Less domestic cash and cash equivalents held in financial institutions | | | (66,546 | ) | | | (199,027 | ) |
| | | | | | | | |
Net debt | | | 905,095 | | | | 567,857 | |
LTM Core adjusted EBITDA from continuing operations | | $ | 480,497 | | | $ | 491,652 | |
| | | | | | | | |
Net leverage ratio | | | 1.88 | | | | 1.15 | |
| (1) | The senior unsecured notes on our Consolidated Balance Sheets as of December 31, 2014 and December 31, 2013 included $8.4 million and $5.3 million in associated debt discount, respectively. The Term loan on our Consolidated Balance Sheets as of December 31, 2014 included $0.3 million in associated debt discount. There was no associated debt discount with the Term loans as of December 31, 2013. |
| (2) | The convertible debt balance on our Consolidated Balance Sheet as of December 31, 2013 included $1.4 million in associated debt discount. |
©2015 Outerwall Inc. All Rights Reserved. These materials may not be reproduced, altered or distributed without the express written consent of Outerwall Inc.
Page 18
|
Supplementary Slides 2014 Q4 Prepared Remarks February 5, 2015 NASDAQ:OUTR |
|
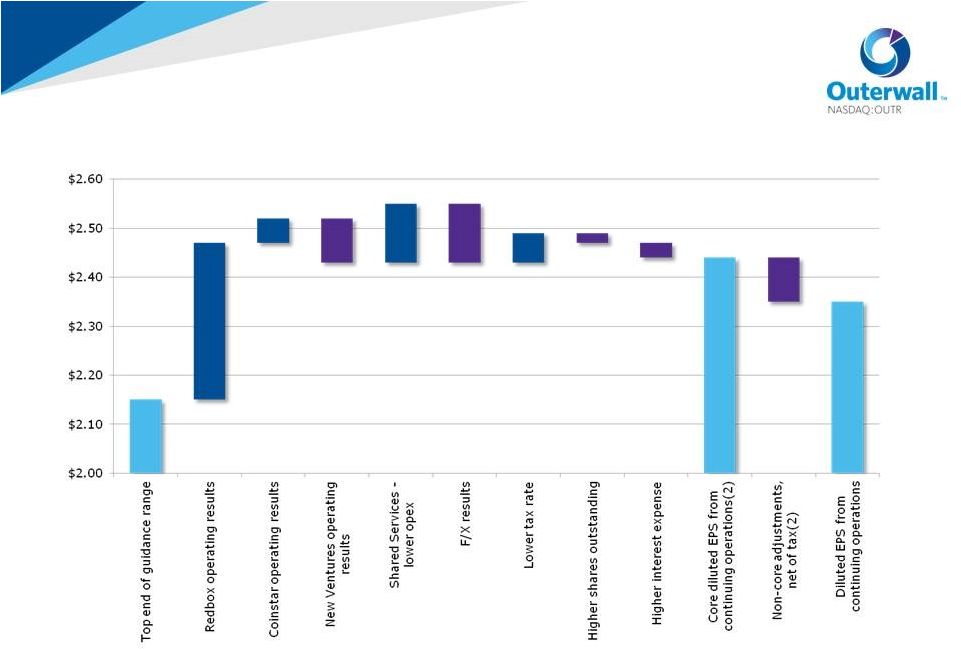
© 2015 Outerwall Inc. All Rights Reserved. These materials may not be reproduced, altered, or distributed without the express written consent of Outerwall Inc. S – 2 2014 Q4 EPS Bridge Actual results versus guidance as of October 30, 2014 (1) $2.15 $0.32 $0.05 $0.12 $(0.12) $0.06 $(0.03) $2.44 $(0.09) $2.35 $(0.09) $(0.02) (1) On January 20, 2015, the company narrowed its guidance for core diluted EPS from continuing operations for the fourth quarter of 2014 to between $2.40 and $2.52 (2) Refer to Appendix A for a discussion of Non-GAAP Financial Measures and Core and Non-Core Results |
|
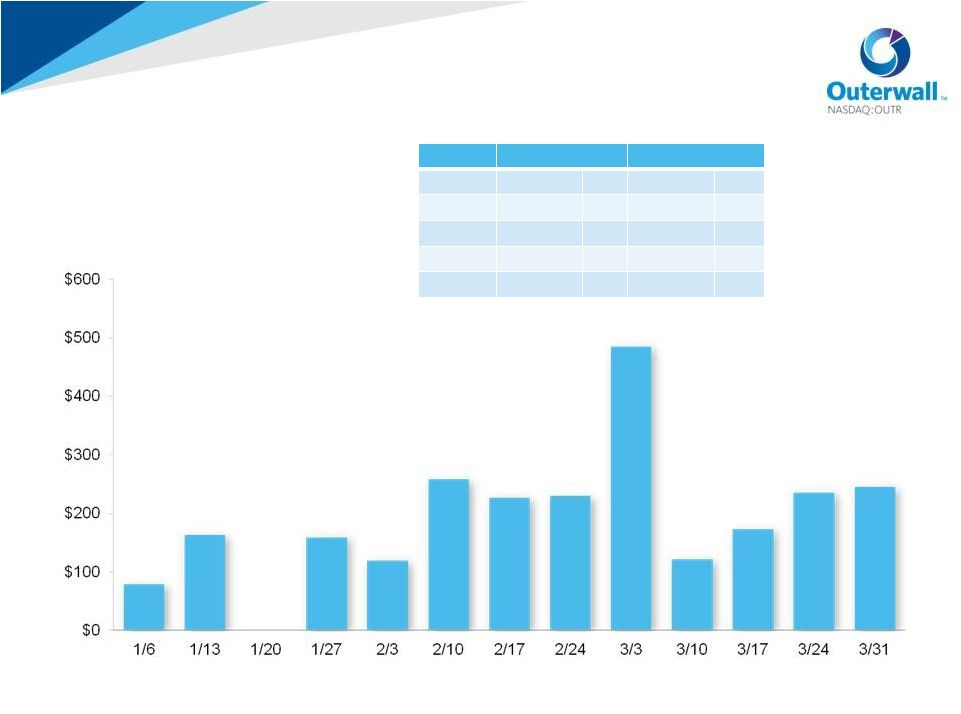
© 2015 Outerwall Inc. All Rights Reserved. These materials may not be reproduced, altered, or distributed without the express written consent of Outerwall Inc. S – 3 2015 Q1 Redbox Release Schedule 1 Q1 2015 data estimated 2 Includes titles with total North American box office greater than $5MM Q1 2015 1 Q1 2014 Box Office 2 Titles Box Office 2 Titles Total $2.50Bn 37 $3.64Bn 45 January $401.0MM 7 $1.48Bn 18 February $834.1MM 13 $450.7MM 12 March $1.26Bn 17 $1.71Bn 15 As of February 5, 2015 Box Office² (MM) 2 4 4 4 2 0 3 2 5 4 2 2 3 # of new releases = |
|
© 2015 Outerwall Inc. All Rights Reserved. These materials may not be reproduced, altered, or distributed without the express written consent of Outerwall Inc. S – 4 2015 Full-Year Guidance As of February 5, 2015 Revenue by Segment ($MM) Redbox $1,835 – $1,965 Coinstar $313 – $318 New Ventures $166 – $181 TOTAL $2,314 – $2,464 Consolidated – Other Core adjusted EBITDA from continuing operations 1 ($MM) $467 – $512 Core diluted EPS from continuing operations 1,2 $6.71 – $7.71 Average diluted shares outstanding 2 (MM) 18.6 – 18.9 Estimated effective tax rate 36% – 38% Free cash flow 1 ($MM) $205 – $245 Capital Expenditures ($MM) Redbox $17 – $22 Coinstar $16 – $20 New Ventures $39 – $48 Corporate $28 – $35 TOTAL $100 – $125 Net Kiosk Installations by Segment Redbox (U.S.) 3 (1,000) – (1,900) Coinstar 0 – (100) New Ventures 600 – 1,200 1 2 Excludes the impact of potential share repurchases in 2015 3 Does not include kiosks in Canada as the company is shutting down its Redbox Canada operations in 2015 See Appendix A for a discussion of Non-GAAP Financial Measures and Core and Non-Core Results |