Exhibit 99.2
Outerwall Inc. 2015 Third Quarter Earnings
Prepared Remarks
October 29, 2015
Today, October 29, 2015, Outerwall Inc. issued a press release announcing financial results for the 2015 third quarter. The following prepared remarks provide additional information related to the company’s operating and financial performance and 2015 full year guidance.
The company will host a conference call today at 2:30 p.m. PDT to discuss 2015 third quarter results and 2015 full year guidance.
The earnings press release, prepared remarks and conference call webcast are available on the Investor Relations section of Outerwall’s website at ir.outerwall.com.
Safe Harbor for Forward-Looking Statements
Certain statements in these prepared remarks are “forward-looking statements” within the meaning of the Private Securities Litigation Reform Act of 1995. The words “believe,” “estimate,” “expect,” “intend,” “will,” “anticipate,” “goals,” variations of such words, and similar expressions identify forward-looking statements, but their absence does not mean that the statement is not forward-looking. The forward-looking statements in these prepared remarks include statements regarding Outerwall Inc.’s anticipated growth and future operating results, including 2015 full year results. Forward-looking statements are not guarantees of future performance and actual results may vary materially from the results expressed or implied in such statements. Differences may result from actions taken by Outerwall Inc. or its subsidiaries, as well as from risks and uncertainties beyond Outerwall Inc.’s control. Such risks and uncertainties include, but are not limited to,
| | • | | competition from other entertainment providers, |
| | • | | the ability to achieve the strategic and financial objectives for our entry into new businesses, including ecoATM and SAMPLEit, |
| | • | | our ability to repurchase stock and the availability of an open trading window, |
| | • | | our declaration and payment of dividends, including our board’s discretion to change the dividend policy, |
| | • | | the termination, non-renewal or renegotiation on materially adverse terms of our contracts with our significant retailers and suppliers, |
| | • | | payment of increased fees to retailers, suppliers and other third-party providers, including financial service providers, |
| | • | | the timing of new DVD releases and the inability to receive delivery of DVDs on the date of their initial release to the general public, or shortly thereafter, or in sufficient quantity, for home entertainment viewing, |
| | • | | the effective management of our content library, |
| | • | | the timing of the release slate and the relative attractiveness of titles in a particular quarter or year, |
| | • | | the ability to attract new retailers, penetrate new markets and distribution channels and react to changing consumer demands, |
| | • | | loss of key personnel or the inability of replacements to quickly and successfully perform in those new roles, |
| | • | | the ability to generate sufficient cash flow to timely and fully service indebtedness and adhere to certain covenants and restrictions, |
| | • | | the ability to adequately protect our intellectual property, and |
| | • | | the application of substantial federal, state, local and foreign laws and regulations specific to our business. |
The foregoing list of risks and uncertainties is illustrative, but by no means exhaustive. For more information on factors that may affect future performance, please review “Risk Factors” described in our most recent Annual Report on Form 10-K and any subsequent Quarterly Reports on Form 10-Q filed with the Securities and Exchange Commission. These forward-looking statements reflect Outerwall Inc.’s expectations as of the date of these prepared remarks. Outerwall Inc. undertakes no obligation to update the information provided herein.
©2015 Outerwall Inc. All Rights Reserved. These materials may not be reproduced, altered or distributed without the express written consent of Outerwall Inc.
Outerwall Inc. 2015 Third Quarter Earnings
Prepared Remarks
October 29, 2015
Non-GAAP Financial Measures
Non-GAAP measures may be provided as a complement to results provided in accordance with United States generally accepted accounting principles (“GAAP”).
We use the following non-GAAP financial measures to evaluate our financial results:
| | • | | Core adjusted EBITDA from continuing operations; |
| | • | | Core diluted earnings per share (“EPS”) from continuing operations; |
| | • | | Net debt and net leverage ratio. |
These measures, the definitions of which are presented in Appendix A, are non-GAAP because they exclude certain amounts which are included in the most directly comparable measure calculated and presented in accordance with GAAP. Our non-GAAP financial measures are not meant to be considered in isolation or as a substitute for our GAAP financial measures and may not be comparable with similarly titled measures of other companies.
Core and Non-Core Results
We distinguish our core activities, those associated with our primary operations which we directly control, fromnon-core activities. Non-core activities are primarily nonrecurring events or events we do not directly control. Ournon-core adjustments for the periods presented include i) goodwill impairment, ii) restructuring costs (including severance and early lease termination costs and related impairment of assets) associated with actions to reduce costs in our continuing operations across the Company, iii) compensation expense for rights to receive cash issued in conjunction with our acquisition of ecoATM and attributable to post-combination services as they are fixed amount acquisition related awards and not indicative of the directly controllable future business results, iv) income or loss from equity method investments, which represents our share of income or loss from entities we do not consolidate or control, v) tax benefits related to a net operating loss adjustment, and vi) tax benefit related to worthless stock deduction (“Non-Core Adjustments”).
We believe investors should consider our core results because they are more indicative of our ongoing performance and trends, are more consistent with how management evaluates our operational results and trends, provide meaningful supplemental information to investors through the exclusion of certain expenses which are either nonrecurring or may not be indicative of our directly controllable business operating results, allow for greater transparency in assessing our performance, help investors better analyze the results of our business and assist in forecasting future periods.
©2015 Outerwall Inc. All Rights Reserved. These materials may not be reproduced, altered or distributed without the express written consent of Outerwall Inc.
Page 2
Outerwall Inc. 2015 Third Quarter Earnings
Prepared Remarks
October 29, 2015
Overview
Our third quarter results demonstrate our ability to drive increased profitability despite an exceptionally weak content schedule that impacted revenue. We continued to drive operational excellence and manage expenses across the organization, and generated strong free cash flow, which more than doubled year-over-year. We also delivered solid growth in core adjusted EBITDA and core diluted EPS from continuing operations and maintained our balanced approach to capital allocation as we repurchased $60.8 million of stock during the quarter, paid $0.30 per share in quarterly dividends and paid down $37.8 million of debt.
Q3 Consolidated Results
The year-over-year comparisons we make in these prepared remarks will be Q3 2015 versus Q3 2014 unless otherwise noted.
| | | | | | | | | | | | |
| | | Three Months Ended
September 30, | | | Change | |
(In millions, except per share data) | | 2015 | | | 2014 | | | % | |
GAAP Results | | | | | | | | | | | | |
Consolidated revenue | | $ | 512.1 | | | $ | 549.9 | | | | (6.9 | )% |
Income from continuing operations | | $ | 37.6 | | | $ | 22.1 | | | | 69.9 | % |
Net income | | $ | 37.3 | | | $ | 17.9 | | | | 108.7 | % |
Diluted earnings from continuing operations per common share* | | $ | 2.12 | | | $ | 1.12 | | | | 89.3 | % |
Net cash provided by operating activities | | $ | 85.6 | | | $ | 49.6 | | | | 72.4 | % |
Core Results** | | | | | | | | | | | | |
Core adjusted EBITDA from continuing operations | | $ | 119.7 | | | $ | 115.9 | | | | 3.3 | % |
Core diluted EPS from continuing operations* | | $ | 2.21 | | | $ | 1.67 | | | | 32.3 | % |
Free cash flow | | $ | 65.6 | | | $ | 30.3 | | | | 116.3 | % |
| * | Beginning in Q1 2015, we applied the two-class method of calculating earnings per share for our GAAP results because the impact of unvested restricted shares as a percentage of total common shares outstanding became more dilutive given the level of stock repurchases over the prior year. Core diluted EPS from continuing operations continues to be reported under the treasury stock method |
| ** | Refer to Appendix A for a discussion of the Use of Non-GAAP Financial Measures and Core and Non-Core Results |
Our Q3 highlights include:
| | • | | We continued to focus on effectively managing expenses across the enterprise, delivering3.3% year-over-year growth in core adjusted EBITDA from continuing operations despite revenue decreasing 6.9% |
| | • | | Core diluted EPS from continuing operations increased 32.3% to $2.21 reflecting increased profitability and a lower share count |
| | • | | We repurchased 938,586 shares of our common stock for $60.8 million |
| | • | | We generated 116.3% growth in free cash flow (FCF) to $65.6 million bringing the year-to-date total to $206.6 million |
©2015 Outerwall Inc. All Rights Reserved. These materials may not be reproduced, altered or distributed without the express written consent of Outerwall Inc.
Page 3
Outerwall Inc. 2015 Third Quarter Earnings
Prepared Remarks
October 29, 2015
Capital Allocation
During Q3 we continued to allocate capital to the initiatives we believe will produce the highest returns, including disciplined investments in the business, repurchasing shares and paying dividends. We reiterate our ongoing commitment to return 75% to 100% of annual free cash flow to shareholders through share repurchases and quarterly cash dividends.
During Q3, we repurchased 938,586 shares of our common stock at an average price of $64.73 per share for $60.8 million through open market purchases. As of September 30, 2015, there was approximately $292.7 million in authority remaining under our current stock repurchase program.
Capital Expenditures
In Q3 our total investment in capital expenditures (CAPEX) on an accrual basis was $20.3 million, primarily reflecting investments in the ecoATM business to optimize the kiosk network, maintenance to support the Redbox and Coinstar kiosk networks, and corporate investments in technology, equipment and facilities. The following is a breakdown of CAPEX by category for Q3:
| | | | | | | | | | | | | | | | |
Q3 2015 CAPEX (Accrual Basis) | |
| (In millions) | | New | | | Maintenance | | | Other | | | Total | |
Redbox | | $ | 1.8 | | | $ | 2.2 | | | $ | 1.0 | | | $ | 5.0 | |
Coinstar | | | 1.0 | | | | 2.4 | | | | — | | | | 3.4 | |
ecoATM | | | 7.3 | | | | — | | | | — | | | | 7.3 | |
All Other | | | 1.2 | | | | — | | | | — | | | | 1.2 | |
Corporate | | | — | | | | — | | | | 3.4 | | | | 3.4 | |
| | | | | | | | | | | | | | | | |
TOTAL | | $ | 11.3 | | | $ | 4.6 | | | $ | 4.4 | | | $ | 20.3 | |
| | | | | | | | | | | | | | | | |
Additional Q3 Consolidated Metrics
| | | | | | |
Metric | | Amount | | | Comment |
Total net interest expense | | $ | 12.0 | MM | | |
Core effective tax rate | | | 35.7 | % | | |
Cash and cash equivalents | | $ | 195.6 | MM | | Includes $73.6MM payable to retailer partners; additionally, $33.9MM of total cash was held in financial institutions domestically |
Total principal value of outstanding debt, including capital leases | | $ | 852.9 | MM | | |
Net leverage ratio* | | | 1.52 | x | | |
| * | Refer to Appendix A for a discussion of Use of Non-GAAP Financial Measures and Core and Non-Core Results |
©2015 Outerwall Inc. All Rights Reserved. These materials may not be reproduced, altered or distributed without the express written consent of Outerwall Inc.
Page 4
Outerwall Inc. 2015 Third Quarter Earnings
Prepared Remarks
October 29, 2015
Q3 Segment Operating Results – Redbox
Key Metrics
| | | | | | | | |
Category | | Q3 2015 | | | Q3 2014 | |
Revenue | | $ | 395.4 | MM | | $ | 435.1 | MM |
Rentals | | | 132.6 | MM | | | 170.8 | MM |
Net revenue per rental | | $ | 2.96 | | | $ | 2.54 | |
Same store sales growth (decline) | | | (8.4 | )% | | | (11.8 | )% |
Gross margin | | | 58.8 | % | | | 57.3 | % |
Segment operating income | | $ | 90.4 | MM | | $ | 88.3 | MM |
Segment operating margin | | | 22.9 | % | | | 20.3 | % |
Unique credit cards renting in quarter | | | 33.0 | MM | | | 38.7 | MM |
Total kiosks (at quarter end) | | | 40,790 | | | | 42,400 | |
Total locations (at quarter end) | | | 33,310 | | | | 34,820 | |
Blu-ray | | | | | | | | |
Blu-ray as percentage of rentals | | | 13.2 | % | | | 15.1 | % |
Blu-ray as percentage of Redbox revenue | | | 16.9 | % | | | 17.6 | % |
In Q3, Redbox revenue was down 9.1% year-over-year to $395.4 million, reflecting the impact of several factors, including:
| | • | | a substantially lower box office that was down45.3% year-over-year, including 7 fewer releases and shift in the mix of content from day and date to28-day delay titles; |
| | • | | a higher impact from secular decline in the physical market; |
| | • | | lower demand from price-sensitive customers following the price increase, particularly in a time of exceptionally weak content as the impact from the price increase was greater during the quarter; |
| | • | | consumer transition to new generation platforms in our video games rental business; |
| | • | | the removal of underperforming kiosks; and |
Content strength had a material impact on Q3 2015. Box office dollars driven by day and date titles was 56.9% lower than Q3 2014 and represented only 40.7% of overall box office in Q3 2015 compared with 51.7% in Q3 2014. Typically, delay titles do not generate the same revenue and rentals as day and date titles. In addition, Q3 2015 had a lower mix of comedy titles than Q3 2014, and historically comedies have performed well for Redbox. The weak box office content coupled with the factors mentioned above resulted in a 22.3% year-over-year decrease in rentals to 132.6 million compared with 170.8 million in Q3 2014.
Q3 net revenue per rental, or average check, increased 16.5% year-over-year to $2.96, driven primarily by the price increase for movies and video games. The higher price points offset the expected increase insingle-night rentals, which represented 60.6% of total rentals, an increase of 210 basis pointsyear-over-year. We continued to invest in customer-specific promotional offerings to lessen the impact of
©2015 Outerwall Inc. All Rights Reserved. These materials may not be reproduced, altered or distributed without the express written consent of Outerwall Inc.
Page 5
Outerwall Inc. 2015 Third Quarter Earnings
Prepared Remarks
October 29, 2015
the demand decline from the price increase and increased competition. Our promotional strategy has expanded to include moremarket-wide activities such as CPG (consumer packaged goods) and Retail programs that reinforce brand awareness and value proposition, as well as attract new customers. Programs included partnerships with Walgreens, The Kroger Co. and7-Eleven, along with Kellogg’s and General Mills.
In Q3 Blu-ray represented 16.9% of revenue and 13.2% of rentals compared with 17.6% of revenue and 15.1% of rentals in Q3 last year. There were 11, or 35.5%, fewer Blu-ray titles and 48.2% lower box office dollarsyear-over-year, which offset the benefit from the higher price point and resulted in Blu-ray revenue that was 13.2% lower than Q3 2014. Blu-ray continues to be a focus for the business as it drives higher profit dollars per rental while delivering a higher quality movie experience at a great value to our customers.
In Q3 unique credit cards renting decreased 14.9% year-over-year and 6.2% from Q2 2015 to 33.0 million, in line with the lower rental demand driven by weaker sequential content, the price increase and increased competition. High frequency renters (HFR), customers that rent four or more titles per quarter, represented 46.0% of revenue in Q3 2015, a decline from 52.1% last year and 48.0% sequentially due to fewer releases available for rental.
While year-over-year revenue and rentals declined in Q3 2015, Redbox segment operating income increased $2.1 million or 2.4% to $90.4 million. Segment operating margin increased 260 basis points to 22.9% driven by a decrease in direct operating expense, primarily due to higher gross margin, which increased 150 basis points year-over-year to 58.8%. The improvement in gross margin reflects higher revenue per rental, primarily driven by the price increase and content mix. In addition to gross margin benefits, we saw improvements in direct operating, marketing and G&A expenses as we continued to drive operating efficiencies in the business to align our cost structure with the decline in physical rental demand.
Video Games Rentals and Revenue
| | | | | | | | |
Video Games Performance | | Q3 2015 | | | Q3 2014 | |
Percentage of rentals | | | 1.4 | % | | | 2.1 | % |
Percentage of Redbox revenue | | | 2.8 | % | | | 4.5 | % |
Video games rentals and revenue declined year-over-year compared with Q3 2014 due to consumer transition to new generation platforms and the decline in the Wii platform. The number of unique titles released at Redbox in Q3 2015 was down 36.4% compared with Q3 2014, as publishers continue to delay their new releases to Q4 to market to a larger installed new generation base during the holiday season.
©2015 Outerwall Inc. All Rights Reserved. These materials may not be reproduced, altered or distributed without the express written consent of Outerwall Inc.
Page 6
Outerwall Inc. 2015 Third Quarter Earnings
Prepared Remarks
October 29, 2015
Last quarter, Redbox announced our commitment to be America’s destination for new generation game rentals and our plans to expand the availability of new generation games across our network of kiosks by the end of the year. We believe Redbox can play a critical role in increasing mainstream consumer adoption of the new formats, providing value to both our industry partners and customers. Offering game rentals for $3 a night versus a $60 purchase price gives Redbox users the same low cost access to new releases that we offer in movies. As a result, we made the decision to focus on purchasing new generation video game content. In Q4 we plan to significantly increase our spend on video games content to further drive this business and expect the percentage of video game rentals will continue to increase with additional content releases and growth in the installed base of new generation consoles over the holiday season.
Redbox has reached agreement with several of the leading game publishers on new business terms that will allow us to increase the number of units in the kiosks to meet growing consumer demand for new generation games. Publishers recognize Redbox’s potential to generate awareness and interest for new generation console games among both casual and core gamers through its large customer base and digital marketing network.
Studio Agreements
In July, Sony Pictures Home Entertainment elected to exercise its option to extend our existing day and date content license agreement with them. In October, Paramount Home Entertainment Inc. also exercised its option to extend their day and date content license. Both extensions are for one year.
Q3 Segment Operating Results – Coinstar
Key Metrics
| | | | | | | | |
Category | | Q3 2015 | | | Q3 2014 | |
Revenue | | $ | 85.7 | MM | | $ | 85.1 | MM |
Average transaction | | $ | 43.50 | | | $ | 41.92 | |
Transactions | | | 19.2 | MM | | | 19.6 | MM |
Same store sales growth | | | 3.2 | % | | | 5.8 | % |
Segment operating income | | $ | 34.5 | MM | | $ | 33.4 | MM |
Segment operating margin | | | 40.3 | % | | | 39.3 | % |
Kiosks (at quarter end) | | | 21,110 | | | | 21,210 | |
Locations (at quarter end) | | | 19,910 | | | | 20,220 | |
Coinstar segment revenue increased $0.6 million, or 0.7%, compared with Q3 2014 primarily due to growth in the number of Coinstar Exchange kiosks and transactions and higher Coinstar U.S. volume. The U.K. business continued to benefit from the increased coin voucher product transaction fee implemented in the U.K. in August 2014, although the benefit was offset in Q3 by the unfavorable exchange rate impact from the strengthening of the U.S. dollar versus the British pound as compared with the prior year. These factors contributed to same store sales growth of 3.2%.
©2015 Outerwall Inc. All Rights Reserved. These materials may not be reproduced, altered or distributed without the express written consent of Outerwall Inc.
Page 7
Outerwall Inc. 2015 Third Quarter Earnings
Prepared Remarks
October 29, 2015
Coinstar segment operating income increased $1.1 million, or 3.1%, year-over-year and segment operating margin increased 100 basis points compared with Q3 2014, as the business continues to identify areas to reduce expenses, particularly in direct operating and marketing.
Q3 Segment Operating Results – ecoATM
Key Metrics
| | | | | | | | |
Category | | Q3 2015 | | | Q3 2014 | |
Revenue | | $ | 31.0 | MM | | $ | 29.7 | MM |
Segment operating loss | | $ | (3.1 | )MM | | $ | (2.0 | )MM |
ASP of value devices sold | | $ | 59.15 | | | $ | 75.95 | |
Number of value devices sold | | | 505,314 | | | | 373,981 | |
Number of overall devices sold | | | 735,781 | | | | 531,265 | |
Kiosks (at quarter end) | | | 2,210 | | | | 1,510 | |
Locations (at quarter end) | | | 1,980 | | | | 1,290 | |
During Q3 we continued to make progress in improving kiosk productivity and reducing expenses as we focus on managing the business to profitability as soon as possible.
As a result of our optimization efforts, while kiosks were up 700 from Q3 2014, sequentially our installed kiosk count decreased by 50. During Q3 we removed 250 underperforming kiosks, primarily in the Grocery channel, and redeployed approximately 180 kiosks into retailer locations that satisfied our productivity thresholds, with the majority in the Mass and Mall channels. This brings year-to-date redeployments to 250.
Q3 segment revenue increased 4.1% compared with Q3 2014 reflecting the growth in our installed kiosk base. At the same time, collections of value devices were down on a per kiosk basis year-over-year primarily due to ongoing carrier marketing of alternative recycling options. This also impacted the number of higher value devices collected, which is the primary driver of the year-over-year decline in average selling price (ASP) of value devices sold.
Sequentially, value devices sold per kiosk increased, reflecting the higher seasonality we have seen historically in Q3, an increase in collections of certain higher value devices as we approached the latest iPhone launch, and the redeployment of underperforming kiosks. As a result, revenue per kiosk also increased from Q2 2015.
In September, Apple announced their iPhone upgrade program. While it is too early to measure the effect this could have on our collections, to date we have not seen an impact.
©2015 Outerwall Inc. All Rights Reserved. These materials may not be reproduced, altered or distributed without the express written consent of Outerwall Inc.
Page 8
Outerwall Inc. 2015 Third Quarter Earnings
Prepared Remarks
October 29, 2015
Segment operating loss increased year-over-year in Q3 due to the increased number of kiosks and the focus on scaling the business during the past year, offset in part by improvements in our operating costs on a per kiosk basis. Sequentially segment operating loss improved due to deliberate efforts to reduce costs, particularly in servicing and supporting the kiosk network.
As the business has historically seen, we expect collections in Q4 2015 to be below Q3 2015 mainly due to seasonality and the increase in carrier marketing around the holiday season. With the reduced level of collections sequentially, we also expect lower net revenue in Q4 compared with Q3.
We expect the ASP on our value devices to decline in Q4 due to the influx of devices entering the secondary market, as well as the typical price decay that occurs when the newest iPhone is released. However, due to the lower number of iPhones expected to be sold during the September to October 2015 timeframe in the U.S., we do not expect the price decline to be as drastic as the decrease in Q4 2014. As we move into the holiday season, we expect an increase in carrier advertising focused on consumer device trade-in.
During Q4 our focus on moving closer to profitability will include improving kiosk performance by continuing to lower per kiosk servicing costs, redeploying additional kiosks to locations that meet our productivity thresholds, and limiting our marketing and G&A spending.
Guidance
We are updating our 2015 annual guidance to reflect changes in our expectations based on Q3 results and our outlook for the remainder of the year. (Exhibit 1)
For the full-year 2015, we expect:
| | • | | consolidated revenue in the range of $2.205 billion to $2.240 billion, |
| | • | | core adjusted EBITDA from continuing operations between $490 million and $510 million, and |
| | • | | core diluted earnings per share between $8.82 and $9.52, which does not reflect any additional share repurchases we may complete during the year. |
We expect Redbox revenue in the range of $1.790 billion to $1.815 billion, reflecting lower revenue in Q3 and a substantial shift in Q4 content with 20 fewer theatrical titles and 8.0% lower box office dollars since our guidance in July. These titles are now expected to be available in our kiosks in the first half of 2016, although as we have said, the release schedule for Redbox titles continually evolves. In addition, the fewer number of customers and the frequency at which they rented in Q3 was impacted by the lack of content and it will take time to return to normal rental patterns. To help increase traffic and frequency of rentals, we are planning to purchase more movie and video game content than we normally would in Q4. Similar to Q4 2012, the higher copy depth is expected to help us reengage consumers following a dearth of content. Further, we are planning to increase the amount of promotion through targeted and retail
©2015 Outerwall Inc. All Rights Reserved. These materials may not be reproduced, altered or distributed without the express written consent of Outerwall Inc.
Page 9
Outerwall Inc. 2015 Third Quarter Earnings
Prepared Remarks
October 29, 2015
programs to encourage new and lapsed consumers to rent and for active consumers to increase their frequency. While this strategy will have an impact on Redbox margins in Q4, we believe the additional content is critical to consumers returning to more normal rental patterns.
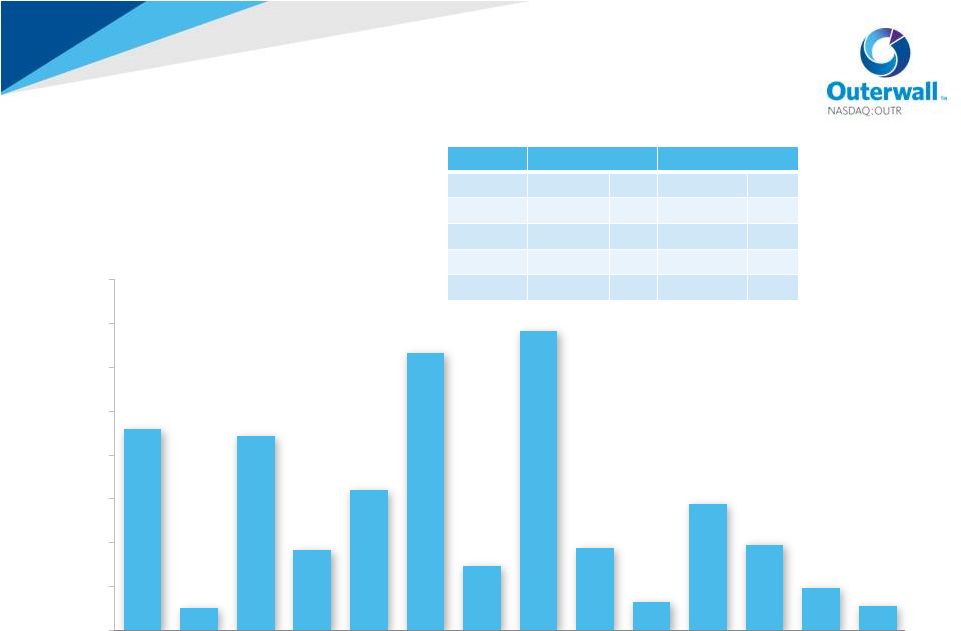
Q4 box office is expected to be $3.8 billion, 7.4% higher than Q4 2014, but with 9 fewer titles. The Q4 box office includes 4 titles that represent $1.8 billion in box office, nearly half the total for the quarter:Avengers: Age of Ultron, Furious 7, Inside OutandJurassic World. (Exhibit 2) Sequentially, Q4 box office is up 181.0% with 10 additional titles. However, historically, blockbuster titles have not rented as well at Redbox as they perform in theaters since many customers have already seen the movie in theaters or purchase the DVD or Blu-ray.
Our guidance incorporates anticipated lower rental demand and shorter average rental duration as a result of the price increase that partially offsets the increase in the per night rental price. In addition, the benefit from our price increase will be less in Q4 than in prior quarters as we will lap the price increase in December.
We expect ecoATM revenue in the range of $100 million to $105 million, a tightening of the range from the prior quarter. We expect lower ASP than we saw in Q3 for value devices primarily due to the impact of the iPhone launch, although we do not expect the decline in ASP to be as substantial as the one in Q4 2014.
We have adjusted the low end of our core adjusted EBITDA from continuing operations up by $9.0 million, despite the lower expected revenue in Q4 for Redbox as a result of title shifts out of 2015, due to concerted efforts to drive profitability and manage expenses.
We have increased our expectations for FCF to between $252 million and $282 million due to the increase in expected core adjusted EBITDA from continuing operations and lower capital expenditures as we look to drive cash flow across the enterprise.
Summary
In Q3 2015 we drove increased profitability despite the headwinds of an exceptionally weak content schedule that impacted revenue. By continuing to focus on operational excellence, productivity and expense management, we delivered solid margin and earnings growth and more than doubled free cash flowyear-over-year. We allocated capital to substantial stock repurchases and our quarterly dividend, and also paid down debt. We are managing ecoATM to profitability as quickly as possible and are addressing top-line growth across the enterprise through multiple initiatives. We will continue to drive the business to create value for our employees, customers, partners and shareholders.
©2015 Outerwall Inc. All Rights Reserved. These materials may not be reproduced, altered or distributed without the express written consent of Outerwall Inc.
Page 10
Outerwall Inc. 2015 Third Quarter Earnings
Prepared Remarks
October 29, 2015
Appendix A
Non-GAAP Financial Measures
Non-GAAP measures may be provided as a complement to results provided in accordance with United States generally accepted accounting principles (“GAAP”).
We use the following non-GAAP financial measures to evaluate our financial results:
| | • | | Core adjusted EBITDA from continuing operations; |
| | • | | Core diluted earnings per share (“EPS”) from continuing operations; |
| | • | | Net debt and net leverage ratio. |
These measures, the definitions of which are presented below, are non-GAAP because they exclude certain amounts which are included in the most directly comparable measure calculated and presented in accordance with GAAP. Our non-GAAP financial measures are not meant to be considered in isolation or as a substitute for our GAAP financial measures and may not be comparable with similarly titled measures of other companies.
Core and Non-Core Results
We distinguish our core activities, those associated with our primary operations which we directly control, fromnon-core activities. Non-core activities are primarily nonrecurring events or events we do not directly control. Ournon-core adjustments for the periods presented include i) goodwill impairment, ii) restructuring costs (including severance and early lease termination costs and related impairment of assets) associated with actions to reduce costs in our continuing operations across the Company, iii) compensation expense for rights to receive cash issued in conjunction with our acquisition of ecoATM and attributable to post-combination services as they are fixed amount acquisition related awards and not indicative of the directly controllable future business results, iv) income or loss from equity method investments, which represents our share of income or loss from entities we do not consolidate or control, v) tax benefits related to a net operating loss adjustment, and vi) tax benefit related to worthless stock deduction (“Non-Core Adjustments”).
We believe investors should consider our core results because they are more indicative of our ongoing performance and trends, are more consistent with how management evaluates our operational results and trends, provide meaningful supplemental information to investors through the exclusion of certain expenses which are either nonrecurring or may not be indicative of our directly controllable business operating results, allow for greater transparency in assessing our performance, help investors better analyze the results of our business and assist in forecasting future periods.
©2015 Outerwall Inc. All Rights Reserved. These materials may not be reproduced, altered or distributed without the express written consent of Outerwall Inc.
Page 11
Outerwall Inc. 2015 Third Quarter Earnings
Prepared Remarks
October 29, 2015
Core Adjusted EBITDA from continuing operations
Our non-GAAP financial measure core adjusted EBITDA from continuing operations is defined as earnings from continuing operations before depreciation, amortization and other; interest expense, net; income taxes; share-based payments expense; and Non-Core Adjustments.
A reconciliation of core adjusted EBITDA from continuing operations to net income from continuing operations, the most comparable GAAP financial measure, is presented in the following table:
| | | | | | | | | | | | | | | | |
| | | Three Months Ended
September 30, | | | Nine Months Ended
September 30, | |
| Dollars in thousands | | 2015 | | | 2014 | | | 2015 | | | 2014 | |
Net income from continuing operations | | $ | 37,592 | | | $ | 22,123 | | | $ | 32,396 | | | $ | 73,562 | |
Depreciation, amortization and other | | | 43,188 | | | | 50,045 | | | | 137,666 | | | | 153,481 | |
Interest expense, net | | | 11,973 | | | | 12,465 | | | | 36,227 | | | | 35,045 | |
Income taxes | | | 20,928 | | | | 13,392 | | | | 64,955 | | | | 35,131 | |
Share-based payments expense(1) | | | 4,864 | | | | 3,249 | | | | 12,125 | | | | 10,093 | |
| | | | | | | | | | | | | | | | |
Adjusted EBITDA from continuing operations | | | 118,545 | | | | 101,274 | | | | 283,369 | | | | 307,312 | |
Non-Core Adjustments: | | | | | | | | | | | | | | | | |
Goodwill impairment | | | — | | | | — | | | | 85,890 | | | | — | |
Restructuring costs | | | — | | | | — | | | | 15,851 | | | | 469 | |
Rights to receive cash issued in connection with the acquisition of ecoATM | | | 854 | | | | 3,274 | | | | 3,779 | | | | 10,033 | |
Loss from equity method investments, net | | | 328 | | | | 11,352 | | | | 593 | | | | 31,261 | |
| | | | | | | | | | | | | | | | |
Core adjusted EBITDA from continuing operations | | $ | 119,727 | | | $ | 115,900 | | | $ | 389,482 | | | $ | 349,075 | |
| | | | | | | | | | | | | | | | |
| (1) | Includes both non-cash share-based compensation for executives, non-employee directors and employees as well as share-based payments for content arrangements. |
Core Diluted EPS from continuing operations
Our non-GAAP financial measure core diluted EPS from continuing operations is defined as diluted earnings per share from continuing operations utilizing the treasury stock method excluding non-core adjustments, net of applicable taxes.
A reconciliation of core diluted EPS from continuing operations to diluted EPS from continuing operations, the most comparable GAAP financial measure, is presented in the following table:
| | | | | | | | | | | | | | | | |
| | | Three Months Ended
September 30, | | | Nine Months Ended
September 30, | |
| | | 2015 | | | 2014 | | | 2015 | | | 2014 | |
Diluted EPS from continuing operations per common share (two-class method) | | $ | 2.12 | | | $ | 1.12 | | | $ | 1.77 | | | $ | 3.37 | |
Adjustment from participating securities allocation and share differential to treasury stock method(1) | | | 0.04 | | | | 0.04 | | | | 0.03 | | | | 0.07 | |
| | | | | | | | | | | | | | | | |
Diluted EPS from continuing operations (treasury stock method) | | | 2.16 | | | | 1.16 | | | | 1.80 | | | | 3.44 | |
Non-Core Adjustments, net of tax:(1) | | | | | | | | | | | | | | | | |
Goodwill impairment | | | — | | | | — | | | | 4.78 | | | | — | |
Restructuring costs | | | — | | | | — | | | | 0.54 | | | | 0.01 | |
Rights to receive cash issued in connection with the acquisition of ecoATM | | | 0.04 | | | | 0.14 | | | | 0.14 | | | | 0.37 | |
Loss from equity method investments, net | | | 0.01 | | | | 0.36 | | | | 0.02 | | | | 0.89 | |
Tax benefit from net operating loss adjustment | | | — | | | | — | | | | — | | | | (0.04 | ) |
Tax benefit of worthless stock deduction | | | — | | | | 0.01 | | | | — | | | | (0.10 | ) |
| | | | | | | | | | | | | | | | |
Core diluted EPS from continuing operations | | $ | 2.21 | | | $ | 1.67 | | | $ | 7.28 | | | $ | 4.57 | |
| | | | | | | | | | | | | | | | |
| (1) | Non-Core Adjustments are presented after-tax using the applicable effective tax rate for the respective periods. |
©2015 Outerwall Inc. All Rights Reserved. These materials may not be reproduced, altered or distributed without the express written consent of Outerwall Inc.
Page 12
Outerwall Inc. 2015 Third Quarter Earnings
Prepared Remarks
October 29, 2015
A reconciliation of amounts used in calculating core diluted EPS from continuing operations in the table above is presented in the following table:
| | | | | | | | | | | | | | | | |
| | | Three Months Ended
September 30, | | | Nine Months Ended
September 30, | |
| In thousands | | 2015 | | | 2014 | | | 2015 | | | 2014 | |
Income from continuing operations attributable to common shares | | $ | 36,462 | | | $ | 21,392 | | | $ | 31,491 | | | $ | 71,309 | |
Add: income from continuing operations allocated to participating securities | | | 1,130 | | | | 731 | | | | 905 | | | | 2,253 | |
| | | | | | | | | | | | | | | | |
Income from continuing operations | | $ | 37,592 | | | $ | 22,123 | | | $ | 32,396 | | | $ | 73,562 | |
| | | | | | | | | | | | | | | | |
Weighted average diluted common shares | | | 17,229 | | | | 19,021 | | | | 17,789 | | | | 21,186 | |
Add: diluted common equivalent shares of participating securities | | | 142 | | | | 126 | | | | 182 | | | | 186 | |
| | | | | | | | | | | | | | | | |
Weighted average diluted shares (treasury stock method) | | | 17,371 | | | | 19,147 | | | | 17,971 | | | | 21,372 | |
| | | | | | | | | | | | | | | | |
Free Cash Flow
Our non-GAAP financial measure free cash flow is defined as net cash provided by operating activities after capital expenditures. We believe free cash flow is an important non-GAAP measure as it provides additional information to users of the financial statements regarding our ability to service, incur or pay down indebtedness and repurchase our securities. A reconciliation of free cash flow to net cash provided by operating activities, the most comparable GAAP financial measure, is presented in the following table:
| | | | | | | | | | | | | | | | |
| | | Three Months Ended
September 30, | | | Nine Months Ended
September 30, | |
| Dollars in thousands | | 2015 | | | 2014 | | | 2015 | | | 2014 | |
Net cash provided by operating activities | | $ | 85,559 | | | $ | 49,627 | | | $ | 266,774 | | | $ | 207,047 | |
Purchase of property and equipment | | | (19,947 | ) | | | (19,295 | ) | | | (60,164 | ) | | | (72,311 | ) |
| | | | | | | | | | | | | | | | |
Free cash flow | | $ | 65,612 | | | $ | 30,332 | | | $ | 206,610 | | | $ | 134,736 | |
| | | | | | | | | | | | | | | | |
Net Debt and Net Leverage Ratio
Our non-GAAP financial measure net debt is defined as the total face value of outstanding debt, including capital leases, less cash and cash equivalents held in financial institutions domestically. Our non-GAAP financial measure net leverage ratio is defined as net debt divided by core adjusted EBITDA from continuing operations for the last twelve months (LTM). We believe net debt and net leverage ratio are important non-GAAP measures because they:
| | • | | are used to assess the degree of leverage by management; |
| | • | | provide additional information to users of the financial statements regarding our ability to service, incur or pay down indebtedness and repurchase our securities as well as additional information about our capital structure; and |
| | • | | are reported quarterly to support covenant compliance under our credit agreement. |
A reconciliation of net debt to total outstanding debt including capital leases, the most comparable GAAP financial measure, is presented in the following table:
©2015 Outerwall Inc. All Rights Reserved. These materials may not be reproduced, altered or distributed without the express written consent of Outerwall Inc.
Page 13
Outerwall Inc. 2015 Third Quarter Earnings
Prepared Remarks
October 29, 2015
| | | | | | | | |
| Dollars in thousands | | September 30,
2015 | | | December 31,
2014 | |
Senior unsecured notes | | $ | 650,000 | | | $ | 650,000 | |
Term loans | | | 139,688 | | | | 146,250 | |
Revolving line of credit | | | 55,000 | | | | 160,000 | |
Capital leases | | | 8,177 | | | | 15,391 | |
| | | | | | | | |
Total principal value of outstanding debt including capital leases | | | 852,865 | | | | 971,641 | |
Less domestic cash and cash equivalents held in financial institutions | | | (33,909 | ) | | | (66,546 | ) |
| | | | | | | | |
Net debt | | | 818,956 | | | | 905,095 | |
LTM Core adjusted EBITDA from continuing operations(1) | | $ | 537,227 | | | $ | 496,820 | |
| | | | | | | | |
Net leverage ratio | | | 1.52 | | | | 1.82 | |
| (1) | LTM Core Adjusted EBITDA from continuing operations for the twelve months ended September 30, 2015 and December 31, 2014 was determined as follows: |
| | | | |
| Dollars in thousands | | | |
Core adjusted EBITDA from continuing operations for the nine months ended September 30, 2015 | | $ | 389,482 | |
Add: Core adjusted EBITDA from continuing operations for the twelve months ended December 31, 2014(1) | | | 496,820 | |
Less: Core adjusted EBITDA from continuing operations for the nine months ended September 30, 2014 | | | (349,075 | ) |
| | | | |
LTM Core adjusted EBITDA from continuing operations for the twelve months ended September 30, 2015 | | $ | 537,227 | |
| | | | |
| (1) | Core adjusted EBITDA from continuing operations for the twelve months ended December 31, 2014 is obtained from our Form 8-K filed on May 8, 2015 for the period ended December 31, 2014, where it is reconciled to net income from continuing operations, the most comparable GAAP financial measure, and represents the LTM core adjusted EBITDA from continuing operations we use in our calculation of net leverage ratio as of December 31, 2014. |
©2015 Outerwall Inc. All Rights Reserved. These materials may not be reproduced, altered or distributed without the express written consent of Outerwall Inc.
Page 14
NASDAQ:OUTR Exhibits 2015 Q3 Prepared Remarks October 29, 2015 |
Exhibit 1: 2015 Full-Year Guidance As of October 29, 2015 Revenue by Segment ($MM) Redbox $1,790 – $1,815 Coinstar $315 – $320 ecoATM $100 – $105 TOTAL $2,205 – $2,240 Consolidated – Other Core adjusted EBITDA from continuing operations 1 $490 – $510 Core diluted EPS from continuing operations 1,2 $8.82 – $9.52 Average diluted shares Outstanding 2 17.67 – 17.73 Estimated effective tax rate 35.5% – 37.5% Free cash flow 1 ($MM) $252 – $282 Capital Expenditures ($MM) Redbox $15 – $18 Coinstar $12 – $14 ecoATM $25 – $31 Corporate $19 – $23 TOTAL $71 – $86 Net Kiosk Installations by Segment Redbox (U.S.) 3 (1,500) – (1,700) Coinstar (150) – (175) ecoATM 400 – 450 1 See Appendix A for a discussion of Non-GAAP Financial Measures and Core and Non-Core Results 2 Excludes the impact of potential share repurchases for the remainder of 2015 3 ($MM) (MM) © 2015 Outerwall Inc. All Rights Reserved. These materials may not be reproduced, altered, or distributed without the express written consent of Outerwall Inc. Does not include kiosks removed as a result of the shutdown of Redbox Canada operations |
$0 $100 $200 $300 $400 $500 $600 $700 $800 10/2 10/6 10/13 10/20 10/27 11/3 11/10 11/17 11/24 12/1 12/8 12/15 12/22 12/29 Box Office (MM) 1 1 2 4 5 1 2 6 3 2 1 Exhibit 2: 2015 Q4 Redbox Release Schedule 1 Q4 2015 data subject to change 2 Includes titles with total North American box office greater than $5MM Q4 2014 Box Office Titles Box Office Titles Total $3.81Bn 36 $3.55Bn 45 October $1.46Bn 10 $663.8MM 10 November $1.65Bn 17 $1.35Bn 16 December $702.6MM 9 $1.54Bn 19 2 As of October 29, 2015 5 # of new releases = 1 2 2 2 Q4 2015 1 © 2015 Outerwall Inc. All Rights Reserved. These materials may not be reproduced, altered, or distributed without the express written consent of Outerwall Inc. |