Management’s Discussion & Analysis of Operations and Financial Condition
Overview of the
Global Nutrient
Industry

This management’s discussion and analysis focuses on long-term vision, strategy and growth opportunities through the perspective of management and includes a discussion of historical performance for the three years ended December 31, 2002.
The following management’s discussion and analysis is in U.S. dollars except where otherwise stated and should be read in conjunction with the consolidated financial statements and related notes on pages 56 – 86 and other financial information on pages 89 to 91. Both pages 22 and 23, titled Core Market Strength, do not form part of the management’s discussion and analysis.
Key factors impacting world nutrient markets
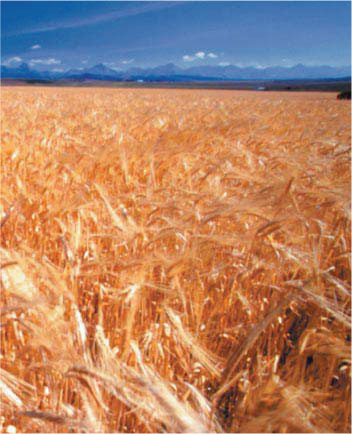
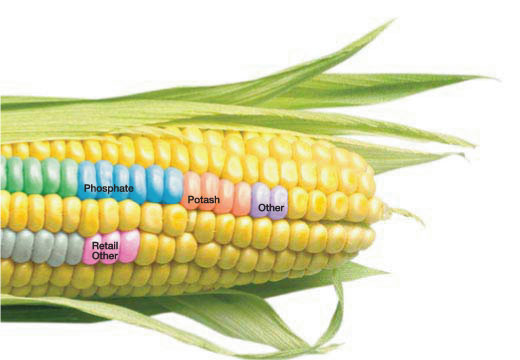
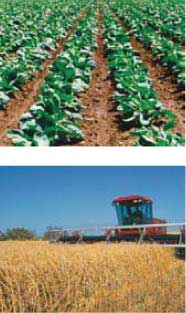
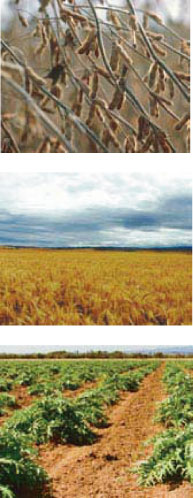
The availability of arable land for food production is essential as less than two percent of food energy comes from the world’s oceans, lakes and rivers. The world’s existing arable land base is gradually declining and the application of nitrogen, phosphate and potash nutrients is needed to improve crop yields in order to feed a world of more than six billion people today. The Potash and Phosphate Institute (PPI) estimates that over 30 percent of the world’s grain production can be directly attributed to balanced nutrient application.
Grain supply and demand
Agriculture is the primary driver of demand for nitrogen, phosphate and potash. In 2002, primarily due to weather-related problems, crop yields were well below average in many of the key grain exporting regions including the United States, Canada and Australia. The decline in grain production in these key regions increased world grain prices late in 2002.
The grain Stocks-to-Use ratio measures the relationship between grain inventories and historical consumption levels. This ratio has declined for the last four years and is currently at over a 20-year low. Over the past five years annual consumption of grain has been outstripping annual production and pricing increases have resulted in 2002.
There is a strong correlation between crop prices and nutrient prices and many of the key drivers for the grain market are common to the nutrient market. Understanding the
18 Management’s Discussion and Analysis
importance of these dynamics to our industry helps explain the global factors influencing our business. The important factors affecting supply and demand are as follows:
Nutrient demand
WORLD POPULATION GROWTH AND ECONOMIC GROWTH RATES
| n | | Demand for grain is driven by world population growth and economic growth rates, especially in developing countries; |
| n | | World population growth and economic growth rates also influence industrial use of nitrogen, phosphate and potash. Industrial demand accounts for 15 percent of total use. |
WEATHER
| n | | Weather conditions affect planting and consequently have a major influence on total use of nutrients in any given season. |
WORLD GRAIN MARKETS
| n | | 85 percent of the world’s fertilizer consumption is used for crop application. Higher grain prices motivate growers to increase output yields. Where possible, the grower will expand seeded acreage and optimize crop inputs. The result is significant growth in demand for nutrients and agronomic application services; |
| n | | Fertilizer consumption is also affected by new technology such as seed genetics. |
Nutrient supply
CHANGES TO PRODUCTION CAPABILITY
| n | | Construction of new facilities and upgrades to existing facilities increase the availability of nutrients. Closures of older, less economic facilities reduce supply. |
CHANGES IN WORLD FERTILIZER PLANT OPERATING RATES
| n | | The ability to supply the market competitively is affected by a number of factors including: fluctuations in the input costs relative to realized prices, unexpected production or transportation problems and political instability in key producing regions which may include South America or the Middle East. |
GOVERNMENT INTERVENTION
| n | | Government intervention can impact either supply or demand by creating barriers to trade in fertilizers, subsidizing domestic fertilizer production or providing price support for agricultural products. |
All these factors interact to set the global nutrient supply and demand balance, which in turn determines prices.
Management’s Discussion and Analysis 19
Overview of the Global Nutrient Industry
Global nutrient supply and demand balance
Over the past 10 years, global nitrogen production capacity and consumption have each grown by approximately two million tonnes per year. The majority of recent nitrogen capacity additions and demand increases have been in Asia and Latin America. Future additions will likely be built in regions with abundant supplies of low-cost natural gas. No new gas-based nitrogen facilities have been built in North America and Western Europe for the past 10 years because of the relatively high cost of natural gas.
World growth in nitrogen demand for 2003 and 2004 is expected to increase by 2.2 percent or 1.8 million tonnes per year. Much of this demand growth will occur in developing countries. A number of these regions have similar farm sizes and crop mixes to North America but nutrient application rates are significantly lower. This makes these countries particularly well suited to improvement in yields through balanced nutrient application.
Growth in new capacity is expected to be less than demand for at least the next three years, as very few new facilities are currently under construction. The tighter supply and demand balance is expected to result in strengthening nitrogen prices over the period.
There are no dominant producers in the global nitrogen sector. We are the largest nitrogen producer in the Western hemisphere yet our production accounts for only three percent of the global nitrogen production. Furthermore, approximately half of the world’s nitrogen production is located in China, the Former Soviet Union (FSU) and India, where operating rates can be unpredictable due to aging plants and poor maintenance practices. By comparison, our facilities undergo regular scheduled maintenance, process optimization and ongoing technology upgrading. As a result, ours are among the most efficient facilities in the world.
20 Management’s Discussion and Analysis
Only one third of the world’s nitrogen is manufactured with low-cost natural gas. New facilities need to be located near competitively priced gas supplies and developed transportation infrastructure to be able to compete internationally. Both our Alaskan and Argentine facilities meet these requirements.
The factors affecting growth in supply and demand for phosphate and potash are somewhat similar.
For phosphate, recent supply additions in Australia and India resulted in a temporary surplus in 2001 and 2002. This led to production shutdowns in North America in 2001 causing pricing to gradually recover in late 2001 and into the first half of 2002. Pricing weakened in the latter half of 2002 with the restart of some of this shut-in production. Globally, there is limited new phosphate capacity projected through 2006 outside of China. Even with the anticipated additions from China, a continued gradual tightening of the supply balance is forecast through 2006. We are purely a domestic regional producer of phosphate with the only plant in Canada and one of three production facilities in the U.S. Pacific Northwest.
In potash, the balance of supply and demand has remained stable. Two major producing associations account for approximately 70 percent of world potash requirements. We are a member of one of these, Canpotex, which is an association of Canadian potash exporters. The second group is comprised of producers from the FSU. Both these groups have the ability to meet normal increases in global demand for the foreseeable future. No new significant potash capacity additions are therefore expected for at least the next five years.
These global supply and demand factors are the key drivers of our Wholesale business and their complex interaction often has unpredictable results, particularly in the short-term when erratic weather patterns are factored in. For these reasons, we must manage our business with a long-term strategic view.
Management’s Discussion and Analysis 21
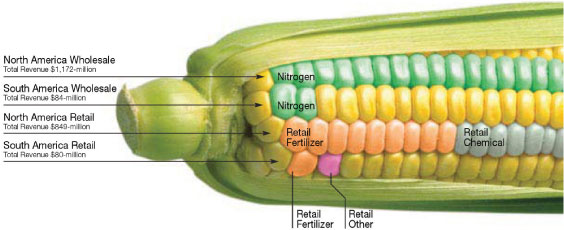
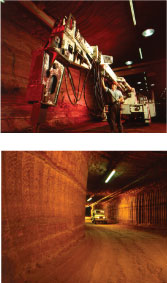
Core Market Strength
| | | | | | | |
 | |  | |  | |  |
| Nitrogen “N” | | Phosphate “P” | | Potash “K” | | Retail Operation |
We can produce 7.2 million
tonnes of nitrogen products
from our 11 facilities in North
America and Argentina. | | 1.3 million tonnes of phosphate
products can be produced at
our two facilities in Alberta,
Canada and Idaho, U.S.
We sell into regional markets,
and are able to save
transportation costs. | | Our Saskatchewan, Canada
facility can produce
1.8 million tonnes annually.
The site has reserves in
excess of 100 years. | | We offer a full range of crop
solutions from our 225 farm
centres in North America
and 18 farm centres and
two satellite facilities in
South America. |
Agrium’s location advantage
Our Operations are strategically located near low-cost raw material inputs and close to key agricultural growing regions. Our locations in Argentina, Alaska and Western Canada give us access to low-cost natural gas. By supplying locally produced product to our Argentine and Western Canadian customers, we have a transportation advantage over our competitors giving us higher realized net prices. Our location advantage comes from producing where costs are low and market potential is high.
| | | | | | | |
| Retail Return on InvestedCapital(%) | | Ammonia Price Advantage($/tonne) | | Phosphate Price Advantage(DAP $/tonne) | | Argentine Urea Price Advantage($/tonne) |
Source: Agrium. | | 
Source: 2002 Green Markets, Delivered (del). | | 
Source: 2002 BJ&A, Western Canadian DAP is MAP adjusted. | | 
Source: 2002 BJ&A, Agrium. |
22 Core Market Strength
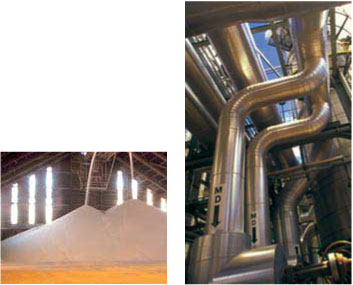
Quality low-cost materials
Producing quality nutrients begins with a reliable, low-cost supply of raw materials. Agrium Operations are strategically located near these raw materials, enhancing our ability to serve customers efficiently and cost-effectively.
| | | | | | | |
| Global Potash ProductionCost Curve(KCI $/tonne) | | North American Ammonia ProductionCost Curve(NH3 $/tonne) | | Natural Gas Advantage($/MMBtu) | | Sulphur Advantage(US$/tonne) |
Source: British Sulphur 2001 Potash Study (excludes producers from the Former Soviet Union). | | 
Source: BJ&A (includes hedging assumptions)
Average 2002 costs. | | 
Source: CIBC, Agrium
Average 2002 prices. | | 
Source: 2002 BJ&A, Agrium, Delivered (del),
Average 2002 costs. |
| | | | | | | |
 | |  | |  | |  |
| The world’s largest potash deposit is located in the province of Saskatchewan, Canada, the lowest-cost producing region in the world. | | Our gas cost has historically been below NYMEX as a result of a cost advantage for natural gas purchased in Western Canada and long-term natural gas supply agreements at our Alaskan and Argentine facilities. | | We own three of the six world-scale plants built in North America since 1980. The Argentine facility is one of the most energy efficient in the world. | | The sulphur we source for our phosphate production is a by-product of oil and gas operations in Western Canada and mining operations in the Western U.S. |
Core Market Strength 23
Our Company

Who we are
We are a major, integrated, international producer and marketer of the three primary nutrients and a number of micronutrients. We are also a major retail supplier of nutrients and agronomic services in North and South America. We are the only North American company integrated from the production of raw material inputs to the supply and servicing of growers. This diversity is what distinguishes us from our competitors.
Our vision
To be a top-tier global Corporation providing diversified agricultural and industrial products and services in a manner that maximizes growth in shareholder value.
Our strategy
Our strategy is focused on achieving shareholder value through global growth and diversification. We manage short-term risks and uncertainties but we focus on long-term reward. Our strategies to achieve our vision are to:
CONTINUOUSLY IMPROVE BASE BUSINESS COMPETITIVENESS:
| n | | Focus on lowering costs and increasing margins; |
| n | | Debottleneck and rationalize assets based on market conditions; |
| n | | Employ best practices and best economic technology; |
| n | | Generate timely, accurate information for decision making; |
| n | | Focus on customer needs. |
DISCIPLINED INVESTMENT APPROACH:
| n | | Build and buy at the right time in the cycle; |
| n | | Use appropriate financial vehicles to support investment; |
| n | | Maintain economic access to capital markets and investment grade rating. |
GROW TO INDUSTRY LEADERSHIP POSITION:
| n | | Capture synergies from size; |
| n | | Enhance geographic and product diversification; |
| n | | Increase market capitalization which will improve liquidity, leading to a premium stock multiple. |
CONTINUE TO BUILD ON OUR HIGH PERFORMANCE CULTURE BY:
| n | | Stressing accountability, commitment and partnership throughout the organization to provide a foundation for sustainable growth. |
This strategic framework builds upon our current operations and is our basis for future profitable growth.
24 Management’s Discussion and Analysis
Our markets and operations
Our key Wholesale sales regions are in North America, North East Asia and Argentina. In these areas we have established a well-developed infrastructure to distribute production from our 14 facilities to our customers.
In our U.S. Retail business, we operate 225 retail farm centres in the Midwest, Pacific Northwest, Northeast and California. Our geographically diverse North American operations help to insulate the business from unfavorable crop prices or adverse weather conditions in any single region.
We also operate 18 farm centres in Argentina supplemented by two satellite outlets. The goal in establishing retail farm centres in Argentina was to introduce bulk blending and application equipment to an industry that was largely focused on bagged, prilled and non-blended nitrogen. These efforts have had a significant impact on the modernization of agriculture in Argentina.
Our risk management strategies
The global fertilizer business, like all agriculture-based industries, is subject to risks and uncertainties in commodity prices, the weather and political uncertainty as well as many risks specific to each product. We strive to minimize risk by focusing on our strengths while maintaining a balance in our product mix that mirrors global demand patterns.
| n | | Wholesale commodity prices are volatile and driven by the world supply and demand balance as well as grain prices. Our business is susceptible to price swings from the time of production until sale which can significantly impact profitability. We mitigate this risk through our geographic sales diversity and by locating production facilities in low-cost natural gas regions; |
| n | | Weather can also have a significant impact on demand. We must manufacture product throughout the year in order to meet peak season demand and we must react quickly to changes in expected weather patterns that affect demand. We do this by decreasing or increasing production and by moving product to locations where demand is strongest. However, our ability to react appropriately is limited by the shortness of the peak selling season; |
| n | | Political and economic uncertainty is an inherent risk in operating in a globally competitive market. Our strategy for mitigating political and economic risk in countries such as Argentina is to partner with large local firms, obtain non-recourse financing and locate facilities where product can be exported and sold in U.S. dollars. |
Our Industry and our Operations face a number of other controllable and uncontrollable risks including the following:
SPECIFIC FACTORS WITHIN OUR CONTROL:
| n | | Selling, general and administrative expenses and non-commodity input costs; |
| n | | Gas and currency hedging decisions; |
| n | | Production rates and inventory levels at multiple locations; |
| n | | Working capital management; |
| n | | Investment capital spending. |
GENERAL FACTORS OUTSIDE OF OUR CONTROL:
| n | | General economic, political or business conditions; |
| n | | Global nutrient supply and demand; |
| n | | Domestic and international pricing; |
| n | | Domestic and foreign government regulation or intervention; |
| n | | Transferability and convertibility of foreign currencies; |
| n | | Fluctuations in natural gas or other commodity input costs; |
| n | | Actions by competitors. |
Management’s Discussion and Analysis 25
Our Company
Our products and services
Nitrogen
We operate eleven production facilities in Western Canada, the United States and Argentina with the capacity to produce 7.2 million tonnes of nitrogen products annually.
| | | | | | | | | | | | | | | | | |
| | | 2002 Production | | | 2002 Sales | |
| Production/ | |
| | |
| |
| Market Area | | (tonnes 000s) | | | (%) | | | (tonnes 000s) | | | (%) | |
|
| Canada | | | 2,498 | | | | 46 | | | | 1,460 | | | | 26 | |
|
| United States | | | 2,466 | | | | 45 | | | | 2,326 | | | | 41 | |
|
| Argentina | | | 516 | | | | 9 | | | | 231 | | | | 4 | |
|
| Export Markets | | | — | | | | — | | | | 1,659 | | | | 29 | |
|
| | | | 5,480 | | | | 100 | | | | 5,676 | | | | 100 | |
|
OUR STRATEGY FOR NITROGEN HAS SEVERAL ELEMENTS:
| n | | Maintaining our competitive position from our existing plants in Western Canada where we have access to lower cost natural gas than U.S.-based plants; |
| n | | Maintaining our competitive industry leadership position in the Western hemisphere through economies of scale; |
| n | | Continuously improving our facilities to drive costs down and improve efficiency and reliability; |
| n | | Managing the risk of volatile natural gas pricing in North America through a disciplined hedging program; |
| n | | Optimizing our extensive storage and distribution infrastructure to ensure our products are in the right place at the right time for our customers; |
| n | | Sourcing product from our domestic production base or from offshore suppliers, depending on specific market conditions; |
| n | | Investing in major international growth opportunities in areas with abundant supplies of low-cost natural gas which can be secured under long-term contracts; |
| n | | Maintaining production discipline by monitoring production costs and inventory levels; |
| n | | Developing innovative technologies to meet the future needs of our customers. |
26 Management’s Discussion and Analysis
Our nitrogen business faces a number of specific risks and uncertainties:
The most significant of these risks and uncertainties include adverse weather conditions, access to cost-competitive natural gas and production reliability at our manufacturing facilities.
| n | | We mitigate risks relating to adverse weather conditions through sales to industrial customers that are not dependent on the weather and geographic distribution; |
| n | | In the long term, we mitigate volatility in natural gas prices by locating or acquiring facilities in areas where we can secure long-term supplies of natural gas at fixed prices. The Alaskan and Argentine nitrogen facilities are examples of this strategy. Approximately 80 percent of our remaining ammonia production is in Alberta where natural gas prices have historically traded at a discount to the NYMEX, providing us with a production cost advantage; |
| n | | In recent years, there has been increased volatility in natural gas prices due largely to declining reserves in both the U.S. and Canada. Our strategies for managing this risk include: |
| | n | | Hedging programs that utilize derivative swap and option agreements to fix the price for a portion of our natural gas input requirements. Our objective is to fix natural gas costs at a price that enables our facilities to remain competitive with imported product; |
| | n | | By purchasing lower-cost imported product, when available, and adjusting production levels at our facilities; |
| | n | | By restricting or shutting-in production at our higher-cost North American nitrogen facilities when cash costs of production are higher than prevailing product prices; |
| | n | | Reflecting increased natural gas input costs in our selling prices where market conditions permit. |
| n | | The main risks currently facing our nitrogen production Operations are the supply of natural gas to our Alaskan facility as discussed in our North America Wholesale section and mechanical production issues at our Argentina facility as addressed in the South America Wholesale section. These two issues could have a material effect on our performance in the near term until the issues are resolved; |
| n | | In the longer term, new technology could enhance the efficiency of nutrient uptake and reduce nutrient run-off. Our own research is focused on controlled release technology that increases the efficiency of nitrogen uptake by regulating nitrogen availability during periods of peak crop growth. At present, sales of these products represent only a small percentage of our sales. |
Nitrogen Volumes
(tonnes 000s)
Nitrogen Unit Revenues
and Costs($/tonne)
Management’s Discussion and Analysis 27
Our Company
Phosphate Volumes
(tonnes 000s)
Phosphate Unit Revenues
and Costs($/tonne)
Phosphate
We have the capacity to produce 1.3 million tonnes of phosphate products each year from our two facilities in Alberta and Idaho. The primary feedstock for the plant in Alberta is the phosphate rock mine in Ontario, which has an estimated reserve life of 17 years. The primary feedstock for the plant in Idaho is the nearby phosphate rock mine, which has an estimated reserve life of eight years and is adjacent to other available reserves. Further investment in our phosphate rock mines is required to access these reserves longer-term, which could increase the Idaho reserves from eight to 20 years.
| | | | | | | | | | | | | | | | | |
| | | 2002 Production | | | 2002 Sales | |
| Production/ | |
| | |
| |
| Market Area | | (tonnes 000s) | | | (%) | | | (tonnes 000s) | | | (%) | |
|
| Canada | | | 631 | | | | 59 | | | | 708 | | | | 63 | |
|
| United States | | | 440 | | | | 41 | | | | 421 | | | | 37 | |
|
| Export Markets | | | – | | | | – | | | | – | | | | – | |
|
| | | | 1,071 | | | | 100 | | | | 1,129 | | | | 100 | |
|
OUR PHOSPHATE STRATEGY IS TO:
| n | | Integrate the supply of phosphate ore and ammonia to our facilities to reduce costs and increase reliability; |
| n | | Continuously improve the operation of our facilities to drive down unit costs and improve efficiency; |
| n | | Capitalize on our low cost of transporting product from our facilities to our key phosphate markets in Western Canada and the Pacific Northwest; |
| n | | Take advantage of low-cost sulphur and sulphuric acid in our regional production locations. Sulphur is used in the manufacture of sulphuric acid which is used in production of phosphate nutrients. Sulphur and sulphuric acid are by-products of oil and gas production and mining operations in Western Canada and the U.S. Pacific Northwest. |
The primary risk facing our phosphate business is the availability and potential cost volatility of key raw materials. We mitigate these risks by owning and integrating the phosphate rock supply and maintaining access to low-cost sulphur. We also have an indirect hedge against volatility in ammonia input costs through our Nitrogen Operations.
Potash
Our potash mine and mill in Saskatchewan currently has the capacity to produce 1.8 million tonnes of potash annually and has sufficient ore reserves to maintain current production levels for the next 100-plus years.
| | | | | | | | | | | | | | | | | |
| | | 2002 Production | | | 2002 Sales | |
| Production/ | |
| | |
| |
| Market Area | | (tonnes 000s) | | | (%) | | | (tonnes 000s) | | | (%) | |
|
| Canada | | | 1,530 | | | | 100 | | | | 136 | | | | 9 | |
|
| United States | | | – | | | | – | | | | 974 | | | | 61 | |
|
| Export Markets | | | – | | | | – | | | | 488 | | | | 30 | |
|
| | | | 1,530 | | | | 100 | | | | 1,598 | | | | 100 | |
|
OUR POTASH STRATEGY IS TO:
| n | | Maintain a low-cost production position through operational excellence and improved productivity; |
| n | | Maintain production discipline to control production costs and inventory levels; |
| n | | Expand U.S. sales, principally through integration with our U.S. Retail business. |
Our potash business faces the same exposure to weather and North American grain prices as nitrogen and phosphate. However the strong international component of our sales provides geographic diversity, which mitigates this risk.
28 Management’s Discussion and Analysis

Retail
Our Retail businesses operate independently but in cooperation with our Wholesale Operations in both North and South America. Retail operations are comprised of 225 farm centres in the United States and 18 in Argentina and provide us with an opportunity to work closely with growers to understand their needs.
Our agronomists and retail crop consultants provide advice and state-of-the-art technical services to growers while promoting agronomic practices that maximize yield and protect the environment. By assisting growers with the science of agriculture, we ensure that farmers return the earth’s natural elements in an efficient manner while expanding their production of safe, abundant and high-quality crops for millions of people.
THE MAIN ELEMENTS OF OUR RETAIL STRATEGY ARE AS FOLLOWS:
| n | | Educate growers in the benefits of balanced nutrient application. This increases the demand for our products and services and improves the profitability of the grower; |
| n | | Minimize risk through geographic and product diversity; |
| n | | Continuously reposition capital investment from underperforming outlets to higher return opportunities; |
| n | | Focus on customer needs and relationships; |
| n | | Provide a source of stable cash flow and attractive investment returns; |
| n | | Provide direct access to growers; |
| n | | Develop innovative sales and collection programs. |
MANAGEMENT OF RETAIL RISKS
Farm centres require only limited investment in capital infrastructure and working capital. Our 225 farm centres are located in 22 U.S. States from California to Maryland. This geographical and product diversity provides additional stability in returns as regional weather patterns or changes in demand tend to compensate across regions.
In Argentina, retail operations face unique risks relating to currency devaluation and extended credit terms. Currency risk is managed by tying prices to U.S. dollars at the point of sale. Receivables can be collected after harvest requiring us to extend credit to growers for as long as 180 days. In order to secure our receivables from growers, we negotiate contracts for delivery of grain and oilseed as settlement for receivables from sales of crop nutrients.
Potash Volumes
(tonnes 000s)
Potash Unit Revenues
and Costs($/tonne)
Management’s Discussion and Analysis 29
Our Performance
and Outlook

Understanding our performance
Business segmentation
Understanding our business segments is important to understanding our performance. We manage and report our business through four primary operating segments and a fifth non-operating segment for Corporate and inter-segment eliminations. The primary operating segments are divided geographically and then into functional areas as follows:
Currency
We use the U.S. dollar as our reporting currency and report in millions of U.S. dollars unless otherwise stated. The U.S. dollar is the international currency for our Industry and the majority of our business is transacted in U.S. dollars or U.S. dollar equivalents.
Seasonality
Our business is seasonal in nature. Agricultural sales are concentrated in the spring and fall planting seasons while produced inventories are accumulated throughout the year. Significant cash collections occur after the planting seasons in North America and after harvest in South America. North and South America have opposite spring and fall seasons. Working capital requirements tend to peak in April and October and are lowest in July and December.
The timing of the start of the spring and fall application seasons is entirely driven by the weather. As the start of the seasons is unpredictable, sales may often shift between quarters and make year-over-year comparisons by quarter difficult or even misleading. We therefore consider the most meaningful historical comparisons to be on a semi-annual calendar year basis.
We market a diverse line of products to a wide variety of industrial customers. These markets provide consistent, year-round demand and in part serve to offset the seasonal nature of the agricultural market. The largest component of our industrial sales is nitrogen products sold to support resin, industrial-grade ammonium nitrate and pulp and paper production.
30 Management’s Discussion and Analysis
The table below sets out the highlights of our consolidated performance by quarter over the three years ended December 31, 2002:
| | | | | | | | | | | | | | | | | | | | | | | | | | | | | | |
| | | | First | | | Second | | | First | | | Third | | | Fourth | | | Second | | | | |
| (millions of dollars except per share data) | | Quarter | | | Quarter | | | Half | | | Quarter | | | Quarter | | | Half | | | Year | |
|
2002 | | | | | | | | | | | | | | | | | | | | | | | | | | | | |
|
| Net sales | | | 318 | | | | 792 | | | | 1,110 | | | | 466 | | | | 507 | | | | 973 | | | | 2,083 | |
|
| Net earnings (loss) | | | (36 | ) | | | 23 | | | | (13 | ) | | | 1 | | | | 12 | | | | 13 | | | | – | |
|
| | per share (basic) | | $ | (0.33 | ) | | $ | 0.16 | | | $ | (0.16 | ) | | $ | (0.01 | ) | | $ | 0.07 | | | $ | 0.07 | | | $ | (0.08 | ) |
|
EBIT(1) | | | (36 | ) | | | 55 | | | | 19 | | | | 19 | | | | 26 | | | | 45 | | | | 64 | |
|
EBITDA(2) | | | (2 | ) | | | 87 | | | | 85 | | | | 61 | | | | 66 | | | | 127 | | | | 212 | |
|
Cash provided by operating activities(3) | | | 2 | | | | 75 | | | | 77 | | | | 28 | | | | 119 | | | | 147 | | | | 224 | |
|
| Capital expenditures | | | 5 | | | | 3 | | | | 8 | | | | 15 | | | | 29 | | | | 44 | | | | 52 | |
|
| Non-cash working capital | | | 278 | | | | 254 | | | | 254 | | | | 300 | | | | 210 | | | | 210 | | | | 210 | |
|
| Total debt | | | 840 | | | | 777 | | | | 777 | | | | 779 | | | | 762 | | | | 762 | | | | 762 | |
|
| 2001 | | | | | | | | | | | | | | | | | | | | | | | | | | | | |
|
| Net sales | | | 381 | | | | 803 | | | | 1,184 | | | | 410 | | | | 469 | | | | 879 | | | | 2,063 | |
|
| Net earnings (loss) | | | 7 | | | | 45 | | | | 52 | | | | (17 | ) | | | (80 | ) | | | (97 | ) | | | (45 | ) |
|
| | per share (basic) | | $ | 0.04 | | | $ | 0.37 | | | $ | 0.41 | | | $ | (0.17 | ) | | $ | (0.72 | ) | | $ | (0.90 | ) | | $ | (0.49 | ) |
|
EBIT(1) | | | 29 | | | | 91 | | | | 120 | | | | (15 | ) | | | (74 | ) | | | (89 | ) | | | 31 | |
|
EBITDA(2) | | | 61 | | | | 122 | | | | 183 | | | | 28 | | | | (39 | ) | | | (11 | ) | | | 172 | |
|
| Cash provided by (used in) operating activities | | | (112 | ) | | | 108 | | | | (4 | ) | | | (12 | ) | | | 103 | | | | 91 | | | | 87 | |
|
| Capital expenditures | | | 37 | | | | 48 | | | | 85 | | | | 35 | | | | 44 | | | | 79 | | | | 164 | |
|
| Non-cash working capital | | | 449 | | | | 404 | | | | 404 | | | | 429 | | | | 283 | | | | 283 | | | | 283 | |
|
| Total debt | | | 970 | | | | 959 | | | | 959 | | | | 977 | | | | 980 | | | | 980 | | | | 980 | |
|
| 2000 | | | | | | | | | | | | | | | | | | | | | | | | | | | | |
|
| Net sales | | | 310 | | | | 700 | | | | 1,010 | | | | 378 | | | | 485 | | | | 863 | | | | 1,873 | |
|
| Net earnings (loss) | | | (4 | ) | | | 51 | | | | 47 | | | | 13 | | | | 22 | | | | 35 | | | | 82 | |
|
| | per share (basic) | | $ | (0.06 | ) | | $ | 0.44 | | | $ | 0.38 | | | $ | 0.10 | | | $ | 0.17 | | | $ | 0.27 | | | $ | 0.65 | |
|
EBIT(1) | | | 3 | | | | 86 | | | | 89 | | | | 29 | | | | 45 | | | | 74 | | | | 163 | |
|
EBITDA(2) | | | 27 | | | | 112 | | | | 139 | | | | 55 | | | | 76 | | | | 131 | | | | 270 | |
|
| Cash provided by (used in) operating activities | | | 20 | | | | 129 | | | | 149 | | | | (61 | ) | | | 168 | | | | 107 | | | | 256 | |
|
| Capital expenditures | | | 39 | | | | 43 | | | | 82 | | | | 42 | | | | 55 | | | | 97 | | | | 179 | |
|
| Non-cash working capital | | | 270 | | | | 216 | | | | 216 | | | | 407 | | | | 299 | | | | 299 | | | | 299 | |
|
| Total debt | | | 656 | | | | 660 | | | | 660 | | | | 909 | | | | 816 | | | | 816 | | | | 816 | |
|
| 1 | | Earnings before interest expense and income taxes. |
| |
| 2 | | Earnings before interest expense, income taxes, depreciation, depletion and amortization. |
| |
| 3 | | The Company has reclassified certain amounts in the 2002 quarterly Statement of Cash Flows within the category of Operating. The individual quarters for 2002 have been adjusted for this reclassification. |
Management’s Discussion and Analysis 31
Our Performance
and Outlook

Non-GAAP disclosure
Management considers earnings (loss) before interest expense and income taxes (EBIT) and earnings (loss) before interest expense, income taxes, depreciation, depletion and amortization (EBITDA) to be key measures of performance. This is because income tax jurisdictions and business segments are not synonymous and management believes that allocation of income tax charges distorts the comparability of historical performance for the different business segments. Similarly, financing and related interest charges cannot be allocated to all business segments on a basis that is meaningful for comparison with other companies.
EBIT and EBITDA are not recognized measures under GAAP and our method of calculation may not be comparable to other companies. EBIT should therefore not be used as an alternative to net earnings (loss) as determined in accordance with GAAP. Similarly, EBITDA should not be used an alternative to cash provided by operating activities as determined in accordance with GAAP.
Objectives
Our key fiscal objective for 2002 was to improve our financial position following a poor year for the Industry in 2001. A number of factors had contributed to debt levels that we considered were significantly higher than prudent:
| n | | High levels of capital expenditures between 1998 and 2000 attributable to the expansion of our international nitrogen assets and capital projects designed to reduce costs in our domestic phosphate operations; |
32 Management’s Discussion and Analysis
| n | | Our acquisition of the Alaskan nitrogen facility and related U.S. West Coast assets in late 2000 was largely debt financed; |
| n | | Record North American gas prices in late 2000 and early 2001, followed by adverse weather in many domestic and international markets, left us with record levels of inventory at the end of the peak spring season in 2001. This required additional debt financing. |
These factors had precluded us from using anticipated cash flow to repay short-term bank indebtedness in 2001 and resulted in a debt-to-debt plus equity ratio significantly in excess of our targets.
Achievements and overall performance
The following table summarizes the increase (decrease) in net earnings (loss) from the prior year for 2002, 2001 and 2000:
| | | | | | | | | | | | | | |
| (millions of dollars) | | 2002 | | | 2001 | | | 2000 | |
|
| Net earnings (loss) previous period | | (45 | ) | | | 82 | | | | 62 | |
|
| North America Wholesale | | | | | | | | | | | | |
|
| | Nitrogen pricing and volumes | | (127 | ) | | | 117 | | | | 130 | |
|
| | Nitrogen manufacturing costs | | | 40 | | | | (140 | ) | | | (49 | ) |
|
| | Phosphate | | | 31 | | | | (13 | ) | | | (41 | ) |
|
| | Potash | | | 9 | | | | (12 | ) | | | 4 | |
|
| | Depreciation | | (6 | ) | | | (25 | ) | | | (14 | ) |
|
| | Facility shut down costs | | | 7 | | | | (15 | ) | | | — | |
|
| North America Retail EBIT | | | 1 | | | | 4 | | | | 4 | |
|
South America Wholesale EBIT(1) | | | 6 | | | | 8 | | | | (5 | ) |
|
South America Retail EBIT(1) | | | 16 | | | | 2 | | | | 6 | |
|
| Selling, general and administrative costs | | | 9 | | | | (7 | ) | | | — | |
|
| Other | | | 8 | | | | (3 | ) | | | (4 | ) |
|
| Interest costs | | | 6 | | | | (37 | ) | | | — | |
|
| Tax impact on variances | | | -- | | | | 43 | | | | (11 | ) |
|
| Argentine charges | | | 45 | | | | (49 | ) | | | — | |
|
| Net earnings (loss) | | | -- | | | | (45 | ) | | | 82 | |
|
| 1 | | Before Argentine charges. |
Improved business fundamentals late in 2002 resulted in a stronger second half than 2001, and a return to modest profitability for the second half of the year. Key factors affecting overall results for the year compared to 2001 and 2000 included the following:
NORTH AMERICA WHOLESALE
| n | | In 2002, selling prices for nitrogen were lower than 2001 due to an Industry-wide reduction of inventory levels and the resultant aggressive price competition. In early 2001, international nitrogen prices rose to record levels as a result of the tight supply situation created by gas-related shutdowns in the first quarter in North America. We benefited from this through our Alaskan nitrogen operations which produced at full capacity; |
| n | | Phosphate gross profit in 2002 improved due primarily to resolution of production problems in prior years at both facilities. |
NORTH AMERICA RETAIL
| n | | A sixth consecutive year of record of earnings before interest expense and income taxes. |
SOUTH AMERICA
| n | | Additional Argentine charges in 2002 relating to the continuing devaluation of the Argentine peso. These losses on devaluation of the Argentine peso were partially offset by recovery of loss provisions on receivables recorded in 2001. Argentine charges are defined as net losses due to the devaluation of the Argentine peso and the forced conversion of U.S. dollar receivables into Argentine pesos (see South America business segment for more detailed explanation); |
| n | | The positive impact of devaluation on Argentine peso denominated costs in 2002; |
| n | | Renegotiation of Argentine gas supply contract prices. |
Management’s Discussion and Analysis 33
Our Performance
and Outlook

CORPORATE AND CONSOLIDATED
Selling, general and administrative costs in the North America Wholesale and Corporate segments have decreased on a combined basis in response to a conscious effort to limit discretionary spending.
In March 2002, we successfully completed an issue of 11.2 million common shares at $9.85 per share for net proceeds of $106-million. Together with improved cash flow generated from Operations and reductions in working capital these proceeds were used to reduce debt. This allowed us to achieve our primary goal for 2002.
Our efforts to reduce debt through the issue of equity and reductions in working capital are also reflected in lower overall interest charges compared to 2001. The increase in interest on the long-term debt component compared to 2001 reflects a full year of interest expense related to our Argentine non-recourse financing completed in the second quarter of 2001. Compared to 2000, interest expense has increased due to financing costs associated with completing the acquisition of the Alaskan nitrogen facility and related U.S. West Coast assets in September of 2000 and discontinuing interest capitalization following start-up of our Argentine nitrogen facility.
CAPITAL EXPENDITURES
Capital expenditures for 2002 were $52-million compared to $164-million in 2001 and $179-million in 2000. The significant reduction was due to two factors:
| n | | The completion of major investment projects in the previous years including our Argentine nitrogen facility, Ontario phosphate mine and the new purified phosphoric acid unit at our Idaho phosphate operation; |
| n | | The deferral of all new investment capital and non-essential sustaining capital in 2002. |
The combination of these actions allowed us to reduce our debt-to-debt plus equity ratio from 57 percent in 2001 to 50 percent in 2002. This is still higher than the 48 percent at the end of 2000 and our goal is to further reduce our debt in 2003.
Outlook for 2003
In 2003, we expect North America Wholesale results to improve in response to an anticipated return to more normal weather conditions and improved nutrient prices and demand. High natural gas costs will increase nitrogen costs and may affect margins but, in tight supply conditions, we expect increased costs to be reflected in selling prices.
Improved weather and anticipated increases in planting of corn and wheat acres in 2003 should also result in another good year for our North America Retail operations.
In South America, the agriculture sector continues to show strength in an otherwise depressed economy and we continue to believe it will be a positive force for economic recovery. Our Argentine nitrogen facility, however, may face production constraints until delivery and installation of a new heat exchanger for the urea plant.
Further discussion of the outlook for 2003 for each of our Operations can be found in the segmented performance section of this report together with discussion of significant uncertainties facing the Operations. Overall, we are expecting these factors to result in improved performance in 2003.
34 Management’s Discussion and Analysis
Industry risk assessment
While global supply and demand balances are tight, there are also a number of unknowns:
| n | | The impact of possible hostilities in the Middle East is difficult to predict. However any disruptions in supply from affected regions would likely have the impact of increasing global nitrogen prices; |
| n | | Weather continues to be a concern in our key markets. Over the past two years a large area of Western Canada experienced some of the worst droughts on record, significantly impacting fertilizer use and crop yields. In certain areas, the poor yields may lead to nutrient carry-over in the soil for the upcoming growing season; |
| n | | In the global market, uncertainty remains regarding China’s level of participation in the international urea market; |
| n | | The ability of nitrogen producers to offset recent increases in North American natural gas prices by increasing nitrogen prices is uncertain. Fourth quarter 2002 regional nitrogen prices in some U.S. markets were below the cash production costs. Some North American producers are also experiencing financial difficulties and their pricing strategies are unpredictable; |
| n | | We have an advantage over many of our North American competitors because of the availability of lower-cost Alberta gas and our fixed base-price contracts in Alaska and Argentina. There is, however, some uncertainty as to the quantity in both the short- and long-term of natural gas deliverable to our Alaskan facility under the Alaska supply contract; |
| n | | We have financially hedged approximately 10 percent of our North American natural gas requirements for 2003. Given tight nitrogen supply conditions, we expect higher costs to be reflected in selling prices. |
Sensitivity of earnings to changes in key variables
The following table illustrates the effect of changes in key variables on net earnings based on levels of activity in 2002. These levels of activity may differ in 2003 and future years and the impact of one factor may compound or offset others. These sensitivities should not, therefore, be used to forecast future results.
| | | | | | | | | | | | | | |
| | | | | | | | | | | | Increase | |
| | | | | | | | Increase | | | (decrease) | |
| | | | Increase | | | (decrease) | | | in earnings | |
| | | | in factor over | | | in net earnings | | | per share(1) | |
| Key variable | | a full year | | | (millions of dollars) | | | ($ per share) | |
|
North America — Wholesale | | | | | | | | | | | | |
|
| Selling Prices | | | | | | | | | | | | |
|
| | Ammonia | | U.S. $10/tonne | | | | 9 | | | | 0.07 | |
|
| | Urea | | U.S. $10/tonne | | | | 15 | | | | 0.12 | |
|
| | Phosphate(2) | | U.S. $10/tonne | | | | 7 | | | | 0.05 | |
|
| | Potash | | U.S. $10/tonne | | | | 10 | | | | 0.08 | |
|
| Natural gas cost(3) | | U.S. $0.10/MMBtu | | | | (4 | ) | | | (0.03 | ) |
|
| Exchange rate from Cdn.$ to U.S.$ | | C$0.01 | | | | (1 | ) | | | (0.01 | ) |
|
South America — Wholesale | | | | | | | | | | | | |
|
| Selling Prices | | | | | | | | | | | | |
|
| | Urea | | U.S. $10/tonne | | | | 3 | | | | 0.02 | |
|
| Exchange rate from Argentine Pesos to U.S.$ | | 2 pesos | | | | 1 | | | | 0.01 | |
|
| 1 | | Based on 126 million common shares outstanding at December 31, 2002. |
| |
| 2 | | MAP or DAP equivalent. |
| |
| 3 | | Based on natural gas requirements not under fixed price contract at January 1, 2002. |
Management’s Discussion and Analysis 35
Our Performance
and Outlook
Commitments
Our future financing and operating commitments are summarized as follows:
| | | | | | | | | | | | | | | | | | | | | |
| (millions of dollars) | | 2003 | | | 2004 | | | 2005 | | | 2006 | | | 2007 | |
|
| Long-term debt and capital leases | | | 25 | | | | 120 | | | | 49 | | | | 51 | | | | 54 | |
|
Operating leases(1) | | | 37 | | | | 31 | | | | 30 | | | | 22 | | | | 18 | |
|
Natural gas(2)(3) | | | 492 | | | | 92 | | | | 89 | | | | 84 | | | | 84 | |
|
Power, sulphuric acid and other(3) | | | 34 | | | | 23 | | | | 23 | | | | 23 | | | | 22 | |
|
| Profertil natural gas and other | | | 25 | | | | 25 | | | | 25 | | | | 25 | | | | 25 | |
|
| 1 | | These leases relate to short-term leases for rail cars and distribution facilities in North America Wholesale and for vehicles and application equipment in North America Retail. |
| |
| 2 | | Represents the minimum commitments for North American natural gas calculated using prevailing NYMEX forward prices at December 31, 2002. We commit a large percentage of our production volume requirements for the next year at floating prices. The prices paid at the time of actual purchase may not reflect this December 31, 2002 benchmark. |
| |
| 3 | | Liquid markets exist for the possible resale of natural gas, sulphuric acid and power purchased under the majority of these commitments. Gains or losses could be incurred on resale of purchases under fixed price commitments. |
Included in the commitments outlined above are scheduled debt repayments of $25-million in 2003 and $120-million in 2004 which we anticipate will be repaid through cash flow from operations.
Liquidity
The actions taken to improve our financial position for 2002 have also strengthened our financial flexibility for 2003. At December 31, 2002, our liquid resources and facilities were comprised of the following:
| n | | Cash and short-term investments of $109-million; |
| n | | Unused short-term bank revolving credit facilities of $281-million; |
| n | | A $125-million facility for the sale of eligible North America Wholesale and North America Retail accounts receivable on a non-recourse basis. At December 31, 2002, we had sold $114-million under this program. These accounts receivable are not reflected in our balance sheet. |
These facilities, together with our cash balances, should be sufficient to meet our commitments. The $225-million syndicated revolving credit facility expires in May, 2003 and we anticipate renewing this facility prior to that date. Our plans are also to continue to limit non-essential capital spending in 2003 to sustaining levels with minimal investment capital. Our average annual sustaining capital expenditures are estimated to be approximately $80- to $100-million.
36 Management’s Discussion and Analysis
Environmental
We are affected by extensive environmental regulations relating to both current and discontinued operations for future site decommissioning, restoration and reclamation. We make provisions for future liabilities over the life of the underlying assets where expenditures are considered likely under existing legislation and are reasonably estimable. Where expenditures are expected to reduce future contamination or increase the life or efficiency of the facility, they are capitalized. Expenditures relating to pre-existing conditions are expensed or charged against provisions. As at December 31, 2002, provisions totalling $94-million are recorded as other liabilities. Contingent liabilities also exist where future liabilities may arise under existing regulations or agreements in effect, but where the timing, nature and extent of remedial work have not been agreed on or cannot be determined.
Key accounting estimates and new standards
Application of accounting estimates requires certain assumptions to be made regarding future events. These estimates require experience and judgment and are subject to inherent risk of inaccuracy, particularly where they relate to events expected to take place well into the future. We therefore examine long-term estimates on a regular basis and adjust them prospectively where necessary.
New accounting standards adopted in 2002 include Section 3062 of the Canadian Institute of Chartered Accountant’s handbook relating to goodwill and other intangible assets. Under this standard, annual amortization of goodwill (approximately $4-million in 2001) was discontinued and replaced with an annual impairment test. This test was completed in the third quarter of 2002 and it was determined that goodwill of our phosphate business amounting to approximately $45-million was impaired. Under the transitional provisions of this standard, $29-million net of tax was charged directly to retained earnings as a change in accounting policy.
Note 2 of the consolidated financial statements outlines the impact of new standards on our financial statements.
In 2003, we anticipate the Canadian Institute of Chartered Accountants will issue a new standard on Asset Retirement Obligations which we expect to be consistent with the Financial Accounting Standards Board Statement 143 in the U.S. This standard will address site remediation issues on retirement and requires liabilities to be recorded if a legal or contractual obligation exists. We do not anticipate that this will have a significant impact on our current site decommissioning, restoration and reclamation obligations on adoption in 2003. We continually review provisions as circumstances and regulations change. Adjustments are made on a prospective basis.
Management’s Discussion and Analysis 37
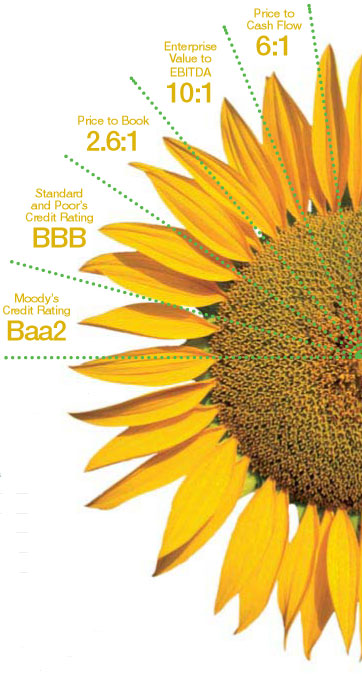
| | | |
| Financial Discipline | | Key value measurements |
| | | at December 31, 2002 |
Our vision is to maximize shareholder value through global growth and diversification. One of the four major strategies that we employ to achieve this vision is maintaining a disciplined investment approach in our management of assets and capital. This strategy has three components: utilizing a counter-cyclical approach to our investment decisions, using appropriate capital market instruments to fund our investments and ensuring economic access to capital markets by protecting our investment grade credit rating.
Source: Agrium.
| | | |
| EBITDA Interest Coverage | | Market Capitalization |
| (multiple) | | (millions of dollars) |
 | |  |
| Debt-to-Debt Plus Equity | | Shareholders’ Equity |
| (%) | | (millions of dollars) |
 | |  |
Capital structure
Maintaining financial flexibility through
our investment grade credit rating is
a long-standing objective. As a result of
the poor year we had in 2001, we had to
strengthen our balance sheet to preserve
this. Therefore, in March of 2002, we
raised net proceeds of $106-million of
new equity capital using the proceeds
to repay existing bank indebtedness.
38 Management’s Discussion and Analysis
Investment value
Between 1998 and 2001 we made significant
investments in a number of projects which
will have long-term benefit to Agrium. This
included investments in nitrogen assets and
retail facilities in Argentina, a phosphate rock
mine in northern Ontario and the upgrading
of our phosphate facility in Idaho. These
projects were completed in 2001.
In 2002, we reduced capital
spending to sustaining only,
deferring many projects in
order to conserve capital.

| | | |
| Capital Expenditures | | EBITDA |
| (millions of dollars) | | (millions of dollars) |
 | |  |
| |
Cashflow from Operating
Activities
(millions of dollars) | | Return on Average
Invested Capital(%) |
 | |  |
Working capital
In 2002, a renewed emphasis was
placed on managing working capital with
the goal that a reduction in working capital
would contribute significantly as a source of
operating cash flow during the year. This goal
was accomplished as inventory and accounts
receivable levels were reduced and changes
to working capital contributed $55-million
to cash flow from Operations in the year.
| | | |
Accounts Receivable/Net
Sales(%) | | Year-end Accounts
Receivable
(millions of dollars) |
 | |  |
| |
| Inventory/Cost of Product | | Year-end Inventory |
| (%) | | (millions of dollars) |
 | |  |
Management’s Discussion and Analysis 39
Segmented
Performance
and Outlook
North America Wholesale Gross
Profit and EBIT(millions of dollars)

North America Wholesale Operations
Performance objectives
Our operating plan for our North America Wholesale business for 2002 was based on an assumption of a return to more normal weather conditions in our key market areas and a modest recovery in nitrogen and phosphate prices. We also planned a number of initiatives and strategies designed to support our overall Corporate vision and to conserve cash resources. These included:| n | | Significant operating cost and capital expenditure reductions or deferrals; |
| n | | Cost and margin improvement initiatives; |
| n | | “Asset management” practices to improve operational reliability; |
| n | | Working capital reductions; |
| n | | Asset optimization and production strategies for reacting to unexpected changes in demand; |
| n | | Resolution of our dispute with Union Oil Company of California (Unocal) and related gas supply issues. |
Achievements and other developments
EARNINGS FROM OPERATIONS BEFORE INTEREST EXPENSE AND INCOME TAXES
EBIT for Wholesale operations in North America was a disappointing $40-million, a reduction from $64-million in 2001 and significantly less than $166-million in 2000. Major contributing factors were as follows:| n | | 2002 nitrogen sales volumes were approximately 500,000 tonnes higher than 2001 and 933,000 higher than 2000. Higher sales volumes in 2002 were the result of increased sales to U.S. and Canadian agricultural customers. In 2000, sales volumes reflected only three months of sales from the Alaskan nitrogen facility and related U.S. West Coast assets, which were acquired in September 2000; |
| n | | Global nitrogen sales prices were lower overall for 2002 compared to 2001 and 2000. However, nitrogen prices were at their lowest point from mid-2001 to mid-2002. An unprecedented drop in global demand during the spring of 2001, as a result of adverse weather conditions and low crop prices, led to high global inventories and low nitrogen prices over this twelve month period. Nitrogen prices strengthened significantly in the second half of 2002, led by a recovery in crop prices, strengthening industrial demand and production interruptions in a number of locations worldwide; |
| n | | 2002 nitrogen unit cost of product sold declined due to the various cost reduction initiatives at a number of our facilities. Our natural gas hedging activity was successful in reducing volatility in our gas costs. After incorporating hedging losses of $46-million in 2002, natural gas costs were similar to 2001 and 2000 which incorporated hedging gains of $70-million and $93-million respectively. Our average gas prices, including hedging, for 2002, 2001 and 2000 were $2.47, $2.53 and $2.34 respectively; |
| n | | Phosphate margins in 2002 improved over 2001 and 2000 as both our Alberta and Idaho phosphate facilities were unaffected by production interruptions which impacted 2000 and 2001. These interruptions related to the impact of the start up of our Ontario phosphate mine on production from our Alberta phosphate facility and the equipment failure at our Idaho facility late in 2000; |
| n | | 2002 potash sales volumes increased by 18 percent over 2001 and seven percent over 2000. These increases were largely due to higher sales to North American customers and higher export volumes; |
| n | | Depreciation and depletion charges for 2002 were slightly higher than 2001 due to write-offs of impaired assets totalling $14-million. 2001 included the $7-million write-off of the Henry, Illinois facility. Depreciation for both 2001 and 2002 was higher than 2000 as a result of these write-offs and the acquisition of the Alaskan nitrogen facility and related U.S. West Coast assets; |
| n | | Selling, general and administrative costs were significantly lower than 2000 and 2001 reflecting lower inter segment cost allocations together with other cost reductions and deferrals. We expect that selling, general and administrative costs will be marginally higher in 2003; |
| n | | Other expenses for 2002 were lower than 2001 mainly due to lower idle facility costs but were higher than 2000. The increase over 2000 is due to idle facility costs and increased site restoration and reclamation provisions. |
40 Management’s Discussion and Analysis
CAPITAL EXPENDITURES
We successfully reduced capital expenditures to $41-million in 2002 compared to $126-million in 2001 and $94-million in 2000. This was achieved by deferring non-essential expenditures as part of our cost reduction initiatives and the completion of major capital projects in prior years.
ALASKAN GAS SUPPLY DISPUTE
Our dispute with Unocal over their natural gas supply and delivery obligations, environmental liabilities and the Earn-out payment is ongoing. Unocal has curtailed supply to our Alaska nitrogen facility since July of 2002. We were able to offset some of these curtailments by obtaining natural gas from other oil and gas companies under interruptible contracts late in 2002. We have initiated legal proceedings against Unocal in respect of these matters and we have asserted in the litigation that Unocal has breached its warranty obligations with respect to gas supply.
As a result of these interruptions, this facility operated at an average of 76 percent of capacity in the second half of the year. While we expect the facility to maintain current average production rates of approximately 75 percent of capacity over the next 12 months, there is a risk that available gas from Unocal and other suppliers may not be sufficient to maintain those rates, particularly during the winter months. Unocal continues to advise us of downward revisions to the reserves. Because of the uncertainty relating to the reserves, no assurance can be given as to the long-term gas supply for this facility. Should the requirements of the facility not be met by Unocal or from existing supply sources from other producers, development of new natural gas reserves will be required to return the facility to full production. This would be expected to take 18 to 36 months from commencement of development.
Operations at the Alaskan facility at current levels will depend on third party supply for volumes above those actually delivered by Unocal. If we are economically unable to offset that reduction from other sources, we may be subject to increased expenses and the plant’s competitive position and carrying value may be impacted.
The agreement for the purchase of the Alaskan assets contains an “Earn-out” arrangement entitling Unocal to certain payments based on the capacity of the plant and forecast prices specified in the agreement for a period of six years following the acquisition. We continue to dispute any liability for an Earn-out payment but have accrued the potential liability arising from the date of acquisition to December 31, 2002. In the event the courts ultimately determine we are liable, additional Earn-out payments may become due in respect of subsequent years.
Outlook for 2003
In 2003, we expect North American demand for nutrients to improve in response to higher grain prices and in anticipation of a return to more normal weather conditions. Demand should be supported by a forecasted increase in seeded acreage for the major crops that consume the most fertilizer, such as corn, wheat and canola. The following table illustrates the significant increases in U.S. cash crop prices over the last year:
U.S. MID-WEST CASH CROP PRICES
| | | | | | | | | | | | | |
| | | Corn | | | Wheat | | | Soybeans | |
| Date | | ($/bushel) | | | ($/bushel) | | | ($/bushel) | |
|
| December 28, 2001 | | $ | 1.93 | | | $ | 3.01 | | | $ | 4.20 | |
|
| December 27, 2002 | | $ | 2.46 | | | $ | 3.46 | | | $ | 5.70 | |
|
| Increase % | | | 27% | | | | 15% | | | | 36% | |
|
The world nitrogen market appears to be relatively tight. This is the result of strong demand from Latin America and parts of Asia, and reduced exportable supplies from countries such as Indonesia and Venezuela. Based on their domestic strike, Venezuelan nitrogen products are not anticipated to be available in any significant volumes until after the 2003 spring season. North American inventories remained more than 20 percent below the five-year average at the end of December 2002. The recent rise in North American gas prices is expected to further tighten the balance of supply and demand.
In the medium term we continue to believe that the shortfall in world nitrogen production capacity additions relative to forecast growth in demand will result in a further tightening of the supply and demand balance.
Management’s Discussion and Analysis 41
Segmented
Performance
and Outlook
Phosphate demand is expected to continue its slow recovery in 2003 as markets continue to absorb the new global capacity. Higher grain prices and low inventories are expected to be positive drivers. However, higher ammonia input costs due to rising natural gas costs may impact margins.
Potash inventories in North America declined to more normal levels by the end of 2002 and potash demand should benefit from expected increases in planted acres of wheat and corn. This should result in firmer prices during 2003.
Nitrogen revenues, costs and gross profit
Sales volumes in 2002 increased over 2001 despite a second year of drought conditions in Western Canada as an aggressive pricing approach resulted in improved sales volumes compared to 2001 when pricing was significantly higher, affecting demand. Sales volumes for 2000 were lower than both 2002 and 2001 mainly due to the inclusion of only three months of sales from the acquisition of the Alaskan nitrogen facility and related U.S. West Coast assets in September of 2000.
Selling prices in the 2002 spring season were substantially lower than in previous years due to an Industry-wide emphasis on a reduction of inventory levels carried over from 2001 and resultant aggressive price competition. International and U.S. prices started to recover in the second half of the year.
Unit cost of product sold was lower than previous years due to increased production volumes and our cost-saving initiatives. Natural gas comprises approximately 70 to 85 percent of the cost of producing ammonia and, after taking hedging gains and losses into account, were at similar levels to 2001 and 2000.
The overall combination of these factors resulted in a decrease in nitrogen gross profit in 2002 of $87-million compared to 2001 and $109-million compared to 2000.
Phosphate revenues, costs and gross profit
Sales volumes for 2002 have increased significantly over 2001 and 2000 primarily due to increased production and availability of product from our Alberta and Idaho facilities. Improved performance at the Alberta facility was attributable to increased supply of phosphate rock from our Ontario mine where the remaining start-up issues were resolved. In 2002, we achieved a production record of one million tonnes at our Ontario facility. Our Idaho facility had a full year of production following mechanical failures at the plant in late 2000 and the start-up of the new purified phosphoric acid unit in mid-2001, both of which impacted production levels.
Phosphate sales prices strengthened in the first half of 2002 due primarily to production cut-backs in North America and some tightening in the balance of supply and demand. This balance had been disrupted in 2000 and 2001 by new capacity from India and Australia. However, in response to improving prices, some production was resumed and global pricing softened again later in the year. Despite being a regional producer, our Operations are affected by international pricing and our domestic prices followed international patterns.
Our unit phosphate production costs continued to fall in 2002 due to absorption of fixed costs over increased production and cost reduction initiatives at all facilities. The cost of phosphate rock ore delivered to Alberta from our Ontario mine also decreased due to improved volumes.
Overall, phosphate gross profit was $37-million in 2002 compared to $6-million in 2001 and $19-million in 2000 as a result of these factors.
Potash revenues, costs and gross profit
Potash sales volumes for 2002 increased over 2001 for both domestic and export sales as a result of increased sales to U.S. customers and increased demand from China and Brazil. Unlike nitrogen and phosphate, our North American markets are primarily in the U.S. and were not impacted by the drought in Western Canada.
Some erosion in international prices occurred in 2002 due to increased price competition for our export sales through Canpotex.
Potash costs of production declined in 2002 due to higher production volumes and to cost reduction initiatives at our Saskatchewan mine.
Overall, potash gross profit was $67-million in 2002 compared to $58-million in 2001 and $70-million in 2000 as a result of these factors.
42 Management’s Discussion and Analysis
North America Retail Operations
Earnings from Operations before interest expense and income taxes
EBIT from Retail operations in North America was a sixth consecutive record for the segment, mainly due to a strong fourth quarter in the Midwest and California. Fertilizer sales revenues declined by five percent due to lower nitrogen prices but were more than offset by increased sales of seed and chemicals. Despite the increase in revenues, gross profit remained unchanged due to lower chemical margins and product mix.We were able to reduce our selling, general and administrative expenses by $2-million in 2002 resulting in higher overall EBIT than the previous year and established a new record for the segment.
Retail outlook and strategy
The new U.S. Government farm aid program, low grain inventories and resultant increased prices should encourage increased planting of corn and wheat acres in 2003 and a reduction in soybeans. Fertilizer application rates are higher on corn and wheat than soybeans and, as a result, the Midwest farm centres should benefit from increased fertilizer sales.
Grower consolidation is expected to continue and lead to consolidation in the retail sector. This will come at the expense of independent dealers as these smaller businesses do not have the revenue base to sufficiently fund the many administrative functions required in today’s market.
Our size, geographic and product diversity, and stability of earnings and cash flow reduce our exposure to risks such as poor weather and economic conditions although we are not immune to their impact. Other areas of concern to our business include:
| n | | Dry conditions in parts of the U.S. Pacific Northwest which may increase the chance that some growers will not receive sufficient water to produce economic yields; |
| n | | The chemical market continues to decrease due to lower chemical use as a result of genetically modified seeds and lower chemical prices resulting from increased generic chemicals; |
| n | | Direct selling to growers from chemical manufacturers. |
We believe we will be able to more than offset reductions in chemical sales with increased sales of genetically modified seed. Chemical manufacturers do not have the ability to seriously erode our customer base because of our distribution network. We do believe these trends offer opportunities to align ourselves more closely with these manufacturers recognizing our contribution to the market.
North America Retail Gross
Profit and EBIT(millions of dollars)
Management’s Discussion and Analysis 43
Segmented
Performance
and Outlook
South America
The political and economic environment
Our operations in Argentina are subject to a number of risks including fluctuations in foreign currency exchange rates, limitation on foreign exchange convertibility and transferability, credit, expropriations and other economic, political and regulatory policies of Government.In January 2002, the Argentine Congress cancelled the “Convertibility Law” which pegged the Argentine peso to the U.S. dollar on an equivalent basis. This led to immediate devaluation of the Argentine peso. Despite conducting our business in South America in U.S. dollars in order to mitigate the currency risk, these new laws forced us to convert our U.S. dollar receivables into Argentine pesos at below market rates. Our 2001 financial statements reflected the initial impact of this devaluation and forced conversion based on a rate of 1.7 Argentine pesos to the U.S. dollar.
The political and economic environment in Argentina remained volatile throughout 2002. The new free-floating Argentine peso continued to devalue against the U.S. dollar before stabilizing in mid-year. The Argentine peso reached a low of 3.80 to the U.S. dollar in mid-year and remained low until the end of the third quarter when the rate improved to 3.60. The Argentine peso strengthened further in the fourth quarter to close the year at approximately 3.37 Argentine pesos to the U.S. dollar. Most agricultural companies, including ourselves, are supporting their employees with cost of living increases and base salary increases in order to offset the 41 percent increase in inflation.
There has been some relaxation in foreign currency convertibility and transferability. Dividends out of audited Argentine profits and payment of interest on foreign third-party debt without permission of the central Bank of Argentina are now permitted. However, there is no assurance the Government of Argentina will not re-establish these restrictions or impose other fiscal changes in the future which could negatively affect the economic viability of our Argentine operations.
Favourable weather conditions have prevailed throughout 2002 in Argentina while global crop prices have risen by 15 to 40 percent over the previous year. The anticipated decrease in fertilizer demand due to the economic climate did not materialize to the extent expected and, together with reduced nitrogen production from our Argentine facility, led to a need for nitrogen imports. Agriculture remains the one sector of the Argentine economy that demonstrated strength in 2002.

44 Management’s Discussion and Analysis
South America Wholesale Operations
Our Wholesale operations in Argentina are conducted through our 50-percent share in the Profertil S.A. (Profertil) joint venture with Repsol YPF, a large international oil and gas company based in Spain.
Earnings from Operations before interest expense and income taxes
Nitrogen sales volumes for the Argentine facility for 2002 were slightly higher than 2001, the first year of commercial production, but below our technical capacity due to unplanned downtime. When operating, the plant production rates were higher than design capacity, but ongoing mechanical problems required unscheduled shutdowns for maintenance and repairs and affected overall production levels.
At the end of the year both the ammonia and urea plants were running above design rates. There are mechanical concerns with the heat exchanger in the urea plant and current repairs are considered temporary until the new urea heat exchanger with upgraded metallurgy is installed early in 2004. The cost of the upgraded heat exchanger is not material. Until the current heat exchanger is replaced, some production interruptions may occur. As a precaution, a back-up unit from our Alberta nitrogen facility will be delivered to Argentina in April 2003 for installation by mid-year, which should minimize the risk of production interruptions.
Sales for 2002 were almost evenly divided between domestic and export sales. Prices for nitrogen are generally denominated in U.S. dollars but domestic sales are settled in equivalent Argentine pesos based on the exchange rate at the time of sale. They are therefore largely insulated from the impact of devaluation. Domestic sales prices are based on parity with imports and declined with international prices throughout the first half of 2002 and recovered later in the year. This was not sufficient to offset earlier declines.
2002 plant costs of production were significantly lower than the previous year for three main reasons:
| n | | Plant labour costs are generally denominated in Argentine pesos and benefited from currency devaluation; |
| n | | Profertil was able to favourably renegotiate the U.S. dollar based pricing of the gas supply contracts for the plant as a result of Government decrees requiring the renegotiation of all U.S. dollar-based contracts. The current pricing agreement will remain in effect until April 2003 and is at a discount to the U.S. base-price specified in the original contract. The natural gas supply for the facility is secured under three 12-year contracts at prices which we anticipate will continue to be competitive with similar export-oriented facilities in Trinidad; |
| n | | Electricity costs have also been renegotiated at significantly lower prices than the prior year. |
Selling, general and administrative expenses for 2002 also declined from the prior year due to the devaluation of the Argentine peso and the relocation of the Corporate head office from Buenos Aires to the plant site in Bahia Blanca.
Argentine peso translation losses of $14-million were recorded on Profertil’s monetary assets, primarily Argentine peso denominated Value Added Taxes receivable. These losses resulted from the decline in the Argentine peso from 1.7 Argentine pesos to the U.S. dollar at the beginning of the year to 3.37 at the end of 2002.
Overall, EBIT for wholesale operations in South America increased by $6-million before Argentine charges compared to the prior year as a result of these factors.
Outlook and strategy
The agriculture sector continues to show strength in an otherwise depressed economy and we continue to believe it will be a positive force for economic recovery. In 2002, planted acres and application rates were better than anticipated and close to 2001 levels and we expect that total nutrient use in Argentina will be higher in 2003. Profertil’s ability to export product for U.S. dollars and currently to retain proceeds offshore in U.S. dollars to repay international debts, affords some protection from further currency and economic risk. It also allows Profertil to participate in the expected recovery of the global fertilizer Industry.
Our challenge and focus in Argentina over the next two years will be to continue reacting to economic and political developments. At the plant, resolving the mechanical problems is key to maximizing returns.
South America Wholesale Gross
Profit and EBIT(millions of dollars)
(1) Before Argentine charges.
Management’s Discussion and Analysis 45
Segmented
Performance
and Outlook
South America Retail Gross
Profit and EBIT(millions of dollars)
(1)Before Argentine charges.
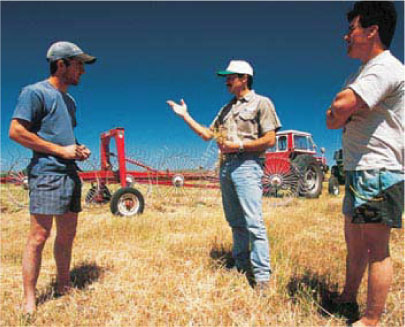
South America Retail Operations
Earnings from Operations before interest expense and income taxes
Our Retail operation in Argentina has fared significantly better than expected in 2002, despite the economic and political difficulties. Revenues were lower than the previous year due to the economic recession and the shortage of available product. However the cost structure has been reduced substantially as a result of the Argentine peso devaluation resulting in a continued growth in gross profit.Selling, general and administrative costs have similarly benefited from the devaluation of the Argentine peso as have non-cash depreciation charges.
Overall EBIT for Retail in South America improved substantially in 2002. The main reason was the recovery of $8-million of the $27-million of receivables provided for in 2001. This was due to more favourable exchange rates than anticipated when the convertibility law was cancelled. Additional losses of $34-million in 2002 (2001 – $23-million) on translation of the assets and liabilities into U.S. dollars were charged directly to the cumulative translation adjustment account under shareholders’ equity in accordance with GAAP as the retail operation is considered self-sustaining.
Outlook and strategy
The uncertain political and economic outlook facing Profertil is also faced by Retail. Until the political and fiscal environment becomes stable, we will continue to experience the risks associated with potential fiscal changes, credit losses, currency rate exposure and currency convertibility and transferability risk. We remain optimistic for the operation because of its importance to the Argentine agricultural sector and our strategy is to continue to further grow the business where we can do so without risking significant additional capital.
There is some risk from the actions of integrated competitors. Integration could lead to inter-segment subsidization of their fertilizer operations by grain trading operations and consequently result in an erosion of margins in Retail.
Other
Other is a non-operating segment consisting of Corporate administrative activity and inter-segment charges and eliminations. The primary reason for the increase over previous years is increased inter-segment interest charges which are offset as income in the respective business segments.
46 Management’s Discussion and Analysis
Forward-Looking
Statements
Except for statements of historical fact, the statements in, or incorporated by reference, in this Management’s Discussion and Analysis of Operations and Financial Position constitute forward-looking statements under applicable securities legislation. These forward-looking statements include, but are not limited to, references to:
| n | | the amount and type of future capital expenditures; |
| n | | business strategies and plans for implementing them; |
| n | | competitive strengths, goals, expansion and growth of our business and operations; and |
| n | | plans and references to our future results. |
These forward-looking statements are based on certain assumptions and analysis made by us in light of our experience and perception of historical trends, current conditions and expected future developments as well as other factors we believe are appropriate in the circumstances. However, whether actual results and developments will conform with our expectations and predictions is subject to a number of risks and uncertainties, including, but not limited to:
| n | | General economic, market and business conditions, including: |
| | n | | supply and demand for grain and other agricultural crops; |
| | n | | changes in government agricultural, safety, environmental and other legislation and policies; |
| | n | | fluctuations in foreign exchange rates, commodity, feedstock and nutrient prices or other costs that cannot be recovered through nutrient price increases; |
| | n | | actions by competitors and others in our market areas, including changes to industry capacity and utilization and product pricing; |
| | n | | performance by customers, suppliers, personnel and counterparties to financial instruments. |
| n | | Weather conditions and seasonal patterns. |
| n | | The outcome of our dispute with Unocal. |
| n | | General operating risks associated with: |
| | n | | the efficiency of our production facilities including currency convertibility and transferability restrictions; |
| | n | | the level and effectiveness of future capital expenditures and reliability of performance of existing capital assets; |
| | n | | ability to transport or deliver production to markets; |
| | n | | present and discontinued mining operations; |
| | n | | investment in foreign jurisdictions; |
| n | | Strategic risks including: |
| | n | | our ability to implement our business strategy; |
| | n | | results of our risk mitigation strategies, including hedging and insurance; |
| | n | | uncertainty as to the feedstock reserves owned or otherwise available to us; |
| | n | | our ability to integrate any assets we may acquire or the performance of those assets; |
| | n | | the opportunities, or lack of opportunities, that may be presented to and pursued by us; |
and other factors, many of which are beyond our control. Consequently, all of the forward-looking statements made in, or incorporated by, reference in this Management’s Discussion and Analysis of Operations and Financial Position are qualified by these cautionary statements and there can be no assurance that the actual results or developments anticipated by us will be realized or, even if substantially realized, that they will have the expected consequences to, or effects on, us.
We do not undertake any obligation to update forward-looking statements even if circumstances or Management’s estimates or opinions should change. Investors should not place undue reliance on forward-looking statements.
Management’s Discussion and Analysis 47