Exhibit 99.2

2004
Management’s Discussion & Analysis of the
Operations and Financial Condition
Agrium Inc. 2004 Management’s Discussion & Analysis
February 9, 2005
This management’s discussion & analysis of operations and financial condition focuses on long-term vision, strategy and growth opportunities, as well as historical performance for the three years ended December 31, 2004. The discussion should be read in conjunction with the cautionary statements regarding forward-looking statements on pages 36 to 37 of this management’s discussion & analysis and our 2004 consolidated financial statements and related notes. Dollar amounts refer to United States (U.S.) dollars except where otherwise stated.
Our quarterly and annual financial information and our Annual Information Form are available on SEDAR (www.sedar.com).
Table of Contents for Management’s Discussion & Analysis
| | | |
| | | Page
|
Overview of 2004 | | 3 |
| | | |
Our business | | 4 |
| | | |
Our vision and strategy | | 4 |
| | | |
Our industry | | 5 |
| | | |
Our operations, products and services | | 7 |
| | | |
Our key business sensitivities | | 12 |
| | | |
Our business segment performance | | 16 |
| | | |
Our consolidated performance | | 24 |
| | | |
Our accounting policies | | 32 |
| | | |
Forward-looking statements | | 36 |
| | | |
Our outlook | | 37 |
| | | |
Business risks | | 39 |

2
Agrium Inc. 2004 Management’s Discussion & Analysis
Overview of 2004
Consolidated financial performance in 2004
With strong market fundamentals and a significant increase in our overall production in 2004 over 2003, we achieved record net sales, gross margins and net earnings:
| n | Consolidated net sales grew by 14 percent to $2.8-billion in 2004 compared with $2.5-billion in 2003; |
| n | Consolidated gross profit was $910-million in 2004 compared with $739-million in 2003; and, |
| n | Consolidated net earnings grew to $276-million in 2004 compared with a net loss of $(21)-million in 2003. |
Financial discipline and strong balance sheet position
We improved our financial position:
| n | 2004 results generated record cash flow from operations in the amount of $449-million; |
| n | Consolidated cash and cash equivalents were $425-million at December 31, 2004 compared to $200-million at December 31, 2003; and, |
| n | Our ratio of debt-to-debt plus equity decreased from 47 percent at December 31, 2003 to 35 percent at December 31, 2004. |
Tight supply/demand market fundamentals
| n | As we entered 2004, strong grain markets, good global economic growth and the resulting tight nutrient supply and demand conditions continued from 2003. Nutrient prices were near historic highs in both the international and North America markets. |
| | |
| n | From late January to early April 2004, shipping difficulties in the Black Sea resulted in significant volatility in international nitrogen prices. Domestic nitrogen, potash and phosphate prices, however, remained relatively stable. |
| | |
| n | By late April 2004, with the planting season beginning in the Northern Hemisphere and strong grain markets continuing, international nitrogen prices bounced back close to historic highs and other nutrient prices continued their ascent higher. |
| | |
| n | In the second half of 2004, although there was some softening of grain prices mainly due to record crop yields in the U.S., nutrient prices remained strong. The global nutrient supply and demand balance remained tight due to strong demand in regions such as Asia and South America, limited new capacity additions and low producer inventories. |
Resolution of Alaskan nitrogen facility uncertainties
We received an Arbitration Panel award for Unocal Oil Company of California’s (Unocal) failure to deliver gas in accordance with the gas sales agreement for our Alaskan nitrogen facility. In 2004, we recorded $50-million ($30-million after tax or $0.21 diluted earnings per share) in liquidated damages under this award.
We also settled our long-standing dispute with Unocal over obligations, including Earn-out obligations, under the Purchase and Sale Agreement (PSA), pursuant to which we acquired this facility. A $36-million gain ($21-million after tax or $0.15 diluted earnings per share) was recorded in the fourth quarter of 2004 as a result of the settlement.
3
Agrium Inc. 2004 Management’s Discussion & Analysis
The settlement agreement establishes a definitive gas supply obligation from Unocal to the Kenai facility until October 31, 2005. It is our expectation the Kenai facility will close in November of 2005 unless we can obtain alternate economic gas supplies.
Our business
We are a major retailer of agricultural products and services in both North America and Argentina and a leading global producer and wholesale marketer of nutrients for agricultural and industrial markets.
We believe that our North America and international wholesale distribution infrastructure and retail operations will play an increasingly important role in our future as world trade of nitrogen gradually increases in response to declining North America and European production. With this belief, we are positioning ourselves for the future:
| n | We plan to further develop our already extensive North America wholesale distribution and storage infrastructure, retail operation and marketing expertise to enhance our ability to have agricultural and industrial products in the right place at the right time; and, |
| n | We plan to capitalize on our production expertise to successfully expand our production in regions where low-cost raw materials are available. |
Our vision and strategy
We compete in the global agribusiness and we remain committed to our long-term vision of becoming:
“A top tierglobalcorporation providingdiversified agricultural and industrial products and servicesin a manner that maximizes growth inshareholder value”
The key implications of our vision are that:
| n | We do not view ourselves as just a commodity fertilizer company in which our products and services are not differentiated; we look for opportunities in related fertilizer markets including those in the supply chain such as distribution, retail and industrial applications; |
| n | To grow, we need to locate our nitrogen production facilities internationally, where low-cost production inputs are available, and we need to build our distribution infrastructure to move product to key markets; |
| n | We will nurture our relationships with existing customers so we can grow with them. We plan to be “the easiest company to do business with”; and, |
| n | We will strive to adhere to the highest standards of corporate governance in order to protect and grow shareholder value. |
Our critical priorities for 2005 include:
| n | Aggressive pursuit of our growth strategy: |
| | ¡ | Our growth objectives include acquisition opportunities in the fertilizer supply chain; and, |
| | ¡ | Incremental expansion in those areas of our business identified as growth areas. Proposed growth areas include investment in offshore low-cost production facilities, a potash expansion, our controlled release nitrogen product (ESN®) and a Profertil urea debottlenecking project. |
| n | Continued improvement in our Environment, Health and Safety (EH&S) performance; |
| n | Limit controllable cost increases (including general and administrative costs) to one-half of the inflation rate, excluding foreign exchange and one time initiative effects; |
| n | Deliver operational excellence through flexible plant operations in periods of high gas prices. This continued emphasis on buy versus manufacture is in support of our continued evolution from a production driven to a market driven organization; and, |
| n | Ongoing focus on corporate governance and, in particular, implementation of a sustainable process across our global operations ensuring compliance with Section 404 of the Sarbanes-Oxley Act. |
4
Agrium Inc. 2004 Management’s Discussion & Analysis
To ensure we remain focused on our strategy, we have implemented performance management and incentive programs requiring employees to set individual goals that are linked to corporate strategies. These goals are supported by measurable Key Performance Indicators (KPI’s), which are monitored throughout the year. Incentives are based on the extent to which predetermined thresholds for these KPI’s, as well as corporate or divisional targets, are met or exceeded.
In addition, senior management and certain other key employees, including our Chief Executive Officer, receive part of their compensation by way of Performance Share Units that are tied to our total shareholder return in relation to a group of 20 peer companies.
Our industry
Fertilizer prices are determined by a variety of demand and supply factors. Although global demand for nutrients tends to grow at a relatively stable rate over time, it is impacted by such factors as grain prices, farm income, weather and the rate of economic growth with the latter also influencing industrial demand. However, significant changes to supply and trade levels often have a larger impact on prices than total change in overall global demand. These supply changes result from increases to global fertilizer production capacity, variances in world operating rates, and significant changes to raw material costs or the impact of government policies.
Demand for nutrients
Factors influencing the demand for our products and services include:
| | Grain and oilseeds
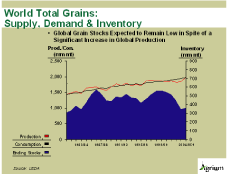
In the long-term, world nutrient and other crop input demand is driven by grain and oilseeds supply and demand fundamentals. Grain includes wheat, rice and coarse grains, which include corn and barley. Oilseeds include soybean, cottonseed, canola and palm oil. Grain and oilseed fundamentals drive crop prices, which influence planting intentions, crop mix, farm incomes and nutrient application rates. Approximately 80 percent to 85 percent of global nitrogen, phosphate and potash demand is used for grain and oilseed production. |
| |
| | Long-term grain demand is created by population growth and by rising living standards that increase both the quantity of food consumed per capita and the quality (protein content) of food consumed. Total grain consumption continues to grow, and global grain production has struggled to keep up. The current 2004 — 2005 growing season is expected to be the first season since 1999 — 2000 that global grain production has met consumption. |
| | Industrial-end uses
In addition to grain and oilseed fundamentals, industrial-end uses of nitrogen, phosphate and potash also drive demand. Industrial applications account for approximately 12 percent to 20 percent of total nutrient consumption. Growth in industrial demand for nitrogen, phosphate and potash is generally tied to overall economic growth. |
| |
| | Industrial uses of nitrogen include explosives for the mining industry, resins and glues for the forest products industry and animal feed supplement. A rapidly growing use for nitrogen is the removal of greenhouse gas emissions from combustion engines and power plants. Industrial uses of phosphate include animal feed, effluent treatment and fire retardant. Potash is used as an animal feed supplement, an ice-melting agent and as a table salt substitute. |
5
Agrium Inc. 2004 Management’s Discussion & Analysis
Supply of nutrients
The supply fundamentals of nitrogen, phosphate and potash commodities are more difficult to predict than the long-term demand fundamentals. Supply is affected by changes to production capacity as a result of plant closures, the start-up of new facilities and by changes to the operating rates of existing facilities. It is also affected by government policies and local market conditions affecting producers’ raw material costs, distribution costs and environmental requirements.
In potash, there have been no world-scale production facilities built in a number of years. The surge in demand for potash over the last three years has been met by increased operating rates, especially from the Saskatchewan and Former Soviet Union producers. During 2004, global potash prices responded to the tight supply and demand market by reaching record high levels.
In phosphate, increased production capacity in China has reduced their reliance on imported phosphate products over the past three years, putting pressure on the key exporting regions, including the U.S., to reduce operating rates. However, growth in demand in other regions, such as Latin America, supported the market in 2004 and led to some price improvement.
The largest market is nitrogen and typical growth in global nitrogen consumption suggests that three to five world-scale facilities need to come into production each year. However, new plant construction does not usually follow this pattern. Cyclically high nitrogen prices often lead to a number of new facilities receiving approval and financing at the same time. Conversely, cyclically low nitrogen prices discourage new plant construction. From 2002 to 2004, there were relatively few new nitrogen facilities brought into production following the cyclical downturn in nitrogen prices that began in 1997. In addition, there was a shift to sustained higher North American natural gas prices during this period, accompanied by substantially higher gas price volatility. This forced the permanent closure of a number of U.S. nitrogen facilities.
Retail and distribution
A number of developments in recent years have heightened the importance of the retail and distribution component in our industry’s supply chain. These include:
| n | The trend to greater North American reliance on imported nitrogen; |
| n | Larger volume and more efficient farm equipment that can put greater demands on the wholesale distribution and retail system for spring seeding and nutrient application; |
| n | The increasing importance of environmental regulations in the transportation, storage, handling and application of fertilizers and chemicals, and the need to meet these regulations efficiently; |
| n | The need to plan for and respond to government policies and legislation that affect the market. |
Consolidation of the retail and distribution business is occurring in North America. The trends identified above are some of the factors that have contributed to this consolidation as businesses make decisions about threats and opportunities.
6
Agrium Inc. 2004 Management’s Discussion & Analysis
Our operations, products and services
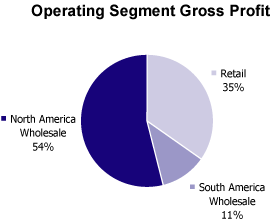
We manage and report our business through three operating segments and a fourth non-operating segment for corporate and inter-segment eliminations. Each operating segment is further divided into major product or revenue streams. The three operating segments are: Retail, North America Wholesale and South America Wholesale.
In 2004 we integrated our North and South America Retail segments into one Retail segment. Prior periods have been restated for comparative purposes.
The relative gross profit contributions of each operating segment in 2004 is illustrated in the following graph:
Retail operations
Our Retail operations in the U.S. conduct operations through our wholly owned subsidiaries, Crop Production Services, Inc. (CPS) in the Midwest and Northeast and Western Farm Service, Inc. (WFS) in the West. In Argentina, operations are conducted through our wholly owned subsidiary, Agroservicios Pampeanos S.A. (ASP).
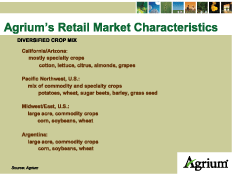
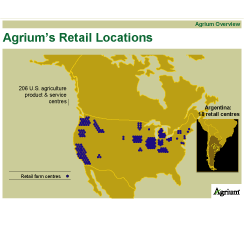
Our Retail segment sells agricultural products and provides a variety of agronomic services to our customers. As of December 31, 2004 these operations comprised 206 retail centres in the U.S. and 21 retail centres in Argentina. In February 2005 our Retail segment acquired 18 retail centres in Chile, Argentina and Bolivia that are not reflected in Agrium’s Retail Locations map.
We manage our Retail operations independently from our Wholesale operations. Our Retail operations in North America and South America purchase approximately 33 percent of their fertilizer from our Wholesale segments in, respectively, North America and South America. Purchases and sales of products between our Retail segment and Wholesale segments are made on arms-length terms.
7
Agrium Inc. 2004 Management’s Discussion & Analysis
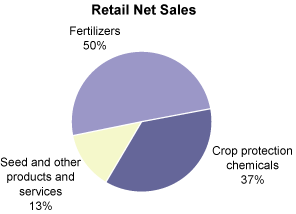
The relative 2004 net sales contribution of each major product and service category in our Retail segment is illustrated below:
| | Retail products and services |
| | Our Retail business has developed relationships with growers by differentiating its products and services. We recognize that our existence is based on the success of our customers. We must provide value to retain customer loyalty. A description of our products and services follows. |
| | | Fertilizers
We offer a complete range of liquid and dry fertilizer products including nitrogen, phosphate, potash and minor elements. |
| |
| | | Our crop advisors work with growers and recommend nutrient programs that are specific to the crop and soil conditions. Soil tests determine the initial fertilization program and tissue tests provide information to make in-season nutrient corrections. |
| |
| | | Based on the crop and soil test results, a blend of various commodity fertilizers is prepared to deliver the exact amount of nutrients required to produce the desired yield. The fertilizer may be applied over the ground (broadcast application), injected into the soil (root-zone application) or applied as the plant is growing (foliar application). This application may be by conventional methods or by using variable rate technology. Our value to the grower is to increase yields, which equates to increased profits. |
| |
| | | Crop protection chemicals
The primary crop protection chemicals are herbicides, insecticides and fungicides. These product categories address the major crop pests: herbicides for weed control, insecticides for insect control and fungicides for plant diseases. Our experienced crop advisors must consider application restrictions, days to harvest and future planting intentions before recommending a chemical application. Company software assists in the evaluation of the appropriate chemical treatments. |
| |
| | | Seed
In recent years, the most dramatic area of change has occurred in seed technology. Genetically modified seed has changed chemical programs for the large-acre commodity crops such as corn, soybeans, cotton, canola and, beginning this year, alfalfa. The technology has almost reduced herbicide programs to one chemical, glyphosate. These large-acre crops are generally grown in the Midwest U.S. Our Midwest facilities have radically changed their business model to include seed sales as a primary activity. Almost two-thirds of our Retail business occurs in California, Arizona and the Pacific Northwest, and business in these regions is essentially unaffected by the seed technology. |
| |
| | | Until now, most of the seed genetics have addressed crop inputs, herbicides and insecticides. Future innovations will address crop output traits. These new traits are expected to increase crop prices for these special uses, resulting in even more input value being shifted to seed. |
8
Agrium Inc. 2004 Management’s Discussion & Analysis
| | | The growing importance of seed sales accompanied by a decline in chemical sales has presented special challenges. However, these developments can be positive to the progressive retailer. Seed unit prices will continue to increase as the seed value increases. Since this technology is patented, a new market has been created. In the past, soybean seed was saved from the previous harvest. Now this patented seed must be purchased every year. In addition, we are marketing seed under our own label. This unique seed provides excellent value to the grower and enhanced returns to the retailer. |
| | Other products and services |
| | | Our Retail business also offers a full complement of services, including product application, soil testing, tissue testing, crop input recommendations and follow-up yield analysis. |
| |
| | | Net sales of our other products and services category primarily consist of application services. These services include liquid and dry fertilizer application, fumigation, chemical spraying and field listing. This application may be by conventional methods or by using variable rate technology. Our own equipment applies the majority of the fertilizer and chemicals we sell. This allows us to better control the quality and to improve the results of our fertility and chemical crop protection programs. |
| |
| | | The soil and tissue tests may be processed by our Madera, California lab or by third-party labs. Our Crop Monitoring Program (CMP) in the Western U.S. involves weekly tissue testing to fine tune nutrient applications to be consistent with changing plant requirements. |
| | | Weather can significantly disrupt or delay field agricultural operations, which may result in reduced or delayed crop input applications. Our extensive fleet of well-maintained application and transportation equipment allows us to address a variety of application challenges. Our large number of facilities also allows for the timely transfer of equipment to season-shortened markets. |
| |
| | | The geographic diversity of our retail locations and customers, the diversity of our retail products and services and the crop diversity of our customers are important elements of our Retail business strategy. These elements help to insulate us from both poor growing conditions that may occur in any single area and poor economic conditions that may occur for a particular crop. |
Wholesale operations
Our Wholesale operations in North America manufacture, market and distribute the three primary nutrients: nitrogen, phosphate and potash, mainly to agricultural customers in North America, Northeast Asia and Mexico and, to a lesser extent, industrial customers in North America. In South America, we are the joint-owners of the Profertil nitrogen production facility with Repsol-YPF S.A. that markets primarily to agricultural customers in Argentina.
| | Wholesale products
Our Wholesale operation’s product mix approximates global consumption patterns. Both our potash sales and our product sales to industrial customers provide a base level of stable cash flows and returns on a significant part of our business. This solid base of performance is leveraged by our nitrogen and phosphate operations, which are more cyclical, however they have greater potential to contribute significant growth to our earnings and cash flow. Within our markets, North and South America have complementary growing seasons that serve to reduce the impact of seasonality on our consolidated earnings. |
9
Agrium Inc. 2004 Management’s Discussion & Analysis
| | The relative 2004 net sales contribution of each major product category in our Wholesale segments are illustrated below: |
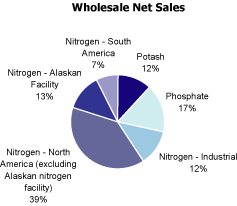
| | Nitrogen
We have the annual capacity to produce over seven million tonnes of nitrogen in liquid and solid form from our
11 facilities in Canada, the U.S. and Argentina. |
| | Our North American facilities, excluding our Kenai, Alaska facility, have an annual capacity to produce approximately 4,867-thousand tonnes of nitrogen. Our Kenai facility has an annual capacity to produce 1,740-thousand tonnes of nitrogen. The Profertil nitrogen facility in Argentina has the annual capacity to produce 1,170-thousand tonnes of nitrogen, which includes our 50 percent share and our joint venture partner’s 50 percent share. |
| |
| | Our primary nitrogen markets are located in the U.S., Western Canada, Argentina, Mexico, Brazil and South Korea. The key to serving these markets efficiently is our well-established distribution and storage infrastructure comprised of a network of owned, leased and third party storage facilities and our transportation arrangements. |
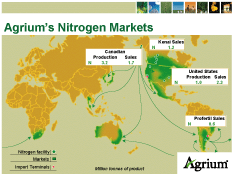
| | The location of our Profertil facility makes it particularly well suited to supplying Brazil, one of the largest and fastest growing agricultural economies in the world. |
| |
| | Natural gas is the primary raw material used in the production of nitrogen-based fertilizer. Almost 89 percent of our North American gas requirement is used in the production of ammonia, the building block of all nitrogen-based fertilizer. With each facility operating at full capacity, total natural gas consumption by Agrium’s nitrogen operations is approximately as follows: |
| | | | | |
| North American nitrogen facilities, excluding Kenai, Alaska | | 270,000 MMBtu/day | |
| Kenai, Alaska facility | | 155,000 MMBtu/day | |
Profertil, Argentina facility(1) | | 90,000 MMBtu/day | |
| (1) | Includes our 50 percent share and our joint venture partner’s 50 percent share |
| | Agrium’s natural gas requirement for its North America nitrogen operations, excluding the Alaskan facility, is purchased from a number of suppliers under contracts that contain mainly one-year terms, with nominal longer-term contracts in place with major suppliers. Natural gas prices under these contracts are generally market indexed with some hedging employed to reduce the impact of the volatility of gas prices. Small amounts of spot market gas are used to meet peak requirements. Our advantage in our North America Wholesale segment, excluding the Alaskan facility, is due to lower cost of gas in western Canada, our primary production area, representing the transportation differential between the U.S. and Alberta (referred to as the “AECO” basis). |
10
Agrium Inc. 2004 Management’s Discussion & Analysis
| | The natural gas requirement for the Alaskan facility is purchased under a low-cost supply agreement with Unocal. As a result of our settlement agreement with Unocal, which terminates our low-cost gas supply after October 2005, we anticipate closure of this facility in November 2005 unless we can obtain alternative sources of economic gas. |
| |
| | The natural gas requirement for the Profertil facility is purchased largely under four firm U.S. dollar denominated contracts wherein two contracts expire in 2012, one contract expires in 2013 and one contract expires in 2017. |
| |
| | For further discussion of the gas costs by operating segment, see page 15 of this management’s discussion & analysis. |
| | Phosphate |
| | Our two phosphate facilities in Redwater, Alberta and Conda, Idaho have a combined annual capacity of approximately 1,324-thousand tonnes. We are the only producer of phosphate in Western Canada. |
| |
| | Our primary phosphate markets are in Western Canada and Northwest U.S. Our facilities supply regional markets close to our operations. We have a delivered cost advantage in these markets relative to the export-oriented producers in central Florida due to transportation and logistical factors. |
| |
| | Phosphate rock, sulphur, sulphuric acid and ammonia are the principal raw materials in the manufacture of phosphate. Price and supply aspects of phosphate rock, sulphur and sulphuric acid are as follows: |
| | | Our two phosphate facilities are supplied with phosphate rock ore from mines that we own and operate and together require approximately four million tonnes of rock ore annually in the production of phosphate. |
| |
| | | It is expected that our Ontario phosphate rock mine reserves are sufficient to satisfy the Alberta phosphate facility’s phosphate rock requirements for approximately 17 more years based on current production capacity. It is expected that our Idaho phosphate rock mine reserves, including only permitted reserves, supplying our Idaho phosphate facility will continue to supply that facility’s requirements for approximately 13 more years based on current production capacity. There are an additional 15 years of reserves in close geographic proximity to our existing mines in Idaho, which have a reasonable probability of being brought into production. Our phosphate unit costs are not significantly affected by changes in international ore prices because we own and operate the mines that supply the ore to our facilities. |
| | Sulphur and sulphuric acid |
| | | Our Alberta facility consumes approximately 400,000 metric tonnes of sulphur annually in the production of phosphate. The facility is supplied with low-cost sulphur from nearby oil refineries, natural gas processing plants and the oil sands in northern Alberta. Our sulphur sources are diversified with multiple suppliers, a variety of source locations and both spot and long-term contracts. The excess quantities of sulphur available to us minimize price volatility and provide a major cost advantage. The facility’s cost of sulphur in 2004 was approximately 17 percent of the Tampa, Florida sulphur index. |
| |
| | | Our Idaho phosphate facility uses, on an annual basis, approximately 360,000 long tons of sulphur equivalent, which is 40 percent sulphur and 60 percent sulphuric acid. While the cost of sulphur to our Idaho facility is higher priced than to our Alberta facility due to the limited supply, it is lower than the cost to our Florida-based competitors. We also maintain a diversified sulphur supply source for our Idaho facility with multiple suppliers and both spot and long-term contracts. Our sulphur cost is offset by a low-cost sulphuric acid supply contract that further helps the Idaho facility’s competitive position. The facility’s blended average cost of sulphur equivalent in 2004 was approximately 27 percent of the Tampa, Florida sulphur index. |
11
Agrium Inc. 2004 Management’s Discussion & Analysis
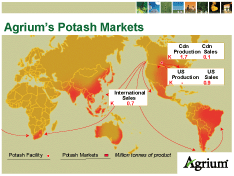
| | Potash
Approximately 35 percent of the world’s potash requirements are produced in Saskatchewan, Canada. Our potash mine and mill at Vanscoy, Saskatchewan has the capacity to produce approximately 1,790-thousand tonnes of potash each year and is among the lowest-cost producers in the world. |
| |
| | Our potash facility is supplied by the adjacent potash mine, which we own and operate. It is expected that the mine has sufficient ore reserves to satisfy the mill for well over 50 years based on current production capacity. |
| |
| | Our primary potash markets are in Southeast Asia, U.S., Brazil, China and Canada. Our potash is marketed overseas by Canpotex Limited (Canpotex), an offshore marketing agency for Saskatchewan potash producers and marketed in North America by our North America Wholesale segment’s marketing team. |
Our key business sensitivities
Our business risks are discussed on pages 39 to 42 of this management’s discussion & analysis. Our financial results are sensitive to a number of factors that affect day-to-day operations. The following table sets out the impact of changes in key measurable variables on our earnings and diluted earnings per share based on levels of activity in 2004. These levels of activity may differ in 2005 and future years, and the impact of one factor may compound or offset others. These sensitivities should not, therefore, be used to forecast future results.
| | | | | | | | | | | | | | | | |
| | | |
| | | | | | | | Impact of change on: | | |
| | | | | | | | | | |
| | | | | Amount of | | | Net earnings | | | | Diluted | | |
| | | | | change over a | | | (millions of | | | | earnings per | | |
| | Key variable | | | full year | | | U.S. dollars) | | | | share(1) | | |
| | | | | | | | | | | | |
| | North America | | | | | | | | | | | | | | |
| | Wholesale selling prices: | | | | | | | | | | | | | | |
| | Ammonia | | | U.S. $10/tonne | | | $ | 10 | | | | $ | 0.07 | | |
| | Urea | | | U.S. $10/tonne | | | | 15 | | | | | 0.10 | | |
| | Other nitrogen | | | U.S. $10/tonne | | | | 7 | | | | | 0.05 | | |
| | Phosphate | | | U.S. $10/tonne | | | | 6 | | | | | 0.04 | | |
| | Potash | | | U.S. $10/tonne | | | | 12 | | | | | 0.08 | | |
| | Natural gas cost(2) | | | U.S. $0.10/MMBtu | | | | 7 | | | | | 0.05 | | |
| | Exchange rate from C$ to U.S. $(3) | | | C $0.01 | | | | 3 | | | | | 0.02 | | |
| | | | | | | | | | | | | | | | |
| | South America | | | | | | | | | | | | | | |
| | Wholesale selling prices: | | | | | | | | | | | | | | |
| | Nitrogen | | | U.S. $10/tonne | | | $ | 4 | | | | $ | 0.03 | | |
| | Exchange rate from Argentine Pesos to U.S. $ | | | 0.3 pesos | | | | 1 | | | | | 0.01 | | |
| | | | | | | | | | | | |
| | (1) Based on 144-million shares outstanding at December 31, 2004. | |
| | (2) Excludes Kenai, Alaska facility. | |
| | (3) Excludes impact of Canadian dollar hedging activities. | |
| | | | | | | | | | | | |
12
Agrium Inc. 2004 Management’s Discussion & Analysis
Some of the factors that can affect these key variables are as follows:
| | Wholesale selling prices
Product prices are primarily determined by the international supply and demand balance. Regional prices are linked to the international prices with a premium for transportation costs from key exporting ports. |
| |
| | In periods of strong crop prices, demand for nutrients may be unaffected even if fertilizer prices increase substantially. This demand inelasticity results because the cost of fertilizers is small relative to the total crop revenue per acre and nutrients can increase crop yields by as much as 40 percent. |
| |
| | Relevant published reference prices for our products are set out in the following table: |
| | | | | | | | | | | | |
| |
| | Our product pricing | |
| | | | | | | | | | | Relevance of | |
| | Product/Market | | | Product Reference | | | | | | Reference Price to | |
| | Destination | | | Price | | | Reference Price Graph 2002 – 2004 | | | Agrium | |
| |
Nitrogen-based fertilizer /
U.S. and Canada | | |
n Urea price at U.S. Gulf Port in New Orleans, Louisiana (NOLA) free on board (fob)
n Western Canada urea price | | |
 | | |
n U.S. Gulf port at New Orleans is the primary port of entry for urea imported into North America
n NOLA urea is a commonly used reference price in North America. Western Canada and U.S. Northern Tier State urea prices tend, over time, to reflect the NOLA price plus a transportation premium
n Agrium’s North American sales of nitrogen-based fertilizers are mainly referenced to the Western Canada and U.S. Northern Tier State urea price
| |
| |
Nitrogen-based fertilizer/
International | | |
n Black Sea urea prill* price
(*prill represents a grade of urea) | | |
 | | |
n Black Sea urea prill price represents the reference price for landed product into Argentina and for sales to Asia-based customers
n Nitrogen-based fertilizer sales from our South America operating segment to Argentina and Brazil based customers are based on a basket of international reference prices, including the Black Sea urea prill reference price, plus a transportation premium
| |
| |
13
Agrium Inc. 2004 Management’s Discussion & Analysis
| | | | | | | | | | | | |
| |
| | Our product pricing | |
| | | | | | | | | | | Relevance of | |
| | Product/Market | | | Product Reference | | | | | | Reference Price to | |
| | Destination | | | Price | | | Reference Price Graph 2002 - 2004 | | | Agrium | |
| |
Phosphate | | |
n Central Florida Diammonium phosphate (DAP) price
n Pacific Northwest mono-ammonium phosphate (MAP) price
n Western Canada MAP price | | |
 | | |
n The majority of North American phosphate production is located in Central Florida
n Agrium MAP has a higher percentage of phosphate than DAP
n Central Florida DAP, Pacific Northwest MAP and Western Canada MAP prices represent the product reference prices in North America
n Agrium’s phosphate sales are mainly in Western Canada and the Pacific Northwest U.S. Prices are based on the Central Florida reference price plus a transportation premium | |
| |
Potash | | |
n Saskatchewan potash fob price
n Cornbelt
potash price | | |
 | | |
n Agrium’s potash is produced in Saskatchewan, Canada
n Agrium’s North American potash sales are largely based on published reference prices
n Agrium’s potash sales outside of North America are determined by Canpotex pursuant to six month to twelve month contracts at negotiated prices or by spot sales | |
| |
14
Agrium Inc. 2004 Management’s Discussion & Analysis
| | Natural gas costs
We consume almost 138-million MMBtu’s of natural gas in our North America facilities each year (including our Kenai facility). At a price of $4.32 per MMBtu, this represents almost 84 percent of the total cost of producing a tonne of ammonia. The balance of our natural gas consumption is for fuel gas at our other manufacturing facilities. |
| |
| | The following table summarizes our gas costs for the North America Wholesale segment and compares them to relevant market indicators. Due to the constraints on the supply of low-cost gas to our Kenai facility in 2003 and 2004, there has been some ongoing erosion of this advantage relative to our Kenai nitrogen production. The Kenai gas supply agreement will be terminated in October 2005 as part of our settlement with Unocal. |
| | | | | | | | | | | | |
| |
| | (U.S. dollars per MMBtu) | | | 2004 | | | 2003 | | | 2002 | |
| | | | | | | | | | | | |
| | NYMEX | | | 6.09 | | | 5.44 | | | 3.25 | |
| | AECO | | | 5.23 | | | 4.74 | | | 2.60 | |
| | | | | | | | | | | | |
| | North America Wholesale | | | | | | | | | | |
| | Average — unhedged | | | 4.32 | | | 3.79 | | | 2.36 | |
| | Hedging impact | | | - | | | (0.09) | | | 0.28 | |
| | Overall weighted average | | | 4.32 | | | 3.70 | | | 2.64 | |
| | | | | | | | | | | | |
| |
| | As indicated in the table on page 12, the effect of a change of $0.10 per MMBtu to the cost of natural gas in North America would be to result in a change in net earnings of $7-million. This assumes all other variables remain constant. |
| |
| | We also have natural gas hedges that do not qualify for hedge accounting treatment and consequently are excluded from our weighted average gas cost. We realized $3-million in gains on these non-qualifying contracts in 2004 ($5-million loss in 2003; $5-million loss in 2002). |
| |
| | Foreign exchange
The international currency of the agribusiness is the U.S. dollar, and accordingly we use the U.S. dollar as our reporting currency. We conduct business in U.S. dollars, Canadian dollars and Argentine pesos, and fluctuations in these currencies can impact our results. We manage our U.S. denominated working capital in our Canadian self-sustaining subsidiaries to minimize the impact of foreign exchange rate fluctuations on our consolidated results, and where appropriate, we use derivative instruments to manage our foreign exchange exposure. |
| |
| | The following table sets out the major types and levels of transactions in Canadian dollars and Argentine pesos that can result in fluctuations in our financial statements due to changes in exchange rates with the U.S. dollar: |
| | | | | | | | | |
| | | | | | | | | |
| | Currency/Transaction Type | | | Converted to U.S.$ at: | | | Foreign Exchange Impact | |
| | Self Sustaining Subsidiaries | | | | | | | |
| | Canadian dollar transactions | | | Transaction rate | | | Included in relevant income or expense | |
| | Canadian dollar assets and liabilities | | | Period-end rate | | | Cumulative Translation Adjustment (CTA) | |
| | Canadian dollar foreign exchange on U.S. dollar working capital in Canadian self-sustaining subsidiaries | | | Period-end rate | | | Statement of operations — foreign exchange | |
| |
15
Agrium Inc. 2004 Management’s Discussion & Analysis
| | | | | | | | | |
| | | | | | | | | |
| | Currency/Transaction Type | | | Converted to U.S.$ at: | | | Foreign Exchange Impact | |
| | Integrated Subsidiaries | | | | | | | |
| | Argentine peso transactions | | | | | | | |
| | Income and expenses | | | Transaction rate | | | Included in relevant income or expense | |
| | Depreciation and amortization | | | Historic rate | | | Depreciation and amortization expense | |
| | Argentine peso monetary assets and liabilities | | | Period-end rate | | | Statement of operations – foreign exchange | |
| | Argentine peso non-monetary assets and liabilities | | | Historic rate | | | No impact | |
| | | | | | | | | |
| | As indicated in the table on page 12 of this management’s discussion & analysis, on a consolidated basis, a $0.01 increase in the value of the Canadian dollar would have a negative effect of $3-million on our net earnings while a 0.3 increase in the value of the Argentine peso would have a negative effect of $1-million. |
Our business segment performance
Retail
In 2004, our Retail operation continued to demonstrate its importance to our overall strategy of growth and stability of earnings, recording its sixth successive year of record net sales.
The main elements of change in the year-over-year EBIT compared to 2003 and 2002 are summarized in the following table:
| | | | | | | | | | | | | | | | | | | | | |
| | | Year ended December 31 | | | Variance Analysis | |
| | | | | | | | | | | | | | | 2004 v. | | | 2003 v. | |
| (millions of U.S. dollars) | | 2004 | | | 2003 | | | 2002 | | | 2003 | | | 2002 | |
| | | | | | | |
| Fertilizers | | | | | | | | | | | | | | | | | | | | |
| Net sales | | | 556 | | | | 468 | | | | 419 | | | | 88 | | | | 49 | |
| Cost of product | | | 425 | | | | 351 | | | | 296 | | | | 74 | | | | 55 | |
| Gross profit | | | 131 | | | | 117 | | | | 123 | | | | 14 | | | | (6 | ) |
| | | | | | | | | | | | | | | | | | | | | |
| Chemicals | | | | | | | | | | | | | | | | | | | | |
| Net sales | | | 416 | | | | 416 | | | | 381 | | | | - | | | | 35 | |
| Cost of product | | | 298 | | | | 297 | | | | 281 | | | | 1 | | | | 16 | |
| Gross profit | | | 118 | | | | 119 | | | | 100 | | | | (1 | ) | | | 19 | |
| | | | | | | | | | | | | | | | | | | | | |
| Seed and other products and services | | | | | | | | | | | | | | | | | | | | |
| Net sales | | | 142 | | | | 131 | | | | 129 | | | | 11 | | | | 2 | |
| Cost of product | | | 75 | | | | 69 | | | | 66 | | | | 6 | | | | 3 | |
| Gross profit | | | 67 | | | | 62 | | | | 63 | | | | 5 | | | | (1 | ) |
| | | | | | | | | | | | | | | | | | | | | |
| Total Gross profit | | | 316 | | | | 298 | | | | 286 | | | | 18 | | | | 12 | |
| | | | | | | | | | | | | | | | | | | | | |
| Selling expenses | | | 222 | | | | 214 | | | | 191 | | | | 8 | | | | 23 | |
| General & administrative | | | 8 | | | | 8 | | | | 8 | | | | - | | | | - | |
| Depreciation & amortization | | | 18 | | | | 19 | | | | 21 | | | | (1 | ) | | | (2 | ) |
| Royalties & other expenses | | | (13 | ) | | | (9 | ) | | | (11 | ) | | | (4 | ) | | | 2 | |
| EBIT | | | 81 | | | | 66 | | | | 77 | | | | 15 | | | | (11 | ) |
16
Agrium Inc. 2004 Management’s Discussion & Analysis
| | Fertilizers
Fertilizer sales reached record levels in 2004 due to both price and volume increases. The cost of product purchased, however, also increased significantly for reasons discussed under our Wholesale business segment. We nevertheless substantially maintained our margins and reflected most cost increases in our selling prices because of the strong demand that resulted from increased grain prices and farm incomes. |
| |
| | In the latter part of 2004, the U.S. Department of Agriculture (USDA) estimated that world soybean and corn inventories would be above expectations mainly due to record U.S. harvests. These moderated expectations for grain prices led to some erosion in grain prices. However, with grain stocks as a percentage of use remaining low compared to historical levels, strong farm incomes and significant nutrient uptake from the soil in 2004, we continue to expect strong fertilizer demand in the spring of 2005. |
| |
| | Crop protection chemicals
Chemical sales and gross profit in 2004 were largely consistent with 2003 and increased over 2002. The insect and disease pressure in the California market that was experienced in 2003 subsided slightly in 2004. Demand for chemicals in 2003 and 2004 was also supported by higher farm incomes, favorable growing conditions in our U.S. market and higher glyphosate prices in the South America market. |
| |
| | Seed and other products and services
Seed sales are a rapidly growing product line in our retail business. They were $57-million in 2004, which represents a 14 percent increase from 2003. Seed sales in 2002 were consistent with 2003 seed sales. This increase is due to the development of genetically modified seeds. The input traits of these seeds reduce chemical costs and the output traits improve crop value though enhanced product performance. Because the genetics in the seed are patented, the grower cannot save seed at harvest to be planted the next year. This situation resulted in a significant increase in seed sales, especially for soybean seeds. |
| |
| | Other products and services include mainly application services. Application service revenues remained relatively stable and were $42-million in 2004 (2003 – $45-million, 2002 – $42-million). |
| |
| | Expenses
Our Retail business is labor intensive, and, during times of peak activity, we employ almost 2,500 full-time employees in our 206 North America retail centres and 21 South America retail centres. Our selling expenses include salary and wages, employee medical insurance and fuel for our service vehicles and equipment. These expenses tend to fluctuate with activity and were therefore correspondingly higher than the two prior years. As a percentage of net sales, however, 2004 selling expenses remained relatively consistent with 2003 and 2002 selling expenses. |
| |
| | Most other expenses in 2004 remained comparable to the previous two years. These include office overhead, depreciation and amortization and equipment rental expenses. |
| |
| | Key operating developments
At year-end 2004, we operated 206 retail centres in California and the Midwest, Northeast, and Pacific Northwest regions of the U.S. This is consistent with 2003 and 19 fewer than in 2002. We continually evaluate the performance of each retail centre, and if performance is below our expectations, we may consolidate, sell or close these outlets. We are also continuing to acquire additional centres. |
17
Agrium Inc. 2004 Management’s Discussion & Analysis
North America Wholesale
2004 was the most successful year for our North America Wholesale segment since 1996 as measured by net sales and gross profit and the second highest EBIT on record since 1995. The main elements of improvement in the year-over-year EBIT compared to 2003 and 2002 are summarized in the following table:
| | | | | | | | | | | | | | | | | | | | | | | | | | | | | | | | | | | | | |
| | | Year ended December 31 | | | Variance Analysis | |
| | | | | | | | | | | | | | | 2004 v. 2003 | | | 2003 v. 2002 | |
| (millions of U.S dollars, thousands of tonnes) | | 2004 | | | 2003 | | | 2002 | | | Change | | | Price | | | Volume | | | Change | | | Price | | | Volume | |
| | | | | | | |
| Nitrogen | | | | | | | | | | | | | | | | | | | | | | | | | | | | | | | | | | | | |
| Tonnes sold | | | 5,159 | | | | 5,156 | | | | 5,556 | | | | 3 | | | | | | | | | | | | (400 | ) | | | | | | | | |
| Net sales | | | 1,180 | | | | 1,044 | | | | 775 | | | | 136 | | | | 135 | | | | 1 | | | | 269 | | | | 325 | | | | (56 | ) |
| Cost of product | | | 865 | | | | 790 | | | | 683 | | | | 75 | | | | (75 | ) | | | - | | | | 107 | | | | (156 | ) | | | 49 | |
| Gross profit | | | 315 | | | | 254 | | | | 92 | | | | 61 | | | | 60 | | | | 1 | | | | 162 | | | | 169 | | | | (7 | ) |
| Selling price per tonne | | | 229 | | | | 202 | | | | 139 | | | | | | | | | | | | | | | | | | | | | | | | | |
| Cost of product per tonne | | | 168 | | | | 153 | | | | 123 | | | | | | | | | | | | | | | | | | | | | | | | | |
| Phosphate | | | | | | | | | | | | | | | | | | | | | | | | | | | | | | | | | | | | |
| Tonnes sold | | | 1,181 | | | | 1,090 | | | | 1,129 | | | | 91 | | | | | | | | | | | | (39 | ) | | | | | | | | |
| Net sales | | | 309 | | | | 261 | | | | 239 | | | | 48 | | | | 26 | | | | 22 | | | | 22 | | | | 30 | | | | (8 | ) |
| Cost of product | | | 238 | | | | 217 | | | | 202 | | | | 21 | | | | (3 | ) | | | (18 | ) | | | 15 | | | | (22 | ) | | | 7 | |
| Gross profit | | | 71 | | | | 44 | | | | 37 | | | | 27 | | | | 23 | | | | 4 | | | | 7 | | | | 8 | | | | (1 | ) |
| Selling price per tonne | | | 262 | | | | 239 | | | | 212 | | | | | | | | | | | | | | | | | | | | | | | | | |
| Cost of product per tonne | | | 202 | | | | 199 | | | | 179 | | | | | | | | | | | | | | | | | | | | | | | | | |
| Potash | | | | | | | | | | | | | | | | | | | | | | | | | | | | | | | | | | | | |
| Tonnes sold | | | 1,796 | | | | 1,662 | | | | 1,598 | | | | 134 | | | | | | | | | | | | 64 | | | | | | | | | |
| Net sales | | | 214 | | | | 160 | | | | 158 | | | | 54 | | | | 40 | | | | 13 | | | | 2 | | | | (4 | ) | | | 6 | |
| Cost of product | | | 108 | | | | 99 | | | | 91 | | | | 9 | | | | - | | | | (8 | ) | | | 8 | | | | (4 | ) | | | (4 | ) |
| Gross profit | | | 106 | | | | 61 | | | | 67 | | | | 45 | | | | 40 | | | | 5 | | | | (6 | ) | | | (8 | ) | | | 2 | |
| Selling price per tonne | | | 119 | | | | 96 | | | | 99 | | | | | | | | | | | | | | | | | | | | | | | | | |
| Cost of product per tonne | | | 60 | | | | 60 | | | | 57 | | | | | | | | | | | | | | | | | | | | | | | | | |
| Total Gross profit | | | 492 | | | | 359 | | | | 196 | | | | 133 | | | | 123 | | | | 10 | | | | 163 | | | | 169 | | | | (6 | ) |
| | | | | | | | | | | | | | | | | | | | | | | | | | | | | | | | | | | | | |
| Selling expenses | | | 17 | | | | 15 | | | | 13 | | | | 2 | | | | | | | | | | | | 2 | | | | | | | | | |
| General & administrative | | | 22 | | | | 20 | | | | 11 | | | | 2 | | | | | | | | | | | | 9 | | | | | | | | | |
| Depreciation & amortization | | | 116 | | | | 99 | | | | 102 | | | | 17 | | | | | | | | | | | | (3 | ) | | | | | | | | |
| Royalties & other expenses | | | 74 | | | | 39 | | | | 30 | | | | 35 | | | | | | | | | | | | 9 | | | | | | | | | |
| Asset impairment | | | - | | | | 235 | | | | - | | | | (235 | ) | | | | | | | | | | | 235 | | | | | | | | | |
| Kenai award and settlement | | | (86 | ) | | | - | | | | - | | | | (86 | ) | | | | | | | | | | | - | | | | | | | | | |
| EBIT | | | 349 | | | | (49 | ) | | | 40 | | | | 398 | | | | | | | | | | | | (89 | ) | | | | | | | | |
| | Nitrogen gross profit
Prices
Except for volatility in international nitrogen prices in the first quarter of 2004 largely due to temporary shipping problems, international and domestic nitrogen prices increased significantly throughout the year mainly due to good economic growth and strong demand from regions such as South America and Asia. Although there were no significant supply restrictions in 2004, supply could not keep pace with this strong demand. |
| |
| | We were able to be particularly responsive to peak regional demand conditions due to our marketing and distribution infrastructure. As a result, our net sales price during 2004 averaged $229 per tonne compared to $202 per tonne in 2003 and $139 per tonne in 2002. In Canada, demand was negatively affected by early winter conditions that impacted crop harvest progress throughout the fall and limited the fall fertilizer application season. Below normal fall application rates, however, traditionally benefit the following spring application season. |
| | Sales volumes
With strong demand and pricing, we operated our production facilities at higher operating rates overall in 2004 as illustrated in the table below. Sales volumes in 2004 were similar to volumes in 2003 and lower than in 2002 due to early winter conditions in the fall of 2004. In the prior two years certain facilities were operated at less than capacity due to high gas costs and weaker demand. |
18
Agrium Inc. 2004 Management’s Discussion & Analysis
| | | | | | | | | | | | | | | | | | | |
| | | |
| | Nitrogen Production and Sales Volumes (in thousands of tonnes) | | | | | | | | |
| | | | | | | 2004 | (1) | | 2003 | | | 2002 | | |
| | | | | | | | | | |
| | Annual Capacity(2) | | | 6,607 | | | | 6,607 | | | | 6,607 | | |
| | Production Volumes | | | 5,360 | | | | 4,827 | | | | 5,286 | | |
| | Sales Volumes | | | 5,159 | | | | 5,156 | | | | 5,556 | | |
| | | | | | | | | | | | | | | | | | | |
| | | |
| | (1) | Effective November 2005, contributions from the Kenai facility will cease as we expect to close the facility. In 2004, annual capacity of the facility was 1,740-thousand tonnes, production volumes were 1,169-thousand tonnes and sales volumes were 1,162-thousand tonnes. | |
| | (2) | We have an additional 300-thousand tonnes of ammonium sulphate capacity and 27-thousand tonnes of micronutrient capacity. | |
| | | |
| | Unit costs
Unit production costs for nitrogen for 2004 averaged $172 per tonne, compared to $154 per tonne in 2003 and $105 per tonne in 2002. Key factors behind this increase in costs over the three-year period include the following: |
| | n | Natural gas accounts for almost 84 percent of the cash cost of producing ammonia. The overall weighted average cost of natural gas supplied to our facilities in North America has increased from $2.64 per MMBtu in 2002 to $3.70 per MMBtu in 2003 and $4.32 per MMBtu in 2004. While our natural gas costs increased, compared to prevailing average natural gas costs per MMBtu on the NYMEX of $3.25 in 2002, $5.44 in 2003 and $6.09 in 2004, we have a significant cost advantage compared to other North American producers; and, |
| | n | Approximately 71 percent of our nitrogen production capacity is located in Canada, and, other than natural gas, which is referenced to U.S. dollars, costs at these plants are denominated in Canadian dollars. Compared to the U.S. dollar, the Canadian dollar has strengthened from an average of C$0.64 in 2002 to C$0.71 in 2003 and to C$0.77 in 2004 resulting in substantial cost increases in U.S. dollar terms. |
| | One of our main focuses is cost control, and aside from the two key factors described above and the impact of changes in production volumes, our controllable costs remained steady. |
| |
| | Nitrogen key operating developments
In 2005, we announced plans to proceed with detailed engineering for a proposed expansion of production for our process-patented controlled release urea fertilizer product Environmentally Smart Nitrogen (ESN®) from 30-thousand tonnes to 150-thousand tonnes annually, at our Carseland, Alberta nitrogen facility. |
| |
| | Phosphate gross profit
Prices
In the first half of 2004, strong export demand led to higher international prices. The hurricanes in Florida disrupted Florida phosphate production in the second half of 2004, which led to lower U.S. production and inventories and supported prices. Higher prices also resulted from the significantly higher production costs in 2004. Both ammonia and sulphur input costs rose substantially for most global phosphate producers. Our realized prices for the year averaged $262 per tonne compared to $239 per tonne in 2003 and $212 per tonne in 2002. |
| |
| | Sales volumes
Both our Alberta phosphate operation and our Ontario phosphate rock mine achieved monthly production records in 2004, and overall, together with our Idaho facility, our phosphate facilities operated at 95 percent of capacity compared to 85 percent in 2003 and 89 percent in 2002. As a result of this additional production and strong demand, we increased sales volumes to 1,181-thousand tonnes compared to 1,090-thousand tonnes in 2003 and 1,129-thousand tonnes in 2002. |
| |
| | Unit costs
Similar to nitrogen, unit costs increased from $170 per tonne in 2002 to $195 per tonne in 2003 and $199 per tonne in 2004. The main reason for this was the increase in the cost of ammonia, described previously under “Nitrogen gross profit”, which is one of the key inputs in the manufacture of our phosphate product, MAP. The strengthening of the Canadian dollar has also impacted the costs at our Alberta phosphate facility and our Ontario phosphate rock mine. |
19
Agrium Inc. 2004 Management’s Discussion & Analysis
| | Phosphate key operating developments
In March of 2004, we concluded a transaction with Astaris Production LLC (Astaris), to acquire certain Astaris assets located at our Idaho phosphate operation. As part of this agreement, we acquired Astaris’ equipment at our site together with various mining assets and phosphate rock reserves in Southeast Idaho. This acquisition extended the life of our phosphate rock supply to the plant from six years to an estimated 13 years. |
| |
| | In August 2004, our Alberta phosphate facility received regulatory approval for the extension of its existing gypsum storage area. This approval contained some conditions, which we expect to meet but should allow for continued operation of the facility and ensure a continuing and reliable supply of phosphate products to growers in Western Canada. |
| |
| | Potash gross profit
Prices
Strong global potash demand resulted in significant price increases in 2004. Despite increased ocean freight rates relating to our international sales, our average realized price increased from $99 per tonne in 2002 and $96 per tonne in 2003 to $119 per tonne in 2004. |
| |
| | Approximately 33 percent of our potash sales are marketed internationally through Canpotex. Our international sales through Canpotex in 2004 were 65 percent higher than 2003 and 78 percent higher than 2002. Our sales in North America in 2004 were 22 percent higher than 2003 and 21 percent higher than 2002. |
| |
| | Sales volumes
The operating rate at our potash facility of 103 percent in 2004 was comparable to 2003 and 2002 and the production volume in 2004 of 1,698-thousand tonnes did not vary significantly from the prior two years. The increase in sales volumes to 1,796-thousand tonnes in 2004 from 1,662-thousand tonnes in 2003 and 1,598-thousand tonnes in 2002 was supported by approximately a 50 percent reduction in the volume of potash inventory at December 31, 2004 over year-end 2003. |
| |
| | Unit Costs
Unit costs increased from $33 per tonne in 2002 to $38 per tonne in 2003 and $41 per tonne in 2004. Potash production costs are mainly Canadian dollar denominated and the strengthening of the Canadian dollar against the U.S. dollar was the major contributor to increased production costs. |
| |
| | Expenses
Selling, general and administrative expenses have increased in both 2004 and 2003 compared to 2002. This increase in both years was primarily a reflection of our improved financial performance that translated into increased performance incentive payments to our employees. Incentives were not paid in 2002, as our financial performance in that year did not meet the incentive plan targets. Costs also increased due to the impact of strengthening Canadian dollar on our Canadian dollar denominated expenses. |
| |
| | Depreciation and amortization increased in 2004 by $17-million over 2003 and $14-million over 2002, primarily due to accelerated depreciation at our Kenai and Kennewick plants. Kenai will be fully depreciated by November 2005 at which time our depreciation charges are expected to decrease significantly. |
| |
| | Royalties and profit taxes were $22-million in 2004 compared to $11-million in 2003 and $13-million in 2002.
The increase in 2004 was largely related to the higher province of Saskatchewan potash resource taxes on increased potash margins. |
20
Agrium Inc. 2004 Management’s Discussion & Analysis
| | Other expenses comprise both recurring and non-recurring items. The level of expenses will vary year-over-year due to the dollar amount of recurring items and the number of one time non-recurring items. Other expenses were $52-million in 2004 compared to $28-million in 2003 and $17-million in 2002. Generally, other expenses increased in 2004 and 2003 over 2002 due to increased costs associated with our dispute with Unocal. In 2004, significant other expenses included: |
| | n | Earn-out costs and additional litigation costs relating to our dispute with Unocal over our Kenai facility. Prior to 2004 Earn-out costs were capitalized; and, |
| | n | Foreign exchange losses related to the impact of the stronger Canadian dollar on Canadian dollar denominated working capital. |
| | As a result of our settlement of all Kenai related issues, we anticipate other expenses will decrease in 2005 compared to 2004 by the amount of Earn-out and related interest expense ($34-million in 2004) and by the elimination of related litigation costs ($13-million in 2004). |
| |
| | Special Items
Kenai asset impairment
In the fourth quarter of 2003, we recorded an impairment of the Kenai facility of $235-million ($140-million after tax) due to reduced gas supplies. |
| |
| | Kenai arbitration award and settlement
During 2004 an Arbitration Panel awarded us liquidated damages for Unocal’s non-delivery of gas obligations under our gas supply agreement. Up to the end of 2004, we recorded $50-million in liquidated damages. |
| |
| | We settled our long-standing dispute with Unocal over obligations under the Purchase and Sale Agreement (PSA) pursuant to which we acquired our Kenai, Alaskan nitrogen facility. |
| |
| | The settlement agreement established a definitive gas supply obligation from Unocal to the Kenai facility up until October 31, 2005. It is our expectation that we will close the Kenai facility in November of 2005 unless we can obtain alternate economic gas supplies. |
| |
| | In addition to resolution of gas supply issues, the key financial components of the agreement were: |
| | n | We received $47-million in recognition of early termination of the existing gas sales agreement (which originally ran until June 2009), environmental claims and other liabilities; and, |
| | n | We paid $22-million in settlement of all contingent Earn-out obligations due to Unocal under the PSA. |
| | The net gain of $36-million ($21-million after tax or $0.15 diluted earnings per share), recorded in the fourth quarter of 2004, was calculated as follows: |
| | | | | | |
| Net cash received | | 25-million | |
| Earn-out adjustment (2001 – 2004) | | 81-million | |
| Adjustment related to termination of gas supply | | (70-million) | |
| | | | |
| Net gain | | 36-million | |
| | | | |
| | This settlement is in addition to $50-million of liquidated damages recorded under the Arbitration Panel award. |
21
Agrium Inc. 2004 Management’s Discussion & Analysis
South America Wholesale
2004 has been another record year of production, net sales, gross profit and EBIT for Profertil, our 50 percent owned Argentine nitrogen facility. A reconciliation of the change in EBIT for our 50 percent share of Profertil is as follows:
| | | | | | | | | | | | | | | | | | | | | | | | | | | | | | | | | | | | | |
| | | Year ended December 31 | | Variance Analysis |
| | | | | | | | | | | | | | | 2004 v. 2003 | | | 2003 v. 2002 | |
| (millions of U.S. dollars, thousands of tonnes) | | 2004 | | | 2003 | | | 2002 | | | Change | | | Price | | | Volume | | | Change | | | Price | | | Volume | |
| | | | | | | |
| Nitrogen | | | | | | | | | | | | | | | | | | | | | | | | | | | | | | | | | | | | |
| Tonnes sold | | | 614 | | | | 634 | | | | 517 | | | | (20 | ) | | | | | | | | | | | 117 | | | | | | | | | |
| Net sales | | | 137 | | | | 111 | | | | 61 | | | | 26 | | | | 30 | | | | (4 | ) | | | 50 | | | | 36 | | | | 14 | |
| Cost of product | | | 38 | | | | 31 | | | | 26 | | | | 7 | | | | (8 | ) | | | 1 | | | | 5 | | | | 1 | | | | (6 | ) |
| Gross profit | | | 99 | | | | 80 | | | | 35 | | | | 19 | | | | 22 | | | | (3 | ) | | | 45 | | | | 37 | | | | 8 | |
| Selling price per tonne | | | 223 | | | | 175 | | | | 118 | | | | | | | | | | | | | | | | | | | | | | | | | |
| Cost of product per tonne | | | 62 | | | | 49 | | | | 50 | | | | | | | | | | | | | | | | | | | | | | | | | |
| Other | | | | | | | | | | | | | | | | | | | | | | | | | | | | | | | | | | | | |
| Tonnes sold | | | 20 | | | | 19 | | | | 14 | | | | 1 | | | | | | | | | | | | 5 | | | | | | | | | |
| Net sales | | | 6 | | | | 5 | | | | 3 | | | | 1 | | | | 1 | | | | - | | | | 2 | | | | 1 | | | | 1 | |
| Cost of product | | | 3 | | | | 3 | | | | 2 | | | | - | | | | - | | | | - | | | | 1 | | | | - | | | | (1 | ) |
| Gross profit | | | 3 | | | | 2 | | | | 1 | | | | 1 | | | | 1 | | | | - | | | | 1 | | | | 1 | | | | - | |
| Selling price per tonne | | | 300 | | | | 263 | | | | 214 | | | | | | | | | | | | | | | | | | | | | | | | | |
| Cost of product per tonne | | | 150 | | | | 158 | | | | 143 | | | | | | | | | | | | | | | | | | | | | | | | | |
| Total Gross profit | | | 102 | | | | 82 | | | | 36 | | | | 20 | | | | 23 | | | | (3 | ) | | | 46 | | | | 38 | | | | 8 | |
| Selling expenses | | | 1 | | | | 1 | | | | 1 | | | | - | | | | | | | | | | | | - | | | | | | | | | |
| General & administrative | | | 3 | | | | 3 | | | | 3 | | | | - | | | | | | | | | | | | - | | | | | | | | | |
| Depreciation & amortization | | | 15 | | | | 15 | | | | 18 | | | | - | | | | | | | | | | | | (3 | ) | | | | | | | | |
| Royalties & other expenses | | | - | | | | - | | | | 16 | | | | - | | | | | | | | | | | | (16 | ) | | | | | | | | |
| EBIT | | | 83 | | | | 63 | | | | (2 | ) | | | 20 | | | | | | | | | | | | 65 | | | | | | | | | |
| | Nitrogen gross profit
Prices
Our primary market for production from Profertil is Argentina, which accounts for 69 percent of Profertil’s sales. This compares to 52 percent in 2003 and 46 percent in 2002. |
| |
| | The price of our sales in Argentina is based on the concept of import parity wherein the price is referenced to a basket of international reference prices and includes the cost of transportation, storage and distribution. The average price of both urea and ammonia fertilizer sales to our customers in Argentina rose by approximately 19 percent in 2004. This increase reflects both the stronger global nitrogen prices resulting from tight global supply and demand and the higher international bulk freight rates experienced in 2004. |
| |
| | International sales to Brazil and other South American countries accounted for approximately 29 percent of Profertil’s sales and were made at international prices. Average prices for both urea and ammonia export sales rose by approximately 25 percent and 75 percent, respectively in 2004 due to tight market fundamentals. |
| |
| | Sales Volumes
Production levels at Profertil in 2003 and 2002 were constrained by mechanical problems with a heat exchanger in the urea plant. Repairs were completed in the second quarter of 2003, and, for the balance of 2003 and throughout 2004, the plant ran consistently above capacity. |
| |
| | With the increase in production and strong demand factors, our 50 percent share of nitrogen sales volumes rose from 517-thousand tonnes in 2002 to 634-thousand tonnes in 2003 and 614-thousand tonnes in 2004. The slight decline in sales volumes from 2003 to 2004 resulted from lower export sales and resulted in higher year-end inventory volume. |
22
Agrium Inc. 2004 Management’s Discussion & Analysis
| | Unit Costs
The average nitrogen cost of product sold per tonne was $62 in 2004 compared to $49 in 2003 and $50 in 2002, reflecting the impact of higher natural gas costs in 2004, which more than offset the favorable impact of higher production volumes on the fixed cost base. |
| |
| | Expenses
Selling, general and administrative costs, which are denominated in Argentine pesos, have remained relatively stable with minimal foreign exchange impacts over the three years ending December 31, 2004. |
| |
| | Plant, property and equipment and the underlying depreciation and amortization charges are translated into U.S. dollars at historic rates. As a result, these charges are not affected by foreign exchange and have also remained relatively unchanged for the three-year period under review. |
| |
| | Key operating developments
The Argentine government is extending an investigation that began in 2002 into competition practices in the domestic urea market. The initial investigation found no uncompetitive practices in the urea market during the period under study. Given that Argentine retailers and farmers continue to be able to access products at international prices, we anticipate future reviews will reach similar conclusions. |
Other
Our Other business segment is a non-operating segment that comprises Corporate and Administrative functions supporting our operating segments, as well as financing, strategic and business development relating to the evaluation of new opportunities.
This segment is also used for the elimination of inter-segment transactions so that the operating segments can be evaluated and managed on a stand-alone basis with all transactions reflected at an arms-length amount of consideration. The main eliminations relate to purchase and sale transactions between our respective retail and wholesale segments and interest on inter-company loans.
Expenses affecting EBIT in our non-operating segment are comprised primarily of general and administrative costs of our headquarters in Calgary, Alberta and corporate office in Denver, Colorado and other expenses such as foreign exchange and business development costs. The change in EBIT from $(51)-million in 2002 to $(59)-million in 2003 and $(46)-million in 2004 was due to a number of offsetting factors:
| n | General and administrative costs increased in 2004 and 2003, primarily reflecting our improved financial performance that translated into increased performance incentive payments to our employees. Incentives were not paid in 2002, as our financial performance in that year did not meet the incentive plan targets. Since general and administrative costs are denominated in Canadian dollars, the strengthening of the Canadian dollar in the last two years also contributed to the increase; |
| n | The corporate administration costs attributable to the evaluation and improvement of corporate governance programs and regulatory compliance increased in 2004; |
| n | Business development costs increased in 2004 and 2003 over 2002. Costs in 2004 largely related to the investigation of the feasibility of potential opportunities in Egypt, and 2003 costs primarily related to the investigation of the feasibility of building a world-scale nitrogen production facility in Australia. In the second quarter of 2004, we decided to delay indefinitely the development of the Australian project; and, |
| n | The cost increases noted above were more than offset by the increase in 2004 of foreign exchange gains on the translation of U.S. dollar working capital in our Canadian parent company. |
23
Agrium Inc. 2004 Management’s Discussion & Analysis
Our consolidated performance
Results of operations
The combination of the highest EBIT from all three operating segments in the last nine years, declining interest charges, and lower effective tax rates resulted in net earnings of $276-million or $1.91 diluted earnings per share, an increase of $297-million over 2003 and $276-million over 2002 net earnings. Our consolidated net earnings were strong, and our diluted earnings per share of $1.91 was the highest on record.
The following table of selected quarterly and annual information for the years ended December 31, 2004, 2003 and 2002 illustrates the seasonal nature of our business as discussed on pages 25 to 26 of this management’s discussion & analysis.
| | | | | | | | | | | | | | | | | | | | | | | | | | | | | |
| (millions of U.S. dollars, except per share amounts) | | | | | | | | | | | | | |
| | | | | | | Net | | | Net Earnings (loss) per | | | | | | | | | | |
| | | | | | | Earnings | | | share: | | | Total | | | Cash & Cash | | | Long-term | |
| | | Net Sales | | | (loss) | | | Basic | | | Diluted | | | Assets | | | Equivalents | | | Liabilities | |
| | | | | | | | | | | | | | | | | | | | | | | | | | | | | |
2004 | | | | | | | | | | | | | | | | | | | | | | | | | | | | |
Q1 | | | 435 | | | | 12 | | | | 0.07 | | | | 0.07 | | | | 2,411 | | | | 202 | | | | 803 | |
Q2 | | | 1,011 | | | | 75 | | | | 0.56 | | | | 0.52 | | | | 2,340 | | | | 196 | | | | 795 | |
Q3 | | | 672 | | | | 87 | | | | 0.65 | | | | 0.60 | | | | 2,509 | | | | 299 | | | | 804 | |
Q4 | | | 720 | | | | 102 | | | | 0.76 | | | | 0.71 | | | | 2,656 | | | | 425 | | | | 797 | |
| |
Year | | | 2,838 | | | | 276 | | | | 2.04 | | | | 1.91 | | | | 2,656 | | | | 425 | | | | 797 | |
| |
| | | | | | | | | | | | | | | | | | | | | | | | | | | | | |
2003 | | | | | | | | | | | | | | | | | | | | | | | | | | | | |
| Q1 | | | 372 | | | | (6 | ) | | | (0.07 | ) | | | (0.07 | ) | | | 2,431 | | | | 136 | | | | 831 | |
| Q2 | | | 929 | | | | 69 | | | | 0.53 | | | | 0.47 | | | | 2,432 | | | | 152 | | | | 834 | |
| Q3 | | | 561 | | | | 25 | | | | 0.18 | | | | 0.17 | | | | 2,429 | | | | 171 | | | | 831 | |
| Q4 | | | 637 | | | | (109 | ) | | | (0.89 | ) | | | (0.89 | ) | | | 2,273 | | | | 200 | | | | 795 | |
| |
| Year | | | 2,499 | | | | (21 | ) | | | (0.25 | ) | | | (0.25 | ) | | | 2,273 | | | | 200 | | | | 795 | |
| |
| | | | | | | | | | | | | | | | | | | | | | | | | | | | | |
2002 | | | | | | | | | | | | | | | | | | | | | | | | | | | | |
| Q1 | | | 318 | | | | (36 | ) | | | (0.33 | ) | | | (0.33 | ) | | | 2,387 | | | | 8 | | | | 923 | |
| Q2 | | | 792 | | | | 23 | | | | 0.16 | | | | 0.15 | | | | 2,267 | | | | 32 | | | | 926 | |
| Q3 | | | 466 | | | | 1 | | | | (0.01 | ) | | | (0.01 | ) | | | 2,124 | | | | 21 | | | | 913 | |
| Q4 | | | 507 | | | | 12 | | | | 0.07 | | | | 0.07 | | | | 2,191 | | | | 109 | | | | 896 | |
| |
| Year | | | 2,083 | | | | - | | | | (0.08 | ) | | | (0.08 | ) | | | 2,191 | | | | 109 | | | | 896 | |
| |
Significant items affecting the comparability of quarterly and annual earnings include the following:
| n | Net earnings and net earnings per share in the third and fourth quarters of 2004 included income of $41-million and $9-million respectively ($25-million after tax or $0.17 diluted earnings per share in the third quarter and $5-million after tax or $ 0.04 diluted earnings per share in the fourth quarter) in liquidated damages from an Arbitration Panel award relating to our Kenai facility; |
| n | Net earnings and net earnings per share for the fourth quarter of 2004 include a $36-million gain ($21-million after tax or $0.15 diluted earnings per share) on the settlement of all outstanding legal claims relating to our Kenai facility; and, |
| n | Net earnings and net earnings per share for the fourth quarter of 2003 included a $235-million impairment charge against our Kenai facility ($140-million after tax or $0.96 diluted earnings per share). |
24
Agrium Inc. 2004 Management’s Discussion & Analysis
| | Income taxes
Our current and future income tax charge represents an effective overall tax rate of 33 percent in 2004. |
| |
| | Excluding the Kenai asset impairment charge in 2003, the comparative effective tax rate would have been 38 percent. The difference in the effective tax rates from 2002 through 2004 is due to changes in the mix of earnings among tax jurisdictions. The deferred tax debit, which arose primarily in our U.S. tax jurisdiction, was triggered largely by Kenai related items in both 2004 and 2003. |
| |
| | While there have been no significant changes in statutory tax rates in any of the jurisdictions in which we operate, the mix of earnings and tax allowances among tax jurisdictions, realization of unrecognized tax assets and many other factors impact these rates. A full explanation of year-to-year variances in these rates for the three years ended December 31, 2004 is provided in note 5 to our consolidated financial statements. |
| |
| | Interest expense
Interest expense has declined from $68-million in 2002 to $63-million in 2003 to $55-million in 2004, reflecting reductions in our debt levels financed from improved cash provided from operating activities and from reductions in capital expenditures. |
| |
| | Cash provided by operating activities
Our results for 2004 generated a record $449-million in operating cash flow, resulting in an increase in our cash balance from $200-million to $425-million. |
| |
| | Record sales, the net settlement received from Unocal in the amount of $25-million and liquidated damages awarded by the Arbitration Panel in the amount of $50-million all contributed to the record cash flows from operating activities for 2004 of $449-million (2003 — $186-million; 2002 — $224-million). |
| |
| | The net non-cash working capital balance at year-end 2004 increased over December 31, 2003 and 2002. With the aging of accounts receivable at the end of 2004 remaining relatively stable, accounts receivable increased over 2003 and 2002 mainly due to increased product prices and a reduction in utilization of the accounts receivable securitization program. Inventory increased at year-end 2004 primarily due to lower sales volumes and higher unit costs of ammonia in the fourth quarter of 2004 than in the same period in 2003 and 2002. The decline in ammonia sales volume resulted primarily from the late harvest and early winter conditions experienced in our key market regions, which limited the application period. The increase in ammonia unit cost resulted mainly from higher natural gas cost. |
| |
| | Dividends and preferred securities charges
In 2004 we paid cash dividends on our common shares of $14-million, or 0.11 cents per common share (2003 — $14-million or 0.11 cents per common share; 2002 — $14-million or 0.11 cents per common share). |
| |
| | In 2004 we paid securities charges on our preferred securities of $9-million (2003 — $11-million, 2002 — $11-million). |
Seasonality
Historically, our agricultural sales have been concentrated in the spring and fall planting seasons. This typically results in stronger earnings for the second and fourth quarters and weaker results in the first and third quarters as illustrated in the quarterly information contained in the table of consolidated results of operations on page 24 of this management’s discussion & analysis.
In order to accommodate peak season demand we must produce and store inventory throughout the year, and this is reflected in inventory levels, which tend to be highest in April and October immediately prior to the peak application seasons. Key input costs such as natural gas may fluctuate significantly between the time the product is manufactured and the time it is sold. Inventory volumes are typically lowest in July and December after the planting seasons; however, inventory levels will be impacted by peak season supply and demand fundamentals and weather conditions. North America and South America have opposite spring and fall seasons.
25
Agrium Inc. 2004 Management’s Discussion & Analysis
Approximately 12 percent of our Wholesale net sales are comprised of nitrogen products that we market to a wide variety of industrial customers. These industrial markets provide consistent, year-round demand and partially mitigate the seasonal and cyclical nature of the agricultural market.
2004 fourth quarter operating results
| | Net earnings |
| |
| | Agrium’s fourth quarter consolidated net earnings were $102-million, up $211-million from the $109-million net loss reported for the same quarter of 2003. Diluted earnings per share were $0.71 compared to a loss of $0.89 for the same quarter last year, which included the write-down of our Kenai facility. While earnings continue to benefit from the tight supply and demand fertilizer fundamentals, our fourth quarter results were improved by the recognition of liquidated damages in the quarter under the Arbitration Panel award and a $36-million gain recognized from the settlement of litigation, both related to our Kenai, Alaska nitrogen facility. |
| |
| | The growth in quarterly net earnings is largely attributed to our Wholesale operations in both North and South America, which have benefited from the tight supply and demand fertilizer fundamentals. |
| |
| | Cash provided by operating activities
Operating activities provided cash of $191-million in the fourth quarter of 2004 compared to $70-million for the same quarter of 2003. The increase of $121-million is due to improved earnings and the Kenai award and settlement. |
| |
| | Business segment performance
Retail |
| | n | In the fourth quarter of 2004, we integrated our North and South America Retail segments into one Retail segment. The change was a reflection of organizational and operational changes that aligned and integrated our South America Retail segment with North America Retail. |
| | n | Fourth quarter Retail EBIT was up $11-million over the same period last year. The increase is attributable to both growth in fertilizer sales prices and volumes. |
| | n | Lower expenses relative to liability claims and accounts receivable write-offs also contributed to the EBIT increase. |
| | n | Wholesale EBIT for the fourth quarter of 2004 was $140-million, up $313-million from a negative EBIT of $173-million for the same period last year. Excluding Kenai related items from both years, Wholesale EBIT for the fourth quarter was $95-million in 2004 and $62-million in 2003. |
| | n | Gross profit in the fourth quarter of 2004 was up by $41-million over the same quarter last year, with increased margin per tonne in every product category. In the quarter, potash experienced the largest increase in gross profit of $17-million, primarily due to higher prices. The growth in potash earnings is a reflection of continued tight supply and demand balance, both internationally and in North America. Phosphate gross margins were up $11-million due to higher prices for MAP driven by higher ammonia prices. Total nitrogen increase in gross profit of $13-million was largely attributed to a $21-million growth in urea gross profit, a reflection of tight supply and demand fundamentals both internationally and in North America. This was partially offset by a $13-million decrease in ammonia gross profit comprised of lower demand due to poor weather conditions in North America and increased cost of product attributable to higher gas costs. |
| | n | Expenses (income) in the fourth quarter of 2004 include $45-million of Kenai related income, comprised of liquidated damages from the Arbitration Panel award and a gain from the settlement of litigation. The prior year fourth quarter includes a Kenai asset impairment pre tax expense of $235-million. Excluding all Kenai related items from both years, expenses for North America Wholesale were up by $8-million in the fourth quarter of 2004 compared to the same period of 2003, largely relating to Kenai Earn-out accrued prior to our settlement with Unocal in December 2004. |
26
Agrium Inc. 2004 Management’s Discussion & Analysis
| | n | South America Wholesale EBIT was $23-million and gross profit was $28-million for the fourth quarter in 2004, up $7-million and $6-million respectively from the same period last year. The increase is primarily attributable to higher urea international prices, which impacted both domestic and export selling prices, consistent with tightened supply and demand balance. |
| | n | EBIT for our Other non-operating business segment for the fourth quarter of 2004 was up $5-million over the same period last year. The increase in EBIT is largely related to foreign exchange gains on the translation of U.S. dollar working capital in our Canadian parent company. |
Capital resources
| | Non-cash working capital
Our non-cash working capital levels are affected by numerous factors including: |
| | n | Seasonality factors discussed on pages 25 to 26 of this management’s discussion & analysis; |
| | n | Demand for our products and services; |
| | n | Selling prices of our products and services; |
| | n | Raw material input and other costs; and, |
| | n | Foreign exchange rates. |
| | The interaction of these factors and the increasing activity in our South America Wholesale business tended to smooth our quarterly net working capital requirement throughout 2004. |
| | | | | | | | | | | | | |
| | | 2004 | | | 2003 | | | 2002 | |
| (millions of U.S. dollars) | | | | | | | | | | | | |
| Sustaining capital | | | 69 | | | | 72 | | | | 50 | |
| Investment capital | | | 13 | | | | 2 | | | | 1 | |
| Kenai Earn-out | | | - | | | | 25 | | | | 1 | |
| | | | | | | | | | |
| | | | 82 | | | | 99 | | | | 52 | |
| | | | | | | | | | |
| | Capital expenditures for 2004 remained at modest levels as we evaluated several investment opportunities potentially requiring significant investment. The slight decrease in 2004 from 2003 related primarily to discontinuing capitalization of the contingent purchase consideration for the Kenai facility (the Earn-out). |
| |
| | Sustaining capital is directed towards maintaining the safe and efficient operation of our facilities as well as extending their useful lives. Investment capital typically includes new opportunities, such as acquisitions, and significant expansion of existing operations. In recent years, investment capital had been restricted in order to conserve cash and improve our financial position, but having largely achieved these objectives, our focus is now on new investment opportunities. |
| |
| | We are planning for a $97-million sustaining capital program in 2005. The most significant projects include: |
| | n | Redwater and Conda phosphate operations gypsum stack extensions for approximately $37-million. These projects will increase the available storage area for by-product gypsum and will extend the life of the storage area at Redwater from two years to five years, based on current production capacity, and extend the life of the storage area at Conda from one year to 10 years, based on current production capacity; |
| | n | North America Wholesale additional sustaining capital for plant sites totaling $27-million. This is on-going sustaining capital to ensure the continued safe and efficient operation of our facilities; and, |
| | n | Retail sustaining capital of $16-million relates to numerous retail centre projects as well as building and equipment costs. |
27
Agrium Inc. 2004 Management’s Discussion & Analysis
| | We are planning for a $77-million investment capital program for 2005. The most significant projects include: |
| | n | ESN 150 Project, which involves the construction of a new coating plant capable of converting the production from one existing urea granulation train at Carseland (150-thousand tonnes per year) to ESN® product. Total project costs of $45-million are expected with approximately $39-million to be expended in 2005; |
| | n | Vanscoy potash operation expansion to allow for an additional 260-thousand tonnes per year of production capacity by 2007. Total project costs are estimated at $56-million with $23-million to be expended in 2005 pending favorable resolution of tax issues with the Government of Saskatchewan. The project is subject to final government approval and, if approved, is anticipated to be complete by Q4 2006; and, |
| | n | Profertil debottleneck project will increase annual urea production by 20 percent by 2007. Our share of this project is expected to cost $30-million with only $4-million to be incurred in 2005. This project is budgeted subject to a favorable resolution to the Government of Argentina’s investigation of urea pricing and assurance that future pricing in Argentina will be market-based and gas contracts will be negotiated. |
| | To the extent that these projects proceed to construction, we expect to finance these projects through existing cash balances and cash provided from operating activities. |
Liquidity
Based on current projections, our liquid resources, together with expected future cash flows provided from operating activities, are expected to be more than sufficient to meet our future requirements and obligations discussed above. At December 31, 2004, these resources consisted of the following:
| | | | | | | | | |
| | | |
| | | | Currency | | U.S. Dollar | | |
| | | | Denomination | | Equivalent | | |
| | | | | | (millions of U.S. dollars) | | |
| | | | | | | | | |
| | Cash and short-term investments | | U.S. Dollars | | | 403 | | |
| | | | Canadian Dollars | | | 18 | | |
| | | | Argentine Pesos | | | 4 | | |
| | | |
| | Short-term bank lines (unused)(1) | | U.S. Dollars | | | 464 | | |
| | | | Argentine Pesos | | | 10 | | |
| | | |
| | Other non-cash working capital(2) | | U.S. Dollars | | | 359 | | |
| | | | | | | | |
| | | | | | | 1,258 | | |
| | | | | | | | |
| | | | | | | | |
| | | | | | | | | |
| | | |
| | (1) Unused amounts are net of letters of credit outstanding as at December 31, 2004 | |
| | (2) As discussed on page 31 of this management’s discussion & analysis, we have an asset securitization program in place in the amount of $125-million | |
| | | |
Depending on the nature, timing and extent of any potential acquisitions or greenfield development opportunities, we may consider other sources of financing.
In January 2005, we issued a redemption notice pursuant to which we will redeem our $175-million, eight percent redeemable preferred securities for cash on February 14, 2005. The redemption price will equal the principal amount of the securities plus accrued and unpaid interest to the date of redemption. As explained on page 35 of this 2004 management’s discussion & analysis, these preferred securities were reclassified to debt effective January 1, 2005. In connection with the redemption, we will record a loss on extinguishment of debt in the first quarter of 2005 in the amount of approximately $3-million, representing the unamortized portion of the debt issuance costs, net of tax. Earnings will benefit in future periods by lower interest charges.
28
Agrium Inc. 2004 Management’s Discussion & Analysis
| | Argentina repatriation conditions
Argentina has no current restrictions on currency transferability or convertibility. Dividends are not subject to Argentine tax to the extent they are paid from retained earnings of our Argentine subsidiary, ASP, and our Argentine joint venture, Profertil. |
| |
| | In the event dividends are paid in excess of retained earnings, there would be a 10 percent withholding tax levied in Argentina. |
| |
| | Financing activities and financial position
One of our primary goals over the last three years had been to strengthen our financial position. Improved operating conditions in all areas of our business as well as specific steps we have taken have allowed us to achieve this goal and build a substantial cash reserve of $425-million for growth opportunities and settling other obligations. |
| |
| | In addition to scheduled repayments of our long-term debt instruments, we took the following steps: |
| | n | Entered into a $450-million three-year syndicated revolving unsecured credit facility which replaced existing credit facilities expiring in 2004 totaling $281-million. In addition to improved pricing and terms, the extended term and higher borrowing limits of the new facility complements our growth strategy and provides us with increased liquidity and flexibility for short-term borrowings; and, |
| | n | Redeemed $50-million, six percent convertible redeemable preferred shares through the issuance of 4.18 million common shares in January 2004. |
| | At December 31, 2004 our debt-to-debt plus equity ratio was 35 percent down from 47 percent in 2003 and from 50 percent in 2002. Our market value debt-to-debt plus equity ratio was 21 percent at December 31, 2004. |
| |
| | Financial covenants
Our credit facilities, debentures and senior notes require us to maintain certain financial ratios and other covenants customary for these types of agreements. |
| | Within our new $450-million bank credit facility, the principal financial covenants are: |
| | n | funded debt to capital ratio of not more than 57.5 percent; and, |
| | n | EBITDA to interest expense ratio of not less than 3.0 |
| | At December 31, 2004, our funded debt to capital ratio, as defined in our bank credit facility agreement, was approximately 15 percent and our EBITDA to interest ratio was approximately 11. There have been no changes during the year to the covenants contained in the debenture and senior note agreements. At December 31, 2004, we were in compliance with all of our covenants, and we believe that we will be in compliance with our covenants in 2005 and the foreseeable future. |
| |
| | Debt ratings |
| | As a result of the improved outlook for our industry in 2004, and the substantial improvement in our liquidity, in April of 2004, Standard & Poor’s Ratings Services revised our long-term outlook to BBB stable from BBB negative. |
| |
| | On February 7, 2005, Moody’s Investors Services revised our long-term outlook to Baa2 stable from Baa2 negative. |
| |
| | As at December 31, 2004, our debt instruments and preferred securities were rated by the principal bond rating services as follows: |
| | | | | | | |
| | | |
| | | | Senior Unsecured Notes | | | |
| | | | and Debentures | | Preferred Securities | |
| | | |
| | | | | | | |
| | Moody’s Investors Services | | (Baa2) | | (Baa3) | |
| | Dominion Bond Rating Service | | (BBB) | | (Pfd - 3Y) | |
| | Standard & Poor’s Ratings Services | | (BBB) | | (BB+) | |
| | | |
29
Agrium Inc. 2004 Management’s Discussion & Analysis
| | Outstanding shares and preferred securities
The number and outstanding principal amount of outstanding shares and preferred securities as at January 31, 2005 are as follows: |
| | | | | | | | | | | | | | | | |
| | | |
| | | | Number of Shares | | | Principal Amount | | | | Market Trading Value | | |
| | | | (millions) | | | (millions of U.S. dollars) | | | | (millions of U.S. dollars) | | |
| | | | | | |
| | Common shares | | | 132 | | | | 553 | | | | | 2,133 | | |
| | | | | | | | | | | | | | | | |
| | | | | | | | | | | | | | | | |
| | Eight percent non-convertible preferred securities(1) | | | 7 | | | | 175 | | | | | 179 | | |
| | | | | | | | | | | | | | | | |
| | (1) Securities were reclassified to debt effective January 1, 2005 in accordance with Canadian GAAP and will be redeemed for cash on February 14, 2005 | | | | | | |
| | | | | | |
| | Future cash requirements
Our existing obligations and commitments requiring future outlays of cash are comprised of the following: |
| | n | Aggregate contractual obligations with legally binding terms; |
| | n | Other obligations; including asset retirement obligations and environmental remediation liabilities, where the extent, timing, or amount of the obligations may be determined by some future event that cannot be determined with substantial accuracy; |
| | n | Employee future benefit obligations; |
| | n | Capital expenditure commitments; |
| | n | Preferred securities charges up to redemption on February 14, 2005 and common share dividends; and, |
| | n | General operating requirements including interest payments, income and other taxes payable and peak seasonal working capital requirements. |
Obligations
| | Contractual obligations
As at December 31, 2004, our aggregate contractual obligations were comprised of the following: |
| | | | | | | | | | | | | | | | | | | | | | | |
| | | |
| | | | Payment due by period: | | | | | | |
| | | | Less than | | | One – three | | | Four – five | | | After five | | | | | |
| | (millions of U.S. dollars) | | one year | | | years | | | years | | | years | | | Total | | |
| | | |
| | Long-term debt (a) | | | 60 | | | | 141 | | | | 30 | | | | 363 | | | | 594 | | |
| | Operating leases (b) | | | 45 | | | | 62 | | | | 23 | | | | 15 | | | | 145 | | |
| | Purchase obligations (c)(d)(e)(f) | | | 584 | | | | 171 | | | | 103 | | | | 127 | | | | 985 | | |
| | | |
| | Total | | | 689 | | | | 374 | | | | 156 | | | | 505 | | | | 1,724 | | |
| | | |
| (a) | | Failure to maintain certain financial ratios and other covenants may trigger early repayment provisions (See financial covenants on page 29 of this management’s discussion & analysis). |
| (b) | | Includes short-term leases for railcars and distribution facilities in North America Wholesale, vehicles and application equipment in North America Retail, and other computer equipment leases. |
| (c) | | Includes minimum commitments for North America natural gas based on prevailing NYMEX forward prices at December 31, 2004. We commit to purchase a large percentage of our production volume requirements for the next year at floating prices, and actual prices may differ. |
| (d) | | Liquid markets exist for the possible resale of North America Wholesale natural gas, sulphuric acid and power purchased under the majority of these commitments, but gains or losses could be incurred on resale. |
| (e) | | Includes our 50 percent share of Profertil’s annual gas purchase commitments of $249-million. |
| (f) | | Purchase obligations exclude employee future benefits, for which employer contributions are expected to be $6-million to $11-million in 2005. |
30
Agrium Inc. 2004 Management’s Discussion & Analysis
| | Other long-term obligations
As at December 31, 2004, our other liabilities included balances related to asset retirement obligations and environmental remediation liabilities and shutdown costs. Estimated timing and amount of cash outflows associated with these liabilities are as follows: |
| | | | | | | | | | | | | | | | | | | | | | | |
| | | |
| | | | Payment due by period: | | | | | | |
| | | | Less than | | | Six - 10 | | | 11 - 15 | | | After 15 | | | | | |
| | (millions of U.S. dollars) | | six years | | | years | | | years | | | years | | | Total | | |
| | | |
| | Asset retirement obligations(1) | | | 26 | | | | 11 | | | | 55 | | | | 556 | | | | 648 | | |
| | | | | | | | | | | | | | | | | | | | | | | |
| | Environmental remediation liabilities and shutdown costs | | | 78 | | | | 35 | | | | 11 | | | | 21 | | | | 145 | | |
| | | | | |
| | | | | | | | | | | | | | | | | | | | | | | |
| | Total | | | 104 | | | | 46 | | | | 66 | | | | 577 | | | | 793 | | |
| | | | | |
| | | |
| (1) Represents the undiscounted, inflation-adjusted estimated cash outflows required to settle the asset retirement obligations in the amount of $52-million at December 31, 2004. See note 15 to our 2004 consolidated financial statements for further discussion of asset retirement obligations. | |
| | | |
Off balance sheet financing arrangements
| | Asset securitization
Under our North American receivables securitization facility, certain of our U.S. subsidiaries may sell up to $125-million of eligible accounts receivable on a non-recourse basis. Fees and expenses paid to the financial institution are based on the accounts receivable sold and prevailing commercial paper rates. The agreement expires in December 2007 and may be terminated earlier by either party. Accounts receivable sold and fees and expenses paid under this program are summarized in note 7 to our 2004 consolidated financial statements. Due to our strong cash position, we did not utilize this securitization facility in 2004. |
| |
| | The facility provides us with the flexibility to immediately realize cash for the sale of receivables up to the amount of the program. |
| |
| | Derivative instruments
We can enter into derivative financial contracts to help us manage volatility in natural gas, foreign exchange rates and interest rates. A formalized hedging policy has been implemented by our Hedging Committee, which operates under authorities and limits approved by the Board of Directors. |
| |
| | The authority and limits specify the percentage of Agrium’s natural gas requirements, currency exposure and interest rates that may be hedged over specified time frames, acceptable counter-parties and counter-party exposure limits based on credit ratings. |
| |
| | Agrium’s accounting policy for derivative instruments and its derivative positions are described in note 1 and note 21 to our 2004 consolidated financial statements. |
| |
| | Related party transactions
We use Canpotex, a potash export and marketing company owned in equal shares by Agrium and two other Saskatchewan potash producers, to market our potash overseas. Refer to note 24 to our 2004 consolidated financial statements for further information on transactions and balances with Canpotex. |
31
Agrium Inc. 2004 Management’s Discussion & Analysis
Our accounting policies
Our financial statements and accounting policies are presented in accordance with Generally Accepted Accounting Principles (GAAP) in Canada. A complete explanation of differences between Canadian and U.S. GAAP is provided in note 25 to our 2004 consolidated financial statements, and a full discussion of our significant accounting policies is provided in note 1 to our 2004 consolidated financial statements.
Application of certain accounting policies requires us to make assessments as to the outcome of future events that may have a material effect on current or future earnings. We make these estimates based on technological assessment, the most recent information available to us as well as considering historical trends. Changes in estimates that may have a material impact on our results are discussed in the context of the underlying financial statement to which they relate.
Critical accounting policies
| We consider an accounting policy to be critical if: |
| n | It requires assumptions to be made that were uncertain at the time the estimate was made; and, |
| n | Changes in the estimate or different estimates that could have been selected could have a material impact on our consolidated results of operations or financial condition. |
The following discussion presents information about our most critical accounting policies:
| | Plant, property and equipment
|
| | We record plant, property and equipment at cost and include the cost of replacements and betterments. In the event we construct a new production facility, cost is defined as expenditures incurred up to the commencement of commercial production, and includes internal and external costs of personnel, material and services as well as interest capitalized during construction.
|
| | There are two key areas requiring significant estimates in the application of our plant, property and equipment policy. These are in the determination of possible impairment and the estimating of the useful lives of assets.
|
| | Impairment occurs when the carrying value of a long-lived asset exceeds both the cash flows it is capable of generating, and its “fair value”. Fair value can be affected by a number of factors such as new technology, market conditions for our products, availability of raw material inputs and estimated service lives of the assets. We review the carrying value of our plant, property and equipment on a regular basis, and where it exceeds fair value we consider the asset to be impaired. If impairment has occurred, an impairment charge is recognized immediately.
|
| | We depreciate our plant, property and equipment based on their estimated service lives, which typically range from three to 25 years. We estimate initial service lives based on experience and current technology. These estimates may be extended through sustaining capital programs or by access to new supplies of raw materials. Factors affecting the fair value of our assets may also affect the useful lives of our assets and these factors are constantly changing. We therefore periodically review the estimated remaining lives of our facilities and adjust our depreciation rates prospectively where appropriate.
|
| | Asset retirement obligations and environmental remediation
|
| | Asset retirement obligations are recognized in the period in which they are incurred if a reasonable estimate of fair value can be determined. The obligation is measured at fair value and is adjusted in subsequent periods through accretion expense. The associated asset retirement costs are capitalized as part of the carrying amount of the related asset. As at December 31, 2004, the discounted carrying value of these obligations was $52-million, using discount rates ranging from seven and one-half percent to eight percent.
|
| | Environmental remediation liabilities relating to existing conditions caused by past operations are expensed based on our best estimate of undiscounted future costs when remediation efforts are probable, and the costs can reasonably be |
32
Agrium Inc. 2004 Management’s Discussion & Analysis
| | estimated based on current law and existing technologies. As at December 31, 2004, accruals for environmental remediation liabilities totaled $112-million.
|
| | Estimating the cost of both asset retirement obligations and environmental remediation liabilities requires extensive judgment about the nature and timing of work to be carried out in view of present environmental laws and regulations and these estimates are subject to considerable uncertainty. Changes in these estimates could have a material impact on our results of operation and financial position.
|
| | Management has discussed the development and selection of these critical accounting policies with the Audit Committee of the Board of Directors and the Audit Committee has reviewed the disclosure presented above relating to these policies.
|
Non-GAAP disclosure
In addition to the primary measures of earnings and earnings per share in accordance with GAAP, in this management’s discussion & analysis, we also make reference to EBIT before special items (earnings before interest expense, income taxes, and special items), EBIT (earnings before interest expense and income taxes), and EBITDA (earnings before interest expense, income taxes, depreciation, amortization and asset impairment). The components of these measures are calculated in accordance with GAAP, but EBIT before special items, EBIT and EBITDA are not recognized measures under GAAP, and our method of calculation may not be comparable with that of other companies. Accordingly, EBIT before special items and EBIT should not be used as an alternative to net earnings (loss) as determined in accordance with GAAP, and similarly, EBITDA should not be used as an alternative to cash provided by (used in) operations.
EBITDA is used extensively in our financing covenants and performance incentive programs, and we consider them to be useful disclosure for this reason. In addition, business segments and income tax jurisdictions are not synonymous, and we believe that the allocation of income taxes distorts the historical comparability of the performance of our business segments. Similarly, financing and related interest charges cannot be attributed to business segments on a meaningful basis that is comparable to other companies.
33
Agrium Inc. 2004 Management’s Discussion & Analysis
The following is a reconciliation of these key non-GAAP measures to net earnings (loss) and net earnings (loss) per share as calculated in accordance with GAAP:
| | | | | | | | | | | | | | | | | | | | | | | | | |
| | | | | | | Wholesale | | | | | | | | | | |
| (millions of U.S. dollars except per share amounts) | | | | | | North | | | South | | | | | | | | | | |
| | | Retail | | | America | | | America | | | Other | | | Consolidated | | | Per share | |
| | | | | | | | | | | | | | | | | | | | | | | | | |
2004 | | | | | | | | | | | | | | | | | | | | | | | | |
EBITDA | | | 99 | | | | 465 | | | | 98 | | | | (39 | ) | | | 623 | | | | | |
Less depreciation and amortization | | | 18 | | | | 116 | | | | 15 | | | | 7 | | | | 156 | | | | | |
Less special items: | | | | | | | | | | | | | | | | | | | | | | | | |
Kenai award and settlement | | | - | | | | 86 | | | | - | | | | - | | | | 86 | | | | | |
| | | | | | | | | | | | | | | | | | | | |
EBIT before special items | | | 81 | | | | 263 | | | | 83 | | | | (46 | ) | | | 381 | | | | | |
Plus special items: | | | | | | | | | | | | | | | | | | | | | | | | |
Kenai award and settlement | | | - | | | | 86 | | | | - | | | | - | | | | 86 | | | | | |
| | | | | | | | | | | | | | | | | | | | |
EBIT | | | 81 | | | | 349 | | | | 83 | | | | (46 | ) | | | 467 | | | | | |
| | | | | | | | | | | | | | | | | | | | |
Interest expense | | | | | | | | | | | | | | | | | | | (55 | ) | | | | |
Income taxes | | | | | | | | | | | | | | | | | | | (136 | ) | | | | |
| | | | | | | | | | | | | | | | | | | | |
Net earnings | | | | | | | | | | | | | | | | | | | 276 | | | | 2.04 | |
| | | | | | | | | | | | | | | | | | | | |
| | | | | | | | | | | | | | | | | | | | | | | | | |
2003 | | | | | | | | | | | | | | | | | | | | | | | | |
| EBITDA | | | 85 | | | | 285 | | | | 78 | | | | (52 | ) | | | 396 | | | | | |
| Less depreciation and amortization | | | 19 | | | | 99 | | | | 15 | | | | 7 | | | | 140 | | | | | |
| | | | | | | | | | | | | | | | | | | | |
| EBIT before special items | | | 66 | | | | 186 | | | | 63 | | | | (59 | ) | | | 256 | | | | | |
| Less special items: | | | | | | | | | | | | | | | | | | | | | | | | |
| Asset impairment | | | - | | | | 235 | | | | - | | | | - | | | | 235 | | | | | |
| | | | | | | | | | | | | | | | | | | | |
| EBIT | | | 66 | | | | (49 | ) | | | 63 | | | | (59 | ) | | | 21 | | | | | |
| | | | | | | | | | | | | | | | | | | | |
| Interest expense | | | | | | | | | | | | | | | | | | | (63 | ) | | | | |
| Income taxes | | | | | | | | | | | | | | | | | | | 21 | | | | | |
| | | | | | | | | | | | | | | | | | | | |
| Net loss | | | | | | | | | | | | | | | | | | | (21 | ) | | | (0.25 | ) |
| | | | | | | | | | | | | | | | | | | | |
| |
2002 | | | | | | | | | | | | | | | | | | | | | | | | |
| EBITDA | | | 98 | | | | 142 | | | | 16 | | | | (44 | ) | | | 212 | | | | | |
| Less depreciation and amortization | | | 21 | | | | 102 | | | | 18 | | | | 7 | | | | 148 | | | | | |
| | | | | | | | | | | | | | | | | | | |
| EBIT | | | 77 | | | | 40 | | | | (2 | ) | | | (51 | ) | | | 64 | | | | | |
| | | | | | | | | | | | | | | | | | | |
| Interest expense | | | | | | | | | | | | | | | | | | | (68 | ) | | | | |
| Income taxes | | | | | | | | | | | | | | | | | | | 4 | | | | | |
| | | | | | | | | | | | | | | | | | | | |
| Net loss | | | | | | | | | | | | | | | | | | | - | | | | (0.08 | ) |
| | | | | | | | | | | | | | | | | | | | |
34
Agrium Inc. 2004 Management’s Discussion & Analysis
Accounting policy changes
There were no accounting policy changes during 2004, however, the following policies were adopted or modified during the two-year period ended December 31, 2004:
| | Stock-based compensation |
| | In the fourth quarter of 2003 we began prospectively expensing the fair value of stock options granted in 2003 and thereafter. In accordance with the prospective method of adoption, no expense was recorded for options granted prior to 2003, but the pro-forma effect on prior years is disclosed in note 18 to our 2004 consolidated financial statements.
|
| | Asset retirement obligations
In the fourth quarter of 2003, we early-adopted the new Canadian GAAP standard for asset retirement obligations. The change in accounting policy was recorded retroactively. Under this standard, the fair value of anticipated asset retirement obligations is capitalized as part of the carrying value of the asset and depreciated over its useful life. The net present value of the corresponding liability is recognized immediately and accreted by a charge to earnings over the useful life of the asset. The effect of this change is disclosed in note 2 to our 2004 consolidated financial statements. |
New accounting standards
| | Classification of liabilities and equity |
| | As a result of continuing efforts to harmonize Canadian and U.S. GAAP, the Canadian Institute of Chartered Accountants amended its standard on the disclosure of financial instruments.
|
| | Under the new provisions, we reclassified our eight percent preferred securities as debt effective January 1, 2005. Upon adoption of the new provisions, dividends previously charged directly to retained earnings, net of tax, will be reflected as interest expense in our consolidated statement of earnings.
|
| | The change will be applied retroactively as a change in accounting policy in our 2005 financial statements. Retroactive application will require the restatement of both our six percent preferred securities that were converted to common shares in the first quarter of 2004 as well as our eight percent preferred securities that will be redeemed in February 2005. The retroactive accounting application will cause a decrease in retained earnings of $5-million in 2004 and $4-million in 2003; an increase in other assets of $5-million in 2004 and $6-million in 2003; an increase in future income tax liability of $7-million in 2004 and $6-million in 2003; an increase in other liabilities of $175-million in 2004 and $207-million in 2003; and a decrease in net earnings of $10-million in 2004, $15-million in 2003 and $11-million in 2002. There will be no impact on diluted earnings per share as a result of this change in accounting policy.
|
| | As discussed on page 28 of this management’s discussion & analysis, in February 2005, we will be redeeming our eight percent preferred securities. Accordingly, only interest expense accrued to the date of redemption will be reflected in our 2005 consolidated statement of earnings. |
35
Agrium Inc. 2004 Management’s Discussion & Analysis
Forward-looking statements
Except for statements of historical fact, the statements in, or incorporated by reference in, this management’s discussion & analysis constitute forward-looking statements under applicable securities legislation. These forward-looking statements include, but are not limited to, references to:
| n | The amount and type of future capital expenditures and capital resources; |
| n | Future cash requirements and long-term obligation; |
| n | Effects of the settlement with Unocal; |
| n | Business strategies and plans for implementing them; |
| n | Critical priorities for 2005; |
| n | Competitive strengths, goals, expansion and growth of our business and operations; |
| n | Innovations in seed crop outputs and future seed volumes, prices and sales; |
| n | Investigations by the Argentine government into competitive practices; |
| n | Risk mitigation activities; |
| n | Plans and references to our future results; |
| n | Disclosures made under the heading “Our outlook” on pages 37 to 38 of this management’s discussion & analysis; and, |
| n | Industry fundamentals. |
These forward-looking statements are based on certain assumptions and analyses made by us in light of our experience and perception of historical trends, current conditions and expected future developments as well as other factors we believe are appropriate in the circumstances. However, such forward-looking statements involve known and unknown risks and uncertainties, including those referred to in this management’s discussion & analysis, which may cause our actual results, performance or achievements to be materially different from any future results, performance or achievements expressed or implied by such forward-looking statements. These risks include, but are not limited to:
| n | General economic, market and business conditions, including: |
| | | ¡ | | Supply and demand for fertilizers, seed and crop protection chemicals; |
| | ¡ | | supply and demand for grain and other agricultural crops; |
| | ¡ | | changes in government agricultural, safety, environmental and other legislation and policies; |
| | ¡ | | fluctuations in foreign exchange rates, commodity, feedstock and nutrient prices or other costs that cannot be recovered through nutrient price increases; |
| | ¡ | | actions by competitors and others including changes to industry capacity and utilization and product pricing; |
| | ¡ | | performance by customers, suppliers, personnel and counterparties to financial instruments; and, |
| | ¡ | | changes in capital markets. |
| n | Weather conditions and seasonal patterns. |
| n | General operating risks associated with: |
| | | ¡ | | investment in foreign jurisdictions; |
| | ¡ | | the level and effectiveness of future capital expenditures and reliability of performance of existing capital assets; |
| | ¡ | | ability to transport or deliver production to markets; |
| | ¡ | | present and discontinued mining operations; |
| | ¡ | | labour disruptions. |
| n | Strategic risks including: |
| | | ¡ | | our ability to implement our business strategy; |
| | ¡ | | results of our risk mitigation strategies, including hedging and insurance; |
| | ¡ | | uncertainty as to the feedstock reserves owned or otherwise available to us; |
| | ¡ | | our ability to integrate any assets we may acquire or the performance of those assets; |
| | ¡ | | the opportunities, or lack of opportunities, that may be presented to and pursued by us; |
| | ¡ | | technological changes; and, |
36
Agrium Inc. 2004 Management’s Discussion & Analysis
Other factors, many of which are beyond our control. Consequently, all of the forward-looking statements made in or incorporated by reference in this management’s discussion & analysis are qualified by these cautionary statements, and there can be no assurance that the actual results or developments anticipated by us will be realized or, even if substantially realized, that they will have the expected consequences to, or effects on, us.
We do not undertake any obligation to update forward-looking statements even if circumstances or management’s estimates or opinions should change. Investors should not place undue reliance on forward-looking statements.
Our outlook
Grain supply and demand outlook
The USDA is forecasting a nine percent (164-million tonnes) increase in global grain production for the 2004 – 2005 crop season. This is the first time in the last five years that production is expected to exceed consumption. However, global grain consumption growth remains strong, and this is expected to limit the increase in ending grain stocks. A large global crop will be required again in the 2005 – 2006 crop season to keep pace with growing world demand.
We anticipate crop prices in the spring of 2005 will be lower than in the spring of 2004 because of the recent increase in global and U.S. grain and oilseed production. However, as global grain stocks as a percentage of use remain low compared to historical levels, there should be some improvement in grain prices from the lows experienced during the fall of 2004 and similar levels of planted acres for 2005.
The discovery of the Asian Rust disease in late 2004 in some U.S. soybean fields is expected to have a negative impact on U.S. soybean acres in 2005 because of the threat of higher production costs and lower yields. Asian Rust has been a common disease in soybean fields elsewhere in the world but had not previously been detected in the U.S. The disease can be controlled through fungicide treatment, but these additional costs may discourage some farmers from soybeans. Increased fungicide treatment may be positive for U.S. retailers such as Agrium. If acres are switched from soybeans, they are likely to move to corn and cotton, which is expected to have a positive impact on the demand for nitrogen fertilizers.
The U.S. farm economy remains robust with back-to-back years of record farm income in 2003 and 2004. Record yields in 2004 and government price support programs should lead to another strong US farm income year for 2005, further supporting demand for agricultural inputs.
The Canadian farm economy continues to be negatively impacted by the U.S. import restrictions of Canadian cattle as well as weather related issues in Western Canada. However, the U.S. – Canada border is slated to re-open in March 2005. A return to normal moisture conditions allowed for above average crop production in 2004. However, early winter conditions negatively impacted crop quality and delayed harvest progress throughout the fall. This should benefit the spring season of 2005 as fall nutrient application rates were below normal.
In South America, the challenges of macro-economic reform remain, but unemployment and inflation are continuing to improve, driven in part by the strong agricultural sector. The Argentine peso has also stabilized against the U.S. dollar and we expect it to trade in a relatively narrow range for 2005.
Global nutrient supply and demand outlook
Despite some erosion in grain prices in the latter part of 2004, demand for agricultural nutrients remains strong in many key regions of the world. Farmers in many countries are shielded from lower global crop prices by government policies and programs.
U.S. nutrient demand in 2005 is expected to remain similar to last year, as acreage for the major crops should be largely unchanged. Application rates should be supported in 2005 by strong farm incomes and significant nutrient uptake from the
37
Agrium Inc. 2004 Management’s Discussion & Analysis
soil in 2004. The growth rate in nutrient demand in some parts of the world may be impacted by the lower soybean and corn prices, particularly in countries like Brazil. However, this may only be noticeable in the latter half of the year and if Northern Hemisphere crops produce another bumper crop next year. Furthermore, world corn prices may start to improve in the spring of 2005 compared to their post harvest lows of 2004.
Growth in global industrial demand for nitrogen, phosphate and potash is also expected remain strong as the world economies continue to grow.
| | Nitrogen |
| | We expect the global nitrogen supply and demand balance to remain tight throughout 2005. No new dedicated ammonia facilities are scheduled to come on stream until late 2005 or early 2006, however production from a new Oman ammonia-urea facility may negatively impact the ammonia market as the ammonia plant is brought into production in advance of the urea plant. International ammonia prices were also at record levels in 2004 in a market that is more thinly traded than urea.
|
| | We anticipate a net increase in urea production capacity of 2.4-million tonnes for 2005, but we are also forecasting an increase in demand of 2.9-million tonnes. China announced the removal of the 11 percent VAT rebate on urea exports and imposed the equivalent of a $31.50 per tonne tax on Chinese exports, effective January 1, 2005. This should be a positive development for international urea prices.
|
| | In North America and Europe, continuing high natural gas prices may limit the ability of some producers to compete with lower-cost production from other areas with access to low-cost natural gas.
|
| | Phosphate |
| | Global phosphate demand growth is expected to exceed the change in capacity in 2005. Over the short term, the majority of new global capacity is forecast to occur in China, where new capacity is expected to be partially offset by closures of lower grade phosphate facilities. Increased global demand and capacity closure are expected to more than offset these capacity increases. In North America, industry consolidation may provide additional stability to the market.
|
| | Potash |
| | The combination of strong demand growth in 2003 and 2004 and limited new capacity additions have resulted in a considerable tightening of the global potash market. The potash market is expected to remain tight in 2005 with the increase in potash demand forecast to exceed the increase in capacity. Higher production rates from existing mines will be required to meet the continued growth in potash demand. |
Distribution and Retail
Spring 2005 agricultural demand for crop nutrients in North America is expected to be strong. The opportunity for fall application in both the U.S. and Canada was reduced by wet weather conditions in both countries. Meanwhile, nutrient removal in 2004 was significant due to the high crop yields. This should lead to large volumes for spring nutrient application, which will place pressure on the North American distribution and retail system. In addition, North America is expected to increase its reliance on offshore nitrogen imports to meet much of its domestic consumption, and this will put additional strain on the North American distribution and retail system.
The discovery of Asian rust in certain soybean growing areas of the U.S. could lead to an increased need for fungicide application for prevention and control of the disease. This development may increase chemical sales for North American retailers.
38
Agrium Inc. 2004 Management’s Discussion & Analysis
Business risks
Similar to other agricultural based companies, we are exposed to various risks and uncertainties in the normal course of our business that can cause variations in our results of operations and affect our financial condition.
In 2004, we enhanced our enterprise risk management process for the management of risks facing our company. Under this process, each department and operating segment of our business is required to formally identify all significant risks, together with the cause of such risks, which they face in their day-to-day activities. These risks are then prioritized in accordance with their potential impact on our business, and the likelihood of occurrence. Mitigating actions that can be taken to reduce exposure are identified. From this process, we are able to establish a detailed risk profile of our business and develop strategies to mitigate the risks. The enterprise risk exposures and mitigation plans are reviewed and approved on an annual basis by the senior leadership of the Company and reviewed annually with our Board of Directors.
Each department monitors risks and mitigating actions and formally reviews the risk profile and mitigation plan on a quarterly basis.
In some cases, financial risk can be reduced through insurance or hedging programs but these programs can be costly in relation to the risks insured, and coverage may only be partial. In other cases, risk management may involve far-reaching strategic decisions with long-term consequences. We also believe that acceptance of some risk is necessary to be successful in achieving our vision.
The following is a discussion of the key business risks which we have identified through this process and the strategies we adopt to mitigate them. However, it should not be assumed that the process will identify and eliminate all risks, or that strategies adopted to mitigate them will be successful.
Product price risk
The wholesale nutrient business is a commodity business with little product differentiation. Product prices are largely affected by supply and demand conditions, and product prices can be volatile.
| Mitigating factors and strategies: |
| n | The product diversity of our wholesale business (nitrogen, potash, phosphate, sulphur) reduces the impact of poor supply and demand fundamentals that can be experienced by a particular product category; |
| n | The geographic diversity of our customer base (North America, international) reduces the impact of poor economic, crop or weather conditions in any one region; |
| n | Our customers have diverse end uses for our products (agriculture and industrial); and, |
| n | We have an extensive retail business that provides stability to our cash flows and earnings. Within our retail business, we have further mitigating factors including: |
| | | ¡ | | Product and service diversity (fertilizer, chemical, seed and application services); and, |
| | ¡ | | Geographic diversity (broad regional U.S. markets, South America). |
Natural gas price and supply risk
Natural gas is the principal raw material used to manufacture nitrogen. Natural gas is subject to price volatility that can be reflected in our selling prices in periods of tight supply and demand, but these conditions do not always prevail.
| Mitigating factors and strategies: |
| n | In the long-term, locating or acquiring our facilities in areas of long-term supplies of lower-cost trapped natural gas; |
| n | In the short-term, we use derivative instruments and other contractual arrangements; |
39
Agrium Inc. 2004 Management’s Discussion & Analysis
| n | Our practice of adjusting our production rates and sourcing supply for our customers from purchased product when conditions dictate reduces our exposure to high natural gas costs; and, |
| n | The majority of our nitrogen sold in North America is produced in Western Canada, which has lower-cost gas than other competitors who produce and sell in North America. |
During 2004, we settled our longstanding dispute with Unocal over gas supply issues for our Kenai facility. The settlement agreement established a definitive gas supply obligation from Unocal to the Kenai facility up until October 31, 2005. It is our expectation we will close the Kenai facility in November 2005 unless alternate economic gas supplies can be obtained.
Weather risk
Anomalies in international and regional weather patterns can have a significant and unpredictable impact on the demand for our products and services, which in turn has an impact on our prices. Our customers have limited windows of opportunity to complete required tasks at each stage of crop cultivation. Should adverse weather occur during these seasonal windows, we could face the possibility of reduced revenue in the season without the opportunity to recover until the following season. In addition, we face the significant risk of inventory carrying costs should our customers’ activities be curtailed during their normal seasons. We must manufacture product throughout the year in order to meet peak season demand, and we must react quickly to changes in expected weather patterns that affect demand.
| Mitigating factors and strategies: |
| n | We utilize long-range weather outlooks in our planning and may adjust production levels accordingly; |
| n | Our extensive distribution and storage system allows us to move products to locations where demand is strongest. However, our ability to react is limited by the shortness of the peak selling season; and, |
| n | Geographic diversity of our wholesale markets and our retail facilities affords some protection against regional weather patterns, and we also strive to mitigate our exposure through sales to industrial customers, which represents approximately 12 percent of our Wholesale net sales. |
Transportation disruption risk
Reducing the delivered cost and ensuring reliability of product delivery to our customers are key success factors of our wholesale marketing operations.
| Mitigating factors and strategies: |
| n | We develop detailed forecasts of product movement needs for each facility and transportation carrier; |
| n | Mutually beneficial long-term relationships with major carriers are continually developed and maintained; |
| n | Some of our production facilities are serviced through multiple carriers and modes of transportation; and, |
| n | We maintain multiple supply points, in case transportation disruption occurs at a particular facility. |
Country risk
We have significant operations in Canada, the U.S. and Argentina and expect to further expand our international operations. International business exposes us to a number of risks, such as uncertain economic conditions in the foreign countries in which we do business, abrupt changes in foreign government policies and regulations, restrictions on the right to convert and repatriate currency and political risks.
| Mitigating factors and strategies: |
| n | We seek to partner with reputable firms with experience or significant presence in foreign countries in which we operate or intend to operate; |
| n | We hire personnel located in the foreign country or who have operating experience in the foreign country; |
| n | Non-recourse project financing with consortiums of international banks is obtained where appropriate; and, |
| n | We maintain excess cash related to international operations in U.S. dollars to the extent practicable. |
40
Agrium Inc. 2004 Management’s Discussion & Analysis
Foreign exchange risk
A significant shift in value of the Canadian dollar against the U.S. dollar could impact the earnings in our Canadian operating subsidiaries, which earn revenues mainly in U.S. dollars and incur expenses mainly in Canadian dollars.
| Mitigating factors and strategies: |
| n | Exposure to currency fluctuations is partially managed through our currency hedging programs; and, |
| n | The cost of natural gas in our Canadian operations provides a partial natural hedge when the Canadian dollar strengthens. The Canadian natural gas purchases are denominated in Canadian dollars referenced to the AECO gas price. The natural hedge is created because the AECO gas reference price substantially correlates, with a basis differential, to the U.S. dollar denominated NYMEX gas price. |
| |
Legislative tax risk
Tax risk includes failure to comply with tax laws in the jurisdictions in which we operate.
| Mitigating factors and strategies: |
| n | Our tax department proactively participates in tax and industry organizations and maintains an extensive network of tax consultants; |
| n | In our international activities, we attempt to partner with reputable firms with experience in the foreign countries; and, |
| n | We have centralized responsibility and oversight of all tax filings. |
| |
Counterparty risk
We face the risk of loss should a counterparty be unable to fulfil its obligation with respect to accounts receivable or other contracts, including derivative hedging contracts.
| Mitigating factors and strategies: |
| n | We have established credit procedures that include rigorous assessment of counterparty’s credit-worthiness and adherence to credit limits; |
| n | For derivative hedging contracts, we have established counterparty trading limits and netting agreements; and, |
| n | In our Retail segment, we service customers in diverse geographic markets, which reduces the impact of poor economic or poor crop conditions in any particular region. |
| |
Security risks
We face security risks associated with our facilities and some of our products.
| Mitigating factors and strategies: |
| n | We continue to work with industry associations, law enforcement and government agencies to ensure our facility and product security requirements are identified and addressed; |
| n | We have developed and implemented a system to proactively identify and manage chemical exposure health risks; |
| n | We have implemented a delivery monitoring system for ammonium nitrate wherein we track all shipments and verify receipt with the customer; |
| n | We have implemented a carrier verification system for all products wherein we examine carrier identification and verifications prior to loading product from our plants and terminals; and, |
| n | Our facilities have developed security plans with security measures, which can be implemented in response to real or perceived security threats. |
41
Agrium Inc. 2004 Management’s Discussion & Analysis
Workplace health and safety risks
Workers face health and safety risks arising from their normal work activities, and we are committed to the health and safety of our employees, our customers and communities in which we operate.
| Mitigating factors and strategies: |
| We use a three-part approach to mitigate environment, health and safety risks: |
| n | We have established a strong Environmental, Health & Safety policy (EH&S Policy) and have developed a management system to implement the EH&S Policy. Our Environment, Health & Safety Management System (EMS) addresses the following key points: |
| | | ¡ | | Health and safety responsibilities and accountabilities; |
| | ¡ | | Continuous improvement processes; |
| | ¡ | | Goal setting and planning; |
| | ¡ | | Security; |
| | ¡ | | Audits and inspections; |
| | ¡ | | Emergency response and crisis management; |
| | ¡ | | Incident reporting, investigation, analysis and corrective actions; |
| | ¡ | | Industrial hygiene and occupational health; and |
| | ¡ | | Waste management |
| n | We deploy the necessary expertise and resources to ensure that regulatory and system requirements are understood, in-place, current and effective; and, |
| n | We have regular audits of external regulatory and internal system requirements and process safety. Corrective actions are monitored for effective and timely closure. |
42