EXHIBIT 99.2
2006
Management’s Discussion &
Analysis of
Operations and Financial
Condition
| | | | | |
| | | | | TABLE OF CONTENTS |
| | | | | |
| | 12 | | | Forward-looking Statements |
| | 14 | | | Executive Summary |
| | 16 | | | Our Business, Strategy & Key Drivers |
| | 18 | | | Our Reporting Structure |
| | 21 | | | Our Retail Business |
| | 31 | | | Our Wholesale Business |
| | 47 | | | Our Advanced Technologies Business |
| | 51 | | | Our Other Business Segment |
| | 52 | | | Outlook |
| | 57 | | | Key Business Sensitivities |
| | 58 | | | Our Consolidated Performance |
| | 71 | | | Our Accounting Policies |
| | 74 | | | Business Risks |
| | 80 | | | Controls & Procedures |
Management’s Discussion & Analysis of Operations and Financial Condition
FEBRUARY 21, 2007
This Management’s Discussion and Analysis (MD&A) of operations and financial condition focuses on long-term vision, strategy and growth opportunities, as well as historical performance for the three years ended December 31, 2006. The discussion should be read in conjunction with the cautionary statement with regard to forward-looking statements on page 12 and the consolidated financial statements and related notes on pages 82 to 120. Dollar amounts refer to United States (U.S.) dollars except where otherwise stated.
The Company’s quarterly and annual financial information and its Annual Information Form (AIF) are available at SEDAR (www.sedar.com).
Forward-looking Statements
Certain statements and other information included in this management’s discussion & analysis constitute forward-looking statements as defined under applicable securities legislation. Forward-looking information is typically identified by the words “believe,” “expect,” “anticipate,” “intend,” “estimate,” “outlook,” “focus,” “potential,” “will,” “should,” “would” and “could” and other similar expressions. These forward-looking statements include, but are not limited to, references to:
| • | | disclosures made under the heading “Outlook;” |
| |
| • | | our 2007 key corporate goals; |
| |
| • | | key drivers for our business and industry trends; |
| |
| • | | the amount and type of future capital expenditures and capital resources; |
| |
| • | | future cash requirements and long-term obligations; |
| |
| • | | business strategies and plans for implementing them; |
| |
| • | | goals, expansion and growth of our business and operations; |
| |
| • | | future seed volumes, prices and sales; |
| |
| • | | availability of raw materials, particularly gas availability or gas price relative to nitrogen prices; |
| |
| • | | risk mitigation activities; and, |
| |
| • | | our future results and plans, including respecting our recent acquisitions. |
Such forward-looking statements involve known and unknown risks and uncertainties, including those referred to in this Management’s Discussion and Analysis (MD&A), which may cause our actual results, performance or achievements to be materially different from any future results, performance or achievements expressed or implied by such forward-looking statements. These risks include, but are not limited to:
| • | | general economic, market and business conditions, including: supply, demand and price of crop nutrients and input or feedstock prices, seed and crop protection products; supply and demand for grain and other agricultural crops; changes in government agricultural, safety, environmental and other legislation and policies; fluctuations in foreign exchange rates, actions by competitors and others including changes to industry capacity and utilization and product pricing; performance by customers, suppliers, personnel and counterparties to financial instruments; and changes in capital markets; |
| |
| • | | weather conditions and seasonal patterns; |
| |
| • | | general operating risks associated with: investment in foreign jurisdictions; the level and effectiveness of future capital expenditures and reliability of performance of existing capital assets; ability to transport or deliver production to markets; present and discontinued mining operations; and labor disruptions; and, |
| |
| • | | strategic risks including: our ability to implement our business strategy; results of our risk mitigation strategies, including hedging and insurance; our ability to integrate any assets we have acquired or we may acquire or the performance of those assets; the opportunities, or lack of opportunities, that may be presented to and pursued by us; technological changes; and other factors, many of which are beyond our control. |
These forward-looking statements are based on certain assumptions and analyses made by us in light of our experience and perception of historical trends, current conditions and expected future developments as well as other factors we believe are appropriate in the circumstances. Expected future developments are based, in part, upon assumptions respecting our ability to successfully integrate recent acquisitions into our existing businesses and to achieve consequent synergies.
| | | |
| 12 | | AGRIUM ANNUAL REPORT 2006 |
All of the forward-looking statements contained in this Management’s Discussion and Analysis are qualified by these cautionary statements and by the assumptions that are stated or inherent in such forward-looking statements. Although we believe these assumptions are reasonable, undue reliance should not be place on these assumptions and such statements, which only apply as of the date of this Management’s Discussion and Analysis. The key assumptions that have been made in connection with the forward-looking statements include the following:
| • | | continuation of the recent positive market developments throughout 2007, including an almost doubling of corn prices, and a resulting increase in U.S. corn and wheat acreage which is expecting to support increased demand for nutrients, crop protection products, seed, and retail services; |
| |
| • | | anticipated continuation of tight world fertilizer markets, supporting higher prices and increased margins; |
| |
| • | | lowering our Canadian phosphate rock costs on a per unit basis by mid-2007; |
| |
| • | | our Kenai, Alaska nitrogen plant production being limited to approximately 75 percent and operating for only about eight months in 2007; |
| |
| • | | the continuation of the Argentine urea price cap to growers of $300 per tonne which could limit our urea margins; |
| |
| • | | increased sales and gross profit to be generated from our new Advanced Technologies business unit with 2007 to represent our first full year of operations in this business segment; |
| |
| • | | achievement of $45-million in unrealized Retail synergies and margin improvement from the Royster-Clark acquisition by the end of 2007; |
| |
| • | | continuation of the recent rise in demand of grains and oilseeds in the U.S., Brazil, Canada, Europe, and various countries in Asia; and, |
| |
| • | | realizing the expected benefits from our Saskatchewan potash mine expansion completed in late 2006. |
The above items and their possible impact are discussed more fully in the relevant parts of this MD&A and the sections headed “Key Business Sensitivities” and “Business Risks.”
Consequently, all of the forward-looking statements made in or incorporated by reference in this MD&A are qualified by these cautionary statements, and there can be no assurance that the actual results or developments anticipated by us will be realized or, even if substantially realized, that they will have the expected consequences to, or effects on, us. Except as required by law, we undertake no obligation to update or revise forward-looking statements even if circumstances or management’s estimates or opinions should change. Investors should not place undue reliance on forward-looking statements.
Non-GAAP Financial Measures
Some financial measures referenced in this MD&A are not GAAP compliant, including EBIT and EBITDA. Please review the discussion of non-GAAP measures on page 72 when referring to these measures.
| | | |
| AGRIUM ANNUAL REPORT 2006 | | 13 |
Executive Summary
OVERVIEW OF 2006
2006 Consolidated Financial Performance
Consolidated net earnings of $33-million were lower than $283-million in 2005 due to a number of challenges in 2006, including:
| • | | a $136-million pre-tax impairment to the carrying cost of our Canadian phosphate operations; |
| |
| • | | reduced U.S. corn acreage and low crop prices in the first half of 2006, that impacted nutrient and other crop input demand; |
| |
| • | | high cost inventory carryover from the fall of 2005; and, |
| |
| • | | protracted Chinese potash price negotiations that resulted in reduced international potash shipments throughout the first half of 2006. |
| | | |
| 14 | | AGRIUM ANNUAL REPORT 2006 |
We achieved record consolidated net sales of $4.2-billion for 2006, almost 27 percent higher than 2005 as we grew our business through three acquisitions in the year. Consolidated gross profit was $956-million in 2006 compared with $1-billion in 2005.
While making three acquisitions totaling $651-million, we held our net debt-to-capital ratio at close to our target 40 percent level in 2006 compared to 13 percent at the end of 2005.
Strong Industry Fundamentals
Agricultural fundamentals have improved substantially since the first half of 2006. As of mid-February 2007:
| • | | Corn prices are almost double year ago levels and are anticipated to remain strong in 2007. This is expected to result in a significant increase in corn acreage and a corresponding increase in demand for nutrients, crop protection products, seed and retail services. |
| |
| • | | Global and North American nitrogen prices are as much as 30 percent above 2006. |
| |
| • | | Benchmark phosphate and potash prices have strengthened over the same period last year, and the early resolution of the Chinese potash negotiation is expected to be a positive development in 2007. |
Transformation through Acquisition & Expansion
In addition to the positive fundamentals developing for 2007, we achieved a number of significant growth milestones in 2006, which should further position us to benefit from strengthening industry conditions.
In 2006, we accomplished the following:
| • | | almost doubled our U.S. retail operations through the acquisition of Royster-Clark, and implemented actions that are expected to result in retail synergies of $45-million by the end of 2007; |
| |
| • | | significantly expanded our North American distribution network; |
| |
| • | | expanded our potash production by over 300,000 tonnes; and, |
| |
| • | | grew our Advanced Technologies business through two acquisitions and a 150,000 tonne expansion of our ESN® facility, and now report this business separately. |
| | | |
| AGRIUM ANNUAL REPORT 2006 | | 15 |
Our Business,
Strategy & Key Drivers
Agrium is one of the world’s largest publicly traded agricultural retailers and fertilizer producers, with 2006 net sales exceeding
$4-billion. We supply nutrients and other crop inputs that increase both crop quality and yields in order to help supply the growing demand for food, animal nutrition and production of bio-fuels.
We have three distinct business segments: Retail, Wholesale and Advanced Technologies. Although each business segment operates independently, there are significant inter-relationships among all three of these businesses and market segments. We believe our position in each provides us with valuable insights across the value chain. Through our Retail business segment, we operate a network of 436 retail centers in the U.S., Argentina and Chile and are the largest agricultural distributor of seed, agricultural chemicals and fertilizer direct to growers in the U.S. Our Wholesale business segment produces and markets seven million product tonnes of nutrients accounting for two to three percent of the global capacity of each of the three primary fertilizer nutrients: nitrogen, potash and phosphate. Our new Advanced Technologies business segment is a leader in developing and supplying environmentally friendly controlled-release, or coated fertilizer, technologies and products. These products are used in the agriculture industry as well as for home and garden, turf and golf courses.
 | | OUR MISSION |
| |
| | | Providing Ingredients for Growth. |
| |
| | | |
| |
| | OUR VISION |
| |
| | | Be one of the World’s Leading Providers of Inputs
for Plant Growth by Creating Value for Each
of our Stakeholders. |
Our actions are guided by the principles of growth and increasing the stability of earnings and cash flow. We will strive to execute on our vision by continuing to diversify our business and focusing on costs, while ensuring we maintain financial discipline with respect to all of our investments. A critical component of our success will continue to be our focus on attracting, retaining and developing our over 6,500 employees.
| | | |
| 16 | | AGRIUM ANNUAL REPORT 2006 |
OUR STRATEGIC GOALS ARE TO:
| • | | invest across the value chain; |
| |
| • | | establish or maintain lowest cost to serve wholesale
position; and, |
| |
| • | | diversify geographically. |
The primary driver for our business is the need for the world’s growers to continue to sustain and increase production of grain, oilseeds and other crops. Our specific business drivers will vary to a certain extent depending on the business segment or product.
The broader drivers for our business as a whole are:
| • | | global and regional grain markets. Higher grain prices normally result in growers expanding seeded acreage and increasing crop input application to optimize yields; |
| |
| • | | supply and demand balance for the three major crop nutrients: |
| | o | | change in demand for nutrients, which is correlated directly with crop prices; |
| |
| | o | | new capacity additions or plant closures; and, |
| |
| | o | | changes in operating rates, which can be affected by changes to cost of production. For nitrogen, this is largely due to changes in natural gas or other energy feedstock costs. For potash and phosphate, this may include mining costs or rock quality factors; |
| • | | government policies or actions that may impact: |
| | o | | the economics and farm practices of the agriculture or crop sector, or the crop input market, which may then impact crop input demand; and, |
| |
| | o | | changes to nutrient capacity, operating rates, or nutrient trade; |
| • | | global and regional gross domestic production (GDP), where the rate of GDP growth can impact industrial demand for our Wholesale products and, in the long-term, agricultural nutrient demand as it supports growing global meat and grain consumption; and, |
| |
| • | | the growing trend towards increased focus on environmental and economically sustainable products and practices. |
| | | |
| AGRIUM ANNUAL REPORT 2006 | | 17 |
Our Reporting Structure
We revised the composition and names of our reporting segments to correspond with our strategic business unit structure and internal reporting in 2006. We operate and report our business through three operating segments.
| • | | Our Retail segment, with net sales of about $2-billion in 2006, operates in North and South America, providing crop inputs and services directly to farmers. |
| |
| • | | Our Wholesale segment, with net sales of about $2.3-billion, operates in North and South America and produces, markets and distributes all major crop nutrients for agricultural and industrial customers both domestically and around the world. |
| |
| • | | Our Advanced Technologies segment operates in North America, with net sales of about $100-million in 2006. This is a new segment created this year after completing two acquisitions and a significant capacity expansion of our production of ESN controlled-release nitrogen fertilizer for broad acre crops. |
We have a fourth non-operating “Other” business segment, which includes Corporate functions that provide support and services to our operating segments. This segment is also used for the elimination of inter-segment transactions.
Net Sales & Gross Profit By Segment & Product
| | | | | | | | | | | | | | | | | | | | | |
| | | | Twelve Months Ended December 31 |
| | | | 2006 | | | | 2005 |
| (millions of U.S. dollars) | | | Net Sales | | | | Gross Profit | | | | Net Sales | | | | Gross Profit | |
Retail | | | | | | | | | | | | | | | | | | | | |
| | | | | | | | | | | | | |
| Fertilizer | | | | 1,065 | | | | | 217 | | | | | 626 | | | | | 141 | |
| | | | | | | | | | | | | |
| Chemicals | | | | 591 | | | | | 154 | | | | | 458 | | | | | 130 | |
| | | | | | | | | | | | | |
| Other | | | | 319 | | | | | 124 | | | | | 158 | | | | | 76 | |
| | | | | | | | | | | | | |
Total | | | | 1,975 | | | | | 495 | | | | | 1,242 | | | | | 347 | |
| | | | | | | | | | | | | |
Wholesale | | | | | | | | | | | | | | | | | | | | |
| | | | | | | | | | | | | |
| Nitrogen | | | | 1,376 | | | | | 291 | | | | | 1,622 | | | | | 479 | |
| | | | | | | | | | | | | |
| Potash | | | | 213 | | | | | 98 | | | | | 255 | | | | | 157 | |
| | | | | | | | | | | | | |
| Phosphate | | | | 298 | | | | | 27 | | | | | 319 | | | | | 59 | |
| | | | | | | | | | | | | |
| Purchase for resale | | | | 382 | | | | | 19 | | | | | – | | | | | – | |
| | | | | | | | | | | | | |
Total | | | | 2,269 | | | | | 435 | | | | | 2,196 | | | | | 695 | |
| | | | | | | | | | | | | |
Advanced Technologies | | | | 101 | | | | | 19 | | | | | – | | | | | – | |
| | | | | | | | | | | | | |
Other | | | | (152 | ) | | | | 7 | | | | | (144 | ) | | | | (4 | ) |
| | | | | | | | | | | | | |
TOTAL | | | | 4,193 | | | | | 956 | | | | | 3,294 | | | | | 1,038 | |
| | | |
| 18 | | AGRIUM ANNUAL REPORT 2006 |
We made three acquisitions in 2006, including a major agricultural retail business in the U.S. and two smaller acquisitions in the specialty fertilizer business. These three acquisitions are intended to enhance our position across the value chain and further broaden our stable earnings base. A summary of these acquisitions is provided below, with more detail contained in each of our business sections.
LARGEST U.S. AGRICULTURAL RETAILER
Agrium acquired control of Royster-Clark on February 9, 2006. Royster-Clark was a major retail distributor of crop nutrients, seed, crop protection products, and associated services to U.S. growers. At the time, they operated over 250 retail centers across the Corn Belt, mid-Atlantic and south-eastern crop regions of the U.S., and more than 30 seed processing, fertilizer granulation and fertilizer blending facilities. Their wholesale fertilizer operations also included significant storage and distribution assets, a related wholesale fertilizer purchase for resale business, as well as two nitrogen production facilities. In 2005, Royster-Clark reported total annual revenues in excess of $1-billion (wholesale and retail combined).
| | | |
| AGRIUM ANNUAL REPORT 2006 | | 19 |
The larger of the two nitrogen production facilities, located at East Dubuque, Illinois, was subsequently sold to Rentech, Inc. in April 2006 for almost $70-million, including net working capital of about $20-million. Agrium has been appointed as the exclusive distributor for nitrogen products from the facility as part of a related 10-year agreement.
The purchase price for Royster-Clark was approximately $404-million after net proceeds from the sale price of the East Dubuque facility. We integrated the Royster-Clark assets into our respective Retail and Wholesale business units in 2006. We expect to be able to capture $45-million in synergies from the newly acquired retail assets and about $10-million in synergies through our wholesale operations by the end of 2007. The anticipated synergies are from a combination of reduced expenses, administrative efficiencies and a significant improvement in margins for nutrients and crop protection products.
LEADER IN ADVANCED TECHNOLOGIES
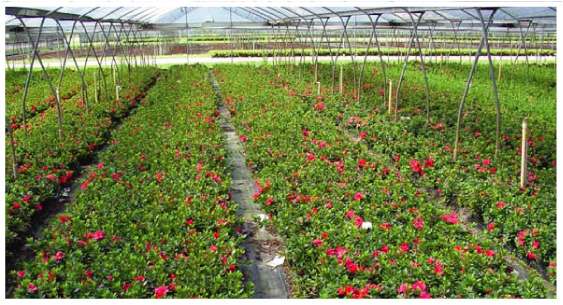
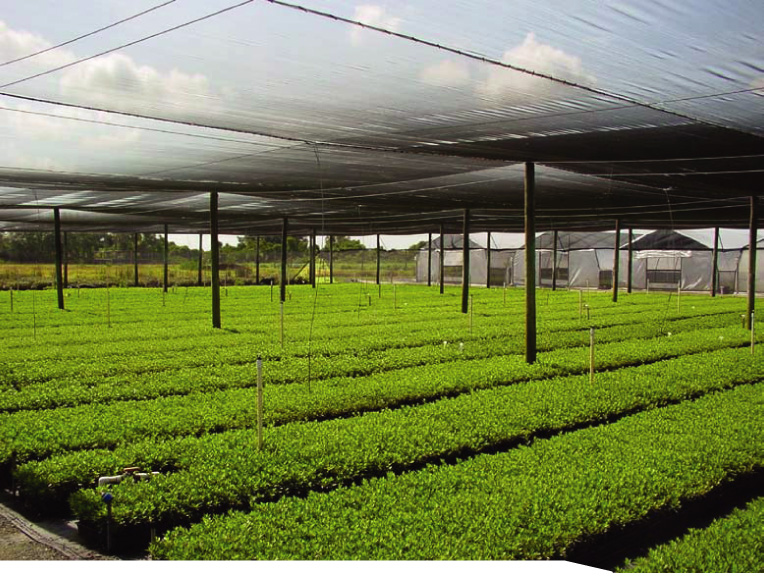
We acquired the fertilizer technology and professional products businesses of Nu-Gro in January 2006 for $86-million, significantly expanding our product line, marketing channels and customer base. Nu-Gro produced and distributed controlled-release and professional turf products, and reported 2005 total annual sales of approximately $70-million and average gross margins of about 24 percent. Their wide range of branded controlled-release nitrogen products are marketed to finished product producers for use on golf courses, sport turf, home lawns, high yield agricultural crops, nurseries and in greenhouses. Professional turf products are marketed directly for use in golf course and lawn care applications.
We acquired the controlled-release fertilizer business of Pursell Technologies in August 2006 for $78.5-million, adding further expertise in the development, commercialization and marketing of polymer-coating technologies. Total 2005 sales revenue on an annualized basis was reported at $74-million with gross margins similar to the Nu-Gro business. In addition, we also purchased the new technology business of Pursell Technologies which included patented technology for emerging non-fertilizer controlled-release products, such as specific crop protection products, for $12.5-million, plus contingent payments based on a percentage of future sales.
| | | |
| 20 | | AGRIUM ANNUAL REPORT 2006 |
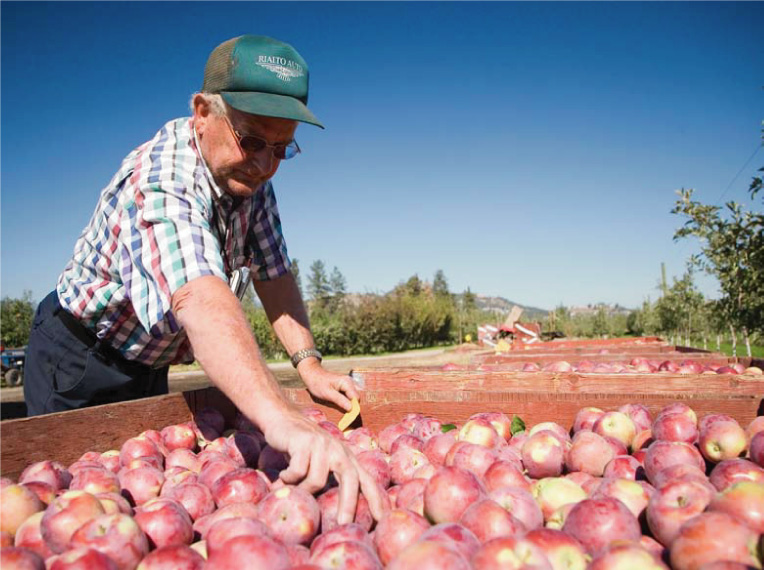
Our Retail Business
Agrium’s retail operations provide crop nutrients, seed, crop protection chemicals and services directly to growers. Our 2006 Retail net sales were $1.98-billion and gross profit was $495-million, accounting for almost half our total company net sales and gross profit. Retail contributed $125-million, or about 30 percent, of our EBITDA in 2006 compared to 17 percent in 2005.
The acquisition of Royster-Clark’s retail operations in February 2006, almost doubled the number of retail centers Agrium operates in the U.S. and increased our retail net sales by over 50 percent. These farm centers now operate under the CPS banner. With the Royster-Clark acquisition, Agrium is now the largest independent agricultural retailer in the United States with over 400 retail facilities across more than 25 states. Our 2006 U.S. retail sales of $1.8-billion represent about five to six percent of total U.S. crop input expenditures of almost $35-billion. The U.S. Department of Agriculture forecast for the 2006 calendar year includes grower purchases of $14-billion in nutrients, $11-billion in seed and $9-billion in crop protection products. Our U.S. farm retail centers typically draw customers from a 20-mile radius. We estimate that we provide crop inputs and services to over 100,000 U.S. growers.
Agrium Retail Diversity
As illustrated in the map above, we market directly to growers from over 400 retail centers across much of the U.S., Argentina and Chile.
Our Retail business operates under three primary trademarks, being:
| | | | | |
| | 1 | | Crop Production Services (CPS) with about $1-billion in sales in 2006 and 324 farm centers, serving the Corn Belt and Eastern agricultural regions of the U.S.; |
| | | | | |
| | 2 | | Western Farm Service (WFS) with about $700-million in sales in 2006 and 82 farm centers serving the Western U.S., California, Arizona, Washington, Oregon and Idaho; and, |
| | | | | |
| | 3 | | Agroservicios Pampeanos S.A. (ASP) in South America with $165-million in sales in 2006 and 30 facilities, primarily in the grain growing region of Argentina and the fruit growing region of Chile. |
| | | |
| 22 | | AGRIUM ANNUAL REPORT 2006 |
Retail Strategy & Key Developments
Our Retail strategy and culture have been carefully developed over more than a decade and are based on five key principles:
| | | |
| | a commitment to a strict program of performance management; |
| | | |
| | growing the business in general and the seed business in particular; |
| | | |
| | building relationships with leading growers in each of our markets; |
| | | |
| | focusing expansion in the prime agricultural regions; and, |
| | | |
| | optimizing returns from economies of scale across all products, systems and services. |
Attention to performance management is possibly the single most important component of our Retail strategy and performance. This component includes attention to customers and employees, accountability, proper management at each retail center, and adoption of appropriate incentive plans to encourage optimal behavior and to reward according to contribution. We strive to deliver superior performance management by ensuring each retail center is empowered to make the right decisions within a defined structure.
KEY RETAIL DEVELOPMENTS
The key priority for our Retail business in 2006 was the timely integration of the Royster-Clark acquisition. The main deliverables were substantively complete by October 2006. However, since our systems and processes were not in place in time for the key spring growing season in 2006, realization of the significant margin benefits from the new structure will not be realized until the 2007 growing season.
| | | |
| AGRIUM ANNUAL REPORT 2006 | | 23 |
Retail Products and Services
Agrium’s retail operations provide nutrients, seed, crop protection chemicals and services directly to growers. We leverage our substantial purchasing economies of scale in order to maximize our margins on our major products and services.
CROP NUTRIENTS
Growers apply nutrients to their cropland in order to optimize yields and maximize the economic returns from their operations. Crops draw nutrients from the soil as they grow and, as a result, these nutrients need to be replenished on a regular basis.
Our Retail operations provide a full line of crop nutrient products in either liquid or dry form including nitrogen, phosphate, potash, sulphur and micronutrients. Our retail farm centers mix these nutrients to the specific ratio required for each grower’s field to optimize yield. The ratio will vary depending on the soil type, the type of crop being grown, yield objectives and nutrient levels already in the soil. We use soil tests to help determine the level of nutrient depletion in the growers’ soil. Our “Crop Monitoring Program” for high-value crops also incorporates leaf testing during the crop cycle. Appropriate nutrients are then applied throughout the growing season to maximize crop yields.
Crop nutrient products are sourced from a wide array of suppliers, which varies depending on the nutrient and the location of the farm center. Our Retail segment operates independently from our Wholesale segment by purchasing product at market prices from a variety of producers and wholesalers, including inter-company purchases from our Wholesale operations. Our U.S. based Retail operations purchased approximately 10 percent of their total crop nutrient requirements from our Wholesale operations in 2006.
| | | |
| 24 | | AGRIUM ANNUAL REPORT 2006 |
CROP PROTECTION PRODUCTS
Crop protection products consist of herbicides, fungicides and insecticides. These three product groups help minimize crop losses to weeds, diseases and insects, thus ensuring optimal crop health resulting in increased yields. Demand for crop protection products is heavily influenced by weather conditions, which can play a significant role in determining the degree of pest pressure in a particular region or crop. Furthermore, insect infestations and crop diseases are often cyclical.
The type of crop protection product used by a grower varies widely depending on the region and crops grown. For example, in California, there are a large number of products used due to the variety of high-value crops grown. In the mid-western U.S. and Argentina, the major crops are corn, soybeans and wheat. Herbicides for weed elimination are used every year and fungicides and insecticides are applied on an as-needed basis. The volume of crop protection sales has declined over the past 10 years as the growing use of genetically modified or enhanced seed varieties (GMOs), primarily for soybeans, corn and cotton, have reduced the requirement for crop protection products. As chemical patents expire, generic chemical use increases further reducing crop protection sales due to lower unit prices.
We provide a full range of quality products for growers. Without sacrificing product performance, certain products are emphasized and the number of suppliers is optimized. This practice reduces working capital requirements and improves purchase economics. The top-selling crop herbicide sold in the mid-western U.S. and Argentina is glysophate, which accounts for close to 20 percent of the eastern U.S. region’s total crop protection sales. This is in contrast to our western facilities which offer over 2,500 different crop protection SKUs for a broad range of crops and pest issues. The top five crop protection products account for less than nine percent of our total crop protection sales in the western region of the U.S.
| | | |
| AGRIUM ANNUAL REPORT 2006 | | 25 |
SEED, SERVICES & OTHER PRODUCTS
Agrium’s farm centers not only supply crop nutrients and crop protection products to growers, they also provide a full range of crop seed and associated services. Our seed sales have been the fastest growing product segment within CPS, as we continue to expand our sales in this $11-billion U.S. seed industry. Our goal is to continue to grow this segment of our business to offset the impact of genetic seed and generic pricing on crop protection product sales.
Our farm centers are an important source of seed for growers. We procure seed from major global seed companies, offering their branded seed as well as our own in-house brand, known as Vigoro. We adopted the former Royster-Clark Vigoro brand for all our branded seed in 2006. Our Vigoro branded seed is chosen by our seed specialists after matching seed variety strengths with unique market conditions. We choose what we view is the best seed offering for each region’s soil and growing conditions and market it under our Vigoro brand. The majority of our branded seed products are marketed at our facilities centered in the Corn Belt and Eastern U.S. Corn, wheat and soybean seeds comprise over 80 percent of our total seed sales in this region. Our private label seed accounts for over 30 percent of our total seed sales on a revenue basis. We believe seed performance is enhanced by matching the appropriate seed with specific soil conditions. We refer to this practice as Precision Placement and our professional crop consultants specialize in bringing this expertise to our customers.
Services offered to growers include applying crop input products, obtaining and analyzing soil and tissue samples and crop scouting. Our crop consultants consider many factors in recommending the type and timing of product application including humidity, wind speed, leaf wetness, temperature, time until harvest and future planting intentions. In addition, to reactive chemical applications, preventive plant health fungicide applications have produced significant corn and soybean yield increases. This application program proactively counters disease pressures on a cost-effective basis before they can impact crop quality and yield.
We are committed to ensuring optimal application rates and minimizing losses during application for our customers and the environment. As part of this commitment, we operate approximately 1,500 weather-monitoring stations in our western region. Our crop advisors use the information from these stations, in conjunction with predictive software, to determine specific crop protection recommendations to protect the grower’s crop. This is particularly important given how quickly insects or diseases can reduce yields in the region.
| | | |
| 26 | | AGRIUM ANNUAL REPORT 2006 |
Retail 2006 Overview of Results
Net sales for our Retail operations were $1,975-million in 2006, compared with $1,242-million in 2005 and $1,114-million in 2004. Of the 2006 total net sales, $683-million was due to the addition of the Royster-Clark’s facilities, acquired in February 2006. Our U.S. Retail operations achieved their tenth consecutive year of improved EBITDA in 2006 of $125-million compared with $113-million in 2005. This is the first year where the record EBITDA was achieved due to a major acquisition. International retail net sales and gross profit were above 2005 by 13 percent and 15 percent, respectively. Total retail EBIT was $95-million in 2006, compared with $96-million in 2005 and $81-million in 2004. Gross profit, sales, selling expense and depreciation were all higher in 2006 due to the addition of Royster-Clark.
We believe that with the Royster-Clark acquisition we are well positioned to capitalize on the positive market conditions in 2007. Our results should be supported by the substantial increase in global crop prices, expected to result in an increase in planted corn and wheat acres and higher nutrient application rates per acre across most of our markets in 2007.
RETAIL PERFORMANCE
| | | | | | | | | | | | | | | | | | | | | | | | | | |
| | | | Year Ended December 31 | | | | Variance Analysis | |
| | | | | | | | | | | | | | | | | | | 2006 v. | | | | 2005 v. | |
| (millions of U.S. dollars) | | | 2006(a) | | | | 2005(a) | | | | 2004(a) | | | | 2005 | | | | 2004 | |
Fertilizers | | | | | | | | | | | | | | | | | | | | | | | | | |
| | | | | | | | | | | | | | | | |
| Net sales | | | | 1,065 | | | | | 626 | | | | | 556 | | | | | 439 | | | | | 70 | |
| | | | | | | | | | | | | | | | |
| Cost of product | | | | 848 | | | | | 485 | | | | | 425 | | | | | 363 | | | | | 60 | |
| | | | | | | | | | | | | | | | |
Gross profit | | | | 217 | | | | | 141 | | | | | 131 | | | | | 76 | | | | | 10 | |
| | | | | | | | | | | | | | | | |
Crop protection products | | | | | | | | | | | | | | | | | | | | | | | | | |
| | | | | | | | | | | | | | | | |
| Net sales | | | | 591 | | | | | 458 | | | | | 416 | | | | | 133 | | | | | 42 | |
| | | | | | | | | | | | | | | | |
| Cost of product | | | | 437 | | | | | 328 | | | | | 298 | | | | | 109 | | | | | 30 | |
| | | | | | | | | | | | | | | | |
Gross profit | | | | 154 | | | | | 130 | | | | | 118 | | | | | 24 | | | | | 12 | |
| | | | | | | | | | | | | | | | |
Seed and other products and services | | | | | | | | | | | | | | | | | | | | | | | | | |
| | | | | | | | | | | | | | | | |
| Net sales | | | | 319 | | | | | 158 | | | | | 142 | | | | | 161 | | | | | 16 | |
| | | | | | | | | | | | | | | | |
| Cost of product | | | | 195 | | | | | 82 | | | | | 75 | | | | | 113 | | | | | 7 | |
| | | | | | | | | | | | | | | | |
Gross profit | | | | 124 | | | | | 76 | | | | | 67 | | | | | 48 | | | | | 9 | |
| | | | | | | | | | | | | | | | |
Total Retail | | | | | | | | | | | | | | | | | | | | | | | | | |
| | | | | | | | | | | | | | | | |
| Total Retail net sales | | | | 1,975 | | | | | 1,242 | | | | | 1,114 | | | | | 733 | | | | | 128 | |
| | | | | | | | | | | | | | | | |
| Total cost of product | | | | 1,480 | | | | | 895 | | | | | 798 | | | | | 585 | | | | | 97 | |
| | | | | | | | | | | | | | | | |
Total gross profit | | | | 495 | | | | | 347 | | | | | 316 | | | | | 148 | | | | | 31 | |
| | | | | | | | | | | | | | | | |
| Selling expenses | | | | 361 | | | | | 239 | | | | | 222 | | | | | 122 | | | | | 17 | |
| | | | | | | | | | | | | | | | |
| General and administrative | | | | 23 | | | | | 10 | | | | | 8 | | | | | 13 | | | | | 2 | |
| | | | | | | | | | | | | | | | |
| Depreciation and amortization | | | | 30 | | | | | 17 | | | | | 18 | | | | | 13 | | | | | (1 | ) |
| | | | | | | | | | | | | | | | |
| Other expenses | | | | (14 | ) | | | | (15 | ) | | | | (13 | ) | | | | 1 | | | | | (2 | ) |
| | | | | | | | | | | | | | | | |
EBIT | | | | 95 | | | | | 96 | | | | | 81 | | | | | (1 | ) | | | | 15 | |
| | |
| (a) | | International Retail net sales were $165-million (2005 – $146-million, 2004 – $118-million) and gross profit was $30-million (2005 – $26-million, 2004 – $22-million). |
| | | |
| AGRIUM ANNUAL REPORT 2006 | | 27 |
FERTILIZER
Our fertilizer Retail net sales reached $1,065-million in 2006, compared with $626-million in 2005 and $556-million in 2004. The increase in sales was due to the addition of $389-million in fertilizer sales from our recently acquired Royster-Clark retail business. Average fertilizer sales prices were slightly higher than in 2005. Fertilizer sales volumes were largely unchanged for our legacy U.S. retail operations and slightly lower than 2005 for the Royster-Clark operations. The volume decrease was primarily due to extremely wet weather in the Eastern U.S. Corn Belt in the second half of 2006 where a higher proportion of Royster-Clark centers are located. Our total U.S. fertilizer Retail sales volumes declined by about three percent in 2006, compared with an estimated seven percent decline in volumes experienced by the domestic industry as a whole for the same period. We believe our sales volumes did not decline as much as the industry average due to our geographic diversity and our strategy of focusing marketing efforts on leading growers. Over 30 percent of our fertilizer sales are in the Western U.S. which cover a wide range of fruit, vegetable and other specialty crops that provide a more diverse, stable fertilizer sales profile, as it is not tied to row crops such as corn and soybeans. We believe our strategy of developing strong relationships with leading growers across all regions in which we operate also reduces variability in our sales volumes, as the leading growers have been increasing the size of their operations unlike the other, less innovative growers. In South America, fertilizer volumes increased about 20 percent as market conditions strengthened considerably in the second half of 2006, South America’s spring application season.
| | | |
| 28 | | AGRIUM ANNUAL REPORT 2006 |
Total gross profit for fertilizer increased to $217-million in 2006, compared with $141-million in 2005 and $131-million in 2004. The increase was due to the addition of the Royster-Clark business and strong returns from our South America operations. Results in the second half of 2006 were lower than expected due to weather issues in the fall application season in the Eastern U.S. Corn Belt, where the former Royster-Clark farm centers are more heavily concentrated.
CROP PROTECTION
Crop protection net sales were $591-million in 2006, compared with $458-million in 2005 and $416-million in 2004. This increase was primarily due to the addition of $151-million in net sales of crop protection products from the Royster-Clark farm centers.
Total gross profit for crop protection products increased to $154-million in 2006, compared with $130-million in 2005 and $118-million in 2004. The increase was due to the addition of Royster-Clark’s retail business.
The decline in gross profit relative to sales was due to low pest pressure in all regions of the U.S., particularly when compared with the severe pest pressure experienced in 2005. Product use was also impacted by lower U.S. corn acreage in 2006, as corn requires a more intensive use of crop protection products than alternative crops such as soybeans or wheat, and the continued increase in GMO corn seed sales, which is often associated with reduced volumes of crop protection products. Lower prices on generic crop protection products were also a factor.
The anticipated substantial increase in corn acres in North America and Argentina is anticipated to produce higher chemical revenues in the spring of 2007. U.S. corn crop protection programs are approximately 70 percent more costly per acre than soybean programs.
| | | |
| AGRIUM ANNUAL REPORT 2006 | | 29 |
SEED, SERVICES & OTHER
Net sales and gross profit for seed, services and other products increased significantly again in 2006. Our seed sales reached $167-million in 2006, a 147 percent increase compared to 2005 levels. Gross profit for this category increased by $48-million in 2006 or 63 percent over the previous year.
Seed sales and gross profit at our legacy retail operations were $80-million and $15-million respectively, both increasing by over 15 percent in 2006. Agrium’s Retail seed sales for U.S. legacy operations have grown at an annual average growth rate of about 14 percent for the past five years.
Retail services sales were $83-million in 2006, a 72 percent increase over 2005. We anticipate that demand for seed and services will remain strong in 2007 with the predicted increase in seeded acreage, strong crop prices and the additional stacked gene seed offerings.
EXPENSES
Retail expenses rose to $400-million in 2006 compared with $251-million in 2005 and $235-million in 2004. The 2006 figures are not directly comparable to prior years due to the significant increase in expenses resulting from the Royster-Clark acquisition. The largest component of expenses is selling expenses, which tend to fluctuate directly with our sales and service activity. Depreciation also rose due to the expanded retail business.
| | | |
| 30 | | AGRIUM ANNUAL REPORT 2006 |
Our Wholesale Business
Our Wholesale business is one of the world’s premier producers, distributors and marketers of crop nutrients. In 2006, we produced almost seven million product tonnes of all major crop nutrients. These crop nutrients were produced at our 13 major production facilities and a number of smaller regional production facilities. We significantly expanded our purchase for resale business, marketing an additional 1.5 million tonnes of all nutrient products in North and South America in 2006. Some key strengths of our Wholesale operations include:
| 1 | | diversity in our product mix, including producing and marketing all major crop nutrients; |
| |
| 2 | | our competitive cost position for most of our Wholesale assets, particularly on a delivered cost basis; and, |
| |
| 3 | | our extensive associated storage and distribution system, which allows us to better serve our customers. |
Agrium Wholesale Facilities, Capacities and Markets
2006 Wholesale Capacity, Production & Sales
(thousands of product tonnes)
| | | | | | | | | | | | | | | | | | | | | | | | | | | | | | | | | | | | | | | | | | | | | | |
| | | | Nitrogen Volumes | | | | Phosphate Volumes | | | | Potash Volumes | |
| | | | Capacity | | | | Production | | | | Sales | | | | Capacity | | | | Production | | | | Sales | | | | Capacity (a) | | | | Production | | | | Sales | |
| North America | | | | | | | | | | | | | | | | | | | | | | | | | | | | | | | | | | | | | | | | | | | | | |
| | | | | | | | | | | | | | | | | | | | | | | | | | | | |
| Canada | | | | 3,625 | | | | | 2,962 | | | | | 1,590 | | | | | 680 | | | | | 420 | | | | | 431 | | | | | 2,100 | | | | | 1,209 | | | | | 89 | |
| | | | | | | | | | | | | | | | | | | | | | | | | | | | |
| U.S. | | | | 1,273 | | | | | 608 | | | | | 2,077 | | | | | 644 | | | | | 475 | | | | | 461 | | | | | | | | | | | | | | | 642 | |
| | | | | | | | | | | | | | | | | | | | | | | | | | | | |
| International (b) | | | | 1,521 | | | | | 1,300 | | | | | 1,393 | | | | | | | | | | | | | | | 14 | | | | | | | | | | | | | | | 548 | |
| | | | | | | | | | | | | | | | | | | | | | | | | | | | |
Total | | | | 6,419 | | | | | 4,870 | | | | | 5,060 | | | | | 1,324 | | | | | 895 | | | | | 906 | | | | | 2,100 | | | | | 1,209 | | | | | 1,279 | |
| | |
| (a) | | Potash capacity expansion was essentially complete by 2006 year end, previous capacity was 1.79 million tonnes. |
| |
| (b) | | International nitrogen capacity includes our 50 percent ownership of the Profertil facility in Argentina and our Kenai, Alaska facility. |
| | | |
| 32 | | AGRIUM ANNUAL REPORT 2006 |
Wholesale Strategy, Key Developments, Products and Services
Agrium’s Wholesale strategy is to maintain our focus on customer service and to continue to grow the business through a combination of expansion and optimization of existing facilities, development of new greenfield facilities and through acquisition. We also intend to continue to expand our distribution capability, particularly as it pertains to increased North American nitrogen import capability and inland distribution. Our Wholesale strategy varies by type of nutrient and are described under each product heading.
The major end consumer for our products is the agriculture market, particularly growers of grains and oilseeds. About 85 percent of our sales are to the agricultural market that uses crop nutrients to help increase crop yields and quality. The remaining 15 percent of our sales are used for a broad range of industrial purposes. For example, urea is used for the production of resins in the lumber industry and phosphates are used as a retardant material to prevent the spread of forest fires. The majority of our industrial sales are nitrogen products produced at our Western Canadian nitrogen facilities. Industrial sales account for about 30 percent of our sales from these facilities. Industrial sales tend to be more evenly distributed throughout the year and are often priced on a cost-plus basis, providing increased stability to our earnings through the year.
NITROGEN (N) PRODUCTS
Nitrogen is the most important nutrient in terms of world production, use and trade. Nitrogen is the key nutrient required to maximize crop yield, growth and protein levels.
We own and operate seven major nitrogen facilities. Together these seven facilities have 3.9 million tonnes of ammonia capacity, or approximately 5.6 million tonnes of net nitrogen capacity in terms of product tonnes. This places Agrium as one of the top three publicly traded nitrogen producers in the world, accounting for two to three percent of global nitrogen capacity. Two of these facilities are directed to international sales, one located in Bahia Blanca, Argentina (Profertil) and one in Kenai, Alaska. We are 50 percent owners of the Profertil urea facility in Bahia Blanca with Repsol YPF, Argentina. This facility has an annual capacity of over 1.2 million tonnes. We marketed approximately half of the nitrogen production from this facility within Argentina in 2006 and expect the proportion of product sold domestically will continue to increase over the next few years. The Kenai, Alaska nitrogen facility has an annual capacity of about 0.9 million tonnes of urea and net trade ammonia, with primary markets including Mexico, South Korea, and Japan. The Kenai facility has experienced natural gas feedstock supply issues and the current expectation is that it will cease production at the end of October 2007, unless new gas supply contracts can be secured.
We operate four large nitrogen facilities in Alberta, Canada and one in Borger, Texas. The majority of the nitrogen produced in Alberta is sold in Western Canada and the North Western and Northern Plains regions of the U.S. Nitrogen products from Borger are sold in the Texas Panhandle and ammonia is sold by pipeline from Texas to the Western Corn Belt.
We also own and operate a number of facilities that upgrade ammonia to other nitrogen products such as nitrogen solutions (UAN) and nitric acid. These include the recently acquired Cincinnati, Ohio nitrogen facility, a facility in Kennewick, Washington and one in Sacramento, California that is also used as an import terminal. Together these facilities produced over 300,000 tonnes of UAN solution and other products in 2006. We also have two smaller UAN upgrading facilities located in Alberta, Canada at Standard and Granum.
| | | |
| AGRIUM ANNUAL REPORT 2006 | | 33 |
Nitrogen Strategy & Key Developments
Our strategy for nitrogen will continue to focus on optimizing our existing nitrogen assets and taking actions to ensure the long-term competitiveness of our products on a delivered cost basis.
Key developments this year included the following:
We are in the final stages of investigating the potential to build a new world-scale nitrogen facility in Egypt and expect to be in a position to make a decision on whether to proceed to construction in the first half of 2007.
We announced we are evaluating the potential for utilizing gasification technology as an alternative energy feedstock to natural gas at two of our existing nitrogen facilities in order to enhance our long-term competitive cost position.
| • | | The first of these gasification projects would entail gasifying asphaltenes, a by-product from the process of refining bitumen or heavy oil from the oilsands from Northern Alberta. We entered into a Memorandum of Understanding with the Northern Lights Partnership in August 2006 for the supply of hydrogen, by-product sulphur and other products from a proposed heavy oil upgrader and gasification facility that would be adjacent to Agrium’s Redwater, Alberta nitrogen and phosphate operations. If this project were to proceed it would not be completed until after 2010. We view the evaluation of the long-term potential to use gasification of asphaltenes as a feedstock in order to enhance the competitiveness of our Alberta nitrogen facilities as a priority. |
| |
| • | | The other proposed gasification project is the development of an industry partnership for a gasification unit at Kenai, Alaska. The project would be to develop a world-class, low-emission coal gasification facility that would create a long-term off-take gas opportunity for our Kenai facility and would also generate competitively priced electricity for the regional power grid. A decision on whether to proceed to the next stage of engineering is expected in 2007. |
We announced that our Kenai, Alaska nitrogen facility had secured sufficient gas supplies to allow continued operation through most of 2007 at 75 percent capacity. The facility was temporarily idled in late October 2006 on seasonal gas supply issues and is expected to restart in March 2007. An important consideration in the facility’s continued operation is the potential future availability of gas at an economic rate, and in the longer term, the potential completion of a gasification unit to provide an economic alternate feedstock.
Profertil S.A. and the Argentine government reached an agreement on short-term support measures for Argentine growers on June 17, 2006 that included establishing a ceiling for the urea price to growers of $300 per tonne. This was intended to improve input cost predictability for growers and was part of a broader government cost control economic program. This agreement did not have a material impact on our 2006 financial results. It could limit our urea margins on domestic Argentine sales if global urea prices remain above last year’s prices for most of 2007. Approximately 55 percent of Profertil’s sales were to the domestic market in 2006.
| | | |
| 34 | | AGRIUM ANNUAL REPORT 2006 |
POTASH (K) PRODUCTS
Agrium is the third largest producer of potash in North America and is expected to account for approximately 10 percent of North American production in 2007. Crops utilize potash to improve resistance to drought and disease as well as to help regulate water balance and starch synthesis.
We produce muriate of potash, otherwise known as potash, at our mine in Vanscoy, Saskatchewan. We sell approximately 60 percent of production to North American markets and the other 40 percent to the international market through our sales to Canpotex Limited (Canpotex). Canpotex is the offshore marketing agency for potash produced in the province of Saskatchewan by the three Canadian potash producers.
Saskatchewan potash mines accounted for about 30 percent of global potash production and 32 percent of world potash trade in 2006. Agrium has an 8.81 percent share of total Canpotex sales, which is expected to increase marginally in 2007 with our recent potash expansion.
There are two major grades of potash: premium/granular grade and standard grade. Premium grade is viewed as a superior product due to its suitability for blending with granular nitrogen and phosphate products. Standard grade is a smaller, less uniform, non-compacted grade of potash that tends to sell at a discount to premium grade.
Agrium’s capacity of premium grade will increase by over 30 percent in 2007 to 1.65 million tonnes with the additional compaction equipment installed as part of our capacity expansion.
Potash Strategy and Key Developments
Our potash strategy focuses on continuing to expand our production capacity both in the near and long term. Recent developments include:
| • | | We completed our 310,000 tonne potash expansion bringing our new total capacity to 2.1 million tonnes in late 2006. This expansion focused on making significant improvements to wet milling, upgrades to hoist motors, skips and conveyer belts, electrical systems and new compactors that increase the percentage of premium product we can produce. We have also added 50,000 tonnes of additional potash storage at the mine site. |
| |
| • | | We are conducting detailed engineering on a second expansion to our Vanscoy potash mine, which could add an additional 350,000 tonnes of capacity. If this project were to proceed, it would bring our total capacity to almost 2.5 million tonnes. A decision on whether to proceed would likely take place in late 2007, after engineering and cost estimate studies are completed. Timing for this expansion would likely be completed in 2010. |
| |
| • | | We have identified possible additional improvements to our Vanscoy mine that could ultimately increase its capacity to three million tonnes. It is too early to provide a timeline or capital cost estimate for expansions to reach this higher capacity figure. |
| |
| • | | We continued to explore and evaluate the opportunity for a new greenfield potash mine in either Manitoba or Saskatchewan. We have conducted preliminary seismic exploration and secured Crown and freehold mineral leases in both provinces. |
| | | |
| AGRIUM ANNUAL REPORT 2006 | | 35 |
PHOSPHATE (P) PRODUCTS
Agrium has a combined capacity of over one million tonnes of phosphate products from two facilities, one in Conda, Idaho and one in Redwater, Alberta. Each facility has a dedicated phosphate rock mine supplying its rock requirements. Agrium is the fourth largest phosphate producer in North America. Phosphate is an important nutrient for plants as it encourages early crop development and stimulates root development and flowering.
Our Conda facility produces monoammonium phosphate (MAP), superphosphoric acid (SPA) and ammonium phosphate sulphate (APS), products primarily sold to the local agricultural market in the U.S. Pacific Northwest region. Our Redwater facility produces MAP for the agricultural market in Western Canada.
The three primary raw materials required to produce granular ammonium phosphates are sulphur, ammonia and phosphate rock. Our Conda facility obtains its rock supply from our Dry Valley rock mine located 32 kilometers from our processing site, The facility sources sulphur locally and from natural gas production facilities in the Western U.S. and from Utah. The phosphate rock for Redwater is obtained from our Kapuskasing mine in Ontario, while ammonia is produced on-site and sulphur is sourced locally in Alberta.
Phosphate Strategy and Key Developments
Our strategic focus for phosphate will be improving and optimizing our base business, while monitoring global opportunities for potential counter-cyclical acquisitions. We experienced an impairment charge on our Canadian phosphate operations in the fourth quarter of 2006 of $136-million pre-tax or $95-million on a non-cash after tax basis. This charge was against both the Redwater phosphate facility and the associated Kapuskasing phosphate mine and resulted from a reduction in the economic life of the rock reserves.
A key focus will be improving our cost position at our Canadian phosphate operations in 2007, compared with 2006 results that were negatively impacted by high iron content in the ore from our Kapuskasing phosphate mine and the stronger Canadian currency. We intend to do this by upgrading the flotation system at the mine site in early 2007 and moving into a higher quality ore area later in the year.
PRODUCT PURCHASED FOR RESALE
Our Wholesale operations purchase crop nutrient products from other international and domestic suppliers for resale to our customers. These activities enable us to leverage our existing strong distribution and customer channels. In addition, through these activities, we are able to increase our sales beyond what would be possible through the sale of our manufactured product alone, particularly as the role of imports into North America has increased over the past few years.
Our purchase for resale business adds value through providing a more complete line of products in areas where our manufactured product may not be able to economically reach some customers. We utilize our purchasing power and leverage our extensive storage and transportation services to add value for customers. With the 2006 acquisition of Royster-Clark, we significantly expanded our purchase for resale business across all crop nutrients.
| | | |
| 36 | | AGRIUM ANNUAL REPORT 2006 |
DISTRIBUTION AND STORAGE
Our distribution and storage assets and systems are an integral part of our Wholesale operations and the value chain. In order to meet the highly seasonal demand for most of our business, we have developed an extensive transportation, storage and warehousing system. We also have a significant number of railcars under long-term lease and utilize various pipelines, barges and ocean vessels to move our product. The Royster-Clark acquisition provided a significant increase to our U.S. Wholesale fertilizer distribution assets in 2006, particularly in the Corn Belt and Eastern U.S. We added an additional 440,000 tonnes of warehouse capacity through the wholesale component of the Royster-Clark acquisition in 2006. We continue to evaluate opportunities to expand our distribution base to allow us to increase our import capability in North America.
Agrium’s Strong Distribution
| | | |
| AGRIUM ANNUAL REPORT 2006 | | 37 |
Wholesale Results
Our Wholesale EBIT was $91-million in 2006, or $227-million excluding the Canadian phosphate asset impairment charge taken in the fourth quarter. This was lower than the $492-million in EBIT in 2005 and $432-million in 2004. Gross profit declined for all three major product groups primarily due to a combination of higher costs of goods sold for all products, lower North American nutrient demand, reduced global demand for potash, and a decrease in output and profitability due to rising input costs from our Kenai nitrogen facility.
WHOLESALE PERFORMANCE
| | | | | | | | | | | | | | | | | | | | | | | | | | | | | | | | | | | | | | | | | | | | | | |
| | | | Year Ended December 31 | | | | Variance Analysis | |
| | | | | | | | | | | | | | | | | | | 2006 v. 2005 | | | | 2005 v. 2004 | |
| (millions of U.S. dollars) | | | 2006 | | | | 2005 | | | | 2004 | | | | Change | | | | Price | | | | Volume | | | | Change | | | | Price | | | | Volume | |
Nitrogen | | | | | | | | | | | | | | | | | | | | | | | | | | | | | | | | | | | | | | | | | | | | | |
| | | | | | | | | | | | | | | | | | | | | | | | | | | | |
| Net sales | | | | 1,376 | | | | | 1,622 | | | | | 1,317 | | | | | (246 | ) | | | | (54 | ) | | | | (192 | ) | | | | 305 | | | | | 302 | | | | | 3 | |
| | | | | | | | | | | | | | | | | | | | | | | | | | | | |
Gross profit | | | | 291 | | | | | 479 | | | | | 409 | | | | | (188 | ) | | | | (111 | ) | | | | (77 | ) | | | | 70 | | | | | 72 | | | | | (2 | ) |
| | | | | | | | | | | | | | | | | | | | | | | | | | | | |
Potash | | | | | | | | | | | | | | | | | | | | | | | | | | | | | | | | | | | | | | | | | | | | | |
| | | | | | | | | | | | | | | | | | | | | | | | | | | | |
| Net sales | | | | 213 | | | | | 255 | | | | | 214 | | | | | (42 | ) | | | | 8 | | | | | (50 | ) | | | | 41 | | | | | 67 | | | | | (26 | ) |
| | | | | | | | | | | | | | | | | | | | | | | | | | | | |
Gross profit | | | | 98 | | | | | 157 | | | | | 106 | | | | | (59 | ) | | | | (28 | ) | | | | (31 | ) | | | | 51 | | | | | 62 | | | | | (11 | ) |
| | | | | | | | | | | | | | | | | | | | | | | | | | | | |
Phosphate | | | | | | | | | | | | | | | | | | | | | | | | | | | | | | | | | | | | | | | | | | | | | |
| | | | | | | | | | | | | | | | | | | | | | | | | | | | |
| Net sales | | | | 298 | | | | | 319 | | | | | 315 | | | | | (21 | ) | | | | 32 | | | | | (53 | ) | | | | 4 | | | | | 33 | | | | | (29 | ) |
| | | | | | | | | | | | | | | | | | | | | | | | | | | | |
Gross profit | | | | 27 | | | | | 59 | | | | | 74 | | | | | (32 | ) | | | | (22 | ) | | | | (10 | ) | | | | (15 | ) | | | | (9 | ) | | | | (6 | ) |
| | | | | | | | | | | | | | | | | | | | | | | | | | | | |
Product purchased for resale | | | | | | | | | | | | | | | | | | | | | | | | | | | | | | | | | | | | | | | | | | | | | |
| | | | | | | | | | | | | | | | | | | | | | | | | | | | |
| Net sales | | | | 382 | | | | | – | | | | | – | | | | | 382 | | | | | – | | | | | 382 | | | | | – | | | | | – | | | | | – | |
| | | | | | | | | | | | | | | | | | | | | | | | | | | | |
Gross profit | | | | 19 | | | | | – | | | | | – | | | | | 19 | | | | | – | | | | | 19 | | | | | – | | | | | – | | | | | – | |
| | | | | | | | | | | | | | | | | | | | | | | | | | | | |
Total net sales | | | | 2,269 | | | | | 2,196 | | | | | 1,846 | | | | | 73 | | | | | (14 | ) | | | | 87 | | | | | 350 | | | | | 402 | | | | | (52 | ) |
| | | | | | | | | | | | | | | | | | | | | | | | | | | | |
Total gross profit | | | | 435 | | | | | 695 | | | | | 589 | | | | | (260 | ) | | | | (161 | ) | | | | (99 | ) | | | | 106 | | | | | 125 | | | | | (19 | ) |
| | | | | | | | | | | | | | | | | | | | | | | | | | | | |
| Selling expenses | | | | 30 | | | | | 20 | | | | | 18 | | | | | 10 | | | | | | | | | | | | | | | 2 | | | | | | | | | | | |
| | | | | | | | | | | | | | | | | | | | | | | | | | | | |
| General & administrative | | | | 29 | | | | | 25 | | | | | 25 | | | | | 4 | | | | | | | | | | | | | | | – | | | | | | | | | | | |
| | | | | | | | | | | | | | | | | | | | | | | | | | | | |
| Depreciation & amortization | | | | 125 | | | | | 122 | | | | | 131 | | | | | 3 | | | | | | | | | | | | | | | (9 | ) | | | | | | | | | | |
| | | | | | | | | | | | | | | | | | | | | | | | | | | | |
| Royalties | | | | 8 | | | | | 35 | | | | | 22 | | | | | (27 | ) | | | | | | | | | | | | | | 13 | | | | | | | | | | | |
| | | | | | | | | | | | | | | | | | | | | | | | | | | | |
| Other expenses | | | | 16 | | | | | 1 | | | | | 47 | | | | | 15 | | | | | | | | | | | | | | | (46 | ) | | | | | | | | | | |
| | | | | | | | | | | | | | | | | | | | | | | | | | | | |
EBIT before special items | | | | 227 | | | | | 492 | | | | | 346 | | | | | (265 | ) | | | | | | | | | | | | | | 146 | | | | | | | | | | | |
| | | | | | | | | | | | | | | | | | | | | | | | | | | | |
Special items | | | | | | | | | | | | | | | | | | | | | | | | | | | | | | | | | | | | | | | | | | | | | |
| | | | | | | | | | | | | | | | | | | | | | | | | | | | |
| Kenai award and settlement | | | | – | | | | | – | | | | | (86 | ) | | | | – | | | | | | | | | | | | | | | 86 | | | | | | | | | | | |
| | | | | | | | | | | | | | | | | | | | | | | | | | | | |
| Asset impairment | | | | 136 | | | | | – | | | | | – | | | | | 136 | | | | | | | | | | | | | | | – | | | | | | | | | | | |
| | | | | | | | | | | | | | | | | | | | | | | | | | | | |
EBIT | | | | 91 | | | | | 492 | | | | | 432 | | | | | (401 | ) | | | | | | | | | | | | | | 60 | | | | | | | | | | | |
| | | |
| 38 | | AGRIUM ANNUAL REPORT 2006 |
Wholesale Expenses
Selling expenses increased by $10-million in 2006, compared with $20-million in 2005 and $18-million in 2004. The increase was primarily due to the addition of Royster-Clark’s wholesale operations, with a smaller impact from the higher Canadian dollar. Also as a result of our recent acquisitions, our depreciation and amortization expenses increased by $3-million or about two percent in 2006. Royalty expenses declined by $27-million in 2006 due to lower potash margins and sales volumes and a temporary reduction in Saskatchewan potash royalty rates in 2006 associated with our potash expansions compared with the previous two years.
Nitrogen Products
NITROGEN GROSS PROFIT
Our nitrogen gross profit declined to $291-million in 2006, compared with $479-million in 2005 and $409-million in 2004 as summarized in the table below. The reduction in gross profit was due to a combination of increased production costs from higher gas costs and lower sales volumes, particularly from our Kenai facility. Our Profertil nitrogen facility in Argentina continued to deliver excellent results in 2006 with record gross profit and production.
NITROGEN PERFORMANCE
| | | | | | | | | | | | | | | | | | | | | | | | | | | | | | | | | | | | | | | | | | | | | | |
| | | | Year Ended December 31 | | | | Variance Analysis | |
| | | | | | | | 2006 v. 2005 | | | | 2005 v. 2004 | |
| (millions of U.S. | | | | | | | | | | | | | | | | | | | | | | | | | | | | | | | | | | | | |
| dollars, thousands | | | | | | | | | | | | | | | | | | | | | | | | | | | | | | | | | | | | |
| of tonnes) | | | 2006 | | | | 2005 | | | | 2004 | | | | Change | | | | Price | | | | Volume | | | | Change | | | | Price | | | | Volume | |
Nitrogen Domestic | | | | | | | | | | | | | | | | | | | | | | | | | | | | | | | | | | | | | | | | | | | | | |
| | | | | | | | | | | | | | | | | | | | | | | | | | | | |
| Total tonnes sold | | | | 3,667 | | | | | 3,939 | | | | | 3,892 | | | | | (272 | ) | | | | | | | | | | | | | | 47 | | | | | | | | | | | |
| | | | | | | | | | | | | | | | | | | | | | | | | | | | |
| Total net sales | | | | 1,044 | | | | | 1,160 | | | | | 924 | | | | | (116 | ) | | | | (36 | ) | | | | (80 | ) | | | | 236 | | | | | 225 | | | | | 11 | |
| | | | | | | | | | | | | | | | | | | | | | | | | | | | |
| Cost of product | | | | 900 | | | | | 931 | | | | | 721 | | | | | (31 | ) | | | | (33 | ) | | | | 64 | | | | | 210 | | | | | (201 | ) | | | | (9 | ) |
| | | | | | | | | | | | | | | | | | | | | | | | | | | | |
| Margin per tonne | | | | 39 | | | | | 58 | | | | | 52 | | | | | | | | | | | | | | | | | | | | | | | | | | | | | | | |
| | | | | | | | | | | | | | | | | | | | | | | | | | | | |
Total gross profit | | | | 144 | | | | | 229 | | | | | 203 | | | | | (85 | ) | | | | (69 | ) | | | | (16 | ) | | | | 26 | | | | | 24 | | | | | 2 | |
| | | | | | | | | | | | | | | | | | | | | | | | | | | | |
Nitrogen International | | | | | | | | | | | | | | | | | | | | | | | | | | | | | | | | | | | | | | | | | | | | | |
| Total tonnes sold | | | | 1,393 | | | | | 1,840 | | | | | 1,881 | | | | | (447 | ) | | | | | | | | | | | | | | (41 | ) | | | | | | | | | | |
| | | | | | | | | | | | | | | | | | | | | | | | | | | | |
| Total net sales | | | | 332 | | | | | 462 | | | | | 393 | | | | | (130 | ) | | | | (18 | ) | | | | (112 | ) | | | | 69 | | | | | 78 | | | | | (9 | ) |
| | | | | | | | | | | | | | | | | | | | | | | | | | | | |
| Cost of product | | | | 185 | | | | | 212 | | | | | 187 | | | | | (27 | ) | | | | (25 | ) | | | | 52 | | | | | 25 | | | | | (30 | ) | | | | 5 | |
| | | | | | | | | | | | | | | | | | | | | | | | | | | | |
| Margin per tonne | | | | 106 | | | | | 136 | | | | | 110 | | | | | | | | | | | | | | | | | | | | | | | | | | | | | | | |
| | | | | | | | | | | | | | | | | | | | | | | | | | | | |
Total gross profit | | | | 147 | | | | | 250 | | | | | 206 | | | | | (103 | ) | | | | (42 | ) | | | | (61 | ) | | | | 44 | | | | | 48 | | | | | (4 | ) |
| | | | | | | | | | | | | | | | | | | | | | | | | | | | |
Nitrogen | | | | | | | | | | | | | | | | | | | | | | | | | | | | | | | | | | | | | | | | | | | | | |
| | | | | | | | | | | | | | | | | | | | | | | | | | | | |
| Total tonnes sold | | | | 5,060 | | | | | 5,779 | | | | | 5,773 | | | | | (719 | ) | | | | | | | | | | | | | | 6 | | | | | | | | | | | |
| | | | | | | | | | | | | | | | | | | | | | | | | | | | |
| Total net sales | | | | 1,376 | | | | | 1,622 | | | | | 1,317 | | | | | (246 | ) | | | | (54 | ) | | | | (192 | ) | | | | 305 | | | | | 303 | | | | | 2 | |
| | | | | | | | | | | | | | | | | | | | | | | | | | | | |
| Cost of product | | | | 1,085 | | | | | 1,143 | | | | | 908 | | | | | (58 | ) | | | | (58 | ) | | | | 116 | | | | | 235 | | | | | (231 | ) | | | | (4 | ) |
| | | | | | | | | | | | | | | | | | | | | | | | | | | | |
| Margin per tonne | | | | 58 | | | | | 83 | | | | | 71 | | | | | | | | | | | | | | | | | | | | | | | | | | | | | | | |
| | | | | | | | | | | | | | | | | | | | | | | | | | | | |
Total gross profit | | | | 291 | | | | | 479 | | | | | 409 | | | | | (188 | ) | | | | (111 | ) | | | | (77 | ) | | | | 70 | | | | | 72 | | | | | (2 | ) |
| | | | | | | | | | | | | | | | | | | | | | | | | | | | |
| Selling price per tonne | | | | 272 | | | | | 281 | | | | | 228 | | | | | | | | | | | | | | | | | | | | | | | | | | | | | | | |
| | | | | | | | | | | | | | | | | | | | | | | | | | | | |
| Cost of product per tonne | | | | 214 | | | | | 198 | | | | | 157 | | | | | | | | | | | | | | | | | | | | | | | | | | | | | | | |
| | | |
| AGRIUM ANNUAL REPORT 2006 | | 39 |
NITROGEN PRICES
Global nitrogen prices remained strong in 2006, although North American prices declined by about five to 10 percent compared with 2005 prices. Lower North American nitrogen prices that occurred through the spring and summer of 2006 were primarily due to lower nutrient demand in North America in the first half of the year. Global nitrogen prices were generally supported by high North American gas prices in the first half of 2006, as well as high production costs in many other regions around the world, including Western and Eastern Europe. The global nitrogen market remained relatively tight, as growth in global nitrogen import demand more than offset significant increases in global nitrogen capacity. Import demand from India was particularly strong in the second half of 2006 due to excellent domestic demand and reduced local production.
NITROGEN PRODUCT COST
Our total nitrogen cost decreased to $1,085-million in 2006, compared with $1,143-million in 2005, due to reduced production. On a per tonne basis our cost of product sold was higher, averaging $214 per tonne in 2006 compared with $198 per tonne in 2005. We purchased approximately 122 million BCF of gas in 2006. This was 22 BCF below last year, primarily due to production at our Kenai facility. The graph on the next page shows the breakdown in gas use by region for 2006. Our four Alberta nitrogen facilities benefit from sourcing less expensive AECO priced gas relative to the U.S. New York Mercantile Exchange (NYMEX) gas price. Alberta is a significant net exporter of natural gas to the U.S. and the Alberta gas price has averaged $1.15 per MMBtu lower than NYMEX over the past three-year period. The Borger, Texas ammonia facility is our only nitrogen facility that produces ammonia in the lower 48 U.S. States and accounted for less than 10 percent of our total 2006 gas purchases.
Our two international-based nitrogen facilities have fixed gas price contracts. In Kenai, we have one-year confidential gas supply contracts with local gas suppliers. Gas prices increased and gas volumes decreased over the previous year due to the tight local gas market. These gas contracts were renegotiated in October 2006 for supply for 2007.
| | | |
| 40 | | AGRIUM ANNUAL REPORT 2006 |

Our Profertil nitrogen facility in Argentina has three long-term firm-price gas contracts denominated in U.S. dollars. These gas contracts are on essentially a fixed price basis and expire in 2011, 2012 and in 2017. Repsol YPF, our joint venture partner in Profertil, is the largest supplier, followed by Petrobras and Pan American Energy. These three contracts account for about 80 percent of our gas requirements. For the remaining 20 percent of our gas requirements, Profertil purchases a mix of spot and shorter-term (one and two-year) contracts, also denominated in U.S. dollars. Non-interruptible transportation contracts are in place for all gas. Gas transportation contracts for 80 percent of Profertil’s gas requirements expire in the year 2015 and for the remaining 20 percent in 2011. We anticipate our gas transport cost to increase in 2007, with the higher rates to be directed to upgrading the gas transportation pipeline system in Argentina, which is positive from a long-term perspective. Including the higher transport cost, our average cost of delivered gas is expected to be slightly above $2 per MMBtu in 2007.
SALES VOLUMES AND OPERATING RATES
Wholesale nitrogen sales volumes in 2006 totaled 5.06 million product tonnes, approximately 12 percent lower than both 2005 and 2004. The decrease was due to lower volumes from the international Kenai facility, due to reduced gas availability, and from decreased production at a few of our North American facilities, caused by lower domestic demand in the first half of 2006 and some unplanned outages. The Profertil facility set a new annual production record, with urea production of 1.28 million tonnes, an 18 percent increase above 2005 levels. Agrium’s 50 percent share of this is 640,000 tonnes of urea. The higher production was largely due to further optimization of the facility in 2006 and a high on-stream factor for the year.
| | | | | | | | | | | | | | | | |
| (U.S.$ per MMBtu) | | | 2006 | | | | 2005 | | | | 2004 | |
| NYMEX | | | | 7.26 | | | | | 8.55 | | | | | 6.09 | |
| | | | | | | | | | |
| AECO | | | | 6.17 | | | | | 7.03 | | | | | 5.23 | |
| | | | | | | | | | |
Basis | | | | 1.09 | | | | | 1.52 | | | | | 0.86 | |
| | | | | | | | | | |
Wholesale | | | | | | | | | | | | | | | |
| | | | | | | | | | |
| Average – unhedged | | | | 5.34 | | | | | 5.36 | | | | | 4.02 | |
| | | | | | | | | | |
| Hedging impact | | | | (0.08 | ) | | | | (0.12 | ) | | | | – | |
| | | | | | | | | | |
| Overall weighted average (a) | | | | 5.26 | | | | | 5.24 | | | | | 4.02 | |
| | |
| (a) | | Weighted average gas price of all gas purchases, including 50 percent of Profertil facility. |
| | | |
| AGRIUM ANNUAL REPORT 2006 | | 41 |
Potash Products
POTASH GROSS PROFIT
Our potash gross profit declined to $98-million in 2006, compared with $157-million in 2005 and $106-million in 2004, as illustrated in the table below. This was the first decline in Agrium’s potash profit in over four years and was due to a combination of lower production and sales volumes and higher cost of goods sold. We lowered our operating rate in the first half of 2006 due to lower domestic and international demand. We also took the mine offline in the second half of 2006 in order to tie in our new capacity expansion. We expect a significant improvement in gross profit in 2007 now that our 17 percent capacity expansion is essentially complete and given the outlook for a tighter global market in 2007. The market is expected to tighten in 2007 due to the flooding of a major Russian potash mine in late 2006 and higher anticipated demand due to strong global crop prices.
POTASH PERFORMANCE
| | | | | | | | | | | | | | | | | | | | | | | | | | | | | | | | | | | | | | | | | | | | | | |
| | | | Year Ended December 31 | | | | Variance Analysis | |
| | | | | | | | 2006 v. 2005 | | | | 2005 v. 2004 | |
| (millions of U.S. dollars, | | | | | | | | | | | | | | | | | | | | | | | | | | | | | | | | | | | | |
| thousands of tonnes) | | | 2006 | | | | 2005 | | | | 2004 | | | | Change | | | | Price | | | | Volume | | | | Change | | | | Price | | | | Volume | |
Potash Domestic | | | | | | | | | | | | | | | | | | | | | | | | | | | | | | | | | | | | | | | | | | | | | |
| | | | | | | | | | | | | | | | | | | | | | | | | | | | |
| Total tonnes sold | | | | 731 | | | | | 860 | | | | | 1,066 | | | | | (129 | ) | | | | | | | | | | | | | | (206 | ) | | | | | | | | | | |
| | | | | | | | | | | | | | | | | | | | | | | | | | | | |
| Total net sales | | | | 143 | | | | | 158 | | | | | 143 | | | | | (15 | ) | | | | 9 | | | | | (24 | ) | | | | 15 | | | | | 42 | | | | | (27 | ) |
| | | | | | | | | | | | | | | | | | | | | | | | | | | | |
| Cost of product | | | | 80 | | | | | 64 | | | | | 79 | | | | | 16 | | | | | (26 | ) | | | | 10 | | | | | (15 | ) | | | | – | | | | | 15 | |
| | | | | | | | | | | | | | | | | | | | | | | | | | | | |
| Margin per tonne | | | | 86 | | | | | 109 | | | | | 60 | | | | | | | | | | | | | | | | | | | | | | | | | | | | | | | |
| | | | | | | | | | | | | | | | | | | | | | | | | | | | |
| Selling price per tonne | | | | 196 | | | | | 184 | | | | | 134 | | | | | | | | | | | | | | | | | | | | | | | | | | | | | | | |
| | | | | | | | | | | | | | | | | | | | | | | | | | | | |
Total gross profit | | | | 63 | | | | | 94 | | | | | 64 | | | | | (31 | ) | | | | (17 | ) | | | | (14 | ) | | | | 30 | | | | | 42 | | | | | (12 | ) |
| | | | | | | | | | | | | | | | | | | | | | | | | | | | |
Potash International | | | | | | | | | | | | | | | | | | | | | | | | | | | | | | | | | | | | | | | | | | | | | |
| | | | | | | | | | | | | | | | | | | | | | | | | | | | |
| Total tonnes sold | | | | 548 | | | | | 751 | | | | | 730 | | | | | (203 | ) | | | | | | | | | | | | | | 21 | | | | | | | | | | | |
| | | | | | | | | | | | | | | | | | | | | | | | | | | | |
| Total net sales | | | | 70 | | | | | 97 | | | | | 71 | | | | | (27 | ) | | | | (1 | ) | | | | (26 | ) | | | | 26 | | | | | 24 | | | | | 2 | |
| | | | | | | | | | | | | | | | | | | | | | | | | | | | |
| Cost of product | | | | 35 | | | | | 34 | | | | | 29 | | | | | 1 | | | | | (10 | ) | | | | 9 | | | | | 5 | | | | | (4 | ) | | | | (1 | ) |
| | | | | | | | | | | | | | | | | | | | | | | | | | | | |
| Margin per tonne | | | | 64 | | | | | 84 | | | | | 58 | | | | | | | | | | | | | | | | | | | | | | | | | | | | | | | |
| | | | | | | | | | | | | | | | | | | | | | | | | | | | |
| Selling price per tonne | | | | 128 | | | | | 129 | | | | | 97 | | | | | | | | | | | | | | | | | | | | | | | | | | | | | | | |
| | | | | | | | | | | | | | | | | | | | | | | | | | | | |
Total gross profit | | | | 35 | | | | | 63 | | | | | 42 | | | | | (28 | ) | | | | (11 | ) | | | | (17 | ) | | | | 21 | | | | | 20 | | | | | 1 | |
| | | | | | | | | | | | | | | | | | | | | | | | | | | | |
Potash | | | | | | | | | | | | | | | | | | | | | | | | | | | | | | | | | | | | | | | | | | | | | |
| | | | | | | | | | | | | | | | | | | | | | | | | | | | |
| Total tonnes sold | | | | 1,279 | | | | | 1,611 | | | | | 1,796 | | | | | (332 | ) | | | | | | | | | | | | | | (185 | ) | | | | | | | | | | |
| | | | | | | | | | | | | | | | | | | | | | | | | | | | |
| Total net sales | | | | 213 | | | | | 255 | | | | | 214 | | | | | (42 | ) | | | | 8 | | | | | (50 | ) | | | | 41 | | | | | 66 | | | | | (25 | ) |
| | | | | | | | | | | | | | | | | | | | | | | | | | | | |
| Cost of product | | | | 115 | | | | | 98 | | | | | 108 | | | | | 17 | | | | | (36 | ) | | | | 19 | | | | | (10 | ) | | | | (4 | ) | | | | 14 | |
| | | | | | | | | | | | | | | | | | | | | | | | | | | | |
| Margin per tonne | | | | 77 | | | | | 97 | | | | | 59 | | | | | | | | | | | | | | | | | | | | | | | | | | | | | | | |
| | | | | | | | | | | | | | | | | | | | | | | | | | | | |
| Selling price per tonne | | | | 167 | | | | | 158 | | | | | 119 | | | | | | | | | | | | | | | | | | | | | | | | | | | | | | | |
| | | | | | | | | | | | | | | | | | | | | | | | | | | | |
Total gross profit | | | | 98 | | | | | 157 | | | | | 106 | | | | | (59 | ) | | | | (28 | ) | | | | (31 | ) | | | | 51 | | | | | 62 | | | | | (11 | ) |
| | | | | | | | | | | | | | | | | | | | | | | | | | | | |
| Cost of product per tonne | | | | 90 | | | | | 61 | | | | | 60 | | | | | | | | | | | | | | | | | | | | | | | | | | | | | | | |
| | | |
| 42 | | AGRIUM ANNUAL REPORT 2006 |
POTASH PRICES
Our actual realized potash price increased six percent in 2006, after rising 37 percent in 2005 and 25 percent in 2004. North American sales prices and margins remained well above international levels. Our average North American sales price increased in 2006 while our average international sales prices were essentially flat. A key development in 2006 was the protracted Chinese potash price negotiations. These negotiations started in late 2005 and extended until late August of 2006. Furthermore, potash demand in Brazil and North America was significantly below 2005 levels due to low crop prices in early 2006 and higher crop input costs. Stronger demand resulting from significantly higher crop prices and an unexpected Russian mine closure are expected to help tighten the potash market again in 2007. A twelve-month potash supply and price agreement with China was completed in early February with a $5 per tonne price increase agreed to over the previous contract.
The North American and international potash markets have separate marketing channels and benchmark prices, although they are highly inter-related. Our international sales are made through the Saskatchewan potash producers’ marketing agency Canpotex, where the reference price is Vancouver, Canada. The reference price for North American sales is the mid-western U.S. potash price.
POTASH PRODUCT COST
Our total potash production cost of product sold rose by 17 percent to $115-million in 2006, compared with $98-million in 2005 and $108-million in 2004. On a per unit tonne basis, costs increased to $90 per tonne in 2006, up significantly from $61 per tonne in 2005 and $60 per tonne in 2004. These figures include both the cost of goods sold and some portion of the freight to our North American markets. The significant increase in our potash cost of product sold in 2006 was largely due to the impact of a slightly higher fixed cost spread over much lower production volumes. We expect our average potash cost of product sold to decline in 2007 closer to 2005 levels, although the extent of the decline will partly depend on the Canadian/U.S. exchange rate.
| | | |
| AGRIUM ANNUAL REPORT 2006 | | 43 |
SALES VOLUMES
Agrium potash sales volumes were 1.28 million tonnes in 2006, approximately 20 percent below the 1.61 million tonnes sold in 2005 and 1.8 million tonnes in 2004. From a production standpoint, we produced 1.21 million tonnes of potash in 2006, compared with 1.7 million tonnes in both 2005 and 2004. The lower production and sales volumes in 2006 were due to two separate developments. In the first half of 2006, we lowered production rates in order to manage inventory levels as a result of prolonged international negotiations with China and India and poor demand in the spring within North America. In the second half of 2006, we had significant planned downtime at the mine to commission the new capacity expansion.
Our reserve engineers estimate our potash mine has sufficient ore reserves to continue production for approximately 65 years based on current and projected production rates.
Phosphate Products
PHOSPHATE GROSS PROFIT
Our 2006 phosphate gross profit was $27-million compared with $59-million in 2005 and $74-million in 2004. The decline in profit and margins in 2006 was due to a substantial increase in production costs and lower production and sales volumes from our Canadian phosphate operations.
PHOSPHATE PERFORMANCE
| | | | | | | | | | | | | | | | | | | | | | | | | | | | | | | | | | | | | | | | | | | | | | |
| | | | Year Ended
December 31 | | | | Variance Analysis | |
| | | | | | | | 2006 v. 2005 | | | | 2005 v. 2004 | |
| (millions of U.S. | | | | | | | | | | | | | | | | | | | | | | | | | | | | | | | | | | | | |
| dollars, thousands | | | 2006 | | | | 2005 | | | | 2004 | | | | Change | | | | Price | | | | Volume | | | | Change | | | | Price | | | | Volume | |
| of tonnes) | | | | | | | | | | | | | | | | | | | | | | | | | | | | | | | | | | | | |
Phosphate | | | | | | | | | | | | | | | | | | | | | | | | | | | | | | | | | | | | | | | | | | | | | |
| | | | | | | | | | | | | | | | | | | | | | | | | | | | |
| Tonnes sold | | | | 906 | | | | | 1,088 | | | | | 1,201 | | | | | (182 | ) | | | | | | | | | | | | | | (113 | ) | | | | | | | | | | |
| | | | | | | | | | | | | | | | | | | | | | | | | | | | |
| Net Sales | | | | 298 | | | | | 319 | | | | | 315 | | | | | (21 | ) | | | | 32 | | | | | (53 | ) | | | | 4 | | | | | 33 | | | | | (29 | ) |
| | | | | | | | | | | | | | | | | | | | | | | | | | | | |
| Cost of product | | | | 271 | | | | | 260 | | | | | 241 | | | | | 11 | | | | | (55 | ) | | | | 44 | | | | | 19 | | | | | (42 | ) | | | | 23 | |
| | | | | | | | | | | | | | | | | | | | | | | | | | | | |
Gross Profit | | | | 27 | | | | | 59 | | | | | 74 | | | | | (32 | ) | | | | (22 | ) | | | | (10 | ) | | | | (15 | ) | | | | (9 | ) | | | | (6 | ) |
| | | | | | | | | | | | | | | | | | | | | | | | | | | | |
| Margin per tonne | | | | 30 | | | | | 54 | | | | | 62 | | | | | | | | | | | | | | | | | | | | | | | | | | | | | | | |
| | | | | | | | | | | | | | | | | | | | | | | | | | | | |
| Selling price per tonne | | | | 329 | | | | | 293 | | | | | 262 | | | | | | | | | | | | | | | | | | | | | | | | | | | | | | | |
| | | | | | | | | | | | | | | | | | | | | | | | | | | | |
| Cost of product per tonne | | | | 299 | | | | | 239 | | | | | 200 | | | | | | | | | | | | | | | | | | | | | | | | | | | | | | | |
| | | |
| 44 | | AGRIUM ANNUAL REPORT 2006 |
PHOSPHATE PRICES
The global benchmark price for most phosphate products is based at the port at Tampa, Florida. The southern U.S. is the largest exporter of phosphates in the world, accounting for almost half of all granular ammonium phosphate (DAP/MAP) traded globally in 2006. We sell virtually all of our phosphate production relatively close to our two phosphate facilities, which are located in Alberta, Canada and Conda, Idaho. These are higher price regions, given the cost to ship product to these regions from Florida.
Benchmark phosphate prices remained relatively strong in 2006, about five percent above 2005 levels and 15 percent above 2004 levels. Prices were supported by plant closures in the southern U.S. at the end of 2005 and early 2006, helping to offset a reduction in global demand. On a global basis, phosphate import demand in North America, China, Latin America and Australia all declined, while Indian import demand increased.
PHOSPHATE PRODUCT COST
Our total phosphate cost of product sold rose by four percent to $271-million in 2006, compared with $260-million in 2005 and $241-million in 2004. On a per unit tonne basis, costs increased to $299 per tonne in 2006, up significantly from $239 per tonne in 2005 and $200 per tonne in 2004. This increase was due largely to increased production costs at our Redwater, Alberta phosphate operations. Our 2006 Canadian MAP production costs rose about 36 percent over 2005. About $20 per tonne of the increase was due to the appreciation of the Canadian dollar and the majority of the remaining increase in costs was associated with higher ore costs and lower volumes from the Kapuskasing phosphate rock mine. Our margins from our Conda, Idaho phosphate operations temporarily improved in 2006, partly due to low cost phosphate rock obtained in a transaction with Astaris in 2004.
| | | |
| AGRIUM ANNUAL REPORT 2006 | | 45 |
We are working on addressing the issue of high iron content in the Kapuskasing phosphate rock in the first half of 2007. We intend to do this by passing the rock through a floatation system, designed to reduce the iron content in the ore, which should be in place by the end of first quarter of 2007. The system is expected to reduce the iron content in the ore before it is processed at the Redwater phosphate facility. We will also be working towards areas of the mine with higher-grade ore. It is expected that average production costs at our Canadian phosphate operations will start to improve in the second half of 2007 as a result of these actions.
The recent quality issues led to a comprehensive drilling program that resulted in a reduction in the estimated economic ore reserve life from 2019 to 2013. The results from the ore assessment combined with a pricing forecast for phosphate fertilizers that reflects significant new global supply additions in 2011 and a relatively strong dollar led to an impairment charge against our Redwater and Kapuskasing phosphate assets of $136-million pre-tax or $95-million as a non-cash after tax charge. We will continue to evaluate longer-term solutions for the ongoing operation of the Redwater phosphate facility beyond 2013, including alternative sources for phosphate rock. Agrium’s mine reserves in Idaho, which supply the Conda, Idaho phosphate facility are estimated to have sufficient ore reserves to continue production for over 20 years, based on current and projected production rates.
SALES VOLUMES
Our total sales volumes declined to 0.91 million tonnes in 2006, compared with 1.1 million tonnes in 2005 and 1.2 million tonnes in 2004. The reduction in sales volumes was primarily due to lower production volumes at our Redwater facility. Sales volumes from our Conda phosphate facility increased slightly compared to the previous two years.
Purchase For Resale Business
The Royster-Clark acquisition contributed additional net sales and gross margins on purchased product for resale, an area of strategic focus. Gross profit was $19-million in 2006 on net sales of $382-million and volumes of 1.52 million tonnes of crop nutrients. Margins were negatively impacted by the high price of crop nutrients in late 2005 and early 2006 when inventories were being built, and the subsequent decline in crop nutrient prices in the key spring application season in North America.
| | | |
| 46 | | AGRIUM ANNUAL REPORT 2006 |
Our Advanced
Technologies Business
Agrium Advanced Technologies offers premium-grade, environmentally sensitive specialty fertilizers and related products to the agriculture, professional turf, broad acre markets as well as a wide variety of specialty markets such as golf, professional horticulture and consumer retailers. The main products or components of this business are:
| 1 | | branded specialty fertilizer products with slow release technologies suitable for golf courses turf, specialty crops, lawn care, horticulture and sport field applications (Polyon, SCU, Duration, Nutralene, Nitroform, IB Nitrogen, Trikote); |
| |
| 2 | | associated branded professional products (ProTurf, Nu-Gro); and, |
| |
| 3 | | ESN®, the only polymer coated, environmentally friendly, controlled-release fertilizer available for broad acre crops. |
Agrium has been developing polymer-coated fertilizer for a number of years, however, 2006 marks the first year that Advanced Technologies was operated and reported as a separate business unit. This was principally a result of the acquisition of two advanced technologies businesses, Nu-Gro and Pursell Technologies (PTI), which gave us the scale to establish a new business unit. We also significantly expanded ESN® capacity at our Carseland, Alberta nitrogen facility.
We produce advanced technologies products at six production facilities with the combined capacity to produce about half a million tonnes of controlled and slow release fertilizers. One of these facilities is a formulating and packaging facility with the capacity to package two million product cases per year. We have the capability to produce a broad spectrum of controlled and slow release fertilizers included polymer-coated, sulphur coated, and reacted products in a variety of sizes and composition to meet the specific needs of our target markets. Additionally, we conduct research and product development activities at these facilities.
Advanced Technologies Strategy & Key Developments
We have purchased and developed premier brands and technologies in the controlled-release nutrient market segment. The brands in our portfolio are recognized worldwide as leading technologies. Our three key strategies and goals going forward are:
| • | | integrate and grow the base business, including identifying and capturing synergies from the three formerly separate businesses; |
| |
| • | | continue to develop and improve our leading technologies and leverage them into new markets; and, |
| |
| • | | expand internationally with our current and future technologies and potentially through acquisitions. |
Key developments for Advanced Technologies in 2006 included:
| • | | acquired two businesses to further expand our portfolio of environmentally friendly controlled-release nitrogen products. Advanced Technologies now has the broadest portfolio of controlled-release products in the world; |
| |
| • | | solidified and consolidated our senior management team in Advanced Technologies with representation from each of the previously separate businesses; |
| |
| • | | integrated Agrium’s pre-existing Advanced Technologies business with the two newly acquired operations; |
| |
| • | | completed construction of the 150,000 tonne ESN® facility in February 2006; and, |
| |
| • | | obtained approval for the use of ESN® on food crops in Canada; approval in the U.S. had previously been obtained. |
Advanced Technologies Products
Advanced fertilizer products and technologies include polymer-coated, polymer coated/sulphur coated, sulphur coated and reacted controlled-release nitrogen fertilizers. These products may be sold directly into the specialties markets or to other manufacturers who combine these products for sale to either the specialties markets or to the lawn and garden segment.
| | | |
| 48 | | AGRIUM ANNUAL REPORT 2006 |
Professional products include nutrients and other products for professional use. Professional customers include golf courses, lawn care companies, horticulture and nurseries, specialty agriculture and pest control operators.
The specialties markets consist of three primary segments; golf courses and other turf, high value crops (e.g. strawberries), and consumer lawn and garden. We do not participate directly in the consumer lawn and garden segment, although we do provide the fertilizer raw materials for sale into this segment. Golf courses are key customers for our products. There are over 17,000 golf courses in the U.S. and an estimated 2,000 golf courses in Canada. Golf courses spend an average of $40,000 per year on fertilizer, seeds and pest control products.
The estimated total non-farm market for controlled-release fertilizers (CRF) in North America, excluding ESN®, is approximately 500,000 tonnes, with a further 200,000 tonnes of CRFs consumed in Western Europe and Japan. The market for CRFs in North America has been growing at an estimated rate of about five percent annually, however the growth rate for polymer-coated CRFs has been growing at a faster rate of about 16 percent as shown in the chart below.
Controlled-release fertilizer technologies consist of:
| • | | Polymer-coated CRFs, ESN®, DurationCR® and Polyon®; |
| |
| • | | Polymer-coated, sulphur coated CRFs (Trikote®); and, |
| |
| • | | Reacted CRFs (Nutralene®, Nitroform®, and IB®Nitrogen). |
In general, the length of the release curve determines the market value of CRFs. With the addition of Nu-Gro and Pursell, we now have a complete line of products to offer our customers.
| | | |
| AGRIUM ANNUAL REPORT 2006 | | 49 |
ESN® encapsulates urea inside a specially designed polymer coating that permits the release of nitrogen to match the needs of the growing plant. As a result, ESN® has the ability to increase crop yields, improve nutrient efficiency, allow a wider window of nutrient application, reduce fuel costs and save growers’ time by lowering the number of passes over a field. Since ESN® is targeted at broad acre agriculture such as corn, potatoes and wheat, we believe the potential market for this product is very large.
Advanced Technologies 2006 Overview of Results
Advanced Technologies includes results from the newly acquired Pursell and Nu-Gro controlled-release fertilizer and professional products businesses in addition to the operating results for ESN® and Duration®, which were formerly reported as part of the North America Wholesale business segment. As a result, there are no year-over-year comparisons available for this business segment. Total sales and gross profit are expected to be significantly higher in 2007 with a full year of the new acquisitions and the benefits from our 2006 ESN expansion in place.
As with many of our other businesses, the Advanced Technologies business is seasonal. The first quarter is typically the strongest, followed closely by the second quarter, which is the in-season demand period for fertilizer. The third quarter is typically the weakest as the fertilizer season winds down.
ADVANCED TECHNOLOGIES PERFORMANCE
| | | | | | |
| | | | Year Ended December 31 | |
| (millions of U.S. dollars) | | | 2006(a) | |
| Net sales | | | | 101 | |
| | | | |
| Cost of product | | | | 82 | |
| | | | |
Gross Profit | | | | 19 | |
| | | | |
| Selling expenses | | | | 5 | |
| | | | |
| General and administrative | | | | 7 | |
| | | | |
| Depreciation and amortization | | | | 8 | |
| | | | |
EBIT | | | | (1 | ) |
| | |
| (a) | | The 2006 figures represent the results of Nu-Gro from the date of acquisition of January 25, 2006 and Pursell from the date of acquisition of August 4, 2006. Duration and ESN figures have been included from July 1, 2006. Prior to July 1, 2006, the Duration and ESN business was included in Wholesale’s results. |
| | | |
| 50 | | AGRIUM ANNUAL REPORT 2006 |
Our Other
Business Segment
Our “Other” business segment is a non-operating segment that comprises Corporate and Administrative functions that provide support and governance to our operating segments.
The Other segment is also used for the elimination of inter-segment transactions so the operating segments can be evaluated and managed on a stand-alone basis, with all transactions reflected at an arm’s-length consideration. The main eliminations relate to purchase and sale transactions between our Retail, Wholesale and Advanced Technologies business segments and interest on inter-company loans.
Expenses included in EBIT of our non-operating segment comprise primarily general and administrative costs of our headquarters in Calgary, Alberta and other expenses such as regulatory compliance, foreign translation gains and losses and business development costs associated with evaluating new growth opportunities. EBIT decreased to $(113)-million in 2006 compared to $(88)-million in 2005 and $(46)-million in 2004.
The decline from prior years was largely due to an increase in general and administrative and other expenses resulting from:
| • | | the higher Canadian dollar which increases general and administrative and other expenses when expressed in U.S. dollars; |
| |
| • | | costs related to evaluating potential merger and acquisition opportunities, investigation of the feasibility of building a nitrogen production facility in Egypt and other Merger and Acquisition costs; and, |
| |
| • | | stock-based compensation expense reflecting the increase in our share price. |
| | | |
| AGRIUM ANNUAL REPORT 2006 | | 51 |
Outlook
We are a significant supplier of crop inputs to growers in North and South America as well as crop nutrients internationally. Therefore a key driver for our business is the ever-growing global demand for grain, as crop inputs help growers increase grain production. While grain prices influence the rate of growth in local and global demand for crop inputs, each nutrient and other crop input has other supply, cost and trade variables that may influence the situation and outlook for each of the nutrients.
Agriculture Outlook
We believe the fundamentals for the global grain market are strong. Global corn and wheat prices in early 2007 were respectively 73 and 16 percent above last year’s level and 58 and 16 percent above the previous five-year average. The significant rise in grain prices that began in the fall of 2006 is indicative of a demand driven event that many market analysts believe will provide a tight grain market for at least the next few years. Global crop yields have not been able to keep up to increases in grain demand in six out of the past seven years. This is partly due to the rise in demand for grain and oilseeds to supply the rapid increase in production of bio-fuels, including ethanol, in North America and globally. This strength in the grain and oilseeds markets should
| | | |
| 52 | | AGRIUM ANNUAL REPORT 2006 |
provide a positive impetus to crop input demand, particularly crop nutrient use within North America and around the world. This is expected to benefit our Retail, Wholesale and to a lesser extent our Advanced Technologies businesses in 2007.
Retail
We believe the outlook for the U.S. and Argentine retail markets in 2007 is robust. This is primarily due to the significant increase in crop prices and the expected increase in crop acreage, particularly corn and wheat acreage in the U.S. and Argentina. Corn prices are expected to be over 70 percent higher than in the spring of 2006 and U.S. growers are anticipated to increase corn plantings by over eight million acres or eight to 10 percent in 2007. U.S. corn uses about 70 percent more chemical inputs and on average 148 pounds of applied nutrients per acre more than soybeans. Corn is the biggest driver for U.S. nutrient use as it accounts for approximately 40 percent of total nutrient consumption. Furthermore, much of the increase in corn acreage will be seeded on land that was planted to corn the previous year or continuous cropped land. In order to achieve close to the same yields, corn grown on land that had corn planted on it the previous year requires up to 60 pounds more nitrogen per acre and over 20 percent more crop protection products applied to it than a corn-on-soybeans rotation.
With the expected increase in crop acreage, particularly for corn and wheat, we expect demand for all crop inputs should be higher than last year in regions that grow these crops. This is expected to benefit our facilities in the U.S. Corn Belt and Argentina. The trend toward using genetically enhanced seed varieties (GMOs) with stacked gene traits is expected to continue, which may limit growth in crop protection product use for facilities located in the U.S. Corn Belt and Argentina. This trend is also expected to continue to provide strong support for growth in seed revenues and margin dollars. Fertilizer prices are expected to remain strong in 2007, which would be positive for our fertilizer margins. Strong wheat and potato prices, combined with steady demand from the fruit and vegetable markets, should benefit primarily the Western U.S. region. While the fundamentals appear to be strong for crop inputs, regional weather patterns can have a significant impact on local crop input demand, particularly nutrients and crop protection products, in any given season.
| | | |
| AGRIUM ANNUAL REPORT 2006 | | 53 |
Wholesale
We anticipate the global supply/demand balance for all three nutrients will remain in a tight, to balanced, position in 2007. A strong agricultural market should support North American and global nutrient demand, and capacity additions are not expected to be excessive relative to expected demand for any of the three nutrients in 2007.
NITROGEN
We anticipate that additions to global nitrogen capacity will increase by about two percent in 2007, excluding changes in Chinese capacity. This would be similar to the historic rate of growth in nitrogen demand. Obtaining accurate information on demand and supply conditions in China is difficult, although most industry analysts believe China will remain a small net exporter of urea for at least the next few years and will continue to apply an export tax on urea exports. Furthermore, the substantial increase in global energy costs have pushed nitrogen production costs higher in many regions around the world and helped raise the floor price for nitrogen products. The higher energy costs include regions such as Western Europe, North America, India and Eastern Europe, particularly the Ukraine. Lower feedstock availability in places like Indonesia and India have also reduced operating rates, helping to keep the market tight, despite significant capacity additions elsewhere over the past few years.
Demand for nitrogen in North America is expected to rebound by over eight percent in 2007 after declining last year. Similarly, global demand rates should be higher in 2007 than 2006, given the strong global crop prices. Nitrogen margins for our North American nitrogen facilities will continue to be dependent on the relationship between North American gas prices and nitrogen prices. We believe our nitrogen margins on our North American sales should widen in 2007 compared to 2006 due to the expected tightness in the nitrogen market.
| | | |
| 54 | | AGRIUM ANNUAL REPORT 2006 |
POTASH
Industry data indicate that global potash demand is estimated to have declined in the first half of 2006 due to lower demand from China, North America and continued economic challenges for Brazilian growers. The prolonged international negotiations between Canpotex and both China and India resulted in a significant decline in global potash trade particularly the first half of 2006. Potash demand picked up in the second half of 2006.
Industry analysts expect a tightening of global potash markets in 2007. Global capacity additions in 2007 are expected to total about 1.2 million nutrient tonnes, representing a three percent increase in capacity. The recent mine flooding and closure at Uralkali’s potash mine in November 2006 is estimated to have taken over one million tonnes of potash (2.1 percent of global capacity) off the market in late 2006. This is expected to reduce net capacity additions to 1.3 percent in 2007. Demand is expected to grow by more than this in 2007, given the strong global grain markets.
| | | |
| AGRIUM ANNUAL REPORT 2006 | | 55 |
PHOSPHATE
Global phosphate demand is estimated to have increased by seven percent in 2005 and declined by two percent in 2006, compared to an annual average growth rate of two percent over the past decade. U.S. plant closures helped balance the phosphate market in 2006. We expect phosphate market conditions to tighten in 2007 with improved demand conditions due in part to increased grain prices. The expected improved demand should come from the U.S., India, and South East Asia. These factors should more than offset the continued lower Chinese import demand resulting from an increase in China’s capacity. In the longer term, the major risk to phosphate profitability results from the announced substantial increase in capacity in the Middle East and China.
Specialty Fertilizers
The outlook for broad acre application of controlled-release fertilizers (ESN®) is positive. Strong grain prices are expected to entice growers to optimize nutrient applications to maximize yields and to search for new ways to save time, while taking environmental factors into consideration. The outlook for the professional turf, professional horticulture and specialty agriculture business is also expected to be positive.
| | | |
| 56 | | AGRIUM ANNUAL REPORT 2006 |
Key Business Sensitivities
Our business risks are discussed on pages 74 to 80. Our financial results are sensitive to a number of factors that affect our operations and margins. The following table sets out the impact of changes in some key variables on our earnings, based on activity levels at the end of 2006.
Most of the key variables identified relate to changes to product margins, which could result from a change in sales prices or input costs. The sensitivity to nitrogen margins includes the impact of changes in North American natural gas prices. The sensitivity to earnings for a $0.50 U.S. per MMBtu change in NYMEX gas prices, assuming no change to the price spread between U.S. and Alberta gas, nor nitrogen prices is $44-million in EBIT and $31-million in net earnings. Since rising gas prices can often have a positive impact on nitrogen prices, depending on the nitrogen supply and demand balance, it is more appropriate to describe sensitivities in terms of changes in margins.
The Retail and Advanced Technologies businesses earnings tend to be more stable, with no key variables that would impact earnings for these businesses to a similar degree.
| | | | | | | | | | | | | | | | |
| | | | | | | | | | | | | | Net Earnings | |
| | | | Change in | | | | EBIT Impact | | | | Impact (b) | |
| | | | Factor(a) | | | | (U.S.$ Millions) | | | | (U.S.$ Millions) | |
| | | | | | | | | | | | | | | | |
| | | | | | | | | | |
Wholesale Margins | | | | | | | | | | | | | | | |
| | | | | | | | | | |
| Nitrogen(c) | | | $ | 10.00 | | | | | 45 | | | | | 31 | |
| | | | | | | | | | |
| Phosphate | | | $ | 10.00 | | | | | 10 | | | | | 7 | |
| | | | | | | | | | |
| Potash | | | $ | 10.00 | | | | | 20 | | | | | 14 | |
| | | | | | | | | | |
| Exchange Rate from C$ to U.S.$ | | | $ | 0.01 | | | | | 5 | | | | | 4 | |
| | | | | | | | | | |
| Exchange rate from Argentine Peso to U.S.$ | | | 0.3 Pesos | | | | 1 | | | | | 1 | |
| | |
| (a) | | Change in factor is per metric tonne unless otherwise specified. |
| |
| (b) | | To convert impact to an EPS basis, divide the net earnings impact by the number of outstanding shares (133 million shares as of December, 31 2006.) |
| |
| (c) | | The sensitivity to nitrogen margins is inclusive of the natural gas sensitivity described in the text above. |
Foreign Exchange
The international currency of the agribusiness is the U.S. dollar, and accordingly we use the U.S. dollar as our reporting currency. We conduct business in U.S. and Canadian dollars, as well as Argentine pesos. Fluctuations in these currencies can impact our financial results. We manage our U.S. denominated working capital in our Canadian self-sustaining subsidiaries to minimize the impact of foreign exchange rate fluctuations on our consolidated results and, where appropriate, we use derivative instruments to help manage our foreign exchange exposure.
| | | |
| AGRIUM ANNUAL REPORT 2006 | | 57 |
Our Consolidated
Performance
Results of Operations
| | | | | | | | | | | | | | | | | | | | | | | | | | | | | | | | | | | | | | | | | |
| (millions of | | | | | | | | | | | | | Net Earnings | | | | | | | | | | | | | | | | | | | | |
| U.S. dollars | | | | | | | | | | | | | (Loss) Per Share: | | | | | | | | | | | | | | | | | | | | |
| except | | | | | | | | | | | | | | | | | | | | | | | | | | | | | | | | | | | | | | Long-term | |
| per share | | | | | | | | Net | | | | | | | | | | | | | | Total | | | | Cash & Cash | | | | Cash | | | | Financial | |
| amounts) | | | Net Sales | | | | Earnings | | | | Basic | | | | Diluted | | | | Assets | | | | Equivalents | | | | Dividends | | | | Liabilities | |
2006 | | | | | | | | | | | | | | | | | | | | | | | | | | | | | | | | | | | | | | | | |
| | | | | | | | | | | | | | | | | | | | | | | | | |
Q1 | | | | 657 | | | | | (48 | ) | | | | (0.37 | ) | | | | (0.37 | ) | | | | 3,552 | | | | | 49 | | | | | – | | | | | 763 | |
| | | | | | | | | | | | | | | | | | | | | | | | | |
Q2 | | | | 1,816 | | | | | 142 | | | | | 1.08 | | | | | 1.06 | | | | | 3,215 | | | | | 69 | | | | | 7 | | | | | 965 | |
| | | | | | | | | | | | | | | | | | | | | | | | | |
Q3 | | | | 821 | | | | | 1 | | | | | 0.01 | | | | | 0.01 | | | | | 3,169 | | | | | 39 | | | | | – | | | | | 926 | |
| | | | | | | | | | | | | | | | | | | | | | | | | |
Q4 | | | | 899 | | | | | (62 | ) | | | | (0.47 | ) | | | | (0.47 | ) | | | | 3,265 | | | | | 109 | | | | | 8 | | | | | 941 | |
| | | | | | | | | | | | | | | | | | | | | | | | | |
Year | | | | 4,193 | | | | | 33 | | | | | 0.25 | | | | | 0.25 | | | | | 3,265 | | | | | 109 | | | | | 15 | | | | | 941 | |
| | | | | | | | | | | | | | | | | | | | | | | | | |
| 2005 | | | | | | | | | | | | | | | | | | | | | | | | | | | | | | | | | | | | | | | | |
| | | | | | | | | | | | | | | | | | | | | | | | | |
| Q1 | | | | 537 | | | | | 24 | | | | | 0.18 | | | | | 0.18 | | | | | 2,677 | | | | | 326 | | | | | – | | | | | 799 | |
| | | | | | | | | | | | | | | | | | | | | | | | | |
| Q2 | | | | 1,180 | | | | | 133 | | | | | 1.01 | | | | | 0.99 | | | | | 2,694 | | | | | 427 | | | | | 7 | | | | | 784 | |
| | | | | | | | | | | | | | | | | | | | | | | | | |
| Q3 | | | | 807 | | | | | 72 | | | | | 0.54 | | | | | 0.54 | | | | | 2,817 | | | | | 415 | | | | | – | | | | | 755 | |
| | | | | | | | | | | | | | | | | | | | | | | | | |
| Q4 | | | | 770 | | | | | 54 | | | | | 0.41 | | | | | 0.40 | | | | | 2,785 | | | | | 300 | | | | | 7 | | | | | 719 | |
| | | | | | | | | | | | | | | | | | | | | | | | | |
| Year | | | | 3,294 | | | | | 283 | | | | | 2.14 | | | | | 2.12 | | | | | 2,785 | | | | | 300 | | | | | 14 | | | | | 719 | |
| | | | | | | | | | | | | | | | | | | | | | | | | |
| 2004 | | | | | | | | | | | | | | | | | | | | | | | | | | | | | | | | | | | | | | | | |
| | | | | | | | | | | | | | | | | | | | | | | | | |
| Q1 | | | | 435 | | | | | 11 | | | | | 0.08 | | | | | 0.08 | | | | | 2,416 | | | | | 202 | | | | | – | | | | | 978 | |
| | | | | | | | | | | | | | | | | | | | | | | | | |
| Q2 | | | | 1,011 | | | | | 74 | | | | | 0.56 | | | | | 0.52 | | | | | 2,345 | | | | | 196 | | | | | 7 | | | | | 970 | |
| | | | | | | | | | | | | | | | | | | | | | | | | |
| Q3 | | | | 672 | | | | | 83 | | | | | 0.63 | | | | | 0.60 | | | | | 2,514 | | | | | 299 | | | | | – | | | | | 979 | |
| | | | | | | | | | | | | | | | | | | | | | | | | |
| Q4 | | | | 720 | | | | | 98 | | | | | 0.75 | | | | | 0.71 | | | | | 2,661 | | | | | 425 | | | | | 7 | | | | | 972 | |
| | | | | | | | | | | | | | | | | | | | | | | | | |
| Year | | | | 2,838 | | | | | 266 | | | | | 2.03 | | | | | 1.91 | | | | | 2,661 | | | | | 425 | | | | | 14 | | | | | 972 | |
Our net earnings were $33-million in 2006 or $0.25 diluted earnings per share, a decrease of $250-million over 2005 and $233-million lower than 2004. The decline was primarily due to lower earnings from our Wholesale operations. Significant items affecting the comparability of quarterly and annual results include the following:
| • | | Net earnings in 2006 included income from three acquisitions that make a majority of their earnings in the second quarter and were financed from a combination of incremental borrowings and cash on hand. |
| |
| • | | Fourth quarter earnings were negatively impacted by the impairment charge on our Canadian phosphate assets of $136-million pre-tax or $95-million as a non-cash after tax charge. |
| | | |
| 58 | | AGRIUM ANNUAL REPORT 2006 |

| • | | Net earnings in the first quarter of 2006 were negatively impacted by pre-tax losses of $43-million ($0.21 diluted loss per share) due to natural gas hedges that did not qualify for hedge accounting treatment. The majority of our natural gas hedges qualified for hedge accounting in 2006. |
| |
| • | | Net earnings in the second quarter of 2006 were favorably impacted by an $18-million non-cash future income tax recovery, discussed below. |
| |
| • | | Net earnings and net earnings per share in the third and fourth quarters of 2004 included income of $41-million and $9-million, respectively ($25-million after tax or $0.17 diluted earnings per share in the third quarter and $5-million after tax or $0.04 diluted earnings per share in the fourth quarter) in liquidated damages from an arbitration panel award relating to our Kenai facility. Net earnings also included a $36-million gain ($21-million after tax or $0.15 diluted earnings per share) in the fourth quarter of 2004 on the settlement of all outstanding legal claims relating to our Kenai facility. |
INCOME TAXES
Our overall effective tax rate was negative 266 percent in 2006, versus 37 percent in 2005 and 33 percent in 2004. The negative 2006 rate includes the impact of Canadian rate reductions enacted during the year and an increase in tax efficient financing. Absent those items, the 2006 rate would have been comparable to 2005. The 2005 rate was higher than 2004 because of the recognition of previously unrecorded losses in 2004. The tax rate for 2007 is expected to be 31 percent.
In addition to changes in statutory income tax rates, the mix of earnings, tax allowances and realization of unrecognized tax assets amongst the jurisdictions in which we operate impact our overall effective tax rate. An explanation of the year-over-year variances in these rates for the three years ended December 31, 2006 is provided in note 5 to our consolidated financial statements.
INTEREST EXPENSE
Annual interest expense increased in 2006 due to the $371-million net increase in bank indebtedness and long-term debt to fund acquisitions, increased working capital needed for our acquired businesses and growth initiatives. Interest expense was $63-million in 2006, compared with $49-million in 2005 and $69-million in 2004.
DIVIDENDS
In 2006 we paid cash dividends on our common shares of $14-million, or 11 cents per common share, compared to $14-million, or 11 cents per common share, in both 2005 and 2004.
SEASONALITY
Agricultural nutrient sales are seasonal, as farmers tend to apply the majority of crop nutrients in the spring and fall. As a result, our earnings tend to be strongest in the second and fourth quarters of the calendar year. The majority of our annual agricultural sales tend to be made in three or four months of the year.
| | | |
| AGRIUM ANNUAL REPORT 2006 | | 59 |
2006 Fourth Quarter
Management’s Discussion and Analysis
NET EARNINGS
Agrium’s fourth quarter consolidated net loss was $62-million compared with net earnings of $54-million for the same quarter of 2005. Diluted loss per share for the fourth quarter of 2006 was $0.47 compared to net earnings of $0.40 per share for the fourth quarter of 2005. EBIT was a loss of $87-million for the fourth quarter of 2006 compared with EBIT of $95-million for the fourth quarter of 2005.
The decrease in year-over-year fourth quarter EBIT of $182-million reflects a $136-million pre-tax impairment of our Wholesale operation’s Canadian phosphate assets. Adjusting for this non-cash impairment charge, EBIT before special items was $49-million, or $46-million lower than the same quarter of 2005. This decrease consisted of an increase in expenses of $70-million offset somewhat by increased gross profit of $24-million. The increase in expenses reflects the following items:
| • | | $42-million increase in selling, general and administrative, and depreciation expenses related primarily to businesses acquired in 2006; |
| |
| • | | $16-million settlement of a commercial dispute recorded as income in the fourth quarter of 2005 offset somewhat by a $13-million gain on the sale of a non-core oil and gas property in the Canadian Arctic in the fourth quarter of 2006; and, |
| |
| • | | $8-million increase in stock-based compensation expense due to a number of factors including the increase in our share price. |
FINANCIAL POSITION AND LIQUIDITY
At the end of the fourth quarter, net cash on hand was $109-million compared to $300-million at December 31, 2005.
Operating activities provided cash of $30-million in the fourth quarter of 2006 compared to $8-million for the same quarter of 2005. Quarter-over-quarter, accounts receivable and accounts payable increased $176-million and $249-million, respectively, primarily due to our acquisitions during the year. Inventory decreased $55-million as a result of lower costs.
The utilization of our accounts receivable securitization facility decreased $59-million during the fourth quarter of 2006 to $108-million at December 31. This facility was not used in the fourth quarter of 2005.
The effective tax rate was 41 percent for the fourth quarter loss of 2006 compared to 36 percent in the fourth quarter income of 2005. The increase was due to the tax effect of a foreign exchange loss incurred on the translation of long-term debt in 2006.
| | | |
| 60 | | AGRIUM ANNUAL REPORT 2006 |
BUSINESS SEGMENT PERFORMANCE
During the fourth quarter of 2006, we revised the composition and names of our reporting segments to correspond with our strategic business unit structure and internal reporting. Our business segments are now Retail, Wholesale, and Advanced Technologies. Prior periods have been restated for comparative purposes.
Retail
Retail’s fourth quarter net sales were $384-million compared to $267-million in the fourth quarter of 2005. Gross profit increased by $35-million compared to the same quarter last year. Retail EBIT was $20-million, down $5-million from the fourth quarter of 2005.
The increase in net sales and gross profit is attributed to:
| • | | an increase in international retail net sales of $8-million and gross profit of $2-million. As a result of strong corn and soybean prices, farmers in Argentina expanded acreage and increased spending on crop inputs to maximize yields and take advantage of strong margins. |
| |
| • | | an increase in domestic sales volumes of $109-million and gross profit of $33-million primarily due to the increased sales volumes from the acquisition of Royster-Clark in February. Net sales and gross profit increased year-over-year for both fertilizers and chemicals. Although results in the fourth quarter of 2006 were significantly higher than those in the same quarter of 2005, they were still negatively impacted by very wet weather in the Eastern Corn Belt that prevented optimal fall crop input application. |
Retail expenses increased by $40-million in the fourth quarter of 2006 versus the same quarter of 2005 mostly due to the increased selling and depreciation expenses associated with the addition of the Royster-Clark operations in the first quarter of 2006.
Wholesale
Wholesale’s fourth quarter net sales were $537-million compared to $554-million in the fourth quarter of 2005. Gross profit decreased by $23-million compared to the same quarter last year. Wholesale EBIT was a loss of $64-million, down $154-million from the fourth quarter of 2005. The impairment of our Canadian phosphate assets accounted for $136-million of the decrease in EBIT. Also included in Wholesale’s fourth quarter EBIT was a $13-million gain on the sale of a non-core oil and gas property in the Canadian Arctic. This impact of this gain was offset by $16-million of income reported in the fourth quarter of 2005 related to the settlement of a commercial dispute.
Nitrogen net sales were $344-million and contributed $65-million in gross profit compared to $414-million and $76-million in net sales and gross profit, respectively, in the same quarter of 2005. The decline in net sales and gross profit is attributed to the following:
| • | | International sales volumes and gross profit were significantly lower than last year due entirely to lower sales from our Kenai facility. Kenai was idled for most of the fourth quarter in 2006 due to a lack of gas supply. Our Profertil facility increased fourth quarter sales volumes by 10 percent year-over-year and gross profit contribution was similar to last year. |
| | | |
| AGRIUM ANNUAL REPORT 2006 | | 61 |
| • | | Domestic nitrogen sales volumes and margins increased compared to the fourth quarter of 2005 due to stronger North American demand and lower natural gas prices. North American nitrogen sales volumes were 35 percent higher in the fourth quarter of 2006 than for the same quarter of 2005 due to favorable pricing and higher ammonia sales through our Borger pipeline system. Average nitrogen margins on domestic sales were $30 per tonne in the fourth quarter of 2006 versus $26 per tonne in the same quarter of 2005, as significantly lower natural gas prices more than offset lower average nitrogen sales prices. |
| |
| • | | Agrium’s overall natural gas costs for product produced in the fourth quarter of 2006 was $4.97 per MMBtu compared to $7.56 per MMBtu for the same quarter of 2005. The U.S. benchmark (NYMEX) natural gas price for the fourth quarter was $6.62 per MMBtu with the AECO (Alberta) basis averaging $1.00 per MMBtu. |
Potash net sales were $49-million and contributed $24-million of gross profit compared to $57-million and $34-million of net sales and gross profit, respectively, in the same quarter of 2005. International sales volumes were higher than the same period in 2005 as Canpotex increased their shipments to compensate for lower volumes in the first half of 2006. International potash sales prices were $8 per tonne lower than the same period last year, while domestic sales prices were largely unchanged. Domestic sales volumes were lower than the prior year due to reduced production resulting from commissioning issues related to our 310,000 tonne expansion at our Vanscoy facility. Reduced production contributed to higher product costs compared to the same quarter in 2005. The expansion was essentially completed in the fourth quarter.
Phosphate net sales were $61-million and contributed gross profit of $4-million compared to $83-million and $10-million of net sales and gross profit, respectively, in the same quarter of 2005. Sales volumes were lower as a result of reduced production at our Redwater facility due to continued rock quality issues at our Kapuskasing mine. Phosphate prices were stronger for all products, particularly for liquid phosphates. The higher prices were offset by higher input costs including sulphur and increased mining costs.
Product purchased for resale contributed an additional $83-million of sales revenue and $4-million of gross profit.
Advanced Technologies
Advanced Technologies contributed $7-million in gross profit and a $2-million loss in EBIT in the seasonally slow fourth quarter.
Other
EBIT for our ‘Other’ non-operating business segment for the fourth quarter of 2006 decreased by $21-million to a loss of $41-million over the same period last year. The negative variance was primarily due to higher stock-based compensation expense as a result of higher share prices at the end of the quarter and increased expenses related to investigating business development opportunities.
| | | |
| 62 | | AGRIUM ANNUAL REPORT 2006 |
Capital Resources
NON-CASH WORKING CAPITAL
Our non-cash working capital levels are affected by numerous factors including:
| • | | seasonality factors discussed on page 59 of this MD&A; |
| |
| • | | building inventory for seasonal peak demand; |
| |
| • | | demand for our products and services; |
| |
| • | | selling prices of our products and services; |
| |
| • | | raw material input and other costs; and, |
| |
| • | | foreign exchange rates. |
The addition of the Royster-Clark business increased our earnings in the second quarter but reduced them in the other three quarters in 2006.
Our working capital averaged $575-million in 2006. The net non-cash working capital balance at year-end 2006 increased over year-end 2005 and 2004.
CAPITAL EXPENDITURES
Sustaining capital is directed towards maintaining the safe and efficient operation of our facilities as well as extending their useful lives. Investment capital typically includes a significant expansion of existing operations or new acquisitions. Both our investment and sustaining capital expenditures increased in 2006, primarily due to the acquisition of Royster-Clark, Nu-Gro, Pursell and the potash expansion in 2006. Our sustaining capital rose to $91-million in 2006 compared with $87-million in 2005.
| | | | | | | | | | | | | | | | |
| | | | | | | | | | | | | |
| (millions of U.S. dollars) | | | 2006 | | | | 2005 | | | | 2004 | |
| | | | | | | | | | | | | |
| Sustaining capital | | | | 91 | | | | | 87 | | | | | 69 | |
| | | | | | | | | | |
| Investment capital | | | | 118 | | | | | 88 | | | | | 13 | |
| | | | | | | | | | |
TOTAL | | | | 209 | | | | | 175 | | | | | 82 | |
Our investment capital expenditures in 2006 included a significant expansion of potash capacity at our Vanscoy facility and the completion of our ESN® capacity expansion at the Carseland facility. Investment capital expenditure for the potash expansion and expanded storage and compaction capacity was $87-million in 2006. This capital cost was $15-million higher than originally planned due to higher than expected labor and material costs, partly associated with an escalation in both local labor and material costs and the stronger Canadian dollar. The ESN® project involved the construction of a new coating plant, capable of converting one existing urea granulation train (150,000 tonnes per year) to ESN®.
| | | |
| AGRIUM ANNUAL REPORT 2006 | | 63 |
We also invested $651-million in new acquisitions in 2006. The most notable include:
| | | |
| | We acquired Royster-Clark on February 9, 2006 for approximately $404-million net of proceeds from the sale of the East-Dubuque nitrogen facility on April 26, 2006 for $70-million, including $20-million in working capital. |
| | | |
| | We employed $85.8-million to acquire the fertilizer technology and professional products business of Nu-Gro as of January 25, 2006. |
| | | |
| | We acquired certain fixed assets and technologies of Pursell on August 8, 2006 for $78.5-million, further enhancing our Advanced Technologies business. We also purchased patented technology for emerging non-fertilizer controlled-release products, such as specific crop protection products, for the consideration of $12.5-million plus contingent payments based on a percentage of future sales. |
Sustaining capital expenditures can vary by year, and capital expenditures in 2007 for Retail may be larger than normal as we expect to continue to bring the Royster-Clark retail assets up to our standards this year. Approximately $10-million is targeted for the replacement of key equipment at our Redwater and Fort Saskatchewan nitrogen operations.
We are planning an investment capital program of approximately $50-million in 2007, including the following:
| | | |
| | additional potash investment and expansion projects; |
| | | |
| | additional investment in Advanced Technologies; |
| | | |
| | Potential expansion of import, storage and distribution facilities in South America; and, |
| | | |
| | possible one-off retail acquisitions. |
We may employ additional capital to pursue our growth strategy in 2007, including various potential acquisitions, expansion or greenfield opportunities. We anticipate we will be able to finance announced projects through cash provided from operating activities and existing lines of credit. In the event we make another significant acquisition in 2007, it may require accessing the debt or equity markets.
| | | |
| 64 | | AGRIUM ANNUAL REPORT 2006 |
Liquidity
We increased our U.S. bank lines from $450-million to $600-million in April 2006 reflecting the growth in our business and associated cash reserves considered prudent for our operating needs. Based on current projections, our liquid resources, together with expected future cash flows provided from operating activities, are expected to be more than sufficient to meet our anticipated future requirements and obligations. At December 31, 2006, these resources consisted of the following:
| | | | | | | | | |
| | | | | | |
| (millions of U.S. dollars) | | Currency Denomination | | U.S. Dollar Equivalent | |
| | | | | | |
| Cash and cash equivalents | | U.S. Dollars | | | 93 | |
| |
| | | Canadian Dollars | | | 8 | |
| |
| | | Argentine Pesos | | | 7 | |
| |
| | | Other | | | 1 | |
| |
| Short-term bank lines (unused)(a) | | U.S. Dollars | | | 431 | |
| |
| | | Argentine Pesos | | | 30 | |
| |
| Other non-cash working capital(b) | | U.S. Dollars | | | 490 | |
| | |
| (a) | | Unused amounts are net of letters of credit outstanding as at December 31, 2006 |
| |
| (b) | | Includes amounts drawn on our asset securitization program. |
Depending on the nature, timing and extent of any potential acquisitions or greenfield development opportunities, we may consider expanding existing sources of financing or accessing other sources of financing.
FINANCING ACTIVITIES AND FINANCIAL POSITION
We have continued to maintain a strong financial position even as we pursued our growth strategy in 2006.
Our cash reserves of $109-million were lower than the build up we experienced last year, as we deployed our cash in completing three acquisitions and two major expansions. We completed a $300-million offering of 30-year, 7.125 percent senior unsecured debentures under a $500-million shelf prospectus dated May 15, 2006. We used these proceeds, in part, to redeem $101-million in private placements, eliminating the restrictive covenants that were inappropriate given the growth in Agrium’s business, as well as to repay a portion of our outstanding short-term indebtedness primarily resulting from the acquisition of Royster-Clark. Pursuant to the terms of the shelf prospectus, we have the ability to issue up to an additional $200-million of debt securities over a25-month period until June 2008. Terms of any debentures offered are determined by market conditions at the date of issue.
| | | |
| AGRIUM ANNUAL REPORT 2006 | | 65 |
At December 31, 2006 our debt-to-capital ratio was 42 percent, up from 29 percent in 2005 and down from 45 percent in 2004. Our net debt-to-capital is also highlighted in the bar graph below.
CASH PROVIDED BY OPERATING ACTIVITIES
We generated $154-million in operating cash flow in 2006 compared with $450-million in 2005 and $440-million in 2004. Our operating cash flow net of our draw on our accounts receivable securitization program was $46-million in 2006. Our resulting cash balance decreased to $109-million in 2006, from $300-million in 2005 and $425-million in 2004.
ARGENTINA CURRENCY REPATRIATION
Dividends are not subject to Argentine tax to the extent they are paid from tax-paid retained earnings of our Argentine subsidiary, ASP, and our Argentine joint venture, Profertil. Profertil paid two dividends to its shareholders in 2006, a $66.5-million ($33.3-million net to Agrium) dividend in March and another $81.2-million ($40.6-million net to Agrium) dividend in December.
In the event dividends are paid in excess of tax-paid retained earnings, there would be a 10 percent withholding tax levied in Argentina on dividends to Agrium.
FINANCIAL COVENANTS
Our credit facilities, debentures and senior notes require us to maintain certain financial ratios and other covenants customary for these types of agreements. At December 31, 2006, we were in compliance with all of our covenants, and expect to be in compliance with our covenants in 2007 and for the foreseeable future.
| | | |
| 66 | | AGRIUM ANNUAL REPORT 2006 |
DEBT RATINGS
As a key part of our financial strategy, we continue to maintain a strong investment grade credit rating, reflecting our commitment to strong liquidity ratios. We expect our credit position to improve in terms of the fundamentals of our business, reflecting strong industry fundamentals and an increase in earnings quality due to recent acquisitions, which diversify and increase the stability of our earnings and cash flow base.
In February 2005, Moody’s Investors Services revised our long-term outlook to Baa2 stable from Baa2 negative.
In November 2005, Dominion Bond Rating Service, Moody’s Investors Services, and Standard & Poor’s Ratings Services confirmed our credit ratings with a stable outlook following the announcement of the proposed acquisitions of Royster-Clark and Nu-Gro.
As at December 31, 2006, the Company’s debt instruments were rated as follows:
| | | | | | |
| | | | | |
| | | | Senior Unsecured Notes and Debentures | |
| | | | | |
| Moody’s Investors Services | | | (Baa2) | |
| | | | |
| Dominion Bond Rating Service | | | (BBB) | |
| | | | |
| Standard & Poor’s Ratings Services | | | (BBB) | |
OUTSTANDING SHARES
The number and outstanding principal amount of outstanding shares as at January 31, 2007 are as follows:
| | | | | | | | | | | | | | | | |
| | | | | | | | | | | | | |
| | | | Number of Shares | | | | Share Capital(millions of | | | | Market Value(millions of | |
| | | | (millions) | | | | U.S. dollars) | | | | U.S. dollars) | |
| | | | | | | | | | | | | |
| Common shares | | | | 133 | | | | | 617 | | | | | 4,621 | |
We had a normal course issuer bid (NCIB) from the Toronto Stock Exchange (TSX) in place from April 2005 until May 2006. During the course of our NCIB we purchased and cancelled approximately 4.7 million shares for $98-million at an average cost of C$25.20 per share, all in 2005. We did not renew, or purchase additional shares, under the program in 2006 given the acquisitions that took place in early 2006.
FUTURE CASH REQUIREMENTS
Our existing obligations and commitments requiring future outlays of cash consist of the following:
| • | | aggregate contractual obligations; |
| |
| • | | other obligations including asset retirement obligations and environmental remediation liabilities, where the extent, timing, or amount of the obligations may be determined by some future event that cannot be determined with substantial accuracy; |
| |
| • | | employee future benefit obligations; |
| |
| • | | general operating requirements including interest payments, income and other taxes payable and peak seasonal working capital requirements; |
| |
| • | | capital expenditure commitments; and, |
| |
| • | | future growth opportunities, including acquisitions. |
| | | |
| AGRIUM ANNUAL REPORT 2006 | | 67 |
Obligations
CONTRACTUAL OBLIGATIONS
As at December 31, 2006, our aggregate contractual obligations were comprised of the following:
| | | | | | | | | | | | | | | | | | | | | | | | | | |
| | | | Payment due by period: | |
| | | | Less than | | | | One to | | | | Four to | | | | After five | | | | | |
| (millions of U.S. dollars) | | | one year | | | | three years | | | | five years | | | | years | | | | Total | |
| Long-term debt (a) (b) | | | | 51 | | | | | 153 | | | | | 212 | | | | | 1,228 | | | | | 1,664 | |
| | | | | | | | | | | | | | | | |
| Operating leases (c) | | | | 57 | | | | | 77 | | | | | 21 | | | | | 23 | | | | | 178 | |
| | | | | | | | | | | | | | | | |
| Purchase obligations (d)(e)(f) | | | | 739 | | | | | 247 | | | | | 149 | | | | | 53 | | | | | 1,188 | |
| | | | | | | | | | | | | | | | |
Total | | | | 847 | | | | | 477 | | | | | 382 | | | | | 1,304 | | | | | 3,010 | |
| | |
| (a) | | Includes interest payments |
| |
| (b) | | Failure to maintain certain financial ratios and other covenants may trigger early repayment provisions (See financial covenants on page 66 of this MD&A). |
| |
| (c) | | Includes short-term leases for railcars and distribution facilities in Wholesale, vehicles and application equipment in Retail and computer equipment lease. |
| |
| (d) | | Includes minimum commitments for North America natural gas based on prevailing NYMEX forward prices at December 31, 2006. We commit to purchase a large percentage of our production volume requirements for the next year at floating prices, and actual prices may differ. |
| |
| (e) | | Includes our 50 percent share of Profertil’s annual gas purchase commitments of $202-million. |
| |
| (f) | | Purchase obligations exclude employee future benefits, for which employer contributions are expected to be approximately $10-million in 2007. |
OTHER LONG-TERM OBLIGATIONS
As at December 31, 2006, our other liabilities included balances related to asset retirement obligations and environmental remediation liabilities. Estimated timing and amount of cash outflows associated with these liabilities are as follows:
| | | | | | | | | | | | | | | | | | | | | | | | | | |
| | | | Payment due by period: | |
| | | | Less than | | | | Six to 10 | | | | 11 to 15 | | | | After 15 | | | | | |
| (millions of U.S. dollars) | | | six years | | | | years | | | | years | | | | years | | | | Total | |
| Asset retirement obligations(a) | | | | 25 | | | | | 21 | | | | | 79 | | | | | 472 | | | | | 597 | |
| | | | | | | | | | | | | | | | |
| Environmental remediation liabilities | | | | 61 | | | | | 22 | | | | | 14 | | | | | 20 | | | | | 117 | |
| | | | | | | | | | | | | | | | |
| Total | | | | 86 | | | | | 43 | | | | | 93 | | | | | 492 | | | | | 714 | |
| | |
| (a) | | Represents the undiscounted, inflation-adjusted estimated cash outflows required to settle the asset retirement obligations in the amount of $71-million at December 31, 2006. See note 17 to our 2006 consolidated financial statements for further discussion of asset retirement obligations. |
| | | |
| 68 | | AGRIUM ANNUAL REPORT 2006 |
Off Balance Sheet Financing Arrangements
ASSET SECURITIZATION
Under our North American receivables securitization facility, certain of our U.S. subsidiaries may sell up to $200-million of eligible accounts receivable. Since these sales are non-recourse to us they are not included in our balance sheet as liabilities. Fees and expenses paid to the financial institution are based on the accounts receivable sold and prevailing commercial paper rates. The agreement expires in December 2007 and may be terminated earlier by either party.
We utilized $108-million of our accounts receivable securitization as at December 31, 2006 and did not utilize it in 2005. The facility provides us with the flexibility to immediately realize cash for the sale of receivables up to the amount of the program.
DERIVATIVE INSTRUMENTS
Substantially all of our natural gas requirements are purchased through indexed price contracts with suppliers, except for the long-term fixed-price supply agreements for Profertil and the contracts for Kenai. In order to minimize our financial risk exposure to potential adverse impacts of natural gas price volatility we periodically enter into natural gas swaps and option contracts.
We utilize a formal analytical process to determine when we enter into hedge contracts. As a practice we take advantage of natural gas price volatility to “collar” our positions, so as to minimize the risk of incurring losses on our hedge positions by trading off a portion of the potential gains. The majority of our hedging positions are collared.
We also enter into foreign currency option and forward contracts to fix the exchange rate or a range of exchange rates used to convert a portion of the Canadian subsidiaries’ U.S. dollar-denominated revenues into Canadian dollars. These revenues are converted into Canadian dollars for purposes of paying the Canadian dollar-denominated operating costs.
These derivative contracts are initiated within the guidelines of our risk management and hedging policies, which require specific authorization for approval and commitment of contracts. We formally document our risk management strategy for undertaking derivative transactions and the relationship between the derivative and the underlying hedged exposure.
Our Board of Directors has delegated authority to our Hedging Committee to hedge the following:
| • | | our natural gas exposure up to 75 percent of planned gas requirements for the current year plus the following two years and 25 percent of planned gas requirements for the third and fourth ensuing years; and, |
| |
| • | | our foreign exchange exposure up to 75 percent of the estimated transactional exposure for the next twelve-month period, 50 percent for months 13 to 24 and 25 percent for months 25 to 36. |
| | | |
| AGRIUM ANNUAL REPORT 2006 | | 69 |
All our derivative contracts are intended to provide an economic hedge of our exposure to gas or foreign exchange risk and our strategy is to achieve hedge accounting treatment for these derivatives whenever possible. Despite providing an economic hedge, derivative contracts may not always qualify for hedge accounting treatment. Derivative contracts that meet the criteria for hedge accounting are off balance sheet, and contracts that do not meet the criteria are recorded on the balance sheet at fair value.
At December 31, 2006, the majority of our natural gas derivative contracts qualified for hedge accounting. The fair value of the off balance sheet qualifying natural gas derivative contracts was $11-million (2005–nil).
At December 31, 2006 and 2005, our foreign exchange derivative contracts qualified for hedge accounting and, accordingly, the fair value of our qualifying foreign exchange derivative contracts was a loss of $1-million at December 31, 2006 (2005 $1-million gain) and was off balance sheet.
Notes 1 and 24 to our consolidated financial statements provide more detail on our accounting policy for financial instruments and the types of derivatives.
RELATED PARTY TRANSACTIONS
We market our potash internationally through sales to Canpotex, a Canadian marketing company in which we have an investment along with two other Saskatchewan potash producers. Refer to note 27 to our 2006 consolidated financial statements for further information on transactions and balances with Canpotex.
| | | |
| 70 | | AGRIUM ANNUAL REPORT 2006 |
Our Accounting Policies
Our financial statements and accounting policies are presented in accordance with generally accepted accounting principles (GAAP) in Canada. A complete explanation of differences between Canadian and U.S. GAAP is provided in note 28 to our 2006 consolidated financial statements, and a full discussion of our significant accounting policies is provided in note 1 to our 2006 consolidated financial statements.
Application of certain accounting policies requires us to make assessments as to the outcome of future events that may have a material effect on current or future earnings. We make these estimates based on technological assessment, the most recent information available to us as well as considering historical trends. Changes in estimates that may have a material impact on our results are discussed in the context of the underlying financial statement to which they relate.
Critical Accounting Policies & Estimates
We consider an accounting policy to be critical if:
| • | | impairment occurs when the carrying value of a long-lived asset exceeds its fair value; and, |
| |
| • | | changes in the estimate or different estimates that could have been selected could have a material impact on our consolidated results of operations or financial condition. |
The following discussion presents information about our most critical accounting policies:
| a) | | Plant, property and equipment |
| |
| | | We record plant, property and equipment at cost and include the cost of replacements and betterments. In the event we construct a new production facility, cost is defined as expenditures incurred up to the commencement of commercial production, and includes internal and external costs of personnel, material and services. |
| |
| | | There are two key areas requiring significant estimates in the application of our plant, property and equipment policy. These are in the determination of possible impairment and the estimating of the useful lives of assets. |
| |
| | | Impairment occurs when the carrying value of a long-lived asset exceeds both the cash flows it is capable of generating and its fair value. Fair value can be affected by a number of factors, such as new technology, market conditions for our products, availability of raw material inputs and estimated service lives of the assets. We review the carrying value of our plant, property and equipment on a regular basis, and where it exceeds both the undiscounted cash flow and fair value we consider the asset to be impaired. If impairment has occurred, an impairment charge is recognized immediately. |
| |
| | | We depreciate our plant, property and equipment based on their estimated service lives, which typically range from three to 25 years. We estimate initial service lives based on experience and current technology. These estimates may be extended through sustaining capital programs or by access to new supplies of raw materials. Factors affecting the fair value of our assets may also affect the useful lives of our assets and these factors are constantly changing. We therefore periodically review the estimated remaining lives of our facilities and adjust our depreciation rates prospectively where appropriate. |
| |
| b) | | Indefinite-Lived Intangible Assets |
| |
| | | Indefinite-lived intangible assets, including goodwill and certain other intangible assets, are assessed for impairment on at least an annual basis or more often if events or circumstances warrant. These impairment tests involve the use of both discounted and undiscounted cash |
| | | |
| AGRIUM ANNUAL REPORT 2006 | | 71 |
| | | flow analyses to assess the fair value of both indefinite-lived and long-lived assets and the recoverability of the carrying value of these assets. These analyses involve estimates of future cash flows, estimated periods of use and applicable discount rates. If the fair values of these assets as determined above are less than the related carrying values, impairment losses would be recognized, as applicable. |
| |
| c) | | Purchase Price Allocations |
| |
| | | During 2006, we acquired Nu-Gro, Royster-Clark, and Pursell. Allocation of the purchase prices for these acquisitions involved considerable judgment in determining the fair values assigned to the tangible and intangible assets acquired and the liabilities assumed on acquisition. Among other things, the determination of these fair values involved the use of discounted cash flow analyses, and estimated future prices, volumes, and operating and integration costs. |
| |
| d) | | Asset retirement obligations and environmental remediation liabilities |
| |
| | | Asset retirement obligations are recognized in the period in which they are incurred if a reasonable estimate of fair value can be determined. An asset retirement obligation is an existing legal obligation associated with the permanent removal from service of a long-lived asset, which results from the acquisition, construction, development or normal operation of the asset. The obligation is measured at fair value and is adjusted in subsequent periods through accretion expense. The associated asset retirement costs are capitalized as part of the carrying amount of the related asset. |
| |
| | | Environmental remediation liabilities relate to existing conditions caused by past operations that give rise to a present, non-retirement-related remediation requirement are expensed based on our best estimate of undiscounted future costs when remediation efforts are probable and when the costs can reasonably be estimated based on current law and existing technologies. |
| |
| | | Estimating the costs of both asset retirement obligations and environmental remediation liabilities requires extensive judgment about the nature and timing of work to be carried out in view of present environmental laws and regulations, and these estimates are subject to considerable uncertainty. Changes in these estimates could have a material impact on our results of operation and financial position. |
Management has discussed the development and selection of these critical accounting policies with the Audit Committee of the Board of Directors and the Audit Committee has reviewed the disclosure presented above relating to these policies.
Non-GAAP Disclosure
In addition to the primary measures of earnings and earnings per share in accordance with GAAP, in this MD&A we also refer to EBIT before special items (earnings before interest expense, income taxes, and special items), EBIT (earnings before interest expense and income taxes), and EBITDA (earnings before interest expense, income taxes, depreciation, amortization and asset impairment). The components of these measures are calculated in accordance with GAAP, but EBIT before special items, EBIT and EBITDA are not recognized measures under GAAP, and our method of calculation may not be comparable with that of other companies. Accordingly, EBIT before special items and EBIT should not be used as an alternative to net earnings (loss) as determined in accordance with GAAP, and similarly EBITDA should not be used as an alternative to cash provided by (used in) operations.
Business segments and income tax jurisdictions are not synonymous, and we believe that the allocation of income taxes distorts the historical comparability of the performance of our business segments. Similarly, financing and related interest charges cannot be attributed to business segments on a meaningful basis that is comparable to other companies.
| | | |
| 72 | | AGRIUM ANNUAL REPORT 2006 |
The following is a reconciliation of these key non-GAAP measures to net earnings (loss) and net earnings (loss) per share as calculated in accordance with GAAP:
| | | | | | | | | | | | | | | | | | | | | | | | | | | | | | | |
(millions of U.S. dollars except per
share amounts) | | | Retail | | | | Wholesale | | | | Advanced
Technologies | | | | Other | | | | Consolidated | | | | Diluted
Per Share | |
| | | | | | | | | | | | | | | | | | | |
2006 | | | | | | | | | | | | | | | | | | | | | | | | | | | | | | |
| | | | | | | | | | | | | | | | | | | |
EBITDA | | | | 125 | | | | | 352 | | | | | 7 | | | | | (107 | ) | | | | 377 | | | | | | |
| | | | | | | | | | | | | | | | | | | |
Less depreciation, amortization and asset impairment | | | | 30 | | | | | 261 | | | | | 8 | | | | | 6 | | | | | 305 | | | | | | |
| | | | | | | | | | | | | | | | | | | |
EBIT | | | | 95 | | | | | 91 | | | | | (1 | ) | | | | (113 | ) | | | | 72 | | | | | | |
| | | | | | | | | | | | | | | | | | | |
Interest expense | | | | | | | | | | | | | | | | | | | | | | | | (63 | ) | | | | | |
| | | | | | | | | | | | | | | | | | | |
Income taxes | | | | | | | | | | | | | | | | | | | | | | | | 24 | | | | | | |
| | | | | | | | | | | | | | | | | | | |
Net earnings | | | | | | | | | | | | | | | | | | | | | | | | 33 | | | | | 0.25 | |
| | | | | | | | | | | | | | | | | | | |
2005 | | | | | | | | | | | | | | | | | | | | | | | | | | | | | | |
| | | | | | | | | | | | | | | | | | | |
| EBITDA | | | | 113 | | | | | 614 | | | | | – | | | | | (81 | ) | | | | 646 | | | | | | |
| | | | | | | | | | | | | | | | | | | |
| Less depreciation and amortization | | | | 17 | | | | | 122 | | | | | – | | | | | 7 | | | | | 146 | | | | | | |
| | | | | | | | | | | | | | | | | | | |
| EBIT | | | | 96 | | | | | 492 | | | | | – | | | | | (88 | ) | | | | 500 | | | | | | |
| | | | | | | | | | | | | | | | | | | |
| Interest expense | | | | | | | | | | | | | | | | | | | | | | | | (49 | ) | | | | | |
| | | | | | | | | | | | | | | | | | | |
| Income taxes | | | | | | | | | | | | | | | | | | | | | | | | (168 | ) | | | | | |
| | | | | | | | | | | | | | | | | | | |
| Net earnings | | | | | | | | | | | | | | | | | | | | | | | | 283 | | | | | 2.12 | |
| | | | | | | | | | | | | | | | | | | |
2004 | | | | | | | | | | | | | | | | | | | | | | | | | | | | | | |
| | | | | | | | | | | | | | | | | | | |
| EBITDA | | | | 99 | | | | | 563 | | | | | – | | | | | (39 | ) | | | | 623 | | | | | | |
| | | | | | | | | | | | | | | | | | | |
| Less depreciation and amortization | | | | 18 | | | | | 131 | | | | | – | | | | | 7 | | | | | 156 | | | | | | |
| | | | | | | | | | | | | | | | | | | |
| Less special items: | | | | | | | | | | | | | | | | | | | | | | | | | | | | | | |
| | | | | | | | | | | | | | | | | | | |
| Kenai award and settlement | | | | | | | | | 86 | | | | | | | | | | – | | | | | 86 | | | | | | |
| | | | | | | | | | | | | | | | | | | |
| EBIT before special items | | | | 81 | | | | | 346 | | | | | – | | | | | (46 | ) | | | | 381 | | | | | | |
| | | | | | | | | | | | | | | | | | | |
| Plus special items: | | | | | | | | | | | | | | | | | | | | | | | | | | | | | | |
| | | | | | | | | | | | | | | | | | | |
| Kenai award and settlement | | | | – | | | | | 86 | | | | | – | | | | | – | | | | | 86 | | | | | | |
| | | | | | | | | | | | | | | | | | | |
| EBIT | | | | 81 | | | | | 432 | | | | | – | | | | | (46 | ) | | | | 467 | | | | | | |
| | | | | | | | | | | | | | | | | | | |
| Interest expense | | | | | | | | | | | | | | | | | | | | | | | | (69 | ) | | | | | |
| | | | | | | | | | | | | | | | | | | |
| Income taxes | | | | | | | | | | | | | | | | | | | | | | | | (132 | ) | | | | | |
| | | | | | | | | | | | | | | | | | | |
| Net earnings | | | | | | | | | | | | | | | | | | | | | | | | 266 | | | | | 1.91 | |
New Accounting Standards
Financial Instruments, Hedging Relations and Other Comprehensive Income
New accounting standards will be in effect for fiscal years beginning on or after October 1, 2006 for recognition and measurement of financial instruments, disclosure of comprehensive income, and hedge accounting. The Corporation will apply these standards beginning on January 1, 2007, resulting in the recognition of other comprehensive income, and the inclusion of accumulated other comprehensive income as a component of shareholders’ equity. The Corporation does not expect that the adoption of these standards will result in a material impact on the consolidated financial statements.
| | | |
| AGRIUM ANNUAL REPORT 2006 | | 73 |
Business Risks
We are exposed to various risks and uncertainties in the normal course of our business that can cause variations in our results from operations and affect our financial condition.
Each business unit and department monitors risks and evaluates and implements mitigating actions where appropriate. We formally review the risk profile and mitigation plans on a quarterly basis.
In some cases, financial risk may be reduced through insurance or hedging programs. However, there may be situations where these programs can be costly in relation to the risks insured, and coverage may only be partial. In other cases, risk management may involve far-reaching strategic decisions with long-term consequences. We also believe that acceptance of certain risks is both necessary and advantageous in any business, and is necessary in order to achieve our growth targets and ultimately our vision.
The following is a discussion of the key business risks that we have identified through this process and the strategies we have adopted to mitigate them. However, it should not be assumed that the process will identify and eliminate all risks, or that strategies adopted to mitigate them will necessarily be successful.
Product Price & Margin
The majority of our wholesale nutrient business is a commodity business with little product differentiation. Product prices are largely affected by supply and demand conditions, input costs and product prices and resulting margins can be volatile.
Mitigating factors and strategies:
| • | | The broad product diversity of our Wholesale business (nitrogen, potash, and phosphate) reduces the impact of poor supply and demand fundamentals that can be experienced by a particular product category. |
| |
| • | | The geographic diversity of our customer base (North America, South America, international) reduces the impact of poor economic, crop or weather conditions in any one region. |
| |
| • | | Our extensive distribution and storage capability can help reduce wholesale variability that may arise from a downturn in demand in a localized area. |
| |
| • | | Our commitment to operational excellence helps ensure rigorous management of operational risks that could compromise production efficiencies or increase operating costs. |
| |
| • | | Our customers have diverse end-uses for our products (agriculture and industrial), with some of our industrial sales prices based on a cost of production plus margin basis. |
| |
| • | | Our Retail and Advanced Technologies businesses provide stability to our annual cash flows and earnings. |
| |
| • | | We also make prepay forward sales and may lock in nitrogen margins using forward gas price hedging. |
| | | |
| 74 | | AGRIUM ANNUAL REPORT 2006 |
| • | | Within our Retail business, we have further mitigating factors including: |
| | o | | product and service diversity (fertilizer, chemical, seed and application services); and, |
| |
| | o | | geographic diversity that helps spread risk associated with regional weather and crops (broad regional U.S. and South American markets). |
Raw Materials
Natural gas is the principal raw material used to manufacture nitrogen and is our single largest purchased raw material for our Wholesale operation. North American natural gas prices are subject to price volatility. An increase in the price of natural gas increases our nitrogen cost of production, and may negatively impact our nitrogen margins for our North American nitrogen sales. This is particularly important for our facilities where we purchase gas on the open market, such as at our four nitrogen facilities in Western Canada and our Borger, Texas nitrogen facility. Higher production costs may, under certain circumstances, be partially or fully reflected in higher domestic and international product prices, but these conditions do not always prevail. Gas availability at our Kenai, Alaska facility continues to be a risk factor given the regional tight gas market and the impact cold weather can have on gas availability. There is also a risk to our Profertil nitrogen facility on the delivered cost of gas.
There are inherent risks associated with mining. For phosphate there are risks associated with the variability of the phosphate rock quality that can impact cost and production volumes. For potash mining there is also a risk of incurring water intake or flooding.
Mitigating factors and strategies:
| • | | Our Kenai and Profertil nitrogen facilities have gas contracts that are not tied to North American gas prices. |
| |
| • | | We successfully concluded gas supply contract negotiations with Alaskan gas producers that is expected to allow continued operation of the Kenai facility until October 31, 2007. |
| |
| • | | In the short term, we use derivative instruments and other contractual arrangements to attempt to reduce the risk of gas price volatility. |
| |
| • | | Our practice of adjusting our production rates and sourcing supply for our customers from purchased product when conditions dictate reduces our exposure to high natural gas costs. |
| |
| • | | The majority of our nitrogen sold in North America is produced in Western Canada, which has lower-cost gas than the average cost for our competitors who produce and sell elsewhere in North America. |
| |
| • | | In the long term, our goal is to increase our nitrogen capacity in areas where long-term supplies of lower-cost trapped natural gas are available. |
| |
| • | | For mining, we have medium-term highly competitive contracts in place with suppliers and maintain high mining standards, employing the latest technologies and techniques to minimize the risk of accident. |
| | | |
| AGRIUM ANNUAL REPORT 2006 | | 75 |
Weather
Anomalies in regional weather patterns can have a significant and unpredictable impact on the demand for our products and services, and may also have an impact on prices. Our customers have limited windows of opportunity to complete required tasks at each stage of crop cultivation. Should adverse weather occur during these seasonal windows, we could face the possibility of reduced revenue in the season without the opportunity to recover until the following season. In addition, we face the significant risk of inventory carrying costs should our customers’ activities be curtailed during their normal seasons. We must manufacture product throughout the year in order to meet peak season demand, and we must react quickly to changes in expected weather patterns that affect demand.
Mitigating factors and strategies:
| • | | Our extensive distribution and storage system allows us to move products to locations where demand is strongest. However, our ability to react is limited by the shortness of the peak selling season and margins on these sales in markets further from our production facilities will be lower due to higher transport costs and potentially lower sales prices. |
| |
| • | | Geographic diversity of our Wholesale markets and our Retail facilities affords some protection against regional weather patterns. |
| |
| • | | We also mitigate our exposure to weather-related risk through our sales to industrial customers, which are not dependent on regional weather factors. Industrial sales represent approximately 15 percent of our Wholesale net sales. |
Climate Change
Canada’s federal government introduced the “Clean Air Act” in the fall of 2006. This piece of legislation intends to regulate a multitude of air pollutants, including emissions contributing to climate change. The impact of this shift in policy is yet to be determined, but ammonia is one of the relevant items listed in the legislation to be further regulated. Agrium is working with the government on its own and through its industry association to identify a sustainable way to reduce emissions at our plants and in growers’ fields.
The fertilizer industry is identified as a “large final emitter” by Canada’s regulators, and as such, many of Agrium’s Canadian production facilities will be subject to regulated reductions in greenhouse gas emissions. The magnitude and time frame, and thereby the additional regulatory burden and compliance costs incurred, are still to be determined. Further, in a globally competitive fertilizer industry there is a risk of an unequal playing field emerging providing a competitive advantage for nitrogen producers who are not subject to equivalent compliance measures.
Mitigating factors and strategies:
| • | | We track our annual air emissions and have proactively undertaken projects designed to improve plant energy efficiencies and reduce all emissions. |
| |
| • | | We have taken, and will continue to take a leadership role in the fertilizer industry’s negotiations with the government on fair and equitable air emission reduction targets and a pragmatic and realistic compliance system that preserves the global competitiveness of the industry. |
| | | |
| 76 | | AGRIUM ANNUAL REPORT 2006 |
Transportation
Reducing the delivered cost and ensuring reliability of product delivery to our customers are key success factors of our Wholesale marketing operations. A potential medium-term risk is the increased regulations and costs of transporting ammonia within North America given the safety risks of transporting this product.
Mitigating factors and strategies:
| • | | We develop detailed forecasts of product movement needs for each facility and mode of transport. |
| |
| • | | We develop a strategic plan, with specific options, to help mitigate the potential for increased cost or the reduced deliverability of ammonia and other products over the medium term, and continue to work with industry associations to address these issues. |
| |
| • | | We continually develop and maintain mutually beneficial long-term relationships with major carriers. |
| |
| • | | Most of our production facilities are serviced through multiple carriers and modes of transportation, providing us with important shipping options. |
| |
| • | | We maintain multiple supply points through our extensive distribution network. |
Country Risk
We have significant operations in Canada and the U.S. We also operate wholesale and retail operations in Argentina and expect to further expand international operations. International business exposes us to a number of risks, such as uncertain economic conditions in the foreign countries in which we do business, abrupt changes in foreign government policies and regulations, restrictions on the right to convert and repatriate currency and political risks.
Mitigating factors and strategies:
| • | | We seek to partner with reputable firms with experience or significant presence in foreign countries in which we operate or intend to operate. |
| |
| • | | We hire personnel located in the foreign country or who have operating experience in the foreign country. |
| |
| • | | We obtain non-recourse project financing with consortiums of international banks where appropriate. |
| |
| • | | We maintain excess cash related to international operations in U.S. dollars to the extent practicable. |
| |
| • | | We increase our required investment return to reflect our perceived risk of conducting business in specific countries. |
| | | |
| AGRIUM ANNUAL REPORT 2006 | | 77 |
Foreign Exchange
A significant shift in value of the Canadian dollar against the U.S. dollar could impact the earnings of our Canadian operations, which earn revenues mainly in U.S. dollars and incur expenses, mainly in Canadian dollars. The major impact would be to our Canadian Potash and Phosphate operations, on a per unit cost of goods sold basis, as well as corporate overhead costs.
Mitigating factors and strategies:
| • | | Exposure to currency fluctuations is partially managed through our currency hedging programs. |
Human Resources
The tight labor market across many areas in which we operate and the associated risk of losing key individuals from the company is a risk to the business.
Mitigating factors and strategies:
| • | | We have a structured annual Succession Planning process focused on actively accelerating the development of leaders through targeted developmental opportunities. |
| |
| • | | We conduct a continuous review and analysis of our Total Compensation program to ensure our offering to employees is competitive in the markets in which we compete for talent. |
| |
| • | | We maintain a focused approach to recruiting, developing and retaining key employees, which will be supported by a formalized Talent Acquisition model currently under development. |
Integration of Acquisitions and Expansions
There is a risk associated with any new acquisition that the new business is not integrated into the broader organization in an optimal manner that would ensure expected or optimal synergies are fully realized. Similarly, there is a risk that expansions to existing facilities or greenfield developments undertaken may not return the anticipated expected return on investment.
Mitigating factors and strategies:
| • | | We have developed a detailed and systematic project review system to analyze the rewards/risks of all significant investment projects, including acquisitions and expansions. Each investment project must pass a “gate” process where it is reviewed by an investment strategy committee to ensure it passes key criteria such as strategic fit, economic return or our hurdle rate and various competitive and risk factors. |
| |
| • | | As part of this process, we assign specific areas of responsibility to key personnel at Agrium with experience in those areas who are then held accountable for results. |
| |
| • | | We conduct extensive due diligence reviews and financial modeling analyses. |
| |
| • | | We complete periodic assessments of previous acquisitions to update and enhance current and future strategies in the spirit of continuous improvement and to ensure we remain a disciplined investor. |
| | | |
| 78 | | AGRIUM ANNUAL REPORT 2006 |
Legislative Tax
Tax risk includes potential changes to tax laws, or in interpretations of tax laws, which may negatively impact our tax expense and therefore operating results in the jurisdictions in which we operate.
Mitigating factors and strategies:
| • | | Our tax department proactively participates in tax and industry organizations and maintains contacts with an extensive network of local and international tax consultants. |
| |
| • | | We have centralized responsibility over the tax function in all the jurisdictions in which we operate. |
Counterparty
We face the risk of loss should a counterparty be unable to fulfill its obligations with respect to accounts receivable or other contracts, including derivative hedging contracts.
Mitigating factors and strategies:
| • | | We have established credit procedures that include rigorous assessment of a counterparty’s credit-worthiness and adherence to credit limits. |
| |
| • | | For derivative hedging contracts, we have established counterparty trading limits and netting agreements. |
| |
| • | | In our Retail segment, we service customers in diverse geographic markets, reducing the impact of poor economic or crop conditions in any particular region. |
Environment, Health & Safety (EH&S)
Agrium faces environmental, health, safety and security risks typical of those found throughout the agriculture sector and the fertilizer supply chain. This includes the potential for risk of physical injury to employees and contractors; possible environmental contamination and human exposure from chemical releases and accidents during manufacturing, transportation, storage and use; and the security of our personnel, products and physical assets domestically and overseas. In 2006, Agrium’s long-standing risk profile changed with the acquisition of three new businesses that included new markets and advance planning associated with prospective overseas expansions.
One additional risk associated with the Royster-Clark acquisition is that some of these retail centers continue to carry agriculture grade ammonium nitrate, which our Wholesale and Retail announced in 2006 that we would no longer produce or carry.
| | | |
| AGRIUM ANNUAL REPORT 2006 | | 79 |
Mitigating factors and strategies:
| • | | We limit the number of farm centers offering ammonium nitrate to less than fifteen, developing a detailed Retail security plan for remaining locations and ensuring that virtually all product is sold as a blend with other fertilizer products and that we blend and apply the product for the grower as much as possible. Our long-term goal is to phase out carrying ammonium nitrate entirely. |
| |
| • | | We ensure strong board, executive and plant management leadership, engagement and participation on EH&S matters. |
| |
| • | | Highly skilled EH&S personnel are at all levels of the organization. |
| |
| • | | An increasingly well-defined set of EH&S Key Performance Indicators, annual goals and systems is cascaded from the Chief Executive Officer throughout the organization. |
| |
| • | | Ongoing, close working relationships with industry associations, government agencies and law enforcement ensure “best practices,” other risk management strategies and new regulations are known, understood and met in a timely fashion. |
| |
| • | | A three-tier system for compliance assurance provides the appropriate levels of management (corporate, business unit, local) with more frequent assessment of their risk reduction opportunities. |
| |
| • | | Annually, we review our EH&S Policy for relevancy and modify it as necessary. |
| |
| • | | We regularly evaluate and redefine the roles of business unit and corporate EH&S personnel. |
| |
| • | | We drive responsibility for compliance assurance deeper into the organization, increasing the frequency at which systemic, regulatory and business risk control measures are evaluated and improved for optimal results. |
Controls & Procedures
Agrium maintains disclosure controls and procedures designed to provide reasonable assurance that information required to be disclosed by Agrium in its annual filings, interim filings (as these terms are defined in Multilateral Instrument 52-109 Certification of Disclosure in Issuers’ Annual and Interim Filings) and other reports filed or submitted by it under provincial and territorial securities legislation is recorded, processed, summarized and reported within the required time periods. Our Chief Executive Officer (CEO) and Chief Financial Officer (CFO), after evaluating the effectiveness of our disclosure controls and procedures as of the end of the period covered by the annual filings, being December 31, 2006, have concluded that, as of such date, our disclosure controls and procedures were effective to provide reasonable assurance that information required to be disclosed by Agrium in reports that it files or submits is (i) recorded, processed, summarized and reported within the time periods as required, and (ii) accumulated and made known to management, including the CEO and CFO, to allow timely decisions regarding required disclosure.
| | | |
| 80 | | AGRIUM ANNUAL REPORT 2006 |
Our disclosure controls and procedures are designed to provide reasonable assurance of achieving their objectives and, as indicated in the preceding paragraph, the CEO and CFO believe that our disclosure controls and procedures are effective at that reasonable assurance level, although the CEO and CFO do not expect that the disclosure controls and procedures will prevent all errors and fraud. A control system, no matter how well conceived or operated, can provide only reasonable, not absolute, assurance that the objectives of the control system are met.
Management is responsible for establishing and maintaining adequate internal control over financial reporting, as defined in Rules 13a-15(f) and 15d-15(f) under the Securities Exchange Act of 1934, as amended. Internal control over financial reporting is designed to provide reasonable assurance regarding the reliability of financial reporting and preparation of financial statements for external purposes in accordance with generally accepted accounting principles.
Under the supervision and with the participation of our management, including our CEO and CFO, we conducted an evaluation of the design and effectiveness of our internal control over financial reporting as of the end of the fiscal year covered by this report based on the framework issued by the Committee of Sponsoring Organizations of the Treadway Commission (“COSO”) inInternal Control — Integrated Framework. We excluded from our assessment the internal control over financial reporting at our Royster-Clark business, which was acquired effective February 9, 2006 and whose financial statements reflect total assets of eight percent, net sales of 22 percent and a loss of four percent before interest expense and income taxes of our consolidated total assets, net sales and income as of and for the fiscal year ended December 31, 2006. Based on this evaluation, management concluded that as of December 31, 2006, the Company did maintain effective internal control over financial reporting.
Management’s assessment of the effectiveness of internal control over financial reporting as of December 31, 2006 was audited by KPMG LLP, an independent registered public accounting firm, as stated in their report, which is included in this 2006 Annual Report to Shareholders.
There have been no changes in Agrium’s internal control over financial reporting during both 2006 and the most recent interim period that have materially affected, or are reasonably likely to materially affect, its internal control over financial reporting.
| | | |
| AGRIUM ANNUAL REPORT 2006 | | 81 |