EXHIBIT 99.2
AGRIUM INC.
2011
MANAGEMENT’S DISCUSSION & ANALYSIS OF
OPERATIONS AND FINANCIAL CONDITION
February 23, 2012
Inside the MD&A
Management’s Discussion and Analysis
This Management’s Discussion and Analysis (“MD&A”) of operations and financial condition focuses on Agrium’s long-term vision, strategy and growth opportunities as well as its historical performance for the two years ended December 31, 2011. The Board of Directors carries out its responsibility for review of this disclosure principally through its audit committee, comprised exclusively of independent directors. The audit committee reviews, and prior to publication, approves, pursuant to the authority delegated to it by the Board of Directors, this disclosure. The reader should consider the cautionary notes regarding forward-looking statements (page 76) and the Consolidated Financial Statements and related notes (pages 82 to 133).
Throughout this MD&A (unless otherwise specified), “Agrium”, “the Company”, “we”, “our”, “us” and similar expressions refer collectively to Agrium Inc. and its subsidiaries, any partnerships involving Agrium Inc. or any of its subsidiaries, and our significant equity investments and joint ventures.
The Company’s consolidated quarterly and annual financial information and its Annual Information Form (“AIF”) are available at SEDAR (www.sedar.com). The Company’s reports are also filed with the United States (“U.S.”) Securities and Exchange Commission on EDGAR (www.sec.gov).
All dollar amounts refer to U.S. dollars except where otherwise stated. 2011 and 2010 financial information presented and discussed in this MD&A is prepared in accordance with International Financial Reporting Standards (“IFRS”) as issued by the International Accounting Standards Board (“IASB”). All financial information prior to 2010 is prepared in accordance with previous Canadian generally accepted accounting principles (“CGAAP”) in place prior to the adoption of IFRS. For more information about our conversion to IFRS, please see note 30 of the Notes to the Consolidated Financial Statements.
FORWARD-LOOKING STATEMENTS
Certain statements and other information included in this MD&A constitute “forward-looking information” within the meaning of applicable Canadian securities legislation or “forward-looking statements” within the meaning of applicable U.S. securities legislation (collectively herein referred to as “forward-looking statements”), including the “safe harbour” provisions of provincial securities legislation and the U.S. Private Securities Litigation Reform Act of 1995, Section 21E of the U.S. Securities Exchange Act of 1934, as amended, and Section 27A of the U.S. Securities Act of 1933, as amended. Forward-looking statements are typically identified by the words “believe”, “expect”, “anticipate”, “project”, “intend”, “estimate”, “outlook”, “focus”, “potential”, “will”, “should”, “would”, “could” and other similar expressions. These forward-looking statements include, but are not limited to, references to: disclosures made under the heading “Crop Input Situation and 2012 Outlook”; our 2012 key corporate goals, including expansion and growth of our business and operations; estimates, forecasts and statements as to management’s expectations with respect to, among other things, business, growth, demand and financial prospects, financial multiples and accretion estimates, future trends, plans, objectives and expectations; key drivers for our business and industry trends; future capital expenditures and capital resources; future cash requirements and long-term obligations; anticipated tax rates; business strategies and plans for implementing them; future crop input sales and prices; availability of raw materials; risk mitigation activities; environmental and civil liabilities; and our future results and plans, including any expected synergies and benefits received from, and our integration plans relating to, our recent, proposed and future acquisitions and dispositions.
These forward-looking statements are based on certain assumptions and analyses made by us in light of our experience and perception of historical trends, current conditions and expected future developments as well as other factors we believe are appropriate in the circumstances. In addition, readers are cautioned not to place undue reliance on the forward-looking statements which involve known and unknown material risks and uncertainties that may cause our actual results, performance or achievements to be materially different from any future results, performance or achievements expressed or implied by such forward-looking statements. Please refer to the discussion under the heading “Key Assumptions and Risks in Respect of Forward-Looking Statements” with respect to the material assumptions and risks associated with the forward-looking statements. All of the forward-looking statements contained in this MD&A are qualified by the cautionary statements contained herein and by stated or inherent assumptions and apply only as of the date of this MD&A. Except as required by law, Agrium disclaims any intention or obligation to update or revise any forward-looking statements as a result of new information or future events.
Additional risks and uncertainties that may affect all forward-looking information included in this MD&A include, but are not limited to, the following:
| ¨ | General economic, market, business and weather conditions, including global agricultural supply/demand factors and crop price levels; global and regional supply/demand factors impacting the crop input application season and the price of crop nutrients and raw materials/feedstock; global economic and market conditions affecting availability of credit and access to capital markets; build-up of inventories in distribution channels; changes to foreign exchange rates; tightening of the labor market; and availability of labor supply; |
| ¨ | Changes in government policies and legislation and regulation, or the interpretation, administration and enforcement thereof, in the jurisdictions in which we operate, regarding agriculture and crop input prices, safety, production processes, environment, greenhouse gas and others; |
AGRIUM2011 ANNUAL REPORT 9
| ¨ | Actions by competitors and others that include changes to industry capacity, utilization rates and product pricing; performance by customers, suppliers and counterparties to financial instruments; potential for expansion plans to be delayed; and restrictions on our ability to transport or deliver production to markets, including potential changes to anti-trust laws, or interpretations thereof, that could negatively impact our international marketing operations through Canpotex Limited (“Canpotex”) the offshore marketing agency for potash produced in the Province of Saskatchewan, wholly-owned by us and the two other major potash producers in Canada; |
| ¨ | Changes in margins and/or levels of supplier rebates for major crop inputs such as crop protection products, nutrients and seed, as well as crop input prices declining below cost of inventory between the time of purchase and sales; |
| ¨ | General operating risks associated with investment in foreign jurisdictions; the level and effectiveness of future capital expenditures; reliability of performance of existing capital assets; and fluctuations in foreign exchange and tax rates in the jurisdictions in which we operate; |
| ¨ | Future operating rates, production costs and sustaining capital of our facilities; unexpected costs from present and discontinued mining operations and/or labor disruptions; changes to timing, construction cost and performance of other parties; and political risks associated with our interest in the Egyptian Misr Fertilizers Production Company S.A.E. (“MOPCO”), Argentine Profertil nitrogen facilities, and other facilities; |
| ¨ | Changes in development plans for our potash expansion project, nitrogen de-bottlenecking and other major capital expansion projects, including the potential for capital construction costs to be higher than expected or construction progress to be delayed, due to factors such as availability of equipment and labor, the performance of other parties, risks associated with technology or inflationary pressure; |
| ¨ | Environmental, health, safety and security risks typical of those found throughout the agriculture, mining and chemical manufacturing sectors and the fertilizer supply chain, including risk of injury to employees and contractors, possible environmental contamination, risks associated with the transportation, storage and use of chemicals and the security of our facilities and personnel; |
| ¨ | Integration risks that might cause anticipated synergies from our recent (including those described in this MD&A) and future acquisitions to be less than expected, including: the acquired business’ actual results being different than those upon which we based our expectations; and industry factors which may affect us and the acquired business in general and thereby impact the demand for our products and services; and |
| ¨ | Strategic risks including our ability to effectively implement our business strategy and our risk mitigation strategies, including hedging and insurance; our ability to close pending and proposed acquisitions and dispositions as anticipated and to integrate and achieve synergies from any assets we may acquire within the time or performance expected of those assets; and the introduction of technologies in the agricultural industry that may be disruptive to our business. |
The above items and their possible impact are discussed more fully in the relevant parts of this MD&A, including the sections headed “Key Business Sensitivities” and “Enterprise Risk Management” and in our Annual Information Form.
Non-IFRS Financial Measures
Some financial measures referenced in this MD&A are not recognized under IFRS, including net earnings (loss) from continuing operations before finance costs, income taxes, depreciation, amortization and asset impairment (“EBITDA”). Net debt includes short-term and long-term debt, net of cash and cash equivalents. Net debt is not a recognized measure under IFRS and our method of calculation may not be comparable to other companies. Please refer to the discussion of non-IFRS measures on page 42 when referring to these measures.
10 CULTIVATING PERFORMANCE.DELIVERING VALUE.
Executive Summary //
Cultivating Performance, Delivering Value
2011 IN REVIEW
2011 was a record year for Agrium. We reported the highest consolidated net earnings (“net earnings”) in our 17-year history, with record earnings from both our Wholesale and Retail business units. Net earnings in 2011 were almost double those achieved in 2010, and surpassed the previous record set in 2008. These outstanding results were achieved in part due to strong demand for all crop inputs, as strong global crop prices and record grower cash margins provided an economic incentive for farmers to optimize planted acreage and yields. Agrium is one of the world’s largest publicly traded wholesale producers and distributors of crop nutrients and the leading global agricultural retailer and provider of controlled-release nutrients. We believe that our unique position across the agricultural value chain, combined with our focus on cultivating strong performance in all that we do and our expectation of the persistent strength in agricultural fundamentals, will allow us to continue delivering value to all of our stakeholders.
2011 // Consolidated and Business Unit Financial Performance
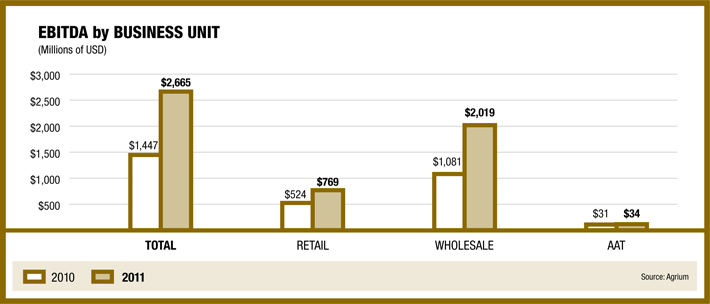
In 2011, Agrium’s net earnings from continuing operations were $1.5-billion, significantly higher than the $730-million in 2010 and higher than the previous record of $1.3-billion in 2008, and were supported by strong industry fundamentals. Our 2011 EBITDA also rose to a record $2.7-billion in 2011, from $1.4-billion in 2010. OurRetail business unit achieved record EBITDA of $769-million in 2011, compared to $524-million in 2010, as a result of stronger demand for crop inputs related to higher crop prices, as well as the inclusion of a full year of results from various acquisitions, including the Landmark Rural Holdings Limited (“Landmark”) business in Australia. OurWholesale business unit also achieved record EBITDA of $2.0-billion in 2011 compared to $1.1-billion in 2010, due to higher margins across all our major nutrient products as a result of higher global nutrient pricing and our competitive cost structure. Agrium’sAdvanced Technologies (“AAT”) business unitproduced EBITDA of $34-million in 2011, compared to $31-million in 2010 due to stronger grower demand and pricing for Environmentally Smart Nitrogen - ESN® (“ESN”) and the inclusion of earnings from recent acquisitions.
AGRIUM2011 ANNUAL REPORT 11
Our Retail Business Unit
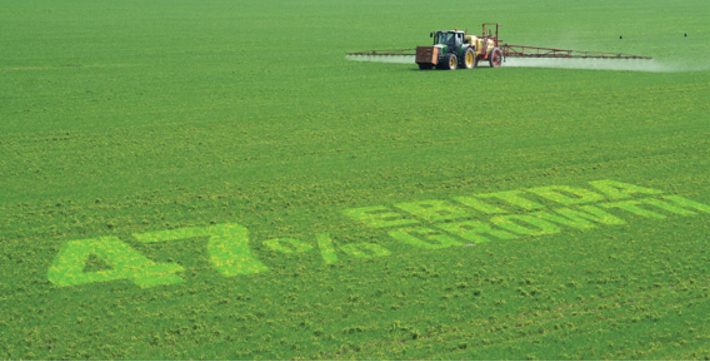
Agrium’s Retail business unit offers innovative crop input products and services to our grower customers across North America, South America and Australia. Our proven ability to supply customers with leading products and services, including high quality seed, crop nutrition, crop protection and related services, has enabled the business to grow significantly in both size and profitability. Our Retail business unit demonstrated significant growth in 2011, with sales increasing by 48 percent to reach a record $10.3-billion and EBITDA increasing by 47 percent to reach a record $769-million.
RETAIL // Strategy
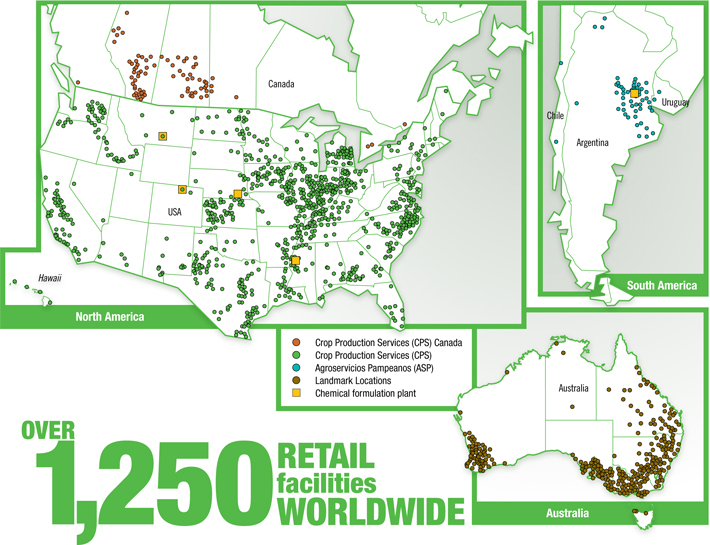
Our proven business model and focus on growth has made us the largest agricultural retailer in the United States, as well as one of the largest in Australia and Argentina. We have also established a growing presence in Western Canada, Uruguay and Chile. Retail works with growers to implement best management practices based on a thorough understanding of local soils, climate conditions and crop requirements. We provide innovative technologies, products and experience, backed by a commitment to sound environmental practices. Retail also offers application services for the products we sell, using the latest equipment and standards to meet growers’ needs. Agrium’s business activities support our farm customers in meeting the demands of a growing global population for healthy foods and a sustainable future.
A core component of our Retail strategy is the focus we place on performance management, building upon our strong grower relationships and the strength of our brands – including our proprietary Loveland Products, Inc. (“Loveland”) crop protection products and Dyna-Gro seed. We provide a complete offering of products and agronomic services in order to achieve greater market penetration and stronger customer loyalty. Additionally, we strive to build strong relationships with leading growers in each of our markets, allowing us to grow along with our customers. As the world’s largest publically traded crop input retailer, we leverage the scale of our retail chain to minimize costs, to grow sales of our proprietary products and to adopt appropriate technologies to more effectively serve our customers. Our proven record of value-added growth is expected to continue to stem from improvements to the base business, particularly through a focus on expanding our seed market share and proprietary crop protection products, as well as through acquisitions. Through it all, we are committed to protecting the environment and the health and safety of our employees, customers and the communities in which we operate.
12 CULTIVATING PERFORMANCE.DELIVERING VALUE.
RETAIL // Key Developments
In December 2010, Agrium acquired Landmark, the leading agricultural retailer in Australia through its acquisition of AWB Limited (“AWB”). Landmark is comprised of more than 250 retail facilities serving the major agricultural regions of the country. Landmark’s sales were $2.2-billion in 2011, and as a result, this acquisition will influence comparability of our year-over-year results, as only one month of Landmark’s results are included in our 2010 results.
In 2011, we continued to make numerous smaller retail acquisitions across the U.S. and Canada, representing an additional 32 retail locations and nearly $210-million in annual sales. One of the larger acquisitions in 2011 was International Mineral Technologies (“Tetra Micronutrients”), a specialty producer, marketer and distributor of custom liquid plant nutrition and dry micronutrients located in Fairbury, Nebraska. Agrium Retail will benefit from the ability to continue marketing Tetra Micronutrients liquid products through our Loveland branded product line, while also capturing the associated manufacturing margin. Additionally, AAT will operate and market product from Tetra Micronutrients’ dry granulation facility.
AGRIUM2011 ANNUAL REPORT 13
RETAIL // Financial Results
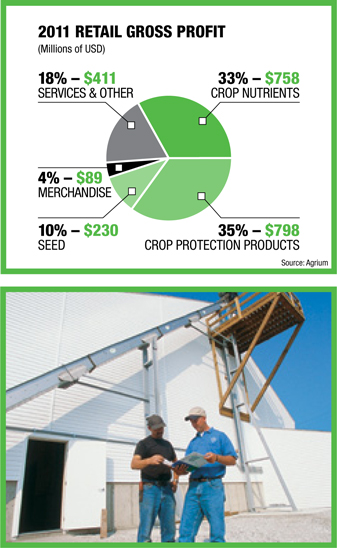
Retail delivered record 2011 results in terms of sales, gross profit and earnings from continuing operations before finance costs and income taxes (“EBIT”). Retail sales reached $10.3-billion in 2011, compared to $7.0-billion in 2010. Gross profit rose to $2.3-billion, from $1.6-billion in 2010. EBIT was $600-million, compared to $409-million in 2010 and EBITDA was $769-million, up from $524-million the year before.
The strength in the 2011 financial results was driven by a combination of strong global crop prices and high planted acreage in key regions, which supported both demand and prices for crop input products. The addition of the Landmark business in 2010 and numerous other smaller 2011 acquisitions were also important contributing factors. Landmark accounted for about $2.2-billion in sales and $419-million in gross profit in 2011. Depreciation and amortization expense increased to $169-million in 2011, compared to $115-million in 2010, primarily due to full-year inclusion of the acquisition of Landmark and other recent retail acquisitions. Record sales were partly offset by a corresponding increase in the cost of product sold, which was $8.0-billion in 2011, compared to $5.4-billion in 2010.
RETAIL // Expenses
Retail selling expense rose to $1.6-billion in 2011, compared to $1.1-billion in 2010. Higher selling expenses were due to the increased scale of the business through acquisitions, the increase in fuel costs and performance-based incentives in our legacy retail operations. The addition of the Landmark business accounted for approximately 70 percent of the increase in selling expenses in 2011. Retail selling expense tends to vary directly with sales activity. We also measure EBIT and EBITDA as a percent of sales, in addition to gross margins. In 2011, EBIT amounted to 6 percent of sales, while EBITDA was 7 percent. Total 2011 selling expense as a percentage of sales was 15.5 percent, slightly lower than the 15.7 percent recorded in 2010.
Retail Performance
| | | | | | | | |
Years ended December 31, (millions of U.S. dollars, except as noted) | | 2011 | | | 2010 | |
Sales | | | 10,316 | | | | 6,969 | |
Cost of product sold | | | 8,030 | | | | 5,418 | |
Gross profit | | | 2,286 | | | | 1,551 | |
Selling | | | 1,595 | | | | 1,094 | |
General and administrative | | | 120 | | | | 61 | |
Earnings from associates | | | (1 | ) | | | — | |
Other income | | | (28 | ) | | | (13 | ) |
EBIT | | | 600 | | | | 409 | |
EBITDA | | | 769 | | | | 524 | |
EBITDA as a percent of sales(%) | | | 7 | | | | 8 | |
Crop nutrients: Products and services
Retail supplies the crop nutrients that are essential to growing healthy plants, including dry and liquid nitrogen, phosphate, potash, sulfur and micronutrients. These are typically bulk blended at Agrium Retail branches to match local conditions and grower requirements for each field and crop. Our Retail agronomists use the 4R Nutrient Stewardship system to help determine the right nutrient source, in the right amounts, applied at the right time and in the right place. The 4R Nutrient Stewardship provides a framework to achieve cropping system goals, like increasing production, increasing grower profitability and improving environmental protection. The four ‘rights’ are interdependent and all are necessary for sustainable plant nutrition management. Our Retail branches understand the complexity of growing crops. They work closely with growers to understand their goals and then deliver the products, the agronomic advice and the product application services that help achieve them. Agrium Retail also delivers additional value to growers through its application business which is provided on a fee-for-service basis.
Agrium Retail operations acquire crop nutrient products from a wide variety of suppliers at market prices, including purchases from Agrium Wholesale. Crop nutrients accounted for 44 percent of Retail sales in 2011.
14 CULTIVATING PERFORMANCE.DELIVERING VALUE.
Crop nutrients: Financial results
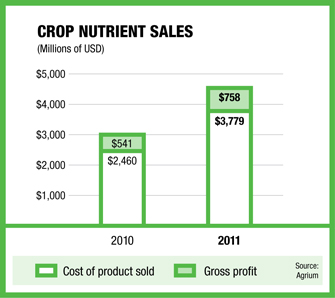
Crop nutrients sales were $4.5-billion in 2011, compared to $3.0-billion in 2010. The increase was due to the full-year impact of the Landmark retail network in Australia, high crop nutrient prices and strong demand due to higher seeded acreage and excellent cash margins for our grower customers. Cost of product sold rose for the same reasons in 2011 to $3.8-billion, compared to $2.5-billion in 2010. Total gross profit for the year was $758-million, compared to $541-million in 2010. The significant increase was due to strong nutrient margins and higher sales volumes in 2011. Margins on crop nutrient sales decreased slightly in 2011 to 16.7 percent, compared to 18.0 percent in 2010, due to lower margins on the recently acquired Landmark business. The Landmark nutrient margins are lower than in North America as Landmark nutrients are sold primarily on a fee-for-service basis rather than blending nutrients at the farm center to the specific needs of each grower’s field.
Crop protection products: Products and services
Agrium Retail’s crop protection business markets a broad spectrum of herbicide, fungicide, adjuvant and insecticide products that help growers minimize yield losses and protect crop quality from weeds, disease and insects. Our Retail business serves as both a retailer of crop protection products and a wholesaler to other retail operators. We buy brand-name and generic products from recognized suppliers and we market more than 250 proprietary, Loveland branded products across more than 30 countries. We are the largest distributor of crop protection products in the U.S. and we own and operate four blending and formulation facilities in Greeley, Colorado; Billings, Montana; Greenville, Mississippi; and Casilda, Argentina.
Crop protection products: Financial results
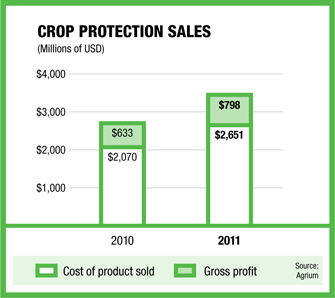
Crop protection sales increased to $3.4-billion in 2011, compared to $2.7-billion in 2010. The cost of crop protection products also increased to $2.7-billion in 2011, compared to $2.1-billion in 2010. Gross profit for this product category reached $798-million in 2011, compared to $633-million in 2010. The notable increase in sales, costs and margins was primarily due to the addition of the Landmark business. Over 29 percent of the increase in sales was due to stronger demand for crop protection products in our legacy retail operations, which more than offset the impact of continued depressed glyphosate prices globally. In North America, our proprietary Loveland products accounted for approximately 16 percent of our total crop protection product sales and contributed margins significantly higher than other crop protection products.
Seed: Products and services
Agrium Retail’s network is an important source of seed product and information for growers in the over $15-billion U.S. seed market. We offer our own Dyna-Gro branded seed and also procure seed from top global suppliers. Our Dyna-Gro seed specialists source key genetics from major seed suppliers and match seed characteristics to local soil and growing conditions for best results in each area. Increases in seed market share, combined with continued technological advancements in seed genetics and our focus on delivering high quality seed products to our customers, all provide significant potential for continued strong growth.
AGRIUM2011 ANNUAL REPORT 15
Seed: Financial results
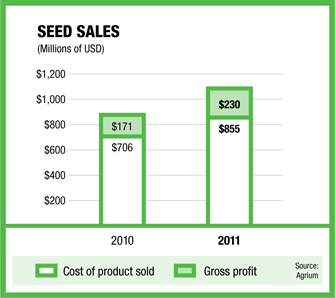
Seed sales reached $1.1-billion in 2011, an increase of 24 percent compared to the $877-million reported in 2010. This significant increase in seed sales was due to a combination of factors: the continued growth of our private label branded Dyna-Gro seed sales; expanded acreage, particularly for corn and cotton crops in the U.S. this year; and the impact of recent acquisitions, including the Landmark business in Australia. Gross profit from seed was $230-million, compared to $171-million in 2010. In 2011, Agrium’s proprietary Dyna-Gro branded seed sales rose by 19 percent over the previous year and accounted for 19 percent of our total seed sales in 2011.
Merchandise: Products and services
The merchandise product category includes wool, fencing, feed supplements, animal health products and other products, such as irrigation equipment. The size of the merchandise category has become large enough to be reported separately as this is a much larger component of the Landmark business than for Agrium’s legacy retail operations.
Merchandise: Financial results
Merchandise sales totaled $629-million for 2011, compared to $158-million in 2010. Gross profit reached $89-million, compared to $14-million in 2010. Virtually all of the year-over-year increase in sales and gross profit was due to the inclusion of Landmark’s significant merchandise business into Agrium Retail.
Services and Other: Products and services
Agrium delivers value to growers and earns customer loyalty through services such as product application, soil and leaf testing and crop scouting. We maintain a large fleet of application equipment in order to ensure timely applications at optimal rates, helping customers to maximize yields while saving time and resources. Landmark services also include agency fees associated with providing customers with livestock and wool marketing and various financial and real estate services.
Crop Production Services offers customers a variety of specialty services in the Western U.S. to help ensure effective crop input applications aimed to optimize yields and minimize input losses on the region’s high-value crops. This includes operation of our Precision Ag Lab laboratory services and a wireless network of weather stations in the region. The stations supply field-specific weather data and soil moisture information to proprietary software that predicts disease and infestation.
Services and Other: Financial results
Sales for this product grouping were $616-million in 2011, compared to $230-million in 2010. This was largely due to the inclusion of the Landmark livestock, wool and agency businesses, and to strong demand for application services in North America as a result of high crop prices. Gross profit reached $411-million in 2011, compared to $192-million the previous year.
Segment Performance
| | | | | | | | |
Years ended December 31, (millions of U.S. dollars, except as noted) | | 2011 | | | 2010 | |
Crop nutrients | | | | | | | | |
Sales | | | 4,537 | | | | 3,001 | |
Cost of product sold | | | 3,779 | | | | 2,460 | |
Gross profit | | | 758 | | | | 541 | |
Gross profit (%) | | | 16.7 | | | | 18.0 | |
Crop protection products | | | | | | | | |
Sales | | | 3,449 | | | | 2,703 | |
Cost of product sold | | | 2,651 | | | | 2,070 | |
Gross profit | | | 798 | | | | 633 | |
Gross profit (%) | | | 23.1 | | | | 23.4 | |
Seed | | | | | | | | |
Sales | | | 1,085 | | | | 877 | |
Cost of product sold | | | 855 | | | | 706 | |
Gross profit | | | 230 | | | | 171 | |
Gross profit (%) | | | 21.2 | | | | 19.5 | |
Merchandise | | | | | | | | |
Sales | | | 629 | | | | 158 | |
Cost of product sold | | | 540 | | | | 144 | |
Gross profit | | | 89 | | | | 14 | |
Gross profit (%) | | | 14.1 | | | | 8.9 | |
Services and other | | | | | | | | |
Sales | | | 616 | | | | 230 | |
Cost of product sold | | | 205 | | | | 38 | |
Gross profit | | | 411 | | | | 192 | |
Gross profit (%) | | | 66.7 | | | | 83.5 | |
Total sales | | | 10,316 | | | | 6,969 | |
Total cost of product sold | | | 8,030 | | | | 5,418 | |
Total gross profit | | | 2,286 | | | | 1,551 | |
Total gross profit (%) | | | 22.2 | | | | 22.3 | |
16 CULTIVATING PERFORMANCE.DELIVERING VALUE.
RETAIL // Quarterly Results
Our Retail business is seasonal in nature and strongly influenced by the North American second-quarter planting season. The second quarter is also important to Agroservicios Pampeanos in South America, as this is the main application season ahead of fall planting of winter wheat. The acquisition of Landmark in Australia is expected to contribute to first quarter sales, but it too has a significant second-quarter performance profile due to input applications ahead of the planting season for winter wheat.
Retail Quarterly Results
| | | | | | | | | | | | | | | | | | | | | | | | | | | | | | | | |
| | | 2011 | | | 2010 | |
| (millions of U.S. dollars, except as noted) | | Q4 | | | Q3 | | | Q2 | | | Q1 | | | Q4 | | | Q3 | | | Q2 | | | Q1 | |
Sales – domestic | | | 1,253 | | | | 1,400 | | | | 3,790 | | | | 1,247 | | | | 1,082 | | | | 1,138 | | | | 3,281 | | | | 1,033 | |
Sales – international | | | 582 | | | | 611 | | | | 858 | | | | 575 | | | | 243 | | | | 106 | | | | 59 | | | | 27 | |
Total sales | | | 1,835 | | | | 2,011 | | | | 4,648 | | | | 1,822 | | | | 1,325 | | | | 1,244 | | | | 3,340 | | | | 1,060 | |
Cost of product sold | | | 1,383 | | | | 1,513 | | | | 3,652 | | | | 1,482 | | | | 974 | | | | 925 | | | | 2,621 | | | | 898 | |
Gross profit | | | 452 | | | | 498 | | | | 996 | | | | 340 | | | | 351 | | | | 319 | | | | 719 | | | | 162 | |
Gross profit (%) | | | 25 | | | | 25 | | | | 21 | | | | 19 | | | | 26 | | | | 26 | | | | 22 | | | | 15 | |
Gross profit by product | | | | | | | | | | | | | | | | | | | | | | | | | | | | | | | | |
Crop nutrients | | | 142 | | | | 124 | | | | 377 | | | | 115 | | | | 140 | | | | 86 | | | | 252 | | | | 63 | |
Crop protection products | | | 145 | | | | 226 | | | | 325 | | | | 102 | | | | 118 | | | | 172 | | | | 274 | | | | 69 | |
Seed | | | 33 | | | | 30 | | | | 132 | | | | 35 | | | | 26 | | | | 24 | | | | 106 | | | | 15 | |
Merchandise | | | 26 | | | | 19 | | | | 27 | | | | 17 | | | | 8 | | | | 2 | | | | 3 | | | | 1 | |
Services and other | | | 106 | | | | 99 | | | | 135 | | | | 71 | | | | 59 | | | | 35 | | | | 84 | | | | 14 | |
EBIT | | | 37 | | | | 92 | | | | 486 | | | | (15 | ) | | | 46 | | | | 70 | | | | 361 | | | | (68 | ) |
EBITDA | | | 80 | | | | 135 | | | | 529 | | | | 25 | | | | 79 | | | | 98 | | | | 388 | | | | (41 | ) |
| * | Table includes Landmark results from December 4, 2010 onward. |
AGRIUM2011 ANNUAL REPORT 17
Our Wholesale Business Unit
18 CULTIVATING PERFORMANCE.DELIVERING VALUE.
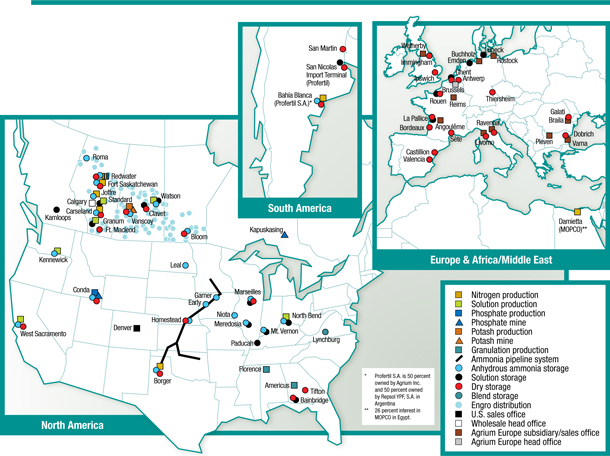
Agrium’s Wholesale business unit is a major global producer, marketer and distributor of all major fertilizer products, with over nine million tonnes of annual crop nutrient production capacity. We have a broad portfolio of assets that produce a diverse mix of crop nutrient products servicing a wide cross section of customers and geographies. The primary end consumer for our products is the agriculture market - in particular, growers of grains, oilseeds and other crops who strive to optimize crop yields and quality. In 2011, our Wholesale business unit capitalized on strong agricultural fundamentals by delivering a record performance, achieving sales of $5.6-billion and $2.0-billion of EBITDA, both of which were the highest in our company history.
2011 Wholesale Capacity, Production and Sales
| | | | | | | | | | | | |
| (thousands of product tonnes) | | Capacity | | | Production | | | Sales (d) | |
Nitrogen Volumes | | | | | | | | | | | | |
North America | | | | | | | | | | | | |
Canada | | | 3,515 | | | | 2,825 | | | | 1,569 | |
U.S. | | | 1,273 | | | | 1,101 | | | | 1,981 | |
International(a) | | | 635 | | | | 561 | | | | 509 | |
Total Nitrogen | | | 5,423 | | | | 4,487 | | | | 4,059 | |
Potash Volumes | | | | | | | | | | | | |
North America | | | | | | | | | | | | |
Canada | | | 2,050 | | | | 1,737 | | | | 131 | |
U.S. | | | | | | | | | | | 715 | |
International | | | | | | | | | | | 919 | |
Total Potash | | | 2,050 | | | | 1,737 | | | | 1,765 | |
Phosphate Volumes | | | | | | | | | | | | |
North America | | | | | | | | | | | | |
Canada | | | 660 | (b) | | | 645 | | | | 584 | |
U.S. | | | 510 | (b) | | | 497 | | | | 543 | |
Total Phosphate | | | 1,170 | (b) | | | 1,142 | | | | 1,127 | |
Other Volumes | | | | | | | | | | | | |
North America | | | | | | | | | | | | |
Canada | | | 355 | | | | 358 | | | | 257 | |
U.S. | | | 294 | | | | 196 | | | | 334 | |
International | | | | | | | | | | | 47 | |
Total Other | | | 649 | | | | 554 | | | | 638 | |
Total Produced Product | | | 9,292 | | | | 7,920 | | | | 7,589 | |
Purchase for Resale Volumes(c) | | | | | | | | | | | | |
North America | | | | | | | | | | | | |
U.S. | | | | | | | | | | | 764 | |
International | | | | | | | | | | | 2,481 | |
Total Purchase for Resale | | | | | | | | | | | 3,245 | |
Total Wholesale | | | 9,292 | | | | 7,920 | | | | 10,834 | |
| (a) | Represents our 50 percent joint-venture interest in the capacity of Profertil S.A. (“Profertil”). |
| (b) | Superphosphoric Acid (“SPA”) and Merchant Grade Phosphoric Acid (“MGA”) are reported in cargo weight. |
| (c) | Purchase for resale includes sales of all the major crop nutrient products. |
| (d) | Sales represent country of sales destination, not country of production. |
AGRIUM2011 ANNUAL REPORT 19
WHOLESALE // Strategy
Our Wholesale strategy focuses on leveraging our strong competitive position within key global crop nutrient markets in order to deliver value for our stakeholders. In addition to employing a rigorous focus on continually improving our core businesses, we actively seek out opportunities to strengthen our industry position through value-enhancing acquisitions and investments. All of our activities are driven by a culture that prides itself on providing products that help to feed the world’s growing population, while constantly striving to protect the environment and the health, safety and security of our employees and contractors. Additionally, we are committed to establishing and maintaining effective relationships with our partners, suppliers and customers, while actively supporting the communities in which we operate.
WHOLESALE // Key Developments
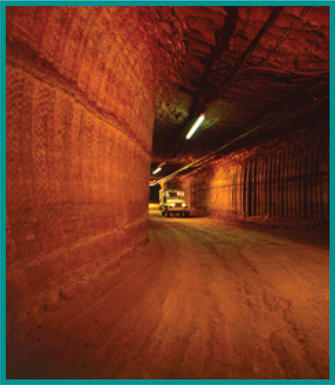
In December 2011, Agrium’s Board of Directors approved the brownfield expansion of our potash facility, located in Vanscoy, Saskatchewan. The project is expected to result in an additional one million tonnes of annual production capacity, increasing our total nameplate capacity to nearly three million tonnes per year. Construction activity has already begun and the project is expected to be completed in the second half of 2014. The capital cost associated with this project is expected to be approximately $1.5-billion or about $1,500 per tonne of additional capacity.(a)
We commenced a brownfield debottlenecking project in the second half of 2011 at our Profertil nitrogen facility in Argentina, in which we have a 50 percent joint-venture interest. The facility has a total capacity of 1.2 million tonnes of urea and 70,000 net tonnes of merchant ammonia. The project is expected to be completed by 2014 and will increase the facility’s total annual production capacity by approximately 123,000 tonnes of urea and 10,000 net tonnes of merchant ammonia. Additionally, it is anticipated that per tonne production costs will be reduced following completion of the debottlenecking project as a result of more efficient gas utilization. Agrium is also constructing a terminal on the Parana River, near the city of Rosario, Argentina. This terminal will include a dedicated berth and two 100,000 tonne dry storage buildings that will move product into a key agricultural region of Argentina. Completion of this project is expected by the end of 2012. The potential for additional expansion opportunities is also being evaluated within our existing North American nitrogen facilities. Engineering scoping studies were initiated in late 2011 and we will be undertaking a detailed evaluation of our findings and establishing a definitive plan for potential future investment.
The Egyptian Nitrogen Products Company S.A.E. (“ENPC”), a wholly-owned subsidiary of MOPCO, in which Agrium owns a 26 percent stake, continued to move forward through most of 2011 with its project to add two new trains to the existing single train at the Egyptian nitrogen facility. The expansion project is expected to triple the facility’s current production capacity, increasing total annual production at the site to 1.95 million tonnes of urea and 150,000 net tonnes of merchant ammonia. Civil unrest within the country resulted in the suspension of construction of the expansion and operations in the fourth quarter of 2011. However, we are optimistic the facility will be allowed to re-open and construction of the expansion restarted in 2012 given its strong environmental performance, as recently reconfirmed by a government appointed independent Egyptian scientific review panel, as well as the positive contribution it can provide the Egyptian economy.
Agrium signed an agreement with OCP S.A. (“OCP”) of Morocco in September 2011 for the long-term supply of phosphate rock to our Canadian Redwater phosphate facility. This new supply of phosphate rock from OCP will replace the phosphate rock currently supplied from our mine at Kapuskasing, Ontario. The move to utilizing rock from OCP is expected to take place in the second half of 2013, at which time economic rock reserves at Kapuskasing will be depleted. The agreement covers rock supply for a period up to 2020, with prices based on a formula that tracks finished product pricing and key published input costs. We will commence construction of an import terminal on the West Coast of Canada in 2012, which will facilitate the handling and delivery of the imported phosphate rock to our facility in Redwater, Alberta. The agreement will enable Agrium to continue benefiting from our competitive sulfur and ammonia cost positions and in-market delivered pricing advantage in Western Canada.
| (a) | Certain scientific and technical information regarding Vanscoy Potash Operations is based on the technical report titled “National Instrument 43-101 Technical Report on Vanscoy Potash Operations” dated February 15, 2012 and with an effective date of December 31, 2011 (the “Technical Report”) prepared by A. Dave Mackintosh, P. Geo of ADM Consulting Limited and Erika D. Stoner of the Company, both of whom are Qualified Persons as defined in National Instrument 43-101 – Standards of Disclosure for Mineral Projects. The Technical Report has been filed with the securities regulatory authorities in each of the provinces of Canada. Portions of the following information are based on assumptions, qualifications and procedures that are not fully described herein. References should be made to the full text of the Technical Report which is available for review on SEDAR located at www.sedar.com. |
20 CULTIVATING PERFORMANCE.DELIVERING VALUE.
Agrium acquired three phosphate leases in the vicinity of Vernal, Utah in 2011. These leases are in the very early stages of evaluation as a potential economically viable source of phosphate rock in the long term.
We concluded the purchase of a 100 percent equity position in Cerealtoscana S.p.A. (“Cerealtoscana”), a fertilizer distribution company in Italy, and Agroport, its subsidiary in Romania, in May of 2011. These entities have been subsequently renamed as Agrium Italia S.p.A. and Agrium-Agroport Romania S.A., respectively. This acquisition represented the addition of 90,000 tonnes of storage to Agrium Europe S.A.’s (“Agrium Europe”) existing fertilizer distribution business and enables us to continue strengthening our presence within growing markets in Europe, while also leveraging the value of our marketing off-take agreement of urea from the MOPCO Egyptian nitrogen facility.
WHOLESALE // Financial Results
Sales from Wholesale operations reached a record $5.6-billion in 2011, compared to $4.0-billion in 2010. Gross profit increased to a record $2.0-billion in 2011, compared to $1.0-billion in 2010. Wholesale EBIT was also a record $1.8-billion in 2011, compared to $889-million in 2010. The record results achieved this year were attributable to robust demand and sales, as well as strong prices and margins for crop nutrients due to the strength in agricultural fundamentals.
WHOLESALE // Expenses
Wholesale expenses were $136-million in 2011, compared with $120-million in 2010. The variance was due primarily to recent acquisitions along with marginal increases across different expense categories.
Wholesale Performance
| | | | | | | | |
Years ended December 31, (millions of U.S. dollars, except as noted) | | 2011 | | | 2010 | |
Nitrogen | | | | | | | | |
Sales | | | 2,051 | | | | 1,458 | |
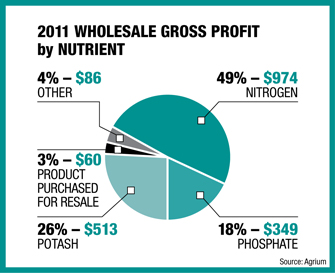
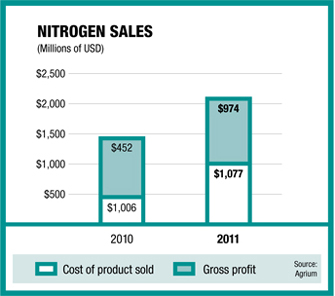
Gross profit | | | 974 | | | | 452 | |
Potash | | | | | | | | |
Sales | | | 809 | | | | 675 | |
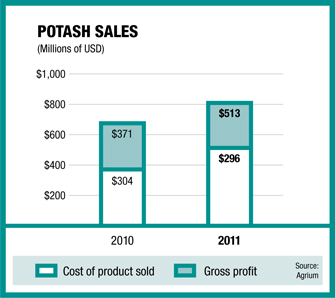
Gross profit | | | 513 | | | | 371 | |
Phosphate | | | | | | | | |
Sales | | | 893 | | | | 596 | |
Gross profit | | | 349 | | | | 106 | |
Other | | | | | | | | |
Sales | | | 257 | | | | 216 | |
Gross profit | | | 86 | | | | 32 | |
Product purchased for resale | | | | | | | | |
Sales | | | 1,566 | | | | 1,039 | |
Gross profit | | | 60 | | | | 48 | |
Total sales | | | 5,576 | | | | 3,984 | |
Total gross profit | | | 1,982 | | | | 1,009 | |
Selling | | | 42 | | | | 35 | |
General and administrative | | | 47 | | | | 34 | |
Earnings from associates | | | (19 | ) | | | (22 | ) |
Other expenses | | | 66 | | | | 73 | |
EBIT | | | 1,846 | | | | 889 | |
EBITDA | | | 2,019 | | | | 1,081 | |
EBITDA as a percent of sales(%) | | | 36 | | | | 27 | |
AGRIUM2011 ANNUAL REPORT 21
Nitrogen[ N ] Products
Nitrogen plays a fundamental role in improving crop growth, yield and protein levels, making it the most important nutrient in global crop nutrient production, trade and consumption. It is also the one crop nutrient that is most likely to show the most immediate adverse impact on a crop’s yield if application rates are reduced. In 2011, Nitrogen represented over 60 percent of the total volume of crop nutrients used globally and approximately half of our 2011 wholesale sales and gross profit on manufactured product.
The building block for virtually all nitrogen products is ammonia, which can be applied directly as a fertilizer or upgraded to urea, urea ammonium nitrate (“UAN”) solutions or ammonium nitrate.
Agrium owns and operates five major nitrogen production facilities in North America and has a 50 percent joint-venture interest in a nitrogen facility in South America, along with five facilities in North America that upgrade ammonia to other nitrogen products, such as UAN and nitric acid. These facilities have a combined annual nitrogen production capacity of approximately 5.4 million tonnes. We also have a 26 percent equity position in an Egyptian nitrogen facility. Collectively, these global production assets place Agrium among the world’s top three publicly traded nitrogen producers.
The competitive position and diversity of our nitrogen production facilities in terms of geography, customer reach and product offering are among our key competitive strengths. Our Alberta production facilities in particular are ideally positioned to benefit from low gas costs relative to other parts of North America, and North America is itself well positioned relative to most other regions of the world due to the development of non-conventional (shale) natural gas. Furthermore, nitrogen prices in North America are generally higher the further from a major port or the Mississippi river system, which includes our core markets of Western Canada, the Northern U.S. Plains and the Pacific Northwest. Our Argentine nitrogen facility also benefits from competitive pricing for natural gas, in addition to a similar in-market advantaged position within Argentina’s large and growing domestic end-market. Furthermore, our equity interest in the Egyptian nitrogen facility provides an advantageous competitive position, with direct access to key markets in Europe and the Americas.
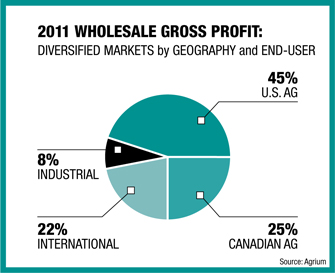
On an annual basis, approximately 75 percent of our nitrogen sales are to agricultural markets, with the remaining 25 percent sold to industrial customers. Domestic demand from agricultural customers is highly seasonal in nature, while industrial demand is more evenly distributed throughout the year. Much of the industrial ammonia that Agrium sells is priced on a gas index-plus margin basis, thereby contributing to stability in sales and earnings throughout the year. As a result, our average sales price for ammonia in a given quarter will be influenced by the relative weighting of industrial sales versus those made to agricultural markets and the differential between industrial and agricultural sales prices. The influence of industrial ammonia tends to be larger in the first and third quarters, which are generally slower quarters for agricultural sales.
Nitrogen // Financial Results
Nitrogen gross profit
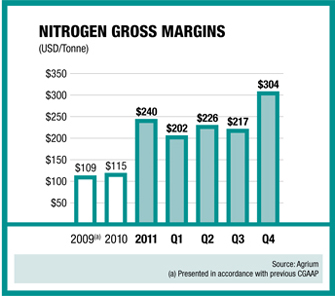
Nitrogen gross profit reached a record of $974-million in 2011, compared to $452-million in 2010. This significant increase was primarily due to higher realized prices for nitrogen products. Our average margins on a per tonne basis were $240 per tonne in 2011, compared to $115 per tonne in 2010.
Nitrogen prices
Agrium’s average realized nitrogen price was $506 per tonne in 2011, compared with $372 per tonne in 2010. Benchmark U.S. Gulf (NOLA) urea prices were $472 per tonne in 2011, a 36 percent increase over 2010. NOLA urea prices started the year at approximately $420 per tonne, rising to $570 per tonne in September 2011, and ending the year at approximately $400 per tonne.
22 CULTIVATING PERFORMANCE.DELIVERING VALUE.
Nitrogen Performance
| | | | | | | | |
Years ended December 31, (millions of U.S. dollars, except as noted) | | 2011 | | | 2010 | |
Nitrogen Domestic | | | | | | | | |
Sales | | | 1,797 | | | | 1,289 | |
Cost of product sold | | | 970 | | | | 911 | |
Gross profit | | | 827 | | | | 378 | |
Tonnes sold (‘000) | | | | | | | | |
Ammonia | | | 1,152 | | | | 1,125 | |
Urea | | | 1,376 | | | | 1,401 | |
Other | | | 1,022 | | | | 952 | |
Total domestic tonnes sold (‘000) | | | 3,550 | | | | 3,478 | |
Selling price per tonne | | | | | | | | |
Ammonia | | | 586 | | | | 432 | |
Urea | | | 544 | | | | 389 | |
Other | | | 367 | | | | 267 | |
Selling price per tonne | | | 506 | | | | 371 | |
Margin per tonne | | | 233 | | | | 108 | |
Nitrogen International | | | | | | | | |
Sales | | | 254 | | | | 169 | |
Cost of product sold | | | 107 | | | | 95 | |
Gross profit | | | 147 | | | | 74 | |
Tonnes sold (‘000) | | | 509 | | | | 440 | |
Selling price per tonne | | | 500 | | | | 386 | |
Margin per tonne | | | 290 | | | | 166 | |
Total Nitrogen | | | | | | | | |
Sales | | | 2,051 | | | | 1,458 | |
Cost of product sold | | | 1,077 | | | | 1,006 | |
Gross profit | | | 974 | | | | 452 | |
Tonnes sold (‘000) | | | 4,059 | | | | 3,918 | |
Selling price per tonne | | | 506 | | | | 372 | |
Cost of product sold per tonne | | | 266 | | | | 257 | |
Margin per tonne | | | 240 | | | | 115 | |
Nitrogen product and gas cost
Nitrogen cost of product sold was $1.1-billion in 2011, compared to $1.0-billion in 2010. On a per tonne basis, cost of product sold in 2011 averaged $266 per tonne, compared with $257 per tonne in 2010. The increase in per tonne cost of product sold was primarily due to higher costs associated with planned turnarounds and unscheduled outages in 2011, as compared to 2010. Production asset depreciation and amortization expense is included in cost of product sold in the amount of $20 per tonne in 2011, compared to $20 per tonne in 2010.
Gas volumes purchased in 2011 were 112 billion cubic feet, up from 104 billion cubic feet in 2010. Agrium’s overall gas cost for 2011 was $4.03 per MMBtu ($3.83 per MMBtu excluding the impact of natural gas derivatives), compared to $4.47 per MMBtu in 2010 ($4.08 per MMBtu excluding the impact of natural gas derivatives). Realized and unrealized hedging gains and losses on gas derivatives are reported below gross profit and are therefore not included in cost of product sold. The average U.S. benchmark price of natural gas on the New York Mercantile Exchange (NYMEX) was $4.07 per MMBtu in 2011, compared with $4.42 per MMBtu in 2010. In 2011, the average Alberta (AECO) basis differential was a $0.33 per MMBtu discount to NYMEX, compared to a discount of $0.43 per MMBtu in 2010.
In Argentina, our Profertil S.A. (“Profertil”) nitrogen facility has three competitively-priced gas contracts, which cover approximately 80 percent of its gas requirements. All three contracts extend to 2017, while additional gas requirements are fulfilled through a mix of spot purchases and short-term (one- and two-year) contracts. Pan American Energy is our largest gas supplier, followed by Petrobras S.A. and Repsol YPF, S.A. The Argentine government has at times limited industrial gas deliveries in order to meet residential demand during the peak winter season.
Natural Gas Prices: North American Indices and Agrium Prices
| | | | | | | | |
| (U.S. dollars per MMBtu) | | 2011 | | | 2010 | |
NYMEX | | | 4.07 | | | | 4.42 | |
AECO | | | 3.74 | | | | 3.99 | |
Basis | | | 0.33 | | | | 0.43 | |
Wholesale | | | | | | | | |
Overall gas cost excluding realized hedging losses | | | 3.83 | | | | 4.08 | |
Realized hedging impact | | | 0.20 | | | | 0.39 | |
Overall gas cost(a) | | | 4.03 | | | | 4.47 | |
| (a) | Weighted average gas price of all gas purchases, including our 50 percent share of the Profertil facility. |
Nitrogen sales volumes and operating rates
Wholesale nitrogen sales volumes for 2011 were 4.1 million tonnes, compared to 3.9 million tonnes in 2010. The nitrogen product category is primarily made up of urea, ammonia, UAN and industrial grade ammonium nitrate. Urea is the most important nitrogen product globally, and accounts for over 40 percent of Agrium’s nitrogen capacity and 2011 production.
Natural Gas Use (BCF)
| | | | | | | | | | | | | | | | | | | | |
| | | Western
Canada | | | U.S.
(Borger, TX) | | | International
(Profertil) | | | Potash
and Other | | | Total | |
2011 | | | 75 | | | | 19 | | | | 15 | | | | 3 | | | | 112 | |
2010 | | | 71 | | | | 18 | | | | 12 | | | | 3 | | | | 104 | |
AGRIUM2011 ANNUAL REPORT 23
Potash[ K ] Products
Agrium is North America’s third largest producer of potash, a nutrient that regulates plant growth processes and helps protect crops from drought and disease. Potash deposits are highly concentrated within only a few regions of the world. The world’s largest known potash deposits are in Saskatchewan, Canada, whose mines accounted for about 46 percent of 2011 global potash reserves. Additionally, Canada accounted for approximately 40 percent of global potash trade in 2011. Agrium produces muriate of potash (“MOP” or “potash”) at our facility in Vanscoy, Saskatchewan.
Potash // Financial Results
Potash gross profit
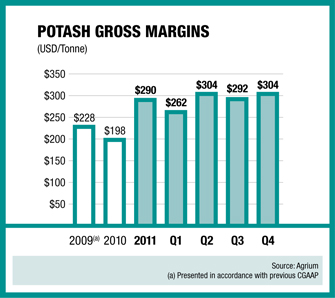
Our potash gross profit was $513-million in 2011, compared to $371-million in 2010. The significant increase in gross profit was due to substantially higher realized sales prices and margins in North America and internationally. On a per tonne basis, potash margins averaged $290 per tonne in 2011, compared with $198 per tonne in 2010.
Potash Performance
| | | | | | | | |
Years ended December 31, (millions of U.S. dollars, except as noted) | | 2011 | | | 2010 | |
Potash Domestic | | | | | | | | |
Sales | | | 471 | | | | 470 | |
Cost of product sold | | | 176 | | | | 215 | |
Gross profit | | | 295 | | | | 255 | |
Tonnes sold (‘000) | | | 846 | | | | 1,119 | |
Selling price per tonne | | | 556 | | | | 420 | |
Margin per tonne | | | 348 | | | | 228 | |
Potash International | | | | | | | | |
Sales | | | 338 | | | | 205 | |
Cost of product sold | | | 120 | | | | 89 | |
Gross profit | | | 218 | | | | 116 | |
Tonnes sold (‘000) | | | 919 | | | | 749 | |
Selling price per tonne | | | 368 | | | | 273 | |
Margin per tonne | | | 238 | | | | 153 | |
Total Potash | | | | | | | | |
Sales | | | 809 | | | | 675 | |
Cost of product sold | | | 296 | | | | 304 | |
Gross profit | | | 513 | | | | 371 | |
Tonnes sold (‘000) | | | 1,765 | | | | 1,868 | |
Selling price per tonne | | | 458 | | | | 361 | |
Cost of product sold per tonne | | | 168 | | | | 163 | |
Margin per tonne | | | 290 | | | | 198 | |
Potash prices
Agrium’s average potash selling price was $458 per tonne in 2011, compared to $361 per tonne in 2010. Our international sales are marketed through Canpotex and these prices are referenced at the mine site. Our average international sales price was $368 per tonne in 2011, a 35 percent increase over 2010. Our realized North American sales price increased by 32 percent to $556 per tonne in 2011. Benchmark potash prices in North America and globally were supported by a rebound in global demand and resulted in high operating rates and a tightening inventory situation through most of 2011. Potash prices in the U.S. Corn Belt started 2011 at roughly $570 per tonne, rose to $630 per tonne by July 2011 and declined to approximately $610 per tonne by the end of 2011.
24 CULTIVATING PERFORMANCE.DELIVERING VALUE.
Potash product cost
Potash cost of product sold in 2011 was $296-million, compared to $304-million in 2010. On a per tonne basis, the average cost of product sold was $168 per tonne, compared to $163 per tonne in 2010. The increase in per tonne costs relative to 2010 was primarily attributable to a decrease in production volumes. Production asset depreciation and amortization expense is included in cost of product sold in the amount of $22 per tonne in 2011, compared to $19 per tonne in 2010.
Potash sales volumes and operating rates
Potash sales volumes were 1.8 million tonnes in 2011, compared to 1.9 million tonnes in 2010. The year-over-year decrease in sales volumes was due primarily to lower beginning inventories and lower production due to a variety of short-term mining related issues experienced at our Vanscoy mine during the second half of 2011. We sold 48 percent of our potash sales into the domestic market in 2011, which was down significantly from the 60 percent sold to domestic customers in 2010. The decrease in domestic sales in 2011 was due to the large increase in demand from international buyers in 2011. Potash sales to international markets represented 52 percent of sales volumes in 2011, up from the 40 percent sold to these markets in 2010. Our international sales are marketed through Canpotex, the offshore marketing agency for potash produced in the province of Saskatchewan, which is wholly-owned by the three major potash producers in Canada. Our share of Canpotex total sales in 2011 was 9 percent.
Our current annual production capacity of 2.05 million tonnes requires 5.9 million tonnes of feed at a grade of 24.6 percent K2O and a milling recovery of 85 percent. Our 2012 Technical Report(a) gives an expected mine life of 46 years when considering Proven and Probable Mineral Reserves and Measured and Indicated Mineral Resources, with an additional 15 years estimated to be contained in Inferred Mineral Resources at our higher forecasted post-expansion rate, which is based on the updated estimate of 65.8 million tonnes of Proven Mineral Reserves (24.5% K2O), 15.2 million tonnes of Probable Mineral Reserves (22.7% K2O), 168.2 million tonnes of Measured Mineral Resources (22.7% K2O) and 113.0 million tonnes of Indicated Mineral Resources (24.9% K2O). Changes to the primary mine life estimate are as a result of the reclassification of Mineral Resources from Inferred to Measured and Indicated due to the drilling campaign executed over the South Block and KP 313 in 2010 and 2011. Mineral resources that are not mineral reserves do not have demonstrated economic viability.
| (a) | Certain scientific and technical information regarding Vanscoy Potash Operations is based on the technical report titled “National Instrument 43-101 Technical Report on Vanscoy Potash Operations” dated February 15, 2012 and with an effective date of December 31, 2011 (the “Technical Report”) prepared by A. Dave Mackintosh, P. Geo of ADM Consulting Limited and Erika D. Stoner of the Company, both of whom are Qualified Persons as defined in National Instrument 43-101 –Standards of Disclosure for Mineral Projects. The Technical Report has been filed with the securities regulatory authorities in each of the provinces of Canada. Portions of the following information are based on assumptions, qualifications and procedures that are not fully described herein. References should be made to the full text of the Technical Report which is available for review on SEDAR located at www.sedar.com. |
AGRIUM2011 ANNUAL REPORT 25
Phosphate[ P ] Products
Agrium is North America’s fifth largest producer of phosphate. Phosphate is a key nutrient that stimulates root development and flowering, while encouraging early crop development. Collectively, Agrium’s two phosphate facilities have the capacity to produce approximately 1.2 million tonnes of phosphate fertilizer products annually.
At our facility in Conda, Idaho, we produce mono-ammonium phosphate (“MAP”) and superphosphoric acid (“SPA”) products, which we sell primarily in the Northwestern U.S. Our Redwater, Alberta facility is the only phosphate facility in Canada and produces MAP primarily for distribution in Western Canada.
Three primary raw materials are required to produce granular ammonium phosphates: phosphate rock, sulfur and ammonia. Each of our two facilities has a dedicated phosphate rock mine; Redwater obtains phosphate rock from our mine in Kapuskasing, Ontario, while our Rasmussen Ridge rock mine supplies our Conda facility, having moved from our Dry Valley mine in 2011. Economic rock reserves at Kapuskasing will be depleted by the second half of 2013. By this time, phosphate rock for our Redwater facility is expected to be sourced primarily from Morocco as part of our long-term agreement with OCP. This agreement covers rock supply for a period up to 2020, with prices based on a formula that accounts for the finished phosphate prices and input prices. This structure provides downside protection to Agrium during periods of low phosphate prices and affords OCP an opportunity to benefit from the upside associated with periods of strong phosphate prices. If the agreement had been in place in 2011, our average phosphate margins would have been lower than in 2011 as our rock costs would have been higher. However, our total average phosphate margins would have still been highly competitive compared to other publicly traded North American phosphate producers due to our other competitive advantages. Our Redwater facility produces ammonia on-site and sources sulfur locally. Given the significant availability of sulfur in the region due to the presence of oil and gas producers, we obtain sulfur at highly favorable prices relative to global prices. Our Conda facility also sources sulfur and sulfuric acid locally, while obtaining the majority of its ammonia from Agrium’s Alberta nitrogen plants. Our competitive cost position on sulfur and ammonia is a major benefit to Agrium’s phosphate business. Agrium’s competitive advantage for phosphate products is also a result of our transportation cost advantage relative to the major phosphate producers based in Florida, given that our facilities are located in close proximity to our key end-markets in Western Canada and the Western U.S.
Phosphate // Financial Results
Phosphate gross profit
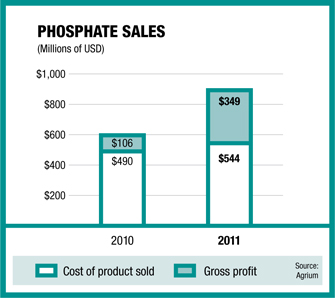
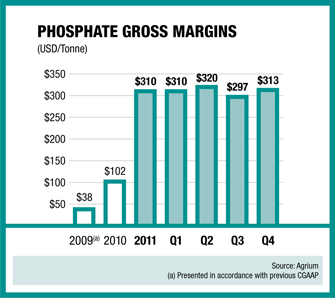
Phosphate gross profit was $349-million in 2011, compared to $106-million in 2010. The substantial increase was due to increased sales volumes and higher per tonne margins for our phosphate products, which was driven by stronger realized sales prices. On a per tonne basis, phosphate margins were $310 per tonne in 2011, compared to $102 per tonne in 2010.
Phosphate Performance
| | | | | | | | |
Years ended December 31, (millions of U.S. dollars, except as noted) | | 2011 | | | 2010 | |
Phosphate | | | | | | | | |
Sales | | | 893 | | | | 596 | |
Cost of product sold | | | 544 | | | | 490 | |
Gross profit | | | 349 | | | | 106 | |
Tonnes sold (‘000) | | | 1,127 | | | | 1,041 | |
Selling price per tonne | | | 792 | | | | 573 | |
Cost of product sold per tonne | | | 482 | | | | 471 | |
Margin per tonne | | | 310 | | | | 102 | |
26 CULTIVATING PERFORMANCE.DELIVERING VALUE.
Phosphate prices
Benchmark phosphate prices continued to increase during 2011, driven by robust global demand, tight supply availability and substantial increases in global prices of phosphate rock, sulfur and ammonia. Central Florida di-ammonium phosphate (“DAP”) prices averaged $621 per tonne in 2011, compared with $492 per tonne in 2010. Benchmark Central Florida prices started the year at approximately $606 per tonne, peaked at $645 per tonne in August and ended the year at about $530 per tonne. Agrium’s realized phosphate prices represent a blend of phosphate products, with over 80 percent of our sales being MAP, and the remainder made up of higher valued SPA and merchant grade phosphoric acid. Our average realized phosphate sales price was $792 per tonne in 2011, compared to $573 per tonne in 2010. Our realized prices for MAP are higher than in the Southern U.S. or Corn Belt, given that Western Canada is a net importer of phosphate products from the Southeastern U.S.
Phosphate product cost
Phosphate cost of product sold was $544-million in 2011, compared to $490-million in 2010. The increase was attributable primarily to higher sales volumes in 2011 relative to 2010 and increases in sulfur costs. On a per tonne basis, cost of product sold was $482 per tonne in 2011, compared with $471 per tonne in 2010. Production asset depreciation and amortization expense is included in cost of product sold in the amount of $41 per tonne in 2011, compared to $65 per tonne in 2010.
Sales volumes and operating rates
Phosphate sales volumes were 1.1 million tonnes in 2011, compared with 1.0 million tonnes in 2010. Higher operating rates achieved in 2011 were due to increased efficiencies at our Conda and Redwater facilities.
Other Wholesale Products
Our Other Wholesale products group is mainly comprised of ammonium sulfate products produced in Western Canada and our Rainbow® Plant Food (“Rainbow”) business, which produces nitrogen, phosphate and potash (“NPK”) products in the Southeastern United States. Ammonium sulfate fertilizer contains both nitrogen and sulfur, resulting in one of the most effective ways of supplying sulfur to soils in an immediately available form.
The Rainbow product line offers homogeneous distributions of NPK products, with a specific combination of nutrients contained within each granule. In contrast to the more common practice of blending different nutrient granules at a farm center, this alternative offers the advantages of reduced product segregation and a more unified distribution of nutrients. Rainbow products are produced at our facilities in Americus, Georgia, and Florence, Alabama and are often used on high-value crops such as cotton, peanuts, vegetables, tobacco, as well as some limited use on row crops.
Other Wholesale // Financial Results
Other Wholesale gross profit was $86-million in 2011, compared with $32-million in 2010. The increase was due primarily to an improvement in realized sales prices and margins for both ammonium sulfate and our Rainbow product line.
Other Performance
| | | | | | | | |
Years ended December 31, (millions of U.S. dollars, except as noted) | | 2011 | | | 2010 | |
Other | | | | | | | | |
Sales | | | 257 | | | | 216 | |
Cost of product sold | | | 171 | | | | 184 | |
Gross profit | | | 86 | | | | 32 | |
Tonnes sold (‘000) | | | | | | | | |
Ammonium sulfate | | | 358 | | | | 347 | |
Other | | | 280 | | | | 344 | |
Total other tonnes sold (‘000) | | | 638 | | | | 691 | |
Selling price per tonne | | | | | | | | |
Ammonium sulfate | | | 366 | | | | 256 | |
Cost of product sold per tonne | | | | | | | | |
Ammonium sulfate | | | 195 | | | | 180 | |
Margin per tonne | | | | | | | | |
Ammonium sulfate | | | 171 | | | | 76 | |
Product Purchased for Resale
In addition to selling our manufactured products, Agrium’s Wholesale unit purchases crop nutrient products from other suppliers for resale to our customers residing primarily in the Americas and Western Europe. This business enables us to leverage the value of our extensive distribution and marketing network beyond what is possible through the sale of our manufactured product alone.
Sales of product purchased for resale were $1.6-billion in 2011, compared with $1.0-billion in 2010. Total sales volumes for this business were 3.2 million tonnes in 2011, compared with 3.0 million
AGRIUM2011 ANNUAL REPORT 27
tonnes in 2010. The increase in volumes was due to the recent acquisition of Cerealtoscana and its subsidiary Agroport in Europe and strong nutrient demand in the Americas, offsetting the impact of cautious buying by distributors in the second half of 2011 due to the economic uncertainty. The breakdown of sales volumes by geographic region were: 0.8 million tonnes in North America; 2.2 million tonnes in Europe and 0.2 million tonnes in South America.
Gross profit from our purchase for resale business was $60-million in 2011, compared with $48-million in 2010. Our average selling price was $483 per tonne in 2011, compared with $346 per tonne in 2010. Our average per tonne margins were $18 per tonne in 2011, slightly higher than the $16 per tonne achieved in 2010.
Distribution and Storage
Agrium Wholesale has developed an extensive transportation, storage and warehousing system to optimize deliverability of product to our agricultural customers in the highly seasonal peak demand periods. In total, our global distribution and storage capacity amounts to over 2.7 million tonnes. We also have over 4,000 railcars under long-term lease and use barges, pipelines, and ocean vessels to move our product. Agrium acquired the remaining 30 percent of Common Market Fertilizers S.A. (“CMF”) and subsequently renamed Agrium Europe in 2010, significantly strengthening our position in Europe, where Agrium Europe owns and leases over 390,000 tonnes of dry and liquid storage at both port and inland sites, including 90,000 tonnes of incremental storage capacity provided through the acquisition of Cerealtoscana and its subsidiary, Agroport. We also plan to move a portion of urea volumes from the expanded Egyptian nitrogen facility into Europe, following completion of the expansion project.
Egyptian Nitrogen Facility: MOPCO
Our equity interest in MOPCO, whose subsidiary, ENPC, owns a nitrogen facility in Damietta, Egypt, contributed $19-million in equity earnings in 2011, compared to $17-million in 2010. The existing annual capacity is 675,000 tonnes of urea and 80,000 net tonnes of merchant ammonia. The project to triple production capacity to 1.95 million tonnes of urea and 150,000 net tonnes of merchant ammonia and operation of the existing facility was temporarily suspended in the fourth quarter due to civil unrest. Agrium will have a 26 percent equity interest in the expanded plant. Agrium also has an associated off-take agreement to market all of the additional export volume resulting from the expansion.
WHOLESALE // Quarterly Results
Given that the agricultural sector is the primary market for our Wholesale business unit, results tend to fluctuate with the seasons of crop production. The second quarter, which coincides with the spring application season in North America, is typically Wholesale’s most important quarter from a sales volume and EBIT perspective. The fourth quarter is also important in terms of sales volume and EBIT, as it encompasses the fall fertilizer application season in the northern hemisphere and the spring application season in Argentina. The first quarter is generally the weakest, as application and sales volumes are light in the winter months. In 2011, the spring season in North America was impacted by extremely wet weather conditions which reduced the window for plantings and applications across much of the Eastern Corn Belt and Western Canada and fall applications were impacted by the severe drought in the Southern U.S. Plains.
28 CULTIVATING PERFORMANCE.DELIVERING VALUE.
Wholesale Quarterly Results
| | | | | | | | | | | | | | | | | | | | | | | | | | | | | | | | |
| | | 2011 | | | 2010 | |
| (millions of U.S. dollars, except as noted) | | Q4 | | | Q3 | | | Q2 | | | Q1 | | | Q4 | | | Q3 | | | Q2 | | | Q1 | |
Sales – external | | | 1,226 | | | | 1,023 | | | | 1,438 | | | | 1,072 | | | | 1,006 | | | | 744 | | | | 970 | | | | 740 | |
Sales – inter-segment | | | 228 | | | | 153 | | | | 275 | | | | 161 | | | | 154 | | | | 121 | | | | 141 | | | | 108 | |
Total sales | | | 1,454 | | | | 1,176 | | | | 1,713 | | | | 1,233 | | | | 1,160 | | | | 865 | | | | 1,111 | | | | 848 | |
Cost of product sold | | | 898 | | | | 779 | | | | 1,093 | | | | 824 | | | | 820 | | | | 688 | | | | 837 | | | | 630 | |
Gross profit | | | 556 | | | | 397 | | | | 620 | | | | 409 | | | | 340 | | | | 177 | | | | 274 | | | | 218 | |
Gross profit (%) | | | 38 | | | | 34 | | | | 36 | | | | 33 | | | | 29 | | | | 20 | | | | 25 | | | | 26 | |
Nitrogen | | | | | | | | | | | | | | | | | | | | | | | | | | | | | | | | |
Sales | | | 595 | | | | 405 | | | | 717 | | | | 334 | | | | 397 | | | | 319 | | | | 481 | | | | 261 | |
Cost of product sold | | | 273 | | | | 228 | | | | 393 | | | | 183 | | | | 237 | | | | 237 | | | | 343 | | | | 189 | |
Gross profit | | | 322 | | | | 177 | | | | 324 | | | | 151 | | | | 160 | | | | 82 | | | | 138 | | | | 72 | |
Tonnes sold (‘000) | | | 1,060 | | | | 817 | | | | 1,433 | | | | 749 | | | | 980 | | | | 950 | | | | 1,256 | | | | 732 | |
Selling price (per tonne) | | | 562 | | | | 497 | | | | 500 | | | | 446 | | | | 406 | | | | 336 | | | | 382 | | | | 358 | |
Margin (per tonne) | | | 304 | | | | 217 | | | | 226 | | | | 202 | | | | 163 | | | | 84 | | | | 109 | | | | 98 | |
Potash | | | | | | | | | | | | | | | | | | | | | | | | | | | | | | | | |
Sales | | | 188 | | | | 167 | | | | 259 | | | | 195 | | | | 158 | | | | 131 | | | | 195 | | | | 191 | |
Cost of product sold | | | 67 | | | | 65 | | | | 94 | | | | 70 | | | | 62 | | | | 71 | | | | 86 | | | | 85 | |
Gross profit | | | 121 | | | | 102 | | | | 165 | | | | 125 | | | | 96 | | | | 60 | | | | 109 | | | | 106 | |
Tonnes sold (‘000) | | | 398 | | | | 347 | | | | 543 | | | | 477 | | | | 417 | | | | 388 | | | | 529 | | | | 534 | |
Selling price (per tonne) | | | 473 | | | | 480 | | | | 477 | | | | 409 | | | | 378 | | | | 340 | | | | 366 | | | | 358 | |
Margin (per tonne) | | | 304 | | | | 292 | | | | 304 | | | | 262 | | | | 228 | | | | 154 | | | | 205 | | | | 199 | |
Phosphate | | | | | | | | | | | | | | | | | | | | | | | | | | | | | | | | |
Sales | | | 232 | | | | 217 | | | | 206 | | | | 238 | | | | 165 | | | | 170 | | | | 134 | | | | 127 | |
Cost of product sold | | | 143 | | | | 135 | | | | 123 | | | | 143 | | | | 111 | | | | 145 | | | | 125 | | | | 109 | |
Gross profit | | | 89 | | | | 82 | | | | 83 | | | | 95 | | | | 54 | | | | 25 | | | | 9 | | | | 18 | |
Tonnes sold (‘000) | | | 285 | | | | 277 | | | | 259 | | | | 306 | | | | 246 | | | | 302 | | | | 243 | | | | 250 | |
Selling price (per tonne) | | | 813 | | | | 784 | | | | 795 | | | | 778 | | | | 672 | | | | 563 | | | | 553 | | | | 506 | |
Margin (per tonne) | | | 313 | | | | 297 | | | | 320 | | | | 310 | | | | 218 | | | | 82 | | | | 39 | | | | 72 | |
Other | | | | | | | | | | | | | | | | | | | | | | | | | | | | | | | | |
Sales | | | 68 | | | | 52 | | | | 82 | | | | 55 | | | | 52 | | | | 38 | | | | 73 | | | | 53 | |
Cost of product sold | | | 45 | | | | 37 | | | | 56 | | | | 33 | | | | 45 | | | | 37 | | | | 59 | | | | 43 | |
Gross profit | | | 23 | | | | 15 | | | | 26 | | | | 22 | | | | 7 | | | | 1 | | | | 14 | | | | 10 | |
Tonnes sold (‘000) | | | 162 | | | | 132 | | | | 188 | | | | 156 | | | | 162 | | | | 132 | | | | 223 | | | | 174 | |
Product purchased for resale | | | | | | | | | | | | | | | | | | | | | | | | | | | | | | | | |
Sales | | | 371 | | | | 335 | | | | 449 | | | | 411 | | | | 388 | | | | 207 | | | | 228 | | | | 216 | |
Cost of product sold | | | 370 | | | | 314 | | | | 427 | | | | 395 | | | | 365 | | | | 198 | | | | 224 | | | | 204 | |
Gross profit | | | 1 | | | | 21 | | | | 22 | | | | 16 | | | | 23 | | | | 9 | | | | 4 | | | | 12 | |
Tonnes sold (‘000) | | | 721 | | | | 599 | | | | 1,014 | | | | 911 | | | | 944 | | | | 620 | | | | 759 | | | | 677 | |
Selling price (per tonne) | | | 514 | | | | 559 | | | | 443 | | | | 451 | | | | 410 | | | | 335 | | | | 301 | | | | 319 | |
Margin (per tonne) | | | 1 | | | | 35 | | | | 22 | | | | 18 | | | | 25 | | | | 14 | | | | 5 | | | | 18 | |
EBIT | | | 507 | | | | 393 | | | | 569 | | | | 377 | | | | 315 | | | | 151 | | | | 276 | | | | 147 | |
EBITDA | | | 552 | | | | 438 | | | | 617 | | | | 412 | | | | 354 | | | | 206 | | | | 339 | | | | 182 | |
AGRIUM2011 ANNUAL REPORT 29
Our Advanced Technologies Business Unit
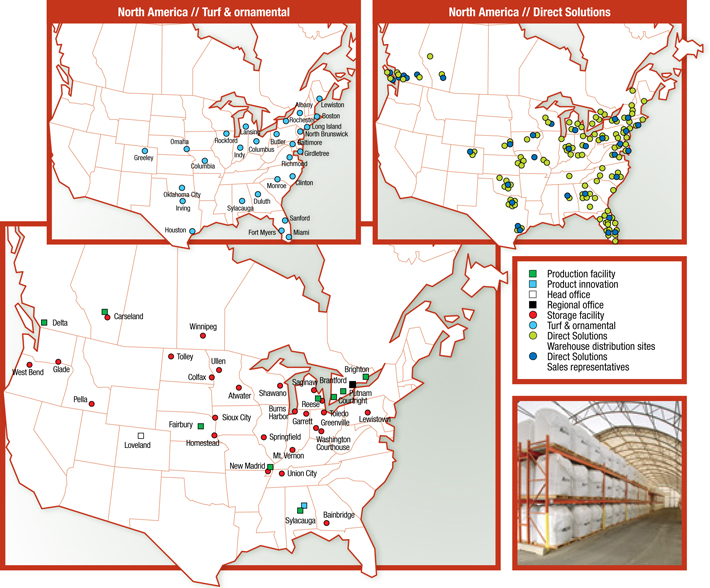
Agrium’s Advanced Technologies business unit is a global leader in the development and sales of Enhanced Efficiency Fertilizer (“EEF”) products, utilizing slow and controlled-release fertilizers to provide both economic and environmental benefits. We add value for our customers by offering the latest technologies through an extensive line of innovative products to a broad range of target markets, including: agriculture, specialty agriculture, professional turf, horticulture and consumer lawn and garden.
ADVANCED TECHNOLOGIES // Strategy and Key Developments
To achieve our aggressive growth target for the AAT business unit in the coming years, we will focus on five core objectives:1) growing end-user demand in key markets;2) expanding ESN capacity;3) capitalizing on international opportunities;4) targeting complimentary acquisitions; and5) developing new technologies and product offerings.
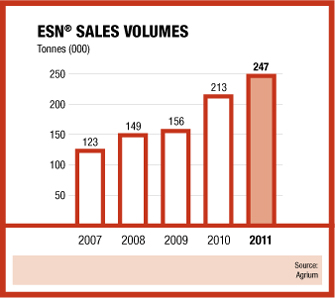
Over the past five years, AAT has grown steadily through a combination of acquisitions, business expansions and capacity additions. AAT made strides in laying the foundation for future growth and development with the establishment of our Direct Solutions sales division in 2010, a direct-to-market sales force with over 100 industry professional field representatives across North America, and the completion of a new ESN facility in New Madrid, Missouri in the spring of 2010. Additionally, Agrium’s Board of Directors approved a 136,000 tonne expansion of this facility in December 2011, which is expected to bring AAT’s total ESN production capacity to 464,000 tonnes upon project completion in the second half of 2012. Over the past year, we also expanded our business in North America with the acquisitions of Evergro Canada (“Evergro”) and Tetra Micronutrients.
In July 2011, AAT announced the acquisition of Evergro, a leading manufacturer and distributor of horticultural and professional turf products in Western Canada. In addition to providing AAT with seven distribution and blending facilities throughout British Columbia and Alberta in Canada, Evergro is expected to also add value to our growing Direct Solutions business through its expertise in providing innovative controlled-release fertilizers, as well as turf, pest control and soil amendment products to North American specialty markets. The geographic location of these operations is expected to provide AAT with an expanded platform to grow our international business in the Pacific Rim. The acquisition of Tetra Micronutrients, a specialty producer, marketer and distributor of custom liquid plant nutrition and dry micronutrients, was completed in July 2011 and represents a strong addition to Agrium’s AAT and Retail businesses. AAT will operate and market product from Tetra Micronutrients’ dry
30 CULTIVATING PERFORMANCE.DELIVERING VALUE.
granulation facility, while Loveland will assume operation of its liquid facility and market production directly to Agrium Retail’s customers. AAT also expects to benefit from the liquid plant nutrition business by marketing products to third party customers.
ADVANCED TECHNOLOGIES // Products and Services
AAT has established itself as a world leader in producing a broad spectrum of slow and controlled-release fertilizers, including polymer-coated, sulfur-coated and reacted products in a variety of sizes and compositions, which are custom designed to meet the specific needs of our target markets. We also demonstrate our commitment to protecting and preserving the environment through specially engineered product offerings with advanced-generation coatings and other technology to prevent nutrient loss to the environment. Our EEF products allow end-users to optimize quality and yield, while reducing the frequency of required application.
AGRIUM2011 ANNUAL REPORT 31
In order to meet the evolving needs of our growing customer base, AAT constantly strives to enhance and optimize our industry-leading portfolio of products. As a result, we place a strong emphasis on product innovation at our research facility in Sylacauga, Alabama, where we focus on the development of new products and improving existing technologies. We also support targeted agronomic research conducted at agricultural institutions across North America and with selected agronomists in The People’s Republic of China, Southeast Asia and Europe.
AAT tailors its branded products to target specific key markets and end-use customers:
| ¨ | AgricultureA polymer-coated, environmentally sensitive, controlled-release fertilizer that provides both environmental and economic benefits for broad acre crops (ESN®). AAT also produces and markets UltraYield® Micronutrients and the new line of Tetra Micronutrients; |
| ¨ | Specialty Agriculture Products designed specifically for high-value crops such as strawberries and other food crops (Polyon®, Duration®, and ESN®); |
| ¨ | Professional TurfBranded specialty fertilizer products with slow-release or controlled-release technologies suitable for golf course turf, lawn care and sport field applications (XCU®, Polyon®, Duration®, Nutralene®, Nitroform®) and associated branded professional products (ProTurf®, Nu-Gro®, Nu-Spec®) in Canada. AAT also markets Precise® controlled-release plant protection for turf; |
| ¨ | HorticultureProducts and blends designed specifically for the nursery market (Polyon®, Duration®, Nitroform®); and |
| ¨ | Consumer Lawn and Garden(Polyon®, Duration®, Nutralene®, XCU®). |
ESN offers several key advantages relative to traditional nitrogen products, including significant improvements in crop yields and quality, a wider application window than traditional nitrogen products and significant environmental benefits. ESN has been shown to increase corn yields significantly in specific agricultural conditions, while also providing yield and quality improvements in crops such as wheat, canola and potatoes. Additionally, ESN provides significant protection against nitrogen loss to the air and water through reduced volatilization, denitrification and leaching.

32 CULTIVATING PERFORMANCE.DELIVERING VALUE.
ADVANCED TECHNOLOGIES // Financial Results
AAT’s sales were $510-million in 2011, compared to $397-million in 2010. Gross profit also increased to $115-million in 2011, compared to $85-million in 2010. The increase in gross profit was primarily attributable to higher realized sales prices, volumes and margins for products in the agricultural business, particularly ESN. Additional contributions to gross profit from acquisitions completed during 2011 were relatively small, but are expected to grow in 2012. EBIT was a $51-million loss in 2011, compared to a gain of $12-million in 2010. The decline in EBIT was due to a $61-million impairment of Agrium’s investment in Hanfeng Evergreen Inc. (“Hanfeng”). Agrium has determined that Hanfeng is not integral to our strategic growth plans in China and accordingly, we have recorded an impairment that has reduced our investment to $29-million to reflect Hanfeng’s recent performance. Agrium plans on maintaining its investment in Hanfeng.
Turf and Ornamental
Sales for our turf and ornamental business were $311-million in 2011, compared to $271-million in 2010. Gross profit for this business was $66-million in 2011, compared to $56-million in 2010. The increase in sales and gross profit was largely due to the impact of investments made during 2010 and 2011 related to product marketing and an expanded Direct Solutions retail sales force.
Agriculture
Sales in the agricultural business were $199-million in 2011, compared to $126-million in 2010. The increase in sales was attributable to higher realized sales prices, as well as higher full-year sales volumes for ESN following capacity additions completed during 2010. Gross profit was $49-million in 2011, compared to $29-million in 2010. Stronger gross profit was due to higher average margins for all crop nutrient products and a significant increase in both volumes and average gross margins for ESN.
ADVANCED TECHNOLOGIES // Expenses
Expenses for AAT were $166-million in 2011, compared to $73-million in 2010. The majority of the increase in expenses relative to 2010 was due to a $61-million impairment of our Hanfeng investment. The increase was also attributable to the expansion of our Direct Solutions sales force to support growth in retail sales to turf and ornamental customers, as well as additional cost contributions related to the acquisitions made during 2011.
Advanced Technologies Financial Results
| | | | | | | | |
| Years ended December 31, | | | | | | |
| (millions of U.S. dollars, except as noted) | | 2011 | | | 2010 | |
Turf and Ornamental | | | | | | | | |
Sales | | | 311 | | | | 271 | |
Cost of product sold | | | 245 | | | | 215 | |
Gross profit | | | 66 | | | | 56 | |
Agriculture | | | | | | | | |
Sales | | | 199 | | | | 126 | |
Cost of product sold | | | 150 | | | | 97 | |
Gross profit | | | 49 | | | | 29 | |
Total sales | | | 510 | | | | 397 | |
Total cost of product sold | | | 395 | | | | 312 | |
Total gross profit | | | 115 | | | | 85 | |
Selling expenses | | | 47 | | | | 30 | |
General and administrative | | | 58 | | | | 46 | |
Earnings from associates | | | (1 | ) | | | (4 | ) |
Other expenses | | | 62 | | | | 1 | |
EBIT | | | (51 | ) | | | 12 | |
EBITDA | | | 34 | | | | 31 | |
EBITDA as a percent of sales(%) | | | 7 | | | | 8 | |
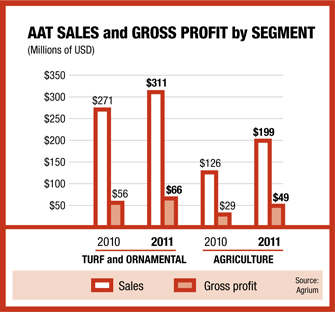
AGRIUM2011 ANNUAL REPORT 33
ADVANCED TECHNOLOGIES // Quarterly Results
As with our other business units, AAT’s business is seasonal. For our turf and ornamental business, the first and second quarters are typically the strongest. This is earlier than the key sales season for the agriculture market, as our customers include golf courses and formulators/ blenders in turf and ornamental businesses, which tend to order product well ahead of the start of the season. For these products, the third quarter has historically been the weakest, as golf courses and blenders for the lawn and garden business already have supplies in place for the summer and fall seasons. Sales are expected to be more evenly distributed across the second through the fourth quarters as ESN becomes a larger component of AAT’s business.
Advanced Technologies Quarterly Results
| | | | | | | | | | | | | | | | | | | | | | | | | | | | | | | | |
| | | 2011 | | | 2010 | |
| (millions of U.S. dollars, except as noted) | | Q4 | | | Q3 | | | Q2 | | | Q1 | | | Q4 | | | Q3 | | | Q2 | | | Q1 | |
Sales – external | | | 124 | | | | 110 | | | | 124 | | | | 66 | | | | 83 | | | | 81 | | | | 125 | | | | 53 | |
Sales – inter-segment | | | 22 | | | | 15 | | | | 34 | | | | 15 | | | | 16 | | | | 12 | | | | 16 | | | | 11 | |
Total sales | | | 146 | | | | 125 | | | | 158 | | | | 81 | | | | 99 | | | | 93 | | | | 141 | | | | 64 | |
Cost of product sold | | | 108 | | | | 101 | | | | 121 | | | | 65 | | | | 75 | | | | 78 | | | | 110 | | | | 49 | |
Gross profit | | | 38 | | | | 24 | | | | 37 | | | | 16 | | | | 24 | | | | 15 | | | | 31 | | | | 15 | |
Gross profit (%) | | | 26 | | | | 19 | | | | 23 | | | | 20 | | | | 24 | | | | 16 | | | | 22 | | | | 23 | |
EBIT | | | (56 | ) | | | (3 | ) | | | 13 | | | | (5 | ) | | | 2 | | | | (4 | ) | | | 15 | | | | (1 | ) |
EBITDA | | | 12 | | | | 3 | | | | 18 | | | | 1 | | | | 7 | | | | 1 | | | | 20 | | | | 3 | |
OUR OTHER BUSINESS UNIT
Our Other business unit is a non-operating segment comprising corporate and administrative functions and costs that provide support and governance to our operating business units.
The Other business unit is also used to eliminate inter-segment transactions so that each operating segment can be evaluated and managed on a stand-alone basis. The eliminations relate to purchase and sale transactions between our Retail, Wholesale and AAT business units.
Expenses included in EBIT of our non-operating segment primarily comprise general and administrative costs from our headquarters in Calgary, Alberta, share-based payment expense and other expenses such as regulatory compliance, foreign exchange gains and losses and business development costs associated with evaluating new growth opportunities.
Other business unit EBIT was a $172-million loss in 2011, compared to a $197-million loss in 2010. The improvement was primarily attributable to a recovery in share-based payments as a result of a decrease in fair value related to the decline in share price year-over-year. This was partially offset by a higher amount of deferred gross profit on Wholesale products sold to Retail that had not yet been sold to external customers at the 2011 year end and an increase in net realized losses from foreign exchange derivatives.
34 CULTIVATING PERFORMANCE.DELIVERING VALUE.
Crop Input Situation and 2012 Outlook
Most crop prices reached near-record highs in 2011, leading to very strong demand for crop inputs and agronomic services. The United States Department of Agriculture (“USDA”) estimates that U.S. net farm income was an all-time record in 2011, exceeding $100-billion for the first time in history and placing growers in a strong financial position entering 2012. Despite the fact that most crop prices are trading below peak levels achieved in 2011, grower economics remain compelling and are expected to support strong demand for crop protection products, top seed genetics and crop nutrients in 2012.
| ¨ | The U.S. corn supply/demand balance is projected to finish 2011/12 at a historically low level. As a result, most analysts project that corn area will increase from 2011/12 levels to between 92 and 94 million acres in 2012/13. |
| ¨ | U.S. ethanol production is projected to consume 40 percent of U.S. corn production in 2011/12. Ethanol production continues on a record pace despite the removal of the blenders’ credit at the end of 2011 based on the U.S. ethanol volume mandate and strong gasoline prices. |
| ¨ | The global wheat supply/demand balance is closer to historic levels than for corn due to the re-emergence of wheat production and exports from Eastern Europe. However, 2012 wheat prices are being supported by high corn prices and weather problems in early 2012 which included extremely cold temperatures in Europe and drought conditions in South America. |
| ¨ | Uncertainty surrounding the global economy contributed to volatility in crop prices in 2011, however we believe short-term agricultural fundamentals are relatively isolated from short-term macroeconomic events. |
Crop Protection Products and Agronomic Services
Robust crop prices and agricultural fundamentals are expected to result in high planted area and support demand for crop protection products and agronomic services in 2012.
| ¨ | Glyphosate demand is expected to be supported by record combined corn, soybean and cotton planted area, however, glyphosate prices are expected to remain under pressure from continued excess global capacity. |
| ¨ | Incremental demand for non-glyphosate herbicides is expected to increase as growers diversify crop protection applications to combat glyphosate resistance. |
| ¨ | Plant health product demand is expected to continue its rapid growth trend, leading to increased demand for fungicides, adjuvants, insecticides and plant nutrition products as well as agronomic services. |
AGRIUM2011 ANNUAL REPORT 35
Seed
Early forecasts are for U.S. corn acreage to increase by at least two million acres in 2012 and higher total seeded acreage. This is expected to support strong demand for seed.
| ¨ | Strong grower economics provide an incentive to use the top seed genetics. While overall seed supply is expected to be sufficient, some of the newest stacked gene corn varieties are expected to be in short supply. |
| ¨ | Seed prices are expected to increase from 2011 levels. |
Crop Nutrients
Demand for crop nutrients was very strong throughout most of 2011, driven by strength in agricultural fundamentals and grower economics. In the second half of 2011, the uncertain global macroeconomic situation combined with a downturn in crop prices led fertilizer buyers to be cautious in making purchase decisions. We expect crop nutrient demand in North America to be flat to slightly higher in 2011/12, but much will depend on weather conditions and crop prices entering the spring planting season.
Nitrogen
| ¨ | Global nitrogen demand is estimated to have increased by over 3 percent in 2011 and is projected to increase by over 3 percent in 2012. |
| ¨ | North American nitrogen demand increased by an estimated 3 percent in 2011 and is forecast to increase by 1 percent in 2012, from very strong 2011 levels. |
| ¨ | Brazil imported record urea volumes in 2011 and demand is expected to strengthen further in 2012. |
| ¨ | In addition to strong demand, global nitrogen supplies were tightened in 2011 as a result of more restrictive export taxes being placed on Chinese urea exports, leading to a greater than 50 percent decline in Chinese urea exports. The sliding scale export tax structure is expected to continue to restrict exports in 2012 from China, but a minor change to the sliding scale formula may reduce the level of the tax during the low tax period slightly. |
| ¨ | There were several other nitrogen supply curtailments in 2011, including shut-downs in North Africa as a result of political unrest and gas restrictions in Trinidad that further tightened the market. |
| ¨ | There are more nitrogen projects expected to start up in 2012 than there has been over the past two years, some of which were delayed from expected 2011 start-up. |
| ¨ | North American nitrogen producers are expected to continue to benefit from relatively low natural gas prices in 2012, driven by shale gas production and being a net importing region for nitrogen products. |
Potash
| ¨ | Global potash shipments were approximately 56 million tonnes in 2011, up 3 percent compared to 2010. Analysts expect growth in global potash shipments to be flat to as high as 3.5 percent in 2012, depending on available supply and the timing of new supply agreements with China and India in 2012. |
| ¨ | North American potash demand increased by 6 percent in 2011 and is forecast to increase by 1 percent in 2012. |
| ¨ | Chinese potash imports increased by over 20 percent in 2011 to over six million tonnes, the highest volume of imports since 2007. Analysts expect China to import more potash in 2012, but delays in negotiating supply agreements could lead to a slight reduction. |
| ¨ | Due to slow demand in late 2011, some major potash producers in Canada and Russia announced that they would reduce potash production in the first quarter of 2012. |
| ¨ | India delayed negotiating its 2011/12 potash supply agreements until the second half of 2011. Once supply agreements were in place, Indian buyers purchased heavily for late 2011 and early 2012. Shipments to cover purchases initially scheduled for the first quarter of 2012 may be delayed one to two months, potentially delaying the 2012/13 negotiations. |
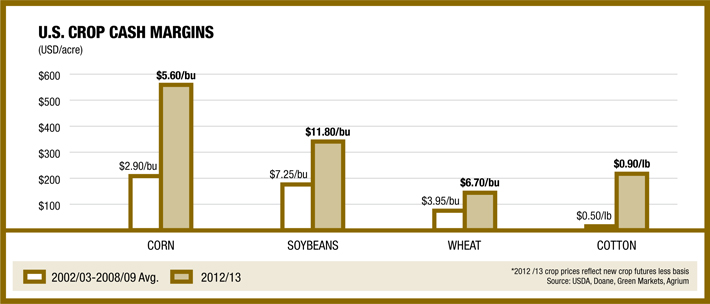
36 CULTIVATING PERFORMANCE.DELIVERING VALUE.
| ¨ | Brazil became the world’s largest potash importer, importing a record 7.7 million tonnes, a 25 percent increase over 2010 levels. Strong corn, soybean and sugar prices are expected to continue to support strong Brazilian potash demand in 2012. |
Phosphate
| ¨ | Global phosphate demand increased by approximately 2 percent in 2011, as demand growth was restricted by available supplies throughout most of the year. Industry analysts project that demand will grow by 2.5 percent in 2012. |
| ¨ | North American phosphate demand increased by approximately 5 percent in 2011 and is projected to increase by 1 percent in 2012. |
| ¨ | Brazilian DAP/MAP imports increased 67 percent to a record 2.6 million tonnes in 2011 and demand is expected to remain strong in 2012. |
| ¨ | China also attempted to increase restrictions on phosphate exports in 2011, but the policy was less effective for phosphates than for urea. Chinese phosphate producers exported slightly lower volumes of DAP and MAP than in 2010, but total phosphate exports increased as producers shifted production and exports to other forms of fertilizers that contained phosphate which were previously not restricted. The Chinese government increased restrictions on these other phosphate fertilizers in late 2011, which most analysts expect will reduce total phosphate exports from China in 2012. |
| ¨ | India further deregulated its phosphate fertilizer market in 2011, allowing retail prices to fluctuate, leading to a significant increase in retail phosphate prices. The impact of this change in policy on demand remains uncertain because phosphate supplies in India were constrained throughout much of 2011. |
| ¨ | As a result of slow traded phosphate demand at the end of 2011, major phosphate producers in the United States, Russia and Morocco have announced significant production curtailments in early 2012, which is expected to keep the market balanced to tight to begin the year. |
| ¨ | The Ma’aden Phosphate Project in Saudi Arabia began production in the second half of 2011 and most analysts expect production to continue to ramp up through the first half of 2012. |

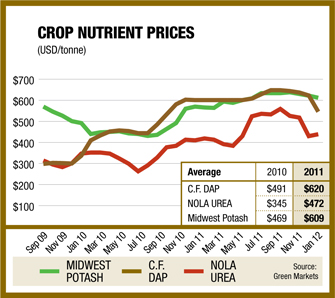
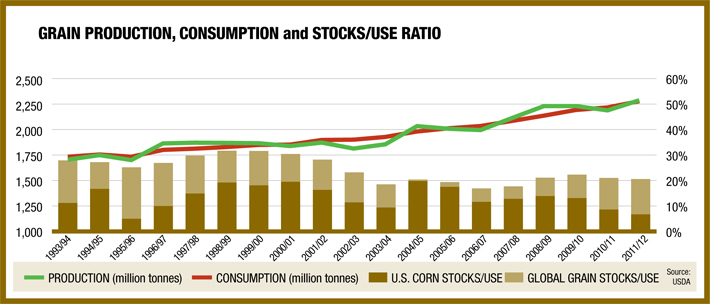
AGRIUM2011 ANNUAL REPORT 37
Key Business Sensitivities
Our financial results are sensitive to a number of factors that affect our operations and resulting net earnings. The following table sets out the impact of changes in some key variables on our earnings based on activity levels at December 31, 2011.
| | | | | | | | | | | | |
| (millions of U.S. dollars, except as noted) | | Change in Factor | | | Consolidated
EBIT Impact | | | Consolidated Net
Earnings Impact (f) | |
Wholesale(a) | | | | | | | | | | | | |
Nitrogen(b)(c) | | $ | 10.00 | | | | 40 | | | | 29 | |
Potash(d) | | $ | 10.00 | | | | 18 | | | | 13 | |
Phosphate | | $ | 10.00 | | | | 11 | | | | 8 | |
Product purchased for resale(e) | | | 1.00 | % | | | 16 | | | | 11 | |
Retail(e) | | | | | | | | | | | | |
Crop nutrients | | | 1.00 | % | | | 45 | | | | 32 | |
Crop protection products | | | 1.00 | % | | | 34 | | | | 24 | |
Seed | | | 1.00 | % | | | 11 | | | | 8 | |
Merchandise | | | 1.00 | % | | | 6 | | | | 4 | |
Exchange rate from CAD to USD | | $ | 0.01 | | | | 5 | | | | 4 | |
| (a) | Change in factor is per metric tonne. |
| (b) | The sensitivity for natural gas price is excluded from this table as changes in gas price may be offset by nitrogen pricing. However, without any offset in pricing, the sensitivity to earnings for a $0.50/MMBtu change in NYMEX gas prices is $44-million in EBIT and $32-million in net earnings. The sensitivity assumes no change to the price spread between U.S. and Alberta natural gas or nitrogen prices and is before the impact of natural gas economic hedge activity. |
| (c) | The sensitivity to nitrogen margins is exclusive of the natural gas sensitivity described in footnote (b) above. |
| (d) | Potash sensitivity does not include potash profit and capital tax. |
| (e) | Change in factor is gross profit as a percentage of net sales. |
| (f) | To convert impact to a fully diluted earnings per share basis, divide the net earnings impact by the weighted average number of outstanding shares (158 million shares for the year ended December 31, 2011). |
Margins
Wholesale
Certain key variables identified relate to changes to product margins, which could result from a change in sales prices or input costs. Nitrogen cost of product sold is affected by changes in North American natural gas prices and nitrogen prices can be impacted by changes in the global nitrogen supply/demand situation. The combination of these market fluctuations can impact nitrogen production margins. Wholesale’s purchase for resale margins are impacted by the volatility in the price for a crop nutrient between the time we purchase the product and the time we sell the product to the end customer.
Retail
Retail product margins are normally more stable than Wholesale margins, as Retail tends to be more of a cost-plus margin business than Wholesale, particularly in nutrients. However, there are several factors that can influence Retail margins. For example, nutrient margins are impacted by the volatility in the price between the time we purchase the product and the time we sell the product to the grower; as well as price volatility driven by the relative timing of our competitors’ nutrient purchases in relation to our purchases. Fluctuations in commodity prices affect the types of crops planted resulting in different crop input needs, but more significantly affect the timing of growers’ decisions on the application levels of our products. Lower crop commodity prices may result in growers delaying purchase and application of crop inputs that would otherwise optimize crop yields. Weather conditions can create significant fluctuations in the timing of Retail’s revenues and related margins based on the ability to plant or harvest and the associated application of inputs. Finally, crop protection and seed margins are influenced by changes in chemical pricing and rebates collected from our suppliers, as well as shortages or oversupply of different products.
Advanced Technologies
A key variable that would impact AAT net earnings is a significant change in the price of UAN or urea, since the ESN product is marketed to growers of major row crops and must compete against other forms of nitrogen products, primarily UAN and urea, for this market segment. Another factor that could impact results would include the potential continued softness in spending by golf courses and other professional product customers.
38 CULTIVATING PERFORMANCE.DELIVERING VALUE.
Foreign Exchange
The international currency of the agribusiness industry is the U.S. dollar and accordingly, we use the U.S. dollar as our reporting currency. We conduct business primarily in U.S. and Canadian dollars, and we also have some exposure to the Argentine peso, Australian dollar, Euro and Romanian ron. Fluctuations in these currencies could also impact our financial results.
Consolidated Performance
Consolidated Results of Operations
| | | | | | | | |
| (millions of U.S. dollars, except per share amounts) | | 2011 | | | 2010 | |
Sales | | | 15,470 | | | | 10,743 | |
Cost of product sold | | | 11,137 | | | | 8,095 | |
Gross profit | | | 4,333 | | | | 2,648 | |
Expenses | | | | | | | | |
Selling | | | 1,673 | | | | 1,144 | |
General and administrative | | | 335 | | | | 368 | |
Earnings from associates | | | (21 | ) | | | (26 | ) |
Other expenses | | | 123 | | | | 49 | |
Earnings before finance costs and income taxes | | | 2,223 | | | | 1,113 | |
Finance costs related to long-term debt | | | 101 | | | | 88 | |
Other finance costs | | | 59 | | | | 31 | |
Earnings before income taxes | | | 2,063 | | | | 994 | |
Income taxes | | | 555 | | | | 264 | |
Consolidated net earnings from continuing operations | | | 1,508 | | | | 730 | |
Consolidated net loss from discontinued operations | | | (133 | ) | | | (17 | ) |
Consolidated net earnings | | | 1,375 | | | | 713 | |
Attributable to: | | | | | | | | |
Equity holders of Agrium | | | 1,371 | | | | 713 | |
Non-controlling interest | | | 4 | | | | — | |
Consolidated net earnings | | | 1,375 | | | | 713 | |
Earnings per share attributable to equity holders of Agrium | | | | | | | | |
Basic earnings per share from continuing operations | | | 9.53 | | | | 4.63 | |
Basic loss per share from discontinued operations | | | (0.84 | ) | | | (0.11 | ) |
Basic earnings per share | | | 8.69 | | | | 4.52 | |
Diluted earnings per share from continuing operations | | | 9.52 | | | | 4.62 | |
Diluted loss per share from discontinued operations | | | (0.84 | ) | | | (0.11 | ) |
Diluted earnings per share | | | 8.68 | | | | 4.51 | |
Our net earnings were $1,375-million in 2011, or $8.68 diluted earnings per share, an increase of $662-million over 2010. The increase was primarily due to higher gross profit from all three strategic business units, with a full year of contribution from the Landmark business acquired in December 2010. Significant items affecting the comparability of annual results include the following:
Gross profit
Gross profit for the year ended December 31, 2011 was $4,333-million, a $1,685-million increase over 2010. The increase was primarily due to:
| ¨ | The addition of the Landmark business accounted for an increase of $394-million in Retail’s gross profit in 2011, with over half of the contribution coming from merchandise and other services. Excluding Landmark, Retail’s gross profit increased by $341-million in 2011 due to higher sales prices for nutrients and strong margins across our major product lines; and |
| ¨ | An increase in Wholesale’s gross profit of $973-million in 2011, as higher crop pricing drove up demand and selling prices for all major products. |
AGRIUM2011 ANNUAL REPORT 39
Selling expenses
Selling expenses were $1,673-million in 2011, compared to $1,144-million in 2010. Depreciation and amortization included in selling expenses was $154-million and $109-million in 2011 and 2010, respectively. Approximately 95 percent of our selling expenses are in our Retail business unit. Selling expenses were higher in 2011 versus 2010 due to the inclusion of the Landmark business in December 2010 which accounted for approximately 70 percent of the increase. The remainder can be attributed to other acquisitions in 2011.
General and administrative expenses
General and administrative expenses increased due to growth in our business, including the effect from acquisitions. This was offset by a recovery of share-based payments. The change in share-based payments recovery of $51-million in 2011 compared to share-based payments expense of $111-million in 2010 was driven by a decrease in share price in 2011 versus an increase in share price in 2010. Our closing share price on the New York Stock Exchange as at December 31, 2011, was $67.11 compared to $91.75 as at December 31, 2010. General and administrative expenses for the years ended December 31, 2011 and 2010 were $335-million and $368-million, respectively.
Depreciation and amortization included in general and administrative expenses was $40-million in 2011 versus $20-million in 2010. This change was driven by growth in our business as capital expenditures increased $222-million during the year.
Earnings from associates
Earnings from associates were $21-million and $26-million in 2011 and 2010, respectively. The majority of our earnings from associates is from our 26 percent interest in MOPCO.
Other expenses (income)
| | | | | | | | |
| (millions of U.S. dollars) | | 2011 | | | 2010 | |
Realized loss on derivative financial instruments | | | 83 | | | | 39 | |
Unrealized (gain) loss on derivative financial instruments | | | (46 | ) | | | 42 | |
Environmental remediation and asset retirement obligations | | | 44 | | | | 7 | |
Gain on disposal of marketable securities | | | — | | | | (52 | ) |
Interest income | | | (78 | ) | | | (50 | ) |
Foreign currency translation gain | | | (43 | ) | | | (47 | ) |
Asset impairment | | | 61 | | | | — | |
Bad debt expense | | | 26 | | | | 31 | |
Potash profit and capital tax | | | 50 | | | | 27 | |
Acquisition costs | | | — | | | | 37 | |
Other | | | 26 | | | | 15 | |
| | | | 123 | | | | 49 | |
Net realized and unrealized losses on derivative financial instruments were $37-million and $81-million for 2011 and 2010, respectively. This change was due primarily to foreign exchange derivatives entered into in the fourth quarter of 2010 in anticipation of the AWB acquisition and the sale of the Commodity Management business. The outstanding positions at December 31, 2010 were settled in the first half of 2011 and there were less derivative positions entered into in 2011.
Environmental remediation and asset retirement obligations increased by $37-million largely due to provisions made for tailings management and environmental cleanup after a fire at one of our sites.
The $52-million gain on disposal of marketable securities from 2010 was from the sale of 1.2 million shares of CF Industries Holdings, Inc.
Asset impairment for 2011 represented a $61-million impairment charge regarding our investment in Hanfeng for which there was no equivalent expense in 2010.
Potash profit and capital tax was $50-million in 2011, an increase of $23-million compared to 2010. The increase was driven by higher sales prices in 2011.
Acquisition costs of $37-million in 2010 resulted from the acquisition of AWB.
Finance costs related to long-term debt
Finance costs related to long-term debt were $101-million in 2011, compared to $88-million in 2010. This increase was due to the inclusion of a full year’s interest on the $500-million long-term debt issued in the fourth quarter of 2010, partially offset by repayment of $125-million of long-term debt that became due in the first quarter of 2011.
40 CULTIVATING PERFORMANCE.DELIVERING VALUE.
Other finance costs
Other finance costs were $59-million in 2011, compared to $31-million in 2010. The increase was primarily driven by higher other interest expense as a result of a full year of interest expense from the Australian trade receivable securitization as a result of the Landmark acquisition in the fourth quarter of 2010.
Income taxes
Our overall effective tax rate remained the same at 27 percent in both 2011 and in 2010.
Changes in statutory income tax rates, the mix of earnings, tax allowances, and realization of unrecognized tax assets amongst the jurisdictions in which we operate can impact our overall effective tax rate. Further details of the year-over-year variances in these rates for the years ended December 31, 2011 and 2010 are provided in note 8 of the Notes to the Consolidated Financial Statements.
Consolidated net loss from discontinued operations
Discontinued operations include the operations of AWB’s Commodity Management business and AWB Harvest Finance Limited (“Harvest Finance”) sold on May 11, 2011. For discussion on AWB, see disclosure under the heading “Business Acquisitions” on page 48.
Net loss from discontinued operations was $133-million for 2011 and $17-million for 2010. For further discussion on discontinued operations, see section “Discontinued Operations” of our 2011 Fourth Quarter Management’s Discussion and Analysis on page 60.
Quarterly Results of Operations
The agricultural products business is seasonal in nature. Consequently, comparisons made on a year-over-year basis are more appropriate than quarter-over-quarter. Crop input sales are primarily concentrated in the spring and fall crop input application seasons, which are in the second quarter and fourth quarter. Crop nutrient inventories are normally accumulated leading up to the application season. Cash collections generally occur after the application season is complete in the Americas and Australia.
| | | | | | | | | | | | | | | | | | | | | | | | | | | | | | | | | | | | | | | | | | | | |
(millions of U.S. dollars,
except per share amounts) | | | | | Consolidated net earnings (loss) from continuing | | | Consolidated net earnings | | | Earnings (loss) per share from continuing operations attributable to equity holders of Agrium | | | Earnings (loss) per share attributable to equity holders of Agrium | | | Total | | | Cash and cash | | | Dividends | | | Long-term
financial | |
| | Sales | | | operations | | | (loss) | | | Basic | | | Diluted | | | Basic | | | Diluted | | | assets | | | equivalents | | | declared | | | liabilities | |
2011 | | | | | | | | | | | | | | | | | | | | | | | | | | | | | | | | | | | | | | | | | | | | |
Q1 | | | 2,954 | | | | 160 | | | | 171 | | | | 1.02 | | | | 1.02 | | | | 1.09 | | | | 1.09 | | | | 14,245 | | | | 447 | | | | — | | | | 2,105 | |
Q2 | | | 6,198 | | | | 728 | | | | 718 | | | | 4.61 | | | | 4.60 | | | | 4.55 | | | | 4.54 | | | | 13,167 | | | | 966 | | | | 9 | | | | 2,107 | |
Q3 | | | 3,141 | | | | 293 | | | | 293 | | | | 1.86 | | | | 1.85 | | | | 1.86 | | | | 1.85 | | | | 12,534 | | | | 755 | | | | — | | | | 2,164 | |
Q4 | | | 3,177 | | | | 327 | | | | 193 | | | | 2.05 | | | | 2.04 | | | | 1.20 | | | | 1.20 | | | | 13,140 | | | | 1,346 | | | | 35 | | | | 2,134 | |
Year | | | 15,470 | | | | 1,508 | | | | 1,375 | | | | 9.53 | | | | 9.52 | | | | 8.69 | | | | 8.68 | | | | 13,140 | | | | 1,346 | | | | 44 | | | | 2,134 | |
2010 | | | | | | | | | | | | | | | | | | | | | | | | | | | | | | | | | | | | | | | | | | | | |
Q1 | | | 1,848 | | | | (1 | ) | | | (1 | ) | | | (0.01 | ) | | | (0.01 | ) | | | (0.01 | ) | | | (0.01 | ) | | | 10,352 | | | | 907 | | | | — | | | | 1,631 | |
Q2 | | | 4,431 | | | | 518 | | | | 518 | | | | 3.29 | | | | 3.28 | | | | 3.29 | | | | 3.28 | | | | 9,748 | | | | 805 | | | | 9 | | | | 1,618 | |
Q3 | | | 2,066 | | | | 61 | | | | 61 | | | | 0.39 | | | | 0.39 | | | | 0.39 | | | | 0.39 | | | | 9,722 | | | | 897 | | | | — | | | | 1,672 | |
Q4 | | | 2,398 | | | | 152 | | | | 135 | | | | 0.97 | | | | 0.97 | | | | 0.86 | | | | 0.86 | | | | 12,892 | | | | 635 | | | | 8 | | | | 2,165 | |
Year | | | 10,743 | | | | 730 | | | | 713 | | | | 4.63 | | | | 4.62 | | | | 4.52 | | | | 4.51 | | | | 12,892 | | | | 635 | | | | 17 | | | | 2,165 | |
2009 (a) | | | | | | | | | | | | | | | | | | | | | | | | | | | | | | | | | | | | | | | | | | | | |
Q1 | | | 1,753 | | | | (60 | ) | | | (60 | ) | | | (0.38 | ) | | | (0.38 | ) | | | (0.38 | ) | | | (0.38 | ) | | | 10,301 | | | | 86 | | | | — | | | | 1,961 | |
Q2 | | | 4,090 | | | | 370 | | | | 370 | | | | 2.36 | | | | 2.35 | | | | 2.36 | | | | 2.35 | | | | 9,688 | | | | 251 | | | | 9 | | | | 1,976 | |
Q3 | | | 1,844 | | | | 26 | | | | 26 | | | | 0.16 | | | | 0.16 | | | | 0.16 | | | | 0.16 | | | | 9,023 | | | | 225 | | | | — | | | | 2,020 | |
Q4 | | | 1,442 | | | | 30 | | | | 30 | | | | 0.19 | | | | 0.19 | | | | 0.19 | | | | 0.19 | | | | 9,785 | | | | 933 | | | | 8 | | | | 2,080 | |
Year | | | 9,129 | | | | 366 | | | | 366 | | | | 2.33 | | | | 2.33 | | | | 2.33 | | | | 2.33 | | | | 9,785 | | | | 933 | | | | 17 | | | | 2,080 | |
| (a) | Presented in accordance with CGAAP. |
AGRIUM2011 ANNUAL REPORT 41
Significant items affecting the comparability of quarterly results include the following:
2011
| ¨ | Sales for all four quarters in 2011 have increased over their respective comparative quarters in 2010 as we had a full year of sales from the Landmark business; |
| ¨ | Our overall selling expenses increased by over 45 percent from $1,144-million in 2010 to $1,673-million in 2011, with the Landmark business accounting for approximately 65 percent, or $349-million of the increase. Non-Landmark selling costs increased by $180-million, almost evenly throughout all four quarters driven by increased payroll costs due to recent acquisitions and higher incentive costs; and |
| ¨ | Our share-based payments expense for the third and fourth quarters of 2011 were recoveries of $46-million and $7-million, respectively, compared to expenses for the third and fourth quarters of 2010 of $78-million and $54-million, respectively, as a result of changes in fair value mostly due to changes in share price. |
2010
| ¨ | We had losses on derivative financial instruments of $68-million and $31-million in the first and fourth quarter, respectively, and gains of $8-million and $10-million in the second and third quarter, respectively; |
| ¨ | While our share price increased by almost half over 2010, our share price dipped in the second quarter of 2010. Our 2010 share-based payments expense increased quarter-over-quarter by $26-million, $53-million, and $20-million in the first, third, and fourth quarter, respectively, and decreased quarter-over-quarter by $61-million in the second quarter; |
| ¨ | Our selling expenses for 2010 increased by $226-million versus 2009. $109-million of that increase was the result of an IFRS reclassification difference as depreciation and amortization is directly charged to selling expenses whereas in 2009, depreciation and amortization was a separate expense line item under CGAAP. The bulk of the remaining $117-million increase occurred in the second and fourth quarters of 2010, driven by increased costs partly associated with new hires and acquisitions and increased fuel costs for Retail. Retail’s selling expenses as a percentage of sales for 2010 was 16 percent compared to 2009 which was 14 percent; and |
| ¨ | Our general and administrative expenses increased by $92-million in the fourth quarter of 2010 compared to the same period of 2009. $54-million relates to a share-based payment IFRS reclassification difference, as this was included in other expenses in 2009. The remaining increase was primarily due to the AWB acquisition. |
2009
| ¨ | We had losses on derivative financial instruments of $69-million and $35-million in the first and fourth quarter, respectively, and gains of $15-million and $5-million in the second and third quarter, respectively; |
| ¨ | Due to the increase in our share price in the first half of 2008 and significant decline in the second half of 2008, in 2009 share-based payments expense decreased quarter-over-quarter by $111-million in the second quarter; |
| ¨ | We had quarter-over-quarter increases of $99-million and $61-million in Retail’s selling expense in the first and second quarter, respectively, primarily as a result of the inclusion of the UAP business for the full year; and |
| ¨ | We had write-downs of $18-million, $32-million, $9-million and $2-million to Wholesale inventory in the first, second, third and fourth quarter, respectively. |
Non-IFRS Financial Measures
In the discussion of our performance for the year, in addition to the primary measures of earnings and earnings per share reported in accordance with IFRS, we make reference to EBITDA. We consider EBITDA to be a useful measure of performance because income tax jurisdictions and business segments are not synonymous and we believe that allocation of income tax charges distorts the comparability of historical performance for the different business segments. Similarly, financing and related interest charges cannot be allocated to all business units on a basis that is meaningful for comparison with other companies.
EBITDA is not a recognized measure under IFRS and our method of calculation may not be comparable to other companies. Similarly, EBITDA should not be used as an alternative to net earnings from continuing operations as determined in accordance with IFRS.
42 CULTIVATING PERFORMANCE.DELIVERING VALUE.
The following table is a reconciliation of EBITDA to consolidated net earnings from continuing operations as determined in accordance with IFRS.
| | | | | | | | | | | | | | | | | | | | |
| (millions of U.S. dollars, except per share amounts) | | Retail | | | Wholesale | | | Advanced
Technologies | | | Other | | | Consolidated | |
2011 | | | | | | | | | | | | | | | | | | | | |
EBITDA | | | 769 | | | | 2,019 | | | | 34 | | | | (157 | ) | | | 2,665 | |
Depreciation and amortization | | | 169 | | | | 173 | | | | 24 | | | | 15 | | | | 381 | |
Asset impairment | | | — | | | | — | | | | 61 | | | | — | | | | 61 | |
EBIT | | | 600 | | | | 1,846 | | | | (51 | ) | | | (172 | ) | | | 2,223 | |
Finance costs related to long-term debt | | | | | | | | | | | | | | | | | | | (101 | ) |
Other finance costs | | | | | | | | | | | | | | | | | | | (59 | ) |
Income taxes | | | | | | | | | | | | | | | | | | | (555 | ) |
Consolidated net earnings from continuing operations | | | | | | | | | | | | | | | | | | | 1,508 | |
Diluted earnings per share from continuing operations attributable to equity holders of Agrium | | | | | | | | | | | | | | | | | | | 9.52 | |
2010 | | | | | | | | | | | | | | | | | | | | |
EBITDA | | | 524 | | | | 1,081 | | | | 31 | | | | (189 | ) | | | 1,447 | |
Depreciation and amortization | | | 115 | | | | 192 | | | | 19 | | | | 8 | | | | 334 | |
EBIT | | | 409 | | | | 889 | | | | 12 | | | | (197 | ) | | | 1,113 | |
Finance costs related to long-term debt | | | | | | | | | | | | | | | | | | | (88 | ) |
Other finance costs | | | | | | | | | | | | | | | | | | | (31 | ) |
Income taxes | | | | | | | | | | | | | | | | | | | (264 | ) |
Consolidated net earnings from continuing operations | | | | | | | | | | | | | | | | | | | 730 | |
Diluted earnings per share from continuing operations attributable to equity holders of Agrium | | | | | | | | | | | | | | | | | | | 4.62 | |
Net debt includes short-term debt and long-term debt, net of cash and cash equivalents. Net debt is not a recognized measure under IFRS and our method of calculation may not be comparable to other companies.
Financial Condition
| | | | | | | | | | | | |
| (millions of U.S. dollars) | | 2011 | | | 2010 | | | 2011 vs. 2010 | |
Assets | | | 13,140 | | | | 12,892 | | | | 248 | |
Liabilities | | | 6,712 | | | | 7,699 | | | | (987 | ) |
Shareholders’ equity | | | 6,428 | | | | 5,193 | | | | 1,235 | |
The following are changes to the financial condition on our Consolidated Balance Sheets for the year ended December 31, 2011.
AGRIUM2011 ANNUAL REPORT 43
| | | | | | | | | | | | | | | | | | |
As at (millions of U.S. dollars) | | December 31, 2011 | | | December 31, 2010 | | | $ Change | | | % Change | | | Explanation of the change in balance |
Assets | | | | | | | | | | | | | | | | | | |
Cash and cash equivalents | | | 1,346 | | | | 635 | | | | 711 | | | | 112 | % | | For discussion of the change in cash balance year-over-year, see “Cash position” on page 47 of this MD&A. |
Accounts receivable | | | 1,984 | | | | 1,759 | | | | 225 | | | | 13 | % | | This increase was attributed to higher Retail receivables of $180-million resulting from higher North American sales and a strong cotton market. Wholesale receivables increased by $81-million due to greater sales and higher prices. |
Net income taxes receivable | | | 56 | | | | 13 | | | | 43 | | | | 331 | % | | This increase is due to the accrual of expected tax recoveries relating to transfer pricing in Canada and the U.S. |
Inventories | | | 2,956 | | | | 2,498 | | | | 458 | | | | 18 | % | | Inventories increased due to receipts from suppliers for North American crop nutrients which were received by year end compared to delays in receipt of inventory in 2010. Inventories also increased due to the higher average cost per tonne. |
Prepaid expenses and deposits | | | 643 | | | | 848 | | | | (205 | ) | | | (24 | %) | | This change was primarily due to a decrease in Retail’s pre-bought crop protection inventory because of less attractive prepay incentives in 2011 compared to 2010. |
Marketable securities | | | — | | | | 3 | | | | (3 | ) | | | (100 | %) | | — |
Property, plant and equipment | | | 2,533 | | | | 2,179 | | | | 354 | | | | 16 | % | | With additions across all three of our strategic business units, our property, plant and equipment increased by $354-million year-over-year, net of regular depreciation. |
Intangibles | | | 678 | | | | 695 | | | | (17 | ) | | | (2 | %) | | — |
Goodwill | | | 2,277 | | | | 2,271 | | | | 6 | | | | 0 | % | | — |
Investments in associates | | | 355 | | | | 405 | | | | (50 | ) | | | (12 | %) | | The decrease was caused by the impairment of Hanfeng in the fourth quarter of 2011 for $61-million offset by other acquisitions of associates. |
Other assets | | | 97 | | | | 48 | | | | 49 | | | | 102 | % | | Other assets increased from the prior year primarily due to a $50-million loan receivable that resulted from the sale of the Commodity Management business in the second quarter of 2011. |
Assets of discontinued operations | | | 70 | | | | 1,504 | | | | (1,434 | ) | | | (95 | %) | | The majority of the Commodity Management business of AWB was divested in the second quarter of 2011. For further discussion on discontinued operations and a condensed balance sheet for discontinued operations, see section “Discontinued Operations” on page 49. |
44 CULTIVATING PERFORMANCE.DELIVERING VALUE.
| | | | | | | | | | | | | | | | | | |
As at (millions of U.S. dollars) | | December 31, 2011 | | | December 31, 2010 | | | $ Change | | | % Change | | | Explanation of the change in balance |
Liabilities | | | | | | | | | | | | | | | | | | |
Short-term debt | | | 245 | | | | 517 | | | | (272 | ) | | | (53 | %) | | The 2011 decrease in short-term debt was primarily due to the repayment of the Australian accounts receivable securitization of approximately $220-million. |
Accounts payable | | | 2,959 | | | | 2,815 | | | | 144 | | | | 5 | % | | Accounts payable increased as a result of higher production in addition to amounts owing as a result of the sale of the Commodity Management business. |
Long-term debt | | | 2,118 | | | | 2,243 | | | | (125 | ) | | | (6 | %) | | Long-term debt decreased due to the repayment of the 8.25 percent $125-million debentures in 2011. |
Provisions for post-employment benefits | | | 192 | | | | 136 | | | | 56 | | | | 41 | % | | This change was due to the revised actuarial estimates as a result of the economic downturn. |
Other provisions | | | 367 | | | | 340 | | | | 27 | | | | 8 | % | | Other provisions increased mainly due to a change in the discount rate applied to asset retirement obligations. |
Other liabilities | | | 59 | | | | 123 | | | | (64 | ) | | | (52 | %) | | Other liabilities decreased with the majority of the decrease due to lower share-based payment accruals. |
Net deferred income tax liabilities | | | 574 | | | | 468 | | | | 106 | | | | 23 | % | | The change resulted from increased tax deferral in Canada. |
Liabilities of discontinued operations | | | 53 | | | | 1,023 | | | | (970 | ) | | | (95 | %) | | The majority of the Commodity Management business of AWB was divested in the second quarter of 2011. For further discussion on discontinued operations and a condensed balance sheet for discontinued operations, see section “Discontinued Operations” on page 49. |
Working Capital
Our working capital from continuing operations, defined as current assets excluding current assets from discontinued operations less current liabilities excluding current liabilities from discontinued operations, at December 31, 2011 was $3,693-million, an increase of $1,438-million over December 31, 2010. See discussion of current assets under the section “Financial Condition” on page 43 for discussion on the drivers behind this change in working capital. See section “Discontinued Operations” on page 49 for a condensed balance sheet for discontinued operations.
| | | | | | | | |
| (millions of U.S. dollars) | | 2011 | | | 2010 | |
Current assets excluding current assets of discontinued operations | | | 7,067 | | | | 5,768 | |
Current liabilities excluding current liabilities of discontinued operations | | | 3,374 | | | | 3,513 | |
Working capital from continuing operations | | | 3,693 | | | | 2,255 | |
AGRIUM2011 ANNUAL REPORT 45
Shareholders’ Equity
Shareholders’ equity was $6,428-million at December 31, 2011, an increase of $1,235-million compared to December 31, 2010. This was primarily driven by a net increase in retained earnings of $1,327-million at December 31, 2011 compared to December 31, 2010 which represents the 2011 consolidated net earnings attributable to equity holders of Agrium less dividends.
Liquidity and Capital Resources
Our liquidity and capital resource needs can be met through a variety of sources including cash on hand, cash provided by operations and short-term borrowings from our committed credit facilities as well as long-term debt and equity capacity from the capital markets. Depending on the nature, timing and extent of any potential acquisitions or greenfield development opportunities, we may consider expanding existing sources of financing or accessing other sources of financing.
Sources and Uses of Cash
| | | | | | | | |
| (millions of U.S. dollars) | | 2011 | | | 2010 | |
Cash provided by operating activities | | | 1,350 | | | | 589 | |
Cash used in investing activities | | | (151 | ) | | | (1,508 | ) |
Cash (used in) provided by financing activities | | | (423 | ) | | | 568 | |
Effect of exchange rate changes on cash and cash equivalents | | | (14 | ) | | | 8 | |
Increase (decrease) in cash and cash equivalents from continuing operations | | | 762 | | | | (343 | ) |
Cash and cash equivalents (used in) provided by discontinued operations | | | (51 | ) | | | 45 | |
Cash provided by operating activities
Cash provided by operating activities is made up of consolidated net earnings from continuing operations adjusted for items not affecting cash, dividends from associates and net changes in non-cash working capital.
Net earnings adjusted for items not affecting cash was a source of cash of $2,065-million in 2011 and $1,171-million in 2010. The significant change in net earnings year-over-year was the primary contributor to this variance. Non-cash items include depreciation and amortization, asset impairment, share-based payments, unrealized loss (gain) on derivative financial instruments and deferred income taxes. Dividends from associates were $16-million in 2011 versus $14-million in 2010.
Non-cash working capital
Our non-cash working capital levels are affected by numerous factors including: demand for our products and services, including pre-sales of product and inventory build leading up to the spring and fall crop input application seasons; selling prices of our products and services; raw material input and other costs; and foreign exchange rates.
The net changes in non-cash working capital for the year ended December 31, 2011 was a use of cash of $731-million versus $596-million for the year ended December 31, 2010. The decrease in cash flow from non-cash working capital for 2011 was primarily driven by increases in accounts receivable and inventories partially offset by a decrease in prepaid expenses and deposits and increased accounts payable.
For further discussion of working capital balance sheet account changes from December 31, 2010 to December 31, 2011, see the section “Financial Condition” on page 43.
Cash used in investing activities
Investing activities used $151-million of cash in 2011, a decrease of $1,357-million compared to 2010.
Business acquisitions
In 2011, we had multiple acquisitions for total consideration of $183-million which included the purchases of Cerealtoscana, Evergro and Tetra Micronutrients. For further discussion, see section “Business Acquisitions” on page 48.
In 2010, we completed the acquisition of 100 percent of the outstanding shares of AWB, which accounted for the use of cash of $1.2-billion. For further discussion on AWB, see section “Business Acquisitions” on page 48.
Disposal of discontinued operations
Proceeds from the disposal of discontinued operations includes $694-million received from the sale of the majority of the Commodity Management business of AWB to Cargill on May 11, 2011. For further discussion on the Commodity Management business, see section “Discontinued Operations” on page 49.
46 CULTIVATING PERFORMANCE.DELIVERING VALUE.
Capital expenditures
| | | | | | | | |
| (millions of U.S. dollars) | | 2011 | | | 2010 | |
Sustaining capital | | | 333 | | | | 229 | |
Investment capital | | | 330 | | | | 212 | |
Total | | | 663 | | | | 441 | |
Sustaining capital includes the cost of replacements and betterments of our facilities. Our sustaining capital expenditures increased in 2011 as Retail had purchased fleet equipment versus leasing in 2010. In addition, Wholesale had maintenance performed at its Redwater facility.
In the prior year, we planned for a sustaining capital program of $400-million to $450-million during 2011. Our actual sustaining capital spent in 2011 was approximately $333-million. The variance was a result of delays in engineering on our Vanscoy potash expansion project, which impacted our related sustaining capital projects in the area. These funds are anticipated to be spent in 2012.
Investment capital typically includes a significant expansion of existing operations or new acquisitions. Our investment capital expenditures increased in 2011 versus 2010 which was attributed to expenditures related to the Vanscoy potash expansion project.
Cash (used in) provided by financing activities
Financing activities used $423-million of cash in 2011, a change of $991-million compared to 2010 when financing activities provided $568-million of cash.
Short-term debt
Cash used to repay short-term debt in 2011 was $293-million compared to cash provided by short-term debt of $42-million in 2010. The use of cash in 2011 was primarily attributed to the repayment of the Australian accounts receivable securitization facility.
Long-term debt
In February 2011, we repaid $125-million aggregate principal amount of 8.25 percent debentures that were due. We also repaid $54-million of the South American credit facilities in the last quarter of 2011.
In late 2010, we sold $500-million aggregate principal amount of 6.125 percent debentures due January 15, 2041. The debentures, registered under the multi-jurisdictional disclosure system in Canada and the U.S., were only offered and sold in the U.S.
Dividends
We declared dividends on our common shares of 28 cents per common share, equating to $44-million in 2011 and 11 cents per common share in 2010, equating to $17-million. Common share dividends paid were $18-million in 2011 and $17-million in 2010.
Common shares
We issued $5-million in common shares for cash related to the exercise of stock options in 2011. Cash received on exercise of stock options was $8-million in 2010.
Cash and cash equivalents (used in) provided by discontinued operations
Cash and cash equivalents used in discontinued operations was $51-million in 2011 versus cash and cash equivalents provided by discontinued operations of $45-million in 2010. For further discussion on discontinued operations including a condensed statement of cash flows for discontinued operations, see section “Discontinued Operations” on page 49.
Cash position
Our end-of-year cash balance was $1,346-million in 2011 and $635-million in 2010. The increase in cash in 2011 was primarily driven by higher cash provided by operating activities offset by significantly lower cash used in investing activities as proceeds received from the disposal of discontinued operations offset capital expenditures. There was also significantly higher cash used in financing activities as both short-term and long-term debt were repaid during the year.
AGRIUM2011 ANNUAL REPORT 47
Business Acquisitions
On December 3, 2010, we acquired 100 percent of AWB, an agribusiness operating in Australia, for $1.2-billion in cash. On May 11, 2011, we completed the sale of the majority of the Commodity Management business acquired from AWB in accordance with an agreement dated December 15, 2010. Cash received from the sale was $694-million.
We retained the Landmark retail operations, including over 200 company-owned locations and relationships with over 140 other points of sale to customers in Australia. The primary purpose of the acquisition was to expand the Retail business unit and provide access to the growing Southeast Asia market. The acquired business is included in the Retail operating segment.
Business acquisitions during 2011 included the following purchases.
| | | | | | | | | | | | | | | | | | | | |
| | | Date | | | Consideration
(millions of U.S. dollars) | | | Purchase type | | | Business Unit | | | Description | |
Cerealtoscana S.p.A and Agroport | | | May 2, 2011 | | | | 27 | | | | 100% of shares | | | | Wholesale | | |
| Crop input
distribution |
|
Evergro Canada | | | July 4, 2011 | | | | 52 | | | | Assets | | | | AAT | | |
| Crop input
manufacturing
and distribution |
|
International Mineral Technologies | | | July 7, 2011 | | | | 44 | | | | Assets | | | | AAT / Retail | | |
| Crop input
manufacturing
and distribution |
|
Other | | | various | | | | 60 | | | | — | | | | Retail | | | | — | |
48 CULTIVATING PERFORMANCE.DELIVERING VALUE.
Discontinued Operations
Discontinued operations include the operations of the Commodity Management business and Harvest Finance, sold on May 11, 2011. Cash received from the sale was $694-million. Also included are the operations and assets and liabilities of the Commodity Management businesses not included in the sale.
| | | | | | | | |
| Condensed information of discontinued operations(millions of U.S. dollars) | | December 31, 2011 | | | December 31, 2010 | |
Operating information | | | | | | | | |
Sales (a) | | | 1,662 | | | | 313 | |
Expenses (b) | | | 1,773 | | | | 333 | |
Loss before income taxes | | | (111 | ) | | | (20 | ) |
Income taxes | | | 22 | | | | (3 | ) |
Consolidated net loss from discontinued operations | | | (133 | ) | | | (17 | ) |
Cash (used in) provided by | | | | | | | | |
Operating activities | | | (119 | ) | | | (252 | ) |
Investing activities | | | 16 | | | | (1 | ) |
Financing activities | | | 52 | | | | 298 | |
| | | | (51 | ) | | | 45 | |
Balance sheet information | | | | | | | | |
Accounts receivable | | | 32 | | | | 743 | |
Inventories | | | 32 | | | | 551 | |
Prepaid expenses and deposits | | | — | | | | 14 | |
Other current assets | | | 4 | | | | 12 | |
Current assets | | | 68 | | | | 1,320 | |
Property, plant and equipment | | | 1 | | | | 86 | |
Goodwill | | | — | | | | 79 | |
Other assets | | | — | | | | 2 | |
Deferred income tax assets | | | 1 | | | | 17 | |
Non-current assets | | | 2 | | | | 184 | |
| | | | 70 | | | | 1,504 | |
Short-term debt | | | 13 | | | | 471 | |
Accounts payable | | | 40 | | | | 549 | |
Current liabilities | | | 53 | | | | 1,020 | |
Deferred income tax liabilities | | | — | | | | 3 | |
Non-current liabilities | | | — | | | | 3 | |
| | | | 53 | | | | 1,023 | |
| (a) | Includes revenue from related parties (grain pools) of $366-million (2010 – $59-million). Grain pools are trusts that collect grain from growers and market it on their behalf. AWB collected management fees from grain pools and had title to grain assets, but participating growers retained all rights to and obligations for net earnings and gains or losses of the pools. |
| (b) | Includes a loss of $10-million on the sale of discontinued operations. |
See section “Discontinued operations” under “2011 Fourth Quarter Management’s Discussion and Analysis” on page 60 for further details on discontinued operations.
AGRIUM2011 ANNUAL REPORT 49
Debt Instruments, Capital Management and Ratings
Debt Instruments
| | | | | | | | | | | | | | | | | | | | | | | | |
| | | | | | | | | | | | 2011 | | | | | | 2010 | |
| (millions of U.S. dollars, except as noted) | | Maturity | | | Rate (%) (a) | | | Total | | | Unutilized | | | Utilized | | | Utilized | |
Short-term debt (b) | | | | | | | | | | | | | | | | | | | | | | | | |
Multi-jurisdictional facility (c) | | | 2016 | | | | — | | | | 1,600 | | | | 1,600 | | | | — | | | | — | |
North American facility (c) | | | 2012 | | | | — | | | | 100 | | | | 100 | | | | — | | | | — | |
European facilities (d) | | | 2013 | | | | 1.13 | | | | 326 | | | | 148 | | | | 178 | | | | 142 | |
South American facilities | | | 2012 | | | | 3.17 | | | | 119 | | | | 52 | | | | 67 | | | | 55 | |
Australian facilities (c) | | | — | | | | — | | | | — | | | | — | | | | — | | | | 320 | |
| | | | | | | | | | | | 2,145 | | | | 1,900 | | | | 245 | | | | 517 | |
| | | | | | |
Current portion of long-term debt | | | | | | | | | | | | | | | | | | | 20 | | | | 125 | |
| | | | | | |
Long-term debt | | | | | | | | | | | | | | | | | | | | | | | | |
Floating rate bank loans | | | 2013-2016 | | | | | | | | | | | | | | | | 35 | | | | 14 | |
Floating rate bank loans | | | 2013 | | | | | | | | | | | | | | | | 460 | | | | 460 | |
6.125% debentures (e) | | | 2041 | | | | | | | | | | | | | | | | 500 | | | | 500 | |
6.75% debentures (e) | | | 2019 | | | | | | | | | | | | | | | | 500 | | | | 500 | |
7.125% debentures (e) | | | 2036 | | | | | | | | | | | | | | | | 300 | | | | 300 | |
7.7% debentures (e) | | | 2017 | | | | | | | | | | | | | | | | 100 | | | | 100 | |
7.8% debentures (e) | | | 2027 | | | | | | | | | | | | | | | | 125 | | | | 125 | |
Other (f) | | | | | | | | | | | | | | | | | | | 98 | | | | 141 | |
| | | | | | | | | | | | | | | | | | | 2,118 | | | | 2,140 | |
Unamortized transaction costs | | | | | | | | | | | | | | | | | | | (20 | ) | | | (22 | ) |
| | | | | | | | | | | | | | | | | | | | 2,098 | | | | 2,118 | |
| (a) | Weighted average rates at December 31, 2011. |
| (b) | The facilities bear interest at various base rates plus a fixed or variable margin. |
| (c) | In 2011, we entered into a syndicated unsecured multi-jurisdictional revolving credit facility consisting of North American and Australian tranches and an accordion feature that allows us to request an increase in the facility of up to $900-million. This facility replaces our North American and Australian accounts receivable securitization facilities which we terminated in late 2011 and a North American facility which we reduced to $100-million from $775-million in January 2012. Outstanding letters of credit issued under our North American facility at December 31, 2011 were $87-million reducing credit available under the facility. |
| (d) | Of the total facility, $7-million (2010 – $1-million) was secured. Security pledged for the utilized balance included accounts receivable and inventory with a total carrying value of $8-million (2010 – $4-million). The utilized balance includes EUR-denominated debt of $106-million (2010 – $93-million). |
| (e) | Debentures have various provisions that allow us to redeem debt prior to maturity, at our option, at specified prices. |
| (f) | Includes South American facilities of $75-million (2010 – $115-million) that bear interest at 4.81 percent repayable in 2013 and 2014. |
Capital Management
Our primary objectives when managing capital are to provide for: (a) a prudent capital structure for raising capital at a reasonable cost for the funding of ongoing operations, capital expenditures, and new growth initiatives; and (b) an appropriate rate of return to shareholders in relation to the risks underlying our assets.
We manage capital in reference to a number of credit ratios, including monitoring the ratios outlined in the table below. Net debt includes short-term debt and long-term debt, net of cash and cash equivalents. Equity includes shareholders’ equity. Interest coverage is the last 12 months EBITDA divided by interest, which includes interest on long-term debt plus other interest. The measures of net debt, equity and EBITDA described above are non-IFRS financial measures and therefore may not be comparable to similar measures presented by other issuers (see discussion under “Non-IFRS Financial Measures” on page 42 of this MD&A for further details). Our strategy for managing capital is unchanged from December 31, 2010.
50 CULTIVATING PERFORMANCE.DELIVERING VALUE.
| | | | | | | | |
| | | 2011 | | | 2010 | |
Net debt to net debt plus equity (%) | | | 14 | | | | 29 | |
Interest coverage (multiple) | | | 16.7 | | | | 12.2 | |
Our strategy in managing capital is to maintain our ratio of net debt to net debt plus equity at approximately 40 percent or lower. In order to maintain or adjust our capital structure, we may adjust the amount of dividends paid to shareholders, return capital to shareholders, issue new shares or issue or redeem debt.
Our revolving credit facilities require that we maintain specific interest coverage and debt to capital ratios as well as other non-financial covenants as defined in the relevant debt agreement. We were in compliance with all covenants at December 31, 2011.
Our authorized share capital consists of an unlimited number of common shares without par value and unlimited preferred shares.
Debt Ratings
The following information relating to Agrium’s credit ratings is provided as it relates to our financing costs, liquidity and operations. Specifically, credit ratings affect Agrium’s ability to obtain short-term and long-term financing and the cost of such financing. A reduction in the current rating on our debt by the rating agencies, particularly a downgrade below investment grade ratings, or a negative change in the outlook could adversely affect Agrium’s cost of financing and our access to sources of liquidity and capital.
DBRS Limited (“DBRS”)
On November 28, 2011, DBRS affirmed its BBB long-term corporate credit rating and stable outlook on Agrium.
Moody’s Investors Service (“Moody’s”)
On September 21, 2011, Moody’s affirmed its Baa2 long-term corporate credit rating and stable outlook on Agrium.
Standard & Poor’s Rating Agency (“S&P”)
On August 23, 2011, S&P affirmed its BBB long-term corporate credit rating and stable outlook on Agrium.
Future Cash Requirements
Contractual obligations and other commitments before discontinued operations
As at December 31, 2011 our aggregate contractual obligations for continuing operations were comprised of the following:
| | | | | | | | | | | | | | | | | | | | |
| | | Payment due by period | |
| (millions of U.S. dollars) | | Less than
one year | | | One to three
years | | | Four to five
years | | | After five
years | | | Total | |
Long-term debt (a) | | | 112 | | | | 674 | | | | 212 | | | | 2,954 | | | | 3,952 | |
Operating leases | | | 171 | | | | 216 | | | | 174 | | | | 165 | | | | 726 | |
Purchase obligations | | | 488 | | | | 390 | | | | 461 | | | | 582 | | | | 1,921 | |
Asset retirement obligations (c) | | | 16 | | | | 16 | | | | 22 | | | | 188 | (b) | | | 242 | |
Environmental remediation liabilities (d) | | | 57 | | | | 33 | | | | 26 | | | | 56 | | | | 172 | |
Total | | | 844 | | | | 1,329 | | | | 895 | | | | 3,945 | | | | 7,013 | |
| (a) | Figures include interest payments and capital lease repayments. |
| (b) | This figure does not include estimated asset retirement obligations related to our potash operations. See discussion below on “Asset retirement obligations”. |
| (c) | Represents the undiscounted, inflation-adjusted estimated cash outflows. |
| (d) | Represents the undiscounted, estimated cash outflows. |
AGRIUM2011 ANNUAL REPORT 51
Long-term debt
See discussion of debt instruments on page 50 of this MD&A. Failure to maintain certain financial ratios and other covenants may trigger early repayment provisions. See discussion of capital management on page 50 of this MD&A.
Operating leases
Operating lease commitments consist primarily of leases for rail cars and contractual commitments at distribution facilities in Wholesale, vehicles and application equipment in Retail, and office equipment and property leases throughout our operations. The commitments represent the minimum payments under each agreement.
Purchase obligations
Purchase obligations include minimum commitments for North American natural gas purchases which are floating-rate contracts, calculated using the prevailing regional gas prices for U.S. facilities and the AECO prices for Canadian facilities. Profertil has three long-term gas contracts denominated in U.S. dollars, expiring in 2017, which are also included in purchase obligations. These three contracts account for approximately 80 percent of Profertil’s gas requirements. Repsol-YPF, our joint venture partner in Profertil, supplies approximately 18 percent of the gas under these contracts.
We have a power co-generation agreement for our Carseland facility, which expires December 31, 2026. The maximum commitment under this agreement is to purchase 60 megawatts of power per hour through 2026. The price for the power is based on a fixed charge adjusted for inflation and a variable charge based on the cost of natural gas, which is provided to the facility for power generation.
In 2011, we entered into an agreement to import phosphate rock to supply our Redwater phosphate facility. The contract will begin in the second half of 2013 and extend to 2020. Our minimum commitment is to purchase 342,000 tonnes in 2013 and 798,000 tonnes from 2014 to 2018, with subsequent volumes to be determined in 2016. The purchase price is based on a formula that tracks finished product pricing and key published phosphate input costs. To facilitate the import of phosphate rock, Agrium Europe entered into a freight contract from 2013 to 2019 for a total commitment of $194-million.
In addition to amounts disclosed in the table above, future capital expenditures including cancelable contracts for potash facility expansion are expected to be approximately; 2012 – $565-million; 2013 – $632-million; and 2014 – $53-million.
Asset retirement obligations
Our mining, extraction, processing and distribution activities result in asset retirement obligations, which are part of our normal course of operations. Such retirement obligations include closure, dismantlement, site restoration or other legal or constructive obligations for termination and retirement of assets. Expenditures may occur before and after completion of operations. We expect to incur expenditures for obligations over the next 30 years, with the exception of potash operations, which are expected to occur after 100 years. Timing of retirement expenditures is dependent on a number of factors such as the life and nature of the asset, legal requirements, and available technology. The discounted, inflation-adjusted estimated cash outflows required to settle the asset retirement obligations are estimated at $209-million as at December 31, 2011.
Environmental remediation liabilities
Environmental expenditures that relate to existing conditions caused by past operations that do not contribute to current or future revenue generation are expensed. Environmental expenditures that extend the life of the property, increase its capacity or mitigate or prevent contamination from future operations are capitalized. The discounted, inflation-adjusted estimated cash outflows required to settle the environmental remediation liabilities are estimated at $131-million as at December 31, 2011.
Future Capital Expenditures
Sustaining Capital
Our sustaining capital is expected to be approximately $450-million to $550-million in 2012 due to a number of large sustaining projects planned for the year. Excluding these larger projects, our sustaining capital expenditures in 2012 would be closer to $350-million on an annual basis. The 2012 sustaining program includes spending at our Wholesale and AAT plant sites in order to ensure efficient, reliable and safe operations of facilities as well as spending for North American and South American Retail operations.
Investment Capital
Our investment capital program planned for 2012 includes the following:
| ¨ | The significant potash expansion project at our Vanscoy potash facility; |
| ¨ | Development of a terminal to import phosphate rock in Canada and a new large fertilizer terminal in Argentina; |
| ¨ | Nitrogen debottleneck expansion projects; |
52 CULTIVATING PERFORMANCE.DELIVERING VALUE.
| ¨ | Spending for Retail expansion opportunities; and |
| ¨ | Additional investment in AAT, including twinning of the New Madrid facility. |
We anticipate that we will be able to finance announced projects through a combination of cash provided from operating activities, existing lines of credit (see discussion under “Debt Instruments” on page 50 of this MD&A for further details) and funds available from new debt or equity securities offerings.
Outstanding Share Data
The number and principal amount of our outstanding shares as at February 29, 2012 were as follows:
| | | | | | | | |
| | | Number of Shares | | | Market Value | |
Common shares | | | 158 million | | | $ | 13-billion | |
As at February 29, 2012, the number of stock options (issuable assuming full conversion, where each option granted can be exercised for one common share) outstanding was approximately nil.
Contingent Liabilities
Litigation
From time to time we become involved in legal or administrative proceedings in the normal conduct of our business. Our assessment of the likely outcome of these matters is based on our judgment of a number of factors, including experience with similar matters, past history, precedents, relevant financial, scientific and other evidence, and facts specific to the matter. We do not believe that these matters in aggregate will have a material effect on our consolidated financial position or results of operations.
Our assessment of specific litigation matters at February 23, 2012 is set out below. For discussion on Idaho Mining Properties and Manitoba Mining Properties, see section “Contingent Environmental Liabilities” on page 72.
Oil-For-Food Programme
On June 27, 2008 the Iraqi government filed a civil lawsuit in the U.S. against AWB and 92 other parties alleging that the defendants participated in an illegal conspiracy to divert funds from the United Nations Oil-For-Food Programme (“OFFP”) escrow account. The lawsuit seeks total damages in excess of $10-billion from the defendants, jointly and severally, as well as treble damages under the U.S. Racketeer Influenced and Corrupt Organizations Act. As to AWB specifically, the lawsuit alleges that AWB unlawfully diverted more than $232-million from the OFFP escrow account. AWB and a number of other defendants filed a motion to dismiss the complaint in January 2010, and there have been no material developments in the case since the motion to dismiss was filed. Although the outcome cannot be predicted, as of February 23, 2012, Agrium does not expect any material financial impact from the lawsuit. If the case against AWB is not dismissed, an adverse decision could have a material effect on AWB and on Agrium’s consolidated financial position and results.
Potash Litigation
During 2008, six separate class action complaints were filed against us and a number of unrelated defendants. The complaints generally allege that the defendants engaged in anti-competitive activity respecting their potash business. The plaintiffs seek injunctive relief and to recover unspecified amounts of damages. We believe that the allegations are without merit. The potential exposure of these lawsuits is indeterminable.
Off Balance Sheet Arrangements
Guarantees
We have guaranteed certain rail car leases of a third party. The lease agreements expire in 2025. Maximum potential future undiscounted payments for guarantees issued were approximately $23-million at December 31, 2011 (2010 – $25-million). Should we be required to act under such agreements, it is expected that no material loss would result after consideration of possible recoveries under recourse provisions.
We are contractually obligated to reimburse a third party for our pro-rata share of any operating losses or other liabilities incurred pursuant to a marketing arrangement. There were no such operating losses or other liabilities in 2011 or 2010.
We were contingently liable at December 31, 2011 for a maximum of $25-million (2010 – $40-million) to repurchase certain assets from some of our rural marketing agents upon expiry of the agency agreement or resignation of the agent. We do not believe this matter will have a material adverse effect on our consolidated financial position or results of operations.
AGRIUM2011 ANNUAL REPORT 53
Financial Instruments
Risk Management
In the normal course of business, our balance sheet, results of operations and cash flows are exposed to various risks. On an annual basis, the Board approves a strategic plan that takes into account the opportunities and major risks of our business and mitigation factors to reduce these risks. The Board also reviews risk management policies and procedures on an annual basis and sets upper limits on the transactional exposure to be managed and the time periods over which exposures may be managed. We manage risk in accordance with our Exposure Management Policy. The objective of the policy is to reduce volatility in cash flow and earnings.
Our derivative financial instruments and the nature of the risks which they are, or may be, subject to are set out in the following table:
| | | | | | | | | | | | | | | | |
| Derivative financial instruments | | Risks | |
| | | Currency | | | Commodity
price | | | Credit | | | Liquidity | |
Foreign currency forward and option contracts | | | X | | | | | | | | X | | | | X | |
Natural gas forward, swap and option contracts, nutrient swap contracts and heat rate swap contracts | | | | | | | X | | | | X | | | | X | |
Market risk
Market risk is the risk that the fair value of future cash flows of a financial instrument will fluctuate because of changes in the market prices. Market risk is comprised of: currency risk, commodity price risk and interest rate risk.
Currency risk
We had the following foreign exchange contracts as at December 31:
Foreign exchange derivative financial instruments outstanding
| | | | | | | | | | | | | | | | | | | | | | | | |
| | | 2011 | | | 2010 | |
Sell/Buy (millions of U.S. dollars, except as noted) | | Notional
(millions, buy
currency) | | | Maturities | | | Fair value
assets
(liabilities) | | | Notional
(millions, buy
currency) | | | Maturities | | | Fair value
assets
(liabilities) | |
Forwards | | | | | | | | | | | | | | | | | | | | | | | | |
USD/CAD | | | — | | | | — | | | | — | | | | CAD 40 | | | | 2011 | | | | 3 | |
CAD/USD | | | — | | | | — | | | | — | | | | USD 370 | | | | 2011 | | | | (7 | ) |
USD/AUD | | | AUD 65 | | | | 2012 | | | | 1 | | | | — | | | | — | | | | — | |
AUD/USD | | | — | | | | — | | | | — | | | | USD 381 | | | | 2011 | | | | (24 | ) |
AUD/CAD | | | CAD 227 | | | | 2012 | | | | (2 | ) | | | — | | | | — | | | | — | |
Swaps | | | | | | | | | | | | | | | | | | | | | | | | |
USD/AUD | | | AUD 31 | | | | 2012 | | | | — | | | | — | | | | — | | | | — | |
| | | | | | | | | | | | (1 | ) | | | | | | | | | | | (28 | ) |
Losses on foreign exchange contracts of $40-million were recognized in 2011 versus losses of $27-million in 2010, which were reported in other expenses.
Commodity price risk
We manage the risk of changes in natural gas, power and nutrient prices using derivative financial instruments. The total change in fair value of non-qualifying derivative financial instruments during 2011 was a gain of $3-million (2010 – loss of $54-million) which is reported in other expenses, of which a loss of $19-million (2010 – loss of $40-million) has been realized.
54 CULTIVATING PERFORMANCE.DELIVERING VALUE.
We had the following natural gas, power and nutrient derivative financial instruments at December 31:
Natural gas, power and nutrient derivative financial instruments outstanding
| | | | | | | | | | | | | | | | | | | | | | | | |
| | | 2011 | | | 2010 | |
| (millions of U.S. dollars, except as noted) | | Notional | | | Maturities | | | Fair value assets (liabilities) | | | Notional | | | Maturities | | | Fair value assets (liabilities) | |
Natural gas (BCF) | | | | | | | | | | | | | | | | | | | | | | | | |
NYMEX contracts | | | | | | | | | | | | | | | | | | | | | | | | |
Swaps – bought | | | 36 | | | | 2012-2013 | | | | (86 | ) | | | 33 | | | | 2011-2013 | | | | (50 | ) |
Swaps – sold | | | (21 | ) | | | 2012-2013 | | | | 48 | | | | — | | | | — | | | | — | |
Collars (swap with options) | | | 3 | | | | 2012 | | | | — | | | | 12 | | | | 2011-2012 | | | | (1 | ) |
El Paso swaps | | | — | | | | — | | | | — | | | | 2 | | | | 2011 | | | | — | |
AECO contracts | | | | | | | | | | | | | | | | | | | | | | | | |
Swaps | | | 5 | | | | 2012 | | | | — | | | | 7 | | | | 2011 | | | | (2 | ) |
| | | | 23 | | | | | | | | (38 | ) | | | 54 | | | | | | | | (53 | ) |
Power – Swaps (GWh) | | | 272 | | | | 2012-2013 | | | | 12 | | | | 412 | | | | 2011-2013 | | | | 4 | |
Nutrient – Urea swaps (short tons) | | | 5 | | | | 2012 | | | | — | | | | — | | | | — | | | | — | |
| | | | | | | | | | | | (26 | ) | | | | | | | | | | | (49 | ) |
Interest rate risk
Our exposure to floating interest rate risk is generally limited to short-term debt, floating rate long-term debt and certain cash and cash equivalents. Exposure to fixed interest rate risk is generally limited to our long-term debt.
Our cash and cash equivalents include highly liquid investments with a term of three months or less that earn interest at market rates. We manage interest rate risk on these investments by maximizing the interest income earned on excess funds while maintaining the liquidity necessary to conduct operations on a day-to-day basis. Fluctuations in market rates of interest on cash and cash equivalents do not have a significant impact on our results of operations due to the short term to maturity of the investments.
Credit risk
Credit risk is the risk that a counterparty to a financial instrument will cause a financial loss for Agrium by not discharging its obligations. We manage credit risk through rigorous credit approval and monitoring practices and through the use of credit insurance. Geographic and industry diversity also mitigate credit risk. The Wholesale business unit sells mainly to large agribusinesses and other industrial users. Letters of credit and credit insurance are used to mitigate risk. The Retail business unit sells to a large customer base dispersed over wide geographic areas in North and South America and Australia. The AAT business unit sells to a diversified customer base including large suppliers in the North American professional turf application market.
We may be exposed to certain losses in the event that counterparties to short-term investments and derivative financial instruments are unable to meet their contractual obligations. We manage this counterparty credit risk with policies requiring that counterparties to short-term investments and derivative financial instruments have an investment grade credit rating and policies that limit the investing of excess funds to liquid instruments with a maximum term of one year and limit the maximum exposure to any one counterparty. We also enter into master netting agreements that mitigate our exposure to counterparty credit risk. At December 31, 2011, all counterparties to derivative financial instruments have maintained an investment grade credit rating and there is no indication that any counterparty will be unable to meet their obligations under derivative financial contracts. The carrying amount of financial assets represents the maximum credit exposure.
Liquidity risk
Liquidity risk is the risk that we will encounter difficulty in meeting our financial obligations when they come due. We manage liquidity risk by monitoring and managing our cash requirements to ensure access to sufficient funds to meet operational and investing requirements. The primary source of liquidity is cash generated from operations and supplemented by credit facilities. We monitor and have access to capital as described under the section “Capital Management” on page 50.
AGRIUM2011 ANNUAL REPORT 55
Fair Value
The fair values of cash and cash equivalents, accounts receivable, short-term debt and accounts payable approximate carrying value due to their short-term nature. The fair value of floating-rate loans approximates carrying value.
The fair value of other financial assets available for sale is derived from active markets where possible, and through the use of valuation techniques including the discounted cash flows model where active markets do not exist. When available, inputs to valuation models are taken from observable markets and where not available judgment is required to establish fair values.
Fair values of derivative financial instruments and marketable securities are recorded at the estimated amount we would receive or pay to terminate the contracts determined based on our assessment of available market information and valuation methodologies based on industry accepted third-party models using assumptions about discount rates and the timing of future cash flows, based on observable market inputs such as interest yield curves.
The weighted average effective interest rate on long-term debt at December 31, 2011 is 5 percent (2010 – 6 percent).
Fair value and carrying value of financial instruments
| | | | | | | | | | | | | | | | |
| | | 2011 | | | 2010 | |
| (millions of U.S. dollars) | | Fair value | | | Carrying value | | | Fair value | | | Carrying value | |
Cash and cash equivalents – FVTPL | | | 1,346 | | | | 1,346 | | | | 635 | | | | 635 | |
Accounts receivable | | | | | | | | | | | | | | | | |
Loans and receivables | | | 1,976 | | | | 1,976 | | | | 1,755 | | | | 1,755 | |
Fair value through profit or loss | | | 8 | | | | 8 | | | | 4 | | | | 4 | |
| | | 1,984 | | | | 1,984 | | | | 1,759 | | | | 1,759 | |
Marketable securities – FVTPL | | | — | | | | — | | | | 3 | | | | 3 | |
Other financial assets | | | | | | | | | | | | | | | | |
Loans and receivables | | | 58 | | | | 58 | | | | 34 | | | | 34 | |
Available for sale | | | 10 | | | | 10 | | | | 2 | | | | 2 | |
Fair value through profit or loss | | | 6 | | | | 6 | | | | 3 | | | | 3 | |
| | | 74 | | | | 74 | | | | 39 | | | | 39 | |
Short-term debt – amortized cost | | | 245 | | | | 245 | | | | 517 | | | | 517 | |
Accounts payable | | | | | | | | | | | | | | | | |
Amortized cost | | | 2,810 | | | | 2,810 | | | | 2,764 | | | | 2,764 | |
Fair value through profit or loss | | | 25 | | | | 25 | | | | 51 | | | | 51 | |
| | | 2,835 | | | | 2,835 | | | | 2,815 | | | | 2,815 | |
Current portion of long-term debt | | | | | | | | | | | | | | | | |
Debentures – amortized cost | | | — | | | | — | | | | 126 | | | | 125 | |
Floating rate debt – amortized cost | | | 20 | | | | 20 | | | | — | | | | — | |
| | | 20 | | | | 20 | | | | 126 | | | | 125 | |
Long-term debt | | | | | | | | | | | | | | | | |
Debentures – amortized cost | | | 1,925 | | | | 1,525 | | | | 1,724 | | | | 1,525 | |
Floating rate debt – amortized cost | | | 573 | | | | 573 | | | | 593 | | | | 593 | |
| | | 2,498 | | | | 2,098 | | | | 2,317 | | | | 2,118 | |
Other financial liabilities | | | | | | | | | | | | | | | | |
Amortized cost | | | 20 | | | | 20 | | | | 14 | | | | 14 | |
Fair value through profit or loss | | | 16 | | | | 16 | | | | 33 | | | | 33 | |
| | | | 36 | | | | 36 | | | | 47 | | | | 47 | |
56 CULTIVATING PERFORMANCE.DELIVERING VALUE.
2011 Fourth Quarter Management’s Discussion and Analysis
Net Earnings
Agrium’s 2011 fourth quarter net earnings were $193-million, or $1.20 diluted earnings per share, compared to net earnings of $135-million, or $0.86 diluted earnings per share, for the same quarter of 2010.
Financial Overview
| | | | | | | | | | | | | | | | |
| | | Three months ended December 31, | |
| (millions of U.S. dollars, except per share amounts and effective tax rate) | | 2011 | | | 2010 | | | $ Change | | | % Change | |
Sales | | | 3,177 | | | | 2,398 | | | | 779 | | | | 32 | % |
Gross profit | | | 1,045 | | | | 725 | | | | 320 | | | | 44 | % |
Expenses | | | 577 | | | | 477 | | | | 100 | | | | 21 | % |
EBIT | | | 468 | | | | 248 | | | | 220 | | | | 89 | % |
Consolidated net earnings from continuing operations (a) | | | 327 | | | | 152 | | | | 175 | | | | 115 | % |
Consolidated net earnings | | | 193 | | | | 135 | | | | 58 | | | | 43 | % |
Diluted earnings per share from continuing operations | | | 2.04 | | | | 0.97 | | | | 1.07 | | | | 110 | % |
Diluted earnings per share | | | 1.20 | | | | 0.86 | | | | 0.34 | | | | 40 | % |
Effective tax rate | | | 23 | % | | | 29 | % | | | N/A | | | | (6 | %) |
| (a) | See “Discontinued Operations” on page 60 for a discussion of our discontinued operations. |
Our consolidated gross profit for the fourth quarter of 2011 increased by $320-million, primarily due to higher gross profit from all three of our strategic business units, with highlights as follows:
| ¨ | An increase in Wholesale’s gross profit of $216-million for the fourth quarter of 2011, as higher crop pricing drove up demand and selling prices for all major products; and |
| ¨ | The addition of the Landmark Australia Retail operations accounted for an increase of $80-million in Retail’s gross profit for the fourth quarter of 2011, with over half of the contribution coming from merchandise and other services. Excluding Landmark, Retail’s gross profit increased by $21-million in the fourth quarter of 2011 due to higher selling prices and strong margins across our major product lines. |
The $100-million increase in expenses for the fourth quarter of 2011 was primarily driven by:
| ¨ | Higher Retail selling expenses of $65-million due to the addition of the Landmark business in December of 2010; |
| ¨ | Increased Retail payroll of $18-million due to other recent acquisitions ($6-million) and higher incentives on existing operations ($11-million); and |
| ¨ | An impairment charge of $61-million regarding our investment in Hanfeng. |
These increases were partially offset by a $7-million recovery in share-based payments expense in the fourth quarter, which is a $61-million favorable change from the same period in 2010 (see section “Other” on page 60 for further discussion).
AGRIUM2011 ANNUAL REPORT 57
Below is a summary of our other (income) expenses for the fourth quarter of 2011 and 2010:
| | | | | | | | |
| | | Three months ended December 31, | |
| (millions of U.S. dollars) | | 2011 | | | 2010 | |
Interest income | | | (21 | ) | | | (14 | ) |
Bad debt (recovery) expense | | | (7 | ) | | | 3 | |
Other | | | (6 | ) | | | 11 | |
Foreign currency translation gain | | | (1 | ) | | | (50 | ) |
AWB acquisition costs | | | — | | | | 37 | |
Unrealized loss on derivative financial instruments | | | 1 | | | | 26 | |
Realized loss on derivative financial instruments | | | 7 | | | | 5 | |
Environmental remediation and asset retirement obligations | | | 15 | | | | 5 | |
Potash profit and capital tax | | | 17 | | | | 16 | |
Asset impairment | | | 61 | | | | — | |
| | | | 66 | | | | 39 | |
The effective tax rate was 23 percent for the fourth quarter of 2011 compared to 29 percent for the same period last year. The decrease in the effective tax rate compared to last year was primarily due to a one-time negative impact in 2010 of the cumulative effect of Canadian tax legislative changes relating to certain share-based payment programs.
Business Segment Performance
Retail
Retail’s 2011 fourth quarter sales were $1.8-billion, a substantial increase over the $1.3-billion in sales for the fourth quarter of 2010. The increase was a result of the addition of the Landmark business, strong price appreciation for nutrients, and increased demand for other crop input products and services this fall season across all our retail operations. Gross profit was a record $452-million this quarter, a 29 percent increase over the $351-million earned in the fourth quarter of 2010. We achieved an EBIT of $37-million in the fourth quarter of 2011, down from the record EBIT of $46-million in the same quarter of 2010. Retail EBITDA reached $769-million in 2011, up significantly from the $524-million achieved last year and about three-quarters of the way to our $1-billion target by end of 2015.
Crop nutrient sales reached $1-billion this quarter, compared to $827-million in the same quarter last year. The 25 percent increase in sales was due to significantly higher nutrient prices and the addition of the Landmark business. This was partially offset by lower North American sales volumes, which were down 9 percent compared to the previous year, due to the longer fall application season last year compared to this year. Agrium expects strong nutrient demand in the front half of 2012 supported by the continued strength in crop prices.
Gross profit for crop nutrients was $142-million this quarter, up from $140-million in the fourth quarter of 2010. Total crop nutrient margins were 14 percent in the fourth quarter of 2011, down 3 percent from the same quarter last year due primarily to high prices and costs.
Crop protection sales were $403-million in the fourth quarter of 2011, a 38 percent increase over the $292-million in sales for the same period last year. This was due to primarily the addition of the Australian Landmark business and higher sales across several product lines in North America. Our private label Loveland chemistry sales were 19 percent higher than the same quarter last year. Total crop protection gross profit this quarter was $145-million, a 23 percent increase over the $118-million recorded in the fourth quarter of 2010 due to the inclusion of the Landmark business and higher volumes domestically. Crop protection product margins as a percentage of sales were 36 percent for the fourth quarter of 2011, down 5 percent from the fourth quarter of 2010 due to lower margins on Landmark’s products. However, margins in our North and South American operations were approximately the same as the fourth quarter of last year.
Our seed sales reached $83-million this quarter compared to $54-million in the fourth quarter of 2010. Gross profit increased to $33-million this quarter, compared to the $26-million for the fourth quarter of 2010. Higher sales and gross profit this quarter was supported by a doubling in sales of our private label Dynagro seed business over the same period last year and higher winter wheat acreage.
Services and other sales were $176-million this quarter, over two and a half times higher than the $68-million reported in the fourth quarter of 2010. Gross profit was $106-million in the fourth quarter of 2011, compared to $59-million for the same period last year. The sizeable increase in sales and gross profit this quarter was due to the addition of the Australian Landmark business, whose services consist primarily of livestock and wool brokerage, and a strong application season in most regions. North American services and other achieved increased sales and gross profit compared to the same period last year, even though nutrient sales volumes were lower than the previous year.
58 CULTIVATING PERFORMANCE.DELIVERING VALUE.
Sales of merchandise this quarter were $143-million, compared to sales of $85-million in the fourth quarter of 2010. Gross profit for this product line was $26-million, compared to $8-million in the fourth quarter of 2010. The increase in sales and gross profit was due to the inclusion of the Landmark business for the full quarter in 2011 results.
Retail selling expenses for the fourth quarter of 2011 were $397-million, up $104-million from last year. The increase was due to a combination of increased operating expenses associated with the Landmark operations and higher fuel and incentive costs within our North American operations. Selling expenses as a percentage of sales were 22 percent in the fourth quarter of 2011, similar to the same period last year.
Wholesale
Wholesale’s sales were a record $1.5-billion in the fourth quarter of 2011, compared to sales of $1.2-billion reported in the fourth quarter of 2010. Gross profit reached $556-million in the fourth quarter of 2011, which was also a fourth quarter record and 64 percent higher than the $340-million achieved in the same period in 2010. Wholesale reported fourth quarter EBIT of $507-million in 2011, significantly surpassing the previous fourth quarter record of $315-million earned in 2010. The record earnings achieved this quarter were attributable to higher realized prices and margins across all three major crop nutrients and strong sales volumes despite the global economic uncertainty experienced during the quarter.
Nitrogen gross profit was $322-million in the fourth quarter of 2011, more than double the $160-million reported in the same period last year due to higher realized prices and sales volumes. Both benchmark and Agrium’s realized prices were higher for all nitrogen products in the fourth quarter of 2011 compared to the same period last year. Wholesale nitrogen sales volumes were higher than the same period last year, primarily due to higher North American and international sales volumes for ammonia and urea, which more than offset lower sales volumes for nitrogen solutions. Nitrogen cost of product sold was $258 per tonne this quarter, higher than the $243 per tonne reported in the fourth quarter of 2010, due primarily to higher input costs associated with production at nitrogen upgrade facilities and increased maintenance costs. Nitrogen margins were a fourth quarter record $304 per tonne this quarter, compared with $163 per tonne in the same period last year. The Egyptian MOPCO nitrogen facility, in which we have a 26 percent equity investment, continues to be shut in. However, we are optimistic the facility will be allowed to re-open in 2012 given its strong environmental performance, as recently reconfirmed by a government appointed independent Egyptian scientific review panel, as well as the positive contribution it can provide the Egyptian economy.
Agrium’s average natural gas cost in cost of product sold was $3.47/MMBtu ($3.77/MMBtu including the impact of realized losses on natural gas derivatives) this quarter, compared to $3.70/MMBtu for the same period in 2010 ($3.97/MMBtu including the impact of realized losses on natural gas derivatives). Hedging gains or losses on all gas derivatives are not taken into account for the calculation of gross profit and are included in other expenses and therefore not included in cost of product sold. The U.S. benchmark (NYMEX) natural gas price for the fourth quarter of 2011 was $3.61/MMBtu, compared to $3.81/MMBtu in the same quarter last year and $4.19/MMBtu in the third quarter of 2011. The AECO (Alberta) basis differential was a $0.24/MMBtu discount to NYMEX in the fourth quarter of 2011, which was slightly lower than the $0.28/MMBtu differential that existed in the fourth quarter of 2010.
Potash gross profit for the fourth quarter of 2011 was $121-million, a 26 percent increase from the $96-million achieved in the same quarter last year. The increase was attributable to stronger domestic and international year-over-year pricing. International sales volumes were 221,000 tonnes this quarter, compared to 181,000 tonnes reported in the fourth quarter of 2010, as a result of increased deliveries against key Canpotex contracts. Domestic sales volumes were 177,000 tonnes this quarter, down from the 236,000 tonnes in the fourth quarter of 2010, due to a combination of lower post season fill demand by North American retailers and lower beginning inventory levels in the fourth quarter of 2011 compared to the same period last year. Potash cost of product sold was $169 per tonne this quarter, compared to $150 per tonne in the fourth quarter of 2010, as a result of unplanned plant maintenance costs. Gross margin on a per tonne basis was $304 in the fourth quarter of 2011, compared to the $228 per tonne realized during the same quarter in 2010.
Phosphate gross profit was $89-million in the fourth quarter of 2011, an increase of 65 percent from the $54-million reported in the same period last year. This substantial increase was attributable to higher production and an increase in realized sales prices, resulting from strong demand in Western Canada and the Northern Plains. Realized sales prices averaged $813 per tonne this quarter, up from $672 per tonne in the fourth quarter of 2010. Phosphate cost of product sold was $500 per tonne in the fourth quarter of 2011, compared to $454 per tonne in the same period last year, primarily due to higher sulfur costs. On a per tonne basis, gross margin in the fourth quarter of 2011 increased significantly to $313 per tonne, compared to $218 per tonne in the same period last year.
Gross profit from product purchased for resale was $1-million this quarter, down from $23-million in the fourth quarter of 2010. The decrease was a result of the significant decline in global crop nutrient prices experienced in the fourth quarter of 2011, which impacted both sales margins and the valuation on inventories, particularly in comparison to the buoyant market conditions that prevailed in the same quarter of last year.
Wholesale’s Other product category, which is primarily comprised of ammonium sulfate and Rainbow granulated products, achieved gross profit of $23-million in the fourth quarter of 2011, compared to $7-million in the same period last year. The increase in gross profit this quarter was mainly due to higher realized prices for both product categories, which was partially offset by lower sales volumes from Rainbow products.
Wholesale expenses in the fourth quarter of 2011 were $49-million, $24-million higher than same period in 2010. The increase was due primarily to mark-to-market losses on natural gas and other derivatives (including foreign exchange) of $17-million.
AGRIUM2011 ANNUAL REPORT 59
Advanced Technologies
AAT’s gross profit was $38-million in the fourth quarter of 2011, significantly higher than the $24-million reported in the fourth quarter of 2010. The increase was attributable to higher realized sales prices and strong demand for ESN, as well as contributions to gross profit from recent acquisitions.
EBIT was a loss of $56-million in the fourth quarter of 2011, a decrease of $58-million compared to the same period last year due to a $61-million impairment of Agrium’s investment in Hanfeng. Agrium has determined that Hanfeng is not integral to our strategic growth plans in China and accordingly, we have recorded an impairment of $61-million, reducing our investment to $29-million to reflect Hanfeng’s recent performance. Agrium plans on maintaining its equity investment in Hanfeng. Excluding the asset impairment, EBITDA was $12-million this quarter, which exceeded the $7-million reported in the fourth quarter of 2010. Stronger sales and gross profit were partly offset by higher selling and general and administrative costs in the fourth quarter of 2011, as compared to the same period last year. Selling and general and administrative costs for AAT were $11-million higher this quarter versus the same period in 2010, due primarily to acquisitions and continued efforts to support the expansion of AAT’s retail sales footprint and presence in turf and ornamental markets in the U.S.
Other
EBIT for our Other non-operating business unit for the fourth quarter of 2011 was a loss of $20-million, compared to a loss of $115-million for the fourth quarter of 2010. This change was primarily driven by:
| ¨ | A $61-million favorable change in share-based payments expense, where there was a $7-million recovery during the fourth quarter of 2011, compared to an expense of $54-million during the fourth quarter of 2010; and |
| ¨ | A $37-million expense in 2010 for AWB acquisition costs. |
Discontinued operations
Discontinued operations include the operations of the Commodity Management businesses and Harvest Finance, sold on May 11, 2011. Cash received from the sale was $694-million. We have agreed to various terms and conditions and indemnifications pursuant to the sale of the Commodity Management business, including an indemnity by AWB for litigation related to the OFFP. Also included are the operations and assets and liabilities of the Commodity Management businesses not included in the sale.
Net loss from discontinued operations was $134-million for the fourth quarter of 2011 compared to $17-million in the same period of 2010. This was attributed to:
| ¨ | An inventory write-off of $85-million relating to misappropriated soybean inventory acquired in the purchase of AWB. The insurance claim is currently in dispute with insurers and future recoveries will be recorded when assessed as virtually certain. |
| ¨ | In the fourth quarter, we paid approximately $37-million (net of recoveries from certain assets) pursuant to guarantees related to Hi-Fert Pty. Ltd. We are in dispute regarding security interests that could offset some or all of the guarantees that were paid out. Future recoveries will be recorded when assessed as virtually certain. |
Non-IFRS financial measures
In the discussion of our performance for the quarter, in addition to the primary measures of earnings and earnings per share reported in accordance with IFRS, we make reference to EBITDA. The following table is a reconciliation of EBITDA to consolidated net earnings from continuing operations as determined in accordance with IFRS:
| | | | | | | | | | | | | | | | | | | | | | | | | | | | | | | | | | | | | | | | |
| | | Three months ended December 31, | |
| | | 2011 | | | 2010 | |
| (millions of U.S. dollars) | | Retail | | | Wholesale | | | Advanced
Technologies | | | Other | | | Consolidated | | | Retail | | | Wholesale | | | Advanced
Technologies | | | Other | | | Consolidated | |
EBITDA | | | 80 | | | | 552 | | | | 12 | | | | (15 | ) | | | 629 | | | | 79 | | | | 354 | | | | 7 | | | | (114 | ) | | | 326 | |
Depreciation and amortization | | | 43 | | | | 45 | | | | 7 | | | | 5 | | | | 100 | | | | 33 | | | | 39 | | | | 5 | | | | 1 | | | | 78 | |
Asset impairment | | | — | | | | — | | | | 61 | | | | — | | | | 61 | | | | — | | | | — | | | | — | | | | — | | | | — | |
EBIT | | | 37 | | | | 507 | | | | (56 | ) | | | (20 | ) | | | 468 | | | | 46 | | | | 315 | | | | 2 | | | | (115 | ) | | | 248 | |
Finance costs related to long-term debt | | | | | | | | | | | | | | | | | | | (25 | ) | | | | | | | | | | | | | | | | | | | (23 | ) |
Other finance costs | | | | | | | | | | | | | | | | | | | (17 | ) | | | | | | | | | | | | | | | | | | | (11 | ) |
Income taxes | | | | | | | | | | | | | | | | | | | (99 | ) | | | | | | | | | | | | | | | | | | | (62 | ) |
Consolidated net earnings from continuing operations | | | | | | | | | | | | | | | | | | | 327 | | | | | | | | | | | | | | | | | | | | 152 | |
60 CULTIVATING PERFORMANCE.DELIVERING VALUE.
Accounting Estimates and New Accounting Standards
2011 and 2010 financial information presented and discussed in this MD&A is prepared in accordance with IFRS as issued by the IASB. All financial information prior to 2010 is prepared in accordance with CGAAP in place prior to the adoption of IFRS.
Critical Accounting Estimates
We prepare our financial statements in accordance with IFRS, which requires us to make assumptions and estimates about future events and apply significant judgments. We base our assumptions, estimates and judgments on our historical experience, current trends and all available information that we believe is relevant at the time we prepare the financial statements. However future events and their effects cannot be determined with certainty. Accordingly, as confirming events occur, actual results could ultimately differ from our assumptions and estimates. Such differences could be material.
Our significant accounting policies are discussed in note 2, Significant Accounting Policies, of our Notes to the Consolidated Financial Statements, included in this Annual Report. We believe that the following accounting estimates are the most critical to help readers understand and evaluate our reported financial results. As well, they require our most difficult, subjective or complex judgments, resulting from the need to make estimates about the effect of matters that are inherently uncertain.
| | | | |
| Description | | Judgments and Uncertainties | | Effect if Actual Results Differ From Assumptions |
| Inventories | | | | |
| | |
We value inventories at the lower of cost and net realizable value through inventory allowances. Subsequent changes in facts or circumstances could result in the reversal of previously recorded allowances. Results could differ if inventory allowances change because actual selling prices or selling costs differ materially from forecasted selling prices and selling costs. | | Calculating allowances depends on a combination of interrelated factors affecting forecasted selling prices, including demand and supply variables. Demand variables include grain and oilseed prices and stock-to-use ratios and changes in inventories in distribution channels. Supply variables include forecasted prices of raw materials such as natural gas, operating rates and crop nutrient inventory levels. | | If the estimated net realizable value of inventories declines below cost, we record an inventory write-down as a charge to earnings. During 2011 and 2010, we did not record any material inventory write-downs. We do not believe there is a reasonable likelihood of a material change in future estimates or assumptions we use to calculate our allowances. However, if estimates change in an unforeseen manner, we may be exposed to losses or gains that could be material. |
| | |
| Rebates | | | | |
| | |
| Our rebate agreements with suppliers, primarily for crop protection products and seed, provide rebates typically based on the achievement of specified purchase volumes, sales to end users over a specified period of time, or when market conditions cause vendors to reduce manufacturers’ suggested retail prices. We account for rebates and prepay discounts as a reduction of the prices of suppliers’ products. We accrue rebates that are probable and can be reasonably estimated. For rebates that are not probable or estimable, we accrue when we achieve certain milestones. We accrue rebates not covered by binding agreements or published vendor programs when we obtain conclusive documentation of right of receipt. | | We record accruals for some rebates by estimating the point at which we will have completed our performance under an agreement. Due to the complexity and diversity of the individual vendor agreements, we use judgment based on analysis and review of historical trends to apply rates negotiated with our vendors to estimated and actual purchase volumes to determine accruals. Amounts accrued throughout the year could be impacted if actual purchase volumes differ from projected volumes. | | We have not made any material changes in the accounting methodology we use to record vendor rebates during the past two fiscal years. If actual results are not consistent with the assumptions and estimates used, we may be exposed to additional adjustments that could materially, either positively or negatively, impact our gross profit and inventory. However we collect substantially all receivables associated with these activities within the following fiscal year and therefore do not require subjective long-term estimates. Adjustments to our gross profit and inventory in the following fiscal year have historically never been material. Vendor rebates receivable at December 31, 2011 were $94-million. |
AGRIUM2011 ANNUAL REPORT 61
| | | | |
| Description | | Judgments and Uncertainties | | Effect if Actual Results Differ From Assumptions |
| Long-Lived Assets | | | | |
| | |
We evaluate long-lived assets other than goodwill and indefinite-lived intangible assets (which we test separately) for impairment whenever events or changes in circumstances indicate that the carrying value may not be recoverable. The impairment test compares the carrying value of the asset to the asset’s recoverable amount, based on the higher of the asset’s value in use, estimated using future discounted cash flows, or fair value less cost to sell. We undertake impairment reviews on an asset-by-asset basis except where assets do not generate cash flows independent of other assets, in which case we do our review at the level at which we group assets into a cash- generating unit (“CGU”). | | Our impairment loss calculations contain uncertainties as they require assumptions and judgment about future cash flows and asset fair values. In determining value in use, we make judgments about the discount and growth rates we apply and assumptions about future sales, product margins and overall market conditions. Fair value assessments are subject to judgment and assumptions about factors including new technology, market conditions for our products, availability of raw material inputs and estimated service lives of assets. We also make judgments about allocating assets to CGUs based on variables that may include common economic and commercial influences, product lines, geographic regions, shared infrastructure, interdependence of cash flows, and management’s monitoring and decision- making about operations. | | Although we have significant carrying amounts for property, plant and equipment, we do not believe there is a reasonable likelihood that there will be a material change in the estimates or assumptions we use to calculate long-lived asset impairment. However, if actual results are not consistent with our estimates and assumptions used in estimating future cash flows and asset fair values, we may be exposed to losses that could be material. We recorded an impairment loss of $61-million in 2011 for an investment in an associate. |
| | |
| Income Taxes | | | | |
| | |
Our income tax returns, like those of most companies, are periodically audited by domestic and foreign tax authorities. Audits include questions about our tax filing positions, including the timing and amount of deductions. We record a liability for such exposures. We recognize tax provisions when it is more likely than not that there will be a future outflow of funds to a taxing authority. In such cases, we provide for the amount that is expected to be settled, where this can be reasonably estimated. In determining our provision for income taxes, we use an annual effective income tax rate based on annual income, permanent differences between book and tax income, and substantially enacted income tax rates. We adjust our annual effective income tax rate as additional information on outcomes or events becomes available. In recording deferred taxes, we estimate the extent to which it is probable that timing differences will reverse. We recognize deferred tax assets only to the extent that we consider it probable that those assets will be recoverable. | | Determining tax provisions requires that we apply judgment as to the ultimate outcome of a filing position, which can change over time depending on facts and circumstances. We make assumptions and apply judgment to estimate the exposures associated with our various filing positions. Changes in tax law, the level and geographical mix of earnings and the results of tax audits also affect our effective income tax rate. Deferred taxes contain uncertainties because of assumptions made about when deferred tax assets are likely to reverse, and a judgment as to whether or not there will be sufficient taxable profits available to offset the tax assets when they do reverse. This requires assumptions regarding future profitability and is therefore inherently uncertain. | | Although we believe that our judgments and estimates are reasonable, actual results could differ. We may be exposed to losses or gains that could be material. This may affect income tax expense and earnings reported in future years. Our effective income tax rate in a given financial statement period could be materially affected to the extent we prevail in matters for which we have recorded a liability, or are required to pay amounts in excess of our recorded liability. |
62 CULTIVATING PERFORMANCE.DELIVERING VALUE.
| | | | |
| Description | | Judgments and Uncertainties | | Effect if Actual Results Differ From Assumptions |
| Goodwill and Intangible Assets | | | | |
| | |
We conduct an impairment test annually in the third quarter and whenever events or changes in circumstances indicate that carrying values may not be recoverable. We test for impairment if a CGU or group of CGUs has goodwill allocated to it, or includes intangible assets that have an indefinite useful life. We determine fair value by relying primarily on the discounted cash flow method. This method estimates fair value using a discounted five year forecasted cash flow with a terminal value. We estimate terminal values with a growth model incorporating a long-term future growth rate based on our most recent views of the long-term outlook for each business. We use observable market data inputs to develop discount rates for each business using a capital asset pricing model, which we believe approximates the discount rate from a market participant’s perspective. | | Assumptions underlying our projected cash flows used in our goodwill impairment test are from several sources, including internal budgets, which contain information on sales, assumed production levels and costs, and product pricing. Estimated fair value of a CGU could be impacted by changes in interest rates, inflation rates, growth rates, foreign currency exchange rates, costs, pricing, capital expenditures and market conditions. Where available and as appropriate, we use our market capitalization and comparative market multiples to corroborate discounted cash flow results. Compared to the use of market multiples, the discounted cash flow approach more closely aligns valuations to the business model for each business, the specific projections of the business and its geographic markets and products. | | We have not made any material changes in the underlying assumptions we use to assess impairment loss on goodwill and other intangible assets during the past two fiscal years. The carrying values of goodwill and indefinite-lived intangible assets at December 31, 2011 were $2.3-billion and $41-million, respectively. We did not identify impairments of goodwill or intangible assets in 2011. We do not believe there is a reasonable likelihood that there will be a material change in the future estimates or assumptions we use to test for impairment losses on goodwill and other intangible assets. However, if actual results are not consistent with our estimates or assumptions, we may be exposed to an impairment charge that could be material. |
| | |
| Share-Based Payments | | | | |
| | |
| We determine costs for share-based payments using market-based valuation techniques. We determine the fair value of our market- based and performance-based non-vested share awards at the date of grant using generally accepted valuation techniques. A portion of our share-based payments expense results from performance-based share awards which require us to estimate the likelihood of achieving company and corporate peer group performance goals. | | We make assumptions and use judgment in applying valuation techniques. These assumptions and judgments include estimating the future volatility of our stock price, expected dividend yield, future employee turnover rates and future employee stock option exercise behaviors and corporate performance. Such judgments and assumptions are inherently uncertain. Changes in these assumptions affect the fair value estimates. | | We do not believe there is a reasonable likelihood there will be a material change in the future estimates or assumptions we use to determine share-based payments expense. However, if actual results are not consistent with our estimates or assumptions, we may be exposed to changes in share-based payments expense that could be material. |
| | |
| Provisions | | | | |
| | |
| Litigation:In the normal course of business, legal proceedings and other claims brought against Agrium expose us to potential losses. Given the nature of these events, in most cases the amounts involved are not reasonably estimable due to uncertainty about the final outcome. | | In estimating the final outcome of litigation, we apply judgment in considering factors including experience with similar matters, past history, precedents, relevant financial, scientific and other evidence and facts specific to the matter. Application of such judgment determines whether we require an accrual or disclosure in the financial statements. | | Given the nature of these provisions, they can change significantly due to the inherent uncertainties in our estimates. Changes could have a material impact on our future earnings. |
| | |
Asset retirement obligations and environmental remediation: We apply a number of assumptions in estimating provisions that we record for asset retirement obligations and environmental remediation associated with Agrium sites. We make these judgments and assumptions due to the nature of the factors impacting the amount that will ultimately be required to settle these obligations when they come due. | | In determining provisions for asset retirement obligations and environmental remediation, we assess factors such as the extent of contamination, the nature of work Agrium is obliged to perform or pay for, changes to environmental laws and regulations and whether any of the costs will be shared with other occupants of Agrium sites. We reduce provisions for recoveries from third parties where recoveries are virtually certain. | | |
AGRIUM2011 ANNUAL REPORT 63
| | | | |
| Description | | Judgments and Uncertainties | | Effect if Actual Results Differ From Assumptions |
| Business Acquisitions – Purchase Price Allocation | | | | |
| | |
We allocate the purchase price of an acquired business to its identifiable assets acquired and liabilities assumed at their estimated fair values at the acquisition date. We record the excess of the purchase price over the amount allocated to the assets and liabilities, if any, to goodwill. We use all available information to estimate fair values. We typically engage external consultants to assist in the fair value determination of identifiable intangible assets and other significant assets or liabilities. We adjust the preliminary purchase price allocation, as necessary, up to one year after the acquisition closing date as we obtain more information about asset valuations and liabilities assumed. | | Our purchase price allocation process involves uncertainty because we make assumptions and apply judgment to estimate the fair value of acquired assets and liabilities. We estimate the fair value of assets and liabilities based upon quoted market prices, and widely accepted valuation techniques, including discounted cash flows and market multiple analyses. Such estimates include assumptions about inputs to our discounted cash flow calculations, industry economic factors and business strategies. | | We completed an acquisition in December 2010 with our acquisition of AWB. We completed our purchase price allocation for that acquisition in the fourth quarter of 2011. |
64 CULTIVATING PERFORMANCE.DELIVERING VALUE.
New Accounting Standards
2011 and 2010 financial information presented and discussed in this MD&A is prepared in accordance with IFRS as issued by the IASB. All financial information prior to 2010 is prepared in accordance with CGAAP in place prior to the adoption of IFRS.
IFRS 7Financial Instruments requires enhanced disclosures for the transfers of financial assets that resulted in derecognition. This standard was adopted by Agrium on January 1, 2011 and was applied prospectively.
The table below outlines our accounting standards and elections under IFRS.
| | |
| IFRS Exemption Options | | Summary of Policy Selection |
| Business Combinations | | |
| |
| Election on transition to IFRS, to either restate all past business combinations in accordance with IFRS 3Business Combinations or to apply an elective exemption from applying IFRS 3 to business combinations completed before the transition date. | | We elected, on transition to IFRS, to apply the exemption such that transactions entered into prior to the transition date were not restated. Because we did not adopt Canadian Institute of Chartered Accountants Handbook section 1582 in 2010, we restated business combinations completed in 2010. |
| |
| Share-Based Payments | | |
| |
| Election not to apply IFRS 2,Share-based Payments, to equity instruments granted on or before November 7, 2002, or which vested before our transition date. Election not to apply IFRS 2 to liabilities arising from share-based payment transactions that settled before the transition date. | | We elected not to apply IFRS 2 to equity instruments granted on or before November 7, 2002, or which vested before our transition date. We have also elected not to apply IFRS 2 to liabilities arising from share-based payment transactions that settled before the transition date. |
| |
| Employee Benefits | | |
| |
| Election to recognize all cumulative actuarial gains and losses through opening retained earnings at the transition date. | | We elected to recognize all cumulative actuarial gains and losses at the date of transition as an adjustment to retained earnings. |
| |
| Foreign Exchange | | |
| |
| Election to reclassify cumulative translation gains or losses in accumulated other comprehensive income to retained earnings. | | We elected to apply the exemption and reclassify the balance of cumulative foreign currency translation gains or losses from other comprehensive income to retained earnings at the transition date, with no resulting change to total shareholders’ equity. |
| |
| Asset Retirement Obligations | | |
| |
| Election to measure the liability and the related depreciation effects of asset retirement obligations at the transition date, rather than recalculating the effect of all such changes retrospectively throughout the life of the obligations. IFRS requires changes in obligations to dismantle, remove and restore items of property, plant and equipment to be added to or deducted from the cost of the asset. | | We elected to apply the exemption from full retrospective application at the transition date. |
Estimates are a mandatory exception in IFRS 1 applied in the conversion from CGAAP to IFRS. Hindsight is not used to create or revise estimates. The estimates we previously made under CGAAP were not revised for application of IFRS except where necessary to reflect any differences in accounting policies.
The following table outlines differences between IFRS and CGAAP and any related impact.
AGRIUM2011 ANNUAL REPORT 65
| | |
Significant Differences Between IFRS and Previous Canadian GAAP | | Impact |
| Employee Benefits | | |
| |
| IFRS permits the recognition of actuarial gains and losses immediately in equity, immediately to earnings, or on a deferred basis to earnings. CGAAP does not permit immediate recognition in equity. Further, IFRS requires expensing of vested past service costs immediately while unvested costs are amortized on a straight-line basis over the vesting period. CGAAP requires amortization of past service costs over the expected average remaining service life of active employees and amortization of costs over the average life expectancy of former employees. | | Transition date impact: none Future impact: greater variability in shareholders’ equity within accumulated other comprehensive income |
| |
| Share-Based Payments | | |
| |
| IFRS requires measurement of cash-settled, share-based awards at fair value, while CGAAP allows measurement of these awards at intrinsic value. In addition, Agrium used straight-line depreciation to recognize graded vesting stock-based instruments under CGAAP, while IFRS requires accounting for each installment as a separate arrangement. | | Transition date impact: reduction in shareholders’ equity and an increase in liabilities Future impact: a continued measurement difference between the intrinsic value and the fair value of cash-settled share-based awards |
| |
| Income Taxes | | |
| |
Classification of deferred income tax under IFRS is non-current whereas CGAAP splits future income taxes between current and non-current components. IFRS requires recognition of the deferred tax impact for temporary differences arising on translation of certain foreign denominated non-monetary assets or liabilities. CGAAP does not allow similar treatment. | | Transition date impact: reclassifying all future income taxes to non-current results in a decrease in current assets and a decrease in non-current income tax liabilities Future impact: remains a classification difference Transition date impact: increase in deferred tax liabilities and a corresponding decrease in retained earnings Future impact: continued recognition of the deferred tax impact with respect to the translation of foreign denominated non-monetary assets or liabilities |
| |
| Provisions | | |
| |
IFRS requires discounting of provisions where the effect of the discounting is material. Provisions are not discounted under CGAAP unless specifically required or when a provision is required to be measured at fair value. The specific provisions for asset retirement obligations under IFRS are measured based on management’s best estimate. The discount rate used in calculating the present value of the cash flow estimates is to be based on risks specific to the liability unless these risks have been incorporated into the cash flow estimates. CGAAP measures asset retirement obligations at fair value incorporating market assumptions. The discount rate used is a credit-adjusted risk-free rate. | | Transition date impact: decrease in environmental liabilities and a corresponding increase to retained earnings Future impact: each period there will be a charge to earnings for accretion of the discount Transition date impact: increase to asset retirement obligations and a corresponding decrease to retained earnings Future impact: decrease in charge to earnings each period for accretion of discount |
66 CULTIVATING PERFORMANCE.DELIVERING VALUE.
| | |
Significant Differences Between IFRS and Previous Canadian GAAP | | Impact |
| Impairment of Assets | | Transition date impact: none |
| |
| Under IFRS, the impairment of assets, excluding financial assets, is tested and measured by comparing the carrying value of an asset or CGU to its recoverable amount. Recoverable amount is measured as the higher of fair value less cost to sell or value-in-use (discounted future cash flows). IFRS permits impairment reversals for assets (excluding goodwill). The IFRS approach has the potential to increase income statement volatility due to the potential for increased write- downs and reversals of write-downs. | | Future impact: increased potential for impairment losses and reversal of previously recorded losses |
| |
| Business Combinations | | |
| |
| IFRS does not include acquisition-related costs within consideration transferred in a business combination whereas the cost of acquisition does include direct, incremental acquisition-related costs under CGAAP. | | Transition date impact: decrease in shareholders’ equity and total assets for acquisition costs Future impact: potential increase in charges to earnings in the amount of acquisition-related costs for business combinations |
| |
| Non-Controlling Interest | | |
| |
| IFRS requires non-controlling interest to be presented as a component of shareholders’ equity separate from the parent’s equity while CGAAP presents non-controlling interest as a separate component between liabilities and equity. | | Transition date impact: increase in shareholders’ equity Future impact: non-controlling interest will continue to be presented within shareholders’ equity |
| |
| Consolidation of Special Purpose Entities and Transfers of Financial Assets | | |
| |
| Under CGAAP, a qualified special purpose entity (“QSPE”) that met certain conditions was not consolidated by a party that was a transferor of assets to the QSPE. Under IFRS, an entity that has transactions with a QSPE may in substance control the entity, requiring consolidation. | | On transition we consolidated a special purpose entity acquired in the AWB acquisition to which we transferred accounts receivable. Receivables transferred that did not meet the IFRS criteria were not recorded as sales and accordingly, we recorded cash received on sale of receivables as secured borrowings |
Accounting Standards and Policy Changes Not Yet Implemented
| | | | | | | | |
New or
amended | | Standard/
Interpretation | | Description | | Proposed date and
method of adoption | | Impact |
| New | | IFRS 10 | | Consolidated Financial Statements implements a single model based on control for the preparation and presentation of financial statements. It introduces a new definition of control, requiring: power over the investee; exposure, or rights, to variable returns from involvement with the investee; and the ability to use power over the investee to affect the amount of returns. This model also applies to investments in associates (IAS 28). | | January 1, 2013; retrospectively | | We do not expect a material impact. |
| | | | |
| New | | IFRS 11 | | Joint Arrangements requires us as a party to joint arrangements to recognize our rights and obligations arising from the arrangement. Our joint arrangements under IFRS 11 will be classified as joint ventures, requiring equity accounting. We currently use proportionate consolidation. | | January 1, 2013; in accordance with IFRS 11 | | Application of the standard could have a material impact on our balance sheet, statement of operations and cash flows but will not affect earnings. |
AGRIUM2011 ANNUAL REPORT 67
| | | | | | | | |
New or
amended | | Standard/
Interpretation | | Description | | Proposed date and
method of adoption | | Impact |
| New | | IFRS 12 | | Disclosure of Interests in Other Entities will require us to disclose information that allows users to evaluate the nature, impact of, and risks associated with our interests in joint arrangements, associates and other entities. | | January 1, 2013 | | We do not expect a material impact. |
| | | | |
| New | | IFRS 13 | | Fair Value Measurement provides a single set of requirements to be applied to all fair value measurements; replacing the existing guidance dispersed across many standards. It provides a definition of fair value as a market-based measurement, along with enhanced disclosures about fair value measurements. | | January 1, 2013; prospectively | | We do not expect a material impact. |
| | | | |
| Amended | | IAS 1 | | Presentation of Financial Statements improves the consistency and clarity of the presentation of items of other comprehensive income by requiring items to be grouped on the basis of whether they may be reclassified subsequently in profit or loss. | | July 1, 2012 | | We are currently assessing these amendments to determine the potential impact. |
| | | | |
| Amended | | IAS 19 | | Employee Benefits provides users with a clearer picture of the commitments resulting from defined benefit plans (DBPs) by eliminating the corridor approach, requiring presentation of gains and losses related to DBPs in other comprehensive income, and adding enhanced disclosure requirements. | | January 1, 2013 | | We are currently assessing these amendments to determine the potential impact. |
| | | | |
| New | | IFRIC 20 | | Stripping Costs in the Production Phase of a Surface Mine establishes when the costs incurred to remove mine waste materials to gain access to mineral ore deposits during the production phase of a surface mine should lead to the recognition of an asset and how that asset should be measured. | | January 1, 2013 | | We do not expect a material impact. |
Enterprise Risk Management
We Manage Risks to our Enterprise
In the normal course, our business activities expose us to risk. The acceptance of certain risks is both necessary and advantageous in order to achieve our growth targets and our vision. We focus on long-term results and manage related risks and uncertainties. Our risk management structure strives to ensure sound business decisions are made that balance risk and reward and drive the maximization of total shareholder return.
Risk Methodology
Through Agrium’s structured Enterprise Risk Management (“ERM”) process, senior management, business units and corporate functions seek to identify and manage risks facing our business. Once identified, risks and related mitigation strategies are evaluated, documented and reviewed on an evergreen basis, with a formal review and quarterly sign-off. Many of these risks cross business units and corporate functions. In these cases, the aggregate risk to Agrium is considered and an overall corporate risk is recorded. Additional mitigation strategies are developed by the senior leadership team for implementation where residual risk is considered to be unacceptably high. Residual risk represents the remaining risk after taking into account existing mitigation strategies.
The risks we identify are assigned to six categories: strategic, financial, operational, market, environmental and political.
68 CULTIVATING PERFORMANCE.DELIVERING VALUE.
Risk Ranking Matrix
At Agrium, we utilize our risk matrix to assess the potential impact of risks based on the expected frequency and consequence of risk events:
| ¨ | We assess consequence based on the potential aggregate impact of a risk event to the following three areas: (a) company reputation; (b) our financial health; and (c) the environment and the health and safety of our employees and external parties; and |
| ¨ | Frequency represents how often a consequence related to a risk is expected to occur – it is akin to probability of loss from the risk. |
Agrium’s Risk Matrix
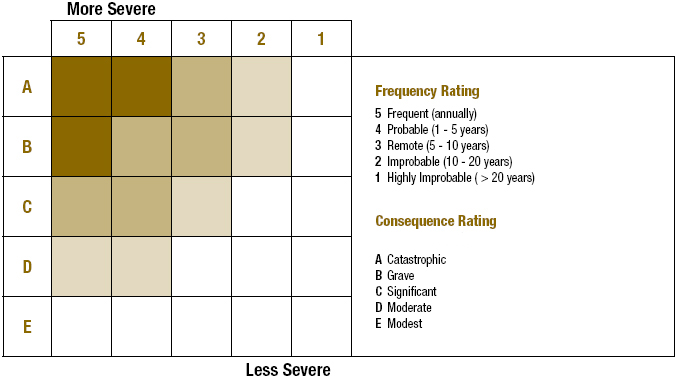
Risk Governance Structure
At Agrium, we believe that good risk management is critical to successful execution of strategy, and that everyone on the Agrium team has a role to play in managing risk.
Board of Directors
| ¨ | Govern risk management directly and through its committees; |
| ¨ | Responsible for understanding the material risks of the business and the related mitigation strategies, and taking reasonable steps to ensure that management has an effective risk management process in place; and |
| ¨ | Individual Committees of the Board oversee specific risks relevant to their areas. For example, the audit committee monitors the risk management process for financial risks; the environment, health, safety and security committee monitors the process for managing environmental, health, safety and security (“EHS&S”) risks; and the compensation committee assesses compensation programs. |
AGRIUM2011 ANNUAL REPORT 69
Management
| ¨ | Risks that are unique to our separate strategic business units are managed by the Presidents of those business units and their teams; and |
| ¨ | Functional risks are managed by the corporate functional heads and their teams. |
Chief Risk Officer
| ¨ | Agrium has appointed a Chief Risk Officer (“CRO”). The CRO is responsible for maintaining an effective ERM Process. The CRO monitors current developments in risk management practices, drives improvements in Agrium’s Risk Management philosophy, program and policies, and champions development of a best practice risk management culture; |
| ¨ | The CRO reports quarterly to the Board and senior management on all significant risks including new or increased risks resulting from changes in operations or external factors; and |
| ¨ | The CRO also formally reports to the Board of Directors on the ERM Process and material risks annually. |
Governance functions
| ¨ | Agrium maintains several risk governance functions which contribute to our overall control environment, including Internal Audit, Corporate EHS&S, and the Internal Control and Disclosure Compliance team. |
Key Business Risks
The following is a discussion of the key business risks facing Agrium:
Product price and margin
Agrium’s operating results are dependent upon product prices and margins, which are in turn dependent on demand for crop inputs. Demand for crop inputs can be affected by a number of factors including weather conditions, outlook for crop nutrient prices and farmer economics, governmental policies, access of our customers to credit, and build-up of inventories in distribution channels.
The majority of our Wholesale nutrient business is a commodity business with little product differentiation. Product prices are largely affected by supply and demand conditions, input costs and product prices and, therefore, resulting margins can be volatile.
Within our Wholesale business, we sell manufactured product as well as product we have purchased for resale. Both sides of the business are subject to margin volatility.
Our Retail and AAT business units experience relatively stable margins, which provide stability to our annual cash flows and earnings. Nonetheless, during times of significant price volatility, margins can be impacted to a certain degree by the above factors.
Raw materials
Natural gas is the principal raw material used to manufacture nitrogen and is our single largest purchased raw material for our Wholesale operation. North American natural gas prices are subject to price volatility. An increase in the price of natural gas increases our nitrogen cost of production, and may negatively impact our nitrogen margins for our North American nitrogen sales. This is particularly important for our nitrogen facilities in Western Canada and Borger, Texas where we purchase gas on the open market. Higher production costs may be partially or fully reflected in higher domestic and international product prices, but these conditions do not always prevail. In addition, the prices for natural gas in North America can vary significantly compared to the prices for natural gas in Europe and Asia. Significantly lower natural gas prices in Europe and/or Asia would give our competitors in Europe and Asia a competitive advantage which could, in turn, decrease international and domestic product prices to a level below what we would consider to be competitive given our input costs.
There is also a risk to the Profertil nitrogen facility on gas deliverability during the winter period, due to strains on gas distribution in Argentina. The Argentine government has at times reduced the amount of gas available to industrial users in favor of residential users during the peak winter demand season. Also, Profertil may not be able to renew its long-term gas supply contracts at favorable rates or at all.
There are inherent risks associated with mining. For phosphate there are risks associated with the variability of the phosphate rock quality that can impact cost and production volumes. For potash mining there is a risk of incurring water intake or flooding, as well as variability in quality that can impact cost and production volumes.
Environment, health, safety and security
We face EHS&S risks typical of those found throughout the agriculture, mining and chemical manufacturing sectors and the international fertilizer supply chain. These include the potential for risk of physical injury to employees and contractors; possible environmental contamination and human exposure from chemical releases and accidents during manufacturing, transportation, storage and use; and the security of our personnel, products, intellectual property and physical assets domestically and overseas from crime, violence, terrorism, and ethnic and international conflicts. In addition, there are threats of natural disasters and risks to health, including pandemic risk.
70 CULTIVATING PERFORMANCE.DELIVERING VALUE.
Unplanned plant downtime
The results of our Wholesale and AAT businesses are dependent on the availability of our manufacturing facilities. Prolonged plant shutdown may result in a significant reduction in product that is available for sale, may affect the environment and/or the community, and may cause an injury to an employee or the public.
Country
We have significant operations in Canada, the U.S. and Australia. We also operate in Argentina, Chile, Uruguay, and a number of European countries and have business investments in Egypt and China. International business exposes us to a number of risks, such as uncertain economic conditions in the foreign countries in which we do business, abrupt changes in foreign government policies and regulations, restrictions on the right to convert and repatriate currency, political risks and the possible interruption of raw material supply due to transportation or government imposed restrictions.
Business acquisitions and expansions
There is a risk that recent acquisitions could fail to fully deliver the expected economic benefits. Similarly, there is a risk that expansions to existing facilities or greenfield developments undertaken may not generate the expected return on investment.
Foreign exchange
A significant shift in the value of the Canadian dollar against the U.S. dollar could impact the earnings of our Canadian operations, which earn revenues mainly in U.S. dollars and incur expenses mainly in Canadian dollars. The major impact would be to our Canadian potash and phosphate operations, on a per unit cost of product basis, as well as our corporate overhead costs. Significant changes in the Canadian dollar can also have a direct impact on our Canadian effective income tax rate.
A significant shift in the value of the Australian dollar against the U.S. dollar could impact the reported earnings of our Australia operations, which earn revenues mainly in Australian dollars, but report in U.S. dollars.
Credit and liquidity
Our business is dependent upon access to operating credit lines to fund our ongoing operations. Should overall credit liquidity in the markets be limited, this could impact our ability to operate under normal conditions.
Counterparty
We face the risk of loss should a counterparty be unable to fulfill its obligations with respect to accounts receivable or other contracts, including derivative financial instruments.
Legislative risk
We are subject to legislation and regulation in the jurisdictions in which we operate. We cannot predict how these laws or their interpretation, administration and enforcement will change over time, and it is possible that future changes could negatively impact our operations, markets or cost structure.
Litigation risk
Agrium, like any other business, is subject to the risk of becoming involved in disputes and litigation. Any material or costly dispute or litigation could adversely impact our consolidated financial position and results of operations. See section “Litigation” under “Contingent Liabilities” on page 53.
Transportation
Reducing the delivered cost and ensuring reliability of product delivery to our customers are key success factors of our Wholesale marketing operations. A potential medium-term risk is the increased regulations and costs of transporting ammonia within North America given the safety risks of transporting this product.
Human resources
Long-term forecasts predict a tight labor market across many areas in which we operate, due to changing demographics including the general aging of the population. A tight labor market, including the associated risk of losing our key individuals, is a risk to the business.
Weather
Anomalies in regional weather patterns can have a significant and unpredictable impact on the demand for our products and services, and may also have an impact on prices. Our customers have limited windows of opportunity to complete required tasks at each stage of crop cultivation. Should adverse weather occur during these seasonal windows, we could face the possibility of reduced revenue in the season without the opportunity to recover until the following season. In addition, we face the significant risk of inventory carrying costs should our customers’ activities be curtailed during their normal seasons. We must manufacture product throughout the year in order to meet peak season demand, and we must react quickly to changes in expected weather patterns that affect demand.
AGRIUM2011 ANNUAL REPORT 71
Environmental Protection Requirements
Agrium’s operations are subject to a variety of federal, provincial, state and local laws, regulations, licenses and permits, the purpose of which is to protect the environment. These environmental protection requirements may apply during design and construction, operation or modification, at the point of plant or mine closure and beyond.
The environmental requirements for new projects typically focus on baseline site conditions; ensuring that the design and equipment selection meet operating requirements; that permitting, pre-construction studies, discharge and other operating requirements will be satisfied; and that safeguards during construction are in place.
Licenses, permits and approvals at operating sites are obtained in accordance with laws and regulations, which may limit or regulate operating conditions, rates and efficiency; land, water and raw material use and management; product storage, quality and transportation; waste storage and disposal; and emissions and other discharges. Additional legal requirements may apply in circumstances where site contamination predates the current applicable regulatory framework or where there is otherwise evidence that remediation activities have not been successful in protecting the environment. These additional requirements may result in an environmental remediation liability that must be resolved.
Finally, the environmental protection requirements that may apply at the time of plant closure can be of two types: environmental remediation liabilities that did not come due or arise until operations ceased, or asset retirement obligations stipulated by contractual obligations or other legal requirements. Asset retirement obligations typically involve the removal of the asset, remediation of any contamination resulting from the use of that asset and reclamation of the land.
Contingent Environmental Liabilities
U.S. Environmental Protection Agency Phosphate Industry Initiative
The U.S. Environmental Protection Agency (“EPA”) has undertaken an industry-wide initiative respecting phosphoric acid and sulfuric acid manufacturing facilities. The primary focus of the initiative is to clarify the scope and applicability of certain exceptions for mineral processing wastes and ensure that facilities comply with the hazardous waste requirements under the U.S. Resource Conservation and Recovery Act (“RCRA”) and related state laws. RCRA is the federal statute which governs the generation, transportation, treatment, storage and disposal of hazardous wastes. The EPA initiative also seeks to clarify the applicability of certain U.S. Clean Air Act (“CAA”) and related federal and state regulatory programs, including Prevention of Significant Deterioration (“PSD”) permitting and Maximum Available Control Technology standards (“MACT”). More recently, EPA also has commenced evaluation of industry’s compliance with certain provisions of the federal Emergency Planning & Community Right to Know Act (“EPCRA”) and the Comprehensive Environmental Response, Compensation & Liability Act (“CERCLA”).
In 2005, the EPA and the Idaho Department of Environmental Quality (“IDEQ”) commenced an investigation of the Conda facility to evaluate compliance with the CAA, RCRA, CERCLA, and relevant state law. The EPA has notified Nu-West Industries, Inc. (“Nu-West”), a wholly-owned subsidiary of Agrium Inc., of potential violations of RCRA, the CAA, EPCRA and CERCLA.
In 2007, the EPA issued a notice of violation (“NOV”) to Nu-West identifying certain alleged violations of the MACT program at the Conda facility. Nu-West understands that EPA’s investigation remains ongoing, however, EPA has yet to identify any further allegations or demands and Nu-West has not yet commenced discussion with the EPA in respect of the EPA’s allegations. Hence, the scope of the EPA’s investigation currently is unknown. Based upon the claims asserted by the EPA to date, however, we do not believe that the ultimate resolution of these allegations will be material to Agrium.
In 2008, the EPA issued a NOV to Nu-West identifying certain alleged violations of RCRA, focusing principally on the government’s interpretation of the so-called Bevill exemption among other regulatory standards. Nu-West is cooperating with the government’s inquiry and is in active discussion to resolve EPA’s allegations. Among other activities designed to assist in obtaining resolution of EPA’s claims, in 2009, Nu-West entered into a voluntary consent order with the EPA to evaluate potential impacts on the environment from the Conda facility’s operations pursuant to section 3013 of RCRA. Nu-West is working cooperatively with EPA and the IDEQ to implement this environmental assessment.
Nu-West, along with other industry members also being evaluated under the same initiative, are involved in ongoing discussions with the EPA, the U.S. Department of Justice and various environmental agencies to resolve these matters. Although Agrium is uncertain as to how the matters will be resolved or if litigation will ensue, potential resolution of the government’s RCRA allegations may be by a settlement and may include requirements to pay certain penalties (which Agrium currently believes will not be material), requirements to modify certain operating practices and undertake certain capital improvement projects, and to provide financial assurance for the future closure, maintenance and monitoring costs for the phosphogypsum stack system at the Conda facility, as well as resolution of the RCRA section 3013 voluntary consent order site investigation findings. At this time, the impact of resolution of these matters cannot be reasonably estimated.
In 2008, the EPA further notified Nu-West that the government had commenced investigation of phosphate industry compliance with certain provisions of CERCLA and EPCRA. In March of 2011, the EPA issued a NOV to Nu-West alleging violations of certain emissions reporting and related requirements under CERCLA and EPCRA. Nu-West has had initial discussions with the EPA regarding these allegations. Because those EPA discussions are ongoing the outcome of this matter currently is unknown; however, at this time we do not believe that the ultimate resolution of these allegations will be material to Agrium.
72 CULTIVATING PERFORMANCE.DELIVERING VALUE.
Legacy environmental remediation activities: Idaho Mining Properties
Nu-West is performing or in the future may perform site investigation and remediation activities at six closed phosphate mines and one mineral processing facility near Soda Springs, Idaho. These sites were mined and operated from as early as 1955 to as late as 1996. Selenium, a trace mineral that is essential for optimal human health but becomes toxic at higher concentrations, was found to be leaching from reclaimed lands associated with historic phosphate mines owned, leased or operated by Nu-West or other parties. Nu-West, the U.S. Government and other phosphate producers have been working diligently to identify the sources of selenium contamination, to develop remedies for the closed mines, and to implement best practices to ensure selenium issues do not become an issue for current and new mining operations.
Detailed investigations and analyses have been conducted for two of Nu-West’s historic mine sites. The former mineral processing facility has been remediated and will be monitored for five years. Since 1996, Nu-West has spent over $14-million on investigation and remediation activities at these seven sites. Nu-West believes that other parties are or may be wholly or partly responsible for conducting or paying for the investigation and remediation of some of these historic sites. Nu-West and other identified parties will conduct site investigations at the remaining historic legacy mines sites starting in 2012.
In 2009, Nu-West initiated a lawsuit against the U.S., which is the owner and lessor of four of the historic mine sites. The lawsuit was brought under the CERCLA to determine the U.S.’ liability to pay for a material portion of the investigation and remediation costs for those sites. That lawsuit is being defended by the U.S. If these claims against the U.S. are successful, it would appreciably reduce Nu-West’s costs and liability at these sites.
Legacy environmental remediation activities: Manitoba Mining Properties
Viridian Inc. (“Viridian”), a wholly-owned Canadian subsidiary of Agrium, is managing investigative and remedial actions at two closed mineral processing sites near Lynn Lake, Manitoba. Viridian is currently negotiating an allocation agreement with another identified joint responsible party. Viridian’s costs and liability at these sites would be appreciably reduced if negotiations are successful. Agrium acquired Viridian in 1996.
Viridian’s Fox Mine operated from 1969 until 1985. It is currently being managed under an operating license with the Manitoba Government. This license requires treatment of acid mine drainage to meet downstream water quality standards. In the past two years, Viridian rebuilt the water treatment plant, providing for additional treatment capacity and control to ensure continued conformance with license requirements. In addition to annual operating costs of between $0.5-million and $1.5-million, Viridian continues to investigate permanent long-term closure options for the site.
The Farley mine site, which was operated from the 1950’s to the 1970’s, is being remediated under a cooperative agreement with the Manitoba Government. The site remediation activities should be substantially completed in 2012.
Vanscoy potash operations
Agrium is currently undergoing tailings management impoundment reorganization at its Vanscoy facility. The tailings management impoundment reorganization is being undertaken to provide sufficient brine storage to fully contain a 300 mm/24 hour storm event, to provide sufficient fine tailings storage to reliably operate the facility for a minimum of five years at all times, and to achieve the items identified in its long term tailings management area plan based on current and expanded production rates. Agrium expects to spend approximately $89-million on the tailings management impoundment reorganization in 2012, with a targeted completion date of 2020.
Climate change and greenhouse gas issues
Directly and indirectly, Agrium generates greenhouse gas (“GHG”) emissions through the production, distribution and use of its products. These emissions may be subject to climate change policy and regulations being developed in North America. However, these policies are developing in a unique way within the various state, provincial and federal jurisdictions.
In the Province of Alberta, legislation has been enacted that impacts facilities emitting greater than 100,000 tonnes of CO2 equivalent (“CO2e”) per year. Existing facilities that exceed this threshold are required to decrease their emissions intensity by 12 percent relative to their 2003-2005 average baseline. If a company is unable to decrease its emissions intensity through increases in operational efficiency, it is still able to comply with the Alberta requirements by purchasing qualifying emission offsets from other sources in Alberta or by contributing to the Climate Change and Emissions Management Fund (“the Fund”). Historically, the contribution costs to the Fund have been set at $15 per tonne of CO2e, although that has recently changed and the contribution costs are now set by order from the Government of Alberta.
Agrium has three facilities in Alberta with CO2e emissions in excess of 100,000 tonnes per year. Those facilities are Redwater Fertilizer Operations, (total typical annual emissions of approximately 750,000 tonnes, excluding NH3-1 unit – NH3-1 can additionally contribute anywhere from zero to approximately 420,000 tonnes of CO2e depending on this unit’s operating time which is directly influenced by market demand and supply factors); Carseland Nitrogen Operations, (total typical annual emissions of approximately 550,000 tonnes); and Fort Saskatchewan Nitrogen Operations (total typical annual emissions of approximately 550,000 tonnes). The annual impact of this legislation on Agrium is expected to range between $1-million to $3-million a year going forward based on current regulations depending on variations in production from year to year which will directly impact CO2 e emissions. These expected annual costs are lower than they otherwise could have been, due in part to Agrium’s implementation of various efficiency and emissions reduction projects. These projects include overall efforts to increase operational efficiency, the purchase of emission offset credits, as well as the construction and operation of a cogeneration facility in
AGRIUM2011 ANNUAL REPORT 73
partnership with TransCanada Pipeline, at Carseland, that captures waste heat and produces emission offset credits. Agrium has also been involved in the development of the Nitrous Oxide Emissions Reduction Protocol (“NERP”) that is designed to generate credits for farmers who reduce their nitrous oxide emissions. The NERP was approved by Alberta Environment in October of 2010. The implementation of the NERP is expected to result in more effective farm application of nitrogen fertilizer, reduced GHG emissions at the farm level and the introduction of additional low-cost offsets to the market.
Agrium’s Canadian retail arm, Crop Production Services (Canada), has a branded service called Carbon Reduction Offset Credit for the aggregation of carbon offsets in accordance with established government regulatory protocols on GHG reduction.
After the Copenhagen meeting in December of 2009, the Canadian federal government indicated its intention to set a target of reducing Canada’s total GHG emissions by 17 percent below 2005 emission levels by 2020. They have subsequently announced that they will achieve these targets through a sector-by-sector approach, aligned with the U.S. as appropriate and also through actions taken by the provinces. Most recently, following the latest meeting of the parties to the Kyoto Protocol, which meeting occurred in Durban, South Africa in December of 2011, Canada has indicated it will not agree to a second Kyoto commitment period beyond 2012. Rather, Canada has indicated that it supports the negotiation of a new binding agreement that includes all major emitters, including the U.S. and China, pursuant to a proposed process that arose out of the Durban meeting entitled the Durban Platform.
In general, the options being considered by U.S. regulators currently lack sufficient detail to assess their potential financial impact. However, Agrium is continuing to monitor U.S. GHG legislative developments, and is evaluating applicability and potential impacts of such programs as they become effective. These programs include the California Global Warming Solutions Act of 2006, the Western Climate Initiative and the EPA’s October 2009 Final Rule for Mandatory Reporting of Greenhouse Gases.
Pursuant to the CAA, the EPA Administrator has made the finding that GHG emissions are air pollutants that endanger public health or welfare. This finding allows the EPA to regulate GHG emissions within the framework of the CAA. The EPA has promulgated regulations effective January 2, 2011 that require Best Available Control Technology on GHG emissions from stationary sources for major modifications that emit more than 75,000 tons of CO2 e, and new major sources that emit more than 100,000 tons CO2 e where such sources are subject to PSD construction permitting. In addition, the EPA finalized its Mandatory Reporting Rule which requires all ammonia, nitric acid and phosphate facilities in the U.S. to begin collecting annual GHG emissions information at each facility according to sector specific methodologies outlined in the rule. 2010 emissions data was reported to EPA in September 2011 and released to the public in January 2012.
Several groups are currently challenging the EPA’s GHG endangerment determination and current regulations in the DC circuit courts, and members of Congress continue to try to tie EPA funding to a rollback of current GHG regulations; however, the outcome of these efforts are far from certain (the GHG reporting requirements are not tied to congressional or legal challenges to EPA’s authority to regulate GHG emissions).
In lieu of federal legislation, States continue to look at regulating GHG emissions within their jurisdiction. The most advanced of these state efforts is California which passed AB32 – The California Global Warming Solutions Act, in 2006. The Act requires the California Air Resources Board (“ARB”) to develop discrete early actions to reduce greenhouse gases while also preparing a scoping plan to identify how best to reduce emissions of GHGs to 1990 levels by 2020. Agrium continues to engage ARB as they develop their requirements and was recently given a position on the working group that will look at agriculture issues in the program.
Agrium will continue to take a leadership role in the fertilizer industry’s negotiations with governments on fair and equitable air emission reduction targets with a goal toward a pragmatic and realistic compliance system that preserves the global competitiveness of the industry. In an effort to reduce CO2 e emissions, Agrium has also developed strategies to improve energy efficiencies in our operations, capture and store carbon, reduce the amount of N2O emissions from our nitric acid facilities and reduce emissions in agriculture.
About 60 percent of the natural gas required to produce ammonia, the basic building block of all nitrogen fertilizer, is used to provide the necessary hydrogen for the process. Given current economically viable technologies, the CO2 emissions related to this process is fixed by the laws of chemistry and cannot be reduced. Use of the remaining natural gas may be managed through improvements in energy efficiency which will reduce CO2 emissions. Significant early action has been implemented by the Company to achieve these improvements and the Fort Saskatchewan facility is currently being used as a demonstration project for implementing an additional energy efficiency program for our nitrogen operations. Independent government sponsored studies estimate for the Canadian industry that a further 3 to 5 percent reduction in combustion emission intensity may be theoretically attainable but will be a challenging and potentially cost prohibitive target.
Where feasible, Agrium is pursuing opportunities to capture CO2 from our nitrogen operations for enhanced oil recovery, industrial use or underground storage. At its Borger, Texas operation, approximately 300,000 tons of CO2 were captured in 2010 for enhanced oil recovery. In 2007, Agrium also signed an agreement to capture CO2 emissions from our Redwater, Alberta facility for enhanced oil recovery. This project is scheduled to become operational in late 2014. Agrium also has N2O reduction technology installed at two of our three operating U.S. nitric acid plants and has plans to install N2O reduction technology at our third plant.
74 CULTIVATING PERFORMANCE.DELIVERING VALUE.
In addition to the stewardship initiatives at our manufacturing plants, Agrium and the fertilizer industry are also promoting efforts to reduce GHG emissions at the field level. At the farm field level, we are working with several groups to promote 4R nutrient stewardship (use of the right fertilizer source at the right time in the right rate and in the right place). Through this stewardship system, farmers are reducing field emissions of GHGs. Careful placement, timing, attention to rate and product selection (all tenets of the 4R system) can significantly reduce these common agricultural emissions.
Agrium estimates that the production stage of its operations account for roughly 95 percent of its overall emissions. Agrium has committed to reducing its North American GHG emissions intensity from the production stage by 10 percent from 2005 levels by 2020.
Controls and Procedures
We maintain disclosure controls and procedures designed to provide reasonable assurance that information required to be disclosed by us in our annual filings, interim filings (as these terms are defined in National Instrument 52-109 Certification of Disclosure in Issuers’ Annual and Interim Filings) and other reports filed or submitted by us under provincial and territorial securities legislation are recorded, processed, summarized and reported within the required time periods. Our Chief Executive Officer (“CEO”) and Chief Financial Officer (“CFO”), after evaluating the effectiveness of our disclosure controls and procedures as of the end of the period covered by the annual filings, being December 31, 2011, have concluded that, as of such date, our disclosure controls and procedures were effective to provide reasonable assurance that information required to be disclosed by Agrium in reports that it files or submits is (i) recorded, processed, summarized and reported within the time periods as required, and (ii) accumulated and made known to management, including the CEO and CFO, to allow timely decisions regarding required disclosure.
Our disclosure controls and procedures are designed to provide reasonable assurance of achieving their objectives and, as indicated in the preceding paragraph, the CEO and CFO believe that our disclosure controls and procedures are effective at that reasonable assurance level, although the CEO and CFO do not expect that the disclosure controls and procedures will prevent all errors and fraud. A control system, no matter how well conceived or operated, can provide only reasonable, not absolute, assurance that the objectives of the control system are met.
Management is responsible for establishing and maintaining adequate internal control over financial reporting, as defined in Rules 13(a)-15(f) and 15(d)-15(f) under the Securities Exchange Act of 1934, as amended. Internal control over financial reporting is designed to provide reasonable assurance regarding the reliability of financial reporting and preparation of financial statements for external purposes in accordance with International Financial Reporting Standards.
Under the supervision and with the participation of our management, including our CEO and CFO, we conducted an evaluation of the design and effectiveness of our internal control over financial reporting as of the end of the fiscal year covered by this report based on the framework issued by the Committee of Sponsoring Organizations of the Treadway Commission in Internal Control – Integrated Framework. Based on this evaluation, management concluded that as of December 31, 2011, we did maintain effective internal control over financial reporting.
The effectiveness of internal control over financial reporting as of December 31, 2011 was audited by KPMG LLP, an independent registered public accounting firm, as stated in their report, which is included in this 2011 Annual Report to Shareholders.
Our Australia operations were acquired on December 3, 2010 and were excluded from management’s evaluation of the effectiveness of the Company’s internal control over financial reporting for 2010, due to the proximity of the acquisition to year-end. During 2011, we successfully completed the integration of our Retail - Australia control environment into the Agrium control environment to ensure controls were operating effectively as at December 31, 2011.
There have been no changes in our internal control over financial reporting during 2011 that have materially affected, or are reasonably likely to materially affect, our internal control over financial reporting.
AGRIUM2011 ANNUAL REPORT 75
Key Assumptions and Risks in Respect of Forward-Looking Statements
Certain statements and other information included in this MD&A constitute “forward-looking information” within the meaning of applicable Canadian securities legislation or “forward-looking statements” within the meaning of applicable U.S. securities legislation (collectively herein referred to as “forward-looking statements”), including the “safe harbour” provisions of provincial securities legislation and the U.S. Private Securities Litigation Reform Act of 1995, Section 21E of the U.S. Securities Exchange Act of 1934, as amended, and Section 27A of the U.S. Securities Act of 1933, as amended. Forward-looking statements are typically identified by the words “believe”, “expect”, “anticipate”, “project”, “intend”, “estimate”, “outlook”, “focus”, “potential”, “will”, “should”, “would”, “could” and other similar expressions. Readers are cautioned not to place undue reliance on forward-looking statements as they are subject to known and unknown risks and uncertainties that may cause the actual results, performance or achievements of the Company to be materially different from any future results, performance or achievements expressed or implied by such forward-looking statements. Except as required by law, Agrium disclaims any intention or obligation to update or revise any forward-looking statements as a result of new information or future events, except as required by law.
The following table outlines certain significant forward-looking statements contained in this MD&A and provides the material assumptions used to develop such forward-looking statements and material risk factors that could cause actual results to differ materially from the forward-looking statements.
| | | | | | | | |
| Forward-looking statements | | Material assumptions | | Material risk factors |
| Synergies to be achieved on the UAP acquisition(a) | | ¨ | | Retail business conditions are assumed to be within normal parameters with respect to prices, margins, product availability, and supplier agreements for our major products. |
| | | | |
| Synergies to be achieved on the AWB acquisition(b) | | ¨ | | Agrium’s ability to successfully integrate the business of Landmark as planned within expected time frames and costs. | | ¨ | | Agrium’s ability to achieve enhanced purchasing efficiencies, expansion in product offerings and a reduction in overhead expenses. These could be affected by industry factors impacting Agrium’s and Landmark’s businesses, generally, and the demand from growers for crop inputs and related products. |
| | | | |
| Retail’s EBITDA to reach $1-billion by 2015 | | ¨ | | Retail business conditions are assumed to be within normal parameters with respect to prices, margins, product availability, and supplier agreements for our major products. | | ¨ | | Retail business conditions are assumed to be within normal parameters with respect to prices, margins, product availability, and supplier agreements for our major products. |
| | | | |
| | ¨ | | Agrium’s ability to identify suitable candidates for acquisitions and negotiate acceptable terms. | | ¨ | | Agrium’s ability to integrate acquisitions, including its ability to achieve efficiencies as planned. |
| | | | |
| | ¨ | | Agrium’s ability to implement its standards, controls, procedures and policies at the acquired business to realize the expected synergies. | | | | |
| | | | |
| Construction of MOPCO’s additional urea trains in 2012 | | ¨ | | The two new plants will be commissioned in 2012. | | ¨ | | Delay in the commissioning of the project due to the governmental changes and demonstrations in Egypt. |
| | | | |
| Brownfield expansion at our Vanscoy, Saskatchewan potash mine, including estimated capacity increase and capital costs associated with the project. | | ¨ | | The expansion construction will be completed on schedule as planned and on budget. | | ¨ | | Labor shortages causing schedule delays and/or cost increases. |
76 CULTIVATING PERFORMANCE.DELIVERING VALUE.
| | | | | | | | |
| Forward-looking statements | | Material assumptions | | Material risk factors |
| Ability to sustain projected potash production with existing reserves and resources. | | ¨ | | Potash reserves are accessible and of sufficient quality to provide the required ore for long-term production. | | ¨ | | Potash – flooding and/or poor ground conditions limit access to major sections of the ore body or results in poor ore quality. |
| | | | |
AAT’s twinning of the ESN facility at New Madrid, MO. The ability to expand the facility’s capacity within timelines and project costs. | | ¨ | | AAT will be able to purchase urea at or below NOLA prices. | | ¨ | | Introduction of new technology into the market. |
| | ¨ | | Location in the Corn Belt will provide logistical benefits. | | ¨ | | Impact of weather conditions on demand. |
| | ¨ | | The increased yields and environmental benefits of ESN will justify premium purchase price over other nitrogen sources. | | ¨ | | Managing the commodity cycle of urea. |
| | | | |
| AAT’s EBITDA to surpass $100-million by 2015 | | ¨ | | Farmers will continue to adopt ESN in North America and abroad. | | ¨ | | Our competitors develop a better product for farmers. |
| | ¨ | | The U.S. economy will recover strengthening the turf and ornamental markets. | | ¨ | | The U.S. economy stagnates. |
| | ¨ | | Turf and ornamental products will continue to be adopted internationally. | | ¨ | | International competitors aggressively market their branded products. |
| | | | |
| Carbon capture and storage project progressing as planned | | ¨ | | Startup by end of 2014. | | ¨ | | Carbon capture and storage funding not received from Alberta Government. |
| | | | | | ¨ | | Upgrader projects (specifically NorthWest Upgrader) cancelled or delayed. |
| | | | | | ¨ | | Issues with Engineering/Procurement or Construction of facility or the pipeline. |
| | |
| 2012 capital spending program(c) | | ¨ | | We believe we will have sufficient financial resources to fund our expected capital program. |
| | |
| | ¨ | | The level of sustaining and investment capital may vary significantly depending on corporate priorities as the year progresses and based on changes in the rate of inflation or engineering costs. |
| | | | |
| Ability to finance announced projects | | ¨ | | We will be able to utilize our available credit facilities or access capital markets for additional sources of financing. | | ¨ | | There can be no assurance that we will be able to utilize our credit facilities or access capital markets. |
| | |
| Completion of Profertil debottlenecking project by 2014, including estimated capacity increase and reduction in production costs. | | ¨ | | Project will be completed on schedule as planned and on budget. This could be affected by escalation in costs and labor shortages causing schedule delays and/or cost increases. |
| (a) | The purpose of this particular financial outlook is to communicate our current expectation of the impact that the UAP acquisition may have on future results of operations. Readers are cautioned that it may not be appropriate for other purposes. |
| (b) | The purpose of this particular financial outlook is to communicate our current expectation of the impact that the AWB acquisition may have on future results of operations. Readers are cautioned that it may not be appropriate for other purposes. |
| (c) | The purpose of this particular financial outlook is to assist readers in assessing our liquidity and capital resources. Readers are cautioned that it may not be appropriate for other purposes. |
AGRIUM2011 ANNUAL REPORT 77
Additional risks and uncertainties that may affect all forward-looking information are discussed throughout the MD&A and in our Annual Information Form. These risks and uncertainties include, but are not limited to, the following:
| ¨ | General economic, market, business and weather conditions, including global agricultural supply/demand factors and crop price levels; global and regional supply/demand factors impacting the crop input application season and the price of crop nutrients and raw materials/feedstock; global economic and market conditions affecting availability of credit and access to capital markets; build-up of inventories in distribution channels; changes to foreign exchange rates; tightening of the labor market; and availability of labor supply; |
| ¨ | Changes in government policies and legislation and regulation, or the interpretation, administration and enforcement thereof, in the jurisdictions in which we operate, regarding agriculture and crop input prices, safety, production processes, environment, greenhouse gas and others; |
| ¨ | Actions by competitors and others that include changes to industry capacity, utilization rates and product pricing; performance by customers, suppliers and counterparties to financial instruments; potential for expansion plans to be delayed; and restrictions on our ability to transport or deliver production to markets, including potential changes to anti-trust laws, or interpretations thereof, that could negatively impact our international marketing operations through Canpotex, the offshore marketing agency for potash produced in the Province of Saskatchewan, wholly-owned by us and the two other major potash producers in Canada; |
| ¨ | Changes in margins and/or levels of supplier rebates for major crop inputs such as crop protection products, nutrients and seed, as well as crop input prices declining below cost of inventory between the time of purchase and sales; |
| ¨ | General operating risks associated with investment in foreign jurisdictions; the level and effectiveness of future capital expenditures; reliability of performance of existing capital assets; and fluctuations in foreign exchange and tax rates in the jurisdictions in which we operate; |
| ¨ | Future operating rates, production costs and sustaining capital of our facilities; unexpected costs from present and discontinued mining operations and/or labor disruptions; changes to timing, construction cost and performance of other parties; and political risks associated with our interest in MOPCO, Argentine Profertil nitrogen facilities, and other facilities; |
| ¨ | Changes in development plans for our potash expansion project, nitrogen debottlenecking and other major capital expansion projects, including the potential for capital construction costs to be higher than expected or construction progress to be delayed, due to factors such as availability of equipment and labor, the performance of other parties, risks associated with technology or inflationary pressure; |
| ¨ | Environmental, health, safety and security risks typical of those found throughout the agriculture, mining and chemical manufacturing sectors and the fertilizer supply chain, including risk of injury to employees and contractors, possible environmental contamination, risks associated with the transportation, storage and use of chemicals and the security of our facilities and personnel; |
| ¨ | Integration risks that might cause anticipated synergies from our recent (including those described in this MD&A) and future acquisitions to be less than expected, including: the acquired business’ actual results being different than those upon which we based our expectations; and industry factors which may affect us and the acquired business in general and thereby impact the demand for our products and services; and |
| ¨ | Strategic risks including our ability to effectively implement our business strategy and our risk mitigation strategies, including hedging and insurance; our ability to close pending and proposed acquisitions and dispositions as anticipated and to integrate and achieve synergies from any assets we may acquire within the time or performance expected of those assets; and the introduction of technologies in the agricultural industry that may be disruptive to our business. |
78 CULTIVATING PERFORMANCE.DELIVERING VALUE.