EXHIBIT 99.2
AGRIUM INC.
2015
MANAGEMENT’S DISCUSSION & ANALYSIS OF
OPERATIONS AND FINANCIAL CONDITION
MANAGEMENT’S DISCUSSION AND ANALYSIS
| | |
| 12 | | AGRIUM ANNUAL REPORT 2015 |
This Management’s Discussion and Analysis (MD&A) of operations and financial condition focuses on Agrium’s long-term vision, strategy and growth opportunities as well as its historical performance for the years ended December 31, 2015 and 2014. The Board of Directors of Agrium (the “Board”) carried out its responsibility for review of this disclosure and, prior to publication, approved this disclosure.
Throughout this MD&A, unless otherwise specified, “Agrium”, “the Company”, “we”, “our”, “us” and similar expressions refer collectively to Agrium Inc. and its subsidiaries, any partnerships involving Agrium Inc. or any of its subsidiaries, its significant equity investments and Agrium Inc.’s share of its joint ventures.
Additional information relating to the Company, including its consolidated quarterly and annual financial information and its Annual Information Form (AIF) for the year ended December 31, 2015, is available under Agrium’s corporate profile on SEDAR (www.sedar.com). The Company’s reports are also filed with the U.S. Securities and Exchange Commission on EDGAR (www.sec.gov).
All dollar amounts refer to U.S. dollars, except where otherwise stated. 2015, 2014 and 2013 financial information presented and discussed in this MD&A is prepared in accordance with International Financial Reporting Standards (IFRS) as issued by the International Accounting Standards Board (IASB).
Certain financial measures in this MD&A, listed in the table below, are not prescribed by, and do not have any standardized meaning under, IFRS. Our method of calculation of the non-IFRS financial measures may not be directly comparable to that of other companies. We consider these non-IFRS financial measures to provide useful information to both management and investors in measuring our financial performance and financial condition. These non-IFRS financial measures should not be considered as a substitute for, or superior to, measures of financial performance prepared in accordance with IFRS. Refer to page 73, “Non-IFRS Financial Measures”, for further details, including a reconciliation of the non-IFRS financial measures to their most directly comparable measures calculated in accordance with IFRS.
|
Non-IFRS financial measures |
|
Cash cost of product manufactured (COPM) |
|
Cash operating coverage ratio |
|
Comparable store sales and normalized comparable store sales |
|
Earnings (loss) from continuing operations before finance costs, income taxes, depreciation and amortization (EBITDA), Adjusted EBITDA, EBITDA to sales |
|
Free cash flow, free cash flow per share, dividends paid as a percent of free cash flow |
|
Wholesale measures, including share of joint ventures: sales, cost of product sold, gross profit |
FORWARD-LOOKING STATEMENTS
Certain statements and other information included in this MD&A constitute “forward-looking information” and/or “financial outlook” within the meaning of applicable Canadian securities legislation or “forward-looking statements” within the meaning of applicable U.S. securities legislation (collectively herein referred to as “forward-looking statements”), including the “safe harbour” provisions of provincial securities legislation and the U.S.Private Securities Litigation Reform Act of 1995, Section 21E of the U.S. Securities Exchange Act of 1934, as amended, and Section 27A of the U.S.Securities Act of 1933, as amended. Forward-looking statements are typically identified by the words “believe”, “expect”, “anticipate”, “project”, “intend”, “estimate”, “outlook”, “focus”, “potential”, “will”, “should”, “would”, “could” and other similar expressions.
Forward-looking statements in this MD&A are intended to provide Agrium securityholders and potential investors with information regarding Agrium, including management’s assessment of future financial and operational plans and outlook, and may not be appropriate for other purposes. These forward-looking statements are subject to a number of assumptions, risks and uncertainties, many of which are beyond our control and which could cause actual results to differ materially from such forward-looking statements. As such, readers should not place undue reliance on these forward-looking statements. Refer to page 82, “Key Assumptions and Risks in Respect of Forward-looking Statements”, for further details.
| | |
| AGRIUM ANNUAL REPORT 2015 | | 13 |
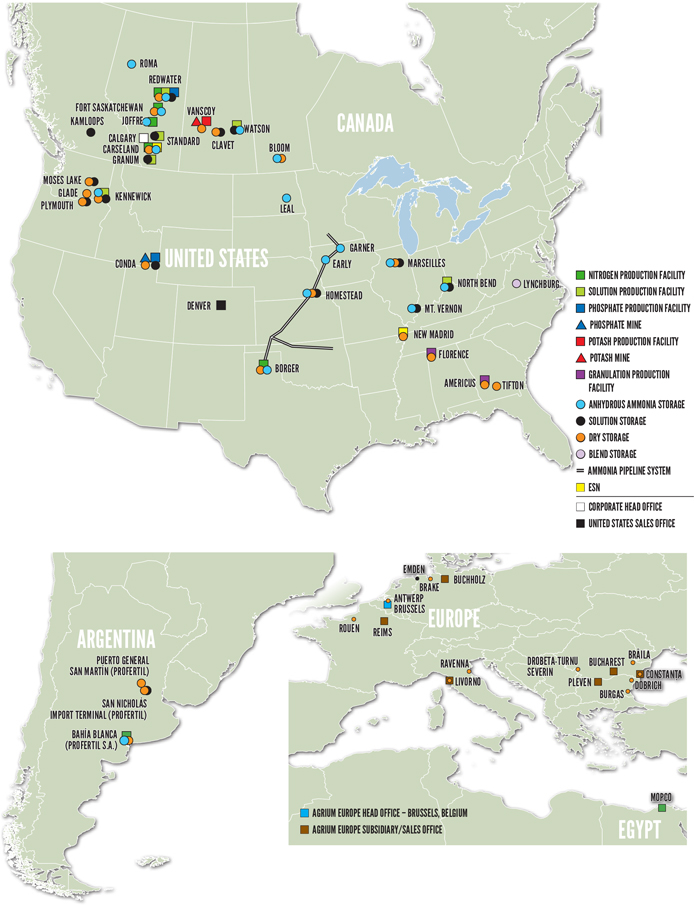
Agrium’s strategic footprint
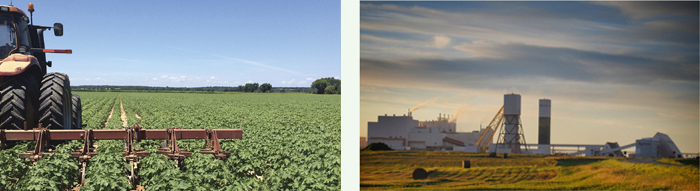
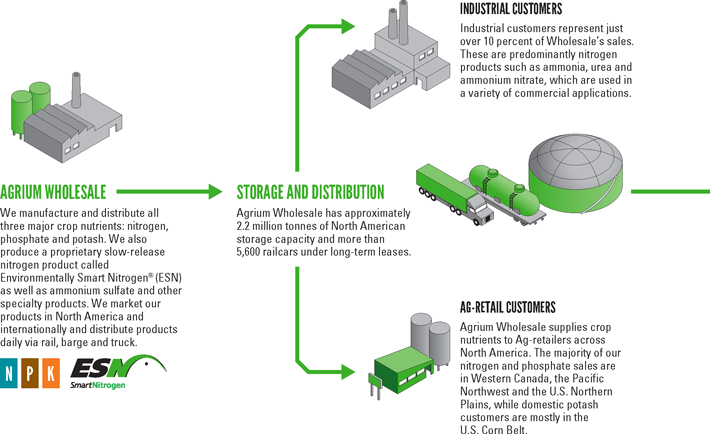
Agrium has significant competitive advantages across our global footprint of operations. We are focused on supplying the important crop inputs, services and solutions farmers require to meet the ever-growing global demand for crops and food, and we are committed to doing so safely and sustainably. Our Retail operations provide us with stability, diversity and long-term earnings growth potential, and our strategically positioned Wholesale operations with low-cost nitrogen and potash operations allow us to reach markets across North America and around the world.
| | |
| 14 | | AGRIUM ANNUAL REPORT 2015 |
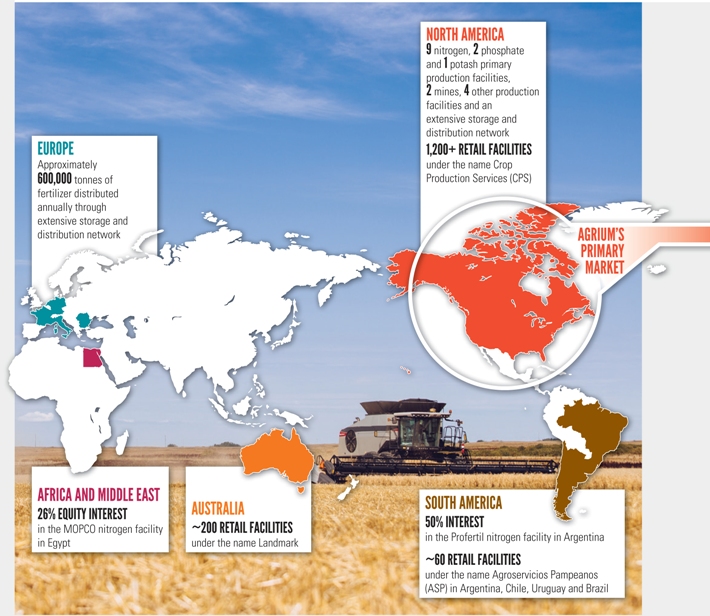
EXTENSIVE COMPETITIVE ADVANTAGES ACROSS OUR STRATEGIC FOOTPRINT
| | |
| AGRIUM ANNUAL REPORT 2015 | | 15 |
Agrium’s business model
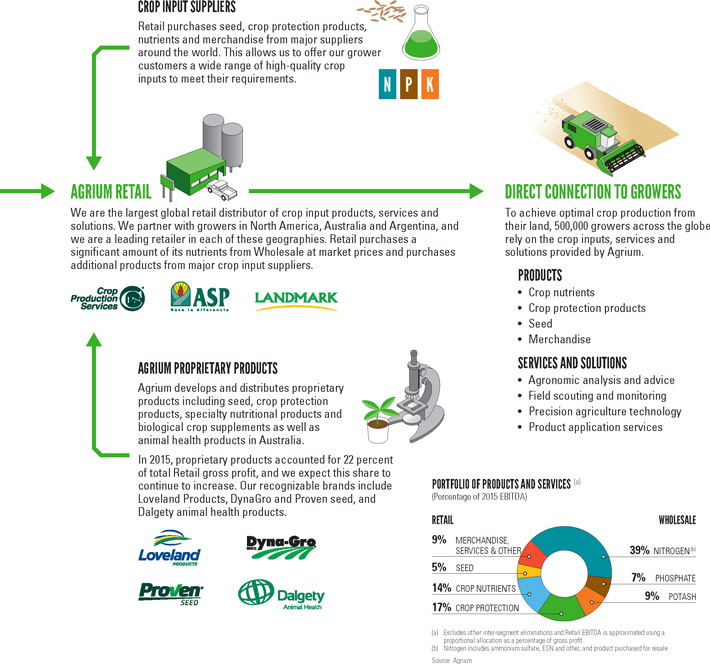
Agrium’s business model combines the production of primary crop nutrients with the world’s largest direct-to-grower distribution network for crop inputs, services and solutions. This structure allows us to generate synergies across the crop input value chain while also achieving higher plant operating rates, leveraging our size and scale with suppliers, capturing significant logistics and distribution synergies, and garnering market intelligence globally throughout our network.
THE MARKET FOR OUR PRODUCTS AND SERVICES
| | |
| 16 | | AGRIUM ANNUAL REPORT 2015 |
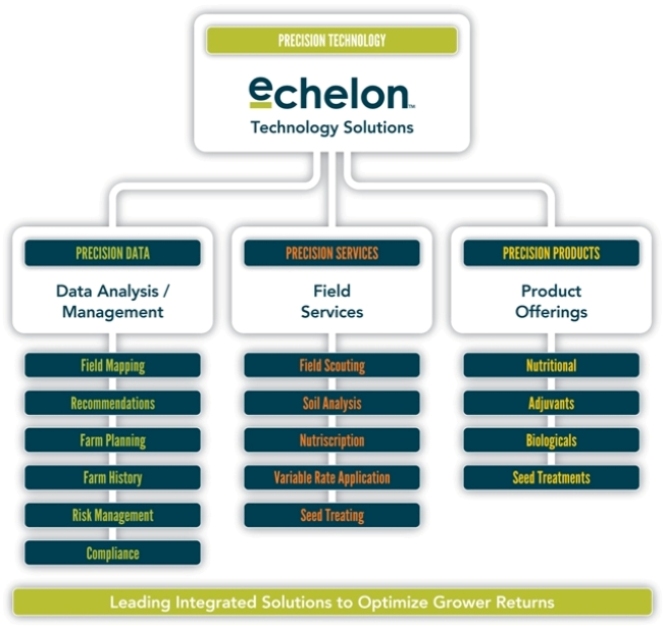
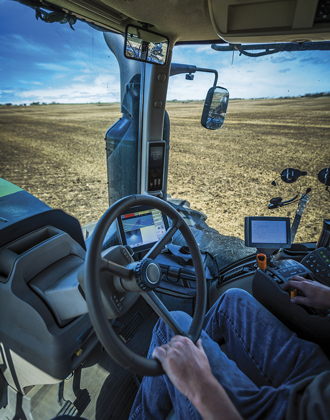
PRECISION AGRICULTURE

Agrium’s Echelon precision agriculture platform brings cutting-edge technology to our grower customers. Precision agriculture uses technology and data to better match crop inputs with soil and crop requirements as they vary across a field rather than treating the whole field homogeneously. Integrating data from satellite imagery, field and yield mapping, soil sampling and foliar analysis to optimize the use of nutrients, crop protection products and seed through variable rate application, Echelon gives growers a powerful set of tools to maximize the productivity of their land. By ensuring products are optimally placed where they will be more fully utilized by the plants, precision agriculture also provides significant environmental benefits and is a highly effective tool in 4R and other agricultural stewardship programs. Echelon works with farm machinery systems and reporting software to seamlessly integrate detailed planning, analysis and record keeping with fieldwork. Agrium is currently touching more than 21 million acres in North America with our Echelon platform.
| | |
| AGRIUM ANNUAL REPORT 2015 | | 17 |
Review of 2015 – A year of execution and controlling our controllables
Consolidated and business unit financial performance
| | | | | | | | | | | | |
| (millions of U.S. dollars, except where noted) | | 2015 | | | 2014 | | | % Change | |
Sales | | | 14,795 | | | | 16,042 | | | | (8 | ) |
Gross profit | | | 3,888 | | | | 3,552 | | | | 9 | |
EBIT | | | 1,616 | | | | 1,160 | | | | 39 | |
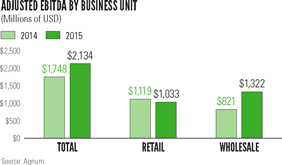
EBITDA | | | 2,096 | | | | 1,710 | | | | 23 | |
Retail EBITDA | | | 1,033 | | | | 1,119 | | | | (8 | ) |
Wholesale Adjusted EBITDA | | | 1,322 | | | | 821 | | | | 61 | |
Diluted earnings per share from continuing operations | | | 6.98 | | | | 5.51 | | | | 27 | |
| ● | | The increase in earnings (loss) from continuing operations before finance costs and income taxes (EBIT) and EBITDA primarily reflects improvements in Wholesale’s production, cost profile and sales volumes and relative stability in our Retail earnings, despite pressure on agricultural commodity prices and lower nutrient prices. |
| ● | | OurRetail business unit’sEBITDA decreased due to weaker crop input demand related to lower global crop prices, drought conditions in Western Canada and foreign currency fluctuations in 2015. Partially offsetting this decline were lower selling and general and administrative expenses, which decreased by $133-million compared to 2014 as a result of our Operational Excellence initiatives and the weakening of global currencies versus the U.S. dollar. |
| ● | | OurWholesale business unit’sAdjusted EBITDA increased as a result of higher earnings from all three major products. Sales volumes for these products increased in 2015 due to improved on-stream time at our production facilities and higher product availability. Cost of product sold per tonne decreased due to higher utilization rates, lower cash fixed costs, a weaker Canadian dollar and lower natural gas costs. This was partially offset by lower selling prices for nitrogen and potash due primarily to global incremental capacity additions and a reduction in the global cost curve from currency devaluations and lower energy prices. |
| ● | | We bought back approximately 5.6 million shares in 2015 at prices we believe were below their intrinsic value, which further supported our growth in earnings per share. |
| | |
| 18 | | AGRIUM ANNUAL REPORT 2015 |
Retail overview and 2015 results
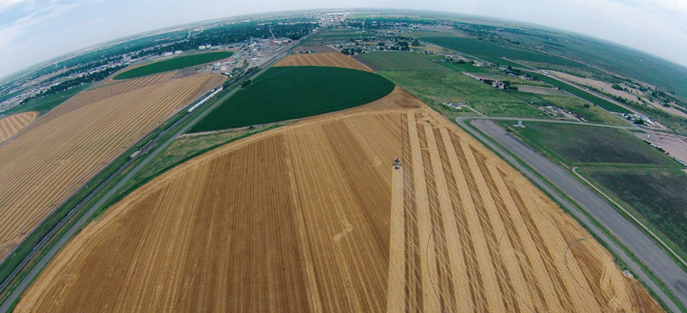
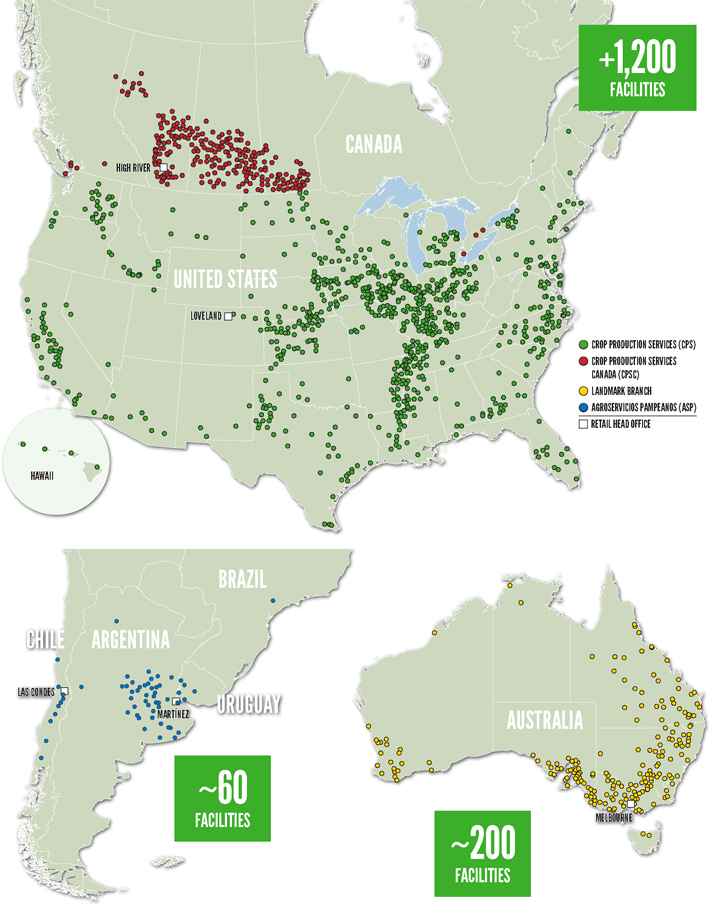
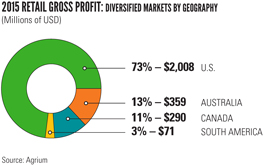
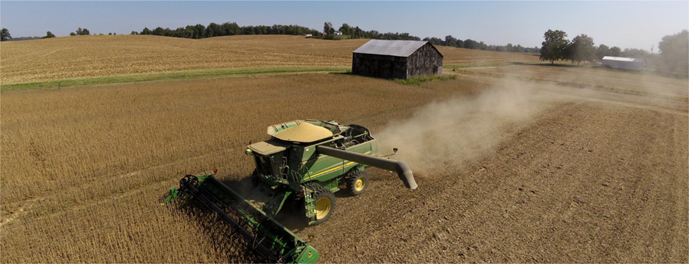
To meet the ever increasing global demand for nutritious food, farmers are faced with the challenge of increasing crop yields in an economic and environmentally sustainable manner. As the world’s largest agricultural retail-distributor of crop inputs, we offer an innovative, custom-built portfolio of products, services and solutions to help our grower customers achieve their yield goals and maximize their returns on investment. We accomplish this through over 1,400 facilities that we operate across the U.S., Canada, Australia and key areas of South America and through the strong partnerships we have built between our grower customers and our agronomists.
Our Retail distribution and services business provides growers with leading products, technologies and extensive agronomic experience, all backed by a commitment to sound environmental practices. Our more than 3,800 agronomists and field experts work directly with growers, helping them maximize the productivity of their farms by implementing the best management practices based on a thorough understanding of soils, climate conditions and crop requirements. Supporting this expertise is our own Echelon precision agriculture platform, which provides diagnostic recommendations to further enhance crop yields and create additional value for the grower.
We also provide innovative proprietary crop protection products and nutritionals under the Loveland Products brand, seed products under the brand names Dyna-Gro and Proven, and animal health products under the Dalgety brand. These leading crop inputs provide growers with options to profitably produce and protect their crops, while delivering higher margins for Agrium. In certain regions, we also provide other rural services.
In Australia, in addition to the above services, we provide livestock marketing and auction services and facilitate real estate and insurance services to our broad customer base. In Canada, we also market crop storage bins, provide fuel sales and services, and offer financial services to our customers.
CROP NUTRIENTS: PRODUCTS AND SERVICES
Retail supplies the crop nutrients essential to growing healthy plants, including nitrogen in both dry and liquid forms, potash, phosphates, sulfur and proprietary micronutrients. Retail acquires crop nutrient products from a wide variety of suppliers at market prices, including purchases from Agrium’s Wholesale business unit. Historically, approximately 30 percent of Retail’s North American crop nutrient purchases come from Wholesale, although for certain regions and products, Wholesale supplies the majority of crop nutrient inputs. The total volume supplied by Wholesale as a percentage of Retail’s needs is expected to grow in 2016. These crop nutrient products are typically blended at the local retail branch or in the field using variable-rate application equipment.
Retail delivers additional value to growers through its application services provided on a fee-for-service basis.
Our Retail branches work closely with growers to understand their goals and customize our delivery of products, agronomic advice and product application services to help achieve those goals. Retail’s agronomists use the 4R Nutrient Stewardship System together with our Echelon precision agriculture platform to help determine the right nutrient source and apply it at the right time, at the right rate and in the right place. Using Echelon’s highly sophisticated tools, our agronomists help growers identify the differences in yield potential within a field and adjust crop inputs accordingly, thereby increasing their productivity and returns while reducing environmental impacts.
Nutrient application windows during the growth cycle of a crop can be very narrow due to the weather, so growers need a reliable and efficient distribution system for crop inputs. Retail’s distribution network – the largest in North America – has efficiently moved on average more than nine million tonnes of crop nutrients to our grower customers annually.
| | |
| AGRIUM ANNUAL REPORT 2015 | | 19 |
RETAIL GLOBAL OPERATIONS
| | |
| 20 | | AGRIUM ANNUAL REPORT 2015 |
CROP PROTECTION PRODUCTS: PRODUCTS AND SERVICES
Retail’s crop protection business markets a broad spectrum of supplier and proprietary herbicide, fungicide, insecticide and adjuvant products that help growers minimize yield losses from weeds, diseases and insects. Our Retail business serves as both a retailer of crop protection products to growers and, to a lesser extent, a wholesaler to other retail operators. We are the largest independent distributor of crop protection products in North America, and we support our products by providing sound technical advice and product application services. As part of our proprietary Loveland crop protection operations, we own and operate numerous blending and formulation facilities, including major production facilities in Greeley, Colorado; Billings, Montana; Greenville, Mississippi; Fairbury, Nebraska; Casilda, Argentina; Buenos Aires, Argentina; and two formulation facilities in Western Australia and Victoria, Australia. We also have an investment in a formulation plant in Winnipeg, Manitoba. Retail also owns significant interests in two agricultural biotechnology companies through our Loveland Products, Inc. business, which allows us to be at the forefront of the latest developments in this technology and develop new crop protection products for our customers.
SEED: PRODUCTS AND SERVICES
What type of seed to use is among a grower’s most important crop input decisions. We provide the seed and seed-related information and analysis our customers need. Beyond our proprietary Dyna-Gro and Proven branded seed, we procure and sell seed from top global suppliers. Our Dyna-Gro seed specialists license leading seed traits from major suppliers, match seed characteristics to local soil and growing conditions, and research and test these choices to ensure the best results for each grower’s area. We continue to see growth in our seed sales and market share over the medium term.
We also have significant investments in canola and rice plant breeding programs to supply industry-leading seed products for these crops. Our canola program has laboratories in Saskatoon, Saskatchewan, and Horsham, Australia, as well as vast germplasm bank and research farms in Saskatchewan with seed marketed under the brand name Proven. Retail’s rice research and development platform, acquired from Bayer CropScience in June 2015 and located in El Campo, Texas, provides the latest in disease-resistant rice hybrids. We expect to sell our proprietary rice seed products commercially in 2017/2018. In total, these proprietary product lines represented 23 percent of our total seed sales in 2015 and added significant margin value to our overall seed sales.
Agrium’s Retail locations also provide seed treatment products and related services, which involve applying crop protection products specifically designed to promote healthy seed germination and early stage plant growth directly to the seed prior to planting.
MERCHANDISE: PRODUCTS AND SERVICES
The merchandise product category includes fencing, feed supplements, livestock-related animal health products, storage and irrigation equipment, and other products. It also includes the fuel and equipment businesses in Canada. Merchandise is a much larger component of our Australian and Canadian Retail operations than our U.S. and South American operations.
SERVICES AND OTHER: PRODUCTS AND SERVICES
Agrium delivers value to growers and earns customer loyalty through services such as product application, soil and leaf testing, crop scouting and precision agriculture services. We maintain a large fleet of application equipment and other rolling stock to ensure timely applications of both nutrients and crop protection products at optimal rates. Our Australian operations also offer livestock marketing, as well as various insurance and real estate services.
PRECISION AGRICULTURE: OVER A DECADE OF EXPERIENCE
Precision agriculture refers to agricultural practices that use information technology, global positioning systems, and related data and production practices to recognize variance in a field’s fertility and yield potential. This information allows growers to better match crop input use and other farming practices to specific field and crop conditions, which helps optimize yields and returns. To obtain the greatest value from precision agriculture technology, providers help growers analyze massive amounts of information including yield maps, detailed field analyses, and soil and foliar nutrient analyses to create specific product recommendations that can be precisely applied to fields. This typically includes variable-rate application of crop inputs as well as monitoring of crop, soil and yield conditions. The technology also helps growers with recordkeeping and mapping. As better measurement and placement of crop inputs maximizes uptake by the plants and minimizes waste, precision agriculture can also deliver significant environmental benefits.
With continual improvements in analytical capabilities, accuracy, connectivity and data synthesis, the focus on and benefits from precision agriculture products and services have been increasing.
| | |
| AGRIUM ANNUAL REPORT 2015 | | 21 |
Agrium has been offering objective precision agriculture services to U.S. grower customers for more than a decade. Echelon – the precision agriculture technology platform we use across North America – offers services such as soil nutrient testing, tissue sampling, yield data mapping, soil fertility management, variable-rate fertilizer application and variable-rate seeding recommendations, along with agronomic advice, proprietary product considerations and recordkeeping. We currently provide this multi-crop service offering to over 35,000 growers and have mapped more than 21 million acres across the U.S., provided field scouting on over 8.8 million acres, and conducted over 65,000 tissue samples and soil tested on over 1.2 million acres to date. With our custom-built Echelon platform, our goal is to ensure that our trusted agronomic advisors also become trusted technological advisors to strengthen our relationships with existing customers and increase opportunities to bring in new customers. This also allows our crop advisors to better analyze and illustrate the effectiveness of new products and practices and to showcase our proprietary products in an unbiased environment. Echelon generates value for Retail primarily through direct charge services such as soil sampling; product bundling opportunities; and objective recommendations for specific products, including our extensive propriety product offering. Furthermore, Echelon is integrated with our Enterprise Resource Planning sales system, which leads to efficiencies from a Retail work order and inventory management perspective.
| | |
| 22 | | AGRIUM ANNUAL REPORT 2015 |
RETAIL >> KEY DEVELOPMENTS IN 2015
Operational Excellence
Agrium’s Retail business is focused on Operational Excellence and the pursuit of continual improvement in all aspects of its operations. A key focus is on continually improving product, service and solution offerings to our half million grower customers. We also strive to continue to grow our propriety product sales, optimize our extensive distribution network, manage working capital and control costs – measures that will continue to drive improvement in our key metrics and financial measures.
| • | | The downturn in agricultural and crop input markets challenged the entire crop input value chain in 2015. Coupled with drought conditions in Western Canada, this held us back from achieving year-over-year improvement in most of our key metrics this year. |
| • | | We were successful in maintaining a low average non-cash working capital to sales ratio of 18 percent, meeting our stated target. |
| • | | To further optimize our distribution network and reduce operational costs, we closed 140 branches, satellites and other retail locations during the year. These efforts tie to our “hub and spoke” strategy, aimed at serving local customers more efficiently with a centralized regional service and distribution structure. These actions supported our cash operating coverage ratio metric, which has declined since 2013. |
| • | | EBITDA to sales declined slightly in 2015 as a result of the weakness in the agricultural commodity and crop input markets. |
Retail metrics
| | | | | | | | | | | | | | | | |
| | | 2013 | | | 2014 | | | 2015 | | | 2015
Target | |
Average non-cash working capital to sales (%) | | | 20 | | | | 17 | | | | 18 | | | | 18 | |
Cash operating coverage ratio (%) (a) | | | 64 | | | | 61 | | | | 62 | | | | 60 | |
EBITDA (millions of U.S. dollars) | | | 986 | | | | 1,119 | | | | 1,033 | | | | 1,300 | |
EBITDA to sales (%) | | | 8 | | | | 9 | | | | 8 | | | | 10 | |
ROCE (%) (b) | | | 9 | | | | 10 | | | | 9 | | | | 13 | |
ROOCE (%) (c) | | | 17 | | | | 18 | | | | 17 | | | | 22 | |
Normalized comparable store sales (%) | | | 5 | | | | (2 | ) | | | (4 | ) | | | N/A | |
| (a) | 2013 metric adjusted to exclude the impact of the Viterra purchase gain of $257-million and a $220-million goodwill impairment for the Australian operations. |
| (b) | Return on capital employed represents last 12 months’ EBIT less income taxes at a tax rate of 28 percent (2014 and 2013 – 27 percent) divided by rolling four quarter average capital employed. Capital employed includes operating capital employed, intangibles and goodwill. |
| (c) | Return on operating capital employed represents last 12 months’ EBIT less income taxes at a tax rate of 28 percent (2014 and 2013 – 27 percent) divided by rolling four quarter average operating capital employed. Operating capital employed includes non-cash working capital, property, plant and equipment, investments in associates and joint ventures and other assets. |
| • | | Our Australian Retail operations made significant improvements in 2015, with EBITDA reaching $94-million compared to $90-million in 2014, despite significant weakness in the Australian dollar compared to the U.S. dollar. The continuing year-over-year improvement reflects ongoing emphasis on cost control and increased proprietary product sales. |
| • | | Normalized comparable store sales (normalized for changes in commodity nutrient prices) decreased by 4 percent in 2015, compared to a 2 percent decrease in 2014. The decrease was driven primarily by the impacts of drought conditions and foreign exchange on our Canadian operations. By contrast, our U.S. locations reported a year-over-year increase of 2 percent, demonstrating the resilience of our operations in this region during a difficult year for the crop input market. |
Focused Growth
| • | | In line with our strategy, Agrium acquired 26 independent retail operator facilities in 2015 for approximately $95-million excluding working capital. We expect these acquisitions to add incremental annual EBITDA of approximately $20-million. Most of these acquisitions took place in North America, where we continue to see the best opportunities for further growth and consolidation on a risk-adjusted basis, given our extensive presence in the region and the potential for significant synergies. We believe the opportunity for additional acquisitions remains robust and will continue to pursue accretive transactions to capture synergies and optimize our strategic footprint in North America. |
| • | | During 2015, Retail also completed the acquisition of Bayer CropScience’s proprietary rice hybrid research platform in El Campo, Texas, which we expect to be another valuable growth platform for Agrium’s seed business. We look to bring these new seed products to market in 2017/2018, thereby providing North American and potentially global rice growers with a new disease-resistant seed to improve yields for this important crop. |
| | |
| AGRIUM ANNUAL REPORT 2015 | | 23 |
Proprietary products – percent of total Retail sales by product
| | | | | | | | |
| (in percentages) | | 2015 | | | 2014 | |
Crop nutrients | | | 7 | | | | 7 | |
Crop protection products | | | 22 | | | | 19 | |
Seed | | | 23 | | | | 23 | |
Total | | | 14 | | | | 12 | |
| ● | | Our proprietary products sales continued to deliver strong results in 2015. Total sales increased by 5 percent, or $74-million, relative to 2014. Proprietary crop protection sales grew by 10 percent while proprietary seed sales decreased by 2 percent over 2014 sales. |
| ● | | Total proprietary and proprietary crop protection product sales as a percentage of total sales both increased in 2015, demonstrating the value and performance of our products in a challenging year for crop inputs. We will continue to highlight the importance and value of these products to our customers to touch more global acres and drive further organic growth across this platform. |
RETAIL >> FINANCIAL RESULTS
Retail performance
| | | | | | | | |
| (millions of U.S. dollars, except as noted) | | 2015 | | | 2014 | |
Sales | | | 12,199 | | | | 12,981 | |
Cost of product sold | | | 9,471 | | | | 10,089 | |
Gross profit | | | 2,728 | | | | 2,892 | |
Expenses | | | | | | | | |
Selling | | | 1,902 | | | | 2,023 | |
General and administrative | | | 112 | | | | 124 | |
Earnings from associates and joint ventures | | | (5 | ) | | | (6 | ) |
Other income | | | (60 | ) | | | (63 | ) |
EBIT | | | 779 | | | | 814 | |
EBITDA | | | 1,033 | | | | 1,119 | |
EBITDA to sales(%) | | | 8 | | | | 9 | |
Selling expense to sales(%) | | | 16 | | | | 16 | |
Cash operating coverage ratio(%) | | | 62 | | | | 61 | |
Comparable store sales(%) | | | (7 | ) | | | (4 | ) |
Normalized comparable store sales(%) | | | (4 | ) | | | (2 | ) |
Average non-cash working capital to sales(%) | | | 18 | | | | 17 | |
Non-cash working capital | | | 2,044 | | | | 2,031 | |
| ● | | Global seed markets and margins were pressured in 2015 by lower crop prices following record crop yields in the U.S. in 2014. Total U.S. crop input expenditures decreased due to the shift from corn to soybean crop area, the loss of 4.5 million acres due to excessive moisture, and lower cotton planted area in 2015. As soybeans require significantly lower inputs than corn, the acreage shift, combined with the decrease in total acres, reduced sales opportunities for U.S. agricultural retailers this year. Despite these market challenges, Agrium grew sales of both corn and soybean seeds in 2015. |
| ● | | Our International and Canadian Retail operations were impacted by weakening regional currencies, which put pressure on their purchases in U.S. dollars and sales to customers in local funds. |
| ● | | Our U.S. Retail earnings this year were also impacted by lower-than-expected fall ammonia applications due to weather conditions that narrowed the application window, limiting ammonia sales volumes and related application services in the fourth quarter of 2015. |
| ● | | As a result of these factors, 2015 Retail EBIT was 4 percent lower than in 2014, while our U.S. operations were comparable to 2014. |
| | |
| 24 | | AGRIUM ANNUAL REPORT 2015 |
RETAIL >> EXPENSES
| ● | | Retail selling expenses decreased by 6 percent in 2015, while total selling expenses as a percentage of sales were consistent with the prior year. Retail also reduced general and administrative costs by $12-million. The reduction in costs was largely a result of Operational Excellence cost-control initiatives including the optimization of our distribution network, reduced depreciation and amortization, and the favorable impact of currency volatility in our International operations. |
| ● | | While total selling and general and administrative costs declined in 2015, our cash operating coverage ratio increased as a result of lower sales related to the weaker agriculture and crop input market. |
| ● | | Depreciation and amortization decreased to $254-million in 2015 from $305-million in 2014 due to our reassessment of the useful lives of our Retail assets at the end of 2014 to better reflect the rate of consumption of our capital assets. |
RETAIL >> PRODUCT LINE PERFORMANCE
Product line performance
| | | | | | | | | | | | | | | | | | | | | | | | |
| | | Sales | | | Gross profit | | | Gross profit (%) | |
| (millions of U.S. dollars, except as noted) | | 2015 | | | 2014 | | | 2015 | | | 2014 | | | 2015 | | | 2014 | |
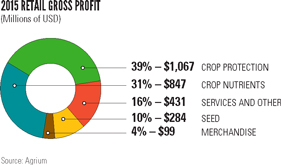
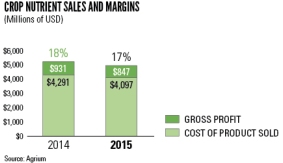
Crop nutrients | | | 4,944 | | | | 5,222 | | | | 847 | | | | 931 | | | | 17 | | | | 18 | |
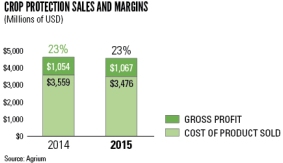
Crop protection products | | | 4,543 | | | | 4,613 | | | | 1,067 | | | | 1,054 | | | | 23 | | | | 23 | |
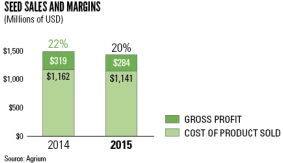
Seed | | | 1,425 | | | | 1,481 | | | | 284 | | | | 319 | | | | 20 | | | | 22 | |
Merchandise | | | 638 | | | | 871 | | | | 99 | | | | 114 | | | | 16 | | | | 13 | |
Services and other | | | 649 | | | | 794 | | | | 431 | | | | 474 | | | | 66 | | | | 60 | |
Total | | | 12,199 | | | | 12,981 | | | | 2,728 | | | | 2,892 | | | | 22 | | | | 22 | |
Crop nutrients: Financial results
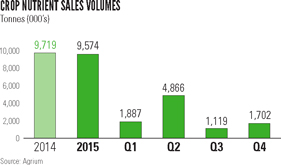
| ● | | Our crop nutrient sales and gross profit decreased in 2015 due to lower nutrient sales prices, margins and volumes compared to 2014. Adverse weather conditions in the Canadian and South American operations drove most of the decline in volumes, which was partly offset by slightly higher nutrient sales volumes within our U.S. operations. As a result, sales volumes were 9.6 million tonnes in 2015 compared to 9.7 million tonnes in 2014. |
| ● | | Gross profit declined by $84-million in 2015, primarily due to the lower nutrient sales prices and lower per-tonne margins. |
| ● | | Our U.S. Retail business was able to maintain crop nutrient gross profit at levels similar to last year despite the reduction in planted corn acres and the lower nutrient price environment. We increased U.S. sales volumes this year by 69,000 tonnes, while margins were down only $4 per tonne from 2014. |
| ● | | Sales of our proprietary nutrient products decreased by 1 percent in 2015 from 2014 levels, due to the weaker crop input market this year. This product line helped support Agrium’s overall crop nutrient margins again in 2015, and we remain focused on growing volumes of this highly value-added product line. |
| | |
| AGRIUM ANNUAL REPORT 2015 | | 25 |
Crop protection products: Financial results
| ● | | In 2015, our crop protection product line delivered gross profit in line with the prior year, despite lower crop prices, dry conditions affecting our Canadian and South American operations and lower glyphosate prices this year. This was offset by an increase in higher-margin proprietary crop protection products. |
| ● | | Our proprietary crop protection products accounted for approximately 22 percent of our total crop protection product sales in 2015, compared to approximately 19 percent in 2014. Sales of our proprietary crop protection products rose 10 percent over last year and continued to represent the largest portion of our total proprietary product offering, primarily under the Loveland Products brand. |
Seed: Financial results
| ● | | Seed sales declined 4 percent in 2015, as lower crop prices pressured seed prices and margins. Higher-value corn and canola acreage also declined this year, as did total U.S. seeded acreage. Furthermore, some growers chose to purchase lower priced seed with fewer traits this year, which also impacted average seed selling prices and margins. As a result, gross profit declined by $35-million in 2015 and gross profit as a percentage of sales was 2 percent lower than in 2014. |
| ● | | Despite the lower U.S. planted acreage and the more challenging year for seed markets in general, we believe we gained market share in the U.S. seed market, selling approximately 5 percent more corn and soybean volumes this year versus 2014. |
| ● | | In 2015, Agrium’s proprietary seed sales decreased in line with the overall demand decline for seed, but our proprietary seed sales remained consistent at 23 percent of total seed sales in both 2015 and 2014. |
Merchandise: Financial results
| ● | | Merchandise sales decreased by 27 percent in 2015 as a result of lower demand and lower prices in our Canadian fuel business. |
| ● | | Merchandise gross profit declined $15-million or 13 percent in 2015, while gross profit as a percentage of sales increased by 3 percent compared to 2014. The higher margins this year reflect the decrease in the lower-margin Canadian fuel business sales and a better cost position in the Australian merchandise business. |
| | |
| 26 | | AGRIUM ANNUAL REPORT 2015 |
Services and Other: Financial results
| ● | | Sales of services and other were down 18 percent in 2015 due mainly to the closure of one of our livestock export operations in Australia. Sales of application and other services were up in North America compared to last year, as growers continued to use our application services and equipment and our precision agriculture tools and technology to help optimize their yields. |
| ● | | Gross profit declined by $43-million in 2015, but gross profit as a percentage of sales increased to 66 percent from 60 percent in 2014. The higher margins in 2015 are largely attributable to the closure of a lower margin livestock export operation and increased demand for higher-margin services in North America. |

| | | | | | | | | | | | | | | | |
| Regional performance | | | | | | | | | | | | | | | | |
| | | 2015 | | | 2014 | |
| (millions of U.S. dollars, except as noted) | | North
America | | | International | | | North
America | | | International | |
Sales | | | 10,124 | | | | 2,075 | | | | 10,463 | | | | 2,518 | |
Cost of product sold | | | 7,826 | | | | 1,645 | | | | 8,080 | | | | 2,009 | |
Gross profit | | | 2,298 | | | | 430 | | | | 2,383 | | | | 509 | |
Gross profit (%) | | | 23 | | | | 21 | | | | 23 | | | | 20 | |
Expenses | | | | | | | | | | | | | | | | |
Selling | | | 1,571 | | | | 331 | | | | 1,622 | | | | 401 | |
General and administrative | | | 79 | | | | 33 | | | | 80 | | | | 44 | |
Earnings from associates and joint ventures | | | (3 | ) | | | (2 | ) | | | (3 | ) | | | (3 | ) |
Other income | | | (35 | ) | | | (25 | ) | | | (39 | ) | | | (24 | ) |
EBIT | | | 686 | | | | 93 | | | | 723 | | | | 91 | |
EBITDA | | | 915 | | | | 118 | | | | 980 | | | | 139 | |
| ● | | Regionally, our North American Retail sales and EBITDA declined in 2015 primarily as a result of lower earnings in our Canadian operations, which were impacted by drought conditions in 2015. Earnings from Canadian operations were also negatively impacted by the much weaker Canadian currency relative to the U.S. dollar. Our U.S. operations saw a 1 percent decline in EBITDA, primarily due to the weaker seed market and slightly lower crop nutrient margins this year. |
| ● | | International Retail sales were also impacted by the weaker agricultural markets and currency fluctuations. However, our Australian operations demonstrated year-over-year improvement in EBITDA and posted record EBITDA results in 2015. |

| | |
| AGRIUM ANNUAL REPORT 2015 | | 27 |
RETAIL >> QUARTERLY RESULTS
| ● | | Our Retail business is seasonal. The most important quarter is the second quarter, which includes the spring application and planting season in North America and the early fall application season in Australia that precedes the winter wheat seeding season. |
| ● | | Western Canada experienced drought conditions during the planting and early growing season in 2015, while the eastern U.S. Corn Belt experienced a wet and late planting season. The wet weather in the U.S. only partially delayed growers from getting into their fields to seed and apply crop inputs. |
| ● | | The third and fourth quarters of 2015 saw a normal fall application window for Canada. In the U.S., however, warmer-than-expected soil temperatures followed by snow and rain in the fourth quarter reduced overall applications of ammonia and other products. We expect this will push some U.S. nitrogen applications into the 2016 spring season. |
Retail quarterly results
| | | | | | | | | | | | | | | | | | | | | | | | | | | | | | | | |
| | | 2015 | | | 2014 | |
| (millions of U.S. dollars, except as noted) | | Q4 | | | Q3 | | | Q2 | | | Q1 | | | Q4 | | | Q3 | | | Q2 | | | Q1 | |
Sales – North America | | | 1,340 | | | | 1,587 | | | | 5,421 | | | | 1,776 | | | | 1,485 | | | | 1,744 | | | | 5,513 | | | | 1,721 | |
Sales – International | | | 425 | | | | 424 | | | | 739 | | | | 487 | | | | 572 | | | | 551 | | | | 884 | | | | 511 | |
Total sales | | | 1,765 | | | | 2,011 | | | | 6,160 | | | | 2,263 | | | | 2,057 | | | | 2,295 | | | | 6,397 | | | | 2,232 | |
Cost of product sold | | | 1,166 | | | | 1,517 | | | | 4,896 | | | | 1,892 | | | | 1,443 | | | | 1,753 | | | | 5,048 | | | | 1,845 | |
Gross profit | | | 599 | | | | 494 | | | | 1,264 | | | | 371 | | | | 614 | | | | 542 | | | | 1,349 | | | | 387 | |
Gross profit (%) | | | 34 | | | | 25 | | | | 21 | | | | 16 | | | | 30 | | | | 24 | | | | 21 | | | | 17 | |
Gross profit by product | | | | | | | | | | | | | | | | | | | | | | | | | | | | | | | | |
Crop nutrients | | | 154 | | | | 113 | | | | 454 | | | | 126 | | | | 156 | | | | 142 | | | | 505 | | | | 128 | |
Crop protection products | | | 268 | | | | 234 | | | | 457 | | | | 108 | | | | 260 | | | | 232 | | | | 457 | | | | 105 | |
Seed | | | 54 | | | | 26 | | | | 164 | | | | 40 | | | | 50 | | | | 27 | | | | 196 | | | | 46 | |
Merchandise | | | 27 | | | | 25 | | | | 27 | | | | 20 | | | | 30 | | | | 36 | | | | 24 | | | | 24 | |
Services and other | | | 96 | | | | 96 | | | | 162 | | | | 77 | | | | 118 | | | | 105 | | | | 167 | | | | 84 | |
EBIT | | | 133 | | | | 64 | | | | 647 | | | | (65 | ) | | | 104 | | | | 51 | | | | 714 | | | | (55 | ) |
EBITDA | | | 199 | | | | 129 | | | | 713 | | | | (8 | ) | | | 181 | | | | 130 | | | | 791 | | | | 17 | |
| | | | | | | | | | | | | | | | | | | | | | | | | | | | | | | | |
| Total Retail | | 2015 | | | 2014 | |
| (in percentages) | | Dec 31 | | | Sept 30 | | | June 30 | | | March 31 | | | Dec 31 | | | Sept 30 | | | June 30 | | | March 31 | |
Average non-cash working capital to sales(a) | | | 18 | | | | 18 | | | | 18 | | | | 18 | | | | 17 | | | | 17 | | | | 17 | | | | 19 | |
Cash operating coverage ratio(a)(c) | | | 62 | | | | 63 | | | | 64 | | | | 62 | | | | 61 | | | | 62 | | | | 61 | | | | 64 | |
EBITDA to sales(a)(c) | | | 8 | | | | 8 | | | | 8 | | | | 8 | | | | 9 | | | | 8 | | | | 9 | | | | 8 | |
ROOCE(a)(c) | | | 17 | | | | 16 | | | | 16 | | | | 17 | | | | 18 | | | | 17 | | | | 19 | | | | 15 | |
ROCE(a)(c) | | | 9 | | | | 9 | | | | 9 | | | | 10 | | | | 10 | | | | 9 | | | | 10 | | | | 8 | |
Comparable store sales(b) | | | (7 | ) | | | | | | | (4 | ) | | | | | | | (4 | ) | | | | | | | (3 | ) | | | | |
Normalized comparable store sales(b) | | | (4 | ) | | | | | | | (1 | ) | | | | | | | (2 | ) | | | | | | | — | | | | | |
| | | | | | | | | | | | | | | | | | | | | | | | | | | | | | | | |
| Retail – North America(a)(c) | | 2015 | | | 2014 | |
| (in percentages) | | Dec 31 | | | Sept 30 | | | June 30 | | | March 31 | | | Dec 31 | | | Sept 30 | | | June 30 | | | March 31 | |
EBITDA to sales | | | 9 | | | | 9 | | | | 9 | | | | 9 | | | | 9 | | | | 9 | | | | 10 | | | | 9 | |
ROOCE | | | 18 | | | | 18 | | | | 17 | | | | 19 | | | | 20 | | | | 19 | | | | 21 | | | | 18 | |
ROCE | | | 9 | | | | 9 | | | | 9 | | | | 10 | | | | 10 | | | | 10 | | | | 11 | | | | 9 | |
| (a) | These measures are based on rolling four quarters ended on the measurement date. |
| (b) | These measures are based on six months ended for June 30 results and 12 months ended for December 31 results. |
| (c) | Adjusted to exclude the impacts of the 2013 Viterra purchase gain of $257-million and a $220-million goodwill impairment for the Australian operations. |
| | |
| 28 | | AGRIUM ANNUAL REPORT 2015 |
Wholesale overview and 2015 results
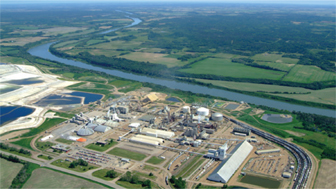
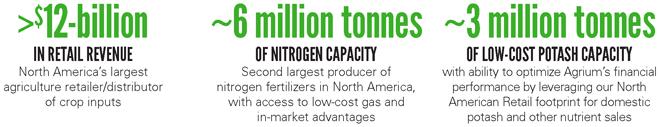
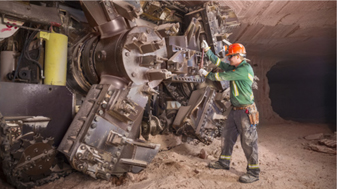
Agrium’s Wholesale business unit produces the crop nutrients essential for optimizing crop yields and quality, making a major contribution to feeding a growing global population. Agrium produces and markets the three primary crop nutrients with a capacity in 2015 of approximately six million tonnes of nitrogen, three million tonnes of potash and more than one million tonnes of phosphate. We are focused on producing, distributing and using these nutrients as efficiently, safely and sustainably as possible. Agrium has competitive cost and in-market advantages across our product lines and significant associated warehousing and distribution assets. Wholesale has recently increased production capacity at its Vanscoy potash facility by one million tonnes, and is in the process of completing its Borger, Texas nitrogen expansion project.
Our Wholesale operations have numerous competitive advantages that help ensure profitability even in challenging market conditions. One key advantage is that the majority of our production capacity and distribution capability is located close to our key end-markets, allowing us to benefit from lower freight costs. Another important advantage stems from our position as the largest agricultural retail distribution business in North America, which allows us to realize meaningful logistical synergies. Our nitrogen facilities have access to some of the lowest cost natural gas globally, due to their locations in Alberta, Canada, and the U.S. Our potash reserves in Saskatchewan, Canada, represent some of the highest quality and lowest cost reserves in the world.
Our potash expansion project has significantly reduced per-tonne cost of production compared to the prior year and is expected to continue to bring this cost down over the next few years as we continue to ramp up the new incremental capacity. Our phosphate business benefits from an in-market transportation advantage, a competitive cost position in sulfur and an integrated ammonia supply from our nitrogen facilities.
Growers use the following three critical crop nutrients to help replenish soil nutrient balance and enhance crop yields and quality.
| | | | |

| | 
| | 
|
| NITROGEN | | POTASH | | PHOSPHATE |
| Role of nutrient |
| Improves crop growth, yield and protein levels | | Regulates plant growth processes and helps protect crops from drought and disease | | Stimulates root development and flowering and encourages early crop development |
| Our products |
| Ammonia, urea, urea ammonium nitrate (UAN) solutions, ammonium nitrate | | Muriate of potash (MOP or “potash”) | | Monoammonium phosphate (MAP), superphosphoric acid (SPA) products |
| Our advantages |
| | | |
• Overall low North American natural gas prices and a further Western Canadian AECO gas advantage relative to NYMEX • Facilities located near key end-markets in the Americas and Europe • Retail distribution network in Western Canada and the U.S. Pacific Northwest, allowing product to be placed in higher netback markets | | • World-scale, high-quality and low-cost advantage • High historical operating rate due to integration with Retail and a balanced geographic sales mix • Capacity expansion that drives lower cost of manufacturing • Partner in a major international marketing and logistics company (Canpotex) | | • Competitive cost position for sulfur and ammonia • In-market freight advantage • Integrated Conda rock supply • Retail distribution network in Western Canada and the U.S. Pacific Northwest, allowing product to be placed in higher netback markets |
| | |
| AGRIUM ANNUAL REPORT 2015 | | 29 |
WHOLESALE GLOBAL OPERATIONS
| | |
| 30 | | AGRIUM ANNUAL REPORT 2015 |
NITROGEN PRODUCTS
Representing approximately 60 percent of the total volume of crop nutrients used globally, nitrogen is the most important crop nutrient in terms of global use and trade. It is also the crop nutrient for which reduced application rates within a growing season are most likely to immediately and adversely impact yield for most crops. For Agrium, nitrogen is the most important nutrient in terms of capacity, production and sales. It represents over 50 percent of our nutrient capacity. Natural gas is the primary input for producing ammonia – the base for virtually all nitrogen products. Ammonia can be applied directly as a fertilizer or upgraded to products such as urea, UAN solutions and ammonium nitrate.
Agrium owns and operates five major nitrogen production facilities in North America and has a 50 percent joint venture interest in Profertil S.A. (“Profertil”), which owns a South American nitrogen facility. We also own four facilities in North America that upgrade ammonia to other nitrogen products such as UAN and nitric acid. These facilities have a combined annual nitrogen production capacity of approximately 5.3 million tonnes. Agrium also has a 26 percent equity ownership position in Misr Fertilizers Production Company S.A.E. (“MOPCO”), which owns an Egyptian nitrogen facility. MOPCO recently completed its planned nitrogen expansion project, bringing the total annual production capacity of the complex to approximately two million tonnes of urea (of which approximately 510,000 tonnes are attributable to Agrium through our equity position). This puts our global nitrogen capacity at approximately 5.8 million tonnes, placing Agrium among the world’s top four publicly traded nitrogen producers.
Our extensive North American nitrogen facilities benefit from the development of long-term, low-cost, non-conventional (shale) natural gas, which has positioned North America among the lowest-cost gas and nitrogen producing regions in the world, and Alberta nitrogen producers continue to benefit from discounted natural gas prices relative to other North American regions. Furthermore, Agrium’s numerous production facilities and extensive North American Retail distribution operations are key competitive advantages. Our Retail network can be leveraged to optimize operating rates and netbacks by placing greater volumes through these distribution channels. We supply much of our nitrogen and phosphate product volumes to our core markets in Western Canada and the U.S. Pacific Northwest, where we obtain more attractive netbacks due to logistical efficiencies. Profertil’s nitrogen facility benefits from similar in-market advantages related to its position in Argentina’s large domestic fertilizer market. The MOPCO Egyptian facility benefits from competitively priced natural gas and direct access to tidewater for international exports.
In 2015, approximately 82 percent of our North American nitrogen sales were directed to agricultural markets, with the remaining 18 percent sold to industrial customers. Agricultural customer demand is seasonal, while industrial demand is more evenly distributed throughout the year. As a result, our average sales price for ammonia in a given quarter will be influenced by the relative weighting of sales to industrial customers compared to sales to the generally higher-return agricultural markets. A high proportion of our industrial ammonia sales are priced on a gas index-plus margin basis, thereby contributing to stability in sales and earnings throughout the year. Industrial ammonia sales volumes were approximately 513,000 tonnes in 2015, compared to 498,000 tonnes in 2014.
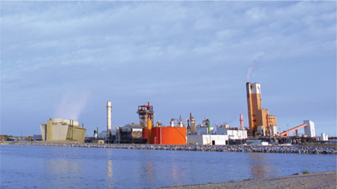
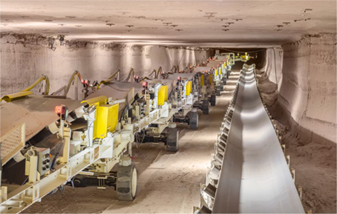
POTASH PRODUCTS
Agrium is North America’s third largest producer of potash. Global potash deposits are highly concentrated in only a few specific regions. The world’s largest known potash deposits are located in Saskatchewan, Canada; and Canada accounted for approximately 34 percent of the global potash trade in 2015. Agrium produces potash at our facility in Vanscoy, Saskatchewan, and exports international sales through our interest in Canpotex – an industry association owned by the three major Canadian potash producers and tasked with marketing potash sold outside of Canada and the U.S. Our share of Canpotex total sales averaged 7.3 percent in 2015 and 7.7 percent in 2014. The downward trend prior to 2016 was a result of recent capacity expansions by the other Canpotex producers. However, following the completion of Agrium’s one million tonne capacity expansion and the Canpotex proving run completed in 2015, our Canpotex allocation has increased to 10.3 percent of total sales for 2016.
| | |
 | |  |
| | |
| AGRIUM ANNUAL REPORT 2015 | | 31 |
PHOSPHATE PRODUCTS
Agrium is North America’s fourth largest producer of phosphate, representing over 7 percent of North American production. Collectively, Agrium’s two phosphate facilities have the capacity to produce approximately 1.2 million tonnes of phosphate-based fertilizer products annually. At our facility in Conda, Idaho, we produce MAP, SPA and merchant-grade phosphoric acid (MGA) products, which are sold primarily in the Northwestern U.S. Our Redwater, Alberta, facility – the only phosphate production site in Canada – produces MAP primarily for distribution in Western Canada.
Producing granular ammonium phosphate requires three primary raw materials: phosphate rock, sulfur and ammonia. Our Conda, Idaho, facility obtains rock from our integrated mine in the region. Our Redwater, Alberta, facility sources rock through a supply agreement with OCP S.A. (“OCP”). This agreement covers rock supply up to 2020, with purchase prices based on a formula derived from the global price of finished phosphate products. The agreement enables Agrium to continue to benefit from our Redwater phosphate facility’s competitive sulfur and ammonia cost positions as well as our in-market logistical advantage in Western Canada.
Our Redwater phosphate facility produces ammonia on-site and sources sulfur locally. Given the abundant supply of sulfur in the region due to the presence of oil and gas producers, we obtain sulfur at highly favorable prices relative to global benchmark prices. Our Conda facility sources sulfur and sulfuric acid domestically, while obtaining the majority of its ammonia from our Alberta nitrogen facilities. Our competitive cost position for sulfur and ammonia is a major advantage. An additional competitive strength is our transportation cost advantage for local customers in Western Canada and the Western U.S. relative to the major phosphate producers based in the Southeastern U.S.
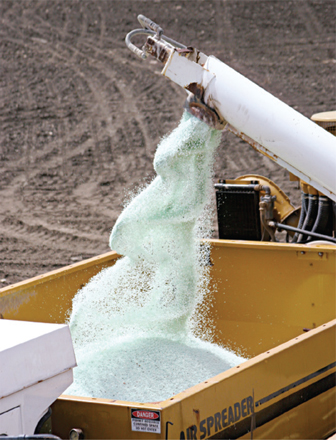
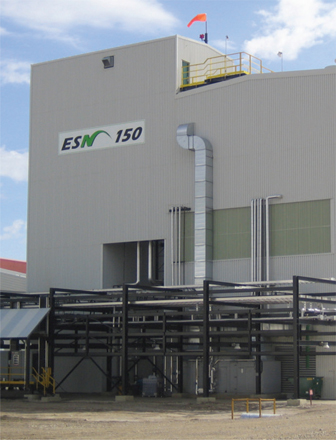
AMMONIUM SULFATE, ENVIRONMENTALLY SMART NITROGEN® (ESN) AND OTHER WHOLESALE PRODUCTS
Our Other Wholesale products primarily comprise ammonium sulfate products produced in Western Canada, ESN and product purchased for resale. Ammonium sulfate fertilizer contains both nitrogen and sulfur, resulting in one of the most effective methods of supplying sulfur to soils in an immediately available form. Agrium produces ammonium sulfate at our Redwater facility, where we have competitive advantages from in-market selling price premiums and logistical advantages as well as lower priced sulfur, which is a byproduct from the oil and gas industry. ESN is a leading controlled release nitrogen fertilizer product that provides growers with significant economic and environmental benefits. This patented coated fertilizer product allows for more efficient delivery of nitrogen to the growing plant based on soil moisture and temperature characteristics.
Our Rainbow® Plant Food (“Rainbow”) operations produce nitrogen, phosphate and potash (NPK) products in the Southeastern U.S. The Rainbow product line offers homogeneous distribution of NPK products with a specific combination of nutrients and additional micronutrients contained in each granule.
In addition to selling our manufactured products, our Wholesale business unit purchases crop nutrient products from other suppliers for resale to customers primarily in Europe. This product purchased for resale business enables us to leverage our distribution and marketing network beyond what is possible through the sale of our manufactured products alone.
| | |
| 32 | | AGRIUM ANNUAL REPORT 2015 |
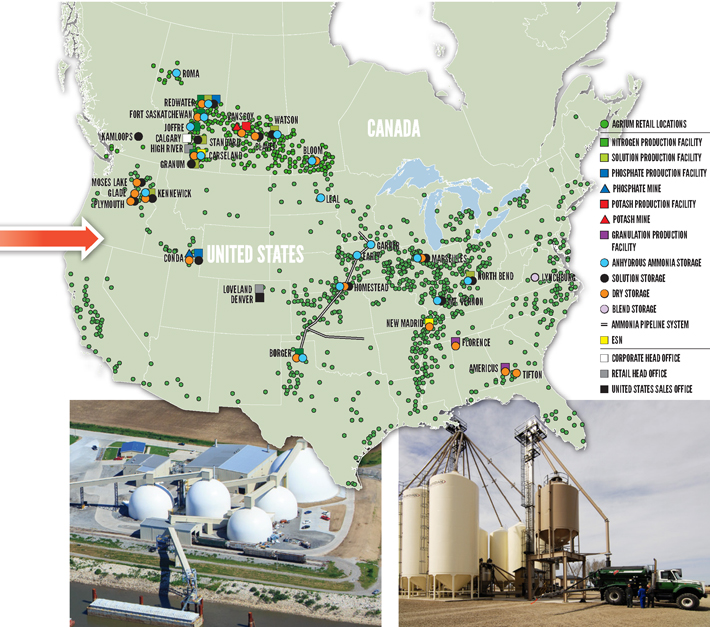
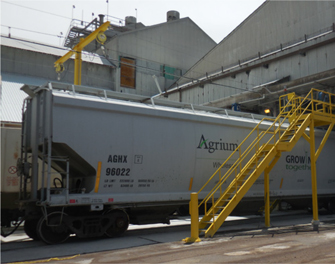
WHOLESALE >> DISTRIBUTION AND STORAGE
Wholesale has an extensive transportation, storage and warehousing network to optimize deliverability of product to our agricultural customers in the highly seasonal peak demand periods. In total, our North American distribution and storage capacity amounts to approximately 2.2 million tonnes. This is in addition to the extensive distribution and warehousing available through our Retail business; and in some cases, warehousing facilities are shared between the business units. We have over 5,600 railcars under long-term operating leases.
| | | | | | | | | | | | |
| 2015 Wholesale capacity, production and sales | | | | | | | | | |
| (thousands of metric product tonnes) | | Capacity (a) | | | Production (a)(b) | | | Sales (c) | |
Nitrogen volumes | | | | | | | | | | | | |
North America | | | | | | | | | | | | |
Canada | | | 3,515 | | | | 2,688 | | | | 1,835 | |
U.S. | | | 1,129 | | | | 961 | | | | 1,821 | |
Total nitrogen | | | 4,644 | | | | 3,649 | | | | 3,656 | |
Potash volumes | | | | | | | | | | | | |
North America | | | | | | | | | | | | |
Canada | | | 3,024 | | | | 1,929 | | | | 204 | |
U.S. | | | | | | | | | | | 929 | |
International | | | | | | | | | | | 601 | |
Total potash | | | 3,024 | | | | 1,929 | | | | 1,734 | |
Phosphate volumes | | | | | | | | | | | | |
North America | | | | | | | | | | | | |
Canada | | | 660 | | | | 595 | | | | 622 | |
U.S. | | | 510 | | | | 547 | | | | 544 | |
Total phosphate | | | 1,170 | | | | 1,142 | | | | 1,166 | |
Ammonium sulfate, ESN and other volumes | | | | | | | | | | | | |
North America | | | | | | | | | | | | |
Canada | | | 546 | | | | 489 | | | | 545 | |
U.S. | | | 559 | | | | 386 | | | | 447 | |
Total ammonium sulfate, ESN and other | | | 1,105 | | | | 875 | | | | 992 | |
Total produced product | | | 9,943 | | | | 7,595 | | | | 7,548 | |
Product purchased for resale volumes(d) | | | | | | | | | | | | |
North America | | | | | | | | | | | | |
U.S. | | | | | | | | | | | 488 | |
International | | | | | | | | | | | 601 | |
Total product purchased for resale | | | | | | | | | | | 1,089 | |
Total Wholesale | | | 9,943 | | | | 7,595 | | | | 8,637 | |
Wholesale equity accounted joint ventures: | | | | | | | | | | | | |
International nitrogen(e) | | | 687 | | | | 445 | | | | 506 | |
International product purchased for resale | | | | | | | | | | | 117 | |
| (a) | Aqua ammonia and nitrates, SPA and MGA are reported by cargo weight. |
| (b) | Production, net of transfers. |
| (c) | Sales represent country of sales destination, not country of production. |
| (d) | Product purchased for resale includes sales of all the major crop nutrient products. |
| (e) | Primarily represents our 50 percent joint venture interest in the capacity of Profertil, which is accounted for using the equity method. |
| | |
| AGRIUM ANNUAL REPORT 2015 | | 33 |
WHOLESALE >> KEY DEVELOPMENTS
| ● | | Wholesale continued to concentrate on Operational Excellence and completing previously identified growth projects. Growth projects included the ramp up of production at our recently expanded Vanscoy potash facility, the associated successful completion of our Canpotex test run at the mine in the fourth quarter of 2015 and progression of our Borger nitrogen expansion project. Our Operational Excellence focus during the year primarily centered on improving the reliability and utilization rates of our facilities, and we attained significant improvements over 2014 levels. |
Operational Excellence
| ● | | In 2015, Wholesale achieved EBITDA improvements from higher asset utilization, phosphate and nitrogen repatriation, and reduced discretionary selling, general and administrative spending. We achieved recurring EBITDA improvements in excess of our Operational Excellence targets and remain focused on delivering further savings in 2016 and beyond. |
| ● | | Capacity utilization of our production facilities was another major focus in 2015. We achieved 89 percent utilization for ammonia production and 94 percent for both potash and phosphate. Each of these utilization rates was a considerable improvement over 2014 levels, and we will strive for further improvements to the on-stream time of our facilities in the coming year. |
| ● | | The portfolio review was another important initiative with further divestitures of non-core assets in 2015, including the West Sacramento nitrogen upgrading facility. The facility had sale proceeds of $27-million in 2015. In late 2014, Agrium decided to discontinue our purchase for resale business in North America and scale back operations in Europe. In 2015, we sold certain under-performing assets related to the business, generating $50-million in sale proceeds and associated reductions in working capital. In Europe, we impaired $19-million of goodwill as a result of our ongoing portfolio review. |
| ● | | Another Operational Excellence initiative is the ‘repatriation’ of phosphate and nitrogen sales to Western Canada - a region with higher netbacks due to freight advantages for our Western Canadian facilities. In 2015, we achieved our multi-year target of 600,000 tonnes of repatriated volumes, with approximately 40 percent of the total targeted volumes achieved in the past year. |
Focused Growth
| ● | | The Vanscoy potash expansion project was completed in 2014. Our focus in 2015 was on ramping up production at the facility in order to complete our Canpotex allocation proving run by year end. We successfully completed the proving run in the fourth quarter, which set our new allocation of international Canpotex sales at 10.3 percent of total Canpotex shipments for 2016. Based on the proving run, our new nameplate capacity for the mine is 3.024 million tonnes. |
| ● | | Cash cost of product manufactured per tonne decreased significantly at the Vanscoy facility following the ramp-up of production after the expansion and due to the impact of the lower Canadian dollar compared to the U.S. dollar this year. We expect to see further reductions in the cash cost of product manufactured as the facility attains full production levels. |
| ● | | In mid-2015, we took steps in the Borger nitrogen expansion project to minimize risk due to significant cost and timeline pressures. We amended the scope of the project to reduce the size of the ammonia plant expansion while continuing with the 610,000 tonne urea facility expansion. We are targeting completion of construction of the project by the end of 2016 with the new capacity expected to come on-line in the first quarter of 2017. Under the new scope and timeline, the project is progressing on time and on budget. |
| ● | | In Egypt, construction on the MOPCO nitrogen facility expansion was completed in 2015, adding two new production trains to the facility. Agrium holds a 26 percent share in the MOPCO facility, which is located in Damietta. The facility previously operated one production train with annual capacity of 650,000 tonnes. The expansion added two additional trains, each with annual production capacity of 650,000 tonnes. Following the provisional acceptance of each additional train, Agrium will have the marketing rights to 100 percent of the additional production and will utilize its global distribution network to market the additional volumes manufactured at the facility. |
| | |
| 34 | | AGRIUM ANNUAL REPORT 2015 |
WHOLESALE >> FINANCIAL RESULTS
| | | | | | | | |
| Wholesale performance | | | | | | |
| (millions of U.S. dollars) | | 2015 | | | 2014 | |
Sales | | | 3,602 | | | | 3,973 | |
Cost of product sold | | | 2,421 | | | | 3,318 | |
Gross profit | | | 1,181 | | | | 655 | |
Expenses | | | | | | | | |
Selling | | | 36 | | | | 44 | |
General and administrative | | | 39 | | | | 48 | |
Loss (earnings) from associates and joint ventures | | | 10 | | | | (18 | ) |
Other expenses | | | 23 | | | | 28 | |
EBIT | | | 1,073 | | | | 553 | |
EBITDA | | | 1,284 | | | | 783 | |
Adjusted EBITDA | | | 1,322 | | | | 821 | |
| ● | | Wholesale gross profit increased over the prior year as significantly lower cost of product sold more than offset lower sales. |
| ● | | The decline in Wholesale sales was due to lower nutrient selling prices in 2015 and our decision to significantly scale back the product purchased for resale business. This decrease was partially offset by higher sales volumes for all three major products due to higher on-stream time and product availability. |
| ● | | Cost of product sold was lower than in 2014 due to lower natural gas costs, lower cash fixed costs, improved operating rates and efficiencies at our facilities, and a weaker Canadian dollar. |
| ● | | Higher Wholesale expenses in 2015 were primarily due to losses from our associates and joint ventures pertaining to our interest in the nitrogen facilities in Egypt and Argentina, which are accounted for in expenses. Partially offsetting this was a decrease of $17-million in selling and general and administrative expenses and a decrease of $5-million in other expenses during the year. Excluding the losses from associates and joint ventures, overall Wholesale expenses declined by 18 percent due to Operational Excellence cost saving initiatives and a weaker Canadian dollar. |
| ● | | Our 26 percent interest in MOPCO reported a $5-million equity loss in 2015 compared to a $1-million equity loss in 2014. The higher loss was due to significant gas curtailments, which limited the ability to run the facility. Our 50 percent interest in Profertil reported a $5-million equity loss in 2015 compared to earnings of $18-million in 2014 due to lower sales volumes, lower selling prices for urea (consistent with global benchmark pricing), and downtime associated with the completion of the energy efficiency project at the facility. |
| | |
| AGRIUM ANNUAL REPORT 2015 | | 35 |
NITROGEN >> FINANCIAL RESULTS
| | | | | | | | | | | | | | | | | | | | | | | | |
| Nitrogen performance | | | | | | | | | | | | | | | | | | |
| | | 2015 | | | 2014 | |
| (millions of U.S. dollars, except as noted) | | Consolidated | | | Equity
accounted
joint ventures | | | Total (a) | | | Consolidated | | | Equity
accounted
joint ventures | | | Total (a) | |
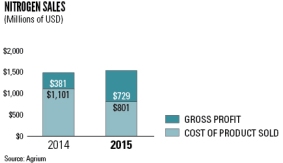
Sales | | | 1,530 | | | | 194 | | | | 1,724 | | | | 1,482 | | | | 197 | | | | 1,679 | |
Cost of product sold | | | 801 | | | | 178 | | | | 979 | | | | 1,101 | | | | 149 | | | | 1,250 | |
Gross profit | | | 729 | | | | 16 | | | | 745 | | | | 381 | | | | 48 | | | | 429 | |
| (a) | Wholesale measures including share of joint ventures. |
| | | | | | | | | | | | | | | | | | | | | | | | | | | | | | | | |
| Nitrogen performance | | | | | | | | | | | | | | | | | | | | | | | | |
| | | 2015 | | | 2014 | |
| | | Ammonia | | | Urea | | | Other | | | Total | | | Ammonia | | | Urea | | | Other | | | Total | |
Tonnes sold (‘000) | | | 1,209 | | | | 1,583 | | | | 864 | | | | 3,656 | | | | 1,042 | | | | 1,287 | | | | 983 | | | | 3,312 | |
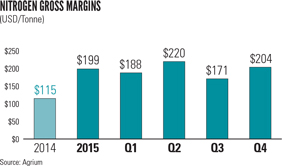
Selling price per tonne (U.S. dollars) | | | 530 | | | | 395 | | | | 305 | | | | 418 | | | | 553 | | | | 443 | | | | 341 | | | | 447 | |
Cost of product sold per tonne (U.S. dollars) | | | | | | | | | | | | | | | 219 | | | | | | | | | | | | | | | | 332 | |
Margin per tonne (U.S. dollars) | | | | | | | | | | | | | | | 199 | | | | | | | | | | | | | | | | 115 | |
Tonnes produced (‘000)(a) | | | 2,653 | | | | 1,780 | | | | | | | | | | | | 2,328 | | | | 1,478 | | | | | | | | | |
Cash COPM per tonne (U.S. dollars) | | | 145 | | | | 134 | | | | | | | | | | | | 242 | | | | 205 | | | | | | | | | |
Capacity utilization (%) (2015 Target: 90%)(b) | | | 89 | | | | | | | | | | | | | | | | 79 | | | | | | | | | | | | | |
| (a) | Gross production, before transfers. |
| (b) | Excludes results from Joffre nitrogen facility. |
Nitrogen gross profit
| ● | | Nitrogen gross profit increased 91 percent in 2015 due to lower cost of product sold and higher sales volumes, which more than offset lower realized selling prices. |
Nitrogen sales volumes and operating rates
| ● | | Our nitrogen product category consists primarily of urea, ammonia, UAN and industrial-grade ammonium nitrate. Urea – the highest volume nitrogen product sold globally – accounted for 43 percent of Agrium’s nitrogen sales volumes in 2015. |
| ● | | Agrium significantly improved its nitrogen operating rates in 2015, with ammonia capacity utilization of 89 percent in 2015 compared to 79 percent in 2014. The lower utilization rate in 2014 was due to several planned and unplanned outages that reduced volumes available for sale and increased cost of product sold. |
Nitrogen prices
| ● | | The 6 percent decrease in average realized nitrogen sales price reflects lower benchmark nitrogen prices throughout 2015. Benchmark prices for international urea and North American ammonia and UAN solutions were down between 5 and 20 percent in 2015 compared to 2014. |
| | |
| 36 | | AGRIUM ANNUAL REPORT 2015 |
Nitrogen product and gas cost
| ● | | The decrease in cost of product sold was primarily due to our average gas costs in 2015 declining by 37 percent from 2014 levels, lower fixed costs, higher utilization rates and a weaker Canadian dollar compared to the prior year. |
| ● | | Production asset depreciation and amortization expense of $19 per tonne in 2015 (compared to $26 per tonne in 2014) is included in cost of product sold. In the fourth quarter of 2015, we revised our depreciation accounting methodology for nitrogen facilities to a units of production basis, which better reflects our consumption pattern of the assets prospectively, rather than the straight-line methodology we had used previously. |
| ● | | Starting January 1, 2015, we designated all our natural gas derivatives as hedges for accounting purposes, with realized gains and losses now recorded in cost of product sold. In 2015, Agrium continued to take advantage of historically low gas prices to secure hedges for 25 percent of our estimated natural gas requirements for 2016 and 2017, and 21 percent of our estimated requirements for 2018. Our average hedged price is $2.78 per MMBtu for 2016 to 2018 hedges. Subsequent to January 2015, we did not add any further long-term natural gas hedges given the current low-price market outlook for North American natural gas. |
| ● | | As of February 2016, we have hedged approximately 44 percent of our anticipated North American natural gas needs for 2016. This takes into account our industrial business, which represents about 18 percent of our total nitrogen sales and, because it is largely based on cost-plus contracts, is not at risk of gas price fluctuations. |
| | | | | | | | |
| Natural gas prices: North American indices and North American Agrium | | | | | | |
| (U.S. dollars per MMBtu) | | 2015 | | | 2014 | |
NYMEX | | | 2.67 | | | | 4.38 | |
AECO | | | 2.18 | | | | 3.87 | |
Basis | | | 0.49 | | | | 0.51 | |
Wholesale | | | | | | | | |
Overall gas cost excluding realized derivative impact | | | 2.36 | | | | 4.26 | |
Realized derivative impact | | | 0.18 | | | | (0.20 | ) |
Overall gas cost(a) | | | 2.54 | | | | 4.06 | |
| (a) | Weighted average gas price of all gas purchases, excluding our 50 percent share of the Profertil facility. |
| | | | | | | | | | | | | | | | | | | | |
| Natural gas use | | | | | | | | | | | | | | | |
| (BCF) | | Western
Canada | | | U.S.
(Borger, Texas) | | | International
(Profertil) | | | Potash
and other | | | Total | |
2015 | | | 84 | | | | 19 | | | | 14 | | | | 1 | | | | 118 | |
2014 | | | 74 | | | | 20 | | | | 13 | | | | 1 | | | | 108 | |
POTASH >> FINANCIAL RESULTS
| | | | | | | | | | | | | | | | | | | | | | | | |
| Potash performance | | | | | | | | | | | | | | | | | | |
| | | 2015 | | | 2014 | |
| (millions of U.S. dollars, except as noted) | | North
America | | | International | | | Total | | | North
America | | | International | | | Total | |
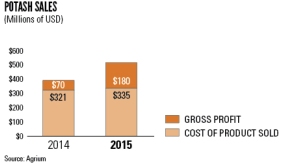
Sales | | | 374 | | | | 141 | | | | 515 | | | | 295 | | | | 96 | | | | 391 | |
Cost of product sold | | | | | | | | | | | 335 | | | | | | | | | | | | 321 | |
Gross profit | | | | | | | | | | | 180 | | | | | | | | | | | | 70 | |
Tonnes sold(’000) | | | 1,133 | | | | 601 | | | | 1,734 | | | | 821 | | | | 443 | | | | 1,264 | |
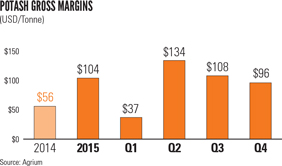
Selling price per tonne | | | 330 | | | | 235 | | | | 297 | | | | 359 | | | | 217 | | | | 309 | |
Cost of product sold per tonne | | | | | | | | | | | 193 | | | | | | | | | | | | 253 | |
Margin per tonne | | | | | | | | | | | 104 | | | | | | | | | | | | 56 | |
Tonnes produced(’000) | | | | | | | | | | | 1,967 | | | | | | | | | | | | 1,058 | |
Cash COPM per tonne | | | | | | | | | | | 96 | | | | | | | | | | | | 157 | |
Capacity utilization (2015 Target: 100%)(a) | | | | | | | | | | | 94 | | | | | | | | | | | | 52 | |
| (a) | Actual and target capacity utilization are adjusted to reflect the tie-in of the Vanscoy expansion and the 2015 ramp-up of production. |
| | |
| AGRIUM ANNUAL REPORT 2015 | | 37 |
Potash gross profit
| ● | | The increase in potash gross profit was due to the completion of the Vanscoy expansion project in late 2014, which led to increased on-stream time for the facility in 2015. In 2014, the facility experienced an extended outage during the fourth quarter to tie in the expansion project, which significantly reduced volumes produced and sold and increased costs per tonne sold during the year. In 2015, we successfully ramped up the expanded capacity and reached two million tonnes of production, resulting in significantly lower costs and higher margins per tonne. |
Potash sales volumes and operating rates
| ● | | The 37 percent increase in potash sales volumes in 2015 was due to the ramp-up of production at the Vanscoy facility following completion of the expansion project. Sales volumes in 2015 were lower than produced volumes, as we refilled our inventory pipelines after being fully drawn down at the end of 2014. |
Potash prices
| ● | | North American and international benchmark potash prices declined in 2015 as a result of competitive pricing pressures. Global benchmark prices were impacted by weakening global currencies against the U.S. dollar, which reduced purchasing power and demand particularly in Brazil, India and Southeast Asia and also lowered the global potash cost curve. Global inventories also built up in end-markets in the second half of 2014 and the first half of 2015, leading to reduced shipments in the second half of 2015. |
| ● | | Benchmark prices in the U.S. Corn Belt trended lower for most of 2015, averaging $399 per tonne in 2015 compared to $428 per tonne in 2014 and ending 2015 at $317 per tonne. This directly impacted our realized selling price per tonne on domestic volumes. |
| ● | | Our international prices are referenced at the mine site, thereby excluding transportation and distribution costs, while our North American sales are referenced at delivered prices and include transportation and distribution costs. |
Potash product cost
| ● | | The cost of product sold for potash increased slightly due to the increase in sales volumes during the year. The cost of product sold per tonne decreased significantly due to fixed costs being distributed over greater production volumes. Production costs also decreased due to the significant weakening of the Canadian dollar against the U.S. dollar this year. Our production costs are reported as a weighted average of domestic and international sale volumes. A shift in relative weighting between these two end-markets can impact our reported average per tonne costs due to the inclusion of freight in the North American cost of product sold. |
| ● | | Production asset depreciation and amortization expense was $42 per tonne in 2015 (compared to $51 per tonne in 2014) and is included in cost of product sold. Effective January 1, 2015 we revised our depreciation accounting methodology for our potash facility to a units of production basis, which better reflects our consumption pattern of the assets prospectively, rather than the straight-line methodology we had previously employed. The impact of the change in accounting methodology was offset by the additional depreciation associated with the capital expenditure for the Vanscoy expansion. |
| | |
| 38 | | AGRIUM ANNUAL REPORT 2015 |
PHOSPHATE >> FINANCIAL RESULTS
| | | | | | | | |
| Phosphate | | | | | | |
| (millions of U.S. dollars, except as noted) | | 2015 | | | 2014 | |
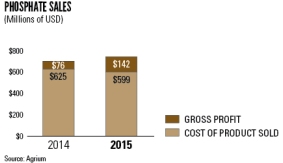
Sales | | | 741 | | | | 701 | |
Cost of product sold | | | 599 | | | | 625 | |
Gross profit | | | 142 | | | | 76 | |
Tonnes sold(’000) | | | 1,166 | | | | 1,142 | |
Selling price per tonne | | | 635 | | | | 614 | |
Cost of product sold per tonne | | | 513 | | | | 548 | |
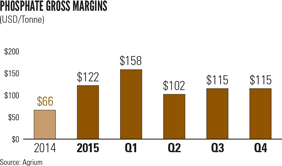
Margin per tonne | | | 122 | | | | 66 | |
Phosphoric acid capacity utilization(%) (2015 Target: 96%) | | | 94 | | | | 92 | |
Phosphate gross profit
| ● | | The increase in phosphate gross profit in 2015 was due to a combination of slightly higher realized prices, increased sales volumes and lower cost of production, mainly driven by slightly higher capacity utilization rates. |
Phosphate sales volumes and operating rates
| ● | | We achieved higher capacity utilization at our phosphate facilities this year, which contributed to the slightly higher sales volumes in 2015. Operating rates at our Redwater and Conda facilities reached 85 percent and 104 percent, respectively, in 2015. |
Phosphate prices
| ● | | Our realized phosphate price represents a blend of phosphate products, with over 81 percent of our sales volumes in 2015 consisting of MAP and the remainder being higher-value SPA, MGA and phosphate solutions. |
| ● | | The increase in phosphate selling price was due to tighter regional supply and increased local market demand as well as high operating rates at our facilities during peak seasonal demand this year. |
Phosphate product cost
| ● | | Total cost of product sold was down 4 percent due to further manufacturing efficiency projects and the impact of the lower Canadian dollar at the Redwater facility and lower fixed costs at both facilities. Higher sales volumes and lower total costs resulted in the cost of product sold per tonne declining by 6 percent. |
| ● | | Production asset depreciation and amortization expense of $43 per tonne in 2015 (compared to $46 per tonne in 2014) is included in the cost of product sold. In the fourth quarter of 2015, we updated our depreciation accounting methodology for phosphate facilities to a units of production basis, which better reflects our consumption pattern of the assets prospectively, rather than the straight-line methodology we had been using previously. |
| | |
| AGRIUM ANNUAL REPORT 2015 | | 39 |
AMMONIUM SULFATE, ESN AND OTHER WHOLESALE PRODUCTS >> FINANCIAL RESULTS
| | | | | | | | |
| Wholesale Other | | | | | | |
| (millions of U.S. dollars, except as noted) | | 2015 | | | 2014 | |
Sales | | | 816 | | | | 1,399 | |
Cost of product sold | | | 686 | | | | 1,271 | |
Gross profit | | | 130 | | | | 128 | |
Tonnes sold(’000) | | | | | | | | |
Product purchased for resale | | | 1,089 | | | | 2,490 | |
Ammonium sulfate | | | 336 | | | | 349 | |
ESN and other | | | 656 | | | | 714 | |
Selling price per tonne | | | | | | | | |
Product purchased for resale | | | 366 | | | | 370 | |
Ammonium sulfate | | | 330 | | | | 332 | |
Cost of product sold per tonne | | | | | | | | |
Product purchased for resale | | | 356 | | | | 360 | |
Ammonium sulfate | | | 140 | | | | 175 | |
Margin per tonne | | | | | | | | |
Product purchased for resale | | | 10 | | | | 10 | |
Ammonium sulfate | | | 190 | | | | 157 | |
| ● | | Ammonium sulfate, ESN and Other gross profit increased due to lower urea input costs and a weaker Canadian dollar. This was partially offset by a downward trend in urea prices. |
| ● | | ESN achieved higher sales volumes through increased market demand for the product and higher product availability during the year. |
| ● | | Sulfate margin per tonne increased due to lower manufacturing costs and a weaker Canadian dollar. |
| ● | | Sales volumes for product purchased for resale declined due to our decision to sell several non-core, lower-return purchase for resale facilities in 2015, related to our ongoing asset portfolio review. European assets were deemed impaired in the fourth quarter of 2015, resulting in a loss of $19-million. |
WHOLESALE >> QUARTERLY RESULTS
The agricultural sector is the primary market for our Wholesale business unit. As a result, the timing of sales fluctuates based on seasonal factors. The second quarter, which coincides with the spring application season in North America, is typically Wholesale’s most important quarter from a sales volume and EBITDA perspective. The fourth quarter is also important in terms of sales volumes and earnings, as it encompasses the fall fertilizer application season in the northern hemisphere and the spring application season in Argentina. The first quarter is generally the weakest, as application and sales volumes are light in the winter months.
| | |
| 40 | | AGRIUM ANNUAL REPORT 2015 |
| | | | | | | | | | | | | | | | | | | | | | | | | | | | | | | | |
| Wholesale quarterly results | | | | | | | | | | | | | | | | | | | | | | | | |
| | | 2015 | | | 2014 | |
| (millions of U.S. dollars, except as noted) | | Q4 | | | Q3 | | | Q2 | | | Q1 | | | Q4 | | | Q3 | | | Q2 | | | Q1 | |
Sales – external | | | 649 | | | | 518 | | | | 848 | | | | 612 | | | | 651 | | | | 626 | | | | 946 | | | | 852 | |
Sales – inter-segment | | | 239 | | | | 155 | | | | 326 | | | | 255 | | | | 246 | | | | 177 | | | | 266 | | | | 209 | |
Total sales | | | 888 | | | | 673 | | | | 1,174 | | | | 867 | | | | 897 | | | | 803 | | | | 1,212 | | | | 1,061 | |
Cost of product sold | | | 568 | | | | 455 | | | | 765 | | | | 633 | | | | 767 | | | | 676 | | | | 985 | | | | 890 | |
Gross profit | | | 320 | | | | 218 | | | | 409 | | | | 234 | | | | 130 | | | | 127 | | | | 227 | | | | 171 | |
Gross profit(%) | | | 36 | | | | 32 | | | | 35 | | | | 27 | | | | 14 | | | | 16 | | | | 19 | | | | 16 | |
Nitrogen | | | | | | | | | | | | | | | | | | | | | | | | | | | | | | | | |
Sales | | | 367 | | | | 295 | | | | 553 | | | | 315 | | | | 404 | | | | 321 | | | | 421 | | | | 336 | |
Cost of product sold | | | 181 | | | | 165 | | | | 283 | | | | 172 | | | | 291 | | | | 244 | | | | 320 | | | | 246 | |
Gross profit | | | 186 | | | | 130 | | | | 270 | | | | 143 | | | | 113 | | | | 77 | | | | 101 | | | | 90 | |
Tonnes sold(’000) | | | 912 | | | | 760 | | | | 1,223 | | | | 761 | | | | 879 | | | | 735 | | | | 906 | | | | 792 | |
Selling price(per tonne) | | | 403 | | | | 388 | | | | 451 | | | | 414 | | | | 459 | | | | 438 | | | | 464 | | | | 424 | |
Cost of product sold(per tonne) | | | 199 | | | | 217 | | | | 231 | | | | 226 | | | | 331 | | | | 333 | | | | 353 | | | | 311 | |
Margin(per tonne) | | | 204 | | | | 171 | | | | 220 | | | | 188 | | | | 128 | | | | 105 | | | | 111 | | | | 113 | |
Potash | | | | | | | | | | | | | | | | | | | | | | | | | | | | | | | | |
Sales | | | 175 | | | | 107 | | | | 166 | | | | 67 | | | | 9 | | | | 79 | �� | | | 175 | | | | 128 | |
Cost of product sold | | | 112 | | | | 65 | | | | 98 | | | | 60 | | | | 59 | | | | 77 | | | | 103 | | | | 82 | |
Gross profit | | | 63 | | | | 42 | | | | 68 | | | | 7 | | | | (50 | ) | | | 2 | | | | 72 | | | | 46 | |
Tonnes sold(’000) | | | 656 | | | | 384 | | | | 509 | | | | 185 | | | | 19 | | | | 251 | | | | 566 | | | | 428 | |
Selling price(per tonne) | | | 267 | | | | 279 | | | | 327 | | | | 361 | | | | 482 | | | | 313 | | | | 310 | | | | 298 | |
Cost of product sold(per tonne) | | | 171 | | | | 171 | | | | 193 | | | | 324 | | | | 2,992 | | | | 304 | | | | 182 | | | | 191 | |
Margin(per tonne) | | | 96 | | | | 108 | | | | 134 | | | | 37 | | | | (2,510 | ) | | | 9 | | | | 128 | | | | 107 | |
Phosphate | | | | | | | | | | | | | | | | | | | | | | | | | | | | | | | | |
Sales | | | 199 | | | | 169 | | | | 192 | | | | 181 | | | | 200 | | | | 173 | | | | 161 | | | | 167 | |
Cost of product sold | | | 162 | | | | 138 | | | | 163 | | | | 136 | | | | 163 | | | | 142 | | | | 155 | | | | 165 | |
Gross profit | | | 37 | | | | 31 | | | | 29 | | | | 45 | | | | 37 | | | | 31 | | | | 6 | | | | 2 | |
Tonnes sold(’000) | | | 325 | | | | 269 | | | | 290 | | | | 282 | | | | 305 | | | | 261 | | | | 268 | | | | 308 | |
Selling price(per tonne) | | | 610 | | | | 629 | | | | 665 | | | | 639 | | | | 656 | | | | 663 | | | | 598 | | | | 544 | |
Cost of product sold(per tonne) | | | 495 | | | | 514 | | | | 563 | | | | 481 | | | | 534 | | | | 546 | | | | 576 | | | | 536 | |
Margin(per tonne) | | | 115 | | | | 115 | | | | 102 | | | | 158 | | | | 122 | | | | 117 | | | | 22 | | | | 8 | |
Ammonium sulfate, ESN and other | | | | | | | | | | | | | | | | | | | | | | | | | | | | | | | | |
Sales | | | 94 | | | | 53 | | | | 159 | | | | 112 | | | | 107 | | | | 65 | | | | 170 | | | | 136 | |
Cost of product sold | | | 61 | | | | 40 | | | | 118 | | | | 80 | | | | 80 | | | | 54 | | | | 134 | | | | 107 | |
Gross profit | | | 33 | | | | 13 | | | | 41 | | | | 32 | | | | 27 | | | | 11 | | | | 36 | | | | 29 | |
Tonnes sold(’000) | | | 251 | | | | 143 | | | | 340 | | | | 258 | | | | 249 | | | | 154 | | | | 357 | | | | 303 | |
Product purchased for resale | | | | | | | | | | | | | | | | | | | | | | | | | | | | | | | | |
Sales | | | 53 | | | | 49 | | | | 104 | | | | 192 | | | | 177 | | | | 165 | | | | 285 | | | | 294 | |
Cost of product sold | | | 52 | | | | 47 | | | | 103 | | | | 185 | | | | 174 | | | | 159 | | | | 273 | | | | 290 | |
Gross profit | | | 1 | | | | 2 | | | | 1 | | | | 7 | | | | 3 | | | | 6 | | | | 12 | | | | 4 | |
Tonnes sold(’000) | | | 148 | | | | 111 | | | | 282 | | | | 548 | | | | 547 | | | | 455 | | | | 683 | | | | 805 | |
Selling price(per tonne) | | | 362 | | | | 444 | | | | 369 | | | | 349 | | | | 326 | | | | 361 | | | | 418 | | | | 365 | |
Cost of product sold(per tonne) | | | 356 | | | | 424 | | | | 367 | | | | 336 | | | | 321 | | | | 349 | | | | 400 | | | | 360 | |
Margin(per tonne) | | | 6 | | | | 20 | | | | 2 | | | | 13 | | | | 5 | | | | 12 | | | | 18 | | | | 5 | |
EBIT | | | 287 | | | | 174 | | | | 380 | | | | 232 | | | | 84 | | | | 100 | | | | 191 | | | | 178 | |
EBITDA | | | 352 | | | | 221 | | | | 429 | | | | 282 | | | | 142 | | | | 158 | | | | 252 | | | | 231 | |
Adjusted EBITDA | | | 372 | | | | 226 | | | | 438 | | | | 286 | | | | 150 | | | | 171 | | | | 263 | | | | 237 | |
| | |
| AGRIUM ANNUAL REPORT 2015 | | 41 |
Other non-operating segment 2015 results
“Other” is a non-operating segment comprising corporate and administrative functions that provide support and governance to our operating business units. Other is also used to eliminate purchase and sale transactions between our Retail and Wholesale business units so each business unit can be evaluated independently.
Expenses included in EBIT of our non-operating segment primarily comprise general and administrative costs at our headquarters in Calgary, Alberta, share-based payments, and other expenses such as regulatory compliance and foreign exchange gains and losses.
Other EBIT decreased by $29-million in 2015 compared to 2014 primarily due to:
| ● | | A $26-million higher gross profit elimination expense as a result of higher inter-segment inventory held at the end of 2015. |
| ● | | A $15-million non-recurring interest recovery received in 2014. |
These were partially offset by:
| ● | | $10-million lower general and administrative expenses due to lower payroll and consulting fees. |
| | |
| 42 | | AGRIUM ANNUAL REPORT 2015 |
2016 Agricultural and crop input market outlook
Crop prices remained under pressure in 2015 as global crop yields were above-trend and planted area remained high. In addition, the strength of the U.S. dollar relative to other global currencies increased the competitiveness of non-U.S. exporters on the global market, which added to the pressure on U.S. crop prices. The U.S. Department of Agriculture projects that Brazilian corn exports will increase by over 50 percent to a record 33 million tonnes in 2015/2016.
North American crop production proved resilient in 2015 considering the adverse growing conditions at the start of the growing season. U.S. corn and soybean yield projections increased throughout the growing season, and corn finished 2015 at its second highest levels ever, after 2014. In Western Canada, a large portion of the growing area received less than half the normal precipitation as of the middle of July, but yields finished at above-average levels. The strong production performance in the face of challenging growing conditions is evidence of the benefits of improved seed genetics and agronomic management in recent years. Strong production helped grower sentiment during a period of relatively low prices.
Analysts project that in 2016, U.S. corn, soybean and cotton planted acreage will increase, assuming normal weather during the planting season. We expect this to support a 1 to 3 percent increase in crop input expenditures, normalizing for the impact of crop nutrient prices. Growers are expected to benefit from lower crop nutrient and fuel prices as well as cash rental rates in 2016. However, at current crop prices, we expect that growers will continue to optimize crop input use and look for opportunities to reduce expenditures in cases where they perceive little risk to yields.
CROP PROTECTION PRODUCT MARKET DRIVERS
| ● | | Increased North American cropping area is expected to support demand for crop protection products – particularly corn and cotton area in the U.S. and pulse crop area in Western Canada. |
| ● | | Pricing for glyphosates and some other crop protection products declined over the past year. |
| ● | | Expect continued growth in non-glyphosate herbicide demand to combat glyphosate resistance. |
| ● | | Fungicide and insecticide demand will depend on weather conditions and resulting disease and insect pressure as well as crop price movement in the second half of 2016. |
SEED MARKET DRIVERS
| ● | | Analysts expect combined North American corn, soybean, cotton and canola area to increase by two to four million acres in 2016, which is expected to support robust seed demand. |
| ● | | We expect that seed price increases will be limited by relatively low prices of the underlying crops. |
| ● | | Growers are expected to continue to target traits that will provide top yield potential for their geography but may forgo upgrading to traits that target problems that present only a low risk in their individual fields. |
| | |
| AGRIUM ANNUAL REPORT 2015 | | 43 |
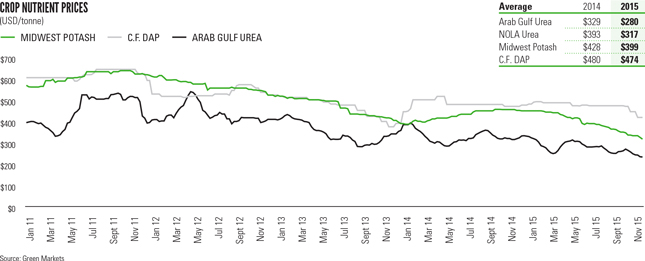
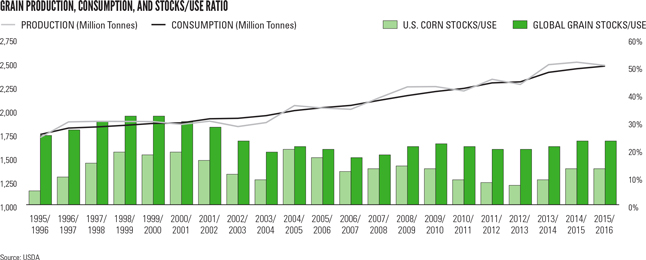
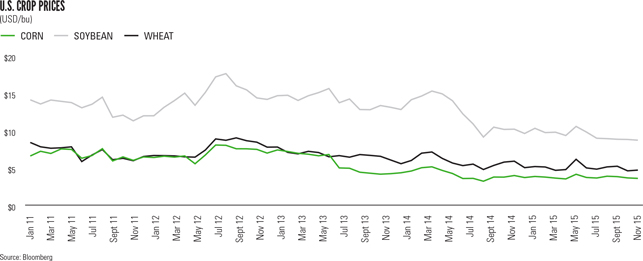
| | |
| 44 | | AGRIUM ANNUAL REPORT 2015 |
NITROGEN MARKET OUTLOOK
| ● | | The global urea market was cost-driven throughout much of 2015, and marginal production costs are expected to remain important throughout 2016. |
| ● | | Global nitrogen costs declined in 2015 with lower crude oil prices driving lower formula-based natural gas prices in Europe and lower coal prices and the weakening of the Chinese yuan driving costs lower in China, which lowered the cost floor in the global urea market. |
| ● | | As of February 2016, benchmark nitrogen prices were down 20 to 40 percent compared to February 2015. |
| ● | | China exported record urea volumes in the first half of 2015, but in the second half of the year exports were lower by 26 percent year-over-year as a result of lower global urea prices. |
| ● | | Chinese urea exports in 2016 are projected to be relatively flat to lower than 2015 levels but will depend on a number of factors, including global demand, prices, Chinese coal costs and potential government actions. |
| ● | | Indian urea imports were robust in 2015 despite below-normal precipitation in the monsoon season and increased domestic production; and while imports may decline slightly in 2016, they are projected to remain historically high. |
| ● | | Offshore imports of urea into the U.S. reached a record high in 2015 at close to seven million tonnes; however, new nitrogen capacity coming on-stream in the U.S. and a slow start to imports in early 2016 are expected to lead to lower offshore imports in 2016. |
| ● | | Global nitrogen demand increased by an estimated 2 percent in 2015, and we expect demand growth between 2 and 3 percent in 2016. |
POTASH MARKET OUTLOOK
| ● | | World potash shipments in the first half of 2015 were strong, supported by refilling of the distribution pipeline that was drawn down in 2014. |
| ● | | In the second half of 2015, a number of factors combined to pressure prices, including weakness in Brazilian demand driven by the weak Brazilian real currency and farm credit constraints, delayed contract execution by Indian buyers due to the weakened rupee value and weak monsoon, and a poor fall application season in the U.S., which left retailers holding higher than expected inventories. |
| ● | | As of February 2016, benchmark potash prices were down 35 to 40 percent compared to February 2015. |
| ● | | Chinese potash imports were a bright spot for the global potash market in 2015 as China imported a record 9.4 million tonnes of potash, compared to eight million tonnes in 2014. |
| ● | | Prospects for Indian potash imports were positive to start 2015, but as the monsoon fell below average levels and the rupee weakened in the second half of the year, Indian buyers delayed their importation, which led 2015 imports to fall below 2014 levels. |
| ● | | On a net basis, global potash capacity was lower in 2015 than 2014; however, producers operated at high capacity utilization rates through the first three quarters of the year, which led to increased producer inventories. |
| ● | | Brazilian potash demand in 2016 is expected to be relatively flat compared to 2015 levels, pressured by continued uncertainty in the domestic economy and constrained credit availability to growers. |
| ● | | Some new brownfield capacity is beginning to ramp up in Canada and Russia in 2016, but the supply and demand balance is expected to be driven more by the production rates at existing mines than by capacity expansions. |
| ● | | Global potash deliveries are projected to increase to between 58 and 60 million tonnes in 2016 from 58.5 million tonnes in 2015. |
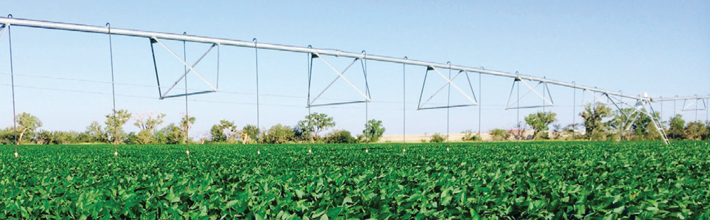
| | |
| AGRIUM ANNUAL REPORT 2015 | | 45 |
PHOSPHATE MARKET OUTLOOK
| ● | | The phosphate market was relatively stable throughout much of the first three quarters of 2015, as Indian diammonium phosphate (DAP) demand was strong but was offset by record volumes of Chinese DAP and MAP exports. |
| ● | | In late 2015, a slowdown in Indian purchases combined with below-average imports by Brazil and a disappointing U.S. fall application season pressured phosphate prices. |
| ● | | As of February 2016, benchmark phosphate prices were down 20 to 30 percent compared to February 2015. |
| ● | | Chinese DAP and MAP exports totaled a record 10.6 million tonnes in 2015 – an increase of close to 50 percent from the previous record set in 2014. |
| ● | | Chinese exports are expected to be a key driver of the phosphate market in 2016. They are projected to be relatively flat to 2015 levels, but this may depend on Indian demand. |
| ● | | Indian DAP imports totaled 5.8 million tonnes in 2015, up 61 percent from 2014 levels; however, strong imports have reportedly built up inventories, which may pressure demand in 2016 depending on the strength of the monsoon and Indian rupee volatility. |
| ● | | Brazilian phosphate demand was relatively weak in 2015, driven by the weaker domestic currency and credit constraints; we expect these challenges to continue in 2016, keeping demand relatively flat to 2015 levels. |
| ● | | Global phosphate demand in 2015 was relatively flat to 2014 levels but is projected to increase by 1 to 2 percent in 2016. |
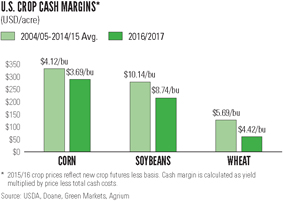
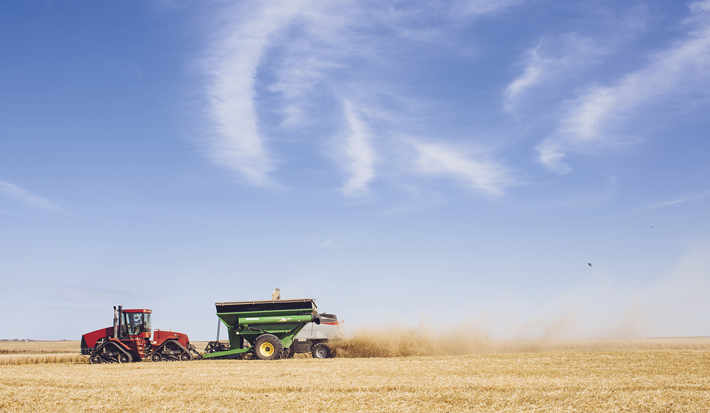
| | |
| 46 | | AGRIUM ANNUAL REPORT 2015 |
Consolidated performance
| | | | | | | | | | | | |
| Selected annual information | | | | | | | | | |
| (millions of U.S. dollars, except per share amounts) | | 2015 | | | 2014 | | | 2013 | |
Sales | | | 14,795 | | | | 16,042 | | | | 15,727 | |
Cost of product sold | | | 10,907 | | | | 12,490 | | | | 11,954 | |
Gross profit | | | 3,888 | | | | 3,552 | | | | 3,773 | |
Expenses | | | 2,272 | | | | 2,392 | | | | 2,143 | |
Earnings before finance costs and income taxes | | | 1,616 | | | | 1,160 | | | | 1,630 | |
Finance costs related to long-term debt | | | 181 | | | | 62 | | | | 90 | |
Other finance costs | | | 71 | | | | 70 | | | | 66 | |
Earnings before income taxes | | | 1,364 | | | | 1,028 | | | | 1,474 | |
Income taxes | | | 376 | | | | 230 | | | | 394 | |
Net earnings from continuing operations | | | 988 | | | | 798 | | | | 1,080 | |
Net loss from discontinued operations | | | — | | | | (78 | ) | | | (17 | ) |
Net earnings | | | 988 | | | | 720 | | | | 1,063 | |
Attributable to: | | | | | | | | | | | | |
Equity holders of Agrium | | | 988 | | | | 714 | | | | 1,062 | |
Non-controlling interest | | | — | | | | 6 | | | | 1 | |
Net earnings | | | 988 | | | | 720 | | | | 1,063 | |
Earnings per share attributable to equity holders of Agrium | | | | | | | | | | | | |
Basic and diluted earnings per share from continuing operations | | | 6.98 | | | | 5.51 | | | | 7.31 | |
Basic and diluted loss per share from discontinued operations | | | — | | | | (0.54 | ) | | | (0.11 | ) |
Basic and diluted earnings per share | | | 6.98 | | | | 4.97 | | | | 7.20 | |
Total assets | | | 16,377 | | | | 17,108 | | | | 15,977 | |
Non-current financial liabilities | | | | | | | | | | | | |
Long-term debt | | | 4,513 | | | | 3,559 | | | | 3,066 | |
Other non-current financial liabilities | | | 50 | | | | 39 | | | | 24 | |
Total non-current financial liabilities | | | 4,563 | | | | 3,598 | | | | 3,090 | |
Dividends declared | | | 478 | | | | 435 | | | | 367 | |
Dividends declared per share | | | 3.41 | | | | 3.03 | | | | 2.50 | |
SALES
2015 vs. 2014
| ● | | Wholesale sales for all three major crop nutrients increased as a result of higher sales volumes. Improved utilization rates increased product available for sale. Sales volume increases for our three major crop nutrients were offset by a decrease in sales of purchase for resale of $523-million as we exited non-core, lower return portions of this business. Our exit from the purchase for resale business is expected to help our Company focus on our core businesses and drive long-term shareholder value. |
| ● | | Retail’s sales decreased due to unfavorable weather conditions and competitive pricing pressure resulting from lower crop prices. |
2014 vs. 2013
| ● | | Retail sales increased as Viterra contributed an additional $1.7-billion in sales in 2014. We acquired the Viterra Agri-product operations in the last quarter of 2013. |
| ● | | Wholesale had lower sales due to lower realized selling prices on all product lines and lower sales volumes from an extended outage to complete the tie-in at our Vanscoy potash facility and an outage at our Redwater nitrogen facility. |
| | |
| AGRIUM ANNUAL REPORT 2015 | | 47 |
GROSS PROFIT
2015 vs. 2014
| ● | | Wholesale’s gross profit significantly increased due to manufacturing cost efficiencies, a weaker Canadian dollar, lower natural gas input costs and higher sales volumes across all three major crop nutrients, despite lower nutrient benchmark prices. |
| ● | | Unfavorable weather conditions and lower crop input prices resulted in lower gross profit for Retail. |
2014 vs. 2013
| ● | | Wholesale’s gross profit decreased as a result of lower realized selling prices for all product lines, higher natural gas input costs, and lower nitrogen and potash sales volumes due to outages at our Redwater, Carseland and Fort Saskatchewan nitrogen facilities and an extended outage to complete the tie-in at our Vanscoy potash facility. |
| ● | | Retail’s gross profit increased due to inclusion of Viterra’s gross profit of $268-million, higher seed sales volume and increased crop nutrient sales. |
NET EARNINGS FROM CONTINUING OPERATIONS
2015 vs. 2014
| ● | | Despite lower nutrient benchmark prices, our net earnings from continuing operations increased by $190-million. The increase reflects improved gross margins primarily as a result of manufacturing cost efficiencies, lower natural gas input costs and reduced operating expenses related to our Operational Excellence program. |
2014 vs. 2013
| ● | | Overall, net earnings from our continuing operations decreased by $282-million due to lower realized selling prices across our product lines and lower sales volumes due to an extended outage to complete the tie-in at our Vanscoy potash facility and outages at our Redwater and Fort Saskatchewan nitrogen facilities. |
NET LOSS FROM DISCONTINUED OPERATIONS
| ● | | During 2014, Agrium completed the sale of the Turf and Ornamental business of Agrium Advanced Technologies (AAT) identified as discontinued operations for $94-million. The remaining components of AAT ceased operations in 2014. |
| ● | | There were no discontinued operations in 2015. |
EXPENSES
| | | | | | | | |
| Expenses breakdown | | | | | | |
| (millions of U.S. dollars) | | 2015 | | | 2014 | |
Selling | | | 1,921 | | | | 2,048 | |
General and administrative | | | 268 | | | | 299 | |
Share-based payments | | | 51 | | | | 50 | |
Loss (earnings) from associates and joint ventures | | | 4 | | | | (23 | ) |
Other expenses | | | 28 | | | | 18 | |
| | | | 2,272 | | | | 2,392 | |
| ● | | Virtually all of our selling expenses were incurred by our Retail business unit. Selling expenses decreased due to lower incentive payments, a decrease in property and vehicle lease expenses and lower depreciation and amortization expense. Consolidated and Retail selling expenses as a percentage of sales were consistent with 2014. |
| ● | | General and administrative expenses decreased by $31-million (10 percent) as a result of reduced payroll and office expenses related to our ongoing Operational Excellence program. |
| ● | | Our earnings from associates and joint ventures decreased due to lower international benchmark prices, lower urea sales volumes and lower selling prices as international grain prices and local demand for urea have decreased. The MOPCO nitrogen facility experienced increased gas supply interruptions during the year, resulting in reduced production, fewer tonnes available for sale and higher costs per tonne. |
| | |
| 48 | | AGRIUM ANNUAL REPORT 2015 |
| | | | | | | | |
| Other expenses breakdown | | | | | | |
| (millions of U.S. dollars) | | 2015 | | | 2014 | |
Loss on foreign exchange and related derivatives and commodity derivatives not designated as hedges | | | 8 | | | | 15 | |
Interest income | | | (68 | ) | | | (83 | ) |
Gain on sale of assets | | | (55 | ) | | | — | |
Goodwill impairment | | | 19 | | | | — | |
Environmental remediation and asset retirement obligations | | | 16 | | | | 24 | |
Bad debt expense | | | 32 | | | | 19 | |
Potash profit and capital tax | | | 16 | | | | 10 | |
Other | | | 60 | | | | 33 | |
| | | | 28 | | | | 18 | |
The increase in other expenses reflects the following:
| ● | | Increase in consultation and restructuring fees related to our Operational Excellence program. |
| ● | | Goodwill impairment of $19-million recognized for our Wholesale Europe operations in 2015. |
| ● | | Lower interest income from a non-recurring interest recovery of $15-million received in 2014. |
| ● | | Bad debt recovery of $11-million recorded in the fourth quarter of 2014. |
| ● | | Partially offset by gain on sales of our Niota and Meredosia storage and distribution facilities and West Sacramento product upgrading facility in 2015. |
DEPRECIATION AND AMORTIZATION
| | | | | | | | | | | | | | | | | | | | | | | | | | | | | | | | |
| Depreciation and amortization by business unit | | | | | | | | | | | | | | | | |
| (millions of U.S. dollars) | | 2015 | | | 2014 | |
| | | Cost of
product sold | | | Selling | | | General and
administrative | | | Total | | | Cost of
product sold | | | Selling | | | General and
administrative | | | Total | |
Retail | | | 6 | | | | 244 | | | | 4 | | | | 254 | | | | 6 | | | | 291 | | | | 8 | | | | 305 | |
Wholesale | | | | | | | | | | | | | | | | | | | | | | | | | | | | | | | | |
Nitrogen | | | 71 | | | | | | | | 1 | | | | 72 | | | | 86 | | | | | | | | | | | | 86 | |
Potash | | | 71 | | | | | | | | | | | | 71 | | | | 65 | | | | | | | | | | | | 65 | |
Phosphate | | | 51 | | | | | | | | | | | | 51 | | | | 52 | | | | | | | | | | | | 52 | |
Other(a) | | | 14 | | | | | | | | 3 | | | | 17 | | | | 20 | | | | | | | | 7 | | | | 27 | |
| | | | 207 | | | | — | | | | 4 | | | | 211 | | | | 223 | | | | — | | | | 7 | | | | 230 | |
Other | | | — | | | | — | | | | 15 | | | | 15 | | | | — | | | | — | | | | 15 | | | | 15 | |
Total | | | 213 | | | | 244 | | | | 23 | | | | 480 | | | | 229 | | | | 291 | | | | 30 | | | | 550 | |
| (a) | Includes product purchased for resale, ammonium sulfate, ESN and other products. |
| ● | | The decrease in our depreciation and amortization expense is due to the change of useful lives of certain property, plant and equipment in our Retail business unit in the last quarter of 2014. This reflects our estimates of their future economic benefits. This decrease was partially offset by an increase in depreciable assets associated with our Vanscoy potash facility expansion. |
| ● | | We also changed our method of depreciation in 2015 from a straight-line basis to the units of production basis for our Wholesale mining and plant assets. |
| | |
| AGRIUM ANNUAL REPORT 2015 | | 49 |
FINANCE COSTS
| ● | | Total finance costs increased by $120-million in 2015 compared to 2014 – the result of additional debentures issued during the year and lower capitalized interest as we completed the tie-in of our Vanscoy potash facility at the end of 2014. |
INCOME TAXES
| ● | | Our overall effective tax rate was 28 percent for 2015 compared to 22 percent for 2014. Excluding the recognition of one-time previously unrecognized tax assets of $36-million in 2014, the effective tax rate for 2014 would have been 26 percent. The increase in the tax rate of 2 percent is primarily due to the increase in the Alberta provincial statutory tax rate in 2015. |
| ● | | Changes in statutory income tax rates, the mix of earnings, tax allowances and realization of unrecognized tax assets among the jurisdictions in which we operate can impact our overall effective tax rate. Further details of the year-over-year variances in these rates for the years ended December 31, 2015 and 2014, are provided in note 7 of the Notes to the Consolidated Financial Statements. |
Sensitivity analysis
Our financial results are sensitive to a number of factors that affect our operations and resulting net earnings. The following table sets out the impact of changes in some key variables on our earnings based on activity levels for the year ended December 31, 2015.
SENSITIVITY ANALYSIS
| | | | | | | | | | | | | | | | | | | | |
| Consolidated and business unit sensitivity impact to EBIT, net earnings and net earnings per diluted share | |
| (millions of U.S. dollars, except as noted) | | Change
in factor | | | Sales
impact | | | EBIT
impact | | | Net
earnings
impact (f) | | | Net earnings
per diluted
share impact (f) | |
Retail(a) | | | | | | | | | | | | | | | | | | | | |
Crop nutrients | | | 1.00 | % | | | 286 | | | | 49 | | | | 35 | | | | 0.25 | |
Crop protection products | | | 1.00 | % | | | 192 | | | | 45 | | | | 32 | | | | 0.23 | |
Seed | | | 1.00 | % | | | 70 | | | | 14 | | | | 10 | | | | 0.07 | |
Merchandise | | | 1.00 | % | | | 39 | | | | 6 | | | | 4 | | | | 0.03 | |
Wholesale(b) | | | | | | | | | | | | | | | | | | | | |
Nitrogen(c) | | $ | 10.00 | | | | 77 | | | | 37 | | | | 27 | | | | 0.19 | |
Potash(d) | | $ | 10.00 | | | | 50 | | | | 17 | | | | 12 | | | | 0.09 | |
Phosphate | | $ | 10.00 | | | | 61 | | | | 12 | | | | 9 | | | | 0.06 | |
Natural gas(e) | | $ | 0.50 | | | | N/A | | | | 45 | | | | 32 | | | | 0.23 | |
Consolidated | | | | | | | | | | | | | | | | | | | | |
Exchange rate from CAD to USD | | $ | 0.01 | | | | 22 | | | | 5 | | | | 4 | | | | 0.03 | |
| (a) | Change in factor is gross profit as a percentage of sales. |
| (b) | Change in factor is margin per metric tonne of North American Wholesale produced sales. |
| (c) | Excludes the impact of natural gas sensitivity described in footnote (e) below. |
| (d) | Excludes the impact of potash production tax and resource surcharge. |
| (e) | Wholesale’s sensitivity to a $0.50/MMBtu change in natural gas prices. The sensitivity assumes no change to the price spread between U.S. and Alberta natural gas and excludes the impact of natural gas derivatives and industrial ammonia sales, which are on a gas index-plus margin basis. |
| (f) | Based on a tax rate of 28 percent and 142 million weighted average outstanding shares. We have 138 million outstanding shares at December 31, 2015. Net earnings per diluted share impact based on 138 million shares would have a negligible difference compared to the net earnings per diluted share impact presented above. |
| | |
| 50 | | AGRIUM ANNUAL REPORT 2015 |
MARGINS
Retail
Retail product margins are normally more stable than Wholesale margins as Retail tends to be more of a cost-plus margin business than Wholesale. However, several factors can influence Retail margins. For example, nutrient margins are impacted by price volatility between the time we purchase the product and the time we sell the product to the grower, as well as price volatility driven by the relative timing of our competitors’ nutrient purchases relative to our purchases. Fluctuations in commodity prices affect the types of crops planted, resulting in different crop input needs and, more significantly, affecting the timing of growers’ decisions on the application levels and rates of our products. Lower crop commodity prices relative to the price of the inputs may result in growers delaying purchase and application of crop inputs that would otherwise optimize crop yields. Weather conditions can create significant fluctuations in the timing of Retail’s sales and the related margins based on the ability to plant or harvest and the associated application of inputs. Finally, crop protection and seed margins are influenced annually by changes in the value of chemicals and newer seed varieties.
Wholesale
Nitrogen cost of product sold is affected by changes in North American natural gas prices, and nitrogen prices are impacted by changes in global nitrogen supply and demand. The combination of these market fluctuations impacts our nitrogen margins. Fluctuations in the cost of raw material inputs such as phosphate rock, sulfur and ammonia affect our phosphate margins. Foreign trade policies and buying strategy affect global supply and demand, which in turn influences potash pricing and margins. Our capacity utilization also affects our nitrogen, potash and phosphate margins. Wholesale’s purchase for resale margins are impacted by price volatility of a crop nutrient between the time we purchase the product and the time we sell it to the customer.
FOREIGN EXCHANGE
The international currency of the agribusiness industry is the U.S. dollar. Accordingly, we use the U.S. dollar as our reporting currency. We conduct business primarily in U.S. and Canadian dollars. We also have some exposure to the Argentine peso, Australian dollar and euro. Fluctuations in these currencies can impact our financial results.
Quarterly results of operations
The agricultural products business is seasonal. Consequently, year-over-year comparisons are more appropriate than quarter-over-quarter comparisons. Crop input sales are primarily concentrated in the spring and fall crop input application seasons. Crop nutrient inventories are normally accumulated leading up to each application season. Our cash collections generally occur after the application season is complete, and our customer prepayments are concentrated in December and January.
| | |
| AGRIUM ANNUAL REPORT 2015 | | 51 |
| | | | | | | | | | | | | | | | | | | | | | | | | | | | | | | | |
| Selected quarterly information | | | | | | | | | | | | | | | | | | | | | | | | |
| (millions of U.S. dollars, except per share amounts) | | 2015
Q4 | | | 2015
Q3 | | | 2015
Q2 | | | 2015
Q1 | | | 2014
Q4 | | | 2014
Q3 | | | 2014
Q2 | | | 2014
Q1 | |
Sales | | | 2,407 | | | | 2,524 | | | | 6,992 | | | | 2,872 | | | | 2,705 | | | | 2,920 | | | | 7,338 | | | | 3,079 | |
Cost of product sold | | | 1,507 | | | | 1,828 | | | | 5,284 | | | | 2,288 | | | | 1,973 | | | | 2,255 | | | | 5,739 | | | | 2,523 | |
Gross profit | | | 900 | | | | 696 | | | | 1,708 | | | | 584 | | | | 732 | | | | 665 | | | | 1,599 | | | | 556 | |
Expenses | | | | | | | | | | | | | | | | | | | | | | | | | | | | | | | | |
Selling | | | 465 | | | | 441 | | | | 585 | | | | 430 | | | | 515 | | | | 480 | | | | 609 | | | | 444 | |
General and administrative | | | 74 | | | | 61 | | | | 66 | | | | 67 | | | | 78 | | | | 70 | | | | 82 | | | | 69 | |
Share-based payments | | | 15 | | | | (15 | ) | | | 6 | | | | 45 | | | | 25 | | | | 10 | | | | (16 | ) | | | 31 | |
(Earnings) loss from associates and joint ventures | | | (5 | ) | | | 10 | | | | (1 | ) | | | — | | | | (2 | ) | | | (7 | ) | | | (13 | ) | | | (1 | ) |
Other expenses (income) | | | 27 | | | | 8 | | | | 26 | | | | (33 | ) | | | 9 | | | | 7 | | | | 42 | | | | (40 | ) |
Earnings before finance costs and income taxes | | | 324 | | | | 191 | | | | 1,026 | | | | 75 | | | | 107 | | | | 105 | | | | 895 | | | | 53 | |
Total finance costs | | | 73 | | | | 55 | | | | 68 | | | | 56 | | | | 40 | | | | 29 | | | | 27 | | | | 36 | |
Income taxes | | | 51 | | | | 37 | | | | 283 | | | | 5 | | | | (3 | ) | | | (15 | ) | | | 243 | | | | 5 | |
Net earnings from continuing operations | | | 200 | | | | 99 | | | | 675 | | | | 14 | | | | 70 | | | | 91 | | | | 625 | | | | 12 | |
Net loss from discontinued operations | | | — | | | | — | | | | — | | | | — | | | | (19 | ) | | | (41 | ) | | | (9 | ) | | | (9 | ) |
Net earnings | | | 200 | | | | 99 | | | | 675 | | | | 14 | | | | 51 | | | | 50 | | | | 616 | | | | 3 | |
Attributable to: | | | | | | | | | | | | | | | | | | | | | | | | | | | | | | | | |
Equity holders of Agrium | | | 201 | | | | 101 | | | | 674 | | | | 12 | | | | 47 | | | | 50 | | | | 615 | | | | 2 | |
Non-controlling interest | | | (1 | ) | | | (2 | ) | | | 1 | | | | 2 | | | | 4 | | | | — | | | | 1 | | | | 1 | |
Earnings per share from continuing operations attributable to equity holders of Agrium: | | | | | | | | | | | | | | | | | | | | | | | | | | | | | | | | |
Basic and diluted | | | 1.45 | | | | 0.72 | | | | 4.71 | | | | 0.08 | | | | 0.46 | | | | 0.63 | | | | 4.34 | | | | 0.08 | |
Earnings per share attributable to equity holders of Agrium: | | | | | | | | | | | | | | | | | | | | | | | | | | | | | | | | |
Basic and diluted | | | 1.45 | | | | 0.72 | | | | 4.71 | | | | 0.08 | | | | 0.33 | | | | 0.35 | | | | 4.28 | | | | 0.02 | |
EBITDA | | | 459 | | | | 306 | | | | 1,145 | | | | 186 | | | | 245 | | | | 248 | | | | 1,037 | | | | 180 | |
Adjusted EBITDA | | | 479 | | | | 311 | | | | 1,154 | | | | 190 | | | | 253 | | | | 261 | | | | 1,048 | | | | 186 | |
Dividends declared | | | 121 | | | | 120 | | | | 125 | | | | 112 | | | | 112 | | | | 107 | | | | 108 | | | | 108 | |
Dividends declared per share | | | 0.875 | | | | 0.875 | | | | 0.875 | | | | 0.78 | | | | 0.78 | | | | 0.75 | | | | 0.75 | | | | 0.75 | |
Significant factors affecting the comparability of quarterly results include the following:
2015
| ● | | We had higher net earnings in the second and fourth quarters of 2015 compared to the same quarters of 2014 as a result of fewer turnarounds, higher manufacturing efficiencies and lower input costs. |
| ● | | In the first and fourth quarters of 2015, we recognized a gain on sale of assets of $38-million and $17-million, respectively, which were recorded under other expenses (income). |
| ● | | Goodwill impairment of $19-million from our Wholesale Europe operations was recorded under other expenses (income) in the fourth quarter of 2015. |
| ● | | Our share-based payments expenses or recoveries in 2015 fluctuated based on changes in our share price and our share performance relative to our peers. |
| | |
| 52 | | AGRIUM ANNUAL REPORT 2015 |
2014
| ● | | We had record sales for a second quarter coming from strong results of the acquired Viterra Agri-products operations and improvement in our international operations. |
| ● | | Our share-based payments expenses or recoveries in 2014 fluctuated based on changes in our share price and our share performance relative to our peers. |
| ● | | We discontinued the operations of our former AAT business unit. Results were recorded under net loss from discontinued operations. |
Financial condition
2015 VS. 2014
The following are changes to the financial condition of our consolidated balance sheet for the year ended December 31, 2015.
| | | | | | | | | | | | | | | | | | |
| Detailed balance sheet analysis | | | |
| (millions of U.S. dollars, except as noted) | | December 31,
2015 | | | December 31,
2014 | | | $ Change | | | % Change | | | Explanation of the change in balance |
Assets | | | | | | | | | | | | | | | | | | |
Cash and cash equivalents | | | 515 | | | | 848 | | | | (333 | ) | | | (39 | %) | | See discussion in the section “Liquidity and Capital Resources”. |
Accounts receivable | | | 2,053 | | | | 2,075 | | | | (22 | ) | | | (1 | %) | | Rebates in Retail are down due to improved collections. |
Income taxes receivable | | | 4 | | | | 138 | | | | (134 | ) | | | (97 | %) | | The 2015 tax provision exceeded tax installment payments made net of current period tax refunds. |
Inventories | | | 3,314 | | | | 3,505 | | | | (191 | ) | | | (5 | %) | | Crop nutrient inventories in Retail are down due to declining prices in the potash and urea markets. Wholesale inventory is down, related primarily to our exit from significant portions of the product purchased for resale business earlier in 2015 as part of our portfolio review. |
Prepaid expenses and deposits | | | 688 | | | | 710 | | | | (22 | ) | | | (3 | %) | | — |
Other current assets | | | 144 | | | | 122 | | | | 22 | | | | 18 | % | | — |
Property, plant and equipment | | | 6,333 | | | | 6,272 | | | | 61 | | | | 1 | % | | Additions of $1.3-billion were primarily offset by reductions related to the impact of foreign currency translation and depreciation. |
Intangibles | | | 632 | | | | 695 | | | | (63 | ) | | | (9 | %) | | — |
Goodwill | | | 1,980 | | | | 2,014 | | | | (34 | ) | | | (2 | %) | | Decrease was due to impairment of $19-million recorded for our Wholesale Europe operations, coupled with the impact of foreign currency translation. |
Investments in associates and joint ventures | | | 607 | | | | 576 | | | | 31 | | | | 5 | % | | — |
Other assets | | | 54 | | | | 78 | | | | (24 | ) | | | (31 | %) | | — |
Deferred income tax assets | | | 53 | | | | 75 | | | | (22 | ) | | | (29 | %) | | Decrease was primarily due to the utilization of losses in Australia. |
Total assets | | | 16,377 | | | | 17,108 | | | | (731 | ) | | | (4 | %) | | |
| | |
| AGRIUM ANNUAL REPORT 2015 | | 53 |
| | | | | | | | | | | | | | | | | | |
| Detailed balance sheet analysis | | | | | | | | | |
| (millions of U.S. dollars, except as noted) | | December 31,
2015 | | | December 31,
2014 | | | $ Change | | | % Change | | | Explanation of the change in balance |
Liabilities | | | | | | | | | | | | | | | | | | |
Short-term debt | | | 835 | | | | 1,527 | | | | (692 | ) | | | (45 | %) | | Positive operating cash flows for the year coupled with proceeds from the issuance of debentures in the first quarter of 2015 were used to decrease short-term borrowings, partially offset by new drawings to finance capital investments and fund working capital requirements. |
Accounts payable | | | 3,919 | | | | 4,197 | | | | (278 | ) | | | (7 | %) | | Decrease of $130-million primarily related to reduction in customer prepayments due to softening commodity markets. Accrued liabilities decreased by $192-million primarily caused by lower accruals related to completion of major capital investment projects. |
Income taxes payable | | | 82 | | | | 5 | | | | 77 | | | | 1,540 | % | | The 2015 tax provision exceeded tax installment payments made. |
Long-term debt | | | 4,521 | | | | 3,570 | | | | 951 | | | | 27 | % | | Long-term debt increased due to the $1-billion debentures issued in the first quarter of 2015 to reduce short-term debt and for general corporate purposes. |
Post-employment benefits | | | 124 | | | | 151 | | | | (27 | ) | | | (18 | %) | | — |
Other provisions | | | 421 | | | | 480 | | | | (59 | ) | | | (12 | %) | | — |
Other liabilities | | | 85 | | | | 69 | | | | 16 | | | | 23 | % | | — |
Deferred income tax liabilities | | | 383 | | | | 422 | | | | (39 | ) | | | (9 | %) | | Decrease was due to the impact of foreign currency translation of the Canadian deferred tax balance. |
Total liabilities | | | 10,370 | | | | 10,421 | | | | (51 | ) | | | (0 | %) | | |
Shareholders’ equity | | | 6,007 | | | | 6,687 | | | | (680 | ) | | | (10 | %) | | |
2014 VS. 2013
| ● | | Total assets increased by 7 percent from 2013 to 2014 primarily due to additions to our property, plant and equipment mostly related to the Vanscoy potash and Borger nitrogen expansion projects. |
| ● | | The increase of 16 percent in non-current financial liabilities is primarily due to the $500-million debentures issued in 2014. |
| | |
| 54 | | AGRIUM ANNUAL REPORT 2015 |
SHAREHOLDERS’ EQUITY
Shareholders’ equity was $6.0-billion at December 31, 2015 – a decrease of $680-million compared to December 31, 2014. The change is the result of the following:
| ● | | Net earnings of $988-million attributable to equity holders of Agrium. |
| | ● | | Share repurchases of $559-million as part of the normal course issuer bid. |
| | ● | | Dividend declarations of $478-million during the year. |
| | ● | | A $609-million increase in foreign currency translation loss in accumulated other comprehensive loss due to the decline in the exchange rates of the Canadian and Australian dollars relative to the U.S. dollar. |
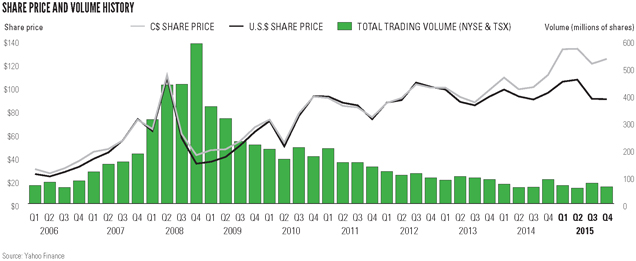
DIVIDENDS
From 2013 to 2015, the Board approved a series of dividend increases as follows:
| | | | | | | | | | | | |
| Dividend increases | | | | | | | | | |
| Approval date | | Dividends declared
per share | | | Frequency | | | Dividends declared
per share on an
annualized basis | |
September 23, 2013 | | $ | 0.75 | | | | Quarterly | | | $ | 3.00 | |
November 3, 2014 | | $ | 0.78 | | | | Quarterly | | | $ | 3.12 | |
May 5, 2015 | | $ | 0.875 | | | | Quarterly | | | $ | 3.50 | |
| | |
| AGRIUM ANNUAL REPORT 2015 | | 55 |
| | | | | | | | | | | | | | | | | | | | | | | | | | |
| Dividends declared | | | | | | | | | | | | | | | | | | | | |
(millions of U.S. dollars, except per share amounts) | | December 31, | |
| 2015 | | | 2014 | |
| Declared | | | Paid to | | | | | | Declared | | | Paid to | | | | |
| Effective | | Per share | | | shareholders | | | Total | | | Effective | | Per share | | | shareholders | | | Total | |
February 24, 2015 | | | 0.78 | | | | April 16, 2015 | | | | 112 | | | February 21, 2014 | | | 0.75 | | | | April 17, 2014 | | | | 108 | |
May 5, 2015 | | | 0.875 | | | | July 16, 2015 | | | | 125 | | | May 7, 2014 | | | 0.75 | | | | July 17, 2014 | | | | 108 | |
August 6, 2015 | | | 0.875 | | | | October 15, 2015 | | | | 120 | | | August 7, 2014 | | | 0.75 | | | | October 16, 2014 | | | | 107 | |
December 10, 2015 | | | 0.875 | | | | January 21, 2016 | | | | 121 | | | December 11, 2014 | | | 0.78 | | | | January 21, 2015 | | | | 112 | |
| | | | 3.41 | | | | | | | | 478 | | | | | | 3.03 | | | | | | | | 435 | |
SHARE REPURCHASES
During 2015, we purchased for cancellation 5,574,331 shares at an average share price of $100.25. We are allowed to purchase for cancellation, on the Toronto Stock Exchange (TSX) or New York Stock Exchange, an additional 6,908,450 (5 percent) of our outstanding shares. Repurchases may be made under a Normal Course Issuer Bid (NCIB) approved by the TSX until February 18, 2017. Shareholders can obtain a copy of the NCIB notice from Agrium without charge. We did not purchase shares in 2014 or between January 1, 2016 and February 24, 2016.
Outstanding share data
The number and principal amount of our outstanding shares at February 19, 2016, were as follows:
| | | | | | | | |
| Outstanding shares at February 19, 2016 | | | | | | |
| | | Number
of shares | | | Market
value | |
Common Shares | | | 138,169,000 | | | $ | 11-billion | |
Liquidity and capital resources
Agrium generally expects that it will be able to meet its working capital requirements, capital resources needs and shareholder returns through a variety of sources, including available cash on hand, cash provided by operations, short-term borrowings from the issuance of commercial paper (“CP”), and borrowings from our credit facilities, as well as long-term debt and equity capacity from the capital markets. Depending on the nature, timing and extent of any liquidity requirements, we may consider expanding existing sources of financing or accessing other sources of financing.
| | | | | | | | | | | | |
| Sources and uses of cash | | | | | | | | | |
| (millions of U.S. dollars) | | 2015 | | | 2014 | | | Change | |
Cash provided by operating activities | | | 1,663 | | | | 1,312 | | | | 351 | |
Cash used in investing activities | | | (1,503 | ) | | | (2,068 | ) | | | 565 | |
Cash (used in) provided by financing activities | | | (573 | ) | | | 856 | | | | (1,429 | ) |
Effect of exchange rate changes on cash and cash equivalents | | | 80 | | | | (35 | ) | | | 115 | |
(Decrease) increase in cash and cash equivalents from continuing operations | | | (333 | ) | | | 65 | | | | (398 | ) |
Cash and cash equivalents used in discontinued operations | | | — | | | | (18 | ) | | | 18 | |
| | |
| 56 | | AGRIUM ANNUAL REPORT 2015 |
| | |
| Cash provided by operating activities – drivers behind the $351-million increase |
Source of cash | | The Company’s cash flows from operations increased by $351-million from 2014 to 2015 as a result of increased net earnings from continuing operations of $190-million while working capital movements remained consistent year-over-year. Factors influencing this increase included lower cash inflows from customers related to lower sales primarily resulting from softening market prices. This was more than offset by lower cash outflows as a result of lower cost of product sold and lower operating expenses attributed to operating efficiencies, lower input costs and favorable foreign exchange movements. The Company made $209-million less payments for income taxes in Canada and in the U.S. in 2015 compared to 2014. |
| Cash used in investing activities – drivers behind the $565-million decrease in use |
Use of cash | | We have significantly lower capital expenditures in 2015 due to the completion of the tie-in of our Vanscoy potash mine expansion at the end of 2014. See further discussion of capital expenditures in the section “Capital Expenditures and Spending”. |
| Cash (used in) provided by financing activities – drivers behind the $1,429-million increase in use |
Source of cash | | We received $1-billion proceeds from issuance of long-term debt in 2015 compared to $512-million in 2014. The debentures were issued under our 2014 base shelf prospectus, which permits issuance in Canada and in the U.S. of common shares, debt and other securities up to $2.5-billion, less the offering price of securities issued between the 2014 filing date of the prospectus and May 2016. |
Use of cash | | Proceeds from the issuance of the above-mentioned long-term debt were used to repay short-term debt comprising of commercial paper; in 2014, we issued commercial paper. We repurchased common shares for an aggregate of $559-million in 2015; no similar activity in 2014. |
CASH POSITION
Our year-end cash balance was $515-million in 2015 and $848-million in 2014. We do not hold material cash balances in currencies other than the U.S. dollar, Canadian dollar and Australian dollar. We held approximately $80-million U.S. dollar equivalent in Australia. We do not depend on repatriation of cash from our foreign subsidiaries to meet our domestic liquidity and capital resources needs.
FREE CASH FLOW
| | | | | | | | |
| Free cash flow | | | | | | |
| (millions of U.S. dollars) | | 2015 | | | 2014 | |
Cash provided by operating activities | | | 1,663 | | | | 1,312 | |
Net changes in non-cash working capital | | | 93 | | | | 95 | |
Sustaining capital expenditures | | | (541 | ) | | | (566 | ) |
Free cash flow | | | 1,215 | | | | 841 | |
The increase in free cash flow from $841-million in 2014 to $1.2-billion in 2015 is a combined result of higher cash provided from our operations and lower sustaining capital expenditures. We benefited from the improved utilization rates and cost savings from Operational Excellence initiatives, lower natural gas input costs and fewer turnarounds in 2015. This increase in free cash flow helped support higher dividend payments and share repurchases in 2015.
| | |
| AGRIUM ANNUAL REPORT 2015 | | 57 |
WORKING CAPITAL
| | | | | | | | |
| Working capital breakdown | | | | | | |
| (millions of U.S. dollars) | | 2015 | | | 2014 | |
Current assets | | | 6,718 | | | | 7,398 | |
Current liabilities | | | 4,929 | | | | 5,853 | |
Working capital | | | 1,789 | | | | 1,545 | |
Our working capital is used to settle our operating expenses, including payments of our inventories and short-term debt and current portion of long-term debt. The increase in our working capital in 2015 is primarily due to a decrease in our accounts payable caused by lower accruals from the completion of our Vanscoy potash facility expansion project and the ongoing Borger nitrogen facility project.
As of December 31, 2015, we have sufficient current assets to meet our current liabilities. See the discussion of current assets in the section “Financial Condition” on page 53 for more information on the drivers of this change in working capital.
CAPITAL EXPENDITURES AND SPENDING
Sustaining capital expenditures include the cost of replacements and betterments of our facilities. Our sustaining capital expenditures decreased in 2015 as we had fewer turnarounds than in 2014.
Investing capital expenditures typically include significant expansion of existing operations or new acquisitions. Our investing capital expenditures decreased in 2015 primarily due to lower expenditures related to the Vanscoy potash facility expansion, which was completed at the end of 2014.
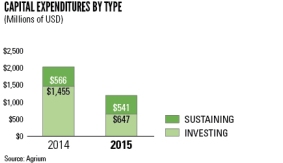
| | | | | | | | |
| Capital spending and expenditures by business unit(a) | | | | | | |
| (millions of U.S. dollars) | | 2015 | | | 2014 | |
Retail | | | | | | | | |
Sustaining | | | 141 | | | | 158 | |
Investing | | | 37 | | | | 41 | |
| | | 178 | | | | 199 | |
Acquisitions(b) | | | 127 | | | | 179 | |
| | | | 305 | | | | 378 | |
Wholesale | | | | | | | | |
Sustaining | | | 388 | | | | 401 | |
Investing | | | 604 | | | | 1,407 | |
| | | | 992 | | | | 1,808 | |
Other | | | | | | | | |
Sustaining | | | 12 | | | | 7 | |
Investing | | | 6 | | | | 7 | |
| | | | 18 | | | | 14 | |
Total | | | | | | | | |
Sustaining | | | 541 | | | | 566 | |
Investing | | | 647 | | | | 1,455 | |
| | | 1,188 | | | | 2,021 | |
Acquisitions(b) | | | 127 | | | | 179 | |
| | | | 1,315 | | | | 2,200 | |
| (a) | Excludes capitalized borrowing costs. |
| (b) | Represents business acquisitions and includes acquired working capital; property, plant and equipment; intangibles; goodwill; and investments in associates and joint ventures. |
| | |
| 58 | | AGRIUM ANNUAL REPORT 2015 |
FUTURE CASH REQUIREMENTS
Contractual obligations and other commitments
Our aggregate contractual obligations for continuing operations at December 31, 2015 are set out in the table below.
| | | | | | | | | | | | | | | | | | | | |
| Contractual and other obligations | | | | | | | | | | | | | | | |
| | | Payment due by period | |
| | | Less than | | | One to three | | | Four to five | | | More than | | | | |
| (millions of U.S. dollars) | | one year | | | years | | | years | | | five years | | | Total | |
Operating | | | | | | | | | | | | | | | | | | | | |
Long-term debt – interest | | | 226 | | | | 437 | | | | 368 | | | | 2,594 | | | | 3,625 | |
Operating leases | | | 137 | | | | 164 | | | | 86 | | | | 100 | | | | 487 | |
Purchase obligations(a) | | | 519 | | | | 452 | | | | 107 | | | | 359 | | | | 1,437 | |
Derivative financial instruments | | | 29 | | | | 33 | | | | — | | | | — | | | | 62 | |
Other commitments | | | 121 | | | | 104 | | | | 17 | | | | 11 | | | | 253 | |
Total operating obligations | | | 1,032 | | | | 1,190 | | | | 578 | | | | 3,064 | | | | 5,864 | |
Capital | | | | | | | | | | | | | | | | | | | | |
Long-term debt – principal repayments | | | 8 | | | | 100 | | | | 500 | | | | 3,925 | | | | 4,533 | |
Asset retirement obligations(b) | | | 18 | | | | 4 | | | | 38 | | | | 166 | (c) | | | 226 | |
Environmental remediation liabilities(b) | | | 33 | | | | 59 | | | | 24 | | | | 47 | | | | 163 | |
Total capital obligations | | | 59 | | | | 163 | | | | 562 | | | | 4,138 | | | | 4,922 | |
Total | | | 1,091 | | | | 1,353 | | | | 1,140 | | | | 7,202 | | | | 10,786 | |
| (a) | Commitments include our proportionate share of commitments of joint ventures. |
| (b) | Represents the undiscounted, estimated cash outflows. |
| (c) | This figure does not include estimated asset retirement obligations related to our potash operations. See the following discussion in the section “Asset retirement obligations”. |
Long-term debt
Long-term debt consists primarily of debentures. Failure to maintain certain financial ratios in respect of our credit facilities and other covenants in the various debt instruments may trigger early repayment provisions. See the discussion in the section “Debt Instruments, Capital Management and Ratings” on page 61.
Operating leases
Operating lease commitments consist primarily of leases for railcars and contractual commitments at distribution facilities in our Wholesale business unit, vehicles and application equipment in our Retail business unit, and office equipment and property leases throughout our operations. The commitments represent the minimum payments under each agreement.
Purchase obligations
Purchase obligations include minimum commitments for North American natural gas purchases, which include both floating rate and fixed rate contracts, and are calculated using the prevailing NYMEX forward prices for U.S. facilities and AECO forward prices for Canadian facilities at December 31, 2015.
Profertil has long-term gas contracts denominated in U.S. dollars, expiring in 2017. These contracts account for approximately 74 percent of Profertil’s gas requirements. YPF S.A. (“YPF”), our joint venture partner in Profertil, supplies approximately 35 percent of the gas under these contracts.
We have a power co-generation agreement for our Carseland facility that expires on December 31, 2026. The maximum commitment under this agreement is to purchase 60 megawatt-hours of power per hour through 2026. The price for the power is based on a fixed charge adjusted for inflation and a variable charge based on the cost of natural gas provided to the facility for power generation.
| | |
| AGRIUM ANNUAL REPORT 2015 | | 59 |
Our phosphate rock supply agreement extends to 2020. Our minimum commitment is to purchase 798,000 tonnes until 2018, with any potential subsequent volumes to be determined in 2016. The purchase price is based on a formula that tracks finished product pricing and key published phosphate input costs. We entered into a freight contract to import phosphate rock extending to 2018, with a total outstanding commitment of $94-million at December 31, 2015.
In addition to amounts disclosed in the preceding table, future capital expenditures include approximately $300-million in relation to the Borger, Texas, nitrogen expansion project.
Asset retirement obligations
Our mining, extraction, processing and distribution activities result in asset retirement obligations that are part of our normal course of operations. Such retirement obligations include closure, dismantlement, site restoration or other legal or constructive obligations for termination and retirement of assets. Expenditures may occur before and after closure. We expect to incur expenditures for our phosphate obligations over the next 58 years. We expect to make payments for our potash and nitrogen obligations after that time. The discounted, inflation-adjusted estimated cash outflows required to settle the asset retirement obligations is $229-million at December 31, 2015.
Environmental remediation liabilities
We establish provisions for environmental expenditures that relate to existing conditions caused by past operations that do not contribute to current or future revenue generation. We capitalize environmental expenditures that extend the life of the property, increase its capacity, or mitigate or prevent contamination from future operations. The discounted, inflation-adjusted estimated cash outflows required to settle the environmental remediation liabilities is $158-million at December 31, 2015.
FUTURE CAPITAL EXPENDITURES
Sustaining capital expenditures
In 2016, our sustaining capital is expected to be approximately $500-million to $550-million for a number of large projects planned for the year, including the following:
| ● | | Reliability projects for Wholesale manufacturing facilities |
| ● | | Wholesale resource development projects |
| ● | | Risk management and risk reduction projects |
| ● | | Planned turnaround inspection and overhaul at certain Wholesale facilities |
| ● | | Spending at our Retail operations in North and South America and Australia |
Investing capital expenditures
Our investing capital program planned for 2016 is expected to be approximately $300-million to $350-million and includes the following:
| ● | | Borger brownfield urea expansion project |
| ● | | Retail investments in growth and efficiency opportunities |
We anticipate that we will be able to finance the announced projects through a combination of cash from operating activities, existing lines of credit (see the discussion in the section “Debt Instruments, Capital Management and Ratings” on page 61 for further details) and funds available from new debt or equity securities offerings.
| | |
| 60 | | AGRIUM ANNUAL REPORT 2015 |
Debt instruments, capital management and ratings
DEBT INSTRUMENTS
Short-term debt consists mainly of U.S. dollar-denominated CP issued in Canada and the U.S. as well as various bank lines of credit for our operations in Europe, South America and Australia. We utilize a $2.5-billion multi-jurisdictional facility, of which $2.45-billion is allocated to North America and $50-million is available to Australia. At December 31, 2015, we had not drawn on our North American tranche. Australian tranche draws were $40-million. We also had $632-million of CP outstanding at December 31, 2015, at a weighted average interest rate of 0.83 percent. Amounts borrowed under the CP program reduce our borrowing capacity under the multi-jurisdictional facility. For our international operations, we had credit facilities of approximately $377-million, of which $163-million was outstanding at December 31, 2015, including $72-million in Europe, $50-million in Australia and $41-million in South America.
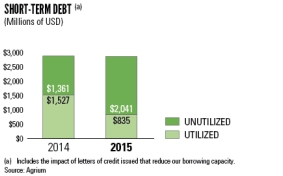
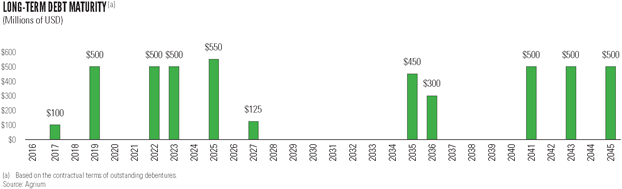
Refer to note 17 of the Notes to the Consolidated Financial Statements for further information on our short-term debt and long-term debt.
CAPITAL MANAGEMENT
Refer to note 3 of the Notes to the Consolidated Financial Statements for further information on our capital management policies.
| | | | | | | | |
| Multi-jurisdictional facility covenants | | | | | | |
| | | Limit | | | 2015 | |
Interest coverage ratio(a) | | ³ | 2.5 | | | | 8.3 | |
Debt-to-capital ratio(b) | | £ | 0.65 | | | | 0.46 | |
| (a) | Calculated as the last 12 months’ EBITDA divided by finance costs, which include interest on long-term debt plus other finance costs. |
| (b) | Calculated as total adjusted debt divided by the sum of total adjusted debt and total equity. For purposes of this ratio, total adjusted debt is calculated as the sum of short-term debt, long-term debt, guarantees and letters of credit (specified in credit facility agreements), net of cash and cash equivalents. |
These covenants were met as at December 31, 2015 and December 31, 2014.
| | |
| AGRIUM ANNUAL REPORT 2015 | | 61 |
DEBT RATINGS
The following information relating to Agrium’s credit ratings is provided as it relates to our financing costs, liquidity and operations. Specifically, credit ratings affect Agrium’s ability to obtain short-term and long-term financing and the cost of such financing. A reduction in the current rating on our debt by the rating agencies, particularly a downgrade below investment grade, or a negative change in the outlook for the Company could adversely affect Agrium’s cost of financing and our access to sources of liquidity and capital.
| | | | | | | | | | | | | | | | |
| Debt ratings breakdown | | | | | | | | | | | | |
| Rating agency | | Date of affirmation | | | Long-term
debt rating | | | USD commercial
paper | | | Ratings
outlook | |
Standard & Poor’s Ratings Services | | | May 26, 2015 | | | | BBB | | | | A-2 | | | | Stable | |
Moody’s Investors Service | | | November 25, 2015 | | | | Baa2 | | | | P-2 | | | | Stable | |
Refer to our 2015 AIF in the section “Item 7 – Description of Capital Structure – 7.3 Debt Ratings” for further information on our ratings, including ratings definitions.
Off-balance sheet arrangements
GUARANTEES
We are contractually obligated to reimburse Canpotex – an industry association of which we are a one-third owner – for our pro-rata share of any operating losses or other liabilities incurred of approximately 7.3 percent in 2015 and 10.3 percent starting in 2016. There were no such losses in 2015 and we believe the probability of conditions arising that would trigger this guarantee is remote. Reimbursements, if any, would be made through reductions of our cash receipts from Canpotex.
Financial instruments
RISK MANAGEMENT
In the normal course of business, our balance sheet, results of operations and cash flows are exposed to various risks. Annually, the Board approves a strategic plan that takes into account the opportunities and major risks of our business and mitigating factors to reduce these risks. The Board sets upper limits on the amounts and time periods over which management may manage risk using derivative financial instruments. Our Corporate Financial Risk Committee reviews risk management policies and procedures annually and monitors compliance with these limits and associated exposure management activity. We manage risk in accordance with our Global Exposure Management Policy, the objective of which is to reduce volatility in cash flows and earnings.
Our derivative financial instruments and the nature of the risks to which they are, or may be, subject are set out in the following table:
| | | | | | | | | | | | | | | | |
| Derivative financial instruments | | | | | | | | | | | | |
| | | Risks | |
| | | Currency | | | Commodity price | | | Credit | | | Liquidity | |
Foreign currency forward, swap and option contracts | | | X | | | | | | | | X | | | | X | |
| | | | |
Natural gas forward, swap and option contracts, nutrient swap contracts and power swap contracts | | | | | | | X | | | | X | | | | X | |
Refer to note 4 of the Notes to the Consolidated Financial Statements for further information on our financial instruments.
| | |
| 62 | | AGRIUM ANNUAL REPORT 2015 |
Enterprise risk management
WE MANAGE RISKS TO OUR ENTERPRISE
In the normal course of operations, our business activities expose us to risk. Acceptance of certain risks is both necessary and advantageous in achieving our growth targets and our vision. We focus on long-term results and manage related risks and uncertainties. Our risk management structure strives to ensure sound business decisions that balance risk and reward while driving maximum shareholder return.
RISK METHODOLOGY
Through Agrium’s structured Enterprise Risk Management (ERM) process, senior management, business units and corporate functions seek to identify and manage risks facing our business. Once identified, risks and related mitigation strategies are evaluated, documented and reviewed on an “evergreen” basis, with a formal review and quarterly sign-off. Many of these risks cross business units and corporate functions. In these cases, the aggregate risk to Agrium is considered and an overall corporate risk is monitored and assessed. The senior leadership team develops additional mitigation strategies for implementation where residual risk – the risk that remains after taking existing mitigation strategies into account – is deemed unacceptably high.
The risks we identify are assigned to six categories: strategic, financial, operational, market, environmental and political.
RISK-RANKING MATRIX
Agrium uses a risk matrix to assess the potential impact of risks based on the expected frequency and consequences of risk events:
| ● | | We assess consequence based on the potential aggregate impact of a risk event on three areas: (a) company reputation, (b) our financial health and (c) the environment and the health and safety of our employees and external parties. |
| ● | | Frequency represents how often a consequence related to a risk is expected to occur. It is akin to probability of loss from the risk. |
AGRIUM’S RISK MATRIX
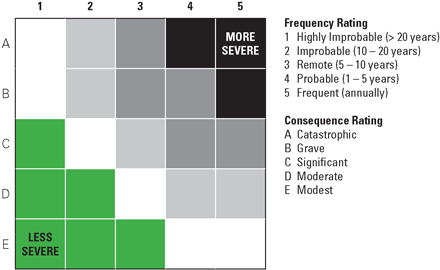
| | |
| AGRIUM ANNUAL REPORT 2015 | | 63 |
RISK GOVERNANCE STRUCTURE
At Agrium, we believe that effective risk management is crucial to successful execution of strategy and that everyone on the Agrium team has a role to play in managing risk.
Board of Directors
| ● | | The Board governs risk management directly and through its committees. |
| ● | | The Board is responsible for understanding the material risks of the business and the related mitigation strategies and for taking reasonable steps to ensure that management has an effective risk management process in place. |
| ● | | Individual committees of the Board oversee specific risks relevant to their areas of responsibility. For example, the Audit Committee monitors the risk management process for financial risks; the Environment, Health, Safety and Security Committee monitors the process for managing environmental, health, safety and security (EHS&S) risks; and the Compensation Committee assesses risks in compensation programs. |
Management
| ● | | Risks unique to our separate business units are managed by the presidents of those business units and their teams. |
| ● | | Functional risks are managed by the corporate functional heads and their teams. |
Chief Risk Officer
| ● | | Agrium has an appointed Chief Risk Officer (CRO). Responsible for maintaining an effective ERM process, the CRO monitors developments in risk management practices, drives improvements in Agrium’s risk management philosophy, program and policies, and champions development of a “best practice” risk management culture. |
| ● | | The CRO reports quarterly to the Board and senior management on all material risks, including new or increased risks resulting from changes in operations or external factors. |
| ● | | The CRO also formally reports to the Board annually on the ERM process and material risks. |
Governance functions
| ● | | Agrium maintains several risk governance functions that contribute to our overall control environment, including Internal Audit, Corporate EHS&S, Legal, and the Internal Control and Compliance team. |
MATERIAL BUSINESS RISKS
Following is a discussion of certain material business risks facing Agrium. Further disclosure of material risks facing Agrium is provided in Agrium’s AIF for the year ended December 31, 2015.
Product price and margin
Agrium’s operating results depend on product prices and margins, which in turn depend on demand for crop inputs. Among the factors that can affect demand for crop inputs are weather conditions, outlook for crop nutrient prices and farming economics, governmental policies, access of our customers to credit and build-up of inventories in distribution channels.
The majority of our Wholesale nutrient business is a commodity business with little product differentiation. Product prices are largely affected by supply and demand conditions, input costs and product prices. Resulting margins can therefore be volatile.
Within our Wholesale business unit, we sell manufactured product as well as product we have purchased for resale. Both components of the business are subject to margin volatility.
Our Retail business unit experiences relatively stable margins, which provide stability to our annual cash flows and earnings. Nonetheless, during times of significant price volatility, margins can be affected to a certain degree by the above factors.
| | |
| 64 | | AGRIUM ANNUAL REPORT 2015 |
Weather
Anomalies in regional weather patterns can have a significant and unpredictable impact on the demand for our products and services. They may also impact prices. Our Retail customers have limited windows of opportunity to complete required tasks at each stage of crop cultivation. Should adverse weather occur during these seasonal windows, we could face the possibility of reduced sales in those seasons without the opportunity to recover until the following season. In addition, we face the significant risk of inventory carrying costs should our customers’ activities be curtailed during their normal seasons. We must manufacture product throughout the year to meet peak season demand and to react quickly to changes in expected weather patterns that affect demand.
Unplanned plant downtime
The results of our Wholesale business depend on the availability of our manufacturing facilities. Prolonged plant shutdown may significantly reduce product available for sale, may affect the environment and/or the community, and may cause injury to an employee or a member of the public.
Transportation
Reducing the delivered cost of product and ensuring reliability of product delivery to our customers are key success factors for our Wholesale marketing operations. Potential medium-term risks are the increased regulations and costs of transporting ammonia within North America given the safety concerns respecting transportation of this product.
Business acquisitions and expansions
We face the risk that recent or future acquisitions could fail to fully deliver the expected economic benefits, or we may experience integration challenges that could result in delays in achieving some or all anticipated synergies and require the allocation of additional resources to integrate the acquired businesses. Similarly, expansions of existing facilities or greenfield developments undertaken may have higher capital construction costs or be delayed or that such projects may not generate the expected return on investment.
Human resources
Long-term forecasts predict a tight labor market across many areas in which we operate due to changing demographics, including the general aging of the population. A tight labor market, including the associated risks of losing key individuals and difficulty attracting and retaining qualified personnel, is a risk to the business.
Raw materials
Natural gas is the principal raw material used to manufacture nitrogen and is the single largest purchased raw material for our Wholesale operations. North American natural gas prices are subject to price volatility. An increase in the price of natural gas increases our nitrogen cost of production and may negatively impact margins for our North American nitrogen sales. This is particularly important for our nitrogen facilities in Western Canada and Borger, Texas, where we purchase gas on the open market. Higher production costs may be partially or fully reflected in higher domestic and international product prices, but these conditions do not always prevail. In addition, the price for natural gas in North America can vary significantly compared to the price for natural gas in Europe and Asia. Significantly lower natural gas prices in Europe and/or Asia would give our competitors in Europe and Asia a competitive advantage, which could, in turn, decrease international and domestic product prices and reduce our margins.
The Profertil nitrogen facility faces risk concerning gas deliverability during winter due to strains on gas distribution and residential demand in Argentina. The Argentine government has at times reduced the amount of gas available to industrial users in favor of residential users during the peak winter demand season. Profertil may also not be able to renew its long-term gas supply contracts at favorable rates or at all.
Mining has inherent risks. For phosphate, variability in the quality of phosphate rock can impact cost and production volumes. Risks for potash mining include water intake or flooding as well as variability in quality, which can impact cost and production volumes.
Counterparty
We face the risk of loss should a counterparty be unable to fulfill its obligations with respect to accounts receivable or other contracts, including derivative financial instruments.
| | |
| AGRIUM ANNUAL REPORT 2015 | | 65 |
Credit and liquidity
Our business depends on access to operating credit lines to fund our ongoing operations. Should overall credit liquidity in the markets be limited, our ability to operate under normal conditions could be impacted. For further discussion, see “Debt Instruments, Capital Management and Ratings – Debt Ratings” on page 61.
Foreign exchange
Currency risk arises from the revaluation of monetary foreign assets and liabilities in conjunction with currency volatility. Foreign monetary asset and liability balances are comprised primarily of intercompany loans and external short-term debt. A significant shift in the value of the Canadian dollar and/or Australian dollar against the U.S. dollar could impact reported earnings.
Additional currency risk stems from the translation of our foreign subsidiaries’ statements of operations to U.S. dollars for consolidation at the parent level. Agrium’s Wholesale business incurs costs in Canadian dollars and earns sales in Canadian and U.S. dollars. Additionally, Agrium’s Canadian and Australian Retail segments operate in their respective local currencies, and results are subsequently translated into the presentation currency. A significant shift in the value of the Canadian dollar and/or Australian dollar against the U.S. dollar could impact reported earnings.
Country
We have significant operations in Canada, the U.S. and Australia. We also operate in a number of South American and European countries, have business investments in Egypt, and depend on phosphate rock from Morocco. International business exposes us to a number of risks, such as uncertain economic conditions in the countries in which we do business, abrupt changes in foreign government policies and regulations, restrictions on the right to convert and repatriate currency, political risks, and the possible interruption of raw material supply due to transportation issues or government-imposed restrictions. We do not engage in business activities in any country that is a state sponsor of terrorism.
We hold a 26 percent interest in MOPCO, which operates a nitrogen facility in Egypt. Notwithstanding our representation on the board of directors and management of MOPCO, we may not be able to maintain significant influence over the operations of MOPCO. There is also a risk to the MOPCO nitrogen facility on gas deliverability, as gas may be diverted for power generation as Egypt is seeing a growing demand for power.
Following its nationalization by the Argentine government in 2012, YPF, as the other 50 percent owner of the Profertil nitrogen facility, may have different business and economic interests or policy objectives under government management than it did in the past, which may be inconsistent with our interests as a 50 percent owner of that facility and which could have an adverse effect on the profitability, financial condition and results of operations of the Profertil facility. During 2015, the Government of Argentina ended its currency controls; however, Argentina is subject to economic uncertainty that could affect our ability to repatriate cash from this country. We do not depend on repatriation of cash from our foreign subsidiaries to meet our liquidity and capital resource needs.
Legislative risk
We are subject to legislation, regulation and government policies in the jurisdictions in which we operate. We cannot predict how these laws, regulations or policies or their interpretation, administration and enforcement will change over time, and it is possible that future changes could negatively impact our operations, markets or cost structure.
Environment, health, safety and security
We face EHS&S risks typical of those found throughout the agriculture, mining and chemical manufacturing sectors and the international fertilizer supply chain. These include the potential of physical injury to employees and contractors; possible environmental contamination and human exposure to chemical releases and accidents during manufacturing, mining, transportation, storage and use; and the security of our personnel, products, intellectual property and physical assets domestically and overseas from intentional acts of destruction, crime, violence, terrorism, and ethnic and international conflicts. In addition, there are risks of natural disasters and risks to health, including pandemic risk.
Litigation risk
Agrium, like any other business, is subject to the risk of becoming involved in disputes and litigation. Any material or costly dispute or litigation could adversely impact our consolidated financial position and results of operations. For further discussion, see “Provisions and Contingencies for Asset Retirement, Environmental and Other Obligations” on page 67.
| | |
| 66 | | AGRIUM ANNUAL REPORT 2015 |
Provisions and contingencies for asset retirement, environmental and other obligations
GENERAL NATURE OF PROVISIONS AND CONTINGENCIES
We are exposed to possible losses for environmental matters and other claims and lawsuits related to our current and acquired businesses. We expect our involvement in such matters to continue in the normal conduct of our business. We will represent our interests vigorously in all of the proceedings in which we are involved.
Legal proceedings and environmental matters are inherently complex and we apply significant judgment in estimating probable outcomes. As a result, the potential exists for adjustments to liabilities and material variances between actual costs and estimates. We may not be able to make a reliable estimate of losses or the range of possible losses when claims do not specify an amount of damages sought, when there are numerous plaintiffs, or when a case is in its early stages.
OUR PROCEDURES FOR ASSESSING PROVISIONS AND CONTINGENCIES
We undertake a review process at each reporting period. Our process includes:
| ● | | Business unit and corporate staff review in consultation with in-house legal counsel and internal accounting professionals to determine whether current information available to us supports our estimates of the financial effect of new or existing matters and our related disclosures. |
| ● | | Consultation with external counsel where appropriate to corroborate business and internal legal counsel’s analysis and conclusions about the facts of each case and the status of litigation. |
| ● | | Discussion and correspondence with third parties. |
| ● | | Review of publicly available information for similar matters involving other companies. |
In assessing provisions and contingencies, we consider the need for accounting recognition and/or disclosure of existing and potentially new matters. Our assessment considers the probability of adverse judgments and the range of possible losses. We base our assessment of probable outcomes of matters on our judgment of a number of factors including:
| ● | | Similar past experience and history |
| ● | | Relevant financial, scientific and other evidence of each matter |
| ● | | Opinions from corporate and outside counsel |
| | |
| AGRIUM ANNUAL REPORT 2015 | | 67 |
ACCOUNTING RECOGNITION OF PROVISIONS AND CONTINGENCIES UNDER IFRS (INTERNATIONAL ACCOUNTING STANDARDS (IAS) 37)
| | | | |
| Likelihood of outcome of matter | | Probability of occurrence (policy) | | Accounting treatment |
Probable | | More likely than not – greater than 50 percent | | Record a provision |
Possible but not probable | | 5 to 50 percent | | Disclose a contingent liability |
Remote | | Less than 5 percent | | No disclosure required |
| | |
| Key definitions | | | | |
Provision | | A liability of uncertain timing or amount, recorded when: |
| | a) a present obligation exists as a result of a past event |
| | b) it is probable that a future outflow of economic benefits will be required to settle the obligation |
| | | c) the amount of the obligation can be reasonably estimated |
Contingent liability | | Either: |
| | a) a possible obligation that arises from past events and whose existence will be confirmed only by future uncertain events not wholly within our control, or |
| | b) a present obligation arising from past events that is not recognized because |
| | i) a future outflow of resources to settle the obligation is not probable, or |
| | | ii) the amount of the obligation cannot be reliably measured |
IAS 37 also requires that we measure a provision at the present value of our best estimate of the expenditure required to settle the obligation and that we consider risks and uncertainties in measurement of provisions.
ENVIRONMENTAL REMEDIATION ACTIVITIES
Some remediation activities at our sites are subject to the U.S. Comprehensive Environmental Response, Compensation, and Liability Act (CERCLA), the U.S. Resource Conservation and Recovery Act (RCRA) and similar federal, state, provincial and local environmental laws. These laws provide for phases of remediation under regulatory oversight, which may include:
| ● | | Remedial action, including construction |
| ● | | Operation, maintenance and long-term monitoring |
Some of the above phases may require feasibility studies, analyses, plans, opportunities for public comment and inspections. Because of the complexity of the CERCLA and RCRA and other oversight processes, the time from identification of a matter through to closure may take several years.
| | |
| 68 | | AGRIUM ANNUAL REPORT 2015 |
| | |
| Current developments – specific environmental and other matters | | |
| Matter | | Developments in 2015 |
| |
Idaho phosphate mining and processing sites | | |
| |
We are subject to investigations by U.S. federal and state agencies of existing and former phosphate mining and processing sites in Idaho. Nu-West Industries, Inc. (“Nu-West”), a wholly owned subsidiary of Agrium, has been notified of potential violations of federal and state statutes. Nu-West is working co-operatively with federal and state agencies and, depending on the site, is in the investigation or risk assessment stage or has, for some sites, begun preliminary work under agreements with the agencies. Completion of investigations, risk assessments or preliminary work will enable Nu-West and the agencies to determine what, if any, remediation work will be required. | | In 2015, Nu-West received aNotice of Intentadvising that trustees for U.S. Federal and State agencies will conduct a damage assessment at the Idaho phosphate mining and processing sites. We expect the trustees to begin the assessment in 2016. |
| | |
Manitoba mining properties | | |
| |
| In 1996, Agrium acquired Viridian Inc. (“Viridian”), which is now a wholly owned Canadian subsidiary of Agrium. Viridian has retained certain liabilities associated with the Fox Mine Site – a closed mineral processing site near Lynn Lake, Manitoba. Viridian is currently treating water draining from the site to meet provincial downstream water quality standards. Viridian has substantially completed the investigation phase of remediation and is currently in discussions with the Province of Manitoba regarding remedial alternatives selection. | | We adjusted the time frame for concurrence and approval from the Province of Manitoba to 36 months from the previous estimate of 24 to 36 months. |
| |
Concurrence and approval from the Province of a remedial design are expected within the next 36 months. For this matter, we have not disclosed information about the amount accrued for site remediation because disclosure of such information would seriously prejudice our position in discussions with the Province. | | |
| | |
Oil-for-Food Programme (OFFP) | | |
| |
On June 27, 2008, the Iraqi government filed a civil lawsuit in the U.S. against AWB, a subsidiary we acquired in 2010, and 92 other parties, in a lawsuit alleging that the defendants participated in an illegal conspiracy to divert funds from the United Nations OFFP escrow account. The lawsuit sought total damages in excess of $10-billion from the defendants, jointly and severally, as well as treble damages under the U.S. Racketeer Influenced and Corrupt Organizations. | | The plaintiff applied for leave to appeal to the U.S. Supreme Court, which was denied in June 2015. The case was subsequently closed. |
For the Idaho phosphate mining and processing sites and Manitoba mining properties matters described above, at the date of issuance of our 2015 Consolidated Financial Statements, we determined that we could not make a reliable estimate of the amount and timing of any financial effect in excess of the amounts accrued. Reasons for this determination include:
| ● | | Complexity of the matters |
| ● | | Early phases of most proceedings |
| ● | | Lack of information on the nature and timing of future actions in the matters |
| ● | | Dependency on the completion and findings of investigations and assessments |
| ● | | Lack of specific information as to the nature, extent, timing and cost of future remediation |
Until we have greater clarity as to our liability and the extent of our financial exposure, it is not practical to make a reliable estimate of the financial effect. As negotiations, discussions and assessments proceed, we may provide estimates. Events or factors that could alleviate our current inability to make reliable estimates for these matters include:
| ● | | Further identification of allegations or demands |
| ● | | Completion of remediation phases |
| ● | | A ruling by a court or other regulatory body having jurisdiction |
| ● | | Initiation of substantive settlement negotiations |
Additional detail of specific litigation matters described above at the date of issuance of this MD&A is set out in our 2015 AIF in the section “Item 5.1 – Business of Agrium – 5.1 (h) Environmental Protection Requirements” .
| | |
| AGRIUM ANNUAL REPORT 2015 | | 69 |
Environmental protection requirements
Agrium’s operations are subject to a variety of federal, provincial, state and local laws, regulations, licenses and permits, the purpose of which is to protect the environment. These environmental protection requirements may apply during design and construction, operation or modification, at the time of plant or mine closure, and beyond.
The environmental requirements for new projects typically focus on baseline site conditions; ensuring that the design and equipment selection meet operating requirements; the satisfaction of permitting, preconstruction studies, discharge and other operating requirements; and the use of appropriate safeguards during construction.
Licenses, permits and approvals at operating sites are obtained in accordance with applicable laws and regulations, which may limit or regulate operating conditions, rates and efficiency; land, water and raw material use and management; product storage, quality and transportation; waste storage and disposal; and emissions and other discharges. Additional legal requirements may apply in circumstances where site contamination predates the current applicable regulatory framework where remediation is ongoing or where there is otherwise evidence that historic remediation activities have not been successful in protecting the environment. These additional requirements may result in an environmental remediation liability that must be resolved.
CLIMATE CHANGE AND GREENHOUSE GAS EMISSIONS
Directly and indirectly, Agrium generates greenhouse gas (GHG) emissions through the production, distribution and use of its products. These emissions may be subject to climate change policy and regulations being developed in North America. However, these policies are developing in a unique way within the various state, provincial and federal jurisdictions.
The Government of Alberta has enacted the Specified Gas Emitters Regulation (SGER), which applies to three Agrium facilities in Alberta with CO2e emissions in excess of 100,000 tonnes per year. In the fall of 2015, the Alberta Government released its Climate Leadership Plan (the “Plan”). Although the specifics of the Plan have not yet been finalized, the Plan is predicated upon the intended early phase-out of coal-fired power plants coupled with an increased focus on renewable energy, and the intended replacement of the existing emissions intensity regime with product-based emissions performance standards. With the increased emission reduction stringency and compliance price in 2016 and 2017, the expected compliance cost is expected to rise to between $3-million and $10-million in 2017.
In the U.S., the Environmental Protection Agency issued GHG emissions regulations that establish a reporting program for emissions of CO2, methane and other GHGs, as well as a permitting program for large GHG emissions sources. While the U.S. Congress has considered various legislative initiatives to reduce or tax GHG emissions, to date it has not enacted any laws in that regard. However, if Congress undertakes comprehensive tax reform in the coming year, it is possible that such reform could include a carbon tax. Legal challenges to these regulations are pending.
Additional details on climate change and greenhouse gas emissions are included in our 2015 AIF in the section “Item 5.1 – Business of Agrium – 5.1 (h) Environmental Protection Requirements”.
| | |
| 70 | | AGRIUM ANNUAL REPORT 2015 |
Controls and procedures
DISCLOSURE CONTROLS AND PROCEDURES
We maintain disclosure controls and procedures designed to provide reasonable assurance that information required to be disclosed by us in our annual filings, interim filings (as these terms are defined in National Instrument 52-109, Certification of Disclosure in Issuers’ Annual and Interim Filings) and other reports filed or submitted by us under provincial and territorial securities legislation is recorded, processed, summarized and reported within the required time periods. Our Chief Executive Officer (CEO) and Chief Financial Officer (CFO), after evaluating the effectiveness of our disclosure controls and procedures as of the end of the period covered by the annual filings, being December 31, 2015, have concluded that, as of such date, our disclosure controls and procedures were effective in providing reasonable assurance that information required to be disclosed by Agrium in its annual filings, interim filings or other reports filed or submitted by it under securities legislation is (a) recorded, processed, summarized and reported within the time periods specified in the securities legislation, and (b) accumulated and communicated to management, including the CEO and CFO, as appropriate, to allow timely decisions regarding required disclosure.
Our disclosure controls and procedures are designed to provide reasonable assurance of achieving their objectives and, as indicated in the preceding paragraph, the CEO and CFO believe that our disclosure controls and procedures are effective at that reasonable assurance level, although the CEO and CFO do not expect that the disclosure controls and procedures will prevent all errors or fraud. A control system, no matter how well conceived or operated, can provide only reasonable, not absolute, assurance that the objectives of the control system will be met.
INTERNAL CONTROL OVER FINANCIAL REPORTING
Management is responsible for establishing and maintaining adequate internal control over financial reporting, as defined in Rules 13a-15(f) and 15d-15(f) under the Securities Exchange Act of 1934, as amended. Internal control over financial reporting is designed to provide reasonable assurance regarding the reliability of financial reporting and preparation of financial statements for external purposes in accordance with IFRS.
Under the supervision and with the participation of our management, including our CEO and CFO, we conducted an evaluation of the design and effectiveness of our internal control over financial reporting as of the end of the fiscal year covered by this report based on the framework issued by the Committee of Sponsoring Organizations of the Treadway Commission (COSO) inInternal Control – Integrated Framework (2013). There was no change in our internal control over financial reporting in 2015 that has materially affected, or is reasonably likely to materially affect, our internal control over financial reporting. Based on this evaluation, the CEO and CFO concluded that as of December 31, 2015, we did maintain effective internal control over financial reporting.
The effectiveness of internal control over financial reporting as of December 31, 2015, was audited by KPMG LLP, an independent registered public accounting firm, as stated in their report, which is included in this 2015 Annual Report to Shareholders.
| | |
| AGRIUM ANNUAL REPORT 2015 | | 71 |
Critical accounting estimates
We prepare our financial statements in accordance with IFRS, which requires us to make judgments, assumptions and estimates in applying accounting policies. Critical estimates are those most subject to uncertainty and which have the most significant risk of resulting in a material adjustment to the carrying amounts of assets and liabilities within the following year.
In note 24 of the Notes to the Consolidated Financial Statements, we have described in detail the following accounting estimates, which are the most critical in helping readers understand and evaluate our reported financial results. In our Consolidated Financial Statements, we have also discussed assumptions underlying our estimates and factors that might impact our estimates.
These critical accounting estimates require our most difficult, subjective or complex judgments, resulting from the need to make estimates about the effects of matters that are inherently uncertain. We have set out below additional information on events, trends and uncertainties that could impact our estimates. As well, we have described the impact on our financial statements of a reasonably possible change in one assumption while holding all other assumptions constant.
|
Impairment testing |
|
Sensitivity of the results of goodwill impairment testing to changes in assumptions is described in note 14 of the Notes to the Consolidated Financial Statements. If actual results are not consistent with our estimates or assumptions, we may be exposed to an impairment that could be material. If key assumptions and estimates about our operations change, including lower than assumed sales growth, higher costs or other negative factors, we could record a material impairment to goodwill. |
Provisions |
|
Because of the judgments made in determining the recognition and amount of our provisions, they can change significantly due to the inherent uncertainties in our estimates. Changes could have a material impact on our future earnings. A change in the assumptions underlying our provisions for environmental remediation and asset retirement could significantly impact our financial position and results of operations. A 1 percent increase in the rate we use to discount our provisions at December 31, 2015, would decrease our consolidated net earnings by $11-million in 2015. A 10 percent change in our provision for litigation at December 31, 2015, would have affected net earnings by $2-million in 2015. As at January 1, 2015, we revised our estimate of the asset retirement obligation related to our nitrogen assets based on a review of the expected timing of decommissioning costs to be incurred. The revision reflects the cumulative knowledge obtained from operating and completing turnarounds on our nitrogen plants, lack of technological change in nitrogen producing equipment, and increased ability to economically procure natural gas. These revised assumptions are consistent with current industry views and assumptions used by our industry peers. The revision in estimate decreased our asset retirement obligation and our property, plant and equipment by $55-million. The reduction in depreciation and accretion expense for the year ended 2015 is $4-million. The expected reduction in depreciation and accretion expense is $4-million in each of the years 2016 through 2018. |
Income taxes |
|
Although we believe our assumptions and estimates are reasonable, our tax assets are realizable and our accruals for tax liabilities are adequate for all open tax years based on our interpretations of tax law and prior experience, actual results could differ. This may affect consolidated income tax expense and earnings in future years. Our effective income tax rate in a given financial statement period could change materially to the extent that we prevail in matters for which we have recorded a liability or are required to pay amounts in excess of our recorded liability. |
Inventory valuation |
|
We continuously assess whether lower prices for our products require that we write down inventories. During 2015 and 2014, we did not record any material inventory write-downs. A 1 percent reduction in our inventories at December 31, 2015, would have reduced consolidated net earnings by $24-million in 2015. Decreases in global prices of our commodities held in inventory have the greatest potential to cause us to write down inventories. |
| | |
| 72 | | AGRIUM ANNUAL REPORT 2015 |
Accounting standards and policy changes
| | | | | | | | |
| New or amended | | Standard/ interpretation | | Description | | Agrium’s date and
method of adoption | | Impact |
New | | IFRS 15 | | Revenue from Contracts with Customersestablishes a new model for revenue earned from a contract with a customer. The standard provides specific guidance on identifying separate performance obligations in the contract and allocating the transaction price to the separate performance obligations. | | Agrium expects to adopt for annual periods beginning on or after January 1, 2018. | | We have established preliminary terms of reference as an initial step in evaluating the impact. We do not anticipate that the impact will be material. |
| | | | | |
| New | | IFRS 16 | | Leases applies a single model for all recognized leases, which would require recognition of lease-related assets and liabilities and the related interest and amortization expense in the financial statements. | | Agrium expects to adopt for annual periods beginning on or after January 1, 2019. | | We expect that adoption will have a material impact on assets and liabilities. However, we are not able, at this time, to estimate the impact. |
| | | | | |
| Amended | | Various | | • IAS 1Disclosure Initiative | | Amendments adopted January 1, 2015. | | No material impact. |
| | | | • IFRS 9 (2014)Financial Instruments | | |
| | | | • IFRS 11Accounting for Acquisitions of Interests in Joint Operations | | |
| | | | • IAS 16 and IAS 38Clarification of Acceptable Methods of Depreciation and Amortization | | | |
| | | | | • Annual Improvements to IFRS (2012-2014) | | | | |
We changed the method of depreciation from the straight-line basis to the units of production basis for our potash facility mining and milling assets beginning January 1, 2015, and our nitrogen and phosphate mining and plant assets beginning October 1, 2015. The change in method of depreciation reflects anticipated changes to our production schedule due to facility expansions, volatility in market conditions, and the frequency and duration of plant turnarounds. The current and expected reduction in depreciation expense is 2015 – $30-million and 2016 – $7-million.
Non-IFRS financial measures
Certain financial measures in our Annual Report are not prescribed by IFRS. We consider these financial measures discussed herein to provide useful information to both management and investors in measuring our financial performance and financial condition.
IFRS requires that we provide and include subtotals and other financial measures in our Consolidated Financial Statements. Such measures become IFRS measures by virtue of being included in the Consolidated Financial Statements. Other measures that are not specifically defined under IFRS and may not be comparable are non-IFRS measures. These non-IFRS measures should not be considered as a substitute for, or superior to, measures of financial performance prepared in accordance with IFRS.
| | |
| AGRIUM ANNUAL REPORT 2015 | | 73 |
The following table outlines our non-IFRS financial measures, their definitions and why management uses each measure.
| | | | |
| Non-IFRS financial measures | | Definition | | Why we use the measure and why it is useful to investors |
Cash COPM | | All fixed and variable costs are accumulated in COPM excluding depreciation and amortization expense and direct freight. | | Enables investors to better understand the performance of our manufacturing operations compared to other crop nutrient producers |
| |
| | When COPM costs are divided by the production tonnes for the period, the result is actual COPM per tonne, which is compared to the standard COPM per tonne – a calculation of fixed and variable costs for a standard or typical period of production. The standard COPM per tonne is multiplied by the production tonnes for the period, and the resulting dollar amount is transferred to inventory. Any remaining costs are recorded directly to cost of product sold as production volume or cost efficiency variances. |
| |
| | Direct freight is a transportation cost to move the product from an Agrium location to the point of sale. |
| |
| | There is no directly comparable IFRS measure for cash cost of product manufactured. |
| | | |
| Cash operating coverage ratio | | Cash operating coverage ratio represents gross profit excluding depreciation and amortization less EBITDA, divided by gross profit excluding depreciation and amortization expense. | | Assists management and investors in understanding the costs and underlying economics of our operations and in assessing our operating performance and our ability to generate free cash flow from our business units and overall as a company. |
| | | |
| Comparable store sales | | Change in current period Retail location sales compared to the prior period. We retain sales of closed locations in the comparable base if the closed location is in close proximity to an existing location, unless we plan to exit the market area or are unable to economically or logistically serve it. We do not adjust for temporary closures, expansions or renovations of stores. | | Used by investors, analysts and management to evaluate performance of farm centers by measuring our ability to achieve sales increases from locations we have owned for more than 12 months. |
| | | |
| Normalized comparable store sales | | Comparable store sales normalized using published NPK benchmark prices, adjusting current year results to reflect nutrient pricing from the previous year. | | Allows users of the comparable store sales metric to evaluate sales growth by adjusting for fluctuations in commodity prices. |
| | | |
| EBITDA | | Earnings (loss) from continuing operations before finance costs, income taxes, depreciation and amortization. | | EBITDA is frequently used by investors and analysts for valuation purposes when multiplied by a factor to estimate the enterprise value of a company. EBITDA is also used in determining annual incentive compensation for certain management employees and in calculating certain of our debt covenants. |
| | | |
| Adjusted EBITDA | | EBITDA before finance costs, income taxes, depreciation and amortization of joint ventures. | | Useful in evaluating our business performance by including our proportionate share of joint ventures in operating results. |
| | | |
| EBITDA to sales | | EBITDA divided by sales. | | Measures earnings generated from each dollar of sales, which is useful to evaluate operating profitability on a basis comparable from period to period. |
| | | |
| Free cash flow | | Cash provided by operating activities excluding the impact of net changes in non-cash working capital less sustaining capital expenditures. In 2015, we revised our definition of free cash flow to simplify the calculation and improve the effectiveness of the metric for management and other users. We have restated our 2014 comparative information. | | Used to assess the quality of our earnings, as it measures our ability to generate cash from our businesses to repay debt, fund business acquisitions, repurchase our shares and pay dividends. Starting 2015, free cash flow is also a component in determining annual incentive compensation for certain management employees and in calculating the value of Performance Share Units awarded as part of management compensation. |
| | |
| 74 | | AGRIUM ANNUAL REPORT 2015 |
| | | | |
| Non-IFRS financial measures | | Definition | | Why we use the measure and why it is useful to investors |
| | |
| Free cash flow per share | | Free cash flow divided by the diluted weighted average number of shares. | | Measures our ability to generate cash from our operations on a per share basis. |
| | | |
Dividends paid as a percent of free cash flow | | Dividends paid divided by free cash flow. | | Provides an analysis of the dividends we pay against free cash flow generated. |
| | |
Wholesale measures that include Agrium’s proportionate share of results of joint ventures: sales, cost of product sold, gross profit | | Wholesale metrics (sales, cost of product sold and gross profit) including the related proportionate share of joint venture equity accounted results. | | Useful in evaluating our Wholesale business performance by including our proportionate share of joint ventures in Wholesale operating results. |
RECONCILIATIONS OF NON-IFRS FINANCIAL MEASURES
| | | | | | | | | | | | | | | | |
| Adjusted EBITDA and EBITDA to EBIT | | | | | | | | | | | | |
| (millions of U.S. dollars) | | Retail | | | Wholesale | | | Other | | | Consolidated | |
2015 | | | | | | | | | | | | | | | | |
Adjusted EBITDA | | | 1,033 | | | | 1,322 | | | | (221 | ) | | | 2,134 | |
Equity accounted joint ventures: | | | | | | | | | | | | | | | | |
Finance costs and income taxes | | | — | | | | 19 | | | | — | | | | 19 | |
Depreciation and amortization | | | — | | | | 19 | | | | — | | | | 19 | |
EBITDA | | | 1,033 | | | | 1,284 | | | | (221 | ) | | | 2,096 | |
Depreciation and amortization | | | 254 | | | | 211 | | | | 15 | | | | 480 | |
EBIT | | | 779 | | | | 1,073 | | | | (236 | ) | | | 1,616 | |
2014 | | | | | | | | | | | | | | | | |
Adjusted EBITDA | | | 1,119 | | | | 821 | | | | (192 | ) | | | 1,748 | |
Equity accounted joint ventures: | | | | | | | | | | | | | | | | |
Finance costs and income taxes | | | — | | | | 24 | | | | — | | | | 24 | |
Depreciation and amortization | | | — | | | | 14 | | | | — | | | | 14 | |
EBITDA | | | 1,119 | | | | 783 | | | | (192 | ) | | | 1,710 | |
Depreciation and amortization | | | 305 | | | | 230 | | | | 15 | | | | 550 | |
EBIT | | | 814 | | | | 553 | | | | (207 | ) | | | 1,160 | |
|
| Retail comparable store sales and Retail normalized comparable store sales | |
| (millions of U.S. dollars, except as noted) | | | | | | | | 2015 | | | 2014 | |
Retail sales from the current period comparable store base | | | | | | | | | | | 12,014 | | | | 11,487 | |
Prior year Retail sales | | | | | | | | | | | 12,981 | | | | 11,913 | |
Comparable store sales (%) | | | | | | | | | | | (7 | ) | | | (4 | ) |
Current year sales normalized for NPK benchmark prices | | | | | | | | | | | 12,464 | | | | 11,635 | |
Normalized comparable store sales (%) | | | | | | | | | | | (4 | ) | | | (2 | ) |
| | | | |
| Retail cash operating coverage ratio | | | | | | | | | | | | |
| (millions of U.S. dollars, except as noted) | | | | | | | | 2015 | | | 2014 | |
Gross profit | | | | | | | | | | | 2,728 | | | | 2,892 | |
Depreciation and amortization in cost of product sold | | | | | | | | | | | 6 | | | | 6 | |
Gross profit excluding depreciation and amortization | | | | | | | | | | | 2,734 | | | | 2,898 | |
EBITDA | | | | | | | | | | | 1,033 | | | | 1,119 | |
Operating expenses excluding depreciation and amortization | | | | | | | | | | | 1,701 | | | | 1,779 | |
Cash operating coverage ratio (%) | | | | | | | | | | | 62 | | | | 61 | |
| | |
| AGRIUM ANNUAL REPORT 2015 | | 75 |
RECONCILIATION OF OTHER FINANCIAL MEASURES
| | | | | | | | | | | | | | | | |
| Return on operating capital employed and return on capital employed | |
| | | December 31, 2015 | | | December 31, 2014 | |
| (millions of U.S. dollars, except as noted) | | Retail
North America | | | Retail | | | Retail
North America | | | Retail | |
| | | | |
EBIT | | | 686 | | | | 779 | | | | 723 | | | | 814 | |
Income taxes at a rate of 28 percent (2014 – 27 percent) | | | 192 | | | | 218 | | | | 195 | | | | 220 | |
EBIT less income taxes | | | 494 | | | | 561 | | | | 528 | | | | 594 | |
| | | | |
Average non-cash working capital | | | 1,757 | | | | 2,200 | | | | 1,731 | | | | 2,249 | |
Average property, plant and equipment | | | 948 | | | | 1,037 | | | | 901 | | | | 1,010 | |
Average investments in associates and joint ventures | | | 47 | | | | 82 | | | | 39 | | | | 83 | |
Average other assets | | | 3 | | | | 11 | | | | 5 | | | | 13 | |
Average operating capital employed | | | 2,755 | | | | 3,330 | | | | 2,676 | | | | 3,355 | |
ROOCE (%) | | | 18 | | | | 17 | | | | 20 | | | | 18 | |
| | | | |
Average operating capital employed | | | 2,755 | | | | 3,330 | | | | 2,676 | | | | 3,355 | |
Average intangibles | | | 604 | | | | 646 | | | | 644 | | | | 710 | |
Average goodwill | | | 1,865 | | | | 1,988 | | | | 1,810 | | | | 1,956 | |
Average capital employed | | | 5,224 | | | | 5,964 | | | | 5,130 | | | | 6,021 | |
ROCE (%) | | | 9 | | | | 9 | | | | 10 | | | | 10 | |
2015 Fourth quarter management’s discussion and analysis CONSOLIDATED NET EARNINGS | |
| Financial overview | | | | | | | | | | | | |
| | | Three months ended December 31, | |
| (millions of U.S. dollars, except per share amounts and where noted) | | 2015 | | | 2014 | | | Change | | | % Change | |
Sales | | | 2,407 | | | | 2,705 | | | | (298 | ) | | | (11 | ) |
Gross profit | | | 900 | | | | 732 | | | | 168 | | | | 23 | |
Expenses | | | 576 | | | | 625 | | | | (49 | ) | | | (8 | ) |
Earnings before finance costs and income taxes | | | 324 | | | | 107 | | | | 217 | | | | 203 | |
Net earnings from continuing operations | | | 200 | | | | 70 | | | | 130 | | | | 186 | |
Net loss from discontinued operations | | | — | | | | (19 | ) | | | 19 | | | | (100 | ) |
Net earnings | | | 200 | | | | 51 | | | | 149 | | | | 292 | |
Diluted earnings per share from continuing operations | | | 1.45 | | | | 0.46 | | | | 0.99 | | | | 215 | |
Diluted loss per share from discontinued operations | | | — | | | | (0.13 | ) | | | 0.13 | | | | (100 | ) |
Diluted earnings per share | | | 1.45 | | | | 0.33 | | | | 1.12 | | | | 339 | |
Effective tax rate (%) | | | 20 | | | | (4 | ) | | | N/A | | | | N/A | |
| | |
| 76 | | AGRIUM ANNUAL REPORT 2015 |
Sales and gross profit
| | | | | | | | | | | | |
| | | Three months ended December 31, | |
| (millions of U.S. dollars) | | 2015 | | | 2014 | | | Change | |
Sales | | | | | | | | | | | | |
Retail | | | 1,765 | | | | 2,057 | | | | (292 | ) |
Wholesale | | | 888 | | | | 897 | | | | (9 | ) |
Other | | | (246 | ) | | | (249 | ) | | | 3 | |
| | | | 2,407 | | | | 2,705 | | | | (298 | ) |
Gross profit | | | | | | | | | | | | |
Retail | | | 599 | | | | 614 | | | | (15 | ) |
Wholesale | | | 320 | | | | 130 | | | | 190 | |
Other | | | (19 | ) | | | (12 | ) | | | (7 | ) |
| | | | 900 | | | | 732 | | | | 168 | |
| ● | | Improved utilization rates in our nitrogen and potash segments led to an increase in product available for sale and higher overall Wholesale sales volumes. Realized selling prices, on the other hand, decreased as a result of weaker market conditions. Reduced sales of product purchased for resale contributed to the decrease in sales as Agrium exited non-core, low return portions of this business. |
| ● | | Wholesale’s gross profit significantly increased due to manufacturing cost efficiencies associated with higher production volumes, reduced overall fixed costs and lower natural gas input costs for the fourth quarter compared to the same period last year. |
| ● | | Retail’s sales and gross profit decreased for the fourth quarter compared to the same period last year primarily due to unfavorable weather conditions and the closure of one of our livestock export businesses in Australia. A decrease in gross profit was partially offset by higher rebates received in the fourth quarter of 2015. |
Expenses
| ● | | General and administrative expenses decreased by $4-million (5 percent) for the fourth quarter compared to the same period last year as a result of reduced payroll and office expenses related to our ongoing Operational Excellence program. |
| ● | | Our share-based payments expense was lower by $10-million due primarily to a slight decrease in our share price in the fourth quarter of 2015 compared to a share price increase in the fourth quarter of 2014. |
| | | | | | | | |
| Other expenses breakdown | |
| | | Three months ended December 31, | |
| (millions of U.S. dollars) | | 2015 | | | 2014 | |
(Gain) loss on foreign exchange and related derivatives and commodity derivatives not designated as hedges | | | (5 | ) | | | 31 | |
Interest income | | | (16 | ) | | | (22 | ) |
Gain on sale of assets | | | (17 | ) | | | — | |
Goodwill impairment | | | 19 | | | | — | |
Environmental remediation and asset retirement obligations | | | 1 | | | | 3 | |
Bad debt expense (recovery) | | | 4 | | | | (11 | ) |
Potash profit and capital tax | | | 3 | | | | 1 | |
Other | | | 38 | | | | 7 | |
| | | | 27 | | | | 9 | |
| | |
| AGRIUM ANNUAL REPORT 2015 | | 77 |
In the fourth quarter of 2015, other expenses increased by $18-million due to the following:
| ● | | Costs of $18-million were incurred in the implementation of our Operational Excellence initiatives in the current quarter relating primarily to severance and closure costs. |
| ● | | We recorded a goodwill impairment of $19-million for our Wholesale Europe operations. |
| ● | | We recognized a $17-million gain from the sale of our West Sacramento nitrogen upgrade facility. |
| ● | | We had losses of $15-million on natural gas derivatives in the fourth quarter of 2014, which we recorded directly to other expenses. 2015 did not have comparable results, as effective January 1, 2015, we began to designate all of our natural gas derivatives as qualifying hedges for accounting purposes. Related gains or losses are now recorded as part of cost of product sold when we sell the related product, while unrealized gains or losses are recorded in equity. |
| ● | | Bad debt recovery of $11-million was recorded in the fourth quarter of 2014. |
Depreciation and amortization
| | | | | | | | | | | | | | | | | | | | | | | | | | | | | | | | |
| | | Three months ended December 31, | |
| (millions ofU.S. dollars) | | 2015 | | | 2014 | |
| | | Cost of
product sold | | | Selling | | | General and
administrative | | | Total | | | Cost of
product sold | | | Selling | | | General and
administrative | | | Total | |
Retail | | | 1 | | | | 64 | | | | 1 | | | | 66 | | | | 1 | | | | 75 | | | | 1 | | | | 77 | |
Wholesale | | | | | | | | | | | | | | | | | | | | | | | | | | | | | | | | |
Nitrogen | | | 18 | | | | | | | | | | | | 18 | | | | 21 | | | | | | | | | | | | 21 | |
Potash | | | 28 | | | | | | | | | | | | 28 | | | | 15 | | | | | | | | | | | | 15 | |
Phosphate | | | 14 | | | | | | | | | | | | 14 | | | | 14 | | | | | | | | | | | | 14 | |
Other(a) | | | 4 | | | | | | | | 1 | | | | 5 | | | | 5 | | | | | | | | 3 | | | | 8 | |
| | | | 64 | | | | — | | | | 1 | | | | 65 | | | | 55 | | | | — | | | | 3 | | | | 58 | |
Other | | | — | | | | — | | | | 4 | | | | 4 | | | | — | | | | — | | | | 3 | | | | 3 | |
Total | | | 65 | | | | 64 | | | | 6 | | | | 135 | | | | 56 | | | | 75 | | | | 7 | | | | 138 | |
| (a) | Includes product purchased for resale, ammonium sulfate, ESN and other products. |
Effective tax rate
| ● | | The effective tax rate on continuing operations of 20 percent for the fourth quarter was higher than the tax rate of (4) percent for the comparative quarter in 2014 due to the recognition of previously unrecognized tax assets in the fourth quarter of 2014. Excluding the recognition of the one-time previously unrecognized tax assets, the effective tax rate would have been 19 percent. |
BUSINESS SEGMENT PERFORMANCE
Retail
| | | | | | | | | | | | |
| | | Three months ended December 31, | |
| (millions of U.S. dollars, except where noted) | | 2015 | | | 2014 | | | Change | |
Sales | | | 1,765 | | | | 2,057 | | | | (292 | ) |
Cost of product sold | | | 1,166 | | | | 1,443 | | | | (277 | ) |
Gross profit | | | 599 | �� | | | 614 | | | | (15 | ) |
EBITDA | | | 199 | | | | 181 | | | | 18 | |
Selling expense as a percentage of sales (%) | | | 26 | | | | 25 | | | | 1 | |
| | |
| 78 | | AGRIUM ANNUAL REPORT 2015 |
| ● | | Retail sales and gross profit during the quarter were lower than the same period last year due to lower crop input prices and wet weather across the U.S. impacting the fall application season. |
| ● | | Total Retail selling expenses decreased by 10 percent compared to the prior year due to lower depreciation and amortization, the impact of currency valuations in our international businesses and cost reduction measures taken across the business in 2015. |
| ● | | Total EBITDA increased 10 percent over the fourth quarter of 2014 primarily due to lower selling expenses, strong margins for crop protection products and improved seed results. Regionally, all key geographies performed well. Canada and the U.S. both showed higher fourth quarter EBITDA figures. Australian EBITDA was down slightly compared to the prior year; however, EBIT in Australia increased compared to the same quarter in 2014 due to a reduction in depreciation and amortization. Our U.S. Retail business also reported an annual 2 percent increase in normalized comparable store sales versus a decrease of 2 percent in 2014. |
| | | | | | | | | | | | | | | | | | | | | | | | | | | | | | | | |
| | | Three months ended December 31, | |
| | | Sales | | | Gross profit | | | Gross profit (%) | |
| (millions of U.S. dollars, except where noted) | | 2015 | | | 2014 | | | Change | | | 2015 | | | 2014 | | | Change | | | 2015 | | | 2014 | |
Crop nutrients | | | 843 | | | | 972 | | | | (129 | ) | | | 154 | | | | 156 | | | | (2 | ) | | | 18 | | | | 16 | |
Crop protection products | | | 541 | | | | 552 | | | | (11 | ) | | | 268 | | | | 260 | | | | 8 | | | | 50 | | | | 47 | |
Seed | | | 75 | | | | 91 | | | | (16 | ) | | | 54 | | | | 50 | | | | 4 | | | | 72 | | | | 55 | |
Merchandise | | | 156 | | | | 211 | | | | (55 | ) | | | 27 | | | | 30 | | | | (3 | ) | | | 17 | | | | 14 | |
Services and other | | | 150 | | | | 231 | | | | (81 | ) | | | 96 | | | | 118 | | | | (22 | ) | | | 64 | | | | 51 | |
Crop nutrients
| ● | | Total crop nutrient sales were 13 percent lower compared to the same period last year due to weaker global pricing and lower application volumes due to weather challenges. However, crop nutrient margins per tonne improved, which offset the lower volumes and resulted in only a 1 percent decline in gross profit. |
| ● | | Total crop nutrient volumes were 6 percent lower this quarter across our Retail operations compared to the same period last year. Volumes were lower in the U.S. due to excess rain in the fall application window, while in Canada and Australia, growers were conservative given the uncertainty over nutrient and agricultural markets. |
| ● | | Total crop nutrient margins increased slightly on a per tonne basis and gross profit as a percentage of sales rose from 16 percent in the fourth quarter of 2014 to 18 percent this quarter reflecting a focus on inventory management. |
Crop protection products
| ● | | Total crop protection sales were down 2 percent this quarter, as slightly higher sales in North America were offset by lower sales in our International operations. U.S. sales were driven by a strong herbicide application season, while Canadian growers purchased higher volumes ahead of the weakening Canadian dollar. In Australia, sales were lower due to the weakening of the Australian dollar against the U.S. dollar; in local currency, Australian sales were higher in the current quarter than in the same quarter last year. |
| ● | | Crop protection margins as a percentage of sales increased 3 percent, primarily due to year-end rebate reconciliation and a higher margin product mix in the current quarter. |
| ● | | Proprietary product sales as a percentage of total sales increased 2 percent compared to the same period in the prior year. |
Seed
| ● | | Seed sales were down 18 percent this quarter compared to the same period last year, primarily due to the significant reduction in planted wheat acres in the U.S. due to wet weather and lower wheat prices. |
| ● | | Despite lower sales, seed margins increased 8 percent compared to the prior year due to strong supplier rebates and seed sales mix. |
Merchandise
| ● | | Merchandise sales decreased compared to the same period last year as a result of lower fuel pricing and demand in Canada and lower animal health and fencing product sales in Australia due to dry conditions. |
| ● | | Gross profit as a percentage of sales increased 3 percent this quarter, primarily due to a reduction in the lower-margin Canadian fuel business compared to the prior year. |
| | |
| AGRIUM ANNUAL REPORT 2015 | | 79 |
Services and other
| ● | | Sales for services and other was down 35 percent this quarter, due mainly to the closure of one of our livestock export businesses in Australia. Application and other services were down in North America, due to the wet conditions in the U.S. during the fall application season. |
Wholesale
| | | | | | | | | | | | |
| | | Three months ended December 31, | |
| (millions of U.S. dollars, except where noted) | | 2015 | | | 2014 | | | Change | |
Sales | | | 888 | | | | 897 | | | | (9 | ) |
Sales volumes (tonnes ’000) | | | 2,292 | | | | 1,999 | | | | 293 | |
Cost of product sold | | | 568 | | | | 767 | | | | (199 | ) |
Gross profit | | | 320 | | | | 130 | | | | 190 | |
Adjusted EBITDA | | | 372 | | | | 150 | | | | 222 | |
Expenses | | | 33 | | | | 46 | | | | (13 | ) |
| ● | | Wholesale successfully completed its Canpotex proving run for the Vanscoy potash expansion at the end of the fourth quarter, resulting in our annual Canpotex allocation increasing to 10.3 percent in 2016 from 7.3 percent in 2015. Higher operating production rates at our nitrogen facilities also supported increased sales volumes this quarter. Total sales were slightly lower this quarter due to lower global nutrient prices and our decision to sell non-core, lower-return purchase for resale facilities in 2015 related to our asset portfolio review. |
| ● | | Adjusted EBITDA increased by $222-million this quarter, and more than doubled compared to the same quarter last year. The increase was primarily due to lower production costs per tonne and higher utilization rates from our potash and nitrogen operations. |
| | | | | | | | | | | | | | | | | | | | | | | | | | | | | | | | | | | | |
| Wholesale product information | | Three months ended December 31, | |
| | | Nitrogen | | | Potash | | | Phosphate | |
| | | 2015 | | | 2014 | | | Change | | | 2015 | | | 2014 | | | Change | | | 2015 | | | 2014 | | | Change | |
Gross profit (millions of U.S. dollars) | | | 186 | | | | 113 | | | | 73 | | | | 63 | | | | (50 | ) | | | 113 | | | | 37 | | | | 37 | | | | — | |
Sales volumes (tonnes 000’s) | | | 912 | | | | 879 | | | | 33 | | | | 656 | | | | 19 | | | | 637 | | | | 325 | | | | 305 | | | | 20 | |
Selling price ($/tonne) | | | 403 | | | | 459 | | | | (56 | ) | | | 267 | | | | 482 | | | | (215 | ) | | | 610 | | | | 656 | | | | (46 | ) |
Cost of product sold ($/tonne) | | | 199 | | | | 331 | | | | (132 | ) | | | 171 | | | | 2,992 | | | | (2,821 | ) | | | 495 | | | | 534 | | | | (39 | ) |
Gross margin ($/tonne) | | | 204 | | | | 128 | | | | 76 | | | | 96 | | | | (2,510 | ) | | | 2,606 | | | | 115 | | | | 122 | | | | (7 | ) |
Nitrogen
| ● | | Nitrogen gross profit increased by 65 percent over the same period last year as a result of higher sales volumes and significantly lower cost of production. |
| ● | | Sales volumes increased by 4 percent over the same period last year, driven by stronger urea and ammonia sales volumes. The increase was due to strong demand in our core markets and higher on-stream time at our production facilities, creating additional product availability compared to the same period last year. Sales volumes were partly impacted by a narrow window for ammonia application in the U.S. and lower nitrogen solution sales volumes due to the closure and subsequent sale of our West Sacramento upgrading facility in 2015. |
| ● | | Cost of product sold per tonne was 40 percent lower than the same period last year. Operational improvements and higher on-stream time compared to the same period last year decreased fixed costs per tonne, while lower natural gas costs reduced variable costs. The weaker Canadian dollar also reduced operating costs at our Canadian plants. |
| ● | | Nitrogen margins were $204 per tonne – a $76 per tonne increase over the same period last year despite a 12 percent reduction in average selling prices. |
| | |
| 80 | | AGRIUM ANNUAL REPORT 2015 |
| | | | | | | | |
| Natural gas prices: North American indices and North American Agrium prices | | Three months ended December 31, | |
| (U.S. dollars per MMBtu) | | 2015 | | | 2014 | |
Overall gas cost excluding realized derivative impact | | | 2.15 | | | | 3.47 | |
Realized derivative impact | | | 0.31 | | | | 0.15 | |
Overall gas cost | | | 2.46 | | | | 3.62 | |
Average NYMEX | | | 2.28 | | | | 3.94 | |
Average AECO | | | 2.00 | | | | 3.17 | |
As of January 1, 2015, we have designated all of our natural gas derivatives as accounting hedges1, with realized gains and losses now recorded to cost of product sold (which also includes transportation and administration costs).
Potash
| ● | | Potash gross profit this quarter was $113-million higher than the same period last year. The significant increase was due to higher production volumes and lower costs this quarter after the completion of the Vanscoy expansion project as compared to the significant outage in the fourth quarter of 2014 in order to tie in the expansion, which resulted in a negative gross profit of $50-million. |
| ● | | Sales volumes were 637,000 tonnes higher compared to the same period in the prior year. Production volumes this quarter were 691,000 tonnes and the Canpotex proving run was completed successfully before the end of 2015. We expect Agrium’s new Canpotex allotment will be 10.3 percent of Canpotex’s total annual international shipments. |
| ● | | Realized selling prices were lower than the same period last year due to slow spot market demand in both domestic and international markets. |
| ● | | Cost of product sold was reduced as a result of cost efficiencies associated with the ramp-up of the Vanscoy expansion compared to the outage last year for the final tie in of the expansion project. The significant weakening of the Canadian dollar also reduced production costs reported in U.S. dollars. As a result, cash cost of product manufactured continued to improve and was $64 per tonne this quarter compared to $89 per tonne in the third quarter of 2015. |
Phosphate
| ● | | Sales volumes were slightly higher than last year, while reduced selling prices were largely offset by lower cost of production. As a result, phosphate margin per tonne was only 6 percent lower than the same quarter last year. |
| ● | | Phosphate gross profit was unchanged from the prior year. |
Wholesale Other
| | | | | | | | | | | | |
| Wholesale Other: gross profit breakdown | | Three months ended December 31, | |
| (millions of U.S. dollars) | | 2015 | | | 2014 | | | Change | |
Ammonium sulfate | | | 16 | | | | 14 | | | | 2 | |
ESN | | | 15 | | | | 13 | | | | 2 | |
Product purchased for resale | | | 1 | | | | 3 | | | | (2 | ) |
Other | | | 2 | | | | — | | | | 2 | |
| | | | 34 | | | | 30 | | | | 4 | |
| ● | | Gross profit for Wholesale’s Other product category increased this quarter primarily due to higher ammonium sulfate sales volumes and higher ESN margins resulting from lower cost of product sold. This was partly offset by lower ESN realized selling prices. |
Expenses
| ● | | Expenses in the current quarter were $13-million lower than the same period last year as a result of lower selling and general and administrative expenses and a $17-million gain on sale of the West Sacramento upgrading facility. Partially offsetting this was a $19-million goodwill impairment in our European purchase for resale business resulting from our ongoing portfolio review in 2015. |
| 1 | In the prior year, unrealized and realized gains and losses on derivatives not designated as hedges were included in other expenses. |
| | |
| AGRIUM ANNUAL REPORT 2015 | | 81 |
Other
EBITDA for our Other non-operating business unit for the fourth quarter of 2015 had a net expense of $92-million, compared to a net expense of $78-million for the fourth quarter of 2014. The variance was due to the following:
| ● | | $7-million higher gross profit elimination expense as a result of higher inter-segment inventory held at the end of the fourth quarter of 2015. |
| ● | | Increase of $12-million in other expenses of our Other business unit primarily due to costs incurred in implementing our Operational Excellence initiatives including severance and closure costs. |
| ● | | $10-million lower share-based payments expenses due primarily to a slight decrease in our share price in the fourth quarter of 2015 compared to a share price increase in the same period last year. |
RECONCILIATIONS OF FOURTH QUARTER NON-IFRS FINANCIAL MEASURES
Adjusted EBITDA and EBITDA to EBIT
| | | | | | | | | | | | | | | | | | | | | | | | | | | | | | | | |
| | | Three months ended December 31, 2015 | | | Three months ended December 31, 2014 | |
| (millions of U.S. dollars) | | Retail | | | Wholesale | | | Other | | | Consolidated | | | Retail | | | Wholesale | | | Other | | | Consolidated | |
Adjusted EBITDA | | | 199 | | | | 372 | | | | (92 | ) | | | 479 | | | | 181 | | | | 150 | | | | (78 | ) | | | 253 | |
Equity accounted joint ventures: | | | | | | | | | | | | | | | | | | | | | | | | | | | | | | | | |
Finance costs and income taxes | | | — | | | | 13 | | | | — | | | | 13 | | | | — | | | | 4 | | | | — | | | | 4 | |
Depreciation and amortization | | | — | | | | 7 | | | | — | | | | 7 | | | | — | | | | 4 | | | | — | | | | 4 | |
EBITDA | | | 199 | | | | 352 | | | | (92 | ) | | | 459 | | | | 181 | | | | 142 | | | | (78 | ) | | | 245 | |
Depreciation and amortization | | | 66 | | | | 65 | | | | 4 | | | | 135 | | | | 77 | | | | 58 | | | | 3 | | | | 138 | |
EBIT | | | 133 | | | | 287 | | | | (96 | ) | | | 324 | | | | 104 | | | | 84 | | | | (81 | ) | | | 107 | |
Key assumptions and risks in respect of forward-looking statements
All of the forward-looking statements contained in this MD&A are qualified by the cautionary statements contained herein and by stated or inherent assumptions and apply only as of the date of this MD&A. Except as required by law, Agrium disclaims any intention or obligation to update or revise any forward-looking statements as a result of new information or future events.
The following table outlines significant forward-looking statements contained in this MD&A and provides the material assumptions used to develop such forward-looking statements and material risk factors that could cause actual results to differ materially from the forward-looking statements. Although Agrium believes the material assumptions outlined below are reasonable, this list is not exhaustive of the factors that may affect any of the forward-looking statements. Readers should not place undue reliance on these assumptions and such forward-looking statements.
| | |
| 82 | | AGRIUM ANNUAL REPORT 2015 |
| | | | | | | | |
| Forward-looking statements | | Material assumptions | | Material risk factors |
| Continued growth in free cash flow and shareholder returns through dividends | | • | | Agrium is able to achieve its performance targets, complete proposed projects on time and on budget, and maintain its investment grade rating. | | • | | Agrium’s ability to generate free cash flows as planned. |
| | • | | Agrium’s business conditions are within normal parameters with respect to prices, margins, product availability and supplier agreements for our major products. | | • | | Unexpected increase in input costs and inflation rate. |
| | | | | • | | Unexpected changes in prices, margins, product availability, foreign exchange or tax rates, or supplier agreements for our major products. |
| Expected results from our Operational Excellence initiatives, including further costs savings, continuous improvement on our utilization rates, and use of our Retail distribution network to enable increased production in Wholesale | | • | | Actual production levels are consistent with forecasts. | | • | | Inflation and currency rate fluctuations that could affect Wholesale’s costs. |
| | | | | • | | Unexpected outages and turnarounds at our facilities. |
| | | | | • | | Unexpected logistics issues that could affect distribution of Wholesale products using Retail’s network. |
| | | | | • | | Continued or further disruptions to natural gas supply at the Profertil and MOPCO nitrogen facilities. |
| Market outlook, including anticipated supply and demand for our three major crop nutrients, product and input price outlook, and other expected economic, legal and business conditions | | • | | Global demand for nitrogen, potash and phosphate will remain stable or increase in 2016. | | • | | Changes in global demand or supply for our three major crop nutrients. |
| | • | | Crop input demand will increase in North America in 2016. | | • | | Changes in government policies, legislation and regulations that could impose restrictions in exportation. |
| | • | | Normal weather will allow intended crop area to be planted within North America in 2016. | | • | | Volatility in global currency values. |
| | | | | • | | Changes in the global prices of key raw materials for the production of crop nutrients. |
| | | | | | • | | Changes in global crop production level, general economic, market, business and weather conditions, industry competition and various events that could disrupt operations and/or crop input market conditions. |
| Factors that will drive improvement in Retail’s key metrics and financial measures, including growth in our proprietary products | | • | | Retail business conditions are within normal parameters with respect to prices, margins, product availability and supplier agreements for our major products. | | • | | Retail’s ability to effectively implement planned business strategy. |
| | • | | Agrium is able to identify suitable candidates for acquisitions and to negotiate acceptable terms. | | • | | Changes in general economic, market, business and weather conditions, industry competition and various events that could disrupt operations. |
| | | • | | Agrium is able to implement its standards, controls, procedures and policies at the acquired businesses to realize the expected synergies. | | • | | General operating risks associated with investment in foreign jurisdictions. |
| Expected percentage of Agrium’s share in Canpotex total sales and statements related to Agrium’s guarantee in Canpotex | | • | | Actual production capacities of Agrium and other Canpotex producers are as expected. | | • | | Agrium’s ability to meet the expected production capacities of its potash facilities. |
| | | | | • | | Unexpected outages or delays on its major turnarounds. |
| Completion of the Borger nitrogen facility expansion, including estimated completion date | | • | | Necessary permits, utilities and project approvals are secured on time. | | • | | Labor shortages and/or inefficiency causing schedule delays and/or cost increases. |
| | • | | Resources are available to meet the project’s scheduled timeline. | | | |
| | | | | | | | | |
| | |
| AGRIUM ANNUAL REPORT 2015 | | 83 |
| | | | | | | | |
| Forward-looking statements | | Material assumptions | | Material risk factors |
| Expected increase in Wholesale’s nitrogen capacity and production coming from the Borger and MOPCO nitrogen expansion projects | | • | | Borger expansion project is completed on time and as planned. | | • | | Change in the demand for and viability of the product. |
| | • | | Actual capacity and production levels are consistent with forecasts. | | • | | Unexpected outages and turnarounds at our facilities. |
| | | | | | • | | Expected volumes are below target. |
| | | | | | • | | Interruptions in the gas supply. |
| | | | | | | • | | Delays in the provisional acceptance of the additional trains. |
| Our ability to sustain projected potash production with existing reserves and resources, including mine life estimates, and expected reductions in cost of production as facility continues to ramp-up | | • | | Potash reserves are accessible and of sufficient quality to provide the required ore for long-term production. | | • | | Flooding and/or poor ground conditions limiting access to major sections of the ore body or resulting in poor ore quality. |
| | • | | Actual production levels are consistent with forecasts. | | • | | Unexpected outages and turnarounds. |
| Agrium’s ability to meet its capital requirements, including the ability to expand existing sources of financing or to access other sources of financing and to meet debt repayments and future obligations in the foreseeable future | | • | | North American and global economic growth. | | • | | Inflation, currency and interest rate fluctuations and changes in tax rates that could affect Agrium’s ability to meet obligations. |
| | • | | Access to capital markets. | | | |
| | • | | Agrium is able to maintain. | | | |
| | | | • Adequate credit ratios. • Investment grade credit ratings. | | • | | Level and performance of future capital expenditures. |
| | | | • Adequate cash generated from operations. | | |
| Expected level of capital expenditures, existing or planned acquisitions, expansion and growth of our business and operations including the development of new markets and products | | • | | Adequate cash is generated from operations and other sources of financing. | | • | | Integration risks that might cause anticipated synergies from our recent and future acquisitions to be less than expected. |
| | • | | Agrium is able to utilize our available credit facilities or access capital markets for additional sources of financing. | | • | | Changes in development plans for our expansion, efficiency, debottleneck and other major projects, including the potential for capital construction costs to be higher than expected or construction progress to be delayed due to various factors. |
| | | | | | • | | The level of sustaining and investing capital may vary significantly depending on corporate priorities as the year progresses and based on changes in the rate of inflation or engineering costs. |
| | | | | | | • | | Potential inability to access or utilize our credit facilities or access capital markets. |
| Statements relating to the supply of our phosphate rock | | • | | Commitments agreed with our suppliers. | | • | | Interruption in the supply of phosphate rock. |
| | | | | | • | | Changes in the terms of agreements with our suppliers. |
| Expected compliance with environmental requirements and associated costs, as well as the installation and timing of emissions reduction technology and impact to Agrium | | • | | Tentative start-up of carbon capture technology in the first quarter of 2017. | | • | | Carbon capture and storage funding not received from Alberta government. |
| | | | | • | | Upgrader projects (specifically the Northwest Upgrader) cancelled or delayed. |
| | | | | • | | Issues with engineering/procurement or construction of the facility or pipeline. |
| Anticipated environmental remediation liabilities and asset retirement obligations | | • | | Timing and amount of expenditures. | | • | | Changes in government policies, legislation and regulations that could increase estimated costs. |
| | | • | | Estimated discount and inflation rates. | | • | | Inflation, currency and interest rate fluctuations. |
| | |
| 84 | | AGRIUM ANNUAL REPORT 2015 |