Exhibit 99.9
/// Wabtec: Investor Presentation September 10, 2018
/// 1 /// DISCLAIMER / FORWARD-LOOKING STATEMENTS Additional Information and Where to Find It Westinghouse Air Brake Technologies (“Wabtec”) has filed a shelf registration statement (including a prospectus) with the U.S. Securities and Exchange Commission (“SEC”). Any offering of securities will be made only by means of a prospectus supplement, which will be filed with the SEC. In connection with any offering of securities pursuant to the shelf registration statement, you may obtain a copy of the applicable prospectus supplement and accompanying prospectus for the offering through the website maintained by the SEC at www.sec.gov or through the underwriters for such offering. In connection with the proposed transaction (the “Proposed Transaction”) between General Electric Company (“GE”) and Wabtec, Transportation Systems Holdings, Inc. (“SpinCo”) will file with the SEC a registration statement on Form S-4/S-1 containing a prospectus or a registration statement on Form 10 and Wabtec will file with the SEC a registration statement on Form S-4 that will include a combined proxy statement/prospectus. If the transaction is effected via an exchange offer, GE will also file with the SEC a Schedule TO with respect thereto. This communication is not a substitute for any proxy statement, registration statement, proxy statement/prospectus or other documents GE, Wabtec and/or SpinCo may file with the SEC in connection with the Proposed Transaction. INVESTORS AND SECURITY HOLDERS ARE URGED TO READ CAREFULLY AND IN THEIR ENTIRETY THESE DOCUMENTS WHEN THEY BECOME AVAILABLE, ANY AMENDMENTS OR SUPPLEMENTS TO THESE DOCUMENTS, AND OTHER DOCUMENTS FILED BY GE, WABTEC OR SPINCO WITH THE SEC IN CONNECTION WITH THE PROPOSED TRANSACTION, BECAUSE THESE DOCUMENTS WILL CONTAIN IMPORTANT INFORMATION. Investors and security holders will be able to obtain free copies of these materials and other documents filed with the SEC by GE, Wabtec and/or SpinCo through the website maintained by the SEC at www.sec.gov. Investors and security holders will also be able to obtain free copies of the documents filed by GE, Wabtec and/or SpinCo with the SEC from the respective companies by directing a written request to GE and/or SpinCo at General Electric Company, 41 Farnsworth Street, Boston, Massachusetts 02210 or by calling 617-443- 3400, or to Wabtec at Wabtec Corporation, 1001 Air Brake Avenue, Wilmerding, PA 15148 or by calling 412-825-1543. No Offer or Solicitation This presentation is for informational purposes only and not intended to and does not constitute an offer to subscribe for, buy or sell, the solicitation of an offer to subscribe for, buy or sell, or an invitation to subscribe for, buy or sell, any securities or the solicitation of any vote or approval in any jurisdiction pursuant to or in connection with the Proposed Transaction or otherwise, nor shall there be any sale, issuance or transfer of securities in any jurisdiction in contravention of applicable law. No offer of securities shall be made except by means of a prospectus meeting the requirements of Section 10 of the Securities Act of 1933, as amended, and otherwise in accordance with applicable law. Participants in the Solicitation This presentation is not a solicitation of a proxy from any investor or security holder. GE, Wabtec, SpinCo, their respective directors, executive officers and other members of their management and employees may be deemed to be participants in the solicitation of proxies from shareholders of Wabtec in connection with the Proposed Transaction. Information regarding the persons who may, under the rules of the SEC, be deemed participants in the solicitation of proxies in connection with the Proposed Transaction, including a description of their direct or indirect interests, by security holdings or otherwise, will be set forth in the relevant materials when filed with the SEC. Information regarding the directors and executive officers of GE is contained in GE’s proxy statement for its 2018 annual meeting of stockholders, filed with the SEC on March 23, 2018, its Annual Report on Form 10-K for the year ended December 31, 2017, which was filed with the SEC on February 23, 2018, its Quarterly Report on Form 10-Q for the quarter ended March 31, 2018, which was filed with the SEC on May 1, 2018, its Quarterly Report on Form 10-Q for the quarter ended June 30, 2018, which was filed with the SEC on July 27, 2018, and certain of its Current Reports filed on Form 8-K. Information regarding the directors and executive officers of Wabtec is contained in Wabtec’s proxy statement for its 2018 annual meeting of stockholders, filed with the SEC on April 5, 2018, its Annual Report on Form 10-K for the year ended December 31, 2017, which was filed with the SEC on February 26, 2018, its Quarterly Report on Form 10-Q for the quarter ended March 31, 2018 which was filed with the SEC on May 4, 2018, its Quarterly Report on Form 10-Q for the quarter ended June 30, 2018, which was filed on July 31, 2018 and certain of its Current Reports filed on Form 8-K. These documents can be obtained free of charge from the sources indicated above.
/// 2 /// DISCLAIMER / FORWARD-LOOKING STATEMENTS Caution Concerning Forward-Looking Statements This presentation contains “forward-looking” statements as that term is defined in Section 27A of the Securities Act of 1933, as amended, and Section 21E of the Securities Exchange Act of 1934, as amended by the Private Securities Litigation Reform Act of 1995, including statements regarding the Proposed Transaction. All statements, other than historical facts, including statements regarding the expected timing and structure of the Proposed Transaction; the ability of the parties to complete the Proposed Transaction considering the various closing conditions; the expected benefits of the Proposed Transaction, including future financial and operating results, the tax consequences of the Proposed Transaction and the combined company’s plans, objectives, expectations and intentions; legal, economic and regulatory conditions; and any assumptions underlying any of the foregoing, are forward-looking statements. Forward-looking statements concern future circumstances and results and other statements that are not historical facts and are sometimes identified by the words “may,” “will,” “should,” “potential,” “intend,” “expect,” “endeavor,” “seek,” “anticipate,” “estimate,” “overestimate,” “underestimate,” “believe,” “could,” “project,” “predict,” “continue,” “target” or other similar words or expressions. Forward-looking statements are based upon current plans, estimates and expectations that are subject to risks, uncertainties and assumptions. Should one or more of these risks or uncertainties materialize, or should underlying assumptions prove incorrect, actual results may vary materially from those indicated or anticipated by such forward-looking statements. The inclusion of such statements should not be regarded as a representation that such plans, estimates or expectations will be achieved. Important factors that could cause actual results to differ materially from such plans, estimates or expectations include, among others, (1) that one or more closing conditions to the Proposed Transaction, including certain regulatory approvals, may not be satisfied or waived, on a timely basis or otherwise, including that a governmental entity may prohibit, delay or refuse to grant approval for the consummation of the Proposed Transaction, may require conditions, limitations or restrictions in connection with such approvals or that the required approval by the stockholders of Wabtec may not be obtained; (2) the risk that the Proposed Transaction may not be completed on the terms or in the time frame expected by GE or Wabtec, or at all; (3) unexpected costs, charges or expenses resulting from the Proposed Transaction; (4) uncertainty of the expected financial performance of the combined company following completion of the Proposed Transaction; (5) failure to realize the anticipated benefits of the Proposed Transaction, including as a result of delay in completing the Proposed Transaction or integrating the businesses of GE Transportation, Wabtec and SpinCo; (6) the ability of the combined company to implement its business strategy; (7) difficulties and delays in achieving revenue and cost synergies of the combined company; (8) inability to retain and hire key personnel; (9) the occurrence of any event that could give rise to termination of the Proposed Transaction; (10) the risk that stockholder litigation in connection with the Proposed Transaction or settlements or investigations may affect the timing or occurrence of the Proposed Transaction or result in significant costs of defense, indemnification and liability; (11) evolving legal, regulatory and tax regimes; (12) changes in general economic and/or industry specific conditions; (13) actions by third parties, including government agencies; and (14) other risk factors as detailed from time to time in GE’s and Wabtec’s respective reports filed with the SEC, including GE’s and Wabtec’s annual reports on Form 10-K, periodic quarterly reports on Form 10-Q, periodic current reports on Form 8-K and other documents filed with the SEC. The foregoing list of important factors is not exclusive. Any forward-looking statements speak only as of the date of this presentation. Neither GE nor Wabtec undertakes any obligation to update any forward-looking statements, whether as a result of new information or development, future events or otherwise, except as required by law. Readers are cautioned not to place undue reliance on any of these forward-looking statements. Non-GAAP Metrics This presentation includes certain non-GAAP financial measures, including EBITDA, EBIT, Adj. EBITDA and Adj. EBIT. While Wabtec believes these are useful supplemental measures for investors, they are not presented in accordance with GAAP. You should not consider non-GAAP measures in isolation or as a substitute for net income, cash flows from operations, or any other items calculated in accordance with GAAP. In addition, the non-GAAP financial measures included in this presentation have inherent material limitations as performance measures because they add back certain expenses incurred by us to net income, resulting in those expenses not being taken into account in the applicable financial measure. Because not all companies use identical calculations, the presentation herein of non-GAAP financial measures may not be comparable to other similarly titled measures of other companies.

/// 3 /// GE Transportation Transaction Overview Wabtec Business Update GE Transportation Business Overview GE Transportation Transaction Rationale Financial Overview TODAY’S PRESENTERS & AGENDA 1 5 2 3 4 Pat Dugan Executive VP & CFO Mondher Bach VP Finance, Global Treasury Presenters Agenda
/// GE TRANSPORTATION TRANSACTION OVERVIEW
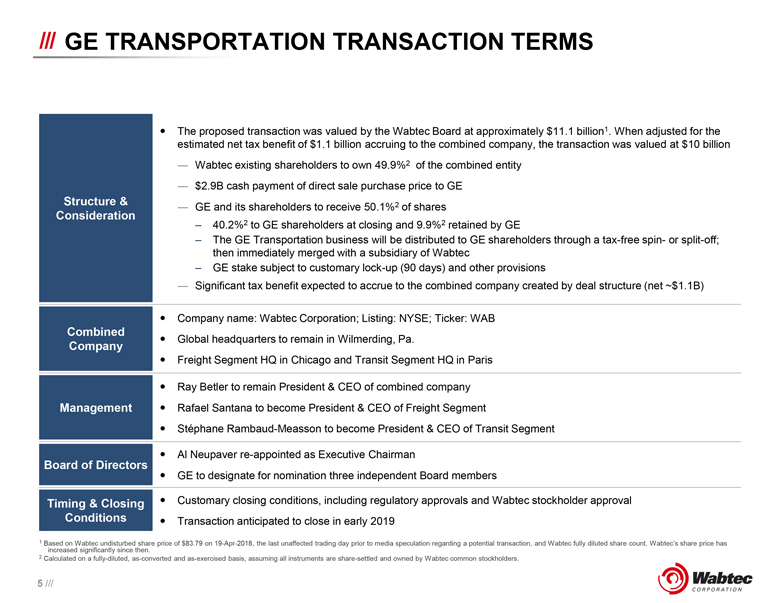
/// 5 /// 1 Based on Wabtec undisturbed share price of $83.79 on 19-Apr-2018, the last unaffected trading day prior to media speculation regarding a potential transaction, and Wabtec fully diluted share count. Wabtec’s share price has increased significantly since then. 2 Calculated on a fully-diluted, as-converted and as-exercised basis, assuming all instruments are share-settled and owned by Wabtec common stockholders. Structure & Consideration The proposed transaction was valued by the Wabtec Board at approximately $11.1 billion1. When adjusted for the estimated net tax benefit of $1.1 billion accruing to the combined company, the transaction was valued at $10 billion ―Wabtec existing shareholders to own 49.9%2 of the combined entity ―$2.9B cash payment of direct sale purchase price to GE ―GE and its shareholders to receive 50.1%2 of shares –40.2%2 to GE shareholders at closing and 9.9%2 retained by GE –The GE Transportation business will be distributed to GE shareholders through a tax-free spin- or split-off; then immediately merged with a subsidiary of Wabtec –GE stake subject to customary lock-up (90 days) and other provisions ―Significant tax benefit expected to accrue to the combined company created by deal structure (net ~$1.1B) Combined Company Company name: Wabtec Corporation; Listing: NYSE; Ticker: WAB Global headquarters to remain in Wilmerding, Pa. Freight Segment HQ in Chicago and Transit Segment HQ in Paris Management Ray Betler to remain President & CEO of combined company Rafael Santana to become President & CEO of Freight Segment Stéphane Rambaud-Measson to become President & CEO of Transit Segment Board of Directors Al Neupaver re-appointed as Executive Chairman GE to designate for nomination three independent Board members Timing & Closing Conditions Customary closing conditions, including regulatory approvals and Wabtec stockholder approval Transaction anticipated to close in early 2019 GE TRANSPORTATION TRANSACTION TERMS
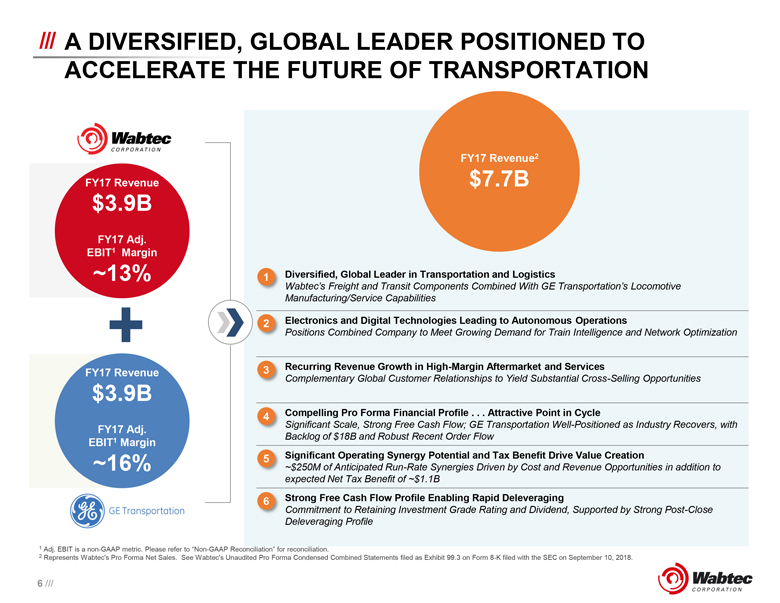
/// 6 /// 1 Adj. EBIT is a non-GAAP metric. Please refer to “Non-GAAP Reconciliation” for reconciliation. 2 Represents Wabtec's Pro Forma Net Sales. See Wabtec's Unaudited Pro Forma Condensed Combined Statements filed as Exhibit 99.3 on Form 8-K filed with the SEC on September 10, 2018. Diversified, Global Leader in Transportation and Logistics Wabtec’s Freight and Transit Components Combined With GE Transportation’s Locomotive Manufacturing/Service Capabilities Electronics and Digital Technologies Leading to Autonomous Operations Positions Combined Company to Meet Growing Demand for Train Intelligence and Network Optimization Recurring Revenue Growth in High-Margin Aftermarket and Services Complementary Global Customer Relationships to Yield Substantial Cross-Selling Opportunities Compelling Pro Forma Financial Profile . . . Attractive Point in Cycle Significant Scale, Strong Free Cash Flow; GE Transportation Well-Positioned as Industry Recovers, with Backlog of $18B and Robust Recent Order Flow Significant Operating Synergy Potential and Tax Benefit Drive Value Creation ~$250M of Anticipated Run-Rate Synergies Driven by Cost and Revenue Opportunities in addition to expected Net Tax Benefit of ~$1.1B Strong Free Cash Flow Profile Enabling Rapid Deleveraging Commitment to Retaining Investment Grade Rating and Dividend, Supported by Strong Post-Close Deleveraging Profile A DIVERSIFIED, GLOBAL LEADER POSITIONED TO ACCELERATE THE FUTURE OF TRANSPORTATION FY17 Revenue $3.9B FY17 Adj. EBIT1 Margin ~13% FY17 Revenue $3.9B FY17 Adj. EBIT1 Margin ~16% FY17 Revenue2 $7.7B 1 2 3 4 5 6
 /// WABTEC BUSINESS UPDATE
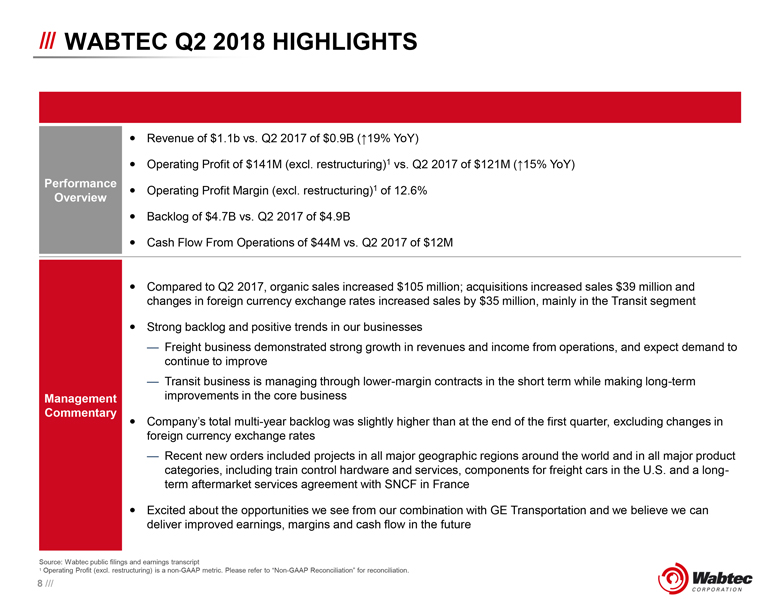
/// 8 /// WABTEC Q2 2018 HIGHLIGHTS Source: Wabtec public filings and earnings transcript 1 Operating Profit (excl. restructuring) is a non-GAAP metric. Please refer to “Non-GAAP Reconciliation” for reconciliation. Performance Overview Revenue of $1.1b vs. Q2 2017 of $0.9B (↑19% YoY) Operating Profit of $141M (excl. restructuring)1 vs. Q2 2017 of $121M (↑15% YoY) Operating Profit Margin (excl. restructuring)1 of 12.6% Backlog of $4.7B vs. Q2 2017 of $4.9B Cash Flow From Operations of $44M vs. Q2 2017 of $12M Management Commentary Compared to Q2 2017, organic sales increased $105 million; acquisitions increased sales $39 million and changes in foreign currency exchange rates increased sales by $35 million, mainly in the Transit segment Strong backlog and positive trends in our businesses —Freight business demonstrated strong growth in revenues and income from operations, and expect demand to continue to improve —Transit business is managing through lower-margin contracts in the short term while making long-term improvements in the core business Company’s total multi-year backlog was slightly higher than at the end of the first quarter, excluding changes in foreign currency exchange rates —Recent new orders included projects in all major geographic regions around the world and in all major product categories, including train control hardware and services, components for freight cars in the U.S. and a long-term aftermarket services agreement with SNCF in France Excited about the opportunities we see from our combination with GE Transportation and we believe we can deliver improved earnings, margins and cash flow in the future
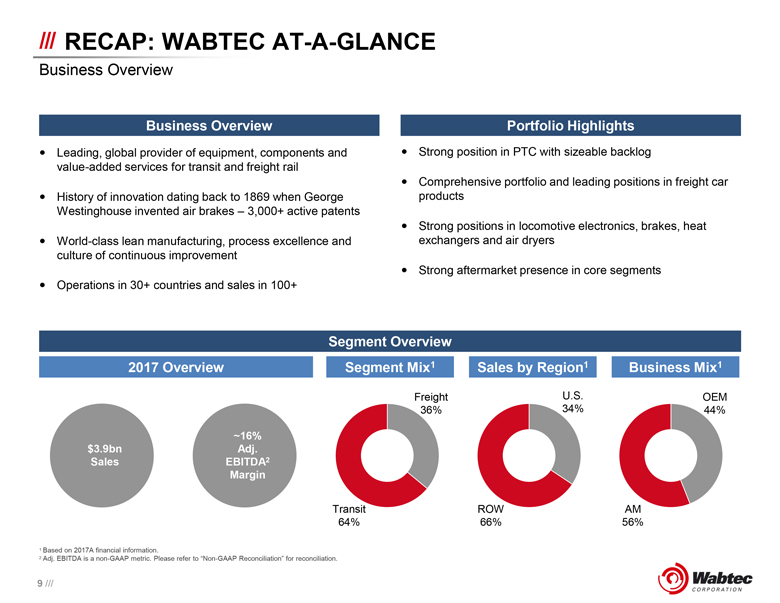
/// 9 /// RECAP: WABTEC AT-A-GLANCE Business Overview Portfolio Highlights Leading, global provider of equipment, components and value-added services for transit and freight rail History of innovation dating back to 1869 when George Westinghouse invented air brakes – 3,000+ active patents World-class lean manufacturing, process excellence and culture of continuous improvement Operations in 30+ countries and sales in 100+ 1 Based on 2017A financial information. 2 Adj. EBITDA is a non-GAAP metric. Please refer to “Non-GAAP Reconciliation” for reconciliation. Strong position in PTC with sizeable backlog Comprehensive portfolio and leading positions in freight car products Strong positions in locomotive electronics, brakes, heat exchangers and air dryers Strong aftermarket presence in core segments Segment Overview Business Mix1 Segment Mix1 2017 Overview Sales by Region1 $3.9bn Sales Freight 36% Transit 64% ~16% Adj. EBITDA2 Margin U.S. 34% ROW 66% OEM 44% AM 56% Business Overview
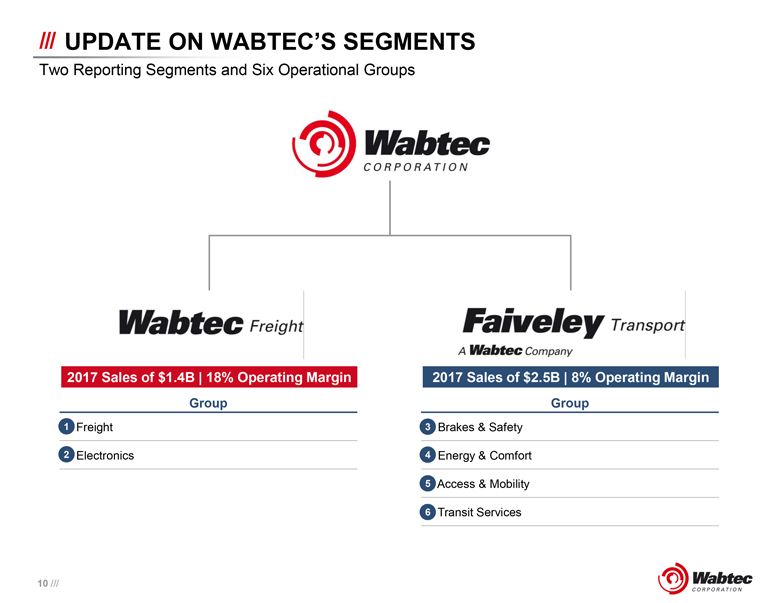
/// 10 /// UPDATE ON WABTEC’S SEGMENTS Group Brakes & Safety Energy & Comfort Access & Mobility Transit Services Two Reporting Segments and Six Operational Groups 2017 Sales of $1.4B | 18% Operating Margin 2017 Sales of $2.5B | 8% Operating Margin Group Freight Electronics 1 2 3 4 5 6
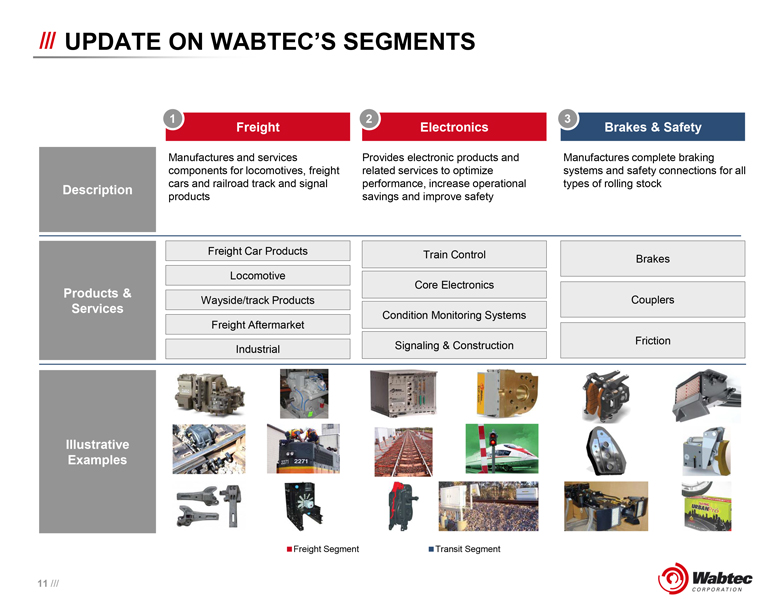
/// 11 /// UPDATE ON WABTEC’S SEGMENTS Freight Electronics Description Products & Services Illustrative Examples Manufactures and services components for locomotives, freight cars and railroad track and signal products Provides electronic products and related services to optimize performance, increase operational savings and improve safety Freight Car Products Locomotive Wayside/track Products Freight Aftermarket Industrial 1 2 Train Control Core Electronics Condition Monitoring Systems Signaling & Construction Brakes & Safety Manufactures complete braking systems and safety connections for all types of rolling stock 3 Brakes Couplers Friction Freight SegmentTransit Segment
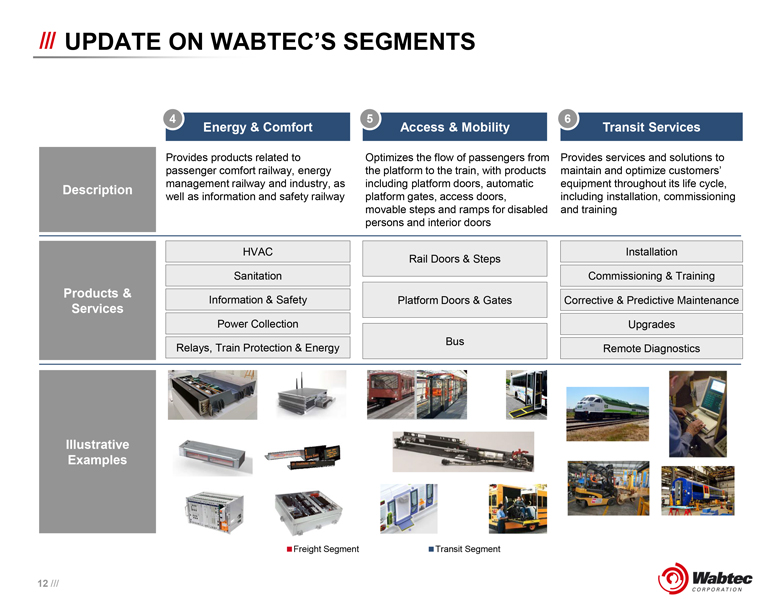
/// 12 /// UPDATE ON WABTEC’S SEGMENTS Energy & Comfort Description Products & Services Provides products related to passenger comfort railway, energy management railway and industry, as well as information and safety railway HVAC Sanitation Information & Safety Power Collection Relays, Train Protection & Energy 4 Access & Mobility Transit Services Optimizes the flow of passengers from the platform to the train, with products including platform doors, automatic platform gates, access doors, movable steps and ramps for disabled persons and interior doors Provides services and solutions to maintain and optimize customers’ equipment throughout its life cycle, including installation, commissioning and training 5 Rail Doors & Steps Platform Doors & Gates Bus Installation Commissioning & Training Corrective & Predictive Maintenance Upgrades Remote Diagnostics 6 Illustrative Examples Freight Segment Transit Segment
/// GE TRANSPORTATION BUSINESS OVERVIEW
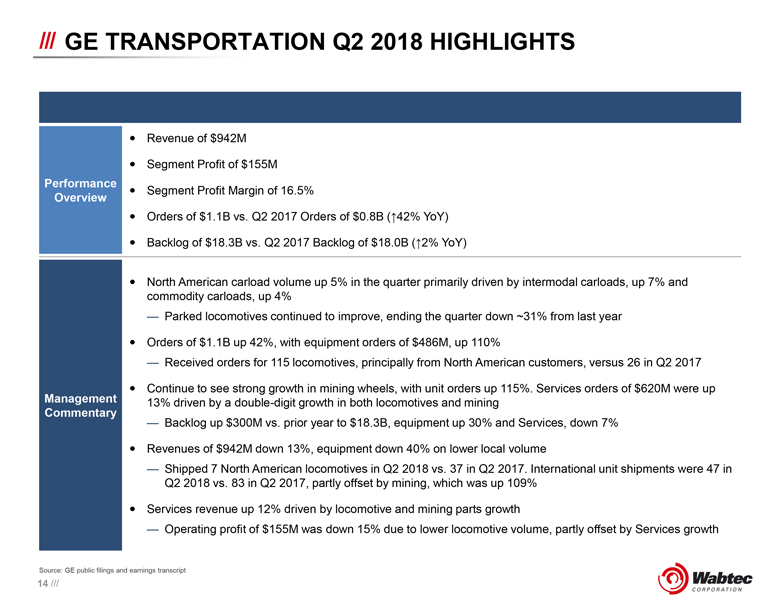
/// 14 /// GE TRANSPORTATION Q2 2018 HIGHLIGHTS Source: GE public filings and earnings transcript Performance Overview Revenue of $942M Segment Profit of $155M Segment Profit Margin of 16.5% Orders of $1.1B vs. Q2 2017 Orders of $0.8B (↑42% YoY) Backlog of $18.3B vs. Q2 2017 Backlog of $18.0B (↑2% YoY) Management Commentary North American carload volume up 5% in the quarter primarily driven by intermodal carloads, up 7% and commodity carloads, up 4% —Parked locomotives continued to improve, ending the quarter down ~31% from last year Orders of $1.1B up 42%, with equipment orders of $486M, up 110% —Received orders for 115 locomotives, principally from North American customers, versus 26 in Q2 2017 Continue to see strong growth in mining wheels, with unit orders up 115%. Services orders of $620M were up 13% driven by a double-digit growth in both locomotives and mining —Backlog up $300M vs. prior year to $18.3B, equipment up 30% and Services, down 7% Revenues of $942M down 13%, equipment down 40% on lower local volume —Shipped 7 North American locomotives in Q2 2018 vs. 37 in Q2 2017. International unit shipments were 47 in Q2 2018 vs. 83 in Q2 2017, partly offset by mining, which was up 109% Services revenue up 12% driven by locomotive and mining parts growth —Operating profit of $155M was down 15% due to lower locomotive volume, partly offset by Services growth
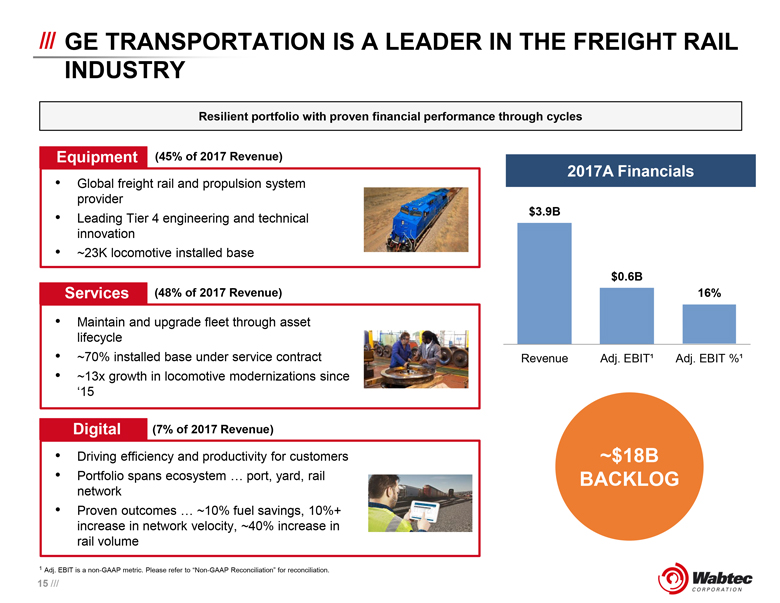
/// 15 /// •Driving efficiency and productivity for customers •Portfolio spans ecosystem … port, yard, rail network •Proven outcomes … ~10% fuel savings, 10%+ increase in network velocity, ~40% increase in rail volume •Maintain and upgrade fleet through asset lifecycle •~70% installed base under service contract •~13x growth in locomotive modernizations since ‘15 GE TRANSPORTATION IS A LEADER IN THE FREIGHT RAIL INDUSTRY •Global freight rail and propulsion system provider •Leading Tier 4 engineering and technical innovation •~23K locomotive installed base Equipment Services Digital ~$18B BACKLOG Resilient portfolio with proven financial performance through cycles $3.9B $0.6B 16% Revenue Adj. EBIT¹ Adj. EBIT %¹ 2017A Financials 1 Adj. EBIT is a non-GAAP metric. Please refer to “Non-GAAP Reconciliation” for reconciliation. (45% of 2017 Revenue) (48% of 2017 Revenue) (7% of 2017 Revenue)
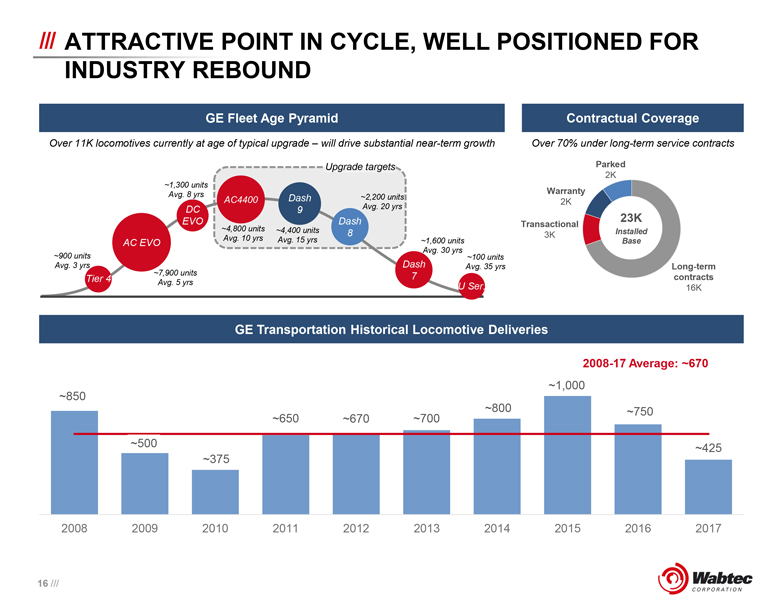
/// 16 /// ATTRACTIVE POINT IN CYCLE, WELL POSITIONED FOR INDUSTRY REBOUND GE Fleet Age Pyramid Contractual Coverage AC EVO AC4400 Dash 9 Dash 8 Dash 7 ~900 units Avg. 3 yrs ~7,900 units Avg. 5 yrs ~1,300 units Avg. 8 yrs ~4,800 units Avg. 10 yrs ~4,400 units Avg. 15 yrs ~2,200 units Avg. 20 yrs ~1,600 units Avg. 30 yrs ~100 units Avg. 35 yrs Upgrade targets Tier 4 DC EVO U Ser. 23K Parked 2K Warranty 2K Transactional 3K Long-term contracts 16K GE Transportation Historical Locomotive Deliveries ~850 ~500 ~375 ~650 ~670 ~700 ~800 ~1,000 ~750 ~425 2008 2009 2010 2011 2012 2013 2014 2015 2016 2017 Over 11K locomotives currently at age of typical upgrade – will drive substantial near-term growth Over 70% under long-term service contracts Installed Base 2008-17 Average: ~670
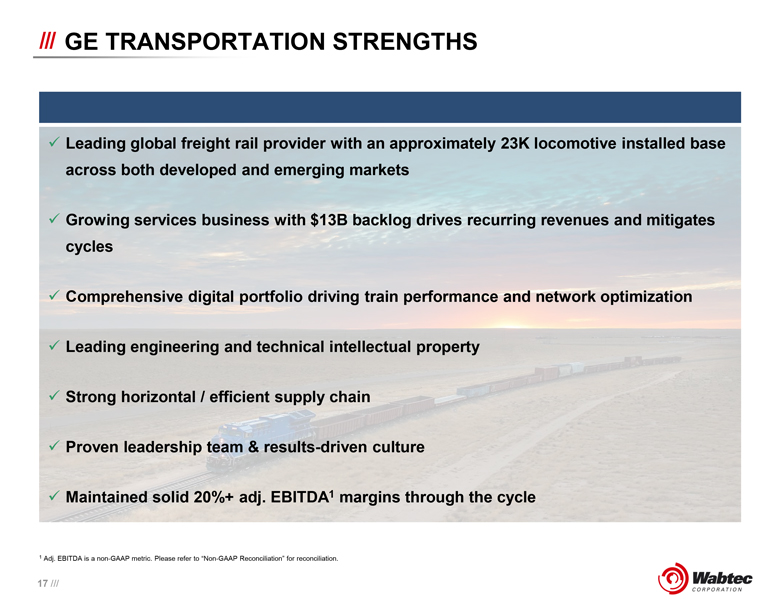
/// 17 /// GE TRANSPORTATION STRENGTHS 1 Adj. EBITDA is a non-GAAP metric. Please refer to “Non-GAAP Reconciliation” for reconciliation. Leading global freight rail provider with an approximately 23K locomotive installed base across both developed and emerging markets Growing services business with $13B backlog drives recurring revenues and mitigates cycles Comprehensive digital portfolio driving train performance and network optimization Leading engineering and technical intellectual property Strong horizontal / efficient supply chain Proven leadership team & results-driven culture Maintained solid 20%+ adj. EBITDA1 margins through the cycle
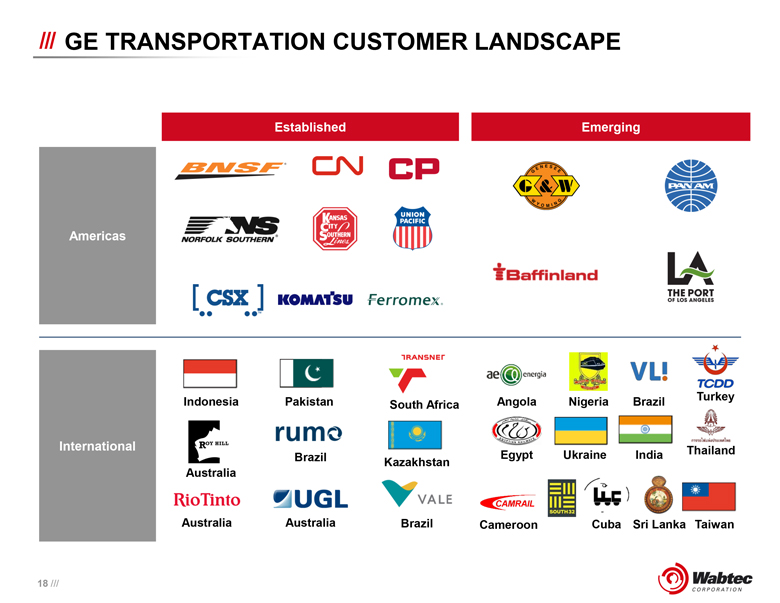
/// 18 /// GE TRANSPORTATION CUSTOMER LANDSCAPE Established Emerging Americas International Indonesia Australia Kazakhstan Pakistan Brazil Australia Brazil Australia South Africa Angola Nigeria Brazil Turkey Egypt Ukraine India Thailand Cuba Sri Lanka Taiwan Cameroon
/// GE TRANSPORTATION TRANSACTION RATIONALE

/// 20 /// GE TRANSPORTATION STRATEGIC RATIONALE Diversified, Global Leader in Transportation and Logistics 1 Electronics and Digital Technologies Leading to Autonomous Operations Opportunity for Recurring Revenue Growth in High-Margin Aftermarket and Services Compelling Pro Forma Financial Profile . . . Attractive Point in Cycle 2 3 4 Significant Operating Synergy Potential and Tax Benefit Drive Value Creation 5 Strong Free Cash Flow Profile Enabling Rapid Deleveraging 6 Combination creates one of the world's largest providers of technology-enabled equipment, systems and services for the locomotive, freight and passenger rail industries
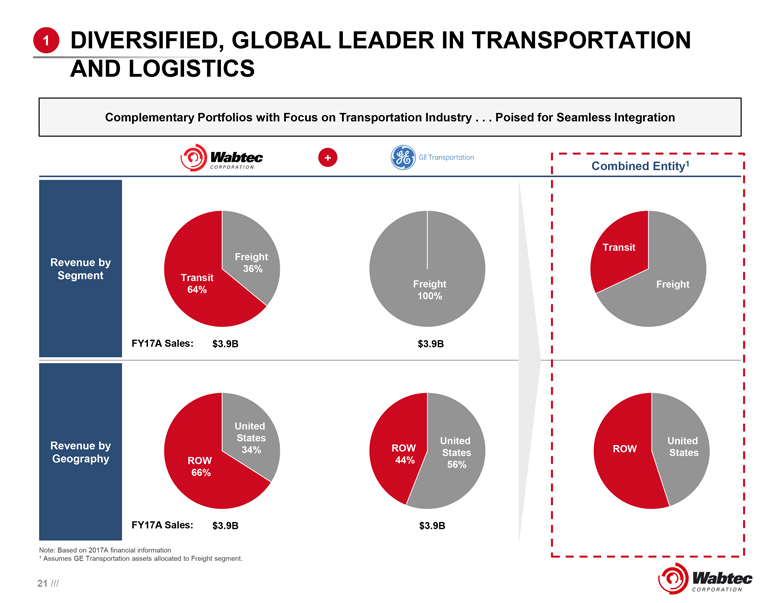
/// 21 /// DIVERSIFIED, GLOBAL LEADER IN TRANSPORTATION AND LOGISTICS Combined Entity1 Revenue by Segment Revenue by Geography + Freight 36% Transit 64% $3.9B. United States 34% ROW 66% $3.9B. United States ROW FY17A Sales: FY17A Sales: United States 56% ROW 44% $3.9B 1 Freight Transit Complementary Portfolios with Focus on Transportation Industry . . . Poised for Seamless Integration Note: Based on 2017A financial information ¹ Assumes GE Transportation assets allocated to Freight segment. Freight 100% $3.9B.

/// 22 /// Trip Optimizer: 7-13% in fuel savings; ~200M gallons of fuel saved/year Smart HPT: Incremental 5-8% fuel saved by automatically managing locomotive consist Locotrol Distributed Power: Enables operation of long, heavy and fuel-efficient trains. Fuel Savings 3%; Crew savings 25% Movement Planner: Plans 42% of rev-ton miles in US; 5-10% in network velocity Transportation Management System: Manages interchange of 9M annual carloads; used by 520 Short Lines Remote Locomotive Monitoring: ~17,000 locomotives monitored daily ELECTRONICS AND DIGITAL TECHNOLOGIES LEADING TO AUTONOMOUS OPERATION Positive Train Control: Implemented across ~70,000 route miles of track; 25,000 locomotives VideoTrax: High-definition video recording on-board locomotives; ~18,000 units installed Brake Control: Installed on ~50% of NAFTA locomotives and freight cars Safety 2 Creates compelling offering to meet growing demand for integrated digital, autonomous solutions Fuel Savings Labor Costs Asset Reliability Enhanced Visibility Network Velocity Path to Autonomous Productivity Efficiency
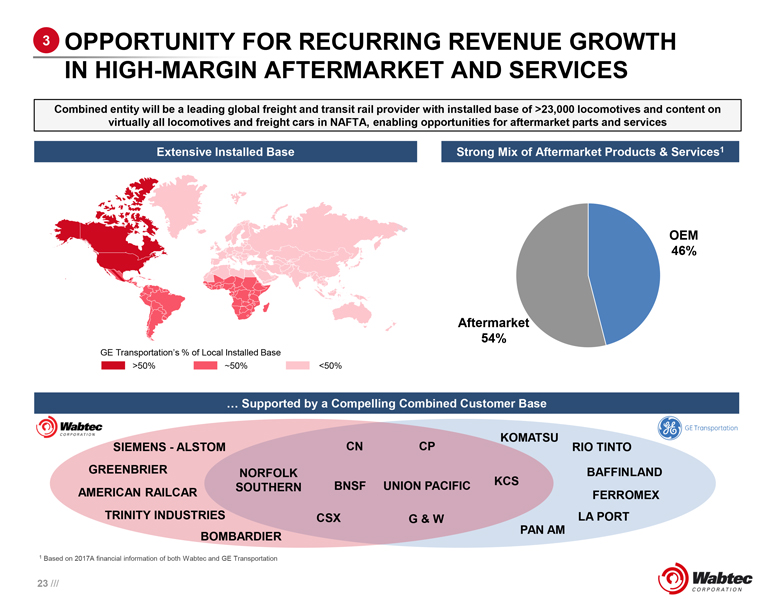
/// 23 /// OPPORTUNITY FOR RECURRING REVENUE GROWTH IN HIGH-MARGIN AFTERMARKET AND SERVICES Combined entity will be a leading global freight and transit rail provider with installed base of >23,000 locomotives and content on virtually all locomotives and freight cars in NAFTA, enabling opportunities for aftermarket parts and services 1 Based on 2017A financial information of both Wabtec and GE Transportation Strong Mix of Aftermarket Products & Services1 Extensive Installed Base >50% ~50% <50% GE Transportation’s % of Local Installed Base 3 … Supported by a Compelling Combined Customer Base BOMBARDIER GREENBRIER AMERICAN RAILCAR TRINITY INDUSTRIES SIEMENS - ALSTOM KOMATSU RIO TINTO FERROMEX LA PORT BAFFINLAND PAN AM CSX UNION PACIFIC G & W NORFOLK SOUTHERN CN CP BNSF KCS Aftermarket 54% OEM 46%
/// 24 /// HIGHLY COMPELLING PRO FORMA FINANCIAL PROFILE … ATTRACTIVE POINT IN CYCLE 4 •Transaction expected to create an ~$8B revenue company with significant scale, higher margins and strong cash flow •Approximately $250M of run-rate operating synergies expected to be achieved by year 4 •Expected to be accretive to Wabtec operating margins •~$150M of annual cash tax savings expected for next 15 years •Strong free cash flow generation anticipated
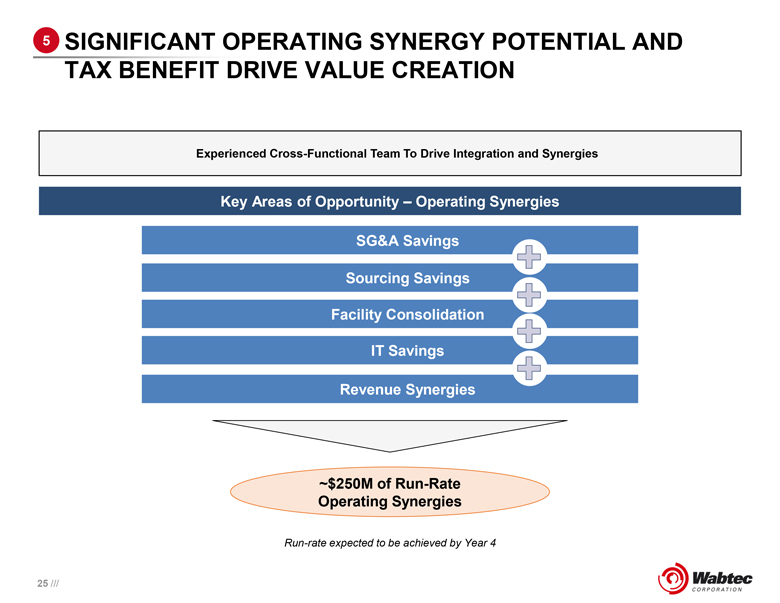
/// 25 /// SIGNIFICANT OPERATING SYNERGY POTENTIAL AND TAX BENEFIT DRIVE VALUE CREATION Experienced Cross-Functional Team To Drive Integration and Synergies 5 Key Areas of Opportunity – Operating Synergies ~$250M of Run-Rate Operating Synergies SG&A Savings Sourcing Savings Facility Consolidation IT Savings Revenue Synergies Run-rate expected to be achieved by Year 4

/// FINANCIAL OVERVIEW
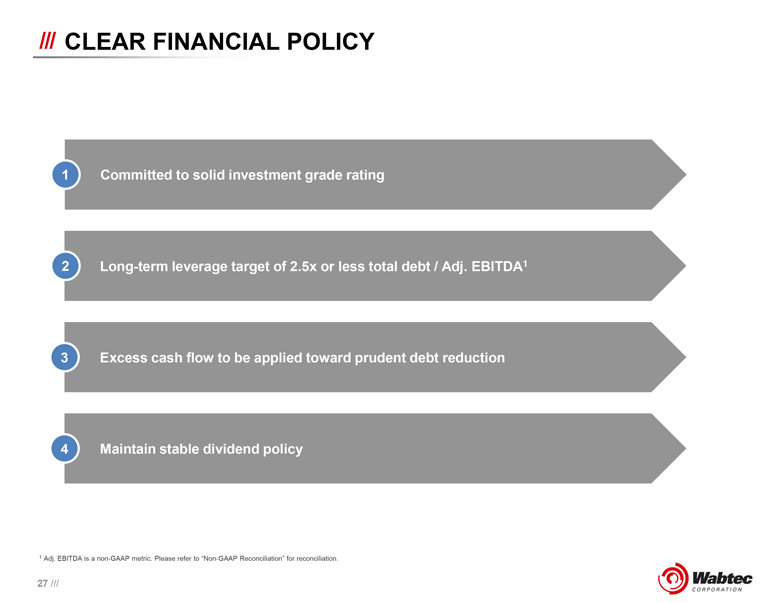
/// 27 /// CLEAR FINANCIAL POLICY Committed to solid investment grade rating Excess cash flow to be applied toward prudent debt reduction Maintain stable dividend policy Long-term leverage target of 2.5x or less total debt / Adj. EBITDA1 1 2 4 3 1 Adj. EBITDA is a non-GAAP metric. Please refer to “Non-GAAP Reconciliation” for reconciliation.

/// 28 /// STRONG FREE CASH FLOW PROFILE ENABLING RAPID DELEVERAGING Wabtec remains committed to paying its quarterly 12c per share dividend to all shareholders Top priority for deployment of excess cash will be debt reduction to achieve target leverage levels Wabtec expects to remain investment grade Wabtec obtained full commitments for a $2.9B bridge facility which has since been reduced to $2.5B via a $0.4B Delay-Draw Term Loan Wabtec refinanced its $1.2B revolving Credit Facility Target < 2.5x gross leverage ratio ―Permanent financing will contemplate an appropriate mix of permanent and pre-payable debt to facilitate achieving leverage targets Deleveraging Target Post Close Wabtec Existing Debt $1.7 (+) Incremental Transaction Debt $2.9 Total Debt $4.6 (-) Cash $0.2 Net Debt $4.4 Target Combined Capitalization at Close¹ ($B) Combined company’s strong free cash flow profile expected to allow for deleveraging and commitment to solid investment grade credit rating Total Debt / Adj. EBITDA2 ¹ Illustratively assumes 31-Dec-2018 transaction closing. 2 Adj. EBITDA is a non-GAAP metric. Please refer to “Non-GAAP Reconciliation” for reconciliation. Current Ratings: Moody’s: Baa3 (Negative Outlook) S&P: BBB (Watch Negative) Fitch: BBB- (Stable Outlook) Target Total Debt / Adj. EBITDA2 < 2.5x
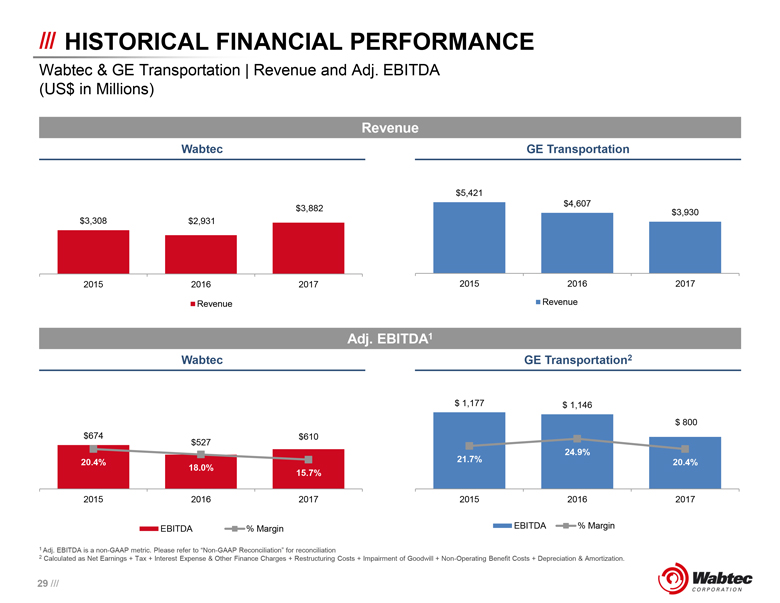
/// 29 /// HISTORICAL FINANCIAL PERFORMANCE Wabtec & GE Transportation | Revenue and Adj. EBITDA (US$ in Millions) Revenue Adj. EBITDA1 Wabtec Wabtec GE Transportation GE Transportation2 1 Adj. EBITDA is a non-GAAP metric. Please refer to “Non-GAAP Reconciliation” for reconciliation 2 Calculated as Net Earnings + Tax + Interest Expense & Other Finance Charges + Restructuring Costs + Impairment of Goodwill + Non-Operating Benefit Costs + Depreciation & Amortization. $3,308 $2,931 $3,882 2015 2016 2017 Revenue $5,421 $4,607 $3,930 2015 2016 2017 Revenue $674 $527 $610 20.4% 18.0% 15.7% 2015 2016 2017 EBITDA % Margin $ 1,177 $ 1,146 $ 800 21.7% 24.9% 20.4% 2015 2016 2017 EBITDA % Margin
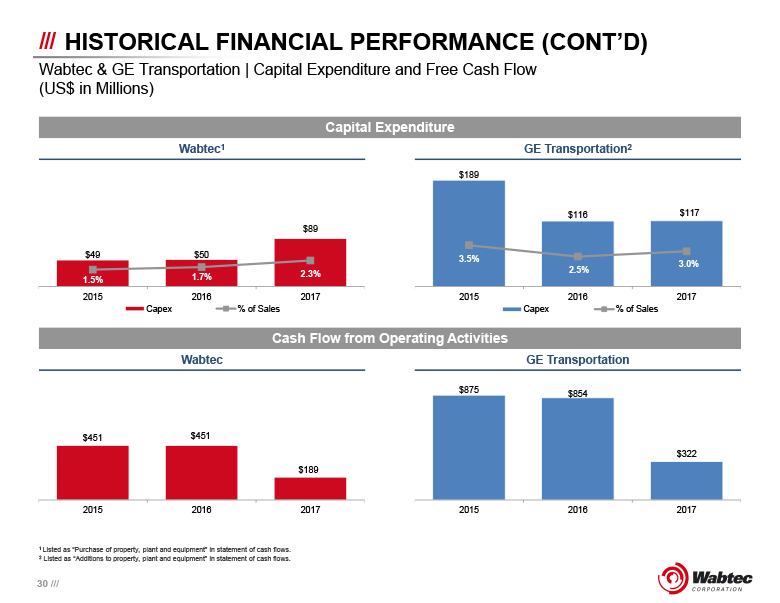
/// 30 /// HISTORICAL FINANCIAL PERFORMANCE (CONT’D) Wabtec & GE Transportation | Capital Expenditure and Free Cash Flow (US$ in Millions) Capital Expenditure Cash Flow from Operating Activities Wabtec1 Wabtec GE Transportation2 GE Transportation 1 Listed as “Purchase of property, plant and equipment” n statement of cash flows. 2 Listed as “Additions to property, plant and equipment” in statement of cash flows. $49 $50 $89 1.5% 1.7% 2.3% 2015 2016 2017 Capex % of Sales $189 $116 $117 3.5% 2.5% 3.0% 2015 2016 2017 Capex % of Sales $451 $451 $189 2015 2016 2017 $875 $854 $322 2015 2016 2017
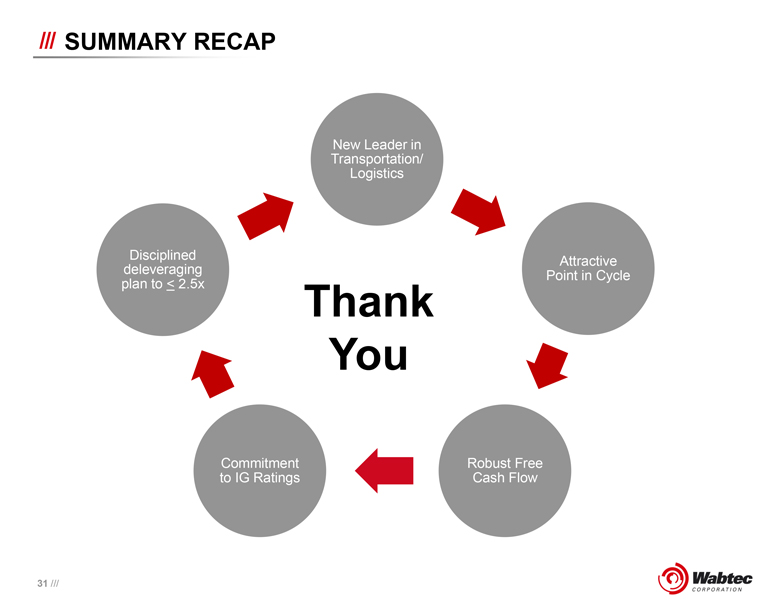
/// 31 /// New Leader in Transportation/ Logistics Attractive Point in Cycle Robust Free Cash Flow Commitment to IG Ratings Disciplined deleveraging plan to < 2.5x Thank You SUMMARY RECAP

/// NON-GAAP RECONCILIATION
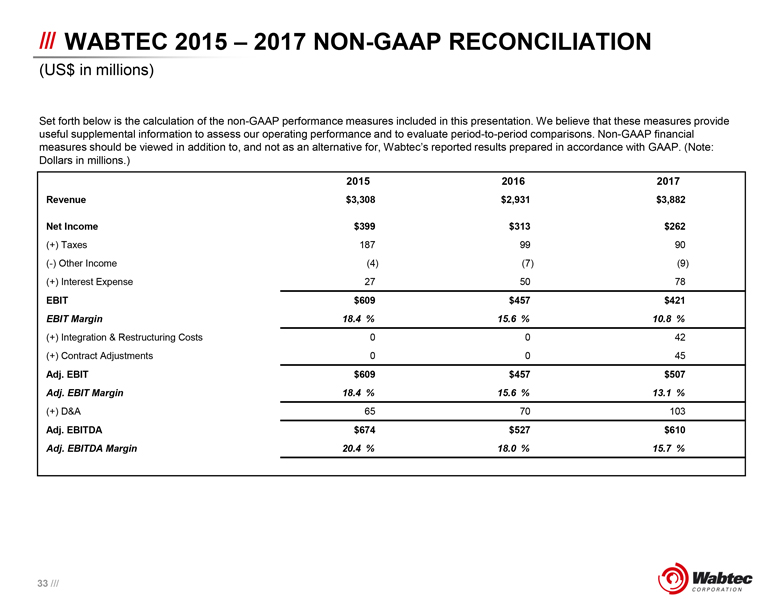
/// 33 /// WABTEC 2015 – 2017 NON-GAAP RECONCILIATION (US$ in millions) Set forth below is the calculation of the non-GAAP performance measures included in this presentation. We believe that these measures provide useful supplemental information to assess our operating performance and to evaluate period-to-period comparisons. Non-GAAP financial measures should be viewed in addition to, and not as an alternative for, Wabtec’s reported results prepared in accordance with GAAP. (Note: Dollars in millions.) 201520162017Revenue$3,308$2,931$3,882Net Income$399$313$262(+) Taxes1879990(-) Other Income(4)(7)(9)(+) Interest Expense275078EBIT$609$457$421EBIT Margin18.4%15.6%10.8%(+) Integration & Restructuring Costs0042(+) Contract Adjustments0045Adj. EBIT$609$457$507Adj. EBIT Margin18.4%15.6%13.1%(+) D&A6570103Adj. EBITDA$674$527$610Adj. EBITDA Margin20.4%18.0%15.7%
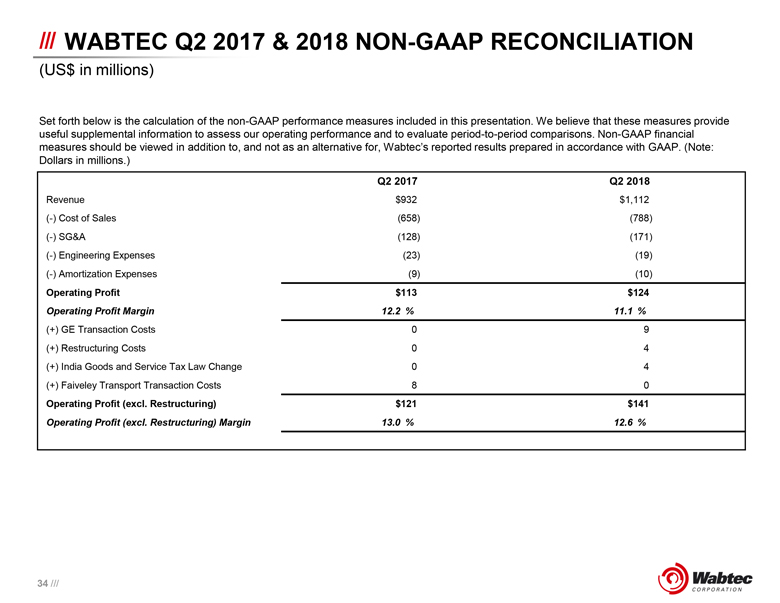
/// 34 /// WABTEC Q2 2017 & 2018 NON-GAAP RECONCILIATION (US$ in millions) Set forth below is the calculation of the non-GAAP performance measures included in this presentation. We believe that these measures provide useful supplemental information to assess our operating performance and to evaluate period-to-period comparisons. Non-GAAP financial measures should be viewed in addition to, and not as an alternative for, Wabtec’s reported results prepared in accordance with GAAP. (Note: Dollars in millions.) Q2 2017Q2 2018Revenue$932$1,112(-) Cost of Sales(658)(788)(-) SG&A(128)(171)(-) Engineering Expenses(23)(19)(-) Amortization Expenses(9)(10)Operating Profit$113$124Operating Profit Margin12.2%11.1%(+) GE Transaction Costs09(+) Restructuring Costs04(+) India Goods and Service Tax Law Change04(+) Faiveley Transport Transaction Costs80Operating Profit (excl. Restructuring)$121$141Operating Profit (excl. Restructuring) Margin13.0%12.6%

/// 35 /// GET 2015 – 2017 NON-GAAP RECONCILIATION (US$ in millions) Note: GET 2017 adj. EBIT and adj. EBIT margin differ from figures presented at the time of merger announcement due to the subsequent completion of the audited carve-out financials and differences in actual corporate allocations, unusuals, non-operating, corporate relief / restructuring, and other costs as compared to figures presented at the time of merger announcement. Set forth below is the calculation of the non-GAAP performance measures included in this presentation. We believe that these measures provide useful supplemental information to assess our operating performance and to evaluate period-to-period comparisons. Non-GAAP financial measures should be viewed in addition to, and not as an alternative for, Wabtec’s reported results prepared in accordance with GAAP. (Note: Dollars in millions.) 201520162017Revenue$5,421$4,607$3,930Net Income$480$534$374(+) NCI8614(+) Taxes34916744(+) Interest Expense152022EBIT$852$728$454(+) Non-Operating Benefit Costs161817(+) Impairment of Goodwill8520(+) Restructuring Costs15178145Adj. EBIT$968$926$616Adj. EBIT Margin17.9%20.1%15.7%(+) D&A$209$220$184Adj. EBITDA$1,177$1,146$800Adj. EBITDA Margin21.7%24.9%20.4%
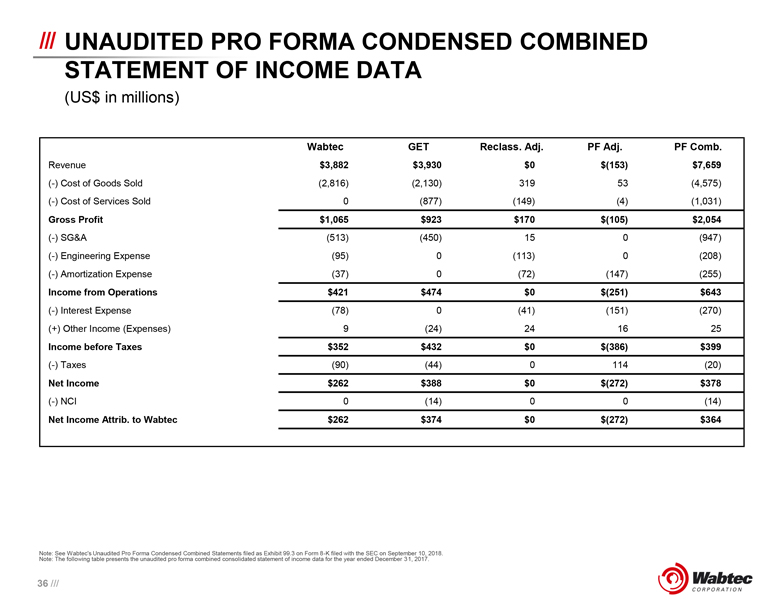
/// 36 /// UNAUDITED PRO FORMA CONDENSED COMBINED STATEMENT OF INCOME DATA (US$ in millions) Note: See Wabtec's Unaudited Pro Forma Condensed Combined Statements filed as Exhibit 99.3 on Form 8-K filed with the SEC on September 10, 2018. Note: The following table presents the unaudited pro forma combined consolidated statement of income data for the year ended December 31, 2017. WabtecGETReclass. Adj.PF Adj.PF Comb.Revenue$3,882$3,930$0$(153)$7,659(-) Cost of Goods Sold(2,816)(2,130)31953(4,575)(-) Cost of Services Sold0(877)(149)(4)(1,031)Gross Profit$1,065$923$170$(105)$2,054(-) SG&A(513)(450)150(947)(-) Engineering Expense(95)0(113)0(208)(-) Amortization Expense(37)0(72)(147)(255)Income from Operations$421$474$0$(251)$643(-) Interest Expense(78)0(41)(151)(270)(+) Other Income (Expenses)9(24)241625Income before Taxes$352$432$0$(386)$399(-) Taxes(90)(44)0114(20)Net Income$262$388$0$(272)$378(-) NCI0(14)00(14)Net Income Attrib. to Wabtec$262$374$0$(272)$364