Exhibit 99.1


This presentation contains “forward-looking” statements as that term is defined in Section 27A of the Securities Act of 1933, as amended, and Section 21E of the Securities Exchange Act of 1934, as amended by the Private Securities Litigation Reform Act of 1995, including statements relating to the impact of the acquisition by Wabtec of GE Transportation (the “GE Transportation merger”) and statements regarding Wabtec’s expectations about future sales and earnings. All statements, other than historical facts, including statements regarding the expected benefits of the GE Transportation merger, including anticipated synergy benefits and statements regarding Wabtec’s plans, objectives, expectations and intentions; legal, economic and regulatory conditions; and any assumptions underlying any of the foregoing, are forward-looking statements.Forward-looking statements concern future circumstances and results and other statements that are not historical facts and are sometimes identified by the words “may,” “will,” “should,” “potential,” “intend,” “expect,” “endeavor,” “seek,” “anticipate,” “estimate,” “overestimate,” “underestimate,” “believe,” “could,” “project,” “predict,” “continue,” “target” or other similar words or expressions. Forward-looking statements are based upon current plans, estimates and expectations that are subject to risks, uncertainties and assumptions. Should one or more of these risks or uncertainties materialize, or should underlying assumptions prove incorrect, actual results may vary materially from those indicated or anticipated by such forward-looking statements. The inclusion of such statements should not be regarded as a representation that such plans, estimates or expectations will be achieved. Important factors that could cause actual results to differ materially from such plans, estimates or expectations include, among others, (1) unexpected costs, charges or expenses resulting from the GE Transportation merger; (2) uncertainty of Wabtec’s expected financial performance; (3) failure to realize the anticipated benefits of the GE Transportation merger, including as a result of integrating GE Transportation into Wabtec; (4) Wabtec’s ability to implement its business strategy; (5) difficulties and delays in achieving revenue and cost synergies; (6) inability to retain and hire key personnel;(7) evolving legal, regulatory and tax regimes; (8) changes in general economic and/or industry specific conditions, including the impacts of tax and tariff programs, industry consolidation and changes in the financial condition or operating strategies of our customers; (9) changes in the expected timing of projects; (10) a decrease in freight or passenger rail traffic; (11) an increase in manufacturing costs; (12) actions by third parties, including government agencies; (13) the severity and duration of the evolving COVID-19 pandemic and the resulting impact on the global economy; and (14) other risk factors as detailed from time to time in Wabtec’s reports filed with the SEC, including Wabtec’s annual report on Form 10-K, periodic quarterly reports on Form 10-Q, periodic current reports on Form 8-K and other documents filed with the SEC. The foregoing list of important factors is not exclusive. Any forward-looking statements speak only as of the date of this communication. Wabtec does not undertake any obligation to update any forward-looking statements, whether as a result of new information or development, future events or otherwise, except as required by law. Readers are cautioned not to place undue reliance on any of these forward-looking statements.This presentation as well as Wabtec’s earnings release and 2020 financial guidance mention certain non-GAAP financial performance measures, including adjusted sales, adjusted operating margin, EBITDA, adjusted EBITDA, adjusted effective tax rate, adjusted income from operations, adjusted interest and other expense and adjusted earnings per diluted share. Wabtec defines EBITDA as income from operations plus depreciation and amortization. While Wabtec believes these are useful supplemental measures for investors, they are not presented in accordance with GAAP. Investors should not consider non-GAAP measures in isolation or as a substitute for net income, cash flows from operations, or any other items calculated in accordance with GAAP. In addition, the non-GAAP financial measures included in this presentation have inherent material limitations as performance measures because they add back certain expenses incurred by the company to GAAP financial measures, resulting in those expenses not being taken into account in the applicable non-GAAP financial measure. Because not all companies use identical calculations, Wabtec’s presentation of non-GAAP financial measures may not be comparable to other similarly titled measures of other companies. With respect to Wabtec’s guidance to certain non-GAAP adjusted financial measures, it is not possible, without unreasonable effort, to forecast and quantify with reasonable accuracy certain adjustments that would be necessary for a reconciliation to the corresponding GAAP financial measures. 2 Forward looking statements & non-GAAP financial information
DURING THE CONFERENCE, WABTEC MANAGEMENT WILL DISCUSS ITS PREVIOUSLY ISSUED GUIDANCE FOR 2020. THIS GUIDANCE HAS NOT BEEN REVISED FOR ANY POTENTIAL IMPACT DUE TO COVID-19, AND MORE RECENTLY WITH VOLATILITY IN THE COMMODITY AND FINANCIAL MARKETS.TO DATE, WABTEC HAS SEEN LIMITED IMPACT TO ITS FIRST QUARTER. HOWEVER, WE ARE CONTINUING TOMONITOR OUR CUSTOMERS AND THE END MARKETS WE SERVE, AS THOSE COULD HAVE AN IMPACT ON WABTEC’SBUSINESS, OPERATIONS AND FINANCIAL PERFORMANCE. 2 Note regarding 2020 business operations and financial guidance
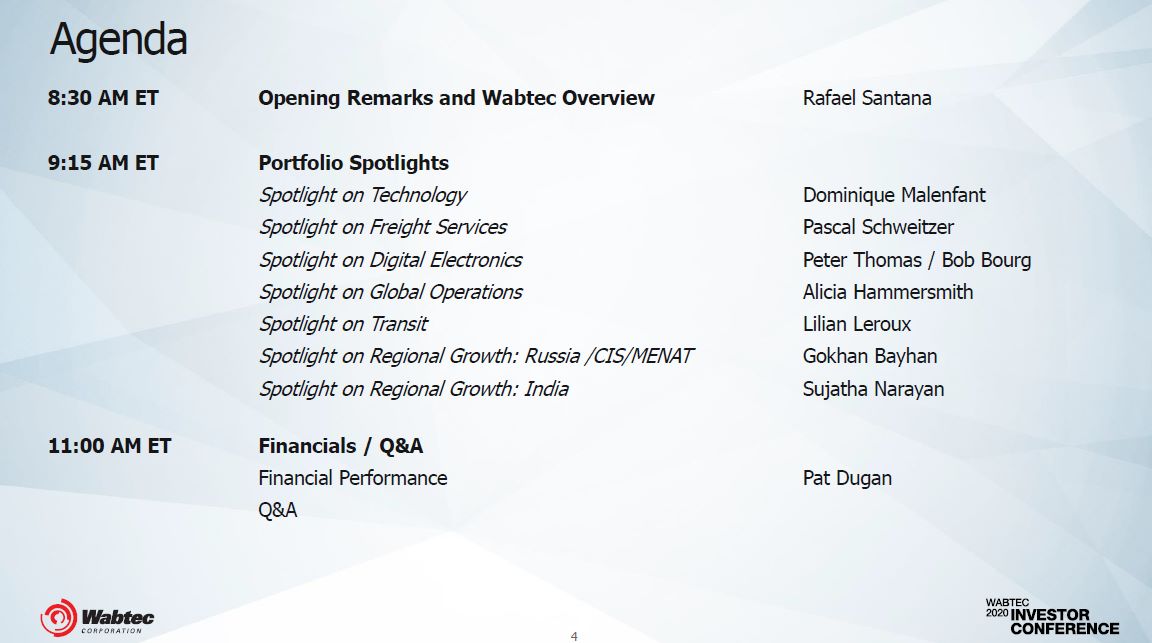
Agenda 2 8:30 AM ET Opening Remarks and Wabtec Overview Rafael Santana 9:15 AM ET Portfolio Spotlights Spotlight on Technology Dominique Malenfant Spotlight on Freight Services Pascal Schweitzer Spotlight on Digital Electronics Peter Thomas / Bob Bourg Spotlight on Global Operations Alicia Hammersmith Spotlight on Transit Lilian Leroux Spotlight on Regional Growth: Russia /CIS/MENAT Gokhan Bayhan Spotlight on Regional Growth: India Sujatha Narayan 11:00 AM ET Financials / Q&A Financial Performance Pat Dugan Q&A

IntroductionRafael Santana

1. Delivering results through the cycles via world-class technology and innovation while leveraging significant installed base 2. Focused on continuous operational improvementand margin expansion 3. Lean operations driving strong cash flow withdisciplined capital allocation 4. Building a stronger and better Wabtec with a purpose- driven culture of accountability What you will hear today Extending the lead as #1 rail technology company in the world 5-YEAR OULOOKMid-Single DigitORGANIC SALES CAGR VS. LOW SINGLE DIGIT FOR INDUSTRY300+ bpsOPERATING MARGINEXPANSION>10%EPS CAGR >90%CASH FROM OPS CONVERSION (1) 6 (1) Cash from Operations conversion % is defined as GAAP Cash from Operations divided by GAAP Net Income plus Depreciation & Amortization
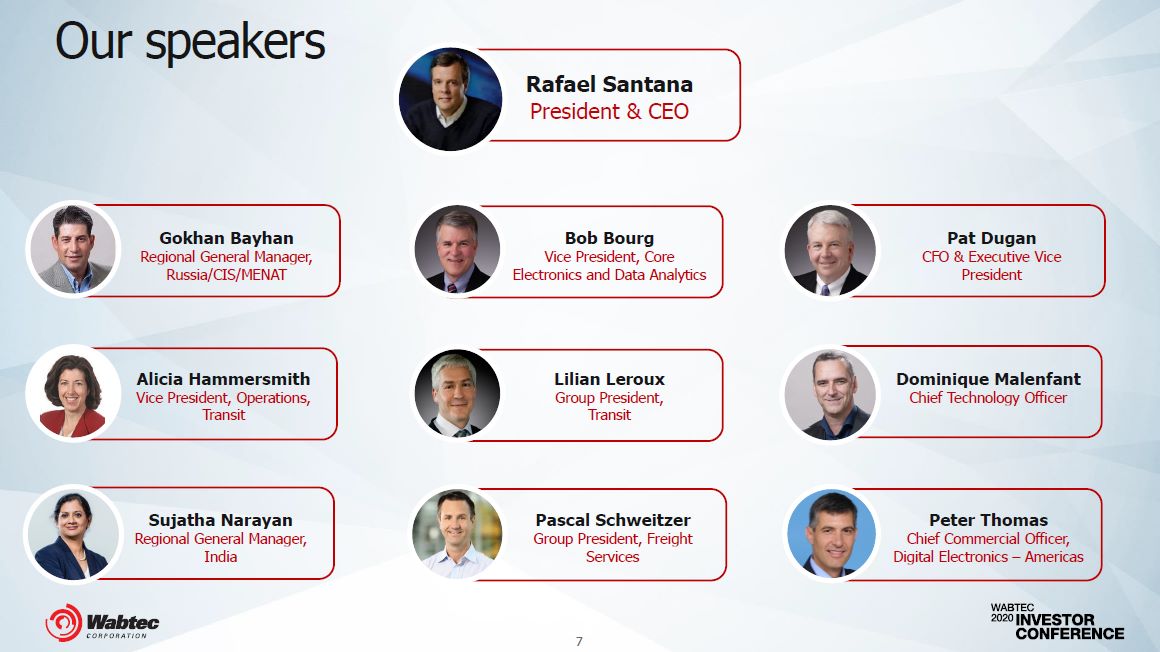
Our speakers Gokhan Bayhan Regional General Manager, Russia/CIS/MENAT Rafael SantanaPresident & CEO Alicia Hammersmith Vice President, Operations, Transit Sujatha Narayan Regional General Manager, India Bob BourgVice President, Core Electronics and Data Analytics Lilian Leroux Group President, Transit Pascal Schweitzer Group President, Freight Services Pat DuganCFO & Executive Vice President Dominique MalenfantChief Technology Officer Peter ThomasChief Commercial Officer,Digital Electronics – Americas 7
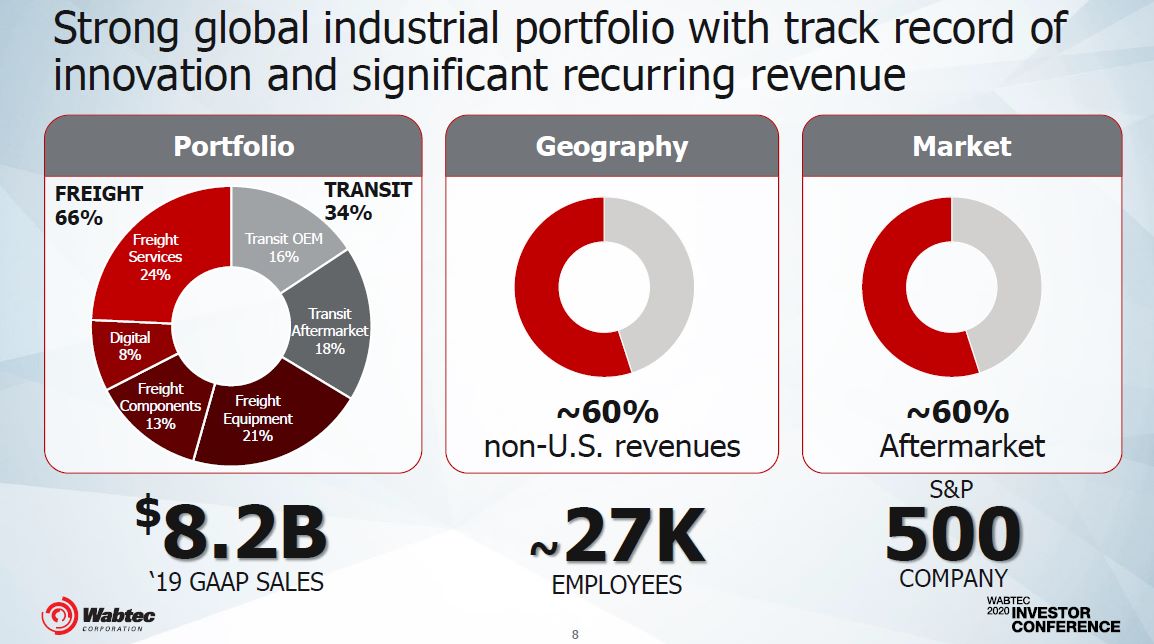
Strong global industrial portfolio with track record of innovation and significant recurring revenuePortfolio Geography Market Transit OEM 16% Transit Aftermarket 18% Freight Equipment 21% Freight Components 13% Digital 8% TRANSIT34% 8.2B $ ‘19 GAAP SALES 500 COMPANY ~60%non-U.S. revenues~27KEMPLOYEES 8 ~60%AftermarketS&P FREIGHT66%Freight Services 24%
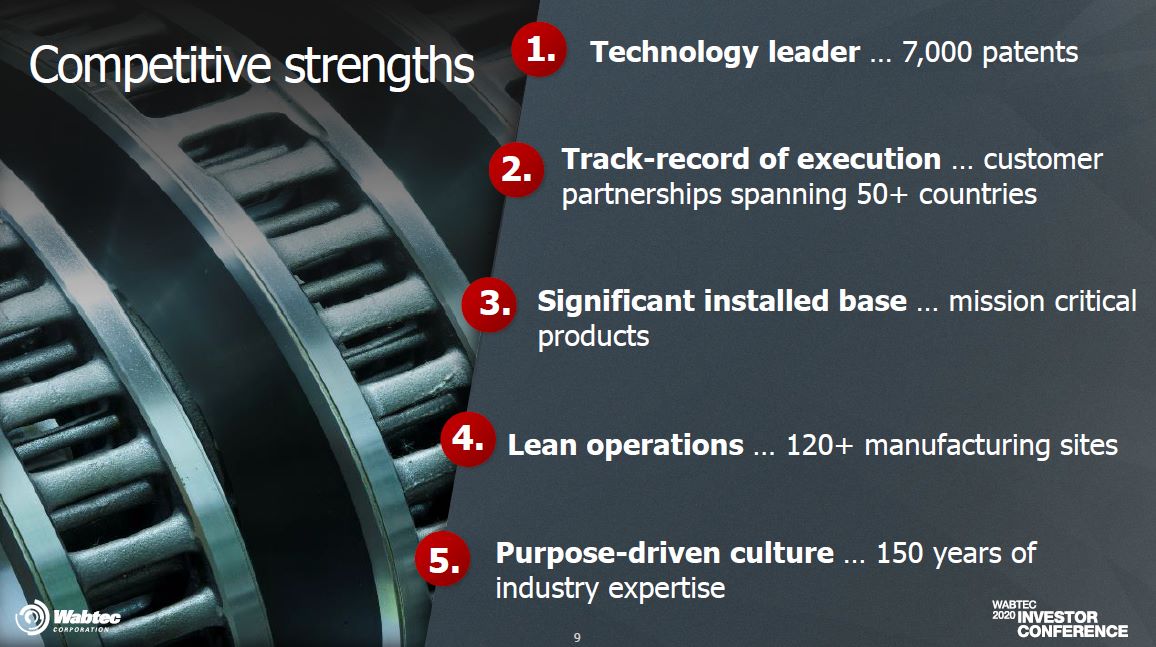
Competitive strengths Purpose-driven culture … 150 years ofindustry expertise 5. Technology leader … 7,000 patents 1. Significant installed base … mission criticalproducts 3. 2. 9 Track-record of execution … customerpartnerships spanning 50+ countries 4. Lean operations … 120+ manufacturing sites
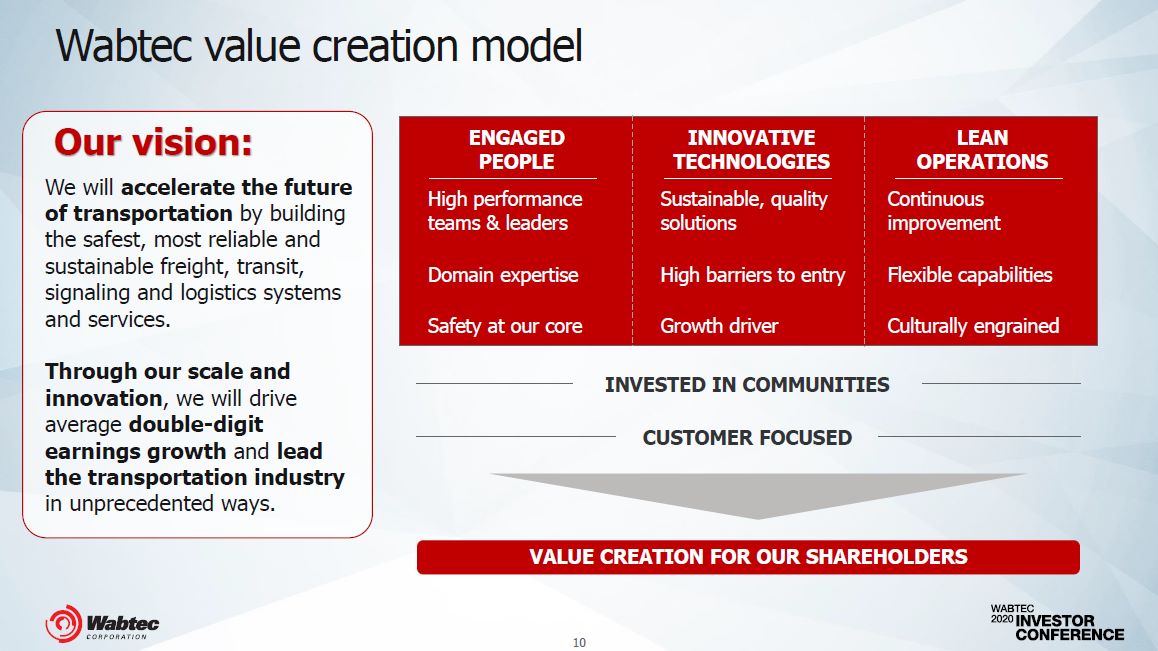
Wabtec value creation model VALUE CREATION FOR OUR SHAREHOLDERS INVESTED IN COMMUNITIES CUSTOMER FOCUSED Through our scale and innovation, we will drive average double-digit earnings growth and lead the transportation industry in unprecedented ways. Our vision:We will accelerate the future of transportation by building the safest, most reliable and sustainable freight, transit, signaling and logistics systems and services. ENGAGEDPEOPLEHigh performance teams & leadersDomain expertiseSafety at our core INNOVATIVETECHNOLOGIESSustainable, quality solutionsHigh barriers to entryGrowth driver LEANOPERATIONSContinuous improvementFlexible capabilitiesCulturally engrained 10
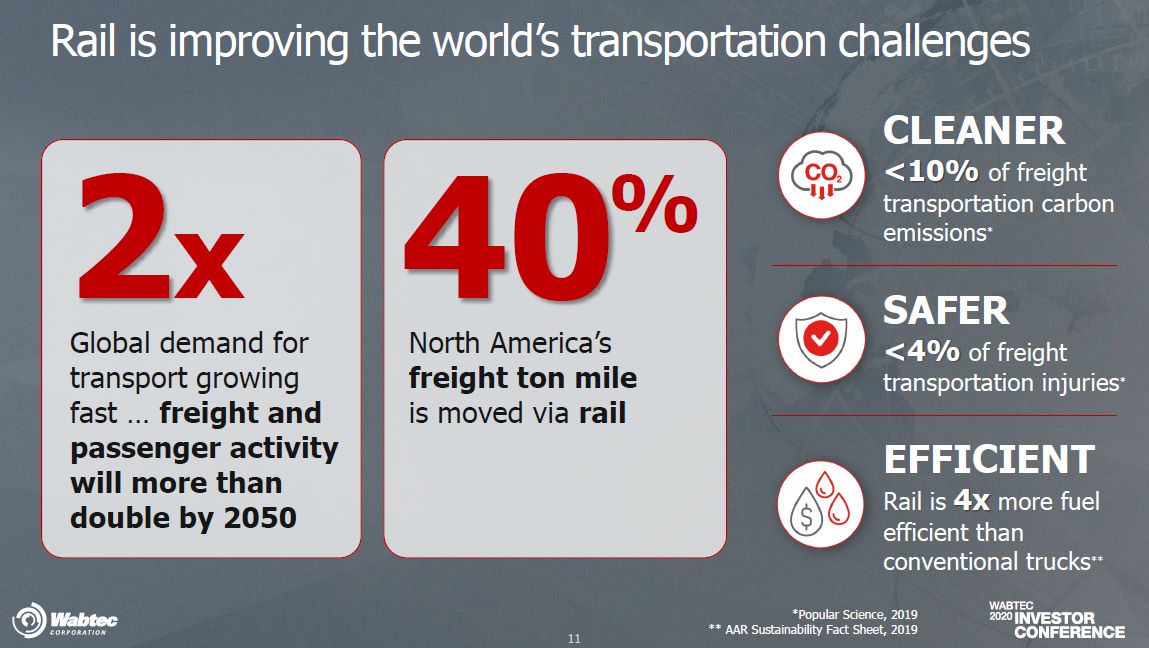
Global demand for transport growing fast … freight andpassenger activity will more than double by 2050 North America’s freight ton mile is moved via rail *Popular Science, 2019** AAR Sustainability Fact Sheet, 2019 Rail is improving the world’s transportation challenges SAFER<4% of freight transportation injuries* EFFICIENTRail is 4x more fuel efficient than conventional trucks** CLEANER<10% of freight transportation carbon emissions* 2x 40 % 11
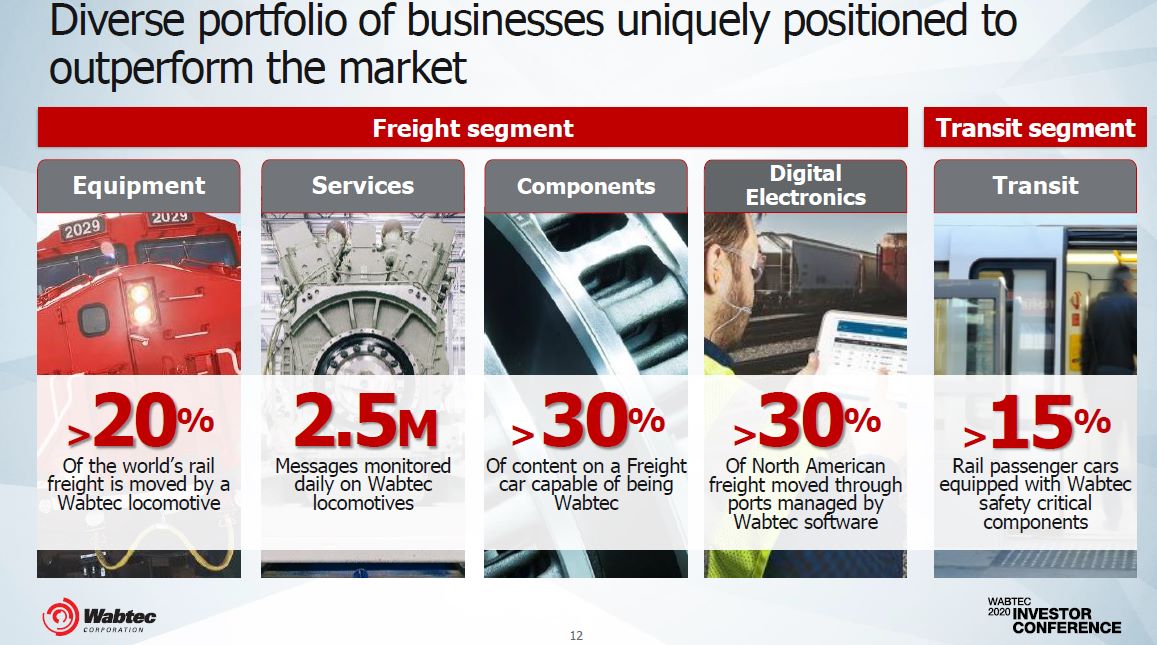
>20% Of the world’s rail freight is moved by a Wabtec locomotive 2.5M Messages monitored daily on Wabtec locomotives > 30% Of content on a Freight car capable of being Wabtec Transit Equipment Services Components DigitalElectronics >30% Of North American freight moved through ports managed by Wabtec software Freight segment Transit segment >15% 14 Rail passenger cars equipped with Wabtec safety critical components Diverse portfolio of businesses uniquely positioned to outperform the market
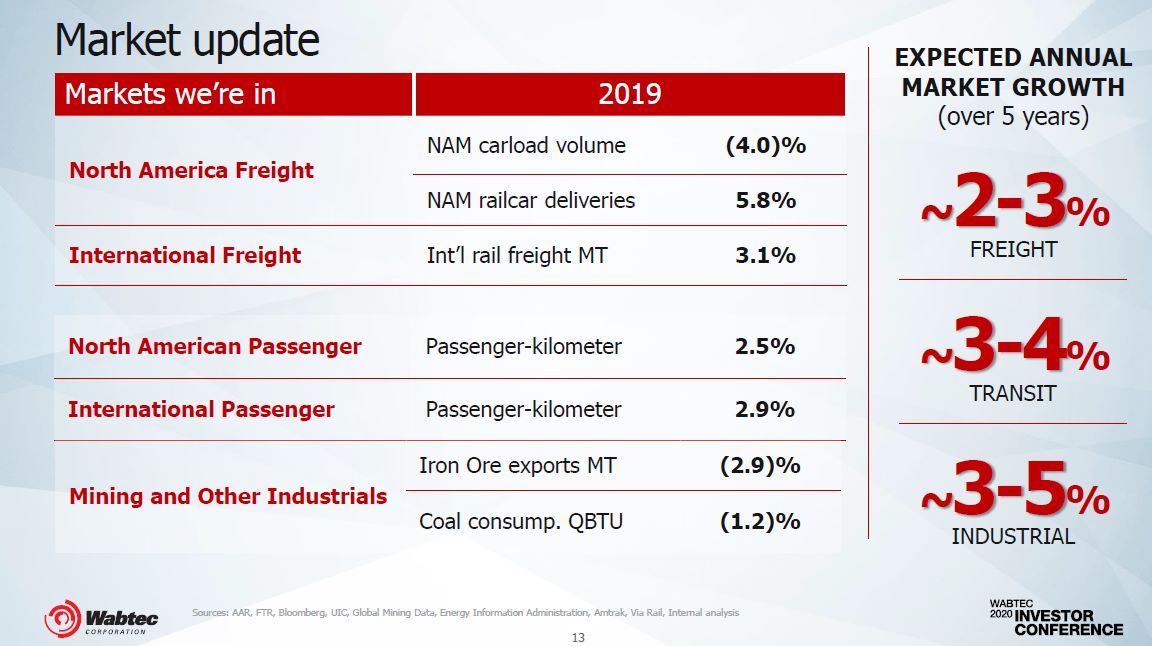
Market update Markets we’re in 2019 North America Freight NAM carload volume (4.0)% NAM railcar deliveries 5.8% International Freight Int’l rail freight MT 3.1% Sources: AAR, FTR, Bloomberg, UIC, Global Mining Data, Energy Information Administration, Amtrak, Via Rail, Internal analysis ~3-4%TRANSIT~3-5% INDUSTRIAL EXPECTED ANNUAL MARKET GROWTH(over 5 years)~2-3%FREIGHT North American Passenger Passenger-kilometer 2.5% International Passenger Passenger-kilometer 2.9% Iron Ore exports MT (2.9)%Mining and Other IndustrialsCoal consump. QBTU (1.2)% 14
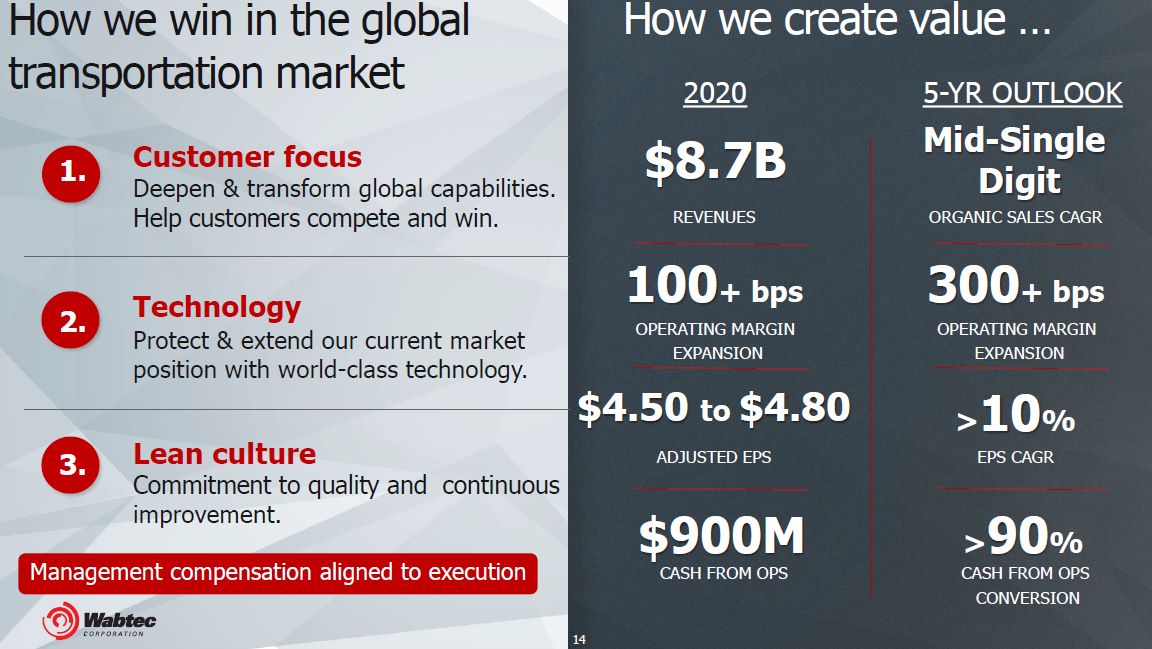
300+ bpsOPERATING MARGINEXPANSION How we win in the global transportation market 1. Customer focusDeepen & transform global capabilities.Help customers compete and win. 2. TechnologyProtect & extend our current market position with world-class technology. 3. Lean cultureCommitment to quality and continuousimprovement. >90%CASH FROM OPSCONVERSION Management compensation aligned to execution How we create value … >10%EPS CAGR 100+ bpsOPERATING MARGINEXPANSION $900MCASH FROM OPS $4.50 to $4.80ADJUSTED EPS 2020$8.7BREVENUES 5-YR OUTLOOKMid-Single DigitORGANIC SALES CAGR 14
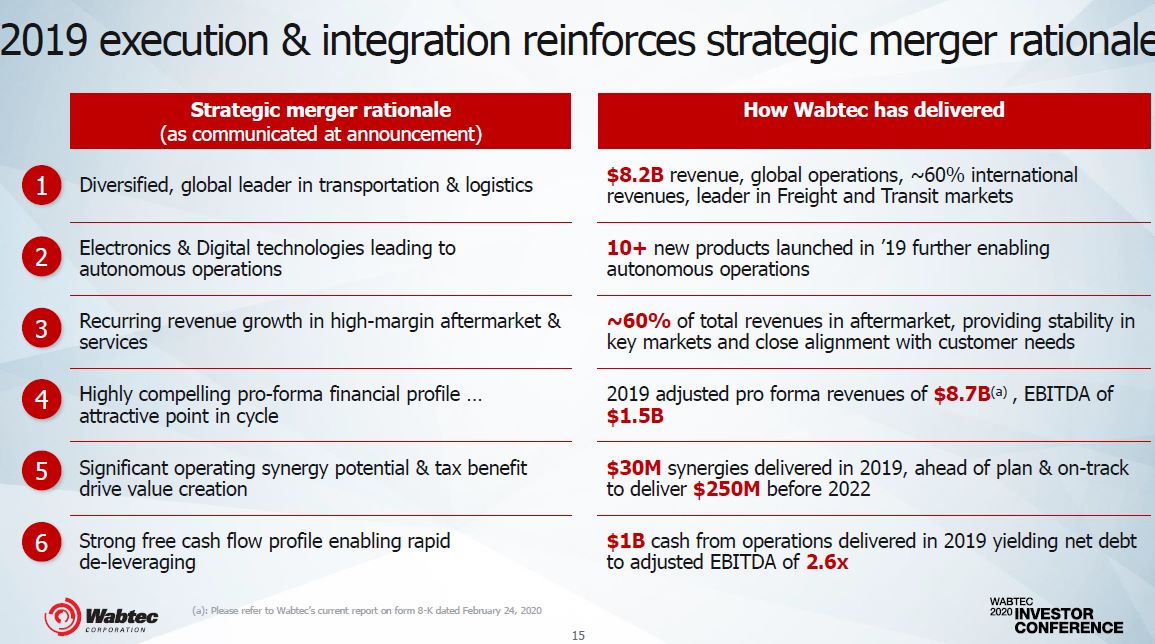
2019 execution & integration reinforces strategic merger rationale Strategic merger rationale(as communicated at announcement) Diversified, global leader in transportation & logistics Electronics & Digital technologies leading to autonomous operations Recurring revenue growth in high-margin aftermarket &services Highly compelling pro-forma financial profile …attractive point in cycle Significant operating synergy potential & tax benefitdrive value creation Strong free cash flow profile enabling rapidde-leveraging 123456 14 How Wabtec has delivered $8.2B revenue, global operations, ~60% international revenues, leader in Freight and Transit markets 10+ new products launched in ’19 further enablingautonomous operations ~60% of total revenues in aftermarket, providing stability inkey markets and close alignment with customer needs 2019 adjusted pro forma revenues of $8.7B(a) , EBITDA of$1.5B $30M synergies delivered in 2019, ahead of plan & on-trackto deliver $250M before 2022 $1B cash from operations delivered in 2019 yielding net debtto adjusted EBITDA of 2.6x (a): Please refer to Wabtec’s current report on form 8-K dated February 24, 2020
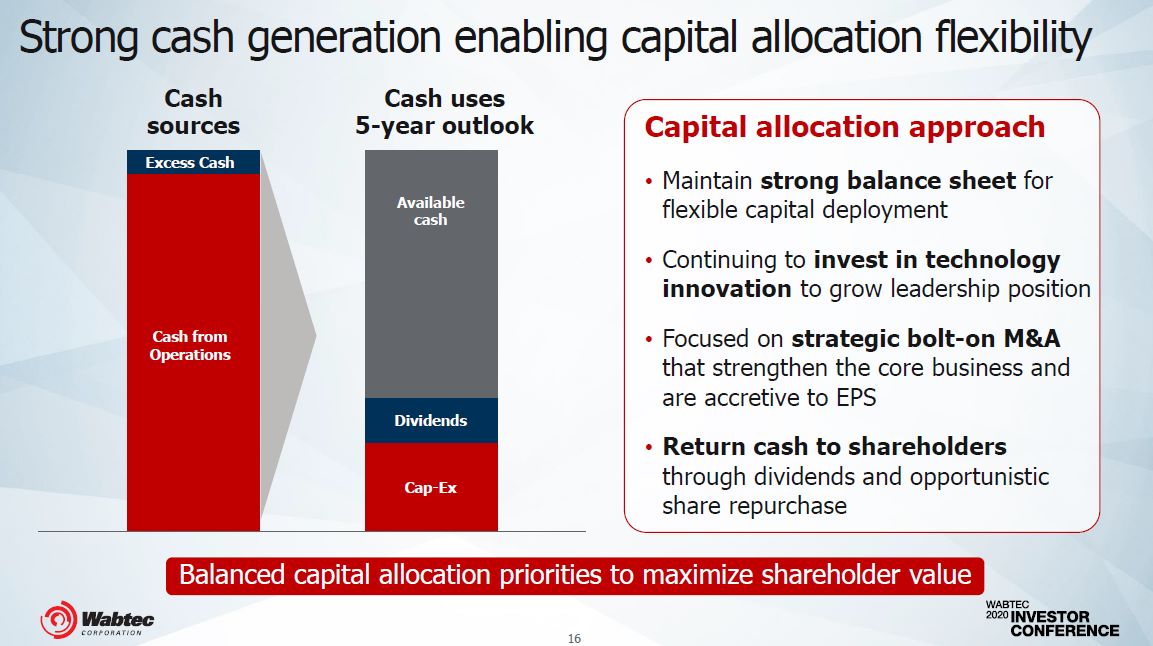
Strong cash generation enabling capital allocation flexibility Dividends Cap-Ex Availablecash Cash from Operations Excess Cash Cash uses5-year outlook Cash sources Balanced capital allocation priorities to maximize shareholder value Capital allocation approachMaintain strong balance sheet for flexible capital deploymentContinuing to invest in technology innovation to grow leadership positionFocused on strategic bolt-on M&A that strengthen the core business and are accretive to EPSReturn cash to shareholders through dividends and opportunistic share repurchase 14
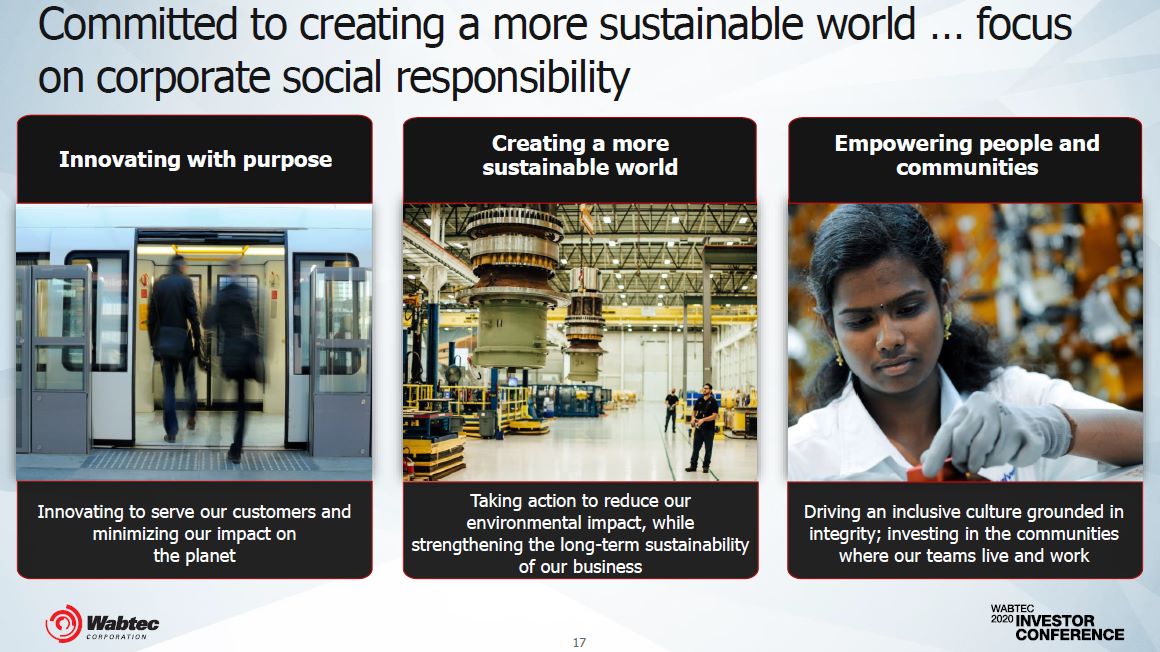
Committed to creating a more sustainable world … focuson corporate social responsibility Creating a moresustainable world Empowering people andcommunities Innovating with purpose Innovating to serve our customers and minimizing our impact onthe planet Taking action to reduce our environmental impact, while strengthening the long-term sustainability of our business Driving an inclusive culture grounded in integrity; investing in the communities where our teams live and work 14

Segment OverviewsRafael Santana
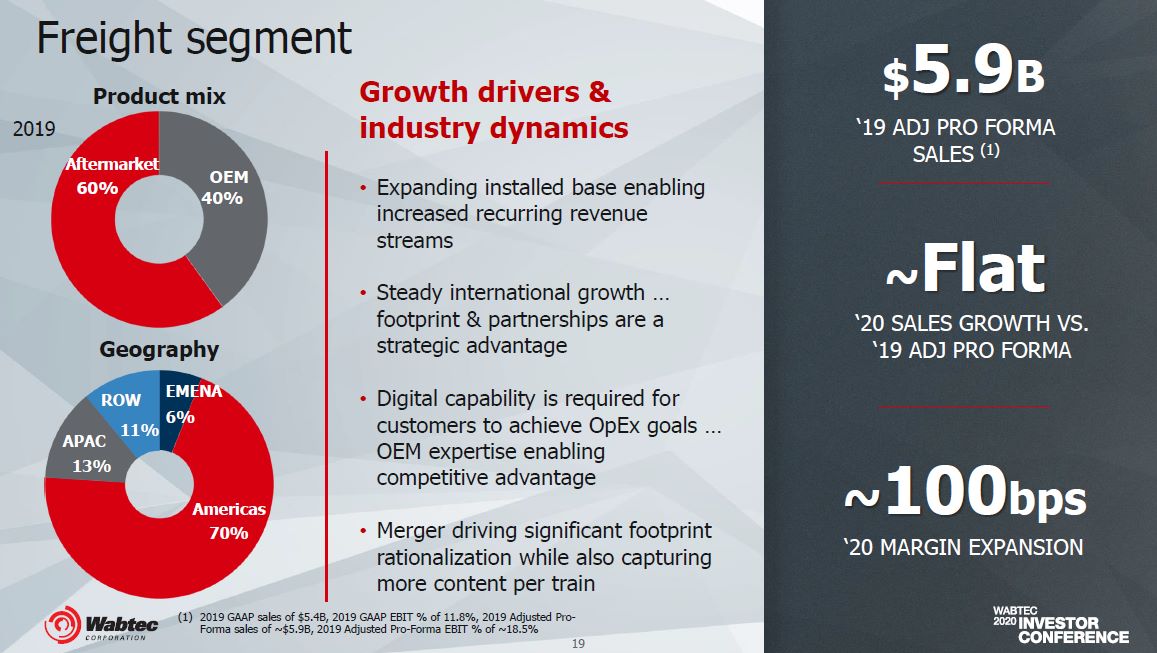
‘19 ADJ PRO FORMASALES (1) $5.9B ~Flat‘20 SALES GROWTH VS.‘19 ADJ PRO FORMA Growth drivers &industry dynamicsExpanding installed base enabling increased recurring revenue streams Steady international growth … footprint & partnerships are a strategic advantage Digital capability is required for customers to achieve OpEx goals … OEM expertise enabling competitive advantage Merger driving significant footprint rationalization while also capturing more content per train Geography Aftermarket60% OEM 40% ROW EMENA Americas70% 11% 6% APAC 13% Freight segmentProduct mix2019 ~100bps‘20 MARGIN EXPANSION (1) 2019 GAAP sales of $5.4B, 2019 GAAP EBIT % of 11.8%, 2019 Adjusted Pro- Forma sales of ~$5.9B, 2019 Adjusted Pro-Forma EBIT % of ~18.5%19
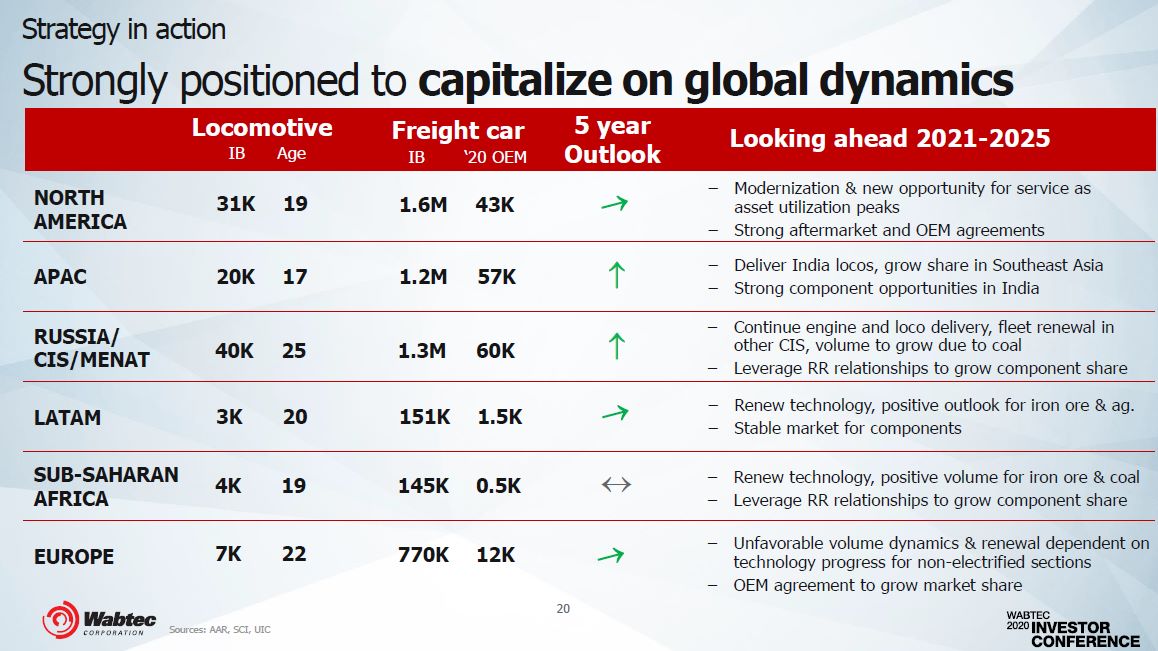
LocomotiveIB Age Sources: AAR, SCI, UIC Strategy in actionStrongly positioned to capitalize on global dynamics 5 year Outlook Looking ahead 2021-2025 − OEM agreement to grow market share − Modernization & new opportunity for service as Freight carIB ‘20 OEM NORTH 31KAMERICA 19 1.6M 43K asset utilization peaks− Strong aftermarket and OEM agreements APAC 20K 17 1.2M 57K Deliver India locos, grow share in Southeast AsiaStrong component opportunities in India RUSSIA/CIS/MENAT 40K 25 1.3M 60K Continue engine and loco delivery, fleet renewal in other CIS, volume to grow due to coalLeverage RR relationships to grow component share LATAM 3K 20 151K 1.5K Renew technology, positive outlook for iron ore & ag.Stable market for components SUB-SAHARAN 4K AFRICA 19 145K 0.5K − Renew technology, positive volume for iron ore & coal− Leverage RR relationships to grow component share EUROPE 7K 22 770K 12K − Unfavorable volume dynamics & renewal dependent ontechnology progress for non-electrified sections 20
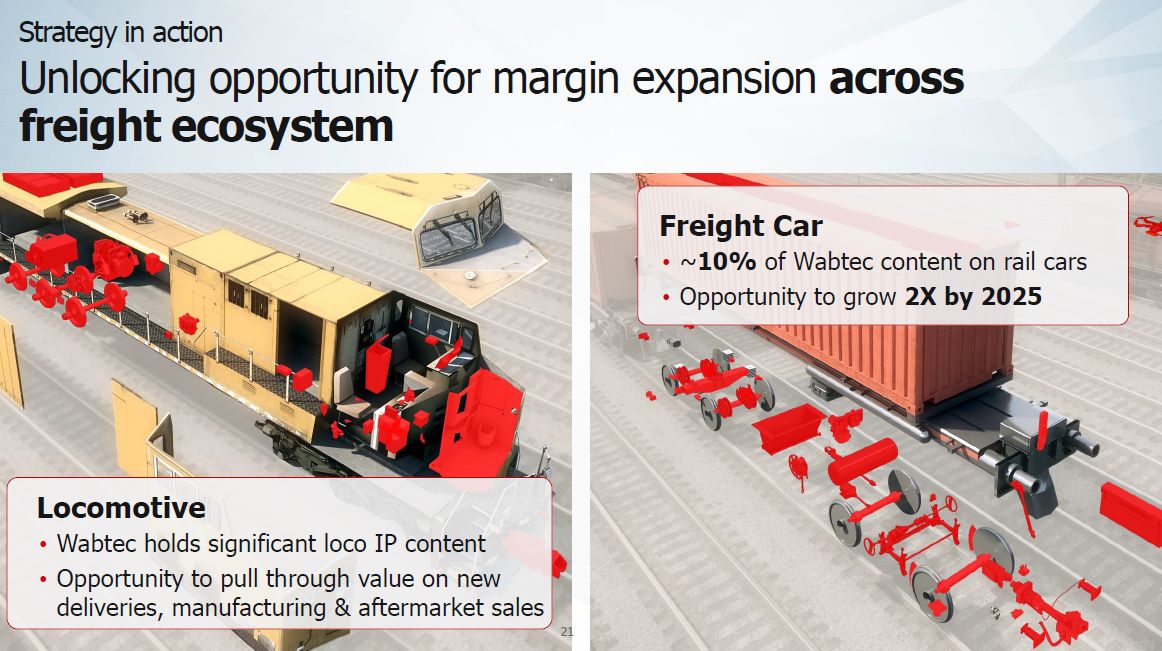
Strategy in action Unlocking opportunity for margin expansion across freight ecosystem LocomotiveWabtec holds significant loco IP contentOpportunity to pull through value on newdeliveries, manufacturing & aftermarket sales Freight Car~10% of Wabtec content on rail carsOpportunity to grow 2X by 2025 22
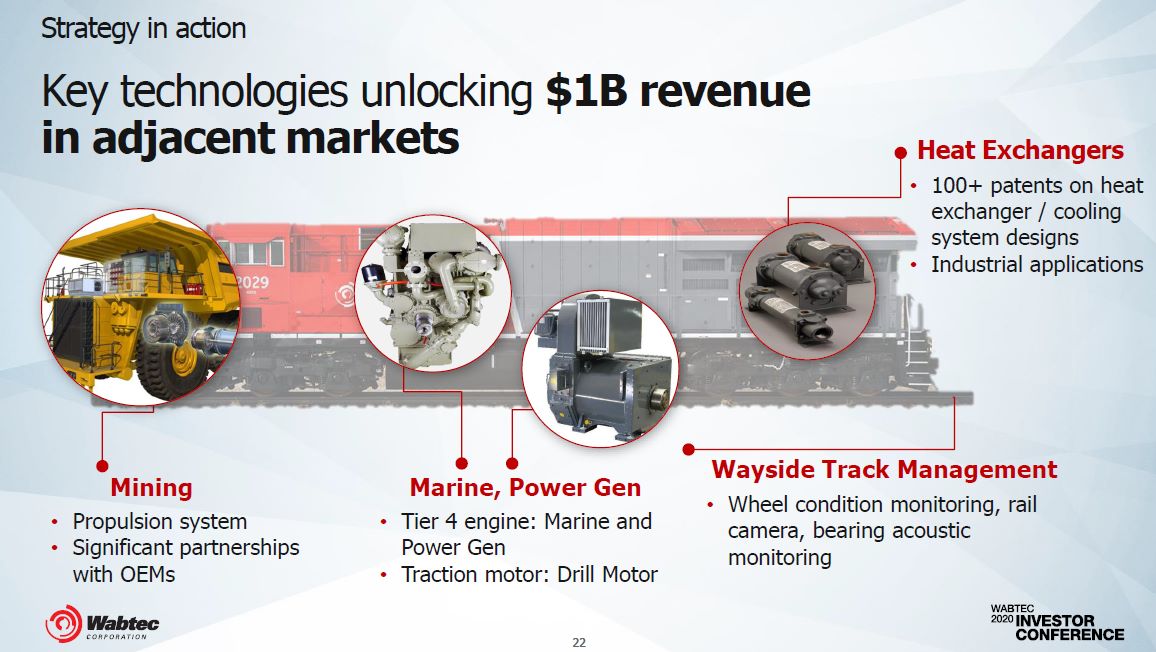
Strategy in action Key technologies unlocking $1B revenue in adjacent markets MiningPropulsion systemSignificant partnershipswith OEMs Wayside Track ManagementWheel condition monitoring, rail camera, bearing acoustic monitoring Heat Exchangers100+ patents on heat exchanger / cooling system designsIndustrial applications Marine, Power GenTier 4 engine: Marine and Power GenTraction motor: Drill Motor 22
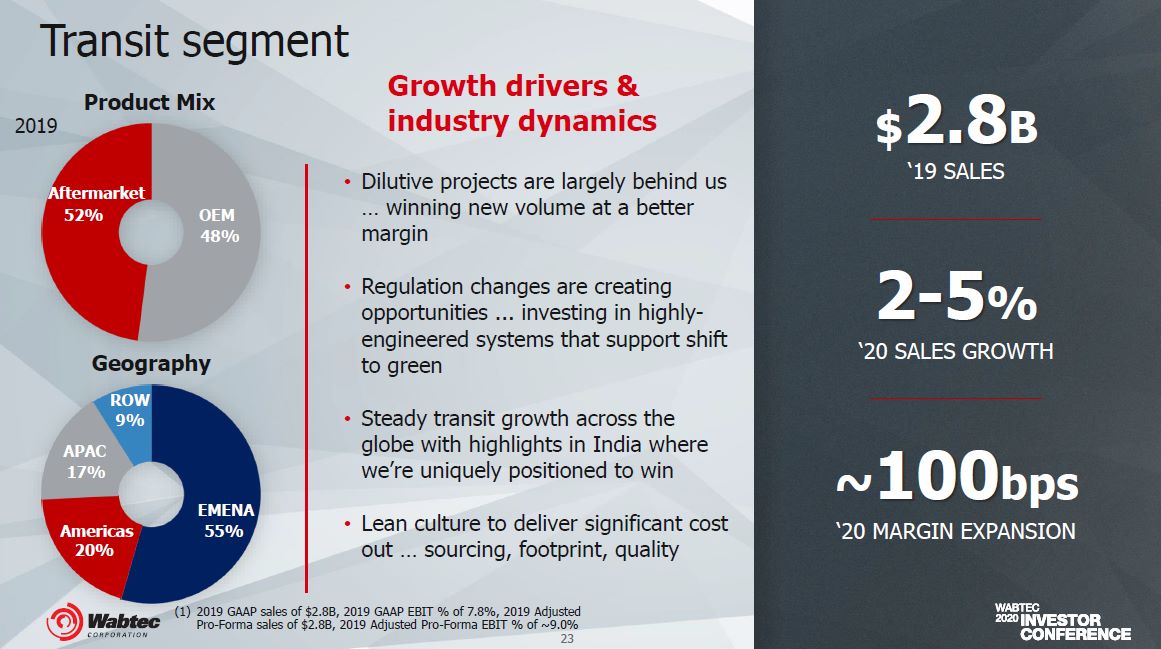
Transit segment Growth drivers & industry dynamics Dilutive projects are largely behind us… winning new volume at a bettermargin Regulation changes are creating opportunities ... investing in highly- engineered systems that support shift to green Steady transit growth across the globe with highlights in India where we’re uniquely positioned to win Lean culture to deliver significant costout … sourcing, footprint, quality OEM 48% Aftermarket 52% EMENA55% Americas20% GeographyROW 9%APAC17% $2.8B‘19 SALES 2-5%‘20 SALES GROWTH Product Mix2019 ~100bps‘20 MARGIN EXPANSION 23 (1) 2019 GAAP sales of $2.8B, 2019 GAAP EBIT % of 7.8%, 2019 Adjusted Pro-Forma sales of $2.8B, 2019 Adjusted Pro-Forma EBIT % of ~9.0%
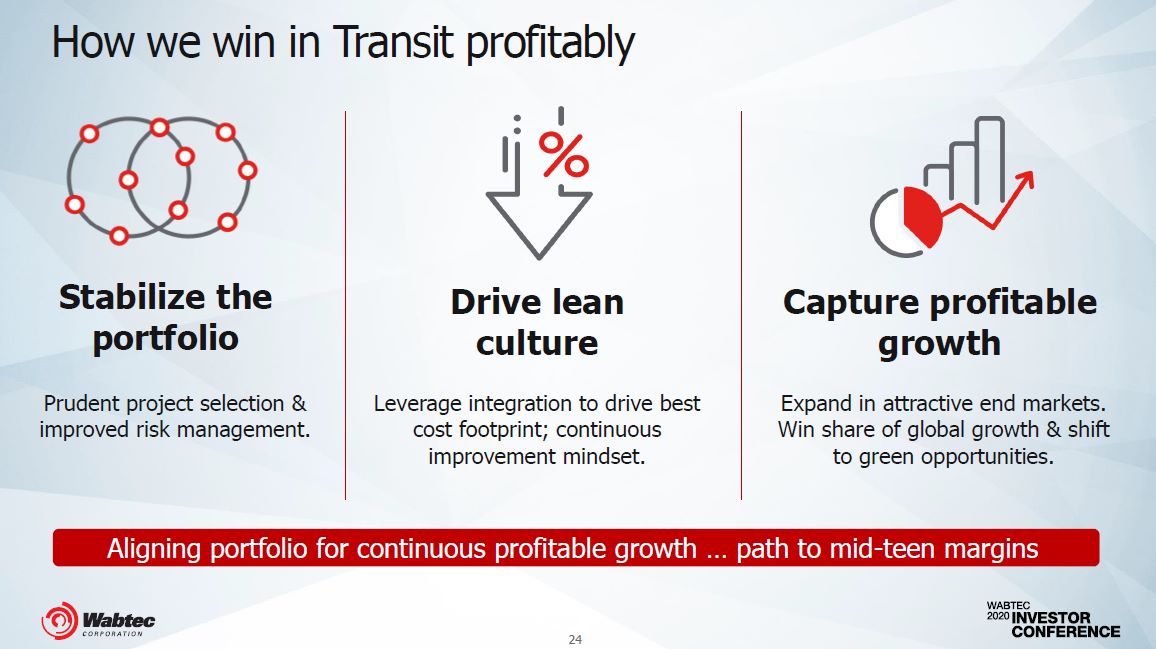
How we win in Transit profitably Aligning portfolio for continuous profitable growth … path to mid-teen margins Stabilize the portfolioPrudent project selection & improved risk management. Capture profitable growthExpand in attractive end markets. Win share of global growth & shift to green opportunities. Drive lean cultureLeverage integration to drive best cost footprint; continuous improvement mindset. 23
TechnologyDominique Malenfant

Technical innovation …at our core st 26 TO MARKET Advanced Adhesion controls system to improve traction efficiency for heavy haul freight locomotives Train Energy Management for freight application AC electric drive system for mining Ultra-Class trucks Global Remote Monitoring & Diagnostic solution Fully electronic SIL 4 brake system in transit Electronic Train Management System (“PTC”) in freight Tier 4 engine w/o aftertreatment … 3 years ahead ofcompetitionMetallic 3D printed parts for rail in productionBattery electric freight locomotive
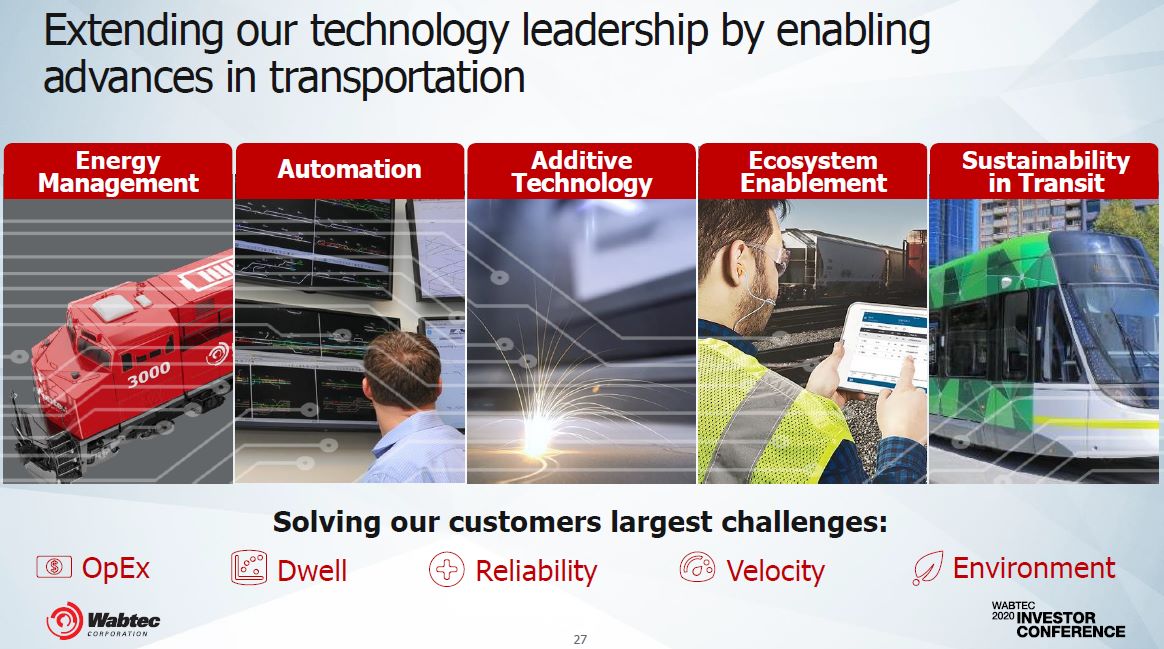
Extending our technology leadership by enabling advances in transportation Environment Solving our customers largest challenges:Dwell Reliability Velocity OpEx EnergyManagement Automation EcosystemEnablement Sustainabilityin Transit AdditiveTechnology 27

Disrupting the rail industry with battery power 100% BATTERY POWERED Up to 30% FUEL AND EMISSIONS SAVINGS Up to 6,000 KWHr Customer Value DriversEnvironment OpEx FUEL=$7B+ ANNUAL NAM LOCO FUEL SPEND Up to 45 MILES ON BATTERY Autonomy BATTERY-ELECTRIC FREIGHT LOCOMOTIVE 28
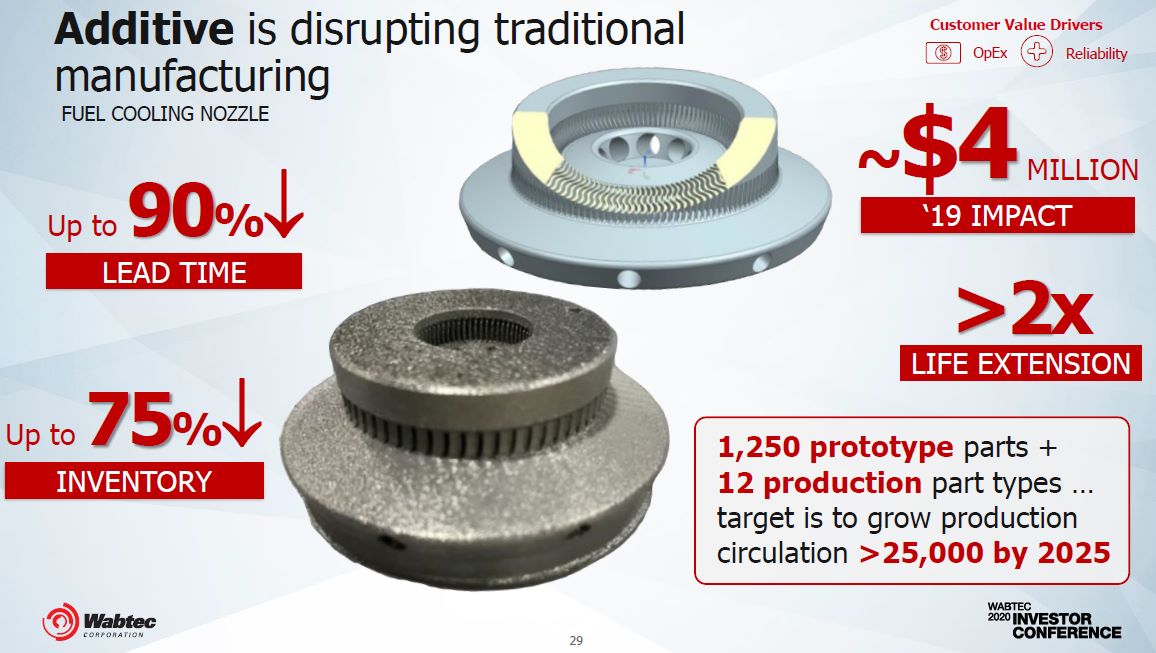
Customer Value DriversOpEx Reliability LIFE EXTENSION >2x LEAD TIME Up to 90% INVENTORY Up to 75% ‘19 IMPACT ~$4 MILLION 1,250 prototype parts + 12 production part types … target is to grow productioncirculation >25,000 by 2025 29 Additive is disrupting traditional manufacturingFUEL COOLING NOZZLE
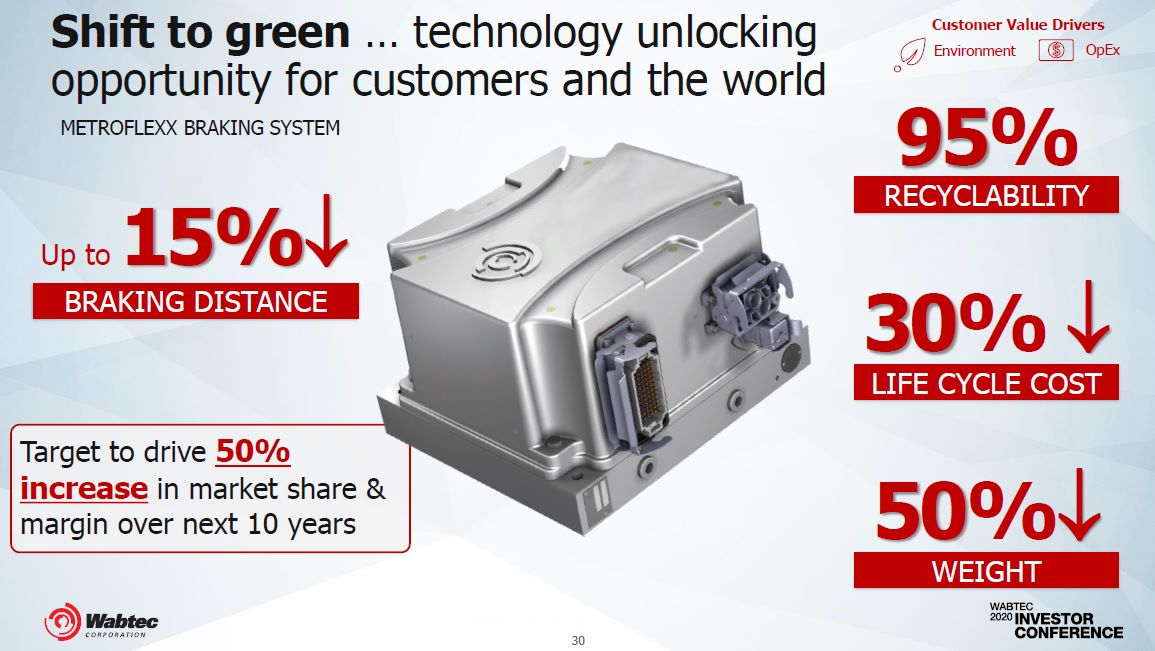
Target to drive 50% increase in market share & margin over next 10 years WEIGHT 50% BRAKING DISTANCE Up to 15% RECYCLABILITY 95% Customer Value DriversEnvironment OpEx LIFE CYCLE COST 30% 30 Shift to green … technology unlockingopportunity for customers and the worldMETROFLEXX BRAKING SYSTEM
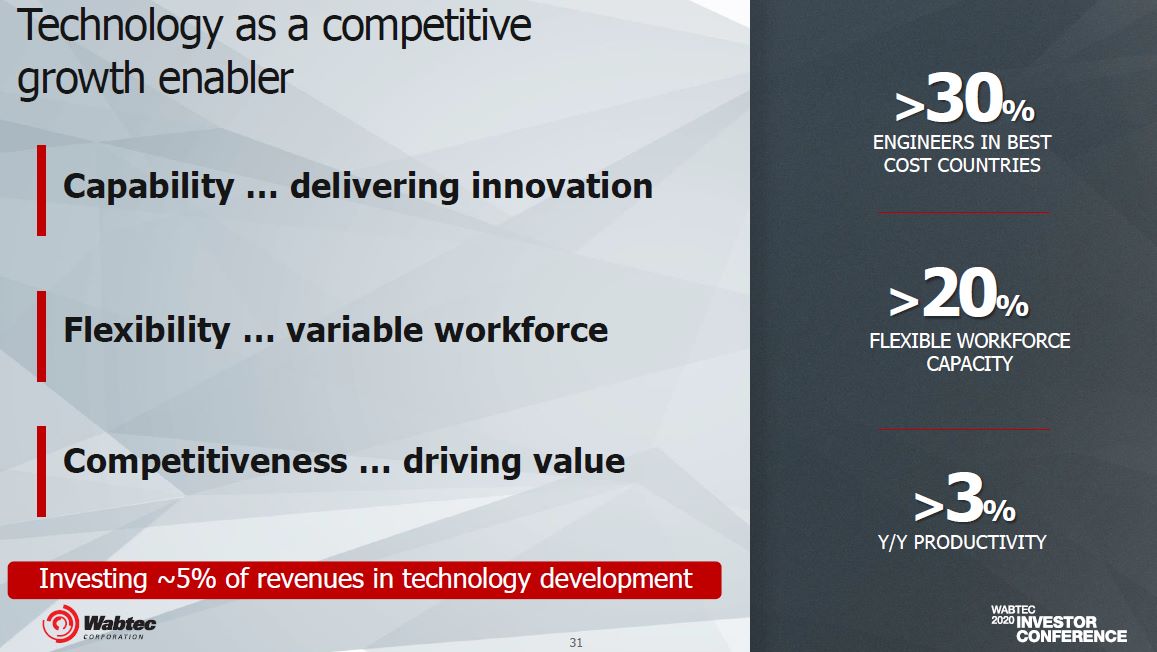
Technology as a competitive growth enabler Investing ~5% of revenues in technology development >20%FLEXIBLE WORKFORCE CAPACITY >30%ENGINEERS IN BESTCOST COUNTRIES >3%Y/Y PRODUCTIVITY Capability … delivering innovation Flexibility … variable workforce Competitiveness … driving value 31

Freight ServicesPascal Schweitzer
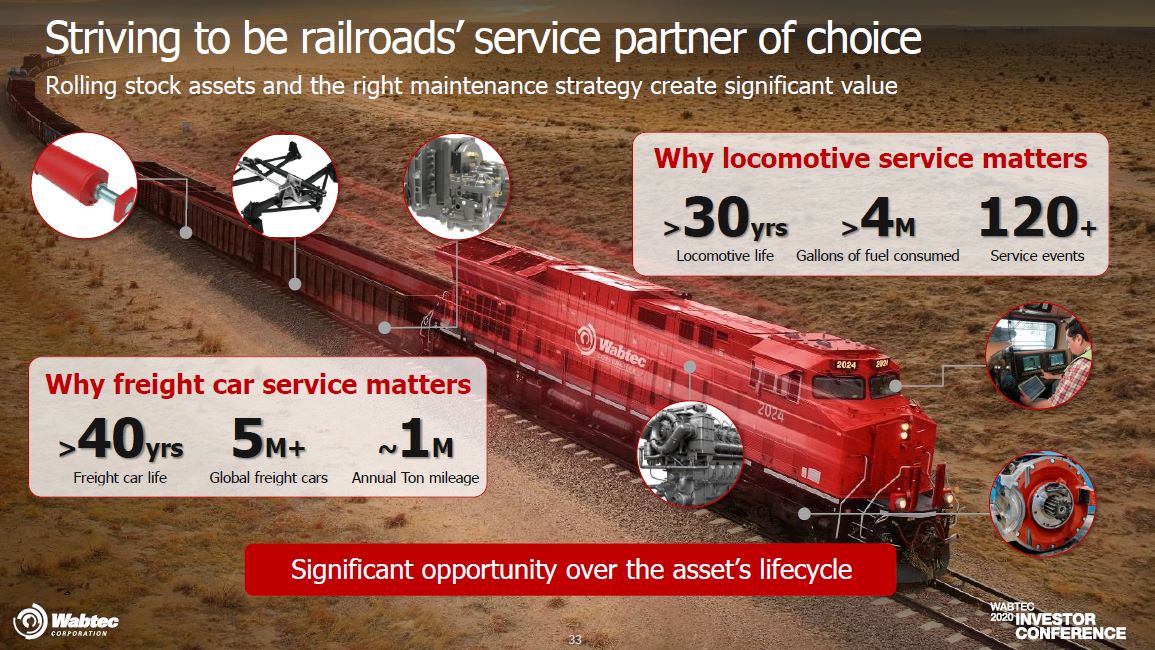
Striving to be railroads’ service partner of choiceRolling stock assets and the right maintenance strategy create significant value Significant opportunity over the asset’s lifecycle Why locomotive service matters >30yrsLocomotive life >4MGallons of fuel consumed 120+Service events Why freight car service matters >40yrsFreight car life 5M+Global freight cars ~1MAnnual Ton mileage 33 33
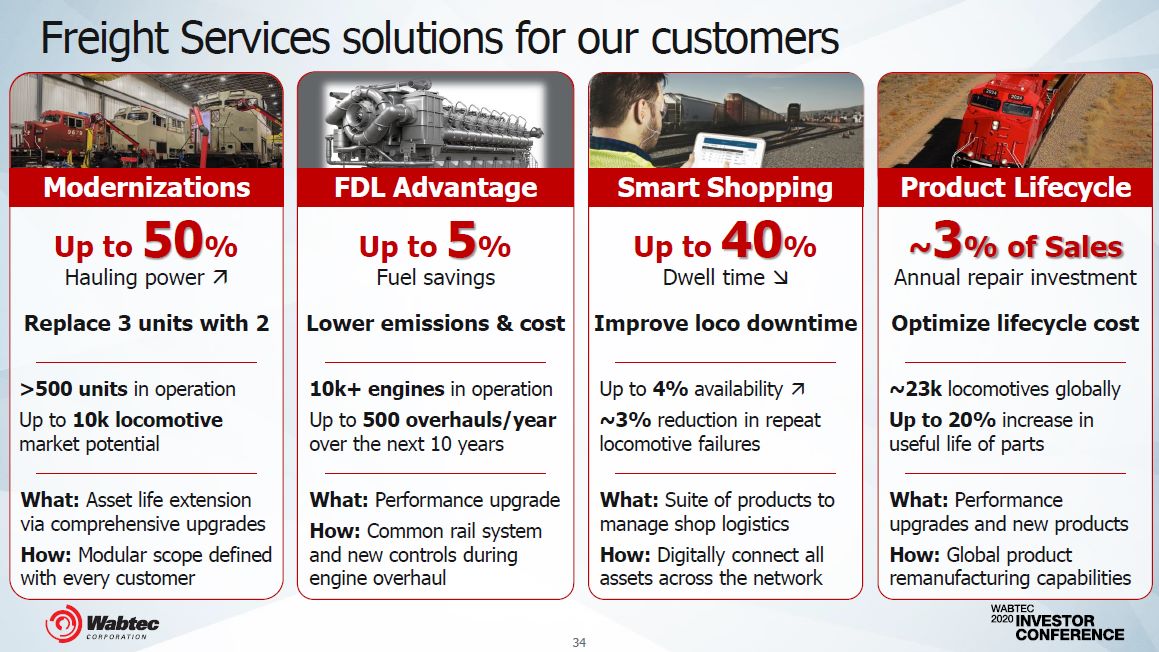
Freight Services solutions for our customers >500 units in operation Up to 10k locomotivemarket potential Modernizations Up to 50%Hauling power Replace 3 units with 2 What: Asset life extension via comprehensive upgradesHow: Modular scope defined with every customer 10k+ engines in operation Up to 500 overhauls/yearover the next 10 years FDL Advantage Up to 5%Fuel savingsLower emissions & cost What: Performance upgradeHow: Common rail system and new controls during engine overhaul Up to 4% availability ~3% reduction in repeat locomotive failures Smart Shopping Up to 40%Dwell time Improve loco downtime What: Suite of products to manage shop logisticsHow: Digitally connect all assets across the network ~23k locomotives globallyUp to 20% increase in useful life of parts ~3% of SalesAnnual repair investmentOptimize lifecycle cost What: Performance upgrades and new productsHow: Global product remanufacturing capabilities Product Lifecycle 34
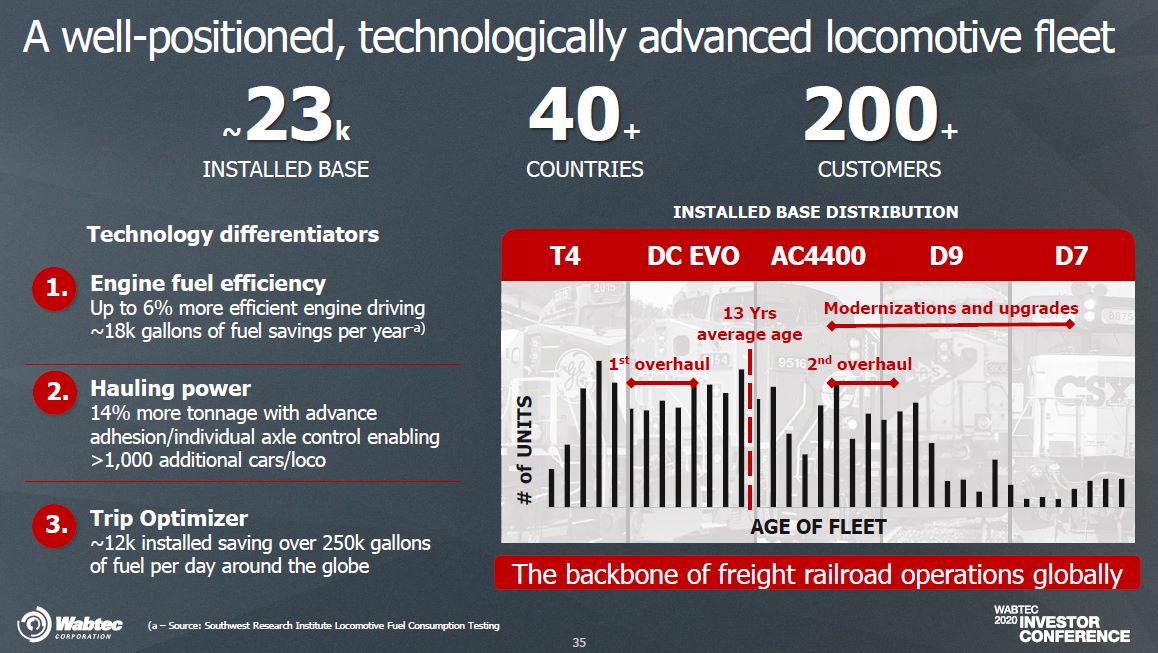
A well-positioned, technologically advanced locomotive fleet ~23kINSTALLED BASE 40+COUNTRIES (a – Source: Southwest Research Institute Locomotive Fuel Consumption Testing T4 200+CUSTOMERSINSTALLED BASE DISTRIBUTIONDC EVO AC4400 D9 D7 Modernizations and upgrades 1st overhaul 2nd overhaul 13 Yrs average age # of UNITS Technology differentiators 1. Engine fuel efficiencyUp to 6% more efficient engine driving~18k gallons of fuel savings per year-a) 2. Hauling power14% more tonnage with advance adhesion/individual axle control enabling>1,000 additional cars/loco 3. Trip Optimizer~12k installed saving over 250k gallonsof fuel per day around the globe AGE OF FLEETThe backbone of freight railroad operations globally 35
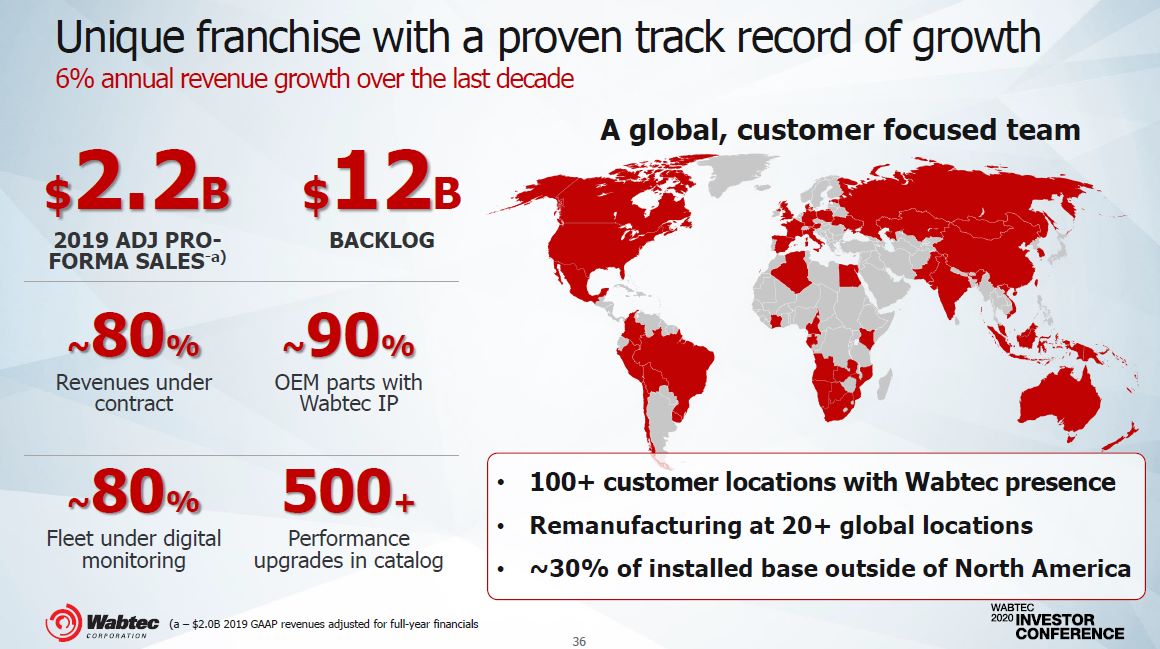
Unique franchise with a proven track record of growth6% annual revenue growth over the last decade $2.2B2019 ADJ PRO- FORMA SALES-a) $12BBACKLOG ~80%Fleet under digital monitoring 500+Performance upgrades in catalog A global, customer focused team (a – $2.0B 2019 GAAP revenues adjusted for full-year financials ~80%Revenues under contract ~90%OEM parts with Wabtec IP 36 100+ customer locations with Wabtec presenceRemanufacturing at 20+ global locations~30% of installed base outside of North America

Long-term fundamentals to deliver growth Our Strategy Capture entitlementMaximize utilizationTrack loco performance over lifecycleLeverage global service platform andinfrastructure Drive outcomesPartner on RR fleet lifecycle strategyRoll-out new offerings at scaleRevitalize aging assets via Mods Optimize lifecycle costRigorous tools to analyze cost structureDedicated engineering organization focused on lifecycle cost managementLEAN and Quality at heart of business Market Drivers Fleet lifecycle+ Favorable fleet age profile … prioritized assetdispatch+ Higher locomotive utilization … acceleratingmaintenance across the board Fleet performance+ Increased demand for availability, reliability, fuel performance … mods and upgrade opportunities+ Strategic partnerships for value Fleet size+ International deliveries, units off warrantyNAM Class I parkingRailroad focus on op ratios, short term impact to maintenance costs 37
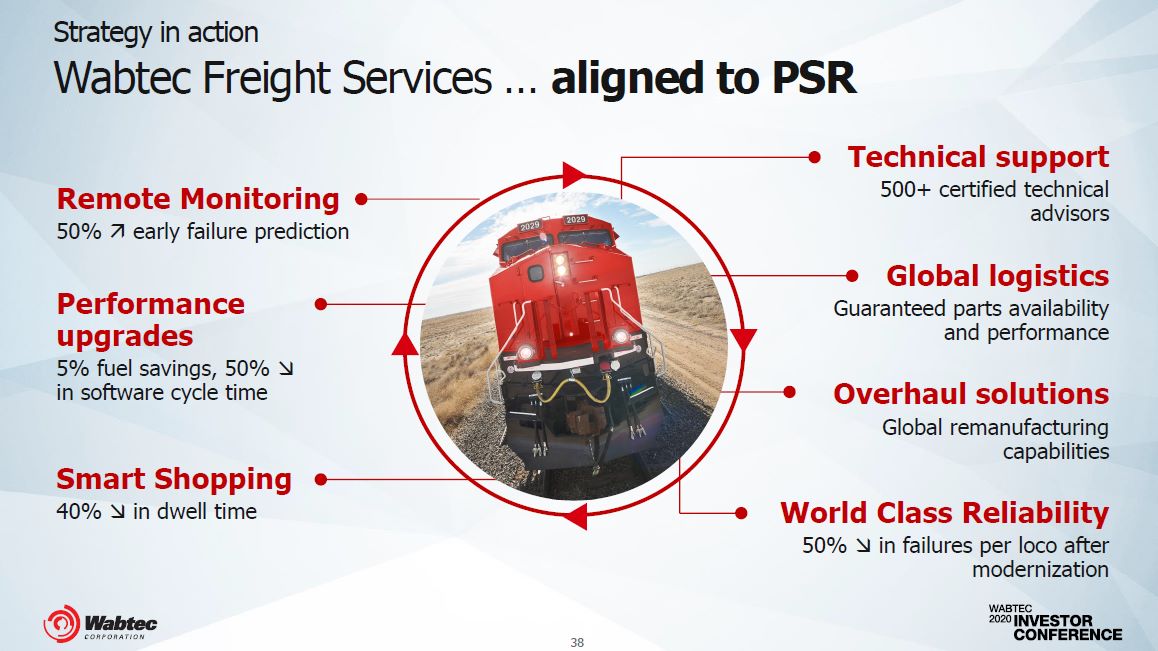
Strategy in action Wabtec Freight Services … aligned to PSR Remote Monitoring50% early failure predictionPerformance upgrades5% fuel savings, 50% in software cycle timeSmart Shopping40% in dwell time Technical support500+ certified technicaladvisorsGlobal logisticsGuaranteed parts availabilityand performanceOverhaul solutionsGlobal remanufacturingcapabilitiesWorld Class Reliability50% in failures per loco aftermodernization 38
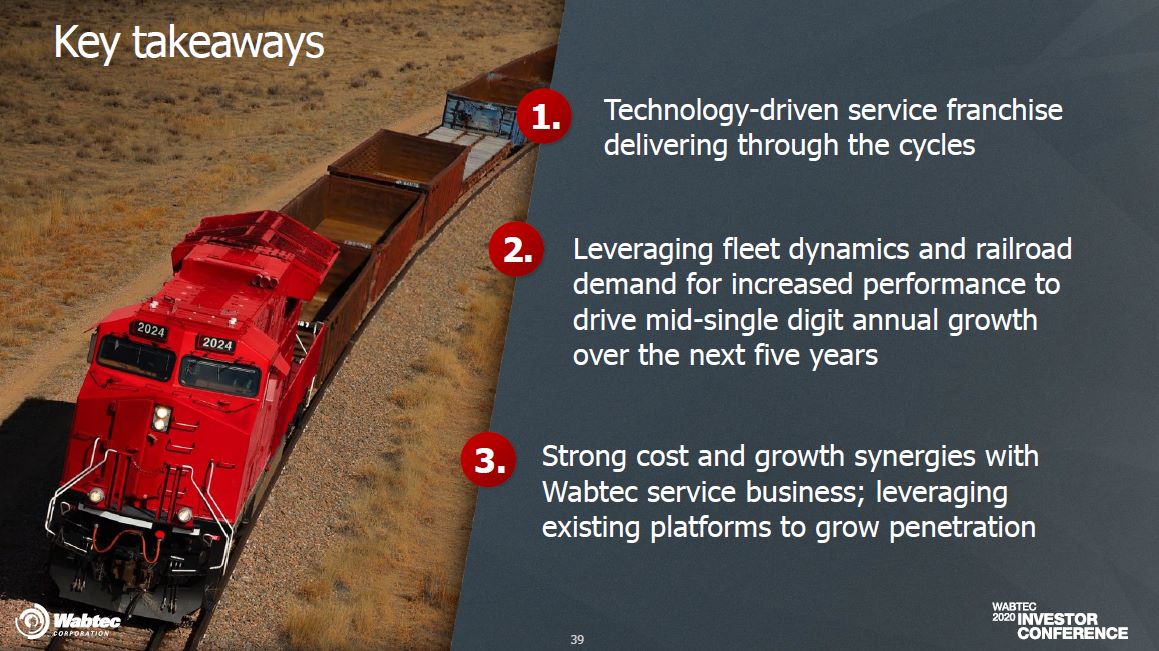
Key takeaways Technology-driven service franchise delivering through the cycles 1. 2. Leveraging fleet dynamics and railroad demand for increased performance to drive mid-single digit annual growth over the next five years Strong cost and growth synergies with Wabtec service business; leveraging existing platforms to grow penetration 3. 39
Digital ElectronicsPeter Thomas & Bob Bourg
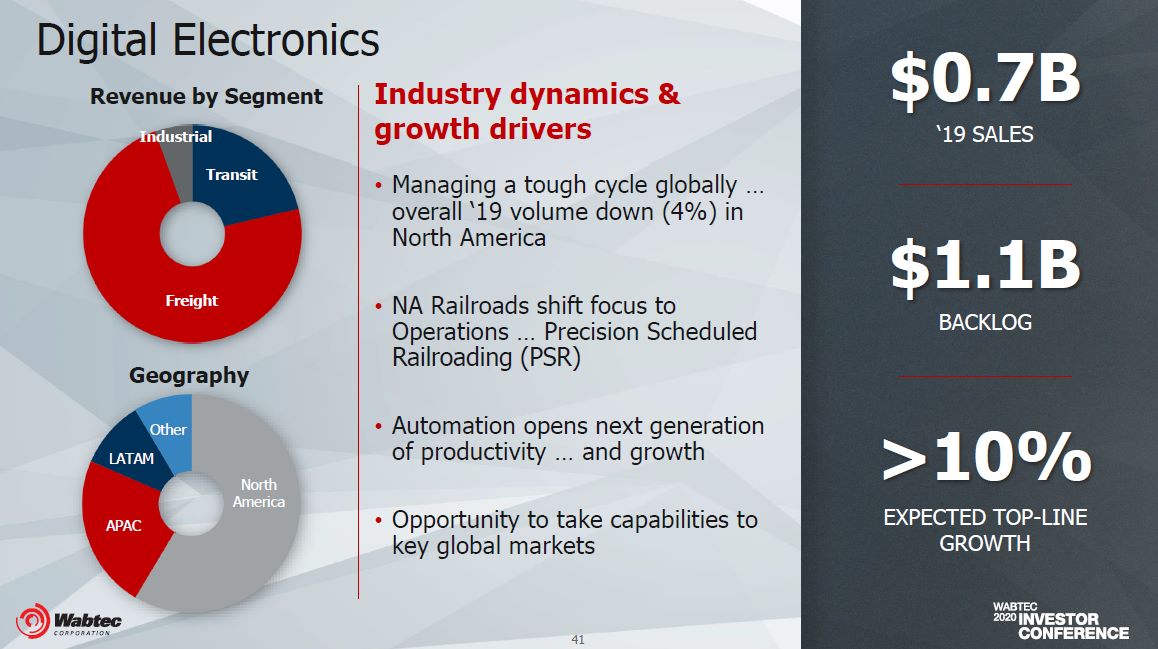
Digital Electronics Industry dynamics & growth driversManaging a tough cycle globally … overall ‘19 volume down (4%) in North America NA Railroads shift focus toOperations … Precision ScheduledRailroading (PSR) Automation opens next generationof productivity … and growth Opportunity to take capabilities to key global markets Geography North America APAC OtherLATAM Freight Transit >10%EXPECTED TOP-LINE GROWTH $0.7B‘19 SALES $1.1BBACKLOG Revenue by SegmentIndustrial 41
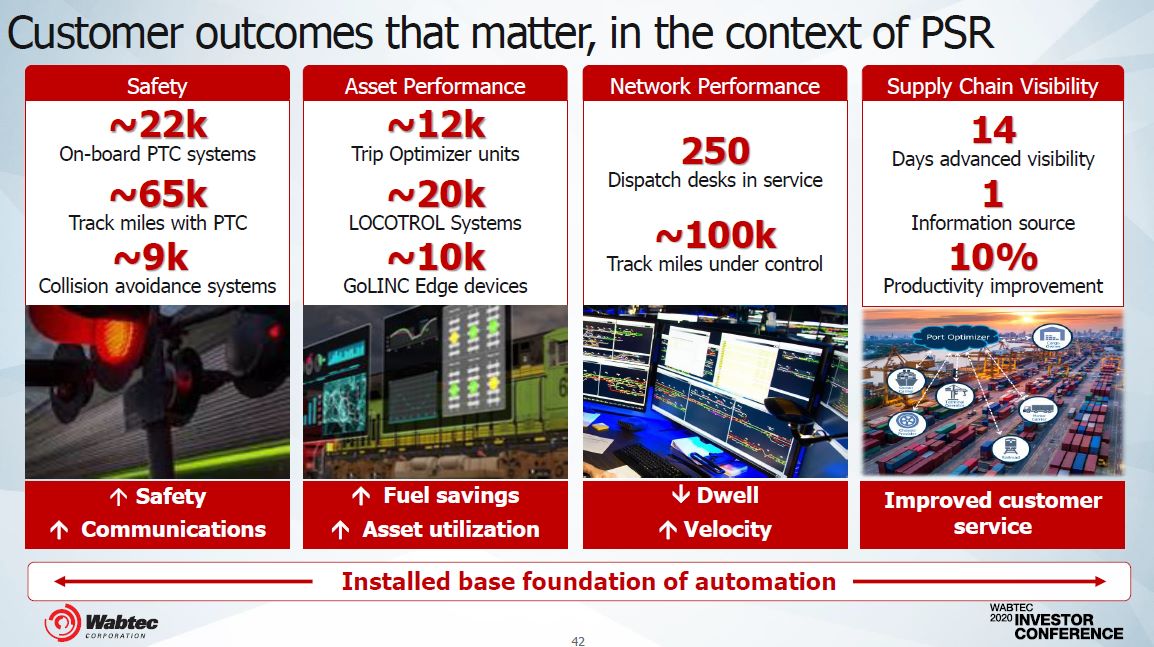
Customer outcomes that matter, in the context of PSR Installed base foundation of automation Safety Communications ~12kTrip Optimizer units~20kLOCOTROL Systems~10kGoLINC Edge devices Fuel savings Asset utilization 14Days advanced visibility1Information source10%Productivity improvement Improved customerservice Safety Asset Performance Network Performance Supply Chain Visibility 250Dispatch desks in service~100kTrack miles under control Dwell Velocity ~22kOn-board PTC systems~65kTrack miles with PTC~9kCollision avoidance systems 42
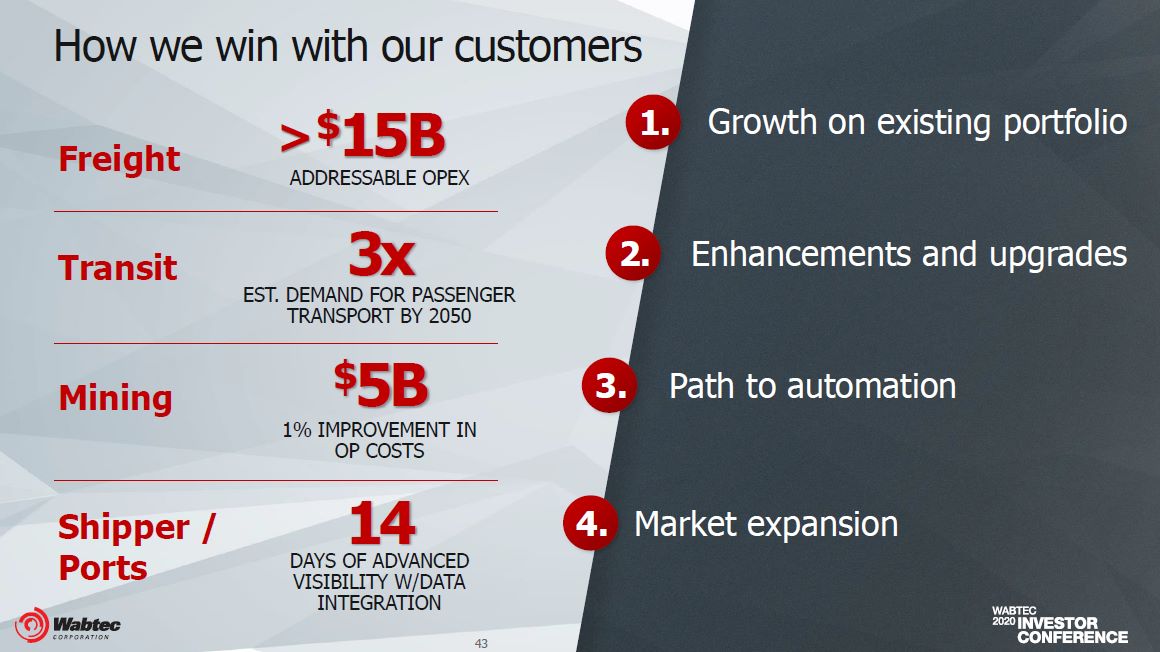
Enhancements and upgrades Market expansion 1. 2. Growth on existing portfolio 3. Path to automation 4. How we win with our customers R INTEGRATION 43 Freight >$15BADDRESSABLE OPEX Transit 3xEST. DEMAND FOR PASSENGETRANSPORT BY 2050 Mining $5B1% IMPROVEMENT IN OP COSTS Shipper / 14Ports DAYS OF ADVANCEDVISIBILITY W/DATA
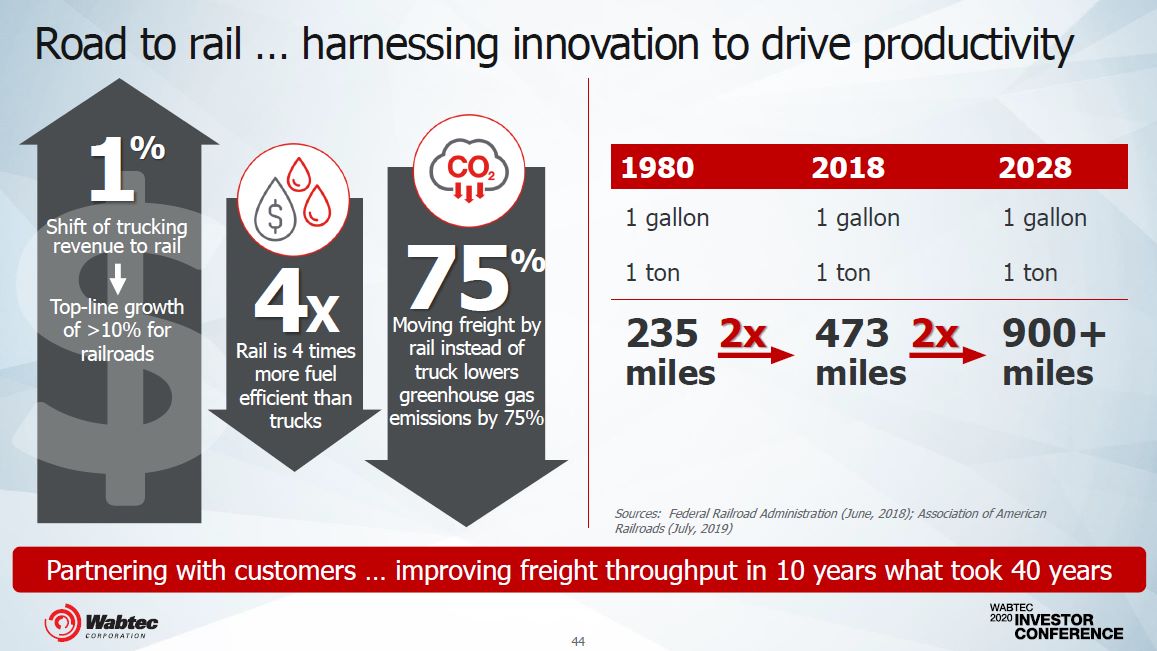
Road to rail … harnessing innovation to drive productivity 4X Rail is 4 times more fuel efficient than trucks Moving freight by rail instead of truck lowers greenhouse gasemissions by 75% Shift of truckingrevenue to rail Top-line growth of >10% for railroads 1% 75% Sources: Federal Railroad Administration (June, 2018); Association of AmericanRailroads (July, 2019) Partnering with customers … improving freight throughput in 10 years what took 40 years 1980 2018 2028 1 gallon 1 gallon 1 gallon 1 ton 1 ton 1 ton 235 2xmiles 473 2xmiles 900+miles 44
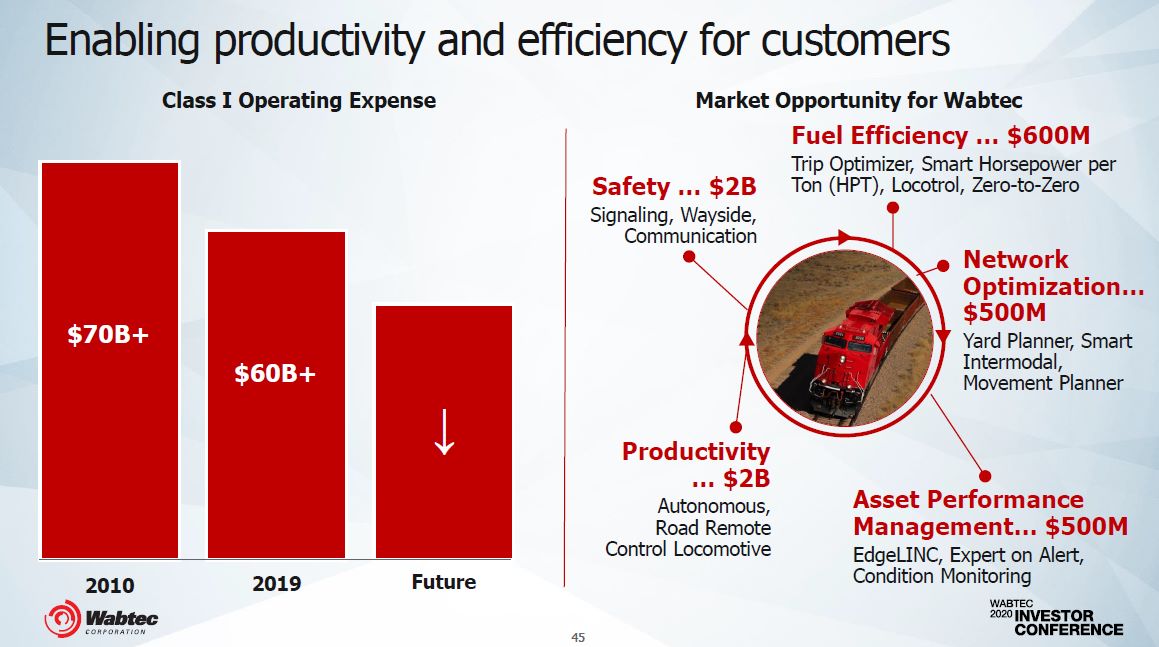
Class I Operating Expense Enabling productivity and efficiency for customers 2019 $60B+ Future ↓ $70B+ 2010 Ton (HPT), Locotrol, Zero-to-Zero NetworkOptimization…$500MYard Planner, Smart Intermodal, Movement Planner Asset PerformanceManagement… $500MEdgeLINC, Expert on Alert, Condition Monitoring Productivity… $2BAutonomous, Road Remote Control Locomotive Market Opportunity for WabtecFuel Efficiency … $600MTrip Optimizer, Smart Horsepower per Safety … $2B Signaling, Wayside,Communication 45
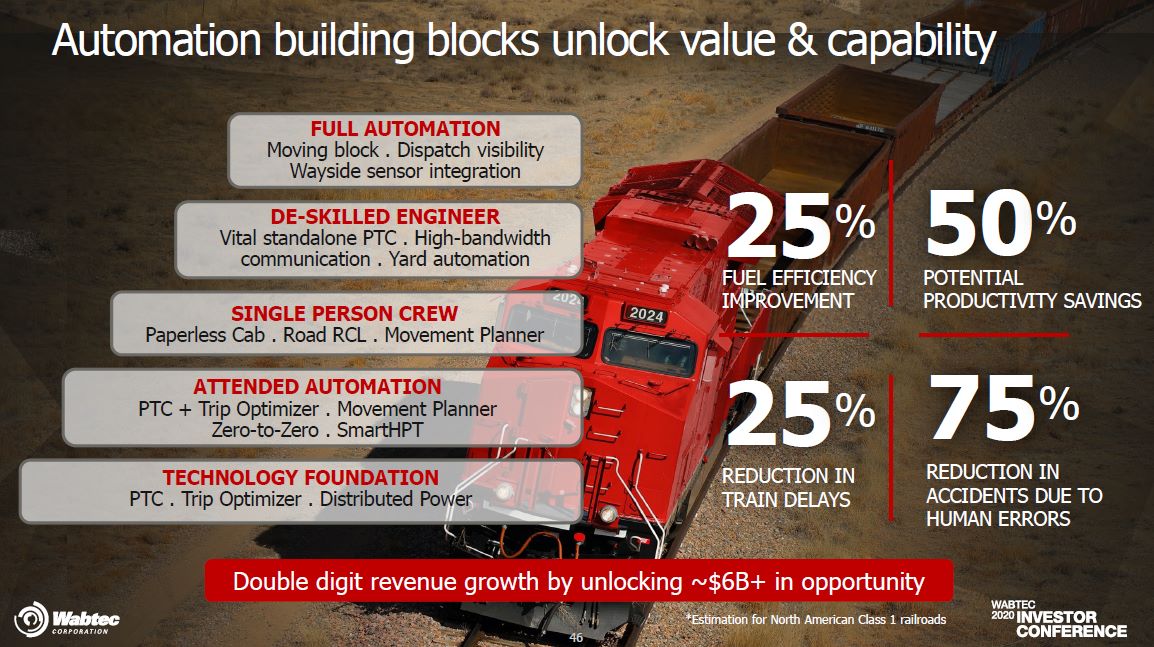
*Estimation for North American Class 1 railroads 25% FUEL EFFICIENCYIMPROVEMENT 50%POTENTIALPRODUCTIVITY SAVINGS 25 % REDUCTION IN TRAIN DELAYS 75%REDUCTION IN ACCIDENTS DUE TO HUMAN ERRORS DE-SKILLED ENGINEER Vital standalone PTC . High-bandwidth communication . Yard automation SINGLE PERSON CREW Paperless Cab . Road RCL . Movement Planner ATTENDED AUTOMATION PTC + Trip Optimizer . Movement Planner Zero-to-Zero . SmartHPT TECHNOLOGY FOUNDATION PTC . Trip Optimizer . Distributed Power FULL AUTOMATIONMoving block . Dispatch visibility Wayside sensor integration Automation building blocks unlock value & capability Double digit revenue growth by unlocking ~$6B+ in opportunity 46 46
Global OperationsAlicia Hammersmith
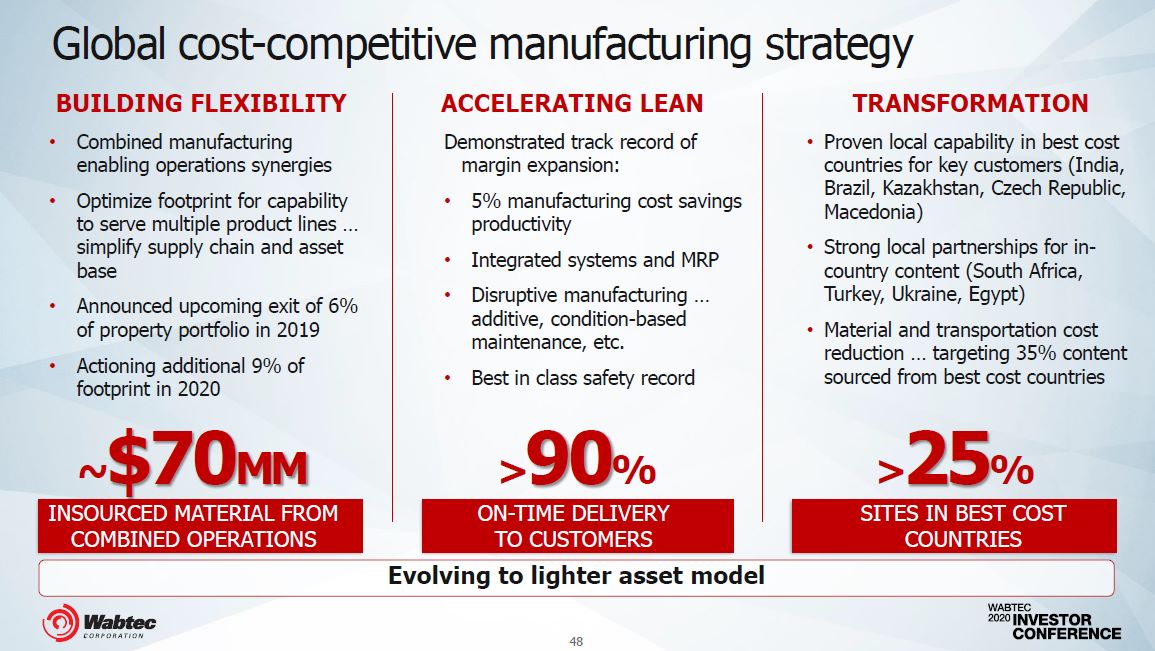
BUILDING FLEXIBILITY >25% SITES IN BEST COST COUNTRIES INSOURCED MATERIAL FROM COMBINED OPERATIONS Global cost-competitive manufacturing strategy ON-TIME DELIVERY TO CUSTOMERS >90% Evolving to lighter asset model 48 Combined manufacturing enabling operations synergiesOptimize footprint for capability to serve multiple product lines … simplify supply chain and asset baseAnnounced upcoming exit of 6%of property portfolio in 2019Actioning additional 9% of footprint in 2020~$70MM TRANSFORMATIONProven local capability in best cost countries for key customers (India, Brazil, Kazakhstan, Czech Republic, Macedonia)Strong local partnerships for in- country content (South Africa, Turkey, Ukraine, Egypt)Material and transportation cost reduction … targeting 35% content sourced from best cost countries ACCELERATING LEANDemonstrated track record of margin expansion: 5% manufacturing cost savingsproductivityIntegrated systems and MRPDisruptive manufacturing … additive, condition-based maintenance, etc.Best in class safety record
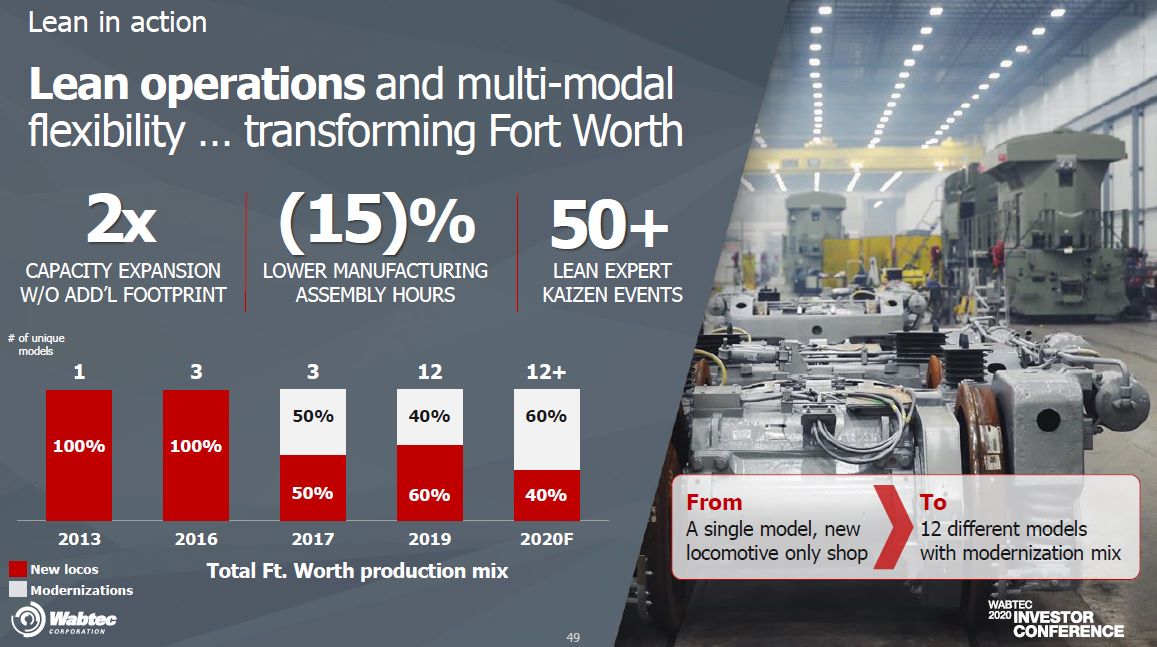
Lean in actionLean operations and multi-modalflexibility … transforming Fort Worth From To A single model, newlocomotive only shop 12 different modelswith modernization mix (15)%LOWER MANUFACTURING ASSEMBLY HOURS 2xCAPACITY EXPANSIONW/O ADD’L FOOTPRINT New locos Modernizations # of uniquemodels 1 3 3 12 12+ 50% 40% 60% 100% 100% 50% 60% 40% 2013 2016 2017 2019 2020F Total Ft. Worth production mix 50+LEAN EXPERTKAIZEN EVENTS 49
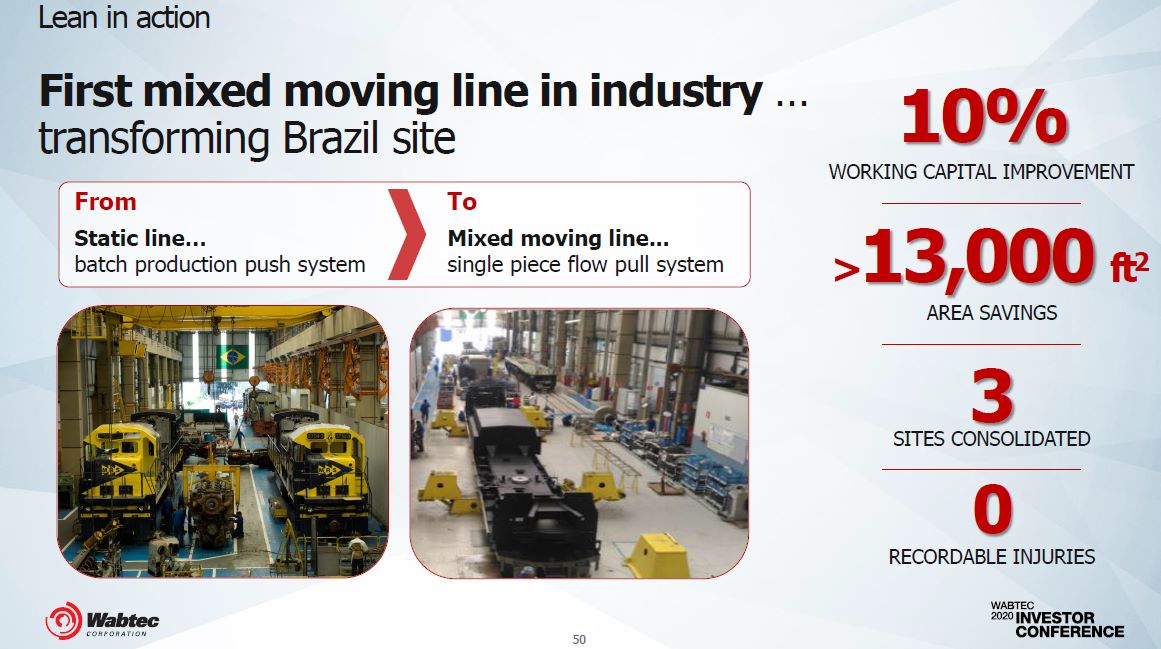
From To Static line…batch production push system Mixed moving line...single piece flow pull system >13,000 ft2 AREA SAVINGS 10%WORKING CAPITAL IMPROVEMENT 3 SITES CONSOLIDATED0 RECORDABLE INJURIES Lean in action First mixed moving line in industry …transforming Brazil site 50
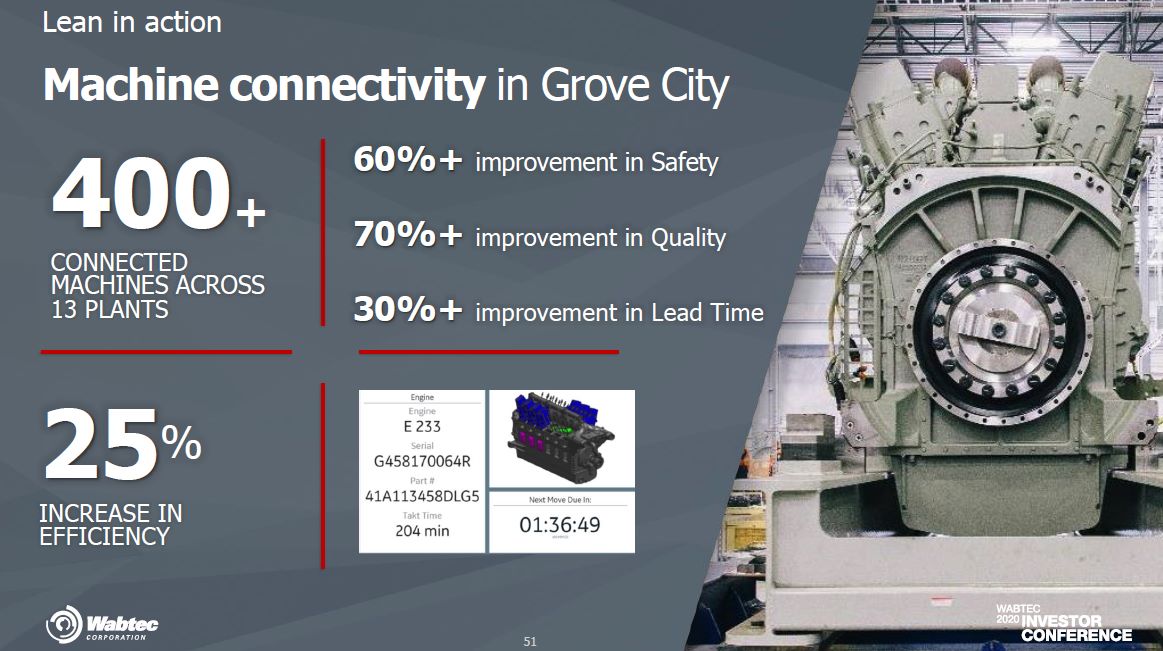
Lean in actionMachine connectivity in Grove City 51 400+CONNECTED MACHINES ACROSS 13 PLANTS 60%+ improvement in Safety70%+ improvement in Quality30%+ improvement in Lead Time 25%INCREASE IN EFFICIENCY
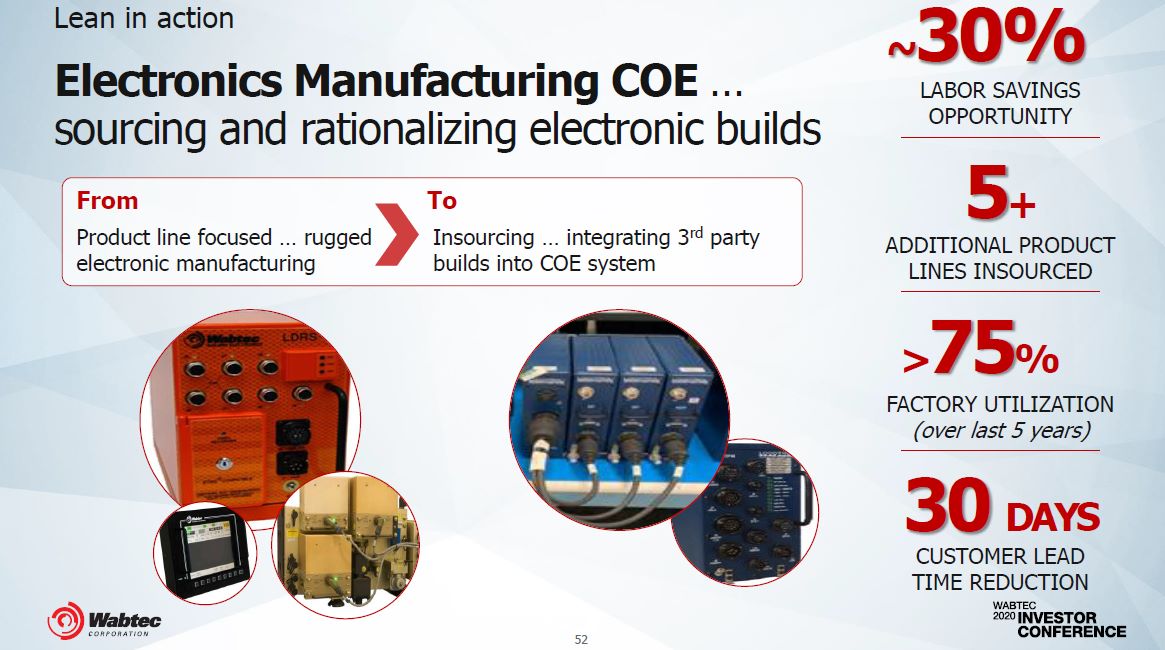
From To Product line focused … ruggedelectronic manufacturing Insourcing … integrating 3rd party builds into COE system ~30% LABOR SAVINGS OPPORTUNITY5+ADDITIONAL PRODUCTLINES INSOURCED>75%FACTORY UTILIZATION(over last 5 years)30 DAYSCUSTOMER LEADTIME REDUCTION Lean in actionElectronics Manufacturing COE …sourcing and rationalizing electronic builds 52
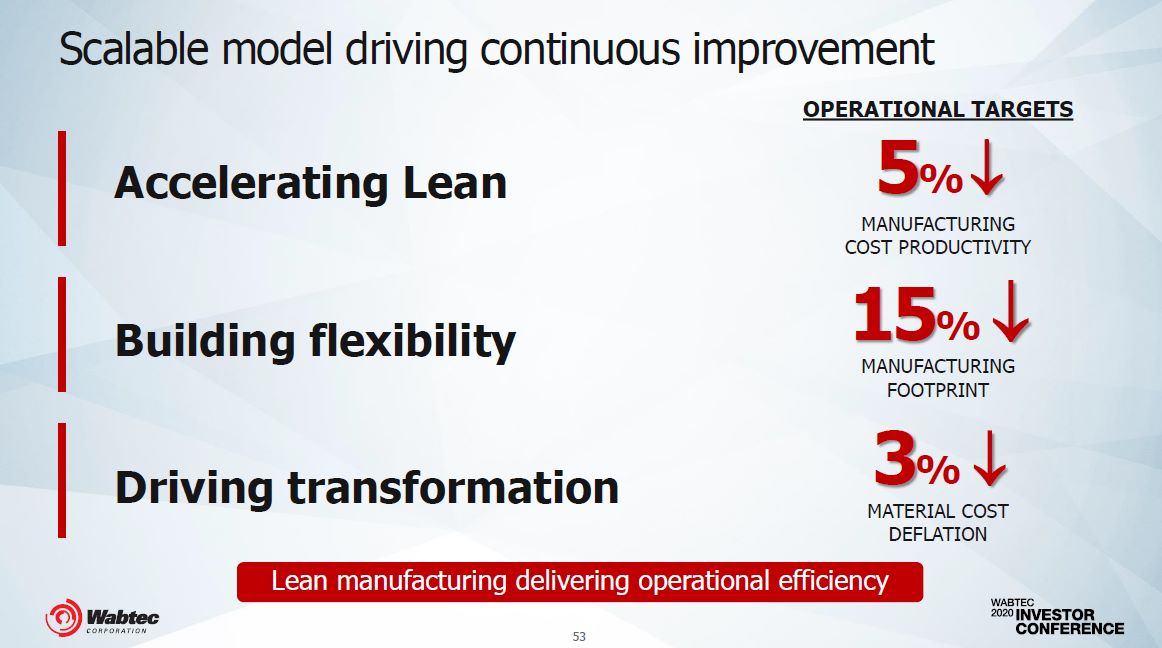
Accelerating Lean Building flexibility Driving transformation 5% MANUFACTURINGCOST PRODUCTIVITY15% MANUFACTURING FOOTPRINT3% MATERIAL COST DEFLATIONLean manufacturing delivering operational efficiency 53 Scalable model driving continuous improvementOPERATIONAL TARGETS
Transit SegmentLilian Leroux
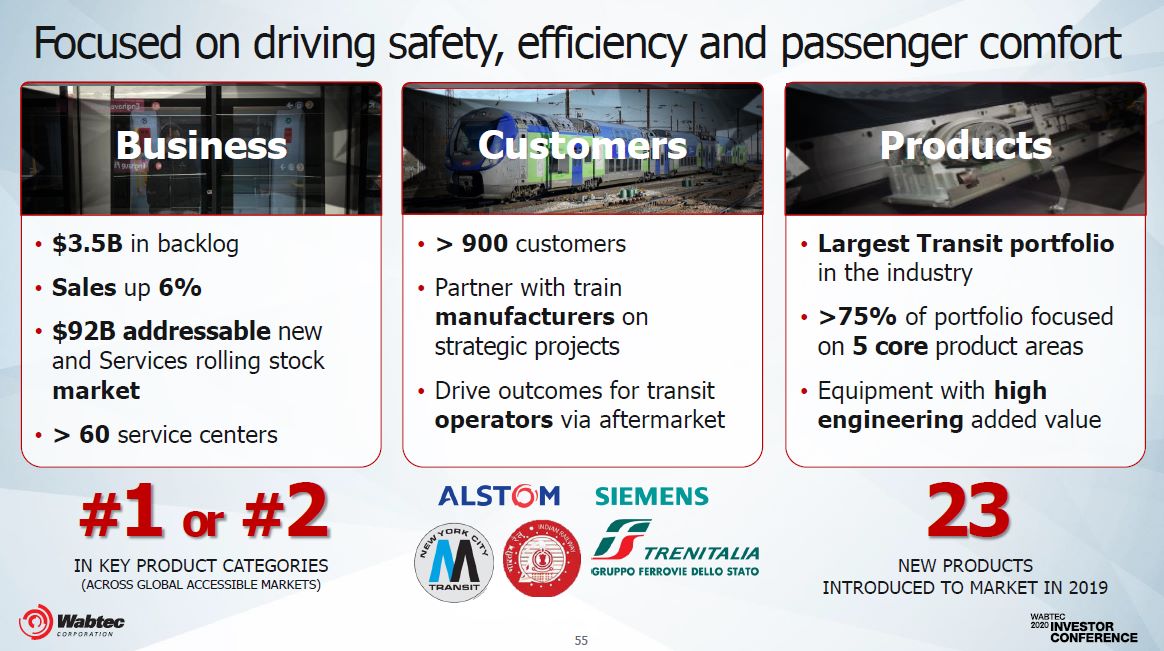
Focused on driving safety, efficiency and passenger comfort Largest Transit portfolioin the industry>75% of portfolio focusedon 5 core product areasEquipment with high engineering added value 23NEW PRODUCTS INTRODUCED TO MARKET IN 2019 $3.5B in backlogSales up 6%$92B addressable new and Services rolling stock market> 60 service centers#1 or #2IN KEY PRODUCT CATEGORIES(ACROSS GLOBAL ACCESSIBLE MARKETS) > 900 customersPartner with train manufacturers on strategic projectsDrive outcomes for transitoperators via aftermarket Business Customers Products 55
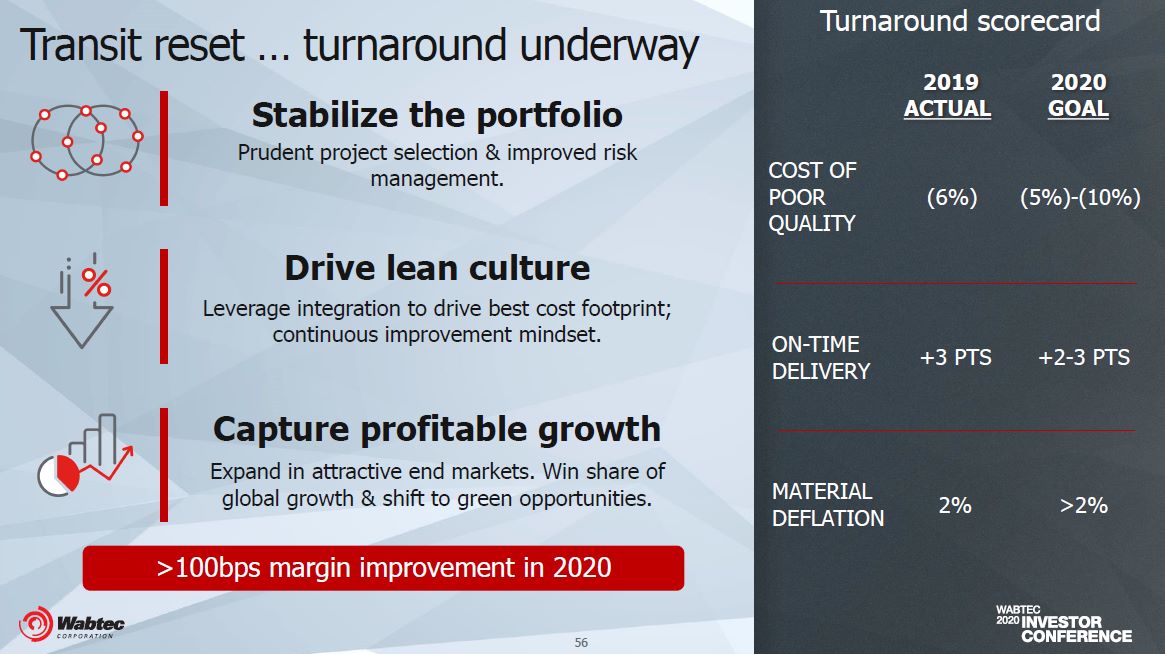
Transit reset … turnaround underway Stabilize the portfolioPrudent project selection & improved risk management. Capture profitable growthExpand in attractive end markets. Win share of global growth & shift to green opportunities. Drive lean cultureLeverage integration to drive best cost footprint;continuous improvement mindset. >100bps margin improvement in 2020 COST OF 2019ACTUAL 2020GOAL POORQUALITY (6%) (5%)-(10%) 56 ON-TIMEDELIVERY +3 PTS +2-3 PTS Turnaround scorecard MATERIAL DEFLATION 2% >2%
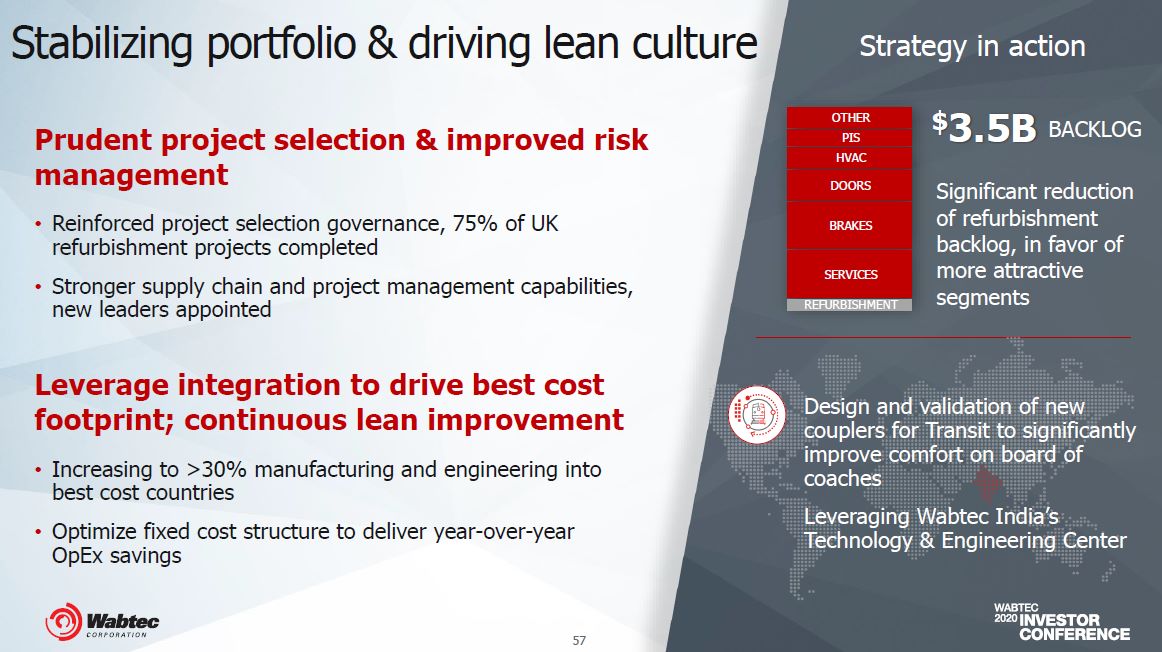
Stabilizing portfolio & driving lean culture Strategy in action OTHER PIS HVAC DOORS BRAKES SERVICES REFURBISHMENT $3.5B BACKLOGSignificant reduction of refurbishment backlog, in favor of more attractive segments Design and validation of new couplers for Transit to significantly improve comfort on board of coachesLeveraging Wabtec India’sTechnology & Engineering Center Prudent project selection & improved riskmanagementReinforced project selection governance, 75% of UK refurbishment projects completedStronger supply chain and project management capabilities,new leaders appointed 57 Leverage integration to drive best cost footprint; continuous lean improvementIncreasing to >30% manufacturing and engineering intobest cost countriesOptimize fixed cost structure to deliver year-over-year OpEx savings
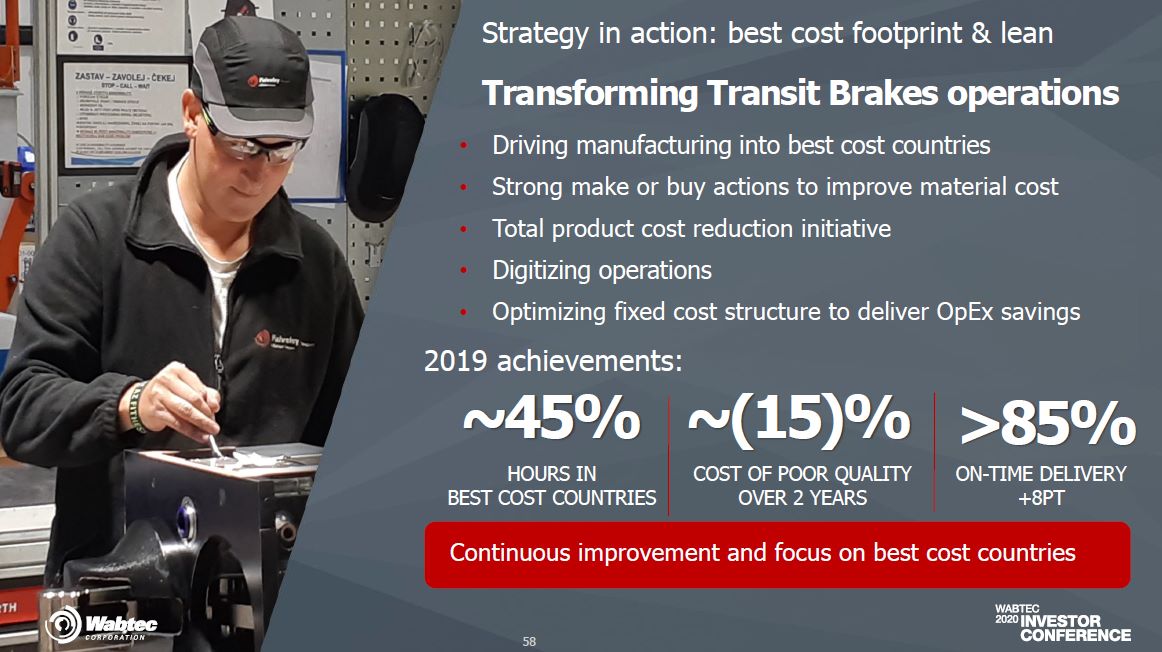
Strategy in action: best cost footprint & lean Transforming Transit Brakes operations COST OF POOR QUALITY OVER 2 YEARS ~45% ~(15)% HOURS INBEST COST COUNTRIES >85%ON-TIME DELIVERY+8PT Driving manufacturing into best cost countriesStrong make or buy actions to improve material costTotal product cost reduction initiativeDigitizing operationsOptimizing fixed cost structure to deliver OpEx savings2019 achievements: Continuous improvement and focus on best cost countries 58
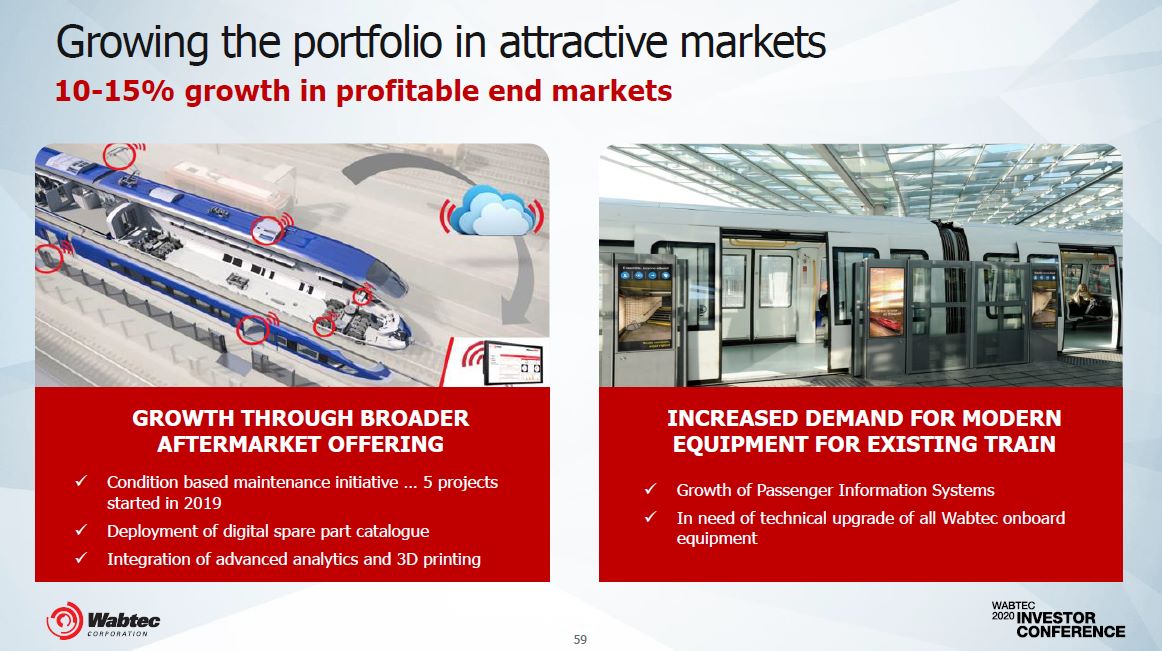
GROWTH THROUGH BROADER AFTERMARKET OFFERINGCondition based maintenance initiative … 5 projectsstarted in 2019Deployment of digital spare part catalogueIntegration of advanced analytics and 3D printing 59 Growing the portfolio in attractive markets10-15% growth in profitable end markets INCREASED DEMAND FOR MODERN EQUIPMENT FOR EXISTING TRAINGrowth of Passenger Information SystemsIn need of technical upgrade of all Wabtec onboard equipment
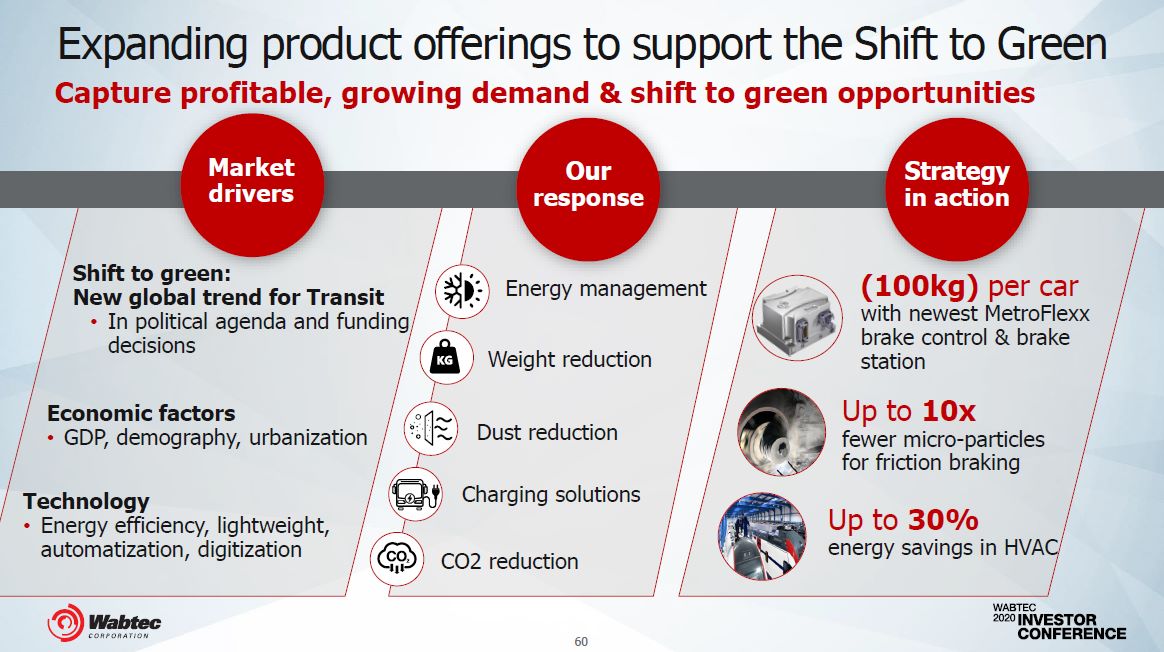
Economic factorsGDP, demography, urbanization Energy management Weight reduction Dust reduction CO2 reduction (100kg) per carwith newest MetroFlexx brake control & brake stationUp to 10xfewer micro-particlesfor friction braking Expanding product offerings to support the Shift to GreenCapture profitable, growing demand & shift to green opportunities Up to 30%energy savings in HVAC Our response Strategy in action Market drivers TechnologyEnergy efficiency, lightweight, automatization, digitization Shift to green:New global trend for TransitIn political agenda and fundingdecisions Charging solutions 60
Russia / CIS / MENATGokhan Bayhan
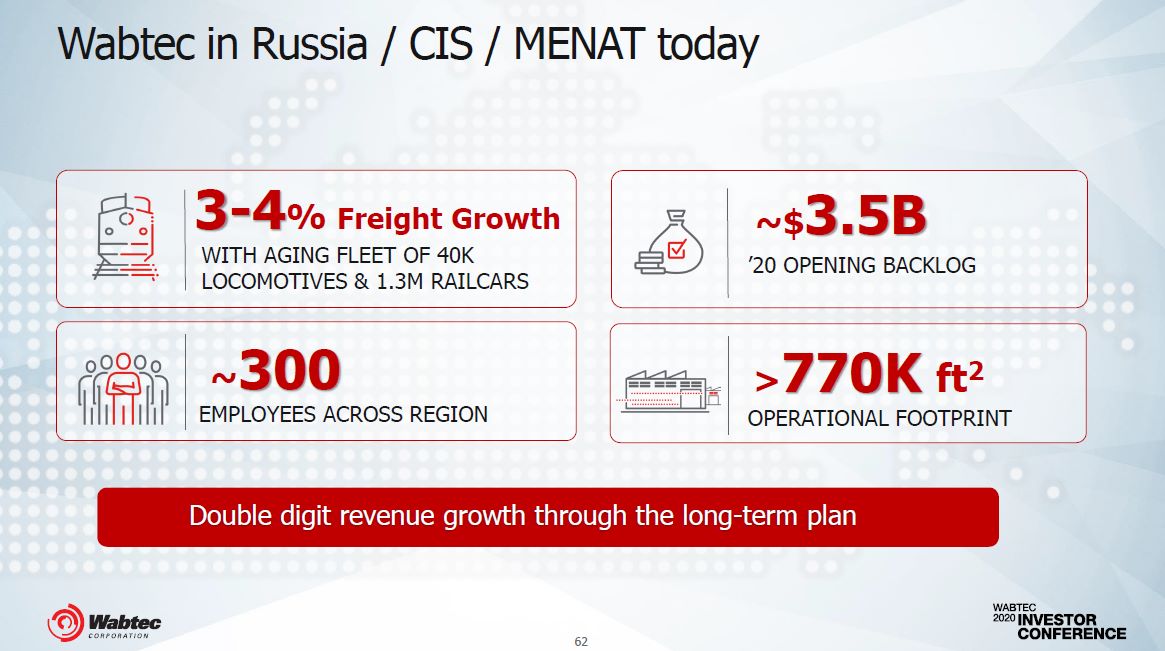
Wabtec in Russia / CIS / MENAT today 3-4% Freight Growth >770K ft2OPERATIONAL FOOTPRINT ~300EMPLOYEES ACROSS REGION WITH AGING FLEET OF 40KLOCOMOTIVES & 1.3M RAILCARS Double digit revenue growth through the long-term plan 62 ~$3.5B’20 OPENING BACKLOG
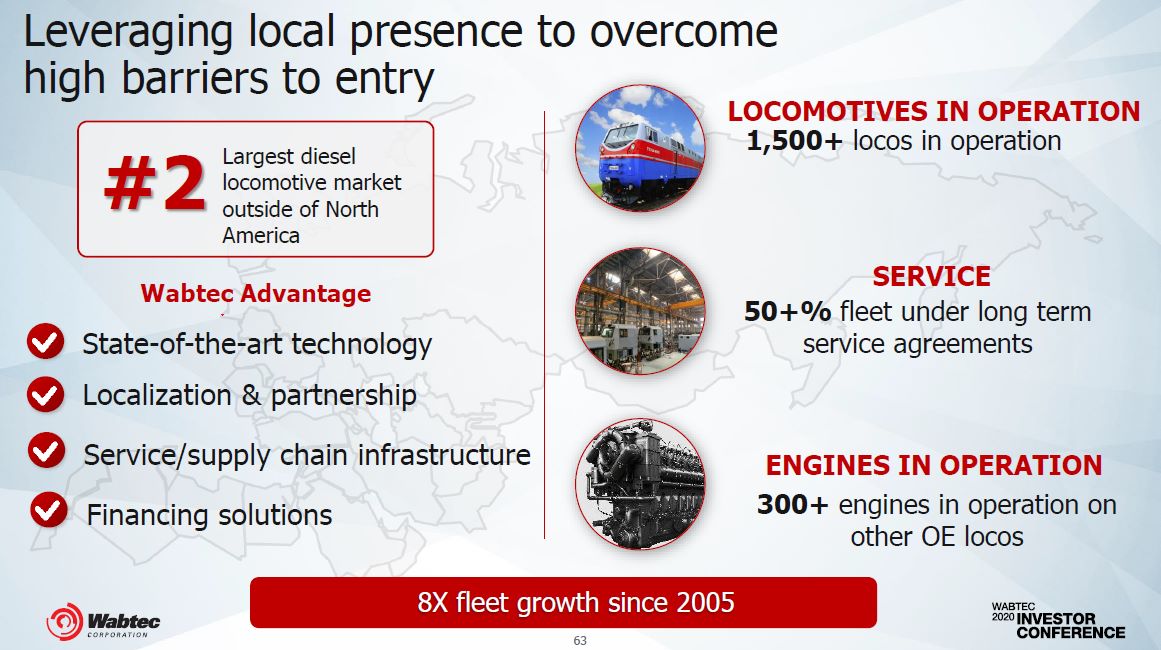
Leveraging local presence to overcome high barriers to entry Wabtec AdvantageState-of-the-art technology Localization & partnershipService/supply chain infrastructure Financing solutions #2 Largest diesel locomotive market outside of North America LOCOMOTIVES IN OPERATION1,500+ locos in operation SERVICE50+% fleet under long termservice agreements ENGINES IN OPERATION300+ engines in operation onother OE locos 8X fleet growth since 2005 63
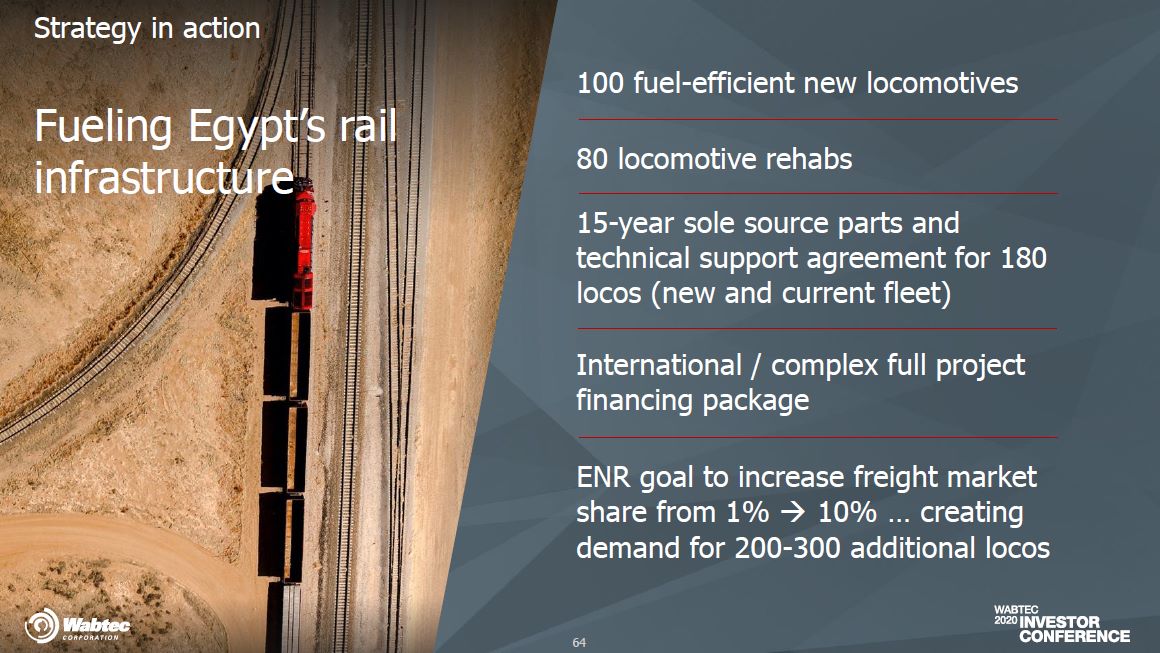
Strategy in action Fueling Egypt’s railinfrastructure 100 fuel-efficient new locomotives 15-year sole source parts and technical support agreement for 180 locos (new and current fleet)International / complex full project financing packageENR goal to increase freight market share from 1% → 10% … creating demand for 200-300 additional locos 80 locomotive rehabs 64 64
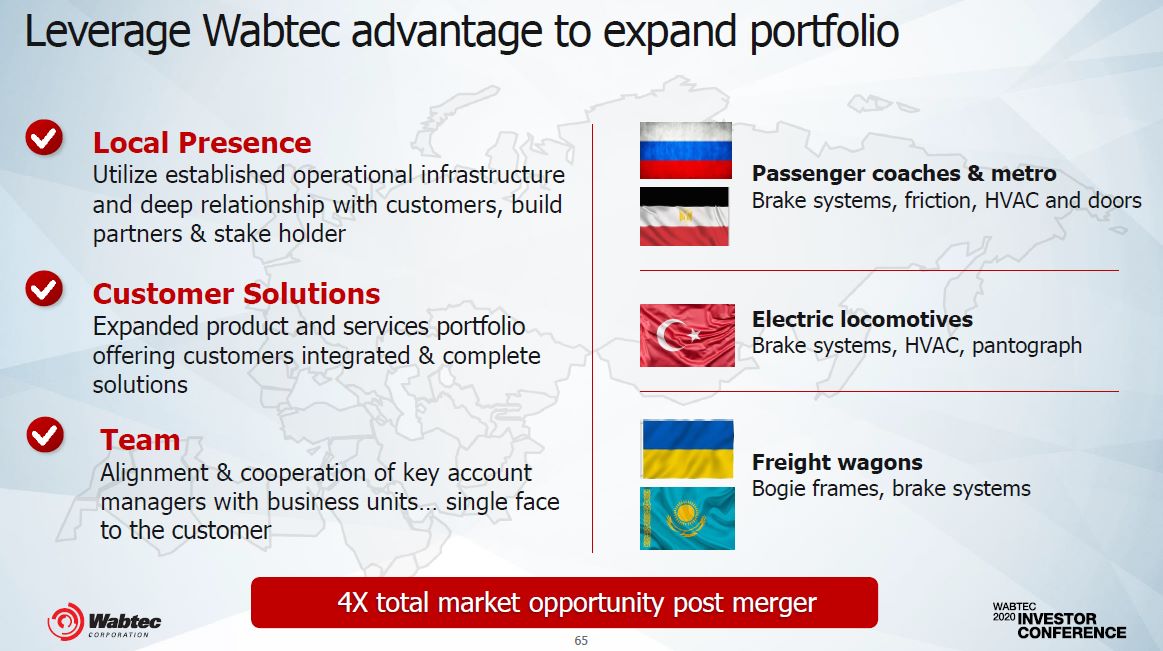
Confidential & Proprietary Leverage Wabtec advantage to expand portfolio 4X total market opportunity post merger Local PresenceUtilize established operational infrastructure and deep relationship with customers, build partners & stake holder Customer SolutionsExpanded product and services portfolio offering customers integrated & complete solutionsTeamAlignment & cooperation of key account managers with business units… single face to the customer Passenger coaches & metroBrake systems, friction, HVAC and doors Electric locomotivesBrake systems, HVAC, pantograph Freight wagonsBogie frames, brake systems 65

IndiaSujatha Narayan
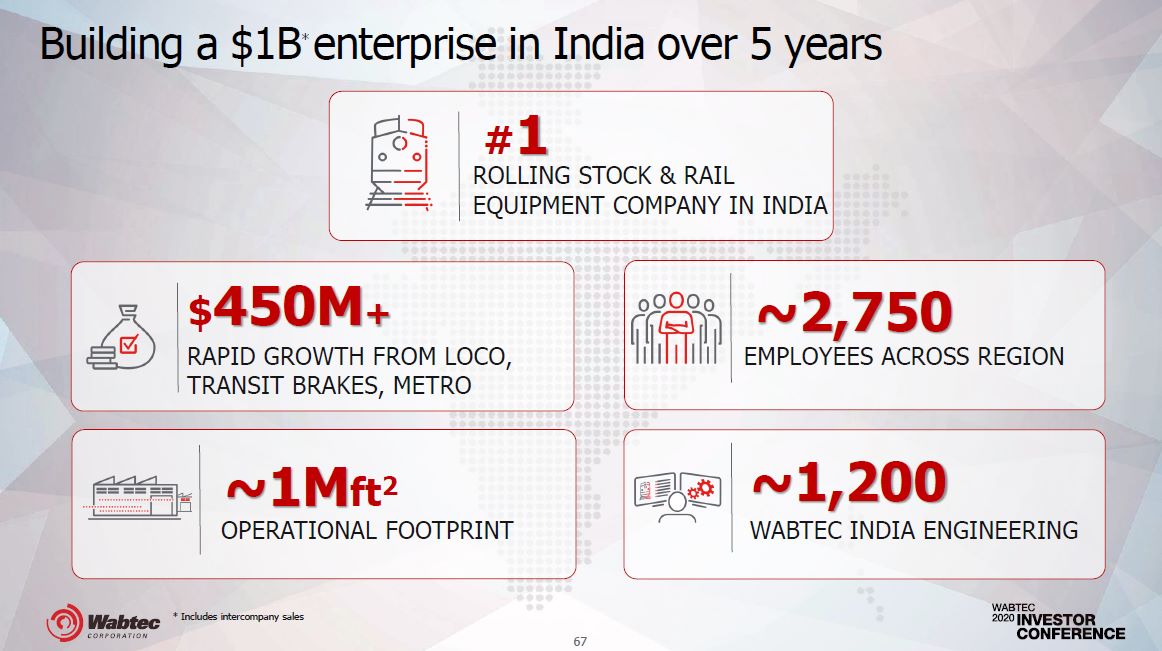
Building a $1B* enterprise in India over 5 years #1 ROLLING STOCK & RAIL EQUIPMENT COMPANY IN INDIA ~1Mft2OPERATIONAL FOOTPRINT $450M+RAPID GROWTH FROM LOCO,TRANSIT BRAKES, METRO ~1,200WABTEC INDIA ENGINEERING ~2,750EMPLOYEES ACROSS REGION 67 * Includes intercompany sales
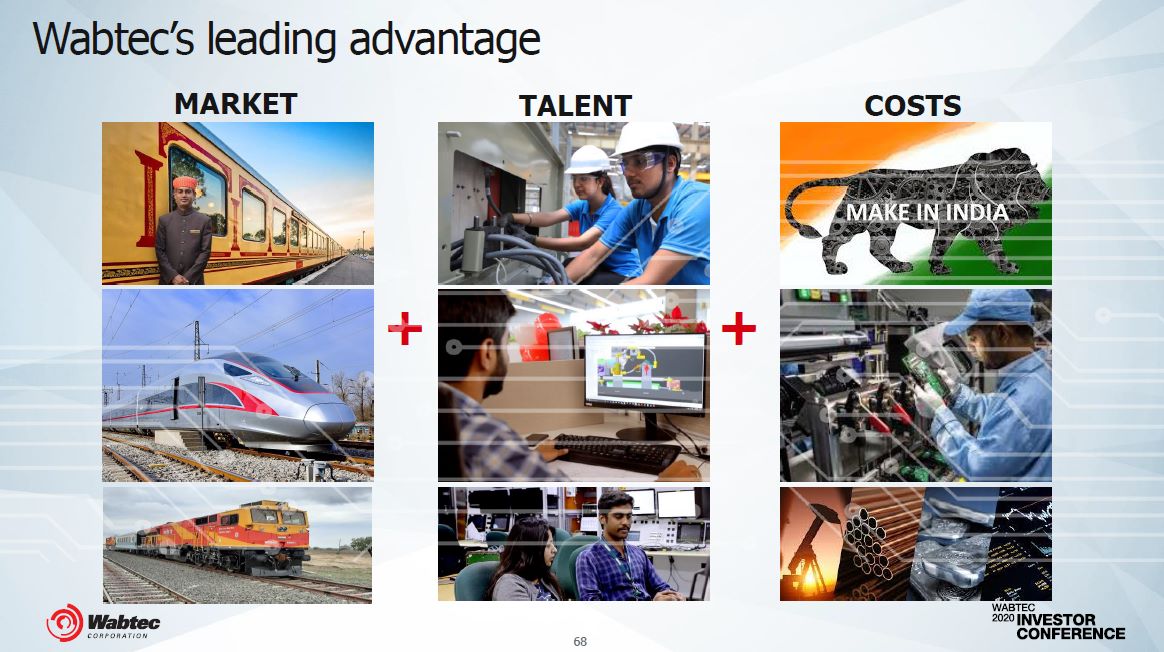
MARKET COSTS + + Wabtec’s leading advantage TALENT 68
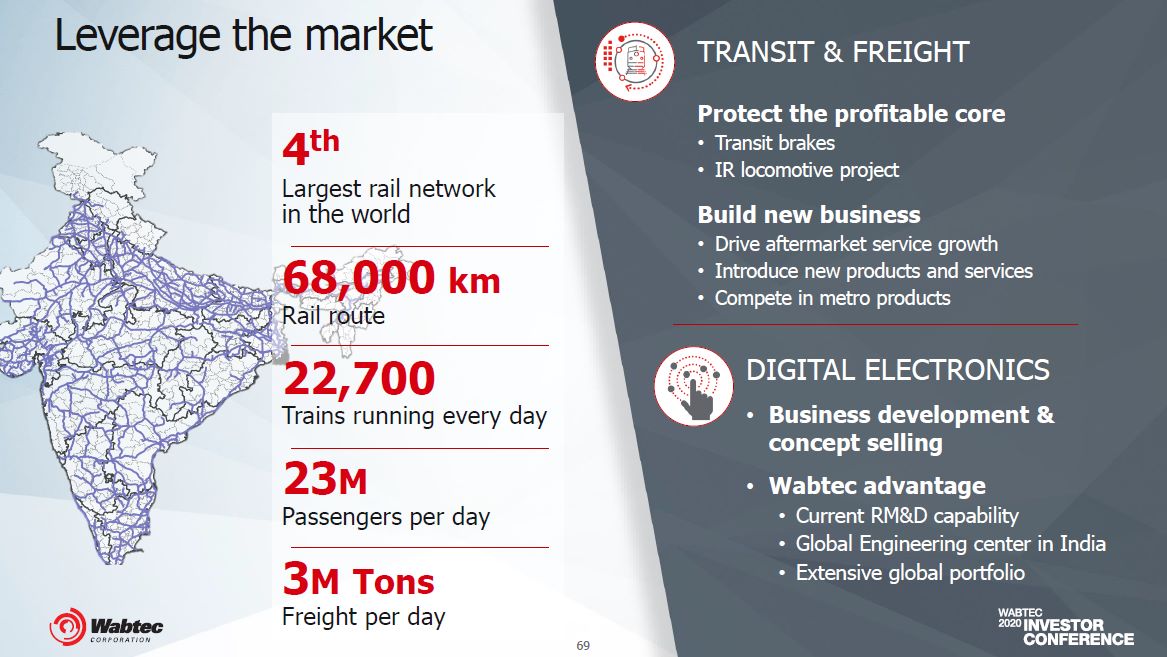
Leverage the market 4thLargest rail networkin the world68,000 kmRail route22,700Trains running every day23MPassengers per day3M TonsFreight per day TRANSIT & FREIGHT Protect the profitable coreTransit brakesIR locomotive projectBuild new businessDrive aftermarket service growthIntroduce new products and servicesCompete in metro productsDIGITAL ELECTRONICSBusiness development & concept sellingWabtec advantageCurrent RM&D capabilityGlobal Engineering center in IndiaExtensive global portfolio 69
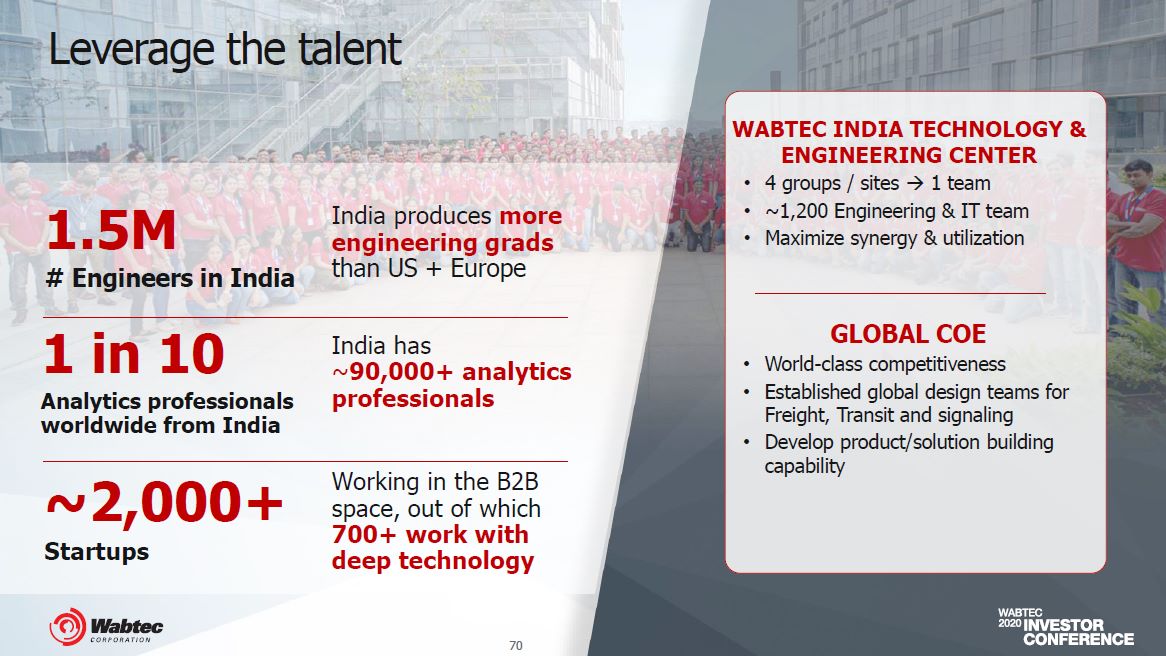
Leverage the talent India has~90,000+ analytics professionals 1 in 10Analytics professionalsworldwide from India Working in the B2B space, out of which 700+ work with deep technology ~2,000+Startups India produces more engineering grads than US + Europe 1.5M# Engineers in India WABTEC INDIA TECHNOLOGY &ENGINEERING CENTER 4 groups / sites → 1 team~1,200 Engineering & IT teamMaximize synergy & utilization GLOBAL COEWorld-class competitivenessEstablished global design teams for Freight, Transit and signalingDevelop product/solution buildingcapability 70
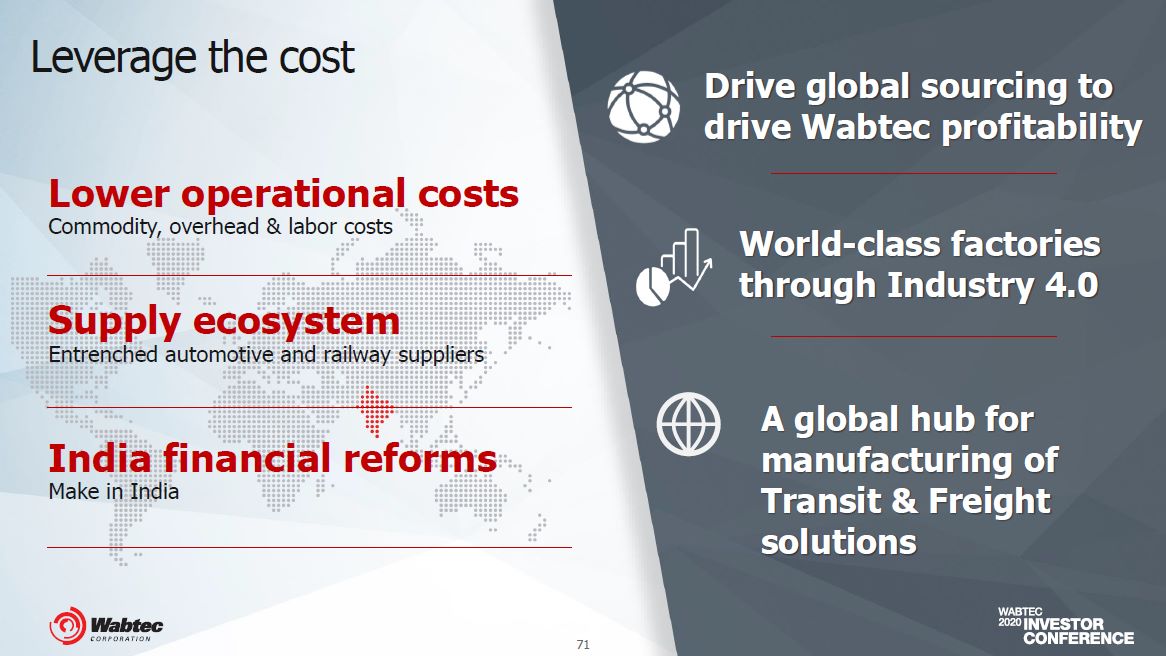
71 Leverage the cost Drive global sourcing to drive Wabtec profitabilityWorld-class factories through Industry 4.0A global hub for manufacturing of Transit & Freight solutions Lower operational costsCommodity, overhead & labor costsSupply ecosystemEntrenched automotive and railway suppliersIndia financial reformsMake in India

FinancialsPatrick Dugan
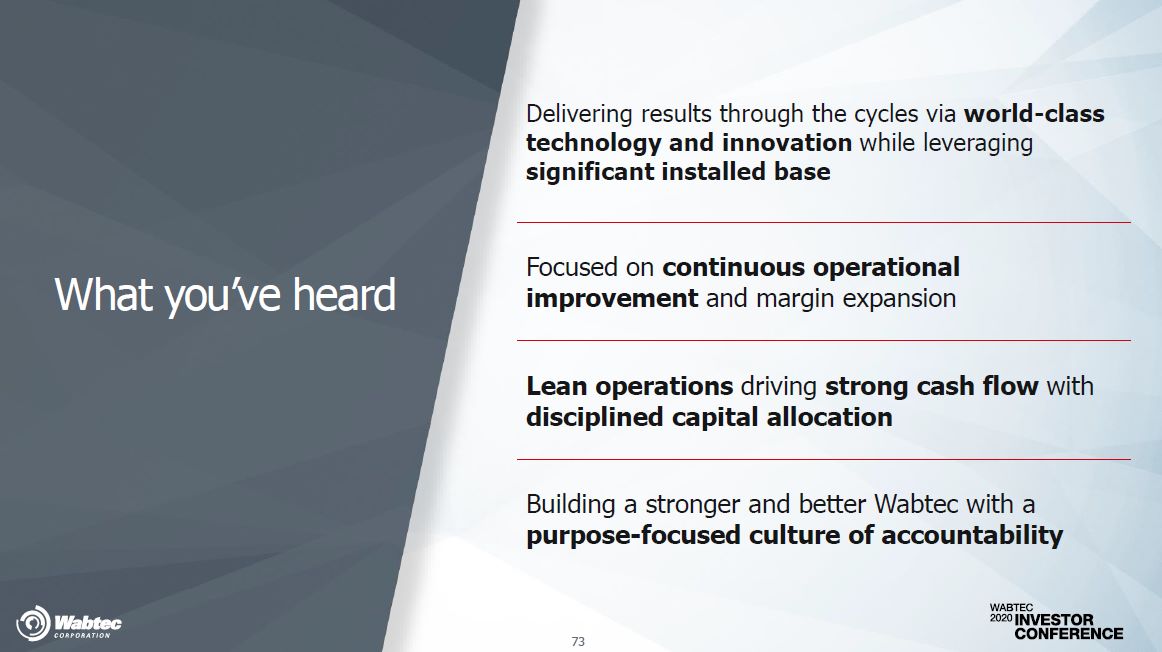
What you’ve heard Delivering results through the cycles via world-class technology and innovation while leveraging significant installed base Focused on continuous operational improvement and margin expansion Lean operations driving strong cash flow withdisciplined capital allocation Building a stronger and better Wabtec with apurpose-focused culture of accountability 73
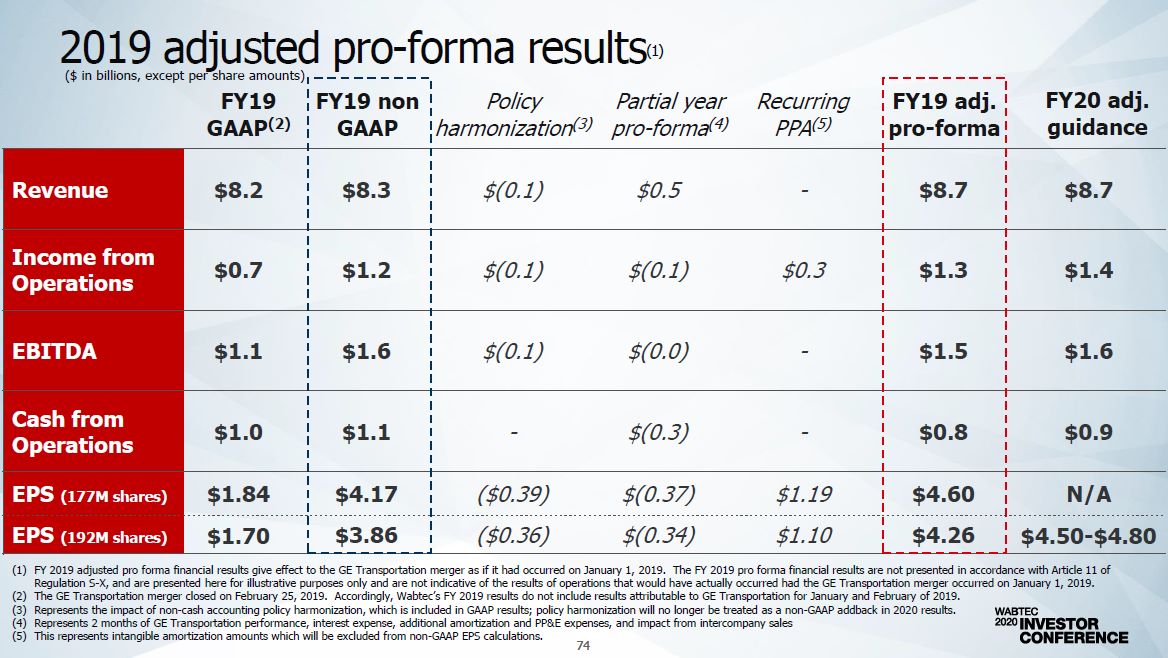
2019 adjusted pro-forma results(1) ($ in billions, except per share amounts) FY19GAAP(2) FY19 nonGAAP Policy Partial year Recurringharmonization(3) pro-forma(4) PPA(5) FY19 adj.pro-forma FY20 adj.guidance Revenue $8.2 $8.3 $(0.1) $0.5 - $8.7 $8.7 Income from Operations $0.7 $1.2 $(0.1) $(0.1) $0.3 $1.3 $1.4 EBITDA $1.1 $1.6 $(0.1) $(0.0) - $1.5 $1.6 Cash from Operations $1.0 $1.1 - $(0.3) - $0.8 $0.9 EPS (177M shares) $1.84 $4.17 ($0.39) $(0.37) $1.19 $4.60 N/A EPS (192M shares) $1.70 $3.86 ($0.36) $(0.34) $1.10 $4.26 $4.50-$4.80 FY 2019 adjusted pro forma financial results give effect to the GE Transportation merger as if it had occurred on January 1, 2019. The FY 2019 pro forma financial results are not presented in accordance with Article 11 of Regulation S-X, and are presented here for illustrative purposes only and are not indicative of the results of operations that would have actually occurred had the GE Transportation merger occurred on January 1, 2019.The GE Transportation merger closed on February 25, 2019. Accordingly, Wabtec’s FY 2019 results do not include results attributable to GE Transportation for January and February of 2019.Represents the impact of non-cash accounting policy harmonization, which is included in GAAP results; policy harmonization will no longer be treated as a non-GAAP addback in 2020 results.Represents 2 months of GE Transportation performance, interest expense, additional amortization and PP&E expenses, and impact from intercompany salesThis represents intangible amortization amounts which will be excluded from non-GAAP EPS calculations. 74

2020 outlook Delivering in challenging environment ‘19GAAP ‘19 Adj.Pro-Forma ‘20 Adj.Guidance Sales $8.2B $8.7B ~$8.7B EBIT % 8% 15% ~16% EPS $1.84 $4.26 ~$4.50 to~$4.80 Cash fromOps $1.1B $0.8B ~$0.9B 75 What we are expectingSalesSoftening NAM Freight (loco, freight car, services)Moderate growth in mods, int’l services, & TransitDigital Electronics growthEBIT %>$150 cumulative net synergies ($120 year over year impact), primarily in FreightNegative mix due to lower Freight & higher TransitLean improvementsCash from Ops~$100 outflow for prior year 1x chargesWorking capital drag due to timingGE Tax payment benefit

Diversified & global sales portfolio Freight $8.2B $8.7B ’19 salesGAAP ’19 salesAdj. pro-forma ’20 outlook Equipment $1.7B $1.9B NAM carload volume flat to down … NAMloco volume partially offset by international Components $1.1B $1.1B Lower freight car build @ ~40K Services $2.0B $2.2B Loco parkings remain @ ‘19 ending levels …NAM offset by int’l & slight mods growth Digital Electronics $0.7B $0.7B Growing product offerings aligned to customer needs Transit Transit OE $1.3B $1.3B Low single digits growth Transit AM $1.5B $1.5B Low single digits growth 76
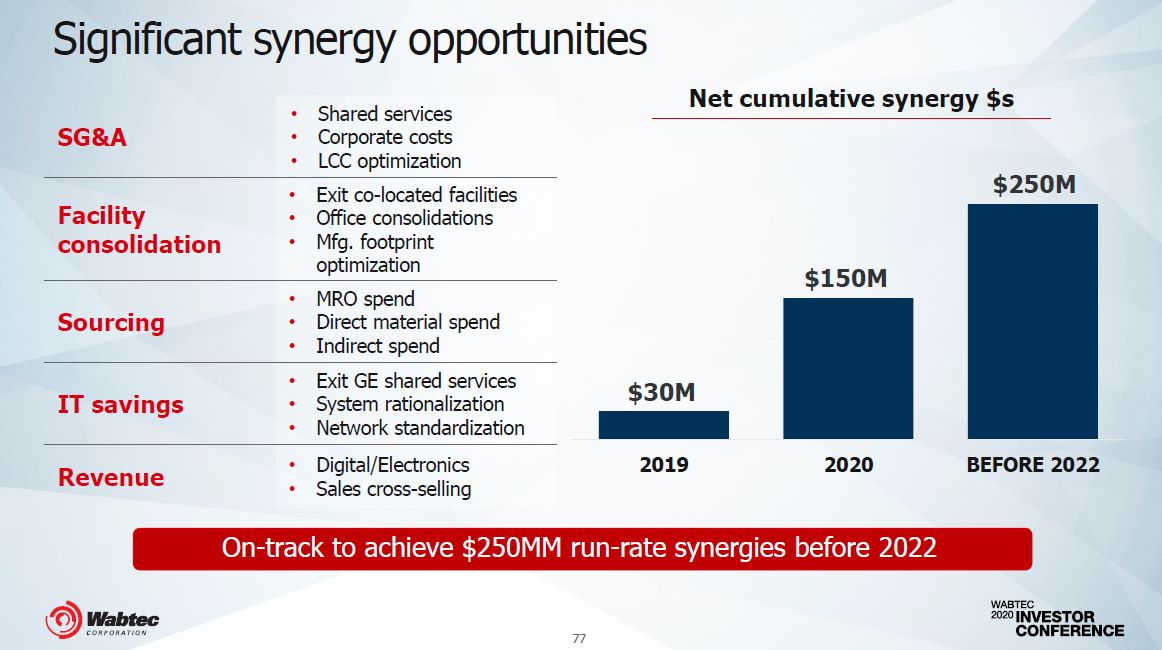
Significant synergy opportunities 2019 2020 BEFORE 2022 $30M Net cumulative synergy $s$250M$150M SG&A Shared servicesCorporate costsLCC optimization Facility consolidation Exit co-located facilitiesOffice consolidationsMfg. footprint optimization Sourcing MRO spendDirect material spendIndirect spend IT savings Exit GE shared servicesSystem rationalizationNetwork standardization Revenue Digital/ElectronicsSales cross-selling On-track to achieve $250MM run-rate synergies before 2022 77
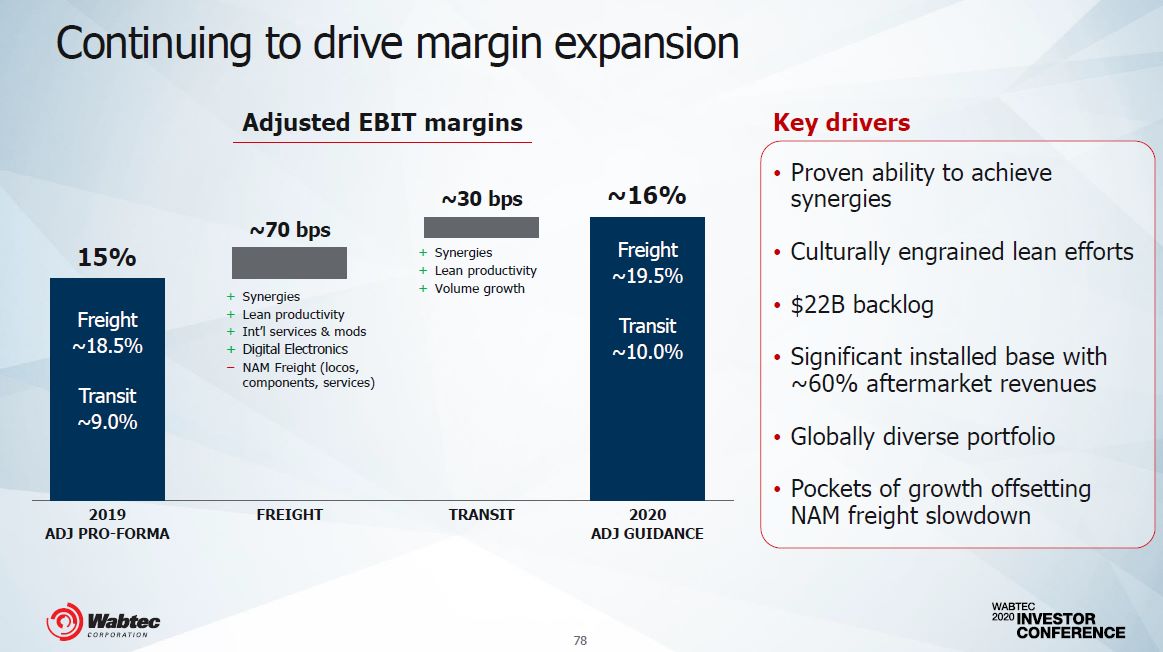
Adjusted EBIT margins Key driversProven ability to achieve synergiesCulturally engrained lean efforts$22B backlogSignificant installed base with~60% aftermarket revenuesGlobally diverse portfolioPockets of growth offsettingNAM freight slowdown Continuing to drive margin expansion TRANSIT + Synergies+ Lean productivity+ Volume growth FREIGHT + Synergies+ Lean productivity+ Int’l services & mods+ Digital Electronics− NAM Freight (locos, components, services) 15% 78 2019ADJ PRO-FORMA ~16% 2020ADJ GUIDANCE Freight~18.5%Transit~9.0% Freight~19.5%Transit~10.0% ~70 bps ~30 bps
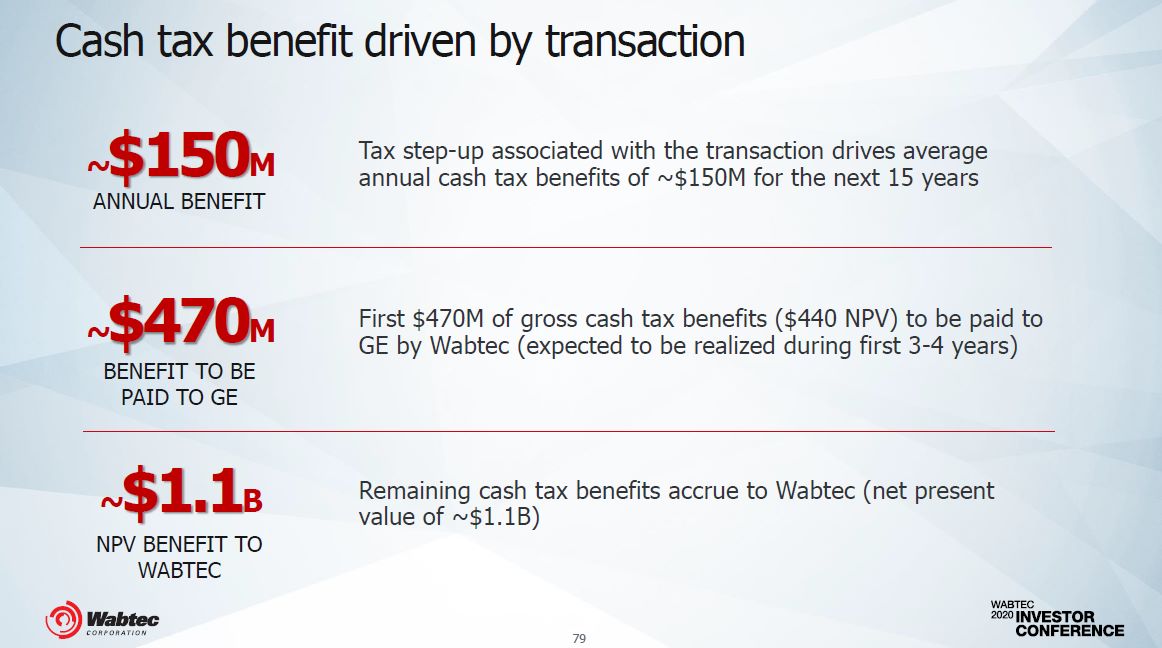
Cash tax benefit driven by transaction Tax step-up associated with the transaction drives average annual cash tax benefits of ~$150M for the next 15 years ~$150MANNUAL BENEFIT First $470M of gross cash tax benefits ($440 NPV) to be paid toGE by Wabtec (expected to be realized during first 3-4 years) ~$470MBENEFIT TO BEPAID TO GE Remaining cash tax benefits accrue to Wabtec (net present value of ~$1.1B) ~$1.1BNPV BENEFIT TO WABTEC 79
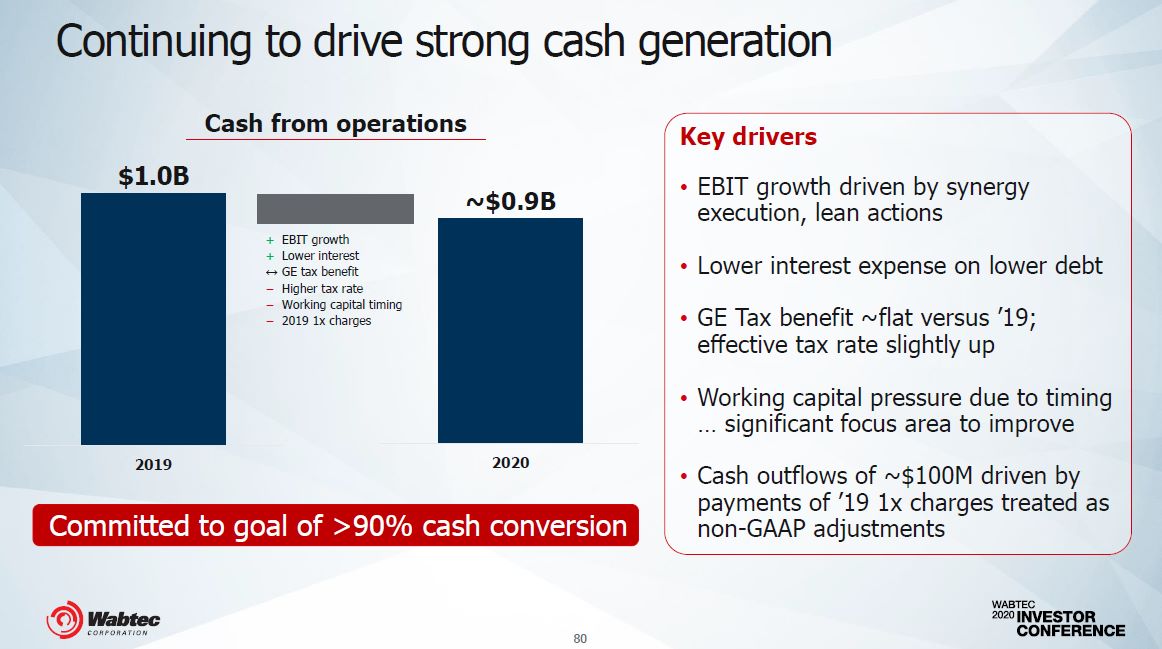
Continuing to drive strong cash generation Key driversEBIT growth driven by synergy execution, lean actionsLower interest expense on lower debtGE Tax benefit ~flat versus ’19;effective tax rate slightly upWorking capital pressure due to timing… significant focus area to improveCash outflows of ~$100M driven bypayments of ’19 1x charges treated asnon-GAAP adjustments 2020 2019 Cash from operations $1.0B + EBIT growth+ Lower interest— GE tax benefitHigher tax rateWorking capital timing2019 1x charges ~$0.9B Committed to goal of >90% cash conversion 80
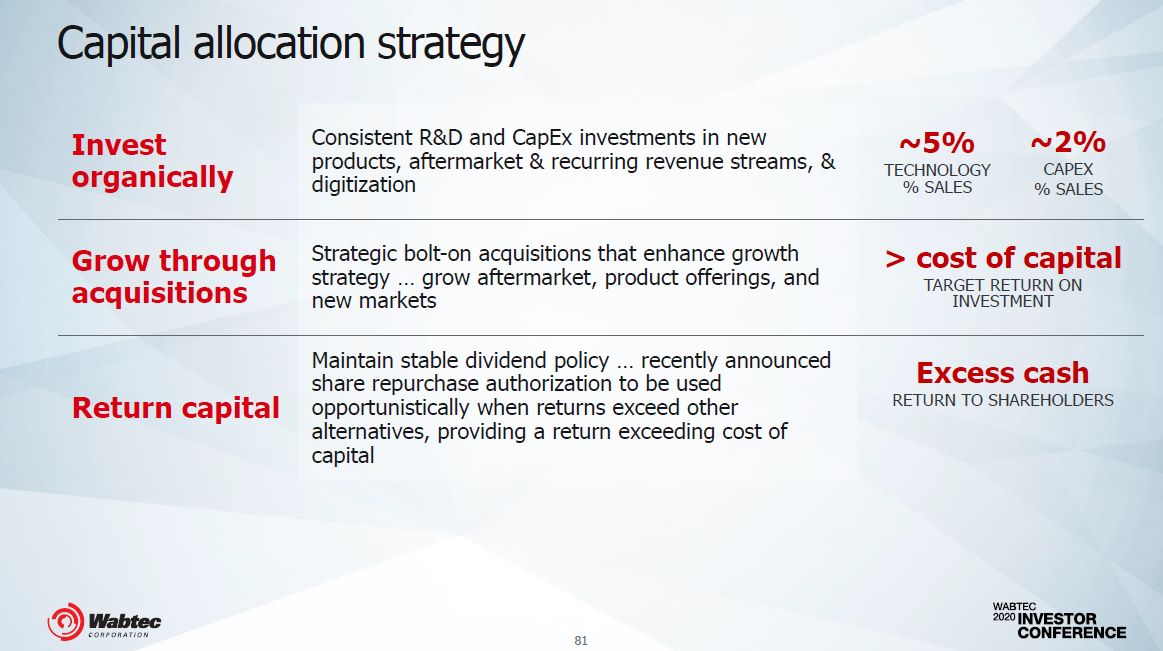
Capital allocation strategy Invest organically Consistent R&D and CapEx investments in new ~5% ~2% products, aftermarket & recurring revenue streams, & TECHNOLOGY CAPEX digitization % SALES % SALES Grow through acquisitions Strategic bolt-on acquisitions that enhance growth > cost of capital strategy … grow aftermarket, product offerings, and TARGET RETURN ON new markets INVESTMENT Return capital Maintain stable dividend policy … recently announced Excess cashshare repurchase authorization to be usedopportunistically when returns exceed other RETURN TO SHAREHOLDERSalternatives, providing a return exceeding cost ofcapital 81
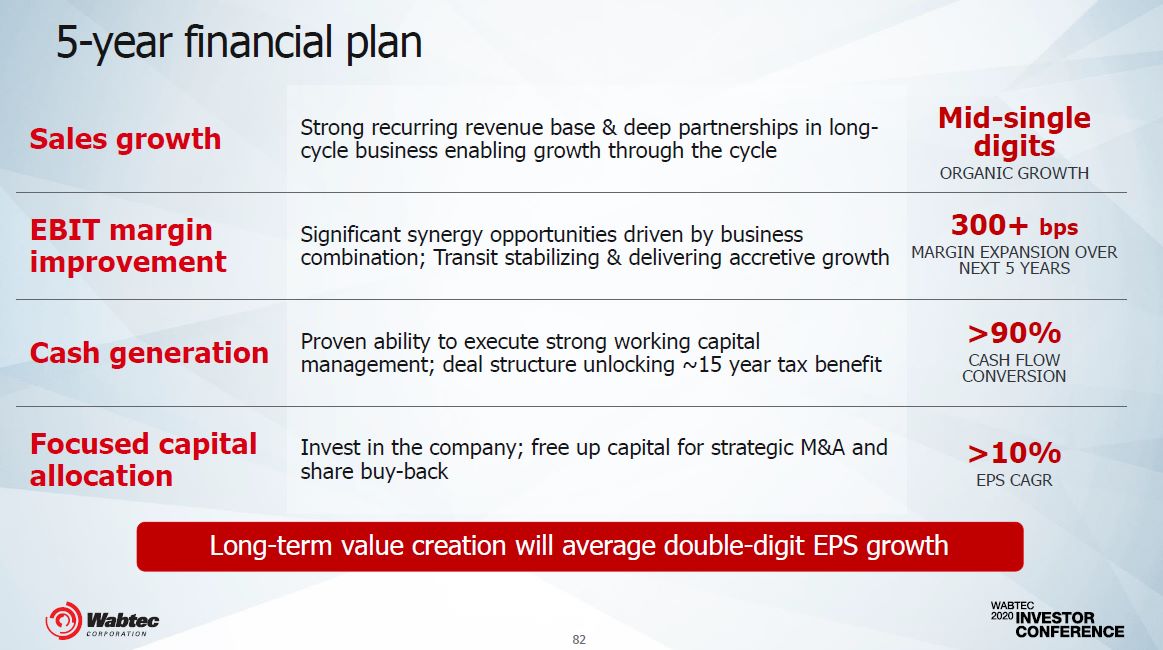
Sales growth Strong recurring revenue base & deep partnerships in long- Mid-singlecycle business enabling growth through the cycle digitsORGANIC GROWTH EBIT marginimprovement Significant synergy opportunities driven by business 300+ bpscombination; Transit stabilizing & delivering accretive growth MARGIN EXPANSION OVERNEXT 5 YEARS Cash generation Proven ability to execute strong working capital >90%management; deal structure unlocking ~15 year tax benefit CASH FLOWCONVERSION Focused capital allocation Invest in the company; free up capital for strategic M&A and >10%share buy-back EPS CAGR 82 Long-term value creation will average double-digit EPS growth 5-year financial plan
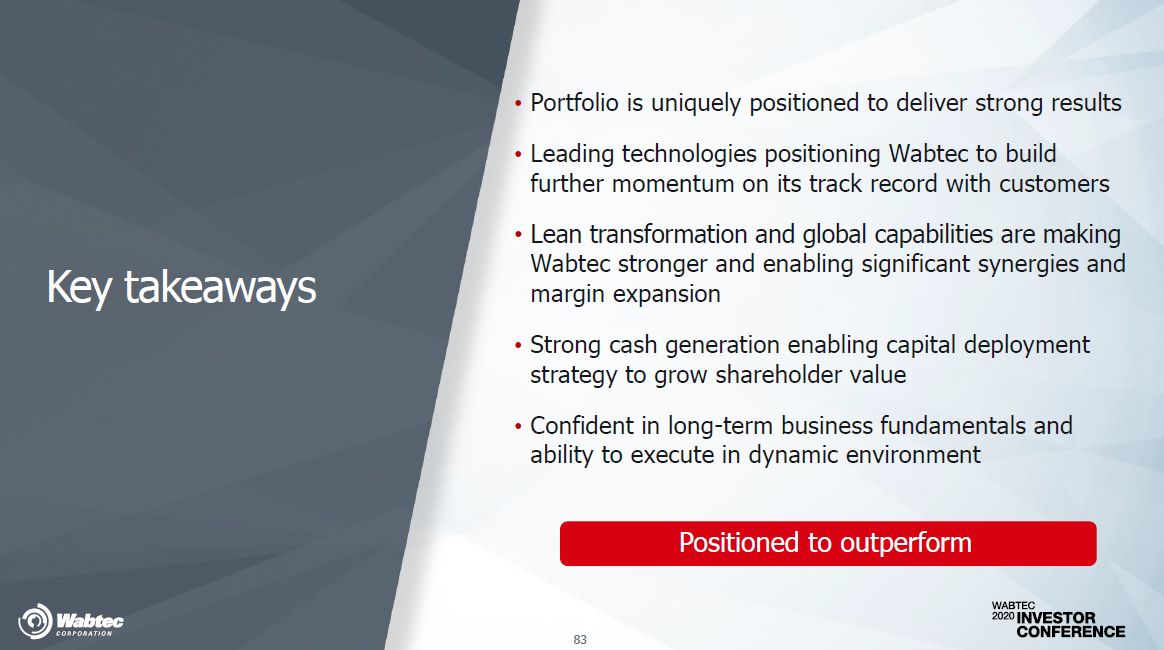
Key takeaways Positioned to outperform Portfolio is uniquely positioned to deliver strong resultsLeading technologies positioning Wabtec to build further momentum on its track record with customersLean transformation and global capabilities are making Wabtec stronger and enabling significant synergies and margin expansionStrong cash generation enabling capital deployment strategy to grow shareholder valueConfident in long-term business fundamentals and ability to execute in dynamic environment 83

Speaker Biographies

Rafael Santana is President and CEO of Wabtec where he brings roughly 25 years of commercial, product management and executive leadership experience to this post, including more than 10 years in the transportation industry. He has a proven track record of transforming businesses, while delivering top- and bottom-line growth.Most recently, he served as President and CEO of GE Transportation, a unit of General Electric company, where he significantly expanded the company’s regional footprint and built strong overhaul and modernization capabilities and backlog through multi-year programs. Prior to that role, he was president & CEO of GE in Latin America, where he helped transform the market into one of GE’s largest and fastest-growing regions. A respected global and business executive, Santana also served as president and CEO of the Turbomachinery Solutions Business of GE Oil & Gas, where he drove significant margin improvement and growth in a contracting marketplace. Prior to joining GE in 2000, Santana worked for six years at ExxonMobil and British American Tobacco.A native of Brazil, Santana has a degree in Engineering from the Universidade Federalde Minas Gerais in Brazil. He currently serves on Wabtec’s Board of Directors. Rafael SantanaPresident & CEO 86
Gokhan Bayhan is General Manager for Wabtec’s Russia/CIS, Europe, M. East and N. Africa region. Prior to the merger of GE Transportation and Wabtec, Bayhan joined GE in 1997 and held multiple roles including Regional Sales Manager Russia, CIS & Turkey, Global Locomotive Strategic Marketing Manager, and Strategic Marketing Leader, Pricing.On December 2009 he was named the General Manager of Russia, CIS and South East Europe and on December 2012 his region was expanded to cover Europe, Middle East and Europe. After the February 2019 Wabtec Corporation acquisition of GE Transportation, he was named the regional leader for the same territory for Wabtec.Bayhan holds a Bachelors of Science in Electrical Engineering from Gannon University, and MBA in Finance from the Katz School of Business at the University of Pittsburgh, and a Masters of Science in Electrical Engineering from Gannon University. 87 Gokhan BayhanRegional General Manager − Russia/CIS
Bob Bourg is Vice President for Core Electronics & Data Analytics at Wabtec Corporation. He has P&L responsibility for a portfolio of products and systems including locomotive electronics, braking systems, event recorders, IoT platforms, and digital solutions for the mining industry.In prior positions with Wabtec, Bourg led strategy & growth initiatives, managed multiple product and services business units, and led efforts for the design and implementation of Positive Train Control systems mandated by the Rail Safety Improvement Act of 2008. Before joining Wabtec, Bourg worked in the instrumentation and controls industry, and he began his career in the U.S. Navy where he helped develop microprocessor-based equipment used in naval nuclear instrumentation and control applications.Bourg holds a BSE degree in Electrical Engineering from Duke University and an MSdegree in Computer Science from George Washington University. 88 Bob BourgVice President for Core Electronics & Data Analytics
Patrick D. Dugan 89 Chief Financial Officer & Executive Vice PresidentPatrick Dugan is Chief Financial Officer (CFO) and Executive Vice President At Wabtec, where he is responsible for all aspects of Investor Relations, Accounting, Tax and Finance, and Information Technology.Dugan joined Wabtec in 2003, and has been a key member of the management team focused on delivering growth through new product development, international expansion and acquisitions. As CFO, Wabtec has grown from ~$2.5B in revenues to nearly ~$9B in revenues, driven largely by the strategic acquisitions of Faiveley Transport and GE Transportation. During those critical combinations, Dugan was instrumental in executing the strategy and business structure, debt and equity financing, as well as integration of these investments. Prior to this role, he was Wabtec’s Corporate Controller and Vice President of Finance.Before joining the company, Dugan was Vice President and CFO at CWI International, Inc., where he helped transform a local chemical operations into a supplier of advanced oilfield technologies, through M&A, product development and international expansion. He also helped guide the start up to acquisition by Weatherford International.Dugan began his career with PWC providing business assurance and advisory services, serving middle market growth companies focused on transformational transactions including M&A, recapitalizations and initial public offerings.He holds an MBA from the Joseph M. Katz Graduate School of Business at the University of Pittsburgh, a Bachelor of Science in Accounting from The Pennsylvania State University, and is a Certified Public Accountant.
Alicia Hammersmith is Vice President of Operations for the Transit segment. She brings 29 years of manufacturing operations expertise spanning three large industrial, technically advanced segments of Aviation, Transportation and Oil & Gas. Hammersmith is skilled in acquisitions, divestitures, consolidations, start-ups, system implementations and tech transfers.Most recently, she was the Materials Leader for GE Aviation responsible for $4.5 billion in inventory across 80+ sites leading demand forecasting, master scheduling, planning, configuration management, fulfillment, distribution and logistics for new equipment and services. Prior to that role, she was the Global Operations Leader for GE Oil & Gas on four-year assignment in Germany managing 10 acquisition sites in five countries in addition to providing operational oversight for European sales and service locations.Hammersmith has eight years in the transportation industry in operations and materials.Hammersmith has a degree in Engineering from the University of Pittsburgh and a Masters in Business from Xavier University. Alicia HammersmithVP Operations, Transit 90
Kristine Kubacki is Vice President of Investor Relations. She brings 14 years of experience as a sell-side analyst covering industrials.Kubacki previously served as executive director and senior analyst for the transportation, logistics and equipment sector at Mizuho Securities USA. Prior to this role, she was vice president of market strategy for Wells Fargo’s commercial vehiclegroup, as well as director of equity research for the global industrial equipment industry at CLSA. Kubacki spent nearly nine years covering the industrial sector at Avondale, and held analyst roles at A.G. Edwards, as well as operations management, process design and supply chain management positions at Procter and Gamble.Kubacki earned her MBA from Washington University, Bachelor of Science degree in chemical engineering from Washington University, and Bachelor of Science in mathematics from Webster University. Kubacki is also a CFA charterholder. Kristine KubackiVP, Investor Relations 91
Lilian Leroux has been the president of Wabtec’s Transit business since 2019 and has spent most of his 25 years career in a variety of leadership, commercial and project management roles across the railway sector. After various positions within industrial and railway companies such as the French national railway operator SNCF, Leroux joined Faiveley Transport in 2001 as Project Manager and then Key Account Manager.From 2004 to 2009, he worked successively as Faiveley Transport Managing Director in Tamworth (U.K.) and then U.K. Managing Director. Following the acquisition of SAB WABCO, he took full P&L responsibility of the region.Leroux was subsequently appointed Services President, a division supporting rail operators and maintainers with the maintenance and optimization operations of original equipment throughout their lifespan. In 2014, Leroux was appointed Brakes & Safety Group President where he was responsible for all Transit Brakes, Couplers, and Friction Product Lines worldwide. He was instrumental in driving growth and successfulintegration of the two compagnies’ brakes product portfolios when Faiveley Transportwas acquired by Wabtec in 2016.Lilian has worked and lived in France, UK, Italy & Germany. He holds the Science Degree in Engineering from INSA Lyon, a leading engineering school in France, and is graduate of INSEAD. 92 Lilian LerouxPresident, Transit
Dominique Malenfant is the Global Technology Officer & Senior Vice President Engineering for Wabtec. In this role, he is responsible for the overall global technology strategy and engineering organization for the company.Malenfant previously served as the Vice president Global Technology & Chief Technology Officer for GE Transportation for 4.5 years where he lead GE Transportation’s overall global technology strategy. Prior to GET, he served as Vice President of Product and Engineering for the Transport Propulsion and Control Business at Bombardier Transport, overseeing 1,200 professionals across eight different countries. Through his 24 withBombardier, he managed Bombardier Transport’s North American division where he was responsible for product management, engineering and supply management. He also led the Center of Expertise R&D group, and has experience in plant management, engineering quality assurance, systems engineering and project management.Malenfant graduated from Laval University in Quebec City with a bachelor’s degree inElectrical Engineering. 93 Dominique MalenfantGlobal Technology Officer
Sujatha Narayan joined Wabtec in August 2017 and in her 2.5 years as Managing Director of Transit business in India, she has led the company through a period of unprecedented profitable growth with a passionate focus on customer satisfaction, operational efficiency, compliance, profitability and employee well-being. In 2019, under her leadership, the Wabtec Transit business was certified as a “Great Place to Work” by Great Place To Work InstitutePrior to her current role, Naryan was the Vice President & General Manager leading the Commercial Solutions Business at 3M India Limited. In the United States, Narayan worked for Rogers Corporation managing R&D & Commercialization of new products in the electronics, industrial and consumer markets.Narayan holds a Masters & PhD in Polymer Science & Engineering from Georgia Institute of Technology, USA and BTech Degree from Indian Institute of Technology, Delhi. She originally hails from Chennai, India. 94 Sujatha NarayanRegional General Manager − India

Pascal Schweitzer is Group President, Wabtec’s Freight Services business, which helps customers maximize the value of their existing assets, over their entire lifecycle, through innovative technologies and business models. In this role, Schweitzer is responsible for improving critical customer outcomes in the areas of product reliability, asset use, velocity, fuel consumption, operating expenses and railcar dwell time. His organization oversees maintenance agreements for part sales, asset maintenance, global remanufacturing, fulfillment and the development of advanced software and analytics.Before the merger with Wabtec, Schweitzer served as GE Transportation’s Vice President, Global Services Organization and prior to that was GE Power’s Services Leader for Europe, where he was responsible for developing and delivering a regional services strategy, while leading the company’s transformation following the acquisition of Alstom. Prior to this, he ran the Gas Turbine Service business for Alstom globally. Before joining Alstom, he was the strategy manager in charge of strategy and IPO projects at Rexel in Paris.Schweitzer received a master’s degree with specialization in finance from the HECBusiness School in Paris. 95 Pascal SchweitzerGroup President, Freight Services
Peter Thomas is the Chief Commercial Officer in the Americas for Wabtec’s Digital Electronics business where he and his team are charged with developing a winning commercial strategy and driving customer focused, outcome oriented commercialization efforts for the company’s suite of software and digital technologies to the rail, port and shipper segments.In his previous role, Thomas was the General Manager for GE Transportation’s Optimization Solutions business and President of RMI. He joined GE Transportation in 2004 as the Marketing Leader for Global Signaling. In 2005, he was promoted to the role of International Sales Leader for Global Signaling and Global Rail Operations and was based in Florence, Italy. He subsequently served as General Manager of Sales for the Middle East/Africa region and was based in Dubai, UAE before being named Chief Marketing Officer forGE Transportation in 2009.Prior to joining GE Transportation, Thomas spent eight years with the GE Fanuc Automation business where he held positions of increasing responsibility in sales, marketing, and operational leadership. Peter is a certified Six Sigma Master Blackbelt and holds both a Bachelor of Science in Marketing and a Master of Business Administration from the University of Alabama at Birmingham. 96 Peter ThomasChief Commercial Officer, Digital Electronics – Americas

Appendix
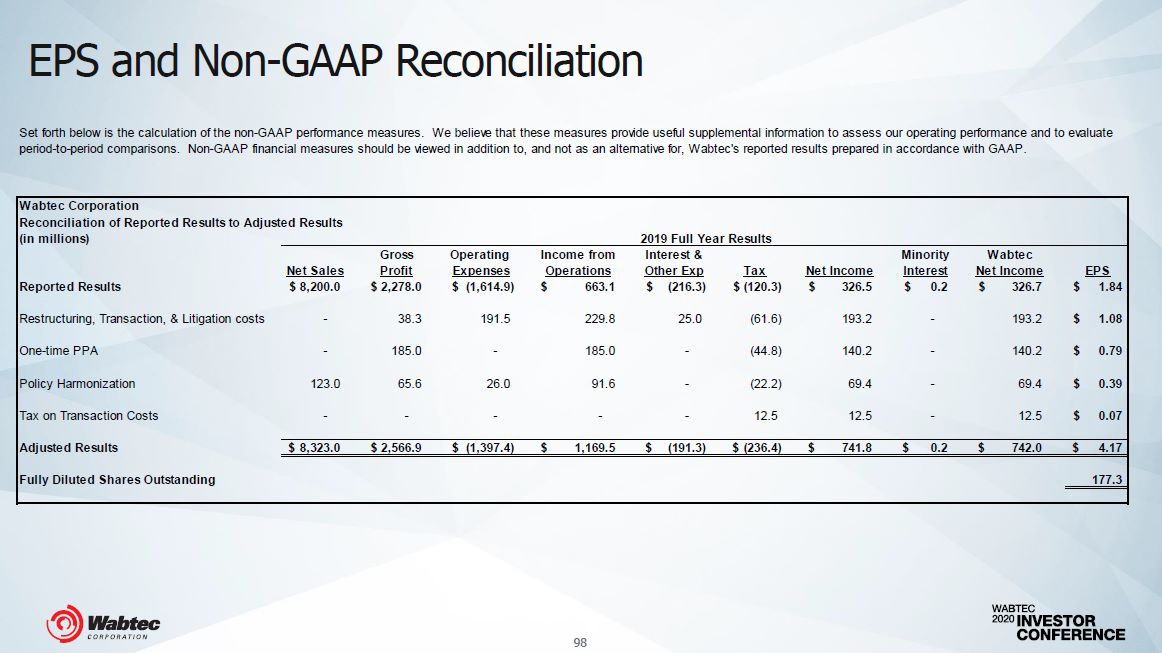
EPS and Non-GAAP Reconciliation 98 Wabtec CorporationReconciliation of Reported Results to Adjusted Results(in millions) 2019 Full Year Results Gross Operating Income from Interest & Minority Wabtec Net Sales Profit Expenses Operations Other Exp Tax Net Income Interest Net Income EPS Reported Results $ 8,200.0 $ 2,278.0 $ (1,614.9) $ 663.1 $ (216.3) $ (120.3) $ 326.5 $ 0.2 $ 326.7 $ 1.84 Restructuring, Transaction, & Litigation costs - 38.3 191.5 229.8 25.0 (61.6) 193.2 - 193.2 $ 1.08 One-time PPA - 185.0 - 185.0 - (44.8) 140.2 - 140.2 $ 0.79 Policy Harmonization 123.0 65.6 26.0 91.6 - (22.2) 69.4 - 69.4 $ 0.39 Tax on Transaction Costs - - - - - 12.5 12.5 - 12.5 $ 0.07 Adjusted Results $ 8,323.0 $ 2,566.9 $ (1,397.4) $ 1,169.5 $ (191.3) $ (236.4) $ 741.8 $ 0.2 $ 742.0 $ 4.17 Fully Diluted Shares Outstanding 177.3 Set forth below is the calculation of the non-GAAP performance measures. We believe that these measures provide useful supplemental information to assess our operating performance and to evaluate period-to-period comparisons. Non-GAAP financial measures should be viewed in addition to, and not as an alternative for, Wabtec’s reported results prepared in accordance with GAAP.
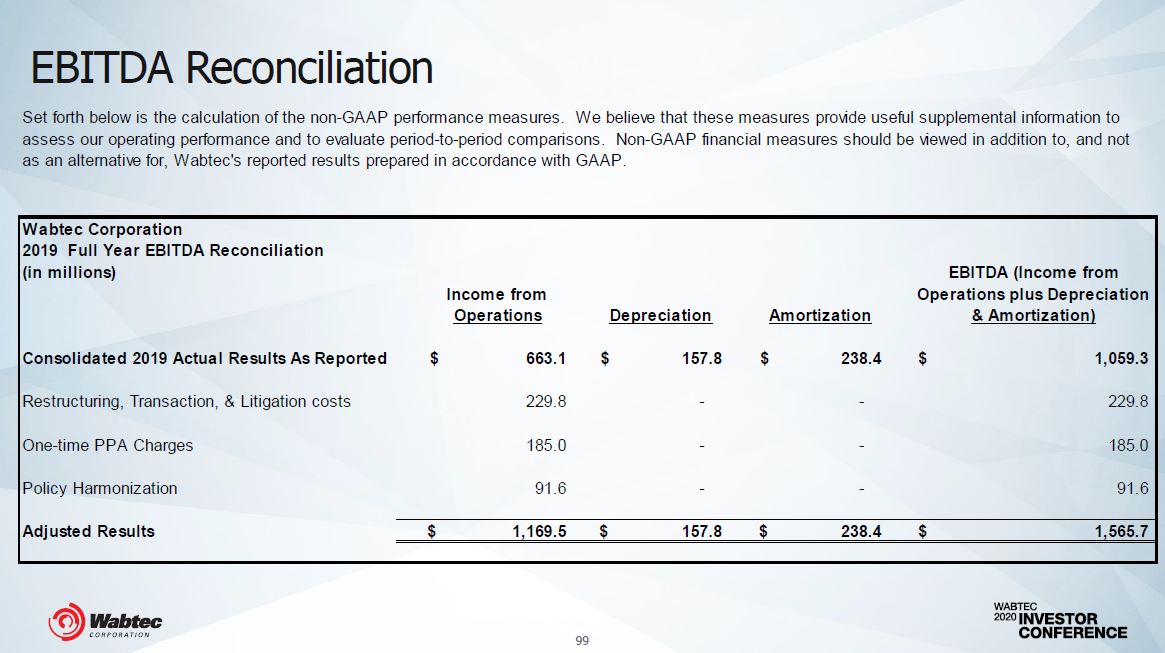
EBITDA Reconciliation 99 Wabtec Corporation Income from Operations$ 663.1229.8185.091.6 Depreciation$ 157.8--- Amortization$ 238.4--- EBITDA (Income from Operations plus Depreciation & Amortization)$ 1,059.3229.8185.091.6 2019 Full Year EBITDA Reconciliation (in millions) Consolidated 2019 Actual Results As Reported Restructuring, Transaction, & Litigation costs One-time PPA Charges Policy Harmonization Adjusted Results $ 1,169.5 $ 157.8 $ 238.4 $ 1,565.7 Set forth below is the calculation of the non-GAAP performance measures. We believe that these measures provide useful supplemental information to assess our operating performance and to evaluate period-to-period comparisons. Non-GAAP financial measures should be viewed in addition to, and not as an alternative for, Wabtec’s reported results prepared in accordance with GAAP.