Free signup for more
- Track your favorite companies
- Receive email alerts for new filings
- Personalized dashboard of news and more
- Access all data and search results
Filing tables
Filing exhibits
WAB similar filings
- 20 May 24 Submission of Matters to a Vote of Security Holders
- 24 Apr 24 Results of Operations and Financial Condition
- 18 Mar 24 Entry into a Material Definitive Agreement
- 13 Mar 24 2 0 2 4 Wabtec Investor Presentation
- 11 Mar 24 Entry into a Material Definitive Agreement
- 27 Feb 24 Wabtec Announces Pricing of Senior Notes Offering
- 14 Feb 24 Wabtec Delivers Strong Fourth Quarter 2023
Filing view
External links
Exhibit 99.1

2 0 2 4 WABTEC INVESTOR PRESENTATION

FORW ARD LOOKI NG S TATEM ENTS & NON- GAAP FI NANCI AL I NFORM ATI ON This communication contains “forward-looking” statements as that term is defined in Section 27A of the Securities Act of 1933, as amended, and Section 21E of the Securities Exchange Act of 1934, as amended by the Private Securities Litigation Reform Act of 1995. All statements, other than historical facts, including statements regarding Wabtec’s plans, objectives, expectations and intentions; Wabtec’s expectations about future sales, earnings and cash conversion; Wabtec’s projected expenses and cost savings associated with its Integration 2.0 initiative; Wabtec’s 5-year outlook (established in March 2022); Wabtec’s expectations for evolving global industry, market and macro-economic conditions and their impact on Wabtec’s business; synergies and other expected benefits from Wabtec’s acquisitions; Wabtec’s expectations for production and demand conditions; and any assumptions underlying any of the foregoing, are forward looking statements. Forward-looking statements concern future circumstances and results and other statements that are not historical facts and are sometimes identified by the words “may,” “will,” “should,” “potential,” “intend,” “expect,” “endeavor,” “seek,” “anticipate,” “estimate,” “overestimate,” “underestimate,” “believe,” “could,” “project,” “predict,” “continue,” “target” or other similar words or expressions. Forward-looking statements are based upon current plans, estimates and expectations that are subject to risks, uncertainties and assumptions. Should one or more of these risks or uncertainties materialize, or should underlying assumptions prove incorrect, actual results may vary materially from those indicated or anticipated by such forward- looking statements. The inclusion of such statements should not be regarded as a representation that such plans, estimates or expectations will be achieved. Important factors that could cause actual results to differ materially from such plans, estimates or expectations include, among others, (1) changes in general economic and/or industry specific conditions, including the impacts of tax and tariff programs, inflation, supply chain disruptions, foreign currency exchange, and industry consolidation; (2) changes in the financial condition or operating strategies of Wabtec's customers; (3) unexpected costs, charges or expenses resulting from acquisitions and potential failure to realize synergies and other anticipated benefits of acquisitions, including as a result of integrating acquired targets into Wabtec; (4) inability to retain and hire key personnel; (5) evolving legal, regulatory and tax regimes; (6) changes in the expected timing of projects; (7) a decrease in freight or passenger rail traffic; (8) an increase in manufacturing costs; (9) actions by third parties, including government agencies; (10) the impacts of epidemics, pandemics, or similar public health crises on the global economy and, in particular, our customers, suppliers and end-markets, (11) potential disruptions, instability, and volatility in global markets as a result of global military action, acts of terrorism or armed conflict, including from the imposition of economic sanctions on Russia resulting from the invasion of Ukraine; (12) cybersecurity and data protection risks and (13) other risk factors as detailed from time to time in Wabtec’s reports filed with the SEC, including Wabtec’s annual report on Form 10-K, periodic quarterly reports on Form 10-Q, current reports on Form 8-K and other documents filed with the SEC. The foregoing list of important factors is not exclusive. Any forward-looking statements speak only as of the date of this communication. Wabtec does not undertake any obligation to update any forward-looking statements, whether as a result of new information or development, future events or otherwise, except as required by law. Readers are cautioned not to place undue reliance on any of these forward-looking statements. This presentation mentions certain non-GAAP financial performance measures, including adjusted gross profit, adjusted operating expenses, adjusted income from operations, adjusted interest and other expense, adjusted net income, adjusted operating margin, adjusted gross margin, adjusted income tax expense, adjusted effective tax rate, adjusted earnings per diluted share, EBITDA and adjusted EBITDA, net debt and operating cash flow conversion rate. Wabtec defines EBITDA as earnings before interest, taxes, depreciation and amortization. Adjusted EBITDA is further adjusted for restructuring costs. Wabtec defines operating cash flow conversion as net cash provided by operating activities divided by net income plus depreciation and amortization including deferred debt cost amortization. While Wabtec believes these are useful supplemental measures for investors, they are not presented in accordance with GAAP. Investors should not consider non-GAAP measures in isolation or as a substitute for net income, cash flows from operations, or any other items calculated in accordance with GAAP. In addition, the non-GAAP financial measures included in this presentation have inherent material limitations as performance measures because they add back certain expenses incurred by the Company to GAAP financial measures, resulting in those expenses not being taken into account in the applicable non-GAAP financial measure. Because not all companies use identical calculations, Wabtec’s presentation of non-GAAP financial measures may not be comparable to other similarly titled measures of other companies. Included in this presentation are reconciliation tables that provide details about how adjusted results relate to GAAP results.
W A B TE C 3 TABLE OF CONTENTS 4 Company profile & key growth drivers 9 Why Wabtec? 19 Global rail fundamentals are attractive 22 Leading the decarbonization of rail 27 Diverse portfolio with unique strategies to drive growth 40 Disciplined value creation 54 Wabtec’s business segments in more detail 60 Appendix

1 COMPANY PROFILE & KEY GROWTH DRIVERS
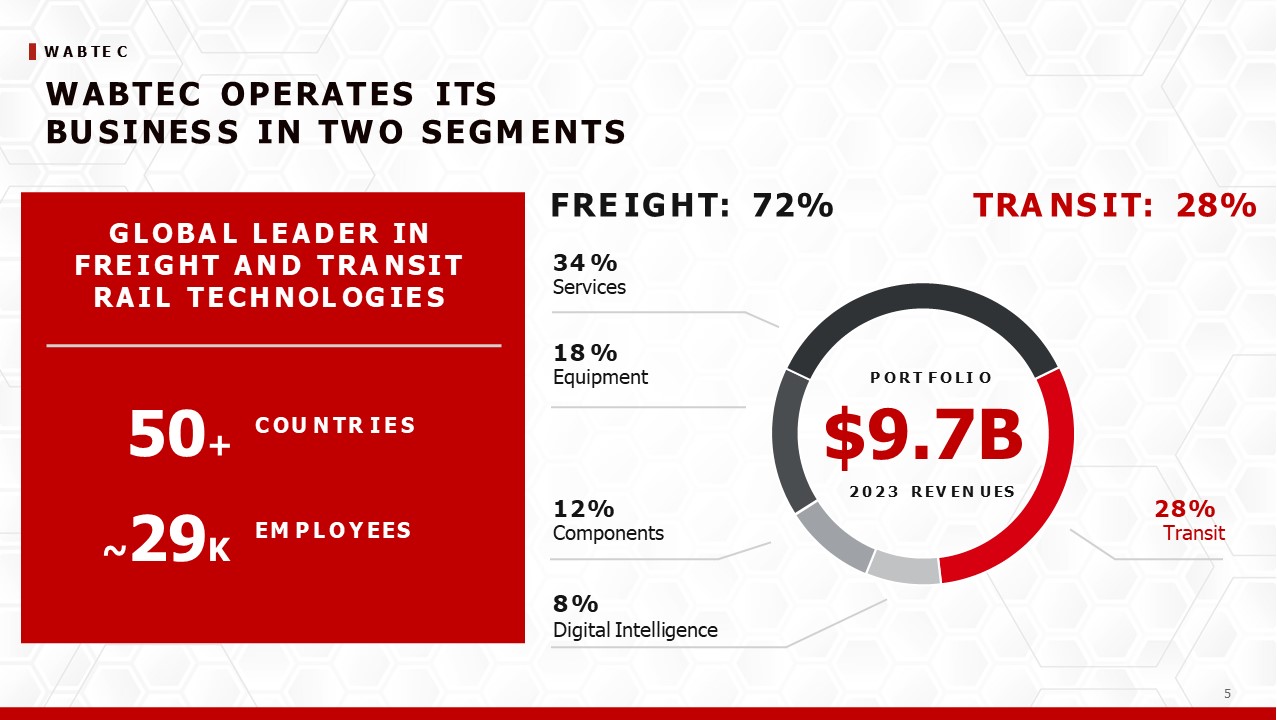
5 W A B TE C W ABTEC OPERATES I TS BU S I NES S I N TW O S EGM ENTS G L OBA L L E A D E R IN F RE I G H T A N D TRA N S I T R A I L T E C H N OL OG IE S 50+ ~29K C OU N TR I E S EM P L O Y EES TRA NS I T: 28% FRE I G H T: 72% 34 % Services P ORT F OLI O $9.7B 2023 R EV EN U ES 12% Components 18 % Equipment 28% Transit 8 % Digital Intelligence

W A B TE C 6 ATTRACTI VE REVENU E PROFI LE 59% 37% 63% 46% A T T R A CT I V E EN D M A RK ET S RO B U S T A FT ERM A RK ET P OR T F OL I O B R OA D SCA L E I N G LO B A L M A RK ET S ST R ON G M I X OF REC U RRI N G REVEN U ES S TRO N G G L O B A L I N D U S TRI A L P O RTF O L I O W I TH TRA C K RE C O RD O F I N N O V A TI O N A N D S I G N I F I C A N T RE C U RRI N G RE V E N U E Freight Transit All Other (Industrial and Mining) 28% 13% OE Aftermarket Americas (47% in U.S.) EMEA APAC 60% 25% 15% Non-Recurring Recurring 54% * 2023 FY results 6

W A B TE C 7 PRI M ARY GROW TH DRI VERS (1 ) 1 Rail cycle recovery 2 International expansion 3 Increase customer productivity, capacity and safety Locomotive fleet renewal Innovative digital technology Lead decarbonization of rail 4 Integration 2.0 5 Strategic M&A Equipment Digital Intelligence Services Transit Components 5 - Y E A R G R O W T H E X P E C T A T I O NS (1) Long-term guidance as of March 9, 2022

W A B TE C 8 RE S I LI E NT PO RTFO LI O TH RO U G H TH E CY CLE (1) Adjusted numbers represent non-GAAP financial measures. See Appendix for additional details and reconciliations FAVORABLE END-MARKETS ROBUST BACKLOG & RECURRING REVENUE DEMONSTRATED EXECUTION S OL ID OU T L OO K S U PPOR T E D B Y R E S IL IE N T A ND MO RE P RE D I C T A BL E E A RN I N G S 72% Freight 28% Transit FREIGHT + Accelerating investment in the fleet + Strong international order pipeline + Growing installed base TRANSIT + Increased global investment in infrastructure + Mega trends favor increasing ridership $7.5B $6.8B Aggressively managing costs and accelerating lean actions; executing on Integration 2.0 Average cash conversion(1) of 93% during 2020 to 2023 46%* recurring revenue OP MARGIN 16.2% 17.0% 4Q20 4Q21 4Q22 4Q23 Strong 12-month backlog provides resiliency and visibility despite macro uncertainty $6.3B $5.5B Significant recurring revenue base drives 62% of profits *based on 2023 sales 11.2% 12.1% GAAP Adjusted(1) Expanded margins despite higher input costs, supply chain disruptions and the exit of our business in Russia *based on 2023 sales 2020 2021 2022 2023 9.9% 13.1% 15.1% 15.9% 2020 2021 2022 2023
2 WHY WABTEC
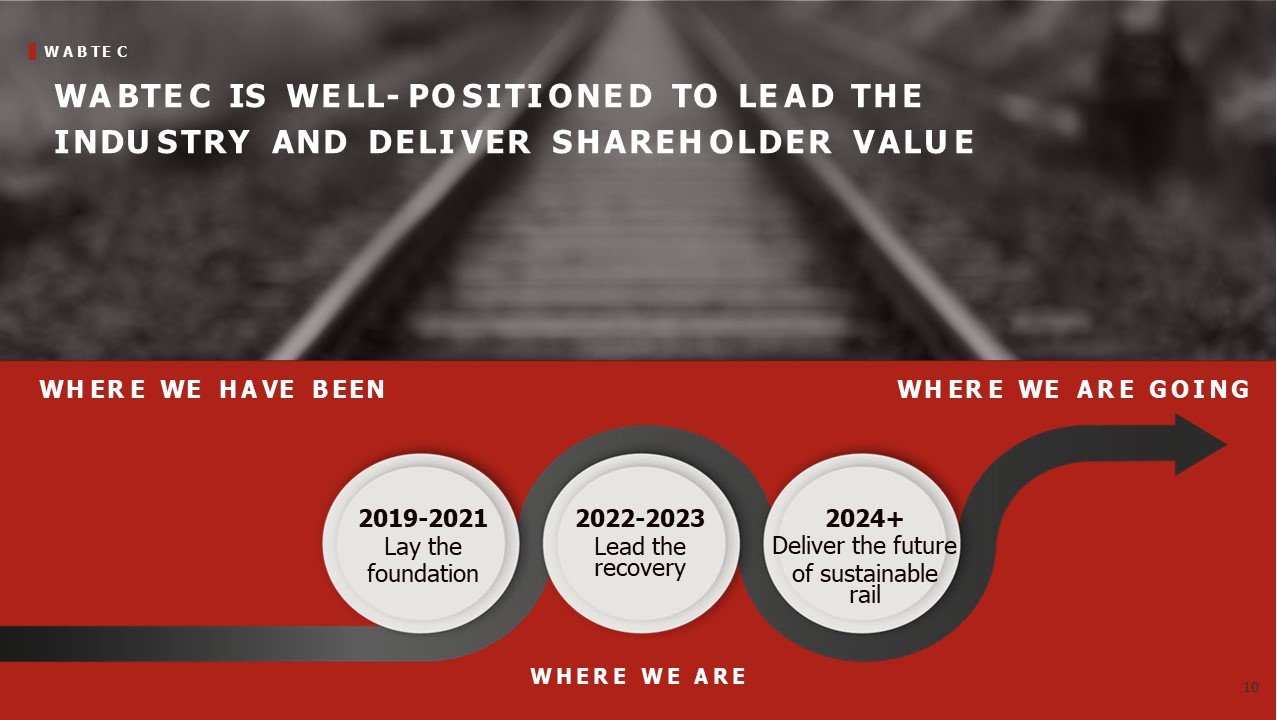
W A B TE C WA BTE C IS WE LL- PO S I TI O NE D TO LE A D TH E I NDU S TRY AND DELI VER S H AREH OLDER VALU E W H E R E W E A R E WH ER E WE A R E G O I N G WH ER E WE H A VE B EEN 2019-2021 Lay the foundation 2022-2023 Lead the recovery 2024+ Deliver the future of sustainable rail 10
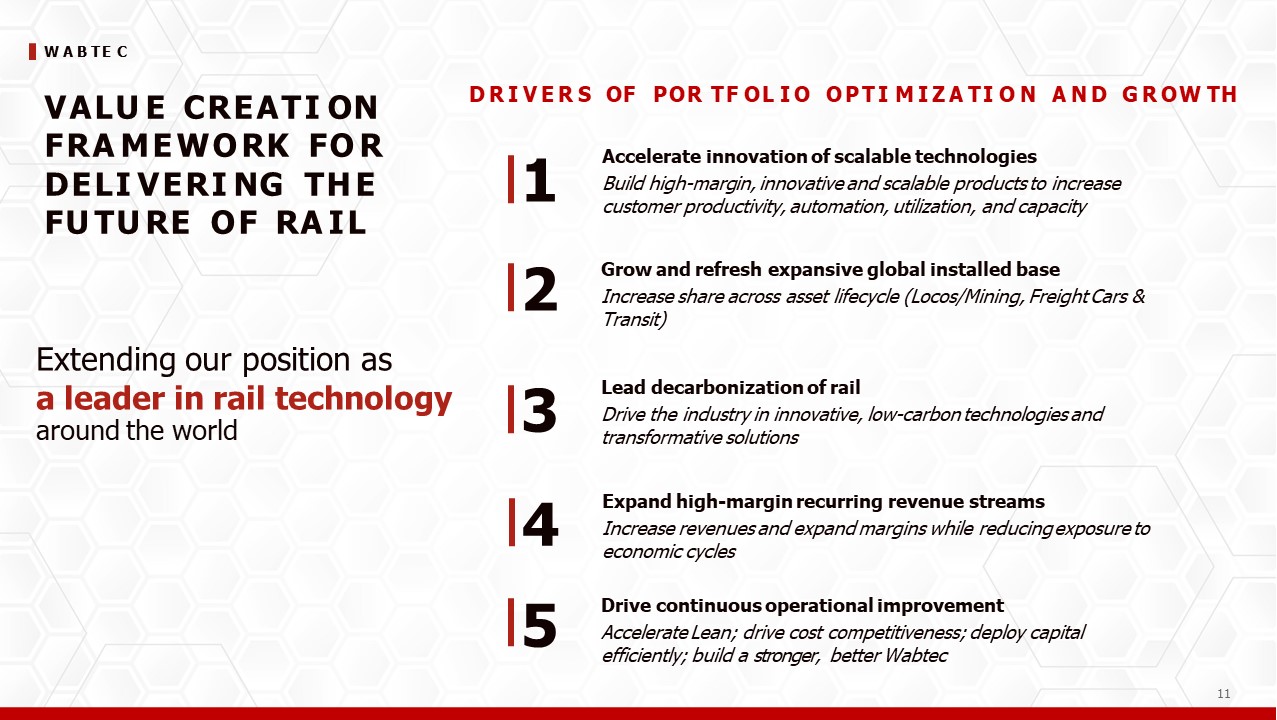
W A B TE C VALU E CREATI ON FRA M E W O RK FO R DELI VERI NG TH E FU TU RE O F RA I L Lead decarbonization of rail Drive the industry in innovative, low-carbon technologies and transformative solutions Grow and refresh expansive global installed base Increase share across asset lifecycle (Locos/Mining, Freight Cars & Transit) Expand high-margin recurring revenue streams Increase revenues and expand margins while reducing exposure to economic cycles Accelerate innovation of scalable technologies Build high-margin, innovative and scalable products to increase customer productivity, automation, utilization, and capacity Drive continuous operational improvement Accelerate Lean; drive cost competitiveness; deploy capital efficiently; build a stronger, better Wabtec D R I V E R S OF POR TF OL I O OPTI M I Z A TI O N A N D G R OW TH Extending our position as a leader in rail technology around the world 1 2 3 4 5 11
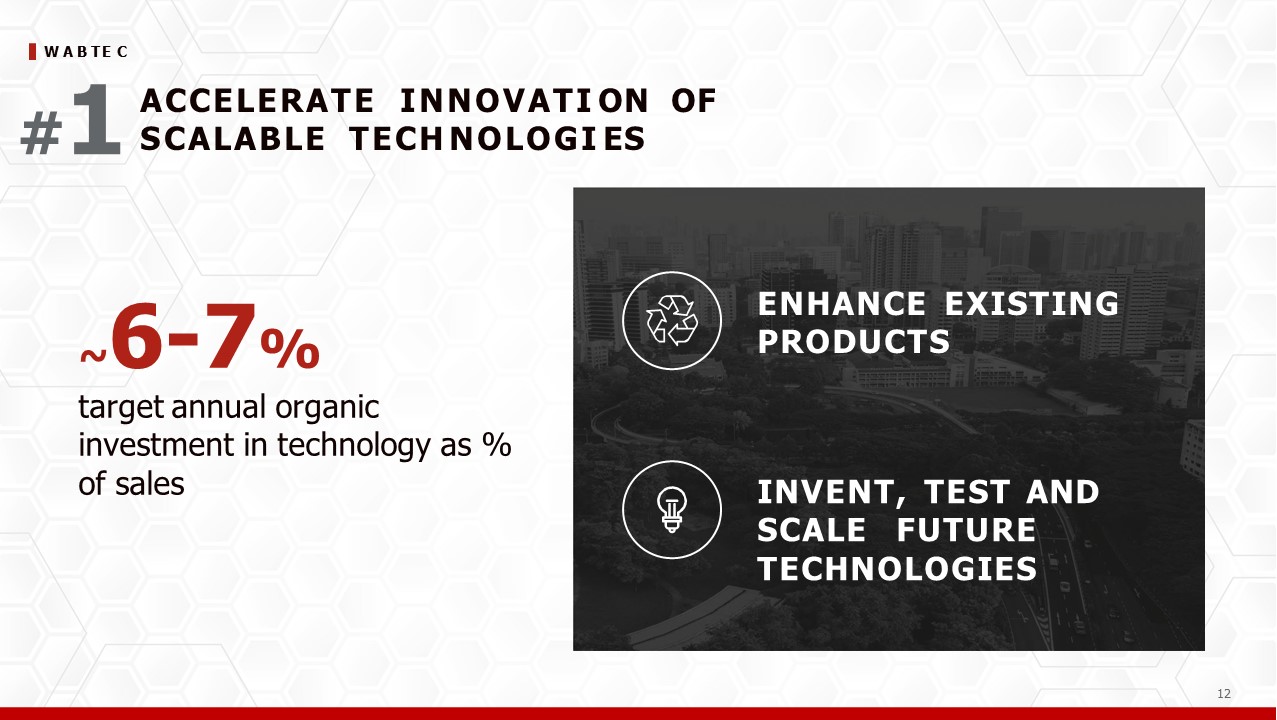
W A B TE C ENHANCE EXISTING PRODUCTS INVENT, TEST AND SCALE FUTURE TECHNOLOGIES 11 ~6-7% target annual organic investment in technology as % of sales ACCELERATE I NNOVATI ON OF S CALABLE TECH NOLOGI ES #1

W A B TE C 13 GROW AND REFRES H EXPANS I VE GLOBAL I NS TALLED BAS E #2 IB Age (years) WAB% 2024-2026 NORTH AMERICA 30K 22 53% APAC 20K 20 14% CIS/EU 26K 25 8% LATAM 3K 22 61% SUB-SAHARAN AFRICA 5K 19 26% Customers projected to spend 1-1.5X the original price of loco on service alone MODS MAINTENANCE COMPONENTS DIGITAL Opportunity for pantograph pull through on FLXdrive High-margin friction products T R A N SI T Pull-through content of up to $250K per new loco Recurring software services DI G I TA L I NT E L L I GE NC E 120+ service events over asset life >1,000 Mod units in operation Strong position with Class I customers FREI G H T S ERVI C ES Average $6K+ on freight car Opportunity to pull through new deliveries, manufacturing & aftermarket sales FREI G H T C A R COM P ON E N T S L OC OM OTI V E M A R K E T 13
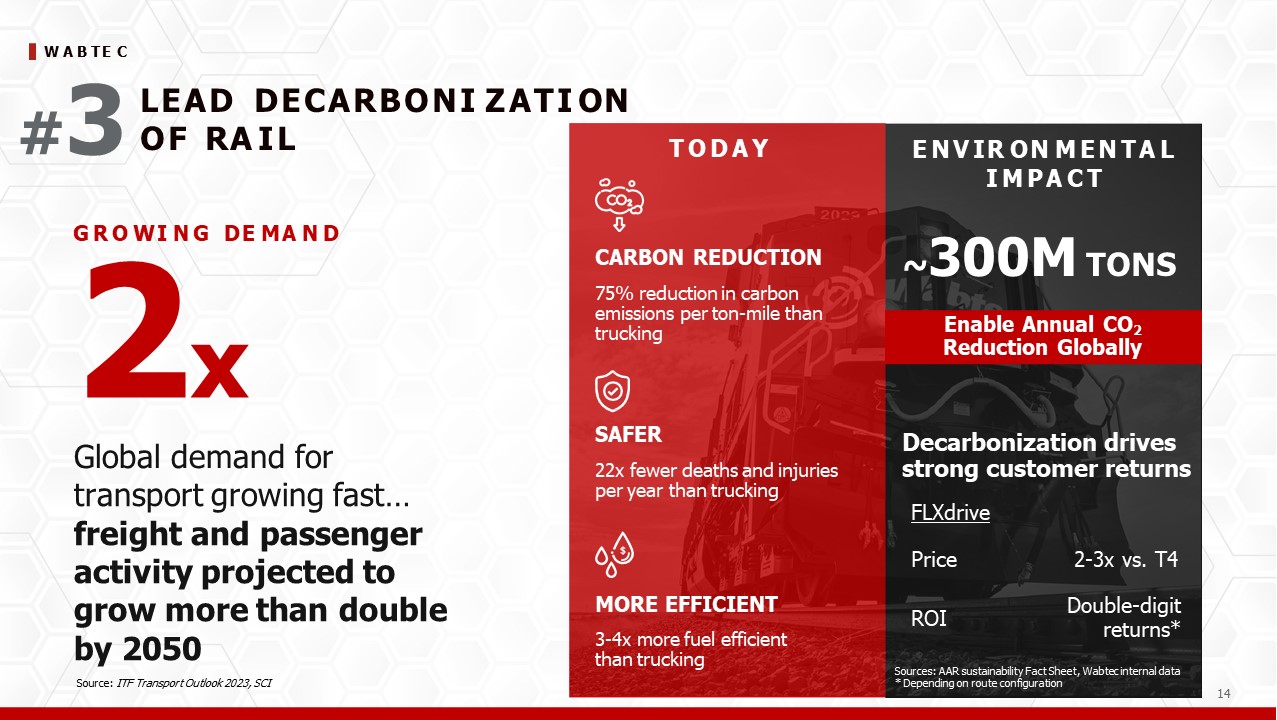
W A B TE C LEAD DECARBONI Z ATI ON O F RA I L #3 2x G R O WI N G DE MA N D T O D A Y E N V IR ON M E N T A L I M P A C T SAFER 22x fewer deaths and injuries per year than trucking CARBON REDUCTION 75% reduction in carbon emissions per ton-mile than trucking MORE EFFICIENT 3-4x more fuel efficient than trucking Decarbonization drives strong customer returns 14 Enable Annual CO2 Reduction Globally ~300M TONS FLXdrive Price 2-3x vs. T4 ROI Double-digit returns* Sources: AAR sustainability Fact Sheet, Wabtec internal data * Depending on route configuration Global demand for transport growing fast… freight and passenger activity projected to grow more than double by 2050 Source: ITF Transport Outlook 2023, SCI
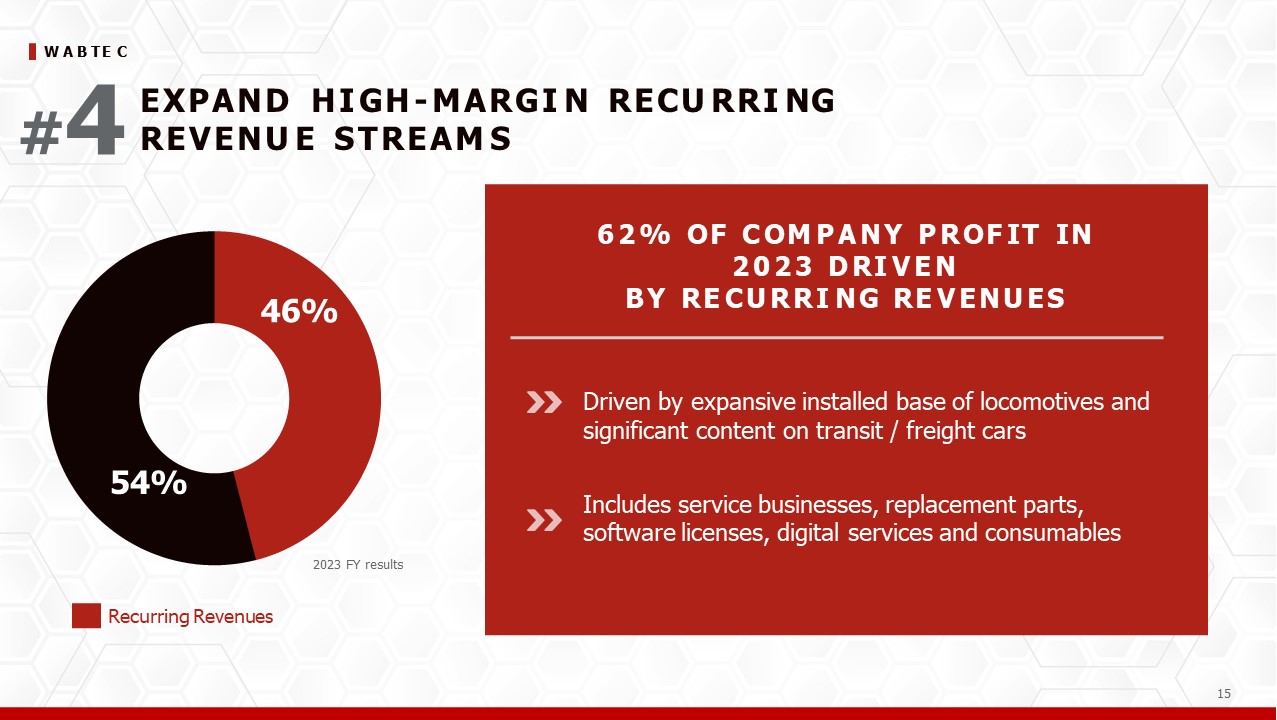
W A B TE C EXPAND H I GH - M ARGI N RECU RRI NG REVENU E S TREAM S #4 6 2 % OF C OM P A N Y P R OF IT IN 2 0 2 3 D RI V E N B Y RE C U RRI N G RE V E N U E S Driven by expansive installed base of locomotives and significant content on transit / freight cars Includes service businesses, replacement parts, software licenses, digital services and consumables 46% 54% Recurring Revenues 14 2023 FY results

W A B TE C 16 DRI VE CONTI NU OU S OPERATI ONAL I M PROVEM ENT #5 5.3 5.9 6.5 4.6% 5.2% 6.4% 2021 2022 2023 102% 93% 89% Continual Focus on Fixed Asset Productivity Operating Cash Conversion(1) in Line With Long-Term Targets C A PI T A L EF F I C I EN C Y M ET R I C S Improve ROIC (1) 2021 2022 2023 Total net sales/property, plant, and equipment, net 2021 2022 2023 (1) Represents a non-GAAP financial measure. See Appendix for details and reconciliation A C C EL ER A T E L EA N Deliver best-in-class manufacturing cost productivity and material cost deflation >90% on-time delivery Engineering productivity focus; yr/yr cost improvement >20% flexible workforce capacity Achieve over-the-cycle working capital cycle improvement D R I V E C OS T C OM PE TI TI V E N E S S ~135 manufacturing sites… drive best cost footprint >25% sites in best-cost countries >35% of engineers in best-cost countries “Should cost” analysis & competitive product benchmarking

W A B TE C W ABTEC OPERATI NG M ODEL … OPERATI ONAL EXCELLENCE E CULTURE Of shared values and mindset of problem solving and continuous improvement CADENCE Operating reviews monitoring pulse.... Site and division level STRATEGY DEVELOPMENT CORE OF COMMON KPI WABTEC MANAGEMENT SYSTEM C OPEORMAETIONAL 17 AREXECHELLEENRCE Safety & Sustainability Customer Commitments Quality & Reliability Cost Optimization

W A B TE C W E’RE COM M I TTED TO CREATI NG A M ORE S U S TAI NABLE FU TU RE SUSTAINABILITY PRINCIPLES Innovating with Purpose We are committed to developing responsible and sustainable products that minimize the impact on the planet 17 SUSTAINABILITY PRINCIPLES Driving Responsible Operations We are committed to providing safe work environments and products that enable productive and efficient use of resources SUSTAINABILITY PRINCIPLES Empowering People and Communities We are committed to driving a diverse and inclusive culture and investing in the communities where our teams live and work
3 GLOBAL RAIL FUNDAMENTALS ARE ATTRACTIVE

W A B TE C M ARKET FOR RAI L CONTI NU ES TO EXPAND K E Y T R E N D S IN FL UE N C IN G G R O W T H Increased focus on environmental sustainability and decarbonization 20 Improved rail infrastructure … enabling economic growth in developing regions. In NA, increased government funding and Class I CAPEX Digitization and automation driving improvements in productivity and efficiency Continued urbanization and globalization driving greater overall demand for freight and passenger transportation RAIL FREIGHT & PASSENGER TRAFFIC EXPECTED TO DOUBLE BY 2050 … LED BY INCREASED INFRASTRUCTURE INVESTMENT & FOCUS ON SUSTAINABILITY Intercity Passenger ‘22-’30: 5.0% CAGR ‘30-’50: 2.7% CAGR Freight ‘22-’30: 2.5% CAGR ‘30-’50: 3.7% CAGR G L O BA L R A IL FO R E C A ST Consistent, positive outlook ahead for next 25+ years. Urban Passenger ‘22-’30: 3.8% CAGR ‘30-’50: 2.5% CAGR Source: ITF Transport Outlook 2023, SCI 1.0 1.5 2.0 2.5 3.0 3.5 4.0 2007 10 15 20 25 30 35 40 45 50 Index to 2007
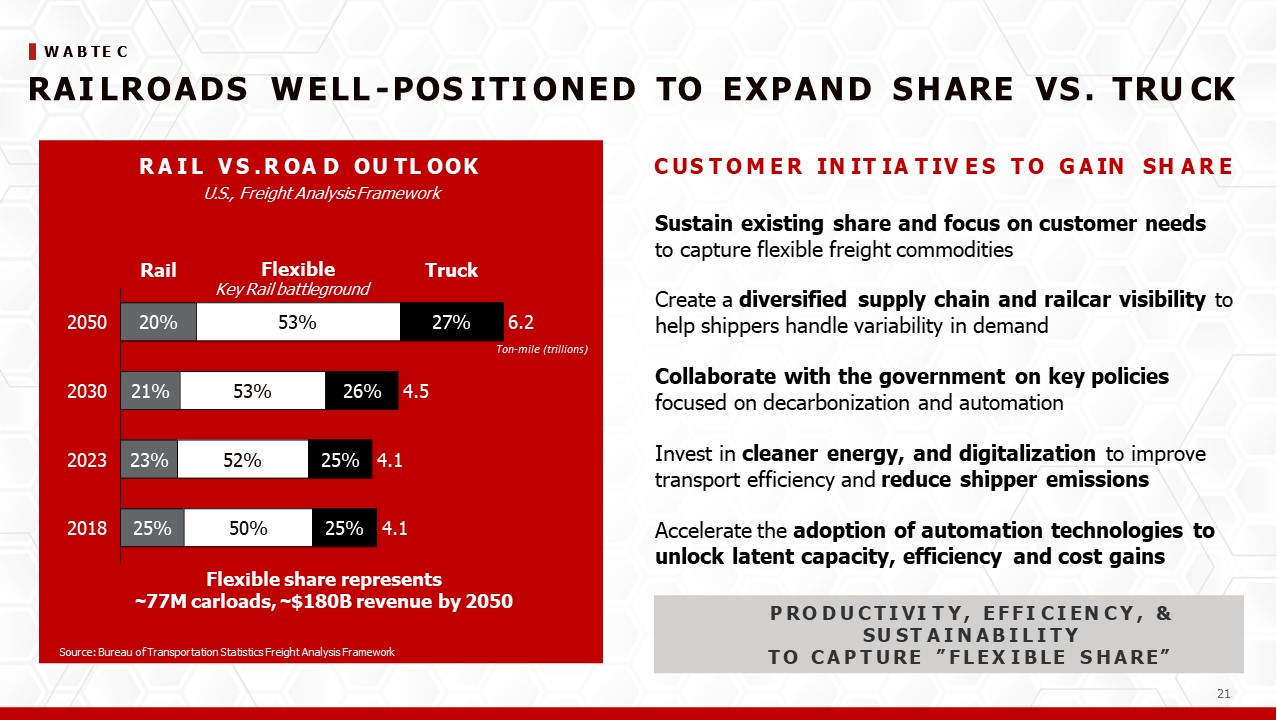
W A B TE C RAI LROADS W ELL - POS I TI ONED TO EXPAND S H ARE VS . TRU CK Sustain existing share and focus on customer needs to capture flexible freight commodities Create a diversified supply chain and railcar visibility to help shippers handle variability in demand Collaborate with the government on key policies focused on decarbonization and automation Invest in cleaner energy, and digitalization to improve transport efficiency and reduce shipper emissions Accelerate the adoption of automation technologies to unlock latent capacity, efficiency and cost gains C US T O M E R IN IT IA T IV E S T O G A IN SH A R E R A I L V S . R OA D OU TL OOK U.S., Freight Analysis Framework P RO D U C T I VI T Y , EFFI C I EN C Y , & SU ST A I N A B I L I T Y T O C A P T U RE ” FLEX I B LE S H A RE” 2030 21% 20 2050 20% 53% 2023 23% 52% Rail Truck 2018 25% 50% 25% 4.1 Flexible share represents ~77M carloads, ~$180B revenue by 2050 25% 4.1 26% 4.5 27% 6.2 Ton-mile (trillions) Flexible Key Rail battleground 53% Source: Bureau of Transportation Statistics Freight Analysis Framework
4 LEADING THE DECARBONIZATION OF RAIL
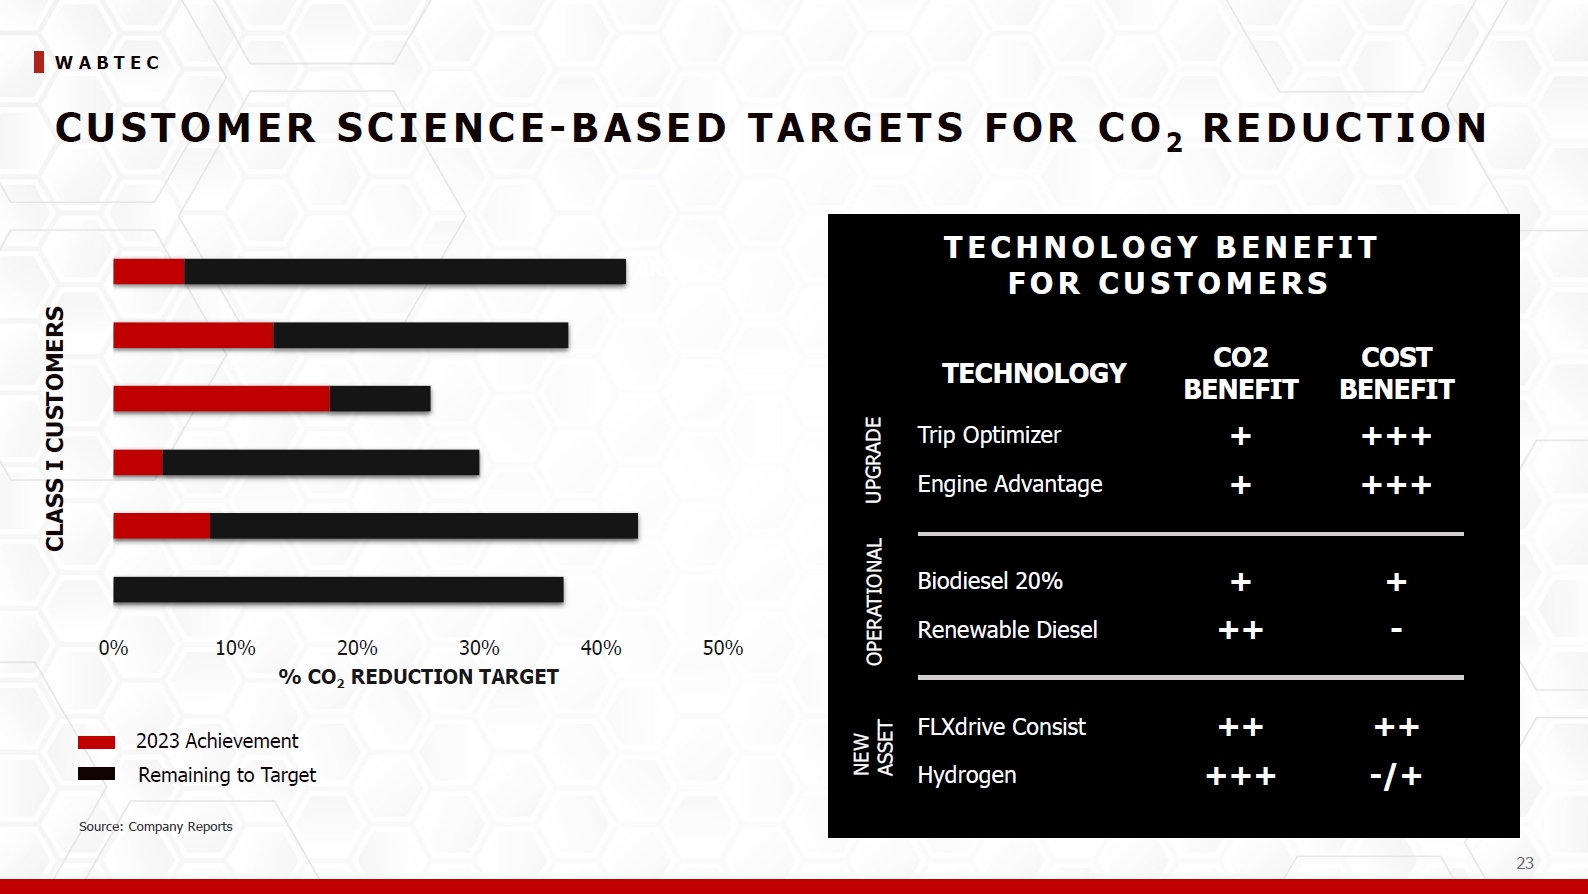
W A B TE C 23 CU S TO M E R S CI E NCE- BAS ED TARGETS FOR CO 2 RE DU CTI O N TECHNOLOGY CO2 BENEFIT COST BENEFIT Trip Optimizer + +++ Engine Advantage + +++ Biodiesel 20% + + Renewable Diesel ++ - FLXdrive Consist ++ ++ Hydrogen +++ -/+ T E C H N OL OG Y B E N E F IT F O R C U ST O ME RS UPGRADE OPERATIONAL NEW ASSET RG CLASS I CUSTOMERS 2023 Achievement Remaining to Target 0% 10% 40% 50% 20% 30% % CO2 REDUCTION TARGET Source: Company Reports

W A B TE C TE CH NI CA L S O LU TI O NS I M PA C T U P TO ~ 3 0 % reduction in emissions and fuel utilization 22% efficiencies today … 18% EPA certified P RO D U C TS I N TE GR ATE D F UE L OPT IM IZ A T ION Movement Planner system Locotrol distributed power Trip Optimizer Platform U P T O 30% TO TA L S A V IN G S * C A P A B I L I TY E V O L U TI O N 3% 4% FUEL SAVINGS ACROSS THE ENTERPRISE NETWORK 4% 6% FUEL SAVINGS ON DISTRIBUTED POWER TRAINS FUEL SAVINGS PER LOCOMOTIVE 15% 22% MOVEMENT PLANNER DISPATCH SYSTEM Optimizes the use of slack time to reduce overall fuel consumption LOCOTROL DISTRIBUTED POWER SYSTEM Optimizes the distribution of power to reduce total horsepower required TRIP OPTIMIZER ENERGY MANAGEMENT SYSTEM Plans the most fuel efficient way to arrive on time * Non-EPA certified reductions reflect current estimates 24
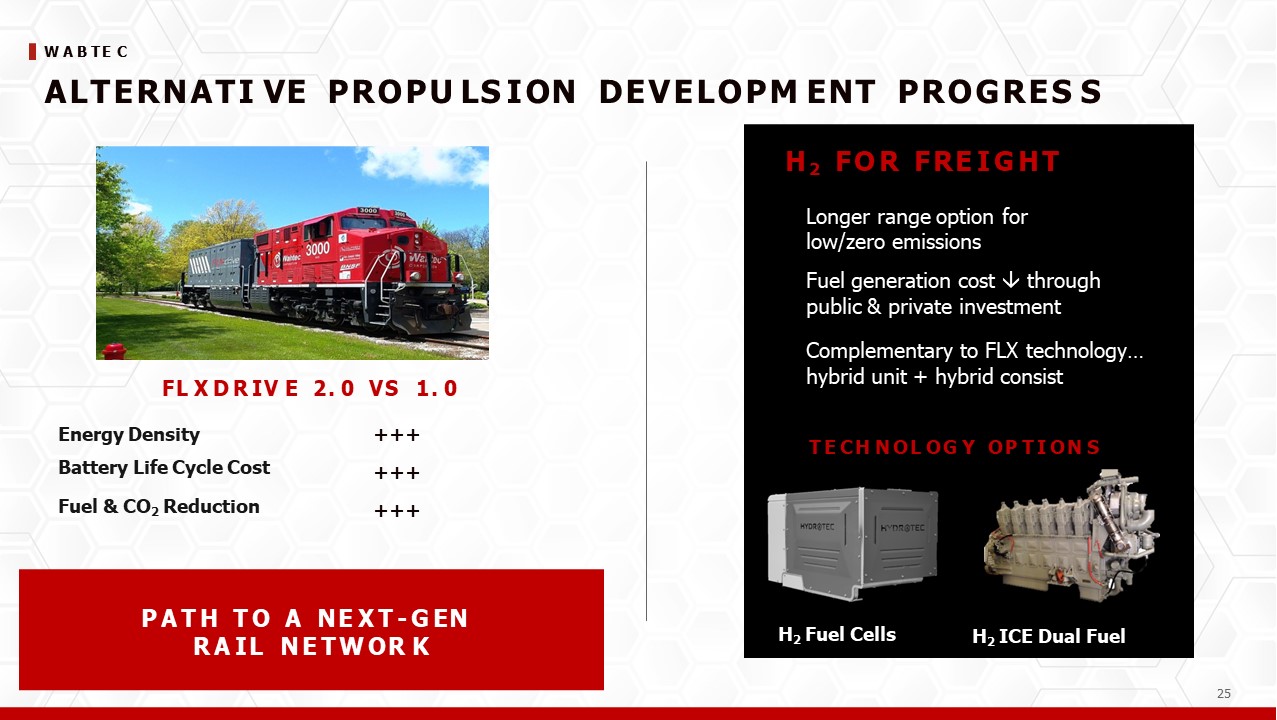
W A B TE C 25 ALTERNATI VE PROPU LS I ON DEVELOPM ENT PROGRES S FL X D R IV E 2. 0 VS 1. 0 Energy Density Battery Life Cycle Cost Fuel & CO2 Reduction +++ +++ +++ H 2 F O R F RE I G H T Longer range option for low/zero emissions Fuel generation cost through public & private investment Complementary to FLX technology… hybrid unit + hybrid consist T E CH N OL OG Y OP T I ON S H2 Fuel Cells H2 ICE Dual Fuel P A T H T O A NE X T - G EN R A IL N E T W OR K

W A B TE C 26 LOCOM OTI VE TECH NOLOGY ROAD M AP FOR S U S TAI NABI LI TY D I ES EL E NGI NE DI G I TA L 2016 2023 2026 2030+ P O TE N TI A L C O 2 R E DU CT I O N Our technologies, such as Trip OptimizerTM and LOCOTROL® enhance the rail industry’s sustainable journey 30% B A T T ERY (M A IN L IN E H Y B R I C O NSI ST ) B A T T ERY ( S W I T CH ER & L O C HYD R O G E N Launch T4 High Efficiency TIER 4 FDL Advantage EVO Advantage MODERNIZATIONS BIOFUELS Advancing the adoption of biofuel 8% 8% >60% Demo FLX drive 2.0 FLX drive 3.0 D 30% Demo FLXswitch A L ) 100% Demo HHP/tender Switcher & Local Main line locomotive Fuel cell/engine 100% 26

5 DIVERSE PORTFOLIO WITH UNIQUE STRATEGIES TO DRIVE GROWTH
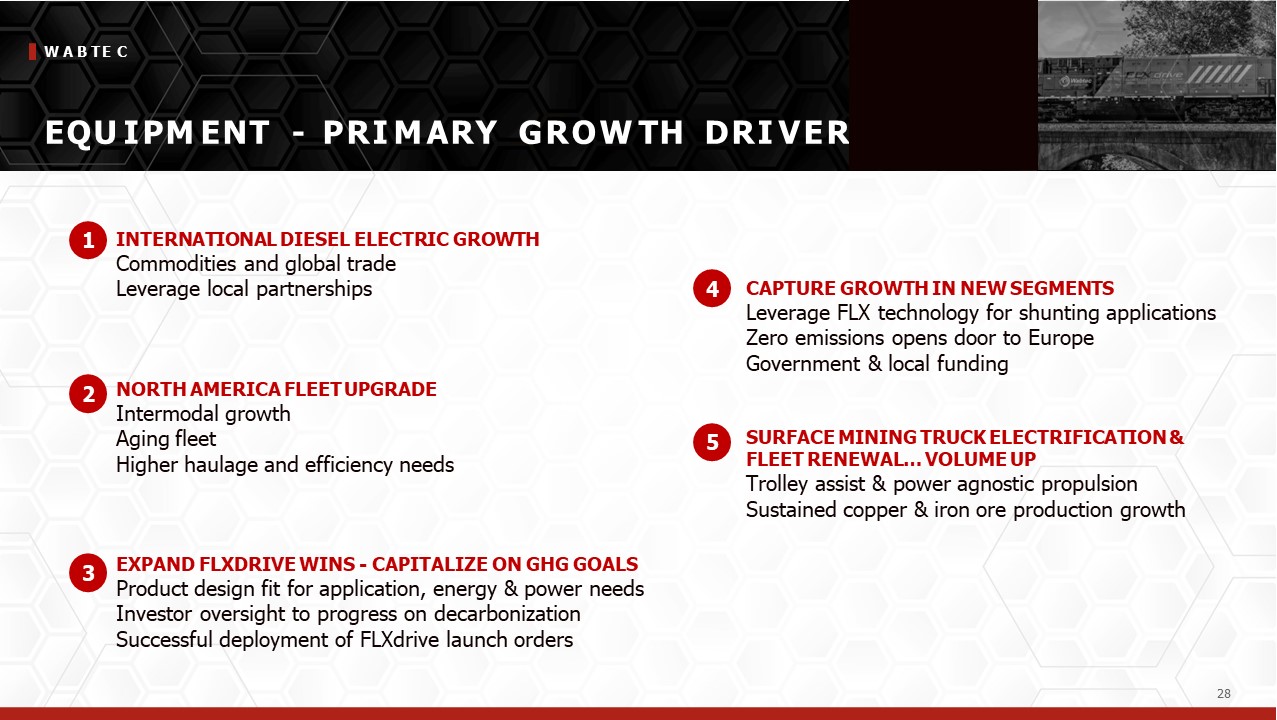
W A B TE C EQU I PM ENT - PRI M ARY GROW TH DRI VERS SURFACE MINING TRUCK ELECTRIFICATION & FLEET RENEWAL… VOLUME UP Trolley assist & power agnostic propulsion Sustained copper & iron ore production growth EXPAND FLXDRIVE WINS - CAPITALIZE ON GHG GOALS Product design fit for application, energy & power needs Investor oversight to progress on decarbonization Successful deployment of FLXdrive launch orders NORTH AMERICA FLEET UPGRADE Intermodal growth Aging fleet Higher haulage and efficiency needs INTERNATIONAL DIESEL ELECTRIC GROWTH Commodities and global trade Leverage local partnerships CAPTURE GROWTH IN NEW SEGMENTS Leverage FLX technology for shunting applications Zero emissions opens door to Europe Government & local funding 1 2 4 5 3 31
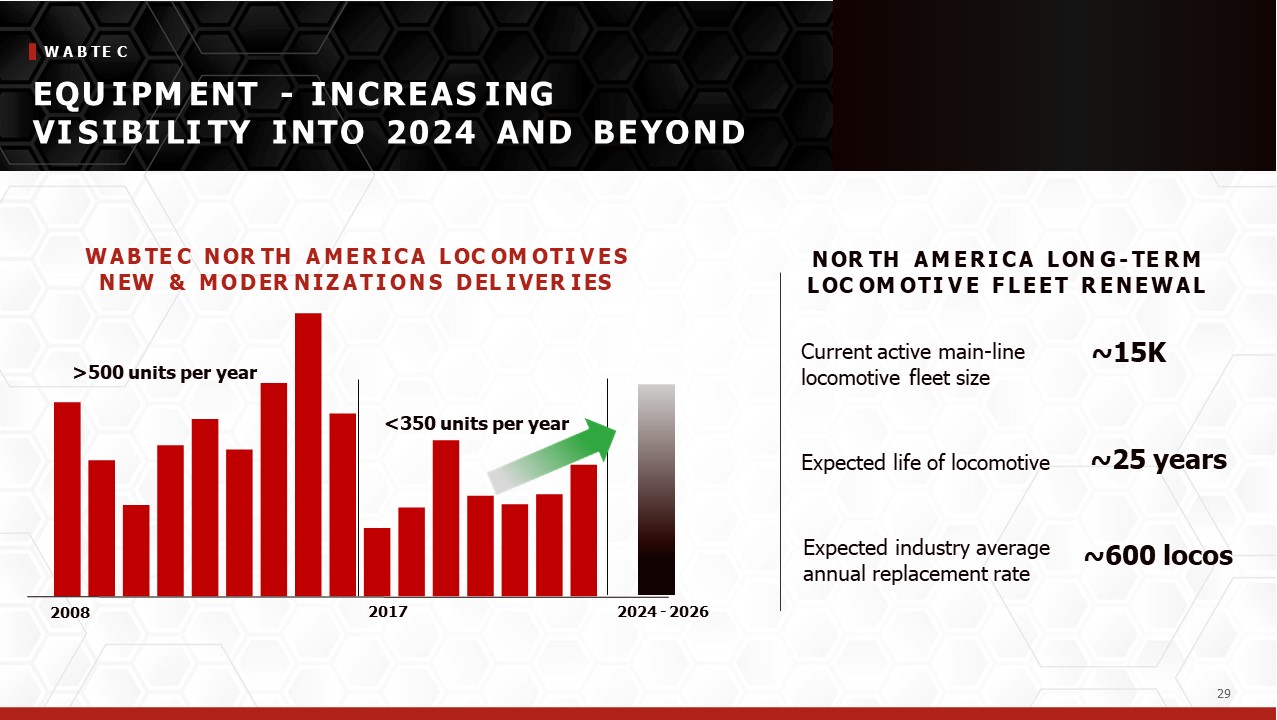
W A B TE C EQU I PM ENT - I NCREAS I NG VI S I BI LI TY I NTO 2024 AND BEYOND Current active main-line locomotive fleet size W A B TE C N OR TH A M E R I C A L OC OM OTI V E S N EW & M O D ER N I Z A T I O N S D EL I VER I ES >500 units per year <350 units per year 2008 2017 2024 - 2026 ~15K ~25 years ~600 locos N OR TH A M E R I C A L ON G - TE R M L OC OM OTI V E F L E E T R E N E W A L Expected life of locomotive 31 Expected industry average annual replacement rate

W A B TE C S POTLI GH T ON I NTERNATI ONAL M ARKETS RESILIENT GROWTH IN THE INTERNATIONAL INSTALLED BASE 2017 2018 2019 2020 2021 2022 2023 *Excludes Canada & Mexico 2024 - 2026 LEVERAGING WABTEC PORTFOLIO AND LOCAL PARTNERSHIPS TO DRIVE PROFITABLE GROWTH IN 2024 AND BEYOND A U ST R A L I A Mining growth Decarbonization focus SOU T H A M E R I CA New concessions Agriculture + mining growth CI S Gateway Asia Europe Fleet renewal & efficiency I N D I A & A F R I CA Economic growth + mining Transit urbanization K EY M A RK ET S & G RO W T H D RI VERS 31
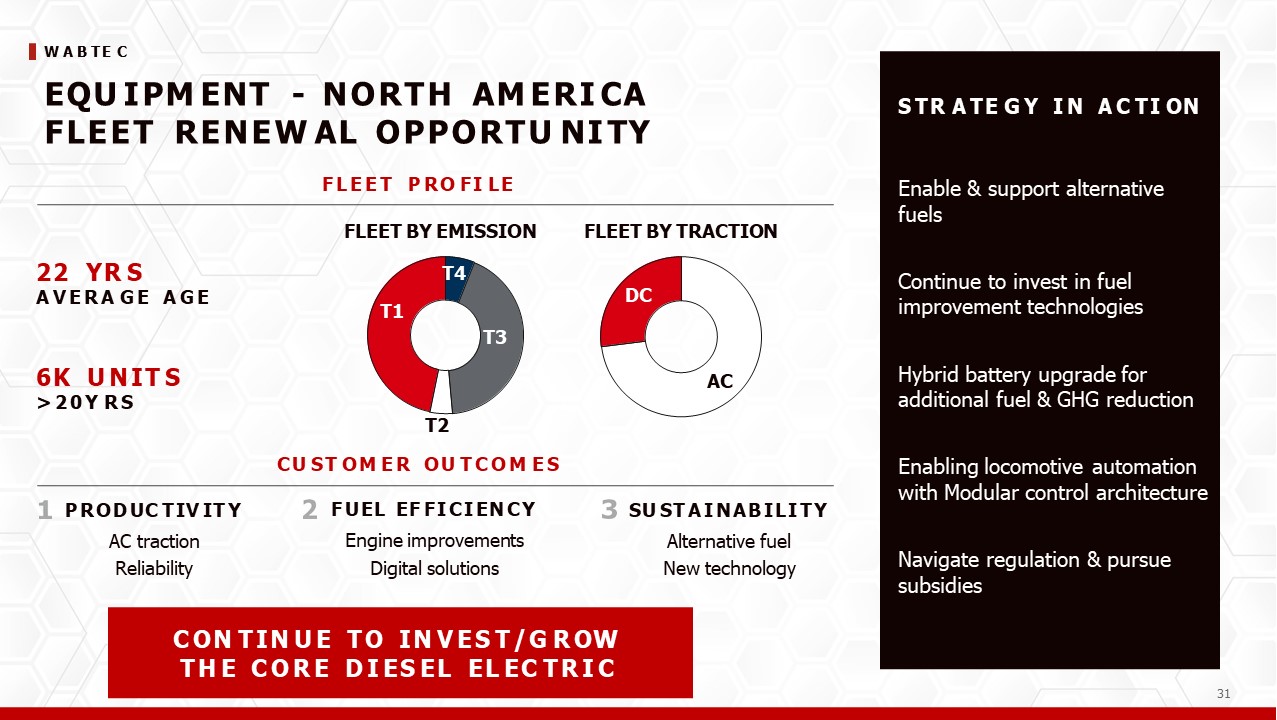
W A B TE C EQU I PM ENT - NORTH AM ERI CA FLEET RENEW AL OPPORTU NI TY S TR A TE G Y I N A C TI ON Enable & support alternative fuels Continue to invest in fuel improvement technologies Hybrid battery upgrade for additional fuel & GHG reduction Enabling locomotive automation with Modular control architecture Navigate regulation & pursue subsidies C ON T IN U E T O IN V E S T /G R OW T H E C O R E D I ES EL EL EC T R I C T1 T3 T4 DC AC T2 CU ST OM E R OU T COM E S 22 YR S A VERA G E A G E 6K U N IT S > 20Y R S FLEET P RO FI LE FLEET BY EMISSION FLEET BY TRACTION SU ST A I N A B I L I T Y Alternative fuel New technology F U EL EF F I C I EN C Y Engine improvements Digital solutions P R O D UC T IV IT Y AC traction Reliability 31
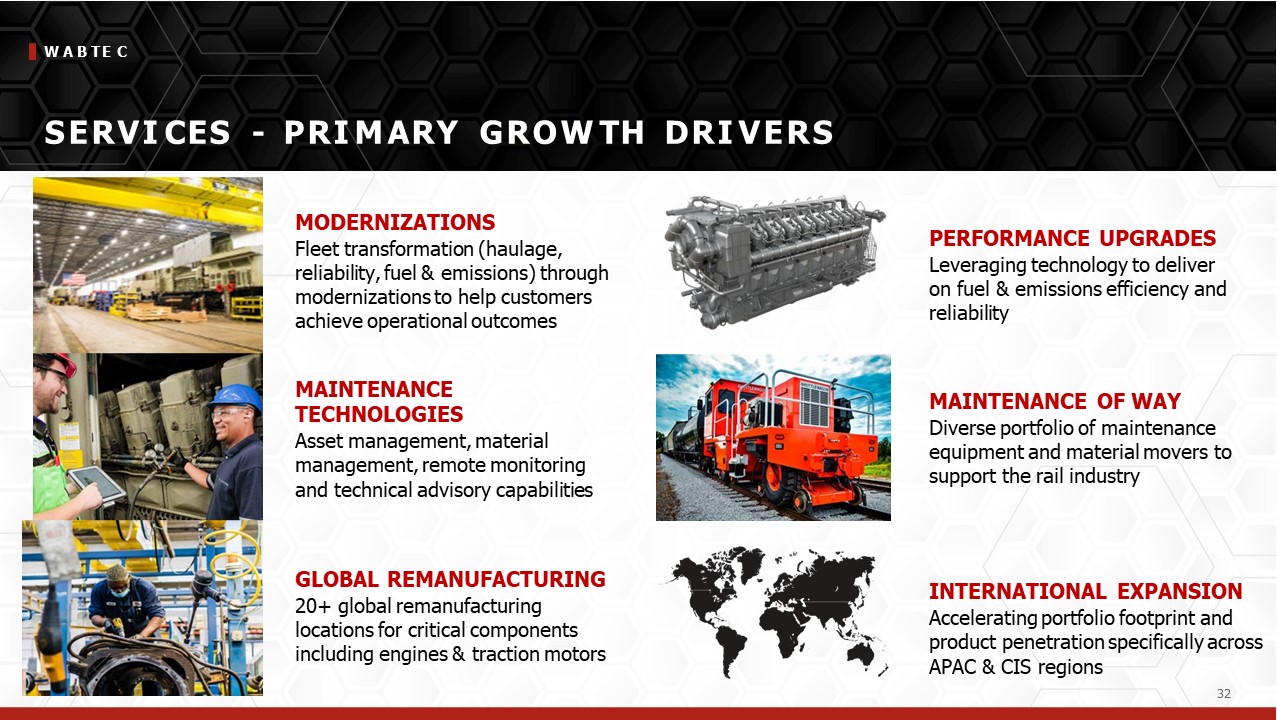
W A B TE C S ERVI CES - PRI M ARY GROW TH DRI VERS GLOBAL REMANUFACTURING 20+ global remanufacturing locations for critical components including engines & traction motors 31 PERFORMANCE UPGRADES Leveraging technology to deliver on fuel & emissions efficiency and reliability MODERNIZATIONS Fleet transformation (haulage, reliability, fuel & emissions) through modernizations to help customers achieve operational outcomes MAINTENANCE TECHNOLOGIES Asset management, material management, remote monitoring and technical advisory capabilities MAINTENANCE OF WAY Diverse portfolio of maintenance equipment and material movers to support the rail industry INTERNATIONAL EXPANSION Accelerating portfolio footprint and product penetration specifically across APAC & CIS regions

33 W A B TE C S ERVI CES - M ODERNI Z ATI ONS ~50% more tractive effort ~25% less fuel & emissions ~40% more reliability C U S TOM E R OU TC OM E S * WA B T E C I MP A CT Developed and scaled Mods business Turning underutilized assets into preferred fleet Significant content pull-through Customer partner of choice Install Wabtec T4 engine on competitor’s switcher L OOK I N G A H E A D 15,000+ available market | <10% penetration Alternative fuels Alternative energy: battery, hydrogen internal combustion engine, fuel cell * Source: Internal Wabtec data and based on customer product configuration Maximize asset value and fleet performance by transforming 20+ year old locomotives to extend life and step-change their performance Solutions jointly defined with each customer based on modular technology building blocks Enabling structural changes in railroad dispatch strategies
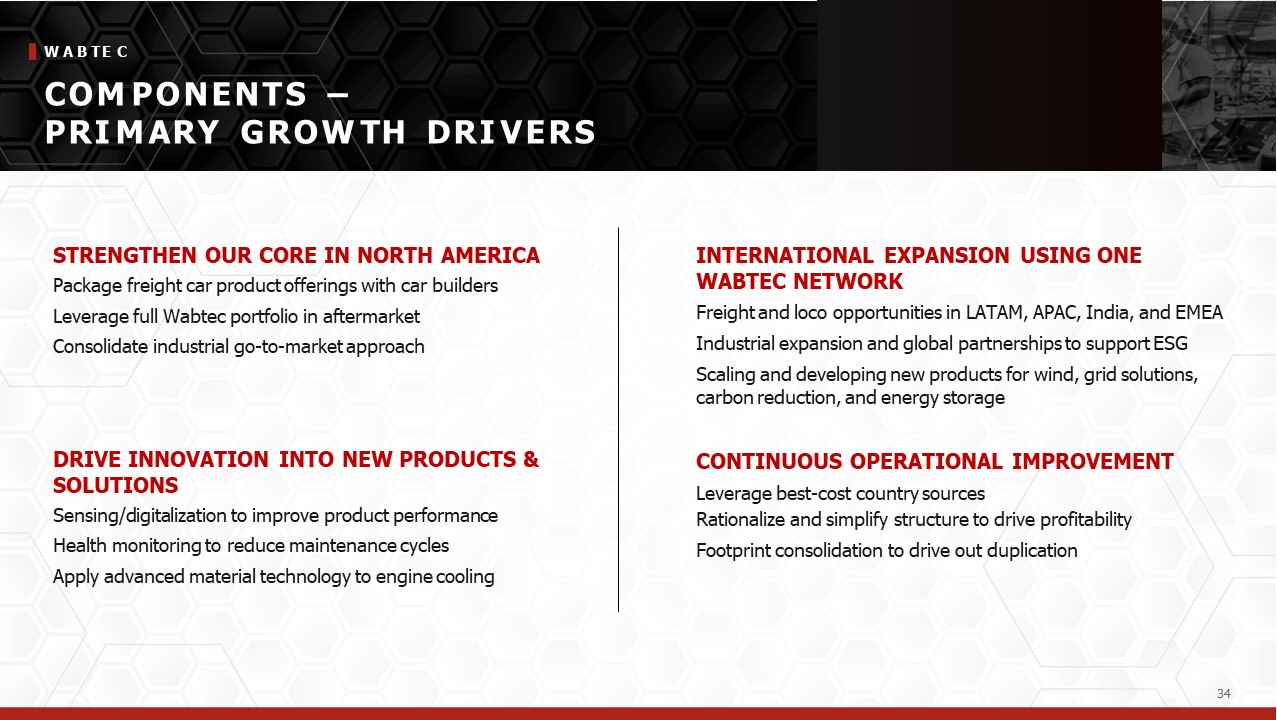
W A B TE C COM PONENTS – PRI M ARY GROW TH DRI VERS DRIVE INNOVATION INTO NEW PRODUCTS & SOLUTIONS Sensing/digitalization to improve product performance Health monitoring to reduce maintenance cycles Apply advanced material technology to engine cooling STRENGTHEN OUR CORE IN NORTH AMERICA Package freight car product offerings with car builders Leverage full Wabtec portfolio in aftermarket Consolidate industrial go-to-market approach INTERNATIONAL EXPANSION USING ONE WABTEC NETWORK Freight and loco opportunities in LATAM, APAC, India, and EMEA Industrial expansion and global partnerships to support ESG Scaling and developing new products for wind, grid solutions, carbon reduction, and energy storage CONTINUOUS OPERATIONAL IMPROVEMENT Leverage best-cost country sources Rationalize and simplify structure to drive profitability Footprint consolidation to drive out duplication 34
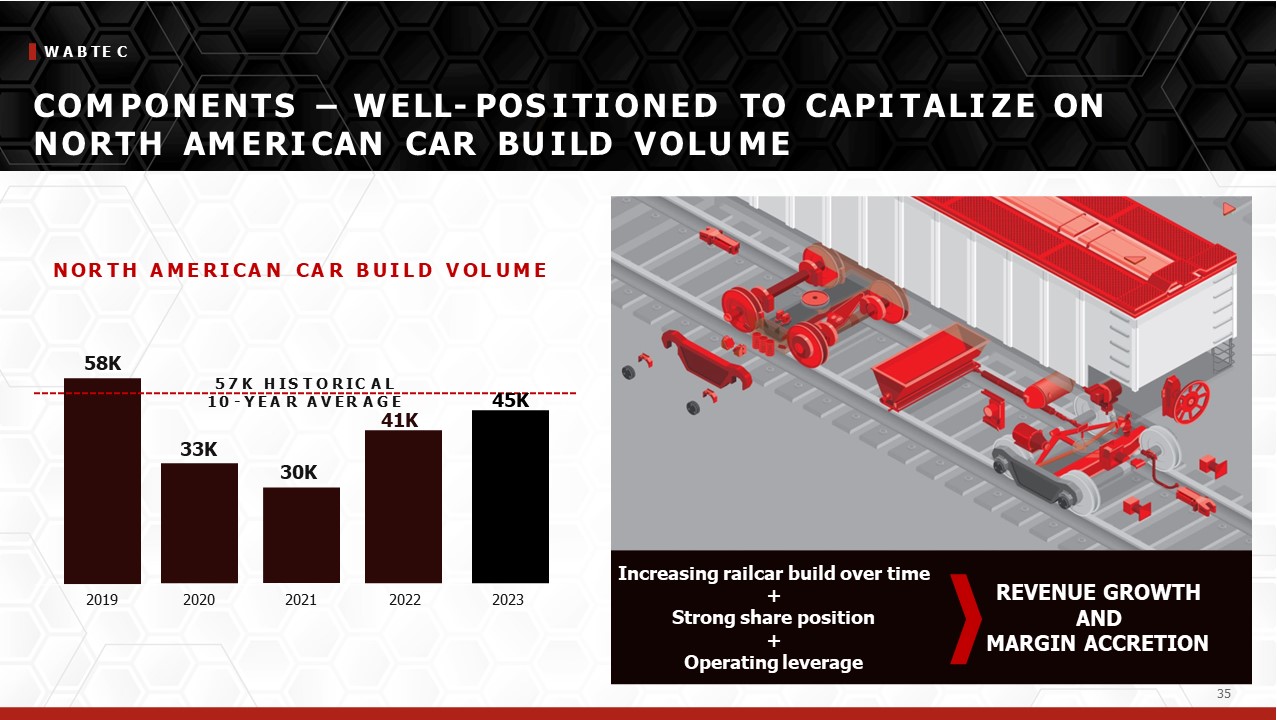
W A B TE C COM PONENTS – W E LL- POS I TI ONED TO CAPI TALI Z E ON NORTH AM ERI CAN CAR BU I LD VOLU M E Increasing railcar build over time + Strong share position + Operating leverage REVENUE GROWTH AND MARGIN ACCRETION 2019 2020 2021 2022 58K 33K 30K 41K 5 7 K H IS T O R IC A L 10 - YEA R A V ER A G E 2023 34 45K N OR T H A M E R I CA N CA R B U I L D V OL U M E

W A B TE C DI GI TAL I NTELLI GENCE - PRI M ARY GROW TH DRI VERS NEXT-GEN NETWORK SOLUTIONS Precision Dispatch 2.0, migrate to Cloud Pacing, Yard Planner system & Service Design INTERNATIONAL MARKETS Expand digital capabilities across Latin America, Europe, and Asia Pacific EVOLVE LOCOTROL PLATFORM Locotrol Expanded Architecture (LXA); Road Remote Control Locomotive (RoadRCL) system; Autonomous Drone Trains EXPAND TRIP OPTIMIZER SUITE Zero-to-Zero & Smart Horse Power/Ton (SHPT); FLXDrive, Alt fuels EVOLUTION OF I-ETMS PTC 2.0, precision reference, moving block; NAM upgrades & international expansion KEY ADJACENCIES Expand reach in digital mining; logistics, KinetiX, asset management & analytics 34
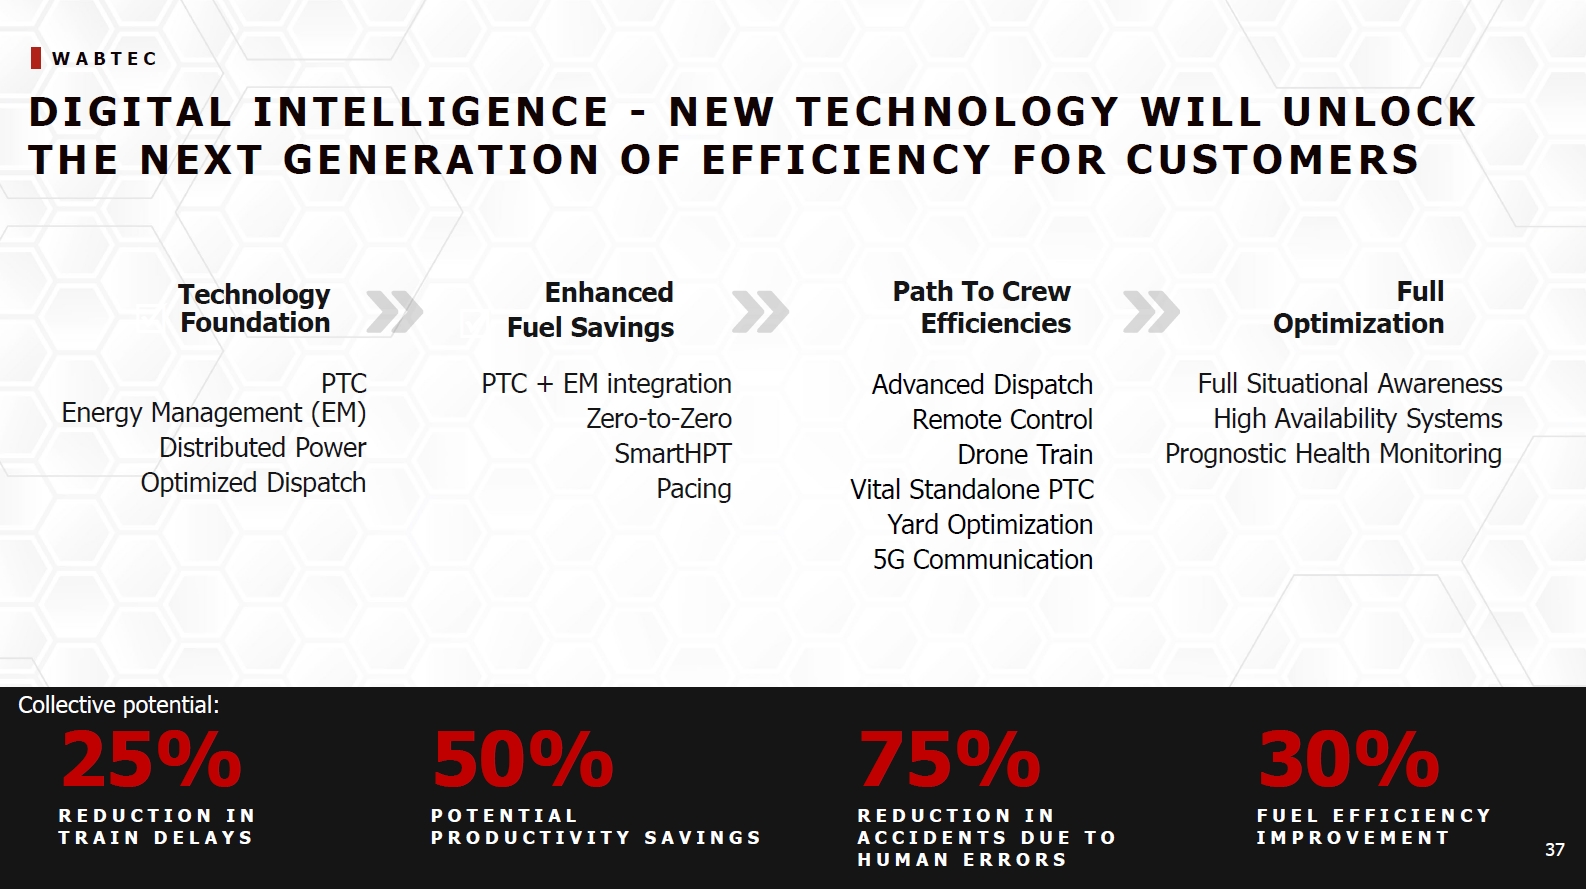
W A B TE C 37 DI GI TAL I NTELLI GENCE - NEW TECH NOLOGY W I LL U NLOCK TH E NEXT GENERATI ON OF EFFI CI ENCY FOR CU S TOM ERS S A V IN G S 50% PO T E N T IA L PR O D U C T IV IT Y 75% R E D U C T IO N IN A C C ID E N T S D U E T O H U M A N E RRO RS 30% FU E L E FFIC IE N C Y IM PR O V E M E N T PTC Energy Management (EM) Distributed Power Optimized Dispatch Full Situational Awareness High Availability Systems Prognostic Health Monitoring Technology Full Optimization Path To Crew Efficiencies Advanced Dispatch Remote Control Drone Train Vital Standalone PTC Yard Optimization 5G Communication Foundation Enhanced Fuel Savings PTC + EM integration Zero-to-Zero SmartHPT Pacing Collective potential: 25% R E D U C T IO N IN T R A I N D E L A Y S 37

W A B TE C TRA NS I T - PRI M ARY GROW TH DRI VERS G O V E R N M E N T FUN D IN G … FUE L IN G T R A N S IT TR A N S POR T Investment in rail technologies to decarbonize transport and reduce congestion I NNO V A T I O N A ND S C A L A B L E T E C H NO L O G I E S Enhancing train performance; maintenance optimization through digitization for transit operators S H IFT T O G R E E N … SUS T A IN A BIL IT Y A N D E S G Suite of energy management, pollution/CO2 reduction, charging, and electrification solutions S E R V IC E S Leveraging a significant install base and wide geographic footprint to help transit operators gain efficiencies, reliability, and productivity 1 2 4 3 38
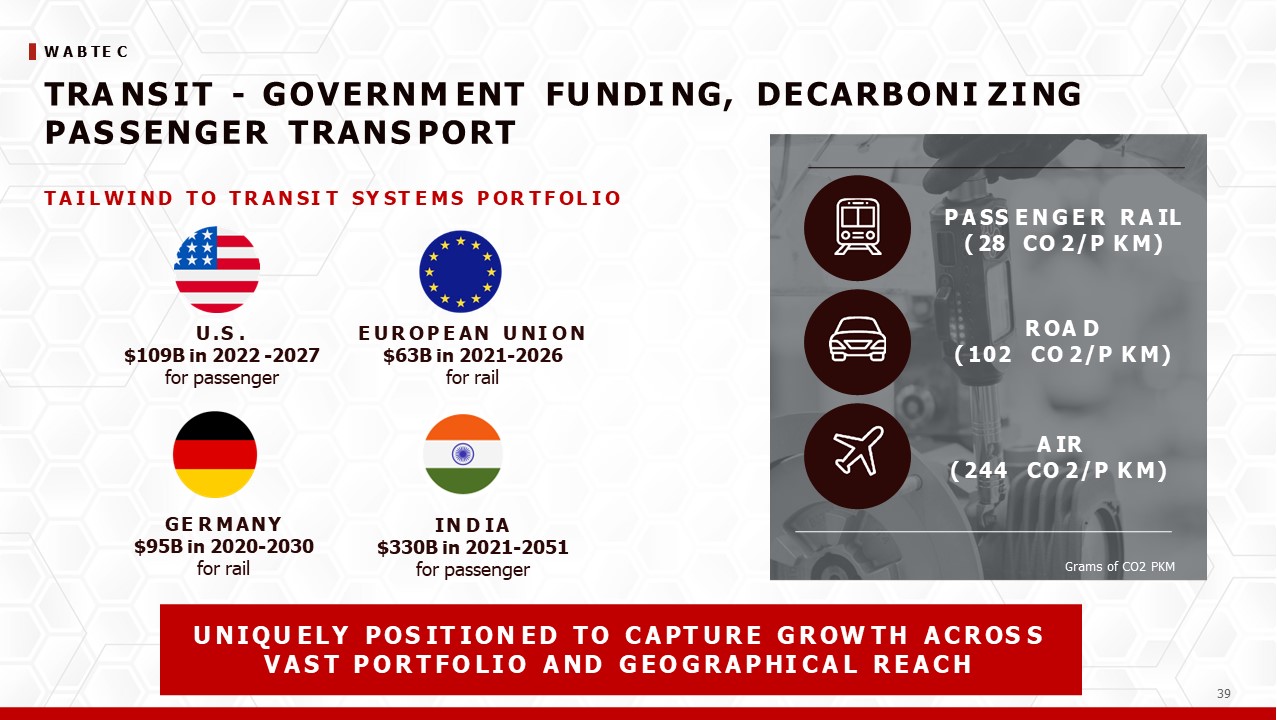
W A B TE C TRA NS I T - GOVERNM ENT FU NDI NG, DECARBONI Z I NG PAS S ENGER TRANS PORT T A I L W I N D T O T R A N SI T SY ST E M S P OR T F OL I O U .S . $109B in 2022 -2027 for passenger E U R O P E AN U NI O N $63B in 2021-2026 for rail IN D IA $330B in 2021-2051 for passenger GE R M ANY $95B in 2020-2030 for rail U N IQU E L Y POS IT ION E D T O C A PT U R E G R OW T H A C R OS S V A S T P O R T F O L I O A ND G E O G R A P HI C A L R E A C H P A SS E N G E R R A IL ( 28 CO 2/P K M) R OA D ( 102 CO 2/P K M) A IR ( 244 CO 2/P K M) Grams of CO2 PKM 38
6 DISCIPLINED VALUE CREATION

W A B TE C 41 PA TH TO TH E FU TU RE … M AXI M I Z E S H AREH OLDER VALU E IN V E S T IN T H E BU SI N E SS Driving long-term profitable growth D RI VERS Deploy proven strategies / accelerate growth drivers Execute on increasing backlog Mix headwinds driven by fleet renewal Invest in innovative technologies that drive profitable growth Best-in-class productivity & integration IN V E S T IN T H E F UTUR E Through M&A with strategic fit & accretive returns M&A as core competency Strategic markets… bolt-ons, adjacencies Attractive assets / end markets that drive growth Valuations that are accretive to earnings and ROIC R E TUR N V ALUE TO S HA R E HO L D E R S Capital allocation priorities Increasing asset productivity Improving ROIC Through disciplined capital allocation Robust cash generation and cash flow
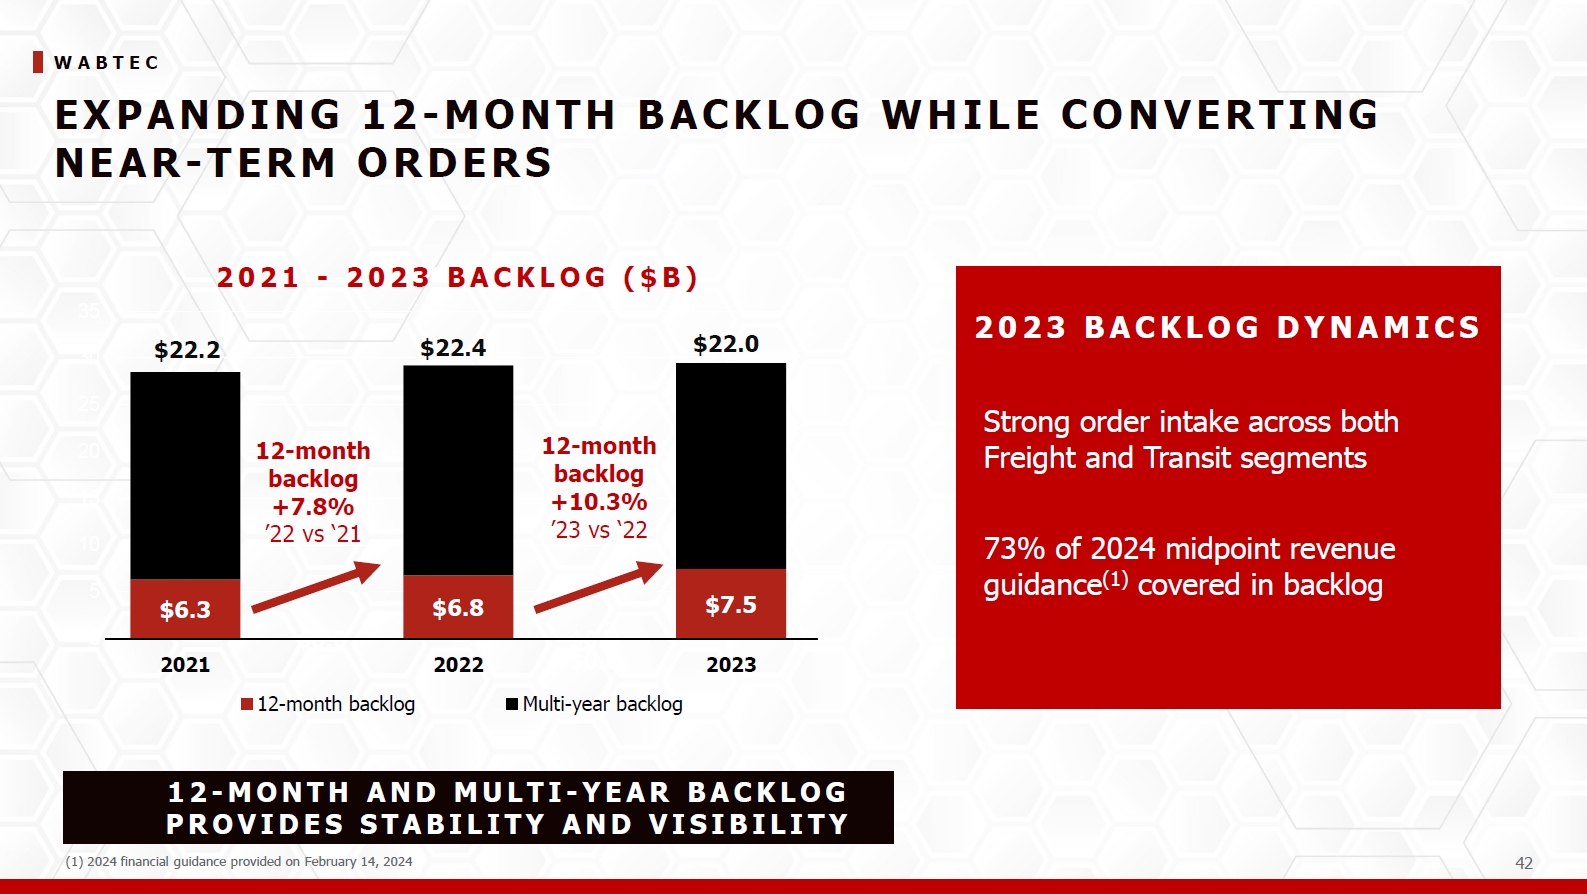
W A B TE C 42 EXPANDI NG 12 - M ONTH BACKLOG W H I LE CONVERTI NG NEAR- TE RM O RDE RS 12 - M ON TH A N D M U L TI - YE AR B AC K LO G P R O V ID E S ST A BIL IT Y A N D V ISIBIL IT Y $6.3 $6.8 $0. $7.5 $22.2 $22.4 0.0 $22.0 0 5 10 15 20 25 30 35 2021 2022 2023 $ 0 12-month backlog Multi-year backlog 2021 - 2 0C2ha3rtBTAit CK L O G ( $B ) 12-month backlog +7.8% ’22 vs ‘21 12-month backlog +10.3% ’23 vs ‘22 2023 B A C K L OG DYN A M IC S Strong order intake across both Freight and Transit segments 73% of 2024 midpoint revenue guidance(1) covered in backlog (1) 2024 financial guidance provided on February 14, 2024

W A B TE C 43 M I X DYNAM I CS CH ANGI NG AS I NDU S TRY RENEW S AGI NG LOCOM OTI VE FLEET E Q UI P M E N T + D I GI TAL TO GR O W F AS TE R TH AN AV E R AGE A C RO SS W A BT E C P O RT F O L I O P R O D UC T MI X Margin Drivers Digital Intelligence Services Components Equipment Transit Sensitivity to the cycle Equipment High Digital Intelligence Medium Services Low Transit Low Components High MA RG I N A CCR E T I O N 5 - Y E A R G R O W T H E X P E C T A T I O NS (1 ) (1) Long-term guidance as of March 9, 2022
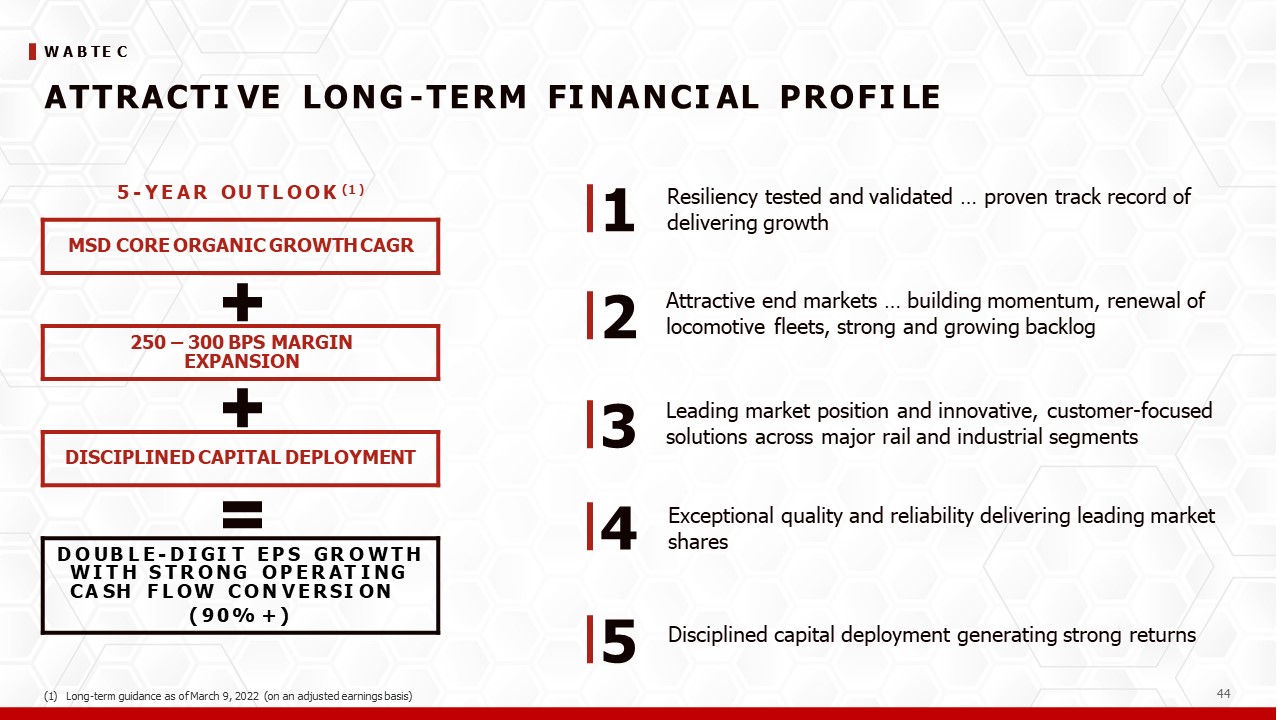
W A B TE C 44 (1) Long-term guidance as of March 9, 2022 (on an adjusted earnings basis) Leading market position and innovative, customer-focused solutions across major rail and industrial segments Attractive end markets … building momentum, renewal of locomotive fleets, strong and growing backlog Exceptional quality and reliability delivering leading market shares Resiliency tested and validated … proven track record of delivering growth 5 - Y E A R OU T L OOK (1 ) MSD CORE ORGANIC GROWTH CAGR 250 – 300 BPS MARGIN EXPANSION DISCIPLINED CAPITAL DEPLOYMENT D O UB L E - D I GI T E P S GR O W T H W I T H S T R O NG O P E R AT I NG CA SH F L OW CON V E R SI ON ( 90% + ) ATTRACTI VE LONG - TERM FI NANCI AL PROFI LE Disciplined capital deployment generating strong returns 1 2 3 4 5

W A B TE C FU TU RE REVENU E GROW TH TARGET AN N UAL R E V E N UE GR O W TH E X PE C T A T ION S 2022 - 2026: MID- SINGLE DIGITS(1 ) 45 (1) Long-term guidance as of March 9, 2022 UNDERLYING RAIL INDUSTRY GROWTH TRENDS Freight carloads Railcar build Passenger ridership Economic strength (GDP) ACCELERATED GROWTH Share gains in portfolio International expansion Technology-driven growth Digital revenue growth 2-3X industry LONG-TERM LOCO FLEET RENEWAL Mods Tier 4 Alternative fuels Battery electric

W A B TE C SA L E S G ROW TH (1 ) E X P E C TE D TO D RI V E I N C RE M E N TA L M A RG I N S O F 2 5 - 30% BA S ED O N W A BT EC ’ S F I X ED - CO S T S T R U CT U R E 15-20% 80-85% 8 2 % OF TOTA L C OS TS 15-20% FIXED MANUFACTURING 80-85% FIXED SG&A 25-30% INCREMENTAL MARGIN C OS T OF G OODS S OL D S G & A 1 8 % OF TOTA L C OS TS Variable Costs 45 (1) Long-term guidance as of March 9, 2022 Variable Costs 15-20% 80-85% Fixed Costs Fixed Costs
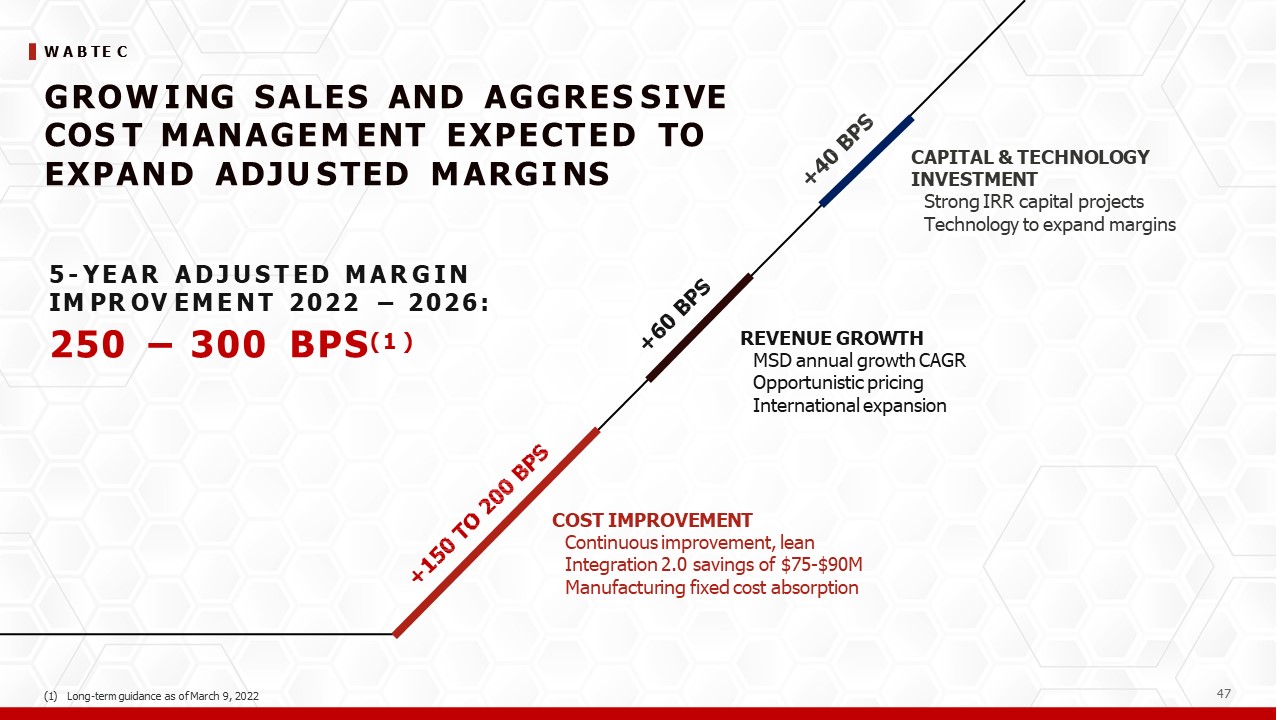
W A B TE C REVENUE GROWTH MSD annual growth CAGR Opportunistic pricing International expansion GROW I NG S ALES AND AGGRES S I VE COS T M ANAGEM ENT EXPECTED TO EXPAND ADJU S TED M ARGI NS 5 - Y E A R A D J U S T E D M A R G I N IM PR OV E M E N T 2022 – 2026: 250 – 300 BPS(1 ) CAPITAL & TECHNOLOGY INVESTMENT Strong IRR capital projects Technology to expand margins 45 (1) Long-term guidance as of March 9, 2022 COST IMPROVEMENT Continuous improvement, lean Integration 2.0 savings of $75-$90M Manufacturing fixed cost absorption

W A B TE C I NVES TI NG I N TH E CORE BU S I NES S H I GH RETU RNS O N CA PI TA L DEPLOYM ENT LONG - TE RM PRO FI TA BLE GROW TH DR IV IN G S T R ON G R E T U R N S ON C A PIT A L A N D T E C H N OL OG Y IN V E S T M E N T S 48 C A P I T A L TE C H N O LO GY Funding business model with capex of ~2% of revenue Minimizing working capital investment Continue to invest in engineering & technology at ~6-7% of sales Invest-in-the-future technology breakthroughs Product innovation Engineering as a competitive advantage
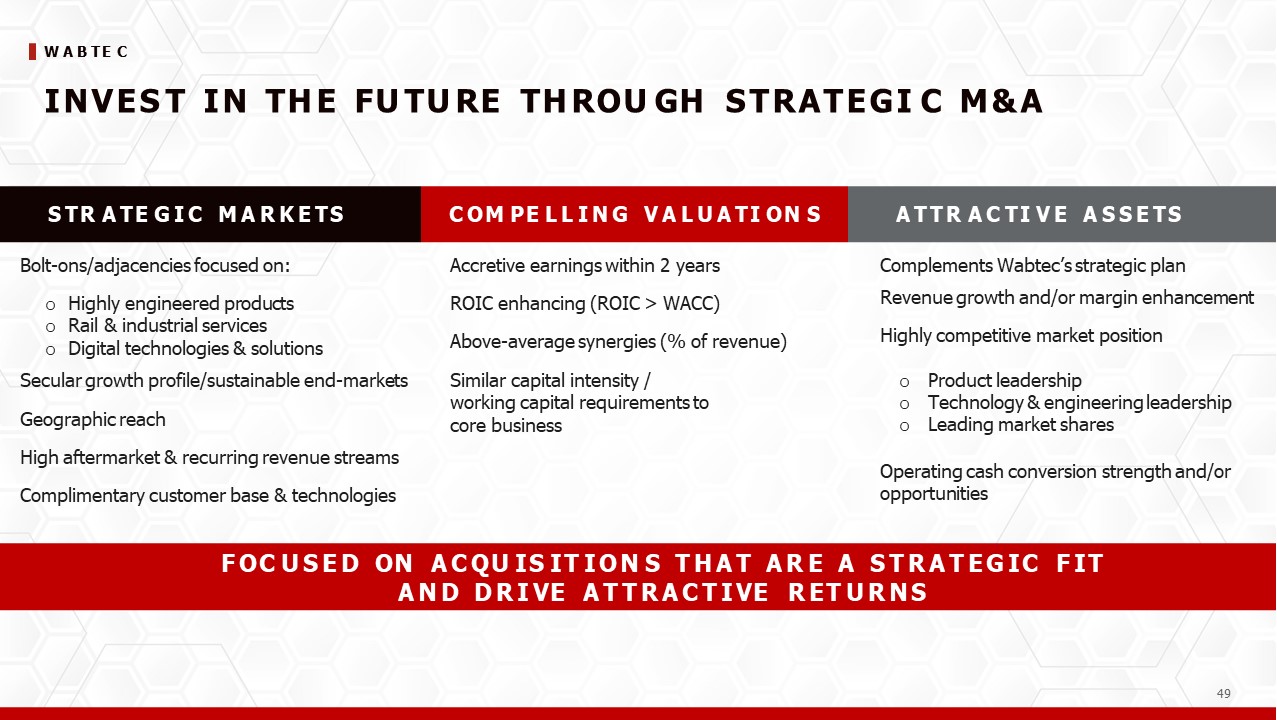
W A B TE C I NVES T I N TH E FU TU RE TH ROU GH S TRATEGI C M & A Bolt-ons/adjacencies focused on: Highly engineered products Rail & industrial services Digital technologies & solutions Secular growth profile/sustainable end-markets Geographic reach High aftermarket & recurring revenue streams Complimentary customer base & technologies Accretive earnings within 2 years ROIC enhancing (ROIC > WACC) Above-average synergies (% of revenue) Similar capital intensity / working capital requirements to core business Complements Wabtec’s strategic plan Revenue growth and/or margin enhancement Highly competitive market position Product leadership Technology & engineering leadership Leading market shares Operating cash conversion strength and/or opportunities S TR A TE G I C M A R K E TS C OM PE L L I N G V A L U A TI ON S A TTR A C TI V E A S S E TS F OC U S E D ON A C QU IS IT ION S T H A T A R E A S T R A T E G IC F IT A N D D R I VE A T T R A C T I VE R ET U R N S 48
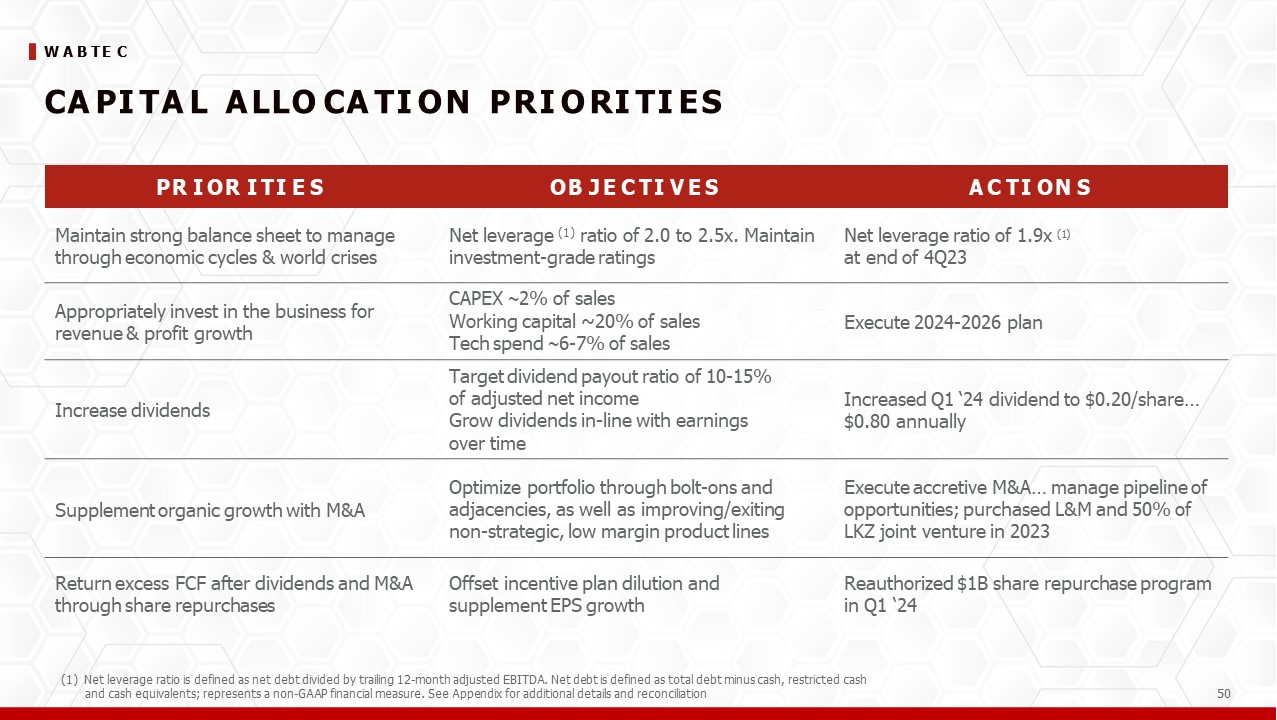
W A B TE C 50 CA PI TA L A LLO CA TI O N PRI O RI TI E S PR I OR I TI E S OB J E C TI V E S A C TI ON S Maintain strong balance sheet to manage through economic cycles & world crises Net leverage (1) ratio of 2.0 to 2.5x. Maintain investment-grade ratings Net leverage ratio of 1.9x (1) at end of 4Q23 Appropriately invest in the business for revenue & profit growth CAPEX ~2% of sales Working capital ~20% of sales Tech spend ~6-7% of sales Execute 2024-2026 plan Increase dividends Target dividend payout ratio of 10-15% of adjusted net income Grow dividends in-line with earnings over time Increased Q1 ‘24 dividend to $0.20/share… $0.80 annually Supplement organic growth with M&A Optimize portfolio through bolt-ons and adjacencies, as well as improving/exiting non-strategic, low margin product lines Execute accretive M&A… manage pipeline of opportunities; purchased L&M and 50% of LKZ joint venture in 2023 Return excess FCF after dividends and M&A through share repurchases Offset incentive plan dilution and supplement EPS growth Reauthorized $1B share repurchase program in Q1 ‘24 (1) Net leverage ratio is defined as net debt divided by trailing 12-month adjusted EBITDA. Net debt is defined as total debt minus cash, restricted cash and cash equivalents; represents a non-GAAP financial measure. See Appendix for additional details and reconciliation
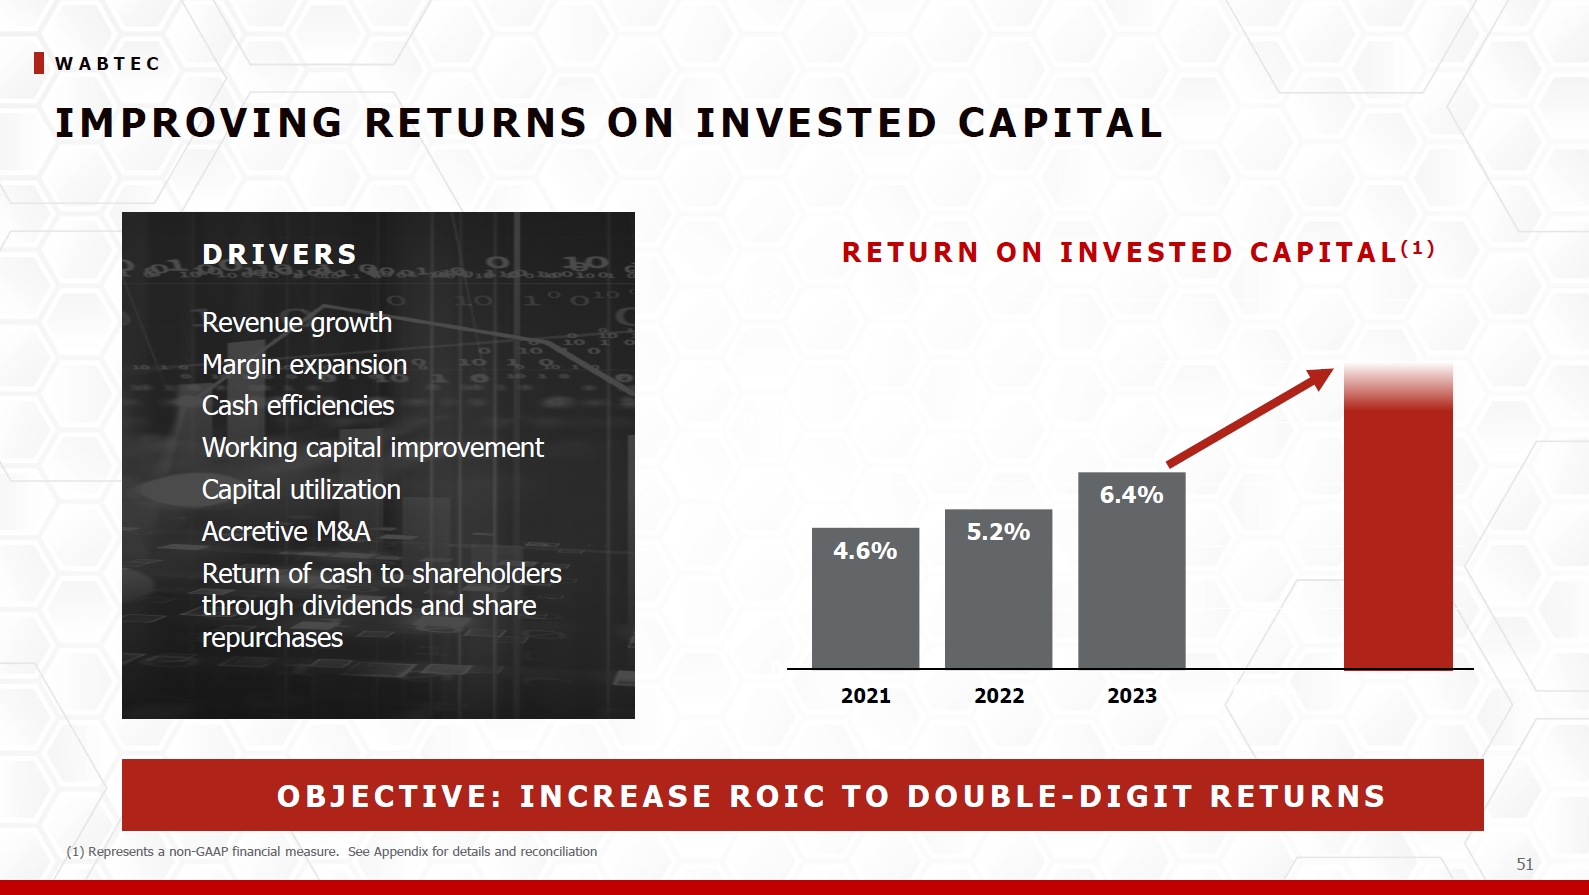
W A B TE C I M PROVI NG RETU RNS ON I NVES TED CAPI TAL 4.6% 5.2% 6.4% 0 0% 0 12 2021 2022 2023 R E TU R N ON I NuVmEnS1TE D C A PI TA L (1 ) Revenue growth Margin expansion Cash efficiencies Working capital improvement Capital utilization Accretive M&A Return of cash to shareholders through dividends and share repurchases 51 DR I VE R S OB J E C T IV E : IN C R E A S E R OIC T O DOU B L E - D I GI T R E TUR N S (1) Represents a non-GAAP financial measure. See Appendix for details and reconciliation

W A B TE C CO NTI NU E D DI S CI PLI NE D CA PI TA L DE PLO Y M E NT A C C RET I VE EA RN I N G S → S T RO N G C A S H FLO W C O N VERS I O N → REI N VES T & RE T UR N C A PI TA L D E PL OY M E N T PR I OR I TI E S Maintain Strong Balance Sheet Maintain investment-grade rating Invest In Sustainable Growth R&D and CapEx Increase Dividends $0.03 quarterly dividend increase in Q1 ‘24 Supplement Organic Growth with M&A Portfolio optimization; accretive investments Repurchase Shares Return excess cash through repurchases DISCIPLINED CAPITAL ALLOCATION are re urchases 51 $409M $1.20B Cash from Ops $308M Full year 2023 Acquisitions Dividends Debt /Other financing Capex $123M $96M $186M Change in cash $79M Share repurchases
W A B TE C KEY I NVES TM ENT H I GH LI GH TS Growth strategy driving strong cash flow and margin expansion Innovative, sustainable technologies expanding Wabtec’s market size Strong long-term business fundamentals driving long-term value creation for shareholders Portfolio positioned to drive long-term profitable growth 1 2 3 4 51
7 WABTEC’S BUSINESS SEGMENTS IN DETAIL
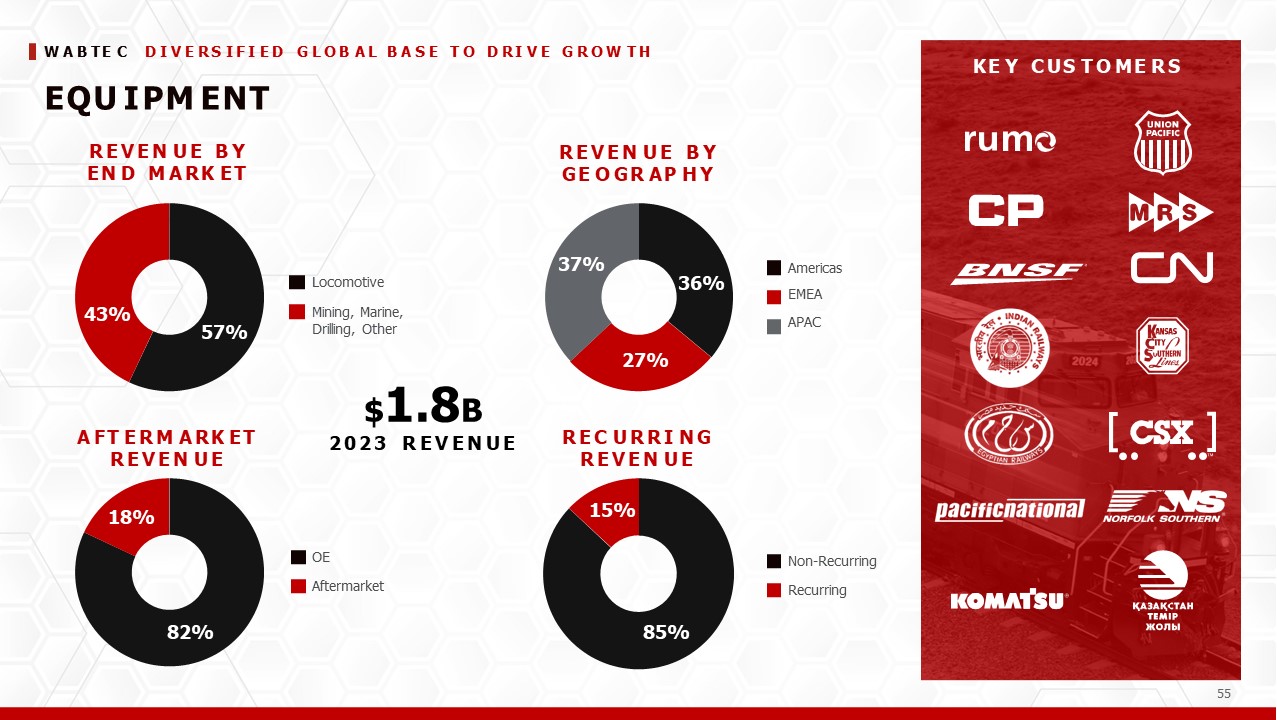
KE Y C US T O ME R S 27% REVEN U E B Y GE O GR AP H Y 85% 15% REC U RRI N G REVEN U E 57% 43% 82% 18% A FT ERM A RK ET REVEN U E OE Aftermarket Locomotive Mining, Marine, Drilling, Other 36% 37% $1.8B 2023 R E V E N U E Non-Recurring Recurring Americas EMEA APAC 55 W A B TE C D I V E RS I F I E D EQU I PM ENT REVEN U E B Y EN D M A RK ET G LOB A L B A S E T O D RI V E G ROW T H
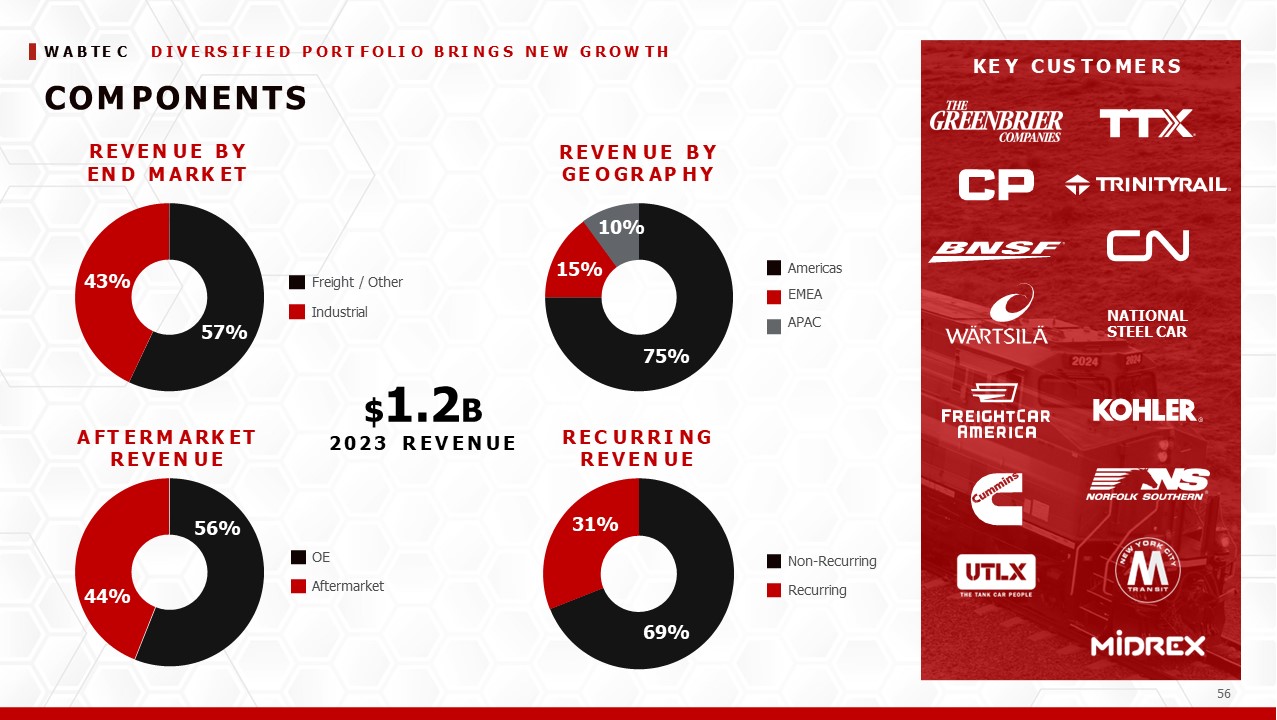
KE Y C US T O ME R S NATIONAL STEEL CAR 10% REVEN U E B Y GE O GR AP H Y 69% 31% REC U RRI N G REVEN U E 57% 43% 56% 44% A FT ERM A RK ET REVEN U E OE Aftermarket Freight / Other Industrial 75% 15% $1.2B 2023 R E V E N U E Non-Recurring Recurring Americas EMEA APAC 55 W A B TE C D I V E RS I F I E D P ORT F OLI O COM PONENTS REVEN U E B Y EN D M A RK ET B RI N G S N E W G ROW T H

W A B TE C KE Y C US T O ME R S REVEN U E B Y GE O GR AP H Y 68% 32% REC U RRI N G REVEN U E 74% 19% S ERVI CES REVEN U E B Y EN D M A RK ET 77% 23% A FT ERM A RK ET REVEN U E OE Aftermarket 82% 4% $2.8B 2022 R E V E N U E Non-Recurring Recurring 7% Freight Maintenance Modernizations Maintenance of Way 8% 6% Americas EMEA APAC LATAM 55

KE Y C US T O ME R S REVEN U E B Y GE O GR AP H Y 72% 28% REC U RRI N G REVEN U E 42% 38% REVEN U E B Y EN D M A RK ET 73% $0.8B 2023 R E V E N U E Non-Recurring Recurring 20% Train Automation Offboard, Back Office Adjacencies 4% 8% 15% North America ANZ LATAM Rest of World 55 W A B TE C WELL - P O S I T I O N E D F O R G RO W T H DI G I TA L I NTE LLI G E NCE
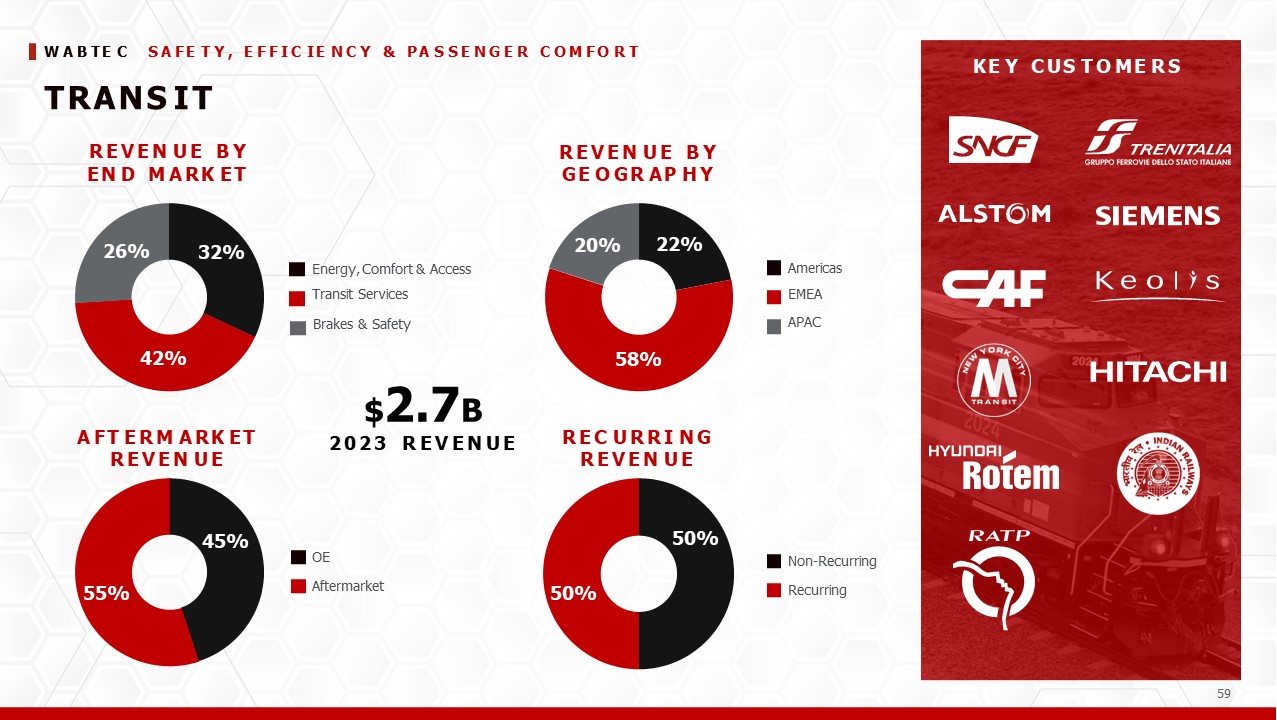
KE Y C US T O ME R S 58% REVEN U E B Y GE O GR AP H Y 50% 50% REC U RRI N G REVEN U E Non-Recurring Recurring Americas EMEA APAC 32% 42% 45% 55% A FT ERM A RK ET REVEN U E OE Aftermarket 20% 22% $2.7B 2023 R E V E N U E 26% Energy, Comfort & Access Transit Services Brakes & Safety 55 W A B TE C S A FE T Y , E FFIC IE N C Y TRANS I T REVEN U E B Y EN D M A RK ET & PA S S E N G E R C O M FO R T

APPENDIX
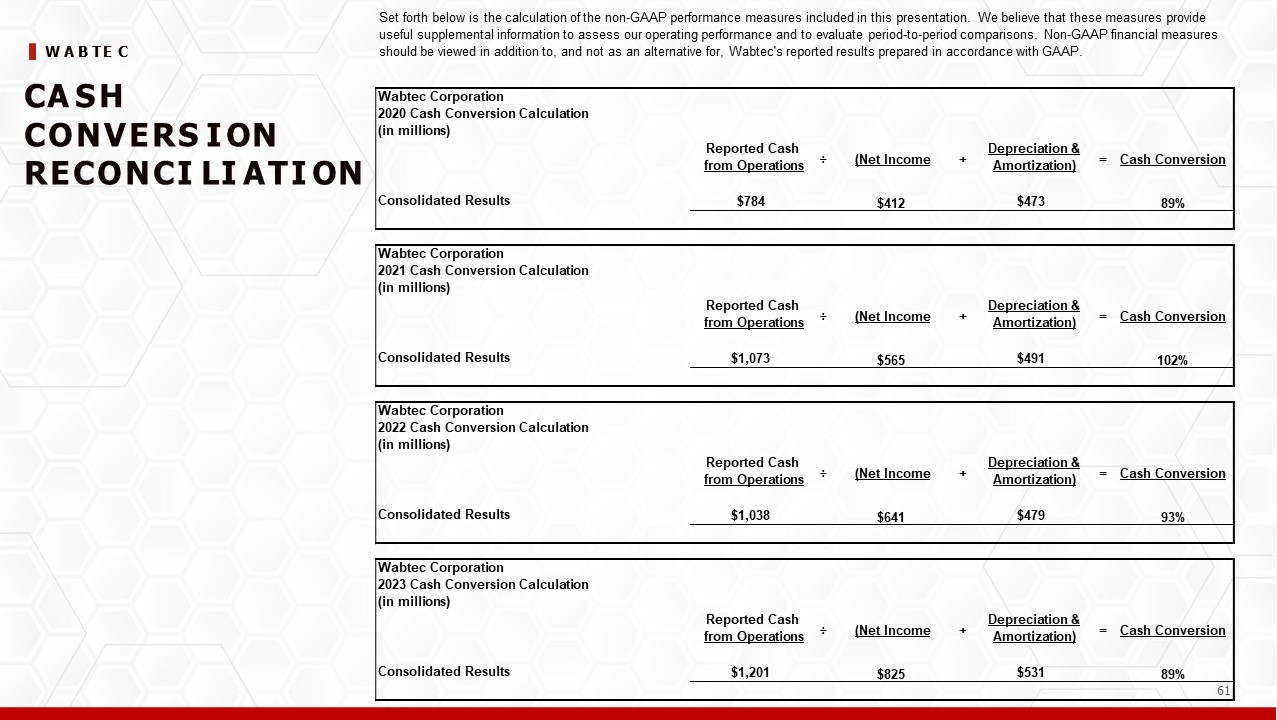
W A B TE C CA S H CONVERS I ON RECONCI LI ATI ON Set forth below is the calculation of the non-GAAP performance measures included in this presentation. We believe that these measures provide useful supplemental information to assess our operating performance and to evaluate period-to-period comparisons. Non-GAAP financial measures should be viewed in addition to, and not as an alternative for, Wabtec's reported results prepared in accordance with GAAP. Wabtec Corporation Reported Cash from Operations $784 ÷ (Net Income $412 + Depreciation & Amortization) $473 = Cash Conversion 89% 2020 Cash Conversion Calculation (in millions) Consolidated Results Wabtec Corporation Reported Cash from Operations $1,073 ÷ (Net Income $565 + Depreciation & Amortization) $491 = Cash Conversion 102% 2021 Cash Conversion Calculation (in millions) Consolidated Results Wabtec Corporation Reported Cash from Operations $1,038 ÷ (Net Income $641 + Depreciation & Amortization) $479 = Cash Conversion 93% 2022 Cash Conversion Calculation (in millions) Consolidated Results Wabtec Corporation Reported Cash from Operations $1,201 ÷ (Net Income $825 + Depreciation & Amortization) $531 = Cash Conversion 89% 2023 Cash Conversion Calculation (in millions) Consolidated Results 61

W A B TE C OPERATI NG M ARGI N RECONCI LI ATI ON 62 In millions Reported Income from Operations $ 745 $ 876 $ 1,011 $ 1,266 Reported Margin 9.9% 11.2% 12.1% 13.1% Restructuring and Porfolio Optimization costs 116 78 52 79 Non-cash Amortization expense 282 287 291 298 Adjusted Income from Operations $ 1,143 $ 1,241 $ 1,354 $ 1,643 Adjusted Margin 15.1% 15.9% 16.2% 17.0% WESTINGHOUSE AIR BRAKE TECHNOLOGIES CORPORATION RECONCILIATION OF REPORTED RESULTS TO ADJUSTED RESULTS (UNAUDITED) Twelve Months Ended December 31, 2020 2021 2022 2023
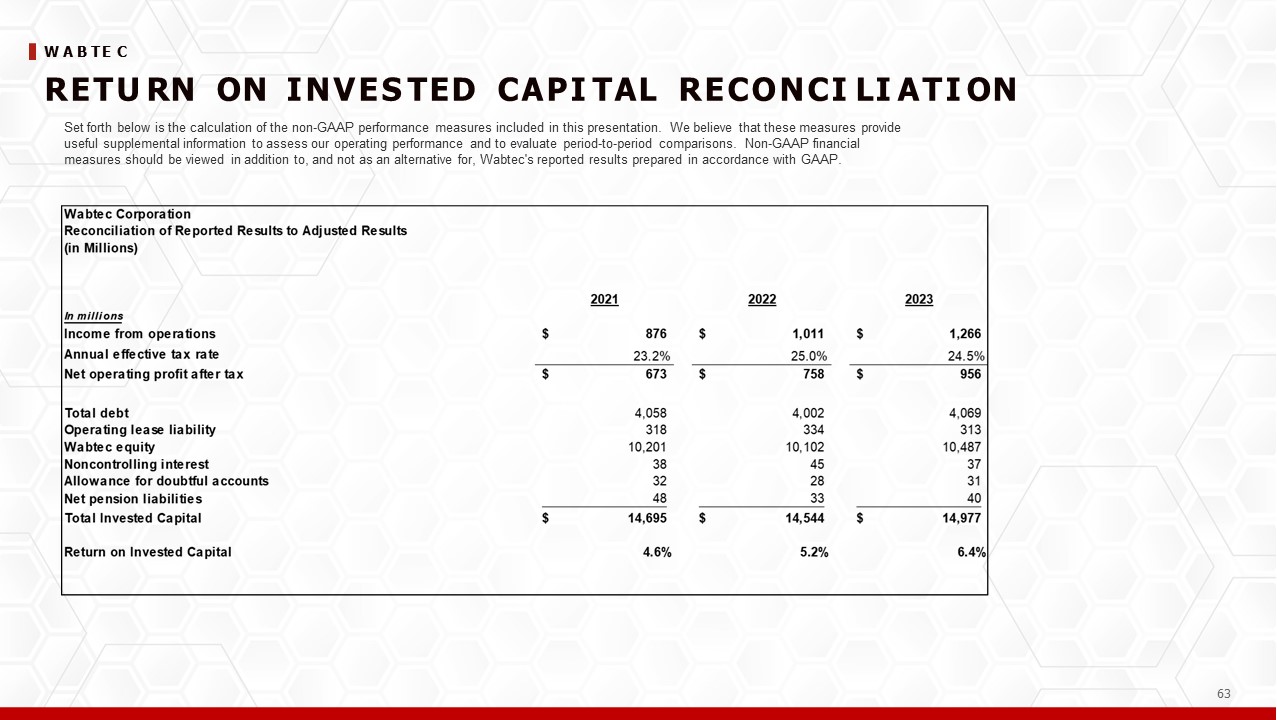
W A B TE C RETU RN ON I NVES TED CAPI TAL RECONCI LI ATI ON Set forth below is the calculation of the non-GAAP performance measures included in this presentation. We believe that these measures provide useful supplemental information to assess our operating performance and to evaluate period-to-period comparisons. Non-GAAP financial measures should be viewed in addition to, and not as an alternative for, Wabtec's reported results prepared in accordance with GAAP. 62

W A B TE C NET LEVERAGE RATI O 62 Set forth below is the calculation of the non-GAAP performance measures included in this press release. We believe that these measures provide useful supplemental information to assess our operating performance and to evaluate period-to-period comparisons. Non-GAAP financial measures should be viewed in addition to, and not as an alternative for, Wabtec's reported results prepared in accordance with GAAP. Wabtec Corporation 2023 Leverage Reconciliation ($ in millions) Total Debt $4,069 Net Debt ÷ Adjusted EBITDA = Net Leverage Less: Cash, cash equivalents and restricted cash $620 $3,449 $1,842 1.9x Net Debt $3,449 Income from Operations $1,266 Other Income (expense) $44 Depreciation & Amortization $526 EBITDA $1,836 Restructuring Costs $6 Adjusted EBITDA $1,842