UNITED STATES
SECURITIES AND EXCHANGE COMMISSION
Washington, D.C. 20549
FORM 10-Q
☑ QUARTERLY REPORT PURSUANT TO SECTION 13 OR 15(d) OF THE SECURITIES EXCHANGE ACT OF 1934
For the quarterly period ended March 31, 2024
OR
☐ TRANSITION REPORT PURSUANT TO SECTION 13 OR 15(d) OF THE SECURITIES EXCHANGE ACT OF 1934
For the period from _____ to _____
333-4028-LA
(Commission file No.)
MINISTRY PARTNERS INVESTMENT COMPANY, LLC
(Exact name of registrant as specified in its charter)
CALIFORNIA |
| 26-3959348 |
(State or other jurisdiction of incorporation or organization) |
| (I.R.S. Employer Identification No.) |
915 West Imperial Highway, Brea, Suite 120, California, 92821
(Address of principal executive offices)
(714) 671-5720
(Registrant’s telephone number, including area code)
Indicate by check mark whether the registrant (1) has filed all reports required to be filed by Section 13 or 15(d) of the Securities Exchange Act of 1934 during the preceding 12 months (or for such shorter period that the registrant was required to file such reports), and (2) has been subject to such filing requirements for the past 90 days. Yes þ No ◻.
Indicate by check mark whether the registrant has submitted electronically every Interactive Data File required to be submitted pursuant to Rule 405 of Regulation S-T (§232.405 of this chapter) during the preceding 12 months (or for such shorter period that the registrant was required to submit such files). Yes þ No ◻
Indicate by check mark whether the registrant is a large accelerated filer, an accelerated filer, a non-accelerated filer, a smaller reporting company filer, or an emerging growth company. See the definitions of “accelerated filer,” “large accelerated filer,” “smaller reporting company,” and “emerging growth company.” in Rule 12b-2 of the Exchange Act. (check one):
| | |
Large accelerated filer ◻ | Accelerated filer ☐ | Non-accelerated filer ◻ |
Smaller reporting company filer ☑ | Emerging growth company ☐ | |
If an emerging growth company, indicate by check mark if the registrant has elected not to use the extended transition period for complying with any new or revised financial accounting standards provided pursuant to Section 13(a) of the Exchange Act. ◻
Indicate by check mark whether the registrant is a shell company (as defined in Rule 12b-2 of the Exchange Act). Yes ☐ No þ.
At March 31, 2024, registrant had issued and outstanding 146,522 units of its Class A common units. The information contained in this Form 10-Q should be read in conjunction with the registrant’s Annual Report on Form 10-K for the year ended December 31, 2023.
MINISTRY PARTNERS INVESTMENT COMPANY, LLC
FORM 10-Q
TABLE OF CONTENTS
| | |
| | |
F - 1 | ||
| F - 2 | |
| F - 3 | |
| F - 4 | |
| F - 5 | |
Management’s Discussion and Analysis of Financial Condition and Results of Operations | 3 | |
17 | ||
17 | ||
| | |
| | |
| | |
18 | ||
18 | ||
18 | ||
18 | ||
18 | ||
18 | ||
19 | ||
| | |
| 20 | |
| | |
Exhibit 31.1: | Certification of Chief Executive Officer pursuant to Rule 13a-14(a) or Rule 15(d)-14(a) | |
Exhibit 31.2: | Certification of Principal Accounting Officer pursuant to Rule 13a-14(a) or Rule 15(d)-14(a) | |
Exhibit 32.1: | Certification pursuant to 18 U.S.C. §1350 as adopted pursuant to section 906 of the Sarbanes-Oxley Act of 2002 | |
Exhibit 32.2: | Certification pursuant to 18 U.S.C. §1350 as adopted pursuant to section 906 of the Sarbanes-Oxley Act of 2002 | |
2
Ministry Partners Investment Company, LLC and Subsidiaries
Consolidated Balance Sheets
March 31, 2024 and December 31, 2023
(dollars in thousands except unit data)
| | | | | | |
| | March 31, | | December 31, | ||
|
| 2024 |
| 2023 | ||
| | (Unaudited) | | (Audited) | ||
Assets: | | | | | | |
Cash and cash equivalents | | $ | 11,193 | | $ | 10,854 |
Restricted cash | | | 1,760 | | | 1,757 |
Certificates of deposit | | | 1,251 | | | 1,279 |
Loans receivable, net of allowance for expected credit losses of $1,449 and $1,501 as of March 31, 2024 and December 31, 2023, respectively | | | 99,901 | | | 98,573 |
Accrued interest receivable | | | 464 | | | 432 |
Investment in joint venture | | | 870 | | | 871 |
Other investments | | | 1,053 | | | 1,052 |
Property and equipment, net | | | 95 | | | 56 |
Foreclosed assets, net | | | 301 | | | 301 |
Servicing assets | | | 88 | | | 98 |
Other assets | | | 971 | | | 1,374 |
Total assets | | $ | 117,947 | | $ | 116,647 |
Liabilities and members’ equity | | | | | | |
Liabilities: | | | | | | |
Lines of credit | | $ | 7,500 | | $ | 4,500 |
Other secured borrowings | | | 7 | | | 7 |
Debt certificates payable, net of debt issuance costs of $130 and $52 as of March 31, 2024 and December 31, 2023, respectively | | | 95,590 | | | 96,979 |
Accrued interest payable | | | 361 | | | 383 |
Other liabilities | | | 1,896 | | | 1,683 |
Total liabilities | | | 105,354 | | | 103,552 |
Members' Equity: | | | | | | |
Series A preferred units, 1,000,000 units authorized, 117,100 units issued and outstanding at March 31, 2024 and December 31, 2023 (liquidation preference of $100 per unit); See Note 13 | | | 11,715 | | | 11,715 |
Class A common units, 1,000,000 units authorized, 146,522 units issued and outstanding at March 31, 2024 and December 31, 2023; See Note 13 | | | 1,509 | | | 1,509 |
Net assets of Ministry Partners for Christ, with donor restrictions | | | 1,700 | | | — |
Accumulated deficit | | | (2,331) | | | (129) |
Total members' equity | | | 12,593 | | | 13,095 |
Total liabilities and members' equity | | $ | 117,947 | | $ | 116,647 |
The accompanying notes are an integral part of these consolidated financial statements.
F-2
Ministry Partners Investment Company, LLC and Subsidiaries
Consolidated Statements of Operations (Unaudited)
For the three months ended March 31, 2024 and 2023
(dollars in thousands)
| | | | | | |
| | Three months ended | ||||
| | March 31, | ||||
|
| 2024 |
| 2023 | ||
Interest income: | | | | | | |
Interest on loans | | $ | 1,660 | | $ | 1,297 |
Interest on interest-bearing accounts | | | 151 | | | 88 |
Total interest income | | | 1,811 | | | 1,385 |
Interest expense: | | | | | | |
Debt certificates | | | 1,182 | | | 860 |
Other debt | | | 83 | | | 58 |
Total interest expense | | | 1,265 | | | 918 |
Net interest income | | | 546 | | | 467 |
Credit for expected credit losses | | | (52) | | | (162) |
Net interest income after credit for expected credit losses | | | 598 | | | 629 |
Non-interest income: | | | | | | |
Broker-dealer commissions and fees | | | 175 | | | 215 |
Other income | | | 36 | | | 63 |
Charitable contributions, with donor restrictions | | | — | | | 400 |
Total non-interest income | | | 211 | | | 678 |
Non-interest expenses: | | | | | | |
Salaries and benefits | | | 527 | | | 762 |
Marketing and promotion | | | 21 | | | 27 |
Office occupancy | | | 47 | | | 47 |
Office operations and other expenses | | | 393 | | | 412 |
Foreclosed assets, net | | | 10 | | | 4 |
Legal and accounting | | | 155 | | | 118 |
Total non-interest expenses | | | 1,153 | | | 1,370 |
Loss before provision for income taxes | | | (344) | | | (63) |
Provision for income taxes and state LLC fees | | | 5 | | | 5 |
Net loss | | $ | (349) | | $ | (68) |
The accompanying notes are an integral part of these consolidated financial statements.
F-3
Ministry Partners Investment Company, LLC and Subsidiaries
Consolidated Statements of Cash Flows (Unaudited)
For the three months ended March 31, 2024 and 2023
| | | | | | |
| | Three months ended | ||||
| | March 31, | ||||
|
| 2024 |
| 2023 | ||
CASH FLOWS FROM OPERATING ACTIVITIES: | | | | | | |
Net loss | | $ | (349) | | $ | (68) |
Adjustments to reconcile net loss to net cash provided (used) by operating activities: | | | | | | |
Depreciation | | | 17 | | | 11 |
Amortization of deferred loan fees | | | (23) | | | (14) |
Amortization of debt issuance costs | | | 17 | | | 20 |
Credit for expected credit losses | | | (52) | | | (162) |
Accretion of loan discount | | | (3) | | | (3) |
Gain on sale of loans | | | — | | | (7) |
Loss on retirement of fixed assets | | | 2 | | | — |
Gain on other investments | | | (1) | | | (1) |
Adoption of new accounting standard | | | — | | | (112) |
Changes in: | | | | | | |
Accrued interest receivable | | | (32) | | | 93 |
Other assets | | | 415 | | | (119) |
Accrued interest payable | | | (21) | | | 33 |
Other liabilities | | | 207 | | | (331) |
Net cash provided (used) by operating activities | | | 177 | | | (660) |
CASH FLOWS FROM INVESTING ACTIVITIES: | | | | | | |
Loan purchases | | | (10) | | | (2,545) |
Loan originations | | | (3,126) | | | (25) |
Loan sales | | | — | | | 7 |
Loan principal collections | | | 1,886 | | | 2,014 |
Purchase of certificates of deposit | | | 27 | | | — |
Purchase of property and equipment | | | (58) | | | — |
Net cash (used) by investing activities | | | (1,281) | | | (549) |
CASH FLOWS FROM FINANCING ACTIVITIES: | | | | | | |
Borrowings, net of repayments on lines of credit | | | 3,000 | | | — |
Net change in debt certificates payable | | | (1,311) | | | 8,966 |
Debt issuance costs | | | (95) | | | (24) |
Dividends paid on preferred units | | | (148) | | | (182) |
Net cash provided by financing activities | | | 1,446 | | | 8,760 |
Net increase in cash and restricted cash | | | 342 | | | 7,551 |
Cash, cash equivalents, and restricted cash at beginning of period | | | 12,611 | | | 9,564 |
Cash, cash equivalents, and restricted cash at end of period | | $ | 12,953 | | $ | 17,115 |
Supplemental disclosures of cash flow information | | | | | | |
Interest paid | | $ | 1,286 | | $ | 885 |
Income taxes paid | | | 12 | | | — |
Supplemental disclosures of non-cash transactions | | | | | | |
Servicing assets recorded | | | — | | | 9 |
Leased assets obtained in exchange of new operating lease liabilities | | | 387 | | | — |
Lease liabilities recorded | | | 387 | | | — |
Dividends declared to preferred unit holders | | | 153 | | | 160 |
The accompanying notes are an integral part of these consolidated financial statements.
F-4
MINISTRY PARTNERS INVESTMENT COMPANY, LLC
NOTES TO CONSOLIDATED FINANCIAL STATEMENTS
The accounting and financial reporting policies of MINISTRY PARTNERS INVESTMENT COMPANY, LLC and its wholly owned subsidiaries, Ministry Partners Funding, LLC, MP Realty Services, Inc., Ministry Partners Securities, LLC, and Ministry Partners for Christ, Inc. conform to accounting principles generally accepted in the United States and general financial industry practices. The accompanying interim consolidated financial statements have not been audited. The Company’s 2023 annual report filed on Form 10-K provides a more detailed description of its accounting policies. In the opinion of management, all adjustments (which include only normal recurring adjustments) necessary to present fairly the financial position, results of operations, and cash flows as of March 31, 2024, and for the three months ended March 31, 2024 and 2023, have been made.
Certain information and note disclosures normally included in financial statements prepared in accordance with generally accepted accounting principles have been condensed or omitted. The results of operations for the periods ended March 31, 2024 and 2023 are not necessarily indicative of the results for the full year.
Note 1: Nature of Business and Summary of Significant Accounting Policies
Nature of Business
Throughout these notes to consolidated financial statements, we refer to Ministry Partners Investment Company, LLC and its subsidiaries as “the Company.” Formed in California in 1991, the Company is a financial services organization specializing in both financing ministries through funding commercial real property secured loans and providing investment services to the Christian community. The Company funds its investments in ministry loans primarily through the sale of debt certificates.
The Company’s wholly-owned subsidiaries are:
| ● | Ministry Partners Funding, LLC, a Delaware limited liability company (“MPF”); |
| ● | MP Realty Services, Inc., a California corporation (“MP Realty”); |
| ● | Ministry Partners Securities, LLC, a Delaware limited liability company (“MP Securities”); and |
F-5
| ● | Ministry Partners for Christ, Inc., a not-for-profit Delaware corporation (“MPC”). |
The Company formed MPF in 2007 and then deactivated the subsidiary on November 30, 2009. In December 2014, the Company reactivated MPF to enable it to serve as collateral agent for loans held as collateral for its Secured Investment Certificates.
The Company formed MP Realty in November 2009, and obtained a license to operate as a corporate real estate broker through the California Department of Real Estate on February 23, 2010. MP Realty has conducted limited operations to date.
The Company formed MP Securities on April 26, 2010, to provide investment and financial planning solutions for individuals, churches, charitable institutions, and faith-based organizations. MP Securities acts as the selling agent for the Company’s public and private placement notes.
The Company formed MPC on December 28, 2018, to be used exclusively for religious and charitable purposes within the meaning of Section 501(c)(3) of the U.S. Internal Revenue Code of 1986 (“IRC”). MPC is a not-for-profit corporation formed and organized under Delaware law. MPC makes charitable grants to Christian educational organizations, and provides accounting, consulting, and financial expertise to aid Christian ministries. On August 23, 2019, the Internal Revenue Service granted MPC tax-exempt status as a private foundation under Section 501(c)(3) of the IRC. The MPC Board of Directors approved its first charitable grants during the year ended December 31, 2020.
Principles of Consolidation
The consolidated financial statements include the accounts of Ministry Partners Investment Company, LLC and its wholly-owned subsidiaries. Management eliminates all significant inter-company balances and transactions in consolidation.
Conversion to LLC
Effective December 31, 2008, the Company converted from a corporation organized under California law to a California limited liability company. After this conversation, the separate existence of Ministry Partners Investment Corporation ceased and the entity continued by operation of law under the name Ministry Partners Investment Company, LLC. As an LLC, a group of managers provides oversight of the Company’s affairs. The managers have full, exclusive, and complete discretion, power, and authority to oversee the management of Company affairs. An Operating Agreement governs the Company’s management structure and governance procedures.
F-6
Risks and Uncertainties
COVID-19, a global pandemic, adversely impacted the broad economy, affecting most industries, including businesses, schools, hospitality-, and travel-based employers, and disrupted the supply and distribution networks that deliver products to the consuming public. While the pandemic has ended, we cannot know at this time if there will be any negative long-term effects to in-person attendance and giving trends at faith-based organizations and churches. Negative attendance and giving trends impacting the organizations that the Company serves could have a material financial impact on the Company.
In addition, Russia’s invasion of Ukraine, increasing current levels of inflation, the disruption of global supply chains, rising interest rates, and recent bank failures are putting strain on the U.S. economy and the U.S. consumer. While it is not possible to know the full extent of the long-term impact of these current events, the Company is disclosing potentially material factors that could impact our business of which it is aware.
Cash, and Cash Equivalents
Cash equivalents include time deposits, and all highly liquid debt instruments with original maturities of three months or less. The Company had demand deposits and money market deposit accounts as of March 31, 2024 and December 31, 2023.
The National Credit Union Share Insurance Fund insures a portion of the Company’s cash held at credit unions, and the Federal Deposit Insurance Corporation insures a portion of cash held by the Company at other financial institutions. The Company holds cash deposits that may exceed insured limits. Management does not expect to incur losses in these cash accounts.
The Company maintains cash accounts with Royal Bank of Canada Dain Rauscher (“RBC Dain”) as part of its clearing agreement for its securities-related activities, and with the Central Registration Depository (“CRD”) for regulatory purposes in connections with its investment advisory and securities-related business. The Company also maintains cash in an account with America’s Christian Credit Union (“ACCU”) as collateral for its secured borrowings. The Company classifies these accounts as restricted cash on its balance sheet.
Certificates of Deposit
Certificates of deposit include investments in certificates of deposit held at financial institutions that carry original maturities of greater than three months. The Company had
F-7
$1.3 million in certificates with terms of greater than three months as of March 31, 2024, and December 31, 2023.
Use of Estimates
The Company’s creation of consolidated financial statements that conform to United States Generally Accepted Accounting Principles ("GAAP") requires management to make estimates and assumptions. These estimates and assumptions affect the reported amounts of assets and liabilities at the date of the financial statements and the reported amounts of revenues and expenses during the reporting period. These estimates govern areas such as the allowance for credit losses and the fair value of financial instruments and foreclosed assets. Actual results could differ from these estimates.
Investments in Joint Venture
In 2016, the Company entered into a joint venture agreement to develop and sell property we acquired as part of a Deed in Lieu of Foreclosure agreement reached with one of our borrowers. The joint venture owns a property located in Santa Clarita, California.
The Company accounts for its investment in the joint venture using the equity method of accounting. Under this method, the Company records its proportionate share of the joint venture’s net income or loss in the statement of operations.
On a periodic basis, or whenever events or circumstances arise that would necessitate analysis, management analyzes the Company’s investment in the joint venture for impairment. In this analysis, management compares the carrying value of the investment to the estimated value of the underlying real property. The Company records any impairment charges as a valuation allowance against the value of the asset. Management records these valuation changes as realized gains or losses on investment on the Company’s consolidated statements of operations. Management determined that investment in the joint venture was not impaired as of March 31, 2024.
Other Investments
In June 2022, MP Securities purchased two ten-year fixed annuities from insurance companies. These annuities each carry unique features, including guaranteed fixed income components, variable income components, premium bonuses, and potential withdrawal charges. The Company carries these investments at cost and adjusts for guaranteed income when such income is realized. The principal balances of these annuities are guaranteed but are not insured; however, management determined that the annuities were not impaired as of March 31, 2024, and December 31, 2023, and does not anticipate losses.
F-8
Loans Receivable
The Company reports loans that management has the intent and ability to hold for the foreseeable future at their outstanding unpaid principal balance adjusted for an allowance for expected credit losses, deferred loan fees and costs, and loan discounts.
Interest Accrual on Loans Receivable
The Company accrues loan interest income daily. Management defers loan origination fees and costs generated in making a loan. The Company amortizes these fees and costs as an adjustment to the related loan yield using the interest method.
Loan discounts can arise from interest accrued and unpaid which the Company adds to loan principal balances when it modifies the loan. The Company does not accrete discounts to income on impaired loans. However, when management determines that a previously impaired loan is no longer impaired, the Company begins accreting loan discounts to interest income over the term of the modified loan. For loans purchased from third parties, loan discounts include differences between the purchase price and the recorded principal balance of the loan. The Company accretes these discounts to interest income over the term of the loan using the interest method.
Management considers a loan impaired if it concludes that the collection of principal or interest according to the terms of the loan agreement is doubtful. The Company stops the accrual of interest when management determines the loan is impaired.
For loans that the Company places on non-accrual status, management reverses all uncollected accrued interest against interest income. Management accounts for the interest on these loans on the cash basis or cost-recovery method until the loan qualifies for return to accrual status. It is not until all the principal and interest amounts contractually due are brought current and future payments are reasonably assured that the Company returns a loan to accrual status.
Allowance for Expected Credit Losses
The Company sets aside an allowance for expected credit losses by charging the provision for expected credit losses account on the Company’s consolidated statements of operations. This charge decreases the Company’s earnings. Management charges off the part of loan balances it believes it will not collect against the allowance. The Company credits subsequent recoveries, if any, to the allowance.
F-9
Loan Portfolio Segments and Classes
Management separates the loan portfolio into portfolio segments for purposes of evaluating the allowance for expected credit losses. A portfolio segment is defined as the level at which the Company develops and documents a systematic method for determining its allowance for expected credit losses. The Company segments the loan portfolio based on loan types and the underlying risk factors present in each loan type. Management periodically reviews and revises such risk factors, as it considers appropriate. The Company’s loan portfolio comprises two segments: ministry-related non-profit loans and commercial loans. The risk characteristics of the Company’s portfolio segments are as follows:
Non-profit Commercial Loans: The Company underwrites its non-profit loans based on the cash flows and other key financial performance indicators of the borrower, as well as the value of the collateral securing the loan. Unlike for-profit commercial borrowers, the cash flows generated by these borrowers often depend on contributions rather than cash flows generated by the operation of a business. In addition, collateral values can fluctuate as many church properties have limited commercial use outside of the ministry sector.
For-profit Commercial Loans: The Company underwrites for-profit loans commercial based on the cash flows and other key financial performance indicators of the borrower, as well as the value of the collateral securing the loan. Repayment of these loans is generally dependent on the success of the business operated on the property being used to secure the loan.
The Company has also segregated its portfolio into the following classes, which are a subsets of segments:
F-10
Management has segregated the loan portfolio into the following portfolio classes: | | |
Loan Class |
| Class Description |
Wholly Owned First Collateral Position, Amortizing | | Wholly owned loans and the retained portion of loans originated by the Company and sold for which the Company possesses a senior lien on the collateral underlying the loan. This class contains only those loans that amortize based on an agreed upon contractual principal and interest payments. |
Wholly Owned Other Collateral Position, Amortizing | | Wholly owned loans and the retained portion of loans originated by the Company and sold for which the Company possesses a lien on the underlying collateral that is superseded by another lien on the same collateral or that is secured by collateral other than real property. This class contains only those loans that amortize based on an agreed upon contractual principal and interest payments. These loans present higher credit risk than loans for which the Company possesses a senior lien due to the increased risk of loss should the loan default. |
Wholly Owned Unsecured, Amortizing | | Wholly owned loans and the retained portion of loans originated by the Company and sold for which the Company does not possess an interest in collateral securing the loan. This class contains only those loans that amortize based on an agreed upon contractual principal and interest payments. These loans present higher credit risk than loans for which the Company possesses a lien due to the increased risk of loss should the loan default. |
Wholly Owned Other Collateral Position, Lines of Credit | | Wholly owned loans and the retained portion of loans originated by the Company and sold for which the Company possesses a lien on the underlying collateral that is superseded by another lien on the same collateral or that is secured by collateral other than real property. This class contains only line of credit agreements. |
Wholly Owned Unsecured, Lines of Credit | | Wholly owned loans and the retained portion of loans originated by the Company and sold for which the Company does not possess an interest in collateral securing the loan. This class contains only line of credit agreements. |
Wholly Owned, Construction | | Wholly owned loans and the retained portion of loans originated by the Company and sold which have been made for the purpose of constructing real property to be used for the borrower’s ministry. These loans present different risks due to the nature of construction projects and the underlying collateral. |
Participations First Collateral Position | | Participated loans purchased from another financial entity for which the Company possesses a senior lien on the collateral underlying the loan. Loan participations purchased may present higher credit risk than wholly owned loans because disposition and direction of actions regarding the management and collection of the loans must be coordinated and negotiated with the other participants, whose best interests regarding the loan may not align with those of the Company. |
Participations Construction | | Loan participations purchased in loans made for the purpose of constructing commercial real property and where the collateral securing the property comprises the construction project. These loans present different risks due to the nature of construction projects and the underlying collateral. |
Finally, the Company segregates each class by risk rating, as loans determined to have lower credit quality present different and greater risk than those of higher credit quality.
F-11
The Company’s credit quality grading system is described in detail below in the section titled “Credit Quality Indicators.”
Allowance for Expected Credit Loss Evaluation
The Company adopted FASB Accounting Standards Update (ASU) No. 2016-13, Financial Instruments - Credit Losses (Topic 326): Measurement of Credit Losses on Financial Instruments ("CECL") on January 1, 2023. CECL replaces the previous methodology for measuring credit losses, which involved estimated allowances for current known and inherent losses within the portfolio. The CECL methodology requires the Company to implement an expected loss model for measuring credit losses, which encompasses allowances for losses expected to be incurred over the life of the borrowings in its portfolio. The allowance for expected credit loss model used under CECL requires the measurement of all expected credit losses for financial assets at amortized cost, as well as certain off-balance sheet credit exposures based on historical experiences, current conditions, and reasonable and supportable forecasts.
In accordance with FASB Accounting Standards Update (ASU) No. 2019-04, Codification Improvements to Topic 326, Financial Instruments-Credit Losses, Topic 815, Derivatives and Hedging, and Topic 825, Financial Instruments, the Company has made the accounting policy election not to measure an allowance for credit losses on accrued interest receivable amounts. This is allowable if the Company writes off uncollectible accrued interest receivable when a loan is 90 days past due or interest is otherwise considered uncollectible, which is its current policy and practice. The Company has also elected to continue to present accrued interest on its loans receivable separately on its consolidated balance sheet.
CECL Model
The CECL methodology does not prescribe any specific model for determining expected losses. Management has determined that, due to the nature of the borrowings in its portfolio and the nature of the collateral securing a significant portion of its borrowings, it would use a “probability of default” calculation as the basis for estimating expected losses. This methodology uses information about the borrower, the loan, and the collateral securing the loan to determine a borrower’s ability to meet the contractual requirements of the loan agreement. It then applies a calculated probability that the borrower will default to the estimated amount of loss the Company would incur in a default scenario. To perform this calculation, the methodology requires management to collect and analyze certain data for the loans in its portfolio including:
F-12
| ● | the value of collateral securing the loan, as supported by third-party appraisals or other valuations; |
| ● | adjustments to the collateral value related to geographical and economic trends, and estimated costs to sell; and |
| ● | the borrower’s ability to meet its contractual obligations as determined by financial information collected regularly from borrowers. |
All loans that the Company does not individually review use the probability of default calculation described above. In addition, management has determined that there are qualitative factors affecting expected credit losses for which the probability of default model cannot account. These qualitative factors represent significant issues that management considers likely to cause estimated credit losses associated with the Company’s existing portfolio to differ from the probability of default calculation. These factors are applied in varying degrees depending on a loan’s segment, class, and credit quality. Management adjusts these factors on an on-going basis, some of which include:
| ● | changes in national, regional, and local economic and industry conditions that affect the collectability of the portfolio; |
| ● | changes in the volume and severity of past due loans, the volume of non-accrual loans, and the volume and severity of adversely classified loans; |
| ● | changes in the value of collateral, including the limitations of using commercial price indices to adjust collateral value; |
| ● | the inherent risk in borrowings with high loan-to-value figures; and |
| ● | broad trends in the Christian church industry in which the Company primarily lends. |
Loans that management has classified as non-performing and impaired receive a specific reserve. For such loans, an allowance is established when the carrying value of that loan is higher than the amount management expects to collect. Management uses multiple approaches to determine the amount the Company expects to collect. These include the discounted cash flow method, using the loan’s underlying collateral value reduced by expected selling costs, or using the observable market price of the impaired loan.
F-13
Individually Reviewed
The Company reviews its loan portfolio monthly by examining several data points. This process includes reviewing delinquency reports, any new information related to the financial condition of its borrowers, and any new appraisal or other collateral valuation. Throughout this process, the Company identifies potential impaired loans. Management generally deems a loan is impaired when current facts and circumstances indicate that it is probable a borrower will be unable to make payments according to the loan agreement. If management has not already deemed a loan impaired, it will classify the loan as non-accrual when it becomes 90 days or more past due. All loans in the loan portfolio are subject to impairment analysis. The Company monitors impaired loans on an ongoing basis as part of management’s loan review and work out process.
Any loans that management has determined are non-performing and impaired are individually analyzed for potential losses. These loans include non-accrual loans, loans 90 days or more past due and still accruing, non-performing modified loans, and loans where the borrowers have defaulted on contractual terms of their loan agreement.
| ● | Non-accrual loans are loans on which management has discontinued interest accruals. |
| ● | Modified loans are loans in which the Company has granted the borrower a concession due to financial distress. Concessions are usually a reduction of the interest rate or a change in the original repayment terms. |
| ● | Loans that have defaulted on other contractual terms could include loans where the borrower has failed to provide required financial information, has violated a covenant, or has otherwise failed to comply with the terms of the loan agreement. |
Management considers several factors when determining impairment status. These factors include the loan’s payment status, the value of any secured collateral, and the probability of collecting scheduled payments when due. Management generally does not classify loans that experience minor payment delays or shortfalls as impaired. Management determines the significance of payment delays or shortfalls on a case-by-case basis, taking into consideration all the circumstances surrounding the loan and the borrower. These circumstances include the length and reasons for the delay, the borrower’s payment history, and the amount of the shortfall in relation to the principal and interest owed.
Management measures impairment on a loan-by-loan basis using one of three methods:
F-14
| ● | the present value of expected future cash flows discounted at the loan’s effective interest rate; |
| ● | the obtainable market price; or |
| ● | the fair value of the collateral if the loan is collateral-dependent. |
Loan Modifications
A loan modification is a loan for which the Company, for reasons related to a borrower’s financial difficulties, grants a concession to a borrower that the Company would not otherwise consider. A modification of a loan usually involves an interest rate reduction, extension of the maturity date, payment reduction, or reduction of accrued interest owed on the loan on a contingent or absolute basis.
Management considers loans that it renews at below-market terms to be loan modifications if the below-market terms represent a concession due to the borrower’s troubled financial condition. The Company classifies loan modifications as impaired loans. For the loans that are not considered to be collateral-dependent, management measures loan modifications at the present value of estimated future cash flows using the loan’s effective rate prior to the loan’s initial modification. The Company reports the change in the present value of cash flows related to the passage of time as interest income. If management considers the loan to be collateral-dependent, impairment is measured based on the fair value of the collateral.
In accordance with industry standards, the Company classifies a loan as impaired if management has modified it as part of a loan modification. However, loan modifications, upon meeting certain performance conditions, are eligible to receive non-classified loan ratings (pass or watch) and to be moved out of non-accrual status. These loans continue to be classified as impaired loans but not necessarily as non-accrual or collateral-dependent loans. Modified loans can be included in the collectively reviewed pool of loans if they return to performing status.
Loan Charge-offs
Management charges off loans or portions thereof when it determines the loans or portions of the loans are uncollectible. The Company evaluates collectability periodically on all loans classified as “Loans of Lesser Quality.” Key factors management uses in assessing a loan’s collectability are the financial condition of the borrower, the value of any secured collateral, and the terms of any workout agreement between the Company and the borrower. In workout situations, the Company charges off the amount deemed
F-15
uncollectible due to the terms of the workout, the inability of the borrower to make agreed upon payments, and the value of the collateral securing the loan.
Credit Quality Indicators
The Company has established a loan grading system to assist its management in analyzing and monitoring the loan portfolio. The Company classifies loans it considers lesser quality (“classified loans”) as watch, special mention, substandard, doubtful, or loss assets. The loan grading system is as follows:
Pass:
The borrower has sufficient cash to fund debt services. The borrower may be able to obtain similar financing from other lenders with comparable terms. The risk of default is considered low.
Watch:
These loans exhibit potential or developing weaknesses that deserve extra attention from credit management personnel. If the developing weakness is not corrected or mitigated, there may be deterioration in the ability of the borrower to repay the debt in the future. Management must report loans graded Watch to executive management and the Board of Managers (“Board”). The potential for loss under adverse circumstances is elevated, but not foreseeable. Watch loans are considered pass loans.
Special mention:
These credit facilities exhibit potential or actual weaknesses that present a higher potential for loss under adverse circumstances and deserve management’s close attention. If uncorrected, these weaknesses may result in deterioration of the repayment prospects for the loan at some future date.
Substandard:
Management considers loans and other credit extensions bearing this grade to be inadequately protected by the current net worth and debt service capacity of the borrower or of any pledged collateral. These obligations, even if apparently protected by collateral value, have well-defined weaknesses related to adverse financial, managerial, economic, ministry, or environmental conditions which have clearly jeopardized repayment of principal and interest as originally intended. Furthermore, there is the possibility that some future loss will be sustained if such weaknesses are not corrected.
F-16
Doubtful:
This classification consists of loans that display the properties of substandard loans with the added characteristic that the severity of the weaknesses makes collection or liquidation in full highly questionable or improbable based upon currently existing facts, conditions, and values. The probability of some loss is very high, but because of certain important and reasonably specific factors, the amount of loss cannot be exactly determined. Such pending factors could include a merger or liquidation, additional capital injection, refinancing plans, or perfection of liens on additional collateral.
Loss:
Loans in this classification are considered uncollectible and cannot be justified as a viable asset. This classification does not mean the loan has absolutely no recovery value, but that it is neither practical nor desirable to defer writing off this loan even though partial recovery may be obtained in the future.
Revenue Recognition
The Company recognizes two primary types of revenue: interest income and non-interest income.
Interest Income
The Company’s principal source of revenue is interest income from loans, which is not within the scope of ASU 2014-09, Revenue from Contracts with Customers and all subsequent amendments to the ASU (collectively, "ASC 606"). Refer to the discussion in “Loans Receivable” above to understand the Company’s recognition of interest income.
Non-interest Income
Non-interest income includes revenue from various types of transactions and services provided to customers. Contracts with customers can include multiple services, which are accounted for as separate “performance obligations” if they are determined to be distinct. Our performance obligations to our customers are generally satisfied when we transfer the promised good or service to our customer, either at a point in time or over time. Revenue from a performance obligation transferred at a point in time is recognized at the time that the customer obtains control over the promised good or service. Revenue from our performance obligations satisfied over time are recognized in a manner that depicts our performance in transferring control of the good or service, which is generally measured based on time elapsed, as our customers simultaneously receive and consume the benefit of our services as they are provided.
F-17
Payment for the majority of our services is variable consideration, as the amount of revenues we expect to receive is subject to factors outside of our control, including market conditions. Variable consideration is only included in revenue when amounts are not subject to significant reversal, which is generally when uncertainty around the amount of revenue to be received is resolved.
Wealth advisory fees
Generally, management recognizes wealth advisory fees over time as the Company renders services to its clients. The Company receives these fees either based on a percentage of the market value of the assets under management, or as a fixed fee based on the services the Company provides to the client. The Company’s delivery of these services represents its related performance obligations. The Company typically collects the wealth advisory fees at the beginning of each quarter from the client’s account. Management recognizes these fees ratably over the related billing period as the Company fulfills its performance obligation. In addition, management recognizes any commissions or referral fees paid related to this revenue ratably over the related billing period as the Company fulfills its performance obligation.
Investment brokerage fees
Investment brokerage fees arise from the selling, distribution, and trade execution services. The Company’s execution of these services fulfills its related performance obligations.
The Company also offers sales and distribution services and earns commissions through the sale of annuity and mutual fund products. The Company acts as an agent in these transactions and recognizes revenue at a point in time when the customer executes a contract with a product carrier. The Company may also receive trailing commissions and 12b-1 fees related to mutual fund and annuity products. Management recognizes this revenue in the period when it is earned, estimating the revenue, if necessary, based on the balance of the investment and the commission rate on the product.
The Company earns and recognizes trade execution commissions on the trade date, which is when the Company fulfills its performance obligation. Payment for the trade execution is due on the settlement date.
Lending Fees
Lending fees represent charges earned for services we provide as part of the lending process, such as late charges, servicing fees, and documentation fees. The Company
F-18
recognizes late charges as earned when they are paid. The Company recognizes revenue on other lending fees in the period in which the Company has performed the service.
Gains on sales of loans receivable
From time to time, the Company sells participation interests in loans receivable that it services. Upon completion of the loan sale, the Company recognizes a gain based on certain factors including the maturity date of the loan, the percentage of the loan sold and retained, and the servicing rate charged to the participant on the sold portion.
Charitable contributions
Charitable contributions include amounts that were donated by a not-for-profit charitable ministry to the Company’s not-for-profit subsidiary, MPC. This revenue comprises donations analyzed by management and determined to be unconditional, non-exchange transactions. Contributions are measured at their fair value at the date of contribution. All contributions are considered to be available for unrestricted use unless specifically restricted by the donor. Amounts received that are designated for future periods or restricted by the donor for specific purposes are reported as carrying donor restrictions. The $1.7 million in charitable contributions recognized during 2023, were permanently restricted by the donor as part of a designated fund agreement that allows for limited annual distributions. These funds are included in the restricted net assets of MPC and are presented on the balance sheet as part of retained earnings.
Gains/losses on sales of foreclosed assets
The Company records a gain or loss from the sale of foreclosed assets when control of the property transfers to the buyer, which generally occurs at the time of an executed deed. When the Company finances the sale of a foreclosed asset to the buyer, the Company assesses whether the buyer is committed to perform their obligation under the contract and whether collectability of the transaction price is probable, among other factors. Once these criteria are met, the foreclosed asset is derecognized and the gain or loss on sale is recorded upon the transfer of control of the property to the buyer. In determining the gain or loss on the sale, the Company adjusts the transaction price and related gain (loss) on sale if a significant financing component is present.
Other non-interest income
Other non-interest income includes fees earned based on service contracts the Company has entered into with credit unions. The Company recognizes the revenue monthly based on the terms of the contracts, which require monthly payments for services the Company
F-19
performs. Other non-interest income also includes realized income and gains on other investments.
Foreclosed Assets
Management records assets acquired through foreclosure or other proceedings at fair market value less estimated costs of disposal. Management determines the fair value at the date of foreclosure, which establishes a new cost for the asset. After foreclosure, the Company carries the asset at the lower of cost or fair value, less estimated costs of disposal. Management evaluates these real estate assets regularly to ensure that the asset’s fair value supports the recorded amount. If necessary, management also ensures that valuation allowances reduce the carrying amount to fair value less estimated costs of disposal. Revenue and expense from the operation of the Company’s foreclosed assets and changes in the valuation allowance are included in net expenses from foreclosed assets. When the Company sells the foreclosed property, it recognizes a gain or loss on the sale equal to the difference between the net sales proceeds received and the carrying amount of the property.
Transfers of Financial Assets
Management accounts for transfers of financial assets as sales when the Company has surrendered control over the asset. Management deems the Company has surrendered control over transferred assets when:
| ● | the assets have been isolated from the Company; |
| ● | the transferee obtains the right (free of conditions that constrain it from taking advantage of that right) to pledge or exchange the transferred asset; and |
| ● | the Company does not maintain effective control over the transferred asset through an agreement to repurchase it before its maturity. |
The Company, from time to time, sells participation interests in mortgage loans it has originated or acquired. To recognize the transfer of a portion of a financial asset as a sale, the transferred portion, and any portion that the transferor continues to hold must represent a participating interest. In addition, the transfer of the participating interest must meet the conditions for surrender of control. To qualify as a participating interest:
| ● | each portion of a financial asset must represent a proportionate ownership interest in an entire financial asset; |
F-20
| ● | from the date of transfer, all cash flows received from the entire financial asset must be divided proportionately among the participating interest holders in an amount equal to their respective share of ownership; |
| ● | the transfer must be made on a non-recourse basis (other than standard representations and warranties made under the loan participation sale agreement); |
| ● | the transfer may not be subordinate to any other participating interest holder; and |
| ● | no party has the right to pledge or exchange the entire financial asset. |
If the transaction does not meet either the participating interest or surrender of control criteria, management accounts for it as a secured borrowing arrangement.
Under some circumstances, when the Company sells a participation in a wholly owned loan receivable that it services, it retains loan-servicing rights, and records a servicing asset that is initially measured at fair value. As quoted market prices are generally not available for these assets, the Company estimates fair value based on the present value of future expected cash flows associated with the loan receivable. The Company amortizes servicing assets over the life of the associated receivable using the interest method. Any gain or loss recognized on the sale of a loan receivable depends in part on both the previous carrying amount of the financial asset involved in the sale, allocated between the asset sold and the interest that continues to be held by the Company based on its relative fair value at the date of transfer, and the proceeds received.
Property and Equipment
The Company states its furniture, fixtures, equipment, and leasehold improvements at cost, less accumulated depreciation and amortization. Management computes depreciation on a straight-line basis over the estimated useful lives of the assets. The useful lives of the Company’s assets range from three to seven years.
Debt Issuance Costs
The Company’s debt consists of borrowings from financial institutions and obligations to investors incurred through the sale of debt certificates. Management presents debt net of debt issuance costs and amortizes debt issuance costs into interest expense over the contractual terms of the debt using the straight-line method.
F-21
Employee Benefit Plans
The Company records contributions to the qualified employee retirement plan as compensation cost in the period incurred. The Company has also entered into a Supplemental Executive Retirement Plan (the “SERP”) with its former President and Chief Executive Officer, Joseph W. Turner, Jr. As the benefits of the plan have fully vested as of December 31, 2023, the Company has already recorded all expenses related to the SERP and no future expenses will be recorded.
Leases
We recognize right-of-use (“ROU”) assets and lease liabilities on the balance sheet for leases with lease terms longer than 12 months. The recognition, measurement and presentation of lease expenses and cash flows depend on the lease classification as a finance or operating lease.
The Company has operating leases for real estate and a vehicle. Its leases have remaining lease terms of one to three years. Our real estate lease agreements may include renewal or termination options for varying periods that are generally at our discretion. In our lease term, we only include those periods related to renewal options we are reasonably certain to exercise. However, we generally do not include these renewal options as we are not reasonably certain to renew at the lease commencement date. This determination is based on our consideration of certain economic, strategic, and other factors that we evaluate at lease commencement date and reevaluate throughout the lease term. Some leases also include options to terminate the leases and we only include those periods beyond the termination date if we are reasonably certain not to exercise the termination option.
Some leasing arrangements require variable payments that are dependent on usage or may vary for other reasons, such as payments for insurance and tax payments. The Company does not include the variable part of lease payments its ROU assets or lease liabilities. Rather, variable payments, other than those dependent upon an index or rate, are expensed when the obligation for those payments is incurred and are included in lease expenses recorded in selling and administrative expenses on the Consolidated Statements of Operations.
If any of the lease agreements have both lease and non-lease components, we treat those as a single lease component for all underlying asset classes. Accordingly, we account for all expenses associated with a lease contract as lease expenses.
F-22
Leases with a term of 12 months or less are not recognized on the balance sheet, but rather expensed on a straight-line basis over the lease term.
Income Taxes
The Company has elected to be treated as a partnership for income tax purposes. Therefore, the Company passes through its income and expenses to its members for tax reporting purposes.
Tesoro Hills, LLC, is a joint venture in which the Company has an investment. Tesoro Hills, according to its operating agreement, has elected to be treated as a partnership for income tax purposes.
The Company and MP Securities are subject to a California LLC fee.
The Company uses a recognition threshold and a measurement attribute for the consolidated financial statement recognition and measurement of a tax position taken in a tax return. The Company recognizes benefits from tax positions in the consolidated financial statements only when it is more likely than not that the tax position will be sustained upon examination by the appropriate taxing authority that would have full knowledge of all relevant information. A tax position that meets the more-likely-than-not recognition threshold is measured at the largest amount of benefit that is greater than 50 percent likely of being realized upon ultimate settlement. Tax positions that previously failed to meet the more-likely-than-not recognition threshold are recognized in the first subsequent financial reporting period in which that threshold is met. Management derecognizes previously recognized tax positions that no longer meet the more-likely-than-not recognition threshold in the first subsequent financial reporting period in which that threshold is no longer met.
Note 2: Pledged Cash and Restricted Cash
Under the terms of its debt agreements, the Company can pledge cash as collateral for its borrowings. On March 31, 2024 and December 31, 2023, the Company had cash of $7 thousand pledged as collateral for its secured borrowings. See “Note 3: Related Party Transactions” for additional details. This is included in restricted cash in the table below.
The following table provides a reconciliation of cash, cash equivalents, and restricted cash reported within the statement of financial position to the amounts reported in the statements of cash flows (dollars in thousands):
F-23
| | | | | | | | | |
| | March 31, | | December 31, | |||||
|
| 2024 |
| 2023 |
| 2023 | |||
Cash and cash equivalents | | $ | 11,193 | | $ | 17,057 | | $ | 10,854 |
Restricted cash | | | 1,760 | | | 58 | | | 1,757 |
Total cash, cash equivalents, and restricted cash shown in the statement of cash flows | | $ | 12,953 | | $ | 17,115 | | $ | 12,611 |
Restricted cash includes $1.7 million donated to MPC as permanently restricted funds under a designated fund agreement. The agreement allows for limited annual distributions of the funds. Other amounts included in restricted cash represent those required to be set aside in the CRD account with Financial Industry Regulation Authority (“FINRA”), funds the Company has deposited with RBC Dain as clearing deposits, and cash maintained in an account with ACCU as collateral for the Company’s secured borrowings. The Company may only use the CRD funds for certain fees charged by FINRA. These fees are to maintain the membership status of the Company or are related to the licensing of registered and associated persons of the Company.
Note 3: Related Party Transactions
Transactions with Equity Owners
Transactions with AdelFi Credit Union, a California state chartered credit union (“AdelFi”)
The tables below summarize transactions the Company conducts with AdelFi, (formerly Evangelical Christian Credit Union), the Company’s largest equity owner.
Related party balances pertaining to the assets of the Company (dollars in thousands):
| | | | | | |
| | March 31, | | December 31, | ||
|
| 2024 |
| 2023 | ||
Total funds held on deposit at AdelFi | | $ | 3,135 | | $ | 3,457 |
Loan participations purchased from and serviced by AdelFi | | | 1,284 | | | 1,298 |
F-24
Related party transactions of the Company (dollars in thousands):
| | | | | | |
| | Three months ended | ||||
| | March 31, | ||||
|
| 2024 |
| 2023 | ||
Interest earned on funds held with AdelFi | | $ | 39 | | $ | — |
Interest income earned on loans purchased from AdelFi | | | 21 | | | 1 |
Fees paid to AdelFi from MP Securities Networking Agreement | | | 3 | | | 2 |
Loan participation interests purchased:
The tables above show the number of loans purchased from Adelfi and the balance of loans serviced by Adelfi. For these loans, management negotiated the pass-through interest rates on a loan-by-loan basis and believes these negotiated terms were equivalent to those that would prevail in an arm’s length transaction.
MP Securities Networking Agreement with AdelFi:
MP Securities has entered into a Networking Agreement with AdelFi pursuant to which MP Securities agreed to offer investment and insurance products and services to AdelFi’s members that:
| (1) | AdelFi or its Board of Directors has approved; |
| (2) | comply with applicable investor suitability standards required by federal and state securities laws and regulations; |
| (3) | are offered in accordance with National Credit Union Administration (“NCUA”) rules and regulations; and |
| (4) | comply with its membership agreement with FINRA. |
The agreement provides that MP Securities will pay AdelFi a percentage of total revenue received by MP Securities from transactions conducted for or on behalf of AdelFi members. Either AdelFi or MP Securities may terminate the Networking Agreement without cause upon thirty days prior written notice.
Transactions with America’s Christian Credit Union, a California state chartered credit union (“ACCU”)
The Company has several related party agreements with ACCU, one of the Company’s equity owners. The following describes the nature and dollar amounts of the material related party transactions with ACCU.
F-25
Related party balances pertaining to the assets of the Company (dollars in thousands):
| | | | | | |
| | March 31, | | December 31, | ||
|
| 2024 |
| 2023 | ||
Total funds held on deposit at ACCU | | $ | 82 | | $ | 164 |
Dollar amount of outstanding loan participations sold to ACCU and serviced by the Company | | | 935 | | | 941 |
Amount owed on ACCU secured borrowings | | | 7 | | | 7 |
Amount owed on ACCU line of credit | | | 3,000 | | | 4,500 |
Loans pledged on ACCU line of credit | | | 7,121 | | | 7,167 |
Related party transactions of the Company (dollars in thousands):
| | | | | | |
| | Three months ended | ||||
| | March 31, | ||||
|
| 2024 |
| 2023 | ||
Interest earned on funds held with ACCU | | $ | — | | $ | 1 |
Dollar amount of net draws (payments) made on ACCU line of credit | | | (1,500) | | | — |
Interest expense on ACCU borrowings | | | 70 | | | 20 |
Income from broker services provided to ACCU by MPS | | | 8 | | | 9 |
Fees paid based on MP Securities Networking Agreement with ACCU | | | 24 | | | 36 |
Loan participation interests sold:
From time to time, the Company sells loan participation interests in loans it originates and services to ACCU. The Company negotiates pass-through interest rates on loan participation interests sold to ACCU on a loan-by-loan basis. Management believes these terms are equivalent to those that prevail in arm’s length transactions.
Effective August 9, 2021, the Company entered into a Master Loan Participation Purchase and Sale Agreement (“the Master LP Agreement”) with ACCU. The Master LP Agreement is intended to facilitate the sale to ACCU of small participation interests in the Company’s originated loans. As a part of any transaction conducted under the Master LP Agreement, the borrower of the loan being sold would become a member of ACCU, thereby meeting the requirements of NCUA regulations that govern loan participation purchases by credit unions. This allows the Company to sell additional participations in the loan to other credit unions.
Sales made under the Master LP Agreement are done on a recourse basis, requiring the Company to repurchase the participation interest in the event of default by the borrower. Under a separate Deposit Control Agreement reached in conjunction with the Master LP Agreement, the Company deposited cash on a one-to-one basis as collateral to secure the participation interest sold to ACCU. This cash is considered restricted cash. The Company
F-26
retains the ability to sell loan participation interests to ACCU outside of the Master LP Agreement.
As of March 31, 2024 and December 31, 2023, $7 thousand in participation interests had been sold and were outstanding under this agreement. These have been classified as secured borrowings on our balance sheet. The Company has deposited equal amounts of cash in an account at ACCU as collateral for these borrowings. These funds are considered restricted cash.
MP Securities Networking Agreement with ACCU:
MP Securities has entered into a Networking Agreement with ACCU pursuant to which MP Securities has agreed to offer investment and insurance products and services to ACCU’s members that:
| (1) | ACCU or its Board of Directors has approved; |
| (2) | comply with applicable investor suitability standards required by federal and state securities laws and regulations; |
| (3) | are offered in accordance with NCUA rules and regulations; and |
| (4) | comply with its membership agreement with FINRA. |
The agreement provides that MP Securities will pay ACCU a percentage of total revenue received by MP Securities from transactions conducted for or on behalf of ACCU members. Either ACCU or MP Securities may terminate the Networking Agreement without cause upon thirty days prior written notice.
Line of Credit:
On September 23, 2021, the Company entered into a Loan and Security Agreement with ACCU. The ACCU line of credit (“ACCU LOC”) is a $5.0 million short-term demand facility with a maturity date of September 23, 2024. See “Note 10: Credit Facilities and Other Debt” for additional terms and conditions of the ACCU LOC. Management believes these terms are equivalent to those that prevail in arm’s length transactions.
Transactions with Kane County Teachers Credit Union (“KCT”)
Our Board Chairperson, R. Michael Lee, serves as the Chief Executive Officer and President of KCT, an Illinois state chartered financial institution.
F-27
Related party balances pertaining to the assets of the Company (dollars in thousands):
| | | | | | |
| | March 31, | | December 31, | ||
|
| 2024 |
| 2023 | ||
Total funds held on deposit at KCT | | $ | 3,251 | | $ | 1,308 |
Amount owed on KCT line of credit | | | 4,500 | | | — |
Loans pledged on KCT lines of credit | | | 11,932 | | | 10,962 |
Certificates of deposit pledged on KCT Warehouse LOC | | | 1,250 | | | 1,250 |
Outstanding loan participations sold to KCT and serviced by the Company | | | 3,365 | | | 3,455 |
Related party transactions of the Company (dollars in thousands):
| | | | | | |
| | Three months ended | ||||
| | March 31, | ||||
|
| 2024 |
| 2023 | ||
Interest earned on funds held with KCT | | $ | 8 | | $ | 10 |
Dollar amount of draws on KCT line of credit | | | 4,500 | | | — |
Interest expense on KCT line of credit | | | 13 | | | — |
Fees paid based on MP Securities Networking Agreement with KCT | | | 5 | | | 8 |
Funds on deposit with KCT:
On March 15, 2024, the Company purchased a $1.3 million certificate of deposit from KCT. The certificate matures on March 15, 2025, and carries an interest rate of 2.25%. This certificate is pledged as a compensating balance deposit on one of the lines of credit the Company holds with KCT. The Company also holds a savings account with KCT.
Lines of credit:
On June 6, 2022, the Company terminated the existing $7.0 million Loan and Security Agreement with KCT. It replaced this agreement with two short-term demand credit facilities, a $5.0 million warehouse line of credit (“KCT Warehouse LOC”) and a $5.0 million operating line of credit (“KCT Operating LOC”). See “Note 10: Credit Facilities and Other Debt” for additional terms and conditions of these credit facilities. Management believes these terms are equivalent to those that prevail in arm’s length transactions.
MP Securities Networking Agreement
MP Securities, the Company’s wholly owned subsidiary, has entered into a Networking Agreement with KCT pursuant to which MP Securities agreed to offer investment and insurance products and services to KCT’s members that:
| (1) | KCT or its Board of Directors has approved; |
F-28
| (2) | comply with applicable investor suitability standards required by federal and state securities laws and regulations; |
| (3) | are offered in accordance with NCUA rules and regulations; and |
| (4) | comply with its membership agreement with FINRA. |
The agreement provides that MP Securities pay KCT a percentage of total revenue received by MP Securities from transactions conducted for or on behalf of KCT members. Either KCT or MP Securities may terminate the Networking Agreement without cause upon thirty days prior written notice.
Loan Participation Interests Sold
Occasionally the Company sells loan participation interests to KCT in the normal course of business. The Company retains the right to service these participation loans sold to KCT, and charges KCT a customary fee for servicing the loan. As of March 31, 2024 and December 31, 2023, respectively, the Company serviced $3.4 million and $3.5 million in loan participations that it has sold to KCT.
Transactions with Other Equity Owners
From time to time the Company will engage in transactions with other owners or related parties.
Related party balances pertaining to the assets of the Company (dollars in thousands):
| | | | | | |
| | March 31, | | December 31, | ||
|
| 2024 |
| 2023 | ||
Outstanding loan participations sold to NFCU and serviced by the Company | | $ | 4,712 | | $ | 4,745 |
Outstanding notes payable to officers and managers | | | 2,781 | | | 2,871 |
Loan Participation Interests
The Company has entered into a Loan Participation Agreement with Navy Federal Credit Union (“NFCU”), an owner of both the Company’s Class A Common Units and Series A Preferred Units. Under this agreement, the Company sold NFCU a $5.0 million loan participation interest in one of its construction loans on March 20, 2020. As part of this agreement, the Company retained the right to service the loan, and it charges NFCU a fee for servicing the loan. Management believes the terms of the agreement are equivalent to those that prevail in arm’s length transactions for similar agreements entered into by other credit unions.
F-29
From time to time, the Company may purchase a loan participation interest from a related party. The Company and its related party will negotiate in good faith the terms and conditions of such a purchase and in accordance with the Company’s related party procedures and governance practices. Each party must approve such a purchase after full disclosure of the related party transaction and must include terms and conditions that would normally be included in arm’s length transactions conducted by independent parties.
Debt Certificates Sold
From time to time, the Company’s Board and members of its executive management team have purchased debt certificates from the Company or have purchased investment products through MP Securities. Debt certificates payable owned by related parties totaled $2.8 million and $2.9 million as of March 31, 2024 and December 31, 2023, respectively.
Transactions with Subsidiaries
The Company has entered into several agreements with its subsidiary, MP Securities. The Company eliminates the income and expense related to these agreements in the consolidated financial statements. MP Securities serves as the managing broker for the Company’s public and private placement note offerings. MP Securities receives compensation related to these broker dealer services ranging from 0.25% to 5.50% over the life of a note. The amount of the compensation depends on the length of the note and the terms of the offering under which MP Securities sold the note.
The Company has also entered into an Administrative Services Agreement with MP Securities. The Administrative Services Agreement provides services such as the use of office space, use of equipment, including computers and phones, and payroll and personnel services. The agreement stipulates that MP Securities will provide ministerial, compliance, marketing, operational, and investor relations-related services in relation to the Company’s debt certificates program. As stated above, the Company eliminates all intercompany transactions related to this agreement in its consolidated financial statements.
Related Party Transaction Policy
The Board has adopted a Related Party Transaction Policy to assist in evaluating transactions the Company may enter into with a related party. Under this policy, a majority of the members of the Company’s Board and majority of its independent Board members must approve a material transaction that it enters into with a related party. As a result, all transactions that the Company undertakes with an affiliate, or a related party are entered into on terms believed by management to be no less favorable than are available from
F-30
unaffiliated third parties. In addition, a majority of the Company’s independent Board members must approve these transactions.
Note 4: Loans Receivable and Allowance for Expected Credit Losses
The Company’s loan portfolio comprises two segments, Non-profit commercial loans to Christian churches and ministries, and for-profit commercial loans. See “Note 1 – Loan Portfolio Segments and Classes” to Part I “Financial Information” of this Report. The loans fall into eight classes:
| ● | wholly owned amortizing loans for which the Company possesses the first collateral position; |
| ● | wholly owned amortizing loans for which the Company possesses security other than a first collateral position on real property; |
| ● | wholly owned amortizing loans that are unsecured; |
| ● | wholly owned lines of credit for which the Company possesses security other than a first collateral position on real property; |
| ● | wholly owned lines of credit that are unsecured; |
| ● | wholly owned construction loans |
| ● | participated amortizing loans purchased for which the Company possesses the first collateral position; and |
| ● | participated construction loans purchased. |
Prior to January 1, 2023, the Company’s loan portfolio comprised one segment – commercial loans – and four classes. Prior period data has been reclassified in the following tables to conform to current period presentation.
The Company primarily originates or purchases participations in loans that are made to Christian non-profit organizations and churches. The purpose of these loans is to purchase, construct, or improve facilities. Occasionally the Company purchases for-profit commercial loans to meet the Company’s revenue and yield goals, as well as to diversify the Company’s loan portfolio. Maturities on the loan portfolio extend through 2038. The loan portfolio had a weighted average interest rate of 6.68% and 6.42% as of March 31, 2024 and December 31, 2023, respectively.
F-31
The table below is a summary of the Company’s mortgage loans owned (dollars in thousands):
| | | | | | |
| | March 31, | | December 31, | ||
|
| 2024 |
| 2023 | ||
Non-profit commercial loans: | | | | | | |
Real estate secured | | $ | 88,799 | | $ | 87,524 |
Unsecured | | | 68 | | | 74 |
Total non-profit commercial loans: | | | 88,867 | | | 87,598 |
For-profit commercial loans: | | | | | | |
Real estate secured | | | 12,787 | | | 12,783 |
Total loans | | | 101,654 | | | 100,381 |
Deferred loan fees, net | | | (139) | | | (139) |
Loan discount | | | (165) | | | (168) |
Allowance for expected credit losses | | | (1,449) | | | (1,501) |
Loans, net | | $ | 99,901 | | $ | 98,573 |
Allowance for expected credit losses
Management believes it has properly calculated the allowance for expected credit losses using CECL methodology as of March 31, 2024 and December 31, 2023. The following table shows the changes in the allowance for expected credit losses for the three months ended March 31, 2024 and the year ended December 31, 2023 (dollars in thousands):
| | | | | | | | | |
| | Three months ended | |||||||
|
| March 31, 2024 | |||||||
Segment: | | Non-profit Commercial | | For-profit Commercial | | Total | |||
Balance, beginning of period | | $ | 1,471 | | $ | 30 | | $ | 1,501 |
Provision (credit) for expected credit loss | | | (53) | | | 1 | | | (52) |
Charge-offs | | | — | | | — | | | — |
Recoveries | | | — | | | — | | | — |
Balance, end of period | | $ | 1,418 | | $ | 31 | | $ | 1,449 |
| | | | | | | | | |
| | Year ended | |||||||
| | December 31, 2023 | |||||||
Segment: | | Non-profit Commercial | | For-profit Commercial | | Total | |||
Balance, beginning of period | | $ | 1,530 | | $ | 21 | | $ | 1,551 |
Adjustment related to implementation of CECL model | | | 129 | | | (16) | | | 113 |
Provision (credit) for expected credit loss | | | (167) | | | 25 | | | (142) |
Charge-offs | | | (21) | | | — | | | (21) |
Recoveries | | | — | | | — | | | — |
Balance, end of period | | $ | 1,471 | | $ | 30 | | $ | 1,501 |
F-32
In the course of its lending operations, the Company has made loans that include commitments to fund additional amounts over the remaining term of the loan. These include construction loans and lines of credit, both revolving and non-revolving. The Company has established an allowance for losses on these unfunded commitments. See "Note 12: Commitments and Contingencies" for details on its allowance for credit losses on off-balance sheet commitments.
The table below presents loans by portfolio segment and the related allowance for expected credit losses. In addition, the table segregates loans and the allowance for expected credit losses by impairment methodology (dollars in thousands).
| | | | | | |
| | Loans and Allowance for | ||||
| | As of | ||||
|
| March 31, 2024 |
| December 31, 2023 | ||
Non-profit Commercial Loans: | | | | | | |
Individually evaluated for impairment | | $ | 16,767 | | $ | 16,792 |
Collectively evaluated for impairment | | | 72,100 | | | 70,806 |
Total Non-profit Commercial Loans | | | 88,867 | | | 87,598 |
For-profit Commercial Loans: | | | | | | |
Individually evaluated for impairment | | | — | | | — |
Collectively evaluated for impairment | | | 12,787 | | | 12,783 |
Total For-profit Commercial Loans | | | 12,787 | | | 12,783 |
Balance | | $ | 101,654 | | $ | 100,381 |
| | | | | | |
Allowance for expected credit losses: | | | | | | |
Non-profit Commercial Loans: | | | | | | |
Individually evaluated for impairment | | $ | 675 | | $ | 669 |
Collectively evaluated for impairment | | | 743 | | | 802 |
Total Non-profit Commercial Loan Allowance | | | 1,418 | | | 1,471 |
For-profit Commercial Loans: | | | | | | |
Individually evaluated for impairment | | | — | | | — |
Collectively evaluated for impairment | | | 31 | | | 30 |
Total For-profit Commercial Loan Allowance | | | 31 | | | 30 |
Balance | | $ | 1,449 | | $ | 1,501 |
F-33
The Company has established a loan grading system to assist management in their analysis and supervision of the loan portfolio. The following tables summarize the credit quality indicators by loan class (dollars in thousands):
| | | | | | | | | | | | | | | | | | | | | |
Credit Quality Indicators (by class) | |||||||||||||||||||||
As of March 31, 2024 | |||||||||||||||||||||
|
| Pass |
| Watch |
| Special Mention |
| Substandard |
| Doubtful |
| Loss |
| Total | |||||||
Non-profit Commercial Loans | | | | | | | | | | | | | | | | | | | | | |
Wholly Owned First Amortizing | | $ | 46,589 | | $ | 22,675 | | $ | 5,408 | | $ | 9,881 | | $ | — | | $ | — | | $ | 84,553 |
Wholly Owned Other Amortizing | | | 1,393 | | | — | | | — | | | 1,478 | | | — | | | — | | | 2,871 |
Wholly Owned Unsecured Amortizing | | | 24 | | | 28 | | | — | | | — | | | — | | | — | | | 52 |
Wholly Owned Unsecured LOC | | | 40 | | | — | | | — | | | — | | | — | | | — | | | 40 |
Participation First | | | 1,284 | | | — | | | — | | | — | | | — | | | — | | | 1,284 |
Total Non-profit Commercial Loans | | | 49,397 | | | 22,703 | | | 5,408 | | | 11,359 | | | — | | | — | | | 88,867 |
For-profit Commercial Loans | | | | | | | | | | | | | | | | | | | | | — |
Wholly Owned First Amortizing | | | 6,771 | | | 2,800 | | | — | | | — | | | — | | | — | | | 9,571 |
Participation First | | | 1,641 | | | 132 | | | — | | | — | | | — | | | — | | | 1,773 |
Participation Construction | | | 1,443 | | | — | | | — | | | — | | | — | | | — | | | 1,443 |
Total For-profit Commercial Loans | | | 9,855 | | | 2,932 | | | — | | | — | | | — | | | — | | | 12,787 |
Total Loans | | $ | 59,252 | | $ | 25,635 | | $ | 5,408 | | $ | 11,359 | | $ | — | | $ | — | | $ | 101,654 |
| | | | | | | | | | | | | | | | | | | | | |
Credit Quality Indicators (by class) | |||||||||||||||||||||
As of December 31, 2023 | |||||||||||||||||||||
|
| Pass |
| Watch |
| Special Mention |
| Substandard |
| Doubtful |
| Loss |
| Total | |||||||
Non-profit Commercial Loans | | | | | | | | | | | | | | | | | | | | | |
Wholly Owned First Amortizing | | $ | 35,106 | | $ | 32,891 | | $ | 5,408 | | $ | 9,882 | | $ | — | | $ | — | | $ | 83,287 |
Wholly Owned Other Amortizing | | | 1,405 | | | — | | | — | | | 1,502 | | | — | | | — | | | 2,907 |
Wholly Owned Unsecured Amortizing | | | 25 | | | 28 | | | — | | | — | | | — | | | — | | | 53 |
Wholly Owned Unsecured LOC | | | 46 | | | — | | | — | | | — | | | — | | | — | | | 46 |
Wholly Owned Construction | | | 7 | | | — | | | — | | | — | | | — | | | — | | | 7 |
Participation First | | | 1,298 | | | — | | | — | | | — | | | — | | | — | | | 1,298 |
Total Non-profit Commercial Loans | | | 37,887 | | | 32,919 | | | 5,408 | | | 11,384 | | | — | | | — | | | 87,598 |
For-profit Commercial Loans | | | | | | | | | | | | | | | | | | | | | |
Participation First | | | 1,776 | | | — | | | — | | | — | | | — | | | — | | | 1,776 |
Participation Construction | | | 1,433 | | | — | | | — | | | — | | | — | | | — | | | 1,433 |
Total For-profit Commercial Loans | | | 12,783 | | | — | | | — | | | — | | | — | | | — | | | 12,783 |
Total Loans | | $ | 50,670 | | $ | 32,919 | | $ | 5,408 | | $ | 11,384 | | $ | — | | $ | — | | $ | 100,381 |
F-34
The following table sets forth certain information with respect to the Company’s loan portfolio delinquencies by loan class and amount (dollars in thousands):
| | | | | | | | | | | | | | | | | | | | | |
Age Analysis of Past Due Loans (by class) | |||||||||||||||||||||
As of March 31, 2024 | |||||||||||||||||||||
|
| 30-59 Days Past Due |
| 60-89 Days Past Due |
| Greater Than 90 Days |
| Total Past |
| Current |
| Total Loans |
| Recorded | |||||||
Non-profit Commercial Loans | | | | | | | | | | | | | | | | | | | | | |
Wholly Owned First Amortizing | | $ | 1,002 | | $ | 6,749 | | $ | 1,831 | | $ | 9,582 | | $ | 74,971 | | $ | 84,553 | | $ | — |
Wholly Owned Other Amortizing | | | — | | | — | | | — | | | — | | | 2,871 | | | 2,871 | | | — |
Wholly Owned Unsecured Amortizing | | | — | | | — | | | — | | | — | | | 52 | | | 52 | | | — |
Wholly Owned Unsecured LOC | | | — | | | — | | | — | | | — | | | 40 | | | 40 | | | — |
Participation First | | | — | | | — | | | — | | | — | | | 1,284 | | | 1,284 | | | — |
Total Non-profit Commercial Loans | | | 1,002 | | | 6,749 | | | 1,831 | | | 9,582 | | | 79,285 | | | 88,867 | | | — |
For-profit Commercial Loans | | | | | | | | | | | | | | | | | | | | | |
Wholly Owned First Amortizing | | | — | | | — | | | — | | | — | | | 9,571 | | | 9,571 | | | — |
Participation First | | | 344 | | | — | | | — | | | 344 | | | 1,429 | | | 1,773 | | | — |
Participation Construction | | | — | | | — | | | — | | | — | | | 1,443 | | | 1,443 | | | — |
Total For-profit Commercial Loans | | | 344 | | | — | | | — | | | 344 | | | 12,443 | | | 12,787 | | | — |
Total Loans | | $ | 1,346 | | $ | 6,749 | | $ | 1,831 | | $ | 9,926 | | $ | 91,728 | | $ | 101,654 | | $ | — |
F-35
| | | | | | | | | | | | | | | | | | | | | |
Age Analysis of Past Due Loans (by class) | |||||||||||||||||||||
As of December 31, 2023 | |||||||||||||||||||||
|
| 30-59 |
| 60-89 Days Past Due |
| Greater Than 90 Days |
| Total Past |
| Current |
| Total Loans |
| Recorded | |||||||
Non-profit Commercial Loans | | | | | | | | | | | | | | | | | | | | | |
Wholly Owned First Amortizing | | $ | 7,020 | | $ | 143 | | $ | 875 | | $ | 8,038 | | $ | 75,249 | | $ | 83,287 | | $ | — |
Wholly Owned Other Amortizing | | | — | | | — | | | — | | | — | | | 2,907 | | | 2,907 | | | — |
Wholly Owned Unsecured Amortizing | | | — | | | — | | | — | | | — | | | 53 | | | 53 | | | — |
Wholly Owned Unsecured LOC | | | — | | | — | | | — | | | — | | | 46 | | | 46 | | | — |
Wholly Owned Construction | | | — | | | — | | | — | | | — | | | 7 | | | 7 | | | — |
Participation First | | | — | | | — | | | — | | | — | | | 1,298 | | | 1,298 | | | — |
Total Non-profit Commercial Loans | | | 7,020 | | | 143 | | | 875 | | | 8,038 | | | 79,560 | | | 87,598 | | | — |
For-profit Commercial Loans | | | | | | | | | | | | | | | | | | | | | |
Participation First | | | — | | | — | | | — | | | — | | | 1,776 | | | 1,776 | | | — |
Participation Construction | | | — | | | — | | | — | | | — | | | 1,433 | | | 1,433 | | | — |
Total For-profit Commercial Loans | | | — | | | — | | | — | | | — | | | 12,783 | | | 12,783 | | | — |
Total Loans | | $ | 7,020 | | $ | 143 | | $ | 875 | | $ | 8,038 | | $ | 92,343 | | $ | 100,381 | | $ | — |
Impaired Loans
The following tables are summaries of impaired loans by loan class. The unpaid principal balance reflects the contractual principal outstanding on the loan. Included in the balance of impaired loans are loan modifications that performed according to contractual terms and that the Company has upgraded to pass or watch since the date of the modification. The recorded investment reflects the unpaid principal balance less any interest payments that management has recorded against principal and less discounts taken. No loans in the Company’s commercial loan segment were classified as impaired or non-accrual at December 31, 2023, nor were there any loan modifications during the three months ended March 31, 2024. The tables below represent the breakdown by class of the non-profit loan portfolio segment only (dollars in thousands):
F-36
| | | | | | |
| | As of | | As of | ||
| | March 31, | | December 31, | ||
Impaired Non-profit commercial Loans (by class) |
| 2024 |
| 2023 | ||
Wholly Owned First Amortizing | | | | | | |
Recorded investment with specific allowance | | $ | 8,241 | | $ | 8,238 |
Recorded with no specific allowance | | | 13,838 | | | 15,166 |
Total recorded investment | | $ | 22,079 | | $ | 23,404 |
Unpaid principal balance | | $ | 22,539 | | $ | 23,870 |
Wholly Owned Other Amortizing | | | | | | |
Recorded investment with specific allowance | | $ | 1,478 | | $ | 1,502 |
Recorded with no specific allowance | | | — | | | — |
Total recorded investment | | $ | 1,478 | | $ | 1,502 |
Unpaid principal balance | | $ | 1,685 | | $ | 1,685 |
Total Impaired Loans | | | | | | |
Recorded investment with specific allowance | | $ | 9,719 | | $ | 9,740 |
Recorded with no specific allowance | | | 13,838 | | | 15,166 |
Total recorded investment | | $ | 23,557 | | $ | 24,906 |
Unpaid principal balance | | $ | 24,224 | | $ | 25,555 |
| | | | | | |
| | For the three months ended | ||||
| | March 31, | | March 31, | ||
Impaired Non-profit Commercial Loans (by class) |
| 2024 |
| 2023 | ||
Wholly Owned First Amortizing | | | | | | |
Average recorded investment | | $ | 22,845 | | $ | 25,132 |
Interest income recognized | | | 317 | | | 303 |
Wholly Owned Other Amortizing | | | | | | |
Average recorded investment | | | 1,490 | | | 1,579 |
Interest income recognized | | | — | | | — |
Total Impaired Loans | | | | | | |
Average recorded investment | | $ | 24,335 | | $ | 26,711 |
Interest income recognized | | | 317 | | | 303 |
A summary of nonaccrual loans by loan class is as follows (dollars in thousands):
| | | | | | |
Loans on Nonaccrual Status (by class) | ||||||
| | as of | ||||
|
| March 31, 2024 |
| December 31, 2023 | ||
Non-profit Commercial Loans: | | | | | | |
Wholly Owned First Amortizing | | $ | 9,881 | | $ | 9,882 |
Wholly Owned Other Amortizing | | | 1,478 | | | 1,502 |
Total | | $ | 11,359 | | $ | 11,384 |
The Company did not modify any loans during the three-month periods ended March 31, 2024 and March 31, 2023.
The Company has one modified loan that is past maturity as of March 31, 2024. This loan has been completely written off as of March 31, 2024.
When loans are modified, the Company monitors borrower performance according to the terms of the modifications to determine whether there are any early indicators for future
F-37
default. Management regularly evaluates loan modifications for potential further impairment and will adjust the risk ratings and specific reserves associated with loan modifications as deemed necessary.
As of March 31, 2024, the Company has made no commitments to advance additional funds in connection with loan modifications.
Note 5: Investments
Joint Venture
In December 2015, the Company finalized an agreement with Intertex Property Management, Inc., a California corporation, to enter into a joint venture to form Tesoro Hills, LLC (the “Valencia Hills Project”). Intertex is a managing member of the LLC, with authority to direct operations. The Company is a non-managing member with no authority beyond limited rights granted to the Company by the operating agreement. The Valencia Hills Project is a joint venture that will develop, and market property formerly classified by the Company as a foreclosed asset. In January 2016, the Company transferred ownership in the foreclosed asset to the Valencia Hills Project. In addition, the Company reclassified the carrying value of the property from foreclosed assets to an investment in a joint venture. The Company’s initial investment in the joint venture was $900 thousand and represented 100% of the ownership of the joint venture. Under the terms of the operating agreement, the members of the joint venture are entitled to receive their respective capital contributions until the balance is reduced to zero. After these payments are made, the Company is entitled to receive 30% of the profits generated by the operation of the joint venture or disposition of the property. The Company’s ownership percentage in the joint venture was 73% and 74%, respectively, as of March 31, 2024 and December 31, 2023.
As of March 31, 2024 and December 31, 2023, the value of the Company’s investment in the joint venture was $870 thousand and $871 thousand, respectively. Management’s impairment analysis of the investment as of March 31, 2024, has determined that the investment is not impaired.
Certificates of Deposit
The Company held an investment in certificates of deposit with an original maturity greater than three months on March 31, 2024 and December 31, 2023.
F-38
Details of certificates with original maturities of greater than three months owned by the Company as of March 31, 2024, are as follows (dollars in thousands):
| | | | | | | | | | | | |
| | | | | | | | | | | | |
As of March 31, 2024 | ||||||||||||
Certificate | | Open Date | | Certificate Amount | | Interest Rate | | Maturity Date | ||||
CD 1 | | 3/15/2024 | | $ | 1,251 | | 2.25% | | 3/15/2025 | |||
The certificate identified above was purchased from KCT and is pledged as a compensating balance under the terms of the KCT Warehouse LOC. See “Note 10: Credit Facilities and Other Debt” for additional terms and conditions of these credit facilities.
Other Investments
In June 2022, the Company entered into two indexed annuity insurance contracts whereby an insurance company guarantees a fixed rate of return in exchange for holding a deposit from the Company for the contracted period of ten years.
Additional information related to these investments is as follows (dollars in thousands):
| | | | | | | | | | | | | | | |
| | | | | | | | | | | Income for the three months ended | ||||
| Investment Type |
| Maturity Date |
| Original Cost |
| Net Carrying Amount |
| March 31, 2024 |
| March 31, 2023 | ||||
| Fixed annuity | | June 2032 | | $ | 1,000 | | $ | 1,053 | | $ | 1 | | $ | 1 |
F-39
Note 6: Revenue Recognition
The Company recognizes two primary types of revenue: interest income and non-interest income. The following tables reflect the Company’s non-interest income disaggregated by financial statement line item. Items outside of the scope of ASC 606 are noted as such (dollars in thousands):
| | | | | | |
| | Three months ended | ||||
| | March 31, | ||||
|
| 2024 |
| 2023 | ||
Non-interest income, in scope of ASC 606 | | | | | | |
Broker-dealer fees and commissions | | $ | 175 | | $ | 215 |
Gains on loan sales | | | — | | | 7 |
Other investment income | | | 1 | | | 1 |
Other non-interest income | | | — | | | 5 |
Non-interest income, out of scope, ASC 606 | | | | | | |
Lending fees | | | 35 | | | 50 |
Charitable contributions, with donor restrictions | | | — | | | 400 |
Total non-interest income | | $ | 211 | | $ | 678 |
In accordance with our accounting policies as governed by ASC 606, Revenue from Contracts with Customers, the following table separates revenue from contracts with customers into categories that are based on the nature, amount, timing, and uncertainty of revenue and cash flows associated with each product and distribution channel. Non-interest revenue earned by the Company’s broker-dealer subsidiary, MP Securities, comprises securities commissions, sale of investment company shares, insurance product revenue, and advisory fee income. Securities commission revenue represents the sale of over-the-counter stock, unit investment trusts, and variable annuities. The Company recognizes the revenue earned from the sale of these products upon satisfaction of performance obligations, which occur on the trade date, and is considered transactional revenue. The Company also earns revenue from the management of invested assets, which management recognizes monthly, as earned, based on the average asset value. We refer to this revenue as assets under management revenue (“AUM”).
F-40
| | | | | | |
| | For the three months ended | ||||
(dollars in thousands) | | March 31, 2024 | | March 31, 2023 | ||
Broker-dealer revenue | | | | | | |
Securities commissions | | | | | | |
Transactional | | $ | 39 | | $ | 15 |
AUM | | | 15 | | | 12 |
| | | 54 | | | 27 |
Sale of investment company products | | | | | | |
Transactional | | | 2 | | | 3 |
AUM | | | 22 | | | 17 |
| | | 24 | | | 20 |
Other insurance product revenue | | | | | | |
Transactional | | | — | | | 78 |
AUM | | | 11 | | | 12 |
| | | 11 | | | 90 |
Advisory fee income | | | | | | |
Transactional | | | — | | | — |
AUM | | | 86 | | | 78 |
| | | 86 | | | 78 |
Total broker-dealer revenue | | | | | | |
Transactional | | | 41 | | | 96 |
AUM | | | 134 | | | 119 |
| | $ | 175 | | $ | 215 |
Note 7: Loan Sales
A summary of loan participation sales and servicing assets are as follows (dollars in thousands):
| | | | | | | | | |
| | As of and for the | |||||||
| | Three months ended | | Year ended | |||||
| | March 31, | | December 31, | |||||
|
| 2024 |
| 2023 |
| 2023 | |||
Loan participation interests sold by the Company | | $ | — | | $ | 7 | | $ | 502 |
Total participation interests sold and serviced by the Company | | | 31,200 | | | 34,006 | | | 31,466 |
Servicing income | | | 32 | | | 37 | | | 134 |
| | | | | | | | | |
Servicing Assets | | | | | | | | | |
Balance, beginning of period | | $ | 98 | | $ | 123 | | $ | 123 |
Additions: | | | | | | | | | |
Servicing obligations from sale of loan participations | | | — | | | 9 | | | 18 |
Subtractions: | | | | | | | | | |
Amortization | | | (10) | | | (10) | | | (43) |
Balance, end of period | | $ | 88 | | $ | 122 | | $ | 98 |
ACCU Loan Participation Agreement (Secured Borrowings)
As detailed in “Note 3: Related Party Transactions,” effective August 9, 2021, the Company entered into a Master Loan Participation Purchase and Sale Agreement with
F-41
ACCU. Under the Master LP Agreement, the Company makes sales on a recourse basis, requiring the Company to repurchase the participation interest in the event of default by the borrower.
During the three months ended March 31, 2023, the Company sold two loan participations for $7 thousand to ACCU under the provisions of the Master LP Agreement. Due to the recourse provisions of the agreement, these participation sales are classified as secured borrowings and are presented as part of other secured borrowings on the Company’s consolidated balance sheets. The Company did not sell any loan participations to ACCU under the provisions of the Master LP Agreement during the three months ended March 31, 2024.
Note 8: Foreclosed Assets
The Company’s investment in foreclosed assets consisted of one property that management valued at $301 thousand at March 31, 2024 and December 31, 2023. There was no allowance for losses on foreclosed assets at March 31, 2024 and December 31, 2023. The Company did not record any provision for losses on foreclosed assets during the three months ended March 31, 2024 and 2023.
Expenses applicable to foreclosed assets include the following (dollars in thousands):
| | | | | | |
| | For the three months ended | ||||
Foreclosed Asset Expenses |
| 2024 |
| 2023 | ||
Provision for losses | | $ | — | | $ | — |
Operating expenses | | | 10 | | | 4 |
Total foreclosed asset expenses | | $ | 10 | | $ | 4 |
F-42
Note 9: Premises and Equipment
The table below summarizes our premises and equipment (dollars in thousands):
| | | | | | |
| | As of | ||||
| | March 31, | | December 31, | ||
|
| 2024 |
| 2023 | ||
| | | | | | |
Furniture and office equipment | | $ | 449 | | $ | 440 |
Computer system | | | 226 | | | 221 |
Leasehold improvements | | | 43 | | | 43 |
Total premises and equipment | | | 718 | | | 704 |
Less accumulated depreciation and amortization | | | (623) | | | (648) |
Premises and equipment, net | | $ | 95 | | $ | 56 |
| | | | | | | |
| | For the three months ended | | ||||
| | March 31, | | March 31, | | ||
|
| 2024 |
| 2023 | | ||
| | | | | | | |
Depreciation and amortization expense | | $ | 17 | | $ | 11 | |
Note 10: Credit Facilities and Other Debt
Details of the Company’s debt facilities as of March 31, 2024, are as follows (dollars in thousands):
| | | | | | | | | | | | | | | | | | |
Nature of | | Interest Rate | | Interest | | Amount | | Amount Available to Borrow | | Maturity | | Amount of | | Other Assets | ||||
KCT Warehouse LOC |
| 9.00% |
| Variable |
| $ | — |
| $ | 5,000 |
| 6/6/2024 |
| $ | 6,940 |
| $ | 1,250 |
KCT Operating LOC | | 9.00% | | Variable | | | 4,500 | | | 500 | | 6/6/2024 | | | 4,993 | | | — |
ACCU LOC | | 9.25% | | Variable | | | 3,000 | | | 2,000 | | 9/23/2024 | | | 7,121 | | | — |
ACCU Secured | | Various | | Fixed | | | 7 | | | — | | Various | | | — | | | 7 |
*Represents cash or certificates of deposit | ||||||||||||||||||
KCT Lines of Credit
On September 30, 2020, Ministry Partners Investment Company, LLC, entered into a Loan and Security Agreement with KCT Credit Union, an Illinois state chartered financial institution. On June 6, 2022, the Company and KCT mutually agreed to terminate this facility and entered into two new facilities. The first facility, the KCT Warehouse LOC, is a $5.0 million short-term demand credit facility with a one-year maturity date ending on June 6, 2024. The KCT Warehouse LOC will automatically renew for another one-year term unless either party furnishes written notice at least 30 days prior to the termination
F-43
date that it does not intend to renew the agreement. The Company has secured the KCT Warehouse LOC with certain of its mortgage loan investments.
The Company may draw funds on the KCT Warehouse LOC at any time until the line is fully drawn. Repayment of each advance is due 120 days after the advance is made or earlier if a collateral loan becomes more than 60 days delinquent, and the Company fails to cure such deficiency. The interest rate on the KCT Warehouse LOC is equal to the prime rate at the time of the draw plus 0.50%. At March 31, 2024, the interest rate on the KCT Warehouse LOC was 9.00%. To secure its obligations under the KCT Warehouse LOC, the Company has agreed to grant a priority first lien and security interest in certain of its mortgage loan investments and maintain a minimum collateralization ratio measured by taking outstanding balance of mortgage notes pledged under the facility as compared to the total amount of principal owed on the KCT Warehouse LOC. The minimum ratio must equal at least 120%. The KCT Warehouse LOC also requires the Company to maintain a deposit of 25% of the total line limit to borrow on the facility. In September 2022, the Company purchased a $1.25 million certificate of deposit from KCT that satisfies this requirement. A total of $6.9 million in loans were pledged on this facility as of March 31, 2024. A total of $6.0 million in loans were pledged on this facility as of December 31, 2023. At March 31, 2024 and December 31, 2023, there were no outstanding borrowings on the KCT Warehouse LOC.
In addition, on June 6, 2022, the Company entered into an Operating Line of Credit Loan and Security Agreement with the KCT, the KCT Operating LOC. The KCT Operating LOC is a $5.0 million short-term demand credit facility with a one-year maturity date ending on June 6, 2024. The KCT Operating LOC will automatically renew for another one-year term unless either party furnishes written notice at least 30 days prior to the termination date that it does not intend to renew the agreement. The Company must secure a minimum of 25% of the line with cash while the remaining portion of the KCT Operating LOC may be secured by certain of its mortgage loan investments.
The Company may draw funds on the KCT Operating LOC at any time until the line is fully drawn. Repayment by the termination date or earlier if a collateral loan becomes more than 60 days delinquent, and the Company fails to cure such deficiency. The interest rate on the KCT Warehouse LOC is equal to the prime rate at the time of the draw plus 0.50%. At March 31, 2024, the interest rate on the KCT Warehouse LOC was 9.00%. To secure its obligations under the KCT Operating LOC, the Company has agreed to grant a priority first lien and security interest in certain of its mortgage loan investments and maintain a minimum collateralization ratio measured by taking the outstanding balance of mortgage notes pledged under the facility as compared to the total amount of principal
F-44
owed less the secured cash on the KCT Operating LOC. The minimum ratio must equal at least 120%. A total of $5.0 million in loans were pledged on this facility as of March 31, 2024. A total of $4.6 million in loans were pledged on this facility as of December 31, 2023. At March 31, 2024, there were $4.5 million in borrowings on the KCT Operating LOC. At December 31, 2023, there were no outstanding borrowings on the KCT Operating LOC.
The KCT Operating LOC and the KCT Warehouse LOC both contain typical affirmative covenants for a credit facility of this nature, including requiring that the Company maintain the pledged collateral free of liens and encumbrances, timely pay the amounts due under the facility and provide KCT with current financial statements and monthly reports. The Company will also be required to comply with certain financial covenants including maintaining a net worth of at least $5.0 million dollars, ensuring that its net worth is equal to at least 5% of its total liabilities and that it will maintain minimum liquidity that equals or exceeds 120% of the outstanding amount owed under the KCT Operating LOC and the KCT Warehouse LOC at the end of each calendar month.
ACCU Line of Credit
On September 23, 2021, Ministry Partners Investment Company, LLC, entered into a Loan and Security Agreement with ACCU. The ACCU LOC is a revolving $5.0 million short-term demand credit facility with an initial one-year maturity date of September 23, 2022. The facility was automatically renewed for an additional one-year term and now matures on September 23, 2024. The ACCU LOC will automatically renew for one additional one-year term unless either party furnishes written notice at least ninety (90) days prior to the termination date that it does not intend to renew the agreement. The facility carried an outstanding balance of $3.0 million and $4.5 million at March 31, 2024 and December 31, 2023, respectively. The interest rate on the facility is equal to the prime rate as published in the Wall Street Journal plus 0.75%. This rate is adjusted on January 10th each year to account for the current prime rate but cannot be adjusted below 4.00%. The interest rate on the ACCU LOC was 9.25% on March 31, 2024.
The Company may draw funds on the ACCU LOC at any time until the line is fully drawn. All outstanding principal and interest amounts are due on the maturity date. To secure its obligations under the ACCU LOC, the Company has agreed to grant a priority first lien and security interest in certain of its mortgage loan investments and maintain a minimum collateralization ratio measured by taking outstanding balance of mortgage notes pledged under the facility as compared to the total amount of principal owed on the ACCU LOC. The minimum ratio must equal at least 120%. The Company must also maintain minimum liquidity that always equals or exceeds $10.0 million during the term of the loan. The
F-45
ACCU LOC contains typical affirmative covenants for a credit facility of this nature. The Company was in compliance with these covenants at March 31, 2024. A total of $7.1 million and $7.2 million in loans were pledged on this facility as of March 31, 2024 and December 31, 2023, respectively.
ACCU Secured Borrowings
As detailed in “Note 3: Related Party Transactions,” on August 9, 2021, the Company entered into a Master Loan Participation Purchase and Sale Agreement with ACCU. The participations sold under the Master LP Agreement are considered secured borrowings and are presented as such on the Company’s balance sheet. $7 thousand in secured borrowings were outstanding under the Master LP Agreement as of March 31, 2024 and December 31, 2023. These borrowings have various contractual maturities ranging from 2028 to 2032.
Note 11: Debt Certificates Payable
The table below provides information on the Company’s debt certificates payable (dollars in thousands):
| | | | | | | | | | | | | | |
| | | | As of | | As of | ||||||||
| | | | March 31, 2024 | | December 31, 2023 | ||||||||
SEC Registered Public Offerings |
| Offering Type |
| Amount |
| Weighted Average Interest Rate | | Amount |
| Weighted Average Interest Rate | ||||
Class 1A Offering | | Unsecured | | $ | 10,142 | | 4.04 | % | | $ | 12,555 | | 4.19 | % |
2021 Class A Offering | | Unsecured | | | 66,240 | | 4.96 | % | | | 69,421 | | 4.95 | % |
2024 Class A Offering | | Unsecured | | | 4,799 | | 5.01 | % | | | — | | — | % |
Public Offering Total | | | | $ | 81,181 | | 4.55 | % | | $ | 81,976 | | 4.83 | % |
| | | | | | | | | | | | | | |
Private Offerings | | Offering Type | | | | | | | | | | | | |
Subordinated Notes | | Unsecured | | $ | 14,539 | | 4.83 | % | | $ | 15,055 | | 4.76 | % |
Private Offering Total | | | | $ | 14,539 | | 4.83 | % | | $ | 15,055 | | 4.76 | % |
| | | | | | | | | | | | | | |
Total Debt Certificates Payable | | | | $ | 95,720 | | 4.60 | % | | $ | 97,031 | | 4.82 | % |
F-46
Future maturities for the Company’s debt certificates during the twelve-month periods ending March 31, are as follows (dollars in thousands):
| | | |
2025 |
| $ | 46,638 |
2026 | | | 22,958 |
2027 | | | 18,359 |
2028 | | | 3,860 |
2029 | | | 3,905 |
Total | | $ | 95,720 |
Debt issuance costs | | | 130 |
Debt certificates payable, net of debt issuance costs | | $ | 95,590 |
Debt issuance costs related to the Company’s debt certificates payable, net of amortization, were $130 thousand and $52 thousand at March 31, 2024 and December 31, 2023, respectively.
The debt certificates are payable to investors who have purchased the securities. Debt certificates pay interest at stated spreads over an index rate. At their option, the investor may reinvest the interest or have the interest paid to them. The Company may repurchase all or a portion of an outstanding debt certificate at any time at its sole discretion. In addition, the Company may permit an investor to redeem all or a portion of a debt certificate prior to maturity at its sole discretion.
SEC Registered Public Offerings
Class 1A Offering
In February 2018, the Company launched its Class 1A Notes Offering. Pursuant to a Registration Statement declared effective on February 27, 2018, the Company registered $90 million of its Class 1A Notes in two series – fixed and variable notes. The Class 1A Notes are unsecured. The interest rate paid on the Fixed Series Notes is determined in reference to a Constant Maturity Treasury Index published by the U.S. Department of Treasury (“CMT Index”) in effect on the date that the note is issued plus a rate spread as described in the Company’s Class 1A Prospectus. The variable index in effect on the date the interest rate is set determines the interest rate paid on a Variable Series Note. The CMT Index refers to the Constant Maturity Treasury rates published by the U.S. Department of Treasury for actively traded Treasury securities. The variable index is equal to the 3-month LIBOR rate. The Class 1A Notes contain restrictive covenants pertaining to paying dividends, making redemptions, acquiring, purchasing, or making certain payments, requiring the maintenance of minimum tangible net worth, limitations on the issuance of additional notes, and incurring of indebtedness. The Company is in compliance with these covenants as of March 31, 2024 and December 31, 2023. The Company issued the
F-47
Class 1A Notes under a Trust Indenture entered into by and between the Company and U.S. Bank. The Class 1A Offering expired on December 31, 2020.
2021 Class A Offering
In January 2021, the Company launched its 2021 Class A Notes Offering. Pursuant to a Registration Statement declared effective on January 8, 2021, the Company registered $125 million of its 2021 Class A Notes in two series – fixed and variable notes. The 2021 Class A Notes are unsecured. Like the Class 1A Notes Offering, the interest rate paid on the Fixed Series Notes is determined in reference to a CMT Index published by the U.S. Department of Treasury in effect on the date that the note is issued plus a rate spread as described in the Company’s 2021 Class A Prospectus. The variable index in effect on the date the interest rate is set determines the interest rate paid on a Variable Series Note. The CMT Index refers to the Constant Maturity Treasury rates published by the U.S. Department of Treasury for actively traded Treasury securities. The variable index is equal to the 3-month LIBOR rate but was replaced by the Secured Overnight Financing Rate (“SOFR”) effective as of July 1, 2023. The Federal Reserve Bank of New York establishes the SOFR, with adjustments made as deemed appropriate. The 2021 Class A Notes contain restrictive covenants pertaining to paying dividends, making redemptions, acquiring, purchasing, or making certain payments, requiring the maintenance of minimum tangible net worth, limitations on the issuance of additional notes, and incurring of indebtedness. The Company is in compliance with these covenants as of March 31, 2024 and December 31, 2023. The Company issued the 2021 Class A Notes under a Trust Indenture entered into by and between the Company and U.S. Bank.
F-48
2024 Class A Offering
In February 2024, the Company launched its 2024 Class A Debt Certificates Offering. Pursuant to a Registration Statement declared effective on February 5, 2024, the Company registered $200 million of its 2024 Class A Debt Certificates in two series – fixed and variable debt certificates. The 2024 Class A Debt Certificates are unsecured. The interest rate paid on the Fixed Series Debt Certificates is determined in reference to a CMT Index published by the U.S. Department of Treasury in effect as of the first business day of the month in which the note is issued plus a rate spread as described in the Company’s 2024 Class A Prospectus. The CMT Index refers to the Constant Maturity Treasury rates published by the U.S. Department of Treasury for actively traded Treasury securities. The variable index in effect on the date the interest rate is set determines the interest rate paid on a Variable Series Debt Certificate. The variable index is equal to the SOFR for three-month financial obligations. The 2024 Class A Certificates contain restrictive covenants pertaining to paying dividends, making redemptions, acquiring, purchasing, or making certain payments, requiring the maintenance of minimum tangible net worth, limitations on the issuance of additional notes, and incurring of indebtedness. The Company is in compliance with these covenants as of March 31, 2024. The Company issued the 2024 Class A Debt Certificates under a Trust Indenture entered into between the Company and U.S. Bank.
Private Offerings
Series 1 Subordinated Capital Notes (“Subordinated Notes”)
In July 2022, the Company renewed the offer and sale of its Subordinated Notes initially launched in February 2013. The Company offers the notes pursuant to a limited private offering to qualified investors that meet the requirements of Rule 506 of Regulation D. The Company offers the Subordinated Notes with maturity terms from 12 to 60 months at an interest rate fixed on the date of issuance, as determined by the then current seven-day average rate reported by the U.S. Federal Reserve Board for interest rate swaps.
Under the Subordinated Notes offering, the Company is subject to certain covenants, including limitations on restricted payments, limitations on the dollar amount of notes that it can sell, restrictions on mergers and acquisitions, and proper maintenance of books and records. The Company was in compliance with these covenants as of March 31, 2024 and December 31, 2023.
F-49
Note 12: Commitments and Contingencies
Unfunded Commitments
The Company is a party to credit-related financial instruments with off-balance-sheet risk in the normal course of business to meet the financing needs of its customers. These financial instruments include un-advanced lines of credit and standby letters of credit. Such commitments may involve elements of credit and interest rate risk that is greater than the amount stated on the balance sheet.
The contractual amount of these commitments represents the Company’s exposure to credit loss. The Company uses the same credit policies in making commitments as it does for on-balance-sheet instruments.
The table below shows the outstanding financial instruments whose contract amounts represent credit risk (dollars in thousands):
| | | | | | |
| | Contract Amount at: | ||||
|
| March 31, 2024 |
| December 31, 2023 | ||
Undisbursed loans | | $ | 478 | | $ | 221 |
Standby letter of credit | | | 2,000 | | | — |
Undisbursed loans are commitments for potential future extensions of credit to existing customers. These loans are sometimes unsecured, and the borrower may not necessarily draw upon the line the total amount of the commitment. Commitments to extend credit generally carry variable rates.
Upon the adoption of CECL on January 1, 2023, the Company made an adjustment to retained earnings of $1 thousand based on its calculation of the estimated losses in its undisbursed loan commitments. This calculation includes an analysis of the risk presented by the loans on which there exist unfunded commitments as well as the probability that those funds will be disbursed. This estimate is subject to change as the commitments mature or are drawn upon. The balance of the allowance for credit losses on off-balance sheet commitments is recorded in other liabilities on the Company’s consolidated balance sheet.
F-50
The following table details activity in the allowance for credit losses on off-balance sheet commitments (dollars in thousands):
| | | | | | |
| | Three months ended | | Year ended | ||
|
| March 31, 2024 |
| December 31, 2023 | ||
Balance, beginning of period | | $ | 2 | | $ | — |
Adjustment related to implementation of CECL model | | | — | | | 1 |
Provision for losses on unfunded commitments | | | — | | | 1 |
Balance, end of period | | $ | 2 | | $ | 2 |
Operating Leases
The Company has a lease agreement for its offices in Brea, California and a vehicle used by executive management. In February 2024, the Company reached an agreement with Olen Pointe Brea Corp. to lease new office space in Brea. The lease agreement commenced on March 15, 2024, with a provision for early possession of the premises effective February 29, 2024. The agreement expires on July 31, 2029. The agreement provides for rent payments beginning at $6,790 per month with annual increases, as well as provisions for a proportional share of operating costs. The agreement also includes one option to extend the lease for an additional five-year term. The calculation of the right-of-use asset for this lease agreement did not include this option to extend, as the Company has not determined that it is likely it will exercise the option. The Company recorded $387 thousand in right-of-use assets and lease liabilities related to this lease. The Company used its incremental borrowing rates to determine the discount rates used in the asset calculations.
In April 2022, the Company signed a three-year lease renewal agreement for its Fresno office beginning May 1, 2022, and terminating April 30, 2025. The agreement does not contain any options to renew. The lease payments associated with the renewal have been included in the future minimum lease payments table below. The Company has determined that all of its leases are operating leases.
F-51
The table below presents information regarding our existing operating leases (dollars in thousands):
| | | | | | | | | | | |
| | For the | | ||||||||
| | Three months ended | | Year ended | | ||||||
| | March 31, | | | December 31, | | |||||
|
| 2024 |
| 2023 |
| | 2023 | | |||
Lease cost | | | | | | | | | | | |
Operating lease cost | | $ | 45 | | $ | 44 | | | $ | 176 | |
Other information | | | | | | | | | | | |
Cash paid for operating leases | | | 13 | | | 51 | | | | 190 | |
Right-of-use assets obtained in exchange for operating lease liabilities | | | 387 | | | — | | | | — | |
Lease liabilities recorded | | | 387 | | | — | | | | — | |
Weighted average remaining lease term (in years) | | | 4.80 | | | 1.27 | | | | 1.24 | |
Weighted-average discount rate | | | 4.60 | % | | 4.28 | % | | | 3.64 | % |
Future minimum lease payments and lease costs for the twelve months ending March 31, are as follows (dollars in thousands):
| | | | | | |
|
| Lease Payments |
| Lease Costs | ||
2025 | | $ | 89 | | $ | 117 |
2026 | | | 87 | | | 84 |
2027 | | | 87 | | | 82 |
2028 | | | 89 | | | 82 |
2029 | | | 92 | | | 82 |
Thereafter | | | 31 | | | 27 |
Total | | $ | 475 | | $ | 474 |
Note 13: Preferred and Common Units under LLC Structure
Holders of the Series A Preferred Units are entitled to receive a quarterly cash dividend that is 25 basis points higher than the one-year LIBOR rate in effect on the last day of the calendar month for which the preferred return is approved. The UK Financial Conduct Authority announced on December 4, 2020, that the USD LIBOR for 1, 3, 6, and 12 months will no longer be published after June 30, 2023. Effective as of July 1, 2023, the Company uses the SOFR as established by the Federal Reserve Bank of New York. In addition to the quarterly cash dividend, the Company has also agreed to set aside an annual amount equal to 10% of its net profits earned for any year, after subtracting from profits the quarterly Series A Preferred Unit dividends paid, for distribution to its Series A Preferred Unit holders.
The Series A Preferred Units have a liquidation preference of $100 per unit and have no voting rights. They are also subject to redemption in whole or in part at the Company’s election on December 31 of any year for an amount equal to the liquidation preference of
F-52
each unit, plus any accrued and declared but unpaid quarterly dividends and preferred distributions on such units. The Series A Preferred Units have priority as to earnings and distributions over the Common Units. The resale of the Company’s Series A Preferred Units and Common Units are subject to the Company’s first right of refusal to purchase units proposed to be transferred. Upon the Company’s failure to pay quarterly dividends for four consecutive quarters, the holders of the Series A Preferred Units have the right to appoint two managers to the Company’s Board of Managers.
The Class A Common Units have voting rights, but have no liquidation preference or rights to dividends, unless declared.
Note 14: Retirement Plans
401(k)
All the Company’s employees are eligible to participate in the Automated Data Processing, Inc. (“ADP”) 401(k) plan effective as of the date their employment commences. No minimum service is required, and the minimum age is 21. Each employee may elect voluntary contributions not to exceed 86% of salary, subject to certain limits based on U.S. tax law. The plan has a matching program, which qualifies as a Safe Harbor 401(k) plan. As a Safe Harbor Section 401(k) plan, the Company matches each eligible employee’s contribution, dollar for dollar, up to 3% of the employee’s compensation, and 50% of the employee’s contribution that exceeds 3% of their compensation, up to a maximum contribution of 5% of the employee’s compensation. Company matching contributions for the three months ended March 31, 2024 and 2023 were $16 thousand and $29 thousand, respectively.
Profit Sharing
The profit-sharing plan is for all employees who, at the end of the calendar year, are at least 21 years old, still employed, and have at least 900 hours of service during the plan year. The Company’s Board of Managers determines the amount annually contributed on behalf of each qualified employee. The Company determines the amount by calculating it as a percentage of the eligible employee’s annual earnings. Plan forfeitures are used to reduce the Company’s annual contribution. The Company did not make or approve a profit-sharing contribution for the three months ended March 31, 2024 and 2023.
F-53
Supplemental Executive Retirement Plan
On March 30, 2022, the Company entered into a SERP with its former President and Chief Executive Officer, Joseph W. Turner, Jr. The SERP is an unfunded non-qualified plan that is intended to provide Mr. Turner with a fixed benefit over a ten-year period after Mr. Turner incurs a separation from service with the Company. The SERP has been established as a supplemental retirement and death benefits arrangement that conforms with the provisions of Section 409(A) of the Internal Revenue Code.
For purposes of the SERP, Mr. Turner’s accrued benefit is subject to a maximum sum of $600,000, with payments made annually in equal monthly installments over a ten-year period. The agreement was amended in 2023 to change the vesting date of the benefits to December 2023. When Mr. Turner retired on December 15, 2023, the entire amount of this benefit had vested. Mr. Turner is entitled to receive $60,000 per year over a ten-year period, payable in equal monthly installments commencing the first day of the month following his separation from service. As Mr. Turner is currently performing consulting services for the Company, the Company does not expect his separation from service to occur until July 2024.
Note 15: Fair Value Measurements
Fair Value Measurements Using Fair Value Hierarchy
The Company classifies measurements of fair value within a hierarchy based upon inputs that give the highest priority to quoted prices in active markets for identical assets or liabilities and the lowest priority to unobservable inputs. The fair value hierarchy is as follows:
| ● | Level 1 inputs are quoted prices (unadjusted) for identical assets or liabilities in active markets. |
| ● | Level 2 inputs include: |
| o | quoted prices for similar assets and liabilities in active markets, |
| o | quoted prices for identical assets and liabilities in inactive markets, |
| o | inputs that are observable for the asset or liability (such as interest rates, prepayment speeds, credit risks, etc.); or |
F-54
| o | inputs that are derived principally from or corroborated by observable market data by correlation or by other means. |
| ● | Level 3 inputs are unobservable and reflect an entity’s own assumptions about the assumptions that market participants would use in pricing the assets or liabilities. |
In certain cases, the inputs used to measure fair value of an asset or liability may fall into multiple levels of the fair value hierarchy. However, in these cases, the asset or liability is classified to only one level of the hierarchy. To determine which level of the hierarchy the asset or liability is classified as a whole, the Company uses the lowest level input that is significant to the fair value measurement in its entirety. The Company’s assessment of the significance of a particular input to the fair value measurement in its entirety requires judgment and considers factors specific to the asset or liability.
F-55
Fair Value of Financial Instruments
The following tables show the carrying amounts and estimated fair values of the Company’s financial instruments (dollars in thousands):
| | | | | | | | | | | | | | | |
| | | | | Fair Value Measurements at March 31, 2024 using | ||||||||||
|
| Carrying |
| Quoted Prices |
| Significant |
| Significant |
| Fair Value | |||||
FINANCIAL ASSETS: | | | | | | | | | | | | | | | |
Cash and restricted cash | | $ | 12,953 | | $ | 12,953 | | $ | — | | $ | — | | $ | 12,953 |
Certificates of deposit | | | 1,251 | | | — | | | 1,251 | | | — | | | 1,251 |
Loans, net | | | 99,901 | | | — | | | — | | | 97,407 | | | 97,407 |
Investment in joint venture | | | 870 | | | — | | | — | | | 870 | | | 870 |
Other investments | | | 1,053 | | | — | | | — | | | 1,053 | | | 1,053 |
Accrued interest receivable | | | 464 | | | — | | | — | | | 464 | | | 464 |
Servicing assets | | | 88 | | | — | | | — | | | 88 | | | 88 |
FINANCIAL LIABILITIES: | | | | | | | | | | | | | | | |
Lines of credit | | $ | 7,500 | | $ | — | | $ | — | | $ | 7,500 | | $ | 7,500 |
Other secured borrowings | | | 7 | | | — | | | — | | | 7 | | | 7 |
Debt certificates payable | | | 95,590 | | | — | | | — | | | 95,624 | | | 95,624 |
Other financial liabilities | | | 514 | | | — | | | — | | | 514 | | | 514 |
| | | | | | | | | | | | | | | |
| | | | | Fair Value Measurements at December 31, 2023 using | ||||||||||
|
| Carrying |
| Quoted Prices |
| Significant |
| Significant |
| Fair Value | |||||
FINANCIAL ASSETS: | | | | | | | | | | | | | | | |
Cash and restricted cash | | $ | 12,611 | | $ | 12,611 | | $ | — | | $ | — | | $ | 12,611 |
Certificates of deposit | | | 1,279 | | | — | | | 1,275 | | | — | | | 1,275 |
Loans, net | | | 98,573 | | | — | | | — | | | 95,913 | | | 95,913 |
Investments in joint venture | | | 871 | | | — | | | — | | | 871 | | | 871 |
Other investments | | | 1,052 | | | — | | | — | | | 1,052 | | | 1,052 |
Accrued interest receivable | | | 432 | | | — | | | — | | | 432 | | | 432 |
Servicing assets | | | 98 | | | — | | | — | | | 98 | | | 98 |
FINANCIAL LIABILITIES: | | | | | | | | | | | | | | | |
Lines of credit | | $ | 4,500 | | $ | — | | $ | — | | $ | 4,501 | | $ | 4,501 |
Other secured borrowings | | | 7 | | | — | | | — | | | 7 | | | 7 |
Debt certificates payable | | | 96,979 | | | — | | | — | | | 97,399 | | | 97,399 |
Other financial liabilities | | | 531 | | | — | | | — | | | 531 | | | 531 |
Management uses judgment in estimating the fair value of the Company’s financial instruments; however, there are inherent weaknesses in any estimation technique. Therefore, for substantially all financial instruments, the fair value estimates presented
F-56
herein are not necessarily indicative of the amounts the Company could have realized in a sales transaction at March 31, 2024 and December 31, 2023.
The Company used the following methods and assumptions to estimate the fair value of financial instruments:
Cash and restricted cash – The carrying amounts reported in the balance sheets approximate fair value for cash.
Certificates of deposit – Management estimates fair value by using a present value discounted cash flow with a discount rate approximating the current market rate for similar assets. Management classifies certificates of deposits as Level 2 of the fair value hierarchy.
Loans (other than collateral-dependent impaired loans) – Management estimates fair value by discounting the future cash flows of the loans. The discount rate the Company uses is the current average rates at which it would make loans to borrowers with similar credit ratings and for the same remaining maturities.
Investments in joint venture – Management estimates fair value by analyzing the operations and marketability of the underlying investment to determine if the investment is other-than-temporarily impaired.
Other investments – Management estimates fair value by determining whether there is an indication of potential lack of performance on the part of the insurance companies in which the investments are made, and whether those indications would impair the investments.
Accrued interest receivable - The carrying amounts reported in the balance sheets approximate fair value for accrued interest receivable. The Company has made the accounting policy election not to measure an allowance for credit losses on accrued interest receivable amounts as the Company writes off accrued interest receivable when a loan is 90 days past due or interest is otherwise considered uncollectible.
Servicing assets – Servicing assets are included in other assets on the balance sheets. The carrying amounts reported in the balance sheets approximate fair value for servicing assets.
Debt certificates payable – Management estimates the fair value of fixed maturity notes by discounting the future cash flows of the notes. The discount rate the Company uses is the rates currently offered for debt certificates payable of similar remaining maturities. Company management estimates the discount rate by using market rates that reflect the interest rate risk inherent in the notes.
F-57
Lines of Credit, Term-debt, Other Secured Borrowings – Management estimates the fair value of borrowings from financial institutions discounting the future cash flows of the borrowings. The discount rate the Company uses is the current incremental borrowing rate for similar types of borrowing arrangements.
Off-Balance Sheet Instruments – Management determines the fair value of loan commitments on fees currently charged to enter into similar agreements, taking into account the remaining term of the agreements and the counterparties’ credit standing. The fair value of loan commitments is insignificant at March 31, 2024 and December 31, 2023.
Fair Value Measured on a Nonrecurring Basis
The Company measures certain assets at fair value on a nonrecurring basis. On these assets, the Company only makes fair value adjustments in certain circumstances (for example, when there is evidence of impairment).
The following table presents the fair value of assets measured on a nonrecurring basis (dollars in thousands):
| | | | | | | | | | | | |
| | Fair Value Measurements Using: | | | ||||||||
|
| Quoted Prices |
| Significant |
| Significant |
| Total | ||||
Assets at March 31, 2024: | | | | | | | | | | | | |
Collateral-dependent impaired loans (net of allowance and discount) | | $ | — | | $ | — | | $ | 2,870 | | $ | 2,870 |
Investment in joint venture | | | — | | | — | | | 870 | | | 870 |
Other investments | | | — | | | — | | | 1,053 | | | 1,053 |
Foreclosed assets (net of allowance) | | | — | | | — | | | 301 | | | 301 |
Total | | $ | — | | $ | — | | $ | 5,094 | | $ | 5,094 |
| | | | | | | | | | | | |
Assets at December 31, 2023: | | | | | | | | | | | | |
Collateral-dependent loans (net of allowance and discount) | | $ | — | | $ | — | | $ | 2,896 | | $ | 2,896 |
Investments in joint venture | | | — | | | — | | | 871 | | | 871 |
Other investments | | | — | | | — | | | 1,052 | | | 1,052 |
Foreclosed assets (net of allowance) | | | — | | | — | | | 301 | | | 301 |
Total | | $ | — | | $ | — | | $ | 5,120 | | $ | 5,120 |
Impaired Loans
The Company measures impaired loans at fair value on a nonrecurring basis. Once a loan is considered impaired, the fair value is measured using one of several methods, including
F-58
collateral liquidation value, the market value of similar debt, or discounted cash flows. Most often management uses the fair value of the underlying real estate collateral to value impaired loans. Such fair values are obtained using independent appraisals, which the Company considers to be Level 3 inputs. The range of these discounts is shown in the table below.
Foreclosed Assets
The Company initially records real estate acquired through foreclosure or other proceedings (foreclosed assets) at fair value at the date of foreclosure less estimated costs of disposal, which establishes a new cost. After foreclosure, management periodically performs valuations on foreclosed assets. The Company carries foreclosed assets held for sale at the lower of cost or fair value, less estimated costs of disposal. The fair values of real properties initially are determined based on appraisals. Management may adjust the appraised values for a range of factors including age of the appraisal, age of comparable properties included in the appraisal, and known changes in the market or in the collateral. The Company makes subsequent valuations of the real properties based either on management estimates or on updated appraisals. If management makes significant adjustments to appraised values based on unobservable inputs, the Company categorizes foreclosed assets under Level 3. Otherwise, if management bases the foreclosed assets’ value on recent appraisals and the only adjustments made are for known contractual selling costs, the Company will categorize the foreclosed assets under Level 2.
Other Investments
Other investments comprise two indexed annuity insurance contracts. The Company measures fair value on its annuity investments on a nonrecurring basis. On these assets, the Company only makes fair value adjustments when there is evidence of impairment. As the principal amounts and recognized income on the annuities is guaranteed, only impairment of the assets would indicate a degradation in their fair value. The Company concluded that no impairment of the annuity investments existed at March 31, 2024 and December 31, 2023. As such, the Company has determined that the carrying value of its other investments equals its fair value at March 31, 2024 and December 31, 2023.
F-59
The table below summarizes the valuation methodologies used to measure the fair value adjustments for Level 3 assets recorded at fair value on a nonrecurring basis (dollars in thousands):
| | | | | | | | | |
March 31, 2024 | |||||||||
Assets |
| Fair Value |
| Valuation |
| Unobservable |
| Range | |
Impaired Loans | | $ | 2,870 | | Discounted appraised value | | Selling cost / Estimated market decrease | | 10% (10%) |
Investment in joint venture | | | 870 | | Internal evaluations | | Estimated future market value | | 0% (0%) |
Other investments | | | 1,053 | | Internal evaluations | | Indications of non-performance by insurance companies | | 0% (0%) |
Foreclosed Assets | | | 301 | | Internal evaluations | | Selling cost | | 6% (6%) |
| | | | | | | | | |
December 31, 2023 | |||||||||
Assets |
| Fair Value |
| Valuation |
| Unobservable |
| Range | |
Impaired loans | | $ | 2,896 | | Discounted appraised value | | Selling cost / Estimated market decrease | | 10% (10%) |
Investments in joint venture | | | 871 | | Internal evaluations | | Estimated future market value | | 0% (0%) |
Other investments | | | 1,052 | | Internal evaluations | | Indications of non-performance by insurance companies | | 0% (0%) |
Foreclosed assets | | | 301 | | Internal evaluations | | Selling cost | | 6% (6%) |
Note 16: Income Taxes and State LLC Fees
MPIC is subject to a California gross receipts LLC fee of approximately $12,000 per year, and the state minimum franchise tax of $800 per year. MP Securities is subject to a California gross receipts LLC fee of approximately $6,000 and the state minimum franchise tax of $800 per year.
MP Realty incurred a tax loss for the years ended December 31, 2023, and 2022, and recorded a provision of $800 per year for the state minimum franchise tax. For the years ended December 31, 2022, and 2021, MP Realty had federal and state net operating loss carryforwards of approximately $432 thousand and $422 thousand, respectively, which begin to expire in the year 2032. Management assessed the realizability of the deferred tax asset and determined that a 100% valuation against the deferred tax asset was appropriate as of March 31, 2024 and December 31, 2023.
MPC is a private foundation that is subject to a federal excise tax on net investment income. It may reduce its federal excise tax rate from 2% to 1% by exceeding a certain payout target for the year. MPC’s provision for current federal excise tax is based on a 1%
F-60
rate on net investment income. Each year the current federal excise tax is levied on interest and dividend income and net realized gains (if any). In addition, MPC may become subject to current federal and state unrelated business income (“UBI”) tax in connection with certain activities. MPC is currently not subject to UBI. Management believes that MPC has appropriate support for the excise and other tax positions taken and, as such, does not have any uncertain tax positions that have a material impact on MPC’s financial position or change in total net assets.
Tax years ended December 31, 2020, through December 31, 2023, remain subject to examination by the Internal Revenue Service and the tax years ended December 31, 2019, through December 31, 2023, remain subject to examination by the California Franchise Tax Board and various other state jurisdictions.
Note 17: Segment Information
The Company’s reportable segments are strategic business units that each offer a unique set of products and services that differ from each other. The Company manages the segments separately because each business requires different management, personnel skills, and marketing strategies.
The Company has three reportable segments that represent the primary businesses reported in the consolidated financial statements: the finance company (the parent company), the broker-dealer (MP Securities), and the charitable organization (Ministry Partners for Christ). The finance company segment uses funds from the sale of debt certificates, income from operations, and the sale of loan participations to originate or purchase mortgage loans. The finance company also services loans. MP Securities generates fee income by selling debt certificates and other investment and insurance products, as well as providing investment advisory and financial planning services. The charitable organization, MPC, accepts contributions and makes charitable grants to Christian educational organizations.
The accounting policies applied to determine the segment information are the same as those described in the summary of significant accounting policies. Management accounts for intersegment revenues and expenses at amounts that assume the Company entered into the transaction with unrelated third parties at the current market prices at the time of the transaction. Management evaluates the performance of each segment based on net income or loss before provision for income taxes and LLC fees.
F-61
Financial information with respect to the reportable segments is as follows (dollars in thousands):
| | | | | | |
| | Three months ended | ||||
|
| March 31, 2024 |
| March 31, 2023 | ||
Revenue from external sources | | | | | | |
Finance Company* | | $ | 1,774 | | $ | 1,416 |
Broker-Dealer | | | 300 | | | 247 |
Charitable Organization | | | 20 | | | 400 |
Adjustments / Eliminations | | | (72) | | | — |
Total | | $ | 2,022 | | $ | 2,063 |
| | | | | | |
Revenue from internal sources | | | | | | |
Finance Company | | $ | — | | $ | — |
Broker-Dealer | | | 159 | | | 461 |
Charitable Organization | | | — | | | — |
Adjustments / Eliminations | | | (159) | | | (461) |
Total | | $ | — | | $ | — |
| | | | | | |
Interest expense | | | | | | |
Finance Company | | $ | 1,609 | | $ | 1,252 |
Broker-Dealer | | | — | | | — |
Charitable Organization | | | — | | | — |
Adjustments / Eliminations | | | (344) | | | (334) |
Total | | $ | 1,265 | | $ | 918 |
| | | | | | |
Total non-interest expense and provision for tax | | | | | | |
Finance Company | | $ | 750 | | $ | 961 |
Broker-Dealer | | | 407 | | | 414 |
Charitable Organization | | | 31 | | | — |
Adjustments / Eliminations | | | (30) | | | — |
Total | | $ | 1,158 | | $ | 1,375 |
| | | | | | |
Net profit (loss) | | | | | | |
Finance Company | | $ | (533) | | $ | (636) |
Broker-Dealer | | | 50 | | | 295 |
Charitable Organization | | | (10) | | | 400 |
Adjustments / Eliminations | | | 144 | | | (127) |
Total | | $ | (349) | | $ | (68) |
| | | | | | |
| | March 31, | | December 31, | ||
|
| 2024 |
| 2023 | ||
| | (Unaudited) | | (Audited) | ||
Total assets | | | | | | |
Finance Company | | $ | 110,859 | | $ | 109,724 |
Broker-Dealer | | | 5,020 | | | 4,977 |
Charitable Organization | | | 2,097 | | | 2,108 |
Other Segments | | | 57 | | | 56 |
Adjustments / Eliminations | | | (86) | | | (218) |
Total | | $ | 117,947 | | $ | 116,647 |
F-62
Note 18: Not-for-profit Subsidiary Activities
The following represent required disclosures related to the activities of MPC, the Company’s wholly owned, not-for-profit organization.
At March 31, 2024 and December 31, 2023, the Company had $341 thousand and $304 thousand, respectively in cash held in a checking account available to meet general expenditure needs for the next twelve months. This does not include $1.7 million in cash that carries permanent donor restrictions. There were no board-designated funds as of March 31, 2024 and December 31, 2023. Management believes the cash available for use by MPC is sufficient to cover its expenses.
At March 31, 2024, MPC had $2.1 million in net assets, $1.7 million of which is permanently restricted by donors. MPC earned interest income of $20 thousand during the three months ended March 31, 2024. MPC earned less than $1 thousand in interest income during the three months ended March 31, 2023. At March 31, 2024 and December 31, 2023, respectively, MPC had $358 thousand and $368 thousand, respectively, in net assets, none of which was permanently restricted by donors.
A breakdown of expenses for MPC for the three-month periods ended March 31, 2024 and 2023, is as follows:
| | | | | | |
| | Three months ended | ||||
|
| March 31, 2024 |
| March 31, 2023 | ||
Expenses | | | | | | |
Charitable grants | | $ | 30 | | $ | — |
General and administrative expenses | | | 1 | | | — |
Total | | $ | 31 | | $ | — |
The change in net assets for MPC for the three-month periods ended March 31, 2024 and 2023 is as follows:
| | | | | | |
| | Three months ended | ||||
| | March 31, 2024 |
| March 31, 2023 | ||
Change in net assets | | $ | (10) | | $ | 400 |
F-63
Item 2: Management’s Discussion and Analysis of Financial Condition and Results of Operations
The following discussion compares the results of operations for the three-month periods ended March 31, 2024 and 2023. It should be read in conjunction with our December 31, 2023, Annual Report on Form 10-K and the accompanying unaudited financial statements and Notes set forth in this report.
SAFE HARBOR CAUTIONARY STATEMENT
This Form 10-Q contains forward-looking statements regarding Ministry Partners Investment Company, LLC and our wholly owned subsidiaries, MPF, MP Realty, MPC, and MP Securities, including, without limitation, statements regarding our expectations with respect to revenue, credit losses, levels of non-performing assets, expenses, earnings, and other measures of financial performance. Statements that are not statements of historical facts may be deemed to be forward-looking statements as that term is defined in the Private Securities Litigation Reform Act of 1995. The words “anticipate”, “believe”, “estimate”, “expect”, “plan”, “intend”, “should”, “seek”, “will”, and similar expressions are intended to identify these forward-looking statements but are not the exclusive means of identifying them. These forward-looking statements reflect the current views of our management.
These forward-looking statements are not guarantees of future performance and involve certain risks and uncertainties that are subject to change based upon numerous factors (many of which are beyond our control). Such risks, uncertainties, and other factors that could cause our financial performance to differ materially from the expectations expressed in such forward-looking statements include, but are not limited to, the risks set forth in our Annual Report on Form 10-K for the year ended December 31, 2023.
As used in this quarterly report, the terms “we”, “us”, “our” or the “Company” means Ministry Partners Investment Company, LLC and our wholly owned subsidiaries, MPF, MP Realty, MP Securities, and MPC.
3
OVERVIEW
The COVID-19 pandemic prompted adjustments to the operations of the individuals, businesses, churches, and the ministries we serve. Management, however, does not perceive any material adverse impact resulting from the pandemic on the Company’s financial position or its ability to conduct business. Despite this, the long-term effects of the pandemic remain uncertain for our borrowers, investors, and clients, leading to continuous monitoring by the Company.
Inflation became a concern for the Federal Reserve Board (“FRB”) beginning in 2021 as inflation outpaced the FRB’s target rate of 2%. In response, the FRB began increasing the fed funds rate in January 2022. Since that time, the fed funds rate has increased by 525 basis points, rising from 0.25% on January 1, 2022, to 5.50% as of December 31, 2023. In its press release for its March 19th - 20th, 2024, meeting, the Federal Reserve noted, “inflation has eased notably over the past year but remains above our longer-run goal of 2 percent”. Looking ahead, the FRB's median projection for the fed funds rate at the end of 2024 is 4.6%, showing that some committee members anticipate reducing the fed funds rate as inflation approaches the FRB’s long run inflation target rate of 2%.
The Company carefully monitors the FRB’s inflation fighting strategy, as it seeks to improve its net interest margin on its interest earning investments. An inverted yield curve with higher short term rates than long term rates can also adversely affect our net interest margin and profitability. See “Trends and Strategic Objectives” and “Results of Operations: March 31, 2024-Net Income and Net Interest Margin” below.
The Company carefully monitors liquidity trends affecting U.S. financial institutions. Management has seen liquidity tighten at financial institutions in the last several years as funds injected into the market during the height of the COVID pandemic get used up. For all FDIC insured institutions the liquidity ratio has decreased 11.4% from 37.55% as of September 30, 2021, to 26.15% as of December 31, 2023. These statistics underscore the significant shift in liquidity dynamics within the banking sector, prompting the Company to remain vigilant in its monitoring efforts.
4
Trends and Strategic Objectives
For the three-month period ended March 31, 2024, and for the year ended December 31, 2023, Company management has identified the following key trends and strategic objectives:
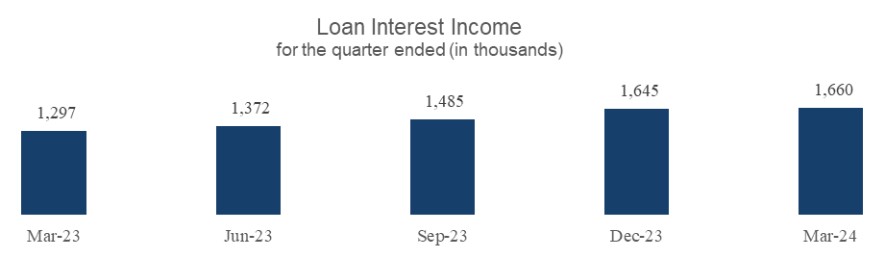
| ● | Improve Net Interest Income on Loan Investments. During the years 2020 – 2022, our strategy of downsizing the Company’s balance sheet resulted in lower interest income from our commercial loan portfolio. As we incrementally paid off our term debt facility over the preceding three years, total assets declined, and our net interest income was subsequently reduced. Company management anticipated that its debt reduction strategy would cause a short-term reduction in net interest income but believes that the long-term benefits of building capital, net equity, and eliminating debt at a discount far outweighed the costs of lower net interest income earned beginning in 2023. After paying off the debt facility, the next phase of our strategy is to regrow our loan portfolio, which we began in 2023. In 2023, we grew the interest income received on loans in each quarter over the previous quarter, for four straight quarters of growth. In the first quarter of 2024, loan interest income was also higher than the fourth quarter of 2023, resulting in five quarters of loan interest income growth. |
| ● | Building the Company’s Capital. As a result of implementing the Company’s debt reduction strategy, the Company’s capitalization and total members equity reached its highest point, up to that time, on December 31, 2022. When the Company commenced its debt reduction strategy in August 2020, its total net equity was $11.1 million. As of March 31, 2024, the Company’s total equity is $12.6 million. Company management’s purposeful strategy to eliminate the Company’s long-term debt has strengthened our capitalization, our net equity, and has provided our investors with a stronger financial company that supports our debt certificates program. |
5
| ● | Improving Core Business Profitability. Over the past three years, the Company’s net income from operations has primarily relied upon income generated through gains reported from discounted principal paydowns made on our term debt facility at a discount. The Company’s intentional strategy of using available cash resources to incrementally reduce our term debt resulted in having less cash resources available to make loan investments. We have begun to rebuild our loan portfolio and as noted above we have grown our quarter over quarter loan interest income for the last five quarters. This growth is mostly due to the increase in loans receivable and to a lesser extent an increase in the interest rates of existing adjustable rate loans. For the three months ended March 31, 2024, we had a net loss of ($349) thousand. While this loss exceeded our March 31, 2023, reported net loss of ($68) thousand, our core profitability improved by $119 thousand. This is because in the first quarter of 2023 we received $400 thousand in a charitable gift that is not part of our core and ongoing income. |
Strategic Objectives. Now that the Company has paid off our term debt credit facility, we are focused on improving the profitability of our core business operations through making profitable commercial loans and growing our non-interest generating sources of income from our faith-based investment advisory services. During 2024, the Company intends to focus on the following objectives:
| (i) | Investing in and growing our commercial loan investments through loan originations, purchase of loan participation interests, and cooperative efforts with our strategic partners to increase the commercial loans we make to non-profit organizations and faith-based owners; |
(ii) | Continuing our efforts to reduce non-interest expenses by reducing overhead expense; |
(iii) | Increasing the sale of our debt certificates to finance the growth in the Company’s balance sheet; |
(iv) | Effectively managing pressures on the Company’s net interest margin on its loan investments in response to an inverted yield curve in financial markets that results in higher short-term costs on our debt certificates while the Company makes longer term investments with the commercial loans it originates; and |
(v) | Continuously expanding the revenues earned by the investment advisory, broker-dealer, and insurance operations at Ministry Partners Securities, LLC. |
6
Financial Condition
Comparison of Financial Condition on March 31, 2024 and December 31, 2023
| | | | | | | | | | | |
| | | | | | | | Comparison | |||
|
| 2024 |
| 2023 |
| $ Difference |
| % Difference | |||
| | (Unaudited) | | (Audited) | | | | | | ||
| | (dollars in thousands) | | | | | | ||||
Assets: | | | | | | | | | | | |
Cash | | $ | 11,193 | | $ | 10,854 | | $ | 339 | | 3% |
Restricted cash | | | 1,760 | | | 1,757 | | | 3 | | 0% |
Certificates of deposit | | | 1,251 | | | 1,279 | | | (28) | | (2%) |
Loans receivable, net of allowance for expected credit losses of $1,449 and $1,501 as of March 31, 2024 and December 31, 2023, respectively | | | 99,901 | | | 98,573 | | | 1,328 | | 1% |
Accrued interest receivable | | | 464 | | | 432 | | | 32 | | 7% |
Investment in joint venture | | | 870 | | | 871 | | | (1) | | (0%) |
Other investments | | | 1,053 | | | 1,052 | | | 1 | | 0% |
Property and equipment, net | | | 95 | | | 56 | | | 39 | | 70% |
Foreclosed assets, net | | | 301 | | | 301 | | | — | | —% |
Servicing assets | | | 88 | | | 98 | | | (10) | | (10%) |
Other assets | | | 971 | | | 1,374 | | | (403) | | (29%) |
Total assets | | $ | 117,947 | | $ | 116,647 | | $ | 1,300 | | 1% |
Liabilities and members’ equity | | | | | | | | | | | |
Liabilities: | | | | | | | | | | | |
Lines of credit | | $ | 7,500 | | $ | 4,500 | | $ | 3,000 | | 100% |
Other secured borrowings | | | 7 | | | 7 | | | — | | 100% |
Debt certificates payable, net of debt issuance costs of $130 and $52 as of March 31, 2024 and December 31, 2023, respectively | | | 95,590 | | | 96,979 | | | (1,389) | | (1%) |
Accrued interest payable | | | 361 | | | 383 | | | (22) | | (6%) |
Other liabilities | | | 1,896 | | | 1,683 | | | 213 | | 13% |
Total liabilities | | | 105,354 | | | 103,552 | | | 1,802 | | 2% |
Members' Equity: | | | | | | | | | | | |
Series A preferred units | | | 11,715 | | | 11,715 | | | — | | —% |
Class A common units | | | 1,509 | | | 1,509 | | | — | | —% |
Net assets of Ministry Partners for Christ, with donor restrictions | | | 1,700 | | | — | | | 1,700 | | —% |
Accumulated equity | | | (2,331) | | | (129) | | | (2,202) | | 1707% |
Total members' equity | | | 12,593 | | | 13,095 | | | (502) | | (4%) |
Total liabilities and members' equity | | $ | 117,947 | | $ | 116,647 | | $ | 1,300 | | 1% |
Cash and Loans
As discussed previously our strategy is to grow our balance sheet and our loan portfolio to increase our net interest income. We plan to rely on the sale of our debt certificates to fund the growth of our on-book loan portfolio and from time to time may supplement that growth by utilizing our lines of credit. For the three months ended March 31, 2024, assets grew 1% due to utilizing $3 million on our line of credit. This was offset by a reduction in our debt certificates payable of $1.4 million. As of March 31, 2024, these funds were invested in both cash and our loan portfolio. Our cash balances grew by $339 thousand, and our net loans receivable grew by $1.3 million. Our loans receivable
7
portfolio grew due to loan purchases of $10 thousand and loan originations of $3.1 million. For the remainder of the year, we expect to invest in our loan receivable portfolio by originating new loans as well as purchasing loans from other financial institutions. While we plan to grow our loan portfolio, we may also sell participation loans in order to facilitate larger origination transactions or for other operational needs.
Allowance for Expected Credit Losses
On January 1, 2023, the Company adopted FASB Accounting Standards Update (ASU) No. 2016-13, Financial Instruments - Credit Losses (Topic 326): Measurement of Credit Losses on Financial Instruments. CECL is an expected loss model which considers an allowance that accounts for all losses expected to be incurred over the life of the assets in the portfolio. The CECL model requires the measurement of all expected credit losses for financial assets measured at amortized cost and certain off-balance sheet credit exposures based on historical experiences, current conditions, and reasonable and supportable forecasts.
In accordance with ASU No. 2019-04, the Company has made the accounting policy election not to measure an allowance for credit losses on accrued interest receivable amounts. This is allowable if the Company writes off uncollectible accrued interest receivable when a loan is 90 days past due or interest is otherwise considered uncollectible. The Company has also elected to continue to present accrued interest on its loans receivable separately on its consolidated balance sheet. See “Note 1” in the “Notes to Consolidated Financial Statements” in the section titled “Allowance for Expected Credit Losses” for additional information.
Debt Certificates Payable
Our debt certificates payable consist of securities sold under publicly registered security offerings as well as promissory notes sold in private placement offerings.
In February 2024, the Company launched its 2024 Class A Debt Certificates Offering. Like its other public offerings, the 2024 Class A Debt Certificates are unsecured and offered in two series – fixed and variable debt certificates. For more details on this offering see Note 11 in the “Notes to Consolidated Financial Statements”.
For the three months ended March 31, 2024, net debt certificates payable decreased by $1.4 million. Despite the decrease for the quarter, the total debt certificates are close to the all-time highwater mark of $97 million as of December 31, 2023. Management continues to invest in marketing and relationship-building efforts to further grow our unsecured debt in order to fund ministry loans. Over the last several years, we have expanded our debt certificates program by building relationships with other faith-based organizations whereby we can offer our various debt certificates products to these organizations and the ministries they serve. Concurrently, MP Securities has continued to increase
8
its retail customer base through client referrals and its networking agreements with key strategic partners.
Members’ Equity
Our total members’ equity decreased by 4% to $12.6 million for the three months ended March 31, 2024, which resulted in a capital to asset ratio of 10.7%. The decrease in members’ equity was attributable to a net loss of ($349) thousand and dividends to members of $153 thousand.
9
Liquidity and Capital Resources
Liquidity Management
Our Board of Managers approves our liquidity policy. The policy sets a minimum liquidity ratio and has a contingency protocol if our liquidity falls below the minimum. Our liquidity ratio was 13% at March 31, 2024, which is above the minimum set by our policy. Our management team regularly prepares cash flow forecasts that we rely upon to ensure that we have sufficient liquidity to conduct our business. While we believe that these expected cash inflows and outflows are reasonable, we can give no assurances that our forecasts or assumptions will prove to be correct. Management believes that we hold adequate sources of liquidity to meet our liquidity needs and have the means to generate more liquidity if necessary.
Growing Liquidity Sources
In 2022, the Company expanded its lines of credit available at financial institutions to three lines with a total of $15 million in credit available. As of March 31, 2024, we had $7.5 million outstanding balance on our lines of credit and had $7.5 million available to borrow. More information on our lines of credit is available below under the section titled “Credit Facilities and Other Borrowings.”
The Company is also continuing to expand its sale of its investor debt certificates through additional marketing and relationship-building activities. However, as described earlier, our investor debt certificates decreased by $1.4 million during the three months ended March 31, 2024. This was due to a couple of anticipated non-renewal of notes at maturity, however, our total debt securities outstanding remain close to our all-time highwater mark of $97 million as of December 31, 2023.
We have also sold loan participations to generate liquidity and believe we can generate additional funding from this source in the future. In 2024 we plan on selling loan participations to facilitate the origination of loans that are larger than the amount management prefers to keep on our balance sheet or for other operational reasons. We limit the size of loans we keep on the balance sheet to reduce the risk of being over concentrated on any one loan.
10
Public and Privately offered Debt Securities
The table below presents a schedule of our maturing debt certificates during the next year, including those that are immediately redeemable by investors, as compared with debt certificates maturing after one year (dollars in thousands):
| | | |
Redeemable debt certificates |
| $ | 6,367 |
Debt certificates maturing in the next 12 months | | | 46,419 |
Debt certificates maturing after 12 months | | | 42,934 |
Total | | $ | 95,720 |
Debt issuance costs | | | 130 |
Debt certificates, net of debt issuance costs | | $ | 95,590 |
Historically, we have been successful in generating reinvestments by our debt certificate holders when the notes they hold mature. Our note renewal rate remains stable, and our advisory team continues to expand their clientele, which has also increased new debt certificates sales.
The table below shows the renewal rates of our maturing notes over the last three years ended December 31:
| | |
2023 |
| 82% |
2022 |
| 63% |
2021 |
| 55% |
The renewal rates for the periods ended March 31, 2024, as compared to March 31, 2023, are as follows:
| ● | Three-month period ended March 31, 2024: 54% |
| ● | Three-month period ended March 31, 2023: 83% |
The renewal rate for March 31, 2024, was lower due to two larger debt certificates that were not reinvested in a new debt certificate when they matured. Management expected these withdrawals and, as a general practice, are in contact with certificate holders well before the maturity date in order to anticipate cash flow needs.
11
Credit Facilities and Other Borrowings
The table below is a summary of the Company’s outstanding debt payable as of March 31, 2024 (dollars in thousands):
| | | | | | | | | | | | | | | | | | |
Nature of | | Interest Rate | | Interest | | Amount | | Amount Available to Borrow | | Maturity | | Amount of | | Other Assets | ||||
KCT Warehouse LOC |
| 9.00% |
| Variable |
| $ | — |
| $ | 5,000 |
| 6/6/2024 |
| $ | 6,940 |
| $ | 1,250 |
KCT Operating LOC | | 9.00% | | Variable | | | 4,500 | | | 500 | | 6/6/2024 | | | 4,993 | | | — |
ACCU LOC | | 9.25% | | Variable | | | 3,000 | | | 2,000 | | 9/23/2024 | | | 7,121 | | | — |
ACCU Secured | | Various | | Fixed | | | 7 | | | — | | Various | | | — | | | 7 |
*Represents cash or certificates of deposit | ||||||||||||||||||
We can draw up to $10 million on the revolving lines of credit. In addition, we can draw up to $5 million on the KCT Warehouse LOC to facilitate warehousing new loan originations. Each draw on the KCT Warehouse LOC needs to be paid down after 120 days. The ACCU secured borrowings comprise loan participation sales that are classified as secured borrowings and will pay down as the loans amortize.
Debt Covenants
Under our credit facility agreements and our debt certificates documents, we are obligated to comply with certain affirmative and negative covenants. Failure to comply with our covenants could require all interest and principal to become due. As of March 31, 2024, we are in compliance with our covenants on our debt certificates payable, KCT Warehouse LOC, KCT Operating LOC, and ACCU LOC.
| ● | For additional information regarding our debt certificates payable, refer to “Note 11. Debt Certificates Payable” to Part I “Financial Information” of this Report. |
| ● | For additional information on our credit facilities, refer to “Note 10. Credit Facilities” to Part I “Financial Information” of this Report. |
12
Results of Operations: March 31, 2024
The analysis below compares the Company’s results of operations for the three-month periods ended March 31, 2024 and 2023.
Net Interest Income and Net Interest Margin
Historically, our earnings have primarily depended upon our net interest income.
| ● | Net interest income is the difference between the interest income we receive from our loans and cash on deposit (“interest-earning assets”) and the interest paid on our debt certificates and borrowings. |
| ● | Net interest margin is net interest income expressed as a percentage of average total interest-earning assets. |
13
The following tables provide information, for average outstanding balances for each major category of interest earnings assets and interest-bearing liabilities, the interest income or interest expense, and the average yield or rate for the periods indicated:
| | | | | | | | | | | | | | | | | |
| | Average Balances and Rates/Yields | | ||||||||||||||
| | For the Three Months Ended March 31, | | ||||||||||||||
| | (Dollars in Thousands) | | ||||||||||||||
| | 2024 | | 2023 | | ||||||||||||
|
| Average |
| Interest |
| Average |
| Average |
| Interest |
| Average |
| ||||
Assets: | | | | | | | | | | | | | | | | | |
Interest-earning accounts with other financial institutions | | $ | 13,920 | | $ | 151 | | 4.35 | % | $ | 11,345 | | $ | 88 | | 3.15 | % |
Interest-earning loans [1] | | | 97,065 | | | 1,660 | | 6.86 | % | | 81,011 | | | 1,297 | | 6.51 | % |
Total interest-earning assets | | | 110,985 | | | 1,811 | | 6.54 | % | | 92,356 | | | 1,385 | | 6.10 | % |
Non-interest-earning assets | | | 4,407 | | | — | | — | % | | 7,304 | | | — | | — | % |
Total Assets | | $ | 115,392 | | $ | 1,811 | | 6.29 | % | $ | 99,660 | | $ | 1,385 | | 5.65 | % |
| | | | | | | | | | | | | | | | | |
Liabilities: | | | | | | | | | | | | | | | | | |
Debt certificates payable gross of debt issuance costs | | | 97,069 | | | 1,165 | | 4.81 | % | | 80,229 | | | 840 | | 4.26 | % |
Other debt | | | 3,677 | | | 83 | | 9.05 | % | | 3,007 | | | 58 | | 7.84 | % |
Total interest-bearing liabilities | | | 100,746 | | | 1,248 | | 4.97 | % | | 83,236 | | | 898 | | 4.39 | % |
Debt issuance cost | | | | | | 17 | | | | | | | | 20 | | | |
Total interest-bearing liabilities net of debt issuance cost | | $ | 100,746 | | $ | 1,265 | | 5.04 | % | $ | 83,236 | | $ | 918 | | 4.49 | % |
| | | | | | | | | | | | | | | | | |
Net interest income | | | | | $ | 546 | | | | | | | $ | 467 | | | |
Net interest margin | | | | | | | | 1.97 | % | | | | | | | 2.06 | % |
[1] | Loans are net of deferred fees and before the allowance for expected credit losses. Non-accrual loans are considered non-interest earning assets for this analysis. |
| | | | | | | | | |
Rate/Volume Analysis of Net Interest Income | |||||||||
| | | |||||||
| | Three Months Ended March 31, 2024 vs. 2023 | |||||||
| | Increase (Decrease) Due to Change in | |||||||
|
| Volume |
| Rate |
| Total | |||
| | (Dollars in Thousands) | |||||||
Increase in Interest Income: | | | | | | | | | |
Interest-earning accounts with other financial institutions | | $ | 25 | | $ | 38 | | $ | 63 |
Interest-earning loans | | | 290 | | | 73 | | | 363 |
Total interest-earning assets | | | 315 | | | 111 | | | 426 |
Increase (Decrease) in Interest Expense: | | | | | | | | | |
Debt certificates payable gross of debt issuance costs | | | 206 | | | 119 | | | 325 |
Other debt | | | 15 | | | 10 | | | 25 |
Debt issuance cost | | | — | | | (3) | | | (3) |
Total interest-bearing liabilities | | | 221 | | | 126 | | | 347 |
Change in net interest income | | $ | 94 | | $ | (15) | | $ | 79 |
Total interest income for the three months ended March 31, 2024, compared to the three months ended March 31, 2023, increased due to both a rate variance and volume variance as shown in the
14
table above. The rate variance on our interest-earning investment accounts was due to an overall market rate increase in banking products. In addition, interest income from interest-earning loans also increased due to both a volume and a rate variance as the Company has focused on growing its loan portfolio starting in 2023. The weighted average rate of our loan portfolio increased in 2024 to 6.68% as of March 31, 2024, from 6.48% as of March 31, 2023, due to higher rates being offered on our loans. Offering rates are higher due to the Fed Funds Rate increases described earlier.
For the three months ended March 31, 2024, total interest expense increased due both to a volume and a rate variance on debt certificates payable. This was due to the growth in debt certificates in 2023 we described earlier as well as the overall market increase in rates. Interest expense on other debt increased slightly. The rate variance on other debt was also due to the global market rates changes described above.
Overall net interest income increased by $79 thousand for the three months ended March 31, 2024, compared to the three months ended March 31, 2023, due to the growth of both loans and debt certificates as the Company has focused on growing its balance sheet. For the three months ended March 31, 2024, compared to the three months ended March 31, 2023, net interest margin decreased by 8 basis points. This is also a result of the items described above. A smaller net interest margin is to be expected when market interest rates such as treasuries have an inverted yield curve, which means shorter term rates are higher than longer term rates. This is because the Company lends its funds out at longer term rates (typically five years) and funds the loan with debt certificates with maturities typically less than five years. Most financial institutions will see smaller net interest margins with inverted yield curves. However, management expects to see the net interest margin stabilize in 2024 as long as the FRB does not increase short term rates. As noted earlier, their current projection is showing a decrease in the fed funds rate in late 2024.
Provision (credit) for expected credit losses and non-interest income and expense
| | | | | | | | | | | |
| | Three months ended | | | |||||||
| | March 31, | | Comparison | |||||||
| | (in thousands) | | | | | |||||
|
| 2024 |
| 2023 |
| $ Diff |
| % Diff | |||
Net interest income | | $ | 546 | | $ | 467 | | $ | 79 | | 17% |
Credit for expected credit losses | | | (52) | | | (162) | | | 110 | | (68%) |
Net interest income after credit for expected credit losses | | | 598 | | | 629 | | | (31) | | (5%) |
Total non-interest income | | | 211 | | | 678 | | | (467) | | (69%) |
Total non-interest expenses | | | 1,153 | | | 1,370 | | | (217) | | (16%) |
Loss before provision for income taxes | | | (344) | | | (63) | | | (281) | | 446% |
Provision for income taxes and state LLC fees | | | 5 | | | 5 | | | — | | —% |
Net loss | | $ | (349) | | $ | (68) | | $ | (281) | | 413% |
15
Net interest income after provision for expected credit losses decreased by $31 thousand for the quarter ended March 31, 2024, over the quarter ended March 31, 2023. This decrease was due to a larger credit for expected credit losses for the quarter ended March 31, 2023, than March 31, 2024. The credit for the quarter ended March 31, 2023, was due to a loan becoming impaired and transferring from the collectively reviewed portion of our allowance analysis under the provisions of CECL to being independently reviewed.
The decrease in total non-interest income for the quarter ended March 31, 2024, compared to the quarter ended March 31, 2023, as shown in the table above, was primarily due to $400 thousand in revenue from charitable contributions for the quarter ended March 31, 2023. In the first quarter of 2023 we received a $400 thousand charitable gift made to our non-profit foundation, MPC. The gift is a non-recurring contribution to MPC, and we do not expect to receive charitable contribution revenue in 2024.
Non-interest expense decreased by $217 thousand for the quarter ended March 31, 2024, compared to the quarter ended March 31, 2023. This decrease was mostly due to lower salaries and benefits expense of $235 thousand. Salaries and benefits were lower in 2024 due to fewer staff as the Company did not replace job vacancies and outsourced its loan servicing beginning in the second quarter of 2023. We do expect to see further reductions in operating expenses in 2024 as the Company evaluates all aspects of its overhead expenses to become a more efficient, effective, and scalable organization. To that end in February 2024, the Company moved its corporate offices to a space with both upgraded amenities and lower operating costs.
16
Item 3: Quantitative and Qualitative Disclosures about Market Risk
We are a smaller reporting company as defined by Rule 12b-2 of the Securities Act of 1934 and are not required to provide the information under this item.
Item 4: Controls and Procedures
Evaluation of Disclosure Controls and Procedures
Our management, including our Chief Financial Officer, supervised and participated in an evaluation of our disclosure controls and procedures as of March 31, 2024. After evaluating the effectiveness of our disclosure controls and procedures (as defined in Exchange Act Rules 13a - 15(e) and 15d - 15(e)) as of the end of the period covered by this quarterly report, our Chief Financial Officer has concluded that as of the evaluation date, our disclosure controls and procedures were adequate and effective to ensure that material information relating to the Company would be made known to them by others within the Company, particularly during the period in which this quarterly report was being prepared.
Disclosure controls and procedures are designed to ensure that information required to be disclosed by us in the reports filed or submitted under the Exchange Act is recorded, processed, summarized, and reported, within the time periods specified in the Securities and Exchange Commission’s rules and forms. Disclosure controls and procedures include, without limitation, controls and procedures designed to ensure that information we are required to disclose in the reports filed under the Exchange Act is accumulated and communicated to our management, including the President and Principal Accounting Officer, as appropriate to allow timely decisions regarding required disclosure.
Changes in Internal Controls
The Company made no changes in internal controls during the three-month period ended March 31, 2024 and 2023.
17
PART II - OTHER INFORMATION
Item 1: Legal Proceedings
Given the nature of our operations, we may from time to time have an interest in, or be involved in, litigation arising out of our business activities. We consider litigation related to our operations to be routine to the conduct of our business. As of March 31, 2024, we are not involved in any litigation matters that could have a material adverse effect on our financial position, results of operations, or cash flows.
Item 1A. Risk Factors
We are a smaller reporting company as defined by Rule 12b-2 of the Securities Act of 1934 and are not required to provide the information under this item.
Item 2: Unregistered Sales of Equity Securities and Use of Proceeds:
None
Item 3: Defaults upon Senior Securities:
None
Item 4: Mine Safety Disclosure:
None
Item 5: Other Information:
None
18
Item 6. Exhibits
| |
Exhibit No. | Description of Exhibit |
31.1 | Certification of Chief Executive Officer pursuant to Rule 13a-14(a) or Rule 15(d)-14(a) (**) |
31.2 | Certification of Principal Accounting Officer pursuant to Rule 13a-14(a) or Rule 15(d)-14(a) (**) |
32.1 | |
32.2 | |
101* | The following information from Ministry Partners Investment Company, LLC’s Quarterly Report on Form 10-Q for the quarter ended March 31, 2024, formatted in XBRL (eXtensible Business Reporting Language): (i) Consolidated Statements of Income for the three-month periods ended March 31, 2024, and 2023; (ii) Consolidated Balance Sheets as of March 31, 2024, and December 31, 2023; (iii) Consolidated Statements of Cash Flows for the three months ended March 31, 2024, and 2023; and (iv) Notes to Consolidated Financial Statements. |
| |
*Pursuant to Rule 406T of Regulation S-T, these interactive data files are deemed not filed or part of a registration statement or prospectus for purposes of Sections 11 or 12 of the Securities Act of 1933 or Section 18 of the Securities Exchange Act of 1934 and otherwise are not subject to liability under those sections.
**Filed herewith
19
SIGNATURE
Pursuant to the requirements of the Securities Exchange Act of 1934, the Registrant has duly caused this report to be signed on its behalf by the undersigned thereunto duly authorized.
Dated: May 13, 2024
| | | |
|
| MINISTRY PARTNERS INVESTMENT COMPANY, LLC | |
| | | |
(Registrant) | | By: | /s/ Darren M. Thompson |
| | Darren M. Thompson, | |
| | Chief Executive Officer | |
20