Technical Engineering AND STAFFING SERVICES Platform For THE POWER AND PROCESS Industries INVESTOR PRESENTATIONNASDAQ: GVP
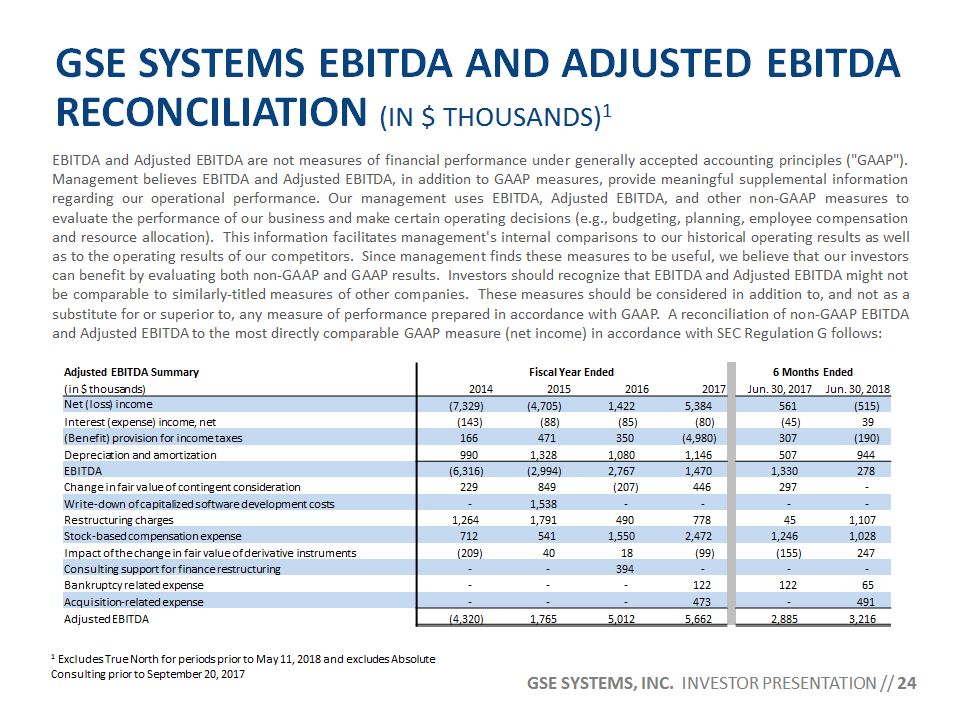
FORWARD LOOKING STATEMENTSand non-gaap financial measures This presentation, our remarks, and answers to questions contain statements that are considered forward-looking statements within the meaning of Section 27A of the Securities Act of 1933, as amended, and Section 21E of the Securities Exchange Act of 1934. These statements reflect our current expectations concerning future events and results. We use words such as "expect," "intend," "believe," "may," "will," "should," "could," "anticipate," and similar expressions to identify forward-looking statements, but their absence does not mean a statement is not forward-looking. These statements are not guarantees of our future performance and are subject to risks, uncertainties, and other important factors that could cause our actual performance or achievements to be materially different from those we project. For a full discussion of these risks, uncertainties, and factors, we encourage you to read our documents on file with the Securities and Exchange Commission, including those set forth in our periodic reports under the forward-looking statements and risk factors sections. We do not intend to update or revise any forward-looking statements, whether as a result of new information, future events, or otherwise.This presentation, our remarks, and answers to questions include references to adjusted EBITDA, adjusted net income, and adjusted earnings per share (“adjusted EPS”), which do not adhere to generally accepted accounting principles (“GAAP”). We define EBITDA as earnings before interest, taxes, depreciation and amortization (“EBITDA”). We define Adjusted EBITDA as EBITDA plus adjustments for consulting support for finance restructuring, stock-based compensation expense, restructuring charges, gain/loss from the changes in fair value of contingent consideration, acquisition-related expense, and customer bankruptcy related expense. We define adjusted net income as net income plus adjustments for consulting support for finance restructuring, stock-based compensation expense, restructuring charges, gain/loss from the changes in fair value of contingent consideration, acquisition-related expense, customer bankruptcy-related expense, tax reform impact, and release of valuation allowance. We define adjusted EPS as adjusted net income divided by fully diluted shares of common stock issued and outstanding. EBITDA, Adjusted EBITDA, adjusted net income, and adjusted EPS are reconciled to net income, the most directly comparable GAAP measure, in the financial tables included in the Appendix to this presentation. We believe that this additional information and the reconciliation we provide may be useful to help evaluate our operations. This information supplements our results as reported in accordance with GAAP and should not be viewed in isolation from, or as a substitute for, our GAAP results.With respect to Adjusted EBITDA on a forward-looking basis and as a combined company following certain recent acquisitions, a reconciliation of the difference between this non-GAAP expectation and the corresponding GAAP measure (expected net income) is not available without unreasonable effort due to potentially high variability, complexity and low visibility as to the items that would be excluded from the GAAP measure in the relevant future period, such as unusual gains and losses, adjustments to the provision for income taxes, depreciation of fixed assets, amortization of intangibles, costs related to restructuring actions and interest expense, and certain anticipated cost synergies, the impact and timing of potential acquisitions and divestitures, and other structural changes or their probable significance. The variability of the excluded items may have a significant, and potentially unpredictable, impact on our future GAAP results.Unless otherwise indicated, all results of operations and the financial condition of the Company are as of June 30, 2018 and all market data set forth in this presentation is as of August 20, 2018. We undertake no duty to update or revise the information in light of new information, future events or otherwise, although we may do so from time to time as management believes is appropriate. Any such updating may be made through the filing of reports or documents with the Securities and Exchange Commission, through press releases or through other public disclosures. 2
Who Is GSE SYSTEMS? 3 We provide technical engineering and highly-skilled personnel to the global power and process industriesPerformance Improvement SegmentWe are a market leader in simulation and engineering programs for the nuclear/fossil power industry We provide computer-based tutorials and simulators to the process industryNuclear Training & Consulting SegmentWe staff nuclear power plants with specialized personnel, primarily in white-collar training and operating roles Our solutions enhance employee and plant performance, reduce risk, increase revenue and lower costs for clients Ticker | Exchange GVP | Nasdaq Headquarters Maryland Number of Employees ~500 Recent price (8/20/18) $3.50 Shares outstanding ~20M Market cap (8/20/18) ~$70M Total cash1 (6/30/18) ~$10M Total debt1 (6/30/18) ~$10M Enterprise value1,2 ~$70M Revenue1 (LTM) ~$100M EV / Revenue1,2 ~0.7x 1 Pro forma True North Consulting acquisition on May 11, 2018 and for the Absolute Consulting acquisition on September 20, 2017 2 Enterprise Value and EV/Revenue are estimates based on the Recent Price, Market Cap, Total Cash and Total Debt amounts as of the dates provided herein and do not represent the Enterprise Value or EV/Revenue as of the date of this presentation.
Annual Financial Highlights1,2 Revenue (in $M) Gross Profit (in $M) Adjusted EPS (Diluted)1 +24% CAGR +20% CAGR Adjusted EBITDA (in $M)1 1 Adjusted EBITDA and Adjusted EPS are non-GAAP financial measures; see GAAP to non-GAAP reconciliation in Appendix 2 Absolute Consulting contributed to GSE’s financial results during the last ten days of 3Q 2017 and during 4Q 2017; otherwise the performance of Absolute and True North Consulting are not included +$10M Improvement +$0.44 Improvement 4
First Half 2018 Financial Highlights1,2 Revenue (in $M) Gross Profit (in $M) Adjusted EPS (Diluted)1 +42% +23% Adjusted EBITDA (in $M)1 1 Adjusted EBITDA and Adjusted EPS are non-GAAP financial measures; see GAAP to non-GAAP reconciliation in Appendix 2 Absolute Consulting fully contributed to GSE’s financial results during 1H’18 and True North contributed to GSE’s financial results during the last six weeks of 1H’18; otherwise the performance of Absolute and True North are not included +$11% +$27% 5
VISION 2020: Acquisition Driven GOALS 1 Capital Needs: ~$60-100M to create ~$20-30M in EBITDA; majority of capital from debt financing, internal cash generation and cash on hand. 2020Target Revenue ~$200-300M Gross margin ~25% R&D (% sales) ~2% SG&A (% sales) ~13-16% Adj. EBITDA2 ~$20-30M 1 Pro-forma annual run-rate objective by fourth quarter 20202 Adjusted EBITDA is a non-GAAP financial measure 6
EV/SALES (TTM)1 2-3x ~1.0x >5x EV/EBITDA (TTM)1,2 10-12x 10-12x >15x Attractive Valuation relative to PEERS 7 PEERS: Performance Improvement Nuclear Training & Consulting Software 1 Normalized average historical trading multiples for peers2 EBITDA is a non-GAAP financial measure
Pro-Forma Revenue – ~$100M (LTM)1 Performance Improvement Nuclear Training & Consulting By Segment By Industry Nuclear Fossil North America Europe By Geography Utilities Other By End-User Asia Non-Power / Process 1 Pro forma for the Absolute Consulting acquisition on September 20, 2017 and the True North Consulting acquisition on May 11, 2018; LTM as of March 31, 20182 Segment & industry data is updated for Pro-Forma LTM as of 6/30/20183 Geography & end-user data is updated for Pro-Forma LTM as of 12/31/2017 8
9 Business Model – How we make Money ~50%30-40+%Engineering Modeling ServicesFixed price, and time and material contractsPercent complete ~50%12-15%Technical / High-Value StaffingTime and material contractsAs service is performed billing occurs <5%80-90%SoftwareSale of perpetual license with recurring MX, or SaaS annual subscriptionLicense upon delivery, ratable recognition over life of MX agreement Performance Improvement Nuclear Training & Consulting Software1 % of Revenue:Gross Margin:Primarily Selling:Business Model:Accounting: 1 Software is a component of GSE’s Performance Improvement segment
Investment Highlights 10 Revitalized underlying core business and strong organic growth Powerful acquisition platform in place to consolidate a fragmented industry Leadership with an “owner/operator” mentality; aligned with shareholders (PRSUs) Track record of building companies through successful M&A transactionsExperience and skill-set to deliver operational improvements Compelling, Scalable Acquisition Platform Expertise from 40+ years of serving clients in the power and process sectorsProven and differentiated technology for simulation and training solutionsDifficult-to-replicate technology and base of talented, specialized employees Aligned, ProvenLeadership 40+ years serving a high-barrier-to-entry market Strong, enduring relationships with blue chip power and process companies Highly Specialized Platform Blue Chip Client Base Landscape targeted for roll-up includes markets with combined size of $4+ billionFavorable industry drivers: recognition of nuclear as a critical source of resilient baseload energy; aging workforce crisis; rising demand for carbon-free electricity Large Addressable Markets Cash and equivalents of ~$10M (as of 6/30/18)$10M long-term debt (as of 6/30/18) Strong Financial Position
GSE SENIOR Leadership 11 Kyle Loudermilk – President & CEO20+ years of executive experience at publicly-listed MicroStrategy and AspenTech, and PE-backed Datatel/Ellucian (Thoma Bravo and Hellman & Freidman)Strong track record revitalizing technology companiesBS, MS, Chemical Engineering – Columbia UniversityHarvard University General Management ProgramChris Sorrells – COO20+ years of experience creating growth strategies for companies at the intersection of power/energy/technology12+ years investing experience as private equity professional; highly experienced utilizing M&A to grow platformsSalomon Smith Barney, Banc of America Securities, NGP Energy Technology PartnersBA – Washington & Lee University; M.Acc. – USC; MBA – College of William & MaryEmmett Pepe – CFO, CPA30+ years of experience in finance management across a variety of business sectors Focus on the software and telecommunications industriesExecutive positions at MicroStrategy, BroadSoft, Software AG, and webMethodsBS, Accounting – Penn State UniversityBahram Meyssami – CTO25 years of experience in the software industryFormer positions at Aspen Technology, Datatel, University of MarylandBS, MS, Ph.D Chemical Engineering – University of MarylandPaul Abbott – President, Nuclear Industry Training and Consulting Division 33 years of experience in nuclear training, consulting and operations Principal of Hyperspring since 2007; former senior reactor operator at two different U.S. nuclear facilities Previously served in the U.S. NavyBS, Nuclear Engineering Technology – Excelsior College August 2015 August 2015 July 2016 December 2015 November 2014
Management incentives aligned withShareholders’ interests 12 Executive officers and directors own ~1.2 million shares or ~6.5% of the Company based on 19.6 million shares outstandingMajority of equity compensation received by executives and key employees is structured in performance-restricted stock units (“PRSUs”) with the following vesting thresholds: GSE share price - 8/20/2018 % of total PRSUs that vest GSE 30-Day VWAP Threshold1 1VWAP = volume weighted average price of GSE common stock GSE share price - 8/24/2015 = Vested = Unvested
Strategy to utilize GSE as an Acquisition Platform 13 Core focus: understand the vendor ecosystems in our target markets – look for asymmetrical risk/reward acquisitions $10-50M30-40%70+Fixed price, and time and material contracts $10-80M12-15% 100+Time and material contracts $5-15M 75-85%30+ Sale of perpetual license with recurring MX, or SaaS annual subscription Performance ImprovementTargets Nuclear Training & Consulting Targets SoftwareTargets Typical Rev. Range:Gross Margin:# of Opportunities:Business Model: $10-60M15-25% 50+Fixed price, and time and material contracts EPC for Transmission and Distribution
Landscape Targeted for Roll-Up: Markets of SIGNIFICANT Size Global Market1 US Market1,2 1 Source: Company estimates based on various publicly available resources and proprietary research2 Only includes white collar labor Global Market1 Global Market1 Performance ImprovementTargets Nuclear Training & Consulting Targets SoftwareTargets EPC for Transmission and Distribution 14
Highly educated, Specializedemployee base (~500)1 16 Performance Improvement Nuclear Training & Consulting Nuclear/Fossil Non-Power / Process Corporate Employees ByTechnical Focus Employees By Industry/Function 1 Pro forma for the Absolute Consulting acquisition on September 20, 2017 and the True North Consulting acquisition on May 11, 2018
Representative Blue chip customers x 17 The trademarks above are the property of the referenced companies; GSE disclaims ownership of such marks. Inclusion of a representative customer herein is not intended to suggest endorsement or recommendation.
What is driving MARKET demand? Growing awareness of the value and resiliency factor of nuclear power as a source of baseload carbon-free energyWidening skills gap and aging workforce—a significant issue in the US power industryIncreasing demand for carbon-free electricity, such as nuclear powerJapan’s restart of nuclear reactors post-FukushimaInitiatives such as “Delivering the Nuclear Promise” 18 1source: NEI, September 20152source: NEI estimates per Power Engineering magazine, February 2015 “Nuclear energy is America’s top source of carbon-free electricity and avoids more than 1/2 billion tons of carbon emissions each year.”1 “39% of the nuclear workforce will be eligible for retirement by 2018, which means the industry must hire 20,000 new workers over the next four years to replace those retiring workers.”2 X
Robust Nuclear INDUSTRY Benefits GSE 19 1source: NEI, May 2017 (China excludes Taiwan); 2source: NEI, November 2016 (excludes V.C. Summer 2,3); 3source: World Nuclear Association, August 2017 TODAY NEAR TERM LONGER TERM Global nuclear reactor installed base1: 449 Ongoing fees for maintenance, re-hosting, retuning, model upgrades, training Nuclear reactors under construction2: 58 New nuclear capacity needed by 2050 to meet Harmony vision3: 1000 GW New simulator sales +Incremental fees for maintenance, re-hosting, retuning, model upgrades New simulator sales+Incremental fees for maintenance, re-hosting, retuning, model upgrades Nuclear Units Under Construction by Country Operable Nuclear Reactors – Top 10 Countries Projected New Capacity (GW per Year) Required to Meet Harmony Targets3 GSE’s opportunity:
Investment CONCLUSIONS 20 GSE is a technical engineering and staffing services company focused on the power and process industries Proven simulation and training technology with a highly-specialized employee base Large addressable markets supported by favorable industry drivers Enduring relationships with blue-chip clients developed over 40+ years Strong financial position, including ~$12M cash and $10M long term debt Strong leadership team aligned with shareholders, driving a new growth plan Powerful, scalable acquisition platform in place to enhance growth and build shareholder value
21 Technical Engineering AND STAFFING SERVICES Platform For THE POWER AND PROCESS Industries Q&A
22 APPENDIX
GSE SYSTEMS Financial History1 23 In prior years, the Company recognized revenue on multiple element arrangements which included sales of its EnVision software product as delivery occurred on each element except post contract support ("PCS"). PCS revenue was recognized ratably over the PCS term. During the fourth quarter of 2015, management determined that that Company had not established vendor specific objective evidence ("VSOE") of the fair value for any of the elements in multiple element transactions including sales of its EnVision software licenses. Accordingly, the consolidated financial statements have been revised to recognize all revenue on multiple element transactions including EnVision software license sales ratably over the PCS terms on these transactions since VSOE did not exist for any of the non-software elements in these multiple element transactions. The revision to revenue resulted in a decrease to revenue and an increase in operating loss of $587,000 for the year ended December 31, 2014. The revision also had the effect of increasing billings in excess by $1.2 million, decreasing unbilled receivables by $62,000, increasing prepaid expenses and other current assets by $291,000 and increasing the accumulated deficit by $415,000 at December 31, 2014 as a result of the cumulative adjustment for prior periods. 1 Excludes True North for periods prior to May 11, 2018 and excludes Absolute Consulting prior to September 20, 2017 2 Non-GAAP financial measure; see GAAP to non-GAAP reconciliation on following pages Financial Summary1 Fiscal Year Ended 6 Months Ended (in $ millions, except shares amounts) 2014 2015 2016 2017 Jun. 30, 2017 Jun. 30, 2018 Revenue 37.5 56.8 53.1 70.9 33.5 47.6 Gross Profit 10.8 12.9 16.3 18.5 9.1 11.2 Gross margin 29% 23% 31% 26% 27% 24% Operating (loss) income (7.5) (4.1) 1.6 0.2 0.7 (0.5) Operating margin (20%) (7%) 3% 0% 2% (1%) Net (loss) income (7.3) (4.7) 1.4 5.4 0.6 (0.5) Diluted EPS ($0.41) ($0.26) $0.08 $0.27 $0.03 ($0.03) Diluted shares 17,887,859 17,892,891 18,512,266 19,605,427 19,471,794 19,920,034 EBITDA (6.3) (3.0) 2.8 1.5 1.3 0.3 Adjusted EBITDA (4.3) 1.8 5.0 5.7 2.9 3.2 Adjusted net (loss) income (5.3) 0.1 3.7 2.7 2.2 2.9 Adjusted EPS - diluted ($0.30) $0.00 $0.20 $0.14 $0.11 $0.14 Balance Sheet (in $ millions) Jun. 30, 2018 Cash and cash equivalents 10.5 Current assets 31.8 Total assets 59.8 Current liabilities 20.4 Long-term debt 9.0 Total stockholders' equity 30.4
GSE SYSTEMS eBITDA and Adjusted EBITDA reconciliation (in $ Thousands)1 24 EBITDA and Adjusted EBITDA are not measures of financial performance under generally accepted accounting principles ("GAAP"). Management believes EBITDA and Adjusted EBITDA, in addition to GAAP measures, provide meaningful supplemental information regarding our operational performance. Our management uses EBITDA, Adjusted EBITDA, and other non-GAAP measures to evaluate the performance of our business and make certain operating decisions (e.g., budgeting, planning, employee compensation and resource allocation). This information facilitates management's internal comparisons to our historical operating results as well as to the operating results of our competitors. Since management finds these measures to be useful, we believe that our investors can benefit by evaluating both non-GAAP and GAAP results. Investors should recognize that EBITDA and Adjusted EBITDA might not be comparable to similarly-titled measures of other companies. These measures should be considered in addition to, and not as a substitute for or superior to, any measure of performance prepared in accordance with GAAP. A reconciliation of non-GAAP EBITDA and Adjusted EBITDA to the most directly comparable GAAP measure (net income) in accordance with SEC Regulation G follows: 1 Excludes True North for periods prior to May 11, 2018 and excludes Absolute Consulting prior to September 20, 2017 Adjusted EBITDA Summary Fiscal Year Ended 6 Months Ended (in $ thousands) 2014 2015 2016 2017 Jun. 30, 2017 Jun. 30, 2018 Net (loss) income (7,329) (4,705) 1,422 5,384 561 (515) Interest (expense) income, net (143) (88) (85) (80) (45) 39 (Benefit) provision for income taxes 166 471 350 (4,980) 307 (190) Depreciation and amortization 990 1,328 1,080 1,146 507 944 EBITDA (6,316) (2,994) 2,767 1,470 1,330 278 Change in fair value of contingent consideration 229 849 (207) 446 297 - Write-down of capitalized software development costs - 1,538 - - - - Restructuring charges 1,264 1,791 490 778 45 1,107 Stock-based compensation expense 712 541 1,550 2,472 1,246 1,028 Impact of the change in fair value of derivative instruments (209) 40 18 (99) (155) 247 Consulting support for finance restructuring - - 394 - - - Bankruptcy related expense - - - 122 122 65 Acquisition-related expense - - - 473 - 491 Adjusted EBITDA (4,320) 1,765 5,012 5,662 2,885 3,216
Adjusted Net Income and Adjusted EPS reconciliation (In $ Thousands, except share amounts)1 25 Adjusted Net Income and adjusted earnings (loss) per share (“adjusted EPS”) are not measures of financial performance under generally accepted accounting principles (“GAAP”). Management believes adjusted net income and adjusted EPS, in addition to GAAP measures, provide meaningful supplemental information regarding our operational performance. Our management uses Adjusted Net Income and other non-GAAP measures to evaluate the performance of our business and make certain operating decisions (e.g., budgeting, planning, employee compensation and resource allocation). This information facilitates management's internal comparisons to our historical operating results as well as to the operating results of our competitors. Since management finds these measures to be useful, we believe that our investors can benefit by evaluating both non-GAAP and GAAP results. Investors should recognize that Adjusted Net Income and Adjusted EPS might not be comparable to similarly-titled measures of other companies. These measures should be considered in addition to, and not as a substitute for or superior to, any measure of performance prepared in accordance with GAAP. A reconciliation of non-GAAP adjusted net income and adjusted EPS to GAAP net income, the most directly comparable GAAP financial measure, is as follows: 1 Excludes True North for periods prior to May 11, 2018 and excludes Absolute Consulting prior to September 20, 2017 Adjusted Net Income (Loss) Summary Fiscal Year Ended 6 Months Ended (in $ thousands, except shares amounts) 2014 2015 2016 2017 Jun. 30, 2017 Jun. 30, 2018 Net (loss) income (7,329) (4,705) 1,422 5,384 561 (515) Change in fair value of contingent consideration 229 849 (207) 446 297 - Write-down of capitalized software development costs - 1,538 - - - - Restructuring charges 1,264 1,791 490 778 45 1,107 Stock-based compensation expense 712 541 1,550 2,472 1,246 1,028 Impact of the change in fair value of derivative instruments (209) 40 18 (99) (155) 247 Consulting support for finance restructuring - - 394 - - - Acquisition-related expense - - - 473 - 491 Amortization of intangible assets related to acquisitions 193 494 289 335 98 462 Bankruptcy related expense - - - 122 122 65 Tax reform impact - - - 2,497 - - Release of valuation allowance - - - (9,382) - - Adjusted net income (loss) (5,140) 548 3,956 3,026 2,214 2,885 Earnings (loss) per share - diluted (0.41) (0.26) 0.08 0.27 0.03 (0.03) Adjusted earnings (loss) per share - diluted (0.29) 0.03 0.21 0.15 0.11 0.14 Weighted average shares outstanding - diluted 17,887,859 17,892,891 18,512,266 19,605,427 19,471,794 19,920,034
contacts 26 Kalle Ahl, CFA (212) 836-9614kahl@equityny.comDevin Sullivan(212) 836-9608dsullivan@equityny.com Kyle Loudermilk, CEO(410) 970-7800kyle.loudermilk@gses.comChris Sorrells, COO(410) 970-7802chris.sorrells@gses.com