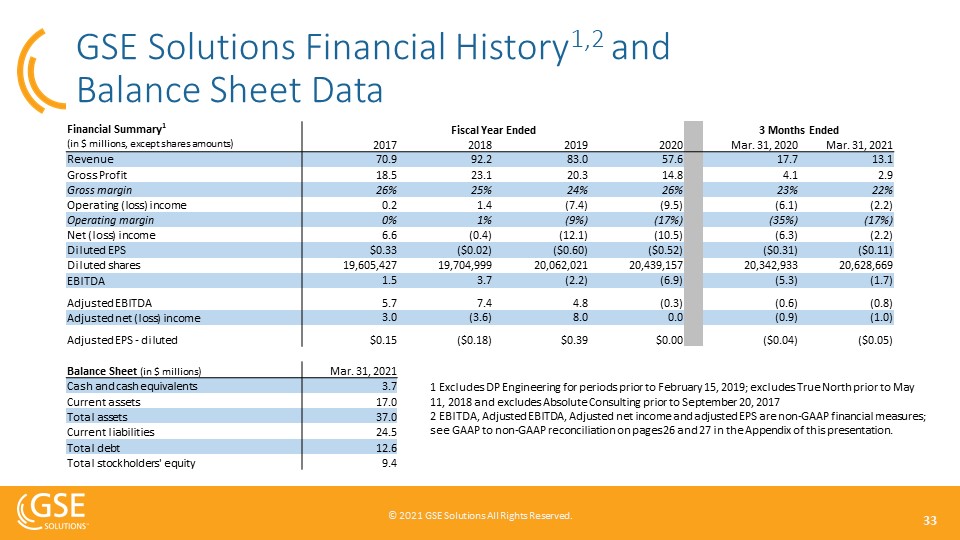
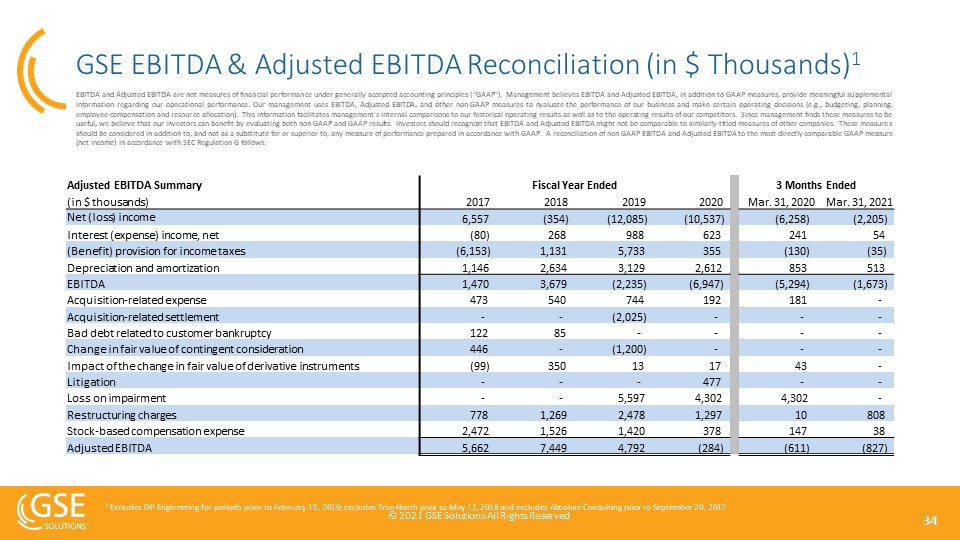
Adjusted Net Income & Adjusted EPS Reconciliation (In $ Thousands, except share amounts)1,2 Adjusted Net Income and adjusted earnings (loss) per share (“adjusted EPS”) are not measures of financial performance under generally accepted accounting principles (“GAAP”). Management believes adjusted net income and adjusted EPS, in addition to GAAP measures, provide meaningful supplemental information regarding our operational performance. Our management uses Adjusted Net Income and other non-GAAP measures to evaluate the performance of our business and make certain operating decisions (e.g., budgeting, planning, employee compensation and resource allocation). This information facilitates management's internal comparisons to our historical operating results as well as to the operating results of our competitors. Since management finds these measures to be useful, we believe that our investors can benefit by evaluating both non-GAAP and GAAP results. Investors should recognize that Adjusted Net Income and Adjusted EPS might not be comparable to similarly-titled measures of other companies. These measures should be considered in addition to, and not as a substitute for or superior to, any measure of performance prepared in accordance with GAAP. A reconciliation of non-GAAP adjusted net income and adjusted EPS to GAAP net income, the most directly comparable GAAP financial measure, is as follows: 1 Excludes DP Engineering for periods prior to February 15, 2019; excludes True North prior to May 11, 2018 and excludes Absolute Consulting prior to September 20, 20172 Adjusted Net Income for prior periods does not include the impact on income tax expense of the adjustments Adjusted Net Income (Loss) Summary Fiscal Year Ended 3 Months Ended (in $ thousands, except shares amounts) 2017 2018 2019 2020 Mar. 31, 2020 Mar. 31, 2021 Net (loss) income 6,557 (354) (12,085) (10,537) (6,258) (2,205) Acquisition-related expense 473 540 744 192 181 - Acquisition-related settlement - - (2,025) - - - Amortization of intangible assets related to acquisitions 335 1,612 2,400 1,943 670 340 Bad debt related to customer bankruptcy 122 85 - - - - Change in fair value of contingent consideration 446 - (1,200) - - - Impact of the change in fair value of derivative instruments (99) 350 13 17 43 - Litigation - - - 477 - - Loss on impairment - - 5,597 4,302 4,302 - Release of valuation allowance (10,555) (339) 6,820 1,589 - - Restructuring charges 778 1,269 2,478 1,297 10 808 Stock-based compensation expense 2,472 1,526 1,420 378 147 38 Tax reform impact 2,497 - - - - - Income tax expense impact of adjustments - (8,251) 3,851 345 - - Adjusted net income (loss) 3,026 (3,562) 8,013 3 (905) (1,019) Earnings (loss) per share - diluted $0.33 ($0.02) ($0.60) ($0.52) (0.31) (0.11) Adjusted earnings (loss) per share - diluted $0.15 ($0.18) $0.39 $0.00 (0.04) (0.05) Weighted average shares outstanding - diluted 19,605,427 19,922,151 20,376,255 20,439,157 20,342,933 20,628,669


