Exhibit 99.1
Investor PresentationGSE Systems, Inc. (“GSE Solutions”)NASDAQ: GVPSeptember 21, 2021
Forward Looking Statements and Non-GAAP Financial Measures This presentation, our remarks, and answers to questions contain statements that are considered forward-looking statements within the meaning of Section 27A of the Securities Act of 1933, as amended, and Section 21E of the Securities Exchange Act of 1934. These statements reflect our current expectations concerning future events and results. We use words such as “expect,” “intend,” “believe,” “may,” “will,” “should,” “could,” “anticipate,” and similar expressions to identify forward-looking statements, but their absence does not mean a statement is not forward-looking. These statements are not guarantees of our future performance and are subject to risks, uncertainties, and other important factors that could cause our actual performance or achievements to be materially different from those we project. For a full discussion of these risks, uncertainties, and factors, we encourage you to read our documents on file with the Securities and Exchange Commission, including those set forth in our periodic reports under the forward-looking statements and risk factors sections. We do not intend to update or revise any forward-looking statements, whether as a result of new information, future events, or otherwise.This presentation, our remarks, and answers to questions include references to Adjusted EBITDA, adjusted net income, and adjusted earnings per share (“adjusted EPS”), which do not adhere to generally accepted accounting principles (“GAAP”). We define EBITDA as earnings before interest, taxes, depreciation and amortization (“EBITDA”). “Adjusted EBITDA” excludes from EBITDA certain non-recurring gains and expense including non-cash loss on impairment, impact of the change in fair value of contingent consideration, restructuring charges, stock-based compensation expense, impact of the change in fair value of derivative instruments, and acquisition-related expense. References to “Adjusted net income” excludes from net income non-cash loss on impairment, impact of the change in fair value of contingent consideration, restructuring charges, stock-based compensation expense, impact of the change in fair value of derivative instruments, acquisition-related expense, and amortization of intangible assets related to acquisitions. We define adjusted EPS as adjusted net income divided by fully diluted shares of common stock issued and outstanding. EBITDA, Adjusted EBITDA, Adjusted net income, and adjusted EPS are reconciled to net income, the most directly comparable GAAP measure, in the financial tables included in the Appendix to this presentation. We believe that this additional information and the reconciliation we provide may be useful to help evaluate our operations. This information supplements our results as reported in accordance with GAAP and should not be viewed in isolation from, or as a substitute for, our GAAP results.We undertake no duty to update or revise the information in light of new information, future events or otherwise, although we may do so from time to time as management believes is appropriate. Any such updating may be made through the filing of reports or documents with the Securities and Exchange Commission, through press releases or through other public disclosures.
GSE: Future of Power Operations Our mission is to deliver advanced engineering services & products, and flexible workforce solutions that support a stable grid, clean energy production and the decarbonization of the power industry.
Corporate Overview
GSE Solutions At A Glance More than four decades of proven industry experience, more than 1,100 installations, and hundreds of customers in over 50 countries spanning the globeDelivers unique and essential engineering and workforce solutions, services and products Solutions include performance optimization, regulatory compliance, simulation, training, and staffing One of the few publicly held independent companies serving the clean energy sector of nuclear power and adjacent industriesGSE supports the future of clean energy production and the decarbonization of the power industry Ticker | Exchange GVP | Nasdaq Headquarters Maryland Number of Employees ~380 Recent price (9/16/21) $1.35 Shares outstanding ~20.6M Market cap (9/16/21) ~$27.8M Total cash (6/30/21) ~$3.8M Total debt1 (6/30/21) ~$12.4M Enterprise value2 ~$36.4M Revenue (2020) ~$57.6M EV / Revenue2 ~0.6x Insider ownership3 ~1.56M shares 1 Total debt includes a Paycheck Protection Program loan of approximately $10M received under the Coronavirus Aid, Relief and Economic Security Act (the “CARES Act”). 2 Enterprise Value and EV/Revenue are estimates based on the Recent Price, Market Cap, Total Cash and Total Debt amounts as of the dates provided herein and do not represent the Enterprise Value or EV/Revenue as of the date of this presentation. 3Per proxy dated 4/30/2021.
GSE Senior Leadership Kyle Loudermilk President and Chief Executive Officer20+ years of executive experience at publicly-listed MicroStrategy. AspenTech, and PE-backed Datatel/Ellucian Strong track record revitalizing technology companiesBS, MS, Chemical Engineering – Columbia University; Harvard University General Management Program Emmett Pepe, CPA Chief Financial Officer30+ years of experience in finance management across a variety of business sectors Focus on the software and telecommunicationExecutive positions at MicroStrategy, BroadSoft, Software AG, and webMethodsBS, Accounting – Penn State University Bahram Meyssami PhD Chief Technology Officer25+ years of experience in the software industryFormer positions at Aspen Technology, Datatel, University of MarylandBS, MS, PhD Chemical Engineering – University of Maryland Don Horn President, Engineering Performance Group 25+ years in energy industry, focused on managerial and engineering responsibilitiesElectrical engineering experience with Foster Wheeler, Houston Lighting & Power, and FluorBS in Electrical Engineering – Colorado State University Brian Greene Vice President, Workforce Solutions Group 15+ years of staffing industry experience More than a decade with System One, with a particular focus on staffing for the nuclear energy and engineering sectorsBA, English – University of West Georgia
The GSE Workforce Solutions division makes sure the right people and skills are in place for customer operations to run smoothly. Our experts help identify solutions and talent to address workforce gaps. How We Work Engineering design and implementation services Simulators that enhance design and performanceOptimizing plant performance and engineering program applications The GSE Engineering is a highly experienced team focused on creating innovative ways to meet our customers’ needs using a combination of our industry-leading services and products. Flexible staffing services End-to-end workforce management programsKnowledge transfer support as aging workforce retireSpecialized nuclear training programs
CONSULTING SIMULATION Virtual CommissioningAdvanced ModelingSystem DesignGeneric SimulationFull-Scope Custom SimulationOn-Demand PlatformEngineering Simulators PLANT MODIFICATIONSMechanical, Electrical, I&CCivil/StructuralFire ProtectionDigital Upgrades DECOMMISSION SERVICESAssessment/ ReadinessProcedures10 CFR 72 ComplianceLicense Termination Staff AugmentationSchedule/Plan EstimatesProject ManagementProcedure Development TRAINING Turn-key ProgramsCustom Programs & DevelopmentOn-Demand TrainingAssessmentsCertified Instructors ENGINEERING PROGRAMSASME OM CodeIn-Service Inspect/TestAppendix JBalance of PlantEngineering Programs SoftwareTraining Courses THERMAL PERFORMANCEAssessment ModelingHeat Balance AnalysisMegawatt ImprovementOnline MonitoringTraining CoursesThermal Performance Software ENGINEERINGSERVICESSystems UpgradesLife ExtensionLicense Renewal Specialty Engineering EOCPRA Evaluations Solutions: Engineering Services & Technology STAFFING Nuclear OperationsProgram CompliancePerformance Analysis Work ManagementCorrective ActionsLicense & RegulatoryDesign for Inspectability
Representative Global Blue-Chip Customers1 1The trademarks above are the property of the referenced companies; GSE disclaims ownership of such marks. Inclusion of a representative customer herein is not intended to suggest endorsement or recommendation.
Business Model: How We Make Money ~45%12-15%Technical / High-Value StaffingTime and material contractsAs service is performed billing occurs ~5%80-90%SoftwareSale of perpetual license with recurring MX, or SaaS annual subscriptionLicense upon delivery, ratable recognition over life of MX agreement Workforce Solutions Software1 % of RevenueGross MarginPrimarily SellingBusiness ModelAccounting 1 Software is a component of GSE’s Engineering group Engineering ~55%30-40+%Engineering Modeling & Modification ServicesFixed price, and time and material contractsPercent complete, or as service is performed billing occurs
Growing Software MX Revenue Streams Revenue history34% 2019-2020 (total software)147% 2020-2021 (over time software)Types of softwareWorkforce training Engineering scenariosAnalytics analysisProgram supportWhy softwareBetter marginsImplementing modernization of systems for better data knowledgeSupport virtual workforce with web-based solutions We have experts to develop and deploy +147% Software & Support Revenue – Over time (in $M)
Web-based Employee Training Software Dynamic Simulation Modeling Software Engineering Program Software Investing in the Future of Software The most accurate, highest-level of advanced modeling used to test engineering changes, system design and human factors engineering. EnVision On-Demand integrates computer-based tutorials and simulations to provide anytime, anywhere access to training content. EP-Plus is a modern, easy to use engineering programs software suite, built on industry standards and best practices by leading experts. Fleet Thermal System Monitoring Software TSM Enterprise is a suite of calculation modules that provide timesaving methods of tracking thermal performance in plant applications.
Won a multiyear subscription for EnVision by a global energy company Announced two MSAs with a total value of $35M at US major utility COVID Business Challenges & Outcomes CHALLENGESClients reduced/postponed staff augmentation engagementsProject stoppage at client facilities due to onsite outbreakDelay in nonessential engineering services projects Leveraged technology to stay connected with clients ACTIONSPrioritized the health and safety of employees and clientsMigrated a significant portion of employees to work remotePursued a hybrid virtual/in-person selling/delivery approach Opportunity to lower costs and reduce real estate footprint Secured three contracts with total value of $8.7M for training & staffing POSITIVE OUTCOMES PPP loan forgiven, GSE is exiting pandemic with stronger balance sheet
Industry Growth Drivers
Utilities NEED Experienced Partners & Expert Solutions What’s Driving The Market Delivering environmental equity Widening skills gap and aging workforce Awareness of the value of nuclear power as a source for carbon-free energy Demand for carbon-free electricity Restart of nuclear reactors post-Fukushima Development of advanced small modular reactors The new administration’s plans to cut carbon emissions NEEDStaff Support NEEDTraining Programs NEEDOptimization Programs NEEDEngineeringModifications NEEDSimulationSolutions Modernizing operations NEEDSoftware Solutions
Investing in Environmental Equity New Executive Actions: Clean EnergyCharged to create a carbon-free power sector by 2035 US on a path to a net-zero economy by 2050Re-establish the President’s Council of Advisors on Science and TechnologyCreation of jobs and skilled-trades to accelerate clean energy and transmission projects Plan to increase the resilience of facilities and operationsLikely phaseout and elimination of fossil fuel subsidies GSE is positioned as an essential enabler of US decarbonization. 2050 2035 2025 2021 US on path to net-zero economy Carbon-free power sector created Embrace new technologies like SMRs Strategy & solution building
GSE Growth Roadmap expand services and technology to the aging nuclear fleet to improve operations, enhance safety and extend plant lifedevelop new innovative software and technologies to modernize and analyze systemsextend capabilities through a customized approach to offer true and compelling value aggressively address cross-over services that fit with natural gas/renewables, wind, solar and hydrogencontinue to work and expand partnerships into advance reactors and small modular reactors (SMR)continue to innovate and improve Organic GrowthDEEPEN New Approaches INTEGRATE deepen partnerships customers and vendorsexpand cross selling effortsimprove power generation assets and operations with products, services and maintenance contractsexpand to adjacent marketsbuild and expand talent network Utilize TechnologyOPTIMIZE Boosting efficiency & driving to net zero carbon emissions 0-3 years 3-5 years 5-7 years
The Robust Nuclear Industry… TODAY: Global nuclear reactor installed base1: 441 Operable Nuclear Reactors – Top 10 Countries 1Source: International Atomic Energy Agency - Power Reactor Information System (August 2020)2Source: World Nuclear Association (August 2017)3Source: Extrapolated from The Conversation, August 2018; International Atomic Energy Agency Years Lifespan Average US Nuclear Plant is ~40 Years Old1 Million Metric Tons, 2019 CO2 Emissions Avoided by the US Power Industry Plants are here for the long-termAn average nuclear plant spans 60 years - existing fleet requires 20-40 years depending on if licenses get extended to 80 yearsNuclear leads in reducing CO2 emissions“Nuclear energy is America’s top source of carbon-free electricity and avoids more than 1/2 billion tons of carbon emissions each year.”GSE solutions them help sustain & growGSE maintenance, services and technology support the aging nuclear fleet to improve operations, enhance safety and extend plant life. Benefits GSE
SMRs & Traditional Nuclear Reactors: Key Differences Safe, Clean, & Affordable Nuclear Power OptionModularityLower Capital InvestmentSiting FlexibilityGreater EfficiencyIncreasing Grid StabilitySafeguards & Security / NonproliferationUS Industry, Manufacturing and Job GrowthEconomic Development Negative Public Awareness - Sometimes viewed by the general public as a dangerous or unstableMore Expensive to Build - Conventional reactor designs are considered multi-billion-dollar infrastructure projectsHigher Operating Costs - although lower than coal, oil, and gas alternativesLarger Footprint SMR need 35-acre footprint, while a traditional nuclear plant generating the same amount of electricity requires nearly 500 acres Although smaller land footprint than other clean energy technologies such as solar and wind. https://www.energy.gov/ne/benefits-small-modular-reactors-smrshttps://www.clean-energy-ideas.com/nuclear-energy/pros-and-cons-of-nuclear-energy/ SMALL MODUAL REACTORS TRADITIONAL REACTORS
Small Modular Reactors (SMR) Gain Traction in 2020-2021 FUTURE OPPORTUNITIES IN SMRSMR solution supports our mission * “A promising new non-emitting technology that has the potential to produce reliable electricity in Canada, supporting the country’s transition to net-zero emissions by 2050.”GSE’s partner NuScale is expected to have first SMR operational by 2027NuScale has invested more than $900m in SMR technology*Others are developing SMRs including GE Hitachi; Rolls-Royce Consortium; and others 1December 2020 - Natural Resources Canada press release outlines next steps for progress on small modular reactor technology.2 www.spglobal.com/platts/en/market-insights/latest-news/electric-power/021221-montana-senate-panel-oks-study-to-convert-colstrip-coal-plant-to-nuclear3 www.eenews.net/eedaily/2021/02/08/stories/1063724579?utm_campaign=edition&utm_medium=email&utm_source=eenews%3Aeedaily4 According to ReportLinker.com SEPT ‘20 US NRC approved the first SMR design by NuScale OCT ‘20 US DOE awarded $160M to build working models of smaller scale nuclear reactor designs NOV ‘20 UK announces ten-point plan for a green industrial revolution, supporting the UK SMR program with a £215 million investment DEC ‘20 DOE announced $30M in funding under its new Advanced Reactor Demonstration Program DEC ‘20 Canada outlines next steps for progress on SMR technology1 FEB ‘21 Montana Senate Committee votes to pass a feasibility study for replacing coal-fired boilers at a coal plant with SMRs2 FEB ‘21 US Rep Mike Simpson calls for breaching four Snake River dams and replacing energy with sources such as SMRs3 Jun’ 21 TerraPower teams with PacifiCorp to demonstrate the viability of carbon-free SMRs in WY Sept ’21 The SMR market is projected to reach USD 11.3 billion by 20264 Sept ’21 Consideration of SMRs for the Caribbean island of Puerto Rico is advancing to the 2nd stage Sept ’21 A new facility opened by NuScale in collaboration with the University of Idaho in Idaho Falls that will enable users learn about the functionality unique to NuScale’s SMR technology
Financials
Approximate Revenue Mix (2020) Engineering Workforce Solutions By Segment By Industry Nuclear Other Power North America Europe By Geography Utilities Other By End User Asia & Other Non-Power / Process
Annual Financial Highlights Consolidated Orders (in $M) Performance Engineering Orders (in $M) Consolidated Orders & Revenue Trend (in $M) Workforce Solutions Orders (in $M) 1 CAGR = Compound Annual Growth Rate2 Adjusted EBITDA and Adjusted EPS are non-GAAP financial measures; see GAAP to non-GAAP reconciliation in Appendix
Quarterly Financial Highlights Consolidated Orders (in $M) Performance Engineering Orders (in $M) Consolidated Orders & Revenue Trend (in $M) Workforce Solutions Orders (in $M) 1 CAGR = Compound Annual Growth Rate2 Adjusted EBITDA and Adjusted EPS are non-GAAP financial measures; see GAAP to non-GAAP reconciliation in Appendix
Peer Group Analysis Ticker * Company Stock Price* Shares Outstanding Market Cap Cash Debt Enterprise Value SALES(TTM) EV/SALES(TTM) GVP GSE Solutions $1.70 20.6 $35.02 $3.75 $12.50 $43.77 $53.02 0.83 Ticker* Company Stock Price* Shares Outstanding Market Cap Cash Debt Enterprise Value SALES(TTM) EV/SALES(TTM) NVEE NV5 Global $93.39 15.2 $1,419.53 $92.93 $172.34 $1,498.94 $646.91 2.32 WLMS Williams Industrial Services Group $5.78 25.9 $149.70 $5.44 $31.68 $175.94 $263.76 0.67 ATCX Atlas Technical Consultants $9.14 31.9 $291.57 $16.33 $445.44 $720.68 $482.18 1.49 LEU Centrus Energy Corp. $36.81 14.0 $515.34 $176.00 $105.00 $444.34 $244.50 1.82 SVIK.ST Studsvik 86.00 SEK 8.2 706.8 SEK 86.9 SEK 121.5 SEK 757.42 SEK 765.23 SEK 0.99 DLHC DLH Holdings Corp. $10.97 12.5 $137.13 $0.42 $60.32 $197.03 $221.51 0.89 PESI Perma-Fix Environmental Services $6.39 12.2 $77.96 $0.71 $6.66 $83.91 $126.07 0.67 Peer Group 1.26 *As of 9/17/2021 and USD Discount to Peer Group -47.56%
Looking to the Future
Investment Highlights Global Blue Chip Client Base Four decades serving a high-barrier-to-entry market Strong, enduring relationships with blue chip power and process companiesDiverse number of clients across entire power industry Experience and skill-set to deliver operational improvementsLeadership with an “owner/operator” mentality Aligned with shareholders – CEO Top Five Shareholder of GSE Aligned, ProvenLeadership Recognition of nuclear as a critical source of resilient baseload carbon-free energy Environmentally-friendly Biden administration--ambitious plans to cut carbon emissionsAging workforce crisis / buoyant outlook for Small Modular Reactor (“SMR”) technology Favorable Industry Drivers Significant discount relative to industry peersGrowing Software as a Service (“SaaS”) revenue stream (higher multiple) Attractive Valuation Expertise from 50+ years of serving clients in the power and process sectorsProven and differentiated technology for simulation and training solutionsDifficult-to-replicate technology and base of talented, specialized employees Highly Specialized Platform Focus on growth, execute on exciting solutions roadmap Streamline operations, contain costs and maximize cash flow Solid Growth Strategy
Photo courteous of NuScale Capitalize on pent-up demand coming to market after COVID-19-driven delaysStrengthen divisional leadershipUnify engineering services under one umbrellaStreamline operations, contain costs and maximize cash flow Disciplined capital structure management and debt paydownDeliver on exciting solutions pipeline Focus on Organic Growth & Operational Improvement
GSE SolutionsKyle LoudermilkPresident and CEOkyle.loudermilk@gses.com+1 410.970.7800 Connect With Us Lytham PartnersAdam LowensteinerVice Presidentgvp@lythampartners.com+ 1 646.829.9702 www.linkedin.com/company/gse-solutions/ www.gses.com investor@gses.com
Appendix
GSE Solutions Financial History1,2 and Balance Sheet Data 1 Excludes DP Engineering for periods prior to February 15, 2019; excludes True North prior to May 11, 2018 and excludes Absolute Consulting prior to September 20, 2017 2 EBITDA, Adjusted EBITDA, Adjusted net income and adjusted EPS are non-GAAP financial measures; see GAAP to non-GAAP reconciliation on pages 26 and 27 in the Appendix of this presentation. Financial Summary1 Fiscal Year Ended 6 Months Ended (in $ millions, except shares amounts) 2017 2018 2019 2020 Jun. 30, 2020 Jun. 30, 2021 Revenue 70.9 92.2 83.0 57.6 32.1 26.6 Gross Profit 18.5 23.1 20.3 14.8 7.7 5.6 Gross margin 26% 25% 24% 26% 24% 21% Operating (loss) income 0.2 1.4 (7.4) (9.5) (8.0) (3.5) Operating margin 0% 1% (9%) (17%) (25%) (13%) Net (loss) income 6.6 (0.4) (12.1) (10.5) (8.4) 1.0 Diluted EPS $0.33 ($0.02) ($0.60) ($0.52) ($0.41) $0.05 Diluted shares 19,605,427 19,704,999 20,062,021 20,439,157 20,375,446 20,638,116 EBITDA 1.5 3.7 (2.2) (6.9) (6.5) 2.1 Adjusted EBITDA 5.7 7.4 4.8 (0.3) (0.8) (1.2) Adjusted net (loss) income 3.0 (3.6) 8.0 0.0 (1.6) (1.6) Adjusted EPS - diluted $0.15 ($0.18) $0.39 $0.00 ($0.08) ($0.08) Balance Sheet (in $ millions) Jun. 30, 2021 Cash and cash equivalents 3.8 Current assets 20.5 Total assets 40.1 Current liabilities 25.5 Total debt 12.4 Total stockholders' equity 13.0
GSE EBITDA & Adjusted EBITDA Reconciliation (in $ Thousands)1 EBITDA and Adjusted EBITDA are not measures of financial performance under generally accepted accounting principles ("GAAP"). Management believes EBITDA and Adjusted EBITDA, in addition to GAAP measures, provide meaningful supplemental information regarding our operational performance. Our management uses EBITDA, Adjusted EBITDA, and other non-GAAP measures to evaluate the performance of our business and make certain operating decisions (e.g., budgeting, planning, employee compensation and resource allocation). This information facilitates management's internal comparisons to our historical operating results as well as to the operating results of our competitors. Since management finds these measures to be useful, we believe that our investors can benefit by evaluating both non-GAAP and GAAP results. Investors should recognize that EBITDA and Adjusted EBITDA might not be comparable to similarly-titled measures of other companies. These measures should be considered in addition to, and not as a substitute for or superior to, any measure of performance prepared in accordance with GAAP. A reconciliation of non-GAAP EBITDA and Adjusted EBITDA to the most directly comparable GAAP measure (net income) in accordance with SEC Regulation G follows: 1 Excludes DP Engineering for periods prior to February 15, 2019; excludes True North prior to May 11, 2018 and excludes Absolute Consulting prior to September 20, 2017 Adjusted EBITDA Summary Fiscal Year Ended 3 Months Ended (in $ thousands) 2017 2018 2019 2020 Jun. 30, 2020 Jun. 30, 2021 Net (loss) income 6,557 (354) (12,085) (10,537) (8,407) 1,026 Interest (expense) income, net (80) 268 988 623 428 103 (Benefit) provision for income taxes (6,153) 1,131 5,733 355 50 (39) Depreciation and amortization 1,146 2,634 3,129 2,612 1,451 994 EBITDA 1,470 3,679 (2,235) (6,947) (6,478) 2,084 Acquisition-related expense 473 540 744 192 188 - Acquisition-related settlement - - (2,025) - - - Bad debt related to customer bankruptcy 122 85 - - - - Change in fair value of contingent consideration 446 - (1,200) - (4) - Employee retention credit - - - - - (5,075) Impact of the change in fair value of derivative instruments (99) 350 13 17 - - Litigation - - - 477 861 - Loss on impairment - - 5,597 4,302 4,302 - Restructuring charges 778 1,269 2,478 1,297 10 808 Stock-based compensation expense 2,472 1,526 1,420 378 324 501 VAT write-off - - - - - 450 Adjusted EBITDA 5,662 7,449 4,792 (284) (797) (1,232)
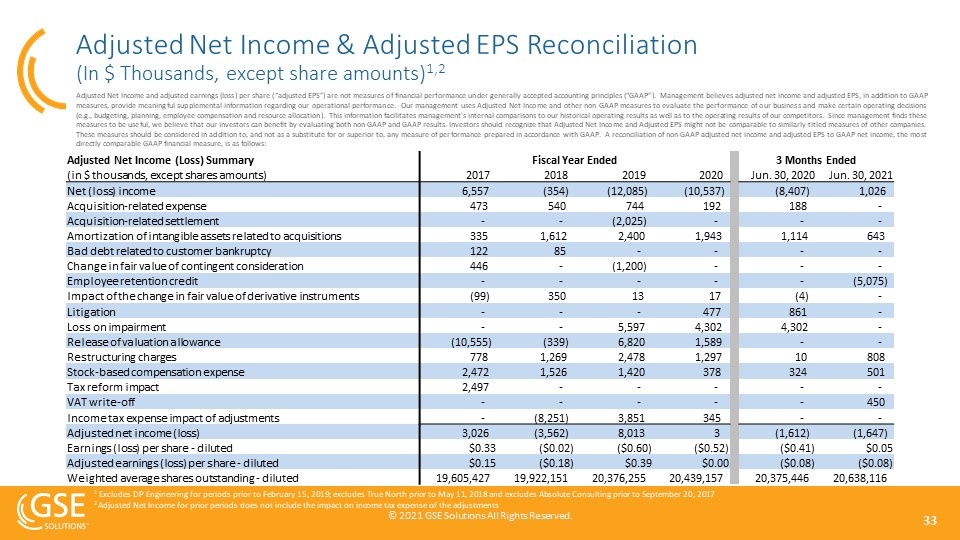
Adjusted Net Income & Adjusted EPS Reconciliation (In $ Thousands, except share amounts)1,2 Adjusted Net Income and adjusted earnings (loss) per share (“adjusted EPS”) are not measures of financial performance under generally accepted accounting principles (“GAAP”). Management believes adjusted net income and adjusted EPS, in addition to GAAP measures, provide meaningful supplemental information regarding our operational performance. Our management uses Adjusted Net Income and other non-GAAP measures to evaluate the performance of our business and make certain operating decisions (e.g., budgeting, planning, employee compensation and resource allocation). This information facilitates management's internal comparisons to our historical operating results as well as to the operating results of our competitors. Since management finds these measures to be useful, we believe that our investors can benefit by evaluating both non-GAAP and GAAP results. Investors should recognize that Adjusted Net Income and Adjusted EPS might not be comparable to similarly-titled measures of other companies. These measures should be considered in addition to, and not as a substitute for or superior to, any measure of performance prepared in accordance with GAAP. A reconciliation of non-GAAP adjusted net income and adjusted EPS to GAAP net income, the most directly comparable GAAP financial measure, is as follows: 1 Excludes DP Engineering for periods prior to February 15, 2019; excludes True North prior to May 11, 2018 and excludes Absolute Consulting prior to September 20, 20172 Adjusted Net Income for prior periods does not include the impact on income tax expense of the adjustments Adjusted Net Income (Loss) Summary Fiscal Year Ended 3 Months Ended (in $ thousands, except shares amounts) 2017 2018 2019 2020 Jun. 30, 2020 Jun. 30, 2021 Net (loss) income 6,557 (354) (12,085) (10,537) (8,407) 1,026 Acquisition-related expense 473 540 744 192 188 - Acquisition-related settlement - - (2,025) - - - Amortization of intangible assets related to acquisitions 335 1,612 2,400 1,943 1,114 643 Bad debt related to customer bankruptcy 122 85 - - - - Change in fair value of contingent consideration 446 - (1,200) - - - Employee retention credit - - - - - (5,075) Impact of the change in fair value of derivative instruments (99) 350 13 17 (4) - Litigation - - - 477 861 - Loss on impairment - - 5,597 4,302 4,302 - Release of valuation allowance (10,555) (339) 6,820 1,589 - - Restructuring charges 778 1,269 2,478 1,297 10 808 Stock-based compensation expense 2,472 1,526 1,420 378 324 501 Tax reform impact 2,497 - - - - - VAT write-off - - - - - 450 Income tax expense impact of adjustments - (8,251) 3,851 345 - - Adjusted net income (loss) 3,026 (3,562) 8,013 3 (1,612) (1,647) Earnings (loss) per share - diluted $0.33 ($0.02) ($0.60) ($0.52) ($0.41) $0.05 Adjusted earnings (loss) per share - diluted $0.15 ($0.18) $0.39 $0.00 ($0.08) ($0.08) Weighted average shares outstanding - diluted 19,605,427 19,922,151 20,376,255 20,439,157 20,375,446 20,638,116