Exhibit 99
Welcome to the Twenty-sixth Annual Meeting of the Shareholders of First Citizens Banc Corp. This is Management’s Presentation given at this meeting.

cautionary statement regarding forward-looking information comments made in this presentation include “forward-looking statements” within the meaning of the private securities litigation reform act of 1995. forward-looking statements are subject to numerous assumptions, risks and uncertainties. although management believes that the expectations reflected in the forward-looking statements are reasonable, actual results or future events could differ, possibly materially, from those anticipated in these forward-looking statements. the forward-looking statements speak only as of the date of this presentation, and first citizens banc corp assumes no duty to update any forward-looking statements to reflect events or circumstances after the date of this presentation, except the extent required by law

financials
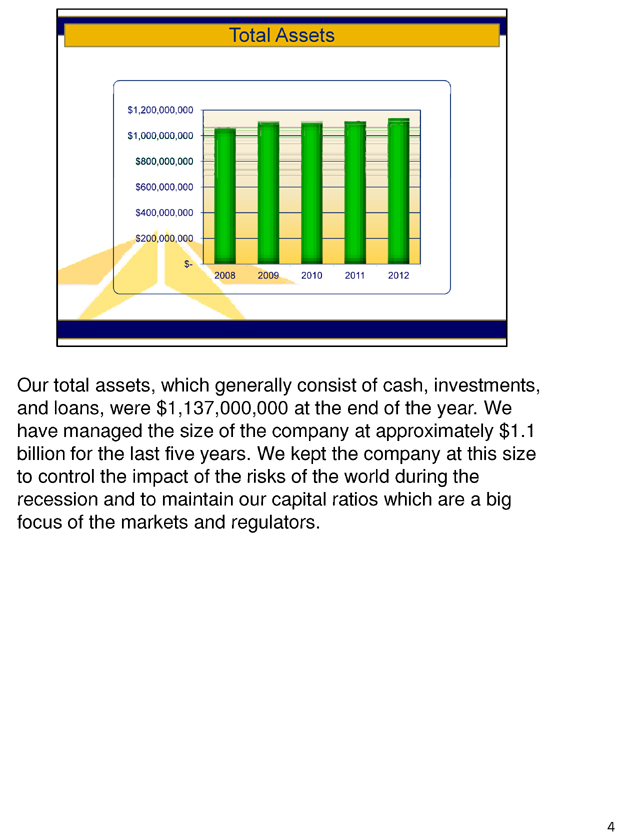
Our total assets, which generally consist of cash, investments, and loans, were $1,137,000,000 at the end of the year. We have managed the size of the company at approximately $1.1 billion for the last five years. We kept the company at this size to control the impact of the risks of the world during the recession and to maintain our capital ratios which are a big focus of the markets and regulators.
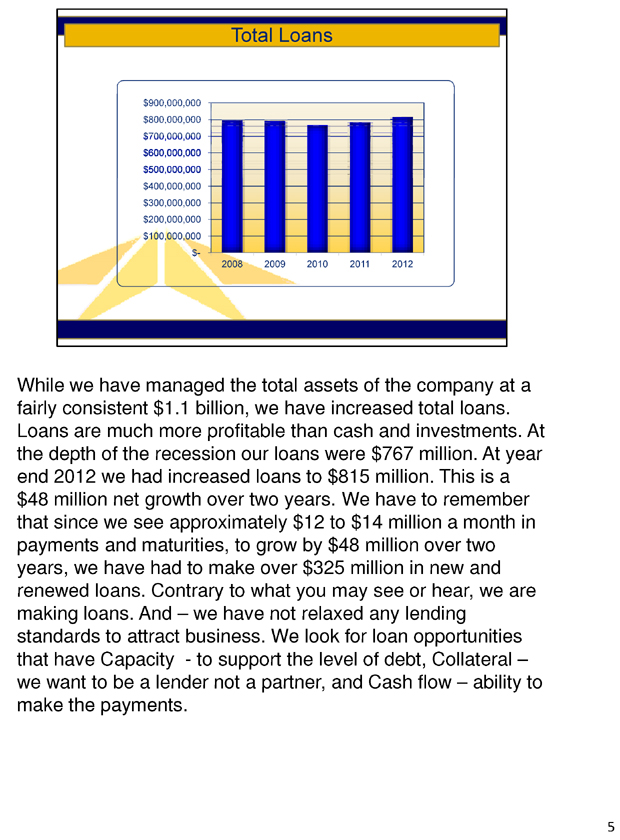
While we have managed the total assets of the company at a fairly consistent $1.1 billion, we have increased total loans. Loans are much more profitable than cash and investments. At the depth of the recession our loans were $767 million. At year end 2012 we had increased loans to $815 million. This is a $48 million net growth over two years. We have to remember that since we see approximately $12 to $14 million a month in payments and maturities, to grow by $48 million over two years, we have had to make over $325 million in new and renewed loans. Contrary to what you may see or hear, we are making loans. And – we have not relaxed any lending standards to attract business. We look for loan opportunities that have Capacity —to support the level of debt, Collateral – we want to be a lender not a partner, and Cash flow – ability to make the payments.
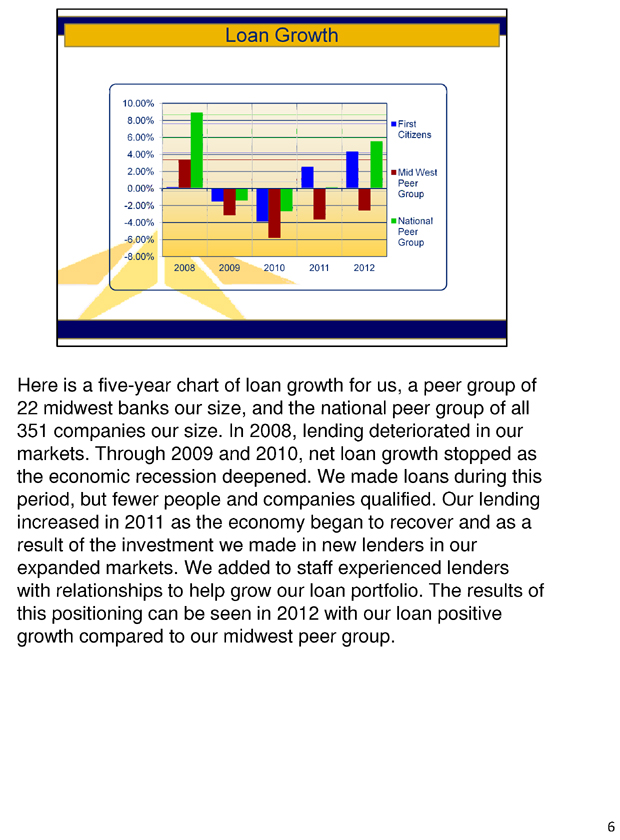
Here is a five-year chart of loan growth for us, a peer group of 22 midwest banks our size, and the national peer group of all 351 companies our size. In 2008, lending deteriorated in our markets. Through 2009 and 2010, net loan growth stopped as the economic recession deepened. We made loans during this period, but fewer people and companies qualified. Our lending increased in 2011 as the economy began to recover and as a result of the investment we made in new lenders in our expanded markets. We added to staff experienced lenders with relationships to help grow our loan portfolio. The results of this positioning can be seen in 2012 with our loan positive growth compared to our midwest peer group.
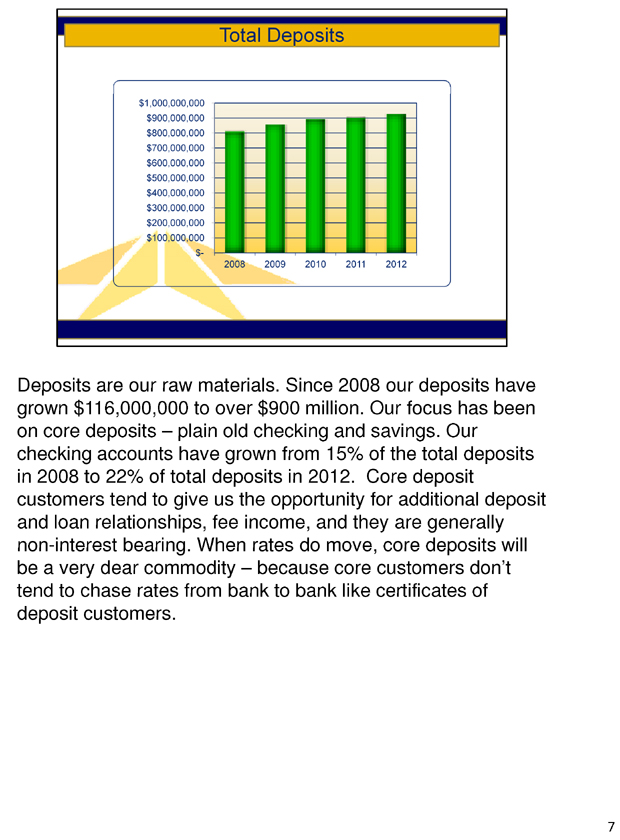
Deposits are our raw materials. Since 2008 our deposits have grown $116,000,000 to over $900 million. Our focus has been on core deposits – plain old checking and savings. Our checking accounts have grown from 15% of the total deposits in 2008 to 22% of total deposits in 2012. Core deposit customers tend to give us the opportunity for additional deposit and loan relationships, fee income, and they are generally non-interest bearing. When rates do move, core deposits will be a very dear commodity – because core customers don’t tend to chase rates from bank to bank like certificates of deposit customers.
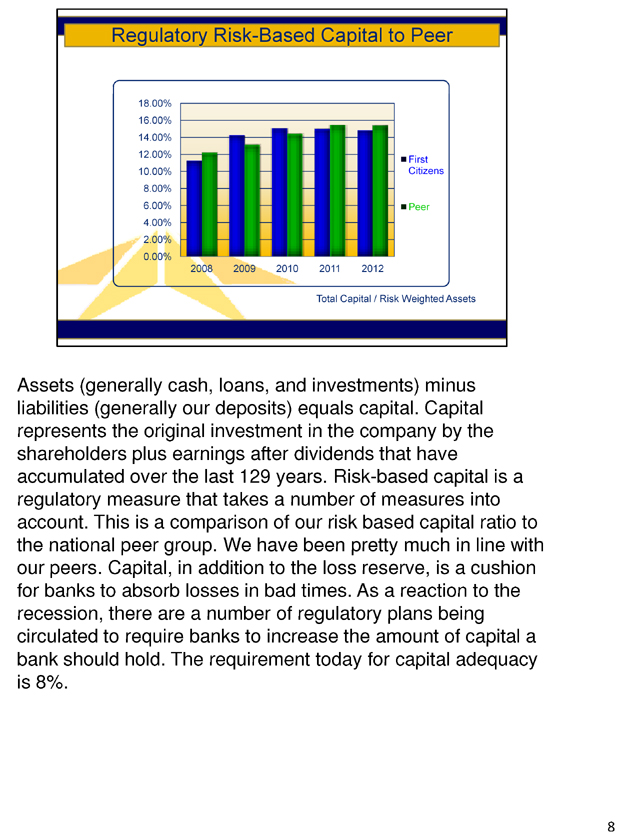
Assets (generally cash, loans, and investments) minus liabilities (generally our deposits) equals capital. Capital represents the original investment in the company by the shareholders plus earnings after dividends that have accumulated over the last 129 years. Risk-based capital is a regulatory measure that takes a number of measures into account. This is a comparison of our risk based capital ratio to the national peer group. We have been pretty much in line with our peers. Capital, in addition to the loss reserve, is a cushion for banks to absorb losses in bad times. As a reaction to the recession, there are a number of regulatory plans being circulated to require banks to increase the amount of capital a bank should hold. The requirement today for capital adequacy is 8%.
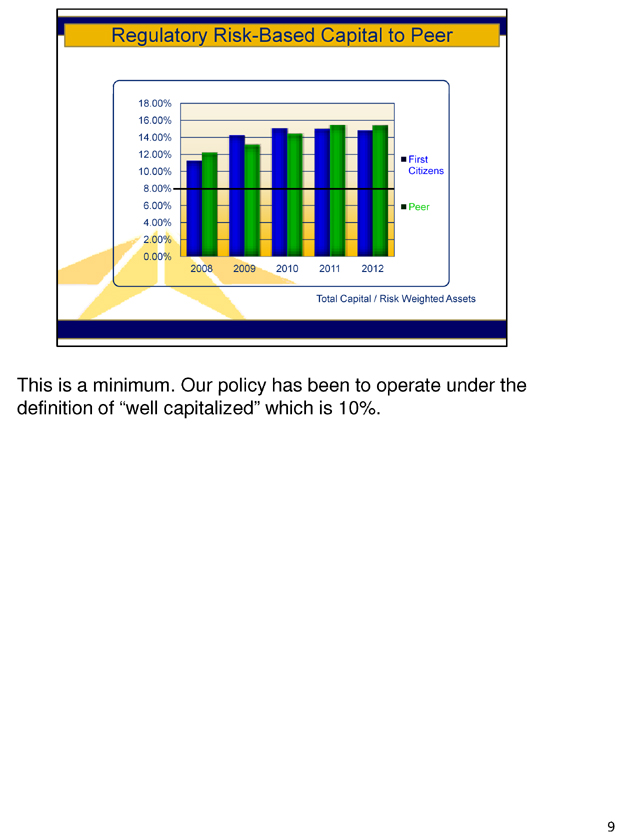
This is a minimum. Our policy has been to operate under the definition of “well capitalized” which is 10%.
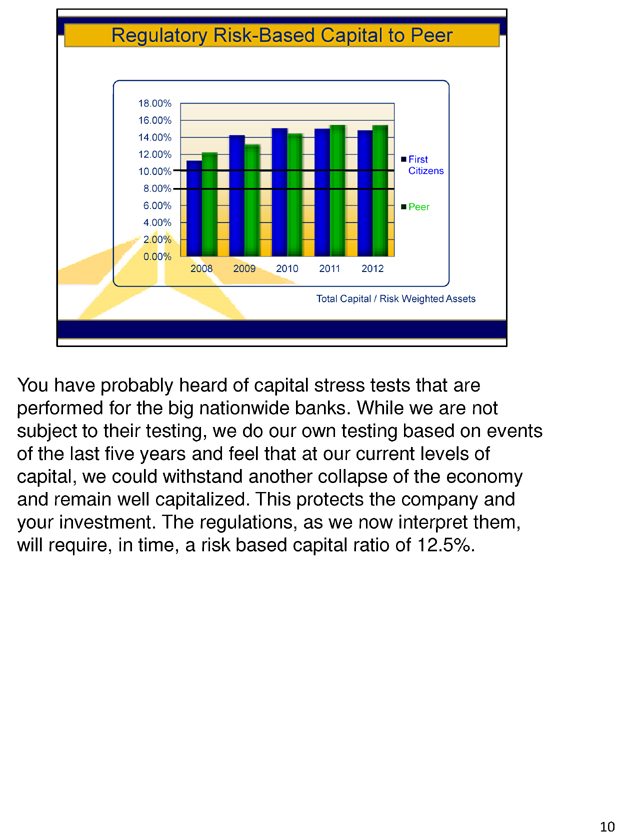
You have probably heard of capital stress tests that are performed for the big nationwide banks. While we are not subject to their testing, we do our own testing based on events of the last five years and feel that at our current levels of capital, we could withstand another collapse of the economy and remain well capitalized. This protects the company and your investment. The regulations, as we now interpret them, will require, in time, a risk based capital ratio of 12.5% .
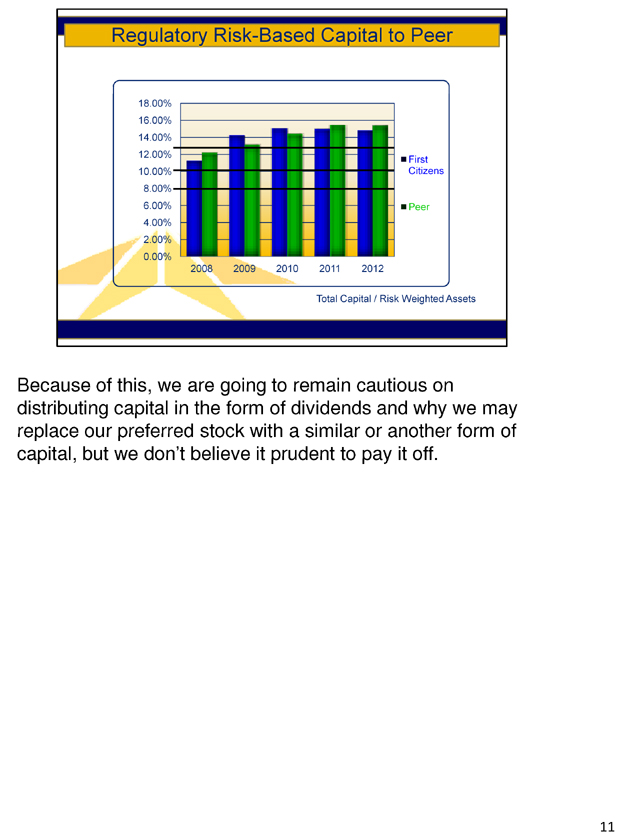
Because of this, we are going to remain cautious on distributing capital in the form of dividends and why we may replace our preferred stock with a similar or another form of capital, but we don’t believe it prudent to pay it off.
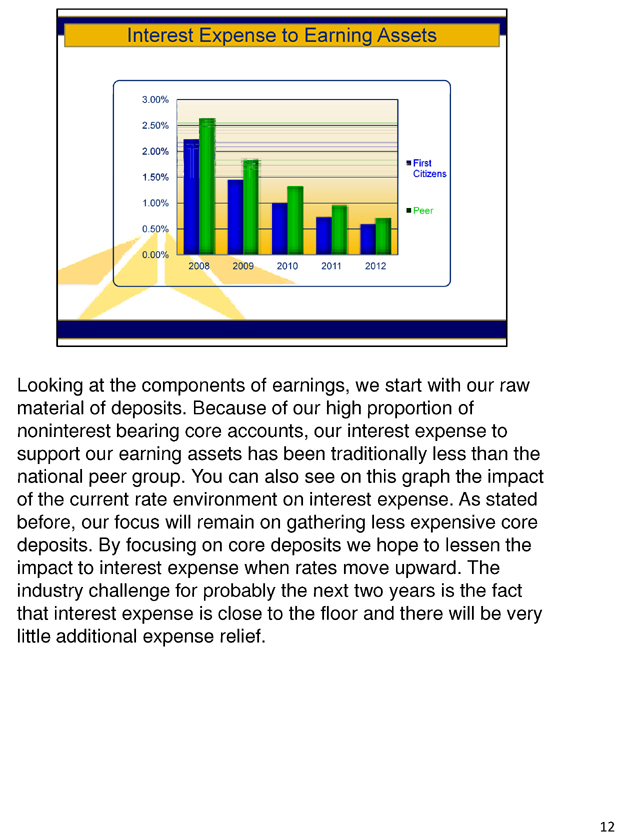
Looking at the components of earnings, we start with our raw material of deposits. Because of our high proportion of noninterest bearing core accounts, our interest expense to support our earning assets has been traditionally less than the national peer group. You can also see on this graph the impact of the current rate environment on interest expense. As stated before, our focus will remain on gathering less expensive core deposits. By focusing on core deposits we hope to lessen the impact to interest expense when rates move upward. The industry challenge for probably the next two years is the fact that interest expense is close to the floor and there will be very little additional expense relief.
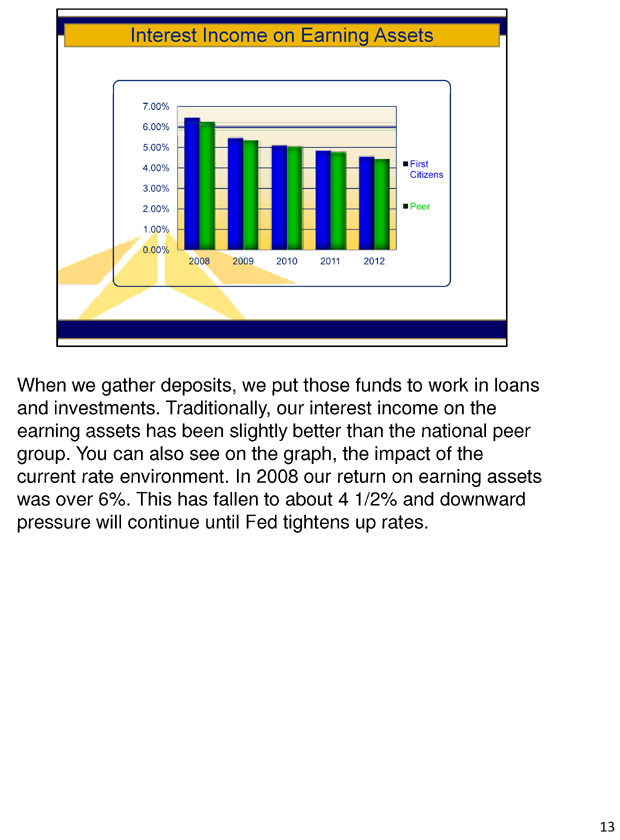
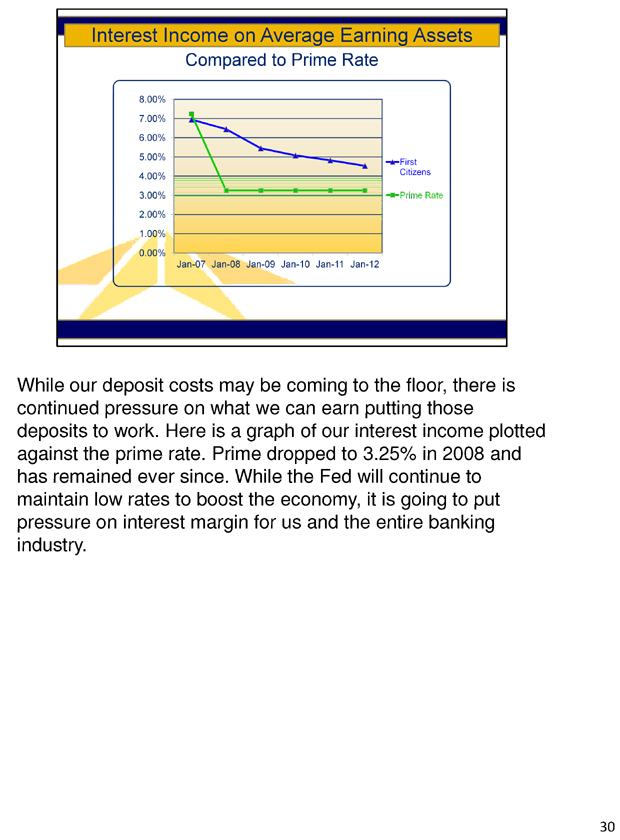
When we gather deposits, we put those funds to work in loans and investments. Traditionally, our interest income on the earning assets has been slightly better than the national peer group. You can also see on the graph, the impact of the current rate environment. In 2008 our return on earning assets was over 6%. This has fallen to about 4 1/2% and downward pressure will continue until Fed tightens up rates.
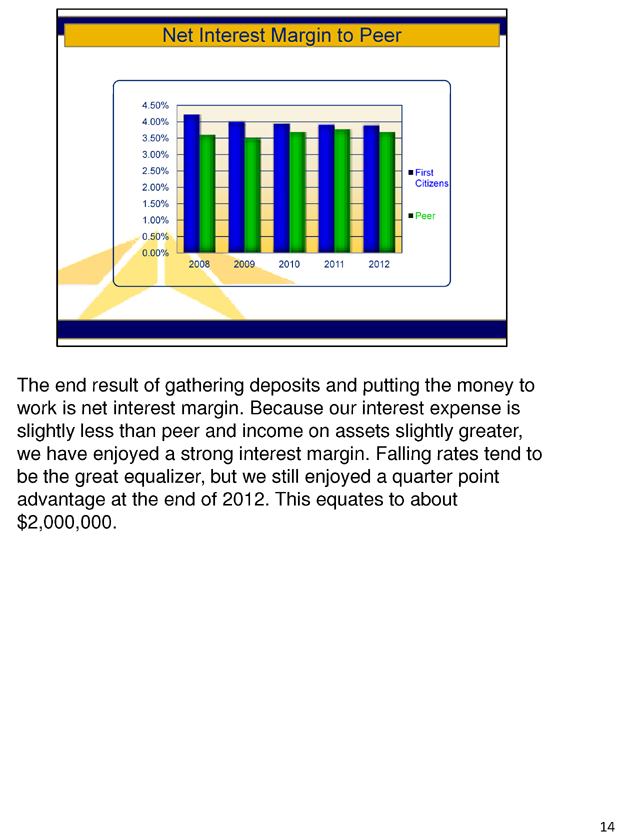
The end result of gathering deposits and putting the money to work is net interest margin. Because our interest expense is slightly less than peer and income on assets slightly greater, we have enjoyed a strong interest margin. Falling rates tend to be the great equalizer, but we still enjoyed a quarter point advantage at the end of 2012. This equates to about $2,000,000.
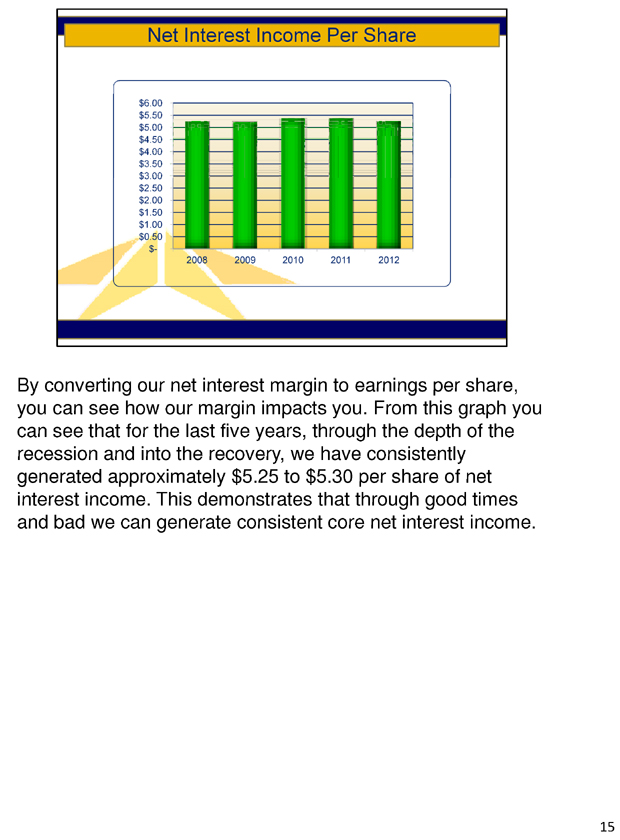
By converting our net interest margin to earnings per share, you can see how our margin impacts you. From this graph you can see that for the last five years, through the depth of the recession and into the recovery, we have consistently generated approximately $5.25 to $5.30 per share of net interest income. This demonstrates that through good times and bad we can generate consistent core net interest income.
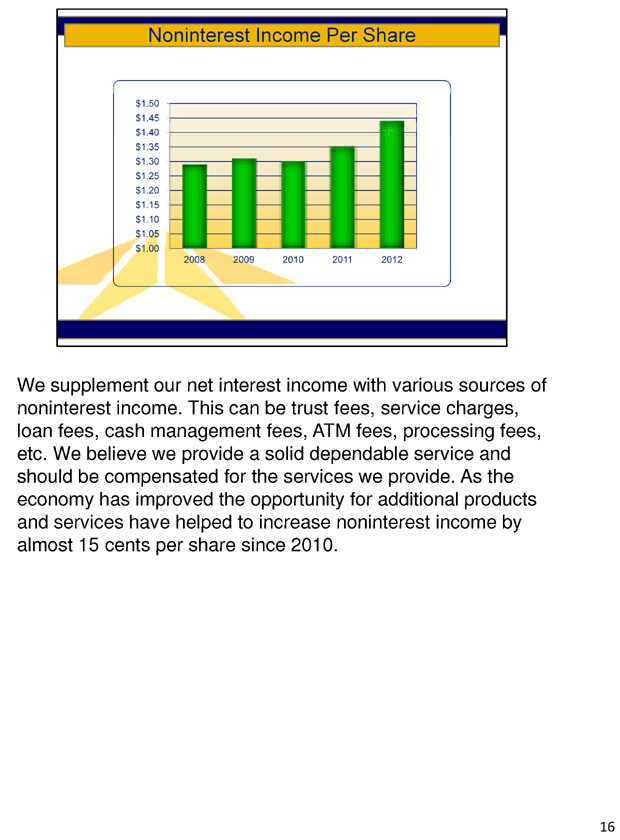
We supplement our net interest income with various sources of noninterest income. This can be trust fees, service charges, loan fees, cash management fees, ATM fees, processing fees, etc. We believe we provide a solid dependable service and should be compensated for the services we provide. As the economy has improved the opportunity for additional products and services have helped to increase noninterest income by almost 15 cents per share since 2010.
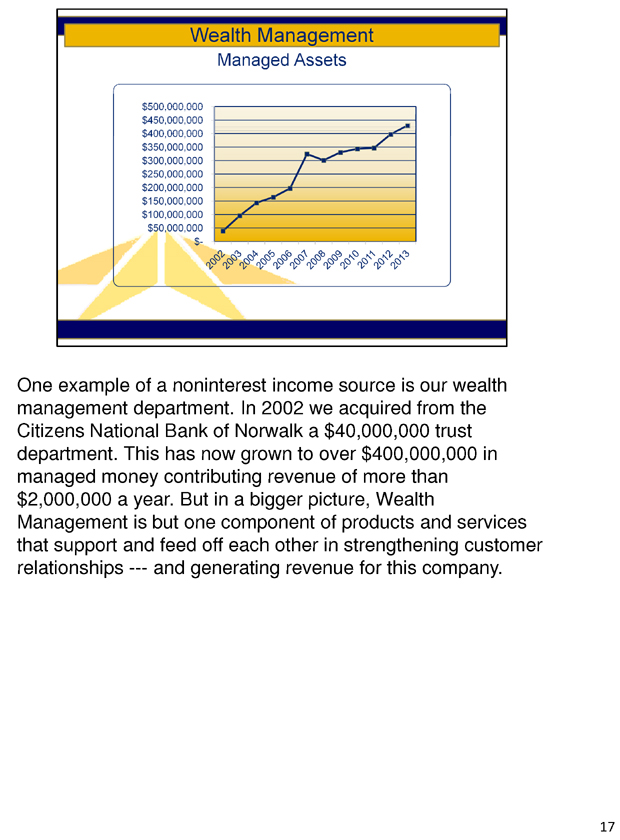
One example of a noninterest income source is our wealth management department. In 2002 we acquired from the Citizens National Bank of Norwalk a $40,000,000 trust department. This has now grown to over $400,000,000 in managed money contributing revenue of more than $2,000,000 a year. But in a bigger picture, Wealth Management is but one component of products and services that support and feed off each other in strengthening customer relationships —- and generating revenue for this company.
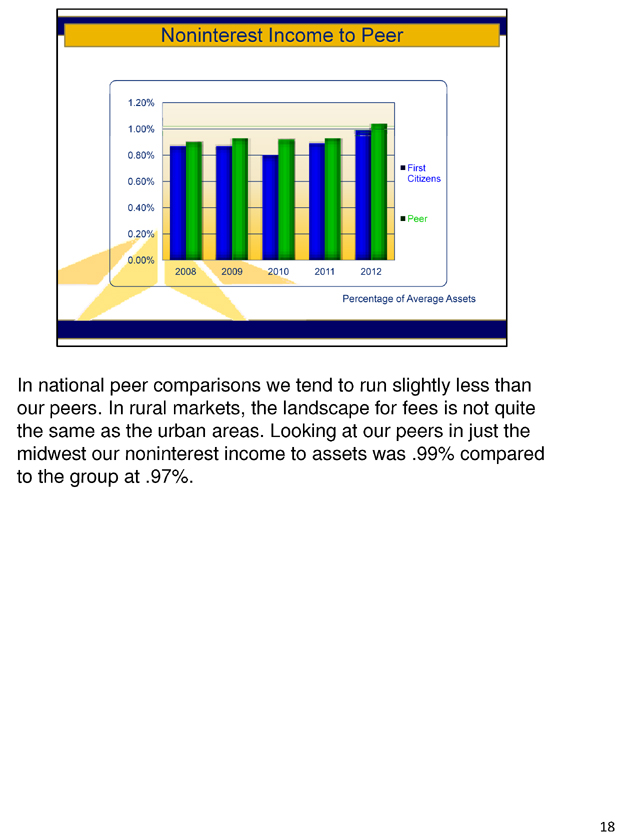
In national peer comparisons we tend to run slightly less than our peers. In rural markets, the landscape for fees is not quite the same as the urban areas. Looking at our peers in just the midwest our noninterest income to assets was .99% compared to the group at .97%.
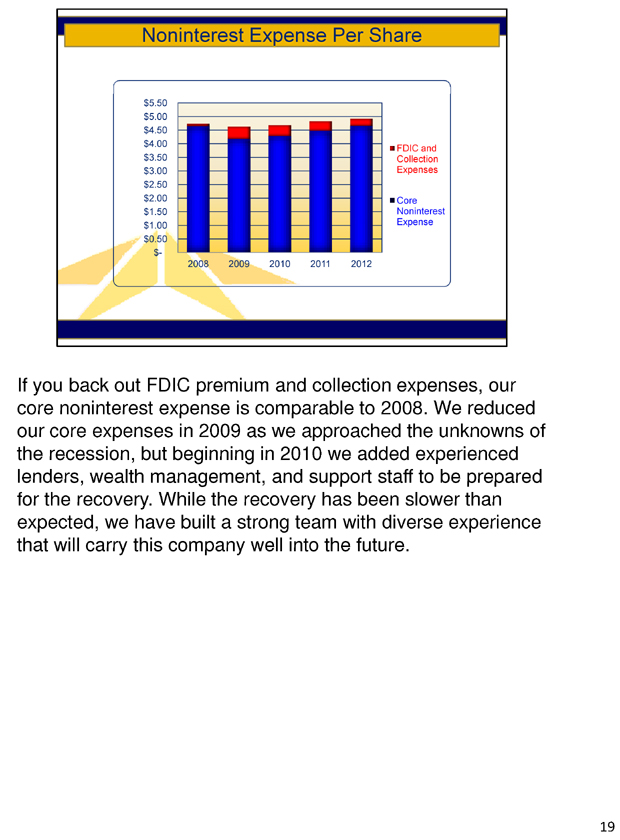
If you back out FDIC premium and collection expenses, our core noninterest expense is comparable to 2008. We reduced our core expenses in 2009 as we approached the unknowns of the recession, but beginning in 2010 we added experienced lenders, wealth management, and support staff to be prepared for the recovery. While the recovery has been slower than expected, we have built a strong team with diverse experience that will carry this company well into the future.
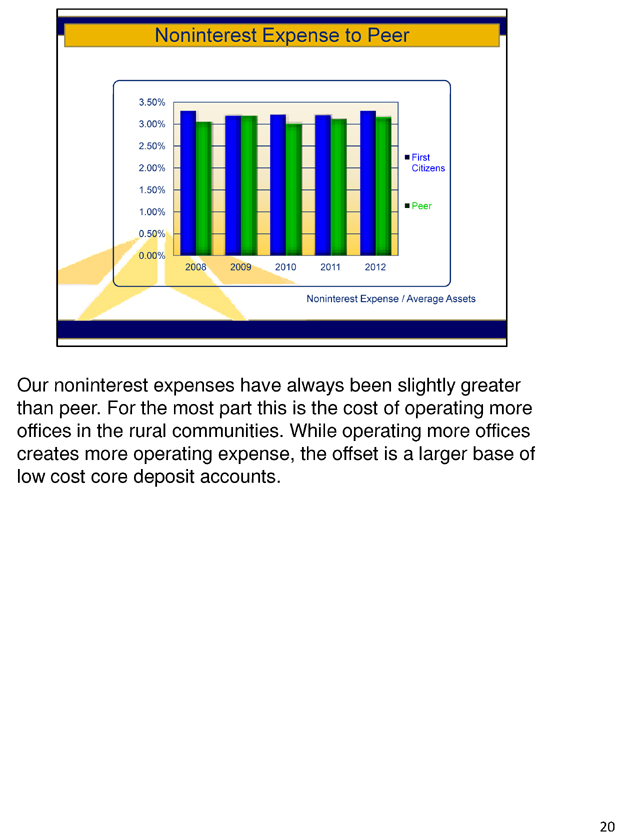
Our noninterest expenses have always been slightly greater than peer. For the most part this is the cost of operating more offices in the rural communities. While operating more offices creates more operating expense, the offset is a larger base of low cost core deposit accounts.
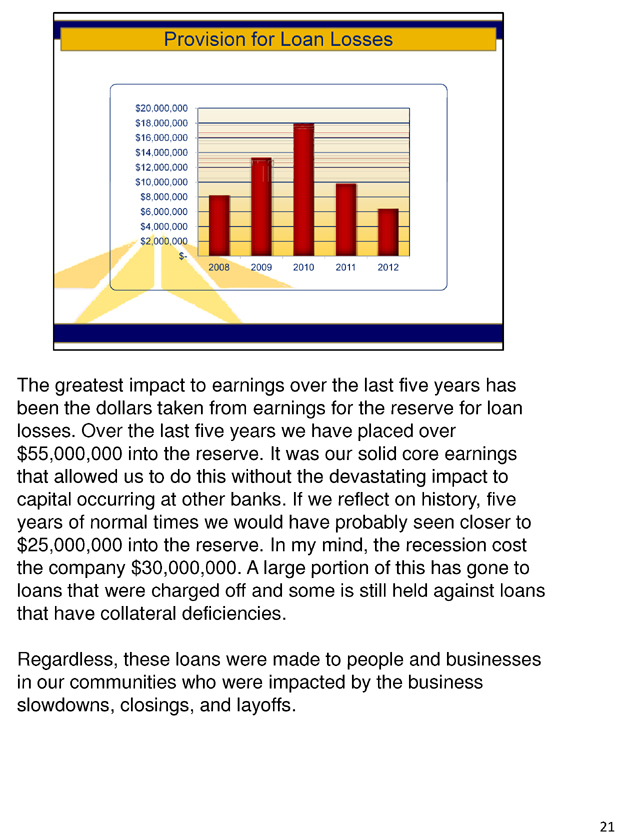
The greatest impact to earnings over the last five years has been the dollars taken from earnings for the reserve for loan losses. Over the last five years we have placed over $55,000,000 into the reserve. It was our solid core earnings that allowed us to do this without the devastating impact to capital occurring at other banks. If we reflect on history, five years of normal times we would have probably seen closer to $25,000,000 into the reserve. In my mind, the recession cost the company $30,000,000. A large portion of this has gone to loans that were charged off and some is still held against loans that have collateral deficiencies.
Regardless, these loans were made to people and businesses in our communities who were impacted by the business slowdowns, closings, and layoffs.
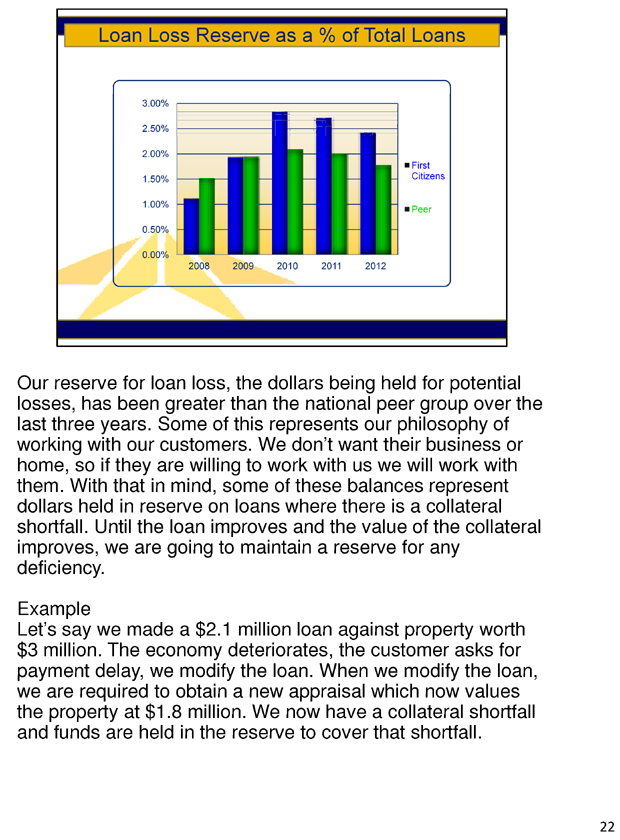
Our reserve for loan loss, the dollars being held for potential losses, has been greater than the national peer group over the last three years. Some of this represents our philosophy of working with our customers. We don’t want their business or home, so if they are willing to work with us we will work with them. With that in mind, some of these balances represent dollars held in reserve on loans where there is a collateral shortfall. Until the loan improves and the value of the collateral improves, we are going to maintain a reserve for any deficiency.
Example
Let’s say we made a $2.1 million loan against property worth $3 million. The economy deteriorates, the customer asks for payment delay, we modify the loan. When we modify the loan, we are required to obtain a new appraisal which now values the property at $1.8 million. We now have a collateral shortfall and funds are held in the reserve to cover that shortfall.
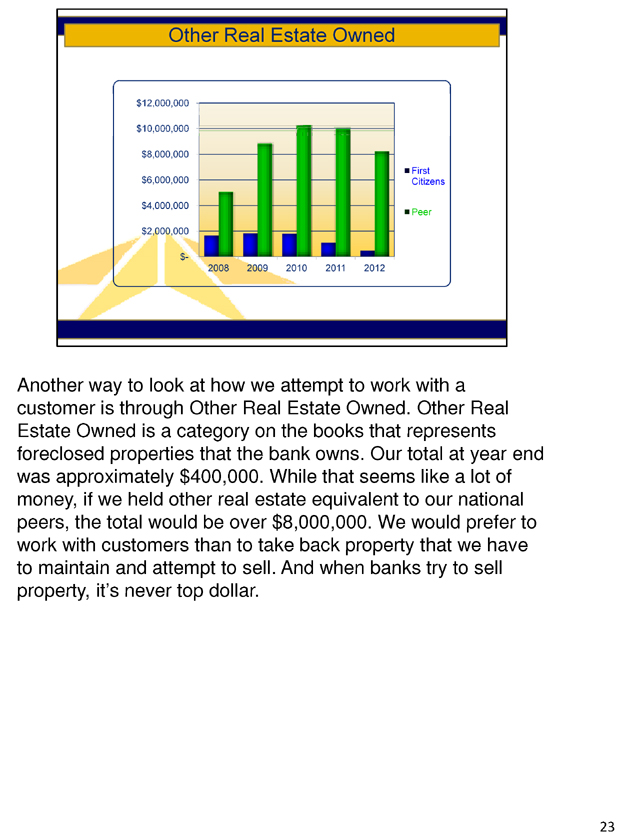
Another way to look at how we attempt to work with a customer is through Other Real Estate Owned. Other Real Estate Owned is a category on the books that represents foreclosed properties that the bank owns. Our total at year end was approximately $400,000. While that seems like a lot of money, if we held other real estate equivalent to our national peers, the total would be over $8,000,000. We would prefer to work with customers than to take back property that we have to maintain and attempt to sell. And when banks try to sell property, it’s never top dollar.
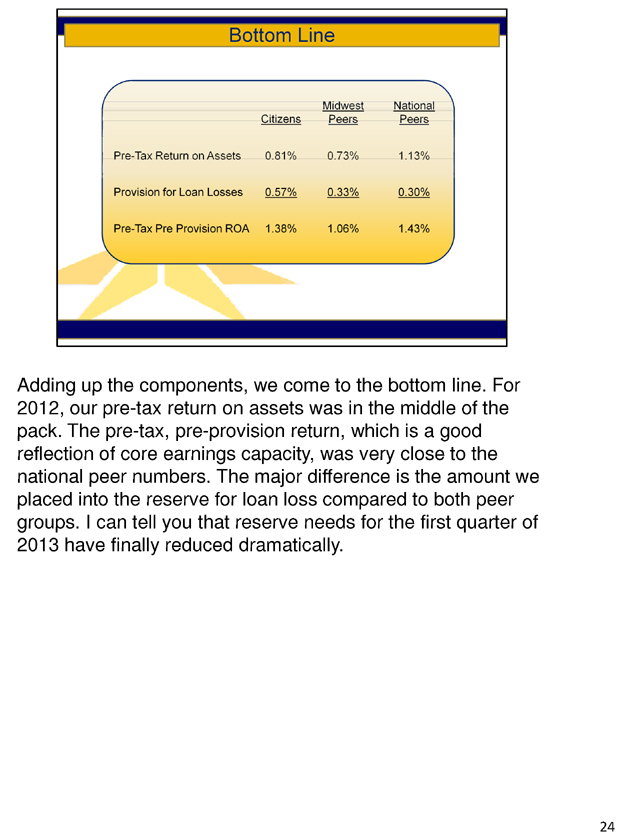
Adding up the components, we come to the bottom line. For 2012, our pre-tax return on assets was in the middle of the pack. The pre-tax, pre-provision return, which is a good reflection of core earnings capacity, was very close to the national peer numbers. The major difference is the amount we placed into the reserve for loan loss compared to both peer groups. I can tell you that reserve needs for the first quarter of 2013 have finally reduced dramatically.
Here are some of the issues affecting Ohio banking for the next year.
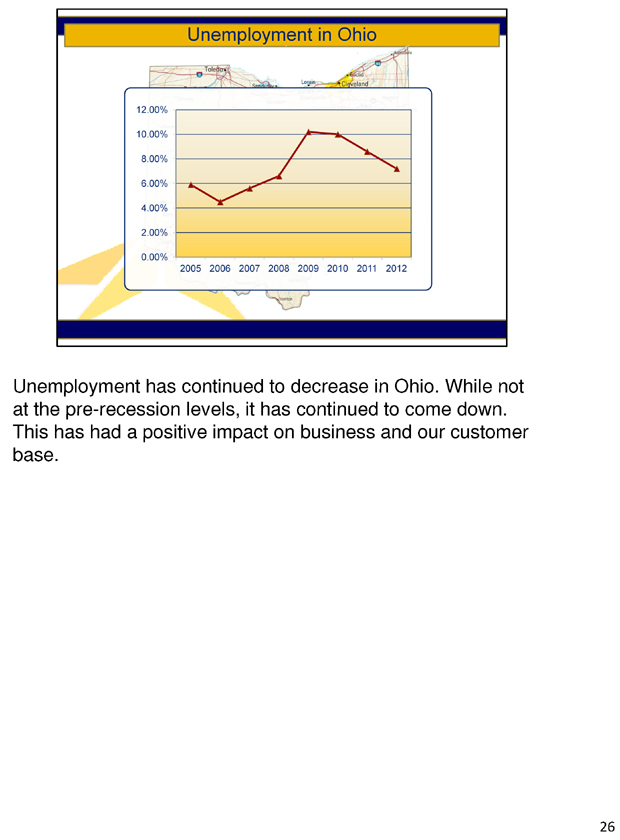
Unemployment has continued to decrease in Ohio. While not at the pre-recession levels, it has continued to come down. This has had a positive impact on business and our customer base.
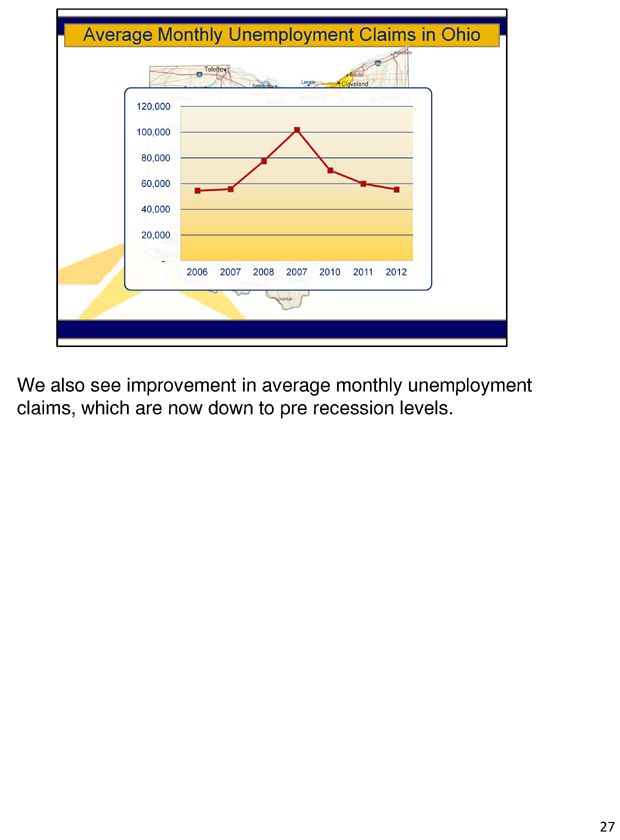
We also see improvement in average monthly unemployment claims, which are now down to pre recession levels.
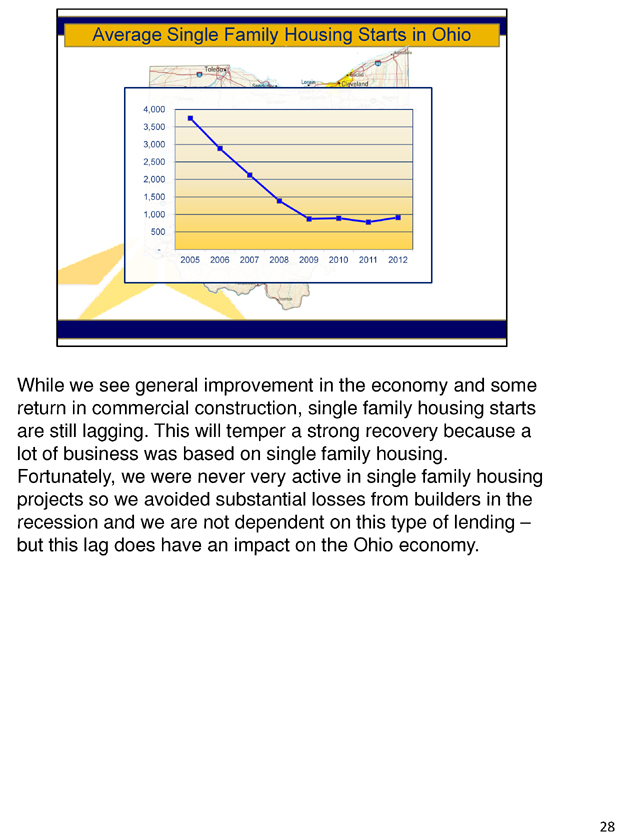
While we see general improvement in the economy and some return in commercial construction, single family housing starts are still lagging. This will temper a strong recovery because a lot of business was based on single family housing.
Fortunately, we were never very active in single family housing projects so we avoided substantial losses from builders in the recession and we are not dependent on this type of lending – but this lag does have an impact on the Ohio economy.
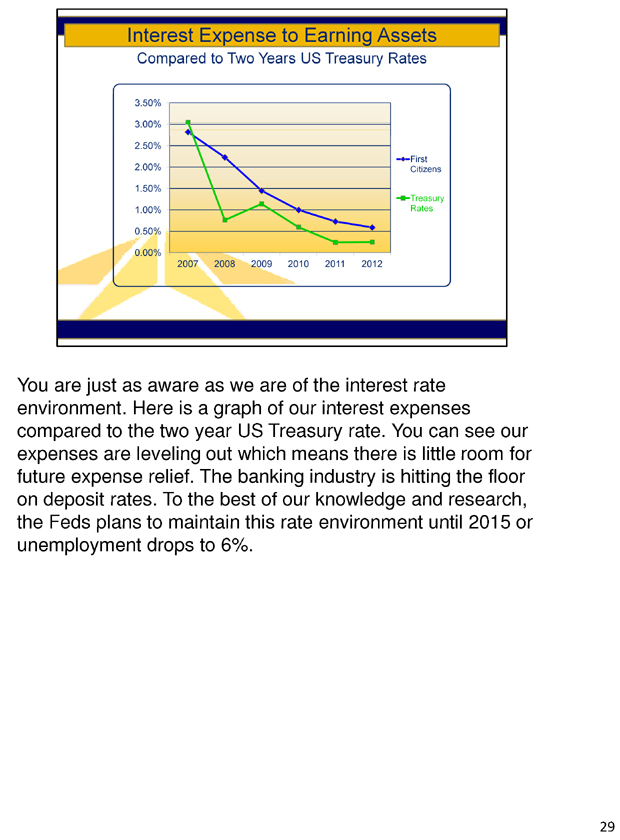
You are just as aware as we are of the interest rate environment. Here is a graph of our interest expenses compared to the two year US Treasury rate. You can see our expenses are leveling out which means there is little room for future expense relief. The banking industry is hitting the floor on deposit rates. To the best of our knowledge and research, the Feds plans to maintain this rate environment until 2015 or unemployment drops to 6%.

strategy
The Teams are In Place.
Over the last two years we have acquired talented people with diverse experiences to strengthen the company. Through training and education our commercial lending, select banking, cash management, and wealth management are working as a cohesive, interactive group building customer relationships. We want long-term relationships, not one off transactions. Our branch network is focused on taking care of the rank and file deposit customers and watching for referral opportunities – all with the goal of cementing a long term relationship and providing us low cost funding. I wish the economy were picking up faster, but the teams are in place and we are well positioned.

Stay with the Formula.
Our formula has been to attract low cost core deposit relationships in rural areas. We put as much of that money to work as we can in those areas. But loan demand in rural communities is soft. So by diversifying into the urban areas around Akron and Columbus we have been able to take advantage of their more robust economic recovery and put our deposit dollars to work.
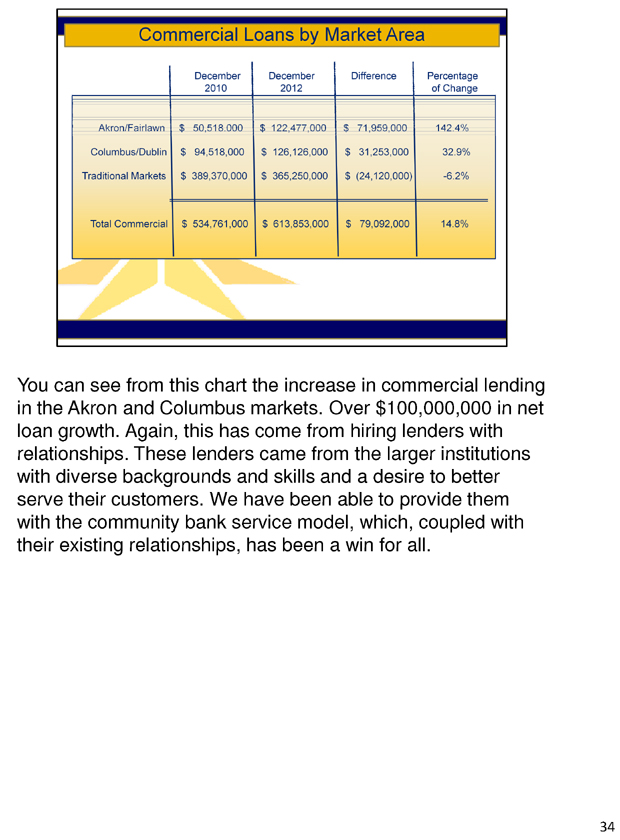
You can see from this chart the increase in commercial lending in the Akron and Columbus markets. Over $100,000,000 in net loan growth. Again, this has come from hiring lenders with relationships. These lenders came from the larger institutions with diverse backgrounds and skills and a desire to better serve their customers. We have been able to provide them with the community bank service model, which, coupled with their existing relationships, has been a win for all.
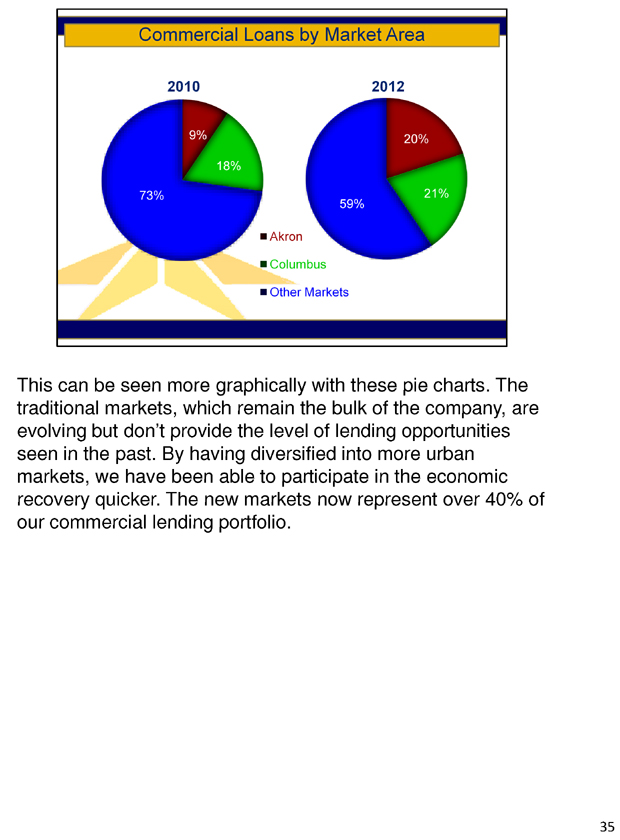
This can be seen more graphically with these pie charts. The traditional markets, which remain the bulk of the company, are evolving but don’t provide the level of lending opportunities seen in the past. By having diversified into more urban markets, we have been able to participate in the economic recovery quicker. The new markets now represent over 40% of our commercial lending portfolio.
Remain Asset Sensitive.
We believe that rates will go up so we are avoiding long-term rate commitments. We encourage and make pricing attractive for variable rates, we prefer fixed commercial commitments under five years, we sell long-term fixed rate mortgages, and we stay short term on investments. We regularly monitor our rate risk and manage the bank to remain positioned to take advantage of an increase in rates.
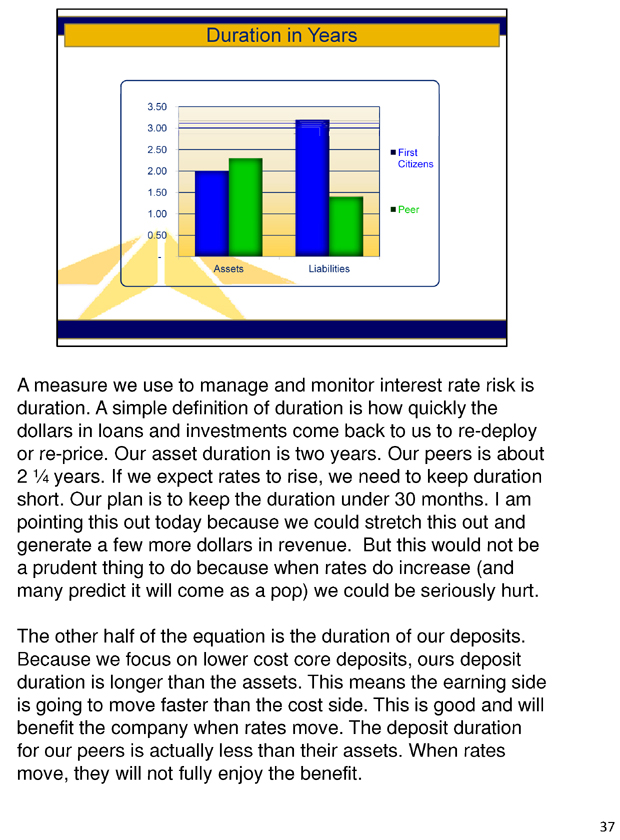
A measure we use to manage and monitor interest rate risk is duration. A simple definition of duration is how quickly the dollars in loans and investments come back to us to re-deploy or re-price. Our asset duration is two years. Our peers is about 2 1/4 years. If we expect rates to rise, we need to keep duration short. Our plan is to keep the duration under 30 months. I am pointing this out today because we could stretch this out and generate a few more dollars in revenue. But this would not be a prudent thing to do because when rates do increase (and many predict it will come as a pop) we could be seriously hurt.
The other half of the equation is the duration of our deposits. Because we focus on lower cost core deposits, ours deposit duration is longer than the assets. This means the earning side is going to move faster than the cost side. This is good and will benefit the company when rates move. The deposit duration for our peers is actually less than their assets. When rates move, they will not fully enjoy the benefit.
Look for Opportunities.
Smaller banks looking for exit strategy – compliance example
Two billion dollars is the new one billion dollars in efficient size Ten years ago the goal was a billion dollars for efficient operations. Today with the increased costs of regulations and compliance, two billion dollars is a good target. We believe our model of attracting solid deposit customers in rural areas, taking care of those areas, and deploying the excess funds in urban markets works. The burden of regulation and compliance and the need for efficiency will bring banks to the market looking for partners. We are positioning ourselves to take advantage of this.
I have seen banking articles that talk about surviving the recession and questioning how do you survive the recovery. We believe we have the team in place, we have a formula that works, we are positioned to take advantage of the recovering economy, and we are looking for growth opportunities.
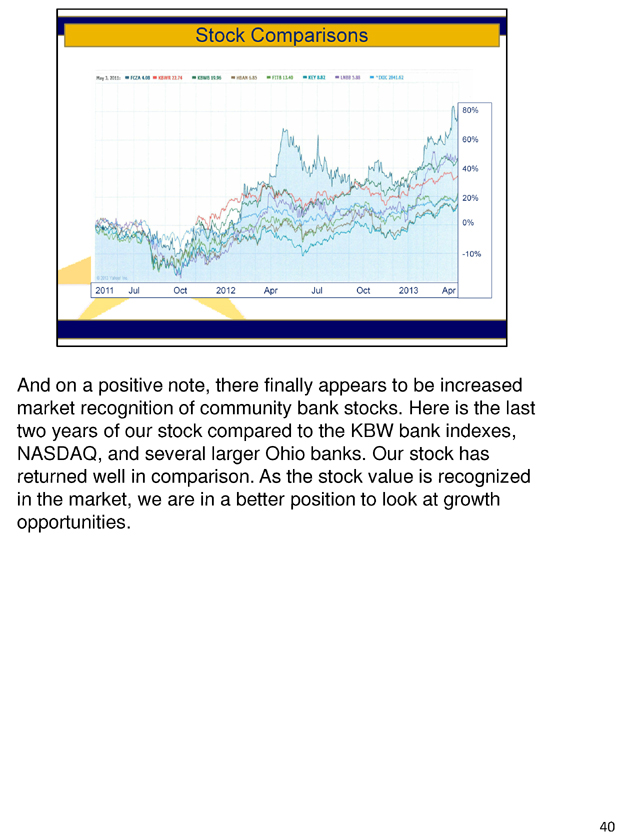
And on a positive note, there finally appears to be increased market recognition of community bank stocks. Here is the last two years of our stock compared to the KBW bank indexes, NASDAQ, and several larger Ohio banks. Our stock has returned well in comparison. As the stock value is recognized in the market, we are in a better position to look at growth opportunities.

questions

first citizens banc corp shareholders meeting moving you ahead