 First Citizens Banc Corp Annual Shareholder Meeting April 21, 2015 Exhibit 99.1 |
 Cautionary Statement Regarding Forward-Looking Information Comments made in this presentation include “forward-looking statements” within the meaning of the Private Securities Litigation Reform Act of 1995. Forward-looking statements are subject to numerous assumptions, risks and uncertainties. Although management believes that the expectations reflected in the forward-looking statements are reasonable, actual results or future events could differ, possibly materially, from those anticipated in these forward- looking statements. The forward-looking statements speak only as of the date of this presentation, and First Citizens Banc Corp assumes no duty to update any forward-looking statements to reflect events or circumstances after the date of this presentation, except to the extent required by law. |
 9 th Largest Publicly Traded Commercial Bank in Ohio Community Bank Operating in 11 Ohio Counties Commercial Banking Retail Banking Wealth Management Key Facts (as of 3/31/15) ($ millions) Assets $1,407.2 Loans $ 984.1 Deposits $1,197.3 Market Cap $ 86.4 Company Overview |
 December 31, 2014 December 31, 2013 Change Balance Sheet Assets $1,213,191,000 $1,167,546,000 3.91% Gross Loans $ 914,857,000 $ 861,241,000 6.23% Deposits $ 968,918,000 $ 942,475,000 2.81% Performance Net Income $ 9,528,000 $ 6,179,000 54.20% Return on Average Assets 0.77% 0.53% 45.28% Return on Average Equity 8.34% 5.97% 39.70% Return on Average Tangible Common Equity 12.44% 9.93% 25.28% Financial Highlights |
 Last Year’s Strategy Commitment Long-term Shareholder Value through Growth and Profitability |
 2014 Company Successes Completed the placement of $25,000,000 in preferred stock - strengthening the capital of the company Opening of Loan Production office in Mayfield Heights Agreement to acquire TCNB, Dayton, Ohio - growing the company $100,000,000 and opening a new market Recognition by SNL Securities for a 61% return in our common stock for 2014 Consolidation of our brand identity under Civista Bank and Civista Bancshares, Inc. |
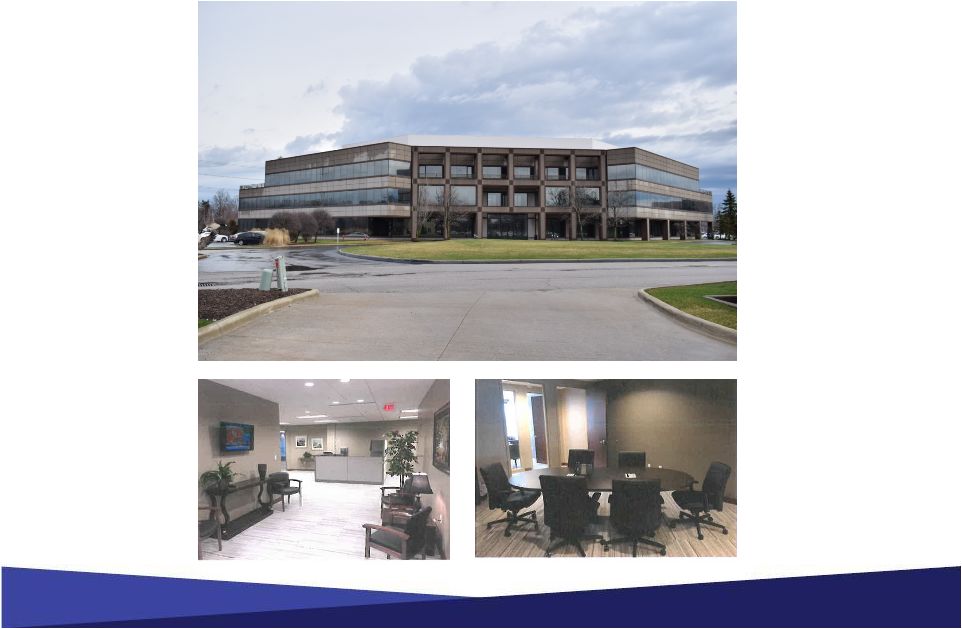 Mayfield Heights Office |
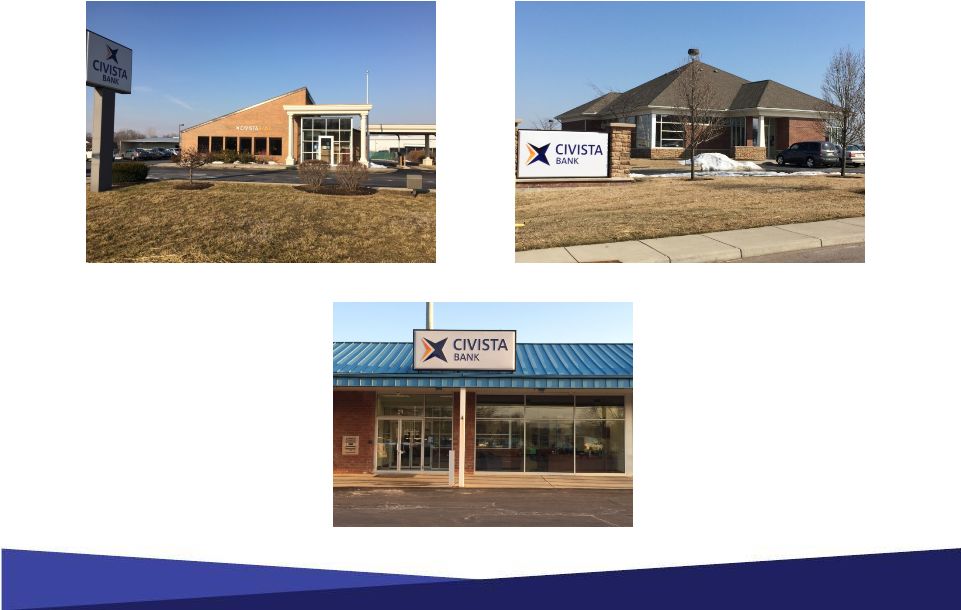 Dayton Offices Huber Heights Springboro Pike Whipp Road |
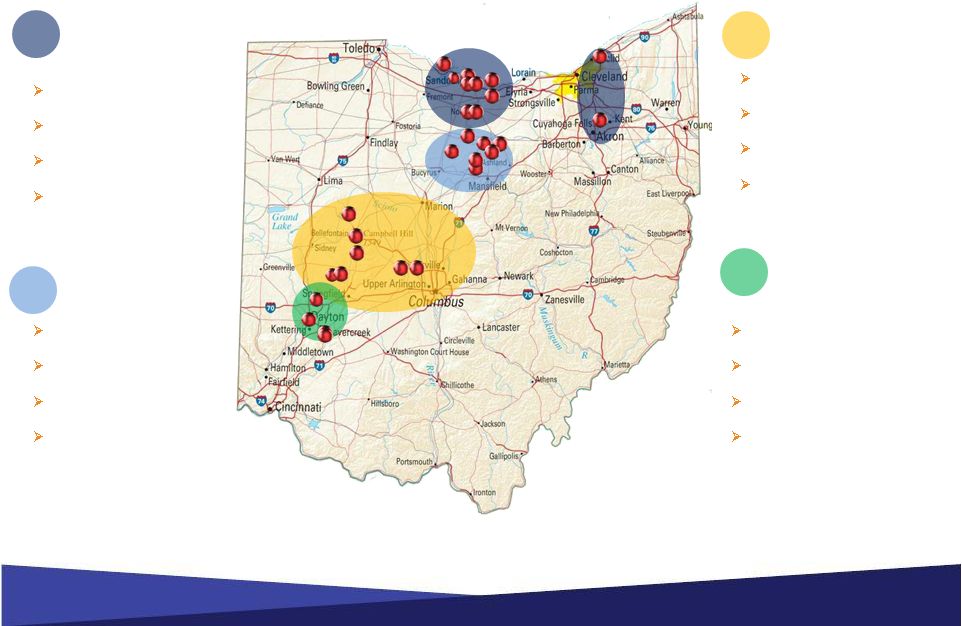 Sandusky / Akron, Ohio $556 million in loans $590 million in deposits 11 branch locations #1 deposit market share in Sandusky, Ohio with ~ 43% market share North Central Ohio $101 million in loans $187million in deposits 7 branch locations ~40% deposit market share West Central Ohio $258 million in loans $192 million in deposits 7 branch locations 23% deposit market share in the rural markets Greater Dayton, Ohio $78 million in loans $90 million in deposits 3 branch locations ~1.47% deposit market share First Citizens Banc Corp Locations |
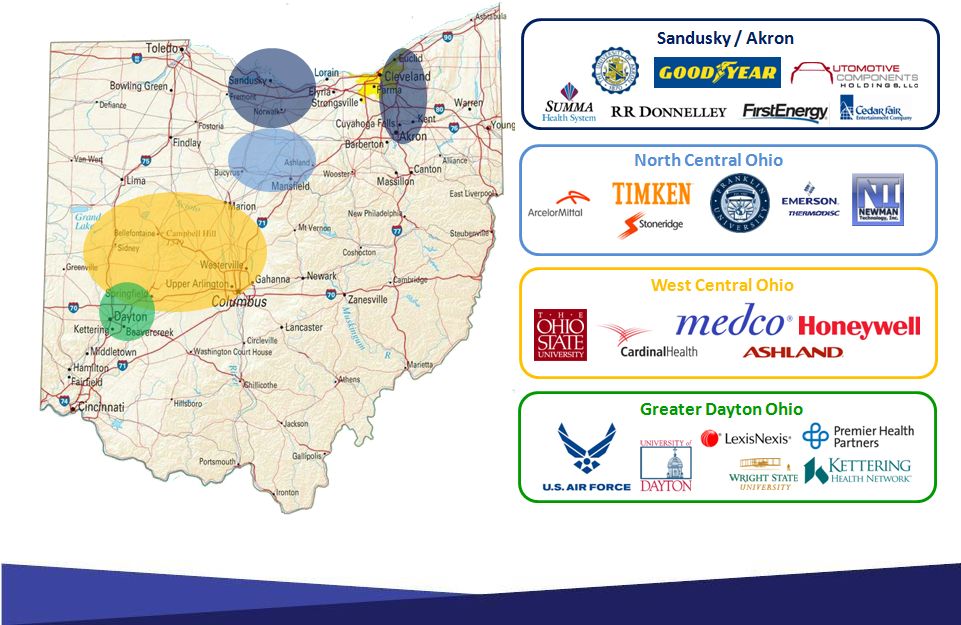 Target Market Highlights |
 SNL Financial Recognition Top Returning Bank Stock for Banks Under $100M in Capitalization 2014 Total Return of 61.15% |
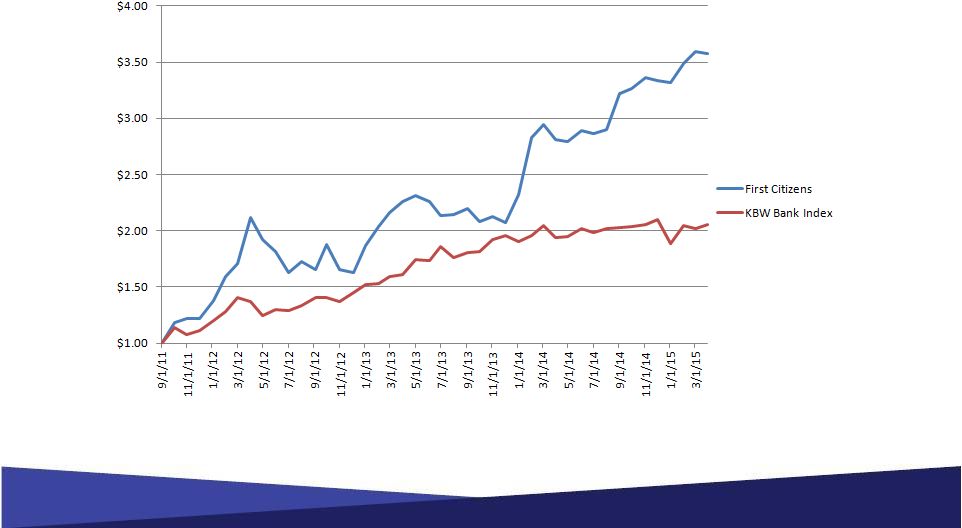 Stock Recovery from September 2011 Low |
 Company Rebranding 316 Citizens Banks in the country 16 Citizens in the State of Ohio Citizens/Champaign confusing Identity confusion on the internet Need to set ourselves apart from the others |
 Company Rebranding Bank Logo |
 Company Rebranding Logo Extensions |
 2014 Operating Successes Grew Loans by $53,600,000 Grew Deposits by $26,400,000 Grew Net Interest Income by $1,892,000 Grew Noninterest Income by $1,812,000 Reduced Noninterest Expense by $1,834,000 Reduced Non-Performing Assets from 2.2% to 1.6% of assets |
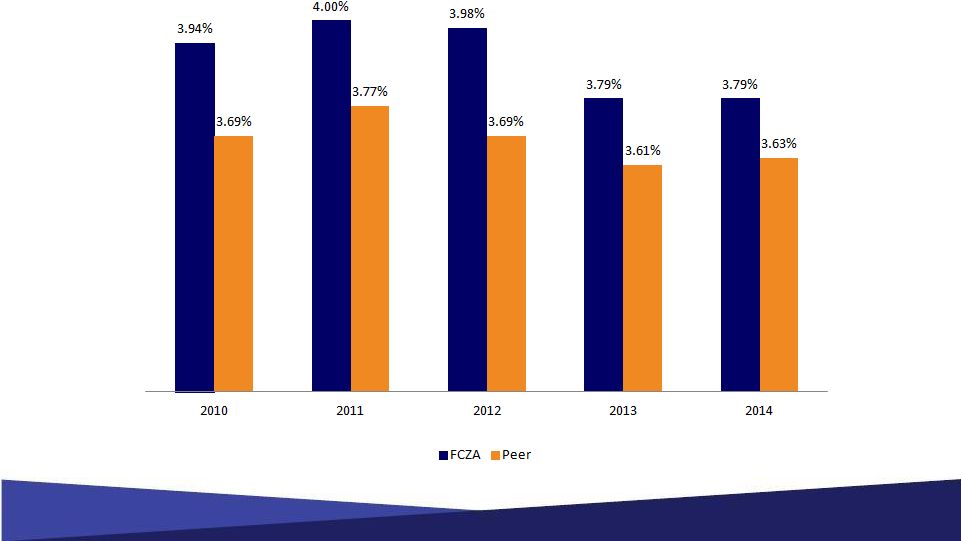 Peer Leading Net Interest Margin |
 Non-Interest Metrics and Initiatives From AB Magazine, November © 2014 SourceMedia, Inc.. All rights reserved. Used by permission and protected by the Copyright Laws of the United States. The printing, copying, redistribution, or retransmission of this Content without expressed written permission is prohibited. *Civista Bank, formerly Citizens and Champaign Banks. Improving efficiency and operating leverage Investment in people * Revised retirement plan in Q2 2014 reducing net expenses $195 thousand in 2014 Rightsizing branch network Projected annual cost savings of $450 thousand Growing fee income platform Wealth management ~$464 million in AUM Earned $3.2 million during 2014, a 19% increase from the prior year Income tax refund processing program Evaluated / refined our process over four tax seasons Specialized payment processing earned $2.3 million during 2014 Non-Interest Income / Average Assets Net Operating Expense / Average Assets 0.85% 0.89% 0.98% 1.00% 1.12% 2010 2011 2012 2013 2014 2.20% 2.24% 2.31% 2.63% 2.17% 2010 2011 2012 2013 2014 |
 Operating Results ($s in thousands, except per share data) For the Years Ended December 31, 2010 2011 2012 2013 2014 Net Interest Income $41,461 $41,361 $40,578 $39,974 $41,866 Provision for Loan Losses 17,940 9,800 6,400 1,100 1,500 Noninterest Income 9,154 9,971 11,200 12,062 13,874 Noninterest Expense 35,774 36,727 38,074 43,384 41,550 Net Income (1,268) 3,958 5,579 6,179 9,528 Net Income Available to Common Shareholders (2,444) 2,782 4,386 5,020 7,655 Basic EPS per Common Share ($0.32) $0.36 $0.57 $0.65 $0.99 Diluted EPS per Common Share (0.32) 0.36 0.57 0.64 0.85 Return on Average Assets (ROAA) (0.11%) 0.35% 0.49% 0.53% 0.77% Return on Average Equity (ROAE) (1.27) 3.96 5.36 5.97 8.34 |
 Our Strategy Remains Unchanged Grow the Company Grow to spread expenses over a larger base Cost of Regulation and Compliance Cost of Technology Grow to spread Risk Diversity of markets and customer base Grow to increase attractiveness of company Expand and diversify shareholder base Increase liquidity of stock |
 Our Strategy Remains Unchanged Grow the Company Leading to Increased Shareholder Value |
 Our Story to the Investment Community |
 |
 THANK YOU |