 Investor Presentation Second Quarter 2015 Dennis G. Shaffer - Executive Vice President & President of Civista Bank Richard J. Dutton - Senior Vice President, Chief Operating Officer 1 Exhibit 99.1 |
 Forward-Looking Statements Comments made in this presentation include “forward-looking statements” within the meaning of the Private Securities Litigation Reform Act of 1995. Forward-looking statements are subject to numerous assumptions, risks and uncertainties. Although management believes that the expectations reflected in the forward-looking statements are reasonable, actual results or future events could differ, possibly materially, from those anticipated in these forward-looking statements. For factors that could cause actual results to differ from our forward-looking statements, please refer to “Risk Factors” in the Company’s Form 10-K filed with the SEC on March 13, 2015. The forward-looking statements speak only as of the date of this presentation, and Civista Bancshares, Inc. assumes no duty to update any forward-looking statements to reflect events or circumstances after the date of this presentation, except to the extent required by law. 2 |
 Contact Information Civista Bancshares, Inc.’s common shares are traded on the NASDAQ Capital Market under the symbol “CIVB.” The Company’s depository shares, each representing 1/40 th ownership interest in a Series B Preferred Share, are traded on the NASDAQ Capital Market under the symbol “CIVBP.” Additional information can be found at: www.civb.com James O. Miller Chairman, President & Chief Executive Officer jomiller@civb.com Telephone: 888.645.4121 3 |
 Corporate Overview 9 th Largest Publicly Traded Commercial Bank in Ohio Community Banking Focused Operations in 11 Ohio Counties – 27 Branches & 1 Loan Production Office Operations in Stable Ohio Markets Acquisitive Franchise Poised for Future Growth Full-Service Banking Organization with Diversified Revenue Streams – Commercial Banking – Retail Banking – Wealth Management – Mortgage Banking 4 NASDAQ: CIVB ¹ Market data as of July 10, 2015. As of June 30, 2015, $s millions Assets $1,317.3 Gross Loans $1,002.9 Deposits $1,075.8 Market Cap. ¹ $81.5 Corporate Overview Key Facts Corporate Rebranding |
 5 Financial Highlights Financial Highlights ($s in thousands, except per share data) June 30, 2015 June 30, 2014 % Change Balance Sheet Assets $1,317,272 $1,185,130 11.15% Gross Loans 1,002,917 867,978 15.55 Deposits 1,075,806 979,136 9.87 Performance Analysis Net Income Available to Common $5,497 $3,890 41.31% ROAA 0.93% 0.78% 19.40 ROAE 10.74% 8.84% 21.55 ROATCE 16.66 13.83 20.48 Market Data ¹ Market Capitalization $84,527 $69,538 Price / Tangible Book Value 124.0% 123.9% Dividend Yield 1.85 2.22 - Tangible book value excludes Goodwill and other intangible assets from the book value calculation - ROATCE equals annualized net income, adjusted for amortization of intangibles, divided by average common equity minus average intangible assets |
 6 Investment Highlights Experienced management team with strong track record Leading Ohio community bank franchise focused on rural and targeted urban markets Demonstrated organic growth and proven acquirer – Opened Loan Production Office on east side of Cleveland (Mayfield Heights) in 2015 Q1 – Completed acquisition of TCNB Financial Corp. in 2015 Q1 Successful unification into Civista brand in 2015 Q2 Continued focus on credit quality Demonstrated earnings growth – Y-o-Y net income available to common shareholders growth of ~41% – ROATCE of 16.66% through Q2 2015 Improving operating leverage – Closed four branches in 2014 – Continued focus on opportunities Capital – Shelf offering positions the Company to take advantage of opportunities |
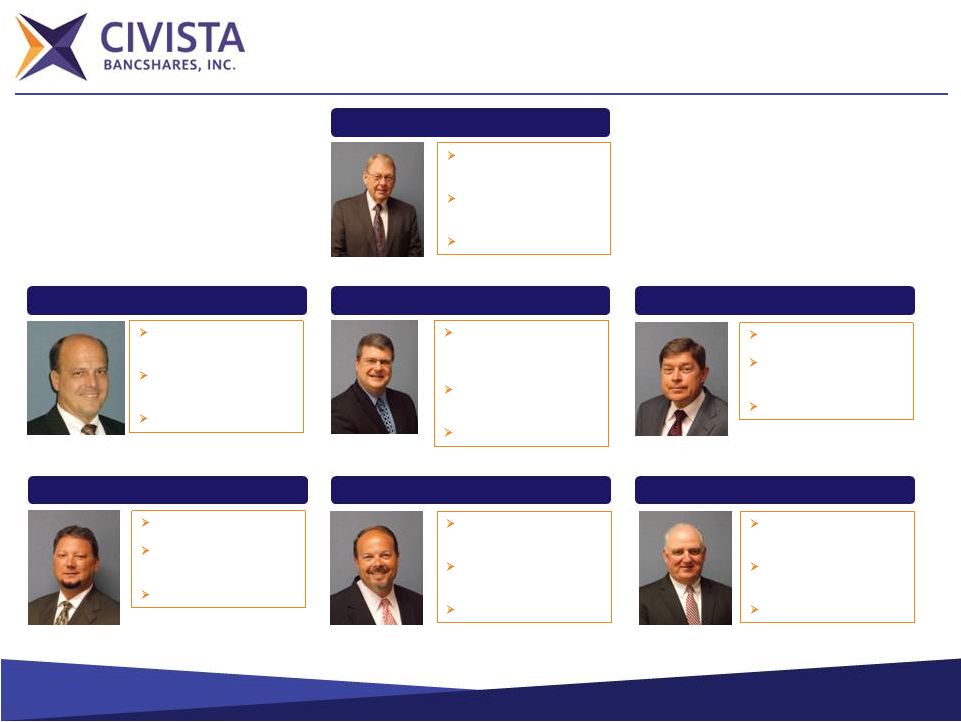 7 Experienced Management Team Chairman, President & CEO 42 years of banking experience Joined in 1987 SVP & Chief Operating Officer 29 years of banking experience Joined in 2007 EVP, Chief Lending Officer & President of Civista Bank 30 years of banking experience Joined in 2009 SVP & General Counsel 14 years of banking experience Joined in 2003 SVP and Controller 27 years of banking experience Joined in 1988 SVP & Chief Risk Officer 20 years of banking experience Joined in 2013 SVP & Chief Credit Officer 31 years of banking experience Joined in 2011 James O. Miller James E. McGookey Paul J. Stark John A. Betts Todd A. Michel Richard J. Dutton Dennis G. Shaffer |
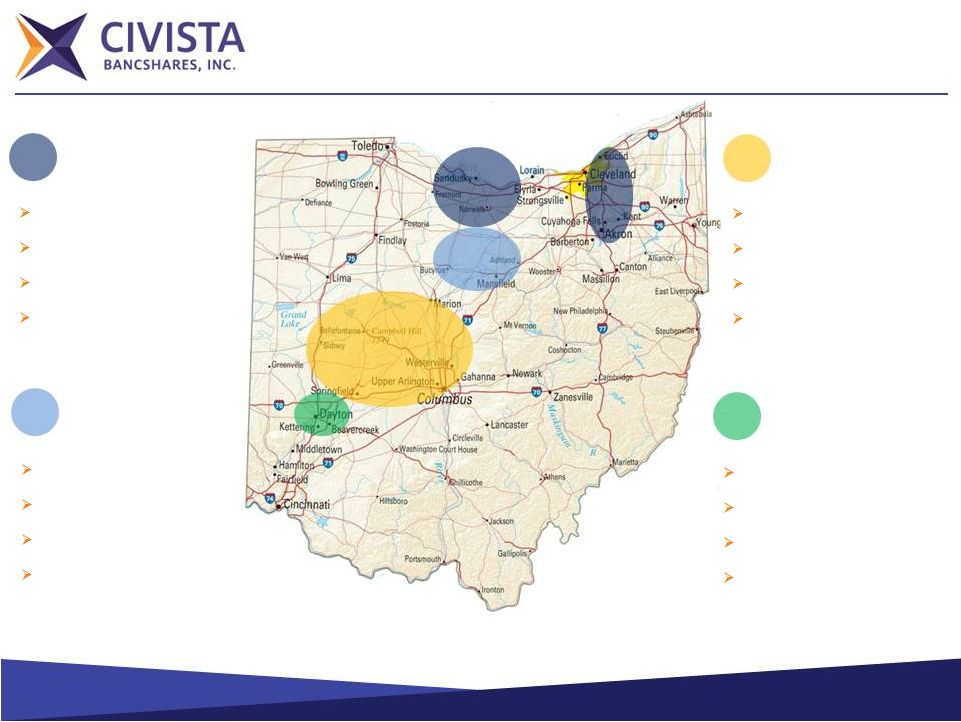 8 Branch Footprint Note: Branch information as of June 30, 2015. Sandusky / Akron / Cleveland, Ohio $567 million in loans $614 million in deposits 11 branch locations #1 deposit market share in Sandusky, Ohio with ~ 43% market share North Central Ohio $93 million in loans $179 million in deposits 7 branch locations ~40% deposit market share $263 million in loans $199 million in deposits 7 branch locations 23% deposit market share in the rural markets West Central Ohio Greater Dayton, Ohio $80 million in loans $84 million in deposits 3 branch locations ~1.47% deposit market share |
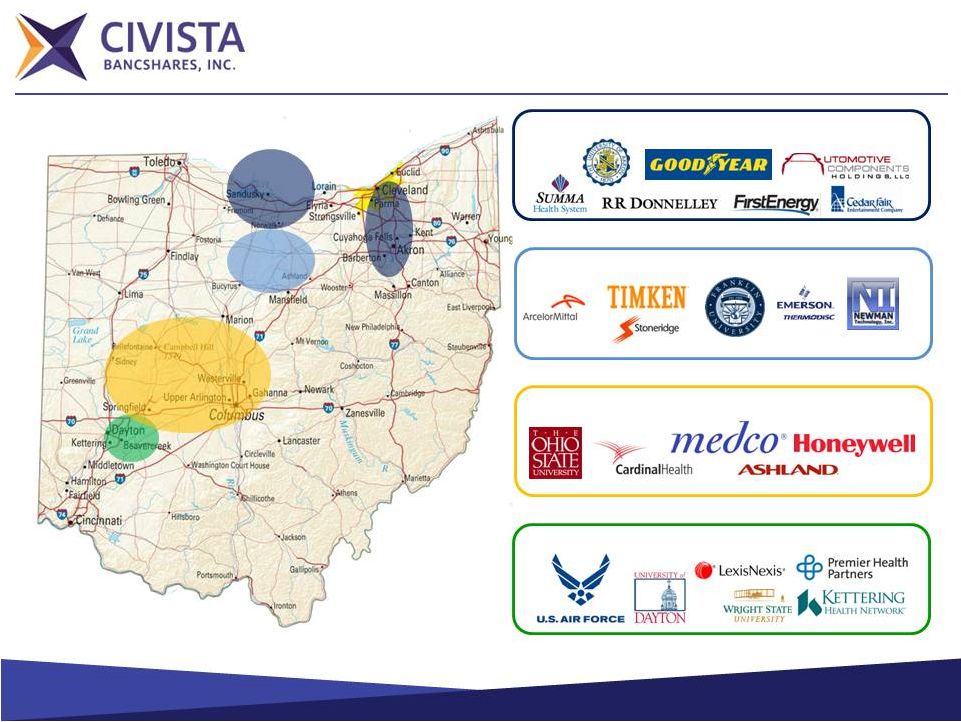 9 Attractive Target Markets Sandusky / Akron / Cleveland North Central Ohio West Central Ohio Greater Dayton Ohio |
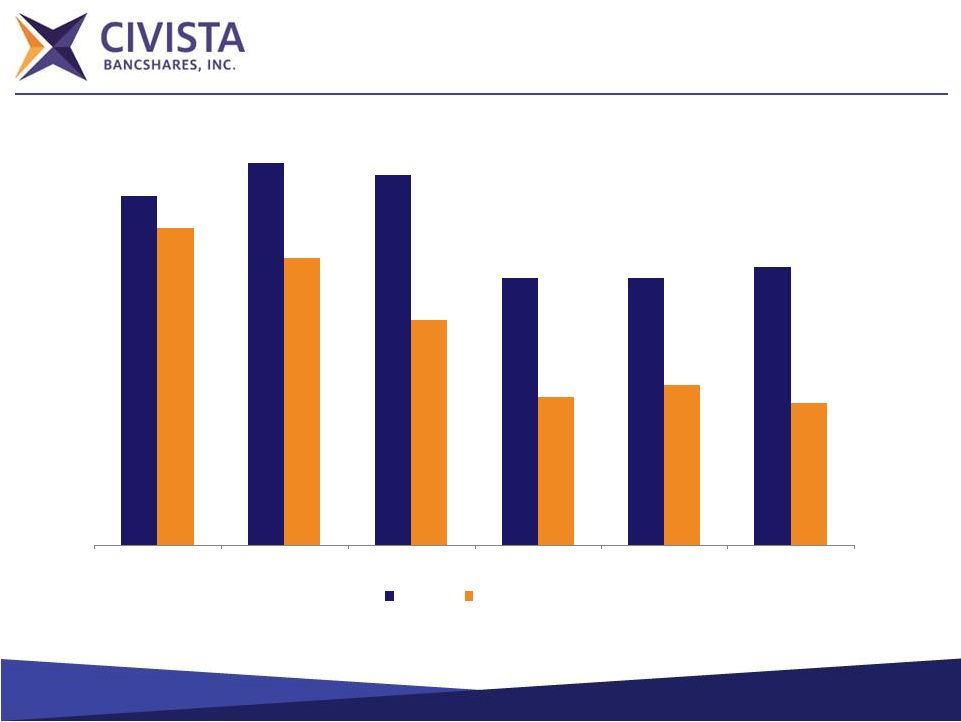
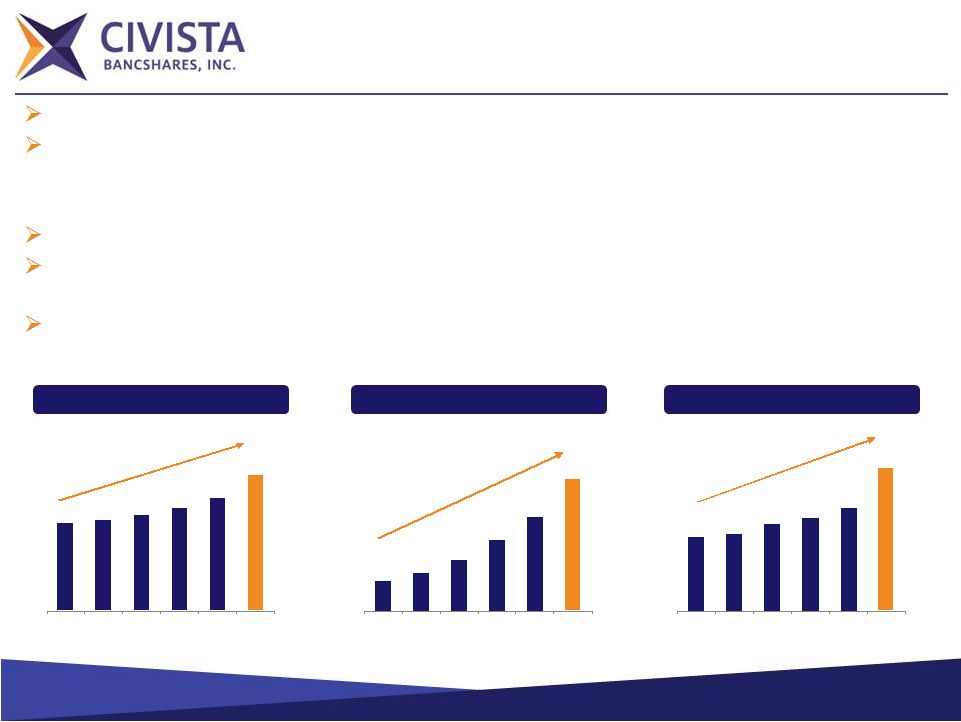 10 Proven Acquirer & Attractive Organic Growth Acquired six banks from 1998 – 2015, serving to increase assets by over $800 million Expanded commercial loan growth in Columbus, Cleveland, Akron and Dayton markets – Since year-end 2010, loan portfolios in these markets have increased from $117 million to $385 million Maintain a low cost, locally generated deposit base Expanded residential mortgage lending with 2013 Q3 hiring of experienced lending team in the Columbus / Dublin, Ohio market Positioned to capitalize on loan opportunities in greater Cleveland, Akron, Columbus, Dayton $s in millions $s in millions $s in millions $1,101 $1,113 $1,137 $1,168 $1,213 $1,317 2010 2011 2012 2013 2014 2015 Q2 $767 $785 $816 $861 $915 $1,003 2010 2011 2012 2013 2014 2015 Q2 $892 $901 $926 $942 $969 $1,076 2010 2011 2012 2013 2014 2015 Q2 Total Deposits Total Gross Loans Total Assets |
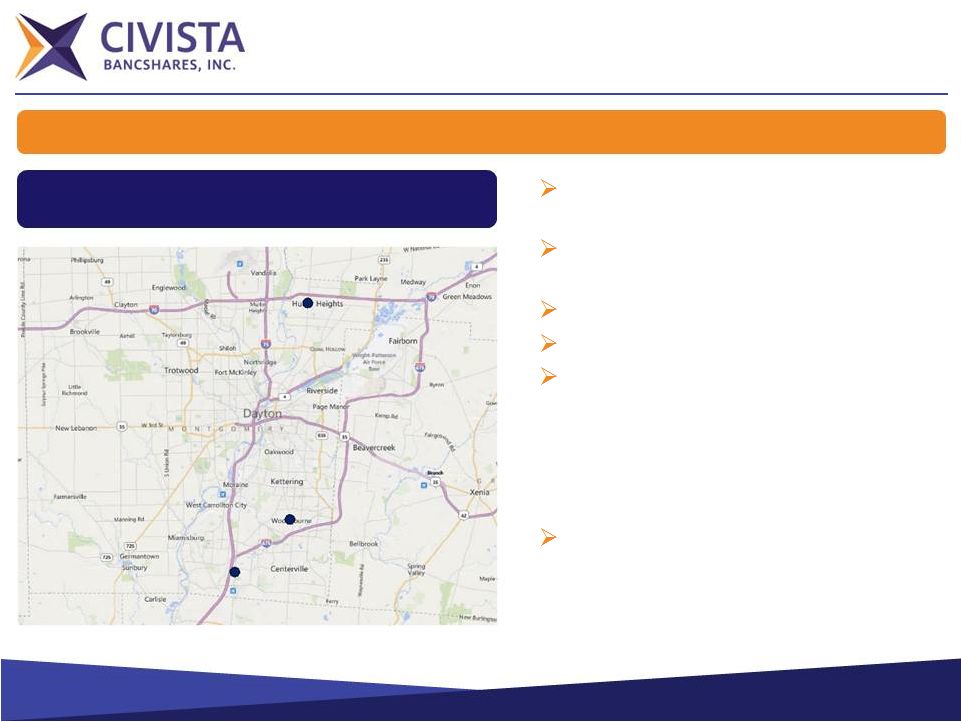 11 TCNB Transaction Highlights Closed and integrated in March 2015 Single Bank Holding Company & Bank Organized in 1999 Total Assets of $105 million Expands Civista’s Presence into the Greater Dayton, Ohio Area – Dayton – Huber Heights – Miamisburg Expected to be Accretive to Earnings in 2015 TCNB Financial Corp. Citizens National Bank of Southwestern Ohio Acquisitive Franchise Positioned for Future Growth |
 12 Successful Rebranding Brand Differentiation 316 “Citizens” Banks in the United States 16 “Citizens” Banks in Ohio Alone Citizens / Champaign Bank Branding Confusing for Existing Customers Avoid Customer Identity Confusion on the Internet NASDAQ: CIVB Why Rebrand? |
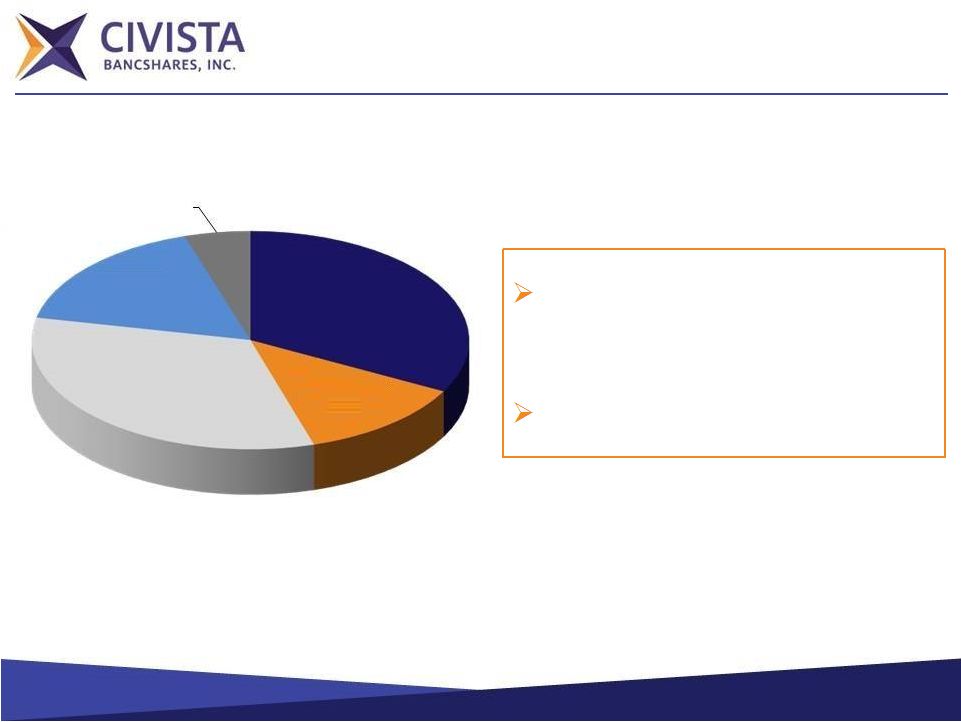 13 Deposit Mix Financial information as of June 30, 2015. Q2 2015 Cost of Interest Bearing Deposits: 0.27% Total Deposits: $1.1 billion Non-Interest Bearing Demand 33% Interest Bearing Demand 12% Savings 33% Brokered Deposits 5% Certificates of Deposit 17% |
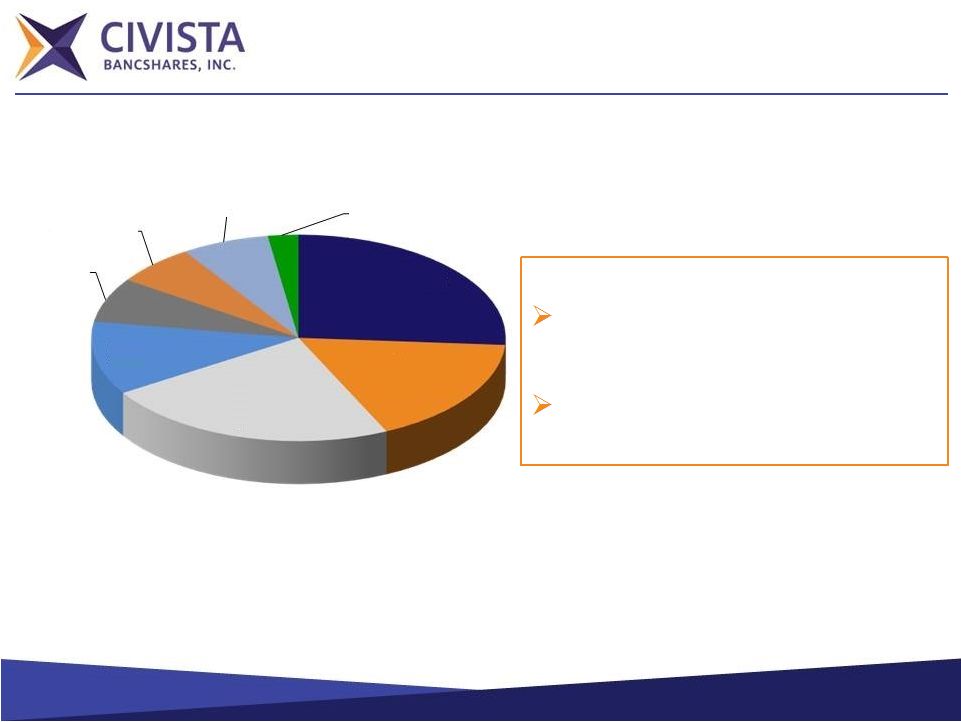 14 Loan Mix Financial information as of June 30, 2015. Q2 2015 Loan Yield: 4.56% Total Gross Loans: $1.0 billion CRE Non-Owner Occupied 26% CRE Owner Occupied 17% Single Family 23% C&I 12% Multi-family 7% Farmland & Agriculture 6% C&D & Land 7% Consumer & Other 2% |
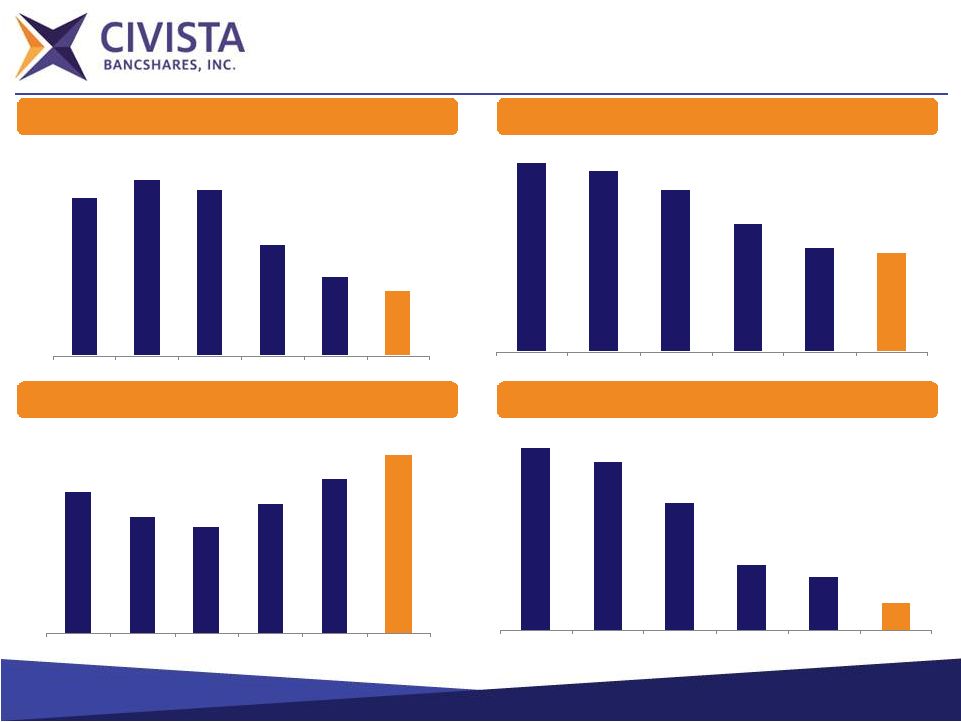 15 Improving Asset Quality Reserves / NPLs NCOs / Average Loans Loan Loss Reserves / Gross Loans NPAs & 90+PD / Assets Loan Loss Reserves / Gross Loans NPAs & 90+PD / Assets 3.16% 3.51% 3.32% 2.22% 1.57% 1.29% 2010 2011 2012 2013 2014 2015 Q2 2.84% 2.70% 2.42% 1.92% 1.56% 1.47% 2010 2011 2012 2013 2014 2015 Q2 70.82% 58.02% 53.05% 64.17% 77.18% 88.80% 2010 2011 2012 2013 2014 2015 Q2 1.46% 1.35% 1.01% 0.53% 0.43% 0.22% 2010 2011 2012 2013 2014 2015 Q2 |
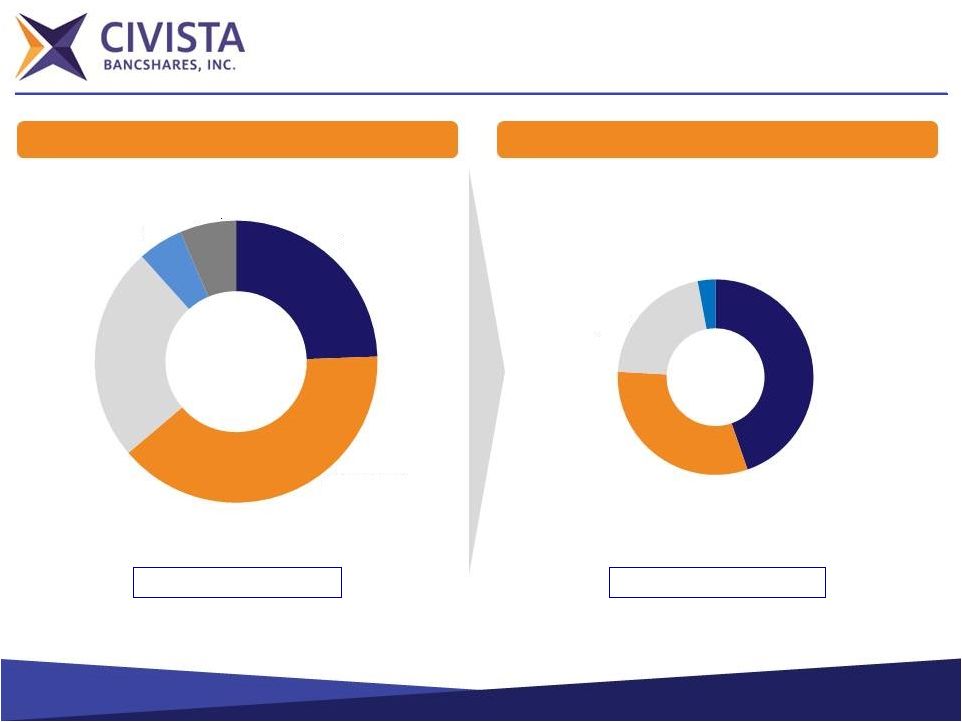 16 Asset Quality Improvement Gross Loans: $767 million Gross Loans: $1.0 billion - Nonaccrual Loans Current, $7.6 Nonaccrual Loans - Past Due, $5.3 Restructured Loans, $3.6 OREO, $0.5 Nonaccrual Loans - Current, $8.5 Nonaccrual Loans - Past Due, $13.7 Restructured Loans, $8.6 OREO, $1.8 90+ Days Delinquent, $2.2 NPAs & 90+ Days Delinquent as of 6/30/2015 NPAs & 90+ Days Delinquent as of 12/31/2010 |
 17 Peer Leading Net Interest Margin Source: SNL Financial. Comparable peers represents banks located in Ohio, Indiana, and Kentucky with total assets between $1.0 billion and $5.0 billion; excludes merger targets. 2015 Peer margin is as of March 31, 2015. 3.94% 4.00% 3.98% 3.79% 3.79% 3.81% 3.88% 3.83% 3.71% 3.57% 3.59% 3.56% 2010Y 2011Y 2012Y 2013Y 2014 YTD 2015 CIVB Peer Median |
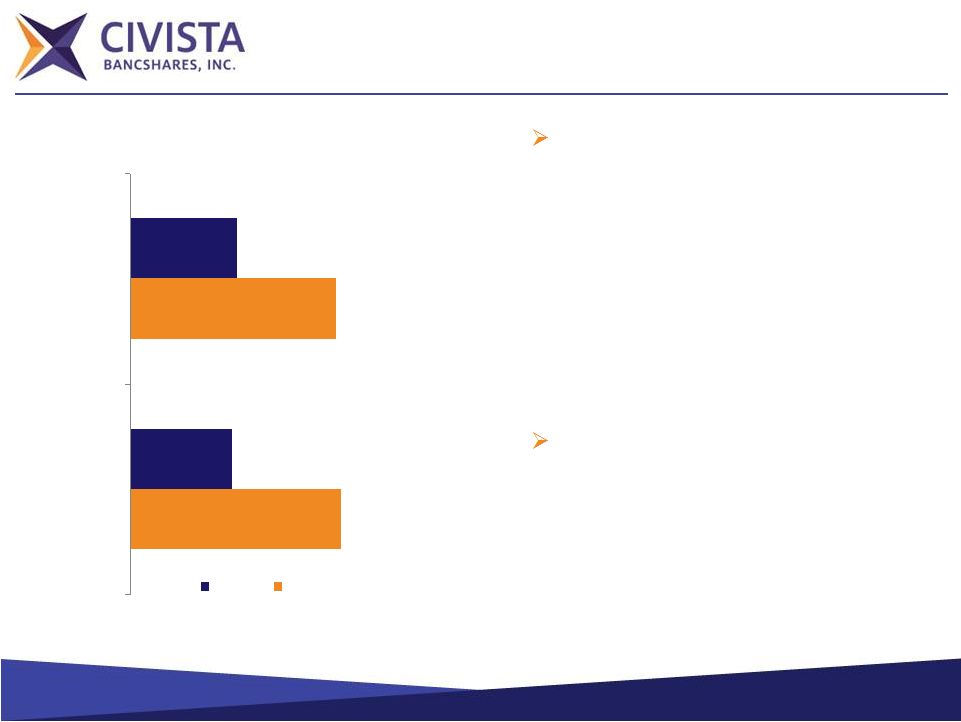 18 Effectively Managing Duration Asset duration of less than two years – Sell fixed rate mortgages – Encourage variable rate commercial lending or swap into variable, if appropriate – Limit fixed rate terms to five years Liability duration greater than three years – Focus on low-cost “sticky” demand deposits – Don’t overprice or overextend time deposits 3.38 3.31 1.64 1.72 Q2 2015 Q2 2014 Assets Liabilities |
 19 Non-Interest Metrics & Initiatives Efficiency Ratio Non-Interest Income / Average Assets Growing fee income platform – Service charges on deposit accounts were $877 thousand and $722 thousand YTD 2015 & 2014 Wealth management – ~$419 million in Assets Under Management – Wealth Management fees were $1.5 million and $1.6 million YTD 2015 & 2014 Mortgage Banking – Gains on sale of mortgage loans were $619 thousand & $231 thousand YTD 2015 & 2014 Income tax refund processing program – Specialized payment processing earned $2.0 and $2.3 million YTD 2015 and 2014 Continuing focus on improving efficiency and operating leverage Investment in people ¹ Continuing evaluation of branch network and opportunities 0.85% 0.89% 0.98% 1.00% 1.11% 1.18% 2010 2011 2012 2013 2014 YTD 2015 65.94% 67.34% 70.57% 80.44% 71.77% 67.23% 2010 2011 2012 2013 2014 YTD 2015 ¹ From AB Magazine, November © 2014 SourceMedia, Inc.. All rights reserved. Used by permission and protected by the Copyright Laws of the United States. The printing, copying, redistribution, or retransmission of this Content without expressed written permission is prohibited. Civista Bank, formerly Citizens and Champaign Banks. |
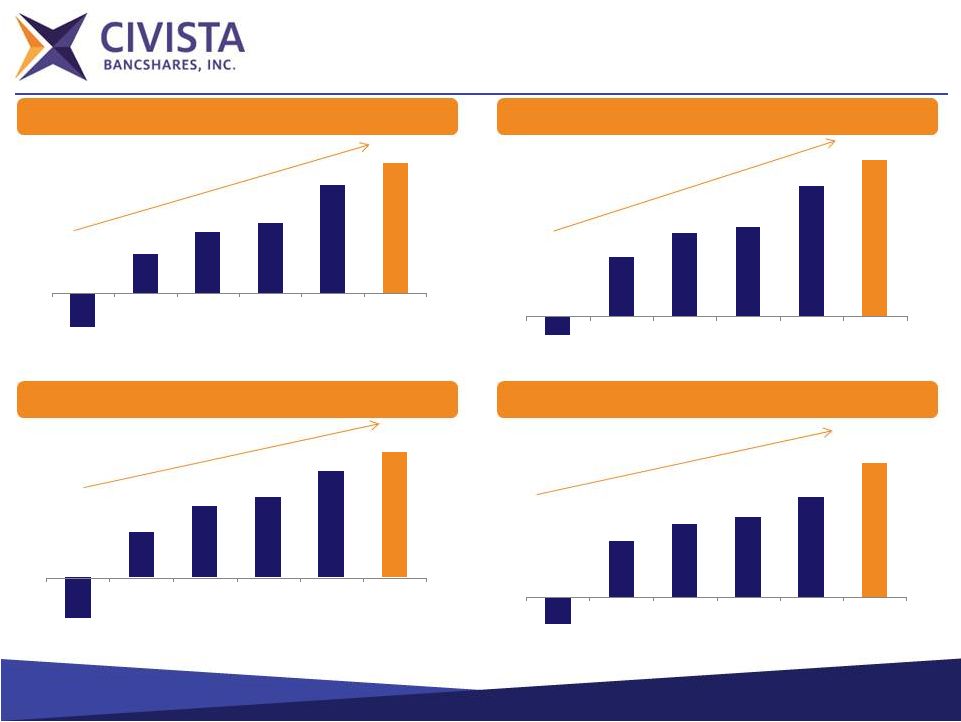 20 Profitability & Returns Analysis ¹ LTM basis. Diluted Earnings per Share ROATCE ROAA Net Income Available to Common Shareholders $(2,444) $2,782 $4,386 $5,020 $7,655 $9,261 2010 2011 2012 2013 2014 2015 Q2¹ -0.11% 0.35% 0.49% 0.53% 0.77% 0.93% 2010 2011 2012 2013 2014 2015 Q2 $(0.32) $0.36 $0.57 $0.64 $0.85 $1.00 2010 2011 2012 2013 2014 2015 Q2¹ -3.42% 7.00% 9.06% 9.93% 12.45% 16.66% 2010 2011 2012 2013 2014 2015 Q2 |
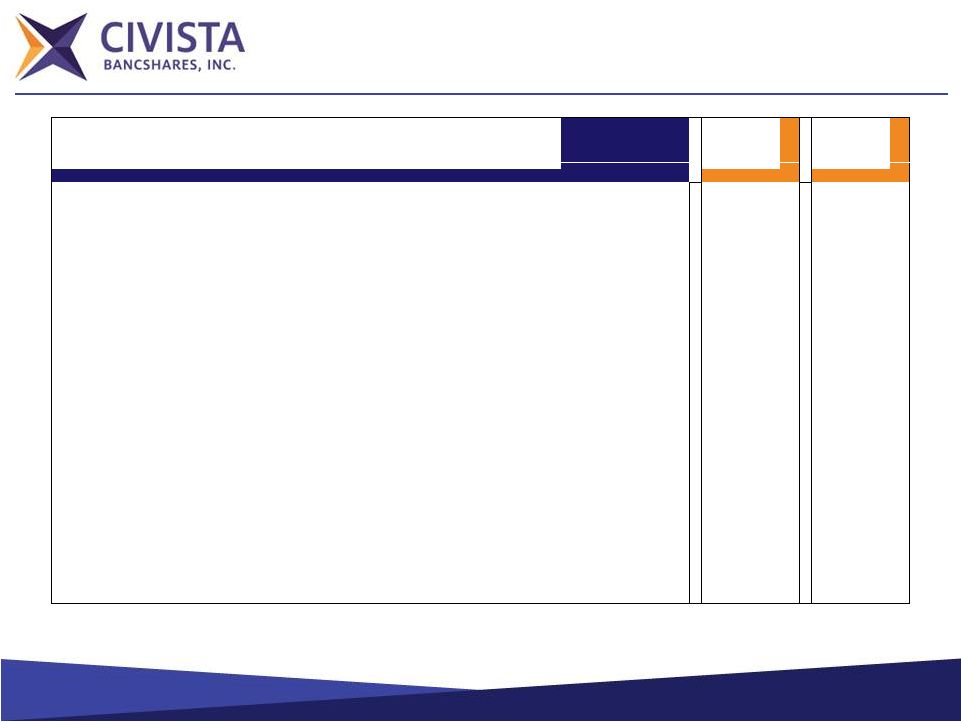    21 Capital Position ¹ LTM basis. At December 31, 2013, the Company had issued the Series B Preferred but had not yet redeemed the Series A Preferred For the Years Ended December 31, Q2 As 2011 2012 2013 2014 2015 Converted Total Equity $102,528 $103,980 $128,376 $115,909 $120,022 $120,022 Preferred Equity $23,151 $23,184 $46,316 $23,132 $22,273 $0 Common Equity $79,377 $80,796 $82,060 $92,777 $97,749 $120,022 TCE / TA 4.93% 5.03% 5.08% 5.80% 5.29% 7.02% Tier 1 Common Capital Ratio 6.77% 6.87% 6.81% 7.57% 7.07% 9.28% Tier 1 Leverage Ratio 9.30% 9.34% 11.64% 10.70% 9.38% 9.38% Tier 1 Risk-based Capital Ratio 13.80% 13.25% 15.82% 13.44% 12.20% 12.20% Total Risk-based Capital Ratio 15.10% 14.84% 17.08% 14.70% 13.45% 13.45% |
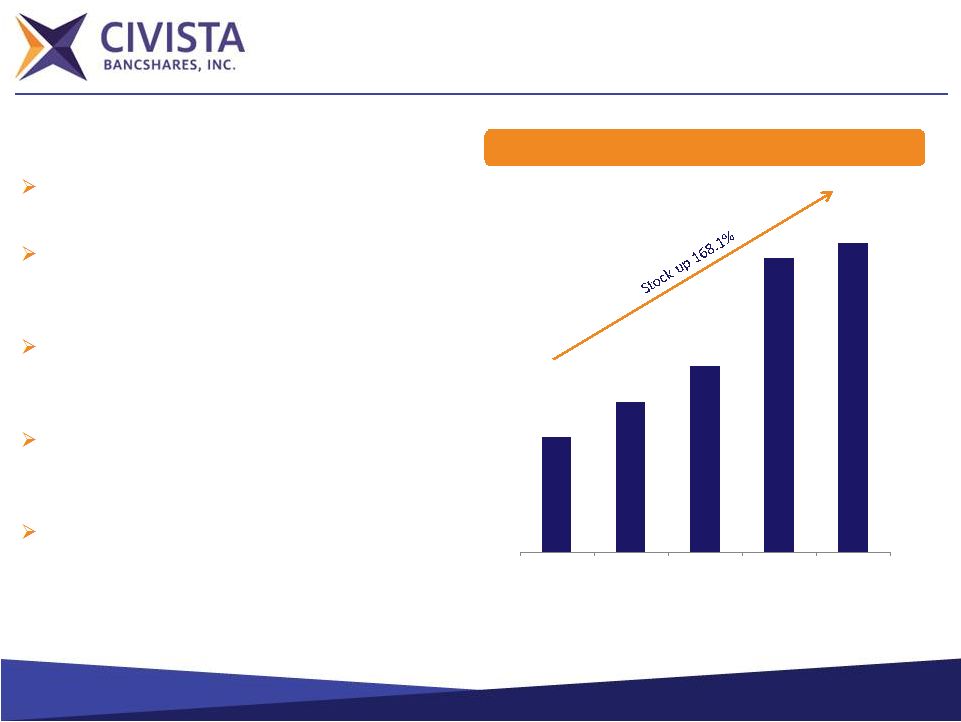 22 Increasing Shareholder Value Source: SNL Financial. Market Data as of June 30, 2015. ¹ Comparable peers represents banks located in Ohio, Indiana, and Kentucky with total assets between $1.0 billion and $5.0 billion; excludes merger targets. Stock Price Dividend yield of 1.85% Dividend payout ratio YTD 2015 is approximately 12.3% Price / Tangible Book Value of 124% as compared to peer average of 153% ¹ Price / LTM EPS of 10.8x as compared to peer average of 14.3x ¹ 61.15% Total Return in 2014 6.03% Total Return through June 30, 2015 $4.03 $5.25 $6.52 $10.28 $10.80 2011 2012 2013 2014 6/30/2015 |
 23 Commitment to Shareholders Long-term Shareholder Value through Growth and Profitability |
 24 Strategic Focus & Growth Strategy Organic growth – Capitalize on commercial and consumer lending opportunities – Grow core deposit base in rural and targeted urban markets – Identify and evaluate loan production opportunities in select metro markets Acquisition opportunities – Rural – Urban Asset quality Efficiency and operating leverage Capital |
 25 Why Invest in CIVB? Strong and Seasoned Management Team Attractively Valued Versus Peers Leading Ohio Community Banking Franchise Platform to Support Future Growth Proven and Disciplined Acquirer |
 Appendix 26 |
   Operating Results ($s in thousands, except per share data) For the Years Ended December 31, LTM Q2 2009 2010 2011 2012 2013 2014 2015 Net Interest Income $40,273 $41,461 $41,361 $40,578 $39,974 $41,866 $44,266 Provision for Loan Losses 13,323 17,940 9,800 6,400 1,100 1,500 800 Noninterest Income 9,633 9,154 9,971 11,200 12,062 13,874 13,923 Noninterest Expense 35,165 35,774 36,727 38,074 43,384 41,550 42,679 Net Income 1,655 (1,268) 3,958 5,579 6,179 9,528 10,869 Net Income Available to Common Shareholders $700 ($2,444) $2,782 $4,386 $5,020 $7,655 $9,262 Diluted EPS per Common Share $0.09 ($0.32) $0.36 $0.57 $0.64 $0.85 $1.00 Return on Average Assets (ROAA) 0.15% (0.11%) 0.35% 0.49% 0.53% 0.77% 0.85% Return on Average Equity (ROAE) 1.68 (1.27) 3.96 5.36 5.97 8.34 9.30 27 |
 28 Thank You |