 Investor Presentation Second Quarter 2017 James O. Miller - Chairman, President & Chief Executive Officer Dennis G. Shaffer - Executive Vice President & President of Civista Bank Richard J. Dutton - Senior Vice President, Chief Operating Officer NASDAQ: CIVB 1 Exhibit 99.1 |
 Forward-Looking Statements 2 This material and any oral presentation that may accompany it contain, and future oral and written statements of the Company and its management may contain, forward-looking statements, within the meaning of such term in the Private Securities Litigation Reform Act of 1995, Section 27A of the Securities Act of 1933 (the “Securities Act”) and Section 21E of the Securities Exchange Act of 1934 (the “Exchange Act”), with respect to the financial condition, results of operations, plans, objectives, future performance and business of the Company. Forward-looking statements, which may be based upon beliefs, expectations and assumptions of the Company’s management and on information available to management at the time the statements are made, are generally identifiable by the use of words such as “believe,” “expect,” “anticipate,” “bode,” “predict,” “suggest,” “project,” “appear,” “plan,” “intend,” “estimate,” “may,” “will,” “would,” “could,” “should,” “likely,” or other similar expressions. Additionally, all statements in this material including forward-looking statements speak only as of the date they are made, and we undertake no obligation to update any statement in light of new information or future events except as may be required by law. Forward-looking statements are not guarantees of performance and are inherently subject to known and unknown risks, uncertainties and assumptions that are difficult to predict and could cause our actual results, performance or achievements to differ materially from those expressed in or implied by the forward-looking statements. Factors that could cause actual results, performance or achievements to differ from results discussed in the forward-looking statements include, but are not limited to, changes in financial markets or national or local economic conditions; sustained weakness or deterioration in the real estate market; volatility and direction of market interest rates; credit risks of lending activities; changes in the allowance for loan losses; legislation or regulatory changes or actions; increases in Federal Deposit Insurance Corporation insurance premiums and assessments; changes in tax laws; failure of or breach in our information and data processing systems; unforeseen litigation; and other risks identified from time-to-time in the Company’s other public documents on file with the SEC, including those risks identified in “Item 1A. Risk Factors” of Part I of the Company’s Annual Report on Form 10-K for the fiscal year ended December 31, 2016. These risks and uncertainties should be considered in evaluating forward-looking statements and undue reliance should not be placed on such statements. |
 3 Contact Information Civista Bancshares, Inc.’s common shares are traded on the NASDAQ Capital Market under the symbol “CIVB.” The Company’s depository shares, each representing 1/40 th ownership interest in a Series B Preferred Share, are traded on the NASDAQ Capital Market under the symbol “CIVBP.” Additional information can be found at: www.civb.com James O. Miller Chairman, President & Chief Executive Officer jomiller@civb.com Telephone: 888.645.4121 |
 Corporate Overview Bank originally founded in 1884 9 Largest Publicly Traded Commercial Bank Headquartered in Ohio Community Banking Focused Operations in 12 Ohio Counties – 27 Branches & 2 Loan Production Offices Operations in 4 of the 5 largest Ohio MSAs Franchise Poised for Acquisitions and Organic Growth Full-Service Banking Organization with Diversified Revenue Streams – Commercial Banking – Retail Banking – Wealth Management – Mortgage Banking – Tax Refund Processing Corporate Overview 4 th |
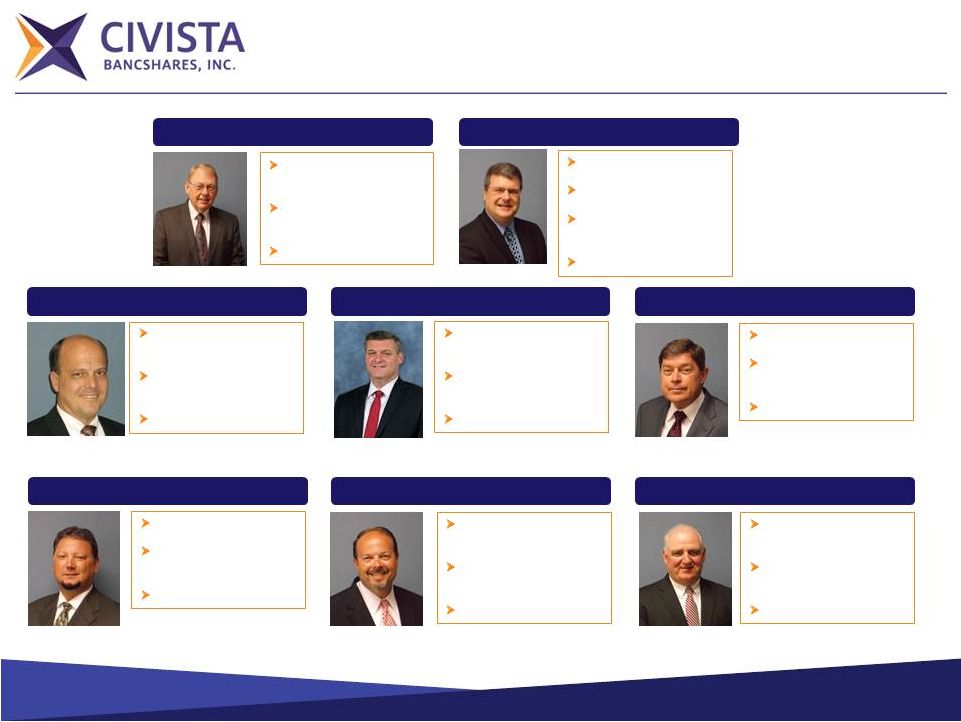 5 Experienced Management Team Chairman, President & CEO 43 years of banking experience Joined in 1986 James O. Miller SVP & Chief Operating Officer 31 years of banking experience Joined in 2007 Richard J. Dutton SVP & Chief Lending Officer 29 years of banking experience Joined in 2016 Charles A. Parcher SVP & General Counsel 15 years of banking experience Joined in 2002 James E. McGookey SVP & Controller 29 years of banking experience Joined in 1988 Todd A. Michel SVP & Chief Risk Officer 21 years of banking experience Joined in 2013 John A. Betts SVP & Chief Credit Officer 32 years of banking experience Joined in 2010 Paul J. Stark Dennis G. Shaffer EVP President, Civista Bank 31 years of banking experience Joined in 2009 |
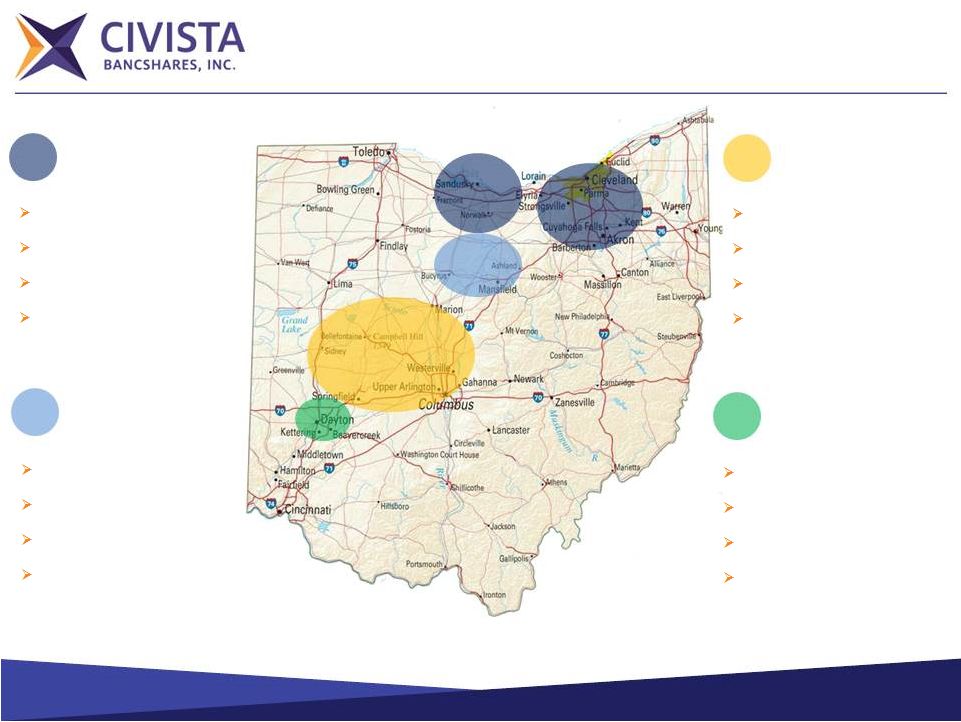 6 Branch Footprint Note: Market share information as of June 30, 2016. Sandusky / Akron / Cleveland, Ohio $679 million in loans $710 million in deposits 12 locations #1 deposit market share in Sandusky, Ohio with ~ 48% market share North Central Ohio $77 million in loans $176 million in deposits 7 locations ~ 37% deposit share in our markets $268 million in loans $200 million in deposits 7 locations 22% deposit market share in the rural markets West Central Ohio Greater Dayton, Ohio $77 million in loans $79 million in deposits 3 locations ~ 4% deposit share in our markets |
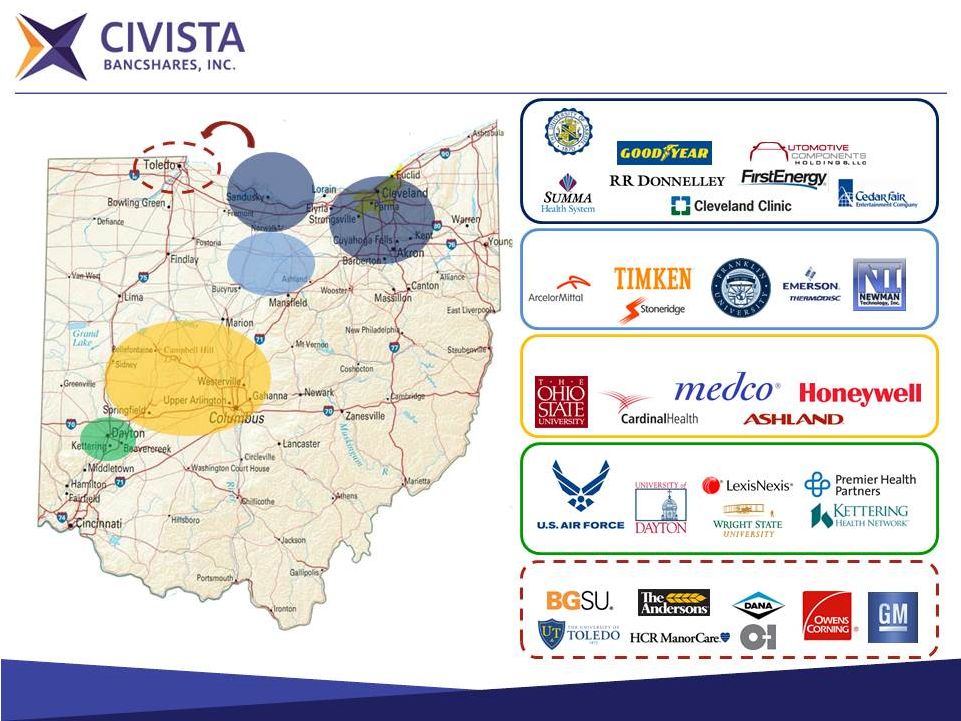 7 7 Attractive Target Markets North Central Ohio West Central Ohio Greater Dayton Ohio Sandusky / Akron / Cleveland Development Opportunity - Toledo |
 8 Investment Highlights Experienced management team with a deep bench Community bank franchise in growth markets with an established operating model – Gather attractive low-cost rural deposits (14 bps total cost of deposits) – Generate loans in select growing urban markets (operations in 4 of the 5 largest MSAs in Ohio) Use of LPOs to extend our reach – Two Loan Production Offices in Cleveland MSA (Westlake and Mayfield Heights) – New Loan Production Office planned in the Toledo MSA Disciplined underwriting verified with strong credit quality metrics – Nonaccrual and 90 days Past Due (excluding PCI ) to Gross Loans of 0.66% as of 6/30/2017 Noninterest income enhanced by unique tax refund processing platform – Continued strong returns in 2017 – ROAA: 1.06% – ROAE: 10.11% – FTE NIM 3.86% Added to Russell 2000 index in June 2017 Source: Company Management and SNL Financial. 1 PCI – purchased credit impaired loans. 1 |
 9 Financial Highlights Source: Company Management and SNL Financial. 1 Non-GAAP reconciliation on page 23. Financial Highlights ($s in thousands, except per share data) June 30, 2017 June 30, 2016 % Change Balance Sheet Assets $1,462,128 $1,359,911 7.52% Gross Loans 1,100,817 1,028,922 6.99% Deposits 1,164,888 1,115,007 4.47% Performance Analysis Net Income Available to Common $7,604 $9,124 (16.66%) ROAA 1.06% 1.31% (19.00%) ROAE 10.11% 15.37% (34.21%) Market Data Market Capitalization ($mm) $212,332 $103,167 Price / Tangible Book Value 1 159.5% 121.1% Price/LTM diluted EPS 13.9x 8.8x |
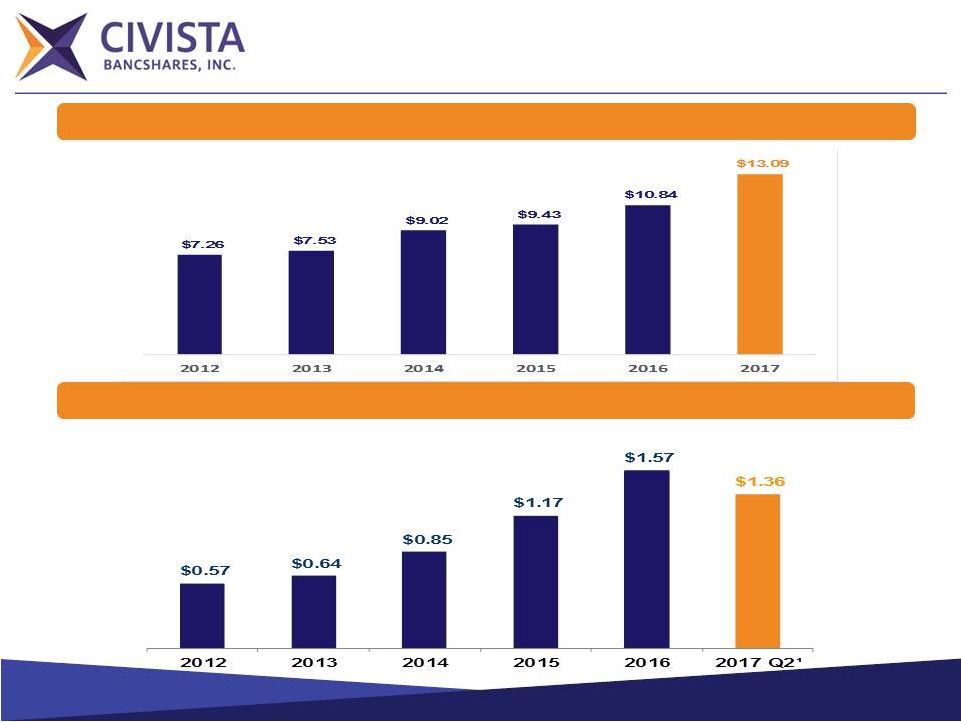 10 Increasing Shareholder Value Source: SNL Financial. 1 Non-GAAP reconciliation on page 23. Tangible Book Value per Share Diluted EPS 1 |
 11 Proven Acquirer & Attractive Organic Growth Source: Company Management and SNL Financial. Completed 6 acquisitions since the formation of the holding company in 1987 Expanded commercial loan growth in Columbus, Cleveland, Akron and Dayton markets – Since year-end 2011, loan portfolios in these markets have increased from $163 million to $431 million through Q2 2017 Maintains a low cost, locally generated deposit base, primarily in rural markets Expanded residential mortgage lending by hiring experienced lending teams in the Columbus / Dublin, Cleveland and Dayton MSAs Total Assets $ in 000s Total Gross Loans $ in millions Total Deposits $ in millions |
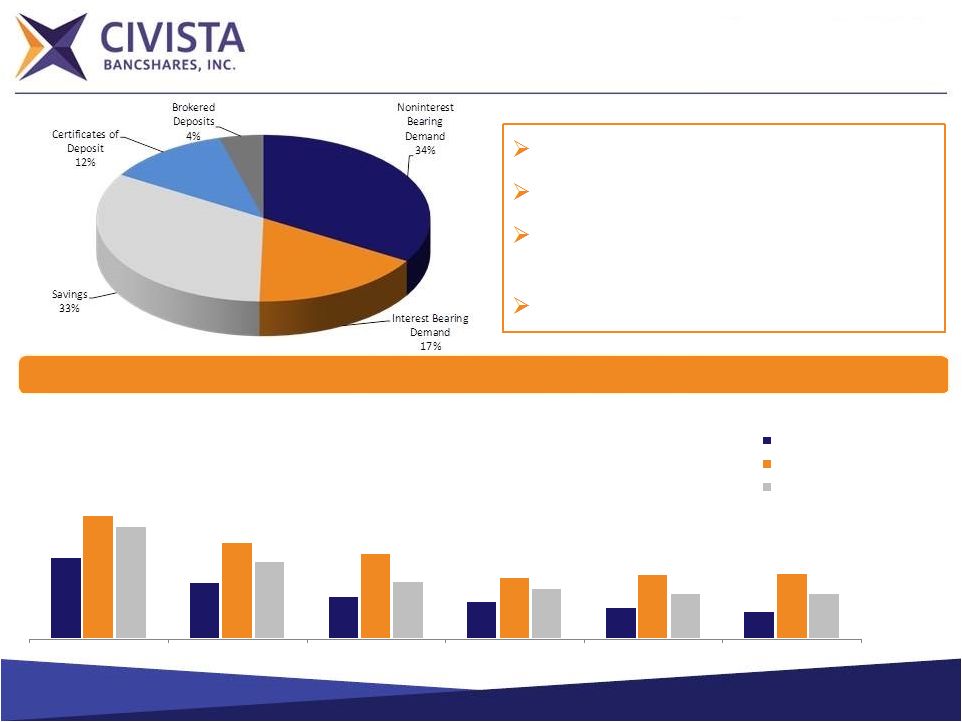 12 Source: Company Management and SNL Financial. 2017 Peer data as of 6/30/2017, or the latest available date. Note: Comparable peers include Management selected public banks located in PA, IN, WV, MI, OH, and WI with total assets between $1.0 billion and $2.0 billion. Deposit Mix Total Deposits: $1.2 billion 2017 Total Cost of Deposits: 0.14% 34% Noninterest Bearing Demand Deposits 2017 Loan/Deposit Ratio: 87% Total Cost of Deposits (%) 0.42% 0.29% 0.22% 0.19% 0.16% 0.14% 0.64% 0.50% 0.44% 0.32% 0.33% 0.34% 0.59% 0.40% 0.30% 0.26% 0.24% 0.24% 2012Y 2013Y 2014Y 2015Y 2016Y 2017Q2 CIVB Peer Median Peer Top Quartile |
 13 Source: Company Management and SNL Financial. 2017 Peer data as of 6/30/2017, or the latest available date. Note: Comparable peers include Management selected public banks located in PA, IN, WV, MI, OH, and WI with total assets between $1.0 billion and $2.0 billion. Loan Mix Total Gross Loans: $1.1 billion 2017 Loan Yield: 4.52% Yield on Loans (%) 5.13% 4.74% 4.58% 4.57% 4.60% 4.52% 5.15% 4.78% 4.67% 4.67% 4.58% 4.49% 5.60% 4.96% 5.02% 4.76% 4.73% 4.73% 2012Y 2013Y 2014Y 2015Y 2016Y 2017Q2 CIVB Peer Median Peer Top Quartile |
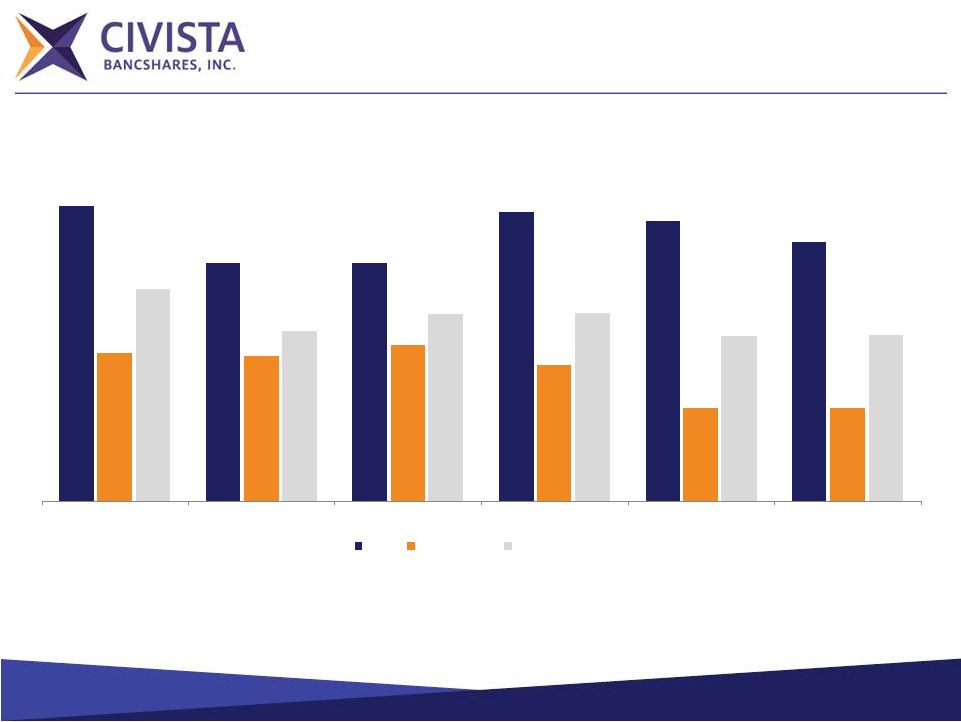 14 Peer Leading FTE Net Interest Margin Source: SNL Financial. 2017 Peer data as of 6/30/2017, or the latest available date. Note: Comparable peers include Management selected public banks located in PA, IN, WV, MI, OH, and WI with total assets between $1.0 billion and $2.0 billion. 3.98% 3.79% 3.79% 3.96% 3.93% 3.86% 3.49% 3.48% 3.52% 3.45% 3.31% 3.31% 3.71% 3.57% 3.62% 3.63% 3.55% 3.55% 2012Y 2013Y 2014Y 2015Y 2016Y 2017Q2 CIVB Peer Median Peer Top Quartile |
 15 Effectively Managing Assets & Liabilities Assets Asset duration of less than two years Sell fixed-rate mortgages Encourage variable-rate commercial lending or swap into variable, if appropriate Generally limit fixed-rate terms to five years Liabilities Liability duration greater than three years Focus on low-cost “sticky” demand deposits Don’t overprice or overextend time deposits |
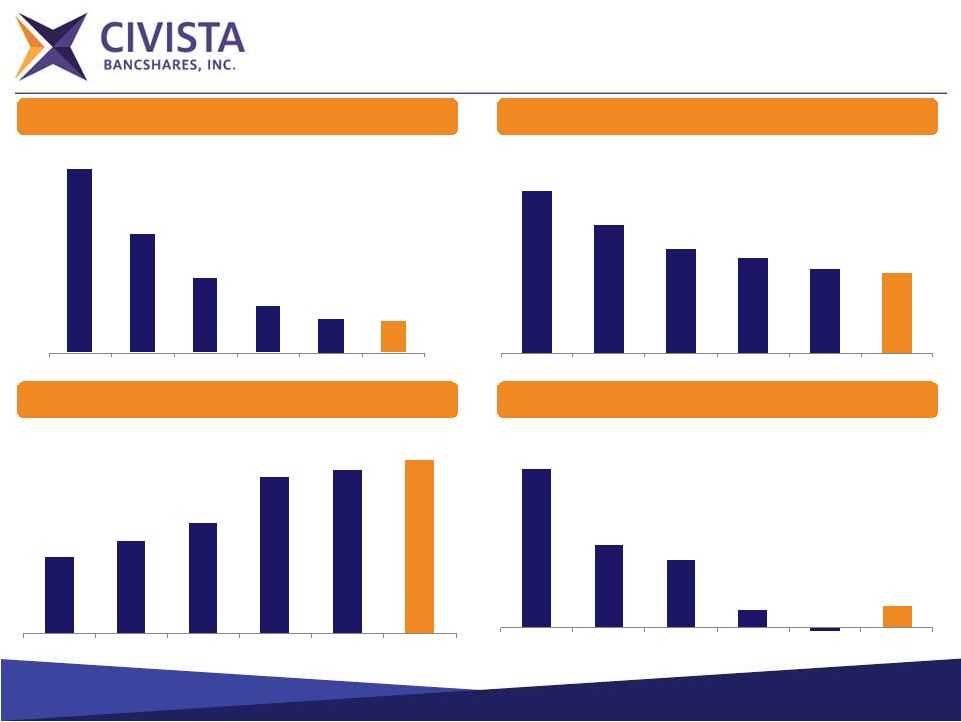 16 Source: Company Management and SNL Financial. 1 Excluding PCI (purchased credit impaired loans). Strong Asset Quality Reserves / NPLs NCOs / Average Loans Loan Loss Reserves / Gross Loans Loan Loss Reserves / Gross Loans 3.67% 2.38% 1.48% 0.92% 0.66% 0.63% 2012 2013 2014 2015 2016 Q2 2017 2.42% 1.92% 1.56% 1.43% 1.26% 1.19% 2012 2013 2014 2015 2016 Q2 2017 53.05% 64.17% 77.18% 108.93% 113.74% 120.54% 2012 2013 2014 2015 2016 Q2 2017 1.01% 0.53% 0.43% 0.11% -0.02% 0.14% 2012 2013 2014 2015 2016 Q2 2017 Nonaccrual & 90 days Past Due¹ / Gross Loans |
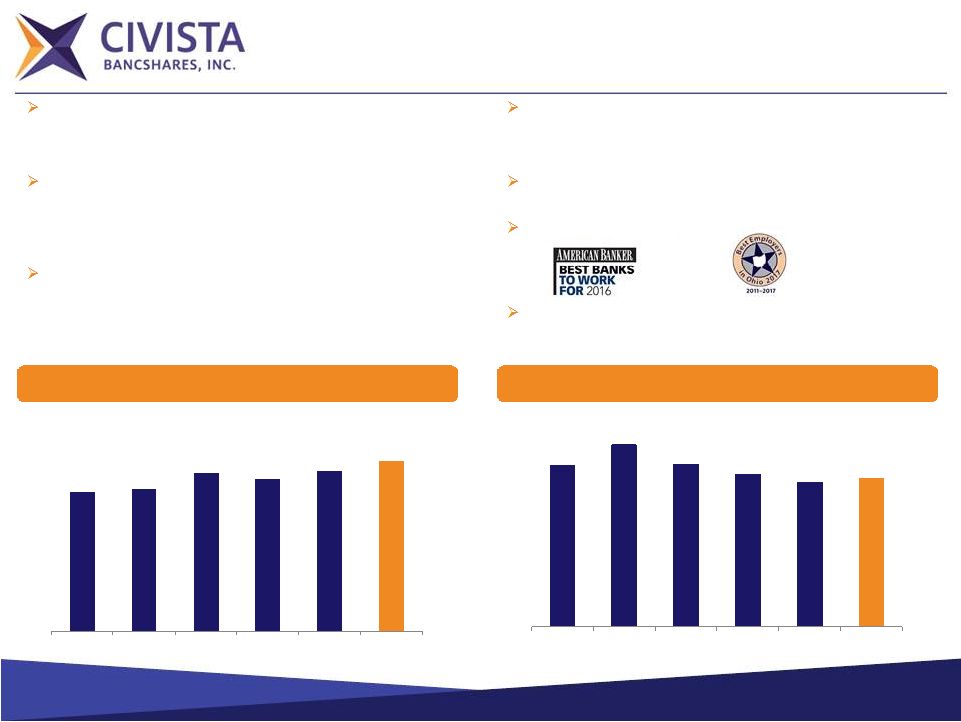 17 Fee Income / Operating Efficiencies Source: Company Management. ¹ From American Banker Magazine, September 2016 © 2016 SourceMedia, Inc. All rights reserved. Used by permission and protected by the Copyright Laws of the United States. The printing, copying, redistribution, or retransmission of this Content without expressed written permission is prohibited. Efficiency Ratio Non-Interest Income / Average Assets Fee income platform – Service charges on deposit accounts were $2.4 million and $2.5 million YTD 2017 and 2016, respectively Mortgage Banking – Gain on sale of loans, primarily mortgage loans, was $735 thousand and $800 thousand YTD 2017 and 2016, respectively Wealth management – ~$452 million and $413 million in Assets Under Management as of June 30, 2017 and June 30, 2016, respectively Income tax refund processing program – Specialized refund processing earned $2.8 YTD 2017 and 2016 Continued focus on improving efficiency and operating leverage Investment in people ¹ Continued evaluation of branch network and organic growth opportunities 0.98% 1.00% 1.11% 1.07% 1.12% 1.20% 2012 2013 2014 2015 2016 Q2 2017 72.20% 81.54% 72.92% 68.14% 64.70% 66.31% 2012 2013 2014 2015 2016 Q2 2017 |
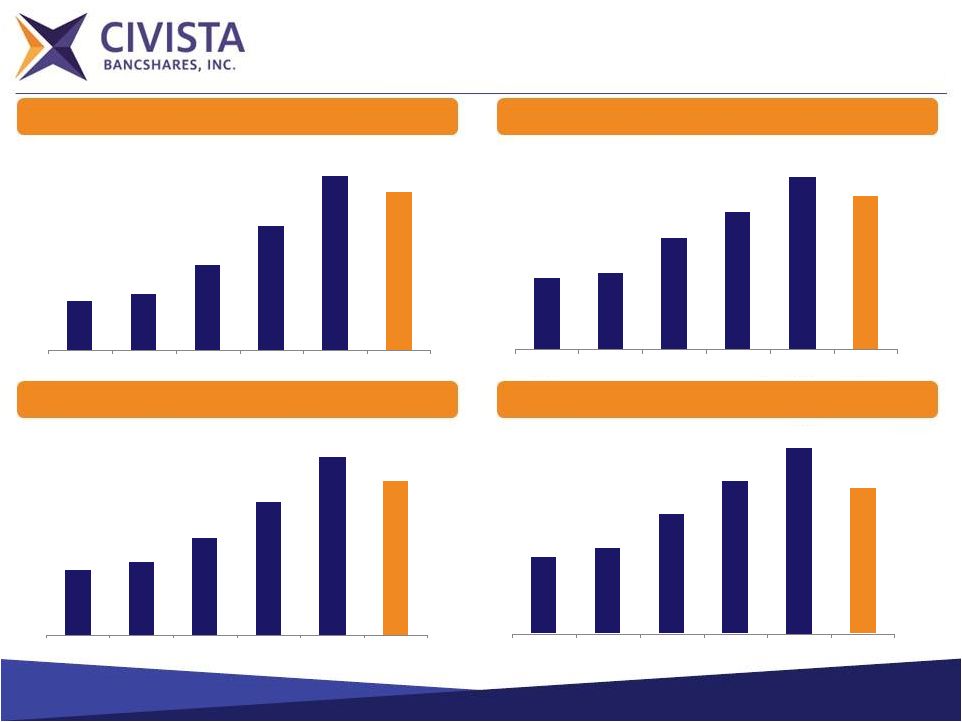 18 Profitability & Returns Analysis Source: Company Management and SNL Financial. Diluted Earnings per Share ROAE ROAA Net Income Available to Common Shareholders $4,386 $5,020 $7,655 $11,168 $15,716 $14,196 2012 2013 2014 2015 2016 2017 Q2¹ 0.49% 0.53% 0.77% 0.95% 1.19% 1.06% 2012 2013 2014 2015 2016 2017 Q2 $0.57 $0.64 $0.85 $1.17 $1.57 $1.36 2012 2013 2014 2015 2016 2017 Q2¹ 5.36% 5.97% 8.34% 10.59% 12.90% 10.11% 2012 2013 2014 2015 2016 2017 Q2 |
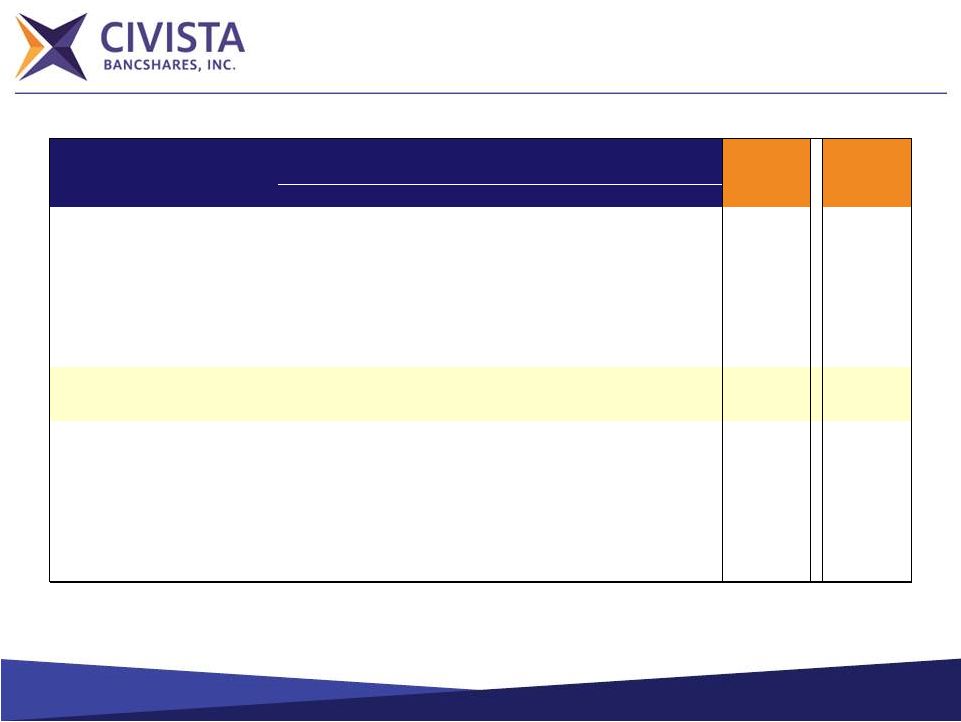 19 1 Illustrates CIVB’s capital position if all of the convertible preferred equity issued on 12/19/2013 (coupon: 6.5%, initial conversion price: $7.82) was converted into common equity. 2 TCE Non-GAAP reconciliation on page 23. Capital Position ($s in thousands, except per share data) As 2012 2013 2014 2015 2016 2017 Q2 Converted 1 Total Equity $103,980 $128,376 $115,909 $125,173 $137,616 $178,843 $178,843 Preferred Equity $23,184 $46,316 $23,132 $22,273 $18,950 $17,568 $0 Common Equity $80,796 $82,060 $92,777 $102,900 $118,666 $161,275 $178,843 TCE / TA 2 5.03% 5.08% 5.80% 5.71% 6.70% 9.30% 9.79% Tier 1 Leverage Ratio 9.34% 11.64% 10.70% 9.96% 10.55% 12.50% 11.07% Tier 1 Risk-based Capital Ratio 13.25% 15.82% 13.44% 12.70% 12.98% 15.87% 15.92% Total Risk-based Capital Ratio 14.84% 17.08% 14.70% 13.96% 14.20% 17.01% 17.08% Successfully raised $32.8 million of capital (issued 1,610,000 shares) in February. For the Years Ended December 31, |
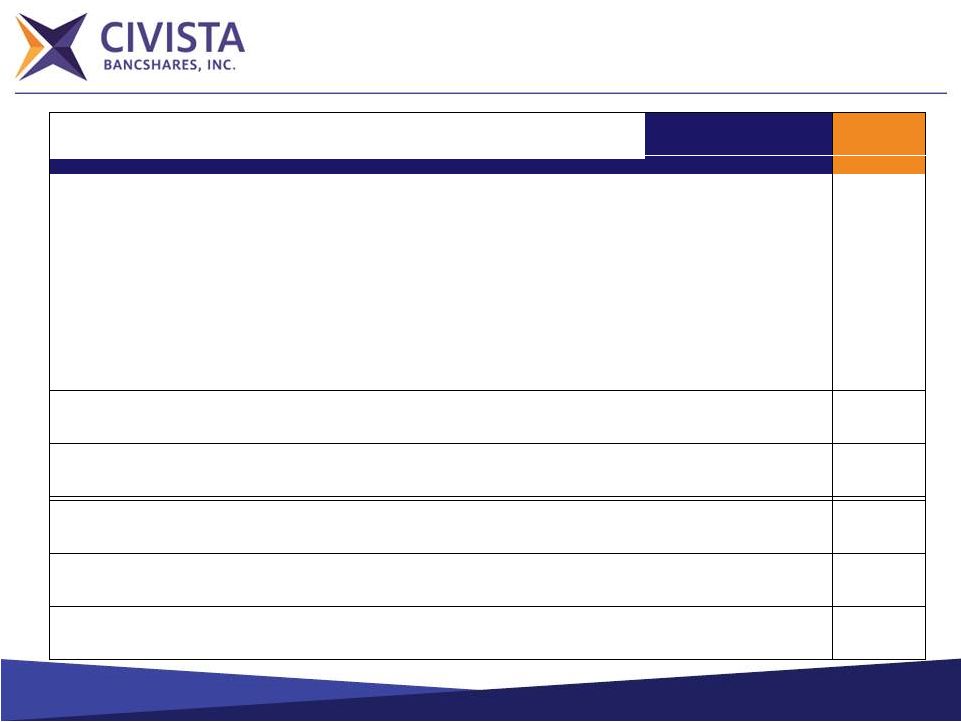  20 Source: Company Management and SNL Financial. Operating Results ($s in thousands, except per share data) LTM Q2 2012 2013 2014 2015 2016 2017 Net Interest Income $40,578 $39,974 $41,866 $47,392 $50,259 $51,343 Provision for Loan Losses 6,400 1,100 1,500 1,200 (1,300) 0 Noninterest Income 11,200 12,062 13,874 14,278 16,132 16,035 Noninterest Expense 38,074 43,384 41,550 42,944 43,855 45,948 Net Income/(Loss) 5,579 6,179 9,528 12,745 17,217 15,542 Net Income Available to Common Shareholders $4,386 $5,020 $7,655 $11,168 $15,716 $14,196 Diluted Earnings/(Loss) per Common Share $0.57 $0.64 $0.85 $1.17 $1.57 $1.36 Return on Average Assets (ROAA) 0.49% 0.53% 0.77% 0.95% 1.19% 1.06% Return on Average Equity (ROAE) 5.36 5.97 8.34 10.59 12.90 10.32% For the Years Ended December 31, |
 21 Compelling Investment Opportunity Strong asset quality Proven acquirer – Completed 6 acquisitions since the formation of the holding company in 1987 Peer leading NIM – Low cost deposits – 20 bps lower than peers – High yield loan portfolio – 3 bps higher than peers Experienced management team with an average of 29 years in banking Strategically positioned in attractive Ohio lending markets funded by low cost deposits – Second loan production office opened in Cleveland MSA – New loan production office planned in the Toledo MSA Significant profitability improvement from 2012 to Q2 2017 – Net Income CAGR: 29.8% – TBV / Share CAGR: 14.0% – EPS CAGR: 21.3% Peer data as of 6/30/2017, or the latest available date. |
   ($s in thousands, except per share data) Actual Recovery Adjusted LTM Q2 2016 2016 2017 Net Interest Income $50,259 ($919) $49,340 $51,343 Provision for Loan Losses (1,300) 1,300 0 0 Noninterest Income 16,132 0 16,132 16,035 Noninterest Expense 43,855 0 43,855 45,948 Net Income/(Loss) 17,217 (1,465) 15,752 15,542 Net Income Available to Common Shareholders $15,716 ($1,465) $14,251 $14,196 Diluted Earnings/(Loss) per Common Share $1.57 ($0.13) $1.44 $1.36 Return on Average Assets (ROAA) 1.19% (0.10%) 1.09% 1.06% Return on Average Equity (ROAE) 12.90 (1.10) 11.80 10.32% 2016 Without Nonrecurring Recovery |
  23 Non-GAAP Reconciliation ($s in thousands, except per share data) Q2 2012 2013 2014 2015 2016 2017 Tangible Common Equity Total Equity 103,980 $ 128,376 $ 115,909 $ 125,173 $ 137,616 $ 178,834 $ Less: Preferred Equity 23,184 46,316 23,132 22,273 18,950 17,568 Less: Goodwill and intangible assets 24,859 24,013 23,243 28,916 28,218 27,893 Tangible common equity 55,937 $ 58,047 $ 69,534 $ 73,984 $ 90,448 $ 133,373 $ Total Shares Outstanding 7,707,917 7,707,917 7,707,917 7,843,578 8,343,509 10,169,181 Tangible book value per share 7.26 $ 7.53 $ 9.02 $ 9.43 $ 10.84 $ 13.12 $ Tangible Assets Total Assets 1,136,971 $ 1,167,546 $ 1,213,191 $ 1,315,041 $ 1,377,263 $ 1,462,015 $ Less: Goodwill and intangible assets 24,859 24,013 23,243 28,916 28,218 27,893 Tangible assets 1,112,112 $ 1,143,533 $ 1,189,948 $ 1,286,125 $ 1,349,045 $ 1,434,122 $ Tangible common equity to tangible assets 5.03% 5.08% 5.84% 5.75% 6.70% 9.30% As of and for the Years Ended December 31, |
 Thank You 24 |