Exhibit 99(c)(2)
Link to searchable text of slide shown above
Link to searchable text of slide shown above
Link to searchable text of slide shown above
Link to searchable text of slide shown above
Link to searchable text of slide shown above
Link to searchable text of slide shown above

Link to searchable text of slide shown above
Link to searchable text of slide shown above
Link to searchable text of slide shown above
Link to searchable text of slide shown above
Link to searchable text of slide shown above
Link to searchable text of slide shown above
Link to searchable text of slide shown above
Link to searchable text of slide shown above
Link to searchable text of slide shown above
Link to searchable text of slide shown above
Link to searchable text of slide shown above
Link to searchable text of slide shown above
Link to searchable text of slide shown above
Link to searchable text of slide shown above
Link to searchable text of slide shown above
Link to searchable text of slide shown above
Link to searchable text of slide shown above
Searchable text section of graphics shown above
PROJECT GRAND SLAM
Presentation to the Special Committee of the Board of Directors of Ranger
June 29, 2006
[LOGO]
PROJECT GRAND SLAM | MATERIALS PREPARED FOR THE SPECIAL COMMITTEE OF THE BOARD OF DIRECTORS OF RANGER | CONFIDENTIAL |
Preface
These materials have been prepared by First Albany Capital (“First Albany” or “FAC”) as part of a presentation being made to the Ranger Corporation (“Ranger” or the “Company”) Special Committee of the Board of Directors (the “Special Committee”) in support of our opinion as to the fairness, from a financial point of view, of the consideration provided for in the proposed transaction involving the Company and Ballpark Capital Partners (“Ballpark” and, such transaction, the “Transaction”). These materials and all analyses contained herein are confidential and are solely for the use of the Special Committee in connection with its evaluation of the Transaction. Any use of these materials or the analyses contained herein for any other purpose or any publication of these materials or the analyses contained herein without the prior written consent of First Albany is strictly prohibited.
These materials are necessarily based upon financial, market, economic and other conditions that exist on, and the information made available to us as of, the date hereof. It should be understood that subsequent developments may affect the analyses provided herein and that we disclaim any undertaking or obligation to advise any person of any change in any fact or matter affecting these materials and the analyses provided herein which may come or be brought to our attention after the date hereof. We have not conducted a physical inspection of any of the assets, properties or facilities of the Company or Ballpark, nor have we made or obtained any independent evaluation or appraisals of any such assets, properties or facilities or any liabilities (contingent or otherwise) of the Company or Ballpark.
Several analytical methodologies have been employed herein and no one method of analysis should be regarded as critical to the overall conclusion we have reached. Each analytical technique has inherent strengths and weaknesses, and the nature of the available information may further affect the value of particular techniques. The conclusions we have reached are based on all the analyses and factors presented herein taken as a whole and also on application of our own experience and judgment. Such conclusions may involve significant elements of subjective judgment and qualitative analysis. We therefore give no opinion as to the value or merit standing alone of any part of the materials that follow. Our only opinion is the formal written opinion that is to be delivered to the Special Committee. Our opinion shall not be disseminated, quoted, referred to, reproduced or disclosed to any party, without the prior written consent of First Albany or as specifically allowed pursuant to our engagement letter with the Company relating to the Transaction.
1
1 | Executive Summary |
PROJECT GRAND SLAM | EXECUTIVE SUMMARY | CONFIDENTIAL |
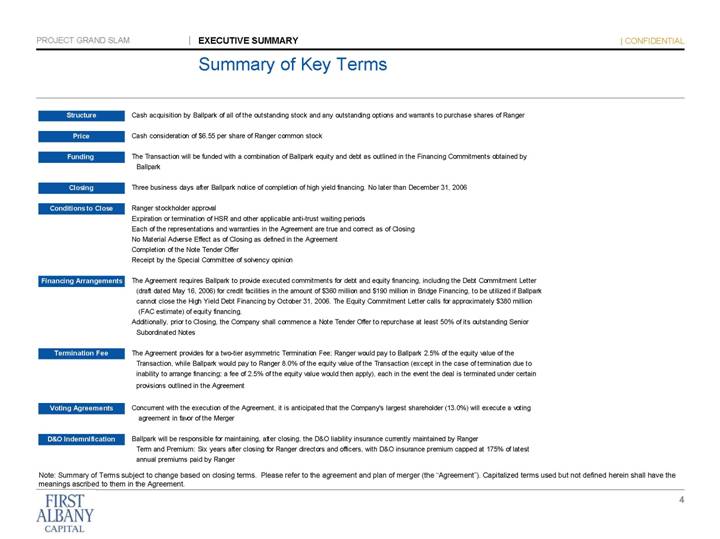
Summary of Key Terms
Structure |
| Cash acquisition by Ballpark of all of the outstanding stock and any outstanding options and warrants to purchase shares of Ranger |
|
|
|
Price |
| Cash consideration of $6.55 per share of Ranger common stock |
|
|
|
Funding |
| The Transaction will be funded with a combination of Ballpark equity and debt as outlined in the Financing Commitments obtained by Ballpark |
|
|
|
Closing |
| Three business days after Ballpark notice of completion of high yield financing. No later than December 31, 2006 |
|
|
|
Conditions to Close |
| Ranger stockholder approval |
|
| Expiration or termination of HSR and other applicable anti-trust waiting periods |
|
| Each of the representations and warranties in the Agreement are true and correct as of Closing |
|
| No Material Adverse Effect as of Closing as defined in the Agreement |
|
| Completion of the Note Tender Offer |
|
| Receipt by the Special Committee of solvency opinion |
|
|
|
Financing Arrangements |
| The Agreement requires Ballpark to provide executed commitments for debt and equity financing, including the Debt Commitment Letter (draft dated May 16, 2006) for credit facilities in the amount of $360 million and $190 million in Bridge Financing, to be utilized if Ballpark cannot close the High Yield Debt Financing by October 31, 2006. The Equity Commitment Letter calls for approximately $380 million (FAC estimate) of equity financing. Additionally, prior to Closing, the Company shall commence a Note Tender Offer to repurchase at least 50% of its outstanding Senior Subordinated Notes |
|
|
|
Termination Fee |
| The Agreement provides for a two-tier asymmetric Termination Fee; Ranger would pay to Ballpark 2.5% of the equity value of the Transaction, while Ballpark would pay to Ranger 8.0% of the equity value of the Transaction (except in the case of termination due to inability to arrange financing; a fee of 2.5% of the equity value would then apply), each in the event the deal is terminated under certain provisions outlined in the Agreement |
|
|
|
Voting Agreements |
| Concurrent with the execution of the Agreement, it is anticipated that the Company’s largest shareholder (13.0%) will execute a voting agreement in favor of the Merger |
|
|
|
D&O Indemnification |
| Ballpark will be responsible for maintaining, after closing, the D&O liability insurance currently maintained by Ranger Term and Premium: Six years after closing for Ranger directors and officers, with D&O insurance premium capped at 175% of latest annual premiums paid by Ranger |
Note: Summary of Terms subject to change based on closing terms. Please refer to the agreement and plan of merger (the “Agreement”). Capitalized terms used but not defined herein shall have the meanings ascribed to them in the Agreement.
4
Transaction Valuation Summary
(in millions, except per share data) |
|
|
| |
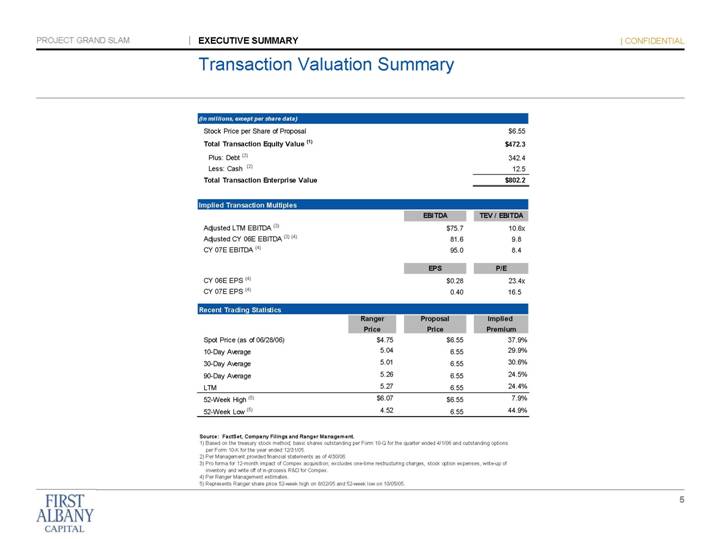
Stock Price per Share of Proposal |
| $ | 6.55 |
|
Total Transaction Equity Value (1) |
| $ | 472.3 |
|
Plus: Debt (2) |
| 342.4 |
| |
Less: Cash (2) |
| 12.5 |
| |
Total Transaction Enterprise Value |
| $ | 802.2 |
|
Implied Transaction Multiples |
| EBITDA |
| TEV / EBITDA |
| |
Adjusted LTM EBITDA (3) |
| $ | 75.7 |
| 10.6 | x |
Adjusted CY 06E EBITDA (3) (4) |
| 81.6 |
| 9.8 |
| |
CY 07E EBITDA (4) |
| 95.0 |
| 8.4 |
| |
|
|
|
|
|
| |
|
| EPS |
| P/E |
| |
CY 06E EPS (4) |
| $ | 0.28 |
| 23.4 | x |
CY 07E EPS (4) |
| 0.40 |
| 16.5 |
| |
|
| Ranger |
| Proposal |
| Implied |
| ||
Recent Trading Statistics |
| Price |
| Price |
| Premium |
| ||
Spot Price (as of 06/28/06) |
| $ | 4.75 |
| $ | 6.55 |
| 37.9 | % |
10-Day Average |
| 5.04 |
| 6.55 |
| 29.9 | % | ||
30-Day Average |
| 5.01 |
| 6.55 |
| 30.6 | % | ||
90-Day Average |
| 5.26 |
| 6.55 |
| 24.5 | % | ||
LTM |
| 5.27 |
| 6.55 |
| 24.4 | % | ||
52-Week High (5) |
| $ | 6.07 |
| $ | 6.55 |
| 7.9 | % |
52-Week Low (5) |
| 4.52 |
| 6.55 |
| 44.9 | % | ||
Source: FactSet, Company Filings and Ranger Management.
(1) | Based on the treasury stock method; basic shares outstanding per Form 10-Q for the quarter ended 4/1/06 and outstanding options per Form 10-K for the year ended 12/31/05. |
(2) | Per Management provided financial statements as of 4/30/06. |
(3) | Pro forma for 12-month impact of Compex acquisition; excludes one-time restructuring charges, stock option expenses, write-up of inventory and write off of in-process R&D for Compex. |
(4) | Per Ranger Management estimates. |
(5) | Represents Ranger share price 52-week high on 8/02/05 and 52-week low on 10/05/05. |
5
2 | Ranger Overview |
PROJECT GRAND SLAM | RANGER OVERVIEW | CONFIDENTIAL |
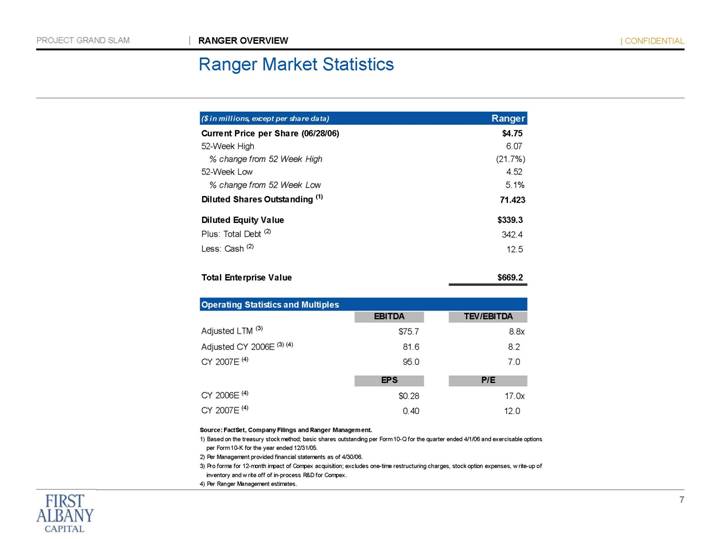
Ranger Market Statistics
($ in millions, except per share data) |
| Ranger |
| |
Current Price per Share (06/28/06) |
| $ | 4.75 |
|
52-Week High |
| 6.07 |
| |
% change from 52 Week High |
| (21.7 | )% | |
52-Week Low |
| 4.52 |
| |
% change from 52 Week Low |
| 5.1 | % | |
Diluted Shares Outstanding (1) |
| 71.423 |
| |
|
|
|
| |
Diluted Equity Value |
| $ | 339.3 |
|
Plus: Total Debt (2) |
| 342.4 |
| |
Less: Cash (2) |
| 12.5 |
| |
|
|
|
| |
Total Enterprise Value |
| $ | 669.2 |
|
Operating Statistics and Multiples
|
| EBITDA |
| TEV/EBITDA |
| |
Adjusted LTM (3) |
| $ | 75.7 |
| 8.8 | x |
Adjusted CY 2006E (3) (4) |
| 81.6 |
| 8.2 |
| |
CY 2007E (4) |
| 95.0 |
| 7.0 |
| |
|
|
|
|
|
| |
|
| EPS |
| P/E |
| |
CY 2006E (4) |
| $ | 0.28 |
| 17.0 | x |
CY 2007E (4) |
| 0.40 |
| 12.0 |
| |
Source: FactSet, Company Filings and Ranger Management.
(1) | Based on the treasury stock method; basic shares outstanding per Form 10-Q for the quarter ended 4/1/06 and exercisable options per Form 10-K for the year ended 12/31/05. |
(2) | Per Management provided financial statements as of 4/30/06. |
(3) | Pro forma for 12-month impact of Compex acquisition; excludes one-time restructuring charges, stock option expenses, write-up of inventory and write off of in-process R&D for Compex. |
(4) | Per Ranger Management estimates. |
7
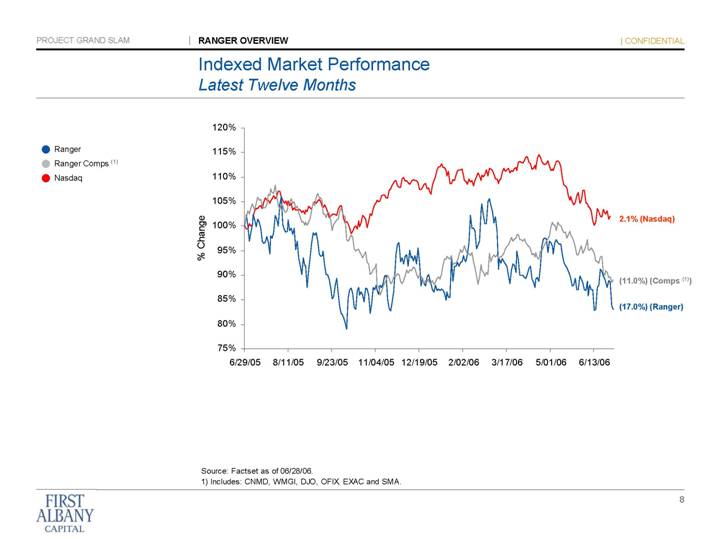
Indexed Market Performance
Latest Twelve Months
Chart showing indexed market performance over a twelve month period (June 29, 2005 through June 28, 2006) of Ranger, Ranger Comps and Nasdaq with the x-axis representing time and the y-axis representing percent change (with 0.0% representing the baseline percent change). The chart includes the following data regarding percent change over the twelve month period:
Ranger |
|
|
|
|
Cumulative performance: |
| (17.0 | %) |
|
|
|
|
|
|
Ranger Comps (1) |
|
|
|
|
Cumulative performance: |
| (11.0 | %) |
|
|
|
|
|
|
Nasdaq |
|
|
|
|
Cumulative performance: |
| 2.1 | % |
|
Source: Factset as of 06/28/06.
(1) Includes: CNMD, WMGI, DJO, OFIX, EXAC and SMA.
8
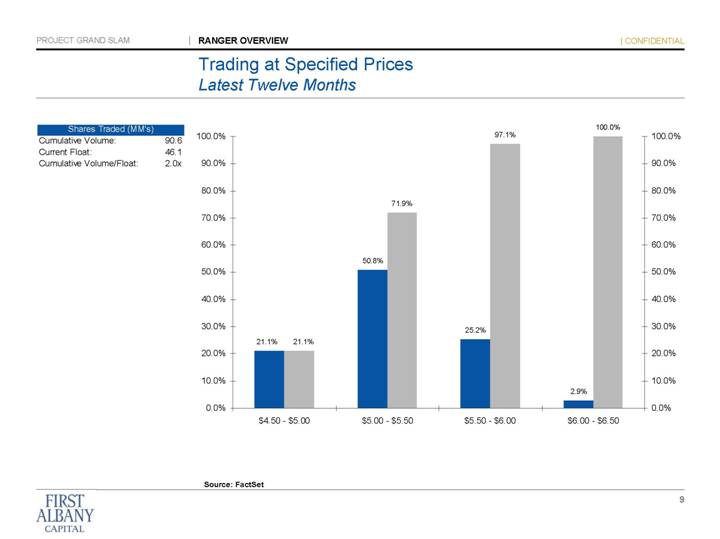
Trading at Specified Prices
Latest Twelve Months
Shares Traded (MM’s)
Cumulative Volume: |
| 90.6 |
|
Current Float: |
| 46.1 |
|
Cumulative Volume/Float: |
| 2.0 | x |
Bar chart summarizing the trading of stock at specified price ranges as a percentage of the trading volume over a twelve month period. The bar charts represent the following information:
Price Range of $4.50 to $5.00 had 21.1% of the trading volume
Price Range of $5.00 to $5.50 had 50.8% of the trading volume
Price Range of $4.50 to $5.50 had 71.9% of the trading volume
Price Range of $5.50 to $6.00 had 25.2% of the trading volume
Price Range of $4.50 to $6.00 had 97.1% of the trading volume
Price Range of $6.00 to $6.50 had 2.9% of the trading volume
Price Range of $4.50 to $6.50 had 100.0% of the trading volume
Source: FactSet
9
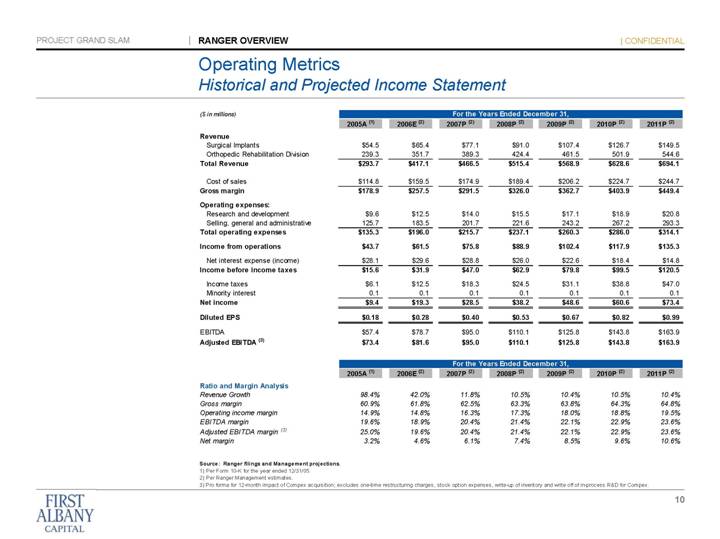
Operating Metrics
Historical and Projected Income Statement
|
| For the Years Ended December 31, |
| |||||||||||||||||||
($ in millions) |
| 2005A (1) |
| 2006E (2) |
| 2007P (2) |
| 2008P (2) |
| 2009P (2) |
| 2010P (2) |
| 2011P (2) |
| |||||||
Revenue |
|
|
|
|
|
|
|
|
|
|
|
|
|
|
| |||||||
Surgical Implants |
| $ | 54.5 |
| $ | 65.4 |
| $ | 77.1 |
| $ | 91.0 |
| $ | 107.4 |
| $ | 126.7 |
| $ | 149.5 |
|
Orthopedic Rehabilitation Division |
| 239.3 |
| 351.7 |
| 389.3 |
| 424.4 |
| 461.5 |
| 501.9 |
| 544.6 |
| |||||||
Total Revenue |
| $ | 293.7 |
| $ | 417.1 |
| $ | 466.5 |
| $ | 515.4 |
| $ | 568.9 |
| $ | 628.6 |
| $ | 694.1 |
|
|
|
|
|
|
|
|
|
|
|
|
|
|
|
|
| |||||||
Cost of sales |
| $ | 114.8 |
| $ | 159.5 |
| $ | 174.9 |
| $ | 189.4 |
| $ | 206.2 |
| $ | 224.7 |
| $ | 244.7 |
|
Gross margin |
| $ | 178.9 |
| $ | 257.5 |
| $ | 291.5 |
| $ | 326.0 |
| $ | 362.7 |
| $ | 403.9 |
| $ | 449.4 |
|
|
|
|
|
|
|
|
|
|
|
|
|
|
|
|
| |||||||
Operating expenses: |
|
|
|
|
|
|
|
|
|
|
|
|
|
|
| |||||||
Research and development |
| $ | 9.6 |
| $ | 12.5 |
| $ | 14.0 |
| $ | 15.5 |
| $ | 17.1 |
| $ | 18.9 |
| $ | 20.8 |
|
Selling, general and administrative |
| 125.7 |
| 183.5 |
| 201.7 |
| 221.6 |
| 243.2 |
| 267.2 |
| 293.3 |
| |||||||
Total operating expenses |
| $ | 135.3 |
| $ | 196.0 |
| $ | 215.7 |
| $ | 237.1 |
| $ | 260.3 |
| $ | 286.0 |
| $ | 314.1 |
|
|
|
|
|
|
|
|
|
|
|
|
|
|
|
|
| |||||||
Income from operations |
| $ | 43.7 |
| $ | 61.5 |
| $ | 75.8 |
| $ | 88.9 |
| $ | 102.4 |
| $ | 117.9 |
| $ | 135.3 |
|
Net interest expense (income) |
| $ | 28.1 |
| $ | 29.6 |
| $ | 28.8 |
| $ | 26.0 |
| $ | 22.6 |
| $ | 18.4 |
| $ | 14.8 |
|
Income before income taxes |
| $ | 15.6 |
| $ | 31.9 |
| $ | 47.0 |
| $ | 62.9 |
| $ | 79.8 |
| $ | 99.5 |
| $ | 120.5 |
|
|
|
|
|
|
|
|
|
|
|
|
|
|
|
|
| |||||||
Income taxes |
| $ | 6.1 |
| $ | 12.5 |
| $ | 18.3 |
| $ | 24.5 |
| $ | 31.1 |
| $ | 38.8 |
| $ | 47.0 |
|
Minority interest |
| 0.1 |
| 0.1 |
| 0.1 |
| 0.1 |
| 0.1 |
| 0.1 |
| 0.1 |
| |||||||
Net income |
| $ | 9.4 |
| $ | 19.3 |
| $ | 28.5 |
| $ | 38.2 |
| $ | 48.6 |
| $ | 60.6 |
| $ | 73.4 |
|
|
|
|
|
|
|
|
|
|
|
|
|
|
|
|
| |||||||
Diluted EPS |
| $ | 0.18 |
| $ | 0.28 |
| $ | 0.40 |
| $ | 0.53 |
| $ | 0.67 |
| $ | 0.82 |
| $ | 0.99 |
|
|
|
|
|
|
|
|
|
|
|
|
|
|
|
|
| |||||||
EBITDA |
| $ | 57.4 |
| $ | 78.7 |
| $ | 95.0 |
| $ | 110.1 |
| $ | 125.8 |
| $ | 143.8 |
| $ | 163.9 |
|
Adjusted EBITDA (3) |
| $ | 73.4 |
| $ | 81.6 |
| $ | 95.0 |
| $ | 110.1 |
| $ | 125.8 |
| $ | 143.8 |
| $ | 163.9 |
|
|
| For the Years Ended December 31, |
| ||||||||||||
|
| 2005A (1) |
| 2006E (2) |
| 2007P (2) |
| 2008P (2) |
| 2009P (2) |
| 2010P (2) |
| 2011P (2) |
|
Ratio and Margin Analysis |
|
|
|
|
|
|
|
|
|
|
|
|
|
|
|
Revenue Growth |
| 98.4 | % | 42.0 | % | 11.8 | % | 10.5 | % | 10.4 | % | 10.5 | % | 10.4 | % |
Gross margin |
| 60.9 | % | 61.8 | % | 62.5 | % | 63.3 | % | 63.8 | % | 64.3 | % | 64.8 | % |
Operating income margin |
| 14.9 | % | 14.8 | % | 16.3 | % | 17.3 | % | 18.0 | % | 18.8 | % | 19.5 | % |
EBITDA margin |
| 19.6 | % | 18.9 | % | 20.4 | % | 21.4 | % | 22.1 | % | 22.9 | % | 23.6 | % |
Adjusted EBITDA margin (3) |
| 25.0 | % | 19.6 | % | 20.4 | % | 21.4 | % | 22.1 | % | 22.9 | % | 23.6 | % |
Net margin |
| 3.2 | % | 4.6 | % | 6.1 | % | 7.4 | % | 8.5 | % | 9.6 | % | 10.6 | % |
Source: Ranger filings and Management projections.
(1) | Per Form 10-K for the year ended 12/31/05. |
(2) | Per Ranger Management estimates. |
(3) | Pro forma for 12-month impact of Compex acquisition; excludes one-time restructuring charges, stock option expenses, write-up of inventory and write off of in-process R&D for Compex. |
10
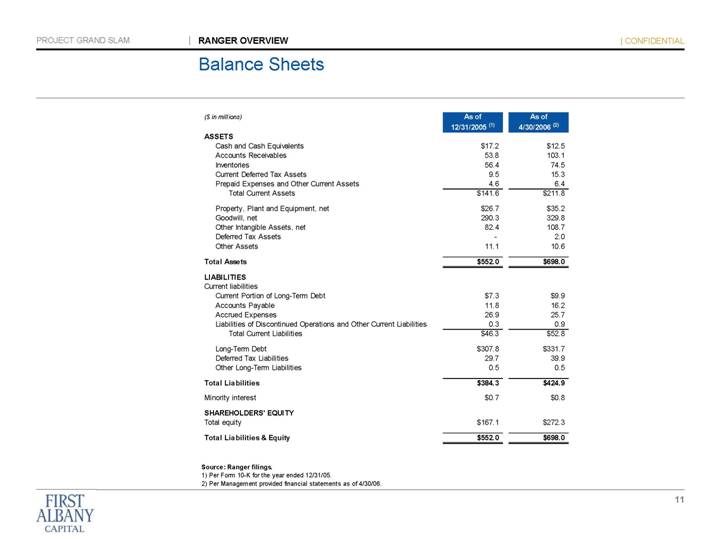
Balance Sheets
|
| As of |
| As of |
| ||
($ in millions) |
| 12/31/2005 (1) |
| 4/30/2006 (2) |
| ||
ASSETS |
|
|
|
|
| ||
Cash and Cash Equivalents |
| $ | 17.2 |
| $ | 12.5 |
|
Accounts Receivables |
| 53.8 |
| 103.1 |
| ||
Inventories |
| 56.4 |
| 74.5 |
| ||
Current Deferred Tax Assets |
| 9.5 |
| 15.3 |
| ||
Prepaid Expenses and Other Current Assets |
| 4.6 |
| 6.4 |
| ||
Total Current Assets |
| $ | 141.6 |
| $ | 211.8 |
|
|
|
|
|
|
|
|
|
Property, Plant and Equipment, net |
| $ | 26.7 |
| $ | 35.2 |
|
Goodwill, net |
| 290.3 |
| 329.8 |
| ||
Other Intangible Assets, net |
| 82.4 |
| 108.7 |
| ||
Deferred Tax Assets |
| — |
| 2.0 |
| ||
Other Assets |
| 11.1 |
| 10.6 |
| ||
|
|
|
|
|
| ||
Total Assets |
| $ | 552.0 |
| $ | 698.0 |
|
|
|
|
|
|
| ||
LIABILITIES |
|
|
|
|
| ||
Current liabilities |
|
|
|
|
| ||
Current Portion of Long-Term Debt |
| $ | 7.3 |
| $ | 9.9 |
|
Accounts Payable |
| 11.8 |
| 16.2 |
| ||
Accrued Expenses |
| 26.9 |
| 25.7 |
| ||
Liabilities of Discontinued Operations and Other Current Liabilities |
| 0.3 |
| 0.9 |
| ||
Total Current Liabilities |
| $ | 46.3 |
| $ | 52.8 |
|
|
|
|
|
|
|
|
|
Long-Term Debt |
| $ | 307.8 |
| $ | 331.7 |
|
Deferred Tax Liabilities |
| 29.7 |
| 39.9 |
| ||
Other Long-Term Liabilities |
| 0.5 |
| 0.5 |
| ||
|
|
|
|
|
| ||
Total Liabilities |
| $ | 384.3 |
| $ | 424.9 |
|
|
|
|
|
|
| ||
Minority interest |
| $ | 0.7 |
| $ | 0.8 |
|
|
|
|
|
|
| ||
SHAREHOLDERS’ EQUITY |
|
|
|
|
| ||
Total equity |
| $ | 167.1 |
| $ | 272.3 |
|
|
|
|
|
|
| ||
Total Liabilities & Equity |
| $ | 552.0 |
| $ | 698.0 |
|
Source: Ranger filings.
(1) Per Form 10-K for the year ended 12/31/05.
(2) Per Management provided financial statements as of 4/30/06.
11
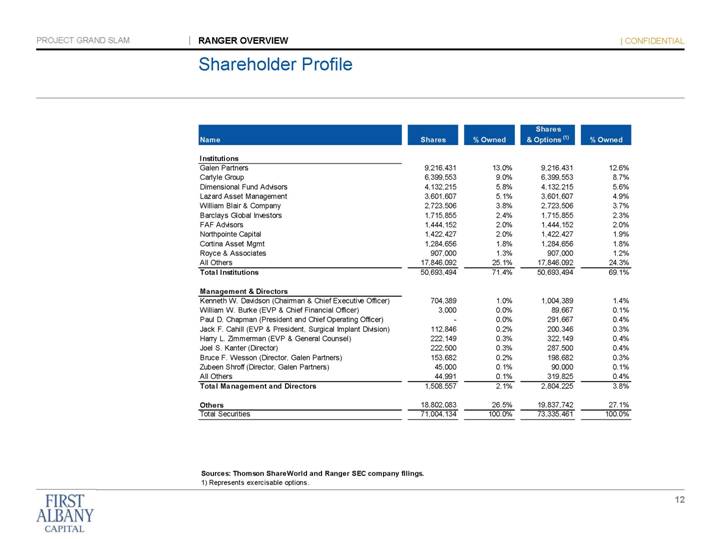
Shareholder Profile
|
|
|
|
|
| Shares |
|
|
|
Name |
| Shares |
| % Owned |
| & Options (1) |
| % Owned |
|
|
|
|
|
|
|
|
|
|
|
Institutions |
|
|
|
|
|
|
|
|
|
Galen Partners |
| 9,216,431 |
| 13.0 | % | 9,216,431 |
| 12.6 | % |
Carlyle Group |
| 6,399,553 |
| 9.0 | % | 6,399,553 |
| 8.7 | % |
Dimensional Fund Advisors |
| 4,132,215 |
| 5.8 | % | 4,132,215 |
| 5.6 | % |
Lazard Asset Management |
| 3,601,607 |
| 5.1 | % | 3,601,607 |
| 4.9 | % |
William Blair & Company |
| 2,723,506 |
| 3.8 | % | 2,723,506 |
| 3.7 | % |
Barclays Global Investors |
| 1,715,855 |
| 2.4 | % | 1,715,855 |
| 2.3 | % |
FAF Advisors |
| 1,444,152 |
| 2.0 | % | 1,444,152 |
| 2.0 | % |
Northpointe Capital |
| 1,422,427 |
| 2.0 | % | 1,422,427 |
| 1.9 | % |
Cortina Asset Mgmt |
| 1,284,656 |
| 1.8 | % | 1,284,656 |
| 1.8 | % |
Royce & Associates |
| 907,000 |
| 1.3 | % | 907,000 |
| 1.2 | % |
All Others |
| 17,846,092 |
| 25.1 | % | 17,846,092 |
| 24.3 | % |
Total Institutions |
| 50,693,494 |
| 71.4 | % | 50,693,494 |
| 69.1 | % |
|
|
|
|
|
|
|
|
|
|
Management & Directors |
|
|
|
|
|
|
|
|
|
Kenneth W. Davidson (Chairman & Chief Executive Officer) |
| 704,389 |
| 1.0 | % | 1,004,389 |
| 1.4 | % |
William W. Burke (EVP & Chief Financial Officer) |
| 3,000 |
| 0.0 | % | 89,667 |
| 0.1 | % |
Paul D. Chapman (President and Chief Operating Officer) |
| — |
| 0.0 | % | 291,667 |
| 0.4 | % |
Jack F. Cahill (EVP & President, Surgical Implant Division) |
| 112,846 |
| 0.2 | % | 200,346 |
| 0.3 | % |
Harry L. Zimmerman (EVP & General Counsel) |
| 222,149 |
| 0.3 | % | 322,149 |
| 0.4 | % |
Joel S. Kanter (Director) |
| 222,500 |
| 0.3 | % | 287,500 |
| 0.4 | % |
Bruce F. Wesson (Director, Galen Partners) |
| 153,682 |
| 0.2 | % | 198,682 |
| 0.3 | % |
Zubeen Shroff (Director, Galen Partners) |
| 45,000 |
| 0.1 | % | 90,000 |
| 0.1 | % |
All Others |
| 44,991 |
| 0.1 | % | 319,825 |
| 0.4 | % |
Total Management and Directors |
| 1,508,557 |
| 2.1 | % | 2,804,225 |
| 3.8 | % |
|
|
|
|
|
|
|
|
|
|
Others |
| 18,802,083 |
| 26.5 | % | 19,837,742 |
| 27.1 | % |
Total Securities |
| 71,004,134 |
| 100.0 | % | 73,335,461 |
| 100.0 | % |
Sources: Thomson ShareWorld and Ranger SEC company filings.
1) Represents exercisable options.
12
3 | Valuation Analysis |
PROJECT GRAND SLAM | VALUATION ANALYSIS | CONFIDENTIAL | |
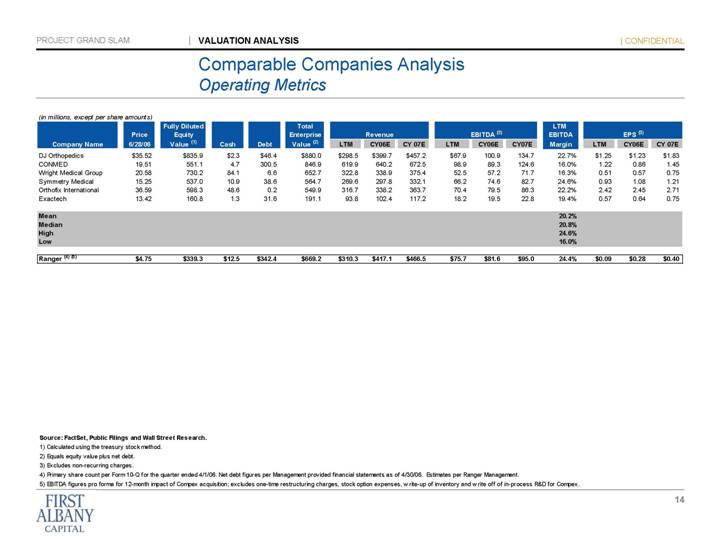
| Comparable Companies Analysis | ||
(in millions, except per share amounts)
|
|
|
| Fully Diluted |
|
|
|
|
| Total |
|
|
|
|
| LTM |
|
|
| ||||||||||||
|
| Price |
| Equity |
|
|
|
|
| Enterprise |
| Revenue |
| EBITDA (3) |
| EBITDA |
| EPS (3) |
| ||||||||||||
Company Name |
| 6/28/06 |
| Value (1) |
| Cash |
| Debt |
| Value (2) |
|
|
|
|
|
|
|
|
|
|
|
|
| Margin |
|
|
| CY06E |
| CY 07E |
|
DJ Orthopedics |
| $ | 35.52 |
| $ | 835.9 |
| $ | 2.3 |
| $ | 46.4 |
| $ | 880.0 |
| $ | 298.5 |
| $ | 399.7 |
| $ | 457.2 |
| $ | 67.9 |
| 100.9 |
| 134.7 |
| 22.7 | % | $ | 1.25 |
| $ | 1.23 |
| $ | 1.83 |
| ||
CONMED |
| 19.51 |
| 551.1 |
| 4.7 |
| 300.5 |
| 846.9 |
| 619.9 |
| 640.2 |
| 672.5 |
| 98.9 |
| 89.3 |
| 124.6 |
| 16.0 | % | 1.22 |
| 0.86 |
| 1.45 |
| ||||||||||||||
Wright Medical Group |
| 20.58 |
| 730.2 |
| 84.1 |
| 6.6 |
| 652.7 |
| 322.8 |
| 338.9 |
| 375.4 |
| 52.5 |
| 57.2 |
| 71.7 |
| 16.3 | % | 0.51 |
| 0.57 |
| 0.75 |
| ||||||||||||||
Symmetry Medical |
| 15.25 |
| 537.0 |
| 10.9 |
| 38.6 |
| 564.7 |
| 269.6 |
| 297.8 |
| 332.1 |
| 66.2 |
| 74.6 |
| 82.7 |
| 24.6 | % | 0.93 |
| 1.08 |
| 1.21 |
| ||||||||||||||
Orthofix International |
| 36.59 |
| 598.3 |
| 48.6 |
| 0.2 |
| 549.9 |
| 316.7 |
| 338.2 |
| 363.7 |
| 70.4 |
| 79.5 |
| 86.3 |
| 22.2 | % | 2.42 |
| 2.45 |
| 2.71 |
| ||||||||||||||
Exactech |
| 13.42 |
| 160.8 |
| 1.3 |
| 31.6 |
| 191.1 |
| 93.8 |
| 102.4 |
| 117.2 |
| 18.2 |
| 19.5 |
| 22.8 |
| 19.4 | % | 0.57 |
| 0.64 |
| 0.75 |
| ||||||||||||||
|
|
|
|
|
|
|
|
|
|
|
|
|
|
|
|
|
|
|
|
|
|
|
|
|
|
|
|
|
|
|
| ||||||||||||||
Mean |
|
|
|
|
|
|
|
|
|
|
|
|
|
|
|
|
|
|
|
|
|
|
| 20.2 | % |
|
|
|
|
|
| ||||||||||||||
Median |
|
|
|
|
|
|
|
|
|
|
|
|
|
|
|
|
|
|
|
|
|
|
| 20.8 | % |
|
|
|
|
|
| ||||||||||||||
High |
|
|
|
|
|
|
|
|
|
|
|
|
|
|
|
|
|
|
|
|
|
|
| 24.6 | % |
|
|
|
|
|
| ||||||||||||||
Low |
|
|
|
|
|
|
|
|
|
|
|
|
|
|
|
|
|
|
|
|
|
|
| 16.0 | % |
|
|
|
|
|
| ||||||||||||||
|
|
|
|
|
|
|
|
|
|
|
|
|
|
|
|
|
|
|
|
|
|
|
|
|
|
|
|
|
|
|
| ||||||||||||||
Ranger (4) (5) |
| $ | 4.75 |
| $ | 339.3 |
| $ | 12.5 |
| $ | 342.4 |
| $ | 669.2 |
| $ | 310.3 |
| $ | 417.1 |
| $ | 466.5 |
| $ | 75.7 |
| $ | 81.6 |
| $ | 95.0 |
| 24.4 | % | $ | 0.09 |
| $ | 0.28 |
| $ | 0.40 |
|
Source: FactSet, Public Filings and Wall Street Research.
(1) | Calculated using the treasury stock method. |
(2) | Equals equity value plus net debt. |
(3) | Excludes non-recurring charges. |
(4) | Primary share count per Form 10-Q for the quarter ended 4/1/06. Net debt figures per Management provided financial statements as of 4/30/06. Estimates per Ranger Management. |
(5) | EBITDA figures pro forma for 12-month impact of Compex acquisition; excludes one-time restructuring charges, stock option expenses, write-up of inventory and write off of in-process R&D for Compex. |
14
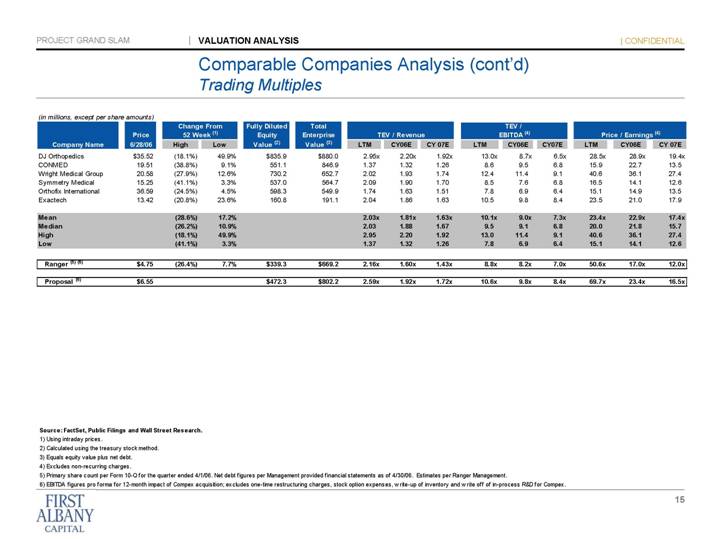
Comparable Companies Analysis (cont'd)
Trading Multiples
(in millions, except per share amounts)
|
| Price |
| Change From |
| Fully Diluted |
| Total |
| TEV / Revenue |
| TEV / |
| Price / Earnings (4) |
| |||||||||||||||||
Company Name |
| 6/28/06 |
| High |
| Low |
| Value (2) |
| Value (3) |
| LTM |
| CY06E |
| CY 07E |
| LTM |
| CY06E |
| CY07E |
| LTM |
| CY06E |
| CY 07E |
| |||
DJ Orthopedics |
| $ | 35.52 |
| (18.1 | )% | 49.9 | % | $ | 835.9 |
| $ | 880.0 |
| 2.95 | x | 2.20 | x | 1.92 | x | 13.0 | x | 8.7 | x | 6.5 | x | 28.5 | x | 28.9 | x | 19.4 | x |
CONMED |
| 19.51 |
| (38.8 | )% | 9.1 | % | 551.1 |
| 846.9 |
| 1.37 |
| 1.32 |
| 1.26 |
| 8.6 |
| 9.5 |
| 6.8 |
| 15.9 |
| 22.7 |
| 13.5 |
| |||
Wright Medical Group |
| 20.58 |
| (27.9 | )% | 12.6 | % | 730.2 |
| 652.7 |
| 2.02 |
| 1.93 |
| 1.74 |
| 12.4 |
| 11.4 |
| 9.1 |
| 40.6 |
| 36.1 |
| 27.4 |
| |||
Symmetry Medical |
| 15.25 |
| (41.1 | )% | 3.3 | % | 537.0 |
| 564.7 |
| 2.09 |
| 1.90 |
| 1.70 |
| 8.5 |
| 7.6 |
| 6.8 |
| 16.5 |
| 14.1 |
| 12.6 |
| |||
Orthofix International |
| 36.59 |
| (24.5 | )% | 4.5 | % | 598.3 |
| 549.9 |
| 1.74 |
| 1.63 |
| 1.51 |
| 7.8 |
| 6.9 |
| 6.4 |
| 15.1 |
| 14.9 |
| 13.5 |
| |||
Exactech |
| 13.42 |
| (20.8 | )% | 23.6 | % | 160.8 |
| 191.1 |
| 2.04 |
| 1.86 |
| 1.63 |
| 10.5 |
| 9.8 |
| 8.4 |
| 23.5 |
| 21.0 |
| 17.9 |
| |||
|
|
|
|
|
|
|
|
|
|
|
|
|
|
|
|
|
|
|
|
|
|
|
|
|
|
|
|
|
| |||
Mean |
|
|
| (28.6 | )% | 17.2 | % |
|
|
|
| 2.03 | x | 1.81 | x | 1.63 | x | 10.1 | x | 9.0 | x | 7.3 | x | 23.4 | x | 22.9 | x | 17.4 | x | |||
Median |
|
|
| (26.2 | )% | 10.9 | % |
|
|
|
| 2.03 |
| 1.88 |
| 1.67 |
| 9.5 |
| 9.1 |
| 6.8 |
| 20.0 |
| 21.8 |
| 15.7 |
| |||
High |
|
|
| (18.1 | )% | 49.9 | % |
|
|
|
| 2.95 |
| 2.20 |
| 1.92 |
| 13.0 |
| 11.4 |
| 9.1 |
| 40.6 |
| 36.1 |
| 27.4 |
| |||
Low |
|
|
| (41.1 | )% | 3.3 | % |
|
|
|
| 1.37 |
| 1.32 |
| 1.26 |
| 7.8 |
| 6.9 |
| 6.4 |
| 15.1 |
| 14.1 |
| 12.6 |
| |||
|
|
|
|
|
|
|
|
|
|
|
|
|
|
|
|
|
|
|
|
|
|
|
|
|
|
|
|
|
| |||
Ranger (5) (6) |
| $ | 4.75 |
| (26.4 | )% | 7.7 | % | $ | 339.3 |
| $ | 669.2 |
| 2.16 | x | 1.60 | x | 1.43 | x | 8.8 | x | 8.2 | x | 7.0 | x | 50.6 | x | 17.0 | x | 12.0 | x |
|
|
|
|
|
|
|
|
|
|
|
|
|
|
|
|
|
|
|
|
|
|
|
|
|
|
|
|
|
| |||
Proposal (6) |
| $ | 6.55 |
|
|
|
|
| $ | 472.3 |
| $ | 802.2 |
| 2.59 | x | 1.92 | x | 1.72 | x | 10.6 | x | 9.8 | x | 8.4 | x | 69.7 | x | 23.4 | x | 16.5 | x |
Source: FactSet, Public Filings and Wall Street Research.
(1) Using intraday prices.
(2) Calculated using the treasury stock method.
(3) Equals equity value plus net debt.
(4) Excludes non-recurring charges.
(5) Primary share count per Form 10-Q for the quarter ended 4/1/06. Net debt figures per Management provided financial statements as of 4/30/06. Estimates per Ranger Management.
(6) EBITDA figures pro forma for 12-month impact of Compex acquisition; excludes one-time restructuring charges, stock option expenses, write-up of inventory and write off of in-process R&D for Compex.
15
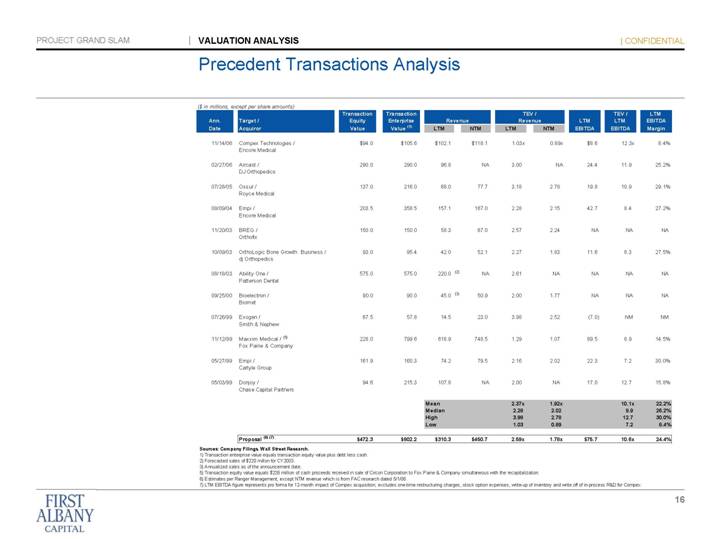
Precedent Transactions Analysis
($ in millions, except per share amounts)
|
|
|
| Transaction |
| Transaction |
|
|
|
|
| TEV / |
|
|
| TEV / |
| LTM |
| |||||||
Ann. |
| Target / |
| Equity |
| Enterprise |
| Revenue |
| Revenue |
| LTM |
| LTM |
| EBITDA |
| |||||||||
Date |
| Acquiror |
| Value |
| Value (1) |
| LTM |
| NTM |
| LTM |
| NTM |
| EBITDA |
| EBITDA |
| Margin |
| |||||
|
|
|
|
|
|
|
|
|
|
|
|
|
|
|
|
|
|
|
|
|
| |||||
11/14/06 |
| Compex Technologies / |
| $ | 94.0 |
| $ | 105.6 |
| $ | 102.1 |
| $ | 118.1 |
| 1.03 | x | 0.89 | x | $ | 8.6 |
| 12.3 | x | 8.4 | % |
|
|
|
|
|
|
|
|
|
|
|
|
|
|
|
|
|
|
|
|
|
| |||||
02/27/06 |
| Aircast / |
| 290.0 |
| 290.0 |
| 96.8 |
| NA |
| 3.00 |
| NA |
| 24.4 |
| 11.9 |
| 25.2 | % | |||||
|
|
|
|
|
|
|
|
|
|
|
|
|
|
|
|
|
|
|
|
|
| |||||
07/28/05 |
| Ossur / |
| 137.0 |
| 216.0 |
| 68.0 |
| 77.7 |
| 3.18 |
| 2.78 |
| 19.8 |
| 10.9 |
| 29.1 | % | |||||
|
|
|
|
|
|
|
|
|
|
|
|
|
|
|
|
|
|
|
|
|
| |||||
08/09/04 |
| Empi / |
| 203.5 |
| 358.5 |
| 157.1 |
| 167.0 |
| 2.28 |
| 2.15 |
| 42.7 |
| 8.4 |
| 27.2 | % | |||||
|
|
|
|
|
|
|
|
|
|
|
|
|
|
|
|
|
|
|
|
|
| |||||
11/20/03 |
| BREG / |
| 150.0 |
| 150.0 |
| 58.3 |
| 67.0 |
| 2.57 |
| 2.24 |
| NA |
| NA |
| NA |
| |||||
|
|
|
|
|
|
|
|
|
|
|
|
|
|
|
|
|
|
|
|
|
| |||||
10/09/03 |
| OrthoLogic Bone Growth Business / dj Orthopedics |
| 93.0 |
| 95.4 |
| 42.0 |
| 52.1 |
| 2.27 |
| 1.83 |
| 11.6 |
| 8.3 |
| 27.5 | % | |||||
|
|
|
|
|
|
|
|
|
|
|
|
|
|
|
|
|
|
|
|
|
| |||||
08/18/03 |
| Ability One / |
| 575.0 |
| 575.0 |
| 220.0 | (2) | NA |
| 2.61 |
| NA |
| NA |
| NA |
| NA |
| |||||
|
|
|
|
|
|
|
|
|
|
|
|
|
|
|
|
|
|
|
|
|
| |||||
09/25/00 |
| Bioelectron / |
| 90.0 |
| 90.0 |
| 45.0 | (3) | 50.9 |
| 2.00 |
| 1.77 |
| NA |
| NA |
| NA |
| |||||
|
|
|
|
|
|
|
|
|
|
|
|
|
|
|
|
|
|
|
|
|
| |||||
07/26/99 |
| Exogen / |
| 67.5 |
| 57.8 |
| 14.5 |
| 23.0 |
| 3.98 |
| 2.52 |
| (7.0 | ) | NM |
| NM |
| |||||
|
|
|
|
|
|
|
|
|
|
|
|
|
|
|
|
|
|
|
|
|
| |||||
11/12/99 |
| Maxxim Medical / (5) |
| 228.0 |
| 799.6 |
| 618.9 |
| 748.5 |
| 1.29 |
| 1.07 |
| 89.5 |
| 8.9 |
| 14.5 | % | |||||
|
|
|
|
|
|
|
|
|
|
|
|
|
|
|
|
|
|
|
|
|
| |||||
05/27/99 |
| Empi / |
| 161.9 |
| 160.3 |
| 74.2 |
| 79.5 |
| 2.16 |
| 2.02 |
| 22.3 |
| 7.2 |
| 30.0 | % | |||||
|
|
|
|
|
|
|
|
|
|
|
|
|
|
|
|
|
|
|
|
|
| |||||
05/03/99 |
| Donjoy / |
| 94.6 |
| 215.3 |
| 107.8 |
| NA |
| 2.00 |
| NA |
| 17.0 |
| 12.7 |
| 15.8 | % | |||||
|
|
|
|
|
|
|
|
|
|
|
|
|
|
|
|
|
|
|
|
|
| |||||
|
|
|
|
|
|
|
| Mean |
|
|
| 2.37 | x | 1.92 | x |
|
| 10.1 | x | 22.2 | % | |||||
|
|
|
|
|
|
|
| Median |
|
|
| 2.28 |
| 2.02 |
|
|
| 9.9 |
| 26.2 | % | |||||
|
|
|
|
|
|
|
| High |
|
|
| 3.98 |
| 2.78 |
|
|
| 12.7 |
| 30.0 | % | |||||
|
|
|
|
|
|
|
| Low |
|
|
| 1.03 |
| 0.89 |
|
|
| 7.2 |
| 8.4 | % | |||||
|
|
|
|
|
|
|
|
|
|
|
|
|
|
|
|
|
|
|
|
|
| |||||
|
| Proposal (6) (7) |
| $ | 472.3 |
| $ | 802.2 |
| $ | 310.3 |
| $ | 450.7 |
| 2.59 | x | 1.78 | x | $ | 75.7 |
| 10.6 | x | 24.4 | % |
Sources: Company Filings, Wall Street Research.
(1) Transaction enterprise value equals transaction equity value plus debt less cash.
(2) Forecasted sales of $220 millon for CY2003.
(3) Annualized sales as of the announcement date.
(5) Transaction equity value equals $228 million of cash proceeds received in sale of Circon Corporation to Fox Paine & Company simultaneous with the recapitalization.
(6) Estimates per Ranger Management, except NTM revenue which is from FAC research dated 5/1/06.
(7) LTM EBITDA figure represents pro forma for 12-month impact of Compex acquisition; excludes one-time restructuring charges, stock option expenses, write-up of inventory and write off of in-process R&D for Compex.
16
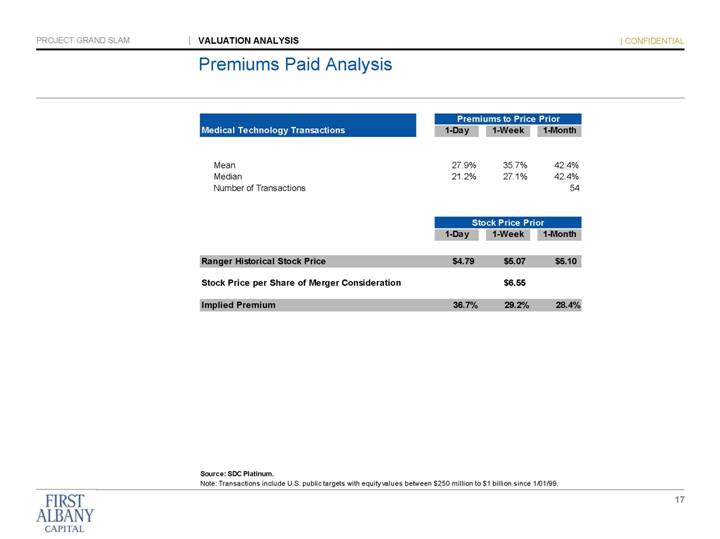
Premiums Paid Analysis
|
| Premiums to Price Prior |
| ||||
Medical Technology Transactions |
| 1-Day |
| 1-Week |
| 1-Month |
|
|
|
|
|
|
|
|
|
Mean |
| 27.9 | % | 35.7 | % | 42.4 | % |
Median |
| 21.2 | % | 27.1 | % | 42.4 | % |
Number of Transactions |
|
|
|
|
| 54 |
|
|
| Stock Price Prior |
| |||||||
|
| 1-Day |
| 1-Week |
| 1-Month |
| |||
|
|
|
|
|
|
|
| |||
Ranger Historical Stock Price |
| $ | 4.79 |
| $ | 5.07 |
| $ | 5.10 |
|
|
|
|
|
|
|
|
| |||
Stock Price per Share of Merger Consideration |
|
|
| $ | 6.55 |
|
|
| ||
|
|
|
|
|
|
|
| |||
Implied Premium |
| 36.7 | % | 29.2 | % | 28.4 | % | |||
Source: SDC Platinum.
Note: Transactions include U.S. public targets with equity values between $250 million to $1 billion since 1/01/99.
17
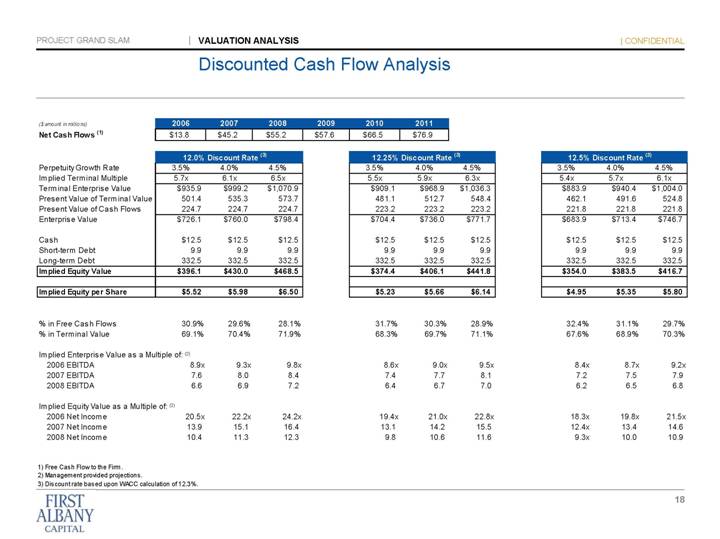
Discounted Cash Flow Analysis
($ amount in millions) |
| 2006 |
| 2007 |
| 2008 |
| 2009 |
| 2010 |
| 2011 |
| ||||||
Net Cash Flows (1) |
| $ | 13.8 |
| $ | 45.2 |
| $ | 55.2 |
| $ | 57.6 |
| $ | 66.5 |
| $ | 76.9 |
|
|
| 12.0% Discount Rate (3) |
| 12.25% Discount Rate (3) |
| 12.5% Discount Rate(3) |
| |||||||||||||||||||||
Perpetuity Growth Rate |
| 3.5 | % | 4.0 | % | 4.5 | % | 3.5 | % | 4.0 | % | 4.5 | % | 3.5 | % | 4.0 | % | 4.5 | % | |||||||||
Implied Terminal Multiple |
| 5.7 | x | 6.1 | x | 6.5 | x | 5.5 | x | 5.9 | x | 6.3 | x | 5.4 | x | 5.7 | x | 6.1 | x | |||||||||
Terminal Enterprise Value |
| $ | 935.9 |
| $ | 999.2 |
| $ | 1,070.9 |
| $ | 909.1 |
| $ | 968.9 |
| $ | 1,036.3 |
| $ | 883.9 |
| $ | 940.4 |
| $ | 1,004.0 |
|
Present Value of Terminal Value |
| 501.4 |
| 535.3 |
| 573.7 |
| 481.1 |
| 512.7 |
| 548.4 |
| 462.1 |
| 491.6 |
| 524.8 |
| |||||||||
Present Value of Cash Flows |
| 224.7 |
| 224.7 |
| 224.7 |
| 223.2 |
| 223.2 |
| 223.2 |
| 221.8 |
| 221.8 |
| 221.8 |
| |||||||||
Enterprise Value |
| $ | 726.1 |
| $ | 760.0 |
| $ | 798.4 |
| $ | 704.4 |
| $ | 736.0 |
| $ | 771.7 |
| $ | 683.9 |
| $ | 713.4 |
| $ | 746.7 |
|
|
|
|
|
|
|
|
|
|
|
|
|
|
|
|
|
|
|
|
| |||||||||
Cash |
| $ | 12.5 |
| $ | 12.5 |
| $ | 12.5 |
| $ | 12.5 |
| $ | 12.5 |
| $ | 12.5 |
| $ | 12.5 |
| $ | 12.5 |
| $ | 12.5 |
|
Short-term Debt |
| 9.9 |
| 9.9 |
| 9.9 |
| 9.9 |
| 9.9 |
| 9.9 |
| 9.9 |
| 9.9 |
| 9.9 |
| |||||||||
Long-term Debt |
| 332.5 |
| 332.5 |
| 332.5 |
| 332.5 |
| 332.5 |
| 332.5 |
| 332.5 |
| 332.5 |
| 332.5 |
| |||||||||
Implied Equity Value |
| $ | 396.1 |
| $ | 430.0 |
| $ | 468.5 |
| $ | 374.4 |
| $ | 406.1 |
| $ | 441.8 |
| $ | 354.0 |
| $ | 383.5 |
| $ | 416.7 |
|
|
|
|
|
|
|
|
|
|
|
|
|
|
|
|
|
|
|
|
| |||||||||
Implied Equity per Share |
| $ | 5.52 |
| $ | 5.98 |
| $ | 6.50 |
| $ | 5.23 |
| $ | 5.66 |
| $ | 6.14 |
| $ | 4.95 |
| $ | 5.35 |
| $ | 5.80 |
|
|
|
|
|
|
|
|
|
|
|
|
|
|
|
|
|
|
|
|
| |||||||||
% in Free Cash Flows |
| 30.9 | % | 29.6 | % | 28.1 | % | 31.7 | % | 30.3 | % | 28.9 | % | 32.4 | % | 31.1 | % | 29.7 | % | |||||||||
% in Terminal Value |
| 69.1 | % | 70.4 | % | 71.9 | % | 68.3 | % | 69.7 | % | 71.1 | % | 67.6 | % | 68.9 | % | 70.3 | % | |||||||||
|
|
|
|
|
|
|
|
|
|
|
|
|
|
|
|
|
|
|
| |||||||||
Implied Enterprise Value as a Multiple of: (2) |
|
|
|
|
|
|
|
|
|
|
|
|
|
|
|
|
|
|
| |||||||||
2006 EBITDA |
| 8.9 | x | 9.3 | x | 9.8 | x | 8.6 | x | 9.0 | x | 9.5 | x | 8.4 | x | 8.7 | x | 9.2 | x | |||||||||
2007 EBITDA |
| 7.6 |
| 8.0 |
| 8.4 |
| 7.4 |
| 7.7 |
| 8.1 |
| 7.2 |
| 7.5 |
| 7.9 |
| |||||||||
2008 EBITDA |
| 6.6 |
| 6.9 |
| 7.2 |
| 6.4 |
| 6.7 |
| 7.0 |
| 6.2 |
| 6.5 |
| 6.8 |
| |||||||||
|
|
|
|
|
|
|
|
|
|
|
|
|
|
|
|
|
|
|
| |||||||||
Implied Equity Value as a Multiple of: (2) |
|
|
|
|
|
|
|
|
|
|
|
|
|
|
|
|
|
|
| |||||||||
2006 Net Income |
| 20.5 | x | 22.2 | x | 24.2 | x | 19.4 | x | 21.0 | x | 22.8 | x | 18.3 | x | 19.8 | x | 21.5 | x | |||||||||
2007 Net Income |
| 13.9 |
| 15.1 |
| 16.4 |
| 13.1 |
| 14.2 |
| 15.5 |
| 12.4 | x | 13.4 |
| 14.6 |
| |||||||||
2008 Net Income |
| 10.4 |
| 11.3 |
| 12.3 |
| 9.8 |
| 10.6 |
| 11.6 |
| 9.3 |
| 10.0 |
| 10.9 |
| |||||||||
(1) Free Cash Flow to the Firm.
(2) Management provided projections.
(3) Discount rate based upon WACC calculation of 12.3%.
18
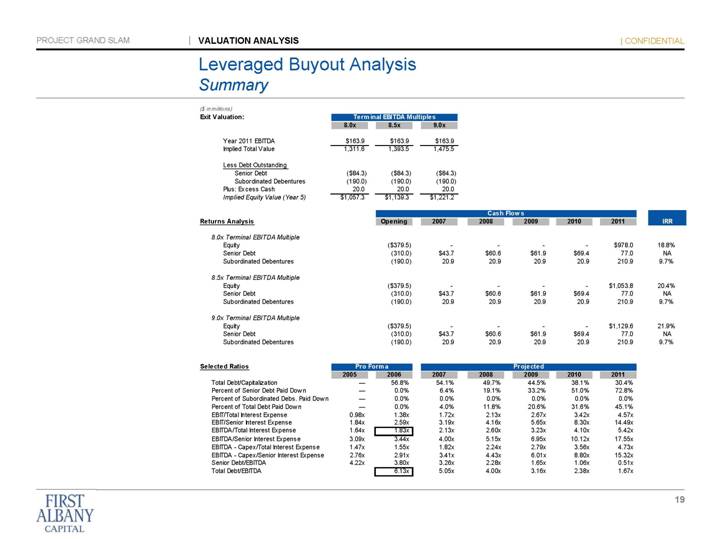
Leveraged Buyout Analysis
Summary
($ in millions)
|
| Terminal EBITDA Multiples |
|
|
|
|
|
|
|
|
|
|
| |||||||||||
Exit Valuation: |
| 8.0x |
| 8.5x |
| 9.0x |
|
|
|
|
|
|
|
|
|
|
| |||||||
|
|
|
|
|
|
|
|
|
|
|
|
|
|
|
|
|
| |||||||
Year 2011 EBITDA |
| $ | 163.9 |
| $ | 163.9 |
| $ | 163.9 |
|
|
|
|
|
|
|
|
|
|
| ||||
Implied Total Value |
| 1,311.6 |
| 1,393.5 |
| 1,475.5 |
|
|
|
|
|
|
|
|
|
|
| |||||||
|
|
|
|
|
|
|
|
|
|
|
|
|
|
|
|
|
| |||||||
Less Debt Outstanding |
|
|
|
|
|
|
|
|
|
|
|
|
|
|
|
|
| |||||||
Senior Debt |
| $ | (84.3 | ) | $ | (84.3 | ) | $ | (84.3 | ) |
|
|
|
|
|
|
|
|
|
| ||||
Subordinated Debentures |
| (190.0 | ) | (190.0 | ) | (190.0 | ) |
|
|
|
|
|
|
|
|
|
| |||||||
Plus: Excess Cash |
| 20.0 |
| 20.0 |
| 20.0 |
|
|
|
|
|
|
|
|
|
|
| |||||||
Implied Equity Value (Year 5) |
| $ | 1,057.3 |
| $ | 1,139.3 |
| $ | 1,221.2 |
|
|
|
|
|
|
|
|
|
|
| ||||
|
|
|
|
|
|
|
|
|
|
|
|
|
|
|
|
|
| |||||||
|
|
|
| Cash Flows |
|
|
| |||||||||||||||||
Returns Analysis |
|
|
| Opening |
| 2007 |
| 2008 |
| 2009 |
| 2010 |
| 2011 |
| IRR |
| |||||||
8.0x Terminal EBITDA Multiple |
|
|
|
|
|
|
|
|
|
|
|
|
|
|
|
|
| |||||||
Equity |
|
|
| $ | (379.5 | ) | — |
| — |
| — |
| — |
| $ | 978.0 |
| 18.8 | % | |||||
Senior Debt |
|
|
| (310.0 | ) | $ | 43.7 |
| $ | 60.6 |
| $ | 61.9 |
| $ | 69.4 |
| 77.0 |
| NA |
| |||
Subordinated Debentures |
|
|
| (190.0 | ) | 20.9 |
| 20.9 |
| 20.9 |
| 20.9 |
| 210.9 |
| 9.7 | % | |||||||
|
|
|
|
|
|
|
|
|
|
|
|
|
|
|
|
|
| |||||||
8.5x Terminal EBITDA Multiple |
|
|
|
|
|
|
|
|
|
|
|
|
|
|
|
|
| |||||||
Equity |
|
|
| $ | (379.5 | ) | — |
| — |
| — |
| — |
| $ | 1,053.8 |
| 20.4 | % | |||||
Senior Debt |
|
|
| (310.0 | ) | $ | 43.7 |
| $ | 60.6 |
| $ | 61.9 |
| $ | 69.4 |
| 77.0 |
| NA |
| |||
Subordinated Debentures |
|
|
| (190.0 | ) | 20.9 |
| 20.9 |
| 20.9 |
| 20.9 |
| 210.9 |
| 9.7 | % | |||||||
|
|
|
|
|
|
|
|
|
|
|
|
|
|
|
|
|
| |||||||
9.0x Terminal EBITDA Multiple |
|
|
|
|
|
|
|
|
|
|
|
|
|
|
|
|
| |||||||
Equity |
|
|
| $ | (379.5 | ) | — |
| — |
| — |
| — |
| $ | 1,129.6 |
| 21.9 | % | |||||
Senior Debt |
|
|
| (310.0 | ) | $ | 43.7 |
| $ | 60.6 |
| $ | 61.9 |
| $ | 69.4 |
| 77.0 |
| NA |
| |||
Subordinated Debentures |
|
|
| (190.0 | ) | 20.9 |
| 20.9 |
| 20.9 |
| 20.9 |
| 210.9 |
| 9.7 | % | |||||||
|
|
|
|
|
|
|
|
|
|
|
|
|
|
|
|
|
| |||||||
|
| Pro Forma |
| Projected |
|
|
| |||||||||||||||||
Selected Ratios |
| 2005 |
| 2006 |
| 2007 |
| 2008 |
| 2009 |
| 2010 |
| 2011 |
|
|
| |||||||
Total Debt/Capitalization |
| — |
| 56.8 | % | 54.1 | % | 49.7 | % | 44.5 | % | 38.1 | % | 30.4 | % |
|
| |||||||
Percent of Senior Debt Paid Down |
| — |
| 0.0 | % | 6.4 | % | 19.1 | % | 33.2 | % | 51.0 | % | 72.8 | % |
|
| |||||||
Percent of Subordinated Debs. Paid Down |
| — |
| 0.0 | % | 0.0 | % | 0.0 | % | 0.0 | % | 0.0 | % | 0.0 | % |
|
| |||||||
Percent of Total Debt Paid Down |
| — |
| 0.0 | % | 4.0 | % | 11.8 | % | 20.6 | % | 31.6 | % | 45.1 | % |
|
| |||||||
EBIT/Total Interest Expense |
| 0.98 | x | 1.38 | x | 1.72 | x | 2.13 | x | 2.67 | x | 3.42 | x | 4.57 | x |
|
| |||||||
EBIT/Senior Interest Expense |
| 1.84 | x | 2.59 | x | 3.19 | x | 4.16 | x | 5.65 | x | 8.30 | x | 14.49 | x |
|
| |||||||
EBITDA/Total Interest Expense |
| 1.64 | x | 1.83 | x | 2.13 | x | 2.60 | x | 3.23 | x | 4.10 | x | 5.42 | x |
|
| |||||||
EBITDA/Senior Interest Expense |
| 3.09 | x | 3.44 | x | 4.00 | x | 5.15 | x | 6.95 | x | 10.12 | x | 17.55 | x |
|
| |||||||
EBITDA - Capex/Total Interest Expense |
| 1.47 | x | 1.55 | x | 1.82 | x | 2.24 | x | 2.79 | x | 3.56 | x | 4.73 | x |
|
| |||||||
EBITDA - Capex/Senior Interest Expense |
| 2.76 | x | 2.91 | x | 3.41 | x | 4.43 | x | 6.01 | x | 8.80 | x | 15.32 | x |
|
| |||||||
Senior Debt/EBITDA |
| 4.22 | x | 3.80 | x | 3.26 | x | 2.28 | x | 1.65 | x | 1.06 | x | 0.51 | x |
|
| |||||||
Total Debt/EBITDA |
|
|
| 6.13 | x | 5.05 | x | 4.00 | x | 3.16 | x | 2.38 | x | 1.67 | x |
|
| |||||||
19
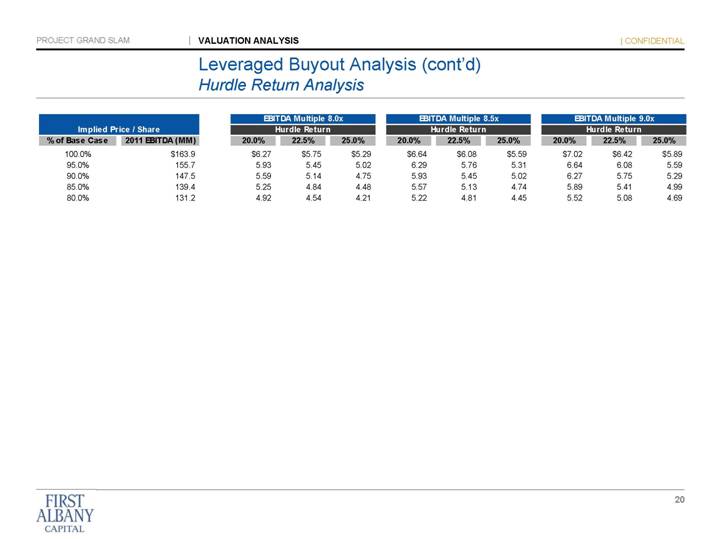
Leveraged Buyout Analysis (cont'd)
Hurdle Return Analysis
Implied Price / Share |
| EBITDA Multiple 8.0x |
| EBITDA Multiple 8.5x |
| EBITDA Multiple 9.0x |
| |||||||||||||||||||||||||
% of Base Case |
| 2011 EBITDA (MM) |
| 20.0% |
| 22.5% |
| 25.0% |
| 20.0% |
| 22.5% |
| 25.0% |
| 20.0% |
| 22.5% |
| 25.0% |
| |||||||||||
100.0 | % |
| $ | 163.9 |
| $ | 6.27 |
| $ | 5.75 |
| $ | 5.29 |
| $ | 6.64 |
| $ | 6.08 |
| $ | 5.59 |
| $ | 7.02 |
| $ | 6.42 |
| $ | 5.89 |
|
95.0 | % |
| 155.7 |
| 5.93 |
| 5.45 |
| 5.02 |
| 6.29 |
| 5.76 |
| 5.31 |
| 6.64 |
| 6.08 |
| 5.59 |
| ||||||||||
90.0 | % |
| 147.5 |
| 5.59 |
| 5.14 |
| 4.75 |
| 5.93 |
| 5.45 |
| 5.02 |
| 6.27 |
| 5.75 |
| 5.29 |
| ||||||||||
85.0 | % |
| 139.4 |
| 5.25 |
| 4.84 |
| 4.48 |
| 5.57 |
| 5.13 |
| 4.74 |
| 5.89 |
| 5.41 |
| 4.99 |
| ||||||||||
80.0 | % |
| 131.2 |
| 4.92 |
| 4.54 |
| 4.21 |
| 5.22 |
| 4.81 |
| 4.45 |
| 5.52 |
| 5.08 |
| 4.69 |
| ||||||||||
20
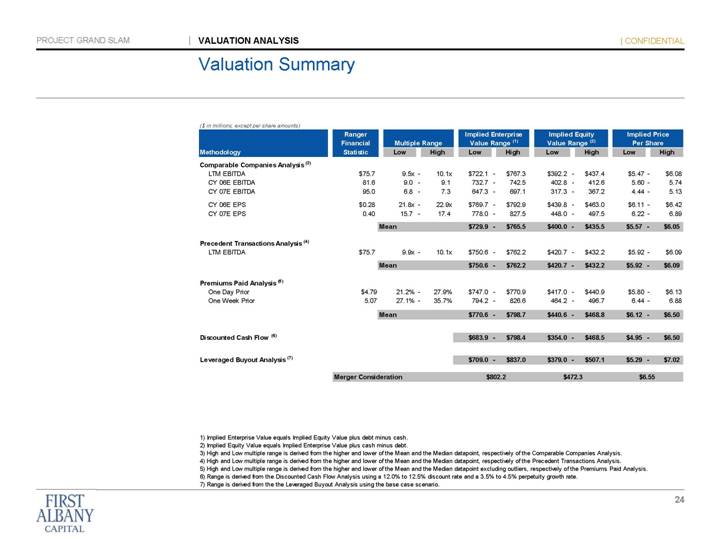
Valuation Summary
($ in millions, except per share amounts)
|
| Ranger |
| Multiple Range |
| Implied Enterprise |
| Implied Equity |
| Implied Price |
| |||||||||||||||||||||||
Methodology |
| Statistic |
| Low |
|
|
| High |
| Low |
|
|
| High |
| Low |
|
|
| High |
| Low |
|
|
| High |
| |||||||
|
|
|
|
|
|
|
|
|
|
|
|
|
|
|
|
|
|
|
|
|
|
|
|
|
|
|
| |||||||
Comparable Companies Analysis (3) |
|
|
|
|
|
|
|
|
|
|
|
|
|
|
|
|
|
|
|
|
|
|
|
|
|
|
| |||||||
LTM EBITDA |
| $ | 75.7 |
| 9.5 | x | - |
| 10.1 | x | $ | 722.1 |
| - |
| $ | 767.3 |
| $ | 392.2 |
| - |
| $ | 437.4 |
| $ | 5.47 |
| - |
| $ | 6.08 |
|
CY 06E EBITDA |
| 81.6 |
| 9.0 |
| - |
| 9.1 |
| 732.7 |
| - |
| 742.5 |
| 402.8 |
| - |
| 412.6 |
| 5.60 |
| - |
| 5.74 |
| |||||||
CY 07E EBITDA |
| 95.0 |
| 6.8 |
| - |
| 7.3 |
| 647.3 |
| - |
| 697.1 |
| 317.3 |
| - |
| 367.2 |
| 4.44 |
| - |
| 5.13 |
| |||||||
|
|
|
|
|
|
|
|
|
|
|
|
|
|
|
|
|
|
|
|
|
|
|
|
|
|
|
| |||||||
CY 06E EPS |
| $ | 0.28 |
| 21.8 | x | - |
| 22.9 | x | $ | 769.7 |
| - |
| $ | 792.9 |
| $ | 439.8 |
| - |
| $ | 463.0 |
| $ | 6.11 |
| - |
| $ | 6.42 |
|
CY 07E EPS |
| 0.40 |
| 15.7 |
| - |
| 17.4 |
| 778.0 |
| - |
| 827.5 |
| 448.0 |
| - |
| 497.5 |
| 6.22 |
| - |
| 6.89 |
| |||||||
|
|
|
|
|
|
|
|
|
|
|
|
|
|
|
|
|
|
|
|
|
|
|
|
|
|
|
| |||||||
|
|
|
| Mean |
|
|
|
|
| $ | 729.9 |
| - |
| $ | 765.5 |
| $ | 400.0 |
| - |
| $ | 435.5 |
| $ | 5.57 |
| - |
| $ | 6.05 |
| |
|
|
|
|
|
|
|
|
|
|
|
|
|
|
|
|
|
|
|
|
|
|
|
|
|
|
|
| |||||||
Precedent Transactions Analysis (4) |
|
|
|
|
|
|
|
|
|
|
|
|
|
|
|
|
|
|
|
|
|
|
|
|
|
|
| |||||||
LTM EBITDA |
| $ | 75.7 |
| 9.9 | x | - |
| 10.1 | x | $ | 750.6 |
| - |
| $ | 762.2 |
| $ | 420.7 |
| - |
| $ | 432.2 |
| $ | 5.92 |
| - |
| $ | 6.09 |
|
|
|
|
|
|
|
|
|
|
|
|
|
|
|
|
|
|
|
|
|
|
|
|
|
|
|
|
| |||||||
|
|
|
| Mean |
|
|
|
|
| $ | 750.6 |
| - |
| $ | 762.2 |
| $ | 420.7 |
| - |
| $ | 432.2 |
| $ | 5.92 |
| - |
| $ | 6.09 |
| |
|
|
|
|
|
|
|
|
|
|
|
|
|
|
|
|
|
|
|
|
|
|
|
|
|
|
|
| |||||||
Premiums Paid Analysis (5) |
|
|
|
|
|
|
|
|
|
|
|
|
|
|
|
|
|
|
|
|
|
|
|
|
|
|
| |||||||
One Day Prior |
| $ | 4.79 |
| 21.2 | % | - |
| 27.9 | % | $ | 747.0 |
| - |
| $ | 770.9 |
| $ | 417.0 |
| - |
| $ | 440.9 |
| $ | 5.80 |
| - |
| $ | 6.13 |
|
One Week Prior |
| 5.07 |
| 27.1 | % | - |
| 35.7 | % | 794.2 |
| - |
| 826.6 |
| 464.2 |
| - |
| 496.7 |
| 6.44 |
| - |
| 6.88 |
| |||||||
|
|
|
|
|
|
|
|
|
|
|
|
|
|
|
|
|
|
|
|
|
|
|
|
|
|
|
| |||||||
|
|
|
| Mean |
|
|
|
|
| $ | 770.6 |
| - |
| $ | 798.7 |
| $ | 440.6 |
| - |
| $ | 468.8 |
| $ | 6.12 |
| - |
| $ | 6.50 |
| |
|
|
|
|
|
|
|
|
|
|
|
|
|
|
|
|
|
|
|
|
|
|
|
|
|
|
|
| |||||||
Discounted Cash Flow (6) |
|
|
|
|
|
|
|
|
| $ | 683.9 |
| - |
| $ | 798.4 |
| $ | 354.0 |
| - |
| $ | 468.5 |
| $ | 4.95 |
| - |
| $ | 6.50 |
| |
|
|
|
|
|
|
|
|
|
|
|
|
|
|
|
|
|
|
|
|
|
|
|
|
|
|
|
| |||||||
Leveraged Buyout Analysis (7) |
|
|
|
|
|
|
|
|
| $ | 709.0 |
| - |
| $ | 837.0 |
| $ | 379.0 |
| - |
| $ | 507.1 |
| $ | 5.29 |
| - |
| $ | 7.02 |
| |
|
|
|
|
|
|
|
|
|
|
|
|
|
|
|
|
|
|
|
|
|
|
|
|
|
|
|
| |||||||
|
| Merger Consideration |
| $ 802.2 |
| $ 472.3 |
| $ 6.55 |
| |||||||||||||||||||||||||
(1) Implied Enterprise Value equals Implied Equity Value plus debt minus cash.
(2) Implied Equity Value equals Implied Enterprise Value plus cash minus debt.
(3) High and Low multiple range is derived from the higher and lower of the Mean and the Median datapoint, respectively of the Comparable Companies Analysis.
(4) High and Low multiple range is derived from the higher and lower of the Mean and the Median datapoint, respectively of the Precedent Transactions Analysis.
(5) High and Low multiple range is derived from the higher and lower of the Mean and the Median datapoint excluding outliers, respectively of the Premiums Paid Analysis.
(6) Range is derived from the Discounted Cash Flow Analysis using a 12.0% to 12.5% discount rate and a 3.5% to 4.5% perpetuity growth rate.
(7) Range is derived from the the Leveraged Buyout Analysis using the base case scenario.
21
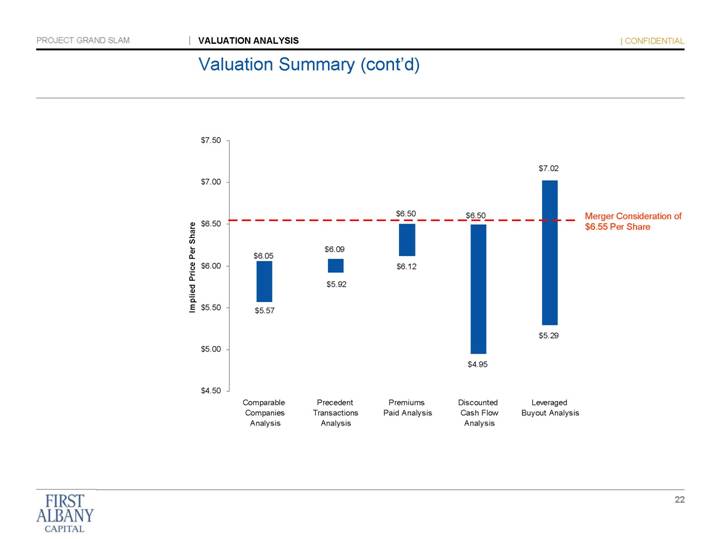
Bar chart representing a summary of certain valuation analyses as compared to the merger consideration of $6.55 per share. X-axis of the chart represents the analysis category and the y-axis of the chart represents implied price per share, with a line across the chart at $6.55 per share to represent the merger consideration in the proposed transaction. The chart includes the following pieces of data for the various valuation criteria:
Comparable Companies Analysis
A bar representing a price range of $5.57 to $6.05
Precedent Transactions Analysis
A bar representing a price range of $5.92 to $6.09
Premiums Paid Analysis
A bar representing a price range of $6.12 to $6.50
Discounted Cash Flow Analysis
A bar representing a price range of $4.95 to $6.50
Leveraged Buyout Analysis
A bar representing a price range of $5.29 to $7.02
22