QuickLinks -- Click here to rapidly navigate through this document[PHOTO]
Tesma International Inc.
Annual Report 2003
TESMA Measuring Our Success
Tesma At A Glance
| | 2003 Operating Highlights
| | Major Customers
|
|---|
Tesma
Engine
Technologies |
|
• Expanded customer base to include Hyundai, Fiat and
the PSA Group
• Expanded product line to include more value-added
assemblies and modules — Hyundai V6 engine front cover
module, General Motors' (GM) 3.9L engine front cover
module
• Established two new entities in Italy on one site to produce
oil and water pump assemblies and front end accessory drive
components for European customers
• Intensified Six Sigma continuous improvement activities
• Established a plant in China to manufacture automatic belt
tensioners for Volkswagen |
|
• General Motors
(including Fiat, Saab, Isuzu)
• Ford
(including Volvo, Mazda,
Jaguar)
• DaimlerChrysler
(including Mitsubishi,
Hyundai)
• Honda
• Toyota
• Renault-Nissan-Samsung
• Hitachi |
|
Tesma Transmission Technologies |
|
• Awarded hub and housing business on new GM
6-speed rear wheel drive transmission
• Launched various new products, including continuously
variable transmission (CVT) cylinders for ZF in Europe and
aluminium clutch pistons for GM
• Expanded research and development (R&D) capabilities
to include high-speed spin burst testing and multi-channel
torque and axial load fatigue testing
• Launched transfer case shafts and hubs for a key
program for Magna Steyr
• Launched transmission centre support housing for GM
• Realized operational efficiency and capacity utilization
improvements through Six Sigma initiatives
• Announced agreement to acquire Davis Industries, Inc.
(Davis), a U.S.-based powertrain supplier (completed
January 2, 2004) |
|
• General Motors
• Ford
(including Mazda)
• DaimlerChrysler
• Allison Transmission
• ZF
• Renault-Nissan-Samsung
• Magna Steyr |
|
Tesma Fuel Technologies |
|
• Focused R&D initiatives on the development of low
permeation capless filler systems, filler pipes and fuel tank
assemblies to meet Low Emission Vehicle (LEV II)
Legislation and Partial Zero Emission Vehicle (PZEV)
legislation
• Continued Six Sigma initiatives, LEAN/Synchronous
manufacturing efforts and VA/VE design improvements
to increase product functionality and reduce costs
• Launched several fuel filler pipe programs in Europe and
North America for Ford and DaimlerChrysler
• Launched the Volkswagen PQ34 PZEV stainless steel
fuel tank in Europe |
|
• General Motors
(including Fiat)
• Ford
(including Volvo)
• DaimlerChrysler
• Volkswagen Group
• BMW
• Audi |
Product Offerings
| | 2004 Goals and Strategy
|
|---|
• Front End Accessory Drive Systems
• Accessory and Timing Drive Tensioners
• Steel, Phenolic and Aluminium Pulleys
• Idler Assemblies
• Engine Front Cover Modules
• Engine Oil Pumps
• Water Pumps
• Cooling Management Systems
• Overrunning Alternator Decouplers
• Cam Covers
• Variable Camshaft Phasing Systems
• Engine Oil Pan Assemblies
• Engine Balance Shaft Assemblies
• Collapsible Drive Shaft Assemblies
• Rocker Covers |
|
• Capitalize on Tesma's component manufacturing
expertise/capabilities and further integrate to value-added
assemblies and modules
• Expand customer base in key markets for our engine front
cover modules, cooling and lubrication systems
• Continue to develop full-service capabilities by further
expanding our design, development, testing and validation
capabilities at both the component and systems levels
• Continue to expand benchmarking capabilities for cooling,
lubrication and engine systems products
• Successfully launch our first oil pumps and pulleys from
our operations in Italy
• Continue to develop unique and innovative products,
technologies and materials
• Successfully launch significant business at our
South Korean operations, including our first engine
front cover module for Hyundai |
|
• Automatic Transmission Clutch Housings and Shaft Assemblies
• Flow-Formed Clutch Housings
• Cam Die-Formed Transmission Shells
• Torque Converter Damper Assemblies
• Oil Pump Assemblies
• Die-Formed Oil Pan Assemblies
• Aluminium Die-Cast and Machined Case Extensions
and Clutch Housings
• Servo Piston and Accumulator Assemblies
• Roller Die-Formed Drive Hubs and Housings
• Fineblanked Products, Separator Plates and Backing Plates
• Flexplates
• Reaction and Input Shells
• CVT — Pistons, Plungers and Clutch Housings
• Friction Clutch Pack Assemblies
• Transfer Case Output Shafts and Flanges
• Torque Converter Stator Shafts |
|
• Successfully integrate the Davis operations
• Expand engineering and testing capabilities to include
complete clutch pack assemblies
• Continue to pursue and expand content in the precision
aluminium transmission die-cast components area
• Continue to pursue value-added sub-assemblies for
various transmission applications
• Expand our transmission oil pump assemblies to include
vane pump technology and unique variable flow
technology
• Expand transfer case component and sub-assembly
capability
• Expand customer base into non-traditional OEM market |
|
• Fuel Caps
• Fuel Filler Inlets and Valves
• Capless Filler Systems
• Steel Fuel Filler Pipes
• Steel Fuel Tank Assemblies
• Vent, Fill and Spud Tubes
• Fuel Sender Units |
|
• Provide leadership in the development and market
introduction of innovative fuel system solutions and
alternative material applications
• Expand our current product portfolio in Europe and
North America
• Provide customers with improved fuel system permeation
and corrosion performance and reduced waste through
improved recyclability
• Successfully launch the JR fuel tank and LX fuel filler pipe
programs for DaimlerChrysler in North America
• Continue with the successful ramp-up of Ford's global C1
fuel filler pipe program in our Austrian facility |
Profile
Tesma International Inc. (Tesma or the Company) designs, engineers, tests and manufactures technologically-advanced engine, transmission and fuel components, modules and systems for the global automotive industry. Tesma employs over 5,500 people in 28 manufacturing facilities (subsequent to the Davis Industries, Inc. acquisition) in North and South America, Europe and Asia and five focused tooling, design and R&D centres supporting our three principal product technology groups: Tesma Engine Technologies, Tesma Transmission Technologies and Tesma Fuel Technologies. Tesma ships its products to Original Equipment Manufacturers (OEMs) on six continents.
Tesma's Class A Subordinate Voting Shares trade on the Toronto Stock Exchange under the symbol TSM. A and the NASDAQ Stock Market under the symbol TSMA.
Forward-Looking Statements: This Annual Report may contain "forward-looking statements" within the meaning of applicable securities legislation. Such statements involve certain risks, assumptions, uncertainties and other factors (as described in Tesma's Annual Information Form, Form 40-F and other public filings) which may cause Tesma's actual future results or performance to differ materially from those expressed or implied herein. Tesma expressly disclaims any intention, and undertakes no obligation, to update or revise any forward-looking statements to reflect subsequent information, events, results, circumstances or otherwise.
| FOLD — OUT | | Tesma At A Glance |
| 02 | | Results |
| 03 | | Global Performance |
| 03 | | Content Per Vehicle |
| 04 | | Chairman's Message |
| 05 | | Letter to Shareholders |
| 09 | | Glossary |
| 10 | | Components, Modules and Systems |
| 13 | | Tesma Engine Technologies |
| 17 | | Tesma Transmission Technologies |
| 21 | | Tesma Fuel Technologies |
| | 22 | | Policies |
| | 22 | | Corporate Constitution |
| | 22 | | Employee's Charter |
| 23 | | Corporate Governance |
| 24 | | Review |
[PHOTO]
Customers. Employees. Shareholders.
They all have expectations.
And Tesma delivers results.
We're an industry leader in quality.
That's what our customers tell us.
They assess our performance every day.
We're a great place to work.
That's what employees tell us — in opinion surveys
and through long-term commitments to our team.
We build shareholder value.
That's what financial metrics tell us.
We're a leader among our peers.
But no one expects more of Tesma
than we do of ourselves.
That's how we measure our success.
The details are inside.
TESMA 1
Results
Financial Highlights
| | December 31
| |
|
|---|
| | % change
|
|---|
| | 2003
| | 2002
|
|---|
(U.S. dollars in millions, except per share and shares amounts)
| |
| |
| |
|
|---|
| Results for the year ended | | | | | | | | |
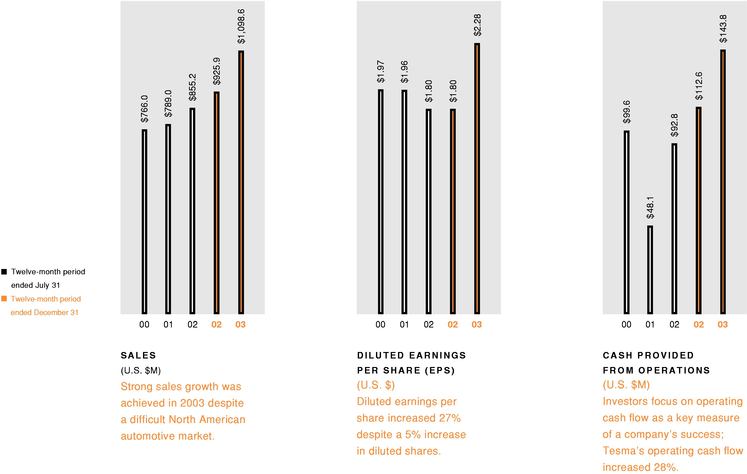
| Sales | | $ | 1,098.6 | | $ | 925.9 | | +19% |
| Income before income taxes | | $ | 110.0 | | $ | 82.9 | | +33% |
| Net income | | $ | 74.1 | | $ | 56.0 | | +32% |
| Operating cash flow | | $ | 143.8 | | $ | 112.6 | | +28% |
| Capital expenditures | | $ | 61.2 | | $ | 68.9 | | -11% |
Earnings per Class A Subordinate |
|
|
|
|
|
|
|
|
| | Voting Share or Class B Share | | | | | | | | |
| | | Basic | | $ | 2.29 | | $ | 1.82 | | +26% |
| | | Diluted | | $ | 2.28 | | $ | 1.80 | | +27% |
| Cash dividends paid per Class A Subordinate | | | | | | | | |
| | Voting Share or Class B Share (CDN $) | | $ | 0.75 | | $ | 0.64 | | |
| Average number of Class A Subordinate | | | | | | | | |
| | Voting Shares and Class B Shares outstanding | | | | | | | | |
| | | Basic | | | 32.3 | | | 30.7 | | +5% |
| | | Diluted | | | 32.5 | | | 31.1 | | +5% |
Year end position, as at |
|
|
|
|
|
|
|
|
| Cash (net of bank indebtedness) | | $ | 122.5 | | $ | 89.0 | | +38% |
| Total assets | | $ | 839.0 | | $ | 656.8 | | +28% |
| Long-term debt (including current portion) | | $ | 66.8 | | $ | 49.4 | | +35% |
| Shareholders' equity | | $ | 549.3 | | $ | 410.2 | | +34% |
| Book Value per Class A Subordinate | | | | | | | | |
| | Voting Share or Class B Share | | $ | 16.92 | | $ | 12.66 | | +34% |
2 TESMA
Global Performance
| | NORTH AMERICA
| | EUROPE
| | OTHER
|
|---|
| | December 31
| | December 31
| | December 31
|
|---|
Operating Segment
|
|---|
| | 2003
| | 2002
| | 2003
| | 2002
| | 2003
| | 2002
|
|---|
(U.S. dollars in millions, except facilities and employees)
| |
| |
| |
| |
| |
| |
|
|---|
| Sales | | $ | 856.0 | | $ | 725.5 | | $ | 235.6 | | $ | 180.6 | | $ | 28.8 | | $ | 33.8 |
| Income before income taxes | | $ | 97.5 | | $ | 87.5 | | $ | 18.3 | | $ | (6.1 | ) | $ | (5.8 | ) | $ | 1.5 |
| Capital assets | | $ | 206.1 | | $ | 197.8 | | $ | 65.2 | | $ | 49.1 | | $ | 32.4 | | $ | 26.2 |
| Manufacturing facilities | | | 15 | | | 15 | | | 6 | | | 5 | | | 4 | | | 3 |
| Employees | | | 3,600 | | | 3,500 | | | 1,100 | | | 1,200 | | | 300 | | | 200 |
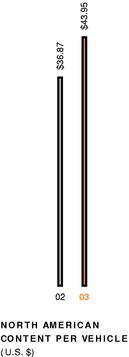
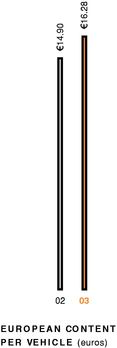
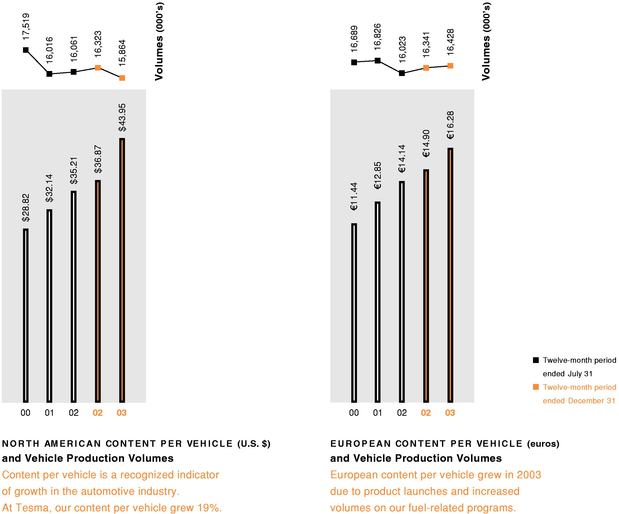
Content Per Vehicle
TESMA 3
[PHOTO]
MANFRED GINGL
Chairman & Chief Executive Officer
Chairman's Message
Tesma's success is very much a measure of our corporate culture and structure, both of which have their roots in Magna. Why have we placed such an emphasis on these two elements of how we do business? The answer is quite simple. It's not enough to have the right structure; a great company needs the right people, too.
Our greatest asset is outstanding and entrepreneurial individuals. We hold them accountable, we challenge and empower them — and we reward them through employee profit participation and share ownership programs. We provide them with training and education programs, as well as the opportunity to use what they have learned. Financial compensation is an important incentive — but so is the sense of pride and ownership that comes from working for, and contributing to, the success of Tesma. And so is "having fun along the way"!
Our manufacturing divisions operate as individual profit centres with dedicated production, finance, human resources and engineering teams. These teams can quickly respond to issues impacting operations, as well as investing in resources to develop opportunities for the future. In a centralized organization, by the time information reaches the top and filters back again, it's often too late.
While we work in a decentralized environment, we still try to capitalize on Tesma's brand identity and purchasing power, as well as its expertise in treasury, finance, information technology, tax and sales by maintaining certain centralized corporate office functions. This structure allows each general manager to focus on his division's performance in quality, delivery and profitability. To ensure consistency in our human resources initiatives and policies within all divisions, Tesma's HR department oversees the implementation and compliance of these initiatives on an ongoing basis.
I believe in our culture and our structure. It is the unique combination of these elements at Tesma that will allow us to continue to drive forward, benefit from trends in the automotive powertrain area and provide further growth and success.
/s/ MANFRED GINGL
MANFRED GINGL
CHAIRMAN & CHIEF EXECUTIVE OFFICER | | |
4 TESMA
[PHOTO]
ANTHONY E. DOBRANOWSKI
President & Chief Financial Officer
Letter to Shareholders
We had another great year. We surpassed our competitors in key performance measures such as return on funds employed, return on assets and return on equity. We increased sales 19% over 2002 and continued to grow our content per vehicle, which rose from U.S. $36.87 to U.S. $43.95 in North America and from €14.90 to €16.28 in Europe. Our North American sales grew 18% to U.S. $856 million despite lower vehicle production volumes. Overall, our bottom line increased to U.S. $74.1 million from U.S. $56.0 million a year ago.
TESMA 5
Why does Tesma remain profitable in the current tough market?
Many factors play a part. I'll point out just a few. First, we have people with the product development and manufacturing skills needed to wring savings from our processes, make continuous improvements, enhance quality and productivity and provide strong technical expertise and service to our customers.
We also have great discipline in the quoting process. We won't quote on jobs just to fill floor space and increase sales. And we are intensifying our focus on initiatives like better supplier management and offshore purchasing.
Geographic diversification allows us to increase our opportunities while mitigating our risks. From a product standpoint, we have expertise on a part of the vehicle that offers relatively great scope for proprietary products and technical proficiency, which we have developed through innovative solutions.
How are your customer relationships evolving?
We have solid and stable relationships with the majority of the world's major vehicle manufacturers. Our operations are efficient and world-class, with the right people and processes in place to help our customers. We are always looking for ways to exceed their expectations. Our industry faces price and margin pressures from OEMs, which means Tesma must make products better, faster and at lower cost than our competitors — and we do.
Our three technology groups have grown by taking single products and building on them. Tesma Engine Technologies, which began by manufacturing pulleys and front end accessory drive components, now makes entire front cover modules and is expanding down the engine. Tesma Transmission Technologies started with a few components and today offers a variety of transmission modules and assemblies. Tesma Fuel Technologies originally manufactured only caps, but has evolved to sell complete filler pipes and tanks as well. That's our organic growth curve.
Our customers are buying more and more systems and modules, rather than individual products — and they are relying on suppliers for engineering and development. In 2003, we derived approximately 80% of our sales from complete, value-added modules and assemblies, up from 75% last year. These types of products also represented about 80% of the business awarded to us during the year.
Our plan is to increase our North American market presence beyond the "Big Three" and to derive 15% of our sales from New Domestic manufacturers by 2006. The acquisition of Davis in early January 2004 moves us closer to this goal. Davis, a U.S.-based automotive parts manufacturer and supplier with annual sales of U.S. $129 million in their recently completed fiscal year, focuses on stamped powertrain components and assemblies that complement our existing product offerings.
Davis gives us, for the first time, a presence close to the assembly facilities of the OEMs in the southern U.S. Just as importantly, the acquisition broadens our customer relationships with non-traditional customers, as a high percentage of Davis' sales are to New Domestics. We expect Davis to be immediately accretive and to add more than U.S. $0.10 per share annually to our earnings in 2004.
80%
In 2003, we derived approximately 80% of our sales from complete, value-added modules and assemblies, up from 75% last year.
6 TESMA
What are you doing to diversify geographically and why?
From a very sound base in North America, we have set our sights on obtaining significant business in Europe and Asia. Our approach is to start small and develop the critical mass required to meet our customers' needs, while achieving good returns and strategic leverage for Tesma.
Global presence is important for the simple reason that our customers are demanding global capability from their suppliers. They expect us to offer global manufacturing, testing and product development, and technical and sales representation. With this in mind, we made a number of moves in 2003.
From a manufacturing perspective, we opened our first Italian operations. We'll use these operations to migrate to Europe some pulley business that is currently exported from Canada and will supply Fiat with oil and water pumps for the European market. We expanded our South Korean facilities and established our first plant in China. It will manufacture automatic belt tensioners for Volkswagen to supply the Chinese market. We are building an infrastructure and a team with potential to broaden our manufacturing capabilities and capitalize on future business opportunities in China.
In terms of testing and product development, we added resources in Korea and began building our capabilities in China. We also improved our ability to conduct testing and product development in Europe. And we increased our technical and sales representation in Japan.
Are more acquisitions likely?
There are three key elements that influence our interest in acquisitions: products, processes and geographic presence. We are reviewing our products to determine whether we should make any changes in our focus due to the emergence of new technologies or for other reasons. We already use more than 50 processes, but there are others, such as those used to manufacture powdered metal and magnesium components, which could strengthen our portfolio. Our decisions with respect to geographic location are a balance between what customers want us to do, what our real needs are and whether we have a viable business model. For example, we are looking to create critical mass in Europe and continue to review acquisition opportunities on that continent.
In evaluating acquisition targets, we try to strike a balance between the price we are willing to pay for a "strategic" versus a "good fit" acquisition; our ability to support the purchase price and future growth requirements; the implementation and integration risks that are inherent in all transactions; and the impact on our shareholders. Other factors include "cultural" and employee fit and reliance on particular customers.
We continue to look for attractive targets, but we will only make deals that make sense for Tesma. Acquisitions are not the only way to expand our business. We are launching new products and generating solid internal growth. For instance, in 2003 we booked new business that will represent over U.S. $270 million in annual sales by the time these programs reach full production volumes in 2007. Our strong balance sheet and cash reserves give us the flexibility to make the best choices for Tesma.
U.S. $270M
In 2003, we booked new business that will represent over U.S. $270 million in annual sales at full production volumes.
TESMA 7
What is the market potential — and how competitive is Tesma?
While outsourcing is an accelerating trend among OEMs, the powertrain sector is one of the least exploited segments and offers the best potential. In spite of Tesma's excellent growth record, we currently represent just 2.3% of the estimated U.S. $46 billion annual global powertrain market for Tesma's product portfolio.
Certainly foreign exchange is a competitive challenge for any Canadian exporter, as the Canadian dollar appreciated by 12% in 2003 against the U.S. dollar. Our Canadian counterparts are in the same boat as Tesma, but we also have competitors in the United States. Up to now, we have managed the impact of foreign exchange; if the dollar appreciates beyond a certain point we'll feel the pain of converting Canadian costs into U.S. dollars for quoting purposes. Still, it's not the end of the world for us.
We do have the flexibility to set up manufacturing facilities locally if appropriate. The Davis acquisition expands our presence in the southern U.S. and improves this flexibility.
Also, one needs to consider where sales are generated. It's not just a question of the differential between the Canadian and U.S. dollars. Our sales are denominated in yen, in euros and in various other currencies. We may lose on one transaction, but benefit on another.
Other aspects of competitiveness include the immediate pressures for customer givebacks. This means we must review and adjust the resources within our facilities to make the most of our manufacturing processes. We're doing an effective job of that.
The question of competitiveness underscores why it's important to diversify our customer base and geographic presence. We don't want to be overly reliant on any single source of business.
How will Tesma measure up in 2004 and beyond?
From 2003 to 2006, vehicle production volumes are expected to grow from 15.9 million units to 16.5 million units in North America and from 16.5 million units to 17.3 million units in Europe. Like the economy and currency fluctuations, industry volumes are among the uncontrollable factors that affect our business. We are determined to optimize Tesma's performance, whatever the conditions.
We anticipate that Tesma's annual sales will increase 12 to 13%, on average, over the next three years. We will enhance our performance metrics through sales growth and rigorous focus on costs and production efficiencies. During nearly a decade as a public company, Tesma has focused on the "Big Three" OEMs. In 2004 and beyond, we will continue to grow this business while highlighting opportunities with other OEMs in North America, Europe and Asia, including the New Domestic OEMs.
I am confident that Tesma will measure up well over the long term, due largely to our strong relationships with customers, employees and shareholders. I'd like to express my personal thanks for their support in 2003.
Tesma's ultimate vision is to be the world's leading Tier 1 supplier of advanced powertrain modules and systems. By designing, testing and building highly-engineered and proprietary products for global markets and a growing customer base, we are well positioned to reach our goal.
/s/ ANTHONY E. DOBRANOWSKI
ANTHONY E. DOBRANOWSKI
PRESIDENT & CHIEF FINANCIAL OFFICER | | |
2.3%
We currently represent just 2.3% of the estimated U.S. $46 billion annual global powertrain market for Tesma's product portfolio.
8 TESMA
Glossary
"Big 3" or Traditional OEMs
Refers to the North American operations of General Motors, Ford Motor Company and DaimlerChrysler
Content Per Vehicle (North America or Europe)
The average dollar (or euro) value of parts produced by Tesma included in each vehicle assembled in North America (or Europe) respectively. It is calculated as Tesma's total product sales to customers in North America or Europe divided by the number of vehicles assembled in each of these markets.
Continuously Variable Transmission (CVT)
A transmission that continuously varies the gear ratios between the engine input and torque output. A CVT allows optimum revolutions per minute (RPM), for maximized fuel economy, engine efficiency, low emissions and improved performance. A manual or automatic transmission has a predefined set of gear ratios, which does not allow for optimal performance.
DaimlerChrysler Group
Includes the automotive companies Chrysler, Mercedes-Benz, Hyundai, MCC (Smart) and Mitsubishi
European Vehicle Production
Vehicles assembled in Western Europe, which includes Austria, Belgium, Finland, France, Germany, Italy, the Netherlands, Norway, Portugal, Spain, Sweden and the United Kingdom
Ford Motor Company
Includes the automotive companies Ford, Volvo, Jaguar, Aston Martin, Mazda and Land Rover
General Motors Group
Includes the automotive companies General Motors, Hummer, Saab, Saturn, Fiat, Isuzu, Subaru (Fuji Heavy Industries), Holden, Opel, Vauxhall and Daewoo
Global Six
The six largest automotive OEMs: General Motors, Ford Motor Company, DaimlerChrysler, Toyota, Volkswagen Group and Renault-Nissan-Samsung
Low Emission Vehicle (Level 2) LEV II
LEV I was the original Low Emission Vehicle specification for conventional gas fueled vehicles and LEV II was established with more stringent specifications for emissions. It was initiated by the California Air Resources Board (CARB).
Modules and Systems
A series of components or sub-assemblies that are integrated into a package.
North American New Domestic OEMs
OEMs that assemble vehicles, engines or transmissions in North America other than the "Big 3" — examples are: Toyota, Honda, Renault-Nissan Samsung and BMW
North American Non-traditional OEMs
OEMs that sell vehicles in North America other than the "Big 3" — examples are: Toyota, Honda and KIA
North American Vehicle Production
The number of light vehicles assembled in the United States, Canada and Mexico
OEM Outsourcing
The procuring of components, modules and systems used in the manufacture of motor vehicles to outside suppliers or manufacturers in order to cut costs.
Original Equipment Manufacturers (OEMs)
Assemblers of complete vehicles, including their engine and transmission operations. OEMs provide the original product design and are directly responsible for manufacturing and modifying the products, making them commercially available and providing warranty coverage.
Partial Zero Emission Vehicle (PZEV)
A lower emission vehicle (a more stringent regulation than LEV II) which does not meet full-zero emission specifications for gas fueled vehicles as set out by CARB regulations.
Powertrain
An engine and transmission combined; can also include the driveshaft and drive axle
Production Part Approval Process (PPAP)
An OEM process where quality and specification monitoring is done prior to the part entering the commercial manufacturing stage.
Six Sigma
A disciplined and data driven approach to eliminate waste and reduce variation in any process using the Breakthrough Methodology which is define, measure, analyze, improve and control.
Tier 1 Supplier
A company that sells their products directly to the Original Equipment Manufacturer (OEM).
Volkswagen Group
Includes the automotive companies Volkswagen, Audi, Seat, Skoda and Auto-Europa
TESMA 9
Components, Modules and Systems
Tesma manufactures thousands of individual components. These products are assembled in a variety of modules and systems for the world's leading vehicle manufacturers. To us, the quality of each component, each module and each system is the foundation of our success.
| [PHOTO] | | Tesma Engine Technologies | | |
| [PHOTO] | | Engine Front Cover Module | | |
| [PHOTO] | | Balance Shaft Assembly | | |
| [PHOTO] | | Water Pump | | |
| [PHOTO] | | Engine Oil Pump | | |
| [PHOTO] | | Water Management (Thermostat) Assembly | | |
| [PHOTO] | | Accessory and Timing Drive Tensioner | | [PHOTO] |
| [PHOTO] | | Water Pump Pulley | | |
| [PHOTO] | | Engine Oil Pan Assembly | | |
| [PHOTO] | | Rocker Cover | | |
| [PHOTO] | | Water Pump Module | | |
| [PHOTO] | | Camshaft Phasing System | | Products shown are representative parts only, illustrating Tesma's capabilities.
Actual parts used in this vehicle may be different. |
10 TESMA
| Tesma Fuel Technologies | | Fuel Tank | | [PHOTO] |
| | | Fuel Filler Pipe | | [PHOTO] |
| | | Fuel Cap | | [PHOTO] |
| | | Universal Sender Unit | | [PHOTO] |
| Tesma Transmission Technologies | | Die-Cast Transmission Case Extension | | [PHOTO] |
| | | Flexplate | | [PHOTO] |
| | | Rotating Clutch Housing | | [PHOTO] |
| [PHOTO] | | Torque Converter Damper Assembly | | [PHOTO] |
| | | Centre Support | | [PHOTO] |
| | | Transmission Oil Pan | | [PHOTO] |
| | | Servo Piston Assembly | | [PHOTO] |
| | | Transmission Oil Pump Assembly | | [PHOTO] |
| | | Clutch Pack Assembly | | [PHOTO] |
| | | Torque Converter Cover | | [PHOTO] |
| | | | |
TESMA 11
[PHOTO]
Quality is not simply about the ability to use gauges or instruments to measure a part's performance. Quality is about process capability. It's about having equipment in place that can accurately perform a particular function — and people in place who can use it most effectively. Tesma stands out in quality. That's how we measure success.
12 TESMA
| [PHOTO] | | [PHOTO] | | [PHOTO] | | |
JON ENOAE |
|
PETER VERT |
|
RANDY SCOTT |
|
|
Group Vice President
Engine Technologies |
|
Director of
Group Engineering &
Product Development
Engine Technologies |
|
Group Controller
Engine Technologies |
|
"Tesma's philosophy is that we don't want to compete at the bottom end of the market — what we refer to in the engineering world as 'quote to print'. Companies that do this wind up competing on price alone. We differentiate ourselves, first of all, by excelling in complex design, engineering, testing, quality and delivery. Secondly, we are establishing ourselves as a leading supplier of modules. In value-added markets, few suppliers can compete with us." |
|
|
|
|
|
|
GM 3.9L V6 ENGINE
FRONT COVER MODULE |
|
|
|
|
|
|
[PHOTO] |
Tesma Engine Technologies
Quality Standout
Tesma is a pioneer and leader in front end accessory drive systems, tensioners and idler assemblies. Our strategy is to combine components at the front of the engine and ship them to our customers as modules. We have unique manufacturing and engineering experience in every facet of the front of the engine, including water and oil pumps, castings to make covers, pulleys, and accessory drive systems.
Tesma Engine Technologies' sales increased 17% to U.S. $745 million in 2003 from U.S. $639 million in 2002. Our success shows that our strategy is working.
Key awards in 2003 included the front cover module and oil pan assembly for GM's 3.9L V6 engine for its higher volume mid-size car platforms. We also won the front cover module and flexplates for Hyundai's largest V6 engine program — Tesma's first major award from this South Korean manufacturer. Front covers are our primary strategic focus. Tesma is one of the few companies that can design, develop and manufacture most of the components that make up the front cover module. Over the next couple of years, the percentage of sales from front cover modules in the Tesma Engine Technologies group will more than double.
Just half a dozen years ago, Tesma made no water pumps. In 2003, we were the largest water pump manufacturer in North America, with annual sales of about 4.5 million units. This equates to more than 30% of all engines assembled during the year in North America. Moreover, through our Litens Automotive Partnership, we are the largest supplier of accessory drive tensioners in the world.
17%
Sales increase in 2003.
TESMA 13
| [PHOTO] | [PHOTO] | [PHOTO] |
|
Our skilled and experienced people — from press operators and tool makers to facility general managers — embrace our focus on operational efficiencies. We look to them to share their ideas for manufacturing process improvements and cost-effective solutions. |
During 2003, Ford China ordered accessory drive tensioners for its 1.3L L4 engine –opening up a new geographic market for our product. We also won the oil and water pump business for PSA's 2.2L diesel engine. While this award represents just U.S. $7 million in sales by 2007, it is a significant order from one of Europe's most successful vehicle manufacturers. In addition, we increased our oil and water pump sales to Ford of Europe by launching these products for the Lion V6 diesel engine.
Highlights for the year included major product launches. Among these were GM's HFV6 engine front cover module, DaimlerChrysler's 5.7L LX engine water pump, GM's GEN IV engine cam cover and balance shaft assemblies for GM's Line 4 and Line 5 engine programs. We also began making oil pumps for the Jaguar V8 and Lincoln LS V8 engines — shipping these pumps to plants in England and the United States. Our launch of the water pump for Honda's Accord was the first time a non-Japanese supplier has provided water pumps to this customer.
During the year, we completed the purchase of 55% of an Italian company with a manufacturing facility near Naples, Italy. This provides a domestic beachhead for our pulley business in Europe and is located close to the Fiat plants it will initially supply. Our first water pumps for Fiat from our wholly-owned subsidiary on the same site have been through the Production Parts Approval Process (PPAP) and will launch in 2004. Three new oil pumps are scheduled for launch in the next couple of years from this facility. We expect our Italian manufacturing capabilities will enhance our penetration of the European market.
In 2003, we set up our first plant in China and it will begin manufacturing automatic belt tensioners for Volkswagen in the first quarter of 2004. China represents great business potential for us. We expect that our plant will become the focal point for expanding our manufacturing and sales in the country. We also increased our presence in Asia last year by adding significant manufacturing space and increasing our testing and product development capabilities in our existing facilities in South Korea.
Important product development initiatives include electric water pumps, variable flow oil pumps, linear and rotary proportional valves and balance shaft driven oil pumps. These products have the potential to represent important new business for us going forward, based on attractive near-term market opportunities and good long-term growth potential.
Tesma's test engineering staff are instrumental in designing and specifying some of the most sophisticated test rigs, customized to the needs of each OEM and product application.
[GRAPHIC]
Tesma's new facilities located in Italy and China
14 TESMA
[PHOTO]
TESMA 15
[PHOTO]
Tesma leads the competition in its ability to select the materials and processes best suited to making a product from among a wide range of in-house choices. Our diversity of materials and manufacturing processes allows us to provide the greatest benefits in terms of cost versus function for each product application. That's how we measure success.
16 TESMA
| [PHOTO] | | [PHOTO] | | [PHOTO] | | |
SAM BOZZO |
|
DAVE PASCOE |
|
BRIAN HOYLE |
|
|
Group Vice President
Transmission Technologies |
|
Director of
Group Engineering &
Product Development
Transmission Technologies |
|
Group Controller
Transmission Technologies |
|
"Many of the people who work in product development have a manufacturing background, because Tesma is built on grassroots manufacturing. So when our people are designing products they are already thinking about the most economical way to manufacture them. At the end of the day, it's about taking cost out of the equation, not about eroding margin — while making a technically better product that can be sold at a lower price." |
|
|
|
|
|
|
CLUTCH HOUSING
FOR MAGNA STEYR |
|
|
|
|
|
|
[PHOTO] |
Tesma Transmission Technologies
Greatest Benefits
In less than a decade, Tesma Transmission Technologies has progressed from a stamper of single components to a successful supplier of value-added assemblies and modules. When Tesma became a public company in 1995, our products represented less than 1% of the North American outsourced transmission module market. Today we have 4% of the total transmission pump business in North America and 1% of the world market.
Tesma Transmission Technologies' sales increased 15% to U.S. $250 million in 2003 from U.S. $218 million in 2002.
A key to our success in 2003 was the continued ramp-up of the Ford 5R110 oil pump; essentially, an oil pump and transmission hydraulic control unit combined. With 66 components and required tolerances to within a few microns, this is the most complex assembly ever launched by Tesma. In 2004, we are ramping up from 1,200 to 2,000 assemblies daily. Nearly 80,000 individual components move along the single assembly line for this product each day.
We are gearing up our facilities by installing equipment, refining designs and conducting tests in order to fill a number of major product launches in 2004. For instance, we have installed large and complex presses to facilitate production of high tolerance components in clutch pack assemblies for ZF, a Tier 1 European-based transmission design and manufacturing company.
We were recently awarded business to supply die-cast and machined components and assemblies to GM. These parts will be used in various transmission applications for certain of their mid-size vehicles, full-size Cadillac models and heavier duty full-size pick-up trucks.
15%
Sales increase in 2003.
TESMA 17
| [PHOTO] | [PHOTO] | [PHOTO] |
|
Our technologies and facilities are second to none. We continually invest in state-of-the-art equipment to enhance our design, development, engineering, testing, program management and manufacturing capabilities. |
We are also preparing to supply flow-formed clutch housings to Magna Steyr Powertrain as part of a large multi-year contract awarded in 2003. This is significant in terms of both volume and strategy. In the past, we have focused primarily on automotive transmissions, but the Magna Steyr business enables us to apply our product capabilities to the transfer case market as well.
During 2003, we enhanced our flow-forming capability. Flow-forming is a process where precision internal splines are produced in various types of material using chipless rotational forming techniques. This manufacturing method enables us to make clutch housings as a single component.
Also, we were awarded business from GM based in part on our decision to add grobing to our broad portfolio of technologies and processes. Grobing involves the incremental forming of splines onto a stamped steel clutch housing by means of rollers forming splines onto a mandrel. This is the first use of grobing by any Tesma division on this type of product and it should create new opportunities for us to win clutch housing and other business where this process is the best application.
The acquisition of Davis in January 2004 adds three manufacturing facilities to this technology group. Davis' main product focus is stamped powertrain components and assemblies, which complements and broadens our current product offerings.
Our priorities in 2004 include expanding our clutch module business for automatic transmissions to enhance our market position. Going forward, our product development program will focus on lightweight differentials, new methods of power transmission from shaft-to-shaft and planetary carriers in each case utilizing various methods of manufacturing to best serve our customers' requirements. We are also continuing to evolve our modules and systems product line, particularly in the oil pump and transfer case areas.
Innovative, highly-engineered, complex — the Ford 5R110 transmission oil pump represents one of the most advanced products in the Tesma modular product portfolio.
Ford 5R55N transmission oil pan manufactured at Davis.
18 TESMA
[PHOTO]
TESMA 19
[PHOTO]
We offer our customers much more than design and manufacturing expertise; as important as these are. In some instances, we have test rigs with capabilities our customers can't duplicate. They come to us for testing because we can simulate a variety of unique operating conditions. Customers can then rewrite performance specifications for their products using the support we provide. That's how we measure success.
20 TESMA
| | | | | [PHOTO] | | |
|
|
|
|
PAUL MANNERS |
|
|
| | | | | Group Vice President
Fuel Technologies | | "The key message is innovation. There is no doubt that success in our business requires us to come up with better-functioning solutions that involve less cost to the customer and to Tesma. At the same time, we recognize that people drive innovation. Attracting, developing, maintaining and stimulating talent is essential to our success. Tesma hires people who can fuel the innovation process that sets us apart from the competition." |
|
|
|
|
|
|
DAIMLERCHRYSLER JR
FUEL TANK |
|
|
|
|
|
|
[PHOTO] |
Tesma Fuel Technologies
We Offer More
In just a few years, Tesma Fuel Technologies has moved rapidly up the value chain from a small parts manufacturer to a full-service fuel systems supplier. We began by producing fuel caps for the European market and now supply caps, fuel filler pipes and entire fuel tank assemblies to OEM customers in North America and Europe.
A key to this evolution was our early introduction of metal filler pipes and tanks, which reduce permeation and improve recyclability. Various U.S. states, beginning with California, have mandated lower fuel permeation rates and increased corrosion resistance on all vehicles. These standards take effect beginning in 2005. Tesma Fuel Technologies continues to work with all of our customers to develop the best technical and commercial solutions to meet these new requirements.
We launched a variety of fuel filler pipe and metal fuel tank programs in late 2002 and 2003. Key programs include fuel filler pipes for Ford, fuel filler tubes and a fuel tank for DaimlerChrysler and fuel tanks for Volkswagen and Volvo. Business awarded in 2003 included fuel filler pipes for General Motors Daewoo of South Korea — expanding our global reach into the Asian market.
Tesma Fuel Technologies' sales increased 51% to U.S. $104 million in 2003 from U.S. $64 million in 2002.
As we look to the future, we aim to continue diversifying our existing product portfolio by developing improved tank ventilation systems, capless refueling systems and universal sender unit modules.
51%
Sales increase in 2003.
TESMA 21
Policies
Corporate Constitution
Tesma's Corporate Constitution includes the following principles:
Employee Equity and Profit Participation
Ten percent of Tesma's profit before tax will be allocated to employees. These funds will be used for the purchase of Tesma shares in trust for employees and for cash distributions to employees, recognizing length of service.
Shareholder Profit Participation
Tesma will distribute, on average, not less than 20 percent of its annual net profit after tax to shareholders.
Management Profit Participation
To obtain long-term contractual commitment from senior management, Tesma provides a compensation arrangement which, in addition to a base salary below industry standards, allows for the distribution of up to six percent of its profit before tax.
Research and Development
Tesma will allocate a minimum of 7 percent of its profit before tax for research and development to ensure its long-term viability.
Social Responsibility
Tesma will allocate a maximum of 2 percent of its profit before tax for charitable, cultural, educational and political purposes to support the basic fabric of society.
Minimum Profit Performance
Management has an obligation to produce a profit. If Tesma does not generate a minimum after-tax return of 4 percent on share capital for two consecutive years, Tesma's Class A shareholders, voting as a class, will have the right to elect additional directors.
Unrelated Investments
Tesma Class A and Class B shareholders, with each class voting separately, will have the right to approve any investment in an unrelated business in the event such investment, together with all other investments in unrelated businesses, exceeds 20 percent of Tesma's equity.
Board of Directors
Tesma believes that outside directors provide independent counsel and discipline. A majority of the members of Tesma's Board of Directors will be outsiders.
Constitutional Amendments
Any change to the Corporate Constitution will require the approval of Tesma's Class A and Class B shareholders, with each class voting separately.
Employee's Charter
Tesma is committed to an operating philosophy which is based on fairness and concern for people. This philosophy is part of Tesma's Fair Enterprise culture in which employees and management share in the responsibility to ensure the success of the Company.
It includes these principles:
Job Security
Being competitive by making a better product for a better price is the best way to enhance job security. Tesma is committed to working together with its employees to help protect their job security.
To assist employees, Tesma will provide:
- •
- Job Counselling
- •
- Training
- •
- Employee Assistance Programs
A Safe and Healthful Workplace
Tesma strives to provide employees with a working environment which is safe and healthful.
Fair Treatment
Tesma offers equal opportunities based on an individual's qualifications and performance, free from discrimination or favouritism.
22 TESMA
Competitive Wages and Benefits
Tesma will provide employees with information which will enable them to compare their total compensation, including total wages and total benefits, with those earned by employees of competitors, as well as with other plants in the community. If total compensation is found not to be competitive, then wages will be adjusted.
Employee Equity and Profit Participation
Tesma believes that every employee should share in the financial success of the Company.
Communication and Information
Through regular monthly meetings between management and employees and through publications, Tesma will provide employees with information so they will know what is going on in the Company and within the industry.
The Hotline
Should an employee have a problem, or feel the above principles are not being met, Tesma encourages such employees to contact the Hotline to register their complaints. Employees do not have to give their name, but if they do, it will be held in strict confidence. Hotline Investigators will answer the call. The Hotline is committed to investigate and resolve all employee concerns or complaints and must report the outcome to Magna's Global Human Resources Department.
Employee Relations Advisory Board
The Employee Relations Advisory Board is a group of people who have proven recognition and credibility relating to humanitarian and social issues. This Board will monitor, advise and ensure that Tesma operates within the spirit of this Employee's Charter and the principles of Tesma's Corporate Constitution.
Corporate Governance
Tesma believes that effective corporate governance structures and practices help to protect the well-being of the Corporation as a whole and its stakeholders. Accordingly, Tesma has adopted a number of structures and procedures to assist in the implementation of effective corporate governance practices and permit the Board of Directors to functions independently of management. These include:
- •
- Tesma's Corporate Constitution, which attempts to strike a balance among Tesma's stakeholders — its employees, managers and investors — by specifically defining their respective rights to participate in the Corporation's profits, while at the same time imposing certain responsibilities and disciplines on management;
- •
- Tesma's Board Charter, which requires that a majority of the Board of Directors be comprised of independent directors, formalizes the Board's overall responsibility for the stewardship of Tesma and assists in defining the limits of management's responsibility;
- •
- Tesma's Audit Committee Charter, which formalizes the Audit Committee's responsibility for ensuring the integrity of Tesma's financial statements and the financial reporting process;
- •
- Tesma's Corporate Governance and Compensation Committee Charter, which invests this Committee with broad authority for the development of Tesma's system of, and overall approach to, corporate governance generally; and
- •
- Tesma's Code of Conduct, applicable equally to our directors, officers and employees, which defines the types of conduct which Tesma encourages and those which it prohibits, and establishes a system of enforcement to ensure effective implementation of the Code.
Each of the above, together with the other elements of Tesma's corporate governance structures and practices, are available for review on Tesma's website (www.tesma.com) under the heading Corporate.
TESMA 23
Review
[PHOTO]
| 25 | | Management's Discussion and Analysis |
| 44 | | Financial Results |
| | | 44 | | Management's Responsibility for Financial Reporting |
| | | 44 | | Auditors' Report |
| | | 45 | | Consolidated Financial Statements |
| | | 52 | | Notes to Consolidated Financial Statements |
| | | 80 | | Quarterly Results of Operations |
| | | 81 | | Historical Financial Summary |
| 82 | | Shareholder Information |
| 84 | | Board of Directors |
| 85 | | Officers |
| 86 | | Corporate Information |
24 TESMA
Management's Discussion and Analysis of Results of Operations and Financial Position
For the year ended December 31, 2003
Tesma International Inc. (Tesma or the Company) designs, engineers, tests and manufactures technologically-advanced powertrain (engine, transmission and fuel) components, modules and systems for the global automotive industry. Subsequent to our acquisition of Davis Industries, Inc. (Davis), we employ approximately 5,500 skilled and motivated people in 28 manufacturing facilities in North and South America, Europe and Asia, and five focused tooling, design and research and development (R&D) centres supporting our three principal product technology groups: Tesma Engine Technologies, Tesma Transmission Technologies and Tesma Fuel Technologies.
Effective December 31, 2002, we changed our fiscal year end from July to December. This change was made, in part, to enable our financial performance to be compared more readily to that of our peer group in the automotive industry. The statements of income and cash flows presented for the immediately preceding period for comparative purposes in our consolidated financial statements are for the five-month period ended December 31, 2002. However, to provide for more informative and appropriate discussion and analysis, the following management's discussion and analysis of our results of operations and financial position (MD&A) will focus on the audited results for the year ended December 31, 2003 compared to results for the unaudited year ended December 31, 2002 (as presented on page 28 of this annual report). This MD&A should be read in conjunction with the accompanying audited consolidated financial statements and notes for the year ended December 31, 2003 found on pages 44 through 79 of this annual report. All amounts reported in this MD&A are in millions of U.S. dollars unless otherwise noted.
OVERVIEW
Our strategic objective is to be the world's leading Tier 1 supplier of advanced powertrain modules and systems. Our ability to develop and manufacture individual components and to assemble them as highly-engineered modules and systems places us at the forefront of industry trends towards modularization and outsourcing. Our reputation for product quality and reliability, our strong customer relationships and our world-class development, manufacturing and testing capabilities help position us to achieve this objective.
We posted strong 2003 results, despite continued vehicle production declines and decreasing market share at our traditional North American customers. Our content per vehicle for the year increased in both of our major markets, reflecting the launch of more complex and value-added modules and systems over the latter part of the year. These launches included our first fully-integrated engine front cover module for General Motors' (GM) High Feature V6 engine, the fuel filler pipe assembly for Ford's high-volume C170 Focus program in Europe and initial ramp-up volumes of several new production programs launched in South Korea.
We completed the acquisition of Davis in early January 2004. This acquisition increases our presence in the United States, including the south, providing us with a closer presence to some of our non-traditional customers. It also improves the balance of our North American operations between Canada and the United States which, given the recent strength of the Canadian dollar, improves our overall competitiveness. The majority of Davis' current product base complements our existing transmission product offerings and other stamped components. Given Davis' existing strong relationships with Ford, Honda and Nissan, we see the opportunity to expand and strengthen our relationships with these customers and offer our broader and more technologically-advanced transmission and engine modules and systems to them.
We also made additional strategic investments in foreign markets during 2003. First, we completed a transaction to acquire a 55% interest in an Italian company which will produce pulleys and other engine components for European customers. We intend to capitalize on this additional presence in Europe with the launch of new production business in the near term (including water pump assemblies) and, over the longer term, as we pursue our objective of increasing the penetration of our more complex modules and systems across the European market. Additionally, we have entered the Chinese market with a moderate investment in a new plant to establish limited production capability. We view China as a market with strong growth potential; however, our initial focus will be to support the operations of some of our current customers that have set up production facilities in China. Through this initial step, we intend to gain valuable insight and experience in operating in China and ultimately reduce risk as we plan for additional investments in this developing automotive market. Our newly established presence will put us in a better position to capitalize on future opportunities that are likely to evolve.
Our content per vehicle increased in both of our major markets as we launched more complex, value-added modules and systems.
We made strategic investments beyond our domestic market through acquisitions and plant start-ups in the United States, Italy and China.
TESMA 25
As previously reported, our future business growth looks strong with the awards of new business during the latter part of the year from some of our traditional customers (new assemblies for DaimlerChrysler and for GM, in particular the engine front cover module, water pump and oil pan for GM's new 3.9L engine used in their higher volume midsize car platforms) and non-traditional customers (including water pumps and oil pumps for the PSA Group, other assemblies for Land Rover, as well as the selection of our South Korean facility by Hyundai Motor Company to supply front cover modules for a new V6 engine program to be produced in both Korea and North America). Our future growth was further solidified by some recent awards of significant business including cam covers for GM's Line 4, 5 and 6 engine programs (which are installed in their mid-size SUV and pick-up truck platforms) and takeover volumes to supply several die-cast and machined components and assemblies that are currently installed into GM's 4T65E, 4T80E and 4L80 transmissions (which are assembled into certain of their mid-size vehicles, full-size Cadillac models and heavier duty full-size pick-up trucks, respectively). This organic growth, combined with the acquired Davis business, provides a solid base for us to continue our track record of growth.
Although we funded a significant portion of the Davis acquisition from our existing cash balances, our financial position continues to be very strong. Our considerable cash reserves that remain will enable us to capitalize on new business opportunities and we continue to look for other potential acquisition targets that, like Davis, will add both growth and profitability, at a reasonable price, and will ultimately increase shareholder value.
As previously communicated, we undertook an evaluation of the viability of our German die-casting operations (Eralmetall) and potential initiatives that could help improve its operating performance. This evaluation was completed during the fourth quarter of 2003. Over the past eighteen months, Eralmetall's new management team has worked hard to improve production and eliminate waste, our employees have agreed to assist in achieving targeted savings and our customers have expressed a willingness to discuss alternatives to support this operation. Although still not meeting our financial expectations, the decision was made to continue operating Eralmetall as a going concern in support of our customers, as doing so is not expected to significantly affect our overall results. We will continue to closely monitor the results of this operation and evaluate its future prospects should results deteriorate.
ACQUISITION OF DAVIS INDUSTRIES, INC.
Subsequent to our year-end, on January 2, 2004, we completed the acquisition of Davis. Through this acquisition, we added over 700 employees and 3 manufacturing facilities located in Indiana (2 facilities) and Tennessee to our North American manufacturing operations. Davis' main product focus is stamped powertrain components and assemblies, including driveplate assemblies, transmission shells and oil pan assemblies and engine valve covers, but also includes some body and chassis stampings and fuel filler door assemblies. For their most recently completed fiscal year ended September 30, 2003, Davis reported sales of approximately $129 million.
The total consideration for the acquisition of all the outstanding shares of Davis amounted to approximately $75.0 million, consisting of $45.1 million paid in cash (including transaction costs), the assumption of $22.0 million of long-term debt, $4.5 million of other long-term obligations and the issuance of a $3.4 million five-year note payable bearing interest at the rate of prime plus 1% per annum (see Note 24(a) of the accompanying audited consolidated financial statements and notes thereto).
OTHER ACQUISITION
In October 2003, we completed the acquisition of a 55% interest in Agla Benevento S.r.l. of Benevento, Italy (subsequently renamed Tesma-Agla S.r.l. (Tesma-Agla)), for cash consideration, including transaction costs, of $1.2 million (net of cash acquired of $0.2 million). The transaction was accounted for under the purchase method of accounting and the initial impact on our consolidated balance sheet was an increase in non-cash working capital of $0.4 million, property, plant, equipment and other long-lived assets of $2.6 million, assumed debt of $2.0 million and net future tax assets of $0.2 million.
Our future growth will be driven by new business awards and acquisitions.
26 TESMA
Pursuant to agreements executed upon the closing of the transaction, the approval of certain strategic, operating and financing decisions of this company are subject to a majority vote by Tesma-Agla's Board of Directors. The Board of Directors consists of four members, of which we are entitled to appoint two (including the Chairman of the Board). We account for our interest in this jointly-controlled entity using the proportionate consolidation method. Tesma-Agla had no operating activities prior to October 2003, but was preparing for the launch of pulleys and other engine components for the European market.
ACCOUNTING CHANGES
Reporting Currency
Effective January 1, 2003, we implemented the previously announced change in our financial reporting currency from the Canadian dollar to the United States dollar (U.S. dollar). This change enables our financial performance to be compared more readily to that of our peer group in the global automotive industry. We implemented this change in accordance with Canadian generally accepted accounting principles (CDN GAAP) and consistent with the requirements under accounting principles generally accepted in the United States (U.S. GAAP). In accordance with these rules, comparative amounts have been restated in U.S. dollars using the current rate method, whereby all revenues, expenses and cash flows are translated at the average exchange rates that were in effect during these periods and all assets and liabilities are translated at the closing rate in effect at the end of these periods. Utilizing this method, the comparative unaudited consolidated statements of income and cash flows for the year ended December 31, 2002, as presented and discussed in this MD&A, were translated into U.S. dollars using an average rate for the year of U.S. $0.6372 per CDN $1.00. The comparative consolidated balance sheet at December 31, 2002 was translated into U.S. dollars using the prevailing rate at December 31, 2002 of U.S. $0.6376 per CDN $1.00.
Stock-Based Compensation
In September 2003, the Canadian Institute of Chartered Accountants (CICA) issued amendments to Handbook Section 3870, "Stock-Based Compensation and other Stock-Based Payments" (CICA 3870) which are effective for fiscal years beginning on or after January 1, 2004. The amended standard now requires recognition of all stock-based compensation transactions at fair value and eliminates the alternative of using the intrinsic value method of accounting with fair value disclosures provided on a pro forma basis. We have elected to adopt these amendments early and to apply them on a retroactive basis to stock-based awards granted on or after August 1, 2002, the date we were initially required to adopt CICA 3870. Upon application of the new rules, we recorded compensation expense totaling $0.5 million and $0.1 million in the years ended December 31, 2003 and 2002, respectively. Diluted earnings per share for these same periods decreased by $0.01 and $nil, respectively, as a result of the adoption of these rules.
Compensation expense to be recognized is determined by first calculating the total estimated fair value of each tranche of stock options as at the date of grant and then recording compensation expense, on an amortized basis, over the applicable vesting periods of the underlying stock options. As such, at each reporting date, cumulative compensation expense will be recognized for each tranche of stock options to the extent that they are vested as at that date. Compensation expense recognized is recorded as part of selling, general and administrative expense, with a corresponding increase to contributed surplus. As the underlying stock options issued on or after August 1, 2002 are exercised, a portion of the accumulated balance in contributed surplus is transferred systematically to the Class A Subordinate Voting Shares issued and reflected as additional proceeds received on these exercises.
REPORTING CURRENCY
The currency in which a company discloses its financial information including its financial statements. Tesma's reporting currency is the U.S. dollar. All of Tesma's divisions with functional currencies other than the U.S. dollar have their financial results converted to U.S. dollars for reporting purposes.
TESMA 27
RESULTS OF OPERATIONS
The Company's comparative consolidated operating results for the years ended December 31, 2003 and 2002 are as follows:
| | 2003
| | 2002
|
|---|
(U.S. dollars in thousands, except per share and share figures)
| | (audited)
| | (unaudited)
|
|---|
| Sales | | $ | 1,098,591 | | $ | 925,921 |
| | |
| |
|
| Cost of goods sold | | | 855,503 | | | 718,136 |
| Selling, general and administrative | | | 69,204 | | | 59,833 |
| Depreciation and amortization | | | 51,609 | | | 40,536 |
| Affiliation and social fees | | | 12,449 | | | 10,404 |
| Interest (income) expense, net | | | (204 | ) | | 1,987 |
| Impairment loss at German die-casting subsidiary | | | — | | | 12,088 |
| | |
| |
|
| Income before income taxes | | | 110,030 | | | 82,937 |
| Income taxes | | | 35,918 | | | 26,978 |
| | |
| |
|
| Net income attributable to Class A Subordinate Voting Shares and Class B Shares | | $ | 74,112 | | $ | 55,959 |
| | |
| |
|
| Earnings per Class A Subordinate Voting Share or Class B Share | | | | | | |
| | Basic | | $ | 2.29 | | $ | 1.82 |
| | Diluted | | $ | 2.28 | | $ | 1.80 |
| | |
| |
|
Average number of Class A Subordinate Voting Shares and Class B Shares
outstanding (in thousands) | | | | | | |
| | Basic | | | 32,344 | | | 30,725 |
| | Diluted | | | 32,531 | | | 31,057 |
| | |
| |
|
Impairment Loss at German Die-Casting Subsidiary
Our comparative results for the year ended December 31, 2002 were significantly affected by an impairment loss booked in 2002 at Eralmetall, our German die-casting subsidiary. Initially prompted by a history of operating losses and projected future losses following the launch of new business at Eralmetall, we initiated and completed a review for impairment on $20.6 million of machinery, equipment, land, buildings and other long-lived assets at this subsidiary. As a result of this review, an impairment loss of $12.1 million ($8.5 million after applicable taxes) was recorded as an operating expense in the year ended December 31, 2002. The impact of this loss on diluted earnings per share for the year ended December 31, 2002 was $0.27.
Foreign Currency Exchange Rates
As substantially all of our operations have functional currencies other than the U.S. dollar, our reported results in U.S. dollars can be affected by movements in the exchange rates of the Canadian dollar, euro, Swiss franc and Korean won, all relative to the U.S. dollar. The magnitude of the impact of foreign exchange on our results in periods presented will primarily depend on, and vary directly with, the size of fluctuations, relative to the U.S. dollar, of the underlying functional currencies in our Canadian, European and South Korean-based operations.
The average exchange rates for our most significant functional currencies relative to the U.S. dollar during the years ended December 31 were as follows:
| | 2003
| | 2002
| | %
|
|---|
| Canadian dollar | | 0.7159 | | 0.6372 | | +12% |
| Euro | | 1.1320 | | 0.9456 | | +20% |
| Korean won | | 0.000840 | | 0.000804 | | +4% |
| | |
| |
| |
|
The impact of the strengthening of foreign currencies relative to the U.S. dollar, in particular strong gains by the Canadian dollar and euro, increased sales by approximately $125 million or 72% of our overall growth in 2003. Similarly, the strengthening of these functional currencies significantly affected all other line items on our income statement, the extent of which will be specifically addressed in each of the respective discussions that follow.
FUNCTIONAL CURRENCY
The currency in which each entity transacts its business. For example, a subsidiary located in Germany uses the euro as its functional currency, and pays its employees and purchases the majority of its materials in its functional currency.
FOREIGN CURRENCY TRANSLATION
When divisional functional currency results are converted to Tesma's reporting currency (U.S. dollars), the results are converted at the average foreign exchange rate for the period.
28 TESMA
The exchange rates in effect as at the end of the years ended December 31 were as follows:
| | 2003
| | 2002
| | %
|
|---|
| Canadian dollar | | 0.7752 | | 0.6376 | | +22% |
| Euro | | 1.2591 | | 1.0411 | | +21% |
| Korean won | | 0.000836 | | 0.000835 | | unch. |
| | |
| |
| |
|
Vehicle Production Volumes
| |
| |
| | Change
|
|---|
| | 2003
| | 2002
| | Units
| | %
|
|---|
(in millions of units)
| |
| |
| |
| |
|
|---|
| North America | | 15.9 | | 16.3 | | (0.4 | ) | -3% |
| Europe | | 16.4 | | 16.3 | | 0.1 | | +1% |
| | |
| |
| |
| |
|
North American vehicle production volumes, as historically reported by us, included medium and heavy trucks. To conform our reporting with most of our industry peers, effective January 1, 2003, we changed our reporting basis to include light vehicles only. All comparative North American vehicle production and content per vehicle amounts have been restated to conform with this new presentation. On this basis, North American vehicle production volumes for the year were 15.9 million units, a 3% decrease from the 16.3 million units produced in the prior year. In 2003, North America's "Big Three" (General Motors, Ford and DaimlerChrysler) Original Equipment Manufacturers (OEMs) continued to offer record levels of attractive financing rates and other consumer incentive campaigns to spur demand and maintain market share. However, the use of these incentive campaigns was unsuccessful in the aggregate as the "Big Three" experienced production declines ranging from 3% to 9% in 2003. As a result, their production share declined largely to the benefit of the New Domestic OEMs (mainly Toyota, Honda and Nissan) which experienced production volume increases ranging from 8% to 11% during the year.
In Europe, vehicle production volumes were 16.4 million, up 1% from last year. However, some of our larger customers, namely DaimlerChrysler and Fiat, experienced production declines of 3% and 16%, respectively, during the year.
Average Content per Vehicle
Average content per vehicle is a measure commonly used in the automotive supply industry to measure a company's growth, penetration and success, excluding the impact of fluctuations in vehicle production levels. Continued growth in content per vehicle indicates success in introducing products onto new programs (primarily engine and transmission) or vehicle platforms, and/or expanded sales on existing programs (i.e. if more vehicle platforms are added to a particular engine program, or if strong demand for certain vehicle platforms, such as SUVs, is driving increased engine production on which we have significant content). Industry analysts use content per vehicle to assess our performance and growth in our two major markets, North America and Europe. This measure is calculated by dividing our production sales to North American and European customers, respectively, by the industry's North American and European total light vehicle production volumes, respectively. Although this measure does indicate growth, management does not place significant emphasis on this measure to assess performance as it has certain shortcomings. The majority of our products are shipped to OEM engine and transmission facilities, not vehicle assembly plants. Many engine and transmission programs are produced in a single facility, and then shipped to many global assembly facilities. As a result, the number of engine and transmissions produced in each major region in which we operate can differ materially from the number of vehicles assembled. Unfortunately, the availability of accurate data for engine and transmission production in each of our three key markets does not currently exist on a timely basis. Therefore, we cannot use an alternative measure to present content information on a timely basis.
Our average content per vehicle for the years ended December 31 was as follows:
| | 2003
| | 2002
| | %
|
|---|
| North America | | $43.95 | | $36.87 | | +19% |
| Europe | | € 16.28 | | € 14.90 | | +9% |
| | |
| |
| |
|
TESMA 29
Sales
| | 2003
| | 2002
| | Change
|
|---|
(in millions)
| |
| |
| |
|
|---|
| North America | | $ | 856.0 | | $ | 725.5 | | +18% |
| Europe | | | 235.6 | | | 180.6 | | +30% |
| Other Automotive | | | 28.8 | | | 33.8 | | -15% |
| Intersegment | | | (21.8 | ) | | (14.0 | ) | |
| | |
| |
| |
|
| Total external sales | | $ | 1,098.6 | | $ | 925.9 | | +19% |
| | |
| |
| |
|
Consolidated sales in 2003 increased 19% from 2002 to $1.1 billion. North American sales rose 18%, while sales increased 30% in our European operations. Our strong growth in North America occurred despite the 3% decrease in North American vehicle production volumes and even larger declines experienced by our largest customers. In Europe, our growth was fueled by the launch of new business, as vehicle production levels increased only slightly over the prior year.
North American Operations
During 2003, our North American operations consisted of 15 manufacturing facilities (13 in Canada and 2 in the United States) employing 3,600 employees. These operations reported sales of $856.0 million for the year, up 18% from $725.5 million in the prior year. The stronger Canadian dollar accounted for approximately $85 million or 65% of this growth. The remaining increase of approximately $45 million represents true native currency growth of 6%, and, as discussed above, was realized despite the 3% to 9% production declines at our largest customers. Our growth was fueled by increases in our average content per vehicle, which grew 19% to $43.95 for the year from $36.87 for 2002. The true native currency growth in 2003 reflects new program launches and higher volumes on production ramp-ups of other recently launched programs.
The new launches include a complex integrated front cover module for the GM High Feature V6 engine, balance shaft assemblies for GM's Line 4 and Line 5 engine programs, water pumps, camshaft phasers and housings for GM's Premium V8 engine, and fuel filler pipe assemblies for DaimlerChrysler's JR car and HB truck programs. We were not able to realize the full benefit of these launches, however, as many of them occurred in the second half of the year at lower than expected levels.
Significant programs on which we achieved higher volumes included the following:
- •
- the complex oil pump assembly and other components supplied for Ford's 5R110 transmission used in the diesel engine application of Ford's heavier duty F-Series trucks;
- •
- front covers with an integrated oil pump, oil pan, thermostat housing and crossover tube and other components for GM's L850 4-cylinder engine program used in some of GM's high volume vehicle platforms (including the Chevrolet Cavalier and Malibu, Pontiac Sunfire and Grand Am and Saturn Ion and VUE models);
- •
- continued strength in demand for GM's GEN III/IV engine installed in light trucks, including full-size pickups (including the Chevrolet Silverado and Avalanche models) and SUVs (including the Chevrolet Tahoe and Suburban and GMC Yukon);
- •
- the water pump assembly for the Honda Accord; and
- •
- certain tensioner and alternator decoupler programs for Ford, GM, Honda and VW.
The above increases in our North American content were partially offset by the continuing pressure for price givebacks. North American sales represented 76% of our consolidated sales for the year compared to 77% last year.
European Operations
Our six European manufacturing facilities located in Germany, Austria and Italy employed 1,100 employees during 2003. These operations experienced a $55.0 million or 30% sales increase in 2003, despite an increase in vehicle production volumes of less than 1%. This growth was fueled by the strengthening of the euro relative to the U.S. dollar, which accounted for approximately $38 million (over two-thirds) of this increase. The remaining $17 million increase in sales for the year resulted from the growth in our European content per vehicle (presented in euros to exclude the impact of foreign exchange fluctuations) of 9% to €16.28 from €14.90 last year.
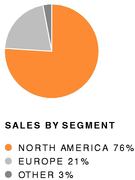
Sales grew 19% to $1.1 billion despite declining vehicle production in North America and a marginal increase in Europe.
30 TESMA
The growth in content per vehicle primarily reflects:
- •
- the initial launch and ramp-up in volumes of the fuel filler pipe assembly for Ford's high-volume C1 (Focus) platform launched in the summer of 2003;
- •
- increased shipments of drive belt tensioners and other components launched for the Volkswagen Group (VW), GM and DaimlerChrysler;
- •
- the continued ramp-up in volumes for a stainless steel fuel tank assembly for the portion of VW's PQ34 program volumes assembled in Mexico and sold in California;
- •
- volume increases on the steel fuel tank assembly programs for Volvo and Audi initially launched during the third quarter of 2002;
- •
- higher sales of the rear-axle crossover component and other parts supplied to DaimlerChrysler; and,
- •
- an increased supply of service parts.
European sales represented 21% of our total consolidated sales in 2003 compared to 19% in the prior year.
Other Automotive
During 2003, our Other Automotive segment consisted of 2 manufacturing facilities in South Korea, one facility in China and a small assembly facility in Brazil, employing approximately 300 people in aggregate. Sales for the year were 15% lower at $28.8 million versus $33.8 million a year earlier and represented approximately 3% of our consolidated sales, compared to approximately 4% last year. The decrease in sales for the year occurred primarily in our South Korean facilities and resulted from lower shipments of the oil pump for the Ford FN transmission, declining volumes on Ford's 1.9L engine oil and water pumps, (which are expected to balance out soon) and lower exports to Japan (as certain older programs produced for Mazda balance out). In addition, a significant amount of tooling sales associated with the 2003 launches at our South Korean facilities were booked in 2002. Many of these new program launches involve long "lead-time" requirements for customers in the United States and Europe, so although initial volumes have been produced and shipped for some of these programs, the sales (and related contribution margin) are deferred until customer receipt and in some instances, acceptance, in accordance with the specific terms of each customer contract. The new launches that occurred in the latter part of the year include the DaimlerChrysler 5.7L engine water pump, an adaptor assembly for the GM line 4 engine program, a front cover and water pump for Renault-Nissan-Samsung's new SM3 engine program, and a front cover and water pump exported to GM North America for their Premium V8 engine used in certain Cadillac models.
Tooling and Other
For 2003, tooling and other sales were constant at $55.3 million. However, translation increases of approximately $6 million resulting from the strengthening of our functional currencies relative to the U.S. dollar were offset by the absence of large tooling sales for the fuel tank assembly programs in Austria which occurred in 2002. For the year, our North American operations recorded 70% of consolidated tooling sales, while Europe and Other Automotive reported 27% and 3%, respectively, compared to 55%, 38%, and 7%, respectively, for the same operations a year ago.
Sales by Geographic Region and by Customer
Sales to our North American customers increased 15% to $728.7 million in 2003 compared to $631.6 million last year, and represented 66% of our consolidated sales in 2003 (68% in 2002). As a result, our North American content per vehicle increased due to the specific programs discussed above. Sales to our European-based customers grew 26% to $326.0 million compared to $258.1 million a year ago, and represented 30% of our consolidated sales in 2003 (28% in 2002). European content per vehicle increased by approximately 9% over a year ago reflecting new fuel system programs launched for our European customers. Sales to Australasian customers increased by 31% to $30.1 million in 2003 compared to $23.0 million last year, and represented approximately 3% of our consolidated sales. Our sales to South American customers increased slightly by 4% to $13.8 million and continue to account for approximately 1% of our consolidated sales.
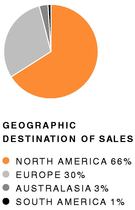
TOOLING
Tooling consists of custom-built moulds, dies or other tools that are designed for the production of unique parts to be supplied to a specific customer.
AUSTRALASIAN CUSTOMERS
Our customers with manufacturing facilities located in Korea, Australia, Japan, China, Thailand, Taiwan, Singapore and other Asian countries.
TESMA 31
Sales to GM, Ford, DaimlerChrysler and the VW Group, our four largest customers, were 76% of total sales in the current and prior year. GM represented approximately 43% of our consolidated sales, similar to 2002. While no single product accounted for more than 10% of our consolidated sales in the years ended December 31, 2003 and 2002, respectively, approximately 20% of consolidated sales were generated from a number of components, modules and assemblies produced for GM's GEN III/IV and L850 engine programs, compared to 18% of sales from these programs in the prior year.
Sales by Product Line
On a product line basis, sales of Tesma Engine Technologies products increased to $745 million compared to $639 million a year ago and accounted for 68% of consolidated sales compared to 69% a year ago. The growth was the result of increased sales of tensioners and decouplers, volume increases in the water pump and die-casting businesses in North America, increased volumes for plastic water management products, an increase in service and aftermarket sales in Europe and translation increases on stronger Canadian dollar and euro currencies relative to the U.S. dollar.
Sales of Tesma Transmission Technologies products rose 15% to $250 million from $218 million a year ago and represented 23% of total sales in 2003, compared to 24% in 2002. The increase is primarily due to the volume increases for the oil pump and other components supplied for the Ford 5R110 transmission and currency translation, primarily due to a stronger Canadian dollar relative to the U.S. dollar.
Sales of Tesma Fuel Technologies products increased 51% to $104 million from $69 million in 2002, driven in part by a strengthening euro relative to the Canadian dollar, as a significant portion of Fuel Technologies products are produced in Europe. Also contributing to the increase was the launch of the high-volume fuel filler pipe for Ford's C1 Focus platform and volume increases on stainless steel fuel tank assemblies for VW, Volvo and Audi. Sales of Tesma Fuel Technologies products represented 9% of consolidated sales in 2003 up from 7% in 2002.
Gross Margin
| | 2003
| | 2002
| | Change
|
|---|
(in millions)
| |
| |
| |
|
|---|
| Sales | | $ | 1,098.6 | | $ | 925.9 | | +19% |
| Cost of goods sold | | | 855.5 | | | 718.1 | | +19% |
| | |
| |
| |
|
| Gross margin | | $ | 243.1 | | $ | 207.8 | | +17% |
| | |
| |
| |
|
| Gross margin percentage | | | 22.1 | % | | 22.4 | % | -1% |
| | |
| |
| |
|
Gross margin as a percentage of sales decreased by 1% in 2003 to 22.1% compared to 22.4% in 2002.
The decline in our gross margin percentage for the year reflected:
- •
- a continued shift in mix (as we execute our strategy) to much higher material content modules and systems (including integrated engine front covers, camshaft phasers, filler pipe assemblies, balance shaft assemblies, combined with volume increases on the Ford 5R110 transmission oil pump and various stainless steel fuel tank programs);
- •
- the negative impact of the 3% decline in North American production volumes (with higher declines experienced at our key customers);
- •
- the continued launch and operating support costs at certain facilities in North America and South Korea, in the midst of, or in preparation for, program launches, (some of which have been delayed);
- •
- higher facility rental costs (with a corresponding but lesser reduction of depreciation) for certain manufacturing facilities sold to MI Developments Inc. (MID) in January 2003 and now leased back (see "Other Matters" below); and
- •
- continued pricing concessions demanded by our customers.
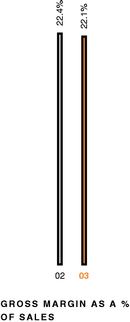
Our four largest customers — GM, Ford, DaimlerChrysler and the VW Group — accounted for 76% of total sales in 2003.
32 TESMA
Partially offsetting these negative factors were positive items that included:
- •
- a lower realized exchange rate on U.S. dollar-denominated material purchases by certain of our Canadian operations;
- •
- recognized R&D tax credits relating to prior fiscal years that were claimed under new rules and interpretations governing claimable expenditures;
- •
- improvements in operating results at our Eralmetall die-casting operation (including employee benefit savings); and
- •
- labour efficiencies on highly-automated programs, improvements in capacity utilization and other production efficiencies achieved at certain of our facilities.
Gross R&D expenditures in 2003 were $18.0 million, $0.5 million higher than the prior year. Customer and government funding and tax credits reduced net R&D expenses by approximately $8 million in 2003 compared to $6 million in 2002. Gross spending on R&D was 16% of income before income taxes in 2003 exceeding our Corporate Constitution requirement of investing no less than 7% of profit before income taxes in R&D.
Income Before Income Taxes
| | 2003
| | 2002
| | Change
|
|---|
(in millions)
| |
| |
| |
|
|---|
| Gross margin | | $ | 243.1 | | $ | 207.8 | | +17% |
| Less: | | | | | | | | |
| Selling, general and administrative | | | 69.3 | | | 59.8 | | +16% |
| Depreciation and amortization | | | 51.6 | | | 40.6 | | +27% |
| Affiliation and social fees | | | 12.4 | | | 10.4 | | +19% |
| Interest (income) expense, net | | | (0.2 | ) | | 2.0 | | -110% |
| Impairment loss at German die-casting subsidiary | | | — | | | 12.1 | | -100% |
| | |
| |
| |
|
| Income before income taxes | | $ | 110.0 | | $ | 82.9 | | +33% |
| | |
| |
| |
|
Income before income taxes increased by 33% to $110.0 million in 2003 compared to $82.9 million in 2002. The increased gross margin on higher sales and interest income (versus interest expense in 2002) was partially offset by higher selling, general and administrative (SG&A) costs, increased depreciation charges, and higher affiliation and social fees paid to Magna International Inc. (Magna).
Fueled by higher content per vehicle levels and the translation impact of a stronger Canadian dollar relative to the U.S. dollar during the year, income before income taxes at our North American operations increased 11% to $97.5 million or 89% of consolidated income before income taxes, compared to $87.6 million in 2002. Our European operations contributed $18.3 million or 17% of consolidated income before income taxes this year compared to a loss of $6.1 million a year ago, largely attributable to the impairment loss recorded at Eralmetall in 2002 totaling $12.1 million. Excluding this impairment loss, our European operations still showed improvement reflecting better capacity utilization on increased sales at our Austrian subsidiary, the positive impact of the employee benefit savings and reduced depreciation charges at Eralmetall, and translation increases due to a strengthening euro. Our Other Automotive operations (which include local sales and engineering offices in Asia and South America) reported a loss before income taxes of $5.8 million in 2003 compared to $1.5 million of income last year. The decline in the results for this segment reflects the balancing out of older programs at our South Korean facilities combined with higher engineering, design and other upfront product development and support costs for current and future program launches. In addition, we also incurred costs associated with the initial start-up of operations in China.
Selling, General and Administrative Expenses
SG&A expenses increased to $69.3 million in 2003 compared to $59.8 million in 2002, or approximately 6.3% and 6.5% respectively of our consolidated sales in these periods. The $9.5 million increase in SG&A costs resulted primarily from foreign exchange translation, which contributed approximately $8 million of additional translated expenses. In addition, other increases during the year included costs incurred for potential acquisitions that did not materialize, $0.5 million of stock compensation expenses booked upon the adoption of new accounting rules, a provision for cost overruns on capital equipment charged by a related party (as described in more detail in Note 20(b)(ii) of the accompanying consolidated financial statements and notes thereto) and increased incentive-based compensation based on significantly higher profitability levels this year (largely due to the negative impact of the impairment loss booked in the prior year). These increases were partially offset by foreign exchange gains (including recognized currency translation gains) in the current year compared to losses recorded in the same period a year ago.
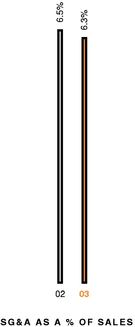
Our Corporate Constitution requires we invest 7% of profit before income taxes on R&D — in 2003 we invested 16%.
TESMA 33
Commencing January 1, 2003, specific charges paid to Magna Services Inc. (ServiceCo), a wholly-owned subsidiary of Magna, were reclassified and recorded primarily as part of SG&A costs (with prior year's comparative amounts restated on the same basis). These specific charges are negotiated annually and are based on the level of benefits or services provided to us by ServiceCo and include, but are not limited to: information technology (WAN infrastructure and support services), human resource and employee relations services (including administration of the Employee Equity Participation and Profit Sharing Program), specialized legal, environmental, finance and treasury support, management and technology training, and an allocated share of the facility and overhead costs dedicated to providing these services. For the year, we paid $1.7 million for specific charges compared to $1.9 million a year ago. The amount paid in 2002 includes approximately $0.4 million of costs billed by ServiceCo for services provided in 2001.
Depreciation and Amortization
Depreciation and amortization expense increased by 27% to $51.6 million in 2003 from $40.6 million in 2002. The increase resulted from our continuing investment in capital assets (over $61 million over the past twelve months) primarily for facility upgrades and equipment for new programs, many of which were put into service for launches during 2003. Further increasing depreciation and amortization for the year was $1.4 million of non-cash provisions recorded in relation to specific assets for which changes in the respective circumstances surrounding their utilization indicated impairments.
Affiliation and Social Fees
Affiliation and social fees paid to Magna increased by 19% to $12.4 million in 2003 compared to $10.4 million in 2002 and include the following:
- •
- Under our amended and restated affiliation agreement with Magna in effect until December 31, 2009 (subject to annual renewals thereafter), we pay an affiliation fee calculated as 1% of our consolidated net sales, subject to certain exceptions for sales from acquired businesses (which are exempt from the calculation of the affiliation fee in the year of acquisition, with 50% inclusion in the year after acquisition and full inclusion in all subsequent years). The affiliation fee is paid to Magna in exchange for, among other things, a non-exclusive worldwide license to use certain Magna trademarks, access to Magna management resources, and the collaboration and sharing of best practices in areas such as new management techniques, employee benefits and programs, marketing and technological initiatives. For the year, we paid $10.8 million under the affiliation agreement, compared to $9.2 million a year ago, entirely a result of our increased sales levels.
- •
- Under our social fee agreement with Magna in effect until December 31, 2009 (subject to annual renewals thereafter), we pay Magna a social fee of 1.5% of profits before income taxes as a contribution towards social and charitable programs coordinated by Magna on behalf of Magna and its affiliated companies. We paid $1.6 million of social fees to Magna in 2003 compared to $1.2 million last year.
Net Interest (Income) Expense, net
Net interest income amounted to $0.2 million in 2003 compared to $2.0 million of interest expense in 2002, due primarily to higher levels of cash and cash equivalents for the majority of 2003 which were available for investment in short-term interest bearing investments.
Impairment Loss at German Die-Casting Subsidiary
As discussed in the Overview section of this MD&A, in the year ended December 31, 2002, we recorded an impairment loss of $12.1 million ($8.5 million after applicable taxes) on capital and other long-lived assets at our German die-casting subsidiary. The impact of this loss on diluted earnings for the year ended December 31, 2002 was $0.27.
34 TESMA
Net Income and Earnings per Share
| | 2003
| | 2002
| | Change
|
|---|
(in millions)
| |
| |
| |
|
|---|
| Income before income taxes | | $ | 110.0 | | $ | 82.9 | | +33% |
| Income taxes | | | 35.9 | | | 26.9 | | +33% |
| | |
| |
| |
|
| Net income attributable to Class A Subordinate Voting Shares and Class B Shares | | $ | 74.1 | | $ | 56.0 | | +32% |
| | |
| |
| |
|
| Earnings per Class A Subordinate Voting Share or Class B Share | | | | | | | | |
| | Basic | | $ | 2.29 | | $ | 1.82 | | +26% |
| | Diluted | | $ | 2.28 | | $ | 1.80 | | +27% |
| | |
| |
| |
|
| Average number of shares outstanding (in millions) | | | | | | | | |
| | Basic | | | 32.3 | | | 30.7 | | +5% |
| | Diluted | | | 32.5 | | | 31.1 | | +5% |
| | |
| |
| |
|
Effective Income Tax Rates
Our effective income tax rate was 32.6% in 2003 compared to 32.5% last year. Significantly impacting the rate during the year was the recognition of a $2.1 million benefit for income tax losses available for carryforward and other future tax deductible amounts at one of our jointly-controlled entities. The initial recognition of these amounts became necessary once the entity established a record of profitability after the launch of its major production programs, and once its projected future operating results (based on existing contracts, at existing and future contracted prices and cost structures) are projected to generate more than sufficient future taxable income to utilize these future tax deductible amounts. Offsetting this benefit was $1.1 million of additional future tax expense recorded in relation to the Ontario government's decision to repeal previously enacted corporate tax rate reductions (thereby increasing the enacted combined corporate income tax rate from 33.62% to 34.52%) and losses at certain operations not tax benefited.
In the prior year, a reduction in the effective tax rate due to tax refunds realized at one of our foreign subsidiaries (as the final stage of prior year tax planning initiatives) was partially offset by the impact of a lower overall effective tax rate recorded on the impairment loss at Eralmetall (reflecting the rates anticipated to be in effect when the amounts would be deductible for tax purposes).
Net Income
Our net income attributable to Class A Subordinate Voting Shares and Class B Shares for the year increased by 32% to $74.1 million from $56.0 million a year ago. Excluding the impact of the impairment charge and foreign currency translation increases, net income would have been essentially unchanged from a year ago.
Earnings Per Share
Earnings per Class A Subordinate Voting Share or Class B Share on a diluted basis increased 27% to $2.28 from $1.80, while basic earnings per Class A Subordinate Voting Share or Class B Share increased 26% to $2.29 from $1.82 in 2002. As discussed earlier, the effect of the impairment loss (excluding its impact on the DPSP and other profit-based fees and compensation) in the year ended December 31, 2002 was to decrease diluted earnings per Class A Subordinate Voting Share or Class B Share by $0.27.
These figures reflect 5% increases in the average number of basic and diluted shares outstanding in the year to 32.3 and 32.5 million, respectively (from 30.7 and 31.1 million, respectively, last year), due primarily to the public offering of 2.85 million shares in July 2002.
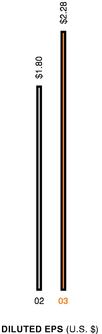
TESMA 35
FINANCIAL CONDITION, LIQUIDITY AND CAPITAL RESOURCES
Cash provided from (used for):
| | 2003
| | 2002
| | Change
|
|---|
(in millions)
| |
| |
| |
|
|---|
| Operating activities | | $ | 101.9 | | $ | 107.5 | | -5% |
| Investing activities | | | (80.0 | ) | | (69.5 | ) | +15% |
| Financing activities | | | (24.5 | ) | | 66.6 | | -137% |
| Effect of exchange rate changes on cash and cash equivalents | | | 30.8 | | | 2.0 | | |
| | |
| |
| |
|
| Net increase in cash and cash equivalents | | $ | 28.2 | | $ | 106.6 | | -74% |
| | |
| |
| |
|
Our cash balances at December 31, 2003, net of bank indebtedness, were $122.5 million compared to $89.0 million a year earlier. The increase occurred because cash provided from operations, proceeds from the sale-leaseback transaction for the Tesma Corporate Campus, the issuance of long-term debt and proceeds from the exercise of stock options during the year exceeded capital expenditures, investments in non-cash working capital, the payment of dividends, debt repayments, reductions in indebtedness levels and funds set aside in escrow for acquisition related activities.
Operating Activities
| | 2003
| | 2002
| | Change
|
|---|
(in millions)
| |
| |
| |
|
|---|
| Net income | | $ | 74.1 | | $ | 56.0 | | +32% |
| Items not involving current cash flows | | | 69.7 | | | 56.6 | | +23% |
| | |
| |
| |
|
| Cash provided from operations | | | 143.8 | | | 112.6 | | +28% |
| Net change in non-cash working capital | | | (41.9 | ) | | (5.1 | ) | +722% |
| | |
| |
| |
|
| Cash provided from operating activities | | $ | 101.9 | | $ | 107.5 | | -5% |
| | |
| |
| |
|
Cash provided from operations, before the effect of changes in non-cash working capital, increased 28% to $143.8 million in 2003 compared to $112.6 million in 2002 due to higher non-cash charges, mainly future tax provisions (versus net recoveries booked in the prior year) and depreciation. Investments in non-cash working capital increased $36.8 million due to increased accounts receivable and inventory levels to support our sales growth, which were only partially offset by higher levels of accounts payable and accruals. As a result, cash provided from operating activities decreased 5% to $101.9 million in 2003 from $107.5 million for the same period last year.
Investing Activities
| | 2003
| | 2002
| | Change
|
|---|
(in millions)
| |
| |
| |
|
|---|
| Capital asset additions | | $ | (61.2 | ) | $ | (68.9 | ) | -11% |
| Funds held in escrow | | | (44.6 | ) | | — | | |
| Investment in subsidiaries | | | (1.4 | ) | | (1.0 | ) | +40% |
| Increase in other assets | | | (0.2 | ) | | (2.0 | ) | -90% |
| Proceeds from disposal of capital and other assets | | | 27.2 | | | 2.4 | | |
| Cash and cash equivalents acquired on investment in subsidiary | | | 0.2 | | | — | | |
| | |
| |
| |
|
| Cash used for investing activities | | $ | (80.0 | ) | $ | (69.5 | ) | +15% |
| | |
| |
| |
|
Investment spending in 2003 increased 15% to $80.0 million compared to $69.5 million in 2002. Cash spent on capital assets decreased 11% to $61.2 million compared to $68.9 million last year and was spent primarily on facility upgrades and machinery and equipment purchased to support new production program launches and increased business.
Capital assets purchased for our North American operations accounted for 62% of the total capital spending in 2003 compared to 72% a year ago. Our European operations accounted for 21% of our total capital spending in both years and our Other Automotive operations accounted for 17% compared to 7% a year ago.
Funds held in escrow consist of $44.6 million of cash deposited into an escrow account (thus restricting its use) as consideration to be issued upon the closing of the Davis acquisition.
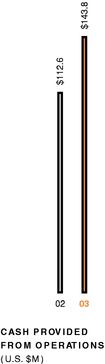
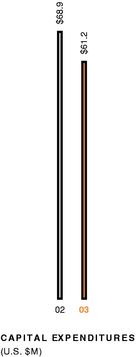
36 TESMA
In October 2003, we invested $1.2 million (net of cash acquired) in an Italian joint venture (see Other Acquisitions discussion). In the prior year, we made payments totaling $1.0 million under earnout provisions associated with our acquisition of Triam Automotive Corporation in 1998.
The $27.2 million of cash proceeds from capital asset disposals relates primarily to the Corporate Campus sale and leaseback transaction completed with MID in January 2003.
Financing Activities
| | 2003
| | 2002
| |
|---|
| Dividends | | $ | (17.3 | ) | $ | (12.2 | ) |
| (Decrease) increase in bank indebtedness | | | (12.4 | ) | | 18.9 | |
| Repayments of long-term debt | | | (2.1 | ) | | (3.6 | ) |
| Issues of long-term debt | | | 6.7 | | | — | |
| Issuance of Class A Subordinate Voting Shares | | | 0.6 | | | 63.5 | |
| Surrender of stock options | | | — | | | — | |
| | |
| |
| |
| Cash provided from (used for) financing activities | | $ | (24.5 | ) | $ | 66.6 | |
| | |
| |
| |
Our Corporate Constitution requires the payment of dividends of at least 20% of after-tax profits on a rolling three-year basis. Dividend payments for the year totaled $17.3 million compared to $12.2 million paid in 2002. This large increase occurred as a result of our change in fiscal year end to December in 2002, which resulted in the payment of dividends on account of an additional two months of income (14 months in total) in fiscal 2003 compared to dividends paid on account of twelve months of income in the prior year. In addition to these extra payments, the dividends paid this year reflect the increase in the number of Class A Subordinate Voting Shares outstanding since our public share offering, completed in July 2002, and the effect of higher translation on the dividend amounts predominately paid in Canadian dollars (with a stronger Canadian dollar relative to the U.S. dollar in 2003).
Funds used to repay advances on operating lines of credit were $12.4 million in 2003 compared to $18.9 million borrowed under operating lines of credit in 2002. Bank indebtedness levels at our Austrian subsidiary were reduced as $6.7 million of long-term debt was negotiated during the year and the proceeds were used to repay operating lines of credit with higher carrying costs. In the prior year, indebtedness levels increased at our South Korean operations (to finance the expansion of one of their facilities and for new machinery and equipment for upcoming programs) and at our Austrian subsidiary (for assembly lines and other equipment for new business launches). In addition, regularly scheduled debt repayments of $2.1 million were made in 2003 compared to $3.6 million a year ago.
During the year, 30,000 Class A Subordinate Voting Shares were issued on the exercise of stock options for consideration totaling approximately $0.6 million, compared to 186,150 shares issued for consideration of $1.4 million last year. In addition, in July 2002, we completed a public offering of 2.85 million Class A Subordinate Voting Shares, which generated cash proceeds, net of underwriter fees and other related costs, totaling $62.1 million.
Effect of Exchange Rate Changes on Cash
The translation impact on our cash balances totaled $30.8 million, reflecting a significant strengthening of the Canadian dollar (the currency in which a majority of our net cash balances are held) relative to the U.S. dollar since December 2002.
Financing Resources
At December 31, 2003, our cash and cash equivalents on hand (net of bank indebtedness) totaled $122.5 million. In addition, we had unused and available credit facilities (excluding those available for foreign exchange purposes) of approximately $69 million. Of our total long-term debt of $66.8 million, only 6% becomes due and payable in 2004, while over 89% does not mature until 2006 or later.
Our ratio of long-term debt to total capitalization was a conservative 10% at the end of 2003, unchanged from December 2002. We expect this ratio to increase as the result of our acquisition of Davis in January 2004, as we assumed $22.0 million of Davis' long-term debt and issued a five-year note payable for $3.4 million as part of the total consideration.
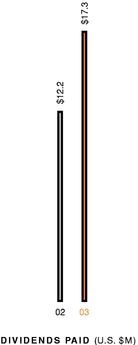
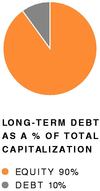
Our Corporate Constitution requires the payment of dividends of at least 20% of after-tax profits on a rolling three-year basis.
TOTAL CAPITALIZATION
Is the sum of long-term debt (excluding current portion) and shareholders' equity.
TESMA 37
Shareholders' Equity
During 2003, shareholders' equity increased by 34% or $139.0 million, due mainly to an increase in undistributed earnings, stock options exercised and an increase in the value of the currency translation account. As a result, the book value per Class A Subordinate Voting Share or Class B Share on a diluted basis increased by 34% to $16.92 (CDN $21.83) at December 31, 2003 from $12.66 (CDN $19.85) in the prior year.
The cumulative currency translation adjustment account represents the unrealized change in the value of our net investment in Canadian operations and foreign subsidiaries having a functional currency other than the U.S. dollar. The $77.8 million increase in the currency translation adjustment account resulted primarily from strong gains in the Canadian dollar and euro (up 22% and 21%, respectively) relative to the U.S. dollar since December 31, 2002.
FOREIGN CURRENCY ACTIVITIES
We operate globally, which gives rise to a risk that our earnings, cash flows and shareholders' equity may be adversely affected by fluctuations in relative foreign exchange rates. More specifically, we have operations in Canada, the United States, Germany, Austria, Italy, Switzerland, South Korea, Brazil, and China with each division or subsidiary operating in the functional currency of the region in which it is located. As a result, there are seven principal currencies in which we currently conduct business (in the order of relative current importance): the Canadian dollar, the euro, the U.S. dollar, the Korean won, the Swiss franc, the Brazilian real and the Chinese renminbi.
In our operations, where possible, we negotiate sales contracts and purchase materials, equipment and labour in the functional currencies of the region in which the operation is located. This allows foreign currency cash flows for the purchase of materials and capital equipment denominated in foreign currencies to be naturally hedged when contracts to deliver certain products are also denominated in the same foreign currencies. In an effort to manage the remaining exposure, we have instituted a foreign currency cash flow hedging program in which we utilize foreign exchange forward contracts to manage foreign exchange risk from our underlying customer contracts. In particular, foreign exchange forward contracts are used for the sole purpose of hedging a significant portion of our projected foreign currency inflows and outflows, consisting primarily of U.S. dollar, euro and Korean won-denominated contractual commitments of our Canadian-based operations (to deliver products to customers, or buy products from suppliers, in addition to the other anticipated transactions expected to be settled in foreign currencies). We do not enter into foreign exchange contracts for speculative purposes.
We have established formal documentation of the relationships between the specific hedging instruments entered into under the hedging program and the underlying cash inflows and outflows expected to result from specific firm commitments or forecasted transactions. The amount and timing of forward contracts are dependent upon a number of factors, including anticipated production delivery schedules, anticipated customer payment dates and anticipated product costs which may be paid in foreign currencies. We formally assess and monitor, both at the inception of the hedge instrument and on an ongoing basis, whether the derivatives used for hedging purposes are effective in offsetting changes in the fair values or cash flows of the hedged items. As long as the derivative remains effective, gains and losses on the derivative contracts are accounted for as a component of the related hedged transaction. If the derivative contracts are determined at any point in time to be ineffective as hedges, previously unrecognized gains or losses pertaining to the portion of the hedged transactions in excess of the projected foreign-denominated cash flows would be recognized in income at the time this condition was identified.
For details concerning the amount and timing of foreign exchange forward contracts at December 31, 2003, refer to Note 14(a) of the accompanying audited consolidated financial statements and notes. In addition, Note 14(c) discusses the risks we face in dealing with counterparties on our foreign-exchange forward contracts and the procedures we employ for mitigating these risks.

Tesma does business in seven principal currencies, producing natural hedges that we supplement with a formal foreign currency cash flow hedging program.
38 TESMA
OTHER MATTERS
Sale-Leaseback Transaction with Magna
On January 31, 2003, we completed a sale-leaseback transaction with MID, then a wholly-owned subsidiary of Magna, for all land and buildings comprising our Corporate Campus, which includes the corporate head office and two manufacturing facilities.
Under the terms of the purchase and sale agreement, the land and buildings comprising the corporate campus (with a carrying value of $23.5 million) were sold to MID for cash proceeds approximating fair value which totaled $25.0 million. The gain of $1.5 million resulting on the sale is being deferred and amortized on a straight-line basis over the term of the leases.
As part of the transaction, we entered into agreements to lease the properties back from MID (at prevailing rates) for a term of twelve years (with an initial option to renew for three years followed by two subsequent five-year renewal options) requiring annual lease payments of approximately $2.7 million per year, with approximately 75% of these payments pertaining to the two manufacturing facilities.
On August 29, 2003, all of the shares of MID were distributed to the shareholders of Magna pursuant to a planned reorganization of Magna. As a result of this distribution, MID became directly controlled by the same entity that indirectly controls us, so that MID remains a related party to us, but is no longer part of the group of companies controlled by Magna.
SUBSEQUENT EVENTS
Acquisition of Davis Industries, Inc.
The acquisition of Davis Industries, Inc. which was completed on January 2, 2004 is discussed in greater detail in the Overview section at the beginning of this MD&A.
Reduction In Ownership Interest of Jointly-Controlled Entity
Pursuant to the agreement signed when we increased our ownership interest in one of our jointly-controlled entities from 45% to 75% in December 2001 (see Note 3 of the accompanying audited consolidated financial statements and notes), the other remaining shareholder retained an option to purchase an additional 25% equity interest from us at any time prior to August 1, 2004 at a formula price. Effective February 7, 2004, this shareholder exercised its option and acquired an additional 25% interest in the jointly-controlled entity for nominal cash consideration. In addition, as part of this transaction, $7.7 million of shareholder loans from the jointly-controlled entity were sold by us to the other shareholder for $7.7 million in cash, thereby bringing each shareholder's proportionate share of loans to an equal basis.
As a result of this transaction, our ownership interest in this jointly-controlled entity will be reduced to 50% effective February 7, 2004 and, commencing February 8, 2004, we will reduce to 50% the proportion of assets, liabilities, revenues, expenses and cash flows included in our consolidated financial statements. This jointly-controlled entity reported total sales of approximately $62 million for the year ended December 31, 2003.
CRITICAL ACCOUNTING POLICIES
This MD&A is based upon the accompanying audited consolidated financial statements, which have been prepared in accordance with CDN GAAP. Note 22 to consolidated financial statements sets out the material differences between CDN GAAP and U.S. GAAP. The preparation of the consolidated financial statements requires management to make estimates and judgments that affect the reported amounts of assets, liabilities, revenues and expenses, and the related disclosure of contingent assets and liabilities. We base our estimates on historical experience and various other assumptions that are believed to be reasonable in the circumstances, the results of which form the basis for making judgments about the carrying value of assets and liabilities. On an ongoing basis, we evaluate our estimates. However, actual results may differ from these estimates under different assumptions or conditions.
We believe the following critical accounting policies affect the more significant judgments and estimates used in the preparation of our consolidated financial statements. Management has discussed the selection of these critical accounting policies with the Audit Committee of the Board of Directors, and the Audit Committee has reviewed our disclosure relating to critical accounting policies in this MD&A.
TESMA 39
Revenue Recognition
Separately Priced Tooling Contracts
With respect to our contracts with OEMs for particular vehicle programs, we perform multiple revenue-generating activities. The most common arrangement is where, in addition to contracting for the production and sale of parts, we also have a separately priced contract with the OEM for related tooling costs. In the majority of these arrangements entered into by us, the construction of the tooling is subcontracted to third party tooling vendors who construct and supply tooling to be used by us in the production of parts for the OEM. On completion of the tooling build, and upon acceptance of the tooling by the OEM, we sell the separately priced tooling to the OEM pursuant to a separate tooling purchase order.
Revenues and cost of sales from separately priced tooling contracts are presented on a gross basis in the consolidated statements of income when we are acting as principal and are subject to significant risks and rewards in connection with the process of bringing the tool to its final state and in the post-sale dealings with our customers. Otherwise, components of revenue and related costs are presented on a net basis. To date, revenues and cost of sales on separately priced tooling contracts have been reported by us on a gross basis.
Revenues from separately priced engineering services and tooling contracts are recognized substantially on a percentage of completion basis, but in some cases, depending on the terms of the contract, the completed contract basis is applied. The percentage of completion method recognizes revenue and cost of sales over the period of the construction of the tool or the period of service for the engineering or design services to be provided. As contracts for tooling and engineering services are usually developed or provided over a term longer than a typical sale arrangement, the use of the percentage of completion method more closely matches revenues and costs to the earnings process. The amount of revenue and cost of sales to be recognized at any reporting date is determined based on an estimate of the stage of completion for the overall tooling job or service to be provided, which is estimated by supervisors and/or managers directly involved in the execution and completion of the tooling job or service to be provided. In circumstances where we recognize tooling or engineering service contracts on a completed contract basis, revenue and cost of sales are recognized only when the contract is completed and the tool is accepted by the customer. All costs net of customer advances are reported in tooling inventory in our consolidated balance sheet until that time.
Tooling contract prices are generally fixed; however, price changes, change orders and program cancellations may affect the ultimate amount of revenue recorded with respect to a contract. Contract costs are estimated at the time of signing the contract and are reviewed at each reporting date. Adjustments to the original estimates of total contract costs are often required as work progresses under the contract and as experience is gained, even though the scope of the work under the contract may not change. When the current estimates of total contract revenue and total contract costs indicate a loss, a provision for the entire loss on the contract is made in the period that this condition is identified. Factors that are considered in arriving at the forecasted loss on a contract include, among others, cost overruns, non-reimbursable costs, change orders and potential price changes. We make these assessments on a contract-by-contract basis.
The Emerging Issues Task Force recently issued Abstract 00-21, "Accounting for Revenue Arrangements with Multiple Deliverables" (EITF 00-21). In addition, the Canadian Institute of Chartered Accountants (CICA) recently issued Emerging Issues Committee Abstract No. 142, "Revenue Arrangements with Multiple Deliverables" (EIC-142). These documents provide guidance on accounting by a vendor for arrangements involving multiple deliverables. They specifically address how a vendor determines whether an arrangement involving multiple deliverables contains more than one unit of accounting and they also address how consideration should be measured and allocated to the separate units of accounting in the arrangement. These Abstracts are effective for revenue arrangements entered into by us on or after January 1, 2004. The effect of these pronouncements on our consolidated financial statements has not been determined.
40 TESMA
Costs for Engineering and Customer-Owned Tooling Arrangements
We expense all costs as incurred related to the design, development and testing of moulds, dies and other tools that we will not own unless a separate customer purchase order, contract or other form of customer documentation exists and supports the reimbursement of all such costs. In certain arrangements with our customers, the costs related to the design, development and testing of moulds, dies and other tools that we will not own and that will be used in subsequent related parts production are reimbursed as part of the piece-price amount recognized upon shipments of the related parts. Such costs are capitalized only when the supply agreement provides us with a contractual guarantee for reimbursement of costs or the non-cancelable right to use the moulds, dies and other tools during the supply agreement.
Similarly, we incur pre-production engineering research and development (ER&D) costs related to the products we eventually intend to produce for our customers under long-term supply agreements. We expense ER&D costs unless a separate customer purchase order, contract or other form of customer documentation exists and supports the reimbursement of all such costs. When customer reimbursement for these costs are to be paid as part of subsequent related production piece-price amounts, costs are expensed as incurred unless a contractual guarantee for reimbursement exists.
Customer-owned tooling and ER&D costs to be reimbursed through piece-price arrangements that qualify for capitalization treatment are recorded in "Other assets" and are amortized on a systematic basis over the related parts production long-term supply agreement. As at December 31, 2003, the total unamortized carrying value of customer-owned tooling or ER&D costs capitalized in Other assets to be reimbursed through piece-price arrangements was not significant.
Long-Lived Asset Impairments
Goodwill
The carrying value of goodwill is subject to an impairment testing annually, or more frequently when an event or circumstance occurs that more likely than not reduces the fair value of a reporting unit below its carrying value. During the year ended December 31, 2003, we assessed the fair value of all reportable segments to which underlying goodwill is attributed and determined that no charge for impairment of goodwill was necessary.
Capital and Other Long-Lived Assets
We evaluate capital and other long-lived assets and consider whether factors exist that indicate a potential impairment in the carrying value of any long-lived assets within the consolidated entity. Indicators of impairment include prolonged operating losses or an event or decision that results in the disposal of, or changes to, the remaining estimated useful life of an existing capital or other long-lived asset (or asset group). An asset (or asset group) is considered to be impaired if the sum of the future undiscounted cash flows expected to result from the asset (or asset group) is less than the carrying value. When an asset is impaired in accordance with the above test, an impairment loss is measured and recognized as the excess, if any, of the carrying value of the asset (or asset group) over the respective fair value. Amounts recorded in this fashion are included as part of regular depreciation and amortization charges and are not separately disclosed unless significant, considered either individually or in aggregate with other similar adjustments.
We believe that accounting estimates related to both goodwill and capital asset impairment assessments are "critical accounting estimates" because: (i) they are subject to significant measurement uncertainty and are susceptible to change as we are required to make forward-looking assumptions regarding the impact of improvement plans on current operations, insourcing and other new business opportunities, program price and cost assumptions on current and future business, the timing of new program launches and future forecasted production volumes; and (ii) any resulting impairment loss could have a material effect on our consolidated net income and on the carrying amounts for goodwill and/or capital assets reported on our consolidated balance sheet.
TESMA 41
Future Income Tax Assets
At December 31, 2003, we had recorded future tax assets (net of related valuation allowances), primarily in relation to loss carryforwards, share issue costs and other future tax deductible amounts, of $2.8 million. The majority of these amounts relate to our Canadian operations.
During the year ended December 31, 2003, we recognized a $2.1 million benefit for income tax losses available for carryforward and other future tax deductible amounts (previously unrecognized) at one of our jointly-controlled entities. In the judgment of management, the initial recognition of these amounts became appropriate once the entity established a record of profitability after the launch of its major production programs, and once its projected future operating results (based on existing contracts, at existing and future contracted prices and cost structures) are projected to generate more than sufficient future taxable income to utilize these future tax deductible amounts. Accordingly, the valuation allowance previously recorded against these future tax deductible amounts was reversed.
On a quarterly basis, we evaluate the carrying value of any future tax assets (net of any valuation allowances) recognized on the consolidated balance sheet by reassessing the sources of taxable income that are anticipated to be available in the future to utilize any tax deductible amounts currently available. The factors used in this reassessment include our forecast of future taxable income and available tax planning strategies that could be implemented to realize the future tax assets (in the specific operations to which they are recorded). We have, and will continue to use, tax planning strategies to realize future tax assets, where applicable, in order to avoid the potential loss of any associated tax benefits.
At December 31, 2003, we had gross income tax loss carryforwards of approximately $36 million, which relate to operations in various jurisdictions in which we operate. Of these losses, $27 million have no expiry date and $9 million expire between 2006 and 2009. The tax benefits of $34 million of these losses have not been recognized in the consolidated financial statements. All of the loss carryforward amounts with no expiry date pertain to one foreign operation with a history of operating losses in recent years. This loss history is generally presumed to be a strong indication that future tax assets relating to loss carryforwards should not be recognized. Similarly, for the remaining losses, the particular operations are either in the midst of significant program launches or are in the pre-production stage such that the likelihood of generating future taxable income to offset these taxable losses is too low to recover the potential benefits. If any of these operations improve to profitable levels in the future, and the improvements are sustained for a prolonged period of time, our earnings will benefit from these loss carryforward pools.
Warranty Obligations, Including Obligations Related to Product Liability and Recalls
In certain circumstances, we are at risk for warranty costs, including product liability and recall costs. Product liability provisions are established based on our best estimate of the amounts necessary to settle existing claims on product default issues. Recall costs are costs incurred when we and/or our customer decide, either voluntarily or involuntarily, to recall a product due to a known or suspected performance issue. Costs typically include the cost of products being replaced and the customer's cost of recall and labour to remove and replace the defective part. When a decision to recall a product has been made or is probable, the estimated cost of the recall is recorded as a charge to net earnings in that period. In making this estimate, judgment is required as to the number of units that may be returned as a result of the recall, the total cost of the recall campaign, the ultimate negotiated sharing of the cost between us and our customer and, in some cases, the extent to which a supplier to us or an insurance provider (where coverage is available and exists) will share in the recall cost. Due to the nature of the costs, we make our best estimate of the expected future costs; however, the ultimate amount of such costs could be materially different.
To date, we have not experienced significant warranty responsibility, including product liability and recall costs. However, we continue to experience increased customer pressure to assume greater warranty responsibility. Currently, we only account for existing or probable claims; however, a significant increase in warranty responsibility for any one of our customers could require us to consider accounting for possible future claims.
42 TESMA
Contingencies
In the ordinary course of business activities, we may be contingently liable for litigation and claims with customers, suppliers or former employees. On an ongoing basis, we assess the likelihood of any adverse judgments or outcomes to these matters, as well as potential ranges of probable costs and losses. A determination of the provision required, if any, for these contingencies is made after analysis of each individual issue. The required provision may change in the future due to new developments in each matter or changes in approach, such as a change in settlement strategy in dealing with these matters.
Contingent liabilities currently recognized in our consolidated financial statements are not significant.
RISKS AND UNCERTAINTIES (FORWARD-LOOKING STATEMENTS)
This MD&A contains statements which, to the extent that they are not recitations of historical fact, may constitute "forward-looking statements" within the meaning of the Private Securities Litigation Reform Act of 1995. Forward-looking statements may include financial and other projections, as well as statements regarding our future plans, objectives or performance, or our underlying assumptions. The words "estimate", "anticipate", "believe", "expect", "intend" and other similar expressions are intended to identify forward-looking statements. Persons reading this MD&A are cautioned that such statements are only predictions, and that our actual future results or performance may be materially different.
Forward-looking information involves certain risks, assumptions, uncertainties and other factors which may cause actual future results or anticipated events to differ materially from those expressed or implied in any forward-looking statements. In our case, these factors principally relate to the risks associated with the automotive industry and include, but are not limited to: our operating and/or financial performance, including the effect of new accounting standards (such as the ongoing requirement for impairment testing of long-lived assets) on our financial results; our ability to identify, negotiate, complete and integrate acquisitions; the ability to finance our business requirements, including raising required funding as necessary; global economic conditions and changes in the various economies in which we operate; our relationship with Magna International Inc.; fluctuations in interest rates; changes in consumer and business confidence levels; consumers' personal debt levels; vehicle prices; the extent and nature of purchasing or leasing incentive campaigns offered by automotive manufacturers; environmental emission and safety regulations; fuel prices and availability; the continuation and extent of outsourcing by automotive manufacturers; the extent, continued use and availability of steel as a primary material for automotive parts versus alternative materials (such as aluminum and plastics); our ability to continue to meet customer specifications relating to product performance, cost, quality and service; industry cyclicality or seasonality; trade and/or labour issues or disruptions; customer pricing pressures, pricing concessions and cost absorptions; warranty, recall and product liability costs and risks; actual levels of program production volumes by our customers compared to original expectations, including program cancellations or delays and changes in product mix; new program launch risks; our dependence on certain engine and transmission programs and the market success and consumer acceptance of the vehicles into which such powertrain products are installed; our relationship with and dependence on certain customers; currency exposure; technological developments by our competitors; governmental, environmental and regulatory policies and our ability to anticipate or respond to changes therein; disruptions of terrorism or war; and other changes in the competitive environment in which we operate.
For a more detailed discussion of some of these factors, refer to the disclosures regarding risks and uncertainties set forth in our Annual Information Form, Form 40-F and other public filings. We do not intend, nor do we undertake any obligation, to update or revise any forward-looking statements to reflect subsequent information, events, results, circumstances or otherwise.
TESMA 43
Management's Responsibility for Financial Reporting
Tesma's management is responsible for the preparation and presentation of the consolidated financial statements and all information in this Annual Report. The consolidated financial statements were prepared by management in accordance with Canadian generally accepted accounting principles, and, where appropriate, reflect estimates based upon the judgment of management. Where alternative accounting methods exist, management has selected those that it considered to be the most appropriate in the circumstances. Financial statements include certain amounts based on estimates and judgments. Management has determined such amounts on a reasonable basis designed to ensure that the consolidated financial statements are presented fairly, in all material respects. Financial information presented elsewhere in this Annual Report has been prepared by management on a basis consistent with the consolidated financial statements. The consolidated financial statements have been reviewed by the Audit Committee, audited by the independent auditors and approved by the Board of Directors of the Company.
Management is responsible for the development and maintenance of systems of internal accounting and administrative controls of high quality, consistent with reasonable cost. Such systems are designed to provide reasonable assurance that the financial information is accurate, relevant and reliable, and that the Company's assets are appropriately accounted for and adequately safeguarded.
Tesma's Audit Committee is appointed by the Board of Directors annually and is comprised solely of outside independent directors. The Committee meets periodically with management, as well as with the independent auditors, to satisfy itself that each is properly discharging its responsibilities, to review the consolidated financial statements and the independent Auditors' Report and to discuss significant financial reporting issues and auditing matters. The Audit Committee reports its finding to the Board of Directors for consideration when approving the consolidated financial statements for issuance to the shareholders.
The consolidated financial statements have been audited by Ernst & Young LLP, the independent auditors, in accordance with Canadian and United States generally accepted auditing standards on behalf of the shareholders of Tesma. The Auditors' Report outlines the nature of their examination and their opinion on the consolidated financial statements of the Company. The independent auditors have full and unrestricted access to the Audit Committee.
Toronto, Canada
February 16, 2004
/s/ ANTHONY E. DOBRANOWSKI
ANTHONY E. DOBRANOWSKI
PRESIDENT & CHIEF FINANCIAL OFFICER | | /s/ JAMES L. MOULDS
JAMES L. MOULDS
VICE PRESIDENT, FINANCE & TREASURER |
Auditors' Report
To the Shareholders ofTesma International Inc.
We have audited the consolidated balance sheets ofTesma International Inc. as at December 31, 2003 and December 31, 2002 and the consolidated statements of income and retained earnings and cash flows for the year ended December 31, 2003, the five-month period ended December 31, 2002 and each of the years in the two-year period ended July 31, 2002. These financial statements are the responsibility of the Company's management. Our responsibility is to express an opinion on these financial statements based on our audits.
We conducted our audits in accordance with Canadian and United States generally accepted auditing standards. Those standards require that we plan and perform an audit to obtain reasonable assurance whether the financial statements are free of material misstatement. An audit includes examining, on a test basis, evidence supporting the amounts and disclosures in the financial statements. An audit also includes assessing the accounting principles used and significant estimates made by management, as well as evaluating the overall financial statement presentation.
In our opinion, these consolidated financial statements present fairly, in all material respects, the financial position of the Company as at December 31, 2003 and 2002 and the results of its operations and its cash flows for the year ended December 31, 2003, the five-month period ended December 31, 2002 and each of the years in the two-year period ended July 31, 2002 in accordance with Canadian generally accepted accounting principles.
As described in Note 1 to these consolidated financial statements, the Company changed its reporting currency to the U.S. dollar effective January 1, 2003 and its accounting policy for stock-based compensation.
|
|
 |
Toronto, Canada
February 16, 2004 | | ERNST & YOUNG LLP
CHARTERED ACCOUNTANTS |
44 TESMA
Consolidated Financial Statements
SIGNIFICANT ACCOUNTING POLICIES
(a) Basis of Presentation
Tesma International Inc. designs, engineers, tests and manufactures technologically-advanced powertrain (engine, transmission and fuel) components, modules and systems for the global automotive industry.
The consolidated financial statements of Tesma International Inc. and its subsidiary entities (the Company) have been prepared following Canadian generally accepted accounting principles (Canadian GAAP). These principles are also in conformity, in all material respects, with United States generally accepted accounting principles (U.S. GAAP), except as described in Note 22 to the consolidated financial statements.
(b) Principles of Consolidation
The consolidated financial statements include the accounts of the Company. The Company accounts for its interests in jointly-controlled entities using the proportionate consolidation method. All significant intercompany balances and transactions have been eliminated.
(c) Reporting Currency and Foreign Currency Translation
Effective January 1, 2003, the Company changed its reporting currency to the United States dollar (U.S. dollar). Prior to January 1, 2003, the Company reported in Canadian dollars. In accordance with Canadian GAAP (and consistent with the requirements under U.S. GAAP), all comparative amounts have been restated to U.S. dollars using the current rate method whereby all revenues, expenses and cash flows are translated at the average exchange rates that were in effect during these periods and all assets and liabilities are translated at the closing rate in effect at the end of these periods. Utilizing this method, the comparative consolidated statements of income and cash flows for the five-month period ended December 31, 2002 and each of the years in the two-year period ended July 31, 2002 are translated into U.S. dollars using an average rate for the period of U.S. $0.6372, U.S. $0.6375, and U.S. $0.6568 per CDN $1.00, respectively. The comparative consolidated balance sheet at December 31, 2002 is translated into U.S. dollars using the prevailing rate at December 31, 2002 of U.S. $0.6376 per CDN $1.00.
For periods up to and including December 31, 2002, assets and liabilities of the Company's self-sustaining foreign subsidiaries and investees having a functional currency other than the Canadian dollar are translated using the exchange rate in effect at the end of the year and revenues and expenses are translated at the average rate during the year. Exchange gains or losses on translation of the Company's net equity investment in these foreign subsidiaries and investees were deferred as a separate component of shareholders' equity.
For periods after December 31, 2002, assets and liabilities of the Company's self-sustaining foreign subsidiaries and Canadian operations having a functional currency other than the U.S. dollar are translated using the exchange rate in effect at the end of the year and revenues and expenses are translated at the average rate during the year. Exchange gains or losses on translation of the Company's net equity investment in Canadian operations and foreign subsidiaries are deferred as a separate component of shareholders' equity. The appropriate amounts of exchange gains or losses accumulated in the separate component of shareholders' equity are reflected in income when there is a reduction in the Company's investment in these operations as a result of capital transactions.
Foreign exchange gains and losses on transactions occurring in a currency different than an operation's functional currency are reflected in income, except for gains and losses on foreign exchange forward contracts used to hedge specific future commitments in foreign currencies. Gains or losses on these contracts are accounted for as a component of the related hedged transaction.
(d) Use of Estimates
The preparation of consolidated financial statements in conformity with Canadian GAAP requires management to make estimates and assumptions that affect the amounts reported in the consolidated financial statements and accompanying notes. Management believes that the estimates utilized in preparing its consolidated financial statements are reasonable and prudent; however, actual results could differ from these estimates.
TESMA 45
(e) Cash and Cash Equivalents
Cash and cash equivalents include cash on account, bonds, demand deposits and other short-term investments with original or remaining maturities of three months or less. Cost approximates fair value.
(f) Inventories
Inventories are valued at the lower of cost and net realizable value, with cost being determined substantially on a first-in, first-out basis. Cost includes the cost of materials, plus direct labour applied to the product and the applicable share of manufacturing overhead.
Tooling inventories, which are predominantly outsourced, are valued at the lower of subcontracted costs and net realizable value.
(g) Capital Assets
Capital assets are recorded at historical cost, including interest capitalized on capital expenditures in progress, less related investment tax credits and government grants.
Depreciation is provided on a straight-line basis over the estimated useful lives of capital assets (including those under capital leases) as follows:
Asset Class
| | Useful Life
|
|---|
| Buildings and building improvements | | 20 to 40 years |
| Leasehold improvements | | amortized in equal amounts over the term of the lease |
| Machinery and equipment | | |
| | General purpose | | 5 to 15 years |
| | Program-dedicated | | 5 to 7 years, or program life, if shorter |
| Computer hardware | | 3 years |
| Computer software | | 2 years |
| Office furniture and other equipment | | 5 to 10 years |
|
(h) Goodwill and Indefinite Life Intangible Assets
Goodwill represents the excess of the purchase price of the Company's interest in subsidiary entities over the fair value of the underlying net identifiable tangible and intangible assets arising on acquisitions.
Effective August 2001, the Company adopted the non-amortization and impairment rules for goodwill and other intangible assets that meet the criteria for indefinite life. Accordingly, these assets are no longer amortized and are subject to an impairment review, conducted annually or upon the occurrence of certain events or circumstances that may indicate an impairment in the carrying value of the goodwill for a reporting unit. Goodwill impairment is assessed based on the comparison of the fair value of each reporting unit to which goodwill has been attributed to the carrying value of the reporting unit's net assets, including goodwill. When the carrying amount of the reporting unit exceeds its fair value, the fair value of the reporting unit's goodwill is compared with its carrying amount to measure the amount of the impairment loss, if any. The fair value of goodwill is determined in the same manner as in a business combination.
Prior to August 1, 2001, goodwill was generally amortized over 10 to 20 years, and in all cases, amortization did not exceed 40 years.
(i) Other Assets
Other assets includes amounts receivable under certain long-term contracts or agreements, deferred preproduction costs, investments and other amounts for which the expected recovery or period of benefit is beyond the next fiscal year.
Deferred preproduction costs are costs incurred in establishing new facilities which require substantial time to reach commercial production capability. Amortization is provided over periods up to five years from the date commercial production is achieved. No amounts were capitalized during the respective periods ended December 31, 2003 and December 31, 2002.
The Company accounts for its investments in which it has significant influence on the equity basis.
46 TESMA
(j) Long-Lived Assets
Long-lived assets are assets that do not meet the definition of a current asset. In the five-month period ended December 2002, the Company adopted new Canadian GAAP rules which established standards for the consideration and potential recognition, measurement and disclosure of an impairment in the carrying value of long-lived assets held for use. In accordance with the new standard, the Company is required to consider whether factors exist that would indicate that there is a potential impairment in the carrying value of any long-lived assets within the consolidated entity. An impairment loss should be recognized when the carrying amount of a long-lived asset or asset group is not recoverable and exceeds its fair value. An asset is considered to be impaired if the estimated undiscounted future cash flows attributable to the asset are less than the associated carrying amount. When an asset is impaired in accordance with the above test, an impairment loss is measured and recognized as the excess, if any, of the carrying value of the asset over the respective fair value.
In the normal course of its operations, changes in events or circumstances surrounding specific production programs can impact the useful life and/or utilization of program-specific or dedicated assets. The Company assesses whether the related assets can be redeployed to other revenue-generating activities. If no alternative uses are identified, the Company will record additional depreciation as necessary to properly reflect changes in the useful life of the affected assets. Amounts recorded in this fashion are included as part of regular deprecation and amortization charges and not separately disclosed unless significant, considered either individually or in aggregate with other similar adjustments.
(k) Revenue Recognition
Revenue from the sale of manufactured products is recognized:
- •
- upon shipment to, or receipt by, our customers (depending on contractual terms);
- •
- upon acceptance, by our customers, of the products delivered in accordance with mutually agreed-upon specifications and quality standards detailed in the underlying contracts or agreements with them;
- •
- when measurable, in accordance with mutually agreed-upon prices; and
- •
- when collection is reasonably assured.
Revenues from separately priced engineering services and tooling contracts are recognized primarily on a percentage of completion basis, but in some cases, depending upon the terms of the contract, the completed contract basis is applied.
Revenue and cost of sales are presented on a gross basis in the consolidated statements of income when the Company is acting as principal and is subject to the significant risks and rewards of the business. Otherwise, components of revenues and related costs are presented on a net basis.
(l) Preproduction Costs Related to Long-Term Supply Agreements
Costs incurred (net of customer subsidies) related to design and engineering, which are reimbursed as part of subsequent related parts production piece price amounts, are expensed as incurred unless a contractual guarantee for reimbursement exists.
Costs incurred (net of customer subsidies) related to design and development costs for moulds, dies and other tools that the Company does not own (and that will be used in, and reimbursed as part of the piece price amounts for, subsequent related parts production) are expensed as incurred unless the supply agreement provides a contractual guarantee for reimbursement or the non-cancelable right to use the moulds, dies and other tools during the supply agreement.
Costs deferred in the above circumstances are amortized to cost of goods sold over the shorter of the anticipated term of the supply agreement or the term of the non-cancelable right.
(m) Government Financing
The Company makes periodic applications for financial assistance under available government assistance programs in the various jurisdictions in which the Company operates. Grants relating to capital expenditures are reflected as a reduction of the cost of the related assets. Grants and tax credits relating to current operating expenditures are recorded as a reduction of expense at the time the eligible expenses are incurred. The Company also receives loans which are recorded as liabilities in amounts equal to the cash received.
TESMA 47
(n) Research and Development
The Company carries out various applied research and development (R&D) programs, some of which are partially or fully funded by governments or by customers of the Company. Funding received is accounted for using the cost reduction approach. Research costs are expensed as incurred. Development costs are expensed as incurred, unless they meet certain criteria under generally accepted accounting principles for deferral and amortization.
(o) Income Taxes
The Company uses the liability method of tax allocation for accounting for income taxes. Under the liability method of tax allocation, future tax assets and liabilities are determined based on differences between the financial reporting and tax bases of assets and liabilities and are measured using the substantively enacted tax rates and laws that will be in effect when the differences are expected to reverse.
(p) Stock-Based Compensation
The Company has two stock-based compensation plans which are described in Note 12. In September 2003, the Canadian Institute of Chartered Accountants (CICA) issued amendments to Handbook Section 3870 "Stock-Based Compensation and other Stock-based Payments" (CICA 3870) which are effective for fiscal years beginning on or after January 1, 2004. The amended standard now requires recognition of all stock-based compensation transactions at fair value and eliminates the alternative of using the intrinsic value method of accounting through fair value disclosures on a pro forma basis. The Company has elected to adopt the amendments to CICA 3870 early and to apply them on a retroactive basis to stock-based awards granted on or after August 1, 2002, the date the Company was initially required to adopt CICA 3870. Upon application of the new rules during the current year ended December 31, 2003 and the comparative five-month period ended December 31, 2002, the Company recorded compensation expense totaling $0.5 million and $0.1 million, respectively. Diluted earnings per share for these same periods decreased by $0.01 and $nil, respectively, as a result of the adoption of these rules. These costs are recorded as selling, general and administrative expenses with a corresponding increase to contributed surplus.
Compensation expense under the non-employee director share-based compensation plan is recorded at fair value as described in Note 12(c).
(q) Post-Retirement Medical Benefits
The Company provides a defined benefit post-retirement medical benefits plan covering eligible employees and retirees. The cost of post-retirement medical benefits is determined using the projected benefit method prorated based on employment services and is expensed as employment services are rendered. Past service costs which arose upon introduction of the plan are being amortized to income over the employees' expected average remaining service lives.
(r) Earnings per Class A Subordinate Voting Share or Class B Share
Basic earnings per Class A Subordinate Voting Share or Class B Share are calculated using the weighted average number of Class A Subordinate Voting Shares outstanding during the year, plus the weighted average number of Class B Shares outstanding during the year.
Diluted earnings per Class A Subordinate Voting Share or Class B Share are calculated using the treasury stock method for the determination of the dilutive effect of outstanding options. Under this method:
- •
- the exercise of options is assumed at the beginning of the period (or at time of issuance, if later) and Class A Subordinate Voting Shares are assumed to have been issued;
- •
- the proceeds from exercise plus future period stock-based compensation expense on each tranche of options granted on or after August 1, 2002 are assumed to be used to purchase Class A Subordinate Voting Shares at the average market price during the period; and
- •
- the incremental number of Class A Subordinate Voting Shares (the difference between the number of Class A Subordinate Voting Shares assumed issued and assumed purchased) is included in the denominator of the diluted earnings per share computation.
48 TESMA
Consolidated Balance Sheets
Tesma International Inc.
Incorporated under the laws of Ontario
As at December 31
| | Note
| | 2003
| | 2002
| |
|---|
(U.S. dollars in thousands)
| |
| | (restated — Note 23)
| |
|---|
| ASSETS | | | | | | | | | |
Current |
|
|
|
|
|
|
|
|
|
| | Cash and cash equivalents | | | | $ | 163,255 | | $ | 135,080 | |
| | Accounts receivable | | 20 | | | 193,160 | | | 146,192 | |
| | Inventories | | 4 | | | 100,216 | | | 74,924 | |
| | Income taxes recoverable | | | | | 2,372 | | | — | |
| | Future tax assets | | 9 | | | 979 | | | 190 | |
| | Prepaid expenses and other | | | | | 10,152 | | | 8,208 | |
| | | | |
| |
| |
| | | | | | 470,134 | | | 364,594 | |
| Capital assets | | 5,6,20 | | | 303,749 | | | 273,105 | |
| Escrow deposit | | 24 | | | 44,635 | | | — | |
| Goodwill | | 7 | | | 15,096 | | | 13,609 | |
| Other assets | | 6,8 | | | 3,527 | | | 5,014 | |
| Future tax assets | | 9 | | | 1,834 | | | 450 | |
| | | | |
| |
| |
| | | | | $ | 838,975 | | $ | 656,772 | |
| | | | |
| |
| |
LIABILITIES AND SHAREHOLDERS' EQUITY |
|
|
|
|
|
|
|
|
|
Current |
|
|
|
|
|
|
|
|
|
| | Bank indebtedness | | 10 | | $ | 40,756 | | $ | 46,086 | |
| | Accounts payable | | 20 | | | 80,398 | | | 77,574 | |
| | Other accrued liabilities | | 12,20 | | | 34,290 | | | 24,156 | |
| | Accrued salaries and wages | | 11 | | | 32,581 | | | 21,015 | |
| | Future tax liabilities | | 9 | | | 16,796 | | | 656 | |
| | Long-term debt due within one year | | 10 | | | 3,919 | | | 1,799 | |
| | Dividends payable | | | | | — | | | 3,251 | |
| | Income taxes payable | | | | | — | | | 9,578 | |
| | | | |
| |
| |
| | | | | | 208,740 | | | 184,115 | |
| | | | |
| |
| |
| Long-term debt | | 10 | | | 62,879 | | | 47,565 | |
| | | | |
| |
| |
| Future tax liabilities | | 9 | | | 18,102 | | | 14,844 | |
| | | | |
| |
| |
Shareholders' equity |
|
|
|
|
|
|
|
|
|
| | Class A Subordinate Voting Shares | | 12 | | | 198,250 | | | 197,701 | |
| | Class B Shares | | 12 | | | 1,894 | | | 1,894 | |
| | Contributed surplus | | 12 | | | 572 | | | 79 | |
| | Retained earnings | | | | | 285,736 | | | 225,599 | |
| | Currency translation adjustment | | 15 | | | 62,802 | | | (15,025 | ) |
| | | | |
| |
| |
| | | | | | 549,254 | | | 410,248 | |
| | | | |
| |
| |
| | | | | $ | 838,975 | | $ | 656,772 | |
| | | | |
| |
| |
Commitments and contingencies (Notes 10, 14 and 21) |
|
|
|
|
|
|
|
|
|
See accompanying notes |
|
|
|
|
|
|
|
|
|
/s/ MANFRED GINGL
MANFRED GINGL
DIRECTOR | | /s/ JUDSON D. WHITESIDE
JUDSON D. WHITESIDE
DIRECTOR |
TESMA 49
Consolidated Statements of Income and Retained Earnings
| |
| | Year
ended
December 31
2003
| | Five-month
period ended
December 31
2002
| | Years ended July 31
| |
|---|
| | Note
| | 2002
| | 2001
| |
|---|
(U.S. dollars in thousands, except per share and share figures)
| |
| |
| | (restated — Note 23)
| |
|---|
| Sales | | 20 | | $ | 1,098,591 | | $ | 399,352 | | $ | 855,162 | | $ | 789,014 | |
| | | | |
| |
| |
| |
| |
| Cost of goods sold | | 11,20 | | | 855,503 | | | 309,978 | | | 667,867 | | | 611,773 | |
| Selling, general and administrative | | 15,16,20 | | | 69,204 | | | 24,759 | | | 55,721 | | | 51,872 | |
| Depreciation and amortization | | 7 | | | 51,609 | | | 17,993 | | | 37,384 | | | 33,906 | |
| Affiliation fees and other charges | | 20 | | | 12,449 | | | 4,347 | | | 9,777 | | | 9,112 | |
| Interest, net | | 10,20 | | | (204 | ) | | 316 | | | 2,556 | | | 1,104 | |
| Impairment loss at German die-casting subsidiary | | 6 | | | — | | | 12,088 | | | — | | | — | |
| | | | |
| |
| |
| |
| |
| Income before income taxes | | | | | 110,030 | | | 29,871 | | | 81,857 | | | 81,247 | |
| Income taxes | | 9 | | | 35,918 | | | 9,249 | | | 28,225 | | | 23,267 | |
| | | | |
| |
| |
| |
| |
| Net income attributable to Class A Subordinate Voting Shares and Class B Shares | | | | | 74,112 | | | 20,622 | | | 53,632 | | | 57,980 | |
| Retained earnings, beginning of period | | | | | 225,599 | | | 211,529 | | | 169,774 | | | 127,131 | |
| Dividends | | | | | (13,975 | ) | | (6,552 | ) | | (11,877 | ) | | (12,397 | ) |
Cumulative adjustment for change in
accounting policy | | 9 | | | — | | | — | | | — | | | (2,659 | ) |
| Surrender of stock options | | | | | — | | | — | | | — | | | (281 | ) |
| | | | |
| |
| |
| |
| |
| Retained earnings, end of period | | | | $ | 285,736 | | $ | 225,599 | | $ | 211,529 | | $ | 169,774 | |
| | | | |
| |
| |
| |
| |
| Earnings per Class A Subordinate | | | | | | | | | | | | | | | |
| | Voting Share or Class B Share | | | | | | | | | | | | | | | |
| | | Basic | | 13 | | $ | 2.29 | | $ | 0.64 | | $ | 1.82 | | $ | 1.98 | |
| | | Diluted | | 13 | | $ | 2.28 | | $ | 0.63 | | $ | 1.80 | | $ | 1.96 | |
| | | | |
| |
| |
| |
| |
| Average number of Class A Subordinate | | | | | | | | | | | | | | | |
| | Voting Shares and Class B Shares outstanding during the period (in thousands) | | | | | | | | | | | | | | | |
| | | Basic | | 13 | | | 32,344 | | | 32,300 | | | 29,454 | | | 29,214 | |
| | | Diluted | | 13 | | | 32,531 | | | 32,513 | | | 29,829 | | | 29,558 | |
| | | | |
| |
| |
| |
| |
See accompanying notes
50 TESMA
Consolidated Statements of Cash Flows
| |
| | Year
ended
December 31
2003
| | Five-month
period ended
December 31
2002
| | Years ended July 31
| |
|---|
| | Note
| | 2002
| | 2001
| |
|---|
(U.S. dollars in thousands)
| |
| |
| | (restated — Note 23)
| |
|---|
| CASH PROVIDED FROM (USED FOR): | | | | | | | | | | | | | | | |
OPERATING ACTIVITIES |
|
|
|
|
|
|
|
|
|
|
|
|
|
|
|
| Net income | | | | $ | 74,112 | | $ | 20,622 | | $ | 53,632 | | $ | 57,980 | |
| Items not involving current cash flows | | 18 | | | 69,697 | | | 26,093 | | | 44,228 | | | 29,935 | |
| | | | |
| |
| |
| |
| |
| | | | | | 143,809 | | | 46,715 | | | 97,860 | | | 87,915 | |
| Net change in non-cash working capital | | 18 | | | (41,949 | ) | | (18,293 | ) | | (6,230 | ) | | (39,709 | ) |
| | | | |
| |
| |
| |
| |
| | | | | | 101,860 | | | 28,422 | | | 91,630 | | | 48,206 | |
| | | | |
| |
| |
| |
| |
INVESTING ACTIVITIES |
|
|
|
|
|
|
|
|
|
|
|
|
|
|
|
| Capital asset additions | | 20 | | | (61,153 | ) | | (28,401 | ) | | (77,589 | ) | | (64,025 | ) |
| Funds held in escrow | | 24 | | | (44,635 | ) | | — | | | — | | | — | |
| Investment in subsidiaries | | 3,7 | | | (1,394 | ) | | (512 | ) | | (500 | ) | | (531 | ) |
| Increase in other assets | | | | | (236 | ) | | (508 | ) | | (1,106 | ) | | (953 | ) |
| Proceeds from disposal of capital and other assets | | 20 | | | 27,234 | | | 1,697 | | | 969 | | | 277 | |
Cash and cash equivalents acquired on investment in
subsidiaries | | 3 | | | 202 | | | — | | | 375 | | | — | |
| | | | |
| |
| |
| |
| |
| | | | | | (79,982 | ) | | (27,724 | ) | | (77,851 | ) | | (65,232 | ) |
| | | | |
| |
| |
| |
| |
FINANCING ACTIVITIES |
|
|
|
|
|
|
|
|
|
|
|
|
|
|
|
Dividends on Class A Subordinate Voting Shares and
Class B Shares | | | | | (17,275 | ) | | (3,276 | ) | | (11,877 | ) | | (12,397 | ) |
| Increase (decrease) in bank indebtedness | | | | | (12,423 | ) | | 25,997 | | | (11,699 | ) | | (2,237 | ) |
| Repayments of long-term debt | | 10 | | | (2,086 | ) | | (1,684 | ) | | (3,239 | ) | | (6,402 | ) |
| Issues of long-term debt | | 10 | | | 6,715 | | | — | | | 79 | | | 5,811 | |
Issuance of Class A Subordinate Voting Shares, net of
related costs | | 12 | | | 549 | | | 257 | | | 63,261 | | | 1,186 | |
| Surrender of stock options | | | | | — | | | — | | | — | | | (281 | ) |
| | | | |
| |
| |
| |
| |
| | | | | | (24,520 | ) | | 21,294 | | | 36,525 | | | (14,320 | ) |
| | | | |
| |
| |
| |
| |
Effect of exchange rate changes on cash and
cash equivalents | | | | | 30,817 | | | 1,793 | | | (1,373 | ) | | (3,159 | ) |
| | | | |
| |
| |
| |
| |
| Net increase (decrease) in cash and cash equivalents | | | | | 28,175 | | | 23,785 | | | 48,931 | | | (34,505 | ) |
| Cash and cash equivalents, beginning of period | | | | | 135,080 | | | 111,295 | | | 62,364 | | | 96,869 | |
| | | | |
| |
| |
| |
| |
| Cash and cash equivalents, end of period | | | | $ | 163,255 | | $ | 135,080 | | $ | 111,295 | | $ | 62,364 | |
| | | | |
| |
| |
| |
| |
See accompanying notes |
|
|
|
|
|
|
|
|
|
|
|
|
|
|
|
TESMA 51
Notes To Consolidated Financial Statements
NOTE 1. SIGNIFICANT ACCOUNTING POLICIES
The significant accounting policies followed by the Company are set out under "Significant Accounting Policies" preceding these consolidated financial statements.
NOTE 2. JOINTLY-CONTROLLED ENTITIES
The consolidated financial statements include the Company's proportionate share of the combined revenues, expenses, assets, liabilities and cash flows of its jointly-controlled entities. As described in Note 3, in October 2003, the Company acquired a 55% ownership interest in an Italian entity which is jointly-controlled by the Company and the former owner. As a result, the Company has three jointly-controlled entities at December 31, 2003 [December 31, 2002 — two]. The amounts included in the Company's consolidated financial statements relating to jointly-controlled entities are as follows:
|
|
|
|
|
|
Years ended July 31
|
|---|
| | Year
ended
December 31
2003
| | Five-month
period ended
December 31
2002
|
|---|
Results of Operations
|
|---|
| | 2002
| | 2001
|
|---|
(U.S. dollars in thousands)
| |
| |
| |
| |
|
|---|
| Sales | | $ | 385,002 | | $ | 134,174 | | $ | 276,140 | | $ | 251,739 |
| Cost of goods sold, other expenses and income taxes(i) | | | 338,909 | | | 117,341 | | | 245,989 | | | 224,498 |
| | |
| |
| |
| |
|
| Net income, after tax allocation | | $ | 46,093 | | $ | 16,833 | | $ | 30,151 | | $ | 27,241 |
| | |
| |
| |
| |
|
Financial Position, as at December 31
|
|
2003
|
|
2002
|
|---|
(U.S. dollars in thousands)
| |
| |
|
|---|
Assets |
|
|
|
|
|
|
| Current assets | | $ | 127,424 | | $ | 105,266 |
| Long-term assets | | | 40,163 | | | 30,502 |
| | |
| |
|
| Total assets | | $ | 167,587 | | $ | 135,768 |
| | |
| |
|
Liabilities and Equity |
|
|
|
|
|
|
| Current liabilities | | $ | 40,736 | | $ | 49,960 |
| Other liabilities | | | 1,787 | | | — |
| Loans from partners and shareholders | | | 36,741 | | | 30,024 |
| Equity | | | 88,323 | | | 55,784 |
| | |
| |
|
| Total liabilities and equity | | $ | 167,587 | | $ | 135,768 |
| | |
| |
|
|
|
|
|
|
|
Years ended July 31
|
|
|---|
| | Year
ended
December 31
2003
| | Five-month
period ended
December 31
2002
| |
|---|
Statements of Cash flows
| |
|---|
| | 2002
| | 2001
| |
|---|
(U.S. dollars in thousands)
| |
| |
| |
| |
| |
|---|
| Cash provided from (used for): | | | | | | | | | | | | | |
| | Operating activities | | $ | 43,132 | | $ | 26,592 | | $ | 39,948 | | $ | 28,433 | |
| | Investing activities | | | (6,633 | ) | | (4,353 | ) | | (13,688 | ) | | (5,202 | ) |
| | Financing activities(ii) | | | (38,823 | ) | | (22,367 | ) | | (30,897 | ) | | (12,935 | ) |
| | |
| |
| |
| |
| |
| | | $ | (2,324 | ) | $ | (128 | ) | $ | (4,637 | ) | $ | 10,296 | |
| | |
| |
| |
| |
| |
- (i)
- The results of operations for the year ended December 31, 2003 include $2.1 million recognized as the benefit for income tax losses available for carryforward and other future tax deductible amounts (previously unrecognized) at one of our jointly-controlled entities (see Note 9(a)(i)).
52 TESMA
As described in Note 9(a)(iii), the results of operations for the five-month period ended December 31, 2002, and the year ended July 31, 2001, include the benefit of income tax refunds totaling $1.8 million and $4.0 million, respectively.
(ii)- Included in cash flows from financing activities for the year ended December 31, 2003 is a net cash distribution to the Company of $41.8 million [five-month period ended December 31, 2002 — $22.4 million; years ended July 31, 2002 — $32.8 million; 2001 — $12.9 million].
Pursuant to agreements among the partners of one of the jointly-controlled entities, net income is to be distributed annually to the partners and each partner is required to loan back to the entity approximately 35% of such distribution, unless otherwise determined by the management committee of the entity. No amounts were required to be loaned back during the year ended December 31, 2003, the five-month period ended December 31, 2002, or in the years ended July 31, 2002 or 2001. The management committee is responsible for overseeing and directing the operations and management of the entity and is comprised of four members, of which the Company is entitled to appoint two. The repayment of this entity's partners' capital of $5.4 million at December 31, 2003 [December 31, 2002 — $5.4 million] and loans are subject to the approval of the management committee.
In another jointly-controlled entity, the Company's share of shareholders' loans totaled $23.9 million at December 31, 2003 [December 31, 2002 — $19.8 million]. These loans are interest bearing at the rate of prime plus 2%, payable monthly, with principal repayment due on August 1, 2004.
Subsequent to December 31, 2003 (as described in Note 24(b)), the other shareholder of one of the Company's jointly-controlled entities exercised an option to purchase an additional 25% equity ownership of this entity from the Company, reducing the Company's ownership to 50%. This option had been outstanding since December 2001, when the Company had completed the acquisition of an additional 30% interest in this entity.
NOTE 3. BUSINESS ACQUISITIONS
Acquisitions in the year ended December 31, 2003
In October 2003, the Company completed the acquisition of a 55% interest in Agla Benevento S.r.l., of Benevento, Italy (subsequently renamed Tesma-Agla S.r.l. (Tesma-Agla)), for cash consideration, including transaction costs, of $1.2 million (net of cash acquired of $0.2 million). Pursuant to agreements executed upon the closing of the transaction, the approval of certain strategic, operating and financing decisions of this company are subject to a majority vote by Tesma-Agla's Board of Directors. The Board of Directors consists of four members, of which the Company is entitled to appoint two (including the Chairman of the Board). The Company accounts for its interest in this jointly-controlled entity using the proportionate consolidation method. Tesma-Agla had no operating activities prior to October 2003 but was preparing for the launch of pulleys and other engine components for the European markets.
The initial impact on the Company's consolidated balance sheet was an increase in non-cash working capital of $0.4 million, property, plant, equipment and other long-lived assets of $2.6 million, debt of $2.0 million and net future tax assets of $0.2 million. These amounts and the results of this entity are included in the European Automotive segment of the Company's operations (see Note 19).
Acquisitions in Prior Years
In December 2001, the Company completed the acquisition of an additional 30% interest in one of its jointly-controlled entities for nominal cash consideration, increasing the Company's ownership to 75%. The transaction was accounted for using the purchase method. The net effect on the Company's balance sheet was a net decrease in working capital of $3.1 million (including cash acquired of $0.4 million), an increase in capital assets of $2.9 million, additional long-term debt acquired of $0.3 million and an increase in goodwill of $0.4 million. Pursuant to agreements executed on the purchase, the only other remaining shareholder of the jointly-controlled entity had an option to purchase an additional 25% equity ownership interest from the Company at any time prior to August 1, 2004 at a formula price. Effective February 7, 2004, the other remaining shareholder exercised this option and repurchased the additional 25% equity ownership of the jointly-controlled entity from the Company, reducing the Company's ownership to 50%, as fully described in Note 24(b). Under the terms of the shareholder agreements (including the period of time that the above option was outstanding), the Company and the remaining shareholder each have the right to nominate one of the two directors composing the board of directors of this jointly-controlled entity.
TESMA 53
NOTE 4. INVENTORIES
Inventories consist of:
| | 2003
| | 2002
|
|---|
(U.S. dollars in thousands)
| |
| |
|
|---|
| Raw materials and supplies | | $ | 35,277 | | $ | 28,023 |
| Work-in-process | | | 13,329 | | | 11,485 |
| Finished goods | | | 28,804 | | | 18,337 |
| Tooling and engineering(i) | | | 22,806 | | | 17,079 |
| | |
| |
|
| | | $ | 100,216 | | $ | 74,924 |
| | |
| |
|
- (i)
- Tooling and engineering inventory represents costs incurred on separately priced tooling and engineering service contracts in excess of billed and unbilled amounts included in accounts receivable.
NOTE 5. CAPITAL ASSETS
Capital assets consist of:
| | 2003
| | 2002
|
|---|
| | Cost
| | Accumulated Depreciation
| | Net Book Value
| | Cost
| | Accumulated Depreciation
| | Net Book Value
|
|---|
(U.S. dollars in thousands)
| |
| |
| |
| |
| |
| |
|
|---|
| Land(i), (ii) | | $ | 16,424 | | $ | — | | $ | 16,424 | | $ | 19,396 | | $ | — | | $ | 19,396 |
| Buildings and leasehold improvements (i), (ii) | | | 80,285 | | | (24,506 | ) | | 55,779 | | | 80,103 | | | (17,972 | ) | | 62,131 |
| Machinery and equipment(ii), (iii) | | | 399,110 | | | (207,163 | ) | | 191,947 | | | 279,810 | | | (138,422 | ) | | 141,388 |
| Computer hardware | | | 12,428 | | | (10,029 | ) | | 2,399 | | | 9,666 | | | (7,509 | ) | | 2,157 |
| Computer software | | | 9,070 | | | (7,453 | ) | | 1,617 | | | 6,519 | | | (5,038 | ) | | 1,481 |
| Office furniture and other equipment | | | 21,278 | | | (14,402 | ) | | 6,876 | | | 16,111 | | | (10,526 | ) | | 5,585 |
| Capital expenditures in progress(iv) | | | 28,707 | | | — | | | 28,707 | | | 40,967 | | | — | | | 40,967 |
| | |
| |
| |
| |
| |
| |
|
| | | $ | 567,302 | | $ | (263,553 | ) | $ | 303,749 | | $ | 452,572 | | $ | (179,467 | ) | $ | 273,105 |
| | |
| |
| |
| |
| |
| |
|
- (i)
- As described in Note 20(a)(ii), the Company sold certain land and buildings described as "the Tesma Corporate campus" to MI Developments Inc. (MID) as part of a sale and leaseback transaction. As a result, land with a carrying value of $5.8 million and buildings with a carrying value of $17.7 million were transferred to MID.
- (ii)
- As fully described in Note 6, during the five-month period ended December 31, 2002, the Company recorded a write-down in the carrying value of long-lived assets at a foreign subsidiary consisting mainly of land, buildings, and machinery and equipment. As part of the write-down, the Company recorded reductions to both the cost and accumulated depreciation balances related to these assets.
- (iii)
- Machinery and equipment at December 31, 2003 includes costs of $13.1 million and accumulated depreciation of $7.6 million for assets under capital leases [December 31, 2002 — $12.3 million and $5.6 million, respectively].
- (iv)
- Capital expenditures in progress include costs incurred to date, including deposits, for machinery and equipment, assembly lines, and facility upgrades and expansions which are still in progress or are not yet in service as at the balance sheet date. Accordingly, depreciation on these assets will not commence until the assets are put into service.
54 TESMA
NOTE 6. IMPAIRMENT LOSS AT GERMAN DIE-CASTING SUBSIDIARY
In the five-month period ended December 31, 2002, the Company, prompted by a history of operating losses and projected future losses following the launch of new business at its German die-casting subsidiary, initiated and completed a review for impairment on $20.6 million of machinery, equipment, land, buildings and other long-lived assets at this subsidiary. As part of this process, the Company determined the fair value of this asset group primarily using a market-based approach which estimates value based on market prices in actual transactions and on asking prices for currently available assets that are in a similar state and condition. The remaining assets, for which the market approach was not possible, were valued using a cost approach, which estimates value based on what a prudent investor would pay to reproduce the assets with a similar application or utility. Utilizing these approaches, the fair value of this asset group was determined to be approximately $8.5 million, requiring the Company to record a $12.1 million write-down of the carrying values of the respective assets of this subsidiary to their estimated fair values and to record a corresponding impairment loss in the five-month period ended December 31, 2002 totaling $8.5 million, net of applicable taxes. The results of this subsidiary (including the impairment loss in the five-month comparative period) are included in the European Automotive segment of the Company's operations (see Note 19).
NOTE 7. GOODWILL
At December 31, 2003, the Company had consolidated goodwill, recorded at carrying value, totaling $15.1 million [December 31, 2002 — $13.6 million]. Commencing August 1, 2001, the Company prospectively adopted the CICA non-amortization and impairment rules for existing goodwill, and accordingly ceased recording amortization of goodwill. Prior to adoption of the new standard, goodwill amortization of $1.1 million was recorded during the year ended July 31, 2001.
Under the terms of the acquisition of Triam Automotive Corporation (Sterling Heights) in October 1998, the Company agreed to pay an additional amount not to exceed $2.5 million in respect of the five-year period commencing February 1, 1998 if Sterling Heights exceeded certain predetermined levels of earnings. During the five-month period ended December 31, 2002 and each of the years in the two-year period ended July 31, 2002, the Company recorded approximately $0.5 million of additional goodwill on these earnout provisions. All required payments under these earnout provisions have been made prior to December 31, 2002.
During the year ended December 31, 2003, the Company assessed the fair value of all the reportable segments to which underlying goodwill is attributed and determined that no charge for impairment of goodwill was required.
NOTE 8. OTHER ASSETS
Other assets consist of:
| | 2003
| | 2002
|
|---|
(U.S. dollars in thousands)
| |
| |
|
|---|
| Long-term receivables | | $ | 1,079 | | $ | 1,705 |
| Net deferred preproduction costs | | | 86 | | | 924 |
| Other | | | 2,362 | | | 2,385 |
| | |
| |
|
| | | $ | 3,527 | | $ | 5,014 |
| | |
| |
|
NOTE 9. INCOME TAXES
(a) Rate Reconciliation
Effective August 1, 2000, the Company adopted the liability method of tax allocation for income taxes. The consolidated financial statements for periods prior to this date have not been restated. The cumulative effect of adopting these recommendations was an increase in future tax liabilities and a reduction to retained earnings of $2.7 million.
TESMA 55
The provision for income taxes differs from the expense that would be obtained by applying Canadian statutory rates as a result of the following:
| |
| |
| |
Years ended July 31
| |
|---|
| | Year
ended
December 31
2003
| | Five-month
period ended
December 31
2002
| |
|---|
| | 2002
| | 2001
| |
|---|
| Canadian statutory income tax rate | | 37.0 | % | 39.0 | % | 40.0 | % | 42.9 | % |
| Manufacturing and processing profits deduction | | (3.4 | ) | (5.4 | ) | (6.2 | ) | (8.2 | ) |
| | |
| |
| |
| |
| |
| Expected income tax rate | | 33.6 | | 33.6 | | 33.8 | | 34.7 | |
Loss carryforwards and other future tax deductible amounts
recognized(i) | | (1.9 | ) | — | | — | | — | |
| Adjustments for enacted tax rate changes(ii) | | 1.0 | | (0.5 | ) | (0.5 | ) | — | |
| Losses not tax benefited in excess of (less than) losses utilized | | 1.5 | | 2.0 | | 1.3 | | (0.1 | ) |
| Foreign rate differentials | | (0.4 | ) | (0.8 | ) | (0.5 | ) | 0.7 | |
| Tax refunds on profit distributions(iii) | | — | | (6.0 | ) | — | | (7.7 | ) |
| Other | | (1.2 | ) | 2.6 | | 0.4 | | 1.0 | |
| | |
| |
| |
| |
| |
| Effective income tax rate | | 32.6 | % | 30.9 | % | 34.5 | % | 28.6 | % |
| | |
| |
| |
| |
| |
- (i)
- During the year ended December 31, 2003, the Company recognized $2.1 million as the benefit for income tax losses available for carryforward and other future tax deductible amounts (previously unrecognized) at one of our jointly-controlled entities. The recognition was a result of the entity establishing a record of profitability subsequent to the launch of its major program combined with projected future operating results (based on existing contracts, at existing and future contracted prices and cost structures) that are projected to generate more than sufficient taxable income to utilize these tax loss carryforwards and other future deductible amounts.
- (ii)
- In accordance with rules under Canadian and U.S. GAAP, at December 31, 2003, the Company recorded additional future tax expense of $1.1 million to reflect an increase in its future tax liabilities as a result of the substantively enacted increase in the Ontario tax rate, thereby increasing the combined federal and provincial corporate rate in Ontario from 33.6% to 34.5% beginning in January 1, 2004.
- (iii)
- During the five-month period ended December 31, 2002, the Company recognized $1.8 million in tax refunds realized by one of the Company's foreign subsidiaries as the final stage of prior year tax planning initiatives. In the year ended July 31, 2001, the Company recognized the full benefit of tax refunds totaling $6.2 million on dividends paid, and to be paid, out of two German subsidiaries. The refunds represented the recovery of taxes paid at higher rates in prior years through the payment of dividends before the end of calendar year 2001.
(b) Provision
The details of the income tax provision are as follows:
| |
| |
| |
Years ended July 31
| |
|---|
| | Year
ended
December 31
2003
| | Five-month
period ended
December 31
2002
| |
|---|
Results of Operations
| |
|---|
| | 2002
| | 2001
| |
|---|
(U.S. dollars in thousands)
| |
| |
| |
| |
| |
|---|
| Current provision (recovery) | | | | | | | | | | | | | |
| | Canadian federal taxes | | $ | 10,114 | | $ | 11,516 | | $ | 11,049 | | $ | 14,285 | |
| | Canadian provincial taxes | | | 4,157 | | | 6,164 | | | 6,853 | | | 7,830 | |
| | Foreign taxes(i) | | | 5,892 | | | (3,568 | ) | | 5,018 | | | 8,319 | |
| | |
| |
| |
| |
| |
| | | $ | 20,163 | | $ | 14,112 | | $ | 22,920 | | $ | 30,434 | |
| | |
| |
| |
| |
| |
| Future provision (recovery) | | | | | | | | | | | | | |
| | Canadian federal taxes | | $ | 9,255 | | $ | (4,192 | ) | $ | 2,961 | | $ | (2,071 | ) |
| | Canadian provincial taxes | | | 5,914 | | | (2,208 | ) | | 1,559 | | | (483 | ) |
| | Foreign taxes(i), (ii) | | | 586 | | | 1,537 | | | 785 | | | (4,613 | ) |
| | |
| |
| |
| |
| |
| | | $ | 15,755 | | $ | (4,863 | ) | $ | 5,305 | | $ | (7,167 | ) |
| | |
| |
| |
| |
| |
| | | $ | 35,918 | | $ | 9,249 | | $ | 28,225 | | $ | 23,267 | |
| | |
| |
| |
| |
| |
- (i)
- Included in the December 31, 2002 current foreign tax recovery and the July 31, 2001 future tax recovery are tax refunds referred to in Note 9(a)(iii).
- (ii)
- Included in the future tax provision for foreign entities for the five-month period ended December 31, 2002 is a $3.6 million recovery consisting of book depreciation (including impairment charges) in excess of tax depreciation recognized as part of the write-down of certain long-lived assets to their fair value for accounting purposes as described in Note 6.
56 TESMA
(c) Future Provision (Recovery)
Future income taxes have been provided (recovered) on temporary differences which consist of the following:
|
|
|
|
|
|
Years ended July 31
|
|
|---|
| | Year
ended
December 31
2003
| | Five-month
period ended
December 31
2002
| |
|---|
| | 2002
| | 2001
| |
|---|
(U.S. dollars in thousands)
| |
| |
| |
| |
| |
|---|
| Tax deferred income | | $ | 14,018 | | $ | (5,038 | ) | $ | 3,431 | | $ | (709 | ) |
| Increase (reduction) for changes in enacted tax rates(Note 9(a)(ii)) | | | 1,101 | | | (146 | ) | | (427 | ) | | — | |
Book depreciation (in excess of) less than tax depreciation
(Note 9(b)(ii)) | | | 534 | | | (3,957 | ) | | (96 | ) | | 301 | |
Book amortization of deferred preproduction costs in excess
of tax basis | | | (351 | ) | | (120 | ) | | (290 | ) | | (305 | ) |
| Tax refunds on profit distributions | | | — | | | 4,506 | | | 2,232 | | | (6,179 | ) |
| Other | | | 453 | | | (108 | ) | | 455 | | | (275 | ) |
| | |
| |
| |
| |
| |
| | | $ | 15,755 | | $ | (4,863 | ) | $ | 5,305 | | $ | (7,167 | ) |
| | |
| |
| |
| |
| |
(d) Future Tax Assets and Liabilities
Future tax assets and liabilities consist of the following:
| | 2003
| | 2002
|
|---|
(U.S. dollars in thousands)
| |
| |
|
|---|
| Current future tax assets | | | | | | |
| | Loss carryforwards(Note 9(a)(i)) | | $ | 635 | | $ | — |
| | Share issue costs | | | 219 | | | 190 |
| | Other | | | 125 | | | — |
| | |
| |
|
| | | $ | 979 | | $ | 190 |
| | |
| |
|
| Long-term future tax assets | | | | | | |
| | Tax depreciation in excess of book depreciation(Note 9(a)(i)) | | $ | 1,209 | | $ | — |
| | Share issue costs | | | 389 | | | 450 |
| | Other | | | 236 | | | — |
| | |
| |
|
| | | $ | 1,834 | | $ | 450 |
| | |
| |
|
| Current future tax liabilities | | | | | | |
| | Tax deferred income(i) | | $ | 16,505 | | $ | — |
| | Net preproduction costs book value in excess of tax value | | | 30 | | | 288 |
| | Tax depreciation in excess of book depreciation | | | — | | | 245 |
| | Other | | | 261 | | | 123 |
| | |
| |
|
| | | $ | 16,796 | | $ | 656 |
| | |
| |
|
| Long-term future tax liabilities | | | | | | |
| | Tax depreciation in excess of book depreciation | | $ | 9,002 | | $ | 6,118 |
| | Tax deferred income(i) | | | 7,113 | | | 5,573 |
| | Net preproduction costs book value in excess of tax value | | | — | | | 24 |
| | Other | | | 1,987 | | | 3,129 |
| | |
| |
|
| | | $ | 18,102 | | $ | 14,844 |
| | |
| |
|
| Net future income tax liabilities | | $ | 32,085 | | $ | 14,860 |
| | |
| |
|
TESMA 57
- (i)
- Due to the Company's change in its fiscal year end from July 31 to December 31 in 2002, certain temporary differences were reclassified to current income taxes payable at December 31, 2002 due to the shortened five-month period. Similar temporary differences that arose subsequent to August 1, 2002, have been recorded as future tax liabilities consistent with the treatment in prior periods.
(e) Taxes Paid
Income taxes paid in cash were $31.5 million for the year ended December 31, 2003 [five-month period ended December 31, 2002 — $10.1 million; years ended July 31, 2002 — $24.8 million; 2001 — $30.5 million].
(f) Loss Carryforwards
At December 31, 2003, certain subsidiaries of the Company have tax loss carryforwards, in various jurisdictions, of approximately $35.9 million. Of these losses, $26.6 million have no expiry date and $9.3 million expire between 2006 and 2009. The tax benefits of $34.3 million of these losses have not been recognized in the consolidated financial statements.
NOTE 10. DEBT
(a) Long-Term Debt
The Company's long-term debt consists of the following:
| | 2003
| | 2002
|
|---|
(U.S. dollars in thousands)
| |
| |
|
|---|
| 6.22% Senior Unsecured Notes(Note 10(b)) | | $ | 46,512 | | $ | 38,256 |
| Bank-term debt(Note 10(c)) | | | 18,058 | | | 8,759 |
| Obligations under capital leases(Note 10(d)) | | | 1,457 | | | 1,645 |
| Other | | | 771 | | | 704 |
| | |
| |
|
| | | | 66,798 | | | 49,364 |
| Less amounts due within one year | | | 3,919 | | | 1,799 |
| | |
| |
|
| | | $ | 62,879 | | $ | 47,565 |
| | |
| |
|
(b) 6.22% Senior Unsecured Notes
The $46.5 million (CDN $60 million) [December 31, 2002 — $38.3 million (CDN $60 million)] 6.22% Senior Unsecured Notes (the Notes) are due May 25, 2006. These Notes require the Company to maintain certain covenants and are denominated in Canadian dollars.
(c) Bank-Term Debt
Bank-term debt consists of amounts originally denominated in the following currencies or legacy currencies:
| | Final maturity
| | Weighted
average
interest rate
| | 2003
| | 2002
|
|---|
(U.S. dollars in thousands)
| |
| |
| |
| |
|
|---|
| Austrian schillings(i) | | 2009 | | 1.95% | | $ | 10,388 | | $ | 6,579 |
| Euros(ii) | | 2008 - 2012 | | 2.15% | | | 5,573 | | | — |
| German deutschmarks(iii) | | 2004 - 2007 | | 6.65% | | | 1,317 | | | 1,320 |
| Other | | 2008 | | 3.80% | | | 780 | | | 860 |
| | | | | | |
| |
|
| | | | | | | $ | 18,058 | | $ | 8,759 |
| | | | | | |
| |
|
- (i)
- Austrian Schillings
Under a banking arrangement which was conditional on the attainment of certain employment and capital expenditure requirements, at December 31, 2003, long-term debt of $10.4 million (€8.3 million) [December 31, 2002 — $6.4 million (€6.2 million)] has been advanced under potential lines totaling $18.3 million (€14.5 million) as conditions required for drawing further funds under this arrangement have not been satisfied. Interest is currently payable at a fixed rate of 1.95%. The loan is repayable in equal semi-annual installments beginning July 1, 2003 and expiring on January 1, 2009. A portion of the loan is collateralized by land and buildings of certain subsidiaries.
58 TESMA
- (ii)
- Euros
At December 31, 2003, bank-term debt of $5.6 million (€4.4 million) has been advanced under total lines of $5.6 million (€4.4 million). Interest is currently payable at a fixed rate of 1.5% and floating rates between 3.41% and 3.61%. The principal amounts are repayable by semi-annual installments. This debt is collateralized by land and building of certain subsidiaries and jointly-controlled entities.
- (iii)
- German Deutschmarks
At December 31, 2003, bank-term debt of $1.3 million (€1.0 million) [December 31, 2002 — $1.3 million (€1.3 million)] has been advanced under total lines of $1.3 million (€1.0 million) [December 31, 2002 –$1.3 million (€1.3 million)]. Interest is currently payable at fixed rates ranging from 6.50% to 7.32%. The principal amounts are repayable at various intervals over the next four years. This debt is collateralized by land, building and specific assets of certain subsidiaries.
(d) Obligations Under Capital Leases
Obligations under capital leases consists of amounts originally denominated in the following currencies or legacy currencies:
| | Final maturity
| | Weighted
average
interest rate
| | 2003
| | 2002
|
|---|
(U.S. dollars in thousands)
| |
| |
| |
| |
|
|---|
| U.S. dollars | | 2004 | | 8.50% | | $ | 669 | | $ | 1,028 |
| German deutschmarks | | 2005 | | 5.75% | | | 492 | | | 604 |
| Euro(i) | | 2006-2008 | | 5.35% | | | 296 | | | — |
| Korean won | | | | 12.80% | | | — | | | 13 |
| | | | | | |
| |
|
| | | | | | | $ | 1,457 | | $ | 1,645 |
| | | | | | |
| |
|
- (i)
- Interest is payable at floating rates currently ranging from 5.06% to 5.83%.
(e) Principal Repayments
Future annual principal repayments on long-term debt are estimated to be as follows for the years ending December 31:
| (U.S. dollars in thousands) | | | |
| 2004 | | $ | 3,919 |
| 2005 | | | 3,287 |
| 2006 | | | 50,114 |
| 2007 | | | 3,370 |
| 2008 | | | 3,238 |
| Thereafter | | | 2,870 |
| | |
|
| | | $ | 66,798 |
| | |
|
(f) Bank Indebtedness
- (i)
- The Company has an unsecured $38.8 million (CDN $50 million) operating line of credit bearing interest at variable rates per annum not exceeding the bank's prime rate of interest. At December 31, 2003, the Company had outstanding letters of credit in the amount of $0.5 million drawn under this line of credit and $38.3 million of this line was unused and available. The related credit agreement requires the Company to maintain certain covenants. The Company also has foreign exchange facilities in the amount of $23.3 million (see Note 14(a)).
- (ii)
- One of the Company's jointly-controlled entities has an unsecured $11.6 million (CDN $15 million) operating line of credit bearing interest at variable rates per annum not exceeding the bank's prime rate of interest all of which was unused and available at December 31, 2003. The related credit agreement provides for the maintenance of certain financial ratios. This jointly-controlled entity also has a foreign exchange facility in the amount of $50 million (see Note 14(a)) and one of its subsidiaries has unsecured demand lines of credit totaling $3.1 million (€2.5 million), all of which were unused and available at December 31, 2003. Interest is payable at a negotiated interest rate based on the European Central Bank's (the ECB) leading interest rate.
TESMA 59
- (iii)
- The Company has various operating lines of credit for its European subsidiaries denominated in euros, or legacy currencies, totaling $22.6 million (€17.9 million). At December 31, 2003, $17.7 million was drawn on these lines while $4.9 million remains unused and available. Interest on the Austrian operating lines of credit is currently payable at negotiated interest rates based on either the Austrian Control Bank Corporation interest rate or the Euribor, as well as floating rates based on Euribor plus a margin ranging from 0.70% to 1.63%. Interest on German operating lines of credit is payable at negotiated interest rates based on the Euribor and the leading interest rates of the ECB. Interest on the Austrian lines of credit is payable at a fixed rate of 6.4%, floating rates based on Euribor plus 0.38% and a negotiated interest rate based on the Austrian National Bank interest rate for operating lines of credit. Accounts receivable and certain assets of the related subsidiaries have been pledged as collateral under these lines of credit.
- (iv)
- The Company's South Korean subsidiary has various operating lines of credit, denominated primarily in Korean won, of $28.7 million (34.4 billion won). At December 31, 2003, $13.3 million of these lines were unused and available. Interest is payable at negotiated variable rates currently ranging from 5.5% to 8.4%, based on prime and daily best lending rates, which are adjusted at periodic intervals. Certain assets of this subsidiary have been pledged as collateral under certain of these lines of credit.
(g) Interest, net
Net interest expense (income) includes:
|
|
|
|
|
|
Years ended July 31
|
|
|---|
| | Year
ended
December 31
2003
| | Five-month
period ended
December 31
2002
| |
|---|
| | 2002
| | 2001
| |
|---|
(U.S. dollars in thousands)
| |
| |
| |
| |
| |
|---|
| Interest on long-term debt | | $ | 3,189 | | $ | 1,142 | | $ | 2,956 | | $ | 3,129 | |
| Other interest income, net — external | | | (3,397 | ) | | (834 | ) | | (418 | ) | | (2,098 | ) |
| Interest expense — Magna | | | | | | | | | | | | | |
| | International Inc. (Magna) | | | 4 | | | 8 | | | 18 | | | 73 | |
| | |
| |
| |
| |
| |
| Interest, net | | $ | (204 | ) | $ | 316 | | $ | 2,556 | | $ | 1,104 | |
| | |
| |
| |
| |
| |
Net interest received in cash was $0.2 million for the year ended December 31, 2003. Net interest paid in cash was $0.6 million for the five-month period ended December 31, 2002 [years ended July 31, 2002 — $2.5 million; July 31, 2001 — $1.2 million].
NOTE 11. POST-RETIREMENT MEDICAL BENEFITS
The Company provides a post-retirement medical benefits plan covering eligible employees and retirees. Retirees sixty years of age or older with ten or more years of service are eligible for benefits. In addition, existing retirees as at the date of plan implementation who meet the above criteria are also eligible for benefits. Benefits are capped based on years of service.
The cost of benefits earned by employees is actuarially determined using the projected benefit method prorated based on service and on management's best estimate of compensation increases, retirement ages of employees, future termination levels and expected returns on plan assets.
The significant actuarial assumptions adopted in measuring the Company's projected benefit obligations are as follows:
|
|
|
|
|
|
Years ended July 31
|
|---|
| | Year
ended
December 31
2003
| | Five-month
period ended
December 31
2002
|
|---|
| | 2002
| | 2001
|
|---|
| Discount rate | | 6.0% | | 6.8% | | 6.8% | | 7.5% |
| Rate of compensation increase | | 4.0% | | 4.0% | | 4.0% | | 4.0% |
| | |
| |
| |
| |
|
60 TESMA
(a) Projected Benefit Obligation
The projected benefit obligation and the net amount included in accrued salaries and wages in the consolidated balance sheets, are calculated as follows:
| | 2003
| | 2002
| |
|---|
(U.S. dollars in thousands)
| |
| |
| |
|---|
| Balance, beginning of period | | $ | 1,708 | | $ | 1,642 | |
| Current service costs | | | 217 | | | 76 | |
| Interest costs on projected benefit obligation | | | 129 | | | 47 | |
| Actuarial (gains) losses and changes in actuarial assumptions | | | 367 | | | (73 | ) |
| Benefits paid | | | (11 | ) | | (3 | ) |
| Currency translation | | | 209 | | | 19 | |
| | |
| |
| |
| Unfunded obligation | | | 2,619 | | | 1,708 | |
| Unrecognized past service costs | | | (1,243 | ) | | (1,181 | ) |
| Unrecognized actuarial gains (losses) | | | (148 | ) | | 196 | |
| | |
| |
| |
| Net amount recognized in the consolidated balance sheet | | $ | 1,228 | | $ | 723 | |
| | |
| |
| |
(b) Net Periodic Cost
The calculation of net periodic cost is as follows:
|
|
|
|
|
|
Years ended July 31
|
|
|---|
| | Year
ended
December 31
2003
| | Five-month
period ended
December 31
2002
| |
|---|
| | 2002
| | 2001
| |
|---|
(U.S. dollars in thousands)
| |
| |
| |
| |
| |
|---|
| Current service costs | | $ | 217 | | $ | 76 | | $ | 140 | | $ | 133 | |
| Interest costs on projected benefit obligation | | | 129 | | | 47 | | | 90 | | | 84 | |
| Amortization of past service costs | | | 83 | | | 31 | | | 75 | | | 77 | |
| Amortization of experience gains | | | — | | | — | | | (10 | ) | | (3 | ) |
| | |
| |
| |
| |
| |
| | | $ | 429 | | $ | 154 | | $ | 295 | | $ | 291 | |
| | |
| |
| |
| |
| |
NOTE 12. CAPITAL STOCK
(a) Class A Subordinate Voting Shares and Class B Shares
Class A Subordinate Voting Shares without par value (unlimited amount authorized) have the following attributes:
- •
- Each share is entitled to one vote per share at all meetings of shareholders; and,
- •
- Each share shall participate equally as to cash dividends with each Class B Share.
Class B Shares without par value (unlimited amount authorized) have the following attributes:
- •
- Each share is entitled to 10 votes per share at all meetings of shareholders;
- •
- Each share shall participate equally as to cash dividends with each Class A Subordinate Voting Share; and,
- •
- Each share may be converted at any time into fully-paid Class A Subordinate Voting Shares on a one-for-one basis.
In the event that either the Class A Subordinate Voting Shares or the Class B Shares are subdivided or consolidated, the other class shall be similarly changed to preserve the relative number of shares in each class.
TESMA 61
Outstanding Class A Subordinate Voting Shares and Class B Shares included in shareholders' equity of the Company consist of:
| | Class A Subordinate Voting Shares
| | Class B Shares
|
|---|
| | Number of shares
| | Consideration
| | Number of shares
| | Consideration
|
|---|
(U.S. dollars in thousands, except number of shares)
| |
| |
| |
| |
|
|---|
| Balance, July 31, 2000 | | 14,899,779 | | $ | 132,094 | | 14,223,900 | | $ | 1,894 |
| Exercise of incentive stock options(Note 12(b)) | | 142,600 | | | 1,186 | | — | | | — |
| | |
| |
| |
| |
|
| Balance, July 31, 2001 | | 15,042,379 | | | 133,280 | | 14,223,900 | | | 1,894 |
Issuance of Class A Subordinate Voting Shares through
public offering(i) | | 2,850,000 | | | 62,777 | | — | | | — |
| Exercise of incentive stock options(Note 12(b)) | | 182,400 | | | 1,387 | | — | | | — |
| | |
| |
| |
| |
|
| Balance, July 31, 2002 | | 18,074,779 | | | 197,444 | | 14,223,900 | | | 1,894 |
| Exercise of incentive stock options(Note 12(b)) | | 35,650 | | | 257 | | — | | | — |
| | |
| |
| |
| |
|
| Balance, December 31, 2002 | | 18,110,429 | | | 197,701 | | 14,223,900 | | | 1,894 |
| Exercise of incentive stock options(Note 12(b)) | | 30,000 | | | 549 | | — | | | — |
| | |
| |
| |
| |
|
| Balance, December 31, 2003 | | 18,140,429 | | $ | 198,250 | | 14,223,900 | | $ | 1,894 |
| | |
| |
| |
| |
|
- (i)
- On July 18, 2002, the Company completed a public offering of Class A Subordinate Voting Shares. The details of the proceeds from the offering are as follows:
| (U.S. dollars in thousands) | | | | |
| Total proceeds on issue of 2,850,000 shares at CDN $35.15 | | $ | 64,707 | |
| Underwriters' fee | | | (2,588 | ) |
| Other expenses of the issue | | | (257 | ) |
| Tax savings in respect of the above fee and expenses | | | 915 | |
| | |
| |
| Net proceeds | | $ | 62,777 | |
| | |
| |
(b) Incentive Stock Option Plan
Under the Company's amended and restated Incentive Stock Option Plan, the Company may grant options to purchase Class A Subordinate Voting Shares to present and future officers, directors and other full-time employees or consultants of the Company. During fiscal 2003, following approval by the Company's Board of Directors, shareholders and other regulatory authorities, the maximum number of shares reserved to be issued for stock options was increased from three million Class A Subordinate Voting Shares to four million. The number of unoptioned shares available to be reserved at December 31, 2003 was 746,500 [December 31, 2002 — 10,000].
All options granted are for a term not exceeding ten years from the date of grant. In general, management options vest 20% on the date of grant, 20% on the first day of the fiscal year or period subsequent to the year of grant, and 20% on each anniversary thereafter. In addition, directors' options generally vest 50% on the date of grant and 50% on August 1 of the following year. The 300,000 options granted to Stronach & Co. (S & Co) vested 162/3% on October 25, 2000 and will vest 162/3% on each of the following five anniversaries of this date. All options allow the holder to purchase Class A Subordinate Voting Shares at a price equal to or greater than the market price of such shares at the date of grant.
62 TESMA
The following is the continuity schedule of the options outstanding:
| | Number of options
| | Range of exercise price
| | Options exercisable
| | Weighted average exercisable
|
|---|
(Share prices in Canadian dollars)
| |
| |
| |
| |
|
|---|
| Balance, July 31, 2001 | | 1,433,400 | | $ | 10.50 – $29.40 | | 624,000 | | $ | 21.89 |
| Exercised | | (182,400 | ) | $ | 10.50 – $26.00 | | (182,400 | ) | $ | 12.03 |
| Vested | | | | | | | 240,600 | | | |
| | |
| |
| |
| |
|
| Balance, July 31, 2002 | | 1,251,000 | | $ | 10.50 – $29.40 | | 682,200 | | $ | 23.33 |
| Granted | | 44,500 | | $ | 31.74 | | | | $ | 31.74 |
| Exercised | | (35,650 | ) | $ | 10.50 – $26.00 | | (35,650 | ) | $ | 11.22 |
| Expired | | (10,000 | ) | $ | 26.00 | | (10,000 | ) | $ | 26.00 |
| Vested | | | | | | | 201,000 | | | |
| | |
| |
| |
| |
|
| Balance, December 31, 2002 | | 1,249,850 | | $ | 10.50 – $31.74 | | 837,550 | | $ | 23.96 |
| Granted | | 275,000 | | $ | 28.80 | | | | $ | 28.80 |
| Exercised | | (30,000 | ) | $ | 17.25 – $26.00 | | (30,000 | ) | $ | 24.63 |
| Expired | | (11,500 | ) | $ | 19.00 – $26.00 | | (11,500 | ) | $ | 25.09 |
| Vested | | | | | | | 243,500 | | | |
| | |
| |
| |
| |
|
| Balance, December 31, 2003 | | 1,483,350 | | $ | 10.50 – $31.74 | | 1,039,550 | | $ | 23.50 |
| | |
| |
| |
| |
|
The following table summarizes the outstanding and exercisable options held by directors, officers, employees and S & Co at December 31, 2003:
| | Options outstanding
| |
|
|---|
| | Exercise price
| | Number of options
| | Remaining contractual life (years)
| | Number of options exercisable
|
|---|
(Share prices in Canadian dollars)
| |
| |
| |
| |
|
|---|
| | | $ | 10.50 | | | 80,000 | | 1.6 | | | 80,000 |
| | | $ | 10.50 | | | 60,000 | | 2.6 | | | 60,000 |
| | | $ | 17.25 | | | 62,000 | | 4.6 | | | 62,000 |
| | | $ | 19.00 | | | 54,000 | | 5.6 | | | 54,000 |
| | | $ | 21.70 | | | 10,000 | | 3.6 | | | 10,000 |
| | | $ | 22.50 | | | 60,000 | | 3.6 | | | 60,000 |
| | | $ | 26.00 | | | 405,350 | | 6.6 | | | 328,750 |
| | | $ | 26.45 | | | 300,000 | | 6.6 | | | 200,000 |
| | | $ | 28.80 | | | 275,000 | | 9.0 | | | 55,000 |
| | | $ | 29.40 | | | 132,500 | | 6.6 | | | 106,000 |
| | | $ | 31.74 | | | 44,500 | | 8.6 | | | 23,800 |
| | | | | | | 1,483,350 | | | | | 1,039,550 |
| | | | | |
| | | |
|
| Weighted average exercise price | | | | | $ | 24.83 | | | | $ | 23.50 |
| | | | | |
| | | |
|
| Weighted average remaining contractual life, in years | | | | | | 6.4 | | | | | 5.7 |
| | | | | |
| | | |
|
As fully described in Note 1(p), the Company adopted the new rules under CICA 3870 which require that all stock-based compensation transactions be accounted for at fair value. The Company determines the total estimated fair value of each tranche of stock options as at the date of grant and then records compensation expense, on an amortized basis, over the applicable vesting periods of the underlying stock options. As such, at each reporting date, cumulative compensation expense will be recognized for each tranche of stock options to the extent that they are vested as at that date.
TESMA 63
The Company elected to adopt the amendments to CICA 3870 early and to apply them on a retroactive basis to stock-based awards granted on or after August 1, 2002, the date the Company was initially required to adopt CICA 3870. As a result, during the current year ended December 31, 2003 and the comparative five-month period ended December 31, 2002, the Company recorded compensation expense totaling $0.5 million and $0.1 million, respectively. The costs were recorded as selling, general and administrative expenses with a corresponding increase to contributed surplus. The balance of contributed surplus related to stock compensation is as follows:
| | 2003
| | 2002
|
|---|
(U.S. dollars in thousands)
| |
| |
|
|---|
| Balance, beginning of period | | $ | 79 | | $ | — |
| Compensation expense | | | 493 | | | 79 |
| | |
| |
|
| Balance, end of period | | $ | 572 | | $ | 79 |
| | |
| |
|
Upon future exercises of the underlying stock options recorded at fair value (i.e. those issued on or after August 1, 2002), the Company will record a reduction to the accumulated balance of contributed surplus and will record a corresponding increase in the value attributed to the Class A Subordinate Voting Shares issued on the exercise of these stock options.
The Company records compensation expense by estimating the fair value of stock options at the date of grant using the Black Scholes option pricing model. The Black Scholes option valuation model used by the Company to determine fair values, along with other currently accepted option valuation models, was developed for use in estimating the fair value of freely traded options which are fully transferable and have no vesting restrictions. In addition, this model requires the input of highly subjective assumptions, including future stock volatility and expected time until exercise. Management believes that the estimates utilized in this model are reasonable for the purpose of estimating and recording compensation expense at fair value.
The weighted average fair value of options granted during the year and the weighted average assumptions used in determining the fair value of options on the date of grant were as follows:
Options Granted
| | August
2003
| | August
2002
| |
|---|
(U.S. dollars in thousands)
| |
| |
| |
|---|
| Expected volatility | | | 29.0 | % | | 24.2 | % |
| Risk-free interest rate | | | 4.0 | % | | 4.5 | % |
| Expected dividend yield | | | 2.2 | % | | 2.0 | % |
| Expected life of options (years) | | | 5 | | | 5 | |
| Weighted average fair value of options granted | | $ | 7.34 | | $ | 7.47 | |
| | |
| |
| |
(c) Non-Employee Director Share-Based Compensation Plan
Under this plan, established during fiscal 2000, non-employee directors can elect to receive a portion of their annual retainers and other Board-related compensation in the form of deferred share units (DSUs) which are credited to the director's account, and the Company records a liability. The number of DSUs issued is based upon the market value of the Company's shares at each allocation date. One DSU has a cash value equal to the market price of one of the Company's Class A Subordinate Voting Shares. Within a specified time after retirement, non-employee directors receive a cash payment equal to the market value of their DSUs. During the year ended December 31, 2003, $0.4 million was recorded as compensation expense (including foreign exchange and revaluation of the DSUs to their fair values at December 31, 2003) and $0.1 million was paid out under this plan [$nil expensed and $0.1 million paid out under this plan in the five-month period ended December 31, 2002]. At December 31, 2003, there were 28,265 DSUs [December 31, 2002 — 19,551] having a total value of $0.6 million [December 31, 2002 — $0.3 million] that were issued and outstanding.
64 TESMA
(d) Maximum Number of Shares
The following table presents the maximum number of shares that would be outstanding if all of the options outstanding at December 31, 2003 were exercised:
| | Number of shares
|
|---|
| Class A Subordinate Voting Shares outstanding at December 31, 2003 | | 18,140,429 |
| Class B Shares outstanding at December 31, 2003 | | 14,223,900 |
| Options to purchase Class A Subordinate Voting Shares | | 1,483,350 |
| | |
|
| | | 33,847,679 |
| | |
|
NOTE 13. EARNINGS PER CLASS A SUBORDINATE VOTING SHARE OR CLASS B SHARE
The following table presents the reconciliation from the weighted average number of Class A Subordinate Voting Shares and Class B Shares outstanding to the weighted average number of these shares outstanding on a diluted basis:
|
|
|
|
|
|
Years ended July 31
|
|---|
| | Year
ended
December 31
2003
| | Five-month
period ended
December 31
2002
|
|---|
| | 2002
| | 2001
|
|---|
(in thousands)
| |
| |
| |
| |
|
|---|
| Average number of Class A Subordinate | | | | | | | | |
| | Voting Shares and Class B Shares outstanding during the period | | 32,344 | | 32,300 | | 29,454 | | 29,214 |
| Effect of dilutive securities: | | | | | | | | |
| | Stock options to purchase Class A Subordinate Voting Shares | | 187 | | 213 | | 375 | | 344 |
| | |
| |
| |
| |
|
Average number of Class A Subordinate Voting Shares and
Class B Shares outstanding during the period on a diluted basis | | 32,531 | | 32,513 | | 29,829 | | 29,558 |
| | |
| |
| |
| |
|
For the year ended December 31, 2003, there were options to purchase 44,500 and 275,000 Class A Subordinate Voting Shares at an exercise price of $31.74 and $28.80, respectively, per share [five-month period ended December 31, 2002 — 44,500 at $31.74 per share] that were outstanding and not included in the computation of diluted earnings per Class A Subordinate Voting Share or Class B Share because their impact was antidilutive. All options to purchase Class A Subordinate Voting Shares outstanding during the years ended July 31, 2002 and July 31, 2001 have been considered in the computation of diluted earnings per Class A Subordinate Voting Share or Class B Share because their impact was dilutive.
NOTE 14. FINANCIAL INSTRUMENTS
(a) Foreign Exchange Contracts and Other Hedging Instruments
- (i)
- Foreign Currency Hedges
The Company operates globally, which gives rise to a risk that its earnings and cash flows may be adversely impacted by fluctuations in foreign exchange. The Company utilizes foreign exchange forward contracts to manage foreign exchange risk from its underlying customer contracts. In particular, the Company uses foreign exchange forward contracts for the sole purpose of hedging a significant portion of projected currency inflows and outflows, which differ from an operation's functional currency. These consist primarily of U.S. dollar, euro and Korean won-denominated contractual commitments to deliver products to the Company's customers or buy products from suppliers to the Company's Canadian operations in addition to other anticipated transactions expected to be settled in foreign currencies. The Company does not enter into foreign exchange contracts for speculative purposes.
TESMA 65
At December 31, 2003, the Company had outstanding foreign exchange forward contracts representing a commitment to sell approximately $61.1 million and €148.6 million, at weighted average rates of exchange of CDN $1.58 and CDN $1.62, respectively, and to buy approximately $72.0 million and €15.3 million at weighted average rates of exchange of CDN $1.47 and CDN $1.39, respectively. These contracts mature over the next five years as follows:
| | For Canadian dollars
|
|---|
| | U.S. dollars amount
| | Weighted average rate
| | Euros amount
| | Weighted average rate
|
|---|
(Amounts in millions, except rates)
| |
| |
| |
| |
|
|---|
| 2004 | | U.S. $(23.4 | ) | 1.55 | | €(41.3 | ) | 1.60 |
| 2004 | | 52.8 | | 1.47 | | 6.9 | | 1.38 |
| 2005 | | (15.5 | ) | 1.59 | | (37.2 | ) | 1.62 |
| 2005 | | 14.4 | | 1.45 | | 5.7 | | 1.40 |
| 2006 | | (13.8 | ) | 1.60 | | (29.9 | ) | 1.64 |
| 2006 | | 4.8 | | 1.57 | | 2.7 | | 1.42 |
| 2007 | | (8.4 | ) | 1.60 | | (23.2 | ) | 1.64 |
| 2008 | | — | | — | | (17.0 | ) | 1.65 |
| | |
| |
| |
| |
|
| | | U.S. $10.9 | | | | €(133.3 | ) | |
| | |
| |
| |
| |
|
At December 31, 2003, the Company also had outstanding foreign-exchange contracts representing a commitment to purchase approximately 4.2 billion Korean won in each of the years ending December 31, 2004 and 2005 at weighted average rates of exchange of CDN $0.001104 and CDN $0.001102, respectively.
The fair values of foreign exchange forward contracts represent an approximation of the amounts the Company would have paid to, or received from, counterparties to unwind its positions at December 31, 2003. The fair value of the Company's net benefit for all foreign exchange forward contracts at December 31, 2003 was approximately $5.1 million [December 31, 2002 — $4.5 million]. If these contracts ceased to be effective as hedges (i.e., if the related projected cash flows changed significantly), previously unrecognized gains or losses pertaining to the portion of the hedging transactions in excess of projected foreign denominated cash flows would be recognized in income at the time this condition was identified.
- (ii)
- Other Financial Instruments
The Company, through one of its jointly-controlled entities, has outstanding foreign-exchange options that require it to sell €1.5 million at a weighted average rate of U.S. $0.92. The fair value of these options at December 31, 2003 is approximately $1.9 million which is $0.5 million lower than the carrying value at December 31, 2002 [December 31, 2002 — $0.3 million lower]. Due to the fact these options do not qualify as part of an effective hedging relationship, the Company recorded a $0.5 million charge against earnings in the year ended December 31, 2003 [five-month period ended December 31, 2002 — $0.3 million]. The charge has been included in selling, general and administrative expenses.
To manage the electricity cost volatility that may arise since the Ontario, Canada hydro-electricity market was deregulated in May 2002, the Company entered into electricity swap contracts to purchase approximately 131,000 mega-watt hours (MWH) of electricity over a three-year period with a weighted average rate of CDN $53.80 per MWH at the inception of the contracts. The swaps remaining at December 31, 2003 have an annual notional energy volume of 45,397 MWH for which the Company pays a fixed average price of CDN $55.74 per MWH and receives a floating average price per MWH based on the hourly Ontario energy price. The net settlements under the electricity swap contracts are recognized in the same period as, and are part of, the hedged transactions. The Company does not enter into electricity supply contracts for speculative purposes. At December 31, 2003, the mark-to-market fair value of this contact was not significant.
66 TESMA
(b) Fair Value
The Company has determined the estimated values of its financial instruments based on appropriate valuation methodologies. However, considerable judgment is required to develop these estimates. Accordingly, these estimated values are not necessarily indicative of the amounts the Company could realize in a current market exchange. The estimated fair value amounts can be materially affected by the use of different assumptions or methodologies. The methods and assumptions used to estimate the fair value of each class of financial instruments are discussed below.
Short-term financial assets and liabilities, including cash and cash equivalents, accounts receivable, bank indebtedness, accounts payable, accrued liabilities and income taxes payable or recoverable, are valued at their carrying amounts as presented in the consolidated balance sheets. The carrying values of the amounts are reasonable estimates of fair value due to the short period to maturity of these financial instruments, except for the obligation for the post-retirement medical benefits plan for which the actuarially determined obligation exceeds the carrying value by $1.4 million as described in Note 11(a).
Fair value information is not readily available for the Company's long-term monetary assets included in other assets. However, management believes the market value of these assets approximates their carrying value.
Rates currently available to the Company for long-term debt, with similar terms and remaining maturities have been used to estimate the fair value of the long-term debt, which approximates the carrying value for all years, except for the $46.5 million (CDN $60 million) 6.22% Senior Unsecured Notes which had a fair value of approximately $48.1 million (CDN $62 million) at December 31, 2003 [December 31, 2002 — $40.2 million (CDN $63 million)].
The Company enters into foreign exchange forward contracts to manage foreign currency risk. If the Company did not use forward contracts, its exposure to financial risks would be higher. The Company does not enter into forward contracts for speculative purposes. The fair values of foreign exchange forward contracts represent an approximation of the amounts that the Company would have paid to or received from counter-parties to unwind its positions prior to maturity. The fair value of the Company's net benefit for all foreign exchange forward contracts, none of which is recorded, is discussed in Note 14(a).
(c) Credit Risk
The Company's financial assets that are exposed to credit risk consist primarily of cash and cash equivalents, accounts receivable (including long-term receivables), escrow deposits and foreign exchange forward contracts with positive fair values.
The Company, in the normal course of business, is exposed to credit risk from its customers substantially all of which are in the automotive industry. These accounts receivable are subject to normal industry credit risks particular to each geographic region in which the Company operates.
Cash and cash equivalents and escrow deposits consist of short-term investments, including bonds, commercial paper and certified deposits with original or remaining maturities of three months or less. The Company limits its exposure to credit risk by investing in bonds and commercial paper of governments and corporations with a minimum credit rating of R1 (low) from the Dominion Bond Rating Service (DBRS) or its equivalent in the United States, and further limits the amount to be invested at this minimum credit rating level to 15% or less of the total invested in these instruments at any time. In addition, the Company deals with banks or financial institutions with a minimum Financial Strength Rating of A from Standard & Poor's or its equivalent. Credit risk is further reduced by limiting the amount which is invested in any one government or corporation.
The Company is also exposed to credit risk from the potential default by any of its counterparties on its foreign exchange forward contracts. The Company mitigates this credit risk by generally dealing only with counterparties which are banks with a minimum credit rating of A from Standard & Poor's or its equivalent, and which are included on an authorized list of counterparties maintained by the Company. The Company also monitors its relative positions with each counterparty. At December 31, 2003, the maximum credit risk, based on the theoretical amount and the term and exchange rates, amounts to approximately $20.0 million. This risk is divided among six financial institutions. The Company does not anticipate non-performance of their contractual obligations by any of the counterparties.
TESMA 67
(d) Interest Rate Risk
The following table summarizes the Company's exposure to interest rate risk as at December 31, 2003:
| |
| | Fixed interest rate maturing in
| |
| |
| |
|---|
| | Floating rate
| | 1 year or less
| | 1 to 5 years
| | More than 5 years
| | Non-interest bearing
| | Total
| |
|---|
(U.S. dollars in thousands, except rates)
| |
| |
| |
| |
| |
| |
| |
|---|
| Financial assets | | | | | | | | | | | | | | | | | | | |
| | Cash | | $ | 163,255 | | | | | | | | | | | | | | $ | 163,255 | |
| | Accounts receivable | | | | | | | | | | | | | | $ | 193,160 | | | 193,160 | |
| | Escrow deposit | | | 44,635 | | | | | | | | | | | | | | | 44,635 | |
| | Other assets | | | 84 | | $ | 47 | | | | | | | | | 2,234 | | | 2,365 | |
Financial liabilities |
|
|
|
|
|
|
|
|
|
|
|
|
|
|
|
|
|
|
|
| | Bank indebtedness | | | (40,756 | ) | | | | | | | | | | | | | | (40,756 | ) |
| | Accounts payable and all other accrued
liabilities and payables | | | | | | | | | | | | | | | (164,065 | ) | | (164,065 | ) |
| | Long-term debt | | | (2,761 | ) | | (2,860 | ) | $ | (58,787 | ) | $ | (2,078 | ) | | (312 | ) | | (66,798 | ) |
| | |
| |
| |
| |
| |
| |
| |
| | | $ | 164,457 | | $ | (2,813 | ) | $ | (58,787 | ) | $ | (2,078 | ) | $ | 31,017 | | $ | 131,796 | |
| | |
| |
| |
| |
| |
| |
| |
| Average fixed rate of long-term debt | | | | | | 2.88% | | | 5.37% | | | 3.30% | | | | | | | |
| | | | | |
| |
| |
| | | | | | | |
NOTE 15. CURRENCY TRANSLATION ADJUSTMENT
The following is a continuity schedule of the currency translation adjustment account included as a separate component of shareholders' equity:
| | 2003
| | 2002
| |
|---|
(U.S. dollars in thousands)
| |
| |
| |
|---|
| Balance, beginning of period | | $ | (15,025 | ) | $ | (20,950 | ) |
| Realized translation (gain) loss on the reduction of the net investment in foreign operations | | | (667 | ) | | 293 | |
| Unrealized translation adjustments | | | 78,494 | | | 5,632 | |
| | |
| |
| |
| Balance, end of period | | $ | 62,802 | | $ | (15,025 | ) |
| | |
| |
| |
Unrealized translation adjustments arise on the translation to U.S. dollars of assets and liabilities of the Company's Canadian operations and self-sustaining foreign operations that operate in functional currencies other than the U.S. dollar. For the year ended December 31, 2003, an unrealized currency translation gain of $78.5 million [five-month period ended December 31, 2002 — gain of $5.6 million] resulted primarily from the strengthening of the euro and Canadian dollar against the U.S. dollar during the period.
The translation gain of $0.7 million for the year ended December 31, 2003 [five-month period ended December 31, 2002 — $0.3 million loss] was realized on the reduction of the net investment in foreign operations upon the payment of dividends and was recorded as a reduction to selling, general and administrative expenses [increase to selling, general and administrative expenses in the five-month period ended December 31, 2002].
NOTE 16. FOREIGN EXCHANGE
Included as part of selling, general and administrative expenses are gains (losses) resulting from foreign exchange as follows:
|
|
|
|
|
|
Years ended July 31
|
|---|
| |
| | Five-month period ended December 31 2002
|
|---|
| | Year ended December 31 2003
|
|---|
| | 2002
| | 2001
|
|---|
(U.S. dollars in thousands)
| |
| |
| |
| |
|
|---|
| Foreign exchange gains (losses) | | $ | 2,308 | | $ | (510 | ) | $ | 1,414 | | $ | 361 |
| | |
| |
| |
| |
|
68 TESMA
NOTE 17. RESEARCH AND DEVELOPMENT
Gross R&D expenditures for the year ended December 31, 2003 were $18.0 million [December 31, 2002 –$6.5 million; years ended July 31, 2002 — $15.6 million; 2001 — $12.4 million]. These expenditures were partially funded by governments or customers in the amount of $7.5 million [December 31, 2002 — $1.7 million; years ended July 31, 2002 — $4.0 million; 2001 — $4.3 million].
NOTE 18. DETAILS OF CASH FROM OPERATING ACTIVITIES
(a) Items Not Involving Current Cash Flows
Items not involving current cash flows consist of:
|
|
|
|
|
|
Years ended July 31
|
|
|---|
| |
| | Five-month period ended December 31 2002
| |
|---|
| | Year ended December 31 2003
| |
|---|
| | 2002
| | 2001
| |
|---|
(U.S. dollars in thousands)
| |
| |
| |
| |
| |
|---|
| Depreciation and amortization | | $ | 51,609 | | $ | 17,993 | | $ | 37,384 | | $ | 33,906 | |
| Future income tax provision (recovery) | | | 15,755 | | | (4,863 | ) | | 5,305 | | | (7,167 | ) |
| Write-down of long-term receivables | | | 853 | | | — | | | — | | | — | |
| (Gain) loss on disposal of capital assets | | | (430 | ) | | (400 | ) | | 101 | | | 283 | |
| Realized translation losses (gains) on the reduction of net investments in foreign operations | | | (667 | ) | | 293 | | | (118 | ) | | 2,215 | |
| Stock-based compensation expense | | | 493 | | | 79 | | | — | | | — | |
| Loss on equity-accounted investee | | | 426 | | | — | | | — | | | — | |
| Net periodic cost on post-retirement medical benefits plan | | | 429 | | | 154 | | | 295 | | | 291 | |
| Impairment loss at German die-casting operations(Note 6) | | | — | | | 12,088 | | | — | | | — | |
| Other | | | 1,229 | | | 749 | | | 1,261 | | | 407 | |
| | |
| |
| |
| |
| |
| | | $ | 69,697 | | $ | 26,093 | | $ | 44,228 | | $ | 29,935 | |
| | |
| |
| |
| |
| |
(b) Net Change in Non-Cash Working Capital
The net change in non-cash working capital, net of foreign exchange fluctuations, consists of:
|
|
|
|
|
|
Years ended July 31
|
|
|---|
| |
| | Five-month period ended December 31 2002
| |
|---|
| | Year ended December 31 2003
| |
|---|
| | 2002
| | 2001
| |
|---|
(U.S. dollars in thousands)
| |
| |
| |
| |
| |
|---|
| Accounts receivable | | $ | (27,186 | ) | $ | (19,359 | ) | $ | (15,306 | ) | $ | (23,572 | ) |
| Inventories | | | (17,756 | ) | | (7,186 | ) | | (5,994 | ) | | (8,116 | ) |
| Prepaid expenses and other | | | (2,489 | ) | | (360 | ) | | (824 | ) | | (179 | ) |
| Accounts payable and other accrued liabilities | | | 9,319 | | | 10,119 | | | 14,294 | | | (6,150 | ) |
| Accrued salaries and wages | | | 10,247 | | | (6,036 | ) | | 2,693 | | | 755 | |
| Income taxes payable (recoverable) | | | (14,084 | ) | | 4,529 | | | (1,093 | ) | | (2,447 | ) |
| | |
| |
| |
| |
| |
| | | $ | (41,949 | ) | $ | (18,293 | ) | $ | (6,230 | ) | $ | (39,709 | ) |
| | |
| |
| |
| |
| |
NOTE 19. SEGMENTED INFORMATION
(a) Operating Segments
The Company currently operates in one industry segment, the automotive powertrain business, designing and manufacturing parts and assemblies primarily for the automotive OEMs or their Tier I and Tier II powertrain component manufacturers.
The Company operates internationally and its manufacturing facilities are arranged geographically to meet the requirements of the Company's customers in each market. Each manufacturing facility has the capability to offer many different powertrain parts and assemblies, as the technological processes employed can be used to make many different parts and assemblies. Additionally, specific marketing and distribution strategies are required in each geographic region.
TESMA 69
The Company currently operates in four geographic segments of which only two are reportable segments. The accounting policies for the segments are the same as those described in Note 1 to the consolidated financial statements and intersegment sales are accounted for at prices which approximate fair value.
Executive management assesses the performance of each segment based on income before income taxes as the management of income tax expense is centralized.
The following tables show certain information with respect to operating segment disclosures:
| | North American
Automotive
| | European
Automotive
| | Other
Automotive
| | Total
| |
|---|
(U.S. dollars in thousands)
| |
| |
| |
| |
| |
|---|
Year ended December 31, 2003 |
|
|
|
|
|
|
|
|
|
|
|
|
|
| Total sales | | $ | 856,000 | | $ | 235,643 | | $ | 28,772 | | $ | 1,120,415 | |
| Intersegment sales | | | (19,069 | ) | | (2,632 | ) | | (123 | ) | | (21,824 | ) |
| | |
| |
| |
| |
| |
| Sales to external customers | | $ | 836,931 | | $ | 233,011 | | $ | 28,649 | | $ | 1,098,591 | |
| | |
| |
| |
| |
| |
| Depreciation and amortization | | $ | 39,810 | | $ | 8,200 | | $ | 3,599 | | $ | 51,609 | |
| | |
| |
| |
| |
| |
| Interest, net | | $ | (2,687 | ) | $ | 1,139 | | $ | 1,344 | | $ | (204 | ) |
| | |
| |
| |
| |
| |
| Income before income taxes | | $ | 97,538 | | $ | 18,251 | | $ | (5,759 | ) | $ | 110,030 | |
| | |
| |
| |
| |
| |
| Capital assets, net(Notes 6, 20 and 24) | | $ | 206,142 | | $ | 65,208 | | $ | 32,399 | | $ | 303,749 | |
| | |
| |
| |
| |
| |
| Capital asset additions(Note 20) | | $ | 38,134 | | $ | 12,859 | | $ | 10,160 | | $ | 61,153 | |
| | |
| |
| |
| |
| |
| Goodwill, at carrying value(Note 7) | | $ | 13,172 | | $ | 1,924 | | $ | — | | $ | 15,096 | |
| | |
| |
| |
| |
| |
Five-month period ended December 31, 2002 |
|
|
|
|
|
|
|
|
|
|
|
|
|
| Total sales | | $ | 312,295 | | $ | 79,462 | | $ | 14,008 | | $ | 405,765 | |
| Intersegment sales | | | (4,668 | ) | | (1,681 | ) | | (64 | ) | | (6,413 | ) |
| | |
| |
| |
| |
| |
| Sales to external customers | | $ | 307,627 | | $ | 77,781 | | $ | 13,944 | | $ | 399,352 | |
| | |
| |
| |
| |
| |
| Depreciation and amortization | | $ | 12,966 | | $ | 3,748 | | $ | 1,279 | | $ | 17,993 | |
| | |
| |
| |
| |
| |
| Interest, net | | $ | (311 | ) | $ | 249 | | $ | 378 | | $ | 316 | |
| | |
| |
| |
| |
| |
| Income before income taxes(Note 6) | | $ | 40,185 | | $ | (10,450 | ) | $ | 136 | | $ | 29,871 | |
| | |
| |
| |
| |
| |
| Capital assets, net(Note 20) | | $ | 197,769 | | $ | 49,102 | | $ | 26,234 | | $ | 273,105 | |
| | |
| |
| |
| |
| |
| Capital asset additions | | $ | 20,006 | | $ | 4,692 | | $ | 3,703 | | $ | 28,401 | |
| | |
| |
| |
| |
| |
| Goodwill, at carrying value(Note 7) | | $ | 13,006 | | $ | 603 | | $ | — | | $ | 13,609 | |
| | |
| |
| |
| |
| |
Year ended July 31, 2002 |
|
|
|
|
|
|
|
|
|
|
|
|
|
| Total sales | | $ | 674,914 | | $ | 161,666 | | $ | 29,591 | | $ | 866,171 | |
| Intersegment sales | | | (9,462 | ) | | (1,547 | ) | | — | | | (11,009 | ) |
| | |
| |
| |
| |
| |
| Sales to external customers | | $ | 665,452 | | $ | 160,119 | | $ | 29,591 | | $ | 855,162 | |
| | |
| |
| |
| |
| |
| Depreciation and amortization | | $ | 28,204 | | $ | 6,413 | | $ | 2,767 | | $ | 37,384 | |
| | |
| |
| |
| |
| |
| Interest, net | | $ | 939 | | $ | 535 | | $ | 1,082 | | $ | 2,556 | |
| | |
| |
| |
| |
| |
| Income before income taxes | | $ | 74,047 | | $ | 6,691 | | $ | 1,119 | | $ | 81,857 | |
| | |
| |
| |
| |
| |
| Capital assets, net | | $ | 189,546 | | $ | 56,732 | | $ | 24,234 | | $ | 270,512 | |
| | |
| |
| |
| |
| |
| Capital asset additions(Note 20) | | $ | 59,375 | | $ | 15,641 | | $ | 2,573 | | $ | 77,589 | |
| | |
| |
| |
| |
| |
| Goodwill, at carrying value(Note 7) | | $ | 12,484 | | $ | 596 | | $ | — | | $ | 13,080 | |
| | |
| |
| |
| |
| |
Year ended July 31, 2001 |
|
|
|
|
|
|
|
|
|
|
|
|
|
| Total sales | | $ | 622,315 | | $ | 144,327 | | $ | 29,926 | | $ | 796,568 | |
| Intersegment sales | | | (5,731 | ) | | (1,823 | ) | | — | | | (7,554 | ) |
| | |
| |
| |
| |
| |
| Sales to external customers | | $ | 616,584 | | $ | 142,504 | | $ | 29,926 | | $ | 789,014 | |
| | |
| |
| |
| |
| |
| Depreciation and amortization(Note 7) | | $ | 25,620 | | $ | 5,496 | | $ | 2,790 | | $ | 33,906 | |
| | |
| |
| |
| |
| |
| Interest, net | | $ | 298 | | $ | (335 | ) | $ | 1,141 | | $ | 1,104 | |
| | |
| |
| |
| |
| |
| Income before income taxes | | $ | 67,966 | | $ | 11,280 | | $ | 2,001 | | $ | 81,247 | |
| | |
| |
| |
| |
| |
| Capital assets, net | | $ | 163,072 | | $ | 41,653 | | $ | 22,701 | | $ | 227,426 | |
| | |
| |
| |
| |
| |
| Capital asset additions | | $ | 52,669 | | $ | 10,272 | | $ | 1,084 | | $ | 64,025 | |
| | |
| |
| |
| |
| |
| Goodwill, net(Note 7) | | $ | 11,645 | | $ | 887 | | $ | — | | $ | 12,532 | |
| | |
| |
| |
| |
| |
70 TESMA
(b) Geographic and Customer Information
The geographic destination of the Company's sales to its external customers is as follows:
|
|
|
|
|
|
Years ended July 31
|
|---|
| |
| | Five-month period ended December 31 2002
|
|---|
| | Year ended December 31 2003
|
|---|
| | 2002
| | 2001
|
|---|
(U.S. dollars in thousands)
| |
| |
| |
| |
|
|---|
| United States | | $ | 589,324 | | $ | 230,212 | | $ | 493,366 | | $ | 457,761 |
| Canada | | | 108,009 | | | 30,744 | | | 77,702 | | | 72,100 |
| Europe | | | 326,017 | | | 112,640 | | | 232,809 | | | 211,124 |
| Other foreign countries | | | 75,241 | | | 25,756 | | | 51,285 | | | 48,029 |
| | |
| |
| |
| |
|
| | | $ | 1,098,591 | | $ | 399,352 | | $ | 855,162 | | $ | 789,014 |
| | |
| |
| |
| |
|
In the year ended December 31, 2003, sales to the Company's four largest customers (including their global subsidiaries) amounted to 43%, 16%, 9% and 7% of total sales [five-month period ended December 31, 2002 — 43%, 17%, 9% and 7%; years ended July 31, 2002 — 42%, 18%, 9%, and 7%; and 2001 — 40%, 20%, 8% and 8%].
NOTE 20. RELATED PARTY TRANSACTIONS
(a) Transactions with Controlling Shareholder
The Company completed transactions with Magna, the Company's controlling shareholder and other companies under Magna's control as follows:
|
|
|
|
|
|
Years ended July 31
|
|---|
| |
| | Five-month period ended December 31 2002
|
|---|
| | Year ended December 31 2003
|
|---|
| | 2002
| | 2001
|
|---|
(U.S. dollars in thousands)
| |
| |
| |
| |
|
|---|
| Sales(i) | | $ | 7,585 | | $ | 3,656 | | $ | 13,418 | | $ | 10,019 |
| Purchases of materials(i) | | $ | 3,591 | | $ | 1,036 | | $ | 3,257 | | $ | 4,571 |
| Rental of facilities(ii) | | $ | 1,877 | | $ | 341 | | $ | 847 | | $ | 641 |
| Affiliation fee(iii) | | $ | 10,816 | | $ | 3,913 | | $ | 8,552 | | $ | 7,890 |
| Social fee(iv) | | $ | 1,633 | | $ | 434 | | $ | 1,225 | | $ | 1,222 |
| Other specific charges(v) | | $ | 1,718 | | $ | 380 | | $ | 1,857 | | $ | 905 |
| Interest | | $ | 4 | | $ | 8 | | $ | 18 | | $ | 73 |
| Construction management fees(ii) | | $ | (1,293 | ) | $ | — | | $ | 1,419 | | $ | — |
| | |
| |
| |
| |
|
- (i)
- Sales to, and purchases from, Magna and other companies under Magna's control, and the resulting accounts receivable and payable balances are typically effected on normal commercial terms.
- (ii)
- On January 31, 2003, the Company completed a sale and leaseback transaction with MID, then a wholly-owned subsidiary of Magna, for all the land and buildings on the Tesma Corporate Campus, which includes the corporate office building and two manufacturing facilities. This transaction was approved by the Company's Board of Directors upon recommendation by a Special Committee of independent directors established to review the transaction.
Under the terms of the purchase and sale agreement, the land and buildings comprising the corporate campus (with a carrying value of $23.5 million) were sold to MID for cash proceeds approximating fair value which totaled $25.0 million. The gain of $1.5 million resulting from the sale is being deferred and amortized on a straight-line basis over the term of the leases.
Under the terms of the transaction, $1.3 million of construction management fees (including carrying charges) previously billed in fiscal 2002 by MID to the Company regarding this project were refunded. In addition, the Company entered into agreements to lease the properties back from MID (at prevailing market rates existing at inception) for a term of twelve years (with an initial option to renew for three years followed by two subsequent five-year renewal options) and is required to make lease payments of approximately $2.7 million per year.
TESMA 71
Rental payments totaling $1.9 million were paid to MID for the period from February 1, 2003 to August 29, 2003, the date when all of the shares of MID were distributed to the shareholders of Magna pursuant to a planned reorganization of Magna. As a result of this distribution, MID became directly controlled by the same entity that indirectly controls the Company, such that MID remains a related party to the Company, but is no longer part of the group of companies controlled by Magna. During the year ended July 31, 2002 and the subsequent five-month period ended December 31, 2002, the Company was billed an aggregate of $13.3 million by MID (acting as project manager) on a cost recovery basis for the construction and development costs associated with these properties.
- (iii)
- The Company is party to an affiliation agreement with Magna that provides for payment by the Company of an affiliation fee in exchange for, among other things, a non-exclusive world-wide license to use certain Magna trademarks, access to Magna management resources, and the collaboration and sharing of best practices in areas such as new management techniques, employee benefits and programs, marketing and technological initiatives. This agreement became effective for a term of seven years and five months commencing August 1, 2002 and expires on December 31, 2009 (subject to annual renewals thereafter). Under this agreement, affiliation fees payable to Magna are calculated as one percent of the Company's consolidated net sales, subject to certain exceptions for sales from acquired businesses (which are exempt from the calculation of the affiliation fee in the year of acquisition, with 50% inclusion in the year after acquisition and full inclusion in subsequent years).
- (iv)
- Under the terms of a social fee agreement, the Company pays Magna a social fee of 1.5% of pre-tax profits as a contribution to social and charitable programs coordinated by Magna on behalf of Magna and its affiliated companies, including the Company. This agreement became effective for a term of seven years and five months, commencing August 1, 2002 and expires on December 31, 2009 (subject to annual renewals thereafter).
- (v)
- Other specific charges, which are recorded primarily as part of selling, general and administrative expenses, are negotiated annually and are based on the level of certain benefits or services provided by Magna Services Inc., a wholly owned subsidiary of Magna. These services include, but are not limited to: information technology (WAN infrastructure and support services), human resource and employee relations services (including administration of the Employee Equity Participation and Profit Sharing Program), specialized legal, environmental, finance and treasury support, management and technology training, and an allocated share of the facility and overhead costs dedicated to providing these services.
(b) Other Related Party Transactions
- (i)
- Rental payments to MID subsequent to August 29, 2003 (the date of the reorganization of Magna) amounted to $1.1 million and were paid under lease agreements entered into at prevailing market rates.
- (ii)
- Effective January 1, 2003, the Company's Austrian subsidiary transferred certain assets and activities into Magna Systemtechnik AG (MST), an entity controlled by Magna established for the training of apprentices in the design, development and manufacturing of tools, prototypes and automotive components. Effective this same date, the Company acquired a minority equity ownership interest in MST and will participate in its ongoing activities to the extent of this equity ownership interest. The Company accounts for this investment using the equity method and accordingly, $0.4 million has been recorded in selling, general and administrative expenses as the Company's share of the net losses of MST to December 31, 2003.
During 2003, the Company incurred $0.4 million of capital costs relating to the portion of certain assembly lines that MST was subcontracted to build (the costs of the completed assembly lines were billed by another supplier). In addition, due to the cost overruns and other issues pertaining to these assembly lines, MST billed the Company an additional $0.8 million, which was expensed in fiscal 2003. At December 31, 2003, the Company had a net payable of $1.0 million due to MST.
- (iii)
- During the year ended December 31, 2003, the Company was billed an additional $0.5 million for costs relating to various tooling and other services provided in 2002 by a company owned by the CEO of the Company. In the five-month period ended December 31, 2002, the Company sold $0.1 million of products and services to this company. At December 31, 2003, $nil was recorded as a net receivable from this company [December 31, 2002 — $0.5 million].
- (iv)
- During 2003, the Company paid $0.4 million to a financing company for the buyout of certain equipment under lease and recorded the amount as due from a related party. The equipment was used in the business activities of the company owned by the CEO of the Company, the activities of which were transferred to MST in 2003. The balance of $0.4 million remains outstanding at December 31, 2003.
72 TESMA
- (v)
- On October 25, 2000, the Company signed a Consulting Services Agreement (CSA) with S & Co. Under the terms of the CSA, S & Co is providing the Company with various consulting services in continental Europe and in other non-North American countries for a period of six years ending October 25, 2006. In consideration for the consulting services to be provided under the CSA, the Board of Directors granted to S & Co options to purchase 300,000 Class A Subordinate Voting Shares at an exercise price of $26.45 per share (see Note 12(b)). The general partner of S & Co is the Chairman of Magna.
- (vi)
- Due to the abandoned merger between the Company and the Magna Steyr Group in December 2001, costs approximating $0.4 million (net of a $1.3 million recovery from Magna pursuant to the merger agreement between the Company and Magna) that had been incurred specifically for the merger transaction were expensed by the Company as part of selling, general and administrative costs in the year ended July 31, 2002.
(c) Outstanding Balances
The outstanding balances with all related parties resulting from these transactions included in the consolidated financial statements at the end of the period are as follows:
| | 2003
| | 2002
|
|---|
(U.S. dollars in thousands)
| |
| |
|
|---|
| Accounts receivable | | $ | 1,560 | | $ | 988 |
| Accounts payable and other accrued liabilities | | $ | 1,882 | | $ | 3,108 |
| | |
| |
|
NOTE 21. COMMITMENTS AND CONTINGENCIES
(a) Operating Leases
The Company had commitments under operating leases requiring future minimum annual rental payments for the years ending December 31 as follows:
| |
|
|---|
(U.S. dollars in thousands)
| |
|
|---|
| 2004 | | $ | 7,944 |
| 2005 | | | 7,056 |
| 2006 | | | 6,210 |
| 2007 | | | 5,259 |
| 2008 | | | 4,839 |
| Thereafter | | | 23,866 |
| | |
|
| | | $ | 55,174 |
| | |
|
During the year, the Company completed a sale and leaseback transaction with MID as described in Note 20(a)(ii), and began to make rental payments under lease agreements with MID of $2.7 million per annum. As a result, approximately 76% [December 31, 2002 — 54%] of the lease commitments at December 31, 2003 are with related parties.
Approximately 11% [December 31, 2002 — 13%] of these lease commitments represent the Company's share of commitments of its proportionately consolidated jointly-controlled entities.
For the year ended December 31, 2003, payments under operating leases amounted to $7.9 million [five-month period ended December 31, 2002 — $2.5 million; years ended July 31, 2002 — $5.0 million; 2001 — $4.1 million].
(b) Purchase Commitments
The Company has commitments to purchase capital assets of approximately $28.7 million as at December 31, 2003 [December 31, 2002 — $25.2 million].
In addition, as described in Note 14(a)(ii), in May 2002 the Company entered into a three-year contract to purchase specified levels of hydro-electricity supply during expected peak and non-peak time periods at specified fixed prices. The total commitment remaining under this contract at December 31, 2003 is approximately $2.5 million [December 31, 2002 — $3.6 million].
TESMA 73
(c) Corporate Constitution
The Company's Corporate Constitution requires that a portion of the Company's profits be distributed or used for certain purposes, including but not limited to the following:
- •
- allocation or distribution of 10% of pre-tax profits to employees and/or the Tesma Employee Equity Participation and Profit Sharing Program (including the Tesma International Inc. (Canadian) Deferred Profit Sharing Plan and the Tesma International of America, Inc. U.S. Employees' Deferred Profit Sharing Plan forming part thereof);
- •
- allocation of a minimum of 7% of pre-tax profits to R&D; and
- •
- payment of dividends to shareholders based on a formula of after-tax profits.
(d) Potential Warranty and Product Recalls
In certain circumstances, the Company is at risk for warranty costs including product liability and recall costs. Product liability provisions are established based on the Company's best estimate of the amounts necessary to settle existing claims on product default issues. Recall costs are costs incurred when the Company and/or the customer decide, either voluntarily or involuntarily, to recall a product due to a known or suspected performance issue. Costs typically include the cost of product being replaced, the customer's cost of recall and labour to remove and replace the defective part. When a decision to recall a product has been made or is probable, the Company's estimated cost of the recall is recorded as a charge to net earnings in that period. In making this estimate, judgment is required as to the number of units that may be returned as a result of the recall, the total cost of the recall campaign, the ultimate negotiated sharing of the cost between the Company and the customer and, in some cases, the extent to which a supplier to the Company or an insurance provider (where coverage is available and exists) will share in the recall cost. Due to the nature of the costs, the Company makes its best estimate of the expected future costs, however, the ultimate amount of such costs could be materially different. To date, the Company has not experienced significant warranty responsibility, including product liability or recall costs. However, the Company continues to experience increased customer pressure to assume greater warranty responsibility. Currently the Company only accounts for existing or probable claims, however, a significant increase in warranty responsibility for any one of the Company's customers could require the Company to consider accounting for possible future claims.
(e) General
In the ordinary course of business activities, the Company may be contingently liable for litigation and claims from customers, suppliers and former employees. On an ongoing basis, the Company assesses the likelihood of any adverse judgments or outcomes to these matters as well as potential ranges of probable costs and losses. A determination of the provision required, if any, for these contingencies is made after analysis of each individual issue. The required provision may change in the future due to new developments in each matter or changes in approach, such as a change in settlement strategy in dealing with these matters. Management believes that adequate provisions have been recorded in the accounts where required. Although it is not possible to estimate the extent of potential costs and losses, if any, management believes, but can provide no assurance, that the ultimate resolution of such contingencies would not have a material adverse effect on the consolidated financial position of the Company.
NOTE 22. UNITED STATES GENERALLY ACCEPTED ACCOUNTING PRINCIPLES
The Company's consolidated financial statements are prepared in accordance with Canadian GAAP which conform in all material respects with U.S. GAAP except for the following:
(a) Derivative Instruments and Hedging
The Company uses foreign exchange forward contracts to manage foreign exchange risk from its underlying customer contracts. As detailed in Note 14, the Company uses foreign exchange forward contracts for the sole purpose of hedging certain of its future committed U.S. dollar and euro inflows and outflows for its Canadian operations. Under Canadian GAAP, gains and losses on these contracts are accounted for as a component of the related hedged transaction.
Effective August 1, 2000, the Company adopted Financial Accounting Standards Board (FASB) Statement No. 133, "Accounting for Derivative Instruments and Hedging Activities", as amended by FASB Statements No. 137, 138 and 149 (collectively, the Statement), which establishes accounting and reporting standards for derivative instruments, including certain derivatives embedded in other contracts and for hedging activities. The Statement requires a company to recognize all of its derivative instruments, whether designated in hedging relationships or not, on the balance sheet at fair value. The accounting for changes in fair value (i.e., gains or losses) of a derivative instrument depends on whether it has been designated and qualifies as part of a hedging relationship. The Statement establishes certain criteria to be met in order to designate a derivative instrument as a hedge and deem a hedge as effective.
74 TESMA
Effective January 1, 2004, the Company implemented a new treasury management system that complies with the documentation requirements for hedge accounting under the Statement. As a result, for the periods prior to December 31, 2003, the Company's derivative portfolio is not eligible for hedge accounting despite the fact that management considers its portfolio to be an effective foreign currency risk management tool and an economic hedge of the Company's projected cash flows.
Accordingly, upon initial adoption of the Statement, the Company recorded a cumulative gain of $1.7 million as a component of comprehensive income, of which $1.4 million has now been realized through U.S. GAAP net income. The amount recorded as the change in fair value of derivative instruments for U.S. GAAP purposes in the year ended December 31, 2003 was nominal [loss of $0.6 million in the five-month period ended December 31, 2002; income of $1.5 million in each of the years in the two-year period ended July 31, 2002, respectively].
The Company has reviewed its other commercial contracts outstanding as at December 31, 2003 in relation to the Statement and has concluded that there are no freestanding derivatives having a significant impact on the consolidated financial statements. In addition, the Company has determined that there are no other embedded derivative instruments outstanding.
(b) Deferred Preproduction Costs
Under U.S. GAAP, the Company would have expensed all preproduction costs as incurred.
(c) Joint Ventures
The Company has certain interests in jointly-controlled entities, which have been proportionately consolidated in the Company's consolidated financial statements. Under U.S. GAAP, the Company would account for its interests in its jointly-controlled entities using the equity method, and accordingly net income, earnings per share and shareholders' equity under U.S. GAAP are not impacted by the proportionate consolidation of these interests in jointly-controlled entities.
As permitted under U.S. GAAP, foreign private issuers using proportionate consolidation instead of the equity method are not required to reconcile their financial statements to U.S. GAAP. Accordingly, the consolidated balance sheets presented under U.S. GAAP reflect a proportionate share of the assets and liabilities of the Company's jointly-controlled entities. It is the Company's assessment that this preparation is more useful and more representative of its assets and obligations.
(d) Accounting for Stock Options
For U.S. GAAP purposes, the Company has historically measured compensation cost related to awards of stock options using the intrinsic value-based method of accounting as prescribed by APB Opinion No. 25, "Accounting for Stock Issued to Employees" (APB 25) and then provided pro forma earnings disclosures as if the fair value method as prescribed under FASB Statement No. 123 "Accounting for Stock-Based Compensation" (FAS 123), had been applied.
As described in Note 1(p), for Canadian GAAP purposes, the Company elected to adopt new amendments to CICA 3870 that now requires that all stock-based compensation be recorded at fair value and charged to income over the vesting period of the underlying awards. These new rules under CICA 3870 are substantially harmonized with the existing fair value rules under FAS 123 and the methodology utilized in calculating and recognizing compensation expense under Canadian GAAP as described in Note 12(b) is consistent with that required for U.S. GAAP.
As a result of this change, the Company has elected to adopt the fair value rules of FAS 123 for its U.S. GAAP reporting. The Company has adopted these rules on a retroactive basis with restatement of prior periods and has included amounts previously calculated as compensation expense for purposes of proforma earnings disclosures as a charge to earnings. The impact of retroactively applying these rules for U.S. GAAP purposes to the comparative five-month period ended December 31, 2002 and the years ended July 31, 2002 and 2001 was to decrease income by $0.4 million, $0.8 million and $0.9 million, respectively, and to record a cumulative adjustment to retained earnings of $2.8 million. Similarly, diluted earnings per share under U.S. GAAP for these periods decreased by $0.01, $0.03 and $0.03, respectively, as a result of the retroactive application of these rules. The corresponding offsets to amounts recognized as compensation expense are recorded as increases to contributed surplus. Subsequently, upon the exercise of the underlying stock options, proportionate amounts originally recorded as contributed surplus are reclassified and recorded as additional value attributed to Class A Subordinate Voting Shares issued on these exercises.
Under U.S. GAAP, compensation expense that is calculated and reported includes all of the Company's options granted since adoption of this U.S. Standard on August 1, 1996. The initial adoption of CICA 3870 for Canadian GAAP (as permitted by the transitional provisions therein) was applied to awards granted on or after the date of initial adoption, which for the Company was August 1, 2002. As such, the amount of compensation expense calculated for U.S. GAAP will differ from that calculated for Canadian GAAP until all options granted prior to August 1, 2002 have fully vested and all related compensation expense has been recorded for U.S. GAAP purposes.
TESMA 75
(e) Recognition of Translation Gains and Losses on Reduction of Net Investment in Canadian Operations and Foreign Subsidiaries
Under U.S. GAAP, FASB Statement No. 52 (FAS 52), the Company would realize a gain or loss only on the portion of the currency translation adjustment included as a separate component of the net investment in an operation with a functional currency different from the Company's reporting currency upon the sale or complete, or substantially complete, liquidation of the related investment. Under FAS 52, no gains or losses are recognized as a result of capital transactions, including the payment of dividends. Under Canadian GAAP, the Company is required to realize a gain or loss equal to the appropriate portion of the cumulative translation adjustment account when there is a reduction in the Company's net investment in operations with functional currencies different from the U.S. dollar (the Company's reporting currency), which includes the payment of dividends.
(f) Statements of Income and Retained Earnings
The following table presents net income, retained earnings and earnings per share information following U.S. GAAP:
|
|
|
|
|
|
Years ended July 31
|
|
|---|
| |
| | Five-month period ended December 31 2002
| |
|---|
| | Year ended December 31 2003
| |
|---|
| | 2002
| | 2001
| |
|---|
(U.S. dollars in thousands)
| |
| | restated — Note 22(d)
| |
|---|
| Net income attributable to Class A Subordinate Voting Shares and Class B Shares under Canadian GAAP | | $ | 74,112 | | $ | 20,622 | | $ | 53,632 | | $ | 57,980 | |
| Adjustments: | | | | | | | | | | | | | |
| Amortization of deferred preproduction costs | | | 636 | | | 235 | | | 562 | | | 573 | |
| Change in fair value of derivative instruments | | | (19 | ) | | (648 | ) | | 1,487 | | | 1,478 | |
Translation (gains) losses realized on the reduction of the
net investment in foreign subsidiaries | | | (667 | ) | | 293 | | | (118 | ) | | 2,215 | |
Stock-based compensation (expense) recovery on stock options
issued for consulting services | | | (384 | ) | | 79 | | | (240 | ) | | (257 | ) |
Reversal of stock-based compensation expense under
Canadian GAAP | | | 493 | | | 79 | | | — | | | — | |
| Stock-based compensation expense under U.S. GAAP | | | (1,198 | ) | | (384 | ) | | (785 | ) | | (943 | ) |
| Compensation expense on repurchase of stock options | | | — | | | — | | | — | | | (274 | ) |
| | |
| |
| |
| |
| |
Net income attributable to Class A Subordinate Voting Shares and
Class B Shares under U.S. GAAP | | | 72,973 | | | 20,276 | | | 54,538 | | | 60,772 | |
| Retained earnings, beginning of period | | | 224,660 | | | 210,936 | | | 168,275 | | | 122,715 | |
| Dividends | | | (13,975 | ) | | (6,552 | ) | | (11,877 | ) | | (12,397 | ) |
Cumulative adjustment for change in accounting policy
(Note 22(d)) | | | — | | | — | | | — | | | (2,815 | ) |
| | |
| |
| |
| |
| |
| Retained earnings, end of period | | $ | 283,658 | | $ | 224,660 | | $ | 210,936 | | $ | 168,275 | |
| | |
| |
| |
| |
| |
| Earnings per Class A Subordinate Voting Share or Class B Share under U.S. GAAP | | | | | | | | | | | | | |
| | | Basic | | $ | 2.26 | | $ | 0.63 | | $ | 1.85 | | $ | 2.08 | |
| | | Diluted | | $ | 2.24 | | $ | 0.62 | | $ | 1.83 | | $ | 2.06 | |
| | |
| |
| |
| |
| |
| Weighted average number of Class A Subordinate | | | | | | | | | | | | | |
| | Voting Shares and Class B Shares outstanding during the year (in thousands) | | | | | | | | | | | | | |
| | | Basic | | | 32,344 | | | 32,300 | | | 29,454 | | | 29,214 | |
| | | Diluted | | | 32,531 | | | 32,513 | | | 29,829 | | | 29,558 | |
| | |
| |
| |
| |
| |
76 TESMA
(g) Comprehensive Income
|
|
|
|
|
|
Years ended July 31
|
|
|---|
| |
| | Five-month period ended December 31 2002
| |
|---|
| | Year ended December 31 2003
| |
|---|
| | 2002
| | 2001
| |
|---|
(U.S. dollars in thousands)
| | restated — Note 22(d)
| |
|---|
| Net income attributable to Class A Subordinate | | | | | | | | | | | | | |
| | Voting Shares and Class B Shares under U.S. GAAP | | $ | 72,973 | | $ | 20,276 | | $ | 54,538 | | $ | 60,772 | |
Adjustments: |
|
|
|
|
|
|
|
|
|
|
|
|
|
Unrealized foreign exchange gains (losses) on translation of
Canadian operations and self-sustaining foreign operations | | | 78,494 | | | 5,632 | | | 1,293 | | | (12,189 | ) |
Adjustment for derivative instruments matured in the period,
included in the cumulative adjustment at July 31, 2001 | | | (372 | ) | | (200 | ) | | (857 | ) | | — | |
| Cumulative adjustment to derivative instruments | | | — | | | — | | | — | | | 1,712 | |
| | |
| |
| |
| |
| |
Comprehensive income attributable to Class A Subordinate Voting
Shares and Class B Shares under U.S. GAAP | | $ | 151,095 | | $ | 25,708 | | $ | 54,974 | | $ | 50,295 | |
| | |
| |
| |
| |
| |
(h) Balance Sheets
The following table presents condensed consolidated balance sheets following accounting policies under U.S. GAAP except as described in Note 22(c):
As at December 31
| | 2003
| | 2002
| |
|---|
(U.S. dollars in thousands)
| |
| | restated — Note 22(d)
| |
|---|
| ASSETS | | | | | | | |
| Current assets | | $ | 470,134 | | $ | 364,598 | |
| Capital assets | | | 303,749 | | | 273,108 | |
| Goodwill and other long-term assets | | | 63,822 | | | 17,700 | |
| Fair value of derivative instruments | | | 3,942 | | | 4,477 | |
| Long-term future tax assets | | | 2,184 | | | 450 | |
| | |
| |
| |
| | | $ | 843,831 | | $ | 660,333 | |
| | |
| |
| |
LIABILITIES AND SHAREHOLDERS' EQUITY |
|
|
|
|
|
|
|
| Current liabilities | | $ | 209,740 | | $ | 184,527 | |
| Long-term debt | | | 62,879 | | | 47,566 | |
| Long-term future tax liabilities | | | 19,432 | | | 15,993 | |
| | |
| |
| |
| | | | 292,051 | | | 248,086 | |
| | |
| |
| |
Shareholders' equity |
|
|
|
|
|
|
|
| Class A Subordinate Voting Shares and Class B Shares(Note 22(d)) | | | 201,797 | | | 201,028 | |
| Contributed surplus(Note 22(d)) | | | 4,961 | | | 3,181 | |
| Retained earnings | | | 283,658 | | | 224,660 | |
| Accumulated other comprehensive income | | | 61,364 | | | (16,622 | ) |
| | |
| |
| |
| | | | 551,780 | | | 412,247 | |
| | |
| |
| |
| | | $ | 843,831 | | $ | 660,333 | |
| | |
| |
| |
TESMA 77
(i) Recently Issued Pronouncements
Under Staff Accounting Bulletin 74, the Company is required to disclose certain information related to new accounting standards which have not yet been adopted due to delayed effective dates.
Canadian GAAP Standards and Guidelines
In 2003, the CICA issued Emerging Issues Committee Abstract No. 142, "Revenue Arrangements with Multiple Deliverables" (EIC-142), which provides guidance on accounting by a vendor for arrangements involving multiple deliverables. It specifically addresses how a vendor determines whether an arrangement involving multiple deliverables contains more than one unit of accounting and also addresses how consideration should be measured and allocated to the separate units of accounting in the arrangement. The guidance in EIC-142 is applicable for revenue arrangements with multiple deliverables entered into by the Company on or after January 1, 2004. Although the Company is currently reviewing EIC-142, the impact of this abstract, if any, on the Company's consolidated financial statements has not been determined.
In 2003, the CICA issued Handbook Section 3110, "Asset Retirement Obligations" (CICA 3110), which establishes standards for the recognition, measurement and disclosure of asset retirement obligations and the related asset retirement costs. This new Section is effective for the Company's 2004 fiscal year and harmonizes Canadian requirements with existing U.S. GAAP. The Company will adopt these rules for Canadian GAAP purposes on January 1, 2004 and the impact on the consolidated financial statements for the implementation of these rules is not expected to be significant.
In 2003, the CICA issued Accounting Guideline AcG-15, "Consolidation of Variable Interest Entities", to provide guidance for applying the principles in Handbook Section 1590, "Subsidiaries", to certain entities. Although the CICA is contemplating amendments to the guideline, it is expected to be effective for the Company's 2005 fiscal year. Although the Company is currently reviewing AcG-15, the impact of the guideline, if any, on the Company's consolidated financial statements has not been determined.
In 2003, the CICA finalized amendments to Accounting Guideline AcG-13, "Hedging Relationships", that clarified certain of the requirements in AcG-13 and provided additional application guidance. AcG-13 is applicable for the Company's 2004 fiscal year. The Company does not expect the adoption of this guideline to have a material impact on its consolidated financial statements.
U.S. GAAP Standards
In 2003, the FASB finalized Emerging Issues Task Force Abstract No. 00-21 ("EITF 00-21"), "Revenue Arrangements with Multiple Deliverables." The guidance in this Abstract is consistent with the guidance in EIC-142, which was recently issued by the CICA. The guidance in EITF 00-21 is applicable for revenue arrangements with multiple deliverables that the Company enters into on or after January 1, 2004.
In 2003, the FASB amended Interpretation No. 46, "Consolidation of Variable Interest Entities" ("FIN 46R"). FIN 46R requires that a variable interest entity ("VIE") be consolidated by a company if that company is subject to a majority of the risk of loss from the VIE's activities and/or is entitled to receive a majority of the VIE's residual returns. For the Company, the requirements of FIN 46R apply in 2003 for all VIEs created after January 31, 2003. For VIEs created before January 31, 2003, the requirements of FIN 46R apply as of December 31, 2004 for a VIE that does not meet the definition of a special-purpose entity ("SPE") and as of January 1, 2004 for a VIE that is an SPE.
Although the Company is currently reviewing EITF 00-21 and FIN 46R, the impact, if any, of these pronouncements on the Company's consolidated financial statements has not been determined.
NOTE 23. COMPARATIVE CONSOLIDATED FINANCIAL STATEMENTS
The Company has retroactively restated the comparative consolidated financial statements for changes in the Company's reporting currency and changes in accounting policy as described in Notes 1(c) and 1(p).
Certain other comparative figures have been reclassified to conform to the current year's method of presentation.
78 TESMA
NOTE 24. SUBSEQUENT EVENTS
(a) Acquisition of Davis Industries, Inc.
On January 2, 2004, the Company completed the acquisition of Davis Industries, Inc. (Davis). Davis at the time of acquisition employed over 700 employees at 3 manufacturing facilities located in Indiana (2 facilities) and Tennessee. The main product focus for Davis is stamped powertrain components and assemblies, including driveplate assemblies, transmission shells and oil pan assemblies, and engine valve covers, but also includes some body and chassis stampings and fuel filler door assemblies. For the most recently completed fiscal year ended September 30, 2003, Davis reported sales of approximately $129 million.
The total consideration issued for the acquisition of all the outstanding shares of Davis amounted to $75.0 million, consisting of $45.1 million paid in cash (including transaction costs), the assumption of $22.0 million of long-term debt (including current portion), $4.5 million of other long-term obligations and the issuance of a five-year, $3.4 million note bearing interest at the rate of prime plus 1% per annum. At December 31, 2003, the Company had cash of $44.6 million that had been deposited into an escrow account (thus restricting its use) to be released to the former shareholders of Davis upon closing and in accordance with the agreements executed therein.
The Company will account for this transaction using the purchase method of accounting and will record 100% of the assets, liabilities, revenues, expenses and cash flows of Davis in its consolidated results commencing January 3, 2004.
The preliminary estimates of the effect this transaction will have on the Company's consolidated balance sheet will be that the $45 million of cash paid (including transaction costs) and an increase in long-term debt and other obligations of $30 million (including current portion and the additional five-year note payable issued by the Company) were issued as total consideration to acquire the following: additional non-cash working capital of approximately $7 million, additional capital assets of $26 million, net future tax assets of $11 million, intangible assets of approximately $4 million and goodwill of $27 million.
(b) Reduction in Ownership Interest of Jointly-Controlled Entity
Pursuant to the agreement that resulted in the increase of the Company's interest in one of its jointly-controlled entities from 45% to 75% in December 2001 (see Note 3), the other remaining shareholder retained an option to purchase an additional 25% equity ownership from the Company at any time prior to August 1, 2004 at a formula price. Effective February 7, 2004, this shareholder exercised its option and acquired an additional 25% interest in the jointly-controlled entity for nominal cash consideration. In addition, as part of the transaction, $7.7 million of shareholder loans due to the Company from the jointly-controlled entity were sold by the Company to the other shareholder for $7.7 million in cash, thereby bringing each shareholder's proportionate share of loans to an equal basis.
As a result of this transaction, the Company's ownership interest in this jointly-controlled entity will be reduced to 50% effective February 7, 2004 and, commencing February 8, 2004, the Company will proportionately consolidate the assets, liabilities, revenues, expenses and cash flows in accordance with its 50% ownership percentage. This jointly-controlled entity reported total sales of approximately $62 million for the year ended December 31, 2003.
TESMA 79
Quarterly Results of Operations
(Quarterly figures unaudited)
(U.S. dollars in thousands, except per share and share figures)
For the Year Ended December 31, 2003
| | March 31
| | June 30
| | September 30
| | December 31
| | Total
|
|---|
| Sales | | $ | 267,373 | | $ | 278,846 | | $ | 254,317 | | $ | 298,055 | | $ | 1,098,591 |
| | |
| |
| |
| |
| |
|
| Net income(i) | | $ | 16,298 | | $ | 21,247 | | $ | 15,908 | | $ | 20,659 | | $ | 74,112 |
| | |
| |
| |
| |
| |
|
| Basic EPS(i) | | $ | 0.50 | | $ | 0.66 | | $ | 0.49 | | $ | 0.64 | | $ | 2.29 |
| | |
| |
| |
| |
| |
|
| Diluted EPS(i) | | $ | 0.50 | | $ | 0.66 | | $ | 0.48 | | $ | 0.63 | | $ | 2.28 |
| | |
| |
| |
| |
| |
|
Weighted average number of shares outstanding on a
diluted basis (in millions) | | | 32.5 | | | 32.5 | | | 32.6 | | | 32.6 | | | 32.5 |
| | |
| |
| |
| |
| |
|
For the Year Ended December 31, 2002
| | March 31
| | June 30
| | September 30
| | December 31
| | Total
|
|---|
| Sales | | $ | 211,208 | | $ | 242,312 | | $ | 224,559 | | $ | 247,842 | | $ | 925,921 |
| | |
| |
| |
| |
| |
|
| Net income(i) | | $ | 13,924 | | $ | 18,253 | | $ | 14,052 | | $ | 9,730 | | $ | 55,959 |
| | |
| |
| |
| |
| |
|
| Basic EPS(i) | | $ | 0.47 | | $ | 0.62 | | $ | 0.44 | | $ | 0.30 | | $ | 1.82 |
| | |
| |
| |
| |
| |
|
| Diluted EPS(i) | | $ | 0.47 | | $ | 0.61 | | $ | 0.44 | | $ | 0.30 | | $ | 1.80 |
| | |
| |
| |
| |
| |
|
Weighted average number of shares outstanding on a
diluted basis (in millions) | | | 29.8 | | | 29.9 | | | 32.1 | | | 32.5 | | | 31.1 |
| | |
| |
| |
| |
| |
|
- (i)
- Restated to reflect the retroactive adoption of new rules for stock-based compensation (see Note 1(p) of the audited consolidated financial statements contained in this Annual Report).
80 TESMA
Historical Financial Summary
Results of Operations
| | Years ended December 31
| | Five-month period ended December 31
| | Years Ended July 31
|
|---|
| | 2003
| | 2002
| | 2002
| | 2002
| | 2001
| | 2000
| | 1999
| | 1998
|
|---|
(U.S. dollars in millions, except per share and shares amounts)
| |
| |
| |
|
|---|
| Sales | | $ | 1,098.6 | | $ | 925.9 | | $ | 399.4 | | $ | 855.2 | | $ | 789.0 | | $ | 766.0 | | $ | 592.9 | | $ | 452.7 |
| | |
| |
| |
| |
| |
| |
| |
| |
|
| Income before income taxes | | $ | 110.0 | | $ | 82.9 | | $ | 29.9 | | $ | 81.9 | | $ | 81.2 | | $ | 90.8 | | $ | 56.2 | | $ | 29.1 |
| | |
| |
| |
| |
| |
| |
| |
| |
|
Net income attributable to Class A
Subordinate Voting Shares and
Class B Shares | | $ | 74.1 | | $ | 56.0 | | $ | 20.6 | | $ | 53.6 | | $ | 58.0 | | $ | 57.7 | | $ | 34.8 | | $ | 20.7 |
| | |
| |
| |
| |
| |
| |
| |
| |
|
| Earnings per Class A Subordinate Voting Share or Class B Share | | | | | | | | | | | | | | | | | | | | | | | | |
| | Basic | | $ | 2.29 | | $ | 1.82 | | $ | 0.64 | | $ | 1.82 | | $ | 1.98 | | $ | 2.01 | | $ | 1.22 | | $ | 0.88 |
| | Diluted | | $ | 2.28 | | $ | 1.80 | | $ | 0.63 | | $ | 1.80 | | $ | 1.96 | | $ | 1.97 | | $ | 1.19 | | $ | 0.71 |
| | |
| |
| |
| |
| |
| |
| |
| |
|
Average number of Class A Subordinate
Voting Shares and Class B Shares
outstanding (in millions) | | | | | | | | | | | | | | | | | | | | | | | | |
| | Basic | | | 32.3 | | | 30.7 | | | 32.3 | | | 29.5 | | | 29.2 | | | 28.8 | | | 28.5 | | | 23.4 |
| | Diluted | | | 32.5 | | | 31.1 | | | 32.5 | | | 29.8 | | | 29.6 | | | 29.3 | | | 29.2 | | | 29.1 |
| | |
| |
| |
| |
| |
| |
| |
| |
|
| Cash flow from operating activities | | $ | 101.9 | | $ | 107.5 | | $ | 28.4 | | $ | 91.6 | | $ | 48.2 | | $ | 99.6 | | $ | 63.1 | | $ | 34.9 |
| | |
| |
| |
| |
| |
| |
| |
| |
|
Cash dividends paid per Class A
Subordinate Voting Share or
Class B Share (CDN $) | | $ | 0.75 | | $ | 0.64 | | $ | 0.16 | | $ | 0.64 | | $ | 0.64 | | $ | 0.545 | | $ | 0.31 | | $ | 0.22 |
| | |
| |
| |
| |
| |
| |
| |
| |
|
Financial Position
| | December 31
| | July 31
|
|---|
As at
|
|---|
| | 2003
| | 2002
| | 2002
| | 2001
| | 2000
| | 1999
| | 1998
|
|---|
(U.S. dollars in millions, except per share amounts and ratios)
| |
| |
|
|---|
| Cash (net of bank indebtedness) | | $ | 122.5 | | $ | 89.0 | | $ | 92.4 | | $ | 33.2 | | $ | 62.9 | | $ | 31.8 | | $ | 25.1 |
| | |
| |
| |
| |
| |
| |
| |
|
| Total assets | | $ | 839.0 | | $ | 656.8 | | $ | 604.8 | | $ | 494.0 | | $ | 482.4 | | $ | 403.2 | | $ | 264.2 |
| | |
| |
| |
| |
| |
| |
| |
|
| Capital expenditures(i) | | $ | 61.2 | | $ | 68.9 | | $ | 76.8 | | $ | 63.6 | | $ | 55.4 | | $ | 46.3 | | $ | 43.0 |
| | |
| |
| |
| |
| |
| |
| |
|
| Long-term debt (excluding current portion) | | $ | 62.9 | | $ | 47.6 | | $ | 47.4 | | $ | 50.3 | | $ | 50.8 | | $ | 54.6 | | $ | 9.3 |
| | |
| |
| |
| |
| |
| |
| |
|
| Shareholders' equity | | $ | 549.3 | | $ | 410.2 | | $ | 389.9 | | $ | 282.8 | | $ | 248.7 | | $ | 201.6 | | $ | 173.0 |
| | |
| |
| |
| |
| |
| |
| |
|
Book value per Class A Subordinate Voting Share
or Class B Share (US $) | | $ | 16.92 | | $ | 12.66 | | $ | 12.07 | | $ | 9.66 | | $ | 8.54 | | $ | 7.05 | | $ | 6.07 |
| | |
| |
| |
| |
| |
| |
| |
|
Book value per Class A Subordinate Voting Share
or Class B Share (CDN $) | | $ | 21.83 | | $ | 19.85 | | $ | 19.17 | | $ | 14.83 | | $ | 12.61 | | $ | 10.62 | | $ | 9.17 |
| | |
| |
| |
| |
| |
| |
| |
|
Long-term debt (excluding current portion) to
total capitalization ratio(ii) | | | 0.10:1 | | | 0.10:1 | | | 0.11:1 | | | 0.15:1 | | | 0.17:1 | | | 0.21:1 | | | 0.05:1 |
| | |
| |
| |
| |
| |
| |
| |
|
- (i)
- December 2002 comparative figure presented on a twelve-month basis.
- (ii)
- Total capitalization is the sum of long-term debt (excluding current portion) and shareholders' equity.
TESMA 81
Shareholder Information
Annual Meeting of Shareholders
The Annual Meeting of Shareholders will be held on Tuesday, May 4, 2004. The meeting will take place at the Design Exchange, 234 Bay Street, Toronto-Dominion Centre, Toronto, Ontario, Canada
commencing at 11:00 a.m.
Transfer Agents and Registrars
Canada
Class A: Computershare Trust Company of Canada
Tel: 1 800 564-6253
(North America/International
toll free 514 982-7555)
Fax: 1 866 249-7775
(North America/International
toll free 416 263-9524)
Mail:
9th Floor, 100 University Avenue
Toronto, Ontario M5J 2Y1
e-mail: service@computershare.com
Internet: www.computershare.com
United States
Class A: Computershare Trust Company, Inc., New York
Tel: 514 982-7555
North America/International toll free
Fax: 416 263-9524
North America/International toll free
Mail:
350 Indiana Street, Suite 800
Golden, Colorado 80401
e-mail: service@computershare.com
Internet: www.computershare.com |
|
Principal Bankers
Canadian Imperial Bank of Commerce, Toronto, Canada
Auditors
Ernst & Young LLP, Toronto, Canada
Dividends
The current quarterly dividend rate is set at CDN $0.16 per share. Dividends are paid quarterly on or about the 15th of March, June, September and December in each year with a record date on or about the last business day of February, May, August and November (subject to approval by the Board of Directors).
Payment of Dividends to Non-Residents
Shareholders with addresses of record in the United States receive dividends in U.S. funds. The dividend amount is converted at the Bank of Canada's noon rate of exchange on the record date. All other non-resident shareholders may elect to receive dividends in U.S. or Canadian funds. In all cases, the applicable Canadian withholding tax is deducted.
Annual Information Form/ Form 40-F
The Company files an Annual Information Form (AIF) with Canadian Provincial Securities Regulators and a Report on Form 40-F with the U.S. Securities and Exchange Commission. The AIF is available on the Tesma website at www.tesma.com or upon written request to the Manager, Investor Relations of the Company at the corporate office. |
|
Investor Information
Inquiries regarding the Company or requests to be placed on our supplementary mailing list, fax list or e-mail list to receive Tesma's Annual and Quarterly Reports or Press Releases, please contact Lynn Riley, Manager, Investor Relations at:
1000 Tesma Way
Concord, Ontario, L4K 5R8
Tel: 905 417-2160
Fax: 905 417-2148
e-mail: lynn. riley@tesma.com |
82 TESMA
Stock Market Information
Stock Exchange Listings
Tesma International Inc. Class A Subordinate Voting Shares are listed on the Toronto Stock Exchange (TSX) — TSM.A and NASDAQ — TSMA.
Index Listings
S&P/TSX Composite
S&P/TSX Capped Composite
S&P/TSX Small Cap
S&P/TSX Capped Consumer
Discretionary Index | | Issued and Outstanding Shares
As at December 31, 2003
Class A Subordinate Voting Shares
(one vote per share) 18,140,429
Class B Shares
(10 votes per share) 14,223,900 | | Magna International Inc. owns, directly and indirectly, all Class B Shares carrying approximately 89% of the total votes attaching to all outstanding shares of the Company. |
Class A Subordinate Voting Share Stock Performance (closing prices)
| |
| | Jan
| | Feb
| | Mar
| | Apr
| | May
| | June
| | July
| | Aug
| | Sept
| | Oct
| | Nov
| | Dec
|
|---|
| TSX (CDN $) | | | | | | | | | | | | | | | | | | | | | | | | | | | | | | | | | |
| High | | 2003 | | $ | 28.50 | | $ | 26.95 | | $ | 26.50 | | $ | 27.86 | | $ | 29.50 | | $ | 27.20 | | $ | 29.45 | | $ | 30.99 | | $ | 32.24 | | $ | 32.25 | | $ | 32.18 | | $ | 31.75 |
| | | 2002 | | $ | 32.46 | | $ | 33.50 | | $ | 37.28 | | $ | 35.15 | | $ | 36.75 | | $ | 39.58 | | $ | 35.05 | | $ | 32.78 | | $ | 33.75 | | $ | 33.00 | | $ | 26.00 | | $ | 27.26 |
Low |
|
2003 |
|
$ |
26.11 |
|
$ |
24.02 |
|
$ |
22.26 |
|
$ |
22.91 |
|
$ |
25.00 |
|
$ |
25.26 |
|
$ |
25.54 |
|
$ |
28.69 |
|
$ |
30.09 |
|
$ |
29.91 |
|
$ |
28.31 |
|
$ |
28.38 |
| | | 2002 | | $ | 29.50 | | $ | 31.00 | | $ | 30.29 | | $ | 32.50 | | $ | 34.75 | | $ | 34.70 | | $ | 31.00 | | $ | 30.01 | | $ | 29.50 | | $ | 24.90 | | $ | 22.50 | | $ | 22.25 |
Close |
|
2003 |
|
$ |
26.61 |
|
$ |
26.00 |
|
$ |
22.79 |
|
$ |
27.75 |
|
$ |
26.00 |
|
$ |
26.05 |
|
$ |
29.22 |
|
$ |
30.50 |
|
$ |
30.61 |
|
$ |
32.25 |
|
$ |
29.60 |
|
$ |
29.25 |
| | | 2002 | | $ | 31.80 | | $ | 33.00 | | $ | 32.55 | | $ | 34.50 | | $ | 36.10 | | $ | 34.76 | | $ | 32.75 | | $ | 30.45 | | $ | 32.45 | | $ | 25.75 | | $ | 23.25 | | $ | 27.24 |
NASDAQ (U.S. $) |
|
|
|
|
|
|
|
|
|
|
|
|
|
|
|
|
|
|
|
|
|
|
|
|
|
|
|
|
|
|
|
|
|
| High | | 2003 | | $ | 18.50 | | $ | 17.71 | | $ | 17.72 | | $ | 19.33 | | $ | 21.00 | | $ | 20.25 | | $ | 20.75 | | $ | 23.50 | | $ | 23.60 | | $ | 24.39 | | $ | 25.01 | | $ | 23.59 |
| | | 2002 | | $ | 20.15 | | $ | 21.10 | | $ | 23.50 | | $ | 22.12 | | $ | 23.90 | | $ | 25.73 | | $ | 23.06 | | $ | 20.59 | | $ | 22.00 | | $ | 20.62 | | $ | 16.85 | | $ | 17.85 |
Low |
|
2003 |
|
$ |
16.50 |
|
$ |
16.00 |
|
$ |
15.50 |
|
$ |
15.84 |
|
$ |
18.15 |
|
$ |
17.80 |
|
$ |
19.94 |
|
$ |
20.50 |
|
$ |
21.70 |
|
$ |
21.34 |
|
$ |
21.34 |
|
$ |
21.00 |
| | | 2002 | | $ | 18.30 | | $ | 19.55 | | $ | 19.32 | | $ | 20.45 | | $ | 22.25 | | $ | 22.10 | | $ | 19.41 | | $ | 19.27 | | $ | 18.83 | | $ | 15.50 | | $ | 14.50 | | $ | 14.25 |
Close |
|
2003 |
|
$ |
17.38 |
|
$ |
17.59 |
|
$ |
16.05 |
|
$ |
19.33 |
|
$ |
18.65 |
|
$ |
19.45 |
|
$ |
20.75 |
|
$ |
22.23 |
|
$ |
22.79 |
|
$ |
24.33 |
|
$ |
22.96 |
|
$ |
22.51 |
| | | 2002 | | $ | 20.09 | | $ | 20.30 | | $ | 21.70 | | $ | 21.77 | | $ | 23.60 | | $ | 22.90 | | $ | 20.54 | | $ | 19.27 | | $ | 20.51 | | $ | 16.35 | | $ | 14.86 | | $ | 16.90 |
|
|
|
|
|
|
|
|
|
|
|
|
|
|
|
|
|
|
|
|
|
|
|
|
|
|
|
|
|
|
|
|
|
|
|
|
|
|
|
|
|
|
|
|
|
|
|
|
|
|
|
|
|
|
|
|
|
|
|
|
|
|
|
|
|
|
|
|
|
|
|
|
|
|
|
|
|
|
Cumulative Relative Total Returns to December 31, 2003 (CDN $)
TESMA 83
Board of Directors
| [PHOTO] | | Manfred Gingl(1)
Director since April 1995; Executive Vice Chairman, Magna International Inc.;
Chairman (since February 2004) and Chief Executive Officer (since April 1995), Tesma International Inc. Previously: Vice Chairman (May 2002 — February 2004) and President (April 1995 — May 2002) of Tesma; Managing Director of Blau International Ges.m.b.H. and President of Blau Autotec Inc. (June 1993 — February 1995); President and Chief Operating Officer (December 1981 — June 1993) and Chief Executive Officer (April 1988 — June 1993) of Magna. Mr. Gingl also serves on the boards of directors of Magna and Decoma International Inc. |
|
|
|
| [PHOTO] | | Oscar B. Marx, III(5)
Director since July 1995; Vice-President, Automotive Sector, TMW Enterprises, Inc.;
Chairman, Amerigon Incorporated
Previously: A variety of positions at Ford Motor Company (1962 — 1994), including Vice President, Ford Automotive Components Group (now Visteon Corporation). Mr. Marx is a Director of Amerigon Incorporated, Parametric Technologies, Inc. and Pullman Industries, Inc. |
|
|
|
| [PHOTO] | | Judson D. Whiteside(2)(7)
Director since July 1995; Senior Partner, Chairman and Chief Executive Officer, Miller Thomson LLP
Mr. Whiteside also serves on the boards of directors of: Addison Estates Limited; Answorth Leasing Corporation; GN Hearing Care Canada Ltd.; Nihon Kenko Zoushin Kenkyukai Canada; The Pampered Chef-Canada, Ltd.; Shaklee Canada Inc.; Teranet Land Information Services Inc.; the Miller Thomson Foundation; and Direct Sellers Assn. of Canada. |
|
|
|
| [PHOTO] | | Hon. David R. Peterson, P.C., Q.C.(5)(6)
Director since February 2002; Chairman, Cassels Brock & Blackwell LLP
Previously: Premier of the Province of Ontario (1985 — 1990); Leader of the Ontario Liberal Party (1982); elected as a Member of the Ontario Legislature (1975). Mr. Peterson also serves on the boards of directors of: BNP Paribas (Canada); Industrial-Alliance Life Insurance Company; INSCAPE Corporation; Ivanhoe Cambridge Inc.; The National Life Assurance Company of Canada; Rogers Communications Inc.; Rogers Wireless Communications Inc.; and numerous charitable, educational and environmental organizations. |
|
|
|
| [PHOTO] | | Siegfried Wolf
Director since June 2002; Executive Vice Chairman, Magna International Inc.
Previously: President and Chief Executive Officer of Magna Steyr (2001 — 2002); President of Magna Europe (1995 — 2000); various senior positions with Magna's European operations beginning in 1994. Mr. Wolf also serves on the boards of directors of Magna, Decoma International Inc. and Intier Automotive Inc. |
|
|
|
| [PHOTO] | | Hon. M. Douglas Young, P.C.(4)(6)
Director since July 2002; Chairman, Summa Strategies Canada Inc.;
Counsel, Patterson Palmer
Previously: Served as Canada's Minister of Transport, Minister of Human Resources Development and Minister of National Defence and Veterans Affairs (1975 — 1997). Mr. Young also serves on the boards of directors of: ARG; Conner's Bros.; Genesee & Wyoming Inc.; Heating Oil Partners; and Magellan Aerospace Corporation. |
|
|
|
| [PHOTO] | | Vincent J. Galifi(3)
Director since February 2004; Executive Vice President and Chief Financial Officer,
Magna International Inc. (since 1997)
Previously: Held a variety of positions in the taxation and finance department of Magna (1989 — 1997); associate at the international accounting firm of Coopers & Lybrand (1982 — 1989). Mr. Galifi also serves on the boards of directors of Decoma International Inc. and Intier Automotive Inc. |
|
|
|
|
|
|
| | | (1) Chairman of the Board |
| | | (2) Chairman of the Audit Committee |
| | | (3) Chairman of the Corporate Governance and Compensation Committee |
| | | (4) Chairman of the Environmental, Health and Safety Committee |
| | | (5) Member of the Audit Committee |
| | | (6) Member of the Corporate Governance and Compensation Committee |
| | | (7) Member of the Environmental, Health and Safety Committee |
84 TESMA
Officers
| [PHOTO] | | Manfred Gingl
Chairman (since February 2004) and Chief Executive Officer (since April 1995), Tesma International Inc.
Previously: Vice Chairman (May 2002 — February 2004) and President (April 1995 — May 2002) of Tesma; Managing Director of Blau International Ges.m.b.H. and President of Blau Autotec Inc. (June 1993 — February 1995); President and Chief Operating Officer (December 1981 — June 1993) and Chief Executive Officer (April 1988 — June 1993) of Magna. Mr. Gingl also serves on the boards of directors of Magna and Decoma International Inc. |
|
|
|
| [PHOTO] | | Anthony E. Dobranowski
President (since May 2002) and Chief Financial Officer (since April 1995)
Previously: Executive Vice President (April 1995 — May 2002) of Tesma; Executive Vice President, Finance and Treasurer of Atoma International Inc. [now Intier Automotive Inc.] (September 1991 — March 1995); various senior financial positions with Atoma and its operating groups (March 1986 — September 1991). |
|
|
|
| [PHOTO] | | Pasquale Cerullo
Executive Vice President, Sales, Marketing and Corporate Development (since March 2002)
Previously: Vice President, Sales and Marketing of Tesma (March 1995 — March 2002); Director, Sales and Marketing at Blau Autotec Inc. [acquired by Tesma in 1995] (August 1993 — March 1995); various sales positions, including Director of Sales, for Tesma (May 1984 — August 1993). |
|
|
|
| [PHOTO] | | James L. Moulds
Vice President, Finance (since September 1999) and Treasurer (since September 2002)
Previously: Controller (August 1995 — September 1999) of Tesma; Manager, Financial Reporting at Magna (October 1994 — July 1995); Manager, Financial Reporting at Atoma International Inc. (April 1994 — September 1994); various public accounting and auditing capacities with Ernst & Young LLP (September 1990 — April 1994). |
|
|
|
| [PHOTO] | | Stefan T. Proniuk
Vice President, Secretary and General Counsel (since April 1995)
Previously: Partner, in the law firm Crossley Mann, Toronto, Ontario (February 1993 — February 1995); consultant to automotive parts and components supplier (September 1992 — January 1993); Vice-President, Secretary and General Counsel of Cosma International Inc. [wholly-owned subsidiary of Magna] (January 1988 — August 1992); Legal Counsel at Magna (August 1987 — January 1988). |
|
|
|
| [PHOTO] | | Thomas More
Controller (since September 2002)
Previously: Assistant Controller of Tesma (February 2001 — September 2002); Controller at two privately-held companies (February 1999 — February 2001); various public accounting and auditing capacities with Ernst & Young LLP (September 1994 — February 1999). |
|
|
|
| [PHOTO] | | Karl H. Steinbauer
Vice President, Manufacturing (since January 2004)
Previously: General Manager of the "light metals" divisions of Tesma (August 2001 — January 2004); Vice President, Operations of Tesma (December 1999 — July 2001); General Manager of the Toral Cast division of Tesma (November 1995 — November 1999); various positions in the fields of engineering, quality, tooling and manufacturing in the European automotive industry (December 1979 — October 1995). |
TESMA 85
Corporate Information
Corporate Office
Tesma International Inc.
1000 Tesma Way
Concord, Ontario
Canada L4K 5R8
Tel: 905 417-2100
Fax: 905 417-2101 |
|
Sales Office Locations:
Canada
Tesma Asia-Pacific Sales
1000 Tesma Way
Concord, Ontario
Canada L4K 5R8
Tel: 905 417-2191
Fax: 905 417-2136
United States
Tesma Corporate Sales
23300 Haggerty Road, Suite 200
Farmington Hills, MI
U.S.A. 48335
Tel: 248 888-5550
Fax: 248 427-1458
Austria
Tesma Motoren-und-
Getriebetechnik Ges.m.b.H.
Tesma Allee 1
A-8261 Sinabelkirchen
Austria
Tel: 011 43-3118-2055
Fax: 011 43-3118-2055-111
Germany
Tesma Vertrieb
Marktplatz 10
D-86441 Zusmarshausen
Germany
Tel: 011 49-8291-790140
Fax: 011 49-8291-790150
France
c/o Magna International
4 route de Gisy
Burospace-bat 6
91570 Bievres
France
Tel: 011 33 (0) 1-69332072
Fax: 011 33 (0) 1-69332079 |
|
Italy
Via Caselle, 6
84099 S. Cipriano-Picentino (Salerno)
Italy
Tel/Fax: 011-39 (0) 89-862065
United Kingdom
Tesma International
Suite 2, Melville House
High Street, Great Dunmow
Essex, CM6 1AF
Great Britain
Tel: 011 44-1371-875333
Fax: 011 44-1371-875151
South Korea
HAC Corporation
4F Mosan Building, 14-4
Yangjae-dong, Seocho-Gu
Seoul 137-130
South Korea
Tel: 011 82-2-571-9350
Fax: 011 82-2-571-9355
Japan
Tesma International
Crest Yasuda Building 3F
3-21 Kanda Nishiki-cho,
Chiyoda-ku, Tokyo 101-0057
Japan
Tel: 011 81 (0) 3518-8980
Fax: 011 81 (0) 3518-8010 |
86 TESMA
Tesma Customers Around The World
[GRAPHIC]
Tesma Global Facilities
| | Sales
| | Manufacturing
| | R&D/Design/Tooling
|
|---|
| Canada | | 2 | | 13 | | 4 |
| United States | | 1 | | 5 | | |
| Brazil | | | | 1 | | |
| United Kingdom | | 1 | | | | |
| Italy | | 1 | | 1 | | |
| Austria | | 1 | | 2 | | 1 |
| Germany | | 1 | | 3 | | |
| Japan | | 1 | | | | |
| South Korea | | 2 | | 2 | | |
| China | | | | 1 | | |
| | |
| |
| |
|

Tesma International Inc.1000 Tesma Way, Concord, Ontario, Canada L4K 5R8 Tel: (905) 417-2100 Fax: (905) 417-2101 www.tesma.com
QuickLinks
Tesma At A GlanceProfileResultsGlobal PerformanceContent Per VehicleChairman's MessageLetter to ShareholdersGlossaryComponents, Modules and SystemsQuality StandoutGreatest BenefitsWe Offer MorePoliciesReviewManagement's Discussion and Analysis of Results of Operations and Financial PositionManagement's Responsibility for Financial ReportingAuditors' ReportConsolidated Financial StatementsConsolidated Balance SheetsConsolidated Statements of Income and Retained EarningsConsolidated Statements of Cash FlowsNotes To Consolidated Financial StatementsQuarterly Results of OperationsHistorical Financial SummaryShareholder InformationBoard of DirectorsOfficersCorporate Information