QuickLinks -- Click here to rapidly navigate through this document
 |
|
Dear Shareholders:
We are pleased to present our results for our first quarter ended March 31, 2004.
Financial Highlights
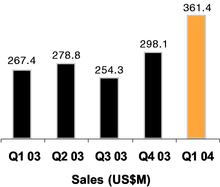
o Sales for the first quarter rose 35% to $361.4 million compared to $267.4 million
for the first quarter of 2003.
o We completed our acquisition of Davis Industries, Inc. (Davis) which added
approximately $35 million in new sales for us this quarter.
o North American vehicle production volumes for the quarter declined slightly
and European production volumes were up 1% in the quarter.
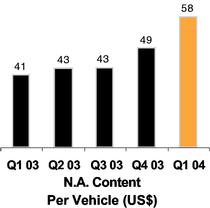
o Content per vehicle increased in North America and Europe 40% and 3%, to $58
and €17, respectively, during the quarter. Davis' operations contributed $8
of content in North America (or approximately half of our overall content growth).
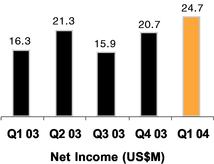
o Net income in the first quarter increased 52% to $24.7 million compared to
$16.3 million in the prior year.
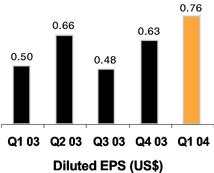
o Diluted earnings per share for the quarter increased to $0.76 from $0.50 in 2003.
o Operating cash flow in the first quarter increased to $46.2 million, an increase of
57% over the $29.4 million generated in the prior year.
o We further solidified our net cash position during the quarter by 14% to
$139.5 million from $122.5 million at December 31, 2003.
We have had a tremendous start in the first quarter. Our numbers are very strong and reflect the benefits of our long-term strategy of providing advanced powertrain modules and systems to our global customers. This strategy, combined with our focus of putting our customers' needs first, is resulting in future growth opportunities for us as well.
I am pleased to announce that the Tesma Board of Directors has appointed Dr. Klaus Blickle as Tesma's President effective May 4, 2004. Dr. Blickle has extensive automotive engineering and executive management experience, particularly in the areas of powertrain testing, engineering and development.
Additional financial and operating highlights are outlined in the attached Management's Discussion and Analysis of Results of Operations and Financial Position for the three months ended March 31, 2004.

Anthony E. Dobranowski
Vice Chairman & Chief Financial Officer |
MANAGEMENT'S DISCUSSION AND ANALYSIS OF
RESULTS OF OPERATIONS AND FINANCIAL POSITION
For the First Quarter Ended March 31, 2004
May 4, 2004
Tesma International Inc. designs, engineers, tests and manufactures technologically-advanced powertrain (engine, transmission and fuel) components, modules and systems for the global automotive industry. We employ approximately 5,700 skilled and motivated people in 28 manufacturing facilities in North and South America, Europe and Asia, and five focused tooling, design and R&D centres supporting our three principal product technology groups: Tesma Engine Technologies, Tesma Transmission Technologies and Tesma Fuel Technologies.
The following management's discussion and analysis of our consolidated operating results and financial position (MD&A) is for the first quarter ended March 31, 2004 and 2003 and should be read in conjunction with the accompanying unaudited interim consolidated financial statements and notes thereto and with the audited consolidated financial statements and notes for the year ended December 31, 2003 and management's discussion and analysis in our 2003 Annual Report. All amounts in this MD&A are in United States dollars (U.S. dollars) unless otherwise noted.
OVERVIEW
Our ultimate vision is to be the world's leading Tier I supplier of advanced powertrain modules and systems. Our ability to develop and manufacture individual components and to assemble them as highly engineered modules and systems continues to place us at the forefront of industry trends towards modularization and outsourcing. As most of our traditional customers know, our primary focus is to not just meet their expectations, but to exceed them. We are demonstrating this same focus and vigor with the non-traditional customers who have recently awarded us new business.
We had a very busy and productive first quarter. We posted record results despite the continuing challenge of production declines and decreasing market share at our traditional North American customers, including General Motors (GM), our largest customer. Many of the launches that we had been preparing for over the last year are starting, and we are beginning to see the positive impact of our investments in the capital and people who have been supporting these launches. Much of this new business includes more technologically-advanced modules and systems. In 2003, approximately 80% of our sales were derived from the supply of complete, value-added modules and assemblies, a trend we expect to continue through 2004. This new business, combined with our recent acquisition of Davis Industries, Inc. (Davis) and the impact of foreign exchange translation, provided strong content per vehicle growth in our largest market during the first quarter.
As previously reported, we completed the acquisition of Davis in early January 2004 (see more detailed discussion below). As a result, we have significantly increased our presence in the United States and acquired manufacturing facilities that are in closer proximity to some of our non-traditional customers, especially the "New Domestics" who continue to experience strong gains in production and market share largely at the expense of the "Big Three" North American automakers.
The future business awards that we highlighted in the latter part of 2003 will increase sales in each of our product technologies groups. This pipeline of new business was bolstered further in the first quarter by the award of the 2007 model year underdrive module for DaimlerChrysler's 62TE transmission, which includes approximately 60 subcomponents (including clutch packs, planetary sets, housings, shafts, pistons and dams) and is expected to add close to $90 million in annual sales when full volumes are reached in 2008. In Europe, future growth was solidified with the award of the full assembly for the Audi D3 fuel tank (for which we currently supply only certain components) and in Asia, where we were awarded the replacement business for a Perkins fan drive assembly.
Our ability to handle this future growth and capitalize on other potential opportunities is supported by our strong financial position. Although we expended approximately $45 million of our cash reserves on the Davis acquisition, we were able to replenish a significant portion of these funds through our cash flow from operations in the first quarter. We continue to look for acquisitions and other opportunities that will add new processes or technologies to our capabilities and/or expand our geographic presence to better serve our customers. With the strong foundation we have been able to build, we are well positioned to continue our growth and ultimately deliver increased shareholder value.
1
ACQUISITION OF DAVIS INDUSTRIES, INC.
The acquisition of Davis added over 700 employees at 3 manufacturing facilities located in Indiana (2 facilities) and Tennessee and a corporate office and research and development centre in Michigan to our North American manufacturing operations. Davis' main product focus is in the area of stamped powertrain components and assemblies, including driveplate assemblies, transmission shells, oil pan assemblies and engine valve covers, but also includes some body and chassis stampings and fuel filler door assemblies.
The total consideration for the acquisition of all the outstanding shares of Davis amounted to approximately $48.5 million, consisting of $44.6 million paid in cash which was held in escrow at our December 2003 year end, $0.5 million in transaction costs and a $3.4 million note bearing interest at the rate of prime plus 1% per annum (See Note 2 of the accompanying unaudited interim consolidated financial statements for the initial effect of this acquisition on our consolidated balance sheet). We also assumed $21.6 million of long-term debt (including current portion) and indebtedness and $5.4 million of other long-term obligations.
Our integration of Davis into our operations during the first quarter has added infrastructure and support costs at each facility in order to establish independent and decentralized operations, consistent with the rest of our global divisions and subsidiaries. Establishing decentralized operations has been a large part of Magna International Inc.'s (Magna), and ultimately our own, historical success, as it instills an entrepreneurial spirit and a focus on manufacturing excellence and technological innovation throughout each operation. We are pleased with the transition thus far, and remain optimistic about the long-term strategic opportunities that the Davis acquisition presents. In the first quarter ended March 31, 2004, the Davis operations added approximately $35 million of sales, increased our North American content per vehicle by over $8 and contributed to our record earnings. Additional details regarding the impact of the Davis operations on our first quarter results is provided in the relevant sections of this MD&A below.
REDUCTION OF OWNERSHIP INTEREST IN JOINTLY-CONTROLLED ENTITY
As previously reported, effective February 7, 2004, our partner in STT Technologies Inc. (STT), one of our jointly-controlled entities, exercised its option and repurchased an additional 25% equity ownership from us for nominal cash consideration. As a result of this transaction, we recorded a net loss of $1.2 million (representing the excess of our carrying value for this 25% equity interest over the consideration received) as part of selling, general and administrative (S,G&A) expenses. This transaction negatively affected our diluted earnings per share by approximately $0.04.
As a consequence of this transaction, our ownership in STT was reduced to 50% and, commencing February 8, 2004, we have proportionately consolidated the assets, liabilities, revenues, expenses and cash flows of STT at our reduced ownership percentage. In addition, as part of the transaction, $7.7 million of shareholder loans owed to us by STT were sold by us to our partner for $7.7 million in cash, thereby matching each shareholder's proportion of total loans to their equity interest.
OUTLOOK
For the full year ending December 31, 2004, our view of production volumes has not changed significantly. We anticipate that production volumes in North America will increase 1% to approximately 16.0 million units, while in Europe, we expect production of approximately 16.4 million units, about the same as the full year volumes experienced in fiscal 2003. Based on these forecasts, the inclusion of the Davis operations, our anticipated tooling and other automotive sales, our projected content per vehicle levels and the impact of foreign exchange at the current rates in effect, we expect to experience overall sales growth of approximately 20% for the year ending December 31, 2004.
ACCOUNTING CHANGES
Stock-based compensation
In 2003, we adopted new rules issued by the Canadian Institute of Chartered Accountants (CICA) under Handbook Section 3870 "Stock-Based Compensation and other Stock-Based Payments" (CICA 3870) which require that stock-based compensation transactions be accounted for at fair value. We adopted these new rules earlier than required by the standard and applied them on a retroactive basis to stock-based awards granted on or after August 1, 2002, the date that we were initially required to adopt CICA 3870. As a result, the comparative period ended March 31, 2003 has been restated and reflects a cumulative adjustment to increase the opening balance of contributed surplus by $0.1 million and decrease opening retained earnings by $0.1 million. In the current quarter ended March 31, 2004, we recorded compensation expense of $0.4 million as part of S,G&A expenses while in the same period a year ago, the expense recorded was nominal.
2
Asset Retirement Obligations
Effective January 1, 2004, the CICA issued Handbook Section CICA 3110 "Asset Retirement Obligations" (CICA 3110). CICA 3110 requires that we estimate and recognize the fair value (discounted to present value) of any liabilities for future asset retirements, where applicable, and record the associated cost over the period of use. For us, this primarily represents the obligation, at the end of each lease term, to restore leased premises back to their condition at the inception of the lease. At lease inception, the present value of this obligation is determined and recognized as a long-term liability with a corresponding amount recognized as an additional capital asset. The amount recognized as a capital asset is amortized and the liability amount is accreted over the period from lease inception to the time we expect to vacate the premises, such that both depreciation and interest expense are recorded as charges against earnings. We adopted these rules effective January 1, 2004 and the resulting impact to the interim consolidated financial statements was not significant.
Hedging Relationships
On January 1, 2004, amended guidance under the CICA Accounting Guideline 13 "Hedging Relationships" (AcG-13) became effective. AcG-13 establishes certain conditions and documentation requirements that must exist at the inception of a hedge in order to apply hedge accounting. On January 1, 2004, our treasury management system complied with the documentation requirements of AcG-13 and, as such, we continue to apply hedge accounting, when applicable, in our consolidated financial statements.
DISCUSSION OF THE RESULTS
Foreign Currency Exchange Rates
As a majority of our operations have functional currencies other than the U.S. dollar, our reported results can be significantly affected by movements in the exchange rates of the Canadian dollar, euro, Swiss franc and Korean won, all relative to the U.S. dollar. The magnitude of the impact of foreign exchange on our results in the periods presented will primarily depend on, and vary directly with, the size of the fluctuations, relative to the U.S. dollar, of the underlying functional currencies in our Canadian, European and South Korean-based operations. The acquisition of Davis, which is based in the United States, will reduce the relative impact of currency fluctuations on our reported results but, only to a limited extent.
The average exchange rates for our most significant functional currencies relative to the U.S. dollar during the current and comparative quarter were as follows:
Average rates for the period
| | Q1 2004
| | Q1 2003
| | %D
|
|---|
| Canadian dollar | | 0.7580 | | 0.6619 | | +15% |
| Euro | | 1.2482 | | 1.0727 | | +16% |
| Korean won | | 0.000855 | | 0.000833 | | +3% |
The exchange rates in effect at the end of the current quarter, at our December 31, 2003 year-end and at the quarter ended a year ago were as follows:
Rates at the end of the period
| | Mar 2004
| | Dec 2003
| | %D Dec
| | Mar 2003
| | %D Mar
|
|---|
| Canadian dollar | | 0.7601 | | 0.7752 | | -2% | | 0.6813 | | +12% |
| Euro | | 1.2111 | | 1.2591 | | -4% | | 1.0762 | | +13% |
| Korean won | | 0.000876 | | 0.000836 | | +5% | | 0.000794 | | +10% |
3
Vehicle Production Volumes
North American vehicle production volumes for the quarter decreased by less than 1% and were approximately 4.1 million units. Among the North American "Big Three" automakers, only DaimlerChrysler (DCX) increased production (by 4% over a weak period for DCX in the prior year), while Ford decreased 1% and General Motors (GM), North America's largest automaker and our largest customer, declined 6%. As a result of the decline in vehicle assembly levels, GM engine plants reduced production of certain "high Tesma content" engines by more than 6%. In contrast to the "Big Three", the other North American OEMs (including the New Domestic manufacturers), led by strong growth at Nissan and Toyota, continued their trend of increasing production (and market share) with growth of 4% versus a year ago.
European Vehicle production levels increased 1% in the quarter to 4.3 million units. Our largest European customers, including Volkswagen Group (VW), DaimlerChrysler and Fiat, all experienced growth similar to this rate.
Sales
Our consolidated sales in the quarter increased 35% to $361.4 million from $267.4 million in the same quarter last year. Of this increase, approximately $40 million, or 42% of the overall growth, can be attributed to higher translated sales on the strengthening of the Canadian dollar and euro relative to the U.S. dollar, $35 million is attributable to the acquisition of Davis and the balance is largely attributable to organic growth. All of these factors contributed to a 40% increase in our North American content per vehicle to $58 and a 3% increase in European content to €17.
North American Operations
Our North American operations consist of 18 manufacturing facilities (13 in Canada and 5 in the U.S.) employing 4,300 employees. These operations reported sales of $288.2 million for the quarter, up 39% from $208.0 million in the same period a year ago. Of this growth, $35 million (over $8 in North American content) was generated by Davis and $29 million resulted from the stronger Canadian dollar (approximately $7 in North American content). The remaining increase in the quarter of $16 million (and the majority of the remaining increase in our content) represents true native currency growth of approximately 8%, and was realized despite the effect of production declines at our largest customer and our reduced ownership level in STT. This "true" growth in sales and content per vehicle was fueled by new program launches and program volume increases, the most notable of which are as follows:
- •
- volume increases on the integrated engine front cover for the GM High Feature V6 engine (initially launched at low volumes in the first quarter of the prior year) which is primarily installed in various Cadillac models;
- •
- increased volumes of tensioner assemblies supplied to Ford and GM for installation on various truck programs;
- •
- the continued ramp up in volumes of balance shaft assemblies for GM's Line 4 and Line 5 engine programs reflecting the launch of GM's new midsize pickups, the GMC Colorado and Chevy Canyon, late in 2003;
- •
- new launches and volume increases in Tesma Fuel Technologies including: filler pipe assemblies for DCX for their HB (Durango), JR (Sebring and Stratus) and LX (Chrysler 300) vehicle platforms, filler pipes for Saturn's VUE SUV and the commencement of production of stainless steel fuel tank assemblies for DCX's JR platform; and,
- •
- higher shipments of flexplates to Nissan and DCX.
These new programs and volume increases more than offset lower production levels for the "high Tesma content" GM engines (as previously discussed) and continued pricing pressures from our major customers during the quarter.
Although North American production volumes declined slightly during the quarter, the acquisition of Davis improved our relative level of business with non-traditional customers and thus our sales and content growth were somewhat insulated from the 6% decline experienced at GM. Sales from our North American operations increased to 78% of our consolidated sales for the quarter, compared to 76% a year ago, as expected given that the majority of Davis' customers are located in North America.
4
European Operations
Our 6 European operations, located in Germany, Austria, and Italy, employ 1,100 employees. During the quarter, sales from our European operations increased by 25% to $72.4 million from $57.8 million a year ago with a stronger euro accounting for approximately $10 million or 69% of this sales growth. The remaining $4 million increase in sales in the quarter was fueled by growth in our European content per vehicle (as mentioned above) and exports, primarily as a result of the following:
- •
- the fuel filler pipe assembly for Ford's high volume global C1 (Focus) platform launched in the third quarter of 2003;
- •
- the continued ramp up in volume for a stainless steel fuel tank assembly for the portion of VW's PQ34 program volumes (Jetta and Beetle platforms) assembled in Mexico and sold in California which launched in early 2003 but only reached expected volume levels in recent months; and,
- •
- the modest 1% increase in European production volume levels.
Sales from our European Operations represented 20% and 21% of our consolidated sales in each of the quarters ended March 31, 2004 and 2003, respectively.
Other Automotive Sales
Our Other Automotive segment consists of 2 manufacturing facilities in South Korea, one in China and a small assembly facility in Brazil, employing approximately 300 people. Sales for the quarter were up 29% to $8.8 million from $6.8 million a year ago and represent 2% of our consolidated sales (3% of consolidated sales in the same period a year ago). The increase in the quarter is primarily the result of increased exports to the United States, including water pumps and oil filter adaptor assemblies for GM's Premium V8 and Line 4 engine programs, respectively, and the ramp up in volume of a water pump for DCX's 5.7L engine launched in the second half of 2003. In addition, and most significantly from a strategic perspective, the increase reflects initial volumes for the RXC transmission oil pump, our first production contract with Hyundai Motor Company. These increases were partially offset by lower releases of oil pumps for Ford's FN transmission and oil and water pumps supplied for the Ford 1.9L engine program which has recently balanced out.
Tooling and other sales for the first quarter increased by $9.0 million to $18.5 million compared to $9.5 million in the same quarter a year ago, with foreign exchange translation accounting for approximately $2 million of the change and the Davis facilities adding $0.9 million. The most significant items recognized in the quarter related to continuously variable transmission programs at Tesma Transmission Technologies and tooling related to upcoming launches for GM at Tesma Engine Technologies.
Our focus on satisfying the needs and demands of our customers is translating into continued growth in all of our major markets. In North America, the Davis acquisition, foreign exchange translation and the continued launch of new product spurred growth in our sales to North American customers by 43% to $253.8 million for the quarter from $177.9 million a year ago (representing 70% of our consolidated sales for the quarter, up from 67% in the quarter a year ago).
Sales to our European-based customers grew in the quarter by 19% to $94.2 million compared to $78.9 million in the same period a year ago (representing 26% and 30% of consolidated sales, respectively). This growth was driven by the stronger euro relative to the U.S. dollar, higher exports of tensioners, balance shaft assemblies and some Davis flexplates to Europe, shipments of the new Ford C1 filler pipe assemblies and higher demand for service parts.
For the quarter, sales to Australasian customers increased by 34% to $9.4 million compared to $7.0 million (3% of consolidated sales for both periods) a year ago, due primarily to new launches for Hyundai in Korea, increased exports of fuel products (particularly the Ford C1 program) from our European operations into Japan and China, offset partially by lower sales to Mazda in Japan due to the balancing out of older programs. Sales to customers in the South American market increased by 11% to $4.0 million (1% of consolidated sales) during the quarter, due primarily to higher exports from our Canadian and European operations.
Sales to our four largest worldwide customers, GM, Ford, DaimlerChrysler and VW, accounted for 72% of our consolidated sales during the quarter (76% for the three-month period a year ago). The improved diversification is, in a large part, attributable to the addition of Davis, which improves our sales to non-traditional "New Domestic" OEMs, in particular Nissan and Honda. Our sales to the global operations of GM, our largest customer group, decreased to 39% of our consolidated sales in the quarter, versus 44% in the same period a year ago, is largely attributable to a different mix of customers in the three Davis facilities and to the lower production levels at GM. While no single product sold to any customer accounted for more than 10% of our consolidated sales in the quarter this year or in the same period last year, modules and systems supplied for the GM GEN IV and L850 engine programs account for approximately 16% of our consolidated sales in the quarter compared to 22% for the same period in the prior year (reflecting the previously mentioned impact of the Davis customer mix and the production slow-down at GM).
5
Gross Margin
Gross margin percentage for the first quarter increased to 22.3% from 20.5% in the comparable period a year ago.
Our gross margin in the quarter was positively impacted by a lower realized exchange rate versus a year ago on U.S. dollar-denominated materials purchased by certain Canadian divisions, which we estimate accounts for approximately 1% of the improvement. The period of the most significant strengthening of the Canadian dollar against the U.S. dollar occurred subsequent to the first quarter of 2003 and resulted in margin improvements in last year's second quarter which were sustained throughout the remainder of 2003 and now into the first quarter of 2004. In addition, our margins have improved over the prior year due to significant year-over-year improvements at our European die-casting facility and higher sales, improved capacity utilization and other operating efficiencies achieved at our North American die-casting, machining and assembly operations.
These positive effects were only partially offset by the global rise in steel prices which we estimate negatively impacted our margins by approximately 0.3% in the quarter. However, the full impact of higher steel prices was not seen in the quarter as the price increases and surcharges were introduced sporadically throughout the quarter. Other factors offsetting our margin improvements in the quarter include the newly acquired Davis facilities, launch support costs at certain of our North American facilities in the midst of, or preparing for, new program launches (some of which have been delayed) and continued pressure from our major customers for price concessions.
In the first quarter a year ago, we estimated that significant launch and higher utility costs negatively impacted our gross margin by approximately 1%.
Selling, General and Administrative Expenses
S,G,&A expenses for the quarter, as a percentage of sales, increased to 6.3% from 6.0% for the same period a year ago. Absolute costs increased from $16.1 million to $22.9 million largely due to the stronger Canadian dollar and euro (up 15% and 16%, respectively) relative to the U.S. dollar, which added approximately $3 million on translation. The operations of Davis (including their combined corporate office and research and development centre which we are in the process of closing) added S,G&A costs of $2.9 million. Other increases to S,G&A include a $1.2 million loss recorded on the sale of a portion of our ownership interest in STT (as discussed earlier in this MD&A), $0.4 million of stock-based compensation expenses recorded in accordance with the new accounting rules adopted in 2003, costs associated with managing our increasing global presence and costs related to the integration of Davis.
We pay Magna Services Inc. (ServiceCo), a wholly-owned subsidiary of Magna, certain specific charges which are negotiated annually and are based on the level of benefits or services provided to us by ServiceCo and include, but are not limited to: information technology (WAN infrastructure and support services), human resource and employee relations services (including administration of the Employee Equity Participation and Profit Sharing Plan), specialized legal, environmental, finance and treasury support, management and technology training, and an allocated share of the facility and overhead costs dedicated to providing these services. In the quarter, S,G&A costs included $0.4 million paid to ServiceCo for specific charges compared to $0.5 million in the same period a year ago.
Depreciation and Amortization
Depreciation and amortization charges for the quarter were $14.8 million compared to $11.3 million in the comparable period in the prior year. Similar to other items in our income statement, foreign currency translation significantly affected reported amounts adding approximately $2 million to depreciation and amortization charges. The remaining increases are due to our continuing investment in capital assets for new program launches and the addition of the assets of Davis which increased depreciation by $1.3 million.
6
Interest, net
Net interest for the quarter was $0.3 million compared to $0.1 million for the same period last year. The increased interest expense is due to the $21.6 million of additional indebtedness and long-term debt assumed and the $3.4 million note payable issued on the Davis acquisition, combined with interest income foregone on the $45.1 million of cash consideration and transaction costs paid. Our net interest expense remains negligible compared to our overall debt levels, as interest income earned on the investment of our cash balances (over $200 million at March 31, 2004) in short-term interest-bearing investments offsets much of our interest expense.
Affiliation and Social Fees
Affiliation and social fees paid to Magna increased to $3.8 million in the quarter from $3.0 million in the same period last year, and were comprised of the following:
- •
- Under our affiliation agreement with Magna in effect until December 31, 2009 (subject to annual renewals thereafter), we pay an affiliation fee calculated as 1% of our consolidated net sales, subject to certain exceptions for sales from acquired businesses (which are exempt from the calculation of the affiliation fee in the year of acquisition, 50% inclusion in the year after acquisition, and full inclusion in all subsequent years). The affiliation fee is paid to Magna in exchange for, among other things, a non-exclusive worldwide license to use certain Magna trademarks, access to Magna management resources, and the collaboration and sharing of best practices in areas such as new management techniques, employee benefits and programs, and marketing and technological initiatives. In the quarter, we paid $3.2 million in affiliation fees on our increased consolidated net sales (excluding sales from Davis which are exempt from the calculation in 2004) compared to $2.6 million in the first quarter a year ago.
- •
- Under our social fee agreement with Magna in effect until December 31, 2009 (subject to annual renewals thereafter), we pay Magna a social fee of 1.5% of pre-tax profits as a contribution to social and charitable programs coordinated by Magna on behalf of Magna and its affiliated companies, (including us). In the quarter, we paid $0.6 million in social fees, compared to $0.4 million in the comparable quarter last year.
Income Before Income Taxes
Income before income taxes increased to $38.8 million for the quarter, from $24.5 million in the same period a year ago. The increase reflects the $25.7 million improvement in our gross margin, partially offset by higher S,G&A costs, increased depreciation charges, higher interest expense and an increase in affiliation and social fees.
North American Operations
At our North American operations, income before income taxes for the quarter was up 52% over the prior year to $32.5 million from $21.4 million. Of the increase, approximately $4 million results from the translation of the results of our Canadian operations into U.S. dollars at higher rates versus a year ago. The remaining growth was fueled by new product launches, the acquisition of Davis and higher gross margins achieved in our Canadian operations primarily on higher sales, efficiencies and the favourable impact of lower realized exchange rates for U.S. dollar-denominated materials purchases.
European Operations
Results for our European operations improved significantly as income before income taxes increased to $7.6 million for the quarter compared to $3.7 million in the quarter a year ago. A large part of the year-over-year increase was achieved at Eralmetall where operating improvements and other positive changes led to a small profit in 2004 compared to a significant loss in the prior year. In addition, new program launches (in particular the stainless steel filler pipe for Ford's C1 (Focus) program and the fuel tank assembly for VW's PQ34 program) in our Austrian facilities increased sales and led to improved profitability levels. Foreign exchange translation due to a stronger euro contributed approximately $1 million in the quarter.
Other Automotive Operations
Our Asian and South American operations (which include our engineering and marketing offices in Brazil, Japan and South Korea) generated a loss before income taxes of approximately $1.3 million in the first quarter, compared to $0.7 million in the comparable quarter last year. The operating loss reflects higher engineering, design and other upfront product development and support costs incurred at our Korean facilities for a significant amount of new business that launches over the next few years. In addition, we incurred increased costs associated with the development of the infrastructure for our operations in China.
7
Provision for Income Taxes
Our effective income tax rate for the quarter was 36.4%, three percentage points higher than the 33.4% in the same period a year ago.
Our effective tax rate increased as expected due to the Ontario Liberal government's decision to repeal previously enacted corporate tax rate reductions and increase the effective combined corporate income tax rate from 33.62% to 34.52% effective January 1, 2004. The remaining increase in our overall effective rate in the quarter was due to the $1.2 million loss recorded on the sale of a 25% ownership interest in STT (discussed earlier in this MD&A) which was not deductible for tax purposes, non-deductible stock-based compensation expense and the inclusion of Davis which is taxed at a higher combined tax rate than our Canadian facilities.
Net Income
Our net income attributable to Class A Subordinate Voting Shares and Class B Shares for the quarter increased to $24.7 million, compared to $16.3 million in the same period a year ago. The increase is due to the higher pretax income levels achieved in our North American and European operations, with approximately one-third of the increase attributable to favourable foreign currency translation.
Earnings per Share
For the quarter, basic and diluted earnings per Class A Subordinate Voting Share or Class B Share increased 52% to $0.76 from $0.50 a year ago.
This growth reflects our higher net income levels offset slightly by increases in the average number of basic and diluted shares outstanding in the quarter to 32.4 million and 32.7 million, respectively, (from 32.3 million and 32.5 million, respectively, a year ago) due to the exercise of stock options over the past twelve months.
FINANCIAL CONDITION, LIQUIDITY AND FINANCIAL RESOURCES
Our cash balances at March 31, 2004, net of bank indebtedness, were $139.5 million compared to $122.5 million at December 31, 2003. The $17.0 million increase in net cash balances in the quarter was provided by cash flow from operating activities, increased indebtedness levels, proceeds received from the sale of a portion of our shareholder loans in STT to our joint venture partner, and proceeds from the issuance of Class A Subordinate Voting Shares on the exercise of stock options, offset by continuing investments in capital and other assets, dividend payments, long-term debt repayments and transaction costs relating to the acquisition of Davis. Additionally, our net cash balances were reduced upon translation primarily as the result of a weakening of the Canadian dollar (the currency in which a majority of our net cash balances are held) since December 31, 2003.
Operating Activities
Cash provided from operations, before the effect of changes in non-cash working capital, increased 57% from $29.4 million in the first quarter of last year to $46.2 million this year. The increase was driven by our higher net income and an increase in non-cash charges consisting mainly of higher future tax provisions, increased depreciation charges, the net loss on the disposal of a portion of STT and stock-based compensation expense.
Cash provided from changes in non-cash working capital in the quarter was $8.1 million compared to $12.5 million invested in non-cash working capital in the same period last year. The cash provided in the current quarter is due primarily to the timing of cash receipts from our largest customer. This offset the usual trend where our working capital levels (especially accounts receivable levels) increase in the first quarter from low levels that exist at our December 31 year-end (reflecting the impact of the holiday shutdown period).
As a result, cash provided from operating activities in the quarter increased to $54.3 million from $16.9 million in the same period last year.
Investing Activities
Cash spent on investing activities in the first quarter was $25.9 million compared to $7.8 million of cash provided for the same period in the prior year. In the current quarter, our spending on capital assets increased to $24.4 million compared to $18.2 million in the first quarter last year primarily for machinery and equipment acquired to support program launches and increased sales activities. In addition, our investment spending in the quarter included $0.4 million of additional cash paid on the Davis acquisition and $1.0 million of cash foregone on the disposal of a portion of our investment in STT. In the first quarter of 2003, our investment spending on new assets was more than offset by $26.1 million of cash received on the disposal of capital and other assets of which $25.0 million was proceeds on the sale, in January 2003, of our corporate campus property to MI Developments Inc. (MID), then a wholly-owned subsidiary of Magna (see Note 6(a)[ii] of the accompanying unaudited interim consolidated financial statements).
8
Capital assets purchased for our North American operations accounted for 78% of the total capital spending in the first quarter (compared to 50% for the same period last year) and our European operations accounted for 14% of our consolidated capital spending in the first three months (versus 28% of our total spending in the same period last year). Capital spending at our Asian and other operations accounted for 8% of our total first quarter spending, compared to 22% last year.
Financing Activities
Cash provided by financing activities in the first quarter was $16.9 million compared to $2.2 million used by financing activities for the same period last year largely due to additional funds provided through operating lines of credit which amounted to $16.1 million in the quarter compared to $3.8 million in the same period a year ago. Indebtedness levels increased as the newly acquired Davis facilities drew on their existing operating lines to support increased working capital levels in the first quarter, our Korean operations increased funds borrowed on their operating lines to fund continued investments in capital assets for new program launches and our Canadian operations had increased levels of outstanding cheques.
As discussed earlier in this MD&A, as part of the transaction in which our ownership interest in STT was reduced from 75% to 50%, $7.7 million of our shareholder loans to STT were sold to our joint venture partner for $7.7 million in cash, thereby bringing each shareholder's proportionate share of loans to an equal basis.
During the quarter, $0.5 million was received on the issuance of Class A Subordinate Voting Shares on the exercise of incentive stock options, while no transactions occurred in the corresponding period last year.
Our net repayments of long-term debt totaled $3.5 million in the quarter compared to $0.3 million in the same period last year. The increase reflects required payments on some of the assumed Davis long-term debt and on certain long-term debt facilities of our Austrian subsidiary.
Our Corporate Constitution requires the payment of dividends of at least 20% of after-tax profits on a rolling three-year basis. During the quarter, dividends totaling $3.9 million (Cdn $0.16 per share) were paid compared to $5.7 million (Cdn $0.16 per share) in the same period a year ago. The higher amount of dividends paid in the first quarter last year was the result of our change in fiscal year end to December 31 in 2002 which required us to pay dividends on account of five months during the first quarter of 2003, compared to dividends paid on account of the usual three months in the current quarter.
Financing Resources
At March 31, 2004, we had cash and cash equivalents on hand (net of bank indebtedness) of $139.5 million. In addition to our cash resources, we had unused and available credit facilities (excluding those available for foreign exchange purposes) of approximately $72 million. Of our total long-term debt of $77.6 million (see Contractual Obligations section below), approximately 87% is not due until 2006 or later.
Our total debt to total capitalization ratio at March 31, 2004 increased to 11%, from 10% at December 31, 2003. This increase was caused by the assumption long-term-debt and the issuance of the note payable as part of the consideration paid on the Davis acquisition.
Shareholders' Equity
Shareholders' equity increased to $561.0 million from $549.3 million at December 31, 2003.
The increase in shareholders' equity is due primarily to net income generated in excess of amounts distributed to shareholders in the form of dividends, offset by a $10.0 million decrease in the currency translation adjustment account. The currency translation adjustment account represents the unrealized change in the value of our net investment in subsidiaries and divisions operating in functional currencies different from our reporting currency, the U.S. dollar. This includes all of our Canadian, European, Asian and South American operating and/or reporting entities which collectively account for the majority of our total equity. The decrease in the currency translation adjustment account occurred as a result of a weakening of the Canadian dollar and euro against the U.S. dollar since December 31, 2003 (down 2% and 4%, respectively).
9
Our Class A Subordinate Voting Shares increased as 63,900 stock options were exercised during the quarter for proceeds of $0.5 million.
Under new rules adopted for stock-based compensation (see Accounting Changes), contributed surplus is now recorded as the offset when compensation expense is recognized on stock options recorded at fair value. The increase in the balance during the quarter reflects $0.4 million of stock-based compensation expense recorded on all options granted on or after August 1, 2002 (the date at which the Company was first required to adopt CICA 3870), including 109,000 options granted in January 2004. As the underlying options recorded at fair value are subsequently exercised, the accumulating balance in contributed surplus will be transferred systematically to Class A Subordinate Voting Shares and considered additional proceeds received on these option exercises.
The increase in our shareholders' equity has resulted in increases to our book value per Class A Subordinate Voting Share or Class B Share on a diluted basis by 2%, to $17.26 per share (Cdn $22.71), from $16.92 per share (Cdn $21.83) at December 31, 2003.
Outstanding Share Information
Our share structure has remained consistent with that in place as at December 31, 2003. For details concerning the nature of our securities, refer to Note 12 "Capital Stock" of the notes to our audited consolidated financial statements for the year ended December 31, 2003 contained in our 2003 Annual Report.
As of May 4, 2004, the following of our securities and options to purchase securities were issued and outstanding:
| Class A Subordinate Voting Shares | | 18,204,329 |
| Class B Shares | | 14,223,900 |
| Stock options to purchase Class A Subordinate Voting Shares | | 1,528,450 |
FOREIGN CURRENCY ACTIVITIES
We operate globally, which gives rise to a risk that our earnings, cash flows and shareholders' equity may be adversely affected by fluctuations in relative foreign exchange rates. More specifically, we have operations in Canada, the United States, Germany, Austria, Italy, Switzerland, South Korea, Brazil, and China, with each division or subsidiary operating in the functional currency of the country or region in which it is located. As a result, we have seven principal functional currencies in which we currently conduct business (in the order of relative current prominence): the Canadian dollar, the euro, the U.S. dollar, the Korean won, the Swiss franc, the Brazilian real and the Chinese renmibis.
Where possible, we negotiate sales contracts and purchase materials, equipment and labour in the functional currency of the country or region in which a particular operation is located. This allows foreign currency cash flows for the purchase of materials and capital equipment denominated in foreign currencies to be naturally hedged when contracts to deliver certain products are also denominated in these same foreign currencies. In an effort to manage the remaining exposure, we have instituted a foreign currency cash flow hedging program in which we utilize foreign exchange forward contracts to manage foreign exchange risk from our underlying customer contracts. In particular, foreign exchange forward contracts are used for the sole purpose of hedging a significant portion of our projected foreign currency inflows and outflows, consisting primarily of U.S. dollar, euro and Korean won denominated contractual commitments of our Canadian-based operations (to deliver products to customers, or buy products from suppliers, in addition to the other anticipated transactions expected to be settled in foreign currencies). We do not enter into foreign exchange contracts for speculative purposes.
We have established formal documentation of the relationships between the specific hedging instruments entered into under the hedging program and the underlying cash inflows and outflows expected to result from specific firm commitments or forecasted transactions. The amount and timing of forward contracts are dependent upon a number of factors, including anticipated production delivery schedules, anticipated customer payment dates and anticipated product costs which may be paid in foreign currencies. We formally assess and monitor, both at the inception of the hedge instrument and on an ongoing basis, whether the derivatives used for hedging purposes are effective in offsetting changes in the fair values or cash flows of the hedged items. As long as the derivative remains effective, gains and losses on the derivative contracts are accounted for as a component of the related hedged transaction. If the derivative contracts are determined at any point in time to be ineffective as hedges, previously unrecognized gains or losses pertaining to the portion of the hedging transactions in excess of the projected foreign denominated cash flows would be recognized in income at the time this condition was identified.
10
For details concerning the amount and timing of foreign exchange forward contracts outstanding at December 31, 2003, refer to Note 14(a) of our audited consolidated financial statements for the year ended December 31, 2003 contained in our 2003 Annual Report. In addition, Note 14(c) contains a discussion of the risks we face in dealing with counterparties on our foreign-exchange forward contracts and the procedures we employ for mitigating these risks.
CRITICAL ACCOUNTING POLICIES
Our discussion and analysis of our results of operations and financial position is based upon the consolidated financial statements, which have been prepared in accordance with Canadian generally accepted accounting principles (GAAP). Note 22 of our audited consolidated financial statements for the year ended December 31, 2003 contained in our 2003 Annual Report sets out the material differences between Canadian and United States GAAP. The preparation of the consolidated financial statements requires management to make estimates and judgments that affect the reported amounts of assets, liabilities, revenues and expenses, and the related disclosure of contingent assets and liabilities. We make estimates based on historical experience and various other assumptions that we believe are reasonable in the circumstances, the results of which form the basis for our judgments about the carrying value of assets and liabilities. On a continuous basis, we evaluate our estimates. However, actual results may differ from these estimates under different assumptions or conditions.
Refer to our annual MD&A contained in our 2003 Annual Report for a full description of our critical accounting policies that affect the more significant judgments and estimates used in the preparation of our consolidated financial statements.
CONTINGENCIES
From time to time, we may be contingently liable for litigation and other claims. Refer to note 21 of our audited consolidated financial statements for the year ended December 31, 2003 contained in our 2003 Annual Report.
CONTRACTUAL OBLIGATIONS AND OFF-BALANCE SHEET FINANCING
At March 31, 2004, we had contractual obligations for which we have recognized liabilities on our consolidated balance sheet that require annual payments as follows:
(U.S. dollars in thousands)
| | Less than
1 year
| | 1-3 years
| | 4-5 years
| | After
5 years
| | Total
|
|---|
| Long-term debt and capital lease obligations | | $ | 5,558 | | $ | 59,526 | | $ | 11,081 | | $ | 1,482 | | $ | 77,646 |
| Long-term license arrangement | | | 76 | | | 152 | | | 152 | | | 228 | | | 608 |
| Purchase obligations [i] | | | — | | | — | | | — | | | — | | | — |
| | |
| |
| |
| |
| |
|
| Total contractual obligations | | $ | 5,634 | | $ | 59,678 | | $ | 11,233 | | $ | 1,710 | | $ | 78,254 |
| | |
| |
| |
| |
| |
|
- [i]
- We had no unconditional purchase obligations other than those related to inventory, services, tooling, royalty arrangements based on future sales and fixed assets in the ordinary course of business.
11
In addition to the above, our obligations with respect to employee future benefit plans as at March 31, 2004, are as follows:
(U.S. dollars in thousands)
| |
|
|---|
| Post-retirement medical benefits obligations | | $ | 6,884 |
| Termination and long service arrangements | | | 4,518 |
| | |
|
| | | $ | 11,402 |
| | |
|
We also have off-balance sheet financing or other contractual arrangements which include: operating lease contracts, foreign exchange forward contracts, a contract to purchase hydroelectricity supply and certain government assistance arrangements with contingent repayment terms. At March 31, 2004, these commitments or arrangements require annual payments as follows:
(U.S. dollars in thousands)
| | Less than 1 year
| | 1-3 years
| | 4-5 years
| | After 5 years
| | Total
|
|---|
| Operating leases with MID [i] | | $ | 2,832 | | $ | 7,599 | | $ | 7,317 | | $ | 23,116 | | $ | 40,864 |
| Operating leases with third parties [i] | | | 3,126 | | | 5,667 | | | 2,781 | | | 750 | | | 12,324 |
| Electricity swap contracts [ii] | | | 1,771 | | | 146 | | | — | | | — | | | 1,917 |
| Foreign exchange instruments [iii] | | | | | | | | | | | | | | | |
| Government assistance arrangements [iv] | | | | | | | | | | | | | | | |
| | |
| |
| |
| |
| |
|
| Total off-balance sheet arrangements | | $ | 7,729 | | $ | 13,412 | | $ | 10,098 | | $ | 23,866 | | $ | 55,105 |
| | |
| |
| |
| |
| |
|
- [i]
- A number of our facilities are subject to operating leases with MID or with third parties. Upon adoption of CICA 3110, we have estimated the present value of obligations to restore leased premises at the end of the respective lease terms back to their condition at the inception of the lease. At March 31, 2004, we have accrued an asset retirement obligation of $1.7 million (including interest accreted to the end of the period). In addition, we have third party operating lease commitments for various manufacturing and office related equipment. These leases are generally of shorter duration.
- [ii]
- As set out in Note 21[b] of our audited consolidated financial statements for the year ended December 31, 2003 contained in our 2003 Annual Report, in May 2002, we entered into a three-year contract (expiring May 2005) to purchase specified levels of hydroelectricity supply during expected peak and non-peak time periods at specified fixed prices. Liabilities for hydroelectricity supply are recorded as the underlying power is supplied to, and used by, our Canadian divisions that are covered under the supply agreement. At March 31, 2004, the remaining commitment under this supply agreement was approximately $1.9 million.
- [iii]
- As discussed earlier in this MD&A, we utilize foreign-exchange forward contracts for the sole purpose of hedging a portion of the projected foreign currency inflows and outflows that are expected to occur throughout the expected duration of underlying production programs. In accordance with Canadian GAAP, presuming the underlying hedge contracts are effective in offsetting actual foreign currency outflows to the extent intended, we utilizes rates in the forward contracts that are maturing during any period (to the extent that the transactions are hedged) to determine the appropriate rates at which foreign currency transactions in the period are recorded. In these instances, no adjustment is recorded through income at each balance sheet date to record the mark-to-market fair value amount that would be required to unwind the contracts outstanding at that date. Refer to Note 14[a] of our audited consolidated financial statements for the year ended December 31, 2003 contained in our 2003 Annual Report for information concerning the foreign-exchange forward contracts outstanding at December 31, 2003 and the unrecognized fair value adjustment at that date.
At March 31, 2004 we, through one of our jointly-controlled entities, have outstanding foreign exchange options that require us to sell €0.4 million at a weighted average rate of U.S. $0.92.
- [iv]
- We periodically receive funding under various government assistance and other incentive programs in the various jurisdictions in which we operate. In some specific instances, some of the funding amounts that we have received may become repayable if certain requirements are not maintained or, in certain circumstances, if the underlying R&D projects reach commercial success and begin to generate revenues. At March 31, 2004, we have approximately $0.3 million of funding that we have received that may be subject to such conditions or requirements. At March 31, 2004, no conditions currently exist that would require any repayments of these amounts we have received to date as funding.
12
RELATED PARTY TRANSACTIONS
We have completed transactions with Magna and other related parties as disclosed in Note 6 of the accompanying unaudited interim consolidated financial statements.
SELECTED ANNUAL AND QUARTERLY FINANCIAL INFORMATION
We are required to disclose the following selected annual information for the three most recently-completed fiscal years:
(U.S. dollars in millions, except per share figures)
| | Year ended
December 31
2003
| | Five-month period ended
December 31
2002
| | Year ended
July 31
2002
|
|---|
| Income Statement Data | | | | | | | | | |
| Sales | | $ | 1,098.6 | | $ | 399.4 | | $ | 855.2 |
| Net income | | $ | 74.1 | | $ | 20.6 | | $ | 53.6 |
| Earnings per Class A Subordinate Voting Share or Class B Share | | | | | | | | | |
| | | Basic | | $ | 2.29 | | $ | 0.64 | | $ | 1.82 |
| | | Diluted | | $ | 2.28 | | $ | 0.63 | | $ | 1.80 |
| Cash dividends paid per Class A Subordinate Voting Share or Class B Share | | $ | 0.75 | | $ | 0.16 | | $ | 0.64 |
| | |
| |
| |
|
Financial Position Data |
|
|
|
|
|
|
|
|
|
| Working capital | | $ | 261.4 | | $ | 180.5 | | $ | 160.3 |
| Total assets | | $ | 839.0 | | $ | 656.8 | | $ | 604.8 |
| Net cash: | | | | | | | | | |
| | Cash and cash equivalents | | $ | 163.3 | | $ | 135.1 | | $ | 111.3 |
| | Bank indebtedness | | $ | 40.8 | | $ | 46.1 | | $ | 18.9 |
| | Long-term debt (including current portion) | | $ | 66.8 | | $ | 49.4 | | $ | 50.1 |
| | |
| |
| |
|
| Net cash | | $ | 55.7 | | $ | 39.6 | | $ | 42.3 |
| | |
| |
| |
|
In December 2002, we changed our year end to December 31 and as such, the comparative period at December 31, 2002 is for the five-month period then ended. Net income and earnings per share in this five-month period ended December 31, 2002 were negatively affected by an $8.5 million impairment loss ($0.26 per share on a diluted basis) recorded on the long-lived asset group at our German die-casting operations in December 2002. In the year ended December 31, 2003, our profitability levels improved versus the prior periods in our North American and European Automotive segments driven by strong sales, content growth associated with new launches and a significant strengthening of the Canadian dollar and euro versus the U.S. dollar. Profitability levels in our Other Automotive segment in 2003 decreased due to higher engineering, design and other upfront product development and support costs for a significant amount of business to be launched in the future.
We are also required to disclose the following selected quarterly information for the eight most recently-completed quarters:
| | For the three-month period ended
|
|---|
(U.S. dollars in millions, except per share and share figures)
| | March 31
2004
| | December 31
2003
| | September 30
2003
| | June 30
2003
|
|---|
| Sales | | $ | 361,415 | | $ | 298,055 | | $ | 254,317 | | $ | 278,846 |
| Net income [i] | | $ | 24,664 | | $ | 20,659 | | $ | 15,908 | | $ | 21,247 |
| Earnings per Class A Subordinate Voting Share or Class B Share | | | | | | | | | | | | |
| | Basic [i] | | $ | 0.76 | | $ | 0.64 | | $ | 0.49 | | $ | 0.66 |
| | Diluted [i] | | $ | 0.76 | | $ | 0.64 | | $ | 0.48 | | $ | 0.66 |
| Average number of shares outstanding on a diluted basis (in millions) | | | 32.7 | | | 32.6 | | | 32.6 | | | 32.5 |
13
| | For the three-month period ended
|
|---|
(U.S. dollars in millions, except per share and share figures)
| | March 31 2003
| | December 31 2002
| | September 30 2002
| | June 30 2002
|
|---|
| Sales | | $ | 267,373 | | $ | 247,842 | | $ | 224,559 | | $ | 242,312 |
| Net income [i] | | $ | 16,298 | | $ | 9,730 | | $ | 14,052 | | $ | 18,253 |
| Earnings per Class A Subordinate Voting Share or Class B Share | | | | | | | | | | | | |
| | Basic [i] | | $ | 0.50 | | $ | 0.30 | | $ | 0.44 | | $ | 0.62 |
| | Diluted [i] | | $ | 0.50 | | $ | 0.30 | | $ | 0.44 | | $ | 0.61 |
| Average number of shares outstanding on a diluted basis (in millions) | | | 32.5 | | | 32.5 | | | 32.1 | | | 29.9 |
- [i]
- Restated to reflect the retroactive adoption of new rules for stock-based compensation (see Note 1 of the accompanying unaudited interim consolidated financial statements).
Year-over-year sales for each of the comparable quarters presented above reflect significant growth caused by foreign currency translation due to the strengthening of the Canadian dollar and euro relative to the U.S. dollar. The majority of the remaining growth in sales and earnings over the prior year was driven by increased content per vehicle levels achieved in our major markets as vehicle production volumes were relatively consistent. Net income and earnings per share in the three-month period ended December 31, 2002 were negatively affected by an $8.5 million impairment loss ($0.26 per share on a diluted basis) recorded on the long-lived asset group at our German die-casting operations in December 2002.
RISKS AND UNCERTAINTIES (FORWARD-LOOKING STATEMENTS)
This MD&A contains statements which, to the extent that they are not recitations of historical fact, may constitute "forward-looking statements" within the meaning of applicable securities legislation, including the Private Securities Litigation Reform Act of 1995. Forward-looking statements may include financial and other projections, as well as statements regarding our future plans, objectives or performance, or our underlying assumptions. The words "estimate", "anticipate", "believe", "expect", "intend" and other similar expressions are intended to identify forward-looking statements. Persons reading this MD&A are cautioned that such statements are only predictions, and that our actual future results or performance may be materially different.
Forward-looking information involves certain risks, assumptions, uncertainties and other factors which may cause actual future results or anticipated events to differ materially from those expressed or implied in any forward-looking statements. In our case, these factors principally relate to the risks associated with the automotive industry and include, but are not limited to: our operating and/or financial performance, including the effect of new accounting standards (such as the ongoing requirement for impairment testing of long-lived assets) on our financial results; our ability to identify, negotiate, complete and integrate acquisitions; the ability to finance our business requirements, including raising required funding as necessary; global economic conditions and changes in the various economies in which we operate; our relationship with Magna International Inc.; fluctuations in interest rates; changes in consumer and business confidence levels; consumers' personal debt levels; vehicle prices; the extent and nature of purchasing or leasing incentive campaigns offered by automotive manufacturers; environmental emission and safety regulations; fuel prices and availability; the continuation and extent of outsourcing by automotive manufacturers; the extent, continued use and availability of steel as a primary material for automotive parts versus alternative materials (such as aluminum and plastics); our ability to continue to meet customer specifications relating to product performance, cost, quality and service; industry cyclicality or seasonality; trade and/or labour issues or disruptions; customer pricing pressures, pricing concessions and cost absorptions; warranty, recall and product liability costs and risks; actual levels of program production volumes by our customers compared to original expectations, including program cancellations or delays and changes in product mix; new program launch risks; our dependence on certain engine and transmission programs and the market success and consumer acceptance of the vehicles into which such powertrain products are installed; our relationship with and dependence on certain customers; currency exposure; technological developments by our competitors; governmental, environmental and regulatory policies and our ability to anticipate or respond to changes therein; disruptions of terrorism or war; and other changes in the competitive environment in which we operate.
For a more detailed discussion of some of these factors, reference is made to the disclosures regarding risks and uncertainties set forth in our Annual Information Form, Form 40-F and other public filings. We do not intend, nor do we undertake any obligation, to update or revise any forward-looking statements to reflect subsequent information, events, results, circumstances or otherwise.
14
TESMA INTERNATIONAL INC.
CONSOLIDATED BALANCE SHEETS
(U.S. dollars in thousands)
As at
| | NOTE
| | March 31
2004
| | December 31
2003
|
|---|
| |
| | (unaudited)
| | (audited)
|
|---|
| ASSETS | | | | | | | | |
| Current: | | | | | | | | |
| | Cash and cash equivalents | | | | $ | 205,496 | | $ | 163,255 |
| | Accounts receivable | | 6 | | | 211,126 | | | 193,160 |
| | Inventories | | | | | 111,504 | | | 100,216 |
| | Prepaid expenses and other | | | | | 12,495 | | | 10,152 |
| | Future tax assets | | | | | 1,282 | | | 979 |
| | Income taxes recoverable | | | | | — | | | 2,372 |
| | | | |
| |
|
| | | | | | 541,903 | | | 470,134 |
| Capital assets | | 2, 3, 6 | | | 332,592 | | | 303,749 |
| Escrow deposit | | 2 | | | — | | | 44,635 |
| Goodwill | | 2, 3 | | | 55,814 | | | 15,096 |
| Other assets | | 2 | | | 7,792 | | | 3,527 |
| Future tax assets | | 2 | | | 5,161 | | | 1,834 |
| | | | |
| |
|
| | | | | $ | 943,262 | | $ | 838,975 |
| | | | |
| |
|
LIABILITIES AND SHAREHOLDERS' EQUITY |
|
|
|
|
|
|
|
|
| Current: | | | | | | | | |
| | Bank indebtedness | | 2 | | $ | 65,977 | | $ | 40,756 |
| | Accounts payable | | 6 | | | 101,983 | | | 80,398 |
| | Other accrued liabilities | | 6 | | | 44,380 | | | 34,126 |
| | Accrued salaries and wages | | 4 | | | 29,664 | | | 27,065 |
| | Income taxes payable | | | | | 3,485 | | | — |
| | Future taxes payable | | | | | 17,087 | | | 16,796 |
| | Long-term debt due within one year | | 2, 3 | | | 5,557 | | | 3,919 |
| | | | |
| |
|
| | | | | | 268,133 | | | 203,060 |
| Long-term debt | | 2, 3 | | | 72,089 | | | 62,879 |
| Future tax liabilities | | | | | 28,780 | | | 18,102 |
| Other long term liabilities | | 2 | | | 13,286 | | | 5,860 |
SHAREHOLDERS' EQUITY |
|
|
|
|
|
|
|
|
| Class A Subordinate Voting Shares, authorized: unlimited (issued: 18,204,329; December 31, 2003 — 18,140,429) | | 4 | | | 198,794 | | | 198,250 |
| Class B Shares, authorized: unlimited (issued: 14,223,900; December 31, 2003 — 14,223,900) | | 4 | | | 1,894 | | | 1,894 |
| Contributed surplus | | 1, 4 | | | 1,004 | | | 572 |
| Retained earnings | | 1 | | | 306,484 | | | 285,736 |
| Currency translation adjustment | | | | | 52,798 | | | 62,802 |
| | | | |
| |
|
| | | | | | 560,974 | | | 549,254 |
| | | | |
| |
|
| | | | | $ | 943,262 | | $ | 838,975 |
| | | | |
| |
|
See accompanying notes
15
TESMA INTERNATIONAL INC.
CONSOLIDATED STATEMENTS OF INCOME AND RETAINED EARNINGS
(U.S. dollars in thousands, except share and per share figures)
| |
| | Three Months Ended
March 31
| |
|---|
| | NOTE
| | 2004
| | 2003
| |
|---|
| |
| | (unaudited)
| | (unaudited)
(restated — see Note 1)
| |
|---|
| Sales | | 6 | | $ | 361,415 | | $ | 267,373 | |
| | | | |
| |
| |
| Cost of goods sold | | 6 | | | 280,869 | | | 212,517 | |
| Selling, general and administrative expenses | | 3, 4, 6, 7 | | | 22,856 | | | 16,063 | |
| Depreciation and amortization | | | | | 14,765 | | | 11,268 | |
| Affiliation and social fees | | 6 | | | 3,834 | | | 2,986 | |
| Interest, net | | 6 | | | 287 | | | 80 | |
| | | | |
| |
| |
| Income before income taxes | | | | | 38,804 | | | 24,459 | |
| Income taxes | | | | | 14,140 | | | 8,161 | |
| | | | |
| |
| |
| Net income for the period attributable to Class A Subordinate Voting Shares and Class B Shares | | | | | 24,664 | | | 16,298 | |
| Retained earnings, beginning of period | | | | | 285,736 | | | 225,678 | |
| Dividends on Class A Subordinate Voting Shares and Class B Shares | | | | | (3,916 | ) | | (2,409 | ) |
| Cumulative adjustment for change in accounting policy | | 1 | | | — | | | (79 | ) |
| | | | |
| |
| |
| Retained earnings, end of period | | | | $ | 306,484 | | $ | 239,488 | |
| | | | |
| |
| |
| Earnings per Class A Subordinate Voting Share or Class B Share | | | | | | | | | |
| | Basic | | | | $ | 0.76 | | $ | 0.50 | |
| | Diluted | | | | $ | 0.76 | | $ | 0.50 | |
| | | | |
| |
| |
| Average number of Class A Subordinate Voting Shares and Class B Shares outstanding during the period (in millions) | | | | | | | | | |
| | Basic | | | | | 32.4 | | | 32.3 | |
| | Diluted | | | | | 32.7 | | | 32.5 | |
| | | | |
| |
| |
See accompanying notes
16
TESMA INTERNATIONAL INC.
CONSOLIDATED STATEMENTS OF CASH FLOW
(U.S. dollars in thousands)
| |
| | Three Months Ended
March 31
| |
|---|
| | NOTE
| | 2004
| | 2003
| |
|---|
| |
| | (unaudited)
| | (unaudited)
(restated — see Note 1)
| |
|---|
CASH PROVIDED FROM (USED FOR):
OPERATING ACTIVITIES | | | | | | | | | |
| Net income | | | | $ | 24,664 | | $ | 16,298 | |
| Items not involving current cash flows | | | | | 21,575 | | | 13,146 | |
| | | | |
| |
| |
| | | | | | 46,239 | | | 29,444 | |
| Net change in non-cash working capital | | | | | 8,029 | | | (12,558 | ) |
| | | | |
| |
| |
| | | | | | 54,268 | | | 16,886 | |
| | | | |
| |
| |
INVESTING ACTIVITIES |
|
|
|
|
|
|
|
|
|
| Capital asset additions | | | | | (24,390 | ) | | (18,155 | ) |
| Proceeds on disposal of interest in jointly-controlled entity, net of cash disposed | | 3 | | | (953 | ) | | — | |
| Increase in other assets | | | | | (488 | ) | | (98 | ) |
| Acquisition of subsidiaries, in excess of funds previously held in escrow | | 2 | | | (427 | ) | | — | |
| Proceeds from disposal of capital and other assets | | 6 | | | 333 | | | 26,073 | |
| | | | |
| |
| |
| | | | | | (25,925 | ) | | 7,820 | |
| | | | |
| |
| |
FINANCING ACTIVITIES |
|
|
|
|
|
|
|
|
|
| Increase in bank indebtedness | | | | | 16,051 | | | 3,757 | |
| Proceeds from loan repayments | | 3 | | | 7,728 | | | — | |
| Issuance of Class A Subordinate Voting Shares | | | | | 544 | | | — | |
| Dividends paid on Class A Subordinate Voting Shares and Class B Shares | | | | | (3,916 | ) | | (5,709 | ) |
| Net repayments of long-term debt | | | | | (3,477 | ) | | (284 | ) |
| | | | |
| |
| |
| | | | | | 16,930 | | | (2,236 | ) |
| | | | |
| |
| |
| Effect of exchange rate changes on cash and cash equivalents | | | | | (3,032 | ) | | 8,622 | |
| | | | |
| |
| |
| Net increase in cash and cash equivalents during the period | | | | | 42,241 | | | 31,092 | |
| Cash and cash equivalents, beginning of period | | | | | 163,255 | | | 135,080 | |
| | | | |
| |
| |
| Cash and cash equivalents, end of period | | | | $ | 205,496 | | $ | 166,172 | |
| | | | |
| |
| |
See accompanying notes
17
NOTES TO CONSOLIDATED FINANCIAL STATEMENTS
1. Basis of Presentation and Accounting Changes
The unaudited interim consolidated financial statements have been prepared following the accounting policies as set out in the Company's 2003 Annual Report, except for the adoption of new accounting pronouncements which include the Canadian Institute of Chartered Accountants (CICA) Handbook Section 3110 "Asset Retirement Obligations" (CICA 3110) and Accounting Guideline AcG-13 "Hedging Relationships" (AcG-13).
CICA 3110 requires the Company to estimate and recognize the fair value (discounted to present value) of any liabilities for future asset retirements, where applicable, and to record the associated cost over the period of use. For Tesma, this primarily represents the obligation, at the end of each lease term, to restore leased premises back to their condition at the inception of the lease. At lease inception, the present value of this obligation is determined and recognized as a long-term liability with a corresponding amount recognized as an additional capital asset. The amount recognized as a capital asset is amortized and the liability amount is accreted over the period from lease inception to the time the Company expects to vacate the premises, such that both depreciation and interest expense are recorded as charges against earnings. The Company adopted these rules effective January 1, 2004 and the resulting impact to the unaudited interim consolidated financial statements was not significant.
AcG-13 establishes certain conditions and documentation requirements that must exist at the inception of a hedge in order to apply hedge accounting. On January 1, 2004, the Company's treasury management system complied with the documentation requirements of AcG-13 and, as such, the Company continues to apply hedge accounting, when applicable, in its consolidated financial statements.
As described in Note 1(p) of the Company's 2003 Annual Report, the Company adopted the new rules under Handbook Section 3870 "Stock-Based Compensation and other Stock-Based Payments" (CICA 3870) which require that all stock-based compensation transactions be accounted for at fair value. The Company adopted the rules on a retroactive basis for all stock-based awards granted on or after August 1, 2002, the date the Company was initially required to adopt CICA 3870. As a result, the comparative quarter ended March 31, 2003 has been restated and reflects a cumulative adjustment to decrease opening retained earnings and increase contributed surplus by $0.1 million, respectively, and to record compensation expense in the period of $nil.
The unaudited interim consolidated financial statements have been prepared in accordance with Canadian generally accepted accounting principles, except that certain disclosures required for annual financial statements have not been included. Accordingly, the unaudited interim consolidated financial statements should be read in conjunction with the Company's audited consolidated financial statements for the year ended December 31, 2003, as contained in the Company's 2003 Annual Report.
In the opinion of management, the unaudited interim consolidated financial statements reflect all adjustments, which consist only of normal and recurring adjustments necessary to present fairly the financial position of the Company at March 31, 2004 and the results of operations and cash flows for the three-month periods ended March 31, 2004 and 2003.
2. Business Acquisition
Acquisition of Davis Industries, Inc.
On January 2, 2004, the Company completed the acquisition of Davis Industries, Inc. (Davis). Davis, at the time of acquisition, employed over 700 employees at 3 manufacturing facilities located in Indiana (2 facilities) and Tennessee and a corporate office and research and development centre in Michigan. The main product focus for Davis is stamped powertrain components and assemblies, including driveplate assemblies, transmission shells, oil pan assemblies and engine valve covers, but also includes some body and chassis stampings and fuel filler door assemblies.
The Company has accounted for this transaction using the purchase method of accounting and has recorded 100% of the assets, liabilities, revenues, expenses and cash flows of Davis in its consolidated results commencing January 3, 2004. Total consideration for the acquisition of all the outstanding shares of Davis amounted to $48.5 million, consisting of $45.1 million paid in cash (including transactions costs of $0.5 million and $44.6 million that was held in escrow at our December 31, 2003 year end) and the issuance of a five-year, $3.4 million note bearing interest at the rate of prime plus 1% per annum. The Company also assumed $21.6 million of long-term debt (including current portion) and indebtedness and $5.4 million of other long-term obligations. The following is a summary of the effect of this acquisition on the Company's consolidated balance sheet:
18
(U.S. dollars in millions)
| |
|---|
| Non-cash working capital | | $ | 4.1 | |
| Capital assets | | | 25.1 | |
| Intangible assets | | | 5.6 | |
| Goodwill | | | 42.2 | |
| Long-term debt (including current portion) and indebtedness | | | (21.6 | ) |
| Long-term employee benefit obligation | | | (5.4 | ) |
| Net future tax liabilities | | | (1.5 | ) |
| | |
| |
| Total consideration | | $ | 48.5 | |
| | |
| |
| Comprised of: | | | | |
| | Cash paid from escrow account | | $ | 44.6 | |
| | Transaction costs | | | 0.5 | |
| | Five-year note bearing interest at prime plus 1% per annum | | | 3.4 | |
| | |
| |
| | | $ | 48.5 | |
| | |
| |
The goodwill recorded on the acquisition is deductible for income tax purposes and includes an estimated future tax asset of approximately $2 million resulting from an excess of the tax basis of goodwill over the amount recorded for accounting purposes. This amount is not permitted to be recorded as a future tax asset under applicable accounting rules. Accordingly, as goodwill is deducted from taxable income in the future (and thus realized for tax purposes), the Company will record corresponding reductions to the amount recorded as goodwill in the purchase equation.
The purchase price and related allocations for this acquisition are preliminary. Adjustments to the purchase price and related preliminary allocations may occur as a result of obtaining more information regarding asset valuations, liabilities assumed, purchase price adjustments pursuant to the purchase agreements, and revisions of preliminary estimates of fair values made at the date of purchase.
These amounts and the results of Davis are included in the North American Automotive segment of the Company's operations (Note 5).
3. Reduction In Ownership Interest of Jointly-Controlled Entity
Pursuant to the agreement that resulted in the increase of the Company's interest in one of its jointly-controlled entities from 45% to 75% in December 2001, the other remaining shareholder retained an option to purchase an additional 25% equity ownership from the Company at any time prior to August 1, 2004 at a formula price. Effective February 7, 2004, this shareholder exercised its option and acquired an additional 25% interest in the jointly-controlled entity for nominal cash consideration.
The impact of this transaction on the Company's consolidated balance sheet was to decrease capital and other assets by $5.5 million, cash and cash equivalents by $1.0 million, future tax and other current assets by $4.3 million, goodwill by $0.2 million and total liabilities and long-term debt by $9.8 million.
As a result of this transaction, the Company recorded a net loss totaling $1.2 million (representing the excess of our carrying value of this 25% equity interest over the consideration received) as part of selling, general and administrative expenses.
In addition, as part of this transaction, $7.7 million of shareholder loans due to the Company from the jointly-controlled entity were sold by the Company to the other shareholder for $7.7 million in cash, thereby bringing each shareholder's proportionate share of loans to an equal basis.
This transaction and the results of this jointly-controlled entity are included in the North American Automotive segment of the Company's operations (Note 5). Effective February 8, 2004, only 50% of the assets, liabilities, revenues, expenses and cash flows of this jointly-controlled entity are included in the Company's consolidated results.
19
4. Capital Stock
(a) Class A Subordinate Voting Shares and Class B Shares
The Company's share structure has remained consistent with that in place as at December 31, 2003. For details concerning the nature of the Company's securities, please refer to Note 12 "Capital Stock" of the notes to the Company's audited consolidated financial statements for the year ended December 31, 2003 contained in the Company's 2003 Annual Report.
Outstanding Class A Subordinate Voting Shares and Class B Shares included in shareholders' equity of the Company consists of:
| | Class A Subordinate
Voting Shares
| | Class B Shares
|
|---|
(U.S. dollars in thousands, except shares)
| | Number of Shares
| | Stated Value
| | Number of Shares
| | Stated Value
|
|---|
| Balance, December 31, 2003 | | 18,140,429 | | $ | 198,250 | | 14,223,900 | | $ | 1,894 |
| Exercise of incentive stock options | | 63,900 | | | 544 | | — | | | — |
| | |
| |
| |
| |
|
| Balance, March 31, 2004 | | 18,204,329 | | $ | 198,794 | | 14,223,900 | | $ | 1,894 |
| | |
| |
| |
| |
|
(b) Incentive Stock Options
Information concerning the Company's Incentive Stock Option Plan is included in Note 12 "Capital Stock" of the notes to the Company's audited consolidated financial statements for the year ended December 31, 2003 contained in the Company's 2003 Report to Shareholders.
The following is a continuity schedule of the options outstanding:
| | Number of Options
| | Range of exercise price
| | Weighted average exercise price
|
|---|
(Share prices in Canadian dollars)
| |
|
|---|
| Balance, December 31, 2003 | | 1,483,350 | | $10.50-$31.74 | | $ | 24.83 |
| Granted | | 109,000 | | $31.55 | | $ | 31.55 |
| Exercised | | (63,900 | ) | $10.50-$26.00 | | $ | 11.19 |
| | |
| |
| |
|
| Balance, March 31, 2004 | | 1,528,450 | | $10.50-$31.74 | | $ | 25.88 |
| | |
| |
| |
|
| Exercisable at March 31, 2004 | | 1,052,450 | | $10.50-$31.74 | | $ | 24.68 |
| | |
| |
| |
|
The Company accounts for all stock-based compensation transactions at fair value. The Company determines the total estimated fair value of each tranche of stock options as at the date of grant and then records compensation expense, on an amortized basis, over the applicable vesting periods of the underlying stock options. As such, at each reporting date, cumulative compensation expense will be recognized for each tranche of stock options to the extent that they are vested.
During the three-month period ended March 31, 2004, the Company recorded $0.4 million (three-month period ended March 31, 2003 — $nil) of compensation expense as part of selling, general and administrative expenses and recorded a corresponding increase to contributed surplus. Upon exercise of the underlying stock options recorded at fair value, (i.e. those issued on or after August 1, 2002), the Company will record a reduction to contributed surplus and a corresponding increase in the value attributed to the Class A Subordinate Voting Shares issued on the exercise of these stock options.
20
The balance of contributed surplus related to stock compensation is as follows:
| | 2004
| | 2003
|
|---|
(U.S. dollars in thousands)
|
|---|
| Opening balance, January 1 | | $ | 572 | | $ | 79 |
| Compensation expense | | | 432 | | | 14 |
| | |
| |
|
| Closing balance, March 31 | | $ | 1,004 | | $ | 93 |
| | |
| |
|
(c) Maximum Number of Shares
The following table presents the maximum number of shares that would be outstanding if all of the options outstanding at March 31, 2004 were exercised:
| | Number of Shares
|
|---|
| Class A Subordinate Voting Shares outstanding at March 31, 2004 | | 18,204,329 |
| Class B Shares outstanding at March 31, 2004 | | 14,223,900 |
| Options to purchase Class A Subordinate Voting Shares | | 1,528,450 |
| | |
|
| | | 33,956,679 |
| | |
|
The maximum number of shares reserved to be issued for stock options is 4,000,000 Class A Subordinate Voting Shares, of which 637,500 are reserved and unoptioned as at March 31, 2004.
(d) Non-Employee Director Share-Based Compensation Plan
Under this plan, non-employee directors can elect to receive a portion of their annual retainers and other Board-related compensation in the form of deferred share units (DSUs) which are credited to the director's account, and the Company records a liability. The number of DSUs issued is based upon the market value of the Company's Class A Subordinate Voting Shares at each allocation date. Each DSU has a cash value equal to the market price of one of the Company's Class A Subordinate Voting Shares. Within a specified time after retirement, non-employee directors receive a cash payment equal to the market value of their DSUs.
Due to the fact these DSUs will require settlement at some point in the future for cash, the Company records each allocation of units issued as compensation expense and records the associated liability in the period they are issued. The value of all DSUs outstanding, and the associated liability, are adjusted at each reporting date to reflect their fair value based on the current market price of the Company's Class A Subordinate Voting Shares.
During the three-month period ended March 31, 2004 $0.1 million (three-month period ended March 31, 2003 — $nil) was recorded as compensation expense (including foreign exchange and the revaluation of the DSUs to their fair values at the period end) and no amounts were paid out under this plan. At March 31, 2004, there were 30,669 DSUs (December 31, 2003 — 28,265) having a total value of $0.7 million (December 31, 2003 — $0.6 million) that were issued and outstanding.
5. Segmented Information
The Company currently operates in one industry segment, the automotive powertrain business, designing and manufacturing parts and assemblies primarily for the automotive OEMs or their Tier I and Tier II powertrain component manufacturers.
The Company operates internationally and its manufacturing facilities are arranged geographically to meet the requirements of the Company's customers in each market. Each manufacturing facility has the capability to offer many different powertrain parts and assemblies, as the technological processes employed can be used to make many different parts and assemblies. Additionally, specific marketing and distribution strategies are required in each geographic region.
The Company currently operates in four geographic segments, of which only two are reportable segments. The accounting policies for the segments are the same as those described in Note 1 to the audited consolidated financial statements for the year ended December 31, 2003 (as contained in the Company's 2003 Annual Report) and intersegment sales are accounted for at prices which approximate fair value.
21
Executive management assesses the performance of each segment based on income before income taxes, as the management of income tax expense is centralized.
The following tables show certain information with respect to operating segment disclosures:
Three months ended:
March 31, 2004
| | North American Automotive
| | European
Automotive
| | Other Automotive
| | Total
|
|---|
| | (U.S. dollars in thousands)
|
|---|
| Total Sales | | $ | 288,202 | | $ | 72,370 | | $ | 8,774 | | $ | 369,346 |
| Intersegment sales | | | 7,267 | | | 557 | | | 107 | | | 7,931 |
| Sales to external customers | | $ | 280,935 | | $ | 71,813 | | $ | 8,667 | | $ | 361,415 |
| Depreciation and amortization | | $ | 11,012 | | $ | 2,650 | | $ | 1,103 | | $ | 14,765 |
| Interest, net | | $ | (490 | ) | $ | 297 | | $ | 480 | | $ | 287 |
| Income before income taxes | | $ | 32,475 | | $ | 7,580 | | $ | (1,251 | ) | $ | 38,804 |
| Capital assets, net | | $ | 232,235 | | $ | 65,640 | | $ | 34,717 | | $ | 332,592 |
| Capital asset additions | | $ | 19,005 | | $ | 3,308 | | $ | 2,077 | | $ | 24,390 |
| Goodwill, at carrying value | | $ | 55,094 | | $ | 720 | | $
| —
| | $ | 55,814 |
March 31, 2003
|
|
|
|
|
|
|
|
|
|
|
|
|
| Total Sales | | $ | 207,973 | | $ | 57,803 | | $ | 6,829 | | $ | 272,605 |
| Intersegment sales | | | 4,721 | | | 488 | | | 23 | | | 5,232 |
| Sales to external customers | | $ | 203,252 | | $ | 57,315 | | $ | 6,806 | | $ | 267,373 |
| Depreciation and amortization | | $ | 8,517 | | $ | 1,862 | | $ | 889 | | $ | 11,268 |
| Interest, net | | $ | (487 | ) | $ | 319 | | $ | 248 | | $ | 80 |
| Income before income taxes | | $ | 21,398 | | $ | 3,716 | | $ | (655 | ) | $ | 24,459 |
| Capital assets, net | | $ | 185,904 | | $ | 53,324 | | $ | 28,051 | | $ | 267,279 |
| Capital asset additions | | $ | 8,990 | | $ | 5,092 | | $ | 4,073 | | $ | 18,155 |
| Goodwill, at carrying value | | $ | 13,058 | | $ | 645 | | $ | — | | $ | 13,703 |
6. Related Party Transactions
(a) Transactions with Controlling Shareholder
The Company completed transactions with Magna International Inc. (Magna), the Company's controlling shareholder, and other companies under Magna's control as follows:
Three months ended March 31
| | 2004
| | 2003
| |
|---|
(U.S. dollars in thousands)
| |
|---|
| Sales [i] | | $ | 2,200 | | $ | 1,926 | |
| Purchases of materials [i] | | $ | 964 | | $ | 837 | |
| Rental of manufacturing facilities [ii] | | $ | — | | $ | 565 | |
| Affiliation fee [iii] | | $ | 3,252 | | $ | 2,621 | |
| Social fee [iv] | | $ | 582 | | $ | 365 | |
| Other specific charges [v] | | $ | 432 | | $ | 534 | |
| Interest, net | | $ | 2 | | $ | — | |
| Construction management fees [ii] | | $ | — | | $ | (1,293 | ) |
- [i]
- Sales to, and purchases from, Magna and other companies under Magna's control, and the resulting accounts receivable and payable balances, are typically effected on normal commercial terms.
- [ii]
- On January 31, 2003, the Company completed a sale and leaseback transaction with MI Developments Inc. (MID), then a wholly-owned subsidiary of Magna, for all the land and buildings on the Tesma Corporate Campus, which includes the corporate office building and two manufacturing facilities. Under the terms of the purchase and sale agreement, the land and buildings comprising the Corporate Campus (with a carrying value of $23.5 million) were sold to MID for cash proceeds approximating fair value which totaled $25.0 million. The gain of $1.5 million resulting from the sale was initially deferred and is now being amortized on a straight-line basis over the term of the leases.
22
Under the terms of this transaction, in the prior year, $1.3 million of construction management fees (including carrying charges) previously billed in fiscal 2002 by MID to the Company on account of this project were refunded. In addition, the Company entered into agreements to lease the properties back from MID (at prevailing market rates existing at inception) for a term of twelve years (with an initial option to renew for three years followed by two subsequent five-year renewal options) and is required to make lease payments of approximately $2.7 million per year. The Company made rental payments totaling $0.6 million to MID in the three-month period ended March 31, 2003. On August 29, 2003, all of the shares of MID were distributed to the shareholders of Magna pursuant to a planned reorganization of Magna. As a result of this distribution, MID became directly controlled by the same entity that indirectly controls the Company, such that MID remains a related party to the Company, but is no longer part of the group of companies controlled by Magna.
- [iii]
- The Company is party to an affiliation agreement with Magna that provides for the payment by the Company of an affiliation fee in exchange for, among other things, a non-exclusive world-wide license to use certain Magna trademarks, access to Magna management resources, and the collaboration and sharing of best practices in areas such as new management techniques, employee benefits and programs, marketing and technological initiatives. This agreement became effective for a term of seven years and five months commencing August 1, 2002 and expires on December 31, 2009 (subject to annual renewals thereafter). Under this agreement, affiliation fees payable to Magna are calculated as 1.0% of the Company's consolidated net sales, subject to certain exceptions for sales from acquired businesses (which are exempt from the calculation of the affiliation fee in the year of acquisition, with 50% inclusion in the year after acquisition and full inclusion in all subsequent years).
- [iv]
- Under the terms of a social fee agreement, the Company pays Magna a social fee of 1.5% of pretax profits as a contribution to social and charitable programs coordinated by Magna on behalf of Magna and its affiliated companies, including the Company. This agreement became effective for a term of seven years and five months commencing August 1, 2002 and expires on December 31, 2009 (subject to annual renewals thereafter).
- [v]
- Other specific charges, which are recorded primarily as part of selling, general and administrative expenses, are negotiated annually and are based on the level of certain benefits or services provided to the Company by Magna Services Inc., a wholly-owned subsidiary of Magna. These services include, but are not limited to: information technology (WAN infrastructure and support services), human resource and employee relations services (including administration of the Employee Equity Participation and Profit Sharing Program), specialized legal, environmental, finance and treasury support, management and technology training, and an allocated share of the facility and overhead costs dedicated to providing these services.
(b) Other Related Party Transactions
- [i]
- Rental payments to MID in the three-month period ended March 31, 2004 amounted to $0.6 million and were paid under lease agreements entered into at prevailing market rates.
- [ii]
- Effective January 1, 2003, the Company's Austrian subsidiary transferred certain assets and activities into Magna Systemtechnik AG (MST), an entity controlled by Magna established for the training of apprentices in the design, development and manufacturing of tools, prototypes and automotive components. Effective the same date, the Company acquired a minority equity ownership interest in MST and participates in its ongoing activities to the extent of this equity ownership interest. The Company accounts for this investment using the equity method and, accordingly, $0.2 million has been recorded in selling, general and administrative expenses as the Company's share of the three-month net loss of MST to March 31, 2004 (three-month period ended March 31, 2003 — $nil).
23
(c) Outstanding Balances
The outstanding balances with all related parties resulting from transactions included in the consolidated financial statements at the end of the period are as follows:
| | March 31 2004
| | December 31 2003
|
|---|
(U.S. dollars in thousands)
|
|---|
| Accounts receivable | | $ | 1,519 | | $ | 1,560 |
| Accounts payable and other accrued liabilities | | $ | 3,254 | | $ | 1,882 |
| | |
| |
|
7. Foreign Exchange
Included as part of selling, general and administrative expenses are gains (losses) resulting from foreign exchange as follows:
Three months ended March 31
| | 2004
| | 2003
| |
|---|
(U.S. dollars in thousands)
| |
|---|
| Foreign exchange gains (losses) | | $ | 1,314 | | $ | (41 | ) |
| | |
| |
| |
8. Comparative Consolidated Financial Statements
The Company has retroactively restated the comparative consolidated financial statements for the change in accounting policy for stock-based compensation as described in Note 1.
Certain other comparative figures have been reclassified to conform to the current year's method of presentation.
24
DIRECTORS
Manfred Gingl
Chairman & Chief Executive Officer
Tesma International Inc.
Executive Vice Chairman
Magna International Inc.
Hon. David R. Peterson, P.C., Q.C.
Chairman
Cassels Brock & Blackwell LLP
Judson D. Whiteside
Chairman & Chief Executive Officer
Miller Thomson LLP
Hon. M. Douglas Young, P.C.
Chairman
Summa Strategies Canada Inc |
|
Oscar B. Marx, III
Vice President, Automotive Sector
TMW Enterprises, Inc.
Vince J. Galifi
Executive Vice President & Chief Financial Officer
Magna International Inc.
Siegfried Wolf
Executive Vice Chairman
Magna International Inc. |
OFFICERS
Manfred Gingl
Chairman & Chief Executive Officer
Klaus Blickle
President
James L. Moulds
Vice President, Finance & Treasurer
Stefan T. Proniuk
Vice President, Secretary & General Counsel
|
|
Anthony E. Dobranowski
Vice Chairman & Chief Financial Officer
Pasquale Cerullo
Executive Vice President, Sales, Marketing
& Corporate Development
Karl Steinbauer
Vice President, Manufacturing
Thomas More
Controller |
| STOCK LISTINGS | | TRANSFER AGENTS AND REGISTRARS |
Class A Subordinate Voting Shares
The Toronto Stock Exchange — TSM.A
NASDAQ — TSMA | | Class A Subordinate Voting Shares
Canada: Computershare Trust Company of Canada, Toronto
United States: Computershare Trust Company, Inc. |
INVESTOR INFORMATION
Inquiries regarding the Company or to be placed on our supplementary mailing list, fax list or e-mail list to receive Tesma's annual and quarterly reports or press releases, please contact Lynn Riley, Manager, Investor Relations at:
Telephone: 905 417-2160 Fax: 905 417-2148 e-mail: lynn.riley@tesma.com

CORPORATE OFFICE LOCATION
1000 Tesma Way, Concord, Ontario, L4K 5R8
Telephone: 905 417-2100 Fax: 905 417-2101 www.tesma.com
QuickLinks
MANAGEMENT'S DISCUSSION AND ANALYSIS OF RESULTS OF OPERATIONS AND FINANCIAL POSITION For the First Quarter Ended March 31, 2004OVERVIEWACQUISITION OF DAVIS INDUSTRIES, INC.REDUCTION OF OWNERSHIP INTEREST IN JOINTLY-CONTROLLED ENTITYOUTLOOKACCOUNTING CHANGESDISCUSSION OF THE RESULTSFINANCIAL CONDITION, LIQUIDITY AND FINANCIAL RESOURCESFOREIGN CURRENCY ACTIVITIESCRITICAL ACCOUNTING POLICIESCONTINGENCIESCONTRACTUAL OBLIGATIONS AND OFF-BALANCE SHEET FINANCINGRELATED PARTY TRANSACTIONSSELECTED ANNUAL AND QUARTERLY FINANCIAL INFORMATIONRISKS AND UNCERTAINTIES (FORWARD-LOOKING STATEMENTS)CONSOLIDATED BALANCE SHEETSCONSOLIDATED STATEMENTS OF INCOME AND RETAINED EARNINGSCONSOLIDATED STATEMENTS OF CASH FLOWNOTES TO CONSOLIDATED FINANCIAL STATEMENTSDIRECTORSOFFICERSINVESTOR INFORMATION