HOSPITALITY PROPERTIES TRUST Acquisition of $2.4 Billion High Quality Net Lease Portfolio RADISSON BLU MINNEAPOLIS DOWNTOWN
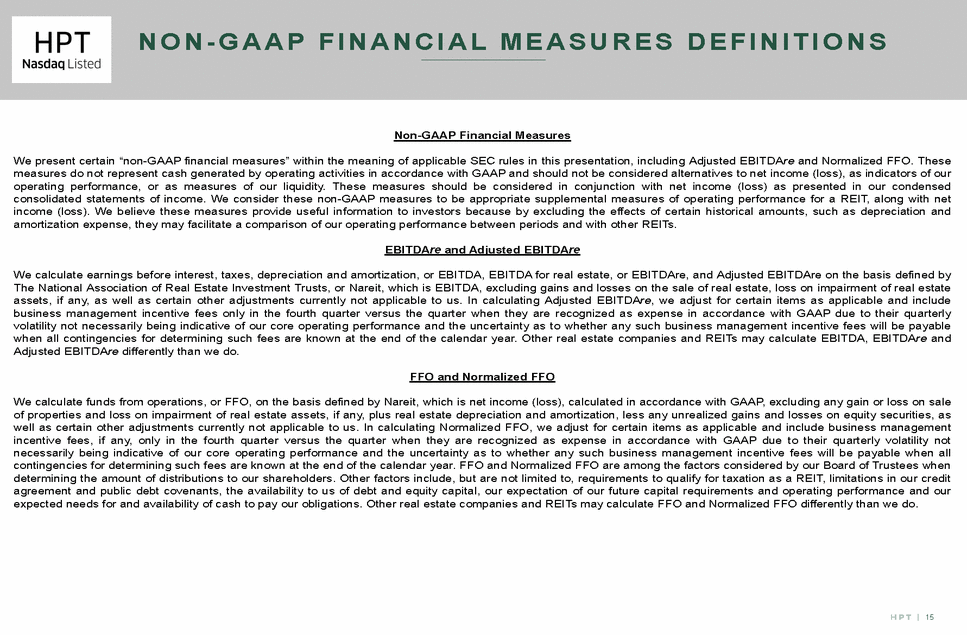
Warning Concerning Forward-Looking Statements. This presentation contains statements that constitute forward-looking statements within the meaning of the Private Securities Litigation Reform Act of 1995 and other securities laws. Also, whenever HPT uses words such as "believe", "expect", "anticipate", "intend", "plan", "estimate", "will", "may" and negatives or derivatives of these or similar expressions, HPT is making forward-looking statements. These forward-looking statements are based upon HPT's present intent, beliefs or expectations, but forward-looking statements are not guaranteed to occur and may not occur. Actual results may differ materially from those contained or implied by HPT's forward-looking statements. Forward-looking statements involve known and unknown risks, uncertainties and other factors, some of which are beyond HPT's control. For example, when HPT discusses timing, terms and expected benefits of the transaction, impact to HPT's investment grade rating, future cash flows and property level rent coverage, ability to pay dividends, ability to raise debt or sell assets, future leverage and interest costs, expectation of not issuing common shares in connection with this transaction, ease of asset management, leasing and sales and integration of portfolio and management, expected transaction costs and extinguishment of debt and accretion to Normalized FFO, HPT is making forward-looking statements. In fact, this transaction may not occur, may be delayed or the terms may change; HPT's expected benefits from this transaction may not occur; HPT's investment grade rating may change or HPT may lose its investment grade rating; HPT's future cash flows, property level rent coverage and ability to pay dividends will depend on HPT's future operating performance, which may decline; HPT may not be able to raise debt at attractive prices or sell the designated amount of assets it intends to sell, and HPT's leverage may be further increased and interest costs may be higher than expected; circumstances beyond HPT’s control may change and HPT may issue common shares or the expected ease of asset management, leasing and sales and integration of portfolio and management may become more difficult; transaction costs may be higher than expected and anticipated extinguishment of debt may be higher than expected or may not occur; and this transaction may not be accretive to Normalized FFO per share. This presentation includes financial projections that could materially differ from actual results for a number of factors, including factors beyond our control. The information contained in HPT’s filings with the Securities and Exchange Commission, or SEC, including under the caption “Risk Factors” in HPT’s periodic reports, or incorporated therein, identifies other important factors that could cause differences from HPT’s forward-looking statements. HPT’s filings with the SEC are available on the SEC’s website at www.sec.gov. You should not place undue reliance upon forward-looking statements. Except as required by law, HPT does not intend to update or change any forward-looking statements as a result of new information, future events or otherwise. Non-GAAP Financial Measures This presentation contains non-GAAP financial measures including normalized funds from operations, or normalized FFO, and Adjusted EBITDA re. Reconciliations for these metrics to the closest U.S. generally accepted accounting principles, or GAAP, metrics are included in an appendix on page 14 hereto. Unless otherwise noted, all data presented is as of March 31, 2019.
TRANS A CTI O N S UMM A R Y (1) Excludes transaction costs. HPT expects transaction costs to be approximately $100 million, including an estimated $72 million to extinguish SMTA’s mortgage debt on the portfolio. (2) This transaction does not include approximately 100 assets owned by SMTA primarily leased to Shopko Stores Inc. as of December 31, 2018. 3 Courthouse Athletic Club Popeyes Red Robin Seamless integration and management due to benefits of The RMR Group platform. Reliable income stream and low capital expenditure requirements. Tenants and industries that benefit from strong demand drivers. High quality portfolio of service and necessity based assets that are easy to asset manage, lease, and sell. HPT has agreed to acquire a net lease portfolio with annual cash base rent of $172 million from Spirit MTA REIT for $2.4 billion in cash.(1) –774 service retail focused net lease properties covering 12 million RSF across the U.S. in 22 different industries with 164 brands. –This acquisition excludes SMTA’s assets leased to certain bankrupt tenants.(2)
A C QU I SI T I O N POR T F OL I O OVER VI EW 1% <1% <1% 4% 2% 3% <1% 1% 2% <1% 4% <1% 3% 1% <1% <1% 2% 7% <1% 1% 3% 9% 6% <1% 1% 2% 3% 1% 4% 1% 2% 3% 3% 2% 2% 2% 2% 7% 1% 9% <1% Weighted Average Occupancy 4% 0.1% % of Rent (1) 9.0% Other 23% Quick Service 14% Movie Theaters 13% Home Furnishings 4% Automotive dealers 5% Restaurants - Casual Dining Grocery 5% Automotive Parts and Service 5% Health and Fitness 7% Specialty Retail 6% Medical / Other Office 7% 4 (1) Alaska (not shown on the map) represents <1% of the portfolio; no acquired properties in Hawaii. Top 10 Industries by Annual Contractual Rent Quick Facts 774~12mm Properties Square Feet $172mm8.6 Years Annual Contractual Rent Weighted Average Lease Term 98%2.68x Rent Coverage 52%of Rent81%of Leases From Master Leases Have Contractual Increases Express Oil Geographical Footprint (% of Annual Contractual Rent)(1)
A C QU I SI T I O N POR T F OL I O OVER VI EW ( cont ’ d) 119 4,055 $56.4 32.8% or Chain Names 22Industries |164 Brands 5 Top 10 Brands Tenant No. of Total SF or Chain Names Industry Locations (000s) Annualized Base Rent $ (mm)% of Total AMC Theatres Movie Theaters14696$10.46.0% The Great Escape Specialty Retail (Furniture)145437.14.1% Crème de la CrèmeEducation91905.43.2% Goodrich Quality Theaters Movie Theaters42455.33.1% Life Time Fitness Health and Fitness34205.23.0% DXLApparel17565.23.0% Buehler's Fresh FoodsGrocery55035.13.0% Car Max Automotive Dealers42014.82.8% Heartland Dental Medical Office592344.22.5% Regal Cinemas Movie Theaters62673.62.1% Top 10 Brands
A C QU I SI T I O N POR T F OL I O OVER VI EW ( c o n t ’d) 81% of Leases Have Contractual Increases 19% 46% $172mm CPI Fixed Flat 35% / Scheduled 28% 8% 6% 6% 2019 2020 2021 2022 2023 2024 2025 2026 2027 2028 2029 2030+ 6 Manageable Near-Term Expirations16% 10% 8% 7% 4% 2%3% 2% Well-Laddered Lease Expirations (% of Contractual Rent) KFC & Taco Bell Lease Structures (% of Contractual Rent)
S TR ATE G I C R ATI O N A LE 7 (1) Before potential asset sales post-acquisition of net lease portfolio. LA Fitness Norms The Great Escape Limited capex requirements. Complementary service-oriented retail platform, which bolsters our existing portfolio. Diversification, with new tenants, new property types and new markets, and limited integration risk. Increased scale, with gross assets exceeding $12.6 billion post transaction. (1) Stronger cash flows, more resilient portfolio and higher rent coverage. Accretive acquisition with potential for future value creation expected.
TRANS A CT I O N ( 1) BE NE FI TS O F THE 1 Gross Assets No. of Properties +774 Pro Forma (2) Pro Forma (2) Status Quo (1) Status Quo (1) 2 Diversifies Tenant Mix (13 Agreements / 23 Brands) 23 Industries | 185+ Brands 3 Unique Secure Hotel Portfolio 19 different hotel brands in multiple hospitality segments. 1.21x Coverage 1.46x Coverage from corporate guarantees and security deposits. (2) Strengthens HPT’s Median property size of ~3.9k square feet. 4 HPT Hotels HPT Travel Centers Net Lease Portfolio averaging $93mm / year $84mm / year since 2016. (1) (2) (3) As of and for the last twelve months ending March 31, 2019. Does not include impact from expected asset sales post-acquisition of net lease portfolio. TravelCenters of America LLC, or TA, has the option to request funding of capital improvements from HPT in return for an increase in rent totaling 8.5% of amounts funded. 8 Pro Forma Capital intensive. Tenant under the leases bears the Tenants bear the cost of 5 – 6% reserves. cost of maintaining the properties.(3)maintaining the properties. Limited Capex Plus owner funded capex Owner funded capex averaging Requirements since 2016. Status Quo (1) Pro Forma 327 hotels managed by brand owners. 62% of minimum hotel returns subject to $208mm of credit support Stable Income Stream from Retail Asset Base Rent Coverage Median annual contractual rent of ~$111k. Predominantly service / necessity based retail. Hotels & Travel Centers 1,280$12.6bn Provides Greater Scale 506 +$2.4bn $10.2bn
DI V E RS I FI E S P O RTFO LI O AND TE NANT CO NCE NT R ATI O N AND I MP RO V E S RE NT CO V E RA G E Complementary Travel Centers 24% Travel Centers 29% Hotels 59% Net Lease 17% (1) Based on HPT’s annualized minimum returns and rents as of and for the twelve months ended March 31, 2019 and net lease portfolio contractual rent. Does not include impact from potential asset sales post-acquisition of net lease portfolio. 9 Courtyard Petro Travel Center Express Oil Regal Cinemas Properties Industries Annual Rent Coverage 5062$840mm1.21x Properties Industries Annual Rent Coverage 1,28023~$1.0bn1.46x Estimated Post-Acquisition HPT Portfolio Composition(1) (Pre-Dispositions) HPT Portfolio Composition (Pre-Acquisition)(1)
KE Y E LE ME NT S O F THETRANS A C TI O N HPT has secured commitments from lenders for an up to $2.0 billion unsecured term loan facility. – HPT may use the proceeds from this term loan facility, borrowings under its existing revolving credit facility, proceeds from the sale of certain assets and / or proceeds from the issuance of new unsecured notes to finance the transaction. HPT does not plan to issue common shares in connection with this Structure & Financing – transaction. HPT intends to sell approximately $500 million of the acquired properties and approximately $300 million of hotel and other existing assets in order to reduce leverage post closing. Planned Asset Sales HPT expects its unsecured debt to remain investment grade rated. Rating Expectations This transaction requires approval by SMTA shareholders and is expected to close in the third quarter of 2019. Approval & Timing 10
S E LE CT FI NANCI A L ME TRI C S Acquisition HPT HPT intends to sell certain assets to enhance the overall portfolio quality and composition, and to maintain a conservative and flexible structure. (1) As of and for the twelve months ended March 31, 2019. Adjusted EBITD Are excludes $53.6 million of incentive fees recorded in 2018. (2) Does not include impact from expected asset sales post-acquisition of net lease portfolio. HPT expects to sell approximately $800 million of assets to reduce leverage following the closing. (3) See page 14 for a reconciliation of Adjusted EBITD Are to the closest GAAP metrics. Estimated post-acquisition Adjusted EBITD Are is based on HPT’s twelve months ended March 31, 2019 and information received from SMTA in connection with this transaction. HPT does not provide a reconciliation of estimated post-acquisition non-GAAP measures that it discusses in this presentation because certain significant information required for such reconciliation is not available without unreasonable efforts or at all, including, the applicable interest rate under HPT’s anticipated term loan, depreciation of applicable assets, general and administrative savings on expected asset sales and interest savings on debt. Without this information, HPT does not believe that a reconciliation of estimated post-acquisition Adjusted EBITD Are would be meaningful. HPT’s hypothetical presentation of estimates post-acquisition could materially differ from actual results. 11 Estimated Post-(After Potential Asset Sales) $11.8bn $5.8bn $2.3bn $334mm $960mm 6.0x 49% Estimated Post-Acquisition HPT(2) (Before Potential Asset Sales) $12.6bn $6.6bn $2.5bn $338mm $1,012mm 6.5x 52% Total Gross Assets Current HPT(1) $10.2bn Total Debt $4.2bn Total Revenues $2.3bn Net Income(3) $331mm Adjusted EBITD Are (3) $852mm Total Debt to Adjusted EBITD Are (3) 4.9x Total Debt to Gross Assets 41%
THE V E RTI CA L LY RMR G RO UP HAS A N ATI O N AL I NTE G R ATE D O P E R ATI N G P L ATFO R M HPT Will Benefit from the RMR Group’s Integration and Management Capabilities The RMR Group currently manages $30 billion of assets. • • Operating platform includes 30 offices throughout the U.S. with over 600 commercial real estate professionals. • Provides national, regional and management expertise. local market leasing, asset management and property • Net lease portfolio and ongoing management is expected to be easily integrated. Ontario, Canada Seattle Minneapolis Newton (Boston) Chicago (2) Long Island Philadelphia Sacramento Baltimore / Annapolis Denver Indianapolis San Jose Washington D.C. (3) Kansas City (2) Norfolk Richmond (2) Los Angeles Albuquerque Phoenix Columbia San Diego Dallas Atlanta (2) Austin (2) Honolulu (2) Houston 12 Puerto Rico
APPENDIX 13
ADJ US T E D E BI TDA re RE CO N CI LI ATI O N 6/30/2018 $97 9/30/2018 $117 12/31/2018 ($109) 3/31/2019 $226 HPT LTM 3/31/19 Net Income (Loss) $331 (+) Interest Expense 49 49 50 50 197 (+ / -) Income Tax Expense (Benefit) 1 1 (1) 1 2 (+) Depreciation and Amortization 100 101 103 99 403 Gain on Sale of Real Estate(1) – – – (160) (160) (-) Shares(2) 1 1 1 0 4 (+) General and Administrative Expense Paid in Common Loss on Early Extinguishment of Debt(3) 0 – – – 0 (+) net(4) (21) (43) 106 (21) 21 (+ / -) Unrealized Gains and Losses on Equity Securities, Incentive Fees Recorded in 2018 54 Note: Dollars in table in millions. (1) (2) (3) (4) HPT recorded a $160 million gain on sale of real estate in the three months ended March 31, 2019, in connection with the sales of 20 travel centers. Amounts represent the equity compensation awarded to HPT’s trustees, our officers and certain other employees of The RMR Group LLC. HPT recorded a $160,000 loss on early extinguishment of debt in the three months ended June 30, 2018 in connection with the amendment of its revolving credit facility and term loan. Unrealized gains and losses on equity securities, net represent the adjustment required to adjust the carrying value of HPT’s investments in The RMR Group Inc. and TA common shares to their fair value as of the end of the period. 14 Adjusted EBITD Are (Excl. Incentive Fees)$852 Adjusted EBITD Are$227$226$150$196$798 EBITD Are$246$268$43$216$774 EBITDA$246$268$43$376$933
NO N - G A A P FI NANCI A L ME AS U RE S DE FI NI TI O N S Non-GAAP Financial Measures We present certain “non-GAAP financial measures” within the meaning of applicable SEC rules in this presentation, including Adjusted EBITD Are and Normalized FFO. These measures do not represent cash generated by operating activities in accordance with GAAP and should not be considered alternatives to net income (loss), as indicators of our operating performance, or as measures of our liquidity. These measures should be considered in conjunction with net income (loss) as presented in our condensed consolidated statements of income. We consider these non-GAAP measures to be appropriate supplemental measures of operating performance for a REIT, along with net income (loss). We believe these measures provide useful information to investors because by excluding the effects of certain historical amounts, such as depreciation and amortization expense, they may facilitate a comparison of our operating performance between periods and with other REITs. EBITD Are and Adjusted EBITD Are We calculate earnings before interest, taxes, depreciation and amortization, or EBITDA, EBITDA for real estate, or EBITD Are, and Adjusted EBITD Are on the basis defined by The National Association of Real Estate Investment Trusts, or Nareit, which is EBITDA, excluding gains and losses on the sale of real estate, loss on impairment of real estate assets, if any, as well as certain other adjustments currently not applicable to us. In calculating Adjusted EBITD Are, we adjust for certain items as applicable and include business management incentive fees only in the fourth quarter versus the quarter when they are recognized as expense in accordance with GAAP due to their quarterly volatility not necessarily being indicative of our core operating performance and the uncertainty as to whether any such business management incentive fees will be payable when all contingencies for determining such fees are known at the end of the calendar year. Other real estate companies and REITs may calculate EBITDA, EBITD Are and Adjusted EBITD Are differently than we do. FFO and Normalized FFO We calculate funds from operations, or FFO, on the basis defined by Nareit, which is net income (loss), calculated in accordance with GAAP, excluding any gain or loss on sale of properties and loss on impairment of real estate assets, if any, plus real estate depreciation and amortization, less any unrealized gains and losses on equity securities, as well as certain other adjustments currently not applicable to us. In calculating Normalized FFO, we adjust for certain items as applicable and include business management incentive fees, if any, only in the fourth quarter versus the quarter when they are recognized as expense in accordance with GAAP due to their quarterly volatility not necessarily being indicative of our core operating performance and the uncertainty as to whether any such business management incentive fees will be payable when all contingencies for determining such fees are known at the end of the calendar year. FFO and Normalized FFO are among the factors considered by our Board of Trustees when determining the amount of distributions to our shareholders. Other factors include, but are not limited to, requirements to qualify for taxation as a REIT, limitations in our credit agreement and public debt covenants, the availability to us of debt and equity capital, our expectation of our future capital requirements and operating performance and our expected needs for and availability of cash to pay our obligations. Other real estate companies and REITs may calculate FFO and Normalized FFO differently than we do. 15
H O S P I TA L I T Y P R O P E R T I E S T R U S T Acquisition of $2.4 Billion High Quality N et Lease Port f olio RADISSON BLU MINNEAPOLIS DOWNTOWN