
MEMC Electronic Materials Fourth Quarter 2011 Earnings Conference Call February 15, 2012
2 Agenda □ Safe Harbor □ Q4 Summary Results □ Variance □ Q4 Segment Highlights □ SunEdison Pipeline & Installations □ Cash Flow □ Debt & Interest Expense □ Outlook & Priorities □ Appendix □ Forward - Looking Statements
3 With the exception of historical information, the matters disclosed in this presentation are forward - looking statements . Such statements involve certain risks and uncertainties that could cause actual results to differ materially from those in the forward - looking statements . Potential risks and uncertainties are described in the Company’s filings with the Securities and Exchange Commission (SEC), including its 2010 Form 10 - K and Form 10 - Qs for Q 1 , Q 2 and Q 3 2011 , in addition to the risks and uncertainties described on page 24 of this presentation . These forward - looking statements represent the Company’s judgment as of the date of this presentation . The Company disclaims, however, any intent or obligation to update these forward - looking statements . This presentation also includes non - GAAP financial measures . You can find a reconciliation of each of these non - GAAP measures to the most directly comparable GAAP financial measure in our earnings press release filed on Form 8 - K today with the SEC and posted in the Investor Relations portion of our web site at www . memc . com . Safe Harbor
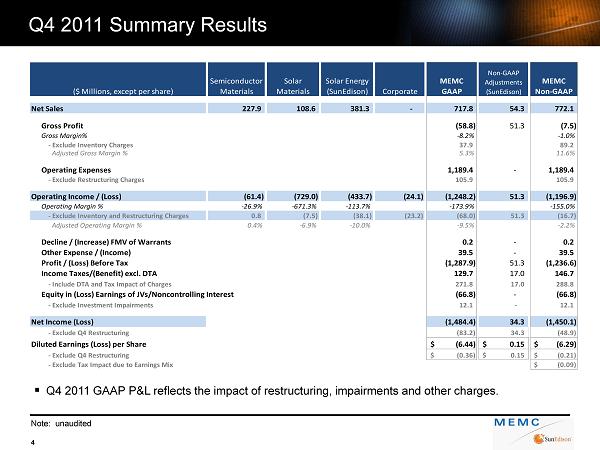
Q4 2011 Summary Results Note: unaudited 4 ▪ Q4 2011 GAAP P&L reflects the impact of restructuring, impairments and other charges. ($ Millions, except per share) Semiconductor Materials Solar Materials Solar Energy (SunEdison) Corporate MEMC GAAP Non-GAAP Adjustments (SunEdison) MEMC Non-GAAP Net Sales 227.9 108.6 381.3 - 717.8 54.3 772.1 Gross Profit (58.8) 51.3 (7.5) Gross Margin% -8.2% -1.0% - Exclude Inventory Charges 37.9 89.2 Adjusted Gross Margin % 5.3% 11.6% Operating Expenses 1,189.4 - 1,189.4 - Exclude Restructuring Charges 105.9 105.9 Operating Income / (Loss) (61.4) (729.0) (433.7) (24.1) (1,248.2) 51.3 (1,196.9) Operating Margin % -26.9% -671.3% -113.7% -173.9% -155.0% - Exclude Inventory and Restructuring Charges 0.8 (7.5) (38.1) (23.2) (68.0) 51.3 (16.7) Adjusted Operating Margin % 0.4% -6.9% -10.0% -9.5% -2.2% Decline / (Increase) FMV of Warrants 0.2 - 0.2 Other Expense / (Income) 39.5 - 39.5 Profit / (Loss) Before Tax (1,287.9) 51.3 (1,236.6) Income Taxes/(Benefit) excl. DTA 129.7 17.0 146.7 - Include DTA and Tax Impact of Charges 271.8 17.0 288.8 Equity in (Loss) Earnings of JVs/Noncontrolling Interest (66.8) - (66.8) - Exclude Investment Impairments 12.1 - 12.1 Net Income (Loss) (1,484.4) 34.3 (1,450.1) - Exclude Q4 Restructuring (83.2) 34.3 (48.9) Diluted Earnings (Loss) per Share (6.44)$ 0.15$ (6.29)$ - Exclude Q4 Restructuring (0.36)$ 0.15$ (0.21)$ - Exclude Tax Impact due to Earnings Mix (0.09)$
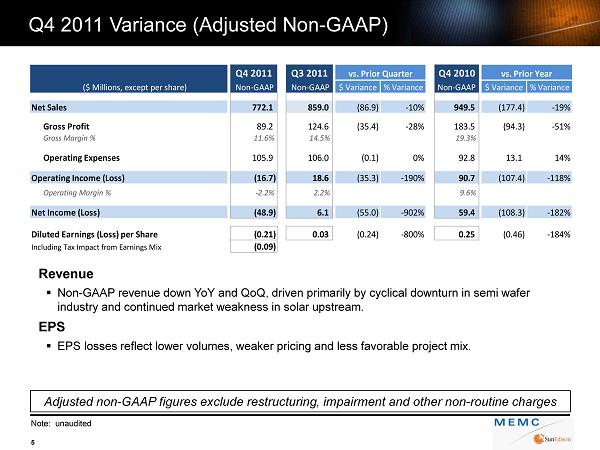
Q4 2011 Variance (Adjusted Non - GAAP) Note: unaudited 5 Revenue ▪ Non - GAAP revenue down YoY and QoQ , driven primarily by cyclical downturn in semi wafer industry and continued market weakness in solar upstream. EPS ▪ EPS losses reflect lower volumes, weaker pricing and less favorable project mix. Adjusted non - GAAP figures exclude restructuring, impairment and other non - routine charges Q4 2011 Q3 2011 Q4 2010 ($ Millions, except per share) Non-GAAP Non-GAAP $ Variance % Variance Non-GAAP $ Variance % Variance Net Sales 772.1 859.0 (86.9) -10% 949.5 (177.4) -19% Gross Profit 89.2 124.6 (35.4) -28% 183.5 (94.3) -51% Gross Margin % 11.6% 14.5% 19.3% Operating Expenses 105.9 106.0 (0.1) 0% 92.8 13.1 14% Operating Income (Loss) (16.7) 18.6 (35.3) -190% 90.7 (107.4) -118% Operating Margin % -2.2% 2.2% 9.6% Net Income (Loss) (48.9) 6.1 (55.0) -902% 59.4 (108.3) -182% Diluted Earnings (Loss) per Share (0.21) 0.03 (0.24) -800% 0.25 (0.46) -184% Including Tax Impact from Earnings Mix (0.09) vs. Prior Quarter vs. Prior Year

Revenue ($ Millions) Operating Profit ($ Millions) Sequential down $41M, or 15% ▪ 11% volume decrease largely in 200mm ▪ 5% ASP decline YOY down $35M, or 13% ▪ 10% volume decline driven by smaller diameters ▪ ASP down 3% Adjusted $0.8M income excluding charges and impairment: Sequential down $18M ▪ ASP softness across all diameters ▪ Lower capacity utilization at smaller diameters YOY down $25M ▪ Lower ASP and lower capacity utilization ▪ Partially offset by net productivity savings of $6M (61.4) Note: unaudited Q4 2011: Semiconductor Materials 6 262.6 251.5 275.3 268.4 227.9 0 100 200 300 Q4 Q1 Q2 Q3 Q4 2010 2011 Adjusted operating income 25.6 8.4 3.4 18.5 0.8 0 10 20 30 Q4 Q1 Q2 Q3 Q4 2010 2011
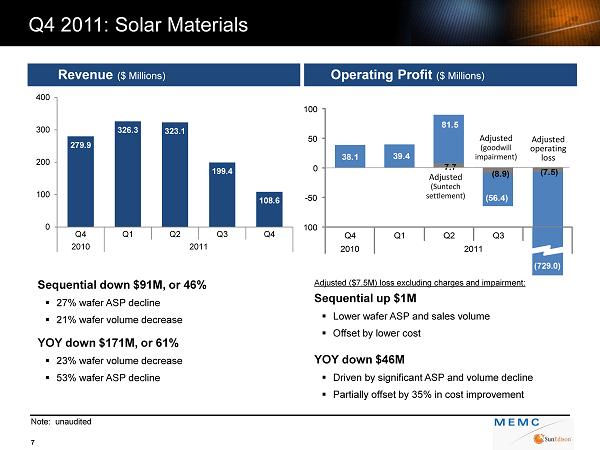
38.1 39.4 7.7 (8.9) (7.5) 81.5 (56.4) - 100 - 50 0 50 100 Q4 Q1 Q2 Q3 Q4 2010 2011 Revenue ($ Millions) Operating Profit ($ Millions) Sequential down $91M, or 46% ▪ 27% wafer ASP decline ▪ 21% wafer volume decrease YOY down $171M, or 61% ▪ 23% wafer volume decrease ▪ 53% wafer ASP decline Adjusted ($7.5M) loss excluding charges and impairment: Sequential up $1M ▪ Lower wafer ASP and sales volume ▪ Offset by lower cost YOY down $46M ▪ Driven by significant ASP and volume decline ▪ Partially offset by 35% in cost improvement Q4 2011: Solar Materials Note: unaudited 7 279.9 326.3 323.1 199.4 108.6 0 100 200 300 400 Q4 Q1 Q2 Q3 Q4 2010 2011 (729.0) Adjusted operating loss Adjusted (goodwill impairment) Adjusted (Suntech settlement)
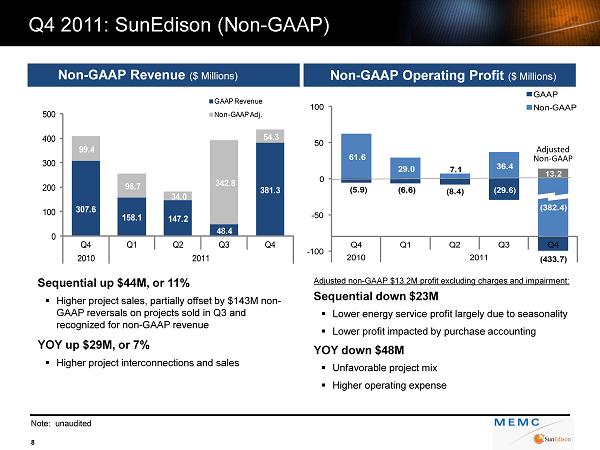
Non - GAAP Revenue ($ Millions) Non - GAAP Operating Profit ($ Millions) Sequential up $44M, or 11% ▪ Higher project sales, partially offset by $143M non - GAAP reversals on projects sold in Q3 and recognized for non - GAAP revenue YOY up $29M, or 7% ▪ Higher project interconnections and sales Adjusted non - GAAP $13.2M profit excluding charges and impairment: Sequential down $23M ▪ Lower energy service profit largely due to seasonality ▪ Lower profit impacted by purchase accounting YOY down $48M ▪ Unfavorable project mix ▪ Higher operating expense (5.9) (6.6) (8.4) (29.6) (382.4) 61.6 29.0 7.1 36.4 (433.7) 13.2 - 100 - 50 0 50 100 Q4 Q1 Q2 Q3 Q4 2010 2011 GAAP Non - GAAP 61.6 61.6 61.6 61.6 61.6 61.6 61.6 61.6 Q4 2011: SunEdison (Non - GAAP) Note: unaudited 8 Adjusted Non - GAAP 158.1 147.2 48.4 381.3 99.4 96.7 34.0 342.8 54.3 0 100 200 300 400 500 Q4 Q1 Q2 Q3 Q4 2010 2011 GAAP Revenue Non - GAAP Adj. 307.6
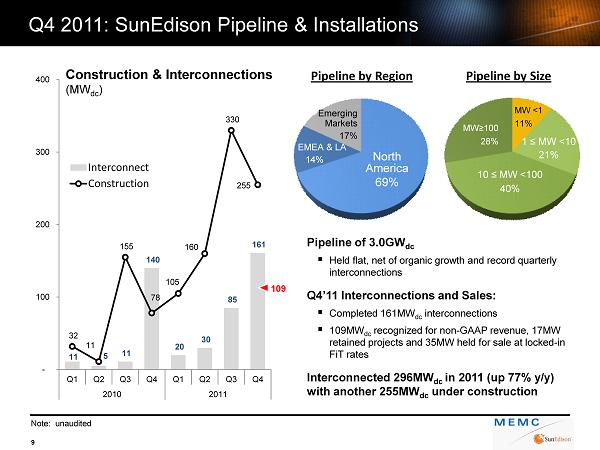
11 5 11 140 20 30 85 161 32 11 155 78 105 160 330 255 - 100 200 300 400 Q1 Q2 Q3 Q4 Q1 Q2 Q3 Q4 2010 2011 Interconnect Construction Q4 2011: SunEdison Pipeline & Installations Note: unaudited 9 Pipeline by Region Pipeline by Size Pipeline of 3.0GW dc ▪ Held flat, net of organic growth and record quarterly interconnections Q4’11 Interconnections and Sales: ▪ Completed 161MW dc interconnections ▪ 109MW dc recognized for non - GAAP revenue, 17MW retained projects and 35MW held for sale at locked - in FiT rates Interconnected 296MW dc in 2011 (up 77% y/y) with another 255MW dc under construction Construction & Interconnections (MW dc ) 10 ≤ MW <100 40% 1 ≤ MW <10 21% MW≥100 28% MW <1 11% North America 69% EMEA & LA 14% Emerging Markets 17% 109
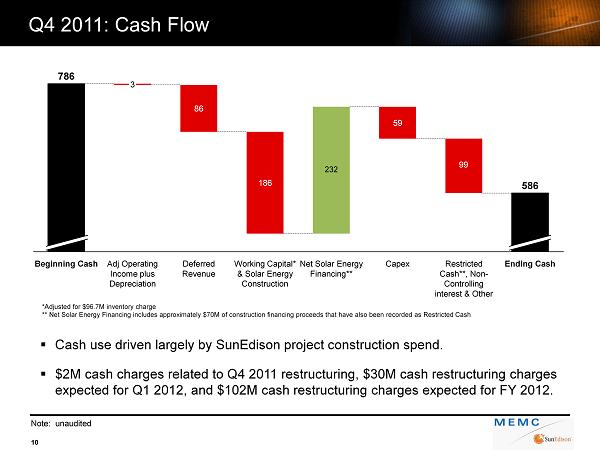
Q4 2011: Cash Flow Note: unaudited 10 ▪ Cash use driven largely by SunEdison project construction spend. ▪ $2M cash charges related to Q4 2011 restructuring, $30M cash restructuring charges expected for Q1 2012, and $102M cash restructuring charges expected for FY 2012. 232 Ending Cash 586 Restricted Cash**, Non - Controlling interest & Other Capex 59 Net Solar Energy Financing** Working Capital* & Solar Energy Construction 186 Deferred Revenue 86 Adj Operating Income plus Depreciation 3 Beginning Cash 786 *Adjusted for $96.7M inventory charge ** Net Solar Energy Financing includes approximately $70M of construction financing proceeds that have also been recorded as Res tricted Cash 99
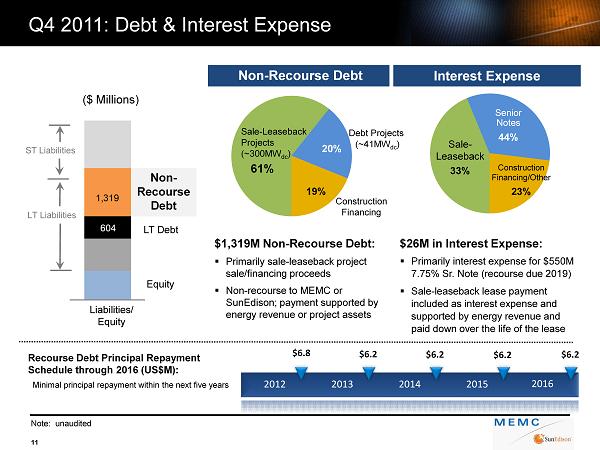
604 1,319 Non - Recourse Debt Interest Expense $1,319M Non - Recourse Debt: ▪ Primarily sale - leaseback project sale/financing proceeds ▪ Non - recourse to MEMC or SunEdison; payment supported by energy revenue or project assets $26M in I nterest Expense: ▪ Primarily interest expense for $550M 7.75% Sr. Note (recourse due 2019) ▪ Sale - leaseback lease payment included as interest expense and supported by energy revenue and paid down over the life of the lease Q4 2011: Debt & Interest Expense 11 Note: unaudited 2016 2012 2013 2014 2015 $6.8 Recourse Debt Principal Repayment Schedule through 2016 (US$M): Minimal principal repayment within the next five years Non - Recourse Debt LT Debt ST Liabilities LT Liabilities Liabilities/ Equity ($ Millions) Equity 19% 20% Debt Projects (~41MW dc ) Construction Financing Construction Financing /Other 23% Senior Notes 44% Sale - Leaseback 33% Sale - Leaseback Projects (~300MW dc ) 61% 2016 $6.2 $6.2 $6.2 $6.2

Outlook & Priorities 12 Macro/Industry Backdrop ▪ Semi market trough in 1Q12; recovery strengthens from 2Q through 4Q 2012 ▪ Financial instability in Europe: credit markets improving but remain uncertain ▪ Solar PV markets remain in an over - supply position; Europe instability and risk an overhang throughout the year Priorities ▪ Cash flow and liquidity ▪ Execute on restructure plan and position for market recovery ▪ Semi market share gain (focus on 300mm); expand margins in the upturn ▪ Optimize pipeline development and achieve y/y growth in systems sales Key Metrics Q1 2012 FY 2012 Semiconductor Revenue Down 10% - 15% QoQ Flat YoY Solar Energy Systems Vol (sold) ~50MW > 400 MW Solar Energy Systems Avg. Price ($/W dc ) ~$4.25 ~$3.75 Operating Expenses ($ millions) <$110 < $375 Capex ($ millions) <$50 < $175 Interest / Other Expense ($ millions) < $25 < $100 Non - GAAP Tax Rate ~30% ~30%
13 Appendix
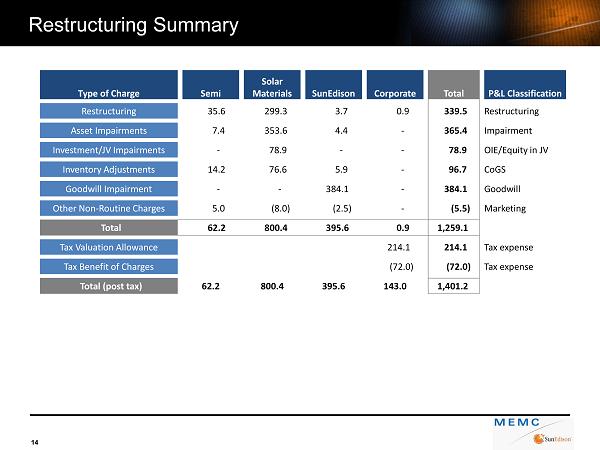
Restructuring Summary 14 Type of Charge Semi Solar Materials SunEdison Corporate Total P&L Classification Restructuring 35.6 299.3 3.7 0.9 339.5 Restructuring Asset Impairments 7.4 353.6 4.4 - 365.4 Impairment Investment/JV Impairments - 78.9 - - 78.9 OIE/Equity in JV Inventory Adjustments 14.2 76.6 5.9 - 96.7 CoGS Goodwill Impairment - - 384.1 - 384.1 Goodwill Other Non - Routine Charges 5.0 (8.0) (2.5) - (5.5) Marketing Total 62.2 800.4 395.6 0.9 1,259.1 Tax Valuation Allowance 214.1 214.1 T ax expense Tax Benefit of Charges (72.0) (72.0) T ax expense Total (post tax) 62.2 800.4 395.6 143.0 1,401.2
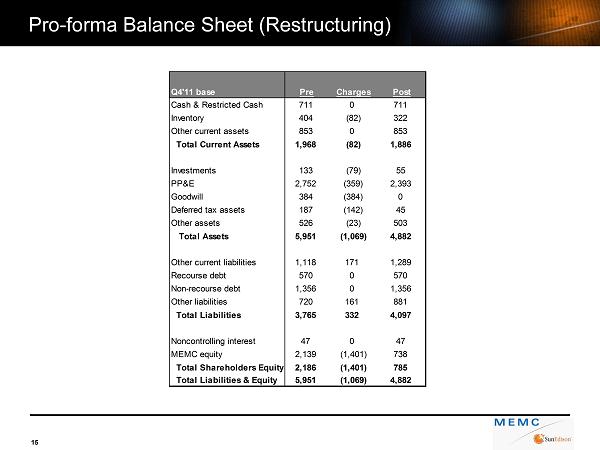
Pro - forma Balance Sheet (Restructuring) 15 Q4'11 base Pre Charges Post Cash & Restricted Cash 711 0 711 Inventory 404 (82) 322 Other current assets 853 0 853 Total Current Assets 1,968 (82) 1,886 Investments 133 (79) 55 PP&E 2,752 (359) 2,393 Goodwill 384 (384) 0 Deferred tax assets 187 (142) 45 Other assets 526 (23) 503 Total Assets 5,951 (1,069) 4,882 Other current liabilities 1,118 171 1,289 Recourse debt 570 0 570 Non-recourse debt 1,356 0 1,356 Other liabilities 720 161 881 Total Liabilities 3,765 332 4,097 Noncontrolling interest 47 0 47 MEMC equity 2,139 (1,401) 738 Total Shareholders Equity 2,186 (1,401) 785 Total Liabilities & Equity 5,951 (1,069) 4,882
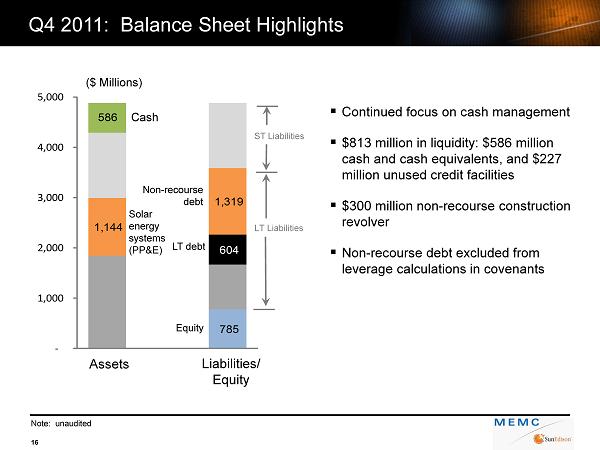
785 1,144 604 586 1,319 - 1,000 2,000 3,000 4,000 5,000 Q4 2011: Balance Sheet Highlights 16 Cash N on - recourse debt LT debt ST Liabilities LT Liabilities Assets Liabilities/ Equity ($ Millions) ▪ Continued focus on cash management ▪ $813 million in liquidity: $586 million cash and cash equivalents, and $227 million unused credit facilities ▪ $300 million non - recourse construction revolver ▪ Non - recourse debt excluded from leverage calculations in covenants Equity Solar energy systems (PP&E) Note: unaudited
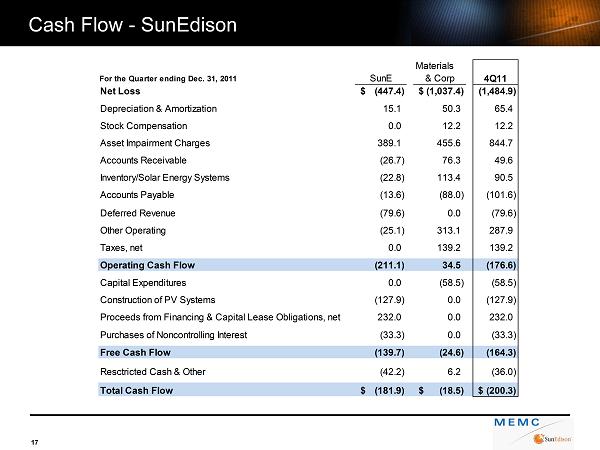
Cash Flow - SunEdison 17 Materials For the Quarter ending Dec. 31, 2011 SunE & Corp 4Q11 Net Loss (447.4)$ (1,037.4)$ (1,484.9) Depreciation & Amortization 15.1 50.3 65.4 Stock Compensation 0.0 12.2 12.2 Asset Impairment Charges 389.1 455.6 844.7 Accounts Receivable (26.7) 76.3 49.6 Inventory/Solar Energy Systems (22.8) 113.4 90.5 Accounts Payable (13.6) (88.0) (101.6) Deferred Revenue (79.6) 0.0 (79.6) Other Operating (25.1) 313.1 287.9 Taxes, net 0.0 139.2 139.2 Operating Cash Flow (211.1) 34.5 (176.6) Capital Expenditures 0.0 (58.5) (58.5) Construction of PV Systems (127.9) 0.0 (127.9) Proceeds from Financing & Capital Lease Obligations, net 232.0 0.0 232.0 Purchases of Noncontrolling Interest (33.3) 0.0 (33.3) Free Cash Flow (139.7) (24.6) (164.3) Resctricted Cash & Other (42.2) 6.2 (36.0) Total Cash Flow (181.9)$ (18.5)$ (200.3)$
18 SunEdison Accounting
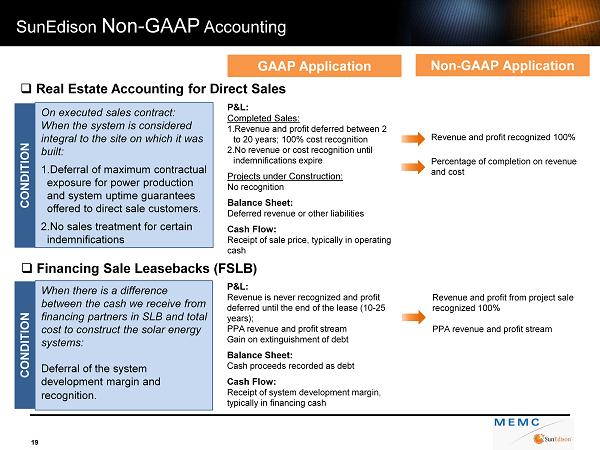
19 □ Real Estate Accounting for Direct Sales On executed sales contract: When the system is considered integral to the site on which it was built: 1.Deferral of maximum contractual exposure for power production and system uptime guarantees offered to direct sale customers . 2.No sales treatment for certain indemnifications CONDITION P&L: Completed Sales: 1. Revenue and profit deferred between 2 to 20 years ; 100% cost recognition 2. No revenue or cost recognition until indemnifications expire Projects under Construction: No recognition Balance Sheet: Deferred revenue or other liabilities Cash Flow: Receipt of sale price, typically in operating cash GAAP Application □ Financing Sale Leasebacks (FSLB) When there is a difference between the cash we receive from financing partners in SLB and total cost to construct the solar energy systems: Deferral of the system development margin and recognition. Revenue and profit recognized 100 % P&L: Revenue is never recognized and profit deferred until the end of the lease (10 - 25 years); PPA revenue and profit stream Gain on extinguishment of debt Balance Sheet: Cash proceeds recorded as debt Cash Flow: Receipt of system development margin, typically in financing cash Non - GAAP Application Revenue and profit from project sale recognized 100 % PPA revenue and profit stream SunEdison Non - GAAP Accounting Percentage of completion on revenue and cost CONDITION

Debt Finance ($M) Year 1 Economics GAAP Revenue - CoGS - Gross profit - Gross margin - Pre - tax cash flow (0.35) Recurring Economics (avg/yr) Energy/incentive revenue 0.30 O&M & Insurance 2 (0.03) Interest expense (0.09) Debt principal repayment (0.11) Pre - tax cash flow 0.07 Depreciation (0.08) Y1 - Y20, Pre - tax profit 0.10 Total Economics (Y1 - Y20) Project pre - tax profit 3 2.00 NPV pre - tax CF (@10%) 0.64 Financing Sale Leaseback ($M) Year 1 Economics GAAP Non - GAAP Revenue - $4.50 CoGS - (3.50) Gross profit - 1.00 Gross margin - 22% Pre - tax cash flow 1.00 1.00 Recurring Economics (avg/yr) Energy/incentive revenue 0.30 0.30 O&M & Insurance 2 (0.03) (0.03) Lease expense (0.23) (0.23) Pre - tax cash flow 0.04 0.04 Depreciation (0.12) - Y1 - Y20, Pre - tax profit (0.08) 0.04 End of Year 20 Economics Loss on fixed asset disposal (1.10) - Gain from d ebt ex tinguishment 4.50 - Total Economics (Y1 - Y20) Project pre - tax profit 3 1.80 1.80 NPV pre - tax CF (@10%) 1.64 1.64 Direct Sale ($M) Year 1 Economics GAAP Non - GAAP Revenue $4.50 $4.50 Revenue deferral 1 (0.68) - CoGS (3.50) (3.50) Gross profit 0.32 1.00 Gross margin 7% 22% Pre - tax cash flow 1.00 1.00 Year 3 Economics Revenue 0.68 - Gross margin 100% - Pre - tax cash flow - - Pre - tax profit 0.68 - Total Economics (Y1 - Y3) Project pre - tax profit 3 1.00 1.00 NPV pre - tax CF (@10%) 1.00 1.00 SunEdison Accounting Key Assumptions: For illustrative purpose only Not intended to represent company project 1. Applies to projects accounted under real estate accounting rules only. Revenue deferral is associated with performance ratio gu arantee and maximum O&M liability exposure; the latter, typically less than 5% of revenue, is not illustrated in the example. Deferred revenue is recognized upon expiration of the rel ated contingency period. 2. Assumes no local tax or other cash expenses. 3. SG&A is not allocated to the project level, and, therefore, is excluded from the project pre - tax profit calculation. 20
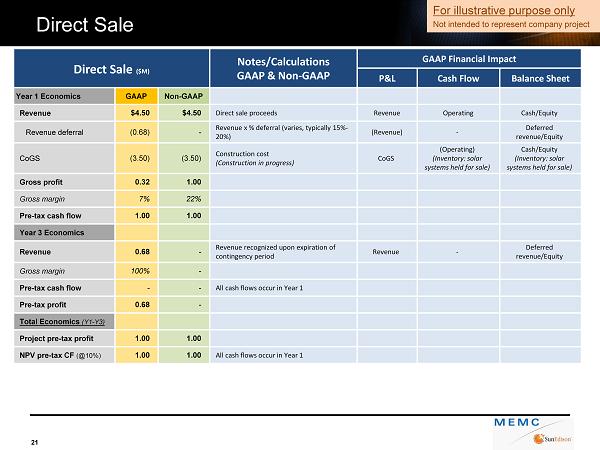
Direct Sale ($M) Notes/Calculations GAAP & Non - GAAP GAAP Financial Impact P&L Cash Flow Balance Sheet Year 1 Economics GAAP Non - GAAP Revenue $ 4.50 $ 4.50 Direct sale proceeds Revenue Operating Cash/Equity Revenue deferral ( 0.68) - Revenue x % deferral (varies, typically 15% - 20%) (Revenue) - Deferred revenue/Equity CoGS (3.50) (3.50) Construction cost (Construction in progress) CoGS (Operating) (Inventory: solar systems held for sale ) Cash/Equity (Inventory: solar systems held for sale ) Gross profit 0.32 1.00 Gross margin 7 % 22% Pre - tax cash flow 1.00 1.00 Year 3 Economics Revenue 0.68 - Revenue recognized upon expiration of contingency period Revenue - Deferred revenue/Equity Gross margin 100% - Pre - tax cash flow - - All cash flows occur in Year 1 Pre - tax profit 0.68 - Total Economics (Y1 - Y3) Project pre - tax profit 1.00 1.00 NPV pre - tax CF (@10%) 1.00 1.00 All cash flows occur in Year 1 Direct Sale For illustrative purpose only Not intended to represent company project 21
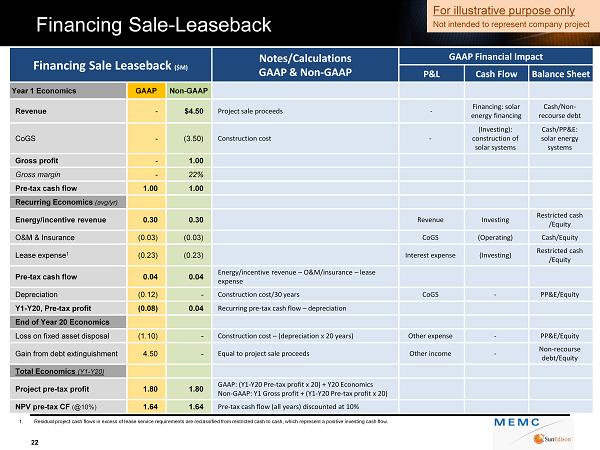
Financing Sale Leaseback ($M) Notes/Calculations GAAP & Non - GAAP GAAP Financial Impact P&L Cash Flow Balance Sheet Year 1 Economics GAAP Non - GAAP Revenue - $4.50 Project sale proceeds - Financing: solar energy financing Cash/Non - recourse debt CoGS - (3.50) Construction cost - (Investing): construction of solar systems Cash/PP&E: solar energy systems Gross profit - 1.00 Gross margin - 22% Pre - tax cash flow 1.00 1.00 Recurring Economics (avg/yr) Energy/incentive revenue 0.30 0.30 Revenue Investing Restricted cash /Equity O&M & Insurance (0.03) (0.03) CoGS (Operating) Cash/Equity Lease expense 1 (0.23) (0.23) Interest expense (Investing) Restricted cash /Equity Pre - tax cash flow 0.04 0.04 Energy/incentive revenue – O&M/insurance – lease expense Depreciation (0.12) - Construction cost/30 years CoGS - PP&E/Equity Y1 - Y20, Pre - tax profit (0.08) 0.04 Recurring pre - tax cash flow – depreciation End of Year 20 Economics Loss on fixed asset disposal (1.10) - Construction cost – (depreciation x 20 years) Other expense - PP&E/Equity Gain from d ebt ex tinguishment 4.50 - Equal to project sale proceeds Other income - Non - recourse debt/Equity Total Economics (Y1 - Y20) Project pre - tax profit 1.80 1.80 GAAP: (Y1 - Y20 Pre - tax profit x 20) + Y20 Economics Non - GAAP: Y1 Gross profit + (Y1 - Y20 Pre - tax profit x 20) NPV pre - tax CF (@10%) 1.64 1.64 Pre - tax cash flow (all years) discounted at 10% Financing Sale - Leaseback For illustrative purpose only Not intended to represent company project 1. Residual project cash flows in excess of lease service requirements are reclassified from restricted cash to cash, which repr ese nt a positive investing cash flow. 22
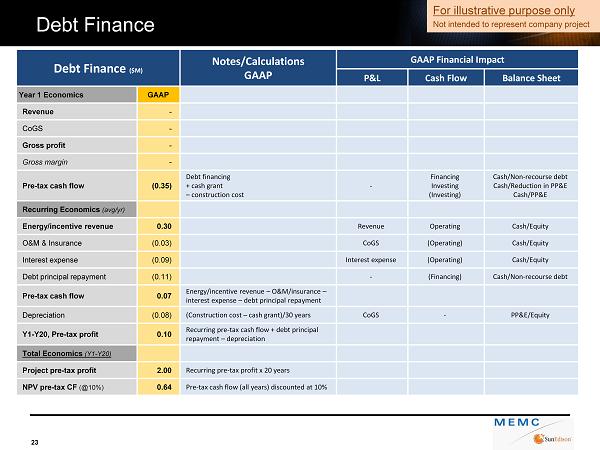
Debt Finance ($M) Notes/Calculations GAAP GAAP Financial Impact P&L Cash Flow Balance Sheet Year 1 Economics GAAP Revenue - CoGS - Gross profit - Gross margin - Pre - tax cash flow (0.35) Debt financing + cash grant – construction cost - Financing Investing (Investing) Cash/Non - recourse debt Cash/Reduction in PP&E Cash/PP&E Recurring Economics (avg/yr) Energy/incentive revenue 0.30 Revenue Operating Cash/Equity O&M & Insurance (0.03) CoGS (Operating) Cash/Equity Interest expense (0.09) Interest expense (Operating) Cash/Equity Debt principal repayment (0.11) - (Financing) Cash/Non - recourse debt Pre - tax cash flow 0.07 Energy/incentive revenue – O&M/insurance – interest expense – debt principal repayment Depreciation (0.08) (Construction cost – cash grant)/30 years CoGS - PP&E/Equity Y1 - Y20, Pre - tax profit 0.10 Recurring pre - tax cash flow + debt principal repayment – depreciation Total Economics (Y1 - Y20) Project pre - tax profit 2.00 Recurring pre - tax profit x 20 years NPV pre - tax CF (@10%) 0.64 Pre - tax cash flow (all years) discounted at 10% Debt Finance For illustrative purpose only Not intended to represent company project 23
Certain matters discussed in this presentation are forward - looking statements, including that for the first quarter 2012 : semiconductor cycle trough in Q 1 2012 , with 10 % - 15 % lower revenue expected in Q 1 2012 vs . Q 4 2011 and orders picking up for Q 2 2012 ; solar energy systems interconnection volume of less than 100 MW, with approximately 50 MW recognized for non - GAAP revenue and 45 MW of balance sheet projects ; solar energy systems average pricing of approximately $ 4 . 25 /watt ; operating expenses less than $ 110 million ; capital spending less than $ 50 million ; interest / other expense less than $ 25 million ; non - GAAP tax rate of approximately 30 % ; For the full year 2012 : semiconductor revenue flat year - over - year, with revenue in second half 2012 stronger than in first half 2012 ; solar energy systems sales volume greater than 400 MW ; solar energy systems average pricing of approximately $ 3 . 75 /watt ; operating expenses less than $ 375 million ; capital spending less than $ 175 million ; interest / other expense less than $ 100 million ; and non - GAAP tax rate of approximately 30 % . Such statements involve certain risks and uncertainties that could cause actual results to differ materially from those in the forward - looking statements . Potential risks and uncertainties include concentrated project development risks related to large scale solar projects ; the availability of attractive project finance and other capital for SunEdison projects ; changes to accounting interpretations or accounting rules ; changes in the pricing environment for silicon wafers and polysilicon , as well as solar power systems ; market demand for our products and services ; the availability and size of government and economic incentives to adopt solar power, including tax policy and credits and renewable portfolio standards ; the ability to effectuate the savings from the restructuring plan ; our ability to maintain adequate liquidity and compliance with our debt covenants ; the need to impair long lived assets or other intangible assets due to changes in the carrying value or realizability of such assets ; the effect of any antidumping or countervailing duties imposed on photovoltaic cells and/or modules in connection with any trade complaints in the United States or elsewhere ; existing or new regulations and policies governing the electric utility industry ; our ability to convert SunEdison pipeline into completed projects in accordance with our current expectations ; dependence on single and limited source suppliers ; utilization of our manufacturing volume and capacity, including the successful ramping of production at our Ipoh facility ; the terms of any potential future amendments to or terminations of our long - term agreements with our solar wafer customers ; general economic conditions, including interest rates, the ability of our customers to pay their debts as they become due ; our ability to realize the benefits of any announced or future facility closings and/or restructurings ; changes in the composition of worldwide taxable income and applicable tax laws and regulations, including our ability to utilize any net operating losses ; failure of third - party subcontractors to construct and install our solar energy systems ; seasonality or quarterly fluctuations in our SunEdison business ; the impact of competitive products and technologies ; inventory levels of our customers ; supply chain difficulties or problems ; interruption of production ; outcome of pending and future litigation matters ; good working order of our manufacturing facilities ; our ability to reduce manufacturing and operating costs ; assumptions underlying management's financial estimates ; delays in the restructuring of our manufacturing operations across different plants ; actions by competitors, customers and suppliers ; changes in the retail industry ; changes in federal or state laws governing utilities ; damage to our brand ; acquisitions of pipeline in our Solar Energy segment ; changes in product specifications and manufacturing processes ; changes in financial market conditions ; changes in foreign economic and political conditions ; changes in technology ; changes in currency exchange rates and other risks described in the company’s filings with the Securities and Exchange Commission . These forward - looking statements represent the company’s judgment as of the date of this press release . The company disclaims, however, any intent or obligation to update these forward - looking statements . Forward - Looking Statements 24