
MEMC Electronic Materials First Quarter 2012 Earnings Conference Call May 9, 2012
2 Agenda □ Safe Harbor □ 1Q12 Summary Results □ Variance □ 1Q12 Review and Highlights □ SunEdison Pipeline & Installations □ Cash Flow □ Balance Sheet & Liquidity □ Outlook □ Appendix □ Forward - Looking Statements
3 With the exception of historical information, the matters disclosed in this presentation are forward - looking statements . Such statements involve certain risks and uncertainties that could cause actual results to differ materially from those in the forward - looking statements . Potential risks and uncertainties are described in the Company’s filings with the Securities and Exchange Commission (SEC), including its 2011 Form 10 - K, in addition to the risks and uncertainties described on page 16 of this presentation . These forward - looking statements represent the Company’s judgment as of the date of this presentation . The Company disclaims, however, any intent or obligation to update these forward - looking statements . This presentation also includes non - GAAP financial measures . You can find a reconciliation of each of these non - GAAP measures to the most directly comparable GAAP financial measure in our earnings press release filed on Form 8 - K today with the SEC and posted in the Investor Relations portion of our web site at www . memc . com . Safe Harbor
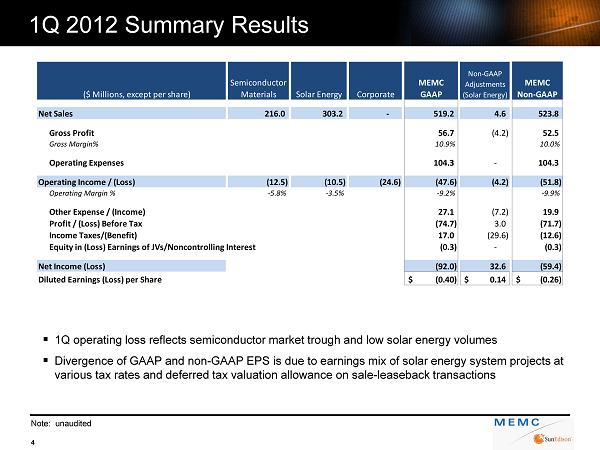
1Q 2012 Summary Results Note: unaudited 4 ▪ 1Q operating loss reflects semiconductor market trough and low solar energy volumes ▪ Divergence of GAAP and non - GAAP EPS is due to earnings mix of solar energy system projects at various tax rates and deferred tax valuation allowance on sale - leaseback transactions ($ Millions, except per share) Semiconductor Materials Solar Energy Corporate MEMC GAAP Non-GAAP Adjustments (Solar Energy) MEMC Non-GAAP Net Sales 216.0 303.2 - 519.2 4.6 523.8 Gross Profit 56.7 (4.2) 52.5 Gross Margin% 10.9% 10.0% Operating Expenses 104.3 - 104.3 Operating Income / (Loss) (12.5) (10.5) (24.6) (47.6) (4.2) (51.8) Operating Margin % -5.8% -3.5% -9.2% -9.9% Other Expense / (Income) 27.1 (7.2) 19.9 Profit / (Loss) Before Tax (74.7) 3.0 (71.7) Income Taxes/(Benefit) 17.0 (29.6) (12.6) Equity in (Loss) Earnings of JVs/Noncontrolling Interest (0.3) - (0.3) Net Income (Loss) (92.0) 32.6 (59.4) Diluted Earnings (Loss) per Share (0.40)$ 0.14$ (0.26)$
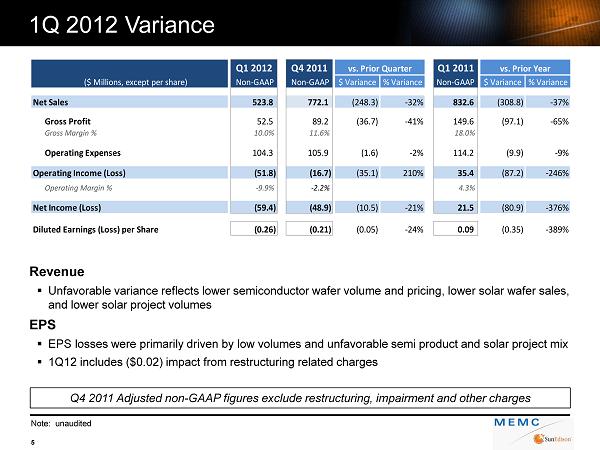
1Q 2012 Variance Note: unaudited 5 Revenue ▪ Unfavorable variance reflects lower semiconductor wafer volume and pricing, lower solar wafer sales, and lower solar project volumes EPS ▪ EPS losses were primarily driven by low volumes and unfavorable semi product and solar project mix ▪ 1Q12 includes ($0.02) impact from restructuring related charges Q4 2011 Adjusted non - GAAP figures exclude restructuring, impairment and other charges Q1 2012 Q4 2011 Q1 2011 ($ Millions, except per share) Non-GAAP Non-GAAP $ Variance % Variance Non-GAAP $ Variance % Variance Net Sales 523.8 772.1 (248.3) -32% 832.6 (308.8) -37% Gross Profit 52.5 89.2 (36.7) -41% 149.6 (97.1) -65% Gross Margin % 10.0% 11.6% 18.0% Operating Expenses 104.3 105.9 (1.6) -2% 114.2 (9.9) -9% Operating Income (Loss) (51.8) (16.7) (35.1) 210% 35.4 (87.2) -246% Operating Margin % -9.9% -2.2% 4.3% Net Income (Loss) (59.4) (48.9) (10.5) -21% 21.5 (80.9) -376% Diluted Earnings (Loss) per Share (0.26) (0.21) (0.05) -24% 0.09 (0.35) -389% vs. Prior Quarter vs. Prior Year
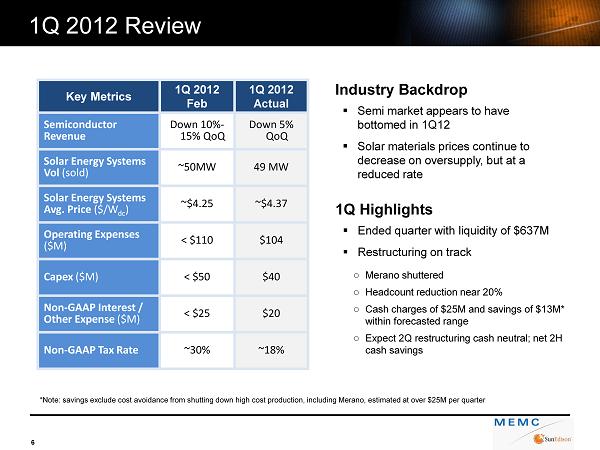
1Q 2012 Review 6 Industry Backdrop ▪ Semi market appears to have bottomed in 1Q12 ▪ Solar materials prices continue to decrease on oversupply, but at a reduced rate 1Q Highlights ▪ Ended quarter with liquidity of $637M ▪ Restructuring on track o Merano shuttered o Headcount reduction near 20% o Cash charges of $25M and savings of $13M* within forecasted range o Expect 2Q restructuring cash neutral; net 2H cash savings Key Metrics 1Q 2012 Feb 1Q 2012 Actual Semiconductor Revenue Down 10% - 15% QoQ Down 5% QoQ Solar Energy Systems Vol (sold) ~50MW 49 MW Solar Energy Systems Avg. Price ($/W dc ) ~$4.25 ~$4.37 Operating Expenses ($M) < $110 $104 Capex ($M) < $50 $40 Non - GAAP Interest / Other Expense ($M) < $25 $20 Non - GAAP Tax Rate ~30% ~18% *Note: savings exclude cost avoidance from shutting down high cost production, including Merano , estimated at over $25M per quarter
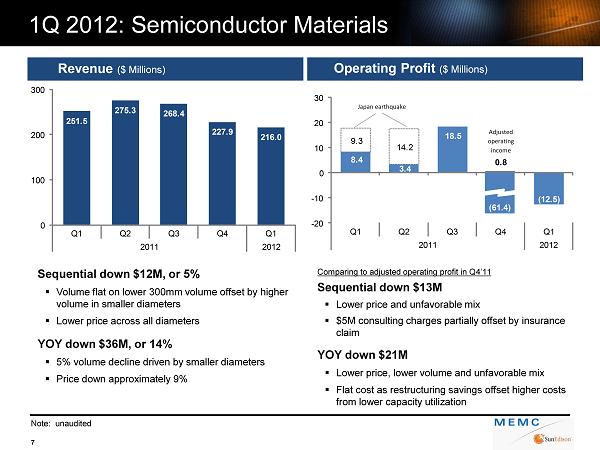
Revenue ($ Millions) Operating Profit ($ Millions) Sequential down $12M, or 5% ▪ Volume flat on l ower 300mm volume offset by higher volume in smaller diameters ▪ Lower price across all diameters YOY down $36M, or 14% ▪ 5% volume decline driven by smaller diameters ▪ Price down approximately 9% Comparing to adjusted operating profit in Q4’11 Sequential down $13M ▪ Lower price and unfavorable mix ▪ $5M consulting charges partially offset by insurance claim YOY down $21M ▪ Lower price , lower volume and unfavorable mix ▪ Flat cost as restructuring savings offset higher costs from lower capacity utilization 8.4 3.4 18.5 0.8 (12.5) 9.3 14.2 - 20 - 10 0 10 20 30 Q1 Q2 Q3 Q4 Q1 2011 2012 (61.4) Note: unaudited 1Q 2012: Semiconductor Materials 7 Adjusted operating income 251.5 275.3 268.4 227.9 216.0 0 100 200 300 Q1 Q2 Q3 Q4 Q1 2011 2012 Japan earthquake

Revenue ($ Millions) Operating Profit ($ Millions) Sequential down $236M, or 43% ▪ $78M lower wafer sales, partially offset by $40M poly inventory reduction ▪ Lower system volumes: sold 49MW vs.109MW in Q4 YOY down $273M, or 47% ▪ $256M lower in solar wafer sales on 82% volume decline and 64% price decline partially offset by poly ▪ 6MW lower in solar project MW sold Comparing to adjusted operating profit in prior quarters Sequential down $20M ▪ Breakeven in materials on lower production costs ▪ Offset by lower system sales YOY down $83M ▪ Down $39M in materials profits on lower wafer volume and pricing ▪ Lower solar systems sales on higher opex 68.4 14.8 27.5 5.7 (14.7) 88.6 (20.0) - 20 20 60 Q1 Q2 Q3 Q4 Q1 2011 2012 1Q 2012: Solar Energy – Non GAAP Note: unaudited 8 (1111.4) Adjusted (restructuring) Adjusted (goodwill impairment) Adjusted (Suntech settlement) 581.1 504.3 590.6 544.2 307.8 0 300 600 Q1 Q2 Q3 Q4 Q1 2011 2012 Non - GAAP Adjusted Non - GAAP
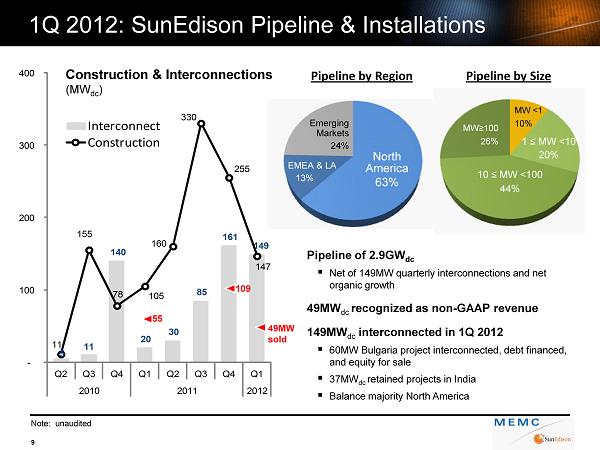
5 11 140 20 30 85 161 149 11 155 78 105 160 330 255 147 - 100 200 300 400 Q2 Q3 Q4 Q1 Q2 Q3 Q4 Q1 2010 2011 2012 Interconnect Construction 1Q 2012: SunEdison Pipeline & Installations Note: unaudited 9 Pipeline by Region Pipeline by Size Pipeline of 2.9GW dc ▪ Net of 149MW quarterly interconnections and net organic growth 49MW dc recognized as non - GAAP revenue 149MW dc interconnected in 1Q 2012 ▪ 60MW Bulgaria project interconnected, debt financed, and equity for sale ▪ 37MW dc retained projects in India ▪ Balance majority North America Construction & Interconnections (MW dc ) 10 ≤ MW <100 44% 1 ≤ MW <10 20% MW≥100 26% MW <1 10% North America 63% EMEA & LA 13% Emerging Markets 24% 109 49MW sold 55
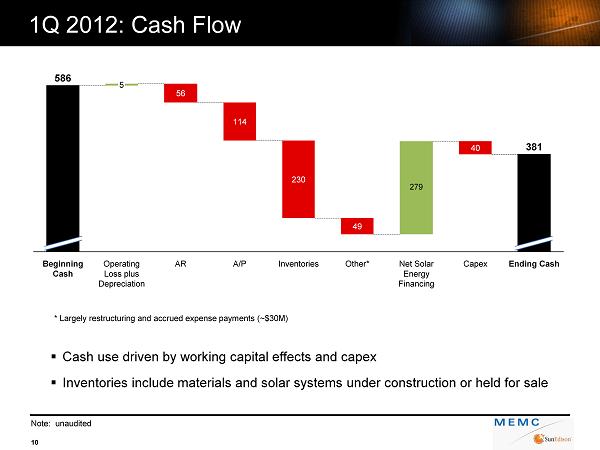
1Q 2012: Cash Flow Note: unaudited 10 ▪ Cash use driven by working capital effects and capex ▪ Inventories include materials and solar systems under construction or held for sale 279 Ending Cash 381 Capex 40 Net Solar Energy Financing Other* 49 Inventories 230 A/P 114 AR 56 Operating Loss plus Depreciation 5 Beginning Cash 586 * Largely restructuring and accrued expense payments (~$30M)
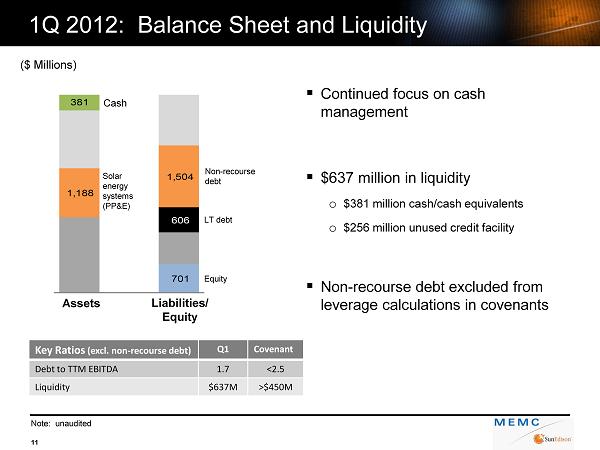
1Q 2012: Balance Sheet and Liquidity 11 ($ Millions) 701 1,188 606 381 1,504 Assets Liabilities/ Equity Cash N on - recourse debt LT debt Equity Solar energy systems (PP&E) Note: unaudited Key Ratios (excl. non - recourse debt) Q1 Covenant Debt to TTM EBITDA 1.7 <2.5 Liquidity $637M >$450M ▪ Continued focus on cash management ▪ $637 million in liquidity o $381 million cash/cash equivalents o $256 million unused credit facility ▪ Non - recourse debt excluded from leverage calculations in covenants
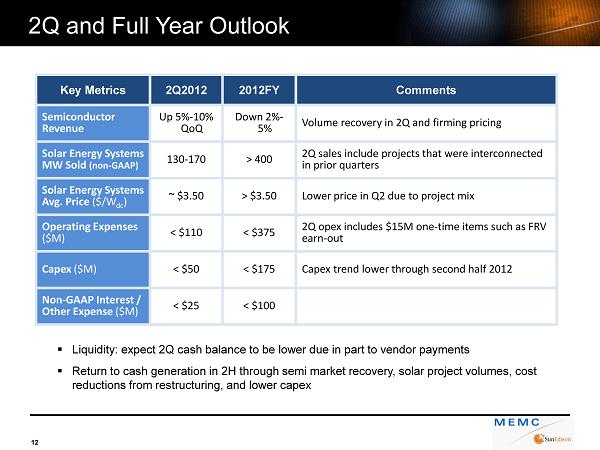
2Q and Full Year Outlook 12 ▪ Liquidity: expect 2Q cash balance to be lower due in part to vendor payments ▪ Return to cash generation in 2H through semi market recovery, solar project volumes, cost reductions from restructuring, and lower capex Key Metrics 2Q2012 2012FY Comments Semiconductor Revenue Up 5% - 10% QoQ Down 2% - 5% Volume recovery in 2Q and firming pricing Solar Energy Systems MW Sold (non - GAAP) 130 - 170 > 400 2Q sales include projects that were interconnected in prior quarters Solar Energy Systems Avg. Price ($/W dc ) ~ $3.50 > $3.50 Lower price in Q2 due to project mix Operating Expenses ($M) < $110 < $375 2Q opex includes $15M one - time items such as FRV earn - out Capex ($M) < $50 < $175 Capex trend lower through second half 2012 Non - GAAP Interest / Other Expense ($M) < $25 < $100
13 Appendix
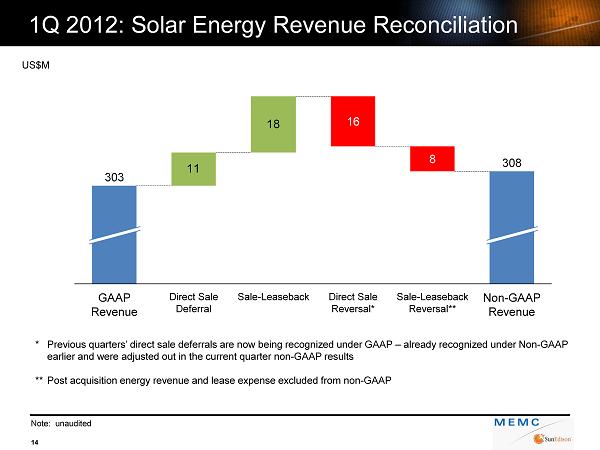
1Q 2012: Solar Energy Revenue Reconciliation Note: unaudited 14 18 11 Non - GAAP Revenue 308 Sale - Leaseback Reversal** 8 Direct Sale Reversal* 16 Sale - Leaseback Direct Sale Deferral GAAP Revenue 303 * Previous quarters’ direct sale deferrals are now being recognized under GAAP – already recognized under Non - GAAP earlier and were adjusted out in the current quarter non - GAAP results ** Post acquisition energy revenue and lease expense excluded from non - GAAP US$M
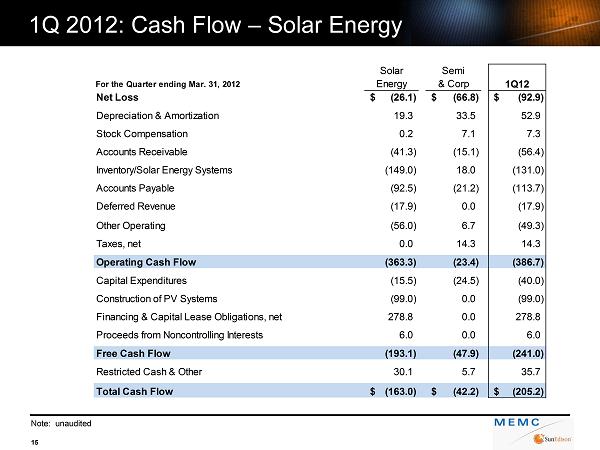
1Q 2012: Cash Flow – Solar Energy 15 Solar Semi For the Quarter ending Mar. 31, 2012 Energy & Corp 1Q12 Net Loss (26.1)$ (66.8)$ (92.9)$ Depreciation & Amortization 19.3 33.5 52.9 Stock Compensation 0.2 7.1 7.3 Accounts Receivable (41.3) (15.1) (56.4) Inventory/Solar Energy Systems (149.0) 18.0 (131.0) Accounts Payable (92.5) (21.2) (113.7) Deferred Revenue (17.9) 0.0 (17.9) Other Operating (56.0) 6.7 (49.3) Taxes, net 0.0 14.3 14.3 Operating Cash Flow (363.3) (23.4) (386.7) Capital Expenditures (15.5) (24.5) (40.0) Construction of PV Systems (99.0) 0.0 (99.0) Financing & Capital Lease Obligations, net 278.8 0.0 278.8 Proceeds from Noncontrolling Interests 6.0 0.0 6.0 Free Cash Flow (193.1) (47.9) (241.0) Restricted Cash & Other 30.1 5.7 35.7 Total Cash Flow (163.0)$ (42.2)$ (205.2)$ Note: unaudited
Certain matters discussed in this presentation are forward - looking statements, including that the company expects that cash savings from the restructuring are expected to exceed charges in 2H12 once severance is paid; that for the second quarter of 2012, the company ex pects semiconductor revenue expected to be up 5% - 10% in Q2 2012 vs. Q1 2012, with solar energy systems sold (non - GAAP) of 130 - 170 MW, solar energy systems average pricing of approximately $3.50/watt, operating expenses of less than $110 million and capital spending of less than $50 million; and that for the full year 2012, the company expects semiconductor revenue to be down 2 - 5% year - over - year, solar energy systems sales volume (non - GAAP) greater than 400 MW, solar energy systems average pricing of greater than $3.50/watt, operating expenses less than $375 million and capital spending less than $175 million; that the Q2 2012 cash balance is expected to be lower and that the com pany expects to return to cash generation in the 2012 second half through semiconductor market recovery, solar project volumes, cost reductio n f rom restructuring and lower capex; and that Q2 restructuring cash charges are expected to be neutral with expected net cash savi ngs for the second half of 2012. Such statements involve certain risks and uncertainties that could cause actual results to differ materially f rom those in the forward - looking statements. Potential risks and uncertainties include concentrated project development risks related to large scale s ola r projects; the availability of attractive project finance and other capital for SunEdison projects; changes to accounting interpretations or ac counting rules; changes in the pricing environment for silicon wafers and polysilicon, as well as solar power systems; market demand for our pro ducts and services; the availability and size of government and economic incentives to adopt solar power, including tax policy and cred its and renewable portfolio standards; the ability to effectuate and realize the savings from the restructuring plan; our ability to maintain a deq uate liquidity and compliance with our debt covenants; the need to impair long lived assets or other intangible assets due to changes in the car ryi ng value or realizability of such assets; the effect of any antidumping or countervailing duties imposed on photovoltaic cells and/or modules in connec ti on with any trade complaints in the United States or elsewhere; existing or new regulations and policies governing the electric uti lity industry; our ability to convert SunEdison pipeline into completed projects in accordance with our current expectations; dependence on sing le and limited source suppliers; utilization of our manufacturing volume and capacity, including the successful ramping of production at our Ip oh facility; the terms of any potential future amendments to or terminations of our long - term agreements with our solar wafer customers; general economic conditions, including interest rates; the ability of our customers to pay their debts as they become due; changes in the comp osi tion of worldwide taxable income and applicable tax laws and regulations, including our ability to utilize any net operating losses; failure of th ird - party subcontractors to construct and install our solar energy systems; seasonality or quarterly fluctuations in our SunEdison busi nes s; the impact of competitive products and technologies; inventory levels of our customers; supply chain difficulties or problems; interruption of production; outcome of pending and future litigation matters; good working order of our manufacturing facilities; our ability to reduce m anu facturing and operating costs; assumptions underlying management's financial estimates; actions by competitors, customers and suppliers; ch ang es in the retail industry; damage to our brand; acquisitions of pipeline in our Solar Energy segment; changes in product specifications an d manufacturing processes; changes in financial market conditions; changes in foreign economic and political conditions; changes in technolog y; changes in currency exchange rates and other risks described in the company’s filings with the Securities and Exchange Commission. These fo rward - looking statements represent the company’s judgment as of the date of this press release. The company disclaims, however, any in tent or obligation to update these forward - looking statements. Forward - Looking Statements 16