Exhibit 13
| | |
| Five Year Selected Financial Highlights | | Dollars in millions, except per share data |
The following data has been derived from our annual consolidated financial statements, including the consolidated balance sheets and the related consolidated statements of operations, cash flows, and stockholders’ equity and the notes thereto. The information below should be read in conjunction with our consolidated financial statements and notes thereto including Note 2 related to significant accounting policies.
| | | | | | | | | | | | | | | | | | |
| | | 2007 | | | 2006 | | | 2005 | | 2004(1) | | 2003 | |
| (in millions, except per share and employment data) | | | | | | | | | | | | | |
Statement of Operations Data: | | | | | | | | | | | | | | | | | | |
| | | | | |
Net sales | | $ | 1,921.8 | | | $ | 1,540.6 | | | $ | 1,107.4 | | $ | 1,028.0 | | $ | 781.1 | |
| | | | | |
Gross margin | | | 1,000.5 | | | | 689.0 | | | | 366.5 | | | 369.4 | | | 232.7 | |
| | | | | |
Marketing and administration(2) | | | 111.3 | | | | 94.9 | | | | 76.3 | | | 71.9 | | | 57.2 | |
| | | | | |
Research and development | | | 39.3 | | | | 35.8 | | | | 33.2 | | | 38.0 | | | 32.9 | |
| | | | | |
Operating income | | | 849.9 | | | | 558.3 | | | | 257.0 | | | 260.5 | | | 142.6 | |
| | | | | |
Nonoperating (income) expense(3) | | | (261.9 | ) | | | (32.2 | ) | | | 4.6 | | | 62.0 | | | (13.3 | ) |
| | | | | |
Net income allocable to common stockholders (4) | | | 826.2 | | | | 369.3 | | | | 249.4 | | | 226.2 | | | 116.6 | |
| | | | | |
Basic income per share | | | 3.66 | | | | 1.66 | | | | 1.17 | | | 1.09 | | | 0.58 | |
| | | | | |
Diluted income per share | | | 3.56 | | | | 1.61 | | | | 1.10 | | | 1.02 | | | 0.53 | |
| | | | | |
Shares used in basic income per share computation | | | 225.6 | | | | 222.1 | | | | 213.5 | | | 207.7 | | | 202.4 | |
| | | | | |
Shares used in diluted income per share computation | | | 232.3 | | | | 229.7 | | | | 226.4 | | | 221.0 | | | 218.7 | |
| | | | | |
Balance Sheet Data: | | | | | | | | | | | | | | | | | | |
| | | | | |
Cash, cash equivalents and short-term investments | | | 1,316.4 | | | | 585.5 | | | | 153.6 | | | 92.3 | | | 130.7 | |
| | | | | |
Working capital | | | 1,145.3 | | | | 641.7 | | | | 211.4 | | | 155.0 | | | 92.3 | |
| | | | | |
Total assets | | | 2,887.2 | | | | 1,765.5 | | | | 1,148.1 | | | 1,028.2 | | | 726.8 | |
| | | | | |
Long-term debt (including current portion of long-term debt) | | | 30.9 | | | | 34.4 | | | | 39.9 | | | 138.7 | | | 114.2 | |
| | | | | |
Stockholders’ equity | | | 2,035.0 | | | | 1,166.9 | | | | 711.3 | | | 442.9 | | | 193.6 | |
| | | | | |
Other Data: | | | | | | | | | | | | | | | | | | |
| | | | | |
Capital expenditures | | | 276.4 | | | | 148.4 | | | | 162.7 | | | 145.8 | | | 67.4 | |
| | | | | |
Employees | | | 5,400 | | | | 5,500 | | | | 5,400 | | | 5,500 | | | 4,900 | |
(1) | In the 2004 first quarter, we completed the acquisition of the remaining 55% interest in Taisil that we did not already own. As a result, the financial results of Taisil were consolidated with our results effective February 1, 2004. |
(2) | Effective January 1, 2006, we adopted the fair value recognition provisions of Statement of Financial Accounting Standards No. 123 (revised 2004), “Share-Based Payment”. Stock-based compensation expense recorded to marketing and administration expense was $25.1 million and $13.1 million in 2007 and 2006, respectively. Amounts recorded to marketing and administration expense during 2005 and prior were less than $4 million per year. |
(3) | Gains of $220.8 million and $18.9 million were recorded to nonoperating income in 2007 and 2006, respectively, due to the mark to market adjustment related to a warrant received from a customer. |
(4) | During 2005, we reversed $67.1 million of valuation allowances related to deferred tax assets. This represented the reversal of all remaining valuation allowances on deferred tax assets. During 2004, we reversed $137.4 million of valuation allowances related to deferred tax assets. |
1
Management’s Discussion and Analysis of Financial Condition and Results of Operations
COMPANY OVERVIEW
We are a global leader in the manufacture and sale of wafers and have been a pioneer in the design and development of wafer technologies over the past four decades. With R&D and manufacturing facilities in the US, Europe and Asia Pacific, we enable the next generation of high performance semiconductor and solar applications. Our customers include major semiconductor device and solar cell manufacturers. We provide wafers in sizes ranging from 100 millimeters (4 inch) to 300 millimeters (12 inch). In the first quarter of 2007, we began delivering 156 millimeter wafers targeted for solar applications. Depending on market conditions, we also sell intermediate products such as polysilicon, silane gas, partial ingots and scrap wafers to semiconductor device and equipment makers, solar customers, flat panel and other industries.
Our financial performance and profitability improved in almost every category in 2007, with the company growing revenue by approximately 25%, gross margin by over 45% and operating profit by over 52%. We also increased our annual polysilicon capacity to over 6,000 metric tons and our 300 millimeter wafer capacity to over 350,000 wafers per month.
RESULTS OF OPERATIONS
| | | | | | | | | | | | |
Net Sales | | 2007 | | | 2006 | | | 2005 | |
| Dollars in millions | | | | | | | | | |
| | | |
Net Sales | | $ | 1,921.8 | | | $ | 1,540.6 | | | $ | 1,107.4 | |
| | | |
Percentage Change | | | 25 | % | | | 39 | % | | | 8 | % |
Our net sales increased by 25% to $1,921.8 million in 2007 from $1,540.6 million in 2006. Increases in volume generated an increase in sales, which was primarily attributable to the introduction of 156 millimeter wafers in 2007 and increases in 300 millimeter wafer shipments. The remaining increase in our sales was due to increases in prices, which were primarily attributable to existing wafer products and intermediate products such as polysilicon, silane gas, partial ingots and scrap wafers. Sales of our excess polysilicon raw material amounted to approximately 22% and slightly less than 19% of total sales in 2007 and 2006, respectively. This percentage is anticipated to slowly decline over time as our wafer sales grow at a faster rate. With the inclusion of prices for the recently introduced 156 millimeter wafers in the calculation of average selling prices, wafer average selling prices declined approximately 41% in 2007 compared to 2006.
Our net sales increased by 39% to $1,540.6 million in 2006 from $1,107.4 million in 2005. The increase was driven by continued price increases on both sales of our excess polysilicon raw material and wafers combined with increased volumes. Our wafer average selling prices for the 2006 year were approximately 10% higher than the average selling prices for the 2005 year. Our raw material polysilicon sales in 2006, as noted above, increased from 2005 in which polysilicon sales were slightly less than 10% of total sales.
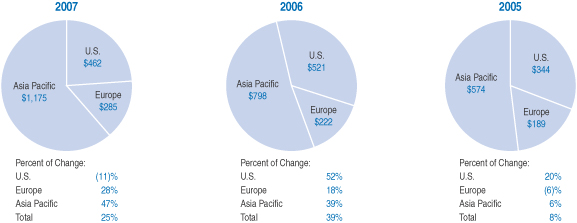
We operate in all the major semiconductor and solar-producing regions of the world, with approximately 76% of our 2007 net sales to customers located outside the United States. Net sales by geographic region for each of the last three years were as follows:
Net Sales by Geographic Area:
Dollars in millions
| | | | | | | | | | | | |
Gross Margin | | 2007 | | | 2006 | | | 2005 | |
| Dollars in millions | | | | | | | | | |
| | | |
Cost of Goods Sold | | $ | 921.3 | | | $ | 851.6 | | | $ | 740.9 | |
| | | |
Gross Margin | | | 1,000.5 | | | | 689.0 | | | | 366.5 | |
| | | |
Gross Margin Percentage | | | 52 | % | | | 45 | % | | | 33 | % |
Our gross margin was $1,000.5 million in 2007 compared to $689.0 million in 2006 and increased as a percentage of sales to 52% from 45%. The increase in gross margins was primarily the result of an improved mix of 156 millimeter wafers, 300 millimeter wafers and polysilicon sales as well as higher average prices on existing wafer products and polysilicon sales throughout the year.
2
Our gross margin improved to $689.0 million, or 45% of net sales, in 2006 compared to $366.5 million, or 33% of net sales, in 2005. The improvement was driven by price increases on both excess polysilicon and wafer sales. Cost of goods sold increased $4.3 million due to the recording of stock compensation expense associated with the adoption of Statement of Financial Accounting Standards No. 123 (revised 2004), “Share-Based Payment” (“SFAS 123R”).
| | | | | | | | | | | | |
Marketing and Administration | | 2007 | | | 2006 | | | 2005 | |
| Dollars in millions | | | | | | | | | |
| | | |
Marketing and Administration | | $ | 111.3 | | | $ | 94.9 | | | $ | 76.3 | |
| | | |
As a Percentage of Net Sales | | | 6 | % | | | 6 | % | | | 7 | % |
Marketing and administration expenses were $111.3 million in 2007 compared to $94.9 million in 2006. As a percentage of net sales, marketing and administration expenses remained consistent with 2006, at 6%. In aggregate dollar amounts, marketing and administration fees increased due to increased stock compensation expense of $12.0 million related to new option grants, as well as higher professional fees and increased freight on customer shipments.
Marketing and administration expenses increased to $94.9 million in 2006 compared to $76.3 million in 2005. The increase was primarily a result of the recording of stock compensation expense associated with the adoption of SFAS 123R and higher professional fees. Stock compensation expense recorded in marketing and administration expenses was $13.1 million in 2006 as compared to $2.1 million in 2005. As a percentage of net sales, marketing and administration expenses in 2006 decreased to 6% compared to 7% in 2005.
| | | | | | | | | | | | |
Research and Development | | 2007 | | | 2006 | | | 2005 | |
| Dollars in millions | | | | | | | | | |
| | | |
Research and Development | | $ | 39.3 | | | $ | 35.8 | | | $ | 33.2 | |
| | | |
As a Percentage of Net Sales | | | 2 | % | | | 2 | % | | | 3 | % |
R&D expenses consisted mainly of product and process development efforts to increase our capability in the areas of flatness, particles and crystal defectivity. Our research and development expenses increased to $39.3 million in 2007 compared to $35.8 million in 2006 mainly due to increased raw material and labor costs on next generation products and higher patent related professional fees.
Our research and development expenses increased to $35.8 million in 2006 compared to $33.2 million in 2005 due to stock compensation expense associated with the adoption of SFAS 123R of $1.4 million in 2006 and a reduction in the amount of R&D grants we received from the Department of Defense.
| | | | | | | | | | | | |
Nonoperating (Income) Expense | | 2007 | | | 2006 | | | 2005 | |
| Dollars in millions | | | | | | | | | |
| | | |
Interest Expense | | $ | 1.4 | | | $ | 2.4 | | | $ | 7.3 | |
| | | |
Interest Income | | | (45.0 | ) | | | (14.6 | ) | | | (4.2 | ) |
| | | |
Gain on Fair Value of Warrant | | | (220.8 | ) | | | (18.9 | ) | | | — | |
| | | |
Other, Net | | | 2.5 | | | | (1.1 | ) | | | 1.5 | |
Interest expense in 2007 decreased to $1.4 million compared to $2.4 million in 2006. The decrease was primarily the result of a decrease in the commitment fees on our revolving credit facility, lower interest expense on factored receivables, an increase in the amount of interest capitalized to property, plant and equipment due to higher capital expenditures and a reduction in our outstanding debt. Interest expense in 2006 decreased to $2.4 million from $7.3 million in 2005 due to our continued reduction of debt during 2005.
In 2007, our interest income increased to $45.0 million, compared to approximately $14.6 million in 2006 and $4.2 million in 2005. This change was primarily due to returns on higher cash and short-term investment balances.
Gain on fair value of warrant represents the mark-to-market adjustment for a warrant received from a customer of $220.8 million in 2007 compared to $18.9 million in 2006. The increase is mainly due to the increase in the price of the customer’s ordinary shares (stock price per share of $82.32 and $34.01 at December 31, 2007 and 2006, respectively).
3
| | | | | | | | | | | | |
Income Taxes | | 2007 | | | 2006 | | | 2005 | |
| Dollars in millions | | | | | | | | | |
Income Tax Expense (Benefit) | | $ | 282.2 | | | $ | 214.8 | | | $ | (2.8 | ) |
| | | |
Income Tax Rate as a % of Income before Income Taxes | | | 25 | % | | | 36 | % | | | (1 | )% |
In 2007, we recorded income tax expense of $282.2 million representing 25% of income before income taxes and minority interests. The decrease in the overall tax rate in 2007 from 2006 was related primarily to the nontaxable gain on the fair value of the customer warrant as well as a reduction in the effective tax rate as a result of an increase in earnings generated by foreign subsidiaries whose earnings are being permanently reinvested and taxed at lower rates.
In 2006, we recorded income tax expense of $214.8 million representing 36% of income before income and minority interests. The increase in the overall tax rate in 2006 from 2005 was related primarily to the release of all existing valuation allowances, a reassessment of income tax contingent liabilities, effects of foreign operations and changes in state items in 2005 (all as described below) and an increase in profitability in 2006.
In 2005, we recognized an income tax benefit of $2.8 million representing a benefit of 1% of income before income taxes and minority interests. The tax benefit was primarily due to reversal of valuation allowances, reassessments in reserves for changes of estimates of $29.6 million, effects of foreign operations on taxes offset by state income tax increases from rate changes and non-realizable state tax loss carry-forwards. We reversed $67.1 million of valuation allowances based on our projected future earnings because we believe it is more likely than not that certain deferred tax assets will be recognized in the future. In making this determination, we considered all available evidence including historical pre-tax and taxable income (losses) and the expected timing of the reversals of existing taxable temporary differences by taxable jurisdiction. We reassessed reserves for changes in estimates benefiting taxes by $29.6 million primarily for allowable depreciation deductions under IRS rules and an election to claim U.S. foreign tax credits. We expensed $10.3 million of state income taxes related to tax rate changes and non-realizable state net operating losses caused by a merger in 2005 for tax purposes. We recognized a tax benefit of $9.4 million primarily from our election to credit foreign taxes. We made certain prior period adjustments that netted to a tax expense of $3.3 million. See “Other Events” below.
FINANCIAL CONDITION
Cash and cash equivalents increased $331.8 million from $527.5 million at December 31, 2006 to $859.3 million at December 31, 2007. See additional discussion in “Liquidity and Capital Resources” below.
Short-term investments increased $399.1 million from $58.0 million at December 31, 2006 to $457.1 million at December 31, 2007. Our improved operating results have allowed us to build our cash balance, which we have continued to invest in short-term investments.
Our inventories decreased $43.8 million or 55% to $36.4 million from the prior year. The decrease was primarily due to the 25% increase in 2007 sales compared to 2006 and improvements in our internal supply chain. Our annualized inventory turns, calculated as the ratio of annualized fourth quarter cost of goods sold divided by the year-end inventory balance, were approximately 27 times at December 31, 2007 versus approximately 11 times at December 31, 2006. We sell our products to certain customers under consignment arrangements. Generally, these consignment arrangements require us to maintain a certain quantity of product in inventory at the customer’s facility or at a storage facility designated by the customer. At December 31, 2007, we had $8.4 million of inventory held on consignment, compared to $6.0 million at December 31, 2006.
Our net property, plant and equipment increased $230.5 million to $834.0 million over the prior year. The increase was primarily due to capital expenditures related to expansions at our plants in Pasadena, Texas, Hsinchu, Taiwan and Merano, Italy and foreign currency changes, offset by depreciation expense.
Our net deferred tax assets totaled $101.3 million at December 31, 2007 (of which $12.0 million was included in prepaid and other assets) compared to $131.4 million at December 31, 2006 (of which $11.9 million was included in prepaid and other assets). In 2007, the decrease of $30.1 million in net deferred tax assets is primarily attributed to the reversal of timing items for the current year, which included pension and other post-retirement reserve items, fixed assets and a tax method change related to repair and maintenance expense. We believe that it is more likely than not, with our projections of future taxable income, that we will generate sufficient taxable income to realize the benefits of the net deferred tax assets existing at December 31, 2007.
Customer warrant increased from $85.5 million at the end of 2006 to $306.3 million at December 31, 2007. During 2006, MEMC signed a long-term supply agreement with a customer. At the same time, MEMC received a fully vested, non-forfeitable warrant to purchase shares of that customer. The warrant becomes exercisable over a five-year period (20%
4
annually commencing January 1, 2008) and has a five-year exercise period from the date each tranche becomes exercisable. We recorded $66.6 million for the original estimated fair value of the warrant with the offset to deferred revenue – long-term. The warrant is considered a derivative and is therefore marked to market each reporting period based on the market price of the underlying security. The current year increase represents the mark-to-market adjustment for the period and is mainly due to the increase in the price of the customer’s ordinary shares.
Other assets increased $10.6 million to $68.1 million at December 31, 2007 from $57.5 million at December 31, 2006. This increase is mainly due to recording the estimated purchase date fair value of less than 10% of the common stock of a customer, which was acquired at the same time as the execution of a long-term supply agreement with that customer with the offset to deferred revenue – long-term.
Accounts payable increased $42.9 million to $168.3 million at December 31, 2007 compared to $125.4 million at the end of 2006. The increase was primarily due to the timing of capital expenditures.
Accrued liabilities increased $8.9 million to $40.8 million at December 31, 2007 from $31.9 million at December 31, 2006. This increase was due to timing of utility and various other payments.
Short-term customer deposits increased $113.6 million to $122.0 million at December 31, 2007, primarily due to a reclassification from other long-term liabilities for the current portion of the refundable customer deposits related to long-term supply agreements of $76.3 million as discussed below. These customer deposits are refundable to the customer within the next twelve months. The remaining increase in customer deposits of $37.3 million at December 31, 2007 relates to cash received from customers for anticipated future sales. In the event the future sales do not occur, these deposits would be returned to the customer.
Income taxes payable increased $21.6 million to $75.9 million at December 31, 2007, compared to $54.3 million at December 31, 2006. This increase is primarily attributed to improved profitability in the U.S. and other worldwide operations over and above the benefit derived from our election to credit foreign taxes. Additionally, there were excess tax benefits related to the exercise of non-qualified stock options. The payable is net of estimated payments made to date.
Long-term deferred revenue relates to customer supply agreements and the original estimated fair value of the warrant described above. We will recognize the deferred revenue on a pro-rata basis as product is shipped over the life of the contracts. The increase in deferred revenue from $68.1 million at December 31, 2006 to $81.4 million at December 31, 2007 is primarily the result of recording the initial fair value of common stock received from a customer as part of a long-term supply agreement initiated in 2006 and increased deposits received in connection with our supply agreements.
Pension and post-employment liabilities decreased $24.0 million to $64.4 million at December 31, 2007, compared to $88.4 million at the end of 2006 (of which $3.8 million and $3.2 million were included in accrued liabilities at December 31, 2007 and 2006, respectively). This decrease was due to a favorable change in plan assumptions, contributions of approximately $15.5 million and an increase in the actual return on plan assets over the actuarially estimated return offset by $5.9 million of net periodic benefit cost.
Other noncurrent liabilities increased $85.1 million to $204.6 million at December 31, 2007, compared to $119.5 million at December 31, 2006. This increase is mainly due to an increase of approximately $46.7 million related to uncertain tax positions and the receipt of refundable customer deposits related to long-term supply agreements.
LIQUIDITY AND CAPITAL RESOURCES
| | | | | | | | | | | | |
| | | 2007 | | | 2006 | | | 2005 | |
| Dollars in millions | | | | | | | | | |
| | | |
Net Cash Provided by (Used in): | | | | | | | | | | | | |
| | | |
Operating Activities | | $ | 917.2 | | | $ | 527.8 | | | $ | 321.0 | |
| | | |
Investing Activities | | | (688.9 | ) | | | (174.2 | ) | | | (152.6 | ) |
| | | |
Financing Activities | | | 76.9 | | | | 40.8 | | | | (94.4 | ) |
In 2007, we generated $917.2 million of cash from operating activities, compared to $527.8 million in 2006 and $321.0 million in 2005. The year over year increases were primarily due to improved operating results.
5
Our principal sources and uses of cash during 2007 were as follows:
Sources:
| | • | | Generated $917.2 million from operations; |
| | • | | Received approximately $115.3 million in refundable customer deposits related to long-term supply agreements; |
| | • | | Received approximately $44.2 million from the exercise of stock options. |
Uses:
| | • | | Purchased approximately $403.7 million of short-term investments, net; |
| | • | | Invested $276.4 million in capital expenditures; |
| | • | | Paid approximately $111.2 million to repurchase common stock; |
| | • | | Paid approximately $6.2 million as a dividend to a minority shareholder in our Korean subsidiary; and |
| | • | | Paid down $5.2 million under long-term debt agreements. |
At December 31, 2007, we had approximately $144.2 million of committed capital expenditures. Capital expenditures in 2007 and committed capital expenditures for 2008 primarily relate to increasing our capacity and capability for our next generation products. We expect our capital expenditures to be approximately 15% of our net sales in 2008.
In 2007, cash from financing activities provided $76.9 million, compared to $40.8 million in 2006. Approximately $115.3 million was received in connection with customer deposits related to supply agreements in 2007 compared to $37.3 million in 2006. These deposits are refundable to the customer after two years, although such deposits are replaced each year with new deposits based on increased volume commitments stated in the contract to reduce our risks associated with nonfulfillment of the contract by the customers. Also contributing to the increase in cash from financing activities was the excess tax benefits from share-based payment arrangements of $40.0 million in 2007, compared to $10.5 million in 2006, and $44.2 million received in connection with stock option exercises, compared to $17.1 million in 2006. These increases were offset by repurchases of our common stock of $111.2 million.
On July 21, 2005, we entered into a Revolving Credit Agreement with National City Bank of the Midwest (“National City Bank”), US Bank National Association, and such other lending institutions as may from time to time become lenders (the “National City Agreement”). The National City Agreement was amended on December 20, 2006 to reduce the commitment fee and the interest spread on loans bearing interest at a rate determined by reference to the LIBOR rate. Additionally, our obligations and the guaranty obligations of our subsidiaries are no longer secured by a pledge of the capital stock of certain of our domestic and foreign subsidiaries. The National City Agreement provides for a $200.0 million revolving credit facility and has a term of five years. Interest on borrowings under the National City Agreement would be payable based on our election at LIBOR plus an applicable margin (currently 0.34%) or at a defined prime rate plus an applicable margin (currently 0.0%). The National City Agreement also provides for us to pay various fees, including a commitment fee (currently 0.08%) on the lenders’ commitments. The National City Agreement contains covenants typical for credit arrangements of comparable size, such as minimum earnings before interest, taxes, depreciation and amortization and an interest coverage ratio. Our obligations under the National City Agreement are guaranteed by certain of our subsidiaries. At December 31, 2007, there were no borrowings under this credit facility, however, credit available under the facility has been reduced by $112.0 million related to the issuance of third party letters of credit.
Credit facilities and related borrowings outstanding at December 31, 2007 were as follows:
| | | | | | |
| | | Committed | | Outstanding |
| Dollars in millions | | | | |
Long-term Debt | | $ | 270.6 | | $ | 30.9 |
| | |
Short-term Borrowings | | | 50.4 | | | — |
| | | | | | |
| | |
Total | | $ | 321.0 | | $ | 30.9 |
| | | | | | |
Of the $270.6 million in committed long-term credit facilities, $112.3 million is unavailable because it relates to the issuance of third party letters of credit. Our weighted-average cost of borrowing was 2.2% and 2.3% at December 31, 2007 and 2006, respectively. Our short-term borrowings are subject to renewal annually with each financial institution through the course of the year.
6
Our contractual obligations as of December 31, 2007 were as follows:
| | | | | | | | | | | | | | | | | |
| | | Payments Due By Period |
Contractual Obligations | | Total | | Less than
1 Year | | 1-3
Years | | 4-5
Years | | After 5
Years |
| Dollars in millions | | | | | | | | | | |
| | | | | |
Long-term Debt1 | | $30.9 | | $ | 5.3 | | $ | 8.3 | | $ | 5.2 | | $ | 12.1 |
| | | | | |
Operating Leases | | 13.1 | | | 4.3 | | | 5.0 | | | 3.3 | | | 0.5 |
| | | | | |
Purchase Obligations2 | | | 688.7 | | | 109.8 | | | 145.0 | | | 132.1 | | | 301.8 |
| | | | | |
Committed Capital Expenditures3 | | | 144.2 | | | 144.2 | | | — | | | — | | | — |
| | | | | |
Employee Related Liabilities4 | | | 99.5 | | | 9.1 | | | — | | | — | | | — |
| | | | | |
Other Long-term Liabilities—Uncertain Tax Positions5 | | | 95.7 | | | — | | | — | | | — | | | — |
| | | | | |
Customer Deposits6 | | | 152.6 | | | 76.3 | | | 76.3 | | | — | | | — |
| | | | | | | | | | | | | | | | | |
| | | | | |
Total Contractual Obligations | | $ | 1,224.7 | | $ | 349.0 | | $ | 234.6 | | $ | 140.6 | | $ | 314.4 |
| | | | | | | | | | | | | | | | | |
The contractual commitments shown above, except for our debt obligations, employee related liabilities, uncertain tax positions and customer deposits, are not recorded on our consolidated balance sheet.
1 | Our long-term debt consists of foreign currency denominated plant expansion borrowings that have notes maturing over the next ten years. |
2 | Represents obligations for agreements to purchase goods or services that are enforceable and legally binding on the Company, including minimum quantities to be purchased, and outstanding purchases for goods or services as of December 31, 2007. |
3 | Committed capital expenditures represent commitments for construction or purchase of property, plant and equipment. They are not recorded as liabilities on our consolidated balance sheet as of December 31, 2007 because we have not yet received the related goods or services or taken title to the property. |
4 | Employee related liabilities include pension, health and welfare benefits and other post-employment benefits. Other than pensions, the employee related liabilities are paid as incurred and accordingly, specific future years’ payments are not reasonably estimable. Amounts in the table due in less than one year relate to pension funding obligations which represent the estimated contribution planned during 2008. Funding projections beyond the next twelve months are not practical to estimate due to the rules affecting tax-deductible contributions and the impact from the plan asset performance, interest rates and potential U.S. and international legislation. |
5 | As of December 31, 2007, $95.7 million of unrecognized tax benefits were included as a component of other long-term liabilities. Due to the inherent uncertainty of the underlying tax positions, we are unable to reasonably estimate in which future periods these unrecognized tax benefits will be settled. |
6 | Customer deposits consist of amounts provided in connection with new long-term supply agreements which must be refunded to the customers according to the terms of the agreements. |
We have agreed to indemnify some of our customers against claims of infringement of the intellectual property rights of others in our sales contracts with these customers. The terms of most of these indemnification obligations generally do not provide for a limitation of our liability. We have not had any claims related to these indemnification obligations.
Our pension expense and pension liability are actuarially determined (see “Critical Accounting Policies and Estimates”). Our total unfunded pension liability related to our various defined benefit pension plans at December 31, 2007 totaled $36.4 million. Our pension obligations are funded in accordance with provisions of federal law. Contributions to our pension plans in 2007 totaled approximately $12.9 million. We expect contributions to our pension plans in 2008 to be approximately $9.1 million.
As of December 31, 2007, we held $111.7 million of short-term investments related to auction rate securities (ARS). The ARS are primarily comprised of interest bearing state sponsored student loan revenue bonds with varying maturity periods and provide short-term liquidity via an auction process that resets the applicable interest rate at predetermined calendar intervals (typically every 7, 28 or 35 days). In the event of an auction failing to settle on its respective settlement date, these funds would remain invested at a “failed” interest rate which is typically higher than the previous market rate until the next successful auction. Of the $111.7 million of ARS outstanding as of December 31, 2007, $106.7 million were subsequently sold. The proceeds of the ARS sales were subsequently reinvested in similar ARS, some of which have failed to settle on their respective settlement date. A portion of those ARS that had failed to settle have subsequently had successful auctions. As of February 22, 2008, we had $96.9 million invested in ARS, $61.8 million of which remain invested at a “failed” interest rate. For those auctions that had failed to settle, we will not be able to access those funds until the next successful auction or another buyer is found outside of the auction process.
7
We do not anticipate having to sell these securities below par value in order to operate our business. See Critical Accounting Policies and Estimates related to our process of evaluating investments for impairment.
As of December 31, 2007, we held $299.5 million of short-term investments in a strategic investment portfolio with a major banking institution primarily invested in corporate, asset-backed and mortgage-backed securities. These investments were initially in an enhanced cash fund with a major banking institution that was subsequently liquidated due to current unfavorable liquidity conditions in the credit and capital markets. Upon our request, the underlying securities of the fund were transferred to a separately managed account with fair values slightly below their par values. These temporary impairments were $4.3 million as of December 31, 2007. We believe the decline in fair value to be directly attributed to the current global credit conditions which we believe are temporary. See Critical Accounting Policies and Estimates related to our process of evaluating investments for impairment.
We believe that, based on our current cash, cash equivalents and short term investment balances of approximately $1.3 billion at December 31, 2007 and expected operating cash flows, the current liquidity concerns in the credit and capital markets will not have a material impact on our liquidity, cash flow, financial flexibility or our ability to fund our operations.
We believe that we have the financial resources needed to meet business requirements for at least the next 12 months, including capital expenditures and working capital requirements.
OTHER EVENTS
Certain adjustments recorded in 2005 related to accounting errors from previous periods. The amount of such adjustments was not material to our consolidated results of operations for 2004 and prior periods, nor is the inclusion of the net expense in the results of operations for 2005 considered material. The effect of these adjustments on gross margin and net income for 2005 was as follows:
| | | | | | | | |
2005 Prior Period Adjustments—increase (decrease) | | Impact on
Gross Margin | | | Impact on
Net Income | |
| Dollars in millions | | | | | | |
| | |
Income Taxes, net | | $ | 2.4 | | | $ | (3.3 | ) |
| | |
Other | | | (3.7 | ) | | | (2.3 | ) |
| | | | | | | | |
| | |
Total | | $ | (1.3 | ) | | $ | (5.6 | ) |
| | | | | | | | |
Included in the Income Taxes, net are prior period adjustments, including a benefit of $6.5 million related to the portion of the interest on senior subordinated notes deductible for tax purposes, additional expense of $2.9 million (tax expense of $7.4 million offset by less depreciation expense and other adjustments) related to the U.S. Generally Accepted Accounting Principles (“US GAAP”) treatment of fixed asset basis under the Korea Asset Revaluation Law, additional expense of $6.0 million associated with non-qualified stock option deductions in prior periods, and additional expense of $0.9 million related to amended tax filings and reassessment of tax basis limitations.
Included in Other are primarily adjustments to cost of goods sold and inventory of approximately $2.4 million for profit not previously eliminated from inventory for product shipped between operations and other adjustments that are not individually significant.
CRITICAL ACCOUNTING POLICIES AND ESTIMATES
The preparation of financial statements in conformity with accounting principles generally accepted in the United States requires management to make estimates and assumptions in certain circumstances that affect amounts reported in the accompanying consolidated financial statements and related footnotes. In preparing these financial statements, management has made its best estimates of certain amounts included in the financial statements. However, application of these accounting policies involves the exercise of judgment and use of assumptions as to future uncertainties and, as a result, actual results could differ from these estimates. Our significant accounting policies are more fully described in Note 2 of Notes to Consolidated Financial Statements herein.
Revenue Recognition
We record revenue for product sales when title transfers, the risks and rewards of ownership have been transferred to the customer, the fee is fixed and determinable and collection of the related receivable is reasonably assured, which is generally at the time of shipment for non-consignment orders. In the case of consignment orders, title passes when the customer pulls
8
the product from the assigned storage facility or storage area or, if the customer does not pull the product within a contractually stated period of time (generally 60–90 days), at the end of that period, or when the customer otherwise agrees to take title to the product. Our wafers are generally made to customer specifications and we conduct rigorous quality control and testing procedures to ensure that the finished wafers meet the customer’s specifications before the product is shipped. We consider international shipping term definitions in our determination of when title passes. We defer revenue for multiple element arrangements based on an average fair value per unit for the total arrangement when we receive cash in excess of fair value. We also defer revenue when pricing is not fixed and determinable or other revenue recognition criteria is not met.
In connection with supply agreements executed during 2006, we received various equity instruments and recorded their fair value to long-term deferred revenue. We will recognize the deferred revenue on a pro-rata basis as product is shipped over the life of the contracts. During 2007, we executed a wafer agreement in which the terms of any equity consideration provided by the customer have not been finalized. If and when the terms are finalized, the estimated fair value of the additional consideration, if determinable and material, will be recorded to deferred revenue.
Inventory
Inventories, which consist of materials, labor and manufacturing overhead, are valued at the lower of cost or market. Raw materials are stated at weighted-average cost. Goods in process and finished goods inventories are stated at standard cost as adjusted for variances, which approximates weighted-average actual cost. The valuation of inventory requires us to estimate excess and slow moving inventory. The determination of the value of excess and slow moving inventory is based upon assumptions of future demand and market conditions. If actual market conditions are less favorable than those projected by management, additional inventory write-downs may be required.
Property, Plant and Equipment
We depreciate our building, improvements, and machinery and equipment evenly over the assets’ estimated useful lives. Changes in circumstances such as technological advances, changes in our business model, or changes in our capital strategy could result in the actual useful lives differing from our estimates. In those cases where we determine that the useful life of property, plant and equipment should be shortened or lengthened, we depreciate the net book value over its revised remaining useful life.
In accordance with SFAS 144, “Accounting for the Impairment or Disposal of Long-Lived Assets,” we periodically assess the impairment of long-lived assets when conditions indicate a possible loss. When necessary, we record charges for impairments of long-lived assets for the amount by which the present value of future cash flows, or some other fair value measure, is less than the carrying value of these assets. We have recorded no significant impairment charges in 2007, 2006 or 2005.
Income Taxes
In determining taxable income for financial statement reporting purposes, we must make certain estimates and judgments. We calculate our current and deferred tax provisions based upon estimates and assumptions that could differ from the actual results reflected in our income tax returns filed during the subsequent year. We record adjustments based on filed returns when we have identified the adjustments and finalized the returns, which is generally in the third and fourth quarters of the subsequent year. These estimates and judgments are applied in the calculation of certain tax liabilities and in the determination of the recoverability of deferred tax assets, which arise from temporary differences between the recognition of assets and liabilities for tax and financial statement reporting purposes. We regularly review our deferred tax assets for realizability, taking into consideration all available evidence, both positive and negative, including historical pre-tax and taxable income (losses), projected future pre-tax and taxable income (losses) and the expected timing of the reversals of existing temporary differences. In arriving at these judgments, the weight given to the potential effect of all positive and negative evidence is commensurate with the extent to which it can be objectively verified.
We adopted Financial Accounting Standards Board Interpretation No. 48, “Accounting for Uncertainty in Income Taxes” (FIN 48), as of January 1, 2007. FIN 48 prescribes a recognition threshold and measurement attribute for the financial statement recognition and measurement of a tax position taken or expected to be taken in a tax return.
We are subject to income taxes in both the U.S. and numerous foreign jurisdictions. From time to time, we are subject to income tax audits in these jurisdictions. We believe that our tax return positions are fully supported, but tax authorities are likely to challenge certain positions, which may not be fully sustained. However, our income tax expense includes amounts intended to satisfy income tax assessments that may result from these challenges. Determining the income tax expense for these potential assessments and recording the related assets and liabilities requires significant judgments and estimates. Under FIN 48, tax benefits are recognized only for tax positions that are more likely than not to be sustained upon
9
examination by tax authorities. The amount recognized is measured as the largest amount of benefit that is greater than 50 percent likely to be realized upon ultimate settlement. Unrecognized tax benefits are tax benefits claimed in our tax returns that do not meet these recognition and measurement standards. Prior to the adoption of FIN 48, uncertain tax positions were accounted for under either FASB Statement No. 5, “Accounting for Contingencies,” or FASB Statement No. 109, “Accounting for Income Taxes.” We believe that our income tax liabilities, including related interest, are adequate in relation to the potential for additional tax assessments. There is a risk, however, that the amounts ultimately paid upon resolution of audits could be materially different from the amounts previously included in our income tax expense and, therefore, could have a material impact on our tax provision, net income and cash flows. We review our liabilities quarterly, and we may adjust such liabilities due to proposed assessments by tax authorities, changes in facts and circumstances, issuance of new regulations or new case law, negotiations between tax authorities of different countries concerning our transfer prices, the resolution of entire audits, or the expiration of statutes of limitations. Adjustments, if required, are most likely to occur in the year during which major audits are closed.
We repatriate a portion of the current year earnings of a certain subsidiary to the United States. We do not provide for U.S. income taxes on the remaining undistributed earnings of our foreign subsidiaries which would be payable if the undistributed earnings were distributed to the U.S., as we consider those foreign earnings to be permanently reinvested outside the U.S. We plan foreign remittance amounts based on projected cash flow needs as well as the working capital and long-term investment requirements of our foreign subsidiaries and our domestic operations.
Employee-Related Liabilities
We have a long-term liability for our defined benefit pension and other post-employment benefit plans. Our obligations are funded in accordance with provisions of federal law. We adopted Statement of Financial Accounting Standards No. 158, “Employers’ Accounting for Defined Benefit Pension and Other Postretirement Plans” (“SFAS 158”) as of December 31, 2006, except for the change in measurement date provisions which will be adopted in the fourth quarter of 2008. SFAS 158 requires an employer to recognize the overfunded or underfunded status of a defined benefit postretirement plan as an asset or liability in its statement of financial position and to recognize changes in that funded status in the year in which the changes occur through comprehensive income.
Our pension and other post-employment liabilities are actuarially determined, and we use various actuarial assumptions, including the discount rate, rate of salary increase, and expected return on assets, to estimate our costs and obligations. If our assumptions do not materialize as expected, expenditures and costs that we incur could differ from our current estimates. We determine the expected return on plan assets based on our pension plans’ actual asset mix as of the beginning of the year. While the assumed expected rate of return on plan assets in 2007 was 8.0%, the actual return experienced in our pension plan assets in the comparable period in 2007 was 14.6%. We consult with the plans’ actuaries to determine a discount rate assumption that reflects the characteristics of our plans, including expected cash outflows from our plans, and utilize an analytical tool that incorporates the concept of a hypothetical yield curve, developed from corporate bond (Aa quality) yield information. Assuming a 100 basis point variation in these assumptions, our 2007 pension expense would have been approximately $2.3 million higher or lower.
Stock-Based Compensation
Effective January 1, 2006, we adopted the fair value recognition provisions of Statement of Financial Accounting Standards No. 123 (revised 2004), “Share-Based Payment” (“SFAS 123R”), using the modified prospective transition method and therefore have not restated prior periods’ results. Under this transition method, stock-based compensation expense for the year ended December 31, 2006 included compensation expense for all stock-based compensation awards granted prior to, but not yet vested as of, January 1, 2006, based on the grant-date fair value estimated in accordance with the original provisions of SFAS No. 123, “Accounting for Stock-Based Compensation”. Stock-based compensation expense for all share-based payment awards granted after December 31, 2005 is based on the grant-date fair value estimated in accordance with the provisions of SFAS 123R. We recognize these compensation costs net of an estimated forfeiture rate and recognize the compensation costs for only those shares expected to vest on a straight-line basis over the requisite service period of the award, which is generally the option vesting term. With the adoption of SFAS 123R, we elected to recognize stock-based compensation expense for all grants on or after January 1, 2006 on a straight-line basis over the requisite service period of the entire award for ratable awards. For awards granted prior to January 1, 2006, we will continue to calculate compensation expense by treating each vesting tranche as a separate award. We estimated the forfeiture rate for 2006 and 2007 based on our historical experience during the preceding four fiscal years.
Prior to January 1, 2006, we accounted for our stock-based compensation plans under the recognition and measurement provisions of Accounting Principles Board Opinion No. 25 (“Opinion 25”), “Accounting for Stock Issued to Employees”, and related interpretations. Accordingly, we generally recognized expense only when we granted options with a discounted
10
exercise price. Any resulting compensation expense was recognized over the associated service period, which was generally the option vesting term.
Determining the appropriate fair value model and calculating the fair value of share-based payment awards require the making of subjective assumptions, including the expected life of the share-based payment awards and stock price volatility. The assumptions used in calculating the fair value of share-based payment awards represent management’s best estimates, but these estimates involve inherent uncertainties and the application of management judgment. As a result, if factors change and we use different assumptions, our stock-based compensation expense could be materially different in the future. In addition, we are required to estimate the expected forfeiture rate and recognize expense only for those shares expected to vest. If our actual forfeiture rate is materially different from our estimate, the stock-based compensation expense could be significantly different from what we have recorded in the current period. As of December 31, 2007, approximately $66.1 million of total estimated unrecognized compensation cost related to stock options is expected to be recognized over a weighted-average period of two years. See Note 12 to the Consolidated Financial Statements for a further discussion on stock-based compensation.
Investments
On July 25, 2006, MEMC received a fully vested, non-forfeitable warrant to purchase common shares of a customer. The warrant becomes exercisable over a five year period (20% annually commencing on January 1, 2008) and has a five year exercise period from the date each tranche becomes exercisable. The warrant is considered a derivative and is therefore marked to market each reporting period. Determining the appropriate fair value model and estimating the fair value of the warrant requires the making of subjective assumptions, including the stock price volatility of the customer. We used a lattice model to estimate the warrant’s fair value. A combination of the customer’s historical and implied stock price volatility was used as an indicator of expected volatility.
Our investment in equity securities consists of a customer’s common stock acquired in connection with the execution of a long-term supply agreement. The fair value of the investment for disclosure purposes was estimated based on the closing stock price on December 31, 2007 reduced by the estimated value of a regulatory restriction on sale. The value of the regulatory restriction on sale was estimated using a Black Scholes model considering the stock price volatility, expected term, dividend yield and risk-free interest rate.
We also have investments in debt securities which require us to make estimates of their fair values to determine the unrealized gains and losses on the securities, if any losses are temporary or other than temporary and concerning the ability and related timing of liquidating our holdings. Unrealized losses are recorded to other income and expense when a decline in fair value is determined to be other-than-temporary. In accordance with FSP FAS 115-1 and 124-1,” The Meaning of Other-Than-Temporary Impairment and Its Application to Certain Investments,” we review several factors to determine whether a loss is other-than-temporary. These factors include but are not limited to the: (i) nature of the investment; (ii) cause and duration of the impairment; (iii) extent to which fair value is less than cost; (iv) financial condition and near term prospects of the issuer; and (v) ability to hold the security for a period of time sufficient to allow for any anticipated recovery in fair value. Realized gains and losses are accounted for on the specific identification method. We determine the fair value of our debt securities using quoted prices from active and inactive markets, traded prices for similar assets, or fair value measurements based on a pricing model. We also review our ability to liquidate our investments within the next 12 month operating cycle to determine the appropriate short or long-term classification. Our ability to liquidate is determined based on a review of current and short-term credit and capital market conditions and the financial condition and near term prospects of the issuer.
RECENTLY ISSUED ACCOUNTING PRONOUNCEMENTS
In September 2006, the FASB issued Statement of Financial Accounting Standards No. 157, “Fair Value Measurements”(“SFAS 157”), which establishes a framework for measuring fair value and expands disclosures about fair value measurements. SFAS 157 is effective for fiscal years beginning after November 15, 2007 and interim periods within those fiscal years. We have determined that the adoption of SFAS 157 will not have a material impact on our consolidated results of operations and financial condition.
In September 2006, the FASB issued SFAS No. 158, “Employers’ Accounting for Defined Benefit Pension and Other Postretirement Plans” (“SFAS 158”). SFAS 158 requires an employer to recognize the overfunded or underfunded status of a defined benefit postretirement plan as an asset or liability in its statement of financial position and to recognize changes in that funded status in the year in which the changes occur through comprehensive income of a business entity. This requirement was effective and adopted during our fiscal year ended December 31, 2006. SFAS 158 also requires an employer to measure the funded status of a plan as of the date of its year-end statement of financial position. This requirement becomes
11
effective for fiscal years ending after December 15, 2008. We have not yet determined the impact the measurement date provision of SFAS 158 will have on our consolidated results of operations and financial condition.
In December 2007, the FASB issued SFAS No. 141R, “Business Combinations” (“SFAS 141R”), which establishes principles and requirements for how an acquirer recognizes and measures in its financial statements the identifiable assets acquired, the liabilities assumed, and any noncontrolling interest in an acquiree, including the recognition and measurement of goodwill acquired in a business combination. The requirements of SFAS 141R are effective for business combinations for which the acquisition date is on or after the beginning of the first annual reporting period beginning on or after December 15, 2008. Earlier adoption is prohibited.
In December 2007, the FASB issued SFAS No. 160, “Noncontrolling Interest in Consolidated Financial Statements, an amendment of ARB No. 51” (“SFAS 160”). SFAS 160 amends ARB 51 to establish accounting and reporting standards for the noncontrolling interest in a subsidiary and for the deconsolidation of a subsidiary. It clarifies that a noncontrolling interest in a subsidiary, which is sometimes referred to as minority interest, is an ownership interest in the consolidated entity that should be reported as equity in the consolidated financial statements. Among other requirements, this statement requires consolidated net income to be reported at amounts that include the amounts attributable to both the parent and the noncontrolling interest. It also requires disclosure, on the face of the consolidated income statement, of the amounts of consolidated net income attributable to the parent and to the noncontrolling interest. The requirements of SFAS 160 are effective for fiscal years, and interim periods within those fiscal years, beginning on or after December 15, 2008. We have not yet determined the impact SFAS 160 will have on our consolidated results of operations and financial condition.
MARKET RISK
The overall objective of our financial risk management program is to reduce the potential negative earnings effects from changes in foreign exchange and interest rates arising in our business activities. We manage these financial exposures through operational means and by using various financial instruments. These practices may change as economic conditions change.
To mitigate financial market risks of foreign currency exchange rates, we utilize currency forward contracts. We do not use derivative financial instruments for speculative or trading purposes. We generally hedge transactional currency risks with currency forward contracts. Gains and losses on these foreign currency exposures are generally offset by corresponding losses and gains on the related hedging instruments, resulting in negligible net exposure to MEMC. A substantial majority of our revenue and capital spending is transacted in U.S. Dollars. However, we do enter into these transactions in other currencies, primarily, the Euro, the Japanese Yen, and certain other Asian currencies. To protect against reductions in value and volatility of future cash flows caused by changes in foreign exchange rates, we have established transaction-based hedging programs. Our hedging programs reduce, but do not always eliminate, the impact of foreign currency exchange rate movements. In addition to the direct effects of changes in exchange rates, such changes typically affect the volume of sales or the foreign currency sales price as competitors’ products become more or less attractive. Our Taiwan, Malaysia and Singapore based subsidiaries use the U.S. Dollar as their functional currencies for US GAAP purposes and do not hedge New Taiwanese Dollar, Malaysian Ringgit or Singapore Dollar exposures.
We are subject to interest rate risk related to our cash equivalent and short-term investment portfolio. To mitigate substantial risk associated with changes in interest rates, we seek to obtain fixed rate securities, actively manage our portfolio duration and diversify across different currencies. Our long-term debt is also at a fixed rate. In addition to interest rate risk on our cash equivalents and short-term investments, we are subject to issuer credit risk as the value of our investments may change based on liquidity issues or adverse economic conditions affecting the creditworthiness of the issuers or group of issuers of the securities we may own. See additional discussion in Liquidity and Capital Resources and Critical Accounting Policies and Estimates. To mitigate such risk, a majority of our investments are in AAA rated municipal or corporate debt instruments. Due to the diversity of and numerous securities in our portfolio, estimating a hypothetical change in value of our portfolio based on estimated changes in interest rates and issuer risk is not practical.
With the receipt of the customer warrant and our investment in a customer’s stock, we are exposed to equity price risk. A hypothetical 10% change in the stock price of our customer in which we maintain a warrant would result in an estimated change in the fair value of the warrant of approximately $42.5 million at December 31, 2007. Our investment in a customer’s stock is carried at cost; however, the fair value of the investment fluctuates with the change in stock price. Considering a discount for lack of marketability due to a regulatory restriction on sale, a 10% change in the stock price of our customer’s stock from the stock price at December 31, 2007 would result in a gain/loss on the fair value of approximately $5.4 million at December 31, 2007.
12
The stock price underlying the warrant as well as the stock price related to the investment in equity securities declined subsequent to December 31, 2007. Based on the closing stock prices on February 21, 2008, the warrant had an estimated value of approximately $93.4 million and the investment in equity securities had an estimated fair value of approximately $31.3 million as of February 21, 2008.
13
Consolidated Statements of Operations
| | | | | | | | | | | | |
| | | For the year ended December 31, | |
| | 2007 | | | 2006 | | | 2005 | |
| In millions, except per share data | | | | | | | | | |
| | | |
Net sales | | $ | 1,921.8 | | | $ | 1,540.6 | | | $ | 1,107.4 | |
| | | |
Cost of goods sold | | | 921.3 | | | | 851.6 | | | | 740.9 | |
| | | | | | | | | | | | |
| | | |
Gross margin | | | 1,000.5 | | | | 689.0 | | | | 366.5 | |
| | | |
Operating expenses: | | | | | | | | | | | | |
| | | |
Marketing and administration | | | 111.3 | | | | 94.9 | | | | 76.3 | |
| | | |
Research and development | | | 39.3 | | | | 35.8 | | | | 33.2 | |
| | | | | | | | | | | | |
| | | |
Operating income | | | 849.9 | | | | 558.3 | | | | 257.0 | |
| | | | | | | | | | | | |
| | | |
Nonoperating (income) expense: | | | | | | | | | | | | |
| | | |
Interest expense | | | 1.4 | | | | 2.4 | | | | 7.3 | |
| | | |
Interest income | | | (45.0 | ) | | | (14.6 | ) | | | (4.2 | ) |
| | | |
Gain on fair value of warrant | | | (220.8 | ) | | | (18.9 | ) | | | — | |
| | | |
Other, net | | | 2.5 | | | | (1.1 | ) | | | 1.5 | |
| | | | | | | | | | | | |
| | | |
Total nonoperating (income) expense | | | (261.9 | ) | | | (32.2 | ) | | | 4.6 | |
| | | | | | | | | | | | |
| | | |
Income before income tax expense (benefit) and minority interests | | | 1,111.8 | | | | 590.5 | | | | 252.4 | |
| | | |
Income tax expense (benefit) | | | 282.2 | | | | 214.8 | | | | (2.8 | ) |
| | | | | | | | | | | | |
| | | |
Income before minority interests | | | 829.6 | | | | 375.7 | | | | 255.2 | |
| | | |
Minority interests | | | (3.4 | ) | | | (6.4 | ) | | | (5.8 | ) |
| | | | | | | | | | | | |
| | | |
Net income | | $ | 826.2 | | | $ | 369.3 | | | $ | 249.4 | |
| | | | | | | | | | | | |
| | | |
Basic income per share | | $ | 3.66 | | | $ | 1.66 | | | $ | 1.17 | |
| | | |
Diluted income per share | | $ | 3.56 | | | $ | 1.61 | | | $ | 1.10 | |
| | | |
Weighted-average shares used in computing basic income per share | | | 225.6 | | | | 222.1 | | | | 213.5 | |
| | | |
Weighted-average shares used in computing diluted income per share | | | 232.3 | | | | 229.7 | | | | 226.4 | |
See accompanying notes to consolidated financial statements.
14
Consolidated Balance Sheets
| | | | | | | | |
| | | As of December 31, | |
| | 2007 | | | 2006 | |
| In millions, except per share data | | | | | | |
| | |
Assets | | | | | | | | |
| | |
Current assets: | | | | | | | | |
| | |
Cash and cash equivalents | | $ | 859.3 | | | $ | 527.5 | |
| | |
Short-term investments | | | 457.1 | | | | 58.0 | |
| | |
Accounts receivable, net | | | 197.9 | | | | 199.0 | |
| | |
Inventories | | | 36.4 | | | | 80.2 | |
| | |
Prepaid and other current assets | | | 38.8 | | | | 34.8 | |
| | | | | | | | |
| | |
Total current assets | | | 1,589.5 | | | | 899.5 | |
| | |
Property, plant and equipment, net | | | 834.0 | | | | 603.5 | |
| | |
Deferred tax assets, net | | | 89.3 | | | | 119.5 | |
| | |
Customer warrant | | | 306.3 | | | | 85.5 | |
| | |
Other assets | | | 68.1 | | | | 57.5 | |
| | | | | | | | |
| | |
Total assets | | $ | 2,887.2 | | | $ | 1,765.5 | |
| | | | | | | | |
| | |
Liabilities and Stockholders’ Equity | | | | | | | | |
| | |
Current liabilities: | | | | | | | | |
| | |
Current portion of long-term debt | | $ | 5.3 | | | $ | 5.0 | |
| | |
Accounts payable | | | 168.3 | | | | 125.4 | |
| | |
Accrued liabilities | | | 40.8 | | | | 31.9 | |
| | |
Accrued wages and salaries | | | 31.9 | | | | 32.8 | |
| | |
Customer deposits | | | 122.0 | | | | 8.4 | |
| | |
Income taxes payable | | | 75.9 | | | | 54.3 | |
| | | | | | | | |
| | |
Total current liabilities | | | 444.2 | | | | 257.8 | |
| | |
Long-term debt, less current portion | | | 25.6 | | | | 29.4 | |
| | |
Pension and post-employment liabilities | | | 60.6 | | | | 85.2 | |
| | |
Deferred revenue | | | 81.4 | | | | 68.1 | |
| | |
Other liabilities | | | 204.6 | | | | 119.5 | |
| | | | | | | | |
| | |
Total liabilities | | | 816.4 | | | | 560.0 | |
| | | | | | | | |
| | |
Minority interests | | | 35.8 | | | | 38.6 | |
| | |
Commitments and contingencies | | | | | | | | |
| | |
Stockholders’ equity: | | | | | | | | |
| | |
Preferred stock, $.01 par value, 50.0 shares authorized, none issued or outstanding at December 31, 2007 or 2006 | | | — | | | | — | |
| | |
Common stock, $.01 par value, 300.0 shares authorized, 231.9 and 224.0 issued at December 31, 2007 and 2006, respectively | | | 2.3 | | | | 2.2 | |
| | |
Additional paid-in capital | | | 358.0 | | | | 242.5 | |
| | |
Retained earnings | | | 1,760.5 | | | | 933.8 | |
| | |
Accumulated other comprehensive income (loss) | | | 29.8 | | | | (7.4 | ) |
| | |
Treasury stock: 2.6 and 0.7 shares at December 31, 2007 and 2006, respectively | | | (115.6 | ) | | | (4.2 | ) |
| | | | | | | | |
| | |
Total stockholders’ equity | | | 2,035.0 | | | | 1,166.9 | |
| | | | | | | | |
| | |
Total liabilities and stockholders’ equity | | $ | 2,887.2 | | | $ | 1,765.5 | |
| | | | | | | | |
See accompanying notes to consolidated financial statements.
15
Consolidated Statements of Cash Flows
| | | | | | | | | | | | |
| | | For the year ended
December 31, | |
| | 2007 | | | 2006 | | | 2005 | |
| In millions | | | | | | | | | |
Cash flows from operating activities: | | | | | | | | | | | | |
| | | |
Net income | | $ | 826.2 | | | $ | 369.3 | | | $ | 249.4 | |
| | | |
Adjustments to reconcile net income to net cash provided by operating activities: | | | | | | | | | | | | |
| | | |
Depreciation and amortization | | | 80.7 | | | | 70.2 | | | | 57.2 | |
| | | |
Minority interests | | | 3.4 | | | | 6.4 | | | | 5.8 | |
| | | |
Stock-based compensation | | | 31.1 | | | | 19.0 | | | | 2.1 | |
| | | |
Provision for (benefit from) deferred taxes | | | 24.5 | | | | 47.1 | | | | (44.1 | ) |
| | | |
Gain on fair value of warrant | | | (220.8 | ) | | | (18.9 | ) | | | — | |
| | | |
Other | | | (1.1 | ) | | | (3.6 | ) | | | 15.6 | |
| | | |
Changes in assets and liabilities: | | | | | | | | | | | | |
| | | |
Short-term investments—trading securities | | | 9.5 | | | | (0.8 | ) | | | 8.3 | |
| | | |
Accounts receivable | | | 6.0 | | | | (69.8 | ) | | | 27.8 | |
| | | |
Inventories | | | 45.5 | | | | 42.6 | | | | 1.3 | |
| | | |
Prepaid and other current assets | | | (3.9 | ) | | | 3.7 | | | | (7.0 | ) |
| | | |
Accounts payable | | | 19.6 | | | | (8.5 | ) | | | 6.5 | |
| | | |
Accrued liabilities | | | 6.9 | | | | (18.7 | ) | | | (4.3 | ) |
| | | |
Accrued wages and salaries | | | (2.6 | ) | | | 5.2 | | | | 8.6 | |
| | | |
Deferred revenue and customer deposits | | | 39.0 | | | | (9.3 | ) | | | 12.8 | |
| | | |
Income taxes payable | | | 18.3 | | | | 45.6 | | | | 23.8 | |
| | | |
Pension and post-employment liabilities | | | (9.9 | ) | | | 10.1 | | | | (11.4 | ) |
| | | |
Other noncurrent assets and liabilities | | | 44.8 | | | | 38.2 | | | | (31.4 | ) |
| | | | | | | | | | | | |
| | | |
Net cash provided by operating activities | | | 917.2 | | | | 527.8 | | | | 321.0 | |
| | | | | | | | | | | | |
Cash flows from investing activities: | | | | | | | | | | | | |
| | | |
Proceeds from sale and maturities of investments | | | 93.2 | | | | 32.2 | | | | 46.2 | |
| | | |
Purchases of investments | | | (506.4 | ) | | | (62.0 | ) | | | (37.9 | ) |
| | | |
Capital expenditures | | | (276.4 | ) | | | (148.4 | ) | | | (162.7 | ) |
| | | |
Other | | | 0.7 | | | | 4.0 | | | | 1.8 | |
| | | | | | | | | | | | |
| | | |
Net cash used in investing activities | | | (688.9 | ) | | | (174.2 | ) | | | (152.6 | ) |
| | | | | | | | | | | | |
| | | |
Cash flows from financing activities: | | | | | | | | | | | | |
| | | |
Net repayments on short-term borrowings | | | — | | | | (13.2 | ) | | | (9.0 | ) |
| | | |
Proceeds from customer deposits related to long-term supply agreements | | | 115.3 | | | | 37.3 | | | | — | |
| | | |
Proceeds from issuance of long-term debt | | | — | | | | — | | | | 60.0 | |
| | | |
Principal payments on long-term debt | | | (5.2 | ) | | | (5.3 | ) | | | (149.5 | ) |
| | | |
Debt financing fees | | | — | | | | — | | | | (1.2 | ) |
| | | |
Excess tax benefits from share-based payment arrangements | | | 40.0 | | | | 10.5 | | | | — | |
| | | |
Dividend to minority interest | | | (6.2 | ) | | | (5.6 | ) | | | (9.5 | ) |
| | | |
Common stock repurchased | | | (111.2 | ) | | | — | | | | — | |
| | | |
Proceeds from issuance of common stock | | | 44.2 | | | | 17.1 | | | | 14.8 | |
| | | | | | | | | | | | |
| | | |
Net cash provided by (used in) financing activities | | | 76.9 | | | | 40.8 | | | | (94.4 | ) |
| | | | | | | | | | | | |
| | | |
Effect of exchange rate changes on cash and cash equivalents | | | 26.6 | | | | 6.6 | | | | 3.0 | |
| | | | | | | | | | | | |
| | | |
Net increase in cash and cash equivalents | | | 331.8 | | | | 401.0 | | | | 77.0 | |
| | | |
Cash and cash equivalents at beginning of period | | | 527.5 | | | | 126.5 | | | | 49.5 | |
| | | | | | | | | | | | |
| | | |
Cash and cash equivalents at end of period | | $ | 859.3 | | | $ | 527.5 | | | $ | 126.5 | |
| | | | | | | | | | | | |
16
| | | | | | | | | | |
| | | |
Supplemental disclosures of cash flow information: | | | | | | | | | | |
| | | |
Interest payments, net of amount capitalized | | $ | 0.4 | | $ | 1.4 | | $ | 6.4 | |
| | | |
Income taxes paid | | $ | 147.8 | | $ | 77.0 | | $ | 27.9 | |
| | | |
Supplemental schedule of non-cash investing and financing activities: | | | | | | | | | | |
| | | |
Accounts payable incurred (relieved) for acquisition of fixed assets | | $ | 19.3 | | $ | 24.9 | | $ | (16.1 | ) |
See accompanying notes to consolidated financial statements.
17
Consolidated Statements of Stockholders’ Equity
| | | | | | | | | | | | | | | | | | | | | | | | | | | | | | | | | | | |
| | | Common Stock
Issued | | Additional
Paid-in
Capital | | | Retained
Earnings | | Accumulated
Other
Comprehensive
Income (Loss) | | | Deferred
Compensation | | | Common Stock
Held in Treasury | | | Total
Stockholders’
Equity | | | Total
Comprehensive
Income (Loss) | |
| | Shares | | Amount | | | | | | Shares | | | Amount | | | |
| In millions | | | | | | | | | | | | | | | | | | | | | | | | | | | |
| | | | | | | | | | |
Balance at December 31, 2004 | | 209.1 | | $ | 2.1 | | $ | 154.7 | | | $ | 308.3 | | $ | (17.4 | ) | | $ | (1.3 | ) | | (0.7 | ) | | $ | (3.6 | ) | | $ | 442.8 | | | | | |
| | | | | | | | | | |
Comprehensive income: | | | | | | | | | | | | | | | | | | | | | | | | | | | | | | | | | | | |
| | | | | | | | | | |
Net income | | — | | | — | | | — | | | | 249.4 | | | — | | | | — | | | — | | | | — | | | | 249.4 | | | $ | 249.4 | |
| | | | | | | | | | |
Net translation adjustment | | — | | | — | | | — | | | | — | | | (22.0 | ) | | | — | | | — | | | | — | | | | (22.0 | ) | | | (22.0 | ) |
| | | | | | | | | | |
Minimum pension liability (net of $12.1 tax) | | — | | | — | | | — | | | | — | | | 3.6 | | | | — | | | — | | | | — | | | | 3.6 | | | | 3.6 | |
| | | | | | | | | | |
Stock plans, net | | 3.2 | | | — | | | 37.0 | | | | — | | | — | | | | 1.2 | | | — | | | | (0.6 | ) | | | 37.6 | | | | | |
| | | | | | | | | | |
Net exercise of warrants | | 10.0 | | | 0.1 | | | (0.1 | ) | | | — | | | — | | | | — | | | — | | | | — | | | | — | | | | | |
| | | | | | | | | | | | | | | | | | | | | | | | | | | | | | | | | | | |
| | | | | | | | | | |
Total comprehensive income | | | | | | | | | | | | | | | | | | | | | | | | | | | | | | | | | $ | 231.0 | |
| | | | | | | | | | | | | | | | | | | | | | | | | | | | | | | | | | | |
| | | | | | | | | | |
Balance at December 31, 2005 | | 222.3 | | $ | 2.2 | | $ | 191.6 | | | $ | 557.7 | | $ | (35.8 | ) | | $ | (0.1 | ) | | (0.7 | ) | | $ | (4.2 | ) | | $ | 711.4 | | | | | |
| | | | | | | | | | | | | | | | | | | | | | | | | | | | | | | | | | | |
| | | | | | | | | | |
SAB 108 cumulative effect adjustment | | — | | | — | | | — | | | | 6.8 | | | — | | | | — | | | — | | | | — | | | | 6.8 | | | | | |
| | | | | | | | | | |
SFAS 158 adjustment (net of $4.4 tax) | | — | | | — | | | — | | | | — | | | 7.1 | | | | — | | | — | | | | — | | | | 7.1 | | | | | |
| | | | | | | | | | |
Comprehensive income: | | | | | | | | | | | | | | | | | | | | | | | | | | | | | | | | | | | |
| | | | | | | | | | |
Net income | | — | | | — | | | — | | | | 369.3 | | | — | | | | — | | | — | | | | — | | | | 369.3 | | | $ | 369.3 | |
| | | | | | | | | | |
Net translation adjustment | | — | | | — | | | — | | | | — | | | 18.6 | | | | — | | | — | | | | — | | | | 18.6 | | | | 18.6 | |
| | | | | | | | | | |
Minimum pension liability (net of $1.6 tax) | | — | | | — | | | — | | | | — | | | 2.7 | | | | — | | | — | | | | — | | | | 2.7 | | | | 2.7 | |
| | | | | | | | | | |
Stock plans, net | | 1.7 | | | — | | | 50.9 | | | | — | | | — | | | | 0.1 | | | — | | | | — | | | | 51.0 | | | | | |
| | | | | | | | | | | | | | | | | | | | | | | | | | | | | | | | | | | |
| | | | | | | | | | |
Total comprehensive income | | | | | | | | | | | | | | | | | | | | | | | | | | | | | | | | | $ | 390.6 | |
| | | | | | | | | | | | | | | | | | | | | | | | | | | | | | | | | | | |
| | | | | | | | | | |
Balance at December 31, 2006 | | 224.0 | | $ | 2.2 | | $ | 242.5 | | | $ | 933.8 | | $ | (7.4 | ) | | $ | — | | | (0.7 | ) | | $ | (4.2 | ) | | $ | 1,166.9 | | | | | |
| | | | | | | | | | | | | | | | | | | | | | | | | | | | | | | | | | | |
| | | | | | | | | | |
FIN 48 adjustment | | — | | | — | | | — | | | | 0.5 | | | — | | | | — | | | — | | | | — | | | | 0.5 | | | | | |
| | | | | | | | | | |
Comprehensive income: | | | | | | | | | | | | | | | | | | | | | | | | | | | | | | | | | | | |
| | | | | | | | | | |
Net income | | — | | | — | | | — | | | | 826.2 | | | — | | | | — | | | — | | | | — | | | | 826.2 | | | $ | 826.2 | |
| | | | | | | | | | |
Net translation adjustment | | — | | | — | | | — | | | | — | | | 32.3 | | | | — | | | — | | | | — | | | | 32.3 | | | | 32.3 | |
| | | | | | | | | | |
Net unrecognized actuarial loss and prior service credit (net of $5.9 tax) | | — | | | — | | | — | | | | — | | | 9.2 | | | | — | | | — | | | | — | | | | 9.2 | | | | 9.2 | |
| | | | | | | | | | |
Net unrealized loss on available-for-sale securities | | — | | | — | | | — | | | | — | | | (4.3 | ) | | | — | | | — | | | | — | | | | (4.3 | ) | | | (4.3 | ) |
| | | | | | | | | | |
Stock plans, net | | 3.4 | | | — | | | 115.6 | | | | — | | | — | | | | — | | | (0.1 | ) | | | (0.2 | ) | | | 115.4 | | | | | |
| | | | | | | | | | |
Common stock repurchases | | — | | | — | | | — | | | | — | | | — | | | | — | | | (1.8 | ) | | | (111.2 | ) | | | (111.2 | ) | | | | |
| | | | | | | | | | |
Net exercise of warrants | | 4.5 | | | 0.1 | | | (0.1 | ) | | | — | | | — | | | | — | | | — | | | | — | | | | — | | | | | |
| | | | | | | | | | | | | | | | | | | | | | | | | | | | | | | | | | | |
| | | | | | | | | | |
Total comprehensive income | | | | | | | | | | | | | | | | | | | | | | | | | | | | | | | | | $ | 863.4 | |
| | | | | | | | | | | | | | | | | | | | | | | | | | | | | | | | | | | |
| | | | | | | | | | |
Balance at December 31, 2007 | | 231.9 | | $ | 2.3 | | $ | 358.0 | | | $ | 1,760.5 | | $ | 29.8 | | | $ | — | | | (2.6 | ) | | $ | (115.6 | ) | | $ | 2,035.0 | | | | | |
| | | | | | | | | | | | | | | | | | | | | | | | | | | | | | | | | | | |
See accompanying notes to consolidated financial statements.
18
Notes to Consolidated Financial Statements
1. NATURE OF OPERATIONS
We are a global leader in the manufacture and sale of wafers and have been a pioneer in the design and development of wafer technologies over the past four decades. With R&D and manufacturing facilities in the US, Europe and Asia Pacific, we enable the next generation of high performance semiconductor and solar applications. Our customers include major semiconductor device and solar cell manufacturers. We provide wafers in sizes ranging from 100 millimeters (4 inch) to 300 millimeters (12 inch). In the first quarter of 2007, we began delivering 156 millimeter wafers targeted for solar applications. Depending on market conditions, we also sell intermediate products such as polysilicon, silane gas, partial ingots and scrap wafers to semiconductor device and equipment makers, solar customers, flat panel and other industries.
2. SUMMARY OF SIGNIFICANT ACCOUNTING POLICIES
(a) Use of Estimates
In preparing our financial statements, we use estimates and assumptions that may affect reported amounts and disclosures. Estimates are used when accounting for investments, depreciation, amortization, accrued liabilities, employee benefits, derivatives, stock based compensation, income taxes and asset valuation allowances. Our actual results could differ from those estimates.
(b) Reclassifications
Prior year amounts for customer deposits and deferred revenue have been reclassified to conform with the current year presentation.
(c) Principles of Consolidation
Our consolidated financial statements include the accounts of MEMC Electronic Materials, Inc. and our wholly and majority-owned subsidiaries. We record minority interest for non-wholly owned consolidated subsidiaries. All significant intercompany balances and transactions among our subsidiaries have been eliminated.
In November 2001, Texas Pacific Group (TPG) acquired a beneficial ownership of approximately 72% of the outstanding stock of MEMC. In connection with that transaction, the assets of a majority-owned subsidiary were understated and a portion of the subsequent depreciation of those assets should have been charged to minority interests. The effect in any individual prior year was not material to our results of operations, financial position or cash flows. During 2006, MEMC adopted the provisions of Staff Accounting Bulletin No. 108 and recorded a cumulative credit adjustment of $6.8 million to beginning retained earnings related to the minority interest that was overstated as of December 31, 2005. As of December 31, 2007, TPG no longer had any beneficial ownership of MEMC stock.
(d) Cash and Cash Equivalents
Cash equivalents include highly liquid commercial paper, time deposits and money market funds with original maturity periods of three months or less when purchased.
Cash and cash equivalents consist of the following:
| | | | | | |
| | | As of December 31, |
| | 2007 | | 2006 |
| Dollars in millions | | | | |
| | |
Cash | | $ | 285.0 | | $ | 85.7 |
| | |
Cash Equivalents | | | | | | |
| | |
Commercial paper | | | 45.5 | | | 110.8 |
| | |
Time deposits | | | 296.9 | | | 65.3 |
| | |
Money market funds | | | 231.9 | | | 265.7 |
| | | | | | |
| | $ | 859.3 | | $ | 527.5 |
| | | | | | |
19
(e) Investments
Short-term investments consist of the following:
Time Deposits. Time deposits are comprised mainly of demand deposits with commercial banks or investment companies having fixed original maturities exceeding three months but less than or equal to one year with fixed interest rates including pre-payment penalties for early withdrawal. Purchases and sales of time deposits are included in investing activities in the Consolidated Statements of Cash Flows.
Trading Investments. Trading investments are stated at fair value, with realized and unrealized gains or losses resulting from changes in fair value recognized currently in non-operating income and expense. Included in trading investments are beneficiary certificates and marketable securities. Purchases and sales of trading investments are included in operating activities in the Consolidated Statements of Cash Flows.
Available-for-Sale Investments. Investments designated as available-for-sale are reported at fair value, with unrealized gains and losses, net of tax, recorded in accumulated other comprehensive income. Purchases and sales of available-for-sale investments are included in investing activities in the Consolidated Statements of Cash Flows.
Long-term investments of $12.4 million and $2.4 million at December 31, 2007 and 2006 consist of less than 10% of the common stock of a customer, which was acquired at the same time as the execution of a long-term supply agreement with that customer. This investment in Other Assets is accounted for under the cost method of accounting. The investment was originally recorded at a cost of $2.4 million until the acquisition date fair value was determined during the first quarter of 2007. The estimated fair value of $12.4 million increased the investment value $10.0 million, with the offset recorded to long-term deferred revenue.
Investments are evaluated at each period end date for impairment. Unrealized losses are recorded to other income and expense when a decline in fair value is determined to be other-than-temporary. In accordance with FSP FAS 115-1 and 124-1, “The Meaning of Other-Than-Temporary Impairment and Its Application to Certain Investments,” we review several factors to determine whether a loss is other-than-temporary. These factors include but are not limited to the: (i) nature of the investment; (ii) cause and duration of the impairment; (iii) extent to which fair value is less than cost; (iv) financial condition and near term prospects of the issuer; and (v) ability to hold the security for a period of time sufficient to allow for any anticipated recovery in fair value. Realized gains and losses are accounted for on the specific identification method. We determine the fair value of our debt securities using quoted prices from active and inactive markets, traded prices for similar assets, or fair value measurements based on a pricing model. We also review our ability to liquidate our investments within the next 12 month operating cycle to determine the appropriate short or long-term classification. Our ability to liquidate is determined based on a review of current and short-term credit and capital market conditions and the financial condition and near term prospects of the issuer.
(f) Allowance for Doubtful Accounts
We establish an allowance for doubtful accounts to adjust our net receivables to amounts considered to be ultimately collectible. Our allowance is based on a variety of factors, including the length of time receivables are past due, significant one-time events, the financial health of our customers and historical experience. The balance of our allowance for doubtful accounts was $0.2 million and $1.4 million as of December 31, 2007 and 2006, respectively.
(g) Inventories
Inventories, which consist of materials, labor and manufacturing overhead, are valued at the lower of cost or market. Raw materials are stated at weighted-average cost. Goods in process and finished goods inventories are stated at standard cost as adjusted for variances, which approximates weighted-average actual cost. The valuation of inventory requires us to estimate excess and slow moving inventory. The determination of the value of excess and slow moving inventory is based upon assumptions of future demand and market conditions. If actual market conditions are less favorable than those projected by management, inventory write-downs may be required.
20
(h) Property, Plant and Equipment
We record property, plant and equipment at cost and depreciate it evenly over the assets’ estimated useful lives as follows:
| | |
| | | Years |
Buildings and improvements | | 4-60 |
| |
Machinery and equipment | | 1-15 |
Depreciation expense for the years ended December 31, 2007, 2006 and 2005 was $79.3 million, $68.2 million and $55.3 million, respectively.
The cost of constructing facilities and equipment includes interest costs. Capitalized interest totaled $1.0 million, $0.7 million and $0.6 million in 2007, 2006 and 2005, respectively.
(i) Impairment of Long-Lived Assets
In accordance with Statement of Financial Accounting Standards No. 144, “Accounting for the Impairment or Disposal of Long-Lived Assets,” we periodically assess the impairment of long-lived assets when conditions indicate a possible loss. When necessary, we record charges for impairments of long-lived assets for the amount by which the present value of future cash flows, or some other fair value measure, is less than the carrying value of these assets. We have recorded no significant impairment charges in 2007, 2006 or 2005.
(j) Operating Leases
The Company enters into lease agreements for a variety of business purposes, including office and manufacturing space, office and manufacturing equipment and computer equipment. A portion of these are noncancellable operating leases.
(k) Customer Deposits
MEMC has executed supply agreements, including any amendments, with multiple customers which required the customers to provide security deposits. As of December 31, 2007 and 2006, the balance of these deposits totaled $152.6 million and $37.3 million, respectively. These deposits are required to be refunded to the customers over the next two years, as set forth in the agreements, unless minimum purchase quantities are not met. These deposits are generally refundable to the customer over two years, although such deposits are replaced each year with new deposits based on increased volume commitments stated in the supply agreements to reduce our risks associated with non-fulfillment of the supply agreements by the customers. The long-term portion of these deposits is included in other noncurrent liabilities on our consolidated balance sheet. As of December 31, 2007, the following obligations were outstanding:
| | | | | | | | | |
| | | Refundable Amounts Due By Period |
| | | Total | | Less than
1 Year | | 1-3
Years |
| Dollars in millions | | | | | | |
Customer Deposits | | $ | 152.6 | | $ | 76.3 | | $ | 76.3 |
(l) Revenue Recognition
We record revenue for product sales when title transfers, the risks and rewards of ownership have been transferred to the customer, the fee is fixed and determinable and collection of the related receivable is reasonably assured, which is generally at the time of shipment for non-consignment orders. In the case of consignment orders, title passes when the customer pulls the product from the assigned MEMC storage facility or storage area or, if the customer does not pull the product within a contractually stated period of time (generally 60–90 days), at the end of that period, or when the customer otherwise agrees to take title to the product. Our wafers are generally made to customer specifications and we conduct rigorous quality control and testing procedures to ensure that the finished wafers meet the customer’s specifications before the product is shipped. We consider international shipping term definitions in our determination of when title passes. We defer revenue for multiple element arrangements based on a fair value per unit for the total arrangement when we receive cash in excess of fair value. We also defer revenue when pricing is not fixed and determinable or other revenue recognition criteria is not met.
As of December 31, 2007 and 2006, MEMC had $6.1 million and $1.5 million, respectively of long-term deferred revenue related to the non-refundable portion of cash received in connection with the new supply agreements executed during 2006,
21
as amended. MEMC also had $75.3 million and $66.6 million of long-term deferred revenue related to additional consideration received from our customers in the form of equity instruments as of December 31, 2007 and 2006, respectively. We recognize the deferred revenue on a pro-rata basis as product is shipped over the life of the contracts.
(m) Derivative Financial Instruments
During 2006, MEMC signed a long-term supply agreement with a customer. At the same time, MEMC received a fully vested, non-forfeitable warrant to purchase common shares of that customer. The warrant becomes exercisable over a five year period (20% annually) beginning January 1, 2008 and has a five year exercise period from the date each tranche becomes exercisable. We recorded $66.6 million for the estimated grant date fair value of the warrant in customer warrant with the offset to deferred revenue – long-term in accordance with EITF 00-8 “Accounting by a Grantee for an Equity Instrument to be received in conjunction with Providing Goods or Services”. This non-cash transaction has been excluded from the Consolidated Statements of Cash Flows. Determining the appropriate fair value model and calculating the fair value of the warrant require the making of estimates and assumptions, including the customer’s stock price volatility, interest rate, dividends, marketability and expected return requirements. We used a lattice model to determine the warrant’s fair value. The assumptions used in calculating the fair value of the warrant represent our best estimates, but these estimates involve inherent uncertainties and the application of our judgment. The warrant is considered a derivative and is therefore marked to market each reporting period. Accordingly, in 2007 and 2006, $220.8 million and $18.9 million, respectively, was recorded as an increase to other assets – long-term and nonoperating income.
We generally use currency forward contracts to manage foreign currency exchange risk relating to current trade receivables with our foreign subsidiaries and current trade receivables and payables with our customers and vendors denominated in foreign currencies (primarily Japanese Yen and Euro). The purpose of our foreign currency derivative activities is to protect us from the risk that the dollar net cash flows resulting from foreign currency transactions will be negatively affected by changes in exchange rates. We do not hold or issue financial instruments for speculative or trading purposes.
Gains or losses on our forward exchange contracts, as well as the offsetting losses or gains on the related hedged receivables, are included in nonoperating (income) expense in the Consolidated Statements of Operations. Net currency losses on unhedged foreign currency positions totaled $1.7 million, $1.1 million and $0.4 million in 2007, 2006 and 2005, respectively.
(n) Translation of Foreign Currencies
We determined the functional currency of each subsidiary based on a number of factors, including the predominant currency for the subsidiary’s expenditures and the subsidiary’s borrowings. When the subsidiary’s local currency is considered its functional currency, we translate its financial statements to U.S. Dollars as follows:
| | • | | Assets and liabilities using exchange rates in effect at the balance sheet date; and |
| | • | | Statement of operations accounts at average exchange rates for the period. |
Adjustments from the translation process are presented in accumulated other comprehensive loss in stockholders’ equity.
(o) Income Taxes
Deferred income taxes arise because of different treatment between financial statement accounting and tax accounting, known as temporary differences. We record the tax effect of these temporary differences as deferred tax assets (generally items that can be used as a tax deduction or credit in future periods) and deferred tax liabilities (generally items that we received a tax deduction for, but have not yet been recorded in the Consolidated Statements of Operations). We regularly review our deferred tax assets for realizability, taking into consideration all available evidence, both positive and negative, including historical pre-tax and taxable income (losses), projected future pre-tax and taxable income (losses) and the expected timing of the reversals of existing temporary differences. In arriving at these judgments, the weight given to the potential effect of all positive and negative evidence is commensurate with the extent to which it can be objectively verified.
We adopted Financial Accounting Standards Board Interpretation No. 48, “Accounting for Uncertainty in Income Taxes” (FIN 48), as of January 1, 2007. FIN 48 prescribes a recognition threshold and measurement attribute for the financial statement recognition and measurement of a tax position taken or expected to be taken in a tax return.
Under FIN 48, tax benefits are recognized only for tax positions that are more likely than not to be sustained upon examination by tax authorities. The amount recognized is measured as the largest amount of benefit that is greater than 50 percent likely to be realized upon ultimate settlement. Unrecognized tax benefits are tax benefits claimed in our tax returns that do not meet these recognition and measurement standards. Prior to the adoption of FIN 48, uncertain tax positions were accounted for under either FASB Statement No. 5, “Accounting for Contingencies,” or FASB Statement No. 109,
22
“Accounting for Income Taxes.” We believe that our income tax liabilities, including related interest, are adequate in relation to the potential for additional tax assessments. There is a risk, however, that the amounts ultimately paid upon resolution of audits could be materially different from the amounts previously included in our income tax expense and, therefore, could have a material impact on our tax provision, net income and cash flows. We review our liabilities quarterly, and we may adjust such liabilities due to proposed assessments by tax authorities, changes in facts and circumstances, issuance of new regulations or new case law, negotiations between tax authorities of different countries concerning our transfer prices, the resolution of entire audits, or the expiration of statutes of limitations. Adjustments are most likely to occur in the year during which major audits are closed.
We repatriate a portion of the current year earnings of a certain subsidiary to the United States. We do not provide for U.S. income taxes on the remaining undistributed earnings of our foreign subsidiaries which would be payable if the undistributed earnings were distributed to the U.S., as we consider those foreign earnings to be permanently reinvested outside the U.S. We plan foreign remittance amounts based on projected cash flow needs as well as the working capital and long-term investment requirements of our foreign subsidiaries and our domestic operations.
(p) Stock-Based Compensation
Prior to January 1, 2006, we accounted for our stock-based compensation plans under the recognition and measurement provisions of Accounting Principles Board Opinion No. 25 (“Opinion 25”), “Accounting for Stock Issued to Employees”, and related interpretations. Accordingly, we generally recognized expense only when we granted options with a discounted exercise price. Any resulting compensation expense was recognized over the associated service period, which was generally the option vesting term.
Prior to January 1, 2006, we provided pro forma disclosure amounts in accordance with Statement of Financial Accounting Standards No. 148, “Accounting for Stock-Based Compensation—Transition and Disclosure” (“SFAS 148”), as if the fair value method defined by SFAS No. 123, “Accounting for Stock-Based Compensation” (“SFAS 123”) had been applied to our stock-based compensation.
Effective January 1, 2006, we adopted the fair value recognition provisions of Statement of Financial Accounting Standards No. 123 (revised 2004), “Share-Based Payment” (“SFAS 123R”), using the modified prospective transition method and therefore have not restated prior periods’ results. Under this transition method, stock-based compensation expense for the year ended December 31, 2006 included compensation expense for all stock-based compensation awards granted prior to, but not yet vested as of, January 1, 2006, based on the grant-date fair value estimated in accordance with the original provisions of SFAS 123. Stock-based compensation expense for all share-based payment awards granted after December 31, 2005 is based on the grant-date fair value estimated in accordance with the provisions of SFAS 123R. We recognize these compensation costs net of an estimated forfeiture rate and recognize the compensation costs for only those shares expected to vest on a straight-line basis over the requisite service period of the award, which is generally the option vesting term. With the adoption of SFAS 123R, we elected to recognize stock-based compensation expense for all grants on or after January 1, 2006 on a straight-line basis over the requisite service period of the entire award for ratable awards. For awards granted prior to January 1, 2006, we will continue to calculate compensation expense by treating each vesting tranche as a separate award. We estimated the forfeiture rate for 2006 and 2007 taking into consideration our historical experience during the preceding four fiscal years.
(q) Contingencies
We record contingent liabilities when the amount can be reasonably estimated and the loss is probable.
(r) Shipping and Handling
Costs to ship products to customers are included in marketing and administration in the consolidated statements of operations. Amounts billed to customers, if any, to cover shipping and handling are included in net sales. Cost to ship products to customers were $10.9 million, $9.6 million and $9.9 million for the years ended December 31, 2007, 2006 and 2005, respectively.
(s) Recent Accounting Pronouncements
In September 2006, the FASB issued Statement of Financial Accounting Standards No. 157, “Fair Value Measurements”(“SFAS 157”), which establishes a framework for measuring fair value and expands disclosures about fair value measurements. SFAS 157 is effective for fiscal years beginning after November 15, 2007 and interim periods within those fiscal years. We have determined that the adoption of SFAS 157 will not have a material impact on our consolidated results of operations and financial condition.
23
In September 2006, the FASB issued SFAS No. 158, “Employers’ Accounting for Defined Benefit Pension and Other Postretirement Plans” (“SFAS 158”). SFAS 158 requires an employer to recognize the overfunded or underfunded status of a defined benefit postretirement plan as an asset or liability in its statement of financial position and to recognize changes in that funded status in the year in which the changes occur through comprehensive income of a business entity. This requirement was effective and adopted during our fiscal year ended December 31, 2006. SFAS 158 also requires an employer to measure the funded status of a plan as of the date of its year-end statement of financial position. This requirement becomes effective for fiscal years ending after December 15, 2008. We have not yet determined the impact the measurement date provision of SFAS 158 will have on our consolidated results of operations and financial condition.
In December 2007, the FASB issued SFAS No. 141R, “Business Combinations” (“SFAS 141R”), which establishes principles and requirements for how an acquirer recognizes and measures in its financial statements the identifiable assets acquired, the liabilities assumed, and any noncontrolling interest in an acquiree, including the recognition and measurement of goodwill acquired in a business combination. The requirements of SFAS 141R are effective for business combinations for which the acquisition date is on or after the beginning of the first annual reporting period beginning on or after December 15, 2008. Earlier adoption is prohibited.
In December 2007, the FASB issued SFAS No. 160, “Noncontrolling Interest in Consolidated Financial Statements, an amendment of ARB No. 51” (“SFAS 160”). SFAS 160 amends ARB 51 to establish accounting and reporting standards for the noncontrolling interest in a subsidiary and for the deconsolidation of a subsidiary. It clarifies that a noncontrolling interest in a subsidiary, which is sometimes referred to as minority interest, is an ownership interest in the consolidated entity that should be reported as equity in the consolidated financial statements. Among other requirements, this statement requires consolidated net income to be reported at amounts that include the amounts attributable to both the parent and the noncontrolling interest. It also requires disclosure, on the face of the consolidated income statement, of the amounts of consolidated net income attributable to the parent and to the noncontrolling interest. The requirements of SFAS 160 are effective for fiscal years, and interim periods within those fiscal years, beginning on or after December 15, 2008. We have not yet determined the impact SFAS 160 will have on our consolidated results of operations and financial condition.
(t) 2005 Adjustments
Certain adjustments recorded in 2005 related to accounting errors from previous periods. The amount of such adjustments was not material to our consolidated results of operations for 2004 and prior periods, nor is the inclusion of the net expense in the results of operations for 2005 considered material. The effect of these adjustments on gross margin and net income was as follows:
| | | | | | | | |
2005 Prior Period Adjustments – increase (decrease) | | Impact
on Gross
Margin | | | Impact
on Net
Income | |
| Dollars in millions | | | | | | |
| | |
Income Taxes, net | | $ | 2.4 | | | $ | (3.3 | ) |
| | |
Other | | | (3.7 | ) | | | (2.3 | ) |
| | | | | | | | |
| | |
Total | | $ | (1.3 | ) | | $ | (5.6 | ) |
| | | | | | | | |
Included in the Income Taxes, net are prior period adjustments, including a benefit of $6.5 million related to the portion of the interest on senior subordinated notes deductible for tax purposes, additional expense of $2.9 million (tax expense of $7.4 million offset by less depreciation expense and other adjustments) related to the U.S. Generally Accepted Accounting Principles (“US GAAP”) treatment of fixed asset basis under the Korea Asset Revaluation Law, additional expense of $6.0 million associated with non-qualified stock option deductions in prior periods (see Note 14), and additional expense of $0.9 million related to amended tax filings and reassessment of tax basis limitations.
Included in Other are primarily adjustments to cost of goods sold and inventory of approximately $2.4 million for profit not previously eliminated from inventory for product shipped between operations and other adjustments that are not individually significant.
24
3. FAIR VALUE OF FINANCIAL INSTRUMENTS
We used the following methods and assumptions to estimate the fair value of derivative and other financial instruments at the relevant balance sheet date:
| | • | | Short-term financial instruments (cash equivalents, short-term investments, accounts receivable and payable, income taxes payable, short-term borrowings, and accrued liabilities)—cost approximates fair value because of the short maturity period, except for short-term investments classified as trading and available for sale investments which are recorded at fair value, which is determined by available active and inactive market prices, traded prices for similar assets or fair value measurements based on pricing models. |
| | • | | Long-term debt—fair value is based on the amount of future cash flows associated with each debt instrument discounted at our current borrowing rate for similar debt instruments of comparable terms. |
| | • | | Currency forward contracts—fair value is measured by the amount that would have been paid to liquidate and repurchase all open contracts. |
| | • | | Customer warrant—Determining the appropriate fair value model and calculating the fair value of the warrant require the making of estimates and assumptions, including the customer’s stock price volatility, interest rate, dividends, marketability and expected return requirements. We used a lattice model to determine the warrant’s fair value. |
| | • | | Investment in equity securities—Our investment in equity securities consists of a customer’s common stock acquired in connection with the execution of a long-term supply agreement. The fair value of the investment was determined based on the closing stock price on December 31, 2007 reduced by the estimated value of a regulatory restriction on sale. |
25
Information on the estimated fair values of financial instruments as of December 31 is as follows:
| | | | | | |
| | | Carrying
Amount | | Estimated
Fair Value |
| Dollars in millions | | | | |
| | |
Currency forward contracts—net sell positions | | | | | | |
| | |
2007 | | $ | 0.1 | | $ | 0.1 |
| | |
2006 | | $ | 0.2 | | $ | 0.2 |
| | |
Warrant to acquire stock | | | | | | |
| | |
2007 | | $ | 306.3 | | $ | 306.3 |
| | |
2006 | | $ | 85.5 | | $ | 85.5 |
| | |
Investment in equity securities | | | | | | |
| | |
2007 | | $ | 12.4 | | $ | 54.1 |
| | |
2006 | | $ | 2.4 | | $ | 12.4 |
| | |
Long-term debt | | | | | | |
| | |
2007 | | $ | 30.9 | | $ | 31.8 |
| | |
2006 | | $ | 34.4 | | $ | 35.2 |
The notional amount of our currency forward contracts was $41.7 million and $53.9 million as of December 31, 2007 and 2006, respectively. The notional amount of the warrant to acquire stock was $205.8 million as of December 31, 2007 and 2006.
The stock price underlying the warrant as well as the stock price related to the investment in equity securities declined subsequent to December 31, 2007. Based on the closing stock prices on February 21, 2008, the warrant had an estimated value of approximately $93.4 million and the investment in equity securities had an estimated fair value of approximately $31.3 million as of February 21, 2008.
4. ACCUMULATED OTHER COMPREHENSIVE INCOME (LOSS)
The components of accumulated other comprehensive income (loss), net of tax, were as follows:
| | | | | | | | |
| | | As of December 31, | |
| | 2007 | | | 2006 | |
| Dollars in millions | | | | | | |
| | |
Accumulated net translation adjustment | | $ | 36.1 | | | $ | 3.8 | |
| | |
Net unrealized loss on available-for-sale securities | | | (4.3 | ) | | | — | |
| | |
Net actuarial loss, prior service credit, and transition obligation (net of $0.3 and $6.2 tax in 2007 and 2006, respectively) | | | (2.0 | ) | | | (11.2 | ) |
| | | | | | | | |
| | |
Total accumulated other comprehensive income (loss) | | $ | 29.8 | | | $ | (7.4 | ) |
| | | | | | | | |
5. SHORT-TERM INVESTMENTS
Short-term investments consist of the following:
| | | | | | | | | | | | |
| | | Cost | | Gross Unrealized
Gain/(Loss)
Recorded in
Earnings | | Gross Unrealized
Loss in Other
Comprehensive
Income(1) | | Fair Value |
| Dollars in millions | | | | | | | | |
| | | | |
As of December 31, 2007 | | | | | | | | | | | | |
| | | | |
Time deposits | | $ | 36.3 | | $ | — | | $ | — | | $ | 36.3 |
26
| | | | | | | | | | | | | |
| | | Cost | | Gross Unrealized
Gain/(Loss)
Recorded in
Earnings | | Gross Unrealized
Loss in Other
Comprehensive
Income(1) | | | Fair Value |
| Dollars in millions | | | | | | | | | |
| | | | |
Available for sale securities: | | | | | | | | | | | | | |
| | | | |
Corporate debt securities | | | 135.2 | | | — | | | (1.0 | ) | | | 134.2 |
| | | | |
Asset-backed securities | | | 85.8 | | | — | | | (1.0 | ) | | | 84.8 |
| | | | |
Mortgage-backed securities | | | 82.8 | | | — | | | (2.3 | ) | | | 80.5 |
| | | | |
Auction rate securities | | | 111.7 | | | — | | | — | | | | 111.7 |
| | | | |
Beneficiary certificates | | | 9.6 | | | — | | | — | | | | 9.6 |
| | | | | | | | | | | | | |
| | | | |
| | $ | 461.4 | | $ | — | | $ | (4.3 | ) | | $ | 457.1 |
As of December 31, 2006 | | | | | | | | | | | | | |
| | | | |
Time deposits | | $ | 38.5 | | $ | — | | $ | — | | | $ | 38.5 |
| | | | |
Trading investments | | | 9.0 | | | 0.5 | | | — | | | | 9.5 |
| | | | |
Available for sale investments: | | | | | | | | | | | | | |
| | | | |
Auction rate securities | | | 10.0 | | | — | | | — | | | | 10.0 |
| | | | | | | | | | | | | |
| | | | |
| | $ | 57.5 | | $ | 0.5 | | $ | — | | | $ | 58.0 |
(1) | The fair value of investments with unrealized loss positions was $299.5 million. We evaluated the nature of these investments, current and expected future market conditions and the short duration of the impairments (all less than twelve months), and have concluded that such amounts were not “other-than-temporary.” |
There were no realized gains or losses on available for sale securities in 2007, 2006 or 2005.
Contractual maturities of our available for sale investments were as follows:
| | | | | | |
| | | Cost | | Fair Value |
| Dollars in millions | | | | |
| | |
As of December 31, 2007 | | | | | | |
| | |
Due in one year or less | | $ | 165.6 | | $ | 165.3 |
| | |
Due after one year | | | 92.7 | | | 92.0 |
| | |
No single maturity date(1) | | | 166.8 | | | 163.5 |
| | | | | | |
| | |
| | $ | 425.1 | | $ | 420.8 |
(1) | Securities with no single maturity date include mortgage- and asset-backed securities. |
6. CREDIT CONCENTRATION
Our customers include semiconductor device and solar cell manufacturers and are located in various geographic regions including North America, Europe, Japan and the Asia Pacific region. Our customers are generally well capitalized, and the concentration of credit risk is considered minimal. Sales to two customers accounted for greater than 10% of our net sales, specifically 13.1% and 10.2%, in 2007. In 2005, we had only one customer comprising over 10% of our sales at 13.7%. In 2006, there were no customers that comprised 10% or greater of our sales.
27
7. INVENTORIES
Inventories consist of the following:
| | | | | | |
| | | As of December 31, |
| | 2007 | | 2006 |
| Dollars in millions | | | | |
| | |
Raw materials and supplies | | $ | 16.2 | | $ | 15.0 |
| | |
Goods in process | | | 6.1 | | | 28.2 |
| | |
Finished goods | | | 14.1 | | | 37.0 |
| | | | | | |
| | |
| | $ | 36.4 | | $ | 80.2 |
| | | | | | |
At December 31, 2007, we had $8.4 million of inventory held on consignment, compared to $6.0 million at December 31, 2006.
8. PROPERTY, PLANT AND EQUIPMENT
Property, plant and equipment consists of the following:
| | | | | | | | |
| | | As of December 31, | |
| | 2007 | | | 2006 | |
| Dollars in millions | | | | | | |
| | |
Land | | $ | 6.0 | | | $ | 5.5 | |
| | |
Buildings and improvements | | | 133.3 | | | | 128.0 | |
| | |
Machinery and equipment | | | 795.0 | | | | 639.3 | |
| | | | | | | | |
| | |
| | | 934.3 | | | | 772.8 | |
| | |
Less accumulated depreciation | | | (377.0 | ) | | | (299.7 | ) |
| | | | | | | | |
| | |
| | | 557.3 | | | | 473.1 | |
| | |
Construction in progress | | | 276.7 | | | | 130.4 | |
| | | | | | | | |
| | |
| | $ | 834.0 | | | $ | 603.5 | |
| | | | | | | | |
9. TEXAS PACIFIC GROUP TRANSACTIONS
In November 2001, TPG acquired a beneficial ownership of approximately 72% of the outstanding stock of MEMC. In February 2005, TPG sold 65.6 million common shares in a public offering, reducing its beneficial ownership to approximately 34%. Additionally, a secondary offering by the investor group led by TPG of 18.3 million shares was completed in August 2005. The shares offered included all of the remaining shares on the resale shelf registration statement filed in February 2004, including 10.0 million shares acquired by TPG upon the exercise of warrants issued in 2001, further reducing TPG’s beneficial ownership to approximately 25%. This reduction in beneficial ownership constituted a change of control under the U.S. tax rules.
In November 2006, TPG sold 19.5 million shares in a privately negotiated sale, an additional 20 million shares of common stock in a privately negotiated sale in February 2007 and an additional 12 million shares in a privately negotiated sale in May 2007. In October 2007 and November 2007, all remaining warrants to purchase our common stock were exercised on a cashless basis, resulting in the issuance of approximately 4.5 million shares of our common stock. As of December 31, 2007, TPG’s beneficial ownership of our common stock and warrants had been reduced to zero.
28
10. SHORT-TERM BORROWING AGREEMENTS
There were no short-term borrowings outstanding at December 31, 2007 and 2006. We have short-term committed loan agreements of approximately $50.4 million at December 31, 2007, which are renewable annually. Of the $50.4 million committed short-term loan agreements, $11.6 million is unavailable because it relates to the issuance of third party letters of credit. Interest rates are negotiated at the time of the borrowings.
11. LONG-TERM DEBT
Long-term debt consists of the following:
| | | | | | | | |
| | | As of December 31, | |
| | 2007 | | | 2006 | |
| Dollars in millions | | | | | | |
| | |
Long-term notes with interest payable semi-annually at rates ranging from 2.1% to 2.9%, due in 2009 through 2017 | | $ | 30.9 | | | $ | 34.4 | |
| | |
Less current portion | | | (5.3 | ) | | | (5.0 | ) |
| | | | | | | | |
| | |
| | $ | 25.6 | | | $ | 29.4 | |
| | | | | | | | |
On July 21, 2005, the Company entered into a Revolving Credit Agreement with National City Bank of the Midwest (National City Bank), US Bank National Association, and such other lending institutions as may from time to time become lenders (the National City Agreement). The National City Agreement was amended on December 20, 2006 to reduce the commitment fee and the interest spread on loans bearing interest at a rate determined by reference to the LIBOR rate. Additionally, our obligations and the guaranty obligations of our subsidiaries are no longer secured by a pledge of the capital stock of certain of our domestic and foreign subsidiaries. The National City Agreement provides for a $200.0 million revolving credit facility and has a term of five years. Interest on borrowings under the National City Agreement will be payable based on the Company’s election at LIBOR plus an applicable margin (currently 0.34%) or at a defined prime rate plus an applicable margin (currently 0.00%). The National City Agreement also provides for us to pay various fees, including a commitment fee (currently 0.08%) on the lenders’ commitments. The National City Agreement contains covenants typical for credit arrangements of comparable size, such as minimum earnings before interest, taxes, depreciation and amortization and an interest coverage ratio. Our obligations under the National City Agreement are guaranteed by certain of our subsidiaries.
Long-term debt at December 31, 2007 totaling $30.9 million owed to a bank by our Japanese subsidiary is guaranteed by us and is secured by the land, buildings and machinery and equipment of our Japanese subsidiary. These loans mature in years ranging from 2009 to 2017. Such guarantees would require us to satisfy the loan obligations in the event that the Japanese subsidiary failed to pay such debt in accordance with its stated terms.
We have long-term committed loan agreements of approximately $270.6 million at December 31, 2007, of which $30.9 million is outstanding. Of the $270.6 million committed long-term loan agreements, which fully expire beginning 2007 and ending 2017, $112.3 million is unavailable as it relates to the issuance of third party letters of credit. We pay commitment fees of up to 0.08 percent on the committed loan agreements.
The aggregate amounts of long-term debt maturing after December 31, 2007 are as follows:
| | | |
| Dollars in millions | | |
| |
2008 | | $ | 5.3 |
| |
2009 | | | 4.9 |
| |
2010 | | | 3.4 |
| |
2011 | | | 2.6 |
| |
2012 | | | 2.6 |
| |
Thereafter | | | 12.1 |
| | | |
| |
| | $ | 30.9 |
| | | |
29
12. STOCKHOLDERS’ EQUITY
Preferred Stock
We have 50.0 million authorized shares of $.01 par value preferred stock and no shares issued and outstanding as of December 31, 2007 and 2006. The Board of Directors is authorized, without further action by the stockholders, to issue any or all of the preferred stock.
Warrants
Pursuant to the 2001 TPG Restructuring Agreement, TPG received warrants to purchase 16.7 million shares of our common stock. We recorded the warrants at their aggregate fair market value of less than one dollar. The warrants were exercisable at an exercise price of $3.00 per share of common stock and expire on November 13, 2011. In 2005, TPG exercised 10.0 million warrants on a cashless basis, resulting in the retirement of 2.0 million additional warrants held by TPG which were used as payment for the exercise price. In 2007, all remaining warrants to purchase our common stock were exercised on a cashless basis, resulting in the issuance of approximately 4.5 million shares of our common stock.
Common Stock
Holders of our $.01 par value common stock are entitled to one vote for each share held on all matters submitted to a vote of stockholders. Subject to the rights of any holders of preferred stock, holders of common stock are entitled to receive ratably such dividends as may be declared by the Board of Directors. In the event of our liquidation, dissolution or winding up, holders of our common stock are entitled to share ratably in the distribution of all assets remaining after payment of liabilities, subject to the rights of any holders of preferred stock. The declaration and payment of future dividends on our common stock, if any, will be at the sole discretion of the Board of Directors and is subject to restrictions as contained in the National City Agreement. There were no dividends declared or paid during the years ended December 31, 2007, 2006 and 2005.
On May 16, 2007, our Board of Directors approved a $500.0 million stock repurchase program. The stock repurchase program allows MEMC to purchase common stock from time to time on the open market or through privately negotiated transactions using available cash. The specific timing and amount of repurchases will vary based on market conditions and other factors. The stock repurchase program may be modified, extended or terminated by the Board of Directors at any time. From the inception of the program in mid June through December 31, 2007, we have repurchased 1.8 million shares of our common stock at a total cost of $111.2 million. During January 2008, we repurchased 1.1 million shares of our common stock at a total cost of $78.6 million.
Stock-Based Compensation
We have equity incentive plans that provide for the award of non-qualified stock options, restricted stock, performance shares, and restricted stock units to employees, non-employee directors, and consultants. We issue new shares to satisfy stock option exercises. As of December 31, 2007, there were 9.8 million shares authorized for future grant under these plans.
Options to employees are generally granted upon hire and semi-annually or annually, usually with four-year ratable vesting, although certain grants have three, four or five-year cliff vesting. In addition, one million options were granted in 2006 with a market condition requiring that, at the end of a four-year term, if MEMC’s common stock price outperforms the S&P 500 market index by a specified amount over that four-year period, the options would vest. These options also provide for an early vesting of 400,000 of these options at the end of three years if MEMC’s common stock price outperforms the S&P 500 market index by a specified amount over the three-year period. No option has a term of more than 10 years.
The exercise price of stock options granted has historically equaled the market price on the date of the grant except as noted below. As discussed in Note 2(p), we adopted SFAS 123R effective January 1, 2006. Prior to this date, we accounted for stock options under Opinion 25. Under the provision of Opinion 25, there was no recorded expense related to grants of stock options. Once exercisable, the employee can purchase shares of our common stock at the market price on the date we granted the option.
In 2002, certain stock options were granted at exercise prices less than the market price on the date of grant. These options were either immediately vested or vested over two to four years. Since these options were issued below the market price of our common stock on the date of issuance, compensation expense was recognized for the intrinsic value of the options of approximately $12.8 million and the expense was recognized based on graded vesting. Compensation expense related to these stock options was $0.1 million and $0.5 million in 2006 and 2005, respectively. There was no expense related to these stock options in 2007.
30
The following table presents information regarding outstanding stock options as of December 31, 2007 and changes during the year then ended with regard to stock options:
| | | | | | | | | | | |
| | | Shares | | | Weighted-
Average
Exercise Price | | Aggregate
Intrinsic
Value (in
millions) | | Average
Remaining
Contractual
Life |
| | | | |
Beginning of year | | 10,629,814 | | | $ | 20.53 | | | | | |
| | | | |
Granted | | 1,777,633 | | | | 56.21 | | | | | |
| | | | |
Exercised | | (3,430,743 | ) | | | 12.88 | | | | | |
| | | | |
Forfeited | | (331,401 | ) | | | 23.39 | | | | | |
| | | | |
Expired | | (1,706 | ) | | | 11.17 | | | | | |
| | | | | | | | | | | |
| | | | |
End of year | | 8,643,597 | | | $ | 30.72 | | $ | 499.3 | | 8 years |
| | | | | | | | | | | |
| | | | |
Options exercisable at year-end | | 787,206 | | | $ | 14.53 | | $ | 58.2 | | 6 years |
| | | | | | | | | | | |
The aggregate intrinsic value in the table above represents the total pre-tax intrinsic value (the difference between our closing stock price on the last trading day of 2007 and the exercise price, multiplied by the number of in-the-money options) that would have been received by the option holders had all option holders exercised their options on December 31, 2007. This amount changes based on the fair market value of our stock. The total intrinsic value of options exercised was $159.9 million, $46.0 million and $42.7 million in 2007, 2006 and 2005, respectively. Cash received from option exercises under option plans was $44.2 million, $17.1 million and $14.8 million and the actual tax benefit realized for the tax deductions from option exercises was $40.3 million, $14.8 million and $21.2 million for 2007, 2006 and 2005, respectively.
We routinely examine our assumptions used in estimating the fair value of employee options granted. As part of this assessment, we have determined that our historical stock price volatility and historical pattern of option exercises are appropriate indicators of expected volatility and expected term. The interest rate is determined based on the implied yield currently available on U.S. Treasury zero-coupon issues with a remaining term equal to the expected term of the award. We estimate the fair value of options using the Black-Scholes option-pricing model for our ratable and cliff vesting options. For the 2006 market condition awards, a lattice binomial model was used. Our weighted-average assumptions are as follows:
| | | | | | | | | | | | |
| | | Black-Scholes | | | Lattice Binomial | |
| | | 2007 | | | 2006 | | | 2005 | | | 2006 | |
| | | | |
Risk-free interest rate | | 4.6 | % | | 4.7 | % | | 3.9 | % | | 4.7 | % |
| | | | |
Expected stock price volatility | | 50.5 | % | | 64.9 | % | | 102.1 | % | | 63.5 | % |
| | | | |
Expected term until exercise (years) | | 4 | | | 4 | | | 4 | | | 5 | |
| | | | |
Expected dividends | | 0.0 | % | | 0.0 | % | | 0.0 | % | | 0.0 | % |
The weighted-average grant-date fair value per share of options granted was $25.34, $18.47 and $10.29 for 2007, 2006 and 2005, respectively. As of December 31, 2007, $66.1 million of total unrecognized compensation cost related to stock options is expected to be recognized over a weighted-average period of two years.
31
Restricted stock units represent the right to receive a share of MEMC stock at a designated time in the future, provided the stock unit is vested at the time. Restricted stock units granted to non-employee directors generally vest over a two-year period from the grant date. Restricted stock units granted to employees have ratable or cliff vesting and certain grants are subject to performance conditions established at the time of grant. Recipients of restricted stock units do not pay any cash consideration for the restricted stock units or the underlying shares, and do not have the right to vote or have any other rights of a shareholder until such time as the underlying shares of stock are distributed. The following table presents information regarding outstanding restricted stock units as of December 31, 2007 and changes during the year then ended:
| | | | | | | | |
| | | Restricted Stock
Units | | | Aggregate Intrinsic
Value (in millions) | | Average Remaining
Contractual Life |
| | | |
Beginning of year | | 141,100 | | | | | | |
| | | |
Granted | | 91,500 | | | | | | |
| | | |
Converted | | (6,562 | ) | | | | | |
| | | | | | | | |
| | | |
End of year | | 226,038 | | | $ | 20.0 | | 2 years |
| | | | | | | | |
At December 31, 2007, there were no restricted stock units which were convertible. As of December 31, 2007, $2.2 million of total unrecognized compensation cost related to restricted stock units is expected to be recognized over a weighted-average period of approximately one year. The weighted-average fair value of restricted stock units on the date of grant was $48.91 and $39.95 in 2007 and 2006, respectively. There were no restricted stock units granted in 2005. We recorded compensation expense related to restricted stock units of $1.3 million, $0.6 million and $0.1 million in 2007, 2006 and 2005, respectively.
Prior to the adoption of SFAS 123R, we presented the tax benefit of stock option exercises as operating cash flows. Upon the adoption of SFAS 123R, tax benefits resulting from tax deductions in excess of the tax benefit related to compensation cost recognized for those options will now be classified as financing cash flows. For the years ended December 31, 2007 and 2006, we recognized $40.0 million and $10.5 million of excess tax benefits from share-based payment arrangements as a cash inflow in financing activities.
Stock-based compensation expense recorded for the years ended December 31 was allocated as follows:
| | | | | | | | | |
| | | 2007 | | 2006 | | 2005 |
| Dollars in millions | | | | | | |
| | | |
Cost of goods sold | | $ | 4.7 | | $ | 4.3 | | $ | — |
| | | |
Marketing and administration | | | 25.1 | | | 13.1 | | | 2.1 |
| | | |
Research and development | | | 1.4 | | | 1.4 | | | — |
| | | | | | | | | |
| | | |
Stock-based employee compensation before related tax effects | | | 31.2 | | | 18.8 | | | 2.1 |
| | | |
Less: Income tax benefit | | | 11.1 | | | 6.9 | | | 0.8 |
| | | | | | | | | |
| | | |
Total stock-based compensation expense, net of related tax effects | | $ | 20.1 | | $ | 11.9 | | $ | 1.3 |
| | | | | | | | | |
The amount of stock-based compensation cost capitalized into inventory at December 31, 2007 and 2006 was $0.1 million and $0.3 million. Prior to the adoption of SFAS 123R on January 1, 2006, stock-based compensation costs were not capitalized.
32
The following table provides pro forma net income and earnings per share had we applied the fair value method of SFAS 123:
| | | | |
| | | 2005 | |
| In millions, except per share data | | | |
| |
Net income allocable to common stockholders, as reported | | $ | 249.4 | |
| |
Add: | | | | |
| |
Stock-based employee compensation included in reported net income, net of related tax effects | | | 1.3 | |
| |
Deduct: | | | | |
| |
Total stock-based employee compensation expense determined under the fair value based method for all awards, net of related tax effects | | | (12.6 | ) |
| | | | |
| |
Pro forma net income allocable to common stockholders | | $ | 238.1 | |
| |
Income per share: | | | | |
| |
Basic—as reported | | $ | 1.17 | |
| |
Basic—pro forma | | $ | 1.12 | |
| |
Diluted—as reported | | $ | 1.10 | |
| |
Diluted—pro forma | | $ | 1.05 | |
13. INCOME PER SHARE
In 2007, 2006 and 2005, basic and diluted earnings per share (EPS) were calculated as follows:
| | | | | | | | | | | | | | | | | | |
| | | 2007 | | 2006 | | 2005 |
| | | Basic | | Diluted | | Basic | | Diluted | | Basic | | Diluted |
| In millions, except per share amounts | | | | | | | | | | | | |
| | | | | | |
EPS Numerator: | | | | | | | | | | | | | | | | | | |
| | | | | | |
Net income allocable to common stockholders | | $ | 826.2 | | $ | 826.2 | | $ | 369.3 | | $ | 369.3 | | $ | 249.4 | | $ | 249.4 |
| | | | | | | | | | | | | | | | | | |
| | | | | | |
EPS Denominator: | | | | | | | | | | | | | | | | | | |
| | | | | | |
Weighted-average shares outstanding | | | 225.6 | | | 225.6 | | | 222.1 | | | 222.1 | | | 213.5 | | | 213.5 |
| | | | | | |
Stock options and restricted stock units | | | — | | | 3.1 | | | — | | | 3.3 | | | — | | | 2.9 |
| | | | | | |
Warrants | | | — | | | 3.6 | | | — | | | 4.3 | | | — | | | 10.0 |
| | | | | | | | | | | | | | | | | | |
| | | | | | |
Total shares | | | 225.6 | | | 232.3 | | | 222.1 | | | 229.7 | | | 213.5 | | | 226.4 |
| | | | | | | | | | | | | | | | | | |
| | | | | | |
Earnings per share | | $ | 3.66 | | $ | 3.56 | | $ | 1.66 | | $ | 1.61 | | $ | 1.17 | | $ | 1.10 |
| | | | | | | | | | | | | | | | | | |
In 2007, 2006, and 2005, options and restricted stock units to purchase 1.0 million, 1.9 million and 0.7 million, respectively, of MEMC stock were excluded from the calculation of diluted EPS because the effect was antidilutive.
14. INCOME TAXES
Income before income taxes, equity in loss of joint venture and minority interests consists of the following:
| | | | | | | | | |
| | | For the year ended
December 31, |
| | 2007 | | 2006 | | 2005 |
| Dollars in millions | | | | | | |
| | | |
U.S. | | $ | 465.5 | | $ | 321.9 | | $ | 113.8 |
| | | |
Foreign | | | 646.3 | | | 268.6 | | | 138.6 |
| | | | | | | | | |
| | | |
| | $ | 1,111.8 | | $ | 590.5 | | $ | 252.4 |
| | | | | | | | | |
33
Income tax expense (benefit) consists of the following:
| | | | | | | | | | | | |
| | | Current | | | Deferred | | | Total | |
| Dollars in millions | | | | | | | | | |
| | | |
Year ended December 31, 2007: | | | | | | | | | | | | |
| | | |
U.S. Federal | | $ | 150.9 | | | $ | 2.7 | | | $ | 153.6 | |
| | | |
State and local | | | (0.6 | ) | | | 0.7 | | | | 0.1 | |
| | | |
Foreign | | | 113.6 | | | | 14.9 | | | | 128.5 | |
| | | | | | | | | | | | |
| | | |
| | $ | 263.9 | | | $ | 18.3 | | | $ | 282.2 | |
| | | | | | | | | | | | |
| | | |
Year ended December 31, 2006: | | | | | | | | | | | | |
| | | |
U.S. Federal | | $ | 84.7 | | | $ | 28.0 | | | $ | 112.7 | |
| | | |
State and local | | | 5.8 | | | | 1.9 | | | | 7.7 | |
| | | |
Foreign | | | 80.5 | | | | 13.9 | | | | 94.4 | |
| | | | | | | | | | | | |
| | | |
| | $ | 171.0 | | | $ | 43.8 | | | $ | 214.8 | |
| | | | | | | | | | | | |
Year ended December 31, 2005: | | | | | | | | | | | | |
| | | |
U.S. Federal | | $ | (14.6 | ) | | $ | (56.0 | ) | | $ | (70.6 | ) |
| | | |
State and local | | | 4.2 | | | | 10.5 | | | | 14.7 | |
| | | |
Foreign | | | 33.9 | | | | 19.2 | | | | 53.1 | |
| | | | | | | | | | | | |
| | | |
| | $ | 23.5 | | | $ | (26.3 | ) | | $ | (2.8 | ) |
| | | | | | | | | | | | |
Effective Tax Rate. Income tax expense (benefit) differed from the amounts computed by applying the U.S. Federal income tax rate of 35% to income before income taxes, equity in loss of joint venture and minority interests as a result of the following:
| | | | | | | | | |
| | | For the year ended
December 31, | |
| | 2007 | | | 2006 | | | 2005 | |
| | | |
Income tax at federal statutory rate | | 35.0 | % | | 35.0 | % | | 35.0 | % |
| | | |
Increase (reduction) in income taxes: | | | | | | | | | |
| | | |
Change in the valuation allowance for deferred tax asset | | — | | | — | | | (26.6 | ) |
| | | |
Effect of foreign operations and repatriation | | (8.4 | ) | | (0.2 | ) | | (3.7 | ) |
| | | |
State income taxes, net of Federal benefit | | 0.5 | | | 0.9 | | | 1.1 | |
| | | |
Reassessment of reserves due to change in estimate | | 0.4 | | | 0.1 | | | (11.7 | ) |
| | | |
Reassessment of rate due to change in estimate | | (0.2 | ) | | 0.7 | | | 4.1 | |
| | | |
Prior period adjustments | | — | | | 0.2 | | | 3.1 | |
| | | |
Other, net | | (1.9 | ) | | (0.3 | ) | | (2.4 | ) |
| | | | | | | | | |
| | | |
Effective tax rate | | 25.4 | % | | 36.4 | % | | (1.1 | )% |
| | | | | | | | | |
34
The “Change in the valuation allowance for deferred tax asset” relates to movement in the valuation allowance against deferred tax assets for domestic temporary differences and tax credits, state and foreign net operating loss carryforwards, and other foreign deferred tax assets. We evaluate all significant available positive and negative evidence, including the existence of losses in recent years and our forecast of future taxable income, in assessing the need for a valuation allowance. The underlying assumptions we used in forecasting future taxable income require significant judgment and take into account our recent financial performance. Based upon this analysis, the valuation allowance of $67.1 million was reversed in 2005, bringing the total valuation allowance to zero.
The “Effect of foreign operations and repatriation” includes the net reduced taxation of foreign profits combining jurisdictions with rates above and below the U.S. federal statutory rate. It also includes the impact of withholding taxes. For 2007, the net decrease represents a benefit of $23.4 million associated with the U.S. foreign tax credit offset by an increase in expense of $29.1 million related to dividends and foreign withholding taxes. Additionally, a benefit of $77.3 million was recognized in relation to a non-taxable gain on warrant income. For 2006, the net decrease represents a benefit of $16.9 million associated with the U.S. foreign tax credit offset by an increase in expense of $15.8 million related to dividends and foreign withholding taxes. For 2005, the net decrease of $9.4 million represents reductions of $12.5 million associated with the U.S. foreign tax credit, $6.7 million of foreign taxes below U.S. statutory rates, and increases of $4.6 million in foreign withholding taxes, $2.3 million related to the recognition of certain additional U.S. residual income tax that is expected to be imposed upon a distribution of unremitted foreign earnings, and $2.8 million in liabilities established for potential transfer pricing and other issues.
The “Reassessment of reserves due to change in estimate” in 2007 and 2006 primarily relate to accrued interest and in 2005 relates to an increase in our estimate of our allowable depreciation deductions totaling $22.4 million, a benefit of $6.0 million related to prior year U.S. tax return amendments to elect foreign tax credits net of previously taken deductions for foreign taxes and a decrease of $1.2 million of other changes in estimate.
The “Prior period adjustments” in 2006 relates primarily to recording additional expense for state net operating losses net of federal benefit and in 2005 included a benefit of $6.5 million related to the portion of the interest on senior subordinated notes deductible for tax purposes for which a liability had been recorded, additional tax expense of $7.4 million related to the US GAAP treatment of fixed asset basis difference under the Korea Asset Revaluation Law, additional expense of $6.0 million associated with non-qualified stock option deductions which had been recorded as a reduction to income tax expense in prior periods, and additional expense of $0.9 million related to amended tax filings and reassessment of tax basis limitations.
The “Reassessment of rate due to change in estimate” for 2007 includes approximately $1.8 million additional benefit related to a Texas law change and the computation of the net operating loss credit carryforward. In 2006 this item includes approximately $3.9 million additional expense related to a Texas tax law change and in 2005 includes approximately $6.3 million of expense related to a change in the blended state tax rate expected to apply to reversing temporary differences in future periods due to changes in expected apportionment ratios and other factors as well as state net operating losses of $4.0 million that expired as a result of a merger in 2005 for tax purposes.
Uncertain Tax Positions. Unrecognized tax benefits are tax benefits claimed in our tax returns that do not meet the recognition and measurement standards outlined in FIN 48. As a result of the adoption of FIN 48 on January 1, 2007, we recorded an increase in retained earnings and a decrease in other long-term liabilities of $0.5 million for uncertain tax positions. The total amount of unrecognized tax benefits, net of federal, state and local deductions, at the date of adoption was $49.2 million, all of which would favorably affect our effective tax rate if recognized. Uncertain tax benefits are included as a component of other long-term liabilities because we do not anticipate that settlement of the liabilities will require payment of cash within the next twelve months. At December 31, 2007, we have $95.7 million of unrecognized tax benefits, net of federal, state and local deductions, associated with open tax years 2001 through 2006 for which we are subject to audit in various federal, state and foreign jurisdictions. The current period change to the reserve is related to the deductibility of interest on senior subordinated notes stemming from the partial acquisition of common shares by TPG and subsequent debt restructuring, refinements of our positions related to the TPG acquisition from 2001 and other worldwide tax items. The entire amount would favorably affect our effective tax rate if recognized. In the second quarter of 2007, the IRS commenced an audit of our 2004 and 2005 tax years. As of December 31, 2007, the IRS has proposed adjustments that management is currently evaluating. In the event of an unfavorable outcome, this liability could be reduced by a potential payment of approximately $20.6 million within the next twelve months. We have already accrued for this liability.
35
A reconciliation of the beginning and ending amount of gross unrecognized tax benefits is as follows:
| | | |
| | | (in millions) |
| |
Balance at January 1, 2007 | | $ | 51.0 |
| |
Additions based on tax positions related to the current year | | | 1.0 |
| |
Additions for tax positions of prior years | | | 45.1 |
| | | |
| |
Balance at December 31, 2007 | | $ | 97.1 |
| | | |
The total amount of accrued interest and penalties at the date of adoption was $0.5 million and is included in other long-term liabilities. The accrual of interest begins in the first reporting period that interest would begin to accrue under the tax law. Penalties, when applicable, are accrued in the financial reporting period in which the uncertain tax position is taken on a tax return. We recognize interest and penalties related to uncertain tax positions in income tax expense, which is consistent with our historical policy. During the year ended December 31, 2007 the Company recognized approximately $3.2 million in interest and penalties and had approximately $3.7 million accrued at December 31, 2007 for the payment of interest and penalties.
Deferred Taxes. The tax effects of the major items recorded as deferred tax assets and liabilities are:
| | | | | | | | |
| | | As of December 31, | |
| | 2007 | | | 2006 | |
| Dollars in millions | | | | | | |
| | |
Deferred tax assets: | | | | | | | | |
| | |
Inventories | | $ | 1.6 | | | $ | 5.6 | |
| | |
Expense accruals | | | 21.3 | | | | 21.4 | |
| | |
Property, plant and equipment | | | 51.3 | | | | 65.6 | |
| | |
Pension, medical and other employee benefits | | | 17.0 | | | | 22.4 | |
| | |
Net operating loss carryforwards – state and foreign | | | 3.3 | | | | 3.9 | |
| | |
Capitalized R&D | | | 7.5 | | | | 8.6 | |
| | |
Other | | | 0.1 | | | | 5.9 | |
| | | | | | | | |
| | |
Total deferred tax assets | | | 102.1 | | | | 133.4 | |
| | | | | | | | |
| | |
Deferred tax liabilities: | | | | | | | | |
| | |
Other | | | (0.8 | ) | | | (2.0 | ) |
| | | | | | | | |
| | |
Total deferred tax liabilities | | | (0.8 | ) | | | (2.0 | ) |
| | | | | | | | |
| | |
Net deferred tax assets | | $ | 101.3 | | | $ | 131.4 | |
| | | | | | | | |
Our deferred tax assets and liabilities, netted by taxing location, are in the following captions in the Consolidated Balance Sheets:
| | | | | | |
| | | As of December 31, |
| | 2007 | | 2006 |
| Dollars in millions | | | | |
| | |
Current deferred tax assets, net (recorded in prepaids and other current assets) | | $ | 12.0 | | $ | 11.9 |
| | |
Noncurrent deferred tax assets, net | | | 89.3 | | | 119.5 |
| | | | | | |
| | |
| | $ | 101.3 | | $ | 131.4 |
| | | | | | |
36
At December 31, 2007, the Company had a $3.3 million deferred tax asset for state income tax loss and credit carryforwards. These carryforwards are scheduled to expire between 2022 and 2026 if unused. Of these, $1.0 million will expire in 2022 and $2.3 million in 2026.
Federal and state income taxes have not been provided on accumulated but undistributed earnings of foreign subsidiaries aggregating approximately $945.8 million and $437.5 million at December 31, 2007 and 2006, respectively, as such earnings have been permanently reinvested in the business. The determination of the amount of the unrecognized deferred tax liability related to the undistributed earnings is not practicable.
15. EMPLOYEE-RELATED LIABILITIES
Pension and Other Post-Employment Benefit Plans
Prior to January 2, 2002, our defined benefit pension plan covered most U.S. employees. Benefits for this plan were based on years of service and qualifying compensation during the final years of employment. Effective January 2, 2002, we amended our defined benefit plan to discontinue future benefit accruals for certain participants. In addition, effective January 2, 2002, no new participants will be added to the plan.
We also have a non-qualified plan under the Employee Retirement Income Security Act of 1974. This plan provides benefits in addition to the defined benefit plan. Eligibility for participation in this plan requires coverage under the defined benefit plan and other specific circumstances. The non-qualified plan has also been amended to discontinue future benefit accruals.
Prior to January 1, 2002, our health care plan provided postretirement medical benefits to full-time U.S. employees who met minimum age and service requirements. The plan is contributory, with retiree contributions adjusted annually, and contains other cost-sharing features such as deductibles and coinsurance. Effective January 1, 2002, we amended our health care plan to discontinue eligibility for postretirement medical benefits for certain participants. In addition, effective January 2, 2002, no new participants will be eligible for postretirement medical benefits under the plan. During 2006, a negative plan amendment was recorded related to the clarification of contributions to be paid by MEMC, resulting in the recording of approximately $11.6 million of unrecognized prior service credit. This credit will be amortized to income using the straight-line method over the remaining life expectancy of those participants.
In July 2005, approximately 88% of eligible employees of our Taiwan subsidiary elected to opt out of their defined benefit pension plan into a new defined contribution plan, creating a one-time curtailment loss of $0.5 million.
We adopted Statement of Financial Accounting Standards No. 158, “Employers’ Accounting for Defined Benefit Pension and Other Postretirement Plans” (“SFAS 158”) as of December 31, 2006, except for the change in measurement date provisions. SFAS 158 requires an employer to recognize the overfunded or underfunded status of a defined benefit postretirement plan as an asset or liability in its statement of financial position and to recognize changes in that funded status in the year in which the changes occur through comprehensive income. As a result of the adoption of the recognition provisions of SFAS 158 as of December 31, 2006, we reclassified $10.3 million from accrued liabilities to pension and post-employment liabilities because we had pension assets exceeding the expected beneficiary payments in 2007. In addition, we reclassified $11.5 million of unrecognized prior service credit and net unrealized gains from the pension and post-employment liabilities to accumulated other comprehensive income, which reduced our recorded liabilities.
37
Net periodic benefit cost consists of the following:
| | | | | | | | | | | | | | | | | | | | | | | | |
Year ended December 31, | | Pension Plans | | | Health Care and Other
Plans | |
| | 2007 | | | 2006 | | | 2005 | | | 2007 | | | 2006 | | | 2005 | |
| Dollars in millions | | | | | | | | | | | | | | | | | | |
| | | | | | |
Service cost | | $ | 3.3 | | | $ | 3.5 | | | $ | 3.7 | | | $ | 0.1 | | | $ | 0.3 | | | $ | 0.4 | |
| | | | | | |
Interest cost | | | 9.8 | | | | 9.4 | | | | 9.3 | | | | 1.6 | | | | 2.3 | | | | 2.5 | |
| | | | | | |
Expected return on plan assets | | | (9.4 | ) | | | (8.5 | ) | | | (7.5 | ) | | | — | | | | — | | | | — | |
| | | | | | |
Amortization of prior service cost | | | — | | | | — | | | | — | | | | (0.5 | ) | | | — | | | | — | |
| | | | | | |
Net actuarial (gain) loss | | | 1.8 | | | | 2.1 | | | | 1.7 | | | | (0.9 | ) | | | (0.6 | ) | | | (0.6 | ) |
| | | | | | |
Settlement and curtailment charges | | | 0.1 | | | | — | | | | 0.5 | | | | — | | | | — | | | | — | |
| | | | | | | | | | | | | | | | | | | | | | | | |
| | | | | | |
Net periodic benefit cost | | $ | 5.6 | | | $ | 6.5 | | | $ | 7.7 | | | $ | 0.3 | | | $ | 2.0 | | | $ | 2.3 | |
| | | | | | | | | | | | | | | | | | | | | | | | |
We use a measurement date of September 30 to determine pension and other postretirement and post-employment benefit measurements for the plans.
The following is a table of actuarial assumptions used to determine the net periodic benefit cost:
| | | | | | | | | | | | | | | | | | |
Year ended December 31, | | Pension Plans | | | Health Care and Other
Plans | |
| | 2007 | | | 2006 | | | 2005 | | | 2007 | | | 2006 | | | 2005 | |
| | | | | | |
Weighted-average assumptions: | | | | | | | | | | | | | | | | | | |
| | | | | | |
Discount rate | | 5.75 | % | | 5.50 | % | | 5.75 | % | | 5.75 | % | | 5.50 | % | | 5.75 | % |
| | | | | | |
Expected return on plan assets | | 8.00 | % | | 8.00 | % | | 8.00 | % | | NA | | | NA | | | NA | |
| | | | | | |
Rate of compensation increase | | 3.75 | % | | 4.00 | % | | 4.50 | % | | 3.75 | % | | 4.00 | % | | 4.50 | % |
| | | | | | |
Current medical cost trend rate | | NA | | | NA | | | NA | | | 7.25 | % | | 7.25 | % | | 8.25 | % |
| | | | | | |
Ultimate medical cost trend rate | | NA | | | NA | | | NA | | | 5.25 | % | | 5.25 | % | | 5.25 | % |
| | | | | | |
Year the rate reaches ultimate trend rate | | NA | | | NA | | | NA | | | 2009 | | | 2008 | | | 2008 | |
38
The following summarizes the change in benefit obligation, change in plan assets, and funded status of the plans:
| | | | | | | | | | | | | | | | |
Year ended December 31, | | Pension Plans | | | Health Care and Other
Plans | |
| | 2007 | | | 2006 | | | 2007 | | | 2006 | |
| Dollars in millions | | | | | | | | | | | | |
| | | | |
Change in benefit obligation: | | | | | | | | | | | | | | | | |
| | | | |
Benefit obligation at beginning of year | | $ | 180.4 | | | $ | 179.6 | | | $ | 29.0 | | | $ | 43.3 | |
| | | | |
Service cost | | | 3.3 | | | | 3.5 | | | | 0.1 | | | | 0.3 | |
| | | | |
Interest cost | | | 9.8 | | | | 9.4 | | | | 1.7 | | | | 2.3 | |
| | | | |
Plan participants’ contributions | | | — | | | | — | | | | 2.5 | | | | 2.1 | |
| | | | |
Actuarial (gain) loss | | | (7.4 | ) | | | (2.0 | ) | | | 1.1 | | | | (1.3 | ) |
| | | | |
Gross benefits paid | | | (12.6 | ) | | | (10.1 | ) | | | (5.7 | ) | | | (6.3 | ) |
| | | | |
Less: Federal subsidy on benefits paid | | | — | | | | — | | | | — | | | | 0.2 | |
| | | | |
Plan amendment | | | — | | | | — | | | | — | | | | (11.6 | ) |
| | | | |
Settlements | | | (0.2 | ) | | | — | | | | — | | | | — | |
| | | | |
Currency exchange loss | | | 0.6 | | | | — | | | | — | | | | — | |
| | | | | | | | | | | | | | | | |
| | | | |
Benefit obligation at end of year | | $ | 173.9 | | | $ | 180.4 | | | $ | 28.7 | | | $ | 29.0 | |
| | | | | | | | | | | | | | | | |
| | | | |
Change in plan assets: | | | | | | | | | | | | | | | | |
| | | | |
Fair value of plan assets at beginning of year | | $ | 119.2 | | | $ | 105.0 | | | $ | — | | | $ | — | |
| | | | |
Actual return on plan assets | | | 17.8 | | | | 8.6 | | | | — | | | | — | |
| | | | |
Employer contributions | | | 12.9 | | | | 15.7 | | | | 3.2 | | | | 4.0 | |
| | | | |
Plan participants’ contributions | | | — | | | | — | | | | 2.5 | | | | 2.1 | |
| | | | |
Gross benefits paid | | | (12.6 | ) | | | (10.1 | ) | | | (5.7 | ) | | | (6.3 | ) |
| | | | |
Less: Federal subsidy on benefits paid | | | — | | | | — | | | | — | | | | 0.2 | |
| | | | |
Settlements | | | (0.2 | ) | | | — | | | | — | | | | — | |
| | | | | | | | | | | | | | | | |
| | | | |
Fair value of plan assets at end of year | | $ | 137.1 | | | $ | 119.2 | | | $ | — | | | $ | — | |
| | | | | | | | | | | | | | | | |
| | | | |
Unfunded status | | $ | (36.8 | ) | | $ | (61.2 | ) | | $ | (28.7 | ) | | $ | (29.0 | ) |
| | | | |
Contributions after measurement date | | | 0.4 | | | | 0.9 | | | | 0.8 | | | | 0.9 | |
| | | | | | | | | | | | | | | | |
| | | | |
Net amount recognized | | $ | (36.4 | ) | | $ | (60.3 | ) | | $ | (27.9 | ) | | $ | (28.1 | ) |
| | | | | | | | | | | | | | | | |
| | | | |
Amounts recognized in statement of financial position: | | | | | | | | | | | | | | | | |
| | | | |
Accrued liabilities, current | | $ | (0.8 | ) | | $ | (1.3 | ) | | $ | (2.9 | ) | | $ | (1.9 | ) |
| | | | |
Pension and post-employment liabilities | | | (35.6 | ) | | | (59.0 | ) | | | (25.0 | ) | | | (26.2 | ) |
| | | | | | | | | | | | | | | | |
| | | | |
Net amount recognized | | $ | (36.4 | ) | | $ | (60.3 | ) | | $ | (27.9 | ) | | $ | (28.1 | ) |
| | | | | | | | | | | | | | | | |
39
Amounts recognized in accumulated other comprehensive income (before tax):
| | | | | | | | | | | | | | |
Year ended December 31, | | Pension Plans | | Health Care and Other
Plans | |
| | 2007 | | 2006 | | 2007 | | | 2006 | |
| Dollars in millions | | | | | | | | | | |
| | | | |
Net actuarial (gain) loss | | $ | 18.8 | | $ | 36.4 | | $ | (5.5 | ) | | $ | (7.5 | ) |
| | | | |
Prior service (credit) cost | | | — | | | — | | | (11.1 | ) | | | (11.6 | ) |
| | | | |
Transition (asset) obligation | | | — | | | 0.1 | | | — | | | | — | |
| | | | | | | | | | | | | | |
| | | | |
Net amount recognized | | $ | 18.8 | | $ | 36.5 | | $ | (16.6 | ) | | $ | (19.1 | ) |
| | | | | | | | | | | | | | |
The estimated amounts that will be amortized from accumulated other comprehensive income into net periodic benefit cost in 2008 are as follows:
| | | | | | | |
| | | Pension Plans | | Health Care and
Other Plans | |
| Dollars in millions | | | | | |
| | |
Actuarial (gain) loss | | $ | 0.4 | | $ | (0.8 | ) |
| | |
Prior service (credit) cost | | | — | | | (0.5 | ) |
| | |
Transition (asset) obligation | | | — | | | — | |
| | | | | | | |
| | |
| | $ | 0.4 | | $ | (1.3 | ) |
| | | | | | | |
The following is a table of the actuarial assumptions used to determine the benefit obligation:
| | | | | | | | | | | | |
Year ended December 31, | | Pension Plans | | | Health Care and
Other Plans | |
| | 2007 | | | 2006 | | | 2007 | | | 2006 | |
| | | | |
Weighted-average assumptions: | | | | | | | | | | | | |
| | | | |
Discount rate | | 6.15 | % | | 5.75 | % | | 6.00 | % | | 5.75 | % |
| | | | |
Rate of compensation increase | | 3.75 | % | | 3.75 | % | | 3.75 | % | | 3.75 | % |
| | | | |
Current medical cost trend rate | | NA | | | NA | | | 8.00 | % | | 7.25 | % |
| | | | |
Ultimate medical cost trend rate | | NA | | | NA | | | 5.00 | % | | 5.25 | % |
| | | | |
Year the rate reaches ultimate trend rate | | NA | | | NA | | | 2013 | | | 2008 | |
Pension plan assets are invested primarily in marketable securities including common stocks, bonds and interest-bearing deposits. The weighted-average allocation of pension benefit plan assets at September 30 was:
| | | | | | | | | |
Asset Category | | Target Allocation | | | Actual Allocation | |
| | | 2007 | | | 2006 | |
| | | |
Equity securities | | 20-65 | % | | 65 | % | | 61 | % |
| | | |
Fixed income securities | | 20-75 | % | | 31 | % | | 29 | % |
| | | |
All other | | 0-20 | % | | 4 | % | | 10 | % |
| | | | | | | | | |
| | | |
Total | | | | | 100 | % | | 100 | % |
40
The investment objectives of our pension plan assets are as follows:
| | • | | To achieve a favorable relative return as compared with inflation; |
| | • | | To achieve an above average total rate of return relative to capital markets; |
| | • | | Preservation of capital through a broad diversification among asset classes which react, as nearly as possible, independently to varying economic and market circumstances; and |
| | • | | Long-term growth, with a degree of emphasis on stable growth, rather than short-term capital gains. |
Our pension expense and pension liability are actuarially determined, and we use various actuarial assumptions, including the discount rate, rate of salary increase, and expected return on assets to estimate our pension costs and obligations. We determine the expected return on plan assets based on our pension plans’ actual asset mix as of the beginning of the year. The expected investment return assumption used for the pension plans reflects what the plans can reasonably expect to earn over a long-term period considering plan target allocations. The expected return includes an inflation assumption and adds real returns for the asset mix and a premium for active management, and subtracts expenses. While the assumed expected rate of return on plan assets in 2007 was 8.0%, the actual return experienced in our pension plan assets in the comparable period in 2007 was 14.6%. We consult with the plans’ actuaries to determine a discount rate assumption for pension and other postretirement and post-employment plans that reflects the characteristics of our plans, including expected cash outflows from our plans, and utilize an analytical tool that incorporates the concept of a hypothetical yield curve, developed from corporate bond (Aa quality) yield information.
Our pension obligations are funded in accordance with provisions of Federal law. Contributions to our pension and post-employment plans in 2007 totaled $12.4 million and $3.1 million, respectively. We expect contributions to our pension and post-employment plans in 2008 to be approximately $9.1 million and $3.0 million, respectively.
The projected benefit obligation, accumulated benefit obligation and fair value of plan assets for pension plans with an accumulated benefit obligation in excess of plan assets were as follows:
| | | | | | |
| | | Pension Plans |
| | 2007 | | 2006 |
| Dollars in millions | | | | |
| | |
Projected benefit obligation, end of year | | $ | 173.9 | | $ | 180.4 |
| | |
Accumulated benefit obligation, end of year | | $ | 163.4 | | $ | 171.1 |
| | |
Fair value of plan assets, end of year | | $ | 137.1 | | $ | 119.2 |
Assumed health care cost trend rates have a significant effect on the amounts reported for health care plans. A 1% change in the medical trend rate would have the following effects at December 31, 2007:
| | | | | | | |
| | | 1% Increase | | 1% Decrease | |
| Dollars in millions | | | | | |
| | |
Total service and interest cost components | | $ | 0.1 | | $ | (0.1 | ) |
| | |
Postretirement benefit obligation | | | 0.7 | | | (0.7 | ) |
We estimate that the future benefits payable for the pension and other postretirement plans are as follows:
| | | | | | |
| | | Pension Plans | | Health Care and
Other Plans |
| Dollars in millions | | | | |
| | |
2008 | | $ | 9.8 | | $ | 3.0 |
| | |
2009 | | | 10.1 | | | 2.9 |
| | |
2010 | | | 11.4 | | | 2.8 |
| | |
2011 | | | 12.3 | | | 2.8 |
| | |
2012 | | | 13.2 | | | 2.8 |
| | |
2013-2017 | | | 77.7 | | | 12.5 |
41
Defined Contribution Plans
We sponsor a defined contribution plan under Section 401(k) of the Internal Revenue Code covering all U.S. salaried and hourly employees, and a defined contribution plan in Taiwan covering most salaried and hourly employees of our Taiwan subsidiary. Our costs included in results of operations totaled $5.6 million, $5.4 million and $4.5 million for 2007, 2006 and 2005, respectively.
Other Employee-Related Liabilities
Employees of our subsidiaries in Italy and Korea are covered by an end of service entitlement that provides payment upon termination of employment. Contributions to these plans are based on statutory requirements and are not actuarially determined. The accrued liability was $35.1 million at December 31, 2007 and $34.9 million at December 31, 2006, and is included in other long-term liabilities and accrued wages and salaries on our balance sheet. The accrued liability is based on the vested benefits to which the employee is entitled assuming employee termination at the measurement date.
16. COMMITMENTS AND CONTINGENCIES
Leases and Purchase Obligations
We lease buildings, equipment and automobiles under operating leases. Rental expense was $5.2 million, $5.3 million and $5.3 million in 2007, 2006 and 2005, respectively. The total future commitment under operating leases as of December 31, 2007 was $13.1 million, of which $11.9 million is noncancellable. Our operating lease obligations as of December 31, 2007 were as follows:
| | | | | | | | | | | | | | |
| | | Payments Due By Period |
| | Total | | 2008 | | 2009 | | 2010 | | 2011 | | 2012 | | Thereafter |
| Dollars in millions | | | | | | | | | | | | | | |
Operating Leases | | $13.1 | | $4.3 | | $3.0 | | $2.0 | | $1.7 | | $1.6 | | $0.5 |
Indemnification
We have agreed to indemnify some of our customers against claims of infringement of the intellectual property rights of others in our sales contracts with these customers. Historically, we have not paid any claims under these indemnification obligations and we do not have any pending indemnification claims.
Legal Proceedings
We are involved in various legal proceedings which arise in the ordinary course of business. Although it is not possible to predict the outcome of these matters, we believe that the ultimate outcome of these proceedings, individually and in the aggregate, will not have a material adverse effect on our financial position, cash flows or results of operations.
17. GEOGRAPHIC SEGMENTS
We are engaged in one reportable segment—the design, manufacture and sale of silicon wafers.
Geographic financial information is as follows:
Net Sales to Customers:
| | | | | | | | | |
| | | 2007 | | 2006 | | 2005 |
| Dollars in millions | | | | | | |
| | | |
United States | | $ | 462.0 | | $ | 521.3 | | $ | 344.1 |
| | | |
Foreign | | | 1,459.8 | | | 1,019.3 | | | 763.3 |
| | | | | | | | | |
| | | |
Total | | $ | 1,921.8 | | $ | 1,540.6 | | $ | 1,107.4 |
| | | | | | | | | |
42
Foreign revenues were derived from sales to the following countries:
| | | | | | | | | |
| | | 2007 | | 2006 | | 2005 |
| Dollars in millions | | | | | | |
| | | |
China | | $ | 405.0 | | $ | 218.1 | | $ | 37.2 |
| | | |
Japan | | | 94.5 | | | 74.7 | | | 91.9 |
| | | |
Korea | | | 299.7 | | | 188.1 | | | 184.2 |
| | | |
Taiwan | | | 324.9 | | | 273.4 | | | 225.4 |
| | | |
Other foreign countries | | | 335.7 | | | 265.0 | | | 224.6 |
| | | | | | | | | |
| | | |
Total | | $ | 1,459.8 | | $ | 1,019.3 | | $ | 763.3 |
| | | | | | | | | |
Net sales are attributed to countries based on the location of the customer.
Our net sales attributable to polysilicon for the years ended December 31, 2007, 2006 and 2005 were 22.5%, 18.5% and 9.6% as a percent of total sales, respectively.
Long-Lived Assets, net of accumulated depreciation:
| | | | | | | | | |
| | | 2007 | | 2006 | | 2005 |
| Dollars in millions | | | | | | |
| | | |
United States | | $ | 351.9 | | $ | 185.0 | | $ | 159.3 |
| | | |
Japan | | | 162.1 | | | 163.1 | | | 176.8 |
| | | |
Korea | | | 71.0 | | | 65.1 | | | 58.6 |
| | | |
Taiwan | | | 225.5 | | | 175.6 | | | 106.9 |
| | | |
Other foreign countries | | | 79.2 | | | 69.9 | | | 44.7 |
| | | | | | | | | |
| | | |
Total | | $ | 889.7 | | $ | 658.7 | | $ | 546.3 |
| | | | | | | | | |
18. UNAUDITED QUARTERLY FINANCIAL INFORMATION
| | | | | | | | | | | | | | | |
2007 | | First
Quarter | | | Second
Quarter | | | Third
Quarter | | Fourth
Quarter | |
| Dollars in millions, except per share data | | | | | | | | | | | |
| | | | |
Net sales | | $ | 440.4 | | | $ | 472.7 | | | $ | 472.8 | | $ | 535.9 | |
| | | | |
Gross margin | | | 222.5 | | | | 245.6 | | | | 238.8 | | | 293.6 | |
| | | | |
Income before minority interests | | | 136.1 | | | | 164.9 | | | | 151.2 | | | 377.4 | |
| | | | |
Minority interests | | | (1.4 | ) | | | (1.3 | ) | | | 0.3 | | | (1.0 | ) |
| | | | |
Net income | | | 134.7 | | | | 163.6 | | | | 151.5 | | | 376.4 | |
| | | | |
Basic income per share | | | 0.60 | | | | 0.73 | | | | 0.67 | | | 1.65 | |
| | | | |
Diluted income per share | | | 0.58 | | | | 0.70 | | | | 0.65 | | | 1.62 | |
| | | | |
Market close stock prices: | | | | | | | | | | | | | | | |
| | | | |
High | | | 63.60 | | | | 67.43 | | | | 63.64 | | | 94.02 | |
| | | | |
Low | | | 40.29 | | | | 54.09 | | | | 53.34 | | | 59.17 | |
43
A gain/(loss) of $(1.1) million, $7.9 million, $9.3 million and $204.7 million was recorded to other nonoperating income in the quarters ended March 31, June 30, September 30 and December 31, 2007, respectively, due to the mark to market adjustment related to a warrant received from a customer in 2006 as discussed in Note 2(m) above.
| | | | | | | | | | | | | | | | |
2006 | | First
Quarter | | | Second
Quarter | | | Third
Quarter | | | Fourth
Quarter | |
| Dollars in millions, except per share data | | | | | | | | | | | | |
| | | | |
Net sales | | $ | 341.5 | | | $ | 370.5 | | | $ | 408.0 | | | $ | 420.6 | |
| | | | |
Gross margin | | | 132.7 | | | | 160.4 | | | | 192.6 | | | | 203.3 | |
| | | | |
Income before minority interests | | | 68.3 | | | | 83.3 | | | | 93.6 | | | | 130.5 | |
| | | | |
Minority interests | | | (1.0 | ) | | | (1.4 | ) | | | (2.5 | ) | | | (1.5 | ) |
| | | | |
Net income | | | 67.3 | | | | 81.9 | | | | 91.1 | | | | 129.0 | |
| | | | |
Basic income per share | | | 0.30 | | | | 0.37 | | | | 0.41 | | | | 0.58 | |
| | | | |
Diluted income per share | | | 0.29 | | | | 0.36 | | | | 0.40 | | | | 0.56 | |
| | | | |
Market close stock prices: | | | | | | | | | | | | | | | | |
| | | | |
High | | | 38.19 | | | | 48.75 | | | | 40.67 | | | | 43.55 | |
| | | | |
Low | | | 23.40 | | | | 30.54 | | | | 27.21 | | | | 33.89 | |
A loss of $2.4 million and a gain of $21.3 million was recorded to other nonoperating income due to the mark to market adjustment related to a warrant received from a customer in the quarters ended September 30, 2006 and December 31, 2006, respectively as discussed in Note 2(m) above.
44
Report of Independent Registered Public Accounting Firm
The Board of Directors and Stockholders
MEMC Electronic Materials, Inc.:
We have audited the accompanying consolidated balance sheets of MEMC Electronic Materials, Inc. and subsidiaries (the Company) as of December 31, 2007 and 2006, and the related consolidated statements of operations, stockholders’ equity, and cash flows for each of the years in the three-year period ended December 31, 2007. We also have audited the Company’s internal control over financial reporting as of December 31, 2007, based on criteria established inInternal Control—Integrated Framework issued by the Committee of Sponsoring Organizations of the Treadway Commission (COSO). The Company’s management is responsible for these consolidated financial statements, for maintaining effective internal control over financial reporting, and for its assessment of the effectiveness of internal control over financial reporting. Our responsibility is to express an opinion on these consolidated financial statements and an opinion on the Company’s internal control over financial reporting based on our audits.
We conducted our audits in accordance with the standards of the Public Company Accounting Oversight Board (United States). Those standards require that we plan and perform the audits to obtain reasonable assurance about whether the financial statements are free of material misstatement and whether effective internal control over financial reporting was maintained in all material respects. Our audits of the consolidated financial statements included examining, on a test basis, evidence supporting the amounts and disclosures in the financial statements, assessing the accounting principles used and significant estimates made by management, and evaluating the overall financial statement presentation. Our audit of internal control over financial reporting included obtaining an understanding of internal control over financial reporting, assessing the risk that a material weakness exists, and testing and evaluating the design and operating effectiveness of internal control based on the assessed risk. Our audits also included performing such other procedures as we considered necessary in the circumstances. We believe that our audits provide a reasonable basis for our opinions.
A company’s internal control over financial reporting is a process designed to provide reasonable assurance regarding the reliability of financial reporting and the preparation of financial statements for external purposes in accordance with U.S. generally accepted accounting principles. A company’s internal control over financial reporting includes those policies and procedures that (1) pertain to the maintenance of records that, in reasonable detail, accurately and fairly reflect the transactions and dispositions of the assets of the company; (2) provide reasonable assurance that transactions are recorded as necessary to permit preparation of financial statements in accordance with generally accepted accounting principles, and that receipts and expenditures of the company are being made only in accordance with authorizations of management and directors of the company; and (3) provide reasonable assurance regarding prevention or timely detection of unauthorized acquisition, use, or disposition of the company’s assets that could have a material effect on the financial statements.
Because of its inherent limitations, internal control over financial reporting may not prevent or detect misstatements. Also, projections of any evaluation of effectiveness to future periods are subject to the risk that controls may become inadequate because of changes in conditions, or that the degree of compliance with the policies or procedures may deteriorate.
In our opinion, the consolidated financial statements referred to above present fairly, in all material respects, the financial position of MEMC Electronic Materials, Inc. and subsidiaries as of December 31, 2007 and 2006, and the results of its operations and its cash flows for each of the years in the three-year period ended December 31, 2007, in conformity with accounting principles generally accepted in the United States of America. Also in our opinion, MEMC Electronic Materials, Inc. and subsidiaries maintained, in all material respects, effective internal control over financial reporting as of December 31, 2007, based on criteria established inInternal Control—Integrated Framework issued by the COSO.
As discussed in Note 2 to the consolidated financial statements, the Company adopted Financial Accounting Standards Board Interpretation No. 48, “Accounting for Uncertainty in Income Taxes, an interpretation of Statement of Financial Accounting Standard No. 109” effective January 1, 2007.
As discussed in Note 2 to the consolidated financial statements, the Company adopted Statement of Financial Accounting Standards (SFAS) No. 123(R), “Share-Based Payment” effective January 1, 2006.
As discussed in Note 2 to the consolidated financial statements, the Company adopted SFAS No. 158, “Employers’ Accounting for Defined Benefit Pension and Other Postretirement Plans” effective December 31, 2006, and the Company changed its method of quantifying errors in 2006.
/s/ KPMG LLP
St. Louis, Missouri
February 28, 2008
45
| Item 9A. | Controls and Procedures |
(a) Evaluation of Disclosure Controls and Procedures
We carried out an evaluation as of December 31, 2007, under the supervision and with the participation of our management, including our Chief Executive Officer and Chief Financial Officer, of the effectiveness of the design and operation of our disclosure controls and procedures, as defined in Rules 13-15(e) and 15d-15(e) under the Securities Exchange Act of 1934, as amended. Based upon that evaluation, our Chief Executive Officer and Chief Financial Officer have concluded that our disclosure controls and procedures were effective as of December 31, 2007.
(b) Management’s Report on Internal Control Over Financial Reporting
Our management is responsible for establishing and maintaining adequate internal control over financial reporting as defined in Rules 13a-15(f) and 15d-15(f) under the Securities Exchange Act of 1934. Our internal control over financial reporting is designed to provide reasonable assurance regarding the reliability of financial reporting and the preparation of financial statements for external purposes in accordance with U.S. generally accepted accounting principles.
As of December 31, 2007, management conducted an assessment of the effectiveness of the Company’s internal control over financial reporting based upon the framework issued by the Committee of Sponsoring Organizations of the Treadway Commission inInternal Control—Integrated Framework. Based on management’s assessment utilizing these criteria, we believe that, as of December 31, 2007, our internal control over financial reporting was effective.
(c) Changes in Internal Control Over Financial Reporting
There have been no changes in the Company’s internal control over financial reporting during the most recently completed fiscal quarter and year ended December 31, 2007 that have materially affected, or are reasonably likely to materially affect, the Company’s internal control over financial reporting.
46