Exhibit 13
Five Year Selected Financial Highlights
The following data has been derived from our annual consolidated financial statements, including the consolidated balance sheets and the related consolidated statements of operations, cash flows, and stockholders’ equity and the notes thereto. The information below should be read in conjunction with our consolidated financial statements and notes thereto including Note 2 related to significant accounting policies.
| | | | | | | | | | | | | | | | | | |
| | | 2009(1) | | | 2008 | | 2007 | | | 2006 | | | 2005 |
| (in millions, except per share and employment data) | | | | | | | | | | | | | |
Statement of Operations Data: | | | | | | | | | | | | | | | | | | |
| | | | | |
Net sales | | $ | 1,163.6 | | | $ | 2,004.5 | | $ | 1,921.8 | | | $ | 1,540.6 | | | $ | 1,107.4 |
| | | | | |
Gross profit | | | 128.1 | | | | 1,004.8 | | | 1,000.5 | | | | 689.0 | | | | 366.5 |
| | | | | |
Marketing and administration(2) | | | 161.9 | | | | 106.5 | | | 111.3 | | | | 94.9 | | | | 76.3 |
| | | | | |
Research and development | | | 40.4 | | | | 40.8 | | | 39.3 | | | | 35.8 | | | | 33.2 |
| | | | | |
Restructuring and impairment costs(3) | | | 53.0 | | | | 4.3 | | | — | | | | — | | | | — |
| | | | | |
Operating (loss) income | | | (127.2 | ) | | | 853.2 | | | 849.9 | | | | 558.3 | | | | 257.0 |
| | | | | |
Non-operating (income) expense(4) | | | (27.0 | ) | | | 268.2 | | | (261.9 | ) | | | (32.2 | ) | | | 4.6 |
| | | | | |
Net (loss) income attributable to MEMC stockholders (5) | | | (68.3 | ) | | | 387.4 | | | 826.2 | | | | 369.3 | | | | 249.4 |
| | | | | |
Basic (loss) income per share | | | (0.31 | ) | | | 1.71 | | | 3.66 | | | | 1.66 | | | | 1.17 |
| | | | | |
Diluted (loss) income per share | | | (0.31 | ) | | | 1.69 | | | 3.56 | | | | 1.61 | | | | 1.10 |
| | | | | |
Balance Sheet Data: | | | | | | | | | | | | | | | | | | |
| | | | | |
Cash, cash equivalents, restricted cash and short-term and long-term investments | | | 1,074.6 | | | | 1,421.4 | | | 1,329.1 | | | | 588.2 | | | | 153.9 |
| | | | | |
Working capital | | | 740.5 | | | | 981.6 | | | 1,145.3 | | | | 641.7 | | | | 211.4 |
| | | | | |
Total assets | | | 3,566.5 | | | | 2,936.7 | | | 2,887.2 | | | | 1,765.5 | | | | 1,148.1 |
| | | | | |
Long-term debt and capital lease obligations (including current portion) | | | 416.6 | | | | 32.2 | | | 30.9 | | | | 34.4 | | | | 39.9 |
| | | | | |
Total MEMC Stockholders’ equity | | | 2,168.6 | | | | 2,082.0 | | | 2,035.0 | | | | 1,166.9 | | | | 711.3 |
| | | | | |
Other Data: | | | | | | | | | | | | | | | | | | |
| | | | | |
Capital expenditures and construction of solar energy systems | | | 253.4 | | | | 303.6 | | | 276.4 | | | | 148.4 | | | | 162.7 |
| | | | | |
Employees | | | 5,100 | | | | 4,900 | | | 5,400 | | | | 5,500 | | | | 5,400 |
| (1) | On November 20, 2009, we completed the acquisition of Sun Edison LLC (“SunEdison”). Results of operations subsequent to the acquisition date and SunEdison’s assets as of December 31, 2009 are included in the consolidated financial data above. |
| (2) | Effective January 1, 2006, we adopted the fair value recognition provisions for share-based payments. Our stock-based compensation expense recorded to marketing and administration expense was $27.3 million, $19.4 million and $25.1 million, $13.1 million in 2009, 2008, 2007 and 2006, respectively. The amount recorded to marketing and administration expense during 2005 was less than $4 million. |
| (3) | Restructuring and impairment costs include $4.3 million in 2008 previously included in Marketing and administration expenses. |
| (4) | Gains (losses) of $5.4 million, ($292.5) million and $220.8 million were recorded to non-operating income (expense) in 2009, 2008 and 2007, respectively, due to the mark to market adjustment related to a warrant received from a customer. |
| (5) | During 2009, we increased our reserve for uncertain tax positions and tax expense by $18.1 million, including related interest, related to various cost allocations and taxable income adjustments attributable to our foreign operations. During 2008, we decreased our reserve for uncertain tax positions and related income tax expense by $29.5 million due to the closure of the Internal Revenue Service examination in the United States of the 2004 and 2005 audit years. During 2005, we reversed $67.1 million of valuation allowances related to deferred tax assets. This represented the reversal of all remaining valuation allowances on deferred tax assets at that time. |
1
Management’s Discussion and Analysis of Financial Condition and Results of Operations
EXECUTIVE OVERVIEW
On November 20, 2009, we completed the acquisition of Sun Edison LLC (“SunEdison”). MEMC acquired all of the outstanding membership units in SunEdison for a purchase price of approximately $314.6 million consisting of cash, the issuance of MEMC common stock and contingent consideration. As a result of the acquisition, SunEdison became a wholly owned subsidiary of MEMC Holdings Corporation, which is a wholly owned subsidiary of MEMC.
Prior to the acquisition, we were engaged in one reportable segment—the design, manufacture and sale of silicon wafers. With the acquisition of SunEdison, we now also participate in the development and maintenance of solar energy systems and the sale of solar energy. Effective with the SunEdison acquisition, we were engaged in two reportable segments: Materials Business (includes the historical operations of MEMC) and Solar Energy Business (consists solely of SunEdison).
Our Materials Business was greatly affected by reduced consumer spending, limited access to credit and other effects of the macroeconomic environment in 2009. In the semiconductor market, all of this, combined with above normal inventory levels at our customers at the beginning of 2009, resulted in a significant reduction in wafer demand in 2009 compared to the prior year, resulting in lower volumes and pricing for our products.
While volumes for solar wafers in our Materials Business increased in 2009 due to incremental market share gains, a lack of financing for solar projects and continued oversupply of polysilicon contributed to pricing pressure on solar products throughout the value chain. Polysilicon revenues also continued to decline in 2009 compared to 2008 because we made a strategic decision to allocate more raw polysilicon to our wafering operations to meet customer needs as well as due to pricing declines caused by the oversupply discussed above. The combination of lower demand and subsequent lower prices resulted in gross profit being negatively impacted. Polysilicon revenues declined to less than 5% of total sales in 2009.
Although our 2009 fourth quarter revenues continued the downward trend compared to the same period in 2008, sequentially we saw the third quarterly improvement in revenue. As of year end 2009, pricing pressure moderated, product volumes continued to increase and our competitive position is improving.
During this economic downturn, we continue to evaluate our manufacturing capabilities to identify opportunities that could allow us to improve our efficiency in overall manufacturing costs and more effectively serve our customers. In 2009, we announced the termination or eventual termination of just over 1,000 manufacturing employees at our St. Peters, Missouri and Sherman, Texas facilities and our Japanese and Korean subsidiaries. The purpose of the workforce reductions was to better align our costs with short and long-term demand, as well as strategically position our manufacturing facilities geographically closer to a number of our customers. In addition, we continue to invest for growth by expanding our polysilicon manufacturing capabilities and initiating a project to build a solar wafer manufacturing plant.
During the third quarter of 2009, we amended two of our long-term solar wafer supply agreements. Under the amendments, the potential aggregate revenues to MEMC under the agreements in 2009 and over the remaining term of the agreements remain unchanged, but volume increases and price reductions for the remainder of 2009 were effectuated. The amendments also provide a deferral mechanism for a 2009 purchase shortfall by the customers (from the increased volume commitment), by allowing the customers to make up the purchase shortfall in subsequent years.
In January 2010, we reached an out of court settlement of a lawsuit related to our long-term solar wafer supply agreement with Conergy AG (“Conergy”). At the same time, we amended this agreement with Conergy, which amendment included a significant reduction in the minimum quantity of wafers that Conergy must purchase over the remaining eight plus years of the agreement, as well as a minimum market share commitment should Conergy’s demand exceed the reduced quantities. The amendment also modifies the pricing terms to be based on market rates similar to other MEMC long-term solar wafer supply agreements. The amendment includes MEMC permanently retaining a portion of the refundable deposits currently held by us.
In order to reduce our concentration of solar wafer customers, we continue to diversify our customer base by serving additional solar wafer customers beyond our long-term solar wafer supply agreements. By the fourth quarter of 2009, approximately 33% of our solar wafer sales were made to customers with whom we did not have long-term agreements.
In the 2009 third quarter, we finalized a formal joint venture agreement with Q-Cells SE (“Q-Cells”) for the purpose of building large scale solar energy systems. Each party has invested approximately $101.6 million in the venture in 2009. The joint venture company contracts with Q-Cells International to develop, acquire and build the plants. The first solar power plant project was fully constructed in the fourth quarter of 2009 and a contract was executed to sell it to a third party.
2
RESULTS OF OPERATIONS
As discussed in “Financial Condition” below, MEMC acquired SunEdison on November 20, 2009 for $314.6 million. Our results of operations for 2009 include the results of SunEdison from November 21, 2009 through December 31, 2009, which did not have a significant impact to the MEMC consolidated results of operations for the year ended December 31, 2009.
| | | | | | | | | | | | |
Net Sales | | 2009 | | | 2008 | | | 2007 | |
| Dollars in millions | | | | | | | | | |
| | | |
Materials Business: | | | | | | | | | | | | |
| | | |
Net Sales | | $ | 1,159.8 | | | $ | 2,004.5 | | | $ | 1,921.8 | |
| | | |
Percentage Change | | | (42 | )% | | | 4 | % | | | 25 | % |
| | | |
Solar Energy Business: | | | | | | | | | | | | |
Net Sales | | $ | 3.8 | | | $ | — | | | $ | — | |
| | | | | | | | | | | | |
| | | |
Total: | | | | | | | | | | | | |
| | | |
Net Sales | | $ | 1,163.6 | | | $ | 2,004.5 | | | $ | 1,921.8 | |
| | | |
Percentage Change | | | (42 | )% | | | 4 | % | | | 25 | % |
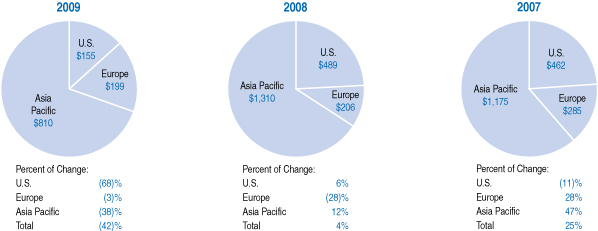
The decrease in our Materials Business sales in 2009 compared to the prior year was primarily the result of pricing decreases of $729.2 million and volume decreases of $121.1 million. Price and volume declines occurred in nearly all products, except for 156 millimeter wafers where we experienced increases of approximately 34% in volumes compared to the prior year. Our overall wafer average selling prices were approximately 45% lower than the overall wafer average selling prices for 2008. This was due to price decreases for all wafers, and to a lesser extent, increases in volumes for 156 millimeter wafers, which have a lower average selling price per wafer. The decrease in sales also resulted from a decrease in polysilicon selling prices which were lower in the current period by approximately 77% compared to the average polysilicon selling prices for 2008, as well as lower volumes. Raw polysilicon sales are expected to remain low as our wafer sales grow and amounted to only 3% in 2009, down from 19% in 2008. While semiconductor demand was down year over year, we have recently seen increases in short-term demand. The significant declines we experienced in short-term pricing for solar wafers in 2009 are expected to moderate in 2010.
Our net sales increased by 4% to $2,004.5 million in 2008 from $1,921.8 million in 2007. This increase was driven by increases in product volumes totaling $108.7 million. Volumes for both 156 millimeter and 300 millimeter wafer shipments increased but were offset by decreases in volumes of all other products, including polysilicon. During 2008, sales for solar applications reached $1 billion. The overall increase in net sales was negatively impacted by pricing decreases of $49.5 million, driven by price decreases for semiconductor wafers, which were only partially offset by price increases for 156 millimeter wafers and intermediate products such as polysilicon, silane gas, ingots and scrap wafers. Our 2008 overall wafer average selling prices were approximately 43% lower than the average selling prices for 2007. This was due to a change in product mix, primarily attributable to the increase in 156 millimeter wafer shipments in 2008, which have a lower average selling price per wafer, as well as price decreases for nearly all diameters of semiconductor wafers. Sales of our excess polysilicon raw material amounted to approximately 19% and 22% of total sales in 2008 and 2007, respectively. Polysilicon selling prices for the year were approximately 15% higher than the average polysilicon selling prices for 2007.
3
We operate in all the major semiconductor and solar-producing regions of the world, with approximately 87% of our 2009 net sales to customers located outside the United States. Net sales by geographic region for each of the last three years were as follows:
Net Sales by Geographic Area:
Dollars in millions
| | | | | | | | | | | | |
Gross Profit | | 2009 | | | 2008 | | | 2007 | |
| Dollars in millions | | | | | | | | | |
| | | |
Materials Business: | | | | | | | | | | | | |
| | | |
Cost of Goods Sold | | $ | 1,032.8 | | | $ | 999.7 | | | $ | 921.3 | |
| | | |
Gross Profit | | | 127.0 | | | | 1,004.8 | | | | 1,000.5 | |
| | | |
Gross Margin Percentage | | | 11 | % | | | 50 | % | | | 52 | % |
| | | |
Solar Energy Business: | | | | | | | | | | | | |
| | | |
Cost of Goods Sold | | $ | 2.7 | | | $ | — | | | $ | — | |
| | | |
Gross Profit | | | 1.1 | | | | — | | | | — | |
| | | |
Gross Margin Percentage | | | 29 | % | | | — | | | | — | |
| | | | | | | | | | | | |
| | | |
Total: | | | | | | | | | | | | |
| | | |
Cost of Goods Sold | | $ | 1,035.5 | | | $ | 999.7 | | | $ | 921.3 | |
| | | |
Gross Profit | | | 128.1 | | | | 1,004.8 | | | | 1,000.5 | |
| | | |
Gross Margin Percentage | | | 11 | % | | | 50 | % | | | 52 | % |
The decline in our Materials Business gross profit dollars and gross margin percentage for the year ended December 31, 2009 was primarily due to decreased wafer and polysilicon pricing and reduced volumes discussed above. Decreases in 2009 gross profit were also the result of increased costs compared to 2008 related to a lower of cost or market adjustment on our inventory of $2.2 million and increased charges for an adverse annual long-term purchase obligation of $2.2 million compared to the prior year. Finally, our factories were running at less than optimal manufacturing rates, resulting in higher per unit costs compared to the prior year periods.
In 2008 our gross profit increased to $1,004.8 million from $1,000.5 million in 2007 primarily due to improved volume and mix of 156 millimeter wafers and 300 millimeter wafers, partially offset by pricing declines as described above. The decrease in gross margin percentage of 2% is primarily the result of overall price declines across most diameters and decreases in polysilicon and intermediate product volumes, as well as the impact of abnormal costs of approximately $16 million in 2008 due to an adverse annual long-term purchase obligation and unallocated fixed overhead costs.
4
| | | | | | | | | | | | |
Marketing and Administration | | 2009 | | | 2008 | | | 2007 | |
| Dollars in millions | | | | | | | | | |
| | | |
Materials Business: | | | | | | | | | | | | |
| | | |
Marketing and Administration | | $ | 150.6 | | | $ | 106.5 | | | $ | 111.3 | |
| | | |
As a Percentage of Materials Business Net Sales | | | 13 | % | | | 5 | % | | | 6 | % |
| | | |
Solar Energy Business: | | | | | | | | | | | | |
| | | |
Marketing and Administration | | $ | 11.3 | | | $ | — | | | $ | — | |
| | | |
As a Percentage of Solar Energy Business Net Sales | | | 297 | % | | | — | | | | — | |
| | | | | | | | | | | | |
| | | |
Total: | | | | | | | | | | | | |
| | | |
Marketing and Administration | | $ | 161.9 | | | $ | 106.5 | | | $ | 111.3 | |
| | | |
As a Percentage of Consolidated Net Sales | | | 14 | % | | | 5 | % | | | 6 | % |
The increase in marketing and administration expenses for our Materials Business for the year ended December 31, 2009 resulted from pre-operating start-up costs for our new manufacturing facility in Ipoh, Malaysia of $14.1 million, increased legal professional services costs of $5.2 million and increased selling costs of $4.6 million. Additional increases include an $8.8 million accrual for a lawsuit we recorded in the second quarter of 2009 compared to net favorable legal settlements in the prior year of $4.3 million. Excluding a benefit in 2008 recognized upon the resignation of a former executive officer of $15.5 million, our stock compensation expense decreased $9.2 million in 2009 compared to the prior year.
Marketing and administration expenses were $106.5 million in 2008 compared to $111.3 million in 2007. The change was primarily due to a decrease in stock compensation expense of $5.7 million driven by the forfeiture of stock options related to the resignation of a former executive officer of $15.5 million, slightly offset by the adjustment of estimated forfeiture rates and new award grants. The change was also due to an additional $5.7 million recorded to our allowance for doubtful accounts compared to the prior year and net favorable legal settlements of $4.3 million.
| | | | | | | | | | | | |
Research and Development | | 2009 | | | 2008 | | | 2007 | |
| Dollars in millions | | | | | | | | | |
| | | |
Materials Business: | | | | | | | | | | | | |
| | | |
Research and Development | | $ | 40.2 | | | $ | 40.8 | | | $ | 39.3 | |
| | | |
As a Percentage of Materials Business Net Sales | | | 3 | % | | | 2 | % | | | 2 | % |
| | | |
Solar Energy Business: | | | | | | | | | | | | |
| | | |
Research and Development | | $ | 0.2 | | | $ | — | | | $ | — | |
| | | |
As a Percentage of Solar Energy Business Net Sales | | | 5 | % | | | — | | | | — | |
| | | | | | | | | | | | |
| | | |
Total: | | | | | | | | | | | | |
| | | |
Research and Development | | $ | 40.4 | | | $ | 40.8 | | | $ | 39.3 | |
| | | |
As a Percentage of Consolidated Net Sales | | | 3 | % | | | 2 | % | | | 2 | % |
R&D expenses in our Materials Business consisted mainly of product and process development efforts to increase our capability in the areas of flatness, particles and crystal defectivity. During 2009, we shifted our silicon-on-insulator project from R&D to the production phase, which contributed to the decrease in spending compared to the prior year. Our research and development expenses increased to $40.8 million in 2008 compared to $39.3 million in 2007 mainly due to increased raw material and labor costs on next generation products and higher patent-related professional fees.
| | | | | | | | | | | |
Restructuring and Impairment Costs | | 2009 | | | 2008 | | | 2007 |
| Dollars in millions | | | | | | | | |
| | | |
Materials Business: | | | | | | | | | | | |
| | | |
Restructuring and Impairment Costs | | $ | 53.0 | | | $ | 4.3 | | | $ | — |
| | | |
As a Percentage of Materials Business Net Sales | | | 5 | % | | | 0.2 | % | | | — |
In order to better align manufacturing capabilities to projected manufacturing needs for the Materials Business, MEMC committed to workforce reductions during the second quarter of 2008 (the “2008 Plan”) and again in the first and second quarters of 2009 (the “2009 Global Plan”). In September 2009, MEMC committed to actions to reduce manufacturing costs by shifting manufacturing from our St. Peters, Missouri and Sherman, Texas facilities to other locations which are closer to a number of MEMC’s customers in the Asia Pacific region (the “2009 US Plan”).
5
The 2009 Global Plan actions reduced our workforce by approximately 500 employees, from 4,800 prior to the reductions. Severance and other costs associated with this plan totaled $12.3 million in 2009. We expect that the 2009 Global Plan reductions in force will result in annualized cost savings of approximately $30 million, primarily in cost of goods sold, because a majority of those affected are manufacturing facility employees. We began realizing some of these savings in the second quarter of 2009.
The 2009 US Plan actions are expected to affect approximately 540 employees in the United States. MEMC will provide severance benefits to those employees who will be terminated, and expects to incur total severance charges related to the terminations of approximately $19 million. We recorded $16.1 million of these charges in 2009 and expect to make the related severance payments at the time of the final production dates for the facilities through the second quarter of 2011. We also anticipate charges of approximately $15.6 million for other related move costs and contract terminations associated with the closings will be expensed as incurred until the final production date in the respective U.S. facilities. In total, we estimate we will incur approximately $34.6 million in cash costs classified as restructuring expenses associated with these announcements. We estimate that the facility closings will result in an annualized savings beginning in the third quarter of 2010 of approximately $10 million, rising to approximately $55 million of annualized savings beginning in the second quarter of 2011.
Due to the significance of the actions announced as part of the 2009 US Plan discussed above, we performed an asset impairment analysis of our St. Peters, Missouri and Sherman, Texas long-lived manufacturing asset groups during the third quarter of 2009. This analysis resulted in asset impairment charges of $24.6 million in the third quarter of 2009 related to these long-lived manufacturing asset groups. These charges were recorded in restructuring and impairment costs in our condensed consolidated statements of operations.
| | | | | | | | | | | | |
Non-operating (Income) Expense | | 2009 | | | 2008 | | | 2007 | |
| Dollars in millions | | | | | | | | | |
| | | |
Materials Business: | | | | | | | | | | | | |
| | | |
Interest Expense | | $ | 2.2 | | | $ | 1.8 | | | $ | 1.4 | |
| | | |
Interest Income | | | (26.5 | ) | | | (46.4 | ) | | | (45.0 | ) |
| | | |
Decline (Increase) in Fair Value of Warrant | | | (5.4 | ) | | | 292.5 | | | | (220.8 | ) |
| | | |
Other, Net | | | 1.0 | | | | 20.3 | | | | 2.5 | |
| | | | | | | | | | | | |
| | | |
Total | | $ | (28.7 | ) | | $ | 268.2 | | | $ | (261.9 | ) |
| | | |
Solar Energy Business: | | | | | | | | | | | | |
| | | |
Interest Expense | | $ | 1.8 | | | $ | — | | | $ | — | |
| | | |
Interest Income | | | — | | | | — | | | | — | |
| | | |
Other, Net | | | (0.1 | ) | | | — | | | | — | |
| | | | | | | | | | | | |
| | | |
Total | | $ | 1.7 | | | $ | — | | | $ | — | |
| | | | | | | | | | | | |
| | | |
Consolidated Total | | $ | (27.0 | ) | | $ | 268.2 | | | $ | (261.9 | ) |
| | | | | | | | | | | | |
Interest income relates to returns on cash equivalents, restricted cash and investments. Interest income was lower in 2009 compared to 2008 and 2007 due to lower average cash equivalent and investment balances throughout the year as we adjusted our portfolio of investments to fund current and future operations and acquisitions.
Decline (increase) in fair value of warrant represents the mark-to-market adjustment for a warrant received from Suntech Power Holdings (“Suntech”). We recorded an increase in the estimated fair value of the warrant of $5.4 million in 2009 compared to a decrease of $292.5 million in 2008 and an increase of $220.8 million in 2007. The change in the estimated fair value of the warrant is driven by the change in the price of Suntech’s ordinary shares, which had a price per share of $16.63, $11.70 and $82.32 at December 31, 2009, 2008 and 2007, respectively.
Other, net expense for the Materials Business in 2009 and 2008 included $2.3 million and $14.5 million, respectively, of other than temporary impairments on our investments. There were no other than temporary impairments on our investments in 2007.
6
| | | | | | | | | | | | |
Income Taxes | | 2009 | | | 2008 | | | 2007 | |
| Dollars in millions | | | | | | | | | |
| | | |
Materials Business: | | | | | | | | | | | | |
| | | |
Income Tax (Benefit) Expense | | $ | (38.5 | ) | | $ | 195.4 | | | $ | 282.2 | |
| | | |
Income Tax Rate as a % of Materials Business (Loss) Income before Income Taxes | | | 44 | % | | | 33 | % | | | 25 | % |
| | | |
Solar Energy Business: | | | | | | | | | | | | |
| | | |
Income Tax (Benefit) | | $ | (3.7 | ) | | $ | — | | | $ | — | |
| | | |
Income Tax Rate as a % of Solar Energy Business Loss before Income Taxes | | | 31 | % | | | — | | | | — | |
| | | |
Consolidated Total: | | | | | | | | | | | | |
| | | |
Income Tax (Benefit) Expense | | $ | (42.2 | ) | | $ | 195.4 | | | $ | 282.2 | |
| | | |
Income Tax Rate as a % of Consolidated (Loss) Income before Income Taxes | | | 42 | % | | | 33 | % | | | 25 | % |
In 2009, we recorded an income tax benefit of $42.2 million representing 42% of loss before income taxes and noncontrolling interests compared to income tax expense of $195.4 million representing 33% of income before income taxes and noncontrolling interests in 2008. The income tax benefit for 2009 resulted from tax losses in higher rate jurisdictions, which can be carried back and applied against prior taxable income, offset by taxable income in lower rate jurisdictions. The current tax benefit is partially offset by the net increase to the reserve for uncertain tax positions of $18.1 million including interest, primarily related to various cost allocations and taxable income adjustments attributable to our foreign operations. In addition, during the year ended December 31, 2009, we recorded additional tax expense of approximately $5.0 million primarily related to interest and penalties assessed by taxing authorities related to exams for the 2006 and 2007 tax years and deferred tax adjustments related to prior years.
The tax expense for 2008 is primarily a result of the non-taxable loss for the mark-to-market adjustment associated with the Suntech warrant. This expense was partially offset by a decrease in the reserve for uncertain tax positions of $44.0 million, including related interest, reducing income tax expense by $29.5 million and increasing income taxes payable by $14.5 million. This was due to the closure of the Internal Revenue Service examination in the United States of the 2004 and 2005 audit years, as well as earnings generated by foreign subsidiaries whose earnings are being permanently reinvested abroad and taxed at lower rates. The 2008 increase in the effective tax rate of 8.0 percentage points as compared to 2007 is a result of the non-taxable loss in 2008 for the mark-to-market adjustment associated with the Suntech warrant for 2008 compared to the non-taxable gain in 2007.
Certain of our Asian subsidiaries have been granted a concessionary tax rate of between 0% and 10% on all qualifying income for a period of up to five to seven years based on investments in certain machinery and equipment and other development and expansion activities, resulting in a tax benefit for 2009 and 2008 of approximately $9.6 million and $37.0 million, respectively. There was no similar tax benefit in 2007. Under the awards, the income tax rate for qualifying income will be taxed at an incentive tax rate lower than the corporate tax rate. The last of these incentives are scheduled to expire in 2016.
We are currently under examination in the U.S. and Italy for the 2006 through 2009 tax years. During the year ended December 31, 2009, we received proposed adjustments from certain taxing authorities related to various cost allocations and taxable income adjustments attributable to our foreign operations during the periods under audit. We disagree with these adjustments and intend to vigorously contest them. We believe it is reasonably possible that the examination could be completed within the next twelve months. The amount of adjustment, if any, and the timing of such adjustment, however, are not reasonably estimable at this time.
We believe our tax positions are in compliance with applicable tax laws and regulations. We routinely review our estimate for our uncertain tax positions and during the year ended December 31, 2009 increased the unrecognized benefit by $18.1 million, including amounts related to interest and penalties for previously identified issues. There is a risk that the amounts ultimately resolved could be materially different from the amounts previously included or reserved for in our income tax liabilities, which could therefore have a material impact on our tax provision, net income, tax liabilities and cash flows in future periods.
| | | | | | | | | | |
Equity in Earnings of Joint Venture, Net of Tax | | 2009 | | | 2008 | | 2007 |
| Dollars in millions | | | | | | | |
| | | |
Materials Business: | | | | | | | | | | |
| | | |
Equity in earnings of joint venture, net of tax | | $ | (11.8 | ) | | $ | — | | $ | — |
In August 2009, we entered into a formal joint venture agreement with Q-Cells SE, a major solar cell producer, to form a joint venture for the purpose of constructing and selling solar energy systems. We sell solar wafers to the solar cell producer and eliminate our pro rata share of the profit on these sales, which is recorded to equity in earnings of joint venture, net of tax in the statement of operations.
7
We expect to recognize the profit on these sales once the solar project is sold to a third party. The first solar power plant project was fully constructed in the fourth quarter of 2009 and a contract was executed to sell it to a third party. The joint venture did not record revenue from the sale of the solar power plant in 2009 because certain administrative prerequisites will not be completed until early 2010. Once all revenue recognition criteria have been met, we will recognize deferred profit of $8.8 million in equity of earnings of joint venture, net of tax. This contract resulted in the joint venture also recognizing an impairment on the solar power plant assets. MEMC’s share of the impairment was approximately $3.0 million, which impairment was recorded in equity in earnings of joint venture as of December 31, 2009. The sale contract requires the majority of payment to be completed by the end of the second quarter of 2010. The parties can then return the proceeds of that sale to the joint venture partners or leave the investment in the entity for one or more future solar power plant projects.
FINANCIAL CONDITION
MEMC acquired SunEdison on November 20, 2009 for $314.6 million by paying cash, issuing MEMC common stock and providing contingent consideration. We recorded $285.3 million of goodwill as a result of our preliminary allocation of the total consideration to tangible and intangible assets acquired and liabilities assumed from SunEdison based on our estimate of their respective fair values at the acquisition date.
Cash and cash equivalents decreased $355.6 million from $988.3 million at December 31, 2008 to $632.7 million at December 31, 2009. See additional discussion in “Liquidity and Capital Resources” below.
Current restricted cash of $37.4 million and non-current restricted cash of $21.0 million at December 31, 2009 consists of cash on deposit in financial institutions restricted from use in operations relating mainly to our Solar Energy Business segment.
Short-term and long-term investments of $383.5 million at December 31, 2009 decreased $49.6 million from $433.1 million at December 31, 2008. This decrease was primarily due to sales and maturities of available for sale investments of $272.5 million and sales of trading securities of $10.9 million, slightly offset by net purchases of cost and equity method investments of $121.7 million and available for sale investments of $10.9 million during the period. The remaining difference is mainly due to net increases in the fair value of our investments compared to the prior year. As of December 31, 2009, we classified $21.1 million of corporate bonds, asset-backed and mortgage-backed securities as non-current assets due to the current conditions in the general debt markets as further discussed in “Liquidity and Capital Resources” below. In addition, at December 31, 2009 we held $110.8 million in fixed income funds with the intent of holding them for a period exceeding 12 months.
Our accounts receivable decreased $24.0 million to $173.3 million at December 31, 2009, compared to $197.3 million at the end of 2008. As a result of the purchase of SunEdison, our accounts receivable balance increased $6.0 million on November 20, 2009. Our overall days sales outstanding was 44 days at December 31, 2009 compared to 42 days at the end of 2008, based on annualized fourth quarter sales for the respective years. The decrease in accounts receivable was primarily attributable to the decrease in sales of $69.0 million, offset by a decrease in past due amounts.
Our inventories at December 31, 2009 increased $79.5 million or 98% to $160.8 million from the prior year. As a result of the purchase of SunEdison, our inventories increased $36.4 million on November 20, 2009. Materials Business inventories increased primarily due to higher production volumes, more continuous production cycles and our decision to build inventories to enhance product availability for our customers. Our Materials Business annualized inventory turns, calculated as the ratio of annualized fourth quarter cost of goods sold divided by the year-end inventory balance, were approximately nine times at December 31, 2009 versus approximately 11 times at December 31, 2008. We sell our products to certain customers under consignment arrangements. Generally, these consignment arrangements require us to maintain a certain quantity of product in inventory at the customer’s facility or at a storage facility designated by the customer. At December 31, 2009, we had $18.9 million of inventory held on consignment, compared to $15.1 million at December 31, 2008.
Income taxes receivable of $72.5 million at December 31, 2009 primarily consist of U.S. net operating losses that can be carried back, resulting in expected future refunds for tax amounts previously paid.
Prepaid and other current assets at December 31, 2009 increased $48.1 million to $87.0 million over the prior year which included an increase of $13.6 million related to the acquired balance from SunEdison. The remaining increase was primarily due to deferred tax assets recorded for net operating losses in foreign taxing jurisdictions.
Our net property, plant and equipment at December 31, 2009 increased $419.5 million to $1,460.7 million over the prior year. As a result of the purchase of SunEdison, we increased our property, plant and equipment by $325.6 million, which included $248.9 million of solar energy systems. The remaining increase was primarily due to capital expenditures of $225.4 million related to expansions at our plants in Merano, Italy, Pasadena, Texas, Ipoh, Malaysia and Hsinchu, Taiwan, construction of solar energy systems of $28.0 million and foreign currency changes, offset by depreciation expense of $122.8 million and asset impairments of $24.6 million. Included in property, plant and equipment is $109.8 million in capital leases related to the Solar Energy Business segment at December 31, 2009.
8
Our net deferred tax assets totaled $127.1 million at December 31, 2009 (of which $31.8 million of current deferred tax assets was included in prepaid and other assets) compared to $70.7 million at December 31, 2008 (of which $1.0 million of current deferred tax assets was included in prepaid and other assets). In 2009, the increase of $56.4 million in net deferred tax assets is primarily attributed to additional deferred tax assets associated with the purchase of SunEdison and net operating losses which cannot be carried back and will be utilized against future income. At December 31, 2009, we have valuation allowances of $21.4 million, primarily related to net operating losses acquired through the purchase of SunEdison, reducing our net deferred tax assets to $127.1 million. We believe that it is more likely than not, with our projections of future taxable income, that we will generate sufficient taxable income to realize the benefits of the net deferred tax assets (which have not been offset by a valuation allowance) at December 31, 2009.
Customer warrant increased from $13.8 million at December 31, 2008 to $19.2 million at December 31, 2009. The current year increase represents the change in the estimated fair value of the Suntech warrant and is mainly due to the increase in the price of Suntech’s ordinary shares.
Goodwill and intangible assets at December 31, 2009 consist of goodwill of $285.3 million and intangibles of $41.8 million, net of amortization of $0.4 million, recorded as a result of the purchase of SunEdison on November 20, 2009.
Other assets increased $23.7 million to $91.1 million at December 31, 2009 from $67.4 million at December 31, 2008. This increase is mainly due to an income tax receivable of $16.4 million related to revised estimates and interest as well as an increase in our U.S. pension asset.
Current portion of long-term debt and capital leases increased $26.1 million to $32.2 million at December 31, 2009. This increase was due to the purchase of SunEdison on November 20, 2009. SunEdison’s current portion of long-term debt and capital leases of $28.0 million at December 31, 2009 relates primarily to solar energy systems.
Accrued liabilities increased $39.3 million to $106.8 million at December 31, 2009 from $67.5 million at December 31, 2008. As a result of the purchase of SunEdison on November 20, 2009, we had SunEdison accrued liabilities of $11.4 million at December 31, 2009. In addition, accrued liabilities increased by $15.2 million due to the restructuring accrual for the plant closures announced in the third quarter of 2009, $8.8 million for the elimination of profit related to the Q-Cells joint venture and $8.8 million due to the accrual for a lawsuit. These increases were partially offset by a $12.8 million payment for accrued withholding taxes.
Short-term customer deposits decreased $103.4 million to $83.6 million at December 31, 2009, primarily due to repayments of refundable customer deposits related to long-term supply agreements of $36.0 million, the application of $44.1 million of deposits against outstanding accounts receivable balances and reclassifications to long-term liabilities based on the amendment of one of our long-term customer agreements. Under the amendment, we will now retain an additional $11.6 million of previously refundable deposits as deferred revenue. In addition, deposits of $12.3 million previously due on January 1, 2010 are no longer due within twelve months of December 31, 2009. These decreases were all slightly offset by a reclassification from other long-term liabilities for the current portion of the refundable customer deposits that are scheduled to be repaid in January 2010.
Long-term debt and capital leases, less current portion increased $358.3 million to $384.4 million at December 31, 2009. This increase is due to the purchase of SunEdison which had long-term debt and capital leases of $363.2 million at December 31, 2009.
Long-term deferred revenue relates to long-term customer supply agreements and the original estimated fair value of the warrant described above. We will recognize the deferred revenue on a pro-rata basis as product is shipped over the life of the agreements. The increase in deferred revenue from $88.8 million at December 31, 2008 to $106.3 million at December 31, 2009 is primarily the result of an amendment to a long-term solar wafer supply agreement. As a result of the amendment, we recorded an additional $11.6 million in deferred revenue to recognize deposits previously provided that are no longer refundable by us, as well as $5.6 million related to the fair value of other consideration received. The remaining difference was due to increased non-refundable deposits of $4.0 million received in connection with our long-term supply agreements, offset by deferred revenue recognized in 2009 of $3.7 million.
Other non-current liabilities increased $127.2 million to $313.3 million at December 31, 2009, compared to $186.1 million at December 31, 2008. As a result of the purchase of SunEdison on November 20, 2009, we assumed other non-current liabilities related to SunEdison of $89.7 million at December 31, 2009. Of this amount, $77.4 million is an estimate of contingent consideration discussed below. The remaining increase was primarily due to an increase of $18.1 million in unrecognized tax benefits related to revised estimates and interest, an increase of $12.3 million due to a reclassification of customer deposits discussed above and an accrual for a lawsuit we recorded in the second quarter of 2009.
The contingent consideration is to be paid to the former SunEdison unit holders if certain operational criteria are met from January 1, 2010 through December 31, 2010. This consideration is to be paid in the form of a combination of cash and MEMC common stock. In order for the full consideration to be paid, the surviving SunEdison entity would have to install 150 megawatts of solar photovoltaic projects and achieve certain profitability thresholds. This would entitle the former SunEdison unit holders to an additional $89.0 million of cash and MEMC common stock. If SunEdison completes less than 80 megawatts of solar photovoltaic projects in 2010, no contingent consideration will be paid. If 80 megawatts or more is completed, the SunEdison unit holders will receive between $25.0 million and $89.0 million of cash and MEMC common stock, based on the terms of the merger agreement. MEMC has estimated and
9
recorded the fair value of the contingent consideration at $77.0 million, which reflects a discount at a credit adjusted interest rate for the period of the contingency, as of the acquisition date. Any future revisions to the estimated fair value of the contingent consideration will be recorded to the statement of operations.
LIQUIDITY AND CAPITAL RESOURCES
| | | | | | | | | | | | |
| | | 2009 | | | 2008 | | | 2007 | |
| Dollars in millions | | | | | | | | | |
| | | |
Net Cash Provided by (Used in): | | | | | | | | | | | | |
| | | |
Operating Activities | | $ | 33.0 | | | $ | 640.9 | | | $ | 917.2 | |
| | | |
Investing Activities | | | (299.8 | ) | | | (335.4 | ) | | | (688.9 | ) |
| | | |
Financing Activities | | | (91.7 | ) | | | (153.3 | ) | | | 76.9 | |
In 2009, we generated $33.0 million of cash from operating activities, compared to $640.9 million in 2008 and $917.2 million in 2007. This decrease in 2009 compared to 2008 was a result of a substantial decrease in operating income slightly offset by favorable changes in working capital and non-current assets and liabilities, as well as a decrease in pension and post-employment contributions. The decrease was also offset by the application of $44.1 million of refundable deposits against outstanding receivables related to supply agreements in year ended December 31, 2009 and $11.6 million of previously refundable deposits that are no longer refundable due to a solar wafer supply agreement amended in the third quarter of 2009.
In 2008, we generated $640.9 million of cash from operating activities, compared to $917.2 million in 2007. The year over year decrease was due to contributions of $76.3 million to our pension and post-employment plans and changes in working capital, including changes in income taxes payable and inventories, as well as non-current assets and liabilities and deferred revenue.
Our principal sources and uses of cash during 2009 were as follows:
Sources:
| | • | | Generated $33.0 million from operations; |
| | • | | Received $283.4 million from investments; and |
| | • | | Received $78.1 million from the financing and sale/leaseback of solar energy systems. |
Uses:
| | • | | Invested $253.4 million in capital expenditures and solar energy systems; |
| | • | | Paid $188.5 million to purchase SunEdison, net of cash acquired; |
| | • | | Repaid $15.6 million related to the financing and sale/leaseback of solar energy systems; |
| | • | | Purchased $132.6 million of investments; and |
| | • | | Refunded $90.4 million, net in customer deposits related to long-term supply agreements. |
At December 31, 2009, we had approximately $115.5 million of committed capital expenditures in our Materials Business. Capital expenditures in 2009 and committed capital expenditures for 2010 primarily relate to increasing our capacity and expanding capability for our next generation products and polysilicon capacity. We currently expect our 2010 capital expenditures in our Materials Business to be approximately 20% of our consolidated revenue.
Our SunEdison business will require access to significant capital resources to fund its expected rapid growth. During the construction phase of solar power plants, we will provide temporal financial support to a project LLC to fund engineering, procurement and installation costs. Once complete, we will either directly sell the project in its entirety to a third party or obtain more permanent capital on behalf of the LLC through debt, sale/leaseback or other financing structures that will typically be secured by the energy producing assets and by the expected cash flows from energy sale.
The total capital necessary will be directly related to the amount of megawatts of energy producing assets installed and interconnected. The company expects its existing liquidity position which includes a revolving credit facility will provide sufficient capital to support the construction phase of its current backlog of projects for 2010 and 2011. The company expects its continuing and concerted effort to secure more permanent sources of non-recourse project capital to generate sufficient resources to support its growth, but the ultimate rate of growth in this business will be dependent upon the market’s appetite for solar project backed debt and the rate associated with that debt.
10
In 2009, cash used in financing activities was $91.7 million, compared to $153.3 million in 2008. The decrease was mainly due to repurchases of our common stock of $15.8 million in 2009 compared to $321.0 million in 2008. Additionally, we repaid approximately $90.4 million, net, in connection with customer deposits related to supply agreements in 2009 compared to $138.0 million received in 2008. These deposits are either refundable to the customer over two years, at the end of the contract or are applied against a portion of current sales on credit. Deposits that are refundable over two years are scheduled to be replaced each year with new deposits based on volume commitments stated in the contract to reduce our risks associated with nonfulfillment of the contract by the customers. The net repayment of customer deposits also includes $11.6 million of previously refundable deposits that are no longer refundable due to a solar wafer supply agreement amended in the third quarter of 2009. Decreases in refundable deposits were also due to application of $44.1 million against outstanding receivables related to supply agreements in the year ended December 31, 2009. Also contributing to the decrease in cash used in financing activities was the excess tax benefits from share-based payment arrangements decrease to $0.3 million in 2009, compared to $19.0 million in 2008, and decrease to $0.7 million in 2009 received in connection with stock option exercises, compared to $19.9 million in 2008.
On July 21, 2005, we entered into a five-year, $200.0 million revolving credit facility agreement with National City Bank of the Midwest, US Bank National Association, and such other lending institutions. This agreement was terminated on December 23, 2009 and replaced with a new revolver with a separate lead bank (see below). Due to the termination of the facility, we recorded additional interest expense of $0.2 million in the quarter ended December 31, 2009 to write-off the remaining balance of the deferred debt issue costs associated with this facility.
On December 23, 2009, we entered into a new corporate revolving credit agreement with Bank of America, N.A., PNC Bank, National Association, US Bank National Association and other lenders named therein and such other lending institutions as may from time to time become lenders (the “Corporate Credit Facility”). The Corporate Credit Facility provides for a $250.0 million revolving credit facility and has a term of three years. The new facility contains an accordion feature, allowing us to request an increase in the size of the facility, up to an aggregate of $400.0 million, upon terms to be agreed upon by the parties at the time of such request.
Interest on borrowings under the Corporate Credit Facility will be based on our election at LIBOR plus an applicable margin (currently 2.50%) or at a defined prime rate plus an applicable margin (currently 1.50%). The Corporate Credit Facility also provides for us to pay various fees, including a commitment fee (currently 0.50%) on the lenders’ commitments. The Corporate Credit Facility contains certain covenants typical for credit arrangements of this size, including covenants relating to a consolidated interest charge ratio, consolidated leverage ratio and a minimum liquidity ratio. Repayment of any amounts borrowed under the new facility is guaranteed by certain of our subsidiaries. The obligations of MEMC and the guaranty obligations of the subsidiaries are secured by a pledge of the capital stock of certain domestic and foreign subsidiaries of MEMC. The other assets of MEMC are not pledged as security for the facility. As of December 31, 2009, we had no outstanding borrowings under this facility, although we had approximately $83.5 million of outstanding third party letters of credit backed by this facility at such date. We met all covenants under this facility at December 31, 2009.
Our solar energy systems for which we have capital lease and finance obligations are included in separate legal entities. The capital lease and finance obligations have recourse to those entities but limited or no recourse to the MEMC parent or SunEdison parent legal entities.
Credit facilities and related borrowings outstanding excluding solar energy system financing at December 31, 2009 were as follows:
| | | | | | |
| | | Committed | | Outstanding |
| Dollars in millions | | | | |
| | |
Long-term Debt | | $ | 316.9 | | $ | 28.4 |
| | |
Short-term Borrowings | | | 26.9 | | | — |
| | | | | | |
| | |
Total | | $ | 343.8 | | $ | 28.4 |
| | | | | | |
Of the $316.9 million in committed long-term financing arrangements, $93.2 million is unavailable because it relates to the issuance of third party letters of credit. Our weighted-average cost of borrowing was 3.0% at December 31, 2009 and 2.2% at December 31, 2008, respectively. Our short-term borrowings are subject to renewal annually with each financial institution through the course of the year.
11
Our contractual obligations as of December 31, 2009 were as follows:
| | | | | | | | | | | | | | | |
| | | Payments Due By Period |
Contractual Obligations | | Total | | Less than
1 Year | | 1-3
Years | | 4-5
Years | | After 5
Years |
| Dollars in millions | | | | | | | | | | |
| | | | | |
Capital Leases | | $ | 185.9 | | $ | 19.7 | | $ | 36.5 | | $ | 19.1 | | $ | 110.6 |
| | | | | |
Long-term Debt | | | 273.5 | | | 16.7 | | | 27.1 | | | 24.7 | | | 205.0 |
| | | | | |
Operating Leases | | | 28.3 | | | 7.2 | | | 9.6 | | | 5.5 | | | 6.0 |
| | | | | |
Purchase Obligations1 | | | 850.1 | | | 98.5 | | | 187.1 | | | 162.2 | | | 402.3 |
| | | | | |
Committed Capital Expenditures2 | | | 121.1 | | | 121.1 | | | — | | | — | | | — |
| | | | | |
Employee Related Liabilities3 | | | 73.3 | | | 0.3 | | | — | | | — | | | — |
| | | | | |
Other Long-term Liabilities—Uncertain Tax Positions4 | | | 74.0 | | | 74.0 | | | — | | | — | | | — |
| | | | | |
Customer Deposits5 | | | 200.0 | | | 83.0 | | | 117.0 | | | — | | | — |
| | | | | |
Contingent Consideration Liability6 | | | 77.4 | | | — | | | 77.4 | | | — | | | — |
| | | | | | | | | | | | | | | |
| | | | | |
Total Contractual Obligations | | $ | 1,883.6 | | $ | 420.5 | | $ | 454.7 | | $ | 211.5 | | $ | 723.9 |
| | | | | | | | | | | | | | | |
The contractual commitments shown above, except for our debt obligations, capital leases, employee related liabilities, uncertain tax positions and customer deposits, are not recorded on our consolidated balance sheet.
| 1 | Represents obligations for agreements to purchase goods or services that are enforceable and legally binding on the Company, including minimum quantities to be purchased, and outstanding purchases for goods or services as of December 31, 2009. |
| 2 | Committed capital expenditures represent commitments for construction or purchase of property, plant and equipment. They are not recorded as liabilities on our consolidated balance sheet as of December 31, 2009 because we have not yet received the related goods or services or taken title to the property. |
| 3 | Employee related liabilities include pension, health and welfare benefits and other post-employment benefits. Other than pensions, the employee related liabilities are paid as incurred and accordingly, specific future years’ payments are not reasonably estimable. Amounts in the table due in less than one year relate to required pension funding obligations which represent the estimated contribution planned during 2010. Funding projections beyond the next twelve months as of December 31, 2009 are not practical to estimate due to the rules affecting tax-deductible contributions and the impact from the plan asset performance, interest rates and potential U.S. and international legislation. |
| 4 | As of December 31, 2009, $74.0 million of unrecognized tax benefits were included as a component of other long-term liabilities. Due to the inherent uncertainty of the underlying tax positions, we are unable to reasonably estimate in which future periods these unrecognized tax benefits will be settled. |
| 5 | Customer deposits consist of amounts provided in connection with long-term supply agreements which must be refunded to the customers according to the terms of the agreements. |
| 6 | In connection with our acquisition of SunEdison, we agreed to make contingent payments to the former SunEdison unit holders if certain operational targets are reached in fiscal 2010. See “Results of Operations” above. |
We have agreed to indemnify some of our Materials Business customers against claims of infringement of the intellectual property rights of others in our sales contracts with these customers. The terms of most of these indemnification obligations generally do not provide for a limitation of our liability. We have not had any claims related to these indemnification obligations as of December 31, 2009.
SunEdison generally warrants the operations of its solar energy systems. Due to the absence of historical material warranty claims and expected future claims, we have not recorded a warranty accrual related to solar energy systems as of December 31, 2009.
Our pension expense and pension liability are actuarially determined. See “Critical Accounting Policies and Estimates.” Effective January 2, 2002, we amended our defined benefit plan to discontinue future benefit accruals for certain participants. In addition,
12
effective January 2, 2002, no new participants will be added to the plan. Our total net unfunded pension liability related to our various defined benefit pension plans at December 31, 2009 totaled $14.4 million. Our pension obligations are funded in accordance with provisions of federal law. Contributions to our pension plans in 2009 totaled approximately $2.3 million. We expect contributions to our pension plans in 2010 to be approximately $0.9 million.
The fair value of our corporate debt securities, auction rate securities and asset-backed and mortgage-backed securities, using Level 3 inputs as prescribed by fair value accounting guidance, may fluctuate based on varying assumptions used in their valuations, which include the tax status (taxable vs. tax-exempt), type of security (type of issuer, collateralization, subordination, etc.), credit quality, duration, likelihood of redemption, insurance coverage and degree of liquidity in the current credit markets. Due to the lack of observable inputs, active markets or transparency to the underlying assets, we may rely on qualitative factors to estimate the fair values of the investments, including general macro-economic information and other data supplied by our investment advisers and brokers.
As of December 31, 2009, we held $64.0 million in a portfolio comprised of corporate bonds and asset-backed and mortgage-backed securities, net of temporary impairments of $2.3 million and other than temporary impairments of $16.8 million, of which $0.3 million is related to non-credit losses and is recorded in accumulated other comprehensive income. As of December 31, 2008, this portfolio had $159.5 million of investments, net of temporary impairments of $14.5 million and other than temporary impairments of $14.5 million. A majority of these investments maintain a floating interest rate based on a range of spreads to the one and three month LIBOR rate. While we believe the decline in fair value related to the temporary impairments to be directly attributable to the current global credit conditions, we believe the time to reach the original carrying value to be greater than 12 months. Accordingly, we have classified $21.1 million of those investments as non-current assets. We do not anticipate having to sell these securities below our cost in order to operate our business. The asset backed securities are collateralized by various types of assets including auto, consumer, home equity, student loan and credit card loans. The collateralized mortgage obligations are collateralized primarily by residential mortgages. Many of these issuances have varying tranches and subordinations and our investments are typically in investment grade and more senior, higher priority tranches.
The credit ratings for our investments in debt securities as of December 31, 2009 are as follows:
| | | | | | | | | | | | |
| | | | | Credit Ratings |
| Dollars in millions | | Fair
Value | | AAA | | AA+
to A- | | BBB+
and Below |
| | | | |
Corporate debt securities | | $ | 23.0 | | $ | — | | $ | 20.1 | | $ | 2.9 |
| | | | |
Asset-backed securities | | | 16.9 | | | 10.5 | | | 6.2 | | | 0.2 |
| | | | |
Mortgage-backed securities | | | 24.1 | | | 18.5 | | | 2.7 | | | 2.9 |
| | | | |
Auction rate securities | | | 38.4 | | | 38.4 | | | — | | | — |
| | | | | | | | | | | | |
| | | | |
| | $ | 102.4 | | $ | 67.4 | | $ | 29.0 | | $ | 6.0 |
| | | | | | | | | | | | |
We take into consideration the credit ratings of the individual securities when evaluating the financial condition and near term prospects of the issuer in determining whether the impairment is temporary or other than temporary. See “Critical Accounting Policies and Estimates” related to our process of evaluating investments for impairment and balance sheet classification.
As of December 31, 2009, we held $38.4 million of short-term investments related to auction rate securities (“ARS”), net of unrealized losses of $2.1 million. As of December 31, 2008, we held $44.1 million of investments related to auction rate securities, net of unrealized losses of $7.3 million. These securities are classified as trading securities and all changes in fair value are recorded to non-operating (income) expense, other. The ARS are comprised of interest bearing state sponsored student loan revenue bonds and municipal bonds with varying maturity periods and typically provide short-term liquidity via an auction process that also resets the applicable interest rate at predetermined calendar intervals (typically every 7, 28 or 35 days). The student loan revenue bonds are collateralized and serviced by underlying student loans and the municipal bonds are serviced through revenue generated by the issuing municipal entity. In the event of an auction failing to settle on its respective settlement date, these funds remain invested at a “failed” interest rate which is typically higher than the previous market rate until the next successful auction. For those auctions that fail to settle, we will not be able to access those funds until the next successful auction, another buyer is found outside of the auction process, the issuer redeems the security or the security matures. We do not anticipate having to sell these securities below our cost in order to operate our business. The ARS are insured through two different monoline insurers that presently maintain a credit rating of AAA or similar designation by S&P, Moody’s and/or Fitch as of December 31, 2009 or by a U.S. government backed student loan program. During November 2008, we accepted an offer from our investment broker to receive an ARS right (the “ARS Right”) that would substantially ensure recovery to par of our ARS between June 2010 and July 2012. As of December 31, 2009, all ARS and the ARS Right were classified as current because we intend to exercise the ARS Right in June 2010.
13
We have elected the fair value option for the ARS Right and have recorded the ARS Right at fair value to other assets and non-operating income, other. At the same time, we reclassified the ARS from the available-for-sale category to trading. As of December 31, 2009, the ARS Right had a value of $2.0 million, which substantially offset the mark-to-market adjustment of our outstanding ARS of $2.1 million. See “Critical Accounting Policies and Estimates” related to our process of evaluating investments for impairment.
We believe that, based on our current cash, cash equivalents, restricted cash and investment balances of approximately $1.1 billion at December 31, 2009 and expected operating cash flows, the current liquidity concerns in the credit and capital markets will not have a material impact on our liquidity, cash flow, financial flexibility or our ability to fund our operations.
We believe that we have the financial resources needed to meet business requirements for at least the next 12 months, including capital expenditures and working capital requirements.
CRITICAL ACCOUNTING POLICIES AND ESTIMATES
The preparation of financial statements in conformity with accounting principles generally accepted in the United States requires us to make estimates and assumptions in certain circumstances that affect amounts reported in the accompanying consolidated financial statements and related footnotes. In preparing these financial statements, we have made our best estimates of certain amounts included in the financial statements. Application of these accounting policies and estimates, however, involves the exercise of judgment and use of assumptions as to future uncertainties and, as a result, actual results could differ from these estimates. In arriving at our critical accounting estimates, factors we consider include how accurate the estimate or assumptions have been in the past, how much the estimate or assumptions have changed and how reasonably likely such change may have a material impact. Our significant accounting policies are more fully described in Note 2 of Notes to Consolidated Financial Statements herein.
Revenue Recognition
Materials Business
Revenue is recognized in our Materials Business segment for product sales when title transfers, the risks and rewards of ownership have been transferred to the customer, the fee is fixed and determinable and collection of the related receivable is reasonably assured, which is generally at the time of shipment for non-consignment orders. In the case of consignment orders, title passes when the customer pulls the product from the assigned storage facility or storage area or, if the customer does not pull the product within a contractually stated period of time (generally 60–90 days), at the end of that period, or when the customer otherwise agrees to take title to the product. Our wafers are generally made to customer specifications and we conduct rigorous quality control and testing procedures to ensure that the finished wafers meet the customer’s specifications before the product is shipped. We consider international shipping term definitions in our determination of when title passes. We defer revenue for multiple element arrangements based on an average fair value per unit for the total arrangement when we receive cash in excess of fair value. We also defer revenue when pricing is not fixed and determinable or other revenue recognition criteria is not met.
In connection with our long-term solar wafer supply agreements and subsequent amendments, we have received various equity instruments and other forms of additional consideration. In each case, we have recorded the estimated fair value of the additional consideration to long-term deferred revenue and will recognize the deferred revenue on a pro-rata basis as product is shipped over the life of the agreements.
Solar Energy Business
For solar energy systems under construction for which a third-party construction contract has not been executed and for which we do not anticipate retaining ownership, the construction costs associated with these in-process solar energy systems are recognized in inventory as work-in-process. We may enter into a sale agreement to sell a completed solar energy system to a third party. In these transactions, we recognize the sale of the solar energy system at the time a sale arrangement with the third party is executed, delivery has occurred and we have determined that the sales price is fixed or determinable and collectible.
We often construct solar energy systems for which we do not have a fixed-price construction contract and, in certain instances, we may construct a system and retain ownership of the system. For these projects, we earn revenues associated with the energy generated by the solar energy system, capitalize the cost of construction to property and equipment and depreciate the system over its estimated useful life. For solar energy systems under construction for which we intend to retain ownership and finance the system, we recognize all costs incurred as construction-in-progress, a component of property, plant and equipment.
We are party to master lease agreements that provide for the sale and simultaneous leaseback of certain solar energy systems constructed by us. Because the terms of the solar energy systems lease schedule may differ from the terms applicable to other solar energy systems, we must determine the appropriate classification of the sale/leaseback on a project-by-project basis. The terms of the lease schedule may result in either one of the following sale/leaseback classifications:
Sale/Capital Leaseback – Sale/capital leaseback classification occurs when the terms of the lease schedule for a solar energy system result in a capital lease classification. Generally, this classification occurs when the term of the lease is greater than 75% of the estimated economic life of the solar energy systems.
14
Failed Sale/Leaseback (Financing) – The financing method is applicable when we have determined that the assets under the lease are real estate. Generally, this occurs due to either the lease involving land or the determination that the leased equipment is integral equipment. If we have concluded the leased asset is real estate, our option to repurchase the assets under our master lease agreements constitutes continuing involvement and the transaction must be accounted for as a financing transaction. This accounting is most often applicable to the land-mounted systems because they either include land in the lease or are deemed integral equipment due to the estimated cost to uninstall, move and reinstall the system and for any diminution in value of the system.
The classification of a sale/leaseback transaction as a capital lease results in the deferral of any profit on the sale. The profit is recognized over the term of the lease as a reduction to depreciation expense. Under a sale/leaseback transaction classified as a failed sale/leaseback (financing transaction), we have no profit to recognize because a sale is not recognized. The full amount of the financing proceeds is recorded as a liability and lease payments are classified as interest expense. Because the payments to the lessor under the financing transaction for the minimum lease payments are considered interest expense, we expect to recognize a gain on the extinguishment of debt at the end of the lease term.
Operations and maintenance revenue is billed and recognized as services are performed. Energy services revenue, generated by energy system rentals, is agreed to be paid by the customer for the electricity generated. We also provide and maintenance and monitoring services.
For MEMC-owned solar energy systems, including those capitalized under capital leases and failed sale/leasebacks classified as financing obligations, we may receive incentives or subsidies from various state governmental jurisdictions that are deferred. Revenue from Solar Renewable Energy Certificates (“SREC”) is recognized when the SRECs are received or generated if we have executed a contract relating to the sale of the SRECs to a third party. Revenue relating to other incentives that are based on the level of energy produced by the solar energy systems is recognized as revenue in the periods in which the incentives are earned. All other incentive revenue is recognized on a straight-line basis over the depreciable life of the solar energy system.
Inventories
Our Materials Business inventories, which consist of raw materials, labor and manufacturing overhead, are valued at the lower of cost or market. Fixed overheads are allocated to the costs of conversion based on the normal capacity of our production facilities. Unallocated overheads during periods of abnormally low production levels are recognized as cost of goods sold in the period in which they are incurred. Materials Business raw materials are stated at weighted-average cost and Materials Business goods in process and finished goods inventories are stated at standard cost as adjusted for variances, which approximates weighted-average actual cost. The valuation of inventory requires us to estimate excess and slow moving inventory. The determination of the value of excess and slow moving inventory is based upon assumptions of future demand and market conditions. If actual market conditions are less favorable than those projected by management, additional inventory write-downs may be required.
Solar Energy Business inventories consist primarily of raw materials (primarily solar panels) and work-in-process. Work-in-process includes materials and other capitalizable costs incurred to construct solar energy systems not under contract to be sold nor expected to be transferred to property and equipment upon completion. The cost of SunEdison inventories is based on the first-in, first-out (FIFO) method for raw material and project-specific cost identification for work-in-process. If SunEdison executes a contract with a customer in which the system will be retained or there will be a capitalized leased asset, the solar panel inventory is reclassified to property plant and equipment – construction in progress when the materials are issued to a jobsite.
Property, Plant and Equipment and Capitalized Leased Solar Energy Systems
We depreciate our building, improvements, and machinery and equipment evenly over the assets’ estimated useful lives. Changes in circumstances such as technological advances, changes in our business model, or changes in our capital strategy could result in the actual useful lives differing from our estimates. In those cases where we determine that the useful life of property, plant and equipment should be shortened or lengthened, we depreciate the net book value over its revised remaining useful life. Concurrent with our polysilicon expansion in 2008, we assessed the useful lives of certain new polysilicon related property, plant and equipment placed in service in 2008, and based on historical experience with similar existing assets, determined that a useful life of 25 years was appropriate. Previously existing polysilicon production assets were depreciated over an estimated useful life of 10 years and have immaterial net book values at December 31, 2009.
When we are entitled to incentive tax credits for property, plant and equipment, we reduce the asset carrying value by the amount of the credit, which reduces future depreciation.
15
Expenditures for repairs and maintenance are charged to income as incurred. Additions and betterments are capitalized. The cost and related accumulated depreciation on property and equipment sold or otherwise disposed of are removed from the capital accounts and any gain or loss is reported in current-year operations.
We may sell a solar energy system and simultaneously lease back the solar energy system from the buyor/lessor under our master lease arrangements or other sale/leaseback arrangements. The gain, if any, on the sale/leaseback transaction is recorded as a deferred gain and is recorded as a contra-asset that reduces the cost of the solar energy system, thereby reducing depreciation expense over the term of the lease. Generally, as a result of various tax attributes that accrue to the benefit of the lessor/tax owner, the cost of the solar energy system is recorded as the net present value of the future minimum lease payments because this amount is lower than the fair market value of the solar energy system at the lease inception date. Solar energy systems that have failed sale treatment and have been leased back under a capital lease are recorded at the lower of the original cost to construct the system or its fair value.
We periodically assess the impairment of long-lived assets/asset groups when conditions indicate a possible loss. Reviews are performed to determine whether the carrying value of an asset is impaired, based on comparisons to undiscounted expected future cash flows or some other fair value measure. If this comparison indicates that there is impairment, the impaired asset is written down to fair value, which is typically calculated using: (i) quoted market prices or (ii) discounted expected future cash flows utilizing an appropriate discount rate. Impairment is based on the excess of the carrying amount over the fair value of those assets.
In September 2009, MEMC committed to actions to reduce manufacturing costs by shifting manufacturing from our St. Peters, Missouri and Sherman, Texas facilities to other locations which are closer to a number of MEMC’s customers. Due to the significance of these actions, we performed an asset impairment analysis of our St. Peters, Missouri and Sherman, Texas long-lived manufacturing asset groups during the third quarter of 2009. Accordingly, we recorded asset impairment charges of $24.6 million in the third quarter of 2009 related to these asset groups. We recorded asset impairment charges of $1.1 million in 2008. There were no asset impairment charges in 2007.
We operate under solar power services agreements with customers that include a requirement for the removal of the solar energy systems at the end of the term of the agreement. These and other asset retirement obligations are recognized at fair value in the period in which they are incurred and the carrying amount of the related long-lived asset is correspondingly increased. Over time, the liability is accreted to its future value. The corresponding asset capitalized at inception is depreciated over the useful life of the asset.
In addition, we could have certain legal obligations for asset retirements related to disposing of materials in the event of closure, abandonment or sale of certain of our manufacturing facilities. We plan to operate the facilities that are subject to the asset retirement obligations for an indeterminate period beyond the foreseeable future and as such, cannot estimate a liability at December 31, 2009, except for one facility, for which we have recorded an asset retirement obligation. We will recognize a liability in the period in which we have determined the time frame that the asset will no longer operate and information is available to reasonably estimate the liability’s fair value.
Business Combinations
We record all assets acquired and liabilities assumed in a business combination including goodwill, identified intangible assets and noncontrolling interests at fair value. In determining the fair value, we use a cost, market or income approach. Assets assumed would be valued at the price that would be received to sell the asset to a market participant and liabilities are valued at the price that would be paid to a market participant to transfer the liability. The initial recording of goodwill and identified intangible assets requires certain estimates and assumptions, especially concerning the determination of the fair values and useful lives of the acquired intangible assets. Intangible assets have been valued based on the nature of the intangible and/or the asset to which they may relate including the use of a cost, income, excess earning or relief from royalty method. The judgments made in the context of the estimated purchase price allocation can materially impact our future results of operations. Accordingly, for significant acquisitions, we obtain assistance from third-party valuation specialists. The valuations are based on information available at the acquisition date.
During the measurement period we will adjust assets or liabilities if new information is obtained about facts and circumstances that existed as of the acquisition date that, if known, would have resulted in adjustments to amounts recognized as of that date. The measurement period shall not exceed one year from the acquisition date. Contingent consideration classified as an asset or a liability will be remeasured to fair value at each reporting date with the changes in fair value recognized in earnings until the contingency is resolved.
Goodwill and Intangible Assets
Goodwill is recorded as the difference, if any, between the aggregate consideration paid for an acquisition and the fair value of the net tangible and intangible assets acquired and liabilities assumed. An intangible asset is recorded if it is separable or if it arises from contractual or other legal rights. Goodwill and intangible assets determined to have indefinite lives are not amortized, but rather are subject to an impairment test annually, on December 1, or whenever events or changes in circumstances indicate that the carrying value may not be recoverable.
16
The goodwill impairment test involves a two-step approach. Under the first step, we determine the fair value of each reporting unit to which goodwill has been assigned. The operating segments of MEMC are the reporting units for the impairment test. We compare the fair value of the reporting unit to its carrying value, including goodwill. If the estimated fair value exceeds the carrying value, no impairment loss is recognized. If the carrying value exceeds the fair value, goodwill is considered potentially impaired and the second step is completed in order to measure the impairment loss. Under the second step, we calculate the implied fair value of goodwill by deducting the fair value of all tangible and intangible net assets, including any unrecognized intangible assets, of the reporting unit from the fair value of the reporting unit as determined in the first step. We then compare the implied fair value of goodwill to the carrying value of goodwill. If the implied fair value of goodwill is less than the carrying value of goodwill, we recognize an impairment loss equal to the difference. Prior to the acquisition of SunEdison on November 20, 2009, we did not have goodwill.
Intangible assets that have determinable estimated lives are amortized over those estimated lives. The straight-line method of amortization is used because it best reflects the pattern in which the economic benefits of the intangible asset are consumed or otherwise used up. The amounts and useful lives assigned to intangible assets acquired, other than goodwill, impact the amount and timing of future amortization. The value of our intangible assets, including goodwill, could be impacted by future adverse changes such as: (i) any future declines in our operating results, (ii) a decline in the valuation of solar industry company stocks, including the valuation of our common stock, (iii) a further significant slowdown in the worldwide economy or the solar industry or (iv) any failure to meet the performance projections included in our forecasts of future operating results.
The useful lives of our intangible assets subject to amortization are as follows:
| | |
| | | Years |
Favorable energy credits | | 4-18 |
| |
Customer relationships | | 7 |
| |
Trade name | | 15 |
| |
Purchased and internally developed software | | 3-10 |
Other intangible assets consist of power plant development arrangements. These assets were recorded in conjunction with the acquisition of SunEdison and relate to anticipated future economic benefits associated with our customer backlog relationships. These intangible assets will be allocated to fixed assets as the construction of the related solar energy systems stemming from the existing backlog is completed.
Income Taxes
In determining taxable income for financial statement reporting purposes, we must make certain estimates and judgments. We calculate our current and deferred tax provisions based upon estimates and assumptions that could differ from the actual results reflected in our income tax returns filed during the subsequent year. We record adjustments based on filed returns when we have identified the adjustments and finalized the returns, which is generally in the third and fourth quarters of the subsequent year. These estimates and judgments are applied in the calculation of certain tax liabilities and in the determination of the recoverability of deferred tax assets, which arise from temporary differences between the recognition of assets and liabilities for tax and financial statement reporting purposes. We regularly review our deferred tax assets for realizability, taking into consideration all available evidence, both positive and negative, including historical pre-tax and taxable income (losses), projected future pre-tax and taxable income (losses) and the expected timing of the reversals of existing temporary differences. In arriving at these judgments, the weight given to the potential effect of all positive and negative evidence is commensurate with the extent to which it can be objectively verified.
We are subject to income taxes in both the U.S. and numerous foreign jurisdictions. From time to time, we are subject to income tax audits in these jurisdictions. We believe that our tax return positions are fully supported, but tax authorities are likely to challenge certain positions, which may not be fully sustained. Our income tax expense includes amounts intended to satisfy income tax assessments that may result from these challenges. Determining the income tax expense for these potential assessments and recording the related assets and liabilities requires significant judgments and estimates. Tax benefits are recognized only for tax positions that are more likely than not to be sustained upon examination by tax authorities. The amount recognized is measured as the largest amount of benefit that is greater than 50 percent likely to be realized upon ultimate settlement. Unrecognized tax benefits are tax benefits claimed in our tax returns that do not meet these recognition and measurement standards. We believe that our income tax liabilities, including related interest, are adequate in relation to the potential for additional tax assessments. There is a risk, however, that the amounts ultimately paid upon resolution of audits could be materially different from the amounts previously included in our income tax expense and, therefore, could have a material impact on our tax provision, net income and cash flows. We review our liabilities quarterly, and we may adjust such liabilities due to proposed assessments by tax authorities, changes in facts and circumstances, issuance of new regulations or new case law, negotiations between tax authorities of different countries concerning our transfer prices, the resolution of entire audits, or the expiration of statutes of limitations. Adjustments, if required, are most likely to occur in the year during which major audits are closed.
17
It has been our practice to repatriate to the U.S. a portion of the current year earnings of only one of our foreign subsidiaries and provide U.S. income taxes that would be payable for these earnings when distributed to the U.S. Prior to 2009, we considered the undistributed earnings of the other wholly owned foreign subsidiaries to be permanently reinvested into their respective businesses. We did not provide U.S. income taxes for these earnings as we determined that they would not be remitted to the U.S. in the foreseeable future. During 2009, we changed our determination with respect to one of these wholly owned foreign subsidiaries. The undistributed earnings of this subsidiary are expected to be remitted to the United States in the foreseeable future and therefore require the provision of U.S. income tax upon remittance. The deferred tax effect of this newly planned remittance was recorded as a discrete net income tax benefit in the amount of $2.4 million in the year ended December, 31 2009. We plan foreign remittance amounts based on projected cash flow needs as well as the working capital and long-term investment requirements of our foreign subsidiaries and our domestic operations. The undistributed earnings of other foreign subsidiaries are not expected to be remitted to the U.S. parent corporation in the foreseeable future.
We have made our best estimates of certain income tax amounts included in the financial statements. Application of our accounting policies and estimates, however, involves the exercise of judgment and use of assumptions as to future uncertainties and, as a result, actual results could differ from these estimates. In arriving at our estimates, factors we consider include how accurate the estimate or assumptions have been in the past, how much the estimate or assumptions have changed and how reasonably likely such change may have a material impact.
Employee-Related Liabilities
We have a long-term net liability for our consolidated defined benefit pension and other post-employment benefit plans. Our obligations are funded in accordance with provisions of federal law. We recognize the overfunded or underfunded status of a defined benefit postretirement plan as an asset or liability in our statement of financial position and recognize changes in that funded status in the year in which the changes occur through comprehensive income.
Our pension and other post-employment liabilities are actuarially determined, and we use various actuarial assumptions, including the discount rate, rate of salary increase, and expected return on assets, to estimate our costs and obligations. If our assumptions do not materialize as expected, expenditures and costs that we incur could differ from our current estimates. We determine the expected return on plan assets based on our pension plans’ actual asset mix as of the beginning of the year. While the assumed expected rate of return on plan assets in 2009 and 2008 was 8.5% and 8.3%, respectively, the actual return experienced in our pension plan assets in the comparable periods in 2009 and 2008 was 17.6% and a loss of 17.7%, respectively. We consult with the plans’ actuaries to determine a discount rate assumption that reflects the characteristics of our plans, including expected cash outflows from our plans, and utilize an analytical tool that incorporates the concept of a hypothetical yield curve, developed from corporate bond (Aa quality) yield information. Assuming a 100 basis point increase in these assumptions, our 2009 pension expense would have been approximately $2.3 million lower. Assuming a 100 basis point decrease in these assumptions, our 2009 pension expense would have been approximately $2.7 million higher.
Stock-Based Compensation
Stock-based compensation expense for all share-based payment awards is based on the estimated grant-date fair value. We recognize these compensation costs net of an estimated forfeiture rate and recognize the compensation costs for only those shares expected to vest on a straight-line basis over the requisite service period of the award, which is generally the option vesting term. We recognize stock-based compensation expense for all grants on a straight-line basis over the requisite service period of the entire award for ratable awards. Compensation expense for awards with market or performance conditions reflects the estimated probability that the market and/or performance conditions will be met and is recognized ratably over the service period(s) of the award. We estimate the future forfeiture rate taking into consideration our historical experience during the preceding four fiscal years.
Determining the appropriate fair value model and calculating the fair value of share-based payment awards require the making of subjective assumptions, including the expected life of the share-based payment awards and stock price volatility. The assumptions used in calculating the fair value of share-based payment awards represent management’s best estimates, but these estimates involve inherent uncertainties and the application of management judgment. As a result, if factors change and we use different assumptions, our stock-based compensation expense could be materially different in the future. In addition, we are required to estimate the expected forfeiture rate and recognize expense only for those shares expected to vest. If our actual forfeiture rate is materially different from our estimate, the stock-based compensation expense could be significantly different from what we have recorded in the current period.
18
Fair Value Measurements
Fair value accounting guidance establishes a hierarchy for inputs used in measuring fair value that maximizes the use of observable inputs and minimizes the use of unobservable inputs by requiring that the most observable inputs be used when available. Observable inputs are inputs that market participants would use in pricing the asset or liability, and are based on market data obtained from sources independent of MEMC. Unobservable inputs are inputs that reflect MEMC’s assumptions about the assumptions market participants would use in pricing the asset or liability based on the best information available in the circumstances. The hierarchy is broken down into three levels based on the reliability of inputs as follows:
| | • | | Level 1—Valuations based on quoted prices in active markets for identical assets or liabilities that MEMC has the ability to access. Valuation adjustments and block discounts are not applied to Level 1 instruments. Because valuations are based on quoted prices that are readily and regularly available in an active market, valuation of these instruments does not entail a significant degree of judgment. |
| | • | | Level 2—Valuations based on quoted prices in markets that are not active or for which all significant inputs are observable, either directly or indirectly. Valuations for Level 2 assets are prepared on an individual asset basis using data obtained from recent transactions for identical securities in inactive markets or pricing data from similar assets in active and inactive markets. |
| | • | | Level 3—Valuations based on inputs that are unobservable and significant to the overall fair value measurement. |
Valuations of our Level 3 available for sale investments are performed using a discounted cash flow model, which involves making assumptions about expected future cash flows based on estimates of current market interest rates. Our models include estimates of market data, including yields or spreads of trading instruments that are believed to be similar or comparable, when available and assumptions that are believed to be reasonable on nonobservable inputs. Such assumptions include the tax status (taxable vs. tax-exempt), type of security (type of issuer, collateralization, subordination, etc.), credit quality, duration, likelihood of redemption, insurance coverage and degree of liquidity in the current credit markets.
Effective April 1, 2009, MEMC adopted an accounting standards update included in the Financial Accounting Standards Board’s (“FASB”) Accounting Standards Codification (“ASC”) 820, “Fair Value Measurements and Disclosures,” which provides additional guidance for estimating fair value when the volume and level of activity for the asset or liability have significantly decreased. This update also includes guidance on identifying circumstances that indicate a transaction is not orderly. MEMC applied the guidance in this update in our evaluation of our asset-backed securities, mortgage-backed securities and corporate debt securities beginning in the second quarter of 2009 and it did not impact our financial position or results of operations.
Derivative Financial Instruments and Hedging Activities
All derivative instruments are recorded on the balance sheet at fair value. Derivatives used to hedge foreign-currency-denominated balance sheet items are not treated as accounting hedges and are reported directly in earnings along with offsetting transaction gains and losses on the items being hedged. Derivatives used to hedge floating rate debt may be accounted for as cash flow hedges, as deemed appropriate. Gains and losses on derivatives designated as cash flow hedges are recorded in other comprehensive income and reclassified to earnings in a manner that matches the timing of the earnings impact of the hedged transactions. The ineffective portion of all hedges, if any, is recognized currently in earnings. Derivatives used to manage the foreign exchange risk associated with a net investment denominated in another currency are accounted for as a net investment hedge. The effective portion of the hedge will be recorded in the same manner as foreign currency translation adjustment in other comprehensive income. When the investment is dissolved and MEMC recognizes a gain or loss in other expense, the associated hedge gain or loss in other comprehensive income will be reclassified to other expense.
On July 25, 2006, MEMC received a fully vested, non-forfeitable warrant to purchase common shares of a customer, Suntech. The warrant becomes exercisable over a five year period (20% annually commencing on January 1, 2008) and has a five year exercise period from the date each tranche becomes exercisable. The warrant is considered a derivative and is therefore marked to market each reporting period. Determining the appropriate fair value model and estimating the fair value of the warrant requires the making of subjective assumptions, including the stock price volatility of Suntech. We used a lattice model to estimate the warrant’s fair value. A combination of Suntech’s historical and implied stock price volatility was used as an indicator of expected volatility.
Through our acquisition of SunEdison, we are party to three interest rate swap instruments that are accounted for using hedge accounting. The interest rate swaps are used to manage risks generally associated with interest rate price fluctuations. Each contract has been accounted for as a qualifying cash flow hedge in accordance with derivative instrument and hedging activities guidance, whereby changes in the fair market value are reflected as adjustments to the fair value of the derivative instruments as reflected in the accompanying consolidated financial statements. The counterparties to these agreements are financial institutions. The fair values of the contracts are estimated by obtaining quotations from the financial institutions, which are parties to our contracts. The fair value is an estimate of the net amount that we would pay on December 31, 2009, if the agreements were transferred to other parties or cancelled by us.
19
Our unconsolidated joint venture with Q-Cells SE, is a Euro functional currency entity accounted for under the equity method, in which we invested 72.5 million Euros. In order to manage the changes in foreign currency and any resulting gain or loss associated with this investment, MEMC entered into a Euro currency forward contract for 70.0 million Euros. The forward contract meets all the criteria for hedge accounting and MEMC expects that the derivative instrument will be effective as an economic hedge of foreign exchange risk associated with the hedged net investment. The effective portion of the hedge will be recorded in the same manner as foreign currency translation adjustment in other comprehensive income. When the investment is returned to MEMC, the associated hedge gain or loss in other comprehensive income will be reclassified to other expense offsetting the gain or loss on the net investment in the Q-Cells joint venture also recorded in other expense.
Investments
Our investment in equity securities includes a customer’s common stock (Gintech) acquired in connection with the execution of a long-term supply agreement. This investment was accounted for under the cost method of accounting until December 2008 when the restriction on sale became less than one year. Subsequently, this investment is accounted for at fair value and is classified as a long-term available-for-sale investment. Prior to the lapse of the restriction on sale, the fair value of the investment was estimated based on the closing stock price, reduced by the estimated value of a put with a term equal to the time until the restriction expired. The restriction on sale expired during December 2009 and as a result, the investment is valued based on a quoted market price.
We also have investments in debt securities which require us to make estimates of their fair values to determine the unrealized gains and losses on the securities, if any losses are temporary or other than temporary and concerning the ability and related timing of liquidating our holdings. Unrealized losses are recorded to other income and expense when a decline in fair value is determined to be other-than-temporary. We review several factors to determine whether a loss is other-than-temporary. These factors include but are not limited to: (i) the nature of the investment; (ii) the cause and duration of the impairment; (iii) the extent to which fair value is less than cost; (iv) the financial condition and near term prospects of the issuer; and (v) our ability to hold the security for a period of time sufficient to allow for any anticipated recovery in fair value. Realized gains and losses are accounted for on the specific identification method. We determine the fair value of our debt securities using quoted prices from active and inactive markets, traded prices for similar assets, or fair value measurements based on a pricing model. We also review our ability to liquidate our investments within the next 12 month operating cycle to determine the appropriate short or long-term classification. Our ability to liquidate is determined based on a review of current and short-term credit and capital market conditions and the financial condition and near term prospects of the issuer.
We entered into a formal joint venture agreement on August 26, 2009 with Q-Cells for the purpose of building large scale solar energy systems. The joint venture is accounted for under the equity method of accounting. As MEMC sells wafers to Q-Cells, the revenue from those sales is recognized consistent with MEMC’s revenue recognition policy, and the costs associated with those wafers are included in cost of goods sold. MEMC defers its pro rata share (50%) of the net profit associated with the sale of the wafers, consistent with its ownership in the joint venture, until the project is sold to a third party, at which point all previously deferred amounts will be recognized as income, as well as any gain or loss on the sale of the project. We have eliminated our pro rata share of the net profit in the statement of operations as equity in earnings of joint venture, net of tax. We review our equity method investments periodically for indicators of impairment.
Effective April 1, 2009, MEMC adopted an accounting standards update included in ASC 320, “Investments—Debt and Equity Securities,” which amends the previous other-than-temporary impairment guidance in US GAAP for debt securities to make the guidance more operational and to improve the presentation and disclosure of other-than-temporary impairments on debt and equity securities in the financial statements. This update does not amend existing recognition and measurement guidance related to other-than-temporary impairments of equity securities. MEMC applied the guidance in this update to our valuations for our asset-backed securities, mortgage-backed securities and corporate debt securities beginning in the second quarter of 2009. As a result of the adoption, we recorded an adjustment of $0.3 million to increase our beginning retained earnings at that date with the offset to accumulated other comprehensive loss.
ACCOUNTING STANDARDS UPDATES NOT YET EFFECTIVE
In June 2009, the FASB issued an accounting standards update included in ASC 860, “Transfers and Servicing,” which removes the concept of a qualifying special-purpose entity from previous guidance. This guidance also clarifies the requirements for isolation and limitations on portions of financial assets that are eligible for sale accounting. This update is effective for fiscal years beginning after November 15, 2009. We will adopt this standard in the first quarter of 2010 and the adoption is not expected to have a material impact on our consolidated financial statements.
In June 2009, the FASB issued an accounting standards update included in ASC 810, “Consolidation,” which amends previous guidance to require an analysis to determine whether a variable interest gives a company a controlling financial interest in a variable interest entity. An ongoing reassessment of financial responsibility is required, including interests in entities formed prior to the effective date of this guidance, and eliminates the quantitative approach previously required for determining whether a company is the primary beneficiary. This update is effective for fiscal years beginning after November 15, 2009. We will adopt this standard in the first quarter of 2010 and the adoption is not expected to have a material impact on our consolidated financial statements.
20
In October 2009, the FASB issued Accounting Standards Update 2009-13 (“ASU 2009-13”), which updates the current guidance pertaining to multiple-element revenue arrangements included in ASC Subtopic 605-25. ASU 2009-13 will be effective for our annual reporting period beginning January 1, 2011. We are currently evaluating the impact of ASU 2009-13 on our consolidated results of operations and financial condition.
MARKET RISK
For MEMC, our market risk is mainly related to financial and capital markets risk.
The overall objective of our financial risk management program is to reduce the potential negative earnings effects from changes in foreign exchange and interest rates arising in our business activities. We manage these financial exposures through operational means and by using various financial instruments. These practices may change as economic conditions change.
To mitigate financial market risks of foreign currency exchange rates, we utilize interest rate swaps and currency forward contracts. We do not use derivative financial instruments for speculative or trading purposes. We generally hedge transactional currency risks with currency forward contracts. Gains and losses on these foreign currency exposures are generally offset by corresponding losses and gains on the related hedging instruments, resulting in negligible net exposure to MEMC. A substantial majority of our revenue and capital spending is transacted in U.S. Dollars. However, we do enter into these transactions in other currencies, primarily, the Euro, the Japanese Yen, the Canadian Dollar and certain other Asian currencies. To protect against reductions in value and volatility of future cash flows caused by changes in foreign exchange rates, we have established transaction-based hedging programs. Our hedging programs reduce, but do not always eliminate, the impact of foreign currency exchange rate movements. In addition to the direct effects of changes in exchange rates, such changes typically affect the volume of sales or the foreign currency sales price as competitors’ products become more or less attractive. Our Taiwan, Malaysia and Singapore based subsidiaries use the U.S. Dollar as their functional currencies for US GAAP purposes and do not hedge New Taiwanese Dollar, Malaysian Ringgit or Singapore Dollar exposures.
Our unconsolidated joint venture with Q-Cells SE is a Euro functional currency entity accounted for under the equity method, in which we invested 72.5 million Euros ($104.6 million at December 31, 2009). In order to manage the changes in foreign currency and any resulting gain or loss associated with this investment, MEMC entered into a Euro currency forward contract for 70.0 million Euros. A hypothetical 10% change in the Euro at December 31, 2009 would result in an estimated change in the fair value of the forward contract of approximately $10.0 million.
Our long-term debt portfolio consists mostly of fixed-rate instruments. Our variable pay-rate borrowings had a fair value of approximately $60.0 million as of December 31, 2009. If the relevant market rate for all of our variable pay-rate borrowings had been 100 basis points higher or lower than actual in 2009, our interest expense would have increased or decreased by approximately $0.5 million on an annualized basis. From time to time, we may hedge floating rates to achieve fixed rates using interest rate swaps. The hedges are designated as cash flow hedges and the gains and losses on the fair value of the swaps are reported in accumulated other comprehensive income. The notional amounts and fair values of our interest ratecash flow hedges at December 31, 2009 were $45.4 million and $0.8 million, respectively. We are also subject to interest rate risk related to our cash equivalents, investments, pension plan assets and capital leases. To mitigate substantial risk associated with changes in interest rates, we seek to obtain fixed rate securities, actively manage our portfolio duration and diversify across different currencies. In addition to interest rate risk on our cash equivalents, investments and pension plan assets, we are subject to issuer credit risk because the value of our investments may change based on liquidity issues or adverse economic conditions affecting the creditworthiness of the issuers or group of issuers of the securities we may own. As of December 31, 2009, our investments were in fixed income funds, individual corporate bonds, asset-backed securities, mortgage-backed securities and auction rate securities, comprised of tax exempt municipal bonds and state sponsored student loan revenue bonds. Our pension plan assets are invested primarily in marketable securities including common stocks, bonds and interest bearing deposits. See additional discussion in “Liquidity and Capital Resources” and “Critical Accounting Policies and Estimates”. Due to the diversity of and numerous securities in our portfolio, estimating a hypothetical change in value of our portfolio based on estimated changes in interest rates and issuer risk is not practical.
The SunEdison sales model is highly sensitive to interest rate fluctuations and the availability of liquidity, and would be adversely affected by increases in interest rates or liquidity constraints. Many of our customers and potential customers depend on debt financing to purchase our solar energy systems. An increase in interest rates could make it difficult for our customers to secure the financing necessary to purchase our solar energy systems on favorable terms, or at all, and thus lower demand for our SunEdison products, reduce revenue and adversely impact our operating results. An increase in interest rates could lower a customer’s return on investment in a system or make alternative investments more attractive relative to solar energy systems, which, in each case, could cause our customers to seek alternative investments that promise higher returns or demand higher returns from our solar energy systems, reduce gross margin and adversely impact our operating results.
21
With the receipt of the Suntech warrant and our investment in a various equity securities, we are exposed to equity price risk. A hypothetical 10% change in the stock price of Suntech would result in an estimated change in the fair value of the warrant of approximately $8 million at December 31, 2009.
UNAUDITED QUARTERLY FINANCIAL INFORMATION
| | | | | | | | | | | | | | | |
2009 | | First
Quarter | | Second
Quarter | | | Third
Quarter | | | Fourth
Quarter | |
| | | | |
| Dollars in millions, except per share data | | | | | | | | | | | |
| | | | |
Net sales | | $ | 214.0 | | $ | 282.9 | | | $ | 310.0 | | | $ | 356.7 | |
| | | | |
Gross profit | | | 19.7 | | | 34.9 | | | | 20.5 | | | | 53.0 | |
| | | | |
Net income(loss) | | | 1.2 | | | (0.4 | ) | | | (64.9 | ) | | | (5.7 | ) |
| | | | |
Net loss (income) attributable to noncontrolling interests | | | 0.8 | | | 1.8 | | | | 0.3 | | | | (1.4 | ) |
| | | | |
Net income (loss) attributable to MEMC stockholders | | | 2.0 | | | 1.4 | | | | (64.6 | ) | | | (7.1 | ) |
| | | | |
Basic income (loss) per share | | | 0.01 | | | 0.01 | | | | (0.29 | ) | | | (0.03 | ) |
| | | | |
Diluted income (loss) per share | | | 0.01 | | | 0.01 | | | | (0.29 | ) | | | (0.03 | ) |
| | | | |
Market close stock prices: | | | | | | | | | | | | | | | |
| | | | |
High | | | 19.03 | | | 20.94 | | | | 20.86 | | | | 16.44 | |
| | | | |
Low | | | 12.31 | | | 14.03 | | | | 15.22 | | | | 11.98 | |
The Materials Business recorded restructuring and impairment costs of $6.7 million, $5.6 million, $39.7 million and $1.0 million to operating expense in the quarters ended March 31, June 30, September 30 and December 31, 2009, respectively, as discussed in Note 4 to the Consolidated Financial Statements.
On November 20, 2009, we completed the acquisition of Sun Edison LLC. Results of operations subsequent to the acquisition date through December 31, 2009 are included in the fourth quarter financial information above and were not material to the consolidated financial statements.
We recorded period expenses to cost of goods sold for unallocated fixed overhead costs of $36.2 million in the quarter ended March 31, 2009. There were no other such costs recorded in the remainder of 2009.
A gain/(loss) of ($0.1) million, $10.1 million, ($6.3) million and $1.7 million was recorded to non-operating expense in the quarters ended March 31, June 30, September 30 and December 31, 2009, respectively, due to the mark to market adjustment related to the Suntech warrant as discussed in Note 2Derivative Financial Instruments and Hedging Activities in the Consolidated Financial Statements.
Net income (loss) included income tax expense (benefit) related to prior years of $2.4 million, ($0.5) million, $1.5 million and $1.6 million in the quarters ended March 31, June 30, September 30 and December 31, 2009, respectively. In addition, we recorded a tax expense of $19.2 million in the third quarter related to uncertain tax positions which included amounts related to interest and penalties for previously identified issues.
22
| | | | | | | | | | | | | | | |
2008 | | First
Quarter | | | Second
Quarter | | | Third
Quarter | | | Fourth
Quarter |
| | | | |
| Dollars in millions, except per share data | | | | | | | | | | | |
| | | | |
Net sales | | $ | 501.4 | | | $ | 531.4 | | | $ | 546.0 | | | $ | 425.7 |
| | | | |
Gross profit | | | 259.3 | | | | 282.8 | | | | 269.7 | | | | 193.0 |
| | | | |
Net (loss) income | | | (40.7 | ) | | | 177.5 | | | | 183.6 | | | | 69.2 |
| | | | |
Net (income) loss attributable to noncontrolling interests | | | (1.1 | ) | | | (1.4 | ) | | | (0.8 | ) | | | 1.1 |
| | | | |
Net (loss) income attributable to MEMC stockholders | | | (41.8 | ) | | | 176.1 | | | | 182.8 | | | | 70.3 |
| | | | |
Basic (loss) income per share | | | (0.18 | ) | | | 0.77 | | | | 0.81 | | | | 0.31 |
| | | | |
Diluted (loss) income per share | | | (0.18 | ) | | | 0.76 | | | | 0.80 | | | | 0.31 |
| | | | |
Market close stock prices: | | | | | | | | | | | | | | | |
| | | | |
High | | | 87.88 | | | | 77.35 | | | | 59.64 | | | | 28.83 |
| | | | |
Low | | | 63.08 | | | | 61.38 | | | | 26.52 | | | | 10.45 |
A loss of $209.4 million, $12.3 million, $9.6 million and $61.2 million was recorded to non-operating (income) expense in the quarters ended March 31, June 30, September 30 and December 31, 2008, respectively, due to the mark to market adjustment related to the Suntech warrant as discussed in Note 2Derivative Financial Instruments and Hedging Activities in the Consolidated Financial Statements.
A decrease in our income tax provision of $44.0 million was recorded in the quarter ended September 30, 2008 related to a reduction in our uncertain tax position as a result of the closure of an IRS exam for the 2004 and 2005 tax years.
23
Consolidated Statements of Operations
| | | | | | | | | | | | |
| | | For the year ended December 31, | |
| | 2009 | | | 2008 | | | 2007 | |
| In millions, except per share data | | | | | | | | | |
| | | |
Net sales | | $ | 1,163.6 | | | $ | 2,004.5 | | | $ | 1,921.8 | |
| | | |
Cost of goods sold | | | 1,035.5 | | | | 999.7 | | | | 921.3 | |
| | | | | | | | | | | | |
| | | |
Gross profit | | | 128.1 | | | | 1,004.8 | | | | 1,000.5 | |
| | | |
Operating expenses: | | | | | | | | | | | | |
| | | |
Marketing and administration | | | 161.9 | | | | 106.5 | | | | 111.3 | |
| | | |
Research and development | | | 40.4 | | | | 40.8 | | | | 39.3 | |
| | | |
Restructuring and impairment costs | | | 53.0 | | | | 4.3 | | | | — | |
| | | | | | | | | | | | |
| | | |
Operating (loss) income | | | (127.2 | ) | | | 853.2 | | | | 849.9 | |
| | | | | | | | | | | | |
| | | |
Non-operating (income) expense: | | | | | | | | | | | | |
| | | |
Interest expense | | | 4.0 | | | | 1.8 | | | | 1.4 | |
| | | |
Interest income | | | (26.5 | ) | | | (46.4 | ) | | | (45.0 | ) |
| | | |
(Increase) decline in fair value of warrant | | | (5.4 | ) | | | 292.5 | | | | (220.8 | ) |
| | | |
Other, net | | | 0.9 | | | | 20.3 | | | | 2.5 | |
| | | | | | | | | | | | |
| | | |
Total non-operating (income) expense | | | (27.0 | ) | | | 268.2 | | | | (261.9 | ) |
| | | | | | | | | | | | |
| | | |
(Loss) income before income tax expense and equity in earnings of joint venture | | | (100.2 | ) | | | 585.0 | | | | 1,111.8 | |
| | | |
Income tax (benefit) expense | | | (42.2 | ) | | | 195.4 | | | | 282.2 | |
| | | | | | | | | | | | |
| | | |
(Loss) income before equity in earnings of joint venture | | | (58.0 | ) | | | 389.6 | | | | 829.6 | |
| | | |
Equity in earnings of joint venture, net of tax | | | (11.8 | ) | | | — | | | | — | |
| | | | | | | | | | | | |
Net (loss) income | | | (69.8 | ) | | | 389.6 | | | | 829.6 | |
| | | | | | | | | | | | |
| | | |
Net loss (income) attributable to noncontrolling interests | | | 1.5 | | | | (2.2 | ) | | | (3.4 | ) |
| | | | | | | | | | | | |
| | | |
Net (loss) income attributable to MEMC stockholders | | $ | (68.3 | ) | | $ | 387.4 | | | $ | 826.2 | |
| | | | | | | | | | | | |
| | | |
Basic (loss) income per share | | $ | (0.31 | ) | | $ | 1.71 | | | $ | 3.66 | |
| | | |
Diluted (loss) income per share | | $ | (0.31 | ) | | $ | 1.69 | | | $ | 3.56 | |
| | | |
Weighted-average shares used in computing basic (loss) income per share | | | 223.9 | | | | 226.9 | | | | 225.6 | |
| | | |
Weighted-average shares used in computing diluted (loss) income per share | | | 223.9 | | | | 228.6 | | | | 232.3 | |
See accompanying notes to consolidated financial statements.
24
Consolidated Balance Sheets
| | | | | | | | |
| | | As of December 31, | |
| | 2009 | | | 2008 | |
| | |
| In millions, except per share data | | | | | | |
| | |
Assets | | | | | | | | |
| | |
Current assets: | | | | | | | | |
| | |
Cash and cash equivalents | | $ | 632.7 | | | $ | 988.3 | |
| | |
Restricted cash | | | 37.4 | | | | — | |
| | |
Short-term investments | | | 85.9 | | | | 148.4 | |
| | |
Accounts receivable, net | | | 173.3 | | | | 197.3 | |
| | |
Inventories | | | 160.8 | | | | 81.3 | |
| | |
Income taxes receivable | | | 72.5 | | | | — | |
| | |
Prepaid and other current assets | | | 87.0 | | | | 38.9 | |
| | | | | | | | |
| | |
Total current assets | | | 1,249.6 | | | | 1,454.2 | |
| | |
Investments | | | 297.6 | | | | 284.7 | |
| | |
Property, plant and equipment, net | | | 1,460.7 | | | | 1,041.2 | |
| | |
Deferred tax assets, net | | | 95.3 | | | | 69.7 | |
| | |
Customer warrant | | | 19.2 | | | | 13.8 | |
| | |
Restricted cash | | | 21.0 | | | | — | |
| | |
Other assets | | | 91.1 | | | | 67.4 | |
| | |
Goodwill | | | 285.3 | | | | — | |
| | |
Intangible assets, net | | | 46.7 | | | | 5.7 | |
| | | | | | | | |
| | |
Total assets | | $ | 3,566.5 | | | $ | 2,936.7 | |
| | | | | | | | |
| | |
Liabilities and Stockholders’ Equity | | | | | | | | |
| | |
Current liabilities: | | | | | | | | |
| | |
Current portion of long-term debt and capital leases | | $ | 32.2 | | | $ | 6.1 | |
| | |
Accounts payable | | | 219.3 | | | | 162.4 | |
| | |
Accrued liabilities | | | 106.8 | | | | 67.5 | |
| | |
Accrued wages and salaries | | | 39.2 | | | | 31.7 | |
| | |
Customer deposits | | | 83.6 | | | | 187.0 | |
| | |
Income taxes payable | | | 28.0 | | | | 17.9 | |
| | | | | | | | |
| | |
Total current liabilities | | | 509.1 | | | | 472.6 | |
| | |
Long-term debt and capital leases, less current portion | | | 384.4 | | | | 26.1 | |
| | |
Pension and post-employment liabilities | | | 46.6 | | | | 46.3 | |
| | |
Deferred revenue | | | 106.3 | | | | 88.8 | |
| | |
Other liabilities | | | 313.3 | | | | 186.1 | |
| | | | | | | | |
| | |
Total liabilities | | | 1,359.7 | | | | 819.9 | |
| | | | | | | | |
| | |
Commitments and contingencies | | | | | | | | |
| | |
Stockholders’ equity: | | | | | | | | |
| | |
Preferred stock, $.01 par value, 50.0 shares authorized, none issued or outstanding at December 31, 2009 or 2008 | | | — | | | | — | |
| | |
Common stock, $.01 par value, 300.0 shares authorized, 237.2 and 233.3 issued at December 31, 2009 and 2008, respectively | | | 2.4 | | | | 2.3 | |
| | |
Additional paid-in capital | | | 507.4 | | | | 425.6 | |
| | |
Retained earnings | | | 2,079.1 | | | | 2,147.1 | |
| | |
Accumulated other comprehensive income (loss) | | | 33.0 | | | | (55.6 | ) |
| | |
Treasury stock: 9.8 and 8.8 shares at December 31, 2009 and 2008, respectively | | | (453.3 | ) | | | (437.4 | ) |
| | | | | | | | |
| | |
Total MEMC stockholders’ equity | | | 2,168.6 | | | | 2,082.0 | |
| | | | | | | | |
| | |
Noncontrolling interests | | | 38.2 | | | | 34.8 | |
| | |
Total stockholders’ equity | | | 2,206.8 | | | | 2,116.8 | |
| | | | | | | | |
| | |
Total liabilities and stockholders’ equity | | $ | 3,566.5 | | | $ | 2,936.7 | |
| | | | | | | | |
See accompanying notes to consolidated financial statements.
25
Consolidated Statements of Cash Flows
| | | | | | | | | | | | |
| | | For the year ended
December 31, | |
| | 2009 | | | 2008 | | | 2007 | |
| | | |
| In millions | | | | | | | | | |
| | | |
Cash flows from operating activities: | | | | | | | | | | | | |
| | | |
Net (loss) income | | $ | (69.8 | ) | | $ | 389.6 | | | $ | 829.6 | |
| | | |
Adjustments to reconcile net income to net cash provided by operating activities: | | | | | | | | | | | | |
| | | |
Depreciation and amortization | | | 124.0 | | | | 104.0 | | | | 80.7 | |
| | | |
Stock-based compensation | | | 36.5 | | | | 28.5 | | | | 31.1 | |
| | | |
Provision (benefit) for deferred taxes | | | (32.4 | ) | | | 54.1 | | | | 24.5 | |
| | | |
(Increase) decline in fair value of warrant | | | (5.4 | ) | | | 292.5 | | | | (220.8 | ) |
| | | |
Impairment charges | | | 24.6 | | | | 1.1 | | | | — | |
| | | |
Other | | | 4.0 | | | | 18.0 | | | | (1.1 | ) |
| | | |
Changes in assets and liabilities (net of effects from acquisition): | | | | | | | | | | | | |
| | | |
Short-term investments—trading securities | | | 10.9 | | | | — | | | | 9.5 | |
| | | |
Accounts receivable | | | 26.0 | | | | (4.3 | ) | | | 6.0 | |
| | | |
Inventories | | | (43.2 | ) | | | (43.7 | ) | | | 45.5 | |
| | | |
Income taxes receivable | | | (72.5 | ) | | | — | | | | — | |
| | | |
Prepaid and other current assets | | | (3.4 | ) | | | (12.0 | ) | | | (3.9 | ) |
| | | |
Accounts payable and accrueds | | | 17.5 | | | | 24.2 | | | | 23.9 | |
| | | |
Deferred revenue and customer deposits | | | 15.4 | | | | (33.1 | ) | | | 39.0 | |
| | | |
Income taxes payable | | | 8.7 | | | | (59.1 | ) | | | 18.3 | |
| | | |
Pension and post-employment liabilities | | | (1.4 | ) | | | (72.4 | ) | | | (9.9 | ) |
| | | |
Other non-current assets and liabilities | | | (6.5 | ) | | | (46.5 | ) | | | 44.8 | |
| | | | | | | | | | | | |
| | | |
Net cash provided by operating activities | | | 33.0 | | | | 640.9 | | | | 917.2 | |
| | | | | | | | | | | | |
| | | |
Cash flows from investing activities: | | | | | | | | | | | | |
| | | |
Cash payments for acquisition, net of cash acquired | | | (188.5 | ) | | | — | | | | — | |
| | | |
Proceeds from sale and maturities of investments | | | 272.5 | | | | 485.5 | | | | 93.2 | |
| | | |
Purchases of investments | | | (10.9 | ) | | | (517.3 | ) | | | (506.4 | ) |
| | | |
Purchases of cost and equity method investments | | | (121.7 | ) | | | — | | | | — | |
| | | |
Capital expenditures | | | (225.4 | ) | | | (303.6 | ) | | | (276.4 | ) |
| | | |
Construction of solar energy systems | | | (28.0 | ) | | | — | | | | — | |
| | | |
Restricted cash | | | 2.2 | | | | — | | | | — | |
| | | |
Other | | | — | | | | — | | | | 0.7 | |
| | | | | | | | | | | | |
| | | |
Net cash used in investing activities | | | (299.8 | ) | | | (335.4 | ) | | | (688.9 | ) |
| | | | | | | | | | | | |
| | | |
Cash flows from financing activities: | | | | | | | | | | | | |
| | | |
Net (repayments of) proceeds from customer deposits related to long-term supply agreements | | | (90.4 | ) | | | 138.0 | | | | 115.3 | |
| | | |
Principal payments on long-term debt | | | (46.0 | ) | | | (6.0 | ) | | | (5.2 | ) |
| | | |
Proceeds from financing obligations | | | 78.1 | | | | — | | | | — | |
| | | |
Repayments of financing and capital lease obligations | | | (15.6 | ) | | | — | | | | — | |
| | | |
Excess tax benefits from share-based payment arrangements | | | 0.3 | | | | 19.0 | | | | 40.0 | |
| | | |
Dividend to noncontrolling interest | | | — | | | | (3.2 | ) | | | (6.2 | ) |
| | | |
Common stock repurchased | | | (15.8 | ) | | | (321.0 | ) | | | (111.2 | ) |
| | | |
Proceeds from issuance of common stock | | | 0.7 | | | | 19.9 | | | | 44.2 | |
| | | |
Debt financing fees | | | (3.0 | ) | | | — | | | | — | |
| | | | | | | | | | | | |
| | | |
Net cash (used in) provided by financing activities | | | (91.7 | ) | | | (153.3 | ) | | | 76.9 | |
| | | | | | | | | | | | |
| | | |
Effect of exchange rate changes on cash and cash equivalents | | | 2.9 | | | | (23.2 | ) | | | 26.6 | |
| | | | | | | | | | | | |
| | | |
Net (decrease) increase in cash and cash equivalents | | | (355.6 | ) | | | 129.0 | | | | 331.8 | |
| | | |
Cash and cash equivalents at beginning of period | | | 988.3 | | | | 859.3 | | | | 527.5 | |
| | | | | | | | | | | | |
| | | |
Cash and cash equivalents at end of period | | $ | 632.7 | | | $ | 988.3 | | | $ | 859.3 | |
| | | | | | | | | | | | |
See accompanying notes to consolidated financial statements.
26
Consolidated Statements of Stockholders’ Equity
| | | | | | | | | | | | | | | | | | | | | | | | | | | | | | | | | | | | |
| | | Common Stock
Issued | | Additional
Paid-in
Capital | | | Retained
Earnings | | | Accumulated
Other
Comprehensive
Income (Loss) | | | Common Stock
Held in Treasury | | | Total MEMC
Stockholders’
Equity | | | Noncontrolling
Interest | | | Total
Stockholders’
Equity | |
| | | Shares | | Amount | | | | | Shares | | | Amount | | | | |
| In millions | | | | | | | | | | | | | | | | | | | | | | | | | | | | |
Balance at December 31, 2006 | | 224.0 | | $ | 2.2 | | $ | 242.5 | | | $ | 933.8 | | | $ | (7.4 | ) | | (0.7 | ) | | $ | (4.2 | ) | | $ | 1,166.9 | | | $ | 38.6 | | | $ | 1,205.5 | |
| | | | | | | | | | | | | | | | | | | | | | | | | | | | | | | | | | | | |
| | | | | | | | | | |
Cumulative effect of adoption of accounting principle related to uncertain tax positions | | — | | | — | | | — | | | | 0.5 | | | | — | | | — | | | | — | | | | 0.5 | | | | — | | | | 0.5 | |
| | | | | | | | | | |
Comprehensive income: | | | | | | | | | | | | | | | | | | | | | | | | | | | | | | | | | | | | |
| | | | | | | | | | |
Net income | | — | | | — | | | — | | | | 826.2 | | | | — | | | — | | | | — | | | | 826.2 | | | | 3.4 | | | | 829.6 | |
| | | | | | | | | | |
Net translation adjustment | | — | | | — | | | — | | | | — | | | | 32.3 | | | — | | | | — | | | | 32.3 | | | | — | | | | 32.3 | |
| | | | | | | | | | |
Net unrecognized actuarial loss and prior service credit (net of $5.9 tax) | | — | | | — | | | — | | | | — | | | | 9.2 | | | — | | | | — | | | | 9.2 | | | | — | | | | 9.2 | |
| | | | | | | | | | |
Net unrealized loss on available-for-sale securities | | — | | | — | | | — | | | | — | | | | (4.3 | ) | | — | | | | — | | | | (4.3 | ) | | | — | | | | (4.3 | ) |
| | | | | | | | | | | | | | | | | | | | | | | | | | | | | | | | | | | | |
| | | | | | | | | | |
Total comprehensive income | | | | | | | | | | | | | | | | | | | | | | | | | | | 863.4 | | | | 3.4 | | | | 866.8 | |
| | | | | | | | | | |
Stock plans, net | | 3.4 | | | — | | | 115.6 | | | | — | | | | — | | | (0.1 | ) | | | (0.2 | ) | | | 115.4 | | | | — | | | | 115.4 | |
| | | | | | | | | | |
Common stock repurchases | | — | | | — | | | — | | | | — | | | | — | | | (1.8 | ) | | | (111.2 | ) | | | (111.2 | ) | | | — | | | | (111.2 | ) |
| | | | | | | | | | |
Net exercise of warrants | | 4.5 | | | 0.1 | | | (0.1 | ) | | | — | | | | — | | | — | | | | — | | | | — | | | | — | | | | — | |
| | | | | | | | | | |
Dividend to noncontrolling interest | | — | | | — | | | — | | | | — | | | | — | | | — | | | | — | | | | — | | | | (6.2 | ) | | | (6.2 | ) |
| | | | | | | | | | | | | | | | | | | | | | | | | | | | | | | | | | | | |
| | | | | | | | | | |
Balance at December 31, 2007 | | 231.9 | | $ | 2.3 | | $ | 358.0 | | | $ | 1,760.5 | | | $ | 29.8 | | | (2.6 | ) | | $ | (115.6 | ) | | $ | 2,035.0 | | | $ | 35.8 | | | $ | 2,070.8 | |
| | | | | | | | | | | | | | | | | | | | | | | | | | | | | | | | | | | | |
| | | | | | | | | | |
Cumulative effect of adoption of accounting principle related to employee benefit plans measurement date provision | | — | | | — | | | — | | | | (0.8 | ) | | | — | | | — | | | | — | | | | (0.8 | ) | | | — | | | | (0.8 | ) |
| | | | | | | | | | |
Comprehensive income: | | | | | | | | | | | | | | | | | | | | | | | | | | | | | | | | | | | | |
| | | | | | | | | | |
Net income | | — | | | — | | | — | | | | 387.4 | | | | — | | | — | | | | — | | | | 387.4 | | | | 2.2 | | | | 389.6 | |
| | | | | | | | | | |
Net translation adjustment | | — | | | — | | | — | | | | — | | | | (14.2 | ) | | — | | | | — | | | | (14.2 | ) | | | — | | | | (14.2 | ) |
| | | | | | | | | | |
Net unrecognized actuarial loss and prior service credit (net of $17.5 tax) | | — | | | — | | | — | | | | — | | | | (32.3 | ) | | — | | | | — | | | | (32.3 | ) | | | — | | | | (32.3 | ) |
| | | | | | | | | | |
Net unrealized loss on available-for-sale securities | | — | | | — | | | — | | | | — | | | | (38.9 | ) | | — | | | | — | | | | (38.9 | ) | | | — | | | | (38.9 | ) |
| | | | | | | | | | | | | | | | | | | | | | | | | | | | | | | | | | | | |
| | | | | | | | | | |
Total comprehensive income | | | | | | | | | | | | | | | | | | | | | | | | | | | 302.0 | | | | 2.2 | | | | 304.2 | |
| | | | | | | | | | |
Stock plans, net | | 1.4 | | | — | | | 67.6 | | | | — | | | | — | | | — | | | | (0.8 | ) | | | 66.8 | | | | — | | | | 66.8 | |
| | | | | | | | | | |
Common stock repurchases | | — | | | — | | | — | | | | — | | | | — | | | (6.2 | ) | | | (321.0 | ) | | | (321.0 | ) | | | — | | | | (321.0 | ) |
| | | | | | | | | | |
Dividend to noncontrolling interest | | — | | | — | | | — | | | | — | | | | — | | | — | | | | — | | | | — | | | | (3.2 | ) | | | (3.2 | ) |
| | | | | | | | | | | | | | | | | | | | | | | | | | | | | | | | | | | | |
| | | | | | | | | | |
Balance at December 31, 2008 | | 233.3 | | $ | 2.3 | | $ | 425.6 | | | $ | 2,147.1 | | | $ | (55.6 | ) | | (8.8 | ) | | $ | (437.4 | ) | | $ | 2,082.0 | | | $ | 34.8 | | | $ | 2,116.8 | |
| | | | | | | | | | | | | | | | | | | | | | | | | | | | | | | | | | | | |
| | | | | | | | | | |
Cumulative effect of adoption of accounting principle related to other-than-temporary impairments on investments | | — | | | — | | | — | | | | 0.3 | | | | (0.3 | ) | | — | | | | — | | | | — | | | | — | | | | — | |
| | | | | | | | | | |
Purchase of Sun Edison LLC | | 3.8 | | | 0.1 | | | 45.8 | | | | — | | | | — | | | — | | | | — | | | | 45.9 | | | | 6.7 | | | | 52.6 | |
| | | | | | | | | | |
Comprehensive income: | | | | | | | | | | | | | | | | | | | | | | | | | | | | | | | | | | | | |
| | | | | | | | | | |
Net loss | | — | | | — | | | — | | | | (68.3 | ) | | | — | | | — | | | | — | | | | (68.3 | ) | | | (1.5 | ) | | | (69.8 | ) |
| | | | | | | | | | |
Net translation adjustment | | — | | | — | | | — | | | | — | | | | 9.4 | | | — | | | | — | | | | 9.4 | | | | (1.8 | ) | | | 7.6 | |
| | | | | | | | | | |
Net unrecognized actuarial gain and prior service credit (net of $1.5 tax) | | — | | | — | | | — | | | | — | | | | 2.6 | | | — | | | | — | | | | 2.6 | | | | — | | | | 2.6 | |
| | | | | | | | | | |
Gain on mark to market for cash flow hedges | | — | | | — | | | — | | | | — | | | | 1.8 | | | — | | | | — | | | | 1.8 | | | | — | | | | 1.8 | |
| | | | | | | | | | |
Net unrealized gain on available-for-sale securities | | — | | | — | | | — | | | | — | | | | 75.1 | | | — | | | | — | | | | 75.1 | | | | — | | | | 75.1 | |
| | | | | | | | | | | | | | | | | | | | | | | | | | | | | | | | | | | | |
| | | | | | | | | | |
Total comprehensive income | | | | | | | | | | | | | | | | | | | | | | | | | | | 20.6 | | | | (3.3 | ) | | | 17.3 | |
| | | | | | | | | | |
Stock plans, net | | 0.1 | | | — | | | 36.0 | | | | — | | | | — | | | — | | | | (0.1 | ) | | | 35.9 | | | | — | | | | 35.9 | |
| | | | | | | | | | |
Common stock repurchases | | — | | | — | | | — | | | | — | | | | — | | | (1.0 | ) | | | (15.8 | ) | | | (15.8 | ) | | | — | | | | (15.8 | ) |
| | | | | | | | | | | | | | | | | | | | | | | | | | | | | | | | | | | | |
| | | | | | | | | | |
Balance at December 31, 2009 | | 237.2 | | $ | 2.4 | | $ | 507.4 | | | $ | 2,079.1 | | | $ | 33.0 | | | (9.8 | ) | | $ | (453.3 | ) | | $ | 2,168.6 | | | $ | 38.2 | | | $ | 2,206.8 | |
| | | | | | | | | | | | | | | | | | | | | | | | | | | | | | | | | | | | |
See accompanying notes to consolidated financial statements.
27
Notes to Consolidated Financial Statements
1. NATURE OF OPERATIONS
We are a global leader in the manufacture and sale of silicon wafers and have been a pioneer in the design and development of wafer technologies over the past fifty years. With manufacturing and research and development facilities in the United States, Europe and Asia Pacific, we enable the next generation of high performance semiconductor and solar applications. Our customers include major semiconductor device and solar cell (device) manufacturers. We provide wafers in sizes ranging from 100 millimeters (4 inch) to 300 millimeters (12 inch). Since 2007, we have been selling 156 millimeter wafers targeted for solar applications. Depending on market conditions, we also sell intermediate products such as polysilicon, silane gas, ingots and scrap wafers to semiconductor device and equipment makers, solar cell and module manufacturers, flat panel and other industries.
On November 20, 2009, we completed the acquisition of Sun Edison LLC (“SunEdison”), a solar energy services provider that integrates the design, installation, monitoring and financing of solar energy systems in order to provide a comprehensive solar energy services solution. SunEdison typically enters into a solar power services agreement to sell electricity generated from solar energy for a fixed period of time. (See Note 3). Prior to the acquisition, we were engaged in one reportable segment—the design, manufacture and sale of silicon wafers. With the acquisition of SunEdison, we now also participate in the development and maintenance of solar energy systems and the sale of solar energy. Effective with the SunEdison acquisition, we were engaged in two reportable segments: Materials Business (includes the historical operations of MEMC) and Solar Energy Business (consists solely of SunEdison).
2. SUMMARY OF SIGNIFICANT ACCOUNTING POLICIES
Accounting Standards Codification
On July 1, 2009, MEMC adopted the Financial Accounting Standards Board (“FASB”) Accounting Standards Codification (“ASC”) 105-10 (“ASC 105-10”). ASC 105-10 establishes the FASB Accounting Standards Codification (the “Codification”) as the source of authoritative accounting principles recognized by the FASB to be applied by nongovernmental entities in the preparation of financial statements in conformity with US GAAP. Rules and interpretive releases of the Securities and Exchange Commission (“SEC”) under authority of federal securities laws are also sources of authoritative US generally accepted accounting principles (“US GAAP”) for SEC registrants. All guidance contained in the Codification carries an equal level of authority. The Codification superseded all existing non-SEC accounting and reporting standards. All other non-grandfathered, non-SEC accounting literature not included in the Codification is non-authoritative. The adoption of this accounting standard did not have a material impact on our financial statements.
Use of Estimates
In preparing our financial statements, we use estimates and assumptions that may affect reported amounts and disclosures. Estimates are used when accounting for investments, depreciation, amortization, leases, accrued liabilities, employee benefits, derivatives, stock based compensation, income taxes, the fair value of assets acquired and liabilities assumed in connection with business combinations, goodwill and asset valuation allowances among others. These estimates and assumptions are based on current facts, historical experience and various other factors that we believe to be reasonable under the circumstances, the results of which form the basis for making judgments about the carrying values of assets and liabilities and the recording of revenue, costs and expenses that are not readily apparent from other sources. To the extent there are material differences between the estimates and actual results, our future results of operations would be affected.
Reclassifications
Effective January 1, 2009, MEMC adopted an accounting standards update included in the FASB’s ASC 810, “Consolidation,” which amends prior guidance to establish accounting and reporting standards for the noncontrolling interest in a subsidiary and for the deconsolidation of a subsidiary. It clarifies that a noncontrolling interest in a subsidiary, which is sometimes referred to as minority interest, is an ownership interest in the consolidated entity that should be reported as equity in the consolidated financial statements. Among other requirements, this statement requires consolidated net income to be reported at amounts that include the amounts attributable to both the parent and the noncontrolling interest. It also requires disclosure, on the face of the consolidated income statement, of the amounts of consolidated net income attributable to the parent and to the noncontrolling interest.
MEMC now includes noncontrolling interests in consolidated net income for current and prior periods. Earnings per share, however, continue to be based on the net income attributable to MEMC stockholders. Additionally, comprehensive income attributable to the noncontrolling interests is deducted from consolidated comprehensive income to arrive at the comprehensive income attributable to MEMC stockholders. Noncontrolling interests have also been reclassified to equity for current and prior periods on the condensed consolidated balance sheet and stockholders’ equity. The adoption of this update did not have a material impact on our financial statements.
28
Certain prior year amounts have been reclassified to conform with the current year presentation, including restructuring and impairment costs and other intangible assets.
Principles of Consolidation
Our consolidated financial statements include the accounts of MEMC Electronic Materials, Inc. and our wholly and majority-owned subsidiaries including the consolidation of SunEdison, effective November 20, 2009, the acquisition date of SunEdison. We record noncontrolling interest for non-wholly owned consolidated subsidiaries. All significant intercompany balances and transactions among our subsidiaries have been eliminated.
Business Combinations
Effective January 1, 2009, MEMC adopted an accounting standards update included in ASC 805, “Business Combinations,” which establishes principles and requirements for how an acquirer recognizes and measures in its financial statements the identifiable assets acquired, the liabilities assumed, and any noncontrolling interest in an acquiree, including the recognition and measurement of goodwill acquired in a business combination. This update is effective for business combinations for which the acquisition date is on or after the beginning of the first annual reporting period beginning on or after December 15, 2008, with the exception of the accounting for valuation allowances on deferred taxes and acquired tax contingencies. The adoption of this update did not impact our financial position on January 1, 2009.
Variable Interest Entities
Variable interest entities (“VIEs”) are primarily entities that lack sufficient equity to finance their activities without additional financial support from other parties or whose equity holders lack the power to direct the activities of the entity. All VIEs must be evaluated to determine the primary beneficiary of the risks and rewards of the VIE. The primary beneficiary is required to consolidate the VIE for financial reporting purposes.
Cash and Cash Equivalents
Cash equivalents include highly liquid commercial paper, time deposits and money market funds with original maturity periods of three months or less when purchased. Total cash and cash equivalents maintained by foreign subsidiaries whose functional currency is not the U.S. dollar were $114.5 million and $138.0 million as of December 31, 2009 and 2008, respectively. Cash and cash equivalents consist of the following:
| | | | | | |
| | | As of December 31, |
| | 2009 | | 2008 |
| Dollars in millions | | | | |
| | |
Cash | | $ | 191.2 | | $ | 82.9 |
| | |
Cash Equivalents: | | | | | | |
| | |
Commercial paper | | | 6.7 | | | — |
| | |
Time deposits | | | 151.7 | | | 119.4 |
| | |
Money market funds | | | 283.1 | | | 786.0 |
| | | | | | |
| | $ | 632.7 | | $ | 988.3 |
| | | | | | |
Restricted Cash
Restricted cash consists of cash on deposit in financial institutions that are restricted from use in operations. In certain transactions, we have agreed to issue a letter of credit or provide security deposits regarding the performance or removal of a solar energy system. Incentive application fees are deposited with local governmental jurisdictions which are held until the construction of the applicable solar energy system is completed. In addition, cash received during the lease term of a sale/leaseback transaction is subject to a security and disbursement agreement which generally establishes a reserve requirement for scheduled lease payments under our master lease agreements as discussed inCapital Leases for each leaseback arrangement, as well as certain additional reserve requirements that may be temporarily required in an accrual account. All of the reserve requirements for scheduled lease payments for all projects under each master lease agreement must be satisfied before cash is disbursed to under the master lease agreements.
Investments
Effective April 1, 2009, MEMC adopted an accounting standards update included in ASC 320, “Investments—Debt and Equity Securities,” which amends the previous other-than-temporary impairment guidance in US GAAP for debt securities to make the
29
guidance more operational and to improve the presentation and disclosure of other-than-temporary impairments on debt and equity securities in the financial statements. This update does not amend existing recognition and measurement guidance related to other-than-temporary impairments of equity securities. MEMC applied the guidance in this update to our valuations for our asset-backed securities, mortgage-backed securities and corporate debt securities beginning in the second quarter of 2009. As a result of the adoption, we recorded an adjustment of $0.3 million to increase our beginning retained earnings at that date with the offset to accumulated other comprehensive loss.
Effective April 1, 2009, MEMC adopted an accounting standards update included in ASC 820, “Fair Value Measurements and Disclosures,” which provides additional guidance for estimating fair value when the volume and level of activity for the asset or liability have significantly decreased. This update also includes guidance on identifying circumstances that indicate a transaction is not orderly. MEMC applied the guidance in this update in our evaluation of our asset-backed securities, mortgage-backed securities and corporate debt securities beginning in the second quarter of 2009 and it did not impact our financial position or results of operations.
Short and long-term investments consist of the following:
Time Deposits. Time deposits, classified as short-term investments, are comprised mainly of demand deposits with commercial banks or investment companies having fixed original maturities exceeding three months but less than or equal to one year, with fixed interest rates and including pre-payment penalties for early withdrawal. Purchases and sales of these time deposits are included in investing activities in the Consolidated Statements of Cash Flows.
Trading Investments. Trading investments are stated at fair value, with realized and unrealized gains or losses resulting from changes in fair value recognized currently in non-operating income and expense. Included in trading investments are auction rate securities. Purchases and sales of trading investments are included in operating activities in the Consolidated Statements of Cash Flows.
Cost and Equity Method Investments. Cost method investments are initially recorded and subsequently carried at their historical cost and income is recorded to the extent there are dividends. We use the equity method of accounting for our equity investments where we hold more than 20 percent of the outstanding stock of the investee’s stock or where we have the ability to significantly influence the operations or financial decisions of the investee. We initially record the investment at cost and adjust the carrying amount each period to recognize our share of the earnings or losses of the investee based on our percentage of ownership. We review our equity and cost method investments periodically for indicators of impairment.
Available-for-Sale Investments. Investments designated as available-for-sale are reported at fair value, with unrealized gains and losses, net of tax, recorded in accumulated other comprehensive income. Purchases and sales of available-for-sale investments are included in investing activities in the Consolidated Statements of Cash Flows.
Investments are evaluated at each period end date for impairment, including classification as temporary or other than temporary. Unrealized losses are recorded to other income and expense when a decline in fair value is determined to be other-than-temporary. We review several factors to determine whether a loss is other-than-temporary. These factors include but are not limited to: (i) the nature of the investment; (ii) the cause and duration of the impairment; (iii) the extent to which fair value is less than cost; (iv) the financial condition and near term prospects of the issuer; and (v) our ability to hold the security for a period of time sufficient to allow for any anticipated recovery in fair value. Realized gains and losses are accounted for on the specific identification method. We determine the fair value of our debt securities using quoted prices from active and inactive markets, traded prices for similar assets, or fair value measurements based on a pricing model. We also review our ability and intent to liquidate our investments within the next 12 month operating cycle to determine the appropriate short or long-term classification. Our ability to liquidate is determined based on a review of current and short-term credit and capital market conditions and the financial condition and near term prospects of the issuer.
Allowance for Doubtful Accounts
We establish an allowance for doubtful accounts to adjust our net receivables to amounts considered to be ultimately collectible. Our allowance is based on a variety of factors, including the length of time receivables are past due, significant one-time events, the financial health of our customers and historical experience. The balance of our allowance for doubtful accounts was $10.0 million and $5.9 million as of December 31, 2009 and 2008, respectively. Provision (decrease) for bad debt expense was $4.2 million, $5.7 million and ($1.2) million for the years ended December 31, 2009, 2008 and 2007, respectively. There were no material write-offs for bad debts for the years ended December 31, 2009 and 2008.
Inventories
Materials Business inventories, which consist of raw materials, labor and manufacturing overhead, are valued at the lower of cost or market. Fixed overheads are allocated to the costs of conversion based on the normal capacity of our production facilities. Unallocated overheads during periods of abnormally low production levels are recognized as cost of goods sold in the period in which they are
30
incurred. Materials Business raw materials are stated at weighted-average cost and Materials Business goods in process and finished goods inventories are stated at standard cost as adjusted for variances, which approximates weighted-average actual cost. The valuation of inventory requires us to estimate excess and slow moving inventory. The determination of the value of excess and slow moving inventory is based upon assumptions of future demand and market conditions. If actual market conditions are less favorable than those projected by management, additional inventory write-downs may be required.
Solar Energy Business inventories consist primarily of raw materials (primarily solar panels) and work-in-process. Work-in-process includes materials and other capitalizable costs incurred to construct solar energy systems not under contract to be sold nor expected to be transferred to property and equipment upon completion. The cost of SunEdison inventories is based on the first-in, first-out (FIFO) method for raw material and project-specific cost identification for work-in-process. If SunEdison executes a contract with a customer in which the system will be retained or there will be a capitalized leased asset, the solar panel inventory is reclassified to property plant and equipment – construction in progress when the materials are issued to a jobsite.
Property, Plant and Equipment
We record property, plant and equipment at cost and depreciate it evenly over the assets’ estimated useful lives as follows:
| | |
| | | Years |
Buildings and improvements | | 4-60 |
| |
Machinery and equipment | | 1-25 |
| |
Solar energy systems | | 23-30 |
Expenditures for repairs and maintenance are charged to income as incurred. Additions and betterments are capitalized. The cost and related accumulated depreciation on property and equipment sold or otherwise disposed of are removed from the capital accounts and any gain or loss is reported in current-year operations. Systems accounted for as capital leases are depreciated over the economic life of lease.
We may sell a solar energy system and simultaneously lease back the solar energy system from the buyor/lessor under our master lease arrangements or other sale/leaseback arrangements. The gain, if any, on the sale/leaseback transaction is recorded as a deferred gain and is recorded as a contra-asset that reduces the cost of the solar energy system, thereby reducing depreciation expense over the term of the lease. Generally, as a result of various tax attributes that accrue to the benefit of the lessor/tax owner, the cost of the solar energy system is recorded as the net present value of the future minimum lease payments because this amount is lower than the fair market value of the solar energy system at the lease inception date. Solar energy systems that have failed sale treatment and have been leased back under a capital lease are recorded at the lower of the original cost to construct the system or its fair value.
Concurrent with our polysilicon expansions in 2008, we assessed the useful lives of certain new polysilicon related property, plant and equipment placed in service in 2008, and based on historical experience with similar existing assets, determined that a useful life of 25 years was appropriate. Previously existing polysilicon production assets were depreciated over an estimated useful life of 10 years and have immaterial net book values at December 31, 2009. Leasehold improvements are depreciated over the shorter of the estimated remaining useful life of the asset or the remaining lease term, including renewal periods considered reasonably assured of execution. Consolidated depreciation expense for the years ended December 31, 2009, 2008 and 2007 was $122.8 million, $103.0 million and $79.3 million, respectively. For SunEdison, depreciation expense was $1.5 million for the period from the acquisition date to December 31, 2009. We recorded $0.6 million of amortization of assets recorded under capital leases, which is included in depreciation expense, for the year ended December 31, 2009.
When we are entitled to incentive tax credits for property, plant and equipment, we reduce the asset carrying value by the amount of the credit, which reduces future depreciation.
The cost of constructing facilities and equipment includes interest costs. Capitalized interest totaled $0.4 million, $0.8 million and $1.0 million in 2009, 2008 and 2007, respectively.
We operate under solar power services agreements with customers that include a requirement for the removal of the solar energy systems at the end of the term of the agreement. These and other asset retirement obligations are recognized at fair value in the period in which they are incurred and the carrying amount of the related long-lived asset is correspondingly increased. Over time, the liability is accreted to its future value. The corresponding asset capitalized at inception is depreciated over the useful life of the asset.
In addition, we could have certain legal obligations for asset retirements related to disposing of materials in the event of closure, abandonment or sale of certain of our manufacturing facilities. We plan to operate the facilities that are subject to the asset retirement
31
obligations for an indeterminate period beyond the foreseeable future and as such, cannot estimate a liability at December 31, 2009, except for one facility, for which we have recorded an asset retirement obligation. We will recognize a liability in the period in which we have determined the time frame that the asset will no longer operate and information is available to reasonably estimate the liability’s fair value.
Impairment of Long-Lived Assets
We periodically assess the impairment of long-lived assets/asset groups when conditions indicate a possible loss. Reviews are performed to determine whether the carrying value of an asset is impaired, based on comparisons to undiscounted expected future cash flows or some other fair value measure. If this comparison indicates that there is impairment, the impaired asset is written down to fair value, which is typically calculated using: (i) quoted market prices or (ii) discounted expected future cash flows utilizing an appropriate discount rate. Impairment is based on the excess of the carrying amount over the fair value of those assets.
In September 2009, MEMC committed to actions to reduce manufacturing costs by shifting manufacturing from our St. Peters, Missouri and Sherman, Texas facilities to other locations which are closer to a number of MEMC’s customers. Due to the significance of these actions, we performed an asset impairment analysis of our St. Peters, Missouri and Sherman, Texas long-lived manufacturing asset groups during the third quarter of 2009. Accordingly, we recorded asset impairment charges of $24.6 million in the third quarter of 2009 related to these asset groups. We recorded asset impairment charges of $1.1 million in 2008 and there were no asset impairment charges in 2007 (see Note 4).
Goodwill and Intangible Assets
Goodwill is recorded as the difference, if any, between the aggregate consideration paid for an acquisition and the fair value of the net tangible and intangible assets acquired and liabilities assumed. Goodwill and intangible assets determined to have indefinite lives are not amortized, but rather are subject to an impairment test annually, on December 1, or whenever events or changes in circumstances indicate that the carrying value may not be recoverable.
The goodwill impairment test involves a two-step approach. Under the first step, we determine the fair value of each reporting unit to which goodwill has been assigned. The operating segments of MEMC are the reporting units for the impairment test. We compare the fair value of the reporting unit to its carrying value, including goodwill. If the estimated fair value exceeds the carrying value, no impairment loss is recognized. If the carrying value exceeds the fair value, goodwill is considered potentially impaired and the second step is completed in order to measure the impairment loss. Under the second step, we calculate the implied fair value of goodwill by deducting the fair value of all tangible and intangible net assets, including any unrecognized intangible assets, of the reporting unit from the fair value of the reporting unit as determined in the first step. We then compare the implied fair value of goodwill to the carrying value of goodwill. If the implied fair value of goodwill is less than the carrying value of goodwill, we recognize an impairment loss equal to the difference. Prior to the acquisition of SunEdison on November 20, 2009, we did not have goodwill.
Intangible assets that have determinable estimated lives are amortized over those estimated lives. The straight-line method of amortization is used because it best reflects the pattern in which the economic benefits of the intangible asset are consumed or otherwise used up. The amounts and useful lives assigned to intangible assets acquired, other than goodwill, impact the amount and timing of future amortization. The value of our intangible assets, including goodwill, could be impacted by future adverse changes such as: (i) any future declines in our operating results, (ii) a decline in the valuation of solar industry company stocks, including the valuation of our common stock, (iii) a further significant slowdown in the worldwide economy or the solar industry or (iv) any failure to meet the performance projections included in our forecasts of future operating results.
The useful lives of our intangible assets subject to amortization are as follows:
| | |
| | | Years |
| |
Favorable energy credits | | 4-18 |
| |
Customer relationships | | 7 |
| |
Trade name | | 15 |
| |
Purchased and internally developed software | | 3-10 |
32
Other intangible assets consist of power plant development arrangements. These assets were recorded in conjunction with the acquisition of SunEdison and relate to anticipated future economic benefits associated with our customer backlog relationships. These intangible assets will be allocated to fixed assets as the construction of the related solar energy systems stemming from the existing backlog is completed.
Operating Leases
The Company enters into lease agreements for a variety of business purposes, including office and manufacturing space, office and manufacturing equipment and computer equipment. A portion of these are noncancellable operating leases.
Capital Leases
We are party to master lease agreements that provide for the sale and simultaneous leaseback of certain solar energy system constructed by SunEdison. As a result of these transactions, we record a lease liability and the solar energy system is retained on our balance sheet. The excess of the cash proceeds of the sale/leaseback over the costs to construct the solar energy system is retained by us and used to fund current operations and new solar energy projects. See further discussion inRevenue Recognition below.
Customer Deposits
MEMC has executed long-term solar wafer supply agreements, including any amendments, with multiple customers which required the customers to provide security deposits. As of December 31, 2009 and 2008, the balance of these deposits totaled $200.0 million and $290.3 million, respectively. These deposits are required to be refunded to the customers over the next two years, at the end of the contract or are applied against a portion of current sales on credit, as set forth in the amended agreements, unless minimum purchase quantities are not met. As a result of amendments to our long-term solar wafer supply agreements in 2009, $44.1 million of deposits were applied against outstanding accounts receivable balances. In addition, we will now retain an additional $11.6 million of previously refundable deposits as deferred revenue and deposits of $12.3 million previously due on January 1, 2010 are no longer due within twelve months of December 31, 2009. The current portion of these customer deposits is $83.0 million. The long-term portion of customer deposits of $117.0 million is included in other non-current liabilities on our consolidated balance sheet.
Revenue Recognition
Materials Business Segment
Revenue is recognized in our Materials Business segment for product sales when title transfers, the risks and rewards of ownership have been transferred to the customer, the fee is fixed and determinable and collection of the related receivable is reasonably assured, which is generally at the time of shipment for non-consignment orders. In the case of consignment orders, title passes when the customer pulls the product from the assigned storage facility or storage area or, if the customer does not pull the product within a contractually stated period of time (generally 60–90 days), at the end of that period, or when the customer otherwise agrees to take title to the product. Our wafers are generally made to customer specifications and we conduct rigorous quality control and testing procedures to ensure that the finished wafers meet the customer’s specifications before the product is shipped. We consider international shipping term definitions in our determination of when title passes. We defer revenue for multiple element arrangements based on an average fair value per unit for the total arrangement when we receive cash in excess of fair value. We also defer revenue when pricing is not fixed and determinable or other revenue recognition criteria is not met.
In connection with our long-term solar wafer supply agreements executed during 2006 and subsequent amendments, we have received various equity instruments and other forms of additional consideration. In each case, we have recorded the estimated fair value of the additional consideration to long-term deferred revenue and will recognize the deferred revenue on a pro-rata basis as product is shipped over the life of the agreements. As of December 31, 2009 and 2008, MEMC had $31.0 million and $16.0 million, respectively of long-term deferred revenue related to the non-refundable portion of cash received in connection with long-term solar wafer supply agreements. MEMC also had $75.3 million and $72.8 million of long-term deferred revenue related to additional consideration received from our customers in the form of equity instruments as of December 31, 2009 and 2008, respectively.
33
Solar Energy Business Segment
For solar energy systems under construction for which a third-party construction contract has not been executed and for which we do not anticipate retaining ownership, the construction costs associated with these in-process solar energy systems are recognized in inventory as work-in-process. We may enter into a sale agreement to sell a completed solar energy system to a third party. In these transactions, we recognize the sale of the solar energy system at the time a sale arrangement with the third party is executed, delivery has occurred and we have determined that the sales price is fixed or determinable and collectible.
We may construct solar energy systems for which we do not have a fixed-price construction contract and, in certain instances, we may construct a system and retain ownership of the system. For these projects, we earn revenues associated with the energy generated by the solar energy system, capitalize the cost of construction to property and equipment and depreciate the system over its estimated useful life. For solar energy systems under construction for which we intend to retain ownership and finance the system, we recognize all costs incurred as construction-in-progress, a component of property, plant and equipment.
We are party to master lease agreements that provide for the sale and simultaneous leaseback of certain solar energy systems constructed by us. Because the terms on a solar energy system lease schedule may differ from that of another solar energy system, we must determine the appropriate classification of the sale/leaseback on a project-by-project basis. The terms of the lease schedule may result in either one of the following sale/leaseback classifications:
Sale/Capital Leaseback – Sale/capital leaseback classification occurs when the terms of the lease schedule for a solar energy system result in a capital lease classification. Generally, this classification occurs when the term of the lease is greater than 75% of the estimated economic life of the solar energy systems.
Failed Sale/Leaseback (Financing) – The financing method is applicable when we have determined that the assets under the lease are real estate. Generally, this occurs due to either the lease involving land or the determination that the leased equipment is integral equipment. If we have concluded the leased asset is real estate, our option to repurchase the assets under our master lease agreements constitutes continuing involvement and the transaction must be accounted for as a financing transaction. This accounting is most often applicable to the land-mounted systems because they either include land in the lease or are deemed integral equipment due to the estimated cost to uninstall, move and reinstall the system and for any diminution in value of the system.
The classification of a sale/leaseback transaction as a capital lease results in the deferral of any profit on the sale. The profit is recognized over the term of the lease as a reduction to depreciation expense. Under a sale/leaseback transaction classified as a failed sale/leaseback (financing transaction), we have no profit to recognize because a sale is not recognized. The full amount of the financing proceeds is recorded as a liability and lease payments are classified as interest expense. Because the payments to the lessor under the financing transaction for the minimum lease payments are considered interest expense, we expect to recognize a gain on the extinguishment of debt at the end of the lease term.
Operations and maintenance revenue is billed and recognized as services are performed. Energy services revenue, generated by energy system rentals, is agreed to be paid by the customer for the electricity generated and maintenance and monitoring services provided by us.
For MEMC-owned solar energy systems, including those capitalized under capital leases and failed sale/leasebacks classified as financing obligations, we may receive incentives or subsidies from various state governmental jurisdictions that are deferred. Revenue from Solar Renewable Energy Certificates (“SREC”) is recognized when the SRECs are received or generated if we have executed a contract relating to the sale of the SRECs to a third party. Revenue relating to other incentives that are based on the level of energy produced by the solar energy systems is recognized as revenue in the periods in which the incentives are earned. All other incentive revenue is recognized on a straight-line basis over the depreciable life of the solar energy system.
Derivative Financial Instruments and Hedging Activities
All derivative instruments are recorded on the balance sheet at fair value. Derivatives used to hedge foreign-currency-denominated balance sheet items are not treated as accounting hedges and are reported directly in earnings along with offsetting transaction gains and losses on the items being hedged. Derivatives used to hedge floating rate debt may be accounted for as cash flow hedges, as deemed appropriate. Gains and losses on derivatives designated as cash flow hedges are recorded in other comprehensive income and reclassified to earnings in a manner that matches the timing of the earnings impact of the hedged transactions. The ineffective portion of all hedges, if any, is recognized currently in earnings. Derivatives used to manage the foreign exchange risk associated with a net investment denominated in another currency are accounted for as a net investment hedge. The effective portion of the hedge will be recorded in the same manner as foreign currency translation adjustment in other comprehensive income. When the investment is dissolved and MEMC recognizes a gain or loss in other expense, the associated hedge gain or loss in other comprehensive income will be reclassified to other expense.
34
During 2006, MEMC signed a long-term supply agreement with a customer, Suntech Power Holdings (“Suntech”). At the same time, MEMC received a fully vested, non-forfeitable warrant to purchase common shares of Suntech. The warrant becomes exercisable over a five year period (20% annually) beginning January 1, 2008 and has a five year exercise period from the date each tranche becomes exercisable. The estimated grant date fair value of the warrant was $66.6 million and was recorded to customer warrant with the offset to deferred revenue – long-term. The non-cash transaction was excluded from the Consolidated Statements of Cash Flows. Determining the appropriate fair value model and calculating the fair value of the warrant require the making of estimates and assumptions, including Suntech’s stock price volatility, interest rate, dividends, marketability and expected return requirements. We used a lattice model to determine the warrant’s fair value. The assumptions used in calculating the fair value of the warrant represent our best estimates, but these estimates involve inherent uncertainties and the application of our judgment. The warrant is considered a derivative and is therefore marked to market each reporting period. Accordingly, in 2009, 2008 and 2007, $(5.4) million, $292.5 million and ($220.8) million, respectively, was recorded as a decrease/(increase) to other assets – long-term and non-operating (income) expense.
We generally use currency forward contracts to manage foreign currency exchange risk relating to current trade receivables with our foreign subsidiaries and current trade receivables and payables with our customers and vendors denominated in foreign currencies (primarily Japanese Yen and Euro). The purpose of our foreign currency forward contract activities is to protect us from the risk that the dollar net cash flows resulting from foreign currency transactions will be negatively affected by changes in exchange rates. We do not hold or issue financial instruments for speculative or trading purposes.
Gains or losses on our forward exchange contracts, as well as the offsetting losses or gains on the related hedged receivables, are included in non-operating (income) expense in the Consolidated Statements of Operations. Net currency losses on unhedged foreign currency positions totaled $0.8 million, $3.0 million and $1.7 million in 2009, 2008 and 2007, respectively.
Through our acquisition of SunEdison, we are party to three interest rate swap instruments that are accounted for using hedge accounting.
Our unconsolidated joint venture with Q-Cells SE is a Euro functional currency entity accounted for under the equity method, in which we invested 72.5 million Euros ($104.6 million at December 31, 2009). In order to manage the changes in foreign currency and any resulting gain or loss associated with this investment, MEMC entered into a Euro currency forward contract for 70.0 million Euros. The forward contract meets all the criteria for hedge accounting and MEMC expects that the derivative instrument will be effective as an economic hedge of foreign exchange risk associated with the hedged net investment. The effective portion of the hedge will be recorded in the same manner as foreign currency translation adjustment in other comprehensive income. When the investment is returned to MEMC, the associated hedge gain or loss in other comprehensive income will be reclassified to other expense offsetting the gain or loss on the net investment in the Q-Cells joint venture also recorded in other expense.
Translation of Foreign Currencies
We determined the functional currency of each subsidiary based on a number of factors, including the predominant currency for the subsidiary’s expenditures and the subsidiary’s borrowings. When the subsidiary’s local currency is considered its functional currency, we translate its financial statements to U.S. Dollars as follows:
| | • | | Assets and liabilities using exchange rates in effect at the balance sheet date; and |
| | • | | Statement of income accounts at average exchange rates for the period. |
Adjustments from the translation process are presented in accumulated other comprehensive income (loss) in stockholders’ equity.
Income Taxes
Deferred income taxes arise because of a different tax basis of assets or liabilities between financial statement accounting and tax accounting, which are known as temporary differences. We record the tax effect of these temporary differences as deferred tax assets (generally items that can be used as a tax deduction or credit in future periods) and deferred tax liabilities (generally items for which we receive a tax deduction, but have not yet been recorded in the Consolidated Statements of Operations). We regularly review our deferred tax assets for realizability, taking into consideration all available evidence, both positive and negative, including historical pre-tax and taxable income (losses), projected future pre-tax and taxable income (losses) and the expected timing of the reversals of existing temporary differences. In arriving at these judgments, the weight given to the potential effect of all positive and negative evidence is commensurate with the extent to which it can be objectively verified.
35
Tax benefits are recognized only for tax positions that are more likely than not to be sustained upon examination by tax authorities. The amount recognized is measured as the largest amount of benefit that is greater than 50 percent likely to be realized upon ultimate settlement. Unrecognized tax benefits are tax benefits claimed in our tax returns that do not meet these recognition and measurement standards. We believe that our income tax liabilities, including related interest, are adequate in relation to the potential for additional tax assessments. There is a risk, however, that the amounts ultimately paid upon resolution of audits could be materially different from the amounts previously included in our income tax expense and, therefore, could have a material impact on our tax provision, net income and cash flows. We review our liabilities quarterly, and we may adjust such liabilities due to proposed assessments by tax authorities, changes in facts and circumstances, issuance of new regulations or new case law, negotiations between tax authorities of different countries concerning our transfer prices between our subsidiaries, the resolution of entire audits, or the expiration of statutes of limitations. Adjustments are most likely to occur in the year during which major audits are closed.
It has been our practice to repatriate to the U.S. a portion of the current year earnings of only one of our foreign subsidiaries and provide U.S. income taxes that would be payable for these earnings when distributed to the U.S. Prior to 2009, we considered the undistributed earnings of the other wholly owned foreign subsidiaries to be permanently reinvested into their respective businesses. We did not provide U.S. income taxes for these earnings as we determined that they would not be remitted to the U.S. in the foreseeable future. During 2009, we changed our determination with respect to one of these wholly owned foreign subsidiaries. The undistributed earnings of this subsidiary are expected to be remitted to the United States in the foreseeable future and therefore require the provision of U.S. income tax upon remittance. We plan foreign remittance amounts based on projected cash flow needs as well as the working capital and long-term investment requirements of our foreign subsidiaries and our domestic operations.
We have made our best estimates of certain income tax amounts included in the financial statements. Application of our accounting policies and estimates, however, involves the exercise of judgment and use of assumptions as to future uncertainties and, as a result, actual results could differ from these estimates. In arriving at our estimates, factors we consider include how accurate the estimate or assumptions have been in the past, how much the estimate or assumptions have changed and how reasonably likely such change may have a material impact.
Stock-Based Compensation
Stock-based compensation expense for all share-based payment awards is based on the estimated grant-date fair value. We recognize these compensation costs net of an estimated forfeiture rate and recognize the compensation costs for only those shares expected to vest on a straight-line basis over the requisite service period of the award, which is generally the option vesting term. We recognize stock-based compensation expense for all grants on a straight-line basis over the requisite service period of the entire award for ratable awards. We estimate the forfeiture rate taking into consideration our historical experience during the preceding four fiscal years.
We routinely examine our assumptions used in estimating the fair value of employee options granted. As part of this assessment, we have determined that our historical stock price volatility and historical pattern of option exercises are appropriate indicators of expected volatility and expected term. The interest rate is determined based on the implied yield currently available on U.S. Treasury zero-coupon issues with a remaining term equal to the expected term of the award. We estimate the fair value of options using the Black-Scholes option-pricing model for our ratable and cliff vesting options.
Contingencies
We record contingent liabilities when the amount can be reasonably estimated and the loss is probable.
Shipping and Handling
Costs to ship products to customers are included in marketing and administration expense in the Consolidated Statements of Operations. Amounts billed to customers, if any, to cover shipping and handling are included in net sales. Cost to ship products to customers were $9.4 million, $11.2 million and $10.9 million for the years ended December 31, 2009, 2008 and 2007, respectively.
Fair Value Measurements
Fair value accounting guidance establishes a hierarchy for inputs used in measuring fair value that maximizes the use of observable inputs and minimizes the use of unobservable inputs by requiring that the most observable inputs be used when available. Observable inputs are inputs that market participants would use in pricing the asset or liability, and are based on market data obtained from sources independent of MEMC. Unobservable inputs reflect assumptions market participants would use in pricing the asset or liability based on the best information available in the circumstances. The hierarchy is broken down into three levels based on the reliability of inputs as follows:
| | • | | Level 1—Valuations based on quoted prices in active markets for identical assets or liabilities that MEMC has the ability to access. Valuation adjustments and block discounts are not applied to Level 1 instruments. Because valuations are based on quoted prices that are readily and regularly available in an active market, valuation of these instruments does not entail a significant degree of judgment. |
36
| | • | | Level 2—Valuations based on quoted prices in markets that are not active or for which all significant inputs are observable, either directly or indirectly. Valuations for Level 2 assets are prepared on an individual asset basis using data obtained from recent transactions for identical securities in inactive markets or pricing data from similar assets in active and inactive markets. |
| | • | | Level 3—Valuations based on inputs that are unobservable and significant to the overall fair value measurement. |
We have elected to account for our auction rate securities right (the “ARS Right”) under the fair value option as discussed in Note 6.
We maintain various financial instruments recorded at cost in the December 31, 2009 and 2008 balance sheets that are not required to be recorded at fair value. For these instruments, we used the following methods and assumptions to estimate the fair value:
| | • | | Cash equivalents, restricted cash, accounts receivable and payable, income taxes payable, short-term borrowings, and accrued liabilities—cost approximates fair value because of the short maturity period; and |
| | • | | Long-term debt—fair value is based on the amount of future cash flows associated with each debt instrument discounted at our current borrowing rate for similar debt instruments of comparable terms. |
Subsequent Events
Effective April 1, 2009, MEMC adopted an accounting standards update included in ASC 855, “Subsequent Events.” This update is intended to establish general standards of accounting for and disclosure of events that occur after the balance sheet date but before financial statements are issued or are available to be issued. It requires the disclosure of the date through which an entity has evaluated subsequent events and the basis for selecting that date; that is, whether that date represents the date the financial statements were issued or were available to be issued. We have evaluated subsequent events or transactions that occurred after the balance sheet date of December 31, 2009 up through March 1, 2010, which is the date the accompanying unaudited condensed consolidated financial statements were issued. MEMC had a nonrecognizable event in January 2010, as discussed more fully in Note 21, when it reached an out of court settlement of a lawsuit related to our solar wafer supply contract with Conergy AG.
Accounting Standards Updates Not Yet Effective
In June 2009, the FASB issued an accounting standards update included in ASC 860, “Transfers and Servicing,” which removes the concept of a qualifying special-purpose entity from previous guidance. This guidance also clarifies the requirements for isolation and limitations on portions of financial assets that are eligible for sale accounting. It is effective for fiscal years beginning after November 15, 2009. We will adopt this standard in the first quarter of 2010 and the adoption is not expected to have a material impact on our consolidated financial statements.
In June 2009, the FASB issued an accounting standards update included in ASC 810, “Consolidation” which amends previous guidance to require an analysis to determine whether a variable interest gives a company a controlling financial interest in a variable interest entity. An ongoing reassessment of financial responsibility is required, including interests in entities formed prior to the effective date of this guidance, and eliminates the quantitative approach previously required for determining whether a company is the primary beneficiary. It is effective for fiscal years beginning after November 15, 2009. We will adopt this standard in the first quarter of 2010 and the adoption is not expected to have a material impact on our consolidated financial statements.
In October 2009, the FASB issued Accounting Standards Update 2009-13 (“ASU 2009-13”), which updates the current guidance pertaining to multiple-element revenue arrangements included in ASC Subtopic 605-25. ASU 2009-13 will be effective for our annual reporting period beginning January 1, 2011. We are currently evaluating the impact of ASU 2009-13 on our consolidated results of operations and financial condition.
37
Supplemental Cash Flow Information
| | | | | | | | | | | |
| | | For the year ended
December 31, |
| | 2009 | | | 2008 | | | 2007 |
| In millions | | | | | | | | |
| | | |
Supplemental disclosures of cash flow information: | | | | | | | | | | | |
| | | |
Interest payments, net of amount capitalized | | $ | 1.4 | | | $ | 1.1 | | | $ | 0.4 |
| | | |
Income taxes paid (refunded), net | | $ | 38.8 | | | $ | 194.4 | | | $ | 147.8 |
| | | |
Supplemental schedule of non-cash investing and financing activities: | | | | | | | | | | | |
| | | |
Accounts payable (relieved) incurred for acquisition of fixed assets | | $ | (13.1 | ) | | $ | (6.9 | ) | | $ | 19.3 |
| | | |
Acquisition of SunEdison: | | | | | | | | | | | |
| | | |
Fair value of assets acquired | | | 794.2 | | | | — | | | | — |
| | | |
Liabilities assumed and noncontrolling interests | | | (479.6 | ) | | | — | | | | — |
| | | |
Shares of MEMC common stock issued | | | (45.8 | ) | | | — | | | | — |
| | | |
Other non-cash consideration | | | (79.5 | ) | | | — | | | | — |
| | | |
Less: cash acquired | | | (0.8 | ) | | | — | | | | — |
| | | | | | | | | | | |
| | | |
Cash paid, net of cash acquired | | $ | 188.5 | | | $ | — | | | $ | — |
3. Acquisition of Sun Edison LLC
On November 20, 2009, we completed the acquisition of SunEdison in order to expand the scope of MEMC’s solar related operations. SunEdison is a developer of solar power projects and a solar energy provider. As a result of the acquisition (MEMC acquired 100% of voting equity), SunEdison became a wholly owned subsidiary of MEMC Holdings Corporation, which is a wholly owned subsidiary of MEMC. The preliminary purchase price for SunEdison was $314.6 million, including cash, MEMC common stock and additional consideration.
The preliminary purchase price is calculated as follows:
| | | |
| In Millions | | |
| |
Cash and payables | | $ | 191.8 |
| |
Shares of MEMC common stock (a) | | | 45.8 |
| |
Contingent consideration | | | 77.0 |
| | | |
| |
Total preliminary purchase price including estimated contingent consideration | | $ | 314.6 |
| | | |
(a) The value was based upon the issuance of 3,795,066 common shares and the closing price of MEMC’s common stock at November 20, 2009, the date of acquisition, or $12.08. |
The contingent consideration is to be paid to the former SunEdison unit holders if certain operational criteria are met from January 1, 2010 through December 31, 2010. In order for the full consideration to be paid, the surviving SunEdison entity would have to install 150 megawatts of solar photovoltaic projects in 2010 and achieve certain profitability thresholds. This would entitle the former SunEdison unit holders to an additional $89.0 million of a combination of cash and MEMC common stock. If SunEdison completes less than 80 megawatts of solar photovoltaic projects, no contingent consideration will be paid. If 80 megawatts or more are completed, the SunEdison unit holders will receive between $25.0 million and $89.0 million of cash and MEMC common stock, based on the terms of the merger agreement. MEMC has estimated the acquisition date fair value of the contingent consideration at $77.0 million, which reflects a discount at a credit adjusted interest rate for the period of the contingency. That measure is based on significant inputs that are not observable in the market, which US GAAP refers to as Level 3 inputs. Key assumptions include (i) a discount percent and (ii) a probability adjusted level of completing solar energy system projects in 2010 between 80 megawatts and 150 megawatts. As of December 31, 2009, the amount recognized for the contingent consideration, the range of outcomes, and the assumptions used to develop the estimates has not changed since the date of the acquisition. Any future revisions to the estimated fair value of the contingent consideration could be material and will be recorded to the statement of operations.
Approximately $21.0 million of the cash consideration and $6.9 million of the share consideration is currently held in escrow pursuant to the terms of the acquisition agreement.
The principal factors that resulted in recognition of goodwill as well as our primary reasons for the acquisition of SunEdison were: (i) partnering with SunEdison should enable the build-up of solar energy system backlog with price certainty for materials cost and (ii) downstream knowledge of solar system demand and pricing should allow our Materials Business to make capital investments with known future volumes. All of the goodwill was assigned to the Solar Energy Business segment.
38
The table below represents a preliminary allocation of the total consideration to tangible and intangible assets acquired and liabilities assumed from SunEdison based on an estimate of the fair value at the acquisition date:
| | | | |
| In Millions | | | |
| |
Preliminary allocation of the purchase price: | | | | |
| |
Cash and cash equivalents | | $ | 0.8 | |
| |
Other current assets | | | 106.4 | |
| |
Property, plant and equipment, net | | | 325.6 | |
| |
Goodwill | | | 285.3 | |
| |
Intangible assets | | | 42.2 | |
| |
Other noncurrent assets | | | 33.9 | |
| |
Current liabilities | | | (167.7 | ) |
| |
Long-term debt and capital leases (excluding current portion) | | | (297.4 | ) |
| |
Other long-term liabilities | | | (7.8 | ) |
| |
Noncontrolling interests | | | (6.7 | ) |
| | | | |
| |
Total preliminary purchase price | | $ | 314.6 | |
| | | | |
We expect that approximately $229.1 million of goodwill will be deductible for tax purposes.
Acquisition related costs of $2.5 million were included in marketing and administration expense for the year ending December 31, 2009. The amount of SunEdison’s revenue and loss included in the consolidated statement of operations for the year ended December 31, 2009 was not material. See a description of intangible assets in Note 12.
The following table reflects the 2009 and 2008 unaudited pro forma operating results of the MEMC as if the SunEdison acquisition had been completed as of January 1, 2009 and 2008, respectively.
| | | | | | | |
| | | For the year ended
December 31, |
| | | 2009 | | | 2008 |
| In Millions | | | | | |
| | |
Net sales, except per share amounts | | $ | 1,266.4 | | | $ | 2,052.4 |
| | |
Net (loss) income attributable to MEMC stockholders | | $ | (94.5 | ) | | $ | 292.1 |
| | |
Basic (loss) income per share | | $ | (0.42 | ) | | $ | 1.26 |
| | |
Diluted (loss) income per share | | $ | (0.42 | ) | | $ | 1.25 |
4. RESTRUCTURING AND IMPAIRMENT COSTS
In order to better align manufacturing capabilities to projected demand, MEMC committed to workforce reductions during the second quarter of 2008 (the “2008 Plan”) and again in the first and second quarters of 2009 (the “2009 Global Plan”). In September 2009, MEMC committed to actions to reduce manufacturing costs by shifting manufacturing from our St. Peters, Missouri and Sherman, Texas facilities to other locations which are closer to a number of MEMC’s customers in the Asia Pacific region (the “2009 US Plan”). MEMC has provided and paid severance benefits to those terminated under the 2008 Plan and the 2009 Global Plan and will provide severance benefits to those employees who will be terminated under the 2009 US Plan. The 2008 Plan and the 2009 Global Plan were completed by September 30, 2008 and June 30, 2009, respectively. We expect the 2009 US Plan to be completed in 2011.
During 2008, we recorded and paid severance and other employee benefits totaling $3.2 million under the 2008 Plan.
39
2009 Restructuring Plans – Materials Business
| | | | | | | | | | | | | | | | | | | | | | | |
| | | Accrued,
January 1,
2009 | | Year-to-Date
Restructuring
Charges | | Cash
Payments | | | Adjustments (1)
| | | Accrued,
December 31,
2009 | | As of December 31, 2009 |
| | | | | | | Cumulative
Costs
Incurred | | Total Costs
Expected to be
Incurred |
| In millions | | | | | | | | | | | | | | | | |
| | | | | | | |
2009 Global Plan | | | | | | | | | | | | | | | | | | | | | | | |
| | | | | | | |
Restructuring and impairment costs: | | | | | | | | | | | | | | | | | | | | | | | |
| | | | | | | |
Severance and other employee benefits | | $ | — | | $ | 12.1 | | $ | (11.9 | ) | | $ | (0.2 | ) | | $ | — | | $ | 11.6 | | $ | 11.6 |
| | | | | | | |
Outplacement costs | | | — | | | 0.4 | | | (0.4 | ) | | | — | | | | — | | | 0.4 | | | 0.4 |
| | | | | | | |
Settlement and curtailment loss, net (Note 17) | | | — | | | 0.3 | | | (0.3 | ) | | | — | | | | — | | | 0.3 | | | 0.3 |
| | | | | | | |
2009 US Plan | | | | | | | | | | | | | | | | | | | | | | | |
| | | | | | | |
Restructuring and impairment costs: | | | | | | | | | | | | | | | | | | | | | | | |
| | | | | | | |
Severance and other employee benefits | | | — | | | 16.1 | | | (0.9 | ) | | | — | | | | 15.2 | | | 16.1 | | | 18.0 |
| | | | | | | |
Asset move costs | | | — | | | — | | | — | | | | — | | | | — | | | — | | | 6.1 |
| | | | | | | |
Contract termination | | | — | | | — | | | — | | | | — | | | | — | | | — | | | 5.8 |
| | | | | | | |
Infrastructure costs | | | — | | | — | | | — | | | | — | | | | — | | | — | | | 3.7 |
| | | | | | | |
Outplacement costs | | | — | | | — | | | — | | | | — | | | | — | | | — | | | 1.0 |
| | | | | | | | | | | | | | | | | | | | | | | |
| | | | | | | |
Total | | $ | — | | $ | 28.9 | | $ | (13.5 | ) | | $ | (0.2 | ) | | $ | 15.2 | | $ | 28.4 | | $ | 46.9 |
| | | | | | | | | | | | | | | | | | | | | | | |
| (1) | Includes foreign currency related adjustments. |
Long-lived Asset Impairment
Due to the significance of the actions announced as part of the 2009 US Plan discussed above, we performed an asset impairment analysis of our St. Peters, Missouri and Sherman, Texas long-lived manufacturing asset groups during the third quarter of 2009. In order to determine the amount of impairment, we estimated the fair value of our asset groups using discounted expected cash flows. Accordingly, we recorded asset impairment charges of $24.6 million in the third quarter of 2009 related to these asset groups. These charges were recorded in restructuring and impairment costs in our condensed consolidated statements of operations.
5. ACCUMULATED OTHER COMPREHENSIVE INCOME (LOSS)
The components of accumulated other comprehensive income (loss), net of tax, were as follows:
| | | | | | | | |
| | | As of December 31, | |
| | 2009 | | | 2008 | |
| In millions | | | | | | |
| | |
Accumulated net translation adjustment | | $ | 31.3 | | | $ | 21.9 | |
| | |
Net unrealized gain (loss) on available-for-sale securities | | | 31.9 | | | | (43.2 | ) |
| | |
Cumulative effect of adoption of accounting principle related to other-than-temporary impairments on investments | | | (0.3 | ) | | | — | |
| | |
Net actuarial loss, prior service credit, and transition obligation (net of $16.0 and $17.8 tax in 2009 and 2008, respectively) | | | (31.7 | ) | | | (34.3 | ) |
| | |
Gain on mark to market for cash flow hedges | | | 1.8 | | | | — | |
| | | | | | | | |
| | |
Total accumulated other comprehensive (loss) income | | $ | 33.0 | | | $ | (55.6 | ) |
| | | | | | | | |
40
6. FAIR VALUE MEASUREMENTS
Fair Value Measurements and Investments
The following table summarizes the financial instruments measured at fair value on a recurring basis in the accompanying consolidated balance sheets:
| | | | | | | | | | | | | | | | | | | | | | | | |
| | | As of December 31, 2009 | | As of December 31, 2008 |
Assets (liabilities) in millions | | Level 1 | | Level 2 | | Level 3 | | Total | | Level 1 | | Level 2 | | Level 3 | | Total |
| | | | | | | | |
Available for sale investments | | $ | 110.8 | | $ | 93.3 | | $ | 11.6 | | $ | 215.7 | | $ | 176.2 | | $ | 153.3 | | $ | 22.8 | | $ | 352.3 |
| | | | | | | | |
Trading investments | | | — | | | — | | | 38.4 | | | 38.4 | | | — | | | — | | | 44.1 | | | 44.1 |
| | | | | | | | |
Auction rate securities right | | | — | | | — | | | 2.0 | | | 2.0 | | | — | | | — | | | 6.2 | | | 6.2 |
| | | | | | | | |
Suntech warrant | | | — | | | — | | | 19.2 | | | 19.2 | | | — | | | — | | | 13.8 | | | 13.8 |
| | | | | | | | |
Interest rate swaps | | | — | | | 0.8 | | | — | | | 0.8 | | | — | | | — | | | — | | | — |
| | | | | | | | |
Currency forward contracts | | | 3.3 | | | — | | | — | | | 3.3 | | | 1.6 | | | — | | | — | | | 1.6 |
| | | | | | | | | | | | | | | | | | | | | | | | |
| | | | | | | | |
| | $ | 114.1 | | $ | 94.1 | | $ | 71.2 | | $ | 279.4 | | $ | 177.8 | | $ | 153.3 | | $ | 86.9 | | $ | 418.0 |
| | | | | | | | | | | | | | | | | | | | | | | | |
During November 2008, we accepted an offer by our investment broker to receive an ARS Right that would substantially ensure recovery to par of our ARS between June 2010 and July 2012. At the same time, we reclassified the ARS from the available-for-sale category to trading. We have elected the fair value option for the ARS Right because its value is highly correlated to the value of the ARS, which are also marked to market. We record changes in the fair value of the ARS Right to other current assets and non-operating income, other. The ARS Right is the only item eligible for the fair value option in other current assets. As of December 31, 2009 and 2008, the ARS Right had a value of $2.0 million and $6.2 million, respectively, which substantially offset the mark-to-market adjustment of our outstanding ARS of $2.1 million and $7.3 million, respectively. To determine the fair value of the ARS Right, we performed a Level 3 valuation using a discounted cash flow model, which involves making assumptions about expected future cash flows based on estimates of current market interest rates considering credit quality of the issuer, duration, and likelihood of redemption.
The Suntech warrant consists of a fully vested, non-forfeitable warrant to purchase common shares of Suntech, a customer, which was received at the time that MEMC signed a long-term supply agreement with Suntech. We used a lattice model to determine the fair value of the Suntech warrant. Determining the appropriate fair value model and calculating the fair value of the warrant requires the making of estimates and assumptions, including Suntech’s stock price volatility, interest rate, dividends, marketability and expected return requirements. The Suntech warrant is considered a derivative and, accordingly, changes in the value of the warrant are recorded in non-operating (income) expense. The notional amount of the warrant was $205.8 million as of December 31, 2009 and 2008.
We acquired less than 10% of the common stock of a customer (“Gintech”) at the same time as the execution of a long-term supply agreement with that customer. This investment was accounted for under the cost method of accounting until December 2008 when the restriction on sale became less than one year. Subsequently, this investment is accounted for at fair value and is classified as a long-term available-for-sale investment.
The carrying amount of our outstanding long-term debt at December 31, 2009 and 2008 was $273.5 million and $32.2 million, respectively. The estimated fair value of that debt was $272.3 million and $31.2 million, respectively, at December 31, 2009 and 2008. A large portion of our debt relates to solar energy system financing at SunEdison. This debt was recorded at fair value on the purchase date of November 20, 2009 and we have therefore assumed the outstanding debt related to SunEdison is at fair value.
The fair value of our currency forward contracts is measured by the amount that would have been paid to liquidate and repurchase all open contracts and was $3.3 million and $1.6 million at December 31, 2009 and 2008, respectively. The notional amount of our currency forward contracts was $113.9 million and $60.9 million as of December 31, 2009 and 2008, respectively. See further disclosures in Note 7.
41
The following table summarizes changes in Level 3 assets measured at fair value on a recurring basis for the years ended December 31, 2009 and 2008:
| | | | | | | | | | | | | | | | | | | | |
| | | Fair Value Measurements
Using Significant Unobservable
Inputs (Level 3) | |
In millions | | Available for
Sale
Investments | | | Trading
Investments | | | Auction Rate
Securities
Right | | | Suntech
Warrant | | | Total | |
| | | | | |
Balance at December 31, 2007 | | $ | 26.8 | | | $ | — | | | $ | — | | | $ | 306.3 | | | $ | 333.1 | |
| | | | | |
Total unrealized gains (losses) included in earnings | | | (10.2 | ) | | | (7.3 | ) | | | 6.2 | | | | (292.5 | ) | | | (303.8 | ) |
| | | | | |
Total unrealized losses included in other comprehensive income, net | | | (0.5 | ) | | | — | | | | — | | | | — | | | | (0.5 | ) |
| | | | | |
Sales, redemptions and maturities | | | (12.5 | ) | | | — | | | | — | | | | — | | | | (12.5 | ) |
| | | | | |
Transfers to Level 3, net | | | 19.2 | | | | 51.4 | | | | — | | | | — | | | | 70.6 | |
| | | | | | | | | | | | | | | | | | | | |
| | | | | |
Balance at December 31, 2008 | | $ | 22.8 | | | $ | 44.1 | | | $ | 6.2 | | | $ | 13.8 | | | $ | 86.9 | |
| | | | | | | | | | | | | | | | | | | | |
| | | | | |
Total unrealized gains (losses) included in earnings | | | (2.3 | ) | | | 5.2 | | | | (4.2 | ) | | | 5.4 | | | | 4.1 | |
| | | | | |
Total unrealized losses included in other comprehensive income, net | | | (9.1 | ) | | | — | | | | — | | | | — | | | | (9.1 | ) |
| | | | | |
Sales, redemptions and maturities | | | (9.7 | ) | | | (10.9 | ) | | | — | | | | — | | | | (20.6 | ) |
| | | | | |
Transfers to Level 3, net | | | 9.9 | | | | — | | | | — | | | | — | | | | 9.9 | |
| | | | | | | | | | | | | | | | | | | | |
| | | | | |
Balance at December 31, 2009 | | $ | 11.6 | | | $ | 38.4 | | | $ | 2.0 | | | $ | 19.2 | | | $ | 71.2 | |
| | | | | | | | | | | | | | | | | | | | |
| | | | | |
The amount of total gains (losses) in 2008 included in earnings attributable to the change in unrealized gains (losses) relating to assets still held December 31, 2008 | | $ | (10.2 | ) | | $ | (7.3 | ) | | $ | 6.2 | | | $ | (292.5 | ) | | $ | (303.8 | ) |
| | | | | |
The amount of total gains (losses) in 2009 included in earnings attributable to the change in unrealized gains (losses) relating to assets still held December 31, 2009 | | $ | (2.3 | ) | | $ | 5.2 | | | $ | (4.2 | ) | | $ | 5.4 | | | $ | 4.1 | |
| | | | | | | | | | | | | | | | | | | | |
Valuations of our Level 3 trading and available for sale financial instruments were performed using a discounted cash flow model which involved making assumptions about expected future cash flows based on estimates of current market interest rates. Our models include estimates of market data, including yields or spreads of trading instruments that are believed to be similar or comparable, when available, and assumptions that are believed to be reasonable on nonobservable inputs. Such assumptions include the tax status (taxable vs. tax-exempt), type of security (type of issuer, collateralization, subordination, etc.), credit quality, duration, likelihood of redemption, insurance coverage and degree of liquidity in the current credit markets.
7. DERIVATIVES AND HEDGING INSTRUMENTS
To mitigate financial market risks of foreign currency exchange rates, we utilize currency forward contracts. As of December 31, 2009, the notional amount of our currency forward contracts was $113.9 million. We do not use derivative financial instruments for speculative or trading purposes. We generally hedge transactional currency risks with currency forward contracts. Gains and losses on these foreign currency exposures are generally offset by corresponding losses and gains on the related hedging instruments, reducing the net exposure to MEMC. A substantial portion of our revenue and capital spending is transacted in U.S. Dollars. However, we do enter into transactions in other currencies, primarily the Euro, the Japanese Yen, and certain other Asian currencies. To protect against reductions in value and volatility of future cash flows caused by changes in foreign exchange rates, we have established transaction-based hedging programs. Our hedging programs reduce, but do not always eliminate, the impact of foreign currency exchange rate movements. At any point in time we may have outstanding contracts with several major financial institutions for these hedging transactions. Our maximum credit risk loss with these institutions is limited to any gain on our outstanding contracts.
Through our acquisition of SunEdison, we are party to three interest rate swap instruments that are accounted for using hedge accounting. These instruments are used to hedge floating rate debt and are accounted for as cash flow hedges. Under the swap agreements, MEMC pays the fixed rate and the counterparties to the agreements pay MEMC a floating interest rate based on the table below. The counterparties to these agreements are financial institutions. The estimated fair value recorded to the balance sheet as provided in the table below is an estimate of the net amount that MEMC would pay on December 31, 2009, if the agreements were transferred to other third parties or cancelled by MEMC. The effective portion of these hedges during the period subsequent to the acquisition of SunEdison through December 31, 2009 was a gain of $1.8 million and was recorded to other comprehensive income. No ineffectiveness was recognized in 2009.
42
| | | | | | | | | | | | | |
| | | Notional Amount (in millions) | | Fixed Rate | | | Variable Rate | | Termination
Date | | Assets
(Liabilities)
Fair Value at
December 31,
2009 | |
| Dollars in millions | | | | | | | | | | | | |
| | | | | |
Interest rate swap #1 | | 4.8 Euros | | 5.1 | % | | Euribor plus 1.5% | | 6/30/2023 | | $ | (0.9 | ) |
| | | | | |
Interest rate swap #2 | | 2.0 Euros | | 5.1 | % | | Euribor plus 1.5% | | 6/30/2023 | | $ | (0.3 | ) |
| | | | | |
Interest rate swap #3 | | 37.2 Canadian Dollars | | 3.3 | % | | Canadian Deposit Offering Rate | | 6/5/2028 | | $ | 2.0 | |
| | | | | | | | | | | | | |
| | | | | |
| | | | | | | | | | | $ | 0.8 | |
| | | | | | | | | | | | | |
Our unconsolidated joint venture with Q-Cells SE, as described in Note 8, is a Euro functional currency entity accounted for under the equity method, in which we invested 72.5 million Euros ($104.6 million at December 31, 2009). In order to manage the changes in foreign currency and any resulting gain or loss associated with this investment, MEMC entered into a Euro currency forward contract for 70.0 million Euros. The fair value of the effective portion of this hedge at December 31, 2009 was a gain of $3.6 million and was recorded to net translation adjustment in other comprehensive income. No ineffectiveness was recognized in 2009.
Suntech warrant consists of a fully vested, non-forfeitable warrant to purchase common shares of Suntech, a customer, which was received at the time that MEMC signed a long-term supply agreement with Suntech. The Suntech warrant exposes MEMC to equity price risk.
MEMC’s hedging activities consist of:
| | | | | | |
In millions | | Balance Sheet Location | | Assets (Liabilities)
Fair Value
As of December 31,
2009 | |
| | |
Derivatives designated as hedging: | | | | | | |
| | |
Interest rate swaps | | Accrued liabilities | | $ | (1.2 | ) |
| | |
Interest rate swaps | | Prepaid and other current assets | | $ | 2.0 | |
| | |
Interest rate swaps | | Accumulated other comprehensive income | | $ | (1.8 | ) |
| | |
Net investment hedge | | Prepaid and other current assets | | $ | 3.6 | |
| | |
Net investment hedge | | Accumulated other comprehensive income | | $ | (3.6 | ) |
| | |
Derivatives not designated as hedging: | | | | | | |
| | |
Suntech warrant | | Customer warrant | | $ | 19.2 | |
| | |
Currency forward contracts | | Prepaid and other current assets | | $ | 0.8 | |
| | |
Currency forward contracts | | Accrued liabilities | | $ | (4.1 | ) |
| | |
In millions | | Statement of Operations Location | | (Gains) Losses
2009 | |
| | |
Derivatives not designated as hedging: | | | | | | |
| | |
Suntech warrant | | Decrease (increase) in fair value of warrant | | $ | (5.4 | ) |
| | |
Currency forward contracts | | Other, net | | $ | 0.8 | |
8. INVESTMENTS
Equity Method Investments
We entered into a formal joint venture agreement on August 26, 2009 with Q-Cells SE (“Q-Cells”) for the purpose of building large scale solar energy systems. Both MEMC and Q-Cells have invested approximately $101.6 million each in the venture in 2009. The joint venture company contracts with Q-Cells International to develop, acquire and build the power plants. The joint venture is accounted for under the equity method of accounting. As MEMC sells wafers to Q-Cells, the revenue from those sales is recognized consistent with MEMC’s revenue recognition policy, and the costs associated with those wafers are included in cost of goods sold. MEMC defers its pro rata share (50%) of the net profit associated with the sale of the wafers, consistent with its ownership in the joint venture, until the power plant is sold to a third party, at which point all previously deferred amounts will be recognized as income, as well as any gain or loss on the sale of the project. We have eliminated our pro rata share of the net profit for the year ended December 31, 2009 of $8.8 million, which is recorded in the statement of operations as equity in earnings of joint venture, net of tax.
43
Operations during the period from inception of the joint venture through December 31, 2009 consisted of the construction of the first solar power plant project, which was fully constructed in the fourth quarter of 2009 for a total cost of approximately $208.0 million. A contract was executed to sell it to a third party, however due to revenue recognition criteria not being met, the joint venture did not record revenue from the sale of the solar power plant in 2009. This contract resulted in the joint venture recognizing an impairment on the plant assets and MEMC’s share of the impairment was approximately $3.0 million, which was recorded in equity in earnings of joint venture as of December 31, 2009. There were no other material items recorded to the statement of operations of the joint venture in 2009. The sale contract requires the majority of payment to be completed by the end of the second quarter of 2010. The parties can then return the proceeds of that sale to the joint venture partners or leave the investment in the entity for one or more future solar power plant projects.
44
Investments Recorded at Fair Value
| | | | | | | | | | | | | | | | | | | | | | | | | | | | | |
| | | Cost | | Gross Unrealized
Gains/(Losses)
and Other-than-
temporary
Impairments
Recorded in
Earnings(1) | | | Other-than-
temporary
Impairments
in Accumulated
Other
Comprehensive
Income (Loss)(2) | | | Unrealized
Gains/(Losses)
in Other
Comprehensive
Income | | | Fair Value | | Fair Value of
Investments in
Unrealized Loss
Positions with no
Recognized
Losses | | Unrealized Losses on
Investments in
Unrealized Loss
Positions with no
Recognized Losses | |
| | | | | | | | Greater than
twelve months | | | Less than
twelve
months | |
| In millions | | | | | | | | | | | | | | | | | | | | | |
| | | | | | | | |
As of December 31, 2009: | | | | | | | | | | | | | | | | | | | | | | | | | | | | | |
| | | | | | | | |
Trading securities: | | | | | | | | | | | | | | | | | | | | | | | | | | | | | |
| | | | | | | | |
Auction rate securities | | $ | 40.5 | | $ | (2.1 | ) | | $ | — | | | $ | — | | | $ | 38.4 | | $ | — | | $ | — | | | $ | — | |
| | | | | | | | |
Available for sale securities: | | | | | | | | | | | | | | | | | | | | | | | | | | | | | |
| | | | | | | | |
Fixed Income Funds | | | 97.5 | | | 7.7 | | | | — | | | | 5.6 | | | | 110.8 | | | — | | | — | | | | — | |
| | | | | | | | |
Corporate debt securities | | | 33.1 | | | (9.7 | ) | | | 1.2 | | | | (1.6 | ) | | | 23.0 | | | 9.4 | | | (1.6 | ) | | | — | |
| | | | | | | | |
Asset-backed securities | | | 19.2 | | | (2.2 | ) | | | 0.1 | | | | (0.2 | ) | | | 16.9 | | | 16.7 | | | (0.2 | ) | | | — | |
| | | | | | | | |
Mortgage-backed securities | | | 30.8 | | | (4.6 | ) | | | (1.6 | ) | | | (0.5 | ) | | | 24.1 | | | 20.9 | | | (0.5 | ) | | | — | |
| | | | | | | | |
Equity investment securities | | | 12.4 | | | — | | | | — | | | | 28.6 | | | | 41.0 | | | — | | | — | | | | — | |
| | | | | | | | | | | | | | | | | | | | | | | | | | | | | |
| | | | | | | | |
| | | 193.0 | | | (8.8 | ) | | | (0.3 | ) | | | 31.9 | | | | 215.8 | | | 47.0 | | | (2.3 | ) | | | — | |
| | | | | | | | |
| | | | | | | | | | | | | | | | | | | | | | | | | | | | | |
| | | | | | | | |
Total | | $ | 233.5 | | $ | (10.9 | ) | | $ | (0.3 | ) | | $ | 31.9 | | | $ | 254.2 | | $ | 47.0 | | $ | (2.3 | ) | | $ | — | |
| | | | | | | | |
| | | | | | | | | | | | | | | | | | | | | | | | | | | | | |
| | | | | | | | |
As of December 31, 2008: | | | | | | | | | | | | | | | | | | | | | | | | | | | | | |
| | | | | | | | |
Trading securities: | | | | | | | | | | | | | | | | | | | | | | | | | | | | | |
| | | | | | | | |
Auction rate securities | | $ | 51.4 | | $ | (7.3 | ) | | $ | — | | | $ | — | | | $ | 44.1 | | $ | — | | $ | — | | | $ | — | |
| | | | | | | | |
Available for sale securities: | | | | | | | | | | | | | | | | | | | | | | | | | | | | | |
| | | | | | | | |
Fixed Income Funds | | | 200.0 | | | 2.0 | | | | — | | | | (33.2 | ) | | | 168.8 | | | 168.8 | | | — | | | | (33.2 | ) |
| | | | | | | | |
Corporate debt securities | | | 94.6 | | | (8.3 | ) | | | — | | | | (2.3 | ) | | | 84.0 | | | 71.7 | | | (2.3 | ) | | | — | |
| | | | | | | | |
Asset-backed securities | | | 46.4 | | | (1.2 | ) | | | — | | | | (4.6 | ) | | | 40.6 | | | 39.5 | | | (4.6 | ) | | | — | |
| | | | | | | | |
Mortgage-backed securities | | | 47.5 | | | (5.0 | ) | | | — | | | | (7.6 | ) | | | 34.9 | | | 32.8 | | | (7.6 | ) | | | — | |
| | | | | | | | |
Beneficiary certificates bond fund | | | 7.1 | | | — | | | | — | | | | 0.3 | | | | 7.4 | | | — | | | — | | | | — | |
| | | | | | | | |
Equity investment securities | | | 12.4 | | | — | | | | — | | | | 4.2 | | | | 16.6 | | | — | | | — | | | | — | |
| | | | | | | | | | | | | | | | | | | | | | | | | | | | | |
| | | | | | | | |
| | | 408.0 | | | (12.5 | ) | | | — | | | | (43.2 | ) | | | 352.3 | | | 312.8 | | | (14.5 | ) | | | (33.2 | ) |
| | | | | | | | |
| | | | | | | | | | | | | | | | | | | | | | | | | | | | | |
Total | | $ | 459.4 | | $ | (19.8 | ) | | $ | — | | | $ | (43.2 | ) | | $ | 396.4 | | $ | 312.8 | | $ | (14.5 | ) | | $ | (33.2 | ) |
| | | | | | | | | | | | | | | | | | | | | | | | | | | | | |
| (1) | Gross unrealized gains/(losses) were recorded to non-operating (income) expense in the consolidated statements of operations. The gains on fixed income funds relate to dividends earned and reinvested. |
| (2) | Represents the cumulative effect of adoption of accounting principle related to other-than-temporary impairments on investments. This required a reclassification of the non-credit related portion of changes in fair value of our investments to other comprehensive income previously recorded in our statement of operations. |
The carrying value of short- and long-term investments consists of the following:
| | | | | | |
| | | As of
December 31, 2009 | | As of
December 31, 2008 |
| In millions | | | | |
| | |
Items measured at fair value on a recurring basis | | $ | 254.2 | | $ | 396.4 |
| | |
Equity method investments | | | 101.6 | | | — |
| | |
Time deposits | | | 4.6 | | | 36.4 |
| | |
Equity investments at cost | | | 23.1 | | | 0.3 |
| | | | | | |
| | |
Total investments | | | 383.5 | | | 433.1 |
| | |
Less: short-term investments | | | 85.9 | | | 148.4 |
| | | | | | |
| | |
Non-current investments | | $ | 297.6 | | $ | 284.7 |
| | | | | | |
45
As of December 31, 2009, we held $110.8 million in fixed income funds, net of temporary gains of $5.6 million, with the intent of holding them for a period exceeding 12 months. As of December 31, 2008, we held fixed income funds with a value of $168.8 million, net of temporary impairments of $33.2 million. We sold our interest in two of these funds in 2009 and received $116.4 million, including realized gains of $1.5 million that were recognized from other comprehensive income. See Note 2 related to our process of evaluating investments for impairment.
As of December 31, 2009, we held $64.0 million in a portfolio comprised of corporate bonds and asset-backed and mortgage-backed securities, net of temporary impairments of $2.3 million and other than temporary impairments of $16.8 million, of which $0.3 million is related to non-credit losses and is recorded in accumulated other comprehensive income. As of December 31, 2008, this portfolio had $159.5 million of investments, net of temporary impairments of $14.5 million and other than temporary impairments of $14.5 million. A majority of these investments maintain a floating interest rate based on a range of spreads to the one and three month LIBOR rate. While we believe the decline in fair value related to the temporary impairments to be directly attributable to the current global credit conditions, we believe the time to reach the original carrying value for certain of these investments to be greater than 12 months. Accordingly, we have classified $21.1 million of those investments as non-current assets.
As of December 31, 2009, we held $38.4 million of short-term investments related to auction rate securities (“ARS”), net of unrealized losses of $2.1 million. As of December 31, 2008, we held $44.1 million of investments related to ARS, net of unrealized losses of $7.3 million. These securities are classified as trading securities and all changes in fair value are recorded to non-operating (income) expense, other. The ARS are comprised of interest bearing state sponsored student loan revenue bonds and municipal bonds with varying maturity periods and typically provide short-term liquidity via an auction process that also resets the applicable interest rate at predetermined calendar intervals (typically every 7, 28 or 35 days). The student loan revenue bonds are collateralized and serviced by underlying student loans and the municipal bonds are serviced through revenue generated by the issuing municipal entity. In the event of an auction failing to settle on its respective settlement date, these funds remain invested at a “failed” interest rate which is typically higher than the previous market rate until the next successful auction. For those auctions that fail to settle, we will not be able to access those funds until the next successful auction, another buyer is found outside of the auction process, the issuer redeems the security or the security matures. We do not anticipate having to sell these securities below our cost in order to operate our business. The ARS are insured through two different monoline insurers that presently maintain a credit rating of AAA or similar designation by S&P, Moody’s and/or Fitch as of December 31, 2009 or by a U.S. government backed student loan program. During November 2008, we accepted an offer from our investment broker to receive an ARS Right that would substantially ensure recovery to par of our ARS between June 2010 and July 2012. As of December 31, 2009, all ARS and the ARS Right were classified as current because we intend to exercise the ARS Right in June 2010.
Our investments include asset-backed securities, mortgage-backed securities and corporate debt securities that have a market value below amortized cost and are not included in other than temporary impairments. The unrealized loss on these investments are considered temporary based on an evaluation of factors including the current credit rating and any changes in the rating since issuance, the current repayment schedule rate as compared to the expected amortization schedule, the fair value of the investment as compared to the amortized cost basis, the subordination level of the security, and any collateral associated with the security. Based on an evaluation of these qualitative factors and the intent to hold these investments for a period of time sufficient to recover all principal associated with the investments, MEMC does not consider the impairments to be other-than-temporary at December 31, 2009.
When the fair value of an investment is less than our cost basis, we evaluate the nature of the investment based on current and expected future market conditions, the duration of impairments, the extent to which fair value is less than cost, historical volatility of the security, the financial condition and near term prospects of the issuer, and our ability to hold the security for a period of time sufficient to allow for any anticipated recovery in fair value. As of December 31, 2009, we have recorded other-than temporary impairments for asset-backed securities, mortgage-backed securities and corporate debt securities. A discounted cash flow analysis was used to calculate the credit loss associated with the impairment considering current repayment of principal and interest as compared to the stated amortization schedule, default rates (if any), subordination level of the security within the structure (e.g. A notes as compared to B notes) and collateral ratios. For floating rate securities, the current coupon rate is used as the discount rate and for fixed rate securities, the original coupon rate is used as the discount rate.
46
During 2009 and 2008, we recorded other than temporary impairments of $2.3 million and $14.5 million, respectively, on our available for sale investments. There were no other than temporary impairments in 2007. The following table presents the changes in other-than-temporary impairments recognized in earnings during the year ended December 31, 2009:
| | | | |
In millions | | Total | |
| |
Amount of other-than-temporary impairments on debt securities held at December 31, 2008 | | $ | 14.5 | |
| |
Other-than-temporary impairment recognized during the three months ended March 31, 2009 | | | 2.3 | |
| |
Non-credit component of other-than-temporary impairment reclassified to accumulated other comprehensive loss on April 1, 2009 in conjunction with cumulative effect transition adjustment | | | (0.3 | ) |
| | | | |
| |
Amount of other-than-temporary impairments recognized in retained earnings on debt securities held at December 31, 2009 | | $ | 16.5 | |
| | | | |
Our unrealized other-than-temporary impairment losses on our debt securities held at December 31, 2009 were as follows:
| | | | |
In millions | | Total | |
| |
Unrealized other-than-temporary impairment losses | | $ | (16.8 | ) |
| |
Unrealized other-than-temporary impairment losses reclassified to accumulated other comprehensive loss on April 1, 2009 in conjunction with cumulative effect transition adjustment | | | 0.3 | |
| |
| | | | |
| |
Net impairment losses recognized in retained earnings | | $ | (16.5 | ) |
| | | | |
Contractual maturities of our available for sale debt securities were as follows:
| | | | | | |
| | | As of December 31, 2009 |
In millions | | Cost | | Fair Value |
| | |
Due in one year or less | | $ | 20.1 | | $ | 18.6 |
| | |
Due after one year through five years | | | 13.0 | | | 4.4 |
| | |
No single maturity date(1) | | | 50.0 | | | 41.0 |
| | | | | | |
| | |
| | $ | 83.1 | | $ | 64.0 |
| | | | | | |
| (1) | Securities with no single maturity date include mortgage- and asset-backed securities which have been classified as current or non-current based on estimated forecasted cash flows. |
9. CREDIT CONCENTRATION
Our customers fall into four categories: (i) semiconductor device and solar cell and module manufacturers, (ii) commercial customers, which principally include large, national retail chains and real estate property management firms; (iii) federal, state and municipal governments; and (iv) utilities. Our customers are located in various geographic regions including North America, Europe and the Asia Pacific region and are generally well capitalized, and the concentration of credit risk is considered minimal. Sales to specific customers exceeding 10% of consolidated net sales for the years ended December 31 were as follows:
| | | | | | | | | |
| | | 2009 | | | 2008 | | | 2007 | |
| | | |
Customer A | | 23.2 | % | | 14.6 | % | | [1 | ] |
| | | |
Customer B | | [1 | ] | | 13.0 | % | | 13.1 | % |
| | | |
Customer C | | [1 | ] | | 10.4 | % | | [1 | ] |
| | | |
Customer D | | [1 | ] | | [1 | ] | | 10.2 | % |
| [1] | Less than 10% of consolidated net sales. |
47
10. INVENTORIES
Inventories consist of the following:
| | | | | | |
| | | As of December 31, |
| | 2009 | | 2008 |
| In millions | | | | |
| | |
Raw materials and supplies | | $ | 47.2 | | $ | 18.8 |
| | |
Goods and work in process | | | 55.4 | | | 6.4 |
| | |
Finished goods | | | 58.2 | | | 56.1 |
| | | | | | |
| | |
| | $ | 160.8 | | $ | 81.3 |
| | | | | | |
SunEdison inventories of $20.3 million at December 31, 2009 consist of raw materials and supplies and goods in process related to the construction of solar energy systems intended for sale. In the event the solar energy system is not sold and will be held and used, it will be capitalized to property, plant and equipment. At December 31, 2009, we had $18.9 million of inventory held on consignment, compared to $15.1 million at December 31, 2008.
11. PROPERTY, PLANT AND EQUIPMENT
Property, plant and equipment consists of the following:
| | | | | | | | |
| | | As of December 31, | |
| | 2009 | | | 2008 | |
| In millions | | | | | | |
| | |
Land | | $ | 7.3 | | | $ | 6.2 | |
| | |
Buildings and improvements | | | 198.1 | | | | 163.2 | |
| | |
Machinery and equipment | | | 1,268.9 | | | | 1,198.3 | |
| | |
Solar energy systems | | | 341.8 | | | | — | |
| | | | | | | | |
| | |
| | | 1,816.1 | | | | 1,367.7 | |
| | |
Less accumulated depreciation | | | (551.7 | ) | | | (478.4 | ) |
| | | | | | | | |
| | |
| | | 1,264.4 | | | | 889.3 | |
| | |
Construction in progress | | | 196.3 | | | | 151.9 | |
| | | | | | | | |
| | |
| | $ | 1,460.7 | | | $ | 1,041.2 | |
| | | | | | | | |
In MEMC’s 2008 Form 10-K, approximately $121.6 million attributable to construction in progress was unintentionally classified as buildings and improvements. The presentation for 2008 above properly includes this amount in construction in progress and excludes the amount from buildings and improvements.
48
12. GOODWILL AND INTANGIBLE ASSETS
All of our goodwill was recorded as part of our purchase of SunEdison on November 20, 2009 as described in Note 3. This purchase also resulted in acquiring certain intangible assets with an estimated acquisition date fair value of approximately $42.2 million. The carrying values of goodwill and intangible assets were as follows:
| | | | | | | | | | | | |
| | | Average
Amortization
Period | | Gross
Carrying
Amount | | Accumulated
Amortization | | | Net Carrying
Amount |
| In millions | | | | | | | | | |
| | | | |
SunEdison 2009 acquisition: | | | | | | | | | | | | |
| | | | |
Goodwill | | | | $ | 285.3 | | | | | | $ | 285.3 |
| | | | |
Intangible assets subject to amortization: | | | | | | | | | | | | |
| | | | |
Favorable energy credits | | 7 | | $ | 14.2 | | $ | (0.3 | ) | | $ | 13.9 |
| | | | |
Customer relationships | | 7 | | | 4.7 | | | [a | ] | | | 4.7 |
| | | | |
Trade name | | 15 | | | 4.0 | | | [a | ] | | | 4.0 |
| | | | |
Internally developed software | | 3 | | | 1.3 | | | (0.1 | ) | | | 1.2 |
| | | | |
Other intangible assets: | | | | | | | | | | | | |
| | | | |
Power plant development arrangements | | | | | 18.0 | | | | | | | 18.0 |
| | | | | | | | | | | | |
| | | | |
Total intangible assets | | 8 | | $ | 42.2 | | $ | (0.4 | ) | | $ | 41.8 |
| | | | | | | | | | | | |
| | | | |
Materials Business: | | | | | | | | | | | | |
| | | | |
2009: | | | | | | | | | | | | |
| | | | |
Intangible assets subject to amortization: Purchased software | | 6 | | $ | 27.4 | | $ | (22.5 | ) | | $ | 4.9 |
| | | | |
2008: | | | | | | | | | | | | |
| | | | |
Intangible assets subject to amortization: Purchased software | | 6 | | $ | 29.8 | | $ | (24.1 | ) | | $ | 5.7 |
[a] Amount was less than $0.1 million.
In 2009, 2008 and 2007, we recognized amortization expense of $1.2 million, $1.0 million, and $1.4 million, respectively. We expect to recognize annual amortization expense as follows:
| | | | | | | | | | | | | | | |
| | | 2010 | | 2011 | | 2012 | | 2013 | | 2014 |
| In millions | | | | | | | | | | |
| | | | | |
Amortization | | $ | 6.4 | | $ | 5.8 | | $ | 5.2 | | $ | 4.2 | | $ | 1.2 |
| 13. | DEBT AND CAPITAL LEASE OBLIGATIONS |
We have short-term committed financing arrangements renewable annually of approximately $26.9 million at December 31, 2009, of which there were no short-term borrowings outstanding at December 31, 2009 and 2008. Of the $26.9 million committed short-term financing arrangements, $11.9 million is unavailable because it relates to the issuance of third party letters of credit. Interest rates are negotiated at the time of the borrowings.
We have non-solar energy system long-term committed financing arrangements of approximately $316.9 million at December 31, 2009, of which $28.4 million is outstanding. Of the $316.9 million committed long-term financing arrangements, which expire beginning 2010 and ending 2017, $93.2 million is unavailable because it relates to the issuance of third party letters of credit. We pay commitment fees of up to 0.5 percent on the committed loan agreements.
Long-term debt and capital leases outstanding consist of the following:
| | | | | | |
| | | As of December 31, |
| | 2009 | | 2008 |
| In millions | | | | |
| | |
Solar energy systems: | | | | | | |
| | |
Capital leases, bearing interest at 3.00% | | $ | 140.9 | | $ | — |
| | |
Finance obligations, bearing interest from 3.00% to 11.11% | | | 245.1 | | | — |
| | |
Long-term notes with interest payable semi-annually at rates ranging from 2.10% to 2.45%, due in 2010 through 2017 | | | 25.4 | | | 32.2 |
| | |
Capital leases for equipment and other debt | | | 5.2 | | | — |
| | | | | | |
| | |
Less current portion | | | 32.2 | | | 6.1 |
| | | | | | |
| | |
| | $ | 384.4 | | $ | 26.1 |
| | | | | | |
49
Our solar energy systems for which we have capital lease and finance obligations are included in separate legal entities. The capital lease and finance obligations have recourse to those entities but limited or no recourse to the MEMC parent or SunEdison parent.
Capital Leases
We are party to master lease agreements that provide for the sale and simultaneous leaseback of certain solar energy systems constructed by us. The aggregate remaining open funding commitments under these master lease agreements at December 31, 2009, were $110.0 million. As of December 31, 2009, we had 225 such lease transactions at approximately $415.5 million. Generally, the terms of the leases are 25 years with certain leases providing terms as low as 10 years and provide for an early buyout option. The specified rental payments are based on projected cash flows that the solar energy system will generate.
Finance Obligations
As more fully described in Notes 2Revenue Recognition, in certain transactions we are required to account for the proceeds of sale/leaseback transactions as financing (failed sale/leaseback transactions). Generally, the solar energy systems subject to the financing collateralizes the lease obligation. Because applying MEMC’s incremental borrowing rate to the financing obligation results in negative amortization throughout the financing period, we account for all payments as interest expense.
Long-term Notes
Long-term notes at December 31, 2009 totaling $25.4 million owed to a bank by our Japanese subsidiary are guaranteed by us and are secured by the land, buildings and machinery and equipment of our Japanese subsidiary. These loans mature in years ranging from 2010 to 2017. Such guarantees would require us to satisfy the loan obligations in the event that the Japanese subsidiary failed to pay such debt in accordance with its stated terms.
Revolving Credit Facility
On July 21, 2005, we entered into a five-year, $200.0 million revolving credit facility agreement with National City Bank of the Midwest, US Bank National Association, and such other lending institutions. This agreement was terminated on December 23, 2009.
On December 23, 2009, we entered into a new corporate revolving credit agreement with Bank of America, N.A., PNC Bank, National Association, US Bank National Association and other lenders named therein and such other lending institutions as may from time to time become lenders (the “Corporate Credit Facility”). The Corporate Credit Facility provides for a $250.0 million revolving credit facility and has a term of three years. The new facility contains an accordion feature, allowing us to request an increase in the size of the facility, up to an aggregate of $400.0 million, upon terms to be agreed upon by the parties at the time of such request.
Interest on borrowings under the Corporate Credit Facility will be based on our election at LIBOR plus an applicable margin (currently 2.50%) or at a defined prime rate plus an applicable margin (currently 1.50%). The Corporate Credit Facility also provides for us to pay various fees, including a commitment fee (currently 0.50%) on the lenders’ commitments. The Corporate Credit Facility contains certain covenants typical for credit arrangements of this size, including covenants relating to a consolidated interest charge ratio, consolidated leverage ratio and a minimum liquidity ratio. Repayment of any amounts borrowed under the new facility is guaranteed by certain of our subsidiaries. The obligations of MEMC and the guaranty obligations of the subsidiaries are secured by a pledge of the capital stock of certain domestic and foreign subsidiaries of MEMC. The other assets of MEMC are not pledged as security for the facility.
As of December 31, 2009, we had no outstanding borrowings under this facility, although we had approximately $83.5 million of outstanding third party letters of credit backed by this facility at such date. We met all covenants under this facility at December 31, 2009.
The aggregate amounts of payments on long-term debt after December 31, 2009 are as follows:
| | | | | | | | | | | | | | | | | | | | | |
| | | 2010 | | 2011 | | 2012 | | 2013 | | 2014 | | Thereafter | | Total |
| In millions | | | | | | | | | | | | | | |
| | | | | | | |
Payments on long-term debt | | $ | 16.7 | | $ | 14.0 | | $ | 13.1 | | $ | 13.0 | | $ | 11.7 | | $ | 205.0 | | $ | 273.5 |
50
The aggregate amounts of payments on capital leases after December 31, 2009 are as follows:
| | | | |
| In millions | | | |
| |
2010 | | $ | 19.7 | |
| |
2011 | | | 18.4 | |
| |
2012 | | | 18.1 | |
| |
2013 | | | 12.0 | |
| |
2014 | | | 7.1 | |
| |
Thereafter | | | 110.6 | |
| | | | |
| |
Total minimum lease payments | | | 185.9 | |
| |
Less amounts representing interest | | | (42.8 | ) |
| | | | |
| |
Present value of minimum lease payments | | | 143.1 | |
| |
Less current portion of obligations under capital leases | | | (15.5 | ) |
| | | | |
| |
Noncurrent portion of obligations under capital leases | | $ | 127.6 | |
| | | | |
14. STOCKHOLDERS’ EQUITY
Preferred Stock
We have 50.0 million authorized shares of $.01 par value preferred stock and no preferred shares issued and outstanding as of December 31, 2009 and 2008. The Board of Directors is authorized, without further action by the stockholders, to issue any or all of the preferred stock.
Common Stock
Holders of our $.01 par value common stock are entitled to one vote for each share held on all matters submitted to a vote of stockholders. Subject to the rights of any holders of preferred stock, holders of common stock are entitled to receive ratably such dividends as may be declared by the Board of Directors. In the event of our liquidation, dissolution or winding up, holders of our common stock are entitled to share ratably in the distribution of all assets remaining after payment of liabilities, subject to the rights of any holders of preferred stock. The declaration and payment of future dividends on our common stock, if any, will be at the sole discretion of the Board of Directors and is subject to restrictions as contained in the Corporate Credit Facility (see Note 13). There were no dividends declared or paid during the years ended December 31, 2009, 2008 and 2007.
As more fully described in Note 3, on November 20, 2009, we completed the acquisition of SunEdison by paying a portion of the consideration in 3,795,066 shares of MEMC common stock with an acquisition date fair value of $45.8 million and providing contingent consideration. The value of the shares was based upon the closing price of MEMC’s common stock at the date of acquisition, or $12.08. Approximately $6.9 million of the share consideration is currently held in escrow pursuant to the terms of the acquisition agreement. The contingent consideration is to be paid to the former SunEdison unit holders if certain operational criteria are met following the acquisition date through December 31, 2010. This consideration is to be paid in the form of a combination of cash and MEMC common stock, the total of which could range between $25.0 million and $89.0 million.
Our Board of Directors has approved a $1.0 billion stock repurchase program. The stock repurchase program allows MEMC to purchase common stock from time to time on the open market or through privately negotiated transactions using available cash. The specific timing and amount of repurchases will vary based on market conditions and other factors and may be modified, extended or terminated by the Board of Directors at any time. In 2009 and 2008, we repurchased 1.0 million and 6.2 million shares of our common stock at a total cost of $15.8 million and $321.0 million, respectively. From inception through December 31, 2009, we have repurchased 9.0 million shares at a total cost of $448.0 million. Due to current market conditions and other uses of cash in the future, the Board suspended the program in April 2009.
Stock-Based Compensation
We have equity incentive plans that provide for the award of non-qualified stock options, restricted stock, performance shares, and restricted stock units to employees, non-employee directors, and consultants. We issue new shares to satisfy stock option exercises. As of December 31, 2009, there were 6.4 million shares authorized for future grant under these plans. Options to employees are generally granted upon hire and annually or semi-annually, usually with four-year ratable vesting, although certain grants have three, four or five-year cliff vesting. No option has a term of more than 10 years. The exercise price of stock options granted has historically equaled the market price on the date of the grant. One million options were granted in 2006 with a market condition requiring that, at the end of a four-year term, if MEMC’s common stock price outperformed the S&P 500 market index by a specified amount over that four-
51
year period, the options would vest. These options were forfeited during December 2008, resulting in a reversal of related stock option expense recognized in previous periods of approximately $10.5 million for the quarter ended December 31, 2008.
The following table presents information regarding outstanding stock options as of December 31, 2009 and changes during the year then ended with regard to stock options:
| | | | | | | | | | | |
| | | Shares | | | Weighted-
Average
Exercise Price | | Aggregate
Intrinsic
Value (in
millions) | | Average
Remaining
Contractual
Life |
| | | | |
Beginning of year | | 5,303,783 | | | $ | 40.29 | | | | | |
| | | | |
Granted | | 6,080,250 | | | | 14.02 | | | | | |
| | | | |
Exercised | | (86,599 | ) | | | 7.47 | | | | | |
| | | | |
Forfeited | | (595,852 | ) | | | 31.99 | | | | | |
| | | | |
Expired | | (319,347 | ) | | | 37.17 | | | | | |
| | | | | | | | | | | |
| | | | |
End of year | | 10,382,235 | | | $ | 25.75 | | $ | 4.1 | | 8 years |
| | | | | | | | | | | |
| | | | |
Options exercisable at year-end | | 2,604,155 | | | $ | 31.12 | | $ | 2.6 | | 6 years |
| | | | | | | | | | | |
The aggregate intrinsic value in the table above represents the total pre-tax intrinsic value (the difference between our closing stock price on the last trading day of 2009 and the exercise price, multiplied by the number of in-the-money options) that would have been received by the option holders had all option holders exercised their options on December 31, 2009. This amount changes based on the fair market value of our stock. The total intrinsic value of options exercised was $0.9 million, $72.7 million and $159.9 million in 2009, 2008 and 2007, respectively. Cash received from option exercises under our option plans was $0.7 million, $19.9 million and $44.2 million and the actual tax benefit realized for the tax deductions from option exercises was $0.4 million, $22.7 million and $40.3 million for 2009, 2008 and 2007, respectively.
Our weighted-average assumptions are as follows:
| | | | | | | | | |
| | | Black-Scholes | |
| | | 2009 | | | 2008 | | | 2007 | |
| | | |
Risk-free interest rate | | 1.8 | % | | 2.5 | % | | 4.6 | % |
| | | |
Expected stock price volatility | | 66.2 | % | | 50.9 | % | | 50.5 | % |
| | | |
Expected term until exercise (years) | | 5 | | | 4 | | | 4 | |
| | | |
Expected dividends | | 0.0 | % | | 0.0 | % | | 0.0 | % |
During 2009, we issued options to our new Chief Executive Officer. Because we do not have a historical pattern of option exercises for our new Chief Executive Officer, and because past exercise patterns for the same level of executive is not expected to be indicative of future exercise patterns, the simplified method described in the Securities and Exchange Commission’s Staff Accounting Bulletin No. 107 was used to estimate the expected term of these stock option grants.
The weighted-average grant-date fair value per share of options granted was $7.62, $27.81 and $25.34 for 2009, 2008 and 2007, respectively. As of December 31, 2009, $53.4 million of total unrecognized compensation cost related to stock options is expected to be recognized over a weighted-average period of 3.0 years.
Restricted stock units represent the right to receive a share of MEMC stock at a designated time in the future, provided the stock unit is vested at the time. Recipients of restricted stock units do not pay any cash consideration for the restricted stock units or the underlying shares, and do not have the right to vote or have any other rights of a shareholder until such time as the underlying shares of stock are distributed. Restricted stock units granted to non-employee directors generally vest over a two-year period from the grant date. Restricted stock units granted to employees usually have three, four or five year cliff vesting, or four-year ratable vesting, and certain grants are subject to performance conditions established at the time of grant.
In conjunction with our purchase of SunEdison on November 20, 2009, we approved a Special Inducement Grant Plan. Pursuant to this plan, SunEdison’s senior management and certain continuing SunEdison employees received an aggregate of 584,372 restricted stock units which will cliff vest on the one year anniversary date of the acquisition. Also under this plan, continuing SunEdison employees were granted an additional aggregate of 1,644,529 restricted stock units which will be subject to both future performance and time vesting requirements. The performance requirements of this latter set of grants are tied to the same metrics as the contingent consideration payable to SunEdison unit holders discussed in Note 3. Assuming certain targets are met, (i) 34% of such earned grants will vest on approximately January 30, 2011, (ii) 33% on December 31, 2011, and (iii) the remaining 33% will vest on December 31, 2012. The expense associated with these RSUs was not considered part of the purchase price of SunEdison because the employees are required to render future service in order to vest in these awards and thus, the compensation expense will be recognized over the future vesting periods as the services are rendered.
52
The following table presents information regarding outstanding restricted stock units as of December 31, 2009 and changes during the year then ended:
| | | | | | | | |
| | | Restricted Stock
Units | | | Aggregate Intrinsic
Value (in millions) | | Average Remaining
Contractual Life |
| | | |
Beginning of year | | 467,889 | | | | | | |
| | | |
Granted | | 2,467,551 | | | | | | |
| | | |
Converted | | (26,062 | ) | | | | | |
| | | |
Forfeited | | (49,947 | ) | | | | | |
| | | | | | | | |
| | | |
End of year | | 2,859,431 | | | $ | 40.4 | | 2.5 years |
| | | | | | | | |
At December 31, 2009, there were no restricted stock units which were convertible. As of December 31, 2009, $27.0 million of total unrecognized compensation cost related to restricted stock units is expected to be recognized over a weighted-average period of approximately 2.5 years. The weighted-average fair value of restricted stock units on the date of grant was $12.26, $63.53 and $48.91 in 2009, 2008 and 2007, respectively.
For the years ended December 31, 2009, 2008 and 2007, we recognized $0.3 million, $19.0 million and $40.0 million of excess tax benefits from share-based payment arrangements as a cash inflow in financing activities and an operating outflow for income taxes payable.
Stock-based compensation expense recorded for the years ended December 31 was allocated as follows:
| | | | | | | | | |
| | | 2009 | | 2008 | | 2007 |
| In millions | | | | | | |
| | | |
Cost of goods sold | | $ | 6.8 | | $ | 6.0 | | $ | 4.7 |
| | | |
Marketing and administration | | | 27.3 | | | 19.4 | | �� | 25.1 |
| | | |
Research and development | | | 3.2 | | | 2.9 | | | 1.4 |
| | | | | | | | | |
| | | |
Stock-based employee compensation before related tax effects | | | 37.3 | | | 28.3 | | | 31.2 |
| | | |
Less: Income tax benefit | | | 13.3 | | | 10.1 | | | 11.1 |
| | | | | | | | | |
| | | |
Total stock-based compensation expense, net of related tax effects | | $ | 24.0 | | $ | 18.2 | | $ | 20.1 |
| | | | | | | | | |
The amount of stock-based compensation cost capitalized into inventory at December 31, 2009 and 2008 was $0.3 million.
15. EARNINGS (LOSS) PER SHARE
In 2009, 2008 and 2007, basic and diluted earnings (loss) per share (EPS) were calculated as follows:
| | | | | | | | | | | | | | | | | | | | |
| | | 2009 | | | 2008 | | 2007 |
| | | Basic | | | Diluted | | | Basic | | Diluted | | Basic | | Diluted |
| In millions, except per share amounts | | | | | | | | | | | | | | |
| | | | | | |
EPS Numerator: | | | | | | | | | | | | | | | | | | | | |
| | | | | | |
Net (loss) income allocable to common stockholders | | $ | (68.3 | ) | | $ | (68.3 | ) | | $ | 387.4 | | $ | 387.4 | | $ | 826.2 | | $ | 826.2 |
| | | | | | |
EPS Denominator: | | | | | | | | | | | | | | | | | | | | |
| | | | | | |
Weighted-average shares outstanding | | | 223.9 | | | | 223.9 | | | | 226.9 | | | 226.9 | | | 225.6 | | | 225.6 |
| | | | | | |
Stock options and restricted stock units | | | — | | | | — | | | | — | | | 1.7 | | | — | | | 3.1 |
| | | | | | |
Warrants | | | — | | | | — | | | | — | | | — | | | — | | | 3.6 |
| | | | | | | | | | | | | | | | | | | | |
| | | | | | |
Total shares | | | 223.9 | | | | 223.9 | | | | 226.9 | | | 228.6 | | | 225.6 | | | 232.3 |
| | | | | | | | | | | | | | | | | | | | |
| | | | | | |
(Loss) earnings per share | | $ | (0.31 | ) | | $ | (0.31 | ) | | $ | 1.71 | | $ | 1.69 | | $ | 3.66 | | $ | 3.56 |
| | | | | | | | | | | | | | | | | | | | |
As discussed in Note 3, 0.6 million shares of the share consideration issued in conjunction with the acquisition of SunEdison is currently held in escrow and have been contingently issued and accordingly, pursuant to the terms of the acquisition agreement, have been excluded from the calculation of basic EPS.
In 2009, all options to purchase MEMC stock and restricted stock units were excluded from the calculation of diluted EPS because the effect was antidilutive due to the net loss incurred for the period. In 2008 and 2007, options and restricted stock units to purchase 3.5 million and 1.0 million shares, respectively, of MEMC stock were excluded from the calculation of diluted EPS because the effect was antidilutive.
53
16. INCOME TAXES
(Loss) income before income tax expense and equity in earnings of joint venture consists of the following:
| | | | | | | | | | |
| | | For the year ended
December 31, |
| | 2009 | | | 2008 | | 2007 |
| In millions | | | | | | | |
| | | |
U.S. | | $ | (178.9 | ) | | $ | 215.9 | | $ | 465.5 |
| | | |
Foreign | | | 78.7 | | | | 369.1 | | | 646.3 |
| | | | | | | | | | |
| | | |
| | $ | (100.2 | ) | | $ | 585.0 | | $ | 1,111.8 |
| | | | | | | | | | |
Income tax (benefit) expense consists of the following:
| | | | | | | | | | | | |
| | | Current | | | Deferred | | | Total | |
| In millions | | | | | | | | | |
| | | |
Year ended December 31, 2009: | | | | | | | | | | | | |
| | | |
U.S. Federal | | $ | (25.0 | ) | | $ | (13.4 | ) | | $ | (38.4 | ) |
| | | |
State and local | | | (2.4 | ) | | | 0.4 | | | | (2.0 | ) |
| | | |
Foreign | | | 9.0 | | | | (10.8 | ) | | | (1.8 | ) |
| | | | | | | | | | | | |
| | | |
| | $ | (18.4 | ) | | $ | (23.8 | ) | | $ | (42.2 | ) |
| | | | | | | | | | | | |
| | | |
Year ended December 31, 2008: | | | | | | | | | | | | |
| | | |
U.S. Federal | | $ | 45.5 | | | $ | 44.0 | | | $ | 89.5 | |
| | | |
State and local | | | (2.3 | ) | | | 1.0 | | | | (1.3 | ) |
| | | |
Foreign | | | 100.4 | | | | 6.8 | | | | 107.2 | |
| | | | | | | | | | | | |
| | | |
| | $ | 143.6 | | | $ | 51.8 | | | $ | 195.4 | |
| | | | | | | | | | | | |
| | | |
Year ended December 31, 2007: | | | | | | | | | | | | |
| | | |
U.S. Federal | | $ | 150.9 | | | $ | 2.7 | | | $ | 153.6 | |
| | | |
State and local | | | (0.6 | ) | | | 0.7 | | | | 0.1 | |
| | | |
Foreign | | | 113.6 | | | | 14.9 | | | | 128.5 | |
| | | | | | | | | | | | |
| | | |
| | $ | 263.9 | | | $ | 18.3 | | | $ | 282.2 | |
| | | | | | | | | | | | |
Effective Tax Rate. Income tax expense (benefit) differed from the amounts computed by applying the U.S. Federal income tax rate of 35% to income before income taxes, equity in loss of joint venture and minority interests as a result of the following:
| | | | | | | | | |
| | | For the year ended
December 31, | |
| | 2009 | | | 2008 | | | 2007 | |
| | | |
Income tax at federal statutory rate | | (35.0 | )% | | 35.0 | % | | 35.0 | % |
| | | |
Increase (reduction) in income taxes: | | | | | | | | | |
| | | |
Effect of foreign operations and repatriation | | (26.6 | ) | | 2.1 | | | (8.4 | ) |
| | | |
State income taxes, net of Federal benefit | | (2.3 | ) | | 0.4 | | | 0.5 | |
| | | |
Tax authority positions, net | | 22.1 | | | (3.7 | ) | | — | |
| | | |
Other, net | | (0.2 | ) | | (0.4 | ) | | (1.7 | ) |
| | | | | | | | | |
| | | |
Effective tax (benefit) expense rate | | (42.0 | )% | | 33.4 | % | | 25.4 | % |
| | | | | | | | | |
The “Effect of foreign operations and repatriation” includes the net reduced taxation of foreign profits from combining jurisdictions with rates above and below the U.S. federal statutory rate and the impact of withholding taxes. The 2009 amount is a result of a benefit associated with net worldwide losses. The 2008 amount includes the non-taxable loss for the mark-to-market adjustment associated with the Suntech warrant and tax impact related to distributions to the U.S. from two foreign subsidiaries. There were no distributions in 2009 due to losses incurred at the foreign subsidiaries. The 2007 amount includes a benefit of $23.4 million associated with the U.S. foreign tax credit offset by an increase in expense of $29.1 million related to dividends and foreign withholding taxes. Additionally, a benefit of $77.3 million was recognized in relation to a non-taxable gain on warrant income.
54
Certain of our Asian subsidiaries have been granted a concessionary tax rate of between 0% and 10% on all qualifying income for a period of up to five to seven years based on investments in certain machinery and equipment and other development and expansion activities, resulting in a tax benefit for 2009 and 2008 of approximately $9.6 million and $37.0 million, respectively. There was no similar tax benefit in 2007. Under the awards, the income tax rate for qualifying income will be taxed at an incentive tax rate lower than the corporate tax rate. The last of these incentives will expire in 2016.
Uncertain Tax Positions. Unrecognized tax benefits are tax benefits claimed in our tax returns that do not meet the recognition and measurement standards. As a result of US GAAP changes in accounting for uncertain tax positions, we recorded an increase in retained earnings and a decrease in other long-term liabilities of $0.5 million for uncertain tax positions on January 1, 2007. The total amount of unrecognized tax benefits, net of federal, state and local deductions, at the date of adoption was $49.2 million, all of which would favorably affect our effective tax rate if recognized. Uncertain tax benefits, including accrued interest and penalties, are included as a component of other long-term liabilities because we do not anticipate that settlement of the liabilities will require payment of cash within the next twelve months. At December 31, 2009 and 2008, we had $74.0 million and $55.9 million, respectively, of unrecognized tax benefits, net of federal, state and local deductions, associated with open tax years for which we are subject to audit in various federal, state and foreign jurisdictions. All of our unrecognized tax benefits at December 31, 2009 and 2008 would favorably affect our effective tax rate if recognized. The change to the reserve in 2009 is due primarily to an increase in the reserve of $18.8 million including related interest, related to various cost allocations and taxable income adjustments attributable to our foreign operations. The change to the reserve during 2008 was related to the closure of the 2004/2005 examination in the United States. The entire amount would favorably affect our effective tax rate if recognized. We are subject to examination in various jurisdictions for the 2003 through 2008 tax years.
In the year ended December 31, 2009, we recorded an income tax benefit of $42.2 million and an effective tax rate of 42.0%, compared to an income tax expense of $195.4 million and an effective tax rate of 33.4% for the year ended December 31, 2008. The income tax benefit for the 2009 primarily resulted from tax losses in higher rate jurisdictions offset by taxable income in lower rate jurisdictions. Net income taxes receivable of $44.5 million at December 31, 2009 consist of net operating losses that can be carried back, resulting in expected future refunds for tax amounts previously paid.
During 2009, we determined that the undistributed earnings of one of our foreign wholly-owned subsidiaries would be remitted to the United States in the foreseeable future. These earnings were previously considered permanently reinvested in the business and the unrecognized deferred tax asset related to these earnings was not recognized. The deferred tax effect of this newly planned remittance was recorded as a discrete net income tax benefit in the amount of $2.4 million in the year ended December, 31 2009. As of December 31, 2009, federal and state income taxes have not been provided on accumulated but undistributed earnings of foreign subsidiaries aggregating approximately $809.5 million and $933.4 million at December 31, 2009 and 2008, respectively, because such earnings have been permanently reinvested in the business. The determination of the amount of the unrecognized deferred tax liability related to our undistributed earnings is not practicable.
We are currently under examination by the Internal Revenue Service (“IRS”) for the 2006 and 2007 tax years. In the year ended December 31, 2009, we received proposed adjustments from the IRS related to various cost allocations and taxable income adjustments attributable to our foreign operations during the periods under audit. We disagree with these adjustments and intend to vigorously contest them. We believe it is reasonably possible that the examination could be completed within the next twelve months. The amount of adjustment, if any, and the timing of such adjustment, however, are not reasonably estimable at this time.
We believe our tax positions are in compliance with applicable tax laws and regulations. We routinely review our estimate for our uncertain tax positions and in the year ended December 31, 2009 increased the unrecognized benefit by $18.1 million, including amounts related to interest and penalties for previously identified issues. There is a risk that the amounts ultimately resolved could be materially different from the amounts previously included or reserved for in our income tax liabilities and could therefore have a material impact on our tax provision, net income, tax liabilities and cash flows in future periods.
During the year ended December 31, 2009, we recorded additional tax expense of approximately $5.0 million primarily related to interest and penalties assessed by taxing authorities related to exams for the 2006 and 2007 tax years and deferred tax adjustments related to prior years.
55
A reconciliation of the beginning and ending amount of gross unrecognized tax benefits is as follows:
| | | | | | | | |
| | | For the year ended
December 31, | |
| | 2009 | | | 2008 | |
| In millions | | | | | | |
| | |
Beginning of year | | $ | 53.0 | | | $ | 97.1 | |
| | |
Additions based on tax positions related to the current year | | | 3.1 | | | | 0.3 | |
| | |
Additions (reductions) for tax positions of prior years | | | 14.3 | | | | (0.4 | ) |
| | |
Reductions related to settlements with taxing authorities | | | (1.0 | ) | | | (44.0 | ) |
| | | | | | | | |
| | |
End of year | | $ | 69.4 | | | $ | 53.0 | |
| | | | | | | | |
The accrual of interest begins in the first reporting period that interest would begin to accrue under the applicable tax law. Penalties, when applicable, are accrued in the financial reporting period in which the uncertain tax position is taken on a tax return. We recognize interest and penalties related to uncertain tax positions in income tax expense, which is consistent with our historical policy. During the years ended December 31, 2009 and 2008 we recognized approximately $1.4 million and $2.2 million, respectively, in interest and penalties and had approximately $4.3 million and $2.7 million accrued at December 31, 2009 and 2008, respectively, for the payment of interest and penalties.
Deferred Taxes. The tax effects of the major items recorded as deferred tax assets and liabilities are:
| | | | | | | | |
| | | As of December 31, | |
| | 2009 | | | 2008 | |
| | |
| In millions | | | | | | |
| | |
Deferred tax assets: | | | | | | | | |
| | |
Inventories | | $ | 11.1 | | | $ | 5.1 | |
| | |
Expense accruals | | | 38.3 | | | | 17.6 | |
| | |
Property, plant and equipment | | | — | | | | 23.0 | |
| | |
Sale/leaseback, solar energy systems | | | 34.0 | | | | — | |
| | |
Pension, medical and other employee benefits | | | 20.0 | | | | 11.7 | |
| | |
Net operating loss carryforwards – state and foreign | | | 29.5 | | | | 2.3 | |
| | |
Capitalized R&D | | | 5.4 | | | | 6.8 | |
| | |
Other | | | 14.2 | | | | 4.4 | |
| | | | | | | | |
| | |
Total deferred tax assets | | | 152.5 | | | | 70.9 | |
| | | | | | | | |
| | |
Valuation allowance | | | (21.4 | ) | | | — | |
| | | | | | | | |
| | |
Net deferred tax assets | | | 131.1 | | | | 70.9 | |
| | | | | | | | |
| | |
Deferred tax liabilities: | | | | | | | | |
| | |
Property, plant and equipment | | | (1.6 | ) | | | — | |
| | |
Other | | | (2.4 | ) | | | (0.2 | ) |
| | | | | | | | |
| | |
Total deferred tax liabilities | | | (4.0 | ) | | | (0.2 | ) |
| | | | | | | | |
| | |
Net deferred tax assets | | $ | 127.1 | | | $ | 70.7 | |
| | | | | | | | |
Our deferred tax assets and liabilities, netted by taxing location, are in the following captions in the Consolidated Balance Sheets:
| | | | | | |
| | | As of December 31, |
| | 2009 | | 2008 |
| In millions | | | | |
| | |
Current deferred tax assets, net (recorded in prepaids and other current assets) | | $ | 31.8 | | $ | 1.0 |
| | |
Non-current deferred tax assets, net | | | 95.3 | | | 69.7 |
| | | | | | |
| | |
| | $ | 127.1 | | $ | 70.7 |
| | | | | | |
Our net deferred tax assets totaled $127.1 million at December 31, 2009 compared to $70.7 million at December 31, 2008. In 2009, the increase of $56.4 million in net deferred tax assets is primarily attributed to additional deferred tax assets associated with the
56
purchase of SunEdison and net operating losses which cannot be carried back and will be utilized against future income. At December 31, 2009, we have valuation allowances of $21.4 million, primarily related to net operating losses acquired through the purchase of SunEdison, reducing our net deferred tax assets to $127.1 million. There were no valuation allowances at December 31, 2008 or 2007 or tax expense in 2009 for changes to the valuation allowance. We believe that it is more likely than not, with our projections of future taxable income, that we will generate sufficient taxable income to realize the benefits of the net deferred tax assets (which have not been offset by a valuation allowance) at December 31, 2009.
At December 31, 2009 and 2008, the Company had a $3.3 million and $2.3 million deferred tax asset for state income tax loss and credit carryforwards. These carryforwards are scheduled to expire in 2027 if unused. Additionally, at December 31, 2009, we had deferred tax assets associated with net operating loss carryforwards of $9.0 million in certain foreign jurisdictions; if unused, these will expire in 2014. We also had a deferred tax asset of $17.2 million related to net operating losses associated with the acquisition of SunEdison which have a full valuation allowance as described above.
17. EMPLOYEE-RELATED LIABILITIES
Pension and Other Post-Employment Benefit Plans
Prior to January 2, 2002, our defined benefit pension plan covered most U.S. employees. Benefits for this plan were based on years of service and qualifying compensation during the final years of employment. Effective January 2, 2002, we amended our defined benefit plan to discontinue future benefit accruals for certain participants. In addition, effective January 2, 2002, no new participants will be added to the plan.
We also have a non-qualified plan under the Employee Retirement Income Security Act of 1974. This plan provides benefits in addition to the defined benefit plan. Eligibility for participation in this plan requires coverage under the defined benefit plan and other specific circumstances. The non-qualified plan has also been amended to discontinue future benefit accruals.
Prior to January 1, 2002, our health care plan provided postretirement medical benefits to full-time U.S. employees who met minimum age and service requirements. The plan is contributory, with retiree contributions adjusted annually, and contains other cost-sharing features such as deductibles and coinsurance. Effective January 1, 2002, we amended our health care plan to discontinue eligibility for postretirement medical benefits for certain participants. In addition, effective January 2, 2002, no new participants will be eligible for postretirement medical benefits under the plan.
ASC 715, “Compensation—Retirement Benefits” (ASC 715), requires an employer to measure the funded status of a plan as of the date of its year-end statement of financial position. This requirement was effective and adopted as of December 31, 2008. As a result of the adoption, we recorded an adjustment to the 2008 beginning retained earnings of $0.8 million.
Net periodic postretirement benefit cost (income) consists of the following:
| | | | | | | | | | | | | | | | | | | | | | | | |
| | | Pension Plans | | | Health Care and Other
Plans | |
Year ended December 31, | | 2009 | | | 2008 | | | 2007 | | | 2009 | | | 2008 | | | 2007 | |
| In millions | | | | | | | | | | | | | | | | | | |
| | | | | | |
Service cost | | $ | 3.0 | | | $ | 3.0 | | | $ | 3.3 | | | $ | — | | | $ | 0.1 | | | $ | 0.1 | |
| | | | | | |
Interest cost | | | 10.0 | | | | 10.5 | | | | 9.8 | | | | 1.5 | | | | 1.6 | | | | 1.6 | |
| | | | | | |
Expected return on plan assets | | | (13.1 | ) | | | (12.6 | ) | | | (9.4 | ) | | | — | | | | — | | | | — | |
| | | | | | |
Amortization of prior service cost | | | — | | | | — | | | | — | | | | (0.5 | ) | | | (0.5 | ) | | | (0.5 | ) |
| | | | | | |
Net actuarial loss (gain) | | | 5.2 | | | | 0.7 | | | | 1.8 | | | | (2.3 | ) | | | (1.4 | ) | | | (0.9 | ) |
| | | | | | |
Settlement and curtailment charges | | | 0.3 | | | | — | | | | 0.1 | | | | — | | | | — | | | | — | |
| | | | | | | | | | | | | | | | | | | | | | | | |
| | | | | | |
Net periodic benefit cost (income) | | $ | 5.4 | | | $ | 1.6 | | | $ | 5.6 | | | $ | (1.3 | ) | | $ | (0.2 | ) | | $ | 0.3 | |
| | | | | | | | | | | | | | | | | | | | | | | | |
To determine pension and other postretirement and post-employment benefit measurements for the plans, we used a measurement date of September 30 in 2007. As a result of the adoption of the ASC 715 measurement date provision, a measurement date of December 31 was used in 2008 and 2009. Net periodic benefit cost above reflects a twelve month period and does not include adjustments to the 2008 beginning retained earnings of $0.7 million and $0.1 million for the pension and post-employment plans, respectively, related to the adoption of the measurement date provisions of ASC 715.
57
The following is a table of actuarial assumptions used to determine the net periodic benefit cost:
| | | | | | | | | | | | | | | | | | |
Year ended December 31, | | Pension Plans | | | Health Care and Other
Plans | |
| | 2009 | | | 2008 | | | 2007 | | | 2009 | | | 2008 | | | 2007 | |
| | | | | | |
Weighted-average assumptions: | | | | | | | | | | | | | | | | | | |
| | | | | | |
Discount rate | | 6.32 | % | | 6.39 | % | | 5.75 | % | | 6.20 | % | | 6.00 | % | | 5.75 | % |
| | | | | | |
Expected return on plan assets | | 8.50 | % | | 8.30 | % | | 8.00 | % | | NA | | | NA | | | NA | |
| | | | | | |
Rate of compensation increase | | 3.75 | % | | 3.75 | % | | 3.75 | % | | 3.75 | % | | 3.75 | % | | 3.75 | % |
| | | | | | |
Current medical cost trend rate | | NA | | | NA | | | NA | | | 8.00 | % | | 8.00 | % | | 7.25 | % |
| | | | | | |
Ultimate medical cost trend rate | | NA | | | NA | | | NA | | | 5.75 | % | | 5.75 | % | | 5.25 | % |
| | | | | | |
Year the rate reaches ultimate trend rate | | NA | | | NA | | | NA | | | 2015 | | | 2014 | | | 2009 | |
The following summarizes the change in benefit obligation, change in plan assets, and funded status of the plans:
| | | | | | | | | | | | | | | | |
Year ended December 31, | | Pension Plans | | | Health Care and Other
Plans | |
| | 2009 | | | 2008 | | | 2009 | | | 2008 | |
| In millions | | | | | | | | | | | | |
| | | | |
Change in benefit obligation: | | | | | | | | | | | | | | | | |
| | | | |
Benefit obligation at beginning of year | | $ | 179.3 | | | $ | 173.9 | | | $ | 26.0 | | | $ | 28.7 | |
| | | | |
Service cost | | | 3.5 | | | | 3.8 | | | | — | | | | 0.1 | |
| | | | |
Interest cost | | | 10.0 | | | | 13.0 | | | | 1.5 | | | | 2.0 | |
| | | | |
Plan participants’ contributions | | | — | | | | — | | | | — | | | | 1.5 | |
| | | | |
Actuarial loss (gain) | | | 13.3 | | | | 4.4 | | | | (1.1 | ) | | | (2.4 | ) |
| | | | |
Gross benefits paid | | | (13.9 | ) | | | (17.7 | ) | | | (1.6 | ) | | | (3.9 | ) |
| | | | |
Settlements and curtailments | | | (0.3 | ) | | | — | | | | — | | | | — | |
| | | | |
Currency exchange (gain) loss | | | (0.1 | ) | | | 1.9 | | | | — | | | | — | |
| | | | | | | | | | | | | | | | |
| | | | |
Benefit obligation at end of year | | $ | 191.8 | | | $ | 179.3 | | | $ | 24.8 | | | $ | 26.0 | |
| | | | | | | | | | | | | | | | |
| | | | |
Change in plan assets: | | | | | | | | | | | | | | | | |
| | | | |
Fair value of plan assets at beginning of year | | $ | 162.0 | | | $ | 137.1 | | | $ | — | | | $ | — | |
| | | | |
Actual gain (loss) on plan assets | | | 26.9 | | | | (31.2 | ) | | | — | | | | — | |
| | | | |
Employer contributions | | | 2.3 | | | | 73.9 | | | | 1.6 | | | | 2.4 | |
| | | | |
Plan participants’ contributions | | | — | | | | — | | | | — | | | | 1.5 | |
| | | | |
Gross benefits paid | | | (13.9 | ) | | | (17.7 | ) | | | (1.6 | ) | | | (3.9 | ) |
| | | | |
Currency exchange gain (loss) | | | 0.1 | | | | (0.1 | ) | | | — | | | | — | |
| | | | | | | | | | | | | | | | |
| | | | |
Fair value of plan assets at end of year | | $ | 177.4 | | | $ | 162.0 | | | $ | — | | | $ | — | |
| | | | | | | | | | | | | | | | |
| | | | |
Net amount recognized | | $ | (14.4 | ) | | $ | (17.3 | ) | | $ | (24.8 | ) | | $ | (26.0 | ) |
| | | | | | | | | | | | | | | | |
| | | | |
Amounts recognized in statement of financial position: | | | | | | | | | | | | | | | | |
| | | | |
Long-term assets | | $ | 9.0 | | | $ | 6.0 | | | $ | — | | | $ | — | |
| | | | |
Accrued liabilities, current | | | (0.3 | ) | | | (0.8 | ) | | | (1.3 | ) | | | (2.2 | ) |
| | | | |
Pension and post-employment liabilities | | | (23.1 | ) | | | (22.5 | ) | | | (23.5 | ) | | | (23.8 | ) |
| | | | | | | | | | | | | | | | |
| | | | |
Net amount recognized | | $ | (14.4 | ) | | $ | (17.3 | ) | | $ | (24.8 | ) | | $ | (26.0 | ) |
| | | | | | | | | | | | | | | | |
Amounts recognized in accumulated other comprehensive income (before tax):
| | | | | | | | | | | | | | |
Year ended December 31, | | Pension Plans | | Health Care and Other
Plans | |
| | 2009 | | 2008 | | 2009 | | | 2008 | |
| In millions | | | | | | | | | | |
| | | | |
Net actuarial loss (gain) | | $ | 63.0 | | $ | 68.9 | | $ | (5.4 | ) | | $ | (6.4 | ) |
| | | | |
Prior service (credit) cost | | | — | | | — | | | (9.9 | ) | | | (10.4 | ) |
| | | | | | | | | | | | | | |
| | | | |
Net amount recognized | | $ | 63.0 | | $ | 68.9 | | $ | (15.3 | ) | | $ | (16.8 | ) |
| | | | | | | | | | | | | | |
58
The estimated amounts that will be amortized from accumulated other comprehensive income into net periodic benefit cost in 2010 are as follows:
| | | | | | | |
| | | Pension Plans | | Health Care and
Other Plans | |
| In millions | | | | | |
| | |
Actuarial loss (gain) | | $ | 8.8 | | $ | (1.3 | ) |
| | |
Prior service (credit) cost | | | — | | | (0.5 | ) |
| | | | | | | |
| | |
| | $ | 8.8 | | $ | (1.8 | ) |
| | | | | | | |
The following is a table of the actuarial assumptions used to determine the benefit obligation:
| | | | | | | | | | | | |
Year ended December 31, | | Pension Plans | | | Health Care and
Other Plans | |
| | 2009 | | | 2008 | | | 2009 | | | 2008 | |
| | | | |
Weighted-average assumptions: | | | | | | | | | | | | |
| | | | |
Discount rate | | 5.56 | % | | 6.32 | % | | 5.66 | % | | 6.20 | % |
| | | | |
Rate of compensation increase | | 3.75 | % | | 3.75 | % | | 3.75 | % | | 3.75 | % |
The composition of our plans and age of our participants are such that, as of December 31, 2009 and 2008, the medical cost trend rate no longer had an effect on the valuation of our health care plans.
The U.S. pension plan assets are invested primarily in marketable securities, including common stocks, bonds and interest-bearing deposits. The weighted-average allocation of pension benefit plan assets at December 31, 2009 and September 30, 2008 was:
| | | | | | | | | | | | | | | |
Asset Category (Dollars in millions) | | 2009
Target Allocation | | | Actual Allocation | | | Fair Value |
| | | 2009 | | | 2008 | | | 2009 | | 2008 |
| | | | | |
Cash | | — | | | 5 | % | | — | | | $ | 8.5 | | $ | — |
| | | | | |
Equity securities | | 60 | % | | 62 | % | | 52 | % | | | 108.2 | | | 82.2 |
| | | | | |
Fixed income securities | | 40 | % | | 33 | % | | 48 | % | | | 57.2 | | | 76.7 |
| | | | | | | | | | | | | | | |
| | | | | |
Total | | 100 | % | | 100 | % | | 100 | % | | $ | 173.9 | | $ | 158.9 |
| | | |
Asset Category (Dollars in millions) | | Asset Value as of
12/31/2009 |
| |
Cash and cash equivalents | | $ | 8.5 |
| |
Equity securities: | | | |
| |
U.S. large cap | | | 50.2 |
| |
Mid cap | | | 11.1 |
| |
Small cap | | | 10.6 |
| |
International | | | 25.1 |
| |
Emerging markets | | | 11.2 |
| |
Fixed income: | | | |
| |
Investment grade bonds | | | 20.7 |
| |
U.S. treasuries | | | 13.1 |
| |
Corporate bonds | | | 23.4 |
| | | |
| |
Total | | $ | 173.9 |
The investment objectives of our pension plan assets are as follows:
| | • | | To achieve a favorable relative return as compared with inflation; |
| | • | | To achieve an above average total rate of return relative to capital markets; |
| | • | | Preservation of capital through a broad diversification among asset classes which react, as nearly as possible, independently to varying economic and market circumstances; and |
| | • | | Long-term growth, with a degree of emphasis on stable growth, rather than short-term capital gains. |
59
Our pension expense and pension liability are actuarially determined, and we use various actuarial assumptions, including the discount rate, rate of salary increase, and expected return on assets to estimate our pension costs and obligations. We determine the expected return on plan assets based on our pension plans’ intended long-term asset mix. The expected investment return assumption used for the pension plans reflects what the plans can reasonably expect to earn over a long-term period considering plan target allocations. The expected return includes an inflation assumption and adds real returns for the asset mix and a premium for active management, and subtracts expenses. While the assumed expected rate of return on plan assets in 2009 and 2008 was 8.5% and 8.3%, respectively, the actual return experienced in our pension plan assets in the comparable periods in 2009 and 2008 was 17.6% and a loss of 17.7%, respectively. We consult with the plans’ actuaries to determine a discount rate assumption for pension and other postretirement and post-employment plans that reflects the characteristics of our plans, including expected cash outflows from our plans, and utilize an analytical tool that incorporates the concept of a hypothetical yield curve.
Our pension obligations are funded in accordance with provisions of Federal law. Contributions to our pension and post-employment plans in 2009 totaled $2.3 million and $1.6 million, respectively. During 2008, we made a $63.5 million contribution to our U.S. pension plan in excess of our minimum funding requirements, which put the plan in an overfunded status. Amounts previously recorded to Pension and post employment liabilities related to the U.S. pension plan were reduced to zero and the overfunded status of $9.0 million at December 31, 2009 was recorded to Other assets—long-term. Our foreign pension plans and health care and other plans continue to maintain an unfunded status as of December 31, 2009 and are recorded in Pension and post-employment liabilities. Except for our U.S. pension plan at the end of 2009, the accumulated benefit obligation for each of our plans exceeded the fair value of plan assets in both 2008 and 2009. As of December 31, 2009, the accumulated benefit obligation for our U.S. pension plan was $161.7 million and the fair value of plan assets was $173.9 million. We expect contributions to our pension and post-employment plans in 2010 to be approximately $0.9 million and $1.3 million, respectively.
MEMC uses appropriate valuation techniques based on the available inputs to measure the fair value of its investments. When available, MEMC measures fair value using Level 1 inputs because they generally provide the most reliable evidence of fair value. As of December 31, 2009 and 2008, the pension plan’s investments in equity and fixed income securities were all valued using Level 1 inputs based on the fair value as determined by quoted market price on a daily basis.
The projected benefit obligation, accumulated benefit obligation and fair value of plan assets for pension plans with an accumulated benefit obligation in excess of plan assets were as follows:
| | | | | | |
| | | Pension Plans |
| | 2009 | | 2008 |
| In millions | | | | |
| | |
Projected benefit obligation, end of year | | $ | 26.9 | | $ | 25.8 |
| | |
Accumulated benefit obligation, end of year | | $ | 25.6 | | $ | 18.9 |
| | |
Fair value of plan assets, end of year | | $ | 3.5 | | $ | 3.0 |
We estimate that the future benefits payable for the pension and other postretirement plans are as follows:
| | | | | | |
| | | Pension Plans | | Health Care and
Other Plans |
| In millions | | | | |
| | |
2010 | | $ | 13.6 | | $ | 1.3 |
| | |
2011 | | | 19.1 | | | 1.8 |
| | |
2012 | | | 12.5 | | | 1.8 |
| | |
2013 | | | 13.3 | | | 1.9 |
| | |
2014 | | | 13.6 | | | 1.9 |
| | |
2015-2019 | | | 70.9 | | | 9.1 |
60
Defined Contribution Plans
We sponsor a defined contribution plan under Section 401(k) of the Internal Revenue Code covering all U.S. salaried and hourly employees, and a defined contribution plan in Taiwan covering most salaried and hourly employees of our Taiwan subsidiary. Our costs included in our statements of income totaled $5.6 million, $5.7 million and $5.6 million for 2009, 2008 and 2007, respectively.
Other Employee-Related Liabilities
Employees of our subsidiaries in Italy and Korea are covered by an end of service entitlement that provides payment upon termination of employment. Contributions to these plans are based on statutory requirements and are not actuarially determined. The accrued liability was $25.1 million at December 31, 2009 and $28.8 million at December 31, 2008, and is included in other long-term liabilities and accrued wages and salaries on our balance sheet. The accrued liability is based on the vested benefits to which the employee is entitled assuming employee termination at the measurement date.
18. LONG-TERM CUSTOMER CONTRACTS
During February 2009, we amended two of our long-term solar wafer supply agreements. Under those amendments, the potential aggregate revenues to MEMC under the agreements for sales in 2009 and aggregate revenues for sales over the remaining term of the contracts remain unchanged, but volume increases and price reductions for 2009 were effectuated.
During the quarter ended June 30, 2009, MEMC applied approximately $44.1 million of refundable security deposits against outstanding accounts receivable balances in accordance with the terms of the long-term customer agreements described above. The application of the deposits against accounts receivables has been reflected as working capital and other operating cash inflows and a decrease in customer deposits in financing cash flows in the condensed consolidated statement of cash flows for year ended December 31, 2009.
We further amended these agreements in the third quarter of 2009 providing for an additional price reduction and volume increase for the second half of 2009. The subsequent amendments also provide a deferral mechanism for a 2009 purchase shortfall by the customers (from the increased volume commitment), by allowing the customers to make up the purchase shortfall in subsequent years. Such deferred volume amounts will be added to the customers’ minimum purchase requirements for future contract years. There was no change in the amount of collateral currently required in the form of deposits. Due to the amendment with the one of these customers, approximately $11.6 million of previously refundable deposits are no longer refundable and have been reclassified from other long-term liabilities to deferred revenue and will be amortized over the remaining term of the contract as an operating income item. The constructive receipt of the non-refundable deposit and corresponding reduction in refundable deposits has been reflected as working capital and other operating cash inflows and a decrease in customer deposits in financing cash flows in the condensed consolidated statement of cash flows for the year ended December 31, 2009. Also in connection with one of the amendments, as additional consideration to MEMC, the customer agreed to sell to us an equity investment in shares of an unrelated entity at its cost of approximately $5 million. We have recorded the investment at fair value with the offset to deferred revenue. The loss of any one of these long-term supply customers could potentially adversely affect our future operating results.
Another solar wafer customer has not made a scheduled refundable capacity reservation deposit that was due under their agreement in early January 2009. We continue to negotiate with this customer and made limited shipments to this customer in 2009 at market prices.
As more fully described in Note 21, in January 2010, we amended our long-term solar wafer supply agreement with Conergy AG (“Conergy”) and reached an out of court settlement of a lawsuit related to that agreement.
19. COMMITMENTS AND CONTINGENCIES
As discussed in Note 3, we issued contingent consideration to be paid to the former SunEdison unit holders if certain operational criteria are met from January 1, 2010 through December 31, 2010. This consideration is to be paid in the form of cash and MEMC common stock and ranges from zero up to $89.0 million.
Capital Lease Obligations
As more fully described in Note 13, we are party to master lease agreements that provides for the sale and simultaneous leaseback of certain solar energy systems constructed by us.
61
Operating Leases and Purchase Obligations
We lease buildings, equipment and automobiles under operating leases. Rental expense was $7.9 million, $5.7 million and $5.2 million in 2009, 2008 and 2007, respectively. The total future commitment under operating leases as of December 31, 2009 was $28.3 million, of which $20.6 million is noncancellable. Our operating lease obligations as of December 31, 2009 were as follows:
| | | | | | | | | | | | | | | | | | | | | |
| | | Payments Due By Period |
| | Total | | 2010 | | 2011 | | 2012 | | 2013 | | 2014 | | Thereafter |
| In millions | | | | | | | | | | | | | | |
Operating Leases | | $ | 28.3 | | $ | 7.2 | | $ | 5.9 | | $ | 3.7 | | $ | 3.0 | | $ | 2.5 | | $ | 6.0 |
We maintain a long-term agreement with a supplier in connection with the purchase of certain raw materials. Our minimum required annual purchase under this agreement is $48.6 million in each of the years from 2009 through 2018. During 2009 and 2008, $15.9 million and $13.7 million were recorded to cost of goods sold related to the estimated shortfall to our annual purchase obligation associated with a take or pay agreement for raw material supply to our Pasadena facility.
Indemnification
We have agreed to indemnify some of our customers against claims of infringement of the intellectual property rights of others in our sales contracts with these customers. Historically, we have not paid any claims under these indemnification obligations and we do not have any pending indemnification claims as of December 31, 2009.
We generally warrant the operation of our solar energy systems. Due to the absence of historical material warranty claims and expected future claims, we have not recorded a warranty accrual related to solar energy systems as of December 31, 2009.
Legal Proceedings
We are involved in various legal proceedings which arise in the ordinary course of business. Although it is not possible to predict the outcome of these matters, we believe that the ultimate outcome of these proceedings, individually and in the aggregate, will not have a material adverse effect on our financial position, cash flows or results of operations.
BP Solar International v. MEMC Electronic Materials, Inc. and MEMC Pasadena, Inc.
In April 2007, BP Solar International, Inc. filed suit against MEMC and MEMC Pasadena, Inc. in the Circuit Court for Frederick County, Maryland (Civil Number 10-C-07-001240) alleging non-delivery of polysilicon powder for 2006. Plaintiff BP Solar subsequently amended the complaint on four separate occasions. The final complaint filed by Plaintiff alleged that MEMC Pasadena failed to supply polysilicon powder to the Plaintiff in 2006 and 2007 under an alleged three-year supply agreement. MEMC has always maintained that no such long term supply agreement ever existed. The case was tried before a jury and on July 31, 2009, the jury returned a verdict in favor of BP Solar, awarding damages of $8.8 million. Both MEMC and BP Solar have appealed.
MEMC and MEMC Pasadena continue to believe that the lawsuit is without merit and we remain committed to a vigorous defense of the case at the appellate level. The appellate court has not yet issued a briefing or argument schedule and a decision in the appeal is not expected for many months. Due to the inherent uncertainties of litigation, MEMC cannot predict the outcome of this appeal. An unfavorable outcome on appeal would result in MEMC having to pay BP Solar the damages originally found by the jury, plus interest. MEMC accrued the full amount of damages of the verdict of $8.8 million in marketing and administration expense and accrued expenses and $3.7 million of income tax benefit, resulting in a net expense of $5.1 million, during the quarter ended June 30, 2009.
S.O.I.TEC Silicon on Insulator Technologies S.A. vs. MEMC Electronic Materials, Inc.
On May 19, 2008, Soitec and Commissariat A L’Energie Atomique (“CEA”) filed a complaint against MEMC in the U.S. District Court for the District of Delaware (Civil Action No. 08-292) alleging infringement, including willful infringement, by MEMC of three U.S. patents related to silicon-on-insulator (SOI) technology, and requested damages and an injunction. Soitec and CEA filed an amended complaint on July 21, 2009, adding a fourth, related patent to the lawsuit. MEMC has filed a counterclaim against Soitec for infringement of one of MEMC’s U.S. patents. Discovery is ongoing. The Court recently bifurcated the case into two phases, a first liability phase which, to the extent liability is found, will be followed by a second damages phase. Trial of the liability phase is scheduled for late October 2010. We believe that Soitec and CEA’s suit against us has no merit, and we are asserting a vigorous
62
defense against these claims, as well as our infringement counterclaim. We do not believe that this case, should it be decided against MEMC, in whole or in part, will have a material adverse effect on us. Due to uncertainty regarding the litigation process, the outcome of this lawsuit is unpredictable and the results of this case could be unfavorable for MEMC.
Semi-Materials Co., Ltd. vs. MEMC Electronic Materials, Inc. and MEMC Pasadena, Inc.
On September 28, 2006, Semi-Materials Co., Ltd. (“Semi-Materials”) filed a complaint against MEMC in the U.S. District Court for the Eastern District of Missouri (Case No. 4:06-CV-01426-FRB) alleging breach of contract, unjust enrichment, fraud, and conversion, and seeking specific performance, all related to a series of purchase orders for chunk polysilicon and polysilicon solar ingot. MEMC filed its answer in the case in December 2006. On MEMC’s motion, the Court dismissed Semi-Materials’ conversion claim.
The parties entered into settlement discussions for this case in November 2007 and December 2007. In early 2008, Semi-Materials claimed that a binding settlement was reached as a result of those late 2007 discussions. MEMC denied Semi-Materials’ allegation that a binding settlement was reached. In January 2008, Semi-Materials moved the trial court to enforce the alleged settlement terms. On March 17, 2008, the trial court sustained Semi-Materials’ motion and found that binding settlement terms had been reached as a result of the late 2007 negotiations between Semi-Materials and MEMC. This decision was immediately appealed by MEMC to the United States Court of Appeals for the Eighth Circuit, and enforcement of the trial court’s order was stayed pending that appeal. The Eighth Circuit heard oral argument on September 26, 2008. Just prior to the September 26 oral argument, Semi-Materials informed MEMC and the Eighth Circuit that Semi-Materials no longer sought enforcement of the alleged settlement agreement (although
Semi-Materials still claimed that a binding settlement was reached in late 2007). Semi-Materials instead requested that the Eighth Circuit vacate the trial court’s March 2008 order enforcing the alleged settlement agreement and remand the case back to the trial court for further proceedings. On May 4, 2009, the Eighth Circuit requested a rehearing of the appeal, which rehearing was held on June 10, 2009. On July 10, 2009, the Eighth Circuit vacated the trial court’s order, and returned the case to the trial court for further proceedings. This case has been set for trial beginning November 15, 2010.
On March 31, 2008, Semi-Materials and its affiliate SMC Shanghai (“SMC”) filed two additional lawsuits against MEMC, one in the United States District Court for the Southern District of Texas (Case No. 4:08-CV-00991) (the “Texas Action”) and another in the United States District Court for the Eastern District of Missouri (Case No. 4:08-CV-00434-JCH) (the “Missouri Action”). In both cases, SMC alleges that: (i) MEMC Pasadena, Inc. (“MEMC Pasadena”) breached an agreement with SMC for SMC to act as MEMC’s exclusive sales agent in China; (ii) MEMC Pasadena breached an agreement with Semi-Materials for Semi-Materials to act as MEMC Pasadena’s exclusive sales agent in Korea; (iii) MEMC tortiously interfered with the purported sales agency agreements among MEMC Pasadena and SMC and Semi-Materials; and (iv) MEMC tortiously interfered with a separate sales agency agreement Semi-Materials claims existed with an unrelated party. In the Missouri Action, Semi-Materials also claims that MEMC tortiously interfered with an expectancy for an on-going business relationship Semi-Materials claims existed with the unrelated party. Upon MEMC’s motions for summary judgment in the Missouri Action, the Court dismissed the claim that MEMC tortiously interfered with the purported sales agency agreements, and the claim that MEMC tortiously interfered with the alleged sales agency agreement between Semi-Materials and the unrelated party. The remaining claims were tried before a jury between January 4 and January 12, 2010. At trial, the jury found in favor of Semi-Materials and SMC on their respective claims for breach of contract against MEMC Pasadena, awarding a verdict of $209,000, and found in favor of MEMC on Semi-Materials’ claim for tortious interference with an expectancy of an ongoing business relationship with the unrelated party. Post-trial motions are due to be filed in February 2010.
No discovery has been undertaken in the Texas Action, and it has been stayed.
We do not believe that the Semi-Materials cases, should the jury’s verdict in the Missouri action be maintained or should the case set for trial in November 2010 ultimately be decided against MEMC, in whole or in part, will have a material adverse effect on us. Due to uncertainty regarding the litigation process, the outcome of these matters are unpredictable and the results of these cases could be unfavorable for MEMC.
Minneapolis Firefighters’ Relief Association v. MEMC Electronic Materials, Inc., et al.
On September 26, 2008, a putative class action lawsuit was filed in the U.S. District Court for the Eastern District of Missouri by plaintiff Minneapolis Firefighters’ Relief Association asserting claims against MEMC and Nabeel Gareeb, MEMC’s former Chief Executive Officer. On October 10, 2008, a substantially similar putative class action lawsuit was filed by plaintiff Donald Jameson against MEMC, Mr. Gareeb and Ken Hannah, MEMC’s former Chief Financial Officer and currently MEMC’s Executive Vice President and President - Solar Materials. These cases purportedly are brought on behalf of all persons who acquired shares of MEMC’s common stock between June 13, 2008 and July 23, 2008, inclusive (the “Class Period”). Both complaints allege that, during the Class Period, MEMC failed to disclose certain material facts regarding MEMC’s operations and performance, which had the effect of artificially inflating MEMC’s stock price in violation of Section 10(b) of the Securities Exchange Act of 1934 (the “Exchange Act”). Plaintiffs further allege that Messrs. Gareeb and Hannah are subject to liability under Section 20(a) of the Act as control persons of MEMC. Plaintiffs seek certification of the putative class, unspecified compensatory damages, interest and costs, as well as
63
ancillary relief. On December 12, 2008, these actions were consolidated, and the Court appointed Mahendra A. Patel as lead plaintiff. Plaintiff filed a consolidated amended complaint on February 23, 2009. Defendants filed a motion to dismiss on April 10, 2009, plaintiff filed his opposition to the motion on May 29, 2009 and defendants filed their reply in support of their motion on June 24, 2009. The parties have fully briefed defendants’ motion to dismiss the consolidated amended complaint, and await the setting of oral argument in the matter.
MEMC and the individual defendants believe this action has no merit and intend to vigorously defend themselves against the claims. However, due to the inherent uncertainties of litigation, we cannot predict the ultimate outcome of this action.
Brian Larkowski v. John Marren, et al.
On November 4, 2008, Brian Larkowski, a purported shareholder of MEMC, filed a derivative action in the Circuit Court of St. Charles County, Missouri against defendants John Marren, Peter Blackmore, Nabeel Gareeb, Marshall Turner, Robert J. Boehlke, C. Douglas Marsh, William E. Stevens, James B. Williams and Michael McNamara (collectively “individual defendants”) and MEMC as a nominal defendant. Each individual defendant is a current or former officer and/or director of MEMC. The lawsuit alleges breach of fiduciary duty, abuse of control, gross mismanagement, waste of corporate assets and unjust enrichment, based on allegations of conduct similar to that alleged in the putative class action lawsuit described above. On December 19, 2008, the court entered a stipulated order staying the derivative action pending resolution of any motions to dismiss in the putative class action described above.
On January 30, 2009, a second putative derivative plaintiff served a demand letter on the Company’s Board of Directors requesting that it investigate factual allegations similar to those underlying theLarkowski derivative action. In response, the Board of Directors appointed a special committee to investigate these allegations. On October 8, 2009, the special committee submitted a final report of its findings to our Board of Directors. In its report, the special committee concluded that there is no substantiation for the claims of wrongful conduct referenced in the demand letter. After its review and consideration, our Board of Directors determined to accept the report of the special committee in its entirety, including the findings and recommendations set forth therein.
Jerry Jones v. MEMC Electronic Materials, Inc., et al.
On December 26, 2008, a putative class action lawsuit was filed in the U.S. District Court for the Eastern District of Missouri by plaintiff, Jerry Jones, purportedly on behalf of all participants in and beneficiaries of MEMC’s 401(k) Savings Plan (the “Plan”) between September 4, 2007 and December 26, 2008, inclusive. The complaint asserted claims against MEMC and certain of its directors, employees and/or other unnamed fiduciaries of the Plan. The complaint alleges that the defendants breached certain fiduciary duties owed under the Employee Retirement Income Security Act (“ERISA”), generally asserting that the defendants failed to make full disclosure to the Plan’s participants of the risks of investing in MEMC’s stock and that the Company’s stock should not have been made available as an investment alternative in the Plan. The misstatements alleged in the complaint significantly overlap with the misstatements alleged in the federal securities class action described above.
On June 1, 2009, an amended class action complaint was filed by Mr. Jones and another purported participant of the Plan, Manuel Acosta, which raises substantially the same claims and is based on substantially the same allegations as the original complaint. However, the amended complaint changes the period of time covered by the action, purporting to be brought on behalf of beneficiaries of and/or participants in the Plan from June 13, 2008 through the present, inclusive (the “Class Period”). The amended complaint seeks unspecified monetary damages, including losses the participants and beneficiaries of the Plan allegedly experienced due to their investment through the Plan in MEMC’s stock, equitable relief and an award of attorney’s fees. No class has been certified and discovery has not begun. The Company and the named directors and employees intend to vigorously defend themselves against these claims, including filing a motion to dismiss the complaint, which motion was filed on July 27, 2009. The motion is fully briefed as of October 9, 2009 and is pending ruling by the court. On January 5, 2010, the plaintiffs filed a notice of supplemental authority pertinent to defendants’ motion to dismiss. On January 14, 2010, the defendants filed a response to plaintiffs’ notice of supplemental authority.
MEMC believes the above class actions and derivative suit are without merit and we will assert a vigorous defense. Due to the inherent uncertainties of litigation, we cannot predict the ultimate outcome or resolution of the foregoing proceedings or estimate the amounts of, or potential range of, loss with respect to these proceedings. An unfavorable outcome could have a material adverse impact on our business, results of operations and financial condition. We have indemnification agreements with each of our present and former directors and officers, under which we are generally required to indemnify each such director or officer against expenses, including attorney’s fees, judgments, fines and settlements, arising from actions such as the lawsuits described above (subject to certain exceptions, as described in the indemnification agreements).
MEMC believes the above class actions and derivative suit are without merit and we will assert a vigorous defense. Due to the inherent uncertainties of litigation, we cannot predict the ultimate outcome or resolution of the foregoing proceedings or estimate the amounts of, or potential range of, loss with respect to these proceedings. An unfavorable outcome could have a material adverse impact on our business, results of operations and financial condition. We have indemnification agreements with each of our present and former directors and officers, under which we are generally required to indemnify each such director or officer against expenses, including attorney’s fees, judgments, fines and settlements, arising from actions such as the lawsuits described above (subject to
64
certain exceptions, as described in the indemnification agreements).
20. REPORTABLE SEGMENTS
Our reportable segments are determined based on the management of the businesses and the types of products sold and services provided. As discussed in Note 1, on November 20, 2009, we completed the acquisition of SunEdison. Prior to this acquisition, we were engaged in one reportable segment—the design, manufacture and sale of silicon wafers, which is now referred to as the Materials Business. Our Materials Business provides semiconductor wafers in sizes ranging from 100 millimeters (4 inch) to 300 millimeters (12 inch) as well as 156 millimeter wafers targeted for solar applications. As a result of the acquisition of SunEdison, we now participate in the development and maintenance of solar energy systems and the sale of solar energy, referred to as the Solar Energy Business. Because the SunEdison acquisition resulted in an additional reportable segment, and because all corporate costs have been allocated to the Materials Business, a recasting of prior period segments was not necessary.
65
| | | | | | | | | | |
| | | For the year ended
December 31, |
| | | 2009 | | | 2008 | | 2007 |
| In millions | | | | | | | |
| | | |
Net sales: | | | | | | | | | | |
| | | |
Materials Business | | $ | 1,159.8 | | | $ | 2,004.5 | | $ | 1,921.8 |
| | | |
Solar Energy Business | | | 3.8 | | | | — | | | — |
| | | | | | | | | | |
| | | |
Consolidated net sales | | $ | 1,163.6 | | | $ | 2,004.5 | | $ | 1,921.8 |
| | | | | | | | | | |
| | | |
Depreciation and amortization: | | | | | | | | | | |
| | | |
Materials Business | | $ | 122.0 | | | $ | 104.0 | | $ | 80.7 |
| | | |
Solar Energy Business | | | 2.0 | | | | — | | | — |
| | | | | | | | | | |
| | | |
Consolidated depreciation and amortization | | $ | 124.0 | | | $ | 104.0 | | $ | 80.7 |
| | | | | | | | | | |
| | | |
Operating (loss) income: | | | | | | | | | | |
| | | |
Materials Business | | $ | (116.8 | ) | | $ | 853.2 | | $ | 849.9 |
| | | |
Solar Energy Business | | | (10.4 | ) | | | — | | | — |
| | | | | | | | | | |
| | | |
Consolidated operating (loss) income | | $ | (127.2 | ) | | $ | 853.2 | | $ | 849.9 |
| | | | | | | | | | |
| | | |
Interest expense: | | | | | | | | | | |
| | | |
Materials Business | | $ | 2.2 | | | $ | 1.8 | | $ | 1.4 |
| | | |
Solar Energy Business | | | 1.8 | | | | — | | | — |
| | | | | | | | | | |
| | | |
Consolidated interest expense | | $ | 4.0 | | | $ | 1.8 | | $ | 1.4 |
| | | | | | | | | | |
| | | |
Total assets: | | | | | | | | | | |
| | | |
Materials Business | | $ | 2,678.9 | | | $ | 2,936.7 | | | |
| | | |
Solar Energy Business | | | 887.6 | | | | — | | | |
| | | | | | | | | | |
| | | |
Consolidated total assets | | $ | 3,566.5 | | | $ | 2,936.7 | | | |
| | | | | | | | | | |
| | | |
Capital expenditures: | | | | | | | | | | |
| | | |
Materials Business | | $ | 225.4 | | | $ | 303.6 | | $ | 276.4 |
| | | |
Solar Energy Business(1) | | | 28.0 | | | | — | | | — |
| | | | | | | | | | |
| | | |
Consolidated capital expenditures | | $ | 253.4 | | | $ | 303.6 | | $ | 276.4 |
| | | | | | | | | | |
| (1) | Includes construction of solar energy systems. |
Equity in earnings of joint venture, net of tax of ($11.8) million in 2009 and equity in joint venture of $101.6 million at December 31, 2009 is part of our Materials Business segment.
Geographic Segments
Geographic financial information is as follows:
Net Sales to Customers:
| | | | | | | | | |
| | | 2009 | | 2008 | | 2007 |
| Dollars in millions | | | | | | |
| | | |
United States | | $ | 154.7 | | $ | 489.0 | | $ | 462.0 |
| | | |
Foreign | | | 1,008.9 | | | 1,515.5 | | | 1,459.8 |
| | | | | | | | | |
| | | |
Total | | $ | 1,163.6 | | $ | 2,004.5 | | $ | 1,921.8 |
| | | | | | | | | |
66
Foreign revenues were derived from sales to the following countries:
| | | | | | | | | |
| | | 2009 | | 2008 | | 2007 |
| Dollars in millions | | | | | | |
| | | |
China | | $ | 296.5 | | $ | 371.8 | | $ | 405.0 |
| | | |
Japan | | | 41.2 | | | 47.5 | | | 94.5 |
| | | |
Korea | | | 91.4 | | | 279.3 | | | 299.7 |
| | | |
Taiwan | | | 333.9 | | | 505.4 | | | 324.9 |
| | | |
Other foreign countries | | | 245.9 | | | 311.5 | | | 335.7 |
| | | | | | | | | |
| | | |
Total | | $ | 1,008.9 | | $ | 1,515.5 | | $ | 1,459.8 |
| | | | | | | | | |
Net sales are attributed to countries based on the location of the customer.
Our net sales attributable to polysilicon for the years ended December 31, 2009, 2008 and 2007 were 2.9%, 18.6% and 22.5% as a percent of total sales, respectively.
Long-Lived Assets, net of accumulated depreciation:
| | | | | | |
| | | 2009 | | 2008 |
| Dollars in millions | | | | |
| | |
United States | | $ | 686.4 | | $ | 416.2 |
| | |
Japan | | | 172.0 | | | 202.6 |
| | |
Taiwan | | | 252.4 | | | 272.7 |
| | |
Italy | | | 259.0 | | | 135.4 |
| | |
Other foreign countries | | | 203.5 | | | 87.4 |
| | | | | | |
| | |
Total | | $ | 1,573.3 | | $ | 1,114.3 |
| | | | | | |
Long-lived assets above exclude goodwill because it is recorded at the Corporate level.
21. SUBSEQUENT EVENTS
In January 2010, we reached an out of court settlement of a lawsuit related to our long-term solar wafer supply agreement with Conergy. At the same time, we amended this agreement with Conergy, which amendment included a significant reduction in the minimum quantity of wafers that Conergy must purchase over the remaining eight plus years of the agreement, as well as a minimum market share commitment should Conergy’s demand exceed the reduced quantities. The amendment also modifies the pricing terms to be based on market rates similar to other MEMC long-term solar wafer supply agreements. The amendment includes MEMC permanently retaining a portion of the refundable deposits currently held by us.
67
Report of Independent Registered Public Accounting Firm
The Board of Directors and Stockholders
MEMC Electronic Materials, Inc.:
We have audited the accompanying consolidated balance sheets of MEMC Electronic Materials, Inc. and subsidiaries (the Company) as of December 31, 2009 and 2008, and the related consolidated statements of operations, stockholders’ equity and cash flows for each of the years in the three-year period ended December 31, 2009. We also have audited the Company’s internal control over financial reporting as of December 31, 2009, based on criteria established inInternal Control – Integrated Framework issued by the Committee of Sponsoring Organizations of the Treadway Commission (COSO). The Company’s management is responsible for these consolidated financial statements, for maintaining effective internal control over financial reporting, and for its assessment of the effectiveness of internal control over financial reporting. Our responsibility is to express an opinion on these consolidated financial statements and an opinion on the Company’s internal control over financial reporting based on our audits.
We conducted our audits in accordance with the standards of the Public Company Accounting Oversight Board (United States). Those standards require that we plan and perform the audits to obtain reasonable assurance about whether the financial statements are free of material misstatement and whether effective internal control over financial reporting was maintained in all material respects. Our audits of the consolidated financial statements included examining, on a test basis, evidence supporting the amounts and disclosures in the financial statements, assessing the accounting principles used and significant estimates made by management, and evaluating the overall financial statement presentation. Our audit of internal control over financial reporting included obtaining an understanding of internal control over financial reporting, assessing the risk that a material weakness exists, and testing and evaluating the design and operating effectiveness of internal control based on the assessed risk. Our audits also included performing such other procedures as we considered necessary in the circumstances. We believe that our audits provide a reasonable basis for our opinions.
A company’s internal control over financial reporting is a process designed to provide reasonable assurance regarding the reliability of financial reporting and the preparation of financial statements for external purposes in accordance with generally accepted accounting principles. A company’s internal control over financial reporting includes those policies and procedures that (1) pertain to the maintenance of records that, in reasonable detail, accurately and fairly reflect the transactions and dispositions of the assets of the company; (2) provide reasonable assurance that transactions are recorded as necessary to permit preparation of financial statements in accordance with generally accepted accounting principles, and that receipts and expenditures of the company are being made only in accordance with authorizations of management and directors of the company; and (3) provide reasonable assurance regarding prevention or timely detection of unauthorized acquisition, use, or disposition of the company’s assets that could have a material effect on the financial statements.
Because of its inherent limitations, internal control over financial reporting may not prevent or detect misstatements. Also, projections of any evaluation of effectiveness to future periods are subject to the risk that controls may become inadequate because of changes in conditions, or that the degree of compliance with the policies or procedures may deteriorate.
The Company acquired SunEdison LLC (SunEdison) on November 20, 2009, and management excluded from its assessment of the effectiveness of the Company’s internal control over financial reporting as of December 31, 2009, SunEdison’s internal control over financial reporting associated with total assets of $887.6 million (of which $327.1 million represents goodwill and intangible assets included within the scope of the assessment) and total revenues of $3.8 million included in the consolidated financial statements of the Company as of and for the year ended December 31, 2009. Our audit of internal control over financial reporting of the Company also excluded an evaluation of the internal control over financial reporting of SunEdison.
In our opinion, the consolidated financial statements referred to above present fairly, in all material respects, the financial position of MEMC Electronic Materials, Inc. and subsidiaries as of December 31, 2009 and 2008, and the results of its operations and its cash flows for each of the years in the three-year period ended December 31, 2009, in conformity with U.S. generally accepted accounting principles. Also in our opinion, MEMC Electronic Materials, Inc. maintained, in all
68
material respects, effective internal control over financial reporting as of December 31, 2009, based on criteria established inInternal Control – Integrated Framework issued by the COSO.
As discussed in Note 2 to the consolidated financial statements, the Company adopted Financial Accounting Standards Board (FASB) Staff Position FAS 115-2 and FAS 124-2,Recognition and Presentation of Other-Than-Temporary Impairments, (included in FASB Accounting Standards Codification (ASC) Topic 320,Investments-Debt and Equity Securities), as of April 1, 2009. The Company adopted FASB No. 141(R),Business Combinations (included in ASC Topic 805,Business Combinations), as of January 1, 2009.
As discussed in Note 17 to the consolidated financial statements, the Company adopted the measurement date provisions of FASB No. 158,Employers’ Accounting for Defined Benefit Pension and Other Postretirement Plans (included in ASC Topic 715,Compensation – Retirement Benefits), as of December 31, 2008.
As discussed in Note 2 to the consolidated financial statements, the Company adopted FASB No. 157,Fair Value Measurements (included in ASC Topic 820,Fair Value Measurements and Disclosures), as of January 1, 2008. The Company adopted FASB Interpretation No. 48,Accounting for Uncertainty in Income Taxes (included in ASC Topic 740,Income Taxes), as of January 1, 2007.
/s/ KPMG LLP
St. Louis, Missouri
March 1, 2010
69
| Item 8A. | Controls and Procedures |
(a) Evaluation of Disclosure Controls and Procedures
We carried out an evaluation as of December 31, 2009, under the supervision and with the participation of our management, including our Chief Executive Officer and Chief Financial Officer, of the effectiveness of the design and operation of our disclosure controls and procedures, as defined in Rules 13-15(e) and 15d-15(e) under the Securities Exchange Act of 1934, as amended. Based upon that evaluation, our Chief Executive Officer and Chief Financial Officer have concluded that our disclosure controls and procedures were effective as of December 31, 2009.
(b) Management’s Report on Internal Control Over Financial Reporting
Our management is responsible for establishing and maintaining adequate internal control over financial reporting as defined in Rules 13a-15(f) and 15d-15(f) under the Securities Exchange Act of 1934. Our internal control over financial reporting is designed to provide reasonable assurance regarding the reliability of financial reporting and the preparation of financial statements for external purposes in accordance with U.S. generally accepted accounting principles.
On November 20, 2009, we acquired all of the outstanding units of Sun Edison LLC. We have excluded this acquisition from our assessment of the effectiveness of our internal control over financial reporting associated with total assets of $887.6 million (of which $327.1 million represents goodwill and intangible assets included with the scope of the assessment) and total revenues of $3.8 million included in the consolidated financial statements of the Company as of and for the year ended December 31, 2009.
As of December 31, 2009, management conducted an assessment of the effectiveness of the Company’s internal control over financial reporting based upon the framework issued by the Committee of Sponsoring Organizations of the Treadway Commission inInternal Control—Integrated Framework. Based on management’s assessment utilizing these criteria, we believe that, as of December 31, 2009, our internal control over financial reporting was effective.
KPMG LLP, our independent registered public accounting firm, who audited and reported on the consolidated financial statements of MEMC included in this report, has issued an attestation report on management’s assessment of internal control over financial reporting.
(c) Changes in Internal Control Over Financial Reporting
There have been no changes in the Company’s internal control over financial reporting other than the acquisition of SunEdison discussed above during the most recently completed fiscal quarter and year ended December 31, 2009 that have materially affected, or are reasonably likely to materially affect, the Company’s internal control over financial reporting.
70
STOCKHOLDER INFORMATION
CORPORATE OFFICE
MEMC Electronic Materials, Inc.
501 Pearl Drive (City of O’Fallon)
St. Peters, Missouri 63376
(636) 474-5000
www.memc.com
TRANSFER AGENT
AND REGISTRAR
Computershare Investor Services, L.L.C.
2 North LaSalle Street
P.O. Box A3504
Chicago, Illinois 60690-3504
(312) 360-5433
www.computershare.com
STOCKHOLDER INQUIRIES
Inquiries regarding address corrections, lost certificates, changes of registration, stock certificate holdings and other stockholder account matters should be directed to MEMC’s transfer agent, Computershare Investor Services, L.L.C., at the address or phone number above.
COMMON STOCK LISTING
MEMC’s common stock is traded on the New York Stock Exchange under the symbol “WFR”. On December 31, 2009, the Company had 270 stockholders of record.
FORM 10-K
Stockholders may obtain a copy of MEMC’s Annual Report on Form 10-K and related financial statement schedules for the year ended December 31, 2009, filed with the Securities and Exchange Commission, by visiting our website (www.memc.com), by writing MEMC’s Investor Relations Department or by calling (636) 474-5000.
CERTIFICATIONS
The New York Stock Exchange (NYSE) requires that our Chief Executive Officer file an annual certificate indicating that he is unaware of any violations of the NYSE listing standards. This certification was executed without qualification by our Chief Executive Officer in May 2009 and filed after our 2009 annual meeting
of stockholders. In addition, the Chief Executive Officer and Chief Financial Officer filed certifications with the SEC regarding the quality of our public disclosure. These certifications can be found as Exhibits 31.1 and 31.2 to our Form 10-K for the fiscal year ended December 31, 2009.
FINANCIAL INFORMATION
MEMC maintains a home page on the Internet at www.memc.com where we publish information, including earnings releases, other news releases and significant corporate disclosures.
INVESTOR RELATIONS
Analyst and investor inquiries should be directed to:
Bill Michalek
Director, IR & Corporate Relations
MEMC Electronic Materials, Inc.
501 Pearl Drive (City of O’Fallon)
St. Peters, Missouri 63376
Tel: (636) 474-5000
Fax: (636) 474-5158
Email: invest@memc.com
| | |
The graph at right compares cumulative total stockholder return with the cumulative total return (assuming reinvestment of dividends) of the S&P 500 Index and the S&P 500 Semiconductors Index. The information on the graph covers the period from December 31, 2004 through December 31, 2009. The stock price performance shown on the graph is not necessarily indicative of future stock price performance. Prepared by Standard and Poor’s Capital 1/25/2010 | | STOCK PRICE PERFORMANCE GRAPH 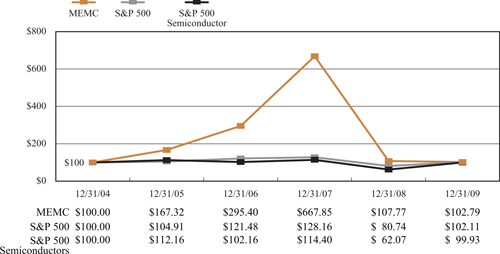
|