Exhibit 99.1
Presentation to Principals for the 2nd Lien Lenders
CONFIDENTIAL // Subject to FRE 408 March 17, 2016
DISCLAIMER
With the exception of historical information, the matters disclosed in this presentation are forward-looking statements. Such statements involve certain risks and uncertainties that could cause actual results to differ materially from those in the forward-looking statements. Potential risks and uncertainties are described in SunEdison’s filings with the Securities and Exchange Commission
(SEC), including Forms 10-K and Forms 10-Q, as well as other filings with the SEC, in addition to the risks and uncertainties described on page 2 of this presentation. These forward-looking statements represent SunEdison’s judgment as of the date of this presentation. SunEdison disclaims any intent or obligation to update these forward-looking statements, except as required by law. This communication shall not constitute an offer to sell or the solicitation of an offer to buy securities nor shall there be any sale of securities in any state in which such solicitation or sale would be unlawful prior to registration or qualification of securities under the laws of any such state. This presentation contains financial information and data regarding SunEdison. No audit or review, including by SunEdison, has been undertaken by an independent third party of this financial information and data contained, presented or referred to in this presentation. In addition, this presentation contains certain projections relating to the possible future performance of SunEdison and its assets. Such projections reflect various assumptions which may or may not prove to be correct. No representations or warranties, express or implied, are made as to the accuracy or reasonableness of such assumptions and projections that have been based thereon. Non-GAAP Financial Measures Certain financial measures included in this presentation are supplemental measures of the Company’s performance and are not U.S. generally accepted accounting principles (“GAAP”) measures. Please refer to the Appendix hereto for a definition of the non GAAP measures used in this presentation.
P. 1 Confidential / Material Non-Public Information / Subject to Confidentiality Agreements
Forward-Looking Statements
This presentation contains forward-looking statements within the meaning of Section 27A of the Securities Act of 1933 and Section 21E of the Securities Exchange Act of 1934. Forward-looking statements can be identified by the fact that they do not relate strictly to historical or current facts. These statements involve estimates, expectations, projections, goals, assumptions, known and unknown risks, and uncertainties and typically include words or variations of words such as “expect,” “anticipate,” “believe,” “intend,” “plan,” “seek,” “estimate,” “predict,” “project,” “goal,” “guidance,” “outlook,” “objective,” “forecast,” “target,” “potential,” “continue,” “would,” “will,” “should,” “could,” or “may” or other comparable terms and phrases. All statements that address operating performance, events, or developments that SunEdison expects or anticipates will occur in the future are forward-looking statements. They may include estimates of expected cash available for distribution (CAFD), earnings, revenues, capital expenditures, liquidity, capital structure, future growth, and other financial performance items (including future dividends per share), descriptions of management’s plans or objectives for future operations, products, or services, or descriptions of assumptions underlying any of the above. Forward-looking statements provide SunEdison’s current expectations or predictions of future conditions, events, or results and speak only as of the date they are made. Although SunEdison believes its expectations and assumptions are reasonable, it can give no assurance that these expectations and assumptions will prove to have been correct and actual results may vary materially.
By their nature, forward-looking statements are subject to risks and uncertainties that could cause actual results to differ materially from those suggested by the forward-looking statements. Factors that might cause such differences include, but are not limited to, delays or unexpected costs during the completion of projects under construction; regulatory requirements and incentives for production of renewable power; operating and financial restrictions under agreements governing indebtedness; the condition of capital markets and our ability to borrow additional funds and access capital markets; the impact of foreign exchange rate fluctuations; the ability to compete against traditional and renewable energy companies; challenges inherent in constructing and maintaining renewable energy projects; the success of ongoing research and development efforts; the ability to successfully integrate the businesses of acquired companies and realize the benefits of such acquisitions; and hazards customary to the power production industry and power generation operations, such as unusual weather conditions and outages. Furthermore, any dividends are subject to available capital, market conditions, and compliance with associated laws and regulations. Many of these factors are beyond SunEdison’s control.
SunEdison disclaims any obligation to update or revise any forward-looking statement to reflect changes in underlying assumptions, factors, or expectations, new information, data, or methods, future events, or other changes, except as required by law. The foregoing list of factors that might cause results to differ materially from those contemplated in the forward-looking statements should be considered in connection with information regarding risks and uncertainties which are described in SunEdison’s Form 10-K for the fiscal year ended December 31, 2014, as well as additional factors it may describe from time to time in other filings with the Securities and Exchange Commission. You should understand that it is not possible to predict or identify all such factors and, consequently, you should not consider any such list to be a complete set of all potential risks or uncertainties.The information contained herein is as of the date on the cover of this presentation unless an earlier date is indicated, in which case the information is as of such earlier date.
P. 2
Confidential / Material Non-Public Information / Subject to Confidentiality Agreements
Contents
Status update & business overview
Discussion of recent headwinds
Path forward & next steps
P. 4
Confidential / Material Non-Public Information / Subject to Confidentiality Agreements
Status Update COMPANY ESTIMATE AS OF 16 MARCH
Headwinds beginning in Q3 2015
Management response
Highlights
Material challenging events
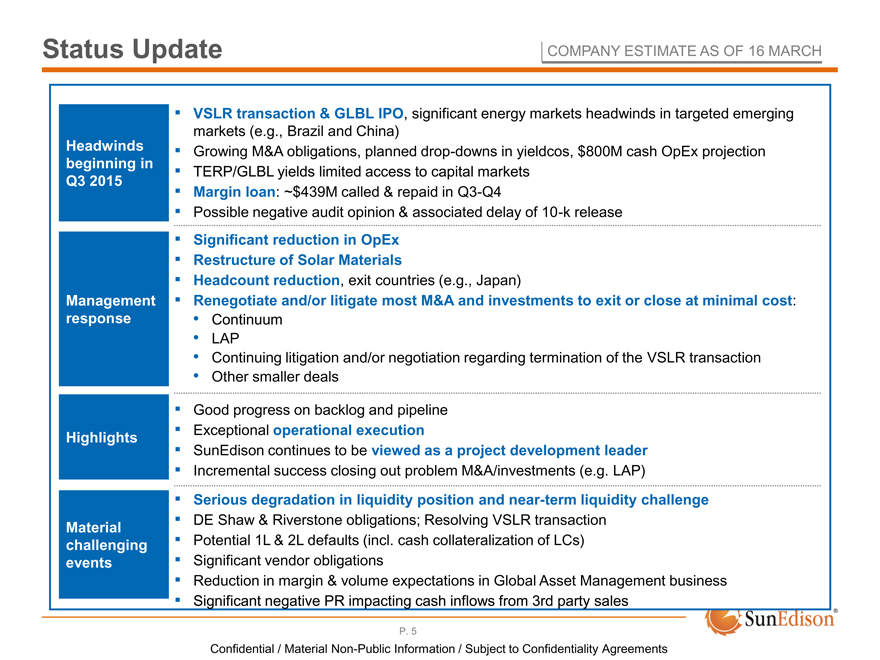
VSLR transaction & GLBL IPO, significant energy markets headwinds in targeted emerging markets (e.g., Brazil and China) Growing M&A obligations, planned drop-downs in yieldcos, $800M cash OpEx projection TERP/GLBL yields limited access to capital markets Margin loan: ~$439M called & repaid in Q3-Q4 Possible negative audit opinion & associated delay of 10-k release
Significant reduction in OpEx Restructure of Solar Materials
Headcount reduction, exit countries (e.g., Japan)
Renegotiate and/or litigate most M&A and investments to exit or close at minimal cost:
Continuum
LAP
Continuing litigation and/or negotiation regarding termination of the VSLR transaction
Other smaller deals
Good progress on backlog and pipeline Exceptional operational execution
SunEdison continues to be viewed as a project development leader
Incremental success closing out problem M&A/investments (e.g. LAP)
Serious degradation in liquidity position and near-term liquidity challenge
DE Shaw & Riverstone obligations; Resolving VSLR transaction Potential 1L & 2L defaults (incl. cash collateralization of LCs) Significant vendor obligations
Reduction in margin & volume expectations in Global Asset Management business Significant negative PR impacting cash inflows from 3rd party sales
P. 5
Confidential / Material Non-Public Information / Subject to Confidentiality Agreements
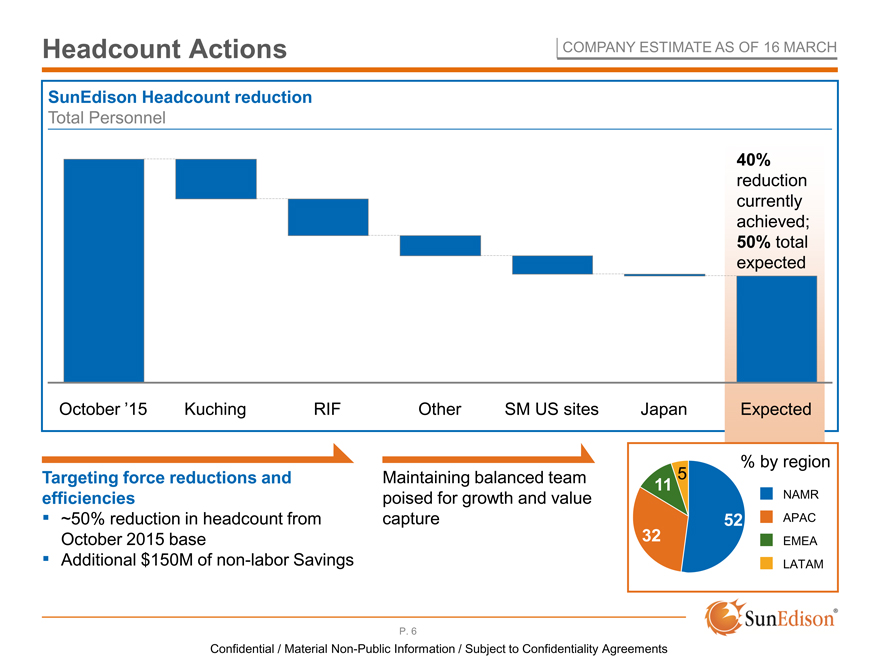
Headcount Actions COMPANY ESTIMATE AS OF 16 MARCH
SunEdison Headcount reduction
Total Personnel
40% reduction currently achieved; 50% total expected
October ’15 Kuching RIF Other SM US sites Japan Expected
Targeting force reductions and efficiencies
Maintaining balanced team poised for growth and value capture
~50% reduction in headcount from October 2015 base Additional $150M of non-labor Savings
% by region 5 11
NAMR
52 APAC
32 EMEA LATAM
P. 6
Confidential / Material Non-Public Information / Subject to Confidentiality Agreements
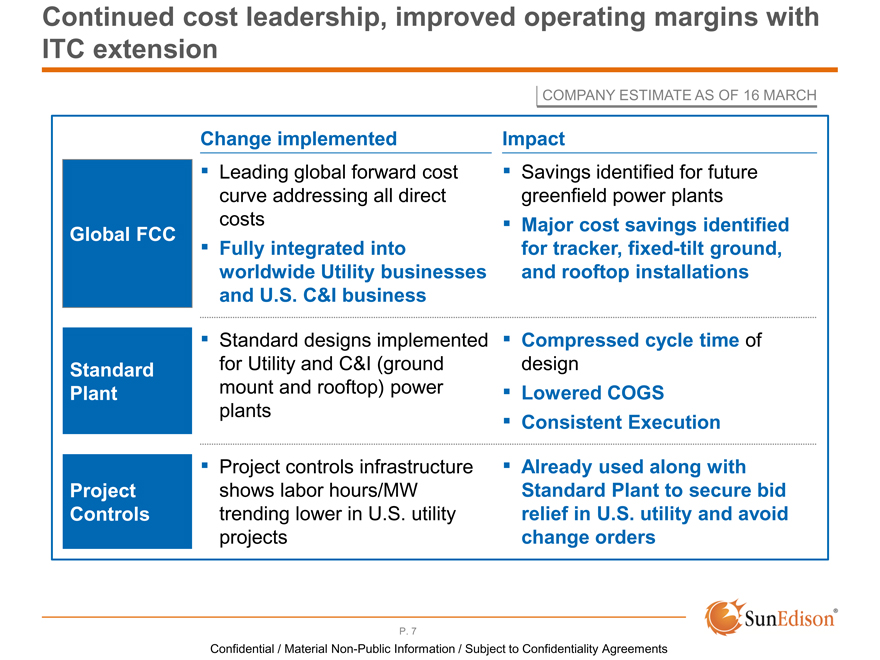
Continued cost leadership, improved operating margins with ITC extension
COMPANY ESTIMATE AS OF 16 MARCH
Change implemented Impact
Global FCC
Standard Plant
Project Controls
Leading global forward cost curve addressing all direct costs
Fully integrated into worldwide Utility businesses and U.S. C&I business
Standard designs implemented for Utility and C&I (ground mount and rooftop) power plants
Project controls infrastructure shows labor hours/MW trending lower in U.S. utility projects
Savings identified for future greenfield power plants
Major cost savings identified for tracker, fixed-tilt ground, and rooftop installations
Compressed cycle time of design
Lowered COGS Consistent Execution
Already used along with Standard Plant to secure bid relief in U.S. utility and avoid change orders
P. 7
Confidential / Material Non-Public Information / Subject to Confidentiality Agreements
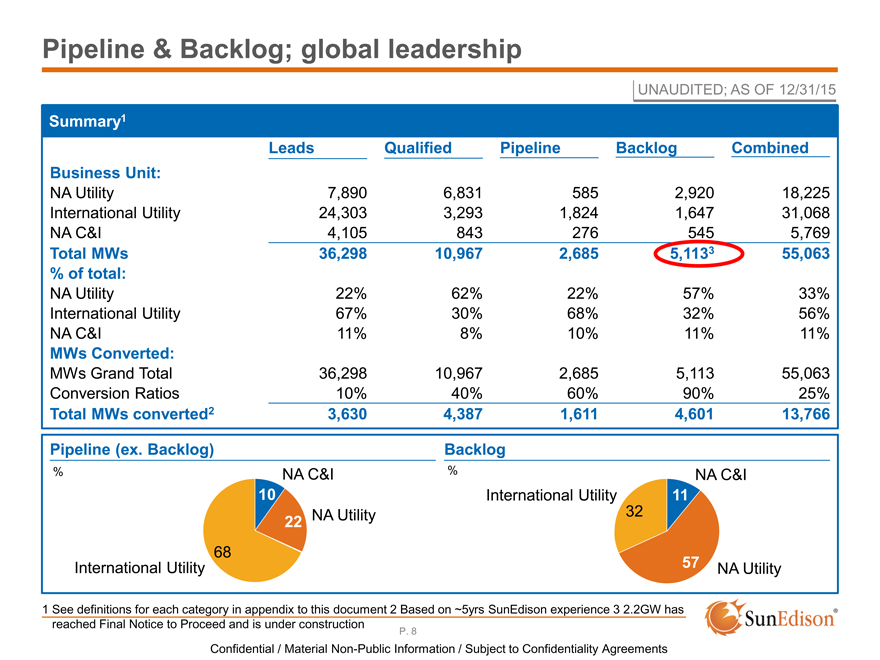
Pipeline & Backlog; global leadership
UNAUDITED; AS OF 12/31/15
Summary1
Leads Qualified Pipeline Backlog Combined Business Unit:
NA Utility 7,890 6,831 585 2,920 18,225 International Utility 24,303 3,293 1,824 1,647 31,068 NA C&I 4,105 843 276 545 5,769
Total MWs 36,298 10,967 2,685 5,1133 55,063 % of total:
NA Utility 22% 62% 22% 57% 33% International Utility 67% 30% 68% 32% 56% NA C&I 11% 8% 10% 11% 11%
MWs Converted:
MWs Grand Total 36,298 10,967 2,685 5,113 55,063 Conversion Ratios 10% 40% 60% 90% 25%
Total MWs converted2 3,630 4,387 1,611 4,601 13,766
Pipeline (ex. Backlog) Backlog
% NA C&I % NA C&I
10 International Utility 11 NA Utility 32
22
68
International Utility 57 NA Utility
1 See definitions for each category in appendix to this document 2 Based on ~5yrs SunEdison experience 3 2.2GW has reached Final Notice to Proceed and is under construction
P. 8
Confidential / Material Non-Public Information / Subject to Confidentiality Agreements
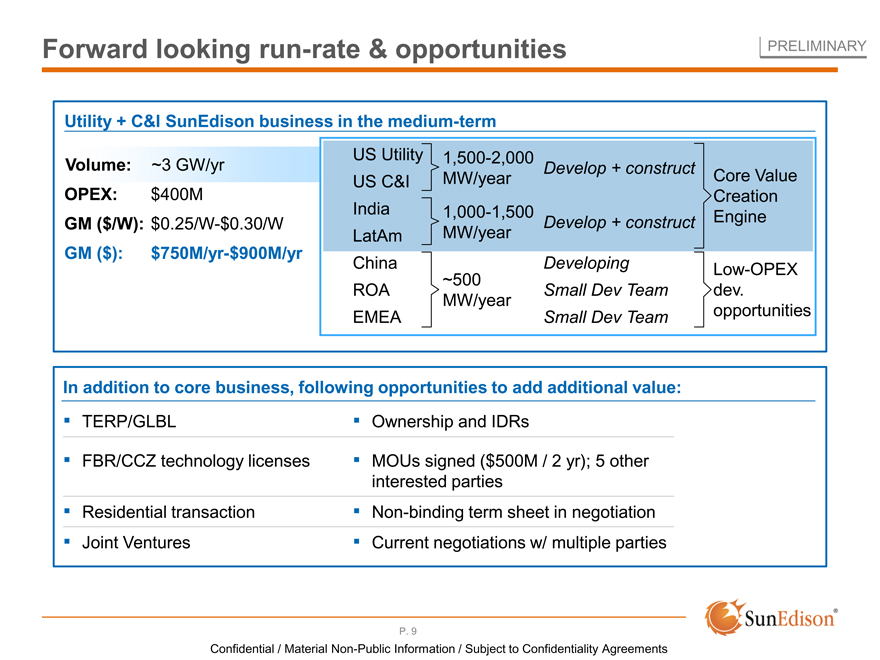
Forward looking run-rate & opportunities PRELIMINARY
Utility + C&I SunEdison business in the medium-term
US Utility 1,500-2,000
Volume: ~3 GW/yr Develop + construct
US C&I MW/year Core Value OPEX: $400M India Creation 1,000-1,500 Engine
GM ($/W): $0.25/W-$0.30/W Develop + construct
LatAm MW/year
GM ($): $750M/yr-$900M/yr
China Developing Low-OPEX ~500 ROA Small Dev Team dev.
MW/year
EMEA Small Dev Team opportunities
In addition to core business, following opportunities to add additional value:
TERP/GLBL
FBR/CCZ technology licenses
Residential transaction Joint Ventures
Ownership and IDRs
MOUs signed ($500M / 2 yr); 5 other interested parties Non-binding term sheet in negotiation Current negotiations w/ multiple parties
P. 9
Confidential / Material Non-Public Information / Subject to Confidentiality Agreements
Contents
Status update & business overview
Discussion of recent headwinds
Path forward & next steps
P. 10
Confidential / Material Non-Public Information / Subject to Confidentiality Agreements
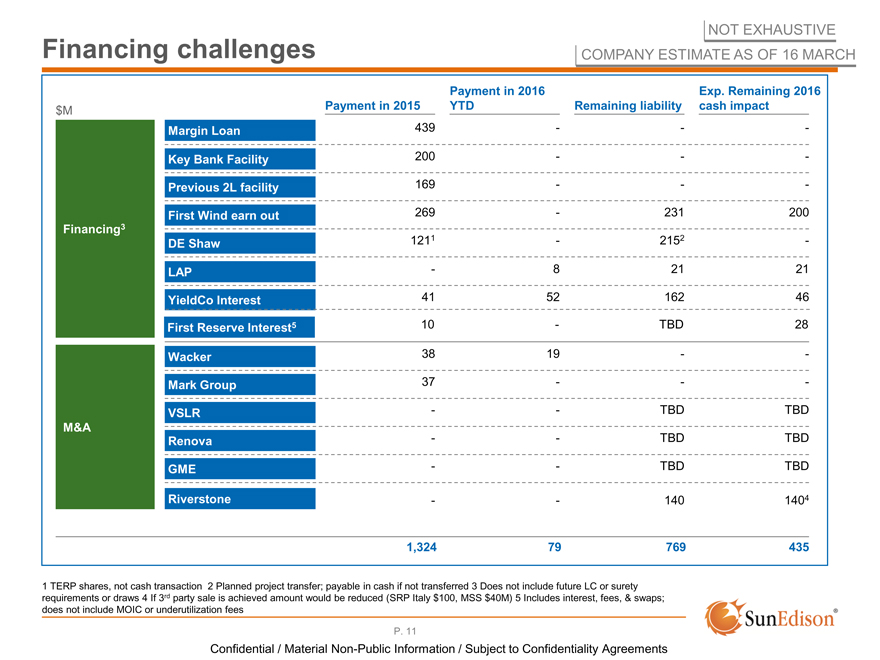
Financing challenges NOT EXHAUSTIVE
COMPANY ESTIMATE AS OF 16 MARCH
Payment in 2016 Exp. Remaining 2016 $M Payment in 2015 YTD Remaining liability cash impact Margin Loan 439 — -Key Bank Facility 200 — -Previous 2L facility 169 — -First Wind earn out 269—231 200 Financing3
DE Shaw 1211—2152 -LAP—8 21 21
YieldCo Interest 41 52 162 46
First Reserve Interest5 10—TBD 28 Wacker 38 19 —
Mark Group 37 — -
VSLR — TBD TBD M&A — TBD TBD
Renova
GME — TBD TBD
Riverstone — 140 1404
1,324 79 769 435
1 TERP shares, not cash transaction 2 Planned project transfer; payable in cash if not transferred 3 Does not include future LC or surety requirements or draws 4 If 3rd party sale is achieved amount would be reduced (SRP Italy $100, MSS $40M) 5 Includes interest, fees, & swaps; does not include MOIC or underutilization fees
P. 11
Confidential / Material Non-Public Information / Subject to Confidentiality Agreements
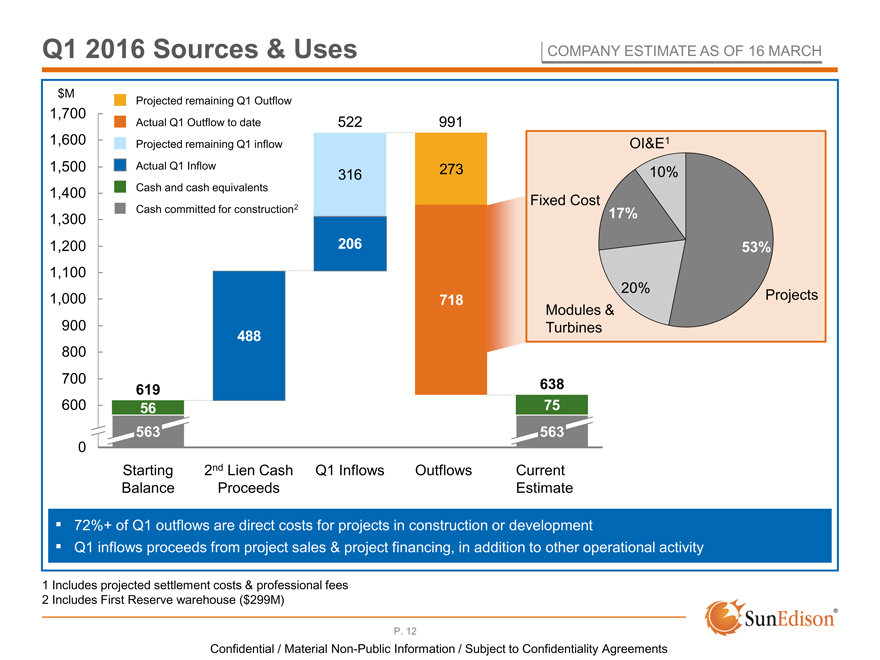
Q1 2016 Sources & Uses COMPANY ESTIMATE AS OF 16 MARCH
$M
Projected remaining Q1 Outflow
1,700
Actual Q1 Outflow to date 522 991
1,600 Projected remaining Q1 inflow OI&E1 1,500 Actual Q1 Inflow 273 10%
316
1,400 Cash and cash equivalents
Fixed Cost
Cash committed for construction2 17%
1,300
1,200 206 53% 1,100 20%
1,000 718 Projects Modules & 900 Turbines
488
800
700 638 619 600 56 75 563 563
0
Starting 2nd Lien Cash Q1 Inflows Outflows Current Balance Proceeds Estimate
? 72%+ of Q1 outflows are direct costs for projects in construction or development
? Q1 inflows proceeds from project sales & project financing, in addition to other operational activity
1 Includes projected settlement costs & professional fees
2 Includes First Reserve warehouse ($299M)
P. 12
Confidential / Material Non-Public Information / Subject to Confidentiality Agreements
COMPANY ESTIMATE AS OF 16 MARCH
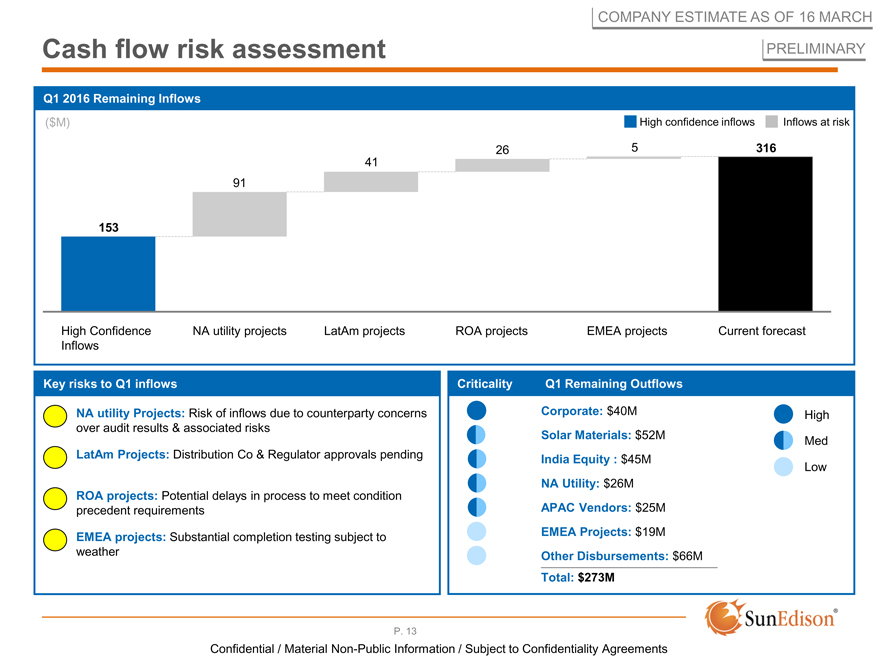
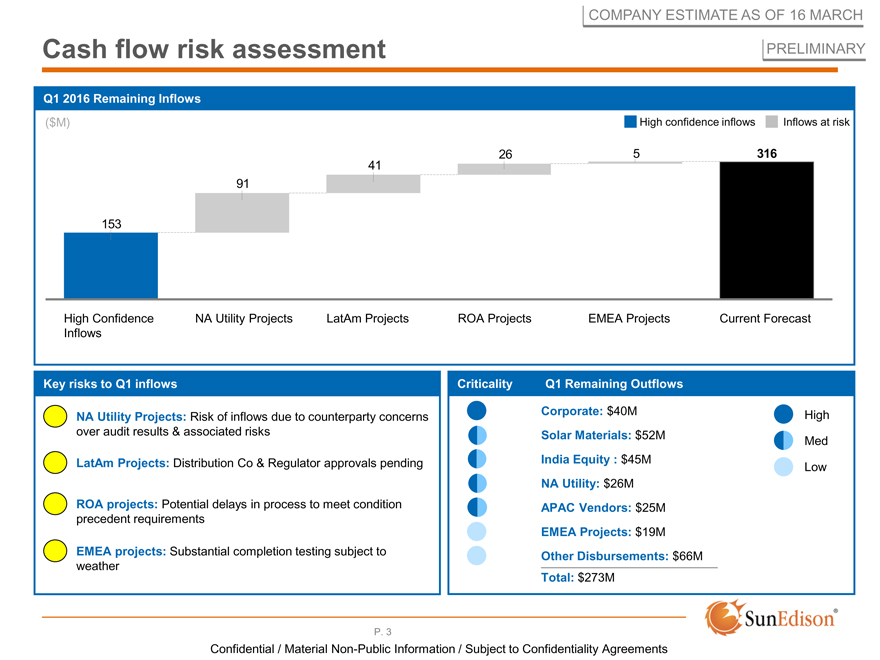
Cash flow risk assessment PRELIMINARY
Q1 2016 Remaining Inflows
($M) High confidence inflows Inflows at risk
26 5 316 41 91
153
High Confidence NA utility projects LatAm projects ROA projects EMEA projects Current forecast Inflows
Key risks to Q1 inflows Criticality Q1 Remaining Outflows
NA utility Projects: Risk of inflows due to counterparty concerns over audit results & associated risks
LatAm Projects: Distribution Co & Regulator approvals pending
ROA projects: Potential delays in process to meet condition precedent requirements
EMEA projects: Substantial completion testing subject to weather
Corporate: $40M
Solar Materials: $52M
India Equity : $45M NA Utility: $26M APAC Vendors: $25M EMEA Projects: $19M
Other Disbursements: $66M Total: $273M
High Med Low
P. 13
Confidential / Material Non-Public Information / Subject to Confidentiality Agreements
Contents
Status update & business overview
Discussion of recent headwinds
Path forward & next steps
P. 14
Confidential / Material Non-Public Information / Subject to Confidentiality Agreements
COMPANY ESTIMATE AS OF 16 MARCH
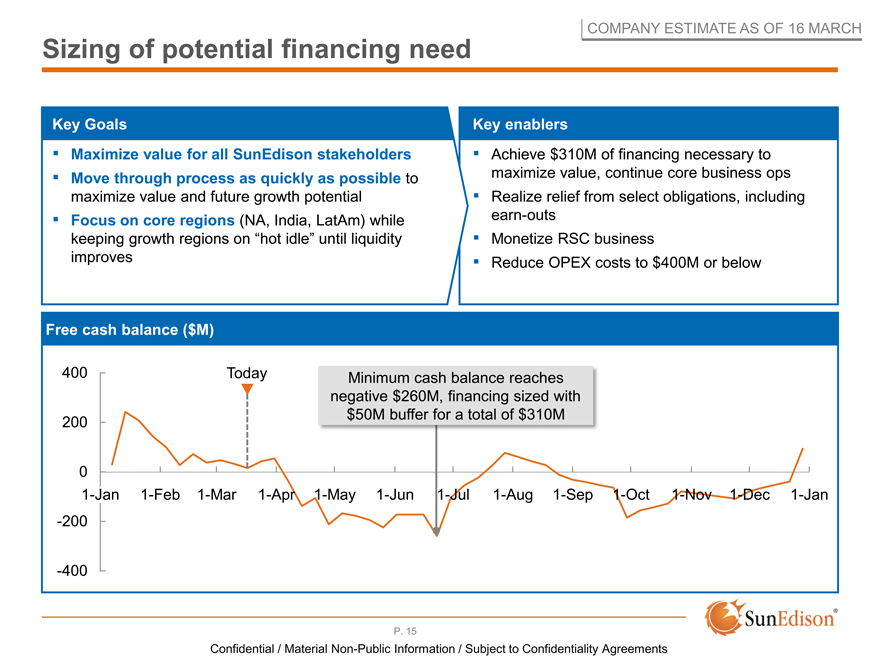
Sizing of potential financing need
Key Goals Key enablers
Maximize value for all SunEdison stakeholders
Move through process as quickly as possible to maximize value and future growth potential Focus on core regions (NA, India, LatAm) while keeping growth regions on “hot idle” until liquidity improves
Achieve $310M of financing necessary to maximize value, continue core business ops Realize relief from select obligations, including earn-outs Monetize RSC business Reduce OPEX costs to $400M or below
Free cash balance ($M)
400 Today Minimum cash balance reaches negative $260M, financing sized with $50M buffer for a total of $310M
200
0
1-Jan 1-Feb 1-Mar 1-Apr 1-May 1-Jun 1-Jul 1-Aug 1-Sep 1-Oct 1-Nov 1-Dec 1-Jan
-200
-400
P. 15
Confidential / Material Non-Public Information / Subject to Confidentiality Agreements
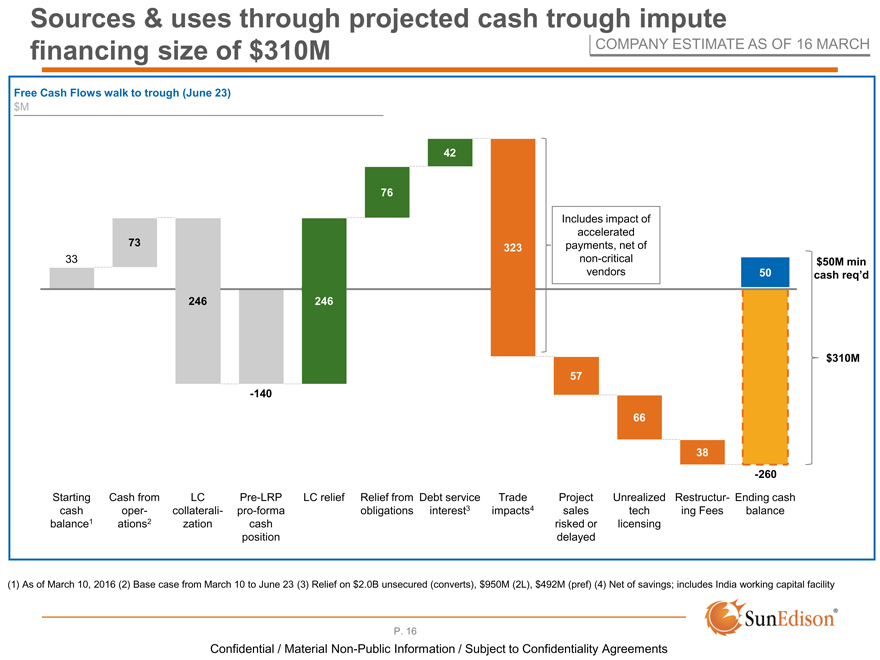
Sources & uses through projected cash trough impute
financing size of $310M COMPANY ESTIMATE AS OF 16 MARCH
Free Cash Flows walk to trough (June 23) $M
42
76
Includes impact of accelerated 73 payments, net of
323
33 non-critical $50M min vendors 50 cash req’d
246 246
$310M 57 -140
66
38
-260
Starting Cash from LC Pre-LRP LC relief Relief from Debt service Trade Project Unrealized Restructur- Ending cash cash oper- collaterali- pro-forma obligations interest3 impacts4 sales tech ing Fees balance balance1 ations2 zation cash risked or licensing position delayed
(1) As of March 10, 2016 (2) Base case from March 10 to June 23 (3) Relief on $2.0B unsecured (converts), $950M (2L), $492M (pref) (4) Net of savings; includes India working capital facility
P. 16
Confidential / Material Non-Public Information / Subject to Confidentiality Agreements
COMPANY ESTIMATE AS OF 16 MARCH
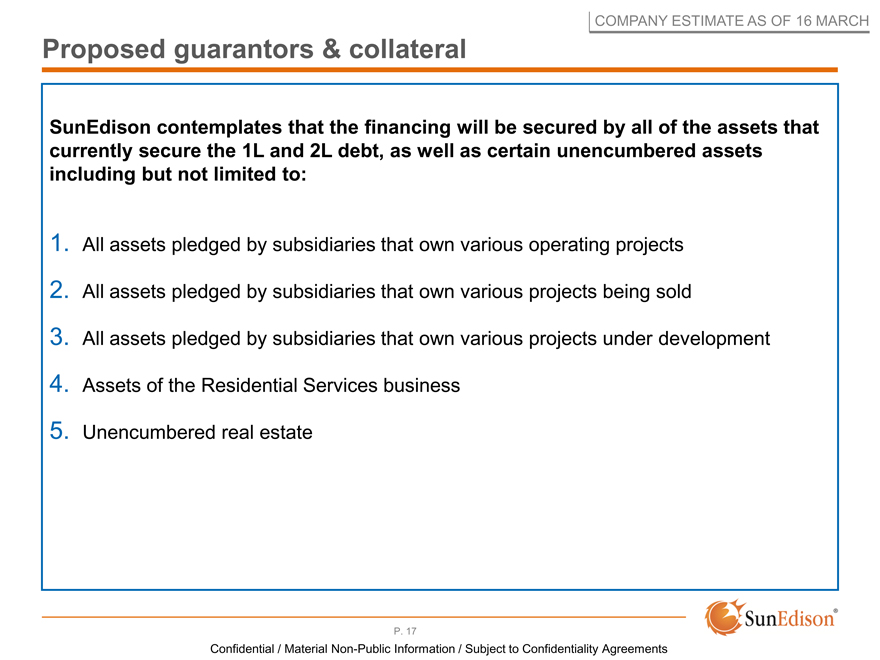
Proposed guarantors & collateral
SunEdison contemplates that the financing will be secured by all of the assets that currently secure the 1L and 2L debt, as well as certain unencumbered assets including but not limited to:
All assets pledged by subsidiaries that own various operating projects
All assets pledged by subsidiaries that own various projects being sold
All assets pledged by subsidiaries that own various projects under development Assets of the Residential Services business Unencumbered real estate
P. 17
Confidential / Material Non-Public Information / Subject to Confidentiality Agreements
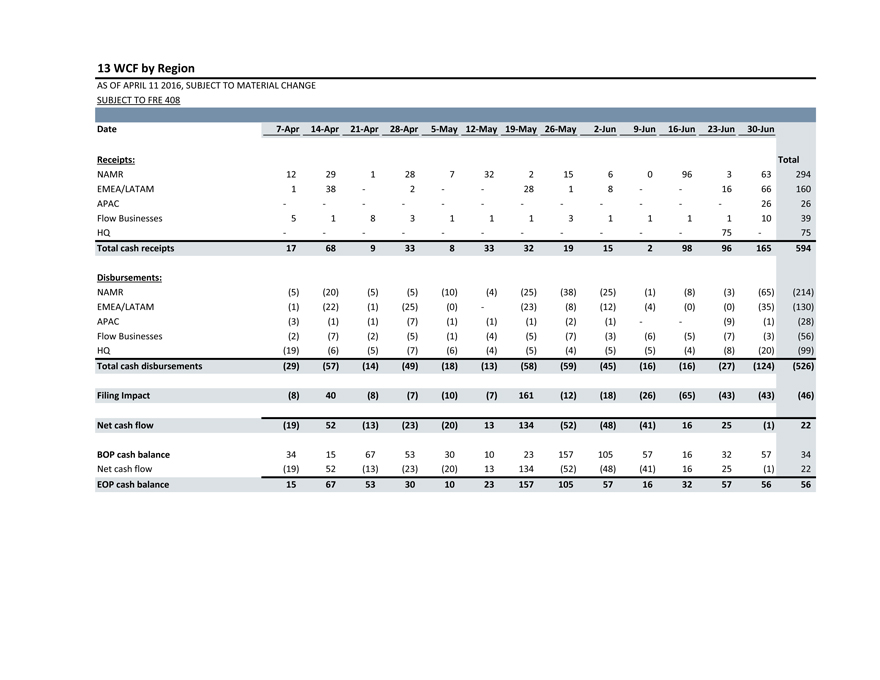
13 WCF by Region
AS OF APRIL 11 2016, SUBJECT TO MATERIAL CHANGE
SUBJECT TO FRE 408
Date 7-Apr 14-Apr 21-Apr28-Apr5-May12-May19-May26-May2-Jun9-Jun16-Jun23-Jun30-Jun
Receipts: Total
NAMR 12 291287322156096363294
EMEA/LATAM 1 38-2--2818--1666160
APAC - -----------2626
Flow Businesses 5 183111311111039
HQ - ----------75-75
Total cash receipts 17 6893383332191529896165594
Disbursements:
NAMR (5) (20)(5)(5)(10)(4)(25)(38)(25)(1)(8)(3)(65)(214)
EMEA/LATAM (1) (22)(1)(25)(0)-(23)(8)(12)(4)(0)(0)(35)(130)
APAC (3) (1)(1)(7)(1)(1)(1)(2)(1)--(9)(1)(28)
Flow Businesses (2) (7)(2)(5)(1)(4)(5)(7)(3)(6)(5)(7)(3)(56)
HQ (19) (6)(5)(7)(6)(4)(5)(4)(5)(5)(4)(8)(20)(99)
Total cash disbursements (29) (57)(14)(49)(18)(13)(58)(59)(45)(16)(16)(27)(124)(526)
Filing Impact (8) 40(8)(7)(10)(7)161(12)(18)(26)(65)(43)(43)(46)
Net cash flow (19) 52(13)(23)(20)13134(52)(48)(41)1625(1)22
BOP cash balance 34 1567533010231571055716325734
Net cash flow (19) 52(13)(23)(20)13134(52)(48)(41)1625(1)22
EOP cash balance 15 6753301023157105571632575656
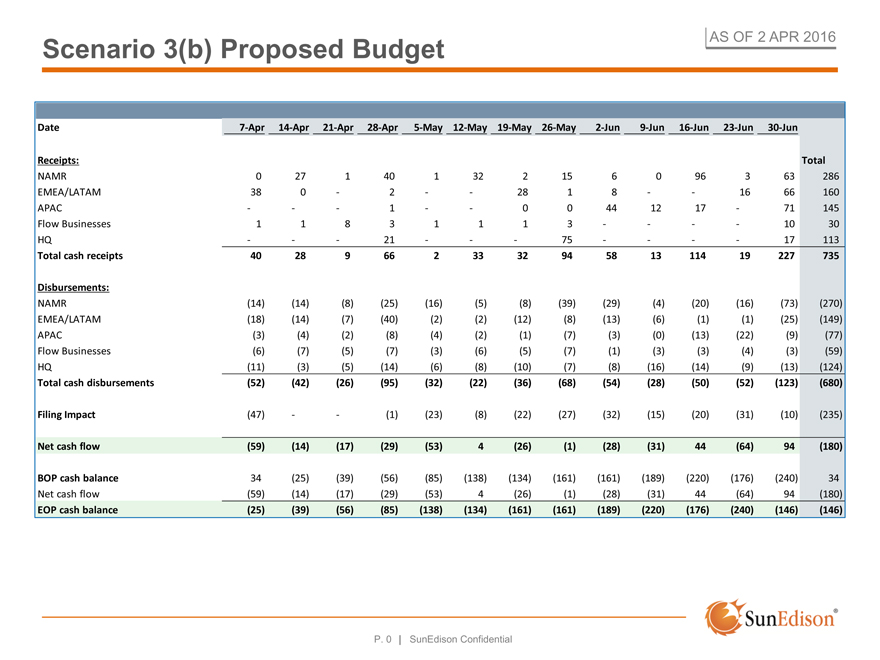
Scenario 3(b) Proposed Budget
AS OF 2 APR 2016
Date 7-Apr 14-Apr21-Apr28-Apr5-May 12-May 19-May 26-May2-Jun9-Jun 16-Jun 23-Jun 30-Jun
Receipts: Total
NAMR 0 271401322156096363286
EMEA/LATAM 38 0-2--2818--1666160
APAC - --1--00441217-71145
Flow Businesses 1 1831113----1030
HQ - --21---75----17113
Total cash receipts 40 289662333294581311419227735
Disbursements:
NAMR (14) (14)(8)(25)(16)(5)(8)(39)(29)(4)(20)(16)(73)(270)
EMEA/LATAM (18) (14)(7)(40)(2)(2)(12)(8)(13)(6)(1)(1)(25)(149)
APAC (3) (4)(2)(8)(4)(2)(1)(7)(3)(0)(13)(22)(9)(77)
Flow Businesses (6) (7)(5)(7)(3)(6)(5)(7)(1)(3)(3)(4)(3)(59)
HQ (11) (3)(5)(14)(6)(8)(10)(7)(8)(16)(14)(9)(13)(124)
Total cash disbursements (52) (42)(26)(95)(32)(22)(36)(68)(54)(28)(50)(52)(123)(680)
Filing Impact (47) --(1)(23)(8)(22)(27)(32)(15)(20)(31)(10)(235)
Net cash flow (59) (14)(17)(29)(53)4(26)(1)(28)(31)44(64)94(180)
BOP cash balance 34 (25)(39)(56)(85)(138)(134)(161)(161)(189)(220)(176)(240)34
Net cash flow (59) (14)(17)(29)(53)4(26)(1)(28)(31)44(64)94(180)
EOP cash balance (25) (39)(56)(85)(138)(134)(161)(161)(189)(220)(176)(240)(146)(146)
P. 0 | SunEdison Confidential
Business Plan Scenarios
Discussion document March 30, 2016
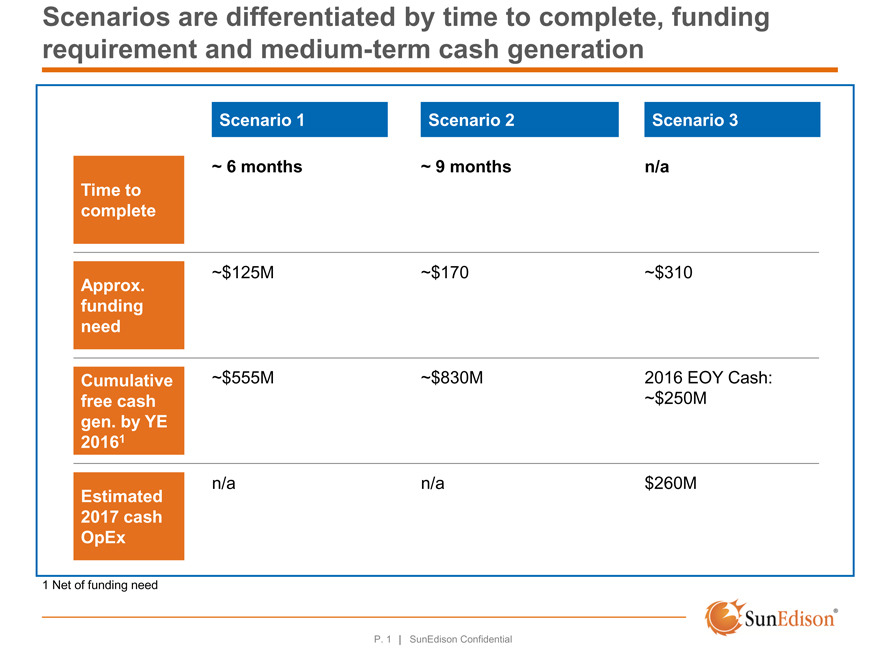
Scenarios are differentiated by time to complete, funding requirement and medium-term cash generation
Scenario 1 Scenario 2Scenario 3
~ 6 months ~ 9 monthsn/a
Time to
complete
~$125M ~$170~$310
Approx.
funding
need
Cumulative ~$555M ~$830M2016 EOY Cash:
free cash ~$250M
gen. by YE
20161
n/a n/a$260M
Estimated
2017 cash
OpEx
1 Net of funding need
P. 1 | SunEdison Confidential
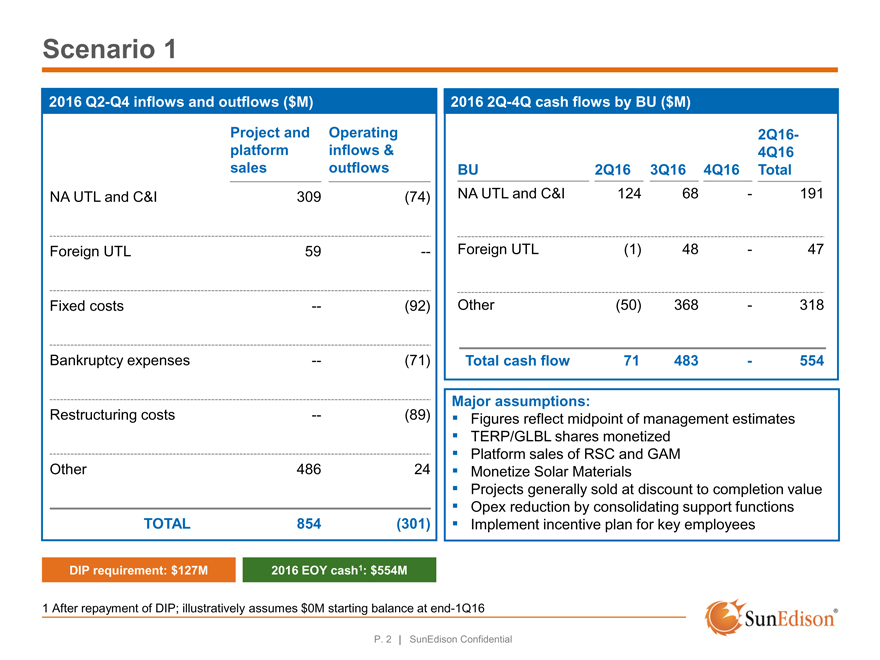
Scenario 1
2016 Q2-Q4 inflows and outflows ($M)
Project and Operating
platform inflows &
sales outflows
NA UTL and C&I 309 (74)
Foreign UTL 59 —
Fixed costs — (92)
Bankruptcy expenses — (71)
Restructuring costs — (89)
Other 486 24
TOTAL 854 (301)
2016 2Q-4Q cash flows by BU ($M)
2Q16-
4Q16
BU 2Q16 3Q164Q16Total
NA UTL and C&I 124 68-191
Finance Stack
Foreign UTL (1) 48-47
Other (50) 368-318
Total cash flow 71 483-554
Major assumptions:
Figures reflect midpoint of management estimates
TERP/GLBL shares monetized
Platform sales of RSC and GAM
Monetize Solar Materials
Projects generally sold at discount to completion value
Opex reduction by consolidating support functions
Implement incentive plan for key employees
DIP requirement: $127M 2016 EOY cash1: $554M
1 After repayment of DIP; illustratively assumes $0M starting balance at end-1Q16
P. 2 | SunEdison Confidential
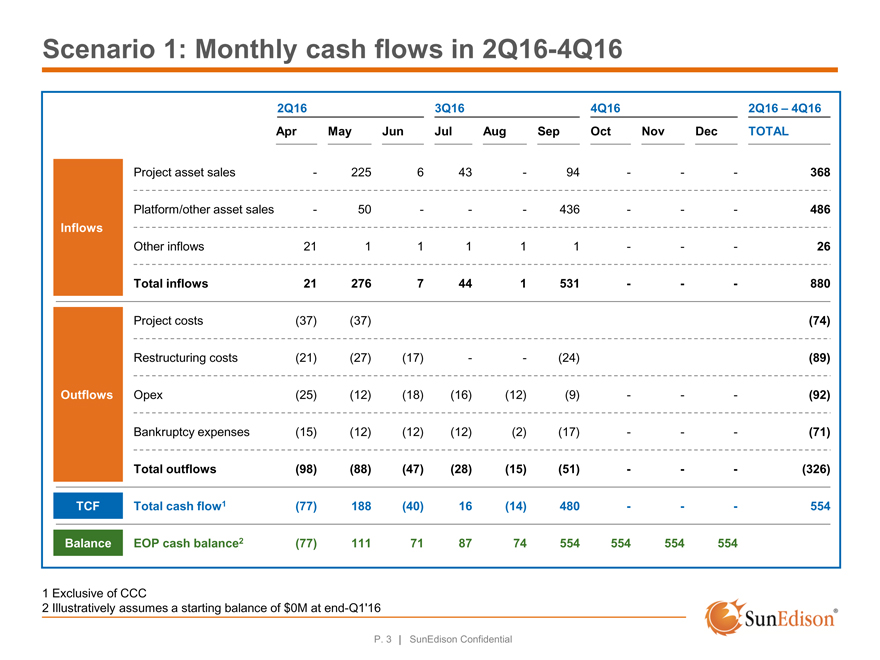
Scenario 1: Monthly cash flows in 2Q16-4Q16
2Q163Q164Q162Q16 – 4Q16
AprMayJunJulAugSepOctNovDecTOTAL
Project asset sales -225643-94---368
Platform/other asset sales -50---436---486
Inflows
Other inflows 2111111---26
Total inflows 212767441531---880
Project costs (37)(37)(74)
Restructuring costs (21)(27)(17)--(24)(89)
Outflows Opex (25)(12)(18)(16)(12)(9)---(92)
Bankruptcy expenses (15)(12)(12)(12)(2)(17)---(71)
Total outflows (98)(88)(47)(28)(15)(51)---(326)
TCF Total cash flow1 (77)188(40)16(14)480---554
Balance EOP cash balance2 (77)111718774554554554554
1 Exclusive of CCC
2 Illustratively assumes a starting balance of $0M at end-Q1’16
P. 3 | SunEdison Confidential
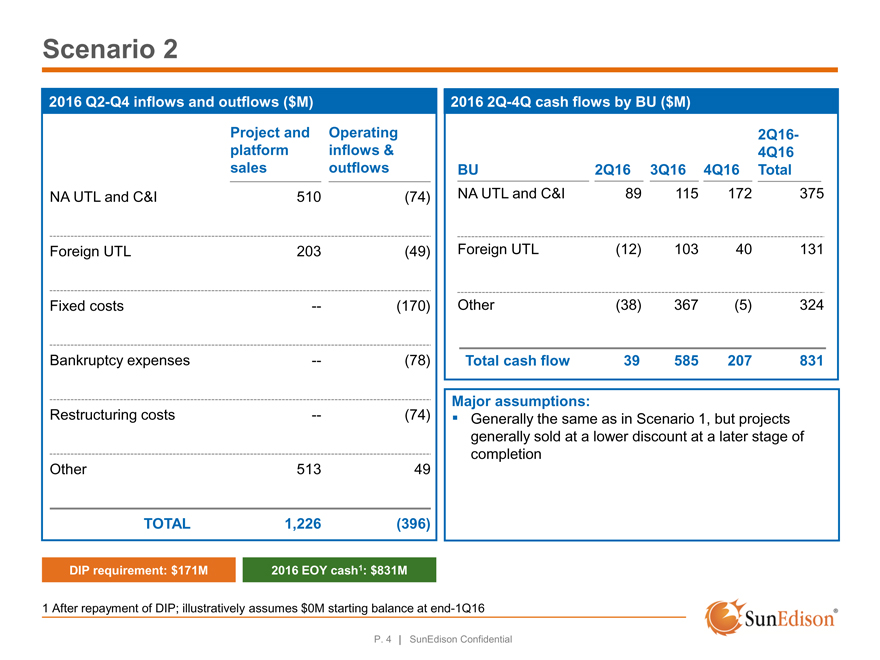
Scenario 2
2016 Q2-Q4 inflows and outflows ($M)
Project and Operating
platform inflows &
sales outflows
NA UTL and C&I 510 (74)
Foreign UTL 203 (49)
Fixed costs — (170)
Bankruptcy expenses — (78)
Restructuring costs — (74)
Other 513 49
TOTAL 1,226 (396)
2016 2Q-4Q cash flows by BU ($M)
2Q16-
4Q16
BU 2Q16 3Q164Q16Total
NA UTL and C&I 89 115172375
Finance Stack
Foreign UTL (12) 10340131
Other (38) 367(5)324
Total cash flow 39 585207831
Major assumptions:
? Generally the same as in Scenario 1, but projects generally sold at a lower discount at a later stage of completion
DIP requirement: $171M 2016 EOY cash1: $831M
1 After repayment of DIP; illustratively assumes $0M starting balance at end-1Q16
P. 4 | SunEdison Confidential
Scenario 2: Monthly cash flows in 2Q16-4Q16
ILLUSTRATIVE
2Q163Q164Q162Q16 – 4Q16
AprMayJunJulAugSepOctNovDecTOTAL
Project asset sales --220216116171515501
Platform/other asset sales -5020--425--250745
Inflows
Other inflows 211111111129
Total inflows 215124122625878162661,275
Project costs (41)(41)(41)------(122)
Restructuring costs (19)(7)(9)-----(40)(74)
Outflows Opex (28)(30)(20)(22)(17)(15)(13)(11)(12)(170)
LRP (15)(12)(12)(12)(2)(17)(2)(2)(2)(78)
Total outflows (102)(90)(82)(35)(19)(33)(16)(14)(54)(444)
TCF Total cash flow1 (81)(39)159(13)43555(7)3212831
Balance EOP cash balance2 (81)(121)392669624616619831
1 Exclusive of CCC
2 Illustratively assumes a starting balance of $0M at end-Q1’16
P. 5 | SunEdison Confidential
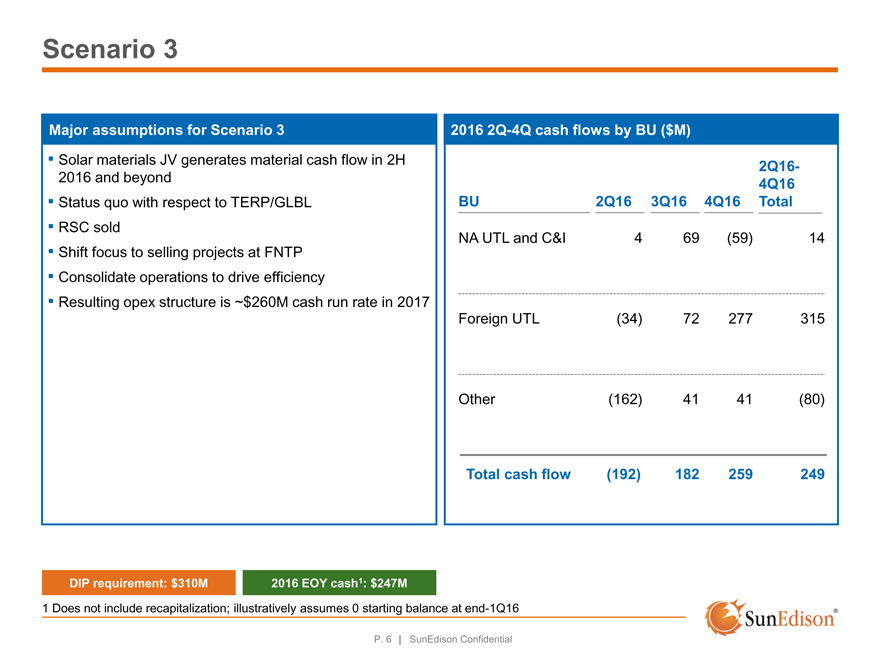
Scenario 3
Major assumptions for Scenario 3
Solar materials JV generates material cash flow in 2H 2016 and beyond
Status quo with respect to TERP/GLBL
RSC sold
Shift focus to selling projects at FNTP
Consolidate operations to drive efficiency
Resulting opex structure is ~$260M cash run rate in 2017
2016 2Q-4Q cash flows by BU ($M)
2Q16-
4Q16
BU 2Q16 3Q164Q16Total
NA UTL and C&I 4 69(59)14
FinanceForeign StackUTL (34) 72277315
Other (162) 4141(80)
Total cash flow (192) 182259249
DIP requirement: $310M 2016 EOY cash1: $247M
1 Does not include recapitalization; illustratively assumes 0 starting balance at end-1Q16
P. 6 | SunEdison Confidential
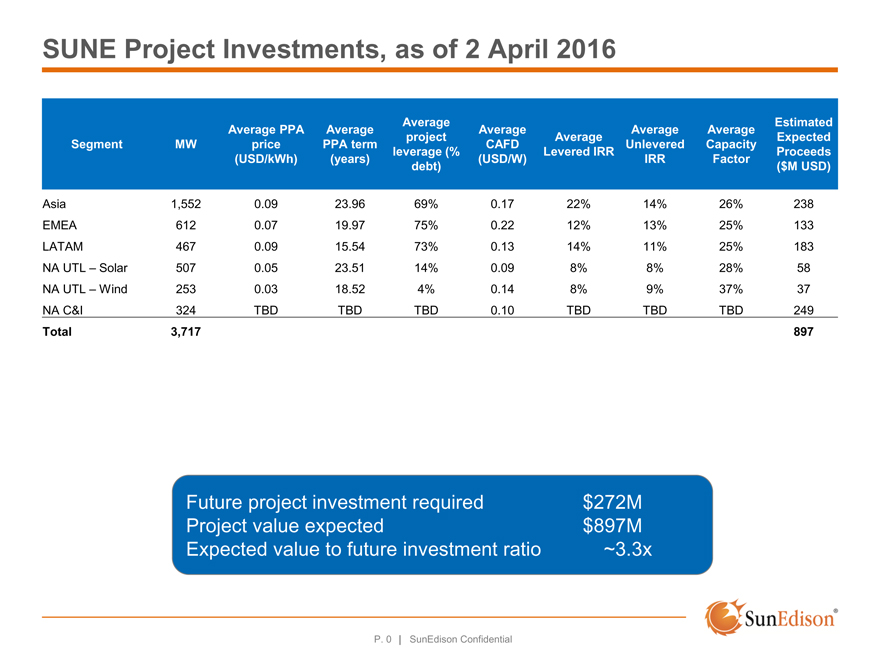
SUNE Project Investments, as of 2 April 2016
AverageEstimated
Average PPAAverageAverageAverageAverage
projectAverageExpected
Segment MW pricePPA termCAFDUnleveredCapacity
leverage (%Levered IRRProceeds
(USD/kWh)(years)(USD/W)IRRFactor
debt)($M USD)
Asia 1,552 0.0923.9669%0.1722%14%26%238
EMEA 612 0.0719.9775%0.2212%13%25%133
LATAM 467 0.0915.5473%0.1314%11%25%183
NA UTL – Solar 507 0.0523.5114%0.098%8%28%58
NA UTL – Wind 253 0.0318.524%0.148%9%37%37
NA C&I 324 TBDTBDTBD0.10TBDTBDTBD249
Total 3,717 897
Future project investment required $272M Project value expected $897M Expected value to future investment ratio ~3.3x
P. 0 | SunEdison Confidential
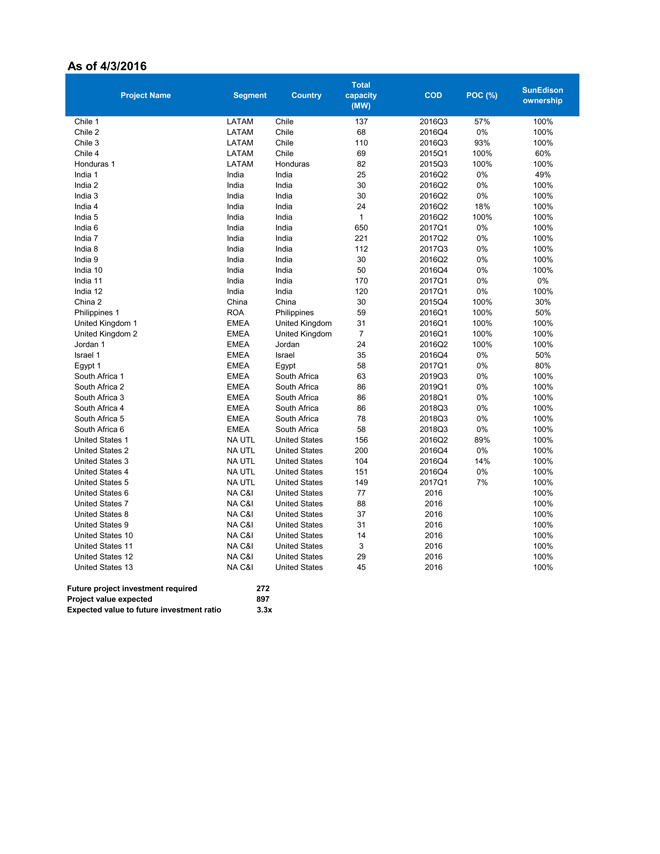
As of 4/3/2016
Total
Project Name Segment CountrycapacityCODPOC (%)SunEdison
(MW)ownership
Chile 1 LATAM Chile1372016Q357%100%
Chile 2 LATAM Chile682016Q40%100%
Chile 3 LATAM Chile1102016Q393%100%
Chile 4 LATAM Chile692015Q1100%60%
Honduras 1 LATAM Honduras822015Q3100%100%
India 1 India India252016Q20%49%
India 2 India India302016Q20%100%
India 3 India India302016Q20%100%
India 4 India India242016Q218%100%
India 5 India India12016Q2100%100%
India 6 India India6502017Q10%100%
India 7 India India2212017Q20%100%
India 8 India India1122017Q30%100%
India 9 India India302016Q20%100%
India 10 India India502016Q40%100%
India 11 India India1702017Q10%0%
India 12 India India1202017Q10%100%
China 2 China China302015Q4100%30%
Philippines 1 ROA Philippines592016Q1100%50%
United Kingdom 1 EMEA United Kingdom312016Q1100%100%
United Kingdom 2 EMEA United Kingdom72016Q1100%100%
Jordan 1 EMEA Jordan242016Q2100%100%
Israel 1 EMEA Israel352016Q40%50%
Egypt 1 EMEA Egypt582017Q10%80%
South Africa 1 EMEA South Africa632019Q30%100%
South Africa 2 EMEA South Africa862019Q10%100%
South Africa 3 EMEA South Africa862018Q10%100%
South Africa 4 EMEA South Africa862018Q30%100%
South Africa 5 EMEA South Africa782018Q30%100%
South Africa 6 EMEA South Africa582018Q30%100%
United States 1 NA UTL United States1562016Q289%100%
United States 2 NA UTL United States2002016Q40%100%
United States 3 NA UTL United States1042016Q414%100%
United States 4 NA UTL United States1512016Q40%100%
United States 5 NA UTL United States1492017Q17%100%
United States 6 NA C&I United States772016100%
United States 7 NA C&I United States882016100%
United States 8 NA C&I United States372016100%
United States 9 NA C&I United States312016100%
United States 10 NA C&I United States142016100%
United States 11 NA C&I United States32016100%
United States 12 NA C&I United States292016100%
United States 13 NA C&I United States452016100%
Future project investment required 272
Project value expected 897
Expected value to future investment ratio 3.3x
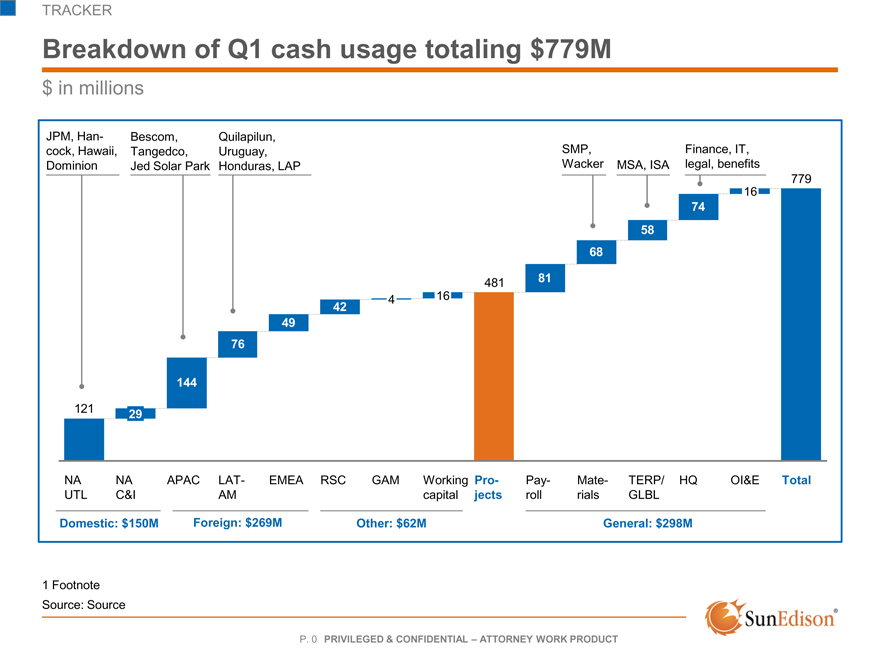
TRACKER
Breakdown of Q1 cash usage totaling $779M
$ in millions
JPM, Han- Bescom, Quilapilun,
cock, Hawaii, Tangedco, Uruguay, SMP,Finance, IT,
Dominion Jed Solar Park Honduras, LAPWackerMSA, ISAlegal, benefits
779
16
74
58
68
48181
416
42
49
76
144
1 2 1 29
NA NA APACLAT-EMEARSCGAMWorkingPro-Pay-Mate-TERP/HQOI&ETotal
UTL C&I AMcapitaljectsrollrialsGLBL
Domestic: $150M Foreign: $269M Other: $62MGeneral: $298M
1 Footnote Source: Source
P. 0 PRIVILEGED & CONFIDENTIAL – ATTORNEY WORK PRODUCT
Presentation to Principals’ Steering
Committee for the 2nd Lien Lenders–Cash Update
DRAFT & SUBJECT TO CHANGE
CONFIDENTIAL // Subject to FRE 408
15 March 2016
DISCLAIMER
With the exception of historical information, the matters disclosed in this presentation are forward-looking statements. Such statements involve certain risks and uncertainties that could cause actual results to differ materially from those in the forward-looking statements. Potential risks and uncertainties are described in SunEdison’s filings with the Securities and Exchange Commission
(SEC), including Forms 10-K and Forms 10-Q, as well as other filings with the SEC, in addition to the risks and uncertainties described on page 2 of this presentation. These forward-looking statements represent SunEdison’s judgment as of the date of this presentation. SunEdison disclaims any intent or obligation to update these forward-looking statements, except as required by law. This communication shall not constitute an offer to sell or the solicitation of an offer to buy securities nor shall there be any sale of securities in any state in which such solicitation or sale would be unlawful prior to registration or qualification of securities under the laws of any such state. This presentation contains financial information and data regarding SunEdison. No audit or review, including by SunEdison, has been undertaken by an independent third party of this financial information and data contained, presented or referred to in this presentation. In addition, this presentation contains certain projections relating to the possible future performance of SunEdison and its assets. Such projections reflect various assumptions which may or may not prove to be correct. No representations or warranties, express or implied, are made as to the accuracy or reasonableness of such assumptions and projections that have been based thereon. Non-GAAP Financial Measures Certain financial measures included in this presentation are supplemental measures of the Company’s performance and are not U.S. generally accepted accounting principles (“GAAP”) measures. Please refer to the Appendix hereto for a definition of the non GAAP measures used in this presentation.
P. 1
Confidential / Material Non-Public Information / Subject to Confidentiality Agreements
Forward-Looking Statements
This presentation contains forward-looking statements within the meaning of Section 27A of the Securities Act of 1933 and Section 21E of the Securities Exchange Act of 1934. Forward-looking statements can be identified by the fact that they do not relate strictly to historical or current facts. These statements involve estimates, expectations, projections, goals, assumptions, known and unknown risks, and uncertainties and typically include words or variations of words such as “expect,” “anticipate,” “believe,” “intend,” “plan,” “seek,” “estimate,” “predict,” “project,” “goal,” “guidance,” “outlook,” “objective,” “forecast,” “target,” “potential,” “continue,” “would,” “will,” “should,” “could,” or “may” or other comparable terms and phrases. All statements that address operating performance, events, or developments that SunEdison expects or anticipates will occur in the future are forward-looking statements. They may include estimates of expected cash available for distribution (CAFD), earnings, revenues, capital expenditures, liquidity, capital structure, future growth, and other financial performance items (including future dividends per share), descriptions of management’s plans or objectives for future operations, products, or services, or descriptions of assumptions underlying any of the above. Forward-looking statements provide SunEdison’s current expectations or predictions of future conditions, events, or results and speak only as of the date they are made. Although SunEdison believes its expectations and assumptions are reasonable, it can give no assurance that these expectations and assumptions will prove to have been correct and actual results may vary materially.
By their nature, forward-looking statements are subject to risks and uncertainties that could cause actual results to differ materially from those suggested by the forward-looking statements. Factors that might cause such differences include, but are not limited to, delays or unexpected costs during the completion of projects under construction; regulatory requirements and incentives for production of renewable power; operating and financial restrictions under agreements governing indebtedness; the condition of capital markets and our ability to borrow additional funds and access capital markets; the impact of foreign exchange rate fluctuations; the ability to compete against traditional and renewable energy companies; challenges inherent in constructing and maintaining renewable energy projects; the success of ongoing research and development efforts; the ability to successfully integrate the businesses of acquired companies and realize the benefits of such acquisitions; and hazards customary to the power production industry and power generation operations, such as unusual weather conditions and outages. Furthermore, any dividends are subject to available capital, market conditions, and compliance with associated laws and regulations. Many of these factors are beyond SunEdison’s control.
SunEdison disclaims any obligation to update or revise any forward-looking statement to reflect changes in underlying assumptions, factors, or expectations, new information, data, or methods, future events, or other changes, except as required by law. The foregoing list of factors that might cause results to differ materially from those contemplated in the forward-looking statements should be considered in connection with information regarding risks and uncertainties which are described in SunEdison’s Form 10-K for the fiscal year ended December 31, 2014, as well as additional factors it may describe from time to time in other filings with the Securities and Exchange Commission. You should understand that it is not possible to predict or identify all such factors and, consequently, you should not consider any such list to be a complete set of all potential risks or uncertainties.
The information contained herein is as of the date on the cover of this presentation unless an earlier date is indicated, in which case the information is as of such earlier date.
P. 2
Confidential / Material Non-Public Information / Subject to Confidentiality Agreements
Cash flow risk assessment
COMPANY ESTIMATE AS OF 16 MARCH
PRELIMINARY
Q1 2016 Remaining Inflows
($M) High confidence inflowsInflows at risk
265316
41
91
153
High Confidence NA Utility Projects LatAm ProjectsROA ProjectsEMEA ProjectsCurrent Forecast
Inflows
Key risks to Q1 inflows
NA Utility Projects: Risk of inflows due to counterparty concerns
over audit results & associated risks
LatAm Projects: Distribution Co & Regulator approvals pending
ROA projects: Potential delays in process to meet condition
precedent requirements
EMEA projects: Substantial completion testing subject to
weather
Criticality Q1 Remaining Outflows
Corporate: $40M High
Solar Materials: $52M Med
India Equity : $45M Low
NA Utility: $26M
APAC Vendors: $25M
EMEA Projects: $19M
Other Disbursements: $66M
Total: $273M
P. 3
Confidential / Material Non-Public Information / Subject to Confidentiality Agreements
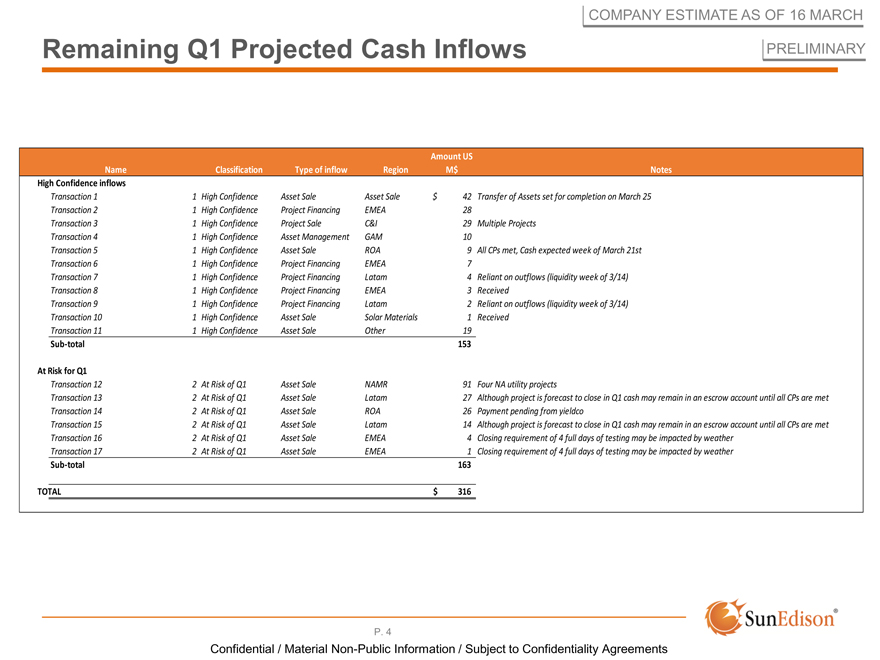
Remaining Q1 Projected Cash Inflows
COMPANY ESTIMATE AS OF 16 MARCH
PRELIMINARY
Amount US
Name Classification Type of inflowRegionM$Notes
High Confidence inflows
Transaction 1 1 High Confidence Asset SaleAsset Sale$42Transfer of Assets set for completion on March 25
Transaction 2 1 High Confidence Project FinancingEMEA28
Transaction 3 1 High Confidence Project SaleC&I29Multiple Projects
Transaction 4 1 High Confidence Asset ManagementGAM10
Transaction 5 1 High Confidence Asset SaleROA9All CPs met, Cash expected week of March 21st
Transaction 6 1 High Confidence Project FinancingEMEA7
Transaction 7 1 High Confidence Project FinancingLatam4Reliant on outflows (liquidity week of 3/14)
Transaction 8 1 High Confidence Project FinancingEMEA3Received
Transaction 9 1 High Confidence Project FinancingLatam2Reliant on outflows (liquidity week of 3/14)
Transaction 10 1 High Confidence Asset SaleSolar Materials1Received
Transaction 11 1 High Confidence Asset SaleOther19
Sub-total 153
At Risk for Q1
Transaction 12 2 At Risk of Q1 Asset SaleNAMR91Four NA utility projects
Transaction 13 2 At Risk of Q1 Asset SaleLatam27Although project is forecast to close in Q1 cash may remain in an escrow account until all CPs are met
Transaction 14 2 At Risk of Q1 Asset SaleROA26Payment pending from yieldco
Transaction 15 2 At Risk of Q1 Asset SaleLatam14Although project is forecast to close in Q1 cash may remain in an escrow account until all CPs are met
Transaction 16 2 At Risk of Q1 Asset SaleEMEA4Closing requirement of 4 full days of testing may be impacted by weather
Transaction 17 2 At Risk of Q1 Asset SaleEMEA1Closing requirement of 4 full days of testing may be impacted by weather
Sub-total 163
TOTAL $316
P. 4
Confidential / Material Non-Public Information / Subject to Confidentiality Agreements