4th Quarter & Full Year 2018 Results, 2019 Outlook & Penn Virginia Combination Update February 27, 2019 N Y S E : D N R w w w . d e n b u r y . c o m
Agenda ● Introduction — John Mayer, Director of Investor Relations ● Denbury Overview and Operational Update — Chris Kendall, President & Chief Executive Officer ● Denbury Financial Review — Mark Allen, Executive Vice President & Chief Financial Officer ● Denbury & Penn Virginia Combination Discussion — Chris Kendall, President & Chief Executive Officer N Y S E : D N R 2 w w w . d e n b u r y . c o m

Cautionary Statements No Offer or Solicitation This presentation relates in part to a proposed business combination transaction (the “Transaction”) between Denbury Resources Inc. (“Denbury”) and Penn Virginia Corporation (“Penn Virginia”). This communication is for informational purposes only and does not constitute an offer to sell or the solicitation of an offer to buy any securities or a solicitation of any vote or approval, in any jurisdiction, pursuant to the Transaction or otherwise, nor shall there be any sale, issuance, exchange or transfer of the securities referred to in this document in any jurisdiction in contravention of applicable law. No offer of securities shall be made except by means of a prospectus meeting the requirements of Section 10 of the Securities Act of 1933, as amended. Important Additional Information In connection with the Transaction, Denbury has filed with the U.S. Securities and Exchange Commission (“SEC”) a registration statement on Form S-4 containing a joint proxy statement of Denbury and Penn Virginia and a prospectus of Denbury. The Transaction will be submitted to Denbury’s stockholders and Penn Virginia’s shareholders for their consideration. Denbury and Penn Virginia intend to file updates of certain information contained in the joint proxy statement/prospectus which is contained in the Form S-4, and may file other documents with the SEC regarding the Transaction. A definitive joint proxy statement/prospectus and any updating materials will be sent to the stockholders of Denbury and the shareholders of Penn Virginia. INVESTORS AND SECURITY HOLDERS OF DENBURY AND PENN VIRGINIA ARE URGED TO READ THE REGISTRATION STATEMENT AND THE JOINT PROXY STATEMENT/PROSPECTUS AND ANY UPDATES OR SUPPLEMENTS THERETO REGARDING THE TRANSACTION AND ALL OTHER RELEVANT DOCUMENTS THAT ARE FILED OR WILL BE FILED WITH THE SEC, CAREFULLY AND IN THEIR ENTIRETY BECAUSE THEY WILL CONTAIN IMPORTANT INFORMATION ABOUT THE TRANSACTION AND RELATED MATTERS. Investors and security holders will be able to obtain free copies of the registration statement and the joint proxy statement/prospectus and all other documents filed or that will be filed with the SEC by Denbury or Penn Virginia through the website maintained by the SEC at http://www.sec.gov. Copies of documents filed with the SEC by Denbury will be made available free of charge on Denbury’s website at www.denbury.com or by directing a request to John Mayer, Director of Investor Relations, Denbury Resources Inc., 5320 Legacy Drive, Plano, TX 75024, Tel. No. (972) 673-2383. Copies of documents filed with the SEC by Penn Virginia will be made available free of charge on Penn Virginia’s website at www.pennvirginia.com, under the heading “SEC Filings,” or by directing a request to Investor Relations, Penn Virginia Corporation, 16285 Park Ten Place, Suite 500, Houston, TX 77084, Tel. No. (713) 722-6540. Participants in the Solicitation Denbury, Penn Virginia and their respective directors and executive officers may be deemed to be participants in the solicitation of proxies in respect to the Transaction. Information regarding Denbury’s directors and executive officers is contained in the proxy statement for Denbury’s 2018 Annual Meeting of Stockholders filed with the SEC on April 12, 2018, and certain of its Current Reports on Form 8-K. You can obtain free copies of these document at the SEC’s website at http://www.sec.gov or by accessing Denbury’s website at www.denbury.com. Information regarding Penn Virginia’s executive officers and directors is contained in the proxy statement for Penn Virginia’s 2018 Annual Meeting of Shareholders filed with the SEC on March 28, 2018, and certain of its Current Reports on Form 8-K. You can obtain free copies of these document at the SEC’s website at www.sec.gov or by accessing Penn Virginia’s website at www.pennvirginia.com. Investors may obtain additional information regarding the interests of those persons and other persons who may be deemed participants in the Transaction by reading the joint proxy statement/prospectus regarding the Transaction. You may obtain free copies of this document as described above. N Y S E : D N R 3 w w w . d e n b u r y . c o m
Cautionary Statements (Cont.) Forward-Looking Statements and Cautionary Statements: The following slides contain “forward-looking statements” within the meaning of Section 27A of the Securities Act of 1933 and Section 21E of the Securities Exchange Act of 1934. All statements, other than statements of historical fact, included in this communication that address activities, events or developments that Denbury or Penn Virginia expects, believes or anticipates will or may occur in the future are forward-looking statements. Words such as “estimate,” “project,” “predict,” “believe,” “expect,” “anticipate,” “potential,” “create,” “intend,” “could,” “may,” “foresee,” “plan,” “will,” “guidance,” “look,” “outlook,” “goal,” “future,” “assume,” “forecast,” “build,” “focus,” “work,” “continue” or the negative of such terms or other variations thereof and words and terms of similar substance used in connection with any discussion of future plans, actions, or events identify forward-looking statements. However, the absence of these words does not mean that the statements are not forward-looking. These forward-looking statements include, but are not limited to, statements regarding the advantages of the proposed Transaction, and conducting EOR in the Eagle Ford formations held by Penn Virginia, pro forma descriptions of the combined company and its operations, integration and transition plans, synergies, opportunities and anticipated future performance, including future years’ combined production levels, operating cash flow and development capital, the EOR potential in the Eagle Ford for recoverable reserves, EUR increases, EOR well capex and projected performance of EOR wells. There are a number of risks and uncertainties that could cause actual results to differ materially from the forward-looking statements included in this communication. These include the expected timing and likelihood of completion of the Transaction, including the timing, receipt and terms and conditions of any required governmental and regulatory approvals of the Transaction that could reduce anticipated benefits or cause the parties to abandon the Transaction, the ability to successfully integrate the businesses, the occurrence of any event, change or other circumstances that could give rise to the termination of the merger agreement, the possibility that stockholders of Denbury may not approve the issuance of new shares of common stock in the Transaction or the amendment of Denbury’s charter or that shareholders of Penn Virginia may not approve the merger agreement, the risk that the parties may not be able to satisfy the conditions to the Transaction in a timely manner or at all, the risk that any announcements relating to the Transaction could have adverse effects on the market price of Denbury’s common stock or Penn Virginia’s common stock, the risk that the Transaction and its announcement could have an adverse effect on Denbury’s and Penn Virginia’s operating results and businesses generally, or cause them to incur substantial costs, the risk that problems may arise in successfully integrating the businesses of the companies, which may result in the combined company not operating as effectively and efficiently as expected, the risk that the combined company may be unable to achieve synergies or it may take longer than expected to achieve those synergies and other important factors that could cause actual results to differ materially from those projected. All such factors are difficult to predict and are beyond Denbury’s or Penn Virginia’s control, including those detailed in Denbury’s annual reports on Form 10-K, quarterly reports on Form 10-Q and current reports on Form 8-K that are available on its website at www.denbury.com and on the SEC’s website at http://www.sec.gov, and those detailed in Penn Virginia’s annual reports on Form 10-K, quarterly reports on Form 10-Q and current reports on Form 8-K that are available on Penn Virginia’s website at www.pennvirginia.com and on the SEC’s website at http://www.sec.gov. Forward-looking statements regarding the Company may be or may concern, among other things, financial forecasts, future hydrocarbon prices and volatility, the sustainability of current oil prices, the degree and length of any price recovery for oil, current or future liquidity sources or their adequacy to support our anticipated future activities, our ability to further reduce our debt levels, possible future write-downs of oil and natural gas reserves, together with assumptions based on current and projected oil and gas prices and oilfield costs, current or future expectations or estimations of our cash flows or the impact of changes in commodity prices on cash flows, availability of capital, borrowing capacity, availability of advantageous commodity derivative contracts or the predicted cash flow benefits therefrom, forecasted capital expenditures, drilling activity or methods, including the timing and location thereof, the nature of any future asset sales or the timing or proceeds thereof, estimated timing of commencement of CO2 flooding of particular fields or areas, including CCA, the availability of capital for CCA pipeline construction, or its ultimate cost or date of completion, timing of CO2 injections and initial production responses in tertiary flooding projects, development activities, finding costs, anticipated future cost savings, capital budgets, interpretation or prediction of formation details, production rates and volumes or forecasts thereof, hydrocarbon reserve quantities and values, CO2 reserves and supply and their availability, potential reserves, barrels or percentages of recoverable original oil in place, potential increases in worldwide tariffs or other trade restrictions, the likelihood, timing and impact of increased interest rates, the impact of regulatory rulings or changes, anticipated outcomes of pending litigation, prospective legislation affecting the oil and gas industry, environmental regulations, mark-to-market values, competition, long-term forecasts of production, rates of return, estimated costs, changes in costs, future capital expenditures and overall economics, worldwide economic conditions and other variables surrounding our estimated original oil in place, operations and future plans. Such forward-looking information is based upon management’s current plans, expectations, estimates, and assumptions and is subject to a number of risks and uncertainties. As a consequence, actual results may differ materially from expectations, estimates or assumptions. Among the factors that could cause actual results to differ materially are fluctuations in worldwide oil prices or in U.S. oil prices and consequently in the prices received or demand for our oil and natural gas; decisions as to production levels and/or pricing by OPEC or production levels by U.S. shale producers in future periods; levels of future capital expenditures; effects of our indebtedness; success of our risk management techniques; accuracy of our cost estimates; availability or terms of credit in the commercial banking or other debt markets; fluctuations in the prices of goods and services; the uncertainty of drilling results and reserve estimates; operating hazards and remediation costs; disruption of operations and damages from well incidents, hurricanes, tropical storms, or other natural occurrences; requirements for capital or its availability; conditions in the worldwide financial, trade and credit markets; general economic conditions; competition; government regulations, including changes in tax or environmental laws or regulations; and unexpected delays, as well as the risks and uncertainties inherent in oil and gas drilling and production activities. N Y S E : D N R 4 w w w . d e n b u r y . c o m
Cautionary Statements (Cont.) Statement Regarding Non-GAAP Financial Measures: This presentation also contains certain non-GAAP financial measures including adjusted cash flows from operations and adjusted EBITDAX. Any non-GAAP measure included herein is accompanied by a reconciliation to the most directly comparable U.S. GAAP measure along with a statement on why the Company believes the measure is beneficial to investors, which statements are included at the end of this presentation. Note to U.S. Investors: Current SEC rules regarding oil and gas reserves information allow oil and gas companies to disclose in filings with the SEC not only proved reserves, but also probable and possible reserves that meet the SEC’s definitions of such terms. We disclose only proved reserves in our filings with the SEC. Denbury’s proved reserves as of December 31, 2017 and December 31, 2018 were estimated by DeGolyer and MacNaughton, an independent petroleum engineering firm. In this presentation, we may make reference to probable and possible reserves, some of which have been estimated by our independent engineers and some of which have been estimated by Denbury’s internal staff of engineers. In this presentation, we also may refer to one or more of estimates of original oil in place, resource or reserves “potential,” barrels recoverable, “risked” and “unrisked” resource potential, estimated ultimate recovery (EUR) or other descriptions of volumes potentially recoverable, which in addition to reserves generally classifiable as probable and possible (2P and 3P reserves), include estimates of resources that do not rise to the standards for possible reserves, and which SEC guidelines strictly prohibit us from including in filings with the SEC. These estimates, as well as the estimates of probable and possible reserves, are by their nature more speculative than estimates of proved reserves and are subject to greater uncertainties, and accordingly the likelihood of recovering those reserves is subject to substantially greater risk. N Y S E : D N R 5 w w w . d e n b u r y . c o m
Denbury Overview & Operational Update Chris Kendall N Y S E : D N R 6 w w w . d e n b u r y . c o m
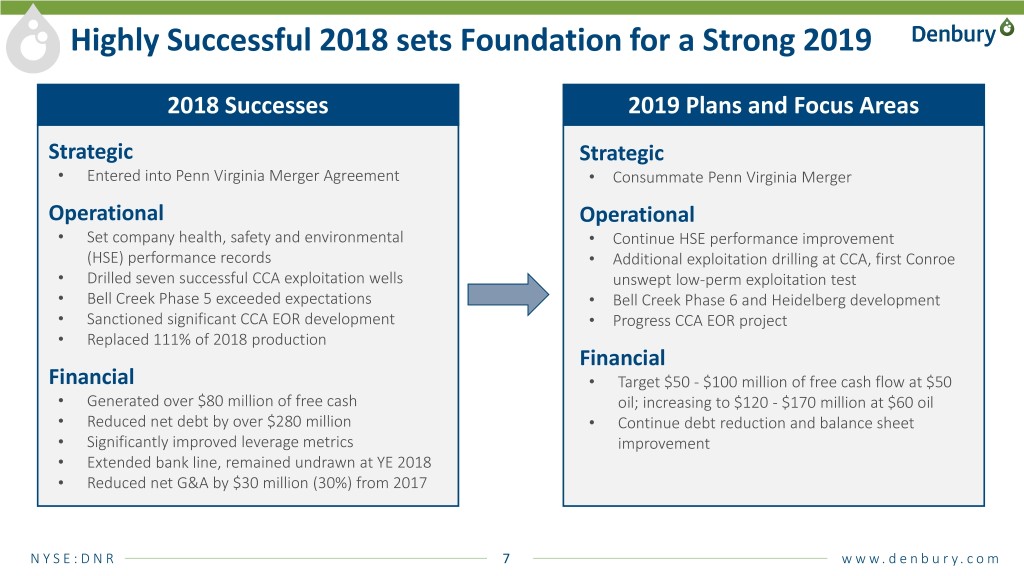
Highly Successful 2018 sets Foundation for a Strong 2019 2018 Successes 2019 Plans and Focus Areas Strategic Strategic • Entered into Penn Virginia Merger Agreement • Consummate Penn Virginia Merger Operational Operational • Set company health, safety and environmental • Continue HSE performance improvement (HSE) performance records • Additional exploitation drilling at CCA, first Conroe • Drilled seven successful CCA exploitation wells unswept low-perm exploitation test • Bell Creek Phase 5 exceeded expectations • Bell Creek Phase 6 and Heidelberg development • Sanctioned significant CCA EOR development • Progress CCA EOR project • Replaced 111% of 2018 production Financial Financial • Target $50 - $100 million of free cash flow at $50 • Generated over $80 million of free cash oil; increasing to $120 - $170 million at $60 oil • Reduced net debt by over $280 million • Continue debt reduction and balance sheet • Significantly improved leverage metrics improvement • Extended bank line, remained undrawn at YE 2018 • Reduced net G&A by $30 million (30%) from 2017 N Y S E : D N R 7 w w w . d e n b u r y . c o m
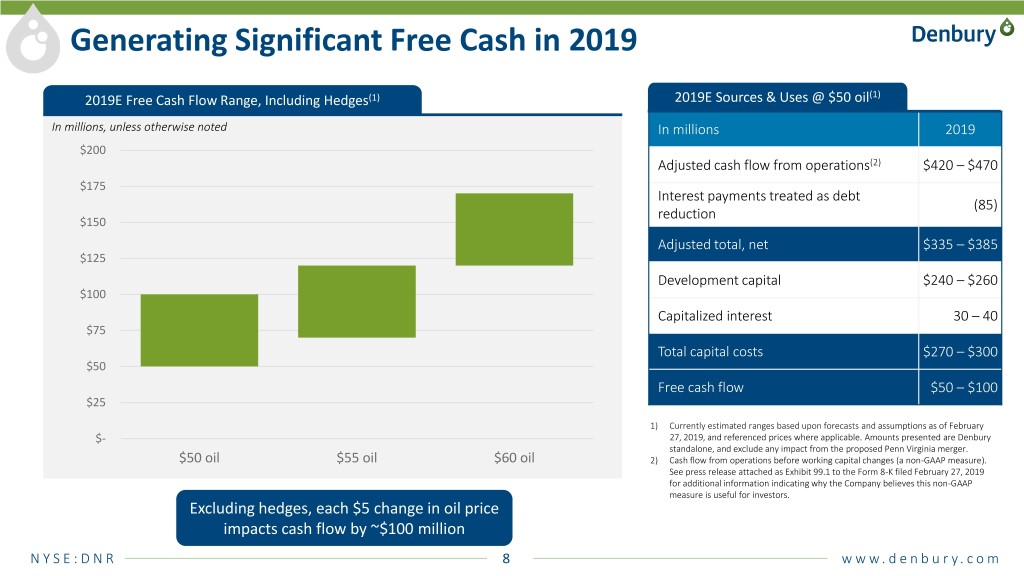
Generating Significant Free Cash in 2019 2019E Free Cash Flow Range, Including Hedges(1) 2019E Sources & Uses @ $50 oil(1) In millions, unless otherwise noted In millions 2019 $200 Adjusted cash flow from operations(2) $420 – $470 $175 Interest payments treated as debt (85) reduction $150 Adjusted total, net $335 – $385 $125 Development capital $240 – $260 $100 Capitalized interest 30 – 40 $75 Total capital costs $270 – $300 $50 Free cash flow $50 – $100 $25 1) Currently estimated ranges based upon forecasts and assumptions as of February $- 27, 2019, and referenced prices where applicable. Amounts presented are Denbury standalone, and exclude any impact from the proposed Penn Virginia merger. $50 oil $55 oil $60 oil 2) Cash flow from operations before working capital changes (a non-GAAP measure). See press release attached as Exhibit 99.1 to the Form 8-K filed February 27, 2019 for additional information indicating why the Company believes this non-GAAP measure is useful for investors. Excluding hedges, each $5 change in oil price impacts cash flow by ~$100 million N Y S E : D N R 8 w w w . d e n b u r y . c o m
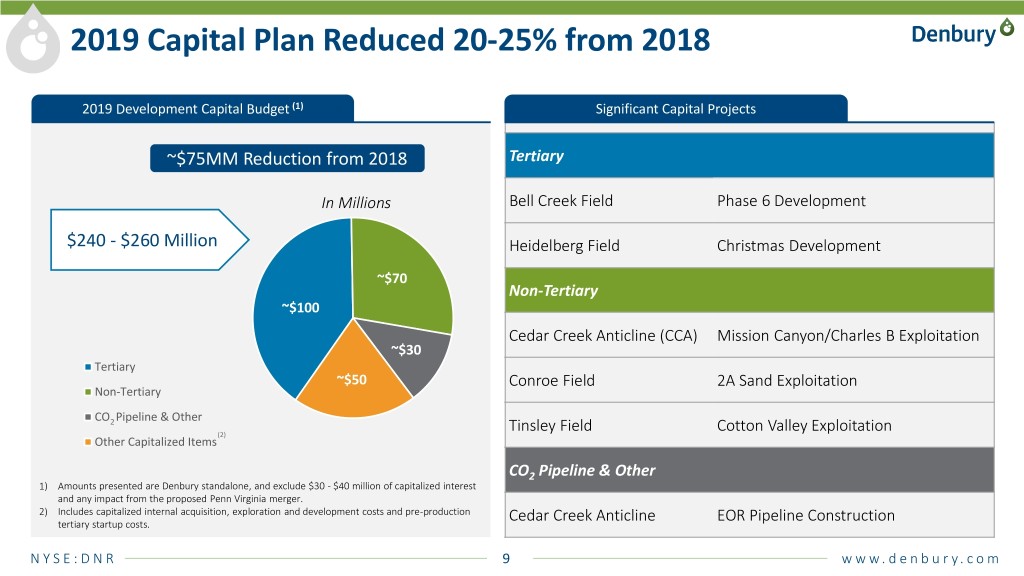
2019 Capital Plan Reduced 20-25% from 2018 2019 Development Capital Budget (1) Significant Capital Projects ~$75MM Reduction from 2018 Tertiary In Millions Bell Creek Field Phase 6 Development $240 - $260 Million Heidelberg Field Christmas Development ~$70 Non-Tertiary ~$100 Cedar Creek Anticline (CCA) Mission Canyon/Charles B Exploitation ~$30 Tertiary ~$50 Conroe Field 2A Sand Exploitation Non-Tertiary CO Pipeline & Other 2 Tinsley Field Cotton Valley Exploitation (2) Other Capitalized Items CO2 Pipeline & Other 1) Amounts presented are Denbury standalone, and exclude $30 - $40 million of capitalized interest and any impact from the proposed Penn Virginia merger. 2) Includes capitalized internal acquisition, exploration and development costs and pre-production Cedar Creek Anticline EOR Pipeline Construction tertiary startup costs. N Y S E : D N R 9 w w w . d e n b u r y . c o m

Production by Area & 2019 Guidance Average Daily Production (BOE/d) 2019E Production Guidance (BOE/d)(1) Field 4Q18 3Q18 4Q17 FY 2018 FY 2017 Delhi 4,526 4,383 4,906 4,368 4,869 Hastings 5,480 5,486 5,747 5,596 4,830 60,341 56,000 - 60,000 Heidelberg 4,269 4,376 4,751 4,355 4,851 Oyster Bayou 4,785 4,578 4,868 4,843 5,007 Tinsley 5,033 5,294 6,241 5,530 6,430 Bell Creek 4,421 3,970 3,571 4,113 3,313 Salt Creek 2,107 2,274 2,172 2,109 1,115 Other tertiary 395 246 7 212 13 Mature area(2) 6,748 6,612 6,763 6,702 7,078 Total tertiary production 37,764 37,219 39,026 37,828 37,506 (2) Gulf Coast non-tertiary 5,799 5,992 5,810 5,930 5,952 Cedar Creek Anticline 14,961 14,208 14,302 14,837 14,754 Other Rockies non-tertiary 1,343 1,409 1,533 1,431 1,537 Total non-tertiary production 22,103 21,609 21,645 22,198 22,243 FY2016 2017 2018 Total continuing production 59,867 58,828 60,671 60,026 59,749 2018 Property divestiture(3) — 353 473 315 549 Actual 2019E Total production 59,867 59,181 61,144 60,341 60,298 1) Amounts presented are Denbury standalone, and exclude any impact from the proposed Penn Virginia merger. 2) Mature area includes Brookhaven, Cranfield, Eucutta, Little Creek, Mallalieu, Martinville, McComb, and Soso fields. 3) Includes tertiary and non-tertiary production from Lockhart Crossing Field, which closed in the third quarter of 2018. N Y S E : D N R 10 w w w . d e n b u r y . c o m
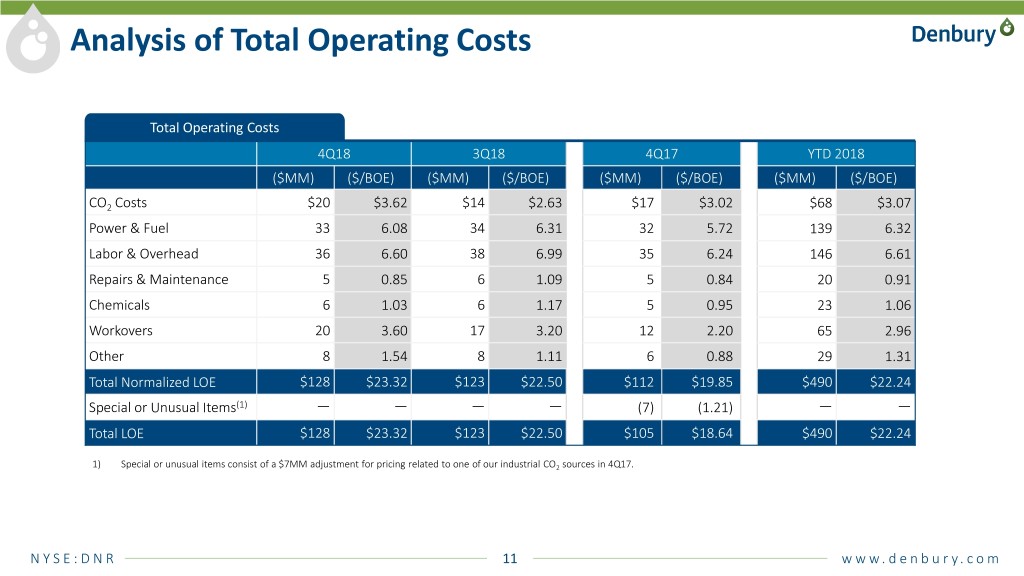
Analysis of Total Operating Costs Total Operating Costs 4Q18 3Q18 4Q17 YTD 2018 ($MM) ($/BOE) ($MM) ($/BOE) ($MM) ($/BOE) ($MM) ($/BOE) CO2 Costs $20 $3.62 $14 $2.63 $17 $3.02 $68 $3.07 Power & Fuel 33 6.08 34 6.31 32 5.72 139 6.32 Labor & Overhead 36 6.60 38 6.99 35 6.24 146 6.61 Repairs & Maintenance 5 0.85 6 1.09 5 0.84 20 0.91 Chemicals 6 1.03 6 1.17 5 0.95 23 1.06 Workovers 20 3.60 17 3.20 12 2.20 65 2.96 Other 8 1.54 8 1.11 6 0.88 29 1.31 Total Normalized LOE $128 $23.32 $123 $22.50 $112 $19.85 $490 $22.24 Special or Unusual Items(1) — — — — (7) (1.21) — — Total LOE $128 $23.32 $123 $22.50 $105 $18.64 $490 $22.24 1) Special or unusual items consist of a $7MM adjustment for pricing related to one of our industrial CO2 sources in 4Q17. N Y S E : D N R 11 w w w . d e n b u r y . c o m
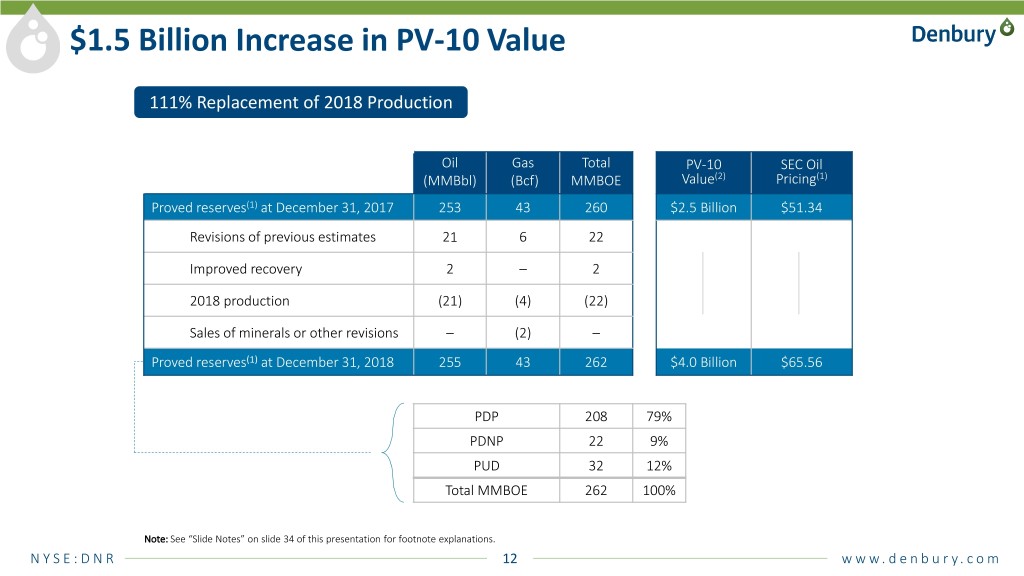
$1.5 Billion Increase in PV-10 Value 111% Replacement of 2018 Production Oil Gas Total PV-10 SEC Oil (MMBbl) (Bcf) MMBOE Value(2) Pricing(1) Proved reserves(1) at December 31, 2017 253 43 260 $2.5 Billion $51.34 Revisions of previous estimates 21 6 22 Improved recovery 2 – 2 2018 production (21) (4) (22) Sales of minerals or other revisions – (2) – Proved reserves(1) at December 31, 2018 255 43 262 $4.0 Billion $65.56 PDP 208 79% PDNP 22 9% PUD 32 12% Total MMBOE 262 100% Note: See “Slide Notes” on slide 34 of this presentation for footnote explanations. N Y S E : D N R 12 w w w . d e n b u r y . c o m
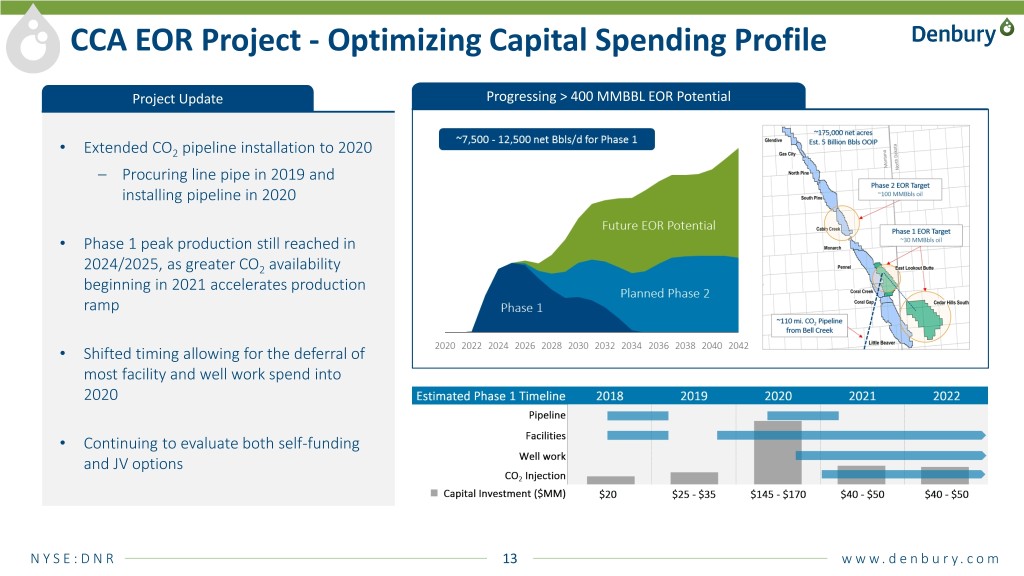
CCA EOR Project - Optimizing Capital Spending Profile Project Update Progressing > 400 MMBBL EOR Potential • Extended CO2 pipeline installation to 2020 – Procuring line pipe in 2019 and installing pipeline in 2020 • Phase 1 peak production still reached in 2024/2025, as greater CO2 availability beginning in 2021 accelerates production ramp • Shifted timing allowing for the deferral of most facility and well work spend into 2020 • Continuing to evaluate both self-funding and JV options N Y S E : D N R 13 w w w . d e n b u r y . c o m

CCA Exploitation Continued Mission Canyon Success, Play-Opening Initial Charles B Test Mission Canyon • Extended play to the north and to the south with Cabin Creek and Little Cedar Creek Anticline Beaver tests • Up to four wells planned for 2019 Mission Canyon Horizontal • Reduced drilling and completion cost per lateral foot by > 20% Charles B Horizontal • Strong program economics @ $50/Bbl IP30: 206 BOPD – > 50% ROR to date IP30: 842 BOPD – Current total net production ~2,000 BOPD IP30: 1,234 BOPD IP30: 761 BOPD • Currently identified up to 14 additional well locations Charles B IP30: 1,001 BOPD • First well online early 1Q; 206 BOPD IP30, 182 BOPD IP60 CCA Formations • Sustained high oil cut (~75%); strong potential for waterflood & EOR 6,750’ Charles B IP30: 330 BOPD 7,000’ • Multiple potential productive Charles B benches identified Mission Canyon IP30: 527 BOPD Lodgepole IP30: 726 BOPD • Planning second Charles B horizontal in Cabin Creek field Interlake • Charles B potential identified across the northern part of CCA, from Cabin Stony Mountain Creek to Glendive Red River 9,000’ • Currently identified up to 14 potential well locations N Y S E : D N R 14 w w w . d e n b u r y . c o m
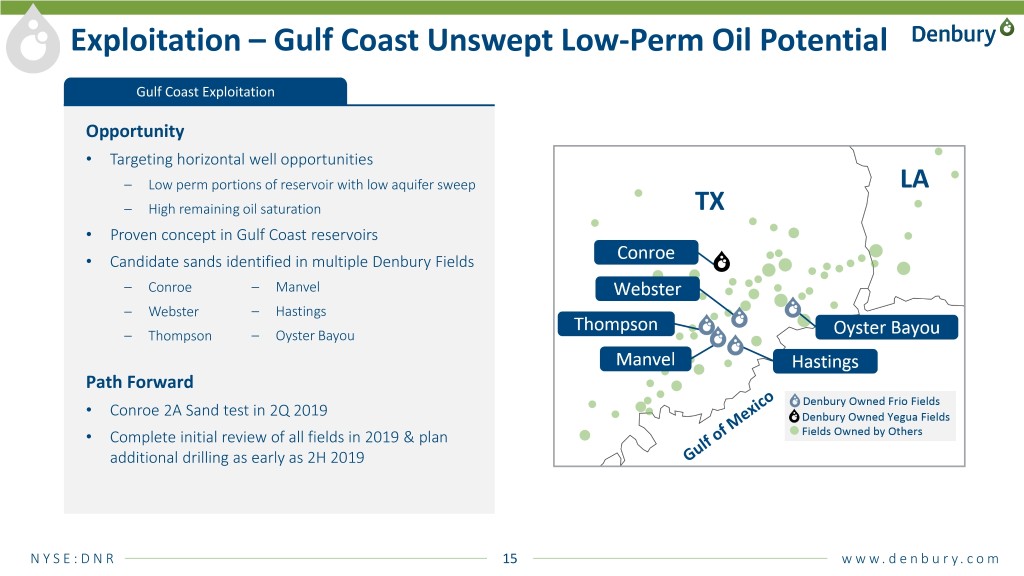
Exploitation – Gulf Coast Unswept Low-Perm Oil Potential Gulf Coast Exploitation Opportunity • Targeting horizontal well opportunities – Low perm portions of reservoir with low aquifer sweep – High remaining oil saturation • Proven concept in Gulf Coast reservoirs • Candidate sands identified in multiple Denbury Fields – Conroe – Manvel – Webster – Hastings – Thompson – Oyster Bayou Path Forward • Conroe 2A Sand test in 2Q 2019 • Complete initial review of all fields in 2019 & plan additional drilling as early as 2H 2019 N Y S E : D N R 15 w w w . d e n b u r y . c o m
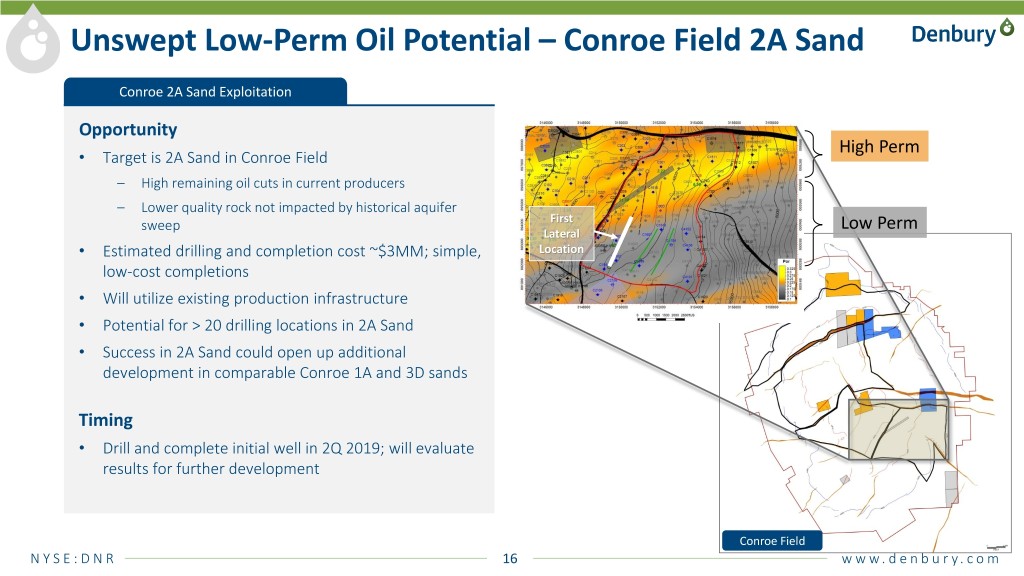
Unswept Low-Perm Oil Potential – Conroe Field 2A Sand Conroe 2A Sand Exploitation Opportunity High Perm • Target is 2A Sand in Conroe Field – High remaining oil cuts in current producers – Lower quality rock not impacted by historical aquifer sweep First Low Perm Lateral • Estimated drilling and completion cost ~$3MM; simple, Location low-cost completions • Will utilize existing production infrastructure • Potential for > 20 drilling locations in 2A Sand • Success in 2A Sand could open up additional development in comparable Conroe 1A and 3D sands Timing • Drill and complete initial well in 2Q 2019; will evaluate results for further development Conroe Field N Y S E : D N R 16 w w w . d e n b u r y . c o m
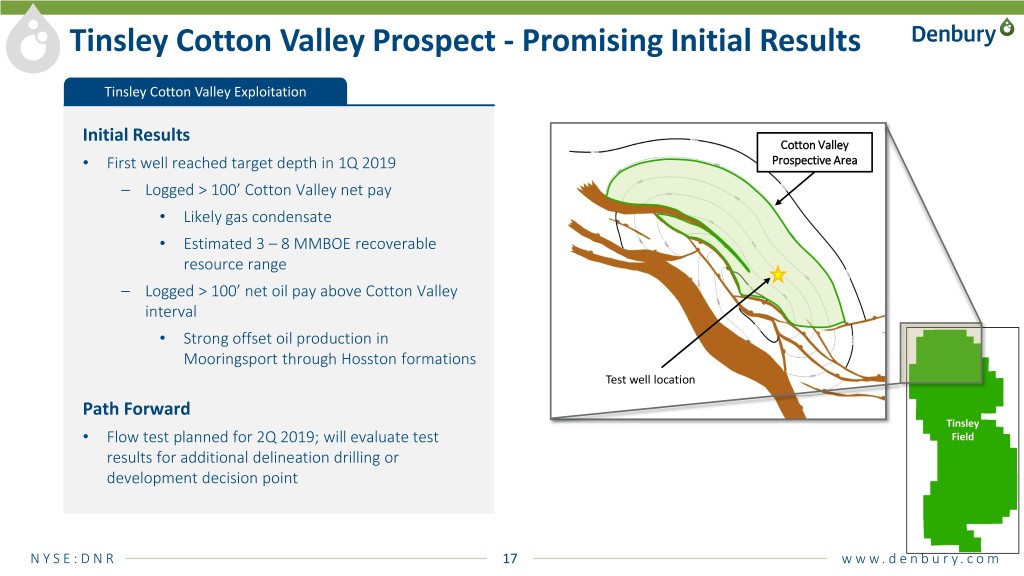
Tinsley Cotton Valley Prospect - Promising Initial Results Tinsley Cotton Valley Exploitation Initial Results Cotton Valley • First well reached target depth in 1Q 2019 Prospective Area – Logged > 100’ Cotton Valley net pay • Likely gas condensate • Estimated 3 – 8 MMBOE recoverable resource range – Logged > 100’ net oil pay above Cotton Valley interval • Strong offset oil production in Mooringsport through Hosston formations Test well location Path Forward Tinsley • Flow test planned for 2Q 2019; will evaluate test Field results for additional delineation drilling or development decision point N Y S E : D N R 17 w w w . d e n b u r y . c o m
Denbury Financial Review Mark Allen N Y S E : D N R 18 w w w . d e n b u r y . c o m
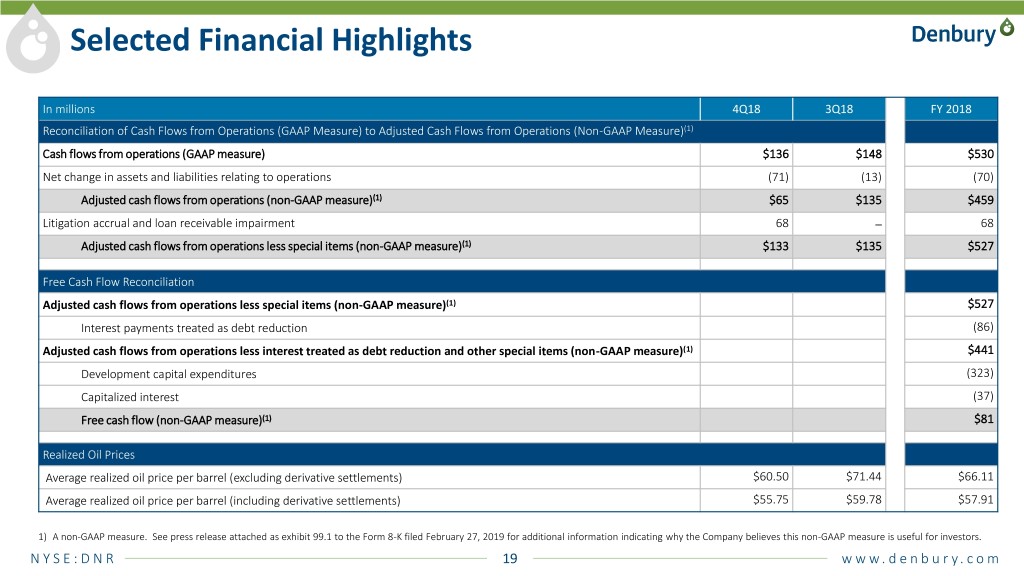
Selected Financial Highlights In millions 4Q18 3Q18 FY 2018 Reconciliation of Cash Flows from Operations (GAAP Measure) to Adjusted Cash Flows from Operations (Non-GAAP Measure)(1) Cash flows from operations (GAAP measure) $136 $148 $530 Net change in assets and liabilities relating to operations (71) (13) (70) Adjusted cash flows from operations (non-GAAP measure)(1) $65 $135 $459 Litigation accrual and loan receivable impairment 68 ─ 68 Adjusted cash flows from operations less special items (non-GAAP measure)(1) $133 $135 $527 Free Cash Flow Reconciliation Adjusted cash flows from operations less special items (non-GAAP measure)(1) $527 Interest payments treated as debt reduction (86) Adjusted cash flows from operations less interest treated as debt reduction and other special items (non-GAAP measure)(1) $441 Development capital expenditures (323) Capitalized interest (37) Free cash flow (non-GAAP measure)(1) $81 Realized Oil Prices Average realized oil price per barrel (excluding derivative settlements) $60.50 $71.44 $66.11 Average realized oil price per barrel (including derivative settlements) $55.75 $59.78 $57.91 1) A non-GAAP measure. See press release attached as exhibit 99.1 to the Form 8-K filed February 27, 2019 for additional information indicating why the Company believes this non-GAAP measure is useful for investors. N Y S E : D N R 19 w w w . d e n b u r y . c o m
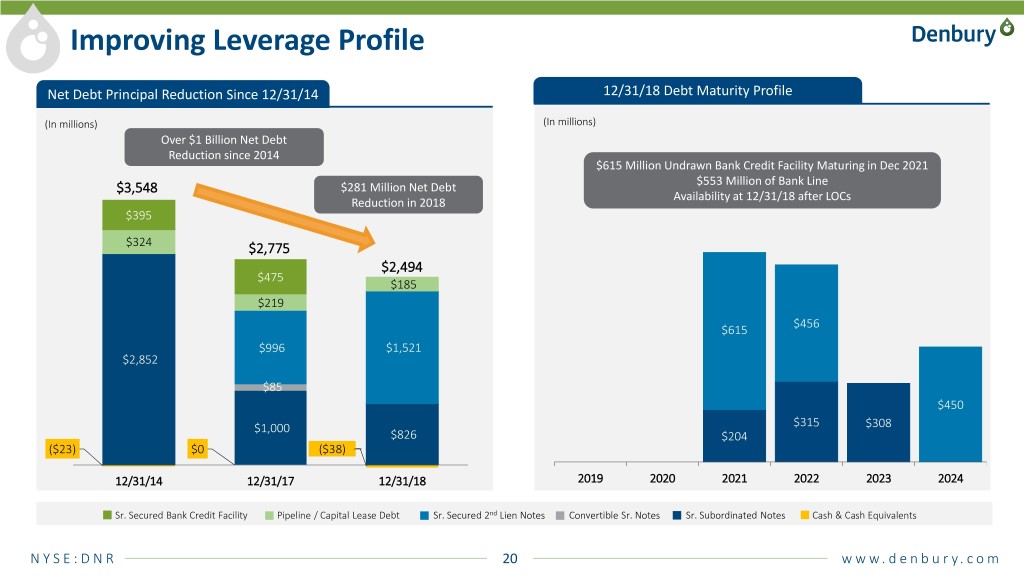
Improving Leverage Profile Net Debt Principal Reduction Since 12/31/14 12/31/18 Debt Maturity Profile (In millions) (In millions) Over $1 Billion Net Debt Reduction since 2014 $615 Million Undrawn Bank Credit Facility Maturing in Dec 2021 $553 Million of Bank Line $3,548 $281 Million Net Debt Availability at 12/31/18 after LOCs Reduction in 2018 $395 $324 $2,775 $2,494 $475 $185 $219 $456 $615 $996 $1,521 $2,852 $85 $450 $1,000 $315 $308 $826 $204 ($23) $0 ($38) 12/31/14 12/31/17 12/31/18 2019 2020 2021 2022 2023 2024 Sr. Secured Bank Credit Facility Pipeline / Capital Lease Debt Sr. Secured 2nd Lien Notes Convertible Sr. Notes Sr. Subordinated Notes Cash & Cash Equivalents N Y S E : D N R 20 w w w . d e n b u r y . c o m
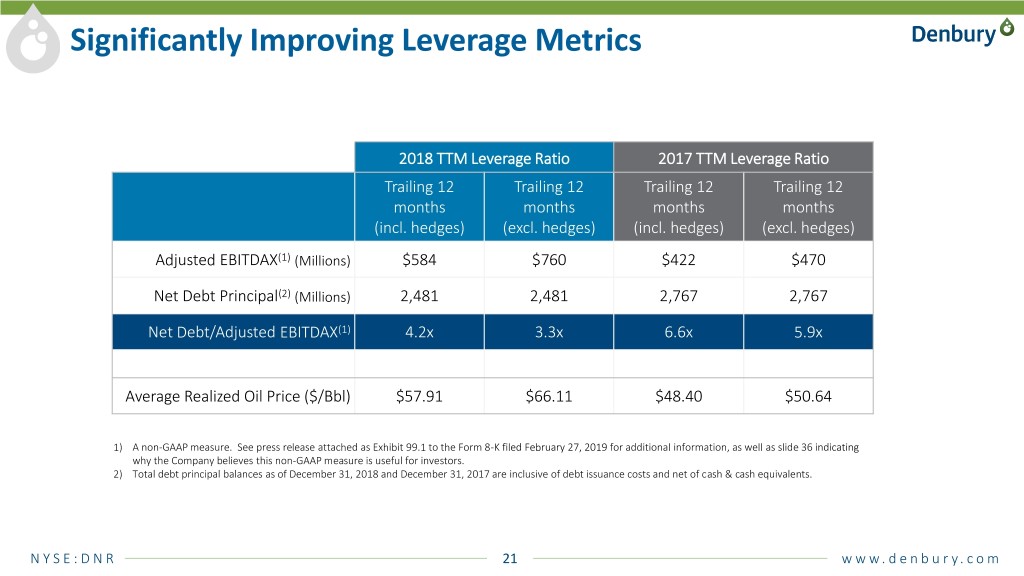
Significantly Improving Leverage Metrics 2018 TTM Leverage Ratio 2017 TTM Leverage Ratio Trailing 12 Trailing 12 Trailing 12 Trailing 12 months months months months (incl. hedges) (excl. hedges) (incl. hedges) (excl. hedges) Adjusted EBITDAX(1) (Millions) $584 $760 $422 $470 Net Debt Principal(2) (Millions) 2,481 2,481 2,767 2,767 Net Debt/Adjusted EBITDAX(1) 4.2x 3.3x 6.6x 5.9x Average Realized Oil Price ($/Bbl) $57.91 $66.11 $48.40 $50.64 1) A non-GAAP measure. See press release attached as Exhibit 99.1 to the Form 8-K filed February 27, 2019 for additional information, as well as slide 36 indicating why the Company believes this non-GAAP measure is useful for investors. 2) Total debt principal balances as of December 31, 2018 and December 31, 2017 are inclusive of debt issuance costs and net of cash & cash equivalents. N Y S E : D N R 21 w w w . d e n b u r y . c o m
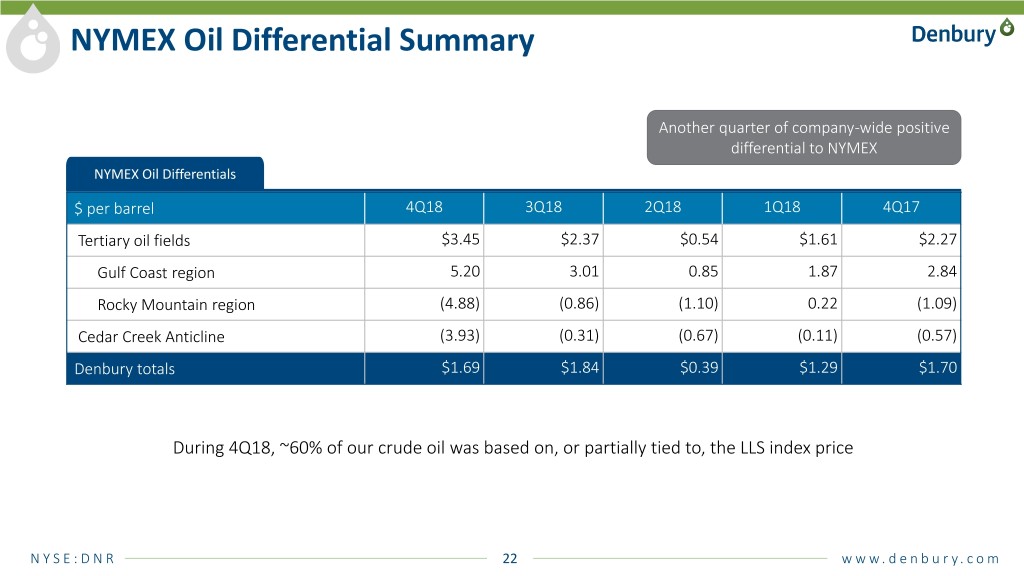
NYMEX Oil Differential Summary Another quarter of company-wide positive differential to NYMEX NYMEX Oil Differentials $ per barrel 4Q18 3Q18 2Q18 1Q18 4Q17 Tertiary oil fields $3.45 $2.37 $0.54 $1.61 $2.27 Gulf Coast region 5.20 3.01 0.85 1.87 2.84 Rocky Mountain region (4.88) (0.86) (1.10) 0.22 (1.09) Cedar Creek Anticline (3.93) (0.31) (0.67) (0.11) (0.57) Denbury totals $1.69 $1.84 $0.39 $1.29 $1.70 During 4Q18, ~60% of our crude oil was based on, or partially tied to, the LLS index price N Y S E : D N R 22 w w w . d e n b u r y . c o m
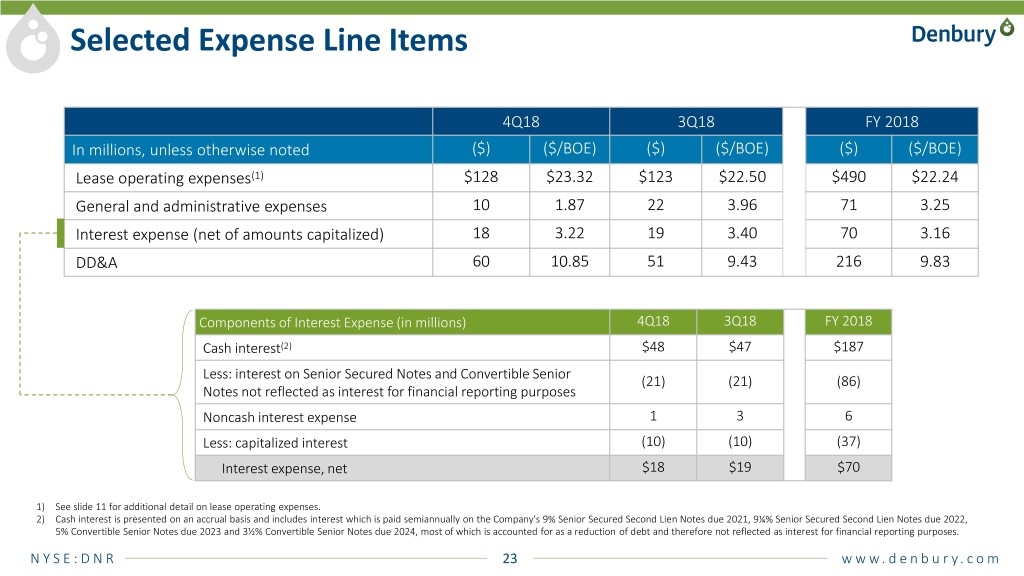
Selected Expense Line Items 4Q18 3Q18 FY 2018 In millions, unless otherwise noted ($) ($/BOE) ($) ($/BOE) ($) ($/BOE) Lease operating expenses(1) $128 $23.32 $123 $22.50 $490 $22.24 General and administrative expenses 10 1.87 22 3.96 71 3.25 Interest expense (net of amounts capitalized) 18 3.22 19 3.40 70 3.16 DD&A 60 10.85 51 9.43 216 9.83 Components of Interest Expense (in millions) 4Q18 3Q18 FY 2018 Cash interest(2) $48 $47 $187 Less: interest on Senior Secured Notes and Convertible Senior (21) (21) (86) Notes not reflected as interest for financial reporting purposes Noncash interest expense 1 3 6 Less: capitalized interest (10) (10) (37) Interest expense, net $18 $19 $70 1) See slide 11 for additional detail on lease operating expenses. 2) Cash interest is presented on an accrual basis and includes interest which is paid semiannually on the Company's 9% Senior Secured Second Lien Notes due 2021, 9¼% Senior Secured Second Lien Notes due 2022, 5% Convertible Senior Notes due 2023 and 3½% Convertible Senior Notes due 2024, most of which is accounted for as a reduction of debt and therefore not reflected as interest for financial reporting purposes. N Y S E : D N R 23 w w w . d e n b u r y . c o m

Hedge Positions – as of February 27, 2019 2019 2020 January February Mar-June 2H WTI Volumes Hedged (Bbls/d) 3,500 3,500 3,500 ─ ─ NYMEX Swap Price(1) $59.05 $59.05 $59.05 ─ ─ Volumes Hedged (Bbls/d) 7,000 9,000 12,000 12,000 2,000 Argus LLS Price Swaps Price Swap Price(1) $66.57 $65.14 $64.67 $64.67 $60.89 Volumes Hedged (Bbls/d) 18,500 18,500 18,500 22,000 1,000 WTI Sold Put Price/Floor NYMEX $48.84/$56.84/$69.94 $48.84/$56.84/$69.94 $48.84/$56.84/$69.94 $48.55/$56.55/$69.17 $50/$60/$82.50 Price/Ceiling Price(1)(2) Volumes Hedged (Bbls/d) 5,500 5,500 5,500 5,500 1,000 Way Collars Way - 3 Argus LLS Sold Put Price/Floor $54.73/$63.09/$79.93 $54.73/$63.09/$79.93 $54.73/$63.09/$79.93 $54.73/$63.09/$79.93 $55/$65/$86.80 Price/Ceiling Price(1)(2) Total Volumes Hedged 34,500 36,500 39,500 39,500 4,000 Weighted Average Floor Prices WTI NYMEX $57.19 $57.19 $57.19 $56.55 $60.00 Argus LLS $65.04 $64.36 $64.17 $64.17 $62.26 1) Averages are volume weighted. 2) If oil prices were to average less than the sold put price, receipts on settlement would be limited to the difference between the floor price and sold put price. N Y S E : D N R 24 w w w . d e n b u r y . c o m
Denbury & Penn Virginia Combination Discussion Chris Kendall N Y S E : D N R 25 w w w . d e n b u r y . c o m
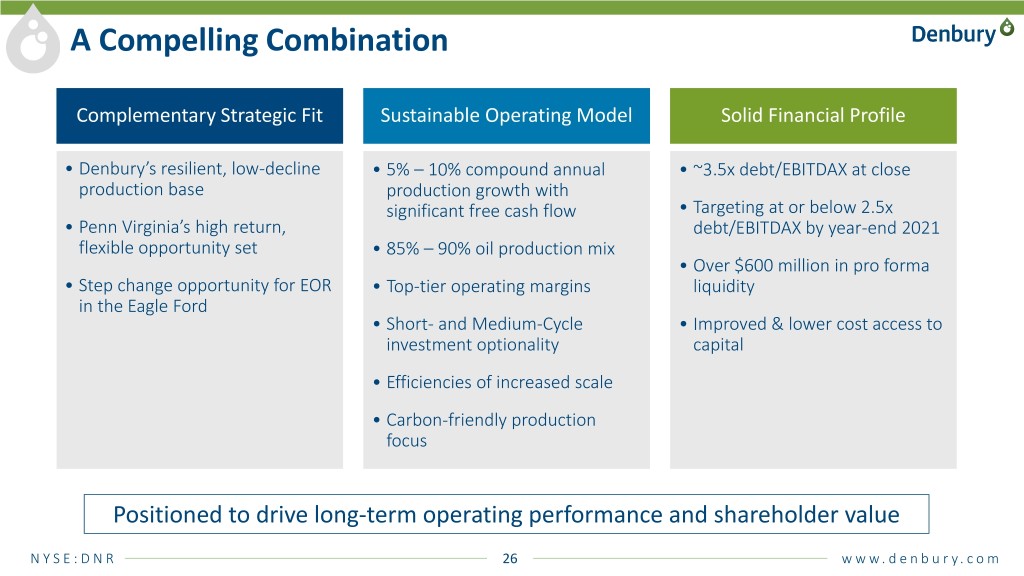
A Compelling Combination Complementary Strategic Fit Sustainable Operating Model Solid Financial Profile • Denbury’s resilient, low-decline • 5% – 10% compound annual • ~3.5x debt/EBITDAX at close production base production growth with significant free cash flow • Targeting at or below 2.5x • Penn Virginia’s high return, debt/EBITDAX by year-end 2021 flexible opportunity set • 85% – 90% oil production mix • Over $600 million in pro forma • Step change opportunity for EOR • Top-tier operating margins liquidity in the Eagle Ford • Short- and Medium-Cycle • Improved & lower cost access to investment optionality capital • Efficiencies of increased scale • Carbon-friendly production focus Positioned to drive long-term operating performance and shareholder value N Y S E : D N R 26 w w w . d e n b u r y . c o m

Updated Preliminary Combined Pro Forma Estimates Average Daily Production Estimates thru 2021 assuming $55 – $60 WTI oil price (MBOE/d) • 5% – 10% compound annual production growth 87 – 93 94 –102 82 83 – 89 • Assumes 2 rig Eagle Ford program in 2019-2020 and 3 rig program in 2021 • 85% – 90% oil production mix • Top-tier operating margins Pro Forma 2018 Estimated 2019 Estimated 2020 Estimated 2021 • Significant free cash flow generation Operating Cash Flow(1) (in millions) • Targeting ~3.5x or lower Debt/EBITDAX in 2019 and ~2.5x or lower $750 - $950 Debt/EBITDAX by end of 2021 $650 -$800 $650 -$800 $716 • CCA Pipeline spend $30MM in 2019 and $100MM in 2020 Operational and Financial Flexibility to Successfully Navigate a Lower Pro Forma 2018 Estimated 2019 Estimated 2020 Estimated 2021 Oil Price Environment Development Capital(2) (in millions) 1) Cash flow before working capital, net of ~$85 million interest treated as debt in Denbury’s financial statements, and excluding transaction costs. 2) Excludes capitalized interest and acquisitions/divestitures. $700 -$800 $742 $600 - $700 Note: These preliminary combined pro forma estimates are estimates based on assumptions that Denbury deems reasonable as $550 - $600 of the date of their preparation in late February 2019. Such assumptions are inherently uncertain and difficult or impossible to predict or estimate and many of them are beyond Denbury’s control. The preliminary combined pro forma estimates also reflect assumptions regarding the continuing nature of certain business decisions that, in reality, would be subject to change. Future results of Denbury or Penn Virginia may differ, possibly materially, from the preliminary combined pro forma estimates. Pro Forma 2018 Estimated 2019 Estimated 2020 Estimated 2021 N Y S E : D N R 27 w w w . d e n b u r y . c o m
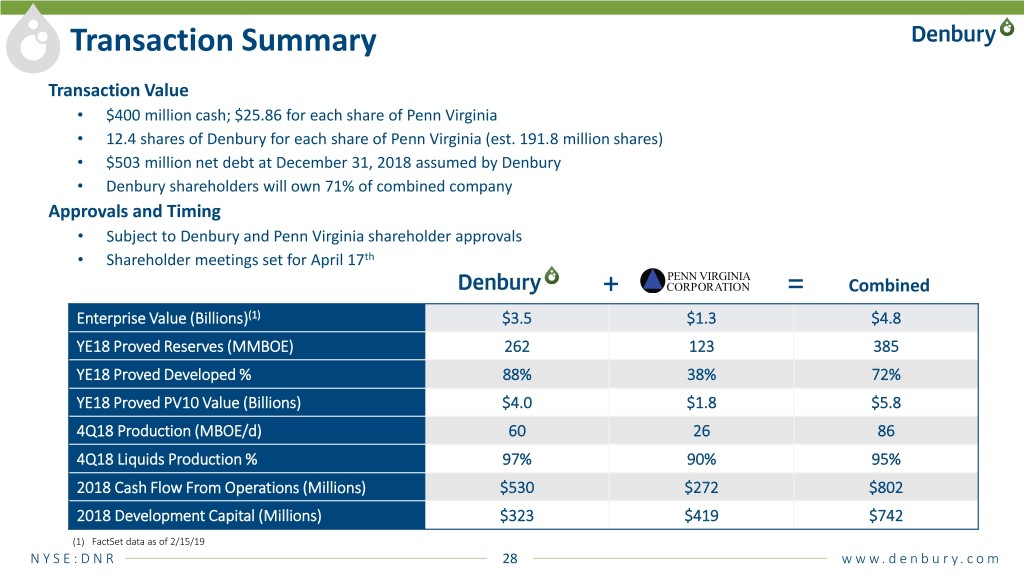
Transaction Summary Transaction Value • $400 million cash; $25.86 for each share of Penn Virginia • 12.4 shares of Denbury for each share of Penn Virginia (est. 191.8 million shares) • $503 million net debt at December 31, 2018 assumed by Denbury • Denbury shareholders will own 71% of combined company Approvals and Timing • Subject to Denbury and Penn Virginia shareholder approvals • Shareholder meetings set for April 17th + = Combined Enterprise Value (Billions)(1) $3.5 $1.3 $4.8 YE18 Proved Reserves (MMBOE) 262 123 385 YE18 Proved Developed % 88% 38% 72% YE18 Proved PV10 Value (Billions) $4.0 $1.8 $5.8 4Q18 Production (MBOE/d) 60 26 86 4Q18 Liquids Production % 97% 90% 95% 2018 Cash Flow From Operations (Millions) $530 $272 $802 2018 Development Capital (Millions) $323 $419 $742 (1) FactSet data as of 2/15/19 N Y S E : D N R 28 w w w . d e n b u r y . c o m
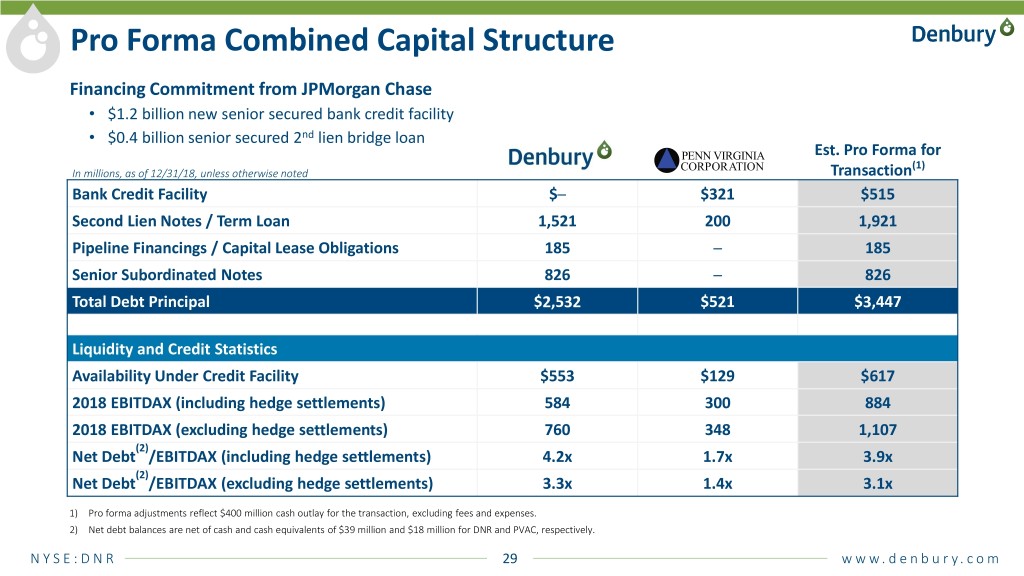
Pro Forma Combined Capital Structure Financing Commitment from JPMorgan Chase • $1.2 billion new senior secured bank credit facility • $0.4 billion senior secured 2nd lien bridge loan Est. Pro Forma for (1) In millions, as of 12/31/18, unless otherwise noted Transaction Bank Credit Facility $─ $321 $515 Second Lien Notes / Term Loan 1,521 200 1,921 Pipeline Financings / Capital Lease Obligations 185 ─ 185 Senior Subordinated Notes 826 ─ 826 Total Debt Principal $2,532 $521 $3,447 Liquidity and Credit Statistics Availability Under Credit Facility $553 $129 $617 2018 EBITDAX (including hedge settlements) 584 300 884 2018 EBITDAX (excluding hedge settlements) 760 348 1,107 (2) Net Debt /EBITDAX (including hedge settlements) 4.2x 1.7x 3.9x (2) Net Debt /EBITDAX (excluding hedge settlements) 3.3x 1.4x 3.1x 1) Pro forma adjustments reflect $400 million cash outlay for the transaction, excluding fees and expenses. 2) Net debt balances are net of cash and cash equivalents of $39 million and $18 million for DNR and PVAC, respectively. N Y S E : D N R 29 w w w . d e n b u r y . c o m
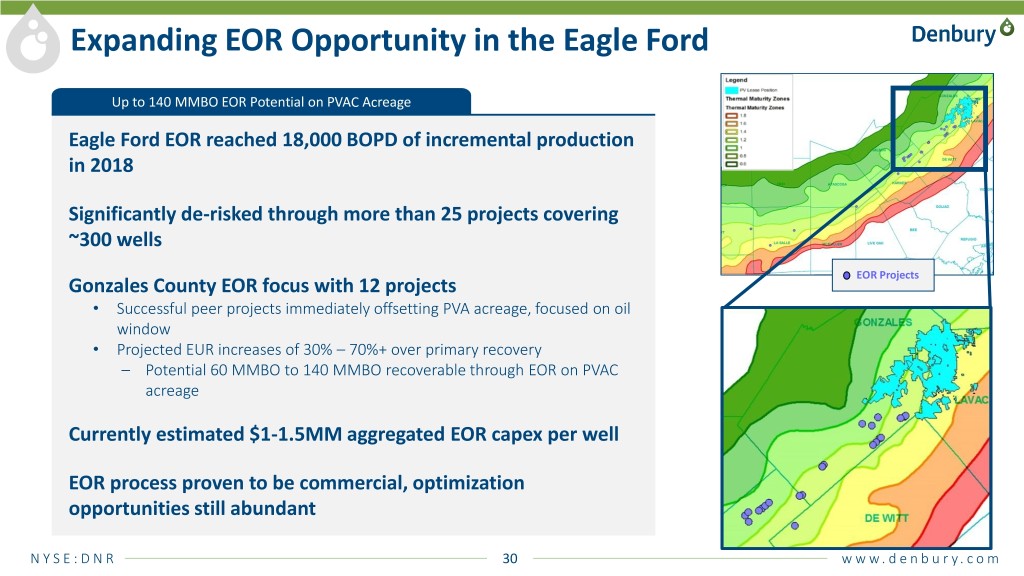
Expanding EOR Opportunity in the Eagle Ford Up to 140 MMBO EOR Potential on PVAC Acreage Eagle Ford EOR reached 18,000 BOPD of incremental production in 2018 Significantly de-risked through more than 25 projects covering ~300 wells EOR Projects Gonzales County EOR focus with 12 projects • Successful peer projects immediately offsetting PVA acreage, focused on oil window • Projected EUR increases of 30% – 70%+ over primary recovery – Potential 60 MMBO to 140 MMBO recoverable through EOR on PVAC acreage Currently estimated $1-1.5MM aggregated EOR capex per well EOR process proven to be commercial, optimization opportunities still abundant N Y S E : D N R 30 w w w . d e n b u r y . c o m
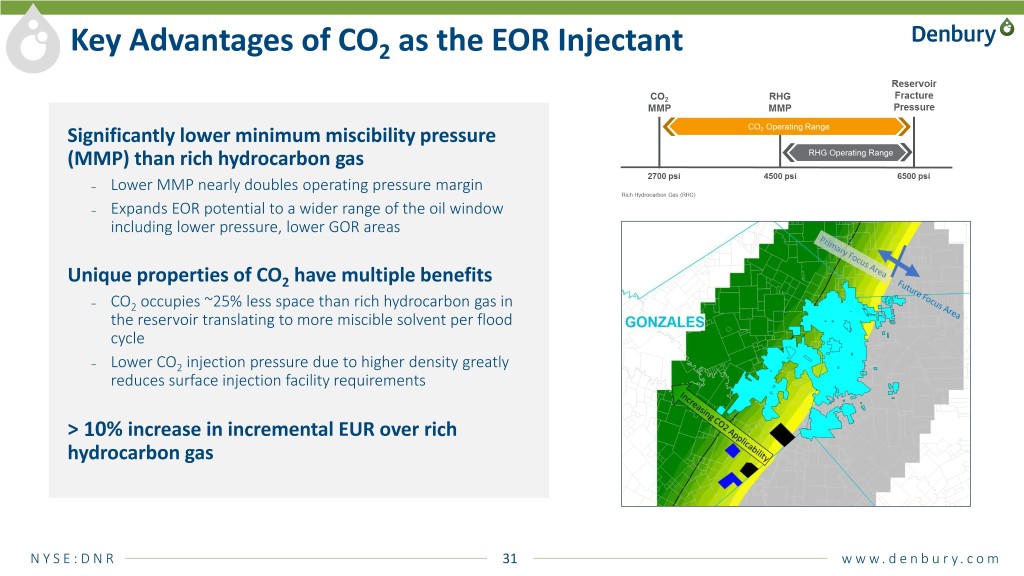
Key Advantages of CO2 as the EOR Injectant Significantly lower minimum miscibility pressure (MMP) than rich hydrocarbon gas – Lower MMP nearly doubles operating pressure margin – Expands EOR potential to a wider range of the oil window including lower pressure, lower GOR areas Unique properties of CO2 have multiple benefits – CO2 occupies ~25% less space than rich hydrocarbon gas in the reservoir translating to more miscible solvent per flood cycle – Lower CO2 injection pressure due to higher density greatly reduces surface injection facility requirements > 10% increase in incremental EUR over rich hydrocarbon gas N Y S E : D N R 31 w w w . d e n b u r y . c o m
Q&A N Y S E : D N R 32 w w w . d e n b u r y . c o m
Appendix N Y S E : D N R 33 w w w . d e n b u r y . c o m
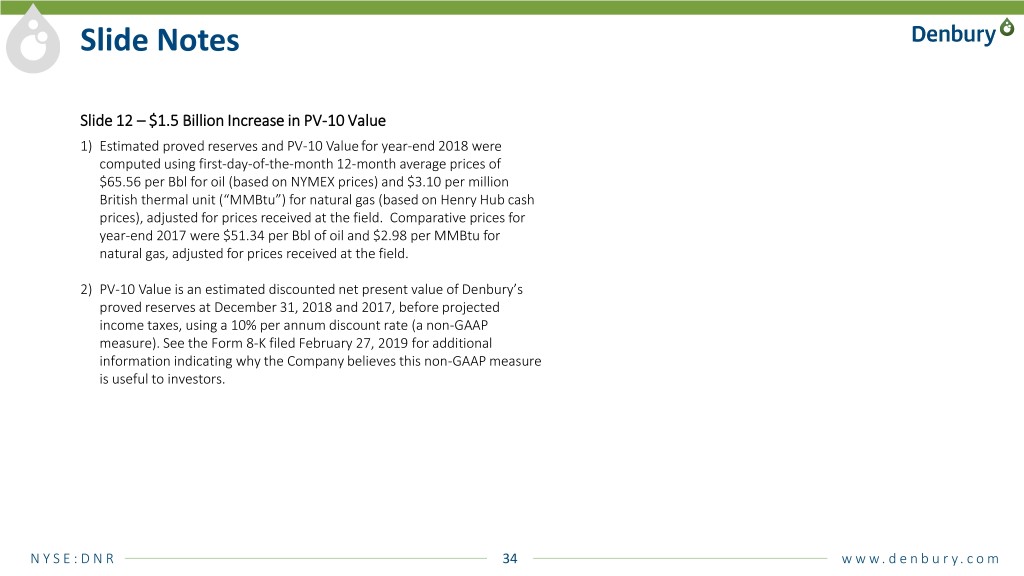
Slide Notes Slide 12 – $1.5 Billion Increase in PV-10 Value 1) Estimated proved reserves and PV-10 Value for year-end 2018 were computed using first-day-of-the-month 12-month average prices of $65.56 per Bbl for oil (based on NYMEX prices) and $3.10 per million British thermal unit (“MMBtu”) for natural gas (based on Henry Hub cash prices), adjusted for prices received at the field. Comparative prices for year-end 2017 were $51.34 per Bbl of oil and $2.98 per MMBtu for natural gas, adjusted for prices received at the field. 2) PV-10 Value is an estimated discounted net present value of Denbury’s proved reserves at December 31, 2018 and 2017, before projected income taxes, using a 10% per annum discount rate (a non-GAAP measure). See the Form 8-K filed February 27, 2019 for additional information indicating why the Company believes this non-GAAP measure is useful to investors. N Y S E : D N R 34 w w w . d e n b u r y . c o m
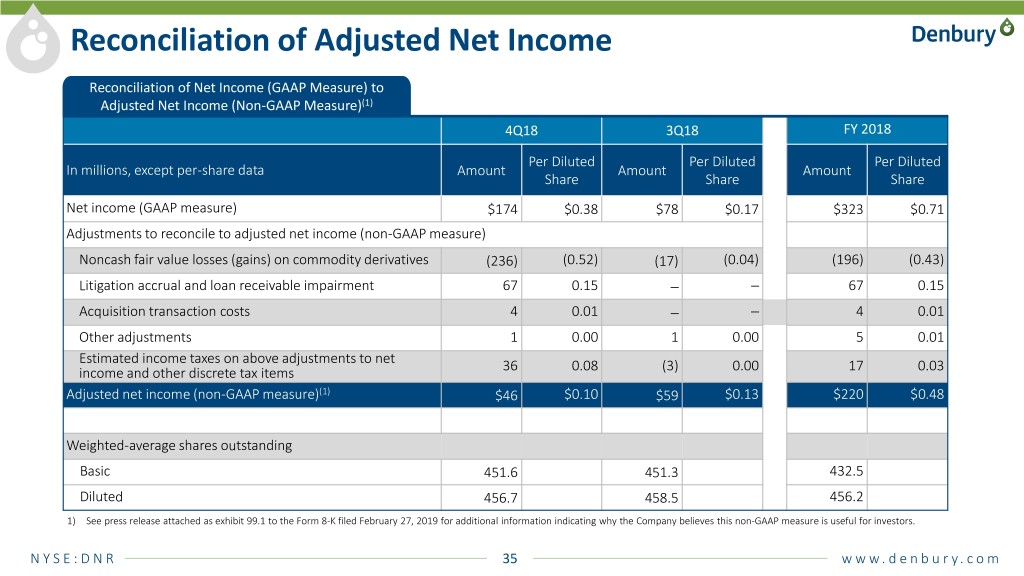
Reconciliation of Adjusted Net Income Reconciliation of Net Income (GAAP Measure) to Adjusted Net Income (Non-GAAP Measure)(1) 4Q18 3Q18 FY 2018 Per Diluted Per Diluted Per Diluted In millions, except per-share data Amount Amount Amount Share Share Share Net income (GAAP measure) $174 $0.38 $78 $0.17 $323 $0.71 Adjustments to reconcile to adjusted net income (non-GAAP measure) Noncash fair value losses (gains) on commodity derivatives (236) (0.52) (17) (0.04) (196) (0.43) Litigation accrual and loan receivable impairment 67 0.15 ─ ─ 67 0.15 Acquisition transaction costs 4 0.01 ─ ─ 4 0.01 Other adjustments 1 0.00 1 0.00 5 0.01 Estimated income taxes on above adjustments to net income and other discrete tax items 36 0.08 (3) 0.00 17 0.03 Adjusted net income (non-GAAP measure)(1) $46 $0.10 $59 $0.13 $220 $0.48 Weighted-average shares outstanding Basic 451.6 451.3 432.5 Diluted 456.7 458.5 456.2 1) See press release attached as exhibit 99.1 to the Form 8-K filed February 27, 2019 for additional information indicating why the Company believes this non-GAAP measure is useful for investors. N Y S E : D N R 35 w w w . d e n b u r y . c o m
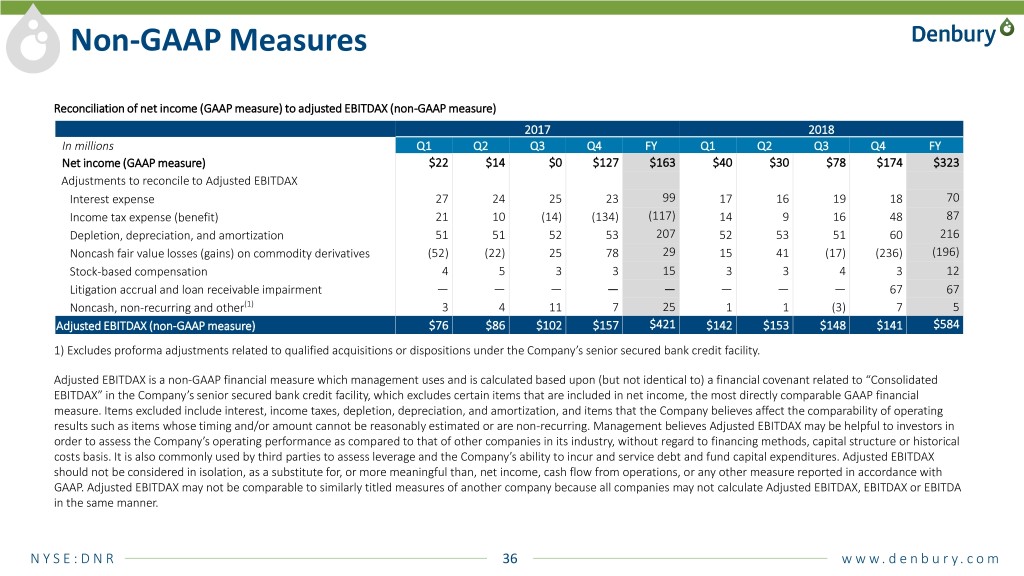
Non-GAAP Measures Reconciliation of net income (GAAP measure) to adjusted EBITDAX (non-GAAP measure) 2017 2018 In millions Q1 Q2 Q3 Q4 FY Q1 Q2 Q3 Q4 FY Net income (GAAP measure) $22 $14 $0 $127 $163 $40 $30 $78 $174 $323 Adjustments to reconcile to Adjusted EBITDAX Interest expense 27 24 25 23 99 17 16 19 18 70 Income tax expense (benefit) 21 10 (14) (134) (117) 14 9 16 48 87 Depletion, depreciation, and amortization 51 51 52 53 207 52 53 51 60 216 Noncash fair value losses (gains) on commodity derivatives (52) (22) 25 78 29 15 41 (17) (236) (196) Stock-based compensation 4 5 3 3 15 3 3 4 3 12 Litigation accrual and loan receivable impairment — — — — — — — — 67 67 Noncash, non-recurring and other(1) 3 4 11 7 25 1 1 (3) 7 5 Adjusted EBITDAX (non-GAAP measure) $76 $86 $102 $157 $421 $142 $153 $148 $141 $584 1) Excludes proforma adjustments related to qualified acquisitions or dispositions under the Company’s senior secured bank credit facility. Adjusted EBITDAX is a non-GAAP financial measure which management uses and is calculated based upon (but not identical to) a financial covenant related to “Consolidated EBITDAX” in the Company’s senior secured bank credit facility, which excludes certain items that are included in net income, the most directly comparable GAAP financial measure. Items excluded include interest, income taxes, depletion, depreciation, and amortization, and items that the Company believes affect the comparability of operating results such as items whose timing and/or amount cannot be reasonably estimated or are non-recurring. Management believes Adjusted EBITDAX may be helpful to investors in order to assess the Company’s operating performance as compared to that of other companies in its industry, without regard to financing methods, capital structure or historical costs basis. It is also commonly used by third parties to assess leverage and the Company’s ability to incur and service debt and fund capital expenditures. Adjusted EBITDAX should not be considered in isolation, as a substitute for, or more meaningful than, net income, cash flow from operations, or any other measure reported in accordance with GAAP. Adjusted EBITDAX may not be comparable to similarly titled measures of another company because all companies may not calculate Adjusted EBITDAX, EBITDAX or EBITDA in the same manner. N Y S E : D N R 36 w w w . d e n b u r y . c o m
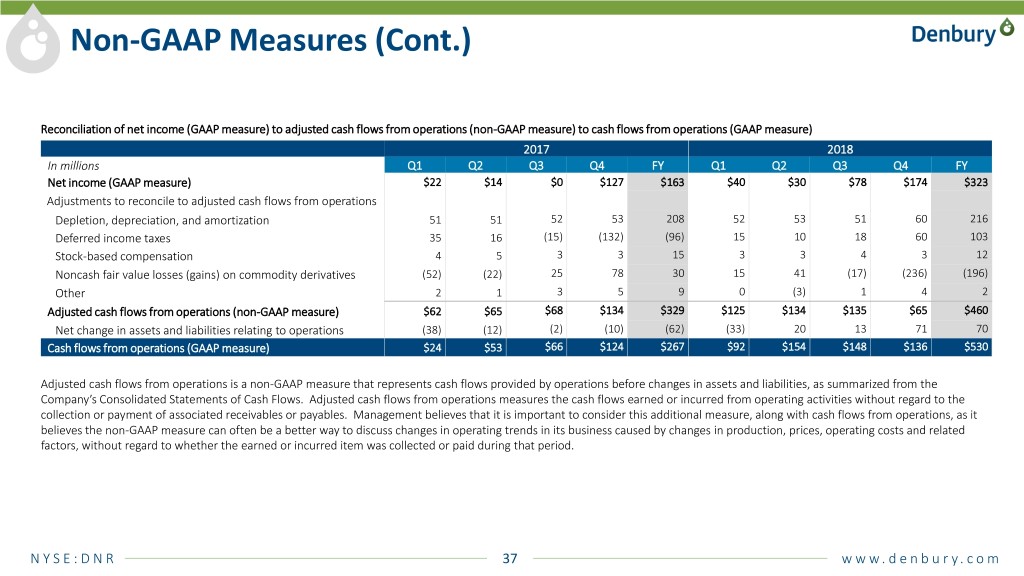
Non-GAAP Measures (Cont.) Reconciliation of net income (GAAP measure) to adjusted cash flows from operations (non-GAAP measure) to cash flows from operations (GAAP measure) 2017 2018 In millions Q1 Q2 Q3 Q4 FY Q1 Q2 Q3 Q4 FY Net income (GAAP measure) $22 $14 $0 $127 $163 $40 $30 $78 $174 $323 Adjustments to reconcile to adjusted cash flows from operations Depletion, depreciation, and amortization 51 51 52 53 208 52 53 51 60 216 Deferred income taxes 35 16 (15) (132) (96) 15 10 18 60 103 Stock-based compensation 4 5 3 3 15 3 3 4 3 12 Noncash fair value losses (gains) on commodity derivatives (52) (22) 25 78 30 15 41 (17) (236) (196) Other 2 1 3 5 9 0 (3) 1 4 2 Adjusted cash flows from operations (non-GAAP measure) $62 $65 $68 $134 $329 $125 $134 $135 $65 $460 Net change in assets and liabilities relating to operations (38) (12) (2) (10) (62) (33) 20 13 71 70 Cash flows from operations (GAAP measure) $24 $53 $66 $124 $267 $92 $154 $148 $136 $530 Adjusted cash flows from operations is a non-GAAP measure that represents cash flows provided by operations before changes in assets and liabilities, as summarized from the Company’s Consolidated Statements of Cash Flows. Adjusted cash flows from operations measures the cash flows earned or incurred from operating activities without regard to the collection or payment of associated receivables or payables. Management believes that it is important to consider this additional measure, along with cash flows from operations, as it believes the non-GAAP measure can often be a better way to discuss changes in operating trends in its business caused by changes in production, prices, operating costs and related factors, without regard to whether the earned or incurred item was collected or paid during that period. N Y S E : D N R 37 w w w . d e n b u r y . c o m


