
Cleansing Presentation July 23, 2020
Cautionary Statements Forward-Looking Statements: The data and/or statements contained in this presentation that are not historical facts are forward-looking statements, as that term is defined in Section 21E of the Securities Exchange Act of 1934, as amended, that involve a number of risks and uncertainties. Such forward-looking statements may be or may concern, among other things, financial forecasts, future hydrocarbon prices and their volatility, current or future liquidity sources or their adequacy to support our anticipated future activities, our ability to refinance or extend the maturities of our long-term indebtedness which matures in 2021 and 2022, possible future write-downs of oil and natural gas reserves and the effect of these factors upon our ability to continue as a going concern, together with assumptions based on current and projected production levels, oil and gas prices and oilfield costs, current or future expectations or estimations of our cash flows or the impact of changes in commodity prices on cash flows, availability of capital, borrowing capacity, price and availability of advantageous commodity derivative contracts or the predicted cash flow benefits therefrom, forecasted capital expenditures, drilling activity or methods, including the timing and location thereof, the nature of any future asset purchases or sales or the timing or proceeds thereof, estimated timing of commencement of CO2 flooding of particular fields or areas, including Cedar Creek Anticline (“CCA”), or the availability of capital for CCA pipeline construction, or its ultimate cost or date of completion, timing of CO2 injections and initial production responses in tertiary flooding projects, development activities, finding costs, anticipated future cost savings, capital budgets, interpretation or prediction of formation details, production rates and volumes or forecasts thereof, hydrocarbon reserve quantities and values, CO2 reserves and supply and their availability, potential reserves, barrels or percentages of recoverable original oil in place, levels of tariffs or other trade restrictions, the likelihood, timing and impact of increased interest rates, the impact of regulatory rulings or changes, outcomes of pending litigation, prospective legislation affecting the oil and gas industry, environmental regulations, mark-to-market values, the extent and length of the drop in worldwide oil demand due to the COVID-19 coronavirus, competition, rates of return, estimated costs, changes in costs, future capital expenditures and overall economics, worldwide economic conditions, the likelihood and extent of an economic slowdown, and other variables surrounding operations and future plans. Such forward-looking statements generally are accompanied by words such as “plan,” “estimate,” “expect,” “predict,” “forecast,” “to our knowledge,” “anticipate,” “projected,” “preliminary,” “should,” “assume,” “believe,” “may” or other words that convey, or are intended to convey, the uncertainty of future events or outcomes. Such forward-looking information is based upon management’s current plans, expectations, estimates, and assumptions and is subject to a number of risks and uncertainties that could significantly and adversely affect current plans, anticipated actions, the timing of such actions and our financial condition and results of operations. As a consequence, actual results may differ materially from expectations, estimates or assumptions expressed in or implied by any forward-looking statements made by us or on our behalf. Among the factors that could cause actual results to differ materially are our ability to comply with the maximum permitted ratio of total net debt to consolidated EBITDAX maintenance financial covenant in our senior secured bank credit facility and the related impact on our ability to continue as a going concern, our ability to refinance our senior debt maturing in 2021 and the related impact on our ability to continue as a going concern, the outcome of any discussions with our lenders and bondholders regarding the terms of a potential restructuring of our indebtedness or recapitalization of the Company and any resulting dilution for our stockholders, fluctuations in worldwide oil prices or in U.S. oil prices and consequently in the prices received or demand for our oil and natural gas; evolving political and military tensions in the Middle East; decisions as to production levels and/or pricing by OPEC or production levels by U.S. shale producers in future periods; levels of future capital expenditures; trade disputes and resulting tariffs or international economic sanctions; effects and maturity dates of our indebtedness; success of our risk management techniques; accuracy of our cost estimates; access to and or terms of credit in the commercial banking or other debt markets; fluctuations in the prices of goods and services; the uncertainty of drilling results and reserve estimates; operating hazards and remediation costs; disruption of operations and damages from well incidents, hurricanes, tropical storms, forest fires, or other natural occurrences; acquisition risks; requirements for capital or its availability; conditions in the worldwide financial, trade and credit markets; general economic conditions; competition; government regulations, including changes in tax or environmental laws or regulations; and unexpected delays, as well as the risks and uncertainties inherent in oil and gas drilling and production activities or that are otherwise discussed in this presentation, including, without limitation, the portions referenced above, and the uncertainties set forth from time to time in our other public reports, filings and public statements. Statement Regarding Non-GAAP Financial Measures: This presentation also contains certain non-GAAP financial measures including free cash flows, adjusted cash flows from operations, adjusted EBITDAX, and PV-10. Any non-GAAP measure included herein is accompanied by a reconciliation to the most directly comparable U.S. GAAP measure along with a statement on why the Company believes the measure is beneficial to investors, which statements are included at the end of this presentation. Note to U.S. Investors: Current SEC rules regarding oil and gas reserves information allow oil and gas companies to disclose in filings with the SEC not only proved reserves, but also probable and possible reserves that meet the SEC’s definitions of such terms. We disclose only proved reserves in our filings with the SEC. Denbury’s proved reserves as of December 31, 2018 and December 31, 2019 were estimated by DeGolyer and MacNaughton, an independent petroleum engineering firm. In this presentation, we may make reference to probable and possible reserves, some of which have been estimated by our independent engineers and some of which have been estimated by Denbury’s internal staff of engineers. In this presentation, we also may refer to one or more of estimates of original oil in place, resource or reserves “potential,” barrels recoverable, “risked” and “unrisked” resource potential, estimated ultimate recovery (EUR) or other descriptions of volumes potentially recoverable, which in addition to reserves generally classifiable as probable and possible (2P and 3P reserves), include estimates of resources that do not rise to the standards for possible reserves, and which SEC guidelines strictly prohibit us from including in filings with the SEC. These estimates, as well as the estimates of probable and possible reserves, are by their nature more speculative than estimates of proved reserves and are subject to greater uncertainties, and accordingly the likelihood of recovering those reserves is subject to substantially greater risk. NYSE:DNR 2

Subject to Nondisclosure Agreement PRIVATE AND CONFIDENTIAL THIS DOCUMENT CONTAINS CONFIDENTIAL INFORMATION ANY DISCLOSURE, DISSEMINATION OR UNAUTHORIZED USE OF THIS DOCUMENT OR INFORMATION CONTAINED HEREIN IS STRICTLY PROHIBITED This presentation was prepared on a confidential basis by management of Denbury Resources Inc. (“DNR” or the “Company”), and is being delivered to certain creditors of the Company and their advisors. This presentation provides summary information only and is being delivered solely for informational purposes. Neither the creditors of the Company, their respective advisors nor any other person may rely upon this presentation for any purpose. This presentation should not be construed as a commitment by the Company to pursue any transaction or any other course of action, and any transaction or course of action described in this presentation may not occur. This presentation is based upon information that is publicly available or which was provided by or on behalf of the management of DNR, including, without limitation, management operating and financial forecasts or projections. Such information involves numerous significant assumptions and subjective determinations that may or may not be correct. No representation or warranty, express or implied, can be made or is made by the Company as to the accuracy or completeness of any such information or the achievability of any such forecasts or projections. Except where otherwise indicated, this presentation speaks as of the date hereof and is necessarily based upon the information available and financial and other conditions and circumstances existing and disclosed as of the date hereof, all of which are subject to change. Management of the Company does not have any obligation to update, bring- down, review or reaffirm this presentation. This presentation is incomplete without reference to, and should be viewed solely in conjunction with, the oral briefing provided by management of the Company. Under no circumstances should the delivery of this presentation imply that any information or analyses included in this presentation would be the same if made as of any other date. Nothing contained in this presentation is, or shall be relied upon as, a promise or representation as to the past, present or future. Nothing contained herein shall be deemed to be a recommendation from the Company to any party to enter into any transaction or to take any course of action. This presentation does not constitute advice of any kind, including, without limitation, legal, tax or accounting advice, and the creditors of the Company and their respective advisors should receive (and rely on) separate and qualified advice as to the matters set forth herein, including legal, tax and accounting advice. These materials do not constitute an offer or solicitation to sell or purchase any securities. THIS PRESENTATION IS CONFIDENTIAL, AND IT MAY NOT BE COPIED BY, OR DISCLOSED OR MADE AVAILABLE TO, ANY PERSON WITHOUT THE PRIOR WRITTEN CONSENT OF THE COMPANY. The Company shall not have any liability, whether direct or indirect, in contract or tort or otherwise, to any person in connection with this presentation. NYSE:DNR 3
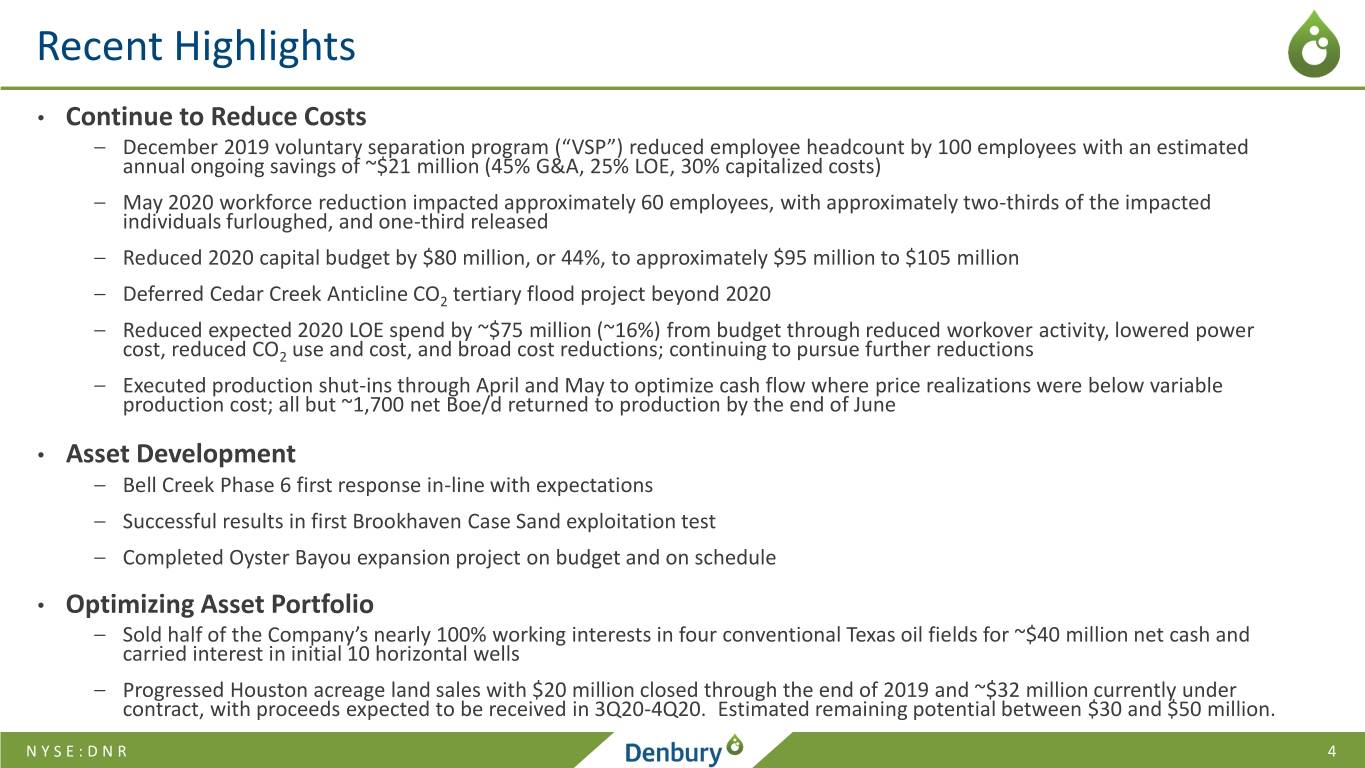
Recent Highlights • Continue to Reduce Costs – December 2019 voluntary separation program (“VSP”) reduced employee headcount by 100 employees with an estimated annual ongoing savings of ~$21 million (45% G&A, 25% LOE, 30% capitalized costs) – May 2020 workforce reduction impacted approximately 60 employees, with approximately two-thirds of the impacted individuals furloughed, and one-third released – Reduced 2020 capital budget by $80 million, or 44%, to approximately $95 million to $105 million – Deferred Cedar Creek Anticline CO2 tertiary flood project beyond 2020 – Reduced expected 2020 LOE spend by ~$75 million (~16%) from budget through reduced workover activity, lowered power cost, reduced CO2 use and cost, and broad cost reductions; continuing to pursue further reductions – Executed production shut-ins through April and May to optimize cash flow where price realizations were below variable production cost; all but ~1,700 net Boe/d returned to production by the end of June • Asset Development – Bell Creek Phase 6 first response in-line with expectations – Successful results in first Brookhaven Case Sand exploitation test – Completed Oyster Bayou expansion project on budget and on schedule • Optimizing Asset Portfolio – Sold half of the Company’s nearly 100% working interests in four conventional Texas oil fields for ~$40 million net cash and carried interest in initial 10 horizontal wells – Progressed Houston acreage land sales with $20 million closed through the end of 2019 and ~$32 million currently under contract, with proceeds expected to be received in 3Q20-4Q20. Estimated remaining potential between $30 and $50 million. NYSE:DNR 4
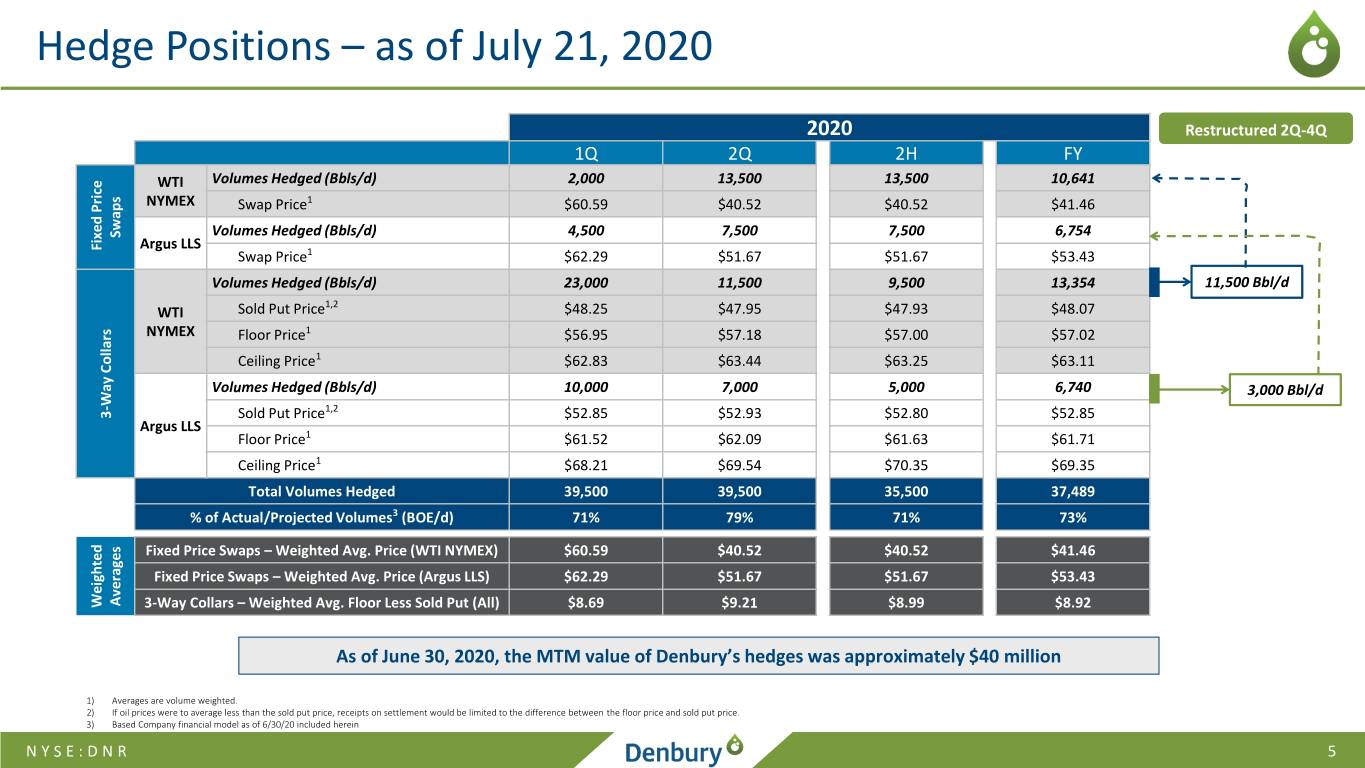
Hedge Positions – as of July 21, 2020 2020 Restructured 2Q-4Q 1Q 2Q 2H FY WTI Volumes Hedged (Bbls/d) 2,000 13,500 13,500 10,641 NYMEX Swap Price1 $60.59 $40.52 $40.52 $41.46 Swaps Volumes Hedged (Bbls/d) 4,500 7,500 7,500 6,754 Fixed Price Fixed Argus LLS Swap Price1 $62.29 $51.67 $51.67 $53.43 Volumes Hedged (Bbls/d) 23,000 11,500 9,500 13,354 11,500 Bbl/d 1,2 WTI Sold Put Price $48.25 $47.95 $47.93 $48.07 NYMEX Floor Price1 $56.95 $57.18 $57.00 $57.02 Ceiling Price1 $62.83 $63.44 $63.25 $63.11 Volumes Hedged (Bbls/d) 10,000 7,000 5,000 6,740 3,000 Bbl/d Way Collars Way - 1,2 3 Sold Put Price $52.85 $52.93 $52.80 $52.85 Argus LLS Floor Price1 $61.52 $62.09 $61.63 $61.71 Ceiling Price1 $68.21 $69.54 $70.35 $69.35 Total Volumes Hedged 39,500 39,500 35,500 37,489 % of Actual/Projected Volumes3 (BOE/d) 71% 79% 71% 73% Fixed Price Swaps – Weighted Avg. Price (WTI NYMEX) $60.59 $40.52 $40.52 $41.46 Fixed Price Swaps – Weighted Avg. Price (Argus LLS) $62.29 $51.67 $51.67 $53.43 Averages Weighted Weighted 3-Way Collars – Weighted Avg. Floor Less Sold Put (All) $8.69 $9.21 $8.99 $8.92 As of June 30, 2020, the MTM value of Denbury’s hedges was approximately $40 million 1) Averages are volume weighted. 2) If oil prices were to average less than the sold put price, receipts on settlement would be limited to the difference between the floor price and sold put price. 3) Based Company financial model as of 6/30/20 included herein NYSE:DNR 5
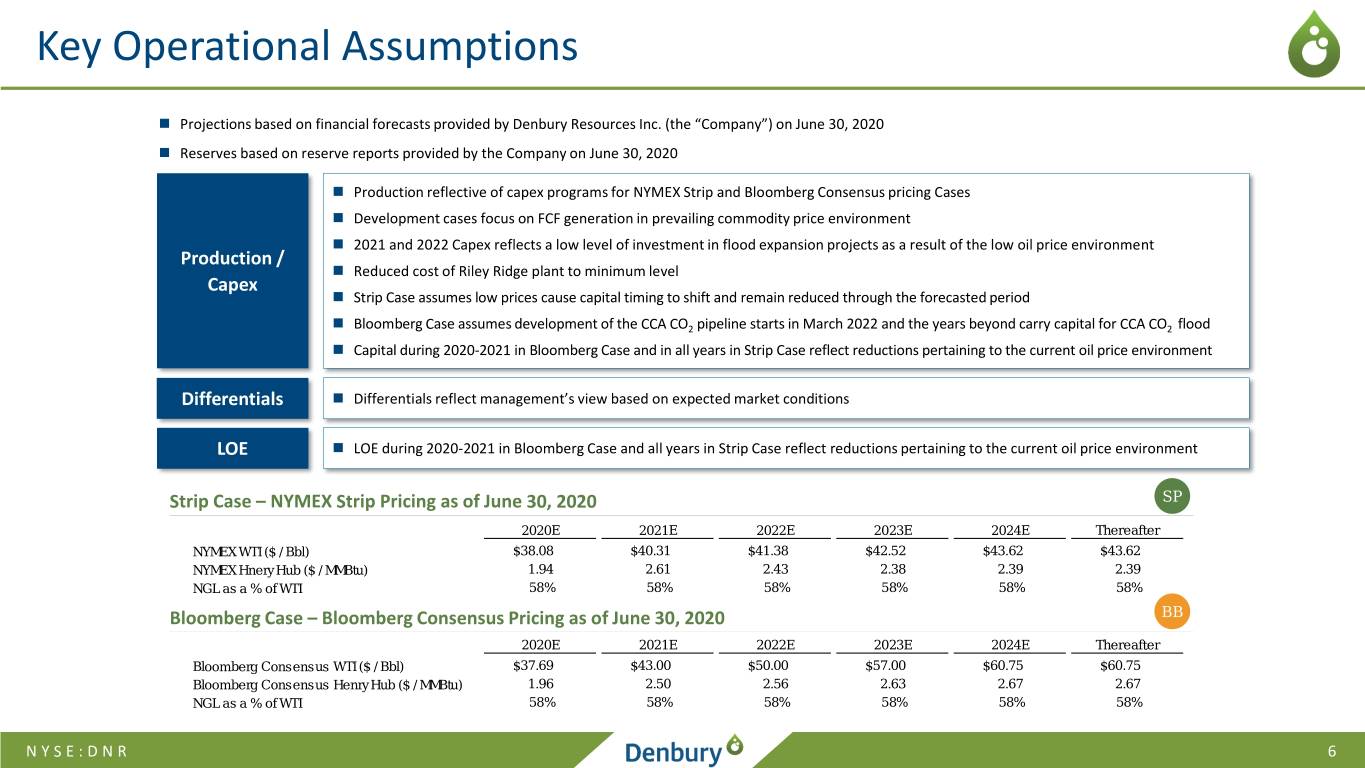
Key Operational Assumptions Projections based on financial forecasts provided by Denbury Resources Inc. (the “Company”) on June 30, 2020 Reserves based on reserve reports provided by the Company on June 30, 2020 Production reflective of capex programs for NYMEX Strip and Bloomberg Consensus pricing Cases Development cases focus on FCF generation in prevailing commodity price environment 2021 and 2022 Capex reflects a low level of investment in flood expansion projects as a result of the low oil price environment Production / Reduced cost of Riley Ridge plant to minimum level Capex Strip Case assumes low prices cause capital timing to shift and remain reduced through the forecasted period Bloomberg Case assumes development of the CCA CO2 pipeline starts in March 2022 and the years beyond carry capital for CCA CO2 flood Capital during 2020-2021 in Bloomberg Case and in all years in Strip Case reflect reductions pertaining to the current oil price environment Differentials Differentials reflect management’s view based on expected market conditions LOE LOE during 2020-2021 in Bloomberg Case and all years in Strip Case reflect reductions pertaining to the current oil price environment Strip Case – NYMEX Strip Pricing as of June 30, 2020 SP 2020E 2021E 2022E 2023E 2024E Thereafter NYMEX WTI ($ / Bbl) $38.08 $40.31 $41.38 $42.52 $43.62 $43.62 NYMEX Hnery Hub ($ / MMBtu) 1.94 2.61 2.43 2.38 2.39 2.39 NGL as a % of WTI 58% 58% 58% 58% 58% 58% Bloomberg Case – Bloomberg Consensus Pricing as of June 30, 2020 BB 2020E 2021E 2022E 2023E 2024E Thereafter Bloomberg Consensus WTI ($ / Bbl) $37.69 $43.00 $50.00 $57.00 $60.75 $60.75 Bloomberg Consensus Henry Hub ($ / MMBtu) 1.96 2.50 2.56 2.63 2.67 2.67 NGL as a % of WTI 58% 58% 58% 58% 58% 58% NYSE:DNR 6
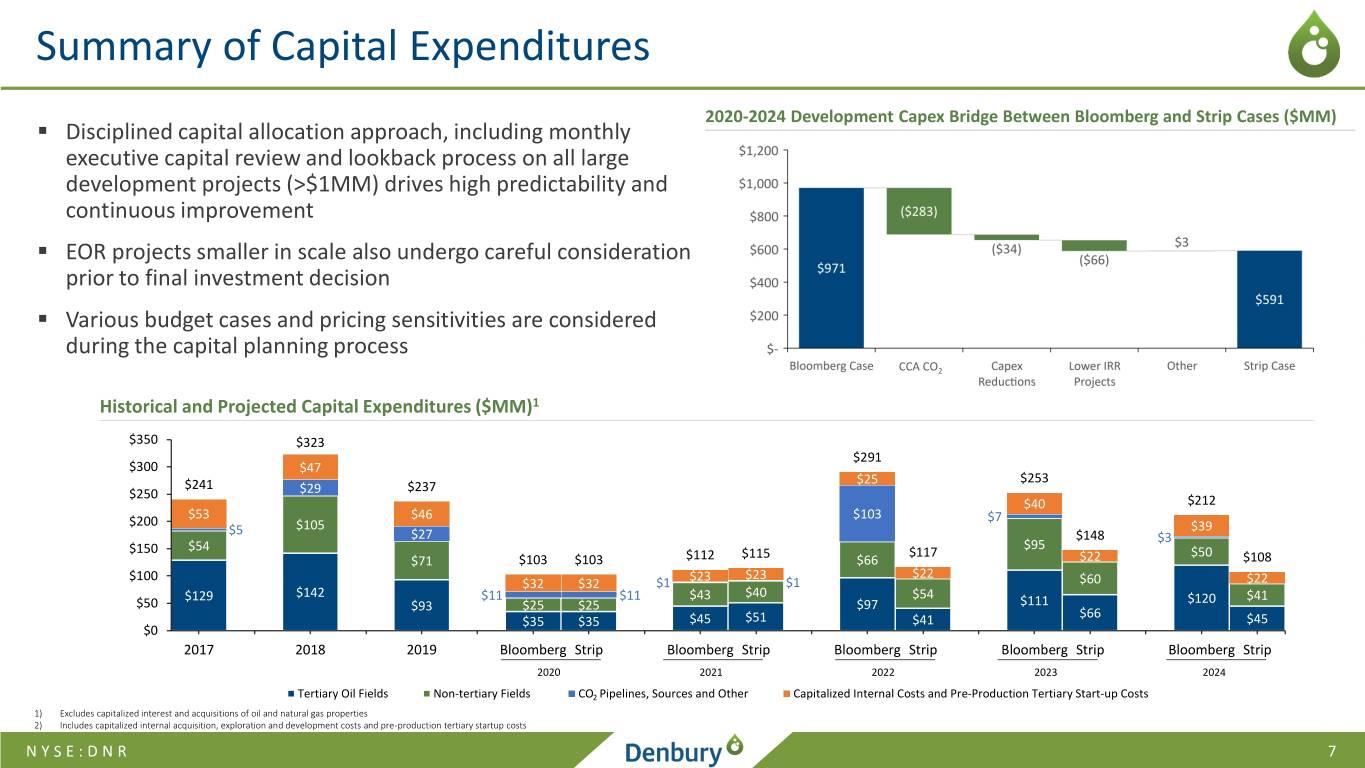
Summary of Capital Expenditures 2020-2024 Development Capex Bridge Between Bloomberg and Strip Cases ($MM) . Disciplined capital allocation approach, including monthly executive capital review and lookback process on all large development projects (>$1MM) drives high predictability and continuous improvement . EOR projects smaller in scale also undergo careful consideration prior to final investment decision . Various budget cases and pricing sensitivities are considered during the capital planning process CCA CO2 Historical and Projected Capital Expenditures ($MM)1 $350 $323 $291 $300 $47 $25 $253 $241 $237 $250 $29 $40 $212 $53 $103 $200 $46 $7 $5 $105 $39 $27 $148 $3 $54 $95 $150 $115 $117 $50 $71 $103 $103 $112 $66 $22 $108 $100 $23 $23 $22 $32 $32 $1 $1 $60 $22 $129 $142 $11 $11 $43 $40 $54 $120 $41 $50 $93 $25 $25 $97 $111 $66 $35 $35 $45 $51 $41 $45 $0 2017 2018 2019 Bloomberg Strip Bloomberg Strip Bloomberg Strip Bloomberg Strip Bloomberg Strip 2020 2021 2022 2023 2024 Tertiary Oil Fields Non-tertiary Fields CO2 Pipelines, Sources and Other Capitalized Internal Costs and Pre-Production Tertiary Start-up Costs 1) Excludes capitalized interest and acquisitions of oil and natural gas properties 2) Includes capitalized internal acquisition, exploration and development costs and pre-production tertiary startup costs NYSE:DNR 7
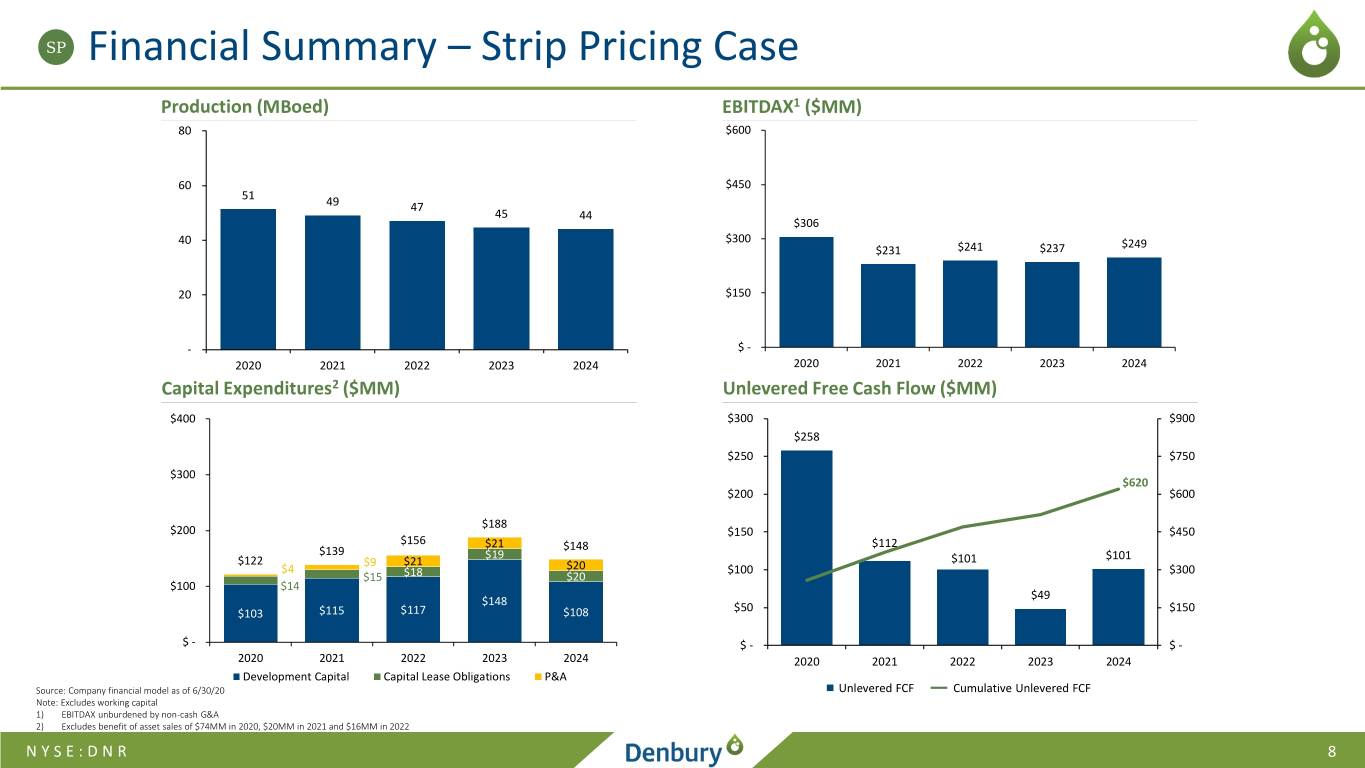
SP Financial Summary – Strip Pricing Case Production (MBoed) EBITDAX1 ($MM) 80 $600 60 $450 51 49 47 45 44 $306 40 $300 $249 $231 $241 $237 20 $150 - $ - 2020 2021 2022 2023 2024 2020 2021 2022 2023 2024 Capital Expenditures2 ($MM) Unlevered Free Cash Flow ($MM) $400 $300 $900 $258 $250 $750 $300 $620 $200 $600 $188 $200 $150 $450 $156 $21 $148 $112 $139 $19 $101 $122 $9 $21 $101 $4 $20 $100 $300 $15 $18 $20 $100 $14 $148 $49 $103 $115 $117 $108 $50 $150 $ - $ - $ - 2020 2021 2022 2023 2024 2020 2021 2022 2023 2024 Development Capital Capital Lease Obligations P&A Source: Company financial model as of 6/30/20 Unlevered FCF Cumulative Unlevered FCF Note: Excludes working capital 1) EBITDAX unburdened by non-cash G&A 2) Excludes benefit of asset sales of $74MM in 2020, $20MM in 2021 and $16MM in 2022 NYSE:DNR 8
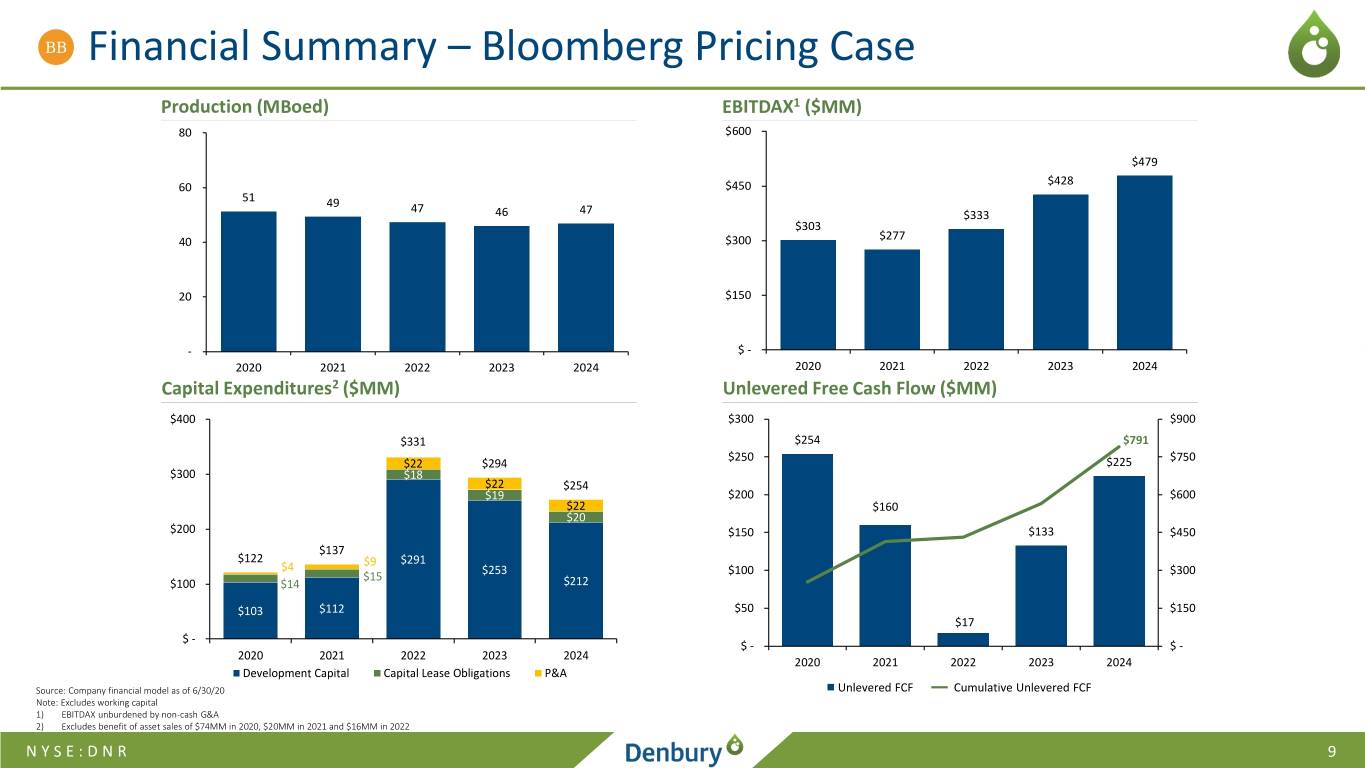
BB Financial Summary – Bloomberg Pricing Case Production (MBoed) EBITDAX1 ($MM) 80 $600 $479 $428 60 $450 51 49 47 46 47 $333 $303 $277 40 $300 20 $150 - $ - 2020 2021 2022 2023 2024 2020 2021 2022 2023 2024 Capital Expenditures2 ($MM) Unlevered Free Cash Flow ($MM) $400 $300 $900 $331 $254 $791 $250 $750 $22 $294 $225 $300 $18 $22 $254 $19 $200 $600 $22 $160 $20 $200 $150 $133 $450 $137 $122 $9 $291 $4 $253 $15 $100 $300 $100 $14 $212 $103 $112 $50 $150 $17 $ - $ - $ - 2020 2021 2022 2023 2024 2020 2021 2022 2023 2024 Development Capital Capital Lease Obligations P&A Source: Company financial model as of 6/30/20 Unlevered FCF Cumulative Unlevered FCF Note: Excludes working capital 1) EBITDAX unburdened by non-cash G&A 2) Excludes benefit of asset sales of $74MM in 2020, $20MM in 2021 and $16MM in 2022 NYSE:DNR 9
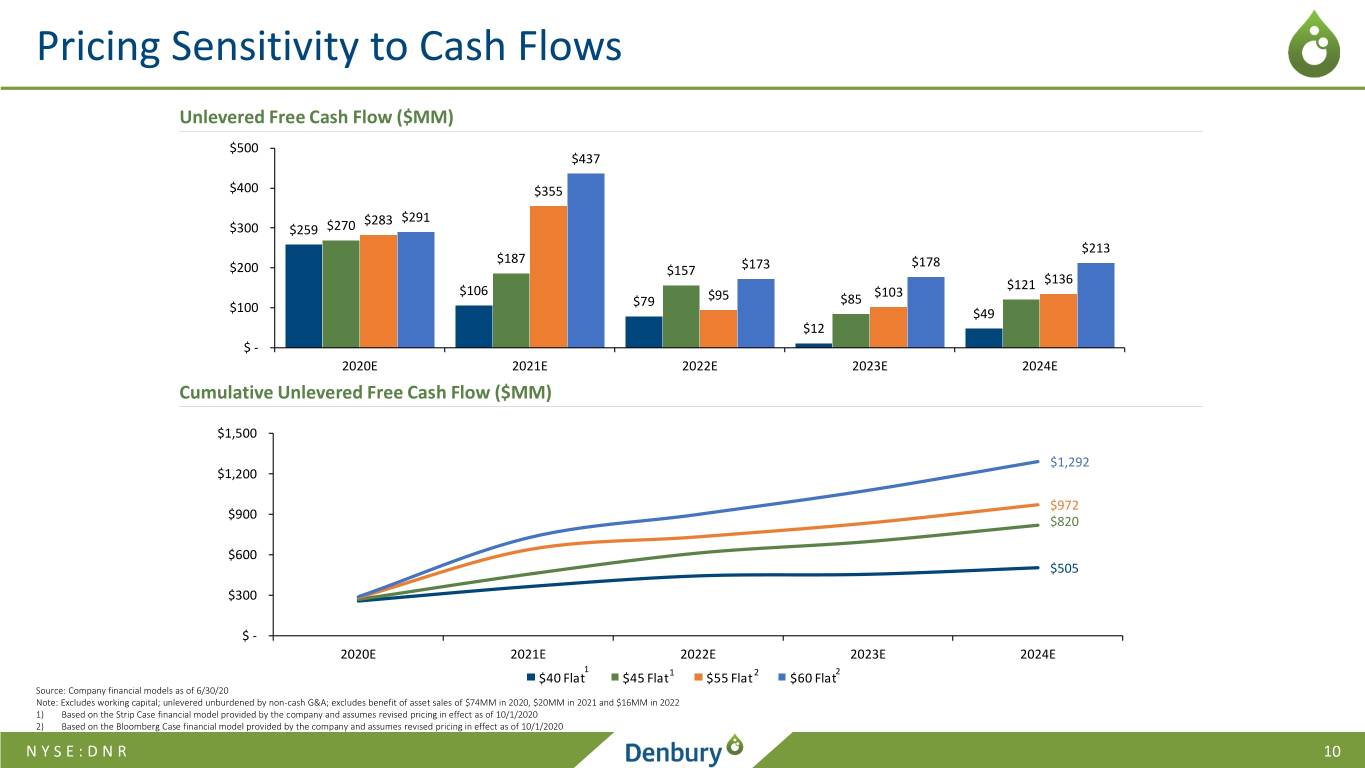
Pricing Sensitivity to Cash Flows Unlevered Free Cash Flow ($MM) $500 $437 $400 $355 $283 $291 $300 $259 $270 $213 $187 $178 $200 $157 $173 $121 $136 $106 $103 $79 $95 $85 $100 $49 $12 $ - 2020E 2021E 2022E 2023E 2024E Cumulative Unlevered Free Cash Flow ($MM) $1,500 $1,292 $1,200 $972 $900 $820 $600 $505 $500 $ - $300$172 $172 $172 $172 $72 $72 $66 $66 $76 $155 $89 $168 $13 $88 $100 $177 $48 $122 $134 $212 2020E 2021E 2022E 2023E 2024E $ - 2020E 2021E 2022E 2023E 2024E 1 2 $40 Flat $45 Flat1 $55 Flat2 $60 Flat Source: Company financial models as of 6/30/20 Note: Excludes working capital; unlevered unburdened by non-cash G&A; excludes benefit of asset sales of $74MM in 2020, $20MM in 2021 and $16MM in 2022 1) Based on the Strip Case financial model provided by the company and assumes revised pricing in effect as of 10/1/2020 2) Based on the Bloomberg Case financial model provided by the company and assumes revised pricing in effect as of 10/1/2020 NYSE:DNR 10
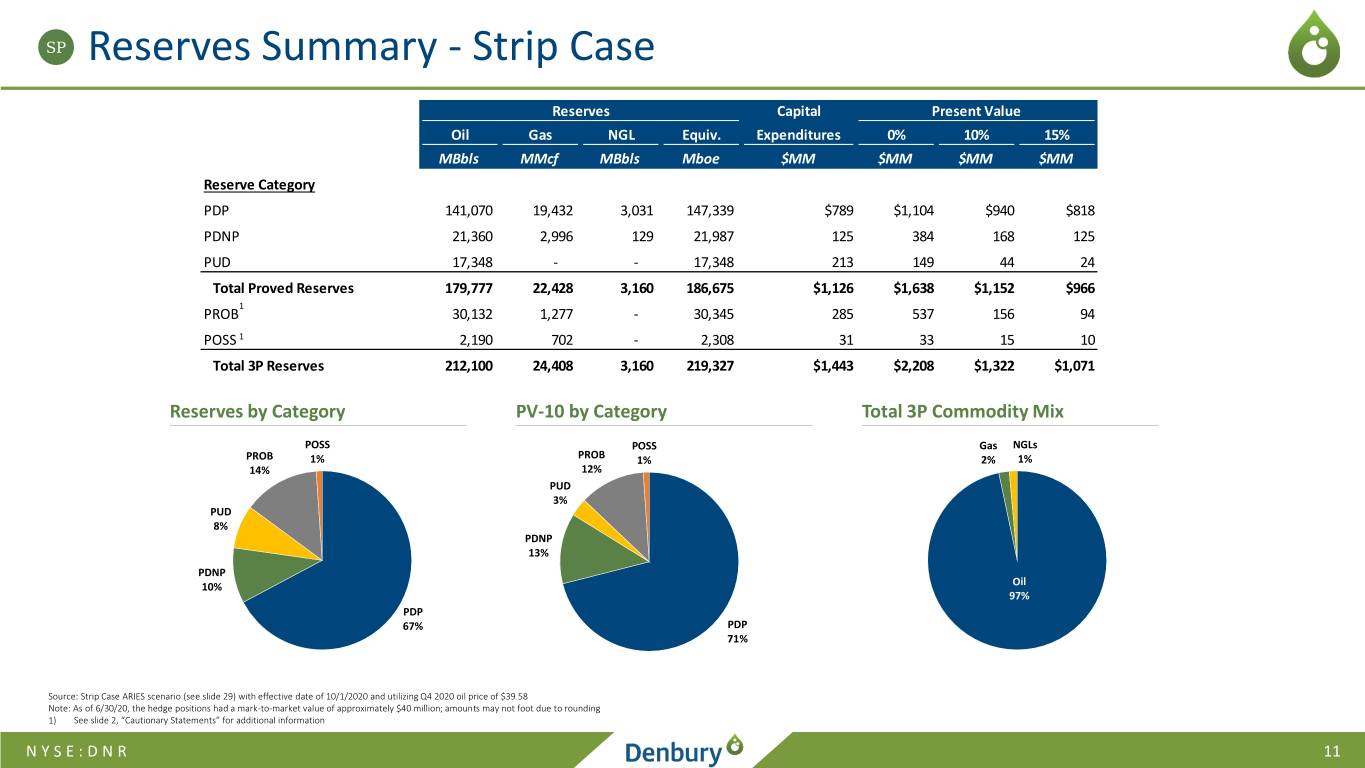
SP Reserves Summary - Strip Case Reserves Capital Present Value Oil Gas NGL Equiv. Expenditures 0% 10% 15% MBbls MMcf MBbls Mboe $MM $MM $MM $MM Reserve Category PDP 141,070 19,432 3,031 147,339 $789 $1,104 $940 $818 PDNP 21,360 2,996 129 21,987 125 384 168 125 PUD 17,348 - - 17,348 213 149 44 24 Total Proved Reserves 179,777 22,428 3,160 186,675 $1,126 $1,638 $1,152 $966 1 PROB 30,132 1,277 - 30,345 285 537 156 94 POSS 1 2,190 702 - 2,308 31 33 15 10 Total 3P Reserves 212,100 24,408 3,160 219,327 $1,443 $2,208 $1,322 $1,071 Reserves by Category PV-10 by Category Total 3P Commodity Mix POSS POSS Gas NGLs PROB 1% PROB 1% 2% 1% 14% 12% PUD 3% PUD 8% PDNP 13% PDNP 10% Oil 97% PDP 67% PDP 71% Source: Strip Case ARIES scenario (see slide 29) with effective date of 10/1/2020 and utilizing Q4 2020 oil price of $39.58 Note: As of 6/30/20, the hedge positions had a mark-to-market value of approximately $40 million; amounts may not foot due to rounding 1) See slide 2, “Cautionary Statements” for additional information NYSE:DNR 11
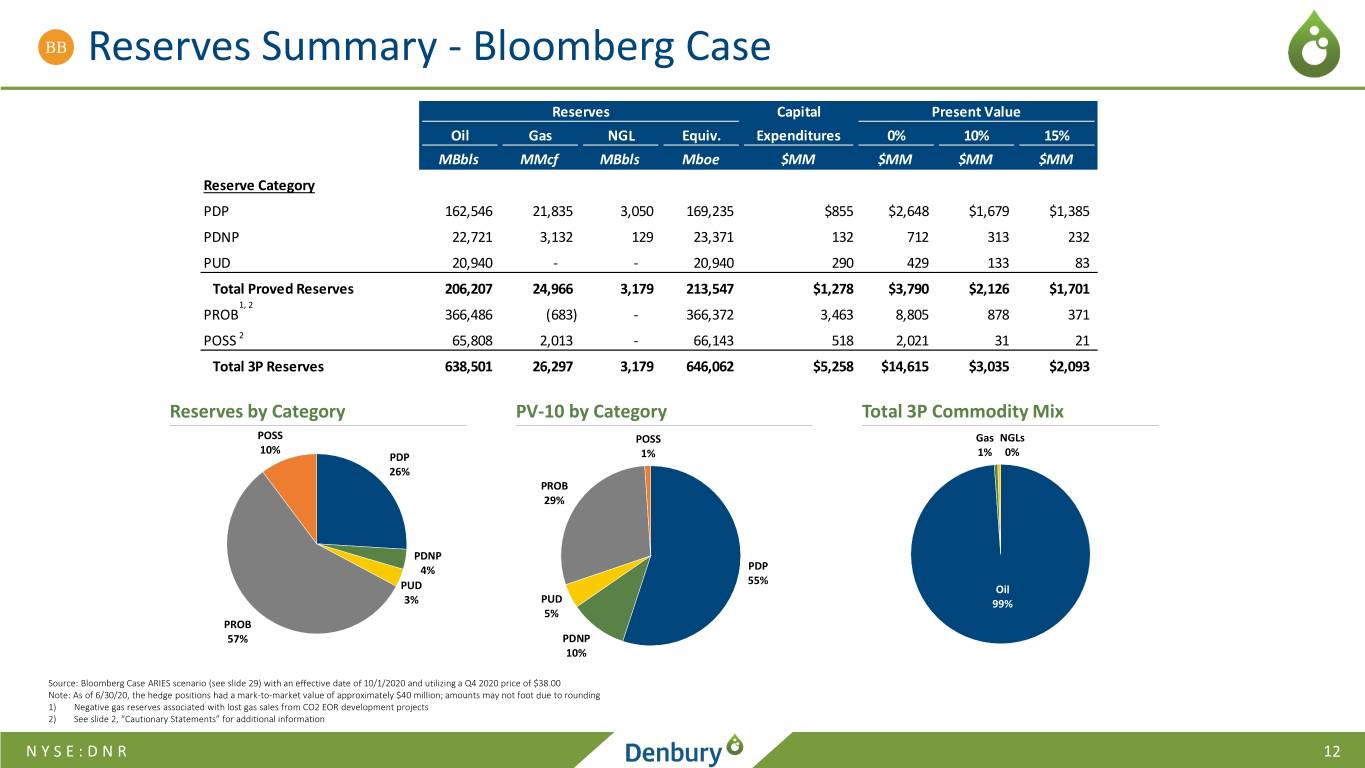
BB Reserves Summary - Bloomberg Case Reserves Capital Present Value Oil Gas NGL Equiv. Expenditures 0% 10% 15% MBbls MMcf MBbls Mboe $MM $MM $MM $MM Reserve Category PDP 162,546 21,835 3,050 169,235 $855 $2,648 $1,679 $1,385 PDNP 22,721 3,132 129 23,371 132 712 313 232 PUD 20,940 - - 20,940 290 429 133 83 Total Proved Reserves 206,207 24,966 3,179 213,547 $1,278 $3,790 $2,126 $1,701 1, 2 PROB 366,486 (683) - 366,372 3,463 8,805 878 371 POSS 2 65,808 2,013 - 66,143 518 2,021 31 21 Total 3P Reserves 638,501 26,297 3,179 646,062 $5,258 $14,615 $3,035 $2,093 Reserves by Category PV-10 by Category Total 3P Commodity Mix POSS POSS Gas NGLs 10% PDP 1% 1% 0% 26% PROB 29% PDNP 4% PDP 55% PUD Oil 3% PUD 99% 5% PROB 57% PDNP 10% Source: Bloomberg Case ARIES scenario (see slide 29) with an effective date of 10/1/2020 and utilizing a Q4 2020 price of $38.00 Note: As of 6/30/20, the hedge positions had a mark-to-market value of approximately $40 million; amounts may not foot due to rounding 1) Negative gas reserves associated with lost gas sales from CO2 EOR development projects 2) See slide 2, “Cautionary Statements” for additional information NYSE:DNR 12
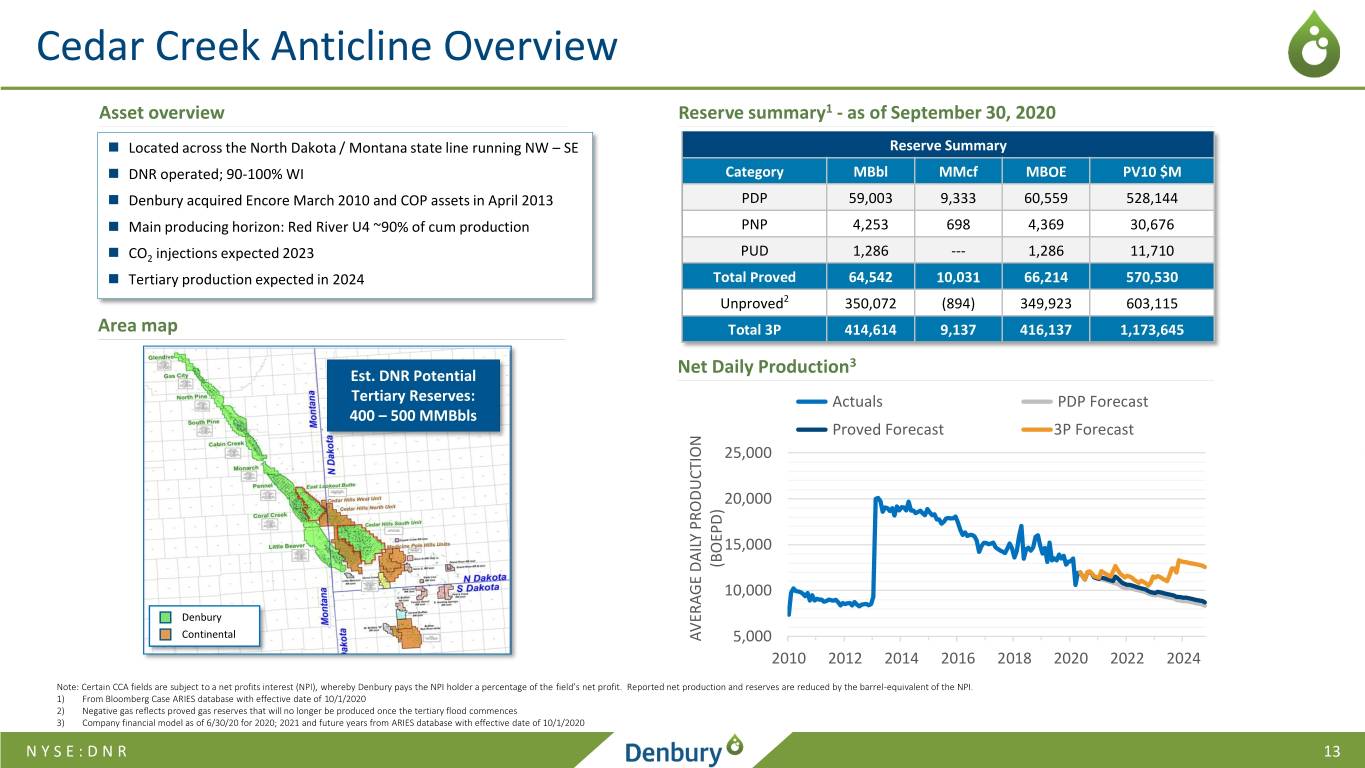
Cedar Creek Anticline Overview Asset overview Reserve summary1 - as of September 30, 2020 Located across the North Dakota / Montana state line running NW – SE Reserve Summary DNR operated; 90-100% WI Category MBbl MMcf MBOE PV10 $M Denbury acquired Encore March 2010 and COP assets in April 2013 PDP 59,003 9,333 60,559 528,144 Main producing horizon: Red River U4 ~90% of cum production PNP 4,253 698 4,369 30,676 CO2 injections expected 2023 PUD 1,286 --- 1,286 11,710 Tertiary production expected in 2024 Total Proved 64,542 10,031 66,214 570,530 Unproved2 350,072 (894) 349,923 603,115 Area map Total 3P 414,614 9,137 416,137 1,173,645 3 Est. DNR Potential Net Daily Production Tertiary Reserves: Actuals PDP Forecast 400 – 500 MMBbls Proved Forecast 3P Forecast 25,000 20,000 15,000 (BOEPD) 10,000 Denbury Continental AVERAGE DAILY PRODUCTION PRODUCTION DAILY AVERAGE 5,000 2010 2012 2014 2016 2018 2020 2022 2024 Note: Certain CCA fields are subject to a net profits interest (NPI), whereby Denbury pays the NPI holder a percentage of the field’s net profit. Reported net production and reserves are reduced by the barrel-equivalent of the NPI. 1) From Bloomberg Case ARIES database with effective date of 10/1/2020 2) Negative gas reflects proved gas reserves that will no longer be produced once the tertiary flood commences 3) Company financial model as of 6/30/20 for 2020; 2021 and future years from ARIES database with effective date of 10/1/2020 NYSE:DNR 13
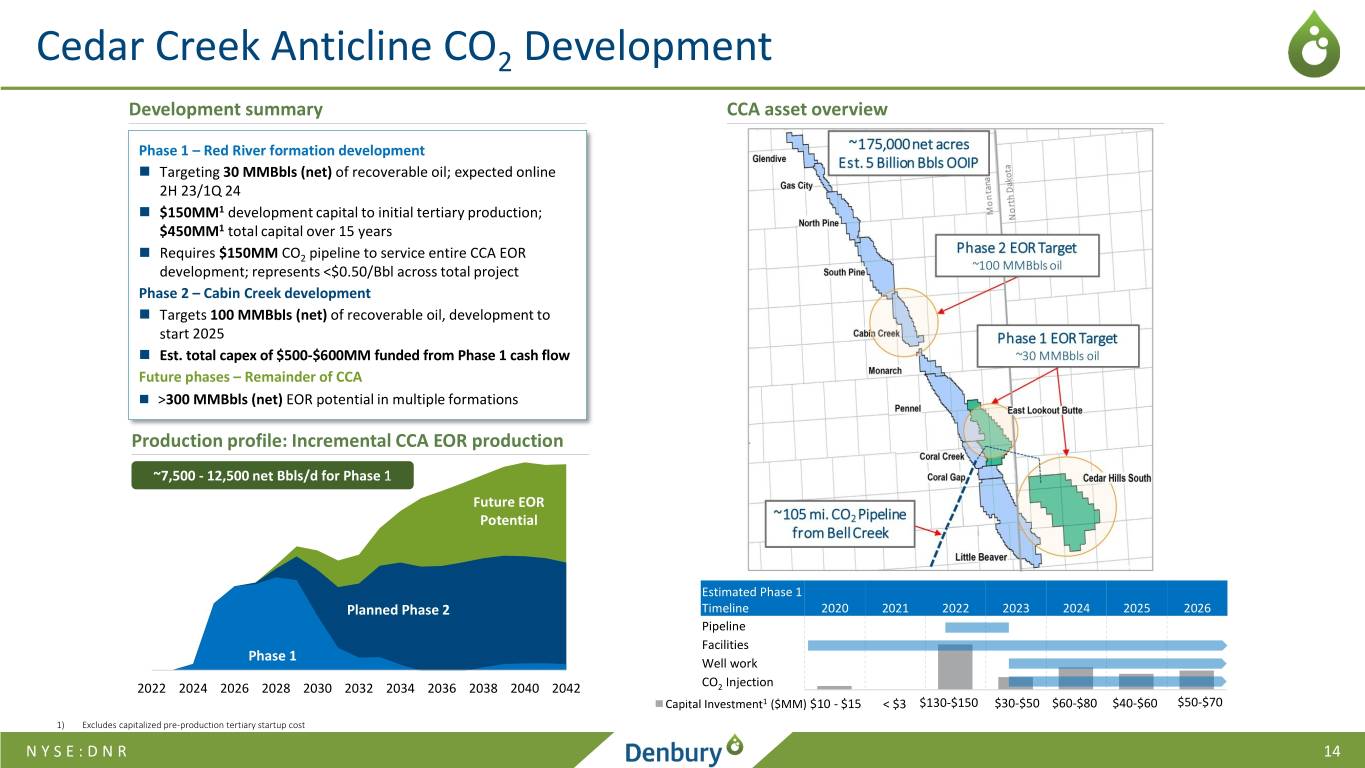
Cedar Creek Anticline CO2 Development Development summary CCA asset overview Phase 1 – Red River formation development Targeting 30 MMBbls (net) of recoverable oil; expected online 2H 23/1Q 24 $150MM1 development capital to initial tertiary production; $450MM1 total capital over 15 years Requires $150MM CO2 pipeline to service entire CCA EOR development; represents <$0.50/Bbl across total project Phase 2 – Cabin Creek development Targets 100 MMBbls (net) of recoverable oil, development to start 2025 Est. total capex of $500-$600MM funded from Phase 1 cash flow Future phases – Remainder of CCA >300 MMBbls (net) EOR potential in multiple formations Production profile: Incremental CCA EOR production ~7,500 - 12,500 net Bbls/d for Phase 1 Future EOR Potential Estimated Phase 1 Planned Phase 2 Timeline 2020 2021 2022 2023 2024 2025 2026 Pipeline Facilities Phase 1 Well work CO Injection 2022 2024 2026 2028 2030 2032 2034 2036 2038 2040 2042 2 Capital Investment1 ($MM) $10 - $15 < $3 $130-$150 $30-$50 $60-$80 $40-$60 $50-$70 1) Excludes capitalized pre-production tertiary startup cost NYSE:DNR 14


