UNITED STATES
SECURITIES AND EXCHANGE COMMISSION
Washington, D.C. 20549
FORM N-CSR
CERTIFIED SHAREHOLDER REPORT OF REGISTERED
MANAGEMENT INVESTMENT COMPANIES
Investment Company Act file number 811-07319
Fidelity Covington Trust
(Exact name of registrant as specified in charter)
245 Summer St., Boston, Massachusetts 02210
(Address of principal executive offices) (Zip code)
Margaret Carey, Secretary
245 Summer St.
Boston, Massachusetts 02210
(Name and address of agent for service)
Registrant's telephone number, including area code:
617-563-7000
Date of fiscal year end: | July 31 |
Date of reporting period: | July 31, 2023 |
Item 1.
Reports to Stockholders


Contents
| Average Annual Total Returns | |||
Periods ended July 31, 2023 | Past 1 year | Past 5 years | Life of Fund |
Fidelity® Dividend ETF for Rising Rates - NAV A | 8.17% | 9.73% | 11.25% |
Fidelity® Dividend ETF for Rising Rates - Market Price B | 7.87% | 9.67% | 11.29% |
Fidelity Dividend Index for Rising Rates℠ A | 8.47% | 10.07% | 11.62% |
Russell 1000® Index A | 12.95% | 11.92% | 13.38% |
| $10,000 Over Life of Fund |
Let's say hypothetically that $10,000 was invested in Fidelity® Dividend ETF for Rising Rates - NAV, on September 12, 2016, when the fund started. The chart shows how the value of your investment would have changed, and also shows how the Fidelity Dividend Index for Rising Rates℠ and Russell 1000® Index performed over the same period. |
 |
Top Holdings (% of Fund's net assets) | ||
| Apple, Inc. | 8.7 | |
| Microsoft Corp. | 7.5 | |
| Broadcom, Inc. | 2.4 | |
| UnitedHealth Group, Inc. | 2.2 | |
| Johnson & Johnson | 2.1 | |
| Visa, Inc. Class A | 2.0 | |
| JPMorgan Chase & Co. | 2.0 | |
| Cisco Systems, Inc. | 1.6 | |
| Merck & Co., Inc. | 1.6 | |
| AbbVie, Inc. | 1.6 | |
| 31.7 | ||
| Market Sectors (% of Fund's net assets) | ||
| Information Technology | 27.9 | |
| Financials | 14.1 | |
| Health Care | 13.4 | |
| Consumer Discretionary | 9.4 | |
| Industrials | 8.8 | |
| Consumer Staples | 6.8 | |
| Communication Services | 6.2 | |
| Energy | 4.6 | |
| Materials | 2.8 | |
| Real Estate | 2.8 | |
| Utilities | 2.6 | |
Asset Allocation (% of Fund's net assets) |
 |
Futures - 0.5% |
| Common Stocks - 99.4% | |||
| Shares | Value ($) | ||
| COMMUNICATION SERVICES - 6.2% | |||
| Diversified Telecommunication Services - 1.2% | |||
| AT&T, Inc. | 199,741 | 2,900,239 | |
| Verizon Communications, Inc. | 107,100 | 3,649,968 | |
| 6,550,207 | |||
| Entertainment - 0.9% | |||
| Electronic Arts, Inc. | 21,370 | 2,913,800 | |
| Warner Music Group Corp. Class A | 56,635 | 1,786,834 | |
| 4,700,634 | |||
| Media - 4.1% | |||
| Cable One, Inc. (a) | 2,494 | 1,805,506 | |
| Comcast Corp. Class A | 109,533 | 4,957,464 | |
| Fox Corp. Class A | 64,827 | 2,168,463 | |
| Interpublic Group of Companies, Inc. | 58,463 | 2,001,188 | |
| News Corp. Class A | 102,815 | 2,037,793 | |
| Nexstar Broadcasting Group, Inc. Class A | 10,201 | 1,904,731 | |
| Omnicom Group, Inc. | 25,237 | 2,135,555 | |
| Paramount Global Class B (a) | 88,648 | 1,421,027 | |
| TEGNA, Inc. | 104,208 | 1,761,115 | |
| The New York Times Co. Class A | 58,346 | 2,378,183 | |
| 22,571,025 | |||
TOTAL COMMUNICATION SERVICES | 33,821,866 | ||
| CONSUMER DISCRETIONARY - 9.4% | |||
| Automobiles - 0.8% | |||
| Ford Motor Co. | 332,630 | 4,394,042 | |
| Broadline Retail - 0.6% | |||
| Kohl's Corp. (a) | 118,542 | 3,372,520 | |
| Hotels, Restaurants & Leisure - 2.3% | |||
| McDonald's Corp. | 25,233 | 7,398,316 | |
| Starbucks Corp. | 52,317 | 5,313,838 | |
| 12,712,154 | |||
| Household Durables - 1.3% | |||
| Newell Brands, Inc. | 247,075 | 2,757,357 | |
| Vistry Group PLC | 408,886 | 4,153,506 | |
| 6,910,863 | |||
| Specialty Retail - 3.4% | |||
| Best Buy Co., Inc. | 46,342 | 3,848,703 | |
| Lowe's Companies, Inc. | 26,538 | 6,217,057 | |
| The Home Depot, Inc. | 25,832 | 8,623,755 | |
| 18,689,515 | |||
| Textiles, Apparel & Luxury Goods - 1.0% | |||
| NIKE, Inc. Class B | 48,226 | 5,323,668 | |
TOTAL CONSUMER DISCRETIONARY | 51,402,762 | ||
| CONSUMER STAPLES - 6.8% | |||
| Beverages - 2.4% | |||
| PepsiCo, Inc. | 36,550 | 6,851,663 | |
| The Coca-Cola Co. | 103,157 | 6,388,513 | |
| 13,240,176 | |||
| Consumer Staples Distribution & Retail - 0.7% | |||
| Target Corp. | 28,351 | 3,869,061 | |
| Food Products - 0.5% | |||
| Tyson Foods, Inc. Class A | 49,829 | 2,776,472 | |
| Household Products - 1.5% | |||
| Procter & Gamble Co. | 53,654 | 8,386,120 | |
| Tobacco - 1.7% | |||
| Altria Group, Inc. | 88,257 | 4,008,633 | |
| Philip Morris International, Inc. | 50,207 | 5,006,642 | |
| 9,015,275 | |||
TOTAL CONSUMER STAPLES | 37,287,104 | ||
| ENERGY - 4.6% | |||
| Oil, Gas & Consumable Fuels - 4.6% | |||
| Chevron Corp. | 33,159 | 5,426,802 | |
| ConocoPhillips Co. | 30,298 | 3,566,681 | |
| Coterra Energy, Inc. | 69,929 | 1,925,845 | |
| Devon Energy Corp. | 32,974 | 1,780,596 | |
| EOG Resources, Inc. | 19,806 | 2,624,889 | |
| Exxon Mobil Corp. | 69,893 | 7,495,325 | |
| Pioneer Natural Resources Co. | 9,918 | 2,238,195 | |
| 25,058,333 | |||
| FINANCIALS - 14.1% | |||
| Banks - 8.2% | |||
| Bank of America Corp. | 208,781 | 6,680,992 | |
| Citigroup, Inc. | 104,601 | 4,985,284 | |
| ING Groep NV (Certificaten Van Aandelen) | 292,545 | 4,283,404 | |
| Intesa Sanpaolo SpA | 1,513,843 | 4,388,031 | |
| JPMorgan Chase & Co. | 69,701 | 11,009,970 | |
| KBC Group NV | 53,831 | 4,059,634 | |
| Truist Financial Corp. | 99,020 | 3,289,444 | |
| Wells Fargo & Co. | 138,649 | 6,400,038 | |
| 45,096,797 | |||
| Capital Markets - 1.0% | |||
| Blackstone, Inc. | 50,344 | 5,275,548 | |
| Financial Services - 2.8% | |||
| The Western Union Co. | 384,942 | 4,688,594 | |
| Visa, Inc. Class A | 46,347 | 11,018,072 | |
| 15,706,666 | |||
| Insurance - 1.5% | |||
| American Financial Group, Inc. | 31,148 | 3,787,908 | |
| Old Republic International Corp. | 158,006 | 4,356,225 | |
| 8,144,133 | |||
| Mortgage Real Estate Investment Trusts - 0.6% | |||
| Annaly Capital Management, Inc. | 175,121 | 3,518,181 | |
TOTAL FINANCIALS | 77,741,325 | ||
| HEALTH CARE - 13.4% | |||
| Biotechnology - 2.9% | |||
| AbbVie, Inc. | 60,390 | 9,033,136 | |
| Amgen, Inc. | 28,517 | 6,677,256 | |
| 15,710,392 | |||
| Health Care Equipment & Supplies - 1.2% | |||
| Medtronic PLC | 77,881 | 6,834,837 | |
| Health Care Providers & Services - 2.2% | |||
| UnitedHealth Group, Inc. | 23,960 | 12,132,625 | |
| Pharmaceuticals - 7.1% | |||
| Bristol-Myers Squibb Co. | 100,987 | 6,280,382 | |
| GSK PLC | 297,078 | 5,292,431 | |
| Johnson & Johnson | 67,544 | 11,315,646 | |
| Merck & Co., Inc. | 85,362 | 9,103,857 | |
| Pfizer, Inc. | 195,002 | 7,031,772 | |
| 39,024,088 | |||
TOTAL HEALTH CARE | 73,701,942 | ||
| INDUSTRIALS - 8.8% | |||
| Aerospace & Defense - 0.9% | |||
| Raytheon Technologies Corp. | 57,467 | 5,053,073 | |
| Air Freight & Logistics - 1.0% | |||
| United Parcel Service, Inc. Class B | 28,919 | 5,411,612 | |
| Ground Transportation - 1.1% | |||
| Union Pacific Corp. | 25,380 | 5,888,668 | |
| Industrial Conglomerates - 2.3% | |||
| 3M Co. | 37,611 | 4,193,627 | |
| Honeywell International, Inc. | 26,664 | 5,176,282 | |
| Jardine Matheson Holdings Ltd. | 67,028 | 3,309,843 | |
| 12,679,752 | |||
| Machinery - 1.0% | |||
| Caterpillar, Inc. | 21,908 | 5,809,344 | |
| Marine Transportation - 1.9% | |||
| A.P. Moller - Maersk A/S Series B | 1,525 | 3,143,946 | |
| Mitsui OSK Lines Ltd. | 142,100 | 3,675,517 | |
| Nippon Yusen KK | 146,700 | 3,560,118 | |
| 10,379,581 | |||
| Professional Services - 0.6% | |||
| Randstad NV | 54,317 | 3,190,790 | |
TOTAL INDUSTRIALS | 48,412,820 | ||
| INFORMATION TECHNOLOGY - 27.9% | |||
| Communications Equipment - 1.6% | |||
| Cisco Systems, Inc. | 167,417 | 8,712,381 | |
| Electronic Equipment, Instruments & Components - 1.0% | |||
| Corning, Inc. | 161,126 | 5,468,616 | |
| IT Services - 1.4% | |||
| IBM Corp. | 52,542 | 7,575,506 | |
| Semiconductors & Semiconductor Equipment - 6.6% | |||
| Broadcom, Inc. | 14,606 | 13,125,682 | |
| Intel Corp. | 237,940 | 8,511,114 | |
| Qualcomm, Inc. | 55,688 | 7,360,283 | |
| Texas Instruments, Inc. | 42,099 | 7,577,820 | |
| 36,574,899 | |||
| Software - 7.5% | |||
| Microsoft Corp. | 123,383 | 41,446,817 | |
| Technology Hardware, Storage & Peripherals - 9.8% | |||
| Apple, Inc. | 242,303 | 47,600,427 | |
| HP, Inc. | 189,741 | 6,229,197 | |
| 53,829,624 | |||
TOTAL INFORMATION TECHNOLOGY | 153,607,843 | ||
| MATERIALS - 2.8% | |||
| Chemicals - 1.9% | |||
| Air Products & Chemicals, Inc. | 6,976 | 2,129,982 | |
| Dow, Inc. | 29,013 | 1,638,364 | |
| Linde PLC | 10,301 | 4,024,292 | |
| LyondellBasell Industries NV Class A | 15,519 | 1,534,208 | |
| The Mosaic Co. | 27,462 | 1,119,351 | |
| 10,446,197 | |||
| Containers & Packaging - 0.7% | |||
| Amcor PLC | 115,413 | 1,184,137 | |
| International Paper Co. | 32,780 | 1,182,047 | |
| Packaging Corp. of America | 9,256 | 1,419,408 | |
| 3,785,592 | |||
| Metals & Mining - 0.2% | |||
| Newmont Corp. (a) | 33,021 | 1,417,261 | |
TOTAL MATERIALS | 15,649,050 | ||
| REAL ESTATE - 2.8% | |||
| Equity Real Estate Investment Trusts (REITs) - 2.8% | |||
| American Tower Corp. | 11,137 | 2,119,482 | |
| Crown Castle International Corp. | 13,005 | 1,408,311 | |
| Healthcare Trust of America, Inc. | 54,111 | 1,056,788 | |
| Medical Properties Trust, Inc. (a) | 91,390 | 922,125 | |
| Omega Healthcare Investors, Inc. | 38,985 | 1,243,622 | |
| Prologis (REIT), Inc. | 20,696 | 2,581,826 | |
| Public Storage | 5,622 | 1,583,999 | |
| Realty Income Corp. | 24,453 | 1,490,899 | |
| Simon Property Group, Inc. | 12,647 | 1,575,816 | |
| Weyerhaeuser Co. | 40,180 | 1,368,531 | |
| 15,351,399 | |||
| UTILITIES - 2.6% | |||
| Electric Utilities - 2.2% | |||
| American Electric Power Co., Inc. | 19,028 | 1,612,433 | |
| Duke Energy Corp. | 21,682 | 2,029,869 | |
| Edison International | 21,690 | 1,560,812 | |
| NextEra Energy, Inc. | 42,325 | 3,102,423 | |
| NRG Energy, Inc. | 35,486 | 1,348,113 | |
| Southern Co. | 31,460 | 2,275,816 | |
| 11,929,466 | |||
| Independent Power and Renewable Electricity Producers - 0.1% | |||
| Clearway Energy, Inc. Class C | 34,377 | 907,897 | |
| Multi-Utilities - 0.3% | |||
| Dominion Energy, Inc. | 29,699 | 1,590,381 | |
TOTAL UTILITIES | 14,427,744 | ||
| TOTAL COMMON STOCKS (Cost $502,490,537) | 546,462,188 | ||
| Money Market Funds - 1.5% | |||
| Shares | Value ($) | ||
| Fidelity Cash Central Fund 5.32% (b) | 2,061,721 | 2,062,133 | |
| Fidelity Securities Lending Cash Central Fund 5.32% (b)(c) | 6,086,966 | 6,087,575 | |
| TOTAL MONEY MARKET FUNDS (Cost $8,149,708) | 8,149,708 | ||
| TOTAL INVESTMENT IN SECURITIES - 100.9% (Cost $510,640,245) | 554,611,896 |
NET OTHER ASSETS (LIABILITIES) - (0.9)% | (5,076,195) |
| NET ASSETS - 100.0% | 549,535,701 |
| Futures Contracts | |||||
Number of contracts | Expiration Date | Notional Amount ($) | Value ($) | Unrealized Appreciation/ (Depreciation) ($) | |
| Purchased | |||||
| Equity Index Contracts | |||||
| CME E-mini S&P 500 Index Contracts (United States) | 12 | Sep 2023 | 2,768,700 | 153,385 | 153,385 |
| The notional amount of futures purchased as a percentage of Net Assets is 0.5% | |||||
| (a) | Security or a portion of the security is on loan at period end. |
| (b) | Affiliated fund that is generally available only to investment companies and other accounts managed by Fidelity Investments. The rate quoted is the annualized seven-day yield of the fund at period end. A complete unaudited listing of the fund's holdings as of its most recent quarter end is available upon request. In addition, each Fidelity Central Fund's financial statements, which are not covered by the Fund's Report of Independent Registered Public Accounting Firm, are available on the SEC's website or upon request. |
| (c) | Investment made with cash collateral received from securities on loan. |
| Affiliate | Value, beginning of period ($) | Purchases ($) | Sales Proceeds ($) | Dividend Income ($) | Realized Gain (loss) ($) | Change in Unrealized appreciation (depreciation) ($) | Value, end of period ($) | % ownership, end of period |
| Fidelity Cash Central Fund 5.32% | 1,664,238 | 37,620,438 | 37,222,543 | 49,256 | - | - | 2,062,133 | 0.0% |
| Fidelity Securities Lending Cash Central Fund 5.32% | 16,551,925 | 117,404,415 | 127,868,765 | 184,646 | - | - | 6,087,575 | 0.0% |
| Total | 18,216,163 | 155,024,853 | 165,091,308 | 233,902 | - | - | 8,149,708 | |
| Valuation Inputs at Reporting Date: | ||||
| Description | Total ($) | Level 1 ($) | Level 2 ($) | Level 3 ($) |
Investments in Securities: | ||||
| Equities: | ||||
Communication Services | 33,821,866 | 33,821,866 | - | - |
Consumer Discretionary | 51,402,762 | 51,402,762 | - | - |
Consumer Staples | 37,287,104 | 37,287,104 | - | - |
Energy | 25,058,333 | 25,058,333 | - | - |
Financials | 77,741,325 | 77,741,325 | - | - |
Health Care | 73,701,942 | 73,701,942 | - | - |
Industrials | 48,412,820 | 48,412,820 | - | - |
Information Technology | 153,607,843 | 153,607,843 | - | - |
Materials | 15,649,050 | 15,649,050 | - | - |
Real Estate | 15,351,399 | 15,351,399 | - | - |
Utilities | 14,427,744 | 14,427,744 | - | - |
| Money Market Funds | 8,149,708 | 8,149,708 | - | - |
| Total Investments in Securities: | 554,611,896 | 554,611,896 | - | - |
Derivative Instruments: | ||||
| Assets | ||||
Futures Contracts | 153,385 | 153,385 | - | - |
| Total Assets | 153,385 | 153,385 | - | - |
| Total Derivative Instruments: | 153,385 | 153,385 | - | - |
Primary Risk Exposure / Derivative Type | Value | |
| Asset ($) | Liability ($) | |
| Equity Risk | ||
Futures Contracts (a) | 153,385 | 0 |
| Total Equity Risk | 153,385 | 0 |
| Total Value of Derivatives | 153,385 | 0 |
| Statement of Assets and Liabilities | ||||
| July 31, 2023 | ||||
| Assets | ||||
| Investment in securities, at value (including securities loaned of $5,983,178) - See accompanying schedule: | ||||
Unaffiliated issuers (cost $502,490,537) | $ | 546,462,188 | ||
Fidelity Central Funds (cost $8,149,708) | 8,149,708 | |||
| Total Investment in Securities (cost $510,640,245) | $ | 554,611,896 | ||
| Segregated cash with brokers for derivative instruments | 134,400 | |||
| Foreign currency held at value (cost $182,326) | 183,933 | |||
| Dividends receivable | 811,244 | |||
| Distributions receivable from Fidelity Central Funds | 7,729 | |||
| Receivable for daily variation margin on futures contracts | 4,800 | |||
Total assets | 555,754,002 | |||
| Liabilities | ||||
| Accrued management fee | $ | 130,726 | ||
| Collateral on securities loaned | 6,087,575 | |||
| Total Liabilities | 6,218,301 | |||
| Net Assets | $ | 549,535,701 | ||
| Net Assets consist of: | ||||
| Paid in capital | $ | 565,839,189 | ||
| Total accumulated earnings (loss) | (16,303,488) | |||
| Net Assets | $ | 549,535,701 | ||
Net Asset Value, offering price and redemption price per share ($549,535,701 ÷ 12,750,000 shares) | $ | 43.10 | ||
| Statement of Operations | ||||
Year ended July 31, 2023 | ||||
| Investment Income | ||||
| Dividends | $ | 18,446,725 | ||
| Income from Fidelity Central Funds (including $184,646 from security lending) | 233,902 | |||
| Total Income | 18,680,627 | |||
| Expenses | ||||
| Management fee | $ | 1,625,282 | ||
| Independent trustees' fees and expenses | 2,921 | |||
| Interest | 1,254 | |||
| Total expenses before reductions | 1,629,457 | |||
| Expense reductions | (183) | |||
| Total expenses after reductions | 1,629,274 | |||
| Net Investment income (loss) | 17,051,353 | |||
| Realized and Unrealized Gain (Loss) | ||||
| Net realized gain (loss) on: | ||||
| Investment Securities: | ||||
| Unaffiliated issuers | (21,299,689) | |||
| Redemptions in-kind | 41,388,416 | |||
| Foreign currency transactions | (98,236) | |||
| Futures contracts | (157,915) | |||
| Total net realized gain (loss) | 19,832,576 | |||
| Change in net unrealized appreciation (depreciation) on: | ||||
| Investment Securities: | ||||
| Unaffiliated issuers | 2,247,029 | |||
| Assets and liabilities in foreign currencies | 57,752 | |||
| Futures contracts | 77,600 | |||
| Total change in net unrealized appreciation (depreciation) | 2,382,381 | |||
| Net gain (loss) | 22,214,957 | |||
| Net increase (decrease) in net assets resulting from operations | $ | 39,266,310 | ||
| Statement of Changes in Net Assets | ||||
Year ended July 31, 2023 | Year ended July 31, 2022 | |||
| Increase (Decrease) in Net Assets | ||||
| Operations | ||||
| Net investment income (loss) | $ | 17,051,353 | $ | 14,434,863 |
| Net realized gain (loss) | 19,832,576 | 16,773,810 | ||
| Change in net unrealized appreciation (depreciation) | 2,382,381 | (47,740,920) | ||
| Net increase (decrease) in net assets resulting from operations | 39,266,310 | (16,532,247) | ||
| Distributions to shareholders | (16,860,450) | (14,425,400) | ||
| Share transactions | ||||
| Proceeds from sales of shares | 115,557,120 | 291,688,328 | ||
| Cost of shares redeemed | (200,570,072) | (138,676,589) | ||
Net increase (decrease) in net assets resulting from share transactions | (85,012,952) | 153,011,739 | ||
| Total increase (decrease) in net assets | (62,607,092) | 122,054,092 | ||
| Net Assets | ||||
| Beginning of period | 612,142,793 | 490,088,701 | ||
| End of period | $ | 549,535,701 | $ | 612,142,793 |
| Other Information | ||||
| Shares | ||||
| Sold | 2,750,000 | 6,600,000 | ||
| Redeemed | (4,900,000) | (3,200,000) | ||
| Net increase (decrease) | (2,150,000) | 3,400,000 | ||
| Fidelity® Dividend ETF for Rising Rates |
| Years ended July 31, | 2023 | 2022 | 2021 | 2020 | 2019 | |||||
Selected Per-Share Data | ||||||||||
| Net asset value, beginning of period | $ | 41.08 | $ | 42.62 | $ | 31.72 | $ | 32.31 | $ | 31.54 |
| Income from Investment Operations | ||||||||||
Net investment income (loss) A,B | 1.22 | 1.08 | .93 | 1.01 | 1.07 | |||||
| Net realized and unrealized gain (loss) | 2.02 | (1.54) | 10.85 | (.56) | .79 | |||||
| Total from investment operations | 3.24 | (.46) | 11.78 | .45 | 1.86 | |||||
| Distributions from net investment income | (1.22) | (1.08) | (.88) | (1.04) | (1.09) | |||||
| Total distributions | (1.22) | (1.08) | (.88) | (1.04) | (1.09) | |||||
| Net asset value, end of period | $ | 43.10 | $ | 41.08 | $ | 42.62 | $ | 31.72 | $ | 32.31 |
Total Return C,D | 8.17% | (1.06)% | 37.57% | 1.86% | 6.09% | |||||
Ratios to Average Net Assets B,E,F | ||||||||||
| Expenses before reductions | .29% | .29% | .29% | .29% | .29% | |||||
| Expenses net of fee waivers, if any | .29% | .29% | .29% | .29% | .29% | |||||
| Expenses net of all reductions | .29% | .29% | .29% | .29% | .29% | |||||
| Net investment income (loss) | 3.04% | 2.54% | 2.44% | 3.15% | 3.42% | |||||
| Supplemental Data | ||||||||||
| Net assets, end of period (000 omitted) | $ | 549,536 | $ | 612,143 | $ | 490,089 | $ | 282,317 | $ | 360,229 |
Portfolio turnover rate G,H | 29% | 28% | 32% | 35% | 35% |
| Average Annual Total Returns | |||
Periods ended July 31, 2023 | Past 1 year | Past 5 years | Life of Fund |
Fidelity® High Dividend ETF - NAV A | 12.22% | 10.66% | 11.49% |
Fidelity® High Dividend ETF - Market Price B | 12.09% | 10.62% | 11.60% |
Fidelity High Dividend Index℠ A | 12.55% | 10.98% | 11.83% |
Russell 1000® Index A | 12.95% | 11.92% | 13.38% |
| $10,000 Over Life of Fund |
Let's say hypothetically that $10,000 was invested in Fidelity® High Dividend ETF - NAV, on September 12, 2016, when the fund started. The chart shows how the value of your investment would have changed, and also shows how the Fidelity High Dividend Index℠ and Russell 1000® Index performed over the same period. |
 |
Top Holdings (% of Fund's net assets) | ||
| Apple, Inc. | 6.4 | |
| Microsoft Corp. | 5.6 | |
| NVIDIA Corp. | 3.6 | |
| JPMorgan Chase & Co. | 2.6 | |
| Procter & Gamble Co. | 2.5 | |
| Exxon Mobil Corp. | 2.2 | |
| PepsiCo, Inc. | 2.2 | |
| The Coca-Cola Co. | 2.0 | |
| Chevron Corp. | 1.9 | |
| Philip Morris International, Inc. | 1.7 | |
| 30.7 | ||
| Market Sectors (% of Fund's net assets) | ||
| Information Technology | 23.0 | |
| Financials | 19.1 | |
| Industrials | 14.5 | |
| Consumer Staples | 12.2 | |
| Energy | 11.0 | |
| Real Estate | 8.6 | |
| Health Care | 6.7 | |
| Consumer Discretionary | 3.6 | |
| Communication Services | 0.9 | |
Asset Allocation (% of Fund's net assets) |
 |
Futures - 0.4% |
| Common Stocks - 99.6% | |||
| Shares | Value ($) | ||
| COMMUNICATION SERVICES - 0.9% | |||
| Diversified Telecommunication Services - 0.2% | |||
| AT&T, Inc. | 92,780 | 1,347,166 | |
| Verizon Communications, Inc. | 49,690 | 1,693,435 | |
| 3,040,601 | |||
| Entertainment - 0.1% | |||
| Electronic Arts, Inc. | 9,905 | 1,350,547 | |
| Warner Music Group Corp. Class A | 26,289 | 829,418 | |
| 2,179,965 | |||
| Media - 0.6% | |||
| Cable One, Inc. (a) | 1,139 | 824,568 | |
| Comcast Corp. Class A | 50,417 | 2,281,873 | |
| Fox Corp. Class A | 30,048 | 1,005,106 | |
| Interpublic Group of Companies, Inc. | 27,140 | 929,002 | |
| News Corp. Class A | 47,771 | 946,821 | |
| Nexstar Broadcasting Group, Inc. Class A | 4,702 | 877,957 | |
| Omnicom Group, Inc. | 11,652 | 985,992 | |
| Paramount Global Class B (a) | 41,144 | 659,538 | |
| TEGNA, Inc. | 48,377 | 817,571 | |
| The New York Times Co. Class A | 27,075 | 1,103,577 | |
| 10,432,005 | |||
TOTAL COMMUNICATION SERVICES | 15,652,571 | ||
| CONSUMER DISCRETIONARY - 3.6% | |||
| Automobiles - 0.3% | |||
| Ford Motor Co. | 403,460 | 5,329,707 | |
| Broadline Retail - 0.3% | |||
| Kohl's Corp. (a) | 144,015 | 4,097,227 | |
| Hotels, Restaurants & Leisure - 0.9% | |||
| McDonald's Corp. | 30,636 | 8,982,475 | |
| Starbucks Corp. | 63,539 | 6,453,656 | |
| 15,436,131 | |||
| Household Durables - 0.4% | |||
| Newell Brands, Inc. | 300,530 | 3,353,915 | |
| Vistry Group PLC | 386,894 | 3,930,109 | |
| 7,284,024 | |||
| Specialty Retail - 1.3% | |||
| Best Buy Co., Inc. | 56,199 | 4,667,327 | |
| Lowe's Companies, Inc. | 32,217 | 7,547,477 | |
| The Home Depot, Inc. | 31,358 | 10,468,555 | |
| 22,683,359 | |||
| Textiles, Apparel & Luxury Goods - 0.4% | |||
| NIKE, Inc. Class B | 58,481 | 6,455,718 | |
TOTAL CONSUMER DISCRETIONARY | 61,286,166 | ||
| CONSUMER STAPLES - 12.2% | |||
| Beverages - 4.2% | |||
| PepsiCo, Inc. | 196,737 | 36,880,318 | |
| The Coca-Cola Co. | 555,130 | 34,379,201 | |
| 71,259,519 | |||
| Consumer Staples Distribution & Retail - 0.3% | |||
| Target Corp. | 34,390 | 4,693,203 | |
| Household Products - 2.5% | |||
| Procter & Gamble Co. | 265,949 | 41,567,829 | |
| Tobacco - 5.2% | |||
| Altria Group, Inc. | 576,089 | 26,165,962 | |
| British American Tobacco PLC (United Kingdom) | 476,982 | 16,051,556 | |
| Imperial Brands PLC | 731,173 | 17,305,349 | |
| Philip Morris International, Inc. | 292,736 | 29,191,634 | |
| 88,714,501 | |||
TOTAL CONSUMER STAPLES | 206,235,052 | ||
| ENERGY - 11.0% | |||
| Oil, Gas & Consumable Fuels - 11.0% | |||
| Chevron Corp. | 193,848 | 31,725,164 | |
| ConocoPhillips Co. | 232,461 | 27,365,309 | |
| Coterra Energy, Inc. | 841,308 | 23,169,622 | |
| Devon Energy Corp. | 355,552 | 19,199,808 | |
| EOG Resources, Inc. | 185,113 | 24,533,026 | |
| Exxon Mobil Corp. | 354,944 | 38,064,195 | |
| Pioneer Natural Resources Co. | 100,902 | 22,770,554 | |
| 186,827,678 | |||
| FINANCIALS - 19.1% | |||
| Banks - 10.6% | |||
| Bank of America Corp. | 900,458 | 28,814,656 | |
| Citigroup, Inc. | 499,858 | 23,823,232 | |
| ING Groep NV (Certificaten Van Aandelen) | 1,220,779 | 17,874,480 | |
| Intesa Sanpaolo SpA | 6,317,624 | 18,312,290 | |
| JPMorgan Chase & Co. | 281,692 | 44,496,068 | |
| KBC Group NV | 224,621 | 16,939,662 | |
| Wells Fargo & Co. | 623,700 | 28,789,992 | |
| 179,050,380 | |||
| Capital Markets - 1.5% | |||
| Blackstone, Inc. | 247,795 | 25,966,438 | |
| Financial Services - 2.0% | |||
| The Western Union Co. | 795,340 | 9,687,241 | |
| Visa, Inc. Class A | 101,225 | 24,064,219 | |
| 33,751,460 | |||
| Insurance - 2.5% | |||
| American Financial Group, Inc. | 164,705 | 20,029,775 | |
| Old Republic International Corp. | 837,889 | 23,100,600 | |
| 43,130,375 | |||
| Mortgage Real Estate Investment Trusts - 2.5% | |||
| Annaly Capital Management, Inc. | 923,945 | 18,562,055 | |
| Rithm Capital Corp. | 2,296,471 | 23,148,428 | |
| 41,710,483 | |||
TOTAL FINANCIALS | 323,609,136 | ||
| HEALTH CARE - 6.7% | |||
| Biotechnology - 2.2% | |||
| AbbVie, Inc. | 102,631 | 15,351,545 | |
| Amgen, Inc. | 49,112 | 11,499,575 | |
| Gilead Sciences, Inc. | 140,766 | 10,717,923 | |
| 37,569,043 | |||
| Health Care Equipment & Supplies - 0.7% | |||
| Medtronic PLC | 134,404 | 11,795,295 | |
| Pharmaceuticals - 3.8% | |||
| Bristol-Myers Squibb Co. | 173,430 | 10,785,612 | |
| GSK PLC | 407,536 | 7,260,236 | |
| Johnson & Johnson | 113,356 | 18,990,531 | |
| Merck & Co., Inc. | 144,982 | 15,462,330 | |
| Pfizer, Inc. | 331,553 | 11,955,801 | |
| 64,454,510 | |||
TOTAL HEALTH CARE | 113,818,848 | ||
| INDUSTRIALS - 14.5% | |||
| Aerospace & Defense - 2.9% | |||
| Lockheed Martin Corp. | 54,897 | 24,504,374 | |
| Raytheon Technologies Corp. | 274,613 | 24,146,721 | |
| 48,651,095 | |||
| Air Freight & Logistics - 1.5% | |||
| United Parcel Service, Inc. Class B | 138,537 | 25,924,429 | |
| Ground Transportation - 1.7% | |||
| Union Pacific Corp. | 122,488 | 28,419,666 | |
| Industrial Conglomerates - 2.7% | |||
| 3M Co. | 194,472 | 21,683,628 | |
| Honeywell International, Inc. | 127,751 | 24,800,302 | |
| 46,483,930 | |||
| Machinery - 1.7% | |||
| Caterpillar, Inc. | 106,122 | 28,140,371 | |
| Marine Transportation - 4.0% | |||
| A.P. Moller - Maersk A/S Series B | 6,739 | 13,893,149 | |
| Kawasaki Kisen Kaisha Ltd. | 738,100 | 22,244,821 | |
| Mitsui OSK Lines Ltd. | 627,700 | 16,235,906 | |
| Nippon Yusen KK | 647,000 | 15,701,408 | |
| 68,075,284 | |||
TOTAL INDUSTRIALS | 245,694,775 | ||
| INFORMATION TECHNOLOGY - 23.0% | |||
| Communications Equipment - 1.1% | |||
| Cisco Systems, Inc. | 359,651 | 18,716,238 | |
| IT Services - 0.9% | |||
| IBM Corp. | 111,496 | 16,075,493 | |
| Semiconductors & Semiconductor Equipment - 8.2% | |||
| Broadcom, Inc. | 31,520 | 28,325,448 | |
| Intel Corp. | 505,194 | 18,070,789 | |
| NVIDIA Corp. | 131,314 | 61,361,719 | |
| Qualcomm, Inc. | 118,808 | 15,702,853 | |
| Texas Instruments, Inc. | 89,985 | 16,197,300 | |
| 139,658,109 | |||
| Software - 5.6% | |||
| Microsoft Corp. | 280,205 | 94,126,464 | |
| Technology Hardware, Storage & Peripherals - 7.2% | |||
| Apple, Inc. | 551,400 | 108,322,529 | |
| HP, Inc. | 394,568 | 12,953,667 | |
| 121,276,196 | |||
TOTAL INFORMATION TECHNOLOGY | 389,852,500 | ||
| REAL ESTATE - 8.6% | |||
| Equity Real Estate Investment Trusts (REITs) - 8.6% | |||
| American Tower Corp. | 82,109 | 15,626,164 | |
| Crown Castle International Corp. | 111,328 | 12,055,709 | |
| Digital Realty Trust, Inc. | 130,391 | 16,249,326 | |
| Healthcare Trust of America, Inc. | 661,882 | 12,926,555 | |
| Medical Properties Trust, Inc. (a) | 1,124,256 | 11,343,743 | |
| Omega Healthcare Investors, Inc. | 482,323 | 15,386,104 | |
| Prologis (REIT), Inc. | 144,705 | 18,051,949 | |
| Public Storage | 52,197 | 14,706,505 | |
| Simon Property Group, Inc. | 121,421 | 15,129,057 | |
| Weyerhaeuser Co. | 428,147 | 14,582,687 | |
| 146,057,799 | |||
| TOTAL COMMON STOCKS (Cost $1,559,841,105) | 1,689,034,525 | ||
| Money Market Funds - 1.0% | |||
| Shares | Value ($) | ||
| Fidelity Cash Central Fund 5.32% (b) | 4,258,481 | 4,259,333 | |
| Fidelity Securities Lending Cash Central Fund 5.32% (b)(c) | 12,023,748 | 12,024,950 | |
| TOTAL MONEY MARKET FUNDS (Cost $16,284,283) | 16,284,283 | ||
| TOTAL INVESTMENT IN SECURITIES - 100.6% (Cost $1,576,125,388) | 1,705,318,808 |
NET OTHER ASSETS (LIABILITIES) - (0.6)% | (9,551,560) |
| NET ASSETS - 100.0% | 1,695,767,248 |
| Futures Contracts | |||||
Number of contracts | Expiration Date | Notional Amount ($) | Value ($) | Unrealized Appreciation/ (Depreciation) ($) | |
| Purchased | |||||
| Equity Index Contracts | |||||
| CME E-mini S&P 500 Index Contracts (United States) | 27 | Sep 2023 | 6,229,575 | 274,053 | 274,053 |
| CME Micro E-mini S&P 500 Index Contracts (United States) | 20 | Sep 2023 | 461,450 | 753 | 753 |
| �� | |||||
| TOTAL FUTURES CONTRACTS | 274,806 | ||||
| The notional amount of futures purchased as a percentage of Net Assets is 0.4% | |||||
| (a) | Security or a portion of the security is on loan at period end. |
| (b) | Affiliated fund that is generally available only to investment companies and other accounts managed by Fidelity Investments. The rate quoted is the annualized seven-day yield of the fund at period end. A complete unaudited listing of the fund's holdings as of its most recent quarter end is available upon request. In addition, each Fidelity Central Fund's financial statements, which are not covered by the Fund's Report of Independent Registered Public Accounting Firm, are available on the SEC's website or upon request. |
| (c) | Investment made with cash collateral received from securities on loan. |
| Affiliate | Value, beginning of period ($) | Purchases ($) | Sales Proceeds ($) | Dividend Income ($) | Realized Gain (loss) ($) | Change in Unrealized appreciation (depreciation) ($) | Value, end of period ($) | % ownership, end of period |
| Fidelity Cash Central Fund 5.32% | 2,743,400 | 111,350,344 | 109,834,411 | 80,442 | - | - | 4,259,333 | 0.0% |
| Fidelity Securities Lending Cash Central Fund 5.32% | 16,059,350 | 250,186,775 | 254,221,175 | 250,098 | - | - | 12,024,950 | 0.0% |
| Total | 18,802,750 | 361,537,119 | 364,055,586 | 330,540 | - | - | 16,284,283 | |
| Valuation Inputs at Reporting Date: | ||||
| Description | Total ($) | Level 1 ($) | Level 2 ($) | Level 3 ($) |
Investments in Securities: | ||||
| Equities: | ||||
Communication Services | 15,652,571 | 15,652,571 | - | - |
Consumer Discretionary | 61,286,166 | 61,286,166 | - | - |
Consumer Staples | 206,235,052 | 206,235,052 | - | - |
Energy | 186,827,678 | 186,827,678 | - | - |
Financials | 323,609,136 | 323,609,136 | - | - |
Health Care | 113,818,848 | 113,818,848 | - | - |
Industrials | 245,694,775 | 245,694,775 | - | - |
Information Technology | 389,852,500 | 389,852,500 | - | - |
Real Estate | 146,057,799 | 146,057,799 | - | - |
| Money Market Funds | 16,284,283 | 16,284,283 | - | - |
| Total Investments in Securities: | 1,705,318,808 | 1,705,318,808 | - | - |
Derivative Instruments: | ||||
| Assets | ||||
Futures Contracts | 274,806 | 274,806 | - | - |
| Total Assets | 274,806 | 274,806 | - | - |
| Total Derivative Instruments: | 274,806 | 274,806 | - | - |
Primary Risk Exposure / Derivative Type | Value | |
| Asset ($) | Liability ($) | |
| Equity Risk | ||
Futures Contracts (a) | 274,806 | 0 |
| Total Equity Risk | 274,806 | 0 |
| Total Value of Derivatives | 274,806 | 0 |
| Statement of Assets and Liabilities | ||||
| July 31, 2023 | ||||
| Assets | ||||
| Investment in securities, at value (including securities loaned of $11,592,710) - See accompanying schedule: | ||||
Unaffiliated issuers (cost $1,559,841,105) | $ | 1,689,034,525 | ||
Fidelity Central Funds (cost $16,284,283) | 16,284,283 | |||
| Total Investment in Securities (cost $1,576,125,388) | $ | 1,705,318,808 | ||
| Segregated cash with brokers for derivative instruments | 294,560 | |||
| Foreign currency held at value (cost $16,910) | 17,024 | |||
| Receivable for fund shares sold | 6,226,804 | |||
| Dividends receivable | 2,475,289 | |||
| Distributions receivable from Fidelity Central Funds | 11,588 | |||
| Receivable for daily variation margin on futures contracts | 10,925 | |||
Total assets | 1,714,354,998 | |||
| Liabilities | ||||
| Payable for investments purchased | $ | 6,170,687 | ||
| Accrued management fee | 392,108 | |||
| Other payables and accrued expenses | 5 | |||
| Collateral on securities loaned | 12,024,950 | |||
| Total Liabilities | 18,587,750 | |||
| Net Assets | $ | 1,695,767,248 | ||
| Net Assets consist of: | ||||
| Paid in capital | $ | 1,643,310,853 | ||
| Total accumulated earnings (loss) | 52,456,395 | |||
| Net Assets | $ | 1,695,767,248 | ||
Net Asset Value, offering price and redemption price per share ($1,695,767,248 ÷ 40,850,000 shares) | $ | 41.51 | ||
| Statement of Operations | ||||
Year ended July 31, 2023 | ||||
| Investment Income | ||||
| Dividends | $ | 54,352,353 | ||
| Income from Fidelity Central Funds (including $250,098 from security lending) | 330,540 | |||
| Total Income | 54,682,893 | |||
| Expenses | ||||
| Management fee | $ | 4,015,094 | ||
| Independent trustees' fees and expenses | 6,738 | |||
| Interest | 6,792 | |||
| Total expenses before reductions | 4,028,624 | |||
| Expense reductions | (328) | |||
| Total expenses after reductions | 4,028,296 | |||
| Net Investment income (loss) | 50,654,597 | |||
| Realized and Unrealized Gain (Loss) | ||||
| Net realized gain (loss) on: | ||||
| Investment Securities: | ||||
| Unaffiliated issuers | (21,424,138) | |||
| Redemptions in-kind | 64,640,243 | |||
| Foreign currency transactions | (295,558) | |||
| Futures contracts | 66,001 | |||
| Total net realized gain (loss) | 42,986,548 | |||
| Change in net unrealized appreciation (depreciation) on: | ||||
| Investment Securities: | ||||
| Unaffiliated issuers | 77,519,102 | |||
| Assets and liabilities in foreign currencies | (22,089) | |||
| Futures contracts | (37,105) | |||
| Total change in net unrealized appreciation (depreciation) | 77,459,908 | |||
| Net gain (loss) | 120,446,456 | |||
| Net increase (decrease) in net assets resulting from operations | $ | 171,101,053 | ||
| Statement of Changes in Net Assets | ||||
Year ended July 31, 2023 | Year ended July 31, 2022 | |||
| Increase (Decrease) in Net Assets | ||||
| Operations | ||||
| Net investment income (loss) | $ | 50,654,597 | $ | 34,784,807 |
| Net realized gain (loss) | 42,986,548 | 95,057,679 | ||
| Change in net unrealized appreciation (depreciation) | 77,459,908 | (104,029,877) | ||
| Net increase (decrease) in net assets resulting from operations | 171,101,053 | 25,812,609 | ||
| Distributions to shareholders | (52,210,250) | (36,931,550) | ||
| Share transactions | ||||
| Proceeds from sales of shares | 615,856,682 | 758,176,457 | ||
| Cost of shares redeemed | (317,034,432) | (521,124,909) | ||
Net increase (decrease) in net assets resulting from share transactions | 298,822,250 | 237,051,548 | ||
| Total increase (decrease) in net assets | 417,713,053 | 225,932,607 | ||
| Net Assets | ||||
| Beginning of period | 1,278,054,195 | 1,052,121,588 | ||
| End of period | $ | 1,695,767,248 | $ | 1,278,054,195 |
| Other Information | ||||
| Shares | ||||
| Sold | 15,700,000 | 19,000,000 | ||
| Redeemed | (8,100,000) | (13,400,000) | ||
| Net increase (decrease) | 7,600,000 | 5,600,000 | ||
| Fidelity® High Dividend ETF |
| Years ended July 31, | 2023 | 2022 | 2021 | 2020 | 2019 | |||||
Selected Per-Share Data | ||||||||||
| Net asset value, beginning of period | $ | 38.44 | $ | 38.05 | $ | 27.56 | $ | 30.12 | $ | 30.15 |
| Income from Investment Operations | ||||||||||
Net investment income (loss) A,B | 1.39 | 1.21 | 1.02 | 1.10 | 1.23 | |||||
| Net realized and unrealized gain (loss) | 3.11 | .44 C | 10.48 | (2.52) | (.03) | |||||
| Total from investment operations | 4.50 | 1.65 | 11.50 | (1.42) | 1.20 | |||||
| Distributions from net investment income | (1.43) | (1.26) | (1.01) | (1.14) | (1.23) | |||||
| Total distributions | (1.43) | (1.26) | (1.01) | (1.14) | (1.23) | |||||
| Net asset value, end of period | $ | 41.51 | $ | 38.44 | $ | 38.05 | $ | 27.56 | $ | 30.12 |
Total Return D,E | 12.22% | 4.43% | 42.42% | (4.54)% | 4.16% | |||||
Ratios to Average Net Assets B,F,G | ||||||||||
| Expenses before reductions | .29% | .29% | .29% | .29% | .29% | |||||
| Expenses net of fee waivers, if any | .29% | .29% | .29% | .29% | .29% | |||||
| Expenses net of all reductions | .29% | .29% | .29% | .29% | .29% | |||||
| Net investment income (loss) | 3.66% | 3.11% | 3.04% | 3.85% | 4.15% | |||||
| Supplemental Data | ||||||||||
| Net assets, end of period (000 omitted) | $ | 1,695,767 | $ | 1,278,054 | $ | 1,052,122 | $ | 520,795 | $ | 362,952 |
Portfolio turnover rate H,I | 52% | 38% | 32% | 49% | 50% |
| Average Annual Total Returns | |||
Periods ended July 31, 2023 | Past 1 year | Past 5 years | Life of Fund |
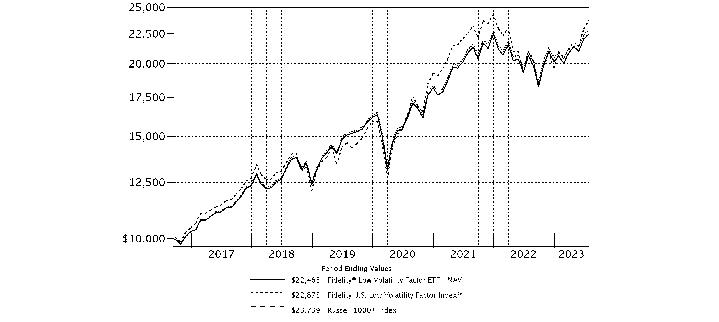
Fidelity® Low Volatility Factor ETF - NAV A | 8.96% | 11.22% | 12.47% |
Fidelity® Low Volatility Factor ETF - Market Price B | 9.11% | 11.21% | 12.63% |
Fidelity U.S. Low Volatility Factor Index℠ A | 9.27% | 11.47% | 12.77% |
Russell 1000® Index A | 12.95% | 11.92% | 13.38% |
| $10,000 Over Life of Fund |
Let's say hypothetically that $10,000 was invested in Fidelity® Low Volatility Factor ETF - NAV, on September 12, 2016, when the fund started. The chart shows how the value of your investment would have changed, and also shows how the Fidelity U.S. Low Volatility Factor Index℠ and Russell 1000® Index performed over the same period. |
 |
Top Holdings (% of Fund's net assets) | ||
| Apple, Inc. | 8.0 | |
| Microsoft Corp. | 6.9 | |
| Alphabet, Inc. Class A | 4.0 | |
| Amazon.com, Inc. | 3.4 | |
| UnitedHealth Group, Inc. | 1.7 | |
| Visa, Inc. Class A | 1.7 | |
| Eli Lilly & Co. | 1.7 | |
| Johnson & Johnson | 1.6 | |
| MasterCard, Inc. Class A | 1.6 | |
| Procter & Gamble Co. | 1.3 | |
| 31.9 | ||
| Market Sectors (% of Fund's net assets) | ||
| Information Technology | 21.1 | |
| Financials | 16.3 | |
| Health Care | 13.6 | |
| Industrials | 11.4 | |
| Consumer Discretionary | 10.3 | |
| Communication Services | 7.8 | |
| Consumer Staples | 6.3 | |
| Energy | 4.3 | |
| Real Estate | 3.2 | |
| Materials | 2.9 | |
| Utilities | 2.5 | |
Asset Allocation (% of Fund's net assets) |
 |
Futures - 0.2% |
| Common Stocks - 99.7% | |||
| Shares | Value ($) | ||
| COMMUNICATION SERVICES - 7.8% | |||
| Diversified Telecommunication Services - 1.2% | |||
| AT&T, Inc. | 191,386 | 2,778,925 | |
| Verizon Communications, Inc. | 102,616 | 3,497,153 | |
| 6,276,078 | |||
| Entertainment - 0.6% | |||
| Activision Blizzard, Inc. | 34,991 | 3,245,765 | |
| Interactive Media & Services - 4.0% | |||
| Alphabet, Inc. Class A (a) | 167,757 | 22,264,709 | |
| Media - 1.5% | |||
| Comcast Corp. Class A | 104,949 | 4,749,992 | |
| Omnicom Group, Inc. | 24,179 | 2,046,027 | |
| TEGNA, Inc. | 99,859 | 1,687,617 | |
| 8,483,636 | |||
| Wireless Telecommunication Services - 0.5% | |||
| T-Mobile U.S., Inc. (a) | 21,311 | 2,936,016 | |
TOTAL COMMUNICATION SERVICES | 43,206,204 | ||
| CONSUMER DISCRETIONARY - 10.3% | |||
| Broadline Retail - 3.4% | |||
| Amazon.com, Inc. (a) | 140,344 | 18,761,186 | |
| Hotels, Restaurants & Leisure - 2.4% | |||
| McDonald's Corp. | 19,610 | 5,749,652 | |
| Starbucks Corp. | 39,125 | 3,973,926 | |
| Yum! Brands, Inc. | 24,126 | 3,321,426 | |
| 13,045,004 | |||
| Specialty Retail - 3.8% | |||
| AutoZone, Inc. (a) | 1,321 | 3,278,352 | |
| O'Reilly Automotive, Inc. (a) | 4,073 | 3,770,743 | |
| The Home Depot, Inc. | 21,214 | 7,082,082 | |
| TJX Companies, Inc. | 47,874 | 4,142,537 | |
| Tractor Supply Co. | 12,789 | 2,864,608 | |
| 21,138,322 | |||
| Textiles, Apparel & Luxury Goods - 0.7% | |||
| NIKE, Inc. Class B | 36,902 | 4,073,612 | |
TOTAL CONSUMER DISCRETIONARY | 57,018,124 | ||
| CONSUMER STAPLES - 6.3% | |||
| Beverages - 2.1% | |||
| PepsiCo, Inc. | 31,443 | 5,894,305 | |
| The Coca-Cola Co. | 88,757 | 5,496,721 | |
| 11,391,026 | |||
| Consumer Staples Distribution & Retail - 0.4% | |||
| Dollar General Corp. | 14,289 | 2,412,841 | |
| Food Products - 1.4% | |||
| General Mills, Inc. | 37,518 | 2,804,095 | |
| Hormel Foods Corp. | 53,512 | 2,187,571 | |
| The Hershey Co. | 11,551 | 2,671,862 | |
| 7,663,528 | |||
| Household Products - 2.4% | |||
| Colgate-Palmolive Co. | 41,583 | 3,171,120 | |
| Kimberly-Clark Corp. | 21,762 | 2,809,474 | |
| Procter & Gamble Co. | 47,131 | 7,366,575 | |
| 13,347,169 | |||
TOTAL CONSUMER STAPLES | 34,814,564 | ||
| ENERGY - 4.3% | |||
| Oil, Gas & Consumable Fuels - 4.3% | |||
| Chevron Corp. | 29,568 | 4,839,099 | |
| ConocoPhillips Co. | 25,686 | 3,023,756 | |
| Coterra Energy, Inc. | 51,977 | 1,431,447 | |
| DT Midstream, Inc. | 19,988 | 1,069,758 | |
| EOG Resources, Inc. | 15,994 | 2,119,685 | |
| Exxon Mobil Corp. | 63,617 | 6,822,287 | |
| Kinder Morgan, Inc. | 81,830 | 1,449,209 | |
| Pioneer Natural Resources Co. | 7,808 | 1,762,031 | |
| The Williams Companies, Inc. | 47,995 | 1,653,428 | |
| 24,170,700 | |||
| FINANCIALS - 16.3% | |||
| Banks - 0.6% | |||
| Commerce Bancshares, Inc. | 58,889 | 3,131,717 | |
| Capital Markets - 2.7% | |||
| Cboe Global Markets, Inc. | 33,340 | 4,656,931 | |
| CME Group, Inc. | 26,675 | 5,307,258 | |
| Intercontinental Exchange, Inc. | 42,997 | 4,936,056 | |
| 14,900,245 | |||
| Financial Services - 5.1% | |||
| Fiserv, Inc. (a) | 47,347 | 5,975,665 | |
| Jack Henry & Associates, Inc. | 23,939 | 4,011,458 | |
| MasterCard, Inc. Class A | 22,388 | 8,827,141 | |
| Visa, Inc. Class A | 39,848 | 9,473,065 | |
| 28,287,329 | |||
| Insurance - 7.9% | |||
| Allstate Corp. | 32,760 | 3,691,397 | |
| Arthur J. Gallagher & Co. | 22,606 | 4,855,769 | |
| Assurant, Inc. | 29,587 | 3,979,747 | |
| Brown & Brown, Inc. | 68,890 | 4,853,301 | |
| Chubb Ltd. | 23,840 | 4,873,134 | |
| Erie Indemnity Co. Class A | 16,156 | 3,585,986 | |
| Marsh & McLennan Companies, Inc. | 28,559 | 5,381,087 | |
| Progressive Corp. | 36,316 | 4,575,090 | |
| The Travelers Companies, Inc. | 24,326 | 4,198,911 | |
| W.R. Berkley Corp. | 60,650 | 3,741,499 | |
| 43,735,921 | |||
TOTAL FINANCIALS | 90,055,212 | ||
| HEALTH CARE - 13.6% | |||
| Biotechnology - 3.0% | |||
| AbbVie, Inc. | 45,334 | 6,781,060 | |
| Amgen, Inc. | 19,962 | 4,674,102 | |
| Vertex Pharmaceuticals, Inc. (a) | 13,872 | 4,887,660 | |
| 16,342,822 | |||
| Health Care Equipment & Supplies - 1.7% | |||
| Abbott Laboratories | 51,390 | 5,721,249 | |
| ResMed, Inc. | 15,987 | 3,554,709 | |
| 9,275,958 | |||
| Health Care Providers & Services - 1.7% | |||
| UnitedHealth Group, Inc. | 19,098 | 9,670,654 | |
| Life Sciences Tools & Services - 1.0% | |||
| Thermo Fisher Scientific, Inc. | 10,602 | 5,816,893 | |
| Pharmaceuticals - 6.2% | |||
| Bristol-Myers Squibb Co. | 71,833 | 4,467,294 | |
| Eli Lilly & Co. | 20,042 | 9,110,091 | |
| Johnson & Johnson | 53,754 | 9,005,408 | |
| Merck & Co., Inc. | 64,253 | 6,852,582 | |
| Zoetis, Inc. Class A | 24,777 | 4,660,306 | |
| 34,095,681 | |||
TOTAL HEALTH CARE | 75,202,008 | ||
| INDUSTRIALS - 11.4% | |||
| Aerospace & Defense - 2.2% | |||
| General Dynamics Corp. | 12,676 | 2,834,100 | |
| L3Harris Technologies, Inc. | 13,104 | 2,483,077 | |
| Lockheed Martin Corp. | 7,990 | 3,566,496 | |
| Northrop Grumman Corp. | 7,004 | 3,116,780 | |
| 12,000,453 | |||
| Commercial Services & Supplies - 1.1% | |||
| Republic Services, Inc. | 21,037 | 3,178,901 | |
| Waste Management, Inc. | 19,868 | 3,254,180 | |
| 6,433,081 | |||
| Ground Transportation - 0.8% | |||
| Union Pacific Corp. | 18,638 | 4,324,389 | |
| Industrial Conglomerates - 1.2% | |||
| 3M Co. | 25,965 | 2,895,098 | |
| Honeywell International, Inc. | 19,704 | 3,825,138 | |
| 6,720,236 | |||
| Machinery - 1.7% | |||
| Illinois Tool Works, Inc. | 12,653 | 3,331,788 | |
| Otis Worldwide Corp. | 32,278 | 2,936,007 | |
| PACCAR, Inc. | 37,067 | 3,192,581 | |
| 9,460,376 | |||
| Professional Services - 4.4% | |||
| Automatic Data Processing, Inc. | 23,784 | 5,880,832 | |
| Booz Allen Hamilton Holding Corp. Class A | 25,267 | 3,059,328 | |
| FTI Consulting, Inc. (a)(b) | 14,399 | 2,522,129 | |
| Maximus, Inc. | 56,438 | 4,727,247 | |
| Paychex, Inc. | 38,997 | 4,892,954 | |
| Verisk Analytics, Inc. | 14,071 | 3,221,415 | |
| 24,303,905 | |||
TOTAL INDUSTRIALS | 63,242,440 | ||
| INFORMATION TECHNOLOGY - 21.1% | |||
| Communications Equipment - 1.3% | |||
| Cisco Systems, Inc. | 139,211 | 7,244,540 | |
| IT Services - 1.6% | |||
| Akamai Technologies, Inc. (a) | 48,005 | 4,536,473 | |
| Amdocs Ltd. | 46,087 | 4,315,587 | |
| 8,852,060 | |||
| Semiconductors & Semiconductor Equipment - 2.4% | |||
| Intel Corp. | 193,352 | 6,916,201 | |
| Texas Instruments, Inc. | 34,677 | 6,241,860 | |
| 13,158,061 | |||
| Software - 7.8% | |||
| Microsoft Corp. | 114,257 | 38,381,211 | |
| Tyler Technologies, Inc. (a) | 12,691 | 5,033,631 | |
| 43,414,842 | |||
| Technology Hardware, Storage & Peripherals - 8.0% | |||
| Apple, Inc. | 225,213 | 44,243,088 | |
TOTAL INFORMATION TECHNOLOGY | 116,912,591 | ||
| MATERIALS - 2.9% | |||
| Chemicals - 1.8% | |||
| Air Products & Chemicals, Inc. | 5,768 | 1,761,143 | |
| Balchem Corp. | 6,432 | 866,648 | |
| Ecolab, Inc. | 8,540 | 1,564,016 | |
| FMC Corp. | 8,184 | 787,546 | |
| Linde PLC | 9,054 | 3,537,126 | |
| Sherwin-Williams Co. | 6,535 | 1,806,928 | |
| 10,323,407 | |||
| Construction Materials - 0.5% | |||
| Martin Marietta Materials, Inc. | 3,087 | 1,378,222 | |
| Vulcan Materials Co. | 6,230 | 1,373,715 | |
| 2,751,937 | |||
| Containers & Packaging - 0.4% | |||
| Aptargroup, Inc. | 8,017 | 973,745 | |
| Packaging Corp. of America | 7,007 | 1,074,523 | |
| 2,048,268 | |||
| Metals & Mining - 0.2% | |||
| Newmont Corp. | 26,489 | 1,136,908 | |
TOTAL MATERIALS | 16,260,520 | ||
| REAL ESTATE - 3.2% | |||
| Equity Real Estate Investment Trusts (REITs) - 2.7% | |||
| Agree Realty Corp. | 13,208 | 855,614 | |
| American Tower Corp. | 10,102 | 1,922,512 | |
| Crown Castle International Corp. | 11,613 | 1,257,572 | |
| CubeSmart | 22,147 | 960,294 | |
| Equinix, Inc. | 2,416 | 1,956,767 | |
| Equity Lifestyle Properties, Inc. | 14,550 | 1,035,669 | |
| Essex Property Trust, Inc. | 4,651 | 1,132,751 | |
| Extra Space Storage, Inc. | 7,215 | 1,006,998 | |
| Mid-America Apartment Communities, Inc. | 6,690 | 1,001,225 | |
| Public Storage | 4,974 | 1,401,425 | |
| Realty Income Corp. | 21,534 | 1,312,928 | |
| Sun Communities, Inc. | 7,152 | 931,906 | |
| 14,775,661 | |||
| Real Estate Management & Development - 0.5% | |||
| CoStar Group, Inc. (a) | 33,435 | 2,807,537 | |
TOTAL REAL ESTATE | 17,583,198 | ||
| UTILITIES - 2.5% | |||
| Electric Utilities - 1.5% | |||
| American Electric Power Co., Inc. | 18,016 | 1,526,676 | |
| Duke Energy Corp. | 20,574 | 1,926,138 | |
| Eversource Energy | 17,332 | 1,253,624 | |
| Southern Co. | 29,849 | 2,159,277 | |
| Xcel Energy, Inc. | 22,492 | 1,410,923 | |
| 8,276,638 | |||
| Multi-Utilities - 1.0% | |||
| Ameren Corp. | 15,658 | 1,341,421 | |
| CMS Energy Corp. | 20,499 | 1,251,874 | |
| Consolidated Edison, Inc. (b) | 15,845 | 1,503,057 | |
| WEC Energy Group, Inc. | 15,352 | 1,379,531 | |
| 5,475,883 | |||
TOTAL UTILITIES | 13,752,521 | ||
| TOTAL COMMON STOCKS (Cost $503,837,258) | 552,218,082 | ||
| Money Market Funds - 0.8% | |||
| Shares | Value ($) | ||
| Fidelity Cash Central Fund 5.32% (c) | 909,559 | 909,740 | |
| Fidelity Securities Lending Cash Central Fund 5.32% (c)(d) | 3,428,106 | 3,428,449 | |
| TOTAL MONEY MARKET FUNDS (Cost $4,338,189) | 4,338,189 | ||
| TOTAL INVESTMENT IN SECURITIES - 100.5% (Cost $508,175,447) | 556,556,271 |
NET OTHER ASSETS (LIABILITIES) - (0.5)% | (2,951,538) |
| NET ASSETS - 100.0% | 553,604,733 |
| Futures Contracts | |||||
Number of contracts | Expiration Date | Notional Amount ($) | Value ($) | Unrealized Appreciation/ (Depreciation) ($) | |
| Purchased | |||||
| Equity Index Contracts | |||||
| CME Micro E-mini S&P 500 Index Contracts (United States) | 50 | Sep 2023 | 1,153,625 | 72,421 | 72,421 |
| The notional amount of futures purchased as a percentage of Net Assets is 0.2% | |||||
| (a) | Non-income producing |
| (b) | Security or a portion of the security is on loan at period end. |
| (c) | Affiliated fund that is generally available only to investment companies and other accounts managed by Fidelity Investments. The rate quoted is the annualized seven-day yield of the fund at period end. A complete unaudited listing of the fund's holdings as of its most recent quarter end is available upon request. In addition, each Fidelity Central Fund's financial statements, which are not covered by the Fund's Report of Independent Registered Public Accounting Firm, are available on the SEC's website or upon request. |
| (d) | Investment made with cash collateral received from securities on loan. |
| Affiliate | Value, beginning of period ($) | Purchases ($) | Sales Proceeds ($) | Dividend Income ($) | Realized Gain (loss) ($) | Change in Unrealized appreciation (depreciation) ($) | Value, end of period ($) | % ownership, end of period |
| Fidelity Cash Central Fund 5.32% | 1,126,798 | 14,495,936 | 14,712,994 | 34,067 | - | - | 909,740 | 0.0% |
| Fidelity Securities Lending Cash Central Fund 5.32% | 1,748,660 | 29,274,831 | 27,595,042 | 8,042 | - | - | 3,428,449 | 0.0% |
| Total | 2,875,458 | 43,770,767 | 42,308,036 | 42,109 | - | - | 4,338,189 | |
| Valuation Inputs at Reporting Date: | ||||
| Description | Total ($) | Level 1 ($) | Level 2 ($) | Level 3 ($) |
Investments in Securities: | ||||
| Equities: | ||||
Communication Services | 43,206,204 | 43,206,204 | - | - |
Consumer Discretionary | 57,018,124 | 57,018,124 | - | - |
Consumer Staples | 34,814,564 | 34,814,564 | - | - |
Energy | 24,170,700 | 24,170,700 | - | - |
Financials | 90,055,212 | 90,055,212 | - | - |
Health Care | 75,202,008 | 75,202,008 | - | - |
Industrials | 63,242,440 | 63,242,440 | - | - |
Information Technology | 116,912,591 | 116,912,591 | - | - |
Materials | 16,260,520 | 16,260,520 | - | - |
Real Estate | 17,583,198 | 17,583,198 | - | - |
Utilities | 13,752,521 | 13,752,521 | - | - |
| Money Market Funds | 4,338,189 | 4,338,189 | - | - |
| Total Investments in Securities: | 556,556,271 | 556,556,271 | - | - |
Derivative Instruments: | ||||
| Assets | ||||
Futures Contracts | 72,421 | 72,421 | - | - |
| Total Assets | 72,421 | 72,421 | - | - |
| Total Derivative Instruments: | 72,421 | 72,421 | - | - |
Primary Risk Exposure / Derivative Type | Value | |
| Asset ($) | Liability ($) | |
| Equity Risk | ||
Futures Contracts (a) | 72,421 | 0 |
| Total Equity Risk | 72,421 | 0 |
| Total Value of Derivatives | 72,421 | 0 |
| Statement of Assets and Liabilities | ||||
| July 31, 2023 | ||||
| Assets | ||||
| Investment in securities, at value (including securities loaned of $3,327,026) - See accompanying schedule: | ||||
Unaffiliated issuers (cost $503,837,258) | $ | 552,218,082 | ||
Fidelity Central Funds (cost $4,338,189) | 4,338,189 | |||
| Total Investment in Securities (cost $508,175,447) | $ | 556,556,271 | ||
| Segregated cash with brokers for derivative instruments | 56,000 | |||
| Cash | 45,224 | |||
| Dividends receivable | 501,501 | |||
| Distributions receivable from Fidelity Central Funds | 3,848 | |||
| Receivable for daily variation margin on futures contracts | 2,000 | |||
Total assets | 557,164,844 | |||
| Liabilities | ||||
| Accrued management fee | $ | 131,686 | ||
| Collateral on securities loaned | 3,428,425 | |||
| Total Liabilities | 3,560,111 | |||
| Net Assets | $ | 553,604,733 | ||
| Net Assets consist of: | ||||
| Paid in capital | $ | 545,183,306 | ||
| Total accumulated earnings (loss) | 8,421,427 | |||
| Net Assets | $ | 553,604,733 | ||
Net Asset Value, offering price and redemption price per share ($553,604,733 ÷ 10,850,000 shares) | $ | 51.02 | ||
| Statement of Operations | ||||
Year ended July 31, 2023 | ||||
| Investment Income | ||||
| Dividends | $ | 8,867,661 | ||
| Income from Fidelity Central Funds (including $8,042 from security lending) | 42,109 | |||
| Total Income | 8,909,770 | |||
| Expenses | ||||
| Management fee | $ | 1,389,867 | ||
| Independent trustees' fees and expenses | 2,393 | |||
| Total expenses before reductions | 1,392,260 | |||
| Expense reductions | (270) | |||
| Total expenses after reductions | 1,391,990 | |||
| Net Investment income (loss) | 7,517,780 | |||
| Realized and Unrealized Gain (Loss) | ||||
| Net realized gain (loss) on: | ||||
| Investment Securities: | ||||
| Unaffiliated issuers | (7,333,706) | |||
| Redemptions in-kind | 8,225,322 | |||
| Futures contracts | 145,567 | |||
| Total net realized gain (loss) | 1,037,183 | |||
| Change in net unrealized appreciation (depreciation) on: | ||||
| Investment Securities: | ||||
| Unaffiliated issuers | 36,488,563 | |||
| Futures contracts | (42,574) | |||
| Total change in net unrealized appreciation (depreciation) | 36,445,989 | |||
| Net gain (loss) | 37,483,172 | |||
| Net increase (decrease) in net assets resulting from operations | $ | 45,000,952 | ||
| Statement of Changes in Net Assets | ||||
Year ended July 31, 2023 | Year ended July 31, 2022 | |||
| Increase (Decrease) in Net Assets | ||||
| Operations | ||||
| Net investment income (loss) | $ | 7,517,780 | $ | 6,029,946 |
| Net realized gain (loss) | 1,037,183 | 57,400,773 | ||
| Change in net unrealized appreciation (depreciation) | 36,445,989 | (66,352,118) | ||
| Net increase (decrease) in net assets resulting from operations | 45,000,952 | (2,921,399) | ||
| Distributions to shareholders | (7,460,700) | (5,937,600) | ||
| Share transactions | ||||
| Proceeds from sales of shares | 126,351,905 | 286,611,056 | ||
| Cost of shares redeemed | (55,150,184) | (344,785,919) | ||
Net increase (decrease) in net assets resulting from share transactions | 71,201,721 | (58,174,863) | ||
| Total increase (decrease) in net assets | 108,741,973 | (67,033,862) | ||
| Net Assets | ||||
| Beginning of period | 444,862,760 | 511,896,622 | ||
| End of period | $ | 553,604,733 | $ | 444,862,760 |
| Other Information | ||||
| Shares | ||||
| Sold | 2,700,000 | 5,950,000 | ||
| Redeemed | (1,200,000) | (7,100,000) | ||
| Net increase (decrease) | 1,500,000 | (1,150,000) | ||
| Fidelity® Low Volatility Factor ETF |
| Years ended July 31, | 2023 | 2022 | 2021 | 2020 | 2019 | |||||
Selected Per-Share Data | ||||||||||
| Net asset value, beginning of period | $ | 47.58 | $ | 48.75 | $ | 38.33 | $ | 36.37 | $ | 32.40 |
| Income from Investment Operations | ||||||||||
Net investment income (loss) A,B | .74 | .62 | .56 | .62 | .62 | |||||
| Net realized and unrealized gain (loss) | 3.44 | (1.17) | 10.43 | 1.95 | 3.92 | |||||
| Total from investment operations | 4.18 | (.55) | 10.99 | 2.57 | 4.54 | |||||
| Distributions from net investment income | (.74) | (.62) | (.57) | (.61) | (.57) | |||||
| Total distributions | (.74) | (.62) | (.57) | (.61) | (.57) | |||||
| Net asset value, end of period | $ | 51.02 | $ | 47.58 | $ | 48.75 | $ | 38.33 | $ | 36.37 |
Total Return C,D | 8.96% | (1.12)% | 28.90% | 7.29% | 14.20% | |||||
Ratios to Average Net Assets B,E,F | ||||||||||
| Expenses before reductions | .29% | .29% | .29% | .29% | .29% | |||||
| Expenses net of fee waivers, if any | .29% | .29% | .29% | .29% | .29% | |||||
| Expenses net of all reductions | .29% | .29% | .29% | .29% | .29% | |||||
| Net investment income (loss) | 1.57% | 1.27% | 1.31% | 1.69% | 1.83% | |||||
| Supplemental Data | ||||||||||
| Net assets, end of period (000 omitted) | $ | 553,605 | $ | 444,863 | $ | 511,897 | $ | 350,708 | $ | 245,502 |
Portfolio turnover rate G,H | 46% | 28% | 46% | 31% | 36% |
| Average Annual Total Returns | |||
Periods ended July 31, 2023 | Past 1 year | Past 5 years | Life of Fund |
Fidelity® Momentum Factor ETF - NAV A | 9.02% | 9.12% | 11.34% |
Fidelity® Momentum Factor ETF - Market Price B | 8.81% | 9.07% | 11.43% |
Fidelity U.S. Momentum Factor Index℠ A | 9.34% | 9.44% | 11.68% |
Russell 1000® Index A | 12.95% | 11.92% | 13.38% |
| $10,000 Over Life of Fund |
Let's say hypothetically that $10,000 was invested in Fidelity® Momentum Factor ETF - NAV, on September 12, 2016, when the fund started. The chart shows how the value of your investment would have changed, and also shows how the Fidelity U.S. Momentum Factor Index℠ and Russell 1000® Index performed over the same period. |
 |
Top Holdings (% of Fund's net assets) | ||
| Apple, Inc. | 7.7 | |
| Microsoft Corp. | 6.6 | |
| Alphabet, Inc. Class A | 3.9 | |
| NVIDIA Corp. | 3.7 | |
| Meta Platforms, Inc. Class A | 2.1 | |
| Berkshire Hathaway, Inc. Class B | 2.0 | |
| Eli Lilly & Co. | 1.8 | |
| Broadcom, Inc. | 1.8 | |
| JPMorgan Chase & Co. | 1.6 | |
| Super Micro Computer, Inc. | 1.4 | |
| 32.6 | ||
| Market Sectors (% of Fund's net assets) | ||
| Information Technology | 28.5 | |
| Financials | 12.7 | |
| Health Care | 11.9 | |
| Industrials | 9.6 | |
| Consumer Discretionary | 9.5 | |
| Communication Services | 8.7 | |
| Consumer Staples | 6.2 | |
| Energy | 4.5 | |
| Materials | 2.9 | |
| Real Estate | 2.7 | |
| Utilities | 2.6 | |
Asset Allocation (% of Fund's net assets) |
 |
Futures - 0.2% |
| Common Stocks - 99.8% | |||
| Shares | Value ($) | ||
| COMMUNICATION SERVICES - 8.7% | |||
| Diversified Telecommunication Services - 0.3% | |||
| Iridium Communications, Inc. | 7,859 | 412,990 | |
| Entertainment - 1.6% | |||
| Atlanta Braves Holdings, Inc. | 231 | 9,406 | |
| Liberty Media Corp. Liberty Formula One Series C (a) | 7,995 | 580,437 | |
| Netflix, Inc. (a) | 3,110 | 1,365,197 | |
| World Wrestling Entertainment, Inc. Class A (b) | 4,670 | 490,350 | |
| 2,445,390 | |||
| Interactive Media & Services - 6.0% | |||
| Alphabet, Inc. Class A (a) | 45,373 | 6,021,905 | |
| Meta Platforms, Inc. Class A (a) | 10,170 | 3,240,162 | |
| 9,262,067 | |||
| Media - 0.8% | |||
| Comcast Corp. Class A | 27,198 | 1,230,981 | |
TOTAL COMMUNICATION SERVICES | 13,351,428 | ||
| CONSUMER DISCRETIONARY - 9.5% | |||
| Hotels, Restaurants & Leisure - 4.4% | |||
| Booking Holdings, Inc. (a) | 537 | 1,595,320 | |
| Las Vegas Sands Corp. | 17,904 | 1,070,838 | |
| McDonald's Corp. | 6,168 | 1,808,458 | |
| Starbucks Corp. | 14,041 | 1,426,144 | |
| Wingstop, Inc. | 5,074 | 855,375 | |
| 6,756,135 | |||
| Household Durables - 1.7% | |||
| D.R. Horton, Inc. | 10,753 | 1,365,846 | |
| Lennar Corp. Class A | 10,146 | 1,286,817 | |
| 2,652,663 | |||
| Specialty Retail - 2.6% | |||
| AutoZone, Inc. (a) | 456 | 1,131,664 | |
| O'Reilly Automotive, Inc. (a) | 1,332 | 1,233,152 | |
| TJX Companies, Inc. | 17,594 | 1,522,409 | |
| 3,887,225 | |||
| Textiles, Apparel & Luxury Goods - 0.8% | |||
| Deckers Outdoor Corp. (a) | 2,249 | 1,222,759 | |
TOTAL CONSUMER DISCRETIONARY | 14,518,782 | ||
| CONSUMER STAPLES - 6.2% | |||
| Beverages - 2.2% | |||
| Monster Beverage Corp. | 11,053 | 635,437 | |
| PepsiCo, Inc. | 7,505 | 1,406,887 | |
| The Coca-Cola Co. | 21,725 | 1,345,429 | |
| 3,387,753 | |||
| Consumer Staples Distribution & Retail - 0.9% | |||
| Walmart, Inc. | 8,302 | 1,327,158 | |
| Food Products - 1.5% | |||
| General Mills, Inc. | 7,503 | 560,774 | |
| Lamb Weston Holdings, Inc. | 4,827 | 500,222 | |
| Lancaster Colony Corp. | 2,294 | 441,893 | |
| Mondelez International, Inc. | 11,168 | 827,884 | |
| 2,330,773 | |||
| Household Products - 1.2% | |||
| Procter & Gamble Co. | 11,695 | 1,827,929 | |
| Personal Care Products - 0.4% | |||
| elf Beauty, Inc. (a) | 5,532 | 645,695 | |
TOTAL CONSUMER STAPLES | 9,519,308 | ||
| ENERGY - 4.5% | |||
| Energy Equipment & Services - 0.9% | |||
| Schlumberger Ltd. | 10,717 | 625,230 | |
| TechnipFMC PLC | 20,350 | 373,219 | |
| Weatherford International PLC (a) | 4,466 | 371,125 | |
| 1,369,574 | |||
| Oil, Gas & Consumable Fuels - 3.6% | |||
| Chevron Corp. | 8,095 | 1,324,828 | |
| ConocoPhillips Co. | 7,031 | 827,689 | |
| Exxon Mobil Corp. | 17,396 | 1,865,547 | |
| Hess Corp. | 2,917 | 442,596 | |
| Marathon Petroleum Corp. | 4,030 | 536,071 | |
| Phillips 66 Co. | 4,402 | 491,043 | |
| 5,487,774 | |||
TOTAL ENERGY | 6,857,348 | ||
| FINANCIALS - 12.7% | |||
| Banks - 1.6% | |||
| JPMorgan Chase & Co. | 15,769 | 2,490,871 | |
| Capital Markets - 2.8% | |||
| Goldman Sachs Group, Inc. | 3,346 | 1,190,741 | |
| Interactive Brokers Group, Inc. | 9,863 | 861,336 | |
| Morgan Stanley | 12,975 | 1,187,991 | |
| MSCI, Inc. | 1,760 | 964,621 | |
| 4,204,689 | |||
| Financial Services - 5.3% | |||
| Berkshire Hathaway, Inc. Class B (a) | 8,700 | 3,062,052 | |
| Fiserv, Inc. (a) | 8,072 | 1,018,767 | |
| MasterCard, Inc. Class A | 4,884 | 1,925,664 | |
| Visa, Inc. Class A | 8,940 | 2,125,306 | |
| 8,131,789 | |||
| Insurance - 3.0% | |||
| Aon PLC | 2,863 | 911,866 | |
| Arch Capital Group Ltd. (a) | 10,642 | 826,777 | |
| Arthur J. Gallagher & Co. | 3,988 | 856,622 | |
| Marsh & McLennan Companies, Inc. | 5,629 | 1,060,616 | |
| Progressive Corp. | 7,510 | 946,110 | |
| 4,601,991 | |||
TOTAL FINANCIALS | 19,429,340 | ||
| HEALTH CARE - 11.9% | |||
| Biotechnology - 3.6% | |||
| Biogen, Inc. (a) | 4,663 | 1,259,896 | |
| Gilead Sciences, Inc. | 21,075 | 1,604,651 | |
| Regeneron Pharmaceuticals, Inc. (a) | 2,113 | 1,567,656 | |
| Sarepta Therapeutics, Inc. (a) | 10,285 | 1,114,791 | |
| 5,546,994 | |||
| Health Care Equipment & Supplies - 3.1% | |||
| Boston Scientific Corp. (a) | 30,206 | 1,566,181 | |
| DexCom, Inc. (a) | 12,458 | 1,551,768 | |
| Stryker Corp. | 5,789 | 1,640,660 | |
| 4,758,609 | |||
| Health Care Providers & Services - 2.0% | |||
| Cardinal Health, Inc. | 16,988 | 1,553,892 | |
| HCA Holdings, Inc. | 5,447 | 1,485,996 | |
| 3,039,888 | |||
| Pharmaceuticals - 3.2% | |||
| Eli Lilly & Co. | 5,909 | 2,685,936 | |
| Merck & Co., Inc. | 20,315 | 2,166,595 | |
| 4,852,531 | |||
TOTAL HEALTH CARE | 18,198,022 | ||
| INDUSTRIALS - 9.6% | |||
| Aerospace & Defense - 2.5% | |||
| Axon Enterprise, Inc. (a) | 3,050 | 567,087 | |
| Lockheed Martin Corp. | 2,189 | 977,104 | |
| Raytheon Technologies Corp. | 11,756 | 1,033,705 | |
| The Boeing Co. (a) | 5,172 | 1,235,332 | |
| 3,813,228 | |||
| Building Products - 0.6% | |||
| Trane Technologies PLC | 4,327 | 862,977 | |
| Commercial Services & Supplies - 1.0% | |||
| Clean Harbors, Inc. (a) | 4,682 | 778,429 | |
| Copart, Inc. (a) | 9,417 | 832,369 | |
| 1,610,798 | |||
| Construction & Engineering - 0.5% | |||
| Quanta Services, Inc. | 4,237 | 854,264 | |
| Electrical Equipment - 1.3% | |||
| Eaton Corp. PLC | 5,100 | 1,047,132 | |
| Rockwell Automation, Inc. | 2,619 | 880,744 | |
| 1,927,876 | |||
| Industrial Conglomerates - 0.8% | |||
| General Electric Co. | 10,164 | 1,161,135 | |
| Machinery - 2.4% | |||
| Deere & Co. | 2,632 | 1,130,707 | |
| Illinois Tool Works, Inc. | 3,718 | 979,024 | |
| PACCAR, Inc. | 10,556 | 909,188 | |
| Toro Co. | 6,331 | 643,546 | |
| 3,662,465 | |||
| Trading Companies & Distributors - 0.5% | |||
| W.W. Grainger, Inc. | 1,084 | 800,523 | |
TOTAL INDUSTRIALS | 14,693,266 | ||
| INFORMATION TECHNOLOGY - 28.5% | |||
| Communications Equipment - 1.5% | |||
| Arista Networks, Inc. (a) | 7,462 | 1,157,282 | |
| Motorola Solutions, Inc. | 3,667 | 1,051,072 | |
| 2,208,354 | |||
| Semiconductors & Semiconductor Equipment - 8.6% | |||
| Analog Devices, Inc. | 6,747 | 1,346,229 | |
| Broadcom, Inc. | 2,982 | 2,679,774 | |
| First Solar, Inc. (a) | 5,535 | 1,147,959 | |
| Lattice Semiconductor Corp. (a) | 11,387 | 1,035,534 | |
| NVIDIA Corp. | 12,209 | 5,705,144 | |
| Rambus, Inc. (a) | 19,386 | 1,213,757 | |
| 13,128,397 | |||
| Software - 9.3% | |||
| Cadence Design Systems, Inc. (a) | 5,331 | 1,247,507 | |
| Fair Isaac Corp. (a) | 1,297 | 1,086,847 | |
| Microsoft Corp. | 30,105 | 10,112,872 | |
| Oracle Corp. | 14,961 | 1,753,878 | |
| 14,201,104 | |||
| Technology Hardware, Storage & Peripherals - 9.1% | |||
| Apple, Inc. | 59,697 | 11,727,477 | |
| Super Micro Computer, Inc. (a) | 6,678 | 2,205,543 | |
| 13,933,020 | |||
TOTAL INFORMATION TECHNOLOGY | 43,470,875 | ||
| MATERIALS - 2.9% | |||
| Chemicals - 1.6% | |||
| Air Products & Chemicals, Inc. | 1,476 | 450,667 | |
| Corteva, Inc. | 6,004 | 338,806 | |
| DuPont de Nemours, Inc. | 4,692 | 364,240 | |
| Linde PLC | 2,336 | 912,605 | |
| PPG Industries, Inc. | 2,286 | 328,955 | |
| 2,395,273 | |||
| Metals & Mining - 1.3% | |||
| ATI, Inc. (a) | 5,941 | 283,267 | |
| Commercial Metals Co. | 4,939 | 282,610 | |
| Freeport-McMoRan, Inc. | 10,712 | 478,291 | |
| Nucor Corp. | 2,307 | 397,012 | |
| Reliance Steel & Aluminum Co. | 1,021 | 299,010 | |
| Steel Dynamics, Inc. | 2,616 | 278,813 | |
| 2,019,003 | |||
TOTAL MATERIALS | 4,414,276 | ||
| REAL ESTATE - 2.7% | |||
| Equity Real Estate Investment Trusts (REITs) - 2.5% | |||
| American Tower Corp. | 2,662 | 506,605 | |
| Americold Realty Trust | 7,379 | 239,227 | |
| Equinix, Inc. | 594 | 481,092 | |
| Gaming & Leisure Properties | 4,635 | 219,977 | |
| Iron Mountain, Inc. | 4,418 | 271,265 | |
| Prologis (REIT), Inc. | 4,868 | 607,283 | |
| Public Storage | 1,221 | 344,017 | |
| Realty Income Corp. | 5,307 | 323,568 | |
| Simon Property Group, Inc. | 2,926 | 364,580 | |
| VICI Properties, Inc. | 9,430 | 296,856 | |
| WP Carey, Inc. | 3,355 | 226,563 | |
| 3,881,033 | |||
| Real Estate Management & Development - 0.2% | |||
| Zillow Group, Inc. Class C (a) | 4,810 | 260,510 | |
TOTAL REAL ESTATE | 4,141,543 | ||
| UTILITIES - 2.6% | |||
| Electric Utilities - 1.3% | |||
| Constellation Energy Corp. | 5,057 | 488,759 | |
| NextEra Energy, Inc. | 11,280 | 826,824 | |
| PG&E Corp. (a) | 23,487 | 413,606 | |
| PNM Resources, Inc. | 6,660 | 298,501 | |
| 2,027,690 | |||
| Gas Utilities - 0.2% | |||
| New Jersey Resources Corp. | 6,288 | 281,074 | |
| Independent Power and Renewable Electricity Producers - 0.2% | |||
| The AES Corp. | 15,942 | 344,825 | |
| Multi-Utilities - 0.6% | |||
| Consolidated Edison, Inc. (b) | 4,377 | 415,202 | |
| Sempra Energy | 3,126 | 465,837 | |
| 881,039 | |||
| Water Utilities - 0.3% | |||
| American Water Works Co., Inc. | 2,758 | 406,612 | |
TOTAL UTILITIES | 3,941,240 | ||
| TOTAL COMMON STOCKS (Cost $132,445,827) | 152,535,428 | ||
| Money Market Funds - 0.6% | |||
| Shares | Value ($) | ||
| Fidelity Cash Central Fund 5.32% (c) | 267,644 | 267,697 | |
| Fidelity Securities Lending Cash Central Fund 5.32% (c)(d) | 632,637 | 632,700 | |
| TOTAL MONEY MARKET FUNDS (Cost $900,397) | 900,397 | ||
| TOTAL INVESTMENT IN SECURITIES - 100.4% (Cost $133,346,224) | 153,435,825 |
NET OTHER ASSETS (LIABILITIES) - (0.4)% | (605,010) |
| NET ASSETS - 100.0% | 152,830,815 |
| Futures Contracts | |||||
Number of contracts | Expiration Date | Notional Amount ($) | Value ($) | Unrealized Appreciation/ (Depreciation) ($) | |
| Purchased | |||||
| Equity Index Contracts | |||||
| CME Micro E-mini S&P 500 Index Contracts (United States) | 12 | Sep 2023 | 276,870 | 14,984 | 14,984 |
| The notional amount of futures purchased as a percentage of Net Assets is 0.2% | |||||
| (a) | Non-income producing |
| (b) | Security or a portion of the security is on loan at period end. |
| (c) | Affiliated fund that is generally available only to investment companies and other accounts managed by Fidelity Investments. The rate quoted is the annualized seven-day yield of the fund at period end. A complete unaudited listing of the fund's holdings as of its most recent quarter end is available upon request. In addition, each Fidelity Central Fund's financial statements, which are not covered by the Fund's Report of Independent Registered Public Accounting Firm, are available on the SEC's website or upon request. |
| (d) | Investment made with cash collateral received from securities on loan. |
| Affiliate | Value, beginning of period ($) | Purchases ($) | Sales Proceeds ($) | Dividend Income ($) | Realized Gain (loss) ($) | Change in Unrealized appreciation (depreciation) ($) | Value, end of period ($) | % ownership, end of period |
| Fidelity Cash Central Fund 5.32% | 180,280 | 5,140,550 | 5,053,133 | 10,750 | - | - | 267,697 | 0.0% |
| Fidelity Securities Lending Cash Central Fund 5.32% | 1,004,850 | 9,007,233 | 9,379,383 | 1,346 | - | - | 632,700 | 0.0% |
| Total | 1,185,130 | 14,147,783 | 14,432,516 | 12,096 | - | - | 900,397 | |
| Valuation Inputs at Reporting Date: | ||||
| Description | Total ($) | Level 1 ($) | Level 2 ($) | Level 3 ($) |
Investments in Securities: | ||||
| Equities: | ||||
Communication Services | 13,351,428 | 13,351,428 | - | - |
Consumer Discretionary | 14,518,782 | 14,518,782 | - | - |
Consumer Staples | 9,519,308 | 9,519,308 | - | - |
Energy | 6,857,348 | 6,857,348 | - | - |
Financials | 19,429,340 | 19,429,340 | - | - |
Health Care | 18,198,022 | 18,198,022 | - | - |
Industrials | 14,693,266 | 14,693,266 | - | - |
Information Technology | 43,470,875 | 43,470,875 | - | - |
Materials | 4,414,276 | 4,414,276 | - | - |
Real Estate | 4,141,543 | 4,141,543 | - | - |
Utilities | 3,941,240 | 3,941,240 | - | - |
| Money Market Funds | 900,397 | 900,397 | - | - |
| Total Investments in Securities: | 153,435,825 | 153,435,825 | - | - |
Derivative Instruments: | ||||
| Assets | ||||
Futures Contracts | 14,984 | 14,984 | - | - |
| Total Assets | 14,984 | 14,984 | - | - |
| Total Derivative Instruments: | 14,984 | 14,984 | - | - |
Primary Risk Exposure / Derivative Type | Value | |
| Asset ($) | Liability ($) | |
| Equity Risk | ||
Futures Contracts (a) | 14,984 | 0 |
| Total Equity Risk | 14,984 | 0 |
| Total Value of Derivatives | 14,984 | 0 |
| Statement of Assets and Liabilities | ||||
| July 31, 2023 | ||||
| Assets | ||||
| Investment in securities, at value (including securities loaned of $613,776) - See accompanying schedule: | ||||
Unaffiliated issuers (cost $132,445,827) | $ | 152,535,428 | ||
Fidelity Central Funds (cost $900,397) | 900,397 | |||
| Total Investment in Securities (cost $133,346,224) | $ | 153,435,825 | ||
| Segregated cash with brokers for derivative instruments | 13,440 | |||
| Dividends receivable | 49,344 | |||
| Distributions receivable from Fidelity Central Funds | 899 | |||
| Receivable for daily variation margin on futures contracts | 480 | |||
Total assets | 153,499,988 | |||
| Liabilities | ||||
| Accrued management fee | $ | 36,473 | ||
| Collateral on securities loaned | 632,700 | |||
| Total Liabilities | 669,173 | |||
| Net Assets | $ | 152,830,815 | ||
| Net Assets consist of: | ||||
| Paid in capital | $ | 165,302,152 | ||
| Total accumulated earnings (loss) | (12,471,337) | |||
| Net Assets | $ | 152,830,815 | ||
Net Asset Value, offering price and redemption price per share ($152,830,815 ÷ 3,100,000 shares) | $ | 49.30 | ||
| Statement of Operations | ||||
Year ended July 31, 2023 | ||||
| Investment Income | ||||
| Dividends | $ | 1,809,469 | ||
| Income from Fidelity Central Funds (including $1,346 from security lending) | 12,096 | |||
| Total Income | 1,821,565 | |||
| Expenses | ||||
| Management fee | $ | 357,227 | ||
| Independent trustees' fees and expenses | 606 | |||
| Total expenses before reductions | 357,833 | |||
| Expense reductions | (609) | |||
| Total expenses after reductions | 357,224 | |||
| Net Investment income (loss) | 1,464,341 | |||
| Realized and Unrealized Gain (Loss) | ||||
| Net realized gain (loss) on: | ||||
| Investment Securities: | ||||
| Unaffiliated issuers | (6,064,059) | |||
| Redemptions in-kind | 3,256,474 | |||
| Futures contracts | 14,499 | |||
| Total net realized gain (loss) | (2,793,086) | |||
| Change in net unrealized appreciation (depreciation) on: | ||||
| Investment Securities: | ||||
| Unaffiliated issuers | 13,282,846 | |||
| Futures contracts | (2,634) | |||
| Total change in net unrealized appreciation (depreciation) | 13,280,212 | |||
| Net gain (loss) | 10,487,126 | |||
| Net increase (decrease) in net assets resulting from operations | $ | 11,951,467 | ||
| Statement of Changes in Net Assets | ||||
Year ended July 31, 2023 | Year ended July 31, 2022 | |||
| Increase (Decrease) in Net Assets | ||||
| Operations | ||||
| Net investment income (loss) | $ | 1,464,341 | $ | 1,047,146 |
| Net realized gain (loss) | (2,793,086) | 9,388,516 | ||
| Change in net unrealized appreciation (depreciation) | 13,280,212 | (18,448,115) | ||
| Net increase (decrease) in net assets resulting from operations | 11,951,467 | (8,012,453) | ||
| Distributions to shareholders | (1,506,200) | (999,550) | ||
| Share transactions | ||||
| Proceeds from sales of shares | 52,044,612 | 86,253,555 | ||
| Cost of shares redeemed | (26,407,433) | (117,256,850) | ||
Net increase (decrease) in net assets resulting from share transactions | 25,637,179 | (31,003,295) | ||
| Total increase (decrease) in net assets | 36,082,446 | (40,015,298) | ||
| Net Assets | ||||
| Beginning of period | 116,748,369 | 156,763,667 | ||
| End of period | $ | 152,830,815 | $ | 116,748,369 |
| Other Information | ||||
| Shares | ||||
| Sold | 1,150,000 | 1,700,000 | ||
| Redeemed | (600,000) | (2,300,000) | ||
| Net increase (decrease) | 550,000 | (600,000) | ||
| Fidelity® Momentum Factor ETF |
| Years ended July 31, | 2023 | 2022 | 2021 | 2020 | 2019 | |||||
Selected Per-Share Data | ||||||||||
| Net asset value, beginning of period | $ | 45.78 | $ | 49.77 | $ | 39.26 | $ | 35.80 | $ | 33.58 |
| Income from Investment Operations | ||||||||||
Net investment income (loss) A,B | .53 | .43 | .25 | .42 | .40 | |||||
| Net realized and unrealized gain (loss) | 3.53 | (4.01) | 10.54 | 3.47 | 2.22 | |||||
| Total from investment operations | 4.06 | (3.58) | 10.79 | 3.89 | 2.62 | |||||
| Distributions from net investment income | (.54) | (.41) | (.28) | (.43) | (.40) | |||||
| Total distributions | (.54) | (.41) | (.28) | (.43) | (.40) | |||||
| Net asset value, end of period | $ | 49.30 | $ | 45.78 | $ | 49.77 | $ | 39.26 | $ | 35.80 |
Total Return C,D | 9.02% | (7.20)% | 27.58% | 11.06% | 7.91% | |||||
Ratios to Average Net Assets B,E,F | ||||||||||
| Expenses before reductions | .29% | .29% | .29% | .29% | .29% | |||||
| Expenses net of fee waivers, if any | .29% | .29% | .29% | .29% | .29% | |||||
| Expenses net of all reductions | .29% | .29% | .29% | .29% | .29% | |||||
| Net investment income (loss) | 1.19% | .88% | .55% | 1.18% | 1.18% | |||||
| Supplemental Data | ||||||||||
| Net assets, end of period (000 omitted) | $ | 152,831 | $ | 116,748 | $ | 156,764 | $ | 88,329 | $ | 121,736 |
Portfolio turnover rate G,H | 137% | 123% | 128% | 138% | 133% |
| Average Annual Total Returns | |||
Periods ended July 31, 2023 | Past 1 year | Past 5 years | Life of Fund |
Fidelity® Quality Factor ETF - NAV A | 10.46% | 11.06% | 12.82% |
Fidelity® Quality Factor ETF - Market Price B | 10.22% | 11.03% | 12.86% |
Fidelity U.S. Quality Factor Index℠ A | 10.75% | 11.37% | 13.15% |
Russell 1000® Index A | 12.95% | 11.92% | 13.38% |
| $10,000 Over Life of Fund |
Let's say hypothetically that $10,000 was invested in Fidelity® Quality Factor ETF - NAV, on September 12, 2016, when the fund started. The chart shows how the value of your investment would have changed, and also shows how the Fidelity U.S. Quality Factor Index℠ and Russell 1000® Index performed over the same period. |
 |
Top Holdings (% of Fund's net assets) | ||
| Apple, Inc. | 7.8 | |
| Microsoft Corp. | 6.7 | |
| Alphabet, Inc. Class A | 3.9 | |
| Tesla, Inc. | 2.5 | |
| Meta Platforms, Inc. Class A | 2.1 | |
| Broadcom, Inc. | 1.8 | |
| UnitedHealth Group, Inc. | 1.8 | |
| Johnson & Johnson | 1.7 | |
| Visa, Inc. Class A | 1.6 | |
| Adobe, Inc. | 1.5 | |
| 31.4 | ||
| Market Sectors (% of Fund's net assets) | ||
| Information Technology | 26.2 | |
| Financials | 13.7 | |
| Health Care | 12.2 | |
| Consumer Discretionary | 11.5 | |
| Industrials | 9.8 | |
| Communication Services | 8.6 | |
| Consumer Staples | 5.7 | |
| Energy | 4.3 | |
| Materials | 2.8 | |
| Real Estate | 2.5 | |
| Utilities | 2.5 | |
Asset Allocation (% of Fund's net assets) |
|
Futures - 0.2% |
| Common Stocks - 99.8% | |||
| Shares | Value ($) | ||
| COMMUNICATION SERVICES - 8.6% | |||
| Diversified Telecommunication Services - 1.2% | |||
| AT&T, Inc. | 95,753 | 1,390,334 | |
| Liberty Global PLC Class A (a) | 41,288 | 766,718 | |
| Verizon Communications, Inc. | 52,144 | 1,777,068 | |
| 3,934,120 | |||
| Entertainment - 0.4% | |||
| Activision Blizzard, Inc. | 16,253 | 1,507,628 | |
| Interactive Media & Services - 6.0% | |||
| Alphabet, Inc. Class A (a) | 94,750 | 12,575,220 | |
| Meta Platforms, Inc. Class A (a) | 21,691 | 6,910,753 | |
| 19,485,973 | |||
| Media - 1.0% | |||
| Comcast Corp. Class A | 53,387 | 2,416,296 | |
| Nexstar Broadcasting Group, Inc. Class A | 4,196 | 783,477 | |
| 3,199,773 | |||
TOTAL COMMUNICATION SERVICES | 28,127,494 | ||
| CONSUMER DISCRETIONARY - 11.5% | |||
| Automobiles - 2.5% | |||
| Tesla, Inc. (a) | 30,589 | 8,180,416 | |
| Hotels, Restaurants & Leisure - 4.4% | |||
| Airbnb, Inc. Class A (a) | 18,869 | 2,871,673 | |
| Booking Holdings, Inc. (a) | 1,061 | 3,152,019 | |
| Domino's Pizza, Inc. | 5,469 | 2,169,771 | |
| McDonald's Corp. | 12,748 | 3,737,714 | |
| Yum! Brands, Inc. | 16,780 | 2,310,103 | |
| 14,241,280 | |||
| Specialty Retail - 3.8% | |||
| AutoZone, Inc. (a) | 912 | 2,263,329 | |
| Lowe's Companies, Inc. | 13,228 | 3,098,924 | |
| O'Reilly Automotive, Inc. (a) | 2,806 | 2,597,767 | |
| The Home Depot, Inc. | 13,385 | 4,468,448 | |
| 12,428,468 | |||
| Textiles, Apparel & Luxury Goods - 0.8% | |||
| NIKE, Inc. Class B | 24,202 | 2,671,659 | |
TOTAL CONSUMER DISCRETIONARY | 37,521,823 | ||
| CONSUMER STAPLES - 5.7% | |||
| Beverages - 1.5% | |||
| Brown-Forman Corp. Class B (non-vtg.) | 21,554 | 1,521,712 | |
| The Coca-Cola Co. | 52,255 | 3,236,152 | |
| 4,757,864 | |||
| Food Products - 0.5% | |||
| The Hershey Co. | 6,872 | 1,589,562 | |
| Household Products - 2.4% | |||
| Colgate-Palmolive Co. | 24,684 | 1,882,402 | |
| Kimberly-Clark Corp. | 12,936 | 1,670,038 | |
| Procter & Gamble Co. | 27,686 | 4,327,322 | |
| 7,879,762 | |||
| Tobacco - 1.3% | |||
| Altria Group, Inc. | 42,449 | 1,928,034 | |
| Philip Morris International, Inc. | 24,926 | 2,485,621 | |
| 4,413,655 | |||
TOTAL CONSUMER STAPLES | 18,640,843 | ||
| ENERGY - 4.3% | |||
| Oil, Gas & Consumable Fuels - 4.3% | |||
| APA Corp. | 17,522 | 709,466 | |
| Chevron Corp. | 17,455 | 2,856,685 | |
| ConocoPhillips Co. | 15,315 | 1,802,882 | |
| Coterra Energy, Inc. | 31,837 | 876,791 | |
| EOG Resources, Inc. | 9,626 | 1,275,734 | |
| Exxon Mobil Corp. | 37,407 | 4,011,527 | |
| Marathon Oil Corp. | 29,220 | 767,609 | |
| Occidental Petroleum Corp. | 15,793 | 997,012 | |
| Texas Pacific Land Corp. | 377 | 567,875 | |
| 13,865,581 | |||
| FINANCIALS - 13.7% | |||
| Banks - 2.4% | |||
| Comerica, Inc. | 32,257 | 1,740,588 | |
| East West Bancorp, Inc. | 30,752 | 1,913,082 | |
| Popular, Inc. | 33,675 | 2,443,121 | |
| Western Alliance Bancorp. | 29,888 | 1,552,682 | |
| 7,649,473 | |||
| Capital Markets - 3.5% | |||
| Ameriprise Financial, Inc. | 7,549 | 2,630,449 | |
| Blackstone, Inc. | 28,796 | 3,017,533 | |
| CME Group, Inc. | 16,064 | 3,196,093 | |
| MSCI, Inc. | 4,732 | 2,593,515 | |
| 11,437,590 | |||
| Consumer Finance - 0.7% | |||
| Discover Financial Services | 21,944 | 2,316,189 | |
| Financial Services - 3.9% | |||
| Essent Group Ltd. | 53,660 | 2,661,536 | |
| MasterCard, Inc. Class A | 12,252 | 4,830,719 | |
| Visa, Inc. Class A | 21,922 | 5,211,517 | |
| 12,703,772 | |||
| Insurance - 3.2% | |||
| Aon PLC | 8,836 | 2,814,266 | |
| Kinsale Capital Group, Inc. | 8,436 | 3,143,507 | |
| Principal Financial Group, Inc. | 26,954 | 2,152,816 | |
| RLI Corp. | 18,276 | 2,438,201 | |
| 10,548,790 | |||
TOTAL FINANCIALS | 44,655,814 | ||
| HEALTH CARE - 12.2% | |||
| Biotechnology - 4.6% | |||
| AbbVie, Inc. | 28,599 | 4,277,838 | |
| Amgen, Inc. | 12,916 | 3,024,281 | |
| Moderna, Inc. (a) | 14,861 | 1,748,545 | |
| Regeneron Pharmaceuticals, Inc. (a) | 3,715 | 2,756,196 | |
| Vertex Pharmaceuticals, Inc. (a) | 9,128 | 3,216,160 | |
| 15,023,020 | |||
| Health Care Providers & Services - 1.8% | |||
| UnitedHealth Group, Inc. | 11,799 | 5,974,660 | |
| Life Sciences Tools & Services - 1.2% | |||
| Mettler-Toledo International, Inc. (a) | 1,543 | 1,940,276 | |
| Waters Corp. (a) | 6,770 | 1,869,942 | |
| 3,810,218 | |||
| Pharmaceuticals - 4.6% | |||
| Johnson & Johnson | 33,227 | 5,566,519 | |
| Merck & Co., Inc. | 40,495 | 4,318,792 | |
| Pfizer, Inc. | 92,172 | 3,323,722 | |
| Royalty Pharma PLC | 58,724 | 1,842,759 | |
| 15,051,792 | |||
TOTAL HEALTH CARE | 39,859,690 | ||
| INDUSTRIALS - 9.8% | |||
| Aerospace & Defense - 0.6% | |||
| Lockheed Martin Corp. | 4,617 | 2,060,890 | |
| Air Freight & Logistics - 1.2% | |||
| Expeditors International of Washington, Inc. | 12,088 | 1,538,802 | |
| United Parcel Service, Inc. Class B | 12,362 | 2,313,301 | |
| 3,852,103 | |||
| Commercial Services & Supplies - 1.1% | |||
| Cintas Corp. | 3,567 | 1,790,777 | |
| Copart, Inc. (a) | 21,813 | 1,928,051 | |
| 3,718,828 | |||
| Electrical Equipment - 0.5% | |||
| Atkore, Inc. (a) | 9,470 | 1,502,605 | |
| Ground Transportation - 2.8% | |||
| CSX Corp. | 55,743 | 1,857,357 | |
| Landstar System, Inc. | 7,311 | 1,488,446 | |
| Norfolk Southern Corp. | 6,847 | 1,599,391 | |
| Old Dominion Freight Lines, Inc. | 4,173 | 1,750,532 | |
| Union Pacific Corp. | 10,779 | 2,500,944 | |
| 9,196,670 | |||
| Industrial Conglomerates - 0.7% | |||
| Honeywell International, Inc. | 11,398 | 2,212,694 | |
| Machinery - 0.6% | |||
| Illinois Tool Works, Inc. | 7,304 | 1,923,289 | |
| Professional Services - 1.3% | |||
| Paychex, Inc. | 20,270 | 2,543,277 | |
| Verisk Analytics, Inc. | 8,107 | 1,856,017 | |
| 4,399,294 | |||
| Trading Companies & Distributors - 1.0% | |||
| Fastenal Co. | 27,756 | 1,626,779 | |
| W.W. Grainger, Inc. | 2,258 | 1,667,510 | |
| 3,294,289 | |||
TOTAL INDUSTRIALS | 32,160,662 | ||
| INFORMATION TECHNOLOGY - 26.2% | |||
| Communications Equipment - 1.2% | |||
| Cisco Systems, Inc. | 75,095 | 3,907,944 | |
| IT Services - 1.2% | |||
| Accenture PLC Class A | 12,144 | 3,841,754 | |
| Semiconductors & Semiconductor Equipment - 6.0% | |||
| Applied Materials, Inc. | 23,891 | 3,621,637 | |
| Broadcom, Inc. | 6,657 | 5,982,313 | |
| KLA Corp. | 6,272 | 3,223,494 | |
| Lam Research Corp. | 5,016 | 3,603,946 | |
| Texas Instruments, Inc. | 18,599 | 3,347,820 | |
| 19,779,210 | |||
| Software - 10.0% | |||
| Adobe, Inc. (a) | 9,047 | 4,941,200 | |
| Cadence Design Systems, Inc. (a) | 13,453 | 3,148,137 | |
| Fair Isaac Corp. (a) | 3,301 | 2,766,139 | |
| Microsoft Corp. | 65,428 | 21,978,574 | |
| 32,834,050 | |||
| Technology Hardware, Storage & Peripherals - 7.8% | |||
| Apple, Inc. | 129,208 | 25,382,905 | |
TOTAL INFORMATION TECHNOLOGY | 85,745,863 | ||
| MATERIALS - 2.8% | |||
| Chemicals - 1.6% | |||
| CF Industries Holdings, Inc. | 7,559 | 620,443 | |
| Dow, Inc. | 14,009 | 791,088 | |
| Linde PLC | 5,352 | 2,090,866 | |
| LyondellBasell Industries NV Class A | 7,292 | 720,887 | |
| Olin Corp. | 9,142 | 527,311 | |
| The Mosaic Co. | 12,734 | 519,038 | |
| 5,269,633 | |||
| Construction Materials - 0.2% | |||
| Eagle Materials, Inc. | 3,691 | 680,510 | |
| Metals & Mining - 1.0% | |||
| Freeport-McMoRan, Inc. | 22,765 | 1,016,457 | |
| Nucor Corp. | 4,885 | 840,660 | |
| Reliance Steel & Aluminum Co. | 2,643 | 774,029 | |
| Steel Dynamics, Inc. | 5,375 | 572,868 | |
| 3,204,014 | |||
TOTAL MATERIALS | 9,154,157 | ||
| REAL ESTATE - 2.5% | |||
| Equity Real Estate Investment Trusts (REITs) - 2.5% | |||
| Agree Realty Corp. | 8,170 | 529,253 | |
| Essex Property Trust, Inc. | 2,862 | 697,040 | |
| Extra Space Storage, Inc. | 4,459 | 622,343 | |
| Gaming & Leisure Properties | 12,390 | 588,029 | |
| NNN (REIT), Inc. | 13,134 | 560,559 | |
| Prologis (REIT), Inc. | 11,257 | 1,404,311 | |
| Public Storage | 3,012 | 848,631 | |
| Realty Income Corp. | 13,065 | 796,573 | |
| Simon Property Group, Inc. | 6,760 | 842,296 | |
| VICI Properties, Inc. | 23,599 | 742,897 | |
| WP Carey, Inc. | 8,254 | 557,393 | |
| 8,189,325 | |||
| UTILITIES - 2.5% | |||
| Electric Utilities - 1.6% | |||
| FirstEnergy Corp. | 20,692 | 815,058 | |
| IDACORP, Inc. | 6,589 | 677,481 | |
| NextEra Energy, Inc. | 24,243 | 1,777,012 | |
| NRG Energy, Inc. | 21,151 | 803,526 | |
| Southern Co. | 18,247 | 1,319,988 | |
| 5,393,065 | |||
| Gas Utilities - 0.4% | |||
| National Fuel Gas Co. | 12,386 | 657,820 | |
| ONE Gas, Inc. (b) | 8,495 | 672,209 | |
| 1,330,029 | |||
| Independent Power and Renewable Electricity Producers - 0.2% | |||
| Clearway Energy, Inc. Class C | 20,548 | 542,673 | |
| Multi-Utilities - 0.3% | |||
| WEC Energy Group, Inc. | 9,568 | 859,780 | |
TOTAL UTILITIES | 8,125,547 | ||
| TOTAL COMMON STOCKS (Cost $297,911,498) | 326,046,799 | ||
| Money Market Funds - 0.2% | |||
| Shares | Value ($) | ||
| Fidelity Cash Central Fund 5.32% (c) | 508,726 | 508,828 | |
| Fidelity Securities Lending Cash Central Fund 5.32% (c)(d) | 161,984 | 162,000 | |
| TOTAL MONEY MARKET FUNDS (Cost $670,828) | 670,828 | ||
| TOTAL INVESTMENT IN SECURITIES - 100.0% (Cost $298,582,326) | 326,717,627 |
NET OTHER ASSETS (LIABILITIES) - 0.0% | 124,912 |
| NET ASSETS - 100.0% | 326,842,539 |
| Futures Contracts | |||||
Number of contracts | Expiration Date | Notional Amount ($) | Value ($) | Unrealized Appreciation/ (Depreciation) ($) | |
| Purchased | |||||
| Equity Index Contracts | |||||
| CME Micro E-mini S&P 500 Index Contracts (United States) | 25 | Sep 2023 | 576,813 | 36,579 | 36,579 |
| The notional amount of futures purchased as a percentage of Net Assets is 0.2% | |||||
| (a) | Non-income producing |
| (b) | Security or a portion of the security is on loan at period end. |
| (c) | Affiliated fund that is generally available only to investment companies and other accounts managed by Fidelity Investments. The rate quoted is the annualized seven-day yield of the fund at period end. A complete unaudited listing of the fund's holdings as of its most recent quarter end is available upon request. In addition, each Fidelity Central Fund's financial statements, which are not covered by the Fund's Report of Independent Registered Public Accounting Firm, are available on the SEC's website or upon request. |
| (d) | Investment made with cash collateral received from securities on loan. |
| Affiliate | Value, beginning of period ($) | Purchases ($) | Sales Proceeds ($) | Dividend Income ($) | Realized Gain (loss) ($) | Change in Unrealized appreciation (depreciation) ($) | Value, end of period ($) | % ownership, end of period |
| Fidelity Cash Central Fund 5.32% | 291,681 | 6,686,052 | 6,468,905 | 15,656 | - | - | 508,828 | 0.0% |
| Fidelity Securities Lending Cash Central Fund 5.32% | 3,524,275 | 24,641,385 | 28,003,660 | 37,353 | - | - | 162,000 | 0.0% |
| Total | 3,815,956 | 31,327,437 | 34,472,565 | 53,009 | - | - | 670,828 | |
| Valuation Inputs at Reporting Date: | ||||
| Description | Total ($) | Level 1 ($) | Level 2 ($) | Level 3 ($) |
Investments in Securities: | ||||
| Equities: | ||||
Communication Services | 28,127,494 | 28,127,494 | - | - |
Consumer Discretionary | 37,521,823 | 37,521,823 | - | - |
Consumer Staples | 18,640,843 | 18,640,843 | - | - |
Energy | 13,865,581 | 13,865,581 | - | - |
Financials | 44,655,814 | 44,655,814 | - | - |
Health Care | 39,859,690 | 39,859,690 | - | - |
Industrials | 32,160,662 | 32,160,662 | - | - |
Information Technology | 85,745,863 | 85,745,863 | - | - |
Materials | 9,154,157 | 9,154,157 | - | - |
Real Estate | 8,189,325 | 8,189,325 | - | - |
Utilities | 8,125,547 | 8,125,547 | - | - |
| Money Market Funds | 670,828 | 670,828 | - | - |
| Total Investments in Securities: | 326,717,627 | 326,717,627 | - | - |
Derivative Instruments: | ||||
| Assets | ||||
Futures Contracts | 36,579 | 36,579 | - | - |
| Total Assets | 36,579 | 36,579 | - | - |
| Total Derivative Instruments: | 36,579 | 36,579 | - | - |
Primary Risk Exposure / Derivative Type | Value | |
| Asset ($) | Liability ($) | |
| Equity Risk | ||
Futures Contracts (a) | 36,579 | 0 |
| Total Equity Risk | 36,579 | 0 |
| Total Value of Derivatives | 36,579 | 0 |
| Statement of Assets and Liabilities | ||||
| July 31, 2023 | ||||
| Assets | ||||
| Investment in securities, at value (including securities loaned of $158,260) - See accompanying schedule: | ||||
Unaffiliated issuers (cost $297,911,498) | $ | 326,046,799 | ||
Fidelity Central Funds (cost $670,828) | 670,828 | |||
| Total Investment in Securities (cost $298,582,326) | $ | 326,717,627 | ||
| Segregated cash with brokers for derivative instruments | 28,000 | |||
| Cash | 13,159 | |||
| Dividends receivable | 319,968 | |||
| Distributions receivable from Fidelity Central Funds | 2,020 | |||
| Receivable for daily variation margin on futures contracts | 1,000 | |||
Total assets | 327,081,774 | |||
| Liabilities | ||||
| Accrued management fee | $ | 77,235 | ||
| Collateral on securities loaned | 162,000 | |||
| Total Liabilities | 239,235 | |||
| Net Assets | $ | 326,842,539 | ||
| Net Assets consist of: | ||||
| Paid in capital | $ | 322,500,604 | ||
| Total accumulated earnings (loss) | 4,341,935 | |||
| Net Assets | $ | 326,842,539 | ||
Net Asset Value, offering price and redemption price per share ($326,842,539 ÷ 6,250,000 shares) | $ | 52.29 | ||
| Statement of Operations | ||||
Year ended July 31, 2023 | ||||
| Investment Income | ||||
| Dividends | $ | 4,931,626 | ||
| Income from Fidelity Central Funds (including $37,353 from security lending) | 53,009 | |||
| Total Income | 4,984,635 | |||
| Expenses | ||||
| Management fee | $ | 787,289 | ||
| Independent trustees' fees and expenses | 1,350 | |||
| Total expenses before reductions | 788,639 | |||
| Expense reductions | (294) | |||
| Total expenses after reductions | 788,345 | |||
| Net Investment income (loss) | 4,196,290 | |||
| Realized and Unrealized Gain (Loss) | ||||
| Net realized gain (loss) on: | ||||
| Investment Securities: | ||||
| Unaffiliated issuers | (5,689,837) | |||
| Redemptions in-kind | 6,599,514 | |||
| Futures contracts | 138,542 | |||
| Total net realized gain (loss) | 1,048,219 | |||
| Change in net unrealized appreciation (depreciation) on: | ||||
| Investment Securities: | ||||
| Unaffiliated issuers | 25,939,079 | |||
| Futures contracts | 3,454 | |||
| Total change in net unrealized appreciation (depreciation) | 25,942,533 | |||
| Net gain (loss) | 26,990,752 | |||
| Net increase (decrease) in net assets resulting from operations | $ | 31,187,042 | ||
| Statement of Changes in Net Assets | ||||
Year ended July 31, 2023 | Year ended July 31, 2022 | |||
| Increase (Decrease) in Net Assets | ||||
| Operations | ||||
| Net investment income (loss) | $ | 4,196,290 | $ | 3,315,679 |
| Net realized gain (loss) | 1,048,219 | 31,054,201 | ||
| Change in net unrealized appreciation (depreciation) | 25,942,533 | (49,818,448) | ||
| Net increase (decrease) in net assets resulting from operations | 31,187,042 | (15,448,568) | ||
| Distributions to shareholders | (4,025,350) | (3,437,350) | ||
| Share transactions | ||||
| Proceeds from sales of shares | 68,034,031 | 184,056,355 | ||
| Cost of shares redeemed | (35,066,993) | (144,177,423) | ||
Net increase (decrease) in net assets resulting from share transactions | 32,967,038 | 39,878,932 | ||
| Total increase (decrease) in net assets | 60,128,730 | 20,993,014 | ||
| Net Assets | ||||
| Beginning of period | 266,713,809 | 245,720,795 | ||
| End of period | $ | 326,842,539 | $ | 266,713,809 |
| Other Information | ||||
| Shares | ||||
| Sold | 1,450,000 | 3,600,000 | ||
| Redeemed | (750,000) | (2,850,000) | ||
| Net increase (decrease) | 700,000 | 750,000 | ||
| Fidelity® Quality Factor ETF |
| Years ended July 31, | 2023 | 2022 | 2021 | 2020 | 2019 | |||||
Selected Per-Share Data | ||||||||||
| Net asset value, beginning of period | $ | 48.06 | $ | 51.19 | $ | 38.19 | $ | 35.28 | $ | 33.47 |
| Income from Investment Operations | ||||||||||
Net investment income (loss) A,B | .72 | .67 | .62 | .62 | .58 | |||||
| Net realized and unrealized gain (loss) | 4.20 | (3.10) | 13.00 | 2.90 | 1.77 | |||||
| Total from investment operations | 4.92 | (2.43) | 13.62 | 3.52 | 2.35 | |||||
| Distributions from net investment income | (.69) | (.70) | (.62) | (.61) | (.54) | |||||
| Total distributions | (.69) | (.70) | (.62) | (.61) | (.54) | |||||
| Net asset value, end of period | $ | 52.29 | $ | 48.06 | $ | 51.19 | $ | 38.19 | $ | 35.28 |
Total Return C,D | 10.46% | (4.79)% | 36.00% | 10.26% | 7.14% | |||||
Ratios to Average Net Assets B,E,F | ||||||||||
| Expenses before reductions | .29% | .29% | .29% | .29% | .29% | |||||
| Expenses net of fee waivers, if any | .29% | .29% | .29% | .29% | .29% | |||||
| Expenses net of all reductions | .29% | .29% | .29% | .29% | .29% | |||||
| Net investment income (loss) | 1.54% | 1.33% | 1.39% | 1.74% | 1.72% | |||||
| Supplemental Data | ||||||||||
| Net assets, end of period (000 omitted) | $ | 326,843 | $ | 266,714 | $ | 245,721 | $ | 147,022 | $ | 162,282 |
Portfolio turnover rate G,H | 43% | 38% | 35% | 41% | 29% |
| Average Annual Total Returns | |||
Periods ended July 31, 2023 | Past 1 year | Life of Fund |
Fidelity® Small-Mid Multifactor ETF - NAV A | 7.92% | 9.49% |
Fidelity® Small-Mid Multifactor ETF - Market Price B | 7.79% | 9.43% |
Fidelity Small-Mid Multifactor Index℠ A | 8.23% | 9.83% |
Dow Jones U.S. Completion Total Stock Market Index℠ A | 10.44% | 8.26% |
| $10,000 Over Life of Fund |
Let's say hypothetically that $10,000 was invested in Fidelity® Small-Mid Multifactor ETF - NAV, on February 26, 2019, when the fund started. The chart shows how the value of your investment would have changed, and also shows how the Fidelity Small-Mid Multifactor Index℠ and Dow Jones U.S. Completion Total Stock Market Index℠ performed over the same period. |
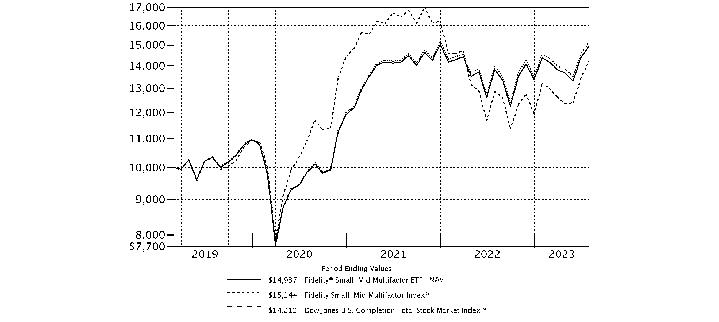 |
Top Holdings (% of Fund's net assets) | ||
| Super Micro Computer, Inc. | 0.6 | |
| First Citizens Bancshares, Inc. | 0.5 | |
| EQT Corp. | 0.4 | |
| Jabil, Inc. | 0.4 | |
| Deckers Outdoor Corp. | 0.4 | |
| Dell Technologies, Inc. | 0.3 | |
| Owens Corning | 0.3 | |
| RPM International, Inc. | 0.3 | |
| Brown-Forman Corp. Class B (non-vtg.) | 0.3 | |
| Manhattan Associates, Inc. | 0.3 | |
| 3.8 | ||
| Market Sectors (% of Fund's net assets) | ||
| Industrials | 18.7 | |
| Financials | 15.2 | |
| Consumer Discretionary | 14.1 | |
| Information Technology | 13.8 | |
| Health Care | 12.5 | |
| Real Estate | 6.0 | |
| Materials | 5.0 | |
| Energy | 4.8 | |
| Consumer Staples | 3.8 | |
| Communication Services | 3.1 | |
| Utilities | 2.6 | |
Asset Allocation (% of Fund's net assets) |
|
Futures - 0.3% |
| Common Stocks - 99.6% | |||
| Shares | Value ($) | ||
| COMMUNICATION SERVICES - 3.1% | |||
| Diversified Telecommunication Services - 0.7% | |||
| Cogent Communications Group, Inc. | 2,473 | 151,447 | |
| Frontier Communications Parent, Inc. (a) | 8,417 | 153,274 | |
| Iridium Communications, Inc. | 4,548 | 238,997 | |
| Liberty Global PLC Class C (a) | 14,005 | 276,739 | |
| Lumen Technologies, Inc. | 39,877 | 71,380 | |
| 891,837 | |||
| Entertainment - 0.5% | |||
| Madison Square Garden Sports Corp. | 992 | 211,048 | |
| Sciplay Corp. (A Shares) (a) | 7,090 | 138,964 | |
| World Wrestling Entertainment, Inc. Class A | 2,208 | 231,840 | |
| 581,852 | |||
| Interactive Media & Services - 0.6% | |||
| Yelp, Inc. (a) | 4,782 | 215,429 | |
| Ziff Davis, Inc. (a) | 2,192 | 158,964 | |
| ZipRecruiter, Inc. (a) | 6,212 | 115,046 | |
| Zoominfo Technologies, Inc. (a) | 9,518 | 243,375 | |
| 732,814 | |||
| Media - 1.3% | |||
| Cable One, Inc. | 232 | 167,954 | |
| John Wiley & Sons, Inc. Class A | 3,150 | 107,825 | |
| News Corp. Class A | 16,045 | 318,012 | |
| Nexstar Broadcasting Group, Inc. Class A | 1,333 | 248,898 | |
| Scholastic Corp. | 3,027 | 130,736 | |
| Sirius XM Holdings, Inc. (b) | 35,630 | 181,713 | |
| TEGNA, Inc. | 10,181 | 172,059 | |
| The New York Times Co. Class A | 6,549 | 266,937 | |
| 1,594,134 | |||
TOTAL COMMUNICATION SERVICES | 3,800,637 | ||
| CONSUMER DISCRETIONARY - 14.1% | |||
| Automobile Components - 1.7% | |||
| Autoliv, Inc. | 2,959 | 298,652 | |
| BorgWarner, Inc. | 7,520 | 349,680 | |
| Dorman Products, Inc. (a) | 1,741 | 147,445 | |
| Gentex Corp. | 8,932 | 299,937 | |
| Gentherm, Inc. (a) | 2,271 | 135,738 | |
| LCI Industries (b) | 1,514 | 206,313 | |
| Lear Corp. | 2,088 | 323,139 | |
| Phinia, Inc. | 1,495 | 42,413 | |
| Visteon Corp. (a) | 1,330 | 204,940 | |
| XPEL, Inc. (a) | 1,885 | 153,119 | |
| 2,161,376 | |||
| Automobiles - 0.5% | |||
| Harley-Davidson, Inc. | 5,124 | 197,838 | |
| Thor Industries, Inc. (b) | 2,284 | 263,779 | |
| Winnebago Industries, Inc. | 2,340 | 160,992 | |
| 622,609 | |||
| Broadline Retail - 0.4% | |||
| Dillard's, Inc. Class A (b) | 353 | 121,093 | |
| Macy's, Inc. | 10,650 | 176,684 | |
| Ollie's Bargain Outlet Holdings, Inc. (a) | 3,232 | 235,548 | |
| 533,325 | |||
| Diversified Consumer Services - 1.5% | |||
| ADT, Inc. | 17,497 | 111,631 | |
| Adtalem Global Education, Inc. (a) | 3,943 | 170,495 | |
| Chegg, Inc. (a) | 8,162 | 82,681 | |
| Frontdoor, Inc. (a) | 5,811 | 202,920 | |
| Graham Holdings Co. | 255 | 149,621 | |
| Grand Canyon Education, Inc. (a) | 1,638 | 177,805 | |
| H&R Block, Inc. | 6,342 | 213,155 | |
| Perdoceo Education Corp. | 9,163 | 122,326 | |
| Service Corp. International | 4,940 | 329,251 | |
| Strategic Education, Inc. | 1,673 | 125,642 | |
| Stride, Inc. (a) | 3,575 | 136,601 | |
| 1,822,128 | |||
| Hotels, Restaurants & Leisure - 2.1% | |||
| Bloomin' Brands, Inc. | 6,525 | 175,327 | |
| Bowlero Corp. Class A (a) | 8,797 | 106,708 | |
| Boyd Gaming Corp. | 3,580 | 244,586 | |
| Choice Hotels International, Inc. (b) | 1,516 | 198,217 | |
| Churchill Downs, Inc. | 2,369 | 274,449 | |
| Cracker Barrel Old Country Store, Inc. | 1,467 | 136,724 | |
| Monarch Casino & Resort, Inc. | 1,777 | 123,182 | |
| Planet Fitness, Inc. (a) | 3,192 | 215,588 | |
| RCI Hospitality Holdings, Inc. | 1,419 | 98,975 | |
| Texas Roadhouse, Inc. Class A | 2,564 | 286,014 | |
| Vail Resorts, Inc. | 1,324 | 311,789 | |
| Wendy's Co. | 8,851 | 190,208 | |
| Wingstop, Inc. | 1,346 | 226,909 | |
| 2,588,676 | |||
| Household Durables - 2.6% | |||
| Cavco Industries, Inc. (a) | 590 | 174,434 | |
| Ethan Allen Interiors, Inc. (b) | 4,322 | 136,013 | |
| KB Home | 4,636 | 250,205 | |
| La-Z-Boy, Inc. | 4,771 | 149,666 | |
| Leggett & Platt, Inc. | 5,919 | 173,190 | |
| M.D.C. Holdings, Inc. | 4,024 | 206,351 | |
| M/I Homes, Inc. (a) | 2,400 | 240,000 | |
| Meritage Homes Corp. | 1,778 | 264,833 | |
| Skyline Champion Corp. (a) | 3,001 | 209,050 | |
| Taylor Morrison Home Corp. (a) | 5,442 | 263,502 | |
| Tempur Sealy International, Inc. | 6,326 | 282,329 | |
| Toll Brothers, Inc. | 4,170 | 334,976 | |
| TopBuild Corp. (a) | 1,243 | 340,495 | |
| TRI Pointe Homes, Inc. (a) | 7,151 | 227,974 | |
| 3,253,018 | |||
| Leisure Products - 1.0% | |||
| Acushnet Holdings Corp. | 3,009 | 179,427 | |
| Brunswick Corp. | 2,854 | 246,329 | |
| JAKKS Pacific, Inc. (a) | 5,485 | 114,307 | |
| Malibu Boats, Inc. Class A (a) | 2,197 | 131,710 | |
| MasterCraft Boat Holdings, Inc. (a) | 4,096 | 125,542 | |
| Polaris, Inc. | 2,158 | 293,143 | |
| Sturm, Ruger & Co., Inc. | 2,366 | 125,280 | |
| 1,215,738 | |||
| Specialty Retail - 2.9% | |||
| Academy Sports & Outdoors, Inc. | 3,587 | 214,467 | |
| Advance Auto Parts, Inc. | 2,053 | 152,723 | |
| Arko Corp. | 15,345 | 127,977 | |
| Asbury Automotive Group, Inc. (a) | 958 | 216,125 | |
| AutoNation, Inc. (a) | 1,579 | 254,187 | |
| Dick's Sporting Goods, Inc. | 2,069 | 291,729 | |
| Five Below, Inc. (a) | 1,789 | 372,720 | |
| Foot Locker, Inc. (b) | 4,199 | 112,827 | |
| Group 1 Automotive, Inc. | 811 | 209,668 | |
| Haverty Furniture Companies, Inc. | 3,431 | 122,144 | |
| Hibbett, Inc. | 1,913 | 88,763 | |
| Monro, Inc. | 2,801 | 102,657 | |
| Murphy U.S.A., Inc. | 894 | 274,485 | |
| Penske Automotive Group, Inc. (b) | 1,369 | 220,984 | |
| The Buckle, Inc. | 3,220 | 117,723 | |
| Valvoline, Inc. | 6,797 | 258,082 | |
| Williams-Sonoma, Inc. (b) | 2,262 | 313,604 | |
| Winmark Corp. | 466 | 169,372 | |
| 3,620,237 | |||
| Textiles, Apparel & Luxury Goods - 1.4% | |||
| Capri Holdings Ltd. (a) | 4,513 | 166,575 | |
| Columbia Sportswear Co. | 1,962 | 154,233 | |
| Crocs, Inc. (a) | 2,268 | 245,738 | |
| Deckers Outdoor Corp. (a) | 852 | 463,224 | |
| Kontoor Brands, Inc. | 3,382 | 143,262 | |
| Skechers U.S.A., Inc. Class A (sub. vtg.) (a) | 5,278 | 293,351 | |
| Tapestry, Inc. | 7,761 | 334,887 | |
| 1,801,270 | |||
TOTAL CONSUMER DISCRETIONARY | 17,618,377 | ||
| CONSUMER STAPLES - 3.8% | |||
| Beverages - 0.6% | |||
| Brown-Forman Corp. Class B (non-vtg.) | 5,835 | 411,951 | |
| MGP Ingredients, Inc. (b) | 1,576 | 179,680 | |
| National Beverage Corp. (a) | 3,209 | 169,596 | |
| 761,227 | |||
| Consumer Staples Distribution & Retail - 1.1% | |||
| Albertsons Companies, Inc. | 9,177 | 199,416 | |
| BJ's Wholesale Club Holdings, Inc. (a) | 4,604 | 305,291 | |
| Casey's General Stores, Inc. | 1,359 | 343,365 | |
| Ingles Markets, Inc. Class A | 1,598 | 135,510 | |
| Sprouts Farmers Market LLC (a) | 6,035 | 236,874 | |
| Weis Markets, Inc. (b) | 1,747 | 115,896 | |
| 1,336,352 | |||
| Food Products - 1.3% | |||
| Cal-Maine Foods, Inc. (b) | 3,053 | 141,018 | |
| Campbell Soup Co. | 6,820 | 312,492 | |
| Flowers Foods, Inc. | 8,607 | 212,679 | |
| Hostess Brands, Inc. Class A (a) | 8,234 | 197,945 | |
| Ingredion, Inc. | 2,638 | 293,504 | |
| John B. Sanfilippo & Son, Inc. | 1,505 | 163,910 | |
| Lancaster Colony Corp. | 1,086 | 209,196 | |
| Tootsie Roll Industries, Inc. | 3,119 | 108,728 | |
| 1,639,472 | |||
| Household Products - 0.2% | |||
| WD-40 Co. (b) | 947 | 217,337 | |
| Personal Care Products - 0.5% | |||
| BellRing Brands, Inc. (a) | 7,181 | 258,157 | |
| elf Beauty, Inc. (a) | 2,904 | 338,955 | |
| 597,112 | |||
| Tobacco - 0.1% | |||
| Vector Group Ltd. | 12,113 | 158,923 | |
TOTAL CONSUMER STAPLES | 4,710,423 | ||
| ENERGY - 4.8% | |||
| Energy Equipment & Services - 0.2% | |||
| Helmerich & Payne, Inc. | 4,881 | 218,522 | |
| Oil, Gas & Consumable Fuels - 4.6% | |||
| Arch Resources, Inc. | 1,174 | 150,789 | |
| Ardmore Shipping Corp. | 8,924 | 125,650 | |
| California Resources Corp. | 4,478 | 238,901 | |
| Chesapeake Energy Corp. | 3,740 | 315,432 | |
| Chord Energy Corp. | 1,752 | 274,784 | |
| Civitas Resources, Inc. (b) | 3,009 | 225,254 | |
| Comstock Resources, Inc. (b) | 11,801 | 150,463 | |
| CONSOL Energy, Inc. | 2,746 | 204,632 | |
| CVR Energy, Inc. | 4,284 | 157,394 | |
| Delek U.S. Holdings, Inc. | 6,066 | 167,361 | |
| DT Midstream, Inc. | 4,270 | 228,530 | |
| EQT Corp. | 11,783 | 497,007 | |
| Evolution Petroleum Corp. | 20,070 | 187,454 | |
| Gulfport Energy Corp. (a) | 2,141 | 219,345 | |
| HF Sinclair Corp. | 5,133 | 267,378 | |
| International Seaways, Inc. | 3,951 | 169,458 | |
| Magnolia Oil & Gas Corp. Class A | 8,825 | 195,474 | |
| Murphy Oil Corp. | 6,065 | 262,433 | |
| Par Pacific Holdings, Inc. (a) | 5,685 | 178,964 | |
| PBF Energy, Inc. Class A | 5,457 | 258,880 | |
| PDC Energy, Inc. | 3,882 | 294,605 | |
| Peabody Energy Corp. | 6,710 | 150,572 | |
| Southwestern Energy Co. (a) | 46,377 | 300,523 | |
| Talos Energy, Inc. (a) | 7,704 | 123,264 | |
| Teekay Tankers Ltd. | 4,241 | 184,950 | |
| Texas Pacific Land Corp. | 196 | 295,235 | |
| 5,824,732 | |||
TOTAL ENERGY | 6,043,254 | ||
| FINANCIALS - 15.2% | |||
| Banks - 6.6% | |||
| 1st Source Corp. | 2,844 | 133,384 | |
| Amalgamated Financial Corp. | 5,782 | 115,409 | |
| Ameris Bancorp | 3,904 | 170,410 | |
| BancFirst Corp. | 1,831 | 182,917 | |
| Bank First National Corp. | 1,666 | 147,208 | |
| Banner Corp. | 2,631 | 125,262 | |
| Cambridge Bancorp | 1,660 | 102,156 | |
| Cathay General Bancorp | 4,387 | 166,881 | |
| City Holding Co. | 1,585 | 156,772 | |
| Columbia Banking Systems, Inc. | 5,468 | 122,210 | |
| Comerica, Inc. | 4,542 | 245,086 | |
| Commerce Bancshares, Inc. | 4,356 | 231,652 | |
| Community Trust Bancorp, Inc. | 3,142 | 120,590 | |
| CVB Financial Corp. | 7,795 | 147,092 | |
| Dime Community Bancshares, Inc. | 4,689 | 105,034 | |
| East West Bancorp, Inc. | 4,661 | 289,961 | |
| Enterprise Financial Services Corp. | 3,091 | 126,731 | |
| First Bancorp, Puerto Rico | 12,686 | 188,387 | |
| First Citizens Bancshares, Inc. | 419 | 599,715 | |
| First Financial Corp., Indiana | 2,999 | 114,592 | |
| First Merchants Corp. | 4,162 | 133,683 | |
| FNB Corp., Pennsylvania | 16,391 | 209,641 | |
| Fulton Financial Corp. | 10,812 | 154,612 | |
| Great Southern Bancorp, Inc. | 2,306 | 127,591 | |
| Hancock Whitney Corp. | 4,178 | 183,874 | |
| Hanmi Financial Corp. | 5,767 | 109,573 | |
| Heritage Financial Corp., Washington | 4,960 | 93,050 | |
| International Bancshares Corp. | 3,767 | 186,994 | |
| Midland States Bancorp, Inc. | 5,308 | 124,366 | |
| NBT Bancorp, Inc. | 3,953 | 147,052 | |
| OFG Bancorp | 5,282 | 176,894 | |
| Old Second Bancorp, Inc. | 8,115 | 129,759 | |
| Peapack-Gladstone Financial Corp. | 3,645 | 106,543 | |
| Popular, Inc. | 3,348 | 242,897 | |
| Preferred Bank, Los Angeles | 1,989 | 131,433 | |
| QCR Holdings, Inc. | 2,666 | 136,579 | |
| S&T Bancorp, Inc. | 4,223 | 133,362 | |
| Southstate Corp. | 3,180 | 246,991 | |
| Stock Yards Bancorp, Inc. | 2,639 | 126,171 | |
| Synovus Financial Corp. | 6,032 | 204,485 | |
| Trico Bancshares | 3,124 | 116,775 | |
| Trustco Bank Corp., New York | 3,784 | 114,996 | |
| UMB Financial Corp. | 2,311 | 164,081 | |
| United Bankshares, Inc., West Virginia | 5,906 | 197,497 | |
| Valley National Bancorp | 19,104 | 196,007 | |
| Webster Financial Corp. | 6,087 | 288,037 | |
| WesBanco, Inc. | 4,556 | 127,614 | |
| Westamerica Bancorp. | 2,806 | 138,027 | |
| Wintrust Financial Corp. | 2,655 | 223,976 | |
| 8,264,009 | |||
| Capital Markets - 1.5% | |||
| Evercore, Inc. Class A | 1,721 | 232,438 | |
| Federated Hermes, Inc. | 4,934 | 166,917 | |
| GCM Grosvenor, Inc. Class A | 14,210 | 111,549 | |
| Houlihan Lokey | 2,340 | 233,649 | |
| Interactive Brokers Group, Inc. | 3,797 | 331,592 | |
| Lazard Ltd. Class A | 5,512 | 193,471 | |
| PJT Partners, Inc. | 2,095 | 166,154 | |
| SEI Investments Co. | 4,177 | 263,109 | |
| StoneX Group, Inc. (a) | 1,800 | 165,618 | |
| 1,864,497 | |||
| Consumer Finance - 0.4% | |||
| Enova International, Inc. (a) | 3,047 | 167,859 | |
| FirstCash Holdings, Inc. | 2,179 | 207,615 | |
| Nelnet, Inc. Class A | 1,686 | 166,374 | |
| 541,848 | |||
| Financial Services - 1.9% | |||
| A-Mark Precious Metals, Inc. | 3,577 | 145,906 | |
| Cass Information Systems, Inc. | 2,412 | 91,535 | |
| Enact Holdings, Inc. | 5,619 | 152,837 | |
| Essent Group Ltd. | 5,164 | 256,134 | |
| Euronet Worldwide, Inc. (a) | 1,953 | 171,610 | |
| EVERTEC, Inc. | 4,284 | 168,490 | |
| International Money Express, Inc. (a) | 5,319 | 128,879 | |
| Jackson Financial, Inc. | 3,955 | 130,594 | |
| Merchants Bancorp | 4,540 | 143,509 | |
| MGIC Investment Corp. | 15,205 | 254,532 | |
| Radian Group, Inc. | 8,857 | 238,519 | |
| The Western Union Co. | 16,023 | 195,160 | |
| Voya Financial, Inc. | 3,927 | 291,619 | |
| 2,369,324 | |||
| Insurance - 4.8% | |||
| American Equity Investment Life Holding Co. | 4,148 | 222,623 | |
| American Financial Group, Inc. | 2,456 | 298,674 | |
| Amerisafe, Inc. | 2,687 | 140,046 | |
| Assurant, Inc. | 2,091 | 281,260 | |
| Axis Capital Holdings Ltd. | 3,733 | 205,763 | |
| Employers Holdings, Inc. | 3,481 | 134,471 | |
| Erie Indemnity Co. Class A | 1,058 | 234,834 | |
| Fidelity National Financial, Inc. | 8,760 | 343,129 | |
| Genworth Financial, Inc. Class A (a) | 32,539 | 190,679 | |
| Globe Life, Inc. | 3,051 | 342,231 | |
| Hanover Insurance Group, Inc. | 1,678 | 190,419 | |
| Kinsale Capital Group, Inc. | 912 | 339,839 | |
| Loews Corp. | 6,400 | 400,960 | |
| National Western Life Group, Inc. | 511 | 215,473 | |
| Old Republic International Corp. | 10,894 | 300,348 | |
| Primerica, Inc. | 1,564 | 332,663 | |
| Reinsurance Group of America, Inc. | 2,317 | 325,191 | |
| RenaissanceRe Holdings Ltd. | 1,570 | 293,213 | |
| RLI Corp. | 1,840 | 245,474 | |
| Safety Insurance Group, Inc. | 1,748 | 125,856 | |
| Selective Insurance Group, Inc. | 2,628 | 271,183 | |
| Unum Group | 7,142 | 347,173 | |
| White Mountains Insurance Group Ltd. | 141 | 218,130 | |
| 5,999,632 | |||
TOTAL FINANCIALS | 19,039,310 | ||
| HEALTH CARE - 12.5% | |||
| Biotechnology - 3.3% | |||
| ADMA Biologics, Inc. (a) | 35,193 | 146,051 | |
| Akero Therapeutics, Inc. (a) | 3,163 | 137,274 | |
| Alkermes PLC (a) | 7,901 | 231,341 | |
| Amicus Therapeutics, Inc. (a) | 14,279 | 194,480 | |
| Ars Pharmaceuticals, Inc. (a) | 17,543 | 128,941 | |
| Catalyst Pharmaceutical Partners, Inc. (a) | 9,596 | 132,713 | |
| Chinook Therapeutics, Inc. (a) | 5,659 | 221,720 | |
| Cytokinetics, Inc. (a) | 4,736 | 157,946 | |
| Deciphera Pharmaceuticals, Inc. (a) | 7,858 | 106,240 | |
| Exelixis, Inc. (a) | 13,791 | 271,821 | |
| Halozyme Therapeutics, Inc. (a) | 5,209 | 223,779 | |
| Ionis Pharmaceuticals, Inc. (a) | 6,003 | 248,704 | |
| Ironwood Pharmaceuticals, Inc. Class A (a) | 13,212 | 146,521 | |
| Kiniksa Pharmaceuticals Ltd. (a) | 8,974 | 169,070 | |
| Neurocrine Biosciences, Inc. (a) | 3,208 | 326,863 | |
| Repligen Corp. (a) | 1,745 | 299,372 | |
| Sarepta Therapeutics, Inc. (a) | 2,919 | 316,390 | |
| Syndax Pharmaceuticals, Inc. (a) | 5,545 | 118,219 | |
| United Therapeutics Corp. (a) | 1,459 | 354,128 | |
| Vaxcyte, Inc. (a) | 3,991 | 191,807 | |
| Vir Biotechnology, Inc. (a) | 5,596 | 78,792 | |
| 4,202,172 | |||
| Health Care Equipment & Supplies - 3.1% | |||
| Atrion Corp. | 199 | 111,561 | |
| Axonics Modulation Technologies, Inc. (a) | 2,997 | 180,929 | |
| Embecta Corp. | 5,378 | 114,767 | |
| Globus Medical, Inc. (a) | 3,204 | 193,105 | |
| Haemonetics Corp. (a) | 2,484 | 229,124 | |
| Integer Holdings Corp. (a) | 2,325 | 215,016 | |
| Integra LifeSciences Holdings Corp. (a) | 3,555 | 161,646 | |
| Lantheus Holdings, Inc. (a) | 3,469 | 300,034 | |
| LeMaitre Vascular, Inc. | 2,796 | 176,791 | |
| Masimo Corp. (a) | 1,742 | 213,047 | |
| Merit Medical Systems, Inc. (a) | 2,862 | 213,706 | |
| Novocure Ltd. (a) | 3,224 | 105,231 | |
| PROCEPT BioRobotics Corp. (a) | 3,711 | 127,807 | |
| QuidelOrtho Corp. (a) | 2,467 | 215,517 | |
| Shockwave Medical, Inc. (a) | 1,420 | 370,052 | |
| Teleflex, Inc. | 1,484 | 372,736 | |
| TransMedics Group, Inc. (a) | 2,445 | 227,825 | |
| UFP Technologies, Inc. (a) | 1,206 | 234,766 | |
| Zynex, Inc. (a)(b) | 8,754 | 85,439 | |
| 3,849,099 | |||
| Health Care Providers & Services - 3.4% | |||
| Acadia Healthcare Co., Inc. (a) | 3,444 | 272,179 | |
| Addus HomeCare Corp. (a) | 1,434 | 131,311 | |
| Amedisys, Inc. (a) | 1,944 | 176,593 | |
| AMN Healthcare Services, Inc. (a) | 2,109 | 225,979 | |
| Chemed Corp. | 556 | 289,726 | |
| Corvel Corp. (a) | 828 | 169,376 | |
| Cross Country Healthcare, Inc. (a) | 4,744 | 122,395 | |
| DaVita HealthCare Partners, Inc. (a) | 2,590 | 264,154 | |
| DocGo, Inc. Class A (a) | 13,573 | 113,877 | |
| Encompass Health Corp. | 4,128 | 272,572 | |
| HealthEquity, Inc. (a) | 3,863 | 262,452 | |
| Henry Schein, Inc. (a) | 4,315 | 339,979 | |
| National Healthcare Corp. | 2,198 | 129,726 | |
| National Research Corp. Class A | 2,881 | 123,624 | |
| Option Care Health, Inc. (a) | 7,448 | 251,593 | |
| Premier, Inc. | 6,123 | 169,913 | |
| Select Medical Holdings Corp. | 6,198 | 186,002 | |
| The Ensign Group, Inc. | 2,475 | 239,753 | |
| U.S. Physical Therapy, Inc. | 1,425 | 165,685 | |
| Universal Health Services, Inc. Class B | 2,199 | 305,573 | |
| 4,212,462 | |||
| Health Care Technology - 0.5% | |||
| Computer Programs & Systems, Inc. (a) | 4,339 | 113,769 | |
| Doximity, Inc. (a)(b) | 5,480 | 195,800 | |
| HealthStream, Inc. | 5,398 | 121,347 | |
| Simulations Plus, Inc. (b) | 3,148 | 156,770 | |
| 587,686 | |||
| Life Sciences Tools & Services - 0.5% | |||
| Bruker Corp. | 3,828 | 263,060 | |
| Maravai LifeSciences Holdings, Inc. (a) | 10,035 | 113,496 | |
| Medpace Holdings, Inc. (a) | 1,050 | 265,829 | |
| 642,385 | |||
| Pharmaceuticals - 1.7% | |||
| Amphastar Pharmaceuticals, Inc. (a) | 4,625 | 280,691 | |
| Catalent, Inc. (a) | 6,057 | 293,886 | |
| Corcept Therapeutics, Inc. (a) | 6,938 | 176,780 | |
| Harmony Biosciences Holdings, Inc. (a) | 3,085 | 109,116 | |
| Innoviva, Inc. (a) | 10,533 | 142,722 | |
| Jazz Pharmaceuticals PLC (a) | 2,146 | 279,881 | |
| Organon & Co. | 9,478 | 208,326 | |
| Perrigo Co. PLC | 6,156 | 225,556 | |
| Prestige Brands Holdings, Inc. (a) | 3,052 | 199,021 | |
| Supernus Pharmaceuticals, Inc. (a) | 4,005 | 122,913 | |
| Ventyx Biosciences, Inc. (a) | 3,362 | 124,562 | |
| 2,163,454 | |||
TOTAL HEALTH CARE | 15,657,258 | ||
| INDUSTRIALS - 18.7% | |||
| Aerospace & Defense - 1.1% | |||
| BWX Technologies, Inc. | 3,698 | 255,162 | |
| Curtiss-Wright Corp. | 1,462 | 279,768 | |
| Hexcel Corp. | 3,299 | 233,173 | |
| Huntington Ingalls Industries, Inc. | 1,355 | 311,203 | |
| Moog, Inc. Class A | 1,731 | 182,517 | |
| Parsons Corp. (a) | 3,072 | 151,818 | |
| 1,413,641 | |||
| Air Freight & Logistics - 0.6% | |||
| C.H. Robinson Worldwide, Inc. | 3,584 | 359,045 | |
| Forward Air Corp. | 1,498 | 178,022 | |
| Hub Group, Inc. Class A (a) | 1,847 | 166,470 | |
| 703,537 | |||
| Building Products - 2.3% | |||
| A.O. Smith Corp. | 4,266 | 309,840 | |
| AAON, Inc. | 2,216 | 233,256 | |
| Allegion PLC | 2,786 | 325,572 | |
| Apogee Enterprises, Inc. | 2,652 | 131,354 | |
| CSW Industrials, Inc. | 1,044 | 188,494 | |
| Griffon Corp. | 3,512 | 146,521 | |
| Lennox International, Inc. | 1,082 | 397,570 | |
| MasterBrand, Inc. | 13,514 | 166,898 | |
| Owens Corning | 3,066 | 429,209 | |
| Simpson Manufacturing Co. Ltd. | 1,853 | 292,774 | |
| UFP Industries, Inc. | 2,404 | 247,035 | |
| 2,868,523 | |||
| Commercial Services & Supplies - 1.6% | |||
| Brady Corp. Class A | 2,905 | 149,840 | |
| Casella Waste Systems, Inc. Class A (a) | 2,398 | 193,495 | |
| Clean Harbors, Inc. (a) | 1,899 | 315,728 | |
| CoreCivic, Inc. (a) | 12,342 | 119,717 | |
| Ennis, Inc. | 5,416 | 116,661 | |
| MSA Safety, Inc. | 1,548 | 256,968 | |
| Rollins, Inc. | 7,964 | 325,170 | |
| Tetra Tech, Inc. | 1,825 | 308,808 | |
| The GEO Group, Inc. (a) | 11,502 | 85,920 | |
| UniFirst Corp. | 836 | 135,683 | |
| 2,007,990 | |||
| Construction & Engineering - 1.9% | |||
| AECOM | 4,264 | 370,968 | |
| Arcosa, Inc. | 2,784 | 214,869 | |
| Comfort Systems U.S.A., Inc. | 1,633 | 284,093 | |
| EMCOR Group, Inc. | 1,742 | 374,600 | |
| MasTec, Inc. (a) | 2,350 | 276,713 | |
| MDU Resources Group, Inc. | 7,772 | 171,917 | |
| MYR Group, Inc. (a) | 1,395 | 198,871 | |
| Northwest Pipe Co. (a) | 2,959 | 96,404 | |
| Sterling Construction Co., Inc. (a) | 3,520 | 211,165 | |
| Valmont Industries, Inc. | 792 | 209,682 | |
| 2,409,282 | |||
| Electrical Equipment - 1.1% | |||
| Acuity Brands, Inc. | 1,254 | 207,211 | |
| Atkore, Inc. (a) | 1,643 | 260,695 | |
| Encore Wire Corp. | 1,008 | 172,056 | |
| nVent Electric PLC | 6,305 | 333,408 | |
| Regal Rexnord Corp. | 2,119 | 330,945 | |
| 1,304,315 | |||
| Ground Transportation - 0.8% | |||
| Knight-Swift Transportation Holdings, Inc. Class A | 5,176 | 314,442 | |
| Landstar System, Inc. | 1,356 | 276,068 | |
| Marten Transport Ltd. | 5,798 | 131,383 | |
| Universal Logistics Holdings, Inc. | 2,889 | 89,819 | |
| Werner Enterprises, Inc. | 3,390 | 159,398 | |
| 971,110 | |||
| Machinery - 4.4% | |||
| AGCO Corp. | 2,150 | 286,165 | |
| Alamo Group, Inc. | 872 | 168,959 | |
| Albany International Corp. Class A | 1,598 | 153,855 | |
| Allison Transmission Holdings, Inc. | 4,305 | 252,660 | |
| Crane Co. | 1,923 | 180,166 | |
| Crane Nxt Co. | 1,932 | 114,278 | |
| Donaldson Co., Inc. | 4,324 | 271,677 | |
| ESAB Corp. | 2,811 | 193,116 | |
| ESCO Technologies, Inc. | 1,603 | 161,182 | |
| Federal Signal Corp. | 3,225 | 197,015 | |
| Franklin Electric Co., Inc. | 1,955 | 193,193 | |
| Graco, Inc. | 5,161 | 409,422 | |
| Hillenbrand, Inc. | 3,636 | 188,854 | |
| ITT, Inc. | 2,939 | 292,724 | |
| Kadant, Inc. | 738 | 164,463 | |
| Lincoln Electric Holdings, Inc. | 1,873 | 375,930 | |
| Lindsay Corp. | 911 | 120,735 | |
| Mueller Industries, Inc. | 2,727 | 221,051 | |
| RBC Bearings, Inc. (a) | 1,056 | 238,709 | |
| SPX Technologies, Inc. (a) | 2,332 | 197,311 | |
| Standex International Corp. | 1,119 | 166,250 | |
| Terex Corp. | 3,461 | 202,918 | |
| Timken Co. | 2,648 | 245,893 | |
| Toro Co. | 3,201 | 325,382 | |
| Watts Water Technologies, Inc. Class A | 1,206 | 224,955 | |
| 5,546,863 | |||
| Marine Transportation - 0.2% | |||
| Matson, Inc. | 2,285 | 213,556 | |
| Professional Services - 3.4% | |||
| Barrett Business Services, Inc. | 1,208 | 109,602 | |
| CACI International, Inc. Class A (a) | 857 | 300,327 | |
| CBIZ, Inc. (a) | 3,244 | 171,575 | |
| Concentrix Corp. | 1,644 | 136,847 | |
| CSG Systems International, Inc. | 2,423 | 125,003 | |
| ExlService Holdings, Inc. (a) | 1,357 | 191,269 | |
| Exponent, Inc. | 2,100 | 188,118 | |
| FTI Consulting, Inc. (a) | 1,400 | 245,224 | |
| Genpact Ltd. | 5,993 | 216,287 | |
| Huron Consulting Group, Inc. (a) | 1,926 | 182,142 | |
| ICF International, Inc. | 1,356 | 159,452 | |
| Insperity, Inc. | 1,693 | 199,181 | |
| KBR, Inc. | 5,031 | 309,356 | |
| Kforce, Inc. | 2,215 | 140,520 | |
| Korn Ferry | 2,971 | 156,512 | |
| Manpower, Inc. | 2,251 | 177,559 | |
| Maximus, Inc. | 2,779 | 232,769 | |
| NV5 Global, Inc. (a) | 1,011 | 110,755 | |
| Paylocity Holding Corp. (a) | 1,387 | 314,641 | |
| Resources Connection, Inc. | 6,457 | 103,183 | |
| Robert Half, Inc. | 3,560 | 263,974 | |
| Science Applications International Corp. | 2,202 | 267,191 | |
| 4,301,487 | |||
| Trading Companies & Distributors - 1.3% | |||
| Applied Industrial Technologies, Inc. | 1,556 | 225,604 | |
| Boise Cascade Co. | 2,177 | 225,298 | |
| McGrath RentCorp. | 1,521 | 146,594 | |
| MSC Industrial Direct Co., Inc. Class A | 2,196 | 221,620 | |
| Rush Enterprises, Inc. Class A | 2,739 | 177,159 | |
| Triton International Ltd. | 2,716 | 228,986 | |
| Watsco, Inc. (b) | 1,059 | 400,503 | |
| 1,625,764 | |||
TOTAL INDUSTRIALS | 23,366,068 | ||
| INFORMATION TECHNOLOGY - 13.8% | |||
| Communications Equipment - 1.1% | |||
| Ciena Corp. (a) | 5,372 | 226,698 | |
| Clearfield, Inc. (a)(b) | 1,796 | 83,945 | |
| Digi International, Inc. (a) | 3,757 | 157,531 | |
| F5, Inc. (a) | 2,009 | 317,904 | |
| Harmonic, Inc. (a) | 9,665 | 144,202 | |
| Juniper Networks, Inc. | 10,591 | 294,430 | |
| NetScout Systems, Inc. (a) | 4,846 | 135,446 | |
| 1,360,156 | |||
| Electronic Equipment, Instruments & Components - 4.4% | |||
| Advanced Energy Industries, Inc. | 1,912 | 239,344 | |
| Arrow Electronics, Inc. (a) | 2,176 | 310,167 | |
| Avnet, Inc. | 4,330 | 210,005 | |
| Badger Meter, Inc. | 1,561 | 257,003 | |
| Bel Fuse, Inc. Class B (non-vtg.) | 3,027 | 162,399 | |
| Belden, Inc. | 2,219 | 214,444 | |
| Cognex Corp. | 5,717 | 312,263 | |
| CTS Corp. | 3,020 | 134,783 | |
| ePlus, Inc. (a) | 2,626 | 147,975 | |
| Fabrinet (a) | 1,620 | 200,297 | |
| Insight Enterprises, Inc. (a) | 1,607 | 235,731 | |
| IPG Photonics Corp. (a) | 1,644 | 216,104 | |
| Jabil, Inc. | 4,297 | 475,549 | |
| Littelfuse, Inc. | 944 | 287,542 | |
| Methode Electronics, Inc. Class A | 2,969 | 99,877 | |
| Napco Security Technologies, Inc. | 4,177 | 156,554 | |
| National Instruments Corp. | 4,885 | 288,215 | |
| Novanta, Inc. (a) | 1,422 | 251,552 | |
| OSI Systems, Inc. (a) | 1,473 | 175,626 | |
| PC Connection, Inc. | 2,369 | 114,683 | |
| Plexus Corp. (a) | 1,694 | 166,842 | |
| Sanmina Corp. (a) | 2,970 | 182,536 | |
| TD SYNNEX Corp. | 1,962 | 193,669 | |
| TTM Technologies, Inc. (a) | 8,886 | 127,603 | |
| Vishay Intertechnology, Inc. | 7,315 | 205,917 | |
| Vishay Precision Group, Inc. (a) | 2,780 | 104,000 | |
| 5,470,680 | |||
| IT Services - 0.6% | |||
| Amdocs Ltd. | 3,833 | 358,922 | |
| DXC Technology Co. (a) | 8,727 | 241,302 | |
| Hackett Group, Inc. | 5,324 | 123,783 | |
| 724,007 | |||
| Semiconductors & Semiconductor Equipment - 2.6% | |||
| Amkor Technology, Inc. | 5,763 | 167,646 | |
| Axcelis Technologies, Inc. (a) | 1,635 | 327,785 | |
| Cirrus Logic, Inc. (a) | 2,358 | 190,526 | |
| Diodes, Inc. (a) | 2,139 | 202,114 | |
| Kulicke & Soffa Industries, Inc. | 3,139 | 187,963 | |
| Lattice Semiconductor Corp. (a) | 4,341 | 394,771 | |
| NVE Corp. (b) | 1,607 | 127,290 | |
| Onto Innovation, Inc. (a) | 2,336 | 290,412 | |
| Photronics, Inc. (a) | 6,985 | 184,753 | |
| Power Integrations, Inc. | 2,455 | 238,479 | |
| Qorvo, Inc. (a) | 3,250 | 357,565 | |
| Rambus, Inc. (a) | 4,813 | 301,342 | |
| Universal Display Corp. | 1,743 | 254,269 | |
| 3,224,915 | |||
| Software - 3.9% | |||
| A10 Networks, Inc. | 8,158 | 126,612 | |
| ACI Worldwide, Inc. (a) | 6,286 | 145,772 | |
| Adeia, Inc. | 12,178 | 146,380 | |
| Agilysys, Inc. (a) | 1,749 | 128,779 | |
| Alarm.com Holdings, Inc. (a) | 2,971 | 164,029 | |
| Aspen Technology, Inc. (a) | 1,169 | 208,667 | |
| Bentley Systems, Inc. Class B | 6,891 | 371,287 | |
| Black Knight, Inc. (a) | 5,196 | 365,383 | |
| BlackLine, Inc. (a) | 2,594 | 150,660 | |
| Box, Inc. Class A (a) | 6,268 | 195,875 | |
| CommVault Systems, Inc. (a) | 2,623 | 204,410 | |
| Dolby Laboratories, Inc. Class A | 2,671 | 236,677 | |
| DoubleVerify Holdings, Inc. (a) | 5,494 | 231,297 | |
| Dropbox, Inc. Class A (a) | 10,392 | 280,064 | |
| Dynatrace, Inc. (a) | 6,777 | 370,634 | |
| Manhattan Associates, Inc. (a) | 2,155 | 410,786 | |
| Model N, Inc. (a) | 3,450 | 114,954 | |
| Progress Software Corp. | 2,860 | 171,772 | |
| Qualys, Inc. (a) | 1,640 | 227,632 | |
| SPS Commerce, Inc. (a) | 1,553 | 280,146 | |
| Teradata Corp. (a) | 5,229 | 297,269 | |
| 4,829,085 | |||
| Technology Hardware, Storage & Peripherals - 1.2% | |||
| Dell Technologies, Inc. | 8,265 | 437,384 | |
| Pure Storage, Inc. Class A (a) | 9,773 | 361,503 | |
| Super Micro Computer, Inc. (a) | 2,340 | 772,821 | |
| 1,571,708 | |||
TOTAL INFORMATION TECHNOLOGY | 17,180,551 | ||
| MATERIALS - 5.0% | |||
| Chemicals - 2.0% | |||
| American Vanguard Corp. | 5,258 | 94,959 | |
| Balchem Corp. | 1,464 | 197,259 | |
| Chase Corp. | 1,251 | 157,488 | |
| Huntsman Corp. | 7,176 | 213,630 | |
| Ingevity Corp. (a) | 2,001 | 128,104 | |
| Innospec, Inc. | 1,465 | 156,960 | |
| NewMarket Corp. | 439 | 198,296 | |
| Olin Corp. | 4,482 | 258,522 | |
| RPM International, Inc. | 3,994 | 412,620 | |
| Sensient Technologies Corp. | 2,271 | 145,435 | |
| Stepan Co. | 1,391 | 133,286 | |
| The Chemours Co. LLC | 6,277 | 232,123 | |
| Westlake Corp. | 1,607 | 220,963 | |
| 2,549,645 | |||
| Construction Materials - 0.3% | |||
| Eagle Materials, Inc. | 1,514 | 279,136 | |
| Knife River Holding Co. | 1,928 | 83,810 | |
| 362,946 | |||
| Containers & Packaging - 1.4% | |||
| Aptargroup, Inc. | 2,344 | 284,702 | |
| Berry Global Group, Inc. | 4,386 | 287,590 | |
| Graphic Packaging Holding Co. | 11,223 | 271,597 | |
| Greif, Inc. Class A | 2,155 | 159,405 | |
| Myers Industries, Inc. | 5,210 | 102,168 | |
| Silgan Holdings, Inc. | 3,768 | 165,227 | |
| Sonoco Products Co. (b) | 3,859 | 226,292 | |
| WestRock Co. | 8,582 | 285,695 | |
| 1,782,676 | |||
| Metals & Mining - 1.0% | |||
| Alpha Metallurgical Resources | 972 | 168,370 | |
| Commercial Metals Co. | 4,474 | 256,002 | |
| Royal Gold, Inc. | 2,276 | 273,439 | |
| Ryerson Holding Corp. | 3,121 | 132,611 | |
| United States Steel Corp. (b) | 8,798 | 224,349 | |
| Warrior Metropolitan Coal, Inc. | 3,906 | 172,841 | |
| 1,227,612 | |||
| Paper & Forest Products - 0.3% | |||
| Louisiana-Pacific Corp. | 3,047 | 231,968 | |
| Sylvamo Corp. | 2,926 | 143,579 | |
| 375,547 | |||
TOTAL MATERIALS | 6,298,426 | ||
| REAL ESTATE - 6.0% | |||
| Equity Real Estate Investment Trusts (REITs) - 5.9% | |||
| Agree Realty Corp. | 3,202 | 207,426 | |
| American Homes 4 Rent Class A | 9,389 | 351,900 | |
| Americold Realty Trust | 8,822 | 286,009 | |
| Apartment Income (REIT) Corp. | 5,640 | 194,806 | |
| Apartment Investment & Management Co. Class A | 15,334 | 127,732 | |
| Apple Hospitality (REIT), Inc. | 9,888 | 153,264 | |
| Brixmor Property Group, Inc. | 10,518 | 239,179 | |
| Broadstone Net Lease, Inc. | 8,931 | 145,575 | |
| CareTrust (REIT), Inc. | 6,589 | 136,985 | |
| City Office REIT, Inc. | 10,102 | 55,258 | |
| Corporate Office Properties Trust (SBI) | 5,857 | 152,282 | |
| Cousins Properties, Inc. | 6,634 | 162,069 | |
| CubeSmart | 6,944 | 301,092 | |
| EastGroup Properties, Inc. | 1,496 | 265,061 | |
| Equity Commonwealth | 6,055 | 118,617 | |
| Essential Properties Realty Trust, Inc. | 6,808 | 167,136 | |
| Federal Realty Investment Trust (SBI) | 2,430 | 246,694 | |
| First Industrial Realty Trust, Inc. | 4,611 | 238,389 | |
| Four Corners Property Trust, Inc. | 5,068 | 133,288 | |
| Getty Realty Corp. | 3,537 | 114,316 | |
| Kilroy Realty Corp. | 4,521 | 161,400 | |
| Lamar Advertising Co. Class A | 2,761 | 272,511 | |
| LTC Properties, Inc. | 3,315 | 111,251 | |
| LXP Industrial Trust (REIT) | 13,996 | 140,940 | |
| Medical Properties Trust, Inc. (b) | 20,372 | 205,553 | |
| National Health Investors, Inc. | 2,524 | 138,593 | |
| NexPoint Diversified Real Estate Trust | 7,728 | 90,340 | |
| NNN (REIT), Inc. | 5,894 | 251,556 | |
| Omega Healthcare Investors, Inc. | 8,253 | 263,271 | |
| Phillips Edison & Co., Inc. (b) | 5,300 | 187,143 | |
| Physicians Realty Trust | 10,755 | 158,529 | |
| Potlatch Corp. | 3,651 | 195,803 | |
| Regency Centers Corp. | 4,775 | 312,906 | |
| Rexford Industrial Realty, Inc. | 5,450 | 300,241 | |
| Sabra Health Care REIT, Inc. | 11,839 | 153,789 | |
| Spirit Realty Capital, Inc. | 5,223 | 210,644 | |
| Stag Industrial, Inc. | 6,488 | 235,514 | |
| Terreno Realty Corp. | 2,890 | 171,493 | |
| Universal Health Realty Income Trust (SBI) | 1,896 | 90,496 | |
| 7,449,051 | |||
| Real Estate Management & Development - 0.1% | |||
| The RMR Group, Inc. | 3,289 | 77,555 | |
TOTAL REAL ESTATE | 7,526,606 | ||
| UTILITIES - 2.6% | |||
| Electric Utilities - 1.4% | |||
| Allete, Inc. | 2,898 | 166,432 | |
| Hawaiian Electric Industries, Inc. | 4,804 | 184,426 | |
| IDACORP, Inc. | 2,058 | 211,604 | |
| NRG Energy, Inc. | 8,055 | 306,009 | |
| OGE Energy Corp. | 7,013 | 253,520 | |
| Otter Tail Corp. (b) | 2,487 | 201,472 | |
| Pinnacle West Capital Corp. | 3,830 | 317,201 | |
| PNM Resources, Inc. | 4,010 | 179,728 | |
| 1,820,392 | |||
| Gas Utilities - 0.5% | |||
| National Fuel Gas Co. | 3,808 | 202,243 | |
| New Jersey Resources Corp. | 4,101 | 183,315 | |
| ONE Gas, Inc. (b) | 2,430 | 192,286 | |
| 577,844 | |||
| Independent Power and Renewable Electricity Producers - 0.2% | |||
| Clearway Energy, Inc. Class C | 5,552 | 146,628 | |
| Ormat Technologies, Inc. (b) | 2,184 | 177,559 | |
| 324,187 | |||
| Multi-Utilities - 0.4% | |||
| Black Hills Corp. | 2,845 | 171,639 | |
| NorthWestern Energy Corp. | 3,047 | 172,064 | |
| Unitil Corp. | 2,317 | 120,577 | |
| 464,280 | |||
| Water Utilities - 0.1% | |||
| Artesian Resources Corp. Class A | 1,879 | 85,607 | |
TOTAL UTILITIES | 3,272,310 | ||
| TOTAL COMMON STOCKS (Cost $116,197,908) | 124,513,220 | ||
| Money Market Funds - 3.7% | |||
| Shares | Value ($) | ||
| Fidelity Cash Central Fund 5.32% (c) | 217,373 | 217,417 | |
| Fidelity Securities Lending Cash Central Fund 5.32% (c)(d) | 4,431,607 | 4,432,050 | |
| TOTAL MONEY MARKET FUNDS (Cost $4,649,467) | 4,649,467 | ||
| TOTAL INVESTMENT IN SECURITIES - 103.3% (Cost $120,847,375) | 129,162,687 |
NET OTHER ASSETS (LIABILITIES) - (3.3)% | (4,186,491) |
| NET ASSETS - 100.0% | 124,976,196 |
| Futures Contracts | |||||
Number of contracts | Expiration Date | Notional Amount ($) | Value ($) | Unrealized Appreciation/ (Depreciation) ($) | |
| Purchased | |||||
| Equity Index Contracts | |||||
| CME E-mini Russell 2000 Index Contracts (United States) | 4 | Sep 2023 | 402,720 | 12,952 | 12,952 |
| The notional amount of futures purchased as a percentage of Net Assets is 0.3% | |||||
| (a) | Non-income producing |
| (b) | Security or a portion of the security is on loan at period end. |
| (c) | Affiliated fund that is generally available only to investment companies and other accounts managed by Fidelity Investments. The rate quoted is the annualized seven-day yield of the fund at period end. A complete unaudited listing of the fund's holdings as of its most recent quarter end is available upon request. In addition, each Fidelity Central Fund's financial statements, which are not covered by the Fund's Report of Independent Registered Public Accounting Firm, are available on the SEC's website or upon request. |
| (d) | Investment made with cash collateral received from securities on loan. |
| Affiliate | Value, beginning of period ($) | Purchases ($) | Sales Proceeds ($) | Dividend Income ($) | Realized Gain (loss) ($) | Change in Unrealized appreciation (depreciation) ($) | Value, end of period ($) | % ownership, end of period |
| Fidelity Cash Central Fund 5.32% | 79,549 | 4,084,812 | 3,946,944 | 4,938 | - | - | 217,417 | 0.0% |
| Fidelity Securities Lending Cash Central Fund 5.32% | 1,034,050 | 16,294,733 | 12,896,733 | 18,149 | - | - | 4,432,050 | 0.0% |
| Total | 1,113,599 | 20,379,545 | 16,843,677 | 23,087 | - | - | 4,649,467 | |
| Valuation Inputs at Reporting Date: | ||||
| Description | Total ($) | Level 1 ($) | Level 2 ($) | Level 3 ($) |
Investments in Securities: | ||||
| Equities: | ||||
Communication Services | 3,800,637 | 3,800,637 | - | - |
Consumer Discretionary | 17,618,377 | 17,618,377 | - | - |
Consumer Staples | 4,710,423 | 4,710,423 | - | - |
Energy | 6,043,254 | 6,043,254 | - | - |
Financials | 19,039,310 | 19,039,310 | - | - |
Health Care | 15,657,258 | 15,657,258 | - | - |
Industrials | 23,366,068 | 23,366,068 | - | - |
Information Technology | 17,180,551 | 17,180,551 | - | - |
Materials | 6,298,426 | 6,298,426 | - | - |
Real Estate | 7,526,606 | 7,526,606 | - | - |
Utilities | 3,272,310 | 3,272,310 | - | - |
| Money Market Funds | 4,649,467 | 4,649,467 | - | - |
| Total Investments in Securities: | 129,162,687 | 129,162,687 | - | - |
Derivative Instruments: | ||||
| Assets | ||||
Futures Contracts | 12,952 | 12,952 | - | - |
| Total Assets | 12,952 | 12,952 | - | - |
| Total Derivative Instruments: | 12,952 | 12,952 | - | - |
Primary Risk Exposure / Derivative Type | Value | |
| Asset ($) | Liability ($) | |
| Equity Risk | ||
Futures Contracts (a) | 12,952 | 0 |
| Total Equity Risk | 12,952 | 0 |
| Total Value of Derivatives | 12,952 | 0 |
| Statement of Assets and Liabilities | ||||
| July 31, 2023 | ||||
| Assets | ||||
| Investment in securities, at value (including securities loaned of $4,357,805) - See accompanying schedule: | ||||
Unaffiliated issuers (cost $116,197,908) | $ | 124,513,220 | ||
Fidelity Central Funds (cost $4,649,467) | 4,649,467 | |||
| Total Investment in Securities (cost $120,847,375) | $ | 129,162,687 | ||
| Segregated cash with brokers for derivative instruments | 12,400 | |||
| Foreign currency held at value (cost $1,224) | 1,201 | |||
| Receivable for investments sold | 203,986 | |||
| Dividends receivable | 51,195 | |||
| Distributions receivable from Fidelity Central Funds | 4,916 | |||
| Receivable for daily variation margin on futures contracts | 2,256 | |||
| Other receivables | 1,096 | |||
Total assets | 129,439,737 | |||
| Liabilities | ||||
| Payable to custodian bank | $ | 2,992 | ||
| Accrued management fee | 28,499 | |||
| Collateral on securities loaned | 4,432,050 | |||
| Total Liabilities | 4,463,541 | |||
| Net Assets | $ | 124,976,196 | ||
| Net Assets consist of: | ||||
| Paid in capital | $ | 125,109,278 | ||
| Total accumulated earnings (loss) | (133,082) | |||
| Net Assets | $ | 124,976,196 | ||
Net Asset Value, offering price and redemption price per share ($124,976,196 ÷ 3,600,000 shares) | $ | 34.72 | ||
| Statement of Operations | ||||
Year ended July 31, 2023 | ||||
| Investment Income | ||||
| Dividends | $ | 1,784,686 | ||
| Income from Fidelity Central Funds (including $18,149 from security lending) | 23,087 | |||
| Total Income | 1,807,773 | |||
| Expenses | ||||
| Management fee | $ | 270,645 | ||
| Independent trustees' fees and expenses | 441 | |||
| Total expenses before reductions | 271,086 | |||
| Expense reductions | (405) | |||
| Total expenses after reductions | 270,681 | |||
| Net Investment income (loss) | 1,537,092 | |||
| Realized and Unrealized Gain (Loss) | ||||
| Net realized gain (loss) on: | ||||
| Investment Securities: | ||||
| Unaffiliated issuers | (2,649,594) | |||
| Redemptions in-kind | 95,289 | |||
| Foreign currency transactions | (3,159) | |||
| Futures contracts | (14,920) | |||
| Total net realized gain (loss) | (2,572,384) | |||
| Change in net unrealized appreciation (depreciation) on: | ||||
| Investment Securities: | ||||
| Unaffiliated issuers | 10,090,207 | |||
| Assets and liabilities in foreign currencies | (25) | |||
| Futures contracts | 4,090 | |||
| Total change in net unrealized appreciation (depreciation) | 10,094,272 | |||
| Net gain (loss) | 7,521,888 | |||
| Net increase (decrease) in net assets resulting from operations | $ | 9,058,980 | ||
| Statement of Changes in Net Assets | ||||
Year ended July 31, 2023 | Year ended July 31, 2022 | |||
| Increase (Decrease) in Net Assets | ||||
| Operations | ||||
| Net investment income (loss) | $ | 1,537,092 | $ | 888,934 |
| Net realized gain (loss) | (2,572,384) | 5,306,202 | ||
| Change in net unrealized appreciation (depreciation) | 10,094,272 | (9,612,227) | ||
| Net increase (decrease) in net assets resulting from operations | 9,058,980 | (3,417,091) | ||
| Distributions to shareholders | (1,518,700) | (905,700) | ||
| Share transactions | ||||
| Proceeds from sales of shares | 48,425,159 | 67,940,474 | ||
| Cost of shares redeemed | (2,938,248) | (59,607,816) | ||
Net increase (decrease) in net assets resulting from share transactions | 45,486,911 | 8,332,658 | ||
| Total increase (decrease) in net assets | 53,027,191 | 4,009,867 | ||
| Net Assets | ||||
| Beginning of period | 71,949,005 | 67,939,138 | ||
| End of period | $ | 124,976,196 | $ | 71,949,005 |
| Other Information | ||||
| Shares | ||||
| Sold | 1,500,000 | 2,000,000 | ||
| Redeemed | (100,000) | (1,800,000) | ||
| Net increase (decrease) | 1,400,000 | 200,000 | ||
| Fidelity® Small-Mid Multifactor ETF |
| Years ended July 31, | 2023 | 2022 | 2021 | 2020 | 2019 A | |||||
Selected Per-Share Data | ||||||||||
| Net asset value, beginning of period | $ | 32.70 | $ | 33.97 | $ | 23.90 | $ | 25.50 | $ | 24.85 |
| Income from Investment Operations | ||||||||||
Net investment income (loss) B,C | .53 | .45 | .38 | .31 | .18 | |||||
| Net realized and unrealized gain (loss) | 2.01 | (1.26) | 10.11 | (1.58) | .64 | |||||
| Total from investment operations | 2.54 | (.81) | 10.49 | (1.27) | .82 | |||||
| Distributions from net investment income | (.52) | (.46) | (.42) | (.33) | (.17) | |||||
| Total distributions | (.52) | (.46) | (.42) | (.33) | (.17) | |||||
| Net asset value, end of period | $ | 34.72 | $ | 32.70 | $ | 33.97 | $ | 23.90 | $ | 25.50 |
Total Return D,E,F | 7.92% | (2.35)% | 44.21% | (4.90)% | 3.35% | |||||
Ratios to Average Net Assets C,G,H | ||||||||||
| Expenses before reductions | .29% | .29% | .29% | .29% | .29% I | |||||
| Expenses net of fee waivers, if any | .29% | .29% | .29% | .29% | .29% I | |||||
| Expenses net of all reductions | .29% | .29% | .29% | .29% | .29% I | |||||
| Net investment income (loss) | 1.65% | 1.35% | 1.23% | 1.32% | 1.70% I | |||||
| Supplemental Data | ||||||||||
| Net assets, end of period (000 omitted) | $ | 124,976 | $ | 71,949 | $ | 67,939 | $ | 19,117 | $ | 7,650 |
Portfolio turnover rate J,K | 65% | 60% | 61% | 52% | 2% L |
| Average Annual Total Returns | |||
Periods ended July 31, 2023 | Past 1 year | Life of Fund |
Fidelity® Stocks for Inflation ETF - NAV A | 7.77% | 10.73% |
Fidelity® Stocks for Inflation ETF - Market Price B | 7.80% | 10.66% |
Fidelity Stocks for Inflation Factor Index℠ A | 8.09% | 11.10% |
Russell 1000® Index A | 12.95% | 12.92% |
| $10,000 Over Life of Fund |
Let's say hypothetically that $10,000 was invested in Fidelity® Stocks for Inflation ETF - NAV, on November 5, 2019, when the fund started. The chart shows how the value of your investment would have changed, and also shows how the Fidelity Stocks for Inflation Factor Index℠ and Russell 1000® Index performed over the same period. |
 |
Top Holdings (% of Fund's net assets) | ||
| Apple, Inc. | 6.2 | |
| Microsoft Corp. | 5.3 | |
| Exxon Mobil Corp. | 2.5 | |
| Nucor Corp. | 2.5 | |
| CF Industries Holdings, Inc. | 2.4 | |
| Eli Lilly & Co. | 2.2 | |
| Steel Dynamics, Inc. | 2.2 | |
| ConocoPhillips Co. | 2.0 | |
| Philip Morris International, Inc. | 1.9 | |
| PBF Energy, Inc. Class A | 1.8 | |
| 29.0 | ||
| Market Sectors (% of Fund's net assets) | ||
| Information Technology | 20.7 | |
| Health Care | 18.1 | |
| Consumer Staples | 10.5 | |
| Financials | 9.5 | |
| Energy | 9.2 | |
| Materials | 7.1 | |
| Industrials | 5.8 | |
| Consumer Discretionary | 5.8 | |
| Real Estate | 4.9 | |
| Utilities | 4.4 | |
| Communication Services | 3.7 | |
Asset Allocation (% of Fund's net assets) |
|
Futures - 0.2% |
| Common Stocks - 99.7% | |||
| Shares | Value ($) | ||
| COMMUNICATION SERVICES - 3.7% | |||
| Diversified Telecommunication Services - 1.0% | |||
| AT&T, Inc. | 16,454 | 238,912 | |
| Iridium Communications, Inc. | 25,231 | 1,325,889 | |
| 1,564,801 | |||
| Interactive Media & Services - 2.2% | |||
| Alphabet, Inc. Class A (a) | 14,980 | 1,988,146 | |
| Meta Platforms, Inc. Class A (a) | 3,534 | 1,125,932 | |
| Ziff Davis, Inc. (a) | 1,800 | 130,536 | |
| 3,244,614 | |||
| Media - 0.5% | |||
| Comcast Corp. Class A | 9,088 | 411,323 | |
| Nexstar Broadcasting Group, Inc. Class A | 810 | 151,243 | |
| TEGNA, Inc. | 8,200 | 138,580 | |
| 701,146 | |||
TOTAL COMMUNICATION SERVICES | 5,510,561 | ||
| CONSUMER DISCRETIONARY - 5.8% | |||
| Broadline Retail - 0.3% | |||
| Macy's, Inc. | 26,664 | 442,356 | |
| Diversified Consumer Services - 0.4% | |||
| H&R Block, Inc. | 16,633 | 559,035 | |
| Hotels, Restaurants & Leisure - 1.3% | |||
| McDonald's Corp. | 3,865 | 1,133,218 | |
| Yum! Brands, Inc. | 5,541 | 762,829 | |
| 1,896,047 | |||
| Household Durables - 0.5% | |||
| Taylor Morrison Home Corp. (a) | 17,337 | 839,458 | |
| Specialty Retail - 3.3% | |||
| Academy Sports & Outdoors, Inc. | 10,416 | 622,773 | |
| AutoZone, Inc. (a) | 299 | 742,034 | |
| Murphy U.S.A., Inc. | 2,491 | 764,812 | |
| O'Reilly Automotive, Inc. (a) | 918 | 849,875 | |
| The Home Depot, Inc. | 3,884 | 1,296,635 | |
| Ulta Beauty, Inc. (a) | 1,326 | 589,805 | |
| 4,865,934 | |||
TOTAL CONSUMER DISCRETIONARY | 8,602,830 | ||
| CONSUMER STAPLES - 10.5% | |||
| Food Products - 3.4% | |||
| Archer Daniels Midland Co. | 30,312 | 2,575,308 | |
| General Mills, Inc. | 32,850 | 2,455,209 | |
| 5,030,517 | |||
| Household Products - 3.5% | |||
| Colgate-Palmolive Co. | 34,630 | 2,640,884 | |
| Kimberly-Clark Corp. | 19,127 | 2,469,296 | |
| 5,110,180 | |||
| Tobacco - 3.6% | |||
| Altria Group, Inc. | 56,074 | 2,546,881 | |
| Philip Morris International, Inc. | 28,100 | 2,802,132 | |
| 5,349,013 | |||
TOTAL CONSUMER STAPLES | 15,489,710 | ||
| ENERGY - 9.2% | |||
| Oil, Gas & Consumable Fuels - 9.2% | |||
| ConocoPhillips Co. | 24,692 | 2,906,742 | |
| Exxon Mobil Corp. | 35,040 | 3,757,690 | |
| Occidental Petroleum Corp. | 38,628 | 2,438,586 | |
| PBF Energy, Inc. Class A | 56,716 | 2,690,607 | |
| Texas Pacific Land Corp. | 1,187 | 1,787,978 | |
| 13,581,603 | |||
| FINANCIALS - 9.5% | |||
| Banks - 0.9% | |||
| First Citizens Bancshares, Inc. | 983 | 1,406,968 | |
| Capital Markets - 0.7% | |||
| Goldman Sachs Group, Inc. | 2,728 | 970,813 | |
| Consumer Finance - 1.0% | |||
| Discover Financial Services | 6,908 | 729,139 | |
| Synchrony Financial | 20,740 | 716,360 | |
| 1,445,499 | |||
| Financial Services - 3.7% | |||
| Essent Group Ltd. | 17,088 | 847,565 | |
| Fiserv, Inc. (a) | 5,697 | 719,018 | |
| MasterCard, Inc. Class A | 3,583 | 1,412,705 | |
| MGIC Investment Corp. | 52,954 | 886,450 | |
| Visa, Inc. Class A | 6,577 | 1,563,550 | |
| 5,429,288 | |||
| Insurance - 3.2% | |||
| American International Group, Inc. | 14,202 | 856,097 | |
| Everest Re Group Ltd. | 2,273 | 819,439 | |
| MetLife, Inc. | 12,092 | 761,433 | |
| Principal Financial Group, Inc. | 8,533 | 681,531 | |
| RLI Corp. | 5,819 | 776,313 | |
| Unum Group | 18,647 | 906,431 | |
| 4,801,244 | |||
TOTAL FINANCIALS | 14,053,812 | ||
| HEALTH CARE - 18.1% | |||
| Biotechnology - 8.3% | |||
| AbbVie, Inc. | 16,347 | 2,445,184 | |
| Amgen, Inc. | 7,792 | 1,824,497 | |
| Gilead Sciences, Inc. | 22,289 | 1,697,084 | |
| Moderna, Inc. (a) | 9,392 | 1,105,063 | |
| Regeneron Pharmaceuticals, Inc. (a) | 2,311 | 1,714,554 | |
| United Therapeutics Corp. (a) | 5,742 | 1,393,698 | |
| Vertex Pharmaceuticals, Inc. (a) | 5,685 | 2,003,053 | |
| 12,183,133 | |||
| Health Care Providers & Services - 3.5% | |||
| Cardinal Health, Inc. | 19,905 | 1,820,710 | |
| Humana, Inc. | 3,412 | 1,558,704 | |
| McKesson Corp. | 4,460 | 1,794,704 | |
| 5,174,118 | |||
| Pharmaceuticals - 6.3% | |||
| Bristol-Myers Squibb Co. | 27,532 | 1,712,215 | |
| Eli Lilly & Co. | 7,213 | 3,278,669 | |
| Merck & Co., Inc. | 23,100 | 2,463,615 | |
| Pfizer, Inc. | 52,821 | 1,904,725 | |
| 9,359,224 | |||
TOTAL HEALTH CARE | 26,716,475 | ||
| INDUSTRIALS - 5.8% | |||
| Aerospace & Defense - 1.0% | |||
| Lockheed Martin Corp. | 1,750 | 781,148 | |
| Northrop Grumman Corp. | 1,654 | 736,030 | |
| 1,517,178 | |||
| Building Products - 1.8% | |||
| Builders FirstSource, Inc. (a) | 7,637 | 1,103,012 | |
| Owens Corning | 6,209 | 869,198 | |
| UFP Industries, Inc. | 6,436 | 661,363 | |
| 2,633,573 | |||
| Electrical Equipment - 0.5% | |||
| Atkore, Inc. (a) | 4,481 | 711,000 | |
| Machinery - 0.9% | |||
| Mueller Industries, Inc. | 9,003 | 729,783 | |
| Snap-On, Inc. | 2,506 | 682,735 | |
| 1,412,518 | |||
| Professional Services - 1.1% | |||
| Automatic Data Processing, Inc. | 3,020 | 746,725 | |
| ExlService Holdings, Inc. (a) | 2,483 | 349,979 | |
| Paychex, Inc. | 4,366 | 547,802 | |
| 1,644,506 | |||
| Trading Companies & Distributors - 0.5% | |||
| Triton International Ltd. | 8,675 | 731,389 | |
TOTAL INDUSTRIALS | 8,650,164 | ||
| INFORMATION TECHNOLOGY - 20.7% | |||
| Communications Equipment - 0.7% | |||
| Cisco Systems, Inc. | 20,371 | 1,060,107 | |
| IT Services - 2.5% | |||
| Accenture PLC Class A | 3,247 | 1,027,188 | |
| Amdocs Ltd. | 4,748 | 444,603 | |
| DXC Technology Co. (a) | 14,652 | 405,128 | |
| Gartner, Inc. (a) | 1,416 | 500,683 | |
| IBM Corp. | 5,674 | 818,077 | |
| VeriSign, Inc. (a) | 2,127 | 448,691 | |
| 3,644,370 | |||
| Semiconductors & Semiconductor Equipment - 4.8% | |||
| Analog Devices, Inc. | 3,809 | 760,010 | |
| Broadcom, Inc. | 1,865 | 1,675,982 | |
| Enphase Energy, Inc. (a) | 2,216 | 336,455 | |
| KLA Corp. | 1,411 | 725,183 | |
| Microchip Technology, Inc. | 6,497 | 610,328 | |
| ON Semiconductor Corp. (a) | 6,303 | 679,148 | |
| Qualcomm, Inc. | 6,315 | 834,654 | |
| Rambus, Inc. (a) | 9,642 | 603,686 | |
| Texas Instruments, Inc. | 4,886 | 879,480 | |
| 7,104,926 | |||
| Software - 6.5% | |||
| Cadence Design Systems, Inc. (a) | 2,989 | 699,456 | |
| Dropbox, Inc. Class A (a) | 17,749 | 478,336 | |
| Fair Isaac Corp. (a) | 673 | 563,954 | |
| Microsoft Corp. | 23,322 | 7,834,326 | |
| 9,576,072 | |||
| Technology Hardware, Storage & Peripherals - 6.2% | |||
| Apple, Inc. | 46,392 | 9,113,708 | |
TOTAL INFORMATION TECHNOLOGY | 30,499,183 | ||
| MATERIALS - 7.1% | |||
| Chemicals - 2.4% | |||
| CF Industries Holdings, Inc. | 43,531 | 3,573,024 | |
| Metals & Mining - 4.7% | �� | ||
| Nucor Corp. | 21,537 | 3,706,302 | |
| Steel Dynamics, Inc. | 29,536 | 3,147,947 | |
| 6,854,249 | |||
TOTAL MATERIALS | 10,427,273 | ||
| REAL ESTATE - 4.9% | |||
| Equity Real Estate Investment Trusts (REITs) - 4.9% | |||
| Gaming & Leisure Properties | 46,530 | 2,208,314 | |
| Omega Healthcare Investors, Inc. | 82,579 | 2,634,270 | |
| VICI Properties, Inc. | 74,430 | 2,343,056 | |
| 7,185,640 | |||
| UTILITIES - 4.4% | |||
| Electric Utilities - 1.7% | |||
| NRG Energy, Inc. | 66,729 | 2,535,035 | |
| Gas Utilities - 1.5% | |||
| National Fuel Gas Co. | 40,057 | 2,127,427 | |
| Independent Power and Renewable Electricity Producers - 1.2% | |||
| Clearway Energy, Inc. Class C | 67,285 | 1,776,997 | |
TOTAL UTILITIES | 6,439,459 | ||
| TOTAL COMMON STOCKS (Cost $141,771,314) | 147,156,710 | ||
| Money Market Funds - 0.1% | |||
| Shares | Value ($) | ||
Fidelity Cash Central Fund 5.32% (b) (Cost $107,212) | 107,190 | 107,212 | |
| TOTAL INVESTMENT IN SECURITIES - 99.8% (Cost $141,878,526) | 147,263,922 |
NET OTHER ASSETS (LIABILITIES) - 0.2% | 234,916 |
| NET ASSETS - 100.0% | 147,498,838 |
| Futures Contracts | |||||
Number of contracts | Expiration Date | Notional Amount ($) | Value ($) | Unrealized Appreciation/ (Depreciation) ($) | |
| Purchased | |||||
| Equity Index Contracts | |||||
| CME E-mini S&P 500 Index Contracts (United States) | 1 | Sep 2023 | 230,725 | 13,260 | 13,260 |
| The notional amount of futures purchased as a percentage of Net Assets is 0.2% | |||||
| (a) | Non-income producing |
| (b) | Affiliated fund that is generally available only to investment companies and other accounts managed by Fidelity Investments. The rate quoted is the annualized seven-day yield of the fund at period end. A complete unaudited listing of the fund's holdings as of its most recent quarter end is available upon request. In addition, each Fidelity Central Fund's financial statements, which are not covered by the Fund's Report of Independent Registered Public Accounting Firm, are available on the SEC's website or upon request. |
| Affiliate | Value, beginning of period ($) | Purchases ($) | Sales Proceeds ($) | Dividend Income ($) | Realized Gain (loss) ($) | Change in Unrealized appreciation (depreciation) ($) | Value, end of period ($) | % ownership, end of period |
| Fidelity Cash Central Fund 5.32% | 111,694 | 6,933,617 | 6,938,099 | 4,447 | - | - | 107,212 | 0.0% |
| Total | 111,694 | 6,933,617 | 6,938,099 | 4,447 | - | - | 107,212 | |
| Valuation Inputs at Reporting Date: | ||||
| Description | Total ($) | Level 1 ($) | Level 2 ($) | Level 3 ($) |
Investments in Securities: | ||||
| Equities: | ||||
Communication Services | 5,510,561 | 5,510,561 | - | - |
Consumer Discretionary | 8,602,830 | 8,602,830 | - | - |
Consumer Staples | 15,489,710 | 15,489,710 | - | - |
Energy | 13,581,603 | 13,581,603 | - | - |
Financials | 14,053,812 | 14,053,812 | - | - |
Health Care | 26,716,475 | 26,716,475 | - | - |
Industrials | 8,650,164 | 8,650,164 | - | - |
Information Technology | 30,499,183 | 30,499,183 | - | - |
Materials | 10,427,273 | 10,427,273 | - | - |
Real Estate | 7,185,640 | 7,185,640 | - | - |
Utilities | 6,439,459 | 6,439,459 | - | - |
| Money Market Funds | 107,212 | 107,212 | - | - |
| Total Investments in Securities: | 147,263,922 | 147,263,922 | - | - |
Derivative Instruments: | ||||
| Assets | ||||
Futures Contracts | 13,260 | 13,260 | - | - |
| Total Assets | 13,260 | 13,260 | - | - |
| Total Derivative Instruments: | 13,260 | 13,260 | - | - |
Primary Risk Exposure / Derivative Type | Value | |
| Asset ($) | Liability ($) | |
| Equity Risk | ||
Futures Contracts (a) | 13,260 | 0 |
| Total Equity Risk | 13,260 | 0 |
| Total Value of Derivatives | 13,260 | 0 |
| Statement of Assets and Liabilities | ||||
| July 31, 2023 | ||||
| Assets | ||||
| Investment in securities, at value - See accompanying schedule: | ||||
Unaffiliated issuers (cost $141,771,314) | $ | 147,156,710 | ||
Fidelity Central Funds (cost $107,212) | 107,212 | |||
| Total Investment in Securities (cost $141,878,526) | $ | 147,263,922 | ||
| Segregated cash with brokers for derivative instruments | 11,200 | |||
| Cash | 42,543 | |||
| Receivable for investments sold | 1,661,661 | |||
| Dividends receivable | 232,558 | |||
| Distributions receivable from Fidelity Central Funds | 377 | |||
| Receivable for daily variation margin on futures contracts | 400 | |||
Total assets | 149,212,661 | |||
| Liabilities | ||||
| Payable for fund shares redeemed | $ | 1,676,123 | ||
| Accrued management fee | 37,700 | |||
| Total Liabilities | 1,713,823 | |||
| Net Assets | $ | 147,498,838 | ||
| Net Assets consist of: | ||||
| Paid in capital | $ | 162,971,612 | ||
| Total accumulated earnings (loss) | (15,472,774) | |||
| Net Assets | $ | 147,498,838 | ||
Net Asset Value, offering price and redemption price per share ($147,498,838 ÷ 4,400,000 shares) | $ | 33.52 | ||
| Statement of Operations | ||||
Year ended July 31, 2023 | ||||
| Investment Income | ||||
| Dividends | $ | 4,658,104 | ||
| Income from Fidelity Central Funds | 4,447 | |||
| Total Income | 4,662,551 | |||
| Expenses | ||||
| Management fee | $ | 602,121 | ||
| Independent trustees' fees and expenses | 1,094 | |||
| Total expenses before reductions | 603,215 | |||
| Expense reductions | (328) | |||
| Total expenses after reductions | 602,887 | |||
| Net Investment income (loss) | 4,059,664 | |||
| Realized and Unrealized Gain (Loss) | ||||
| Net realized gain (loss) on: | ||||
| Investment Securities: | ||||
| Unaffiliated issuers | (14,017,400) | |||
| Redemptions in-kind | 2,066,581 | |||
| Futures contracts | 8,736 | |||
| Total net realized gain (loss) | (11,942,083) | |||
| Change in net unrealized appreciation (depreciation) on: | ||||
| Investment Securities: | ||||
| Unaffiliated issuers | 19,409,648 | |||
| Futures contracts | 13,260 | |||
| Total change in net unrealized appreciation (depreciation) | 19,422,908 | |||
| Net gain (loss) | 7,480,825 | |||
| Net increase (decrease) in net assets resulting from operations | $ | 11,540,489 | ||
| Statement of Changes in Net Assets | ||||
Year ended July 31, 2023 | Year ended July 31, 2022 | |||
| Increase (Decrease) in Net Assets | ||||
| Operations | ||||
| Net investment income (loss) | $ | 4,059,664 | $ | 2,664,450 |
| Net realized gain (loss) | (11,942,083) | 4,384,711 | ||
| Change in net unrealized appreciation (depreciation) | 19,422,908 | (16,922,706) | ||
| Net increase (decrease) in net assets resulting from operations | 11,540,489 | (9,873,545) | ||
| Distributions to shareholders | (4,166,950) | (2,544,600) | ||
| Share transactions | ||||
| Proceeds from sales of shares | 7,889,065 | 327,785,389 | ||
| Cost of shares redeemed | (128,142,495) | (101,071,269) | ||
Net increase (decrease) in net assets resulting from share transactions | (120,253,430) | 226,714,120 | ||
| Total increase (decrease) in net assets | (112,879,891) | 214,295,975 | ||
| Net Assets | ||||
| Beginning of period | 260,378,729 | 46,082,754 | ||
| End of period | $ | 147,498,838 | $ | 260,378,729 |
| Other Information | ||||
| Shares | ||||
| Sold | 250,000 | 9,900,000 | ||
| Redeemed | (4,050,000) | (3,200,000) | ||
| Net increase (decrease) | (3,800,000) | 6,700,000 | ||
| Fidelity® Stocks for Inflation ETF |
| Years ended July 31, | 2023 | 2022 | 2021 | 2020 A | ||||
Selected Per-Share Data | ||||||||
| Net asset value, beginning of period | $ | 31.75 | $ | 30.72 | $ | 24.07 | $ | 24.94 |
| Income from Investment Operations | ||||||||
Net investment income (loss) B,C | .61 | .54 | .39 | .38 | ||||
| Net realized and unrealized gain (loss) | 1.80 | 1.00 D | 7.08 | (.90) | ||||
| Total from investment operations | 2.41 | 1.54 | 7.47 | (.52) | ||||
| Distributions from net investment income | (.64) | (.51) | (.82) | (.35) | ||||
| Total distributions | (.64) | (.51) | (.82) | (.35) | ||||
| Net asset value, end of period | $ | 33.52 | $ | 31.75 | $ | 30.72 | $ | 24.07 |
Total Return E,F,G | 7.77% | 5.03% | 31.78% | (1.88)% | ||||
Ratios to Average Net Assets C,H,I | ||||||||
| Expenses before reductions | .29% | .29% | .29% | .29% J,K | ||||
| Expenses net of fee waivers, if any | .29% | .29% | .29% | .29% J,K | ||||
| Expenses net of all reductions | .29% | .29% | .29% | .29% J,K | ||||
| Net investment income (loss) | 1.95% | 1.68% | 1.34% | 2.16% J,K | ||||
| Supplemental Data | ||||||||
| Net assets, end of period (000 omitted) | $ | 147,499 | $ | 260,379 | $ | 46,083 | $ | 3,610 |
Portfolio turnover rate L,M | 105% | 76% | 52% | 65% N |
| Average Annual Total Returns | |||
Periods ended July 31, 2023 | Past 1 year | Life of Fund |
Fidelity® U.S. Multifactor ETF - NAV A | 10.78% | 12.46% |
Fidelity® U.S. Multifactor ETF - Market Price B | 10.69% | 12.98% |
Fidelity U.S. Multifactor Index℠ A | 11.13% | 12.82% |
Russell 1000® Index A | 12.95% | 12.15% |
| $10,000 Over Life of Fund |
Let's say hypothetically that $10,000 was invested in Fidelity® U.S. Multifactor ETF - NAV, on September 15, 2020, when the fund started. The chart shows how the value of your investment would have changed, and also shows how the Fidelity U.S. Multifactor Index℠ and Russell 1000® Index performed over the same period. |
 |
Top Holdings (% of Fund's net assets) | ||
| Apple, Inc. | 7.5 | |
| Microsoft Corp. | 6.4 | |
| Alphabet, Inc. Class A | 4.1 | |
| Eli Lilly & Co. | 1.7 | |
| Johnson & Johnson | 1.6 | |
| Procter & Gamble Co. | 1.6 | |
| Exxon Mobil Corp. | 1.6 | |
| The Home Depot, Inc. | 1.6 | |
| Broadcom, Inc. | 1.4 | |
| McDonald's Corp. | 1.4 | |
| 28.9 | ||
| Market Sectors (% of Fund's net assets) | ||
| Information Technology | 24.2 | |
| Financials | 15.3 | |
| Health Care | 13.2 | |
| Industrials | 11.1 | |
| Consumer Discretionary | 9.8 | |
| Communication Services | 7.9 | |
| Consumer Staples | 6.4 | |
| Energy | 4.3 | |
| Materials | 2.7 | |
| Real Estate | 2.6 | |
| Utilities | 2.3 | |
Asset Allocation (% of Fund's net assets) |
|
Futures - 0.1% |
| Common Stocks - 99.8% | |||
| Shares | Value ($) | ||
| COMMUNICATION SERVICES - 7.9% | |||
| Diversified Telecommunication Services - 0.5% | |||
| AT&T, Inc. | 13,298 | 193,087 | |
| Entertainment - 0.7% | |||
| Activision Blizzard, Inc. | 2,534 | 235,054 | |
| Interactive Media & Services - 4.5% | |||
| Alphabet, Inc. Class A (a) | 10,759 | 1,427,934 | |
| Ziff Davis, Inc. (a) | 1,649 | 119,585 | |
| 1,547,519 | |||
| Media - 2.2% | |||
| Comcast Corp. Class A | 7,223 | 326,913 | |
| Fox Corp. Class A | 4,649 | 155,509 | |
| Nexstar Broadcasting Group, Inc. Class A | 737 | 137,613 | |
| TEGNA, Inc. | 7,563 | 127,815 | |
| 747,850 | |||
TOTAL COMMUNICATION SERVICES | 2,723,510 | ||
| CONSUMER DISCRETIONARY - 9.8% | |||
| Diversified Consumer Services - 1.4% | |||
| H&R Block, Inc. | 6,935 | 233,085 | |
| Service Corp. International | 3,756 | 250,337 | |
| 483,422 | |||
| Hotels, Restaurants & Leisure - 2.3% | |||
| McDonald's Corp. | 1,617 | 474,104 | |
| Yum! Brands, Inc. | 2,308 | 317,742 | |
| 791,846 | |||
| Household Durables - 1.0% | |||
| Lennar Corp. Class A | 2,682 | 340,158 | |
| Specialty Retail - 5.1% | |||
| Academy Sports & Outdoors, Inc. | 4,342 | 259,608 | |
| AutoZone, Inc. (a) | 125 | 310,215 | |
| Murphy U.S.A., Inc. | 1,037 | 318,390 | |
| O'Reilly Automotive, Inc. (a) | 382 | 353,652 | |
| The Home Depot, Inc. | 1,630 | 544,159 | |
| 1,786,024 | |||
TOTAL CONSUMER DISCRETIONARY | 3,401,450 | ||
| CONSUMER STAPLES - 6.4% | |||
| Consumer Staples Distribution & Retail - 0.7% | |||
| Dollar General Corp. | 1,336 | 225,597 | |
| Food Products - 0.7% | |||
| The Hershey Co. | 1,091 | 252,359 | |
| Household Products - 3.2% | |||
| Colgate-Palmolive Co. | 3,771 | 287,576 | |
| Kimberly-Clark Corp. | 2,024 | 261,298 | |
| Procter & Gamble Co. | 3,560 | 556,428 | |
| 1,105,302 | |||
| Tobacco - 1.8% | |||
| Altria Group, Inc. | 6,319 | 287,009 | |
| Philip Morris International, Inc. | 3,479 | 346,926 | |
| 633,935 | |||
TOTAL CONSUMER STAPLES | 2,217,193 | ||
| ENERGY - 4.3% | |||
| Oil, Gas & Consumable Fuels - 4.3% | |||
| ConocoPhillips Co. | 2,733 | 321,729 | |
| Coterra Energy, Inc. | 8,316 | 229,023 | |
| Exxon Mobil Corp. | 5,114 | 548,425 | |
| Texas Pacific Land Corp. | 103 | 155,149 | |
| Valero Energy Corp. | 1,743 | 224,690 | |
| 1,479,016 | |||
| FINANCIALS - 15.3% | |||
| Banks - 0.9% | |||
| Popular, Inc. | 4,277 | 310,296 | |
| Financial Services - 5.6% | |||
| Essent Group Ltd. | 6,816 | 338,074 | |
| Fiserv, Inc. (a) | 1,615 | 203,829 | |
| Jack Henry & Associates, Inc. | 702 | 117,634 | |
| MasterCard, Inc. Class A | 1,015 | 400,194 | |
| MGIC Investment Corp. | 21,108 | 353,348 | |
| The Western Union Co. | 8,469 | 103,152 | |
| Visa, Inc. Class A | 1,863 | 442,891 | |
| 1,959,122 | |||
| Insurance - 8.8% | |||
| AFLAC, Inc. | 4,799 | 347,160 | |
| Arch Capital Group Ltd. (a) | 5,167 | 401,424 | |
| Chubb Ltd. | 1,762 | 360,170 | |
| Everest Re Group Ltd. | 906 | 326,622 | |
| Progressive Corp. | 2,694 | 339,390 | |
| RLI Corp. | 2,323 | 309,911 | |
| The Travelers Companies, Inc. | 1,835 | 316,739 | |
| Unum Group | 7,436 | 361,464 | |
| W.R. Berkley Corp. | 4,646 | 286,612 | |
| 3,049,492 | |||
TOTAL FINANCIALS | 5,318,910 | ||
| HEALTH CARE - 13.2% | |||
| Biotechnology - 5.1% | |||
| AbbVie, Inc. | 2,859 | 427,649 | |
| Amgen, Inc. | 1,261 | 295,263 | |
| Gilead Sciences, Inc. | 3,521 | 268,089 | |
| Regeneron Pharmaceuticals, Inc. (a) | 358 | 265,604 | |
| United Therapeutics Corp. (a) | 817 | 198,302 | |
| Vertex Pharmaceuticals, Inc. (a) | 878 | 309,355 | |
| 1,764,262 | |||
| Health Care Providers & Services - 1.3% | |||
| AMN Healthcare Services, Inc. (a) | 2,009 | 215,264 | |
| Molina Healthcare, Inc. (a) | 712 | 216,797 | |
| 432,061 | |||
| Pharmaceuticals - 6.8% | |||
| Bristol-Myers Squibb Co. | 4,535 | 282,032 | |
| Eli Lilly & Co. | 1,264 | 574,551 | |
| Johnson & Johnson | 3,384 | 566,922 | |
| Merck & Co., Inc. | 4,053 | 432,252 | |
| Pfizer, Inc. | 9,206 | 331,968 | |
| Royalty Pharma PLC | 5,505 | 172,747 | |
| 2,360,472 | |||
TOTAL HEALTH CARE | 4,556,795 | ||
| INDUSTRIALS - 11.1% | |||
| Aerospace & Defense - 2.2% | |||
| Lockheed Martin Corp. | 866 | 386,556 | |
| Northrop Grumman Corp. | 818 | 364,010 | |
| 750,566 | |||
| Air Freight & Logistics - 1.0% | |||
| Expeditors International of Washington, Inc. | 2,722 | 346,511 | |
| Commercial Services & Supplies - 1.1% | |||
| Waste Management, Inc. | 2,357 | 386,053 | |
| Electrical Equipment - 1.0% | |||
| Atkore, Inc. (a) | 2,216 | 351,613 | |
| Machinery - 3.2% | |||
| Allison Transmission Holdings, Inc. | 6,800 | 399,092 | |
| Mueller Industries, Inc. | 4,451 | 360,798 | |
| Snap-On, Inc. | 1,237 | 337,008 | |
| 1,096,898 | |||
| Professional Services - 2.6% | |||
| Automatic Data Processing, Inc. | 855 | 211,407 | |
| ExlService Holdings, Inc. (a) | 703 | 99,088 | |
| Genpact Ltd. | 2,604 | 93,978 | |
| Paychex, Inc. | 1,237 | 155,206 | |
| Science Applications International Corp. | 2,994 | 363,292 | |
| 922,971 | |||
TOTAL INDUSTRIALS | 3,854,612 | ||
| INFORMATION TECHNOLOGY - 24.2% | |||
| Communications Equipment - 0.9% | |||
| Cisco Systems, Inc. | 5,776 | 300,583 | |
| IT Services - 2.6% | |||
| Accenture PLC Class A | 920 | 291,042 | |
| Akamai Technologies, Inc. (a) | 1,415 | 133,718 | |
| Amdocs Ltd. | 1,344 | 125,852 | |
| IBM Corp. | 1,607 | 231,697 | |
| VeriSign, Inc. (a) | 603 | 127,203 | |
| 909,512 | |||
| Semiconductors & Semiconductor Equipment - 3.3% | |||
| Analog Devices, Inc. | 1,080 | 215,492 | |
| Broadcom, Inc. | 528 | 474,487 | |
| KLA Corp. | 400 | 205,580 | |
| Texas Instruments, Inc. | 1,385 | 249,300 | |
| 1,144,859 | |||
| Software - 9.5% | |||
| Adobe, Inc. (a) | 684 | 373,580 | |
| Cadence Design Systems, Inc. (a) | 846 | 197,972 | |
| Fair Isaac Corp. (a) | 190 | 159,214 | |
| Microsoft Corp. | 6,612 | 2,221,103 | |
| Qualys, Inc. (a) | 976 | 135,469 | |
| Synopsys, Inc. (a) | 444 | 200,599 | |
| 3,287,937 | |||
| Technology Hardware, Storage & Peripherals - 7.9% | |||
| Apple, Inc. | 13,151 | 2,583,519 | |
| HP, Inc. | 4,542 | 149,114 | |
| 2,732,633 | |||
TOTAL INFORMATION TECHNOLOGY | 8,375,524 | ||
| MATERIALS - 2.7% | |||
| Chemicals - 0.9% | |||
| CF Industries Holdings, Inc. | 3,686 | 302,547 | |
| Metals & Mining - 0.9% | |||
| Nucor Corp. | 1,909 | 328,520 | |
| Paper & Forest Products - 0.9% | |||
| Louisiana-Pacific Corp. | 4,214 | 320,812 | |
TOTAL MATERIALS | 951,879 | ||
| REAL ESTATE - 2.6% | |||
| Equity Real Estate Investment Trusts (REITs) - 2.6% | |||
| Public Storage | 1,157 | 325,985 | |
| VICI Properties, Inc. | 10,043 | 316,154 | |
| WP Carey, Inc. | 3,964 | 267,689 | |
| 909,828 | |||
| UTILITIES - 2.3% | |||
| Gas Utilities - 0.8% | |||
| National Fuel Gas Co. | 5,073 | 269,427 | |
| Independent Power and Renewable Electricity Producers - 0.6% | |||
| Clearway Energy, Inc. Class C | 8,510 | 224,749 | |
| Multi-Utilities - 0.9% | |||
| Consolidated Edison, Inc. | 3,338 | 316,643 | |
TOTAL UTILITIES | 810,819 | ||
| TOTAL COMMON STOCKS (Cost $31,653,505) | 34,599,536 | ||
| Money Market Funds - 0.1% | |||
| Shares | Value ($) | ||
Fidelity Cash Central Fund 5.32% (b) (Cost $18,721) | 18,717 | 18,721 | |
| TOTAL INVESTMENT IN SECURITIES - 99.9% (Cost $31,672,226) | 34,618,257 |
NET OTHER ASSETS (LIABILITIES) - 0.1% | 34,950 |
| NET ASSETS - 100.0% | 34,653,207 |
| Futures Contracts | |||||
Number of contracts | Expiration Date | Notional Amount ($) | Value ($) | Unrealized Appreciation/ (Depreciation) ($) | |
| Purchased | |||||
| Equity Index Contracts | |||||
| CME Micro E-mini S&P 500 Index Contracts (United States) | 2 | Sep 2023 | 46,145 | 2,260 | 2,260 |
| The notional amount of futures purchased as a percentage of Net Assets is 0.1% | |||||
| (a) | Non-income producing |
| (b) | Affiliated fund that is generally available only to investment companies and other accounts managed by Fidelity Investments. The rate quoted is the annualized seven-day yield of the fund at period end. A complete unaudited listing of the fund's holdings as of its most recent quarter end is available upon request. In addition, each Fidelity Central Fund's financial statements, which are not covered by the Fund's Report of Independent Registered Public Accounting Firm, are available on the SEC's website or upon request. |
| Affiliate | Value, beginning of period ($) | Purchases ($) | Sales Proceeds ($) | Dividend Income ($) | Realized Gain (loss) ($) | Change in Unrealized appreciation (depreciation) ($) | Value, end of period ($) | % ownership, end of period |
| Fidelity Cash Central Fund 5.32% | - | 450,393 | 431,672 | 189 | - | - | 18,721 | 0.0% |
| Total | - | 450,393 | 431,672 | 189 | - | - | 18,721 | |
| Valuation Inputs at Reporting Date: | ||||
| Description | Total ($) | Level 1 ($) | Level 2 ($) | Level 3 ($) |
Investments in Securities: | ||||
| Equities: | ||||
Communication Services | 2,723,510 | 2,723,510 | - | - |
Consumer Discretionary | 3,401,450 | 3,401,450 | - | - |
Consumer Staples | 2,217,193 | 2,217,193 | - | - |
Energy | 1,479,016 | 1,479,016 | - | - |
Financials | 5,318,910 | 5,318,910 | - | - |
Health Care | 4,556,795 | 4,556,795 | - | - |
Industrials | 3,854,612 | 3,854,612 | - | - |
Information Technology | 8,375,524 | 8,375,524 | - | - |
Materials | 951,879 | 951,879 | - | - |
Real Estate | 909,828 | 909,828 | - | - |
Utilities | 810,819 | 810,819 | - | - |
| Money Market Funds | 18,721 | 18,721 | - | - |
| Total Investments in Securities: | 34,618,257 | 34,618,257 | - | - |
Derivative Instruments: | ||||
| Assets | ||||
Futures Contracts | 2,260 | 2,260 | - | - |
| Total Assets | 2,260 | 2,260 | - | - |
| Total Derivative Instruments: | 2,260 | 2,260 | - | - |
Primary Risk Exposure / Derivative Type | Value | |
| Asset ($) | Liability ($) | |
| Equity Risk | ||
Futures Contracts (a) | 2,260 | 0 |
| Total Equity Risk | 2,260 | 0 |
| Total Value of Derivatives | 2,260 | 0 |
| Statement of Assets and Liabilities | ||||
| July 31, 2023 | ||||
| Assets | ||||
| Investment in securities, at value - See accompanying schedule: | ||||
Unaffiliated issuers (cost $31,653,505) | $ | 34,599,536 | ||
Fidelity Central Funds (cost $18,721) | 18,721 | |||
| Total Investment in Securities (cost $31,672,226) | $ | 34,618,257 | ||
| Segregated cash with brokers for derivative instruments | 2,240 | |||
| Cash | 14,846 | |||
| Dividends receivable | 25,700 | |||
| Distributions receivable from Fidelity Central Funds | 82 | |||
| Receivable for daily variation margin on futures contracts | 80 | |||
Total assets | 34,661,205 | |||
| Liabilities | ||||
| Accrued management fee | $ | 7,998 | ||
| Total Liabilities | 7,998 | |||
| Net Assets | $ | 34,653,207 | ||
| Net Assets consist of: | ||||
| Paid in capital | $ | 32,802,229 | ||
| Total accumulated earnings (loss) | 1,850,978 | |||
| Net Assets | $ | 34,653,207 | ||
Net Asset Value, offering price and redemption price per share ($34,653,207 ÷ 1,300,000 shares) | $ | 26.66 | ||
| Statement of Operations | ||||
Year ended July 31, 2023 | ||||
| Investment Income | ||||
| Dividends | $ | 442,256 | ||
| Income from Fidelity Central Funds | 189 | |||
| Total Income | 442,445 | |||
| Expenses | ||||
| Management fee | $ | 66,133 | ||
| Independent trustees' fees and expenses | 104 | |||
| Total expenses before reductions | 66,237 | |||
| Expense reductions | (172) | |||
| Total expenses after reductions | 66,065 | |||
| Net Investment income (loss) | 376,380 | |||
| Realized and Unrealized Gain (Loss) | ||||
| Net realized gain (loss) on: | ||||
| Investment Securities: | ||||
| Unaffiliated issuers | (702,633) | |||
| Redemptions in-kind | 650,191 | |||
| Futures contracts | 1,292 | |||
| Total net realized gain (loss) | (51,150) | |||
| Change in net unrealized appreciation (depreciation) on: | ||||
| Investment Securities: | ||||
| Unaffiliated issuers | 2,839,986 | |||
| Futures contracts | 2,260 | |||
| Total change in net unrealized appreciation (depreciation) | 2,842,246 | |||
| Net gain (loss) | 2,791,096 | |||
| Net increase (decrease) in net assets resulting from operations | $ | 3,167,476 | ||
| Statement of Changes in Net Assets | ||||
Year ended July 31, 2023 | Year ended July 31, 2022 | |||
| Increase (Decrease) in Net Assets | ||||
| Operations | ||||
| Net investment income (loss) | $ | 376,380 | $ | 236,930 |
| Net realized gain (loss) | (51,150) | 433,050 | ||
| Change in net unrealized appreciation (depreciation) | 2,842,246 | (1,195,944) | ||
| Net increase (decrease) in net assets resulting from operations | 3,167,476 | (525,964) | ||
| Distributions to shareholders | (365,300) | (235,000) | ||
| Share transactions | ||||
| Proceeds from sales of shares | 20,841,939 | 9,088,569 | ||
| Cost of shares redeemed | (3,667,295) | (5,142,624) | ||
Net increase (decrease) in net assets resulting from share transactions | 17,174,644 | 3,945,945 | ||
| Total increase (decrease) in net assets | 19,976,820 | 3,184,981 | ||
| Net Assets | ||||
| Beginning of period | 14,676,387 | 11,491,406 | ||
| End of period | $ | 34,653,207 | $ | 14,676,387 |
| Other Information | ||||
| Shares | ||||
| Sold | 850,000 | 350,000 | ||
| Redeemed | (150,000) | (200,000) | ||
| Net increase (decrease) | 700,000 | 150,000 | ||
| Fidelity® U.S. Multifactor ETF |
| Years ended July 31, | 2023 | 2022 | 2021 A | |||
Selected Per-Share Data | ||||||
| Net asset value, beginning of period | $ | 24.46 | $ | 25.54 | $ | 20.09 |
| Income from Investment Operations | ||||||
Net investment income (loss) B,C | .41 | .41 | .31 D | |||
| Net realized and unrealized gain (loss) | 2.19 | (1.09) | 5.62 | |||
| Total from investment operations | 2.60 | (.68) | 5.93 | |||
| Distributions from net investment income | (.40) | (.40) | (.48) | |||
| Total distributions | (.40) | (.40) | (.48) | |||
| Net asset value, end of period | $ | 26.66 | $ | 24.46 | $ | 25.54 |
Total Return E,F,G | 10.78% | (2.64)% | 29.94% | |||
Ratios to Average Net Assets C,H,I | ||||||
| Expenses before reductions | .29% | .29% | .29% J | |||
| Expenses net of fee waivers, if any | .29% | .29% | .29% J | |||
| Expenses net of all reductions | .29% | .29% | .29% J | |||
| Net investment income (loss) | 1.66% | 1.63% | 1.56% D,J | |||
| Supplemental Data | ||||||
| Net assets, end of period (000 omitted) | $ | 34,653 | $ | 14,676 | $ | 11,491 |
Portfolio turnover rate K,L | 45% | 46% | 30% M |
| Average Annual Total Returns | |||
Periods ended July 31, 2023 | Past 1 year | Past 5 years | Life of Fund |
Fidelity® Value Factor ETF - NAV A | 12.33% | 10.54% | 12.67% |
Fidelity® Value Factor ETF - Market Price B | 12.37% | 10.51% | 12.75% |
Fidelity U.S. Value Factor Index℠ A | 12.64% | 10.85% | 13.00% |
Russell 1000® Index A | 12.95% | 11.92% | 13.38% |
| $10,000 Over Life of Fund |
Let's say hypothetically that $10,000 was invested in Fidelity® Value Factor ETF - NAV, on September 12, 2016, when the fund started. The chart shows how the value of your investment would have changed, and also shows how the Fidelity U.S. Value Factor Index℠ and Russell 1000® Index performed over the same period. |
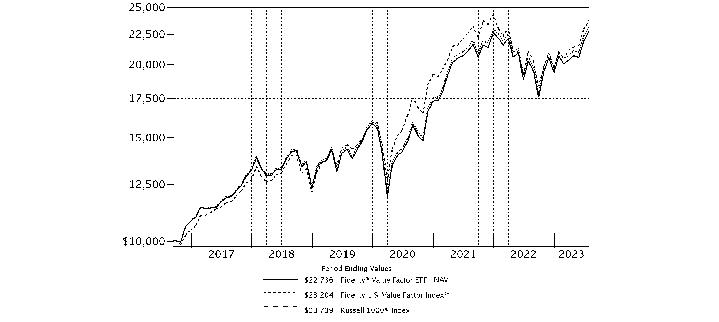 |
Top Holdings (% of Fund's net assets) | ||
| Apple, Inc. | 8.0 | |
| Microsoft Corp. | 6.9 | |
| Alphabet, Inc. Class A | 4.0 | |
| Amazon.com, Inc. | 3.4 | |
| Meta Platforms, Inc. Class A | 2.3 | |
| Berkshire Hathaway, Inc. Class B | 2.0 | |
| Broadcom, Inc. | 2.0 | |
| UnitedHealth Group, Inc. | 1.8 | |
| Visa, Inc. Class A | 1.7 | |
| Johnson & Johnson | 1.7 | |
| 33.8 | ||
| Market Sectors (% of Fund's net assets) | ||
| Information Technology | 25.6 | |
| Financials | 14.5 | |
| Health Care | 12.2 | |
| Consumer Discretionary | 11.1 | |
| Industrials | 9.3 | |
| Communication Services | 8.8 | |
| Consumer Staples | 5.8 | |
| Energy | 4.5 | |
| Real Estate | 2.7 | |
| Materials | 2.7 | |
| Utilities | 2.5 | |
Asset Allocation (% of Fund's net assets) |
|
Futures - 0.3% |
| Common Stocks - 99.7% | |||
| Shares | Value ($) | ||
| COMMUNICATION SERVICES - 8.8% | |||
| Diversified Telecommunication Services - 0.4% | |||
| Liberty Global PLC Class A (a) | 91,894 | 1,706,472 | |
| Interactive Media & Services - 6.3% | |||
| Alphabet, Inc. Class A (a) | 159,560 | 21,176,803 | |
| Meta Platforms, Inc. Class A (a) | 38,230 | 12,180,078 | |
| 33,356,881 | |||
| Media - 2.1% | |||
| Comcast Corp. Class A | 100,151 | 4,532,834 | |
| Fox Corp. Class A | 59,535 | 1,991,446 | |
| Nexstar Broadcasting Group, Inc. Class A | 9,368 | 1,749,193 | |
| Paramount Global Class B (b) | 81,421 | 1,305,179 | |
| TEGNA, Inc. | 95,759 | 1,618,327 | |
| 11,196,979 | |||
TOTAL COMMUNICATION SERVICES | 46,260,332 | ||
| CONSUMER DISCRETIONARY - 11.1% | |||
| Automobiles - 1.3% | |||
| Ford Motor Co. | 249,342 | 3,293,808 | |
| General Motors Co. | 86,760 | 3,328,981 | |
| 6,622,789 | |||
| Broadline Retail - 3.8% | |||
| Amazon.com, Inc. (a) | 136,668 | 18,269,778 | |
| Macy's, Inc. | 120,611 | 2,000,936 | |
| 20,270,714 | |||
| Diversified Consumer Services - 0.5% | |||
| H&R Block, Inc. (b) | 75,141 | 2,525,489 | |
| Hotels, Restaurants & Leisure - 2.0% | |||
| Booking Holdings, Inc. (a) | 1,647 | 4,892,908 | |
| McDonald's Corp. | 20,053 | 5,879,540 | |
| 10,772,448 | |||
| Household Durables - 2.2% | |||
| Lennar Corp. Class A | 29,815 | 3,781,436 | |
| Taylor Morrison Home Corp. (a) | 78,082 | 3,780,730 | |
| Toll Brothers, Inc. | 47,678 | 3,829,974 | |
| 11,392,140 | |||
| Specialty Retail - 1.3% | |||
| The Home Depot, Inc. | 21,259 | 7,097,105 | |
TOTAL CONSUMER DISCRETIONARY | 58,680,685 | ||
| CONSUMER STAPLES - 5.8% | |||
| Consumer Staples Distribution & Retail - 0.6% | |||
| Kroger Co. | 65,190 | 3,170,842 | |
| Food Products - 1.7% | |||
| Archer Daniels Midland Co. | 38,042 | 3,232,048 | |
| Bunge Ltd. | 27,855 | 3,027,003 | |
| Tyson Foods, Inc. Class A | 43,002 | 2,396,071 | |
| 8,655,122 | |||
| Household Products - 2.0% | |||
| Kimberly-Clark Corp. | 23,929 | 3,089,234 | |
| Procter & Gamble Co. | 47,759 | 7,464,732 | |
| 10,553,966 | |||
| Tobacco - 1.5% | |||
| Altria Group, Inc. | 77,075 | 3,500,747 | |
| Philip Morris International, Inc. | 44,217 | 4,409,319 | |
| 7,910,066 | |||
TOTAL CONSUMER STAPLES | 30,289,996 | ||
| ENERGY - 4.5% | |||
| Oil, Gas & Consumable Fuels - 4.5% | |||
| Chevron Corp. | 28,639 | 4,687,059 | |
| ConocoPhillips Co. | 25,231 | 2,970,193 | |
| Coterra Energy, Inc. | 53,116 | 1,462,815 | |
| EQT Corp. | 38,178 | 1,610,348 | |
| Exxon Mobil Corp. | 61,273 | 6,570,917 | |
| Marathon Oil Corp. | 48,782 | 1,281,503 | |
| Marathon Petroleum Corp. | 14,793 | 1,967,765 | |
| PBF Energy, Inc. Class A (b) | 28,186 | 1,337,144 | |
| Valero Energy Corp. | 12,870 | 1,659,072 | |
| 23,546,816 | |||
| FINANCIALS - 14.5% | |||
| Banks - 4.2% | |||
| Bank of America Corp. | 158,332 | 5,066,624 | |
| Citigroup, Inc. | 73,266 | 3,491,858 | |
| JPMorgan Chase & Co. | 55,198 | 8,719,076 | |
| Wells Fargo & Co. | 101,946 | 4,705,827 | |
| 21,983,385 | |||
| Capital Markets - 0.7% | |||
| Goldman Sachs Group, Inc. | 11,165 | 3,973,289 | |
| Consumer Finance - 2.0% | |||
| Ally Financial, Inc. | 76,397 | 2,333,164 | |
| Capital One Financial Corp. | 25,779 | 3,016,659 | |
| Discover Financial Services | 25,109 | 2,650,255 | |
| Synchrony Financial | 73,322 | 2,532,542 | |
| 10,532,620 | |||
| Financial Services - 6.4% | |||
| Berkshire Hathaway, Inc. Class B (a) | 30,797 | 10,839,312 | |
| Essent Group Ltd. | 59,067 | 2,929,723 | |
| MGIC Investment Corp. | 182,688 | 3,058,197 | |
| PayPal Holdings, Inc. (a) | 60,151 | 4,560,649 | |
| The Western Union Co. | 281,742 | 3,431,618 | |
| Visa, Inc. Class A | 37,874 | 9,003,786 | |
| 33,823,285 | |||
| Insurance - 1.2% | |||
| American International Group, Inc. | 52,644 | 3,173,380 | |
| Unum Group | 64,809 | 3,150,365 | |
| 6,323,745 | |||
TOTAL FINANCIALS | 76,636,324 | ||
| HEALTH CARE - 12.2% | |||
| Biotechnology - 1.8% | |||
| AbbVie, Inc. | 45,644 | 6,827,430 | |
| Moderna, Inc. (a) | 23,414 | 2,754,891 | |
| 9,582,321 | |||
| Health Care Providers & Services - 4.9% | |||
| Centene Corp. (a) | 53,929 | 3,672,026 | |
| CVS Health Corp. | 55,910 | 4,175,918 | |
| Elevance Health, Inc. | 10,067 | 4,747,899 | |
| Humana, Inc. | 8,526 | 3,894,933 | |
| UnitedHealth Group, Inc. | 18,936 | 9,588,622 | |
| 26,079,398 | |||
| Pharmaceuticals - 5.5% | |||
| Bristol-Myers Squibb Co. | 73,368 | 4,562,756 | |
| Johnson & Johnson | 53,322 | 8,933,035 | |
| Merck & Co., Inc. | 64,649 | 6,894,816 | |
| Pfizer, Inc. | 147,049 | 5,302,587 | |
| Viatris, Inc. | 293,988 | 3,095,694 | |
| 28,788,888 | |||
TOTAL HEALTH CARE | 64,450,607 | ||
| INDUSTRIALS - 9.3% | |||
| Aerospace & Defense - 0.7% | |||
| Lockheed Martin Corp. | 7,950 | 3,548,642 | |
| Air Freight & Logistics - 0.7% | |||
| United Parcel Service, Inc. Class B | 21,166 | 3,960,794 | |
| Building Products - 1.9% | |||
| Builders FirstSource, Inc. (a) | 29,120 | 4,205,802 | |
| Owens Corning | 23,486 | 3,287,805 | |
| UFP Industries, Inc. | 24,129 | 2,479,496 | |
| 9,973,103 | |||
| Electrical Equipment - 0.5% | |||
| Atkore, Inc. (a) | 16,802 | 2,665,973 | |
| Industrial Conglomerates - 0.5% | |||
| 3M Co. | 26,032 | 2,902,568 | |
| Machinery - 2.7% | |||
| Caterpillar, Inc. | 15,906 | 4,217,794 | |
| Deere & Co. | 9,093 | 3,906,353 | |
| Mueller Industries, Inc. | 33,576 | 2,721,671 | |
| PACCAR, Inc. | 37,422 | 3,223,157 | |
| 14,068,975 | |||
| Passenger Airlines - 0.5% | |||
| United Airlines Holdings, Inc. (a) | 48,023 | 2,608,129 | |
| Professional Services - 0.8% | |||
| Manpower, Inc. | 25,888 | 2,042,045 | |
| Robert Half, Inc. | 27,260 | 2,021,329 | |
| 4,063,374 | |||
| Trading Companies & Distributors - 1.0% | |||
| Triton International Ltd. | 32,395 | 2,731,222 | |
| United Rentals, Inc. | 5,904 | 2,743,471 | |
| 5,474,693 | |||
TOTAL INDUSTRIALS | 49,266,251 | ||
| INFORMATION TECHNOLOGY - 25.6% | |||
| Communications Equipment - 1.3% | |||
| Cisco Systems, Inc. | 132,346 | 6,887,286 | |
| IT Services - 2.8% | |||
| Accenture PLC Class A | 21,458 | 6,788,238 | |
| Cognizant Technology Solutions Corp. Class A | 62,874 | 4,151,570 | |
| DXC Technology Co. (a) | 137,637 | 3,805,663 | |
| 14,745,471 | |||
| Semiconductors & Semiconductor Equipment - 4.9% | |||
| Broadcom, Inc. | 11,661 | 10,479,158 | |
| Micron Technology, Inc. | 76,755 | 5,479,539 | |
| Qualcomm, Inc. | 43,410 | 5,737,500 | |
| Skyworks Solutions, Inc. | 37,178 | 4,252,048 | |
| 25,948,245 | |||
| Software - 6.9% | |||
| Microsoft Corp. | 108,575 | 36,472,514 | |
| Technology Hardware, Storage & Peripherals - 9.7% | |||
| Apple, Inc. | 214,011 | 42,042,456 | |
| Hewlett Packard Enterprise Co. | 259,118 | 4,503,471 | |
| HP, Inc. | 140,601 | 4,615,931 | |
| 51,161,858 | |||
TOTAL INFORMATION TECHNOLOGY | 135,215,374 | ||
| MATERIALS - 2.7% | |||
| Chemicals - 1.6% | |||
| CF Industries Holdings, Inc. | 12,357 | 1,014,263 | |
| Dow, Inc. | 22,867 | 1,291,299 | |
| Linde PLC | 8,735 | 3,412,502 | |
| LyondellBasell Industries NV Class A | 11,919 | 1,178,312 | |
| Olin Corp. | 14,945 | 862,028 | |
| The Mosaic Co. | 20,822 | 848,705 | |
| 8,607,109 | |||
| Metals & Mining - 1.1% | |||
| Cleveland-Cliffs, Inc. (a) | 45,379 | 800,939 | |
| Freeport-McMoRan, Inc. | 37,184 | 1,660,266 | |
| Nucor Corp. | 7,980 | 1,373,278 | |
| Steel Dynamics, Inc. | 8,779 | 935,666 | |
| United States Steel Corp. (b) | 31,735 | 809,243 | |
| 5,579,392 | |||
TOTAL MATERIALS | 14,186,501 | ||
| REAL ESTATE - 2.7% | |||
| Equity Real Estate Investment Trusts (REITs) - 2.3% | |||
| Boston Properties, Inc. | 14,454 | 963,070 | |
| Host Hotels & Resorts, Inc. | 60,596 | 1,114,966 | |
| Kilroy Realty Corp. | 24,680 | 881,076 | |
| Medical Properties Trust, Inc. (b) | 84,462 | 852,222 | |
| Potlatch Corp. | 20,937 | 1,122,851 | |
| Prologis (REIT), Inc. | 18,958 | 2,365,011 | |
| Simon Property Group, Inc. | 11,634 | 1,449,596 | |
| VICI Properties, Inc. | 40,817 | 1,284,919 | |
| Vornado Realty Trust | 39,724 | 892,996 | |
| Weyerhaeuser Co. | 37,030 | 1,261,242 | |
| 12,187,949 | |||
| Real Estate Management & Development - 0.4% | |||
| CBRE Group, Inc. (a) | 15,175 | 1,264,229 | |
| Jones Lang LaSalle, Inc. (a) | 5,958 | 992,305 | |
| 2,256,534 | |||
TOTAL REAL ESTATE | 14,444,483 | ||
| UTILITIES - 2.5% | |||
| Electric Utilities - 1.5% | |||
| American Electric Power Co., Inc. | 18,614 | 1,577,350 | |
| NRG Energy, Inc. | 35,817 | 1,360,688 | |
| PG&E Corp. (a) | 93,829 | 1,652,329 | |
| PPL Corp. | 48,395 | 1,332,314 | |
| Southern Co. | 30,425 | 2,200,945 | |
| 8,123,626 | |||
| Gas Utilities - 0.2% | |||
| National Fuel Gas Co. | 20,997 | 1,115,151 | |
| Independent Power and Renewable Electricity Producers - 0.2% | |||
| Clearway Energy, Inc. Class C | 34,859 | 920,626 | |
| Multi-Utilities - 0.6% | |||
| Consolidated Edison, Inc. | 16,542 | 1,569,174 | |
| Sempra Energy | 11,083 | 1,651,589 | |
| 3,220,763 | |||
TOTAL UTILITIES | 13,380,166 | ||
| TOTAL COMMON STOCKS (Cost $493,386,419) | 526,357,535 | ||
| Money Market Funds - 1.0% | |||
| Shares | Value ($) | ||
| Fidelity Cash Central Fund 5.32% (c) | 1,107,609 | 1,107,830 | |
| Fidelity Securities Lending Cash Central Fund 5.32% (c)(d) | 4,344,241 | 4,344,675 | |
| TOTAL MONEY MARKET FUNDS (Cost $5,452,505) | 5,452,505 | ||
| TOTAL INVESTMENT IN SECURITIES - 100.7% (Cost $498,838,924) | 531,810,040 |
NET OTHER ASSETS (LIABILITIES) - (0.7)% | (3,949,718) |
| NET ASSETS - 100.0% | 527,860,322 |
| Futures Contracts | |||||
Number of contracts | Expiration Date | Notional Amount ($) | Value ($) | Unrealized Appreciation/ (Depreciation) ($) | |
| Purchased | |||||
| Equity Index Contracts | |||||
| CME Micro E-mini S&P 500 Index Contracts (United States) | 60 | Sep 2023 | 1,384,350 | 70,127 | 70,127 |
| The notional amount of futures purchased as a percentage of Net Assets is 0.3% | |||||
| (a) | Non-income producing |
| (b) | Security or a portion of the security is on loan at period end. |
| (c) | Affiliated fund that is generally available only to investment companies and other accounts managed by Fidelity Investments. The rate quoted is the annualized seven-day yield of the fund at period end. A complete unaudited listing of the fund's holdings as of its most recent quarter end is available upon request. In addition, each Fidelity Central Fund's financial statements, which are not covered by the Fund's Report of Independent Registered Public Accounting Firm, are available on the SEC's website or upon request. |
| (d) | Investment made with cash collateral received from securities on loan. |
| Affiliate | Value, beginning of period ($) | Purchases ($) | Sales Proceeds ($) | Dividend Income ($) | Realized Gain (loss) ($) | Change in Unrealized appreciation (depreciation) ($) | Value, end of period ($) | % ownership, end of period |
| Fidelity Cash Central Fund 5.32% | 474,486 | 17,425,544 | 16,792,200 | 30,216 | - | - | 1,107,830 | 0.0% |
| Fidelity Securities Lending Cash Central Fund 5.32% | 834,375 | 53,345,301 | 49,835,001 | 9,446 | - | - | 4,344,675 | 0.0% |
| Total | 1,308,861 | 70,770,845 | 66,627,201 | 39,662 | - | - | 5,452,505 | |
| Valuation Inputs at Reporting Date: | ||||
| Description | Total ($) | Level 1 ($) | Level 2 ($) | Level 3 ($) |
Investments in Securities: | ||||
| Equities: | ||||
Communication Services | 46,260,332 | 46,260,332 | - | - |
Consumer Discretionary | 58,680,685 | 58,680,685 | - | - |
Consumer Staples | 30,289,996 | 30,289,996 | - | - |
Energy | 23,546,816 | 23,546,816 | - | - |
Financials | 76,636,324 | 76,636,324 | - | - |
Health Care | 64,450,607 | 64,450,607 | - | - |
Industrials | 49,266,251 | 49,266,251 | - | - |
Information Technology | 135,215,374 | 135,215,374 | - | - |
Materials | 14,186,501 | 14,186,501 | - | - |
Real Estate | 14,444,483 | 14,444,483 | - | - |
Utilities | 13,380,166 | 13,380,166 | - | - |
| Money Market Funds | 5,452,505 | 5,452,505 | - | - |
| Total Investments in Securities: | 531,810,040 | 531,810,040 | - | - |
Derivative Instruments: | ||||
| Assets | ||||
Futures Contracts | 70,127 | 70,127 | - | - |
| Total Assets | 70,127 | 70,127 | - | - |
| Total Derivative Instruments: | 70,127 | 70,127 | - | - |
Primary Risk Exposure / Derivative Type | Value | |
| Asset ($) | Liability ($) | |
| Equity Risk | ||
Futures Contracts (a) | 70,127 | 0 |
| Total Equity Risk | 70,127 | 0 |
| Total Value of Derivatives | 70,127 | 0 |
| Statement of Assets and Liabilities | ||||
| July 31, 2023 | ||||
| Assets | ||||
| Investment in securities, at value (including securities loaned of $4,311,890) - See accompanying schedule: | ||||
Unaffiliated issuers (cost $493,386,419) | $ | 526,357,535 | ||
Fidelity Central Funds (cost $5,452,505) | 5,452,505 | |||
| Total Investment in Securities (cost $498,838,924) | $ | 531,810,040 | ||
| Segregated cash with brokers for derivative instruments | 67,200 | |||
| Dividends receivable | 440,344 | |||
| Distributions receivable from Fidelity Central Funds | 4,474 | |||
| Receivable for daily variation margin on futures contracts | 2,390 | |||
| Other receivables | 4,295 | |||
Total assets | 532,328,743 | |||
| Liabilities | ||||
| Accrued management fee | $ | 123,746 | ||
| Collateral on securities loaned | 4,344,675 | |||
| Total Liabilities | 4,468,421 | |||
| Net Assets | $ | 527,860,322 | ||
| Net Assets consist of: | ||||
| Paid in capital | $ | 540,357,082 | ||
| Total accumulated earnings (loss) | (12,496,760) | |||
| Net Assets | $ | 527,860,322 | ||
Net Asset Value, offering price and redemption price per share ($527,860,322 ÷ 10,350,000 shares) | $ | 51.00 | ||
| Statement of Operations | ||||
Year ended July 31, 2023 | ||||
| Investment Income | ||||
| Dividends | $ | 10,192,682 | ||
| Income from Fidelity Central Funds (including $9,446 from security lending) | 39,662 | |||
| Total Income | 10,232,344 | |||
| Expenses | ||||
| Management fee | $ | 1,348,237 | ||
| Independent trustees' fees and expenses | 2,392 | |||
| Total expenses before reductions | 1,350,629 | |||
| Expense reductions | (345) | |||
| Total expenses after reductions | 1,350,284 | |||
| Net Investment income (loss) | 8,882,060 | |||
| Realized and Unrealized Gain (Loss) | ||||
| Net realized gain (loss) on: | ||||
| Investment Securities: | ||||
| Unaffiliated issuers | (8,595,970) | |||
| Redemptions in-kind | 15,085,153 | |||
| Futures contracts | 56,793 | |||
| Total net realized gain (loss) | 6,545,976 | |||
| Change in net unrealized appreciation (depreciation) on: | ||||
| Investment Securities: | ||||
| Unaffiliated issuers | 38,183,141 | |||
| Futures contracts | 11,052 | |||
| Total change in net unrealized appreciation (depreciation) | 38,194,193 | |||
| Net gain (loss) | 44,740,169 | |||
| Net increase (decrease) in net assets resulting from operations | $ | 53,622,229 | ||
| Statement of Changes in Net Assets | ||||
Year ended July 31, 2023 | Year ended July 31, 2022 | |||
| Increase (Decrease) in Net Assets | ||||
| Operations | ||||
| Net investment income (loss) | $ | 8,882,060 | $ | 7,743,147 |
| Net realized gain (loss) | 6,545,976 | 55,705,980 | ||
| Change in net unrealized appreciation (depreciation) | 38,194,193 | (90,000,723) | ||
| Net increase (decrease) in net assets resulting from operations | 53,622,229 | (26,551,596) | ||
| Distributions to shareholders | (8,641,250) | (7,920,650) | ||
| Share transactions | ||||
| Proceeds from sales of shares | 80,746,346 | 409,246,223 | ||
| Cost of shares redeemed | (97,539,980) | (325,370,322) | ||
Net increase (decrease) in net assets resulting from share transactions | (16,793,634) | 83,875,901 | ||
| Total increase (decrease) in net assets | 28,187,345 | 49,403,655 | ||
| Net Assets | ||||
| Beginning of period | 499,672,977 | 450,269,322 | ||
| End of period | $ | 527,860,322 | $ | 499,672,977 |
| Other Information | ||||
| Shares | ||||
| Sold | 1,750,000 | 8,250,000 | ||
| Redeemed | (2,200,000) | (6,650,000) | ||
| Net increase (decrease) | (450,000) | 1,600,000 | ||
| Fidelity® Value Factor ETF |
| Years ended July 31, | 2023 | 2022 | 2021 | 2020 | 2019 | |||||
Selected Per-Share Data | ||||||||||
| Net asset value, beginning of period | $ | 46.27 | $ | 48.94 | $ | 34.85 | $ | 34.53 | $ | 33.90 |
| Income from Investment Operations | ||||||||||
Net investment income (loss) A,B | .87 | .79 | .64 | .73 | .70 | |||||
| Net realized and unrealized gain (loss) | 4.70 | (2.65) | 14.07 | .28 | .59 | |||||
| Total from investment operations | 5.57 | (1.86) | 14.71 | 1.01 | 1.29 | |||||
| Distributions from net investment income | (.84) | (.81) | (.62) | (.69) | (.66) | |||||
| Total distributions | (.84) | (.81) | (.62) | (.69) | (.66) | |||||
| Net asset value, end of period | $ | 51.00 | $ | 46.27 | $ | 48.94 | $ | 34.85 | $ | 34.53 |
Total Return C,D | 12.33% | (3.86)% | 42.56% | 3.12% | 3.95% | |||||
Ratios to Average Net Assets B,E,F | ||||||||||
| Expenses before reductions | .29% | .29% | .29% | .29% | .29% | |||||
| Expenses net of fee waivers, if any | .29% | .29% | .29% | .29% | .29% | |||||
| Expenses net of all reductions | .29% | .29% | .29% | .29% | .29% | |||||
| Net investment income (loss) | 1.91% | 1.61% | 1.50% | 2.13% | 2.09% | |||||
| Supplemental Data | ||||||||||
| Net assets, end of period (000 omitted) | $ | 527,860 | $ | 499,673 | $ | 450,269 | $ | 189,916 | $ | 136,403 |
Portfolio turnover rate G,H | 43% | 46% | 42% | 45% | 31% |
| Fidelity Central Fund | Investment Manager | Investment Objective | Investment Practices | Expense RatioA |
| Fidelity Money Market Central Funds | Fidelity Management & Research Company LLC (FMR) | Each fund seeks to obtain a high level of current income consistent with the preservation of capital and liquidity. | Short-term Investments | Less than .005% |
| Tax cost | Gross unrealized appreciation | Gross unrealized depreciation | Net unrealized appreciation (depreciation) | |
| Fidelity Dividend ETF for Rising Rates | $511,622,296 | $83,253,954 | $(40,264,354) | $42,989,600 |
| Fidelity High Dividend ETF | 1,581,136,115 | 199,600,269 | (75,417,576) | 124,182,693 |
| Fidelity Low Volatility Factor ETF | 508,386,061 | 69,411,769 | (21,241,559) | 48,170,210 |
| Fidelity Momentum Factor ETF | 133,367,074 | 21,935,475 | (1,866,724) | 20,068,751 |
| Fidelity Quality Factor ETF | 298,797,321 | 41,107,199 | (13,186,893) | 27,920,306 |
| Fidelity Small-Mid Multifactor ETF | 120,972,842 | 15,179,121 | (6,989,276) | 8,189,845 |
| Fidelity Stocks for Inflation ETF | 141,922,428 | 13,209,662 | (7,868,168) | 5,341,494 |
| Fidelity U.S. Multifactor ETF | 31,689,760 | 3,850,175 | (921,678) | 2,928,497 |
| Fidelity Value Factor ETF | 499,298,970 | 62,204,784 | (29,693,714) | 32,511,070 |
| Undistributed ordinary income | Capital loss carryforward | Net unrealized appreciation (depreciation) on securities and other investments | |
| Fidelity Dividend ETF for Rising Rates | $413,605 | $ (59,736,344) | $43,019,251 |
| Fidelity High Dividend ETF | - | (71,499,125) | 124,201,629 |
| Fidelity Low Volatility Factor ETF | 211,898 | (39,960,681) | 48,170,210 |
| Fidelity Momentum Factor ETF | - | (32,540,088) | 20,068,751 |
| Fidelity Quality Factor ETF | 142,798 | (23,721,169) | 27,920,306 |
| Fidelity Small-Mid Multifactor ETF | - | (8,320,224) | 8,189,822 |
| Fidelity Stocks for Inflation ETF | - | (20,814,268) | 5,341,494 |
| Fidelity U.S. Multifactor ETF | 5,980 | (1,083,499) | 2,928,497 |
| Fidelity Value Factor ETF | 381,146 | (45,388,976) | 32,511,070 |
| Short-term | Long-term | Total capital loss carryforward | |
| Fidelity Dividend ETF for Rising Rates | $ (27,351,906) | $ (32,384,438) | $ (59,736,344) |
| Fidelity High Dividend ETF | (37,157,065) | (34,342,060) | (71,499,125) |
| Fidelity Low Volatility Factor ETF | (25,713,255) | (14,247,426) | (39,960,681) |
| Fidelity Momentum Factor ETF | (32,199,777) | (340,311) | (32,540,088) |
| Fidelity Quality Factor ETF | (17,277,163) | (6,444,006) | (23,721,169) |
| Fidelity Small-Mid Multifactor ETF | (6,770,927) | (1,549,297) | (8,320,224) |
| Fidelity Stocks for Inflation ETF | (17,304,578) | (3,509,690) | (20,814,268) |
| Fidelity U.S. Multifactor ETF | (688,778) | (394,721) | (1,083,499) |
| Fidelity Value Factor ETF | (28,724,493) | (16,664,483) | (45,388,976) |
| Ordinary Losses | |
| Fidelity High Dividend ETF | $(246,109) |
| Fidelity Small-Mid Multifactor ETF | (2,680) |
| July 31, 2023 | ||
| Ordinary Income | Total | |
| Fidelity Dividend ETF for Rising Rates | $16,860,450 | $16,860,450 |
| Fidelity High Dividend ETF | 52,210,250 | 52,210,250 |
| Fidelity Low Volatility Factor ETF | 7,460,700 | 7,460,700 |
| Fidelity Momentum Factor ETF | 1,506,200 | 1,506,200 |
| Fidelity Quality Factor ETF | 4,025,350 | 4,025,350 |
| Fidelity Small-Mid Multifactor ETF | 1,518,700 | 1,518,700 |
| Fidelity Stocks for Inflation ETF | 4,166,950 | 4,166,950 |
| Fidelity U.S. Multifactor ETF | 365,300 | 365,300 |
| Fidelity Value Factor ETF | 8,641,250 | 8,641,250 |
| July 31, 2022 | ||
| Ordinary Income | Total | |
| Fidelity Dividend ETF for Rising Rates | $14,425,400 | $14,425,400 |
| Fidelity High Dividend ETF | 36,931,550 | 36,931,550 |
| Fidelity Low Volatility Factor ETF | 5,937,600 | 5,937,600 |
| Fidelity Momentum Factor ETF | 999,550 | 999,550 |
| Fidelity Quality Factor ETF | 3,437,350 | 3,437,350 |
| Fidelity Small-Mid Multifactor ETF | 905,700 | 905,700 |
| Fidelity Stocks for Inflation ETF | 2,544,600 | 2,544,600 |
| Fidelity U.S. Multifactor ETF | 235,000 | 235,000 |
| Fidelity Value Factor ETF | 7,920,650 | 7,920,650 |
| Equity Risk | Equity risk relates to the fluctuations in the value of financial instruments as a result of changes in market prices (other than those arising from interest rate risk or foreign exchange risk), whether caused by factors specific to an individual investment, its issuer, or all factors affecting all instruments traded in a market or market segment. |
| Purchases ($) | Sales ($) | |
| Fidelity Dividend ETF for Rising Rates | 157,511,726 | 156,794,417 |
| Fidelity High Dividend ETF | 714,860,771 | 697,745,447 |
| Fidelity Low Volatility Factor ETF | 219,768,654 | 215,115,659 |
| Fidelity Momentum Factor ETF | 166,768,778 | 163,954,809 |
| Fidelity Quality Factor ETF | 117,016,021 | 116,592,522 |
| Fidelity Small-Mid Multifactor ETF | 60,617,478 | 58,257,340 |
| Fidelity Stocks for Inflation ETF | 216,692,483 | 217,621,838 |
| Fidelity U.S. Multifactor ETF | 9,841,972 | 9,638,776 |
| Fidelity Value Factor ETF | 196,017,174 | 196,331,203 |
| In-Kind Subscriptions ($) | In-Kind Redemptions ($) | |
| Fidelity Dividend ETF for Rising Rates | 111,394,937 | 198,524,166 |
| Fidelity High Dividend ETF | 594,423,423 | 313,396,955 |
| Fidelity Low Volatility Factor ETF | 125,436,747 | 54,746,046 |
| Fidelity Momentum Factor ETF | 51,577,311 | 26,175,464 |
| Fidelity Quality Factor ETF | 67,441,105 | 34,661,785 |
| Fidelity Small-Mid Multifactor ETF | 47,921,611 | 2,909,849 |
| Fidelity Stocks for Inflation ETF | 7,832,300 | 127,119,676 |
| Fidelity U.S. Multifactor ETF | 20,645,052 | 3,611,585 |
| Fidelity Value Factor ETF | 80,271,251 | 96,954,227 |
| Fee Rate | |
| Fidelity Dividend ETF for Rising Rates | .29% |
| Fidelity High Dividend ETF | .29% |
| Fidelity Low Volatility Factor ETF | .29% |
| Fidelity Momentum Factor ETF | .29% |
| Fidelity Quality Factor ETF | .29% |
| Fidelity Small-Mid Multifactor ETF | .29% |
| Fidelity Stocks for Inflation ETF | .29% |
| Fidelity U.S. Multifactor ETF | .29% |
| Fidelity Value Factor ETF | .29% |
| Borrower or Lender | Average Loan Balance | Weighted Average Interest Rate | Interest Expense | |
| Fidelity Dividend ETF for Rising Rates | Borrower | $9,374,000 | 4.82% | $1,254 |
| Fidelity High Dividend ETF | Borrower | $50,779,000 | 4.82% | $6,792 |
| Total Security Lending Fees Paid to NFS | Security Lending Income From Securities Loaned to NFS | Value of Securities Loaned to NFS at Period End | |
| Fidelity Dividend ETF for Rising Rates | $19,765 | $- | $- |
| Fidelity High Dividend ETF | $26,955 | $2 | $- |
| Fidelity Low Volatility Factor ETF | $807 | $- | $- |
| Fidelity Momentum Factor ETF | $138 | $- | $- |
| Fidelity Quality Factor ETF | $3,977 | $- | $- |
| Fidelity Small-Mid Multifactor ETF | $1,918 | $31 | $- |
| Fidelity Value Factor ETF | $958 | $- | $- |
| Custodian credits | |
Fidelity Dividend ETF for Rising Rates | $183 |
| Fidelity High Dividend ETF | 328 |
| Fidelity Low Volatility Factor ETF | 270 |
| Fidelity Momentum Factor ETF | 609 |
| Fidelity Quality Factor ETF | 294 |
| Fidelity Small-Mid Multifactor ETF | 405 |
| Fidelity Stocks for Inflation ETF | 328 |
| Fidelity U.S. Multifactor ETF | 172 |
| Fidelity Value Factor ETF | 345 |
| The Example is based on an investment of $1,000 invested at the beginning of the period and held for the entire period (February 1, 2023 to July 31, 2023). |
Annualized Expense Ratio- A | Beginning Account Value February 1, 2023 | Ending Account Value July 31, 2023 | Expenses Paid During Period- C February 1, 2023 to July 31, 2023 | |||||||
| Fidelity® Dividend ETF for Rising Rates | .29% | |||||||||
| Actual | $ 1,000 | $ 1,053.60 | $ 1.48 | |||||||
Hypothetical-B | $ 1,000 | $ 1,023.36 | $ 1.45 | |||||||
| Fidelity® High Dividend ETF | .29% | |||||||||
| Actual | $ 1,000 | $ 1,074.10 | $ 1.49 | |||||||
Hypothetical-B | $ 1,000 | $ 1,023.36 | $ 1.45 | |||||||
| Fidelity® Low Volatility Factor ETF | .29% | |||||||||
| Actual | $ 1,000 | $ 1,088.50 | $ 1.50 | |||||||
Hypothetical-B | $ 1,000 | $ 1,023.36 | $ 1.45 | |||||||
| Fidelity® Momentum Factor ETF | .29% | |||||||||
| Actual | $ 1,000 | $ 1,117.80 | $ 1.52 | |||||||
Hypothetical-B | $ 1,000 | $ 1,023.36 | $ 1.45 | |||||||
| Fidelity® Quality Factor ETF | .29% | |||||||||
| Actual | $ 1,000 | $ 1,119.20 | $ 1.52 | |||||||
Hypothetical-B | $ 1,000 | $ 1,023.36 | $ 1.45 | |||||||
| Fidelity® Small-Mid Multifactor ETF | .29% | |||||||||
| Actual | $ 1,000 | $ 1,038.70 | $ 1.47 | |||||||
Hypothetical-B | $ 1,000 | $ 1,023.36 | $ 1.45 | |||||||
| Fidelity® Stocks for Inflation ETF | .29% | |||||||||
| Actual | $ 1,000 | $ 1,055.30 | $ 1.48 | |||||||
Hypothetical-B | $ 1,000 | $ 1,023.36 | $ 1.45 | |||||||
| Fidelity® U.S. Multifactor ETF | .29% | |||||||||
| Actual | $ 1,000 | $ 1,084.00 | $ 1.50 | |||||||
Hypothetical-B | $ 1,000 | $ 1,023.36 | $ 1.45 | |||||||
| Fidelity® Value Factor ETF | .29% | |||||||||
| Actual | $ 1,000 | $ 1,102.00 | $ 1.51 | |||||||
Hypothetical-B | $ 1,000 | $ 1,023.36 | $ 1.45 | |||||||
| Fidelity® Dividend ETF for Rising Rates | |
| September 2022 | 76% |
| December 2022 | 80% |
| March 2023 | 80% |
| June 2023 | 80% |
| Fidelity® High Dividend ETF | |
| September 2022 | 66% |
| December 2022 | 66% |
| March 2023 | 63% |
| June 2023 | 63% |
| Fidelity® Low Volatility Factor ETF | |
| September 2022 | 100% |
| December 2022 | 100% |
| March 2023 | 100% |
| June 2023 | 100% |
| Fidelity® Momentum Factor ETF | |
| September 2022 | 100% |
| December 2022 | 100% |
| March 2023 | 100% |
| June 2023 | 100% |
| Fidelity® Quality Factor ETF | |
| September 2022 | 99% |
| December 2022 | 99% |
| March 2023 | 100% |
| June 2023 | 100% |
| Fidelity® Small-Mid Multifactor ETF | |
| September 2022 | 85% |
| December 2022 | 85% |
| March 2023 | 87% |
| June 2023 | 87% |
| Fidelity® Stocks for Inflation ETF | |
| September 2022 | 89% |
| December 2022 | 100% |
| March 2023 | 99% |
| June 2023 | 99% |
| Fidelity® U.S. Multifactor ETF | |
| September 2022 | 99% |
| December 2022 | 99% |
| March 2023 | 100% |
| June 2023 | 100% |
| Fidelity® Value Factor ETF | |
| September 2022 | 100% |
| December 2022 | 100% |
| March 2023 | 100% |
| June 2023 | 100% |
| Fidelity® Dividend ETF for Rising Rates | |
| September 2022 | 91.84% |
| December 2022 | 91.40% |
| March 2023 | 98.21% |
| June 2023 | 98.21% |
| Fidelity® High Dividend ETF | |
| September 2022 | 84.74% |
| December 2022 | 84.74% |
| March 2023 | 82.78% |
| June 2023 | 82.78% |
| Fidelity® Low Volatility Factor ETF | |
| September 2022 | 100% |
| December 2022 | 100% |
| March 2023 | 100% |
| June 2023 | 100% |
| Fidelity® Momentum Factor ETF | |
| September 2022 | 100% |
| December 2022 | 100% |
| March 2023 | 100% |
| June 2023 | 100% |
| Fidelity® Quality Factor ETF | |
| September 2022 | 100% |
| December 2022 | 100% |
| March 2023 | 100% |
| June 2023 | 100% |
| Fidelity® Small-Mid Multifactor ETF | |
| September 2022 | 87.75% |
| December 2022 | 87.75% |
| March 2023 | 92.30% |
| June 2023 | 92.30% |
| Fidelity® Stocks for Inflation ETF | |
| September 2022 | 100% |
| December 2022 | 100% |
| March 2023 | 100% |
| June 2023 | 100% |
| Fidelity® U.S. Multifactor ETF | |
| September 2022 | 100% |
| December 2022 | 100% |
| March 2023 | 100% |
| June 2023 | 100% |
| Fidelity® Value Factor ETF | |
| September 2022 | 100% |
| December 2022 | 100% |
| March 2023 | 100% |
| June 2023 | 100% |
| Fidelity® Dividend ETF for Rising Rates | |
| September 2022 | 5.98% |
| December 2022 | 6.30% |
| March 2023 | 1.79% |
| June 2023 | 1.79% |
| Fidelity® High Dividend ETF | |
| September 2022 | 15.26% |
| December 2022 | 15.26% |
| March 2023 | 14.17% |
| June 2023 | 14.17% |
| Fidelity® Small-Mid Multifactor ETF | |
| September 2022 | 12.25% |
| December 2022 | 12.25% |
| March 2023 | 7.70% |
| June 2023 | 7.70% |
 |


Contents
| Average Annual Total Returns | |||
Periods ended July 31, 2023 | Past 1 year | Life of Fund |
Fidelity® Blue Chip Growth ETF - NAV A | 25.44% | 15.19% |
Fidelity® Blue Chip Growth ETF - Market Price B | 25.27% | 15.30% |
Russell 1000® Growth Index A | 17.31% | 15.30% |
| $10,000 Over Life of Fund |
Let's say hypothetically that $10,000 was invested in Fidelity® Blue Chip Growth ETF - NAV, on June 2, 2020, when the fund started. The chart shows how the value of your investment would have changed, and also shows how the Russell 1000® Growth Index performed over the same period. |
 |
Top Holdings (% of Fund's net assets) | ||
| Apple, Inc. | 10.2 | |
| NVIDIA Corp. | 9.7 | |
| Microsoft Corp. | 9.2 | |
| Amazon.com, Inc. | 7.9 | |
| Alphabet, Inc. Class A | 6.1 | |
| Meta Platforms, Inc. Class A | 4.7 | |
| Marvell Technology, Inc. | 2.7 | |
| Uber Technologies, Inc. | 2.6 | |
| Tesla, Inc. | 2.3 | |
| Netflix, Inc. | 2.1 | |
| 57.5 | ||
| Market Sectors (% of Fund's net assets) | ||
| Information Technology | 40.8 | |
| Consumer Discretionary | 21.3 | |
| Communication Services | 14.8 | |
| Health Care | 8.7 | |
| Industrials | 4.5 | |
| Energy | 2.6 | |
| Consumer Staples | 2.5 | |
| Financials | 2.3 | |
| Materials | 0.7 | |
| Real Estate | 0.2 | |
| Utilities | 0.0 | |
Asset Allocation (% of Fund's net assets) |
 |
Futures - 0.4% |
| Common Stocks - 98.4% | |||
| Shares | Value ($) | ||
| COMMUNICATION SERVICES - 14.8% | |||
| Entertainment - 2.4% | |||
| Bilibili, Inc. ADR (a) | 420 | 8,009 | |
| Netflix, Inc. (a) | 37,235 | 16,345,048 | |
| Sea Ltd. ADR (a) | 33,357 | 2,218,908 | |
| Take-Two Interactive Software, Inc. (a) | 2,019 | 308,786 | |
| 18,880,751 | |||
| Interactive Media & Services - 12.3% | |||
| Alphabet, Inc. Class A (a) | 358,721 | 47,609,451 | |
| Meta Platforms, Inc. Class A (a) | 114,960 | 36,626,256 | |
| Snap, Inc. Class A (a) | 1,038,663 | 11,799,212 | |
| 96,034,919 | |||
| Wireless Telecommunication Services - 0.1% | |||
| T-Mobile U.S., Inc. (a) | 4,605 | 634,431 | |
TOTAL COMMUNICATION SERVICES | 115,550,101 | ||
| CONSUMER DISCRETIONARY - 21.3% | |||
| Automobile Components - 0.1% | |||
| Aptiv PLC (a) | 4,350 | 476,282 | |
| Automobiles - 2.8% | |||
| Rivian Automotive, Inc. (a) | 124,957 | 3,453,811 | |
| Tesla, Inc. (a) | 67,881 | 18,153,416 | |
| 21,607,227 | |||
| Broadline Retail - 8.5% | |||
| Alibaba Group Holding Ltd. sponsored ADR (a) | 28,541 | 2,915,749 | |
| Amazon.com, Inc. (a) | 460,328 | 61,536,647 | |
| MercadoLibre, Inc. (a) | 313 | 387,510 | |
| Ollie's Bargain Outlet Holdings, Inc. (a) | 9,459 | 689,372 | |
| PDD Holdings, Inc. ADR (a) | 8,768 | 787,542 | |
| 66,316,820 | |||
| Diversified Consumer Services - 0.1% | |||
| New Oriental Education & Technology Group, Inc. sponsored ADR (a) | 10,644 | 597,448 | |
| Hotels, Restaurants & Leisure - 3.2% | |||
| Airbnb, Inc. Class A (a) | 49,501 | 7,533,557 | |
| Caesars Entertainment, Inc. (a) | 64,732 | 3,820,483 | |
| Chipotle Mexican Grill, Inc. (a) | 383 | 751,553 | |
| Draftkings Holdings, Inc. (a) | 12,955 | 411,710 | |
| Hilton Worldwide Holdings, Inc. | 11,581 | 1,800,730 | |
| Marriott International, Inc. Class A | 20,053 | 4,046,896 | |
| McDonald's Corp. | 2,163 | 634,192 | |
| Penn Entertainment, Inc. (a) | 69,310 | 1,822,160 | |
| Restaurant Brands International, Inc. | 6,536 | 500,367 | |
| Starbucks Corp. | 17,443 | 1,771,686 | |
| Sweetgreen, Inc. Class A (a) | 71,307 | 1,074,596 | |
| Trip.com Group Ltd. ADR (a) | 13,758 | 564,628 | |
| Yum China Holdings, Inc. | 5,491 | 335,061 | |
| Yum! Brands, Inc. | 1,702 | 234,314 | |
| 25,301,933 | |||
| Leisure Products - 0.1% | |||
| Peloton Interactive, Inc. Class A (a) | 46,607 | 452,554 | |
| Specialty Retail - 4.2% | |||
| Abercrombie & Fitch Co. Class A (a) | 16,123 | 638,632 | |
| American Eagle Outfitters, Inc. | 207,330 | 2,912,987 | |
| Aritzia, Inc. (a) | 14,982 | 285,063 | |
| Bath & Body Works, Inc. | 6,460 | 239,408 | |
| Five Below, Inc. (a) | 14,263 | 2,971,553 | |
| Foot Locker, Inc. | 27,757 | 745,831 | |
| Lowe's Companies, Inc. | 56,797 | 13,305,833 | |
| RH (a) | 13,167 | 5,111,034 | |
| TJX Companies, Inc. | 49,925 | 4,320,010 | |
| Victoria's Secret & Co. (a) | 10,177 | 208,527 | |
| Warby Parker, Inc. (a) | 98,779 | 1,475,758 | |
| Wayfair LLC Class A (a) | 7,079 | 551,242 | |
| Williams-Sonoma, Inc. | 3,069 | 425,486 | |
| 33,191,364 | |||
| Textiles, Apparel & Luxury Goods - 2.3% | |||
| Capri Holdings Ltd. (a) | 1,020 | 37,648 | |
| Crocs, Inc. (a) | 14,459 | 1,566,633 | |
| Deckers Outdoor Corp. (a) | 3,719 | 2,021,983 | |
| lululemon athletica, Inc. (a) | 13,457 | 5,093,878 | |
| NIKE, Inc. Class B | 68,893 | 7,605,098 | |
| On Holding AG (a) | 10,897 | 392,292 | |
| PVH Corp. | 6,917 | 620,040 | |
| Ralph Lauren Corp. | 2,478 | 325,436 | |
| VF Corp. | 26,871 | 532,315 | |
| 18,195,323 | |||
TOTAL CONSUMER DISCRETIONARY | 166,138,951 | ||
| CONSUMER STAPLES - 2.5% | |||
| Beverages - 1.3% | |||
| Boston Beer Co., Inc. Class A (a) | 3,368 | 1,251,010 | |
| Celsius Holdings, Inc. (a) | 56,327 | 8,150,517 | |
| Constellation Brands, Inc. Class A (sub. vtg.) | 1,110 | 302,808 | |
| PepsiCo, Inc. | 3,584 | 671,857 | |
| 10,376,192 | |||
| Consumer Staples Distribution & Retail - 1.1% | |||
| Dollar Tree, Inc. (a) | 37,598 | 5,802,499 | |
| Target Corp. | 5,277 | 720,152 | |
| Walmart, Inc. | 11,552 | 1,846,703 | |
| 8,369,354 | |||
| Household Products - 0.1% | |||
| Procter & Gamble Co. | 3,877 | 605,975 | |
| Personal Care Products - 0.0% | |||
| Oddity Tech Ltd. | 7,181 | 382,675 | |
TOTAL CONSUMER STAPLES | 19,734,196 | ||
| ENERGY - 2.6% | |||
| Oil, Gas & Consumable Fuels - 2.6% | |||
| Antero Resources Corp. (a) | 16,057 | 429,525 | |
| Cenovus Energy, Inc. (Canada) | 11,591 | 220,454 | |
| Cheniere Energy, Inc. | 3,491 | 565,053 | |
| Denbury, Inc. (a) | 11,783 | 1,035,844 | |
| Diamondback Energy, Inc. | 16,760 | 2,469,083 | |
| EOG Resources, Inc. | 25,402 | 3,366,527 | |
| Exxon Mobil Corp. | 20,144 | 2,160,243 | |
| Hess Corp. | 33,834 | 5,133,633 | |
| Northern Oil & Gas, Inc. | 6,131 | 241,377 | |
| Occidental Petroleum Corp. | 29,129 | 1,838,914 | |
| Pioneer Natural Resources Co. | 10,169 | 2,294,838 | |
| 19,755,491 | |||
| FINANCIALS - 2.3% | |||
| Consumer Finance - 0.4% | |||
| American Express Co. | 19,848 | 3,351,930 | |
| Financial Services - 1.9% | |||
| Berkshire Hathaway, Inc. Class B (a) | 965 | 339,641 | |
| Block, Inc. Class A (a) | 31,802 | 2,561,015 | |
| MasterCard, Inc. Class A | 23,909 | 9,426,841 | |
| Visa, Inc. Class A | 9,099 | 2,163,105 | |
| 14,490,602 | |||
TOTAL FINANCIALS | 17,842,532 | ||
| HEALTH CARE - 8.7% | |||
| Biotechnology - 1.1% | |||
| Alnylam Pharmaceuticals, Inc. (a) | 11,032 | 2,155,653 | |
| Argenx SE ADR (a) | 1,678 | 846,517 | |
| Ascendis Pharma A/S sponsored ADR (a) | 1,785 | 160,918 | |
| Exact Sciences Corp. (a) | 3,214 | 313,494 | |
| Generation Bio Co. (a) | 939 | 4,770 | |
| Karuna Therapeutics, Inc. (a) | 2,106 | 420,716 | |
| Moonlake Immunotherapeutics (a) | 6,449 | 392,164 | |
| Regeneron Pharmaceuticals, Inc. (a) | 3,619 | 2,684,972 | |
| Vertex Pharmaceuticals, Inc. (a) | 4,842 | 1,706,030 | |
| 8,685,234 | |||
| Health Care Equipment & Supplies - 1.6% | |||
| Axonics Modulation Technologies, Inc. (a) | 9,799 | 591,566 | |
| Boston Scientific Corp. (a) | 35,952 | 1,864,111 | |
| DexCom, Inc. (a) | 39,697 | 4,944,658 | |
| Insulet Corp. (a) | 5,196 | 1,437,993 | |
| Intuitive Surgical, Inc. (a) | 856 | 277,686 | |
| Shockwave Medical, Inc. (a) | 6,647 | 1,732,208 | |
| Stryker Corp. | 5,493 | 1,556,771 | |
| 12,404,993 | |||
| Health Care Providers & Services - 2.4% | |||
| agilon health, Inc. (a) | 2,677 | 51,265 | |
| Alignment Healthcare, Inc. (a) | 7,815 | 48,531 | |
| Guardant Health, Inc. (a) | 37,565 | 1,465,786 | |
| Humana, Inc. | 5,012 | 2,289,632 | |
| Surgery Partners, Inc. (a) | 12,157 | 469,625 | |
| UnitedHealth Group, Inc. | 28,304 | 14,332,296 | |
| 18,657,135 | |||
| Health Care Technology - 0.0% | |||
| Certara, Inc. (a) | 4,447 | 86,583 | |
| Life Sciences Tools & Services - 0.6% | |||
| Danaher Corp. | 9,444 | 2,408,787 | |
| ICON PLC (a) | 1,544 | 388,177 | |
| Olink Holding AB ADR (a) | 8,223 | 156,237 | |
| Thermo Fisher Scientific, Inc. | 3,169 | 1,738,704 | |
| 4,691,905 | |||
| Pharmaceuticals - 3.0% | |||
| Eli Lilly & Co. | 31,459 | 14,299,688 | |
| Novo Nordisk A/S Series B sponsored ADR | 20,833 | 3,356,196 | |
| Zoetis, Inc. Class A | 31,226 | 5,873,298 | |
| 23,529,182 | |||
TOTAL HEALTH CARE | 68,055,032 | ||
| INDUSTRIALS - 4.5% | |||
| Aerospace & Defense - 0.7% | |||
| Howmet Aerospace, Inc. | 20,207 | 1,033,386 | |
| L3Harris Technologies, Inc. | 2,083 | 394,708 | |
| Lockheed Martin Corp. | 1,137 | 507,523 | |
| Northrop Grumman Corp. | 688 | 306,160 | |
| The Boeing Co. (a) | 12,959 | 3,095,257 | |
| TransDigm Group, Inc. | 387 | 348,192 | |
| 5,685,226 | |||
| Commercial Services & Supplies - 0.1% | |||
| ACV Auctions, Inc. Class A (a) | 31,788 | 555,972 | |
| Electrical Equipment - 0.1% | |||
| Eaton Corp. PLC | 2,970 | 609,800 | |
| Ground Transportation - 3.1% | |||
| Avis Budget Group, Inc. (a) | 3,548 | 781,589 | |
| Bird Global, Inc. Class A (a) | 5,840 | 14,483 | |
| Hertz Global Holdings, Inc. (a) | 26,074 | 439,347 | |
| Lyft, Inc. (a) | 221,003 | 2,808,948 | |
| Uber Technologies, Inc. (a) | 411,138 | 20,334,885 | |
| 24,379,252 | |||
| Passenger Airlines - 0.2% | |||
| Delta Air Lines, Inc. | 12,309 | 569,414 | |
| United Airlines Holdings, Inc. (a) | 20,711 | 1,124,814 | |
| 1,694,228 | |||
| Professional Services - 0.2% | |||
| Paycom Software, Inc. | 3,905 | 1,440,008 | |
| Trading Companies & Distributors - 0.1% | |||
| FTAI Aviation Ltd. | 28,217 | 908,870 | |
TOTAL INDUSTRIALS | 35,273,356 | ||
| INFORMATION TECHNOLOGY - 40.8% | |||
| Communications Equipment - 0.1% | |||
| Arista Networks, Inc. (a) | 3,060 | 474,575 | |
| IT Services - 0.5% | |||
| MongoDB, Inc. Class A (a) | 3,789 | 1,604,263 | |
| Okta, Inc. (a) | 22,770 | 1,750,102 | |
| Shopify, Inc. Class A (a) | 3,848 | 259,948 | |
| Snowflake, Inc. (a) | 3,860 | 685,961 | |
| 4,300,274 | |||
| Semiconductors & Semiconductor Equipment - 17.8% | |||
| Advanced Micro Devices, Inc. (a) | 42,732 | 4,888,541 | |
| ASML Holding NV (depository receipt) | 1,542 | 1,104,704 | |
| Enphase Energy, Inc. (a) | 2,982 | 452,757 | |
| GlobalFoundries, Inc. (a) | 84,899 | 5,407,217 | |
| Impinj, Inc. (a) | 3,085 | 205,523 | |
| Marvell Technology, Inc. | 323,958 | 21,099,385 | |
| Monolithic Power Systems, Inc. | 4,000 | 2,237,960 | |
| NVIDIA Corp. | 161,909 | 75,658,457 | |
| NXP Semiconductors NV | 60,099 | 13,400,875 | |
| ON Semiconductor Corp. (a) | 65,887 | 7,099,324 | |
| Skyworks Solutions, Inc. | 2,157 | 246,696 | |
| SolarEdge Technologies, Inc. (a) | 1,584 | 382,473 | |
| Taiwan Semiconductor Manufacturing Co. Ltd. sponsored ADR | 37,610 | 3,729,032 | |
| Teradyne, Inc. | 23,364 | 2,638,730 | |
| 138,551,674 | |||
| Software - 12.2% | |||
| Adobe, Inc. (a) | 1,930 | 1,054,108 | |
| Bill Holdings, Inc. (a) | 13,573 | 1,701,240 | |
| Confluent, Inc. (a) | 7,684 | 265,405 | |
| Datadog, Inc. Class A (a) | 9,329 | 1,088,881 | |
| HubSpot, Inc. (a) | 6,974 | 4,048,756 | |
| Intuit, Inc. | 5,310 | 2,717,127 | |
| Microsoft Corp. | 213,662 | 71,773,339 | |
| Oracle Corp. | 5,938 | 696,112 | |
| Palantir Technologies, Inc. (a) | 18,544 | 367,913 | |
| Salesforce, Inc. (a) | 33,181 | 7,466,057 | |
| ServiceNow, Inc. (a) | 2,838 | 1,654,554 | |
| Splunk, Inc. (a) | 8,959 | 970,528 | |
| Workday, Inc. Class A (a) | 1,379 | 327,002 | |
| Zoom Video Communications, Inc. Class A (a) | 14,573 | 1,068,930 | |
| 95,199,952 | |||
| Technology Hardware, Storage & Peripherals - 10.2% | |||
| Apple, Inc. | 406,356 | 79,828,633 | |
TOTAL INFORMATION TECHNOLOGY | 318,355,108 | ||
| MATERIALS - 0.7% | |||
| Chemicals - 0.0% | |||
| Linde PLC | 848 | 331,288 | |
| Metals & Mining - 0.7% | |||
| ATI, Inc. (a) | 7,945 | 378,818 | |
| Carpenter Technology Corp. | 10,836 | 648,643 | |
| Freeport-McMoRan, Inc. | 91,390 | 4,080,564 | |
| 5,108,025 | |||
TOTAL MATERIALS | 5,439,313 | ||
| REAL ESTATE - 0.2% | |||
| Equity Real Estate Investment Trusts (REITs) - 0.1% | |||
| Equinix, Inc. | 468 | 379,043 | |
| Welltower, Inc. | 6,211 | 510,234 | |
| 889,277 | |||
| Real Estate Management & Development - 0.1% | |||
| Zillow Group, Inc. Class C (a) | 12,158 | 658,477 | |
TOTAL REAL ESTATE | 1,547,754 | ||
| UTILITIES - 0.0% | |||
| Electric Utilities - 0.0% | |||
| NextEra Energy, Inc. | 3,169 | 232,287 | |
| TOTAL COMMON STOCKS (Cost $628,565,003) | 767,924,121 | ||
| Money Market Funds - 0.9% | |||
| Shares | Value ($) | ||
State Street Institutional Treasury Plus Money Market Fund Trust Class 5.15% (b) (Cost $6,636,788) | 6,636,788 | 6,636,788 | |
| TOTAL INVESTMENT IN SECURITIES - 99.3% (Cost $635,201,791) | 774,560,909 |
NET OTHER ASSETS (LIABILITIES) - 0.7% | 5,822,177 |
| NET ASSETS - 100.0% | 780,383,086 |
| Futures Contracts | |||||
Number of contracts | Expiration Date | Notional Amount ($) | Value ($) | Unrealized Appreciation/ (Depreciation) ($) | |
| Purchased | |||||
| Equity Index Contracts | |||||
| CME E-mini NASDAQ 100 Index Contracts (United States) | 7 | Sep 2023 | 2,220,050 | (555) | (555) |
| CME E-mini S&P 500 Index Contracts (United States) | 5 | Sep 2023 | 1,153,625 | (137) | (137) |
| TOTAL FUTURES CONTRACTS | (692) | ||||
| The notional amount of futures purchased as a percentage of Net Assets is 0.4% | |||||
| (a) | Non-income producing |
| (b) | The rate quoted is the annualized seven-day yield of the fund at period end. |
| Valuation Inputs at Reporting Date: | ||||
| Description | Total ($) | Level 1 ($) | Level 2 ($) | Level 3 ($) |
Investments in Securities: | ||||
| Equities: | ||||
Communication Services | 115,550,101 | 115,550,101 | - | - |
Consumer Discretionary | 166,138,951 | 166,138,951 | - | - |
Consumer Staples | 19,734,196 | 19,734,196 | - | - |
Energy | 19,755,491 | 19,755,491 | - | - |
Financials | 17,842,532 | 17,842,532 | - | - |
Health Care | 68,055,032 | 68,055,032 | - | - |
Industrials | 35,273,356 | 35,273,356 | - | - |
Information Technology | 318,355,108 | 318,355,108 | - | - |
Materials | 5,439,313 | 5,439,313 | - | - |
Real Estate | 1,547,754 | 1,547,754 | - | - |
Utilities | 232,287 | 232,287 | - | - |
| Money Market Funds | 6,636,788 | 6,636,788 | - | - |
| Total Investments in Securities: | 774,560,909 | 774,560,909 | - | - |
Derivative Instruments: | ||||
| Liabilities | ||||
Futures Contracts | (692) | (692) | - | - |
| Total Liabilities | (692) | (692) | - | - |
| Total Derivative Instruments: | (692) | (692) | - | - |
Primary Risk Exposure / Derivative Type | Value | |
| Asset ($) | Liability ($) | |
| Equity Risk | ||
Futures Contracts (a) | 0 | (692) |
| Total Equity Risk | 0 | (692) |
| Total Value of Derivatives | 0 | (692) |
| Statement of Assets and Liabilities | ||||
| July 31, 2023 | ||||
| Assets | ||||
Investment in securities, at value - See accompanying schedule Unaffiliated issuers (cost $635,201,791): | $ | 774,560,909 | ||
| Segregated cash with brokers for derivative instruments | 330,400 | |||
| Cash | 7,347 | |||
| Foreign currency held at value (cost $163) | 163 | |||
| Receivable for investments sold | 2,295,447 | |||
| Receivable for fund shares sold | 31,203,291 | |||
| Dividends receivable | 115,283 | |||
| Receivable for daily variation margin on futures contracts | 7,827 | |||
Total assets | 808,520,667 | |||
| Liabilities | ||||
| Payable for investments purchased | $ | 27,792,587 | ||
| Accrued management fee | 344,907 | |||
| Other payables and accrued expenses | 87 | |||
| Total Liabilities | 28,137,581 | |||
| Net Assets | $ | 780,383,086 | ||
| Net Assets consist of: | ||||
| Paid in capital | $ | 724,462,424 | ||
| Total accumulated earnings (loss) | 55,920,662 | |||
| Net Assets | $ | 780,383,086 | ||
Net Asset Value, offering price and redemption price per share ($780,383,086 ÷ 24,950,000 shares) | $ | 31.28 | ||
| Statement of Operations | ||||
Year ended July 31, 2023 | ||||
| Investment Income | ||||
| Dividends | $ | 2,732,916 | ||
| Expenses | ||||
| Management fee | $ | 2,713,572 | ||
| Independent trustees' fees and expenses | 2,152 | |||
| Total expenses before reductions | 2,715,724 | |||
| Expense reductions | (190) | |||
| Total expenses after reductions | 2,715,534 | |||
| Net Investment income (loss) | 17,382 | |||
| Realized and Unrealized Gain (Loss) | ||||
| Net realized gain (loss) on: | ||||
| Investment Securities: | ||||
| Redemptions in-kind | 5,140,160 | |||
| Unaffiliated issuers | (30,865,470) | |||
| Foreign currency transactions | (1,210) | |||
| Futures contracts | (45,044) | |||
| Total net realized gain (loss) | (25,771,564) | |||
| Change in net unrealized appreciation (depreciation) on: | ||||
| Investment Securities: | ||||
| Unaffiliated issuers | 168,912,690 | |||
| Assets and liabilities in foreign currencies | (717) | |||
| Futures contracts | (692) | |||
| Total change in net unrealized appreciation (depreciation) | 168,911,281 | |||
| Net gain (loss) | 143,139,717 | |||
| Net increase (decrease) in net assets resulting from operations | $ | 143,157,099 | ||
| Statement of Changes in Net Assets | ||||
Year ended July 31, 2023 | Year ended July 31, 2022 | |||
| Increase (Decrease) in Net Assets | ||||
| Operations | ||||
| Net investment income (loss) | $ | 17,382 | $ | (699,043) |
| Net realized gain (loss) | (25,771,564) | (25,007,726) | ||
| Change in net unrealized appreciation (depreciation) | 168,911,281 | (94,362,764) | ||
| Net increase (decrease) in net assets resulting from operations | 143,157,099 | (120,069,533) | ||
| Share transactions | ||||
| Proceeds from sales of shares | 296,642,887 | 209,141,668 | ||
| Cost of shares redeemed | (22,813,838) | (132,864,696) | ||
Net increase (decrease) in net assets resulting from share transactions | 273,829,049 | 76,276,972 | ||
| Total increase (decrease) in net assets | 416,986,148 | (43,792,561) | ||
| Net Assets | ||||
| Beginning of period | 363,396,938 | 407,189,499 | ||
| End of period | $ | 780,383,086 | $ | 363,396,938 |
| Other Information | ||||
| Shares | ||||
| Sold | 11,300,000 | 6,575,000 | ||
| Redeemed | (925,000) | (4,425,000) | ||
| Net increase (decrease) | 10,375,000 | 2,150,000 | ||
| Fidelity® Blue Chip Growth ETF |
| Years ended July 31, | 2023 | 2022 | 2021 | 2020 A | ||||
Selected Per-Share Data | ||||||||
| Net asset value, beginning of period | $ | 24.93 | $ | 32.77 | $ | 22.74 | $ | 20.00 |
| Income from Investment Operations | ||||||||
Net investment income (loss) B,C | - D | (.05) | (.08) | (.01) | ||||
| Net realized and unrealized gain (loss) | 6.35 | (7.79) | 10.11 | 2.75 | ||||
| Total from investment operations | 6.35 | (7.84) | 10.03 | 2.74 | ||||
| Distributions from net investment income | - | - | - D | - | ||||
| Net asset value, end of period | $ | 31.28 | $ | 24.93 | $ | 32.77 | $ | 22.74 |
Total Return E,F,G | 25.44% | (23.92)% | 44.14% | 13.68% | ||||
Ratios to Average Net Assets C,H,I | ||||||||
| Expenses before reductions | .59% | .59% | .59% | .59% J | ||||
| Expenses net of fee waivers, if any | .59% | .59% | .59% | .59% J | ||||
| Expenses net of all reductions | .59% | .59% | .59% | .59% J | ||||
| Net investment income (loss) | -% K | (.17)% | (.27)% | (.34)% J | ||||
| Supplemental Data | ||||||||
| Net assets, end of period (000 omitted) | $ | 780,383 | $ | 363,397 | $ | 407,189 | $ | 41,494 |
Portfolio turnover rate L,M | 30% | 57% | 63% | 11% N |
| Average Annual Total Returns | |||
Periods ended July 31, 2023 | Past 1 year | Life of Fund |
Fidelity® Blue Chip Value ETF - NAV A | 5.35% | 14.70% |
Fidelity® Blue Chip Value ETF - Market Price B | 5.26% | 13.50% |
Russell 1000® Value Index A | 8.28% | 13.98% |
| $10,000 Over Life of Fund |
Let's say hypothetically that $10,000 was invested in Fidelity® Blue Chip Value ETF - NAV, on June 2, 2020, when the fund started. The chart shows how the value of your investment would have changed, and also shows how the Russell 1000® Value Index performed over the same period. |
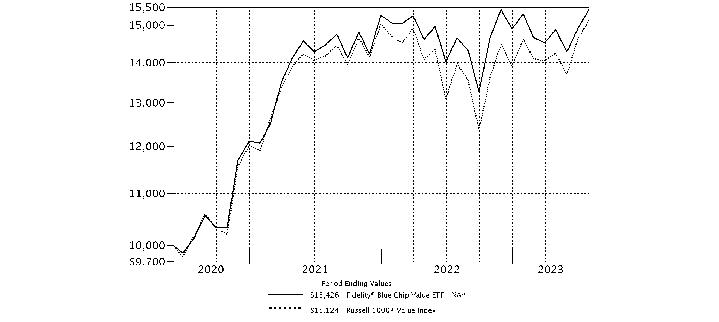 |
Top Holdings (% of Fund's net assets) | ||
| Berkshire Hathaway, Inc. Class B | 5.3 | |
| Exxon Mobil Corp. | 4.5 | |
| Comcast Corp. Class A | 3.6 | |
| JPMorgan Chase & Co. | 3.4 | |
| Cigna Group | 2.8 | |
| Bank of America Corp. | 2.5 | |
| Johnson & Johnson | 2.5 | |
| Centene Corp. | 2.4 | |
| Cisco Systems, Inc. | 2.4 | |
| Activision Blizzard, Inc. | 2.3 | |
| 31.7 | ||
| Market Sectors (% of Fund's net assets) | ||
| Financials | 24.6 | |
| Health Care | 20.0 | |
| Consumer Staples | 10.8 | |
| Utilities | 10.2 | |
| Energy | 8.6 | |
| Information Technology | 7.3 | |
| Industrials | 6.9 | |
| Communication Services | 5.9 | |
| Consumer Discretionary | 2.3 | |
| Materials | 1.7 | |
| Real Estate | 0.6 | |
Asset Allocation (% of Fund's net assets) |
 |
| Common Stocks - 98.9% | |||
| Shares | Value ($) | ||
| COMMUNICATION SERVICES - 5.9% | |||
| Entertainment - 2.3% | |||
| Activision Blizzard, Inc. | 32,194 | 2,986,315 | |
| Media - 3.6% | |||
| Comcast Corp. Class A | 101,905 | 4,612,220 | |
TOTAL COMMUNICATION SERVICES | 7,598,535 | ||
| CONSUMER DISCRETIONARY - 2.3% | |||
| Diversified Consumer Services - 1.3% | |||
| H&R Block, Inc. | 51,622 | 1,735,015 | |
| Specialty Retail - 1.0% | |||
| Ross Stores, Inc. | 10,896 | 1,249,117 | |
TOTAL CONSUMER DISCRETIONARY | 2,984,132 | ||
| CONSUMER STAPLES - 10.8% | |||
| Beverages - 1.3% | |||
| Coca-Cola European Partners PLC | 16,104 | 1,020,833 | |
| Keurig Dr. Pepper, Inc. | 21,488 | 730,807 | |
| 1,751,640 | |||
| Consumer Staples Distribution & Retail - 2.3% | |||
| BJ's Wholesale Club Holdings, Inc. (a) | 6,473 | 429,225 | |
| Dollar General Corp. | 8,013 | 1,353,075 | |
| U.S. Foods Holding Corp. (a) | 28,562 | 1,220,454 | |
| 3,002,754 | |||
| Food Products - 3.0% | |||
| Mondelez International, Inc. | 39,356 | 2,917,460 | |
| Tyson Foods, Inc. Class A | 16,000 | 891,520 | |
| 3,808,980 | |||
| Household Products - 2.2% | |||
| Procter & Gamble Co. | 13,008 | 2,033,150 | |
| The Clorox Co. | 5,027 | 761,490 | |
| 2,794,640 | |||
| Personal Care Products - 2.0% | |||
| Haleon PLC ADR | 103,989 | 916,143 | |
| Kenvue, Inc. | 37,898 | 897,425 | |
| Unilever PLC sponsored ADR | 13,433 | 721,755 | |
| 2,535,323 | |||
TOTAL CONSUMER STAPLES | 13,893,337 | ||
| ENERGY - 8.6% | |||
| Oil, Gas & Consumable Fuels - 8.6% | |||
| Antero Resources Corp. (a) | 18,659 | 499,128 | |
| ConocoPhillips Co. | 15,522 | 1,827,250 | |
| Equinor ASA sponsored ADR | 32,156 | 986,546 | |
| Exxon Mobil Corp. | 54,368 | 5,830,424 | |
| Occidental Petroleum Corp. | 16,075 | 1,014,815 | |
| Ovintiv, Inc. | 18,603 | 857,412 | |
| 11,015,575 | |||
| FINANCIALS - 24.6% | |||
| Banks - 11.1% | |||
| Bank of America Corp. | 101,425 | 3,245,600 | |
| Cullen/Frost Bankers, Inc. | 2,582 | 280,354 | |
| JPMorgan Chase & Co. | 27,346 | 4,319,574 | |
| M&T Bank Corp. | 10,576 | 1,479,159 | |
| PNC Financial Services Group, Inc. | 10,180 | 1,393,540 | |
| U.S. Bancorp | 28,574 | 1,133,816 | |
| Wells Fargo & Co. | 52,759 | 2,435,355 | |
| 14,287,398 | |||
| Capital Markets - 3.2% | |||
| Affiliated Managers Group, Inc. | 5,833 | 808,687 | |
| BlackRock, Inc. Class A | 3,125 | 2,308,906 | |
| Invesco Ltd. | 11,048 | 185,606 | |
| Northern Trust Corp. | 9,289 | 744,235 | |
| 4,047,434 | |||
| Financial Services - 5.3% | |||
| Berkshire Hathaway, Inc. Class B (a) | 19,488 | 6,858,999 | |
| Insurance - 5.0% | |||
| Chubb Ltd. | 9,373 | 1,915,935 | |
| The Travelers Companies, Inc. | 17,255 | 2,978,386 | |
| Willis Towers Watson PLC | 7,097 | 1,499,809 | |
| 6,394,130 | |||
TOTAL FINANCIALS | 31,587,961 | ||
| HEALTH CARE - 20.0% | |||
| Health Care Providers & Services - 11.5% | |||
| Centene Corp. (a) | 44,973 | 3,062,212 | |
| Cigna Group | 12,454 | 3,675,175 | |
| CVS Health Corp. | 18,559 | 1,386,172 | |
| Elevance Health, Inc. | 4,282 | 2,019,520 | |
| Humana, Inc. | 3,860 | 1,763,364 | |
| UnitedHealth Group, Inc. | 5,733 | 2,903,019 | |
| 14,809,462 | |||
| Pharmaceuticals - 8.5% | |||
| AstraZeneca PLC sponsored ADR | 31,245 | 2,240,267 | |
| Bristol-Myers Squibb Co. | 47,569 | 2,958,316 | |
| Johnson & Johnson | 19,197 | 3,216,073 | |
| Sanofi SA sponsored ADR | 46,836 | 2,499,637 | |
| 10,914,293 | |||
TOTAL HEALTH CARE | 25,723,755 | ||
| INDUSTRIALS - 6.9% | |||
| Aerospace & Defense - 3.4% | |||
| L3Harris Technologies, Inc. | 5,783 | 1,095,821 | |
| Lockheed Martin Corp. | 2,780 | 1,240,909 | |
| Northrop Grumman Corp. | 4,600 | 2,047,000 | |
| 4,383,730 | |||
| Electrical Equipment - 1.3% | |||
| Eaton Corp. PLC | 1,697 | 348,428 | |
| Regal Rexnord Corp. | 8,175 | 1,276,772 | |
| 1,625,200 | |||
| Machinery - 1.6% | |||
| Deere & Co. | 1,760 | 756,096 | |
| Oshkosh Corp. | 2,847 | 262,123 | |
| Pentair PLC | 14,420 | 1,002,190 | |
| 2,020,409 | |||
| Professional Services - 0.6% | |||
| Maximus, Inc. | 9,811 | 821,769 | |
TOTAL INDUSTRIALS | 8,851,108 | ||
| INFORMATION TECHNOLOGY - 7.3% | |||
| Communications Equipment - 2.4% | |||
| Cisco Systems, Inc. | 58,390 | 3,038,616 | |
| Electronic Equipment, Instruments & Components - 0.2% | |||
| TE Connectivity Ltd. | 1,827 | 262,156 | |
| IT Services - 2.2% | |||
| Amdocs Ltd. | 15,927 | 1,491,404 | |
| Cognizant Technology Solutions Corp. Class A | 20,694 | 1,366,425 | |
| 2,857,829 | |||
| Semiconductors & Semiconductor Equipment - 1.2% | |||
| Broadcom, Inc. | 356 | 319,919 | |
| Micron Technology, Inc. | 13,361 | 953,842 | |
| NXP Semiconductors NV | 1,286 | 286,752 | |
| 1,560,513 | |||
| Software - 1.3% | |||
| Gen Digital, Inc. | 48,466 | 942,664 | |
| Open Text Corp. | 16,262 | 698,453 | |
| 1,641,117 | |||
TOTAL INFORMATION TECHNOLOGY | 9,360,231 | ||
| MATERIALS - 1.7% | |||
| Chemicals - 1.4% | |||
| DuPont de Nemours, Inc. | 24,018 | 1,864,517 | |
| Metals & Mining - 0.3% | |||
| Newmont Corp. | 9,095 | 390,357 | |
TOTAL MATERIALS | 2,254,874 | ||
| REAL ESTATE - 0.6% | |||
| Real Estate Management & Development - 0.6% | |||
| CBRE Group, Inc. (a) | 9,176 | 764,453 | |
| UTILITIES - 10.2% | |||
| Electric Utilities - 7.7% | |||
| Constellation Energy Corp. | 16,127 | 1,558,675 | |
| Edison International | 19,669 | 1,415,381 | |
| Evergy, Inc. | 16,861 | 1,011,154 | |
| NextEra Energy, Inc. | 16,499 | 1,209,377 | |
| PG&E Corp. (a) | 143,359 | 2,524,552 | |
| Portland General Electric Co. | 12,978 | 618,661 | |
| Southern Co. | 21,771 | 1,574,914 | |
| 9,912,714 | |||
| Independent Power and Renewable Electricity Producers - 0.8% | |||
| The AES Corp. | 49,113 | 1,062,314 | |
| Multi-Utilities - 1.7% | |||
| Dominion Energy, Inc. | 27,241 | 1,458,756 | |
| National Grid PLC sponsored ADR | 9,692 | 653,047 | |
| 2,111,803 | |||
TOTAL UTILITIES | 13,086,831 | ||
| TOTAL COMMON STOCKS (Cost $116,518,058) | 127,120,792 | ||
| Money Market Funds - 1.5% | |||
| Shares | Value ($) | ||
State Street Institutional Treasury Plus Money Market Fund Trust Class 5.15% (b) (Cost $1,861,792) | 1,861,792 | 1,861,792 | |
| TOTAL INVESTMENT IN SECURITIES - 100.4% (Cost $118,379,850) | 128,982,584 |
NET OTHER ASSETS (LIABILITIES) - (0.4)% | (484,477) |
| NET ASSETS - 100.0% | 128,498,107 |
| (a) | Non-income producing |
| (b) | The rate quoted is the annualized seven-day yield of the fund at period end. |
| Valuation Inputs at Reporting Date: | ||||
| Description | Total ($) | Level 1 ($) | Level 2 ($) | Level 3 ($) |
Investments in Securities: | ||||
| Equities: | ||||
Communication Services | 7,598,535 | 7,598,535 | - | - |
Consumer Discretionary | 2,984,132 | 2,984,132 | - | - |
Consumer Staples | 13,893,337 | 13,893,337 | - | - |
Energy | 11,015,575 | 11,015,575 | - | - |
Financials | 31,587,961 | 31,587,961 | - | - |
Health Care | 25,723,755 | 25,723,755 | - | - |
Industrials | 8,851,108 | 8,851,108 | - | - |
Information Technology | 9,360,231 | 9,360,231 | - | - |
Materials | 2,254,874 | 2,254,874 | - | - |
Real Estate | 764,453 | 764,453 | - | - |
Utilities | 13,086,831 | 13,086,831 | - | - |
| Money Market Funds | 1,861,792 | 1,861,792 | - | - |
| Total Investments in Securities: | 128,982,584 | 128,982,584 | - | - |
| Statement of Assets and Liabilities | ||||
| July 31, 2023 | ||||
| Assets | ||||
Investment in securities, at value - See accompanying schedule Unaffiliated issuers (cost $118,379,850): | $ | 128,982,584 | ||
| Cash | 409 | |||
| Receivable for investments sold | 963,143 | |||
| Dividends receivable | 112,030 | |||
Total assets | 130,058,166 | |||
| Liabilities | ||||
| Payable for investments purchased | $ | 1,497,676 | ||
| Accrued management fee | 62,383 | |||
| Total Liabilities | 1,560,059 | |||
| Net Assets | $ | 128,498,107 | ||
| Net Assets consist of: | ||||
| Paid in capital | $ | 120,394,422 | ||
| Total accumulated earnings (loss) | 8,103,685 | |||
| Net Assets | $ | 128,498,107 | ||
Net Asset Value, offering price and redemption price per share ($128,498,107 ÷ 4,450,000 shares) | $ | 28.88 | ||
| Statement of Operations | ||||
Year ended July 31, 2023 | ||||
| Investment Income | ||||
| Dividends | $ | 2,699,887 | ||
| Expenses | ||||
| Management fee | $ | 751,125 | ||
| Independent trustees' fees and expenses | 632 | |||
| Total expenses before reductions | 751,757 | |||
| Expense reductions | (9) | |||
| Total expenses after reductions | 751,748 | |||
| Net Investment income (loss) | 1,948,139 | |||
| Realized and Unrealized Gain (Loss) | ||||
| Net realized gain (loss) on: | ||||
| Investment Securities: | ||||
| Redemptions in-kind | 3,457,839 | |||
| Unaffiliated issuers | (1,110,565) | |||
| Foreign currency transactions | 12 | |||
| Futures contracts | (4,693) | |||
| Total net realized gain (loss) | 2,342,593 | |||
| Change in net unrealized appreciation (depreciation) on investment securities | 1,420,433 | |||
| Net gain (loss) | 3,763,026 | |||
| Net increase (decrease) in net assets resulting from operations | $ | 5,711,165 | ||
| Statement of Changes in Net Assets | ||||
Year ended July 31, 2023 | Year ended July 31, 2022 | |||
| Increase (Decrease) in Net Assets | ||||
| Operations | ||||
| Net investment income (loss) | $ | 1,948,139 | $ | 1,429,112 |
| Net realized gain (loss) | 2,342,593 | 1,521,586 | ||
| Change in net unrealized appreciation (depreciation) | 1,420,433 | (2,033,797) | ||
| Net increase (decrease) in net assets resulting from operations | 5,711,165 | 916,901 | ||
| Distributions to shareholders | (2,839,975) | (3,452,325) | ||
| Share transactions | ||||
| Proceeds from sales of shares | 32,169,213 | 25,101,299 | ||
| Cost of shares redeemed | (20,717,724) | (2,855,376) | ||
Net increase (decrease) in net assets resulting from share transactions | 11,451,489 | 22,245,923 | ||
| Total increase (decrease) in net assets | 14,322,679 | 19,710,499 | ||
| Net Assets | ||||
| Beginning of period | 114,175,428 | 94,464,929 | ||
| End of period | $ | 128,498,107 | $ | 114,175,428 |
| Other Information | ||||
| Shares | ||||
| Sold | 1,125,000 | 875,000 | ||
| Redeemed | (750,000) | (100,000) | ||
| Net increase (decrease) | 375,000 | 775,000 | ||
| Fidelity® Blue Chip Value ETF |
| Years ended July 31, | 2023 | 2022 | 2021 | 2020 A | ||||
Selected Per-Share Data | ||||||||
| Net asset value, beginning of period | $ | 28.02 | $ | 28.63 | $ | 20.23 | $ | 20.00 |
| Income from Investment Operations | ||||||||
Net investment income (loss) B,C | .43 | .39 | .32 | .03 | ||||
| Net realized and unrealized gain (loss) | 1.04 | (.03) | 8.32 | .21 | ||||
| Total from investment operations | 1.47 | .36 | 8.64 | .24 | ||||
| Distributions from net investment income | (.42) | (.39) | (.24) | (.01) | ||||
| Distributions from net realized gain | (.19) | (.58) | - | - | ||||
| Total distributions | (.61) | (.97) | (.24) | (.01) | ||||
| Net asset value, end of period | $ | 28.88 | $ | 28.02 | $ | 28.63 | $ | 20.23 |
Total Return D,E,F | 5.35% | 1.27% | 42.83% | 1.23% | ||||
Ratios to Average Net Assets C,G,H | ||||||||
| Expenses before reductions | .59% | .59% | .59% | .59% I | ||||
| Expenses net of fee waivers, if any | .59% | .59% | .59% | .59% I | ||||
| Expenses net of all reductions | .59% | .59% | .58% | .59% I | ||||
| Net investment income (loss) | 1.53% | 1.36% | 1.22% | 1.02% I | ||||
| Supplemental Data | ||||||||
| Net assets, end of period (000 omitted) | $ | 128,498 | $ | 114,175 | $ | 94,465 | $ | 8,093 |
Portfolio turnover rate J,K | 35% | 54% | 97% | 20% L |
| Average Annual Total Returns | |||
Periods ended July 31, 2023 | Past 1 year | Life of Fund |
Fidelity® Growth Opportunities ETF - NAV A | 23.80% | -4.27% |
Fidelity® Growth Opportunities ETF - Market Price B | 23.60% | -5.24% |
Russell 1000® Growth Index A | 17.31% | 6.55% |
| $10,000 Over Life of Fund |
Let's say hypothetically that $10,000 was invested in Fidelity® Growth Opportunities ETF - NAV, on February 2, 2021, when the fund started. The chart shows how the value of your investment would have changed, and also shows how the Russell 1000® Growth Index performed over the same period. |
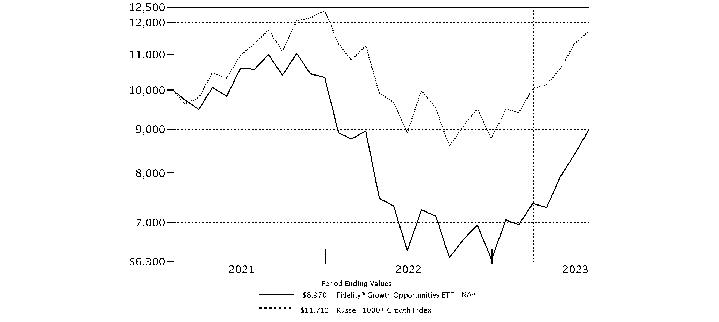 |
Top Holdings (% of Fund's net assets) | ||
| Microsoft Corp. | 10.1 | |
| NVIDIA Corp. | 8.3 | |
| Amazon.com, Inc. | 4.8 | |
| Alphabet, Inc. Class C | 4.4 | |
| Meta Platforms, Inc. Class A | 3.5 | |
| T-Mobile U.S., Inc. | 3.4 | |
| Uber Technologies, Inc. | 3.1 | |
| Alphabet, Inc. Class A | 2.9 | |
| ON Semiconductor Corp. | 2.4 | |
| Roku, Inc. Class A | 2.3 | |
| 45.2 | ||
| Market Sectors (% of Fund's net assets) | ||
| Information Technology | 44.5 | |
| Communication Services | 19.6 | |
| Financials | 10.3 | |
| Health Care | 9.8 | |
| Consumer Discretionary | 7.3 | |
| Industrials | 4.3 | |
| Energy | 2.7 | |
| Utilities | 1.1 | |
| Consumer Staples | 0.3 | |
Asset Allocation (% of Fund's net assets) |
 |
| Common Stocks - 99.9% | |||
| Shares | Value ($) | ||
| COMMUNICATION SERVICES - 19.6% | |||
| Entertainment - 3.9% | |||
| Netflix, Inc. (a) | 2,517 | 1,104,887 | |
| Roku, Inc. Class A (a) | 47,562 | 4,578,794 | |
| Sea Ltd. ADR (a) | 28,931 | 1,924,490 | |
| 7,608,171 | |||
| Interactive Media & Services - 11.6% | |||
| Alphabet, Inc.: | |||
| Class A (a) | 42,176 | 5,597,599 | |
| Class C (a) | 65,021 | 8,654,945 | |
| Meta Platforms, Inc. Class A (a) | 21,233 | 6,764,834 | |
| Snap, Inc. Class A (a) | 53,249 | 604,909 | |
| Zoominfo Technologies, Inc. (a) | 42,289 | 1,081,330 | |
| 22,703,617 | |||
| Media - 0.7% | |||
| Magnite, Inc. (a) | 62,013 | 938,257 | |
| TechTarget, Inc. (a) | 10,538 | 342,274 | |
| The Trade Desk, Inc. (a) | 1,422 | 129,772 | |
| 1,410,303 | |||
| Wireless Telecommunication Services - 3.4% | |||
| T-Mobile U.S., Inc. (a) | 47,295 | 6,515,832 | |
TOTAL COMMUNICATION SERVICES | 38,237,923 | ||
| CONSUMER DISCRETIONARY - 7.3% | |||
| Automobile Components - 0.1% | |||
| Aptiv PLC (a) | 2,122 | 232,338 | |
| Automobiles - 0.3% | |||
| Rivian Automotive, Inc. (a) | 13,253 | 366,313 | |
| Tesla, Inc. (a) | 438 | 117,134 | |
| 483,447 | |||
| Broadline Retail - 4.8% | |||
| Amazon.com, Inc. (a) | 69,761 | 9,325,650 | |
| Household Durables - 0.0% | |||
| Lennar Corp. Class A | 307 | 38,937 | |
| Leisure Products - 0.0% | |||
| Peloton Interactive, Inc. Class A (a) | 5,991 | 58,173 | |
| Specialty Retail - 2.0% | |||
| Carvana Co. Class A (a) | 18,981 | 872,177 | |
| Cazoo Group Ltd. Class A (a) | 3,570 | 6,533 | |
| Floor & Decor Holdings, Inc. Class A (a) | 14,790 | 1,698,632 | |
| Lowe's Companies, Inc. | 4,066 | 952,542 | |
| RH (a) | 479 | 185,933 | |
| Wayfair LLC Class A (a) | 1,780 | 138,609 | |
| 3,854,426 | |||
| Textiles, Apparel & Luxury Goods - 0.1% | |||
| lululemon athletica, Inc. (a) | 612 | 231,660 | |
TOTAL CONSUMER DISCRETIONARY | 14,224,631 | ||
| CONSUMER STAPLES - 0.3% | |||
| Beverages - 0.1% | |||
| Boston Beer Co., Inc. Class A (a) | 673 | 249,979 | |
| Consumer Staples Distribution & Retail - 0.2% | |||
| BJ's Wholesale Club Holdings, Inc. (a) | 4,840 | 320,940 | |
| Food Products - 0.0% | |||
| Local Bounti Corp. (a) | 3,086 | 13,393 | |
TOTAL CONSUMER STAPLES | 584,312 | ||
| ENERGY - 2.7% | |||
| Oil, Gas & Consumable Fuels - 2.7% | |||
| Antero Resources Corp. (a) | 58,549 | 1,566,186 | |
| Canadian Natural Resources Ltd. | 9,053 | 550,533 | |
| Exxon Mobil Corp. | 896 | 96,087 | |
| Hess Corp. | 6,153 | 933,595 | |
| Occidental Petroleum Corp. | 484 | 30,555 | |
| Ovintiv, Inc. | 23,735 | 1,093,946 | |
| Tourmaline Oil Corp. | 20,566 | 1,065,848 | |
| 5,336,750 | |||
| FINANCIALS - 10.3% | |||
| Capital Markets - 0.9% | |||
| Coinbase Global, Inc. (a) | 3,253 | 320,778 | |
| LPL Financial | 6,226 | 1,427,995 | |
| 1,748,773 | |||
| Financial Services - 9.4% | |||
| Apollo Global Management, Inc. | 2,697 | 220,372 | |
| Block, Inc. Class A (a) | 56,128 | 4,519,988 | |
| Dlocal Ltd. (a) | 62,078 | 941,723 | |
| Fiserv, Inc. (a) | 14,174 | 1,788,901 | |
| Global Payments, Inc. | 15,209 | 1,676,792 | |
| Marqeta, Inc. Class A (a) | 243,780 | 1,360,292 | |
| MasterCard, Inc. Class A | 3,622 | 1,428,082 | |
| Nuvei Corp. (a)(b) | 52,134 | 1,778,291 | |
| Nuvei Corp. (Canada) (a)(b) | 4,626 | 157,761 | |
| Payoneer Global, Inc. (a) | 9,705 | 51,631 | |
| Repay Holdings Corp. (a) | 75,794 | 632,880 | |
| Shift4 Payments, Inc. (a) | 10,395 | 717,151 | |
| Visa, Inc. Class A | 12,775 | 3,037,001 | |
| 18,310,865 | |||
TOTAL FINANCIALS | 20,059,638 | ||
| HEALTH CARE - 9.8% | |||
| Biotechnology - 1.8% | |||
| Alnylam Pharmaceuticals, Inc. (a) | 1,465 | 286,261 | |
| ALX Oncology Holdings, Inc. (a) | 2,298 | 14,041 | |
| Argenx SE ADR (a) | 1,534 | 773,872 | |
| Ascendis Pharma A/S sponsored ADR (a) | 67 | 6,040 | |
| Blueprint Medicines Corp. (a) | 1,453 | 95,898 | |
| Celldex Therapeutics, Inc. (a) | 8,932 | 315,836 | |
| Cytokinetics, Inc. (a) | 11,478 | 382,791 | |
| Icosavax, Inc. (a) | 23,437 | 206,949 | |
| Keros Therapeutics, Inc. (a) | 3,661 | 153,323 | |
| Morphic Holding, Inc. (a) | 2,051 | 116,353 | |
| Nuvalent, Inc. Class A (a) | 3,518 | 175,372 | |
| PTC Therapeutics, Inc. (a) | 665 | 26,826 | |
| Repligen Corp. (a) | 750 | 128,670 | |
| Vaxcyte, Inc. (a) | 11,890 | 571,433 | |
| Verve Therapeutics, Inc. (a) | 3,101 | 63,539 | |
| Zentalis Pharmaceuticals, Inc. (a) | 7,407 | 197,841 | |
| 3,515,045 | |||
| Health Care Equipment & Supplies - 2.0% | |||
| Boston Scientific Corp. (a) | 33,200 | 1,721,420 | |
| Insulet Corp. (a) | 1,383 | 382,745 | |
| Penumbra, Inc. (a) | 2,423 | 735,041 | |
| TransMedics Group, Inc. (a) | 10,105 | 941,584 | |
| 3,780,790 | |||
| Health Care Providers & Services - 4.8% | |||
| agilon health, Inc. (a) | 57,727 | 1,105,472 | |
| Alignment Healthcare, Inc. (a) | 1,344 | 8,346 | |
| Centene Corp. (a) | 29,258 | 1,992,177 | |
| Humana, Inc. | 4,326 | 1,976,247 | |
| P3 Health Partners, Inc. Class A (a) | 20,863 | 46,316 | |
| UnitedHealth Group, Inc. | 8,403 | 4,255,027 | |
| 9,383,585 | |||
| Life Sciences Tools & Services - 0.8% | |||
| 10X Genomics, Inc. (a) | 1,896 | 119,410 | |
| Danaher Corp. | 3,060 | 780,484 | |
| Thermo Fisher Scientific, Inc. | 1,329 | 729,169 | |
| 1,629,063 | |||
| Pharmaceuticals - 0.4% | |||
| Eli Lilly & Co. | 1,835 | 834,099 | |
TOTAL HEALTH CARE | 19,142,582 | ||
| INDUSTRIALS - 4.3% | |||
| Aerospace & Defense - 0.5% | |||
| The Boeing Co. (a) | 4,062 | 970,209 | |
| Commercial Services & Supplies - 0.3% | |||
| ACV Auctions, Inc. Class A (a) | 29,668 | 518,893 | |
| Electrical Equipment - 0.1% | |||
| Bloom Energy Corp. Class A (a) | 6,964 | 124,377 | |
| Nextracker, Inc. Class A | 965 | 40,868 | |
| 165,245 | |||
| Ground Transportation - 3.4% | |||
| Lyft, Inc. (a) | 41,144 | 522,940 | |
| Uber Technologies, Inc. (a) | 121,638 | 6,016,215 | |
| 6,539,155 | |||
| Professional Services - 0.0% | |||
| Paycom Software, Inc. | 263 | 96,984 | |
TOTAL INDUSTRIALS | 8,290,486 | ||
| INFORMATION TECHNOLOGY - 44.5% | |||
| Communications Equipment - 0.2% | |||
| Lumentum Holdings, Inc. (a) | 8,276 | 433,331 | |
| Electronic Equipment, Instruments & Components - 2.8% | |||
| Coherent Corp. (a) | 5,979 | 283,165 | |
| Flex Ltd. (a) | 139,117 | 3,806,241 | |
| Jabil, Inc. | 12,513 | 1,384,814 | |
| 5,474,220 | |||
| IT Services - 2.5% | |||
| Cloudflare, Inc. (a) | 1,897 | 130,457 | |
| EPAM Systems, Inc. (a) | 7,548 | 1,787,442 | |
| Globant SA (a) | 1,885 | 329,366 | |
| MongoDB, Inc. Class A (a) | 5,217 | 2,208,878 | |
| Okta, Inc. (a) | 1,325 | 101,840 | |
| Shopify, Inc. Class A (a) | 1,339 | 90,490 | |
| Snowflake, Inc. (a) | 504 | 89,566 | |
| Twilio, Inc. Class A (a) | 2,730 | 180,262 | |
| 4,918,301 | |||
| Semiconductors & Semiconductor Equipment - 18.2% | |||
| Advanced Micro Devices, Inc. (a) | 33,964 | 3,885,482 | |
| Applied Materials, Inc. | 8,233 | 1,248,040 | |
| Enphase Energy, Inc. (a) | 997 | 151,375 | |
| GlobalFoundries, Inc. (a) | 14,321 | 912,104 | |
| Impinj, Inc. (a) | 1,285 | 85,607 | |
| Lam Research Corp. | 1,042 | 748,667 | |
| Lattice Semiconductor Corp. (a) | 1,014 | 92,213 | |
| Marvell Technology, Inc. | 28,501 | 1,856,270 | |
| Monolithic Power Systems, Inc. | 140 | 78,329 | |
| NVIDIA Corp. | 34,844 | 16,282,253 | |
| NXP Semiconductors NV | 18,524 | 4,130,482 | |
| ON Semiconductor Corp. (a) | 42,597 | 4,589,827 | |
| Taiwan Semiconductor Manufacturing Co. Ltd. sponsored ADR | 13,555 | 1,343,978 | |
| 35,404,627 | |||
| Software - 18.5% | |||
| Adobe, Inc. (a) | 1,191 | 650,488 | |
| Autodesk, Inc. (a) | 432 | 91,580 | |
| Bill Holdings, Inc. (a) | 7,669 | 961,232 | |
| Confluent, Inc. (a) | 13,016 | 449,573 | |
| Datadog, Inc. Class A (a) | 9,977 | 1,164,515 | |
| DoubleVerify Holdings, Inc. (a) | 18,591 | 782,681 | |
| Dynatrace, Inc. (a) | 32,874 | 1,797,879 | |
| Elastic NV (a) | 12,840 | 853,218 | |
| Five9, Inc. (a) | 8,931 | 783,695 | |
| HubSpot, Inc. (a) | 1,961 | 1,138,459 | |
| Intapp, Inc. (a) | 17,870 | 733,742 | |
| Intuit, Inc. | 2,039 | 1,043,356 | |
| Microsoft Corp. | 58,799 | 19,751,759 | |
| Oracle Corp. | 14,212 | 1,666,073 | |
| Palo Alto Networks, Inc. (a) | 2,539 | 634,648 | |
| Salesforce, Inc. (a) | 6,386 | 1,436,914 | |
| ServiceNow, Inc. (a) | 3,197 | 1,863,851 | |
| Workday, Inc. Class A (a) | 969 | 229,779 | |
| 36,033,442 | |||
| Technology Hardware, Storage & Peripherals - 2.3% | |||
| Apple, Inc. | 21,817 | 4,285,950 | |
| Pure Storage, Inc. Class A (a) | 6,985 | 258,375 | |
| 4,544,325 | |||
TOTAL INFORMATION TECHNOLOGY | 86,808,246 | ||
| UTILITIES - 1.1% | |||
| Electric Utilities - 1.1% | |||
| Constellation Energy Corp. | 5,533 | 534,764 | |
| PG&E Corp. (a) | 94,114 | 1,657,348 | |
| 2,192,112 | |||
| TOTAL COMMON STOCKS (Cost $152,870,581) | 194,876,680 | ||
| Money Market Funds - 0.1% | |||
| Shares | Value ($) | ||
State Street Institutional Treasury Plus Money Market Fund Trust Class 5.15% (c) (Cost $306,503) | 306,503 | 306,503 | |
| TOTAL INVESTMENT IN SECURITIES - 100.0% (Cost $153,177,084) | 195,183,183 |
NET OTHER ASSETS (LIABILITIES) - 0.0% | (84,100) |
| NET ASSETS - 100.0% | 195,099,083 |
| (a) | Non-income producing |
| (b) | Security exempt from registration under Rule 144A of the Securities Act of 1933. These securities may be resold in transactions exempt from registration, normally to qualified institutional buyers. At the end of the period, the value of these securities amounted to $1,936,052 or 1.0% of net assets. |
| (c) | The rate quoted is the annualized seven-day yield of the fund at period end. |
| Valuation Inputs at Reporting Date: | ||||
| Description | Total ($) | Level 1 ($) | Level 2 ($) | Level 3 ($) |
Investments in Securities: | ||||
| Equities: | ||||
Communication Services | 38,237,923 | 38,237,923 | - | - |
Consumer Discretionary | 14,224,631 | 14,224,631 | - | - |
Consumer Staples | 584,312 | 584,312 | - | - |
Energy | 5,336,750 | 5,336,750 | - | - |
Financials | 20,059,638 | 20,059,638 | - | - |
Health Care | 19,142,582 | 19,142,582 | - | - |
Industrials | 8,290,486 | 8,290,486 | - | - |
Information Technology | 86,808,246 | 86,808,246 | - | - |
Utilities | 2,192,112 | 2,192,112 | - | - |
| Money Market Funds | 306,503 | 306,503 | - | - |
| Total Investments in Securities: | 195,183,183 | 195,183,183 | - | - |
| Statement of Assets and Liabilities | ||||
| July 31, 2023 | ||||
| Assets | ||||
Investment in securities, at value - See accompanying schedule Unaffiliated issuers (cost $153,177,084): | $ | 195,183,183 | ||
| Cash | 280 | |||
| Dividends receivable | 6,445 | |||
Total assets | 195,189,908 | |||
| Liabilities | ||||
| Accrued management fee | $ | 90,825 | ||
| Total Liabilities | 90,825 | |||
| Net Assets | $ | 195,099,083 | ||
| Net Assets consist of: | ||||
| Paid in capital | $ | 174,553,744 | ||
| Total accumulated earnings (loss) | 20,545,339 | |||
| Net Assets | $ | 195,099,083 | ||
Net Asset Value, offering price and redemption price per share ($195,099,083 ÷ 10,875,000 shares) | $ | 17.94 | ||
| Statement of Operations | ||||
Year ended July 31, 2023 | ||||
| Investment Income | ||||
| Dividends | $ | 593,747 | ||
| Income before foreign taxes withheld | $ | 593,747 | ||
| Less foreign taxes withheld | (33,462) | |||
| Total Income | 560,285 | |||
| Expenses | ||||
| Management fee | $ | 636,426 | ||
| Independent trustees' fees and expenses | 456 | |||
| Total expenses before reductions | 636,882 | |||
| Expense reductions | (70) | |||
| Total expenses after reductions | 636,812 | |||
| Net Investment income (loss) | (76,527) | |||
| Realized and Unrealized Gain (Loss) | ||||
| Net realized gain (loss) on: | ||||
| Investment Securities: | ||||
| Redemptions in-kind | 2,203,470 | |||
| Unaffiliated issuers | (5,587,832) | |||
| Foreign currency transactions | (23,276) | |||
| Futures contracts | 38,610 | |||
| Total net realized gain (loss) | (3,369,028) | |||
| Change in net unrealized appreciation (depreciation) on investment securities | 44,562,111 | |||
| Net gain (loss) | 41,193,083 | |||
| Net increase (decrease) in net assets resulting from operations | $ | 41,116,556 | ||
| Statement of Changes in Net Assets | ||||
Year ended July 31, 2023 | Year ended July 31, 2022 | |||
| Increase (Decrease) in Net Assets | ||||
| Operations | ||||
| Net investment income (loss) | $ | (76,527) | $ | (96,288) |
| Net realized gain (loss) | (3,369,028) | (14,454,858) | ||
| Change in net unrealized appreciation (depreciation) | 44,562,111 | (5,201,464) | ||
| Net increase (decrease) in net assets resulting from operations | 41,116,556 | (19,752,610) | ||
| Share transactions | ||||
| Proceeds from sales of shares | 118,430,789 | 59,102,297 | ||
| Cost of shares redeemed | (26,758,280) | (16,719,011) | ||
Net increase (decrease) in net assets resulting from share transactions | 91,672,509 | 42,383,286 | ||
| Total increase (decrease) in net assets | 132,789,065 | 22,630,676 | ||
| Net Assets | ||||
| Beginning of period | 62,310,018 | 39,679,342 | ||
| End of period | $ | 195,099,083 | $ | 62,310,018 |
| Other Information | ||||
| Shares | ||||
| Sold | 8,550,000 | 3,500,000 | ||
| Redeemed | (1,975,000) | (1,075,000) | ||
| Net increase (decrease) | 6,575,000 | 2,425,000 | ||
| Fidelity® Growth Opportunities ETF |
| Years ended July 31, | 2023 | 2022 | 2021 A | |||
Selected Per-Share Data | ||||||
| Net asset value, beginning of period | $ | 14.49 | $ | 21.16 | $ | 20.00 |
| Income from Investment Operations | ||||||
Net investment income (loss) B,C | (.01) | (.03) | (.03) | |||
| Net realized and unrealized gain (loss) | 3.46 | (6.64) | 1.19 | |||
| Total from investment operations | 3.45 | (6.67) | 1.16 | |||
| Net asset value, end of period | $ | 17.94 | $ | 14.49 | $ | 21.16 |
Total Return D,E,F | 23.80% | (31.53)% | 5.82% | |||
Ratios to Average Net Assets C,G,H | ||||||
| Expenses before reductions | .59% | .59% | .59% I | |||
| Expenses net of fee waivers, if any | .59% | .59% | .59% I | |||
| Expenses net of all reductions | .59% | .59% | .59% I | |||
| Net investment income (loss) | (.07)% | (.19)% | (.33)% I | |||
| Supplemental Data | ||||||
| Net assets, end of period (000 omitted) | $ | 195,099 | $ | 62,310 | $ | 39,679 |
Portfolio turnover rate J,K | 78% | 99% | 49% L |
| Average Annual Total Returns | |||
Periods ended July 31, 2023 | Past 1 year | Life of Fund |
Fidelity® Magellan® ETF - NAV A | 7.21% | 4.74% |
Fidelity® Magellan® ETF - Market Price B | 6.85% | 4.31% |
S&P 500® Index A | 13.02% | 9.27% |
| $10,000 Over Life of Fund |
Let's say hypothetically that $10,000 was invested in Fidelity® Magellan® ETF - NAV, on February 2, 2021, when the fund started. The chart shows how the value of your investment would have changed, and also shows how the S&P 500® Index performed over the same period. |
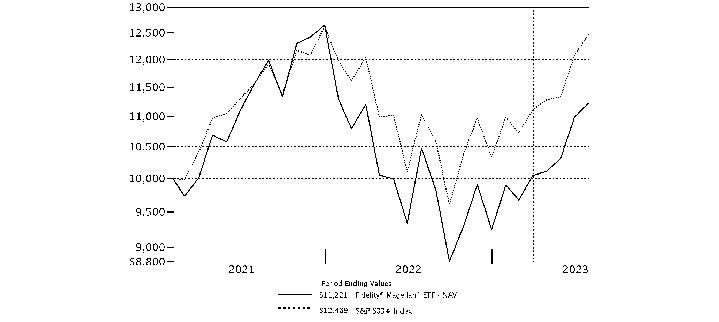 |
Top Holdings (% of Fund's net assets) | ||
| Microsoft Corp. | 8.3 | |
| NVIDIA Corp. | 4.7 | |
| UnitedHealth Group, Inc. | 3.0 | |
| Eli Lilly & Co. | 2.5 | |
| Visa, Inc. Class A | 2.4 | |
| MasterCard, Inc. Class A | 2.2 | |
| Costco Wholesale Corp. | 2.1 | |
| Linde PLC | 2.0 | |
| Broadcom, Inc. | 2.0 | |
| Thermo Fisher Scientific, Inc. | 2.0 | |
| 31.2 | ||
| Market Sectors (% of Fund's net assets) | ||
| Information Technology | 34.8 | |
| Industrials | 20.4 | |
| Health Care | 15.3 | |
| Financials | 14.2 | |
| Consumer Discretionary | 6.8 | |
| Materials | 4.4 | |
| Consumer Staples | 2.1 | |
| Communication Services | 2.0 | |
Asset Allocation (% of Fund's net assets) |
 |
| Common Stocks - 100.0% | |||
| Shares | Value ($) | ||
| COMMUNICATION SERVICES - 2.0% | |||
| Interactive Media & Services - 2.0% | |||
| Meta Platforms, Inc. Class A (a) | 3,132 | 997,855 | |
| CONSUMER DISCRETIONARY - 6.8% | |||
| Hotels, Restaurants & Leisure - 4.0% | |||
| Airbnb, Inc. Class A (a) | 4,699 | 715,141 | |
| Hilton Worldwide Holdings, Inc. | 4,271 | 664,098 | |
| Yum! Brands, Inc. | 4,566 | 628,601 | |
| 2,007,840 | |||
| Specialty Retail - 2.8% | |||
| AutoZone, Inc. (a) | 287 | 712,254 | |
| O'Reilly Automotive, Inc. (a) | 731 | 676,752 | |
| 1,389,006 | |||
TOTAL CONSUMER DISCRETIONARY | 3,396,846 | ||
| CONSUMER STAPLES - 2.1% | |||
| Consumer Staples Distribution & Retail - 2.1% | |||
| Costco Wholesale Corp. | 1,929 | 1,081,532 | |
| FINANCIALS - 14.2% | |||
| Capital Markets - 4.6% | |||
| Ares Management Corp. | 5,123 | 508,304 | |
| Moody's Corp. | 2,452 | 864,943 | |
| S&P Global, Inc. | 2,337 | 921,970 | |
| 2,295,217 | |||
| Financial Services - 6.1% | |||
| Fiserv, Inc. (a) | 6,037 | 761,930 | |
| MasterCard, Inc. Class A | 2,803 | 1,105,167 | |
| Visa, Inc. Class A | 5,095 | 1,211,234 | |
| 3,078,331 | |||
| Insurance - 3.5% | |||
| Arthur J. Gallagher & Co. | 3,950 | 848,460 | |
| Marsh & McLennan Companies, Inc. | 4,883 | 920,055 | |
| 1,768,515 | |||
TOTAL FINANCIALS | 7,142,063 | ||
| HEALTH CARE - 15.3% | |||
| Health Care Equipment & Supplies - 1.3% | |||
| Boston Scientific Corp. (a) | 12,962 | 672,080 | |
| Health Care Providers & Services - 4.6% | |||
| Humana, Inc. | 1,785 | 815,442 | |
| UnitedHealth Group, Inc. | 2,941 | 1,489,234 | |
| 2,304,676 | |||
| Life Sciences Tools & Services - 5.1% | |||
| Danaher Corp. | 3,808 | 971,268 | |
| Mettler-Toledo International, Inc. (a) | 478 | 601,071 | |
| Thermo Fisher Scientific, Inc. | 1,833 | 1,005,694 | |
| 2,578,033 | |||
| Pharmaceuticals - 4.3% | |||
| Eli Lilly & Co. | 2,758 | 1,253,649 | |
| Zoetis, Inc. Class A | 4,732 | 890,042 | |
| 2,143,691 | |||
TOTAL HEALTH CARE | 7,698,480 | ||
| INDUSTRIALS - 20.4% | |||
| Aerospace & Defense - 2.8% | |||
| HEICO Corp. Class A | 4,633 | 650,242 | |
| TransDigm Group, Inc. | 841 | 756,665 | |
| 1,406,907 | |||
| Commercial Services & Supplies - 4.0% | |||
| Cintas Corp. | 1,410 | 707,876 | |
| Copart, Inc. (a) | 7,699 | 680,515 | |
| Waste Connections, Inc. (United States) | 4,293 | 606,043 | |
| 1,994,434 | |||
| Construction & Engineering - 1.3% | |||
| Quanta Services, Inc. | 3,250 | 655,265 | |
| Electrical Equipment - 4.0% | |||
| AMETEK, Inc. | 4,006 | 635,352 | |
| Eaton Corp. PLC | 3,828 | 785,965 | |
| Rockwell Automation, Inc. | 1,718 | 577,746 | |
| 1,999,063 | |||
| Machinery - 1.3% | |||
| Ingersoll Rand, Inc. | 9,851 | 642,975 | |
| Professional Services - 5.6% | |||
| Automatic Data Processing, Inc. | 3,060 | 756,616 | |
| Equifax, Inc. | 870 | 177,550 | |
| Paychex, Inc. | 5,100 | 639,897 | |
| TransUnion Holding Co., Inc. | 6,473 | 515,833 | |
| Verisk Analytics, Inc. | 3,277 | 750,236 | |
| 2,840,132 | |||
| Trading Companies & Distributors - 1.4% | |||
| United Rentals, Inc. | 1,517 | 704,920 | |
TOTAL INDUSTRIALS | 10,243,696 | ||
| INFORMATION TECHNOLOGY - 34.8% | |||
| Communications Equipment - 1.2% | |||
| Motorola Solutions, Inc. | 2,124 | 608,802 | |
| Electronic Equipment, Instruments & Components - 2.7% | |||
| Amphenol Corp. Class A | 7,944 | 701,535 | |
| CDW Corp. | 3,565 | 666,905 | |
| 1,368,440 | |||
| IT Services - 3.2% | |||
| Accenture PLC Class A | 2,964 | 937,661 | |
| Gartner, Inc. (a) | 1,886 | 666,871 | |
| 1,604,532 | |||
| Semiconductors & Semiconductor Equipment - 15.1% | |||
| Analog Devices, Inc. | 4,004 | 798,918 | |
| Broadcom, Inc. | 1,128 | 1,013,677 | |
| First Solar, Inc. (a) | 3,167 | 656,836 | |
| KLA Corp. | 1,735 | 891,703 | |
| Lam Research Corp. | 1,345 | 966,369 | |
| NVIDIA Corp. | 5,075 | 2,371,497 | |
| ON Semiconductor Corp. (a) | 8,371 | 901,975 | |
| 7,600,975 | |||
| Software - 12.6% | |||
| Cadence Design Systems, Inc. (a) | 3,295 | 771,063 | |
| Fortinet, Inc. (a) | 7,614 | 591,760 | |
| Microsoft Corp. | 12,323 | 4,139,539 | |
| Synopsys, Inc. (a) | 1,774 | 801,493 | |
| 6,303,855 | |||
TOTAL INFORMATION TECHNOLOGY | 17,486,604 | ||
| MATERIALS - 4.4% | |||
| Chemicals - 3.2% | |||
| Linde PLC | 2,615 | 1,021,602 | |
| Sherwin-Williams Co. | 2,203 | 609,130 | |
| 1,630,732 | |||
| Construction Materials - 1.2% | |||
| Vulcan Materials Co. | 2,614 | 576,387 | |
TOTAL MATERIALS | 2,207,119 | ||
| TOTAL COMMON STOCKS (Cost $41,363,844) | 50,254,195 | ||
| Money Market Funds - 1.1% | |||
| Shares | Value ($) | ||
State Street Institutional Treasury Plus Money Market Fund Trust Class 5.15% (b) (Cost $577,298) | 577,298 | 577,298 | |
| TOTAL INVESTMENT IN SECURITIES - 101.1% (Cost $41,941,142) | 50,831,493 |
NET OTHER ASSETS (LIABILITIES) - (1.1)% | (556,637) |
| NET ASSETS - 100.0% | 50,274,856 |
| (a) | Non-income producing |
| (b) | The rate quoted is the annualized seven-day yield of the fund at period end. |
| Valuation Inputs at Reporting Date: | ||||
| Description | Total ($) | Level 1 ($) | Level 2 ($) | Level 3 ($) |
Investments in Securities: | ||||
| Equities: | ||||
Communication Services | 997,855 | 997,855 | - | - |
Consumer Discretionary | 3,396,846 | 3,396,846 | - | - |
Consumer Staples | 1,081,532 | 1,081,532 | - | - |
Financials | 7,142,063 | 7,142,063 | - | - |
Health Care | 7,698,480 | 7,698,480 | - | - |
Industrials | 10,243,696 | 10,243,696 | - | - |
Information Technology | 17,486,604 | 17,486,604 | - | - |
Materials | 2,207,119 | 2,207,119 | - | - |
| Money Market Funds | 577,298 | 577,298 | - | - |
| Total Investments in Securities: | 50,831,493 | 50,831,493 | - | - |
| Statement of Assets and Liabilities | ||||
| July 31, 2023 | ||||
| Assets | ||||
Investment in securities, at value - See accompanying schedule Unaffiliated issuers (cost $41,941,142): | $ | 50,831,493 | ||
| Cash | 55 | |||
| Receivable for investments sold | 593,690 | |||
| Dividends receivable | 10,046 | |||
| Other receivables | 98 | |||
Total assets | 51,435,382 | |||
| Liabilities | ||||
| Payable for investments purchased | $ | 1,136,363 | ||
| Accrued management fee | 24,163 | |||
| Total Liabilities | 1,160,526 | |||
| Net Assets | $ | 50,274,856 | ||
| Net Assets consist of: | ||||
| Paid in capital | $ | 50,017,710 | ||
| Total accumulated earnings (loss) | 257,146 | |||
| Net Assets | $ | 50,274,856 | ||
Net Asset Value, offering price and redemption price per share ($50,274,856 ÷ 2,250,000 shares) | $ | 22.34 | ||
| Statement of Operations | ||||
Year ended July 31, 2023 | ||||
| Investment Income | ||||
| Dividends | $ | 396,185 | ||
| Expenses | ||||
| Management fee | $ | 261,422 | ||
| Independent trustees' fees and expenses | 225 | |||
| Total expenses before reductions | 261,647 | |||
| Expense reductions | (37) | |||
| Total expenses after reductions | 261,610 | |||
| Net Investment income (loss) | 134,575 | |||
| Realized and Unrealized Gain (Loss) | ||||
| Net realized gain (loss) on: | ||||
| Investment Securities: | ||||
| Redemptions in-kind | 298,829 | |||
| Unaffiliated issuers | (4,484,419) | |||
| Total net realized gain (loss) | (4,185,590) | |||
| Change in net unrealized appreciation (depreciation) on investment securities | 7,292,125 | |||
| Net gain (loss) | 3,106,535 | |||
| Net increase (decrease) in net assets resulting from operations | $ | 3,241,110 | ||
| Statement of Changes in Net Assets | ||||
Year ended July 31, 2023 | Year ended July 31, 2022 | |||
| Increase (Decrease) in Net Assets | ||||
| Operations | ||||
| Net investment income (loss) | $ | 134,575 | $ | 24,387 |
| Net realized gain (loss) | (4,185,590) | (3,743,475) | ||
| Change in net unrealized appreciation (depreciation) | 7,292,125 | (2,178,468) | ||
| Net increase (decrease) in net assets resulting from operations | 3,241,110 | (5,897,556) | ||
| Distributions to shareholders | (144,575) | (32,550) | ||
| Share transactions | ||||
| Proceeds from sales of shares | 4,485,324 | 19,270,749 | ||
| Cost of shares redeemed | (3,834,411) | (2,655,560) | ||
Net increase (decrease) in net assets resulting from share transactions | 650,913 | 16,615,189 | ||
| Total increase (decrease) in net assets | 3,747,448 | 10,685,083 | ||
| Net Assets | ||||
| Beginning of period | 46,527,408 | 35,842,325 | ||
| End of period | $ | 50,274,856 | $ | 46,527,408 |
| Other Information | ||||
| Shares | ||||
| Sold | 225,000 | 800,000 | ||
| Redeemed | (200,000) | (125,000) | ||
| Net increase (decrease) | 25,000 | 675,000 | ||
| Fidelity® Magellan® ETF |
| Years ended July 31, | 2023 | 2022 | 2021 A | |||
Selected Per-Share Data | ||||||
| Net asset value, beginning of period | $ | 20.91 | $ | 23.12 | $ | 20.00 |
| Income from Investment Operations | ||||||
Net investment income (loss) B,C | .06 | .01 | - D | |||
| Net realized and unrealized gain (loss) | 1.44 | (2.20) | 3.13 | |||
| Total from investment operations | 1.50 | (2.19) | 3.13 | |||
| Distributions from net investment income | (.07) | (.02) | (.01) | |||
| Total distributions | (.07) | (.02) | (.01) | |||
| Net asset value, end of period | $ | 22.34 | $ | 20.91 | $ | 23.12 |
Total Return E,F,G | 7.21% | (9.50)% | 15.65% | |||
Ratios to Average Net Assets C,H,I | ||||||
| Expenses before reductions | .59% | .59% | .59% J | |||
| Expenses net of fee waivers, if any | .59% | .59% | .59% J | |||
| Expenses net of all reductions | .59% | .59% | .59% J | |||
| Net investment income (loss) | .30% | .05% | .01% J | |||
| Supplemental Data | ||||||
| Net assets, end of period (000 omitted) | $ | 50,275 | $ | 46,527 | $ | 35,842 |
Portfolio turnover rate K,L | 89% | 68% | 41% M |
| Average Annual Total Returns | |||
Periods ended July 31, 2023 | Past 1 year | Life of Fund |
Fidelity® New Millennium ETF - NAV A | 21.36% | 20.69% |
Fidelity® New Millennium ETF - Market Price B | 21.21% | 19.59% |
S&P 500® Index A | 13.02% | 15.23% |
| $10,000 Over Life of Fund |
Let's say hypothetically that $10,000 was invested in Fidelity® New Millennium ETF - NAV, on June 2, 2020, when the fund started. The chart shows how the value of your investment would have changed, and also shows how the S&P 500® Index performed over the same period. |
 |
Top Holdings (% of Fund's net assets) | ||
| Microsoft Corp. | 7.1 | |
| Apple, Inc. | 6.1 | |
| Amazon.com, Inc. | 2.9 | |
| NVIDIA Corp. | 2.4 | |
| Meta Platforms, Inc. Class A | 2.3 | |
| Alphabet, Inc. Class A | 2.0 | |
| Eli Lilly & Co. | 1.9 | |
| Exxon Mobil Corp. | 1.8 | |
| Visa, Inc. Class A | 1.6 | |
| UnitedHealth Group, Inc. | 1.6 | |
| 29.7 | ||
| Market Sectors (% of Fund's net assets) | ||
| Information Technology | 29.2 | |
| Industrials | 14.3 | |
| Health Care | 11.7 | |
| Consumer Discretionary | 10.5 | |
| Financials | 9.7 | |
| Communication Services | 7.7 | |
| Energy | 5.2 | |
| Consumer Staples | 4.1 | |
| Materials | 3.9 | |
| Real Estate | 1.7 | |
| Utilities | 1.7 | |
Asset Allocation (% of Fund's net assets) |
 |
| Common Stocks - 99.7% | |||
| Shares | Value ($) | ||
| COMMUNICATION SERVICES - 7.7% | |||
| Entertainment - 2.1% | |||
| Endeavor Group Holdings, Inc. (a) | 21,832 | 515,235 | |
| Netflix, Inc. (a) | 2,677 | 1,175,123 | |
| Spotify Technology SA (a) | 2,729 | 407,740 | |
| World Wrestling Entertainment, Inc. Class A | 1,242 | 130,410 | |
| 2,228,508 | |||
| Interactive Media & Services - 4.3% | |||
| Alphabet, Inc. Class A (a) | 16,397 | 2,176,210 | |
| Meta Platforms, Inc. Class A (a) | 7,718 | 2,458,955 | |
| 4,635,165 | |||
| Media - 1.3% | |||
| Comcast Corp. Class A | 32,212 | 1,457,915 | |
TOTAL COMMUNICATION SERVICES | 8,321,588 | ||
| CONSUMER DISCRETIONARY - 10.5% | |||
| Automobile Components - 0.6% | |||
| Aptiv PLC (a) | 5,814 | 636,575 | |
| Broadline Retail - 2.9% | |||
| Amazon.com, Inc. (a) | 23,870 | 3,190,942 | |
| Hotels, Restaurants & Leisure - 2.5% | |||
| Airbnb, Inc. Class A (a) | 2,037 | 310,011 | |
| Booking Holdings, Inc. (a) | 205 | 609,014 | |
| Chipotle Mexican Grill, Inc. (a) | 208 | 408,154 | |
| Churchill Downs, Inc. | 4,067 | 471,162 | |
| Hilton Worldwide Holdings, Inc. | 3,474 | 540,172 | |
| Yum! Brands, Inc. | 2,315 | 318,706 | |
| 2,657,219 | |||
| Household Durables - 1.0% | |||
| Lennar Corp. Class A | 4,314 | 547,145 | |
| NVR, Inc. (a) | 82 | 517,128 | |
| 1,064,273 | |||
| Specialty Retail - 1.8% | |||
| Dick's Sporting Goods, Inc. | 2,343 | 330,363 | |
| Floor & Decor Holdings, Inc. Class A (a) | 3,005 | 345,124 | |
| TJX Companies, Inc. | 14,254 | 1,233,399 | |
| 1,908,886 | |||
| Textiles, Apparel & Luxury Goods - 1.7% | |||
| NIKE, Inc. Class B | 8,307 | 917,010 | |
| Ralph Lauren Corp. | 4,051 | 532,018 | |
| Tapestry, Inc. | 9,732 | 419,936 | |
| 1,868,964 | |||
TOTAL CONSUMER DISCRETIONARY | 11,326,859 | ||
| CONSUMER STAPLES - 4.1% | |||
| Beverages - 2.4% | |||
| Boston Beer Co., Inc. Class A (a) | 1,179 | 437,928 | |
| Constellation Brands, Inc. Class A (sub. vtg.) | 1,062 | 289,714 | |
| Diageo PLC sponsored ADR | 1,590 | 279,745 | |
| Keurig Dr. Pepper, Inc. | 16,779 | 570,654 | |
| The Coca-Cola Co. | 15,815 | 979,423 | |
| 2,557,464 | |||
| Consumer Staples Distribution & Retail - 1.5% | |||
| Alimentation Couche-Tard, Inc. Class A (multi-vtg.) | 5,302 | 268,427 | |
| BJ's Wholesale Club Holdings, Inc. (a) | 10,012 | 663,896 | |
| Performance Food Group Co. (a) | 5,898 | 352,464 | |
| Target Corp. | 2,518 | 343,631 | |
| 1,628,418 | |||
| Personal Care Products - 0.2% | |||
| Kenvue, Inc. | 10,108 | 239,357 | |
TOTAL CONSUMER STAPLES | 4,425,239 | ||
| ENERGY - 5.2% | |||
| Energy Equipment & Services - 1.6% | |||
| Baker Hughes Co. Class A | 15,462 | 553,385 | |
| Schlumberger Ltd. | 14,173 | 826,853 | |
| TechnipFMC PLC | 19,022 | 348,863 | |
| 1,729,101 | |||
| Oil, Gas & Consumable Fuels - 3.6% | |||
| Antero Resources Corp. (a) | 4,131 | 110,504 | |
| Canadian Natural Resources Ltd. | 8,470 | 514,976 | |
| Cheniere Energy, Inc. | 3,520 | 569,747 | |
| Exxon Mobil Corp. | 18,047 | 1,935,360 | |
| Hess Corp. | 4,701 | 713,283 | |
| 3,843,870 | |||
TOTAL ENERGY | 5,572,971 | ||
| FINANCIALS - 9.7% | |||
| Banks - 3.2% | |||
| Bank of America Corp. | 36,092 | 1,154,944 | |
| JPMorgan Chase & Co. | 5,649 | 892,316 | |
| PNC Financial Services Group, Inc. | 2,815 | 385,345 | |
| Wells Fargo & Co. | 23,028 | 1,062,972 | |
| 3,495,577 | |||
| Capital Markets - 0.7% | |||
| Morgan Stanley | 8,326 | 762,329 | |
| Financial Services - 3.4% | |||
| Block, Inc. Class A (a) | 6,214 | 500,413 | |
| Fiserv, Inc. (a) | 8,545 | 1,078,464 | |
| Shift4 Payments, Inc. (a) | 4,711 | 325,012 | |
| Visa, Inc. Class A | 7,487 | 1,779,885 | |
| 3,683,774 | |||
| Insurance - 2.4% | |||
| Arch Capital Group Ltd. (a) | 4,585 | 356,209 | |
| Chubb Ltd. | 5,997 | 1,225,847 | |
| First American Financial Corp. | 4,270 | 270,633 | |
| Marsh & McLennan Companies, Inc. | 2,683 | 505,531 | |
| RenaissanceRe Holdings Ltd. | 1,156 | 215,895 | |
| 2,574,115 | |||
TOTAL FINANCIALS | 10,515,795 | ||
| HEALTH CARE - 11.7% | |||
| Biotechnology - 1.1% | |||
| Gilead Sciences, Inc. | 4,793 | 364,939 | |
| Legend Biotech Corp. ADR (a) | 3,612 | 272,778 | |
| Regeneron Pharmaceuticals, Inc. (a) | 692 | 513,402 | |
| 1,151,119 | |||
| Health Care Equipment & Supplies - 2.5% | |||
| Boston Scientific Corp. (a) | 21,097 | 1,093,879 | |
| GE Healthcare Holding LLC | 4,053 | 316,134 | |
| Hologic, Inc. (a) | 4,870 | 386,775 | |
| Masimo Corp. (a) | 1,901 | 232,492 | |
| Stryker Corp. | 2,229 | 631,721 | |
| 2,661,001 | |||
| Health Care Providers & Services - 2.8% | |||
| agilon health, Inc. (a) | 13,308 | 254,848 | |
| Centene Corp. (a) | 5,293 | 360,400 | |
| Cigna Group | 1,984 | 585,478 | |
| LifeStance Health Group, Inc. (a) | 11,859 | 111,356 | |
| UnitedHealth Group, Inc. | 3,466 | 1,755,078 | |
| 3,067,160 | |||
| Life Sciences Tools & Services - 2.2% | |||
| Danaher Corp. | 3,111 | 793,492 | |
| IQVIA Holdings, Inc. (a) | 1,666 | 372,784 | |
| Thermo Fisher Scientific, Inc. | 1,715 | 940,952 | |
| West Pharmaceutical Services, Inc. | 832 | 306,209 | |
| 2,413,437 | |||
| Pharmaceuticals - 3.1% | |||
| AstraZeneca PLC sponsored ADR | 8,270 | 592,959 | |
| Eli Lilly & Co. | 4,562 | 2,073,657 | |
| Merck & Co., Inc. | 4,992 | 532,397 | |
| Novo Nordisk A/S Series B sponsored ADR | 976 | 157,234 | |
| 3,356,247 | |||
TOTAL HEALTH CARE | 12,648,964 | ||
| INDUSTRIALS - 14.3% | |||
| Aerospace & Defense - 3.8% | |||
| BWX Technologies, Inc. | 7,173 | 494,937 | |
| Howmet Aerospace, Inc. | 16,579 | 847,850 | |
| Lockheed Martin Corp. | 1,961 | 875,332 | |
| Northrop Grumman Corp. | 1,507 | 670,615 | |
| The Boeing Co. (a) | 4,950 | 1,182,308 | |
| 4,071,042 | |||
| Building Products - 0.8% | |||
| Builders FirstSource, Inc. (a) | 3,230 | 466,509 | |
| Fortune Brands Home & Security, Inc. | 4,972 | 353,360 | |
| 819,869 | |||
| Construction & Engineering - 1.1% | |||
| Quanta Services, Inc. | 3,557 | 717,162 | |
| Willscot Mobile Mini Holdings (a) | 9,937 | 476,479 | |
| 1,193,641 | |||
| Electrical Equipment - 2.0% | |||
| Eaton Corp. PLC | 4,524 | 928,868 | |
| Generac Holdings, Inc. (a) | 3,960 | 608,652 | |
| Regal Rexnord Corp. | 4,155 | 648,928 | |
| 2,186,448 | |||
| Ground Transportation - 1.0% | |||
| Uber Technologies, Inc. (a) | 22,200 | 1,098,012 | |
| Industrial Conglomerates - 1.0% | |||
| General Electric Co. | 8,983 | 1,026,218 | |
| Machinery - 3.2% | |||
| Caterpillar, Inc. | 2,766 | 733,460 | |
| Fortive Corp. | 4,079 | 319,590 | |
| Ingersoll Rand, Inc. | 12,177 | 794,793 | |
| ITT, Inc. | 5,452 | 543,019 | |
| Parker Hannifin Corp. | 2,497 | 1,023,795 | |
| 3,414,657 | |||
| Professional Services - 1.1% | |||
| FTI Consulting, Inc. (a) | 2,805 | 491,324 | |
| KBR, Inc. | 8,991 | 552,857 | |
| WNS Holdings Ltd. sponsored ADR (a) | 2,797 | 193,301 | |
| 1,237,482 | |||
| Trading Companies & Distributors - 0.3% | |||
| United Rentals, Inc. | 730 | 339,216 | |
TOTAL INDUSTRIALS | 15,386,585 | ||
| INFORMATION TECHNOLOGY - 29.2% | |||
| Communications Equipment - 1.1% | |||
| Cisco Systems, Inc. | 22,221 | 1,156,381 | |
| Electronic Equipment, Instruments & Components - 1.7% | |||
| Flex Ltd. (a) | 29,193 | 798,720 | |
| Jabil, Inc. | 6,429 | 711,497 | |
| Keysight Technologies, Inc. (a) | 2,226 | 358,564 | |
| 1,868,781 | |||
| IT Services - 0.9% | |||
| MongoDB, Inc. Class A (a) | 1,056 | 447,110 | |
| Shopify, Inc. Class A (a) | 8,305 | 561,252 | |
| 1,008,362 | |||
| Semiconductors & Semiconductor Equipment - 7.6% | |||
| Advanced Micro Devices, Inc. (a) | 11,036 | 1,262,518 | |
| Analog Devices, Inc. | 3,985 | 795,127 | |
| Marvell Technology, Inc. | 1,110 | 72,294 | |
| NVIDIA Corp. | 5,618 | 2,625,235 | |
| NXP Semiconductors NV | 4,677 | 1,042,877 | |
| ON Semiconductor Corp. (a) | 10,087 | 1,086,874 | |
| Taiwan Semiconductor Manufacturing Co. Ltd. sponsored ADR | 7,546 | 748,186 | |
| Teradyne, Inc. | 4,864 | 549,340 | |
| 8,182,451 | |||
| Software - 11.8% | |||
| Adobe, Inc. (a) | 2,286 | 1,248,545 | |
| Dynatrace, Inc. (a) | 9,987 | 546,189 | |
| Intuit, Inc. | 1,411 | 722,009 | |
| Microsoft Corp. | 22,918 | 7,698,616 | |
| Oracle Corp. | 8,838 | 1,036,079 | |
| Salesforce, Inc. (a) | 4,211 | 947,517 | |
| Workday, Inc. Class A (a) | 2,185 | 518,129 | |
| 12,717,084 | |||
| Technology Hardware, Storage & Peripherals - 6.1% | |||
| Apple, Inc. | 33,281 | 6,538,052 | |
TOTAL INFORMATION TECHNOLOGY | 31,471,111 | ||
| MATERIALS - 3.9% | |||
| Chemicals - 1.5% | |||
| Celanese Corp. Class A | 2,547 | 319,368 | |
| Element Solutions, Inc. | 19,119 | 400,734 | |
| Linde PLC | 2,218 | 866,506 | |
| 1,586,608 | |||
| Construction Materials - 0.3% | |||
| Martin Marietta Materials, Inc. | 877 | 391,545 | |
| Containers & Packaging - 0.4% | |||
| O-I Glass, Inc. (a) | 19,209 | 441,039 | |
| Metals & Mining - 1.7% | |||
| Commercial Metals Co. | 2,409 | 137,843 | |
| Franco-Nevada Corp. | 4,602 | 671,533 | |
| Freeport-McMoRan, Inc. | 22,547 | 1,006,724 | |
| 1,816,100 | |||
TOTAL MATERIALS | 4,235,292 | ||
| REAL ESTATE - 1.7% | |||
| Equity Real Estate Investment Trusts (REITs) - 1.4% | |||
| Essex Property Trust, Inc. | 941 | 229,181 | |
| Gaming & Leisure Properties | 6,950 | 329,847 | |
| Prologis (REIT), Inc. | 5,835 | 727,916 | |
| Spirit Realty Capital, Inc. | 5,345 | 215,564 | |
| 1,502,508 | |||
| Real Estate Management & Development - 0.3% | |||
| CBRE Group, Inc. (a) | 4,358 | 363,065 | |
TOTAL REAL ESTATE | 1,865,573 | ||
| UTILITIES - 1.7% | |||
| Electric Utilities - 1.3% | |||
| Constellation Energy Corp. | 5,802 | 560,763 | |
| Southern Co. | 12,108 | 875,893 | |
| 1,436,656 | |||
| Independent Power and Renewable Electricity Producers - 0.4% | |||
| Vistra Corp. | 14,670 | 411,640 | |
TOTAL UTILITIES | 1,848,296 | ||
| TOTAL COMMON STOCKS (Cost $87,851,092) | 107,618,273 | ||
| Money Market Funds - 1.2% | |||
| Shares | Value ($) | ||
State Street Institutional Treasury Plus Money Market Fund Trust Class 5.15% (b) (Cost $1,273,394) | 1,273,394 | 1,273,394 | |
| TOTAL INVESTMENT IN SECURITIES - 100.9% (Cost $89,124,486) | 108,891,667 |
NET OTHER ASSETS (LIABILITIES) - (0.9)% | (969,101) |
| NET ASSETS - 100.0% | 107,922,566 |
| (a) | Non-income producing |
| (b) | The rate quoted is the annualized seven-day yield of the fund at period end. |
| Valuation Inputs at Reporting Date: | ||||
| Description | Total ($) | Level 1 ($) | Level 2 ($) | Level 3 ($) |
Investments in Securities: | ||||
| Equities: | ||||
Communication Services | 8,321,588 | 8,321,588 | - | - |
Consumer Discretionary | 11,326,859 | 11,326,859 | - | - |
Consumer Staples | 4,425,239 | 4,425,239 | - | - |
Energy | 5,572,971 | 5,572,971 | - | - |
Financials | 10,515,795 | 10,515,795 | - | - |
Health Care | 12,648,964 | 12,648,964 | - | - |
Industrials | 15,386,585 | 15,386,585 | - | - |
Information Technology | 31,471,111 | 31,471,111 | - | - |
Materials | 4,235,292 | 4,235,292 | - | - |
Real Estate | 1,865,573 | 1,865,573 | - | - |
Utilities | 1,848,296 | 1,848,296 | - | - |
| Money Market Funds | 1,273,394 | 1,273,394 | - | - |
| Total Investments in Securities: | 108,891,667 | 108,891,667 | - | - |
| Statement of Assets and Liabilities | ||||
| July 31, 2023 | ||||
| Assets | ||||
Investment in securities, at value - See accompanying schedule Unaffiliated issuers (cost $89,124,486): | $ | 108,891,667 | ||
| Segregated cash with brokers for derivative instruments | 33,600 | |||
| Cash | 664 | |||
| Receivable for investments sold | 5,441,664 | |||
| Receivable for fund shares sold | 2,579,157 | |||
| Dividends receivable | 20,755 | |||
| Receivable for daily variation margin on futures contracts | 995 | |||
Total assets | 116,968,502 | |||
| Liabilities | ||||
| Payable for investments purchased | $ | 8,996,615 | ||
| Accrued management fee | 49,321 | |||
| Total Liabilities | 9,045,936 | |||
| Net Assets | $ | 107,922,566 | ||
| Net Assets consist of: | ||||
| Paid in capital | $ | 91,907,582 | ||
| Total accumulated earnings (loss) | 16,014,984 | |||
| Net Assets | $ | 107,922,566 | ||
Net Asset Value, offering price and redemption price per share ($107,922,566 ÷ 3,125,000 shares) | $ | 34.54 | ||
| Statement of Operations | ||||
Year ended July 31, 2023 | ||||
| Investment Income | ||||
| Dividends | $ | 1,318,103 | ||
| Expenses | ||||
| Management fee | $ | 492,076 | ||
| Independent trustees' fees and expenses | 393 | |||
| Total expenses before reductions | 492,469 | |||
| Expense reductions | (126) | |||
| Total expenses after reductions | 492,343 | |||
| Net Investment income (loss) | 825,760 | |||
| Realized and Unrealized Gain (Loss) | ||||
| Net realized gain (loss) on: | ||||
| Investment Securities: | ||||
| Redemptions in-kind | 7,235,412 | |||
| Unaffiliated issuers | (3,109,284) | |||
| Foreign currency transactions | (10) | |||
| Futures contracts | 203 | |||
| Total net realized gain (loss) | 4,126,321 | |||
| Change in net unrealized appreciation (depreciation) on: | ||||
| Investment Securities: | ||||
| Unaffiliated issuers | 13,991,436 | |||
| Assets and liabilities in foreign currencies | 14 | |||
| Total change in net unrealized appreciation (depreciation) | 13,991,450 | |||
| Net gain (loss) | 18,117,771 | |||
| Net increase (decrease) in net assets resulting from operations | $ | 18,943,531 | ||
| Statement of Changes in Net Assets | ||||
Year ended July 31, 2023 | Year ended July 31, 2022 | |||
| Increase (Decrease) in Net Assets | ||||
| Operations | ||||
| Net investment income (loss) | $ | 825,760 | $ | 816,005 |
| Net realized gain (loss) | 4,126,321 | 1,262,284 | ||
| Change in net unrealized appreciation (depreciation) | 13,991,450 | (1,701,394) | ||
| Net increase (decrease) in net assets resulting from operations | 18,943,531 | 376,895 | ||
| Distributions to shareholders | (1,058,225) | (1,100,175) | ||
| Share transactions | ||||
| Proceeds from sales of shares | 63,669,740 | 3,720,338 | ||
| Cost of shares redeemed | (29,908,118) | (7,128,248) | ||
Net increase (decrease) in net assets resulting from share transactions | 33,761,622 | (3,407,910) | ||
| Total increase (decrease) in net assets | 51,646,928 | (4,131,190) | ||
| Net Assets | ||||
| Beginning of period | 56,275,638 | 60,406,828 | ||
| End of period | $ | 107,922,566 | $ | 56,275,638 |
| Other Information | ||||
| Shares | ||||
| Sold | 2,150,000 | 125,000 | ||
| Redeemed | (975,000) | (250,000) | ||
| Net increase (decrease) | 1,175,000 | (125,000) | ||
| Fidelity® New Millennium ETF |
| Years ended July 31, | 2023 | 2022 | 2021 | 2020 A | ||||
Selected Per-Share Data | ||||||||
| Net asset value, beginning of period | $ | 28.86 | $ | 29.11 | $ | 20.37 | $ | 20.00 |
| Income from Investment Operations | ||||||||
Net investment income (loss) B,C | .30 | .40 | .36 | .03 | ||||
| Net realized and unrealized gain (loss) | 5.78 | (.12) | 8.75 | .36 | ||||
| Total from investment operations | 6.08 | .28 | 9.11 | .39 | ||||
| Distributions from net investment income | (.33) | (.53) | (.37) | (.02) | ||||
| Distributions from net realized gain | (.07) | - | - | - | ||||
| Total distributions | (.40) | (.53) | (.37) | (.02) | ||||
| Net asset value, end of period | $ | 34.54 | $ | 28.86 | $ | 29.11 | $ | 20.37 |
Total Return D,E,F | 21.36% | 1.00% | 45.03% | 1.95% | ||||
Ratios to Average Net Assets C,G,H | ||||||||
| Expenses before reductions | .59% | .59% | .59% | .59% I | ||||
| Expenses net of fee waivers, if any | .59% | .59% | .59% | .59% I | ||||
| Expenses net of all reductions | .59% | .59% | .58% | .59% I | ||||
| Net investment income (loss) | .99% | 1.36% | 1.33% | 1.00% I | ||||
| Supplemental Data | ||||||||
| Net assets, end of period (000 omitted) | $ | 107,923 | $ | 56,276 | $ | 60,407 | $ | 6,112 |
Portfolio turnover rate J,K | 76% | 36% | 68% | 10% L |
| Average Annual Total Returns | |||
Periods ended July 31, 2023 | Past 1 year | Life of Fund |
Fidelity® Real Estate Investment ETF - NAV A | -9.93% | 4.23% |
Fidelity® Real Estate Investment ETF - Market Price B | -10.11% | 4.16% |
MSCI US IMI Real Estate 25/50 Index A | -9.65% | 2.61% |
S&P 500® Index A | 13.02% | 9.27% |
| $10,000 Over Life of Fund |
Let's say hypothetically that $10,000 was invested in Fidelity® Real Estate Investment ETF - NAV, on February 2, 2021, when the fund started. The chart shows how the value of your investment would have changed, and also shows how the MSCI US IMI Real Estate 25/50 Index and S&P 500® Index performed over the same period. |
 |
Top Holdings (% of Fund's net assets) | ||
| Prologis (REIT), Inc. | 10.6 | |
| Crown Castle International Corp. | 8.1 | |
| Equinix, Inc. | 7.1 | |
| Ventas, Inc. | 5.0 | |
| Welltower, Inc. | 4.5 | |
| Digital Realty Trust, Inc. | 4.1 | |
| UDR, Inc. | 3.9 | |
| Mid-America Apartment Communities, Inc. | 3.6 | |
| SBA Communications Corp. Class A | 3.3 | |
| CBRE Group, Inc. | 3.3 | |
| 53.5 | ||
| Top REIT Sectors (% of Fund's net assets) | ||
| REITs - Diversified | 27.0 | |
| REITs - Apartments | 13.5 | |
| REITs - Warehouse/Industrial | 11.2 | |
| REITs - Health Care | 9.5 | |
| REITs - Shopping Centers | 8.0 | |
Asset Allocation (% of Fund's net assets) |
|
| Common Stocks - 98.9% | |||
| Shares | Value ($) | ||
| Equity Real Estate Investment Trusts (REITs) - 93.2% | |||
| REITs - Apartments - 13.5% | |||
| American Homes 4 Rent Class A | 8,037 | 301,227 | |
| Equity Residential (SBI) | 4,583 | 302,203 | |
| Invitation Homes, Inc. | 8,685 | 308,318 | |
| Mid-America Apartment Communities, Inc. | 3,670 | 549,252 | |
| UDR, Inc. | 14,228 | 581,641 | |
| 2,042,641 | |||
| REITs - Diversified - 27.0% | |||
| Apartment Income (REIT) Corp. | 6,246 | 215,737 | |
| Crown Castle International Corp. | 11,268 | 1,220,212 | |
| Digital Realty Trust, Inc. | 4,930 | 614,377 | |
| Elme Communities (SBI) | 1,935 | 31,444 | |
| Equinix, Inc. | 1,320 | 1,069,094 | |
| Gaming & Leisure Properties | 3,764 | 178,639 | |
| Lamar Advertising Co. Class A | 2,535 | 250,205 | |
| SBA Communications Corp. Class A | 2,281 | 499,425 | |
| 4,079,133 | |||
| REITs - Health Care - 9.5% | |||
| Ventas, Inc. | 15,550 | 754,486 | |
| Welltower, Inc. | 8,310 | 682,667 | |
| 1,437,153 | |||
| REITs - Hotels - 5.0% | |||
| DiamondRock Hospitality Co. | 21,839 | 185,632 | |
| Host Hotels & Resorts, Inc. | 17,750 | 326,600 | |
| RLJ Lodging Trust | 10,916 | 112,435 | |
| Ryman Hospitality Properties, Inc. | 1,460 | 139,123 | |
| 763,790 | |||
| REITs - Management/Investment - 5.3% | |||
| NNN (REIT), Inc. | 10,012 | 427,312 | |
| Weyerhaeuser Co. | 11,185 | 380,961 | |
| 808,273 | |||
| REITs - Manufactured Homes - 3.9% | |||
| Equity Lifestyle Properties, Inc. | 2,919 | 207,774 | |
| Sun Communities, Inc. | 2,952 | 384,646 | |
| 592,420 | |||
| REITs - Regional Malls - 0.4% | |||
| Tanger Factory Outlet Centers, Inc. | 2,435 | 57,003 | |
| REITs - Shopping Centers - 8.0% | |||
| Kimco Realty Corp. | 18,540 | 375,620 | |
| Phillips Edison & Co., Inc. | 7,022 | 247,947 | |
| Regency Centers Corp. | 5,242 | 343,508 | |
| SITE Centers Corp. | 8,104 | 113,861 | |
| Urban Edge Properties | 8,040 | 136,760 | |
| 1,217,696 | |||
| REITs - Single Tenant - 2.7% | |||
| Four Corners Property Trust, Inc. | 3,961 | 104,174 | |
| Spirit Realty Capital, Inc. | 7,401 | 298,482 | |
| 402,656 | |||
| REITs - Storage - 6.7% | |||
| CubeSmart | 11,231 | 486,976 | |
| Extra Space Storage, Inc. | 1,542 | 215,217 | |
| Iron Mountain, Inc. | 5,099 | 313,079 | |
| 1,015,272 | |||
| REITs - Warehouse/Industrial - 11.2% | |||
| Prologis (REIT), Inc. | 12,794 | 1,596,051 | |
| Terreno Realty Corp. | 1,559 | 92,511 | |
| 1,688,562 | |||
TOTAL EQUITY REAL ESTATE INVESTMENT TRUSTS (REITS) | 14,104,599 | ||
| Real Estate Management & Development - 5.7% | |||
| Real Estate Services - 5.7% | |||
| CBRE Group, Inc. (a) | 5,908 | 492,195 | |
| CoStar Group, Inc. (a) | 2,243 | 188,345 | |
| Zillow Group, Inc. Class C (a) | 3,418 | 185,119 | |
| 865,659 | |||
| TOTAL COMMON STOCKS (Cost $16,239,711) | 14,970,258 | ||
| Money Market Funds - 1.1% | |||
| Shares | Value ($) | ||
State Street Institutional Treasury Plus Money Market Fund Trust Class 5.15% (b) (Cost $167,489) | 167,489 | 167,489 | |
| TOTAL INVESTMENT IN SECURITIES - 100.0% (Cost $16,407,200) | 15,137,747 |
NET OTHER ASSETS (LIABILITIES) - 0.0% | (3,593) |
| NET ASSETS - 100.0% | 15,134,154 |
| (a) | Non-income producing |
| (b) | The rate quoted is the annualized seven-day yield of the fund at period end. |
| Valuation Inputs at Reporting Date: | ||||
| Description | Total ($) | Level 1 ($) | Level 2 ($) | Level 3 ($) |
Investments in Securities: | ||||
| Common Stocks | 14,970,258 | 14,970,258 | - | - |
| Money Market Funds | 167,489 | 167,489 | - | - |
| Total Investments in Securities: | 15,137,747 | 15,137,747 | - | - |
| Statement of Assets and Liabilities | ||||
| July 31, 2023 | ||||
| Assets | ||||
Investment in securities, at value - See accompanying schedule Unaffiliated issuers (cost $16,407,200): | $ | 15,137,747 | ||
| Receivable for investments sold | 53,540 | |||
| Dividends receivable | 6,906 | |||
| Other receivables | 2,773 | |||
Total assets | 15,200,966 | |||
| Liabilities | ||||
| Payable for investments purchased | $ | 57,945 | ||
| Accrued management fee | 7,480 | |||
| Other payables and accrued expenses | 1,387 | |||
| Total Liabilities | 66,812 | |||
| Net Assets | $ | 15,134,154 | ||
| Net Assets consist of: | ||||
| Paid in capital | $ | 17,515,881 | ||
| Total accumulated earnings (loss) | (2,381,727) | |||
| Net Assets | $ | 15,134,154 | ||
Net Asset Value, offering price and redemption price per share ($15,134,154 ÷ 725,000 shares) | $ | 20.87 | ||
| Statement of Operations | ||||
Year ended July 31, 2023 | ||||
| Investment Income | ||||
| Dividends | $ | 505,167 | ||
| Expenses | ||||
| Management fee | $ | 96,814 | ||
| Independent trustees' fees and expenses | 89 | |||
| Total Expenses | 96,903 | |||
| Net Investment income (loss) | 408,264 | |||
| Realized and Unrealized Gain (Loss) | ||||
| Net realized gain (loss) on: | ||||
| Investment Securities: | ||||
| Redemptions in-kind | 192,538 | |||
| Unaffiliated issuers | (970,377) | |||
| Total net realized gain (loss) | (777,839) | |||
| Change in net unrealized appreciation (depreciation) on investment securities | (1,729,975) | |||
| Net gain (loss) | (2,507,814) | |||
| Net increase (decrease) in net assets resulting from operations | $ | (2,099,550) | ||
| Statement of Changes in Net Assets | ||||
Year ended July 31, 2023 | Year ended July 31, 2022 | |||
| Increase (Decrease) in Net Assets | ||||
| Operations | ||||
| Net investment income (loss) | $ | 408,264 | $ | 322,595 |
| Net realized gain (loss) | (777,839) | 414,223 | ||
| Change in net unrealized appreciation (depreciation) | (1,729,975) | (1,439,266) | ||
| Net increase (decrease) in net assets resulting from operations | (2,099,550) | (702,448) | ||
| Distributions to shareholders | (452,000) | (456,700) | ||
| Share transactions | ||||
| Proceeds from sales of shares | 1,073,585 | 7,736,496 | ||
| Cost of shares redeemed | (3,644,415) | (3,056,221) | ||
Net increase (decrease) in net assets resulting from share transactions | (2,570,830) | 4,680,275 | ||
| Total increase (decrease) in net assets | (5,122,380) | 3,521,127 | ||
| Net Assets | ||||
| Beginning of period | 20,256,534 | 16,735,407 | ||
| End of period | $ | 15,134,154 | $ | 20,256,534 |
| Other Information | ||||
| Shares | ||||
| Sold | 50,000 | 300,000 | ||
| Redeemed | (175,000) | (125,000) | ||
| Net increase (decrease) | (125,000) | 175,000 | ||
| Fidelity® Real Estate Investment ETF |
| Years ended July 31, | 2023 | 2022 | 2021 A | |||
Selected Per-Share Data | ||||||
| Net asset value, beginning of period | $ | 23.83 | $ | 24.79 | $ | 20.00 |
| Income from Investment Operations | ||||||
Net investment income (loss) B,C | .52 | .39 | .21 | |||
| Net realized and unrealized gain (loss) | (2.91) | (.80) | 4.79 | |||
| Total from investment operations | (2.39) | (.41) | 5.00 | |||
| Distributions from net investment income | (.57) | (.55) | (.21) | |||
| Total distributions | (.57) | (.55) | (.21) | |||
| Net asset value, end of period | $ | 20.87 | $ | 23.83 | $ | 24.79 |
Total Return D,E,F | (9.93)% | (1.68)% | 25.17% | |||
Ratios to Average Net Assets C,G,H | ||||||
| Expenses before reductions | .59% | .59% | .59% I | |||
| Expenses net of fee waivers, if any | .59% | .59% | .59% I | |||
| Expenses net of all reductions | .59% | .59% | .58% I | |||
| Net investment income (loss) | 2.49% | 1.58% | 1.80% I | |||
| Supplemental Data | ||||||
| Net assets, end of period (000 omitted) | $ | 15,134 | $ | 20,257 | $ | 16,735 |
Portfolio turnover rate J,K | 33% | 24% | 23% L |
| Average Annual Total Returns | |||
Periods ended July 31, 2023 | Past 1 year | Life of Fund |
Fidelity® Small-Mid Cap Opportunities ETF - NAV A | 9.02% | 5.71% |
Fidelity® Small-Mid Cap Opportunities ETF - Market Price B | 8.91% | 4.75% |
Russell 2500™ Index A | 8.05% | 1.51% |
| $10,000 Over Life of Fund |
Let's say hypothetically that $10,000 was invested in Fidelity® Small-Mid Cap Opportunities ETF - NAV, on February 2, 2021, when the fund started. The chart shows how the value of your investment would have changed, and also shows how the Russell 2500™ Index performed over the same period. |
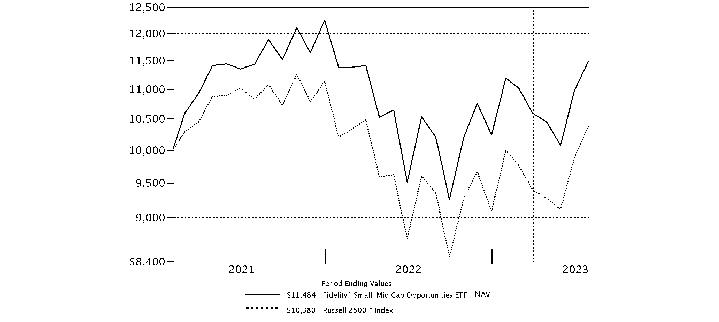 |
Top Holdings (% of Fund's net assets) | ||
| Builders FirstSource, Inc. | 2.0 | |
| TechnipFMC PLC | 1.7 | |
| TFI International, Inc. | 1.5 | |
| Tempur Sealy International, Inc. | 1.4 | |
| Hess Corp. | 1.4 | |
| AutoZone, Inc. | 1.3 | |
| Arch Capital Group Ltd. | 1.2 | |
| ON Semiconductor Corp. | 1.2 | |
| Amdocs Ltd. | 1.2 | |
| BJ's Wholesale Club Holdings, Inc. | 1.2 | |
| 14.1 | ||
| Market Sectors (% of Fund's net assets) | ||
| Industrials | 22.5 | |
| Financials | 15.8 | |
| Consumer Discretionary | 12.8 | |
| Information Technology | 12.6 | |
| Health Care | 10.7 | |
| Materials | 6.9 | |
| Energy | 6.3 | |
| Consumer Staples | 4.5 | |
| Real Estate | 3.9 | |
| Utilities | 1.6 | |
| Communication Services | 1.3 | |
Asset Allocation (% of Fund's net assets) |
|
| Common Stocks - 98.9% | |||
| Shares | Value ($) | ||
| COMMUNICATION SERVICES - 1.3% | |||
| Interactive Media & Services - 0.4% | |||
| Ziff Davis, Inc. (a) | 1,712 | 124,154 | |
| Media - 0.9% | |||
| Nexstar Broadcasting Group, Inc. Class A | 1,700 | 317,424 | |
TOTAL COMMUNICATION SERVICES | 441,578 | ||
| CONSUMER DISCRETIONARY - 12.8% | |||
| Automobile Components - 0.6% | |||
| Adient PLC (a) | 2,852 | 121,381 | |
| Patrick Industries, Inc. | 818 | 70,798 | |
| 192,179 | |||
| Diversified Consumer Services - 0.6% | |||
| Adtalem Global Education, Inc. (a) | 1,699 | 73,465 | |
| Duolingo, Inc. (a) | 835 | 129,584 | |
| 203,049 | |||
| Hotels, Restaurants & Leisure - 2.8% | |||
| Brinker International, Inc. (a) | 3,255 | 127,856 | |
| Churchill Downs, Inc. | 2,713 | 314,301 | |
| Light & Wonder, Inc. Class A (a) | 2,169 | 152,481 | |
| Red Rock Resorts, Inc. | 2,110 | 102,335 | |
| Wyndham Hotels & Resorts, Inc. | 3,631 | 282,928 | |
| 979,901 | |||
| Household Durables - 2.9% | |||
| Helen of Troy Ltd. (a) | 1,007 | 142,289 | |
| KB Home | 3,087 | 166,605 | |
| LGI Homes, Inc. (a) | 1,580 | 219,225 | |
| Tempur Sealy International, Inc. | 11,157 | 497,937 | |
| 1,026,056 | |||
| Specialty Retail - 3.9% | |||
| Academy Sports & Outdoors, Inc. | 788 | 47,115 | |
| AutoZone, Inc. (a) | 187 | 464,082 | |
| Dick's Sporting Goods, Inc. | 2,040 | 287,640 | |
| Murphy U.S.A., Inc. | 852 | 261,590 | |
| Upbound Group, Inc. | 3,914 | 135,542 | |
| Williams-Sonoma, Inc. | 1,286 | 178,291 | |
| 1,374,260 | |||
| Textiles, Apparel & Luxury Goods - 2.0% | |||
| Crocs, Inc. (a) | 2,541 | 275,317 | |
| Gildan Activewear, Inc. | 3,290 | 102,319 | |
| Tapestry, Inc. | 7,887 | 340,324 | |
| 717,960 | |||
TOTAL CONSUMER DISCRETIONARY | 4,493,405 | ||
| CONSUMER STAPLES - 4.5% | |||
| Consumer Staples Distribution & Retail - 3.2% | |||
| BJ's Wholesale Club Holdings, Inc. (a) | 6,111 | 405,220 | |
| Performance Food Group Co. (a) | 6,146 | 367,285 | |
| U.S. Foods Holding Corp. (a) | 7,872 | 336,371 | |
| 1,108,876 | |||
| Food Products - 1.3% | |||
| Lamb Weston Holdings, Inc. | 1,584 | 164,150 | |
| Nomad Foods Ltd. (a) | 13,962 | 248,244 | |
| Seaboard Corp. | 17 | 61,285 | |
| 473,679 | |||
TOTAL CONSUMER STAPLES | 1,582,555 | ||
| ENERGY - 6.3% | |||
| Energy Equipment & Services - 1.7% | |||
| TechnipFMC PLC | 32,243 | 591,337 | |
| Oil, Gas & Consumable Fuels - 4.6% | |||
| Antero Resources Corp. (a) | 10,095 | 270,041 | |
| Cheniere Energy, Inc. | 2,092 | 338,611 | |
| Denbury, Inc. (a) | 1,778 | 156,304 | |
| Hess Corp. | 3,183 | 482,957 | |
| Marathon Oil Corp. | 4,751 | 124,809 | |
| Murphy Oil Corp. | 5,077 | 219,682 | |
| Sitio Royalties Corp. | 1,261 | 34,476 | |
| 1,626,880 | |||
TOTAL ENERGY | 2,218,217 | ||
| FINANCIALS - 15.8% | |||
| Banks - 6.3% | |||
| BOK Financial Corp. | 1,862 | 165,867 | |
| Cadence Bank | 7,915 | 198,271 | |
| Eastern Bankshares, Inc. | 12,875 | 181,795 | |
| First Bancorp, Puerto Rico | 10,487 | 155,732 | |
| First Citizens Bancshares, Inc. | 146 | 208,970 | |
| First Hawaiian, Inc. | 5,046 | 104,402 | |
| First Interstate Bancsystem, Inc. | 5,392 | 154,912 | |
| Independent Bank Group, Inc. | 2,625 | 117,784 | |
| M&T Bank Corp. | 699 | 97,762 | |
| Pinnacle Financial Partners, Inc. | 3,073 | 233,241 | |
| Synovus Financial Corp. | 6,528 | 221,299 | |
| Trico Bancshares | 817 | 30,539 | |
| Webster Financial Corp. | 3,417 | 161,692 | |
| Wintrust Financial Corp. | 1,990 | 167,876 | |
| 2,200,142 | |||
| Capital Markets - 1.5% | |||
| LPL Financial | 1,475 | 338,306 | |
| Raymond James Financial, Inc. | 1,736 | 191,082 | |
| 529,388 | |||
| Consumer Finance - 1.4% | |||
| Discover Financial Services | 2,625 | 277,069 | |
| Encore Capital Group, Inc. (a) | 1,240 | 66,340 | |
| PROG Holdings, Inc. (a) | 4,029 | 163,497 | |
| 506,906 | |||
| Financial Services - 0.4% | |||
| Walker & Dunlop, Inc. | 1,503 | 136,743 | |
| Insurance - 6.2% | |||
| American Financial Group, Inc. | 1,515 | 184,239 | |
| Arch Capital Group Ltd. (a) | 5,354 | 415,952 | |
| Assurant, Inc. | 1,877 | 252,475 | |
| Enstar Group Ltd. (a) | 428 | 109,517 | |
| First American Financial Corp. | 6,362 | 403,224 | |
| Old Republic International Corp. | 11,205 | 308,922 | |
| Primerica, Inc. | 1,333 | 283,529 | |
| Reinsurance Group of America, Inc. | 1,505 | 211,227 | |
| 2,169,085 | |||
TOTAL FINANCIALS | 5,542,264 | ||
| HEALTH CARE - 10.7% | |||
| Biotechnology - 1.6% | |||
| Acelyrin, Inc. | 701 | 17,413 | |
| ALX Oncology Holdings, Inc. (a) | 263 | 1,607 | |
| Arcellx, Inc. (a) | 719 | 24,626 | |
| Arcutis Biotherapeutics, Inc. (a) | 118 | 1,287 | |
| Argenx SE ADR (a) | 314 | 158,407 | |
| Blueprint Medicines Corp. (a) | 1,021 | 67,386 | |
| Celldex Therapeutics, Inc. (a) | 466 | 16,478 | |
| Cytokinetics, Inc. (a) | 905 | 30,182 | |
| Day One Biopharmaceuticals, Inc. (a) | 954 | 12,631 | |
| Immunocore Holdings PLC ADR (a) | 536 | 35,365 | |
| Keros Therapeutics, Inc. (a) | 176 | 7,371 | |
| Nuvalent, Inc. Class A (a) | 910 | 45,364 | |
| Prelude Therapeutics, Inc. (a) | 393 | 1,537 | |
| PTC Therapeutics, Inc. (a) | 756 | 30,497 | |
| Vaxcyte, Inc. (a) | 774 | 37,198 | |
| Vericel Corp. (a) | 528 | 18,966 | |
| Verve Therapeutics, Inc. (a) | 588 | 12,048 | |
| Xenon Pharmaceuticals, Inc. (a) | 824 | 30,422 | |
| Zentalis Pharmaceuticals, Inc. (a) | 771 | 20,593 | |
| 569,378 | |||
| Health Care Equipment & Supplies - 2.8% | |||
| Envista Holdings Corp. (a) | 6,871 | 236,431 | |
| Haemonetics Corp. (a) | 2,002 | 184,664 | |
| Hologic, Inc. (a) | 2,910 | 231,112 | |
| ICU Medical, Inc. (a) | 777 | 138,446 | |
| TransMedics Group, Inc. (a) | 2,152 | 200,523 | |
| 991,176 | |||
| Health Care Providers & Services - 3.5% | |||
| Acadia Healthcare Co., Inc. (a) | 3,390 | 267,912 | |
| AdaptHealth Corp. (a) | 7,558 | 103,847 | |
| agilon health, Inc. (a) | 5,345 | 102,357 | |
| Molina Healthcare, Inc. (a) | 1,243 | 378,481 | |
| Owens & Minor, Inc. (a) | 5,347 | 102,876 | |
| Universal Health Services, Inc. Class B | 2,034 | 282,645 | |
| 1,238,118 | |||
| Health Care Technology - 0.7% | |||
| Evolent Health, Inc. (a) | 3,399 | 103,296 | |
| Phreesia, Inc. (a) | 4,160 | 131,955 | |
| 235,251 | |||
| Life Sciences Tools & Services - 1.7% | |||
| 10X Genomics, Inc. (a) | 539 | 33,946 | |
| Charles River Laboratories International, Inc. (a) | 1,093 | 229,027 | |
| ICON PLC (a) | 142 | 35,700 | |
| Medpace Holdings, Inc. (a) | 695 | 175,953 | |
| West Pharmaceutical Services, Inc. | 311 | 114,460 | |
| 589,086 | |||
| Pharmaceuticals - 0.4% | |||
| Arvinas Holding Co. LLC (a) | 664 | 16,414 | |
| Axsome Therapeutics, Inc. (a) | 451 | 35,390 | |
| Prestige Brands Holdings, Inc. (a) | 368 | 23,997 | |
| Ventyx Biosciences, Inc. (a) | 561 | 20,785 | |
| Verona Pharma PLC ADR (a) | 1,517 | 33,511 | |
| 130,097 | |||
TOTAL HEALTH CARE | 3,753,106 | ||
| INDUSTRIALS - 22.5% | |||
| Aerospace & Defense - 0.5% | |||
| Curtiss-Wright Corp. | 890 | 170,310 | |
| Building Products - 2.5% | |||
| Builders FirstSource, Inc. (a) | 4,919 | 710,448 | |
| Hayward Holdings, Inc. (a) | 13,758 | 183,807 | |
| 894,255 | |||
| Commercial Services & Supplies - 0.4% | |||
| The Brink's Co. | 2,001 | 145,993 | |
| Construction & Engineering - 2.7% | |||
| AECOM | 2,683 | 233,421 | |
| EMCOR Group, Inc. | 1,420 | 305,357 | |
| Granite Construction, Inc. | 5,007 | 204,937 | |
| Willscot Mobile Mini Holdings (a) | 3,965 | 190,122 | |
| 933,837 | |||
| Electrical Equipment - 3.8% | |||
| Acuity Brands, Inc. | 1,219 | 201,428 | |
| AMETEK, Inc. | 1,810 | 287,066 | |
| Atkore, Inc. (a) | 1,856 | 294,492 | |
| Regal Rexnord Corp. | 2,532 | 395,448 | |
| Vertiv Holdings Co. | 5,670 | 147,477 | |
| 1,325,911 | |||
| Ground Transportation - 2.2% | |||
| TFI International, Inc. | 4,187 | 537,401 | |
| XPO, Inc. (a) | 3,366 | 233,062 | |
| 770,463 | |||
| Machinery - 3.8% | |||
| Allison Transmission Holdings, Inc. | 3,329 | 195,379 | |
| Crane Co. | 2,695 | 252,495 | |
| Crane Nxt Co. | 2,695 | 159,409 | |
| Federal Signal Corp. | 2,707 | 165,371 | |
| ITT, Inc. | 3,302 | 328,879 | |
| SPX Technologies, Inc. (a) | 2,930 | 247,907 | |
| 1,349,440 | |||
| Professional Services - 5.2% | |||
| ASGN, Inc. (a) | 2,913 | 222,320 | |
| CACI International, Inc. Class A (a) | 888 | 311,191 | |
| Concentrix Corp. | 1,869 | 155,576 | |
| ExlService Holdings, Inc. (a) | 1,272 | 179,288 | |
| Genpact Ltd. | 5,652 | 203,981 | |
| KBR, Inc. | 5,211 | 320,424 | |
| Kforce, Inc. | 1,206 | 76,509 | |
| Maximus, Inc. | 1,959 | 164,086 | |
| WNS Holdings Ltd. sponsored ADR (a) | 2,554 | 176,507 | |
| 1,809,882 | |||
| Trading Companies & Distributors - 1.4% | |||
| Applied Industrial Technologies, Inc. | 988 | 143,250 | |
| Beacon Roofing Supply, Inc. (a) | 2,881 | 246,815 | |
| Rush Enterprises, Inc. Class A | 1,840 | 119,011 | |
| 509,076 | |||
TOTAL INDUSTRIALS | 7,909,167 | ||
| INFORMATION TECHNOLOGY - 12.6% | |||
| Communications Equipment - 0.5% | |||
| Lumentum Holdings, Inc. (a) | 3,545 | 185,616 | |
| Electronic Equipment, Instruments & Components - 4.7% | |||
| Advanced Energy Industries, Inc. | 2,585 | 323,590 | |
| Coherent Corp. (a) | 3,876 | 183,567 | |
| Fabrinet (a) | 2,144 | 265,084 | |
| Flex Ltd. (a) | 6,945 | 190,015 | |
| Insight Enterprises, Inc. (a) | 1,775 | 260,375 | |
| TD SYNNEX Corp. | 2,665 | 263,062 | |
| Vontier Corp. | 5,256 | 162,568 | |
| 1,648,261 | |||
| IT Services - 1.2% | |||
| Amdocs Ltd. | 4,377 | 409,862 | |
| Semiconductors & Semiconductor Equipment - 3.1% | |||
| Allegro MicroSystems LLC (a) | 2,344 | 120,974 | |
| Cirrus Logic, Inc. (a) | 515 | 41,612 | |
| Ichor Holdings Ltd. (a) | 3,524 | 136,449 | |
| Lattice Semiconductor Corp. (a) | 2,483 | 225,804 | |
| MACOM Technology Solutions Holdings, Inc. (a) | 2,131 | 149,000 | |
| ON Semiconductor Corp. (a) | 3,808 | 410,312 | |
| 1,084,151 | |||
| Software - 2.1% | |||
| Dynatrace, Inc. (a) | 5,102 | 279,028 | |
| Sprout Social, Inc. (a) | 1,970 | 112,566 | |
| Tenable Holdings, Inc. (a) | 4,530 | 220,430 | |
| Zoom Video Communications, Inc. Class A (a) | 1,671 | 122,568 | |
| 734,592 | |||
| Technology Hardware, Storage & Peripherals - 1.0% | |||
| Avid Technology, Inc. (a) | 4,111 | 98,006 | |
| Seagate Technology Holdings PLC | 4,332 | 275,082 | |
| 373,088 | |||
TOTAL INFORMATION TECHNOLOGY | 4,435,570 | ||
| MATERIALS - 6.9% | |||
| Chemicals - 2.7% | |||
| Cabot Corp. | 2,200 | 156,200 | |
| Element Solutions, Inc. | 8,375 | 175,540 | |
| Olin Corp. | 3,854 | 222,299 | |
| The Chemours Co. LLC | 9,644 | 356,635 | |
| Tronox Holdings PLC | 3,268 | 43,432 | |
| 954,106 | |||
| Construction Materials - 1.3% | |||
| Eagle Materials, Inc. | 1,606 | 296,098 | |
| Summit Materials, Inc. | 4,610 | 166,790 | |
| 462,888 | |||
| Containers & Packaging - 0.8% | |||
| O-I Glass, Inc. (a) | 11,803 | 270,997 | |
| Metals & Mining - 1.6% | |||
| Commercial Metals Co. | 4,490 | 256,918 | |
| Constellium NV (a) | 5,325 | 101,654 | |
| Steel Dynamics, Inc. | 1,826 | 194,615 | |
| 553,187 | |||
| Paper & Forest Products - 0.5% | |||
| Louisiana-Pacific Corp. | 2,576 | 196,111 | |
TOTAL MATERIALS | 2,437,289 | ||
| REAL ESTATE - 3.9% | |||
| Equity Real Estate Investment Trusts (REITs) - 2.6% | |||
| CubeSmart | 9,229 | 400,169 | |
| Douglas Emmett, Inc. | 16,893 | 248,327 | |
| Essential Properties Realty Trust, Inc. | 6,746 | 165,614 | |
| LXP Industrial Trust (REIT) | 8,609 | 86,693 | |
| 900,803 | |||
| Real Estate Management & Development - 1.3% | |||
| Cushman & Wakefield PLC (a) | 15,204 | 149,455 | |
| Jones Lang LaSalle, Inc. (a) | 1,949 | 324,606 | |
| 474,061 | |||
TOTAL REAL ESTATE | 1,374,864 | ||
| UTILITIES - 1.6% | |||
| Electric Utilities - 0.5% | |||
| PG&E Corp. (a) | 9,568 | 168,492 | |
| Gas Utilities - 0.7% | |||
| Brookfield Infrastructure Corp. A Shares | 5,557 | 259,623 | |
| Independent Power and Renewable Electricity Producers - 0.4% | |||
| The AES Corp. | 6,960 | 150,544 | |
TOTAL UTILITIES | 578,659 | ||
| TOTAL COMMON STOCKS (Cost $29,866,160) | 34,766,674 | ||
| Money Market Funds - 1.2% | |||
| Shares | Value ($) | ||
State Street Institutional Treasury Plus Money Market Fund Trust Class 5.15% (b) (Cost $399,975) | 399,975 | 399,975 | |
| TOTAL INVESTMENT IN SECURITIES - 100.1% (Cost $30,266,135) | 35,166,649 |
NET OTHER ASSETS (LIABILITIES) - (0.1)% | (18,112) |
| NET ASSETS - 100.0% | 35,148,537 |
| (a) | Non-income producing |
| (b) | The rate quoted is the annualized seven-day yield of the fund at period end. |
| Valuation Inputs at Reporting Date: | ||||
| Description | Total ($) | Level 1 ($) | Level 2 ($) | Level 3 ($) |
Investments in Securities: | ||||
| Equities: | ||||
Communication Services | 441,578 | 441,578 | - | - |
Consumer Discretionary | 4,493,405 | 4,493,405 | - | - |
Consumer Staples | 1,582,555 | 1,582,555 | - | - |
Energy | 2,218,217 | 2,218,217 | - | - |
Financials | 5,542,264 | 5,542,264 | - | - |
Health Care | 3,753,106 | 3,753,106 | - | - |
Industrials | 7,909,167 | 7,909,167 | - | - |
Information Technology | 4,435,570 | 4,435,570 | - | - |
Materials | 2,437,289 | 2,437,289 | - | - |
Real Estate | 1,374,864 | 1,374,864 | - | - |
Utilities | 578,659 | 578,659 | - | - |
| Money Market Funds | 399,975 | 399,975 | - | - |
| Total Investments in Securities: | 35,166,649 | 35,166,649 | - | - |
| Statement of Assets and Liabilities | ||||
| July 31, 2023 | ||||
| Assets | ||||
Investment in securities, at value - See accompanying schedule Unaffiliated issuers (cost $30,266,135): | $ | 35,166,649 | ||
| Dividends receivable | 3,462 | |||
Total assets | 35,170,111 | |||
| Liabilities | ||||
| Payable for investments purchased | $ | 4,617 | ||
| Accrued management fee | 16,957 | |||
| Total Liabilities | 21,574 | |||
| Net Assets | $ | 35,148,537 | ||
| Net Assets consist of: | ||||
| Paid in capital | $ | 34,516,899 | ||
| Total accumulated earnings (loss) | 631,638 | |||
| Net Assets | $ | 35,148,537 | ||
Net Asset Value, offering price and redemption price per share ($35,148,537 ÷ 1,550,000 shares) | $ | 22.68 | ||
| Statement of Operations | ||||
Year ended July 31, 2023 | ||||
| Investment Income | ||||
| Dividends | $ | 350,383 | ||
| Expenses | ||||
| Management fee | $ | 176,672 | ||
| Independent trustees' fees and expenses | 147 | |||
| Total expenses before reductions | 176,819 | |||
| Expense reductions | (10) | |||
| Total expenses after reductions | 176,809 | |||
| Net Investment income (loss) | 173,574 | |||
| Realized and Unrealized Gain (Loss) | ||||
| Net realized gain (loss) on: | ||||
| Investment Securities: | ||||
| Redemptions in-kind | 51,925 | |||
| Unaffiliated issuers | (2,176,380) | |||
| Foreign currency transactions | (5) | |||
| Futures contracts | (1,685) | |||
| Total net realized gain (loss) | (2,126,145) | |||
| Change in net unrealized appreciation (depreciation) on investment securities | 4,570,740 | |||
| Net gain (loss) | 2,444,595 | |||
| Net increase (decrease) in net assets resulting from operations | $ | 2,618,169 | ||
| Statement of Changes in Net Assets | ||||
Year ended July 31, 2023 | Year ended July 31, 2022 | |||
| Increase (Decrease) in Net Assets | ||||
| Operations | ||||
| Net investment income (loss) | $ | 173,574 | $ | 127,019 |
| Net realized gain (loss) | (2,126,145) | (1,352,161) | ||
| Change in net unrealized appreciation (depreciation) | 4,570,740 | (1,276,518) | ||
| Net increase (decrease) in net assets resulting from operations | 2,618,169 | (2,501,660) | ||
| Distributions to shareholders | (192,175) | (131,575) | ||
| Share transactions | ||||
| Proceeds from sales of shares | 5,939,963 | 8,178,290 | ||
| Cost of shares redeemed | (964,910) | (2,355,247) | ||
Net increase (decrease) in net assets resulting from share transactions | 4,975,053 | 5,823,043 | ||
| Total increase (decrease) in net assets | 7,401,047 | 3,189,808 | ||
| Net Assets | ||||
| Beginning of period | 27,747,490 | 24,557,682 | ||
| End of period | $ | 35,148,537 | $ | 27,747,490 |
| Other Information | ||||
| Shares | ||||
| Sold | 275,000 | 350,000 | ||
| Redeemed | (50,000) | (100,000) | ||
| Net increase (decrease) | 225,000 | 250,000 | ||
| Fidelity® Small-Mid Cap Opportunities ETF |
| Years ended July 31, | 2023 | 2022 | 2021 A | |||
Selected Per-Share Data | ||||||
| Net asset value, beginning of period | $ | 20.94 | $ | 22.84 | $ | 20.00 |
| Income from Investment Operations | ||||||
Net investment income (loss) B,C | .12 | .10 | .03 | |||
| Net realized and unrealized gain (loss) | 1.76 | (1.89) | 2.84 | |||
| Total from investment operations | 1.88 | (1.79) | 2.87 | |||
| Distributions from net investment income | (.14) | (.11) | (.03) | |||
| Total distributions | (.14) | (.11) | (.03) | |||
| Net asset value, end of period | $ | 22.68 | $ | 20.94 | $ | 22.84 |
Total Return D,E,F | 9.02% | (7.88)% | 14.36% | |||
Ratios to Average Net Assets C,G,H | ||||||
| Expenses before reductions | .60% | .62% | .64% I | |||
| Expenses net of fee waivers, if any | .60% | .62% | .64% I | |||
| Expenses net of all reductions | .60% | .62% | .63% I | |||
| Net investment income (loss) | .59% | .45% | .22% I | |||
| Supplemental Data | ||||||
| Net assets, end of period (000 omitted) | $ | 35,149 | $ | 27,747 | $ | 24,558 |
Portfolio turnover rate J,K | 38% | 42% | 37% L |
| Average Annual Total Returns | |||
Periods ended July 31, 2023 | Past 1 year | Life of Fund |
Fidelity® Sustainable U.S. Equity ETF - NAV A | 14.25% | 4.80% |
Fidelity® Sustainable U.S. Equity ETF - Market Price B | 14.14% | 5.01% |
Russell 3000® Index A | 12.65% | 3.44% |
MSCI USA IMI ESG Leaders Index A | 13.04% | 4.51% |
| $10,000 Over Life of Fund |
Let's say hypothetically that $10,000 was invested in Fidelity® Sustainability U.S. Equity ETF - NAV, on June 15, 2021, when the fund started. The chart shows how the value of your investment would have changed, and also shows how the Russell 3000® Index performed over the same period. |
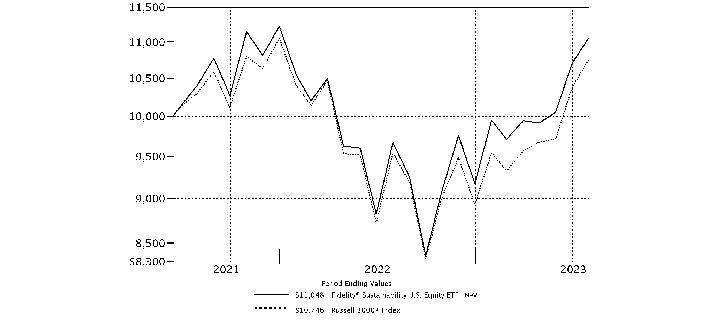 |
Top Holdings (% of Fund's net assets) | ||
| Microsoft Corp. | 7.9 | |
| NVIDIA Corp. | 4.0 | |
| Apple, Inc. | 3.1 | |
| Salesforce, Inc. | 2.8 | |
| Intuit, Inc. | 2.4 | |
| Cigna Group | 2.3 | |
| Alphabet, Inc. Class A | 2.2 | |
| Procter & Gamble Co. | 2.2 | |
| Danaher Corp. | 2.2 | |
| The Travelers Companies, Inc. | 2.2 | |
| 31.3 | ||
| Market Sectors (% of Fund's net assets) | ||
| Information Technology | 29.3 | |
| Health Care | 13.2 | |
| Financials | 12.1 | |
| Industrials | 10.4 | |
| Consumer Discretionary | 10.0 | |
| Communication Services | 6.2 | |
| Consumer Staples | 5.3 | |
| Materials | 4.5 | |
| Energy | 3.0 | |
| Real Estate | 2.1 | |
| Utilities | 1.8 | |
Asset Allocation (% of Fund's net assets) |
 |
| Common Stocks - 97.9% | |||
| Shares | Value ($) | ||
| COMMUNICATION SERVICES - 6.2% | |||
| Entertainment - 1.8% | |||
| Netflix, Inc. (a) | 424 | 186,123 | |
| Interactive Media & Services - 2.2% | |||
| Alphabet, Inc. Class A (a) | 1,734 | 230,136 | |
| Media - 2.2% | |||
| Comcast Corp. Class A | 2,683 | 121,433 | |
| Interpublic Group of Companies, Inc. | 2,923 | 100,054 | |
| 221,487 | |||
TOTAL COMMUNICATION SERVICES | 637,746 | ||
| CONSUMER DISCRETIONARY - 10.0% | |||
| Automobile Components - 0.8% | |||
| Aptiv PLC (a) | 784 | 85,840 | |
| Automobiles - 1.2% | |||
| General Motors Co. | 2,132 | 81,805 | |
| Tesla, Inc. (a) | 173 | 46,265 | |
| 128,070 | |||
| Broadline Retail - 2.0% | |||
| Amazon.com, Inc. (a) | 1,520 | 203,194 | |
| Diversified Consumer Services - 1.2% | |||
| Adtalem Global Education, Inc. (a) | 2,876 | 124,358 | |
| Hotels, Restaurants & Leisure - 1.5% | |||
| Marriott International, Inc. Class A | 762 | 153,779 | |
| Household Durables - 0.8% | |||
| Taylor Morrison Home Corp. (a) | 1,690 | 81,830 | |
| Specialty Retail - 1.6% | |||
| Lowe's Companies, Inc. | 684 | 160,241 | |
| Textiles, Apparel & Luxury Goods - 0.9% | |||
| Tapestry, Inc. | 2,203 | 95,059 | |
TOTAL CONSUMER DISCRETIONARY | 1,032,371 | ||
| CONSUMER STAPLES - 5.3% | |||
| Consumer Staples Distribution & Retail - 1.4% | |||
| Albertsons Companies, Inc. | 4,239 | 92,113 | |
| Sprouts Farmers Market LLC (a) | 1,337 | 52,477 | |
| 144,590 | |||
| Food Products - 1.1% | |||
| Darling Ingredients, Inc. (a) | 825 | 57,131 | |
| Nomad Foods Ltd. (a) | 2,889 | 51,366 | |
| 108,497 | |||
| Household Products - 2.2% | |||
| Procter & Gamble Co. | 1,468 | 229,448 | |
| Personal Care Products - 0.6% | |||
| Estee Lauder Companies, Inc. Class A | 373 | 67,140 | |
TOTAL CONSUMER STAPLES | 549,675 | ||
| ENERGY - 3.0% | |||
| Energy Equipment & Services - 1.4% | |||
| Baker Hughes Co. Class A | 4,210 | 150,676 | |
| Oil, Gas & Consumable Fuels - 1.6% | |||
| Cheniere Energy, Inc. | 581 | 94,041 | |
| Occidental Petroleum Corp. | 1,071 | 67,612 | |
| 161,653 | |||
TOTAL ENERGY | 312,329 | ||
| FINANCIALS - 12.1% | |||
| Banks - 1.9% | |||
| Bank of America Corp. | 5,956 | 190,592 | |
| Capital Markets - 5.3% | |||
| BlackRock, Inc. Class A | 162 | 119,694 | |
| Moody's Corp. | 413 | 145,686 | |
| Northern Trust Corp. | 1,722 | 137,967 | |
| State Street Corp. | 2,024 | 146,619 | |
| 549,966 | |||
| Consumer Finance - 1.5% | |||
| American Express Co. | 913 | 154,187 | |
| Financial Services - 1.2% | |||
| MasterCard, Inc. Class A | 320 | 126,170 | |
| Insurance - 2.2% | |||
| The Travelers Companies, Inc. | 1,315 | 226,982 | |
TOTAL FINANCIALS | 1,247,897 | ||
| HEALTH CARE - 13.2% | |||
| Biotechnology - 1.7% | |||
| Moderna, Inc. (a) | 329 | 38,710 | |
| Vertex Pharmaceuticals, Inc. (a) | 389 | 137,060 | |
| 175,770 | |||
| Health Care Providers & Services - 4.4% | |||
| Centene Corp. (a) | 1,629 | 110,919 | |
| Cigna Group | 788 | 232,539 | |
| CVS Health Corp. | 1,420 | 106,060 | |
| 449,518 | |||
| Life Sciences Tools & Services - 3.6% | |||
| Danaher Corp. | 894 | 228,024 | |
| ICON PLC (a) | 570 | 143,304 | |
| 371,328 | |||
| Pharmaceuticals - 3.5% | |||
| Merck & Co., Inc. | 2,000 | 213,300 | |
| Zoetis, Inc. Class A | 785 | 147,651 | |
| 360,951 | |||
TOTAL HEALTH CARE | 1,357,567 | ||
| INDUSTRIALS - 10.4% | |||
| Air Freight & Logistics - 1.3% | |||
| United Parcel Service, Inc. Class B | 724 | 135,482 | |
| Building Products - 1.2% | |||
| Johnson Controls International PLC | 1,739 | 120,947 | |
| Electrical Equipment - 2.4% | |||
| Acuity Brands, Inc. | 605 | 99,970 | |
| Generac Holdings, Inc. (a) | 415 | 63,786 | |
| Regal Rexnord Corp. | 543 | 84,806 | |
| 248,562 | |||
| Machinery - 2.1% | |||
| Deere & Co. | 240 | 103,104 | |
| Ingersoll Rand, Inc. | 1,764 | 115,136 | |
| 218,240 | |||
| Professional Services - 3.4% | |||
| KBR, Inc. | 3,552 | 218,412 | |
| Manpower, Inc. | 1,006 | 79,353 | |
| Verisk Analytics, Inc. | 231 | 52,885 | |
| 350,650 | |||
TOTAL INDUSTRIALS | 1,073,881 | ||
| INFORMATION TECHNOLOGY - 29.3% | |||
| Electronic Equipment, Instruments & Components - 0.7% | |||
| Flex Ltd. (a) | 2,591 | 70,890 | |
| IT Services - 2.0% | |||
| Accenture PLC Class A | 655 | 207,209 | |
| Semiconductors & Semiconductor Equipment - 8.8% | |||
| Advanced Micro Devices, Inc. (a) | 1,048 | 119,891 | |
| NVIDIA Corp. | 886 | 414,019 | |
| NXP Semiconductors NV | 643 | 143,376 | |
| ON Semiconductor Corp. (a) | 1,596 | 171,969 | |
| SolarEdge Technologies, Inc. (a) | 256 | 61,814 | |
| 911,069 | |||
| Software - 14.7% | |||
| Adobe, Inc. (a) | 309 | 168,767 | |
| Intuit, Inc. | 485 | 248,175 | |
| Microsoft Corp. | 2,417 | 811,919 | |
| Salesforce, Inc. (a) | 1,279 | 287,788 | |
| 1,516,649 | |||
| Technology Hardware, Storage & Peripherals - 3.1% | |||
| Apple, Inc. | 1,622 | 318,642 | |
TOTAL INFORMATION TECHNOLOGY | 3,024,459 | ||
| MATERIALS - 4.5% | |||
| Chemicals - 1.8% | |||
| Linde PLC | 478 | 186,740 | |
| Containers & Packaging - 2.7% | |||
| Avery Dennison Corp. | 904 | 166,345 | |
| Crown Holdings, Inc. | 1,201 | 111,405 | |
| 277,750 | |||
TOTAL MATERIALS | 464,490 | ||
| REAL ESTATE - 2.1% | |||
| Equity Real Estate Investment Trusts (REITs) - 2.1% | |||
| Prologis (REIT), Inc. | 1,728 | 215,568 | |
| UTILITIES - 1.8% | |||
| Electric Utilities - 1.1% | |||
| NextEra Energy, Inc. | 1,580 | 115,814 | |
| Water Utilities - 0.7% | |||
| American Water Works Co., Inc. | 491 | 72,388 | |
TOTAL UTILITIES | 188,202 | ||
| TOTAL COMMON STOCKS (Cost $8,907,367) | 10,104,185 | ||
| Money Market Funds - 1.8% | |||
| Shares | Value ($) | ||
State Street Institutional Treasury Plus Money Market Fund Trust Class 5.15% (b) (Cost $183,354) | 183,354 | 183,354 | |
| TOTAL INVESTMENT IN SECURITIES - 99.7% (Cost $9,090,721) | 10,287,539 |
NET OTHER ASSETS (LIABILITIES) - 0.3% | 29,031 |
| NET ASSETS - 100.0% | 10,316,570 |
| (a) | Non-income producing |
| (b) | The rate quoted is the annualized seven-day yield of the fund at period end. |
| Valuation Inputs at Reporting Date: | ||||
| Description | Total ($) | Level 1 ($) | Level 2 ($) | Level 3 ($) |
Investments in Securities: | ||||
| Equities: | ||||
Communication Services | 637,746 | 637,746 | - | - |
Consumer Discretionary | 1,032,371 | 1,032,371 | - | - |
Consumer Staples | 549,675 | 549,675 | - | - |
Energy | 312,329 | 312,329 | - | - |
Financials | 1,247,897 | 1,247,897 | - | - |
Health Care | 1,357,567 | 1,357,567 | - | - |
Industrials | 1,073,881 | 1,073,881 | - | - |
Information Technology | 3,024,459 | 3,024,459 | - | - |
Materials | 464,490 | 464,490 | - | - |
Real Estate | 215,568 | 215,568 | - | - |
Utilities | 188,202 | 188,202 | - | - |
| Money Market Funds | 183,354 | 183,354 | - | - |
| Total Investments in Securities: | 10,287,539 | 10,287,539 | - | - |
| Statement of Assets and Liabilities | ||||
| July 31, 2023 | ||||
| Assets | ||||
Investment in securities, at value - See accompanying schedule Unaffiliated issuers (cost $9,090,721): | $ | 10,287,539 | ||
| Receivable for investments sold | 28,472 | |||
| Dividends receivable | 5,546 | |||
Total assets | 10,321,557 | |||
| Liabilities | ||||
| Accrued management fee | $ | 4,987 | ||
| Total Liabilities | 4,987 | |||
| Net Assets | $ | 10,316,570 | ||
| Net Assets consist of: | ||||
| Paid in capital | $ | 9,669,347 | ||
| Total accumulated earnings (loss) | 647,223 | |||
| Net Assets | $ | 10,316,570 | ||
Net Asset Value, offering price and redemption price per share ($10,316,570 ÷ 475,000 shares) | $ | 21.72 | ||
| Statement of Operations | ||||
Year ended July 31, 2023 | ||||
| Investment Income | ||||
| Dividends | $ | 108,815 | ||
| Special dividends | 19,934 | |||
| Total Income | 128,749 | |||
| Expenses | ||||
| Management fee | $ | 46,132 | ||
| Independent trustees' fees and expenses | 36 | |||
| Total Expenses | 46,168 | |||
| Net Investment income (loss) | 82,581 | |||
| Realized and Unrealized Gain (Loss) | ||||
| Net realized gain (loss) on: | ||||
| Investment Securities: | ||||
| Unaffiliated issuers | (274,000) | |||
| Total net realized gain (loss) | (274,000) | |||
| Change in net unrealized appreciation (depreciation) on investment securities | 1,506,035 | |||
| Net gain (loss) | 1,232,035 | |||
| Net increase (decrease) in net assets resulting from operations | $ | 1,314,616 | ||
| Statement of Changes in Net Assets | ||||
Year ended July 31, 2023 | Year ended July 31, 2022 | |||
| Increase (Decrease) in Net Assets | ||||
| Operations | ||||
| Net investment income (loss) | $ | 82,581 | $ | 29,286 |
| Net realized gain (loss) | (274,000) | (169,763) | ||
| Change in net unrealized appreciation (depreciation) | 1,506,035 | (408,202) | ||
| Net increase (decrease) in net assets resulting from operations | 1,314,616 | (548,679) | ||
| Distributions to shareholders | (79,775) | (36,950) | ||
| Share transactions | ||||
| Proceeds from sales of shares | 3,318,417 | 4,831,792 | ||
| Cost of shares redeemed | - | (1,603,015) | ||
Net increase (decrease) in net assets resulting from share transactions | 3,318,417 | 3,228,777 | ||
| Total increase (decrease) in net assets | 4,553,258 | 2,643,148 | ||
| Net Assets | ||||
| Beginning of period | 5,763,312 | 3,120,164 | ||
| End of period | $ | 10,316,570 | $ | 5,763,312 |
| Other Information | ||||
| Shares | ||||
| Sold | 175,000 | 225,000 | ||
| Redeemed | - | (75,000) | ||
| Net increase (decrease) | 175,000 | 150,000 | ||
| Fidelity® Sustainability U.S. Equity ETF |
| Years ended July 31, | 2023 | 2022 | 2021 A | |||
Selected Per-Share Data | ||||||
| Net asset value, beginning of period | $ | 19.21 | $ | 20.80 | $ | 20.00 |
| Income from Investment Operations | ||||||
Net investment income (loss) B,C | .20 D | .11 | - E | |||
| Net realized and unrealized gain (loss) | 2.51 | (1.57) | .80 | |||
| Total from investment operations | 2.71 | (1.46) | .80 | |||
| Distributions from net investment income | (.20) | (.13) | - | |||
| Total distributions | (.20) | (.13) | - | |||
| Net asset value, end of period | $ | 21.72 | $ | 19.21 | $ | 20.80 |
Total Return F,G | 14.25% | (7.01)% | 3.99% | |||
Ratios to Average Net Assets C,H,I | ||||||
| Expenses before reductions | .59% | .59% | .59% J | |||
| Expenses net of fee waivers, if any | .59% | .59% | .59% J | |||
| Expenses net of all reductions | .59% | .59% | .59% J | |||
| Net investment income (loss) | 1.06% D | .56% | (.07)% J | |||
| Supplemental Data | ||||||
| Net assets, end of period (000 omitted) | $ | 10,317 | $ | 5,763 | $ | 3,120 |
Portfolio turnover rate K,L | 45% | 66% | 23% M |
| Average Annual Total Returns | |||
Periods ended July 31, 2023 | Past 1 year | Life of Fund |
Fidelity® Women's Leadership ETF - NAV A | 12.98% | -0.26% |
Fidelity® Women's Leadership ETF - Market Price B | 12.85% | -0.14% |
Russell 3000® Index A | 12.65% | 3.44% |
MSCI USA Women's Leadership Index A | 9.20% | -1.62% |
| $10,000 Over Life of Fund |
Let's say hypothetically that $10,000 was invested in Fidelity® Women's Leadership ETF - NAV, on June 15, 2021, when the fund started. The chart shows how the value of your investment would have changed, and also shows how the Russell 3000® Index performed over the same period. |
 |
Top Holdings (% of Fund's net assets) | ||
| Microsoft Corp. | 3.9 | |
| Apple, Inc. | 2.7 | |
| Accenture PLC Class A | 2.2 | |
| Amazon.com, Inc. | 2.1 | |
| NVIDIA Corp. | 2.1 | |
| Vertex Pharmaceuticals, Inc. | 1.9 | |
| Hologic, Inc. | 1.8 | |
| Salesforce, Inc. | 1.8 | |
| Adobe, Inc. | 1.7 | |
| MasterCard, Inc. Class A | 1.7 | |
| 21.9 | ||
| Market Sectors (% of Fund's net assets) | ||
| Information Technology | 25.6 | |
| Financials | 13.5 | |
| Health Care | 13.2 | |
| Industrials | 12.3 | |
| Consumer Discretionary | 11.5 | |
| Materials | 4.9 | |
| Communication Services | 4.7 | |
| Consumer Staples | 3.7 | |
| Energy | 3.3 | |
| Real Estate | 2.2 | |
| Utilities | 2.1 | |
Asset Allocation (% of Fund's net assets) |
 |
| Common Stocks - 97.0% | |||
| Shares | Value ($) | ||
| COMMUNICATION SERVICES - 4.7% | |||
| Entertainment - 2.1% | |||
| Netflix, Inc. (a) | 102 | 44,775 | |
| The Walt Disney Co. (a) | 294 | 26,134 | |
| 70,909 | |||
| Interactive Media & Services - 1.2% | |||
| Alphabet, Inc. Class C (a) | 170 | 22,629 | |
| Bumble, Inc. (a) | 1,036 | 19,187 | |
| 41,816 | |||
| Media - 1.4% | |||
| Interpublic Group of Companies, Inc. | 1,371 | 46,929 | |
TOTAL COMMUNICATION SERVICES | 159,654 | ||
| CONSUMER DISCRETIONARY - 11.5% | |||
| Automobiles - 0.7% | |||
| General Motors Co. | 644 | 24,710 | |
| Broadline Retail - 3.3% | |||
| Amazon.com, Inc. (a) | 549 | 73,390 | |
| Etsy, Inc. (a) | 207 | 21,042 | |
| Kohl's Corp. | 657 | 18,692 | |
| 113,124 | |||
| Diversified Consumer Services - 1.3% | |||
| Adtalem Global Education, Inc. (a) | 658 | 28,452 | |
| Bright Horizons Family Solutions, Inc. (a) | 162 | 15,719 | |
| 44,171 | |||
| Hotels, Restaurants & Leisure - 1.7% | |||
| Marriott International, Inc. Class A | 186 | 37,537 | |
| Vail Resorts, Inc. | 86 | 20,252 | |
| 57,789 | |||
| Household Durables - 0.9% | |||
| Taylor Morrison Home Corp. (a) | 670 | 32,441 | |
| Specialty Retail - 3.1% | |||
| Aritzia, Inc. (a) | 558 | 10,617 | |
| Best Buy Co., Inc. | 237 | 19,683 | |
| Foot Locker, Inc. | 296 | 7,954 | |
| Lowe's Companies, Inc. | 160 | 37,483 | |
| Williams-Sonoma, Inc. | 212 | 29,392 | |
| 105,129 | |||
| Textiles, Apparel & Luxury Goods - 0.5% | |||
| Tapestry, Inc. | 407 | 17,562 | |
TOTAL CONSUMER DISCRETIONARY | 394,926 | ||
| CONSUMER STAPLES - 3.7% | |||
| Consumer Staples Distribution & Retail - 0.5% | |||
| Albertsons Companies, Inc. | 793 | 17,232 | |
| Food Products - 1.8% | |||
| Bunge Ltd. | 181 | 19,669 | |
| The Hershey Co. | 181 | 41,867 | |
| 61,536 | |||
| Household Products - 0.8% | |||
| The Clorox Co. | 164 | 24,843 | |
| Personal Care Products - 0.6% | |||
| Estee Lauder Companies, Inc. Class A | 117 | 21,060 | |
TOTAL CONSUMER STAPLES | 124,671 | ||
| ENERGY - 3.3% | |||
| Energy Equipment & Services - 0.9% | |||
| Baker Hughes Co. Class A | 870 | 31,137 | |
| Oil, Gas & Consumable Fuels - 2.4% | |||
| Antero Resources Corp. (a) | 782 | 20,919 | |
| EQT Corp. | 433 | 18,264 | |
| Marathon Petroleum Corp. | 145 | 19,288 | |
| Occidental Petroleum Corp. | 392 | 24,747 | |
| 83,218 | |||
TOTAL ENERGY | 114,355 | ||
| FINANCIALS - 13.5% | |||
| Banks - 4.9% | |||
| Bank of America Corp. | 1,712 | 54,784 | |
| Citigroup, Inc. | 611 | 29,120 | |
| First Horizon National Corp. | 1,280 | 17,446 | |
| Huntington Bancshares, Inc. | 2,159 | 26,426 | |
| JPMorgan Chase & Co. | 253 | 39,964 | |
| 167,740 | |||
| Capital Markets - 1.9% | |||
| Franklin Resources, Inc. | 689 | 20,146 | |
| NASDAQ, Inc. | 930 | 46,956 | |
| 67,102 | |||
| Financial Services - 3.3% | |||
| MasterCard, Inc. Class A | 148 | 58,353 | |
| WEX, Inc. (a) | 288 | 54,533 | |
| 112,886 | |||
| Insurance - 3.4% | |||
| Hartford Financial Services Group, Inc. | 746 | 53,622 | |
| Marsh & McLennan Companies, Inc. | 147 | 27,698 | |
| Progressive Corp. | 272 | 34,267 | |
| 115,587 | |||
TOTAL FINANCIALS | 463,315 | ||
| HEALTH CARE - 13.2% | |||
| Biotechnology - 3.6% | |||
| Alnylam Pharmaceuticals, Inc. (a) | 114 | 22,276 | |
| Moderna, Inc. (a) | 107 | 12,590 | |
| Sage Therapeutics, Inc. (a) | 286 | 9,918 | |
| Vertex Pharmaceuticals, Inc. (a) | 187 | 65,888 | |
| Zai Lab Ltd. ADR (a) | 392 | 11,784 | |
| 122,456 | |||
| Health Care Equipment & Supplies - 2.3% | |||
| Hologic, Inc. (a) | 800 | 63,536 | |
| Insulet Corp. (a) | 60 | 16,605 | |
| 80,141 | |||
| Health Care Providers & Services - 4.3% | |||
| Centene Corp. (a) | 556 | 37,858 | |
| Cigna Group | 155 | 45,741 | |
| CVS Health Corp. | 408 | 30,474 | |
| Elevance Health, Inc. | 71 | 33,486 | |
| 147,559 | |||
| Life Sciences Tools & Services - 0.8% | |||
| ICON PLC (a) | 110 | 27,655 | |
| Pharmaceuticals - 2.2% | |||
| Eli Lilly & Co. | 53 | 24,091 | |
| Zoetis, Inc. Class A | 265 | 49,844 | |
| 73,935 | |||
TOTAL HEALTH CARE | 451,746 | ||
| INDUSTRIALS - 12.3% | |||
| Air Freight & Logistics - 1.1% | |||
| United Parcel Service, Inc. Class B | 207 | 38,736 | |
| Electrical Equipment - 4.3% | |||
| AMETEK, Inc. | 270 | 42,822 | |
| Eaton Corp. PLC | 146 | 29,977 | |
| nVent Electric PLC | 760 | 40,189 | |
| Regal Rexnord Corp. | 145 | 22,646 | |
| Sunrun, Inc. (a) | 590 | 11,198 | |
| 146,832 | |||
| Ground Transportation - 0.4% | |||
| ArcBest Corp. | 115 | 13,377 | |
| Machinery - 3.3% | |||
| Deere & Co. | 82 | 35,227 | |
| Federal Signal Corp. | 427 | 26,085 | |
| Hillenbrand, Inc. | 339 | 17,608 | |
| Otis Worldwide Corp. | 365 | 33,200 | |
| 112,120 | |||
| Passenger Airlines - 0.2% | |||
| JetBlue Airways Corp. (a) | 1,099 | 8,539 | |
| Professional Services - 3.0% | |||
| Leidos Holdings, Inc. | 343 | 32,081 | |
| Manpower, Inc. | 239 | 18,852 | |
| Planet Labs PBC Class A (a) | 2,311 | 8,597 | |
| Science Applications International Corp. | 357 | 43,318 | |
| 102,848 | |||
TOTAL INDUSTRIALS | 422,452 | ||
| INFORMATION TECHNOLOGY - 25.6% | |||
| Communications Equipment - 0.9% | |||
| Arista Networks, Inc. (a) | 200 | 31,018 | |
| Electronic Equipment, Instruments & Components - 2.2% | |||
| CDW Corp. | 193 | 36,105 | |
| Flex Ltd. (a) | 700 | 19,152 | |
| Insight Enterprises, Inc. (a) | 139 | 20,390 | |
| 75,647 | |||
| IT Services - 2.2% | |||
| Accenture PLC Class A | 237 | 74,975 | |
| Semiconductors & Semiconductor Equipment - 6.5% | |||
| Advanced Micro Devices, Inc. (a) | 344 | 39,354 | |
| Axcelis Technologies, Inc. (a) | 186 | 37,289 | |
| Marvell Technology, Inc. | 483 | 31,458 | |
| NVIDIA Corp. | 154 | 71,963 | |
| NXP Semiconductors NV | 199 | 44,373 | |
| 224,437 | |||
| Software - 11.1% | |||
| Adobe, Inc. (a) | 109 | 59,533 | |
| HubSpot, Inc. (a) | 95 | 55,152 | |
| Intuit, Inc. | 108 | 55,264 | |
| Microsoft Corp. | 392 | 131,674 | |
| Pagerduty, Inc. (a) | 581 | 15,060 | |
| Salesforce, Inc. (a) | 280 | 63,003 | |
| 379,686 | |||
| Technology Hardware, Storage & Peripherals - 2.7% | |||
| Apple, Inc. | 474 | 93,117 | |
TOTAL INFORMATION TECHNOLOGY | 878,880 | ||
| MATERIALS - 4.9% | |||
| Chemicals - 2.3% | |||
| Cabot Corp. | 282 | 20,022 | |
| Celanese Corp. Class A | 168 | 21,066 | |
| Eastman Chemical Co. | 225 | 19,256 | |
| The Chemours Co. LLC | 524 | 19,378 | |
| 79,722 | |||
| Construction Materials - 0.7% | |||
| Summit Materials, Inc. | 632 | 22,866 | |
| Metals & Mining - 1.9% | |||
| Commercial Metals Co. | 805 | 46,062 | |
| Schnitzer Steel Industries, Inc. Class A | 536 | 19,409 | |
| 65,471 | |||
TOTAL MATERIALS | 168,059 | ||
| REAL ESTATE - 2.2% | |||
| Equity Real Estate Investment Trusts (REITs) - 2.2% | |||
| Equity Lifestyle Properties, Inc. | 574 | 40,857 | |
| Ventas, Inc. | 721 | 34,983 | |
| 75,840 | |||
| UTILITIES - 2.1% | |||
| Electric Utilities - 0.9% | |||
| NextEra Energy, Inc. | 435 | 31,886 | |
| Water Utilities - 1.2% | |||
| American Water Works Co., Inc. | 272 | 40,100 | |
TOTAL UTILITIES | 71,986 | ||
| TOTAL COMMON STOCKS (Cost $2,984,024) | 3,325,884 | ||
| Money Market Funds - 3.4% | |||
| Shares | Value ($) | ||
State Street Institutional Treasury Plus Money Market Fund Trust Class 5.15% (b) (Cost $116,964) | 116,964 | 116,964 | |
| TOTAL INVESTMENT IN SECURITIES - 100.4% (Cost $3,100,988) | 3,442,848 |
NET OTHER ASSETS (LIABILITIES) - (0.4)% | (14,415) |
| NET ASSETS - 100.0% | 3,428,433 |
| (a) | Non-income producing |
| (b) | The rate quoted is the annualized seven-day yield of the fund at period end. |
| Valuation Inputs at Reporting Date: | ||||
| Description | Total ($) | Level 1 ($) | Level 2 ($) | Level 3 ($) |
Investments in Securities: | ||||
| Equities: | ||||
Communication Services | 159,654 | 159,654 | - | - |
Consumer Discretionary | 394,926 | 394,926 | - | - |
Consumer Staples | 124,671 | 124,671 | - | - |
Energy | 114,355 | 114,355 | - | - |
Financials | 463,315 | 463,315 | - | - |
Health Care | 451,746 | 451,746 | - | - |
Industrials | 422,452 | 422,452 | - | - |
Information Technology | 878,880 | 878,880 | - | - |
Materials | 168,059 | 168,059 | - | - |
Real Estate | 75,840 | 75,840 | - | - |
Utilities | 71,986 | 71,986 | - | - |
| Money Market Funds | 116,964 | 116,964 | - | - |
| Total Investments in Securities: | 3,442,848 | 3,442,848 | - | - |
| Statement of Assets and Liabilities | ||||
| July 31, 2023 | ||||
| Assets | ||||
Investment in securities, at value - See accompanying schedule Unaffiliated issuers (cost $3,100,988): | $ | 3,442,848 | ||
| Receivable for investments sold | 33,299 | |||
| Dividends receivable | 1,585 | |||
Total assets | 3,477,732 | |||
| Liabilities | ||||
| Payable for investments purchased | $ | 47,641 | ||
| Accrued management fee | 1,658 | |||
| Total Liabilities | 49,299 | |||
| Net Assets | $ | 3,428,433 | ||
| Net Assets consist of: | ||||
| Paid in capital | $ | 3,547,462 | ||
| Total accumulated earnings (loss) | (119,029) | |||
| Net Assets | $ | 3,428,433 | ||
Net Asset Value, offering price and redemption price per share ($3,428,433 ÷ 175,000 shares) | $ | 19.59 | ||
| Statement of Operations | ||||
Year ended July 31, 2023 | ||||
| Investment Income | ||||
| Dividends | $ | 53,188 | ||
| Expenses | ||||
| Management fee | $ | 20,979 | ||
| Independent trustees' fees and expenses | 17 | |||
| Total Expenses | 20,996 | |||
| Net Investment income (loss) | 32,192 | |||
| Realized and Unrealized Gain (Loss) | ||||
| Net realized gain (loss) on: | ||||
| Investment Securities: | ||||
| Redemptions in-kind | 161,282 | |||
| Unaffiliated issuers | (292,017) | |||
| Foreign currency transactions | (8) | |||
| Total net realized gain (loss) | (130,743) | |||
| Change in net unrealized appreciation (depreciation) on investment securities | 583,271 | |||
| Net gain (loss) | 452,528 | |||
| Net increase (decrease) in net assets resulting from operations | $ | 484,720 | ||
| Statement of Changes in Net Assets | ||||
Year ended July 31, 2023 | Year ended July 31, 2022 | |||
| Increase (Decrease) in Net Assets | ||||
| Operations | ||||
| Net investment income (loss) | $ | 32,192 | $ | 14,603 |
| Net realized gain (loss) | (130,743) | (157,065) | ||
| Change in net unrealized appreciation (depreciation) | 583,271 | (292,520) | ||
| Net increase (decrease) in net assets resulting from operations | 484,720 | (434,982) | ||
| Distributions to shareholders | (31,525) | (13,700) | ||
| Share transactions | ||||
| Proceeds from sales of shares | 2,547,748 | 1,499,632 | ||
| Cost of shares redeemed | (2,199,862) | (474,202) | ||
Net increase (decrease) in net assets resulting from share transactions | 347,886 | 1,025,430 | ||
| Total increase (decrease) in net assets | 801,081 | 576,748 | ||
| Net Assets | ||||
| Beginning of period | 2,627,352 | 2,050,604 | ||
| End of period | $ | 3,428,433 | $ | 2,627,352 |
| Other Information | ||||
| Shares | ||||
| Sold | 150,000 | 75,000 | ||
| Redeemed | (125,000) | (25,000) | ||
| Net increase (decrease) | 25,000 | 50,000 | ||
| Fidelity® Women's Leadership ETF |
| Years ended July 31, | 2023 | 2022 | 2021 A | |||
Selected Per-Share Data | ||||||
| Net asset value, beginning of period | $ | 17.52 | $ | 20.51 | $ | 20.00 |
| Income from Investment Operations | ||||||
Net investment income (loss) B,C | .16 | .11 | - D | |||
| Net realized and unrealized gain (loss) | 2.08 | (3.01) | .51 | |||
| Total from investment operations | 2.24 | (2.90) | .51 | |||
| Distributions from net investment income | (.17) | (.09) | - | |||
| Total distributions | (.17) | (.09) | - | |||
| Net asset value, end of period | $ | 19.59 | $ | 17.52 | $ | 20.51 |
Total Return E,F | 12.98% | (14.14)% | 2.53% | |||
Ratios to Average Net Assets C,G,H | ||||||
| Expenses before reductions | .59% | .59% | .59% I | |||
| Expenses net of fee waivers, if any | .59% | .59% | .59% I | |||
| Expenses net of all reductions | .59% | .59% | .59% I | |||
| Net investment income (loss) | .91% | .56% | .08% I | |||
| Supplemental Data | ||||||
| Net assets, end of period (000 omitted) | $ | 3,428 | $ | 2,627 | $ | 2,051 |
Portfolio turnover rate J,K | 72% | 64% | 5% L |
| Tax cost | Gross unrealized appreciation | Gross unrealized depreciation | Net unrealized appreciation (depreciation) | |
| Fidelity Blue Chip Growth ETF | $648,686,433 | $161,623,770 | $ (35,749,294) | $125,874,476 |
| Fidelity Blue Chip Value ETF | 118,943,682 | 15,347,591 | (5,308,689) | 10,038,902 |
| Fidelity Growth Opportunities ETF | 155,783,805 | 43,850,468 | (4,451,090) | 39,399,378 |
| Fidelity Magellan ETF | 42,055,838 | 9,079,661 | (304,006) | 8,775,655 |
| Fidelity New Millennium ETF | 89,317,459 | 20,260,414 | (686,206) | 19,574,208 |
| Fidelity Real Estate Investment ETF | 16,559,314 | 611,526 | (2,033,093) | (1,421,567) |
| Fidelity Small-Mid Cap Opportunities ETF | 30,347,867 | 6,482,889 | (1,664,107) | 4,818,782 |
| Fidelity Sustainable U.S. Equity ETF | 9,180,054 | 1,499,577 | (392,092) | 1,107,485 |
| Fidelity Women's Leadership ETF | 3,172,707 | 461,058 | (190,917) | 270,141 |
| Undistributed ordinary income | Capital loss carryforward | Net unrealized appreciation (depreciation) on securities and other investments | |
| Fidelity Blue Chip Growth ETF | $- | $ (69,953,822) | $125,874,484 |
| Fidelity Blue Chip Value ETF | 111,778 | (2,046,995) | 10,038,902 |
| Fidelity Growth Opportunities ETF | - | (18,717,238) | 39,399,378 |
| Fidelity Magellan ETF | - | (8,518,509) | 8,775,655 |
| Fidelity New Millennium ETF | - | (3,559,238) | 19,574,222 |
| Fidelity Real Estate Investment ETF | - | (960,160) | (1,421,567) |
Fidelity Small-Mid Cap Opportunities ETF | - | (4,187,144) | 4,818,782 |
| Fidelity Sustainable U.S. Equity ETF | 3,416 | (463,678) | 1,107,485 |
| Fidelity Women's Leadership ETF | 1,754 | (390,924) | 270,141 |
| Short-term | Long-term | Total capital loss carryforward | |
| Fidelity Blue Chip Growth ETF | $ (43,610,384) | $ (26,343,438) | $ (69,953,822) |
| Fidelity Blue Chip Value ETF | (1,191,788) | (855,207) | (2,046,995) |
| Fidelity Growth Opportunities ETF | (13,365,074) | (5,352,164) | (18,717,238) |
| Fidelity Magellan ETF | (6,595,196) | (1,923,313) | (8,518,509) |
| Fidelity New Millennium ETF | (1,383,007) | (2,176,231) | (3,559,238) |
| Fidelity Real Estate Investment ETF | (406,757) | (553,403) | (960,160) |
Fidelity Small-Mid Cap Opportunities ETF | (2,433,568) | (1,753,576) | (4,187,144) |
| Fidelity Sustainable U.S. Equity ETF | (174,560) | (289,118) | (463,678) |
| Fidelity Women's Leadership ETF | (149,043) | (241,881) | (390,924) |
| Ordinary Losses | |
| Fidelity Growth Opportunities ETF | $(136,801) |
| July 31, 2023 | |||
| Ordinary Income | Long-term Capital Gains | Total | |
| Fidelity Blue Chip Growth ETF | $- | $- | $- |
| Fidelity Blue Chip Value ETF | 1,923,675 | 916,300 | 2,839,975 |
| Fidelity Growth Opportunities ETF | - | - | - |
| Fidelity Magellan ETF | 144,575 | - | 144,575 |
| Fidelity New Millennium ETF | 924,275 | 133,950 | 1,058,225 |
| Fidelity Real Estate Investment ETF | 452,000 | - | 452,000 |
Fidelity Small-Mid Cap Opportunities ETF | 192,175 | - | 192,175 |
| Fidelity Sustainable U.S. Equity ETF | 79,775 | - | 79,775 |
| Fidelity Women's Leadership ETF | 31,525 | - | 31,525 |
| July 31, 2022 | |||
| Ordinary Income | Long-term Capital Gains | Total | |
| Fidelity Blue Chip Growth ETF | $- | $- | $- |
| Fidelity Blue Chip Value ETF | 3,109,325 | 343,000 | 3,452,325 |
| Fidelity Growth Opportunities ETF | - | - | - |
| Fidelity Magellan ETF | 32,550 | - | 32,550 |
| Fidelity New Millennium ETF | 1,100,175 | - | 1,100,175 |
| Fidelity Real Estate Investment ETF | 456,700 | - | 456,700 |
Fidelity Small-Mid Cap Opportunities ETF | 131,575 | - | 131,575 |
| Fidelity Sustainable U.S. Equity ETF | 36,950 | - | 36,950 |
| Fidelity Women's Leadership ETF | 13,700 | - | 13,700 |
| Equity Risk | Equity risk relates to the fluctuations in the value of financial instruments as a result of changes in market prices (other than those arising from interest rate risk or foreign exchange risk), whether caused by factors specific to an individual investment, its issuer, or all factors affecting all instruments traded in a market or market segment. |
| Purchases ($) | Sales ($) | |
| Fidelity Blue Chip Growth ETF | 185,628,584 | 135,974,081 |
| Fidelity Blue Chip Value ETF | 45,027,096 | 42,244,756 |
| Fidelity Growth Opportunities ETF | 101,678,004 | 80,411,782 |
| Fidelity Magellan ETF | 39,729,235 | 39,103,582 |
| Fidelity New Millennium ETF | 93,552,325 | 60,300,126 |
| Fidelity Real Estate Investment ETF | 5,441,770 | 5,647,252 |
| Fidelity Small-Mid Cap Opportunities ETF | 12,614,333 | 10,908,700 |
| Fidelity Sustainable U.S. Equity ETF | 4,147,612 | 3,376,002 |
| Fidelity Women's Leadership ETF | 2,423,194 | 2,457,995 |
| In-Kind Subscriptions ($) | In-Kind Redemptions ($) | |
| Fidelity Blue Chip Growth ETF | 231,989,497 | 19,037,541 |
| Fidelity Blue Chip Value ETF | 26,801,209 | 17,534,098 |
| Fidelity Growth Opportunities ETF | 90,730,035 | 20,486,252 |
| Fidelity Magellan ETF | 3,897,711 | 3,260,112 |
| Fidelity New Millennium ETF | 29,718,317 | 27,410,936 |
| Fidelity Real Estate Investment ETF | 983,786 | 3,420,955 |
| Fidelity Small-Mid Cap Opportunities ETF | 3,819,844 | 644,488 |
| Fidelity Sustainable U.S. Equity ETF | 2,513,528 | - |
| Fidelity Women's Leadership ETF | 1,856,195 | 1,527,005 |
| Fee Rate | |
| Fidelity Blue Chip Growth ETF | .59% |
| Fidelity Blue Chip Value ETF | .59% |
| Fidelity Growth Opportunities ETF | .59% |
| Fidelity Magellan ETF | .59% |
| Fidelity New Millennium ETF | .59% |
| Fidelity Real Estate Investment ETF | .59% |
| Fidelity Small-Mid Cap Opportunities ETF | .60% |
| Fidelity Sustainable U.S. Equity ETF | .59% |
| Fidelity Women's Leadership ETF | .59% |
| Amount | |
| Fidelity Blue Chip Growth ETF | $2,739 |
| Fidelity Blue Chip Value ETF | 611 |
| Fidelity Growth Opportunities ETF | 1,487 |
| Fidelity Magellan ETF | 355 |
| Fidelity New Millennium ETF | 784 |
| Fidelity Real Estate Investment ETF | 121 |
| Fidelity Small-Mid Cap Opportunities ETF | 223 |
| Fidelity Sustainable U.S. Equity ETF | 48 |
| Fidelity Women's Leadership ETF | 34 |
| Purchases ($) | Sales ($) | Realized Gain (Loss) ($) | |
| Fidelity Blue Chip Growth ETF | 9,752,524 | 2,320,020 | 4,019 |
| Fidelity Blue Chip Value ETF | 1,397,295 | 1,856,523 | 169,602 |
| Fidelity Growth Opportunities ETF | 3,579,035 | 1,440,972 | 108,356 |
| Fidelity Magellan ETF | 797,070 | 962,653 | (82,758) |
| Fidelity New Millennium ETF | 4,167,142 | 485,847 | (101,908) |
| Fidelity Real Estate Investment ETF | 43,668 | 8,061 | (433) |
| Fidelity Small-Mid Cap Opportunities ETF | 153,369 | 321,916 | (130,512) |
| Fidelity Sustainable U.S. Equity ETF | 152,888 | 148,046 | (9,582) |
| Fidelity Women's Leadership ETF | 37,478 | 17,786 | (3,325) |
| Custodian credits | |
| Fidelity Blue Chip Growth ETF | $190 |
| Fidelity Blue Chip Value ETF | 9 |
| Fidelity Growth Opportunities ETF | 70 |
| Fidelity Magellan ETF | 37 |
| Fidelity New Millennium ETF | 126 |
Fidelity Small-Mid Cap Opportunities ETF | 10 |
| The Example is based on an investment of $1,000 invested at the beginning of the period and held for the entire period (February 1, 2023 to July 31, 2023). |
Annualized Expense Ratio- A | Beginning Account Value February 1, 2023 | Ending Account Value July 31, 2023 | Expenses Paid During Period- C February 1, 2023 to July 31, 2023 | |||||||
| Fidelity® Blue Chip Growth ETF | .59% | |||||||||
| Actual | $ 1,000 | $ 1,310.60 | $ 3.38 | |||||||
Hypothetical-B | $ 1,000 | $ 1,021.87 | $ 2.96 | |||||||
| Fidelity® Blue Chip Value ETF | .59% | |||||||||
| Actual | $ 1,000 | $ 1,007.80 | $ 2.94 | |||||||
Hypothetical-B | $ 1,000 | $ 1,021.87 | $ 2.96 | |||||||
| Fidelity® Growth Opportunities ETF | .59% | |||||||||
| Actual | $ 1,000 | $ 1,272.80 | $ 3.32 | |||||||
Hypothetical-B | $ 1,000 | $ 1,021.87 | $ 2.96 | |||||||
| Fidelity® Magellan® ETF | .59% | |||||||||
| Actual | $ 1,000 | $ 1,133.70 | $ 3.12 | |||||||
Hypothetical-B | $ 1,000 | $ 1,021.87 | $ 2.96 | |||||||
| Fidelity® New Millennium ETF | .59% | |||||||||
| Actual | $ 1,000 | $ 1,121.40 | $ 3.10 | |||||||
Hypothetical-B | $ 1,000 | $ 1,021.87 | $ 2.96 | |||||||
| Fidelity® Real Estate Investment ETF | .59% | |||||||||
| Actual | $ 1,000 | $ 950.50 | $ 2.85 | |||||||
Hypothetical-B | $ 1,000 | $ 1,021.87 | $ 2.96 | |||||||
| Fidelity® Small-Mid Cap Opportunities ETF | .60% | |||||||||
| Actual | $ 1,000 | $ 1,026.40 | $ 3.01 | |||||||
Hypothetical-B | $ 1,000 | $ 1,021.82 | $ 3.01 | |||||||
| Fidelity® Sustainable U.S. Equity ETF | .59% | |||||||||
| Actual | $ 1,000 | $ 1,110.50 | $ 3.09 | |||||||
Hypothetical-B | $ 1,000 | $ 1,021.87 | $ 2.96 | |||||||
| Fidelity® Women's Leadership ETF | .59% | |||||||||
| Actual | $ 1,000 | $ 1,077.90 | $ 3.04 | |||||||
Hypothetical-B | $ 1,000 | $ 1,021.87 | $ 2.96 | |||||||
| Fidelity® Blue Chip Value ETF | |
September 2022 December 2022 March 2023 June 2023 | 100% 100% 100% 100% |
| Fidelity® Magellan ETF | |
September 2022 December 2022 March 2023 June 2023 | 100% 100% 100% 100% |
| Fidelity® New Millennium ETF | |
September 2022 December 2022 March 2023 June 2023 | 100% 100% 100% 100% |
| Fidelity® Small-Mid Cap Opportunities ETF | |
September 2022 December 2022 March 2023 June 2023 | 100% 100% 100% 100% |
| Fidelity® Sustainable U.S. Equity ETF | |
September 2022 December 2022 March 2023 June 2023 | 100% 100% 100% 100% |
| Fidelity® Women's Leadership ETF | |
September 2022 December 2022 March 2023 June 2023 | 100% 100% 100% 100% |
| Fidelity® Blue Chip Value ETF | |
September 2022 December 2022 March 2023 June 2023 | 100% 100% 100% 100% |
Fidelity® Magellan ETF September 2022 December 2022 March 2023 June 2023 | 100% 100% 100% 100% |
| Fidelity® New Millennium ETF | |
September 2022 December 2022 March 2023 June 2023 | 100% 100% 100% 100% |
Fidelity® Small-Mid Cap Opportunities ETF | |
September 2022 December 2022 March 2023 June 2023 | 100% 100% 100% 100% |
| Fidelity® Sustainable U.S. Equity ETF | |
September 2022 December 2022 March 2023 June 2023 | 100% 100% 100% 100% |
| Fidelity® Women's Leadership ETF | |
September 2022 December 2022 March 2023 June 2023 | 100% 100% 100% 100% |
| Fidelity® Real Estate Investment ETF | |
September 2022 December 2022 March 2023 June 2023 | 100% 100% 82.04% 82.04% |
| December, 2022 | |
| Fidelity® New Millennium ETF | 99.42% |
 |
Item 2.
Code of Ethics
As of the end of the period, July 31, 2023, Fidelity Covington Trust (the trust) has adopted a code of ethics, as defined in Item 2 of Form N-CSR, that applies to its President and Treasurer and its Chief Financial Officer. A copy of the code of ethics is filed as an exhibit to this Form N-CSR.
Item 3.
Audit Committee Financial Expert
The Board of Trustees of the trust has determined that Donald F. Donahue is an audit committee financial expert, as defined in Item 3 of Form N-CSR. Mr. Donahue is independent for purposes of Item 3 of Form N-CSR.
Item 4.
Principal Accountant Fees and Services
Fees and Services
The following table presents fees billed by Deloitte & Touche LLP, the member firms of Deloitte Touche Tohmatsu, and their respective affiliates (collectively, “Deloitte Entities”) in each of the last two fiscal years for services rendered to Fidelity Growth Opportunities ETF, Fidelity Magellan ETF, Fidelity Real Estate Investment ETF, Fidelity Small-Mid Cap Opportunities ETF, Fidelity Stocks for Inflation ETF, Fidelity Sustainable U.S. Equity ETF, and Fidelity Women's Leadership ETF (the “Funds”):
Services Billed by Deloitte Entities
July 31, 2023 FeesA
July 31, 2022 FeesA
| Audit Fees | Audit-Related Fees | Tax Fees | All Other Fees |
Fidelity Growth Opportunities ETF | $12,200 | $- | $4,000 | $300 |
Fidelity Magellan ETF | $12,200 | $- | $4,000 | $300 |
Fidelity Real Estate Investment ETF | $12,200 | $- | $4,000 | $300 |
Fidelity Small-Mid Cap Opportunities ETF | $12,200 | $- | $4,000 | $300 |
Fidelity Stocks for Inflation ETF | $12,900 | $- | $4,600 | $300 |
Fidelity Sustainable U.S. Equity ETF | $12,500 | $- | $4,500 | $400 |
Fidelity Women's Leadership ETF | $12,500 | $- | $4,500 | $400 |
|
|
|
|
|
|
|
|
|
|
A Amounts may reflect rounding.
The following table presents fees billed by PricewaterhouseCoopers LLP (“PwC”) in each of the last two fiscal years for services rendered to Fidelity Blue Chip Growth ETF, Fidelity Blue Chip Value ETF, Fidelity Dividend ETF for Rising Rates, Fidelity High Dividend ETF, Fidelity Low Volatility Factor ETF, Fidelity Momentum Factor ETF, Fidelity New Millennium ETF, Fidelity Quality Factor ETF, Fidelity Small-Mid Multifactor ETF, Fidelity U.S. Multifactor ETF, and Fidelity Value Factor ETF (the “Funds”):
Services Billed by PwC
July 31, 2023 FeesA
| Audit Fees | Audit-Related Fees | Tax Fees | All Other Fees |
Fidelity Blue Chip Growth ETF | $14,900 | $- | $4,600 | $500 |
Fidelity Blue Chip Value ETF | $14,900 | $- | $4,600 | $500 |
Fidelity Dividend ETF for Rising Rates | $11,900 | $- | $4,600 | $400 |
Fidelity High Dividend ETF | $12,000 | $- | $4,600 | $400 |
Fidelity Low Volatility Factor ETF | $11,700 | $- | $4,400 | $400 |
Fidelity Momentum Factor ETF | $11,700 | $- | $4,400 | $400 |
Fidelity New Millennium ETF | $14,900 | $- | $4,600 | $500 |
Fidelity Quality Factor ETF | $11,700 | $- | $4,400 | $400 |
Fidelity Small-Mid Multifactor ETF | $14,500 | $- | $4,900 | $500 |
Fidelity U.S. Multifactor ETF | $14,900 | $- | $4,600 | $500 |
Fidelity Value Factor ETF | $11,700 | $- | $4,400 | $400 |
July 31, 2022 FeesA
| Audit Fees | Audit-Related Fees | Tax Fees | All Other Fees | |
Fidelity Blue Chip Growth ETF | $14,400 | $- | $4,600 | $500 | |
Fidelity Blue Chip Value ETF | $14,400 | $- | $4,600 | $500 | |
Fidelity Dividend ETF for Rising Rates | $11,700 | $- | $4,600 | $400 | |
Fidelity High Dividend ETF | $11,700 | $- | $4,600 | $400 | |
Fidelity Low Volatility Factor ETF | $11,400 | $- | $4,400 | $400 | |
Fidelity Momentum Factor ETF | $11,400 | $- | $4,400 | $400 | |
Fidelity New Millennium ETF | $14,400 | $- | $4,600 | $500 | |
Fidelity Quality Factor ETF | $11,400 | $- | $4,400 | $400 | |
Fidelity Small-Mid Multifactor ETF | $14,200 | $- | $4,900 | $500 | |
Fidelity U.S. Multifactor ETF | $14,400 | $- | $4,600 | $500 | |
Fidelity Value Factor ETF | $11,400 | $- | $4,400 | $400 | |
A Amounts may reflect rounding.
The following table(s) present(s) fees billed by Deloitte Entities and PwC that were required to be approved by the Audit Committee for services that relate directly to the operations and financial reporting of the Fund(s) and that are rendered on behalf of Fidelity Management & Research Company LLC ("FMR") and entities controlling, controlled by, or under common control with FMR (not including any sub-adviser whose role is primarily portfolio management and is subcontracted with or overseen by another investment adviser) that provide ongoing services to the Fund(s) (“Fund Service Providers”):
Services Billed by Deloitte Entities
| July 31, 2023A | July 31, 2022A |
Audit-Related Fees | $- | $- |
Tax Fees | $- | $- |
All Other Fees | $- | $- |
A Amounts may reflect rounding.
Services Billed by PwC
| July 31, 2023A | July 31, 2022A |
Audit-Related Fees | $8,284,200 | $7,914,600 |
Tax Fees | $1,000 | $353,200 |
All Other Fees | $- | $- |
A Amounts may reflect rounding.
“Audit-Related Fees” represent fees billed for assurance and related services that are reasonably related to the performance of the fund audit or the review of the fund's financial statements and that are not reported under Audit Fees.
“Tax Fees” represent fees billed for tax compliance, tax advice or tax planning that relate directly to the operations and financial reporting of the fund.
“All Other Fees” represent fees billed for services provided to the fund or Fund Service Provider, a significant portion of which are assurance related, that relate directly to the operations and financial reporting of the fund, excluding those services that are reported under Audit Fees, Audit-Related Fees or Tax Fees.
Assurance services must be performed by an independent public accountant.
* * *
The aggregate non-audit fees billed by Deloitte Entities and PwC for services rendered to the Fund(s), FMR (not including any sub-adviser whose role is primarily portfolio management and is subcontracted with or overseen by another investment adviser), and any Fund Service Provider for each of the last two fiscal years of the Fund(s) are as follows:
Billed By | July 31, 2023A | July 31, 2022A |
Deloitte Entities | $268,800 | $489,500 |
PwC | $13,642,800 | $13,290,200 |
A Amounts may reflect rounding.
The trust's Audit Committee has considered non-audit services that were not pre-approved that were provided by Deloitte Entities and PwC to Fund Service Providers to be compatible with maintaining the independence of Deloitte Entities and PwC in its(their) audit of the Fund(s), taking into account representations from Deloitte Entities and PwC, in accordance with Public Company Accounting Oversight Board rules, regarding its independence from the Fund(s) and its(their) related entities and FMR’s review of the appropriateness and permissibility under applicable law of such non-audit services prior to their provision to the Fund(s) Service Providers.
Audit Committee Pre-Approval Policies and Procedures
The trust’s Audit Committee must pre-approve all audit and non-audit services provided by a fund’s independent registered public accounting firm relating to the operations or financial reporting of the fund. Prior to the commencement of any audit or non-audit services to a fund, the Audit Committee reviews the services to determine whether they are appropriate and permissible under applicable law.
The Audit Committee has adopted policies and procedures to, among other purposes, provide a framework for the Committee’s consideration of non-audit services by the audit firms that audit the Fidelity funds. The policies and procedures require that any non-audit service provided by a fund audit firm to a Fidelity fund and any non-audit service provided by a fund auditor to a Fund Service Provider that relates directly to the operations and financial reporting of a Fidelity fund (“Covered Service”) are subject to approval by the Audit Committee before such service is provided.
All Covered Services must be approved in advance of provision of the service either: (i) by formal resolution of the Audit Committee, or (ii) by oral or written approval of the service by the Chair of the Audit Committee (or if the Chair is unavailable, such other member of the Audit Committee as may be designated by the Chair to act in the Chair’s absence). The approval contemplated by (ii) above is permitted where the Treasurer determines that action on such an engagement is necessary before the next meeting of the Audit Committee.
Non-audit services provided by a fund audit firm to a Fund Service Provider that do not relate directly to the operations and financial reporting of a Fidelity fund are reported to the Audit Committee periodically.
Non-Audit Services Approved Pursuant to Rule 2-01(c)(7)(i)(C) and (ii) of Regulation S-X (“De Minimis Exception”)
There were no non-audit services approved or required to be approved by the Audit Committee pursuant to the De Minimis Exception during the Fund’s(s’) last two fiscal years relating to services provided to (i) the Fund(s) or (ii) any Fund Service Provider that relate directly to the operations and financial reporting of the Fund(s).
The Registrant has not retained, for the preparation of the audit report on the financial statements included in the Form N-CSR, a registered public accounting firm that has a branch or office that is located in a foreign jurisdiction and that the Public Company Accounting Oversight Board (the “PCAOB”) has determined that the PCAOB is unable to inspect or investigate completely because of a position taken by an authority in the foreign jurisdiction.
The Registrant is not a “foreign issuer,” as defined in 17 CFR 240.3b-4.
Item 5.
Audit Committee of Listed Registrants
The Audit Committee is a separately-designated standing audit committee in accordance with Section 3(a)(58)(A) of the Securities Exchange Act of 1934. As of July 31, 2023, the members of the Audit Committee were Donald Donahue, Thomas Bostick, Thomas Kennedy and Susan Tomasky.
Item 6.
Investments
(a)
Not applicable.
(b)
Not applicable.
Item 7.
Disclosure of Proxy Voting Policies and Procedures for Closed-End Management Investment Companies
Not applicable.
Item 8.
Portfolio Managers of Closed-End Management Investment Companies
Not applicable.
Item 9.
Purchase of Equity Securities by Closed-End Management Investment Company and Affiliated Purchasers
Not applicable.
Item 10.
Submission of Matters to a Vote of Security Holders
There were no material changes to the procedures by which shareholders may recommend nominees to the trust’s Board of Trustees.
Item 11.
Controls and Procedures
(a)(i) The President and Treasurer and the Chief Financial Officer have concluded that the trust’s disclosure controls and procedures (as defined in Rule 30a-3(c) under the Investment Company Act) provide reasonable assurances that material information relating to the trust is made known to them by the appropriate persons, based on their evaluation of these controls and procedures as of a date within 90 days of the filing date of this report.
(a)(ii) There was no change in the trust’s internal control over financial reporting (as defined in Rule 30a-3(d) under the Investment Company Act) that occurred during the period covered by this report that has materially affected, or is reasonably likely to materially affect, the trust’s internal control over financial reporting.
Item 12.
Disclosure of Securities Lending Activities for Closed-End Management
Investment Companies
Not applicable.
Item 13.
Exhibits
(a) | (1) | Code of Ethics pursuant to Item 2 of Form N-CSR is filed and attached hereto as EX-99.CODE ETH. |
(a) | (2) | |
(a) | (3) | Not applicable. |
(b) |
|
SIGNATURES
Pursuant to the requirements of the Securities Exchange Act of 1934 and the Investment Company Act of 1940, the registrant has duly caused this report to be signed on its behalf by the undersigned, thereunto duly authorized.
Fidelity Covington Trust
By: | /s/Stacie M. Smith |
| Stacie M. Smith |
| President and Treasurer |
|
|
Date: | September 21, 2023 |
Pursuant to the requirements of the Securities Exchange Act of 1934 and the Investment Company Act of 1940, this report has been signed below by the following persons on behalf of the registrant and in the capacities and on the dates indicated.
By: | /s/Stacie M. Smith |
| Stacie M. Smith |
| President and Treasurer |
|
|
Date: | September 21, 2023 |
By: | /s/John J. Burke III |
| John J. Burke III |
| Chief Financial Officer |
|
|
Date: | September 21, 2023 |