UNITED STATES
SECURITIES AND EXCHANGE COMMISSION
Washington, D.C. 20549
FORM N-CSR
CERTIFIED SHAREHOLDER REPORT OF REGISTERED
MANAGEMENT INVESTMENT COMPANIES
Investment Company Act file number 811-07319
Fidelity Covington Trust
(Exact name of registrant as specified in charter)
245 Summer St., Boston, Massachusetts 02210
(Address of principal executive offices) (Zip code)
Margaret Carey, Secretary
245 Summer St.
Boston, Massachusetts 02210
(Name and address of agent for service)
Registrant's telephone number, including area code:
617-563-7000
| |
Date of fiscal year end: | August 31 |
|
|
Date of reporting period: | August 31, 2023 |
Item 1. Reports to Stockholders
Fidelity® High Yield Factor ETF
Fidelity® Preferred Securities & Income ETF
Annual Report
August 31, 2023
Contents
To view a fund's proxy voting guidelines and proxy voting record for the 12-month period ended June 30, visit http://www.fidelity.com/proxyvotingresults or visit the Securities and Exchange Commission's (SEC) web site at http://www.sec.gov.
You may also call 1-800-FIDELITY to request a free copy of the proxy voting guidelines.
Standard & Poor's, S&P and S&P 500 are registered service marks of The McGraw-Hill Companies, Inc. and have been licensed for use by Fidelity Distributors Corporation.
Other third-party marks appearing herein are the property of their respective owners.
All other marks appearing herein are registered or unregistered trademarks or service marks of FMR LLC or an affiliated company. © 2023 FMR LLC. All rights reserved.
This report and the financial statements contained herein are submitted for the general information of the shareholders of the Funds. This report is not authorized for distribution to prospective investors in the Funds unless preceded or accompanied by an effective prospectus.
A fund files its complete schedule of portfolio holdings with the SEC for the first and third quarters of each fiscal year on Form N-PORT. Forms N-PORT are available on the SEC's web site at http://www.sec.gov. A fund's Forms N-PORT may be reviewed and copied at the SEC's Public Reference Room in Washington, DC. Information regarding the operation of the SEC's Public Reference Room may be obtained by calling 1-800-SEC-0330.
For a complete list of a fund's portfolio holdings, view the most recent holdings listing, semiannual report, or annual report on Fidelity's web site at http://www.fidelity.com, http://www.institutional.fidelity.com, or http://www.401k.com, as applicable.
NOT FDIC INSURED •MAY LOSE VALUE •NO BANK GUARANTEE
Neither the Funds nor Fidelity Distributors Corporation is a bank.
NAV and closing market price average annual returns reflect the change in the value of an investment, assuming reinvestment of distributions from dividend income and capital gains (the profits earned upon the sale of securities that have grown in value, if any) at NAV and Market Price, respectively, and assumes a constant rate of performance each year. The hypothetical investment and the fund's returns do not reflect the deduction of taxes that a shareholder would pay on fund distributions or the redemption or selling of fund shares. How a fund did yesterday is no guarantee of how it will do tomorrow.
| Average Annual Total Returns |
| | | | |
Periods ended August 31, 2023 | Past 1 year | Past 5 years | Life of Fund |
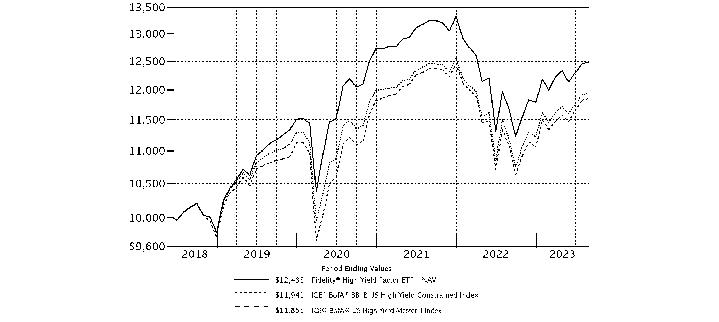
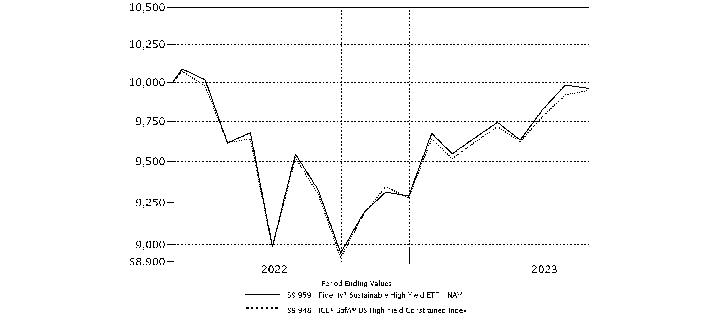
Fidelity® High Yield Factor ETF - NAV A | 6.90% | 4.21% | 4.34% |
Fidelity® High Yield Factor ETF - Market Price B | 7.63% | 4.20% | 4.30% |
ICE® BofA® BB-B US High Yield Constrained Index A | 6.72% | 3.31% | 3.46% |
ICE® BofA® US High Yield Master II Index A | 7.01% | 3.16% | 3.31% |
A From June 12, 2018
B From June 14, 2018, date initially listed on the NYSE ARCA exchange.
| $10,000 Over Life of Fund |
| |
Let's say hypothetically that $10,000 was invested in Fidelity® High Yield Factor ETF - NAV, on June 12, 2018, when the fund started. The chart shows how the value of your investment would have changed, and also shows how the ICE® BofA® BB-B US High Yield Constrained Index and ICE® BofA® US High Yield Master II Index performed over the same period. |
|
|
Fidelity® High Yield Factor ETF
Market Recap:
High-yield bonds gained 7.03% for the 12 months ending August 31, 2023, according to the ICE BofA® US High Yield Constrained Index, as continued global economic expansion, falling commodity prices and a slowing in the pace of inflation provided a favorable backdrop for higher-risk assets. U.S. large-cap stocks spearheaded the broad rally, driven by the shares of a narrow set of mega-cap companies in the information technology and communication services sectors, largely due to exuberance related to generative artificial intelligence. Aggressive monetary tightening by the U.S. Federal Reserve continued amid consistent pressure on core inflation, a measure that excludes food and energy. Since March 2022, the Fed has hiked its benchmark interest rate 11 times. The latest bump came in late July, a fourth consecutive raise of a stepped down 25 basis points. After a rough 2022 (-11.21%), high yield sharply reversed course to begin the new year and made a fairly steady advance through the end of August. The index rose in June (+1.63%) and July (+1.43%) before a modest gain in August (+0.30%), held back by softness in manufacturing and jobs. By industry for the full 12 months, leisure (+11%), financial services, energy and basic industry (+10% each) led the way. Conversely, notable laggards included telecommunications (+1%) and media (+2%).
Comments from Lead Manager Michael Cheng, Co-Manager Benjamin Harrison and Co-Manager Alexandre Karam:
For the fiscal year ending August 31, 2023, the exchange-traded fund's net asset value gained 6.90%, versus 6.72% for the ICE BofA BB-B US High Yield Constrained Index. The fund's core investment in high-yield bonds rose 7.23% and contributed to performance versus the benchmark. By industry, market selection was the primary contributor, especially an underweight in telecommunications. The biggest contributor to performance versus the benchmark were security selection and an underweight in media. Our choices and an underweight in technology & electronics and our picks and an overweight in capital goods also boosted the fund's relative performance. Lastly, the fund's position in cash was a notable contributor. The top individual relative contributor was an underweight in Centurylink (-19%). The second-largest relative contributor was an overweight in Royal Caribbean Cruises (+30%). Royal Caribbean Cruises was among our biggest holdings. A stake in Seagate gained 17% and notably helped. In contrast, the biggest detractor from performance versus the benchmark was security selection in financial services. Also hurting our result were our choices and an underweight in healthcare and security selection and an overweight in real estate. The fund's stake in Icahn Enterprises gained 0% and was the largest individual relative detractor. Icahn Enterprises was among the fund's largest holdings this period. A second notable relative detractor was an overweight in Kennedy-wilson (-10%). An overweight in Pra (-1%) also hurt. By quality, positioning in bonds rated BB added the most value, whereas those rated B hurt the most. Notable changes in positioning include higher allocations to the leisure and services industries.
Note to shareholders:
On June 8, 2023, Michael Weaver came off of the fund.
The views expressed above reflect those of the portfolio manager(s) only through the end of the period as stated on the cover of this report and do not necessarily represent the views of Fidelity or any other person in the Fidelity organization. Any such views are subject to change at any time based upon market or other conditions and Fidelity disclaims any responsibility to update such views. These views may not be relied on as investment advice and, because investment decisions for a Fidelity fund are based on numerous factors, may not be relied on as an indication of trading intent on behalf of any Fidelity fund.
Fidelity® High Yield Factor ETF
| Top Bond Issuers (% of Fund's net assets) |
(with maturities greater than one year) |
| TransDigm, Inc. | 3.3 | |
| Royal Caribbean Cruises Ltd. | 2.3 | |
| Ford Motor Credit Co. LLC | 2.2 | |
| FMG Resources Pty Ltd. | 2.1 | |
| CCO Holdings LLC/CCO Holdings Capital Corp. | 1.7 | |
| Carnival Corp. | 1.6 | |
| Mineral Resources Ltd. | 1.6 | |
| Performance Food Group, Inc. | 1.6 | |
| LPL Holdings, Inc. | 1.4 | |
| Asbury Automotive Group, Inc. | 1.4 | |
| | 19.2 | |
| |
| Market Sectors (% of Fund's net assets) |
| |
| Energy | 16.7 | |
| Diversified Financial Services | 5.8 | |
| Metals/Mining | 5.5 | |
| Services | 5.2 | |
| Healthcare | 4.9 | |
| |
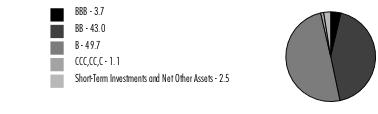
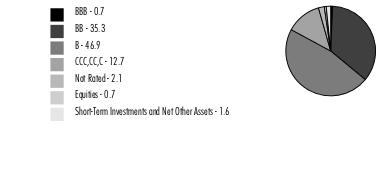
Quality Diversification (% of Fund's net assets) |
|
| |
| We have used ratings from Moody's Investors Service, Inc. Where Moody's® ratings are not available, we have used S&P® ratings. All ratings are as of the date indicated and do not reflect subsequent changes. |
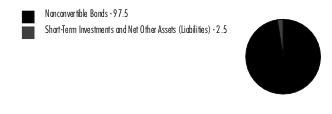
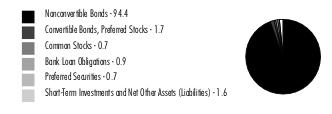
Asset Allocation (% of Fund's net assets) |
|
|
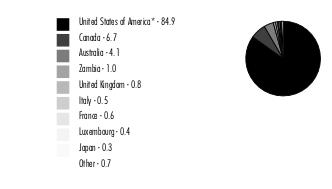
Geographic Diversification (% of Fund's net assets) |
|
* Includes Short-Term investments and Net Other Assets (Liabilities). Percentages are adjusted for the effect of derivatives, if applicable. |
| |
Fidelity® High Yield Factor ETF
Showing Percentage of Net Assets
| Nonconvertible Bonds - 97.5% |
| | | Principal Amount (a) | Value ($) |
| Aerospace - 4.4% | | | |
| Bombardier, Inc.: | | | |
| 7.5% 2/1/29 (b) | | 1,572,000 | 1,540,380 |
| 7.875% 4/15/27 (b) | | 750,000 | 748,598 |
| Hexcel Corp. 4.95% 8/15/25 | | 269,000 | 262,348 |
| TransDigm, Inc.: | | | |
| 4.875% 5/1/29 | | 3,982,000 | 3,582,948 |
| 6.25% 3/15/26 (b) | | 3,018,000 | 2,989,237 |
| 6.875% 12/15/30 (b) | | 3,000,000 | 3,019,800 |
| VistaJet Malta Finance PLC / XO Management Holding, Inc. 9.5% 6/1/28 (b) | | 500,000 | 461,401 |
TOTAL AEROSPACE | | | 12,604,712 |
| Air Transportation - 1.7% | | | |
| Air Canada 3.875% 8/15/26 (b) | | 600,000 | 554,053 |
| Allegiant Travel Co. 7.25% 8/15/27 (b) | | 270,000 | 264,263 |
| American Airlines, Inc.: | | | |
| 7.25% 2/15/28 (b) | | 215,000 | 211,198 |
| 11.75% 7/15/25 (b) | | 534,900 | 585,471 |
| American Airlines, Inc. / AAdvantage Loyalty IP Ltd. 5.5% 4/20/26 (b) | | 591,831 | 580,754 |
| Bristow Group, Inc. 6.875% 3/1/28 (b) | | 166,000 | 155,273 |
| Rand Parent LLC 8.5% 2/15/30 (b) | | 300,000 | 285,602 |
| Spirit Loyalty Cayman Ltd. / Spirit IP Cayman Ltd. 8% 9/20/25 (b) | | 1,102,000 | 1,103,284 |
| United Airlines, Inc. 4.375% 4/15/26 (b) | | 982,900 | 926,316 |
| United Continental Holdings, Inc. 4.875% 1/15/25 | | 369,000 | 359,971 |
TOTAL AIR TRANSPORTATION | | | 5,026,185 |
| Automotive & Auto Parts - 3.6% | | | |
| Allison Transmission, Inc. 3.75% 1/30/31 (b) | | 3,214,000 | 2,684,542 |
| Ford Motor Credit Co. LLC: | | | |
| 3.37% 11/17/23 | | 787,000 | 780,471 |
| 4.687% 6/9/25 | | 1,143,000 | 1,100,256 |
| 6.8% 5/12/28 | | 3,000,000 | 2,998,797 |
| 6.95% 3/6/26 | | 1,400,000 | 1,403,535 |
| Gates Global LLC/Gates Global Co. 6.25% 1/15/26 (b) | | 175,000 | 173,256 |
| Jaguar Land Rover Automotive PLC 7.75% 10/15/25 (b) | | 175,000 | 175,608 |
| LCM Investments Holdings 8.25% 8/1/31 (b) | | 165,000 | 165,106 |
| Tenneco, Inc. 8% 11/17/28 (b) | | 500,000 | 410,625 |
| Thor Industries, Inc. 4% 10/15/29 (b) | | 443,000 | 372,160 |
TOTAL AUTOMOTIVE & AUTO PARTS | | | 10,264,356 |
| Banks & Thrifts - 0.8% | | | |
| AG TTMT Escrow Issuer LLC 8.625% 9/30/27 (b) | | 500,000 | 515,304 |
| PennyMac Financial Services, Inc. 5.75% 9/15/31 (b) | | 700,000 | 588,349 |
| Quicken Loans LLC/Quicken Loans Co-Issuer, Inc. 3.625% 3/1/29 (b) | | 1,200,000 | 1,021,359 |
| UniCredit SpA 7.296% 4/2/34 (b)(c) | | 89,693 | 86,276 |
TOTAL BANKS & THRIFTS | | | 2,211,288 |
| Broadcasting - 4.8% | | | |
| AMC Networks, Inc. 4.75% 8/1/25 | | 300,000 | 281,207 |
| Clear Channel Outdoor Holdings, Inc. 9% 9/15/28 (b) | | 300,000 | 301,500 |
| DISH Network Corp. 11.75% 11/15/27 (b) | | 2,608,000 | 2,646,184 |
| Gray Television, Inc. 7% 5/15/27 (b) | | 955,000 | 857,169 |
| iHeartCommunications, Inc. 4.75% 1/15/28 (b) | | 500,000 | 385,350 |
| Nexstar Media, Inc. 4.75% 11/1/28 (b) | | 4,348,000 | 3,814,116 |
| Sinclair Television Group, Inc. 4.125% 12/1/30 (b) | | 500,000 | 322,220 |
| Sirius XM Radio, Inc.: | | | |
| 3.125% 9/1/26 (b) | | 1,947,000 | 1,757,557 |
| 3.875% 9/1/31 (b) | | 1,000,000 | 778,310 |
| TEGNA, Inc.: | | | |
| 4.625% 3/15/28 | | 1,500,000 | 1,339,745 |
| 5% 9/15/29 | | 500,000 | 440,000 |
| Univision Communications, Inc.: | | | |
| 7.375% 6/30/30 (b) | | 505,000 | 488,753 |
| 8% 8/15/28 (b) | | 420,000 | 419,769 |
TOTAL BROADCASTING | | | 13,831,880 |
| Building Materials - 0.6% | | | |
| Beacon Roofing Supply, Inc. 6.5% 8/1/30 (b) | | 290,000 | 286,474 |
| Griffon Corp. 5.75% 3/1/28 | | 600,000 | 559,202 |
| Jeld-Wen, Inc. 4.625% 12/15/25 (b) | | 235,000 | 227,821 |
| Standard Industries, Inc./New Jersey 4.375% 7/15/30 (b) | | 867,000 | 743,205 |
TOTAL BUILDING MATERIALS | | | 1,816,702 |
| Cable/Satellite TV - 2.9% | | | |
| CCO Holdings LLC/CCO Holdings Capital Corp.: | | | |
| 4.25% 1/15/34 (b) | | 1,211,000 | 927,380 |
| 4.5% 8/15/30 (b) | | 750,000 | 630,898 |
| 4.5% 5/1/32 | | 1,982,000 | 1,606,797 |
| 6.375% 9/1/29 (b) | | 1,821,000 | 1,723,953 |
| CSC Holdings LLC: | | | |
| 4.5% 11/15/31 (b) | | 1,550,000 | 1,102,153 |
| 11.25% 5/15/28 (b) | | 500,000 | 493,162 |
| DIRECTV Financing LLC / DIRECTV Financing Co-Obligor, Inc. 5.875% 8/15/27 (b) | | 673,000 | 596,425 |
| Dolya Holdco 18 DAC 5% 7/15/28 (b) | | 450,000 | 397,820 |
| Ziggo BV 4.875% 1/15/30 (b) | | 1,000,000 | 840,551 |
TOTAL CABLE/SATELLITE TV | | | 8,319,139 |
| Capital Goods - 0.8% | | | |
| ATS Corp. 4.125% 12/15/28 (b) | | 440,000 | 390,646 |
| EnerSys 4.375% 12/15/27 (b) | | 1,232,000 | 1,127,280 |
| Patrick Industries, Inc. 4.75% 5/1/29 (b) | | 897,000 | 766,935 |
TOTAL CAPITAL GOODS | | | 2,284,861 |
| Chemicals - 1.9% | | | |
| Avient Corp. 5.75% 5/15/25 (b) | | 105,000 | 103,603 |
| CVR Partners LP 6.125% 6/15/28 (b) | | 320,000 | 286,486 |
| INEOS Quattro Finance 2 PLC 3.375% 1/15/26 (b) | | 480,000 | 438,737 |
| Nufarm Australia Ltd. 5% 1/27/30 (b) | | 455,000 | 404,720 |
| Olin Corp. 5% 2/1/30 | | 2,104,300 | 1,926,843 |
| Olympus Water U.S. Holding Corp. 9.75% 11/15/28 (b) | | 700,000 | 705,129 |
| The Chemours Co. LLC 5.75% 11/15/28 (b) | | 1,927,000 | 1,731,061 |
TOTAL CHEMICALS | | | 5,596,579 |
| Consumer Products - 2.6% | | | |
| BlueLinx Corp. 6% 11/15/29 (b) | | 225,000 | 200,858 |
| Ferrellgas LP/Ferrellgas Finance Corp. 5.375% 4/1/26 (b) | | 556,000 | 522,657 |
| Grubhub Holdings, Inc. 5.5% 7/1/27 (b) | | 86,000 | 59,448 |
| HFC Prestige Products, Inc./HFC Prestige International U.S. LLC 6.625% 7/15/30 (b) | | 1,700,000 | 1,696,804 |
| Newell Brands, Inc. 6.375% 9/15/27 | | 300,000 | 293,891 |
| Rakuten Group, Inc. 10.25% 11/30/24 (b) | | 1,000,000 | 1,002,500 |
| Tempur Sealy International, Inc. 3.875% 10/15/31 (b) | | 3,015,000 | 2,422,971 |
| TripAdvisor, Inc. 7% 7/15/25 (b) | | 1,386,000 | 1,382,695 |
TOTAL CONSUMER PRODUCTS | | | 7,581,824 |
| Containers - 0.9% | | | |
| Ardagh Packaging Finance PLC/Ardagh MP Holdings U.S.A., Inc. 5.25% 4/30/25 (b) | | 161,000 | 156,886 |
| Ball Corp.: | | | |
| 5.25% 7/1/25 | | 263,000 | 259,333 |
| 6.875% 3/15/28 | | 750,000 | 761,242 |
| BWAY Holding Co. 7.875% 8/15/26 (b) | | 800,000 | 787,796 |
| LABL, Inc. 9.5% 11/1/28 (b) | | 300,000 | 308,781 |
| Sealed Air Corp./Sealed Air Cor 6.125% 2/1/28 (b) | | 390,000 | 383,205 |
TOTAL CONTAINERS | | | 2,657,243 |
| Diversified Financial Services - 5.8% | | | |
| BrightSphere Investment Group, Inc. 4.8% 7/27/26 | | 1,687,000 | 1,610,048 |
| Castlelake Aviation Finance 5% 4/15/27 (b) | | 414,000 | 381,664 |
| Coinbase Global, Inc. 3.625% 10/1/31 (b) | | 500,000 | 336,620 |
| Credit Acceptance Corp. 6.625% 3/15/26 | | 1,462,000 | 1,423,023 |
| Emerald Debt Merger Sub LLC 6.625% 12/15/30 (b) | | 200,000 | 196,884 |
| Enova International, Inc. 8.5% 9/15/25 (b) | | 325,000 | 319,768 |
| First Cash Financial Services, Inc. 5.625% 1/1/30 (b) | | 3,023,000 | 2,744,374 |
| Icahn Enterprises LP/Icahn Enterprises Finance Corp. 4.375% 2/1/29 | | 1,203,000 | 949,582 |
| Ladder Capital Finance Holdings LLLP/Ladder Capital Finance Corp. 4.75% 6/15/29 (b) | | 498,000 | 418,674 |
| LPL Holdings, Inc.: | | | |
| 4% 3/15/29 (b) | | 3,063,000 | 2,722,801 |
| 4.375% 5/15/31 (b) | | 1,679,000 | 1,475,004 |
| MidCap Financial Issuer Trust 5.625% 1/15/30 (b) | | 250,000 | 201,250 |
| Nationstar Mortgage Holdings, Inc. 6% 1/15/27 (b) | | 500,000 | 476,250 |
| Navient Corp. 9.375% 7/25/30 | | 700,000 | 703,129 |
| OneMain Finance Corp.: | | | |
| 3.875% 9/15/28 | | 1,014,000 | 831,480 |
| 6.625% 1/15/28 | | 471,000 | 440,385 |
| PRA Group, Inc. 8.375% 2/1/28 (b) | | 337,000 | 307,687 |
| StoneX Group, Inc. 8.625% 6/15/25 (b) | | 1,225,000 | 1,240,423 |
TOTAL DIVERSIFIED FINANCIAL SERVICES | | | 16,779,046 |
| Diversified Media - 0.5% | | | |
| Lamar Media Corp. 3.625% 1/15/31 | | 1,625,000 | 1,356,875 |
| Energy - 16.7% | | | |
| Aethon United BR LP / Aethon United Finance Corp. 8.25% 2/15/26 (b) | | 185,000 | 185,925 |
| AmeriGas Partners LP/AmeriGas Finance Corp. 9.375% 6/1/28 (b) | | 500,000 | 512,515 |
| Antero Midstream Partners LP/Antero Midstream Finance Corp. 5.375% 6/15/29 (b) | | 633,000 | 593,150 |
| Antero Resources Corp. 8.375% 7/15/26 (b) | | 275,000 | 285,311 |
| Baytex Energy Corp.: | | | |
| 8.5% 4/30/30 (b) | | 3,027,000 | 3,069,215 |
| 8.75% 4/1/27 (b) | | 145,000 | 148,389 |
| Buckeye Partners LP 4.5% 3/1/28 (b) | | 1,550,000 | 1,406,625 |
| California Resources Corp. 7.125% 2/1/26 (b) | | 140,000 | 140,360 |
| Chord Energy Corp. 6.375% 6/1/26 (b) | | 508,000 | 500,695 |
| Citgo Petroleum Corp.: | | | |
| 6.375% 6/15/26 (b) | | 715,000 | 698,240 |
| 7% 6/15/25 (b) | | 624,000 | 617,760 |
| Civitas Resources, Inc. 5% 10/15/26 (b) | | 1,275,000 | 1,210,026 |
| CNX Midstream Partners LP 4.75% 4/15/30 (b) | | 403,000 | 347,765 |
| Comstock Resources, Inc.: | | | |
| 5.875% 1/15/30 (b) | | 476,000 | 420,418 |
| 6.75% 3/1/29 (b) | | 600,000 | 561,406 |
| Coronado Finance Pty Ltd. 10.75% 5/15/26 (b) | | 160,000 | 165,578 |
| CVR Energy, Inc. 5.75% 2/15/28 (b) | | 3,113,000 | 2,833,826 |
| Delek Logistics Partners LP 7.125% 6/1/28 (b) | | 2,236,000 | 2,078,541 |
| DT Midstream, Inc. 4.125% 6/15/29 (b) | | 800,000 | 708,735 |
| Energy Ventures GoM LLC / EnVen Finance Corp. 11.75% 4/15/26 (b) | | 160,000 | 165,929 |
| EnLink Midstream LLC 6.5% 9/1/30 (b) | | 300,000 | 300,767 |
| EQM Midstream Partners LP 7.5% 6/1/27 (b) | | 750,000 | 756,986 |
| Genesis Energy LP/Genesis Energy Finance Corp. 8.875% 4/15/30 | | 600,000 | 597,593 |
| Harvest Midstream I LP 7.5% 9/1/28 (b) | | 50,000 | 50,110 |
| Hilcorp Energy I LP/Hilcorp Finance Co. 6.25% 11/1/28 (b) | | 500,000 | 482,338 |
| Holly Energy Partners LP/Holly Energy Finance Corp. 5% 2/1/28 (b) | | 460,000 | 431,510 |
| Howard Midstream Energy Partners LLC 8.875% 7/15/28 (b) | | 500,000 | 517,795 |
| Independence Energy Finance LLC: | | | |
| 7.25% 5/1/26 (b) | | 402,000 | 396,018 |
| 9.25% 2/15/28 (b) | | 500,000 | 511,485 |
| Matador Resources Co.: | | | |
| 5.875% 9/15/26 | | 165,300 | 161,223 |
| 6.875% 4/15/28 (b) | | 1,976,000 | 1,972,876 |
| Moss Creek Resources Holdings, Inc. 7.5% 1/15/26 (b) | | 362,000 | 346,513 |
| Murphy Oil Corp. 5.75% 8/15/25 | | 543,000 | 536,379 |
| Nabors Industries, Inc. 7.375% 5/15/27 (b) | | 200,000 | 195,180 |
| New Fortress Energy, Inc. 6.5% 9/30/26 (b) | | 3,849,000 | 3,577,733 |
| Northern Oil & Gas, Inc.: | | | |
| 8.125% 3/1/28 (b) | | 306,000 | 306,737 |
| 8.75% 6/15/31 (b) | | 2,000,000 | 2,043,037 |
| NuStar Logistics LP 5.625% 4/28/27 | | 160,000 | 155,240 |
| Oceaneering International, Inc. 4.65% 11/15/24 | | 301,000 | 294,709 |
| Patterson-UTI Energy, Inc. 5.15% 11/15/29 | | 270,000 | 248,802 |
| PBF Holding Co. LLC/PBF Finance Corp.: | | | |
| 6% 2/15/28 | | 465,000 | 439,848 |
| 7.875% 9/15/30 (b) | | 450,000 | 447,773 |
| Perenti Finance Pty Ltd. 6.5% 10/7/25 (b) | | 530,000 | 514,895 |
| Range Resources Corp. 8.25% 1/15/29 | | 599,000 | 621,852 |
| Rockies Express Pipeline LLC 4.8% 5/15/30 (b) | | 504,000 | 440,291 |
| Seadrill Finance Ltd. 8.375% 8/1/30 (b) | | 120,000 | 123,000 |
| SM Energy Co. 6.75% 9/15/26 | | 450,000 | 448,110 |
| Summit Midstream Holdings LLC 9% 10/15/26 (b) | | 300,000 | 289,500 |
| Sunoco LP/Sunoco Finance Corp.: | | | |
| 4.5% 5/15/29 | | 1,708,000 | 1,544,629 |
| 4.5% 4/30/30 | | 1,781,000 | 1,587,923 |
| Tallgrass Energy Partners LP / Tallgrass Energy Finance Corp.: | | | |
| 6% 9/1/31 (b) | | 500,000 | 444,060 |
| 7.5% 10/1/25 (b) | | 105,000 | 105,639 |
| Talos Production, Inc. 12% 1/15/26 | | 105,000 | 109,463 |
| Tervita Corp. 11% 12/1/25 (b) | | 510,000 | 532,165 |
| Transocean Titan Finance Ltd. 8.375% 2/1/28 (b) | | 222,000 | 228,152 |
| U.S.A. Compression Partners LP: | | | |
| 6.875% 4/1/26 | | 2,106,000 | 2,082,350 |
| 6.875% 9/1/27 | | 296,000 | 288,549 |
| Valaris Ltd. 8.375% 4/30/30 (b) | | 300,000 | 305,565 |
| Venture Global Calcasieu Pass LLC 6.25% 1/15/30 (b) | | 928,000 | 904,021 |
| Venture Global LNG, Inc. 8.125% 6/1/28 (b) | | 1,000,000 | 1,008,744 |
| Vital Energy, Inc.: | | | |
| 7.75% 7/31/29 (b) | | 214,000 | 192,600 |
| 10.125% 1/15/28 | | 176,000 | 178,640 |
| Weatherford International Ltd.: | | | |
| 6.5% 9/15/28 (b) | | 522,000 | 523,227 |
| 8.625% 4/30/30 (b) | | 2,124,000 | 2,172,832 |
| Western Gas Partners LP 3.1% 2/1/25 | | 2,249,000 | 2,153,763 |
TOTAL ENERGY | | | 48,221,031 |
| Entertainment/Film - 0.6% | | | |
| Live Nation Entertainment, Inc. 4.875% 11/1/24 (b) | | 1,348,000 | 1,324,145 |
| Resorts World Las Vegas LLC / RWLV Capital, Inc. 8.45% 7/27/30 (b) | | 500,000 | 493,713 |
TOTAL ENTERTAINMENT/FILM | | | 1,817,858 |
| Environmental - 1.3% | | | |
| GFL Environmental, Inc. 4% 8/1/28 (b) | | 4,209,000 | 3,757,450 |
| Food & Drug Retail - 1.6% | | | |
| Albertsons Companies LLC/Safeway, Inc./New Albertson's, Inc./Albertson's LLC 6.5% 2/15/28 (b) | | 988,000 | 983,434 |
| Murphy Oil U.S.A., Inc.: | | | |
| 3.75% 2/15/31 (b) | | 400,000 | 336,480 |
| 4.75% 9/15/29 | | 2,850,000 | 2,615,103 |
| Parkland Corp. 5.875% 7/15/27 (b) | | 614,000 | 593,412 |
TOTAL FOOD & DRUG RETAIL | | | 4,528,429 |
| Food/Beverage/Tobacco - 3.2% | | | |
| HLF Financing SARL LLC / Herbalife International, Inc. 4.875% 6/1/29 (b) | | 300,000 | 224,469 |
| Lamb Weston Holdings, Inc. 4.125% 1/31/30 (b) | | 1,000,000 | 879,437 |
| Performance Food Group, Inc. 4.25% 8/1/29 (b) | | 5,099,000 | 4,487,418 |
| Post Holdings, Inc. 4.5% 9/15/31 (b) | | 1,000,000 | 861,487 |
| Turning Point Brands, Inc. 5.625% 2/15/26 (b) | | 1,603,000 | 1,496,208 |
| Vector Group Ltd. 5.75% 2/1/29 (b) | | 1,414,000 | 1,230,948 |
TOTAL FOOD/BEVERAGE/TOBACCO | | | 9,179,967 |
| Gaming - 2.7% | | | |
| Caesars Entertainment, Inc.: | | | |
| 6.25% 7/1/25 (b) | | 822,300 | 815,917 |
| 8.125% 7/1/27 (b) | | 750,000 | 761,499 |
| Carnival Corp. 10.5% 6/1/30 (b) | | 750,000 | 798,848 |
| CDI Escrow Issuer, Inc. 5.75% 4/1/30 (b) | | 1,701,000 | 1,581,941 |
| Churchill Downs, Inc. 5.5% 4/1/27 (b) | | 246,000 | 237,006 |
| International Game Technology PLC 4.125% 4/15/26 (b) | | 205,000 | 194,608 |
| Las Vegas Sands Corp. 3.9% 8/8/29 | | 750,000 | 660,275 |
| MGM Resorts International 6.75% 5/1/25 | | 151,000 | 151,251 |
| Ontario Gaming GTA LP 8% 8/1/30 (b) | | 145,000 | 146,565 |
| Premier Entertainment Sub LLC 5.625% 9/1/29 (b) | | 400,000 | 319,280 |
| Raptor Acquisition Corp. / Raptor Co-Issuer LLC 4.875% 11/1/26 (b) | | 677,000 | 638,668 |
| Scientific Games Corp. 7.5% 9/1/31 (b) | | 210,000 | 212,933 |
| Wynn Resorts Finance LLC / Wynn Resorts Capital Corp. 7.125% 2/15/31 (b) | | 1,350,000 | 1,326,653 |
TOTAL GAMING | | | 7,845,444 |
| Healthcare - 4.9% | | | |
| AMN Healthcare 4% 4/15/29 (b) | | 866,000 | 740,680 |
| Bausch Health Companies, Inc. 4.875% 6/1/28 (b) | | 2,828,000 | 1,678,116 |
| Community Health Systems, Inc. 4.75% 2/15/31 (b) | | 1,976,000 | 1,472,120 |
| CTR Partnership LP/CareTrust Capital Corp. 3.875% 6/30/28 (b) | | 545,000 | 474,834 |
| DaVita HealthCare Partners, Inc. 4.625% 6/1/30 (b) | | 2,099,000 | 1,800,424 |
| IQVIA, Inc. 6.5% 5/15/30 (b) | | 2,465,000 | 2,478,193 |
| Mozart Borrower LP: | | | |
| 3.875% 4/1/29 (b) | | 800,000 | 698,380 |
| 5.25% 10/1/29 (b) | | 845,000 | 750,382 |
| Organon & Co. / Organon Foreign Debt Co-Issuer BV 5.125% 4/30/31 (b) | | 650,000 | 553,802 |
| RegionalCare Hospital Partners Holdings, Inc. 9.875% 8/15/30 (b) | | 300,000 | 296,250 |
| Tenet Healthcare Corp.: | | | |
| 4.375% 1/15/30 | | 2,960,000 | 2,629,480 |
| 6.75% 5/15/31 (b) | | 450,000 | 447,773 |
TOTAL HEALTHCARE | | | 14,020,434 |
| Homebuilders/Real Estate - 2.5% | | | |
| Anywhere Real Estate Group LLC 7% 4/15/30 (b) | | 304,000 | 273,980 |
| Arcosa, Inc. 4.375% 4/15/29 (b) | | 230,000 | 206,878 |
| DTZ U.S. Borrower LLC 8.875% 9/1/31 (b) | | 500,000 | 504,100 |
| Greystar Real Estate Partners 7.75% 9/1/30 (b) | | 130,000 | 131,307 |
| HAT Holdings I LLC/HAT Holdings II LLC 6% 4/15/25 (b) | | 889,000 | 872,619 |
| Kennedy-Wilson, Inc. 4.75% 2/1/30 | | 1,250,000 | 962,963 |
| LGI Homes, Inc. 4% 7/15/29 (b) | | 860,000 | 711,094 |
| MPT Operating Partnership LP/MPT Finance Corp. 3.5% 3/15/31 | | 1,000,000 | 649,373 |
| Office Properties Income Trust 2.65% 6/15/26 | | 153,000 | 114,452 |
| Realogy Group LLC/Realogy Co.-Issuer Corp. 5.25% 4/15/30 (b) | | 20,000 | 13,883 |
| RHP Hotel Properties LP/RHP Finance Corp. 7.25% 7/15/28 (b) | | 400,000 | 401,999 |
| Service Properties Trust: | | | |
| 4.65% 3/15/24 | | 113,000 | 111,441 |
| 4.75% 10/1/26 | | 355,000 | 308,183 |
| 5.25% 2/15/26 | | 181,000 | 166,682 |
| 7.5% 9/15/25 | | 408,300 | 403,418 |
| Starwood Property Trust, Inc. 4.375% 1/15/27 (b) | | 502,000 | 448,316 |
| Uniti Group LP / Uniti Group Finance, Inc. 10.5% 2/15/28 (b) | | 850,000 | 847,989 |
TOTAL HOMEBUILDERS/REAL ESTATE | | | 7,128,677 |
| Hotels - 0.6% | | | |
| Carnival Holdings (Bermuda) Ltd. 10.375% 5/1/28 (b) | | 575,000 | 625,361 |
| Travel+Leisure Co. 6.625% 7/31/26 (b) | | 370,000 | 367,210 |
| Wyndham Hotels & Resorts, Inc. 4.375% 8/15/28 (b) | | 882,000 | 804,383 |
TOTAL HOTELS | | | 1,796,954 |
| Insurance - 0.4% | | | |
| HUB International Ltd. 7.25% 6/15/30 (b) | | 500,000 | 508,945 |
| NMI Holdings, Inc. 7.375% 6/1/25 (b) | | 747,000 | 752,057 |
TOTAL INSURANCE | | | 1,261,002 |
| Leisure - 3.9% | | | |
| Carnival Corp.: | | | |
| 4% 8/1/28 (b) | | 3,273,000 | 2,928,473 |
| 6% 5/1/29 (b) | | 272,000 | 246,191 |
| 7% 8/15/29 (b) | | 145,000 | 147,123 |
| 7.625% 3/1/26 (b) | | 102,000 | 101,690 |
| 9.875% 8/1/27 (b) | | 410,000 | 432,921 |
| NCL Corp. Ltd. 8.375% 2/1/28 (b) | | 500,000 | 515,365 |
| Royal Caribbean Cruises Ltd.: | | | |
| 5.5% 8/31/26 (b) | | 1,355,000 | 1,298,384 |
| 8.25% 1/15/29 (b) | | 750,000 | 783,797 |
| 11.625% 8/15/27 (b) | | 4,152,000 | 4,522,090 |
| Viking Cruises Ltd. 9.125% 7/15/31 (b) | | 300,000 | 309,941 |
TOTAL LEISURE | | | 11,285,975 |
| Metals/Mining - 5.5% | | | |
| Arsenal AIC Parent LLC 8% 10/1/30 (b) | | 170,000 | 173,611 |
| Cleveland-Cliffs, Inc. 5.875% 6/1/27 | | 596,000 | 573,958 |
| Eldorado Gold Corp. 6.25% 9/1/29 (b) | | 300,000 | 255,732 |
| ERO Copper Corp. 6.5% 2/15/30 (b) | | 500,000 | 434,280 |
| First Quantum Minerals Ltd.: | | | |
| 6.875% 10/15/27 (b) | | 390,000 | 376,869 |
| 8.625% 6/1/31 (b) | | 2,500,000 | 2,544,056 |
| FMG Resources Pty Ltd.: | | | |
| 4.375% 4/1/31 (b) | | 203,000 | 170,128 |
| 5.875% 4/15/30 (b) | | 6,484,000 | 6,018,890 |
| HudBay Minerals, Inc. 4.5% 4/1/26 (b) | | 859,000 | 810,780 |
| Mineral Resources Ltd.: | | | |
| 8% 11/1/27 (b) | | 500,000 | 498,253 |
| 8.125% 5/1/27 (b) | | 923,000 | 921,006 |
| 8.5% 5/1/30 (b) | | 3,064,000 | 3,074,958 |
TOTAL METALS/MINING | | | 15,852,521 |
| Paper - 0.3% | | | |
| Ardagh Metal Packaging Finance U.S.A. LLC/Ardagh Metal Packaging Finance PLC 6% 6/15/27 (b) | | 360,000 | 351,042 |
| Louisiana-Pacific Corp. 3.625% 3/15/29 (b) | | 483,000 | 415,619 |
TOTAL PAPER | | | 766,661 |
| Restaurants - 0.9% | | | |
| 1011778 BC Unlimited Liability Co./New Red Finance, Inc. 4% 10/15/30 (b) | | 2,980,000 | 2,524,511 |
| Services - 5.2% | | | |
| Allied Universal Holdco LLC / Allied Universal Finance Corp. 6.625% 7/15/26 (b) | | 923,000 | 877,906 |
| Aramark Services, Inc. 5% 4/1/25 (b) | | 150,000 | 148,167 |
| Avis Budget Car Rental LLC/Avis Budget Finance, Inc. 5.75% 7/15/27 (b) | | 518,000 | 494,338 |
| Brand Energy & Infrastructure Services, Inc. 10.375% 8/1/30 (b) | | 400,000 | 412,512 |
| CoreCivic, Inc. 8.25% 4/15/26 | | 429,000 | 430,702 |
| Fair Isaac Corp. 4% 6/15/28 (b) | | 1,959,000 | 1,791,404 |
| Iron Mountain, Inc.: | | | |
| 5% 7/15/28 (b) | | 2,527,000 | 2,340,158 |
| 5.25% 7/15/30 (b) | | 821,000 | 740,810 |
| Neptune BidCo U.S., Inc. 9.29% 4/15/29 (b) | | 700,000 | 653,672 |
| Ritchie Bros. Holdings, Inc. 7.75% 3/15/31 (b) | | 2,026,000 | 2,095,431 |
| TriNet Group, Inc. 3.5% 3/1/29 (b) | | 2,619,000 | 2,254,907 |
| WASH Multifamily Acquisition, Inc. 5.75% 4/15/26 (b) | | 270,000 | 250,396 |
| Williams Scotsman International, Inc. 4.625% 8/15/28 (b) | | 2,700,000 | 2,463,750 |
TOTAL SERVICES | | | 14,954,153 |
| Steel - 0.5% | | | |
| ATI, Inc. 7.25% 8/15/30 | | 1,000,000 | 1,010,200 |
| Carpenter Technology Corp. 7.625% 3/15/30 | | 500,000 | 506,105 |
TOTAL STEEL | | | 1,516,305 |
| Super Retail - 3.3% | | | |
| Asbury Automotive Group, Inc.: | | | |
| 4.75% 3/1/30 | | 1,535,000 | 1,345,691 |
| 5% 2/15/32 (b) | | 3,142,000 | 2,695,479 |
| Bath & Body Works, Inc.: | | | |
| 6.875% 11/1/35 | | 687,000 | 642,372 |
| 9.375% 7/1/25 (b) | | 968,000 | 1,012,730 |
| Gap, Inc. 3.625% 10/1/29 (b) | | 300,000 | 228,385 |
| Group 1 Automotive, Inc. 4% 8/15/28 (b) | | 2,579,000 | 2,289,895 |
| Nordstrom, Inc. 4.25% 8/1/31 | | 600,000 | 451,368 |
| QVC, Inc. 4.375% 9/1/28 | | 500,000 | 282,887 |
| Sally Holdings LLC 5.625% 12/1/25 | | 105,000 | 104,289 |
| Staples, Inc. 7.5% 4/15/26 (b) | | 500,000 | 413,699 |
TOTAL SUPER RETAIL | | | 9,466,795 |
| Technology - 4.5% | | | |
| Alteryx, Inc. 8.75% 3/15/28 (b) | | 435,000 | 419,769 |
| Atkore, Inc. 4.25% 6/1/31 (b) | | 792,000 | 681,078 |
| Cloud Software Group, Inc. 6.5% 3/31/29 (b) | | 1,135,000 | 1,015,206 |
| CNT PRNT/CDK GLO II/FIN 8% 6/15/29 (b) | | 300,000 | 301,950 |
| CommScope, Inc. 4.75% 9/1/29 (b) | | 500,000 | 371,569 |
| Consensus Cloud Solutions, Inc. 6.5% 10/15/28 (b) | | 1,176,000 | 1,062,881 |
| Gen Digital, Inc. 5% 4/15/25 (b) | | 193,000 | 189,196 |
| Go Daddy Operating Co. LLC / GD Finance Co., Inc. 3.5% 3/1/29 (b) | | 540,000 | 464,153 |
| Hughes Satellite Systems Corp. 6.625% 8/1/26 | | 500,000 | 433,750 |
| Iron Mountain Information Management Services, Inc. 5% 7/15/32 (b) | | 3,089,000 | 2,667,239 |
| MicroStrategy, Inc. 6.125% 6/15/28 (b) | | 195,000 | 174,569 |
| Open Text Corp. 3.875% 12/1/29 (b) | | 2,964,000 | 2,513,536 |
| PTC, Inc. 3.625% 2/15/25 (b) | | 440,000 | 424,658 |
| Seagate HDD Cayman: | | | |
| 3.125% 7/15/29 | | 203 | 154 |
| 8.25% 12/15/29 (b) | | 255,000 | 267,495 |
| Uber Technologies, Inc. 7.5% 5/15/25 (b) | | 1,371,000 | 1,384,235 |
| Veritas U.S., Inc./Veritas Bermuda Ltd. 7.5% 9/1/25 (b) | | 400,000 | 327,765 |
| Xerox Corp. 4.8% 3/1/35 | | 250,000 | 168,633 |
| Xerox Holdings Corp. 5% 8/15/25 (b) | | 105,000 | 100,138 |
TOTAL TECHNOLOGY | | | 12,967,974 |
| Telecommunications - 4.6% | | | |
| Altice Financing SA 5.75% 8/15/29 (b) | | 800,000 | 633,733 |
| Altice France SA: | | | |
| 5.5% 10/15/29 (b) | | 1,810,000 | 1,302,326 |
| 8.125% 2/1/27 (b) | | 199,000 | 168,182 |
| Cogent Communications Group, Inc. 7% 6/15/27 (b) | | 2,030,000 | 1,970,521 |
| Consolidated Communications, Inc. 5% 10/1/28 (b) | | 300,000 | 224,826 |
| Dycom Industries, Inc. 4.5% 4/15/29 (b) | | 1,101,000 | 983,061 |
| Frontier Communications Holdings LLC: | | | |
| 5% 5/1/28 (b) | | 1,149,000 | 984,525 |
| 6% 1/15/30 (b) | | 555,000 | 410,032 |
| 8.75% 5/15/30 (b) | | 443,000 | 430,567 |
| Intelsat Jackson Holdings SA 6.5% 3/15/30 (b) | | 700,000 | 641,838 |
| Level 3 Financing, Inc.: | | | |
| 3.875% 11/15/29 (b) | | 1,482,000 | 1,308,745 |
| 10.5% 5/15/30 (b) | | 415,000 | 421,553 |
| Sabre GLBL, Inc. 9.25% 4/15/25 (b) | | 31,900 | 31,425 |
| Telecom Italia Capital SA 7.2% 7/18/36 | | 1,741,000 | 1,573,396 |
| ViaSat, Inc. 5.625% 4/15/27 (b) | | 700,000 | 625,363 |
| Virgin Media Finance PLC 5% 7/15/30 (b) | | 500,000 | 405,654 |
| Virgin Media Secured Finance PLC 5.5% 5/15/29 (b) | | 800,000 | 731,280 |
| Windstream Escrow LLC 7.75% 8/15/28 (b) | | 300,000 | 243,214 |
| Zayo Group Holdings, Inc. 4% 3/1/27 (b) | | 400,000 | 299,775 |
TOTAL TELECOMMUNICATIONS | | | 13,390,016 |
| Textiles/Apparel - 0.1% | | | |
| Foot Locker, Inc. 4% 10/1/29 (b) | | 127,000 | 95,589 |
| Kontoor Brands, Inc. 4.125% 11/15/29 (b) | | 50,000 | 42,469 |
TOTAL TEXTILES/APPAREL | | | 138,058 |
| Transportation Ex Air/Rail - 0.7% | | | |
| XPO Escrow Sub LLC 7.5% 11/15/27 (b) | | 1,927,000 | 1,959,295 |
| Utilities - 2.2% | | | |
| Calpine Corp.: | | | |
| 3.75% 3/1/31 (b) | | 1,162,000 | 968,790 |
| 5.25% 6/1/26 (b) | | 105,000 | 103,023 |
| NRG Energy, Inc. 3.375% 2/15/29 (b) | | 1,000,000 | 824,267 |
| PG&E Corp. 5.25% 7/1/30 | | 3,000,000 | 2,665,265 |
| Talen Energy Supply LLC 8.625% 6/1/30 (b) | | 450,000 | 468,544 |
| Vistra Operations Co. LLC 5.625% 2/15/27 (b) | | 1,334,000 | 1,284,255 |
TOTAL UTILITIES | | | 6,314,144 |
| TOTAL NONCONVERTIBLE BONDS (Cost $289,867,754) | | | 281,024,344 |
| | | | |
| Money Market Funds - 2.2% |
| | | Shares | Value ($) |
Fidelity Cash Central Fund 5.43% (d) (Cost $6,320,516) | | 6,319,252 | 6,320,516 |
| | | | |
| TOTAL INVESTMENT IN SECURITIES - 99.7% (Cost $296,188,270) | 287,344,860 |
NET OTHER ASSETS (LIABILITIES) - 0.3% | 905,062 |
| NET ASSETS - 100.0% | 288,249,922 |
| | |
Legend
| (a) | Amount is stated in United States dollars unless otherwise noted. |
| (b) | Security exempt from registration under Rule 144A of the Securities Act of 1933. These securities may be resold in transactions exempt from registration, normally to qualified institutional buyers. At the end of the period, the value of these securities amounted to $225,342,772 or 78.2% of net assets. |
| (c) | Coupon rates for floating and adjustable rate securities reflect the rates in effect at period end. |
| (d) | Affiliated fund that is generally available only to investment companies and other accounts managed by Fidelity Investments. The rate quoted is the annualized seven-day yield of the fund at period end. A complete unaudited listing of the fund's holdings as of its most recent quarter end is available upon request. In addition, each Fidelity Central Fund's financial statements, which are not covered by the Fund's Report of Independent Registered Public Accounting Firm, are available on the SEC's website or upon request. |
Affiliated Central Funds
Fiscal year to date information regarding the Fund's investments in Fidelity Central Funds, including the ownership percentage, is presented below.
| Affiliate | Value, beginning of period ($) | Purchases ($) | Sales Proceeds ($) | Dividend Income ($) | Realized Gain (loss) ($) | Change in Unrealized appreciation (depreciation) ($) | Value, end of period ($) | % ownership, end of period |
| Fidelity Cash Central Fund 5.43% | 7,518,427 | 119,964,171 | 121,162,082 | 288,186 | - | - | 6,320,516 | 0.0% |
| Total | 7,518,427 | 119,964,171 | 121,162,082 | 288,186 | - | - | 6,320,516 | |
| | | | | | | | | |
Amounts in the dividend income column in the above table include any capital gain distributions from underlying funds, which are presented in the corresponding line item in the Statement of Operations, if applicable.
Amounts included in the purchases and sales proceeds columns may include in-kind transactions, if applicable.
Investment Valuation
The following is a summary of the inputs used, as of August 31, 2023, involving the Fund's assets and liabilities carried at fair value. The inputs or methodology used for valuing securities may not be an indication of the risk associated with investing in those securities. For more information on valuation inputs, and their aggregation into the levels used below, please refer to the Investment Valuation section in the accompanying Notes to Financial Statements.
| Valuation Inputs at Reporting Date: |
| Description | Total ($) | Level 1 ($) | Level 2 ($) | Level 3 ($) |
Investments in Securities: | | | | |
|
| Corporate Bonds | 281,024,344 | - | 281,024,344 | - |
|
| Money Market Funds | 6,320,516 | 6,320,516 | - | - |
| Total Investments in Securities: | 287,344,860 | 6,320,516 | 281,024,344 | - |
Fidelity® High Yield Factor ETF
| Statement of Assets and Liabilities |
| | | | August 31, 2023 |
| | | | | |
| Assets | | | | |
| Investment in securities, at value - See accompanying schedule: | | | | |
Unaffiliated issuers (cost $289,867,754) | $ | 281,024,344 | | |
Fidelity Central Funds (cost $6,320,516) | | 6,320,516 | | |
| | | | | |
| | | | | |
| Total Investment in Securities (cost $296,188,270) | | | $ | 287,344,860 |
| Interest receivable | | | | 4,647,155 |
| Distributions receivable from Fidelity Central Funds | | | | 20,914 |
Total assets | | | | 292,012,929 |
| Liabilities | | | | |
| Payable for investments purchased | $ | 2,062,278 | | |
| Distributions payable | | 1,593,400 | | |
| Accrued management fee | | 107,329 | | |
| Total Liabilities | | | | 3,763,007 |
| Net Assets | | | $ | 288,249,922 |
| Net Assets consist of: | | | | |
| Paid in capital | | | $ | 326,677,295 |
| Total accumulated earnings (loss) | | | | (38,427,373) |
| Net Assets | | | $ | 288,249,922 |
Net Asset Value, offering price and redemption price per share ($288,249,922 ÷ 6,200,000 shares) | | | $ | 46.49 |
| Statement of Operations |
| | | | Year ended August 31, 2023 |
| Investment Income | | | | |
| Dividends | | | $ | 5,273 |
| Interest | | | | 17,256,598 |
| Income from Fidelity Central Funds | | | | 288,186 |
| Total Income | | | | 17,550,057 |
| Expenses | | | | |
| Management fee | $ | 1,221,361 | | |
| Independent trustees' fees and expenses | | 1,395 | | |
| Total expenses before reductions | | 1,222,756 | | |
| Expense reductions | | (3,154) | | |
| Total expenses after reductions | | | | 1,219,602 |
| Net Investment income (loss) | | | | 16,330,455 |
| Realized and Unrealized Gain (Loss) | | | | |
| Net realized gain (loss) on: | | | | |
| Investment Securities: | | | | |
| Unaffiliated issuers | | (14,212,104) | | |
| Redemptions in-kind | | (2,915,270) | | |
| Total net realized gain (loss) | | | | (17,127,374) |
| Change in net unrealized appreciation (depreciation) on investment securities | | | | 18,328,525 |
| Net gain (loss) | | | | 1,201,151 |
| Net increase (decrease) in net assets resulting from operations | | | $ | 17,531,606 |
| Statement of Changes in Net Assets |
| |
| | Year ended August 31, 2023 | | Year ended August 31, 2022 |
| Increase (Decrease) in Net Assets | | | | |
| Operations | | | | |
| Net investment income (loss) | $ | 16,330,455 | $ | 13,042,306 |
| Net realized gain (loss) | | (17,127,374) | | (16,010,975) |
| Change in net unrealized appreciation (depreciation) | | 18,328,525 | | (32,513,552) |
| Net increase (decrease) in net assets resulting from operations | | 17,531,606 | | (35,482,221) |
| Distributions to shareholders | | (16,489,950) | | (19,199,200) |
| | | | | |
| Share transactions | | | | |
| Proceeds from sales of shares | | 46,271,158 | | 122,215,264 |
| Cost of shares redeemed | | (34,058,789) | | (70,069,896) |
| | | | | |
Net increase (decrease) in net assets resulting from share transactions | | 12,212,369 | | 52,145,368 |
| Total increase (decrease) in net assets | | 13,254,025 | | (2,536,053) |
| | | | | |
| Net Assets | | | | |
| Beginning of period | | 274,995,897 | | 277,531,950 |
| End of period | $ | 288,249,922 | $ | 274,995,897 |
| | | | | |
| Other Information | | | | |
| Shares | | | | |
| Sold | | 1,000,000 | | 2,350,000 |
| Redeemed | | (750,000) | | (1,350,000) |
| Net increase (decrease) | | 250,000 | | 1,000,000 |
| | | | | |
Financial Highlights
| Fidelity® High Yield Factor ETF |
| |
| Years ended August 31, | | 2023 | | 2022 | | 2021 | | 2020 | | 2019 |
Selected Per-Share Data | | | | | | | | | | |
| Net asset value, beginning of period | $ | 46.22 | $ | 56.07 | $ | 54.49 | $ | 52.32 | $ | 50.21 |
| Income from Investment Operations | | | | | | | | | | |
Net investment income (loss) A,B | | 2.781 | | 2.383 | | 2.250 | | 2.518 | | 2.589 |
| Net realized and unrealized gain (loss) | | .297 | | (8.748) | | 2.335 | | 2.323 | | 2.006 |
| Total from investment operations | | 3.078 | | (6.365) | | 4.585 | | 4.841 | | 4.595 |
| Distributions from net investment income | | (2.808) | | (2.355) | | (2.195) | | (2.429) | | (2.485) |
| Distributions from net realized gain | | - | | (1.128) | | (.808) | | (.242) | | - |
| Total distributions | | (2.808) | | (3.483) | | (3.003) | | (2.671) | | (2.485) |
| Net asset value, end of period | $ | 46.49 | $ | 46.22 | $ | 56.07 | $ | 54.49 | $ | 52.32 |
Total Return C,D | | 6.90% | | (11.85)% | | 8.66% | | 9.61% | | 9.48% |
Ratios to Average Net Assets B,E,F | | | | | | | | | | |
| Expenses before reductions | | .45% | | .45% | | .45% | | .45% | | .44% G |
| Expenses net of fee waivers, if any | | .45% | | .45% | | .45% | | .45% | | .44% G |
| Expenses net of all reductions | | .45% | | .45% | | .45% | | .45% | | .44% G |
| Net investment income (loss) | | 6.02% | | 4.64% | | 4.07% | | 4.84% | | 5.03% |
| Supplemental Data | | | | | | | | | | |
| Net assets, end of period (000 omitted) | $ | 288,250 | $ | 274,996 | $ | 277,532 | $ | 114,421 | $ | 68,016 |
Portfolio turnover rate H | | 84% I | | 72% I | | 177% I | | 179% I | | 76% |
ACalculated based on average shares outstanding during the period.
BNet investment income (loss) is affected by the timing of the declaration of dividends by any underlying mutual funds or exchange-traded funds (ETFs). Net investment income (loss) of any mutual funds or ETFs is not included in the Fund's net investment income (loss) ratio.
CBased on net asset value.
DTotal returns would have been lower if certain expenses had not been reduced during the applicable periods shown.
EFees and expenses of any underlying mutual funds or exchange-traded funds (ETFs) are not included in the Fund's expense ratio. The Fund indirectly bears its proportionate share of these expenses. For additional expense information related to investments in Fidelity Central Funds, please refer to the "Investments in Fidelity Central Funds" note found in the Notes to Financial Statements section of the most recent Annual or Semi-Annual report.
FExpense ratios reflect operating expenses of the class. Expenses before reductions do not reflect amounts reimbursed, waived, or reduced through arrangements with the investment adviser, brokerage services, or other offset arrangements, if applicable, and do not represent the amount paid by the class during periods when reimbursements, waivers or reductions occur.
GThe size and fluctuation of net assets and expense amounts may cause ratios to differ from contractual rates.
HAmount does not include the portfolio activity of any underlying mutual funds or exchange-traded funds (ETFs).
IPortfolio turnover rate excludes securities received or delivered in-kind.
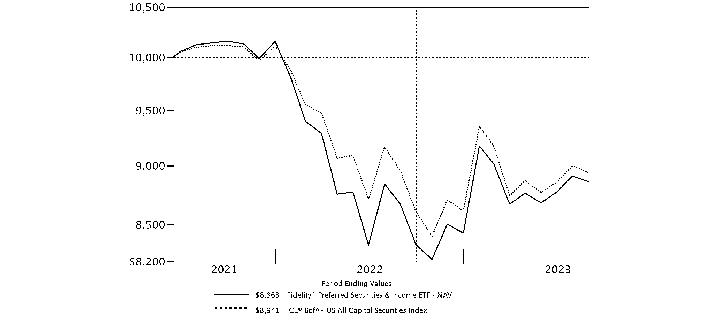
NAV and closing market price average annual returns reflect the change in the value of an investment, assuming reinvestment of distributions from dividend income and capital gains (the profits earned upon the sale of securities that have grown in value, if any) at NAV and Market Price, respectively, and assumes a constant rate of performance each year. The hypothetical investment and the fund's returns do not reflect the deduction of taxes that a shareholder would pay on fund distributions or the redemption or selling of fund shares. How a fund did yesterday is no guarantee of how it will do tomorrow.
| Average Annual Total Returns |
| | | | |
Periods ended August 31, 2023 | Past 1 year | Life of Fund |
Fidelity® Preferred Securities & Income ETF - NAV A | 2.19% | -5.31% |
Fidelity® Preferred Securities & Income ETF - Market Price B | 2.70% | -5.12% |
ICE® BofA® US All Capital Securities Index A | -0.19% | -4.94% |
ICE U.S. All Capital Securities Constrained Custom Index A | -0.56% | -5.15% |
A From June 15, 2021
B From June 17, 2021, date initially listed on the CboeBZX exchange.
| $10,000 Over Life of Fund |
| |
Let's say hypothetically that $10,000 was invested in Fidelity® Preferred Securities & Income ETF - NAV, on June 15, 2021, when the fund started. The chart shows how the value of your investment would have changed, and also shows how the ICE® BofA® US All Capital Securities Index performed over the same period. |
|
|
Fidelity® Preferred Securities & Income ETF
Market Recap:
U.S. equities gained 15.94% for the 12 months ending August 31, 2023, according to the S&P 500® index, as continued global economic expansion, falling commodity prices and a slowing in the pace of inflation provided a favorable backdrop for higher-risk assets. Large-cap stocks spearheaded the rally, which was driven by the shares of a narrow set of mega-cap companies in the information technology and communication services sectors, largely due to exuberance related to generative artificial intelligence. Aggressive monetary tightening by the U.S. Federal Reserve continued amid consistent pressure on core inflation, a measure that excludes food and energy. Since March 2022, the Fed has hiked its benchmark interest rate 11 times. The latest bump came in late July, a fourth consecutive raise of a stepped-down 25 basis points. The S&P 500® gained 3.21% in July but snapped a five-month rally in August (-1.59%), held back by softness in manufacturing and jobs. Still, U.S. stocks ended August up 18.73% year to date. In fixed income, the Bloomberg U.S. Aggregate Bond Index returned -1.19%, as taxable investment-grade bonds showed year-to-date improvement after returning -13.01% in 2022. For the full 12 months, short-term bonds outpaced long-term issues, while lower-quality (higher yielding) bonds topped higher-quality debt. Higher-risk assets, including corporate bonds and asset-backed securities, fared better than U.S. Treasuries.
Comments from Co-Managers Adam Kramer and Brian Chang:
For the fiscal year, the exchange-traded fund's (ETF) net asset value gained 2.19% and its market price gained 2.70%, topping the -0.56% return of the ICE US All Capital Securities Constrained Custom Index and the -0.19% result of the benchmark, the ICE BofA® US All Capital Securities Index. Security selection drove the fund's outperformance of the supplemental index the past 12 months, especially our picks in the banking industry. Positioning in financial services and energy helped relative performance to a lesser extent. Among the top individual relative contributors were non-index stakes in MSTDW (+15%) and Goldman Sachs Group (+15%), both sizable holdings from the financial services group. An overweight in banking firm Wells Fargo (+12%), the fund's top holding, also helped. In contrast, positioning in the insurance industry meaningfully detracted from our relative result. Exposure to First Republic Bank was the biggest individual detractor versus the supplemental index. First Republic was not held at period end. Elsewhere within banking, it hurt to overweight Huntington Bancshares (-16%). This period we reduced our position in Huntington. In insurance, a larger-than index investment in Charles Schwab (-9%) detracted. Noteworthy changes in positioning include a higher allocation to the insurance and utility industries, as well as reduced exposure to banking.
The views expressed above reflect those of the portfolio manager(s) only through the end of the period as stated on the cover of this report and do not necessarily represent the views of Fidelity or any other person in the Fidelity organization. Any such views are subject to change at any time based upon market or other conditions and Fidelity disclaims any responsibility to update such views. These views may not be relied on as investment advice and, because investment decisions for a Fidelity fund are based on numerous factors, may not be relied on as an indication of trading intent on behalf of any Fidelity fund.
Fidelity® Preferred Securities & Income ETF
Top Holdings (% of Fund's net assets) |
| |
| Wells Fargo & Co. 5.9% | 3.7 | |
| Bank of America Corp. 5.875% | 2.9 | |
| Morgan Stanley 3 month U.S. LIBOR + 3.160% 8.712% | 2.5 | |
| Goldman Sachs Group, Inc. 4.4% | 2.4 | |
| Citigroup, Inc. 6.3% | 2.3 | |
| Charles Schwab Corp. 4% | 2.0 | |
| Goldman Sachs Group, Inc. CME Term SOFR 3 Month Index + 3.130% 8.5009% | 1.9 | |
| PNC Financial Services Group, Inc. 5% | 1.5 | |
| BP Capital Markets PLC 4.875% | 1.5 | |
| Citigroup, Inc. 3.875% | 1.4 | |
| | 22.1 | |
| |
| Market Sectors (% of Fund's net assets) |
| |
| Financials | 66.1 | |
| Utilities | 14.4 | |
| Energy | 8.1 | |
| Communication Services | 4.2 | |
| Industrials | 3.0 | |
| Real Estate | 2.2 | |
| Consumer Discretionary | 1.1 | |
| |
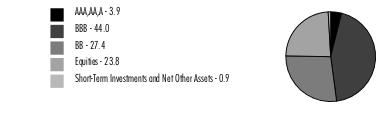
Quality Diversification (% of Fund's net assets) |
|
| |
| We have used ratings from Moody's Investors Service, Inc. Where Moody's® ratings are not available, we have used S&P® ratings. All ratings are as of the date indicated and do not reflect subsequent changes. |
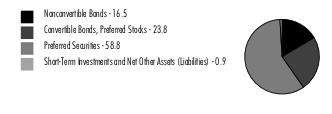
Asset Allocation (% of Fund's net assets) |
|
|
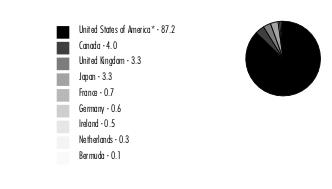
Geographic Diversification (% of Fund's net assets) |
|
* Includes Short-Term investments and Net Other Assets (Liabilities). Percentages are adjusted for the effect of derivatives, if applicable. |
| |
Fidelity® Preferred Securities & Income ETF
Showing Percentage of Net Assets
| Nonconvertible Bonds - 16.5% |
| | | Principal Amount (a) | Value ($) |
| COMMUNICATION SERVICES - 1.6% | | | |
| Diversified Telecommunication Services - 0.1% | | | |
| British Telecommunications PLC 4.875% 11/23/81 (b)(c) | | 50,000 | 41,016 |
| Media - 0.2% | | | |
| Paramount Global 6.25% 2/28/57 (c) | | 78,000 | 61,072 |
| Wireless Telecommunication Services - 1.3% | | | |
| Vodafone Group PLC 7% 4/4/79 (c) | | 400,000 | 402,886 |
TOTAL COMMUNICATION SERVICES | | | 504,974 |
| ENERGY - 2.0% | | | |
| Oil, Gas & Consumable Fuels - 2.0% | | | |
| Enterprise Products Operating LP: | | | |
| CME Term SOFR 3 Month Index + 2.980% 8.6194% 8/16/77 (c)(d) | | 33,000 | 32,390 |
| 5.25% 8/16/77 (c) | | 126,000 | 110,860 |
| 5.375% 2/15/78 (c) | | 67,000 | 55,603 |
| Transcanada Trust: | | | |
| 5.3% 3/15/77 (c) | | 161,000 | 140,070 |
| 5.5% 9/15/79 (c) | | 128,000 | 107,523 |
| 5.625% 5/20/75 (c) | | 95,000 | 89,154 |
| 5.875% 8/15/76 (c) | | 129,000 | 118,958 |
| | | | 654,558 |
| FINANCIALS - 8.7% | | | |
| Capital Markets - 0.1% | | | |
| Ares Finance Co. III LLC 4.125% 6/30/51 (b)(c) | | 50,000 | 37,869 |
| Financial Services - 0.9% | | | |
| Apollo Management Holdings LP 4.95% 1/14/50 (b)(c) | | 324,000 | 298,157 |
| Insurance - 7.7% | | | |
| American International Group, Inc. 5.75% 4/1/48 (c) | | 129,000 | 121,808 |
| Assurant, Inc. 7% 3/27/48 (c) | | 61,000 | 59,092 |
| Liberty Mutual Group, Inc.: | | | |
| 4.125% 12/15/51 (b)(c) | | 150,000 | 121,126 |
| 4.3% 2/1/61 (b) | | 125,000 | 76,501 |
| Meiji Yasuda Life Insurance Co. 5.2% 10/20/45 (b)(c) | | 200,000 | 194,546 |
| MetLife, Inc.: | | | |
| 6.4% 12/15/66 (c) | | 319,000 | 315,593 |
| 10.75% 8/1/69 (c) | | 128,000 | 163,840 |
| Muenchener Rueckversicherungs-Gesellschaft AG in Muenchen 5.875% 5/23/42 (b)(c) | | 200,000 | 196,356 |
| Nippon Life Insurance Co.: | | | |
| 3.4% 1/23/50 (b)(c) | | 100,000 | 86,193 |
| 4.7% 1/20/46 (b)(c) | | 200,000 | 192,488 |
| 5.1% 10/16/44 (b)(c) | | 200,000 | 196,000 |
| PartnerRe Finance B LLC 4.5% 10/1/50 (c) | | 67,000 | 56,182 |
| Prudential Financial, Inc.: | | | |
| 3.7% 10/1/50 (c) | | 200,000 | 170,199 |
| 5.125% 3/1/52 (c) | | 150,000 | 134,009 |
| 6% 9/1/52 (c) | | 200,000 | 191,032 |
| Sumitomo Life Insurance Co. 4% 9/14/77 (b)(c) | | 200,000 | 185,294 |
| | | | 2,460,259 |
TOTAL FINANCIALS | | | 2,796,285 |
| UTILITIES - 4.2% | | | |
| Electric Utilities - 2.3% | | | |
| Emera, Inc. 6.75% 6/15/76 (c) | | 125,000 | 120,000 |
| NextEra Energy Capital Holdings, Inc. 5.65% 5/1/79 (c) | | 104,000 | 96,389 |
| PPL Capital Funding, Inc. 3 month U.S. LIBOR + 2.660% 8.2029% 3/30/67 (c)(d) | | 30,000 | 27,171 |
| Southern Co.: | | | |
| 3.75% 9/15/51 (c) | | 150,000 | 129,555 |
| 4% 1/15/51 (c) | | 400,000 | 370,926 |
| | | | 744,041 |
| Multi-Utilities - 1.9% | | | |
| CMS Energy Corp.: | | | |
| 3.75% 12/1/50 (c) | | 409,000 | 308,036 |
| 4.75% 6/1/50 (c) | | 300,000 | 262,026 |
| Sempra 4.125% 4/1/52 (c) | | 25,000 | 20,215 |
| | | | 590,277 |
TOTAL UTILITIES | | | 1,334,318 |
| TOTAL NONCONVERTIBLE BONDS (Cost $5,705,442) | | | 5,290,135 |
| | | | |
| Nonconvertible Preferred Stocks - 23.8% |
| | | Shares | Value ($) |
| COMMUNICATION SERVICES - 2.6% | | | |
| Diversified Telecommunication Services - 1.5% | | | |
| AT&T, Inc.: | | | |
| 4.75% | | 20,000 | 387,500 |
| 5.35% | | 4,500 | 101,565 |
| | | | 489,065 |
| Wireless Telecommunication Services - 1.1% | | | |
| Telephone & Data Systems, Inc.: | | | |
| 6.00% | | 3,500 | 53,375 |
| 6.625% | | 2,000 | 34,900 |
| U.S. Cellular Corp. | | 3,000 | 52,500 |
| U.S. Cellular Corp.: | | | |
| 5.50% | | 3,000 | 53,190 |
| 6.25% | | 8,000 | 152,600 |
| | | | 346,565 |
TOTAL COMMUNICATION SERVICES | | | 835,630 |
| CONSUMER DISCRETIONARY - 0.3% | | | |
| Automobiles - 0.3% | | | |
| Ford Motor Co. 6.50% | | 4,000 | 95,200 |
| ENERGY - 1.2% | | | |
| Oil, Gas & Consumable Fuels - 1.2% | | | |
| DCP Midstream Partners LP 7.95% (c) | | 775 | 19,608 |
| Energy Transfer LP: | | | |
| 7.60% (c) | | 8,005 | 198,764 |
| 7.625% (c) | | 3,460 | 87,849 |
| Series C, 3 month U.S. LIBOR + 4.530% 7.375% (c)(d) | | 2,623 | 66,887 |
| | | | 373,108 |
| FINANCIALS - 12.9% | | | |
| Banks - 3.9% | | | |
| Bank of America Corp.: | | | |
| 4.25% | | 3,000 | 53,220 |
| 4.375% | | 20,000 | 362,600 |
| Cadence Bank 5.50% | | 2,000 | 37,980 |
| Fifth Third Bancorp Series K 4.95% | | 1,000 | 20,480 |
| JPMorgan Chase & Co. 4.55% | | 22,900 | 444,260 |
| KeyCorp: | | | |
| 6.125% (c) | | 2,000 | 42,240 |
| 6.20% (c) | | 2,000 | 39,620 |
| PacWest Bancorp 7.75% (c) | | 1,000 | 20,690 |
| Regions Financial Corp.: | | | |
| 4.45% | | 1,500 | 25,275 |
| 5.75% (c) | | 3,000 | 61,350 |
| U.S. Bancorp Series M, 4.00% | | 2,500 | 41,650 |
| Webster Financial Corp. Series F, 5.25% | | 250 | 4,583 |
| Western Alliance Bancorp. (c) | | 700 | 11,109 |
| Wintrust Financial Corp.: | | | |
| 6.50% (c) | | 2,000 | 44,504 |
| Series E, 6.875% (c) | | 2,000 | 46,760 |
| | | | 1,256,321 |
| Capital Markets - 2.7% | | | |
| Affiliated Managers Group, Inc. 4.75% | | 3,000 | 53,130 |
| Charles Schwab Corp. 4.45% | | 4,500 | 87,503 |
| Morgan Stanley: | | | |
| 6.875% (c) | | 1,250 | 31,650 |
| Series K, 5.85% (c) | | 13,275 | 316,742 |
| Series O, 4.50% | | 2,300 | 42,665 |
| Northern Trust Corp. Series E, 4.70% | | 1,500 | 31,005 |
| Oaktree Capital Group LLC 6.55% | | 2,000 | 43,000 |
| SCE Trust III 5.75% (c) | | 1,550 | 37,510 |
| State Street Corp. Series G, 5.35% (c) | | 1,000 | 22,650 |
| Stifel Financial Corp. Series D, 4.50% | | 12,000 | 194,280 |
| | | | 860,135 |
| Consumer Finance - 0.2% | | | |
| Capital One Financial Corp. 4.25% | | 1,000 | 16,080 |
| Navient Corp. 6.00% | | 1,500 | 28,905 |
| Synchrony Financial Series A, 5.625% | | 1,000 | 16,330 |
| | | | 61,315 |
| Financial Services - 0.9% | | | |
| Carlyle Finance LLC 4.625% | | 2,500 | 41,400 |
| Equitable Holdings, Inc.: | | | |
| 4.30% | | 1,000 | 15,450 |
| Series A 5.25% | | 3,000 | 60,000 |
| KKR Group Finance Co. IX LLC 4.625% | | 5,000 | 87,450 |
| Voya Financial, Inc. Series B, 5.35% (c) | | 3,500 | 82,600 |
| | | | 286,900 |
| Insurance - 5.2% | | | |
| Aegon Funding Co. LLC 5.10% | | 3,950 | 81,370 |
| Allstate Corp.: | | | |
| 5.10% | | 10,000 | 199,800 |
| Series I, 4.75% | | 2,000 | 38,080 |
| Series J, 7.375% | | 1,000 | 26,490 |
| American Financial Group, Inc.: | | | |
| 4.50% | | 6,000 | 105,240 |
| 5.125% | | 1,000 | 20,100 |
| Arch Capital Group Ltd.: | | | |
| 5.45% | | 4,000 | 85,760 |
| Series G, 4.55% | | 2,250 | 41,659 |
| Assurant, Inc. 5.25% | | 3,250 | 64,870 |
| Athene Holding Ltd.: | | | |
| Series C, 6.375% (c) | | 9,000 | 219,060 |
| Series D, 4.875% | | 4,000 | 67,960 |
| Series E, 7.75% (c) | | 1,000 | 25,280 |
| Brighthouse Financial, Inc. | | 4,000 | 69,640 |
| Brighthouse Financial, Inc. Series D, 0.00% | | 2,500 | 38,075 |
| Globe Life, Inc. Series D, 4.25% | | 2,500 | 48,600 |
| Hartford Financial Services Group, Inc. Series G, 6.00% | | 1,000 | 25,000 |
| Prudential Financial, Inc.: | | | |
| 5.625% | | 2,000 | 48,191 |
| 5.95% | | 1,500 | 37,065 |
| Reinsurance Group of America, Inc. 7.125% (c) | | 5,000 | 130,100 |
| RenaissanceRe Holdings Ltd. Series G, 4.20% | | 1,550 | 25,591 |
| Unum Group 6.25% | | 3,000 | 68,310 |
| W.R. Berkley Corp. 4.25% | | 11,000 | 213,950 |
| | | | 1,680,191 |
TOTAL FINANCIALS | | | 4,144,862 |
| INDUSTRIALS - 1.3% | | | |
| Trading Companies & Distributors - 1.3% | | | |
| FTAI Aviation Ltd.: | | | |
| 8.00% (c) | | 2,000 | 48,640 |
| 8.25% (c) | | 1,500 | 36,975 |
| 8.25% (c) | | 5,000 | 119,600 |
| WESCO International, Inc. (c) | | 8,000 | 218,000 |
| | | | 423,215 |
| REAL ESTATE - 2.2% | | | |
| Equity Real Estate Investment Trusts (REITs) - 2.2% | | | |
| American Homes 4 Rent 6.25% | | 1,750 | 39,988 |
| Digital Realty Trust, Inc.: | | | |
| 5.25% | | 1,750 | 36,873 |
| Series L, 5.20% | | 10,000 | 209,900 |
| Public Storage: | | | |
| 4.00% | | 17,500 | 320,250 |
| Series F, 5.15% | | 1,500 | 35,805 |
| Series G, 5.05% | | 1,000 | 24,080 |
| Series I, 4.875% | | 1,500 | 33,555 |
| Summit Hotel Properties, Inc. Series F, 5.875% | | 775 | 14,609 |
| | | | 715,060 |
| UTILITIES - 3.3% | | | |
| Electric Utilities - 1.4% | | | |
| Entergy Louisiana LLC 4.875% | | 1,500 | 32,520 |
| Entergy Mississippi LLC 4.90% | | 1,250 | 28,025 |
| Entergy New Orleans LLC 5.50% | | 2,000 | 46,200 |
| Entergy, Inc. 4.875% | | 1,250 | 27,400 |
| Pacific Gas & Electric Co. Series A | | 6,000 | 124,800 |
| SCE Trust V 5.45% (c) | | 1,550 | 35,495 |
| Southern Co.: | | | |
| 4.20% | | 4,500 | 91,260 |
| Series A, 4.95% | | 2,500 | 56,000 |
| | | | 441,700 |
| Independent Power and Renewable Electricity Producers - 0.1% | | | |
| Brookfield Renewable Partners LP 5.25% | | 2,395 | 46,631 |
| Multi-Utilities - 1.8% | | | |
| Algonquin Power & Utilities Corp. Series A, 6.20% (c) | | 9,000 | 218,520 |
| Brookfield Infrastructure Partners LP: | | | |
| 5.125% | | 825 | 14,883 |
| Class A 5.00% | | 825 | 14,372 |
| DTE Energy Co.: | | | |
| 4.375% | | 2,825 | 58,732 |
| 4.375% | | 3,000 | 60,570 |
| Series E, 5.25% | | 1,000 | 23,810 |
| NiSource, Inc. 6.50% (c) | | 5,000 | 124,500 |
| SCE Trust VI | | 2,375 | 45,101 |
| | | | 560,488 |
TOTAL UTILITIES | | | 1,048,819 |
| TOTAL NONCONVERTIBLE PREFERRED STOCKS (Cost $8,236,856) | | | 7,635,894 |
| | | | |
| Preferred Securities - 58.8% |
| | | Principal Amount (a) | Value ($) |
| CONSUMER DISCRETIONARY - 0.8% | | | |
| Automobiles - 0.8% | | | |
| General Motors Financial Co., Inc. 5.7% (c)(e) | | 302,000 | 265,996 |
| ENERGY - 4.9% | | | |
| Oil, Gas & Consumable Fuels - 4.9% | | | |
| BP Capital Markets PLC: | | | |
| 4.375% (c)(e) | | 125,000 | 122,016 |
| 4.875% (c)(e) | | 525,000 | 480,385 |
| Enbridge, Inc.: | | | |
| 5.5% 7/15/77 (c) | | 126,000 | 113,996 |
| 5.75% 7/15/80 (c) | | 126,000 | 115,623 |
| 6% 1/15/77 (c) | | 68,000 | 64,602 |
| 6.25% 3/1/78 (c) | | 123,000 | 118,414 |
| Energy Transfer LP: | | | |
| 3 month U.S. LIBOR + 4.020% 9.6542% (c)(d)(e) | | 225,000 | 208,026 |
| 7.125% (c)(e) | | 350,000 | 317,094 |
| EnLink Midstream Partners LP 3 month U.S. LIBOR + 4.110% 9.6184% (c)(d)(e) | | 31,000 | 28,157 |
| | | | 1,568,313 |
| FINANCIALS - 44.5% | | | |
| Banks - 23.6% | | | |
| Bank of America Corp.: | | | |
| 5.875% (c)(e) | | 963,000 | 914,888 |
| 6.1% (c)(e) | | 200,000 | 202,157 |
| 6.125% (c)(e) | | 100,000 | 97,599 |
| Citigroup, Inc.: | | | |
| 3.875% (c)(e) | | 511,000 | 447,899 |
| 4.15% (c)(e) | | 89,000 | 74,378 |
| 5.95% (c)(e) | | 418,000 | 410,371 |
| 6.3% (c)(e) | | 745,000 | 746,051 |
| Fifth Third Bancorp 4.5% (c)(e) | | 50,000 | 45,876 |
| Huntington Bancshares, Inc. 5.625% (c)(e) | | 226,000 | 207,249 |
| JPMorgan Chase & Co.: | | | |
| 4.6% (c)(e) | | 300,000 | 282,623 |
| 5% (c)(e) | | 401,000 | 394,422 |
| 6.1% (c)(e) | | 321,000 | 327,580 |
| 6.125% (c)(e) | | 150,000 | 151,987 |
| KeyCorp 5% (c)(e) | | 100,000 | 78,600 |
| M&T Bank Corp. 5.125% (c)(e) | | 50,000 | 42,241 |
| PNC Financial Services Group, Inc.: | | | |
| CME Term SOFR 3 Month Index + 3.930% 9.3115% (c)(d)(e) | | 50,000 | 50,737 |
| 5% (c)(e) | | 542,000 | 482,029 |
| Regions Financial Corp. 5.75% (c)(e) | | 75,000 | 72,402 |
| Truist Financial Corp.: | | | |
| 4.8% (c)(e) | | 50,000 | 45,475 |
| 4.95% (c)(e) | | 135,000 | 127,115 |
| 5.1% (c)(e) | | 403,000 | 362,861 |
| 5.125% (c)(e) | | 60,000 | 48,355 |
| U.S. Bancorp: | | | |
| 3.7% (c)(e) | | 400,000 | 303,158 |
| 5.3% (c)(e) | | 115,000 | 100,090 |
| Wells Fargo & Co.: | | | |
| 3.9% (c)(e) | | 266,000 | 238,008 |
| 5.875% (c)(e) | | 80,000 | 80,302 |
| 5.9% (c)(e) | | 1,171,000 | 1,173,596 |
| 7.625% (c)(e) | | 75,000 | 77,377 |
| | | | 7,585,426 |
| Capital Markets - 14.9% | | | |
| Bank of New York Mellon Corp.: | | | |
| 3.7% (c)(e) | | 425,000 | 379,776 |
| 3.75% (c)(e) | | 96,000 | 78,958 |
| 4.625% (c)(e) | | 200,000 | 183,610 |
| 4.7% (c)(e) | | 65,000 | 64,430 |
| Charles Schwab Corp.: | | | |
| 4% (c)(e) | | 831,000 | 635,748 |
| 4% (c)(e) | | 200,000 | 175,060 |
| 5% (c)(e) | | 100,000 | 88,694 |
| Goldman Sachs Group, Inc.: | | | |
| CME Term SOFR 3 Month Index + 3.130% 8.5009% (c)(d)(e) | | 616,000 | 617,238 |
| 4.125% (c)(e) | | 29,000 | 24,728 |
| 4.4% (c)(e) | | 894,000 | 777,942 |
| 5.3% (c)(e) | | 279,000 | 273,467 |
| Morgan Stanley: | | | |
| 3 month U.S. LIBOR + 3.160% 8.712% (c)(d)(e) | | 765,000 | 791,471 |
| 5.875% (c)(e) | | 400,000 | 384,897 |
| Northern Trust Corp. 4.6% (c)(e) | | 60,000 | 54,126 |
| State Street Corp. 5.625% (c)(e) | | 248,000 | 238,573 |
| | | | 4,768,718 |
| Consumer Finance - 3.7% | | | |
| Ally Financial, Inc.: | | | |
| 4.7% (c)(e) | | 470,000 | 331,174 |
| 4.7% (c)(e) | | 220,000 | 142,091 |
| American Express Co. 3.55% (c)(e) | | 382,000 | 320,953 |
| Capital One Financial Corp. 3.95% (c)(e) | | 400,000 | 310,950 |
| Discover Financial Services 5.5% (c)(e) | | 100,000 | 76,288 |
| | | | 1,181,456 |
| Financial Services - 0.2% | | | |
| Equitable Holdings, Inc. 4.95% (c)(e) | | 75,000 | 72,717 |
| Insurance - 2.1% | | | |
| Dai-Ichi Life Insurance Co. Ltd. 4% (b)(c)(e) | | 200,000 | 189,122 |
| Markel Group, Inc. 6% (c)(e) | | 200,000 | 196,962 |
| MetLife, Inc. 3.85% (c)(e) | | 275,000 | 258,469 |
| SBL Holdings, Inc. 6.5% (b)(c)(e) | | 34,000 | 19,799 |
| | | | 664,352 |
TOTAL FINANCIALS | | | 14,272,669 |
| INDUSTRIALS - 1.7% | | | |
| Trading Companies & Distributors - 1.7% | | | |
| AerCap Holdings NV 5.875% 10/10/79 (c) | | 150,000 | 148,293 |
| Air Lease Corp.: | | | |
| 4.125% (c)(e) | | 56,000 | 40,863 |
| 4.65% (c)(e) | | 300,000 | 264,054 |
| Aircastle Ltd. 5.25% (b)(c)(e) | | 126,000 | 100,706 |
| | | | 553,916 |
| UTILITIES - 6.9% | | | |
| Electric Utilities - 4.0% | | | |
| Duke Energy Corp. 4.875% (c)(e) | | 425,000 | 423,773 |
| Edison International: | | | |
| 5% (c)(e) | | 344,000 | 303,786 |
| 5.375% (c)(e) | | 366,000 | 332,443 |
| Electricite de France SA 9.125% (b)(c)(e) | | 200,000 | 213,436 |
| | | | 1,273,438 |
| Independent Power and Renewable Electricity Producers - 1.1% | | | |
| Vistra Corp.: | | | |
| 7% (b)(c)(e) | | 295,000 | 277,441 |
| 8% (b)(c)(e) | | 90,000 | 88,704 |
| | | | 366,145 |
| Multi-Utilities - 1.8% | | | |
| Dominion Energy, Inc.: | | | |
| 4.35% (c)(e) | | 225,000 | 193,785 |
| 4.65% (c)(e) | | 75,000 | 68,993 |
| Sempra 4.875% (c)(e) | | 325,000 | 313,312 |
| | | | 576,090 |
TOTAL UTILITIES | | | 2,215,673 |
| TOTAL PREFERRED SECURITIES (Cost $20,231,883) | | | 18,876,567 |
| | | | |
| Money Market Funds - 1.0% |
| | | Shares | Value ($) |
Fidelity Cash Central Fund 5.43% (f) (Cost $325,515) | | 325,450 | 325,515 |
| | | | |
| TOTAL INVESTMENT IN SECURITIES - 100.1% (Cost $34,499,696) | 32,128,111 |
NET OTHER ASSETS (LIABILITIES) - (0.1)% | (32,873) |
| NET ASSETS - 100.0% | 32,095,238 |
| | |
Legend
| (a) | Amount is stated in United States dollars unless otherwise noted. |
| (b) | Security exempt from registration under Rule 144A of the Securities Act of 1933. These securities may be resold in transactions exempt from registration, normally to qualified institutional buyers. At the end of the period, the value of these securities amounted to $2,514,754 or 7.8% of net assets. |
| (c) | Coupon rates for floating and adjustable rate securities reflect the rates in effect at period end. |
| (d) | Coupon is indexed to a floating interest rate which may be multiplied by a specified factor and/or subject to caps or floors. |
| (e) | Security is perpetual in nature with no stated maturity date. |
| (f) | Affiliated fund that is generally available only to investment companies and other accounts managed by Fidelity Investments. The rate quoted is the annualized seven-day yield of the fund at period end. A complete unaudited listing of the fund's holdings as of its most recent quarter end is available upon request. In addition, each Fidelity Central Fund's financial statements, which are not covered by the Fund's Report of Independent Registered Public Accounting Firm, are available on the SEC's website or upon request. |
Affiliated Central Funds
Fiscal year to date information regarding the Fund's investments in Fidelity Central Funds, including the ownership percentage, is presented below.
| Affiliate | Value, beginning of period ($) | Purchases ($) | Sales Proceeds ($) | Dividend Income ($) | Realized Gain (loss) ($) | Change in Unrealized appreciation (depreciation) ($) | Value, end of period ($) | % ownership, end of period |
| Fidelity Cash Central Fund 5.43% | 1,165,886 | 10,246,690 | 11,087,061 | 36,018 | - | - | 325,515 | 0.0% |
| Total | 1,165,886 | 10,246,690 | 11,087,061 | 36,018 | - | - | 325,515 | |
| | | | | | | | | |
Amounts in the dividend income column in the above table include any capital gain distributions from underlying funds, which are presented in the corresponding line item in the Statement of Operations, if applicable.
Amounts included in the purchases and sales proceeds columns may include in-kind transactions, if applicable.
Investment Valuation
The following is a summary of the inputs used, as of August 31, 2023, involving the Fund's assets and liabilities carried at fair value. The inputs or methodology used for valuing securities may not be an indication of the risk associated with investing in those securities. For more information on valuation inputs, and their aggregation into the levels used below, please refer to the Investment Valuation section in the accompanying Notes to Financial Statements.
| Valuation Inputs at Reporting Date: |
| Description | Total ($) | Level 1 ($) | Level 2 ($) | Level 3 ($) |
Investments in Securities: | | | | |
|
| Equities: | | | | |
Communication Services | 835,630 | 835,630 | - | - |
Consumer Discretionary | 95,200 | 95,200 | - | - |
Energy | 373,108 | 373,108 | - | - |
Financials | 4,144,862 | 4,144,862 | - | - |
Industrials | 423,215 | 423,215 | - | - |
Real Estate | 715,060 | 715,060 | - | - |
Utilities | 1,048,819 | 1,048,819 | - | - |
|
| Corporate Bonds | 5,290,135 | - | 5,290,135 | - |
|
| Preferred Securities | 18,876,567 | - | 18,876,567 | - |
|
| Money Market Funds | 325,515 | 325,515 | - | - |
| Total Investments in Securities: | 32,128,111 | 7,961,409 | 24,166,702 | - |
Fidelity® Preferred Securities & Income ETF
| Statement of Assets and Liabilities |
| | | | August 31, 2023 |
| | | | | |
| Assets | | | | |
| Investment in securities, at value - See accompanying schedule: | | | | |
Unaffiliated issuers (cost $34,174,181) | $ | 31,802,596 | | |
Fidelity Central Funds (cost $325,515) | | 325,515 | | |
| | | | | |
| | | | | |
| Total Investment in Securities (cost $34,499,696) | | | $ | 32,128,111 |
| Dividends receivable | | | | 37,093 |
| Interest receivable | | | | 80,627 |
| Distributions receivable from Fidelity Central Funds | | | | 748 |
| Other receivables | | | | 43 |
Total assets | | | | 32,246,622 |
| Liabilities | | | | |
| Distributions payable | $ | 136,000 | | |
| Accrued management fee | | 15,384 | | |
| Total Liabilities | | | | 151,384 |
| Net Assets | | | $ | 32,095,238 |
| Net Assets consist of: | | | | |
| Paid in capital | | | $ | 39,147,209 |
| Total accumulated earnings (loss) | | | | (7,051,971) |
| Net Assets | | | $ | 32,095,238 |
Net Asset Value, offering price and redemption price per share ($32,095,238 ÷ 1,600,000 shares) | | | $ | 20.06 |
| Statement of Operations |
| | | | Year ended August 31, 2023 |
| Investment Income | | | | |
| Dividends | | | $ | 1,545,845 |
| Interest | | | | 59,013 |
| Income from Fidelity Central Funds | | | | 36,018 |
| Total Income | | | | 1,640,876 |
| Expenses | | | | |
| Management fee | $ | 184,887 | | |
| Independent trustees' fees and expenses | | 160 | | |
| Total expenses before reductions | | 185,047 | | |
| Expense reductions | | (933) | | |
| Total expenses after reductions | | | | 184,114 |
| Net Investment income (loss) | | | | 1,456,762 |
| Realized and Unrealized Gain (Loss) | | | | |
| Net realized gain (loss) on: | | | | |
| Investment Securities: | | | | |
| Unaffiliated issuers | | (3,256,717) | | |
| Total net realized gain (loss) | | | | (3,256,717) |
| Change in net unrealized appreciation (depreciation) on investment securities | | | | 2,451,438 |
| Net gain (loss) | | | | (805,279) |
| Net increase (decrease) in net assets resulting from operations | | | $ | 651,483 |
| Statement of Changes in Net Assets |
| |
| | Year ended August 31, 2023 | | Year ended August 31, 2022 |
| Increase (Decrease) in Net Assets | | | | |
| Operations | | | | |
| Net investment income (loss) | $ | 1,456,762 | $ | 1,028,374 |
| Net realized gain (loss) | | (3,256,717) | | (1,304,286) |
| Change in net unrealized appreciation (depreciation) | | 2,451,438 | | (4,847,016) |
| Net increase (decrease) in net assets resulting from operations | | 651,483 | | (5,122,928) |
| Distributions to shareholders | | (1,416,301) | | (1,189,250) |
| Distributions to shareholders from tax return of capital | | (195,299) | | - |
| | | | | |
| Total Distributions | | (1,611,600) | | (1,189,250) |
| Share transactions | | | | |
| Proceeds from sales of shares | | 1,002,305 | | 34,118,167 |
| Cost of shares redeemed | | (1,015,599) | | (1,037,642) |
| | | | | |
Net increase (decrease) in net assets resulting from share transactions | | (13,294) | | 33,080,525 |
| Total increase (decrease) in net assets | | (973,411) | | 26,768,347 |
| | | | | |
| Net Assets | | | | |
| Beginning of period | | 33,068,649 | | 6,300,302 |
| End of period | $ | 32,095,238 | $ | 33,068,649 |
| | | | | |
| Other Information | | | | |
| Shares | | | | |
| Sold | | 50,000 | | 1,400,000 |
| Redeemed | | (50,000) | | (50,000) |
| Net increase (decrease) | | - | | 1,350,000 |
| | | | | |
Financial Highlights
| Fidelity® Preferred Securities & Income ETF |
| |
| Years ended August 31, | | 2023 | | 2022 | | 2021 A |
Selected Per-Share Data | | | | | | |
| Net asset value, beginning of period | $ | 20.67 | $ | 25.20 | $ | 25.00 |
| Income from Investment Operations | | | | | | |
Net investment income (loss) B,C | | .937 | | .886 | | .170 |
| Net realized and unrealized gain (loss) | | (.510) | | (4.485) | | .187 |
| Total from investment operations | | .427 | | (3.599) | | .357 |
| Distributions from net investment income | | (.856) | | (.931) | | (.157) |
| Tax return of capital | | (.181) | | - | | - |
| Total distributions | | (1.037) | | (.931) | | (.157) |
| Net asset value, end of period | $ | 20.06 | $ | 20.67 | $ | 25.20 |
Total Return D,E | | 2.19% | | (14.50)% | | 1.44% |
Ratios to Average Net Assets C,F,G | | | | | | |
| Expenses before reductions | | .59% | | .59% | | .59% H |
| Expenses net of fee waivers, if any | | .59% | | .59% | | .59% H |
| Expenses net of all reductions | | .59% | | .59% | | .59% H |
| Net investment income (loss) | | 4.65% | | 3.98% | | 3.16% H |
| Supplemental Data | | | | | | |
| Net assets, end of period (000 omitted) | $ | 32,095 | $ | 33,069 | $ | 6,300 |
Portfolio turnover rate I | | 50% | | 21% | | -% |
AFor the period June 15, 2021 (commencement of operations) through August 31, 2021.
BCalculated based on average shares outstanding during the period.
CNet investment income (loss) is affected by the timing of the declaration of dividends by any underlying mutual funds or exchange-traded funds (ETFs). Net investment income (loss) of any mutual funds or ETFs is not included in the Fund's net investment income (loss) ratio.
DTotal returns would have been lower if certain expenses had not been reduced during the applicable periods shown.
EBased on net asset value.
FFees and expenses of any underlying mutual funds or exchange-traded funds (ETFs) are not included in the Fund's expense ratio. The Fund indirectly bears its proportionate share of these expenses. For additional expense information related to investments in Fidelity Central Funds, please refer to the "Investments in Fidelity Central Funds" note found in the Notes to Financial Statements section of the most recent Annual or Semi-Annual report.
GExpense ratios reflect operating expenses of the class. Expenses before reductions do not reflect amounts reimbursed, waived, or reduced through arrangements with the investment adviser, brokerage services, or other offset arrangements, if applicable, and do not represent the amount paid by the class during periods when reimbursements, waivers or reductions occur.
HAnnualized.
IAmount does not include the portfolio activity of any underlying mutual funds or exchange-traded funds (ETFs).
For the period ended August 31, 2023
1. Organization.
Fidelity High Yield Factor ETF and Fidelity Preferred Securities & Income ETF (the Funds) are exchange-traded funds of Fidelity Covington Trust (the Trust) and are authorized to issue an unlimited number of shares. Fidelity Preferred Securities & Income ETF is a non-diversified exchange-traded fund. The Trust is registered under the Investment Company Act of 1940, as amended (the 1940 Act), as an open-end management investment company organized as a Massachusetts business trust.
2. Investments in Fidelity Central Funds.
Funds may invest in Fidelity Central Funds, which are open-end investment companies generally available only to other investment companies and accounts managed by the investment adviser and its affiliates. The Schedule of Investments lists any Fidelity Central Funds held as an investment as of period end, but does not include the underlying holdings of each Fidelity Central Fund. An investing fund indirectly bears its proportionate share of the expenses of the underlying Fidelity Central Funds.
Based on its investment objective, each Fidelity Central Fund may invest or participate in various investment vehicles or strategies that are similar to those of the investing fund. These strategies are consistent with the investment objectives of the investing fund and may involve certain economic risks which may cause a decline in value of each of the Fidelity Central Funds and thus a decline in the value of the investing fund.
| Fidelity Central Fund | Investment Manager | Investment Objective | Investment Practices | Expense RatioA |
| Fidelity Money Market Central Funds | Fidelity Management & Research Company LLC (FMR) | Each fund seeks to obtain a high level of current income consistent with the preservation of capital and liquidity. | Short-term Investments | Less than .005% |
A Expenses expressed as a percentage of average net assets and are as of each underlying Central Fund's most recent annual or semi-annual shareholder report.
A complete unaudited list of holdings for each Fidelity Central Fund is available upon request or at the Securities and Exchange Commission website at www.sec.gov. In addition, the financial statements of the Fidelity Central Funds, which are not covered by the Report of Independent Registered Public Accounting Firm, are available on the Securities and Exchange Commission website or upon request.
3. Significant Accounting Policies.
Each Fund is an investment company and applies the accounting and reporting guidance of the Financial Accounting Standards Board (FASB) Accounting Standards Codification Topic 946 Financial Services - Investment Companies. The financial statements have been prepared in conformity with accounting principles generally accepted in the United States of America (GAAP), which require management to make certain estimates and assumptions at the date of the financial statements. Actual results could differ from those estimates. Subsequent events, if any, through the date that the financial statements were issued have been evaluated in the preparation of the financial statements. Each Fund's Schedule of Investments lists any underlying mutual funds or exchange-traded funds (ETFs) but does not include the underlying holdings of these funds. The following summarizes the significant accounting policies of each Fund:
Investment Valuation. Investments are valued as of 4:00 p.m. Eastern time on the last calendar day of the period. The Board of Trustees (the Board) has designated each Fund's investment adviser as the valuation designee responsible for the fair valuation function and performing fair value determinations as needed. The investment adviser has established a Fair Value Committee (the Committee) to carry out the day-to-day fair valuation responsibilities and has adopted policies and procedures to govern the fair valuation process and the activities of the Committee. In accordance with these fair valuation policies and procedures, which have been approved by the Board, each Fund attempts to obtain prices from one or more third party pricing services or brokers to value its investments. When current market prices, quotations or currency exchange rates are not readily available or reliable, investments will be fair valued in good faith by the Committee, in accordance with the policies and procedures. Factors used in determining fair value vary by investment type and may include market or investment specific events, transaction data, estimated cash flows, and market observations of comparable investments. The frequency that the fair valuation procedures are used cannot be predicted and they may be utilized to a significant extent. The Committee manages each Fund's fair valuation practices and maintains the fair valuation policies and procedures. Each Fund's investment adviser reports to the Board information regarding the fair valuation process and related material matters.
Each Fund categorizes the inputs to valuation techniques used to value its investments into a disclosure hierarchy consisting of three levels as shown below:
Level 1 - unadjusted quoted prices in active markets for identical investments
Level 2 - other significant observable inputs (including quoted prices for similar investments, interest rates, prepayment speeds, etc.)
Level 3 - unobservable inputs (including the Fund's own assumptions based on the best information available)
Valuation techniques used to value each Fund's investments by major category are as follows:
Debt securities, including restricted securities, are valued based on evaluated prices received from third party pricing services or from brokers who make markets in such securities. Corporate bonds and preferred securities are valued by pricing services who utilize matrix pricing which considers yield or price of bonds of comparable quality, coupon, maturity and type or by broker-supplied prices. When independent prices are unavailable or unreliable, debt securities may be valued utilizing pricing methodologies which consider similar factors that would be used by third party pricing services. For foreign debt securities, when significant market or security specific events arise, valuations may be determined in good faith in accordance with procedures adopted by the Board. Debt securities are generally categorized as Level 2 in the hierarchy but may be Level 3 depending on the circumstances. The Fund invests a significant portion of its assets in below investment grade securities. The value of these securities can be more volatile due to changes in the credit quality of the issuer and is sensitive to changes in economic, market and regulatory conditions.
Equity securities, including restricted securities, for which market quotations are readily available, are valued at the last reported sale price or official closing price as reported by a third party pricing service on the primary market or exchange on which they are traded and are categorized as Level 1 in the hierarchy. In the event there were no sales during the day or closing prices are not available, securities are valued at the last quoted bid price or may be valued using the last available price and are generally categorized as Level 2 in the hierarchy. For foreign equity securities, when market or security specific events arise, comparisons to the valuation of American Depositary Receipts (ADRs), futures contracts, ETFs and certain indexes as well as quoted prices for similar securities may be used and would be categorized as Level 2 in the hierarchy. For equity securities, including restricted securities, where observable inputs are limited, assumptions about market activity and risk are used and these securities may be categorized as Level 3 in the hierarchy.
Investments in open-end mutual funds, including the Fidelity Central Funds, are valued at their closing net asset value (NAV) each business day and are categorized as Level 1 in the hierarchy.
Changes in valuation techniques may result in transfers in or out of an assigned level within the disclosure hierarchy. The aggregate value of investments by input level as of August 31, 2023 is included at the end of each Fund's Schedule of Investments.
Investment Transactions and Income. For financial reporting purposes and for processing shareholder transactions, the Funds' investment holdings and NAV include trades executed through the end of the last business day of the period and prior business day, respectively. The NAV per share for processing shareholder transactions is calculated as of the close of business (normally 4:00 p.m. Eastern time) of the New York Stock Exchange, Archipelago Exchange (NYSE Arca) for Fidelity High Yield Factor ETF, and of the Cboe BZX Exchange, Inc. (CboeBZX) for Fidelity Preferred Securities & Income ETF. Gains and losses on securities sold are determined on the basis of identified cost. Dividend income is recorded on the ex-dividend date, except for certain dividends from foreign securities where the ex-dividend date may have passed, which are recorded as soon as the Funds are informed of the ex-dividend date. Non-cash dividends included in dividend income, if any, are recorded at the fair market value of the securities received. Income and capital gain distributions from Fidelity Central Funds, if any, are recorded on the ex-dividend date. Certain distributions received by the Funds represent a return of capital or capital gain. The Funds determine the components of these distributions subsequent to the ex-dividend date, based upon receipt of tax filings or other correspondence relating to the underlying investment. These distributions are recorded as a reduction of cost of investments and/or as a realized gain. Interest income is accrued as earned and includes coupon interest and amortization of premium and accretion of discount on debt securities as applicable. Debt obligations may be placed on non-accrual status and related interest income may be reduced by ceasing current accruals and writing off interest receivables when the collection of all or a portion of interest has become doubtful based on consistently applied procedures. A debt obligation is removed from non-accrual status when the issuer resumes interest payments or when collectability of interest is reasonably assured.
Expenses. Expenses directly attributable to a fund are charged to that fund. Expenses attributable to more than one fund are allocated among the respective funds on the basis of relative net assets or other appropriate methods. Expenses included in the accompanying financial statements reflect the expenses of that fund and do not include any expenses associated with any underlying mutual funds or exchange-traded funds. Although not included in a fund's expenses, a fund indirectly bears its proportionate share of these expenses through the net asset value of each underlying mutual fund or exchange-traded fund. Expense estimates are accrued in the period to which they relate and adjustments are made when actual amounts are known.
Income Tax Information and Distributions to Shareholders. Each year, each Fund intends to qualify as a regulated investment company under Subchapter M of the Internal Revenue Code, including distributing substantially all of its taxable income and realized gains. As a result, no provision for U.S. Federal income taxes is required. As of August 31, 2023, each Fund did not have any unrecognized tax benefits in the financial statements; nor is each Fund aware of any tax positions for which it is reasonably possible that the total amounts of unrecognized tax benefits will significantly change in the next twelve months. Each Fund files a U.S. federal tax return, in addition to state and local tax returns as required. Each Fund's federal income tax returns are subject to examination by the Internal Revenue Service (IRS) for a period of three fiscal years after they are filed. State and local tax returns may be subject to examination for an additional fiscal year depending on the jurisdiction.
Distributions are declared and recorded on the ex-dividend date. Income and capital gain distributions are determined in accordance with income tax regulations, which may differ from GAAP.
Capital accounts within the financial statements are adjusted for permanent book-tax differences. These adjustments have no impact on net assets or the results of operations. Capital accounts are not adjusted for temporary book-tax differences which will reverse in a subsequent period.
Book-tax differences are primarily due to passive foreign investment companies (PFIC), prior period premium and discount on debt securities, equity-debt classifications, redemptions in-kind, partnerships, tax return of capital distribution, capital loss carryforwards and losses deferred due to wash sales and excise tax regulations.
As of period end, the cost and unrealized appreciation (depreciation) in securities, and derivatives if applicable, for federal income tax purposes were as follows for each Fund:
| | Tax cost | Gross unrealized appreciation | Gross unrealized depreciation | Net unrealized appreciation (depreciation) |
| Fidelity High Yield Factor ETF | $296,188,270 | $2,509,581 | $(11,352,991) | $(8,843,410) |
Fidelity Preferred Securities & Income ETF | 34,481,727 | 275,697 | (2,629,313) | (2,353,616) |
The tax-based components of distributable earnings as of period end were as follows for each Fund:
| | Capital loss carryforward | Net unrealized appreciation (depreciation) on securities and other investments |
| Fidelity High Yield Factor ETF | $(29,567,669) | $(8,843,410) |
Fidelity Preferred Securities & Income ETF | (4,548,334) | (2,353,616) |
Capital loss carryforwards are only available to offset future capital gains of the Funds to the extent provided by regulations and may be limited. The capital loss carryforward information presented below, including any applicable limitation, is estimated as of fiscal period end and is subject to adjustment.
| | Short-term | Long-term | Total capital loss carryforward |
| Fidelity High Yield Factor ETF | $(12,626,744) | $(16,940,925) | $(29,567,669) |
Fidelity Preferred Securities & Income ETF | (2,091,775) | (2,456,559) | (4,548,334) |
For the applicable period ended August 31, 2023, Fidelity Preferred Securities & Income ETF's distributions exceeded the aggregate amount of taxable income and net realized gains resulting in a return of capital for tax purposes. This was due to reductions in taxable income available for distribution after certain distributions had been made.
The tax character of distributions paid was as follows:
| August 31, 2023 | | | |
| | Ordinary Income | Tax Return of Capital | Total |
| Fidelity High Yield Factor ETF | $16,489,950 | $- | $16,489,950 |
Fidelity Preferred Securities & Income ETF | 1,416,301 | 195,299 | 1,611,600 |
| August 31, 2022 | | | |
| | Ordinary Income | Long-term Capital Gains | Total |
| Fidelity High Yield Factor ETF | $18,235,536 | $963,664 | $19,199,200 |
Fidelity Preferred Securities & Income ETF | 1,189,250 | - | 1,189,250 |
Restricted Securities (including Private Placements). Funds may invest in securities that are subject to legal or contractual restrictions on resale. These securities generally may be resold in transactions exempt from registration or to the public if the securities are registered. Disposal of these securities may involve time-consuming negotiations and expense, and prompt sale at an acceptable price may be difficult. Information regarding restricted securities held at period end is included at the end of the Schedule of Investments, if applicable.
4. Purchases and Sales of Investments.
Purchases and sales of securities, other than short-term securities, U.S. government securities and in-kind transactions, as applicable, are noted in the table below.
| | Purchases ($) | Sales ($) |
| Fidelity High Yield Factor ETF | 250,640,798 | 223,983,403 |
| Fidelity Preferred Securities & Income ETF | 15,955,839 | 15,112,626 |
Securities received and delivered in-kind through subscriptions and redemptions are noted in the table below.
| | In-Kind Subscriptions ($) | In-Kind Redemptions ($) |
| Fidelity High Yield Factor ETF | 40,593,400 | 29,103,218 |
5. Fees and Other Transactions with Affiliates.
Management Fee. Fidelity Management & Research Company LLC (the investment adviser) provides the Funds with investment management related services for which the Funds pay a monthly management fee that is based on an annual rate of each Fund's average net assets as noted in the table below. Under the management contract, the investment adviser pays all other expenses, except the compensation of the independent Trustees and certain miscellaneous expenses such as proxy and shareholder meeting expenses.
| | Fee Rate |
| Fidelity High Yield Factor ETF | .45% |
| Fidelity Preferred Securities & Income ETF | .59% |
Brokerage Commissions. A portion of portfolio transactions were placed with brokerage firms which are affiliates of the investment adviser. Brokerage commissions are included in net realized gain (loss) and change in net unrealized appreciation (depreciation) in the Statement of Operations. The commissions paid to these affiliated firms were as follows:
| | Amount |
| Fidelity Preferred Securities & Income ETF | 347 |
Interfund Trades. Funds may purchase from or sell securities to other Fidelity Funds under procedures adopted by the Board. The procedures have been designed to ensure these interfund trades are executed in accordance with Rule 17a-7 of the 1940 Act. Any interfund trades are included within the respective purchases and sales amounts shown in the Purchases and Sales of Investments note. During the period, there were no interfund trades.
6. Expense Reductions.
Through arrangements with each applicable Fund's custodian, credits realized as a result of certain uninvested cash balances were used to reduce each applicable Fund's expenses. All of the applicable expense reductions are noted in the table below.
| | Custodian credits |
| Fidelity High Yield Factor ETF | $3,154 |
Fidelity Preferred Securities & Income ETF | 933 |
7. Share Transactions.
Funds issue and redeem shares at NAV only with certain authorized participants in large increments known as Creation Units. Purchases of Creation Units are made by tendering a basket of designated securities and/or cash to a fund and redemption proceeds are paid with a basket of securities from a fund's portfolio with a balancing cash component to equate the market value of the basket of securities delivered or redeemed to the NAV per Creation Unit on the transaction date. Cash may be substituted equivalent to the value of certain securities generally when they are not available in sufficient quantity for delivery. A fund's shares are available in smaller increments to investors in the secondary market at market prices and may be subject to commissions. Authorized participants pay a transaction fee to the shareholder servicing agent when purchasing and redeeming Creation Units of a fund. The transaction fee is used to offset the costs associated with the issuance and redemption of Creation Units.
8. Other.
A fund's organizational documents provide former and current trustees and officers with a limited indemnification against liabilities arising in connection with the performance of their duties to the fund. In the normal course of business, a fund may also enter into contracts that provide general indemnifications. A fund's maximum exposure under these arrangements is unknown as this would be dependent on future claims that may be made against a fund. The risk of material loss from such claims is considered remote.
9. Risk and Uncertainties.
Many factors affect a fund's performance. Developments that disrupt global economies and financial markets, such as pandemics, epidemics, outbreaks of infectious diseases, war, terrorism, and environmental disasters, may significantly affect a fund's investment performance. The effects of these developments to a fund will be impacted by the types of securities in which a fund invests, the financial condition, industry, economic sector, and geographic location of an issuer, and a fund's level of investment in the securities of that issuer. Significant concentrations in security types, issuers, industries, sectors, and geographic locations may magnify the factors that affect a fund's performance.
To the Board of Trustees of Fidelity Covington Trust and Shareholders of Fidelity High Yield Factor ETF and Fidelity Preferred Securities & Income ETF
Opinions on the Financial Statements
We have audited the accompanying statements of assets and liabilities, including the schedules of investments, of Fidelity High Yield Factor ETF and Fidelity Preferred Securities & Income ETF (two of the funds constituting Fidelity Covington Trust, hereafter collectively referred to as the "Funds") as of August 31, 2023, the related statements of operations for the year ended August 31, 2023, the statements of changes in net assets for each of the two years in the period ended August 31, 2023, including the related notes, and the financial highlights for each of the periods indicated therein (collectively referred to as the "financial statements"). In our opinion, the financial statements present fairly, in all material respects, the financial position of the each of the Funds as of August 31, 2023, the results of each of their operations for the year then ended, the changes in each of their net assets for each of the two years in the period ended August 31, 2023 and each of their financial highlights for each of the periods indicated therein in conformity with accounting principles generally accepted in the United States of America.
Basis for Opinions
These financial statements are the responsibility of the Funds' management. Our responsibility is to express an opinion on the Funds' financial statements based on our audits. We are a public accounting firm registered with the Public Company Accounting Oversight Board (United States) (PCAOB) and are required to be independent with respect to the Funds in accordance with the U.S. federal securities laws and the applicable rules and regulations of the Securities and Exchange Commission and the PCAOB.
We conducted our audits of these financial statements in accordance with the standards of the PCAOB. Those standards require that we plan and perform the audit to obtain reasonable assurance about whether the financial statements are free of material misstatement, whether due to error or fraud.
Our audits included performing procedures to assess the risks of material misstatement of the financial statements, whether due to error or fraud, and performing procedures that respond to those risks. Such procedures included examining, on a test basis, evidence regarding the amounts and disclosures in the financial statements. Our audits also included evaluating the accounting principles used and significant estimates made by management, as well as evaluating the overall presentation of the financial statements. Our procedures included confirmation of securities owned as of August 31, 2023 by correspondence with the custodian and brokers; when replies were not received from brokers, we performed other auditing procedures. We believe that our audits provide a reasonable basis for our opinions.
/s/ PricewaterhouseCoopers LLP
Boston, Massachusetts
October 18, 2023
We have served as the auditor of one or more investment companies in the Fidelity group of funds since 1932.
The Trustees, Members of the Advisory Board (if any), and officers of the trust and funds, as applicable, are listed below. The Board of Trustees governs each fund and is responsible for protecting the interests of shareholders. The Trustees are experienced executives who meet periodically throughout the year to oversee each fund's activities, review contractual arrangements with companies that provide services to each fund, oversee management of the risks associated with such activities and contractual arrangements, and review each fund's performance. Except for Vijay Advani, each of the Trustees oversees 322 funds. Mr. Advani oversees 215 funds.
The Trustees hold office without limit in time except that (a) any Trustee may resign; (b) any Trustee may be removed by written instrument, signed by at least two-thirds of the number of Trustees prior to such removal; (c) any Trustee who requests to be retired or who has become incapacitated by illness or injury may be retired by written instrument signed by a majority of the other Trustees; and (d) any Trustee may be removed at any special meeting of shareholders by a two-thirds vote of the outstanding voting securities of the trust. Each Trustee who is not an interested person (as defined in the 1940 Act) of the trust and the funds is referred to herein as an Independent Trustee. Each Independent Trustee shall retire not later than the last day of the calendar year in which his or her 75th birthday occurs. The Independent Trustees may waive this mandatory retirement age policy with respect to individual Trustees. Officers and Advisory Board Members hold office without limit in time, except that any officer or Advisory Board Member may resign or may be removed by a vote of a majority of the Trustees at any regular meeting or any special meeting of the Trustees. Except as indicated, each individual has held the office shown or other offices in the same company for the past five years.
The funds' Statement of Additional Information (SAI) includes more information about the Trustees. To request a free copy, call Fidelity at 1-800-FIDELITY.
Experience, Skills, Attributes, and Qualifications of the Trustees. The Governance and Nominating Committee has adopted a statement of policy that describes the experience, qualifications, attributes, and skills that are necessary and desirable for potential Independent Trustee candidates (Statement of Policy). The Board believes that each Trustee satisfied at the time he or she was initially elected or appointed a Trustee, and continues to satisfy, the standards contemplated by the Statement of Policy. The Governance and Nominating Committee also engages professional search firms to help identify potential Independent Trustee candidates who have the experience, qualifications, attributes, and skills consistent with the Statement of Policy. From time to time, additional criteria based on the composition and skills of the current Independent Trustees, as well as experience or skills that may be appropriate in light of future changes to board composition, business conditions, and regulatory or other developments, have also been considered by the professional search firms and the Governance and Nominating Committee. In addition, the Board takes into account the Trustees' commitment and participation in Board and committee meetings, as well as their leadership of standing and ad hoc committees throughout their tenure.
In determining that a particular Trustee was and continues to be qualified to serve as a Trustee, the Board has considered a variety of criteria, none of which, in isolation, was controlling. The Board believes that, collectively, the Trustees have balanced and diverse experience, qualifications, attributes, and skills, which allow the Board to operate effectively in governing each fund and protecting the interests of shareholders. Information about the specific experience, skills, attributes, and qualifications of each Trustee, which in each case led to the Board's conclusion that the Trustee should serve (or continue to serve) as a trustee of the funds, is provided below.
Board Structure and Oversight Function. Robert A. Lawrence is an interested person and currently serves as Chair. The Trustees have determined that an interested Chair is appropriate and benefits shareholders because an interested Chair has a personal and professional stake in the quality and continuity of services provided to the funds. Independent Trustees exercise their informed business judgment to appoint an individual of their choosing to serve as Chair, regardless of whether the Trustee happens to be independent or a member of management. The Independent Trustees have determined that they can act independently and effectively without having an Independent Trustee serve as Chair and that a key structural component for assuring that they are in a position to do so is for the Independent Trustees to constitute a substantial majority for the Board. The Independent Trustees also regularly meet in executive session. David M. Thomas serves as Lead Independent Trustee and as such (i) acts as a liaison between the Independent Trustees and management with respect to matters important to the Independent Trustees and (ii) with management prepares agendas for Board meetings.
Fidelity® funds are overseen by different Boards of Trustees. The funds' Board oversees Fidelity's high income and certain equity funds, and other Boards oversee Fidelity's alternative investment, investment-grade bond, money market, asset allocation, and other equity funds. The asset allocation funds may invest in Fidelity® funds overseen by the funds' Board. The use of separate Boards, each with its own committee structure, allows the Trustees of each group of Fidelity® funds to focus on the unique issues of the funds they oversee, including common research, investment, and operational issues. On occasion, the separate Boards establish joint committees to address issues of overlapping consequences for the Fidelity® funds overseen by each Board.
The Trustees operate using a system of committees to facilitate the timely and efficient consideration of all matters of importance to the Trustees, each fund, and fund shareholders and to facilitate compliance with legal and regulatory requirements and oversight of the funds' activities and associated risks. The Board, acting through its committees, has charged FMR and its affiliates with (i) identifying events or circumstances the occurrence of which could have demonstrably adverse effects on the funds' business and/or reputation; (ii) implementing processes and controls to lessen the possibility that such events or circumstances occur or to mitigate the effects of such events or circumstances if they do occur; and (iii) creating and maintaining a system designed to evaluate continuously business and market conditions in order to facilitate the identification and implementation processes described in (i) and (ii) above. Because the day-to-day operations and activities of the funds are carried out by or through FMR, its affiliates, and other service providers, the funds' exposure to risks is mitigated but not eliminated by the processes overseen by the Trustees. While each of the Board's committees has responsibility for overseeing different aspects of the funds' activities, oversight is exercised primarily through the Operations, Audit, and Compliance Committees. Appropriate personnel, including but not limited to the funds' Chief Compliance Officer (CCO), FMR's internal auditor, the independent accountants, the funds' Treasurer and portfolio management personnel, make periodic reports to the Board's committees, as appropriate, including an annual review of Fidelity's risk management program for the Fidelity® funds. The responsibilities of each standing committee, including their oversight responsibilities, are described further under "Standing Committees of the Trustees."
Interested Trustees*:
Correspondence intended for a Trustee who is an interested person may be sent to Fidelity Investments, 245 Summer Street, Boston, Massachusetts 02210.
Name, Year of Birth; Principal Occupations and Other Relevant Experience+
Bettina Doulton (1964)
Year of Election or Appointment: 2020
Trustee
Ms. Doulton also serves as Trustee of other Fidelity® funds. Prior to her retirement, Ms. Doulton served in a variety of positions at Fidelity Investments, including as a managing director of research (2006-2007), portfolio manager to certain Fidelity® funds (1993-2005), equity analyst and portfolio assistant (1990-1993), and research assistant (1987-1990). Ms. Doulton currently owns and operates Phi Builders + Architects and Cellardoor Winery. Previously, Ms. Doulton served as a member of the Board of Brown Capital Management, LLC (2014-2018).
Robert A. Lawrence (1952)
Year of Election or Appointment: 2020
Trustee
Chair of the Board of Trustees
Mr. Lawrence also serves as Trustee of other funds. Previously, Mr. Lawrence served as a Trustee and Member of the Advisory Board of certain funds. Prior to his retirement in 2008, Mr. Lawrence served as Vice President of certain Fidelity® funds (2006-2008), Senior Vice President, Head of High Income Division of Fidelity Management & Research Company (investment adviser firm, 2006-2008), and President of Fidelity Strategic Investments (investment adviser firm, 2002-2005).
* Determined to be an "Interested Trustee" by virtue of, among other things, his or her affiliation with the trust or various entities under common control with FMR.
+ The information includes the Trustee's principal occupation during the last five years and other information relating to the experience, attributes, and skills relevant to the Trustee's qualifications to serve as a Trustee, which led to the conclusion that the Trustee should serve as a Trustee for each fund.
Independent Trustees:
Correspondence intended for an Independent Trustee may be sent to Fidelity Investments, P.O. Box 55235, Boston, Massachusetts 02205-5235.
Name, Year of Birth; Principal Occupations and Other Relevant Experience+
Vijay C. Advani (1960)
Year of Election or Appointment: 2023
Trustee
Mr. Advani also serves as Trustee or Member of the Advisory Board of other funds. Previously, Mr. Advani served as Executive Chairman (2020-2022), Chief Executive Officer (2017-2020) and Chief Operating Officer (2016-2017) of Nuveen (global investment manager). He also served in various capacities at Franklin Resources (global investment manager), including Co-President (2015-2016), Executive Vice President, Global Advisory Services (2008-2015), Head of Global Retail Distribution (2005-2008), Executive Managing Director, International Retail Development (2002-2005), Managing Director, Product Developments, Sales & Marketing, Asia, Eastern Europe and Africa (2000-2002) and President, Templeton Asset Management India (1995-2000). Mr. Advani also served as Senior Investment Officer of International Finance Corporation (private equity and venture capital arm of The World Bank, 1984-1995). Mr. Advani is Chairman Emeritus of the U.S. India Business Council (2018-present), a Director of The Global Impact Investing Network (2019-present), a Director of LOK Capital (Mauritius) (2022-present), a member of the Advisory Council of LOK Capital (2022-present), a Senior Advisor of Neuberger Berman (2021-present), a Senior Advisor of Seviora Holdings Pte. Ltd (Temasek-Singapore) (2021-present), a Director of Seviora Capital (Singapore) (2021-present) and an Advisor of EQUIAM (2021-present). Mr. Advani formerly served as a member of the Board of BowX Acquisition Corp. (special purpose acquisition company, 2020-2021), a member of the Board of Intellecap (advisory arm of The Aavishkaar Group, 2018-2020), a member of the Board of Nuveen Investments, Inc. (2017-2020) and a member of the Board of Docusign (software, 2016-2019).
Thomas P. Bostick (1956)
Year of Election or Appointment: 2021
Trustee
Lieutenant General Bostick also serves as Trustee of other Fidelity® funds. Prior to his retirement, General Bostick (United States Army, Retired) held a variety of positions within the U.S. Army, including Commanding General and Chief of Engineers, U.S. Army Corps of Engineers (2012-2016) and Deputy Chief of Staff and Director of Human Resources, U.S. Army (2009-2012). General Bostick currently serves as a member of the Board and Finance and Governance & Sustainability Committees of CSX Corporation (transportation, 2020-present) and a member of the Board and Corporate Governance and Nominating Committee of Perma-Fix Environmental Services, Inc. (nuclear waste management, 2020-present). General Bostick serves as Chief Executive Officer of Bostick Global Strategies, LLC (consulting, 2016-present), as a member of the Board of HireVue, Inc. (video interview and assessment, 2020-present), as a member of the Board of Allonnia (biotechnology and engineering solutions, 2022-present) and on the Advisory Board of Solugen, Inc. (specialty bio-based chemicals manufacturer, 2022-present). Previously, General Bostick served as a Member of the Advisory Board of certain Fidelity® funds (2021), President, Intrexon Bioengineering (2018-2020) and Chief Operating Officer (2017-2020) and Senior Vice President of the Environment Sector (2016-2017) of Intrexon Corporation (biopharmaceutical company).
Dennis J. Dirks (1948)
Year of Election or Appointment: 2018
Trustee
Mr. Dirks also serves as Trustee of other Fidelity® funds. Prior to his retirement in May 2003, Mr. Dirks served as Chief Operating Officer and as a member of the Board of The Depository Trust & Clearing Corporation (financial markets infrastructure), President, Chief Operating Officer and a member of the Board of The Depository Trust Company (DTC), President and a member of the Board of the National Securities Clearing Corporation (NSCC), Chief Executive Officer and a member of the Board of the Government Securities Clearing Corporation and Chief Executive Officer and a member of the Board of the Mortgage-Backed Securities Clearing Corporation. Mr. Dirks currently serves as a member of the Finance Committee (2016-present) and Board (2017-present) and is Treasurer (2018-present) of the Asolo Repertory Theatre.
Donald F. Donahue (1950)
Year of Election or Appointment: 2018
Trustee
Mr. Donahue also serves as Trustee of other Fidelity® funds. Mr. Donahue serves as President and Chief Executive Officer of Miranda Partners, LLC (risk consulting for the financial services industry, 2012-present). Previously, Mr. Donahue served as Chief Executive Officer (2006-2012), Chief Operating Officer (2003-2006) and Managing Director, Customer Marketing and Development (1999-2003) of The Depository Trust & Clearing Corporation (financial markets infrastructure). Mr. Donahue currently serves as a member (2007-present) and Co-Chairman (2016-present) of the Board of United Way of New York. Mr. Donahue previously served as a member of the Advisory Board of certain Fidelity® funds (2015-2018) and as a member of the Board of The Leadership Academy (previously NYC Leadership Academy) (2012-2022).
Vicki L. Fuller (1957)
Year of Election or Appointment: 2020
Trustee
Ms. Fuller also serves as Trustee of other Fidelity® funds. Previously, Ms. Fuller served as a member of the Advisory Board of certain Fidelity® funds (2018-2020), Chief Investment Officer of the New York State Common Retirement Fund (2012-2018) and held a variety of positions at AllianceBernstein L.P. (global asset management, 1985-2012), including Managing Director (2006-2012) and Senior Vice President and Senior Portfolio Manager (2001-2006). Ms. Fuller currently serves as a member of the Board, Audit Committee and Nominating and Governance Committee of two Blackstone business development companies (2020-present), as a member of the Board of Treliant, LLC (consulting, 2019-present), as a member of the Board of Ariel Alternatives, LLC (private equity, 2022-present) and as a member of the Board and Chair of the Audit Committee of Gusto, Inc. (software, 2021-present). In addition, Ms. Fuller currently serves as a member of the Board of Roosevelt University (2019-present) and as a member of the Executive Board of New York University's Stern School of Business. Ms. Fuller previously served as a member of the Board, Audit Committee and Nominating and Governance Committee of The Williams Companies, Inc. (natural gas infrastructure, 2018-2021).
Patricia L. Kampling (1959)
Year of Election or Appointment: 2020
Trustee
Ms. Kampling also serves as Trustee of other Fidelity® funds. Prior to her retirement, Ms. Kampling served as Chairman of the Board and Chief Executive Officer (2012-2019), President and Chief Operating Officer (2011-2012) and Executive Vice President and Chief Financial Officer (2010-2011) of Alliant Energy Corporation. Ms. Kampling currently serves as a member of the Board, Finance Committee and Governance, Compensation and Nominating Committee of Xcel Energy Inc. (utilities company, 2020-present) and as a member of the Board, Audit, Finance and Risk Committee and Safety, Environmental, Technology and Operations Committee and Chair of the Executive Development and Compensation Committee of American Water Works Company, Inc. (utilities company, 2019-present). In addition, Ms. Kampling currently serves as a member of the Board of the Nature Conservancy, Wisconsin Chapter (2019-present). Previously, Ms. Kampling served as a Member of the Advisory Board of certain Fidelity® funds (2020), a member of the Board, Compensation Committee and Executive Committee and Chair of the Audit Committee of Briggs & Stratton Corporation (manufacturing, 2011-2021), a member of the Board of Interstate Power and Light Company (2012-2019) and Wisconsin Power and Light Company (2012-2019) (each a subsidiary of Alliant Energy Corporation) and as a member of the Board and Workforce Development Committee of the Business Roundtable (2018-2019).
Thomas A. Kennedy (1955)
Year of Election or Appointment: 2021
Trustee
Mr. Kennedy also serves as Trustee of other Fidelity® funds. Previously, Mr. Kennedy served as a Member of the Advisory Board of certain Fidelity® funds (2020) and held a variety of positions at Raytheon Company (aerospace and defense, 1983-2020), including Chairman and Chief Executive Officer (2014-2020) and Executive Vice President and Chief Operating Officer (2013-2014). Mr. Kennedy served as Executive Chairman of the Board of Directors of Raytheon Technologies Corporation (aerospace and defense, 2020-2021). Mr. Kennedy serves as a Director of the Board of Directors of Textron Inc. (aerospace and defense, 2023-present).
Oscar Munoz (1959)
Year of Election or Appointment: 2021
Trustee
Mr. Munoz also serves as Trustee of other Fidelity® funds. Prior to his retirement, Mr. Munoz served as Executive Chairman (2020-2021), Chief Executive Officer (2015-2020), President (2015-2016) and a member of the Board (2010-2021) of United Airlines Holdings, Inc. Mr. Munoz currently serves as a member of the Board of CBRE Group, Inc. (commercial real estate, 2020-present), a member of the Board of Univision Communications, Inc. (Hispanic media, 2020-present), a member of the Board of Archer Aviation Inc. (2021-present), a member of the Defense Business Board of the United States Department of Defense (2021-present) and a member of the Board of Salesforce.com, Inc. (cloud-based software, 2022-present). Previously, Mr. Munoz served as a Member of the Advisory Board of certain Fidelity® funds (2021).
David M. Thomas (1949)
Year of Election or Appointment: 2018
Trustee
Lead Independent Trustee
Mr. Thomas also serves as Trustee of other Fidelity® funds. Previously, Mr. Thomas served as Executive Chairman (2005-2006) and Chairman and Chief Executive Officer (2000-2005) of IMS Health, Inc. (pharmaceutical and healthcare information solutions). Mr. Thomas currently serves as a member of the Board of Fortune Brands Home and Security (home and security products, 2004-present) and as Director (2013-present) and Non-Executive Chairman of the Board (2022-present) of Interpublic Group of Companies, Inc. (marketing communication).
Susan Tomasky (1953)
Year of Election or Appointment: 2020
Trustee
Ms. Tomasky also serves as Trustee of other Fidelity® funds. Prior to her retirement, Ms. Tomasky served in various executive officer positions at American Electric Power Company, Inc. (1998-2011), including most recently as President of AEP Transmission (2007-2011). Ms. Tomasky currently serves as a member of the Board and Sustainability Committee and as Chair of the Audit Committee of Marathon Petroleum Corporation (2018-present) and as a member of the Board, Executive Committee, Corporate Governance Committee and Organization and Compensation Committee and as Lead Director of the Board of Public Service Enterprise Group, Inc. (utilities company, 2012-present) and as a member of the Board of its subsidiary company, Public Service Electric and Gas Co. (2021-present). In addition, Ms. Tomasky currently serves as a member (2009-present) and President (2020-present) of the Board of the Royal Shakespeare Company - America (2009-present), as a member of the Board of the Columbus Association for the Performing Arts (2011-present) and as a member of the Board and Kenyon in the World Committee of Kenyon College (2016-present). Previously, Ms. Tomasky served as a Member of the Advisory Board of certain Fidelity® funds (2020), as a member of the Board of the Columbus Regional Airport Authority (2007-2020), as a member of the Board (2011-2018) and Lead Independent Director (2015-2018) of Andeavor Corporation (previously Tesoro Corporation) (independent oil refiner and marketer) and as a member of the Board of Summit Midstream Partners LP (energy, 2012-2018).
Michael E. Wiley (1950)
Year of Election or Appointment: 2013
Trustee
Mr. Wiley also serves as Trustee of other Fidelity® funds. Previously, Mr. Wiley served as a member of the Advisory Board of certain Fidelity® funds (2018-2020), Chairman, President and CEO of Baker Hughes, Inc. (oilfield services, 2000-2004). Mr. Wiley also previously served as a member of the Board of Andeavor Corporation (independent oil refiner and marketer, 2005-2018), a member of the Board of Andeavor Logistics LP (natural resources logistics, 2015-2018) and a member of the Board of High Point Resources (exploration and production, 2005-2020).
+ The information includes the Trustee's principal occupation during the last five years and other information relating to the experience, attributes, and skills relevant to the Trustee's qualifications to serve as a Trustee, which led to the conclusion that the Trustee should serve as a Trustee for each fund.
Advisory Board Members and Officers:
Correspondence intended for a Member of the Advisory Board (if any) may be sent to Fidelity Investments, P.O. Box 55235, Boston, Massachusetts 02205-5235. Correspondence intended for an officer or Peter S. Lynch may be sent to Fidelity Investments, 245 Summer Street, Boston, Massachusetts 02210. Officers appear below in alphabetical order.
Name, Year of Birth; Principal Occupation
Peter S. Lynch (1944)
Year of Election or Appointment: 2018
Member of the Advisory Board
Mr. Lynch also serves as a Member of the Advisory Board of other Fidelity® funds. Mr. Lynch is Vice Chairman and a Director of Fidelity Management & Research Company LLC (investment adviser firm). In addition, Mr. Lynch serves as a Trustee of Boston College and as the Chairman of the Inner-City Scholarship Fund. Previously, Mr. Lynch served as Vice Chairman and a Director of FMR Co., Inc. (investment adviser firm) and on the Special Olympics International Board of Directors (1997-2006).
Karen B. Peetz (1955)
Year of Election or Appointment: 2023
Member of the Advisory Board
Ms. Peetz also serves as a Member of the Advisory Board of other funds. Previously, Ms. Peetz served as Chief Administration Officer (2020-2023) of Citigroup Inc. (a diversified financial service company). She also served in various capacities at Bank of New York Mellon Corporation, including President (2013-2016), Vice Chairman, Senior Executive Vice President and Chief Executive Officer of Financial Markets & Treasury Services (2010-2013), Senior Executive Vice President and Chief Executive Officer of Global Corporate Trust (2003-2008), Senior Vice President and Division Manager of Global Payments & Trade Services (2002-2003) and Senior Vice President and Division Manager of Domestic Corporate Trust (1998-2002). Ms. Peetz also served in various capacities at Chase Manhattan Corporation (1982-1998), including Senior Vice President and Manager of Corporate Trust International Business (1996-1998), Managing Director and Manager of Corporate Trust Services (1994-1996) and Managing Director and Group Manager of Financial Institution Sales (1990-1993). Ms. Peetz currently serves as Chair of Amherst Holdings Advisory Council (2018-present), Trustee of Johns Hopkins University (2016-present), Chair of the Carey Business School Advisory Council, Member of the Johns Hopkins Medicine Board and Finance Committee and Chair of the Lyme and Tick Related Disease Institute Advisory Council. Ms. Peetz previously served as a member of the Board of Guardian Life Insurance Company of America (2019-2023), a member of the Board of Trane Technologies (2018-2022), a member of the Board of Wells Fargo Corp. (2017-2019), a member of the Board of SunCoke Energy Inc. (2012-2016), a member of the Board of Private Export Funding Corporation (2010-2016) and as a Trustee of Penn State University (2010-2014) and the United Way of New York City (2008-2010).
Heather Bonner (1977)
Year of Election or Appointment: 2023
Assistant Treasurer
Ms. Bonner also serves as an officer of other funds. Ms. Bonner serves as Senior Vice President (2022-present), and is an employee of Fidelity Investments. Ms. Bonner serves as Assistant Treasurer of Fidelity CRET Trustee LLC (2022-present). Prior to joining Fidelity, Ms. Bonner served as Managing Director at AQR Capital Management (2013-2022) and was the Treasurer and Principal Financial Officer of the AQR Funds (2013-2022).
Craig S. Brown (1977)
Year of Election or Appointment: 2022
Deputy Treasurer
Mr. Brown also serves as an officer of other funds. Mr. Brown serves as Assistant Treasurer of FIMM, LLC (2021-present) and is an employee of Fidelity Investments (2013-present). Previously, Mr. Brown served as Assistant Treasurer of certain Fidelity® funds (2019-2022).
John J. Burke III (1964)
Year of Election or Appointment: 2018
Chief Financial Officer
Mr. Burke also serves as Chief Financial Officer of other funds. Mr. Burke serves as Head of Investment Operations for Fidelity Fund and Investment Operations (2018-present) and is an employee of Fidelity Investments (1998-present). Previously Mr. Burke served as head of Asset Management Investment Operations (2012-2018).
Margaret Carey (1973)
Year of Election or Appointment: 2023
Secretary and Chief Legal Officer (CLO)
Ms. Carey also serves as an officer of other funds and as CLO of certain other Fidelity entities. She is a Senior Vice President and Deputy General Counsel of FMR LLC (diversified financial services company, 2019-present), and is an employee of Fidelity Investments.
William C. Coffey (1969)
Year of Election or Appointment: 2019
Assistant Secretary
Mr. Coffey also serves as Assistant Secretary of other funds. He is Senior Vice President and Deputy General Counsel of FMR LLC (diversified financial services company, 2010-present), and is an employee of Fidelity Investments. Previously, Mr. Coffey served as Secretary and CLO of certain funds (2018-2019); CLO, Secretary, and Senior Vice President of Fidelity Management & Research Company and FMR Co., Inc. (investment adviser firms, 2018-2019); Secretary of Fidelity SelectCo, LLC and Fidelity Investments Money Management, Inc. (investment adviser firms, 2018-2019); CLO of Fidelity Management & Research (Hong Kong) Limited, FMR Investment Management (UK) Limited, and Fidelity Management & Research (Japan) Limited (investment adviser firms, 2018-2019); and Assistant Secretary of certain funds (2009-2018).
Timothy M. Cohen (1969)
Year of Election or Appointment: 2018
Vice President
Mr. Cohen also serves as Vice President of other funds. Mr. Cohen serves as Co-Head of Equity (2018-present), a Director of Fidelity Management & Research (Japan) Limited (investment adviser firm, 2016-present), and is an employee of Fidelity Investments. Previously, Mr. Cohen served as Executive Vice President of Fidelity SelectCo, LLC (2019), Head of Global Equity Research (2016-2018), Chief Investment Officer - Equity and a Director of Fidelity Management & Research (U.K.) Inc. (investment adviser firm, 2013-2015) and as a Director of Fidelity Management & Research (Hong Kong) Limited (investment adviser firm, 2017).
Jonathan Davis (1968)
Year of Election or Appointment: 2013
Assistant Treasurer
Mr. Davis also serves as an officer of other funds. Mr. Davis serves as Vice President Assistant Treasurer and is an employee of Fidelity Investments. Mr. Davis serves as Assistant Treasurer of certain Fidelity entities.
Laura M. Del Prato (1964)
Year of Election or Appointment: 2018
Assistant Treasurer
Ms. Del Prato also serves as an officer of other funds. Ms. Del Prato serves as Assistant Treasurer of FIMM, LLC (2021-present) and is an employee of Fidelity Investments (2017-present). Previously, Ms. Del Prato served as President and Treasurer of The North Carolina Capital Management Trust: Cash Portfolio and Term Portfolio (2018-2020). Prior to joining Fidelity Investments, Ms. Del Prato served as a Managing Director and Treasurer of the JPMorgan Mutual Funds (2014-2017). Prior to JPMorgan, Ms. Del Prato served as a partner at Cohen Fund Audit Services (accounting firm, 2012-2013) and KPMG LLP (accounting firm, 2004-2012).
Colm A. Hogan (1973)
Year of Election or Appointment: 2020
Assistant Treasurer
Mr. Hogan also serves as an officer of other funds. Mr. Hogan serves as Assistant Treasurer of FIMM, LLC (2021-present) and FMR Capital, Inc. (2017-present) and is an employee of Fidelity Investments (2005-present). Previously, Mr. Hogan served as Deputy Treasurer of certain Fidelity® funds (2016-2020) and Assistant Treasurer of certain Fidelity® funds (2016-2018).
Pamela R. Holding (1964)
Year of Election or Appointment: 2018
Vice President
Ms. Holding also serves as Vice President of other funds. Ms. Holding serves as Co-Head of Equity (2018-present) and is an employee of Fidelity Investments (2013-present). Previously, Ms. Holding served as Executive Vice President of Fidelity SelectCo, LLC (2019) and as Chief Investment Officer of Fidelity Institutional Asset Management (2013-2018).
Chris Maher (1972)
Year of Election or Appointment: 2020
Deputy Treasurer
Mr. Maher also serves as an officer of other funds. Mr. Maher serves as Assistant Treasurer of FIMM, LLC (2021-present) and FMR Capital, Inc. (2017-present), and is an employee of Fidelity Investments (2008-present). Previously, Mr. Maher served as Assistant Treasurer of certain funds (2013-2020); Vice President of Asset Management Compliance (2013), Vice President of the Program Management Group of FMR (investment adviser firm, 2010-2013), and Vice President of Valuation Oversight (2008-2010).
Jason P. Pogorelec (1975)
Year of Election or Appointment: 2020
Chief Compliance Officer
Mr. Pogorelec also serves as Chief Compliance Officer of other funds. Mr. Pogorelec is a Senior Vice President of Asset Management Compliance for Fidelity Investments and is an employee of Fidelity Investments. Mr. Pogorelec serves as Compliance Officer of Fidelity Management & Research Company LLC (investment adviser firm, 2023-present). Previously, Mr. Pogorelec served as Vice President, Associate General Counsel for Fidelity Investments (2010-2020) and Assistant Secretary of certain Fidelity® funds (2015-2020).
Brett Segaloff (1972)
Year of Election or Appointment: 2021
Anti-Money Laundering (AML) Officer
Mr. Segaloff also serves as an AML Officer of other funds and other related entities. He is Director, Anti-Money Laundering (2007-present) of FMR LLC (diversified financial services company) and is an employee of Fidelity Investments (1996-present).
Stacie M. Smith (1974)
Year of Election or Appointment: 2018
President and Treasurer
Ms. Smith also serves as an officer of other funds. Ms. Smith serves as Assistant Treasurer of certain Fidelity entities, is an employee of Fidelity Investments, and has served in other fund officer roles.
Jim Wegmann (1979)
Year of Election or Appointment: 2019
Assistant Treasurer
Mr. Wegmann also serves as an officer of other funds. Mr. Wegmann serves as Assistant Treasurer of FIMM, LLC (2021-present) and is an employee of Fidelity Investments (2011-present). Previously, Mr. Wegmann served as Assistant Treasurer of certain Fidelity® funds (2019-2021).
As a shareholder, you incur two types of costs: (1) transaction costs, which may include sales charges (loads) on purchase payments or redemption proceeds, as applicable and (2) ongoing costs, which generally include management fees, distribution and/or service (12b-1) fees and other Fund expenses. This Example is intended to help you understand your ongoing costs (in dollars) of investing in a fund and to compare these costs with the ongoing costs of investing in other mutual funds.
| The Example is based on an investment of $1,000 invested at the beginning of the period and held for the entire period (March 1, 2023 to August 31, 2023). |
Actual Expenses
The first line of the accompanying table provides information about actual account values and actual expenses. You may use the information in this line, together with the amount you invested, to estimate the expenses that you paid over the period. Simply divide your account value by $1,000.00 (for example, an $8,600 account value divided by $1,000.00 = 8.6), then multiply the result by the number in the first line for a class/Fund under the heading entitled "Expenses Paid During Period" to estimate the expenses you paid on your account during this period. If any fund is a shareholder of any underlying mutual funds or exchange-traded funds (ETFs) (the Underlying Funds), such fund indirectly bears its proportional share of the expenses of the Underlying Funds in addition to the direct expenses incurred presented in the table. These fees and expenses are not included in the annualized expense ratio used to calculate the expense estimate in the table below.
Hypothetical Example for Comparison Purposes
The second line of the accompanying table provides information about hypothetical account values and hypothetical expenses based on the actual expense ratio and an assumed rate of return of 5% per year before expenses, which is not the actual return. The hypothetical account values and expenses may not be used to estimate the actual ending account balance or expenses you paid for the period. You may use this information to compare the ongoing costs of investing in the Fund and other funds. To do so, compare this 5% hypothetical example with the 5% hypothetical examples that appear in the shareholder reports of the other funds. If any fund is a shareholder of any Underlying Funds, such fund indirectly bears its proportional share of the expenses of the Underlying Funds in addition to the direct expenses as presented in the table. These fees and expenses are not included in the annualized expense ratio used to calculate the expense estimate in the table below.
Please note that the expenses shown in the table are meant to highlight your ongoing costs only and do not reflect any transaction costs. Therefore, the second line of the table is useful in comparing ongoing costs only, and will not help you determine the relative total costs of owning different funds. In addition, if these transactional costs were included, your costs would have been higher.
| | | | | Annualized Expense Ratio- A | | Beginning Account Value March 1, 2023 | | Ending Account Value August 31, 2023 | | Expenses Paid During Period- C March 1, 2023 to August 31, 2023 |
| | | | | | | | | | |
| Fidelity® High Yield Factor ETF | | | | .45% | | | | | | |
| Actual | | | | | | $ 1,000 | | $ 1,040.80 | | $ 2.31 |
Hypothetical-B | | | | | | $ 1,000 | | $ 1,022.94 | | $ 2.29 |
| | | | | | | | | | |
| Fidelity® Preferred Securities & Income ETF | | | | .59% | | | | | | |
| Actual | | | | | | $ 1,000 | | $ 982.90 | | $ 2.95 |
Hypothetical-B | | | | | | $ 1,000 | | $ 1,022.23 | | $ 3.01 |
| |
A Annualized expense ratio reflects expenses net of applicable fee waivers.
B 5% return per year before expenses
C Expenses are equal to the annualized expense ratio, multiplied by the average account value over the period, multiplied by 184/ 365 (to reflect the one-half year period). The fees and expenses of any Underlying Funds are not included in each annualized expense ratio.
The dividend and capital gains distributions for the fund(s) are available on Fidelity.com or Institutional.Fidelity.com.
A percentage of the dividends distributed during the fiscal year for the following funds were derived from interest on U.S. Government securities which is generally exempt from state income tax:
| Fidelity High Yield Factor ETF | 0.01% |
| Fidelity Preferred Securities & Income ETF | 0.01% |
A percentage of the dividends distributed during the fiscal year for the following funds qualify for the dividends-received deduction for corporate shareholders:
| Fidelity Preferred Securities & Income ETF | |
| September 2022 | 2% |
| October 2022 | 36% |
| November 2022 | 36% |
| December 2022 | 36% |
| January 2023 | 24% |
| February 2023 | 24% |
| March 2023 | 24% |
| April 2023 | 24% |
| May 2023 | 24% |
| June 2023 | 24% |
| July 2023 | 24% |
| August 2023 | 24% |
A percentage of the dividends distributed during the fiscal year for the following funds may be taken into account as a dividend for purposes of the maximum rate under section 1(h)(11) of the Internal Revenue Code.
| Fidelity Preferred Securities & Income ETF | |
| September 2022 | 1.77% |
| October 2022 | 36.43% |
| November 2022 | 36.43% |
| December 2022 | 36.43% |
| January 2023 | 24.86% |
| February 2023 | 24.86% |
| March 2023 | 24.86% |
| April 2023 | 24.86% |
| May 2023 | 24.86% |
| June 2023 | 24.86% |
| July 2023 | 24.86% |
| August 2023 | 24.86% |
A percentage of the dividends distributed during the fiscal year for the following funds qualify as a section 199A dividend:
| Fidelity Preferred Securities & Income ETF | |
| September 2022 | 0.11% |
| October 2022 | 2.24% |
| November 2022 | 2.24% |
| December 2022 | 2.24% |
| January 2023 | 1.25% |
| February 2023 | 1.25% |
| March 2023 | 1.25% |
| April 2023 | 1.25% |
| May 2023 | 1.25% |
| June 2023 | 1.25% |
| July 2023 | 1.25% |
| August 2023 | 1.25% |
The funds hereby designate the amounts noted below as distributions paid in the calendar year 2022 as qualifying to be taxed as interest-related dividends for nonresident alien shareholders:
| Fidelity High Yield Factor ETF | $10,765,285 |
| Fidelity Preferred Securities & Income ETF | $605,333 |
The funds hereby designate the amounts noted below as distributions paid during the fiscal year ended 2023 as qualifying to be taxed as section 163(j) interest dividends:
| Fidelity High Yield Factor ETF | $15,245,316 |
| Fidelity Preferred Securities & Income ETF | $1,079,835 |
The funds will notify shareholders in January 2024 of amounts for use in preparing 2023 income tax returns.
Board Approval of Investment Advisory Contracts and Management Fees
Fidelity High Yield Factor ETF
Fidelity Preferred Securities & Income ETF
Each year, the Board of Trustees, including the Independent Trustees (together, the Board), considers the renewal of each fund's management contract with Fidelity Management & Research Company LLC (FMR) and the sub-advisory agreements (together, the Advisory Contracts) for each fund. FMR and the sub-advisers are referred to herein as the Investment Advisers. The Board, assisted by the advice of fund counsel and Independent Trustees' counsel, requests and considers a broad range of information relevant to the renewal of the Advisory Contracts throughout the year.
The Board meets regularly and, at each of its meetings, covers an extensive agenda of topics and materials and considers factors that are relevant to its annual consideration of the renewal of each fund's Advisory Contracts, including the services and support provided to each fund and its shareholders. The Board, acting directly and through its Committees (each of which is composed of and chaired by Independent Trustees), requests and receives information concerning the annual consideration of the renewal of each fund's Advisory Contracts. The Board also meets as needed to review matters specifically related to the Board's annual consideration of the renewal of the Advisory Contracts. Members of the Board may also meet with trustees of other Fidelity funds through joint ad hoc committees to discuss certain matters relevant to all of the Fidelity funds.
Approval of Stub Period Continuation. At its May 2023 meeting, the Board of Trustees voted to continue each fund's management contract with FMR and the sub-advisory agreements, in each case, where applicable, for two months from June 1, 2023 through July 31, 2023. The Board considered that the approval of each fund's Advisory Contracts will not result in any changes in (i) the investment process or strategies employed in the management of each fund's assets; (ii) the fees and expenses paid by shareholders; (iii) the nature, extent or quality of services provided under each fund's Advisory Contracts; or (iv) the day-to-day management of each fund or the persons primarily responsible for such management. The Board also considered that since its last approval of each fund's Advisory Contracts, FMR had provided additional information on each fund in support of the annual contract renewal process, including competitive analyses on total expenses and management fees and in-depth reviews of fund performance and fund profitability information. The Board concluded that each fund's Advisory Contracts are fair and reasonable, and that each fund's Advisory Contracts should be renewed, without modification, through July 31, 2023, with the understanding that the Board would consider the annual renewal for a full one year period in July 2023.
At its July 2023 meeting, the Board unanimously determined to renew each fund's Advisory Contracts. In reaching its determination, the Board considered all factors it believed relevant, including (i) the nature, extent, and quality of the services provided to each fund and its shareholders (including the investment performance of each fund); (ii) the competitiveness relative to peer funds of each fund's management fee and total expense ratio; (iii) the total costs of the services provided by and the profits realized by FMR and its affiliates (Fidelity) from its relationships with each fund; and (iv) the extent to which, if any, economies of scale exist and are realized as each fund grows, and whether any economies of scale are appropriately shared with fund shareholders. The Board also considered the broad range of investment choices available to shareholders from FMR's competitors and that each fund's shareholders have chosen to invest in the fund, which is part of the Fidelity family of funds. The Board's decision to renew the Advisory Contracts was not based on any single factor.
The Board reached a determination, with the assistance of fund counsel and Independent Trustees' counsel and through the exercise of its business judgment, that the renewal of the Advisory Contracts was in the best interests of each fund and its shareholders and that the compensation payable under the Advisory Contracts was fair and reasonable, in light of all of the surrounding circumstances.
Nature, Extent, and Quality of Services Provided. The Board considered staffing as it relates to the funds, including the backgrounds and experience of investment personnel of the Investment Advisers, and also considered the Investment Advisers' implementation of each fund's investment program. The Independent Trustees also had discussions with senior management of Fidelity's investment operations and investment groups. The Board considered the structure of the investment personnel compensation program and whether this structure provides appropriate incentives to act in the best interests of each fund. Additionally, the Board considered the portfolio managers' investments, if any, in the funds that they manage.
Resources Dedicated to Investment Management and Support Services. The Board and the Fund Oversight and Research Committees reviewed the general qualifications and capabilities of Fidelity's investment staff, including its size, education, experience, and resources, as well as Fidelity's approach to recruiting, training, managing, and compensating investment personnel. The Board noted the resources devoted to expansion of Fidelity's global investment organization, and that Fidelity's analysts have extensive resources, tools, and capabilities that allow them to conduct sophisticated quantitative and fundamental analysis, as well as credit analysis of issuers, counterparties, and guarantors. Further, the Board considered that Fidelity's investment professionals have sufficient access to global information and data so as to provide competitive investment results over time, and that those professionals also have access to sophisticated tools that permit them to assess portfolio construction and risk and performance attribution characteristics continuously, as well as to transmit new information and research conclusions rapidly around the world. Additionally, in its deliberations, the Board considered Fidelity's trading, risk management, compliance, and technology and operations capabilities and resources, which are integral parts of the investment management process.
Shareholder and Administrative Services. The Board considered (i) the nature, extent, quality, and cost of advisory and administrative services provided by the Investment Advisers and their affiliates under the Advisory Contracts and under separate agreements covering pricing and bookkeeping and securities lending services for each fund; (ii) the nature and extent of Fidelity's supervision of third party service providers, principally State Street Bank and Trust Company, each fund's transfer agent and custodian; and (iii) the resources devoted by Fidelity to, and the record of compliance with, each fund's compliance policies and procedures. The Board also reviewed the allocation of fund brokerage, including allocations to brokers affiliated with the Investment Advisers, the use of brokerage commissions to pay fund expenses, and the use of "soft" commission dollars to pay for research services. The Board also considered each fund's securities lending activities and any payments made to Fidelity relating to securities lending.
The Board noted that the growth of fund assets over time across the complex allows Fidelity to reinvest in the development of services designed to enhance the value and convenience of the Fidelity funds as investment vehicles. These services include 24-hour access to account information and market information over the Internet and through telephone representatives, investor education materials, and asset allocation tools. The Board also considered that it reviews customer service metrics such as telephone response times, continuity of services on the website and metrics addressing services at Fidelity Investor Centers.
Investment in a Large Fund Family. The Board considered the benefits to shareholders of investing in a fund that is part of a large family of funds offering a variety of investment disciplines and providing a large variety of fund investor services. The Board noted that Fidelity had taken, or had made recommendations that resulted in the Fidelity funds taking, a number of actions over the previous year that benefited particular funds and/or the Fidelity funds in general.
Investment Performance. The Board took into account discussions that occur with representatives of the Investment Advisers, and reports that it receives, at Board meetings throughout the year with representatives of the Investment Advisers relating to fund investment performance. In this regard the Board noted that as part of regularly scheduled fund reviews and other reports to the Board on fund performance, the Board considered annualized return information for each fund for different time periods, measured against an appropriate securities market index (benchmark index) and, for Fidelity High Yield Factor ETF, an appropriate peer group of funds with similar objectives (peer group). The Board also considered information about performance attribution. In its ongoing evaluation of fund investment performance, the Board gives particular attention to information indicating changes in performance of the funds over different time periods and discussed with the Investment Advisers the reasons for any overperformance or underperformance. The Board also considered information on each fund's bid-ask spread and premium/discount.
In addition to reviewing absolute and relative fund performance, the Independent Trustees periodically consider the appropriateness of fund performance metrics in evaluating the results achieved. In general, the Independent Trustees believe that fund performance should be evaluated based on net performance (after fees and expenses) of the fund compared to appropriate benchmark indices, over appropriate time periods that may include full market cycles, and compared to peer groups, as applicable, over the same periods, taking into account relevant factors including the following: general market conditions; issuer-specific information; and fund cash flows and other factors.
Based on its review, the Board concluded that the nature, extent, and quality of services provided to each fund under the Advisory Contracts should continue to benefit the shareholders of each fund.
Competitiveness of Management Fee and Total Expense Ratio. The Board was provided with information regarding industry trends in management fees and expenses. In its review of each fund's management fee and total expense ratio, the Board considered each fund's all-inclusive fee rate and also considered other expenses, such as transfer agent fees, pricing and bookkeeping fees, and custodial, legal, and audit fees, paid by FMR under each fund's all-inclusive arrangement. The Board noted that Fidelity may agree to waive fees or reimburse expenses from time to time, and the extent to which, if any, it has done so for the fund.
Comparisons of Management Fees and Total Expense Ratios. Among other things, the Board reviewed data for selected groups of competitive funds and classes (referred to as "mapped groups") that were compiled by Fidelity based on combining similar investment objective categories (as classified by Lipper) that have comparable investment mandates. The data reviewed by the Board included (i) gross management fee comparisons (before taking into account expense reimbursements or caps) relative to the total universe of funds within the mapped group; (ii) gross management fee comparisons relative to a subset of non-Fidelity funds in the mapped group that are similar in size and management fee structure to each fund (referred to as the "asset size peer group"); (iii) total expense comparisons of each fund relative to funds and classes in the mapped group that have a similar load structure to the fund (referred to as the "similar load structure group"); and (iv) total expense comparisons of each fund relative to funds and classes in the similar load structure group that are similar in size and management fee structure to the fund (referred to as the "total expense asset size peer group"). The total expense asset size peer group comparison excludes performance adjustments and fund-paid 12b-1 fees to eliminate variability in fee structures.
For Fidelity High Yield Factor ETF, the information provided to the Board indicated that the fund's management fee rate ranked below the competitive median of the mapped group for the 12-month period ended September 30, 2022 and below the competitive median of the asset size peer group for the 12-month period ended September 30, 2022. Further, the information provided to the Board indicated that the total expense ratio of the fund ranked below the competitive median of the similar load structure group for the 12-month period ended September 30, 2022 and below the competitive median of the total expense asset size peer group for the 12-month period ended September 30, 2022.
For Fidelity Preferred Securities & Income ETF, the information provided to the Board indicated that the fund's management fee rate ranked above the competitive median of the mapped group for the 12-month period ended September 30, 2022 and above the competitive median of the asset size peer group for the 12-month period ended September 30, 2022. Further, the information provided to the Board indicated that the total expense ratio of the fund ranked above the competitive median of the similar load structure group for the 12-month period ended September 30, 2022 and above the competitive median of the total expense asset size peer group for the 12-month period ended September 30, 2022. The Board considered that the fund's mapped group includes ETFs ranging across 21 Lipper investment objectives and is dominated by ETFs that focus on investment grade securities. The Board noted that when compared to the subset of ETFs that have a flexible income investment objective, Fidelity Preferred Securities & Income ETF ranked below the subset's median management fee and its total expenses compared favorably to other flexible income strategy funds in the similar load structure group.
Fees Charged to Other Fidelity Clients. The Board also considered Fidelity fee structures and other information with respect to clients of Fidelity, such as other funds advised or subadvised by Fidelity, pension plan clients, and other institutional clients with similar mandates. The Board noted that a joint ad hoc committee created by it and the boards of other Fidelity funds periodically reviews and compares Fidelity's institutional investment advisory business with its business of providing services to the Fidelity funds and also noted the most recent findings of the committee. The Board noted that the committee's review included a consideration of the differences in services provided, fees charged, and costs incurred, as well as competition in the markets serving the different categories of clients.
Based on its review, the Board concluded that each fund's management fee is fair and reasonable in light of the services that the fund receives and the other factors considered. Further, based on its review of total expense ratios and fees charged to other Fidelity clients, the Board concluded that each fund's total expense ratio was reasonable in light of the services that the fund and its shareholders receive and the other factors considered.
Costs of the Services and Profitability. The Board considered the revenues earned and the expenses incurred by Fidelity in conducting the business of developing, marketing, distributing, managing, administering and servicing each fund and servicing each fund's shareholders. The Board also considered the level of Fidelity's profits in respect of all the Fidelity funds.
On an annual basis, Fidelity presents to the Board information about the profitability of its relationships with each fund. Fidelity calculates profitability information for each fund, as well as aggregate profitability information for groups of Fidelity funds and all Fidelity funds, using a series of detailed revenue and cost allocation methodologies which originate with the books and records of Fidelity on which Fidelity's audited financial statements are based. The Audit Committee of the Board reviews any significant changes from the prior year's methodologies and the full Board approves such changes.
A public accounting firm has been engaged annually by the Board as part of the Board's assessment of Fidelity's profitability analysis. The engagement includes the review and assessment of the methodologies used by Fidelity in determining the revenues and expenses attributable to Fidelity's fund business, and completion of agreed-upon procedures in respect of the mathematical accuracy of certain fund profitability information and its conformity to established allocation methodologies. After considering the reports issued under the engagement and information provided by Fidelity, the Board concluded that while other allocation methods may also be reasonable, Fidelity's profitability methodologies are reasonable in all material respects.
The Board also reviewed Fidelity's non-fund businesses and potential indirect benefits such businesses may have received as a result of their association with Fidelity's fund business (i.e., fall-out benefits) as well as cases where Fidelity's affiliates may benefit from the funds' business. The Board considered areas where potential indirect benefits to the Fidelity funds from their relationships with Fidelity may exist. The Board's consideration of these matters was informed by the findings of a joint ad hoc committee created by it and the boards of other Fidelity funds to evaluate potential fall-out benefits.
The Board considered the costs of the services provided by and the profits realized by Fidelity in connection with the operation of each fund and was satisfied that the profitability was not excessive.
Economies of Scale. The Board considered whether there have been economies of scale in respect of the management of the Fidelity funds, whether the Fidelity funds (including each fund) have appropriately benefited from any such economies of scale, and whether there is potential for realization of any further economies of scale. The Board considered the extent to which each fund will benefit from economies of scale as assets grow through increased services to the fund, through waivers or reimbursements, or through fee or expense ratio reductions. The Board recognized that, due to each fund's current contractual arrangements, its expense ratio will not decline if the fund's operating costs decrease as assets grow, or rise as assets decrease. The Board also noted that a committee (the Economies of Scale Committee) created by it and the boards of other Fidelity funds periodically analyzes whether Fidelity attains economies of scale in respect of the management and servicing of the Fidelity funds, whether the Fidelity funds have appropriately benefited from such economies of scale, and whether there is potential for realization of any further economies of scale.
The Board concluded, taking into account the analysis of the Economies of Scale Committee, that economies of scale, if any, are being appropriately shared between fund shareholders and Fidelity.
Additional Information Requested by the Board. In order to develop fully the factual basis for consideration of the Fidelity funds' advisory contracts, the Board requested and received additional information on certain topics, including: (i) fund flow and performance trends, in particular the underperformance of certain funds and strategies, and Fidelity's long-term strategies for certain funds, including any consideration of fund liquidations or mergers; (ii) the operation of performance fees and competitor use of performance fees; (iii) Fidelity's pricing philosophy compared to competitors; (iv) fund profitability methodology and data; (v) evaluation of competitive fund data and peer group classifications and fee and expense comparisons; (vi) the management fee and expense structures for different funds and classes and information about the differences between various fee and expense structures; (vii) group fee breakpoints and related voluntary fee waivers; and (viii) information regarding other accounts managed by Fidelity and the funds' sub-advisory arrangements.
Conclusion. Based on its evaluation of all of the conclusions noted above, and after considering all factors it believed relevant, the Board, including the Independent Trustees, concluded that the advisory and sub-advisory fee arrangements are fair and reasonable in light of all of the surrounding circumstances and that each fund's Advisory Contracts should be renewed through July 31, 2024.
1.9887634.105
HIE-ANN-1023
Fidelity® Sustainable High Yield ETF
Annual Report
August 31, 2023
Contents
To view a fund's proxy voting guidelines and proxy voting record for the 12-month period ended June 30, visit http://www.fidelity.com/proxyvotingresults or visit the Securities and Exchange Commission's (SEC) web site at http://www.sec.gov.
You may also call 1-800-FIDELITY to request a free copy of the proxy voting guidelines.
Standard & Poor's, S&P and S&P 500 are registered service marks of The McGraw-Hill Companies, Inc. and have been licensed for use by Fidelity Distributors Corporation.
Other third-party marks appearing herein are the property of their respective owners.
All other marks appearing herein are registered or unregistered trademarks or service marks of FMR LLC or an affiliated company. © 2023 FMR LLC. All rights reserved.
This report and the financial statements contained herein are submitted for the general information of the shareholders of the Fund. This report is not authorized for distribution to prospective investors in the Fund unless preceded or accompanied by an effective prospectus.
A fund files its complete schedule of portfolio holdings with the SEC for the first and third quarters of each fiscal year on Form N-PORT. Forms N-PORT are available on the SEC's web site at http://www.sec.gov. A fund's Forms N-PORT may be reviewed and copied at the SEC's Public Reference Room in Washington, DC. Information regarding the operation of the SEC's Public Reference Room may be obtained by calling 1-800-SEC-0330.
For a complete list of a fund's portfolio holdings, view the most recent holdings listing, semiannual report, or annual report on Fidelity's web site at http://www.fidelity.com, http://www.institutional.fidelity.com, or http://www.401k.com, as applicable.
NOT FDIC INSURED •MAY LOSE VALUE •NO BANK GUARANTEE
Neither the Fund nor Fidelity Distributors Corporation is a bank.
NAV and closing market price average annual returns reflect the change in the value of an investment, assuming reinvestment of distributions from dividend income and capital gains (the profits earned upon the sale of securities that have grown in value, if any) at NAV and Market Price, respectively, and assumes a constant rate of performance each year. The hypothetical investment and the fund's returns do not reflect the deduction of taxes that a shareholder would pay on fund distributions or the redemption or selling of fund shares. How a fund did yesterday is no guarantee of how it will do tomorrow.
| Average Annual Total Returns |
| | | | |
Periods ended August 31, 2023 | Past 1 year | Life of Fund |
Fidelity® Sustainable High Yield ETF - NAV A | 6.83% | -0.27% |
Fidelity® Sustainable High Yield ETF - Market Price B | 7.59% | -0.08% |
ICE® BofA® US High Yield Constrained Index A | 7.03% | -0.34% |
ICE US High Yield Best-in-Class ESG Index A | 6.54% | -0.95% |
A From February 15, 2022
B From February 17, 2022, date initially listed on the NYSE Arca exchange.
| $10,000 Over Life of Fund |
| |
Let's say hypothetically that $10,000 was invested in Fidelity® Sustainable High Yield ETF - NAV, on February 15, 2022, when the fund started. The chart shows how the value of your investment would have changed, and also shows how the ICE® BofA® US High Yield Constrained Index performed over the same period. |
|
|
Market Recap:
High-yield bonds gained 7.03% for the 12 months ending August 31, 2023, according to the ICE BofA® US High Yield Constrained Index, as continued global economic expansion, falling commodity prices and a slowing in the pace of inflation provided a favorable backdrop for higher-risk assets. U.S. large-cap stocks spearheaded the broad rally, driven by the shares of a narrow set of mega-cap companies in the information technology and communication services sectors, largely due to exuberance related to generative artificial intelligence. Aggressive monetary tightening by the U.S. Federal Reserve continued amid consistent pressure on core inflation, a measure that excludes food and energy. Since March 2022, the Fed has hiked its benchmark interest rate 11 times. The latest bump came in late July, a fourth consecutive raise of a stepped down 25 basis points. After a rough 2022 (-11.21%), high yield sharply reversed course to begin the new year and made a fairly steady advance through the end of August. The index rose in June (+1.63%) and July (+1.43%) before a modest gain in August (+0.30%), held back by softness in manufacturing and jobs. By industry for the full 12 months, leisure (+11%), financial services, energy and basic industry (+10% each) led the way. Conversely, notable laggards included telecommunications (+1%) and media (+2%).
Comments from Co-Managers Adam Kramer, Michael Cheng and Brian Chang:
For the fiscal year, the exchange-traded fund's (ETF) net asset value gained 6.83% and its market price gained 7.59%, versus 6.54% for the ICE US High Yield Best-in-Class ESG Index and 7.03% for the benchmark, the ICE BofA® US High Yield Constrained Index. The fund's core investment in high-yield bonds gained 7.53% the past 12 months and contributed to performance versus the ESG index. By industry, security selection was the primary relative contributor, especially in retail, services and leisure. The fund's top individual relative contributor stemmed from our decision to avoid index component Altice USA (-11%), in the media category. Other notable contributors included a non-benchmark stake in Brand Energy (+38%), from the services industry, and an overweight in Royal Caribbean Cruises (+37%), which we established this period. Conversely, security selection in telecommunications meaningfully detracted from performance versus the ESG index. Our picks in health care and energy hurt to a lesser extent. The largest individual relative detractor was a non-index position in Cano Health (-58%). Also hurting our relative result were overweights in CenturyLink (-21%) and Altice Financial (-10%), both from the telecommunications industry. Notable changes in positioning include increased exposure to basic industry and a lower allocation to media.
Note to shareholders:
Application of FMR's environmental, social and governance (ESG) ratings process and/or its sustainable investing exclusion criteria may affect the fund's exposure to certain issuers, sectors, regions, and countries and may affect the Fund's performance.
The views expressed above reflect those of the portfolio manager(s) only through the end of the period as stated on the cover of this report and do not necessarily represent the views of Fidelity or any other person in the Fidelity organization. Any such views are subject to change at any time based upon market or other conditions and Fidelity disclaims any responsibility to update such views. These views may not be relied on as investment advice and, because investment decisions for a Fidelity fund are based on numerous factors, may not be relied on as an indication of trading intent on behalf of any Fidelity fund.
| Top Bond Issuers (% of Fund's net assets) |
(with maturities greater than one year) |
| Uber Technologies, Inc. | 2.6 | |
| New Fortress Energy, Inc. | 1.9 | |
| Community Health Systems, Inc. | 1.9 | |
| MPT Operating Partnership LP/MPT Finance Corp. | 1.9 | |
| Tenet Healthcare Corp. | 1.7 | |
| CCO Holdings LLC/CCO Holdings Capital Corp. | 1.6 | |
| Stericycle, Inc. | 1.6 | |
| Go Daddy Operating Co. LLC / GD Finance Co., Inc. | 1.5 | |
| The Chemours Company LLC | 1.5 | |
| Methanex Corp. | 1.4 | |
| | 17.6 | |
| |
| Market Sectors (% of Fund's net assets) |
| |
| Energy | 14.6 | |
| Technology | 12.1 | |
| Services | 8.7 | |
| Healthcare | 8.0 | |
| Chemicals | 5.1 | |
| |
Quality Diversification (% of Fund's net assets) |
|
| |
| We have used ratings from Moody's Investors Service, Inc. Where Moody's® ratings are not available, we have used S&P® ratings. All ratings are as of the date indicated and do not reflect subsequent changes. |
Asset Allocation (% of Fund's net assets) |
|
|
Geographic Diversification (% of Fund's net assets) |
|
* Includes Short-Term investments and Net Other Assets (Liabilities). Percentages are adjusted for the effect of derivatives, if applicable. |
| |
Showing Percentage of Net Assets
| Corporate Bonds - 96.1% |
| | | Principal Amount (a) | Value ($) |
| Convertible Bonds - 1.7% | | | |
| Broadcasting - 1.0% | | | |
| DISH Network Corp.: | | | |
| 2.375% 3/15/24 | | 20,000 | 18,900 |
| 3.375% 8/15/26 | | 120,000 | 72,600 |
| | | | 91,500 |
| Homebuilders/Real Estate - 0.4% | | | |
| Redfin Corp. 0.5% 4/1/27 | | 61,000 | 38,735 |
| Super Retail - 0.1% | | | |
| Wayfair LLC 0.625% 10/1/25 | | 12,000 | 10,410 |
| Technology - 0.2% | | | |
| MicroStrategy, Inc. 0% 2/15/27 | | 18,000 | 12,398 |
TOTAL CONVERTIBLE BONDS | | | 153,043 |
| Nonconvertible Bonds - 94.4% | | | |
| Aerospace - 1.5% | | | |
| ATI, Inc. 4.875% 10/1/29 | | 50,000 | 45,142 |
| Bombardier, Inc. 6% 2/15/28 (b) | | 80,000 | 74,770 |
| TransDigm, Inc. 4.875% 5/1/29 | | 20,000 | 17,996 |
| | | | 137,908 |
| Air Transportation - 0.3% | | | |
| Rand Parent LLC 8.5% 2/15/30 (b) | | 30,000 | 28,560 |
| Automotive & Auto Parts - 1.3% | | | |
| Ford Motor Credit Co. LLC 4.687% 6/9/25 | | 25,000 | 24,065 |
| Macquarie AirFinance Holdings 8.375% 5/1/28 (b) | | 10,000 | 10,210 |
| McLaren Finance PLC 7.5% 8/1/26 (b) | | 5,000 | 4,400 |
| PECF USS Intermediate Holding III Corp. 8% 11/15/29 (b) | | 10,000 | 6,378 |
| Rivian Holdco & Rivian LLC & Rivian Automotive LLC 6 month U.S. LIBOR + 5.620% 10.9311% 10/15/26 (b)(c)(d) | | 70,000 | 69,769 |
| | | | 114,822 |
| Banks & Thrifts - 0.1% | | | |
| Western Alliance Bancorp. 3% 6/15/31 (c) | | 10,000 | 7,909 |
| Broadcasting - 1.3% | | | |
| Clear Channel Outdoor Holdings, Inc.: | | | |
| 5.125% 8/15/27 (b) | | 5,000 | 4,478 |
| 7.5% 6/1/29 (b) | | 6,000 | 4,472 |
| 9% 9/15/28 (b) | | 10,000 | 10,050 |
| DISH Network Corp. 11.75% 11/15/27 (b) | | 20,000 | 20,293 |
| Univision Communications, Inc.: | | | |
| 5.125% 2/15/25 (b) | | 42,000 | 41,423 |
| 7.375% 6/30/30 (b) | | 31,000 | 30,003 |
| 8% 8/15/28 (b) | | 5,000 | 4,997 |
| | | | 115,716 |
| Building Materials - 0.8% | | | |
| Advanced Drain Systems, Inc. 6.375% 6/15/30 (b) | | 10,000 | 9,850 |
| Beacon Roofing Supply, Inc. 6.5% 8/1/30 (b) | | 9,000 | 8,891 |
| Cornerstone Building Brands, Inc. 6.125% 1/15/29 (b) | | 40,000 | 32,474 |
| Eco Material Technologies, Inc. 7.875% 1/31/27 (b) | | 15,000 | 14,625 |
| Oscar Acquisition Co. LLC / Oscar Finance, Inc. 9.5% 4/15/30 (b) | | 5,000 | 4,680 |
| | | | 70,520 |
| Cable/Satellite TV - 2.2% | | | |
| CCO Holdings LLC/CCO Holdings Capital Corp.: | | | |
| 4.25% 1/15/34 (b) | | 50,000 | 38,290 |
| 4.75% 3/1/30 (b) | | 25,000 | 21,495 |
| 4.75% 2/1/32 (b) | | 110,000 | 91,025 |
| DIRECTV Financing LLC / DIRECTV Financing Co-Obligor, Inc. 5.875% 8/15/27 (b) | | 50,000 | 44,311 |
| DISH DBS Corp. 5.75% 12/1/28 (b) | | 5,000 | 3,881 |
| | | | 199,002 |
| Capital Goods - 0.8% | | | |
| Chart Industries, Inc. 9.5% 1/1/31 (b) | | 18,000 | 19,381 |
| Patrick Industries, Inc. 4.75% 5/1/29 (b) | | 42,000 | 35,910 |
| Vertical Holdco GmbH 7.625% 7/15/28 (b) | | 14,000 | 12,974 |
| | | | 68,265 |
| Chemicals - 5.1% | | | |
| Axalta Coating Systems LLC 3.375% 2/15/29 (b) | | 20,000 | 16,963 |
| Kobe U.S. Midco 2, Inc. 9.25% 11/1/26 pay-in-kind (b)(c) | | 15,000 | 10,950 |
| Methanex Corp.: | | | |
| 5.125% 10/15/27 | | 70,000 | 65,661 |
| 5.65% 12/1/44 | | 75,000 | 61,344 |
| NOVA Chemicals Corp.: | | | |
| 4.25% 5/15/29 (b) | | 50,000 | 40,545 |
| 4.875% 6/1/24 (b) | | 20,000 | 19,671 |
| Nufarm Australia Ltd. 5% 1/27/30 (b) | | 45,000 | 40,027 |
| Olympus Water U.S. Holding Corp.: | | | |
| 6.25% 10/1/29 (b) | | 60,000 | 48,304 |
| 9.75% 11/15/28 (b) | | 15,000 | 15,110 |
| SCIH Salt Holdings, Inc. 6.625% 5/1/29 (b) | | 5,000 | 4,412 |
| The Chemours Co. LLC 4.625% 11/15/29 (b) | | 165,000 | 137,172 |
| | | | 460,159 |
| Consumer Products - 0.5% | | | |
| Macy's Retail Holdings LLC 5.875% 4/1/29 (b) | | 16,000 | 14,464 |
| Tempur Sealy International, Inc. 4% 4/15/29 (b) | | 35,000 | 30,064 |
| | | | 44,528 |
| Containers - 2.2% | | | |
| Ardagh Packaging Finance PLC/Ardagh MP Holdings U.S.A., Inc.: | | | |
| 5.25% 8/15/27 (b) | | 77,000 | 65,505 |
| 5.25% 8/15/27 (b) | | 27,000 | 22,969 |
| Ball Corp. 6% 6/15/29 | | 5,000 | 4,926 |
| Crown Americas LLC/Crown Americas Capital Corp. IV 4.75% 2/1/26 | | 50,000 | 48,213 |
| Graphic Packaging International, Inc. 4.75% 7/15/27 (b) | | 25,000 | 23,747 |
| LABL, Inc. 10.5% 7/15/27 (b) | | 15,000 | 14,357 |
| OI European Group BV 4.75% 2/15/30 (b) | | 20,000 | 18,230 |
| | | | 197,947 |
| Diversified Financial Services - 3.1% | | | |
| Aercap Global Aviation Trust 6.5% 6/15/45 (b)(c) | | 50,000 | 49,302 |
| Coinbase Global, Inc. 3.625% 10/1/31 (b) | | 20,000 | 13,465 |
| Fortress Transportation & Infrastructure Investors LLC 5.5% 5/1/28 (b) | | 40,000 | 37,157 |
| GGAM Finance Ltd.: | | | |
| 7.75% 5/15/26 (b) | | 10,000 | 10,000 |
| 8% 6/15/28 (b) | | 15,000 | 15,212 |
| Hightower Holding LLC 6.75% 4/15/29 (b) | | 20,000 | 17,408 |
| HTA Group Ltd. 7% 12/18/25 (b) | | 38,000 | 35,911 |
| OneMain Finance Corp.: | | | |
| 3.5% 1/15/27 | | 20,000 | 17,405 |
| 3.875% 9/15/28 | | 105,000 | 86,100 |
| | | | 281,960 |
| Energy - 14.5% | | | |
| Archrock Partners LP / Archrock Partners Finance Corp. 6.25% 4/1/28 (b) | | 30,000 | 28,639 |
| Atlantica Sustainable Infrastructure PLC 4.125% 6/15/28 (b) | | 105,000 | 93,628 |
| California Resources Corp. 7.125% 2/1/26 (b) | | 100,000 | 100,257 |
| Centennial Resource Production LLC 5.875% 7/1/29 (b) | | 30,000 | 28,800 |
| CGG SA 8.75% 4/1/27 (b) | | 67,000 | 57,660 |
| CNX Resources Corp.: | | | |
| 6% 1/15/29 (b) | | 40,000 | 38,095 |
| 7.375% 1/15/31 (b) | | 5,000 | 4,991 |
| Crestwood Midstream Partners LP/Crestwood Midstream Finance Corp. 6% 2/1/29 (b) | | 80,000 | 78,538 |
| CVR Energy, Inc. 5.75% 2/15/28 (b) | | 20,000 | 18,206 |
| Energean PLC 6.5% 4/30/27 (b) | | 40,000 | 36,484 |
| Global Partners LP/GLP Finance Corp. 6.875% 1/15/29 | | 35,000 | 33,075 |
| Holly Energy Partners LP/Holly Energy Finance Corp. 5% 2/1/28 (b) | | 40,000 | 37,523 |
| MEG Energy Corp. 5.875% 2/1/29 (b) | | 100,000 | 95,533 |
| Murphy Oil Corp. 6.375% 7/15/28 | | 30,000 | 29,981 |
| New Fortress Energy, Inc. 6.5% 9/30/26 (b) | | 178,000 | 165,455 |
| Northern Oil & Gas, Inc. 8.125% 3/1/28 (b) | | 30,000 | 30,072 |
| Oceaneering International, Inc. 6% 2/1/28 | | 50,000 | 47,004 |
| SM Energy Co. 6.5% 7/15/28 | | 30,000 | 29,325 |
| Southwestern Energy Co. 5.375% 3/15/30 | | 20,000 | 18,724 |
| Sunnova Energy Corp. 5.875% 9/1/26 (b) | | 80,000 | 70,397 |
| Sunoco LP/Sunoco Finance Corp. 4.5% 5/15/29 | | 90,000 | 81,391 |
| Tallgrass Energy Partners LP / Tallgrass Energy Finance Corp.: | | | |
| 6% 3/1/27 (b) | | 25,000 | 23,956 |
| 7.5% 10/1/25 (b) | | 35,000 | 35,213 |
| Teine Energy Ltd. 6.875% 4/15/29 (b) | | 70,000 | 64,925 |
| Transocean Titan Finance Ltd. 8.375% 2/1/28 (b) | | 8,000 | 8,222 |
| Transocean, Inc.: | | | |
| 8% 2/1/27 (b) | | 45,000 | 43,898 |
| 8.75% 2/15/30 (b) | | 9,500 | 9,719 |
| | | | 1,309,711 |
| Environmental - 2.9% | | | |
| Covanta Holding Corp. 4.875% 12/1/29 (b) | | 106,000 | 91,160 |
| Darling Ingredients, Inc. 6% 6/15/30 (b) | | 5,000 | 4,887 |
| Madison IAQ LLC 5.875% 6/30/29 (b) | | 30,000 | 25,260 |
| Stericycle, Inc.: | | | |
| 3.875% 1/15/29 (b) | | 80,000 | 69,655 |
| 5.375% 7/15/24 (b) | | 70,000 | 69,754 |
| | | | 260,716 |
| Food & Drug Retail - 1.8% | | | |
| Albertsons Companies LLC/Safeway, Inc./New Albertson's, Inc./Albertson's LLC: | | | |
| 3.25% 3/15/26 (b) | | 50,000 | 46,474 |
| 4.875% 2/15/30 (b) | | 25,000 | 22,938 |
| Emergent BioSolutions, Inc. 3.875% 8/15/28 (b) | | 35,000 | 16,800 |
| Murphy Oil U.S.A., Inc. 3.75% 2/15/31 (b) | | 25,000 | 21,030 |
| Parkland Corp. 4.625% 5/1/30 (b) | | 60,000 | 52,894 |
| | | | 160,136 |
| Food/Beverage/Tobacco - 1.7% | | | |
| Performance Food Group, Inc. 4.25% 8/1/29 (b) | | 20,000 | 17,601 |
| Post Holdings, Inc.: | | | |
| 4.5% 9/15/31 (b) | | 30,000 | 25,845 |
| 4.625% 4/15/30 (b) | | 20,000 | 17,720 |
| TreeHouse Foods, Inc. 4% 9/1/28 | | 30,000 | 25,678 |
| Triton Water Holdings, Inc. 6.25% 4/1/29 (b) | | 45,000 | 38,252 |
| U.S. Foods, Inc. 4.625% 6/1/30 (b) | | 30,000 | 26,665 |
| | | | 151,761 |
| Healthcare - 7.9% | | | |
| Akumin Escrow, Inc. 7.5% 8/1/28 (b) | | 30,000 | 19,875 |
| Cano Health, Inc. 6.25% 10/1/28 (b) | | 59,000 | 20,060 |
| Charles River Laboratories International, Inc. 3.75% 3/15/29 (b) | | 10,000 | 8,826 |
| Community Health Systems, Inc.: | | | |
| 4.75% 2/15/31 (b) | | 104,000 | 77,480 |
| 5.25% 5/15/30 (b) | | 70,000 | 55,204 |
| 6.875% 4/15/29 (b) | | 35,000 | 21,466 |
| 8% 3/15/26 (b) | | 20,000 | 19,523 |
| DaVita HealthCare Partners, Inc. 3.75% 2/15/31 (b) | | 67,000 | 53,355 |
| Encompass Health Corp. 4.625% 4/1/31 | | 30,000 | 26,308 |
| Horizon Pharma U.S.A., Inc. 5.5% 8/1/27 (b) | | 30,000 | 30,640 |
| Jazz Securities DAC 4.375% 1/15/29 (b) | | 20,000 | 17,919 |
| Omega Healthcare Investors, Inc. 3.25% 4/15/33 | | 17,000 | 12,688 |
| Organon & Co. / Organon Foreign Debt Co-Issuer BV 5.125% 4/30/31 (b) | | 45,000 | 38,340 |
| Owens & Minor, Inc. 6.625% 4/1/30 (b) | | 20,000 | 18,194 |
| Pediatrix Medical Group, Inc. 5.375% 2/15/30 (b) | | 95,000 | 86,635 |
| RegionalCare Hospital Partners Holdings, Inc.: | | | |
| 5.375% 1/15/29 (b) | | 50,000 | 34,567 |
| 9.875% 8/15/30 (b) | | 10,000 | 9,875 |
| RP Escrow Issuer LLC 5.25% 12/15/25 (b) | | 15,000 | 11,553 |
| Tenet Healthcare Corp. 6.125% 10/1/28 | | 160,000 | 154,101 |
| | | | 716,609 |
| Homebuilders/Real Estate - 4.4% | | | |
| Anywhere Real Estate Group LLC 7% 4/15/30 (b) | | 8,000 | 7,210 |
| Greystar Real Estate Partners 7.75% 9/1/30 (b) | | 5,000 | 5,050 |
| Howard Hughes Corp. 4.375% 2/1/31 (b) | | 65,000 | 51,802 |
| MPT Operating Partnership LP/MPT Finance Corp.: | | | |
| 4.625% 8/1/29 | | 25,000 | 18,054 |
| 5% 10/15/27 | | 190,000 | 150,096 |
| Railworks Holdings LP 8.25% 11/15/28 (b) | | 30,000 | 28,650 |
| Realogy Group LLC/Realogy Co.-Issuer Corp. 5.25% 4/15/30 (b) | | 1,000 | 694 |
| Rithm Capital Corp. 6.25% 10/15/25 (b) | | 10,000 | 9,425 |
| Taylor Morrison Communities, Inc./Monarch Communities, Inc. 5.125% 8/1/30 (b) | | 50,000 | 45,857 |
| TRI Pointe Homes, Inc. 5.25% 6/1/27 | | 40,000 | 38,150 |
| Uniti Group LP / Uniti Group Finance, Inc. 10.5% 2/15/28 (b) | | 45,000 | 44,894 |
| | | | 399,882 |
| Hotels - 0.9% | | | |
| Hilton Domestic Operating Co., Inc. 3.625% 2/15/32 (b) | | 100,000 | 83,630 |
| Leisure - 3.3% | | | |
| Carnival Corp.: | | | |
| 5.75% 3/1/27 (b) | | 6,000 | 5,637 |
| 6% 5/1/29 (b) | | 125,000 | 113,139 |
| Constellation Merger Sub, Inc. 8.5% 9/15/25 (b) | | 25,000 | 20,875 |
| MajorDrive Holdings IV LLC 6.375% 6/1/29 (b) | | 35,000 | 28,842 |
| Royal Caribbean Cruises Ltd.: | | | |
| 5.375% 7/15/27 (b) | | 30,000 | 28,230 |
| 5.5% 4/1/28 (b) | | 95,000 | 88,906 |
| Viking Cruises Ltd. 9.125% 7/15/31 (b) | | 10,000 | 10,331 |
| | | | 295,960 |
| Metals/Mining - 3.8% | | | |
| Coeur d'Alene Mines Corp. 5.125% 2/15/29 (b) | | 30,000 | 26,297 |
| Constellium NV 3.75% 4/15/29 (b) | | 20,000 | 17,183 |
| Eldorado Gold Corp. 6.25% 9/1/29 (b) | | 35,000 | 29,835 |
| ERO Copper Corp. 6.5% 2/15/30 (b) | | 75,000 | 65,142 |
| First Quantum Minerals Ltd. 6.875% 10/15/27 (b) | | 30,000 | 28,990 |
| FMG Resources Pty Ltd. 6.125% 4/15/32 (b) | | 60,000 | 55,831 |
| HudBay Minerals, Inc. 6.125% 4/1/29 (b) | | 18,000 | 16,923 |
| IAMGOLD Corp. 5.75% 10/15/28 (b) | | 40,000 | 30,687 |
| Mineral Resources Ltd. 8.5% 5/1/30 (b) | | 75,000 | 75,268 |
| | | | 346,156 |
| Paper - 2.4% | | | |
| Berry Global, Inc. 5.625% 7/15/27 (b) | | 70,000 | 68,617 |
| Clydesdale Acquisition Holdings, Inc. 6.625% 4/15/29 (b) | | 40,000 | 38,062 |
| Domtar Corp. 6.75% 10/1/28 (b) | | 30,000 | 25,952 |
| Mercer International, Inc. 5.125% 2/1/29 | | 100,000 | 81,806 |
| | | | 214,437 |
| Publishing/Printing - 0.2% | | | |
| Mcgraw-Hill Education, Inc. 8% 8/1/29 (b) | | 23,000 | 20,478 |
| Restaurants - 0.5% | | | |
| Yum! Brands, Inc. 4.625% 1/31/32 | | 50,000 | 44,738 |
| Services - 8.3% | | | |
| AECOM 5.125% 3/15/27 | | 50,000 | 47,972 |
| APX Group, Inc. 5.75% 7/15/29 (b) | | 40,000 | 34,460 |
| Aramark Services, Inc.: | | | |
| 5% 4/1/25 (b) | | 35,000 | 34,572 |
| 5% 2/1/28 (b) | | 40,000 | 37,317 |
| Avis Budget Car Rental LLC/Avis Budget Finance, Inc.: | | | |
| 5.375% 3/1/29 (b) | | 12,000 | 11,016 |
| 5.75% 7/15/27 (b) | | 31,000 | 29,598 |
| Brand Energy & Infrastructure Services, Inc. 10.375% 8/1/30 (b) | | 35,000 | 36,095 |
| Dun & Bradstreet Corp. 5% 12/15/29 (b) | | 12,000 | 10,770 |
| GEMS MENASA Cayman Ltd. 7.125% 7/31/26 (b) | | 25,000 | 24,231 |
| Hertz Corp. 4.625% 12/1/26 (b) | | 50,000 | 45,270 |
| Life Time, Inc. 8% 4/15/26 (b) | | 85,000 | 84,363 |
| Neptune BidCo U.S., Inc. 9.29% 4/15/29 (b) | | 20,000 | 18,676 |
| Sotheby's 7.375% 10/15/27 (b) | | 30,000 | 27,311 |
| StoneMor, Inc. 8.5% 5/15/29 (b) | | 30,000 | 25,035 |
| Uber Technologies, Inc. 4.5% 8/15/29 (b) | | 233,000 | 213,335 |
| WASH Multifamily Acquisition, Inc. 5.75% 4/15/26 (b) | | 80,000 | 74,191 |
| | | | 754,212 |
| Steel - 0.2% | | | |
| ATI, Inc. 7.25% 8/15/30 | | 10,000 | 10,102 |
| Infrabuild Australia Pty Ltd. 12% 10/1/24 (b) | | 10,000 | 9,708 |
| | | | 19,810 |
| Super Retail - 4.4% | | | |
| At Home Group, Inc. 4.875% 7/15/28 (b) | | 30,000 | 14,427 |
| Bath & Body Works, Inc.: | | | |
| 6.75% 7/1/36 | | 30,000 | 27,693 |
| 6.95% 3/1/33 | | 30,000 | 28,039 |
| Carvana Co.: | | | |
| 4.875% 9/1/29 (b) | | 65,000 | 38,792 |
| 9% 12/1/28 pay-in-kind (b) | | 9,000 | 7,740 |
| 9% 6/1/30 pay-in-kind (b) | | 14,000 | 12,040 |
| 9% 6/1/31 pay-in-kind (b) | | 17,000 | 14,620 |
| EG Global Finance PLC 6.75% 2/7/25 (b) | | 90,000 | 88,679 |
| LBM Acquisition LLC 6.25% 1/15/29 (b) | | 40,000 | 34,903 |
| Michaels Companies, Inc. 5.25% 5/1/28 (b) | | 70,000 | 58,363 |
| Nordstrom, Inc. 4.375% 4/1/30 | | 30,000 | 23,969 |
| Upbound Group, Inc. 6.375% 2/15/29 (b) | | 50,000 | 45,425 |
| | | | 394,690 |
| Technology - 11.4% | | | |
| Athenahealth Group, Inc. 6.5% 2/15/30 (b) | | 30,000 | 26,054 |
| Atkore, Inc. 4.25% 6/1/31 (b) | | 30,000 | 25,798 |
| Black Knight InfoServ LLC 3.625% 9/1/28 (b) | | 30,000 | 27,600 |
| Block, Inc. 3.5% 6/1/31 | | 107,000 | 87,736 |
| Cloud Software Group, Inc. 9% 9/30/29 (b) | | 20,000 | 17,878 |
| Coherent Corp. 5% 12/15/29 (b) | | 15,000 | 13,323 |
| CommScope, Inc. 4.75% 9/1/29 (b) | | 45,000 | 33,441 |
| Elastic NV 4.125% 7/15/29 (b) | | 55,000 | 47,280 |
| Entegris Escrow Corp. 5.95% 6/15/30 (b) | | 76,000 | 72,779 |
| Entegris, Inc. 3.625% 5/1/29 (b) | | 60,000 | 51,569 |
| Gen Digital, Inc.: | | | |
| 5% 4/15/25 (b) | | 55,000 | 53,916 |
| 7.125% 9/30/30 (b) | | 30,000 | 30,202 |
| Go Daddy Operating Co. LLC / GD Finance Co., Inc. 3.5% 3/1/29 (b) | | 160,000 | 137,527 |
| GrafTech Global Enterprises, Inc. 9.875% 12/15/28 (b) | | 5,000 | 4,875 |
| MicroStrategy, Inc. 6.125% 6/15/28 (b) | | 10,000 | 8,952 |
| NCR Corp.: | | | |
| 5.125% 4/15/29 (b) | | 20,000 | 18,189 |
| 6.125% 9/1/29 (b) | | 27,500 | 28,323 |
| ON Semiconductor Corp. 3.875% 9/1/28 (b) | | 15,000 | 13,353 |
| Open Text Corp.: | | | |
| 3.875% 2/15/28 (b) | | 30,000 | 26,698 |
| 3.875% 12/1/29 (b) | | 55,000 | 46,641 |
| Open Text Holdings, Inc.: | | | |
| 4.125% 2/15/30 (b) | | 10,000 | 8,617 |
| 4.125% 12/1/31 (b) | | 18,000 | 14,941 |
| Rackspace Hosting, Inc. 3.5% 2/15/28 (b) | | 15,000 | 7,120 |
| Seagate HDD Cayman: | | | |
| 4.125% 1/15/31 | | 20,000 | 16,335 |
| 4.75% 1/1/25 | | 35,000 | 34,282 |
| 5.75% 12/1/34 | | 15,000 | 13,284 |
| 8.25% 12/15/29 (b) | | 10,000 | 10,490 |
| Sensata Technologies BV: | | | |
| 4% 4/15/29 (b) | | 30,000 | 26,343 |
| 5% 10/1/25 (b) | | 35,000 | 34,111 |
| TTM Technologies, Inc. 4% 3/1/29 (b) | | 30,000 | 26,058 |
| Uber Technologies, Inc. 8% 11/1/26 (b) | | 20,000 | 20,364 |
| Virtusa Corp. 7.125% 12/15/28 (b) | | 40,000 | 32,750 |
| VM Consolidated, Inc. 5.5% 4/15/29 (b) | | 20,000 | 18,229 |
| | | | 1,035,058 |
| Telecommunications - 4.8% | | | |
| Altice Financing SA 5.75% 8/15/29 (b) | | 90,000 | 71,295 |
| Altice France Holding SA 6% 2/15/28 (b) | | 75,000 | 32,813 |
| Altice France SA 5.125% 7/15/29 (b) | | 35,000 | 24,741 |
| C&W Senior Financing Designated Activity Co. 6.875% 9/15/27 (b) | | 50,000 | 46,000 |
| Frontier Communications Holdings LLC 8.75% 5/15/30 (b) | | 25,000 | 24,298 |
| IHS Netherlands Holdco BV 8% 9/18/27 (b) | | 10,000 | 8,937 |
| Level 3 Financing, Inc. 3.75% 7/15/29 (b) | | 110,000 | 65,616 |
| Millicom International Cellular SA 4.5% 4/27/31 (b) | | 40,000 | 31,414 |
| SBA Communications Corp. 3.125% 2/1/29 | | 15,000 | 12,843 |
| Uniti Group, Inc. 6% 1/15/30 (b) | | 130,000 | 85,874 |
| Virgin Media Finance PLC 5% 7/15/30 (b) | | 30,000 | 24,339 |
| Zayo Group Holdings, Inc. 6.125% 3/1/28 (b) | | 15,000 | 9,750 |
| | | | 437,920 |
| Textiles/Apparel - 0.2% | | | |
| Crocs, Inc. 4.125% 8/15/31 (b) | | 10,000 | 7,925 |
| Victoria's Secret & Co. 4.625% 7/15/29 (b) | | 15,000 | 10,860 |
| | | | 18,785 |
| Transportation Ex Air/Rail - 0.3% | | | |
| Seaspan Corp. 5.5% 8/1/29 (b) | | 40,000 | 31,090 |
| Utilities - 1.3% | | | |
| DPL, Inc. 4.35% 4/15/29 | | 30,000 | 25,838 |
| PG&E Corp.: | | | |
| 5% 7/1/28 | | 50,000 | 45,995 |
| 5.25% 7/1/30 | | 25,000 | 22,211 |
| TerraForm Power Operating LLC 4.75% 1/15/30 (b) | | 30,000 | 25,710 |
| | | | 119,754 |
TOTAL NONCONVERTIBLE BONDS | | | 8,542,829 |
| TOTAL CORPORATE BONDS (Cost $9,158,660) | | | 8,695,872 |
| | | | |
| Common Stocks - 0.7% |
| | | Shares | Value ($) |
| Automotive & Auto Parts - 0.1% | | | |
| Aptiv PLC (e) | | 100 | 10,145 |
| Capital Goods - 0.2% | | | |
| Regal Rexnord Corp. | | 80 | 12,975 |
| Energy - 0.1% | | | |
| New Fortress Energy, Inc. | | 400 | 12,416 |
| Healthcare - 0.1% | | | |
| Centene Corp. (e) | | 205 | 12,638 |
| Technology - 0.2% | | | |
| Coherent Corp. (e) | | 380 | 14,299 |
| TOTAL COMMON STOCKS (Cost $62,888) | | | 62,473 |
| | | | |
| Bank Loan Obligations - 0.9% |
| | | Principal Amount (a) | Value ($) |
| Leisure - 0.2% | | | |
| ClubCorp Holdings, Inc. Tranche B 1LN, term loan 3 month U.S. LIBOR + 2.750% 8.2879% 9/18/24 (c)(d)(f) | | 24,934 | 24,573 |
| Services - 0.4% | | | |
| Ascend Learning LLC 2LN, term loan CME Term SOFR 1 Month Index + 5.750% 11.1811% 12/10/29 (c)(d)(f) | | 5,000 | 4,265 |
| Finastra U.S.A., Inc. Tranche 2LN, term loan 3 month U.S. LIBOR + 7.250% 12.981% 6/13/25 (c)(d)(f) | | 18,000 | 17,974 |
| Neptune BidCo U.S., Inc. Tranche B 1LN, term loan CME Term SOFR 1 Month Index + 5.000% 10.3985% 4/11/29 (c)(d)(f) | | 14,963 | 13,610 |
TOTAL SERVICES | | | 35,849 |
| Technology - 0.3% | | | |
| Ultimate Software Group, Inc.: | | | |
| 1LN, term loan 1 month U.S. LIBOR + 3.250% 8.6184% 5/3/26 (c)(d)(f) | | 19,949 | 19,926 |
| 2LN, term loan CME Term SOFR 3 Month Index + 5.250% 10.6184% 5/3/27 (c)(d)(f) | | 5,000 | 4,965 |
TOTAL TECHNOLOGY | | | 24,891 |
| TOTAL BANK LOAN OBLIGATIONS (Cost $81,491) | | | 85,313 |
| | | | |
| Preferred Securities - 0.7% |
| | | Principal Amount (a) | Value ($) |
| Air Transportation - 0.3% | | | |
| AerCap Holdings NV 5.875% 10/10/79 (c) | | 30,000 | 29,659 |
| Banks & Thrifts - 0.4% | | | |
| Ally Financial, Inc. 4.7% (c)(g) | | 50,000 | 35,231 |
| TOTAL PREFERRED SECURITIES (Cost $76,118) | | | 64,890 |
| | | | |
| Money Market Funds - 0.9% |
| | | Shares | Value ($) |
Fidelity Cash Central Fund 5.43% (h) (Cost $76,427) | | 76,411 | 76,427 |
| | | | |
| TOTAL INVESTMENT IN SECURITIES - 99.3% (Cost $9,455,584) | 8,984,975 |
NET OTHER ASSETS (LIABILITIES) - 0.7% | 61,258 |
| NET ASSETS - 100.0% | 9,046,233 |
| | |
Legend
| (a) | Amount is stated in United States dollars unless otherwise noted. |
| (b) | Security exempt from registration under Rule 144A of the Securities Act of 1933. These securities may be resold in transactions exempt from registration, normally to qualified institutional buyers. At the end of the period, the value of these securities amounted to $6,976,650 or 77.1% of net assets. |
| (c) | Coupon rates for floating and adjustable rate securities reflect the rates in effect at period end. |
| (d) | Coupon is indexed to a floating interest rate which may be multiplied by a specified factor and/or subject to caps or floors. |
| (f) | Remaining maturities of bank loan obligations may be less than the stated maturities shown as a result of contractual or optional prepayments by the borrower. Such prepayments cannot be predicted with certainty. |
| (g) | Security is perpetual in nature with no stated maturity date. |
| (h) | Affiliated fund that is generally available only to investment companies and other accounts managed by Fidelity Investments. The rate quoted is the annualized seven-day yield of the fund at period end. A complete unaudited listing of the fund's holdings as of its most recent quarter end is available upon request. In addition, each Fidelity Central Fund's financial statements, which are not covered by the Fund's Report of Independent Registered Public Accounting Firm, are available on the SEC's website or upon request. |
Affiliated Central Funds
Fiscal year to date information regarding the Fund's investments in Fidelity Central Funds, including the ownership percentage, is presented below.
| Affiliate | Value, beginning of period ($) | Purchases ($) | Sales Proceeds ($) | Dividend Income ($) | Realized Gain (loss) ($) | Change in Unrealized appreciation (depreciation) ($) | Value, end of period ($) | % ownership, end of period |
| Fidelity Cash Central Fund 5.43% | 299,904 | 1,891,622 | 2,115,099 | 5,622 | - | - | 76,427 | 0.0% |
| Total | 299,904 | 1,891,622 | 2,115,099 | 5,622 | - | - | 76,427 | |
| | | | | | | | | |
Amounts in the dividend income column in the above table include any capital gain distributions from underlying funds, which are presented in the corresponding line item in the Statement of Operations, if applicable.
Amounts included in the purchases and sales proceeds columns may include in-kind transactions, if applicable.
Investment Valuation
The following is a summary of the inputs used, as of August 31, 2023, involving the Fund's assets and liabilities carried at fair value. The inputs or methodology used for valuing securities may not be an indication of the risk associated with investing in those securities. For more information on valuation inputs, and their aggregation into the levels used below, please refer to the Investment Valuation section in the accompanying Notes to Financial Statements.
| Valuation Inputs at Reporting Date: |
| Description | Total ($) | Level 1 ($) | Level 2 ($) | Level 3 ($) |
Investments in Securities: | | | | |
|
| Equities: | | | | |
Consumer Discretionary | 10,145 | 10,145 | - | - |
Energy | 12,416 | 12,416 | - | - |
Health Care | 12,638 | 12,638 | - | - |
Industrials | 12,975 | 12,975 | - | - |
Information Technology | 14,299 | 14,299 | - | - |
|
| Corporate Bonds | 8,695,872 | - | 8,695,872 | - |
|
| Bank Loan Obligations | 85,313 | - | 85,313 | - |
|
| Preferred Securities | 64,890 | - | 64,890 | - |
|
| Money Market Funds | 76,427 | 76,427 | - | - |
| Total Investments in Securities: | 8,984,975 | 138,900 | 8,846,075 | - |
| Statement of Assets and Liabilities |
| | | | August 31, 2023 |
| | | | | |
| Assets | | | | |
| Investment in securities, at value - See accompanying schedule: | | | | |
Unaffiliated issuers (cost $9,379,157) | $ | 8,908,548 | | |
Fidelity Central Funds (cost $76,427) | | 76,427 | | |
| | | | | |
| | | | | |
| Total Investment in Securities (cost $9,455,584) | | | $ | 8,984,975 |
| Dividends receivable | | | | 35 |
| Interest receivable | | | | 141,399 |
| Distributions receivable from Fidelity Central Funds | | | | 454 |
Total assets | | | | 9,126,863 |
| Liabilities | | | | |
| Payable for investments purchased | $ | 23,487 | | |
| Distributions payable | | 53,000 | | |
| Accrued management fee | | 4,143 | | |
| Total Liabilities | | | | 80,630 |
| Net Assets | | | $ | 9,046,233 |
| Net Assets consist of: | | | | |
| Paid in capital | | | $ | 10,029,341 |
| Total accumulated earnings (loss) | | | | (983,108) |
| Net Assets | | | $ | 9,046,233 |
Net Asset Value, offering price and redemption price per share ($9,046,233 ÷ 200,000 shares) | | | $ | 45.23 |
| Statement of Operations |
| | | | Year ended August 31, 2023 |
| Investment Income | | | | |
| Dividends | | | $ | 5,378 |
| Interest | | | | 647,133 |
| Income from Fidelity Central Funds | | | | 5,622 |
| Total Income | | | | 658,133 |
| Expenses | | | | |
| Management fee | $ | 49,401 | | |
| Independent trustees' fees and expenses | | 44 | | |
| Total expenses before reductions | | 49,445 | | |
| Expense reductions | | (353) | | |
| Total expenses after reductions | | | | 49,092 |
| Net Investment income (loss) | | | | 609,041 |
| Realized and Unrealized Gain (Loss) | | | | |
| Net realized gain (loss) on: | | | | |
| Investment Securities: | | | | |
| Unaffiliated issuers | | (359,381) | | |
| Total net realized gain (loss) | | | | (359,381) |
| Change in net unrealized appreciation (depreciation) on investment securities | | | | 341,668 |
| Net gain (loss) | | | | (17,713) |
| Net increase (decrease) in net assets resulting from operations | | | $ | 591,328 |
| Statement of Changes in Net Assets |
| |
| | Year ended August 31, 2023 | | For the period February 15, 2022 (commencement of operations) through August 31, 2022 |
| Increase (Decrease) in Net Assets | | | | |
| Operations | | | | |
| Net investment income (loss) | $ | 609,041 | $ | 280,716 |
| Net realized gain (loss) | | (359,381) | | (169,092) |
| Change in net unrealized appreciation (depreciation) | | 341,668 | | (812,277) |
| Net increase (decrease) in net assets resulting from operations | | 591,328 | | (700,653) |
| Distributions to shareholders | | (596,600) | | (277,200) |
| | | | | |
| Share transactions | | | | |
| Proceeds from sales of shares | | - | | 10,029,358 |
| | | | | |
Net increase (decrease) in net assets resulting from share transactions | | - | | 10,029,358 |
| Total increase (decrease) in net assets | | (5,272) | | 9,051,505 |
| | | | | |
| Net Assets | | | | |
| Beginning of period | | 9,051,505 | | - |
| End of period | $ | 9,046,233 | $ | 9,051,505 |
| | | | | |
| Other Information | | | | |
| Shares | | | | |
| Sold | | - | | 200,000 |
| Net increase (decrease) | | - | | 200,000 |
| | | | | |
Financial Highlights
| Fidelity® Sustainable High Yield ETF |
| |
| Years ended August 31, | | 2023 | | 2022 A |
Selected Per-Share Data | | | | |
| Net asset value, beginning of period | $ | 45.26 | $ | 50.00 |
| Income from Investment Operations | | | | |
Net investment income (loss) B,C | | 3.045 | | 1.404 |
| Net realized and unrealized gain (loss) | | (.092) | | (4.758) |
| Total from investment operations | | 2.953 | | (3.354) |
| Distributions from net investment income | | (2.983) | | (1.386) |
| Total distributions | | (2.983) | | (1.386) |
| Net asset value, end of period | $ | 45.23 | $ | 45.26 |
Total Return D,E,F | | 6.83% | | (6.78)% |
Ratios to Average Net Assets C,G,H | | | | |
| Expenses before reductions | | .55% | | .55% I |
| Expenses net of fee waivers, if any | | .55% | | .55% I |
| Expenses net of all reductions | | .55% | | .55% I |
| Net investment income (loss) | | 6.78% | | 5.49% I |
| Supplemental Data | | | | |
| Net assets, end of period (000 omitted) | $ | 9,046 | $ | 9,052 |
Portfolio turnover rate J | | 48% | | 24% K |
AFor the period February 15, 2022 (commencement of operations) through August 31, 2022.
BCalculated based on average shares outstanding during the period.
CNet investment income (loss) is affected by the timing of the declaration of dividends by any underlying mutual funds or exchange-traded funds (ETFs). Net investment income (loss) of any mutual funds or ETFs is not included in the Fund's net investment income (loss) ratio.
DTotal returns would have been lower if certain expenses had not been reduced during the applicable periods shown.
EBased on net asset value.
FTotal returns for periods of less than one year are not annualized.
GFees and expenses of any underlying mutual funds or exchange-traded funds (ETFs) are not included in the Fund's expense ratio. The Fund indirectly bears its proportionate share of these expenses. For additional expense information related to investments in Fidelity Central Funds, please refer to the "Investments in Fidelity Central Funds" note found in the Notes to Financial Statements section of the most recent Annual or Semi-Annual report.
HExpense ratios reflect operating expenses of the class. Expenses before reductions do not reflect amounts reimbursed, waived, or reduced through arrangements with the investment adviser, brokerage services, or other offset arrangements, if applicable, and do not represent the amount paid by the class during periods when reimbursements, waivers or reductions occur.
IAnnualized.
JAmount does not include the portfolio activity of any underlying mutual funds or exchange-traded funds (ETFs).
KAmount not annualized.
For the period ended August 31, 2023
1. Organization.
Fidelity Sustainable High Yield ETF (the Fund) is an exchange-traded fund of Fidelity Covington Trust (the Trust) and is authorized to issue an unlimited number of shares. The Trust is registered under the Investment Company Act of 1940, as amended (the 1940 Act), as an open-end management investment company organized as a Massachusetts business trust.
2. Investments in Fidelity Central Funds.
Funds may invest in Fidelity Central Funds, which are open-end investment companies generally available only to other investment companies and accounts managed by the investment adviser and its affiliates. The Schedule of Investments lists any Fidelity Central Funds held as an investment as of period end, but does not include the underlying holdings of each Fidelity Central Fund. An investing fund indirectly bears its proportionate share of the expenses of the underlying Fidelity Central Funds.
Based on its investment objective, each Fidelity Central Fund may invest or participate in various investment vehicles or strategies that are similar to those of the investing fund. These strategies are consistent with the investment objectives of the investing fund and may involve certain economic risks which may cause a decline in value of each of the Fidelity Central Funds and thus a decline in the value of the investing fund.
| Fidelity Central Fund | Investment Manager | Investment Objective | Investment Practices | Expense RatioA |
| Fidelity Money Market Central Funds | Fidelity Management & Research Company LLC (FMR) | Each fund seeks to obtain a high level of current income consistent with the preservation of capital and liquidity. | Short-term Investments | Less than .005% |
A Expenses expressed as a percentage of average net assets and are as of each underlying Central Fund's most recent annual or semi-annual shareholder report.
A complete unaudited list of holdings for each Fidelity Central Fund is available upon request or at the Securities and Exchange Commission website at www.sec.gov. In addition, the financial statements of the Fidelity Central Funds which contain the significant accounting policies (including investment valuation policies) of those funds, and are not covered by the Report of Independent Registered Public Accounting Firm, are available on the Securities and Exchange Commission website or upon request.
3. Significant Accounting Policies.
The Fund is an investment company and applies the accounting and reporting guidance of the Financial Accounting Standards Board (FASB) Accounting Standards Codification Topic 946 Financial Services - Investment Companies. The financial statements have been prepared in conformity with accounting principles generally accepted in the United States of America (GAAP), which require management to make certain estimates and assumptions at the date of the financial statements. Actual results could differ from those estimates. Subsequent events, if any, through the date that the financial statements were issued have been evaluated in the preparation of the financial statements. The Fund's Schedule of Investments lists any underlying mutual funds or exchange-traded funds (ETFs) but does not include the underlying holdings of these funds. The following summarizes the significant accounting policies of the Fund:
Investment Valuation. Investments are valued as of 4:00 p.m. Eastern time on the last calendar day of the period. The Board of Trustees (the Board) has designated the Fund's investment adviser as the valuation designee responsible for the fair valuation function and performing fair value determinations as needed. The investment adviser has established a Fair Value Committee (the Committee) to carry out the day-to-day fair valuation responsibilities and has adopted policies and procedures to govern the fair valuation process and the activities of the Committee. In accordance with these fair valuation policies and procedures, which have been approved by the Board, the Fund attempts to obtain prices from one or more third party pricing services or brokers to value its investments. When current market prices, quotations or currency exchange rates are not readily available or reliable, investments will be fair valued in good faith by the Committee, in accordance with the policies and procedures. Factors used in determining fair value vary by investment type and may include market or investment specific events, transaction data, estimated cash flows, and market observations of comparable investments. The frequency that the fair valuation procedures are used cannot be predicted and they may be utilized to a significant extent. The Committee manages the Fund's fair valuation practices and maintains the fair valuation policies and procedures. The Fund's investment adviser reports to the Board information regarding the fair valuation process and related material matters.
The Fund categorizes the inputs to valuation techniques used to value its investments into a disclosure hierarchy consisting of three levels as shown below:
Level 1 - unadjusted quoted prices in active markets for identical investments
Level 2 - other significant observable inputs (including quoted prices for similar investments, interest rates, prepayment speeds, etc.)
Level 3 - unobservable inputs (including the Fund's own assumptions based on the best information available)
Valuation techniques used to value the Fund's investments by major category are as follows:
Debt securities, including restricted securities, are valued based on evaluated prices received from third party pricing services or from brokers who make markets in such securities. Corporate bonds, bank loan obligations and preferred securities are valued by pricing services who utilize matrix pricing which considers yield or price of bonds of comparable quality, coupon, maturity and type or by broker-supplied prices. When independent prices are unavailable or unreliable, debt securities may be valued utilizing pricing methodologies which consider similar factors that would be used by third party pricing services. For foreign debt securities, when significant market or security specific events arise, valuations may be determined in good faith in accordance with procedures adopted by the Board. Debt securities are generally categorized as Level 2 in the hierarchy but may be Level 3 depending on the circumstances. The Fund invests a significant portion of its assets in below investment grade securities. The value of these securities can be more volatile due to changes in the credit quality of the issuer and is sensitive to changes in economic, market and regulatory conditions.
Equity securities, including restricted securities, for which market quotations are readily available, are valued at the last reported sale price or official closing price as reported by a third party pricing service on the primary market or exchange on which they are traded and are categorized as Level 1 in the hierarchy. In the event there were no sales during the day or closing prices are not available, securities are valued at the last quoted bid price or may be valued using the last available price and are generally categorized as Level 2 in the hierarchy. For foreign equity securities, when market or security specific events arise, comparisons to the valuation of American Depositary Receipts (ADRs), futures contracts, ETFs and certain indexes as well as quoted prices for similar securities may be used and would be categorized as Level 2 in the hierarchy. For equity securities, including restricted securities, where observable inputs are limited, assumptions about market activity and risk are used and these securities may be categorized as Level 3 in the hierarchy.
Investments in open-end mutual funds, including the Fidelity Central Funds, are valued at their closing net asset value (NAV) each business day and are categorized as Level 1 in the hierarchy.
Changes in valuation techniques may result in transfers in or out of an assigned level within the disclosure hierarchy. The aggregate value of investments by input level as of August 31, 2023 is included at the end of the Fund's Schedule of Investments.
Investment Transactions and Income. For financial reporting purposes and for processing shareholder transactions, the Fund's investment holdings and NAV include trades executed through the end of the last business day of the period and prior business day, respectively. The NAV per share for processing shareholder transactions is calculated as of the close of business (normally 4:00 p.m. Eastern time) of the New York Stock Exchange, Archipelago Exchange (NYSE Arca). Gains and losses on securities sold are determined on the basis of identified cost. Dividend income is recorded on the ex-dividend date, except for certain dividends from foreign securities where the ex-dividend date may have passed, which are recorded as soon as the Fund is informed of the ex-dividend date. Non-cash dividends included in dividend income, if any, are recorded at the fair market value of the securities received. Income and capital gain distributions from Fidelity Central Funds, if any, are recorded on the ex-dividend date. Interest income is accrued as earned and includes coupon interest and amortization of premium and accretion of discount on debt securities as applicable. Debt obligations may be placed on non-accrual status and related interest income may be reduced by ceasing current accruals and writing off interest receivables when the collection of all or a portion of interest has become doubtful based on consistently applied procedures. A debt obligation is removed from non-accrual status when the issuer resumes interest payments or when collectability of interest is reasonably assured.
Expenses. Expenses directly attributable to a fund are charged to that fund. Expenses attributable to more than one fund are allocated among the respective funds on the basis of relative net assets or other appropriate methods. Expenses included in the accompanying financial statements reflect the expenses of that fund and do not include any expenses associated with any underlying mutual funds or exchange-traded funds. Although not included in a fund's expenses, a fund indirectly bears its proportionate share of these expenses through the net asset value of each underlying mutual fund or exchange-traded fund. Expense estimates are accrued in the period to which they relate and adjustments are made when actual amounts are known.
Income Tax Information and Distributions to Shareholders. Each year, the Fund intends to qualify as a regulated investment company under Subchapter M of the Internal Revenue Code, including distributing substantially all of its taxable income and realized gains. As a result, no provision for U.S. Federal income taxes is required. As of August 31, 2023, the Fund did not have any unrecognized tax benefits in the financial statements; nor is the Fund aware of any tax positions for which it is reasonably possible that the total amounts of unrecognized tax benefits will significantly change in the next twelve months. The Fund files a U.S. federal tax return, in addition to state and local tax returns as required. The Fund's federal income tax returns are subject to examination by the Internal Revenue Service (IRS) for a period of three fiscal years after they are filed. State and local tax returns may be subject to examination for an additional fiscal year depending on the jurisdiction.
Distributions are declared and recorded on the ex-dividend date. Income and capital gain distributions are determined in accordance with income tax regulations, which may differ from GAAP.
Capital accounts within the financial statements are adjusted for permanent book-tax differences. These adjustments have no impact on net assets or the results of operations. Capital accounts are not adjusted for temporary book-tax differences which will reverse in a subsequent period.
Book-tax differences are primarily due to prior period premium and discount on debt securities, capital loss carryforwards and losses deferred due to wash sales.
As of period end, the cost and unrealized appreciation (depreciation) in securities, and derivatives if applicable, for federal income tax purposes were as follows:
| Gross unrealized appreciation | $156,196 |
| Gross unrealized depreciation | (627,881) |
| Net unrealized appreciation (depreciation) | $(471,685) |
| Tax Cost | $9,456,660 |
The tax-based components of distributable earnings as of period end were as follows:
| Undistributed ordinary income | $15,457 |
| Capital loss carryforward | $(526,881) |
| Net unrealized appreciation (depreciation) on securities and other investments | $(471,685) |
Capital loss carryforwards are only available to offset future capital gains of the Fund to the extent provided by regulations and may be limited. The capital loss carryforward information presented below, including any applicable limitation, is estimated as of fiscal period end and is subject to adjustment.
Short-term | $(352,215) |
Long-term | (174,666) |
| Total capital loss carryforward | $(526,881) |
The tax character of distributions paid was as follows:
| | August 31, 2023 | August 31, 2022 |
| Ordinary Income | $596,600 | $277,200 |
Restricted Securities (including Private Placements). Funds may invest in securities that are subject to legal or contractual restrictions on resale. These securities generally may be resold in transactions exempt from registration or to the public if the securities are registered. Disposal of these securities may involve time-consuming negotiations and expense, and prompt sale at an acceptable price may be difficult. Information regarding restricted securities held at period end is included at the end of the Schedule of Investments, if applicable.
Loans and Other Direct Debt Instruments. Direct debt instruments are interests in amounts owed to lenders by corporate or other borrowers. These instruments may be in the form of loans, trade claims or other receivables and may include standby financing commitments such as revolving credit facilities that obligate a fund to supply additional cash to the borrower on demand. Loans may be acquired through assignment, participation, or may be made directly to a borrower. Such instruments are presented in the Bank Loan Obligations section in the Schedule of Investments. Certain funds may also invest in unfunded loan commitments, which are contractual obligations for future funding. Information regarding unfunded commitments is included at the end of the Schedule of Investments, if applicable.
4. Purchases and Sales of Investments.
Purchases and sales of securities, other than short-term securities and in-kind transactions, as applicable, are noted in the table below.
| | Purchases ($) | Sales ($) |
| Fidelity Sustainable High Yield ETF | 4,308,412 | 4,155,925 |
5. Fees and Other Transactions with Affiliates.
Management Fee. Fidelity Management & Research Company LLC (the investment adviser) provides the Fund with investment management related services for which the Funds pay a monthly management fee that is based on an annual rate of .55% of average net assets. Under the management contract, the investment adviser pays all other expenses, except the compensation of the independent Trustees and certain miscellaneous expenses such as proxy and shareholders meeting expenses.
Interfund Trades. Funds may purchase from or sell securities to other Fidelity Funds under procedures adopted by the Board. The procedures have been designed to ensure these interfund trades are executed in accordance with Rule 17a-7 of the 1940 Act. Any interfund trades are included within the respective purchases and sales amounts shown in the Purchases and Sales of Investments note. Interfund trades during the period are noted in the table below.
| | Purchases ($) | Sales ($) | Realized Gain (Loss) ($) |
| Fidelity Sustainable High Yield ETF | 9,020 | - | - |
6. Expense Reductions.
Through arrangements with the Fund's custodian, credits realized as a result of certain uninvested cash balances were used to reduce the Fund's expenses by $353.
7. Share Transactions.
Funds issue and redeem shares at NAV only with certain authorized participants in large increments known as Creation Units. Purchases of Creation Units are made by tendering a basket of designated securities and/or cash to a fund and redemption proceeds are paid with a basket of securities from a fund's portfolio with a balancing cash component to equate the market value of the basket of securities delivered or redeemed to the NAV per Creation Unit on the transaction date. Cash may be substituted equivalent to the value of certain securities generally when they are not available in sufficient quantity for delivery. A fund's shares are available in smaller increments to investors in the secondary market at market prices and may be subject to commissions. Authorized participants pay a transaction fee to the shareholder servicing agent when purchasing and redeeming Creation Units of a fund. The transaction fee is used to offset the costs associated with the issuance and redemption of Creation Units.
8. Other.
A fund's organizational documents provide former and current trustees and officers with a limited indemnification against liabilities arising in connection with the performance of their duties to the fund. In the normal course of business, a fund may also enter into contracts that provide general indemnifications. A fund's maximum exposure under these arrangements is unknown as this would be dependent on future claims that may be made against a fund. The risk of material loss from such claims is considered remote.
9. Risk and Uncertainties.
Many factors affect a fund's performance. Developments that disrupt global economies and financial markets, such as pandemics, epidemics, outbreaks of infectious diseases, war, terrorism, and environmental disasters, may significantly affect a fund's investment performance. The effects of these developments to a fund will be impacted by the types of securities in which a fund invests, the financial condition, industry, economic sector, and geographic location of an issuer, and a fund's level of investment in the securities of that issuer. Significant concentrations in security types, issuers, industries, sectors, and geographic locations may magnify the factors that affect a fund's performance.
To the Board of Trustees of Fidelity Covington Trust and Shareholders of Fidelity Sustainable High Yield ETF
Opinion on the Financial Statements
We have audited the accompanying statement of assets and liabilities, including the schedule of investments, of Fidelity Sustainable High Yield ETF (one of the funds constituting Fidelity Covington Trust, referred to hereafter as the "Fund") as of August 31, 2023, the related statement of operations for the year ended August 31, 2023, and the statement of changes in net assets and the financial highlights for the year ended August 31, 2023 and for the period February 15, 2022 (commencement of operations) through August 31, 2022, including the related notes (collectively referred to as the "financial statements"). In our opinion, the financial statements present fairly, in all material respects, the financial position of the Fund as of August 31, 2023, the results of its operations for the year then ended, and the changes in its net assets and the financial highlights for the year ended August 31, 2023 and for the period February 15, 2022 (commencement of operations) through August 31, 2022 in conformity with accounting principles generally accepted in the United States of America.
Basis for Opinion
These financial statements are the responsibility of the Fund's management. Our responsibility is to express an opinion on the Fund's financial statements based on our audits. We are a public accounting firm registered with the Public Company Accounting Oversight Board (United States) (PCAOB) and are required to be independent with respect to the Fund in accordance with the U.S. federal securities laws and the applicable rules and regulations of the Securities and Exchange Commission and the PCAOB.
We conducted our audits of these financial statements in accordance with the standards of the PCAOB. Those standards require that we plan and perform the audit to obtain reasonable assurance about whether the financial statements are free of material misstatement, whether due to error or fraud.
Our audits included performing procedures to assess the risks of material misstatement of the financial statements, whether due to error or fraud, and performing procedures that respond to those risks. Such procedures included examining, on a test basis, evidence regarding the amounts and disclosures in the financial statements. Our audits also included evaluating the accounting principles used and significant estimates made by management, as well as evaluating the overall presentation of the financial statements. Our procedures included confirmation of securities owned as of August 31, 2023 by correspondence with the custodian, agent banks and brokers; when replies were not received from brokers, we performed other auditing procedures. We believe that our audits provide a reasonable basis for our opinion.
/s/ PricewaterhouseCoopers LLP
Boston, Massachusetts
October 16, 2023
We have served as the auditor of one or more investment companies in the Fidelity group of funds since 1932.
The Trustees, Members of the Advisory Board (if any), and officers of the trust and fund, as applicable, are listed below. The Board of Trustees governs the fund and is responsible for protecting the interests of shareholders. The Trustees are experienced executives who meet periodically throughout the year to oversee the fund's activities, review contractual arrangements with companies that provide services to the fund, oversee management of the risks associated with such activities and contractual arrangements, and review the fund's performance. Except for Vijay Advani, each of the Trustees oversees 322 funds. Mr. Advani oversees 215 funds.
The Trustees hold office without limit in time except that (a) any Trustee may resign; (b) any Trustee may be removed by written instrument, signed by at least two-thirds of the number of Trustees prior to such removal; (c) any Trustee who requests to be retired or who has become incapacitated by illness or injury may be retired by written instrument signed by a majority of the other Trustees; and (d) any Trustee may be removed at any special meeting of shareholders by a two-thirds vote of the outstanding voting securities of the trust. Each Trustee who is not an interested person (as defined in the 1940 Act) of the trust and the fund is referred to herein as an Independent Trustee. Each Independent Trustee shall retire not later than the last day of the calendar year in which his or her 75th birthday occurs. The Independent Trustees may waive this mandatory retirement age policy with respect to individual Trustees. Officers and Advisory Board Members hold office without limit in time, except that any officer or Advisory Board Member may resign or may be removed by a vote of a majority of the Trustees at any regular meeting or any special meeting of the Trustees. Except as indicated, each individual has held the office shown or other offices in the same company for the past five years.
The fund's Statement of Additional Information (SAI) includes more information about the Trustees. To request a free copy, call Fidelity at 1-800-FIDELITY.
Experience, Skills, Attributes, and Qualifications of the Trustees. The Governance and Nominating Committee has adopted a statement of policy that describes the experience, qualifications, attributes, and skills that are necessary and desirable for potential Independent Trustee candidates (Statement of Policy). The Board believes that each Trustee satisfied at the time he or she was initially elected or appointed a Trustee, and continues to satisfy, the standards contemplated by the Statement of Policy. The Governance and Nominating Committee also engages professional search firms to help identify potential Independent Trustee candidates who have the experience, qualifications, attributes, and skills consistent with the Statement of Policy. From time to time, additional criteria based on the composition and skills of the current Independent Trustees, as well as experience or skills that may be appropriate in light of future changes to board composition, business conditions, and regulatory or other developments, have also been considered by the professional search firms and the Governance and Nominating Committee. In addition, the Board takes into account the Trustees' commitment and participation in Board and committee meetings, as well as their leadership of standing and ad hoc committees throughout their tenure.
In determining that a particular Trustee was and continues to be qualified to serve as a Trustee, the Board has considered a variety of criteria, none of which, in isolation, was controlling. The Board believes that, collectively, the Trustees have balanced and diverse experience, qualifications, attributes, and skills, which allow the Board to operate effectively in governing the fund and protecting the interests of shareholders. Information about the specific experience, skills, attributes, and qualifications of each Trustee, which in each case led to the Board's conclusion that the Trustee should serve (or continue to serve) as a trustee of the fund, is provided below.
Board Structure and Oversight Function. Robert A. Lawrence is an interested person and currently serves as Chair. The Trustees have determined that an interested Chair is appropriate and benefits shareholders because an interested Chair has a personal and professional stake in the quality and continuity of services provided to the fund. Independent Trustees exercise their informed business judgment to appoint an individual of their choosing to serve as Chair, regardless of whether the Trustee happens to be independent or a member of management. The Independent Trustees have determined that they can act independently and effectively without having an Independent Trustee serve as Chair and that a key structural component for assuring that they are in a position to do so is for the Independent Trustees to constitute a substantial majority for the Board. The Independent Trustees also regularly meet in executive session. David M. Thomas serves as Lead Independent Trustee and as such (i) acts as a liaison between the Independent Trustees and management with respect to matters important to the Independent Trustees and (ii) with management prepares agendas for Board meetings.
Fidelity® funds are overseen by different Boards of Trustees. The fund's Board oversees Fidelity's high income and certain equity funds, and other Boards oversee Fidelity's alternative investment, investment-grade bond, money market, asset allocation, and other equity funds. The asset allocation funds may invest in Fidelity® funds overseen by the fund's Board. The use of separate Boards, each with its own committee structure, allows the Trustees of each group of Fidelity® funds to focus on the unique issues of the funds they oversee, including common research, investment, and operational issues. On occasion, the separate Boards establish joint committees to address issues of overlapping consequences for the Fidelity® funds overseen by each Board.
The Trustees operate using a system of committees to facilitate the timely and efficient consideration of all matters of importance to the Trustees, the fund, and fund shareholders and to facilitate compliance with legal and regulatory requirements and oversight of the fund's activities and associated risks. The Board, acting through its committees, has charged FMR and its affiliates with (i) identifying events or circumstances the occurrence of which could have demonstrably adverse effects on the fund's business and/or reputation; (ii) implementing processes and controls to lessen the possibility that such events or circumstances occur or to mitigate the effects of such events or circumstances if they do occur; and (iii) creating and maintaining a system designed to evaluate continuously business and market conditions in order to facilitate the identification and implementation processes described in (i) and (ii) above. Because the day-to-day operations and activities of the fund are carried out by or through FMR, its affiliates, and other service providers, the fund's exposure to risks is mitigated but not eliminated by the processes overseen by the Trustees. While each of the Board's committees has responsibility for overseeing different aspects of the fund's activities, oversight is exercised primarily through the Operations, Audit, and Compliance Committees. Appropriate personnel, including but not limited to the fund's Chief Compliance Officer (CCO), FMR's internal auditor, the independent accountants, the fund's Treasurer and portfolio management personnel, make periodic reports to the Board's committees, as appropriate, including an annual review of Fidelity's risk management program for the Fidelity® funds. The responsibilities of each standing committee, including their oversight responsibilities, are described further under "Standing Committees of the Trustees."
Interested Trustees*:
Correspondence intended for a Trustee who is an interested person may be sent to Fidelity Investments, 245 Summer Street, Boston, Massachusetts 02210.
Name, Year of Birth; Principal Occupations and Other Relevant Experience+
Bettina Doulton (1964)
Year of Election or Appointment: 2020
Trustee
Ms. Doulton also serves as Trustee of other Fidelity® funds. Prior to her retirement, Ms. Doulton served in a variety of positions at Fidelity Investments, including as a managing director of research (2006-2007), portfolio manager to certain Fidelity® funds (1993-2005), equity analyst and portfolio assistant (1990-1993), and research assistant (1987-1990). Ms. Doulton currently owns and operates Phi Builders + Architects and Cellardoor Winery. Previously, Ms. Doulton served as a member of the Board of Brown Capital Management, LLC (2014-2018).
Robert A. Lawrence (1952)
Year of Election or Appointment: 2020
Trustee
Chair of the Board of Trustees
Mr. Lawrence also serves as Trustee of other funds. Previously, Mr. Lawrence served as a Trustee and Member of the Advisory Board of certain funds. Prior to his retirement in 2008, Mr. Lawrence served as Vice President of certain Fidelity® funds (2006-2008), Senior Vice President, Head of High Income Division of Fidelity Management & Research Company (investment adviser firm, 2006-2008), and President of Fidelity Strategic Investments (investment adviser firm, 2002-2005).
* Determined to be an "Interested Trustee" by virtue of, among other things, his or her affiliation with the trust or various entities under common control with FMR.
+ The information includes the Trustee's principal occupation during the last five years and other information relating to the experience, attributes, and skills relevant to the Trustee's qualifications to serve as a Trustee, which led to the conclusion that the Trustee should serve as a Trustee for the fund.
Independent Trustees:
Correspondence intended for an Independent Trustee may be sent to Fidelity Investments, P.O. Box 55235, Boston, Massachusetts 02205-5235.
Name, Year of Birth; Principal Occupations and Other Relevant Experience+
Vijay C. Advani (1960)
Year of Election or Appointment: 2023
Trustee
Mr. Advani also serves as Trustee or Member of the Advisory Board of other funds. Previously, Mr. Advani served as Executive Chairman (2020-2022), Chief Executive Officer (2017-2020) and Chief Operating Officer (2016-2017) of Nuveen (global investment manager). He also served in various capacities at Franklin Resources (global investment manager), including Co-President (2015-2016), Executive Vice President, Global Advisory Services (2008-2015), Head of Global Retail Distribution (2005-2008), Executive Managing Director, International Retail Development (2002-2005), Managing Director, Product Developments, Sales & Marketing, Asia, Eastern Europe and Africa (2000-2002) and President, Templeton Asset Management India (1995-2000). Mr. Advani also served as Senior Investment Officer of International Finance Corporation (private equity and venture capital arm of The World Bank, 1984-1995). Mr. Advani is Chairman Emeritus of the U.S. India Business Council (2018-present), a Director of The Global Impact Investing Network (2019-present), a Director of LOK Capital (Mauritius) (2022-present), a member of the Advisory Council of LOK Capital (2022-present), a Senior Advisor of Neuberger Berman (2021-present), a Senior Advisor of Seviora Holdings Pte. Ltd (Temasek-Singapore) (2021-present), a Director of Seviora Capital (Singapore) (2021-present) and an Advisor of EQUIAM (2021-present). Mr. Advani formerly served as a member of the Board of BowX Acquisition Corp. (special purpose acquisition company, 2020-2021), a member of the Board of Intellecap (advisory arm of The Aavishkaar Group, 2018-2020), a member of the Board of Nuveen Investments, Inc. (2017-2020) and a member of the Board of Docusign (software, 2016-2019).
Thomas P. Bostick (1956)
Year of Election or Appointment: 2021
Trustee
Lieutenant General Bostick also serves as Trustee of other Fidelity® funds. Prior to his retirement, General Bostick (United States Army, Retired) held a variety of positions within the U.S. Army, including Commanding General and Chief of Engineers, U.S. Army Corps of Engineers (2012-2016) and Deputy Chief of Staff and Director of Human Resources, U.S. Army (2009-2012). General Bostick currently serves as a member of the Board and Finance and Governance & Sustainability Committees of CSX Corporation (transportation, 2020-present) and a member of the Board and Corporate Governance and Nominating Committee of Perma-Fix Environmental Services, Inc. (nuclear waste management, 2020-present). General Bostick serves as Chief Executive Officer of Bostick Global Strategies, LLC (consulting, 2016-present), as a member of the Board of HireVue, Inc. (video interview and assessment, 2020-present), as a member of the Board of Allonnia (biotechnology and engineering solutions, 2022-present) and on the Advisory Board of Solugen, Inc. (specialty bio-based chemicals manufacturer, 2022-present). Previously, General Bostick served as a Member of the Advisory Board of certain Fidelity® funds (2021), President, Intrexon Bioengineering (2018-2020) and Chief Operating Officer (2017-2020) and Senior Vice President of the Environment Sector (2016-2017) of Intrexon Corporation (biopharmaceutical company).
Dennis J. Dirks (1948)
Year of Election or Appointment: 2018
Trustee
Mr. Dirks also serves as Trustee of other Fidelity® funds. Prior to his retirement in May 2003, Mr. Dirks served as Chief Operating Officer and as a member of the Board of The Depository Trust & Clearing Corporation (financial markets infrastructure), President, Chief Operating Officer and a member of the Board of The Depository Trust Company (DTC), President and a member of the Board of the National Securities Clearing Corporation (NSCC), Chief Executive Officer and a member of the Board of the Government Securities Clearing Corporation and Chief Executive Officer and a member of the Board of the Mortgage-Backed Securities Clearing Corporation. Mr. Dirks currently serves as a member of the Finance Committee (2016-present) and Board (2017-present) and is Treasurer (2018-present) of the Asolo Repertory Theatre.
Donald F. Donahue (1950)
Year of Election or Appointment: 2018
Trustee
Mr. Donahue also serves as Trustee of other Fidelity® funds. Mr. Donahue serves as President and Chief Executive Officer of Miranda Partners, LLC (risk consulting for the financial services industry, 2012-present). Previously, Mr. Donahue served as Chief Executive Officer (2006-2012), Chief Operating Officer (2003-2006) and Managing Director, Customer Marketing and Development (1999-2003) of The Depository Trust & Clearing Corporation (financial markets infrastructure). Mr. Donahue currently serves as a member (2007-present) and Co-Chairman (2016-present) of the Board of United Way of New York. Mr. Donahue previously served as a member of the Advisory Board of certain Fidelity® funds (2015-2018) and as a member of the Board of The Leadership Academy (previously NYC Leadership Academy) (2012-2022).
Vicki L. Fuller (1957)
Year of Election or Appointment: 2020
Trustee
Ms. Fuller also serves as Trustee of other Fidelity® funds. Previously, Ms. Fuller served as a member of the Advisory Board of certain Fidelity® funds (2018-2020), Chief Investment Officer of the New York State Common Retirement Fund (2012-2018) and held a variety of positions at AllianceBernstein L.P. (global asset management, 1985-2012), including Managing Director (2006-2012) and Senior Vice President and Senior Portfolio Manager (2001-2006). Ms. Fuller currently serves as a member of the Board, Audit Committee and Nominating and Governance Committee of two Blackstone business development companies (2020-present), as a member of the Board of Treliant, LLC (consulting, 2019-present), as a member of the Board of Ariel Alternatives, LLC (private equity, 2022-present) and as a member of the Board and Chair of the Audit Committee of Gusto, Inc. (software, 2021-present). In addition, Ms. Fuller currently serves as a member of the Board of Roosevelt University (2019-present) and as a member of the Executive Board of New York University's Stern School of Business. Ms. Fuller previously served as a member of the Board, Audit Committee and Nominating and Governance Committee of The Williams Companies, Inc. (natural gas infrastructure, 2018-2021).
Patricia L. Kampling (1959)
Year of Election or Appointment: 2020
Trustee
Ms. Kampling also serves as Trustee of other Fidelity® funds. Prior to her retirement, Ms. Kampling served as Chairman of the Board and Chief Executive Officer (2012-2019), President and Chief Operating Officer (2011-2012) and Executive Vice President and Chief Financial Officer (2010-2011) of Alliant Energy Corporation. Ms. Kampling currently serves as a member of the Board, Finance Committee and Governance, Compensation and Nominating Committee of Xcel Energy Inc. (utilities company, 2020-present) and as a member of the Board, Audit, Finance and Risk Committee and Safety, Environmental, Technology and Operations Committee and Chair of the Executive Development and Compensation Committee of American Water Works Company, Inc. (utilities company, 2019-present). In addition, Ms. Kampling currently serves as a member of the Board of the Nature Conservancy, Wisconsin Chapter (2019-present). Previously, Ms. Kampling served as a Member of the Advisory Board of certain Fidelity® funds (2020), a member of the Board, Compensation Committee and Executive Committee and Chair of the Audit Committee of Briggs & Stratton Corporation (manufacturing, 2011-2021), a member of the Board of Interstate Power and Light Company (2012-2019) and Wisconsin Power and Light Company (2012-2019) (each a subsidiary of Alliant Energy Corporation) and as a member of the Board and Workforce Development Committee of the Business Roundtable (2018-2019).
Thomas A. Kennedy (1955)
Year of Election or Appointment: 2021
Trustee
Mr. Kennedy also serves as Trustee of other Fidelity® funds. Previously, Mr. Kennedy served as a Member of the Advisory Board of certain Fidelity® funds (2020) and held a variety of positions at Raytheon Company (aerospace and defense, 1983-2020), including Chairman and Chief Executive Officer (2014-2020) and Executive Vice President and Chief Operating Officer (2013-2014). Mr. Kennedy served as Executive Chairman of the Board of Directors of Raytheon Technologies Corporation (aerospace and defense, 2020-2021). Mr. Kennedy serves as a Director of the Board of Directors of Textron Inc. (aerospace and defense, 2023-present).
Oscar Munoz (1959)
Year of Election or Appointment: 2021
Trustee
Mr. Munoz also serves as Trustee of other Fidelity® funds. Prior to his retirement, Mr. Munoz served as Executive Chairman (2020-2021), Chief Executive Officer (2015-2020), President (2015-2016) and a member of the Board (2010-2021) of United Airlines Holdings, Inc. Mr. Munoz currently serves as a member of the Board of CBRE Group, Inc. (commercial real estate, 2020-present), a member of the Board of Univision Communications, Inc. (Hispanic media, 2020-present), a member of the Board of Archer Aviation Inc. (2021-present), a member of the Defense Business Board of the United States Department of Defense (2021-present) and a member of the Board of Salesforce.com, Inc. (cloud-based software, 2022-present). Previously, Mr. Munoz served as a Member of the Advisory Board of certain Fidelity® funds (2021).
David M. Thomas (1949)
Year of Election or Appointment: 2018
Trustee
Lead Independent Trustee
Mr. Thomas also serves as Trustee of other Fidelity® funds. Previously, Mr. Thomas served as Executive Chairman (2005-2006) and Chairman and Chief Executive Officer (2000-2005) of IMS Health, Inc. (pharmaceutical and healthcare information solutions). Mr. Thomas currently serves as a member of the Board of Fortune Brands Home and Security (home and security products, 2004-present) and as Director (2013-present) and Non-Executive Chairman of the Board (2022-present) of Interpublic Group of Companies, Inc. (marketing communication).
Susan Tomasky (1953)
Year of Election or Appointment: 2020
Trustee
Ms. Tomasky also serves as Trustee of other Fidelity® funds. Prior to her retirement, Ms. Tomasky served in various executive officer positions at American Electric Power Company, Inc. (1998-2011), including most recently as President of AEP Transmission (2007-2011). Ms. Tomasky currently serves as a member of the Board and Sustainability Committee and as Chair of the Audit Committee of Marathon Petroleum Corporation (2018-present) and as a member of the Board, Executive Committee, Corporate Governance Committee and Organization and Compensation Committee and as Lead Director of the Board of Public Service Enterprise Group, Inc. (utilities company, 2012-present) and as a member of the Board of its subsidiary company, Public Service Electric and Gas Co. (2021-present). In addition, Ms. Tomasky currently serves as a member (2009-present) and President (2020-present) of the Board of the Royal Shakespeare Company - America (2009-present), as a member of the Board of the Columbus Association for the Performing Arts (2011-present) and as a member of the Board and Kenyon in the World Committee of Kenyon College (2016-present). Previously, Ms. Tomasky served as a Member of the Advisory Board of certain Fidelity® funds (2020), as a member of the Board of the Columbus Regional Airport Authority (2007-2020), as a member of the Board (2011-2018) and Lead Independent Director (2015-2018) of Andeavor Corporation (previously Tesoro Corporation) (independent oil refiner and marketer) and as a member of the Board of Summit Midstream Partners LP (energy, 2012-2018).
Michael E. Wiley (1950)
Year of Election or Appointment: 2013
Trustee
Mr. Wiley also serves as Trustee of other Fidelity® funds. Previously, Mr. Wiley served as a member of the Advisory Board of certain Fidelity® funds (2018-2020), Chairman, President and CEO of Baker Hughes, Inc. (oilfield services, 2000-2004). Mr. Wiley also previously served as a member of the Board of Andeavor Corporation (independent oil refiner and marketer, 2005-2018), a member of the Board of Andeavor Logistics LP (natural resources logistics, 2015-2018) and a member of the Board of High Point Resources (exploration and production, 2005-2020).
+ The information includes the Trustee's principal occupation during the last five years and other information relating to the experience, attributes, and skills relevant to the Trustee's qualifications to serve as a Trustee, which led to the conclusion that the Trustee should serve as a Trustee for the fund.
Advisory Board Members and Officers:
Correspondence intended for a Member of the Advisory Board (if any) may be sent to Fidelity Investments, P.O. Box 55235, Boston, Massachusetts 02205-5235. Correspondence intended for an officer or Peter S. Lynch may be sent to Fidelity Investments, 245 Summer Street, Boston, Massachusetts 02210. Officers appear below in alphabetical order.
Name, Year of Birth; Principal Occupation
Peter S. Lynch (1944)
Year of Election or Appointment: 2018
Member of the Advisory Board
Mr. Lynch also serves as a Member of the Advisory Board of other Fidelity® funds. Mr. Lynch is Vice Chairman and a Director of Fidelity Management & Research Company LLC (investment adviser firm). In addition, Mr. Lynch serves as a Trustee of Boston College and as the Chairman of the Inner-City Scholarship Fund. Previously, Mr. Lynch served as Vice Chairman and a Director of FMR Co., Inc. (investment adviser firm) and on the Special Olympics International Board of Directors (1997-2006).
Karen B. Peetz (1955)
Year of Election or Appointment: 2023
Member of the Advisory Board
Ms. Peetz also serves as a Member of the Advisory Board of other funds. Previously, Ms. Peetz served as Chief Administration Officer (2020-2023) of Citigroup Inc. (a diversified financial service company). She also served in various capacities at Bank of New York Mellon Corporation, including President (2013-2016), Vice Chairman, Senior Executive Vice President and Chief Executive Officer of Financial Markets & Treasury Services (2010-2013), Senior Executive Vice President and Chief Executive Officer of Global Corporate Trust (2003-2008), Senior Vice President and Division Manager of Global Payments & Trade Services (2002-2003) and Senior Vice President and Division Manager of Domestic Corporate Trust (1998-2002). Ms. Peetz also served in various capacities at Chase Manhattan Corporation (1982-1998), including Senior Vice President and Manager of Corporate Trust International Business (1996-1998), Managing Director and Manager of Corporate Trust Services (1994-1996) and Managing Director and Group Manager of Financial Institution Sales (1990-1993). Ms. Peetz currently serves as Chair of Amherst Holdings Advisory Council (2018-present), Trustee of Johns Hopkins University (2016-present), Chair of the Carey Business School Advisory Council, Member of the Johns Hopkins Medicine Board and Finance Committee and Chair of the Lyme and Tick Related Disease Institute Advisory Council. Ms. Peetz previously served as a member of the Board of Guardian Life Insurance Company of America (2019-2023), a member of the Board of Trane Technologies (2018-2022), a member of the Board of Wells Fargo Corp. (2017-2019), a member of the Board of SunCoke Energy Inc. (2012-2016), a member of the Board of Private Export Funding Corporation (2010-2016) and as a Trustee of Penn State University (2010-2014) and the United Way of New York City (2008-2010).
Heather Bonner (1977)
Year of Election or Appointment: 2023
Assistant Treasurer
Ms. Bonner also serves as an officer of other funds. Ms. Bonner serves as Senior Vice President (2022-present), and is an employee of Fidelity Investments. Ms. Bonner serves as Assistant Treasurer of Fidelity CRET Trustee LLC (2022-present). Prior to joining Fidelity, Ms. Bonner served as Managing Director at AQR Capital Management (2013-2022) and was the Treasurer and Principal Financial Officer of the AQR Funds (2013-2022).
Craig S. Brown (1977)
Year of Election or Appointment: 2022
Deputy Treasurer
Mr. Brown also serves as an officer of other funds. Mr. Brown serves as Assistant Treasurer of FIMM, LLC (2021-present) and is an employee of Fidelity Investments (2013-present). Previously, Mr. Brown served as Assistant Treasurer of certain Fidelity® funds (2019-2022).
John J. Burke III (1964)
Year of Election or Appointment: 2018
Chief Financial Officer
Mr. Burke also serves as Chief Financial Officer of other funds. Mr. Burke serves as Head of Investment Operations for Fidelity Fund and Investment Operations (2018-present) and is an employee of Fidelity Investments (1998-present). Previously Mr. Burke served as head of Asset Management Investment Operations (2012-2018).
Margaret Carey (1973)
Year of Election or Appointment: 2023
Secretary and Chief Legal Officer (CLO)
Ms. Carey also serves as an officer of other funds and as CLO of certain other Fidelity entities. She is a Senior Vice President and Deputy General Counsel of FMR LLC (diversified financial services company, 2019-present), and is an employee of Fidelity Investments.
William C. Coffey (1969)
Year of Election or Appointment: 2019
Assistant Secretary
Mr. Coffey also serves as Assistant Secretary of other funds. He is Senior Vice President and Deputy General Counsel of FMR LLC (diversified financial services company, 2010-present), and is an employee of Fidelity Investments. Previously, Mr. Coffey served as Secretary and CLO of certain funds (2018-2019); CLO, Secretary, and Senior Vice President of Fidelity Management & Research Company and FMR Co., Inc. (investment adviser firms, 2018-2019); Secretary of Fidelity SelectCo, LLC and Fidelity Investments Money Management, Inc. (investment adviser firms, 2018-2019); CLO of Fidelity Management & Research (Hong Kong) Limited, FMR Investment Management (UK) Limited, and Fidelity Management & Research (Japan) Limited (investment adviser firms, 2018-2019); and Assistant Secretary of certain funds (2009-2018).
Timothy M. Cohen (1969)
Year of Election or Appointment: 2018
Vice President
Mr. Cohen also serves as Vice President of other funds. Mr. Cohen serves as Co-Head of Equity (2018-present), a Director of Fidelity Management & Research (Japan) Limited (investment adviser firm, 2016-present), and is an employee of Fidelity Investments. Previously, Mr. Cohen served as Executive Vice President of Fidelity SelectCo, LLC (2019), Head of Global Equity Research (2016-2018), Chief Investment Officer - Equity and a Director of Fidelity Management & Research (U.K.) Inc. (investment adviser firm, 2013-2015) and as a Director of Fidelity Management & Research (Hong Kong) Limited (investment adviser firm, 2017).
Jonathan Davis (1968)
Year of Election or Appointment: 2013
Assistant Treasurer
Mr. Davis also serves as an officer of other funds. Mr. Davis serves as Vice President Assistant Treasurer and is an employee of Fidelity Investments. Mr. Davis serves as Assistant Treasurer of certain Fidelity entities.
Laura M. Del Prato (1964)
Year of Election or Appointment: 2018
Assistant Treasurer
Ms. Del Prato also serves as an officer of other funds. Ms. Del Prato serves as Assistant Treasurer of FIMM, LLC (2021-present) and is an employee of Fidelity Investments (2017-present). Previously, Ms. Del Prato served as President and Treasurer of The North Carolina Capital Management Trust: Cash Portfolio and Term Portfolio (2018-2020). Prior to joining Fidelity Investments, Ms. Del Prato served as a Managing Director and Treasurer of the JPMorgan Mutual Funds (2014-2017). Prior to JPMorgan, Ms. Del Prato served as a partner at Cohen Fund Audit Services (accounting firm, 2012-2013) and KPMG LLP (accounting firm, 2004-2012).
Colm A. Hogan (1973)
Year of Election or Appointment: 2020
Assistant Treasurer
Mr. Hogan also serves as an officer of other funds. Mr. Hogan serves as Assistant Treasurer of FIMM, LLC (2021-present) and FMR Capital, Inc. (2017-present) and is an employee of Fidelity Investments (2005-present). Previously, Mr. Hogan served as Deputy Treasurer of certain Fidelity® funds (2016-2020) and Assistant Treasurer of certain Fidelity® funds (2016-2018).
Pamela R. Holding (1964)
Year of Election or Appointment: 2018
Vice President
Ms. Holding also serves as Vice President of other funds. Ms. Holding serves as Co-Head of Equity (2018-present) and is an employee of Fidelity Investments (2013-present). Previously, Ms. Holding served as Executive Vice President of Fidelity SelectCo, LLC (2019) and as Chief Investment Officer of Fidelity Institutional Asset Management (2013-2018).
Chris Maher (1972)
Year of Election or Appointment: 2020
Deputy Treasurer
Mr. Maher also serves as an officer of other funds. Mr. Maher serves as Assistant Treasurer of FIMM, LLC (2021-present) and FMR Capital, Inc. (2017-present), and is an employee of Fidelity Investments (2008-present). Previously, Mr. Maher served as Assistant Treasurer of certain funds (2013-2020); Vice President of Asset Management Compliance (2013), Vice President of the Program Management Group of FMR (investment adviser firm, 2010-2013), and Vice President of Valuation Oversight (2008-2010).
Jason P. Pogorelec (1975)
Year of Election or Appointment: 2020
Chief Compliance Officer
Mr. Pogorelec also serves as Chief Compliance Officer of other funds. Mr. Pogorelec is a Senior Vice President of Asset Management Compliance for Fidelity Investments and is an employee of Fidelity Investments. Mr. Pogorelec serves as Compliance Officer of Fidelity Management & Research Company LLC (investment adviser firm, 2023-present). Previously, Mr. Pogorelec served as Vice President, Associate General Counsel for Fidelity Investments (2010-2020) and Assistant Secretary of certain Fidelity® funds (2015-2020).
Brett Segaloff (1972)
Year of Election or Appointment: 2021
Anti-Money Laundering (AML) Officer
Mr. Segaloff also serves as an AML Officer of other funds and other related entities. He is Director, Anti-Money Laundering (2007-present) of FMR LLC (diversified financial services company) and is an employee of Fidelity Investments (1996-present).
Stacie M. Smith (1974)
Year of Election or Appointment: 2018
President and Treasurer
Ms. Smith also serves as an officer of other funds. Ms. Smith serves as Assistant Treasurer of certain Fidelity entities, is an employee of Fidelity Investments, and has served in other fund officer roles.
Jim Wegmann (1979)
Year of Election or Appointment: 2019
Assistant Treasurer
Mr. Wegmann also serves as an officer of other funds. Mr. Wegmann serves as Assistant Treasurer of FIMM, LLC (2021-present) and is an employee of Fidelity Investments (2011-present). Previously, Mr. Wegmann served as Assistant Treasurer of certain Fidelity® funds (2019-2021).
As a shareholder, you incur two types of costs: (1) transaction costs, which may include sales charges (loads) on purchase payments or redemption proceeds, as applicable and (2) ongoing costs, which generally include management fees, distribution and/or service (12b-1) fees and other Fund expenses. This Example is intended to help you understand your ongoing costs (in dollars) of investing in a fund and to compare these costs with the ongoing costs of investing in other mutual funds.
| The Example is based on an investment of $1,000 invested at the beginning of the period and held for the entire period (March 1, 2023 to August 31, 2023). |
Actual Expenses
The first line of the accompanying table provides information about actual account values and actual expenses. You may use the information in this line, together with the amount you invested, to estimate the expenses that you paid over the period. Simply divide your account value by $1,000.00 (for example, an $8,600 account value divided by $1,000.00 = 8.6), then multiply the result by the number in the first line for a class/Fund under the heading entitled "Expenses Paid During Period" to estimate the expenses you paid on your account during this period. If any fund is a shareholder of any underlying mutual funds or exchange-traded funds (ETFs) (the Underlying Funds), such fund indirectly bears its proportional share of the expenses of the Underlying Funds in addition to the direct expenses incurred presented in the table. These fees and expenses are not included in the annualized expense ratio used to calculate the expense estimate in the table below.
Hypothetical Example for Comparison Purposes
The second line of the accompanying table provides information about hypothetical account values and hypothetical expenses based on the actual expense ratio and an assumed rate of return of 5% per year before expenses, which is not the actual return. The hypothetical account values and expenses may not be used to estimate the actual ending account balance or expenses you paid for the period. You may use this information to compare the ongoing costs of investing in the Fund and other funds. To do so, compare this 5% hypothetical example with the 5% hypothetical examples that appear in the shareholder reports of the other funds. If any fund is a shareholder of any Underlying Funds, such fund indirectly bears its proportional share of the expenses of the Underlying Funds in addition to the direct expenses as presented in the table. These fees and expenses are not included in the annualized expense ratio used to calculate the expense estimate in the table below.
Please note that the expenses shown in the table are meant to highlight your ongoing costs only and do not reflect any transaction costs. Therefore, the second line of the table is useful in comparing ongoing costs only, and will not help you determine the relative total costs of owning different funds. In addition, if these transactional costs were included, your costs would have been higher.
| | | | | Annualized Expense Ratio- A | | Beginning Account Value March 1, 2023 | | Ending Account Value August 31, 2023 | | Expenses Paid During Period- C March 1, 2023 to August 31, 2023 |
| | | | | | | | | | |
| Fidelity® Sustainable High Yield ETF | | | | .55% | | | | | | |
| Actual | | | | | | $ 1,000 | | $ 1,043.10 | | $ 2.83 |
Hypothetical-B | | | | | | $ 1,000 | | $ 1,022.43 | | $ 2.80 |
| |
A Annualized expense ratio reflects expenses net of applicable fee waivers.
B 5% return per year before expenses
C Expenses are equal to the annualized expense ratio, multiplied by the average account value over the period, multiplied by 184/ 365 (to reflect the one-half year period). The fees and expenses of any Underlying Funds are not included in each annualized expense ratio.
The dividend and capital gains distributions for the fund(s) are available on Fidelity.com or Institutional.Fidelity.com.
The fund designates $358,050 of distributions paid in the calendar year 2022 as qualifying to be taxed as interest-related dividends for nonresident alien shareholders.
The fund designates $551,565 of distributions paid during the fiscal year ended 2023 as qualifying to be taxed as section 163(j) interest dividends.
The fund will notify shareholders in January 2024 of amounts for use in preparing 2023 income tax returns.
Board Approval of Investment Advisory Contracts and Management Fees
Fidelity Sustainable High Yield ETF
Each year, the Board of Trustees, including the Independent Trustees (together, the Board), considers the renewal of the fund's management contract with Fidelity Management & Research Company LLC (FMR) and the sub-advisory agreements (together, the Advisory Contracts) for the fund. FMR and the sub-advisers are referred to herein as the Investment Advisers. The Board, assisted by the advice of fund counsel and Independent Trustees' counsel, requests and considers a broad range of information relevant to the renewal of the Advisory Contracts throughout the year.
The Board meets regularly and, at each of its meetings, covers an extensive agenda of topics and materials and considers factors that are relevant to its annual consideration of the renewal of the fund's Advisory Contracts, including the services and support provided to the fund and its shareholders. The Board, acting directly and through its Committees (each of which is composed of and chaired by Independent Trustees), requests and receives information concerning the annual consideration of the renewal of the fund's Advisory Contracts. The Board also meets as needed to review matters specifically related to the Board's annual consideration of the renewal of the Advisory Contracts. Members of the Board may also meet with trustees of other Fidelity funds through joint ad hoc committees to discuss certain matters relevant to all of the Fidelity funds.
Approval of Stub Period Continuation. At its May 2023 meeting, the Board of Trustees voted to continue the fund's management contract with FMR and the sub-advisory agreements, in each case, where applicable, for two months from June 1, 2023 through July 31, 2023. The Board considered that the approval of the fund's Advisory Contracts will not result in any changes in (i) the investment process or strategies employed in the management of the fund's assets; (ii) the fees and expenses paid by shareholders; (iii) the nature, extent or quality of services provided under the fund's Advisory Contracts; or (iv) the day-to-day management of the fund or the persons primarily responsible for such management. The Board also considered that since its last approval of the fund's Advisory Contracts, FMR had provided additional information on the fund in support of the annual contract renewal process, including competitive analyses on total expenses and management fees and in-depth reviews of fund performance and fund profitability information. The Board concluded that the fund's Advisory Contracts are fair and reasonable, and that the fund's Advisory Contracts should be renewed, without modification, through July 31, 2023, with the understanding that the Board would consider the annual renewal for a full one year period in July 2023.
At its July 2023 meeting, the Board unanimously determined to renew the fund's Advisory Contracts. In reaching its determination, the Board considered all factors it believed relevant, including (i) the nature, extent, and quality of the services provided to the fund and its shareholders (including the investment performance of the fund); (ii) the competitiveness relative to peer funds of the fund's management fee and total expense ratio; (iii) the total costs of the services provided by and the profits realized by FMR and its affiliates (Fidelity) from its relationships with the fund; and (iv) the extent to which, if any, economies of scale exist and are realized as the fund grows, and whether any economies of scale are appropriately shared with fund shareholders. The Board also considered the broad range of investment choices available to shareholders from FMR's competitors and that the fund's shareholders have chosen to invest in the fund, which is part of the Fidelity family of funds. The Board's decision to renew the Advisory Contracts was not based on any single factor.
The Board reached a determination, with the assistance of fund counsel and Independent Trustees' counsel and through the exercise of its business judgment, that the renewal of the Advisory Contracts was in the best interests of the fund and its shareholders and that the compensation payable under the Advisory Contracts was fair and reasonable, in light of all of the surrounding circumstances.
Nature, Extent, and Quality of Services Provided. The Board considered staffing as it relates to the fund, including the backgrounds and experience of investment personnel of the Investment Advisers, and also considered the Investment Advisers' implementation of the fund's investment program. The Independent Trustees also had discussions with senior management of Fidelity's investment operations and investment groups. The Board considered the structure of the investment personnel compensation program and whether this structure provides appropriate incentives to act in the best interests of the fund. Additionally, the Board considered the portfolio managers' investments, if any, in the funds that they manage.
Resources Dedicated to Investment Management and Support Services. The Board and the Fund Oversight and Research Committees reviewed the general qualifications and capabilities of Fidelity's investment staff, including its size, education, experience, and resources, as well as Fidelity's approach to recruiting, training, managing, and compensating investment personnel. The Board noted the resources devoted to expansion of Fidelity's global investment organization, and that Fidelity's analysts have extensive resources, tools, and capabilities that allow them to conduct sophisticated quantitative and fundamental analysis, as well as credit analysis of issuers, counterparties, and guarantors. Further, the Board considered that Fidelity's investment professionals have sufficient access to global information and data so as to provide competitive investment results over time, and that those professionals also have access to sophisticated tools that permit them to assess portfolio construction and risk and performance attribution characteristics continuously, as well as to transmit new information and research conclusions rapidly around the world. Additionally, in its deliberations, the Board considered Fidelity's trading, risk management, compliance, and technology and operations capabilities and resources, which are integral parts of the investment management process.
Shareholder and Administrative Services. The Board considered (i) the nature, extent, quality, and cost of advisory and administrative services provided by the Investment Advisers and their affiliates under the Advisory Contracts and under separate agreements covering pricing and bookkeeping and securities lending services for the fund; (ii) the nature and extent of Fidelity's supervision of third party service providers, principally State Street Bank and Trust Company, the fund's transfer agent and custodian; and (iii) the resources devoted by Fidelity to, and the record of compliance with, the fund's compliance policies and procedures. The Board also reviewed the allocation of fund brokerage, including allocations to brokers affiliated with the Investment Advisers, the use of brokerage commissions to pay fund expenses, and the use of "soft" commission dollars to pay for research services. The Board also considered the fund's securities lending activities and any payments made to Fidelity relating to securities lending.
The Board noted that the growth of fund assets over time across the complex allows Fidelity to reinvest in the development of services designed to enhance the value and convenience of the Fidelity funds as investment vehicles. These services include 24-hour access to account information and market information over the Internet and through telephone representatives, investor education materials, and asset allocation tools. The Board also considered that it reviews customer service metrics such as telephone response times, continuity of services on the website and metrics addressing services at Fidelity Investor Centers.
Investment in a Large Fund Family. The Board considered the benefits to shareholders of investing in a fund that is part of a large family of funds offering a variety of investment disciplines and providing a large variety of fund investor services. The Board noted that Fidelity had taken, or had made recommendations that resulted in the Fidelity funds taking, a number of actions over the previous year that benefited particular funds and/or the Fidelity funds in general.
Investment Performance. The Board took into account discussions that occur with representatives of the Investment Advisers, and reports that it receives, at Board meetings throughout the year with representatives of the Investment Advisers relating to fund investment performance. In this regard the Board noted that as part of regularly scheduled fund reviews and other reports to the Board on fund performance, the Board considered annualized return information for the fund for different time periods, measured against an appropriate securities market index (benchmark index). The Board also considered information about performance attribution. In its ongoing evaluation of fund investment performance, the Board gives particular attention to information indicating changes in performance of the fund over different time periods and discussed with the Investment Advisers the reasons for any overperformance or underperformance. The Board also considered information on the fund's bid-ask spread and premium/discount.
In addition to reviewing absolute and relative fund performance, the Independent Trustees periodically consider the appropriateness of fund performance metrics in evaluating the results achieved. The Independent Trustees generally give greater weight to fund performance over longer time periods than over shorter time periods. Depending on the circumstances, the Independent Trustees may be satisfied with a fund's performance notwithstanding that it lags its benchmark index for certain periods.
Based on its review, the Board concluded that the nature, extent, and quality of services provided to the fund under the Advisory Contracts should continue to benefit the shareholders of the fund.
Competitiveness of Management Fee and Total Expense Ratio. The Board was provided with information regarding industry trends in management fees and expenses. In its review of the fund's management fee and total expense ratio, the Board considered the fund's all-inclusive fee rate and also considered other expenses, such as transfer agent fees, pricing and bookkeeping fees, and custodial, legal, and audit fees, paid by FMR under the fund's all-inclusive arrangement. The Board noted that Fidelity may agree to waive fees or reimburse expenses from time to time, and the extent to which, if any, it has done so for the fund.
Comparisons of Management Fees and Total Expense Ratios. Among other things, the Board reviewed data for selected groups of competitive funds and classes (referred to as "mapped groups") that were compiled by Fidelity based on combining similar investment objective categories (as classified by Lipper) that have comparable investment mandates. The data reviewed by the Board included (i) gross management fee comparisons (before taking into account expense reimbursements or caps) relative to the total universe of funds within the mapped group; (ii) gross management fee comparisons relative to a subset of non-Fidelity funds in the mapped group that are similar in size and management fee structure to the fund (referred to as the "asset size peer group"); (iii) total expense comparisons of the fund relative to funds and classes in the mapped group that have a similar load structure to the fund (referred to as the "similar load structure group"); and (iv) total expense comparisons of the fund relative to funds and classes in the similar load structure group that are similar in size and management fee structure to the fund (referred to as the "total expense asset size peer group"). The total expense asset size peer group comparison excludes performance adjustments and fund-paid 12b-1 fees to eliminate variability in fee structures.
The information provided to the Board indicated that the fund's management fee rate ranked above the competitive median of the mapped group for the 12-month period ended September 30, 2022 and above the competitive median of the asset size peer group for the 12-month period ended September 30, 2022. Further, the information provided to the Board indicated that the total expense ratio of the fund ranked below the competitive median of the similar load structure group for the 12-month period ended September 30, 2022 and above the competitive median of the total expense asset size peer group for the 12-month period ended September 30, 2022. The Board considered that the fund has an all-inclusive management fee that covers substantially all of the fund's expenses. The Board noted that, when compared to competitors based on total expenses, the fund ranked below the similar sales load group median.
Fees Charged to Other Fidelity Clients. The Board also considered Fidelity fee structures and other information with respect to clients of Fidelity, such as other funds advised or subadvised by Fidelity, pension plan clients, and other institutional clients with similar mandates. The Board noted that a joint ad hoc committee created by it and the boards of other Fidelity funds periodically reviews and compares Fidelity's institutional investment advisory business with its business of providing services to the Fidelity funds and also noted the most recent findings of the committee. The Board noted that the committee's review included a consideration of the differences in services provided, fees charged, and costs incurred, as well as competition in the markets serving the different categories of clients.
Based on its review, the Board concluded that the fund's management fee is fair and reasonable in light of the services that the fund receives and the other factors considered. Further, based on its review of total expense ratios and fees charged to other Fidelity clients, the Board concluded that the fund's total expense ratio was reasonable in light of the services that the fund and its shareholders receive and the other factors considered.
Costs of the Services and Profitability. The Board considered the revenues earned and the expenses incurred by Fidelity in conducting the business of developing, marketing, distributing, managing, administering and servicing the fund and servicing the fund's shareholders. The Board also considered the level of Fidelity's profits in respect of all the Fidelity funds.
On an annual basis, Fidelity presents to the Board information about the profitability of its relationships with the fund. Fidelity calculates profitability information for the fund, as well as aggregate profitability information for groups of Fidelity funds and all Fidelity funds, using a series of detailed revenue and cost allocation methodologies which originate with the books and records of Fidelity on which Fidelity's audited financial statements are based. The Audit Committee of the Board reviews any significant changes from the prior year's methodologies and the full Board approves such changes.
A public accounting firm has been engaged annually by the Board as part of the Board's assessment of Fidelity's profitability analysis. The engagement includes the review and assessment of the methodologies used by Fidelity in determining the revenues and expenses attributable to Fidelity's fund business, and completion of agreed-upon procedures in respect of the mathematical accuracy of certain fund profitability information and its conformity to established allocation methodologies. After considering the reports issued under the engagement and information provided by Fidelity, the Board concluded that while other allocation methods may also be reasonable, Fidelity's profitability methodologies are reasonable in all material respects.
The Board also reviewed Fidelity's non-fund businesses and potential indirect benefits such businesses may have received as a result of their association with Fidelity's fund business (i.e., fall-out benefits) as well as cases where Fidelity's affiliates may benefit from the funds' business. The Board considered areas where potential indirect benefits to the Fidelity funds from their relationships with Fidelity may exist. The Board's consideration of these matters was informed by the findings of a joint ad hoc committee created by it and the boards of other Fidelity funds to evaluate potential fall-out benefits.
The Board considered the costs of the services provided by and the profits realized by Fidelity in connection with the operation of the fund and was satisfied that the profitability was not excessive.
Economies of Scale. The Board considered whether there have been economies of scale in respect of the management of the Fidelity funds, whether the Fidelity funds (including the fund) have appropriately benefited from any such economies of scale, and whether there is potential for realization of any further economies of scale. The Board considered the extent to which the fund will benefit from economies of scale as assets grow through increased services to the fund, through waivers or reimbursements, or through fee or expense ratio reductions. The Board recognized that, due to the fund's current contractual arrangements, its expense ratio will not decline if the fund's operating costs decrease as assets grow, or rise as assets decrease. The Board also noted that a committee (the Economies of Scale Committee) created by it and the boards of other Fidelity funds periodically analyzes whether Fidelity attains economies of scale in respect of the management and servicing of the Fidelity funds, whether the Fidelity funds have appropriately benefited from such economies of scale, and whether there is potential for realization of any further economies of scale.
The Board concluded, taking into account the analysis of the Economies of Scale Committee, that economies of scale, if any, are being appropriately shared between fund shareholders and Fidelity.
Additional Information Requested by the Board. In order to develop fully the factual basis for consideration of the Fidelity funds' advisory contracts, the Board requested and received additional information on certain topics, including: (i) fund flow and performance trends, in particular the underperformance of certain funds and strategies, and Fidelity's long-term strategies for certain funds, including any consideration of fund liquidations or mergers; (ii) the operation of performance fees and competitor use of performance fees; (iii) Fidelity's pricing philosophy compared to competitors; (iv) fund profitability methodology and data; (v) evaluation of competitive fund data and peer group classifications and fee and expense comparisons; (vi) the management fee and expense structures for different funds and classes and information about the differences between various fee and expense structures; (vii) group fee breakpoints and related voluntary fee waivers; and (viii) information regarding other accounts managed by Fidelity and the funds' sub-advisory arrangements.
Conclusion. Based on its evaluation of all of the conclusions noted above, and after considering all factors it believed relevant, the Board, including the Independent Trustees, concluded that the advisory and sub-advisory fee arrangements are fair and reasonable in light of all of the surrounding circumstances and that the fund's Advisory Contracts should be renewed through July 31, 2024.
1.9904449.101
SHY-ANN-1023
Item 2.
Code of Ethics
As of the end of the period, August 31, 2023, Fidelity Covington Trust (the trust) has adopted a code of ethics, as defined in Item 2 of Form N-CSR, that applies to its President and Treasurer and its Chief Financial Officer. A copy of the code of ethics is filed as an exhibit to this Form N-CSR.
Item 3.
Audit Committee Financial Expert
The Board of Trustees of the trust has determined that Donald F. Donahue is an audit committee financial expert, as defined in Item 3 of Form N-CSR. Mr. Donahue is independent for purposes of Item 3 of Form N-CSR.
Item 4.
Principal Accountant Fees and Services
Fees and Services
The following table presents fees billed by PricewaterhouseCoopers LLP (“PwC”) in each of the last two fiscal years for services rendered to Fidelity High Yield Factor ETF, Fidelity Preferred Securities & Income ETF, and Fidelity Sustainable High Yield ETF (the “Funds”):
Services Billed by PwC
August 31, 2023 FeesA
| | | | |
| Audit Fees | Audit-Related Fees | Tax Fees | All Other Fees |
Fidelity High Yield Factor ETF | $37,900 | $- | $7,600 | $1,200 |
Fidelity Preferred Securities & Income ETF | $38,200 | $- | $7,600 | $1,200 |
Fidelity Sustainable High Yield ETF | $37,100 | $- | $7,700 | $1,100 |
| | | | |
| Audit Fees | Audit-Related Fees | Tax Fees | All Other Fees |
Fidelity High Yield Factor ETF | $36,300 | $- | $7,400 | $1,100 |
Fidelity Preferred Securities & Income ETF | $36,400 | $- | $7,400 | $1,100 |
Fidelity Sustainable High Yield ETF | $30,600 | $- | $7,100 | $600 |
|
|
|
|
|
A Amounts may reflect rounding.
B Fidelity Sustainable High Yield ETF commenced operations on February 15, 2022.
The following table(s) present(s) fees billed by PwC that were required to be approved by the Audit Committee for services that relate directly to the operations and financial reporting of the Fund(s) and that are rendered on behalf of Fidelity Management & Research Company LLC ("FMR") and entities controlling, controlled by, or under common control with FMR (not including any sub-adviser whose role is primarily portfolio management and is subcontracted with or overseen by another investment adviser) that provide ongoing services to the Fund(s) (“Fund Service Providers”):
Services Billed by PwC
| | |
| August 31, 2023A | August 31, 2022A,B |
Audit-Related Fees | $8,284,200 | $7,914,600 |
Tax Fees | $1,000 | $353,200 |
All Other Fees | $- | $- |
A Amounts may reflect rounding.
B May include amounts billed prior to the Fidelity Sustainable High Yield ETF’s commencement of operations.
“Audit-Related Fees” represent fees billed for assurance and related services that are reasonably related to the performance of the fund audit or the review of the fund's financial statements and that are not reported under Audit Fees.
“Tax Fees” represent fees billed for tax compliance, tax advice or tax planning that relate directly to the operations and financial reporting of the fund.
“All Other Fees” represent fees billed for services provided to the fund or Fund Service Provider, a significant portion of which are assurance related, that relate directly to the operations and financial reporting of the fund, excluding those services that are reported under Audit Fees, Audit-Related Fees or Tax Fees.
Assurance services must be performed by an independent public accountant.
* * *
The aggregate non-audit fees billed by PwC for services rendered to the Fund(s), FMR (not including any sub-adviser whose role is primarily portfolio management and is subcontracted with or overseen by another investment adviser), and any Fund Service Provider for each of the last two fiscal years of the Fund(s) are as follows:
| | | |
Billed By | August 31, 2023A | August 31, 2022A,B |
PwC | $13,614,200 | $13,259,900 |
A Amounts may reflect rounding.
B May include amounts billed prior to the Fidelity Sustainable High Yield ETF’s commencement of operations.
The trust's Audit Committee has considered non-audit services that were not pre-approved that were provided by PwC to Fund Service Providers to be compatible with maintaining the independence of PwC in its(their) audit of the Fund(s), taking into account representations from PwC, in accordance with Public Company Accounting Oversight Board rules, regarding its independence from the Fund(s) and its(their) related entities and FMR’s review of the appropriateness and permissibility under applicable law of such non-audit services prior to their provision to the Fund(s) Service Providers.
Audit Committee Pre-Approval Policies and Procedures
The trust’s Audit Committee must pre-approve all audit and non-audit services provided by a fund’s independent registered public accounting firm relating to the operations or financial reporting of the fund. Prior to the commencement of any audit or non-audit services to a fund, the Audit Committee reviews the services to determine whether they are appropriate and permissible under applicable law.
The Audit Committee has adopted policies and procedures to, among other purposes, provide a framework for the Committee’s consideration of non-audit services by the audit firms that audit the Fidelity funds. The policies and procedures require that any non-audit service provided by a fund audit firm to a Fidelity fund and any non-audit service provided by a fund auditor to a Fund Service Provider that relates directly to the operations and financial reporting of a Fidelity fund (“Covered Service”) are subject to approval by the Audit Committee before such service is provided.
All Covered Services must be approved in advance of provision of the service either: (i) by formal resolution of the Audit Committee, or (ii) by oral or written approval of the service by the Chair of the Audit Committee (or if the Chair is unavailable, such other member of the Audit Committee as may be designated by the Chair to act in the Chair’s absence). The approval contemplated by (ii) above is permitted where the Treasurer determines that action on such an engagement is necessary before the next meeting of the Audit Committee.
Non-audit services provided by a fund audit firm to a Fund Service Provider that do not relate directly to the operations and financial reporting of a Fidelity fund are reported to the Audit Committee periodically.
Non-Audit Services Approved Pursuant to Rule 2-01(c)(7)(i)(C) and (ii) of Regulation S-X (“De Minimis Exception”)
There were no non-audit services approved or required to be approved by the Audit Committee pursuant to the De Minimis Exception during the Fund’s(s’) last two fiscal years relating to services provided to (i) the Fund(s) or (ii) any Fund Service Provider that relate directly to the operations and financial reporting of the Fund(s).
The Registrant has not retained, for the preparation of the audit report on the financial statements included in the Form N-CSR, a registered public accounting firm that has a branch or office that is located in a foreign jurisdiction and that the Public Company Accounting Oversight Board (the “PCAOB”) has determined that the PCAOB is unable to inspect or investigate completely because of a position taken by an authority in the foreign jurisdiction.
The Registrant is not a “foreign issuer,” as defined in 17 CFR 240.3b-4.
Item 5.
Audit Committee of Listed Registrants
The Audit Committee is a separately-designated standing audit committee in accordance with Section 3(a)(58)(A) of the Securities Exchange Act of 1934. As of August 31, 2023, the members of the Audit Committee were Donald F. Donahue, Thomas Bostick, Thomas Kennedy and Susan Tomasky.
Item 6.
Investments
(a)
Not applicable.
(b)
Not applicable.
Item 7.
Disclosure of Proxy Voting Policies and Procedures for Closed-End Management Investment Companies
Not applicable.
Item 8.
Portfolio Managers of Closed-End Management Investment Companies
Not applicable.
Item 9.
Purchase of Equity Securities by Closed-End Management Investment Company and Affiliated Purchasers
Not applicable.
Item 10.
Submission of Matters to a Vote of Security Holders
There were no material changes to the procedures by which shareholders may recommend nominees to the trust’s Board of Trustees.
Item 11.
Controls and Procedures
(a)(i) The President and Treasurer and the Chief Financial Officer have concluded that the trust’s disclosure controls and procedures (as defined in Rule 30a-3(c) under the Investment Company Act) provide reasonable assurances that material information relating to the trust is made known to them by the appropriate persons, based on their evaluation of these controls and procedures as of a date within 90 days of the filing date of this report.
(a)(ii) There was no change in the trust’s internal control over financial reporting (as defined in Rule 30a-3(d) under the Investment Company Act) that occurred during the period covered by this report that has materially affected, or is reasonably likely to materially affect, the trust’s internal control over financial reporting.
Item 12.
Disclosure of Securities Lending Activities for Closed-End Management
Investment Companies
Not applicable.
Item 13.
Exhibits
SIGNATURES
Pursuant to the requirements of the Securities Exchange Act of 1934 and the Investment Company Act of 1940, the registrant has duly caused this report to be signed on its behalf by the undersigned, thereunto duly authorized.
Fidelity Covington Trust
| |
By: | /s/Stacie M. Smith |
| Stacie M. Smith |
| President and Treasurer |
|
|
Date: | October 23, 2023 |
Pursuant to the requirements of the Securities Exchange Act of 1934 and the Investment Company Act of 1940, this report has been signed below by the following persons on behalf of the registrant and in the capacities and on the dates indicated.
| |
By: | /s/Stacie M. Smith |
| Stacie M. Smith |
| President and Treasurer |
|
|
Date: | October 23, 2023 |
| |
By: | /s/John J. Burke III |
| John J. Burke III |
| Chief Financial Officer |
|
|
Date: | October 23, 2023 |