UNITED STATES
SECURITIES AND EXCHANGE COMMISSION
Washington, D.C. 20549
FORM N-CSR
CERTIFIED SHAREHOLDER REPORT OF REGISTERED
MANAGEMENT INVESTMENT COMPANIES
Investment Company Act file number 811-07319
Fidelity Covington Trust
(Exact name of registrant as specified in charter)
245 Summer St., Boston, Massachusetts 02210
(Address of principal executive offices) (Zip code)
Margaret Carey, Secretary
245 Summer St.
Boston, Massachusetts 02210
(Name and address of agent for service)
Registrant's telephone number, including area code:
617-563-7000
| |
Date of fiscal year end: | February 29 |
|
|
Date of reporting period: | February 29, 2024 |
Item 1.
Reports to Stockholders
Fidelity® Enhanced Small Cap ETF
Annual Report
February 29, 2024
Contents
To view a fund's proxy voting guidelines and proxy voting record for the 12-month period ended June 30, visit http://www.fidelity.com/proxyvotingresults or visit the Securities and Exchange Commission's (SEC) web site at http://www.sec.gov.
You may also call 1-800-FIDELITY to request a free copy of the proxy voting guidelines.
Standard & Poor's, S&P and S&P 500 are registered service marks of The McGraw-Hill Companies, Inc. and have been licensed for use by Fidelity Distributors Corporation.
Other third-party marks appearing herein are the property of their respective owners.
All other marks appearing herein are registered or unregistered trademarks or service marks of FMR LLC or an affiliated company. © 2024 FMR LLC. All rights reserved.
This report and the financial statements contained herein are submitted for the general information of the shareholders of the Fund. This report is not authorized for distribution to prospective investors in the Fund unless preceded or accompanied by an effective prospectus.
A fund files its complete schedule of portfolio holdings with the SEC for the first and third quarters of each fiscal year on Form N-PORT. Forms N-PORT are available on the SEC's web site at http://www.sec.gov. A fund's Forms N-PORT may be reviewed and copied at the SEC's Public Reference Room in Washington, DC. Information regarding the operation of the SEC's Public Reference Room may be obtained by calling 1-800-SEC-0330.
For a complete list of a fund's portfolio holdings, view the most recent holdings listing, semiannual report, or annual report on Fidelity's web site at http://www.fidelity.com, http://www.institutional.fidelity.com, or http://www.401k.com, as applicable.
NOT FDIC INSURED •MAY LOSE VALUE •NO BANK GUARANTEE
Neither the Fund nor Fidelity Distributors Corporation is a bank.
NAV and closing market price average annual returns reflect the change in the value of an investment, assuming reinvestment of distributions from dividend income and capital gains (the profits earned upon the sale of securities that have grown in value, if any) at NAV and Market Price, respectively, and assumes a constant rate of performance each year. The hypothetical investment and the fund's returns do not reflect the deduction of taxes that a shareholder would pay on fund distributions or the redemption or selling of fund shares. How a fund did yesterday is no guarantee of how it will do tomorrow.
| Average Annual Total Returns |
| | | | |
Periods ended February 29, 2024 | Past 1 year | Past 5 years | Past 10 years |
| Fidelity® Enhanced Small Cap ETF - NAV | 15.26% | 9.05% | 7.94% |
Fidelity® Enhanced Small Cap ETF - Market Price A | 15.52% | 9.10% | 7.97% |
| Russell 2000® Index | 10.05% | 6.89% | 7.13% |
A From November 17, 2023, date initially listed on the NYSE Arca exchange.
Returns from November 18, 2023 through February 29, 2024 are those of Fidelity Enhanced Small Cap ETF. Returns prior to the
Reorganization on November 17, 2023 are those of Fidelity Small Cap Enhanced Index Fund ("Predecessor Fund").
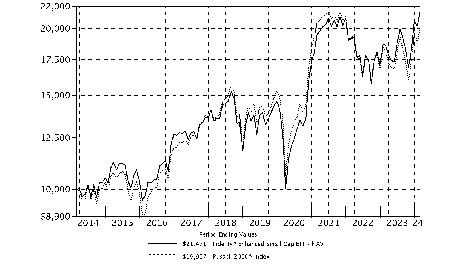
| $10,000 Over 10 Years |
| |
Let's say hypothetically that $10,000 was invested in Fidelity® Enhanced Small Cap ETF - NAV on February 28, 2014. The chart shows how the value of your investment would have changed, and also shows how the Russell 2000® Index performed over the same period. |
|
|
Market Recap:
U.S. equities gained 30.45% for the 12 months ending February 29, 2024, according to the S&P 500® index, as robust earnings, a slowing in the pace of inflation and resilient late-cycle expansion of the U.S. economy aided risk assets. The index ended February at a record high. Notably, the rally has been driven by a narrow set of firms in the information technology and communication services sectors, largely due to excitement for generative artificial intelligence. This is mostly reflected in semiconductor-related stocks (+113%) and media & entertainment (+68%) names. A likely shift in monetary policy also provided a boost. Aggressive rate hikes by the U.S. Federal Reserve continued until late July, when the Fed decided to pause a series of increases that began in March 2022 at a 22-year high while it observed the effect on inflation and the economy. Following the Fed's November 1 meeting, when the central bank hinted it might be done raising rates, the S&P 500® reversed a three-month decline and gained 14.09% through year-end and added 1.68% in January and 5.34% in February. By sector for the full 12 months, information technology (+61%) and communication services (+58%) were standouts, with AI a major tailwind. In sharp contrast, the defensive-oriented utilities sector (-1%) fared worst. Other notable laggards included real estate (+7%) and consumer staples (+8%), each also considered defensive, and energy (+6%).
Comments from Co-Managers Max Kaufmann, Shashi Naik, Anna Lester and George Liu:
For the fiscal year ending February 29, 2024, the exchange-traded fund's net asset value gained 15.26% and its market price returned 15.52%, versus 10.05% for the Russell 2000 Index. (Effective November 20, 2023, Fidelity Small Cap Enhanced Index Fund ("Predecessor Fund") was reorganized into the Fund. Performance prior to reorganization is that of the Predecessor Fund.) Relative to the benchmark, security selection was the primary contributor, led by industrials. Stock selection in consumer discretionary also helped. Security selection and an overweight in information technology, primarily within the technology hardware & equipment industry, also boosted relative performance. Also bolstering our relative result was stock picking in communication services. The top individual relative contributor was an overweight in Super Micro Computer (+803%). Super Micro Computer was the fund's largest holding. This period we decreased our investment in Super Micro Computer. The second-largest relative contributor was an overweight in Cimpress (+176%). An overweight in Installed Building Prod (+108%) also contributed. Installed Building Prod was one of the fund's biggest holdings. In contrast, the biggest detractor from performance versus the benchmark was stock selection in real estate. An overweight in communication services also hampered the fund's result. Also detracting from our result were stock picks and an overweight in materials. Lastly, the fund's position in cash was a notable detractor. The largest individual relative detractor was an overweight in Commscope Holding (-84%). The second-largest relative detractor this period was avoiding Microstrategy, a benchmark component that gained 290%. An overweight in Omnicell (-57%) also detracted. This was a position we established this period.
Note to Shareholders:
On December 30, 2023, George Liu assumed co-management responsibilities for the fund. After nearly 30 years in the industry, portfolio manager Maximilian (Max) Kaufmann has decided to retire from Fidelity effective March 31, 2024.
The views expressed above reflect those of the portfolio manager(s) only through the end of the period as stated on the cover of this report and do not necessarily represent the views of Fidelity or any other person in the Fidelity organization, or Geode Capital Management, LLC, (the ETF's subadviser) or any other person in the Geode organization. Any such views are subject to change at any time based upon market or other conditions and Fidelity and Geode disclaim any responsibility to update such views. These views may not be relied on as investment advice and, because investment decisions for a Fidelity fund are based on numerous factors, may not be relied on as an indication of trading intent on behalf of any Fidelity fund.
The views expressed above reflect those of the portfolio manager(s) only through the end of the period as stated on the cover of this report and do not necessarily represent the views of Fidelity or any other person in the Fidelity organization. Any such views are subject to change at any time based upon market or other conditions and Fidelity disclaims any responsibility to update such views. These views may not be relied on as investment advice and, because investment decisions for a Fidelity fund are based on numerous factors, may not be relied on as an indication of trading intent on behalf of any Fidelity fund.
Top Holdings (% of Fund's net assets) |
| |
| Super Micro Computer, Inc. | 2.1 | |
| Carvana Co. Class A | 0.8 | |
| Installed Building Products, Inc. | 0.8 | |
| Matador Resources Co. | 0.8 | |
| Qualys, Inc. | 0.7 | |
| Duolingo, Inc. | 0.7 | |
| Selective Insurance Group, Inc. | 0.7 | |
| Abercrombie & Fitch Co. Class A | 0.7 | |
| Fabrinet | 0.7 | |
| H.B. Fuller Co. | 0.7 | |
| | 8.7 | |
| |
| Market Sectors (% of Fund's net assets) |
| |
| Industrials | 18.0 | |
| Financials | 15.7 | |
| Information Technology | 14.5 | |
| Health Care | 14.4 | |
| Consumer Discretionary | 13.0 | |
| Energy | 5.9 | |
| Materials | 5.0 | |
| Real Estate | 4.2 | |
| Communication Services | 3.9 | |
| Consumer Staples | 2.2 | |
| Utilities | 1.2 | |
| |
Asset Allocation (% of Fund's net assets) |
|
Futures - 1.7% |
|
Showing Percentage of Net Assets
| Common Stocks - 98.0% |
| | | Shares | Value ($) |
| COMMUNICATION SERVICES - 3.9% | | | |
| Diversified Telecommunication Services - 1.0% | | | |
| ATN International, Inc. | | 8,796 | 295,018 |
| Bandwidth, Inc. (a) | | 70,697 | 1,452,116 |
| Lumen Technologies, Inc. (a) | | 1,727,344 | 2,798,297 |
| Ooma, Inc. (a) | | 69,743 | 711,379 |
| | | | 5,256,810 |
| Entertainment - 0.7% | | | |
| Eventbrite, Inc. (a) | | 26,078 | 146,037 |
| Lions Gate Entertainment Corp.: | | | |
| Class A (a)(b) | | 100,720 | 977,991 |
| Class B (a) | | 110,657 | 1,004,766 |
| Madison Square Garden Entertainment Corp. | | 32,121 | 1,236,337 |
| | | | 3,365,131 |
| Interactive Media & Services - 1.1% | | | |
| Bumble, Inc. (a) | | 63,660 | 728,907 |
| TrueCar, Inc. (a) | | 181,630 | 632,072 |
| Vimeo, Inc. (a) | | 261,153 | 1,250,923 |
| Yelp, Inc. (a) | | 71,940 | 2,765,374 |
| Zedge, Inc. (a) | | 20,142 | 80,165 |
| | | | 5,457,441 |
| Media - 0.9% | | | |
| EchoStar Holding Corp. Class A (a)(b) | | 48,151 | 631,260 |
| John Wiley & Sons, Inc. Class A | | 76,956 | 2,566,483 |
| TEGNA, Inc. | | 91,730 | 1,285,137 |
| | | | 4,482,880 |
| Wireless Telecommunication Services - 0.2% | | | |
| Spok Holdings, Inc. | | 7,672 | 137,866 |
| Telephone & Data Systems, Inc. | | 58,054 | 888,226 |
| | | | 1,026,092 |
TOTAL COMMUNICATION SERVICES | | | 19,588,354 |
| CONSUMER DISCRETIONARY - 13.0% | | | |
| Automobile Components - 0.6% | | | |
| Cooper-Standard Holding, Inc. (a) | | 44,287 | 622,675 |
| The Goodyear Tire & Rubber Co. (a) | | 159,066 | 1,889,704 |
| Visteon Corp. (a) | | 4,104 | 464,244 |
| | | | 2,976,623 |
| Automobiles - 0.6% | | | |
| Winnebago Industries, Inc. | | 40,080 | 2,874,938 |
| Broadline Retail - 0.2% | | | |
| ContextLogic, Inc. (a)(b) | | 68,112 | 442,728 |
| Dillard's, Inc. Class A | | 1,839 | 762,688 |
| | | | 1,205,416 |
| Diversified Consumer Services - 1.2% | | | |
| 2U, Inc. (a) | | 506,210 | 228,098 |
| Chegg, Inc. (a) | | 63,454 | 567,279 |
| Duolingo, Inc. (a) | | 15,382 | 3,676,298 |
| Frontdoor, Inc. (a) | | 43,267 | 1,356,853 |
| | | | 5,828,528 |
| Hotels, Restaurants & Leisure - 2.1% | | | |
| Dine Brands Global, Inc. | | 2,936 | 142,425 |
| Everi Holdings, Inc. (a) | | 68,710 | 814,901 |
| International Game Technology PLC | | 101,474 | 2,757,049 |
| Light & Wonder, Inc. Class A (a) | | 19,427 | 1,952,608 |
| PlayAGS, Inc. (a) | | 11,726 | 108,817 |
| Red Robin Gourmet Burgers, Inc. (a)(b) | | 49,555 | 370,671 |
| Sabre Corp. (a) | | 137,957 | 365,586 |
| Shake Shack, Inc. Class A (a) | | 10,646 | 1,131,883 |
| Texas Roadhouse, Inc. Class A | | 1,410 | 210,612 |
| Wingstop, Inc. | | 8,188 | 2,874,397 |
| | | | 10,728,949 |
| Household Durables - 4.0% | | | |
| Cavco Industries, Inc. (a) | | 4,321 | 1,609,875 |
| Flexsteel Industries, Inc. (b) | | 15,038 | 524,074 |
| Green Brick Partners, Inc. (a) | | 36,086 | 2,111,031 |
| Installed Building Products, Inc. (b) | | 17,220 | 4,114,375 |
| KB Home | | 6,478 | 430,334 |
| M.D.C. Holdings, Inc. | | 3,915 | 245,471 |
| M/I Homes, Inc. (a) | | 24,931 | 3,165,988 |
| Meritage Homes Corp. | | 16,718 | 2,635,760 |
| Taylor Morrison Home Corp. (a) | | 41,772 | 2,364,713 |
| TRI Pointe Homes, Inc. (a) | | 87,993 | 3,113,192 |
| | | | 20,314,813 |
| Leisure Products - 0.0% | | | |
| Bowflex, Inc. (a) | | 100,162 | 19,281 |
| Sturm, Ruger & Co., Inc. | | 2,406 | 104,228 |
| | | | 123,509 |
| Specialty Retail - 4.2% | | | |
| Abercrombie & Fitch Co. Class A (a) | | 27,846 | 3,557,605 |
| Asbury Automotive Group, Inc. (a) | | 3,335 | 696,448 |
| CarParts.com, Inc. (a) | | 173,911 | 443,473 |
| Carvana Co. Class A (a) | | 55,196 | 4,191,032 |
| Group 1 Automotive, Inc. | | 1,347 | 364,566 |
| Murphy U.S.A., Inc. | | 6,265 | 2,612,568 |
| National Vision Holdings, Inc. (a) | | 39,626 | 927,248 |
| Sally Beauty Holdings, Inc. (a) | | 90,918 | 1,148,294 |
| Sonic Automotive, Inc. Class A (sub. vtg.) (b) | | 28,921 | 1,518,353 |
| Stitch Fix, Inc. (a) | | 79,016 | 255,222 |
| The Aaron's Co., Inc. | | 13,430 | 104,083 |
| The Container Store Group, Inc. (a) | | 71,979 | 99,331 |
| The ODP Corp. (a) | | 46,352 | 2,617,961 |
| Upbound Group, Inc. | | 45,681 | 1,542,191 |
| Urban Outfitters, Inc. (a) | | 28,085 | 1,166,932 |
| Winmark Corp. | | 413 | 156,754 |
| | | | 21,402,061 |
| Textiles, Apparel & Luxury Goods - 0.1% | | | |
| Lakeland Industries, Inc. | | 19,796 | 356,724 |
| Rocky Brands, Inc. | | 7,381 | 184,156 |
| | | | 540,880 |
TOTAL CONSUMER DISCRETIONARY | | | 65,995,717 |
| CONSUMER STAPLES - 2.2% | | | |
| Beverages - 1.1% | | | |
| Coca-Cola Bottling Co. Consolidated | | 3,669 | 3,084,895 |
| Primo Water Corp. | | 160,606 | 2,603,423 |
| | | | 5,688,318 |
| Consumer Staples Distribution & Retail - 0.3% | | | |
| Ingles Markets, Inc. Class A | | 10,723 | 825,778 |
| Natural Grocers by Vitamin Cottage, Inc. | | 17,904 | 296,669 |
| PriceSmart, Inc. | | 2,117 | 178,124 |
| | | | 1,300,571 |
| Food Products - 0.1% | | | |
| Fresh Del Monte Produce, Inc. | | 19,772 | 473,144 |
| Vital Farms, Inc. (a) | | 11,900 | 213,843 |
| | | | 686,987 |
| Personal Care Products - 0.6% | | | |
| BellRing Brands, Inc. (a) | | 28,181 | 1,604,908 |
| elf Beauty, Inc. (a) | | 5,192 | 1,082,688 |
| Herbalife Ltd. (a) | | 10,911 | 96,344 |
| | | | 2,783,940 |
| Tobacco - 0.1% | | | |
| Turning Point Brands, Inc. | | 7,258 | 183,627 |
| Vector Group Ltd. | | 26,944 | 300,695 |
| | | | 484,322 |
TOTAL CONSUMER STAPLES | | | 10,944,138 |
| ENERGY - 5.9% | | | |
| Energy Equipment & Services - 1.7% | | | |
| Archrock, Inc. | | 20,795 | 379,925 |
| Borr Drilling Ltd. | | 25,753 | 155,033 |
| Bristow Group, Inc. (a) | | 16,944 | 456,641 |
| DMC Global, Inc. (a) | | 602 | 10,041 |
| Helix Energy Solutions Group, Inc. (a) | | 124,567 | 1,121,103 |
| Helmerich & Payne, Inc. | | 5,185 | 199,052 |
| Kodiak Gas Services, Inc. | | 35,270 | 899,385 |
| Nabors Industries Ltd. (a)(b) | | 6,317 | 495,063 |
| Nabors Industries Ltd. warrants 6/11/26 (a) | | 10,764 | 90,418 |
| Oceaneering International, Inc. (a) | | 80,317 | 1,587,064 |
| Oil States International, Inc. (a) | | 37,212 | 200,573 |
| Patterson-UTI Energy, Inc. | | 25,560 | 295,729 |
| Tidewater, Inc. (a) | | 33,125 | 2,319,744 |
| U.S. Silica Holdings, Inc. (a) | | 31,067 | 357,271 |
| | | | 8,567,042 |
| Oil, Gas & Consumable Fuels - 4.2% | | | |
| Ardmore Shipping Corp. | | 33,221 | 539,177 |
| California Resources Corp. | | 4,217 | 220,001 |
| Civitas Resources, Inc. | | 16,056 | 1,102,726 |
| CNX Resources Corp. (a) | | 27,900 | 584,505 |
| CONSOL Energy, Inc. | | 3,346 | 287,154 |
| Delek U.S. Holdings, Inc. | | 54,295 | 1,385,065 |
| DHT Holdings, Inc. | | 24,569 | 265,837 |
| Equitrans Midstream Corp. | | 69,362 | 741,480 |
| Frontline PLC (NY Shares) | | 1,221 | 27,509 |
| FutureFuel Corp. | | 26,190 | 155,307 |
| Green Plains, Inc. (a) | | 128,687 | 2,741,033 |
| Magnolia Oil & Gas Corp. Class A (b) | | 54,826 | 1,243,454 |
| Matador Resources Co. (b) | | 64,602 | 4,079,616 |
| Murphy Oil Corp. | | 74,286 | 2,946,926 |
| Overseas Shipholding Group, Inc. | | 13,763 | 83,679 |
| PBF Energy, Inc. Class A | | 2,073 | 96,809 |
| Permian Resource Corp. Class A | | 112,212 | 1,746,019 |
| Scorpio Tankers, Inc. | | 15,008 | 1,007,487 |
| Teekay Tankers Ltd. | | 15,922 | 872,844 |
| Uranium Energy Corp. (a) | | 58,992 | 382,268 |
| Vitesse Energy, Inc. (b) | | 43,772 | 994,938 |
| W&T Offshore, Inc. | | 2,119 | 6,399 |
| | | | 21,510,233 |
TOTAL ENERGY | | | 30,077,275 |
| FINANCIALS - 15.7% | | | |
| Banks - 7.0% | | | |
| 1st Source Corp. | | 12,290 | 611,796 |
| Amalgamated Financial Corp. | | 4,679 | 107,991 |
| Ameris Bancorp | | 36,158 | 1,675,200 |
| Atlantic Union Bankshares Corp. | | 30,884 | 1,027,202 |
| Axos Financial, Inc. (a) | | 21,120 | 1,100,774 |
| BancFirst Corp. | | 29,895 | 2,622,987 |
| Bancorp, Inc., Delaware (a) | | 50,883 | 2,271,417 |
| Banner Corp. | | 19,278 | 845,148 |
| Berkshire Hills Bancorp, Inc. | | 37,507 | 806,025 |
| Byline Bancorp, Inc. | | 9,762 | 203,440 |
| Cadence Bank | | 48,427 | 1,340,459 |
| Capital City Bank Group, Inc. | | 2,403 | 68,125 |
| Central Pacific Financial Corp. | | 24,217 | 451,889 |
| Community Bank System, Inc. | | 10,098 | 457,439 |
| Community Trust Bancorp, Inc. | | 7,210 | 286,670 |
| CVB Financial Corp. | | 44,230 | 752,795 |
| Financial Institutions, Inc. | | 15,167 | 278,466 |
| First Bancorp, Puerto Rico | | 141,852 | 2,408,647 |
| First Busey Corp. | | 36,178 | 834,265 |
| First Commonwealth Financial Corp. | | 24,165 | 314,870 |
| First Financial Bankshares, Inc. | | 18,634 | 576,536 |
| Great Southern Bancorp, Inc. | | 23,186 | 1,208,918 |
| Heartland Financial U.S.A., Inc. | | 39,441 | 1,340,994 |
| Hope Bancorp, Inc. | | 13,212 | 144,936 |
| Lakeland Financial Corp. (b) | | 41,420 | 2,638,454 |
| Mercantile Bank Corp. | | 3,416 | 125,845 |
| Midland States Bancorp, Inc. | | 8,900 | 216,715 |
| NBT Bancorp, Inc. | | 4,448 | 152,967 |
| Northfield Bancorp, Inc. (b) | | 8,393 | 84,769 |
| Northwest Bancshares, Inc. | | 48,004 | 550,126 |
| OFG Bancorp | | 27,873 | 1,009,560 |
| Peapack-Gladstone Financial Corp. | | 11,424 | 276,804 |
| Provident Financial Services, Inc. (b) | | 170,375 | 2,569,255 |
| Renasant Corp. | | 42,108 | 1,331,034 |
| Sierra Bancorp | | 14,576 | 271,259 |
| Simmons First National Corp. Class A | | 31,063 | 596,410 |
| Stellar Bancorp, Inc. (b) | | 15,377 | 364,435 |
| UMB Financial Corp. | | 25,659 | 2,094,031 |
| Univest Corp. of Pennsylvania | | 10,172 | 203,643 |
| WesBanco, Inc. | | 10,077 | 292,031 |
| Westamerica Bancorp. | | 21,878 | 1,000,043 |
| | | | 35,514,370 |
| Capital Markets - 3.1% | | | |
| Assetmark Financial Holdings, Inc. (a) | | 70,639 | 2,497,089 |
| BGC Group, Inc. Class A | | 395,489 | 2,748,649 |
| Federated Hermes, Inc. | | 68,603 | 2,416,884 |
| Oppenheimer Holdings, Inc. Class A (non-vtg.) | | 4,960 | 189,968 |
| Stifel Financial Corp. | | 23,496 | 1,782,407 |
| StoneX Group, Inc. (a) | | 31,593 | 2,188,131 |
| Virtus Investment Partners, Inc. | | 10,668 | 2,478,390 |
| WisdomTree Investments, Inc. | | 171,093 | 1,379,010 |
| | | | 15,680,528 |
| Consumer Finance - 0.8% | | | |
| EZCORP, Inc. (non-vtg.) Class A (a)(b) | | 29,600 | 310,504 |
| Green Dot Corp. Class A (a) | | 27,418 | 225,102 |
| LendingTree, Inc. (a) | | 21,393 | 846,521 |
| PROG Holdings, Inc. | | 75,843 | 2,341,273 |
| Regional Management Corp. | | 12,164 | 284,638 |
| | | | 4,008,038 |
| Financial Services - 1.8% | | | |
| Compass Diversified Holdings | | 39,322 | 904,406 |
| Federal Agricultural Mortgage Corp. Class C (non-vtg.) | | 10,579 | 1,892,266 |
| i3 Verticals, Inc. Class A (a) | | 3,103 | 66,125 |
| Marqeta, Inc. Class A (a) | | 120,859 | 789,209 |
| NMI Holdings, Inc. (a) | | 22,607 | 680,019 |
| Payoneer Global, Inc. (a) | | 184,383 | 896,101 |
| Remitly Global, Inc. (a) | | 124,948 | 2,576,428 |
| StoneCo Ltd. Class A (a) | | 55,095 | 948,185 |
| Waterstone Financial, Inc. | | 28,944 | 366,142 |
| | | | 9,118,881 |
| Insurance - 2.3% | | | |
| American Equity Investment Life Holding Co. (a) | | 6,523 | 362,287 |
| Amerisafe, Inc. (b) | | 10,999 | 580,307 |
| CNO Financial Group, Inc. | | 13,158 | 351,187 |
| Goosehead Insurance (a) | | 22,888 | 1,731,477 |
| Kinsale Capital Group, Inc. | | 5,354 | 2,763,628 |
| Oscar Health, Inc. (a) | | 140,973 | 2,292,221 |
| Selective Insurance Group, Inc. | | 35,152 | 3,672,681 |
| | | | 11,753,788 |
| Mortgage Real Estate Investment Trusts - 0.7% | | | |
| Apollo Commercial Real Estate Finance, Inc. (b) | | 43,257 | 484,911 |
| BrightSpire Capital, Inc. | | 76,938 | 531,642 |
| KKR Real Estate Finance Trust, Inc. | | 112,322 | 1,095,140 |
| Ladder Capital Corp. Class A | | 51,714 | 559,028 |
| TPG RE Finance Trust, Inc. | | 67,580 | 505,498 |
| | | | 3,176,219 |
TOTAL FINANCIALS | | | 79,251,824 |
| HEALTH CARE - 14.4% | | | |
| Biotechnology - 7.4% | | | |
| 2seventy bio, Inc. (a)(b) | | 51,016 | 265,283 |
| ACADIA Pharmaceuticals, Inc. (a) | | 30,952 | 719,324 |
| Adaptimmune Therapeutics PLC sponsored ADR (a)(b) | | 98,114 | 154,039 |
| Adicet Bio, Inc. (a) | | 78,821 | 185,229 |
| Adverum Biotechnologies, Inc. (a) | | 117,523 | 232,696 |
| Affimed NV (a) | | 80,385 | 48,392 |
| Agenus, Inc. (a) | | 345,055 | 231,187 |
| Agios Pharmaceuticals, Inc. (a) | | 2,174 | 70,264 |
| Akebia Therapeutics, Inc. (a)(b) | | 326,663 | 516,128 |
| Alector, Inc. (a) | | 44,330 | 308,980 |
| Alkermes PLC (a) | | 40,155 | 1,192,202 |
| Allakos, Inc. (a) | | 205,389 | 303,976 |
| Allovir, Inc. (a) | | 73,332 | 54,016 |
| Alpine Immune Sciences, Inc. (a) | | 15,609 | 549,749 |
| Amicus Therapeutics, Inc. (a) | | 74,168 | 950,834 |
| Anika Therapeutics, Inc. (a) | | 5,548 | 134,705 |
| Annexon, Inc. (a) | | 51,282 | 285,641 |
| Arbutus Biopharma Corp. (a) | | 76,225 | 213,430 |
| Arcturus Therapeutics Holdings, Inc. (a) | | 17,920 | 694,579 |
| Arcus Biosciences, Inc. (a) | | 11,111 | 212,553 |
| Arcutis Biotherapeutics, Inc. (a)(b) | | 67,186 | 690,672 |
| Ardelyx, Inc. (a) | | 17,836 | 166,232 |
| Arrowhead Pharmaceuticals, Inc. (a) | | 16,015 | 514,082 |
| Assembly Biosciences, Inc. (a)(b) | | 7,222 | 92,369 |
| Atara Biotherapeutics, Inc. (a) | | 139,495 | 108,527 |
| Atreca, Inc. (a) | | 941 | 245 |
| Avid Bioservices, Inc. (a)(b) | | 15,041 | 115,515 |
| Beam Therapeutics, Inc. (a) | | 6,205 | 245,035 |
| Biohaven Ltd. (a) | | 16,447 | 791,759 |
| bluebird bio, Inc. (a) | | 79,328 | 110,266 |
| Blueprint Medicines Corp. (a) | | 8,070 | 754,706 |
| Bolt Biotherapeutics, Inc. (a)(b) | | 49,829 | 56,805 |
| BridgeBio Pharma, Inc. (a) | | 14,381 | 491,111 |
| CareDx, Inc. (a) | | 34,683 | 369,027 |
| Carisma Therapeutics, Inc. (b) | | 14,964 | 38,607 |
| Carisma Therapeutics, Inc. rights (a)(c) | | 304,482 | 3 |
| Cartesian Therapeutics, Inc. (a) | | 84,061 | 61,491 |
| Cartesian Therapeutics, Inc. rights (a)(c) | | 85,524 | 11,118 |
| Catalyst Pharmaceutical Partners, Inc. (a) | | 24,713 | 396,149 |
| Celldex Therapeutics, Inc. (a) | | 3,251 | 156,243 |
| Cerevel Therapeutics Holdings (a) | | 2,492 | 102,172 |
| Cogent Biosciences, Inc. (a) | | 17,623 | 123,361 |
| Corbus Pharmaceuticals Holdings, Inc. (a) | | 1,944 | 60,070 |
| Crinetics Pharmaceuticals, Inc. (a) | | 3,856 | 157,865 |
| Cytokinetics, Inc. (a) | | 12,394 | 895,343 |
| CytomX Therapeutics, Inc. (a)(b) | | 104,853 | 256,890 |
| Denali Therapeutics, Inc. (a) | | 15,359 | 303,801 |
| Design Therapeutics, Inc. (a) | | 41,569 | 115,562 |
| Disc Medicine, Inc. (a) | | 4,507 | 309,496 |
| Dynavax Technologies Corp. (a) | | 8,681 | 109,988 |
| Dyne Therapeutics, Inc. (a) | | 15,243 | 410,037 |
| Eagle Pharmaceuticals, Inc. (a) | | 11,624 | 68,117 |
| Editas Medicine, Inc. (a) | | 41,210 | 414,573 |
| Enanta Pharmaceuticals, Inc. (a) | | 15,605 | 224,244 |
| Fate Therapeutics, Inc. (a) | | 87,244 | 618,560 |
| FibroGen, Inc. (a) | | 166,580 | 284,852 |
| Fortress Biotech, Inc. (a)(b) | | 3,552 | 7,388 |
| Gritstone Bio, Inc. (a) | | 75,386 | 211,081 |
| Halozyme Therapeutics, Inc. (a) | | 19,046 | 758,221 |
| Heron Therapeutics, Inc. (a)(b) | | 172,785 | 459,608 |
| Homology Medicines, Inc. (a) | | 40,370 | 37,140 |
| Ideaya Biosciences, Inc. (a) | | 5,866 | 262,210 |
| Immunovant, Inc. (a) | | 6,518 | 230,542 |
| Insmed, Inc. (a) | | 36,756 | 1,018,876 |
| Intellia Therapeutics, Inc. (a) | | 11,162 | 358,523 |
| Iovance Biotherapeutics, Inc. (a)(b) | | 13,472 | 214,340 |
| Ironwood Pharmaceuticals, Inc. Class A (a) | | 48,380 | 456,223 |
| Jounce Therapeutics, Inc. rights (a)(c) | | 118,367 | 1 |
| Kalvista Pharmaceuticals, Inc. (a) | | 23,831 | 325,293 |
| Karyopharm Therapeutics, Inc. (a)(b) | | 166,484 | 193,121 |
| Kodiak Sciences, Inc. (a) | | 80,308 | 482,651 |
| Krystal Biotech, Inc. (a) | | 2,238 | 356,894 |
| Kura Oncology, Inc. (a) | | 34,647 | 730,359 |
| Macrogenics, Inc. (a) | | 42,559 | 763,508 |
| Madrigal Pharmaceuticals, Inc. (a) | | 1,674 | 395,399 |
| Mersana Therapeutics, Inc. (a) | | 165,413 | 899,847 |
| MiMedx Group, Inc. (a) | | 19,769 | 161,315 |
| Mirum Pharmaceuticals, Inc. (a) | | 10,431 | 299,474 |
| Mustang Bio, Inc. (a) | | 4,579 | 6,090 |
| Myriad Genetics, Inc. (a) | | 7,283 | 152,433 |
| Nkarta, Inc. (a) | | 2,283 | 27,579 |
| Nurix Therapeutics, Inc. (a) | | 31,402 | 387,815 |
| Oncternal Therapeutics, Inc. rights (a)(c) | | 1,148 | 0 |
| Organogenesis Holdings, Inc. Class A (a) | | 51,910 | 185,319 |
| ORIC Pharmaceuticals, Inc. (a) | | 53,018 | 675,449 |
| Ovid Therapeutics, Inc. (a) | | 43,354 | 147,404 |
| Precigen, Inc. (a) | | 137,992 | 212,508 |
| Protagonist Therapeutics, Inc. (a) | | 21,875 | 664,563 |
| PTC Therapeutics, Inc. (a) | | 20,533 | 578,825 |
| Puma Biotechnology, Inc. (a)(b) | | 27,826 | 173,078 |
| RAPT Therapeutics, Inc. (a) | | 8,720 | 74,730 |
| Recursion Pharmaceuticals, Inc. (a)(b) | | 21,699 | 292,069 |
| Relay Therapeutics, Inc. (a) | | 30,369 | 304,297 |
| Revolution Medicines, Inc. (a) | | 16,976 | 500,452 |
| Rhythm Pharmaceuticals, Inc. (a) | | 3,385 | 146,977 |
| Rigel Pharmaceuticals, Inc. (a) | | 121,443 | 184,593 |
| Rocket Pharmaceuticals, Inc. (a) | | 22,882 | 670,443 |
| Sana Biotechnology, Inc. (a)(b) | | 40,131 | 402,915 |
| Sangamo Therapeutics, Inc. (a) | | 174,155 | 202,020 |
| SpringWorks Therapeutics, Inc. (a) | | 7,122 | 350,830 |
| Surface Oncology, Inc. rights (a)(c) | | 60,289 | 1 |
| Sutro Biopharma, Inc. (a) | | 48,694 | 239,088 |
| Syndax Pharmaceuticals, Inc. (a) | | 21,608 | 506,492 |
| TG Therapeutics, Inc. (a) | | 13,308 | 229,164 |
| Travere Therapeutics, Inc. (a) | | 39,869 | 301,410 |
| Twist Bioscience Corp. (a) | | 19,376 | 761,283 |
| Vanda Pharmaceuticals, Inc. (a) | | 57,858 | 258,625 |
| Vaxcyte, Inc. (a) | | 14,349 | 1,059,243 |
| Vera Therapeutics, Inc. (a) | | 17,830 | 839,436 |
| Veracyte, Inc. (a) | | 4,855 | 114,335 |
| Vericel Corp. (a) | | 3,139 | 143,390 |
| Voyager Therapeutics, Inc. (a) | | 36,679 | 305,169 |
| Xbiotech, Inc. (a)(b) | | 12,740 | 79,752 |
| Y-mAbs Therapeutics, Inc. (a) | | 12,885 | 215,180 |
| Zentalis Pharmaceuticals, Inc. (a) | | 12,499 | 186,360 |
| Zymeworks, Inc. (a) | | 15,301 | 183,765 |
| | | | 37,333,196 |
| Health Care Equipment & Supplies - 3.5% | | | |
| Accuray, Inc. (a) | | 241,709 | 628,443 |
| Angiodynamics, Inc. (a) | | 13,111 | 71,979 |
| Artivion, Inc. (a) | | 39,817 | 768,468 |
| Atricure, Inc. (a) | | 37,938 | 1,326,692 |
| Avanos Medical, Inc. (a) | | 83,138 | 1,543,873 |
| AxoGen, Inc. (a) | | 12,263 | 129,497 |
| Axonics, Inc. (a) | | 2,615 | 177,663 |
| Cerus Corp. (a) | | 203,668 | 443,996 |
| Haemonetics Corp. (a) | | 9,305 | 679,079 |
| Inari Medical, Inc. (a) | | 26,635 | 1,228,406 |
| Integer Holdings Corp. (a) | | 2,629 | 289,952 |
| IRadimed Corp. | | 1,598 | 67,068 |
| Lantheus Holdings, Inc. (a) | | 37,992 | 2,483,917 |
| LivaNova PLC (a) | | 7,669 | 420,338 |
| Merit Medical Systems, Inc. (a) | | 25,516 | 1,944,319 |
| Omnicell, Inc. (a) | | 52,061 | 1,366,081 |
| RxSight, Inc. (a) | | 6,807 | 371,458 |
| SurModics, Inc. (a) | | 18,668 | 595,509 |
| Tactile Systems Technology, Inc. (a) | | 21,308 | 324,947 |
| Varex Imaging Corp. (a) | | 17,924 | 308,293 |
| Zimvie, Inc. (a) | | 141,776 | 2,403,103 |
| | | | 17,573,081 |
| Health Care Providers & Services - 1.2% | | | |
| 23andMe Holding Co. Class A (a) | | 411,220 | 234,395 |
| Addus HomeCare Corp. (a) | | 6,786 | 626,212 |
| Guardant Health, Inc. (a) | | 34,891 | 662,929 |
| HealthEquity, Inc. (a) | | 6,894 | 569,513 |
| National Healthcare Corp. (b) | | 3,682 | 363,266 |
| Option Care Health, Inc. (a) | | 102,021 | 3,292,218 |
| Patterson Companies, Inc. | | 10,832 | 293,439 |
| | | | 6,041,972 |
| Health Care Technology - 0.4% | | | |
| HealthStream, Inc. | | 38,047 | 1,037,922 |
| Phreesia, Inc. (a) | | 34,714 | 859,172 |
| Veradigm, Inc. (a)(b) | | 56,643 | 339,292 |
| | | | 2,236,386 |
| Life Sciences Tools & Services - 0.3% | | | |
| Adaptive Biotechnologies Corp. (a) | | 56,008 | 230,193 |
| Codexis, Inc. (a) | | 51,203 | 238,094 |
| Medpace Holdings, Inc. (a) | | 1,250 | 496,900 |
| Nanostring Technologies, Inc. (a)(b) | | 74,619 | 8,947 |
| OmniAb, Inc. (a) | | 63,415 | 370,344 |
| Pacific Biosciences of California, Inc. (a) | | 22,892 | 126,593 |
| | | | 1,471,071 |
| Pharmaceuticals - 1.6% | | | |
| Amneal Intermediate, Inc. (a) | | 82,053 | 452,933 |
| Amphastar Pharmaceuticals, Inc. (a) | | 12,717 | 592,231 |
| Amylyx Pharmaceuticals, Inc. (a) | | 10,780 | 203,203 |
| Arvinas Holding Co. LLC (a) | | 14,471 | 665,377 |
| Atea Pharmaceuticals, Inc. (a) | | 38,557 | 166,181 |
| Axsome Therapeutics, Inc. (a) | | 4,204 | 342,122 |
| Cara Therapeutics, Inc. (a) | | 94,187 | 80,078 |
| Corcept Therapeutics, Inc. (a) | | 25,404 | 596,994 |
| CymaBay Therapeutics, Inc. (a) | | 6,780 | 218,248 |
| Edgewise Therapeutics, Inc. (a) | | 12,076 | 197,201 |
| Eyepoint Pharmaceuticals, Inc. (a)(b) | | 17,404 | 473,563 |
| Intra-Cellular Therapies, Inc. (a) | | 13,712 | 953,258 |
| NGM Biopharmaceuticals, Inc. (a) | | 28,410 | 43,183 |
| Ocular Therapeutix, Inc. (a) | | 39,248 | 394,835 |
| Odonate, Inc. (a) | | 35 | 117,250 |
| Pacira Biosciences, Inc. (a) | | 8,853 | 263,111 |
| Prestige Brands Holdings, Inc. (a) | | 15,685 | 1,091,362 |
| Relmada Therapeutics, Inc. (a)(b) | | 51,289 | 314,145 |
| Supernus Pharmaceuticals, Inc. (a) | | 2,486 | 73,834 |
| Terns Pharmaceuticals, Inc. (a) | | 33,308 | 243,815 |
| Ventyx Biosciences, Inc. (a) | | 61,204 | 433,324 |
| WAVE Life Sciences (a) | | 31,691 | 152,434 |
| | | | 8,068,682 |
TOTAL HEALTH CARE | | | 72,724,388 |
| INDUSTRIALS - 18.0% | | | |
| Aerospace & Defense - 0.7% | | | |
| AAR Corp. (a) | | 36,846 | 2,460,576 |
| Astronics Corp. (a) | | 21,829 | 418,462 |
| Park Aerospace Corp. | | 10,380 | 157,984 |
| Rocket Lab U.S.A., Inc. Class A (a)(b) | | 82,216 | 376,960 |
| Virgin Galactic Holdings, Inc. (a)(b) | | 64,841 | 112,823 |
| | | | 3,526,805 |
| Air Freight & Logistics - 0.1% | | | |
| Forward Air Corp. | | 8,866 | 329,195 |
| Building Products - 1.6% | | | |
| American Woodmark Corp. (a) | | 4,071 | 408,077 |
| Apogee Enterprises, Inc. | | 27,215 | 1,556,970 |
| Griffon Corp. | | 23,266 | 1,661,192 |
| Janus International Group, Inc. (a) | | 129,569 | 1,859,315 |
| Jeld-Wen Holding, Inc. (a) | | 41,682 | 758,612 |
| PGT Innovations, Inc. (a) | | 4,286 | 179,026 |
| Resideo Technologies, Inc. (a) | | 60,064 | 1,341,229 |
| Simpson Manufacturing Co. Ltd. | | 1,967 | 410,474 |
| | | | 8,174,895 |
| Commercial Services & Supplies - 2.2% | | | |
| ABM Industries, Inc. | | 34,553 | 1,427,384 |
| ACV Auctions, Inc. Class A (a) | | 61,979 | 1,100,127 |
| Brady Corp. Class A | | 37,761 | 2,200,711 |
| CECO Environmental Corp. (a) | | 10,892 | 246,704 |
| Cimpress PLC (a) | | 33,268 | 3,260,597 |
| Interface, Inc. | | 21,416 | 336,660 |
| Steelcase, Inc. Class A | | 36,804 | 505,687 |
| The Brink's Co. | | 23,969 | 1,985,352 |
| | | | 11,063,222 |
| Construction & Engineering - 2.0% | | | |
| Arcosa, Inc. | | 4,922 | 408,526 |
| Comfort Systems U.S.A., Inc. | | 7,452 | 2,278,300 |
| Dycom Industries, Inc. (a) | | 4,832 | 611,200 |
| EMCOR Group, Inc. | | 10,432 | 3,270,641 |
| Fluor Corp. (a) | | 63,945 | 2,353,176 |
| Limbach Holdings, Inc. (a) | | 29,323 | 1,443,865 |
| | | | 10,365,708 |
| Electrical Equipment - 2.9% | | | |
| Array Technologies, Inc. (a) | | 55,870 | 762,067 |
| Atkore, Inc. | | 12,531 | 2,122,751 |
| Encore Wire Corp. | | 5,010 | 1,207,410 |
| EnerSys | | 32,170 | 2,955,780 |
| Enovix Corp. (a)(b) | | 7,344 | 71,604 |
| LSI Industries, Inc. | | 33,090 | 477,489 |
| Nextracker, Inc. Class A | | 4,779 | 268,771 |
| Powell Industries, Inc. (b) | | 12,956 | 2,399,969 |
| Preformed Line Products Co. | | 10,754 | 1,478,460 |
| Thermon Group Holdings, Inc. (a) | | 46,512 | 1,269,312 |
| Vicor Corp. (a) | | 40,441 | 1,506,023 |
| | | | 14,519,636 |
| Ground Transportation - 0.1% | | | |
| Marten Transport Ltd. | | 24,438 | 460,656 |
| Machinery - 2.7% | | | |
| Alamo Group, Inc. | | 1,585 | 320,630 |
| Albany International Corp. Class A (b) | | 6,366 | 597,576 |
| Enerpac Tool Group Corp. Class A | | 20,214 | 681,414 |
| Gorman-Rupp Co. | | 4,993 | 186,389 |
| Hurco Companies, Inc. | | 16,732 | 432,188 |
| Hyster-Yale Materials Handling, Inc. Class A | | 21,337 | 1,256,323 |
| L.B. Foster Co. Class A (a) | | 6,559 | 155,645 |
| Mueller Water Products, Inc. Class A | | 101,851 | 1,583,783 |
| Proto Labs, Inc. (a) | | 11,843 | 431,440 |
| SPX Technologies, Inc. (a) | | 5,069 | 594,036 |
| Tennant Co. | | 8,684 | 982,942 |
| Terex Corp. | | 55,295 | 3,171,168 |
| Watts Water Technologies, Inc. Class A | | 15,323 | 3,125,126 |
| | | | 13,518,660 |
| Marine Transportation - 0.6% | | | |
| Matson, Inc. | | 27,543 | 3,058,650 |
| Passenger Airlines - 0.7% | | | |
| Joby Aviation, Inc. (a)(b) | | 22,889 | 128,636 |
| SkyWest, Inc. (a) | | 51,133 | 3,283,761 |
| Sun Country Airlines Holdings, Inc. (a) | | 9,466 | 141,990 |
| | | | 3,554,387 |
| Professional Services - 2.8% | | | |
| Barrett Business Services, Inc. | | 10,694 | 1,304,561 |
| Conduent, Inc. (a) | | 19,833 | 68,226 |
| CRA International, Inc. | | 8,198 | 1,086,563 |
| CSG Systems International, Inc. (b) | | 46,254 | 2,523,618 |
| ExlService Holdings, Inc. (a) | | 106,034 | 3,299,778 |
| Huron Consulting Group, Inc. (a) | | 15,665 | 1,537,206 |
| Insperity, Inc. | | 1,858 | 189,126 |
| Parsons Corp. (a) | | 20,156 | 1,624,775 |
| Planet Labs PBC Class A (a) | | 163,263 | 357,546 |
| TriNet Group, Inc. | | 1,306 | 167,181 |
| TrueBlue, Inc. (a) | | 13,238 | 155,547 |
| Ttec Holdings, Inc. | | 10,670 | 186,192 |
| Upwork, Inc. (a) | | 138,920 | 1,819,852 |
| | | | 14,320,171 |
| Trading Companies & Distributors - 1.6% | | | |
| Alta Equipment Group, Inc. (b) | | 11,608 | 133,260 |
| Applied Industrial Technologies, Inc. | | 5,917 | 1,123,579 |
| Beacon Roofing Supply, Inc. (a) | | 14,248 | 1,223,761 |
| Boise Cascade Co. | | 1,561 | 212,156 |
| Custom Truck One Source, Inc. Class A (a) | | 14,694 | 94,335 |
| DXP Enterprises, Inc. (a) | | 9,229 | 327,814 |
| GATX Corp. | | 5,259 | 667,052 |
| Global Industrial Co. | | 20,193 | 885,463 |
| H&E Equipment Services, Inc. | | 29,704 | 1,677,979 |
| McGrath RentCorp. | | 992 | 123,484 |
| MRC Global, Inc. (a) | | 37,747 | 435,223 |
| Rush Enterprises, Inc. Class A | | 25,231 | 1,228,750 |
| | | | 8,132,856 |
TOTAL INDUSTRIALS | | | 91,024,841 |
| INFORMATION TECHNOLOGY - 14.5% | | | |
| Communications Equipment - 0.2% | | | |
| CommScope Holding Co., Inc. (a) | | 437,766 | 509,997 |
| Extreme Networks, Inc. (a) | | 36,649 | 463,243 |
| | | | 973,240 |
| Electronic Equipment, Instruments & Components - 3.3% | | | |
| Arlo Technologies, Inc. (a) | | 24,930 | 259,521 |
| Badger Meter, Inc. | | 10,439 | 1,656,565 |
| Bel Fuse, Inc. Class B (non-vtg.) | | 2,547 | 132,368 |
| Belden, Inc. | | 32,476 | 2,766,306 |
| Benchmark Electronics, Inc. | | 45,875 | 1,408,821 |
| Fabrinet (a) | | 15,860 | 3,418,940 |
| FARO Technologies, Inc. (a) | | 20,675 | 462,913 |
| Itron, Inc. (a) | | 20,909 | 1,937,846 |
| Kimball Electronics, Inc. (a) | | 37,738 | 849,482 |
| OSI Systems, Inc. (a) | | 1,513 | 198,475 |
| PC Connection, Inc. | | 15,669 | 1,040,108 |
| Sanmina Corp. (a) | | 43,194 | 2,729,861 |
| | | | 16,861,206 |
| Semiconductors & Semiconductor Equipment - 1.9% | | | |
| Axcelis Technologies, Inc. (a) | | 13,451 | 1,515,524 |
| Diodes, Inc. (a) | | 6,467 | 439,627 |
| Lattice Semiconductor Corp. (a) | | 28,328 | 2,170,208 |
| MaxLinear, Inc. Class A (a) | | 56,794 | 1,104,075 |
| PDF Solutions, Inc. (a) | | 59,569 | 2,024,750 |
| Photronics, Inc. (a) | | 58,618 | 1,687,612 |
| Rambus, Inc. (a) | | 10,047 | 595,184 |
| | | | 9,536,980 |
| Software - 7.0% | | | |
| 8x8, Inc. (a) | | 607,562 | 1,719,400 |
| AppFolio, Inc. (a) | | 3,213 | 777,835 |
| Aurora Innovation, Inc. (a)(b) | | 70,433 | 178,900 |
| Blackbaud, Inc. (a) | | 25,719 | 1,779,240 |
| BlackLine, Inc. (a) | | 43,553 | 2,470,762 |
| CommVault Systems, Inc. (a) | | 27,846 | 2,665,141 |
| Domo, Inc. Class B (a) | | 136,145 | 1,567,029 |
| E2open Parent Holdings, Inc. (a) | | 61,241 | 259,049 |
| Everbridge, Inc. (a) | | 19,809 | 560,000 |
| LivePerson, Inc. (a) | | 261,349 | 331,913 |
| Liveramp Holdings, Inc. (a) | | 77,346 | 2,705,563 |
| MeridianLink, Inc. (a) | | 11,976 | 227,065 |
| ON24, Inc. | | 15,541 | 109,098 |
| Pagerduty, Inc. (a) | | 79,383 | 1,917,893 |
| Progress Software Corp. | | 19,330 | 1,031,449 |
| PROS Holdings, Inc. (a) | | 23,594 | 843,486 |
| Q2 Holdings, Inc. (a) | | 70,937 | 3,279,418 |
| Qualys, Inc. (a) | | 21,489 | 3,693,100 |
| Rapid7, Inc. (a) | | 25,072 | 1,468,718 |
| SecureWorks Corp. (a) | | 25,429 | 167,831 |
| Sprinklr, Inc. (a) | | 84,633 | 1,102,768 |
| Sprout Social, Inc. (a) | | 7,898 | 488,254 |
| SPS Commerce, Inc. (a) | | 16,526 | 3,059,954 |
| Tenable Holdings, Inc. (a) | | 27,469 | 1,322,907 |
| Upland Software, Inc. (a) | | 35,489 | 103,983 |
| Yext, Inc. (a) | | 82,566 | 488,791 |
| Zuora, Inc. (a) | | 130,171 | 1,051,782 |
| | | | 35,371,329 |
| Technology Hardware, Storage & Peripherals - 2.1% | | | |
| IonQ, Inc. (a)(b) | | 21,034 | 217,912 |
| Super Micro Computer, Inc. (a) | | 12,031 | 10,420,283 |
| | | | 10,638,195 |
TOTAL INFORMATION TECHNOLOGY | | | 73,380,950 |
| MATERIALS - 5.0% | | | |
| Chemicals - 2.2% | | | |
| American Vanguard Corp. | | 64,672 | 693,284 |
| Balchem Corp. | | 1,981 | 311,393 |
| Ecovyst, Inc. (a) | | 58,002 | 559,719 |
| H.B. Fuller Co. | | 42,317 | 3,365,471 |
| Hawkins, Inc. | | 5,955 | 418,339 |
| Innospec, Inc. | | 16,220 | 2,015,659 |
| Minerals Technologies, Inc. | | 41,670 | 3,015,241 |
| Rayonier Advanced Materials, Inc. (a) | | 35,181 | 119,264 |
| Sensient Technologies Corp. (b) | | 10,498 | 702,106 |
| Trinseo PLC | | 38,524 | 173,358 |
| | | | 11,373,834 |
| Containers & Packaging - 0.4% | | | |
| Myers Industries, Inc. | | 87,826 | 1,688,894 |
| Pactiv Evergreen, Inc. | | 39,394 | 581,062 |
| | | | 2,269,956 |
| Metals & Mining - 2.2% | | | |
| Arch Resources, Inc. | | 2,591 | 428,266 |
| ATI, Inc. (a) | | 40,702 | 2,001,724 |
| Carpenter Technology Corp. | | 41,294 | 2,669,657 |
| Constellium NV (a) | | 70,220 | 1,361,566 |
| Materion Corp. (b) | | 11,055 | 1,484,908 |
| Olympic Steel, Inc. | | 2,891 | 196,646 |
| Ryerson Holding Corp. | | 23,853 | 753,278 |
| SunCoke Energy, Inc. | | 106,676 | 1,142,500 |
| Worthington Steel, Inc. | | 28,020 | 887,113 |
| | | | 10,925,658 |
| Paper & Forest Products - 0.2% | | | |
| Clearwater Paper Corp. (a) | | 20,783 | 816,564 |
TOTAL MATERIALS | | | 25,386,012 |
| REAL ESTATE - 4.2% | | | |
| Equity Real Estate Investment Trusts (REITs) - 3.9% | | | |
| Alexanders, Inc. | | 1,175 | 259,734 |
| American Assets Trust, Inc. | | 79,567 | 1,716,260 |
| Ashford Hospitality Trust, Inc. (a)(b) | | 77,822 | 150,196 |
| Community Healthcare Trust, Inc. | | 6,078 | 164,957 |
| EastGroup Properties, Inc. | | 12,397 | 2,178,029 |
| Empire State Realty Trust, Inc. | | 199,023 | 1,984,259 |
| Global Medical REIT, Inc. | | 89,691 | 802,734 |
| Global Net Lease, Inc. (b) | | 80,209 | 578,307 |
| LXP Industrial Trust (REIT) | | 64,540 | 558,916 |
| National Storage Affiliates Trust | | 9,533 | 341,377 |
| NexPoint Residential Trust, Inc. | | 5,265 | 153,791 |
| Phillips Edison & Co., Inc. | | 54,011 | 1,929,273 |
| Physicians Realty Trust | | 11,313 | 127,045 |
| Retail Opportunity Investments Corp. | | 39,747 | 513,929 |
| Ryman Hospitality Properties, Inc. | | 27,318 | 3,236,637 |
| SITE Centers Corp. | | 42,789 | 581,075 |
| Tanger, Inc. | | 18,405 | 530,248 |
| Terreno Realty Corp. | | 50,653 | 3,256,988 |
| Universal Health Realty Income Trust (SBI) | | 12,999 | 504,101 |
| Urban Edge Properties | | 22,522 | 383,099 |
| | | | 19,950,955 |
| Real Estate Management & Development - 0.3% | | | |
| Anywhere Real Estate, Inc. (a) | | 35,263 | 221,099 |
| Compass, Inc. (a) | | 62,943 | 248,625 |
| Cushman & Wakefield PLC (a) | | 18,418 | 183,996 |
| Opendoor Technologies, Inc. (a) | | 241,841 | 744,870 |
| | | | 1,398,590 |
TOTAL REAL ESTATE | | | 21,349,545 |
| UTILITIES - 1.2% | | | |
| Electric Utilities - 0.5% | | | |
| Allete, Inc. | | 29,175 | 1,652,472 |
| MGE Energy, Inc. | | 1,404 | 88,719 |
| Otter Tail Corp. (b) | | 5,594 | 506,033 |
| Portland General Electric Co. | | 2,593 | 104,161 |
| | | | 2,351,385 |
| Gas Utilities - 0.2% | | | |
| New Jersey Resources Corp. | | 31,577 | 1,313,919 |
| Independent Power and Renewable Electricity Producers - 0.2% | | | |
| Altus Power, Inc. Class A (a)(b) | | 33,989 | 231,465 |
| Clearway Energy, Inc.: | | | |
| Class A | | 18,652 | 377,890 |
| Class C | | 17,411 | 379,560 |
| | | | 988,915 |
| Water Utilities - 0.3% | | | |
| American States Water Co. | | 16,411 | 1,171,910 |
| Consolidated Water Co., Inc. | | 6,715 | 198,495 |
| SJW Group | | 5,931 | 326,561 |
| | | | 1,696,966 |
TOTAL UTILITIES | | | 6,351,185 |
| TOTAL COMMON STOCKS (Cost $413,734,853) | | | 496,074,229 |
| | | | |
| U.S. Treasury Obligations - 0.2% |
| | | Principal Amount (d) | Value ($) |
U.S. Treasury Bills, yield at date of purchase 5.29% to 5.3% 3/7/24 to 5/16/24 (e) (Cost $1,133,111) | | 1,140,000 | 1,133,096 |
| | | | |
| Money Market Funds - 6.0% |
| | | Shares | Value ($) |
| Fidelity Cash Central Fund 5.39% (f) | | 8,989,198 | 8,990,995 |
| Fidelity Securities Lending Cash Central Fund 5.39% (f)(g) | | 21,309,359 | 21,311,490 |
| TOTAL MONEY MARKET FUNDS (Cost $30,302,484) | | | 30,302,485 |
| | | | |
| TOTAL INVESTMENT IN SECURITIES - 104.2% (Cost $445,170,448) | 527,509,810 |
NET OTHER ASSETS (LIABILITIES) - (4.2)% | (21,429,904) |
| NET ASSETS - 100.0% | 506,079,906 |
| | |
| Futures Contracts |
| | Number of contracts | Expiration Date | Notional Amount ($) | Value ($) | Unrealized Appreciation/ (Depreciation) ($) |
| Purchased | | | | | |
| | | | | | |
| Equity Index Contracts | | | | | |
| CME E-mini Russell 2000 Index Contracts (United States) | 83 | Mar 2024 | 8,537,795 | 500,647 | 500,647 |
| | | | | | |
| The notional amount of futures purchased as a percentage of Net Assets is 1.7% |
Legend
| (b) | Security or a portion of the security is on loan at period end. |
| (d) | Amount is stated in United States dollars unless otherwise noted. |
| (e) | Security or a portion of the security was pledged to cover margin requirements for futures contracts. At period end, the value of securities pledged amounted to $583,579. |
| (f) | Affiliated fund that is generally available only to investment companies and other accounts managed by Fidelity Investments. The rate quoted is the annualized seven-day yield of the fund at period end. A complete unaudited listing of the fund's holdings as of its most recent quarter end is available upon request. In addition, each Fidelity Central Fund's financial statements, which are not covered by the Fund's Report of Independent Registered Public Accounting Firm, are available on the SEC's website or upon request. |
| (g) | Investment made with cash collateral received from securities on loan. |
Affiliated Central Funds
Fiscal year to date information regarding the Fund's investments in Fidelity Central Funds, including the ownership percentage, is presented below.
| Affiliate | Value, beginning of period ($) | Purchases ($) | Sales Proceeds ($) | Dividend Income ($) | Realized Gain (loss) ($) | Change in Unrealized appreciation (depreciation) ($) | Value, end of period ($) | % ownership, end of period |
| Fidelity Cash Central Fund 5.39% | 8,573,464 | 204,549,458 | 204,131,927 | 378,989 | - | - | 8,990,995 | 0.0% |
| Fidelity Securities Lending Cash Central Fund 5.39% | 44,526,740 | 175,229,169 | 198,444,420 | 88,263 | 2,245 | (2,244) | 21,311,490 | 0.1% |
| Total | 53,100,204 | 379,778,627 | 402,576,347 | 467,252 | 2,245 | (2,244) | 30,302,485 | |
| | | | | | | | | |
Amounts in the dividend income column in the above table include any capital gain distributions from underlying funds, which are presented in the corresponding line item in the Statement of Operations, if applicable.
Amounts in the dividend income column for Fidelity Securities Lending Cash Central Fund represents the income earned on investing cash collateral, less rebates paid to borrowers and any lending agent fees associated with the loan, plus any premium payments received for lending certain types of securities.
Amounts included in the purchases and sales proceeds columns may include in-kind transactions, if applicable.
Investment Valuation
The following is a summary of the inputs used, as of February 29, 2024, involving the Fund's assets and liabilities carried at fair value. The inputs or methodology used for valuing securities may not be an indication of the risk associated with investing in those securities. For more information on valuation inputs, and their aggregation into the levels used below, please refer to the Investment Valuation section in the accompanying Notes to Financial Statements.
| Valuation Inputs at Reporting Date: |
| Description | Total ($) | Level 1 ($) | Level 2 ($) | Level 3 ($) |
Investments in Securities: | | | | |
|
| Equities: | | | | |
Communication Services | 19,588,354 | 19,588,354 | - | - |
Consumer Discretionary | 65,995,717 | 65,995,717 | - | - |
Consumer Staples | 10,944,138 | 10,944,138 | - | - |
Energy | 30,077,275 | 30,077,275 | - | - |
Financials | 79,251,824 | 79,251,824 | - | - |
Health Care | 72,724,388 | 72,713,265 | - | 11,123 |
Industrials | 91,024,841 | 91,024,841 | - | - |
Information Technology | 73,380,950 | 73,380,950 | - | - |
Materials | 25,386,012 | 25,386,012 | - | - |
Real Estate | 21,349,545 | 21,349,545 | - | - |
Utilities | 6,351,185 | 6,351,185 | - | - |
|
| U.S. Government and Government Agency Obligations | 1,133,096 | - | 1,133,096 | - |
|
| Money Market Funds | 30,302,485 | 30,302,485 | - | - |
| Total Investments in Securities: | 527,509,810 | 526,365,591 | 1,133,096 | 11,123 |
Derivative Instruments: Assets | | | | |
Futures Contracts | 500,647 | 500,647 | - | - |
| Total Assets | 500,647 | 500,647 | - | - |
| Total Derivative Instruments: | 500,647 | 500,647 | - | - |
Value of Derivative Instruments
The following table is a summary of the Fund's value of derivative instruments by primary risk exposure as of February 29, 2024. For additional information on derivative instruments, please refer to the Derivative Instruments section in the accompanying Notes to Financial Statements.
Primary Risk Exposure / Derivative Type | Value |
| Asset ($) | Liability ($) |
| Equity Risk | | |
Futures Contracts (a) | 500,647 | 0 |
| Total Equity Risk | 500,647 | 0 |
| Total Value of Derivatives | 500,647 | 0 |
(a)Reflects gross cumulative appreciation (depreciation) on futures contracts as presented in the Schedule of Investments. In the Statement of Assets and Liabilities, the period end daily variation margin is included in receivable or payable for daily variation margin on futures contracts, and the net cumulative appreciation (depreciation) is included in Total accumulated earnings (loss).
| Statement of Assets and Liabilities |
| | | | February 29, 2024 |
| | | | | |
| Assets | | | | |
| Investment in securities, at value (including securities loaned of $20,858,873) - See accompanying schedule: | | | | |
Unaffiliated issuers (cost $414,867,964) | $ | 497,207,325 | | |
Fidelity Central Funds (cost $30,302,484) | | 30,302,485 | | |
| | | | | |
| | | | | |
| Total Investment in Securities (cost $445,170,448) | | | $ | 527,509,810 |
| Cash | | | | 29,635 |
| Receivable for investments sold | | | | 8,338,885 |
| Dividends receivable | | | | 288,529 |
| Distributions receivable from Fidelity Central Funds | | | | 41,536 |
| Receivable for daily variation margin on futures contracts | | | | 60,649 |
| Other receivables | | | | 2,441 |
Total assets | | | | 536,271,485 |
| Liabilities | | | | |
| Payable for fund shares redeemed | $ | 8,765,118 | | |
| Accrued management fee | | 116,687 | | |
| Other payables and accrued expenses | | 4,429 | | |
| Collateral on securities loaned | | 21,305,345 | | |
| Total Liabilities | | | | 30,191,579 |
| Net Assets | | | $ | 506,079,906 |
| Net Assets consist of: | | | | |
| Paid in capital | | | $ | 453,473,055 |
| Total accumulated earnings (loss) | | | | 52,606,851 |
| Net Assets | | | $ | 506,079,906 |
Net Asset Value, offering price and redemption price per share ($506,079,906 ÷ 17,321,356 shares) | | | $ | 29.22 |
| Statement of Operations |
| | | | Year ended February 29, 2024 |
| Investment Income | | | | |
| Dividends | | | $ | 6,718,777 |
| Interest | | | | 26,617 |
| Income from Fidelity Central Funds (including $88,263 from security lending) | | | | 467,252 |
| Total Income | | | | 7,212,646 |
| Expenses | | | | |
| Management fee | $ | 2,551,454 | | |
| Independent trustees' fees and expenses | | 3,413 | | |
| Miscellaneous | | 11,754 | | |
| Total expenses before reductions | | 2,566,621 | | |
| Expense reductions | | (3,509) | | |
| Total expenses after reductions | | | | 2,563,112 |
| Net Investment income (loss) | | | | 4,649,534 |
| Realized and Unrealized Gain (Loss) | | | | |
| Net realized gain (loss) on: | | | | |
| Investment Securities: | | | | |
| Unaffiliated issuers | | 3,174,058 | | |
| Redemptions in-kind | | 29,724,397 | | |
| Fidelity Central Funds | | 2,245 | | |
| Futures contracts | | (106,111) | | |
| Total net realized gain (loss) | | | | 32,794,589 |
| Change in net unrealized appreciation (depreciation) on: | | | | |
| Investment Securities: | | | | |
| Unaffiliated issuers | | 27,423,408 | | |
| Fidelity Central Funds | | (2,244) | | |
| Futures contracts | | 283,082 | | |
| Total change in net unrealized appreciation (depreciation) | | | | 27,704,246 |
| Net gain (loss) | | | | 60,498,835 |
| Net increase (decrease) in net assets resulting from operations | | | $ | 65,148,369 |
See Organization and Merger information note regarding reorganization from mutual fund to exchange traded fund.
| Statement of Changes in Net Assets |
| |
| | Year ended February 29, 2024 | | Year ended February 28, 2023 |
| Increase (Decrease) in Net Assets | | | | |
| Operations | | | | |
| Net investment income (loss) | $ | 4,649,534 | $ | 5,449,677 |
| Net realized gain (loss) | | 32,794,589 | | (26,454,327) |
| Change in net unrealized appreciation (depreciation) | | 27,704,246 | | 865,031 |
| Net increase (decrease) in net assets resulting from operations | | 65,148,369 | | (20,139,619) |
| Distributions to shareholders | | (4,715,442) | | (28,460,527) |
| | | | | |
| Share transactions | | | | |
| Proceeds from sales of shares | | 117,577,525 | | 54,476,948 |
| Reinvestment of distributions | | 4,092,903 | | 26,941,979 |
| Cost of shares redeemed | | (261,496,096) | | (102,513,711) |
| | | | | |
Net increase (decrease) in net assets resulting from share transactions | | (139,825,668) | | (21,094,784) |
| Total increase (decrease) in net assets | | (79,392,741) | | (69,694,930) |
| | | | | |
| Net Assets | | | | |
| Beginning of period | | 585,472,647 | | 655,167,577 |
| End of period | $ | 506,079,906 | $ | 585,472,647 |
| | | | | |
| Other Information | | | | |
| Shares | | | | |
| Sold | | 4,564,341 | | 2,217,524 |
| Issued in reinvestment of distributions | | 163,135 | | 1,060,903 |
| Redeemed | | (10,287,720) | | (4,201,984) |
| Net increase (decrease) | | (5,560,244) | | (923,557) |
| | | | | |
See Organization and Merger information note regarding reorganization from mutual fund to exchange traded fund.
Share activity is further described in Organization and Merger information notes, amounts have been adjusted to reflect the impact of the change in capital structure associated with the merger. All financial information prior to the merger is that of the Predecessor Fund.
Financial Highlights
| Fidelity® Enhanced Small Cap ETF |
| |
| Years ended February 28, | | 2024 A,B | | 2023 B | | 2022 B | | 2021 B | | 2020 A,B |
Selected Per-Share Data | | | | | | | | | | |
| Net asset value, beginning of period | $ | 25.58 | $ | 27.53 | $ | 34.05 | $ | 22.27 | $ | 24.75 |
| Income from Investment Operations | | | | | | | | | | |
Net investment income (loss) C,D | | .22 | | .24 | | .14 | | .16 | | .24 |
| Net realized and unrealized gain (loss) | | 3.65 | | (.99) | | (.40) | | 11.80 | | (2.48) |
| Total from investment operations | | 3.87 | | (.75) | | (.26) | | 11.96 | | (2.24) |
| Distributions from net investment income | | (.23) | | (.22) | | (.14) | | (.18) | | (.24) |
| Distributions from net realized gain | | - | | (1.00) | | (6.12) | | - | | - |
| Total distributions | | (.23) | | (1.20) E | | (6.26) | | (.18) | | (.24) |
| Net asset value, end of period | $ | 29.22 | $ | 25.58 | $ | 27.53 | $ | 34.05 | $ | 22.27 |
Total Return F,G | | 15.26% | | (2.62)% | | (1.64)% | | 53.78% | | (9.18)% |
Ratios to Average Net Assets D,H,I | | | | | | | | | | |
| Expenses before reductions | | .48% | | .55% | | .63% | | .64% | | .64% |
| Expenses net of fee waivers, if any | | .48% | | .55% | | .63% | | .64% | | .64% |
| Expenses net of all reductions | | .48% | | .55% | | .63% | | .64% | | .64% |
| Net investment income (loss) | | .87% | | .94% | | .41% | | .62% | | .94% |
| Supplemental Data | | | | | | | | | | |
| Net assets, end of period (000 omitted) | $ | 506,080 | $ | 585,473 | $ | 655,168 | $ | 689,131 | $ | 515,960 |
Portfolio turnover rate J | | 97% K | | 98% | | 96% | | 44% | | 79% |
AFor the year ended February 29.
BAs further described in Organization and Merger information notes, per share amounts have been adjusted to reflect the impact of the change in capital structure associated with the merger. All financial information prior to the merger is that of the Predecessor Fund.
CCalculated based on average shares outstanding during the period.
DNet investment income (loss) is affected by the timing of the declaration of dividends by any underlying mutual funds or exchange-traded funds (ETFs). Net investment income (loss) of any mutual funds or ETFs is not included in the Fund's net investment income (loss) ratio.
ETotal distributions per share do not sum due to rounding.
FTotal returns would have been lower if certain expenses had not been reduced during the applicable periods shown.
GBased on net asset value.
HFees and expenses of any underlying mutual funds or exchange-traded funds (ETFs) are not included in the Fund's expense ratio. The Fund indirectly bears its proportionate share of these expenses. For additional expense information related to investments in Fidelity Central Funds, please refer to the "Investments in Fidelity Central Funds" note found in the Notes to Financial Statements section of the most recent Annual or Semi-Annual report.
IExpense ratios reflect operating expenses of the class. Expenses before reductions do not reflect amounts reimbursed, waived, or reduced through arrangements with the investment adviser, brokerage services, or other offset arrangements, if applicable, and do not represent the amount paid by the class during periods when reimbursements, waivers or reductions occur.
JAmount does not include the portfolio activity of any underlying mutual funds or exchange-traded funds (ETFs).
KPortfolio turnover rate excludes securities received or delivered in-kind.
For the period ended February 29, 2024
1. Organization.
Fidelity Enhanced Small Cap ETF (the Fund) is an exchange-traded fund of Fidelity Covington Trust (the Trust) and is authorized to issue an unlimited number of shares. The Trust is registered under the Investment Company Act of 1940, as amended (the 1940 Act), as an open-end management investment company organized as a Massachusetts business trust.
Effective November 17, 2023, Fidelity Small Cap Enhanced Index Fund (Predecessor Fund) reorganized into the newly created Fidelity Enhanced Small Cap ETF. The Predecessor Fund was the accounting survivor in the reorganization, and, as such, the financial statements and financial highlights of the Fund reflects the financial information of the Predecessor Fund through November 17, 2023 (see Merger Information note).
2. Investments in Fidelity Central Funds.
Funds may invest in Fidelity Central Funds, which are open-end investment companies generally available only to other investment companies and accounts managed by the investment adviser and its affiliates. The Schedule of Investments lists any Fidelity Central Funds held as an investment as of period end, but does not include the underlying holdings of each Fidelity Central Fund. An investing fund indirectly bears its proportionate share of the expenses of the underlying Fidelity Central Funds.
Based on its investment objective, each Fidelity Central Fund may invest or participate in various investment vehicles or strategies that are similar to those of the investing fund. These strategies are consistent with the investment objectives of the investing fund and may involve certain economic risks which may cause a decline in value of each of the Fidelity Central Funds and thus a decline in the value of the investing fund.
| Fidelity Central Fund | Investment Manager | Investment Objective | Investment Practices | Expense RatioA |
| Fidelity Money Market Central Funds | Fidelity Management & Research Company LLC (FMR) | Each fund seeks to obtain a high level of current income consistent with the preservation of capital and liquidity. | Short-term Investments | Less than .005% |
A Expenses expressed as a percentage of average net assets and are as of each underlying Central Fund's most recent annual or semi-annual shareholder report.
A complete unaudited list of holdings for each Fidelity Central Fund is available upon request or at the Securities and Exchange Commission website at www.sec.gov. In addition, the financial statements of the Fidelity Central Funds, which are not covered by the Report of Independent Registered Public Accounting Firm, are available on the Securities and Exchange Commission website or upon request.
3. Significant Accounting Policies.
The Fund is an investment company and applies the accounting and reporting guidance of the Financial Accounting Standards Board (FASB) Accounting Standards Codification Topic 946 Financial Services - Investment Companies. The financial statements have been prepared in conformity with accounting principles generally accepted in the United States of America (GAAP), which require management to make certain estimates and assumptions at the date of the financial statements. Actual results could differ from those estimates. Subsequent events, if any, through the date that the financial statements were issued have been evaluated in the preparation of the financial statements. The Fund's Schedule of Investments lists any underlying mutual funds or exchange-traded funds (ETFs) but does not include the underlying holdings of these funds. The following summarizes the significant accounting policies of the Fund:
Investment Valuation. Investments are valued as of 4:00 p.m. Eastern time on the last calendar day of the period. The Board of Trustees (the Board) has designated the Fund's investment adviser as the valuation designee responsible for the fair valuation function and performing fair value determinations as needed. The investment adviser has established a Fair Value Committee (the Committee) to carry out the day-to-day fair valuation responsibilities and has adopted policies and procedures to govern the fair valuation process and the activities of the Committee. In accordance with these fair valuation policies and procedures, which have been approved by the Board, the Fund attempts to obtain prices from one or more third party pricing services or brokers to value its investments. When current market prices, quotations or currency exchange rates are not readily available or reliable, investments will be fair valued in good faith by the Committee, in accordance with the policies and procedures. Factors used in determining fair value vary by investment type and may include market or investment specific events, transaction data, estimated cash flows, and market observations of comparable investments. The frequency that the fair valuation procedures are used cannot be predicted and they may be utilized to a significant extent. The Committee manages the Fund's fair valuation practices and maintains the fair valuation policies and procedures. The Fund's investment adviser reports to the Board information regarding the fair valuation process and related material matters.
The Fund categorizes the inputs to valuation techniques used to value its investments into a disclosure hierarchy consisting of three levels as shown below:
Level 1 - unadjusted quoted prices in active markets for identical investments
Level 2 - other significant observable inputs (including quoted prices for similar investments, interest rates, prepayment speeds, etc.)
Level 3 - unobservable inputs (including the Fund's own assumptions based on the best information available)
Valuation techniques used to value the Fund's investments by major category are as follows:
Equity securities, including restricted securities, for which market quotations are readily available, are valued at the last reported sale price or official closing price as reported by a third party pricing service on the primary market or exchange on which they are traded and are categorized as Level 1 in the hierarchy. In the event there were no sales during the day or closing prices are not available, securities are valued at the last quoted bid price or may be valued using the last available price and are generally categorized as Level 2 in the hierarchy. For foreign equity securities, when market or security specific events arise, comparisons to the valuation of American Depositary Receipts (ADRs), futures contracts, ETFs and certain indexes as well as quoted prices for similar securities may be used and would be categorized as Level 2 in the hierarchy. For equity securities, including restricted securities, where observable inputs are limited, assumptions about market activity and risk are used and these securities may be categorized as Level 3 in the hierarchy.
Debt securities, including restricted securities, are valued based on evaluated prices received from third party pricing services or from brokers who make markets in such securities. U.S. government and government agency obligations are valued by pricing services who utilize matrix pricing which considers yield or price of bonds of comparable quality, coupon, maturity and type or by broker-supplied prices. When independent prices are unavailable or unreliable, debt securities may be valued utilizing pricing methodologies which consider similar factors that would be used by third party pricing services. Debt securities are generally categorized as Level 2 in the hierarchy but may be Level 3 depending on the circumstances.
Futures contracts are valued at the settlement price established each day by the board of trade or exchange on which they are traded and are categorized as Level 1 in the hierarchy. Investments in open-end mutual funds, including the Fidelity Central Funds, are valued at their closing net asset value (NAV) each business day and are categorized as Level 1 in the hierarchy.
Changes in valuation techniques may result in transfers in or out of an assigned level within the disclosure hierarchy. The aggregate value of investments by input level as of February 29, 2024 is included at the end of the Fund's Schedule of Investments.
Investment Transactions and Income. For financial reporting purposes, the Fund's investment holdings and NAV include trades executed through the end of the last business day of the period. The NAV per share for processing shareholder transactions is calculated as of the close of business (normally 4:00 p.m. Eastern time) of the New York Stock Exchange, Archipelago Exchange (NYSE Arca) and includes trades executed through the end of the prior business day. Gains and losses on securities sold are determined on the basis of identified cost and include proceeds received from litigation. Commissions paid to certain brokers with whom the investment adviser, or its affiliates, places trades on behalf of a fund include an amount in addition to trade execution, which may be rebated back to a fund. Any such rebates are included in net realized gain (loss) on investments in the Statement of Operations. Dividend income is recorded on the ex-dividend date, except for certain dividends from foreign securities where the ex-dividend date may have passed, which are recorded as soon as the Fund is informed of the ex-dividend date. Non-cash dividends included in dividend income, if any, are recorded at the fair market value of the securities received. Income and capital gain distributions from Fidelity Central Funds, if any, are recorded on the ex-dividend date. Interest income is accrued as earned and includes coupon interest and amortization of premium and accretion of discount on debt securities as applicable.
Expenses. Expenses directly attributable to a fund are charged to that fund. Expenses attributable to more than one fund are allocated among the respective funds on the basis of relative net assets or other appropriate methods. Expenses included in the accompanying financial statements reflect the expenses of that fund and do not include any expenses associated with any underlying mutual funds or exchange-traded funds. Although not included in a fund's expenses, a fund indirectly bears its proportionate share of these expenses through the net asset value of each underlying mutual fund or exchange-traded fund. Expense estimates are accrued in the period to which they relate and adjustments are made when actual amounts are known.
Income Tax Information and Distributions to Shareholders. Each year, the Fund intends to qualify as a regulated investment company under Subchapter M of the Internal Revenue Code, including distributing substantially all of its taxable income and realized gains. As a result, no provision for U.S. Federal income taxes is required. As of February 29, 2024, the Fund did not have any unrecognized tax benefits in the financial statements; nor is the Fund aware of any tax positions for which it is reasonably possible that the total amounts of unrecognized tax benefits will significantly change in the next twelve months. The Fund files a U.S. federal tax return, in addition to state and local tax returns as required. The Fund's federal income tax returns are subject to examination by the Internal Revenue Service (IRS) for a period of three fiscal years after they are filed. State and local tax returns may be subject to examination for an additional fiscal year depending on the jurisdiction. Realized gain or loss resulting from in-kind redemptions is not taxable to the Fund and is not distributed to shareholders of the Fund.
Distributions are declared and recorded on the ex-dividend date. Income and capital gain distributions are determined in accordance with income tax regulations, which may differ from GAAP.
Capital accounts within the financial statements are adjusted for permanent book-tax differences. These adjustments have no impact on net assets or the results of operations. Capital accounts are not adjusted for temporary book-tax differences which will reverse in a subsequent period.
Book-tax differences are primarily due to futures contracts, redemptions in-kind, capital loss carryforwards and losses deferred due to wash sales.
As of period end, the cost and unrealized appreciation (depreciation) in securities, and derivatives if applicable, for federal income tax purposes were as follows:
| Gross unrealized appreciation | $121,978,191 |
| Gross unrealized depreciation | (42,670,333) |
| Net unrealized appreciation (depreciation) | $79,307,858 |
| Tax Cost | $448,201,952 |
The tax-based components of distributable earnings as of period end were as follows:
| Capital loss carryforward | $(26,590,945) |
| Net unrealized appreciation (depreciation) on securities and other investments | $79,307,858 |
Capital loss carryforwards are only available to offset future capital gains of the Fund to the extent provided by regulations and may be limited. The capital loss carryforward information presented below, including any applicable limitation, is estimated as of fiscal period end and is subject to adjustment.
Short-term | $(26,590,945) |
| Total capital loss carryforward | $(26,590,945) |
The tax character of distributions paid was as follows:
| | February 29, 2024 | February 28, 2023 |
| Ordinary Income | $4,715,442 | $4,900,302 |
| Long-term Capital Gains | - | 23,560,225 |
| Total | $4,715,442 | $28,460,527 |
4. Derivative Instruments.
Risk Exposures and the Use of Derivative Instruments. The Fund's investment objectives allow for various types of derivative instruments, including futures contracts. Derivatives are investments whose value is primarily derived from underlying assets, indices or reference rates and may be transacted on an exchange or over-the-counter (OTC). Derivatives may involve a future commitment to buy or sell a specified asset based on specified terms, to exchange future cash flows at periodic intervals based on a notional principal amount, or for one party to make one or more payments upon the occurrence of specified events in exchange for periodic payments from the other party.
Derivatives were used to increase returns and to manage exposure to certain risks as defined below. The success of any strategy involving derivatives depends on analysis of numerous economic factors, and if the strategies for investment do not work as intended, the objectives may not be achieved.
Derivatives were used to increase or decrease exposure to the following risk(s):
| | |
| Equity Risk | Equity risk relates to the fluctuations in the value of financial instruments as a result of changes in market prices (other than those arising from interest rate risk or foreign exchange risk), whether caused by factors specific to an individual investment, its issuer, or all factors affecting all instruments traded in a market or market segment. |
Funds are also exposed to additional risks from investing in derivatives, such as liquidity risk and counterparty credit risk. Liquidity risk is the risk that a fund will be unable to close out the derivative in the open market in a timely manner. Counterparty credit risk is the risk that the counterparty will not be able to fulfill its obligation to a fund. Counterparty credit risk related to exchange-traded contracts may be mitigated by the protection provided by the exchange on which they trade.
Investing in derivatives may involve greater risks than investing in the underlying assets directly and, to varying degrees, may involve risk of loss in excess of any initial investment and collateral received and amounts recognized in the Statement of Assets and Liabilities. In addition, there may be the risk that the change in value of the derivative contract does not correspond to the change in value of the underlying instrument.
Futures Contracts. A futures contract is an agreement between two parties to buy or sell a specified underlying instrument for a fixed price at a specified future date. Futures contracts were used to manage exposure to the stock market.
Upon entering into a futures contract, a fund is required to deposit either cash or securities (initial margin) with a clearing broker in an amount equal to a certain percentage of the face value of the contract. Futures contracts are marked-to-market daily and subsequent daily payments are made or received by a fund depending on the daily fluctuations in the value of the futures contracts and are recorded as unrealized appreciation or (depreciation). This receivable and/or payable, if any, is included in daily variation margin on futures contracts in the Statement of Assets and Liabilities. Realized gain or (loss) is recorded upon the expiration or closing of a futures contract. The net realized gain (loss) and change in net unrealized appreciation (depreciation) on futures contracts during the period is presented in the Statement of Operations.
Any open futures contracts at period end are presented in the Schedule of Investments under the caption "Futures Contracts". The notional amount at value reflects each contract's exposure to the underlying instrument or index at period end, and is representative of volume of activity during the period unless an average notional amount is presented. Any securities deposited to meet initial margin requirements are identified in the Schedule of Investments. Any cash deposited to meet initial margin requirements is presented as segregated cash with brokers for derivative instruments in the Statement of Assets and Liabilities.
5. Purchases and Sales of Investments.
Purchases and sales of securities, other than short-term securities, U.S. government securities and in-kind transactions, as applicable, are noted in the table below.
| | Purchases ($) | Sales ($) |
| Fidelity Enhanced Small Cap ETF | 477,499,690 | 531,682,748 |
Securities received and delivered in-kind through subscriptions and redemptions are noted in the table below.
| | In-Kind Subscriptions ($) | In-Kind Redemptions ($) |
| Fidelity Enhanced Small Cap ETF | 7,996,741 | 43,749,644 |
Unaffiliated Redemptions In-Kind. Shares that were redeemed in-kind for investments, including accrued interest and cash, if any, are shown in the table below. The net realized gain or loss on investments delivered through in-kind redemptions is included in the "Net realized gain (loss) on: Redemptions in-kind" line in the accompanying Statement of Operations. The amount of the in-kind redemptions is included in share transactions in the accompanying Statement of Changes in Net Assets. There was no gain or loss for federal income tax purposes.
| | Shares | Total net realized gain or loss ($) | Total Proceeds ($) |
| Fidelity Small Cap Enhanced Index Fund | 1,671,952 | 13,826,828 | 42,723,306 |
6. Fees and Other Transactions with Affiliates.
Management Fee. Fidelity Management & Research Company LLC (the investment adviser) provides the Fund with investment management related services for which the Funds pay a monthly management fee that is based on an annual rate of .28% of average net assets. Under the management contract, the investment adviser pays all other expenses, except the compensation of the independent Trustees and certain miscellaneous expenses such as proxy and shareholders meeting expenses. The management fee is reduced by an amount equal to the fees and expenses paid by the Fund to the independent Trustees.
During the period March 1, 2023 through November 17, 2023, the Predecessor Fund paid an all-inclusive management fee based on annual rate of .55% of the Fund's average net assets; and the investment adviser paid all ordinary operating expenses of the Fund, except fees and expenses of the independent Trustees and certain miscellaneous expenses such as proxy and shareholder meeting expenses. The management fee was reduced by an amount equal to the fees and expenses paid by the Fund to the independent Trustees.
Brokerage Commissions. A portion of portfolio transactions were placed with brokerage firms which are affiliates of the investment adviser. Brokerage commissions are included in net realized gain (loss) and change in net unrealized appreciation (depreciation) in the Statement of Operations. The commissions paid to these affiliated firms were as follows:
| | Amount |
| Fidelity Small Cap Enhanced Index Fund | $1,756 |
Interfund Trades. Funds may purchase from or sell securities to other Fidelity Funds under procedures adopted by the Board. The procedures have been designed to ensure these interfund trades are executed in accordance with Rule 17a-7 of the 1940 Act. Any interfund trades are included within the respective purchases and sales amounts shown in the Purchases and Sales of Investments note. Interfund trades during the period are noted in the table below.
| | Purchases ($) | Sales ($) | Realized Gain (Loss) ($) |
| Fidelity Enhanced Small Cap ETF | 12,498,851 | 15,991,104 | (459,627) |
7. Committed Line of Credit.
During the period September 1, 2023 through November 17, 2023, the Predecessor Fund participated with other funds managed by the investment adviser or an affiliate in a $4.25 billion credit facility (the "line of credit") to be utilized for temporary or emergency purposes to fund shareholder redemptions or for other short-term liquidity purposes. The commitment fees on the pro-rata portion of the line of credit were borne by the investment adviser. During the period, there were no borrowings on this line of credit.
8. Security Lending.
Funds lend portfolio securities from time to time in order to earn additional income. Lending agents are used, including National Financial Services (NFS), an affiliate of the investment adviser. Pursuant to a securities lending agreement, NFS will receive a fee, which is capped at 9.9% of a fund's daily lending revenue, for its services as lending agent. A fund may lend securities to certain qualified borrowers, including NFS. On the settlement date of the loan, a fund receives collateral (in the form of U.S. Treasury obligations, letters of credit and/or cash) against the loaned securities and maintains collateral in an amount not less than 100% of the market value of the loaned securities during the period of the loan. The market value of the loaned securities is determined at the close of business of a fund and any additional required collateral is delivered to a fund on the next business day. A fund or borrower may terminate the loan at any time, and if the borrower defaults on its obligation to return the securities loaned because of insolvency or other reasons, a fund may apply collateral received from the borrower against the obligation. A fund may experience delays and costs in recovering the securities loaned. Any cash collateral received is invested in the Fidelity Securities Lending Cash Central Fund. Any loaned securities are identified as such in the Schedule of Investments, and the value of loaned securities and cash collateral at period end, as applicable, are presented in the Statement of Assets and Liabilities. Security lending income represents the income earned on investing cash collateral, less rebates paid to borrowers and any lending agent fees associated with the loan, plus any premium payments received for lending certain types of securities. Security lending income is presented in the Statement of Operations as a component of income from Fidelity Central Funds. Affiliated security lending activity, if any, was as follows:
| | Total Security Lending Fees Paid to NFS | Security Lending Income From Securities Loaned to NFS | Value of Securities Loaned to NFS at Period End |
| Fidelity Enhanced Small Cap ETF | $8,684 | $2,414 | $57,346 |
9. Expense Reductions.
Through arrangements with the Fund's custodian, credits realized as a result of certain uninvested cash balances were used to reduce the Fund's expenses by $3,509.
10. Share Transactions.
Funds issue and redeem shares at NAV only with certain authorized participants in large increments known as Creation Units. Purchases of Creation Units are made by tendering a basket of designated securities to a fund and redemption proceeds are paid with a basket of securities from a fund's portfolio with a balancing cash component to equate the market value of the basket of securities delivered or redeemed to the NAV per Creation Unit on the transaction date. Cash may be substituted equivalent to the value of certain securities generally when they are not available in sufficient quantity for delivery. A fund's shares are available in smaller increments to investors in the secondary market at market prices and may be subject to commissions. Authorized participants pay a transaction fee to the shareholder servicing agent when purchasing and redeeming Creation Units of a fund. The transaction fee is used to offset the costs associated with the issuance and redemption of Creation Units.
11. Other.
A fund's organizational documents provide former and current trustees and officers with a limited indemnification against liabilities arising in connection with the performance of their duties to the fund. In the normal course of business, a fund may also enter into contracts that provide general indemnifications. A fund's maximum exposure under these arrangements is unknown as this would be dependent on future claims that may be made against a fund. The risk of material loss from such claims is considered remote.
The Board of Trustees approved to change the fiscal year end of the Funds to June 30th effective March 1, 2024.
12. Merger Information.
On November 17, 2023, Fidelity Small Cap Enhanced Index Fund (Predecessor Fund) reorganized into a newly created Fidelity Enhanced Small Cap ETF (ETF) pursuant an Agreement and Plan of Reorganization (the Agreement) approved by its Board of Trustees. Per the Agreement, shareholders of the Predecessor Fund received ETF shares equal in value to the shares of the Predecessor Fund they owned on the day the reorganization was effective. The Predecessor Fund was the accounting survivor after the reorganization. As such, performance and financial history prior to the reorganization is that of the Predecessor Fund. Historical share transactions and per share information for the Predecessor Fund was retroactively adjusted to reflect the change in capital structure due to the reorganization.
For financial reporting purposes, the assets and liabilities of the Predecessor Fund and shares issued by the ETF were recorded at fair value; however, the cost basis of the investments received from the Predecessor Fund were carried forward and will be utilized for purposes of the ETF's ongoing reporting of realized and unrealized gains and losses to more closely align subsequent reporting of realized gains with amounts distributable to shareholders for tax purposes. The reorganization qualified as a tax-free reorganization for federal income tax purposes with no gain or loss recognized to the funds or their shareholders. Costs incurred in connection with the reorganization were paid by the Predecessor Fund.
| Predecessor Fund/Accounting Survivor | Investments $ | Unrealized appreciation (depreciation) $ | Net Assets $ | Shares Exchanged | Shares Exchanged Ratio |
| Fidelity Small Cap Enhanced Index Fund | 510,635,061 | 30,515,551 | 511,993,789 | 20,479,785 | .5077880000 |
| Legal Acquiring ETF | Net Assets $ | Total net assets after the acquisition $ |
| Fidelity Enhanced Small Cap ETF | 25 | 511,993,814 |
Pro forma results of operations of the combined entity for the entire period ended February 29, 2024, as though the acquisition had occurred as of the beginning of the year (rather than on the actual acquisition date), are as follows:
| Net investment income (loss) | $5,714,131 |
| Total net realized gain (loss) | 32,794,589 |
| Total change in net unrealized appreciation (depreciation) | 27,704,246 |
| Net increase (decrease) in net assets resulting from operations | $66,212,966 |
Because the combined investment portfolios have been managed as a single portfolio since the acquisition was completed, it is not practicable to separate the amounts of revenue and earnings of the Predecessor Fund that has been included in the ETF's Statement of Operations since November 17, 2023.
13. Risk and Uncertainties.
Many factors affect a fund's performance. Developments that disrupt global economies and financial markets, such as pandemics, epidemics, outbreaks of infectious diseases, war, terrorism, and environmental disasters, may significantly affect a fund's investment performance. The effects of these developments to a fund will be impacted by the types of securities in which a fund invests, the financial condition, industry, economic sector, and geographic location of an issuer, and a fund's level of investment in the securities of that issuer. Significant concentrations in security types, issuers, industries, sectors, and geographic locations may magnify the factors that affect a fund's performance.
To the Board of Trustees of Fidelity Covington Trust and Shareholders of Fidelity Enhanced Small Cap ETF
Opinion on the Financial Statements
We have audited the accompanying statement of assets and liabilities, including the schedule of investments, of Fidelity Enhanced Small Cap ETF (one of the funds constituting Fidelity Covington Trust, referred to hereafter as the "Fund") as of February 29, 2024, the related statement of operations for the year ended February 29, 2024, the statement of changes in net assets for each of the two years in the period ended February 29, 2024, including the related notes, and the financial highlights for each of the five years in the period ended February 29, 2024 (collectively referred to as the "financial statements"). In our opinion, the financial statements present fairly, in all material respects, the financial position of the Fund as of February 29, 2024, the results of its operations for the year then ended, the changes in its net assets for each of the two years in the period ended February 29, 2024 and the financial highlights for each of the five years in the period ended February 29, 2024 in conformity with accounting principles generally accepted in the United States of America.
Basis for Opinion
These financial statements are the responsibility of the Fund's management. Our responsibility is to express an opinion on the Fund's financial statements based on our audits. We are a public accounting firm registered with the Public Company Accounting Oversight Board (United States) (PCAOB) and are required to be independent with respect to the Fund in accordance with the U.S. federal securities laws and the applicable rules and regulations of the Securities and Exchange Commission and the PCAOB.
We conducted our audits of these financial statements in accordance with the standards of the PCAOB. Those standards require that we plan and perform the audit to obtain reasonable assurance about whether the financial statements are free of material misstatement, whether due to error or fraud.
Our audits included performing procedures to assess the risks of material misstatement of the financial statements, whether due to error or fraud, and performing procedures that respond to those risks. Such procedures included examining, on a test basis, evidence regarding the amounts and disclosures in the financial statements. Our audits also included evaluating the accounting principles used and significant estimates made by management, as well as evaluating the overall presentation of the financial statements. Our procedures included confirmation of securities owned as of February 29, 2024 by correspondence with the custodian and brokers. We believe that our audits provide a reasonable basis for our opinion.
/s/ PricewaterhouseCoopers LLP
Boston, Massachusetts
April 16, 2024
We have served as the auditor of one or more investment companies in the Fidelity group of funds since 1932.
The Trustees, Members of the Advisory Board (if any), and officers of the trust and fund, as applicable, are listed below. The Board of Trustees governs the fund and is responsible for protecting the interests of shareholders. The Trustees are experienced executives who meet periodically throughout the year to oversee the fund's activities, review contractual arrangements with companies that provide services to the fund, oversee management of the risks associated with such activities and contractual arrangements, and review the fund's performance. Except for Vijay Advani, each of the Trustees oversees 323 funds. Mr. Advani oversees 216 funds.
The Trustees hold office without limit in time except that (a) any Trustee may resign; (b) any Trustee may be removed by written instrument, signed by at least two-thirds of the number of Trustees prior to such removal; (c) any Trustee who requests to be retired or who has become incapacitated by illness or injury may be retired by written instrument signed by a majority of the other Trustees; and (d) any Trustee may be removed at any special meeting of shareholders by a two-thirds vote of the outstanding voting securities of the trust. Each Trustee who is not an interested person (as defined in the 1940 Act) of the trust and the fund is referred to herein as an Independent Trustee. Each Independent Trustee shall retire not later than the last day of the calendar year in which his or her 75th birthday occurs. The Independent Trustees may waive this mandatory retirement age policy with respect to individual Trustees. Officers and Advisory Board Members hold office without limit in time, except that any officer or Advisory Board Member may resign or may be removed by a vote of a majority of the Trustees at any regular meeting or any special meeting of the Trustees. Except as indicated, each individual has held the office shown or other offices in the same company for the past five years.
The fund's Statement of Additional Information (SAI) includes more information about the Trustees. To request a free copy, call Fidelity at 1-800-FIDELITY.
Experience, Skills, Attributes, and Qualifications of the Trustees. The Governance and Nominating Committee has adopted a statement of policy that describes the experience, qualifications, attributes, and skills that are necessary and desirable for potential Independent Trustee candidates (Statement of Policy). The Board believes that each Trustee satisfied at the time he or she was initially elected or appointed a Trustee, and continues to satisfy, the standards contemplated by the Statement of Policy. The Governance and Nominating Committee also engages professional search firms to help identify potential Independent Trustee candidates who have the experience, qualifications, attributes, and skills consistent with the Statement of Policy. From time to time, additional criteria based on the composition and skills of the current Independent Trustees, as well as experience or skills that may be appropriate in light of future changes to board composition, business conditions, and regulatory or other developments, have also been considered by the professional search firms and the Governance and Nominating Committee. In addition, the Board takes into account the Trustees' commitment and participation in Board and committee meetings, as well as their leadership of standing and ad hoc committees throughout their tenure.
In determining that a particular Trustee was and continues to be qualified to serve as a Trustee, the Board has considered a variety of criteria, none of which, in isolation, was controlling. The Board believes that, collectively, the Trustees have balanced and diverse experience, qualifications, attributes, and skills, which allow the Board to operate effectively in governing the fund and protecting the interests of shareholders. Information about the specific experience, skills, attributes, and qualifications of each Trustee, which in each case led to the Board's conclusion that the Trustee should serve (or continue to serve) as a trustee of the fund, is provided below.
Board Structure and Oversight Function. Robert A. Lawrence is an interested person and currently serves as Chair. The Trustees have determined that an interested Chair is appropriate and benefits shareholders because an interested Chair has a personal and professional stake in the quality and continuity of services provided to the fund. Independent Trustees exercise their informed business judgment to appoint an individual of their choosing to serve as Chair, regardless of whether the Trustee happens to be independent or a member of management. The Independent Trustees have determined that they can act independently and effectively without having an Independent Trustee serve as Chair and that a key structural component for assuring that they are in a position to do so is for the Independent Trustees to constitute a substantial majority for the Board. The Independent Trustees also regularly meet in executive session. David M. Thomas serves as Lead Independent Trustee and as such (i) acts as a liaison between the Independent Trustees and management with respect to matters important to the Independent Trustees and (ii) with management prepares agendas for Board meetings.
Fidelity® funds are overseen by different Boards of Trustees. The fund's Board oversees Fidelity's high income and certain equity funds, and other Boards oversee Fidelity's alternative investment, investment-grade bond, money market, asset allocation, and other equity funds. The asset allocation funds may invest in Fidelity® funds overseen by the fund's Board. The use of separate Boards, each with its own committee structure, allows the Trustees of each group of Fidelity® funds to focus on the unique issues of the funds they oversee, including common research, investment, and operational issues. On occasion, the separate Boards establish joint committees to address issues of overlapping consequences for the Fidelity® funds overseen by each Board.
The Trustees operate using a system of committees to facilitate the timely and efficient consideration of all matters of importance to the Trustees, the fund, and fund shareholders and to facilitate compliance with legal and regulatory requirements and oversight of the fund's activities and associated risks. The Board, acting through its committees, has charged FMR and its affiliates with (i) identifying events or circumstances the occurrence of which could have demonstrably adverse effects on the fund's business and/or reputation; (ii) implementing processes and controls to lessen the possibility that such events or circumstances occur or to mitigate the effects of such events or circumstances if they do occur; and (iii) creating and maintaining a system designed to evaluate continuously business and market conditions in order to facilitate the identification and implementation processes described in (i) and (ii) above. Because the day-to-day operations and activities of the fund are carried out by or through FMR, its affiliates, and other service providers, the fund's exposure to risks is mitigated but not eliminated by the processes overseen by the Trustees. While each of the Board's committees has responsibility for overseeing different aspects of the fund's activities, oversight is exercised primarily through the Operations, Audit, and Compliance Committees. Appropriate personnel, including but not limited to the fund's Chief Compliance Officer (CCO), FMR's internal auditor, the independent accountants, the fund's Treasurer and portfolio management personnel, make periodic reports to the Board's committees, as appropriate, including an annual review of Fidelity's risk management program for the Fidelity® funds. The responsibilities of each standing committee, including their oversight responsibilities, are described further under "Standing Committees of the Trustees."
Interested Trustees*:
Correspondence intended for a Trustee who is an interested person may be sent to Fidelity Investments, 245 Summer Street, Boston, Massachusetts 02210.
Name, Year of Birth; Principal Occupations and Other Relevant Experience+
Bettina Doulton (1964)
Year of Election or Appointment: 2020
Trustee
Ms. Doulton also serves as Trustee of other Fidelity® funds. Prior to her retirement, Ms. Doulton served in a variety of positions at Fidelity Investments, including as a managing director of research (2006-2007), portfolio manager to certain Fidelity® funds (1993-2005), equity analyst and portfolio assistant (1990-1993), and research assistant (1987-1990). Ms. Doulton currently owns and operates Phi Builders + Architects and Cellardoor Winery. Previously, Ms. Doulton served as a member of the Board of Brown Capital Management, LLC (2014-2018).
Robert A. Lawrence (1952)
Year of Election or Appointment: 2020
Trustee
Chair of the Board of Trustees
Mr. Lawrence also serves as Trustee of other funds. Previously, Mr. Lawrence served as a Trustee and Member of the Advisory Board of certain funds. Prior to his retirement in 2008, Mr. Lawrence served as Vice President of certain Fidelity® funds (2006-2008), Senior Vice President, Head of High Income Division of Fidelity Management & Research Company (investment adviser firm, 2006-2008), and President of Fidelity Strategic Investments (investment adviser firm, 2002-2005).
* Determined to be an "Interested Trustee" by virtue of, among other things, his or her affiliation with the trust or various entities under common control with FMR.
+ The information includes the Trustee's principal occupation during the last five years and other information relating to the experience, attributes, and skills relevant to the Trustee's qualifications to serve as a Trustee, which led to the conclusion that the Trustee should serve as a Trustee for the fund.
Independent Trustees:
Correspondence intended for an Independent Trustee may be sent to Fidelity Investments, P.O. Box 55235, Boston, Massachusetts 02205-5235.
Name, Year of Birth; Principal Occupations and Other Relevant Experience+
Vijay C. Advani (1960)
Year of Election or Appointment: 2023
Trustee
Mr. Advani also serves as Trustee or Member of the Advisory Board of other funds. Previously, Mr. Advani served as Executive Chairman (2020-2022), Chief Executive Officer (2017-2020) and Chief Operating Officer (2016-2017) of Nuveen (global investment manager). He also served in various capacities at Franklin Resources (global investment manager), including Co-President (2015-2016), Executive Vice President, Global Advisory Services (2008-2015), Head of Global Retail Distribution (2005-2008), Executive Managing Director, International Retail Development (2002-2005), Managing Director, Product Developments, Sales & Marketing, Asia, Eastern Europe and Africa (2000-2002) and President, Templeton Asset Management India (1995-2000). Mr. Advani also served as Senior Investment Officer of International Finance Corporation (private equity and venture capital arm of The World Bank, 1984-1995). Mr. Advani is Chairman Emeritus of the U.S. India Business Council (2018-present), a Director of The Global Impact Investing Network (2019-present), a Director of LOK Capital (Mauritius) (2022-present), a member of the Advisory Council of LOK Capital (2022-present), a Senior Advisor of Neuberger Berman (2021-present), a Senior Advisor of Seviora Holdings Pte. Ltd (Temasek-Singapore) (2021-present), a Director of Seviora Capital (Singapore) (2021-present) and an Advisor of EQUIAM (2021-present). Mr. Advani formerly served as a member of the Board of BowX Acquisition Corp. (special purpose acquisition company, 2020-2021), a member of the Board of Intellecap (advisory arm of The Aavishkaar Group, 2018-2020), a member of the Board of Nuveen Investments, Inc. (2017-2020) and a member of the Board of Docusign (software, 2016-2019).
Thomas P. Bostick (1956)
Year of Election or Appointment: 2021
Trustee
Lieutenant General Bostick also serves as Trustee of other Fidelity® funds. Prior to his retirement, General Bostick (United States Army, Retired) held a variety of positions within the U.S. Army, including Commanding General and Chief of Engineers, U.S. Army Corps of Engineers (2012-2016) and Deputy Chief of Staff and Director of Human Resources, U.S. Army (2009-2012). General Bostick currently serves as a member of the Board and Finance and Governance & Sustainability Committees of CSX Corporation (transportation, 2020-present) and a member of the Board and Corporate Governance and Nominating Committee of Perma-Fix Environmental Services, Inc. (nuclear waste management, 2020-present). General Bostick serves as Chief Executive Officer of Bostick Global Strategies, LLC (consulting, 2016-present), as a member of the Board of HireVue, Inc. (video interview and assessment, 2020-present), as a member of the Board of Allonnia (biotechnology and engineering solutions, 2022-present) and on the Advisory Board of Solugen, Inc. (specialty bio-based chemicals manufacturer, 2022-present). Previously, General Bostick served as a Member of the Advisory Board of certain Fidelity® funds (2021), President, Intrexon Bioengineering (2018-2020) and Chief Operating Officer (2017-2020) and Senior Vice President of the Environment Sector (2016-2017) of Intrexon Corporation (biopharmaceutical company).
Donald F. Donahue (1950)
Year of Election or Appointment: 2018
Trustee
Mr. Donahue also serves as Trustee of other Fidelity® funds. Mr. Donahue serves as President and Chief Executive Officer of Miranda Partners, LLC (risk consulting for the financial services industry, 2012-present). Previously, Mr. Donahue served as Chief Executive Officer (2006-2012), Chief Operating Officer (2003-2006) and Managing Director, Customer Marketing and Development (1999-2003) of The Depository Trust & Clearing Corporation (financial markets infrastructure). Mr. Donahue currently serves as a member (2007-present) and Co-Chairman (2016-present) of the Board of United Way of New York. Mr. Donahue previously served as a member of the Advisory Board of certain Fidelity® funds (2015-2018) and as a member of the Board of The Leadership Academy (previously NYC Leadership Academy) (2012-2022).
Vicki L. Fuller (1957)
Year of Election or Appointment: 2020
Trustee
Ms. Fuller also serves as Trustee of other Fidelity® funds. Previously, Ms. Fuller served as a member of the Advisory Board of certain Fidelity® funds (2018-2020), Chief Investment Officer of the New York State Common Retirement Fund (2012-2018) and held a variety of positions at AllianceBernstein L.P. (global asset management, 1985-2012), including Managing Director (2006-2012) and Senior Vice President and Senior Portfolio Manager (2001-2006). Ms. Fuller currently serves as a member of the Board, Audit Committee and Nominating and Governance Committee of two Blackstone business development companies (2020-present), as a member of the Board of Treliant, LLC (consulting, 2019-present), as a member of the Board of Ariel Alternatives, LLC (private equity, 2022-present) and as a member of the Board and Chair of the Audit Committee of Gusto, Inc. (software, 2021-present). In addition, Ms. Fuller currently serves as a member of the Board of Roosevelt University (2019-present) and as a member of the Executive Board of New York University's Stern School of Business. Ms. Fuller previously served as a member of the Board, Audit Committee and Nominating and Governance Committee of The Williams Companies, Inc. (natural gas infrastructure, 2018-2021).
Patricia L. Kampling (1959)
Year of Election or Appointment: 2020
Trustee
Ms. Kampling also serves as Trustee of other Fidelity® funds. Prior to her retirement, Ms. Kampling served as Chairman of the Board and Chief Executive Officer (2012-2019), President and Chief Operating Officer (2011-2012) and Executive Vice President and Chief Financial Officer (2010-2011) of Alliant Energy Corporation. Ms. Kampling currently serves as a member of the Board, Finance Committee and Governance, Compensation and Nominating Committee of Xcel Energy Inc. (utilities company, 2020-present) and as a member of the Board, Audit, Finance and Risk Committee and Safety, Environmental, Technology and Operations Committee and Chair of the Executive Development and Compensation Committee of American Water Works Company, Inc. (utilities company, 2019-present). In addition, Ms. Kampling currently serves as a member of the Board of the Nature Conservancy, Wisconsin Chapter (2019-present). Previously, Ms. Kampling served as a Member of the Advisory Board of certain Fidelity® funds (2020), a member of the Board, Compensation Committee and Executive Committee and Chair of the Audit Committee of Briggs & Stratton Corporation (manufacturing, 2011-2021), a member of the Board of Interstate Power and Light Company (2012-2019) and Wisconsin Power and Light Company (2012-2019) (each a subsidiary of Alliant Energy Corporation) and as a member of the Board and Workforce Development Committee of the Business Roundtable (2018-2019).
Thomas A. Kennedy (1955)
Year of Election or Appointment: 2021
Trustee
Mr. Kennedy also serves as Trustee of other Fidelity® funds. Previously, Mr. Kennedy served as a Member of the Advisory Board of certain Fidelity® funds (2020) and held a variety of positions at Raytheon Company (aerospace and defense, 1983-2020), including Chairman and Chief Executive Officer (2014-2020) and Executive Vice President and Chief Operating Officer (2013-2014). Mr. Kennedy served as Executive Chairman of the Board of Directors of Raytheon Technologies Corporation (aerospace and defense, 2020-2021). Mr. Kennedy serves as a Director of the Board of Directors of Textron Inc. (aerospace and defense, 2023-present).
Oscar Munoz (1959)
Year of Election or Appointment: 2021
Trustee
Mr. Munoz also serves as Trustee of other Fidelity® funds. Prior to his retirement, Mr. Munoz served as Executive Chairman (2020-2021), Chief Executive Officer (2015-2020), President (2015-2016) and a member of the Board (2010-2021) of United Airlines Holdings, Inc. Mr. Munoz currently serves as a member of the Board of CBRE Group, Inc. (commercial real estate, 2020-present), a member of the Board of Univision Communications, Inc. (Hispanic media, 2020-present), a member of the Board of Archer Aviation Inc. (2021-present), a member of the Defense Business Board of the United States Department of Defense (2021-present) and a member of the Board of Salesforce.com, Inc. (cloud-based software, 2022-present). Previously, Mr. Munoz served as a Member of the Advisory Board of certain Fidelity® funds (2021).
David M. Thomas (1949)
Year of Election or Appointment: 2018
Trustee
Lead Independent Trustee
Mr. Thomas also serves as Trustee of other Fidelity® funds. Previously, Mr. Thomas served as Executive Chairman (2005-2006) and Chairman and Chief Executive Officer (2000-2005) of IMS Health, Inc. (pharmaceutical and healthcare information solutions). Mr. Thomas currently serves as a member of the Board of Fortune Brands Home and Security (home and security products, 2004-present) and as Director (2013-present) and Non-Executive Chairman of the Board (2022-present) of Interpublic Group of Companies, Inc. (marketing communication).
Susan Tomasky (1953)
Year of Election or Appointment: 2020
Trustee
Ms. Tomasky also serves as Trustee of other Fidelity® funds. Prior to her retirement, Ms. Tomasky served in various executive officer positions at American Electric Power Company, Inc. (1998-2011), including most recently as President of AEP Transmission (2007-2011). Ms. Tomasky currently serves as a member of the Board and Sustainability Committee and as Chair of the Audit Committee of Marathon Petroleum Corporation (2018-present) and as a member of the Board, Executive Committee, Corporate Governance Committee and Organization and Compensation Committee and as Lead Director of the Board of Public Service Enterprise Group, Inc. (utilities company, 2012-present) and as a member of the Board of its subsidiary company, Public Service Electric and Gas Co. (2021-present). In addition, Ms. Tomasky currently serves as a member (2009-present) and President (2020-present) of the Board of the Royal Shakespeare Company - America (2009-present), as a member of the Board of the Columbus Association for the Performing Arts (2011-present) and as a member of the Board and Kenyon in the World Committee of Kenyon College (2016-present). Previously, Ms. Tomasky served as a Member of the Advisory Board of certain Fidelity® funds (2020), as a member of the Board of the Columbus Regional Airport Authority (2007-2020), as a member of the Board (2011-2018) and Lead Independent Director (2015-2018) of Andeavor Corporation (previously Tesoro Corporation) (independent oil refiner and marketer) and as a member of the Board of Summit Midstream Partners LP (energy, 2012-2018).
Michael E. Wiley (1950)
Year of Election or Appointment: 2013
Trustee
Mr. Wiley also serves as Trustee of other Fidelity® funds. Previously, Mr. Wiley served as a member of the Advisory Board of certain Fidelity® funds (2018-2020), Chairman, President and CEO of Baker Hughes, Inc. (oilfield services, 2000-2004). Mr. Wiley also previously served as a member of the Board of Andeavor Corporation (independent oil refiner and marketer, 2005-2018), a member of the Board of Andeavor Logistics LP (natural resources logistics, 2015-2018) and a member of the Board of High Point Resources (exploration and production, 2005-2020).
+ The information includes the Trustee's principal occupation during the last five years and other information relating to the experience, attributes, and skills relevant to the Trustee's qualifications to serve as a Trustee, which led to the conclusion that the Trustee should serve as a Trustee for the fund.
Advisory Board Members and Officers:
Correspondence intended for a Member of the Advisory Board (if any) may be sent to Fidelity Investments, P.O. Box 55235, Boston, Massachusetts 02205-5235. Correspondence intended for an officer or Peter S. Lynch may be sent to Fidelity Investments, 245 Summer Street, Boston, Massachusetts 02210.
Name, Year of Birth; Principal Occupations+
Peter S. Lynch (1944)
Year of Election or Appointment: 2018
Member of the Advisory Board
Mr. Lynch also serves as a Member of the Advisory Board of other Fidelity® funds. Mr. Lynch is Vice Chairman and a Director of Fidelity Management & Research Company LLC (investment adviser firm). In addition, Mr. Lynch serves as a Trustee of Boston College and as the Chairman of the Inner-City Scholarship Fund. Previously, Mr. Lynch served as Vice Chairman and a Director of FMR Co., Inc. (investment adviser firm) and on the Special Olympics International Board of Directors (1997-2006).
Karen B. Peetz (1955)
Year of Election or Appointment: 2023
Member of the Advisory Board
Ms. Peetz also serves as a Member of the Advisory Board of other funds. Previously, Ms. Peetz served as Chief Administration Officer (2020-2023) of Citigroup Inc. (a diversified financial service company). She also served in various capacities at Bank of New York Mellon Corporation, including President (2013-2016), Vice Chairman, Senior Executive Vice President and Chief Executive Officer of Financial Markets & Treasury Services (2010-2013), Senior Executive Vice President and Chief Executive Officer of Global Corporate Trust (2003-2008), Senior Vice President and Division Manager of Global Payments & Trade Services (2002-2003) and Senior Vice President and Division Manager of Domestic Corporate Trust (1998-2002). Ms. Peetz also served in various capacities at Chase Manhattan Corporation (1982-1998), including Senior Vice President and Manager of Corporate Trust International Business (1996-1998), Managing Director and Manager of Corporate Trust Services (1994-1996) and Managing Director and Group Manager of Financial Institution Sales (1990-1993). Ms. Peetz currently serves as Chair of Amherst Holdings Advisory Council (2018-present), Trustee of Johns Hopkins University (2016-present), Chair of the Carey Business School Advisory Council, Member of the Johns Hopkins Medicine Board and Finance Committee and Chair of the Lyme and Tick Related Disease Institute Advisory Council. Ms. Peetz previously served as a member of the Board of Guardian Life Insurance Company of America (2019-2023), a member of the Board of Trane Technologies (2018-2022), a member of the Board of Wells Fargo Corp. (2017-2019), a member of the Board of SunCoke Energy Inc. (2012-2016), a member of the Board of Private Export Funding Corporation (2010-2016) and as a Trustee of Penn State University (2010-2014) and the United Way of New York City (2008-2010).
Heather Bonner (1977)
Year of Election or Appointment: 2023
Assistant Treasurer
Ms. Bonner also serves as an officer of other funds. Ms. Bonner is a Senior Vice President (2022-present) and is an employee of Fidelity Investments (2022-present). Ms. Bonner serves as Senior Vice President, Vice President, Treasurer, or Director of certain Fidelity entities. Prior to joining Fidelity, Ms. Bonner served as Managing Director at AQR Capital Management (2013-2022) and was the Treasurer and Principal Financial Officer of the AQR Funds (2013-2022).
Craig S. Brown (1977)
Year of Election or Appointment: 2022
Deputy Treasurer
Mr. Brown also serves as an officer of other funds. Mr. Brown is a Vice President (2015-present) and is an employee of Fidelity Investments. Mr. Brown serves as Assistant Treasurer of FIMM, LLC (2021-present). Previously, Mr. Brown served as Assistant Treasurer of certain Fidelity® funds (2019-2022).
John J. Burke III (1964)
Year of Election or Appointment: 2018
Chief Financial Officer
Mr. Burke also serves as Chief Financial Officer of other funds. Mr. Burke is Head of Fidelity Fund and Investment Operations (2018-present) and is an employee of Fidelity Investments. Mr. Burke serves as President, Executive Vice President, or Director of certain Fidelity entities. Previously Mr. Burke served as head of Asset Management Investment Operations (2012-2018).
Margaret Carey (1973)
Year of Election or Appointment: 2023
Secretary and Chief Legal Officer (CLO)
Ms. Carey also serves as an officer of other funds and as CLO of certain Fidelity entities. Ms. Carey is a Senior Vice President, Deputy General Counsel (2019-present) and is an employee of Fidelity Investments.
William C. Coffey (1969)
Year of Election or Appointment: 2019
Assistant Secretary
Mr. Coffey also serves as Assistant Secretary of other funds. Mr. Coffey is a Senior Vice President, Deputy General Counsel (2010-present) and is an employee of Fidelity Investments. Previously, Mr. Coffey served as Secretary and CLO of certain funds (2018-2019); CLO, Secretary, or Senior Vice President of certain Fidelity entities and Assistant Secretary of certain funds (2009-2018).
Timothy M. Cohen (1969)
Year of Election or Appointment: 2018
Vice President
Mr. Cohen also serves as Vice President of other funds. Mr. Cohen is Co-Head of Equity (2018-present) and is an employee of Fidelity Investments. Mr. Cohen serves as President or Director of certain Fidelity entities. Previously, Mr. Cohen served as Executive Vice President of Fidelity SelectCo, LLC (2019) and Head of Global Equity Research (2016-2018).
Jonathan Davis (1968)
Year of Election or Appointment: 2013
Assistant Treasurer
Mr. Davis also serves as an officer of other funds. Mr. Davis is a Vice President (2006-present) and is an employee of Fidelity Investments. Mr. Davis serves as Assistant Treasurer or Director of certain Fidelity entities.
Laura M. Del Prato (1964)
Year of Election or Appointment: 2018
Assistant Treasurer
Ms. Del Prato also serves as an officer of other funds. Ms. Del Prato is a Senior Vice President (2017-present) and is an employee of Fidelity Investments. Ms. Del Prato serves as Vice President or Assistant Treasurer of certain Fidelity entities. Previously, Ms. Del Prato served as President and Treasurer of The North Carolina Capital Management Trust: Cash Portfolio and Term Portfolio (2018-2020).
Colm A. Hogan (1973)
Year of Election or Appointment: 2020
Assistant Treasurer
Mr. Hogan also serves as an officer of other funds. Mr. Hogan is a Vice President (2016-present) and is an employee of Fidelity Investments. Mr. Hogan serves as Assistant Treasurer of certain Fidelity entities. Previously, Mr. Hogan served as Deputy Treasurer of certain Fidelity® funds (2016-2020) and Assistant Treasurer of certain Fidelity® funds (2016-2018).
Pamela R. Holding (1964)
Year of Election or Appointment: 2018
Vice President
Ms. Holding also serves as Vice President of other funds. Ms. Holding is Co-Head of Equity (2018-present) and is an employee of Fidelity Investments. Previously, Ms. Holding served as Executive Vice President of Fidelity SelectCo, LLC (2019) and as Chief Investment Officer of Fidelity Institutional Asset Management (2013-2018).
Chris Maher (1972)
Year of Election or Appointment: 2020
Deputy Treasurer
Mr. Maher also serves as an officer of other funds. Mr. Maher is a Vice President (2008-present) and is an employee of Fidelity Investments. Mr. Maher serves as Assistant Treasurer of certain Fidelity entities. Previously, Mr. Maher served as Assistant Treasurer of certain funds (2013-2020).
Jason P. Pogorelec (1975)
Year of Election or Appointment: 2020
Chief Compliance Officer
Mr. Pogorelec also serves as Chief Compliance Officer of other funds. Mr. Pogorelec is a Senior Vice President of Asset Management Compliance (2020-present) and is an employee of Fidelity Investments. Mr. Pogorelec serves as Compliance Officer of Fidelity Management & Research Company LLC (investment adviser firm, 2023-present) and Ballyrock Investment Advisors LLC (2023-present). Previously, Mr. Pogorelec served as a Vice President, Associate General Counsel for Fidelity Investments (2010-2020) and Assistant Secretary of certain Fidelity® funds (2015-2020).
Brett Segaloff (1972)
Year of Election or Appointment: 2021
Anti-Money Laundering (AML) Officer
Mr. Segaloff also serves as AML Officer of other funds. Mr. Segaloff is a Vice President (2022-present) and is an employee of Fidelity Investments. Mr. Segaloff serves as Anti Money Laundering Compliance Officer or Anti Money Laundering/Bank Secrecy Act Compliance Officer of certain Fidelity entities.
Stacie M. Smith (1974)
Year of Election or Appointment: 2018
President and Treasurer
Ms. Smith also serves as an officer of other funds. Ms. Smith is a Senior Vice President (2016-present) and is an employee of Fidelity Investments. Ms. Smith serves as Assistant Treasurer of certain Fidelity entities and has served in other fund officer roles.
Jim Wegmann (1979)
Year of Election or Appointment: 2019
Assistant Treasurer
Mr. Wegmann also serves as an officer of other funds. Mr. Wegmann is a Vice President (2016-present) and is an employee of Fidelity Investments. Mr. Wegmann serves as Assistant Treasurer of FIMM, LLC (2021-present). Previously, Mr. Wegmann served as Assistant Treasurer of certain Fidelity® funds (2019-2021).
+ The information includes principal occupation during the last five years.
As a shareholder, you incur two types of costs: (1) transaction costs, which may include sales charges (loads) on purchase payments or redemption proceeds, as applicable and (2) ongoing costs, which generally include management fees, distribution and/or service (12b-1) fees and other Fund expenses. This Example is intended to help you understand your ongoing costs (in dollars) of investing in a fund and to compare these costs with the ongoing costs of investing in other mutual funds.
| The Example is based on an investment of $1,000 invested at the beginning of the period and held for the entire period (September 1, 2023 to February 29, 2024). |
Actual Expenses
The first line of the accompanying table provides information about actual account values and actual expenses. You may use the information in this line, together with the amount you invested, to estimate the expenses that you paid over the period. Simply divide your account value by $1,000.00 (for example, an $8,600 account value divided by $1,000.00 = 8.6), then multiply the result by the number in the first line for a class/Fund under the heading entitled "Expenses Paid During Period" to estimate the expenses you paid on your account during this period. If any fund is a shareholder of any underlying mutual funds or exchange-traded funds (ETFs) (the Underlying Funds), such fund indirectly bears its proportional share of the expenses of the Underlying Funds in addition to the direct expenses incurred presented in the table. These fees and expenses are not included in the annualized expense ratio used to calculate the expense estimate in the table below.
Hypothetical Example for Comparison Purposes
The second line of the accompanying table provides information about hypothetical account values and hypothetical expenses based on the actual expense ratio and an assumed rate of return of 5% per year before expenses, which is not the actual return. The hypothetical account values and expenses may not be used to estimate the actual ending account balance or expenses you paid for the period. You may use this information to compare the ongoing costs of investing in the Fund and other funds. To do so, compare this 5% hypothetical example with the 5% hypothetical examples that appear in the shareholder reports of the other funds. If any fund is a shareholder of any Underlying Funds, such fund indirectly bears its proportional share of the expenses of the Underlying Funds in addition to the direct expenses as presented in the table. These fees and expenses are not included in the annualized expense ratio used to calculate the expense estimate in the table below.
Please note that the expenses shown in the table are meant to highlight your ongoing costs only and do not reflect any transaction costs. Therefore, the second line of the table is useful in comparing ongoing costs only, and will not help you determine the relative total costs of owning different funds. In addition, if these transactional costs were included, your costs would have been higher.
| | | | | Annualized Expense Ratio- A | | Beginning Account Value September 1, 2023 | | Ending Account Value February 29, 2024 | | Expenses Paid During Period- C September 1, 2023 to February 29, 2024 |
| | | | | | | | | | |
| Fidelity® Enhanced Small Cap ETF | | | | .41% | | | | | | |
| Actual | | | | | | $ 1,000 | | $ 1,117.30 | | $ 2.16 |
Hypothetical-B | | | | | | $ 1,000 | | $ 1,022.82 | | $ 2.06 |
| |
A Annualized expense ratio reflects expenses net of applicable fee waivers.
B 5% return per year before expenses
C Expenses are equal to the annualized expense ratio, multiplied by the average account value over the period, multiplied by 182/ 366 (to reflect the one-half year period). The fees and expenses of any Underlying Funds are not included in each annualized expense ratio.
The dividend and capital gains distributions for the fund(s) are available on Fidelity.com or Institutional.Fidelity.com.
Fidelity Enhanced Small Cap ETF designates $38,382 of distributions distributed in December during the fiscal year as qualifying to be taxed as section 163(j) interest dividends.
Fidelity Enhanced Small Cap ETF designates 28% of the dividends distributed in December during the fiscal year as qualifying for the dividends-received deduction for corporate shareholders.
Fidelity Enhanced Small Cap ETF designates 28.25% of the dividends distributed in December during the fiscal year as amounts which may be taken into account as a dividend for the purposes of the maximum rate under section 1(h)(11) of the Internal Revenue Code.
Fidelity Enhanced Small Cap ETF designates 71.76% of the dividends distributed in December during the fiscal year as a section 199A dividend.
Fidelity Small Cap Enhanced Index Fund designates $152,267 of distributions distributed in November during the fiscal year as qualifying to be taxed as section 163(j) interest dividends.
Fidelity Small Cap Enhanced Index Fund designates 70% of the dividends distributed in November during the fiscal year as qualifying for the dividends-received deduction for corporate shareholders.
Fidelity Small Cap Enhanced Index Fund designates 94.71% of the dividends distributed in November during the fiscal year as amounts which may be taken into account as a dividend for the purposes of the maximum rate under section 1(h)(11) of the Internal Revenue Code.
Fidelity Small Cap Enhanced Index Fund designates 5.30% of the dividends distributed in November during the fiscal year as a section 199A dividend.
The fund will notify shareholders in January 2025 of amounts for use in preparing 2024 income tax returns.
Board Approval of Investment Advisory Contracts and Management Fees
Fidelity Enhanced Small Cap ETF
At the June 2023 meeting, the Board of Trustees, including the Independent Trustees (together, the Board), voted to approve the management contract with Fidelity Management & Research Company LLC (FMR) (the Advisory Contract) for the fund. The Board, assisted by the advice of fund counsel and Independent Trustees' counsel, considered a broad range of information.
Nature, Extent, and Quality of Services Provided. The Board considered Fidelity's staffing as it relates to the fund, including the backgrounds of investment personnel of Fidelity, and also considered the fund's investment objective, strategies, and related investment philosophy. The Board considered the structure of the investment personnel compensation program and whether this structure provides appropriate incentives to act in the best interests of the fund.
Resources Dedicated to Investment Management and Support Services. The Board and the Fund Oversight and Research Committees reviewed the general qualifications and capabilities of Fidelity's investment staff, including its size, education, experience, and resources, as well as Fidelity's approach to recruiting, training, managing, and compensating investment personnel. The Board noted that Fidelity has continued to increase the resources devoted to non-U.S. offices, including expansion of Fidelity's global investment organization. The Board also noted that Fidelity's analysts have extensive resources, tools and capabilities that allow them to conduct sophisticated quantitative and fundamental analysis, as well as credit analysis of issuers, counterparties, and guarantors. Further, the Board considered that Fidelity's investment professionals have sufficient access to global information and data so as to provide competitive investment results over time, and that those professionals also have access to sophisticated tools that permit them to assess portfolio construction and risk and performance attribution characteristics continuously, as well as to transmit new information and research conclusions rapidly around the world. Additionally, in its deliberations, the Board considered Fidelity's trading, risk management, compliance, and technology and operations capabilities and resources, which are integral parts of the investment management process. The Board also considered Fidelity's investments in business continuity planning, and its success in continuously providing services to the Fidelity funds notwithstanding the severe disruptions caused by the COVID-19 pandemic.
Shareholder and Administrative Services. The Board considered the nature, extent, quality, and cost of advisory, administrative, and shareholder services to be performed by FMR and its affiliates under the Advisory Contract and under separate agreements covering pricing and bookkeeping, and securities lending services for the fund. The Board also considered the nature and extent of the supervision of third-party service providers, principally transfer agent, custodians, subcustodians, and pricing vendors.
The Board noted that the growth of fund assets over time across the complex allows Fidelity to reinvest in the development of services designed to enhance the value and convenience of the Fidelity funds as investment vehicles. These services include 24-hour access to account information and market information over the Internet and through telephone representatives, investor education materials and asset allocation tools, and the expanded availability of Fidelity Investor Centers.
Investment Performance. The fund will commence operations by acquiring the assets of the relevant acquired fund in a reorganization, and the acquired fund is to be the accounting survivor after the reorganization. Therefore, the Trustees were provided with performance information for the relevant acquired fund. The Board considered FMR's proprietary enhanced index investment methodology, which the Board is familiar with through its supervision of the Fidelity Enhanced Index funds.
Based on its review, the Board concluded that the nature, extent, and quality of services to be provided to the fund under the Advisory Contract should benefit the shareholders of the fund.
Competitiveness of Management Fee and Total Expense Ratio. In reviewing the Advisory Contracts, the Board considered the fund's all-inclusive fee rate. The Board also considered other expenses, such as transfer agent fees, pricing and bookkeeping fees, and custodial, legal, and audit fees, paid by FMR under the all-inclusive arrangement. The Board noted that the fund's proposed management fee rate is below the median fee rate of funds with similar Lipper investment objective categories and comparable investment mandates, regardless of whether their management fee structures are comparable. The Board also considered that the projected total expense ratio of the fund is below the median of those funds and classes used by the Board for management fee comparisons.
Based on its review, the Board concluded that the fund's management fee and projected total expense ratio were reasonable in light of the services that the fund and its shareholders will receive and the other factors considered.
Costs of the Services and Profitability. The fund will commence operations by acquiring the assets of the relevant acquired fund in a reorganization, and the acquired fund is to be the accounting survivor after the reorganization. The revenue, cost, or profitability data for the relevant acquired fund was available for the Board to review in respect of the fund.
Economies of Scale. The Board considered economies of scale based on the operating experience of the relevant acquired fund to permit assessment thereof. It noted that, notwithstanding the entrepreneurial risk associated with converting a mutual fund into an exchange-traded fund, the management fee for the fund was set at a level normally associated, by comparison with competitors, with very high fund net assets. The Board also considered Fidelity's assertion that the level of the fund's fee anticipated economies of scale at lower asset levels even before, if ever, economies of scale are achieved. The Board also noted that the fund and its shareholders would have access to the very considerable number and variety of services available through Fidelity and its affiliates.
Based on its evaluation of all of the conclusions noted above, and after considering all factors it believed relevant, the Board concluded that the advisory fee arrangements are fair and reasonable, and that the fund's Advisory Contract should be approved.
The Securities and Exchange Commission adopted Rule 22e-4 under the Investment Company Act of 1940 (the Liquidity Rule) to promote effective liquidity risk management throughout the open-end investment company industry, thereby reducing the risk that funds will be unable to meet their redemption obligations and mitigating dilution of the interests of fund shareholders.
The Fund has adopted and implemented a liquidity risk management program (the Program) reasonably designed to assess and manage the Fund's liquidity risk and to comply with the requirements of the Liquidity Rule. The Fund's Board of Trustees (the Board) has designated the Fund's investment adviser as administrator of the Program. The Fidelity advisers have established a Liquidity Risk Management Committee (the LRM Committee) to manage the Program for each of the Fidelity Funds. The LRM Committee monitors the adequacy and effectiveness of implementation of the Program and on a periodic basis assesses each Fund's liquidity risk based on a variety of factors including (1) the Fund's investment strategy, (2) portfolio liquidity and cash flow projections during normal and reasonably foreseeable stressed conditions, (3) shareholder redemptions, (4) borrowings and other funding sources and (5) certain factors specific to ETFs including the effect of the Fund's prices and spreads, market participants, and basket compositions on the overall liquidity of the Fund's portfolio, as applicable.
In accordance with the Program, each of the Fund's portfolio investments is classified into one of four defined liquidity categories based on a determination of a reasonable expectation for how long it would take to convert the investment to cash (or sell or dispose of the investment) without significantly changing its market value.
- Highly liquid investments - cash or convertible to cash within three business days or less
- Moderately liquid investments - convertible to cash in three to seven calendar days
- Less liquid investments - can be sold or disposed of, but not settled, within seven calendar days
- Illiquid investments - cannot be sold or disposed of within seven calendar days
Liquidity classification determinations take into account a variety of factors including various market, trading and investment-specific considerations, as well as market depth, and generally utilize analysis from a third-party liquidity metrics service.
The Liquidity Rule places a 15% limit on a fund's illiquid investments and requires funds that do not primarily hold assets that are highly liquid investments to determine and maintain a minimum percentage of the fund's net assets to be invested in highly liquid investments (highly liquid investment minimum or HLIM). The Program includes provisions reasonably designed to comply with the 15% limit on illiquid investments and for determining, periodically reviewing and complying with the HLIM requirement as applicable.
At a recent meeting of the Fund's Board of Trustees, the LRM Committee provided a written report to the Board pertaining to the operation, adequacy, and effectiveness of the Program for the period December 1, 2022 through November 30, 2023. The report concluded that the Program is operating effectively and is reasonably designed to assess and manage the Fund's liquidity risk.
1.9910154.100
CPE-ANN-0424
Item 2.
Code of Ethics
As of the end of the period, February 29, 2024, Fidelity Covington Trust (the trust) has adopted a code of ethics, as defined in Item 2 of Form N-CSR, that applies to its President and Treasurer and its Chief Financial Officer. A copy of the code of ethics is filed as an exhibit to this Form N-CSR.
Item 3.
Audit Committee Financial Expert
The Board of Trustees of the trust has determined that Donald F. Donahue is an audit committee financial expert, as defined in Item 3 of Form N-CSR. Mr. Donahue is independent for purposes of Item 3 of Form N-CSR.
Item 4.
Principal Accountant Fees and Services
Fees and Services
The following table presents fees billed by PricewaterhouseCoopers LLP (“PwC”) in each of the last two fiscal years for services rendered to Fidelity Enhanced Small Cap ETF (the “Fund”):
Services Billed by PwC
February 29, 2024 FeesA,B
| | | | |
| Audit Fees | Audit-Related Fees | Tax Fees | All Other Fees |
Fidelity Enhanced Small Cap ETF | $39,200 | $- | $9,800 | $100 |
| | | | |
| Audit Fees | Audit-Related Fees | Tax Fees | All Other Fees |
Fidelity Enhanced Small Cap ETF | $- | $- | $- | $- |
A Amounts may reflect rounding.
B Fidelity Enhanced Small Cap ETF commenced operations on November 17, 2023.
The following table(s) present(s) fees billed by PwC that were required to be approved by the Audit Committee for services that relate directly to the operations and financial reporting of the Fund(s) and that are rendered on behalf of Fidelity Management &
Research Company LLC ("FMR") and entities controlling, controlled by, or under common control with FMR (not including any sub-adviser whose role is primarily portfolio management and is subcontracted with or overseen by another investment adviser) that provide ongoing services to the Fund(s) (“Fund Service Providers”):
Services Billed by PwC
| | |
| February 29, 2024A,B | February 28, 2023A |
Audit-Related Fees | $9,422,800 | $8,469,200 |
Tax Fees | $61,000 | $1,000 |
All Other Fees | $- | $- |
A Amounts may reflect rounding.
B May include amounts billed prior to the Fidelity Enhanced Small Cap ETF’s commencement of operations.
“Audit-Related Fees” represent fees billed for assurance and related services that are reasonably related to the performance of the fund audit or the review of the fund's financial statements and that are not reported under Audit Fees.
“Tax Fees” represent fees billed for tax compliance, tax advice or tax planning that relate directly to the operations and financial reporting of the fund.
“All Other Fees” represent fees billed for services provided to the fund or Fund Service Provider, a significant portion of which are assurance related, that relate directly to the operations and financial reporting of the fund, excluding those services that are reported under Audit Fees, Audit-Related Fees or Tax Fees.
Assurance services must be performed by an independent public accountant.
* * *
The aggregate non-audit fees billed by PwC for services rendered to the Fund(s), FMR (not including any sub-adviser whose role is primarily portfolio management and is subcontracted with or overseen by another investment adviser), and any Fund Service Provider for each of the last two fiscal years of the Fund(s) are as follows:
| | |
Billed By | February 29, 2024A,B | February 28, 2023 |
PwC | $15,038,400 | $- |
A Amounts may reflect rounding.
B May include amounts billed prior to the Fidelity Enhanced Small Cap ETF’s commencement of operations.
The trust's Audit Committee has considered non-audit services that were not pre-approved that were provided by PwC to Fund Service Providers to be compatible with maintaining the independence of PwC in its(their) audit of the Fund(s), taking into account representations from PwC, in accordance with Public Company Accounting Oversight Board rules, regarding its independence from the Fund(s) and its(their) related entities and FMR’s review of the appropriateness and permissibility under applicable law of such non-audit services prior to their provision to the Fund(s) Service Providers.
Audit Committee Pre-Approval Policies and Procedures
The trust’s Audit Committee must pre-approve all audit and non-audit services provided by a fund’s independent registered public accounting firm relating to the operations or financial reporting of the fund. Prior to the commencement of any audit or non-audit services to a fund, the Audit Committee reviews the services to determine whether they are appropriate and permissible under applicable law.
The Audit Committee has adopted policies and procedures to, among other purposes, provide a framework for the Committee’s consideration of non-audit services by the audit firms that audit the Fidelity funds. The policies and procedures require that any non-audit service provided by a fund audit firm to a Fidelity fund and any non-audit service provided by a fund auditor to a Fund Service Provider that relates directly to the operations and financial reporting of a Fidelity fund (“Covered Service”) are subject to approval by the Audit Committee before such service is provided.
All Covered Services must be approved in advance of provision of the service either: (i) by formal resolution of the Audit Committee, or (ii) by oral or written approval of the service by the Chair of the Audit Committee (or if the Chair is unavailable, such other member of the Audit Committee as may be designated by the Chair to act in the Chair’s absence). The approval contemplated by (ii) above is permitted where the Treasurer determines that action on such an engagement is necessary before the next meeting of the Audit Committee.
Non-audit services provided by a fund audit firm to a Fund Service Provider that do not relate directly to the operations and financial reporting of a Fidelity fund are reported to the Audit Committee periodically.
Non-Audit Services Approved Pursuant to Rule 2-01(c)(7)(i)(C) and (ii) of Regulation S-X (“De Minimis Exception”)
There were no non-audit services approved or required to be approved by the Audit Committee pursuant to the De Minimis Exception during the Fund’s(s’) last two fiscal
years relating to services provided to (i) the Fund(s) or (ii) any Fund Service Provider that relate directly to the operations and financial reporting of the Fund(s).
The Registrant has not retained, for the preparation of the audit report on the financial statements included in the Form N-CSR, a registered public accounting firm that has a branch or office that is located in a foreign jurisdiction and that the Public Company Accounting Oversight Board (the “PCAOB”) has determined that the PCAOB is unable to inspect or investigate completely because of a position taken by an authority in the foreign jurisdiction.
The Registrant is not a “foreign issuer,” as defined in 17 CFR 240.3b-4.
Item 5.
Audit Committee of Listed Registrants
The Audit Committee is a separately-designated standing audit committee in accordance with Section 3(a)(58)(A) of the Securities Exchange Act of 1934. As of February 29, 2024, the members of the Audit Committee were Donald F. Donahue, Vijay C. Advani, Thomas A. Kennedy, Karen B. Peetz, and Susan Tomasky.
Item 6.
Investments
(a)
Not applicable.
(b)
Not applicable.
Item 7.
Disclosure of Proxy Voting Policies and Procedures for Closed-End Management Investment Companies
Not applicable.
Item 8.
Portfolio Managers of Closed-End Management Investment Companies
Not applicable.
Item 9.
Purchase of Equity Securities by Closed-End Management Investment Company and Affiliated Purchasers
Not applicable.
Item 10.
Submission of Matters to a Vote of Security Holders
There were no material changes to the procedures by which shareholders may recommend nominees to the trust’s Board of Trustees.
Item 11.
Controls and Procedures
(a)(i) The President and Treasurer and the Chief Financial Officer have concluded that the trust’s disclosure controls and procedures (as defined in Rule 30a-3(c) under the Investment Company Act) provide reasonable assurances that material information relating to the trust is made known to them by the appropriate persons, based on their evaluation of these controls and procedures as of a date within 90 days of the filing date of this report.
(a)(ii) There was no change in the trust’s internal control over financial reporting (as defined in Rule 30a-3(d) under the Investment Company Act) that occurred during the period covered by this report that has materially affected, or is reasonably likely to materially affect, the trust’s internal control over financial reporting.
Item 12.
Disclosure of Securities Lending Activities for Closed-End Management
Investment Companies
Not applicable.
Item 18.
Recovery of Erroneously Awarded Compensation
(a)
Not applicable.
(b)
Not applicable.
Item 19.
Exhibits
SIGNATURES
Pursuant to the requirements of the Securities Exchange Act of 1934 and the Investment Company Act of 1940, the registrant has duly caused this report to be signed on its behalf by the undersigned, thereunto duly authorized.
Fidelity Covington Trust
| |
By: | /s/Stacie M. Smith |
| Stacie M. Smith |
| President and Treasurer (Principal Executive Officer) |
|
|
Date: | April 22, 2024 |
Pursuant to the requirements of the Securities Exchange Act of 1934 and the Investment Company Act of 1940, this report has been signed below by the following persons on behalf of the registrant and in the capacities and on the dates indicated.
| |
By: | /s/Stacie M. Smith |
| Stacie M. Smith |
| President and Treasurer (Principal Executive Officer) |
|
|
Date: | April 22, 2024 |
| |
By: | /s/John J. Burke III |
| John J. Burke III |
| Chief Financial Officer (Principal Financial Officer) |
|
|
Date: | April 22, 2024 |