Table of Contents
UNITED STATES
SECURITIES AND EXCHANGE COMMISSION
Washington, D.C. 20549
FORM N-CSR
CERTIFIED SHAREHOLDER REPORT OF REGISTERED
MANAGEMENT INVESTMENT COMPANIES
Investment Company Act file number 811-07319
Fidelity Covington Trust
(Exact name of registrant as specified in charter)
245 Summer St., Boston, Massachusetts 02210
(Address of principal executive offices) (Zip code)
Marc Bryant, Secretary
245 Summer St.
Boston, Massachusetts 02210
(Name and address of agent for service)
Registrant’s telephone number, including area code: 617-563-7000
Date of fiscal year end: July 31
Date of reporting period: July 31, 2014
Table of Contents
| Item 1. | Reports to Stockholders |
Table of Contents
Fidelity® MSCI Consumer Discretionary Index ETF
Fidelity MSCI Consumer Staples Index ETF
Fidelity MSCI Energy Index ETF
Fidelity MSCI Financials Index ETF
Fidelity MSCI Health Care Index ETF
Fidelity MSCI Industrials Index ETF
Fidelity MSCI Information Technology Index ETF
Fidelity MSCI Materials Index ETF
Fidelity MSCI Telecommunication Services Index ETF
Fidelity MSCI Utilities Index ETF
Annual Report
July 31, 2014


Table of Contents
| Market Recap | 3 | A review of what happened in markets during the period. | ||||
| Performance and Management’s Discussion of Fund Performance | 4 | How each fund has done over time, the Portfolio Manager’s review of each fund’s performance and a summary of each fund’s holdings. | ||||
| Shareholder Expense Example | 24 | An example of shareholder expenses. | ||||
| Investments | 26 | A complete list of each fund’s investments with their market values. | ||||
| Financial Statements | 66 | Statements of assets and liabilities, operations, and changes in net assets, as well as financial highlights. | ||||
| Notes | 74 | Notes to the financial statements. | ||||
| Report of Independent Registered Public Accounting Firm | 78 | |||||
| Premium/Discount Analysis | 79 | Information regarding each fund’s NAV and market price. | ||||
| Trustees and Officers | 82 | |||||
| Distributions | 86 | |||||
To view a fund’s proxy voting guidelines and proxy voting record for the period ended June, 30, visit http://www.fidelity.com/proxyvotingresults or visit the Securities and Exchange Commission’s (SEC) web site at http://www.sec.gov. You may also call 1-800-FIDELITY to request a free copy of the proxy voting guidelines.
The funds or securities referred to herein are not sponsored, endorsed, or promoted by MSCI, and MSCI bears no liability with respect to any such funds or securities or any index on which such funds or securities are based. The prospectus contains a more detailed description of the limited relationship MSCI has with Fidelity and any related funds.
Standard & Poor’s, S&P and S&P 500 are registered service marks of The McGraw-Hill Companies, Inc. and have been licensed for use by Fidelity Distributors Corporation.
Other third party marks appearing herein are the property of their respective owners.
All other marks appearing herein are registered or unregistered trademarks or service marks of FMR LLC or an affiliated company.
© 2014 FMR LLC. All Rights reserved.
This report and the financial statements contained herein are submitted for the general information of the shareholders of the funds. This report is not authorized for distribution to prospective investors in the funds unless preceded or accompanied by an effective prospectus.
A fund files its complete schedule of portfolio holdings with the SEC for the first and third quarters of each fiscal year on Form N-Q. Forms N-Q are available on the SEC’s web site at http://www.sec.gov. A fund’s Forms N-Q may be reviewed and copied at the SEC’s Public Reference Room in Washington, DC. Information regarding the operation of the SEC’s Public Reference Room may be obtained by calling 1-800-SEC-0330. For a complete list of a fund’s portfolio holdings, view the most recent holdings listing on Fidelity’s web site at http://www.fidelity.com, http://www.advisor.fidelity.com, or http://www.401k.com, as applicable.
NOT FDIC INSURED Ÿ MAY LOSE VALUE Ÿ NO BANK GUARANTEE
Neither the funds nor Fidelity Distributors Corporation is a bank.
| Annual Report | 2 |
Table of Contents
U.S. stocks overcame a slowing economy early in 2014 to post a strong gain for the period from October 21, 2013, through July 31, 2014, supported by healthy corporate profits and continued low interest rates. The S&P 500® Index rose 12.42%, reaching an all-time high near period end. The technology-heavy Nasdaq Composite Index® gained 12.53%, driven by advancing shares of Apple, Facebook, Google and other large-cap companies. Among S&P 500® sectors, information technology (+21%) led the way amid strong demand for hardware, software and semiconductors, with the latter setting global sales records during the period. Health care (+17%) also performed well, with hefty contributions from pharmaceuticals, biotechnology & life sciences companies. Materials (+14%) rose amid higher prices for many commodity products. Energy (+14%) advanced due to strong global demand for crude oil, healthy U.S. output and the threat of supply disruptions in Iraq. Utilities (+10%) approached the index’s return, aided by fairly low input costs. Financials (+9%) lagged the broader market amid unfavorable interest rate trends for the industry and low trading volumes. Consumer discretionary (+7%) also trailed the index, as retailers suffered from lackluster customer traffic. Consumer staples (+6%) proved the worst performer, as many investors preferred to invest in stock sectors with more exposure to the growing economy. Volatility remained tame overall, with markets supported by declining unemployment, near-record profit margins for companies, muted cost inflation and low corporate debt levels. Geopolitical tensions remained a concern at period end, however, with conflict in Ukraine and strained relations between Russia and the West posing a potential threat to global growth.
| 3 | Annual Report |
Table of Contents
Fidelity® MSCI Consumer Discretionary Index ETF
The information provided in the tables below shows you the performance of Fidelity® MSCI Consumer Discretionary Index ETF, with comparisons over different time periods to the fund’s relevant benchmarks, including an appropriate broad-based market index. Seeing the returns over different time periods can help you assess the fund’s performance against relevant measurements. The performance information includes cumulative total returns and is further explained in this section.*
The fund’s net asset value (NAV) performance is based on the NAV calculated each business day. It is calculated in accordance with the standard formula for valuing investment company shares as of the close of regular trading hours on NYSE Arca, Inc. (NYSE Arca) (normally 4:00 p.m. Eastern Time). The fund’s market price performance is based on the daily closing price of the shares of the fund on NYSE Arca. Since ETFs are bought and sold at prices set by the market – which can result in a premium or discount to NAV – the returns calculated using market price (market return) can differ from those calculated using NAV (NAV return). For information on these differences, please visit Fidelity.com or call Fidelity. The $10,000 table and the fund’s returns do not reflect the deduction of taxes that a shareholder would pay on fund distributions or the redemption or selling of fund shares. How a fund did yesterday is no guarantee of how it will do tomorrow.
Current performance may be higher or lower than the performance data quoted. For month-end performance figures, please visit fidelity.com/etfs/sector-etfs/overview or call Fidelity. The performance data featured represents past performance, which is no guarantee of future results. Investment return and principal value will fluctuate; therefore, you may have a gain or loss when you sell your shares.
| Fiscal Period Ended July 31, 2014 | ||||
| Cumulative Total Returns | Life of fundA | |||
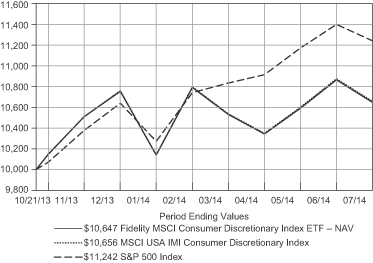
Fidelity MSCI Consumer Discretionary Index ETF – NAV | 6.47% | |||
Fidelity MSCI Consumer Discretionary Index ETF – Market Price | 6.59% | |||
MSCI USA IMI Consumer Discretionary Index | 6.56% | |||
S&P 500 Index | 12.42% | |||
Cumulative total returns reflect performance over the period shown. This information represents returns as of the end of the fund’s fiscal period.
| Period Ended June 30, 2014 | ||||
| Cumulative Total Returns | Life of fundA | |||
Fidelity MSCI Consumer Discretionary Index ETF – NAV | 8.63% | |||
Fidelity MSCI Consumer Discretionary Index ETF – Market Price | 8.59% | |||
MSCI USA IMI Consumer Discretionary Index | 8.74% | |||
S&P 500 Index | 13.99% | |||
This information shows the returns of the fund and its index for the applicable time period through the end of the most recent calendar quarter, as opposed to through the end of the fund’s fiscal period as shown in the previous table.
Average annual total returns take Fidelity MSCI Consumer Discretionary Index ETF’s cumulative total return and show you what would have happened if Fidelity MSCI Consumer Discretionary Index ETF’s shares had performed at a constant rate each year. These numbers will be reported once the fund is a year old.
The fund’s expense ratio is 0.12%. Expense ratio is the total annual operating expense ratio from the most recent prospectus. A fund’s net expenses paid may be different. Please refer to the most recent prospectus for more information on a fund’s expenses.
| A | From October 21, 2013. |
| * | Total returns are historical and include changes in share price and reinvestment of dividends and capital gains distributions, if any. |
| $10,000 Over Life of Fund | ||
Let’s say hypothetically that $10,000 was invested in Fidelity MSCI Consumer Discretionary Index ETF – NAV on October 21, 2013, when the fund started. The chart shows how the value of your investment would have changed, and also shows how the MSCI USA IMI Consumer Discretionary Index and the S&P 500 Index performed over the same period.
| Annual Report | 4 |
Table of Contents
Fidelity® MSCI Consumer Discretionary Index ETF
Management’s Discussion of Fund Performance
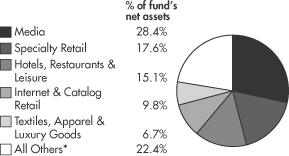
From its inception on October 21, 2013, through July 31, 2014, the exchange-traded fund’s (ETF) net asset value advanced 6.47%, in line with the 6.56% return of the MSCI USA IMI Consumer Discretionary Index. The ETF’s market price gained 6.59% over the same time frame, while the broad-market S&P 500® Index returned 12.42%. Consumer discretionary stocks produced the second-lowest return among the 10 MSCI market sectors during the period. Brick-and-mortar retailers continued to struggle after a harsh winter, and the group reported weak first-quarter sales across the board. Intense competition in the industry hurt margins, which dampened the performance of many stocks in the index. Multiple factors weighed on consumers’ decisions to spend on discretionary products, including concern over rising oil prices later in the period and an uptick in inflation, despite reduced debt loads and early signs of wage growth. However, the fundamental picture seemed to be improving, as housing strengthened, unemployment trended lower and auto sales improved. In fact, domestic car sales saw healthy sales volumes, largely driven by demand from buyers who had delayed purchases in recent years. Additionally, signs of economic improvement in the broad market, despite some volatility, lifted consumer confidence, while greater access to credit and attractive lending rates boosted affordability. Looking at industries within the sector, retailers – specifically apparel and home-furnishing retail, along with specialty and general merchandise stores – produced some of the lowest results. Internet retail performed about in line with the index; however, benchmark heavyweight and global e-commerce giant Amazon.com was hurt by mixed financial results this period, partly due to weakness in international markets. On the flip side, the movies & entertainment and cable & satellite segments – the two largest industry weightings, combined making up roughly 23% of the index, on average – performed well, as media companies benefited from a generally optimistic consumer and firms found ways to capitalize on paid content. In the former category, shares of Walt Disney were lifted by the success of the company’s animated films and an increase in visits to its theme parks.
Note to shareholders: Effective May 30, 2014, the fund eliminated the 25% limitation of assets invested in securities of a single issuer.
The views expressed above reflect those of the portfolio manager(s) only through the end of the period as stated on the cover of this report and do not necessarily represent the views of Fidelity or any other person in the Fidelity organization, or BlackRock Fund Advisors (the ETF’s sub-adviser) or any other person in the BlackRock organization. Any such views are subject to change at any time based upon market or other conditions and Fidelity and BlackRock disclaim any responsibility to update such views. These views may not be relied on as investment advice and, because investment decisions for a Fidelity fund are based on numerous factors, may not be relied on as an indication of trading intent on behalf of any Fidelity fund.
Investment Summary
| Top Ten Stocks as of July 31, 2014 | ||||
| % of fund’s net assets | ||||
The Walt Disney Co. | 5.4 | |||
Amazon.com, Inc. | 4.6 | |||
Comcast Corp. Class A | 4.3 | |||
Home Depot, Inc. | 4.3 | |||
McDonald’s Corp. | 3.5 | |||
Time Warner, Inc. | 2.8 | |||
priceline.com, Inc. | 2.4 | |||
Ford Motor Co. | 2.3 | |||
Starbucks Corp. | 2.2 | |||
NIKE, Inc. Class B | 2.0 | |||
|
| |||
| 33.8 | ||||
|
| |||
| Industries as of July 31, 2014 | ||||
| * | Includes short-term investments and net other assets. |
| 5 | Annual Report |
Table of Contents
Fidelity® MSCI Consumer Staples Index ETF
Performance
The information provided in the tables below shows you the performance of Fidelity® MSCI Consumer Staples Index ETF, with comparisons over different time periods to the fund’s relevant benchmarks, including an appropriate broad-based market index. Seeing the returns over different time periods can help you assess the fund’s performance against relevant measurements. The performance information includes cumulative total returns and is further explained in this section.*
The fund’s net asset value (NAV) performance is based on the NAV calculated each business day. It is calculated in accordance with the standard formula for valuing investment company shares as of the close of regular trading hours on NYSE Arca, Inc. (NYSE Arca) (normally 4:00 p.m. Eastern Time). The fund’s market price performance is based on the daily closing price of the shares of the fund on NYSE Arca. Since ETFs are bought and sold at prices set by the market – which can result in a premium or discount to NAV – the returns calculated using market price (market return) can differ from those calculated using NAV (NAV return). For information on these differences, please visit Fidelity.com or call Fidelity. The $10,000 table and the fund’s returns do not reflect the deduction of taxes that a shareholder would pay on fund distributions or the redemption or selling of fund shares. How a fund did yesterday is no guarantee of how it will do tomorrow.
Current performance may be higher or lower than the performance data quoted. For month-end performance figures, please visit fidelity.com/etfs/sector-etfs/overview or call Fidelity. The performance data featured represents past performance, which is no guarantee of future results. Investment return and principal value will fluctuate; therefore, you may have a gain or loss when you sell your shares.
| Fiscal Period Ended July 31, 2014 | ||||
| Cumulative Total Returns | Life of fundA | |||
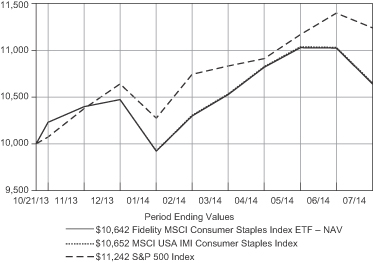
Fidelity MSCI Consumer Staples Index ETF – NAV | 6.42% | |||
Fidelity MSCI Consumer Staples Index ETF – Market Price | 6.50% | |||
MSCI USA IMI Consumer Staples Index | 6.52% | |||
S&P 500 Index | 12.42% | |||
Cumulative total returns reflect performance over the period shown. This information represents returns as of the end of the fund’s fiscal period.
| Period Ended June 30, 2014 | ||||
| Cumulative Total Returns | Life of fundA | |||
Fidelity MSCI Consumer Staples Index ETF – NAV | 10.24% | |||
Fidelity MSCI Consumer Staples Index ETF – Market Price | 10.16% | |||
MSCI USA IMI Consumer Staples Index | 10.33% | |||
S&P 500 Index | 13.99% | |||
This information shows the returns of the fund and its index for the applicable time period through the end of the most recent calendar quarter, as opposed to through the end of the fund’s fiscal period as shown in the previous table.
Average annual total returns take Fidelity MSCI Consumer Staples Index ETF’s cumulative total return and show you what would have happened if Fidelity MSCI Consumer Staples Index ETF’s shares had performed at a constant rate each year. These numbers will be reported once the fund is a year old.
The fund’s expense ratio is 0.12%. Expense ratio is the total annual operating expense ratio from the most recent prospectus. A fund’s net expenses paid may be different. Please refer to the most recent prospectus for more information on a fund’s expenses.
| A | From October 21, 2013. |
| * | Total returns are historical and include changes in share price and reinvestment of dividends and capital gains distributions, if any. |
| $10,000 Over Life of Fund |
Let’s say hypothetically that $10,000 was invested in Fidelity MSCI Consumer Staples Index ETF – NAV on October 21, 2013, when the fund started. The chart shows how the value of your investment would have changed, and also shows how the MSCI USA IMI Consumer Staples Index and the S&P 500 Index performed over the same period.
| Annual Report | 6 |
Table of Contents
Fidelity® MSCI Consumer Staples Index ETF
Management’s Discussion of Fund Performance
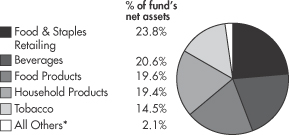
From its inception on October 21, 2013, through July 31, 2014, the exchange-traded fund’s (ETF) net asset value rose 6.42%, in line with the 6.52% return of the MSCI USA IMI Consumer Staples Index. The ETF’s market price gained 6.50% over the same time frame, while the broad-market S&P 500® Index returned 12.42%. The period was uneventful for consumer staples, as the traditionally defensive sector languished while investors searched elsewhere for higher returns given a slowly improving yet volatile economy. Business conditions remained steady, but company fundamentals were largely uninspiring, due partly to disappointing growth rates in developed markets and slower-than-expected consumption in emerging markets (EM). Also, currency weakness in EM early in 2014 hurt staples firms with exposure there. Cost pressures in the sector were benign overall, with no pricing wars of note. However, many companies remained focused on cutting costs, which helped account for decent earnings results and minimal earnings volatility, while merger-and-acquisition activity among a handful of firms added a bit of a spark. In terms of industries, household products – which made up nearly 20% of the MSCI sector index – did poorly, as demand was flat for basic products; the weak-performing shares of consumer products giant Procter & Gamble dampened the group’s return. Two smaller segments of the index, personal products and food retail, also struggled. In the former, Nu Skin Enterprises and Avon Products put up poor numbers, while Whole Foods Market couldn’t keep pace in the latter. On the plus side, packaged foods & meats and drug retail bettered the index, with the latter industry boosted by strong returns from drugstore chains CVS Caremark and Walgreen. Beverage-related industries also did well, especially distillers & vintners, where names such as Beam lifted performance.
Note to shareholders: Effective May 30, 2014, the fund eliminated the 25% limitation of assets invested in securities of a single issuer.
The views expressed above reflect those of the portfolio manager(s) only through the end of the period as stated on the cover of this report and do not necessarily represent the views of Fidelity or any other person in the Fidelity organization, or BlackRock Fund Advisors (the ETF’s sub-adviser) or any other person in the BlackRock organization. Any such views are subject to change at any time based upon market or other conditions and Fidelity and BlackRock disclaim any responsibility to update such views. These views may not be relied on as investment advice and, because investment decisions for a Fidelity fund are based on numerous factors, may not be relied on as an indication of trading intent on behalf of any Fidelity fund.
Investment Summary
| Top Ten Stocks as of July 31, 2014 | ||||
| % of fund’s net assets | ||||
The Procter & Gamble Co. | 12.0 | |||
The Coca-Cola Co. | 8.9 | |||
PepsiCo, Inc. | 7.7 | |||
Philip Morris International, Inc. | 7.5 | |||
Wal-Mart Stores, Inc. | 6.8 | |||
CVS Caremark Corp. | 5.2 | |||
Altria Group, Inc. | 4.6 | |||
Walgreen Co. | 3.6 | |||
Mondelez International, Inc. Class A | 3.5 | |||
Colgate-Palmolive Co. | 3.4 | |||
|
| |||
| 63.2 | ||||
|
| |||
| Industries as of July 31, 2014 | ||||
| * | Includes short-term investments and net other assets. |
| 7 | Annual Report |
Table of Contents
Fidelity® MSCI Energy Index ETF
Performance
The information provided in the tables below shows you the performance of Fidelity® MSCI Energy Index ETF, with comparisons over different time periods to the fund’s relevant benchmarks, including an appropriate broad-based market index. Seeing the returns over different time periods can help you assess the fund’s performance against relevant measurements. The performance information includes cumulative total returns and is further explained in this section.*
The fund’s net asset value (NAV) performance is based on the NAV calculated each business day. It is calculated in accordance with the standard formula for valuing investment company shares as of the close of regular trading hours on NYSE Arca, Inc. (NYSE Arca) (normally 4:00 p.m. Eastern Time). The fund’s market price performance is based on the daily closing price of the shares of the fund on NYSE Arca. Since ETFs are bought and sold at prices set by the market – which can result in a premium or discount to NAV – the returns calculated using market price (market return) can differ from those calculated using NAV (NAV return). For information on these differences, please visit Fidelity.com or call Fidelity. The $10,000 table and the fund’s returns do not reflect the deduction of taxes that a shareholder would pay on fund distributions or the redemption or selling of fund shares. How a fund did yesterday is no guarantee of how it will do tomorrow.
Current performance may be higher or lower than the performance data quoted. For month-end performance figures, please visit fidelity.com/etfs/sector-etfs/overview or call Fidelity. The performance data featured represents past performance, which is no guarantee of future results. Investment return and principal value will fluctuate; therefore, you may have a gain or loss when you sell your shares.
| Fiscal Period Ended July 31, 2014 | ||||
| Cumulative Total Returns | Life of fundA | |||
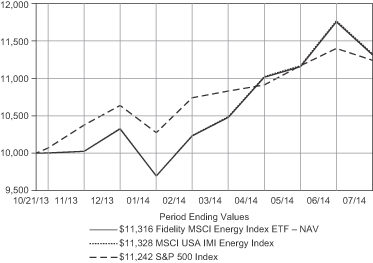
Fidelity MSCI Energy Index ETF – NAV | 13.16% | |||
Fidelity MSCI Energy Index ETF – Market Price | 13.20% | |||
MSCI USA IMI Energy Index | 13.28% | |||
S&P 500 Index | 12.42% | |||
Cumulative total returns reflect performance over the period shown. This information represents returns as of the end of the fund’s fiscal period.
| Period Ended June 30, 2014 | ||||
| Cumulative Total Returns | Life of fundA | |||
Fidelity MSCI Energy Index ETF – NAV | 17.57% | |||
Fidelity MSCI Energy Index ETF – Market Price | 17.57% | |||
MSCI USA IMI Energy Index | 17.70% | |||
S&P 500 Index | 13.99% | |||
This information shows the returns of the fund and its index for the applicable time period through the end of the most recent calendar quarter, as opposed to through the end of the fund’s fiscal period as shown in the previous table.
Average annual total returns take Fidelity MSCI Energy Index ETF’s cumulative total return and show you what would have happened if Fidelity MSCI Energy Index ETF’s shares had performed at a constant rate each year. These numbers will be reported once the fund is a year old.
The fund’s expense ratio is 0.12%. Expense ratio is the total annual operating expense ratio from the most recent prospectus. A fund’s net expenses paid may be different. Please refer to the most recent prospectus for more information on a fund’s expenses.
| A | From October 21, 2013. |
| * | Total returns are historical and include changes in share price and reinvestment of dividends and capital gains distributions, if any. |
| $10,000 Over Life of Fund | ||
Let’s say hypothetically that $10,000 was invested in Fidelity MSCI Energy Index ETF – NAV on October 21, 2013, when the fund started. The chart shows how the value of your investment would have changed, and also shows how the MSCI USA IMI Energy Index and the S&P 500 Index performed over the same period.
| Annual Report | 8 |
Table of Contents
Fidelity® MSCI Energy Index ETF
Management’s Discussion of Fund Performance
From its inception on October 21, 2013, through July 31, 2014, the exchange-traded fund’s (ETF) net asset value rose 13.16%, in line with the 13.28% return of the MSCI USA IMI Energy Index. The ETF’s market price gained 13.20% over the same time frame, while the broad-market S&P 500® Index returned 12.42%. The ongoing boom in North American oil and natural gas production lifted several index segments to gains of more than 20% for the period. Oil & gas storage & transport gained 29% as U.S. pipeline companies benefited from moving the glut of midcontinent-produced oil and gas to coastal refiners. Refining & marketing – which made up 6% of the index, on average – was another outperformer, as expansion of the U.S. pipeline system brought more U.S. crude to Gulf Coast refiners for processing. Equipment & services firms such as Schlumberger and Halliburton also benefited from the exploration boom. Conversely, integrated oil & gas, which makes up nearly 40% the index, fell short, returning 12%. Nonetheless, large index components Exxon Mobil and Chevron were notable gainers here, as global oil prices rose in the new year amid tensions in Iraq and elsewhere in the Middle East. Coal & consumable fuels (-10%) posted the energy sector’s only negative result, due mainly to increased regulation and the nation’s shift from coal to natural gas and renewable energy. Elsewhere in exploration & production, shares of U.S. driller Noble Energy fell on lowered production guidance, while Cobalt International Energy declined on news of a failed effort in the Gulf of Mexico.
Note to shareholders: Effective May 30, 2014, the fund eliminated the 25% limitation of assets invested in securities of a single issuer.
The views expressed above reflect those of the portfolio manager(s) only through the end of the period as stated on the cover of this report and do not necessarily represent the views of Fidelity or any other person in the Fidelity organization, or BlackRock Fund Advisors (the ETF’s sub-adviser) or any other person in the BlackRock organization. Any such views are subject to change at any time based upon market or other conditions and Fidelity and BlackRock disclaim any responsibility to update such views. These views may not be relied on as investment advice and, because investment decisions for a Fidelity fund are based on numerous factors, may not be relied on as an indication of trading intent on behalf of any Fidelity fund.
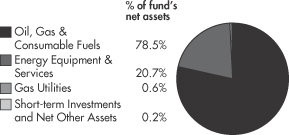
Investment Summary
| Top Ten Stocks as of July 31, 2014 | ||||
| % of fund’s net assets | ||||
Exxon Mobil Corp. | 20.3 | |||
Chevron Corp. | 11.7 | |||
Schlumberger Ltd. | 6.7 | |||
ConocoPhillips | 4.8 | |||
Occidental Petroleum Corp. | 3.7 | |||
EOG Resources, Inc. | 2.8 | |||
Halliburton Co. | 2.8 | |||
Anadarko Petroleum Corp. | 2.6 | |||
Phillips 66 | 2.3 | |||
Apache Corp. | 1.9 | |||
|
| |||
| 59.6 | ||||
|
| |||
| Industries as of July 31, 2014 |
| 9 | Annual Report |
Table of Contents
Fidelity® MSCI Financials Index ETF
Performance
The information provided in the tables below shows you the performance of Fidelity® MSCI Financials Index ETF, with comparisons over different time periods to the fund’s relevant benchmarks, including an appropriate broad-based market index. Seeing the returns over different time periods can help you assess the fund’s performance against relevant measurements. The performance information includes cumulative total returns and is further explained in this section.*
The fund’s net asset value (NAV) performance is based on the NAV calculated each business day. It is calculated in accordance with the standard formula for valuing investment company shares as of the close of regular trading hours on NYSE Arca, Inc. (NYSE Arca) (normally 4:00 p.m. Eastern Time). The fund’s market price performance is based on the daily closing price of the shares of the fund on NYSE Arca. Since ETFs are bought and sold at prices set by the market – which can result in a premium or discount to NAV – the returns calculated using market price (market return) can differ from those calculated using NAV (NAV return). For information on these differences, please visit Fidelity.com or call Fidelity. The $10,000 table and the fund’s returns do not reflect the deduction of taxes that a shareholder would pay on fund distributions or the redemption or selling of fund shares. How a fund did yesterday is no guarantee of how it will do tomorrow.
Current performance may be higher or lower than the performance data quoted. For month-end performance figures, please visit fidelity.com/etfs/sector-etfs/overview or call Fidelity. The performance data featured represents past performance, which is no guarantee of future results. Investment return and principal value will fluctuate; therefore, you may have a gain or loss when you sell your shares.
| Fiscal Period Ended July 31, 2014 | ||||
| Cumulative Total Returns | Life of fundA | |||
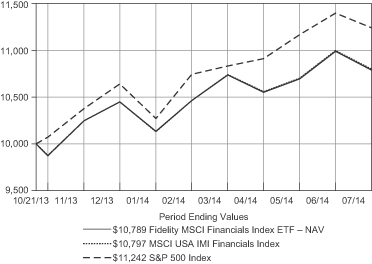
Fidelity MSCI Financials Index ETF – NAV | 7.89% | |||
Fidelity MSCI Financials Index ETF – Market Price | 8.09% | |||
MSCI USA IMI Financials Index | 7.97% | |||
S&P 500 Index | 12.42% | |||
Cumulative total returns reflect performance over the period shown. This information represents returns as of the end of the fund’s fiscal period.
| Period Ended June 30, 2014 | ||||
| Cumulative Total Returns | Life of fundA | |||
Fidelity MSCI Financials Index ETF – NAV | 9.92% | |||
Fidelity MSCI Financials Index ETF – Market Price | 9.79% | |||
MSCI USA IMI Financials Index | 9.98% | |||
S&P 500 Index | 13.99% | |||
This information shows the returns of the fund and its index for the applicable time period through the end of the most recent calendar quarter, as opposed to through the end of the fund’s fiscal period as shown in the previous table.
Average annual total returns take Fidelity MSCI Financials Index ETF’s cumulative total return and show you what would have happened if Fidelity MSCI Financials Index ETF’s shares had performed at a constant rate each year. These numbers will be reported once the fund is a year old.
The fund’s expense ratio is 0.12%. Expense ratio is the total annual operating expense ratio from the most recent prospectus. A fund’s net expenses paid may be different. Please refer to the most recent prospectus for more information on a fund’s expenses.
| A | From October 21, 2013. |
| * | Total returns are historical and include changes in share price and reinvestment of dividends and capital gains distributions, if any. |
| $10,000 Over Life of Fund | ||
Let’s say hypothetically that $10,000 was invested in Fidelity MSCI Financials Index ETF – NAV on October 21, 2013, when the fund started. The chart shows how the value of your investment would have changed, and also shows how the MSCI USA IMI Financials Index and the S&P 500 Index performed over the same period.
| Annual Report | 10 |
Table of Contents
Fidelity® MSCI Financials Index ETF
Management’s Discussion of Fund Performance
From its inception on October 21, 2013, through July 31, 2014, the exchange-traded fund’s (ETF) net asset value rose 7.89%, roughly in line with the 7.97% return of the MSCI USA IMI Financials Index. The ETF’s market price gained 8.09% over the same period, while the broad-market S&P 500® Index returned 12.42%. The sector got off to a strong start in the last quarter of 2013, benefiting from an improved economic outlook, expectations of higher interest rates and continued monetary support from the U.S. Federal Reserve. However, in 2014, declining interest rates and low market volatility hampered performance. For the reporting period, diversified and regional banks – which together made up about one-third of the benchmark – generally did well because a pickup in loan volumes helped offset pressure from continued low interest rates and ongoing regulatory issues. Standouts included diversified bank Wells Fargo, a 7% weight in the MSCI sector index. Investment banking & brokerage stocks received a lift from increased merger-and-acquisition activity, despite slowing trading volumes. Consumer finance stocks, such as American Express, gained from improved consumer spending and credit trends, while asset management & custody banks climbed as the rising equity market helped boost assets under management. By contrast, property & casualty insurance stocks, including AFLAC, lagged, held back by unfavorable pricing and renewal trends in the new year, along with a shift away from more-defensive segments. Real estate investment trust (REIT) segments – which in aggregate accounted for 20% of the index – turned in mixed results, but tended to benefit as rates fell and investors looked for yield. Detractors, however, included specialized REIT Rayonier, which saw its stock decline due to pricing pressures in its specialty cellulose business.
Note to shareholders: Effective May 30, 2014, the fund eliminated the 25% limitation of assets invested in securities of a single issuer.
The views expressed above reflect those of the portfolio manager(s) only through the end of the period as stated on the cover of this report and do not necessarily represent the views of Fidelity or any other person in the Fidelity organization, or BlackRock Fund Advisors (the ETF’s sub-adviser) or any other person in the BlackRock organization. Any such views are subject to change at any time based upon market or other conditions and Fidelity and BlackRock disclaim any responsibility to update such views. These views may not be relied on as investment advice and, because investment decisions for a Fidelity fund are based on numerous factors, may not be relied on as an indication of trading intent on behalf of any Fidelity fund.
Investment Summary
| Top Ten Stocks as of July 31, 2014 | ||||
| % of fund’s net assets | ||||
Wells Fargo & Co. | 7.1 | |||
JPMorgan Chase & Co. | 6.1 | |||
Bank of America Corp. | 4.5 | |||
Citigroup, Inc. | 4.2 | |||
Berkshire Hathaway, Inc. Class B | 3.9 | |||
American Express Co. | 2.4 | |||
US Bancorp | 2.2 | |||
The Goldman Sachs Group, Inc. | 2.1 | |||
American International Group, Inc. | 2.0 | |||
Simon Property Group, Inc. | 1.5 | |||
|
| |||
| 36.0 | ||||
|
| |||
| Industries as of July 31, 2014 | ||||
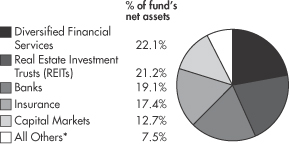
| * | Includes short-term investments and net other liabilities. |
| 11 | Annual Report |
Table of Contents
Fidelity® MSCI Health Care Index ETF
Performance
The information provided in the tables below shows you the performance of Fidelity® MSCI Health Care Index ETF, with comparisons over different time periods to the fund’s relevant benchmarks, including an appropriate broad-based market index. Seeing the returns over different time periods can help you assess the fund’s performance against relevant measurements. The performance information includes cumulative total returns and is further explained in this section.*
The fund’s net asset value (NAV) performance is based on the NAV calculated each business day. It is calculated in accordance with the standard formula for valuing investment company shares as of the close of regular trading hours on NYSE Arca, Inc. (NYSE Arca) (normally 4:00 p.m. Eastern Time). The fund’s market price performance is based on the daily closing price of the shares of the fund on NYSE Arca. Since ETFs are bought and sold at prices set by the market – which can result in a premium or discount to NAV – the returns calculated using market price (market return) can differ from those calculated using NAV (NAV return). For information on these differences, please visit Fidelity.com or call Fidelity. The $10,000 table and the fund’s returns do not reflect the deduction of taxes that a shareholder would pay on fund distributions or the redemption or selling of fund shares. How a fund did yesterday is no guarantee of how it will do tomorrow.
Current performance may be higher or lower than the performance data quoted. For month-end performance figures, please visit fidelity.com/etfs/sector-etfs/overview or call Fidelity. The performance data featured represents past performance, which is no guarantee of future results. Investment return and principal value will fluctuate; therefore, you may have a gain or loss when you sell your shares.
| Fiscal Period Ended July 31, 2014 | ||||
| Cumulative Total Returns | Life of fundA | |||
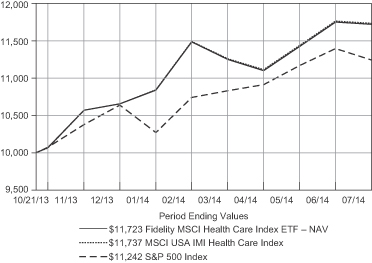
Fidelity MSCI Health Care Index ETF – NAV | 17.23% | |||
Fidelity MSCI Health Care Index ETF – Market Price | 17.35% | |||
MSCI USA IMI Health Care Index | 17.37% | |||
S&P 500 Index | 12.42% | |||
Cumulative total returns reflect performance over the period shown. This information represents returns as of the end of the fund’s fiscal period.
| Period Ended June 30, 2014 | ||||
| Cumulative Total Returns | Life of fundA | |||
Fidelity MSCI Health Care Index ETF – NAV | 17.51% | |||
Fidelity MSCI Health Care Index ETF – Market Price | 17.55% | |||
MSCI USA IMI Health Care Index | 17.65% | |||
S&P 500 Index | 13.99% | |||
This information shows the returns of the fund and its index for the applicable time period through the end of the most recent calendar quarter, as opposed to through the end of the fund’s fiscal period as shown in the previous table.
Average annual total returns take Fidelity MSCI Health Care Index ETF’s cumulative total return and show you what would have happened if Fidelity MSCI Health Care Index ETF’s shares had performed at a constant rate each year. These numbers will be reported once the fund is a year old.
The fund’s expense ratio is 0.12%. Expense ratio is the total annual operating expense ratio from the most recent prospectus. A fund’s net expenses paid may be different. Please refer to the most recent prospectus for more information on a fund’s expenses.
| A | From October 21, 2013. |
| * | Total returns are historical and include changes in share price and reinvestment of dividends and capital gains distributions, if any. |
| $10,000 Over Life of Fund |
Let’s say hypothetically that $10,000 was invested in Fidelity MSCI Health Care Index ETF – NAV on October 21, 2013, when the fund started. The chart shows how the value of your investment would have changed, and also shows how the MSCI USA IMI Health Care Index and the S&P 500 Index performed over the same period.
| Annual Report | 12 |
Table of Contents
Fidelity® MSCI Health Care Index ETF
Management’s Discussion of Fund Performance
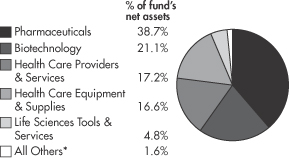
From its inception on October 21, 2013, through July 31, 2014, the exchange-traded fund’s (ETF) net asset value rose 17.23%, in line with the 17.37% return of the MSCI USA IMI Health Care Index. The ETF’s market price gained 17.35% over the same time frame, while the broad-market S&P 500® Index returned 12.42%. Strong fundamentals continued to underpin the sector’s solid performance, while long-term tailwinds remained a source of stability – an aging global population, an expanding middle class in emerging markets, a strong product innovation cycle and the beginnings of a massive digitalization of the health care economy. Despite some volatility in higher-growth areas such as biotechnology, the sector’s diversified composition, attractive valuation and defensive qualities helped it maintain its strong performance. Pharmaceuticals, the largest industry in the index, struggled a bit during the period, hurt partly by the likelihood of increased government regulation and expiring patents, but was boosted by merger-and-acquisition (M&A) activity, which fueled outsized gains in many stocks, most notably the purchase of Forest Laboratories by Ireland-based Actavis. Big-benchmark component biotechnology experienced some headwinds during the period, as investor concerns that the group’s multiyear rally had possibly reached its peak caused the stocks to sell off on heavy volume during a brief window in March and April. Congressional inquiries about drug pricing also weighed on the industry, but strong gains among large benchmark names, such as Gilead Sciences, helped push biotech in front of the index. Managed health care stocks, although a smaller portion of the index, did well, while life science tools & services companies, such as Illumina, continued to benefit from that industry’s innovative gene sequencing technology. On the down side, health care equipment and health care supplies stocks, including Cerner in the former area, felt the pressure from hospitals’ attempts to rein in costs and trailed the index.
Note to shareholders: Effective May 30, 2014, the fund eliminated the 25% limitation of assets invested in securities of a single issuer.
The views expressed above reflect those of the portfolio manager(s) only through the end of the period as stated on the cover of this report and do not necessarily represent the views of Fidelity or any other person in the Fidelity organization, or BlackRock Fund Advisors (the ETF’s sub-adviser) or any other person in the BlackRock organization. Any such views are subject to change at any time based upon market or other conditions and Fidelity and BlackRock disclaim any responsibility to update such views. These views may not be relied on as investment advice and, because investment decisions for a Fidelity fund are based on numerous factors, may not be relied on as an indication of trading intent on behalf of any Fidelity fund.
Investment Summary
| Top Ten Stocks as of July 31, 2014 | ||||
| % of fund’s net assets | ||||
Johnson & Johnson | 10.1 | |||
Pfizer, Inc. | 6.6 | |||
Merck & Co., Inc. | 6.0 | |||
Gilead Sciences, Inc. | 5.0 | |||
Amgen, Inc. | 3.4 | |||
Bristol-Myers Squibb Co. | 3.0 | |||
AbbVie, Inc. | 3.0 | |||
UnitedHealth Group, Inc. | 2.9 | |||
Biogen Idec, Inc. | 2.8 | |||
Celgene Corp. | 2.5 | |||
|
| |||
| 45.3 | ||||
|
| |||
| Industries as of July 31, 2014 |
| * | Includes short-term investments and net other assets. |
| 13 | Annual Report |
Table of Contents
Fidelity® MSCI Industrials Index ETF
Performance
The information provided in the tables below shows you the performance of Fidelity® MSCI Industrials Index ETF, with comparisons over different time periods to the fund’s relevant benchmarks, including an appropriate broad-based market index. Seeing the returns over different time periods can help you assess the fund’s performance against relevant measurements. The performance information includes cumulative total returns and is further explained in this section.*
The fund’s net asset value (NAV) performance is based on the NAV calculated each business day. It is calculated in accordance with the standard formula for valuing investment company shares as of the close of regular trading hours on NYSE Arca, Inc. (NYSE Arca) (normally 4:00 p.m. Eastern Time). The fund’s market price performance is based on the daily closing price of the shares of the fund on NYSE Arca. Since ETFs are bought and sold at prices set by the market – which can result in a premium or discount to NAV – the returns calculated using market price (market return) can differ from those calculated using NAV (NAV return). For information on these differences, please visit Fidelity.com or call Fidelity. The $10,000 table and the fund’s returns do not reflect the deduction of taxes that a shareholder would pay on fund distributions or the redemption or selling of fund shares. How a fund did yesterday is no guarantee of how it will do tomorrow.
Current performance may be higher or lower than the performance data quoted. For month-end performance figures, please visit fidelity.com/etfs/sector-etfs/overview or call Fidelity. The performance data featured represents past performance, which is no guarantee of future results. Investment return and principal value will fluctuate; therefore, you may have a gain or loss when you sell your shares.
| Fiscal Period Ended July 31, 2014 | ||||
| Cumulative Total Returns | Life of fundA | |||
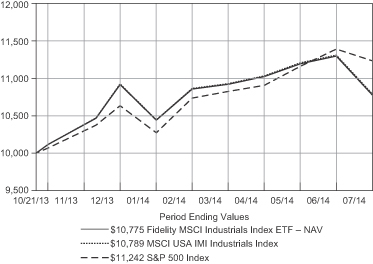
Fidelity MSCI Industrials Index ETF – NAV | 7.75% | |||
Fidelity MSCI Industrials Index ETF – Market Price | 7.75% | |||
MSCI USA IMI Industrials Index | 7.89% | |||
S&P 500 Index | 12.42% | |||
Cumulative total returns reflect performance over the period shown. This information represents returns as of the end of the fund’s fiscal period.
| Period Ended June 30, 2014 | ||||
| Cumulative Total Returns | Life of fundA | |||
Fidelity MSCI Industrials Index ETF – NAV | 13.01% | |||
Fidelity MSCI Industrials Index ETF – Market Price | 13.05% | |||
MSCI USA IMI Industrials Index | 13.13% | |||
S&P 500 Index | 13.99% | |||
This information shows the returns of the fund and its index for the applicable time period through the end of the most recent calendar quarter, as opposed to through the end of the fund’s fiscal period as shown in the previous table.
Average annual total returns take Fidelity MSCI Industrials Index ETF’s cumulative total return and show you what would have happened if Fidelity MSCI Industrials Index ETF’s shares had performed at a constant rate each year. These numbers will be reported once the fund is a year old.
The fund’s expense ratio is 0.12%. Expense ratio is the total annual operating expense ratio from the most recent prospectus. A fund’s net expenses paid may be different. Please refer to the most recent prospectus for more information on a fund’s expenses.
| A | From October 21, 2013. |
| * | Total returns are historical and include changes in share price and reinvestment of dividends and capital gains distributions, if any. |
| $10,000 Over Life of Fund |
Let’s say hypothetically that $10,000 was invested in Fidelity MSCI Industrials Index ETF – NAV on October 21, 2013, when the fund started. The chart shows how the value of your investment would have changed, and also shows how the MSCI USA IMI Industrials Index and the S&P 500 Index performed over the same period.
| Annual Report | 14 |
Table of Contents
Fidelity® MSCI Industrials Index ETF
Management’s Discussion of Fund Performance
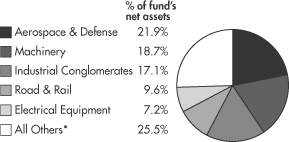
From its inception on October 21, 2013, through July 31, 2014, the exchange-traded fund’s (ETF) net asset value rose 7.75%, roughly in line with the 7.89% return of the MSCI USA IMI Industrials Index. The ETF’s market price gained 7.75% over the same time frame, while the broad-market S&P 500® Index returned 12.42%. Against the backdrop of a subdued but ongoing global economic recovery and relatively stable fuel prices, transportation stocks were standout performers in the industrials sector, with airlines, trucking and railroads notching returns of 52%, 24% and 20%, respectively. Aerospace & defense, the largest index group, on average, produced a result that was roughly in line with the overall index, returning about 8%. Industrial conglomerates, the second-biggest index group by average weighting, lagged with a 4% gain, weighed down partly by index heavyweight General Electric. Rail carrier Union Pacific stood out for its strong contribution. Industrial conglomerate 3M was a noteworthy outperformer in its group, and heavy equipment maker Caterpillar was among the double-digit gainers in the index. Defense contractors also were well-represented in the top performers, notably Lockheed Martin and General Dynamics. On the negative side, commercial aircraft manufacturer Boeing saw its stock price lose ground, as did aircraft parts supplier Precision Castparts. Two stocks in the construction & engineering segment, KBR and Chicago Bridge & Iron, also ended the period with negative returns. In the trading companies & distributors segment, W.W. Grainger was a laggard.
Note to shareholders: Effective May 30, 2014, the fund eliminated the 25% limitation of assets invested in securities of a single issuer.
The views expressed above reflect those of the portfolio manager(s) only through the end of the period as stated on the cover of this report and do not necessarily represent the views of Fidelity or any other person in the Fidelity organization, or BlackRock Fund Advisors (the ETF’s sub-adviser) or any other person in the BlackRock organization. Any such views are subject to change at any time based upon market or other conditions and Fidelity and BlackRock disclaim any responsibility to update such views. These views may not be relied on as investment advice and, because investment decisions for a Fidelity fund are based on numerous factors, may not be relied on as an indication of trading intent on behalf of any Fidelity fund.
Investment Summary
| Top Ten Stocks as of July 31, 2014 | ||||
| % of fund’s net assets | ||||
General Electric Co. | 10.9 | |||
United Technologies Corp. | 4.0 | |||
Union Pacific Corp. | 3.9 | |||
3M Co. | 3.8 | |||
The Boeing Co. | 3.7 | |||
United Parcel Service, Inc. Class B | 3.0 | |||
Honeywell International, Inc. | 3.0 | |||
Caterpillar, Inc. | 2.8 | |||
Danaher Corp. | 2.0 | |||
Lockheed Martin Corp. | 2.0 | |||
|
| |||
| 39.1 | ||||
|
| |||
| Industries as of July 31, 2014 |
| * | Includes short-term investments and net other assets. |
| 15 | Annual Report |
Table of Contents
Fidelity® MSCI Information Technology Index ETF
Performance
The information provided in the tables below shows you the performance of Fidelity® MSCI Information Technology Index ETF, with comparisons over different time periods to the fund’s relevant benchmarks, including an appropriate broad-based market index. Seeing the returns over different time periods can help you assess the fund’s performance against relevant measurements. The performance information includes cumulative total returns and is further explained in this section.*
The fund’s net asset value (NAV) performance is based on the NAV calculated each business day. It is calculated in accordance with the standard formula for valuing investment company shares as of the close of regular trading hours on NYSE Arca, Inc. (NYSE Arca) (normally 4:00 p.m. Eastern Time). The fund’s market price performance is based on the daily closing price of the shares of the fund on NYSE Arca. Since ETFs are bought and sold at prices set by the market – which can result in a premium or discount to NAV – the returns calculated using market price (market return) can differ from those calculated using NAV (NAV return). For information on these differences, please visit Fidelity.com or call Fidelity. The $10,000 table and the fund’s returns do not reflect the deduction of taxes that a shareholder would pay on fund distributions or the redemption or selling of fund shares. How a fund did yesterday is no guarantee of how it will do tomorrow.
Current performance may be higher or lower than the performance data quoted. For month-end performance figures, please visit fidelity.com/etfs/sector-etfs/overview or call Fidelity. The performance data featured represents past performance, which is no guarantee of future results. Investment return and principal value will fluctuate; therefore, you may have a gain or loss when you sell your shares.
| Fiscal Period Ended July 31, 2014 | ||||
| Cumulative Total Returns | Life of fundA | |||
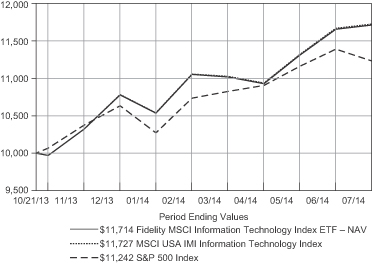
Fidelity MSCI Information Technology Index ETF – NAV | 17.14% | |||
Fidelity MSCI Information Technology Index ETF – Market Price | 17.30% | |||
MSCI USA IMI Information Technology Index | 17.27% | |||
S&P 500 Index | 12.42% | |||
Cumulative total returns reflect performance over the period shown. This information represents returns as of the end of the fund’s fiscal period.
| Period Ended June 30, 2014 | ||||
| Cumulative Total Returns | Life of fundA | |||
Fidelity MSCI Information Technology Index ETF – NAV | 16.58% | |||
Fidelity MSCI Information Technology Index ETF – Market Price | 16.66% | |||
MSCI USA IMI Information Technology Index | 16.70% | |||
S&P 500 Index | 13.99% | |||
This information shows the returns of the fund and its index for the applicable time period through the end of the most recent calendar quarter, as opposed to through the end of the fund’s fiscal period as shown in the previous table.
Average annual total returns take Fidelity MSCI Information Technology Index ETF’s cumulative total return and show you what would have happened if Fidelity MSCI Information Technology Index ETF’s shares had performed at a constant rate each year. These numbers will be reported once the fund is a year old.
The fund’s expense ratio is 0.12%. Expense ratio is the total annual operating expense ratio from the most recent prospectus. A fund’s net expenses paid may be different. Please refer to the most recent prospectus for more information on a fund’s expenses.
| A | From October 21, 2013. |
| * | Total returns are historical and include changes in share price and reinvestment of dividends and capital gains distributions, if any. |
| $10,000 Over Life of Fund |
Let’s say hypothetically that $10,000 was invested in Fidelity MSCI Information Technology Index ETF – NAV on October 21, 2013, when the fund started. The chart shows how the value of your investment would have changed, and also shows how the MSCI USA IMI Information Technology Index and the S&P 500 Index performed over the same period.
| Annual Report | 16 |
Table of Contents
Fidelity® MSCI Information Technology Index ETF
Management’s Discussion of Fund Performance
From its inception on October 21, 2013, through July 31, 2014, the exchange-traded fund’s (ETF) net asset value rose 17.14%, in line with the 17.27% return of the MSCI USA IMI Information Technology Index. The ETF’s market price gained 17.30% over the same time frame, while the broad-market S&P 500® Index returned 12.42%. As concern over weak first-quarter 2014 U.S. economic growth gave way to relief about a second-quarter economic rebound, cyclically sensitive index groups such as semiconductors and technology hardware, storage & peripherals posted solid gains of 32% and 30%, respectively. Technology stocks were especially strong from mid-June onward, as investors piled into a number of large-cap favorites in the sector. With that said, application software, data processing & outsourced services and Internet software & services were laggards. During the period, smartphone maker and index heavyweight Apple was a standout, as were two stocks tied to the personal computer market: operating software maker Microsoft and chipmaker Intel. Social network provider Facebook also turned in above-market results. Conversely, the shares of professional network LinkedIn recorded a steep loss during the period. Rackspace Hosting, offering Web hosting for businesses, also saw its shares decline significantly, as did data analysis software firm Splunk. Two other stocks that ran into trouble during the period were Cree, which makes LED lighting, and CommVault Systems, a provider of data and information management software and related services.
Note to shareholders: Effective May 30, 2014, the fund eliminated the 25% limitation of assets invested in securities of a single issuer.
The views expressed above reflect those of the portfolio manager(s) only through the end of the period as stated on the cover of this report and do not necessarily represent the views of Fidelity or any other person in the Fidelity organization, or BlackRock Fund Advisors (the ETF’s sub-adviser) or any other person in the BlackRock organization. Any such views are subject to change at any time based upon market or other conditions and Fidelity and BlackRock disclaim any responsibility to update such views. These views may not be relied on as investment advice and, because investment decisions for a Fidelity fund are based on numerous factors, may not be relied on as an indication of trading intent on behalf of any Fidelity fund.
Investment Summary
| Top Ten Stocks as of July 31, 2014 | ||||
| % of fund’s net assets | ||||
Apple, Inc. | 14.8 | |||
Microsoft Corp. | 8.4 | |||
International Business Machines Corp. | 4.7 | |||
Intel Corp. | 4.2 | |||
Google, Inc. Class C | 4.0 | |||
Google, Inc. Class A | 4.0 | |||
Oracle Corp. | 3.6 | |||
Facebook, Inc. Class A | 3.4 | |||
Cisco Systems, Inc. | 3.2 | |||
QUALCOMM, Inc. | 3.1 | |||
|
| |||
| 53.4 | ||||
|
| |||
| Industries as of July 31, 2014 | ||||
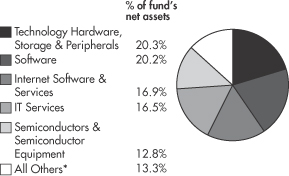
| * | Includes short-term investments and net other assets. |
| 17 | Annual Report |
Table of Contents
Fidelity® MSCI Materials Index ETF
Performance
The information provided in the tables below shows you the performance of Fidelity® MSCI Materials Index ETF, with comparisons over different time periods to the fund’s relevant benchmarks, including an appropriate broad-based market index. Seeing the returns over different time periods can help you assess the fund’s performance against relevant measurements. The performance information includes cumulative total returns and is further explained in this section.*
The fund’s net asset value (NAV) performance is based on the NAV calculated each business day. It is calculated in accordance with the standard formula for valuing investment company shares as of the close of regular trading hours on NYSE Arca, Inc. (NYSE Arca) (normally 4:00 p.m. Eastern Time). The fund’s market price performance is based on the daily closing price of the shares of the fund on NYSE Arca. Since ETFs are bought and sold at prices set by the market – which can result in a premium or discount to NAV – the returns calculated using market price (market return) can differ from those calculated using NAV (NAV return). For information on these differences, please visit Fidelity.com or call Fidelity. The $10,000 table and the fund’s returns do not reflect the deduction of taxes that a shareholder would pay on fund distributions or the redemption or selling of fund shares. How a fund did yesterday is no guarantee of how it will do tomorrow.
Current performance may be higher or lower than the performance data quoted. For month-end performance figures, please visit fidelity.com/etfs/sector-etfs/overview or call Fidelity. The performance data featured represents past performance, which is no guarantee of future results. Investment return and principal value will fluctuate; therefore, you may have a gain or loss when you sell your shares.
| Fiscal Period Ended July 31, 2014 | ||||
| Cumulative Total Returns | Life of fundA | |||
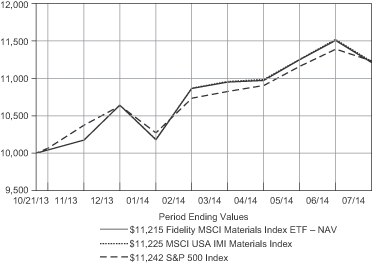
Fidelity MSCI Materials Index ETF – NAV | 12.15% | |||
Fidelity MSCI Materials Index ETF – Market Price | 12.31% | |||
MSCI USA IMI Materials Index | 12.25% | |||
S&P 500 Index | 12.42% | |||
Cumulative total returns reflect performance over the period shown. This information represents returns as of the end of the fund’s fiscal period.
| Period Ended June 30, 2014 | ||||
| Cumulative Total Returns | Life of fundA | |||
Fidelity MSCI Materials Index ETF – NAV | 15.11% | |||
Fidelity MSCI Materials Index ETF – Market Price | 15.07% | |||
MSCI USA IMI Materials Index | 15.22% | |||
S&P 500 Index | 13.99% | |||
This information shows the returns of the fund and its index for the applicable time period through the end of the most recent calendar quarter, as opposed to through the end of the fund’s fiscal period as shown in the previous table.
Average annual total returns take Fidelity MSCI Materials Index ETF’s cumulative total return and show you what would have happened if Fidelity MSCI Materials Index ETF’s shares had performed at a constant rate each year. These numbers will be reported once the fund is a year old.
The fund’s expense ratio is 0.12%. Expense ratio is the total annual operating expense ratio from the most recent prospectus. A fund’s net expenses paid may be different. Please refer to the most recent prospectus for more information on a fund’s expenses.
| A | From October 21, 2013. |
| * | Total returns are historical and include changes in share price and reinvestment of dividends and capital gains distributions, if any. |
| $10,000 Over Life of Fund | ||
Let’s say hypothetically that $10,000 was invested in Fidelity MSCI Materials Index ETF – NAV on October 21, 2013, when the fund started. The chart shows how the value of your investment would have changed, and also shows how the MSCI USA IMI Materials Index and the S&P 500 Index performed over the same period.
| Annual Report | 18 |
Table of Contents
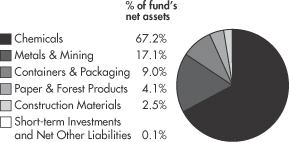
Fidelity® MSCI Materials Index ETF
Management’s Discussion of Fund Performance
From its inception on October 21, 2013, through July 31, 2014, the exchange-traded fund’s (ETF) net asset value rose 12.15%, roughly in line with the 12.25% return of the MSCI USA IMI Materials Index. The ETF’s market price gained 12.31% over the same time frame, while the broad-market S&P 500® Index returned 12.42%. Materials is a cyclical sector that’s driven by the ups and downs of commodity prices, which, in turn, tend to respond to broader economic conditions. During the period, accommodative central banks, an ongoing economic recovery in developed markets and easing concerns about emerging markets following a scare early in 2014 were positives for materials stocks. The MSCI sector index was particularly sensitive to the performance of four chemicals groups – commodity chemicals, diversified chemicals, specialty chemicals, and fertilizers & agricultural chemicals – because they jointly accounted for about 58% of the index during the period. Commodity chemicals turned in an especially strong result, advancing roughly 30%. One of the success stories in this group was Netherlands-based LyondellBasell Industries. In diversified chemicals, one noteworthy contributor was Dow Chemical. Elsewhere, the stock of aluminum producer Alcoa was a standout, posting a gain of 77%. At the same time, shares of another diversified chemicals producer, FMC, did poorly. Gold miner Newmont Mining also lost ground, reflecting a relatively flat price for gold. Iron ore and metallurgical coal producer Cliffs Natural Resources weighed on performance as well.
Note to shareholders: Effective May 30, 2014, the fund eliminated the 25% limitation of assets invested in securities of a single issuer.
The views expressed above reflect those of the portfolio manager(s) only through the end of the period as stated on the cover of this report and do not necessarily represent the views of Fidelity or any other person in the Fidelity organization, or BlackRock Fund Advisors (the ETF’s sub-adviser) or any other person in the BlackRock organization. Any such views are subject to change at any time based upon market or other conditions and Fidelity and BlackRock disclaim any responsibility to update such views. These views may not be relied on as investment advice and, because investment decisions for a Fidelity fund are based on numerous factors, may not be relied on as an indication of trading intent on behalf of any Fidelity fund.
Investment Summary
| Top Ten Stocks as of July 31, 2014 | ||||
| % of fund’s net assets | ||||
The Dow Chemical Co. | 7.5 | |||
EI du Pont de Nemours & Co. | 7.2 | |||
Monsanto Co. | 7.2 | |||
LyondellBasell Industries N.V. Class A | 5.9 | |||
Freeport-McMoRan, Inc. | 4.7 | |||
Praxair, Inc. | 4.5 | |||
Ecolab, Inc. | 3.5 | |||
Air Products & Chemicals, Inc. | 3.4 | |||
PPG Industries, Inc. | 3.3 | |||
International Paper Co. | 2.4 | |||
|
| |||
| 49.6 | ||||
|
| |||
| Industries as of July 31, 2014 | ||
| 19 | Annual Report |
Table of Contents
Fidelity® MSCI Telecommunication Services Index ETF
Performance
The information provided in the tables below shows you the performance of Fidelity® MSCI Telecommunication Services Index ETF, with comparisons over different time periods to the fund’s relevant benchmarks, including an appropriate broad-based market index. Seeing the returns over different time periods can help you assess the fund’s performance against relevant measurements. The performance information includes cumulative total returns and is further explained in this section.*
The fund’s net asset value (NAV) performance is based on the NAV calculated each business day. It is calculated in accordance with the standard formula for valuing investment company shares as of the close of regular trading hours on NYSE Arca, Inc. (NYSE Arca) (normally 4:00 p.m. Eastern Time). The fund’s market price performance is based on the daily closing price of the shares of the fund on NYSE Arca. Since ETFs are bought and sold at prices set by the market – which can result in a premium or discount to NAV – the returns calculated using market price (market return) can differ from those calculated using NAV (NAV return). For information on these differences, please visit Fidelity.com or call Fidelity. The $10,000 table and the fund’s returns do not reflect the deduction of taxes that a shareholder would pay on fund distributions or the redemption or selling of fund shares. How a fund did yesterday is no guarantee of how it will do tomorrow.
Current performance may be higher or lower than the performance data quoted. For month-end performance figures, please visit fidelity.com/etfs/sector-etfs/overview or call Fidelity. The performance data featured represents past performance which is no guarantee of future results. Investment return and principal value will fluctuate; therefore, you may have a gain or loss when you sell your shares.
| Fiscal Period Ended July 31, 2014 | ||||
| Cumulative Total Returns | Life of fundA | |||
Fidelity MSCI Telecommunication Services Index ETF – NAV | 8.57% | |||
Fidelity MSCI Telecommunication Services Index ETF – Market Price | 8.57% | |||
MSCI USA IMI Telecommunication Services 25/50 Index | 8.21% | |||
S&P 500 Index | 12.42% | |||
Cumulative total returns reflect performance over the period shown. This information represents returns as of the end of the fund’s fiscal period.
| Period Ended June 30, 2014 | ||||
| Cumulative Total Returns | Life of fundA | |||
Fidelity MSCI Telecommunication Services Index ETF – NAV | 7.68% | |||
Fidelity MSCI Telecommunication Services Index ETF – Market Price | 7.69% | |||
MSCI USA IMI Telecommunication Services 25/50 Index | 7.31% | |||
S&P 500 Index | 13.99% | |||
This information shows the returns of the fund and its index for the applicable time period through the end of the most recent calendar quarter, as opposed to through the end of the fund’s fiscal period as shown in the previous table.
Average annual total returns take Fidelity MSCI Telecommunication Services Index ETF’s cumulative total return and show you what would have happened if Fidelity MSCI Telecommunication Services Index ETF’s shares had performed at a constant rate each year. These numbers will be reported once the fund is a year old.
The fund’s expense ratio is 0.12%. Expense ratio is the total annual operating expense ratio from the most recent prospectus. A fund’s net expenses paid may be different. Please refer to the most recent prospectus for more information on a fund’s expenses.
| A | From October 21, 2013. |
| * | Total returns are historical and include changes in share price and reinvestment of dividends and capital gains distributions, if any. |
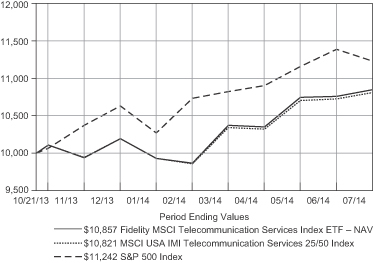
| $10,000 Over Life of Fund | ||
Let’s say hypothetically that $10,000 was invested in Fidelity MSCI Telecommunication Services Index ETF – NAV on October 21, 2013, when the fund started. The chart shows how the value of your investment would have changed, and also shows how the MSCI USA IMI Telecommunication Services 25/50 Index and the S&P 500 Index performed over the same period.
| Annual Report | 20 |
Table of Contents
Fidelity® MSCI Telecommunication Services Index ETF
Management’s Discussion of Fund Performance
From its inception on October 21, 2013, through July 31, 2014, the exchange-traded fund’s (ETF) net asset value advanced 8.57%, compared with the 8.21% return of the MSCI USA IMI Telecommunication Services 25/50 Index. The ETF’s market price gained 8.57% over the same time frame, while the broad-market S&P 500® Index returned 12.42%. The period was marked by continued vigorous competition among the four major U.S. wireless carriers (AT&T, Verizon Communications, Sprint and T-Mobile), with each attempting to lure customers by offering various incentives to switch providers. Demand for wireless bandwidth continued its upward trend, and yield-hungry investors were attracted to the substantial dividends being paid by some telecom stocks; however, these positives were tempered by a decline in consumer spending in the sector combined with rising capital expenditures as firms looked to expand and improve their networks. The large benchmark-dominating integrated telecommunication services segment outperformed the broader sector during the period. Here, index heavyweights AT&T and Verizon Communications – which combined made up nearly half the sector index, on average – lifted performance. Additionally, another integrated telecom name, CenturyLink, notably boosted the group’s return. Alternative carriers also bettered the index, with Frontier Communications and tw telecom adding to industry results. On the flip side, the smaller, generally more volatile wireless telecom names fared the worst. In this category, NII Holdings and NTELOS Holdings detracted. NII, and its more familiar Nextel brand, lost more than 90% of its value during the period on a series of challenges, while NTELOS, operator of nTelos Wireless and Dish; detracted due to a revenue miss. NII Holdings was not held at period end.
Note to shareholders: Effective May 30, 2014, the fund eliminated the 25% limitation of assets invested in securities of a single issuer.
The views expressed above reflect those of the portfolio manager(s) only through the end of the period as stated on the cover of this report and do not necessarily represent the views of Fidelity or any other person in the Fidelity organization, or BlackRock Fund Advisors (the ETF’s sub-adviser) or any other person in the BlackRock organization. Any such views are subject to change at any time based upon market or other conditions and Fidelity and BlackRock disclaim any responsibility to update such views. These views may not be relied on as investment advice and, because investment decisions for a Fidelity fund are based on numerous factors, may not be relied on as an indication of trading intent on behalf of any Fidelity fund.
Investment Summary
| Top Ten Stocks as of July 31, 2014 | ||||
| % of fund’s net assets | ||||
Verizon Communications, Inc. | 22.5 | |||
AT&T, Inc. | 22.4 | |||
CenturyLink, Inc. | 4.7 | |||
SBA Communications Corp. Class A | 4.4 | |||
T-Mobile US, Inc. | 3.2 | |||
Windstream Holdings, Inc. | 3.1 | |||
Level 3 Communications, Inc. | 3.1 | |||
Frontier Communications Corp. | 2.9 | |||
tw telecom, Inc. | 2.8 | |||
Sprint Corp. | 2.5 | |||
|
| |||
| 71.6 | ||||
|
| |||
| Industries as of July 31, 2014 | ||||
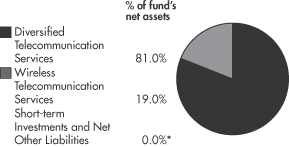
| * | Rounds to less than 0.1%. |
| 21 | Annual Report |
Table of Contents
Fidelity® MSCI Utilities Index ETF
Performance
The information provided in the tables below shows you the performance of Fidelity® MSCI Utilities Index ETF, with comparisons over different time periods to the fund’s relevant benchmarks, including an appropriate broad-based market index. Seeing the returns over different time periods can help you assess the fund’s performance against relevant measurements. The performance information includes cumulative total returns and is further explained in this section.*
The fund’s net asset value (NAV) performance is based on the NAV calculated each business day. It is calculated in accordance with the standard formula for valuing investment company shares as of the close of regular trading hours on NYSE Arca, Inc. (NYSE Arca) (normally 4:00 p.m. Eastern Time). The fund’s market price performance is based on the daily closing price of the shares of the fund on NYSE Arca. Since ETFs are bought and sold at prices set by the market – which can result in a premium or discount to NAV – the returns calculated using market price (market return) can differ from those calculated using NAV (NAV return). For information on these differences, please visit Fidelity.com or call Fidelity. The $10,000 table and the fund’s returns do not reflect the deduction of taxes that a shareholder would pay on fund distributions or the redemption or selling of fund shares. How a fund did yesterday is no guarantee of how it will do tomorrow.
Current performance may be higher or lower than the performance data quoted. For month-end performance figures, please visit fidelity.com/etfs/sector-etfs/overview or call Fidelity. The performance data featured represents past performance, which is no guarantee of future results. Investment return and principal value will fluctuate; therefore, you may have a gain or loss when you sell your shares.
| Fiscal Period Ended July 31, 2014 | ||||
| Cumulative Total Returns | Life of fundA | |||
Fidelity MSCI Utilities Index ETF – NAV | 10.13% | |||
Fidelity MSCI Utilities Index ETF – Market Price | 10.13% | |||
MSCI USA IMI Utilities Index | 10.24% | |||
S&P 500 Index | 12.42% | |||
Cumulative total returns reflect performance over the period shown. This information represents returns as of the end of the fund’s fiscal period.
| Period Ended June 30, 2014 | ||||
| Cumulative Total Returns | Life of fundA | |||
Fidelity MSCI Utilities Index ETF – NAV | 18.28% | |||
Fidelity MSCI Utilities Index ETF – Market Price | 18.32% | |||
MSCI USA IMI Utilities Index | 18.43% | |||
S&P 500 Index | 13.99% | |||
This information shows the returns of the fund and its index for the applicable time period through the end of the most recent calendar quarter, as opposed to through the end of the fund’s fiscal period as shown in the previous table.
Average annual total returns take Fidelity MSCI Utilities Index ETF’s cumulative total return and show you what would have happened if Fidelity MSCI Utilities Index ETF’s shares had performed at a constant rate each year. These numbers will be reported once the fund is a year old.
The fund’s expense ratio is 0.12%. Expense ratio is the total annual operating expense ratio from the most recent prospectus. A fund’s net expenses paid may be different. Please refer to the most recent prospectus for more information on a fund’s expenses.
| A | From October 21, 2013. |
| * | Total returns are historical and include changes in share price and reinvestment of dividends and capital gains distributions, if any. |
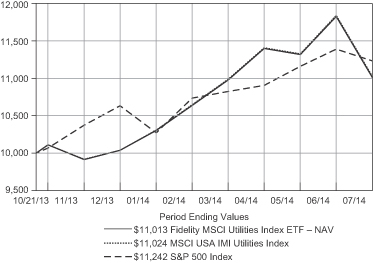
| $10,000 Over Life of Fund | ||
Let’s say hypothetically that $10,000 was invested in Fidelity MSCI Utilities Index ETF – NAV on October 21, 2013, when the fund started. The chart shows how the value of your investment would have changed, and also shows how the MSCI USA IMI Utilities Index and the S&P 500 Index performed over the same period.
| Annual Report | 22 |
Table of Contents
Fidelity® MSCI Utilities Index ETF
Management’s Discussion of Fund Performance
From its inception on October 21, 2013, through July 31, 2014, the exchange-traded fund’s (ETF) net asset value rose 10.13%, roughly in line with the 10.24% return of the MSCI USA IMI Utilities Index. The ETF’s market price gained 10.13% over the same time frame, while the broad-market S&P 500® Index returned 12.42%. There was a broad rally in all segments of the utilities sector during the period. Utilities operating in both regulated and unregulated markets performed well, regardless of the extent of regulation or how commodity-sensitive the companies were. Utilities companies that tend to be more sensitive to power prices benefited from their rise. Regulated companies were buoyed by lower interest rates and heightened volatility, as investors sought more-stable stocks. The best-performing segment of the MSCI sector index was oil & gas storage & transport, a small group that benefited from continued growth in U.S. natural gas production. The top contributor to absolute performance – primarily because it represented about 6% of the index – was Florida electric utility Nextera Energy. The company’s share price soared in June, as investors responded positively to the firm’s joint natural gas pipeline project with EQT and the announcement of the firm’s initial public offering (IPO) of an alternative energy master limited partnership (MLP). MLPs combine the tax benefits of a limited partnership with the liquidity of a publicly traded company. Chicago-based electric utility Exelon’s stock rose due to the company’s upward earnings revisions resulting from rising power prices. The share price of Washington, D.C., utility Pepco Holdings spiked in late April when Exelon announced its intention to buy the firm. By far the biggest negative impact during the period came from Ohio’s FirstEnergy, which tumbled in November because investors believed the company’s plan to spend $2.8 billion over four years for an electricity transmission project could jeopardize the company’s dividend payout.
Note to shareholders: Effective May 30, 2014, the fund eliminated the 25% limitation of assets invested in securities of a single issuer.
The views expressed above reflect those of the portfolio manager(s) only through the end of the period as stated on the cover of this report and do not necessarily represent the views of Fidelity or any other person in the Fidelity organization, or BlackRock Fund Advisors (the ETF’s sub-adviser) or any other person in the BlackRock organization. Any such views are subject to change at any time based upon market or other conditions and Fidelity and BlackRock disclaim any responsibility to update such views. These views may not be relied on as investment advice and, because investment decisions for a Fidelity fund are based on numerous factors, may not be relied on as an indication of trading intent on behalf of any Fidelity fund.
Investment Summary
| Top Ten Stocks as of July 31, 2014 | ||||
| % of fund’s net assets | ||||
Duke Energy Corp. | 7.9 | |||
NextEra Energy, Inc. | 6.4 | |||
Dominion Resources, Inc. | 6.1 | |||
The Southern Co. | 6.0 | |||
Exelon Corp. | 4.1 | |||
American Electric Power Co., Inc. | 4.0 | |||
Sempra Energy | 3.6 | |||
PPL Corp. | 3.2 | |||
PG&E Corp. | 3.2 | |||
Public Service Enterprise Group, Inc. | 2.8 | |||
|
| |||
| 47.3 | ||||
|
| |||
| Industries as of July 31, 2014 | ||||
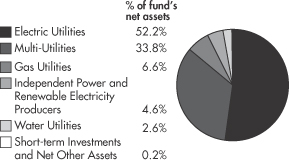
| 23 | Annual Report |
Table of Contents
Shareholder Expense Example (Unaudited)
As a shareholder of a Fund, you incur two types of costs: (1) transaction costs, and (2) ongoing costs, including management fees and other Fund expenses. This Example is intended to help you understand your ongoing costs (in dollars) of investing in a Fund and to compare these costs with the ongoing costs of investing in other funds.
The actual expense Example is based on an investment of $1,000 invested for the one-half year period and held for the entire period (February 1, 2014 to July 31, 2014). The hypothetical expense Example is based on an investment of $1,000 invested for the one-half year period (February 1, 2014 to July 31, 2014).
Actual Expenses
For each fund, the first line of the accompanying table provides information about actual account values and actual expenses. You may use the information in this line, together with the amount you invested, to estimate the expenses that you paid over the period. Simply divide your account value by $1,000.00 (for example, an $8,600 account value divided by $1,000.00 = 8.6), then multiply the result by the number in the first line for each Fund under the heading entitled “Expenses Paid During Period” to estimate the expenses you paid on your account during this period. In addition, each Fund, as a shareholder in the underlying money market fund, will indirectly bear its pro-rata share of the fees and expenses incurred by the underlying money market fund. These fees and expenses are not included in each Fund’s annualized expense ratio used to calculate the expense estimates in the table below.
Hypothetical Example for Comparison Purposes
For each fund, the second line of the accompanying table provides information about hypothetical account values and hypothetical expenses based on the Fund’s actual expense ratio and an assumed rate of return of 5% per year before expenses, which is not the Fund’s actual return. The hypothetical account values and expenses may not be used to estimate the actual ending account balance or expenses you paid for the period. You may use this information to compare the ongoing costs of investing in the Fund and other funds. To do so, compare this 5% hypothetical example with the 5% hypothetical examples that appear in the shareholder reports of the other funds. In addition, each Fund, as a shareholder in the underlying money market fund, will indirectly bear its pro-rata share of the fees and expenses incurred by the underlying money market fund. These fees and expenses are not included in each Fund’s annualized expense ratio used to calculate the expense estimates in the table below.
Please note that the expenses shown in the table are meant to highlight your ongoing costs only and do not reflect any transaction costs. Therefore, the second line of the table is useful in comparing ongoing costs only, and will not help you determine the relative total costs of owning different funds.
| Annualized Expense RatioA | Beginning Account Value February 1, 2014 | Ending Account Value July 31, 2014 | Expenses Paid During PeriodB February 1, 2014 to July 31, 2014 | |||||||||||||
Fidelity MSCI Consumer Discretionary Index ETF | .12% | |||||||||||||||
Actual | $ | 1,000.00 | $ | 1,050.00 | $ | 0.61 | ||||||||||
HypotheticalC | $ | 1,000.00 | $ | 1,024.20 | $ | 0.60 | ||||||||||
Fidelity MSCI Consumer Staples Index ETF | .12% | |||||||||||||||
Actual | $ | 1,000.00 | $ | 1,072.70 | $ | 0.62 | ||||||||||
HypotheticalC | $ | 1,000.00 | $ | 1,024.20 | $ | 0.60 | ||||||||||
Fidelity MSCI Energy Index ETF | .12% | |||||||||||||||
Actual | $ | 1,000.00 | $ | 1,167.10 | $ | 0.64 | ||||||||||
HypotheticalC | $ | 1,000.00 | $ | 1,024.20 | $ | 0.60 | ||||||||||
Fidelity MSCI Financials Index ETF | .12% | |||||||||||||||
Actual | $ | 1,000.00 | $ | 1,064.80 | $ | 0.61 | ||||||||||
HypotheticalC | $ | 1,000.00 | $ | 1,024.20 | $ | 0.60 | ||||||||||
Fidelity MSCI Health Care Index ETF | .12% | |||||||||||||||
Actual | $ | 1,000.00 | $ | 1,081.50 | $ | 0.62 | ||||||||||
HypotheticalC | $ | 1,000.00 | $ | 1,024.20 | $ | 0.60 | ||||||||||
Fidelity MSCI Industrials Index ETF | .12% | |||||||||||||||
Actual | $ | 1,000.00 | $ | 1,032.00 | $ | 0.60 | ||||||||||
HypotheticalC | $ | 1,000.00 | $ | 1,024.20 | $ | 0.60 | ||||||||||
| Annual Report | 24 |
Table of Contents
| Annualized Expense RatioA | Beginning Account Value February 1, 2014 | Ending Account Value July 31, 2014 | Expenses Paid During PeriodB February 1, 2014 to July 31, 2014 | |||||||||||||
Fidelity MSCI Information Technology Index ETF | .12% | |||||||||||||||
Actual | $ | 1,000.00 | $ | 1,111.90 | $ | 0.63 | ||||||||||
HypotheticalC | $ | 1,000.00 | $ | 1,024.20 | $ | 0.60 | ||||||||||
Fidelity MSCI Materials Index ETF | .12% | |||||||||||||||
Actual | $ | 1,000.00 | $ | 1,101.60 | $ | 0.63 | ||||||||||
HypotheticalC | $ | 1,000.00 | $ | 1,024.20 | $ | 0.60 | ||||||||||
Fidelity MSCI Telecommunication Services Index ETF | .12% | |||||||||||||||
Actual | $ | 1,000.00 | $ | 1,093.30 | $ | 0.62 | ||||||||||
HypotheticalC | $ | 1,000.00 | $ | 1,024.20 | $ | 0.60 | ||||||||||
Fidelity MSCI Utilities Index ETF | .12% | |||||||||||||||
Actual | $ | 1,000.00 | $ | 1,068.80 | $ | 0.62 | ||||||||||
HypotheticalC | $ | 1,000.00 | $ | 1,024.20 | $ | 0.60 | ||||||||||
| A | Annualized expense ratio reflects expenses net of applicable fee waivers. |
| B | Expenses are equal to each Fund’s annualized expense ratio, multiplied by the average account value over the period, multiplied by 181/365 (to reflect the one-half year period). |
| C | 5% return per year before expenses. |
| 25 | Annual Report |
Table of Contents
Fidelity MSCI Consumer Discretionary Index ETF
Showing Percentage of Net Assets
| Common Stocks – 99.9% | ||||||||
| Shares | Value | |||||||
AUTO COMPONENTS – 4.7% |
| |||||||
Auto Parts & Equipment – 4.4% |
| |||||||
American Axle & Manufacturing Holdings, Inc. (a) | 1,938 | $ | 35,640 | |||||
Autoliv, Inc. | 2,671 | 265,791 | ||||||
BorgWarner, Inc. | 6,452 | 401,637 | ||||||
Dana Holding Corp. | 4,232 | 94,712 | ||||||
Delphi Automotive PLC | 8,682 | 579,958 | ||||||
Dorman Products, Inc. (a) | 891 | 38,652 | ||||||
Drew Industries, Inc. | 629 | 28,305 | ||||||
Federal-Mogul Holdings Corp. Class A (a) | 849 | 13,533 | ||||||
Fox Factory Holding Corp. (a) | 526 | 7,827 | ||||||
Gentex Corp. | 4,157 | 120,137 | ||||||
Gentherm, Inc. (a) | 929 | 38,879 | ||||||
Johnson Controls, Inc. | 18,828 | 889,435 | ||||||
Lear Corp. | 2,170 | 204,349 | ||||||
Modine Manufacturing Co. (a) | 1,413 | 19,457 | ||||||
Motorcar Parts of America, Inc. (a) | 449 | 9,995 | ||||||
Standard Motor Products, Inc. | 581 | 20,945 | ||||||
Superior Industries International, Inc. | 605 | 11,320 | ||||||
Tenneco, Inc. (a) | 1,722 | 109,691 | ||||||
Tower International, Inc. (a) | 605 | 19,057 | ||||||
TRW Automotive Holdings Corp. (a) | 3,236 | 331,010 | ||||||
Visteon Corp. (a) | 1,309 | 125,009 | ||||||
|
| |||||||
| 3,365,339 | ||||||||
|
| |||||||
Tires & Rubber – 0.3% |
| |||||||
Cooper Tire & Rubber Co. | 1,769 | 51,106 | ||||||
The Goodyear Tire & Rubber Co. | 7,022 | 176,744 | ||||||
|
| |||||||
| 227,850 | ||||||||
|
| |||||||
TOTAL AUTO COMPONENTS |
| 3,593,189 | ||||||
|
| |||||||
AUTOMOBILES – 5.3% |
| |||||||
Automobile Manufacturers – 4.8% |
| |||||||
Ford Motor Co. | 104,270 | 1,774,675 | ||||||
General Motors Co. | 36,043 | 1,218,974 | ||||||
Tesla Motors, Inc. (a) | 2,445 | 545,969 | ||||||
Thor Industries, Inc. | 1,369 | 72,516 | ||||||
Winnebago Industries, Inc. (a) | 798 | 18,753 | ||||||
|
| |||||||
| 3,630,887 | ||||||||
|
| |||||||
Motorcycle Manufacturers – 0.5% |
| |||||||
Harley-Davidson, Inc. | 6,228 | 385,015 | ||||||
|
| |||||||
TOTAL AUTOMOBILES |
| 4,015,902 | ||||||
|
| |||||||
DISTRIBUTORS – 0.9% |
| |||||||
Distributors – 0.9% |
| |||||||
Core-Mark Holding Co., Inc. | 668 | 31,529 | ||||||
Genuine Parts Co. | 4,351 | 360,350 | ||||||
LKQ Corp. (a) | 8,553 | 223,704 | ||||||
| Shares | Value | |||||||
Pool Corp. | 1,273 | $ | 69,709 | |||||
Weyco Group, Inc. | 229 | 5,945 | ||||||
|
| |||||||
TOTAL DISTRIBUTORS |
| 691,237 | ||||||
|
| |||||||
DIVERSIFIED CONSUMER SERVICES – 1.4% |
| |||||||
Education Services – 0.6% |
| |||||||
American Public Education, Inc. (a) | 506 | 18,064 | ||||||
Apollo Group, Inc. Class A (non-vtg.) (a) | 2,850 | 79,601 | ||||||
Bridgepoint Education, Inc. (a) | 509 | 6,113 | ||||||
Bright Horizons Family Solutions, Inc. (a) | 929 | 38,619 | ||||||
Capella Education Co. | 315 | 20,147 | ||||||
Career Education Corp. (a) | 1,847 | 9,438 | ||||||
DeVry Education Group, Inc. | 1,613 | 64,472 | ||||||
Graham Holdings Co. Class B | 132 | 90,519 | ||||||
Grand Canyon Education, Inc. (a) | 1,253 | 53,879 | ||||||
ITT Educational Services, Inc. (a) | 454 | 6,460 | ||||||
K12, Inc. (a) | 1,010 | 23,543 | ||||||
Strayer Education, Inc. (a) | 319 | 16,531 | ||||||
Universal Technical Institute, Inc. | 627 | 7,505 | ||||||
|
| |||||||
| 434,891 | ||||||||
|
| |||||||
Specialized Consumer Services – 0.8% |
| |||||||
Ascent Capital Group, Inc. Class A (a) | 343 | 21,259 | ||||||
H&R Block, Inc. | 7,757 | 249,232 | ||||||
LifeLock, Inc. (a) | 1,274 | 17,683 | ||||||
Matthews International Corp. Class A | 795 | 34,575 | ||||||
Outerwall, Inc. (a) | 507 | 27,895 | ||||||
Regis Corp. | 1,596 | 22,232 | ||||||
Service Corp. International | 6,049 | 127,029 | ||||||
Sotheby’s Class A | 1,663 | 65,938 | ||||||
Steiner Leisure Ltd. (a) | 394 | 15,725 | ||||||
Weight Watchers International, Inc. | 798 | 17,309 | ||||||
|
| |||||||
| 598,877 | ||||||||
|
| |||||||
TOTAL DIVERSIFIED CONSUMER SERVICES |
| 1,033,768 | ||||||
|
| |||||||
HOTELS, RESTAURANTS & LEISURE – 15.1% |
| |||||||
Casinos & Gaming – 2.6% |
| |||||||
Bally Technologies, Inc. (a) | 1,121 | 67,451 | ||||||
Boyd Gaming Corp. (a) | 2,116 | 23,276 | ||||||
Caesars Acquisition Co. (a) | 1,399 | 16,088 | ||||||
Caesars Entertainment Corp. (a) | 1,648 | 26,368 | ||||||
Churchill Downs, Inc. | 392 | 33,908 | ||||||
International Game Technology | 6,952 | 117,697 | ||||||
Isle of Capri Casinos, Inc. (a) | 627 | 4,960 | ||||||
Las Vegas Sands Corp. | 11,523 | 850,974 | ||||||
MGM Resorts International (a) | 11,106 | 298,085 | ||||||
Multimedia Games Holding Co., Inc. (a) | 852 | 20,550 | ||||||
Penn National Gaming, Inc. (a) | 2,047 | 21,453 | ||||||
Scientific Games Corp. Class A (a) | 1,551 | 13,245 | ||||||
Wynn Resorts Ltd. | 2,292 | 488,654 | ||||||
|
| |||||||
| 1,982,709 | ||||||||
|
| |||||||
See accompanying notes which are an integral part of the financial statements.
| Annual Report | 26 |
Table of Contents
| Common Stocks – continued | ||||||||
| Shares | Value | |||||||
HOTELS, RESTAURANTS & LEISURE – continued |
| |||||||
Hotels, Resorts & Cruise Lines – 2.7% |
| |||||||
Belmond Ltd. (a) | 2,587 | $ | 32,079 | |||||
Carnival Corp. | 10,897 | 394,689 | ||||||
Choice Hotels International, Inc. | 912 | 42,764 | ||||||
Diamond Resorts International Inc. (a) | 961 | 23,987 | ||||||
Extended Stay America, Inc. | 1,189 | 26,800 | ||||||
Interval Leisure Group, Inc. | 1,171 | 24,802 | ||||||
Marcus Corp. | 498 | 8,800 | ||||||
Marriott International, Inc. Class A | 6,676 | 432,004 | ||||||
Marriott Vacations Worldwide Corp. (a) | 848 | 48,802 | ||||||
Royal Caribbean Cruises Ltd. | 4,710 | 280,951 | ||||||
Starwood Hotels & Resorts Worldwide, Inc. | 5,432 | 417,395 | ||||||
Wyndham Worldwide Corp. | 3,628 | 274,095 | ||||||
|
| |||||||
| 2,007,168 | ||||||||
|
| |||||||
Leisure Facilities – 0.3% |
| |||||||
ClubCorp Holdings Inc. | 912 | 15,422 | ||||||
International Speedway Corp. Class A | 741 | 22,467 | ||||||
Intrawest Resorts Holdings Inc. (a) | 565 | 6,367 | ||||||
Life Time Fitness, Inc. (a) | 1,139 | 44,820 | ||||||
Six Flags Entertainment Corp. | 1,880 | 71,854 | ||||||
Vail Resorts, Inc. | 1,026 | 77,463 | ||||||
|
| |||||||
| 238,393 | ||||||||
|
| |||||||
Restaurants – 9.5% |
| |||||||
Biglari Holdings, Inc. (a) | 40 | 17,000 | ||||||
BJ’s Restaurants, Inc. (a) | 741 | 25,394 | ||||||
Bloomin’ Brands, Inc. (a) | 2,152 | 42,158 | ||||||
Bob Evans Farms, Inc. | 749 | 35,585 | ||||||
Bravo Brio Restaurant Group, Inc. (a) | 469 | 6,988 | ||||||
Brinker International, Inc. | 1,896 | 85,017 | ||||||
Buffalo Wild Wings, Inc. (a) | 531 | 77,165 | ||||||
Chipotle Mexican Grill, Inc. (a) | 879 | 591,128 | ||||||
Chuys Holdings, Inc. (a) | 451 | 12,921 | ||||||
Cracker Barrel Old Country Store, Inc. | 538 | 52,164 | ||||||
Darden Restaurants, Inc. | 3,715 | 173,676 | ||||||
Del Frisco’s Restaurant Group, Inc. (a) | 687 | 14,647 | ||||||
Denny’s Corp. (a) | 2,622 | 17,961 | ||||||
DineEquity, Inc. | 494 | 40,039 | ||||||
Domino’s Pizza, Inc. | 1,588 | 114,336 | ||||||
Dunkin’ Brands Group, Inc. | 3,021 | 129,480 | ||||||
Fiesta Restaurant Group, Inc. (a) | 736 | 33,400 | ||||||
Ignite Restaurant Group, Inc. (a) | 228 | 2,930 | ||||||
Jack in the Box, Inc. (a) | 1,197 | 68,456 | ||||||
Krispy Kreme Doughnuts, Inc. (a) | 1,900 | 29,089 | ||||||
McDonald’s Corp. | 28,052 | 2,652,597 | ||||||
Noodles & Co. (a) | 409 | 11,493 | ||||||
Panera Bread Co. Class A (a) | 752 | 110,770 | ||||||
Papa John’s International, Inc. | 909 | 37,896 | ||||||
Popeyes Louisiana Kitchen, Inc. (a) | 684 | 27,565 | ||||||
Potbelly Corp. (a) | 454 | 5,262 | ||||||
Red Robin Gourmet Burgers, Inc. (a) | 400 | 25,744 | ||||||
Ruby Tuesday, Inc. (a) | 1,822 | 10,950 | ||||||
| Shares | Value | |||||||
Ruth’s Hospitality Group, Inc. | 1,026 | $ | 11,645 | |||||
Sonic Corp. (a) | 1,539 | 31,780 | ||||||
Starbucks Corp. | 21,422 | 1,664,061 | ||||||
Texas Roadhouse, Inc. Class A | 1,906 | 47,421 | ||||||
The Cheesecake Factory, Inc. | 1,384 | 59,346 | ||||||
Wendy’s Co. | 7,892 | 64,320 | ||||||
Yum! Brands, Inc. | 12,558 | 871,525 | ||||||
|
| |||||||
| 7,201,909 | ||||||||
|
| |||||||
TOTAL HOTELS, RESTAURANTS & LEISURE |
| 11,430,179 | ||||||
|
| |||||||
HOUSEHOLD DURABLES – 4.0% |
| |||||||
Consumer Electronics – 0.6% |
| |||||||
Garmin Ltd. | 3,314 | 182,403 | ||||||
Harman International Industries, Inc. | 1,928 | 209,284 | ||||||
Universal Electronics, Inc. (a) | 456 | 21,719 | ||||||
|
| |||||||
| 413,406 | ||||||||
|
| |||||||
Home Furnishings – 0.6% |
| |||||||
Ethan Allen Interiors, Inc. | 741 | 16,984 | ||||||
La-Z-Boy, Inc. | 1,482 | 31,181 | ||||||
Leggett & Platt, Inc. | 3,931 | 128,937 | ||||||
Mohawk Industries, Inc. (a) | 1,748 | 218,098 | ||||||
Tempur Sealy International, Inc. (a) | 1,714 | 93,773 | ||||||
|
| |||||||
| 488,973 | ||||||||
|
| |||||||
Homebuilding – 1.5% |
| |||||||
Beazer Homes U.S.A., Inc. (a) | 741 | 11,374 | ||||||
Cavco Industries, Inc. (a) | 227 | 16,206 | ||||||
D.R. Horton, Inc. | 8,269 | 171,168 | ||||||
Hovnanian Enterprises, Inc. Class A (a) | 3,192 | 12,768 | ||||||
KB Home | 2,131 | 34,735 | ||||||
Lennar Corp. Class A | 4,916 | 178,107 | ||||||
M.D.C. Holdings, Inc. | 1,138 | 30,692 | ||||||
M/I Homes, Inc. (a) | 685 | 14,097 | ||||||
Meritage Homes Corp. (a) | 1,069 | 40,943 | ||||||
NVR, Inc. (a) | 120 | 135,175 | ||||||
PulteGroup, Inc. | 9,712 | 171,417 | ||||||
Ryland Group, Inc. | 1,313 | 42,147 | ||||||
Standard Pacific Corp. (a) | 4,332 | 32,663 | ||||||
Taylor Morrison Home Corp. Class A (a) | 920 | 16,358 | ||||||
Toll Brothers, Inc. (a) | 4,791 | 156,618 | ||||||
TRI Pointe Homes, Inc. (a) | 4,105 | 55,459 | ||||||
WCI Communities, Inc. (a) | 523 | 8,990 | ||||||
William Lyon Homes Class A (a) | 463 | 11,399 | ||||||
|
| |||||||
| 1,140,316 | ||||||||
|
| |||||||
Household Appliances – 0.5% |
| |||||||
Helen of Troy Ltd. (a) | 804 | 43,119 | ||||||
iRobot Corp. (a) | 795 | 25,734 | ||||||
NACCO Industries, Inc. Class A | 131 | 6,247 | ||||||
Whirlpool Corp. | 2,191 | 312,524 | ||||||
|
| |||||||
| 387,624 | ||||||||
|
| |||||||
See accompanying notes which are an integral part of the financial statements.
| 27 | Annual Report |
Table of Contents
Fidelity MSCI Consumer Discretionary Index ETF
Investments – continued
| Common Stocks – continued | ||||||||
| Shares | Value | |||||||
HOUSEHOLD DURABLES – continued |
| |||||||
Housewares & Specialties – 0.8% |
| |||||||
CSS Industries, Inc. | 279 | $ | 6,889 | |||||
Jarden Corp. (a) | 3,590 | 200,681 | ||||||
Libbey, Inc. (a) | 629 | 16,379 | ||||||
Newell Rubbermaid, Inc. | 7,896 | 256,462 | ||||||
Tupperware Brands Corp. | 1,433 | 104,294 | ||||||
|
| |||||||
| 584,705 | ||||||||
|
| |||||||
TOTAL HOUSEHOLD DURABLES |
| 3,015,024 | ||||||
|
| |||||||
INTERNET & CATALOG RETAIL – 9.8% |
| |||||||
Catalog Retail – 0.6% |
| |||||||
HSN, Inc. | 977 | 54,605 | ||||||
Liberty Media Corp. Interactive Series A (a) | 13,279 | 372,476 | ||||||
|
| |||||||
| 427,081 | ||||||||
|
| |||||||
Internet Retail – 9.2% |
| |||||||
1-800-FLOWERS.com, Inc. Class A (a) | 741 | 3,794 | ||||||
Amazon.com, Inc. (a) | 11,062 | 3,462,295 | ||||||
Blue Nile, Inc. (a) | 393 | 10,120 | ||||||
Expedia, Inc. | 2,971 | 235,957 | ||||||
FTD Cos., Inc. (a) | 549 | 18,084 | ||||||
Groupon, Inc. Class A (a) | 12,604 | 81,548 | ||||||
HomeAway, Inc. (a) | 2,506 | 87,008 | ||||||
Lands’ End, Inc. (a) | 522 | 18,369 | ||||||
Liberty Media Corp. Series A (a) | 2,009 | 138,942 | ||||||
Netflix, Inc. (a) | 1,609 | 680,157 | ||||||
NutriSystem, Inc. | 798 | 12,808 | ||||||
Orbitz Worldwide, Inc. (a) | 2,499 | 22,116 | ||||||
Overstock.com, Inc. (a) | 461 | 7,491 | ||||||
PetMed Express, Inc. | 570 | 7,809 | ||||||
priceline.com, Inc. (a) | 1,478 | 1,836,341 | ||||||
RetailMeNot, Inc. (a) | 811 | 19,837 | ||||||
Shutterfly, Inc. (a) | 1,083 | 53,414 | ||||||
TripAdvisor, Inc. (a) | 3,297 | 312,688 | ||||||
Vitacost.com, Inc. (a) | 387 | 3,088 | ||||||
|
| |||||||
| 7,011,866 | ||||||||
|
| |||||||
TOTAL INTERNET & CATALOG RETAIL |
| 7,438,947 | ||||||
|
| |||||||
LEISURE PRODUCTS – 1.3% |
| |||||||
Leisure Products – 1.3% |
| |||||||
Arctic Cat, Inc. | 397 | 14,133 | ||||||
Black Diamond, Inc. (a) | 642 | 5,637 | ||||||
Brunswick Corp. | 2,634 | 106,229 | ||||||
Callaway Golf Co. | 2,269 | 17,244 | ||||||
Hasbro, Inc. | 3,349 | 167,316 | ||||||
Leapfrog Enterprises, Inc. Class A (a) | 1,939 | 14,000 | ||||||
Mattel, Inc. | 9,630 | 341,143 | ||||||
Polaris Industries, Inc. | 1,767 | 260,703 | ||||||
Smith & Wesson Holding Corp. (a) | 1,553 | 19,180 | ||||||
Sturm, Ruger & Co., Inc. | 562 | 28,077 | ||||||
|
| |||||||
TOTAL LEISURE PRODUCTS |
| 973,662 | ||||||
|
| |||||||
| Shares | Value | |||||||
MEDIA – 28.4% |
| |||||||
Advertising – 1.2% |
| |||||||
Clear Channel Outdoor Holding, Inc. Class A | 1,036 | $ | 7,822 | |||||
Harte-Hanks, Inc. | 1,368 | 8,974 | ||||||
Interpublic Group of Companies, Inc. | 12,037 | 237,249 | ||||||
Lamar Advertising Co. Class A | 2,278 | 114,242 | ||||||
National CineMedia, Inc. | 1,734 | 27,848 | ||||||
Omnicom Group, Inc. | 7,331 | 513,097 | ||||||
ReachLocal, Inc. (a) | 285 | 1,824 | ||||||
Sizmek, Inc. (a) | 627 | 5,699 | ||||||
|
| |||||||
| 916,755 | ||||||||
|
| |||||||
Broadcasting – 2.8% |
| |||||||
CBS Corp. Class B (non-vtg.) | 13,796 | 784,027 | ||||||
Cumulus Media, Inc. Class A (a) | 3,375 | 17,483 | ||||||
Discovery Communications, Inc. Class A (a) | 4,169 | 355,240 | ||||||
Discovery Communications, Inc. Class C (non-vtg.) (a) | 2,282 | 191,916 | ||||||
Entercom Communications Corp. Class A (a) | 627 | 5,925 | ||||||
Entravision Communications Corp. | 1,828 | 10,219 | ||||||
Gray Television, Inc. (a) | 1,469 | 17,892 | ||||||
Liberty Media Corp. (a) | 5,322 | 250,134 | ||||||
Liberty Media Corp. Class A (a) | 2,661 | 125,200 | ||||||
Media General, Inc. (a) | 1,154 | 23,265 | ||||||
Nexstar Broadcasting Group, Inc. Class A | 891 | 41,512 | ||||||
Scripps Networks Interactive, Inc. Class A | 2,386 | 196,630 | ||||||
Sinclair Broadcast Group, Inc. Class A | 1,936 | 62,552 | ||||||
|
| |||||||
| 2,081,995 | ||||||||
|
| |||||||
Cable & Satellite – 11.2% |
| |||||||
AMC Networks, Inc. Class A (a) | 1,731 | 103,635 | ||||||
Cablevision Systems Corp. – NY Group Class A | 5,476 | 105,249 | ||||||
Charter Communications, Inc. Class A (a) | 2,108 | 325,728 | ||||||
Comcast Corp. Class A | 60,626 | 3,257,435 | ||||||
Comcast Corp. Class A (special) (non-vtg.) | 12,908 | 690,191 | ||||||
DIRECTV (a) | 13,719 | 1,180,520 | ||||||
DISH Network Corp. Class A (a) | 6,225 | 385,078 | ||||||
Liberty Global PLC Series A (a) | 6,287 | 261,539 | ||||||
Liberty Global PLC Series C (a) | 15,053 | 601,969 | ||||||
Loral Space & Communications Ltd. (a) | 374 | 27,040 | ||||||
Sirius XM Holdings, Inc. (a) | 86,297 | 291,684 | ||||||
Starz – Liberty Capital Series A (a) | 2,404 | 68,538 | ||||||
Time Warner Cable, Inc. | 7,866 | 1,141,357 | ||||||
|
| |||||||
| 8,439,963 | ||||||||
|
| |||||||
Movies & Entertainment – 12.2% |
| |||||||
AMC Entertainment Holdings, Inc. | 638 | 14,444 | ||||||
Carmike Cinemas, Inc. (a) | 634 | 19,933 | ||||||
Cinemark Holdings, Inc. | 2,958 | 97,022 | ||||||
DreamWorks Animation SKG, Inc. Class A (a) | 1,995 | 39,900 | ||||||
See accompanying notes which are an integral part of the financial statements.
| Annual Report | 28 |
Table of Contents
| Common Stocks – continued | ||||||||
| Shares | Value | |||||||
MEDIA – continued |
| |||||||
Movies & Entertainment – continued |
| |||||||
Lions Gate Entertainment Corp. | 2,333 | $ | 71,856 | |||||
Live Nation Entertainment, Inc. (a) | 3,985 | 92,492 | ||||||
Regal Entertainment Group Class A | 2,451 | 47,696 | ||||||
SFX Entertainment, Inc. (a) | 1,463 | 10,022 | ||||||
The Madison Square Garden Co. | 1,806 | 107,168 | ||||||
The Walt Disney Co. | 47,169 | 4,050,874 | ||||||
Time Warner, Inc. | 25,298 | 2,100,240 | ||||||
Twenty-First Century Fox, Inc. Class A | 41,326 | 1,309,208 | ||||||
Twenty-First Century Fox, Inc. Class B | 12,432 | 393,597 | ||||||
Viacom, Inc. Class B (non-vtg.) | 10,974 | 907,221 | ||||||
World Wrestling Entertainment, Inc. Class A | 900 | 11,232 | ||||||
|
| |||||||
| 9,272,905 | ||||||||
|
| |||||||
Publishing – 1.0% |
| |||||||
E.W. Scripps Co. Class A (a) | 906 | 19,642 | ||||||
Gannett Co., Inc. | 6,436 | 210,586 | ||||||
John Wiley & Sons, Inc. Class A | 1,348 | 81,001 | ||||||
Journal Communications, Inc. Class A (a) | 972 | 10,575 | ||||||
Meredith Corp. | 1,027 | 47,160 | ||||||
Morningstar, Inc. | 569 | 38,584 | ||||||
New Media Investment Group, Inc. (a) | 738 | 11,114 | ||||||
News Corp. Class A (a) | 10,769 | 190,073 | ||||||
Scholastic Corp. | 794 | 28,124 | ||||||
The McClatchy Co. Class A (a) | 1,824 | 8,810 | ||||||
The New York Times Co. Class A | 3,870 | 48,336 | ||||||
Time, Inc. (a) | 3,158 | 76,108 | ||||||
|
| |||||||
| 770,113 | ||||||||
|
| |||||||
TOTAL MEDIA |
| 21,481,731 | ||||||
|
| |||||||
MULTILINE RETAIL – 4.7% |
| |||||||
Department Stores – 1.8% |
| |||||||
Dillard’s, Inc. Class A | 741 | 88,342 | ||||||
J.C. Penney Co., Inc. (a) | 4,118 | 38,627 | ||||||
Kohl’s Corp. | 6,075 | 325,256 | ||||||
Macy’s, Inc. | 10,356 | 598,473 | ||||||
Nordstrom, Inc. | 4,059 | 281,005 | ||||||
Sears Holdings Corp. (a) | 1,523 | 58,102 | ||||||
|
| |||||||
| 1,389,805 | ||||||||
|
| |||||||
General Merchandise Stores – 2.9% |
| |||||||
Big Lots, Inc. | 1,653 | 72,319 | ||||||
Burlington Stores, Inc. (a) | 857 | 28,050 | ||||||
Dollar General Corp. (a) | 9,077 | 501,323 | ||||||
Dollar Tree, Inc. (a) | 5,889 | 320,774 | ||||||
Family Dollar Stores, Inc. | 2,899 | 216,700 | ||||||
Fred’s, Inc. Class A | 1,026 | 16,241 | ||||||
Target Corp. | 17,047 | 1,015,831 | ||||||
Tuesday Morning Corp. (a) | 1,264 | 20,805 | ||||||
|
| |||||||
| 2,192,043 | ||||||||
|
| |||||||
TOTAL MULTILINE RETAIL |
| 3,581,848 | ||||||
|
| |||||||
| Shares | Value | |||||||
SPECIALTY RETAIL – 17.6% |
| |||||||
Apparel Retail – 4.4% |
| |||||||
Abercrombie & Fitch Co. Class A | 2,168 | $ | 85,289 | |||||
Aeropostale, Inc. (a) | 2,051 | 6,809 | ||||||
American Eagle Outfitters, Inc. | 4,902 | 52,255 | ||||||
ANN, Inc. (a) | 1,310 | 48,143 | ||||||
Ascena Retail Group, Inc. (a) | 3,927 | 63,068 | ||||||
bebe stores, Inc. | 1,026 | 2,883 | ||||||
Brown Shoe Co., Inc. | 1,195 | 33,687 | ||||||
Chico’s FAS, Inc. | 4,269 | 67,493 | ||||||
Destination Maternity Corp. | 344 | 6,546 | ||||||
DSW, Inc. Class A | 2,148 | 57,115 | ||||||
Express, Inc. (a) | 2,425 | 37,733 | ||||||
Finish Line, Inc. Class A | 1,370 | 36,017 | ||||||
Foot Locker, Inc. | 4,154 | 197,440 | ||||||
Francescas Holdings Corp. (a) | 1,197 | 15,298 | ||||||
Gap, Inc. | 6,944 | 278,524 | ||||||
Genesco, Inc. (a) | 684 | 52,169 | ||||||
Guess?, Inc. | 1,824 | 47,442 | ||||||
L Brands, Inc. | 7,006 | 406,138 | ||||||
New York & Co., Inc. (a) | 912 | 3,073 | ||||||
Ross Stores, Inc. | 6,084 | 391,810 | ||||||
Shoe Carnival, Inc. | 399 | 7,102 | ||||||
Stage Stores, Inc. | 898 | 16,182 | ||||||
Stein Mart, Inc. | 790 | 10,254 | ||||||
The Buckle, Inc. | 809 | 36,001 | ||||||
The Cato Corp. Class A | 798 | 24,626 | ||||||
The Children’s Place Retail Stores, Inc. | 632 | 31,726 | ||||||
The Men’s Wearhouse, Inc. | 1,142 | 57,465 | ||||||
Tilly’s, Inc. Class A (a) | 285 | 2,158 | ||||||
TJX Companies, Inc. | 20,162 | 1,074,433 | ||||||
Urban Outfitters, Inc. (a) | 3,358 | 119,981 | ||||||
Zumiez, Inc. (a) | 626 | 17,434 | ||||||
|
| |||||||
| 3,286,294 | ||||||||
|
| |||||||
Automotive Retail – 2.7% |
| |||||||
Advance Auto Parts, Inc. | 2,065 | 250,092 | ||||||
America’s Car Mart, Inc. (a) | 231 | 8,649 | ||||||
Asbury Automotive Group, Inc. (a) | 796 | 53,754 | ||||||
AutoNation, Inc. (a) | 2,208 | 117,731 | ||||||
AutoZone, Inc. (a) | 955 | 493,764 | ||||||
CarMax, Inc. (a) | 6,319 | 308,430 | ||||||
CST Brands, Inc. | 2,158 | 72,142 | ||||||
Group 1 Automotive, Inc. | 618 | 45,683 | ||||||
Lithia Motors, Inc. Class A | 671 | 59,618 | ||||||
Monro Muffler Brake, Inc. | 855 | 43,425 | ||||||
Murphy USA, Inc. (a) | 1,335 | 65,976 | ||||||
O’Reilly Automotive, Inc. (a) | 3,011 | 451,650 | ||||||
Penske Automotive Group, Inc. | 1,297 | 60,246 | ||||||
Sonic Automotive, Inc. Class A | 973 | 23,663 | ||||||
The Pep Boys – Manny, Moe & Jack (a) | 1,368 | 14,473 | ||||||
|
| |||||||
| 2,069,296 | ||||||||
|
| |||||||
See accompanying notes which are an integral part of the financial statements.
| 29 | Annual Report |
Table of Contents
Fidelity MSCI Consumer Discretionary Index ETF
Investments – continued
| Common Stocks – continued | ||||||||
| Shares | Value | |||||||
SPECIALTY RETAIL – continued |
| |||||||
Computer & Electronics Retail – 0.6% |
| |||||||
Best Buy Co., Inc. | 8,348 | $ | 248,186 | |||||
Conn’s, Inc. (a) | 779 | 31,160 | ||||||
GameStop Corp. Class A | 3,273 | 137,368 | ||||||
hhgregg, Inc. (a) | 446 | 3,171 | ||||||
Rent-A-Center, Inc. | 1,476 | 35,335 | ||||||
|
| |||||||
| 455,220 | ||||||||
|
| |||||||
Home Improvement Retail – 6.2% |
| |||||||
Home Depot, Inc. | 39,908 | 3,226,562 | ||||||
Lowe’s Companies, Inc. | 29,191 | 1,396,789 | ||||||
Lumber Liquidators Holdings, Inc. (a) | 773 | 41,912 | ||||||
Sears Hometown & Outlet Stores, Inc. (a) | 386 | 7,319 | ||||||
Tile Shop Holdings, Inc. (a) | 690 | 6,976 | ||||||
|
| |||||||
| 4,679,558 | ||||||||
|
| |||||||
Homefurnishing Retail – 1.0% |
| |||||||
Aarons, Inc. Class A | 1,833 | 48,355 | ||||||
Bed Bath & Beyond, Inc. (a) | 6,028 | 381,512 | ||||||
Haverty Furniture Companies, Inc. | 570 | 12,671 | ||||||
Kirkland’s, Inc. (a) | 363 | 6,828 | ||||||
Mattress Firm Holding Corp. (a) | 399 | 18,593 | ||||||
Pier 1 Imports, Inc. | 2,799 | 42,153 | ||||||
Restoration Hardware Holdings, Inc. (a) | 892 | 72,957 | ||||||
Select Comfort Corp. (a) | 1,589 | 32,098 | ||||||
Williams-Sonoma, Inc. | 2,546 | 170,760 | ||||||
|
| |||||||
| 785,927 | ||||||||
|
| |||||||
Specialty Stores – 2.7% |
| |||||||
Barnes & Noble, Inc. (a) | 1,135 | 23,631 | ||||||
Big 5 Sporting Goods Corp. | 595 | 5,896 | ||||||
Cabela’s, Inc. Class A (a) | 1,415 | 82,579 | ||||||
Dick’s Sporting Goods, Inc. | 2,855 | 121,423 | ||||||
Five Below, Inc. (a) | 1,228 | 44,969 | ||||||
GNC Holdings, Inc. Class A | 2,686 | 88,128 | ||||||
Hibbett Sports, Inc. (a) | 741 | 36,983 | ||||||
MarineMax, Inc. (a) | 688 | 11,469 | ||||||
Office Depot, Inc. (a) | 14,454 | 72,415 | ||||||
PetSmart, Inc. | 2,789 | 190,042 | ||||||
Sally Beauty Holdings, Inc. (a) | 4,607 | 119,552 | ||||||
Signet Jewelers Ltd. | 2,158 | 219,663 | ||||||
Staples, Inc. | 18,574 | 215,273 | ||||||
The Container Store Group, Inc. (a) | 566 | 11,903 | ||||||
Tiffany & Co., Inc. | 3,626 | 353,934 | ||||||
Tractor Supply Co. | 3,935 | 244,639 | ||||||
Ulta Salon, Cosmetics & Fragrance, Inc. (a) | 1,723 | 159,085 | ||||||
Vitamin Shoppe, Inc. (a) | 885 | 37,745 | ||||||
Winmark Corp. | 90 | 5,892 | ||||||
|
| |||||||
| 2,045,221 | ||||||||
|
| |||||||
TOTAL SPECIALTY RETAIL |
| 13,321,516 | ||||||
|
| |||||||
| Shares | Value | |||||||
TEXTILES, APPAREL & LUXURY GOODS – 6.7% |
| |||||||
Apparel, Accessories & Luxury Goods – 4.2% |
| |||||||
Carter’s, Inc. | 1,528 | $ | 116,984 | |||||
Coach, Inc. | 7,858 | 271,572 | ||||||
Columbia Sportswear Co. | 399 | 29,829 | ||||||
Fossil Group, Inc. (a) | 1,375 | 134,750 | ||||||
G-III Apparel Group Ltd. (a) | 562 | 43,651 | ||||||
Hanesbrands, Inc. | 2,814 | 274,956 | ||||||
Iconix Brand Group, Inc. (a) | 1,305 | 55,110 | ||||||
Kate Spade & Co. (a) | 3,487 | 131,913 | ||||||
lululemon athletica, Inc. (a) | 3,096 | 119,103 | ||||||
Michael Kors Holdings Ltd. (a) | 5,483 | 446,755 | ||||||
Movado Group, Inc. | 519 | 21,243 | ||||||
Oxford Industries, Inc. | 433 | 25,794 | ||||||
PVH Corp. | 2,312 | 254,736 | ||||||
Quiksilver, Inc. (a) | 3,850 | 11,512 | ||||||
Ralph Lauren Corp. | 1,691 | 263,559 | ||||||
Tumi Holdings, Inc. (a) | 1,477 | 31,135 | ||||||
Under Armour, Inc. Class A (a) | 4,625 | 308,719 | ||||||
Vera Bradley, Inc. (a) | 657 | 13,028 | ||||||
VF Corp. | 9,998 | 612,577 | ||||||
Vince Holding Corp. (a) | 471 | 15,915 | ||||||
|
| |||||||
| 3,182,841 | ||||||||
|
| |||||||
Footwear – 2.5% |
| |||||||
Crocs, Inc. (a) | 2,499 | 39,659 | ||||||
Deckers Outdoor Corp. (a) | 976 | 86,386 | ||||||
NIKE, Inc. Class B | 20,051 | 1,546,534 | ||||||
Skechers U.S.A., Inc. Class A (a) | 1,140 | 59,474 | ||||||
Steven Madden Ltd. (a) | 1,703 | 54,240 | ||||||
Wolverine World Wide, Inc. | 2,850 | 69,141 | ||||||
|
| |||||||
| 1,855,434 | ||||||||
|
| |||||||
Textiles – 0.0% |
| |||||||
Unifi, Inc. (a) | 454 | 13,003 | ||||||
|
| |||||||
TOTAL TEXTILES, APPAREL & LUXURY GOODS |
| 5,051,278 | ||||||
|
| |||||||
TOTAL COMMON STOCKS |
| 75,628,281 | ||||||
|
| |||||||
| Money Market Funds – 0.1% | ||||||||
SSgA US Treasury Money Market Fund, 0.00% (b) | 88,417 | 88,417 | ||||||
|
| |||||||
TOTAL INVESTMENT PORTFOLIO – 100.0% |
| 75,716,698 | ||||||
NET OTHER ASSETS (LIABILITIES) – 0.0% |
| 24,571 | ||||||
|
| |||||||
NET ASSETS – 100% |
| $ | 75,741,269 | |||||
|
| |||||||
Legend
| (a) | Non-income producing. |
| (b) | The rate quoted is the annualized seven-day yield of the fund at period end. |
See accompanying notes which are an integral part of the financial statements.
| Annual Report | 30 |
Table of Contents
Other Information
The following is a summary of the inputs used, as of July 31, 2014, involving the Fund’s assets and liabilities carried at fair value. The inputs or methodology used for valuing securities may not be an indication of the risk associated with investing in those securities. For more information on valuation inputs, and their aggregation into the levels used in the table below, please refer to the Investment Valuation section at the end of this listing.
| Valuation Inputs at Reporting Date: | ||||||||||||||||
| Description | Total | Level 1 | Level 2 | Level 3 | ||||||||||||
Investments in Securities: | ||||||||||||||||
Common Stocks | $ | 75,628,281 | $ | 75,628,281 | $ | — | $ | — | ||||||||
Money Market Funds | 88,417 | 88,417 | — | — | ||||||||||||
|
|
|
|
|
|
|
| |||||||||
Total Investments in Securities: | $ | 75,716,698 | $ | 75,716,698 | $ | — | $ | — | ||||||||
|
|
|
|
|
|
|
| |||||||||
See accompanying notes which are an integral part of the financial statements.
| 31 | Annual Report |
Table of Contents
Fidelity MSCI Consumer Staples Index ETF
Investments July 31, 2014
Showing Percentage of Net Assets
| Common Stocks – 99.8% | ||||||||
| Shares | Value | |||||||
BEVERAGES – 20.6% |
| |||||||
Brewers – 0.7% |
| |||||||
Molson Coors Brewing Co. Class B | 6,398 | $ | 432,057 | |||||
The Boston Beer Co., Inc. Class A (a) | 387 | 85,295 | ||||||
|
| |||||||
| 517,352 | ||||||||
|
| |||||||
Distillers & Vintners – 1.4% |
| |||||||
Brown-Forman Corp. Class B | 5,140 | 445,381 | ||||||
Constellation Brands, Inc. Class A (a) | 7,015 | 584,069 | ||||||
|
| |||||||
| 1,029,450 | ||||||||
|
| |||||||
Soft Drinks – 18.5% |
| |||||||
Coca-Cola Bottling Co. Consolidated | 220 | 15,360 | ||||||
Coca-Cola Enterprises, Inc. | 10,218 | 464,408 | ||||||
Dr Pepper Snapple Group, Inc. | 8,317 | 488,707 | ||||||
Monster Beverage Corp. (a) | 5,969 | 381,777 | ||||||
National Beverage Corp. (a) | 504 | 8,639 | ||||||
PepsiCo, Inc. | 63,961 | 5,634,964 | ||||||
The Coca-Cola Co. | 166,570 | 6,544,535 | ||||||
|
| |||||||
| 13,538,390 | ||||||||
|
| |||||||
TOTAL BEVERAGES |
| 15,085,192 | ||||||
|
| |||||||
FOOD & STAPLES RETAILING – 23.8% |
| |||||||
Drug Retail – 9.1% |
| |||||||
CVS Caremark Corp. | 49,681 | 3,793,641 | ||||||
Rite Aid Corp. (a) | 40,750 | 272,618 | ||||||
Walgreen Co. | 37,934 | 2,608,721 | ||||||
|
| |||||||
| 6,674,980 | ||||||||
|
| |||||||
Food Distributors – 1.5% |
| |||||||
SpartanNash Co. | 1,621 | 33,976 | ||||||
Sysco Corp. | 24,605 | 878,152 | ||||||
The Andersons, Inc. | 1,132 | 61,151 | ||||||
The Chefs’ Warehouse, Inc. (a) | 857 | 15,058 | ||||||
United Natural Foods, Inc. (a) | 2,100 | 123,102 | ||||||
|
| |||||||
| 1,111,439 | ||||||||
|
| |||||||
Food Retail – 3.3% |
| |||||||
Casey’s General Stores, Inc. | 1,619 | 107,129 | ||||||
Ingles Markets, Inc. Class A | 493 | 12,088 | ||||||
Natural Grocers by Vitamin Cottage, Inc. (a) | 433 | 9,820 | ||||||
Roundy’s, Inc. | 10 | 48 | ||||||
Safeway, Inc. | 9,677 | 333,469 | ||||||
Sprouts Farmers Market Inc. (a) | 3,750 | 114,413 | ||||||
SUPERVALU, Inc. (a) | 8,803 | 80,724 | ||||||
Susser Holdings Corp. (a) | 726 | 58,203 | ||||||
The Fresh Market, Inc. (a) | 1,745 | 52,228 | ||||||
The Kroger Co. | 20,635 | 1,010,702 | ||||||
The Pantry, Inc. (a) | 995 | 17,821 | ||||||
Village Super Market, Inc. Class A | 326 | 7,668 | ||||||
Weis Markets, Inc. | 533 | 22,738 | ||||||
Whole Foods Market, Inc. | 14,603 | 558,127 | ||||||
|
| |||||||
| 2,385,178 | ||||||||
|
| |||||||
| Shares | Value | |||||||
Hypermarkets & Super Centers – 9.9% |
| |||||||
Costco Wholesale Corp. | 18,479 | $ | 2,172,021 | |||||
PriceSmart, Inc. | 833 | 68,556 | ||||||
Wal-Mart Stores, Inc. | 67,965 | 5,000,865 | ||||||
|
| |||||||
| 7,241,442 | ||||||||
|
| |||||||
TOTAL FOOD & STAPLES RETAILING |
| 17,413,039 | ||||||
|
| |||||||
FOOD PRODUCTS – 19.6% |
| |||||||
Agricultural Products – 3.0% |
| |||||||
Alico, Inc. | 168 | 6,201 | ||||||
Archer-Daniels-Midland Co. | 27,680 | 1,284,352 | ||||||
Bunge Ltd. | 6,195 | 488,414 | ||||||
Darling International, Inc. (a) | 6,963 | 130,347 | ||||||
Fresh Del Monte Produce, Inc. | 1,911 | 57,215 | ||||||
Ingredion, Inc. | 3,146 | 231,640 | ||||||
|
| |||||||
| 2,198,169 | ||||||||
|
| |||||||
Packaged Foods & Meats – 16.6% |
| |||||||
Annie’s, Inc. (a) | 723 | 21,097 | ||||||
B&G Foods, Inc. | 2,285 | 64,140 | ||||||
Boulder Brands, Inc. (a) | 2,553 | 28,977 | ||||||
Cal-Maine Foods, Inc. | 610 | 43,432 | ||||||
Calavo Growers, Inc. | 586 | 20,211 | ||||||
Campbell Soup Co. | 8,627 | 358,797 | ||||||
Chiquita Brands International, Inc. (a) | 1,911 | 18,326 | ||||||
ConAgra Foods, Inc. | 17,666 | 532,277 | ||||||
Dean Foods Co. | 4,024 | 61,648 | ||||||
Diamond Foods, Inc. (a) | 999 | 26,833 | ||||||
Flowers Foods, Inc. | 7,900 | 150,811 | ||||||
General Mills, Inc. | 26,250 | 1,316,437 | ||||||
Hillshire Brands Co. | 5,146 | 323,014 | ||||||
Hormel Foods Corp. | 6,096 | 275,905 | ||||||
J&J Snack Foods Corp. | 633 | 57,027 | ||||||
Kellogg Co. | 11,338 | 678,353 | ||||||
Keurig Green Mountain, Inc. | 5,231 | 623,954 | ||||||
Kraft Foods Group, Inc. | 25,059 | 1,342,786 | ||||||
Lancaster Colony Corp. | 814 | 71,103 | ||||||
McCormick & Co., Inc. (non-vtg.) | 5,014 | 329,821 | ||||||
Mead Johnson Nutrition Co. | 8,484 | 775,777 | ||||||
Mondelez International, Inc. Class A | 71,379 | 2,569,644 | ||||||
Pilgrim’s Pride Corp. (a) | 2,719 | 76,023 | ||||||
Pinnacle Foods, Inc. | 2,461 | 74,150 | ||||||
Post Holdings, Inc. (a) | 1,849 | 83,057 | ||||||
Sanderson Farms, Inc. | 887 | 80,797 | ||||||
Seaboard Corp. (a) | 16 | 45,632 | ||||||
Seneca Foods Corp. Class A (a) | 333 | 9,530 | ||||||
Snyders-Lance, Inc. | 2,070 | 51,357 | ||||||
The Hain Celestial Group, Inc. (a) | 2,098 | 179,379 | ||||||
The Hershey Co. | 6,525 | 575,179 | ||||||
The JM Smucker Co. | 4,358 | 434,231 | ||||||
Tootsie Roll Industries, Inc. | 905 | 23,829 | ||||||
TreeHouse Foods, Inc. (a) | 1,740 | 127,890 | ||||||
Tyson Foods, Inc. Class A | 12,981 | 483,023 | ||||||
See accompanying notes which are an integral part of the financial statements.
| Annual Report | 32 |
Table of Contents
| Common Stocks – continued | ||||||||
| Shares | Value | |||||||
FOOD PRODUCTS – continued |
| |||||||
Packaged Foods & Meats – continued |
| |||||||
WhiteWave Foods Co. Class A (a) | 7,322 | $ | 218,122 | |||||
|
| |||||||
| 12,152,569 | ||||||||
|
| |||||||
TOTAL FOOD PRODUCTS |
| 14,350,738 | ||||||
|
| |||||||
HOUSEHOLD PRODUCTS – 19.4% | ||||||||
Household Products – 19.4% |
| |||||||
Central Garden and Pet Co. (a) | 515 | 4,733 | ||||||
Central Garden and Pet Co. Class A (a) | 1,365 | 12,735 | ||||||
Church & Dwight Co., Inc. | 5,782 | 371,089 | ||||||
Colgate-Palmolive Co. | 38,612 | 2,448,001 | ||||||
Energizer Holdings, Inc. | 2,633 | 302,163 | ||||||
Harbinger Group, Inc. (a) | 2,807 | 32,926 | ||||||
Kimberly-Clark Corp. | 15,942 | 1,655,895 | ||||||
Spectrum Brands Holdings, Inc. | 1,000 | 83,400 | ||||||
The Clorox Co. | 5,464 | 474,658 | ||||||
The Procter & Gamble Co. | 113,896 | 8,806,439 | ||||||
WD-40 Co. | 616 | 41,124 | ||||||
|
| |||||||
TOTAL HOUSEHOLD PRODUCTS |
| 14,233,163 | ||||||
|
| |||||||
PERSONAL PRODUCTS – 1.9% |
| |||||||
Personal Products – 1.9% |
| |||||||
Avon Products, Inc. | 18,303 | 241,600 | ||||||
Elizabeth Arden, Inc. (a) | 1,167 | 24,075 | ||||||
Herbalife Ltd. | 3,399 | 178,108 | ||||||
Inter Parfums, Inc. | 726 | 18,970 | ||||||
Medifast, Inc. (a) | 486 | 13,953 | ||||||
Nu Skin Enterprises, Inc. Class A | 2,385 | 139,976 | ||||||
Revlon, Inc. Class A (a) | 571 | 17,415 | ||||||
The Estee Lauder Cos., Inc. Class A | 10,036 | 737,245 | ||||||
USANA Health Sciences, Inc. (a) | 300 | 19,155 | ||||||
|
| |||||||
TOTAL PERSONAL PRODUCTS |
| 1,390,497 | ||||||
|
| |||||||
| Shares | Value | |||||||
TOBACCO – 14.5% |
| |||||||
Tobacco – 14.5% |
| |||||||
Alliance One International, Inc. (a) | 3,971 | $ | 9,014 | |||||
Altria Group, Inc. | 83,734 | 3,399,600 | ||||||
Lorillard, Inc. | 15,232 | 921,231 | ||||||
Philip Morris International, Inc. | 66,598 | 5,461,702 | ||||||
Reynolds American, Inc. | 13,551 | 756,823 | ||||||
Universal Corp. | 408 | 21,188 | ||||||
Vector Group Ltd. | 3,128 | 64,218 | ||||||
|
| |||||||
TOTAL TOBACCO |
| 10,633,776 | ||||||
|
| |||||||
TOTAL COMMON STOCKS |
| 73,106,405 | ||||||
|
| |||||||
| Money Market Funds – 0.2% | ||||||||
SSgA US Treasury Money Market Fund, 0.00% (b) | 119,135 | 119,135 | ||||||
|
| |||||||
TOTAL INVESTMENT PORTFOLIO – 100.0% |
| 73,225,540 | ||||||
NET OTHER ASSETS (LIABILITIES) – 0.0% |
| 18,321 | ||||||
|
| |||||||
NET ASSETS – 100% |
| $ | 73,243,861 | |||||
|
| |||||||
Legend
| (a) | Non-income producing. |
| (b) | The rate quoted is the annualized seven-day yield of the fund at period end. |
Other Information
The following is a summary of the inputs used, as of July 31, 2014, involving the Fund’s assets and liabilities carried at fair value. The inputs or methodology used for valuing securities may not be an indication of the risk associated with investing in those securities. For more information on valuation inputs, and their aggregation into the levels used in the table below, please refer to the Investment Valuation section at the end of this listing.
| Valuation Inputs at Reporting Date: | ||||||||||||||||
| Description | Total | Level 1 | Level 2 | Level 3 | ||||||||||||
Investments in Securities: | ||||||||||||||||
Common Stocks | $ | 73,106,405 | $ | 73,106,405 | $ | — | $ | — | ||||||||
Money Market Funds | 119,135 | 119,135 | — | — | ||||||||||||
|
|
|
|
|
|
|
| |||||||||
Total Investments in Securities: | $ | 73,225,540 | $ | 73,225,540 | $ | — | $ | — | ||||||||
|
|
|
|
|
|
|
| |||||||||
See accompanying notes which are an integral part of the financial statements.
| 33 | Annual Report |
Table of Contents
Fidelity MSCI Energy Index ETF
Investments July 31, 2014
Showing Percentage of Net Assets
| Common Stocks – 99.8% | ||||||||
| Shares | Value | |||||||
ENERGY EQUIPMENT & SERVICES – 20.7% |
| |||||||
Oil & Gas Drilling – 2.8% |
| |||||||
Atwood Oceanics, Inc. (a) | 4,232 | $ | 203,771 | |||||
Diamond Offshore Drilling, Inc. | 4,806 | 224,873 | ||||||
Ensco PLC Class A | 16,140 | 817,491 | ||||||
Helmerich & Payne, Inc. | 7,444 | 790,999 | ||||||
Hercules Offshore, Inc. (a) | 11,239 | 39,674 | ||||||
Nabors Industries Ltd. | 18,366 | 498,820 | ||||||
Noble Corp. PLC | 17,571 | 551,202 | ||||||
Parker Drilling Co. (a) | 8,320 | 51,418 | ||||||
Patterson-UTI Energy, Inc. | 9,985 | 342,985 | ||||||
Pioneer Energy Services Corp. (a) | 4,368 | 64,253 | ||||||
Rowan Cos. PLC Class A | 8,630 | 263,388 | ||||||
Unit Corp. (a) | 3,089 | 195,688 | ||||||
|
| |||||||
| 4,044,562 | ||||||||
|
| |||||||
Oil & Gas Equipment & Services – 17.9% |
| |||||||
Baker Hughes, Inc. | 30,195 | 2,076,510 | ||||||
Basic Energy Services, Inc. (a) | 2,395 | 57,456 | ||||||
Bristow Group, Inc. | 2,508 | 178,996 | ||||||
C&J Energy Services, Inc. (a) | 3,092 | 92,636 | ||||||
Cameron International Corp. (a) | 14,981 | 1,062,303 | ||||||
CARBO Ceramics, Inc. | 1,447 | 180,209 | ||||||
CHC Group Ltd. (a) | 2,270 | 16,344 | ||||||
Core Laboratories N.V. | 3,098 | 453,640 | ||||||
Dawson Geophysical Co. | 541 | 13,579 | ||||||
Dresser-Rand Group, Inc. (a) | 5,285 | 314,510 | ||||||
Dril-Quip, Inc. (a) | 2,811 | 283,265 | ||||||
Era Group, Inc. (a) | 1,352 | 36,234 | ||||||
Exterran Holdings, Inc. | 4,127 | 174,366 | ||||||
FMC Technologies, Inc. (a) | 16,311 | 991,709 | ||||||
Forum Energy Technologies, Inc. (a) | 4,170 | 138,819 | ||||||
Frank’s International N.V. | 2,700 | 62,505 | ||||||
Geospace Technologies Corp. (a) | 356 | 14,325 | ||||||
Gulf Island Fabrication, Inc. | 954 | 18,603 | ||||||
Gulfmark Offshore, Inc. Class A | 416 | 15,920 | ||||||
Halliburton Co. | 58,764 | 4,054,128 | ||||||
Helix Energy Solutions Group, Inc. (a) | 6,968 | 177,196 | ||||||
Hornbeck Offshore Services, Inc. (a) | 2,282 | 99,723 | ||||||
ION Geophysical Corp. (a) | 9,007 | 33,776 | ||||||
Key Energy Services, Inc. (a) | 9,489 | 58,263 | ||||||
Matrix Service Co. (a) | 1,860 | 49,941 | ||||||
McDermott International, Inc. (a) | 16,399 | 119,713 | ||||||
National Oilwell Varco, Inc. | 29,603 | 2,399,027 | ||||||
Natural Gas Services Group, Inc. (a) | 855 | 26,676 | ||||||
Newpark Resources, Inc. (a) | 5,957 | 72,854 | ||||||
Nuverra Environmental Solutions, Inc. (a) | 1,136 | 21,152 | ||||||
Oceaneering International, Inc. | 7,482 | 508,103 | ||||||
Oil States International, Inc. (a) | 3,210 | 196,741 | ||||||
PHI, Inc. (non-vtg.) (a) | 838 | 33,059 | ||||||
RigNet, Inc. (a) | 916 | 50,948 | ||||||
RPC, Inc. | 4,576 | 102,960 | ||||||
Schlumberger Ltd. | 90,230 | 9,780,030 | ||||||
| Shares | Value | |||||||
SEACOR Holdings, Inc. (a) | 1,351 | $ | 102,622 | |||||
Seventy Seven Energy, Inc. (a) | 2,644 | 59,305 | ||||||
Superior Energy Services, Inc. | 10,951 | 367,954 | ||||||
Tesco Corp. | 2,288 | 44,662 | ||||||
TETRA Technologies, Inc. (a) | 5,435 | 59,839 | ||||||
Tidewater, Inc. | 3,432 | 162,231 | ||||||
Weatherford International PLC (a) | 53,143 | 1,188,809 | ||||||
Willbros Group, Inc. (a) | 2,808 | 32,545 | ||||||
|
| |||||||
| 25,984,186 | ||||||||
|
| |||||||
TOTAL ENERGY EQUIPMENT & SERVICES |
| 30,028,748 | ||||||
|
| |||||||
GAS UTILITIES – 0.6% |
| |||||||
Gas Utilities – 0.6% | ||||||||
ONEOK, Inc. | 14,360 | 925,215 | ||||||
|
| |||||||
OIL, GAS & CONSUMABLE FUELS – 78.5% |
| |||||||
Coal & Consumable Fuels – 0.7% | ||||||||
Alpha Natural Resources, Inc. (a) | 10,200 | 34,578 | ||||||
Arch Coal, Inc. | 14,768 | 43,861 | ||||||
Cloud Peak Energy, Inc. (a) | 4,264 | 66,007 | ||||||
CONSOL Energy, Inc. | 15,819 | 614,093 | ||||||
Peabody Energy Corp. | 18,787 | 284,999 | ||||||
Solazyme, Inc. (a) | 3,857 | 37,336 | ||||||
|
| |||||||
| 1,080,874 | ||||||||
|
| |||||||
Integrated Oil & Gas – 37.1% |
| |||||||
Chevron Corp. | 131,837 | 17,038,614 | ||||||
Exxon Mobil Corp. | 298,393 | 29,523,003 | ||||||
Hess Corp. | 20,236 | 2,002,959 | ||||||
Occidental Petroleum Corp. | 54,888 | 5,363,107 | ||||||
|
| |||||||
| 53,927,683 | ||||||||
|
| |||||||
Oil & Gas Exploration & Production – 28.5% |
| |||||||
Abraxas Petroleum Corp. (a) | 6,316 | 32,212 | ||||||
Anadarko Petroleum Corp. | 34,797 | 3,718,059 | ||||||
Antero Resources Corp. (a) | 3,631 | 209,726 | ||||||
Apache Corp. | 27,262 | 2,798,717 | ||||||
Apco Oil and Gas International, Inc. (a) | 705 | 9,736 | ||||||
Approach Resources, Inc. (a) | 2,593 | 54,557 | ||||||
Athlon Energy, Inc. (a) | 3,615 | 172,291 | ||||||
Bill Barrett Corp. (a) | 3,437 | 82,522 | ||||||
Bonanza Creek Energy, Inc. (a) | 2,248 | 126,023 | ||||||
BPZ Resources, Inc. (a) | 7,072 | 18,529 | ||||||
Cabot Oil & Gas Corp. | 29,181 | 961,514 | ||||||
Callon Petroleum Co. (a) | 2,718 | 26,854 | ||||||
Carrizo Oil & Gas, Inc. (a) | 2,981 | 183,063 | ||||||
Chesapeake Energy Corp. | 36,705 | 967,911 | ||||||
Cimarex Energy Co. | 6,016 | 836,344 | ||||||
Clayton Williams Energy, Inc. (a) | 432 | 45,969 | ||||||
Cobalt International Energy, Inc. (a) | 19,965 | 319,839 | ||||||
Comstock Resources, Inc. | 3,131 | 74,079 | ||||||
Concho Resources, Inc. (a) | 7,719 | 1,086,835 | ||||||
ConocoPhillips | 84,671 | 6,985,357 | ||||||
Contango Oil & Gas Co. (a) | 1,144 | 46,023 | ||||||
See accompanying notes which are an integral part of the financial statements.
| Annual Report | 34 |
Table of Contents
| Common Stocks – continued | ||||||||
| Shares | Value | |||||||
OIL, GAS & CONSUMABLE FUELS – continued |
| |||||||
Oil & Gas Exploration & Production – continued |
| |||||||
Continental Resources, Inc. (a) | 3,205 | $ | 470,430 | |||||
Denbury Resources, Inc. | 24,586 | 416,733 | ||||||
Devon Energy Corp. | 26,734 | 2,018,417 | ||||||
Diamondback Energy, Inc. (a) | 3,255 | 267,659 | ||||||
Emerald Oil, Inc. (a) | 3,745 | 27,488 | ||||||
Energen Corp. | 5,052 | 412,395 | ||||||
Energy XXI Bermuda Ltd. | 5,639 | 112,554 | ||||||
EOG Resources, Inc. | 37,728 | 4,128,952 | ||||||
EP Energy Corp. (a) | 3,367 | 67,340 | ||||||
EQT Corp. | 10,424 | 977,980 | ||||||
EXCO Resources, Inc. | 11,330 | 52,231 | ||||||
Forest Oil Corp. (a) | 7,285 | 14,861 | ||||||
Gastar Exploration, Inc. (a) | 3,938 | 26,070 | ||||||
Goodrich Petroleum Corp. (a) | 2,483 | 47,823 | ||||||
Gulfport Energy Corp. (a) | 5,899 | 315,066 | ||||||
Halcon Resources Corp. (a) | 17,361 | 103,298 | ||||||
Jones Energy, Inc. Class A (a) | 829 | 15,602 | ||||||
Kodiak Oil & Gas Corp. (a) | 18,437 | 286,511 | ||||||
Kosmos Energy Ltd. (a) | 8,019 | 77,223 | ||||||
Laredo Petroleum Holdings, Inc. (a) | 4,958 | 134,560 | ||||||
LinnCo LLC | 8,880 | 258,319 | ||||||
Magnum Hunter Resources Corp. (a) | 11,274 | 72,492 | ||||||
Marathon Oil Corp. | 48,145 | 1,865,619 | ||||||
Matador Resources Co. (a) | 4,806 | 129,954 | ||||||
Midstates Petroleum Co., Inc. (a) | 2,392 | 15,261 | ||||||
Miller Energy Resources, Inc. (a) | 2,184 | 10,680 | ||||||
Murphy Oil Corp. | 12,031 | 747,486 | ||||||
Newfield Exploration Co. (a) | 9,403 | 378,941 | ||||||
Noble Energy, Inc. | 24,861 | 1,653,008 | ||||||
Northern Oil and Gas, Inc. (a) | 4,162 | 66,967 | ||||||
Oasis Petroleum, Inc. (a) | 7,000 | 374,150 | ||||||
PDC Energy, Inc. (a) | 2,475 | 134,293 | ||||||
Penn Virginia Corp. (a) | 4,567 | 59,462 | ||||||
PetroQuest Energy, Inc. (a) | 3,524 | 22,589 | ||||||
Pioneer Natural Resources Co. | 9,873 | 2,186,475 | ||||||
QEP Resources, Inc. | 11,765 | 388,833 | ||||||
Quicksilver Resources, Inc. (a) | 7,384 | 13,882 | ||||||
Range Resources Corp. | 11,313 | 855,150 | ||||||
Resolute Energy Corp. (a) | 3,448 | 26,343 | ||||||
Rex Energy Corp. (a) | 2,285 | 31,510 | ||||||
Rosetta Resources, Inc. (a) | 4,262 | 217,660 | ||||||
RSP Permian, Inc. (a) | 1,529 | 45,182 | ||||||
Sanchez Energy Corp. (a) | 3,628 | 115,080 | ||||||
SandRidge Energy, Inc. (a) | 25,688 | 153,100 | ||||||
SM Energy Co. | 4,652 | 365,368 | ||||||
Southwestern Energy Co. (a) | 24,398 | 990,071 | ||||||
Stone Energy Corp. (a) | 3,835 | 145,922 | ||||||
Swift Energy Co. (a) | 3,016 | 33,327 | ||||||
Triangle Petroleum Corp. (a) | 4,472 | 48,298 | ||||||
Ultra Petroleum Corp. (a) | 10,609 | 243,158 | ||||||
Vaalco Energy, Inc. (a) | 3,848 | 26,551 | ||||||
| Shares | Value | |||||||
W&T Offshore, Inc. | 2,600 | $ | 34,866 | |||||
Warren Resources, Inc. (a) | 4,965 | 29,244 | ||||||
Whiting Petroleum Corp. (a) | 8,210 | 726,503 | ||||||
WPX Energy, Inc. (a) | 13,269 | 272,943 | ||||||
|
| |||||||
| 41,468,040 | ||||||||
|
| |||||||
Oil & Gas Refining & Marketing – 6.2% |
| |||||||
Alon USA Energy, Inc. | 1,965 | 25,250 | ||||||
Clean Energy Fuels Corp. (a) | 5,058 | 50,378 | ||||||
CVR Energy, Inc. | 1,228 | 57,814 | ||||||
Delek US Holdings, Inc. | 3,675 | 107,384 | ||||||
Green Plains, Inc. | 1,939 | 72,693 | ||||||
HollyFrontier Corp. | 13,086 | 615,173 | ||||||
Marathon Petroleum Corp. | 20,351 | 1,698,901 | ||||||
PBF Energy, Inc. Class A | 6,065 | 164,361 | ||||||
Phillips 66 | 40,583 | 3,291,687 | ||||||
Renewable Energy Group, Inc. (a) | 2,253 | 25,234 | ||||||
REX American Resources Corp. (a) | 426 | 35,933 | ||||||
Tesoro Corp. | 9,108 | 560,506 | ||||||
Valero Energy Corp. | 36,787 | 1,868,780 | ||||||
Western Refining, Inc. | 3,855 | 157,901 | ||||||
World Fuel Services Corp. | 4,994 | 214,492 | ||||||
|
| |||||||
| 8,946,487 | ||||||||
|
| |||||||
Oil & Gas Storage & Transportation – 6.0% |
| |||||||
Cheniere Energy, Inc. (a) | 15,628 | 1,105,837 | ||||||
Enbridge Energy Management LLC (a) | 3,414 | 115,769 | ||||||
EnLink Midstream LLC | 2,848 | 108,822 | ||||||
Kinder Morgan Management LLC (a) | 7,184 | 552,633 | ||||||
Kinder Morgan, Inc. | 46,281 | 1,665,190 | ||||||
SemGroup Corp. Class A | 2,948 | 227,232 | ||||||
Spectra Energy Corp. | 46,293 | 1,894,310 | ||||||
Targa Resources Corp. | 2,617 | 333,667 | ||||||
The Williams Cos., Inc. | 48,490 | 2,745,989 | ||||||
|
| |||||||
| 8,749,449 | ||||||||
|
| |||||||
TOTAL OIL, GAS & CONSUMABLE FUELS |
| 114,172,533 | ||||||
|
| |||||||
TOTAL COMMON STOCKS |
| 145,126,496 | ||||||
|
| |||||||
| Money Market Funds – 0.1% | ||||||||
SSgA US Treasury Money Market Fund, 0.00% (b) | 199,607 | 199,607 | ||||||
|
| |||||||
TOTAL INVESTMENT PORTFOLIO – 99.9% |
| 145,326,103 | ||||||
NET OTHER ASSETS (LIABILITIES) – 0.1% |
| 98,891 | ||||||
|
| |||||||
NET ASSETS – 100% |
| $ | 145,424,994 | |||||
|
| |||||||
See accompanying notes which are an integral part of the financial statements.
| 35 | Annual Report |
Table of Contents
Fidelity MSCI Energy Index ETF
Investments – continued
Legend
| (a) | Non-income producing. |
| (b) | The rate quoted is the annualized seven-day yield of the fund at period end. |
Other Information
The following is a summary of the inputs used, as of July 31, 2014, involving the Fund’s assets and liabilities carried at fair value. The inputs or methodology used for valuing securities may not be an indication of the risk associated with investing in those securities. For more information on valuation inputs, and their aggregation into the levels used in the table below, please refer to the Investment Valuation section at the end of this listing.
| Valuation Inputs at Reporting Date: | ||||||||||||||||
| Description | Total | Level 1 | Level 2 | Level 3 | ||||||||||||
Investments in Securities: | ||||||||||||||||
Common Stocks | $ | 145,126,496 | $ | 145,126,496 | $ | — | $ | — | ||||||||
Money Market Funds | 199,607 | 199,607 | — | — | ||||||||||||
|
|
|
|
|
|
|
| |||||||||
Total Investments in Securities: | $ | 145,326,103 | $ | 145,326,103 | $ | — | $ | — | ||||||||
|
|
|
|
|
|
|
| |||||||||
See accompanying notes which are an integral part of the financial statements.
| Annual Report | 36 |
Table of Contents
Fidelity MSCI Financials Index ETF
Investments July 31, 2014
Showing Percentage of Net Assets
| Common Stocks – 99.9% | ||||||||
| Shares | Value | |||||||
BANKS – 19.1% |
| |||||||
Diversified Banks – 9.6% |
| |||||||
Comerica, Inc. | 6,462 | $ | 324,780 | |||||
US Bancorp | 64,716 | 2,720,014 | ||||||
Wells Fargo & Co. | 177,479 | 9,033,681 | ||||||
|
| |||||||
| 12,078,475 | ||||||||
|
| |||||||
Regional Banks – 9.5% |
| |||||||
1st Source Corp. | 480 | 13,627 | ||||||
Arrow Financial Corp. | 534 | 13,564 | ||||||
Associated Banc-Corp | 5,694 | 102,036 | ||||||
Bancfirst Corp. | 252 | 15,347 | ||||||
Bancorp, Inc. (a) | 1,314 | 12,483 | ||||||
BancorpSouth, Inc. | 3,041 | 63,466 | ||||||
Bank of Hawaii Corp. | 1,579 | 90,287 | ||||||
Bank of the Ozarks, Inc. | 2,353 | 72,402 | ||||||
BankUnited, Inc. | 3,503 | 109,434 | ||||||
Banner Corp. | 693 | 27,886 | ||||||
BB&T Corp. | 25,269 | 935,458 | ||||||
BBCN Bancorp, Inc. | 2,678 | 40,224 | ||||||
BOK Financial Corp. | 856 | 56,701 | ||||||
Boston Private Financial Holdings, Inc. | 3,047 | 38,027 | ||||||
Bryn Mawr Bank Corp. | 470 | 13,865 | ||||||
Camden National Corp. | 288 | 10,204 | ||||||
Capital Bank Financial Corp. Class A (a) | 1,240 | 28,247 | ||||||
Cardinal Financial Corp. | 1,073 | 18,949 | ||||||
Cathay General Bancorp | 2,670 | 68,325 | ||||||
Centerstate Banks, Inc. | 1,642 | 17,110 | ||||||
Central Pacific Financial Corp. | 826 | 14,785 | ||||||
CIT Group, Inc. | 6,990 | 343,279 | ||||||
City Holding Co. | 567 | 23,616 | ||||||
City National Corp. | 1,766 | 132,891 | ||||||
CoBiz Financial, Inc. | 1,290 | 14,603 | ||||||
Columbia Banking System, Inc. | 1,927 | 49,119 | ||||||
Commerce Bancshares, Inc. | 3,123 | 140,722 | ||||||
Community Bank System, Inc. | 1,509 | 53,162 | ||||||
Community Trust Bancorp, Inc. | 629 | 22,009 | ||||||
Cullen/Frost Bankers, Inc. | 1,975 | 153,991 | ||||||
Customers Bancorp, Inc. (a) | 986 | 18,695 | ||||||
CVB Financial Corp. | 3,553 | 54,325 | ||||||
Eagle Bancorp, Inc. (a) | 909 | 30,279 | ||||||
East West Bancorp, Inc. | 5,163 | 175,852 | ||||||
Enterprise Financial Services Corp. | 790 | 13,786 | ||||||
Fifth Third Bancorp | 30,219 | 618,885 | ||||||
First BanCorp (a) | 4,223 | 21,706 | ||||||
First BanCorp/NC | 628 | 10,098 | ||||||
First Citizens BancShares, Inc. Class A | 241 | 53,586 | ||||||
First Commonwealth Financial Corp. | 3,517 | 30,106 | ||||||
First Community Bancshares, Inc. | 558 | 8,208 | ||||||
First Financial Bancorp | 2,090 | 34,151 | ||||||
First Financial Bankshares, Inc. | 1,817 | 53,383 | ||||||
First Financial Corp. | 455 | 13,950 | ||||||
| Shares | Value | |||||||
First Horizon National Corp. | 8,388 | $ | 98,811 | |||||
First Interstate Bancsystem, Inc. | 733 | 19,131 | ||||||
First Merchants Corp. | 1,249 | 24,893 | ||||||
First Midwest Bancorp, Inc. | 2,839 | 45,992 | ||||||
First NBC Bank Holding Co. (a) | 658 | 20,918 | ||||||
First Niagara Financial Group, Inc. | 12,629 | 108,609 | ||||||
First Republic Bank | 4,529 | 211,595 | ||||||
FirstMerit Corp. | 5,858 | 103,101 | ||||||
Flushing Financial Corp. | 1,015 | 18,859 | ||||||
FNB Corp. | 5,632 | 69,274 | ||||||
Fulton Financial Corp. | 6,797 | 77,078 | ||||||
Glacier Bancorp, Inc. | 2,660 | 70,437 | ||||||
Great Southern Bancorp, Inc. | 381 | 11,880 | ||||||
Hancock Holding Co. | 2,953 | 95,795 | ||||||
Hanmi Financial Corp. | 1,127 | 23,802 | ||||||
Heartland Financial USA, Inc. | 576 | 13,726 | ||||||
Home BancShares, Inc. | 1,822 | 54,769 | ||||||
HomeTrust Bancshares, Inc. (a) | 696 | 10,586 | ||||||
Huntington Bancshares, Inc. | 29,813 | 292,764 | ||||||
Iberiabank Corp. | 1,138 | 74,664 | ||||||
Independent Bank Corp. | 855 | 31,216 | ||||||
Independent Bank Group, Inc. | 204 | 9,794 | ||||||
International Bancshares Corp. | 2,130 | 53,996 | ||||||
Investors Bancorp, Inc. | 12,954 | 134,074 | ||||||
KeyCorp | 31,565 | 427,390 | ||||||
Lakeland Bancorp, Inc. | 1,396 | 14,016 | ||||||
Lakeland Financial Corp. | 658 | 23,945 | ||||||
M&T Bank Corp. | 4,205 | 510,907 | ||||||
MB Financial, Inc. | 1,995 | 53,745 | ||||||
National Penn Bancshares, Inc. | 4,196 | 43,219 | ||||||
NBT Bancorp, Inc. | 1,670 | 39,028 | ||||||
OFG Bancorp | 1,622 | 25,887 | ||||||
Old National Bancorp | 3,800 | 50,844 | ||||||
PacWest Bancorp | 1,534 | 63,922 | ||||||
Peoples Bancorp, Inc. | 374 | 8,725 | ||||||
Pinnacle Financial Partners, Inc. | 1,175 | 43,475 | ||||||
Popular, Inc. (a) | 3,698 | 117,966 | ||||||
PrivateBancorp, Inc. | 2,668 | 76,838 | ||||||
Prosperity Bancshares, Inc. | 2,359 | 137,129 | ||||||
Regions Financial Corp. | 50,619 | 513,277 | ||||||
Renasant Corp. | 1,153 | 32,745 | ||||||
Republic Bancorp, Inc. Class A | 362 | 8,420 | ||||||
S&T Bancorp, Inc. | 1,055 | 25,668 | ||||||
Signature Bank (a) | 1,678 | 191,946 | ||||||
Simmons First National Corp. Class A | 629 | 24,927 | ||||||
South State Corp. | 862 | 50,091 | ||||||
Southside Bancshares, Inc. | 740 | 21,689 | ||||||
State Bank Financial Corp. | 1,143 | 18,871 | ||||||
Sterling Bancorp/DE | 3,062 | 36,438 | ||||||
Stock Yards Bancorp, Inc. | 576 | 16,860 | ||||||
SunTrust Banks, Inc. | 18,977 | 722,075 | ||||||
Susquehanna Bancshares, Inc. | 6,661 | 67,809 | ||||||
SVB Financial Group (a) | 1,777 | 193,729 | ||||||
See accompanying notes which are an integral part of the financial statements.
| 37 | Annual Report |
Table of Contents
Fidelity MSCI Financials Index ETF
Investments – continued
| Common Stocks – continued | ||||||||
| Shares | Value | |||||||
BANKS – continued |
| |||||||
Regional Banks – continued |
| |||||||
Synovus Financial Corp. | 5,046 | $ | 118,833 | |||||
Talmer Bancorp, Inc. Class A (a) | 2,433 | 32,578 | ||||||
Taylor Capital Group, Inc. (a) | 438 | 9,338 | ||||||
TCF Financial Corp. | 5,569 | 88,046 | ||||||
Texas Capital Bancshares, Inc. (a) | 1,561 | 81,250 | ||||||
The PNC Financial Services Group, Inc. | 18,974 | 1,566,493 | ||||||
Towne Bank | 1,259 | 18,608 | ||||||
Trico Bancshares | 482 | 10,782 | ||||||
TriState Capital Holdings Inc. (a) | 992 | 9,712 | ||||||
Trustmark Corp. | 2,273 | 52,347 | ||||||
UMB Financial Corp. | 1,413 | 80,018 | ||||||
Umpqua Holdings Corp. | 6,205 | 104,989 | ||||||
Union Bankshares Corp. | 1,589 | 37,945 | ||||||
United Bankshares, Inc. | 2,284 | 73,271 | ||||||
United Community Banks, Inc. (a) | 1,089 | 18,023 | ||||||
Univest Corp. of Pennsylvania | 549 | 10,387 | ||||||
Valley National Bancorp | 6,729 | 64,464 | ||||||
ViewPoint Financial Group, Inc. | 1,336 | 33,587 | ||||||
Washington Trust Bancorp, Inc. | 571 | 19,642 | ||||||
Webster Financial Corp. | 3,238 | 92,833 | ||||||
WesBanco, Inc. | 976 | 29,163 | ||||||
Westamerica BanCorp. | 956 | 45,716 | ||||||
Western Alliance Bancorp (a) | 2,842 | 65,082 | ||||||
Wilshire Bancorp, Inc. | 2,565 | 24,162 | ||||||
Wintrust Financial Corp. | 1,616 | 74,869 | ||||||
Zions BanCorp. | 7,163 | 206,438 | ||||||
|
| |||||||
| 12,038,750 | ||||||||
|
| |||||||
TOTAL BANKS |
| 24,117,225 | ||||||
|
| |||||||
CAPITAL MARKETS – 12.7% |
| |||||||
Asset Management & Custody Banks – 7.3% |
| |||||||
Affiliated Managers Group, Inc. (a) | 1,876 | 373,793 | ||||||
Ameriprise Financial, Inc. | 6,774 | 810,170 | ||||||
Artisan Partners Asset Management, Inc. Class A | 1,068 | 55,643 | ||||||
BlackRock, Inc. | 4,757 | 1,449,601 | ||||||
Calamos Asset Management, Inc. Class A | 691 | 8,195 | ||||||
Cohen & Steers, Inc. | 706 | 29,306 | ||||||
Eaton Vance Corp. | 4,374 | 153,659 | ||||||
Federated Investors, Inc. Class B | 3,345 | 94,396 | ||||||
Financial Engines, Inc. | 1,875 | 73,031 | ||||||
Franklin Resources, Inc. | 14,578 | 789,399 | ||||||
GAMCO Investors, Inc. Class A | 177 | 13,564 | ||||||
ICG Group, Inc. (a) | 1,275 | 21,573 | ||||||
Invesco Ltd. | 15,373 | 578,486 | ||||||
Janus Capital Group, Inc. | 5,424 | 61,779 | ||||||
Legg Mason, Inc. | 3,804 | 180,500 | ||||||
Northern Trust Corp. | 8,001 | 535,187 | ||||||
NorthStar Asset Management Group, Inc. (a) | 6,515 | 116,684 | ||||||
| Shares | Value | |||||||
Pzena Investment Management, Inc. Class A | 653 | $ | 6,798 | |||||
Safeguard Scientifics, Inc. (a) | 750 | 14,887 | ||||||
SEI Investments Co. | 5,113 | 183,148 | ||||||
State Street Corp. | 15,319 | 1,079,070 | ||||||
T Rowe Price Group, Inc. | 9,332 | 724,723 | ||||||
The Bank of New York Mellon Corp. | 40,285 | 1,572,726 | ||||||
Virtus Investment Partners, Inc. (a) | 259 | 53,108 | ||||||
Waddell & Reed Financial, Inc. Class A | 3,012 | 159,003 | ||||||
Walter Investment Management Corp. (a) | 1,330 | 36,681 | ||||||
WisdomTree Investments, Inc. (a) | 4,042 | 41,471 | ||||||
|
| |||||||
| 9,216,581 | ||||||||
|
| |||||||
Diversified Capital Markets – 0.0% |
| |||||||
HFF, Inc. Class A | 1,229 | 41,737 | ||||||
|
| |||||||
Investment Banking & Brokerage – 5.4% |
| |||||||
BGC Partners, Inc. Class A | 6,571 | 51,451 | ||||||
Cowen Group, Inc. Class A (a) | 4,273 | 17,092 | ||||||
E*TRADE Financial Corp. (a) | 10,231 | 215,056 | ||||||
Evercore Partners, Inc. Class A | 1,215 | 66,290 | ||||||
FXCM, Inc. Class A | 1,374 | 18,714 | ||||||
GFI Group, Inc. | 2,617 | 11,855 | ||||||
Greenhill & Co., Inc. | 956 | 43,756 | ||||||
INTL. FCStone, Inc. (a) | 678 | 13,289 | ||||||
Investment Technology Group, Inc. (a) | 1,335 | 24,417 | ||||||
KCG Holdings, Inc. Class A (a) | 3,099 | 35,391 | ||||||
LPL Financial Holdings, Inc. | 2,849 | 135,271 | ||||||
Morgan Stanley | 52,650 | 1,702,701 | ||||||
Oppenheimer Holdings, Inc. Class A | 380 | 8,672 | ||||||
Piper Jaffray Cos. (a) | 575 | 29,670 | ||||||
Raymond James Financial, Inc. | 4,548 | 231,721 | ||||||
Stifel Financial Corp. (a) | 2,141 | 98,036 | ||||||
TD Ameritrade Holding Corp. | 9,854 | 316,510 | ||||||
The Charles Schwab Corp. | 41,522 | 1,152,235 | ||||||
The Goldman Sachs Group, Inc. | 15,274 | 2,640,416 | ||||||
|
| |||||||
| 6,812,543 | ||||||||
|
| |||||||
TOTAL CAPITAL MARKETS |
| 16,070,861 | ||||||
|
| |||||||
CONSUMER FINANCE – 5.1% |
| |||||||
Consumer Finance – 5.1% |
| |||||||
American Express Co. | 33,956 | 2,988,128 | ||||||
Capital One Financial Corp. | 20,330 | 1,617,048 | ||||||
Cash America International, Inc. | 992 | 44,035 | ||||||
Credit Acceptance Corp. (a) | 325 | 36,961 | ||||||
Discover Financial Services | 16,713 | 1,020,496 | ||||||
Encore Capital Group, Inc. (a) | 917 | 38,954 | ||||||
Ezcorp, Inc. Class A (a) | 2,182 | 21,362 | ||||||
First Cash Financial Services, Inc. (a) | 976 | 55,056 | ||||||
Green Dot Corp. Class A (a) | 1,072 | 19,285 | ||||||
Navient Corp. | 15,215 | 261,698 | ||||||
Nelnet, Inc. Class A | 928 | 38,261 | ||||||
Portfolio Recovery Associates, Inc. (a) | 1,771 | 104,418 | ||||||
SLM Corp. | 15,569 | 137,941 | ||||||
See accompanying notes which are an integral part of the financial statements.
| Annual Report | 38 |
Table of Contents
| Common Stocks – continued | ||||||||
| Shares | Value | |||||||
CONSUMER FINANCE – continued |
| |||||||
Consumer Finance – continued |
| |||||||
Springleaf Holdings, Inc. (a) | 1,132 | $ | 29,636 | |||||
World Acceptance Corp. (a) | 310 | 25,135 | ||||||
|
| |||||||
TOTAL CONSUMER FINANCE |
| 6,438,414 | ||||||
|
| |||||||
DIVERSIFIED FINANCIAL SERVICES – 22.1% |
| |||||||
Multi-Sector Holdings – 4.2% |
| |||||||
Berkshire Hathaway, Inc. Class B (a) | 39,775 | 4,988,978 | ||||||
FNFV Group (a) | 2,944 | 48,164 | ||||||
Leucadia National Corp. | 10,985 | 271,440 | ||||||
PICO Holdings, Inc. (a) | 849 | 18,805 | ||||||
|
| |||||||
| 5,327,387 | ||||||||
|
| |||||||
Other Diversified Financial Services – 15.0% |
| |||||||
Bank of America Corp. | 375,230 | 5,722,257 | ||||||
Citigroup, Inc. | 107,813 | 5,273,134 | ||||||
JPMorgan Chase & Co. | 134,450 | 7,753,731 | ||||||
Voya Financial Inc. | 5,037 | 186,873 | ||||||
|
| |||||||
| 18,935,995 | ||||||||
|
| |||||||
Specialized Finance – 2.9% |
| |||||||
CBOE Holdings, Inc. | 3,069 | 148,754 | ||||||
CME Group, Inc. | 11,346 | 838,923 | ||||||
Interactive Brokers Group, Inc. Class A | 1,856 | 42,716 | ||||||
Intercontinental Exchange, Inc. | 4,090 | 786,180 | ||||||
MarketAxess Holdings, Inc. | 1,423 | 80,015 | ||||||
McGraw Hill Financial, Inc. | 9,649 | 774,043 | ||||||
Moody’s Corp. | 6,826 | 593,862 | ||||||
MSCI, Inc. (a) | 3,931 | 177,878 | ||||||
PHH Corp. (a) | 1,995 | 46,583 | ||||||
The NASDAQ OMX Group, Inc. | 4,278 | 180,489 | ||||||
|
| |||||||
| 3,669,443 | ||||||||
|
| |||||||
TOTAL DIVERSIFIED FINANCIAL SERVICES |
| 27,932,825 | ||||||
|
| |||||||
INSURANCE – 17.4% |
| |||||||
Insurance Brokers – 1.9% |
| |||||||
Aon PLC | 10,165 | 857,519 | ||||||
Arthur J Gallagher & Co. | 5,525 | 248,625 | ||||||
Brown & Brown, Inc. | 4,387 | 135,032 | ||||||
eHealth, Inc. (a) | 594 | 12,296 | ||||||
Marsh & McLennan Cos., Inc. | 19,485 | 989,253 | ||||||
Willis Group Holdings PLC | 5,718 | 233,009 | ||||||
|
| |||||||
| 2,475,734 | ||||||||
|
| |||||||
Life & Health Insurance – 5.1% |
| |||||||
Aflac, Inc. | 16,177 | 966,414 | ||||||
American Equity Investment Life Holding Co. | 2,542 | 56,280 | ||||||
Citizens, Inc. (a) | 1,845 | 12,435 | ||||||
CNO Financial Group, Inc. | 7,594 | 122,871 | ||||||
FBL Financial Group, Inc. Class A | 454 | 19,422 | ||||||
Fidelity & Guaranty Life | 412 | 8,903 | ||||||
Kansas City Life Insurance Co. | 136 | 5,939 | ||||||
| Shares | Value | |||||||
Lincoln National Corp. | 9,411 | $ | 493,042 | |||||
MetLife, Inc. | 33,918 | 1,784,087 | ||||||
Primerica, Inc. | 2,010 | 92,621 | ||||||
Principal Financial Group, Inc. | 10,541 | 523,677 | ||||||
Protective Life Corp. | 2,789 | 193,501 | ||||||
Prudential Financial, Inc. | 16,375 | 1,424,134 | ||||||
StanCorp Financial Group, Inc. | 1,551 | 93,587 | ||||||
Symetra Financial Corp. | 2,924 | 66,667 | ||||||
Torchmark Corp. | 4,717 | 248,775 | ||||||
Unum Group | 9,208 | 316,111 | ||||||
|
| |||||||
| 6,428,466 | ||||||||
|
| |||||||
Multi-line Insurance – 3.5% |
| |||||||
American Financial Group, Inc. | 2,744 | 153,637 | ||||||
American International Group, Inc. | 49,389 | 2,567,240 | ||||||
Assurant, Inc. | 2,543 | 161,125 | ||||||
Genworth Financial, Inc. Class A (a) | 17,611 | 230,704 | ||||||
Hartford Financial Services Group, Inc. | 15,918 | 543,759 | ||||||
HCC Insurance Holdings, Inc. | 3,542 | 165,341 | ||||||
Horace Mann Educators Corp. | 1,439 | 41,227 | ||||||
Kemper Corp. | 1,571 | 54,372 | ||||||
Loews Corp. | 12,431 | 523,718 | ||||||
|
| |||||||
| 4,441,123 | ||||||||
|
| |||||||
Property & Casualty Insurance – 5.7% |
| |||||||
ACE Ltd. | 11,949 | 1,196,095 | ||||||
Allied World Assurance Co. Holdings AG | 3,539 | 127,439 | ||||||
AMERISAFE, Inc. | 727 | 26,608 | ||||||
Amtrust Financial Services, Inc. | 1,183 | 50,443 | ||||||
Arch Capital Group Ltd. (a) | 4,801 | 256,613 | ||||||
Argo Group International Holdings Ltd. | 1,002 | 49,910 | ||||||
Aspen Insurance Holdings Ltd. | 2,311 | 92,463 | ||||||
Assured Guaranty Ltd. | 6,255 | 139,612 | ||||||
Axis Capital Holdings Ltd. | 3,835 | 165,480 | ||||||
Baldwin & Lyons, Inc. Class B | 478 | 11,807 | ||||||
Cincinnati Financial Corp. | 5,523 | 254,168 | ||||||
Donegal Group, Inc. Class A | 514 | 7,751 | ||||||
EMC Insurance Group, Inc. | 190 | 5,592 | ||||||
Employers Holdings, Inc. | 1,321 | 28,137 | ||||||
First American Financial Corp. | 3,854 | 104,598 | ||||||
FNF Group (a) | 8,833 | 239,463 | ||||||
Global Indemnity PLC (a) | 467 | 11,642 | ||||||
HCI Group, Inc. | 336 | 13,406 | ||||||
Hilltop Holdings, Inc. (a) | 2,565 | 52,582 | ||||||
Infinity Property & Casualty Corp. | 448 | 29,012 | ||||||
MBIA, Inc. (a) | 5,256 | 50,352 | ||||||
Meadowbrook Insurance Group, Inc. | 2,025 | 12,211 | ||||||
National Interstate Corp. | 279 | 7,558 | ||||||
Old Republic International Corp. | 8,781 | 126,359 | ||||||
OneBeacon Insurance Group Ltd. Class A | 771 | 11,411 | ||||||
ProAssurance Corp. | 2,246 | 97,993 | ||||||
RLI Corp. | 1,372 | 58,639 | ||||||
Safety Insurance Group, Inc. | 550 | 27,505 | ||||||
Selective Insurance Group, Inc. | 2,103 | 46,876 | ||||||
See accompanying notes which are an integral part of the financial statements.
| 39 | Annual Report |
Table of Contents
Fidelity MSCI Financials Index ETF
Investments – continued
| Common Stocks – continued | ||||||||
| Shares | Value | |||||||
INSURANCE – continued |
| |||||||
Property & Casualty Insurance – continued |
| |||||||
State Auto Financial Corp. | 571 | $ | 12,054 | |||||
Stewart Information Services Corp. | 723 | 21,307 | ||||||
The Allstate Corp. | 15,868 | 927,485 | ||||||
The Chubb Corp. | 8,717 | 755,851 | ||||||
The Hanover Insurance Group, Inc. | 1,548 | 89,490 | ||||||
The Navigators Group, Inc. (a) | 422 | 25,658 | ||||||
The Progressive Corp. | 20,071 | 470,464 | ||||||
The Travelers Cos., Inc. | 12,505 | 1,119,948 | ||||||
United Fire Group, Inc. | 854 | 24,134 | ||||||
Universal Insurance Holdings Inc. | 1,294 | 15,606 | ||||||
WR Berkley Corp. | 3,878 | 172,998 | ||||||
XL Group PLC | 9,797 | 315,855 | ||||||
|
| |||||||
| 7,252,575 | ||||||||
|
| |||||||
Reinsurance – 1.2% |
| |||||||
Alleghany Corp. (a) | 591 | 244,585 | ||||||
Endurance Specialty Holdings Ltd. | 1,575 | 83,302 | ||||||
Enstar Group Ltd. (a) | 370 | 51,060 | ||||||
Everest Re Group Ltd. | 1,682 | 262,241 | ||||||
Greenlight Capital Re Ltd. (a) | 1,176 | 38,055 | ||||||
Maiden Holdings Ltd. | 1,932 | 22,179 | ||||||
Montpelier Re Holdings Ltd. | 1,520 | 44,886 | ||||||
PartnerRe Ltd. | 1,649 | 172,090 | ||||||
Platinum Underwriters Holdings Ltd. | 992 | 58,131 | ||||||
Reinsurance Group of America, Inc. | 2,512 | 201,613 | ||||||
RenaissanceRe Holdings Ltd. | 1,479 | 144,661 | ||||||
Third Point Reinsurance Ltd. (a) | 2,185 | 31,814 | ||||||
Validus Holdings Ltd. | 3,148 | 114,996 | ||||||
|
| |||||||
| 1,469,613 | ||||||||
|
| |||||||
TOTAL INSURANCE |
| 22,067,511 | ||||||
|
| |||||||
REAL ESTATE INVESTMENT TRUSTS (REITS) – 21.2% |
| |||||||
Diversified REIT’s – 1.8% |
| |||||||
American Realty Capital Properties, Inc. | 31,786 | 416,714 | ||||||
Cousins Properties, Inc. | 7,417 | 91,822 | ||||||
Duke Realty Corp. | 11,581 | 208,342 | ||||||
Empire State Realty Trust, Inc. Class A | 3,334 | 54,144 | ||||||
First Potomac Realty Trust | 2,085 | 27,501 | ||||||
Investors Real Estate Trust | 3,895 | 33,185 | ||||||
Lexington Realty Trust | 7,716 | 84,413 | ||||||
Liberty Property Trust | 5,223 | 183,693 | ||||||
One Liberty Properties, Inc. | 444 | 9,200 | ||||||
PS Business Parks, Inc. | 709 | 58,492 | ||||||
RAIT Financial Trust | 2,884 | 22,207 | ||||||
Select Income REIT | 1,441 | 39,988 | ||||||
Spirit Realty Capital, Inc. | 14,035 | 162,385 | ||||||
Vornado Realty Trust | 5,989 | 634,954 | ||||||
Washington Real Estate Investment Trust | 2,363 | 64,085 | ||||||
Winthrop Realty Trust | 1,237 | 18,642 | ||||||
WP Carey, Inc. | 3,205 | 210,665 | ||||||
|
| |||||||
| 2,320,432 | ||||||||
|
| |||||||
| Shares | Value | |||||||
Health Care REIT’s – 0.0% |
| |||||||
CareTrust REIT Inc. (a) | 707 | $ | 12,061 | |||||
|
| |||||||
Hotel & Resort REIT’s – 0.0% |
| |||||||
Chatham Lodging Trust | 1,133 | 23,986 | ||||||
|
| |||||||
Industrial REIT’s – 0.8% |
| |||||||
DCT Industrial Trust, Inc. | 11,590 | 90,750 | ||||||
EastGroup Properties, Inc. | 1,097 | 68,409 | ||||||
First Industrial Realty Trust, Inc. | 4,027 | 72,687 | ||||||
Monmouth Real Estate Investment Corp. Class A | 2,109 | 21,680 | ||||||
Prologis, Inc. | 17,755 | 724,582 | ||||||
STAG Industrial, Inc. | 1,615 | 36,887 | ||||||
|
| |||||||
| 1,014,995 | ||||||||
|
| |||||||
Mortgage REIT’s – 1.7% |
| |||||||
AG Mortgage Investment Trust, Inc. | 1,007 | 18,468 | ||||||
Altisource Residential Corp. | 2,112 | 48,977 | ||||||
American Capital Agency Corp. | 12,572 | 290,665 | ||||||
American Capital Mortgage Investment Corp. | 1,822 | 36,312 | ||||||
Annaly Capital Management, Inc. | 33,627 | 373,260 | ||||||
Anworth Mortgage Asset Corp. | 4,816 | 24,465 | ||||||
Apollo Commercial Real Estate Finance, Inc. | 1,904 | 31,549 | ||||||
Apollo Residential Mortgage, Inc. | 1,150 | 18,745 | ||||||
ARMOUR Residential REIT, Inc. | 12,691 | 53,429 | ||||||
Capstead Mortgage Corp. | 3,396 | 43,605 | ||||||
Chimera Investment Corp. | 36,959 | 117,160 | ||||||
Colony Financial, Inc. | 3,831 | 84,857 | ||||||
CYS Investments, Inc. | 5,736 | 50,936 | ||||||
Dynex Capital, Inc. | 1,830 | 15,189 | ||||||
Hatteras Financial Corp. | 3,428 | 65,646 | ||||||
Invesco Mortgage Capital, Inc. | 4,368 | 74,169 | ||||||
iStar Financial, Inc. (a) | 2,862 | 41,155 | ||||||
MFA Financial, Inc. | 13,012 | 105,918 | ||||||
New Residential Investment Corp. | 10,244 | 61,259 | ||||||
New York Mortgage Trust, Inc. | 3,712 | 28,026 | ||||||
Newcastle Investment Corp. | 13,397 | 59,885 | ||||||
NorthStar Realty Finance Corp. (a) | 6,515 | 104,891 | ||||||
PennyMac Mortgage Investment Trust | 1,036 | 22,181 | ||||||
Redwood Trust, Inc. | 2,929 | 55,592 | ||||||
Resource Capital Corp. | 4,539 | 25,010 | ||||||
Starwood Property Trust, Inc. | 7,830 | 184,788 | ||||||
Two Harbors Investment Corp. | 12,991 | 132,898 | ||||||
Western Asset Mortgage Capital Corp. | 1,753 | 23,841 | ||||||
|
| |||||||
| 2,192,876 | ||||||||
|
| |||||||
Office REIT’s – 2.2% |
| |||||||
Alexandria Real Estate Equities, Inc. | 2,543 | 199,880 | ||||||
BioMed Realty Trust, Inc. | 6,834 | 146,931 | ||||||
Boston Properties, Inc. | 5,452 | 651,241 | ||||||
Brandywine Realty Trust | 5,616 | 87,329 | ||||||
CoreSite Realty Corp. | 757 | 24,724 | ||||||
Corporate Office Properties Trust | 3,138 | 89,025 | ||||||
See accompanying notes which are an integral part of the financial statements.
| Annual Report | 40 |
Table of Contents
| Common Stocks – continued | ||||||||
| Shares | Value | |||||||
REAL ESTATE INVESTMENT TRUSTS (REITS) – continued |
| |||||||
Office REIT’s – continued |
| |||||||
CyrusOne, Inc. | 1,230 | $ | 30,565 | |||||
Digital Realty Trust, Inc. | 4,576 | 294,649 | ||||||
Douglas Emmett, Inc. | 4,843 | 137,977 | ||||||
DuPont Fabros Technology, Inc. | 2,370 | 64,962 | ||||||
Equity Commonwealth | 3,782 | 101,585 | ||||||
Franklin Street Properties Corp. | 3,164 | 38,411 | ||||||
Government Properties Income Trust | 2,444 | 57,067 | ||||||
Gramercy Property Trust, Inc. | 4,185 | 24,733 | ||||||
Highwoods Properties, Inc. | 3,187 | 134,077 | ||||||
Hudson Pacific Properties, Inc. | 2,133 | 54,605 | ||||||
Kilroy Realty Corp. | 2,911 | 180,016 | ||||||
Mack-Cali Realty Corp. | 3,012 | 63,553 | ||||||
Parkway Properties, Inc./MD | 2,462 | 51,037 | ||||||
Piedmont Office Realty Trust, Inc. Class A | 5,476 | 106,508 | ||||||
QTS Realty Trust, Inc. Class A | 614 | 16,732 | ||||||
SL Green Realty Corp. | 1,511 | 162,886 | ||||||
|
| |||||||
| 2,718,493 | ||||||||
|
| |||||||
Residential REIT’s – 2.9% |
| |||||||
American Campus Communities, Inc. | 3,719 | 144,743 | ||||||
American Homes 4 Rent Class A | 5,058 | 92,157 | ||||||
American Residential Properties, Inc. (a) | 1,158 | 20,983 | ||||||
Apartment Investment & Management Co. Class A | 5,230 | 178,761 | ||||||
Associated Estates Realty Corp. | 2,185 | 38,609 | ||||||
AvalonBay Communities, Inc. | 4,603 | 681,612 | ||||||
Camden Property Trust | 3,046 | 220,409 | ||||||
Campus Crest Communities, Inc. | 2,288 | 18,304 | ||||||
Education Realty Trust, Inc. | 3,820 | 40,339 | ||||||
Equity Lifestyle Properties, Inc. | 2,799 | 123,968 | ||||||
Equity Residential | 12,200 | 788,730 | ||||||
Essex Property Trust, Inc. | 2,202 | 417,433 | ||||||
Home Properties, Inc. | 2,024 | 133,159 | ||||||
Mid-America Apartment Communities, Inc. | 2,673 | 186,896 | ||||||
Post Properties, Inc. | 1,931 | 104,660 | ||||||
Silver Bay Realty Trust Corp. | 1,224 | 19,780 | ||||||
Starwood Waypoint Residential Trust (a) | 1,445 | 37,989 | ||||||
Sun Communities, Inc. | 1,485 | 78,156 | ||||||
UDR, Inc. | 8,924 | 259,510 | ||||||
|
| |||||||
| 3,586,198 | ||||||||
|
| |||||||
Retail REIT’s – 4.3% |
| |||||||
Acadia Realty Trust | 1,984 | 56,008 | ||||||
Agree Realty Corp. | 572 | 16,748 | ||||||
Alexander’s, Inc. | 81 | 29,403 | ||||||
Brixmor Property Group, Inc. | 3,006 | 68,086 | ||||||
CBL & Associates Properties, Inc. | 6,161 | 115,211 | ||||||
Cedar Realty Trust, Inc. | 2,772 | 17,464 | ||||||
DDR Corp. | 10,983 | 192,642 | ||||||
Equity One, Inc. | 2,296 | 53,313 | ||||||
Excel Trust, Inc. | 2,105 | 27,260 | ||||||
| Shares | Value | |||||||
Federal Realty Investment Trust | 2,392 | $ | 292,063 | |||||
General Growth Properties, Inc. | 18,818 | 439,777 | ||||||
Getty Realty Corp. | 941 | 17,286 | ||||||
Glimcher Realty Trust | 5,148 | 55,289 | ||||||
Inland Real Estate Corp. | 3,186 | 32,943 | ||||||
Kimco Realty Corp. | 14,534 | 325,271 | ||||||
Kite Realty Group Trust | 4,679 | 28,542 | ||||||
National Retail Properties, Inc. | 4,373 | 155,548 | ||||||
Pennsylvania Real Estate Investment Trust | 2,428 | 46,690 | ||||||
Ramco-Gershenson Properties Trust | 2,396 | 39,774 | ||||||
Realty Income Corp. | 7,852 | 338,029 | ||||||
Regency Centers Corp. | 3,282 | 178,409 | ||||||
Retail Opportunity Investments Corp. | 3,135 | 48,373 | ||||||
Retail Properties of America, Inc. Class A | 8,556 | 128,768 | ||||||
Rouse Properties, Inc. | 1,216 | 20,611 | ||||||
Saul Centers, Inc. | 433 | 20,641 | ||||||
Simon Property Group, Inc. | 11,167 | 1,878,178 | ||||||
Tanger Factory Outlet Centers | 3,426 | 118,711 | ||||||
Taubman Centers, Inc. | 2,238 | 164,627 | ||||||
The Macerich Co. | 4,983 | 323,945 | ||||||
Washington Prime Group, Inc. (a) | 5,150 | 97,283 | ||||||
Weingarten Realty Investors | 4,111 | 135,293 | ||||||
|
| |||||||
| 5,462,186 | ||||||||
|
| |||||||
Specialized REIT’s – 7.5% |
| |||||||
American Tower Corp. | 14,020 | 1,323,348 | ||||||
Ashford Hospitality Prime, Inc. | 204 | 3,397 | ||||||
Ashford Hospitality Trust, Inc. | 3,028 | 34,852 | ||||||
Aviv REIT, Inc. | 980 | 27,881 | ||||||
Chesapeake Lodging Trust | 1,661 | 49,298 | ||||||
Corrections Corp. of America | 4,115 | 132,585 | ||||||
Crown Castle International Corp. | 11,859 | 879,701 | ||||||
CubeSmart | 5,109 | 93,035 | ||||||
DiamondRock Hospitality Co. | 7,007 | 85,906 | ||||||
EPR Properties | 1,928 | 103,919 | ||||||
Extra Space Storage, Inc. | 3,950 | 204,333 | ||||||
FelCor Lodging Trust, Inc. | 4,094 | 42,864 | ||||||
Gaming and Leisure Properties, Inc. | 3,217 | 108,316 | ||||||
HCP, Inc. | 16,245 | 674,655 | ||||||
Health Care REIT, Inc. | 10,328 | 657,171 | ||||||
Healthcare Realty Trust, Inc. | 3,407 | 84,153 | ||||||
Healthcare Trust of America, Inc. Class A | 8,793 | 104,725 | ||||||
Hersha Hospitality Trust | 7,589 | 50,163 | ||||||
Hospitality Properties Trust | 5,310 | 151,707 | ||||||
Host Hotels & Resorts, Inc. | 26,858 | 583,893 | ||||||
LaSalle Hotel Properties | 3,769 | 131,124 | ||||||
LTC Properties, Inc. | 1,253 | 48,027 | ||||||
Medical Properties Trust, Inc. | 6,341 | 85,350 | ||||||
National Health Investors, Inc. | 1,002 | 59,910 | ||||||
Omega Healthcare Investors, Inc. | 4,470 | 163,334 | ||||||
Pebblebrook Hotel Trust | 2,280 | 82,992 | ||||||
Plum Creek Timber Co., Inc. | 6,285 | 260,010 | ||||||
Potlatch Corp. | 1,438 | 59,389 | ||||||
See accompanying notes which are an integral part of the financial statements.
| 41 | Annual Report |
Table of Contents
Fidelity MSCI Financials Index ETF
Investments – continued
| Common Stocks – continued | ||||||||
| Shares | Value | |||||||
REAL ESTATE INVESTMENT TRUSTS (REITS) – continued |
| |||||||
Specialized REIT’s – continued |
| |||||||
Public Storage | 5,203 | $ | 892,887 | |||||
Rayonier, Inc. | 4,540 | 154,632 | ||||||
RLJ Lodging Trust | 4,738 | 132,854 | ||||||
Ryman Hospitality Properties, Inc. | 1,622 | 77,451 | ||||||
Sabra Health Care REIT, Inc. | 1,795 | 49,722 | ||||||
Senior Housing Properties Trust | 7,219 | 165,026 | ||||||
Sovran Self Storage, Inc. | 1,183 | 90,760 | ||||||
Strategic Hotels & Resorts, Inc. (a) | 8,398 | 95,821 | ||||||
Summit Hotel Properties, Inc. | 3,131 | 32,155 | ||||||
Sunstone Hotel Investors, Inc. | 7,128 | 101,146 | ||||||
The Geo Group, Inc. | 2,465 | 84,821 | ||||||
Universal Health Realty Income Trust | 77 | 3,239 | ||||||
Ventas, Inc. | 10,443 | 663,130 | ||||||
Weyerhaeuser Co. | 18,729 | 586,592 | ||||||
|
| |||||||
| 9,416,274 | ||||||||
|
| |||||||
TOTAL REAL ESTATE INVESTMENT TRUSTS (REITS) |
| 26,747,501 | ||||||
|
| |||||||
REAL ESTATE MANAGEMENT & DEVELOPMENT – 1.0% |
| |||||||
Diversified Real Estate Activities – 0.1% | ||||||||
Alexander & Baldwin, Inc. | 1,707 | 65,156 | ||||||
Tejon Ranch Co. (a) | 548 | 15,673 | ||||||
The St Joe Co. (a) | 2,259 | 51,595 | ||||||
|
| |||||||
| 132,424 | ||||||||
|
| |||||||
Real Estate Development – 0.1% |
| |||||||
Forestar Group, Inc. (a) | 1,214 | 22,702 | ||||||
The Howard Hughes Corp. (a) | 1,208 | 175,667 | ||||||
|
| |||||||
| 198,369 | ||||||||
|
| |||||||
Real Estate Operating Companies – 0.1% |
| |||||||
Forest City Enterprises, Inc. Class A (a) | 5,551 | 106,413 | ||||||
|
| |||||||
Real Estate Services – 0.7% |
| |||||||
Altisource Portfolio Solutions S.A. (a) | 573 | 62,102 | ||||||
CBRE Group, Inc. Class A (a) | 10,682 | 329,433 | ||||||
Jones Lang LaSalle, Inc. | 1,580 | 195,446 | ||||||
Kennedy-Wilson Holdings, Inc. | 2,459 | 57,541 | ||||||
Realogy Holdings Corp. (a) | 5,173 | 190,159 | ||||||
|
| |||||||
| 834,681 | ||||||||
|
| |||||||
TOTAL REAL ESTATE MANAGEMENT & DEVELOPMENT |
| 1,271,887 | ||||||
|
| |||||||
THRIFTS & MORTGAGE FINANCE – 1.3% |
| |||||||
Thrifts & Mortgage Finance – 1.3% | ||||||||
Astoria Financial Corp. | 3,224 | 41,525 | ||||||
Bank Mutual Corp. | 1,564 | 9,431 | ||||||
Beneficial Mutual Bancorp, Inc. (a) | 1,317 | 17,226 | ||||||
Berkshire Hills Bancorp, Inc. | 949 | 22,937 | ||||||
BofI Holding, Inc. (a) | 483 | 36,027 | ||||||
Brookline Bancorp, Inc. | 2,503 | 22,602 | ||||||
Capitol Federal Financial, Inc. | 4,873 | 57,014 | ||||||
Dime Community Bancshares, Inc. | 1,042 | 15,755 | ||||||
| Shares | Value | |||||||
Essent Group Ltd. (a) | 1,304 | $ | 23,746 | |||||
EverBank Financial Corp. | 2,967 | 56,373 | ||||||
Federal Agricultural Mortgage Corp. Class C | 313 | 9,124 | ||||||
Flagstar Bancorp, Inc. (a) | 796 | 14,567 | ||||||
Home Loan Servicing Solutions Ltd. | 2,521 | 53,949 | ||||||
HomeStreet, Inc. | 475 | 8,284 | ||||||
Hudson City Bancorp, Inc. | 16,878 | 164,561 | ||||||
Ladder Capital Corp. Class A (a) | 1,410 | 24,816 | ||||||
MGIC Investment Corp. (a) | 11,475 | 84,800 | ||||||
Nationstar Mortgage Holdings, Inc. (a) | 879 | 26,818 | ||||||
New York Community Bancorp, Inc. | 15,764 | 250,332 | ||||||
Northfield Bancorp, Inc. | 2,241 | 28,595 | ||||||
Northwest Bancshares, Inc. | 3,177 | 39,395 | ||||||
Ocwen Financial Corp. (a) | 4,078 | 123,033 | ||||||
Oritani Financial Corp. | 1,373 | 20,320 | ||||||
People’s United Financial, Inc. | 11,011 | 159,880 | ||||||
Provident Financial Services, Inc. | 1,986 | 33,186 | ||||||
Radian Group, Inc. | 6,879 | 87,088 | ||||||
TFS Financial Corp. (a) | 3,310 | 44,619 | ||||||
TrustCo Bank Corp. | 3,351 | 22,083 | ||||||
United Financial Bancorp, Inc. | 2,103 | 26,666 | ||||||
Walker & Dunlop, Inc. (a) | 630 | 8,600 | ||||||
Washington Federal, Inc. | 3,688 | 77,301 | ||||||
WSFS Financial Corp. | 338 | 24,198 | ||||||
|
| |||||||
TOTAL THRIFTS & MORTGAGE FINANCE |
| 1,634,851 | ||||||
|
| |||||||
TOTAL COMMON STOCKS |
| 126,281,075 | ||||||
|
| |||||||
| Money Market Funds – 0.1% | ||||||||
SSgA US Treasury Money Market Fund, 0.00% (b) | 121,482 | 121,482 | ||||||
|
| |||||||
TOTAL INVESTMENT PORTFOLIO – 100.0% |
| 126,402,557 | ||||||
NET OTHER ASSETS (LIABILITIES) – 0.0% |
| (5,675 | ) | |||||
|
| |||||||
NET ASSETS – 100% |
| $ | 126,396,882 | |||||
|
| |||||||
Legend
| (a) | Non-income producing. |
| (b) | The rate quoted is the annualized seven-day yield of the fund at period end. |
See accompanying notes which are an integral part of the financial statements.
| Annual Report | 42 |
Table of Contents
Other Information
The following is a summary of the inputs used, as of July 31, 2014, involving the Fund’s assets and liabilities carried at fair value. The inputs or methodology used for valuing securities may not be an indication of the risk associated with investing in those securities. For more information on valuation inputs, and their aggregation into the levels used in the table below, please refer to the Investment Valuation section at the end of this listing.
| Valuation Inputs at Reporting Date: | ||||||||||||||||
| Description | Total | Level 1 | Level 2 | Level 3 | ||||||||||||
Investments in Securities: | ||||||||||||||||
Common Stocks | $ | 126,281,075 | $ | 126,281,075 | $ | — | $ | — | ||||||||
Money Market Funds | 121,482 | 121,482 | — | — | ||||||||||||
|
|
|
|
|
|
|
| |||||||||
Total Investments in Securities: | $ | 126,402,557 | $ | 126,402,557 | $ | — | $ | — | ||||||||
|
|
|
|
|
|
|
| |||||||||
See accompanying notes which are an integral part of the financial statements.
| 43 | Annual Report |
Table of Contents
Fidelity MSCI Health Care Index ETF
Investments July 31, 2014
Showing Percentage of Net Assets
| Common Stocks – 99.7% | ||||||||
| Shares | Value | |||||||
BIOTECHNOLOGY – 21.1% | ||||||||
Biotechnology – 21.1% |
| |||||||
ACADIA Pharmaceuticals, Inc. (a) | 5,189 | $ | 105,181 | |||||
Acceleron Pharma, Inc. (a) | 932 | 27,606 | ||||||
Achillion Pharmaceuticals, Inc. (a) | 4,386 | 30,044 | ||||||
Acorda Therapeutics, Inc. (a) | 2,613 | 76,483 | ||||||
Aegerion Pharmaceuticals, Inc. (a) | 115 | 3,865 | ||||||
Agios Pharmaceuticals, Inc. (a) | 1,028 | 41,428 | ||||||
Alexion Pharmaceuticals, Inc. (a) | 13,257 | 2,107,730 | ||||||
Alkermes PLC (a) | 9,662 | 413,147 | ||||||
Alnylam Pharmaceuticals, Inc. (a) | 3,629 | 196,148 | ||||||
AMAG Pharmaceuticals, Inc. (a) | 1,262 | 24,092 | ||||||
Amgen, Inc. | 50,572 | 6,442,367 | ||||||
Anacor Pharmaceuticals, Inc. (a) | 2,235 | 37,213 | ||||||
Arena Pharmaceuticals, Inc. (a) | 14,601 | 67,603 | ||||||
Ariad Pharmaceuticals, Inc. (a) | 11,826 | 68,118 | ||||||
Array BioPharma, Inc. (a) | 7,735 | 30,940 | ||||||
Arrowhead Research Corp. (a) | 3,062 | 38,734 | ||||||
Asterias Biotherapeutics, Inc. (a) | 216 | 486 | ||||||
Auspex Pharmaceuticals, Inc. (a) | 493 | 8,978 | ||||||
BioCryst Pharmaceuticals, Inc. (a) | 3,761 | 47,088 | ||||||
Biogen Idec, Inc. (a) | 15,837 | 5,295,734 | ||||||
BioMarin Pharmaceutical, Inc. (a) | 9,676 | 598,170 | ||||||
Bluebird Bio, Inc. (a) | 1,309 | 43,721 | ||||||
Celgene Corp. (a) | 54,400 | 4,740,960 | ||||||
Celldex Therapeutics, Inc. (a) | 5,970 | 78,147 | ||||||
Cepheid, Inc. (a) | 4,648 | 174,951 | ||||||
Chimerix, Inc. (a) | 1,633 | 37,102 | ||||||
Clovis Oncology, Inc. (a) | 22 | 802 | ||||||
CTI BioPharma Corp. (a) | 8,555 | 22,157 | ||||||
Cubist Pharmaceuticals, Inc. (a) | 5,004 | 304,744 | ||||||
Dendreon Corp. (a) | 10,578 | 21,897 | ||||||
Dyax Corp. (a) | 9,055 | 85,298 | ||||||
Dynavax Technologies Corp. (a) | 17,558 | 25,986 | ||||||
Emergent Biosolutions, Inc. (a) | 2,073 | 45,606 | ||||||
Enanta Pharmaceuticals, Inc. (a) | 417 | 15,683 | ||||||
Epizyme, Inc. (a) | 643 | 20,139 | ||||||
Exact Sciences Corp. (a) | 5,422 | 84,637 | ||||||
Exelixis, Inc. (a) | 13,064 | 52,779 | ||||||
Foundation Medicine, Inc. (a) | 870 | 19,592 | ||||||
Genomic Health, Inc. (a) | 1,030 | 26,244 | ||||||
Geron Corp. (a) | 9,744 | 23,434 | ||||||
Gilead Sciences, Inc. (a) | 103,037 | 9,433,037 | ||||||
Halozyme Therapeutics, Inc. (a) | 7,082 | 68,979 | ||||||
Hyperion Therapeutics, Inc. (a) | 631 | 14,368 | ||||||
Idenix Pharmaceuticals, Inc. (a) | 4,506 | 110,037 | ||||||
ImmunoGen, Inc. (a) | 5,785 | 62,362 | ||||||
Immunomedics, Inc. (a) | 6,081 | 19,702 | ||||||
Incyte Corp. Ltd. (a) | 9,952 | 473,417 | ||||||
Infinity Pharmaceuticals, Inc. (a) | 2,939 | 26,716 | ||||||
Insmed, Inc. (a) | 2,205 | 37,683 | ||||||
Insys Therapeutics, Inc. (a) | 765 | 20,678 | ||||||
Intercept Pharmaceuticals, Inc. (a) | 884 | 205,406 | ||||||
| Shares | Value | |||||||
InterMune, Inc. (a) | 6,490 | $ | 284,716 | |||||
Intrexon Corp. (a) | 2,613 | 57,721 | ||||||
Ironwood Pharmaceuticals, Inc. (a) | 7,448 | 110,230 | ||||||
Isis Pharmaceuticals, Inc. (a) | 7,845 | 243,117 | ||||||
Karyopharm Therapeutics, Inc. (a) | 975 | 33,823 | ||||||
Keryx Biopharmaceuticals, Inc. (a) | 5,938 | 89,367 | ||||||
KYTHERA Biopharmaceuticals, Inc. (a) | 933 | 31,330 | ||||||
Lexicon Pharmaceuticals, Inc. (a) | 17,503 | 25,729 | ||||||
Ligand Pharmaceuticals, Inc. Class B (a) | 1,121 | 55,120 | ||||||
MacroGenics, Inc. (a) | 1,294 | 26,268 | ||||||
MannKind Corp. (a) | 13,635 | 113,989 | ||||||
Medivation, Inc. (a) | 5,114 | 379,612 | ||||||
Merrimack Pharmaceuticals, Inc. (a) | 6,192 | 36,595 | ||||||
MiMedx Group, Inc. (a) | 5,559 | 38,413 | ||||||
Momenta Pharmaceuticals, Inc. (a) | 3,227 | 34,335 | ||||||
Myriad Genetics, Inc. (a) | 4,890 | 176,529 | ||||||
Neurocrine Biosciences, Inc. (a) | 5,061 | 68,728 | ||||||
NewLink Genetics Corp. (a) | 1,119 | 23,700 | ||||||
Novavax, Inc. (a) | 15,643 | 67,734 | ||||||
NPS Pharmaceuticals, Inc. (a) | 6,550 | 183,007 | ||||||
OncoMed Pharmaceuticals, Inc. (a) | 613 | 13,235 | ||||||
Ophthotech Corp. (a) | 1,015 | 39,646 | ||||||
Opko Health, Inc. (a) | 15,128 | 133,429 | ||||||
Orexigen Therapeutics, Inc. (a) | 6,095 | 30,414 | ||||||
Organovo Holdings, Inc. (a) | 4,151 | 31,423 | ||||||
Osiris Therapeutics, Inc. (a) | 1,161 | 17,183 | ||||||
PDL BioPharma, Inc. | 10,208 | 95,751 | ||||||
Pharmacyclics, Inc. (a) | 4,257 | 512,713 | ||||||
Portola Pharmaceuticals, Inc. (a) | 2,066 | 51,939 | ||||||
PTC Therapeutics, Inc. (a) | 1,175 | 31,044 | ||||||
Puma Biotechnology, Inc. (a) | 1,704 | 377,811 | ||||||
Raptor Pharmaceutical Corp. (a) | 4,125 | 35,516 | ||||||
Receptos, Inc. (a) | 1,258 | 52,094 | ||||||
Regeneron Pharmaceuticals, Inc. (a) | 5,251 | 1,660,471 | ||||||
Repligen Corp. (a) | 2,052 | 43,030 | ||||||
Rigel Pharmaceuticals, Inc. (a) | 5,278 | 17,259 | ||||||
Sangamo Biosciences, Inc. (a) | 4,539 | 53,923 | ||||||
Sarepta Therapeutics, Inc. (a) | 2,577 | 54,993 | ||||||
Seattle Genetics, Inc. (a) | 6,992 | 246,118 | ||||||
Spectrum Pharmaceuticals, Inc. (a) | 4,383 | 30,856 | ||||||
Synageva BioPharma Corp. (a) | 1,310 | 89,617 | ||||||
Synergy Pharmaceuticals, Inc. (a) | 5,784 | 21,112 | ||||||
Synta Pharmaceuticals Corp. (a) | 3,346 | 13,217 | ||||||
TESARO, Inc. (a) | 1,313 | 37,762 | ||||||
Theravance, Inc. (a) | 5,692 | 123,516 | ||||||
Ultragenyx Pharmaceutical, Inc. (a) | 510 | 22,287 | ||||||
United Therapeutics Corp. (a) | 3,208 | 291,736 | ||||||
Vanda Pharmaceuticals, Inc. (a) | 2,278 | 33,487 | ||||||
Vertex Pharmaceuticals, Inc. (a) | 15,817 | 1,406,290 | ||||||
XOMA Corp. (a) | 725 | 2,813 | ||||||
ZIOPHARM Oncology, Inc. (a) | 5,248 | 16,426 | ||||||
|
| |||||||
TOTAL BIOTECHNOLOGY |
| 39,624,593 | ||||||
|
| |||||||
See accompanying notes which are an integral part of the financial statements.
| Annual Report | 44 |
Table of Contents
| Common Stocks – continued | ||||||||
| Shares | Value | |||||||
HEALTH CARE EQUIPMENT & SUPPLIES – 16.6% |
| |||||||
Health Care Equipment – 15.4% |
| |||||||
Abaxis, Inc. | 1,416 | $ | 67,133 | |||||
Abbott Laboratories | 103,362 | 4,353,607 | ||||||
ABIOMED, Inc. (a) | 2,561 | 65,562 | ||||||
Accuray, Inc. (a) | 5,139 | 40,444 | ||||||
Analogic Corp. | 815 | 58,607 | ||||||
AngioDynamics, Inc. (a) | 1,806 | 26,368 | ||||||
AtriCure, Inc. (a) | 1,661 | 27,357 | ||||||
Baxter International, Inc. | 36,389 | 2,717,894 | ||||||
Becton Dickinson and Co. | 12,942 | 1,504,378 | ||||||
Boston Scientific Corp. (a) | 88,922 | 1,136,423 | ||||||
Cantel Medical Corp. | 2,353 | 78,896 | ||||||
Cardiovascular Systems, Inc. (a) | 1,811 | 48,897 | ||||||
CareFusion Corp. (a) | 13,931 | 610,038 | ||||||
CONMED Corp. | 1,817 | 70,863 | ||||||
Covidien PLC | 30,199 | 2,612,515 | ||||||
CR Bard, Inc. | 5,214 | 778,085 | ||||||
Cyberonics, Inc. (a) | 1,799 | 106,987 | ||||||
Cynosure, Inc. Class A (a) | 1,316 | 29,926 | ||||||
DexCom, Inc. (a) | 4,878 | 183,803 | ||||||
Edwards Lifesciences Corp. (a) | 7,185 | 648,446 | ||||||
Exactech, Inc. (a) | 689 | 15,668 | ||||||
GenMark Diagnostics, Inc. (a) | 2,689 | 28,772 | ||||||
Globus Medical, Inc. Class A (a) | 2,857 | 63,711 | ||||||
Greatbatch, Inc. (a) | 1,634 | 80,899 | ||||||
HeartWare International, Inc. (a) | 1,065 | 89,684 | ||||||
Hill-Rom Holdings, Inc. | 3,853 | 151,808 | ||||||
Hologic, Inc. (a) | 14,687 | 382,890 | ||||||
IDEXX Laboratories, Inc. (a) | 3,460 | 430,701 | ||||||
Insulet Corp. (a) | 3,709 | 131,076 | ||||||
Integra LifeSciences Holdings Corp. (a) | 1,764 | 83,649 | ||||||
Intuitive Surgical, Inc. (a) | 2,560 | 1,171,328 | ||||||
Invacare Corp. | 1,942 | 29,072 | ||||||
Masimo Corp. (a) | 3,608 | 86,881 | ||||||
Medtronic, Inc. | 67,044 | 4,139,297 | ||||||
Natus Medical, Inc. (a) | 2,070 | 59,554 | ||||||
Navidea Biopharmaceuticals, Inc. (a) | 9,406 | 12,510 | ||||||
NuVasive, Inc. (a) | 2,981 | 111,430 | ||||||
NxStage Medical, Inc. (a) | 3,895 | 51,998 | ||||||
Orthofix International N.V. (a) | 1,290 | 42,647 | ||||||
PhotoMedex, Inc. (a) | 785 | 8,470 | ||||||
ResMed, Inc. | 9,456 | 489,253 | ||||||
Rockwell Medical, Inc. (a) | 2,448 | 24,725 | ||||||
Sirona Dental Systems, Inc. (a) | 3,713 | 297,783 | ||||||
St Jude Medical, Inc. | 19,050 | 1,241,869 | ||||||
STERIS Corp. | 3,961 | 201,536 | ||||||
Stryker Corp. | 22,792 | 1,818,118 | ||||||
SurModics, Inc. (a) | 905 | 17,186 | ||||||
Symmetry Medical, Inc. (a) | 2,458 | 21,655 | ||||||
Teleflex, Inc. | 2,744 | 295,639 | ||||||
Thoratec Corp. (a) | 3,783 | 122,947 | ||||||
Tornier N.V. (a) | 2,440 | 50,581 | ||||||
| Shares | Value | |||||||
Varian Medical Systems, Inc. (a) | 6,935 | $ | 569,710 | |||||
Volcano Corp. (a) | 3,478 | 57,422 | ||||||
Wright Medical Group, Inc. (a) | 3,138 | 96,713 | ||||||
Zeltiq Aesthetics, Inc. (a) | 2,021 | 40,905 | ||||||
Zimmer Holdings, Inc. | 11,327 | 1,133,493 | ||||||
|
| |||||||
| 28,817,809 | ||||||||
|
| |||||||
Health Care Supplies – 1.2% |
| |||||||
Alere, Inc. (a) | 5,264 | 210,560 | ||||||
Align Technology, Inc. (a) | 4,640 | 251,534 | ||||||
Anika Therapeutics, Inc. (a) | 945 | 39,747 | ||||||
Cerus Corp. (a) | 4,658 | 16,396 | ||||||
DENTSPLY International, Inc. | 9,500 | 440,990 | ||||||
Endologix, Inc. (a) | 4,279 | 60,548 | ||||||
Haemonetics Corp. (a) | 3,483 | 123,890 | ||||||
ICU Medical, Inc. (a) | 903 | 52,600 | ||||||
LDR Holding Corp. (a) | 775 | 17,755 | ||||||
Meridian Bioscience, Inc. | 2,749 | 54,183 | ||||||
Merit Medical Systems, Inc. (a) | 2,716 | 34,873 | ||||||
Neogen Corp. (a) | 2,453 | 107,098 | ||||||
OraSure Technologies, Inc. (a) | 3,741 | 30,788 | ||||||
Quidel Corp. (a) | 1,939 | 46,284 | ||||||
Spectranetics Corp. (a) | 2,744 | 70,384 | ||||||
Staar Surgical Co. (a) | 1,979 | 25,470 | ||||||
The Cooper Cos., Inc. | 3,207 | 515,942 | ||||||
Vascular Solutions, Inc. (a) | 1,117 | 27,556 | ||||||
West Pharmaceutical Services, Inc. | 4,678 | 190,629 | ||||||
|
| |||||||
| 2,317,227 | ||||||||
|
| |||||||
TOTAL HEALTH CARE EQUIPMENT & SUPPLIES |
| 31,135,036 | ||||||
|
| |||||||
HEALTH CARE PROVIDERS & SERVICES – 17.2% |
| |||||||
Health Care Services – 4.1% |
| |||||||
Air Methods Corp. (a) | 2,478 | 124,519 | ||||||
Amedisys, Inc. (a) | 1,835 | 37,030 | ||||||
AMN Healthcare Services, Inc. (a) | 3,096 | 40,558 | ||||||
Bio-Reference Labs, Inc. (a) | 1,677 | 52,641 | ||||||
BioScrip, Inc. (a) | 4,536 | 33,975 | ||||||
Chemed Corp. | 1,183 | 120,489 | ||||||
Corvel Corp. (a) | 774 | 31,177 | ||||||
DaVita HealthCare Partners, Inc. (a) | 11,467 | 807,735 | ||||||
Envision Healthcare Holdings, Inc. (a) | 7,949 | 284,177 | ||||||
ExamWorks Group, Inc. (a) | 2,470 | 87,166 | ||||||
Express Scripts Holding Co. (a) | 51,987 | 3,620,894 | ||||||
Gentiva Health Services, Inc. (a) | 1,817 | 32,888 | ||||||
Healthways, Inc. (a) | 2,100 | 36,309 | ||||||
IPC The Hospitalist Co., Inc. (a) | 1,151 | 56,606 | ||||||
Laboratory Corp. of America | 5,695 | 590,515 | ||||||
Landauer, Inc. | 645 | 27,832 | ||||||
LHC Group, Inc. (a) | 810 | 19,019 | ||||||
MEDNAX, Inc. (a) | 6,753 | 399,642 | ||||||
Omnicare, Inc. | 6,682 | 417,625 | ||||||
Premier, Inc. (a) | 2,179 | 61,666 | ||||||
See accompanying notes which are an integral part of the financial statements.
| 45 | Annual Report |
Table of Contents
Fidelity MSCI Health Care Index ETF
Investments – continued
| Common Stocks – continued | ||||||||
| Shares | Value | |||||||
HEALTH CARE PROVIDERS & SERVICES – continued |
| |||||||
Health Care Services – continued |
| |||||||
Quest Diagnostics, Inc. | 9,655 | $ | 589,920 | |||||
Team Health Holdings, Inc. (a) | 4,675 | 264,371 | ||||||
The Providence Service Corp. (a) | 770 | 30,500 | ||||||
|
| |||||||
| 7,767,254 | ||||||||
|
| |||||||
Health Care Distributors – 3.7% |
| |||||||
AmerisourceBergen Corp. | 15,398 | 1,184,260 | ||||||
Cardinal Health, Inc. | 23,002 | 1,648,093 | ||||||
Henry Schein, Inc. (a) | 5,754 | 668,903 | ||||||
McKesson Corp. | 15,422 | 2,958,865 | ||||||
MWI Veterinary Supply, Inc. (a) | 874 | 123,461 | ||||||
Owens & Minor, Inc. | 4,227 | 139,871 | ||||||
Patterson Cos., Inc. | 5,653 | 220,524 | ||||||
PharMerica Corp. (a) | 1,972 | 53,224 | ||||||
|
| |||||||
| 6,997,201 | ||||||||
|
| |||||||
Health Care Facilities – 2.4% |
| |||||||
Acadia Healthcare Co., Inc. (a) | 3,128 | 149,081 | ||||||
Amsurg Corp. (a) | 2,740 | 130,862 | ||||||
Brookdale Senior Living, Inc. (a) | 11,000 | 381,145 | ||||||
Capital Senior Living Corp. (a) | 1,827 | 45,017 | ||||||
Community Health Systems, Inc. (a) | 7,593 | 362,186 | ||||||
Five Star Quality Care, Inc. (a) | 2,699 | 12,335 | ||||||
Hanger, Inc. (a) | 2,319 | 73,396 | ||||||
HCA Holdings, Inc. (a) | 20,720 | 1,353,223 | ||||||
HealthSouth Corp. | 5,911 | 226,569 | ||||||
Kindred Healthcare, Inc. | 4,256 | 101,718 | ||||||
LifePoint Hospitals, Inc. (a) | 3,138 | 225,057 | ||||||
Select Medical Holdings Corp. | 6,099 | 94,779 | ||||||
Surgical Care Affiliates, Inc. (a) | 903 | 26,530 | ||||||
Tenet Healthcare Corp. (a) | 6,476 | 341,739 | ||||||
The Ensign Group, Inc. | 1,361 | 44,818 | ||||||
Universal Health Services, Inc. Class B | 6,157 | 656,336 | ||||||
US Physical Therapy, Inc. | 800 | 27,952 | ||||||
VCA, Inc. (a) | 5,631 | 209,980 | ||||||
|
| |||||||
| 4,462,723 | ||||||||
|
| |||||||
Managed Health Care – 7.0% |
| |||||||
Aetna, Inc. | 24,305 | 1,884,367 | ||||||
Centene Corp. (a) | 3,648 | 262,984 | ||||||
Cigna Corp. | 18,347 | 1,651,964 | ||||||
Health Net, Inc. (a) | 5,328 | 219,460 | ||||||
Humana, Inc. | 10,341 | 1,216,619 | ||||||
Magellan Health, Inc. (a) | 1,824 | 105,062 | ||||||
Molina Healthcare, Inc. (a) | 2,020 | 82,517 | ||||||
Triple-S Management Corp. Class B (a) | 1,523 | 26,318 | ||||||
UnitedHealth Group, Inc. | 66,263 | 5,370,616 | ||||||
Universal American Corp. | 2,580 | 20,485 | ||||||
WellCare Health Plans, Inc. (a) | 1,856 | 115,777 | ||||||
WellPoint, Inc. | 18,928 | 2,078,484 | ||||||
|
| |||||||
| 13,034,653 | ||||||||
|
| |||||||
TOTAL HEALTH CARE PROVIDERS & SERVICES |
| 32,261,831 | ||||||
|
| |||||||
| Shares | Value | |||||||
HEALTH CARE TECHNOLOGY – 1.2% |
| |||||||
Health Care Technology – 1.2% |
| |||||||
Allscripts Healthcare Solutions, Inc. (a) | 11,383 | $ | 181,217 | |||||
athenahealth, Inc. (a) | 2,487 | 309,383 | ||||||
Cerner Corp. (a) | 20,784 | 1,147,277 | ||||||
Computer Programs & Systems, Inc. | 729 | 47,983 | ||||||
HealthStream, Inc. (a) | 1,452 | 36,242 | ||||||
HMS Holdings Corp. (a) | 5,841 | 107,533 | ||||||
MedAssets, Inc. (a) | 4,139 | 87,912 | ||||||
Medidata Solutions, Inc. (a) | 3,459 | 155,102 | ||||||
Omnicell, Inc. (a) | 2,366 | 64,828 | ||||||
Quality Systems, Inc. | 3,075 | 47,693 | ||||||
Veeva Systems, Inc. Class A (a) | 1,815 | 43,197 | ||||||
Vocera Communications, Inc. (a) | 1,330 | 16,718 | ||||||
|
| |||||||
TOTAL HEALTH CARE TECHNOLOGY |
| 2,245,085 | ||||||
|
| |||||||
LIFE SCIENCES TOOLS & SERVICES – 4.8% |
| |||||||
Life Sciences Tools & Services – 4.8% |
| |||||||
Accelerate Diagnostics, Inc. (a) | 1,657 | 30,124 | ||||||
Affymetrix, Inc. (a) | 4,906 | 42,192 | ||||||
Agilent Technologies, Inc. | 22,375 | 1,255,014 | ||||||
Albany Molecular Research, Inc. (a) | 1,647 | 31,359 | ||||||
Bio-Rad Laboratories, Inc. Class A (a) | 1,327 | 152,592 | ||||||
Bruker Corp. (a) | 7,863 | 178,726 | ||||||
Cambrex Corp. (a) | 2,064 | 43,488 | ||||||
Charles River Laboratories International, Inc. (a) | 3,201 | 173,526 | ||||||
Covance, Inc. (a) | 3,778 | 317,050 | ||||||
Fluidigm Corp. (a) | 1,717 | 49,158 | ||||||
Illumina, Inc. (a) | 8,595 | 1,374,426 | ||||||
Luminex Corp. (a) | 2,486 | 45,245 | ||||||
Mettler-Toledo International, Inc. (a) | 1,977 | 508,366 | ||||||
PAREXEL International Corp. (a) | 3,774 | 202,135 | ||||||
PerkinElmer, Inc. | 7,526 | 347,852 | ||||||
Quintiles Transnational Holdings, Inc. (a) | 3,905 | 214,502 | ||||||
Sequenom, Inc. (a) | 7,775 | 29,156 | ||||||
Techne Corp. | 2,465 | 230,034 | ||||||
Thermo Fisher Scientific, Inc. | 26,243 | 3,188,524 | ||||||
Waters Corp. (a) | 5,689 | 588,470 | ||||||
|
| |||||||
TOTAL LIFE SCIENCES TOOLS & SERVICES |
| 9,001,939 | ||||||
|
| |||||||
PERSONAL PRODUCTS – 0.1% |
| |||||||
Personal Products – 0.1% |
| |||||||
Prestige Brands Holdings, Inc. (a) | 3,472 | 106,938 | ||||||
|
| |||||||
PHARMACEUTICALS – 38.7% |
| |||||||
Pharmaceuticals – 38.7% |
| |||||||
AbbVie, Inc. | 106,407 | 5,569,342 | ||||||
AcelRx Pharmaceuticals, Inc. (a) | 1,669 | 11,616 | ||||||
Actavis PLC (a) | 17,684 | 3,788,974 | ||||||
Akorn, Inc. (a) | 4,857 | 164,798 | ||||||
Allergan, Inc. | 19,996 | 3,316,537 | ||||||
See accompanying notes which are an integral part of the financial statements.
| Annual Report | 46 |
Table of Contents
| Common Stocks – continued | ||||||||
| Shares | Value | |||||||
PHARMACEUTICALS – continued |
| |||||||
Pharmaceuticals – continued |
| |||||||
Aratana Therapeutics, Inc. (a) | 1,284 | $ | 14,805 | |||||
Auxilium Pharmaceuticals, Inc. (a) | 3,127 | 62,603 | ||||||
AVANIR Pharmaceuticals, Inc. Class A (a) | 10,216 | 53,225 | ||||||
Bristol-Myers Squibb Co. | 110,542 | 5,595,636 | ||||||
Depomed, Inc. (a) | 3,870 | 38,506 | ||||||
Eli Lilly & Co. | 67,503 | 4,121,733 | ||||||
Endo International PLC (a) | 9,505 | 637,595 | ||||||
Endocyte, Inc. (a) | 83 | 551 | ||||||
Furiex Pharmaceuticals, Inc. | 373 | 3,644 | ||||||
Horizon Pharma, Inc. (a) | 2,987 | 25,389 | ||||||
Hospira, Inc. (a) | 11,119 | 616,771 | ||||||
Impax Laboratories, Inc. (a) | 4,405 | 103,033 | ||||||
Intra-Cellular Therapies, Inc. (a) | 1,285 | 18,620 | ||||||
Jazz Pharmaceuticals PLC (a) | 3,492 | 487,937 | ||||||
Johnson & Johnson | 189,471 | 18,964,152 | ||||||
Mallinckrodt PLC (a) | 3,889 | 270,752 | ||||||
Merck & Co., Inc. | 196,960 | 11,175,510 | ||||||
Mylan, Inc. (a) | 24,977 | 1,233,114 | ||||||
Nektar Therapeutics (a) | 8,506 | 89,738 | ||||||
Pacira Pharmaceuticals, Inc. (a) | 2,160 | 198,720 | ||||||
Perrigo Co. PLC | 8,973 | 1,349,988 | ||||||
Pfizer, Inc. | 427,517 | 12,269,738 | ||||||
Questcor Pharmaceuticals, Inc. | 4,036 | 363,119 | ||||||
Relypsa, Inc. (a) | 667 | 15,081 | ||||||
Repros Therapeutics, Inc. (a) | 1,548 | 21,703 | ||||||
Revance Therapeutics, Inc. (a) | 817 | 25,066 | ||||||
Sagent Pharmaceuticals, Inc. (a) | 1,399 | 35,647 | ||||||
| Shares | Value | |||||||
Salix Pharmaceuticals Ltd. (a) | 4,241 | $ | 559,430 | |||||
Sciclone Pharmaceuticals, Inc. (a) | 3,373 | 16,258 | ||||||
Sucampo Pharmaceuticals, Inc. Class A (a) | 1,177 | 6,944 | ||||||
The Medicines Co. (a) | 4,296 | 100,398 | ||||||
Theravance Biopharma, Inc. (a) | 1,632 | 45,745 | ||||||
Vivus, Inc. (a) | 6,216 | 29,961 | ||||||
XenoPort, Inc. (a) | 4,013 | 17,216 | ||||||
Zoetis, Inc. | 33,583 | 1,105,217 | ||||||
|
| |||||||
TOTAL PHARMACEUTICALS |
| 72,524,812 | ||||||
|
| |||||||
TOTAL COMMON STOCKS |
| 186,900,234 | ||||||
|
| |||||||
| Money Market Funds – 0.2% | ||||||||
SSgA US Treasury Money Market Fund, 0.00% (b) | 268,776 | 268,776 | ||||||
|
| |||||||
TOTAL INVESTMENT PORTFOLIO – 99.9% |
| 187,169,010 | ||||||
NET OTHER ASSETS (LIABILITIES) – 0.1% |
| 212,988 | ||||||
|
| |||||||
NET ASSETS – 100% |
| $ | 187,381,998 | |||||
|
| |||||||
Legend
| (a) | Non-income producing. |
| (b) | The rate quoted is the annualized seven-day yield of the fund at period end. |
Other Information
The following is a summary of the inputs used, as of July 31, 2014, involving the Fund’s assets and liabilities carried at fair value. The inputs or methodology used for valuing securities may not be an indication of the risk associated with investing in those securities. For more information on valuation inputs, and their aggregation into the levels used in the table below, please refer to the Investment Valuation section at the end of this listing.
| Valuation Inputs at Reporting Date: | ||||||||||||||||
| Description | Total | Level 1 | Level 2 | Level 3 | ||||||||||||
Investments in Securities: | ||||||||||||||||
Common Stocks | $ | 186,900,234 | $ | 186,896,590 | $ | — | $ | 3,644 | ||||||||
Money Market Funds | 268,776 | 268,776 | — | — | ||||||||||||
|
|
|
|
|
|
|
| |||||||||
Total Investments in Securities: | $ | 187,169,010 | $ | 187,165,366 | $ | — | $ | 3,644 | ||||||||
|
|
|
|
|
|
|
| |||||||||
See accompanying notes which are an integral part of the financial statements.
| 47 | Annual Report |
Table of Contents
Fidelity MSCI Industrials Index ETF
Investments July 31, 2014
Showing Percentage of Net Assets
| Common Stocks – 99.9% | ||||||||
| Shares | Value | |||||||
AEROSPACE & DEFENSE – 21.9% |
| |||||||
Aerospace & Defense – 21.9% |
| |||||||
AAR Corp. | 1,725 | $ | 46,402 | |||||
Aerovironment, Inc. (a) | 897 | 28,247 | ||||||
Alliant Techsystems, Inc. | 1,390 | 180,603 | ||||||
American Science & Engineering, Inc. | 364 | 22,859 | ||||||
Astronics Corp. (a) | 526 | 30,508 | ||||||
B/E Aerospace, Inc. (a) | 4,607 | 392,240 | ||||||
Cubic Corp. | 996 | 43,685 | ||||||
Curtiss-Wright Corp. | 1,876 | 119,145 | ||||||
DigitalGlobe, Inc. (a) | 3,134 | 81,954 | ||||||
Engility Holdings, Inc. (a) | 680 | 23,501 | ||||||
Esterline Technologies Corp. (a) | 1,399 | 151,861 | ||||||
Exelis, Inc. | 8,261 | 139,115 | ||||||
GenCorp, Inc. (a) | 2,175 | 38,606 | ||||||
General Dynamics Corp. | 12,715 | 1,484,731 | ||||||
HEICO Corp. | 897 | 44,096 | ||||||
Hexcel Corp. (a) | 4,309 | 160,510 | ||||||
Honeywell International, Inc. | 32,582 | 2,992,005 | ||||||
Huntington Ingalls Industries, Inc. | 2,127 | 193,387 | ||||||
Kratos Defense & Security Solutions, Inc. (a) | 2,012 | 14,688 | ||||||
L-3 Communications Holdings, Inc. | 3,755 | 394,125 | ||||||
Lockheed Martin Corp. | 11,953 | 1,995,792 | ||||||
Moog, Inc. Class A (a) | 1,828 | 120,685 | ||||||
National Presto Industries, Inc. | 212 | 13,589 | ||||||
Northrop Grumman Corp. | 9,010 | 1,110,663 | ||||||
Orbital Sciences Corp. (a) | 2,625 | 67,384 | ||||||
Precision Castparts Corp. | 6,343 | 1,451,278 | ||||||
Raytheon Co. | 13,765 | 1,249,449 | ||||||
Rockwell Collins, Inc. | 5,322 | 389,943 | ||||||
Spirit Aerosystems Holdings, Inc. Class A (a) | 5,173 | 168,485 | ||||||
Taser International, Inc. (a) | 2,250 | 27,135 | ||||||
Teledyne Technologies, Inc. (a) | 1,553 | 141,634 | ||||||
Textron, Inc. | 12,351 | 449,206 | ||||||
The Boeing Co. | 30,899 | 3,722,711 | ||||||
The KEYW Holding Corp. (a) | 1,363 | 17,855 | ||||||
TransDigm Group, Inc. | 2,201 | 369,592 | ||||||
Triumph Group, Inc. | 2,289 | 145,008 | ||||||
United Technologies Corp. | 38,041 | 4,000,011 | ||||||
|
| |||||||
TOTAL AEROSPACE & DEFENSE |
| 22,022,688 | ||||||
|
| |||||||
AIR FREIGHT & LOGISTICS – 6.0% |
| |||||||
Air Freight & Logistics – 6.0% |
| |||||||
Air Transport Services Group, Inc. (a) | 750 | 5,752 | ||||||
Atlas Air Worldwide Holdings, Inc. (a) | 300 | 10,266 | ||||||
CH Robinson Worldwide, Inc. | 6,486 | 437,546 | ||||||
Echo Global Logistics, Inc. (a) | 769 | 16,926 | ||||||
Expeditors International of Washington, Inc. | 8,859 | 382,532 | ||||||
FedEx Corp. | 12,970 | 1,905,034 | ||||||
Forward Air Corp. | 1,350 | 60,439 | ||||||
| Shares | Value | |||||||
Hub Group, Inc. Class A (a) | 1,600 | $ | 73,888 | |||||
Park-Ohio Holdings Corp. | 357 | 21,191 | ||||||
United Parcel Service, Inc. Class B | 31,127 | 3,022,120 | ||||||
UTi Worldwide, Inc. (a) | 4,142 | 39,183 | ||||||
XPO Logistics, Inc. (a) | 2,312 | 71,418 | ||||||
|
| |||||||
TOTAL AIR FREIGHT & LOGISTICS |
| 6,046,295 | ||||||
|
| |||||||
AIRLINES – 1.2% |
| |||||||
Airlines – 1.2% |
| |||||||
Alaska Air Group, Inc. | 1,514 | 66,571 | ||||||
Allegiant Travel Co. | 210 | 24,730 | ||||||
American Airlines Group, Inc. | 7,887 | 306,410 | ||||||
Delta Air Lines, Inc. | 9,271 | 347,292 | ||||||
Hawaiian Holdings, Inc. (a) | 600 | 8,358 | ||||||
Republic Airways Holdings, Inc. (a) | 525 | 5,218 | ||||||
SkyWest, Inc. | 600 | 6,414 | ||||||
Southwest Airlines Co. | 7,657 | 216,540 | ||||||
Spirit Airlines, Inc. (a) | 805 | 52,663 | ||||||
United Continental Holdings, Inc. (a) | 4,075 | 189,039 | ||||||
|
| |||||||
TOTAL AIRLINES |
| 1,223,235 | ||||||
|
| |||||||
AUTO COMPONENTS – 0.2% |
| |||||||
Auto Parts & Equipment – 0.2% |
| |||||||
Allison Transmission Holdings, Inc. | 6,565 | 192,223 | ||||||
|
| |||||||
BUILDING PRODUCTS – 1.9% |
| |||||||
Building Products – 1.9% |
| |||||||
AAON, Inc. | 1,904 | 37,356 | ||||||
Allegion PLC | 4,179 | 214,926 | ||||||
American Woodmark Corp. (a) | 543 | 15,964 | ||||||
AO Smith Corp. | 3,403 | 158,920 | ||||||
Apogee Enterprises, Inc. | 1,275 | 41,374 | ||||||
Armstrong World Industries, Inc. (a) | 2,035 | 99,064 | ||||||
Builders FirstSource, Inc. (a) | 2,175 | 12,919 | ||||||
Continental Building Products, Inc. (a) | 661 | 8,718 | ||||||
Fortune Brands Home & Security, Inc. | 7,230 | 273,222 | ||||||
Gibraltar Industries, Inc. (a) | 1,275 | 18,730 | ||||||
Griffon Corp. | 1,695 | 18,255 | ||||||
Insteel Industries, Inc. | 750 | 13,762 | ||||||
Lennox International, Inc. | 2,041 | 174,138 | ||||||
Masco Corp. | 15,577 | 324,002 | ||||||
NCI Building Systems, Inc. (a) | 1,280 | 21,453 | ||||||
Owens Corning | 4,624 | 157,447 | ||||||
Patrick Industries, Inc. (a) | 344 | 14,328 | ||||||
PGT, Inc. (a) | 1,968 | 18,224 | ||||||
Ply Gem Holdings, Inc. (a) | 899 | 7,489 | ||||||
Quanex Building Products Corp. | 1,650 | 28,198 | ||||||
Simpson Manufacturing Co., Inc. | 1,800 | 54,738 | ||||||
Trex Co., Inc. (a) | 1,398 | 39,354 | ||||||
Universal Forest Products, Inc. | 881 | 38,570 | ||||||
USG Corp. (a) | 3,908 | 103,367 | ||||||
|
| |||||||
TOTAL BUILDING PRODUCTS |
| 1,894,518 | ||||||
|
| |||||||
See accompanying notes which are an integral part of the financial statements.
| Annual Report | 48 |
Table of Contents
| Common Stocks – continued | ||||||||
| Shares | Value | |||||||
COMMERCIAL SERVICES & SUPPLIES – 6.1% |
| |||||||
Commercial Printing – 0.3% |
| |||||||
Deluxe Corp. | 2,198 | $ | 120,912 | |||||
Ennis, Inc. | 1,200 | 17,016 | ||||||
InnerWorkings, Inc. (a) | 1,458 | 11,883 | ||||||
Multi-Color Corp. | 597 | 23,504 | ||||||
Quad/Graphics, Inc. | 1,074 | 22,683 | ||||||
RR Donnelley & Sons Co. | 8,690 | 150,858 | ||||||
|
| |||||||
| 346,856 | ||||||||
|
| |||||||
Diversified Support Services – 1.3% |
| |||||||
Cintas Corp. | 4,455 | 278,883 | ||||||
Civeo Corp. (a) | 4,205 | 106,807 | ||||||
Copart, Inc. (a) | 4,950 | 165,231 | ||||||
G&K Services, Inc. Class A | 884 | 42,512 | ||||||
Healthcare Services Group, Inc. | 2,927 | 76,512 | ||||||
Iron Mountain, Inc. | 7,125 | 238,759 | ||||||
KAR Auction Services, Inc. | 6,079 | 178,175 | ||||||
McGrath RentCorp | 1,050 | 36,277 | ||||||
Mobile Mini, Inc. | 2,038 | 76,955 | ||||||
Performant Financial Corp. (a) | 1,472 | 14,116 | ||||||
UniFirst Corp. | 665 | 64,645 | ||||||
Viad Corp. | 916 | 19,438 | ||||||
|
| |||||||
| 1,298,310 | ||||||||
|
| |||||||
Environmental & Facilities Services – 2.6% |
| |||||||
ABM Industries, Inc. | 2,320 | 57,095 | ||||||
Ceco Environmental Corp. | 880 | 11,950 | ||||||
Clean Harbors, Inc. (a) | 2,516 | 144,997 | ||||||
Covanta Holding Corp. | 5,175 | 105,674 | ||||||
Republic Services, Inc. | 12,608 | 478,221 | ||||||
Rollins, Inc. | 2,858 | 80,910 | ||||||
SP Plus Corp. (a) | 908 | 17,797 | ||||||
Stericycle, Inc. (a) | 3,722 | 437,893 | ||||||
Team, Inc. (a) | 836 | 33,114 | ||||||
Tetra Tech, Inc. | 2,851 | 69,222 | ||||||
US Ecology, Inc. | 895 | 40,508 | ||||||
Waste Connections, Inc. | 5,130 | 242,854 | ||||||
Waste Management, Inc. | 19,294 | 866,108 | ||||||
|
| |||||||
| 2,586,343 | ||||||||
|
| |||||||
Office Services & Supplies – 0.7% |
| |||||||
ACCO Brands Corp. (a) | 5,025 | 33,266 | ||||||
Herman Miller, Inc. | 2,563 | 74,942 | ||||||
HNI Corp. | 1,958 | 69,196 | ||||||
Interface, Inc. | 2,925 | 46,361 | ||||||
Kimball International, Inc. Class B | 1,275 | 20,107 | ||||||
Knoll, Inc. | 2,100 | 35,301 | ||||||
MSA Safety, Inc. | 1,370 | 70,939 | ||||||
Pitney Bowes, Inc. | 8,856 | 239,643 | ||||||
Steelcase, Inc. Class A | 4,030 | 60,853 | ||||||
United Stationers, Inc. | 1,737 | 67,013 | ||||||
West Corp. | 1,122 | 28,914 | ||||||
|
| |||||||
| 746,535 | ||||||||
|
| |||||||
| Shares | Value | |||||||
Security & Alarm Services – 1.2% |
| |||||||
The ADT Corp. | 7,998 | $ | 278,330 | |||||
The Brink’s Co. | 2,019 | 54,190 | ||||||
Tyco International Ltd. | 20,112 | 867,833 | ||||||
|
| |||||||
| 1,200,353 | ||||||||
|
| |||||||
TOTAL COMMERCIAL SERVICES & SUPPLIES |
| 6,178,397 | ||||||
|
| |||||||
CONSTRUCTION & ENGINEERING – 2.5% |
| |||||||
Construction & Engineering – 2.5% |
| |||||||
AECOM Technology Corp. (a) | 3,899 | 132,371 | ||||||
Aegion Corp. (a) | 1,638 | 37,527 | ||||||
Ameresco, Inc. Class A (a) | 775 | 5,828 | ||||||
Argan, Inc. | 426 | 14,441 | ||||||
Chicago Bridge & Iron Co. N.V. | 4,231 | 250,983 | ||||||
Comfort Systems USA, Inc. | 1,650 | 24,585 | ||||||
Dycom Industries, Inc. (a) | 1,503 | 42,264 | ||||||
EMCOR Group, Inc. | 2,934 | 120,089 | ||||||
Fluor Corp. | 7,026 | 511,985 | ||||||
Foster Wheeler AG | 4,348 | 143,310 | ||||||
Furmanite Corp. (a) | 1,650 | 15,098 | ||||||
Granite Construction, Inc. | 1,598 | 52,015 | ||||||
Great Lakes Dredge & Dock Corp. (a) | 2,475 | 17,869 | ||||||
Jacobs Engineering Group, Inc. (a) | 5,777 | 293,529 | ||||||
KBR, Inc. | 6,454 | 133,340 | ||||||
Layne Christensen Co. (a) | 825 | 8,951 | ||||||
MasTec, Inc. (a) | 2,712 | 73,739 | ||||||
MYR Group, Inc. (a) | 900 | 22,329 | ||||||
Northwest Pipe Co. (a) | 396 | 14,197 | ||||||
Orion Marine Group, Inc. (a) | 1,200 | 12,972 | ||||||
Pike Corp. (a) | 1,326 | 10,688 | ||||||
Primoris Services Corp. | 1,696 | 40,500 | ||||||
Quanta Services, Inc. (a) | 9,320 | 312,127 | ||||||
Tutor Perini Corp. (a) | 1,725 | 46,972 | ||||||
URS Corp. | 3,168 | 181,431 | ||||||
|
| |||||||
TOTAL CONSTRUCTION & ENGINEERING |
| 2,519,140 | ||||||
|
| |||||||
DIVERSIFIED CONSUMER SERVICES – 0.1% |
| |||||||
Specialized Consumer Services – 0.1% |
| |||||||
Hillenbrand, Inc. | 2,802 | 84,200 | ||||||
|
| |||||||
ELECTRICAL EQUIPMENT – 7.2% |
| |||||||
Electrical Components & Equipment – 6.9% |
| |||||||
Acuity Brands, Inc. | 1,883 | 201,989 | ||||||
AMETEK, Inc. | 10,700 | 520,983 | ||||||
Brady Corp. Class A | 2,100 | 54,915 | ||||||
Eaton Corp. PLC | 20,790 | 1,412,057 | ||||||
Emerson Electric Co. | 30,747 | 1,957,047 | ||||||
Encore Wire Corp. | 884 | 37,075 | ||||||
EnerSys, Inc. | 2,069 | 131,237 | ||||||
Enphase Energy, Inc. (a) | 925 | 9,527 | ||||||
Franklin Electric Co., Inc. | 1,753 | 64,247 | ||||||
See accompanying notes which are an integral part of the financial statements.
| 49 | Annual Report |
Table of Contents
Fidelity MSCI Industrials Index ETF
Investments – continued
| Common Stocks – continued | ||||||||
| Shares | Value | |||||||
ELECTRICAL EQUIPMENT – continued |
| |||||||
Electrical Components & Equipment – continued |
| |||||||
FuelCell Energy, Inc. (a) | 9,765 | $ | 24,217 | |||||
Generac Holdings, Inc. (a) | 3,000 | 130,200 | ||||||
General Cable Corp. | 2,175 | 48,350 | ||||||
GrafTech International Ltd. (a) | 5,325 | 44,730 | ||||||
Hubbell, Inc. Class B | 2,284 | 267,091 | ||||||
Plug Power, Inc. (a) | 6,399 | 34,683 | ||||||
Polypore International, Inc. (a) | 1,952 | 84,131 | ||||||
Powell Industries, Inc. | 438 | 25,584 | ||||||
Preformed Line Products Co. | 132 | 7,153 | ||||||
Regal-Beloit Corp. | 1,976 | 138,893 | ||||||
Rockwell Automation, Inc. | 6,073 | 678,111 | ||||||
Roper Industries, Inc. | 4,355 | 627,425 | ||||||
Sensata Technologies Holding N.V. (a) | 6,984 | 322,940 | ||||||
SolarCity Corp. (a) | 1,634 | 116,880 | ||||||
Thermon Group Holdings, Inc. (a) | 1,395 | 34,010 | ||||||
Vicor Corp. (a) | 825 | 6,501 | ||||||
|
| |||||||
| 6,979,976 | ||||||||
|
| |||||||
Heavy Electrical Equipment – 0.3% |
| |||||||
AZZ, Inc. | 1,125 | 49,095 | ||||||
Capstone Turbine Corp. (a) | 14,946 | 20,775 | ||||||
Power Solutions International, Inc. (a) | 208 | 12,705 | ||||||
PowerSecure International, Inc. (a) | 942 | 9,260 | ||||||
The Babcock & Wilcox Co. | 4,812 | 149,364 | ||||||
|
| |||||||
| 241,199 | ||||||||
|
| |||||||
TOTAL ELECTRICAL EQUIPMENT |
| 7,221,175 | ||||||
|
| |||||||
INDUSTRIAL CONGLOMERATES – 17.1% |
| |||||||
Industrial Conglomerates – 17.1% |
| |||||||
3M Co. | 27,532 | 3,878,984 | ||||||
Carlisle Cos., Inc. | 2,806 | 224,536 | ||||||
Danaher Corp. | 27,499 | 2,031,626 | ||||||
General Electric Co. | 438,528 | 11,028,979 | ||||||
Raven Industries, Inc. | 1,564 | 43,589 | ||||||
|
| |||||||
TOTAL INDUSTRIAL CONGLOMERATES |
| 17,207,714 | ||||||
|
| |||||||
MACHINERY – 18.7% |
| |||||||
Construction & Farm Machinery & Heavy Trucks – 8.6% |
| |||||||
AGCO Corp. | 3,879 | 188,946 | ||||||
Alamo Group, Inc. | 302 | 14,354 | ||||||
American Railcar Industries, Inc. | 431 | 29,489 | ||||||
Astec Industries, Inc. | 834 | 32,418 | ||||||
Caterpillar, Inc. | 27,909 | 2,811,832 | ||||||
Commercial Vehicle Group, Inc. (a) | 1,125 | 10,305 | ||||||
Cummins, Inc. | 7,766 | 1,082,503 | ||||||
Deere & Co. | 15,364 | 1,307,630 | ||||||
Douglas Dynamics, Inc. | 975 | 16,283 | ||||||
Federal Signal Corp. | 2,775 | 40,126 | ||||||
FreightCar America, Inc. | 525 | 11,330 | ||||||
| Shares | Value | |||||||
Greenbrier Cos., Inc. | 1,176 | $ | 75,793 | |||||
Joy Global, Inc. | 4,413 | 261,514 | ||||||
Lindsay Corp. | 577 | 46,708 | ||||||
Meritor, Inc. (a) | 4,075 | 51,223 | ||||||
Navistar International Corp. (a) | 2,149 | 75,580 | ||||||
Oshkosh Corp. | 3,687 | 170,413 | ||||||
PACCAR, Inc. | 15,489 | 964,500 | ||||||
Terex Corp. | 4,829 | 166,649 | ||||||
The Manitowoc Co., Inc. | 5,882 | 156,226 | ||||||
The Toro Co. | 2,492 | 147,850 | ||||||
Titan International, Inc. | 2,346 | 35,002 | ||||||
Trinity Industries, Inc. | 6,778 | 295,792 | ||||||
Twin Disc, Inc. | 375 | 10,815 | ||||||
Wabash National Corp. (a) | 3,000 | 40,830 | ||||||
WABCO Holdings, Inc. (a) | 2,542 | 247,794 | ||||||
Wabtec Corp. | 4,188 | 337,888 | ||||||
|
| |||||||
| 8,629,793 | ||||||||
|
| |||||||
Industrial Machinery – 10.1% |
| |||||||
Actuant Corp. Class A | 3,014 | 97,292 | ||||||
Albany International Corp. Class A | 1,257 | 45,051 | ||||||
Altra Industrial Motion Corp. | 1,200 | 37,620 | ||||||
Barnes Group, Inc. | 2,014 | 68,980 | ||||||
Blount International, Inc. (a) | 1,845 | 24,096 | ||||||
Briggs & Stratton Corp. | 2,100 | 38,493 | ||||||
Chart Industries, Inc. (a) | 1,316 | 100,082 | ||||||
CIRCOR International, Inc. | 682 | 49,015 | ||||||
CLARCOR, Inc. | 2,195 | 130,186 | ||||||
Colfax Corp. (a) | 3,369 | 212,146 | ||||||
Columbus McKinnon Corp. | 825 | 19,181 | ||||||
Crane Co. | 2,033 | 139,484 | ||||||
Donaldson Co., Inc. | 6,077 | 235,727 | ||||||
Dover Corp. | 7,455 | 639,341 | ||||||
Dynamic Materials Corp. | 600 | 12,288 | ||||||
EnPro Industries, Inc. (a) | 921 | 63,015 | ||||||
ESCO Technologies, Inc. | 1,134 | 38,046 | ||||||
Flowserve Corp. | 6,019 | 445,647 | ||||||
Global Brass & Copper Holdings, Inc. | 909 | 13,799 | ||||||
Graco, Inc. | 2,679 | 198,648 | ||||||
Harsco Corp. | 3,525 | 89,077 | ||||||
Hyster-Yale Materials Handling, Inc. | 390 | 31,239 | ||||||
IDEX Corp. | 3,525 | 267,266 | ||||||
Illinois Tool Works, Inc. | 17,659 | 1,454,572 | ||||||
Ingersoll-Rand PLC | 12,146 | 714,063 | ||||||
ITT Corp. | 3,989 | 183,374 | ||||||
John Bean Technologies Corp. | 1,275 | 33,214 | ||||||
Kadant, Inc. | 466 | 17,773 | ||||||
Kennametal, Inc. | 3,448 | 145,781 | ||||||
LB Foster Co. Class A | 448 | 20,899 | ||||||
Lincoln Electric Holdings, Inc. | 3,362 | 223,371 | ||||||
Mueller Industries, Inc. | 2,484 | 69,130 | ||||||
Mueller Water Products, Inc. Class A | 6,975 | 54,056 | ||||||
Nordson Corp. | 2,664 | 200,253 | ||||||
See accompanying notes which are an integral part of the financial statements.
| Annual Report | 50 |
Table of Contents
| Common Stocks – continued | ||||||||
| Shares | Value | |||||||
MACHINERY – continued |
| |||||||
Industrial Machinery – continued |
| |||||||
Pall Corp. | 4,843 | $ | 375,187 | |||||
Parker Hannifin Corp. | 6,515 | 748,899 | ||||||
Pentair PLC | 8,618 | 552,155 | ||||||
Proto Labs, Inc. (a) | 949 | 76,869 | ||||||
RBC Bearings, Inc. | 1,003 | 55,646 | ||||||
Rexnord Corp. (a) | 3,330 | 89,610 | ||||||
Snap-on, Inc. | 2,533 | 304,467 | ||||||
SPX Corp. | 1,670 | 165,547 | ||||||
Standex International Corp. | 554 | 36,536 | ||||||
Stanley Black & Decker, Inc. | 6,470 | 565,802 | ||||||
Sun Hydraulics Corp. | 982 | 35,823 | ||||||
Tennant Co. | 769 | 56,099 | ||||||
The ExOne Co. (a) | 461 | 15,079 | ||||||
The Middleby Corp. (a) | 2,526 | 184,044 | ||||||
Timken Co. | 3,266 | 144,684 | ||||||
Trimas Corp. (a) | 1,950 | 61,776 | ||||||
Valmont Industries, Inc. | 1,118 | 162,814 | ||||||
Watts Water Technologies, Inc. Class A | 1,200 | 70,152 | ||||||
Woodward, Inc. | 2,651 | 132,444 | ||||||
Xylem, Inc. | 8,090 | 285,496 | ||||||
|
| |||||||
| 10,231,334 | ||||||||
|
| |||||||
TOTAL MACHINERY |
| 18,861,127 | ||||||
|
| |||||||
MARINE – 0.3% |
| |||||||
Marine – 0.3% |
| |||||||
Kirby Corp. (a) | 2,232 | 259,939 | ||||||
Matson, Inc. | 450 | 12,127 | ||||||
|
| |||||||
TOTAL MARINE |
| 272,066 | ||||||
|
| |||||||
PROFESSIONAL SERVICES – 3.7% |
| |||||||
Human Resource & Employment Services – 1.2% |
| |||||||
Barrett Business Services, Inc. | 306 | 17,466 | ||||||
CDI Corp. | 675 | 9,362 | ||||||
Heidrick & Struggles International, Inc. | 750 | 14,003 | ||||||
Insperity, Inc. | 981 | 31,304 | ||||||
Kelly Services, Inc. Class A | 1,280 | 20,403 | ||||||
Kforce, Inc. | 1,295 | 25,758 | ||||||
Korn/Ferry International (a) | 2,175 | 63,989 | ||||||
Manpowergroup, Inc. | 3,478 | 270,901 | ||||||
On Assignment, Inc. (a) | 2,130 | 57,531 | ||||||
Robert Half International, Inc. | 6,027 | 293,214 | ||||||
Towers Watson & Co. Class A | 3,090 | 315,242 | ||||||
TrueBlue, Inc. (a) | 1,805 | 48,717 | ||||||
WageWorks, Inc. (a) | 1,449 | 60,481 | ||||||
|
| |||||||
| 1,228,371 | ||||||||
|
| |||||||
Research & Consulting Services – 2.5% |
| |||||||
Acacia Research Corp. | 2,175 | 37,106 | ||||||
CBIZ, Inc. (a) | 1,978 | 16,140 | ||||||
Equifax, Inc. | 5,346 | 406,777 | ||||||
| Shares | Value | |||||||
Exponent, Inc. | 587 | $ | 41,724 | |||||
FTI Consulting, Inc. (a) | 1,800 | 66,528 | ||||||
Huron Consulting Group, Inc. (a) | 1,040 | 62,858 | ||||||
ICF International, Inc. (a) | 780 | 26,965 | ||||||
IHS, Inc. Class A (a) | 2,968 | 389,906 | ||||||
Mistras Group, Inc. (a) | 750 | 15,840 | ||||||
Navigant Consulting, Inc. (a) | 2,117 | 34,549 | ||||||
Nielsen N.V. | 13,240 | 610,496 | ||||||
Pendrell Corp. (a) | 5,006 | 7,359 | ||||||
Resources Connection, Inc. | 1,761 | 26,591 | ||||||
RPX Corp. (a) | 1,942 | 30,295 | ||||||
The Advisory Board Co. (a) | 1,575 | 78,971 | ||||||
The Corporate Executive Board Co. | 1,491 | 92,546 | ||||||
The Dun & Bradstreet Corp. | 1,616 | 177,808 | ||||||
Verisk Analytics, Inc. Class A (a) | 6,565 | 394,163 | ||||||
|
| |||||||
| 2,516,622 | ||||||||
|
| |||||||
TOTAL PROFESSIONAL SERVICES |
| 3,744,993 | ||||||
|
| |||||||
ROAD & RAIL – 9.6% |
| |||||||
Railroads – 7.3% |
| |||||||
CSX Corp. | 44,084 | 1,318,993 | ||||||
Genesee & Wyoming, Inc. Class A (a) | 2,272 | 226,587 | ||||||
Kansas City Southern | 4,825 | 526,214 | ||||||
Norfolk Southern Corp. | 13,554 | 1,377,900 | ||||||
Union Pacific Corp. | 39,812 | 3,913,918 | ||||||
|
| |||||||
| 7,363,612 | ||||||||
|
| |||||||
Trucking – 2.3% |
| |||||||
AMERCO | 343 | 90,264 | ||||||
ArcBest Corp. | 1,060 | 33,634 | ||||||
Avis Budget Group, Inc. (a) | 4,696 | 263,868 | ||||||
Celadon Group, Inc. | 975 | 20,709 | ||||||
Con-way, Inc. | 2,483 | 122,536 | ||||||
Heartland Express, Inc. | 2,116 | 47,504 | ||||||
Hertz Global Holdings, Inc. (a) | 19,645 | 554,382 | ||||||
JB Hunt Transport Services, Inc. | 4,107 | 317,307 | ||||||
Knight Transportation, Inc. | 2,625 | 62,895 | ||||||
Landstar System, Inc. | 1,992 | 131,731 | ||||||
Marten Transport Ltd. | 1,125 | 22,770 | ||||||
Old Dominion Freight Line, Inc. (a) | 2,818 | 178,887 | ||||||
Quality Distribution, Inc. (a) | 1,125 | 15,019 | ||||||
Roadrunner Transportation Systems, Inc. (a) | 1,233 | 30,997 | ||||||
Ryder System, Inc. | 2,344 | 201,889 | ||||||
Saia, Inc. (a) | 1,055 | 48,161 | ||||||
Swift Transportation Co. (a) | 3,881 | 79,366 | ||||||
Universal Truckload Services, Inc. | 297 | 7,214 | ||||||
Werner Enterprises, Inc. | 2,076 | 51,028 | ||||||
YRC Worldwide, Inc. (a) | 736 | 19,268 | ||||||
|
| |||||||
| 2,299,429 | ||||||||
|
| |||||||
TOTAL ROAD & RAIL |
| 9,663,041 | ||||||
|
| |||||||
See accompanying notes which are an integral part of the financial statements.
| 51 | Annual Report |
Table of Contents
Fidelity MSCI Industrials Index ETF
Investments – continued
| Common Stocks – continued | ||||||||
| Shares | Value | |||||||
TRADING COMPANIES & DISTRIBUTORS – 3.2% |
| |||||||
Trading Companies & Distributors – 3.2% |
| |||||||
Aceto Corp. | 1,204 | $ | 20,179 | |||||
Air Lease Corp. | 4,222 | 145,448 | ||||||
Aircastle Ltd. | 2,837 | 50,924 | ||||||
Applied Industrial Technologies, Inc. | 1,747 | 84,660 | ||||||
Beacon Roofing Supply, Inc. (a) | 2,172 | 60,034 | ||||||
CAI International, Inc. (a) | 750 | 14,317 | ||||||
DXP Enterprises, Inc. (a) | 468 | 33,242 | ||||||
Fastenal Co. | 12,316 | 546,215 | ||||||
GATX Corp. | 1,903 | 117,986 | ||||||
H&E Equipment Services, Inc. (a) | 1,392 | 50,363 | ||||||
HD Supply Holdings, Inc. (a) | 4,646 | 118,101 | ||||||
Kaman Corp. | 1,051 | 42,051 | ||||||
MRC Global, Inc. (a) | 4,429 | 118,830 | ||||||
MSC Industrial Direct Co., Inc. Class A | 2,086 | 177,915 | ||||||
NOW, Inc. (a) | 4,691 | 151,003 | ||||||
Rush Enterprises, Inc. Class A (a) | 1,275 | 44,918 | ||||||
Stock Building Supply Holdings, Inc. (a) | 614 | 9,063 | ||||||
TAL International Group, Inc. (a) | 1,419 | 62,720 | ||||||
Titan Machinery, Inc. (a) | 825 | 12,095 | ||||||
United Rentals, Inc. (a) | 4,228 | 447,745 | ||||||
Veritiv Corp. (a) | 359 | 14,331 | ||||||
Watsco, Inc. | 1,125 | 100,766 | ||||||
WESCO International, Inc. (a) | 1,927 | 151,250 | ||||||
WW Grainger, Inc. | 2,708 | 636,786 | ||||||
|
| |||||||
TOTAL TRADING COMPANIES & DISTRIBUTORS |
| 3,210,942 | ||||||
|
| |||||||
| Shares | Value | |||||||
TRANSPORTATION INFRASTRUCTURE – 0.2% |
| |||||||
Airport Services – 0.2% |
| |||||||
Macquarie Infrastructure Co. LLC | 2,763 | $ | 192,636 | |||||
Wesco Aircraft Holdings, Inc. (a) | 3,023 | 57,286 | ||||||
|
| |||||||
TOTAL TRANSPORTATION INFRASTRUCTURE |
| 249,922 | ||||||
|
| |||||||
TOTAL COMMON STOCKS |
| 100,591,676 | ||||||
|
| |||||||
| Money Market Funds – 0.0% | ||||||||
SSgA US Treasury Money Market Fund, | 37,937 | 37,937 | ||||||
|
| |||||||
TOTAL INVESTMENT PORTFOLIO – 99.9% |
| 100,629,613 | ||||||
NET OTHER ASSETS (LIABILITIES) – 0.1% |
| 76,199 | ||||||
|
| |||||||
NET ASSETS – 100% |
| $ | 100,705,812 | |||||
|
| |||||||
Legend
| (a) | Non-income producing. |
| (b) | The rate quoted is the annualized seven-day yield of the fund at period end. |
Other Information
The following is a summary of the inputs used, as of July 31, 2014, involving the Fund’s assets and liabilities carried at fair value. The inputs or methodology used for valuing securities may not be an indication of the risk associated with investing in those securities. For more information on valuation inputs, and their aggregation into the levels used in the table below, please refer to the Investment Valuation section at the end of this listing.
| Valuation Inputs at Reporting Date: | ||||||||||||||||
| Description | Total | Level 1 | Level 2 | Level 3 | ||||||||||||
Investments in Securities: | ||||||||||||||||
Common Stocks | $ | 100,591,676 | $ | 100,591,676 | $ | — | $ | — | ||||||||
Money Market Funds | 37,937 | 37,937 | — | — | ||||||||||||
|
|
|
|
|
|
|
| |||||||||
Total Investments in Securities: | $ | 100,629,613 | $ | 100,629,613 | $ | — | $ | — | ||||||||
|
|
|
|
|
|
|
| |||||||||
See accompanying notes which are an integral part of the financial statements.
| Annual Report | 52 |
Table of Contents
Fidelity MSCI Information Technology Index ETF
Investments July 31, 2014
Showing Percentage of Net Assets
| Common Stocks – 99.9% | ||||||||
| Shares | Value | |||||||
COMMERCIAL SERVICES & SUPPLIES – 0.0% |
| |||||||
Diversified Support Services – 0.0% |
| |||||||
EnerNOC, Inc. (a) | 1,169 | $ | 20,948 | |||||
|
| |||||||
COMMUNICATIONS EQUIPMENT – 8.5% |
| |||||||
Communications Equipment – 8.5% |
| |||||||
ADTRAN, Inc. | 2,623 | 58,336 | ||||||
ARRIS Group, Inc. (a) | 5,435 | 185,714 | ||||||
Aruba Networks, Inc. (a) | 4,708 | 84,085 | ||||||
Black Box Corp. | 744 | 15,401 | ||||||
Brocade Communications Systems, Inc. | 19,613 | 180,636 | ||||||
CalAmp Corp. (a) | 1,494 | 25,413 | ||||||
Calix, Inc. (a) | 1,612 | 14,975 | ||||||
Ciena Corp. (a) | 4,695 | 91,693 | ||||||
Cisco Systems, Inc. | 231,563 | 5,842,335 | ||||||
CommScope Holding Co., Inc. (a) | 3,762 | 92,696 | ||||||
Comtech Telecommunications Corp. | 744 | 25,147 | ||||||
Digi International, Inc. (a) | 1,240 | 10,242 | ||||||
EchoStar Corp. Class A (a) | 1,952 | 98,966 | ||||||
Emulex Corp. (a) | 3,245 | 19,081 | ||||||
Extreme Networks, Inc. (a) | 4,454 | 20,934 | ||||||
F5 Networks, Inc. (a) | 3,385 | 381,117 | ||||||
Finisar Corp. (a) | 4,342 | 85,668 | ||||||
Harmonic, Inc. (a) | 4,588 | 27,528 | ||||||
Harris Corp. | 4,786 | 326,740 | ||||||
Infinera Corp. (a) | 5,460 | 50,232 | ||||||
InterDigital, Inc. | 1,842 | 81,214 | ||||||
Ixia (a) | 2,506 | 26,814 | ||||||
JDS Uniphase Corp. (a) | 10,610 | 125,941 | ||||||
Juniper Networks, Inc. (a) | 22,511 | 529,909 | ||||||
Motorola Solutions, Inc. | 10,264 | 653,612 | ||||||
NETGEAR, Inc. (a) | 1,633 | 51,129 | ||||||
Oplink Communications, Inc. (a) | 868 | 16,544 | ||||||
Palo Alto Networks, Inc. (a) | 2,328 | 188,242 | ||||||
Parkervision, Inc. (a) | 4,604 | 5,755 | ||||||
Plantronics, Inc. | 1,909 | 89,666 | ||||||
Polycom, Inc. (a) | 6,144 | 78,766 | ||||||
QUALCOMM, Inc. | 76,019 | 5,602,600 | ||||||
Riverbed Technology, Inc. (a) | 6,776 | 121,290 | ||||||
Ruckus Wireless, Inc. (a) | 2,745 | 35,438 | ||||||
ShoreTel, Inc. (a) | 2,941 | 18,175 | ||||||
Sonus Networks, Inc. (a) | 10,061 | 35,515 | ||||||
Ubiquiti Networks, Inc. (a) | 991 | 37,886 | ||||||
ViaSat, Inc. (a) | 1,961 | 114,660 | ||||||
|
| |||||||
TOTAL COMMUNICATIONS EQUIPMENT |
| 15,450,095 | ||||||
|
| |||||||
ELECTRONIC EQUIPMENT, INSTRUMENTS & COMPONENTS – 4.2% |
| |||||||
Electronic Components – 1.5% |
| |||||||
Aeroflex Holding Corp. (a) | 1,207 | 12,746 | ||||||
Amphenol Corp. Class A | 7,103 | 683,095 | ||||||
AVX Corp. | 2,233 | 30,369 | ||||||
Belden, Inc. | 1,970 | 133,763 | ||||||
| Shares | Value | |||||||
Corning, Inc. | 62,527 | $ | 1,228,656 | |||||
Dolby Laboratories, Inc. Class A (a) | 2,215 | 98,878 | ||||||
DTS, Inc. (a) | 751 | 13,586 | ||||||
II-VI, Inc. (a) | 2,371 | 32,530 | ||||||
InvenSense, Inc. (a) | 3,380 | 77,774 | ||||||
Knowles Corp. (a) | 3,839 | 111,638 | ||||||
Littelfuse, Inc. | 998 | 86,746 | ||||||
Rogers Corp. (a) | 836 | 47,953 | ||||||
Universal Display Corp. (a) | 1,897 | 58,162 | ||||||
Vishay Intertechnology, Inc. | 6,103 | 89,897 | ||||||
|
| |||||||
| 2,705,793 | ||||||||
|
| |||||||
Electronic Equipment & Instruments – 0.6% |
| |||||||
Badger Meter, Inc. | 620 | 30,938 | ||||||
Checkpoint Systems, Inc. (a) | 1,860 | 22,766 | ||||||
Cognex Corp. (a) | 3,720 | 152,446 | ||||||
Coherent, Inc. (a) | 1,116 | 65,743 | ||||||
Control4 Corp. (a) | 545 | 9,161 | ||||||
Daktronics, Inc. | 1,612 | 17,893 | ||||||
Electro Scientific Industries, Inc. | 1,364 | 8,157 | ||||||
FARO Technologies, Inc. (a) | 754 | 38,175 | ||||||
FEI Co. | 1,909 | 146,229 | ||||||
FLIR Systems, Inc. | 6,345 | 211,162 | ||||||
GSI Group, Inc. (a) | 1,364 | 15,727 | ||||||
Itron, Inc. (a) | 1,764 | 63,469 | ||||||
MTS Systems Corp. | 714 | 47,124 | ||||||
National Instruments Corp. | 4,590 | 146,146 | ||||||
Newport Corp. (a) | 1,736 | 30,050 | ||||||
OSI Systems, Inc. (a) | 868 | 57,548 | ||||||
RealD, Inc. (a) | 1,982 | 20,950 | ||||||
Rofin-Sinar Technologies, Inc. (a) | 1,240 | 27,069 | ||||||
Vishay Precision Group, Inc. (a) | 620 | 8,947 | ||||||
|
| |||||||
| 1,119,700 | ||||||||
|
| |||||||
Electronic Manufacturing Services – 1.4% |
| |||||||
Benchmark Electronics, Inc. (a) | 2,404 | 58,056 | ||||||
CTS Corp. | 1,364 | 23,720 | ||||||
Fabrinet (a) | 1,371 | 25,501 | ||||||
Flextronics International Ltd. (a) | 27,241 | 283,034 | ||||||
IPG Photonics Corp. (a) | 1,500 | 101,025 | ||||||
Jabil Circuit, Inc. | 8,303 | 165,728 | ||||||
Kemet Corp. (a) | 2,108 | 10,392 | ||||||
Maxwell Technologies, Inc. (a) | 1,292 | 14,057 | ||||||
Measurement Specialties, Inc. (a) | 730 | 62,773 | ||||||
Mercury Systems, Inc. (a) | 1,488 | 16,442 | ||||||
Methode Electronics, Inc. | 1,612 | 51,552 | ||||||
Multi-Fineline Electronix, Inc. (a) | 496 | 4,841 | ||||||
Park Electrochemical Corp. | 863 | 24,302 | ||||||
Plexus Corp. (a) | 1,516 | 59,624 | ||||||
Sanmina Corp. (a) | 3,690 | 85,940 | ||||||
TE Connectivity Ltd. | 18,430 | 1,140,633 | ||||||
Trimble Navigation Ltd. (a) | 11,661 | 360,325 | ||||||
TTM Technologies, Inc. (a) | 2,480 | 18,625 | ||||||
|
| |||||||
| 2,506,570 | ||||||||
|
| |||||||
See accompanying notes which are an integral part of the financial statements.
| 53 | Annual Report |
Table of Contents
Fidelity MSCI Information Technology Index ETF
Investments – continued
| Common Stocks – continued | ||||||||
| Shares | Value | |||||||
ELECTRONIC EQUIPMENT, INSTRUMENTS & COMPONENTS – continued |
| |||||||
Technology Distributors – 0.7% |
| |||||||
Agilysys, Inc. (a) | 723 | $ | 9,507 | |||||
Anixter International, Inc. | 1,240 | 106,603 | ||||||
Arrow Electronics, Inc. (a) | 4,487 | 260,022 | ||||||
Avnet, Inc. | 6,197 | 262,319 | ||||||
CDW Corp. | 3,881 | 119,884 | ||||||
Electro Rent Corp. | 741 | 11,300 | ||||||
Ingram Micro, Inc. Class A (a) | 6,943 | 199,264 | ||||||
Insight Enterprises, Inc. (a) | 1,873 | 49,204 | ||||||
PC Connection, Inc. | 490 | 10,011 | ||||||
ScanSource, Inc. (a) | 1,254 | 44,906 | ||||||
SYNNEX Corp. (a) | 1,265 | 81,592 | ||||||
Tech Data Corp. (a) | 1,718 | 107,873 | ||||||
|
| |||||||
| 1,262,485 | ||||||||
|
| |||||||
TOTAL ELECTRONIC EQUIPMENT, INSTRUMENTS & COMPONENTS |
| 7,594,548 | ||||||
|
| |||||||
INTERNET SOFTWARE & SERVICES – 16.9% |
| |||||||
Internet Software & Services – 16.9% |
| |||||||
Akamai Technologies, Inc. (a) | 8,045 | 474,816 | ||||||
Angie’s List, Inc. (a) | 2,022 | 16,843 | ||||||
AOL, Inc. (a) | 3,586 | 138,240 | ||||||
Bankrate, Inc. (a) | 2,494 | 42,049 | ||||||
Bazaarvoice, Inc. (a) | 2,362 | 17,502 | ||||||
Benefitfocus, Inc. (a) | 467 | 17,998 | ||||||
Blucora, Inc. (a) | 1,735 | 29,617 | ||||||
Brightcove, Inc. (a) | 1,140 | 6,783 | ||||||
Carbonite, Inc. (a) | 501 | 4,875 | ||||||
ChannelAdvisor Corp. (a) | 898 | 20,591 | ||||||
comScore, Inc. (a) | 1,391 | 50,340 | ||||||
Constant Contact, Inc. (a) | 1,364 | 42,461 | ||||||
Conversant, Inc. (a) | 2,852 | 66,651 | ||||||
Cornerstone OnDemand, Inc. (a) | 2,146 | 89,789 | ||||||
CoStar Group, Inc. (a) | 1,431 | 205,678 | ||||||
Cvent, Inc. (a) | 666 | 18,189 | ||||||
Dealertrack Technologies, Inc. (a) | 1,984 | 74,539 | ||||||
Demand Media, Inc. (a) | 2,184 | 11,859 | ||||||
Demandware, Inc. (a) | 1,361 | 81,987 | ||||||
Dice Holdings, Inc. (a) | 1,860 | 17,038 | ||||||
Digital River, Inc. (a) | 1,368 | 19,549 | ||||||
E2open, Inc. (a) | 896 | 14,497 | ||||||
EarthLink Holdings Corp. | 4,712 | 18,565 | ||||||
eBay, Inc. (a) | 55,292 | 2,919,418 | ||||||
Endurance International Group Holdings, Inc. (a) | 2,363 | 32,208 | ||||||
Envestnet, Inc. (a) | 1,276 | 55,646 | ||||||
Equinix, Inc. (a) | 2,220 | 476,234 | ||||||
Facebook, Inc. Class A (a) | 84,372 | 6,129,626 | ||||||
Gogo, Inc. (a) | 2,324 | 37,672 | ||||||
Google, Inc. Class A (a) | 12,626 | 7,317,398 | ||||||
Google, Inc. Class C (a) | 12,864 | 7,353,062 | ||||||
| Shares | Value | |||||||
IAC/InterActiveCorp | 3,435 | $ | 230,832 | |||||
Internap Network Services Corp. (a) | 2,232 | 16,093 | ||||||
IntraLinks Holdings, Inc. (a) | 1,834 | 14,709 | ||||||
j2 Global, Inc. | 2,028 | 99,210 | ||||||
LinkedIn Corp. Class A (a) | 4,660 | 841,782 | ||||||
Liquidity Services, Inc. (a) | 1,222 | 16,485 | ||||||
LivePerson, Inc. (a) | 2,232 | 26,293 | ||||||
LogMeIn, Inc. (a) | 1,071 | 43,600 | ||||||
Marchex, Inc. | 1,522 | 16,742 | ||||||
Marin Software, Inc. (a) | 812 | 7,446 | ||||||
Marketo, Inc. (a) | 821 | 22,454 | ||||||
MercadoLibre, Inc. | 1,493 | 138,103 | ||||||
Millennial Media, Inc. (a) | 2,037 | 7,028 | ||||||
Monster Worldwide, Inc. (a) | 4,082 | 26,533 | ||||||
Move, Inc. (a) | 1,730 | 25,258 | ||||||
NIC, Inc. | 2,732 | 46,089 | ||||||
Pandora Media, Inc. (a) | 7,561 | 189,932 | ||||||
Perficient, Inc. (a) | 1,555 | 26,419 | ||||||
QuinStreet, Inc. (a) | 1,789 | 8,927 | ||||||
Rackspace Hosting, Inc. (a) | 5,446 | 164,959 | ||||||
RealNetworks, Inc. (a) | 1,116 | 8,392 | ||||||
Rocket Fuel, Inc. (a) | 578 | 15,265 | ||||||
SciQuest, Inc. (a) | 1,244 | 19,145 | ||||||
Shutterstock, Inc. (a) | 539 | 42,010 | ||||||
SPS Commerce, Inc. (a) | 725 | 38,679 | ||||||
Stamps.com, Inc. (a) | 648 | 20,496 | ||||||
Textura Corp. (a) | 915 | 22,848 | ||||||
Travelzoo, Inc. (a) | 361 | 6,224 | ||||||
Trulia, Inc. (a) | 1,238 | 74,936 | ||||||
Twitter, Inc. (a) | 5,305 | 239,733 | ||||||
VeriSign, Inc. (a) | 5,702 | 308,193 | ||||||
VistaPrint N.V. (a) | 1,344 | 66,205 | ||||||
Web.com Group, Inc. (a) | 2,209 | 58,649 | ||||||
WebMD Health Corp. (a) | 1,590 | 79,230 | ||||||
XO Group, Inc. (a) | 1,134 | 12,667 | ||||||
Xoom Corp. (a) | 1,037 | 22,461 | ||||||
Yahoo!, Inc. (a) | 43,155 | 1,545,381 | ||||||
Yelp, Inc. (a) | 2,694 | 180,929 | ||||||
Zillow, Inc. Class A (a) | 1,259 | 180,704 | ||||||
|
| |||||||
TOTAL INTERNET SOFTWARE & SERVICES |
| 30,712,761 | ||||||
|
| |||||||
IT SERVICES – 16.5% |
| |||||||
Data Processing & Outsourced Services – 9.1% |
| |||||||
Alliance Data Systems Corp. (a) | 2,389 | 626,611 | ||||||
Automatic Data Processing, Inc. | 21,666 | 1,761,662 | ||||||
Blackhawk Network Holdings, Inc. Class B (a) | 1,839 | 51,290 | ||||||
Broadridge Financial Solutions, Inc. | 5,346 | 215,818 | ||||||
Cardtronics, Inc. (a) | 2,002 | 77,197 | ||||||
Cass Information Systems, Inc. | 407 | 18,368 | ||||||
Computer Sciences Corp. | 6,545 | 408,342 | ||||||
Convergys Corp. | 4,582 | 88,845 | ||||||
See accompanying notes which are an integral part of the financial statements.
| Annual Report | 54 |
Table of Contents
| Common Stocks – continued | ||||||||
| Shares | Value | |||||||
IT SERVICES – continued |
| |||||||
Data Processing & Outsourced Services – continued |
| |||||||
CoreLogic, Inc. (a) | 3,935 | $ | 107,032 | |||||
CSG Systems International, Inc. | 1,592 | 41,456 | ||||||
DST Systems, Inc. | 1,609 | 144,923 | ||||||
Euronet Worldwide, Inc. (a) | 2,180 | 109,087 | ||||||
EVERTEC, Inc. | 2,967 | 66,342 | ||||||
ExlService Holdings, Inc. (a) | 1,456 | 40,841 | ||||||
Fidelity National Information Services, Inc. | 13,052 | 736,133 | ||||||
Fiserv, Inc. (a) | 11,429 | 704,826 | ||||||
FleetCor Technologies, Inc. (a) | 3,340 | 443,519 | ||||||
Global Cash Access Holdings, Inc. (a) | 2,867 | 23,997 | ||||||
Global Payments, Inc. | 3,229 | 223,673 | ||||||
Heartland Payment Systems, Inc. | 1,629 | 77,377 | ||||||
Higher One Holdings, Inc. (a) | 1,240 | 5,183 | ||||||
Jack Henry & Associates, Inc. | 3,844 | 224,297 | ||||||
Mastercard, Inc. Class A | 46,174 | 3,423,802 | ||||||
MAXIMUS, Inc. | 3,024 | 125,073 | ||||||
MoneyGram International, Inc. (a) | 1,389 | 20,071 | ||||||
Paychex, Inc. | 14,759 | 605,267 | ||||||
Sykes Enterprises, Inc. (a) | 1,743 | 36,080 | ||||||
Syntel, Inc. (a) | 751 | 64,864 | ||||||
TeleTech Holdings, Inc. (a) | 881 | 24,254 | ||||||
The Western Union Co. | 24,602 | 429,797 | ||||||
Total System Services, Inc. | 7,577 | 242,464 | ||||||
Vantiv, Inc. Class A (a) | 6,349 | 208,120 | ||||||
VeriFone Systems, Inc. (a) | 4,979 | 166,846 | ||||||
Visa, Inc. Class A | 22,671 | 4,783,808 | ||||||
WEX, Inc. (a) | 1,752 | 189,076 | ||||||
|
| |||||||
| 16,516,341 | ||||||||
|
| |||||||
IT Consulting & Other Services – 7.4% |
| |||||||
Accenture PLC Class A | 28,637 | 2,270,341 | ||||||
Acxiom Corp. (a) | 3,371 | 61,757 | ||||||
Booz Allen Hamilton Holding Corp. | 2,952 | 65,652 | ||||||
CACI International, Inc. Class A (a) | 951 | 65,610 | ||||||
CIBER, Inc. (a) | 3,224 | 11,252 | ||||||
Cognizant Technology Solutions Corp. Class A (a) | 27,323 | 1,340,193 | ||||||
Computer Task Group, Inc. | 613 | 8,778 | ||||||
EPAM Systems, Inc. (a) | 1,692 | 65,413 | ||||||
Forrester Research, Inc. | 496 | 19,185 | ||||||
Gartner, Inc. (a) | 4,127 | 282,369 | ||||||
iGATE Corp. (a) | 1,605 | 57,266 | ||||||
International Business Machines Corp. | 44,471 | 8,523,757 | ||||||
Leidos Holdings, Inc. | 3,013 | 111,300 | ||||||
Lionbridge Technologies, Inc. (a) | 3,031 | 17,368 | ||||||
ManTech International Corp. Class A | 1,041 | 28,107 | ||||||
Sapient Corp. (a) | 5,384 | 79,468 | ||||||
Science Applications International Corp. | 1,996 | 83,373 | ||||||
ServiceSource International, Inc. (a) | 3,224 | 14,282 | ||||||
Teradata Corp. (a) | 7,152 | 301,528 | ||||||
Unisys Corp. (a) | 2,324 | 49,478 | ||||||
| Shares | Value | |||||||
Virtusa Corp. (a) | 1,246 | $ | 38,975 | |||||
|
| |||||||
| 13,495,452 | ||||||||
|
| |||||||
TOTAL IT SERVICES |
| 30,011,793 | ||||||
|
| |||||||
OFFICE ELECTRONICS – 0.5% |
| |||||||
Office Electronics – 0.5% |
| |||||||
Xerox Corp. | 50,560 | 670,426 | ||||||
Zebra Technologies Corp. Class A (a) | 2,285 | 182,960 | ||||||
|
| |||||||
TOTAL OFFICE ELECTRONICS |
| 853,386 | ||||||
|
| |||||||
SEMICONDUCTORS & SEMICONDUCTOR EQUIPMENT – 12.8% |
| |||||||
Semiconductor Equipment – 1.8% |
| |||||||
Advanced Energy Industries, Inc. (a) | 1,736 | 29,200 | ||||||
Amkor Technology, Inc. (a) | 5,932 | 52,498 | ||||||
Applied Materials, Inc. | 54,452 | 1,141,314 | ||||||
Brooks Automation, Inc. | 2,976 | 30,296 | ||||||
Cabot Microelectronics Corp. (a) | 1,089 | 43,767 | ||||||
Cohu, Inc. | 1,116 | 12,443 | ||||||
Entegris, Inc. (a) | 6,200 | 71,238 | ||||||
FormFactor, Inc. (a) | 2,480 | 16,740 | ||||||
GT Advanced Technologies, Inc. (a) | 5,975 | 82,694 | ||||||
KLA-Tencor Corp. | 7,478 | 534,602 | ||||||
Kulicke & Soffa Industries, Inc. (a) | 3,560 | 48,487 | ||||||
Lam Research Corp. | 7,314 | 511,980 | ||||||
MKS Instruments, Inc. | 2,373 | 75,414 | ||||||
Nanometrics, Inc. (a) | 992 | 15,436 | ||||||
PDF Solutions, Inc. (a) | 1,223 | 23,433 | ||||||
Photronics, Inc. (a) | 2,728 | 21,742 | ||||||
Rudolph Technologies, Inc. (a) | 1,380 | 12,710 | ||||||
SunEdison, Inc. (a) | 11,424 | 228,480 | ||||||
Teradyne, Inc. | 8,756 | 159,534 | ||||||
Tessera Technologies, Inc. | 2,140 | 54,377 | ||||||
Ultratech, Inc. (a) | 1,240 | 29,363 | ||||||
Veeco Instruments, Inc. (a) | 1,761 | 61,124 | ||||||
Xcerra Corp. (a) | 2,196 | 20,533 | ||||||
|
| |||||||
| 3,277,405 | ||||||||
|
| |||||||
Semiconductors – 11.0% |
| |||||||
Advanced Micro Devices, Inc. (a) | 27,897 | 109,077 | ||||||
Altera Corp. | 14,262 | 466,653 | ||||||
Ambarella, Inc. (a) | 974 | 27,866 | ||||||
Analog Devices, Inc. | 14,069 | 698,244 | ||||||
Applied Micro Circuits Corp. (a) | 3,343 | 27,914 | ||||||
Atmel Corp. (a) | 19,220 | 157,604 | ||||||
Avago Technologies Ltd. | 11,230 | 779,137 | ||||||
Broadcom Corp. Class A | 23,876 | 913,496 | ||||||
Cavium, Inc. (a) | 2,356 | 109,907 | ||||||
Ceva, Inc. (a) | 992 | 14,116 | ||||||
Cirrus Logic, Inc. (a) | 2,852 | 63,970 | ||||||
Cree, Inc. (a) | 5,448 | 257,309 | ||||||
Cypress Semiconductor Corp. (a) | 6,556 | 66,281 | ||||||
Diodes, Inc. (a) | 1,661 | 42,356 | ||||||
Entropic Communications, Inc. (a) | 3,844 | 10,725 | ||||||
See accompanying notes which are an integral part of the financial statements.
| 55 | Annual Report |
Table of Contents
Fidelity MSCI Information Technology Index ETF
Investments – continued
| Common Stocks – continued | ||||||||
| Shares | Value | |||||||
SEMICONDUCTORS & SEMICONDUCTOR EQUIPMENT – continued |
| |||||||
Semiconductors – continued |
| |||||||
Exar Corp. (a) | 1,954 | $ | 18,817 | |||||
Fairchild Semiconductor International, Inc. (a) | 5,704 | 86,815 | ||||||
First Solar, Inc. (a) | 3,359 | 211,987 | ||||||
Freescale Semiconductor Ltd. (a) | 4,604 | 92,172 | ||||||
Inphi Corp. (a) | 1,005 | 15,336 | ||||||
Integrated Device Technology, Inc. (a) | 6,394 | 91,818 | ||||||
Integrated Silicon Solution, Inc. | 1,388 | 20,293 | ||||||
Intel Corp. | 223,502 | 7,574,483 | ||||||
International Rectifier Corp. (a) | 3,222 | 80,034 | ||||||
Intersil Corp. Class A | 5,704 | 73,182 | ||||||
IXYS Corp. | 1,116 | 12,745 | ||||||
Kopin Corp. (a) | 2,852 | 9,782 | ||||||
Lattice Semiconductor Corp. (a) | 5,208 | 35,623 | ||||||
Linear Technology Corp. | 10,614 | 468,449 | ||||||
M/A-COM Technology Solutions Holdings, Inc. (a) | 675 | 13,433 | ||||||
Magnachip Semiconductor Corp. (a) | 1,505 | 21,085 | ||||||
Marvell Technology Group Ltd. | 16,569 | 221,030 | ||||||
Maxim Integrated Products, Inc. | 12,653 | 370,859 | ||||||
MaxLinear, Inc. Class A (a) | 1,343 | 12,732 | ||||||
Mellanox Technologies Ltd. (a) | 1,692 | 70,472 | ||||||
Micrel, Inc. | 2,232 | 23,347 | ||||||
Microchip Technology, Inc. | 8,992 | 404,820 | ||||||
Micron Technology, Inc. (a) | 47,672 | 1,456,380 | ||||||
Microsemi Corp. (a) | 4,216 | 101,100 | ||||||
Monolithic Power Systems, Inc. | 1,646 | 67,881 | ||||||
NVE Corp. (a) | 219 | 14,531 | ||||||
NVIDIA Corp. | 25,569 | 447,458 | ||||||
OmniVision Technologies, Inc. (a) | 2,480 | 55,552 | ||||||
ON Semiconductor Corp. (a) | 19,940 | 170,686 | ||||||
PMC – Sierra, Inc. (a) | 8,715 | 58,652 | ||||||
Power Integrations, Inc. | 1,347 | 72,509 | ||||||
Rambus, Inc. (a) | 4,836 | 55,662 | ||||||
RF Micro Devices, Inc. (a) | 12,649 | 141,163 | ||||||
Semtech Corp. (a) | 3,095 | 69,111 | ||||||
Silicon Image, Inc. (a) | 3,472 | 17,325 | ||||||
Silicon Laboratories, Inc. (a) | 1,860 | 75,758 | ||||||
Skyworks Solutions, Inc. | 8,525 | 432,729 | ||||||
Spansion, Inc. Class A (a) | 2,427 | 46,040 | ||||||
SunPower Corp. (a) | 1,881 | 69,089 | ||||||
Synaptics, Inc. (a) | 1,607 | 116,074 | ||||||
Texas Instruments, Inc. | 48,766 | 2,255,428 | ||||||
TriQuint Semiconductor, Inc. (a) | 6,978 | 125,464 | ||||||
Xilinx, Inc. | 11,988 | 493,066 | ||||||
|
| |||||||
| 20,015,627 | ||||||||
|
| |||||||
TOTAL SEMICONDUCTORS & SEMICONDUCTOR EQUIPMENT |
| 23,293,032 | ||||||
|
| |||||||
| Shares | Value | |||||||
SOFTWARE – 20.2% |
| |||||||
Application Software – 5.6% |
| |||||||
ACI Worldwide, Inc. (a) | 5,205 | $ | 97,542 | |||||
Actuate Corp. (a) | 2,010 | 8,482 | ||||||
Adobe Systems, Inc. (a) | 21,314 | 1,473,011 | ||||||
Advent Software, Inc. | 1,842 | 59,791 | ||||||
ANSYS, Inc. (a) | 4,146 | 318,993 | ||||||
Aspen Technology, Inc. (a) | 4,186 | 181,840 | ||||||
Autodesk, Inc. (a) | 10,042 | 535,741 | ||||||
Blackbaud, Inc. | 2,052 | 75,329 | ||||||
Bottomline Technologies de, Inc. (a) | 1,736 | 49,146 | ||||||
BroadSoft, Inc. (a) | 1,229 | 29,988 | ||||||
Cadence Design Systems, Inc. (a) | 13,020 | 219,127 | ||||||
Callidus Software, Inc. (a) | 2,066 | 22,148 | ||||||
Citrix Systems, Inc. (a) | 8,257 | 559,247 | ||||||
Compuware Corp. | 9,796 | 89,144 | ||||||
Concur Technologies, Inc. (a) | 2,165 | 201,258 | ||||||
Ebix, Inc. | 1,370 | 17,207 | ||||||
Ellie Mae, Inc. (a) | 1,221 | 35,067 | ||||||
Epiq Systems, Inc. | 1,364 | 19,669 | ||||||
ePlus, Inc. (a) | 283 | 15,477 | ||||||
FactSet Research Systems, Inc. | 1,822 | 218,877 | ||||||
Fair Isaac Corp. | 1,586 | 90,640 | ||||||
Guidance Software, Inc. (a) | 744 | 5,759 | ||||||
Guidewire Software, Inc. (a) | 3,020 | 122,310 | ||||||
Informatica Corp. (a) | 4,948 | 156,951 | ||||||
Interactive Intelligence Group, Inc. (a) | 731 | 33,165 | ||||||
Intuit, Inc. | 12,085 | 990,607 | ||||||
Jive Software, Inc. (a) | 1,810 | 14,335 | ||||||
Manhattan Associates, Inc. (a) | 3,416 | 100,294 | ||||||
Mentor Graphics Corp. | 4,340 | 85,715 | ||||||
MicroStrategy, Inc. Class A (a) | 405 | 57,968 | ||||||
Monotype Imaging Holdings, Inc. | 1,733 | 51,799 | ||||||
Net 1 UEPS Technologies, Inc. (a) | 1,739 | 18,520 | ||||||
Netscout Systems, Inc. (a) | 1,775 | 75,491 | ||||||
Nuance Communications, Inc. (a) | 11,399 | 207,234 | ||||||
Pegasystems, Inc. | 1,611 | 34,427 | ||||||
PROS Holdings, Inc. (a) | 1,029 | 26,363 | ||||||
PTC, Inc. (a) | 5,340 | 192,026 | ||||||
Qlik Technologies, Inc. (a) | 4,068 | 107,639 | ||||||
RealPage, Inc. (a) | 2,484 | 40,005 | ||||||
Salesforce.com, Inc. (a) | 25,736 | 1,396,178 | ||||||
Seachange International, Inc. (a) | 1,698 | 12,718 | ||||||
Silver Spring Networks, Inc. (a) | 904 | 9,655 | ||||||
SolarWinds, Inc. (a) | 3,074 | 126,464 | ||||||
Solera Holdings, Inc. | 3,100 | 198,400 | ||||||
Splunk, Inc. (a) | 4,815 | 226,401 | ||||||
SS&C Technologies Holdings, Inc. (a) | 3,200 | 138,592 | ||||||
Synchronoss Technologies, Inc. (a) | 1,488 | 60,130 | ||||||
Synopsys, Inc. (a) | 6,947 | 262,388 | ||||||
Tangoe, Inc. (a) | 1,585 | 21,873 | ||||||
Telenav, Inc. (a) | 1,449 | 7,202 | ||||||
The Ultimate Software Group, Inc. (a) | 1,210 | 163,241 | ||||||
See accompanying notes which are an integral part of the financial statements.
| Annual Report | 56 |
Table of Contents
| Common Stocks – continued | ||||||||
| Shares | Value | |||||||
SOFTWARE – continued |
| |||||||
Application Software – continued |
| |||||||
TIBCO Software, Inc. (a) | 6,945 | $ | 134,039 | |||||
TiVo, Inc. (a) | 5,468 | 73,599 | ||||||
Tyler Technologies, Inc. (a) | 1,413 | 128,201 | ||||||
Verint Systems, Inc. (a) | 2,651 | 124,438 | ||||||
VirnetX Holding Corp. (a) | 1,984 | 27,736 | ||||||
Vringo, Inc. (a) | 3,472 | 11,319 | ||||||
Workday, Inc. Class A (a) | 3,811 | 319,514 | ||||||
|
| |||||||
| 10,080,420 | ||||||||
|
| |||||||
Home Entertainment Software – 0.7% |
| |||||||
Activision Blizzard, Inc. | 22,469 | 502,856 | ||||||
Electronic Arts, Inc. (a) | 13,902 | 467,107 | ||||||
Glu Mobile, Inc. (a) | 3,883 | 21,784 | ||||||
Rosetta Stone, Inc. (a) | 755 | 7,278 | ||||||
Take-Two Interactive Software, Inc. (a) | 4,434 | 99,233 | ||||||
Zynga, Inc. Class A (a) | 29,722 | 86,788 | ||||||
|
| |||||||
| 1,185,046 | ||||||||
|
| |||||||
Systems Software – 13.9% |
| |||||||
CA, Inc. | 15,107 | 436,290 | ||||||
CommVault Systems, Inc. (a) | 2,007 | 96,376 | ||||||
FireEye, Inc. (a) | 2,934 | 104,157 | ||||||
Fortinet, Inc. (a) | 6,287 | 154,346 | ||||||
Gigamon, Inc. (a) | 519 | 5,989 | ||||||
Imperva, Inc. (a) | 903 | 20,020 | ||||||
Infoblox, Inc. (a) | 2,258 | 27,367 | ||||||
MICROS Systems, Inc. (a) | 3,210 | 217,092 | ||||||
Microsoft Corp. | 354,473 | 15,299,055 | ||||||
NetSuite, Inc. (a) | 1,531 | 129,079 | ||||||
Oracle Corp. | 161,735 | 6,532,477 | ||||||
Progress Software Corp. (a) | 2,080 | 48,214 | ||||||
Proofpoint, Inc. (a) | 1,320 | 46,556 | ||||||
Qualys, Inc. (a) | 835 | 19,948 | ||||||
Rally Software Development Corp. (a) | 720 | 7,322 | ||||||
Red Hat, Inc. (a) | 8,529 | 495,705 | ||||||
Rovi Corp. (a) | 4,423 | 103,366 | ||||||
ServiceNow, Inc. (a) | 5,715 | 336,042 | ||||||
Symantec Corp. | 31,055 | 734,761 | ||||||
Tableau Software, Inc. Class A (a) | 1,722 | 111,930 | ||||||
Varonis Systems, Inc. (a) | 239 | 5,038 | ||||||
VASCO Data Security International, Inc. (a) | 1,436 | 19,487 | ||||||
VMware, Inc. Class A (a) | 3,825 | 380,052 | ||||||
|
| |||||||
| 25,330,669 | ||||||||
|
| |||||||
TOTAL SOFTWARE |
| 36,596,135 | ||||||
|
| |||||||
| Shares | Value | |||||||
TECHNOLOGY HARDWARE, |
| |||||||
Computer Hardware – 16.8% |
| |||||||
3D Systems Corp. (a) | 4,703 | $ | 235,761 | |||||
Apple, Inc. | 280,669 | 26,823,536 | ||||||
Cray, Inc. (a) | 1,736 | 46,039 | ||||||
Diebold, Inc. | 2,728 | 102,791 | ||||||
Hewlett-Packard Co. | 85,526 | 3,045,581 | ||||||
NCR Corp. (a) | 7,458 | 230,825 | ||||||
Silicon Graphics International Corp. (a) | 1,364 | 12,972 | ||||||
Super Micro Computer, Inc. (a) | 1,635 | 42,788 | ||||||
|
| |||||||
| 30,540,293 | ||||||||
|
| |||||||
Computer Storage & Peripherals – 3.5% |
| |||||||
Electronics For Imaging, Inc. (a) | 2,108 | 92,900 | ||||||
EMC Corp. | 91,063 | 2,668,146 | ||||||
Immersion Corp. (a) | 1,246 | 17,008 | ||||||
Lexmark International, Inc. Class A | 2,623 | 125,983 | ||||||
NetApp, Inc. | 14,878 | 577,861 | ||||||
QLogic Corp. (a) | 3,968 | 36,109 | ||||||
Quantum Corp. (a) | 11,036 | 13,795 | ||||||
SanDisk Corp. | 10,132 | 929,206 | ||||||
Seagate Technology PLC | 14,794 | 866,928 | ||||||
Western Digital Corp. | 10,086 | 1,006,885 | ||||||
|
| |||||||
| 6,334,821 | ||||||||
|
| |||||||
TOTAL TECHNOLOGY HARDWARE, STORAGE & PERIPHERALS |
| 36,875,114 | ||||||
|
| |||||||
TOTAL COMMON STOCKS |
| 181,407,812 | ||||||
|
| |||||||
| Money Market Funds – 0.1% | ||||||||
SSgA US Treasury Money Market Fund, 0.00% (b) | 188,394 | 188,394 | ||||||
|
| |||||||
TOTAL INVESTMENT PORTFOLIO – 100.0% |
| 181,596,206 | ||||||
NET OTHER ASSETS (LIABILITIES) – 0.0% |
| 14,927 | ||||||
|
| |||||||
NET ASSETS – 100% |
| $ | 181,611,133 | |||||
|
| |||||||
Legend
| (a) | Non-income producing. |
| (b) | The rate quoted is the annualized seven-day yield of the fund at period end. |
See accompanying notes which are an integral part of the financial statements.
| 57 | Annual Report |
Table of Contents
Fidelity MSCI Information Technology Index ETF
Investments – continued
Other Information
The following is a summary of the inputs used, as of July 31, 2014, involving the Fund’s assets and liabilities carried at fair value. The inputs or methodology used for valuing securities may not be an indication of the risk associated with investing in those securities. For more information on valuation inputs, and their aggregation into the levels used in the table below, please refer to the Investment Valuation section at the end of this listing.
| Valuation Inputs at Reporting Date: | ||||||||||||||||
| Description | Total | Level 1 | Level 2 | Level 3 | ||||||||||||
Investments in Securities: | ||||||||||||||||
Common Stocks | $ | 181,407,812 | $ | 181,407,812 | $ | — | $ | — | ||||||||
Money Market Funds | 188,394 | 188,394 | — | — | ||||||||||||
|
|
|
|
|
|
|
| |||||||||
Total Investments in Securities: | $ | 181,596,206 | $ | 181,596,206 | $ | — | $ | — | ||||||||
|
|
|
|
|
|
|
| |||||||||
See accompanying notes which are an integral part of the financial statements.
| Annual Report | 58 |
Table of Contents
Fidelity MSCI Materials Index ETF
Investments July 31, 2014
Showing Percentage of Net Assets
| Common Stocks – 99.9% | ||||||||
| Shares | Value | |||||||
CHEMICALS – 67.2% | ||||||||
Commodity Chemicals – 7.7% | ||||||||
Axiall Corp. | 7,959 | $ | 340,884 | |||||
Cabot Corp. | 7,288 | 381,818 | ||||||
Calgon Carbon Corp. (a) | 5,504 | 116,685 | ||||||
Hawkins, Inc. | 1,088 | 37,264 | ||||||
Koppers Holdings, Inc. | 2,323 | 83,698 | ||||||
Kronos Worldwide, Inc. | 2,652 | 39,541 | ||||||
LyondellBasell Industries N.V. Class A | 52,683 | 5,597,569 | ||||||
Tredegar Corp. | 2,584 | 50,491 | ||||||
Tronox Ltd. Class A | 7,062 | 187,426 | ||||||
Westlake Chemical Corp. | 5,287 | 462,031 | ||||||
|
| |||||||
| 7,297,407 | ||||||||
|
| |||||||
Diversified Chemicals – 18.1% |
| |||||||
Eastman Chemical Co. | 17,291 | 1,362,185 | ||||||
EI du Pont de Nemours & Co. | 105,201 | 6,765,476 | ||||||
FMC Corp. | 15,074 | 983,126 | ||||||
Huntsman Corp. | 23,327 | 607,668 | ||||||
LSB Industries, Inc. (a) | 2,190 | 84,337 | ||||||
Olin Corp. | 9,048 | 240,406 | ||||||
The Dow Chemical Co. | 137,874 | 7,041,225 | ||||||
|
| |||||||
| 17,084,423 | ||||||||
|
| |||||||
Fertilizers & Agricultural Chemicals – 11.1% |
| |||||||
American Vanguard Corp. | 2,942 | 37,334 | ||||||
CF Industries Holdings, Inc. | 6,293 | 1,575,390 | ||||||
Intrepid Potash, Inc. (a) | 6,396 | 94,725 | ||||||
Monsanto Co. | 59,523 | 6,731,456 | ||||||
The Mosaic Co. | 36,651 | 1,689,978 | ||||||
The Scotts Miracle-Gro Co. Class A | 5,298 | 281,853 | ||||||
|
| |||||||
| 10,410,736 | ||||||||
|
| |||||||
Industrial Gases – 8.8% |
| |||||||
Air Products & Chemicals, Inc. | 24,005 | 3,167,460 | ||||||
Airgas, Inc. | 7,559 | 808,208 | ||||||
Praxair, Inc. | 33,336 | 4,271,675 | ||||||
|
| |||||||
| 8,247,343 | ||||||||
|
| |||||||
Specialty Chemicals – 21.5% |
| |||||||
A Schulman, Inc. | 3,304 | 131,301 | ||||||
Advanced Emissions Solutions, Inc. (a) | 2,356 | 50,395 | ||||||
Albemarle Corp. | 9,021 | 553,348 | ||||||
Ashland, Inc. | 8,390 | 878,013 | ||||||
Balchem Corp. | 3,462 | 173,100 | ||||||
Celanese Corp. | 17,803 | 1,036,313 | ||||||
Chemtura Corp. (a) | 10,986 | 255,534 | ||||||
Cytec Industries, Inc. | 3,852 | 388,474 | ||||||
Ecolab, Inc. | 30,696 | 3,331,437 | ||||||
Ferro Corp. (a) | 8,884 | 111,405 | ||||||
Flotek Industries, Inc. (a) | 5,637 | 162,627 | ||||||
FutureFuel Corp. | 2,722 | 42,899 | ||||||
HB Fuller Co. | 5,699 | 254,460 | ||||||
Innophos Holdings, Inc. | 2,542 | 153,613 | ||||||
Innospec, Inc. | 2,773 | 111,502 | ||||||
| Shares | Value | |||||||
International Flavors & Fragrances, Inc. | 9,230 | $ | 932,138 | |||||
Kraton Performance Polymers, Inc. (a) | 3,740 | 77,081 | ||||||
Landec Corp. (a) | 2,894 | 35,336 | ||||||
Minerals Technologies, Inc. | 3,919 | 227,576 | ||||||
NewMarket Corp. | 1,178 | 455,886 | ||||||
OM Group, Inc. | 3,604 | 101,885 | ||||||
OMNOVA Solutions, Inc. (a) | 5,372 | 43,352 | ||||||
Platform Specialty Products Corp. (a) | 13,141 | 324,714 | ||||||
PolyOne Corp. | 10,780 | 409,101 | ||||||
PPG Industries, Inc. | 15,708 | 3,115,839 | ||||||
Quaker Chemical Corp. | 1,503 | 106,127 | ||||||
Rayonier Advanced Materials, Inc. (a) | 4,777 | 155,061 | ||||||
Rockwood Holdings, Inc. | 8,389 | 662,228 | ||||||
RPM International, Inc. | 15,111 | 667,604 | ||||||
Sensient Technologies Corp. | 5,713 | 299,933 | ||||||
Sigma-Aldrich Corp. | 13,547 | 1,360,390 | ||||||
Stepan Co. | 2,288 | 110,099 | ||||||
The Sherwin-Williams Co. | 9,668 | 1,993,832 | ||||||
The Valspar Corp. | 9,217 | 691,736 | ||||||
WR Grace & Co. (a) | 8,296 | 754,936 | ||||||
Zep, Inc. | 2,235 | 34,844 | ||||||
|
| |||||||
| 20,194,119 | ||||||||
|
| |||||||
TOTAL CHEMICALS |
| 63,234,028 | ||||||
|
| |||||||
CONSTRUCTION MATERIALS – 2.5% |
| |||||||
Construction Materials – 2.5% |
| |||||||
Eagle Materials, Inc. | 5,382 | 488,793 | ||||||
Headwaters, Inc. (a) | 8,364 | 89,411 | ||||||
Martin Marietta Materials, Inc. | 6,406 | 795,817 | ||||||
United States Lime & Minerals, Inc. | 255 | 14,693 | ||||||
Vulcan Materials Co. | 14,811 | 935,019 | ||||||
|
| |||||||
TOTAL CONSTRUCTION MATERIALS |
| 2,323,733 | ||||||
|
| |||||||
CONTAINERS & PACKAGING – 9.0% |
| |||||||
Metal & Glass Containers – 3.7% |
| |||||||
Aptargroup, Inc. | 7,424 | 453,606 | ||||||
Ball Corp. | 15,145 | 927,783 | ||||||
Berry Plastics Group, Inc. (a) | 12,028 | 292,160 | ||||||
Crown Holdings, Inc. (a) | 15,719 | 731,719 | ||||||
Greif, Inc. Class A | 2,881 | 144,568 | ||||||
Myers Industries, Inc. | 3,281 | 60,633 | ||||||
Owens-Illinois, Inc. (a) | 18,672 | 582,380 | ||||||
Silgan Holdings, Inc. | 5,053 | 248,709 | ||||||
|
| |||||||
| 3,441,558 | ||||||||
|
| |||||||
Paper Packaging – 5.3% |
| |||||||
Avery Dennison Corp. | 10,884 | 513,834 | ||||||
Bemis Co., Inc. | 11,521 | 449,434 | ||||||
Graphic Packaging Holding Co. (a) | 37,133 | 445,596 | ||||||
MeadWestvaco Corp. | 19,818 | 828,392 | ||||||
Packaging Corp. of America | 11,153 | 737,883 | ||||||
Rock Tenn Co. Class A | 8,122 | 807,570 | ||||||
See accompanying notes which are an integral part of the financial statements.
| 59 | Annual Report |
Table of Contents
Fidelity MSCI Materials Index ETF
Investments – continued
| Common Stocks – continued | ||||||||
| Shares | Value | |||||||
CONTAINERS & PACKAGING – continued |
| |||||||
Paper Packaging – continued |
| |||||||
Sealed Air Corp. | 23,184 | $ | 744,670 | |||||
Sonoco Products Co. | 11,590 | 453,633 | ||||||
|
| |||||||
| 4,981,012 | ||||||||
|
| |||||||
TOTAL CONTAINERS & PACKAGING |
| 8,422,570 | ||||||
|
| |||||||
METALS & MINING – 17.1% |
| |||||||
Aluminum – 2.4% |
| |||||||
Alcoa, Inc. | 122,217 | 2,003,137 | ||||||
Century Aluminum Co. (a) | 6,093 | 114,548 | ||||||
Kaiser Aluminum Corp. | 2,051 | 158,378 | ||||||
|
| |||||||
| 2,276,063 | ||||||||
|
| |||||||
Diversified Metals & Mining – 5.9% |
| |||||||
Compass Minerals International, Inc. | 3,792 | 326,188 | ||||||
Freeport-McMoRan, Inc. | 117,758 | 4,382,953 | ||||||
Globe Specialty Metals, Inc. | 6,777 | 128,966 | ||||||
Horsehead Holding Corp. (a) | 5,734 | 107,398 | ||||||
Materion Corp. | 2,244 | 72,503 | ||||||
Molycorp, Inc. (a) | 21,943 | 45,861 | ||||||
RTI International Metals, Inc. (a) | 3,265 | 81,168 | ||||||
US Silica Holdings, Inc. | 6,081 | 341,874 | ||||||
Walter Energy, Inc. | 7,185 | 41,314 | ||||||
|
| |||||||
| 5,528,225 | ||||||||
|
| |||||||
Gold – 2.1% |
| |||||||
Allied Nevada Gold Corp. (a) | 11,589 | 36,274 | ||||||
Gold Resource Corp. | 4,369 | 23,068 | ||||||
Newmont Mining Corp. | 56,471 | 1,406,693 | ||||||
Royal Gold, Inc. | 7,304 | 551,963 | ||||||
|
| |||||||
| 2,017,998 | ||||||||
|
| |||||||
Precious Metals & Minerals – 0.6% |
| |||||||
Coeur Mining, Inc. (a) | 11,793 | 91,986 | ||||||
Hecla Mining Co. | 38,832 | 122,709 | ||||||
McEwen Mining, Inc. (a) | 25,325 | 72,176 | ||||||
Stillwater Mining Co. (a) | 13,583 | 243,136 | ||||||
|
| |||||||
| 530,007 | ||||||||
|
| |||||||
Steel – 6.1% | ||||||||
AK Steel Holding Corp. (a) | 15,572 | 141,705 | ||||||
Allegheny Technologies, Inc. | 12,336 | 464,450 | ||||||
AM Castle & Co. (a) | 1,864 | 15,434 | ||||||
Carpenter Technology Corp. | 6,038 | 326,897 | ||||||
Cliffs Natural Resources, Inc. | 16,561 | 288,990 | ||||||
Commercial Metals Co. | 12,687 | 218,724 | ||||||
Haynes International, Inc. | 1,428 | 71,114 | ||||||
Nucor Corp. | 36,106 | 1,813,243 | ||||||
Olympic Steel, Inc. | 1,088 | 23,860 | ||||||
Reliance Steel & Aluminum Co. | 8,798 | 600,464 | ||||||
Schnitzer Steel Industries, Inc. Class A | 3,001 | 80,157 | ||||||
Steel Dynamics, Inc. | 25,267 | 535,913 | ||||||
SunCoke Energy, Inc. (a) | 7,917 | 180,745 | ||||||
TimkenSteel Corp. (a) | 4,202 | 182,829 | ||||||
| Shares | Value | |||||||
United States Steel Corp. | 16,388 | $ | 548,834 | |||||
Universal Stainless & Alloy Products, Inc. (a) | 816 | 23,525 | ||||||
Worthington Industries, Inc. | 6,011 | 229,921 | ||||||
|
| |||||||
| 5,746,805 | ||||||||
|
| |||||||
TOTAL METALS & MINING |
| 16,099,098 | ||||||
|
| |||||||
PAPER & FOREST PRODUCTS – 4.1% |
| |||||||
Forest Products – 0.4% |
| |||||||
Boise Cascade Co. (a) | 3,821 | 107,561 | ||||||
Deltic Timber Corp. | 1,299 | 79,369 | ||||||
Louisiana-Pacific Corp. (a) | 16,085 | 217,791 | ||||||
|
| |||||||
| 404,721 | ||||||||
|
| |||||||
Paper Products – 3.7% |
| |||||||
Clearwater Paper Corp. (a) | 2,387 | 161,361 | ||||||
Domtar Corp. | 7,383 | 265,197 | ||||||
International Paper Co. | 47,274 | 2,245,515 | ||||||
KapStone Paper and Packaging Corp. (a) | 9,798 | 291,393 | ||||||
Neenah Paper, Inc. | 1,844 | 91,499 | ||||||
PH Glatfelter Co. | 4,888 | 116,334 | ||||||
Resolute Forest Products, Inc. (a) | 7,528 | 115,856 | ||||||
Schweitzer-Mauduit International, Inc. | 3,461 | 141,313 | ||||||
Wausau Paper Corp. | 4,836 | 48,699 | ||||||
|
| |||||||
| 3,477,167 | ||||||||
|
| |||||||
TOTAL PAPER & FOREST PRODUCTS |
| 3,881,888 | ||||||
|
| |||||||
TOTAL COMMON STOCKS |
| 93,961,317 | ||||||
|
| |||||||
| Money Market Funds – 0.2% | ||||||||
SSgA US Treasury Money Market Fund, | 177,447 | 177,447 | ||||||
|
| |||||||
TOTAL INVESTMENT PORTFOLIO – 100.1% |
| 94,138,764 | ||||||
NET OTHER ASSETS (LIABILITIES) – (0.1%) |
| (97,200 | ) | |||||
|
| |||||||
NET ASSETS – 100% |
| $ | 94,041,564 | |||||
|
| |||||||
Legend
| (a) | Non-income producing. |
| (b) | The rate quoted is the annualized seven-day yield of the fund at period end. |
See accompanying notes which are an integral part of the financial statements.
| Annual Report | 60 |
Table of Contents
Other Information
The following is a summary of the inputs used, as of July 31, 2014, involving the Fund’s assets and liabilities carried at fair value. The inputs or methodology used for valuing securities may not be an indication of the risk associated with investing in those securities. For more information on valuation inputs, and their aggregation into the levels used in the table below, please refer to the Investment Valuation section at the end of this listing.
| Valuation Inputs at Reporting Date: | ||||||||||||||||
| Description | Total | Level 1 | Level 2 | Level 3 | ||||||||||||
Investments in Securities: | ||||||||||||||||
Common Stocks | $ | 93,961,317 | $ | 93,961,317 | $ | — | $ | — | ||||||||
Money Market Funds | 177,447 | 177,447 | — | — | ||||||||||||
|
|
|
|
|
|
|
| |||||||||
Total Investments in Securities: | $ | 94,138,764 | $ | 94,138,764 | $ | — | $ | — | ||||||||
|
|
|
|
|
|
|
| |||||||||
See accompanying notes which are an integral part of the financial statements.
| 61 | Annual Report |
Table of Contents
Fidelity MSCI Telecommunication Services Index ETF
Investments July 31, 2014
Showing Percentage of Net Assets
| Common Stocks – 100.0% | ||||||||
| Shares | Value | |||||||
DIVERSIFIED TELECOMMUNICATION SERVICES – 81.0% |
| |||||||
Alternative Carriers – 17.6% |
| |||||||
8x8, Inc. (a) | 139,657 | $ | 1,128,429 | |||||
Cogent Communications Holdings, Inc. | 31,422 | 1,090,658 | ||||||
inContact, Inc. (a) | 121,610 | 971,664 | ||||||
Inteliquent, Inc. | 66,544 | 706,032 | ||||||
Iridium Communications, Inc. (a) | 131,724 | 1,077,502 | ||||||
Level 3 Communications, Inc. (a) | 47,132 | 2,072,865 | ||||||
Lumos Networks Corp. | 63,524 | 974,458 | ||||||
Premiere Global Services, Inc. (a) | 75,333 | 986,862 | ||||||
tw telecom, Inc. (a) | 47,084 | 1,918,202 | ||||||
Vonage Holdings Corp. (a) | 280,938 | 977,664 | ||||||
|
| |||||||
| 11,904,336 | ||||||||
|
| |||||||
Integrated Telecommunication Services – 63.4% |
| |||||||
AT&T, Inc. | 424,228 | 15,098,274 | ||||||
Atlantic Tele-Network, Inc. | 18,146 | 1,061,722 | ||||||
CenturyLink, Inc. | 80,383 | 3,154,229 | ||||||
Cincinnati Bell, Inc. (a) | 273,981 | 1,043,868 | ||||||
Consolidated Communications Holdings, Inc. | 54,965 | 1,230,117 | ||||||
Frontier Communications Corp. | 298,884 | 1,957,690 | ||||||
General Communication, Inc. Class A (a) | 86,413 | 954,000 | ||||||
IDT Corp. Class B | 61,677 | 961,544 | ||||||
Verizon Communications, Inc. | 301,241 | 15,188,571 | ||||||
Windstream Holdings, Inc. | 181,899 | 2,084,563 | ||||||
|
| |||||||
| 42,734,578 | ||||||||
|
| |||||||
TOTAL DIVERSIFIED TELECOMMUNICATION SERVICES |
| 54,638,914 | ||||||
|
| |||||||
| Shares | Value | |||||||
WIRELESS TELECOMMUNICATION SERVICES – 19.0% |
| |||||||
Wireless Telecommunication Services – 19.0% |
| |||||||
Boingo Wireless, Inc. (a) | 139,639 | $ | 853,194 | |||||
Contra Leap Wireless (a) | 18,242 | 45,970 | ||||||
NTELOS Holdings Corp. | 68,127 | 820,249 | ||||||
SBA Communications Corp. Class A (a) | 28,023 | 2,996,500 | ||||||
Shenandoah Telecommunications Co. | 39,658 | 1,098,923 | ||||||
Spok Holdings, Inc. | 67,643 | 1,012,616 | ||||||
Sprint Corp. (a) | 233,832 | 1,718,665 | ||||||
T-Mobile US, Inc. (a) | 64,770 | 2,133,524 | ||||||
Telephone & Data Systems, Inc. | 47,852 | 1,196,300 | ||||||
United States Cellular Corp. (a) | 23,780 | 929,560 | ||||||
|
| |||||||
TOTAL WIRELESS TELECOMMUNICATION SERVICES |
| 12,805,501 | ||||||
|
| |||||||
TOTAL COMMON STOCKS |
| 67,444,415 | ||||||
|
| |||||||
| Money Market Funds – 0.0% | ||||||||
SSgA US Treasury Money Market Fund, 0.00% (b) | 6,888 | 6,888 | ||||||
|
| |||||||
TOTAL INVESTMENT PORTFOLIO – 100.0% |
| 67,451,303 | ||||||
NET OTHER ASSETS (LIABILITIES) – 0.0% |
| (4,358 | ) | |||||
|
| |||||||
NET ASSETS – 100% |
| $ | 67,446,945 | |||||
|
| |||||||
Legend
| (a) | Non-income producing. |
| (b) | The rate quoted is the annualized seven-day yield of the fund at period end. |
Other Information
The following is a summary of the inputs used, as of July 31, 2014, involving the Fund’s assets and liabilities carried at fair value. The inputs or methodology used for valuing securities may not be an indication of the risk associated with investing in those securities. For more information on valuation inputs, and their aggregation into the levels used in the table below, please refer to the Investment Valuation section at the end of this listing.
| Valuation Inputs at Reporting Date: | ||||||||||||||||
| Description | Total | Level 1 | Level 2 | Level 3 | ||||||||||||
Investments in Securities: | ||||||||||||||||
Common Stocks | $ | 67,444,415 | $ | 67,398,445 | $ | — | $ | 45,970 | ||||||||
Money Market Funds | 6,888 | 6,888 | — | — | ||||||||||||
|
|
|
|
|
|
|
| |||||||||
Total Investments in Securities: | $ | 67,451,303 | $ | 67,405,333 | $ | — | $ | 45,970 | ||||||||
|
|
|
|
|
|
|
| |||||||||
See accompanying notes which are an integral part of the financial statements.
| Annual Report | 62 |
Table of Contents
Fidelity MSCI Utilities Index ETF
Investments July 31, 2014
Showing Percentage of Net Assets
| Common Stocks – 99.8% | ||||||||
| Shares | Value | |||||||
ELECTRIC UTILITIES – 52.2% |
| |||||||
Electric Utilities – 52.2% |
| |||||||
ALLETE, Inc. | 8,098 | $ | 379,958 | |||||
American Electric Power Co., Inc. | 92,031 | 4,784,692 | ||||||
Cleco Corp. | 11,487 | 640,285 | ||||||
Duke Energy Corp. | 133,220 | 9,609,159 | ||||||
Edison International | 58,423 | 3,201,580 | ||||||
El Paso Electric Co. | 7,717 | 284,371 | ||||||
Empire District Electric Co. | 8,310 | 203,678 | ||||||
Entergy Corp. | 33,721 | 2,455,900 | ||||||
Exelon Corp. | 157,608 | 4,898,457 | ||||||
FirstEnergy Corp. | 74,937 | 2,338,784 | ||||||
Great Plains Energy, Inc. | 29,185 | �� | 723,496 | |||||
Hawaiian Electric Industries, Inc. | 19,314 | 456,197 | ||||||
IDACORP, Inc. | 9,551 | 511,456 | ||||||
ITC Holdings Corp. | 29,808 | 1,076,069 | ||||||
MGE Energy, Inc. | 6,564 | 246,938 | ||||||
NextEra Energy, Inc. | 82,108 | 7,709,120 | ||||||
Northeast Utilities | 59,562 | 2,614,772 | ||||||
NRG Yield, Inc. Class A | 6,216 | 324,786 | ||||||
OGE Energy Corp. | 37,561 | 1,350,318 | ||||||
Otter Tail Corp. | 6,198 | 173,296 | ||||||
Pepco Holdings, Inc. | 47,397 | 1,272,610 | ||||||
Pinnacle West Capital Corp. | 20,858 | 1,115,694 | ||||||
PNM Resources, Inc. | 15,186 | 389,521 | ||||||
Portland General Electric Co. | 14,861 | 474,512 | ||||||
PPL Corp. | 119,019 | 3,926,437 | ||||||
The Southern Co. | 167,472 | 7,249,863 | ||||||
UIL Holdings Corp. | 10,774 | 378,275 | ||||||
Unitil Corp. | 2,623 | 83,936 | ||||||
UNS Energy Corp. | 7,926 | 478,889 | ||||||
Westar Energy, Inc. | 24,404 | 879,520 | ||||||
Xcel Energy, Inc. | 94,069 | 2,897,325 | ||||||
|
| |||||||
TOTAL ELECTRIC UTILITIES |
| 63,129,894 | ||||||
|
| |||||||
GAS UTILITIES – 6.6% |
| |||||||
Gas Utilities – 6.6% | ||||||||
AGL Resources, Inc. | 22,499 | 1,161,848 | ||||||
Atmos Energy Corp. | 18,743 | 905,662 | ||||||
Chesapeake Utilities Corp. | 1,885 | 122,695 | ||||||
National Fuel Gas Co. | 13,487 | 929,389 | ||||||
New Jersey Resources Corp. | 8,026 | 409,968 | ||||||
Northwest Natural Gas Co. | 5,212 | 225,263 | ||||||
ONE Gas, Inc. | 9,809 | 353,124 | ||||||
Piedmont Natural Gas Co., Inc. | 14,790 | 513,065 | ||||||
Questar Corp. | 33,208 | 738,546 | ||||||
South Jersey Industries, Inc. | 6,260 | 335,348 | ||||||
Southwest Gas Corp. | 8,853 | 438,489 | ||||||
The Laclede Group, Inc. | 7,979 | 374,853 | ||||||
UGI Corp. | 21,722 | 1,054,386 | ||||||
WGL Holdings, Inc. | 9,892 | 385,590 | ||||||
|
| |||||||
TOTAL GAS UTILITIES |
| 7,948,226 | ||||||
|
| |||||||
| Shares | Value | |||||||
INDEPENDENT POWER AND RENEWABLE ELECTRICITY PRODUCERS – 4.6% |
| |||||||
Independent Power Producers & Energy Traders – 4.6% |
| |||||||
AES Corp. | 129,944 | $ | 1,898,482 | |||||
Calpine Corp. (a) | 67,969 | 1,498,037 | ||||||
Dynegy, Inc. (a) | 9,454 | 251,003 | ||||||
NRG Energy, Inc. | 61,445 | 1,902,337 | ||||||
Ormat Technologies, Inc. | 3,172 | 81,806 | ||||||
|
| |||||||
TOTAL INDEPENDENT POWER AND RENEWABLE ELECTRICITY PRODUCERS |
| 5,631,665 | ||||||
|
| |||||||
MULTI-UTILITIES – 33.8% |
| |||||||
Multi-Utilities – 33.8% |
| |||||||
Alliant Energy Corp. | 20,990 | 1,185,935 | ||||||
Ameren Corp. | 45,850 | 1,762,933 | ||||||
Avista Corp. | 11,344 | 352,004 | ||||||
Black Hills Corp. | 8,471 | 446,506 | ||||||
CenterPoint Energy, Inc. | 76,978 | 1,872,105 | ||||||
CMS Energy Corp. | 50,520 | 1,461,544 | ||||||
Consolidated Edison, Inc. | 55,289 | 3,101,160 | ||||||
Dominion Resources, Inc. | 109,673 | 7,418,282 | ||||||
DTE Energy Co. | 33,445 | 2,468,910 | ||||||
Integrys Energy Group, Inc. | 15,139 | 992,513 | ||||||
MDU Resources Group, Inc. | 34,049 | 1,072,884 | ||||||
NiSource, Inc. | 59,306 | 2,234,650 | ||||||
NorthWestern Corp. | 7,401 | 342,074 | ||||||
PG&E Corp. | 86,378 | 3,858,505 | ||||||
Public Service Enterprise Group, Inc. | 95,528 | 3,359,720 | ||||||
SCANA Corp. | 25,366 | 1,290,622 | ||||||
Sempra Energy | 43,932 | 4,380,460 | ||||||
TECO Energy, Inc. | 44,244 | 772,500 | ||||||
Vectren Corp. | 15,654 | 596,261 | ||||||
Wisconsin Energy Corp. | 42,690 | 1,860,430 | ||||||
|
| |||||||
TOTAL MULTI-UTILITIES |
| 40,829,998 | ||||||
|
| |||||||
WATER UTILITIES – 2.6% |
| |||||||
Water Utilities – 2.6% |
| |||||||
American States Water Co. | 7,459 | 227,872 | ||||||
American Water Works Co., Inc. | 33,782 | 1,613,766 | ||||||
Aqua America, Inc. | 33,515 | 796,987 | ||||||
California Water Service Group | 9,202 | 209,529 | ||||||
Connecticut Water Service, Inc. | 2,189 | 69,807 | ||||||
Middlesex Water Co. | 3,237 | 65,776 | ||||||
Pattern Energy Group Inc. | 7,023 | 217,643 | ||||||
SJW Corp. | 154 | 4,129 | ||||||
|
| |||||||
TOTAL WATER UTILITIES |
| 3,205,509 | ||||||
|
| |||||||
TOTAL COMMON STOCKS |
| 120,745,292 | ||||||
|
| |||||||
See accompanying notes which are an integral part of the financial statements.
| 63 | Annual Report |
Table of Contents
Fidelity MSCI Utilities Index ETF
Investments – continued
| Money Market Funds – 0.1% | ||||||||
| Shares | Value | |||||||
SSgA US Treasury Money Market Fund, 0.00% (b) | 46,736 | $ | 46,736 | |||||
|
| |||||||
TOTAL INVESTMENT PORTFOLIO – 99.9% |
| 120,792,028 | ||||||
NET OTHER ASSETS (LIABILITIES) – 0.1% |
| 156,633 | ||||||
|
| |||||||
NET ASSETS – 100% |
| $ | 120,948,661 | |||||
|
| |||||||
Legend
| (a) | Non-income producing. |
| (b) | The rate quoted is the annualized seven-day yield of the fund at period end. |
Other Information
The following is a summary of the inputs used, as of July 31, 2014, involving the Fund’s assets and liabilities carried at fair value. The inputs or methodology used for valuing securities may not be an indication of the risk associated with investing in those securities. For more information on valuation inputs, and their aggregation into the levels used in the table below, please refer to the Investment Valuation section at the end of this listing.
| Valuation Inputs at Reporting Date: | ||||||||||||||||
| Description | Total | Level 1 | Level 2 | Level 3 | ||||||||||||
Investments in Securities: | ||||||||||||||||
Common Stocks | $ | 120,745,292 | $ | 120,745,292 | $ | — | $ | — | ||||||||
Money Market Funds | 46,736 | 46,736 | — | — | ||||||||||||
|
|
|
|
|
|
|
| |||||||||
Total Investments in Securities: | $ | 120,792,028 | $ | 120,792,028 | $ | — | $ | — | ||||||||
|
|
|
|
|
|
|
| |||||||||
See accompanying notes which are an integral part of the financial statements.
| Annual Report | 64 |
Table of Contents
[THIS PAGE INTENTIONALLY LEFT BLANK]
| 65 | Annual Report |
Table of Contents
| Statements of Assets and Liabilities | ||||||||||||||||||||
| July 31, 2014 | ||||||||||||||||||||
| Fidelity MSCI Consumer Discretionary Index ETF | Fidelity MSCI Consumer Staples Index ETF | Fidelity MSCI Energy Index ETF | Fidelity MSCI Financials Index ETF | Fidelity MSCI Health Care Index ETF | ||||||||||||||||
Assets | ||||||||||||||||||||
Investments in securities, at value – See accompanying schedule | $ | 75,716,698 | $ | 73,225,540 | $ | 145,326,103 | $ | 126,402,557 | $ | 187,169,010 | ||||||||||
Cash | — | — | — | 835 | — | |||||||||||||||
Receivable for investments sold | — | — | — | — | 574 | |||||||||||||||
Receivable for fund shares sold | — | — | 7,351 | — | 10,695 | |||||||||||||||
Dividends receivable | 32,382 | 161,496 | 105,305 | 77,096 | 221,784 | |||||||||||||||
|
|
|
|
|
|
|
|
|
| |||||||||||
Total assets | 75,749,080 | 73,387,036 | 145,438,759 | 126,480,488 | 187,402,063 | |||||||||||||||
|
|
|
|
|
|
|
|
|
| |||||||||||
Liabilities | ||||||||||||||||||||
Payable to custodian bank | — | — | — | — | 487 | |||||||||||||||
Payable for investments purchased | — | 59,391 | — | 71,185 | 1,427 | |||||||||||||||
Payable for fund shares redeemed | — | 74,045 | — | — | — | |||||||||||||||
Accrued management fees | 7,811 | 9,739 | 13,765 | 12,421 | 18,151 | |||||||||||||||
|
|
|
|
|
|
|
|
|
| |||||||||||
Total liabilities | 7,811 | 143,175 | 13,765 | 83,606 | 20,065 | |||||||||||||||
|
|
|
|
|
|
|
|
|
| |||||||||||
Net Assets | $ | 75,741,269 | $ | 73,243,861 | $ | 145,424,994 | $ | 126,396,882 | $ | 187,381,998 | ||||||||||
|
|
|
|
|
|
|
|
|
| |||||||||||
Net Assets consist of: | ||||||||||||||||||||
Paid in capital | $ | 75,050,139 | $ | 76,401,850 | $ | 142,917,549 | $ | 125,526,000 | $ | 179,272,367 | ||||||||||
Undistributed net investment income | 25,993 | 194,075 | 102,023 | 68,243 | 214,168 | |||||||||||||||
Accumulated undistributed net realized gain (loss) on investments | (130,614 | ) | (42,793 | ) | (75,557 | ) | (120,472 | ) | (61,247 | ) | ||||||||||
Net unrealized appreciation (depreciation) on investments | 795,751 | (3,309,271 | ) | 2,480,979 | 923,111 | 7,956,710 | ||||||||||||||
|
|
|
|
|
|
|
|
|
| |||||||||||
Net Assets | $ | 75,741,269 | $ | 73,243,861 | $ | 145,424,994 | $ | 126,396,882 | $ | 187,381,998 | ||||||||||
|
|
|
|
|
|
|
|
|
| |||||||||||
Shares outstanding | 2,850,000 | 2,800,000 | 5,200,000 | 4,750,000 | 6,450,000 | |||||||||||||||
|
|
|
|
|
|
|
|
|
| |||||||||||
Net Asset Value, offering price and redemption price per share | $ | 26.58 | $ | 26.16 | $ | 27.97 | $ | 26.61 | $ | 29.05 | ||||||||||
|
|
|
|
|
|
|
|
|
| |||||||||||
Investments at cost | $ | 74,920,947 | $ | 76,534,811 | $ | 142,845,124 | $ | 125,479,446 | $ | 179,212,300 | ||||||||||
|
|
|
|
|
|
|
|
|
| |||||||||||
See accompanying notes which are an integral part of the financial statements.
| Annual Report | 66 |
Table of Contents
| Statements of Assets and Liabilities | ||||||||||||||||||||
| July 31, 2014 | ||||||||||||||||||||
| Fidelity MSCI Industrials Index ETF | Fidelity MSCI Information Technology Index ETF | Fidelity MSCI Materials Index ETF | Fidelity MSCI Telecommunication Services Index ETF | Fidelity MSCI Utilities Index ETF | ||||||||||||||||
Assets | ||||||||||||||||||||
Investments in securities, at value – See accompanying schedule | $ | 100,629,613 | $ | 181,596,206 | $ | 94,138,764 | $ | 67,451,303 | $ | 120,792,028 | ||||||||||
Receivable for fund shares sold | — | 3,921 | 5,687 | 963 | 2,598 | |||||||||||||||
Dividends receivable | 88,916 | 28,607 | 71,828 | 365,871 | 165,480 | |||||||||||||||
|
|
|
|
|
|
|
|
|
| |||||||||||
Total assets | 100,718,529 | 181,628,734 | 94,216,279 | 67,818,137 | 120,960,106 | |||||||||||||||
|
|
|
|
|
|
|
|
|
| |||||||||||
Liabilities | ||||||||||||||||||||
Payable for investments purchased | — | — | 165,656 | 364,439 | — | |||||||||||||||
Accrued management fees | 12,717 | 17,601 | 9,059 | 6,753 | 11,445 | |||||||||||||||
|
|
|
|
|
|
|
|
|
| |||||||||||
Total liabilities | 12,717 | 17,601 | 174,715 | 371,192 | 11,445 | |||||||||||||||
|
|
|
|
|
|
|
|
|
| |||||||||||
Net Assets | $ | 100,705,812 | $ | 181,611,133 | $ | 94,041,564 | $ | 67,446,945 | $ | 120,948,661 | ||||||||||
|
|
|
|
|
|
|
|
|
| |||||||||||
Net Assets consist of: | ||||||||||||||||||||
Paid in capital | $ | 105,321,700 | $ | 172,029,144 | $ | 92,912,612 | $ | 65,784,124 | $ | 124,639,555 | ||||||||||
Undistributed net investment income | 19,395 | 69,961 | 55,744 | 315,702 | 185,062 | |||||||||||||||
Accumulated undistributed net realized gain (loss) on investments | (80,968 | ) | (116,533 | ) | (66,556 | ) | (133,409 | ) | (21,484 | ) | ||||||||||
Net unrealized appreciation (depreciation) on investments | (4,554,315 | ) | 9,628,561 | 1,139,764 | 1,480,528 | (3,854,472 | ) | |||||||||||||
|
|
|
|
|
|
|
|
|
| |||||||||||
Net Assets | $ | 100,705,812 | $ | 181,611,133 | $ | 94,041,564 | $ | 67,446,945 | $ | 120,948,661 | ||||||||||
|
|
|
|
|
|
|
|
|
| |||||||||||
Shares outstanding | 3,750,000 | 6,200,000 | 3,400,000 | 2,500,000 | 4,500,000 | |||||||||||||||
|
|
|
|
|
|
|
|
|
| |||||||||||
Net Asset Value, offering price and redemption price per share | $ | 26.85 | $ | 29.29 | $ | 27.66 | $ | 26.98 | $ | 26.88 | ||||||||||
|
|
|
|
|
|
|
|
|
| |||||||||||
Investments at cost | $ | 105,183,928 | $ | 171,967,645 | $ | 92,999,000 | $ | 65,970,775 | $ | 124,646,500 | ||||||||||
|
|
|
|
|
|
|
|
|
| |||||||||||
See accompanying notes which are an integral part of the financial statements.
| 67 | Annual Report |
Table of Contents
Financial Statements – continued
| Statements of Operations | �� | |||||||||||||||||||
| For the period October 21, 2013 (commencement of operations) to July 31, 2014 | ||||||||||||||||||||
| Fidelity MSCI Consumer Discretionary Index ETF | Fidelity MSCI Consumer Staples Index ETF | Fidelity MSCI Energy Index ETF | Fidelity MSCI Financials Index ETF | Fidelity MSCI Health Care Index ETF | ||||||||||||||||
Investment Income | ||||||||||||||||||||
Dividends | $ | 442,529 | $ | 793,222 | $ | 878,746 | $ | 1,044,741 | $ | 1,074,964 | ||||||||||
|
|
|
|
|
|
|
|
|
| |||||||||||
Expenses | ||||||||||||||||||||
Management fees | 39,721 | 35,902 | 55,369 | 59,222 | 86,152 | |||||||||||||||
Independent trustees’ compensation | 615 | 495 | 804 | 904 | 1,294 | |||||||||||||||
|
|
|
|
|
|
|
|
|
| |||||||||||
Total expenses | 40,336 | 36,397 | 56,173 | 60,126 | 87,446 | |||||||||||||||
|
|
|
|
|
|
|
|
|
| |||||||||||
Net investment income (loss) | 402,193 | 756,825 | 822,573 | 984,615 | 987,518 | |||||||||||||||
|
|
|
|
|
|
|
|
|
| |||||||||||
Realized and Unrealized Gain (Loss) | ||||||||||||||||||||
Net realized gain (loss) on investment securities | (131,590 | ) | (54,784 | ) | (85,226 | ) | (128,816 | ) | (61,459 | ) | ||||||||||
Net realized gain (loss) on In-kind redemptions | 131,127 | 2,337,254 | 3,233,239 | 1,569,042 | 1,547,310 | |||||||||||||||
|
|
|
|
|
|
|
|
|
| |||||||||||
Total net realized gain (loss) | (463 | ) | 2,282,470 | 3,148,013 | 1,440,226 | 1,485,851 | ||||||||||||||
|
|
|
|
|
|
|
|
|
| |||||||||||
Change in net unrealized appreciation (depreciation) on investment securities | 795,751 | (3,309,271 | ) | 2,480,979 | 923,111 | 7,956,710 | ||||||||||||||
|
|
|
|
|
|
|
|
|
| |||||||||||
Net gain (loss) | 795,288 | (1,026,801 | ) | 5,628,992 | 2,363,337 | 9,442,561 | ||||||||||||||
|
|
|
|
|
|
|
|
|
| |||||||||||
Net increase (decrease) in net assets resulting from operations | $ | 1,197,481 | $ | (269,976 | ) | $ | 6,451,565 | $ | 3,347,952 | $ | 10,430,079 | |||||||||
|
|
|
|
|
|
|
|
|
| |||||||||||
See accompanying notes which are an integral part of the financial statements.
| Annual Report | 68 |
Table of Contents
| Statements of Operations | ||||||||||||||||||||
| For the period October 21, 2013 (commencement of operations) to July 31, 2014 | ||||||||||||||||||||
| Fidelity MSCI Industrials Index ETF | Fidelity MSCI Information Technology Index ETF | Fidelity MSCI Materials Index ETF | Fidelity MSCI Telecommunication Services Index ETF | Fidelity MSCI Utilities Index ETF | ||||||||||||||||
Investment Income | ||||||||||||||||||||
Dividends | $ | 862,630 | $ | 873,943 | $ | 616,750 | $ | 870,328 | $ | 1,077,608 | ||||||||||
|
|
|
|
|
|
|
|
|
| |||||||||||
Expenses | ||||||||||||||||||||
Management fees | 58,016 | 82,779 | 41,528 | 28,454 | 39,022 | |||||||||||||||
Independent trustees’ compensation | 869 | 1,253 | 628 | 422 | 524 | |||||||||||||||
|
|
|
|
|
|
|
|
|
| |||||||||||
Total expenses | 58,885 | 84,032 | 42,156 | 28,876 | 39,546 | |||||||||||||||
|
|
|
|
|
|
|
|
|
| |||||||||||
Net investment income (loss) | 803,745 | 789,911 | 574,594 | 841,452 | 1,038,062 | |||||||||||||||
|
|
|
|
|
|
|
|
|
| |||||||||||
Realized and Unrealized Gain (Loss) | ||||||||||||||||||||
Net realized gain (loss) on investment securities | (90,561 | ) | (119,061 | ) | (72,584 | ) | (149,032 | ) | (28,725 | ) | ||||||||||
Net realized gain (loss) on In-kind redemptions | 3,750,707 | 2,880,785 | 2,226,063 | (117,283 | ) | 1,044,458 | ||||||||||||||
|
|
|
|
|
|
|
|
|
| |||||||||||
Total net realized gain (loss) | 3,660,146 | 2,761,724 | 2,153,479 | (266,315 | ) | 1,015,733 | ||||||||||||||
|
|
|
|
|
|
|
|
|
| |||||||||||
Change in net unrealized appreciation (depreciation) on investment securities | (4,554,315 | ) | 9,628,561 | 1,139,764 | 1,480,528 | (3,854,472 | ) | |||||||||||||
|
|
|
|
|
|
|
|
|
| |||||||||||
Net gain (loss) | (894,169 | ) | 12,390,285 | 3,293,243 | 1,214,213 | (2,838,739 | ) | |||||||||||||
|
|
|
|
|
|
|
|
|
| |||||||||||
Net increase (decrease) in net assets resulting from operations | $ | (90,424 | ) | $ | 13,180,196 | $ | 3,867,837 | $ | 2,055,665 | $ | (1,800,677 | ) | ||||||||
|
|
|
|
|
|
|
|
|
| |||||||||||
See accompanying notes which are an integral part of the financial statements.
| 69 | Annual Report |
Table of Contents
Financial Statements – continued
| Statements of Changes in Net Assets | ||||||||||||||||||||
| For the period October 21, 2013 (commencement of operations) to July 31, 2014 | ||||||||||||||||||||
| Fidelity MSCI Consumer Discretionary Index ETF | Fidelity MSCI Consumer Staples Index ETF | Fidelity MSCI Energy Index ETF | Fidelity MSCI Financials Index ETF | Fidelity MSCI Health Care Index ETF | ||||||||||||||||
Increase (Decrease) in Net Assets | ||||||||||||||||||||
Operations | ||||||||||||||||||||
Net investment income (loss) | $ | 402,193 | $ | 756,825 | $ | 822,573 | $ | 984,615 | $ | 987,518 | ||||||||||
Net realized gain (loss) | (463 | ) | 2,282,470 | 3,148,013 | 1,440,226 | 1,485,851 | ||||||||||||||
Change in net unrealized appreciation (depreciation) | 795,751 | (3,309,271 | ) | 2,480,979 | 923,111 | 7,956,710 | ||||||||||||||
|
|
|
|
|
|
|
|
|
| |||||||||||
Net increase (decrease) in net assets resulting from operations | 1,197,481 | (269,976 | ) | 6,451,565 | 3,347,952 | 10,430,079 | ||||||||||||||
|
|
|
|
|
|
|
|
|
| |||||||||||
Distributions to shareholders from net investment income | (376,200 | ) | (562,750 | ) | (720,550 | ) | (916,500 | ) | (773,350 | ) | ||||||||||
|
|
|
|
|
|
|
|
|
| |||||||||||
Share transactions | ||||||||||||||||||||
Proceeds from sales of shares | 81,215,834 | 111,358,389 | 158,350,208 | 148,751,276 | 191,567,033 | |||||||||||||||
Cost of shares redeemed | (6,295,846 | ) | (37,281,802 | ) | (18,656,229 | ) | (24,785,846 | ) | (13,841,764 | ) | ||||||||||
|
|
|
|
|
|
|
|
|
| |||||||||||
Net increase (decrease) in net assets resulting from share transactions | 74,919,988 | 74,076,587 | 139,693,979 | 123,965,430 | 177,725,269 | |||||||||||||||
|
|
|
|
|
|
|
|
|
| |||||||||||
Total increase (decrease) in net assets | 75,741,269 | 73,243,861 | 145,424,994 | 126,396,882 | 187,381,998 | |||||||||||||||
Net Assets | ||||||||||||||||||||
Beginning of period | — | — | — | — | — | |||||||||||||||
|
|
|
|
|
|
|
|
|
| |||||||||||
End of period | $ | 75,741,269 | $ | 73,243,861 | $ | 145,424,994 | $ | 126,396,882 | $ | 187,381,998 | ||||||||||
|
|
|
|
|
|
|
|
|
| |||||||||||
Undistributed net investment income included in net assets at end of period | $ | 25,993 | $ | 194,075 | $ | 102,023 | $ | 68,243 | $ | 214,168 | ||||||||||
|
|
|
|
|
|
|
|
|
| |||||||||||
Other Information | ||||||||||||||||||||
Shares | ||||||||||||||||||||
Sold | 3,100,000 | 4,200,000 | 5,850,000 | 5,700,000 | 6,950,000 | |||||||||||||||
Redeemed | (250,000 | ) | (1,400,000 | ) | (650,000 | ) | (950,000 | ) | (500,000 | ) | ||||||||||
|
|
|
|
|
|
|
|
|
| |||||||||||
Net increase (decrease) | 2,850,000 | 2,800,000 | 5,200,000 | 4,750,000 | 6,450,000 | |||||||||||||||
|
|
|
|
|
|
|
|
|
| |||||||||||
See accompanying notes which are an integral part of the financial statements.
| Annual Report | 70 |
Table of Contents
| Statements of Changes in Net Assets | ||||||||||||||||||||
| For the period October 21, 2013 (commencement of operations) to July 31, 2014 | ||||||||||||||||||||
| Fidelity MSCI Industrials Index ETF | Fidelity MSCI Information Technology Index ETF | Fidelity MSCI Materials Index ETF | Fidelity MSCI Telecommunication Services Index ETF | Fidelity MSCI Utilities Index ETF | ||||||||||||||||
Increase (Decrease) in Net Assets | ||||||||||||||||||||
Operations | ||||||||||||||||||||
Net investment income (loss) | $ | 803,745 | $ | 789,911 | $ | 574,594 | $ | 841,452 | $ | 1,038,062 | ||||||||||
Net realized gain (loss) | 3,660,146 | 2,761,724 | 2,153,479 | (266,315 | ) | 1,015,733 | ||||||||||||||
Change in net unrealized appreciation (depreciation) | (4,554,315 | ) | 9,628,561 | 1,139,764 | 1,480,528 | (3,854,472 | ) | |||||||||||||
|
|
|
|
|
|
|
|
|
| |||||||||||
Net increase (decrease) in net assets resulting from operations | (90,424 | ) | 13,180,196 | 3,867,837 | 2,055,665 | (1,800,677 | ) | |||||||||||||
|
|
|
|
|
|
|
|
|
| |||||||||||
Distributions to shareholders from net investment income | (784,350 | ) | (719,950 | ) | (518,850 | ) | (525,750 | ) | (853,000 | ) | ||||||||||
|
|
|
|
|
|
|
|
|
| |||||||||||
Share transactions | ||||||||||||||||||||
Proceeds from sales of shares | 143,316,457 | 190,371,557 | 111,416,040 | 73,177,842 | 134,515,263 | |||||||||||||||
Cost of shares redeemed | (41,735,871 | ) | (21,220,670 | ) | (20,723,463 | ) | (7,260,812 | ) | (10,912,925 | ) | ||||||||||
|
|
|
|
|
|
|
|
|
| |||||||||||
Net increase (decrease) in net assets resulting from share transactions | 101,580,586 | 169,150,887 | 90,692,577 | 65,917,030 | 123,602,338 | |||||||||||||||
|
|
|
|
|
|
|
|
|
| |||||||||||
Total increase (decrease) in net assets | 100,705,812 | 181,611,133 | 94,041,564 | 67,446,945 | 120,948,661 | |||||||||||||||
Net Assets | ||||||||||||||||||||
Beginning of period | — | — | — | — | — | |||||||||||||||
|
|
|
|
|
|
|
|
|
| |||||||||||
End of period | $ | 100,705,812 | $ | 181,611,133 | $ | 94,041,564 | $ | 67,446,945 | $ | 120,948,661 | ||||||||||
|
|
|
|
|
|
|
|
|
| |||||||||||
Undistributed net investment income included in net assets at end of period | $ | 19,395 | $ | 69,961 | $ | 55,744 | $ | 315,702 | $ | 185,062 | ||||||||||
|
|
|
|
|
|
|
|
|
| |||||||||||
Other Information | ||||||||||||||||||||
Shares | ||||||||||||||||||||
Sold | 5,250,000 | 6,950,000 | 4,150,000 | 2,800,000 | 4,900,000 | |||||||||||||||
Redeemed | (1,500,000 | ) | (750,000 | ) | (750,000 | ) | (300,000 | ) | (400,000 | ) | ||||||||||
|
|
|
|
|
|
|
|
|
| |||||||||||
Net increase (decrease) | 3,750,000 | 6,200,000 | 3,400,000 | 2,500,000 | 4,500,000 | |||||||||||||||
|
|
|
|
|
|
|
|
|
| |||||||||||
See accompanying notes which are an integral part of the financial statements.
| 71 | Annual Report |
Table of Contents
Financial Statements – continued
| Financial Highlights | ||||||||||||||||||||
| Fidelity MSCI Consumer Discretionary Index ETF | Fidelity MSCI Consumer Staples Index ETF | Fidelity MSCI Energy Index ETF | Fidelity MSCI Financials Index ETF | Fidelity MSCI Health Care Index ETF | ||||||||||||||||
| Year ended July 31, | 2014A | 2014A | 2014A | 2014A | 2014A | |||||||||||||||
Selected Per-Share Data | ||||||||||||||||||||
Net asset value, beginning of period | $ | 25.17 | $ | 25.00 | $ | 24.98 | $ | 25.00 | $ | 24.97 | ||||||||||
|
|
|
|
|
|
|
|
|
| |||||||||||
Income from Investment Operations | ||||||||||||||||||||
Net investment income (loss)B | 0.25 | 0.52 | 0.38 | 0.41 | 0.30 | |||||||||||||||
Net realized and unrealized gain (loss) | 1.38 | 1.09 | C | 2.89 | 1.56 | 3.99 | ||||||||||||||
|
|
|
|
|
|
|
|
|
| |||||||||||
Total from investment operations | 1.63 | 1.61 | 3.27 | 1.97 | 4.29 | |||||||||||||||
|
|
|
|
|
|
|
|
|
| |||||||||||
Distributions from net investment income | (0.22 | ) | (0.45 | ) | (0.28 | ) | (0.36 | ) | (0.21 | ) | ||||||||||
|
|
|
|
|
|
|
|
|
| |||||||||||
Total distributions | (0.22 | ) | (0.45 | ) | (0.28 | ) | (0.36 | ) | (0.21 | ) | ||||||||||
|
|
|
|
|
|
|
|
|
| |||||||||||
Net asset value, end of period | $ | 26.58 | $ | 26.16 | $ | 27.97 | $ | 26.61 | $ | 29.05 | ||||||||||
|
|
|
|
|
|
|
|
|
| |||||||||||
Total ReturnD | 6.47 | % | 6.42 | % | 13.16 | % | 7.89 | % | 17.23 | % | ||||||||||
Ratios to Average Net AssetsE,F | ||||||||||||||||||||
Expenses before reductions | .12 | % | .12 | % | .12 | % | .12 | % | .12 | % | ||||||||||
Expenses net of fee waivers, if any | .12 | % | .12 | % | .12 | % | .12 | % | .12 | % | ||||||||||
Expenses net of all reductions | .12 | % | .12 | % | .12 | % | .12 | % | .12 | % | ||||||||||
Net investment income (loss) | 1.20 | % | 2.51 | % | 1.76 | % | 1.97 | % | 1.36 | % | ||||||||||
Supplemental Data | ||||||||||||||||||||
Net assets, end of period (000 omitted) | $ | 75,741 | $ | 73,244 | $ | 145,425 | $ | 126,397 | $ | 187,382 | ||||||||||
Portfolio turnover rateG,H,I | 5 | % | 3 | % | 4 | % | 6 | % | 4 | % | ||||||||||
| A | For the period October 21, 2013 (commencement of operations) to July 31, 2014. |
| B | Calculated based on average shares outstanding during the period. |
| C | The amount shown for a share outstanding does not correspond with the aggregate net gain (loss) on investments for the period due to the timing of share transactions in relation to fluctuating market values of the investments of a Fund. |
| D | Total returns for periods of less than one year are not annualized. |
| E | Annualized. |
| F | Expense ratios reflect operating expenses of the Fund. Expenses before reductions do not reflect amounts reimbursed by the investment adviser or reductions from brokerage service arrangements or reductions from other expense offset arrangements and do not represent the amount paid by the Fund during periods when reimbursements or reductions occur. Expenses net of fee waivers reflect expenses after reimbursement by the investment adviser but prior to reductions from brokerage service arrangements or other expense offset arrangements. Expenses net of all reductions represent the net expenses paid by the Fund but do not include expenses of the investment companies in which the fund invests. |
| G | Amount does not include the portfolio activity of any underlying funds. |
| H | Amount not annualized. |
| I | Portfolio turnover rate excludes securities received or delivered in-kind. |
See accompanying notes which are an integral part of the financial statements.
| Annual Report | 72 |
Table of Contents
| Financial Highlights | ||||||||||||||||||||
| Fidelity MSCI Industrials Index ETF | Fidelity MSCI Information Technology Index ETF | Fidelity MSCI Materials Index ETF | Fidelity MSCI Telecommunication Services Index ETF | Fidelity MSCI Utilities Index ETF | ||||||||||||||||
| Year ended July 31, | 2014A | 2014A | 2014A | 2014A | 2014A | |||||||||||||||
Selected Per-Share Data | ||||||||||||||||||||
Net asset value, beginning of period | $ | 25.20 | $ | 25.18 | $ | 24.95 | $ | 25.26 | $ | 24.99 | ||||||||||
|
|
|
|
|
|
|
|
|
| |||||||||||
Income from Investment Operations | ||||||||||||||||||||
Net investment income (loss)B | 0.35 | 0.25 | 0.35 | 0.72 | 0.67 | |||||||||||||||
Net realized and unrealized gain (loss) | 1.61 | C | 4.06 | 2.67 | 1.42 | 1.85 | C | |||||||||||||
|
|
|
|
|
|
|
|
|
| |||||||||||
Total from investment operations | 1.96 | 4.31 | 3.02 | 2.14 | 2.52 | |||||||||||||||
|
|
|
|
|
|
|
|
|
| |||||||||||
Distributions from net investment income | (0.31 | ) | (0.20 | ) | (0.31 | ) | (0.42 | ) | (0.63 | ) | ||||||||||
|
|
|
|
|
|
|
|
|
| |||||||||||
Total distributions | (0.31 | ) | (0.20 | ) | (0.31 | ) | (0.42 | ) | (0.63 | ) | ||||||||||
|
|
|
|
|
|
|
|
|
| |||||||||||
Net asset value, end of period | $ | 26.85 | $ | 29.29 | $ | 27.66 | $ | 26.98 | $ | 26.88 | ||||||||||
|
|
|
|
|
|
|
|
|
| |||||||||||
Total ReturnD | 7.75 | % | 17.14 | % | 12.15 | % | 8.57 | % | 10.13 | % | ||||||||||
Ratios to Average Net AssetsE,F | ||||||||||||||||||||
Expenses before reductions | .12 | % | .12 | % | .12 | % | .12 | % | .12 | % | ||||||||||
Expenses net of fee waivers, if any | .12 | % | .12 | % | .12 | % | .12 | % | .12 | % | ||||||||||
Expenses net of all reductions | .12 | % | .12 | % | .12 | % | .12 | % | .12 | % | ||||||||||
Net investment income (loss) | 1.65 | % | 1.14 | % | 1.64 | % | 3.51 | % | 3.15 | % | ||||||||||
Supplemental Data | ||||||||||||||||||||
Net assets, end of period (000 omitted) | $ | 100,706 | $ | 181,611 | $ | 94,042 | $ | 67,447 | $ | 120,949 | ||||||||||
Portfolio turnover rateG,H,I | 4 | % | 4 | % | 5 | % | 21 | % | 6 | % | ||||||||||
| A | For the period October 21, 2013 (commencement of operations) to July 31, 2014. |
| B | Calculated based on average shares outstanding during the period. |
| C | The amount shown for a share outstanding does not correspond with the aggregate net gain (loss) on investments for the period due to the timing of share transactions in relation to fluctuating market values of the investments of a Fund. |
| D | Total returns for periods of less than one year are not annualized. |
| E | Annualized. |
| F | Expense ratios reflect operating expenses of the Fund. Expenses before reductions do not reflect amounts reimbursed by the investment adviser or reductions from brokerage service arrangements or reductions from other expense offset arrangements and do not represent the amount paid by the Fund during periods when reimbursements or reductions occur. Expenses net of fee waivers reflect expenses after reimbursement by the investment adviser but prior to reductions from brokerage service arrangements or other expense offset arrangements. Expenses net of all reductions represent the net expenses paid by the Fund but do not include expenses of the investment companies in which the fund invests. |
| G | Amount does not include the portfolio activity of any underlying funds. |
| H | Amount not annualized. |
| I | Portfolio turnover rate excludes securities received or delivered in-kind. |
See accompanying notes which are an integral part of the financial statements.
| 73 | Annual Report |
Table of Contents
For the period ended July 31, 2014
1. Organization.
Fidelity MSCI Consumer Discretionary Index ETF, Fidelity MSCI Consumer Staples Index ETF, Fidelity MSCI Energy Index ETF, Fidelity MSCI Financials Index ETF, Fidelity MSCI Health Care Index ETF, Fidelity MSCI Industrials Index ETF, Fidelity MSCI Information Technology Index ETF, Fidelity MSCI Materials Index ETF, Fidelity MSCI Telecommunication Services Index ETF and Fidelity MSCI Utilities Index ETF (the Funds) are non-diversified exchange-traded funds of Fidelity Covington Trust (the Trust) and are authorized to issue an unlimited number of shares. The Trust is registered under the Investment Company Act of 1940, as amended (the 1940 Act), as an open-end management investment company organized as a Massachusetts business trust.
2. Significant Accounting Policies.
The financial statements have been prepared in conformity with accounting principles generally accepted in the United States of America (GAAP), which require management to make certain estimates and assumptions at the date of the financial statements. Actual results could differ from those estimates. Subsequent events, if any, through the date that the financial statements were issued have been evaluated in the preparation of the financial statements. The following summarizes the significant accounting policies of the Funds:
Investment Valuation. Investments are valued as of 4:00 p.m. Eastern time on the last calendar day of the period. In accordance with valuation policies and procedures approved by the Board of Trustees (the Board), each Fund attempts to obtain prices from one or more third party pricing vendors or brokers to value its investments. When current market prices, quotations or currency exchange rates are not readily available or reliable, investments will be fair valued in good faith by the Fidelity SelectCo, LLC (SelectCo) Fair Value Committee (the Committee), in accordance with procedures adopted by the Board. Factors used in determining fair value vary by investment type and may include market or investment specific events. The frequency with which these procedures are used cannot be predicted and they may be utilized to a significant extent. The Committee oversees each Fund’s valuation policies and procedures and is responsible for approving and reporting to the Board all fair value determinations.
Each Fund categorizes the inputs to valuation techniques used to value its investments into a disclosure hierarchy consisting of three levels as shown below:
Level 1 – quoted prices in active markets for identical investments
Level 2 – other significant observable inputs (including quoted prices for similar investments, interest rates, prepayment speeds, etc.)
Level 3 – unobservable inputs (including the Fund’s own assumptions based on the best information available)
Valuation techniques used to value each Fund’s investments by major category are as follows:
Equity securities, including restricted securities, for which market quotations are readily available, are valued at the last reported sale price or official closing price as reported by a third party pricing vendor on the primary market or exchange on which they are traded and are categorized as Level 1 in the hierarchy. In the event there were no sales during the day or closing prices are not available, securities are valued at the last quoted bid price or may be valued using the last available price and are generally categorized as Level 2 in the hierarchy. For foreign equity securities, when market or security specific events arise, comparisons to the valuation of American Depositary Receipts (ADRs), futures contracts, Exchange-Traded Funds (ETFs) and certain indexes as well as quoted prices for similar securities may be used and would be categorized as Level 2 in the hierarchy in these circumstances. Utilizing these techniques may result in transfers between Level 1 and Level 2. For equity securities, including restricted securities, where observable inputs are limited, assumptions about market activity and risk are used and these securities may be categorized as Level 3 in the hierarchy.
Investments in open-end mutual funds (Underlying Funds) are valued at their closing net asset value (NAV) each business day and are categorized as Level 1 in the hierarchy. If an unaffiliated open-end mutual fund’s NAV is unavailable, shares of that fund may be valued by another method that the Board believes reflects fair value in accordance with the Board’s fair value pricing policies and is categorized as Level 2 in the hierarchy.
Changes in valuation techniques may result in transfers in or out of an assigned level within the disclosure hierarchy. The aggregate value of investments by input level, as of July 31, 2014, is included at the end of each Fund’s Schedule of Investments.
Investment Transactions and Income. For financial reporting purposes, the Funds’ investment holdings and NAV include trades executed through the end of the last business day of the period. The NAV per share for processing shareholder transactions is calculated as of the close of business of NYSE Arca, normally 4:00 p.m. Eastern time and includes trades executed through the end of the prior business day. Gains and losses on securities sold are determined on the basis of identified cost and may include proceeds received from litigation. Dividend income is recorded on the ex-dividend date, except for certain dividends from foreign securities where the ex-dividend date may have passed, which are recorded as soon as a fund is informed of the ex-dividend date. Non-cash dividends included in dividend income, if any, are recorded at the fair market value of the securities received. Distributions received on securities that represent a return of capital or capital gain are recorded as a reduction of cost of investments and/or as a realized gain. Subsequent to ex-dividend date a fund determines the components of these distributions, based upon receipt of tax filings or other correspondence relating to the underlying investment. Interest income is accrued as earned.
| Annual Report | 74 |
Table of Contents
2. Significant Accounting Policies – continued
Expenses. Expenses directly attributable to a fund are charged to that fund. Expenses attributable to more than one fund are allocated among the respective funds on the basis of relative net assets or other appropriate methods. Expenses included in the accompanying financial statements reflect the expenses of each Fund and do not include any expenses associated with the Underlying Funds. Expense estimates are accrued in the period to which they relate and adjustments are made when actual amounts are known.
Income Tax Information and Distributions to Shareholders. Each year, each Fund intends to qualify as a regulated investment company under Subchapter M of the Internal Revenue Code, including distributing substantially all of its taxable income and realized gains. As a result, no provision for income taxes is required. As of July 31, 2014, each Fund did not have any unrecognized tax benefits in the financial statements; nor is each Fund aware of any tax positions for which it is reasonably possible that the total amounts of unrecognized tax benefits will significantly change in the next twelve months. Each Fund files a U.S. federal tax return, in addition to state and local tax returns as required. A fund’s federal income tax returns are subject to examination by the Internal Revenue Service (IRS) for a period of three fiscal years after they are filed. State and local tax returns may be subject to examination for an additional fiscal year depending on the jurisdiction. Realized gain or loss resulting from in-kind redemptions is not taxable to the Fund and is not distributed to shareholders of the Fund. Foreign taxes are provided for based on each Fund’s understanding of the tax rules and rates that exist in the foreign markets in which it invests.
Distributions are declared and recorded on the ex-dividend date. Income and capital gain distributions are determined in accordance with income tax regulations, which may differ from GAAP.
Capital accounts within the financial statements are adjusted for permanent book-tax differences. These adjustments have no impact on net assets or the results of operations. Capital accounts are not adjusted for temporary book-tax differences which will reverse in a subsequent period.
Book-tax differences are primarily due to passive foreign investment companies (PFIC), market discount and redemptions in kind, capital loss carryforwards, losses deferred due to wash sales and excise tax regulations.
The federal tax cost of investment securities and unrealized appreciation (depreciation) as of period end were as follows for each Fund:
Tax cost | Gross unrealized | Gross unrealized | Net unrealized | |||||||||||||
Fidelity MSCI Consumer Discretionary Index ETF | $ | 74,942,521 | $ | 3,136,873 | $ | (2,362,696 | ) | $ | 774,177 | |||||||
Fidelity MSCI Consumer Staples Index ETF | 76,546,891 | 113,250 | (3,434,601 | ) | (3,321,351 | ) | ||||||||||
Fidelity MSCI Energy Index ETF | 142,875,714 | 4,897,553 | (2,447,164 | ) | 2,450,389 | |||||||||||
Fidelity MSCI Financials Index ETF | 125,499,848 | 2,741,072 | (1,838,363 | ) | 902,709 | |||||||||||
Fidelity MSCI Health Care Index ETF | 179,252,819 | 10,511,253 | (2,595,062 | ) | 7,916,191 | |||||||||||
Fidelity MSCI Industrials Index ETF | 105,189,672 | 881,922 | (5,441,981 | ) | (4,560,059 | ) | ||||||||||
Fidelity MSCI Information Technology Index ETF | 172,000,285 | 11,988,422 | (2,392,501 | ) | 9,595,921 | |||||||||||
Fidelity MSCI Materials Index ETF | 93,014,137 | 3,139,141 | (2,014,514 | ) | 1,124,627 | |||||||||||
Fidelity MSCI Telecommunication Services Index ETF | 66,011,748 | 2,749,884 | (1,310,329 | ) | 1,439,555 | |||||||||||
Fidelity MSCI Utilities Index ETF | 124,656,292 | 170,490 | (4,034,754 | ) | (3,864,264 | ) | ||||||||||
The tax-based components of distributable earnings as of period end were as follows for each Fund:
Undistributed | Capital loss | Net unrealized | ||||||||||
Fidelity MSCI Consumer Discretionary Index ETF | $ | 25,993 | $ | — | $ | 774,177 | ||||||
Fidelity MSCI Consumer Staples Index ETF | 194,075 | — | (3,321,351 | ) | ||||||||
Fidelity MSCI Energy Index ETF | 102,023 | — | 2,450,389 | |||||||||
Fidelity MSCI Financials Index ETF | 68,243 | — | 902,709 | |||||||||
Fidelity MSCI Health Care Index ETF | 214,168 | (6 | ) | 7,916,191 | ||||||||
Fidelity MSCI Industrials Index ETF | 19,618 | — | (4,560,059 | ) | ||||||||
Fidelity MSCI Information Technology Index ETF | 69,961 | (861 | ) | 9,595,921 | ||||||||
Fidelity MSCI Materials Index ETF | 55,744 | — | 1,124,627 | |||||||||
Fidelity MSCI Telecommunication Services Index ETF | 315,702 | — | 1,439,555 | |||||||||
Fidelity MSCI Utilities Index ETF | 185,062 | — | (3,864,264 | ) | ||||||||
| 75 | Annual Report |
Table of Contents
Notes to Financial Statements – continued
2. Significant Accounting Policies – continued
Capital loss carryforwards are only available to offset future capital gains of the Funds to the extent provided by regulations and may be limited. Under the Regulated Investment Company Modernization Act of 2010 (the Act), the Funds are permitted to carry forward capital losses incurred in taxable years beginning after December 22, 2010 for an unlimited period and such capital losses are required to be used prior to any losses that expire. The capital loss carryforward information presented below, including any applicable limitation, is estimated as of fiscal period end and is subject to adjustment.
| No expiration Short-term | Total capital loss carryforward | |||||||
Fidelity MSCI Health Care Index ETF | $ | (6 | ) | $ | (6 | ) | ||
Fidelity MSCI Information Technology Index ETF | (861 | ) | (861 | ) | ||||
Certain of the Funds intend to elect to defer to the next fiscal year capital losses recognized during the period November 1, 2013 to July 31, 2014. Loss deferrals were as follows:
| Capital losses | ||||
Fidelity MSCI Consumer Discretionary Index ETF | $ | (109,040 | ) | |
Fidelity MSCI Consumer Staples Index ETF | (30,713 | ) | ||
Fidelity MSCI Energy Index ETF | (44,967 | ) | ||
Fidelity MSCI Financials Index ETF | (100,070 | ) | ||
Fidelity MSCI Health Care Index ETF | (20,722 | ) | ||
Fidelity MSCI Industrials Index ETF | (75,447 | ) | ||
Fidelity MSCI Information Technology Index ETF | (83,032 | ) | ||
Fidelity MSCI Materials Index ETF | (51,419 | ) | ||
Fidelity MSCI Telecommunication Services Index ETF | (92,436 | ) | ||
Fidelity MSCI Utilities Index ETF | (11,692 | ) | ||
The tax character of distributions paid was as follows:
| July 31, 2014 | ||||||||
Ordinary income | Total | |||||||
Fidelity MSCI Consumer Discretionary Index ETF | $ | 376,200 | $ | 376,200 | ||||
Fidelity MSCI Consumer Staples Index ETF | 562,750 | 562,750 | ||||||
Fidelity MSCI Energy Index ETF | 720,550 | 720,550 | ||||||
Fidelity MSCI Financials Index ETF | 916,500 | 916,500 | ||||||
Fidelity MSCI Health Care Index ETF | 773,350 | 773,350 | ||||||
Fidelity MSCI Industrials Index ETF | 784,350 | 784,350 | ||||||
Fidelity MSCI Information Technology Index ETF | 719,950 | 719,950 | ||||||
Fidelity MSCI Materials Index ETF | 518,850 | 518,850 | ||||||
Fidelity MSCI Telecommunication Services Index ETF | 525,750 | 525,750 | ||||||
Fidelity MSCI Utilities Index ETF | 853,000 | 853,000 | ||||||
3. Purchases and Sales of Investments.
Purchases and sales of securities, other than short-term securities and in-kind transactions, were as follows:
| Purchases | Sales | |||||||
Fidelity MSCI Consumer Discretionary Index ETF | $ | 2,254,585 | $ | 2,111,104 | ||||
Fidelity MSCI Consumer Staples Index ETF | 1,605,424 | 1,013,253 | ||||||
Fidelity MSCI Energy Index ETF | 3,053,187 | 2,738,971 | ||||||
Fidelity MSCI Financials Index ETF | 4,887,603 | 3,825,987 | ||||||
Fidelity MSCI Health Care Index ETF | 4,646,982 | 3,796,947 | ||||||
Fidelity MSCI Industrials Index ETF | 2,735,909 | 2,492,046 | ||||||
Fidelity MSCI Information Technology Index ETF | 4,134,252 | 3,625,082 | ||||||
Fidelity MSCI Materials Index ETF | 2,583,916 | 3,250,326 | ||||||
Fidelity MSCI Telecommunication Services Index ETF | 7,727,351 | 7,034,563 | ||||||
Fidelity MSCI Utilities Index ETF | 3,085,291 | 2,833,520 | ||||||
| Annual Report | 76 |
Table of Contents
3. Purchases and Sales of Investments – continued
Securities received or delivered in-kind through subscriptions and redemptions were as follows:
| In-kind Subscriptions | In-kind Redemptions | |||||||
Fidelity MSCI Consumer Discretionary Index ETF | $ | 80,987,245 | $ | 6,277,588 | ||||
Fidelity MSCI Consumer Staples Index ETF | 110,992,238 | 37,148,013 | ||||||
Fidelity MSCI Energy Index ETF | 157,866,938 | 18,628,788 | ||||||
Fidelity MSCI Financials Index ETF | 147,559,752 | 24,576,042 | ||||||
Fidelity MSCI Health Care Index ETF | 191,005,319 | 13,797,101 | ||||||
Fidelity MSCI Industrials Index ETF | 142,921,895 | 41,620,013 | ||||||
Fidelity MSCI Information Technology Index ETF | 190,023,252 | 21,195,808 | ||||||
Fidelity MSCI Materials Index ETF | 111,268,299 | 19,932,885 | ||||||
Fidelity MSCI Telecommunication Services Index ETF | 73,113,785 | 7,253,974 | ||||||
Fidelity MSCI Utilities Index ETF | 134,190,649 | 10,857,552 | ||||||
4. Fees and Other Transactions with Affiliates.
Management Fee. SelectCo provides each Fund with investment management related services for which the Fund pays a monthly management fee that is based on an annual rate of .12% of each Fund’s average net assets. Under the management contract, SelectCo pays all other expenses, except the compensation of the independent Trustees and certain other expenses such as interest expense. The management fee paid to SelectCo is reduced by an amount equal to the fees and expenses paid by each fund to the independent Trustees.
Sub-Adviser. BlackRock Fund Advisors (BFA), serves as sub-adviser for the Funds. BFA provides discretionary investment advisory services to the Funds and is paid by SelectCo for providing these services.
5. Share Transactions.
The Funds issue and redeem shares at Net Asset Value only with certain authorized participants in large increments known as Creation Units. Purchases of Creation Units are made by tendering a basket of designated stocks to a fund and redemption proceeds are paid with a basket of securities from a fund’s portfolio with a balancing cash component to equate the market value of the basket of securities delivered or redeemed to the NAV per Creation Unit on the transaction date. Cash may be substituted equivalent to the value of certain securities generally when they are not available in sufficient quantity for delivery. A fund’s shares are available in smaller increments to investors in the secondary market at market prices and may be subject to commissions. Authorized participants pay a transaction fee to the shareholder servicing agent when purchasing and redeeming Creation Units of a fund. The transaction fee is used to defray the costs associated with the issuance and redemption of Creation Units.
6. Other.
The Funds’ organizational documents provide former and current directors and officers with a limited indemnification against liabilities arising in connection with the performance of their duties to the Funds. In the normal course of business, the Funds may also enter into contracts that provide general indemnifications. The Funds’ maximum exposure under these arrangements is unknown as this would be dependent on future claims that may be made against the Funds. The risk of material loss from such claims is considered remote.
| 77 | Annual Report |
Table of Contents
Report of Independent Registered Public Accounting Firm
To the Trustees of Fidelity Covington Trust and Shareholders of Fidelity MSCI Consumer Discretionary Index ETF, Fidelity MSCI Consumer Staples Index ETF, Fidelity MSCI Energy Index ETF, Fidelity MSCI Financials Index ETF, Fidelity MSCI Health Care Index ETF, Fidelity MSCI Industrials Index ETF, Fidelity MSCI Information Technology Index ETF, Fidelity MSCI Materials Index ETF, Fidelity MSCI Telecommunication Services Index ETF and Fidelity MSCI Utilities Index ETF:
We have audited the accompanying statements of assets and liabilities of Fidelity MSCI Consumer Discretionary Index, ETF, Fidelity MSCI Consumer Staples Index ETF, Fidelity MSCI Energy Index ETF, Fidelity MSCI Financials Index ETF, Fidelity MSCI Health Care Index ETF, Fidelity MSCI Industrials Index ETF, Fidelity MSCI Information Technology Index ETF, Fidelity MSCI Materials Index ETF, Fidelity MSCI Telecommunication Services Index ETF and Fidelity MSCI Utilities Index ETF (the Funds), each a fund of the Fidelity Covington Trust, including the schedules of investments, as of July 31, 2014, and the related statements of operations, the statements of changes in net assets and financial highlights for the period October 21, 2013 (commencement of operations) to July 31, 2014. These financial statements and financial highlights are the responsibility of the Funds’ management. Our responsibility is to express an opinion on these financial statements and financial highlights based on our audits.
We conducted our audits in accordance with the standards of the Public Company Accounting Oversight Board (United States). Those standards require that we plan and perform the audit to obtain reasonable assurance about whether the financial statements and financial highlights are free of material misstatement. The Funds are not required to have, nor were we engaged to perform, an audit of their internal control over financial reporting. Our audits included consideration of internal control over financial reporting as a basis for designing audit procedures that are appropriate in the circumstances, but not for the purpose of expressing an opinion on the effectiveness of the Funds’ internal control over financial reporting. Accordingly, we express no such opinion. An audit also includes examining, on a test basis, evidence supporting the amounts and disclosures in the financial statements, assessing the accounting principles used and significant estimates made by management, as well as evaluating the overall financial statement presentation. Our procedures included confirmation of securities owned as of July 31, 2014, by correspondence with the custodians and brokers; where replies were not received from brokers, we performed other auditing procedures. We believe that our audits provide a reasonable basis for our opinion.
In our opinion, the financial statements and financial highlights referred to above present fairly, in all material respects, the financial position of Fidelity MSCI Consumer Discretionary Index, ETF, Fidelity MSCI Consumer Staples Index ETF, Fidelity MSCI Energy Index ETF, Fidelity MSCI Financials Index ETF, Fidelity MSCI Health Care Index ETF, Fidelity MSCI Industrials Index ETF, Fidelity MSCI Information Technology Index ETF, Fidelity MSCI Materials Index ETF, Fidelity MSCI Telecommunication Services Index ETF and Fidelity MSCI Utilities Index ETF as of July 31, 2014, and the results of their operations, the changes in their net assets and the financial highlights for the period October 21, 2013 (commencement of operations) to July 31, 2014, in conformity with accounting principles generally accepted in the United States of America.
DELOITTE & TOUCHE LLP
Boston, Massachusetts
September 22, 2014
| Annual Report | 78 |
Table of Contents
Premium/Discount Analysis (Unaudited)
Shares of each fund are listed on NYSE Arca and can be bought and sold on the secondary market at market prices. Although the market price is expected to approximate the fund’s NAV, it is possible that the market price and NAV will vary significantly. The closing market price is the daily closing price as reported on NYSE Arca.
Premiums or discounts are the differences (expressed as a basis point differential with 1 basis point equaling 1/100 of 1%) between the fund’s NAV and closing market price. A premium indicates that the closing market price is trading above the NAV. A discount indicates that the closing market price is trading below the NAV. A discrepancy may exist with respect to the timing of when the NAV is calculated and the determination of the closing market price.
The chart below presents information about the differences between each fund’s daily closing market price and each fund’s NAV.
Fidelity MSCI Consumer Discretionary Index ETF
| Period Ended July 31, 2014 | ||||||||||||
| From commencement of operations* to July 31, 2014 | Closing Price Below NAV | Closing Price Above or Equal to NAV | ||||||||||
| Basis Point Differential | Number of Days | % of Total Days | Number of Days | % of Total Days | ||||||||
| 0 – <25 | 57 | 29.08 | % | 139 | 70.92 | % | ||||||
| 25 – <50 | 0 | — | 0 | — | ||||||||
| 50 – <75 | 0 | — | 0 | — | ||||||||
| 75 – <100 | 0 | — | 0 | — | ||||||||
| 100 or above | 0 | — | 0 | — | ||||||||
| Total | 57 | 29.08 | % | 139 | 70.92 | % | ||||||
| * | October 21, 2013. |
Fidelity MSCI Consumer Staples Index ETF
| Period Ended July 31, 2014 | ||||||||||||
| From commencement of operations* to July 31, 2014 | Closing Price Below NAV | Closing Price Above or Equal to NAV | ||||||||||
| Basis Point Differential | Number of Days | % of Total Days | Number of Days | % of Total Days | ||||||||
| 0 – <25 | 49 | 25.00 | % | 146 | 74.49 | % | ||||||
| 25 – <50 | 1 | 0.51 | % | 0 | — | |||||||
| 50 – <75 | 0 | — | 0 | — | ||||||||
| 75 – <100 | 0 | — | 0 | — | ||||||||
| 100 or above | 0 | — | 0 | — | ||||||||
| Total | 50 | 25.51 | % | 146 | 74.49 | % | ||||||
| * | October 21, 2013. |
Fidelity MSCI Energy Index ETF
| Period Ended July 31, 2014 | ||||||||||||
| From commencement of operations* to July 31, 2014 | Closing Price Below NAV | Closing Price Above or Equal to NAV | ||||||||||
| Basis Point Differential | Number of Days | % of Total Days | Number of Days | % of Total Days | ||||||||
| 0 – <25 | 36 | 18.37 | % | 156 | 79.59 | % | ||||||
| 25 – <50 | 0 | — | 2 | 1.02 | % | |||||||
| 50 – <75 | 0 | — | 1 | 0.51 | % | |||||||
| 75 – <100 | 0 | — | 1 | 0.51 | % | |||||||
| 100 or above | 0 | — | 0 | — | ||||||||
| Total | 36 | 18.37 | % | 160 | 81.63 | % | ||||||
| * | October 21, 2013. |
| 79 | Annual Report |
Table of Contents
Premium/Discount Analysis (Unaudited) – continued
Fidelity MSCI Financials Index ETF
| Period Ended July 31, 2014 | ||||||||||||
| From commencement of operations* to July 31, 2014 | Closing Price Below NAV | Closing Price Above or Equal to NAV | ||||||||||
| Basis Point Differential | Number of Days | % of Total Days | Number of Days | % of Total Days | ||||||||
| 0 – <25 | 40 | 20.41 | % | 154 | 78.57 | % | ||||||
| 25 – <50 | 1 | 0.51 | % | 1 | 0.51 | % | ||||||
| 50 – <75 | 0 | — | 0 | — | ||||||||
| 75 – <100 | 0 | — | 0 | — | ||||||||
| 100 or above | 0 | — | 0 | — | ||||||||
| Total | 41 | 20.92 | % | 155 | 79.08 | % | ||||||
| * | October 21, 2013. |
Fidelity MSCI Health Care Index ETF
| Period Ended July 31, 2014 | ||||||||||||
| From commencement of operations* to July 31, 2014 | Closing Price Below NAV | Closing Price Above or Equal to NAV | ||||||||||
| Basis Point Differential | Number of Days | % of Total Days | Number of Days | % of Total Days | ||||||||
| 0 – <25 | 37 | 18.88 | % | 155 | 79.08 | % | ||||||
| 25 – <50 | 0 | — | 4 | 2.04 | % | |||||||
| 50 – <75 | 0 | — | 0 | — | ||||||||
| 75 – <100 | 0 | — | 0 | — | ||||||||
| 100 or above | 0 | — | 0 | — | ||||||||
| Total | 37 | 18.88 | % | 159 | 81.12 | % | ||||||
| * | October 21, 2013. |
Fidelity MSCI Industrials Index ETF
| Period Ended July 31, 2014 | ||||||||||||
| From commencement of operations* to July 31, 2014 | Closing Price Below NAV | Closing Price Above or Equal to NAV | ||||||||||
| Basis Point Differential | Number of Days | % of Total Days | Number of Days | % of Total Days | ||||||||
| 0 – <25 | 56 | 28.57 | % | 140 | 71.43 | % | ||||||
| 25 – <50 | 0 | — | 0 | — | ||||||||
| 50 – <75 | 0 | — | 0 | — | ||||||||
| 75 – <100 | 0 | — | 0 | — | ||||||||
| 100 or above | 0 | — | 0 | — | ||||||||
| Total | 56 | 28.57 | % | 140 | 71.43 | % | ||||||
| * | October 21, 2013. |
Fidelity MSCI Information Technology Index ETF
| Period Ended July 31, 2014 | ||||||||||||
| From commencement of operations* to July 31, 2014 | Closing Price Below NAV | Closing Price Above or Equal to NAV | ||||||||||
| Basis Point Differential | Number of Days | % of Total Days | Number of Days | % of Total Days | ||||||||
| 0 – <25 | 40 | 20.41 | % | 155 | 79.08 | % | ||||||
| 25 – <50 | 0 | — | 1 | 0.51 | % | |||||||
| 50 – <75 | 0 | — | 0 | — | ||||||||
| 75 – <100 | 0 | — | 0 | — | ||||||||
| 100 or above | 0 | — | 0 | — | ||||||||
| Total | 40 | 20.41 | % | 156 | 79.59 | % | ||||||
| * | October 21, 2013. |
| Annual Report | 80 |
Table of Contents
Fidelity MSCI Materials Index ETF
| Period Ended July 31, 2014 | ||||||||||||
| From commencement of operations* to July 31, 2014 | Closing Price Below NAV | Closing Price Above or Equal to NAV | ||||||||||
| Basis Point Differential | Number of Days | % of Total Days | Number of Days | % of Total Days | ||||||||
| 0 – <25 | 54 | 27.55 | % | 137 | 69.90 | % | ||||||
| 25 – <50 | 3 | 1.53 | % | 2 | 1.02 | % | ||||||
| 50 – <75 | 0 | — | 0 | — | ||||||||
| 75 – <100 | 0 | — | 0 | — | ||||||||
| 100 or above | 0 | — | 0 | — | ||||||||
| Total | 57 | 29.08 | % | 139 | 70.92 | % | ||||||
| * | October 21, 2013. |
Fidelity MSCI Telecommunication Services Index ETF
| Period Ended July 31, 2014 | ||||||||||||
| From commencement of operations* to July 31, 2014 | Closing Price Below NAV | Closing Price Above or Equal to NAV | ||||||||||
| Basis Point Differential | Number of Days | % of Total Days | Number of Days | % of Total Days | ||||||||
| 0 – <25 | 76 | 38.78 | % | 112 | 57.14 | % | ||||||
| 25 – <50 | 3 | 1.53 | % | 2 | 1.02 | % | ||||||
| 50 – <75 | 2 | 1.02 | % | 1 | 0.51 | % | ||||||
| 75 – <100 | 0 | — | 0 | — | ||||||||
| 100 or above | 0 | — | 0 | — | ||||||||
| Total | 81 | 41.33 | % | 115 | 58.67 | % | ||||||
| * | October 21, 2013. |
Fidelity MSCI Utilities Index ETF
| Period Ended July 31, 2014 | ||||||||||||
| From commencement of operations* to July 31, 2014 | Closing Price Below NAV | Closing Price Above or Equal to NAV | ||||||||||
| Basis Point Differential | Number of Days | % of Total Days | Number of Days | % of Total Days | ||||||||
| 0 – <25 | 46 | 23.47 | % | 147 | 75.00 | % | ||||||
| 25 – <50 | 1 | 0.51 | % | 1 | 0.51 | % | ||||||
| 50 – <75 | 0 | — | 1 | 0.51 | % | |||||||
| 75 – <100 | 0 | — | 0 | — | ||||||||
| 100 or above | 0 | — | 0 | — | ||||||||
| Total | 47 | 23.98 | % | 149 | 76.02 | % | ||||||
| * | October 21, 2013. |
| 81 | Annual Report |
Table of Contents
Trustees and Officers (Unaudited)
The Trustees and officers of the trust and funds, as applicable, are listed below. The Board of Trustees governs each fund and is responsible for protecting the interests of shareholders. The Trustees are experienced executives who meet periodically throughout the year to oversee each fund’s activities, review contractual arrangements with companies that provide services to each fund, oversee management of the risks associated with such activities and contractual arrangements, and review each fund’s performance. Each of the Trustees oversee 74 funds.
The Trustees hold office without limit in time except that (a) any Trustee may resign; (b) any Trustee may be removed by written instrument, signed by at least two-thirds of the number of Trustees prior to such removal; (c) any Trustee who requests to be retired or who has become incapacitated by illness or injury may be retired by written instrument signed by a majority of the other Trustees; and (d) any Trustee may be removed at any special meeting of shareholders by a two-thirds vote of the outstanding voting securities of the trust. The officers hold office without limit in time, except that any officer may resign or may be removed by a vote of a majority of the Trustees at any regular meeting or any special meeting of the Trustees. Except as indicated, each individual has held the office shown or other offices in the same company for the past five years.
Experience, Skills, Attributes, and Qualifications of the Funds’ Trustees. The Governance and Nominating Committee has adopted a statement of policy that describes the experience, qualifications, attributes, and skills that are necessary and desirable for potential Independent Trustee candidates (Statement of Policy). The Board believes that each Trustee satisfied at the time he or she was initially elected or appointed a Trustee, and continues to satisfy, the standards contemplated by the Statement of Policy. The Governance and Nominating Committee also engages professional search firms to help identify potential Independent Trustee candidates who have the experience, qualifications, attributes, and skills consistent with the Statement of Policy. From time to time, additional criteria based on the composition and skills of the current Independent Trustees, as well as experience or skills that may be appropriate in light of future changes to board composition, business conditions, and regulatory or other developments, have also been considered by the professional search firms and the Governance and Nominating Committee. In addition, the Board takes into account the Trustees’ commitment and participation in Board and committee meetings, as well as their leadership of standing and ad hoc committees throughout their tenure.
In determining that a particular Trustee was and continues to be qualified to serve as a Trustee, the Board has considered a variety of criteria, none of which, in isolation, was controlling. The Board believes that, collectively, the Trustees have balanced and diverse experience, qualifications, attributes, and skills, which allow the Board to operate effectively in governing each fund and protecting the interests of shareholders. Information about the specific experience, skills, attributes, and qualifications of each Trustee, which in each case led to the Board’s conclusion that the Trustee should serve (or continue to serve) as a trustee of the funds, is provided below.
Board Structure and Oversight Function. Brian B. Hogan is an interested person (as defined in the 1940 Act) and currently serves as Chairman. The Trustees have determined that an interested Chairman is appropriate and benefits shareholders because an interested Chairman has a personal and professional stake in the quality and continuity of services provided to the funds. Independent Trustees exercise their informed business judgment to appoint an individual of their choosing to serve as Chairman, regardless of whether the Trustee happens to be independent or a member of management. The Independent Trustees have determined that they can act independently and effectively without having an Independent Trustee serve as Chairman and that a key structural component for assuring that they are in a position to do so is for the Independent Trustees to constitute a substantial majority for the Board. The Independent Trustees also regularly meet in executive session. Michael E. Wiley serves as Chairman of the Independent Trustees and as such (i) acts as a liaison between the Independent Trustees and management with respect to matters important to the Independent Trustees and (ii) with management prepares agendas for Board meetings.
Fidelity funds are overseen by different Boards of Trustees. The funds’ Board oversees Fidelity’s sector portfolios. Other Boards oversee Fidelity’s equity and high income funds, and Fidelity’s investment grade bond, money market, and asset allocation funds. The use of separate Boards, each with its own committee structure, allows the Trustees of each group of Fidelity funds to focus on the unique issues of the funds they oversee, including common research, investment, and operational issues. On occasion, the separate Boards establish joint committees to address issues of overlapping consequences for the Fidelity funds overseen by each Board.
The Trustees operate using a system of committees to facilitate the timely and efficient consideration of all matters of importance to the Trustees, each fund, and fund shareholders and to facilitate compliance with legal and regulatory requirements and oversight of the funds’ activities and associated risks. The Board, acting through its committees, has charged SelectCo and its affiliates with (i) identifying events or circumstances the occurrence of which could have demonstrably adverse effects on the funds’ business and/or reputation; (ii) implementing processes and controls to lessen the possibility that such events or circumstances occur or to mitigate the effects of such events or circumstances if they do occur; and (iii) creating and maintaining a system designed to evaluate continuously business and market conditions in order to facilitate the identification and implementation processes described in (i) and (ii) above. Because the day-to-day operations and activities of the funds are carried out by or through SelectCo, its affiliates, and other service providers, the funds’ exposure to risks is mitigated but not eliminated by the processes overseen by the Trustees. While each of the Board’s committees has responsibility for overseeing different aspects of the funds’ activities, oversight is exercised primarily through the Operations and Audit Committees. Appropriate personnel, including but not limited to the funds’ Chief Compliance Officer (CCO), SelectCo’s internal auditor, the independent accountants, the funds’ Treasurer and portfolio management personnel, make periodic reports to the Board’s committees, as appropriate. The responsibilities of each standing committee, including their oversight responsibilities, are described further under “Standing Committees of the Funds’ Trustees.”
| Annual Report | 82 |
Table of Contents
The funds’ Statement of Additional Information (SAI) includes more information about the Trustees. To request a free copy, call Fidelity at 1- 800- FIDELITY.
Interested Trustee*:
Correspondence intended for the Trustee who is an interested person may be sent to Fidelity Investments, 245 Summer Street, Boston, Massachusetts 02210.
Name, Year of Birth; Principal Occupations and Other Relevant Experience+ |
Brian B. Hogan (1964) |
Year of Election or Appointment: 2014 |
Trustee |
Chairman of the Board of Trustees |
Mr. Hogan also serves as Trustee or Vice President of other funds. Mr. Hogan serves as President of FMR’s Equity |
| * | Trustee has been determined to be an “Interested Trustee” by virtue of, among other things, his affiliation with the trust or various entities under common control with SelectCo. |
| + | The information above includes the Trustee’s principal occupation during the last five years and other information relating to the experience, attributes, and skills relevant to the Trustee’s qualifications to serve as a Trustee, which led to the conclusion that the Trustee should serve as a Trustee for the fund. |
Independent Trustees:
Correspondence intended for each Independent Trustee (that is, the Trustees other than the Interested Trustees) may be sent to Fidelity Investments, P.O. Box 55235, Boston, Massachusetts 02205-5235.
Name, Year of Birth; Principal Occupations and Other Relevant Experience+ |
David A. Rosow (1942) |
Year of Election or Appointment: 2013 Trustee |
Mr. Rosow also serves as Trustee of other Fidelity funds. Mr. Rosow is Chairman and Chief Executive Officer of International Golf Group, Inc. (golf course development, 1989-present). Previously, Mr. Rosow served as Chairman and Chief Executive Officer of Rosow & Company, Inc. (private investment company, 1989-2011), a Lead Director of Hudson United Bancorp (2001-2006) and as a Director of TD Banknorth (1996-2006). In addition, Mr. Rosow is a member (2008–present) and President (2009-present) of the Town Council of Palm Beach, Florida. Mr. Rosow served as a Member of the Advisory Board of other Fidelity funds (2012-2013). |
Garnett A. Smith (1947) |
Year of Election or Appointment: 2013 Trustee |
Mr. Smith also serves as Trustee of other Fidelity funds. Prior to Mr. Smith’s retirement, he served as Chairman and Chief Executive Officer of Inbrand Corp. (manufacturer of personal absorbent products, 1990-1997). He also served as President (1986-1990) of Inbrand Corp. Prior to his employment with Inbrand Corp., he was employed by a retail fabric chain and North Carolina National Bank. In addition, Mr. Smith served as a Member of the Advisory Board of other Fidelity funds (2012-2013) and as a board member of the Jackson Hole Land Trust (2009-2012). |
Michael E. Wiley (1950) |
Year of Election or Appointment: 2013 |
Trustee |
Chairman of the Independent Trustees |
Mr. Wiley also serves as Trustee of other Fidelity funds. Mr. Wiley serves as a Director of Asia Pacific Exploration Consolidated (international oil and gas exploration and production, 2008-present). Mr. Wiley serves as a Director of Tesoro Corporation (independent oil refiner and marketer, 2005-present), and a Director of Bill Barrett Corporation (exploration and production, 2005-present). In addition, Mr. Wiley also serves as a Director of Post Oak Bank (privately-held bank, 2004-present). Previously, Mr. Wiley served as a Trustee of other Fidelity funds (2008-2013), as a member of the Board of Trustees of the University of Tulsa (2000-2006; 2007-2010), as a Senior Energy Advisor of Katzenbach Partners, LLC (consulting, 2006-2007), as an Advisory Director of Riverstone Holdings (private investment), Chairman, President, and CEO of Baker Hughes, Inc. (oilfield services, 2000-2004), and as Director of Spinnaker Exploration Company (exploration and production, 2001-2005). |
| + | The information above includes each Trustee’s principal occupation during the last five years and other information relating to the experience, attributes, and skills relevant to each Trustee’s qualifications to serve as a Trustee, which led to the conclusion that each Trustee should serve as a Trustee for each fund. |
| 83 | Annual Report |
Table of Contents
Trustees and Officers (Unaudited) – continued
Officers:
Except for Anthony R. Rochte, correspondence intended for each executive officer may be sent to Fidelity Investments, 245 Summer Street, Boston, Massachusetts 02210. Correspondence intended for Mr. Rochte may be sent to SelectCo, 1225 17th Street, Denver, Colorado 80202-5541. Officers appear below in alphabetical order.
Name, Year of Birth; Principal Occupation |
Christopher S. Bartel (1971) |
Year of Election or Appointment: 2013 |
Vice President |
Mr. Bartel also serves as Vice President of other funds. Mr. Bartel serves as a Director, President, and Chief Executive Officer of Fidelity Management & Research (Japan) Inc. (2012-present), a Director of Fidelity Management & Research (Hong Kong) (2012-present), and Senior Vice President of Global Equity Research (2010-present). Previously, Mr. Bartel served as Senior Vice President of Equity Research (2009-2010), Managing Director of Research (2006-2009), and an analyst and portfolio manager (2000-2006). |
Elizabeth Paige Baumann (1968) |
Year of Election or Appointment: 2013 |
Anti-Money Laundering (AML) Officer |
Ms. Baumann also serves as AML Officer of other funds. She is Chief AML Officer of FMR LLC (2012-present) and is an employee of Fidelity Investments. Previously, Ms. Baumann served as Vice President and Deputy Anti-Money Laundering Officer (2007-2012). |
Marc Bryant (1966) |
Year of Election or Appointment: 2013 |
Secretary |
Mr. Bryant also serves as an officer of other funds. He is Senior Vice President and Deputy General Counsel of FMR LLC. Prior to joining Fidelity Investments, Mr. Bryant served as a Senior Vice President and the Head of Global Retail Legal for AllianceBernstein L.P. (2006-2010), and as the General Counsel for ProFund Advisors LLC (2001-2006). |
William C. Coffey (1969) |
Year of Election or Appointment: 2013 |
Assistant Secretary |
Mr. Coffey also serves as Assistant Secretary of other funds. He is Senior Vice President and Deputy General Counsel of FMR LLC (2010-present), and is an employee of Fidelity Investments. Previously, Mr. Coffey served as Vice President and Associate General Counsel of FMR LLC (2005-2009). |
Jonathan Davis (1968) |
Year of Election or Appointment: 2013 |
Assistant Treasurer |
Mr. Davis also serves as Assistant Treasurer of other funds. Mr. Davis is an employee of Fidelity Investments. Previously, Mr. Davis served as Vice President and Associate General Counsel of FMR LLC (2003-2010). |
Adrien E. Deberghes (1967) |
Year of Election or Appointment: 2013 |
President and Treasurer |
Mr. Deberghes also serves as an officer of other funds. He is an employee of Fidelity Investments (2008-present). Prior to joining Fidelity Investments, Mr. Deberghes was Senior Vice President of Mutual Fund Administration at State Street Corporation (2007-2008), Senior Director of Mutual Fund Administration at Investors Bank & Trust (2005-2007), and Director of Finance for Dunkin’ Brands (2000-2005). |
Stephanie J. Dorsey (1969) |
Year of Election or Appointment: 2013 |
Assistant Treasurer |
Ms. Dorsey also serves as an officer of other funds. She is an employee of Fidelity Investments (2008-present) and has served in other fund officer roles. Prior to joining Fidelity Investments, Ms. Dorsey served as Treasurer (2004-2008) of the JPMorgan Mutual Funds and Vice President (2004-2008) of JPMorgan Chase Bank. |
Howard J. Galligan III (1966) |
Year of Election or Appointment: 2014 |
Chief Financial Officer |
Mr. Galligan also serves as Chief Financial Officer of other funds. Mr. Galligan serves as President of Fidelity Pricing and Cash Management Services (FPCMS) (2014-present) and as a Director of Strategic Advisers, Inc. (2008-present). Previously, Mr. Galligan served as Chief Administrative Officer of Asset Management (2011-2014) and Chief Operating Officer and Senior Vice President of Investment Support for Strategic Advisers, Inc. (2003-2011). |
| Annual Report | 84 |
Table of Contents
Name, Year of Birth; Principal Occupation |
James D. Gryglewicz (1972) |
Year of Election or Appointment: 2014 |
Chief Compliance Officer |
Mr. Gryglewicz also serves as Chief Compliance Officer of other funds. Mr. Gryglewicz serves as Vice President of Asset Management Compliance (2009-present) and is an employee of Fidelity Investments (2004-present). |
Brian B. Hogan (1964) |
Year of Election or Appointment: 2013 |
Vice President |
Mr. Hogan also serves as Trustee or Vice President of other funds. Mr. Hogan serves as President of FMR’s Equity Division (2009-present). Previously, Mr. Hogan served as Senior Vice President, Equity Research of FMR (2006-2009) and as a portfolio manager. |
Chris Maher (1972) |
Year of Election or Appointment: 2013 |
Assistant Treasurer |
Mr. Maher serves as Assistant Treasurer of other funds. Mr. Maher is Vice President of Valuation Oversight and is an employee of Fidelity Investments. Previously, Mr. Maher served as Vice President of Asset Management Compliance (2013), Vice President of FMR’s Program Management Group (2010–2013), and Vice President of Valuation Oversight (2008–2010). |
Kenneth B. Robins (1969) |
Year of Election or Appointment: 2013 |
Deputy Treasurer |
Mr. Robins also serves as an officer of other funds. Mr. Robins serves as Executive Vice President of Fidelity Investments Money Management, Inc. (FIMM) (2013-present) and is an employee of Fidelity Investments (2004-present). Previously, Mr. Robins served in other fund officer roles. |
Anthony R. Rochte (1968) |
Year of Election or Appointment: 2013 |
Vice President |
Mr. Rochte also serves as Vice President of other funds. Mr. Rochte serves as President of Fidelity SelectCo, LLC (2012-present) and is an employee of Fidelity Investments (2012-present). Prior to joining Fidelity Investments, Mr. Rochte served as Senior Managing Director and head of State Street Global Advisors’ North American Intermediary Business Group (2006-2012). |
Stacie M. Smith (1974) |
Year of Election or Appointment: 2013 |
Assistant Treasurer |
Ms. Smith also serves as an officer of other funds. She is an employee of Fidelity Investments (2009-present) and has served in other fund officer roles. Prior to joining Fidelity Investments, Ms. Smith served as Senior Audit Manager of Ernst & Young LLP (1996-2009). |
Renee Stagnone (1975) |
Year of Election or Appointment: 2013 |
Deputy Treasurer |
Ms. Stagnone also serves as Deputy Treasurer of other funds. Ms. Stagnone is an employee of Fidelity Investments. |
Joseph F. Zambello (1957) |
Year of Election or Appointment: 2013 |
Deputy Treasurer |
Mr. Zambello also serves as Deputy Treasurer of other funds. Mr. Zambello is an employee of Fidelity Investments. Previously, Mr. Zambello served as Vice President of FMR’s Program Management Group (2009-2011) and Vice President of the Transfer Agent Oversight Group (2005-2009). |
| 85 | Annual Report |
Table of Contents
A percentage of the dividends distributed during the fiscal year for the following funds qualifies for the dividend-received deduction for corporate shareholders:
| December 2013 | March 2014 | June 2014 | ||||||||||
| Fidelity MSCI Consumer Discretionary Index ETF | 100 | % | 100 | % | 100 | % | ||||||
| Fidelity MSCI Consumer Staples Index ETF | 100 | % | 84 | % | 84 | % | ||||||
| Fidelity MSCI Energy Index ETF | 96 | % | 98 | % | 98 | % | ||||||
| Fidelity MSCI Financials Index ETF | 54 | % | 61 | % | 61 | % | ||||||
| Fidelity MSCI Health Care Index ETF | 100 | % | 100 | % | 100 | % | ||||||
| Fidelity MSCI Industrials Index ETF | 99 | % | 100 | % | 100 | % | ||||||
| Fidelity MSCI Information Technology Index ETF | 100 | % | 100 | % | 100 | % | ||||||
| Fidelity MSCI Materials Index ETF | 95 | % | 100 | % | 100 | % | ||||||
| Fidelity MSCI Telecommunication Services Index ETF | 100 | % | 100 | % | 100 | % | ||||||
| Fidelity MSCI Utilities Index ETF | 100 | % | 100 | % | 100 | % | ||||||
A percentage of the dividends distributed during the fiscal year for the following funds may be taken into account as a dividend for purposes of the maximum rate under section 1(h)(11) of the Internal Revenue Code.
December 2013 | March 2014 | June 2014 | ||||||||||
| Fidelity MSCI Consumer Discretionary Index ETF | 100 | % | 100 | % | 100 | % | ||||||
| Fidelity MSCI Consumer Staples Index ETF | 100 | % | 81 | % | 81 | % | ||||||
| Fidelity MSCI Energy Index ETF | 100 | % | 100 | % | 100 | % | ||||||
| Fidelity MSCI Financials Index ETF | 57 | % | 65 | % | 65 | % | ||||||
| Fidelity MSCI Health Care Index ETF | 90 | % | 100 | % | 100 | % | ||||||
| Fidelity MSCI Industrials Index ETF | 100 | % | 100 | % | 100 | % | ||||||
| Fidelity MSCI Information Technology Index ETF | 100 | % | 100 | % | 100 | % | ||||||
| Fidelity MSCI Materials Index ETF | 100 | % | 100 | % | 100 | % | ||||||
| Fidelity MSCI Telecommunication Services Index ETF | 100 | % | 100 | % | 100 | % | ||||||
| Fidelity MSCI Utilities Index ETF | 100 | % | 100 | % | 100 | % | ||||||
The funds will notify shareholders in January 2015 of amounts for use in preparing 2014 income tax returns.
| Annual Report | 86 |
Table of Contents
[THIS PAGE INTENTIONALLY LEFT BLANK]
| 87 | Annual Report |
Table of Contents
Investment Adviser
Fidelity SelectCo, LLC
Denver, CO
Investment Sub-Adviser
BlackRock Fund Advisors
San Francisco, CA
General Distributor
Fidelity Distributors Corporation
Smithfield, RI
Transfer and Service Agents
State Street Bank and Trust Company
Boston, MA
Fidelity Service Company, Inc.
Boston, MA
Custodian
State Street Bank and Trust Company
Quincy, MA
The Fidelity Telephone Connection
1-800-FIDELITY
| | ||
EXT-ANN-0914 696394.1.0 1.9584796.100 | Corporate Headquarters 245 Summer St., Boston, MA 02210 www.fidelity.com |
Table of Contents
| Item 2. | Code of Ethics |
As of the end of the period, July 31, 2014, Fidelity Covington Trust (the trust) has adopted a code of ethics, as defined in Item 2 of Form N-CSR, that applies to its President and Treasurer and its Chief Financial Officer. A copy of the code of ethics is filed as an exhibit to this Form N-CSR.
| Item 3. | Audit Committee Financial Expert |
The Board of Trustees of the trust has determined that David A. Rosow is an audit committee financial expert, as defined in Item 3 of Form N-CSR. Mr. Rosow is independent for purposes of Item 3 of Form N-CSR.
Table of Contents
| Item 4. | Principal Accountant Fees and Services |
Fees and Services
The following table presents fees billed by Deloitte & Touche LLP, the member firms of Deloitte Touche Tohmatsu, and their respective affiliates (collectively, “Deloitte Entities”) in each of the last two fiscal years for services rendered to Fidelity MSCI Consumer Discretionary Index ETF, Fidelity MSCI Consumer Staples Index ETF, Fidelity MSCI Energy Index ETF, Fidelity MSCI Financials Index ETF, Fidelity MSCI Health Care Index ETF, Fidelity MSCI Industrials Index ETF, Fidelity MSCI Information Technology Index ETF, Fidelity MSCI Materials Index ETF, Fidelity MSCI Telecommunication Services Index ETF and Fidelity MSCI Utilities Index ETF (the “Funds”):
Services Billed by Deloitte Entities
July 31, 2014 FeesA,B
| Audit Fees | Audit- Related Fees | Tax Fees | All Other Fees | |||||||||||||
Fidelity MSCI Consumer Discretionary Index ETF | $ | 12,000 | $ | — | $ | 2,500 | $ | 500 | ||||||||
Fidelity MSCI Consumer Staples Index ETF | $ | 12,000 | $ | — | $ | 2,500 | $ | 500 | ||||||||
Fidelity MSCI Energy Index ETF | $ | 12,000 | $ | — | $ | 2,500 | $ | 500 | ||||||||
Fidelity MSCI Financials Index ETF | $ | 12,000 | $ | — | $ | 2,500 | $ | 500 | ||||||||
Fidelity MSCI Health Care Index ETF | $ | 12,000 | $ | — | $ | 2,500 | $ | 500 | ||||||||
Fidelity MSCI Industrials Index ETF | $ | 12,000 | $ | — | $ | 2,500 | $ | 500 | ||||||||
Fidelity MSCI Information Technology Index ETF | $ | 12,000 | $ | — | $ | 2,500 | $ | 500 | ||||||||
Fidelity MSCI Materials Index ETF | $ | 12,000 | $ | — | $ | 2,500 | $ | 500 | ||||||||
Fidelity MSCI Telecommunication Services Index ETF | $ | 12,000 | $ | — | $ | 2,500 | $ | 500 | ||||||||
Fidelity MSCI Utilities Index ETF | $ | 12,000 | $ | — | $ | 2,500 | $ | 500 | ||||||||
Table of Contents
July 31, 2013 FeesA,B
| Audit Fees | Audit- Related Fees | Tax Fees | All Other Fees | |||||||||||||
Fidelity MSCI Consumer Discretionary Index ETF | $ | — | $ | — | $ | — | $ | — | ||||||||
Fidelity MSCI Consumer Staples Index ETF | $ | — | $ | — | $ | — | $ | — | ||||||||
Fidelity MSCI Energy Index ETF | $ | — | $ | — | $ | — | $ | — | ||||||||
Fidelity MSCI Financials Index ETF | $ | — | $ | — | $ | — | $ | — | ||||||||
Fidelity MSCI Health Care Index ETF | $ | — | $ | — | $ | — | $ | — | ||||||||
Fidelity MSCI Industrials Index ETF | $ | — | $ | — | $ | — | $ | — | ||||||||
Fidelity MSCI Information Technology Index ETF | $ | — | $ | — | $ | — | $ | — | ||||||||
Fidelity MSCI Materials Index ETF | $ | — | $ | — | $ | — | $ | — | ||||||||
Fidelity MSCI Telecommunication Services Index ETF | $ | — | $ | — | $ | — | $ | — | ||||||||
Fidelity MSCI Utilities Index ETF | $ | — | $ | — | $ | — | $ | — | ||||||||
| A | Amounts may reflect rounding. |
| B | Fidelity MSCI Consumer Discretionary Index ETF, Fidelity MSCI Consumer Staples Index ETF, Fidelity MSCI Energy Index ETF, Fidelity MSCI Financials Index ETF, Fidelity MSCI Health Care Index ETF, Fidelity MSCI Industrials Index ETF, Fidelity MSCI Information Technology Index ETF, Fidelity MSCI Materials Index ETF, Fidelity MSCI Telecommunication Services Index ETF and Fidelity MSCI Utilities Index ETF commenced operations on October 21, 2013. |
Table of Contents
The following table presents fees billed by Deloitte Entities that were required to be approved by the Audit Committee for services that relate directly to the operations and financial reporting of the Funds and that are rendered on behalf of Fidelity Management & Research Company (“FMR”) and entities controlling, controlled by, or under common control with FMR (not including any sub-adviser whose role is primarily portfolio management and is subcontracted with or overseen by another investment adviser) that provide ongoing services to the Funds (“Fund Service Providers”):
Services Billed by Deloitte Entities
| July 31, 2014A,B | July 31, 2013A,B | |||||||
Audit-Related Fees | $ | 355,000 | $ | 915,000 | ||||
Tax Fees | $ | — | $ | — | ||||
All Other Fees | $ | 745,000 | $ | 765,000 | ||||
| A | Amounts may reflect rounding. |
| B | May include amounts billed prior to the Fidelity MSCI Consumer Discretionary Index ETF, Fidelity MSCI Consumer Staples Index ETF, Fidelity MSCI Energy Index ETF, Fidelity MSCI Financials Index ETF, Fidelity MSCI Health Care Index ETF, Fidelity MSCI Industrials Index ETF, Fidelity MSCI Information Technology Index ETF, Fidelity MSCI Materials Index ETF, Fidelity MSCI Telecommunication Services Index ETF and Fidelity MSCI Utilities Index ETF’s commencement operations. |
“Audit-Related Fees” represent fees billed for assurance and related services that are reasonably related to the performance of the fund audit or the review of the fund’s financial statements and that are not reported under Audit Fees.
“Tax Fees” represent fees billed for tax compliance, tax advice or tax planning that relate directly to the operations and financial reporting of the fund.
“All Other Fees” represent fees billed for services provided to the fund or Fund Service Provider, a significant portion of which are assurance related, that relate directly to the operations and financial reporting of the fund, excluding those services that are reported under Audit Fees, Audit-Related Fees or Tax Fees.
Assurance services must be performed by an independent public accountant.
* * *
The aggregate non-audit fees billed by Deloitte Entities for services rendered to the Funds, FMR (not including any sub-adviser whose role is primarily portfolio management and is subcontracted with or overseen by another investment adviser), and any Fund Service Provider for each of the last two fiscal years of the Funds are as follows:
Billed By | July 31, 2014 A,B | July 31, 2013 A,B | ||||||
Deloitte Entities | $ | 1,965,000 | $ | 1,775,000 | ||||
| A | Amounts may reflect rounding. |
| B | May include amounts billed prior to the Fidelity MSCI Consumer Discretionary Index ETF, Fidelity MSCI Consumer Staples Index ETF, Fidelity MSCI Energy Index ETF, Fidelity MSCI Financials Index ETF, Fidelity MSCI Health Care Index ETF, Fidelity MSCI Industrials Index ETF, Fidelity MSCI Information Technology Index ETF, Fidelity MSCI Materials Index ETF, Fidelity MSCI Telecommunication Services Index ETF and Fidelity MSCI Utilities Index ETF’s commencement operations. |
Table of Contents
The trust’s Audit Committee has considered non-audit services that were not pre-approved that were provided by Deloitte Entities to Fund Service Providers to be compatible with maintaining the independence of Deloitte Entities in its audit of the Funds, taking into account representations from Deloitte Entities, in accordance with Public Company Accounting Oversight Board rules, regarding its independence from the Funds and its related entities and FMR’s review of the appropriateness and permissibility under applicable law of such non-audit services prior to their provision to the Fund Service Providers.
Audit Committee Pre-Approval Policies and Procedures
The trust’s Audit Committee must pre-approve all audit and non-audit services provided by a fund’s independent registered public accounting firm relating to the operations or financial reporting of the fund. Prior to the commencement of any audit or non-audit services to a fund, the Audit Committee reviews the services to determine whether they are appropriate and permissible under applicable law.
The Audit Committee has adopted policies and procedures to, among other purposes, provide a framework for the Committee’s consideration of non-audit services by the audit firms that audit the Fidelity funds. The policies and procedures require that any non-audit service provided by a fund audit firm to a Fidelity fund and any non-audit service provided by a fund auditor to a Fund Service Provider that relates directly to the operations and financial reporting of a Fidelity fund (“Covered Service”) are subject to approval by the Audit Committee before such service is provided.
All Covered Services must be approved in advance of provision of the service either: (i) by formal resolution of the Audit Committee, or (ii) by oral or written approval of the service by the Chair of the Audit Committee (or if the Chair is unavailable, such other member of the Audit Committee as may be designated by the Chair to act in the Chair’s absence). The approval contemplated by (ii) above is permitted where the Treasurer determines that action on such an engagement is necessary before the next meeting of the Audit Committee.
Non-audit services provided by a fund audit firm to a Fund Service Provider that do not relate directly to the operations and financial reporting of a Fidelity fund are reported to the Audit Committee on a periodic basis.
Non-Audit Services Approved Pursuant to Rule 2-01(c)(7)(i)(C) and (ii) of Regulation S-X (“De Minimis Exception”)
There were no non-audit services approved or required to be approved by the Audit Committee pursuant to the De Minimis Exception during the Funds’ last two fiscal years relating to services provided to (i) the Funds or (ii) any Fund Service Provider that relate directly to the operations and financial reporting of the Funds.
Table of Contents
| Item 5. | Audit Committee of Listed Registrants |
The Board of Trustees of Fidelity Covington Trust has established a separately-designated standing audit committee in accordance with Section 3(a)(58)(A) of the Securities Exchange Act of 1934. As of July 31, 2014, the members of the audit committee were David A. Rosow, Garnett A. Smith and Michael E. Wiley.
| Item 6. | Investments |
| (a) | Not applicable. |
| (b) | Not applicable |
| Item 7. | Disclosure of Proxy Voting Policies and Procedures for Closed-End Management Investment Companies |
Not applicable.
| Item 8. | Portfolio Managers of Closed-End Management Investment Companies |
Not applicable.
| Item 9. | Purchase of Equity Securities by Closed-End Management Investment Company and Affiliated Purchasers |
Not applicable.
| Item 10. | Submission of Matters to a Vote of Security Holders |
There were no material changes to the procedures by which shareholders may recommend nominees to the trust’s Board of Trustees.
| Item 11. | Controls and Procedures |
(a)(i) The President and Treasurer and the Chief Financial Officer have concluded that the trust’s disclosure controls and procedures (as defined in Rule 30a-3(c) under the Investment Company Act) provide reasonable assurances that material information relating to the trust is made known to them by the appropriate persons, based on their evaluation of these controls and procedures as of a date within 90 days of the filing date of this report.
(a)(ii) There was no change in the trust’s internal control over financial reporting (as defined in Rule 30a-3(d) under the Investment Company Act) that occurred during the second fiscal quarter of the period covered by this report that has materially affected, or is reasonably likely to materially affect, the trust’s internal control over financial reporting.
Table of Contents
| Item 12. | Exhibits |
| (a) | (1) | Code of Ethics pursuant to Item 2 of Form N-CSR is filed and attached hereto as EX-99.CODE ETH. | ||
| (a) | (2) | Certification pursuant to Rule 30a-2(a) under the Investment Company Act of 1940 (17 CFR 270.30a-2(a)) is filed and attached hereto as Exhibit 99.CERT. | ||
| (a) | (3) | Not applicable. | ||
| (b) | Certification pursuant to Rule 30a-2(b) under the Investment Company Act of 1940 (17 CFR 270.30a-2(b)) is furnished and attached hereto as Exhibit 99.906CERT. | |||
Table of Contents
SIGNATURES
Pursuant to the requirements of the Securities Exchange Act of 1934 and the Investment Company Act of 1940, the registrant has duly caused this report to be signed on its behalf by the undersigned, thereunto duly authorized.
| Fidelity Covington Trust | ||
| By: | /s/ Adrien E. Deberghes | |
| Adrien E. Deberghes | ||
| President and Treasurer | ||
| Date: | September 25, 2014 | |
Pursuant to the requirements of the Securities Exchange Act of 1934 and the Investment Company Act of 1940, this report has been signed below by the following persons on behalf of the registrant and in the capacities and on the dates indicated.
| By: | /s/ Adrien E. Deberghes | |
| Adrien E. Deberghes | ||
| President and Treasurer | ||
| Date: | September 25, 2014 | |
| By: | /s/ Howard J. Galligan III | |
| Howard J. Galligan III | ||
| Chief Financial Officer | ||
| Date: | September 25, 2014 | |