Table of Contents
UNITED STATES
SECURITIES AND EXCHANGE COMMISSION
Washington, D.C. 20549
FORMN-CSR
CERTIFIED SHAREHOLDER REPORT OF REGISTERED
MANAGEMENT INVESTMENT COMPANIES
Investment Company Act file number811-07319
Fidelity Covington Trust
(Exact name of registrant as specified in charter)
245 Summer St., Boston, Massachusetts 02210
(Address of principal executive offices) (Zip code)
Cynthia Lo Bessette, Secretary
245 Summer St.
Boston, Massachusetts 02210
(Name and address of agent for service)
Registrant’s telephone number, including area code: 617-563-7000
Date of fiscal year end: October 31
Date of reporting period: October 31, 2019
Table of Contents
| Item 1. | Reports to Stockholders |
Table of Contents
Fidelity® International High Dividend ETF
Fidelity® International Value Factor ETF
Fidelity® Targeted Emerging Markets Factor ETF
Fidelity® Targeted International Factor ETF
Annual Report
October 31, 2019

See the inside front cover for important information about access to your fund’s shareholder reports.

Table of Contents
Beginning on January 1, 2021, as permitted by regulations adopted by the Securities and Exchange Commission, paper copies of a fund’s shareholder reports will no longer be sent by mail, unless you specifically request paper copies of the reports from the fund or from your financial intermediary, such as a financial advisor, broker-dealer or bank. Instead, the reports will be made available on a website, and you will be notified by mail each time a report is posted and provided with a website link to access the report.
If you already elected to receive shareholder reports electronically, you will not be affected by this change and you need not take any action. You may elect to receive shareholder reports and other communications from a fund electronically, by contacting your financial intermediary. For Fidelity customers, visit Fidelity’s web site or call Fidelity using the contact information listed below.
You may elect to receive all future reports in paper free of charge. If you wish to continue receiving paper copies of your shareholder reports, you may contact your financial intermediary or, if you are a Fidelity customer, visit Fidelity’s website, or call Fidelity at the applicable toll-free number listed below. Your election to receive reports in paper will apply to all funds held with the fund complex/your financial intermediary.
| Account Type | Website | Phone Number | ||
Brokerage, Mutual Fund, or Annuity Contracts: | fidelity.com/mailpreferences | 1-800-343-3548 | ||
Employer Provided Retirement Accounts: | netbenefits.fidelity.com/preferences (choose ‘no’ under Required Disclosures to continue print) | 1-800-343-0860 |
Table of Contents
To view a fund’s proxy voting guidelines and proxy voting record for the period ended June, 30, visit http://www.fidelity.com/proxyvotingresults or visit the Securities and Exchange Commission’s (SEC) web site at http://www.sec.gov. You may also call1-800-FIDELITY to request a free copy of the proxy voting guidelines.
Standard & Poor’s, S&P and S&P 500 are registered service marks of The McGraw-Hill Companies, Inc. and have been licensed for use by Fidelity Distributors Corporation.
Other third party marks appearing herein are the property of their respective owners.
All other marks appearing herein are registered or unregistered trademarks or service marks of FMR LLC or an affiliated company.
© 2019 FMR LLC. All Rights reserved.
This report and the financial statements contained herein are submitted for the general information of the shareholders of the funds. This report is not authorized for distribution to prospective investors in the funds unless preceded or accompanied by an effective prospectus.
A fund files its complete schedule of portfolio holdings with the SEC for the first and third quarters of each fiscal year on FormN-PORT. FormsN-PORT are available on the SEC’s web site at http://www.sec.gov. A fund’s FormsN-PORT may be reviewed and copied at the SEC’s Public Reference Room in Washington, DC. Information regarding the operation of the SEC’s Public Reference Room may be obtained by calling1-800-SEC-0330. For a complete list of a fund’s portfolio holdings, view the most recent holdings listing on Fidelity’s web site at http://www.fidelity.com, http://www.advisor.fidelity.com, or http://www.401k.com, as applicable.
NOT FDIC INSURED• MAY LOSE VALUE• NO BANK GUARANTEE
Neither the funds nor Fidelity Distributors Corporation is a bank.
| 3 | Annual Report | |||
Table of Contents
The MSCI ACWI (All Country World Index) ex USA Index gained 11.47% for the 12 months ending October 31, 2019, as international stocks reflected a confluence of factors, including escalating trade tension, and moderating but still positive global economic growth. Currency fluctuations were largely modest and varied by region, muting the overall impact on international equity returns. In late December, the U.S. Federal Reserve shifted from raising interest rates to a more dovish policy in 2019, joining many foreign central banks. In June, international stocks rose 6.03%, as policy stimulus in China stabilized that country’s economic growth. The Fed cut its policy rate in July for the first time since 2008. However, the index returned-1.21% for the month, followed by-3.08% in August. In September, the Fed cut its policy rate another quarter point, citing concerns about slowing economic growth and muted inflation, and did the same in October, leading to monthly gains of 2.59% and 3.49%, respectively. For the full 12 months, the growth-oriented information technology sector (+22%) led the way, followed by utilities (+20%) and real estate (+18%), two high-dividend-yielding categories. Conversely, energy was roughly flat, while materials (+6%) and communication services (7%) also lagged. By region, Asia Pacific ex Japan (+16%), Europe ex U.K (+13%), Canada (+12%) and emerging markets (+12%) fared best. Meanwhile, the U.K. (+7%) and Japan (+10%) trailed the broader market.
| Annual Report | 4 | |||
Table of Contents
Fidelity® International High Dividend ETF
Performance(Unaudited)
The information provided in the tables below shows you the performance of Fidelity® International High Dividend ETF, with comparisons over different time periods to the fund’s relevant benchmarks, including an appropriate broad-based market index. Seeing the returns over different time periods can help you assess the fund’s performance against relevant measurements. The performance information includes average annual total returns and is further explained in this section.*
The fund’s net asset value (NAV) performance is based on the NAV calculated each business day. It is calculated in accordance with the standard formula for valuing investment company shares as of the close of regular trading hours on NYSE Arca, Inc. (NYSE Arca) (normally 4:00 p.m. Eastern Time). The fund’s market price performance is based on the daily closing price of the shares of the fund on NYSE Arca. Since ETFs are bought and sold at prices set by the market – which can result in a premium or discount to NAV – the returns calculated using market price (market return) can differ from those calculated using NAV (NAV return). For information on these differences, please visit Fidelity.com or see the prospectus. The fund’s returns do not reflect the deduction of taxes that a shareholder would pay on fund distributions or the redemption or selling of fund shares. How a fund did yesterday is no guarantee of how it will do tomorrow.
Current performance may be higher or lower than the performance data quoted. Formonth-end performance figures, please visit fidelity.com/etfs/factor-etfs/overview or call Fidelity. The performance data featured represents past performance, which is no guarantee of future results. Investment return and principal value will fluctuate; therefore, you may have a gain or loss when you sell your shares.
| Fiscal Periods Ended October 31, 2019 | ||||||||
| Average Annual Total Returns | Past 1 Year | Life of fund | ||||||
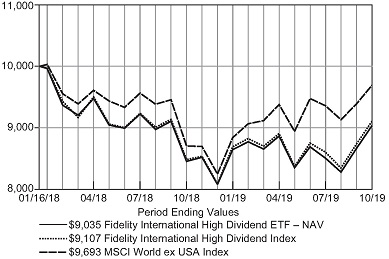
Fidelity International High Dividend ETF – NAVA | 6.84% | -5.52% | ||||||
Fidelity International High Dividend ETF – Market PriceB | 6.43% | -6.41% | ||||||
Fidelity International High Dividend IndexA | 7.28% | -5.10% | ||||||
MSCI World ex USA IndexA | 11.35% | -1.73% | ||||||
Average annual total returns represent just that – the average return on an annual basis for Fidelity® International High Dividend ETF and the fund’s benchmarks, assuming consistent performance over the periods shown, based on the cumulative return and the length of the period. This information represents returns as of the end of the fund’s fiscal period.
| A | From January 16, 2018. |
| B | From January 18, 2018, date initially listed on the NYSE ARCA exchange. |
| * | Total returns are historical and include changes in share price and reinvestment of dividends and capital gains distributions, if any. |
| $10,000 Over Life of Fund |
Let’s say hypothetically that $10,000 was invested in Fidelity International High Dividend ETF – NAV on January 16, 2018, when the fund started. The chart shows how the value of your investment would have changed, and also shows how the Fidelity International High Dividend Index and the MSCI World ex USA Index performed over the same period.
| 5 | Annual Report | |||
Table of Contents
Fidelity® International High Dividend ETF
Management’s Discussion of Fund Performance
For the fiscal year ending October 31, 2019, the exchange-traded fund’s (ETF) net asset value rose 6.84% and its market price gained 6.43 %. This compares with an increase of 7.28% for the Fidelity International High Dividend Index, designed to reflect the performance of large andmid-capitalization developed international high dividend-paying stocks that are expected to continue to pay and grow their dividends. Ten of the eleven sectors in the index advanced over the 12 months, led by communication services and health care, which each rose about 14%. Among individual stocks, several Japanese equities contributed, led by homebuilder Sekisui House (+54%), auto makerToyota Motor (+23%) and Nippon Telegraph and Telephone (+24%). In the utilities sector, U.K.-based SSE (+25%) and France’s Engie (+20%) performed strongly. In contrast, shares of U.K.-based energy services company Centrica returned-41%; in July, the company announced weak profits, a dividend cut and the departure of its chief executive. Elsewhere, holding shares of Japanese automaker Nissan Motor(-26%) detracted, largely because the company reduced its dividend and announced weaker-than-expected earnings in May. Other notable detractors included Hong Kong’s Bank of East Asia(-29%) and Japanese electric utility Kansai Electric Power(-16%).
Note to Shareholders: On March 22, 2019, Pat Waddell retired and is no longer a portfolio manager with Geode Capital Management.
The views expressed above reflect those of the portfolio manager(s) only through the end of the period as stated on the cover of this report and do not necessarily represent the views of Fidelity or any other person in the Fidelity organization, or Geode Capital Management, LLC, (the ETF’s subadviser) or any other person in the Geode organization. Any such views are subject to change at any time based upon market or other conditions and Fidelity and Geode disclaim any responsibility to update such views. These views may not be relied on as investment advice and, because investment decisions for a Fidelity fund are based on numerous factors, may not be relied on as an indication of trading intent on behalf of any Fidelity fund.
| Annual Report | 6 | |||
Table of Contents
Fidelity® International High Dividend ETF
Investment Summary(Unaudited)
| Geographic Diversification as of October 31, 2019 |
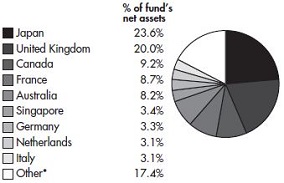
| * | Includes Net Other Assets (Liabilities). |
Percentages are based on country or territory of incorporation and are adjusted for the effect of futures contracts, if applicable
| Top Ten Stocks as of October 31, 2019 | ||||
% of fund’s net assets | ||||
SSE PLC | 3.2 | |||
Toyota Motor Corp. | 2.9 | |||
Vodafone Group PLC | 2.5 | |||
Royal Dutch Shell PLC Class B | 2.5 | |||
Nippon Telegraph & Telephone Corp. | 2.3 | |||
NTT DOCOMO, Inc. | 2.3 | |||
WPP PLC | 2.2 | |||
AGL Energy Ltd. | 2.2 | |||
Sekisui House Ltd. | 2.2 | |||
Wesfarmers Ltd. | 2.0 | |||
|
| |||
| 24.3 | ||||
|
| |||
| Top Market Sectors as of October 31, 2019 | ||||
% of fund’s net assets | ||||
Financials | 27.8 | |||
Consumer Discretionary | 19.5 | |||
Energy | 13.2 | |||
Communication Services | 11.0 | |||
Utilities | 8.7 | |||
Industrials | 8.0 | |||
Consumer Staples | 6.1 | |||
Health Care | 4.0 | |||
Materials | 1.0 | |||
| Asset Allocation as of October 31, 2019 | ||||
% of funds’s net assets | ||||
Stocks and Equity Futures | 100.0% | |||
Short-Term Investments and Net Other Assets (Liabilities) | 0.0% | |||
Percentages shown as 0.0% may reflect amounts less than 0.05%.
| 7 | Annual Report | |||
Table of Contents
Fidelity® International Value Factor ETF
Performance(Unaudited)
The information provided in the tables below shows you the performance of Fidelity® International Value Factor ETF, with comparisons over different time periods to the fund’s relevant benchmarks, including an appropriate broad-based market index. Seeing the returns over different time periods can help you assess the fund’s performance against relevant measurements. The performance information includes average annual total returns and is further explained in this section.*
The fund’s net asset value (NAV) performance is based on the NAV calculated each business day. It is calculated in accordance with the standard formula for valuing investment company shares as of the close of regular trading hours on NYSE Arca, Inc. (NYSE Arca) (normally 4:00 p.m. Eastern Time). The fund’s market price performance is based on the daily closing price of the shares of the fund on NYSE Arca. Since ETFs are bought and sold at prices set by the market – which can result in a premium or discount to NAV – the returns calculated using market price (market return) can differ from those calculated using NAV (NAV return). For information on these differences, please visit Fidelity.com or see the prospectus. The fund’s returns do not reflect the deduction of taxes that a shareholder would pay on fund distributions or the redemption or selling of fund shares. How a fund did yesterday is no guarantee of how it will do tomorrow.
Current performance may be higher or lower than the performance data quoted. Formonth-end performance figures, please visit fidelity.com/etfs/factor-etfs/overview or call Fidelity. The performance data featured represents past performance, which is no guarantee of future results. Investment return and principal value will fluctuate; therefore, you may have a gain or loss when you sell your shares.
| Fiscal Periods Ended October 31, 2019 | ||||||||
| Average Annual Total Returns | Past 1 Year | Life of fund | ||||||
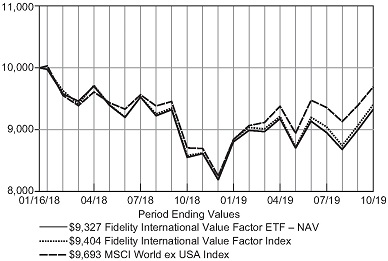
Fidelity International Value Factor ETF – NAVA | 9.04% | -3.82% | ||||||
Fidelity International Value Factor ETF – Market PriceB | 8.51% | -4.73% | ||||||
Fidelity International Value Factor IndexA | 9.55% | -3.38% | ||||||
MSCI World ex USA IndexA | 11.35% | -1.73% | ||||||
Average annual total returns represent just that – the average return on an annual basis for Fidelity® International Value Factor ETF and the fund’s benchmarks, assuming consistent performance over the periods shown, based on the cumulative return and the length of the period. This information represents returns as of the end of the fund’s fiscal period.
| A | From January 16, 2018. |
| B | From January 18, 2018, date initially listed on the NYSE ARCA exchange. |
| * | Total returns are historical and include changes in share price and reinvestment of dividends and capital gains distributions, if any. |
| $10,000 Over Life of Fund |
Let’s say hypothetically that $10,000 was invested in Fidelity International Value Factor ETF – NAV on January 16, 2018, when the fund started. The chart shows how the value of your investment would have changed, and also shows how the Fidelity International Value Factor Index and the MSCI World ex USA Index performed over the same period.
| Annual Report | 8 | |||
Table of Contents
Fidelity® International Value Factor ETF
Management’s Discussion of Fund Performance
For the fiscal year ending October 31, 2019, the exchange-traded fund’s (ETF) net asset value rose 9.04% and its market price gained 8.51%. This compares with an increase of 9.55% for the Fidelity International Value Factor Index, designed to reflect the performance of large andmid-capitalization developed international stocks with attractive valuations. Eight of the 11 sectors in the Fidelity index gained in value over the 12 months, led by utilities (+29%) and information technology (+26%). The energy sector(-10%) performed the worst. Individually, Air Canada (+88%) contributed strongly in absolute terms, reflecting the firm’s favorable financial results. Generally rising iron ore prices helped boost shares of Australian mining company Fortescue Metals (+57%). Nestle (+29%) also contributed, as the Swiss packaged-foods giant reported healthy sales. In contrast, the biggest individual detractor was German media company ProSiebenSat.1 Media(-43%), whose shares were pressured due to the company’s management difficulties and ongoing competitive challenges. Japanese steel manufacturer Nippon Steel(-24%) suffered after management lowered the company’s full-year profit and production forecast.
Note to Shareholders: On March 22, 2019, Pat Waddell retired and is no longer a portfolio manager with Geode Capital Management.
The views expressed above reflect those of the portfolio manager(s) only through the end of the period as stated on the cover of this report and do not necessarily represent the views of Fidelity or any other person in the Fidelity organization, or Geode Capital Management, LLC, (the ETF’s subadviser) or any other person in the Geode organization. Any such views are subject to change at any time based upon market or other conditions and Fidelity and Geode disclaim any responsibility to update such views. These views may not be relied on as investment advice and, because investment decisions for a Fidelity fund are based on numerous factors, may not be relied on as an indication of trading intent on behalf of any Fidelity fund.
| 9 | Annual Report | |||
Table of Contents
Fidelity® International Value Factor ETF
Investment Summary(Unaudited)
| Geographic Diversification as of October 31, 2019 |
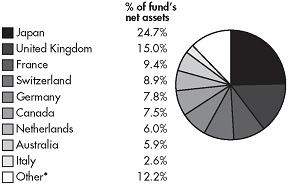
| * | Includes Net Other Assets (Liabilities). |
Percentages are based on country or territory of incorporation and are adjusted for the effect of futures contracts, if applicable
| Top Ten Stocks as of October 31, 2019 | ||||
| % of fund’s net assets | ||||
Nestle S.A. | 2.4 | |||
Royal Dutch Shell PLC Class B | 1.7 | |||
Roche Holding AG | 1.7 | |||
Novartis AG | 1.7 | |||
SAP SE | 1.7 | |||
Daiwa House Industry Co. Ltd. | 1.4 | |||
Allianz SE | 1.4 | |||
Sony Corp. | 1.4 | |||
Astellas Pharma, Inc. | 1.4 | |||
Mitsubishi UFJ Financial Group, Inc. | 1.4 | |||
|
| |||
| 16.2 | ||||
|
| |||
| Top Market Sectors as of October 31, 2019 | ||||
| % of fund’s net assets | ||||
Financials | 20.7 | |||
Industrials | 15.0 | |||
Consumer Staples | 11.8 | |||
Health Care | 11.2 | |||
Consumer Discretionary | 9.6 | |||
Materials | 6.6 | |||
Information Technology | 6.0 | |||
Energy | 5.8 | |||
Communication Services | 5.2 | |||
Utilities | 3.8 | |||
Real Estate | 3.5 | |||
| Asset Allocation as of October 31, 2019 | ||||
| % of funds’s net assets | ||||
Stocks and Equity Futures | 99.9% | |||
Net Other Assets (Liabilities) | 0.1% | |||
| Annual Report | 10 | |||
Table of Contents
Fidelity® Targeted Emerging Markets Factor ETF
Performance(Unaudited)
Average annual total return reflects the change in the value of an investment, assuming reinvestment of distributions from dividend income and capital gains (the profits earned upon the sale of securities that have grown in value, if any) and assuming a constant rate of performance each year. The hypothetical investment and the average annual total returns do not reflect the deduction of taxes that a shareholder would pay on fund distributions or the redemption of fund shares. During periods of reimbursement by Fidelity, a fund’s total return will be greater than it would be had the reimbursement not occurred. How a fund did yesterday is no guarantee of how it will do tomorrow.
Average annual total returns for Fidelity® Targeted Emerging Markets Factor ETF will be reported once the fund is a year old.
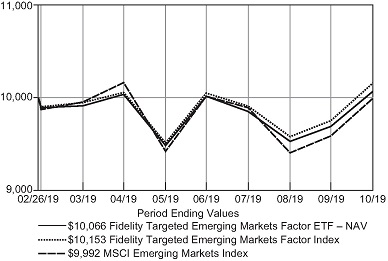
| $10,000 Over Life of Fund |
Let’s say hypothetically that $10,000 was invested in Fidelity Targeted Emerging Markets Factor ETF – NAV on February 26, 2019, when the fund started. The chart shows how the value of your investment would have changed, and also shows how the Fidelity Targeted Emerging Markets Factor Index and the MSCI Emerging Markets Index performed over the same period.
| 11 | Annual Report | |||
Table of Contents
Fidelity® Targeted Emerging Markets Factor ETF
Management’s Discussion of Fund Performance
From its inception date on February 26, 2019, through the end of its fiscal year on October 31, 2019, the exchange-traded fund’s (ETF) net asset value rose 0.66% and its market price gained 1.10%. This compares with an increase of 1.53% for the Fidelity Targeted Emerging Markets Factor Index, designed to reflect the performance of stocks of large and mid-capitalization emerging markets companies with attractive valuations, high quality profiles, positive momentum signals, lower volatility than the broader emerging markets equity market, and lower correlation to the U.S. equity market. Among individual fund positions, Sino Biopharmaceutical (+69%) contributed to performance; this Hong Kong-listed pharmaceutical company benefited from strong sales growth and a large pipeline of new drugs. Semiconductor foundry Taiwan Semiconductor Manufacturing (+30%) also contributed, as this company reported better-than-expected quarterly financial results. Other notable contributors included Chinese sportswear company Anta Sports Products (+71%) and Hong Kong-based apparel company Bosideng International Holdings (+60%). In contrast, China-based Baidu (-40%) struggled, as the company anticipated continued challenges for its core online search-advertising business. Shares of MedyTox, South Korea’s leading maker of the widely used cosmetic product Medytoxin, fell after the company faced a product recall. Other detractors included Korean information technology services company SK Holdings (-35%) and Hong Kong-based China Resources Pharmaceutical Group (-31%).
The views expressed above reflect those of the portfolio manager(s) only through the end of the period as stated on the cover of this report and do not necessarily represent the views of Fidelity or any other person in the Fidelity organization, or Geode Capital Management, LLC, (the ETF’s subadviser) or any other person in the Geode organization. Any such views are subject to change at any time based upon market or other conditions and Fidelity and Geode disclaim any responsibility to update such views. These views may not be relied on as investment advice and, because investment decisions for a Fidelity fund are based on numerous factors, may not be relied on as an indication of trading intent on behalf of any Fidelity fund.
| Annual Report | 12 | |||
Table of Contents
Fidelity® Targeted Emerging Markets Factor ETF
Investment Summary(Unaudited)
| Geographic Diversification as of October 31, 2019 | ||
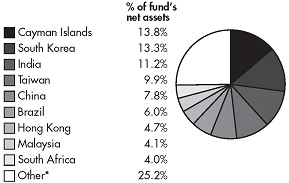
| * | Includes Net Other Assets (Liabilities). |
Percentages are based on country or territory of incorporation and are adjusted for the effect of futures contracts, if applicable
| Top Ten Stocks as of October 31, 2019 | ||||
| % of fund’s net assets | ||||
Alibaba Group Holding Ltd. ADR | 4.1 | |||
Samsung Electronics Co. Ltd. | 3.4 | |||
Taiwan Semiconductor Manufacturing Co. Ltd. | 2.5 | |||
China Construction Bank Corp. Class H | 1.4 | |||
Sino Biopharmaceutical Ltd. | 1.4 | |||
China Resources Gas Group Ltd. | 1.3 | |||
HDFC Bank Ltd. | 1.3 | |||
Inter RAO UES PJSC | 1.2 | |||
Petronas Gas Bhd | 1.2 | |||
Cia de Transmissao de Energia Eletrica Paulista | 1.2 | |||
|
| |||
| 19.0 | ||||
|
| |||
| Top Market Sectors as of October 31, 2019 | ||||
| % of fund’s net assets | ||||
Financials | 21.2 | |||
Consumer Discretionary | 18.8 | |||
Information Technology | 10.9 | |||
Consumer Staples | 10.5 | |||
Industrials | 10.3 | |||
Communication Services | 7.4 | |||
Utilities | 7.2 | |||
Health Care | 7.2 | |||
Energy | 3.4 | |||
Materials | 2.5 | |||
| Asset Allocation as of October 31, 2019 | ||||
| % of funds’s net assets | ||||
Stocks and Equity Futures | 99.9% | |||
Net Other Assets (Liabilities) | 0.1% | |||
| 13 | Annual Report | |||
Table of Contents
Fidelity® Targeted International Factor ETF
Performance(Unaudited)
Average annual total return reflects the change in the value of an investment, assuming reinvestment of distributions from dividend income and capital gains (the profits earned upon the sale of securities that have grown in value, if any) and assuming a constant rate of performance each year. The hypothetical investment and the average annual total returns do not reflect the deduction of taxes that a shareholder would pay on fund distributions or the redemption of fund shares. During periods of reimbursement by Fidelity, a fund’s total return will be greater than it would be had the reimbursement not occurred. How a fund did yesterday is no guarantee of how it will do tomorrow.
Average annual total returns for Fidelity® Targeted International Factor ETF will be reported once the fund is a year old.
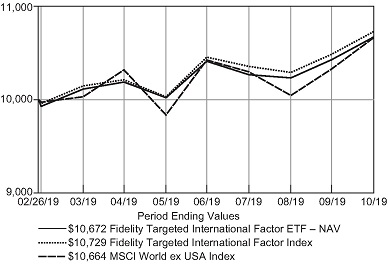
| $10,000 Over Life of Fund |
Let’s say hypothetically that $10,000 was invested in Fidelity Targeted International Factor ETF – NAV on February 26, 2019, when the fund started. The chart shows how the value of your investment would have changed, and also shows how the Fidelity Targeted International Factor Index and the MSCI World ex USA Index performed over the same period.
| Annual Report | 14 | |||
Table of Contents
Fidelity® Targeted International Factor ETF
Management’s Discussion of Fund Performance
From its inception date on February 26, 2019, through the end of its fiscal year on October 31, 2019, the exchange-traded fund’s (ETF) net asset value rose 6.72% and its market price gained 7.04%. This compares with an increase of 7.29% for the Fidelity Targeted International Factor Index, designed to reflect the performance of stocks of large and mid-capitalization developed international companies with attractive valuations, high quality profiles, positive momentum signals, lower volatility than the broader developed international equity market, and lower correlation to the U.S. equity market. Among individual fund positions, Nestle (+21%) contributed, as the Swiss packaged-foods giant reported favorable sales growth. Japanese video game publisher Bandai Namco Holdings (+49%) saw a sharp gain in July after the stock was added to Japan’s Nikkei 225 Stock Average. Other contributors included Italian electric utility Enel (+30%); Oriental Land Company (+36%), a Japanese tourism company; and Japanese retail holding company Fast Retailing (+32%). On the negative side, Japanese retail company Ryohin Keikaku (-28%) struggled, as the company issued a weaker-than-expected financial forecast. Several large property owners in Hong Kong, including Hong Kong Land Holdings (-20%) and Swire Pacific (-18%) posted weak returns, partly due to strengthening political protests on the island. Other notable detractors included Japanese convenience store operator Seven & I Holdings (-22%) and electric utility Tokyo Electric Power (-26%).
The views expressed above reflect those of the portfolio manager(s) only through the end of the period as stated on the cover of this report and do not necessarily represent the views of Fidelity or any other person in the Fidelity organization, or Geode Capital Management, LLC, (the ETF’s subadviser) or any other person in the Geode organization. Any such views are subject to change at any time based upon market or other conditions and Fidelity and Geode disclaim any responsibility to update such views. These views may not be relied on as investment advice and, because investment decisions for a Fidelity fund are based on numerous factors, may not be relied on as an indication of trading intent on behalf of any Fidelity fund.
| 15 | Annual Report | |||
Table of Contents
Fidelity® Targeted International Factor ETF
Investment Summary(Unaudited)
| Geographic Diversification as of October 31, 2019 |
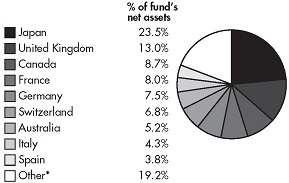
| * | Includes Net Other Assets (Liabilities). |
Percentages are based on country or territory of incorporation and are adjusted for the effect of futures contracts, if applicable
| Top Ten Stocks as of October 31, 2019 | ||||
| % of fund’s net assets | ||||
Nestle S.A. | 2.4 | |||
Enel SpA | 1.3 | |||
Vonovia SE | 1.2 | |||
Nippon Building Fund, Inc. | 1.1 | |||
Air Liquide S.A. | 1.1 | |||
Japan Prime Realty Investment Corp. | 1.1 | |||
Asahi Kasei Corp. | 1.1 | |||
KDDI Corp. | 1.0 | |||
Canadian Apartment Properties REIT | 1.0 | |||
LEG Immobilien AG | 1.0 | |||
|
| |||
| 12.3 | ||||
|
| |||
| Top Market Sectors as of October 31, 2019 | ||||
| % of fund’s net assets | ||||
Financials | 16.2 | |||
Consumer Staples | 16.1 | |||
Materials | 11.8 | |||
Industrials | 10.8 | |||
Communication Services | 8.8 | |||
Consumer Discretionary | 7.9 | |||
Utilities | 7.8 | |||
Real Estate | 7.2 | |||
Health Care | 6.6 | |||
Energy | 4.0 | |||
Information Technology | 2.3 | |||
| Asset Allocation as of October 31, 2019 | ||||
| % of funds’s net assets | ||||
Stocks | 99.5% | |||
Net Other Assets (Liabilities) | 0.5% | |||
| Annual Report | 16 | |||
Table of Contents
Fidelity® International High Dividend ETF
Schedule of Investments October 31, 2019
Showing Percentage of Net Assets
| Common Stocks – 99.3% | ||||||||
| Shares | Value | |||||||
AUSTRALIA – 8.2% | ||||||||
AGL Energy Ltd. | 71,156 | $ | 970,236 | |||||
Alumina Ltd. | 39,928 | 62,480 | ||||||
Coca-Cola Amatil Ltd. | 20,024 | 140,106 | ||||||
National Australia Bank Ltd. | 35,345 | 697,085 | ||||||
Sonic Healthcare Ltd. | 7,294 | 143,503 | ||||||
Wesfarmers Ltd. | 31,965 | 876,114 | ||||||
Westpac Banking Corp. | 36,592 | 711,589 | ||||||
|
| |||||||
TOTAL AUSTRALIA | 3,601,113 | |||||||
|
| |||||||
BELGIUM – 0.4% | ||||||||
Anheuser-Busch InBev S.A. | 1,956 | 157,157 | ||||||
|
| |||||||
TOTAL BELGIUM | 157,157 | |||||||
|
| |||||||
BERMUDA – 0.4% | ||||||||
Jardine Matheson Holdings Ltd. | 3,092 | 176,615 | ||||||
|
| |||||||
TOTAL BERMUDA | 176,615 | |||||||
|
| |||||||
CANADA – 9.2% | ||||||||
CI Financial Corp. | 35,015 | 509,633 | ||||||
Enbridge, Inc. | 23,808 | 867,109 | ||||||
Great-West Lifeco, Inc. | 22,436 | 545,612 | ||||||
Inter Pipeline Ltd. | 42,255 | 709,329 | ||||||
Nutrien Ltd. | 1,130 | 54,059 | ||||||
Power Financial Corp. | 23,396 | 547,109 | ||||||
SNC-Lavalin Group, Inc. | 8,986 | 162,445 | ||||||
The Bank of Nova Scotia | 11,789 | 676,138 | ||||||
|
| |||||||
TOTAL CANADA | 4,071,434 | |||||||
|
| |||||||
DENMARK – 2.7% | ||||||||
Danske Bank A/S | 27,021 | 385,542 | ||||||
Pandora A/S | 16,213 | 797,241 | ||||||
|
| |||||||
TOTAL DENMARK | 1,182,783 | |||||||
|
| |||||||
FINLAND – 1.4% | ||||||||
Nordea Bank Abp | 1,477 | 10,800 | ||||||
Orion Oyj Class B | 1,536 | 68,079 | ||||||
Sampo Oyj Class A | 11,405 | 467,332 | ||||||
UPM-Kymmene Oyj | 1,677 | 54,502 | ||||||
|
| |||||||
TOTAL FINLAND | 600,713 | |||||||
|
| |||||||
FRANCE – 8.7% | ||||||||
BNP Paribas S.A. | 13,384 | 698,741 | ||||||
Bouygues S.A. | 6,811 | 288,660 | ||||||
Cie de Saint-Gobain | 7,500 | 305,062 | ||||||
Cie Generale des Etablissements Michelin SCA | 6,524 | 793,835 | ||||||
Sanofi | 1,721 | 158,583 | ||||||
TOTAL S.A. | 15,324 | 805,577 | ||||||
| Shares | Value | |||||||
Valeo S.A. | 21,494 | $ | 799,235 | |||||
|
| |||||||
TOTAL FRANCE | 3,849,693 | |||||||
|
| |||||||
GERMANY – 3.3% | ||||||||
BASF SE | 1,049 | 79,826 | ||||||
Bayer AG | 1,640 | 127,268 | ||||||
Covestro AG (a) | 945 | 45,373 | ||||||
Daimler AG | 14,686 | 858,439 | ||||||
Deutsche Post AG | 9,549 | 338,137 | ||||||
|
| |||||||
TOTAL GERMANY | 1,449,043 | |||||||
|
| |||||||
HONG KONG – 0.8% | ||||||||
The Bank of East Asia Ltd. | 153,001 | 369,032 | ||||||
|
| |||||||
TOTAL HONG KONG | 369,032 | |||||||
|
| |||||||
ITALY – 3.1% | ||||||||
Atlantia SpA | 9,915 | 244,829 | ||||||
Eni SpA | 33,446 | 506,192 | ||||||
Intesa Sanpaolo SpA | 247,244 | 619,337 | ||||||
|
| |||||||
TOTAL ITALY | 1,370,358 | |||||||
|
| |||||||
JAPAN – 23.6% | ||||||||
Daiwa Securities Group, Inc. | 92,800 | 420,818 | ||||||
ITOCHU Corp. | 13,681 | 287,708 | ||||||
Japan Tobacco, Inc. | 6,900 | 156,926 | ||||||
JFE Holdings, Inc. | 4,600 | 58,229 | ||||||
JXTG Holdings, Inc. | 121,400 | 572,656 | ||||||
Lawson, Inc. | 2,400 | 132,901 | ||||||
Marubeni Corp. | 30,000 | 212,742 | ||||||
Mitsubishi Corp. | 9,700 | 248,271 | ||||||
Mitsubishi Tanabe Pharma Corp. | 9,000 | 108,510 | ||||||
Mitsui & Co. Ltd. | 15,700 | 271,504 | ||||||
Nippon Telegraph & Telephone Corp. | 20,300 | 1,010,582 | ||||||
Nissan Motor Co. Ltd. | 82,500 | 526,674 | ||||||
NTT DOCOMO, Inc. | 36,600 | 1,008,288 | ||||||
ORIX Corp. | 32,900 | 519,899 | ||||||
Sekisui House Ltd. | 44,500 | 965,080 | ||||||
Subaru Corp. | 29,100 | 841,553 | ||||||
Sumitomo Corp. | 15,400 | 251,414 | ||||||
Sumitomo Mitsui Financial Group, Inc. | 15,904 | 571,419 | ||||||
Takeda Pharmaceutical Co. Ltd. | 4,930 | 179,323 | ||||||
The Kansai Electric Power Co., Inc. | 65,100 | 762,283 | ||||||
Toyota Motor Corp. | 18,167 | 1,268,780 | ||||||
|
| |||||||
TOTAL JAPAN | 10,375,560 | |||||||
|
| |||||||
JERSEY – 2.3% | ||||||||
Glencore PLC | 12,432 | 37,465 | ||||||
WPP PLC | 78,428 | 978,532 | ||||||
|
| |||||||
TOTAL JERSEY | 1,015,997 | |||||||
|
| |||||||
See accompanying notes which are an integral part of the financial statements.
| 17 | Annual Report | |||
Table of Contents
Fidelity® International High Dividend ETF
Schedule of Investments – continued
Common Stocks – continued | ||||||||
| Shares | Value | |||||||
NETHERLANDS – 3.1% | ||||||||
ABN AMRO Bank N.V. (a) | 19,965 | $ | 371,635 | |||||
ING Groep N.V. | 50,715 | 572,864 | ||||||
Randstad N.V. | 4,701 | 260,264 | ||||||
Unilever N.V. | 3,099 | 183,012 | ||||||
|
| |||||||
TOTAL NETHERLANDS | 1,387,775 | |||||||
|
| |||||||
NORWAY – 2.2% | ||||||||
Mowi ASA | 3,576 | 87,182 | ||||||
Telenor ASA | 46,788 | 875,862 | ||||||
|
| |||||||
TOTAL NORWAY | 963,044 | |||||||
|
| |||||||
PORTUGAL – 0.2% | ||||||||
Jeronimo Martins SGPS S.A. | 5,094 | 85,476 | ||||||
|
| |||||||
TOTAL PORTUGAL | 85,476 | |||||||
|
| |||||||
SINGAPORE – 3.4% | ||||||||
DBS Group Holdings Ltd. | 33,100 | 632,585 | ||||||
Singapore Telecommunications Ltd. | 347,100 | 841,949 | ||||||
Singapore Telecommunications Ltd. | 600 | 1,456 | ||||||
|
| |||||||
TOTAL SINGAPORE | 1,475,990 | |||||||
|
| |||||||
SPAIN – 2.4% | ||||||||
Banco Santander S.A. | 145,559 | 583,457 | ||||||
Repsol S.A. | 29,323 | 480,748 | ||||||
|
| |||||||
TOTAL SPAIN | 1,064,205 | |||||||
|
| |||||||
SWEDEN – 1.6% | ||||||||
Skanska AB Class B | 11,789 | 250,902 | ||||||
Svenska Handelsbanken AB Class A | 46,936 | 469,861 | ||||||
|
| |||||||
TOTAL SWEDEN | 720,763 | |||||||
|
| |||||||
SWITZERLAND – 2.3% | ||||||||
Alcon, Inc. (b) | 645 | 38,092 | ||||||
Nestle S.A. | 3,956 | 422,348 | ||||||
Novartis AG | 3,167 | 276,378 | ||||||
Roche Holding AG | 933 | 280,704 | ||||||
|
| |||||||
TOTAL SWITZERLAND | 1,017,522 | |||||||
|
| |||||||
UNITED KINGDOM – 20.0% | ||||||||
AstraZeneca PLC | 2,013 | 195,592 | ||||||
Aviva PLC | 93,927 | 505,167 | ||||||
| Shares | Value | |||||||
BP PLC | 123,700 | $ | 784,029 | |||||
Centrica PLC | 728,358 | 684,588 | ||||||
GlaxoSmithKline PLC | 7,885 | 180,642 | ||||||
HSBC Holdings PLC | 113,204 | 854,904 | ||||||
Imperial Brands PLC | 3,694 | 80,982 | ||||||
Persimmon PLC | 26,283 | 775,220 | ||||||
Reckitt Benckiser Group PLC | 1,925 | 148,715 | ||||||
Rio Tinto PLC | 910 | 47,316 | ||||||
Royal Dutch Shell PLC Class B | 38,257 | 1,099,157 | ||||||
Royal Mail PLC | 59,459 | 162,975 | ||||||
SSE PLC | 85,902 | 1,428,191 | ||||||
Standard Life Aberdeen PLC | 138,997 | 546,451 | ||||||
Unilever PLC | 2,967 | 177,657 | ||||||
Vodafone Group PLC | 546,367 | 1,113,977 | ||||||
|
| |||||||
TOTAL UNITED KINGDOM | 8,785,563 | |||||||
|
| |||||||
TOTAL COMMON STOCKS |
| 43,719,836 | ||||||
|
| |||||||
| Money Market Fund – 0.0% | ||||||||
Fidelity Cash Central Fund, | 9,674 | 9,676 | ||||||
|
| |||||||
TOTAL INVESTMENT IN SECURITIES – 99.3% |
| 43,729,512 | ||||||
NET OTHER ASSETS (LIABILITIES) – 0.7% |
| 292,807 | ||||||
|
| |||||||
NET ASSETS – 100.0% | $ | 44,022,319 | ||||||
|
| |||||||
Categorizations in the Schedule of Investments are based on country or territory of incorporation.
Legend
| (a) | Security is exempt from registration under Rule 144A of the Securities Act of 1933. These securities may be resold in transactions exempt from registration, normally to qualified institutional buyers. At the end of the period, the value of these securities amounted to $417,008 or 0.9% of net assets. |
| (b) | Non-income producing. |
| (c) | Affiliated fund that is generally available only to investment companies and other accounts managed by Fidelity Investments. The rate quoted is the annualized seven-day yield of the fund at period end. A complete unaudited listing of the fund’s holdings as of its most recent quarter end is available upon request. In addition, each Fidelity Central Fund’s financial statements, which are not covered by the Fund’s Report of Independent Registered Public Accounting Firm, are available on the SEC’s website or upon request. |
See accompanying notes which are an integral part of the financial statements.
| Annual Report | 18 | |||
Table of Contents
| Futures Contracts | ||||||||||||||||||||
Number of contracts | Expiration Date | Notional Amount | Value | Unrealized Appreciation/ (Depreciation) | ||||||||||||||||
| Purchased | ||||||||||||||||||||
Equity Index Contract | ||||||||||||||||||||
ICE MSCI EAFE Index Future Contracts | 3 | December 2019 | $ | 293,580 | $ | 6,920 | $ | 6,920 | ||||||||||||
|
| |||||||||||||||||||
The notional amount of futures purchased as a percentage of Net Assets is 0.7%
Affiliated Central Funds
Information regarding fiscal year to date income earned by the Fund from investments in Fidelity Central Funds is as follows:
| Fund | Income earned | |||
| Fidelity Cash Central Fund | $ | 836 | ||
|
| |||
Amounts in the income column in the above table include any capital gain distributions from underlying funds, which are presented in the corresponding line-item in the Statement of Operations, if applicable.
Investment Valuation
The following is a summary of the inputs used, as of October 31, 2019, involving the Fund’s assets and liabilities carried at fair value. The inputs or methodology used for valuing securities may not be an indication of the risk associated with investing in those securities. For more information on valuation inputs, and their aggregation into the levels used in the table below, please refer to the Investment Valuation section in the accompanying Notes to Financial Statements.
| Valuation Inputs at Reporting Date: | ||||||||||||||||
| Description | Total | Level 1 | Level 2 | Level 3 | ||||||||||||
Investments in Securities: | ||||||||||||||||
Equities: | ||||||||||||||||
Communication Services | $ | 5,830,646 | $ | 5,830,646 | $ | — | $ | — | ||||||||
Consumer Discretionary | 8,502,171 | 8,502,171 | — | — | ||||||||||||
Consumer Staples | 1,772,462 | 1,772,462 | — | — | ||||||||||||
Energy | 5,824,797 | 5,824,797 | — | — | ||||||||||||
Financials | 12,287,010 | 12,287,010 | — | — | ||||||||||||
Health Care | 1,756,674 | 1,756,674 | — | — | ||||||||||||
Industrials | 3,461,528 | 3,461,528 | — | — | ||||||||||||
Materials | 439,250 | 439,250 | — | — | ||||||||||||
Utilities | 3,845,298 | 3,845,298 | — | — | ||||||||||||
Money Market Fund | 9,676 | 9,676 | — | — | ||||||||||||
|
|
|
|
|
|
|
| |||||||||
Total Investments in Securities: | $ | 43,729,512 | $ | 43,729,512 | $ | — | $ | — | ||||||||
|
|
|
|
|
|
|
| |||||||||
Derivative Instruments: | ||||||||||||||||
Assets | ||||||||||||||||
Futures Contracts | $ | 6,920 | $ | 6,920 | $ | — | $ | — | ||||||||
|
|
|
|
|
|
|
| |||||||||
Total Assets | $ | 6,920 | $ | 6,920 | — | $ | — | |||||||||
|
|
|
|
|
|
|
| |||||||||
Total Derivative Instruments: | $ | 6,920 | $ | 6,920 | $ | — | $ | — | ||||||||
|
|
|
|
|
|
|
| |||||||||
Value of Derivative Instruments
The following table is a summary of the Fund’s value of derivative instruments by primary risk exposure as of October 31, 2019. For additional information on derivative instruments, please refer to the Derivative Instruments section in the accompanying Notes to Financial Statements.
| Primary Risk/ Derivative Type | Value | |||||||
| Asset | Liabilities | |||||||
| Equity Risk | ||||||||
| Futures Contracts(a) | $ | 6,920 | $ | 0 | ||||
|
|
|
| |||||
| Total Equity Risk | 6,920 | 0 | ||||||
|
|
|
| |||||
| Total Value of Derivatives | $ | 6,920 | $ | 0 | ||||
|
|
|
| |||||
| (a) | Reflects gross cumulative appreciation (depreciation) on futures contracts as presented in the Schedule of Investments. In the Statement of Assets and Liabilities, the period end daily variation margin is included in receivable or payable for daily variation margin on futures contracts, and the net cumulative appreciation (depreciation) is included in total accumulated earnings (loss). |
See accompanying notes which are an integral part of the financial statements.
| 19 | Annual Report | |||
Table of Contents
Fidelity® International Value Factor ETF
Schedule of Investments October 31, 2019
Showing Percentage of Net Assets
| Common Stocks – 99.2% | ||||||||
| Shares | Value | |||||||
AUSTRALIA – 5.9% | ||||||||
AGL Energy Ltd. | 7,543 | $ | 102,851 | |||||
Australia & New Zealand Banking Group Ltd. | 8,574 | 158,046 | ||||||
BHP Group Ltd. | 5,287 | 131,023 | ||||||
CSL Ltd. | 620 | 109,427 | ||||||
Macquarie Group Ltd. | 1,588 | 146,601 | ||||||
Wesfarmers Ltd. | 4,507 | 123,530 | ||||||
|
| |||||||
TOTAL AUSTRALIA | 771,478 | |||||||
|
| |||||||
BERMUDA – 1.1% | ||||||||
Hongkong Land Holdings Ltd. | 6,864 | 37,752 | ||||||
Jardine Matheson Holdings Ltd. | 1,823 | 104,130 | ||||||
|
| |||||||
TOTAL BERMUDA | 141,882 | |||||||
|
| |||||||
CANADA – 7.5% | ||||||||
Air Canada (a) | 4,278 | 152,333 | ||||||
Canadian Natural Resources Ltd. | 3,933 | 99,169 | ||||||
Fairfax Financial Holdings Ltd. | 231 | 97,865 | ||||||
Manulife Financial Corp. | 7,151 | 133,182 | ||||||
Open Text Corp. | 1,293 | 52,246 | ||||||
Power Corp. of Canada | 4,846 | 112,145 | ||||||
Sun Life Financial, Inc. | 2,836 | 127,234 | ||||||
Suncor Energy, Inc. | 3,719 | 110,573 | ||||||
Teck Resources Ltd. Class B | 6,734 | 106,447 | ||||||
|
| |||||||
TOTAL CANADA | 991,194 | |||||||
|
| |||||||
CAYMAN ISLANDS – 0.7% | ||||||||
CK Asset Holdings Ltd. | 13,000 | 90,748 | ||||||
|
| |||||||
TOTAL CAYMAN ISLANDS | 90,748 | |||||||
|
| |||||||
DENMARK – 2.2% | ||||||||
Novo Nordisk A/S. Class B | 2,213 | 120,861 | ||||||
Pandora A/S | 3,421 | 168,221 | ||||||
|
| |||||||
TOTAL DENMARK | 289,082 | |||||||
|
| |||||||
FRANCE – 9.4% | ||||||||
Capgemini SE | 910 | 102,456 | ||||||
Cie de Saint-Gobain | 3,563 | 144,925 | ||||||
Danone S.A. | 1,024 | 84,924 | ||||||
Peugeot S.A. | 5,033 | 127,422 | ||||||
Publicis Groupe S.A. | 1,956 | 84,098 | ||||||
Renault S.A. | 2,105 | 107,431 | ||||||
Sanofi | 1,367 | 125,964 | ||||||
Schneider Electric SE | 1,798 | 166,962 | ||||||
Societe Generale S.A. | 5,417 | 153,758 | ||||||
TOTAL S.A. | 2,729 | 143,463 | ||||||
|
| |||||||
TOTAL FRANCE | 1,241,403 | |||||||
|
| |||||||
| Shares | Value | |||||||
GERMANY – 7.8% | ||||||||
Allianz SE | 758 | $ | 185,142 | |||||
Bayer AG | 1,338 | 103,832 | ||||||
Deutsche Lufthansa AG | 9,004 | 156,105 | ||||||
E.ON SE | 10,341 | 104,227 | ||||||
Fresenius Medical Care AG & Co. KGaA | 768 | 55,573 | ||||||
Fresenius SE & Co. KGaA | 1,158 | 60,863 | ||||||
SAP SE | 1,661 | 220,078 | ||||||
Vonovia SE | 2,606 | 138,668 | ||||||
|
| |||||||
TOTAL GERMANY | 1,024,488 | |||||||
|
| |||||||
HONG KONG – 1.7% | ||||||||
AIA Group Ltd. | 15,000 | 150,173 | ||||||
Hong Kong Exchanges & Clearing Ltd. | 2,532 | 79,166 | ||||||
|
| |||||||
TOTAL HONG KONG | 229,339 | |||||||
|
| |||||||
ITALY – 2.6% | ||||||||
Enel SpA | 18,159 | 140,554 | ||||||
Eni SpA | 4,448 | 67,319 | ||||||
UniCredit SpA | 10,195 | 129,259 | ||||||
|
| |||||||
TOTAL ITALY | 337,132 | |||||||
|
| |||||||
JAPAN – 24.7% | ||||||||
Astellas Pharma, Inc. | 10,500 | 180,704 | ||||||
Brother Industries Ltd. | 5,400 | 102,760 | ||||||
Chubu Electric Power Co., Inc. | 3,700 | 55,694 | ||||||
Daiwa House Industry Co. Ltd. | 5,500 | 190,226 | ||||||
Fujitsu Ltd. | 1,300 | 115,819 | ||||||
Hitachi Ltd. | 3,300 | 124,342 | ||||||
Honda Motor Co. Ltd. | 6,000 | 163,460 | ||||||
ITOCHU Corp. | 6,900 | 145,105 | ||||||
Japan Tobacco, Inc. | 5,400 | 122,811 | ||||||
JXTG Holdings, Inc. | 14,700 | 69,341 | ||||||
KDDI Corp. | 4,800 | 133,301 | ||||||
Marubeni Corp. | 18,300 | 129,773 | ||||||
Mazda Motor Corp. | 11,900 | 110,746 | ||||||
Medipal Holdings Corp. | 5,900 | 135,603 | ||||||
Mitsubishi Corp. | 5,400 | 138,213 | ||||||
Mitsubishi UFJ Financial Group, Inc. | 33,900 | 178,870 | ||||||
Mitsui & Co. Ltd. | 8,200 | 141,805 | ||||||
Nikon Corp. | 8,600 | 110,695 | ||||||
Nippon Telegraph & Telephone Corp. | 2,500 | 124,456 | ||||||
ORIX Corp. | 9,000 | 142,222 | ||||||
Seven & i Holdings Co. Ltd. | 3,700 | 140,476 | ||||||
Showa Denko KK | 5,800 | 165,154 | ||||||
Sony Corp. | 3,000 | 184,045 | ||||||
Sumitomo Corp. | 8,400 | 137,135 | ||||||
|
| |||||||
TOTAL JAPAN | 3,242,756 | |||||||
|
| |||||||
See accompanying notes which are an integral part of the financial statements.
| Annual Report | 20 | |||
Table of Contents
| Common Stocks – continued | ||||||||
| Shares | Value | |||||||
JERSEY – 0.9% | ||||||||
Glencore PLC | 39,303 | $ | 118,445 | |||||
|
| |||||||
TOTAL JERSEY | 118,445 | |||||||
|
| |||||||
LUXEMBOURG – 0.7% | ||||||||
ArcelorMittal | 6,356 | 93,786 | ||||||
|
| |||||||
TOTAL LUXEMBOURG | 93,786 | |||||||
|
| |||||||
NETHERLANDS – 6.0% | ||||||||
Aegon N.V. | 21,470 | 92,813 | ||||||
Fiat Chrysler Automobiles N.V. | 10,711 | 166,383 | ||||||
Heineken Holding N.V. | 562 | 53,529 | ||||||
ING Groep N.V. | 12,263 | 138,520 | ||||||
Koninklijke Ahold Delhaize N.V. | 3,186 | 79,328 | ||||||
Randstad N.V. | 2,507 | 138,796 | ||||||
Unilever N.V. | 2,085 | 123,130 | ||||||
|
| |||||||
TOTAL NETHERLANDS | 792,499 | |||||||
|
| |||||||
NORWAY – 0.4% | ||||||||
Equinor ASA | 3,181 | 58,839 | ||||||
|
| |||||||
TOTAL NORWAY | 58,839 | |||||||
|
| |||||||
SINGAPORE – 1.4% | ||||||||
Singapore Telecommunications Ltd. | 30,100 | 73,013 | ||||||
Wilmar International Ltd. | 39,900 | 109,982 | ||||||
|
| |||||||
TOTAL SINGAPORE | 182,995 | |||||||
|
| |||||||
SPAIN – 0.9% | ||||||||
Telefonica S.A. | 15,174 | 116,350 | ||||||
|
| |||||||
TOTAL SPAIN | 116,350 | |||||||
|
| |||||||
SWEDEN – 1.4% | ||||||||
Essity AB Class B | 2,086 | 65,092 | ||||||
Volvo AB Class B | 7,720 | 115,452 | ||||||
|
| |||||||
TOTAL SWEDEN | 180,544 | |||||||
|
| |||||||
SWITZERLAND – 8.9% | ||||||||
Adecco Group AG | 2,330 | 138,123 | ||||||
| Shares | Value | |||||||
Credit Suisse Group AG | 9,939 | $ | 123,218 | |||||
Nestle S.A. | 2,977 | 317,828 | ||||||
Novartis AG | 2,524 | 220,265 | ||||||
Roche Holding AG | 749 | 225,345 | ||||||
UBS Group AG | 12,071 | 142,429 | ||||||
|
| |||||||
TOTAL SWITZERLAND | 1,167,208 | |||||||
|
| |||||||
UNITED KINGDOM – 15.0% | ||||||||
Aviva PLC | 27,414 | 147,441 | ||||||
Barclays PLC | 74,896 | 162,794 | ||||||
BHP Group PLC | 5,638 | 119,393 | ||||||
British American Tobacco PLC | 3,591 | 125,686 | ||||||
Carnival PLC | 3,234 | 129,529 | ||||||
Centrica PLC | 101,725 | 95,612 | ||||||
GlaxoSmithKline PLC | 6,213 | 142,337 | ||||||
J Sainsbury PLC | 29,881 | 78,767 | ||||||
Legal & General Group PLC | 40,906 | 139,728 | ||||||
Micro Focus International PLC | 4,997 | 68,612 | ||||||
RELX PLC | 5,345 | 128,641 | ||||||
Rio Tinto PLC | 2,568 | 133,524 | ||||||
Royal Dutch Shell PLC Class B | 7,907 | 227,175 | ||||||
Unilever PLC | 2,061 | 123,408 | ||||||
Vodafone Group PLC | 70,263 | 143,258 | ||||||
|
| |||||||
TOTAL UNITED KINGDOM | 1,965,905 | |||||||
|
| |||||||
TOTAL COMMON STOCKS |
| 13,036,073 | ||||||
|
| |||||||
TOTAL INVESTMENT IN SECURITIES – 99.2% |
| 13,036,073 | ||||||
NET OTHER ASSETS (LIABILITIES) – 0.8% |
| 99,290 | ||||||
|
| |||||||
NET ASSETS – 100.0% | $ | 13,135,363 | ||||||
|
| |||||||
Categorizations in the Schedule of Investments are based on country or territory of incorporation.
Legend
| (a) | Non-income producing. |
| Futures Contracts | ||||||||||||||||||||
Number of contracts | Expiration Date | Notional Amount | Value | Unrealized Appreciation/ (Depreciation) | ||||||||||||||||
Purchased | ||||||||||||||||||||
Equity Index Contract | ||||||||||||||||||||
ICE MSCI EAFE Index Future Contracts | 1 | December 2019 | $ | 97,860 | $ | 1,886 | $ | 1,886 | ||||||||||||
|
| |||||||||||||||||||
The notional amount of futures purchased as a percentage of Net Assets is 0.7%
See accompanying notes which are an integral part of the financial statements.
| 21 | Annual Report | |||
Table of Contents
Fidelity® International Value Factor ETF
Schedule of Investments – continued
Affiliated Central Funds
Information regarding fiscal year to date income earned by the Fund from investments in Fidelity Central Funds is as follows:
| Fund | Income earned | |||
| Fidelity Cash Central Fund | $ | 58 | ||
|
| |||
Amounts in the income column in the above table include any capital gain distributions from underlying funds, which are presented in the corresponding line-item in the Statement of Operations, if applicable.
Investment Valuation
The following is a summary of the inputs used, as of October 31, 2019, involving the Fund’s assets and liabilities carried at fair value. The inputs or methodology used for valuing securities may not be an indication of the risk associated with investing in those securities. For more information on valuation inputs, and their aggregation into the levels used in the table below, please refer to the Investment Valuation section in the accompanying Notes to Financial Statements.
| Valuation Inputs at Reporting Date: | ||||||||||||||||
| Description | Total | Level 1 | Level 2 | Level 3 | ||||||||||||
Investments in Securities: | ||||||||||||||||
Equities: | ||||||||||||||||
Communication Services | $ | 674,476 | $ | 674,476 | $ | — | $ | — | ||||||||
Consumer Discretionary | 1,391,462 | 1,391,462 | — | — | ||||||||||||
Consumer Staples | 1,424,961 | 1,424,961 | — | — | ||||||||||||
Energy | 775,879 | 775,879 | — | — | ||||||||||||
Financials | 2,740,606 | 2,740,606 | — | — | ||||||||||||
Health Care | 1,480,774 | 1,480,774 | — | — | ||||||||||||
Industrials | 1,937,498 | 1,937,498 | — | — | ||||||||||||
Information Technology | 786,313 | 786,313 | — | — | ||||||||||||
Materials | 867,772 | 867,772 | — | — | ||||||||||||
Real Estate | 457,394 | 457,394 | — | — | ||||||||||||
Utilities | 498,938 | 498,938 | — | — | ||||||||||||
|
|
|
|
|
|
|
| |||||||||
Total Investments in Securities: | $ | 13,036,073 | $ | 13,036,073 | $ | — | $ | — | ||||||||
|
|
|
|
|
|
|
| |||||||||
Derivative Instruments: | ||||||||||||||||
Assets | ||||||||||||||||
Futures Contracts | $ | 1,886 | $ | 1,886 | $ | — | $ | — | ||||||||
|
|
|
|
|
|
|
| |||||||||
Total Assets | $ | 1,886 | $ | 1,886 | — | $ | — | |||||||||
|
|
|
|
|
|
|
| |||||||||
Total Derivative Instruments: | $ | 1,886 | $ | 1,886 | $ | — | $ | — | ||||||||
|
|
|
|
|
|
|
| |||||||||
Value of Derivative Instruments
The following table is a summary of the Fund’s value of derivative instruments by primary risk exposure as of October 31, 2019. For additional information on derivative instruments, please refer to the Derivative Instruments section in the accompanying Notes to Financial Statements.
| �� | ||||||||
| Primary Risk/ Derivative Type | Value | |||||||
| Asset | Liabilities | |||||||
Equity Risk | ||||||||
Futures Contracts(a) | $ | 1,886 | $ | 0 | ||||
|
|
|
| |||||
Total Equity Risk | 1,886 | 0 | ||||||
|
|
|
| |||||
Total Value of Derivatives | $ | 1,886 | $ | 0 | ||||
|
|
|
| |||||
| (a) | Reflects gross cumulative appreciation (depreciation) on futures contracts as presented in the Schedule of Investments. In the Statement of Assets and Liabilities, the period end daily variation margin is included in receivable or payable for daily variation margin on futures contracts, and the net cumulative appreciation (depreciation) is included in total accumulated earnings (loss). |
See accompanying notes which are an integral part of the financial statements.
| Annual Report | 22 | |||
Table of Contents
Fidelity® Targeted Emerging Markets Factor ETF
Schedule of Investments October 31, 2019
Showing Percentage of Net Assets
| Common Stocks – 97.1% | ||||||||
| Shares | Value | |||||||
BERMUDA – 2.0% | ||||||||
China Resources Gas Group Ltd. | 22,000 | $ | 132,798 | |||||
Cosan Ltd. Class A (a) | 1,623 | 27,299 | ||||||
Credicorp Ltd. | 171 | 36,601 | ||||||
|
| |||||||
TOTAL BERMUDA | 196,698 | |||||||
|
| |||||||
BRAZIL – 3.8% | ||||||||
Ambev S.A. | 21,200 | 91,873 | ||||||
B3 S.A. - Brasil Bolsa Balcao | 4,500 | 54,285 | ||||||
BB Seguridade Participacoes S.A. | 2,800 | 23,717 | ||||||
Cosan S.A. | 1,800 | 25,937 | ||||||
IRB Brasil Resseguros S/A | 2,400 | 22,615 | ||||||
Itausa - Investimentos Itau S.A. | 11,700 | 39,997 | ||||||
Lojas Renner S.A. | 6,870 | 86,935 | ||||||
Vale S.A. (a) | 2,800 | 32,953 | ||||||
|
| |||||||
TOTAL BRAZIL | 378,312 | |||||||
|
| |||||||
BRITISH VIRGIN ISLANDS – 0.1% | ||||||||
Hollysys Automation Technologies Ltd. | 562 | 7,930 | ||||||
|
| |||||||
TOTAL BRITISH VIRGIN ISLANDS | 7,930 | |||||||
|
| |||||||
CAYMAN ISLANDS – 13.8% | ||||||||
Alibaba Group Holding Ltd. ADR (a) | 2,308 | 407,754 | ||||||
ANTA Sports Products Ltd. | 8,000 | 78,408 | ||||||
Autohome, Inc. ADR (a) | 198 | 16,743 | ||||||
Baozun, Inc. ADR (a) | 405 | 17,625 | ||||||
Bosideng International Holdings Ltd. | 154,000 | 79,791 | ||||||
Chinasoft International Ltd. | 26,000 | 11,215 | ||||||
Fu Shou Yuan International Group Ltd. | 60,000 | 53,063 | ||||||
Hengan International Group Co. Ltd. | 10,500 | 73,431 | ||||||
Huazhu Group Ltd. ADR | 701 | 26,540 | ||||||
JD.com, Inc. ADR (a) | 1,975 | 61,521 | ||||||
Kingdee International Software Group Co. Ltd. | 14,000 | 15,401 | ||||||
Momo, Inc. ADR | 526 | 17,631 | ||||||
NetEase, Inc. ADR | 131 | 37,448 | ||||||
New Oriental Education & Technology Group, Inc. ADR (a) | 363 | 44,308 | ||||||
Shenzhou International Group Holdings Ltd. | 4,900 | 67,910 | ||||||
SINA Corp. (a) | 378 | 14,969 | ||||||
Sino Biopharmaceutical Ltd. | 89,000 | 133,115 | ||||||
TAL Education Group ADR (a) | 1,149 | 49,189 | ||||||
Vipshop Holdings Ltd. ADR (a) | 2,924 | 33,743 | ||||||
Want Want China Holdings Ltd. | 100,000 | 84,482 | ||||||
YY, Inc. ADR (a) | 245 | 13,926 | ||||||
Zhen Ding Technology Holding Ltd. | 5,000 | 23,772 | ||||||
|
| |||||||
TOTAL CAYMAN ISLANDS | 1,361,985 | |||||||
|
| |||||||
| Shares | Value | |||||||
CHILE – 0.7% | ||||||||
Banco de Credito e Inversiones S.A. | 324 | $ | 18,039 | |||||
Cia Cervecerias Unidas S.A. | 5,392 | 53,803 | ||||||
|
| |||||||
TOTAL CHILE | 71,842 | |||||||
|
| |||||||
CHINA – 7.8% | ||||||||
Agricultural Bank of China Ltd. Class H | 58,000 | 23,908 | ||||||
Anhui Conch Cement Co. Ltd. Class H | 3,000 | 17,975 | ||||||
Bank of China Ltd. Class H | 131,000 | 53,664 | ||||||
Bank of Communications Co. Ltd. Class H | 40,000 | 27,361 | ||||||
China Construction Bank Corp. Class H | 170,000 | 136,895 | ||||||
China Everbright Bank Co. Ltd. Class H | 20,000 | 9,214 | ||||||
China Merchants Bank Co. Ltd. Class H | 7,000 | 33,499 | ||||||
China Minsheng Banking Corp. Ltd. Class H | 19,000 | 13,312 | ||||||
China Pacific Insurance Group Co. Ltd. Class H | 5,600 | 20,368 | ||||||
China Railway Signal & Communication Corp. Ltd. Class H (b) | 19,000 | 11,372 | ||||||
China Shenhua Energy Co. Ltd. Class H | 11,000 | 22,376 | ||||||
China Telecom Corp. Ltd. Class H | 62,000 | 26,427 | ||||||
Guotai Junan Securities Co. Ltd. Class H (b) | 5,600 | 8,576 | ||||||
Industrial & Commercial Bank of China Ltd. Class H | 128,000 | 92,129 | ||||||
Inner Mongolia Yitai Coal Co. Ltd. Class B | 17,046 | 14,881 | ||||||
Jiangsu Expressway Co. Ltd. Class H | 68,000 | 90,424 | ||||||
PICC Property & Casualty Co. Ltd. Class H | 16,000 | 20,317 | ||||||
Ping An Insurance Group Co. of China Ltd. Class H | 8,000 | 92,650 | ||||||
TravelSky Technology Ltd. Class H | 7,000 | 15,990 | ||||||
Trip.com Group Ltd. ADR (a) | 1,079 | 35,596 | ||||||
|
| |||||||
TOTAL CHINA | 766,934 | |||||||
|
| |||||||
COLOMBIA – 0.3% | ||||||||
Bancolombia S.A. | 2,476 | 30,108 | ||||||
|
| |||||||
TOTAL COLOMBIA | 30,108 | |||||||
|
| |||||||
CYPRUS – 0.9% | ||||||||
Globaltrans Investment PLC GDR | 10,398 | 88,903 | ||||||
|
| |||||||
TOTAL CYPRUS | 88,903 | |||||||
|
| |||||||
EGYPT – 0.4% | ||||||||
Commercial International Bank Egypt SAE | 7,150 | 35,883 | ||||||
Egypt Kuwait Holding Co. SAE | 5,376 | 7,467 | ||||||
|
| |||||||
TOTAL EGYPT | 43,350 | |||||||
|
| |||||||
See accompanying notes which are an integral part of the financial statements.
| 23 | Annual Report | |||
Table of Contents
Fidelity® Targeted Emerging Markets Factor ETF
Schedule of Investments – continued
| Common Stocks – continued | ||||||||
| Shares | Value | |||||||
GREECE – 0.6% | ||||||||
JUMBO S.A. | 3,139 | $ | 61,266 | |||||
|
| |||||||
TOTAL GREECE | 61,266 | |||||||
|
| |||||||
HONG KONG – 4.7% | ||||||||
China Everbright Ltd. | 8,000 | 11,884 | ||||||
China Mobile Ltd. | 8,500 | 69,207 | ||||||
China Resources Pharmaceutical Group Ltd. (b) | 92,500 | 85,583 | ||||||
China Unicom Hong Kong Ltd. | 28,000 | 27,764 | ||||||
CITIC Ltd. | 80,000 | 105,156 | ||||||
CNOOC Ltd. | 22,000 | 33,017 | ||||||
Guangdong Investment Ltd. | 54,000 | 117,152 | ||||||
Hua Hong Semiconductor Ltd. (b) | 6,000 | 12,114 | ||||||
|
| |||||||
TOTAL HONG KONG | 461,877 | |||||||
|
| |||||||
HUNGARY – 1.2% | ||||||||
Richter Gedeon Nyrt | 6,186 | 114,646 | ||||||
|
| |||||||
TOTAL HUNGARY | 114,646 | |||||||
|
| |||||||
INDIA – 11.2% | ||||||||
Bajaj Auto Ltd. | 1,071 | 48,999 | ||||||
Coal India Ltd. | 6,588 | 19,264 | ||||||
Divi’s Laboratories Ltd. | 4,663 | 115,297 | ||||||
Eicher Motors Ltd. | 169 | 53,662 | ||||||
Federal Bank Ltd. | 21,583 | 25,481 | ||||||
HCL Technologies Ltd. | 700 | 11,467 | ||||||
HDFC Bank Ltd. | 7,490 | 129,830 | ||||||
Hero MotoCorp Ltd. | 1,189 | 45,299 | ||||||
Hindustan Unilever Ltd. | 3,863 | 118,391 | ||||||
ICICI Lombard General Insurance Co. Ltd. (b) | 1,645 | 31,120 | ||||||
Indiabulls Housing Finance Ltd. | 3,784 | 11,017 | ||||||
Info Edge India Ltd. | 716 | 25,914 | ||||||
Infosys Ltd. | 4,961 | 47,919 | ||||||
InterGlobe Aviation Ltd. (b) | 3,703 | 76,003 | ||||||
Kotak Mahindra Bank Ltd. | 2,337 | 51,840 | ||||||
Mindtree Ltd. | 154 | 1,547 | ||||||
Muthoot Finance Ltd. | 2,990 | 29,809 | ||||||
Nestle India Ltd. | 436 | 91,813 | ||||||
NMDC Ltd. | 8,415 | 13,349 | ||||||
Oil & Natural Gas Corp. Ltd. | 10,258 | 20,478 | ||||||
Petronet LNG Ltd. | 4,988 | 20,126 | ||||||
Pidilite Industries Ltd. | 802 | 15,837 | ||||||
Power Finance Corp. Ltd. (a) | 17,235 | 26,503 | ||||||
REC Ltd. | 13,753 | 27,088 | ||||||
Tata Consultancy Services Ltd. | 1,202 | 38,435 | ||||||
Tech Mahindra Ltd. | 628 | 6,538 | ||||||
Wipro Ltd. | 1,836 | 6,707 | ||||||
|
| |||||||
TOTAL INDIA | 1,109,733 | |||||||
|
| |||||||
| Shares | Value | |||||||
INDONESIA – 2.5% | ||||||||
Bank Central Asia Tbk PT | 24,100 | $ | 53,996 | |||||
Bank Rakyat Indonesia Persero Tbk PT | 135,700 | 40,699 | ||||||
Kalbe Farma Tbk PT | 859,600 | 97,675 | ||||||
Telekomunikasi Indonesia Persero Tbk PT | 122,100 | 35,751 | ||||||
United Tractors Tbk PT | 10,600 | 16,368 | ||||||
|
| |||||||
TOTAL INDONESIA | 244,489 | |||||||
|
| |||||||
JERSEY – 0.1% | ||||||||
WNS Holdings Ltd. ADR (a) | 189 | 11,688 | ||||||
|
| |||||||
TOTAL JERSEY | 11,688 | |||||||
|
| |||||||
LUXEMBOURG – 0.1% | ||||||||
Ternium S.A. ADR | 455 | 9,095 | ||||||
|
| |||||||
TOTAL LUXEMBOURG | 9,095 | |||||||
|
| |||||||
MALAYSIA – 4.1% | ||||||||
DiGi.Com Bhd | 19,700 | 22,159 | ||||||
Nestle Malaysia Bhd | 1,900 | 65,796 | ||||||
Petronas Chemicals Group Bhd | 5,700 | 10,190 | ||||||
Petronas Gas Bhd | 30,300 | 120,664 | ||||||
PPB Group Bhd | 14,900 | 64,542 | ||||||
Public Bank Bhd | 7,300 | 35,465 | ||||||
Westports Holdings Bhd | 83,900 | 85,938 | ||||||
|
| |||||||
TOTAL MALAYSIA | 404,754 | |||||||
|
| |||||||
MAURITIUS – 0.2% | ||||||||
MakeMyTrip Ltd. (a) | 725 | 16,689 | ||||||
|
| |||||||
TOTAL MAURITIUS | 16,689 | |||||||
|
| |||||||
MEXICO – 3.4% | ||||||||
Banco del Bajio S.A. (b) | 8,900 | 14,338 | ||||||
Grupo Aeroportuario del Pacifico SAB de CV Class B | 9,400 | 98,552 | ||||||
Grupo Aeroportuario del Sureste SAB de CV Class B | 6,005 | 98,470 | ||||||
Kimberly-Clark de Mexico SAB de CV Class A | 37,200 | 75,013 | ||||||
Megacable Holdings SAB de CV | 9,000 | 36,975 | ||||||
Orbia Advance Corp. SAB de CV | 5,700 | 12,300 | ||||||
|
| |||||||
TOTAL MEXICO | 335,648 | |||||||
|
| |||||||
PHILIPPINES – 2.2% | ||||||||
BDO Unibank, Inc. | 8,810 | 26,874 | ||||||
Globe Telecom, Inc. | 540 | 19,397 | ||||||
Jollibee Foods Corp. | 14,540 | 66,429 | ||||||
Manila Electric Co. | 15,990 | 106,558 | ||||||
|
| |||||||
TOTAL PHILIPPINES | 219,258 | |||||||
|
| |||||||
See accompanying notes which are an integral part of the financial statements.
| Annual Report | 24 | |||
Table of Contents
| Common Stocks – continued | ||||||||
| Shares | Value | |||||||
POLAND – 0.2% | ||||||||
Asseco Poland S.A. | 698 | $ | 9,372 | |||||
Cyfrowy Polsat S.A. | 1,213 | 8,794 | ||||||
|
| |||||||
TOTAL POLAND | 18,166 | |||||||
|
| |||||||
QATAR – 0.8% | ||||||||
Qatar Islamic Bank SAQ | 6,554 | 27,397 | ||||||
Qatar National Bank QPSC | 10,474 | 55,232 | ||||||
|
| |||||||
TOTAL QATAR | 82,629 | |||||||
|
| |||||||
RUSSIA – 3.7% | ||||||||
Alrosa PJSC | 6,210 | 7,216 | ||||||
Gazprom PJSC | 10,180 | 41,277 | ||||||
Inter RAO UES PJSC | 1,818,000 | 122,480 | ||||||
LUKOIL PJSC | 339 | 31,295 | ||||||
MMC Norilsk Nickel PJSC | 67 | 18,691 | ||||||
Novatek PJSC | 830 | 17,604 | ||||||
Rostelecom PJSC | 5,200 | 6,366 | ||||||
Sberbank of Russia PJSC | 23,290 | 85,315 | ||||||
Surgutneftegas PJSC | 22,500 | 15,088 | ||||||
Tatneft PJSC | 1,590 | 18,553 | ||||||
|
| |||||||
TOTAL RUSSIA | 363,885 | |||||||
|
| |||||||
SAUDI ARABIA – 0.8% | ||||||||
Jarir Marketing Co. | 1,345 | 56,808 | ||||||
Riyad Bank | 3,886 | 23,004 | ||||||
|
| |||||||
TOTAL SAUDI ARABIA | 79,812 | |||||||
|
| |||||||
SOUTH AFRICA – 4.0% | ||||||||
Absa Group Ltd. | 3,919 | 40,169 | ||||||
AVI Ltd. | 11,445 | 65,608 | ||||||
Capitec Bank Holdings Ltd. | 483 | 43,887 | ||||||
Kumba Iron Ore Ltd. | 466 | 11,348 | ||||||
Motus Holdings Ltd. | 12,130 | 57,541 | ||||||
Nedbank Group Ltd. | 2,420 | 36,704 | ||||||
Sappi Ltd. | 4,748 | 12,192 | ||||||
Telkom S.A. SOC Ltd. | 1,406 | 6,433 | ||||||
The Foschini Group Ltd. | 5,480 | 63,103 | ||||||
Truworths International Ltd. | 14,218 | 50,406 | ||||||
Vodacom Group Ltd. | 1,437 | 12,539 | ||||||
|
| |||||||
TOTAL SOUTH AFRICA | 399,930 | |||||||
|
| |||||||
SOUTH KOREA – 13.3% | ||||||||
Cheil Worldwide, Inc. | 1,029 | 21,762 | ||||||
DB Insurance Co. Ltd. | 867 | 37,413 | ||||||
Douzone Bizon Co. Ltd. | 27 | 1,693 | ||||||
Hanwha Corp. | 4,767 | 96,742 | ||||||
Hyundai Marine & Fire Insurance Co. Ltd. | 1,675 | 36,140 | ||||||
Kangwon Land, Inc. | 2,094 | 56,095 | ||||||
| Shares | Value | |||||||
Kia Motors Corp. | 1,826 | $ | 66,391 | |||||
KMW Co. Ltd. (a) | 30 | 1,374 | ||||||
KT&G Corp. | 1,189 | 101,599 | ||||||
LG Display Co. Ltd. (a) | 267 | 3,114 | ||||||
LG Uplus Corp. | 2,199 | 25,273 | ||||||
Lotte Chemical Corp. | 49 | 9,504 | ||||||
Medy-Tox, Inc. | 253 | 71,341 | ||||||
Meritz Fire & Marine Insurance Co. Ltd. | 2,250 | 35,568 | ||||||
NCSoft Corp. | 70 | 30,864 | ||||||
Pearl Abyss Corp. (a) | 151 | 27,947 | ||||||
POSCO | 90 | 16,265 | ||||||
S-1 Corp. | 1,060 | 84,870 | ||||||
Samsung Electro-Mechanics Co. Ltd. | 75 | 7,242 | ||||||
Samsung Electronics Co. Ltd. | 7,691 | 331,222 | ||||||
Samsung SDI Co. Ltd. | 70 | 13,608 | ||||||
Samsung SDS Co. Ltd. | 49 | 8,437 | ||||||
SK Hynix, Inc. | 732 | 51,290 | ||||||
SK Telecom Co. Ltd. | 143 | 28,959 | ||||||
Woongjin Coway Co. Ltd. | 737 | 57,812 | ||||||
Yuhan Corp. | 478 | 91,696 | ||||||
|
| |||||||
TOTAL SOUTH KOREA | 1,314,221 | |||||||
|
| |||||||
TAIWAN – 9.9% | ||||||||
Catcher Technology Co. Ltd. | 3,000 | 25,379 | ||||||
Chunghwa Telecom Co. Ltd. | 11,000 | 40,396 | ||||||
E.Sun Financial Holding Co. Ltd. | 60,550 | 54,697 | ||||||
Far EasTone Telecommunications Co. Ltd. | 11,000 | 26,330 | ||||||
Feng Hsin Steel Co. Ltd. | 9,000 | 15,552 | ||||||
Formosa Plastics Corp. | 8,000 | 25,654 | ||||||
Foxconn Technology Co. Ltd. | 9,000 | 19,241 | ||||||
Lite-On Technology Corp. | 13,000 | 21,398 | ||||||
Novatek Microelectronics Corp. | 4,000 | 25,707 | ||||||
Pou Chen Corp. | 50,000 | 66,808 | ||||||
Radiant Opto-Electronics Corp. | 5,000 | 19,837 | ||||||
Realtek Semiconductor Corp. | 3,000 | 22,280 | ||||||
Sino-American Silicon Products, Inc. | 6,000 | 18,060 | ||||||
Taichung Commercial Bank Co. Ltd. | 96,784 | 37,288 | ||||||
Taiwan Business Bank | 93,900 | 39,564 | ||||||
Taiwan Cooperative Financial Holding Co. Ltd. | 69,070 | 47,446 | ||||||
Taiwan Mobile Co. Ltd. | 8,000 | 29,772 | ||||||
Taiwan Semiconductor Manufacturing Co. Ltd. | 25,000 | 244,688 | ||||||
Tripod Technology Corp. | 5,000 | 19,346 | ||||||
Uni-President Enterprises Corp. | 36,000 | 88,766 | ||||||
Voltronic Power Technology Corp. | 3,150 | 69,718 | ||||||
Yageo Corp. | 2,000 | 20,591 | ||||||
|
| |||||||
TOTAL TAIWAN | 978,518 | |||||||
|
| |||||||
THAILAND – 2.2% | ||||||||
Advanced Info Service PCL | 4,400 | 33,375 | ||||||
See accompanying notes which are an integral part of the financial statements.
| 25 | Annual Report | |||
Table of Contents
Fidelity® Targeted Emerging Markets Factor ETF
Schedule of Investments – continued
| Common Stocks – continued | ||||||||
| Shares | Value | |||||||
THAILAND – continued | ||||||||
Airports of Thailand PCL | 42,500 | $ | 110,157 | |||||
Intouch Holdings PCL Class F | 12,000 | 26,234 | ||||||
The Siam Cement PCL | 700 | 8,509 | ||||||
Tisco Financial Group PCL | 11,500 | 37,140 | ||||||
|
| |||||||
TOTAL THAILAND | 215,415 | |||||||
|
| |||||||
TURKEY – 1.5% | ||||||||
Akbank T.A.S. (a) | 20,936 | 25,304 | ||||||
BIM Birlesik Magazalar AS | 8,728 | 72,239 | ||||||
Turkiye Garanti Bankasi AS (a) | 15,632 | 25,154 | ||||||
Turkiye Is Bankasi AS Class C (a) | 21,485 | 21,796 | ||||||
|
| |||||||
TOTAL TURKEY | 144,493 | |||||||
|
| |||||||
UNITED ARAB EMIRATES – 0.2% | ||||||||
Emirates Telecommunications Group Co. PJSC | 3,502 | 15,790 | ||||||
|
| |||||||
TOTAL UNITED ARAB EMIRATES |
| 15,790 | ||||||
|
| |||||||
UNITED STATES OF AMERICA – 0.4% | ||||||||
Yum China Holdings, Inc. | 1,032 | 43,860 | ||||||
|
| |||||||
TOTAL UNITED STATES OF AMERICA |
| 43,860 | ||||||
|
| |||||||
TOTAL COMMON STOCKS | 9,591,924 | |||||||
|
| |||||||
| Preferred Stock – 2.3% | ||||||||
BRAZIL – 2.2% | ||||||||
Banco Bradesco S.A. | 9,200 | 80,679 | ||||||
| Shares | Value | |||||||
Banco do Estado do Rio Grande do Sul S.A. Class B | 2,900 | $ | 16,168 | |||||
Cia de Transmissao de Energia Eletrica Paulista | 20,300 | 119,305 | ||||||
|
| |||||||
TOTAL BRAZIL | 216,152 | |||||||
|
| |||||||
RUSSIA – 0.1% | ||||||||
Transneft PJSC | 3 | 7,790 | ||||||
|
| |||||||
TOTAL RUSSIA | 7,790 | |||||||
|
| |||||||
TOTAL PREFERRED STOCKS | 223,942 | |||||||
|
| |||||||
TOTAL INVESTMENT IN SECURITIES – 99.4%(Cost $9,680,010) |
| 9,815,866 | ||||||
NET OTHER ASSETS (LIABILITIES) – 0.6% |
| 56,406 | ||||||
|
| |||||||
NET ASSETS – 100.0% | $ | 9,872,272 | ||||||
|
| |||||||
Categorizations in the Schedule of Investments are based on country or territory of incorporation.
Legend
| (a) | Non-income producing. |
| (b) | Security is exempt from registration under Rule 144A of the Securities Act of 1933. These securities may be resold in transactions exempt from registration, normally to qualified institutional buyers. At the end of the period, the value of these securities amounted to $239,106 or 2.4% of net assets. |
| Futures Contracts | ||||||||||||||||||||
| Number of contracts | Expiration Date | Notional Amount | Value | Unrealized Appreciation/ (Depreciation) | ||||||||||||||||
Purchased | ||||||||||||||||||||
Equity Index Contract | ||||||||||||||||||||
ICE MSCI Emerging Markets Index Contracts | 1 | December 2019 | $ | 52,070 | $ | 248 | $ | 248 | ||||||||||||
|
| |||||||||||||||||||
The notional amount of futures purchased as a percentage of Net Assets is 0.5%
Affiliated Central Funds
Information regarding fiscal year to date income earned by the Fund from investments in Fidelity Central Funds is as follows:
|
| |||||||||||||||||||
| Fund | Income earned | |||||||||||||||||||
Fidelity Cash Central Fund | $ | 750 | ||||||||||||||||||
|
| |||||||||||||||||||
Amounts in the income column in the above table include any capital gain distributions from underlying funds, which are presented in the corresponding line-item in the Statement of Operations, if applicable.
See accompanying notes which are an integral part of the financial statements.
| Annual Report | 26 | |||
Table of Contents
Investment Valuation
The following is a summary of the inputs used, as of October 31, 2019, involving the Fund’s assets and liabilities carried at fair value. The inputs or methodology used for valuing securities may not be an indication of the risk associated with investing in those securities. For more information on valuation inputs, and their aggregation into the levels used in the table below, please refer to the Investment Valuation section in the accompanying Notes to Financial Statements.
| Valuation Inputs at Reporting Date: | ||||||||||||||||
| Description | Total | Level 1 | Level 2 | Level 3 | ||||||||||||
Investments in Securities: | ||||||||||||||||
Equities: | ||||||||||||||||
Communication Services | $ | 705,145 | $ | 705,145 | $ | — | $ | — | ||||||||
Consumer Discretionary | 1,853,551 | 1,853,551 | — | — | ||||||||||||
Consumer Staples | 1,047,356 | 1,047,356 | — | — | ||||||||||||
Energy | 323,563 | 323,563 | — | — | ||||||||||||
Financials | 2,018,300 | 2,018,300 | — | — | ||||||||||||
Health Care | 709,353 | 709,353 | — | — | ||||||||||||
Industrials | 1,004,933 | 1,004,933 | — | — | ||||||||||||
Information Technology | 1,085,974 | 1,085,974 | — | — | ||||||||||||
Materials | 244,097 | 244,097 | — | — | ||||||||||||
Utilities | 599,652 | 599,652 | — | — | ||||||||||||
Preferred Stock | 223,942 | 223,942 | — | — | ||||||||||||
|
|
|
|
|
|
|
| |||||||||
Total Investments in Securities: | $ | 9,815,866 | $ | 9,815,866 | $ | — | $ | — | ||||||||
|
|
|
|
|
|
|
| |||||||||
Derivative Instruments: | ||||||||||||||||
Assets | ||||||||||||||||
Futures Contracts | $ | 248 | $ | 248 | $ | — | $ | — | ||||||||
|
|
|
|
|
|
|
| |||||||||
Total Assets | $ | 248 | $ | 248 | — | $ | — | |||||||||
|
|
|
|
|
|
|
| |||||||||
Total Derivative Instruments: | $ | 248 | $ | 248 | $ | — | $ | — | ||||||||
|
|
|
|
|
|
|
| |||||||||
Value of Derivative Instruments
The following table is a summary of the Fund’s value of derivative instruments by primary risk exposure as of October 31, 2019. For additional information on derivative instruments, please refer to the Derivative Instruments section in the accompanying Notes to Financial Statements.
| Primary Risk/ Derivative Type | Value | |||||||
| Asset | Liabilities | |||||||
| Equity Risk | ||||||||
| Futures Contracts(a) | $ | 248 | $ | 0 | ||||
|
|
|
| |||||
| Total Equity Risk | 248 | 0 | ||||||
|
|
|
| |||||
| Total Value of Derivatives | $ | 248 | $ | 0 | ||||
|
|
|
| |||||
| (a) | Reflects gross cumulative appreciation (depreciation) on futures contracts as presented in the Schedule of Investments. In the Statement of Assets and Liabilities, the period end daily variation margin is included in receivable or payable for daily variation margin on futures contracts, and the net cumulative appreciation (depreciation) is included in total accumulated earnings (loss). |
See accompanying notes which are an integral part of the financial statements.
| 27 | Annual Report | |||
Table of Contents
Fidelity® Targeted International Factor ETF
Schedule of Investments October 31, 2019
Showing Percentage of Net Assets
| Common Stocks – 99.5% | ||||||||
| Shares | Value | |||||||
AUSTRALIA – 5.2% | ||||||||
Alumina Ltd. | 55,459 | $ | 86,784 | |||||
Aristocrat Leisure Ltd. | 1,227 | 26,745 | ||||||
ASX Ltd. | 386 | 21,904 | ||||||
Caltex Australia Ltd. | 1,019 | 19,156 | ||||||
Coca-Cola Amatil Ltd. | 8,381 | 58,641 | ||||||
Commonwealth Bank of Australia | 1,259 | 68,268 | ||||||
Magellan Financial Group Ltd. | 518 | 17,201 | ||||||
Medibank Pvt Ltd. | 9,103 | 21,210 | ||||||
Ramsay Health Care Ltd. | 481 | 22,710 | ||||||
Rio Tinto Ltd. | 1,506 | 94,348 | ||||||
Sonic Healthcare Ltd. | 1,301 | 25,596 | ||||||
Wesfarmers Ltd. | 1,198 | 32,835 | ||||||
Westpac Banking Corp. | 2,752 | 53,517 | ||||||
|
| |||||||
TOTAL AUSTRALIA | 548,915 | |||||||
|
| |||||||
BELGIUM – 0.5% | ||||||||
Sofina S.A. | 170 | 37,579 | ||||||
UCB S.A. | 131 | 10,557 | ||||||
|
| |||||||
TOTAL BELGIUM | 48,136 | |||||||
|
| |||||||
BERMUDA – 0.5% | ||||||||
Jardine Matheson Holdings Ltd. | 500 | 28,560 | ||||||
Jardine Strategic Holdings Ltd. | 810 | 26,187 | ||||||
|
| |||||||
TOTAL BERMUDA | 54,747 | |||||||
|
| |||||||
CANADA – 8.7% | ||||||||
Alimentation Couche-Tard, Inc. Class B | 2,508 | 75,215 | ||||||
BCE, Inc. | 2,212 | 104,932 | ||||||
Canadian Apartment Properties REIT | 2,560 | 106,591 | ||||||
Canadian National Railway Co. | 524 | 46,866 | ||||||
Canadian Natural Resources Ltd. | 790 | 19,919 | ||||||
Canadian Pacific Railway Ltd. | 136 | 30,927 | ||||||
CCL Industries, Inc. Class B | 1,777 | 73,139 | ||||||
CI Financial Corp. | 1,897 | 27,610 | ||||||
Constellation Software, Inc. | 16 | 15,802 | ||||||
Great-West Lifeco, Inc. | 1,414 | 34,387 | ||||||
Intact Financial Corp. | 370 | 38,177 | ||||||
Kirkland Lake Gold Ltd. | 1,979 | 92,932 | ||||||
Manulife Financial Corp. | 2,596 | 48,349 | ||||||
Parkland Fuel Corp. | 422 | 14,018 | ||||||
Power Corp. of Canada | 1,470 | 34,018 | ||||||
Power Financial Corp. | 1,373 | 32,107 | ||||||
Royal Bank of Canada | 1,116 | 90,019 | ||||||
Suncor Energy, Inc. | 797 | 23,696 | ||||||
|
| |||||||
TOTAL CANADA | 908,704 | |||||||
|
| |||||||
DENMARK – 2.6% | ||||||||
Chr Hansen Holding A/S | 824 | 63,250 | ||||||
Coloplast A/S Class B | 100 | 12,050 | ||||||
| Shares | Value | |||||||
Novo Nordisk A/S. Class B | 838 | $ | 45,767 | |||||
Novozymes A/S Class B | 1,579 | 74,344 | ||||||
Pandora A/S | 738 | 36,290 | ||||||
SimCorp A/S | 117 | 10,453 | ||||||
Tryg A/S | 1,062 | 29,662 | ||||||
|
| |||||||
TOTAL DENMARK | 271,816 | |||||||
|
| |||||||
FINLAND – 1.5% | ||||||||
Elisa Oyj | 1,703 | 93,012 | ||||||
Kone Oyj Class B | 694 | 44,150 | ||||||
Neste Oyj | 122 | 4,403 | ||||||
Orion Oyj Class B | 233 | 10,327 | ||||||
|
| |||||||
TOTAL FINLAND | 151,892 | |||||||
|
| |||||||
FRANCE – 8.0% | ||||||||
Air Liquide S.A. | 836 | 111,048 | ||||||
Bureau Veritas S.A. | 954 | 24,355 | ||||||
CNP Assurances | 2,127 | 42,178 | ||||||
Danone S.A. | 817 | 67,757 | ||||||
Dassault Systemes SE | 96 | 14,567 | ||||||
Edenred | 537 | 28,269 | ||||||
Eutelsat Communications S.A. | 4,089 | 77,528 | ||||||
Getlink SE | 1,731 | 28,978 | ||||||
Hermes International | 25 | 17,984 | ||||||
Ipsen S.A. | 74 | 7,882 | ||||||
Kering S.A. | 48 | 27,313 | ||||||
L’Oreal S.A. | 281 | 82,048 | ||||||
LVMH Moet Hennessy Louis Vuitton SE | 123 | 52,472 | ||||||
Pernod Ricard S.A. | 326 | 60,174 | ||||||
Safran S.A. | 304 | 48,094 | ||||||
Sanofi | 542 | 49,943 | ||||||
Sodexo S.A. | 121 | 13,306 | ||||||
TOTAL S.A. | 596 | 31,332 | ||||||
Vinci S.A. | 448 | 50,265 | ||||||
|
| |||||||
TOTAL FRANCE | 835,493 | |||||||
|
| |||||||
GERMANY – 7.5% | ||||||||
Allianz SE | 356 | 86,953 | ||||||
Beiersdorf AG | 357 | 42,265 | ||||||
Carl Zeiss Meditec AG | 76 | 8,286 | ||||||
Covestro AG (a) | 1,569 | 75,333 | ||||||
Deutsche Boerse AG | 313 | 48,506 | ||||||
Fraport AG Frankfurt Airport Services Worldwide | 443 | 37,026 | ||||||
LEG Immobilien AG | 928 | 106,501 | ||||||
Merck KGaA | 119 | 14,188 | ||||||
MTU Aero Engines AG | 167 | 44,589 | ||||||
Muenchener Rueckversicherungs-Gesellschaft AG in Muenchen | 207 | 57,486 | ||||||
ProSiebenSat.1 Media SE | 5,978 | 88,275 | ||||||
See accompanying notes which are an integral part of the financial statements.
| Annual Report | 28 | |||
Table of Contents
| Common Stocks – continued | ||||||||
| Shares | Value | |||||||
GERMANY – continued | ||||||||
SAP SE | 323 | $ | 42,797 | |||||
Vonovia SE | 2,419 | 128,717 | ||||||
|
| |||||||
TOTAL GERMANY | 780,922 | |||||||
|
| |||||||
HONG KONG – 3.0% | ||||||||
CLP Holdings Ltd. | 9,500 | 98,626 | ||||||
Hang Seng Bank Ltd. | 1,500 | 31,356 | ||||||
Link REIT | 9,500 | 103,596 | ||||||
Swire Pacific Ltd. Class A | 8,500 | 81,030 | ||||||
|
| |||||||
TOTAL HONG KONG | 314,608 | |||||||
|
| |||||||
ISRAEL – 0.8% | ||||||||
Bank Leumi Le-Israel BM | 5,002 | 36,417 | ||||||
Israel Discount Bank Ltd. Class A | 7,869 | 35,946 | ||||||
Nice Ltd. (b) | 80 | 12,648 | ||||||
|
| |||||||
TOTAL ISRAEL | 85,011 | |||||||
|
| |||||||
ITALY – 4.3% | ||||||||
Atlantia SpA | 1,328 | 32,792 | ||||||
Enel SpA | 17,927 | 138,758 | ||||||
Eni SpA | 560 | 8,475 | ||||||
Moncler SpA | 707 | 27,235 | ||||||
Poste Italiane SpA (a) | 3,164 | 38,394 | ||||||
Recordati SpA | 186 | 7,815 | ||||||
Snam SpA | 19,312 | 99,078 | ||||||
Terna Rete Elettrica Nazionale SpA | 15,340 | 101,352 | ||||||
|
| |||||||
TOTAL ITALY | 453,899 | |||||||
|
| |||||||
JAPAN – 23.5% | ||||||||
Asahi Kasei Corp. | 9,800 | 109,943 | ||||||
Astellas Pharma, Inc. | 2,600 | 44,746 | ||||||
Bandai Namco Holdings, Inc. | 500 | 30,873 | ||||||
Central Japan Railway Co. | 200 | 41,291 | ||||||
Daito Trust Construction Co. Ltd. | 800 | 106,454 | ||||||
Fast Retailing Co. Ltd. | 100 | 62,089 | ||||||
FUJIFILM Holdings Corp. | 400 | 17,705 | ||||||
Haseko Corp. | 2,300 | 29,924 | ||||||
Hikari Tsushin, Inc. | 100 | 22,058 | ||||||
Hoya Corp. | 500 | 44,462 | ||||||
ITOCHU Corp. | 2,300 | 48,368 | ||||||
Japan Airlines Co. Ltd. | 1,000 | 31,244 | ||||||
Japan Exchange Group, Inc. | 2,200 | 36,650 | ||||||
Japan Prime Realty Investment Corp. | 23 | 110,538 | ||||||
Kajima Corp. | 2,600 | 36,018 | ||||||
Kao Corp. | 1,200 | 97,165 | ||||||
KDDI Corp. | 3,900 | 108,307 | ||||||
Keihan Holdings Co. Ltd. | 800 | 37,929 | ||||||
Kintetsu Group Holdings Co. Ltd. | 700 | 38,309 | ||||||
Kobayashi Pharmaceutical Co. Ltd. | 900 | 72,423 | ||||||
| Shares | Value | |||||||
Mitsui & Co. Ltd. | 2,700 | $ | 46,692 | |||||
MS&AD Insurance Group Holdings, Inc. | 1,100 | 35,743 | ||||||
Nippon Building Fund, Inc. | 15 | 113,899 | ||||||
Nippon Telegraph & Telephone Corp. | 2,000 | 99,565 | ||||||
Nissan Chemical Corp. | 2,100 | 87,119 | ||||||
Nomura Research Institute Ltd. | 1,000 | 21,400 | ||||||
NTT Data Corp. | 1,300 | 17,239 | ||||||
NTT DOCOMO, Inc. | 3,800 | 104,686 | ||||||
Obayashi Corp. | 3,500 | 36,300 | ||||||
Obic Co. Ltd. | 200 | 25,280 | ||||||
Oriental Land Co. Ltd. | 300 | 44,129 | ||||||
ORIX Corp. | 2,700 | 42,666 | ||||||
Secom Co. Ltd. | 500 | 46,602 | ||||||
Sekisui House Ltd. | 1,600 | 34,699 | ||||||
SG Holdings Co. Ltd. | 1,300 | 32,371 | ||||||
Shimano, Inc. | 200 | 33,522 | ||||||
Shionogi & Co. Ltd. | 600 | 36,214 | ||||||
Skylark Holdings Co. Ltd. | 1,400 | 25,475 | ||||||
Sony Financial Holdings, Inc. | 1,300 | 28,157 | ||||||
Suntory Beverage & Food Ltd. | 1,600 | 68,451 | ||||||
Suzuken Co. Ltd/Aichi Japan | 500 | 26,854 | ||||||
Toho Co. Ltd. | 1,900 | 76,887 | ||||||
Tokio Marine Holdings, Inc. | 900 | 48,905 | ||||||
Tokyo Electric Power Co. Holdings, Inc. (b) | 20,700 | 96,226 | ||||||
Toyo Suisan Kaisha Ltd. | 1,500 | 63,339 | ||||||
Trend Micro, Inc. | 400 | 20,372 | ||||||
USS Co. Ltd. | 1,300 | 25,352 | ||||||
|
| |||||||
TOTAL JAPAN | 2,464,640 | |||||||
|
| |||||||
JERSEY – 0.4% | ||||||||
Experian PLC | 1,329 | 41,798 | ||||||
|
| |||||||
TOTAL JERSEY | 41,798 | |||||||
|
| |||||||
NETHERLANDS – 2.9% | ||||||||
ASR Nederland N.V. | 907 | 33,190 | ||||||
Euronext N.V. (a) | 554 | 44,642 | ||||||
Heineken Holding N.V. | 411 | 39,146 | ||||||
Heineken N.V. | 471 | 48,044 | ||||||
SBM Offshore N.V. | 117 | 2,011 | ||||||
Unilever N.V. | 1,607 | 94,902 | ||||||
Wolters Kluwer N.V. | 498 | 36,669 | ||||||
|
| |||||||
TOTAL NETHERLANDS | 298,604 | |||||||
|
| |||||||
NEW ZEALAND – 0.8% | ||||||||
Meridian Energy Ltd. | 29,554 | 87,163 | ||||||
|
| |||||||
TOTAL NEW ZEALAND | 87,163 | |||||||
|
| |||||||
NORWAY – 1.2% | ||||||||
Equinor ASA | 291 | 5,383 | ||||||
Orkla ASA | 4,425 | 42,507 | ||||||
See accompanying notes which are an integral part of the financial statements.
| 29 | Annual Report | |||
Table of Contents
Fidelity® Targeted International Factor ETF
Schedule of Investments – continued
| Common Stocks – continued | ||||||||
| Shares | Value | |||||||
NORWAY – continued | ||||||||
Telenor ASA | 4,133 | $ | 77,369 | |||||
|
| |||||||
TOTAL NORWAY | 125,259 | |||||||
|
| |||||||
SINGAPORE – 1.1% | ||||||||
Oversea-Chinese Banking Corp. Ltd. | 5,456 | 43,955 | ||||||
Singapore Exchange Ltd. | 5,300 | 34,828 | ||||||
United Overseas Bank Ltd. | 2,100 | 41,415 | ||||||
|
| |||||||
TOTAL SINGAPORE | 120,198 | |||||||
|
| |||||||
SPAIN – 3.8% | ||||||||
Aena SME S.A. (a) | 190 | 34,859 | ||||||
Amadeus IT Group S.A. | 218 | 16,130 | ||||||
Enagas S.A. | 4,254 | 105,280 | ||||||
Endesa S.A. | 3,770 | 102,594 | ||||||
Industria de Diseno Textil S.A. | 1,289 | 40,181 | ||||||
Red Electrica Corp. S.A. | 4,901 | 98,663 | ||||||
|
| |||||||
TOTAL SPAIN | 397,707 | |||||||
|
| |||||||
SWEDEN – 3.4% | ||||||||
Atlas Copco AB Class A | 1,218 | 43,027 | ||||||
Essity AB Class B | 1,544 | 48,180 | ||||||
Hennes & Mauritz AB. Class B | 1,807 | 37,756 | ||||||
ICA Gruppen AB | 823 | 36,395 | ||||||
Industrivarden AB Class A | 1,590 | 35,141 | ||||||
Securitas AB Class B | 1,666 | 26,640 | ||||||
Swedish Match AB | 993 | 46,608 | ||||||
Telia Co. AB | 18,632 | 81,913 | ||||||
|
| |||||||
TOTAL SWEDEN | 355,660 | |||||||
|
| |||||||
SWITZERLAND – 6.8% | ||||||||
Baloise Holding AG | 195 | 36,015 | ||||||
Givaudan S.A. | 31 | 91,036 | ||||||
Nestle S.A. | 2,376 | 253,665 | ||||||
Novartis AG | 1,122 | 97,915 | ||||||
Partners Group Holding AG | 49 | 38,207 | ||||||
Roche Holding AG | 330 | 99,284 | ||||||
Sonova Holding AG | 50 | 11,455 | ||||||
Swisscom AG | 173 | 88,385 | ||||||
|
| |||||||
TOTAL SWITZERLAND | 715,962 | |||||||
|
| |||||||
UNITED KINGDOM – 13.0% | ||||||||
3i Group PLC | 2,735 | 39,963 | ||||||
Admiral Group PLC | 1,297 | 33,971 | ||||||
| Shares | Value | |||||||
AstraZeneca PLC | 613 | $ | 59,562 | |||||
BHP Group PLC | 4,180 | 88,517 | ||||||
BP PLC | 4,571 | 28,972 | ||||||
British American Tobacco PLC | 2,300 | 80,501 | ||||||
Compass Group PLC | 1,148 | 30,574 | ||||||
Croda International PLC | 1,274 | 79,477 | ||||||
Diageo PLC | 2,286 | 93,706 | ||||||
Direct Line Insurance Group PLC | 8,362 | 29,473 | ||||||
GlaxoSmithKline PLC | 2,235 | 51,203 | ||||||
Halma PLC | 482 | 11,697 | ||||||
InterContinental Hotels Group PLC | 272 | 16,419 | ||||||
Legal & General Group PLC | 12,707 | 43,405 | ||||||
Lloyds Banking Group PLC | 84,919 | 62,480 | ||||||
London Stock Exchange Group PLC | 516 | 46,481 | ||||||
Next PLC | 252 | 21,486 | ||||||
Reckitt Benckiser Group PLC | 906 | 69,993 | ||||||
RELX PLC | 2,105 | 50,662 | ||||||
Rentokil Initial PLC | 5,852 | 34,453 | ||||||
Rightmove PLC | 12,400 | 96,149 | ||||||
Rio Tinto PLC | 1,924 | 100,039 | ||||||
Royal Dutch Shell PLC Class B | 1,786 | 51,313 | ||||||
Smith & Nephew PLC | 617 | 13,207 | ||||||
Tate & Lyle PLC | 3,733 | 32,543 | ||||||
The Sage Group PLC | 1,391 | 12,970 | ||||||
Tullow Oil PLC | 900 | 2,400 | ||||||
Unilever PLC | 1,297 | 77,661 | ||||||
|
| |||||||
TOTAL UNITED KINGDOM | 1,359,277 | |||||||
|
| |||||||
TOTAL COMMON STOCKS | 10,420,411 | |||||||
|
| |||||||
TOTAL INVESTMENT IN SECURITIES – 99.5% |
| 10,420,411 | ||||||
NET OTHER ASSETS (LIABILITIES) – 0.5% |
| 52,746 | ||||||
|
| |||||||
NET ASSETS – 100.0% |
| $ | 10,473,157 | |||||
|
| |||||||
Categorizations in the Schedule of Investments are based on country or territory of incorporation.
Legend
| (a) | Security is exempt from registration under Rule 144A of the Securities Act of 1933. These securities may be resold in transactions exempt from registration, normally to qualified institutional buyers. At the end of the period, the value of these securities amounted to $193,228 or 1.8% of net assets. |
| (b) | Non-income producing. |
Affiliated Central Funds
Information regarding fiscal year to date income earned by the Fund from investments in Fidelity Central Funds is as follows:
| Fund | Income earned | |||
Fidelity Cash Central Fund | $ | 133 | ||
|
| |||
See accompanying notes which are an integral part of the financial statements.
| Annual Report | 30 | |||
Table of Contents
Amounts in the income column in the above table include any capital gain distributions from underlying funds, which are presented in the corresponding line-item in the Statement of Operations, if applicable.
Investment Valuation
All investments are categorized as Level 1 under the Fair Value Hierarchy. The inputs or methodology used for valuing securities may not be an indication of the risk associated with investing in those securities. For more information on valuation inputs please refer to the Investment Valuation section in the accompanying Notes to Financial Statements.
See accompanying notes which are an integral part of the financial statements.
| 31 | Annual Report | |||
Table of Contents
| Statements of Assets and Liabilities | ||||||||||||||||
| October 31, 2019 | ||||||||||||||||
Fidelity International Dividend ETF | Fidelity International Value Factor ETF | Fidelity Targeted Emerging Markets Factor ETF | Fidelity Targeted International | |||||||||||||
Assets | ||||||||||||||||
Investments in securities, at value – See accompanying schedule: | ||||||||||||||||
Unaffiliated issuers | $ | 43,719,836 | $ | 13,036,073 | $ | 9,815,866 | $ | 10,420,411 | ||||||||
Fidelity Central Funds | 9,676 | — | — | — | ||||||||||||
|
|
|
|
|
|
|
| |||||||||
Total Investments in Securities | $ | 43,729,512 | $ | 13,036,073 | $ | 9,815,866 | $ | 10,420,411 | ||||||||
Segregated cash with brokers for derivative instruments | 13,500 | 4,500 | 2,600 | — | ||||||||||||
Cash | 11,369 | 18,509 | 36,283 | 3,155 | ||||||||||||
Foreign currency held at value (cost $11,466, $5,291, $32,834 and $18,883, respectively) | 11,345 | 5,329 | 33,041 | 19,067 | ||||||||||||
Dividends receivable | 281,927 | 75,473 | 5,143 | 33,923 | ||||||||||||
Distributions receivable from Fidelity Central Funds | 19 | — | — | — | ||||||||||||
|
|
|
|
|
|
|
| |||||||||
Total assets | 44,047,672 | 13,139,884 | 9,892,933 | 10,476,556 | ||||||||||||
|
|
|
|
|
|
|
| |||||||||
Liabilities | ||||||||||||||||
Payable for investments purchased | 10,297 | — | — | — | ||||||||||||
Accrued management fees | 14,171 | 4,226 | 3,690 | 3,399 | ||||||||||||
Payable for daily variation margin on futures contracts | 885 | 295 | 395 | — | ||||||||||||
Other payables and accrued expenses | — | — | 16,576 | — | ||||||||||||
|
|
|
|
|
|
|
| |||||||||
Total liabilities | 25,353 | 4,521 | 20,661 | 3,399 | ||||||||||||
|
|
|
|
|
|
|
| |||||||||
Net Assets | $ | 44,022,319 | $ | 13,135,363 | $ | 9,872,272 | $ | 10,473,157 | ||||||||
|
|
|
|
|
|
|
| |||||||||
Net Assets consist of: | ||||||||||||||||
Paid in capital | 46,061,430 | 14,928,188 | 10,008,903 | 10,020,760 | ||||||||||||
Total accumulated earnings (loss) | (2,039,111 | ) | (1,792,825 | ) | (136,631 | ) | 452,397 | |||||||||
|
|
|
|
|
|
|
| |||||||||
Net Assets | $ | 44,022,319 | $ | 13,135,363 | $ | 9,872,272 | $ | 10,473,157 | ||||||||
|
|
|
|
|
|
|
| |||||||||
Shares outstanding | 2,100,000 | 600,000 | 400,000 | 400,000 | ||||||||||||
|
|
|
|
|
|
|
| |||||||||
Net Asset Value, offering price and redemption price per share | $ | 20.96 | $ | 21.89 | $ | 24.68 | $ | 26.18 | ||||||||
|
|
|
|
|
|
|
| |||||||||
Investments at cost – Unaffiliated issuers | $ | 44,247,974 | $ | 13,348,331 | $ | 9,680,010 | $ | 9,838,109 | ||||||||
Investments at cost – Fidelity Central Funds | 9,676 | — | — | — | ||||||||||||
|
|
|
|
|
|
|
| |||||||||
Investments at cost | $ | 44,257,650 | $ | 13,348,331 | $ | 9,680,010 | $ | 9,838,109 | ||||||||
|
|
|
|
|
|
|
| |||||||||
See accompanying notes which are an integral part of the financial statements.
| Annual Report | 32 | |||
Table of Contents
| Statements of Operations | ||||||||||||||||
| For the year ended October 31, 2019 | ||||||||||||||||
Fidelity International High Dividend ETF | Fidelity International Value Factor ETF | Fidelity Targeted Emerging Markets Factor ETFA | Fidelity Targeted International Factor ETFA | |||||||||||||
Investment Income | ||||||||||||||||
Dividends | $ | 1,793,487 | $ | 531,611 | $ | 260,300 | $ | 277,320 | ||||||||
Non-Cash dividends | 150,883 | 45,835 | — | — | ||||||||||||
Interest | 38 | 4 | 11 | — | ||||||||||||
Income from Fidelity Central Funds | 836 | 58 | 750 | 133 | ||||||||||||
|
|
|
|
|
|
|
| |||||||||
Income before foreign taxes withheld | 1,945,244 | 577,508 | 261,061 | 277,453 | ||||||||||||
Less foreign taxes withheld | (160,036 | ) | (50,401 | ) | (30,050 | ) | (30,929 | ) | ||||||||
|
|
|
|
|
|
|
| |||||||||
Total income | 1,785,208 | 527,107 | 231,011 | 246,524 | ||||||||||||
|
|
|
|
|
|
|
| |||||||||
Expenses | ||||||||||||||||
Management fees | 126,857 | 49,774 | 29,807 | 27,003 | ||||||||||||
Independent trustees’ compensation | 166 | 72 | 33 | 35 | ||||||||||||
|
|
|
|
|
|
|
| |||||||||
Total expenses before reductions | 127,023 | 49,846 | 29,840 | 27,038 | ||||||||||||
Expense reductions | (100 | ) | (61 | ) | (31 | ) | — | |||||||||
|
|
|
|
|
|
|
| |||||||||
Total expenses | 126,923 | 49,785 | 29,809 | 27,038 | ||||||||||||
|
|
|
|
|
|
|
| |||||||||
Net investment income (loss) | 1,658,285 | 477,322 | 201,202 | 219,486 | ||||||||||||
|
|
|
|
|
|
|
| |||||||||
Realized and Unrealized Gain (Loss) | ||||||||||||||||
Net realized gain (loss) on investment securities | (1,332,544 | ) | (927,484 | ) | (265,464 | ) | (136,009 | ) | ||||||||
Net realized gain (loss) on futures contracts | 283 | 1,755 | (1,494 | ) | — | |||||||||||
Net realized gain (loss) on foreign currency transactions | (5,314 | ) | (2,357 | ) | (268 | ) | 694 | |||||||||
|
|
|
|
|
|
|
| |||||||||
Total net realized gain (loss) | (1,337,575 | ) | (928,086 | ) | (267,226 | ) | (135,315 | ) | ||||||||
|
|
|
|
|
|
|
| |||||||||
Change in net unrealized appreciation (depreciation) on investment securities (net of decrease in deferred foreign taxes of $–, $–, $16,576 and $–, respectively.) | 2,179,188 | 1,559,742 | 119,280 | 582,302 | ||||||||||||
Change in net unrealized appreciation (depreciation) on futures contracts | 6,920 | 1,886 | 248 | — | ||||||||||||
Change in net unrealized appreciation (depreciation) on assets and liabilities in foreign currencies | 2,082 | 1,020 | 265 | 324 | ||||||||||||
|
|
|
|
|
|
|
| |||||||||
Total change in net unrealized appreciation (depreciation) | 2,188,190 | 1,562,648 | 119,793 | 582,626 | ||||||||||||
|
|
|
|
|
|
|
| |||||||||
Net gain (loss) | 850,615 | 634,562 | (147,433 | ) | 447,311 | |||||||||||
|
|
|
|
|
|
|
| |||||||||
Net increase (decrease) in net assets resulting from operations | $ | 2,508,900 | $ | 1,111,884 | $ | 53,769 | $ | 666,797 | ||||||||
|
|
|
|
|
|
|
| |||||||||
| A | For the period February 26, 2019 (commencement of operations) to October 31, 2019. |
See accompanying notes which are an integral part of the financial statements.
| 33 | Annual Report | |||
Table of Contents
Financial Statements – continued
| Statements of Changes in Net Assets | ||||||||||||||||
| Fidelity International High Dividend ETF | Fidelity International Value Factor ETF | |||||||||||||||
Year ended October 31, 2019 | Year ended October 31, 2018A | Year ended October 31, 2019 | Year ended October 31, 2018A | |||||||||||||
Increase (Decrease) in Net Assets | ||||||||||||||||
Operations | ||||||||||||||||
Net investment income (loss) | $ | 1,658,285 | $ | 534,726 | $ | 477,322 | $ | 343,627 | ||||||||
Net realized gain (loss) | (1,337,575 | ) | (246,580 | ) | (928,086 | ) | (548,885 | ) | ||||||||
Change in net unrealized appreciation (depreciation) | 2,188,190 | (2,708,057 | ) | 1,562,648 | (1,873,151 | ) | ||||||||||
|
|
|
|
|
|
|
| |||||||||
Net increase (decrease) in net assets resulting from operations | 2,508,900 | (2,419,911 | ) | 1,111,884 | (2,078,409 | ) | ||||||||||
|
|
|
|
|
|
|
| |||||||||
Distributions to shareholders | (1,635,200 | ) | (492,900 | ) | (508,200 | ) | (318,100 | ) | ||||||||
|
|
|
|
|
|
|
| |||||||||
Share transactions | ||||||||||||||||
Proceeds from sales of shares | 24,648,439 | 21,412,991 | — | 14,928,188 | ||||||||||||
|
|
|
|
|
|
|
| |||||||||
Net increase (decrease) in net assets resulting from share transactions | 24,648,439 | 21,412,991 | — | 14,928,188 | ||||||||||||
|
|
|
|
|
|
|
| |||||||||
Total increase (decrease) in net assets | 25,522,139 | 18,500,180 | 603,684 | 12,531,679 | ||||||||||||
Net Assets | ||||||||||||||||
Beginning of year | 18,500,180 | — | 12,531,679 | — | ||||||||||||
|
|
|
|
|
|
|
| |||||||||
End of year | $ | 44,022,319 | $ | 18,500,180 | $ | 13,135,363 | $ | 12,531,679 | ||||||||
|
|
|
|
|
|
|
| |||||||||
Other Information | ||||||||||||||||
Shares | ||||||||||||||||
Sold | 1,200,000 | 900,000 | — | 600,000 | ||||||||||||
Redeemed | — | — | — | — | ||||||||||||
|
|
|
|
|
|
|
| |||||||||
Net increase (decrease) | 1,200,000 | 900,000 | — | 600,000 | ||||||||||||
|
|
|
|
|
|
|
| |||||||||
| A | For the period from January 16, 2018 (commencement of operations) to October 31, 2018. |
See accompanying notes which are an integral part of the financial statements.
| Annual Report | 34 | |||
Table of Contents
| Statements of Changes in Net Assets | ||||||||
Fidelity Targeted Emerging Markets Factor ETF Year ended October 31, 2019A | Fidelity Targeted International Factor ETF Year ended October 31, 2019A | |||||||
Increase (Decrease) in Net Assets | ||||||||
Operations | ||||||||
Net investment income (loss) | $ | 201,202 | $ | 219,486 | ||||
Net realized gain (loss) | (267,226 | ) | (135,315 | ) | ||||
Change in net unrealized appreciation (depreciation) | 119,793 | 582,626 | ||||||
|
|
|
| |||||
Net increase (decrease) in net assets resulting from operations | 53,769 | 666,797 | ||||||
|
|
|
| |||||
Distributions to shareholders | (190,400 | ) | (214,400 | ) | ||||
|
|
|
| |||||
Share transactions | ||||||||
Proceeds from sales of shares | 10,008,903 | 10,020,760 | ||||||
|
|
|
| |||||
Net increase (decrease) in net assets resulting from share transactions | 10,008,903 | 10,020,760 | ||||||
|
|
|
| |||||
Total increase (decrease) in net assets | 9,872,272 | 10,473,157 | ||||||
Net Assets | ||||||||
Beginning of year | — | — | ||||||
|
|
|
| |||||
End of year | $ | 9,872,272 | $ | 10,473,157 | ||||
|
|
|
| |||||
Other Information | ||||||||
Shares | ||||||||
Sold | 400,000 | 400,000 | ||||||
Redeemed | — | — | ||||||
|
|
|
| |||||
Net increase (decrease) | 400,000 | 400,000 | ||||||
|
|
|
| |||||
| A | For the period February 26, 2019 (commencement of operations) to October 31, 2019. |
See accompanying notes which are an integral part of the financial statements.
| 35 | Annual Report | |||
Table of Contents
Financial Statements – continued
| Financial Highlights | ||||||||
| Fidelity International High Dividend ETF | ||||||||
Year ended October 31, 2019 | Year ended October 31, 2018A | |||||||
SelectedPer-Share Data | ||||||||
Net asset value, beginning of period | $ | 20.56 | $ | 25.08 | ||||
|
|
|
| |||||
Income from Investment Operations | ||||||||
Net investment income (loss)B | 1.04 | 0.82 | ||||||
Net realized and unrealized gain (loss) | 0.31 | (4.63 | ) | |||||
|
|
|
| |||||
Total from investment operations | 1.35 | (3.81 | ) | |||||
|
|
|
| |||||
Distributions from net investment income | (0.95 | ) | (0.71 | ) | ||||
|
|
|
| |||||
Total distributions | (0.95 | ) | (0.71 | ) | ||||
|
|
|
| |||||
Net asset value, end of period | $ | 20.96 | $ | 20.56 | ||||
|
|
|
| |||||
Total ReturnC,D | 6.84 | % | (15.44 | )% | ||||
Ratios to Average Net AssetsE,F | ||||||||
Expense before reductions | .39 | % | .39 | %G | ||||
Expenses net of fee waivers, if any | .39 | % | .39 | %G | ||||
Expenses net of all reductions | .39 | % | .39 | %G | ||||
Net investment income (loss) | 5.07 | % | 4.59 | %G | ||||
Supplemental Data | ||||||||
Net assets, end of period (000 omitted) | $ | 44,022 | $ | 18,500 | ||||
Portfolio turnover rateH,I | 47 | % | 42 | %J | ||||
| A | For the period January 16, 2018 (commencement of operations) to October 31, 2018. |
| B | Calculated based on average shares outstanding during the period. |
| C | Total returns for periods of less than one year are not annualized. |
| D | Total returns would have been lower if certain expenses had not been reduced during the applicable periods shown. |
| E | Expense ratios reflect operating expenses of the Fund. Expenses before reductions do not reflect amounts reimbursed by the investment adviser or reductions from brokerage service arrangements or reductions from other expense offset arrangements and do not represent the amount paid by the Fund during periods when reimbursements or reductions occur. Expenses net of fee waivers reflect expenses after reimbursement by the investment adviser but prior to the reductions from brokerage service arrangements or other expense offset arrangements. Expenses net of all reductions represent the net expenses paid by the Fund but do not include expenses of the investment companies in which the fund invests. |
| F | Fees and expenses of any underlying Fidelity Central Funds are not included in the Funds’ expense ratio. Each Fund indirectly bears its proportionate share of expenses of any underlying Fidelity Central Funds. |
| G | Annualized. |
| H | Amount does not include the portfolio activity of any underlying funds. |
| I | Portfolio turnover rate excludes securities received or deliveredin-kind. |
| J | Amount not annualized. |
See accompanying notes which are an integral part of the financial statements.
| Annual Report | 36 | |||
Table of Contents
| Financial Highlights | ||||||||
| Fidelity International Value Factor ETF | ||||||||
Year ended October 31, 2019 | Year ended October 31, 2018A | |||||||
SelectedPer-Share Data | ||||||||
Net asset value, beginning of period | $ | 20.89 | $ | 25.00 | ||||
|
|
|
| |||||
Income from Investment Operations | ||||||||
Net investment income (loss)B | 0.80 | 0.62 | ||||||
Net realized and unrealized gain (loss) | 1.05 | (4.18 | ) | |||||
|
|
|
| |||||
Total from investment operations | 1.85 | (3.56 | ) | |||||
|
|
|
| |||||
Distributions from net investment income | (0.85 | ) | (0.55 | ) | ||||
|
|
|
| |||||
Total distributions | (0.85 | ) | (0.55 | ) | ||||
|
|
|
| |||||
Net asset value, end of period | $ | 21.89 | $ | 20.89 | ||||
|
|
|
| |||||
Total ReturnC,D | 9.04 | % | (14.46 | )% | ||||
Ratios to Average Net AssetsE,F | ||||||||
Expense before reductions | .39 | % | .39 | %G | ||||
Expenses net of fee waivers, if any | .39 | % | .39 | %G | ||||
Expenses net of all reductions | .39 | % | .39 | %G | ||||
Net investment income (loss) | 3.74 | % | 3.38 | %G | ||||
Supplemental Data | ||||||||
Net assets, end of period (000 omitted) | $ | 13,135 | $ | 12,532 | ||||
Portfolio turnover rateH | 56 | % | 65 | %I,J | ||||
| A | For the period January 16, 2018 (commencement of operations) to October 31, 2018. |
| B | Calculated based on average shares outstanding during the period. |
| C | Total returns for periods of less than one year are not annualized. |
| D | Total returns would have been lower if certain expenses had not been reduced during the applicable periods shown. |
| E | Expense ratios reflect operating expenses of the Fund. Expenses before reductions do not reflect amounts reimbursed by the investment adviser or reductions from brokerage service arrangements or reductions from other expense offset arrangements and do not represent the amount paid by the Fund during periods when reimbursements or reductions occur. Expenses net of fee waivers reflect expenses after reimbursement by the investment adviser but prior to the reductions from brokerage service arrangements or other expense offset arrangements. Expenses net of all reductions represent the net expenses paid by the Fund but do not include expenses of the investment companies in which the fund invests. |
| F | Fees and expenses of any underlying Fidelity Central Funds are not included in the Funds’ expense ratio. Each Fund indirectly bears its proportionate share of expenses of any underlying Fidelity Central Funds. |
| G | Annualized. |
| H | Amount does not include the portfolio activity of any underlying funds. |
| I | Amount not annualized. |
| J | Portfolio turnover rate excludes securities received or deliveredin-kind. |
See accompanying notes which are an integral part of the financial statements.
| 37 | Annual Report | |||
Table of Contents
Financial Statements – continued
| Financial Highlights | ||||
Fidelity Targeted Emerging Markets Factor ETF Year ended October 31, 2019A | ||||
SelectedPer-Share Data | ||||
Net asset value, beginning of period | $ | 25.00 | ||
|
| |||
Income from Investment Operations | ||||
Net investment income (loss)B | 0.50 | |||
Net realized and unrealized gain (loss) | (0.34 | ) | ||
|
| |||
Total from investment operations | 0.16 | |||
|
| |||
Distributions from net investment income | (0.48 | ) | ||
|
| |||
Total distributions | (0.48 | ) | ||
|
| |||
Net asset value, end of period | $ | 24.68 | ||
|
| |||
Total ReturnC,D | 0.66 | % | ||
Ratios to Average Net AssetsE,F,G | ||||
Expense before reductions | .45 | % | ||
Expenses net of fee waivers, if any | .45 | % | ||
Expenses net of all reductions | .45 | % | ||
Net investment income (loss) | 3.05 | % | ||
Supplemental Data | ||||
Net assets, end of period (000 omitted) | $ | 9,872 | ||
Portfolio turnover rateH,I | 34 | % | ||
| A | For the period February 26, 2019 (commencement of operations) to October 31, 2019. |
| B | Calculated based on average shares outstanding during the period. |
| C | Total returns for periods of less than one year are not annualized. |
| D | Total returns would have been lower if certain expenses had not been reduced during the applicable periods shown. |
| E | Annualized. |
| F | Expense ratios reflect operating expenses of the Fund. Expenses before reductions do not reflect amounts reimbursed by the investment adviser or reductions from brokerage service arrangements or reductions from other expense offset arrangements and do not represent the amount paid by the Fund during periods when reimbursements or reductions occur. Expenses net of fee waivers reflect expenses after reimbursement by the investment adviser but prior to the reductions from brokerage service arrangements or other expense offset arrangements. Expenses net of all reductions represent the net expenses paid by the Fund but do not include expenses of the investment companies in which the fund invests. |
| G | Fees and expenses of any underlying Fidelity Central Funds are not included in the Funds’ expense ratio. Each Fund indirectly bears its proportionate share of expenses of any underlying Fidelity Central Funds. |
| H | Amount does not include the portfolio activity of any underlying funds. |
| I | Amount not annualized. |
See accompanying notes which are an integral part of the financial statements.
| Annual Report | 38 | |||
Table of Contents
| Financial Highlights | ||||
Fidelity Targeted International Factor ETF Year ended | ||||
SelectedPer-Share Data | ||||
Net asset value, beginning of period | $ | 25.05 | ||
|
| |||
Income from Investment Operations | ||||
Net investment income (loss)B | 0.55 | |||
Net realized and unrealized gain (loss) | 1.12 | |||
|
| |||
Total from investment operations | 1.67 | |||
|
| |||
Distributions from net investment income | (0.54 | ) | ||
|
| |||
Total distributions | (0.54 | ) | ||
|
| |||
Net asset value, end of period | $ | 26.18 | ||
|
| |||
Total ReturnC | 6.72 | % | ||
Ratios to Average Net AssetsD,E,F | ||||
Expense before reductions | .39 | % | ||
Expenses net of fee waivers, if any | .39 | % | ||
Expenses net of all reductions | .39 | % | ||
Net investment income (loss) | 3.18 | % | ||
Supplemental Data | ||||
Net assets, end of period (000 omitted) | $ | 10,473 | ||
Portfolio turnover rateG,H,I | 35 | % | ||
| A | For the period February 26, 2019 (commencement of operations) to October 31, 2019. |
| B | Calculated based on average shares outstanding during the period. |
| C | Total returns for periods of less than one year are not annualized. |
| D | Annualized. |
| E | Expense ratios reflect operating expenses of the Fund. Expenses before reductions do not reflect amounts reimbursed by the investment adviser or reductions from brokerage service arrangements or reductions from other expense offset arrangements and do not represent the amount paid by the Fund during periods when reimbursements or reductions occur. Expenses net of fee waivers reflect expenses after reimbursement by the investment adviser but prior to the reductions from brokerage service arrangements or other expense offset arrangements. Expenses net of all reductions represent the net expenses paid by the Fund but do not include expenses of the investment companies in which the fund invests. |
| F | Fees and expenses of any underlying Fidelity Central Funds are not included in the Funds’ expense ratio. Each Fund indirectly bears its proportionate share of expenses of any underlying Fidelity Central Funds. |
| G | Amount does not include the portfolio activity of any underlying funds. |
| H | Amount not annualized. |
| I | Portfolio turnover rate excludes securities received or deliveredin-kind. |
See accompanying notes which are an integral part of the financial statements.
| 39 | Annual Report | |||
Table of Contents
For the period ended October 31, 2019
1. Organization.
Fidelity International High Dividend ETF, Fidelity International Value Factor ETF, Fidelity Targeted Emerging Markets Factor ETF and Fidelity Targeted International Factor ETF (the Funds) are exchange-traded funds of Fidelity Covington Trust (the Trust) and are authorized to issue an unlimited number of shares. The Trust is registered under the Investment Company Act of 1940, as amended (the 1940 Act), as anopen-end management investment company organized as a Massachusetts business trust. Certain Funds’ investments in emerging markets can be subject to social, economic, regulatory and political uncertainties and can be extremely volatile.
2. Investments in Fidelity Central Funds.
The Funds invest in Fidelity Central Funds, which areopen-end investment companies generally available only to other investment companies and accounts managed by the investment adviser and its affiliates. The Funds’ Schedules of Investments list each of the Fidelity Central Funds held as of period end, if any, as an investment of each Fund, but do not include the underlying holdings of each Fidelity Central Fund. As an Investing Fund, each Fund indirectly bears its proportionate share of the expenses of the underlying Fidelity Central Funds.
The Money Market Central Funds seek preservation of capital and current income and are managed by Fidelity Investments Money Management, Inc. (FIMM), an affiliate of the investment adviser. Annualized expenses of the Money Market Central Funds as of their most recent shareholder report date ranged from less than .005% to 0.01%.
A complete unaudited list of holdings for each Fidelity Central Fund is available upon request or at the Securities and Exchange Commission (the SEC) website at www.sec.gov. In addition, the financial statements of the Fidelity Central Funds, which are not covered by the Funds’ Report of Independent Registered Public Accounting Firm, are available on the SEC website or upon request.
3. Significant Accounting Policies.
Each Fund is an investment company and applies the accounting and reporting guidance of the Financial Accounting Standards Board (FASB) Accounting Standards Codification Topic 946 Financial Services – Investments Companies. The financial statements have been prepared in conformity with accounting principles generally accepted in the United States of America (GAAP), which require management to make certain estimates and assumptions at the date of the financial statements. Actual results could differ from those estimates. Subsequent events, if any, through the date that the financial statements were issued have been evaluated in the preparation of the financial statements. The following summarizes the significant accounting policies of the Funds:
Investment Valuation. Investments are valued as of 4:00 p.m. Eastern time on the last calendar day of the period. The Board of Trustees (the Board) has delegated the day to day responsibility for the valuation of each Fund’s investments to the Fair Value Committee (the Committee) established by each Fund’s investment adviser. In accordance with valuation policies and procedures approved by the Board, each Fund attempts to obtain prices from one or more third party pricing vendors or brokers to value its investments. When current market prices, quotations or currency exchange rates are not readily available or reliable, investments will be fair valued in good faith by the Committee, in accordance with procedures adopted by the Board. Factors used in determining fair value vary by investment type and may include market or investment specific events. The frequency with which these procedures are used cannot be predicted and they may be utilized to a significant extent. The Committee oversees each Fund’s valuation policies and procedures and reports to the Board on the Committee’s activities and fair value determinations. The Board monitors the appropriateness of the procedures used in valuing each Fund’s investments and ratifies the fair value determinations of the Committee.
Each Fund categorizes the inputs to valuation techniques used to value its investments into a disclosure hierarchy consisting of three levels as shown below:
Level 1 – quoted prices in active markets for identical investments
Level 2 – other significant observable inputs (including quoted prices for similar investments, interest rates, prepayment speeds, etc.)
Level 3 – unobservable inputs (including the Fund’s own assumptions based on the best information available)
Valuation techniques used to value each Fund’s investments by major category are as follows:
Equity securities, including restricted securities, for which market quotations are readily available, are valued at the last reported sale price or official closing price as reported by a third party pricing vendor on the primary market or exchange on which they are traded and are categorized as Level 1 in the hierarchy. In the event there were no sales during the day or closing prices are not available, securities are valued at the last quoted bid price or may be valued using the last available price and are generally categorized as Level 2 in the hierarchy. For foreign equity securities, when market or security specific events arise, comparisons to the valuation of American Depositary Receipts (ADRs), futures contracts, Exchange-Traded Funds (ETFs) and certain indexes as well as quoted prices for similar securities may be used and would be categorized as Level 2 in the hierarchy. For equity securities, including restricted securities, where observable inputs are limited, assumptions about market activity and risk are used and these securities may be categorized as Level 3 in the hierarchy.
| Annual Report | 40 | |||
Table of Contents
3. Significant Accounting Policies – continued
Futures contracts are valued at the settlement price established each day by the board of trade or exchange on which they are traded and are categorized as Level 1 in the hierarchy. Investments inopen-end mutual funds, including the Fidelity Central Funds, are valued at their closing net asset value (NAV) each business day and are categorized as Level 1 in the hierarchy.
Changes in valuation techniques may result in transfers in or out of an assigned level within the disclosure hierarchy. The aggregate value of investments by input level, as of October 31, 2019, is included at the end of each Fund’s Schedule of Investments.
Foreign Currency. The Funds may use foreign currency contracts to facilitate transactions in foreign-denominated securities. Gains and losses from these transactions may arise from changes in the value of the foreign currency or if the counterparties do not perform under the contracts’ terms.
Foreign-denominated assets, including investment securities, and liabilities are translated into U.S. dollars at the exchange rates at period end. Purchases and sales of investment securities, income and dividends received and expenses denominated in foreign currencies are translated into U.S. dollars at the exchange rate in effect on the transaction date.
The effects of exchange rate fluctuations on investments are included with the net realized and unrealized gain (loss) on investment securities. Other foreign currency transactions resulting in realized and unrealized gain (loss) are disclosed separately.
Investment Transactions and Income. For financial reporting purposes and for processing shareholder transactions, the Funds’ investment holdings and NAV include trades executed through the end of the last business day of the period and prior business day, respectively. The NAV per share for processing shareholder transactions is calculated as of the close of business of NYSE Arca for Fidelity International High Dividend ETF and Fidelity International Value Factor ETF and of Cboe BZX Exchange, Inc. (CboeBZX) for Fidelity Targeted Emerging Markets Factor ETF and Fidelity Targeted International Factor ETF, normally 4:00 p.m. Eastern time. Gains and losses on securities sold are determined on the basis of identified cost. Dividend income is recorded on theex-dividend date, except for certain dividends from foreign securities where theex-dividend date may have passed, which are recorded as soon as the Funds are informed of theex-dividend date.Non-cash dividends included in dividend income, if any, are recorded at the fair market value of the securities received. Income and capital gain distributions from Fidelity Central Funds, if any, are recorded on theex-dividend date. Investment income is recorded net of foreign taxes withheld where recovery of such taxes is uncertain.
Expenses. Expenses directly attributable to a fund are charged to that fund. Expenses attributable to more than one fund are allocated among the respective funds on the basis of relative net assets or other appropriate methods. Expense estimates are accrued in the period to which they relate and adjustments are made when actual amounts are known.
Income Tax Information and Distributions to Shareholders. Each year, each Fund intends to qualify as a regulated investment company under Subchapter M of the Internal Revenue Code, including distributing substantially all of its taxable income and realized gains. As a result, no provision for U.S. Federal income taxes is required. As of October 31, 2019 each Fund did not have any unrecognized tax benefits in the financial statements; nor is each Fund aware of any tax positions for which it is reasonably possible that the total amounts of unrecognized tax benefits will significantly change in the next twelve months. Each Fund files a U.S. federal tax return, in addition to state and local tax returns as required. Each Fund’s federal income tax returns are subject to examination by the Internal Revenue Service (IRS) for a period of three fiscal years after they are filed. State and local tax returns may be subject to examination for an additional fiscal year depending on the jurisdiction. Foreign taxes are provided for based on each Fund’s understanding of the tax rules and rates that exist in the foreign markets in which it invests. Fidelity Targeted Emerging Markets Factor ETF is subject to a tax imposed on capital gains by certain countries in which it invests. An estimated deferred tax liability for net unrealized appreciation on the applicable securities is included in Other payables and accrued expenses on the Statement of Assets & Liabilities.
Distributions are declared and recorded on theex-dividend date. Income and capital gain distributions are determined in accordance with income tax regulations, which may differ from GAAP.
Capital accounts within the financial statements are adjusted for permanentbook-tax differences. These adjustments have no impact on net assets or the results of operations. Capital accounts are not adjusted for temporarybook-tax differences which will reverse in a subsequent period.
Book-tax differences are primarily due to futures contracts, foreign currency transactions, passive foreign investment companies (PFIC) and losses deferred due to wash sales.
| 41 | Annual Report | |||
Table of Contents
Notes to Financial Statements – continued
3. Significant Accounting Policies – continued
As of period end, the cost and unrealized appreciation (depreciation) in securities, and derivatives if applicable, for federal income tax purposes were as follows for each Fund:
| Tax cost | Gross unrealized appreciation | Gross unrealized depreciation | Net unrealized appreciation (depreciation) on securities and other investments | |||||||||||||
Fidelity International High Dividend ETF | $ | 44,568,752 | $ | 2,064,320 | $ | (2,903,560 | ) | $ | (839,240 | ) | ||||||
Fidelity International Value Factor ETF | 13,413,079 | 910,279 | (1,287,285 | ) | (377,006 | ) | ||||||||||
Fidelity Targeted Emerging Markets Factor ETF | 9,698,202 | 706,506 | (588,842 | ) | 117,664 | |||||||||||
Fidelity Targeted International Factor ETF | 9,880,330 | 771,713 | (231,632 | ) | 540,081 | |||||||||||
Thetax-based components of distributable earnings as of period end were as follows for each Fund:
| Undistributed ordinary income | Undistributed capital gains | Capital loss carryforward | Net unrealized (depreciation) | |||||||||||||
Fidelity International High Dividend ETF | $ | 112,108 | $ | — | $ | (1,313,328 | ) | $ | (837,889 | ) | ||||||
Fidelity International Value Factor ETF | 13,702 | — | (1,429,391 | ) | (377,137 | ) | ||||||||||
Fidelity Targeted Emerging Markets Factor ETF | 28,176 | — | (266,160 | ) | 101,354 | |||||||||||
Fidelity Targeted International Factor ETF | 49,685 | — | (137,693 | ) | 540,405 | |||||||||||
Capital loss carryforwards are only available to offset future capital gains of the Funds to the extent provided by regulations and may be limited. Under the Regulated Investment Company Modernization Act of 2010 (the Act), the Funds are permitted to carry forward capital losses incurred in taxable years beginning after December 22, 2010 for an unlimited period and such capital losses are required to be used prior to any losses that expire. The capital loss carryforward information presented below, including any applicable limitation, is estimated as of fiscal year end and is subject to adjustment.
| No-expiration Short-term | No-expiration Long-term | Total capital loss carryforward | ||||||||||
Fidelity International High Dividend ETF | $ | (910,768 | ) | $ | (402,560 | ) | $ | (1,313,328 | ) | |||
Fidelity International Value Factor ETF | (892,341 | ) | (537,050 | ) | (1,429,391 | ) | ||||||
Fidelity Targeted Emerging Markets Factor ETF | (265,413 | ) | (747 | ) | (266,160 | ) | ||||||
Fidelity Targeted International Factor ETF | (137,693 | ) | — | (137,693 | ) | |||||||
The tax character of distributions paid was as follows:
| October 31, 2019 | ||||||||||||||||
Ordinary Income | Long-Term Capital Gain | Tax Return Of Capital | Total | |||||||||||||
Fidelity International High Dividend ETF | $ | 1,635,200 | $ | — | $ | — | $ | 1,635,200 | ||||||||
Fidelity International Value Factor ETF | 508,200 | — | — | 508,200 | ||||||||||||
Fidelity Targeted Emerging Markets Factor ETFA | 190,400 | — | — | 190,400 | ||||||||||||
Fidelity Targeted International Factor ETFA | 214,400 | — | — | 214,400 | ||||||||||||
A For the period February 26, 2019 (commencement of operations) to October 31, 2019.
|
| |||||||||||||||
| October 31, 2018 | ||||||||||||||||
Fidelity International High Dividend ETFA | $ | 492,900 | $ | — | $ | — | $ | 492,900 | ||||||||
Fidelity International Value Factor ETFA | 318,100 | — | — | 318,100 | ||||||||||||
Fidelity Targeted Emerging Markets Factor ETF | — | — | — | — | ||||||||||||
Fidelity Targeted International Factor ETF | — | — | — | — | ||||||||||||
| A | For the period from January 16, 2018 (commencement of operations) to October 31, 2018. |
Restricted Securities. The Fund’s may invest in securities that are subject to legal or contractual restrictions on resale. These securities generally may be resold in transactions exempt from registration or to the public if the securities are registered. Disposal of these securities may involve time-consuming negotiations and expense, and prompt sale at an acceptable price may be difficult. Information regarding restricted securities is included at the end of each applicable Fund’s Schedule of Investments.
| Annual Report | 42 | |||
Table of Contents
4. Derivative Instruments.
Risk Exposures and the Use of Derivative Instruments. The Funds’ investment objective allows the Funds to enter into various types of derivative contracts, including futures contracts. Derivatives are investments whose value is primarily derived from underlying assets, indices or reference rates and may be transacted on an exchange orover-the-counter (OTC). Derivatives may involve a future commitment to buy or sell a specified asset based on specified terms, to exchange future cash flows at periodic intervals based on a notional principal amount, or for one party to make one or more payments upon the occurrence of specified events in exchange for periodic payments from the other party.
The Funds used derivatives to increase returns and to manage exposure to certain risks as defined below. The success of any strategy involving derivatives depends on analysis of numerous economic factors, and if the strategies for investment do not work as intended, the Funds may not achieve their objectives.
The Funds’ use of derivatives increased or decreased their exposure to the following risk:
| Equity risk | Equity risk relates to the fluctuations in the value of financial instruments as a result of changes in market prices (other than those arising from interest rate risk or foreign exchange risk), whether caused by factors specific to an individual investment, its issuer, or all factors affecting all instruments traded in a market or market segment. |
The Funds are also exposed to additional risks from investing in derivatives, such as liquidity risk and counterparty credit risk. Liquidity risk is the risk that the Funds will be unable to close out the derivative in the open market in a timely manner. Counterparty credit risk is the risk that the counterparty will not be able to fulfill its obligation to the Funds. Counterparty credit risk related to exchange-traded futures contracts may be mitigated by the protection provided by the exchange on which they trade.
Investing in derivatives may involve greater risks than investing in the underlying assets directly and, to varying degrees, may involve risk of loss in excess of any initial investment and collateral received and amounts recognized in the Statements of Assets and Liabilities. In addition, there may be the risk that the change in value of the derivative contract does not correspond to the change in value of the underlying instrument.
Futures Contracts.A futures contract is an agreement between two parties to buy or sell a specified underlying instrument for a fixed price at a specified future date. The Funds used futures contracts to manage their exposure to the stock market.
Upon entering into a futures contract, a fund is required to deposit either cash or securities (initial margin) with a clearing broker in an amount equal to a certain percentage of the face value of the contract. Futures contracts aremarked-to-market daily and subsequent daily payments (variation margin) are made or received by a fund depending on the daily fluctuations in the value of the futures contracts and are recorded as unrealized appreciation or (depreciation). This receivable and/or payable, if any, is included in daily variation margin on futures contracts in the Statements of Assets and Liabilities. Realized gain or (loss) is recorded upon the expiration or closing of a futures contract. The net realized gain (loss) and change in net unrealized appreciation (depreciation) on futures contracts during the period is presented in the Statements of Operations.
Any open futures contracts at period end are presented in the Schedule of Investments under the caption “Futures Contracts”. The notional amount at value reflects each contract’s exposure to the underlying instrument or index at period end and is representative of volume of activity during the period. Cash deposited to meet initial margin requirements is presented as segregated cash with brokers for derivative instruments in the Statements of Assets and Liabilities.
5. Purchases and Sales of Investments.
Purchases and sales of securities, other than short-term securities andin-kind transactions, were as follows:
| Purchases | Sales | |||||||
Fidelity International High Dividend ETF | $ | 15,626,433 | $ | 15,235,379 | ||||
Fidelity International Value Factor ETF | 7,075,339 | 7,083,829 | ||||||
Fidelity Targeted Emerging Markets Factor ETF | 13,221,434 | 3,276,413 | ||||||
Fidelity Targeted International Factor ETF | 4,621,723 | 3,528,802 | ||||||
Securities received or deliveredin-kind through subscriptions and redemptions were as follows:
| In-kind Subscriptions | In-kind Redemptions | |||||||
Fidelity International High Dividend ETF | $ | 24,051,243 | $ | — | ||||
Fidelity International Value Factor ETF | — | — | ||||||
Fidelity Targeted Emerging Markets Factor ETF | — | — | ||||||
Fidelity Targeted International Factor ETF | 8,916,338 | — | ||||||
| 43 | Annual Report | |||
Table of Contents
Notes to Financial Statements – continued
6. Fees and Other Transactions with Affiliates.
Management Fee. FMR Co., Inc. (FMRC) (the investment adviser), an affiliate of FMR provides the Funds with investment management related services for which the Funds pay a monthly management fee that is based on an annual rate of .39% of each Fund’s average net assets for Fidelity International High Dividend ETF, Fidelity International Value Factor ETF and Fidelity Targeted International Factor ETF. Under the management contract, the investment adviser pays all other expenses, except the compensation of the independent Trustees and certain other expenses such as interest expense.
Fidelity Targeted Emerging Markets Factor ETF’s management fee is based on an annual rate of .45% of average net assets. Under the management contract, the investment adviser pays all other expenses, except the compensation of the independent Trustees and certain other expenses such as interest expense.
Sub-Adviser.Geode Capital Management, LLC (Geode), serves assub-adviser for the Funds. Geode provides discretionary investment advisory services to the Funds and is paid by the investment adviser for providing these services.
Interfund Trades. The Funds may purchase from or sell securities to other funds affiliated with eachsub-adviser under procedures adopted by the Board. The procedures have been designed to ensure these interfund trades are executed in accordance with Rule17a-7 of the 1940 Act. Interfund trades are included within the respective purchases and sales amounts shown in the Purchases and Sales of Investments note.
7. Expense Reductions.
Through arrangements with each applicable Fund’s custodian, credits realized as a result of certain uninvested cash balances were used to reduce each applicable Fund’s expenses by the following amounts:
| Amount | ||||
Fidelity International High Dividend ETF | $ | 100 | ||
Fidelity International Value Factor ETF | 61 | |||
Fidelity Targeted Emerging Markets Factor ETF | 31 | |||
8. Share Transactions.
The Funds issue and redeem shares at NAV only with certain authorized participants in large increments known as Creation Units. Purchases of Creation Units are made by tendering a basket of designated stocks to a Fund and redemption proceeds are paid with a basket of securities from a fund’s portfolio with a balancing cash component to equate the market value of the basket of securities delivered or redeemed to the NAV per Creation Unit on the transaction date. Cash may be substituted equivalent to the value of certain securities generally when they are not available in sufficient quantity for delivery. A fund’s shares are available in smaller increments to investors in the secondary market at market prices and may be subject to commissions. Authorized participants pay a transaction fee to the shareholder servicing agent when purchasing and redeeming Creation Units of a fund. The transaction fee is used to defray the costs associated with the issuance and redemption of Creation Units.
9. Other.
The Funds’ organizational documents provide former and current trustees and officers with a limited indemnification against liabilities arising in connection with the performance of their duties to the Funds. In the normal course of business, the Funds may also enter into contracts that provide general indemnifications. The Funds’ maximum exposure under these arrangements is unknown as this would be dependent on future claims that may be made against the Funds. The risk of material loss from such claims is considered remote.
| Annual Report | 44 | |||
Table of Contents
Report of Independent Registered Public Accounting Firm
To the Board of Trustees of Fidelity Covington Trust and Shareholders of Fidelity International High Dividend ETF, Fidelity International Value Factor ETF, Fidelity Targeted Emerging Markets Factor ETF and Fidelity Targeted International Factor ETF:
Opinion on the Financial Statements and Financial Highlights
We have audited the accompanying statements of assets and liabilities of Fidelity International High Dividend ETF, Fidelity International Value Factor ETF, Fidelity Targeted Emerging Markets Factor ETF and Fidelity Targeted International Factor ETF (the “Funds”), each a fund of Fidelity Covington Trust, including the schedules of investments, as of October 31, 2019, the related statements of operations for the year then ended, and the statements of changes in net assets and the financial highlights for the year then ended and for the period from January 16, 2018 (commencement of operations) to October 31, 2018, and the related notes, except for; Fidelity Targeted Emerging Markets Factor ETF and Fidelity Targeted International Factor ETF; the related statements of operations, the statements of changes in net assets and the financial highlights for the period from February 26, 2019 (commencement of operations) to October 31, 2019, and the related notes. In our opinion, the financial statements and financial highlights present fairly, in all material respects, the financial position of each of the Funds as of October 31, 2019, the results of their operations, and the changes in their net assets and the financial highlights for the year then ended and for the period from January 16, 2018 (commencement of operations) to October 31, 2018, except for; Fidelity Targeted Emerging Markets Factor ETF and Fidelity Targeted International Factor ETF; the results of their operations, the changes in their net assets and the financial highlights for the period from February 26, 2019 (commencement of operations) to October 31, 2019, in conformity with accounting principles generally accepted in the United States of America.
Basis for Opinion
These financial statements and financial highlights are the responsibility of the Funds’ management. Our responsibility is to express an opinion on the Funds’ financial statements and financial highlights based on our audits. We are a public accounting firm registered with the Public Company Accounting Oversight Board (United States) (PCAOB) and are required to be independent with respect to the Funds in accordance with the U.S. federal securities laws and the applicable rules and regulations of the Securities and Exchange Commission and the PCAOB.
We conducted our audits in accordance with the standards of the PCAOB. Those standards require that we plan and perform the audit to obtain reasonable assurance about whether the financial statements and financial highlights are free of material misstatement, whether due to error or fraud. The Funds are not required to have, nor were we engaged to perform, an audit of their internal control over financial reporting. As part of our audits we are required to obtain an understanding of internal control over financial reporting but not for the purpose of expressing an opinion on the effectiveness of the Funds’ internal control over financial reporting. Accordingly, we express no such opinion.
Our audits included performing procedures to assess the risks of material misstatement of the financial statements and financial highlights, whether due to error or fraud, and performing procedures that respond to those risks. Such procedures included examining, on a test basis, evidence regarding the amounts and disclosures in the financial statements and financial highlights. Our audits also included evaluating the accounting principles used and significant estimates made by management, as well as evaluating the overall presentation of the financial statements and financial highlights. Our procedures included confirmation of securities owned as of October 31, 2019, by correspondence with the custodians and brokers; when replies were not received from brokers, we performed other auditing procedures. We believe that our audits provide a reasonable basis for our opinion.
/s/ Deloitte & Touche LLP
Boston, Massachusetts
December 16, 2019
We have served as the auditor of one or more of the Fidelity investment companies since 1999.
| 45 | Annual Report | |||
Table of Contents
Premium/Discount Analysis(Unaudited)
Shares of each fund are listed on NYSE Arca or CboeBZX and can be bought and sold on the secondary market at market prices. Although the market price is expected to approximate the fund’s NAV, it is possible that the market price and NAV will vary significantly. The closing market price is the daily closing price as reported on NYSE Arca or CboeBZX.
Premiums or discounts are the differences (expressed as a basis point differential with 1 basis point equaling 1/100 of 1%) between the fund’s NAV and closing market price. A premium indicates that the closing market price is trading above the NAV. A discount indicates that the closing market price is trading below the NAV. A discrepancy may exist with respect to the timing of when the NAV is calculated and the determination of the closing market price.
The chart below presents information about the differences between each fund’s daily closing market price and each fund’s NAV.
Fidelity International High Dividend ETF
| Period Ended October 31, 2019 | ||||||||||||
| From commencement of operations* to October 31, 2019 | Closing Price Below NAV | Closing Price Above or Equal to NAV | ||||||||||
| Basis Point Differential | Number of Days | % of Total Days | Number of Days | % of Total Days | ||||||||
| 0 – <25 | 42 | 9.30 | % | 87 | 19.29 | % | ||||||
| 25 – <50 | 9 | 2.00 | % | 122 | 27.06 | % | ||||||
| 50 – <75 | 3 | 0.67 | % | 116 | 25.72 | % | ||||||
| 75 – <100 | 3 | 0.67 | % | 48 | 10.64 | % | ||||||
| 100 or above | 2 | 0.44 | % | 19 | 4.21 | % | ||||||
| Total | 59 | 13.08 | % | 392 | 86.92 | % | ||||||
| * | From January 18, 2018, date initially listed on the NYSE ARCA exchange. |
Fidelity International Value Factor ETF
| Period Ended October 31, 2019 | ||||||||||||
| From commencement of operations* to October 31, 2019 | Closing Price Below NAV | Closing Price Above or Equal to NAV | ||||||||||
| Basis Point Differential | Number of Days | % of Total Days | Number of Days | % of Total Days | ||||||||
| 0 – <25 | 71 | 15.74 | % | 148 | 32.82 | % | ||||||
| 25 – <50 | 20 | 4.43 | % | 113 | 25.06 | % | ||||||
| 50 – <75 | 3 | 0.67 | % | 65 | 14.41 | % | ||||||
| 75 – <100 | 2 | 0.44 | % | 20 | 4.43 | % | ||||||
| 100 or above | 3 | 0.67 | % | 6 | 1.33 | % | ||||||
| Total | 99 | 21.95 | % | 352 | 78.05 | % | ||||||
| * | From January 18, 2018, date initially listed on the NYSE ARCA exchange. |
Fidelity Targeted Emerging Markets Factor ETF
| Period Ended October 31, 2019 | ||||||||||||
| From commencement of operations* to October 31, 2019 | Closing Price Below NAV | Closing Price Above or Equal to NAV | ||||||||||
| Basis Point Differential | Number of Days | % of Total Days | Number of Days | % of Total Days | ||||||||
| 0 – <25 | 31 | 18.03 | % | 70 | 40.69 | % | ||||||
| 25 – <50 | 6 | 3.49 | % | 54 | 31.40 | % | ||||||
| 50 – <75 | 1 | 0.58 | % | 7 | 4.07 | % | ||||||
| 75 – <100 | 3 | 1.74 | % | 0 | — | |||||||
| 100 or above | 0 | — | 0 | — | ||||||||
| Total | 41 | 23.84 | % | 131 | 76.16 | % | ||||||
| * | From February 28, 2019, date initially listed on the CboeBZX exchange. |
| Annual Report | 46 | |||
Table of Contents
Fidelity Targeted International Factor ETF
| Period Ended October 31, 2019 | ||||||||||||
| From commencement of operations* to October 31, 2019 | Closing Price Below NAV | Closing Price Above or Equal to NAV | ||||||||||
| Basis Point Differential | Number of Days | % of Total Days | Number of Days | % of Total Days | ||||||||
| 0 – <25 | 8 | 4.00 | % | 30 | 15.00 | % | ||||||
| 25 – <50 | 0 | — | 64 | 32.00 | % | |||||||
| 50 – <75 | 2 | 1.00 | % | 61 | 30.50 | % | ||||||
| 75 – <100 | 0 | — | 27 | 13.50 | % | |||||||
| 100 or above | 0 | — | 8 | 4.00 | % | |||||||
| Total | 10 | 5.00 | % | 190 | 95.00 | % | ||||||
| * | From February 28, 2019, date initially listed on the CboeBZX exchange. |
| 47 | Annual Report | |||
Table of Contents
Trustees and Officers(Unaudited)
The Trustees, Members of the Advisory Board (if any), and officers of the trust and funds, as applicable, are listed below. The Board of Trustees governs each fund and is responsible for protecting the interests of shareholders. The Trustees are experienced executives who meet periodically throughout the year to oversee each fund’s activities, review contractual arrangements with companies that provide services to each fund, oversee management of the risks associated with such activities and contractual arrangements, and review each fund’s performance. Except for Michael E. Wiley, each of the Trustees oversees 298 funds. Mr. Wiley oversees 197 funds.
The Trustees hold office without limit in time except that (a) any Trustee may resign; (b) any Trustee may be removed by written instrument, signed by at leasttwo-thirds of the number of Trustees prior to such removal; (c) any Trustee who requests to be retired or who has become incapacitated by illness or injury may be retired by written instrument signed by a majority of the other Trustees; and (d) any Trustee may be removed at any special meeting of shareholders by atwo-thirds vote of the outstanding voting securities of the trust. Each Trustee who is not an interested person (as defined in the 1940 Act) of the trust and the funds is referred to herein as an Independent Trustee. Each Independent Trustee shall retire not later than the last day of the calendar year in which his or her 75th birthday occurs. The Independent Trustees may waive this mandatory retirement age policy with respect to individual Trustees. Officers and Advisory Board Members hold office without limit in time, except that any officer or Advisory Board Member may resign or may be removed by a vote of a majority of the Trustees at any regular meeting or any special meeting of the Trustees. Except as indicated, each individual has held the office shown or other offices in the same company for the past five years.
The funds’ Statement of Additional Information (SAI) includes more information about the Trustees. To request a free copy, call Fidelity at1-800-FIDELITY.
Experience, Skills, Attributes, and Qualifications of the Trustees. The Governance and Nominating Committee has adopted a statement of policy that describes the experience, qualifications, attributes, and skills that are necessary and desirable for potential Independent Trustee candidates (Statement of Policy). The Board believes that each Trustee satisfied at the time he or she was initially elected or appointed a Trustee, and continues to satisfy, the standards contemplated by the Statement of Policy. The Governance and Nominating Committee also engages professional search firms to help identify potential Independent Trustee candidates who have the experience, qualifications, attributes, and skills consistent with the Statement of Policy. From time to time, additional criteria based on the composition and skills of the current Independent Trustees, as well as experience or skills that may be appropriate in light of future changes to board composition, business conditions, and regulatory or other developments, have also been considered by the professional search firms and the Governance and Nominating Committee. In addition, the Board takes into account the Trustees’ commitment and participation in Board and committee meetings, as well as their leadership of standing and ad hoc committees throughout their tenure.
In determining that a particular Trustee was and continues to be qualified to serve as a Trustee, the Board has considered a variety of criteria, none of which, in isolation, was controlling. The Board believes that, collectively, the Trustees have balanced and diverse experience, qualifications, attributes, and skills, which allow the Board to operate effectively in governing each fund and protecting the interests of shareholders. Information about the specific experience, skills, attributes, and qualifications of each Trustee, which in each case led to the Board’s conclusion that the Trustee should serve (or continue to serve) as a trustee of the funds, is provided below.
Board Structure and Oversight Function. James C. Curvey is an interested person and currently serves as Chairman. The Trustees have determined that an interested Chairman is appropriate and benefits shareholders because an interested Chairman has a personal and professional stake in the quality and continuity of services provided to the funds. Independent Trustees exercise their informed business judgment to appoint an individual of their choosing to serve as Chairman, regardless of whether the Trustee happens to be independent or a member of management. The Independent Trustees have determined that they can act independently and effectively without having an Independent Trustee serve as Chairman and that a key structural component for assuring that they are in a position to do so is for the Independent Trustees to constitute a substantial majority for the Board. The Independent Trustees also regularly meet in executive session. Ned C. Lautenbach serves as Chairman of the Independent Trustees and as such (i) acts as a liaison between the Independent Trustees and management with respect to matters important to the Independent Trustees and (ii) with management prepares agendas for Board meetings.
Fidelity® funds are overseen by different Boards of Trustees. The funds’ Board oversees Fidelity’s high income and certain equity funds, and other Boards oversee Fidelity’s investment-grade bond, money market, asset allocation, and other equity funds. The asset allocation funds may invest in Fidelity® funds overseen by the funds’ Board. The use of separate Boards, each with its own committee structure, allows the Trustees of each group of Fidelity® funds to focus on the unique issues of the funds they oversee, including common research, investment, and operational issues. On occasion, the separate Boards establish joint committees to address issues of overlapping consequences for the Fidelity® funds overseen by each Board.
| Annual Report | 48 | |||
Table of Contents
The Trustees operate using a system of committees to facilitate the timely and efficient consideration of all matters of importance to the Trustees, each fund, and fund shareholders and to facilitate compliance with legal and regulatory requirements and oversight of the funds’ activities and associated risks. The Board, acting through its committees, has charged FMR and its affiliates with (i) identifying events or circumstances the occurrence of which could have demonstrably adverse effects on the funds’ business and/or reputation; (ii) implementing processes and controls to lessen the possibility that such events or circumstances occur or to mitigate the effects of such events or circumstances if they do occur; and (iii) creating and maintaining a system designed to evaluate continuously business and market conditions in order to facilitate the identification and implementation processes described in (i) and (ii) above. Because theday-to-day operations and activities of the funds are carried out by or through FMR, its affiliates, and other service providers, the funds’ exposure to risks is mitigated but not eliminated by the processes overseen by the Trustees. While each of the Board’s committees has responsibility for overseeing different aspects of the funds’ activities, oversight is exercised primarily through the Operations, Audit, and Compliance Committees. Appropriate personnel, including but not limited to the funds’ Chief Compliance Officer (CCO), FMR’s internal auditor, the independent accountants, the funds’ Treasurer and portfolio management personnel, make periodic reports to the Board’s committees, as appropriate, including an annual review of Fidelity’s risk management program for the Fidelity® funds. The responsibilities of each standing committee, including their oversight responsibilities, are described further under “Standing Committees of the Trustees”.
Interested Trustees*:
Correspondence intended for a Trustee who is an interested person may be sent to Fidelity Investments, 245 Summer Street, Boston, Massachusetts 02210.
Name, Year of Birth; Principal Occupations and Other Relevant Experience+ |
James C. Curvey (1935) |
Year of Election or Appointment: 2018 |
Trustee |
Chairman of the Board of Trustees |
Mr. Curvey also serves as Trustee of other Fidelity® funds. Mr. Curvey is Vice Chairman (2007-present) and Director of FMR LLC (diversified financial services company). In addition, Mr. Curvey is an Overseer Emeritus for the Boston Symphony Orchestra, a Director of Artis-Naples, and a Trustee of Brewster Academy in Wolfeboro, New Hampshire. Previously, Mr. Curvey served as a Director of Fidelity Research & Analysis Co. (investment adviser firm, 2009-2018), Director of Fidelity Investments Money Management, Inc. (investment adviser firm, 2009-2014) and a Director of FMR and FMR Co., Inc. (investment adviser firms, 2007-2014). |
* Determined to be an “Interested Trustee” by virtue of, among other things, his or her affiliation with the trust or various entities under common control with FMR.
|
+ The information includes the Trustee’s principal occupation during the last five years and other information relating to the experience, attributes, and skills relevant to the Trustee’s qualifications to serve as a Trustee, which led to the conclusion that the Trustee should serve as a Trustee for each fund. |
Independent Trustees:
|
Correspondence intended for an Independent Trustee may be sent to Fidelity Investments, P.O. Box 55235, Boston, Massachusetts 02205-5235.
|
Name, Year of Birth; Principal Occupations and Other Relevant Experience+ |
Dennis J. Dirks (1948) |
Year of Election or Appointment: 2018 |
Trustee |
Mr. Dirks also serves as Trustee of other Fidelity® funds. Prior to his retirement in May 2003, Mr. Dirks was Chief Operating Officer and a member of the Board of The Depository Trust & Clearing Corporation (DTCC). He also served as President, Chief Operating Officer, and Board member of The Depository Trust Company (DTC) and President and Board member of the National Securities Clearing Corporation (NSCC). In addition, Mr. Dirks served as Chief Executive Officer and Board member of the Government Securities Clearing Corporation, Chief Executive Officer and Board member of the Mortgage-Backed Securities Clearing Corporation, as a Trustee and a member of the Finance Committee of Manhattan College (2005-2008), as a Trustee and a member of the Finance Committee of AHRC of Nassau County (2006-2008), as a member of the Independent Directors Council (IDC) Governing Council (2010-2015), and as a member of the Board of Directors for The Brookville Center for Children’s Services, Inc. (2009-2017). Mr. Dirks is a member of the Finance Committee (2016-present) and Board of Directors (2017-present) and is Treasurer (2018-present) of the Asolo Repertory Theatre. |
Donald F. Donahue (1950) |
| 49 | Annual Report | |||
Table of Contents
Trustees and Officers (Unaudited) – continued
Name, Year of Birth; Principal Occupations and Other Relevant Experience+ |
Year of Election or Appointment: 2018 |
Trustee |
Mr. Donahue also serves as a Trustee of other Fidelity® funds. Mr. Donahue is President and Chief Executive Officer of Miranda Partners, LLC (risk consulting for the financial services industry, 2012-present). Previously, Mr. Donahue served as a Member of the Advisory Board of certain Fidelity® funds (2015-2018) and Chief Executive Officer (2006-2012), Chief Operating Officer (2003-2006), and Managing Director, Customer Marketing and Development (1999-2003) of The Depository Trust & Clearing Corporation (financial markets infrastructure). Mr. Donahue serves as a Member (2007-present) andCo-Chairman (2016-present) of the Board of Directors of United Way of New York, Member of the Board of Directors of NYC Leadership Academy (2012-present) and Member of the Board of Advisors of Ripple Labs, Inc. (financial services, 2015-present). He also served as Chairman (2010-2012) and Member of the Board of Directors (2012-2013) of Omgeo, LLC (financial services), Treasurer of United Way of New York (2012-2016), and Member of the Board of Directors of XBRL US (financial servicesnon-profit, 2009-2012) and the International Securities Services Association (2009-2012). |
Alan J. Lacy (1953) |
Year of Election or Appointment: 2018 |
Trustee |
Mr. Lacy also serves as Trustee of other Fidelity® funds. Mr. Lacy serves as a Director of Bristol-Myers Squibb Company (global pharmaceuticals, 2008-present). He is a Trustee of the California Chapter of The Nature Conservancy (2015-present) and a Director of the Center for Advanced Study in the Behavioral Sciences at Stanford University (2015-present). In addition, Mr. Lacy served as Senior Adviser (2007-2014) of Oak Hill Capital Partners, L.P. (private equity) and also served as Chief Executive Officer (2005) and Vice Chairman (2005-2006) of Sears Holdings Corporation (retail) and Chief Executive Officer and Chairman of the Board of Sears, Roebuck and Co. (retail, 2000-2005). Previously, Mr. Lacy served as Chairman (2014-2017) and a member (2010-2017) of the Board of Directors of Dave & Buster’s Entertainment, Inc. (restaurant and entertainment complexes), as Chairman (2008-2011) and a member (2006-2015) of the Board of Trustees of the National Parks Conservation Association, and as a member of the Board of Directors for The Hillman Companies, Inc. (hardware wholesalers, 2010-2014), Earth Fare, Inc. (retail grocery, 2010-2014), and The Western Union Company (global money transfer, 2006-2011). |
Ned C. Lautenbach (1944) |
Year of Election or Appointment: 2018 |
Trustee |
Chairman of the Independent Trustees |
Mr. Lautenbach also serves as Trustee of other Fidelity® funds. Mr. Lautenbach currently serves as Chair (2018-present) and Member (2013-present) of the Board of Governors, State University System of Florida and is a member of the Council on Foreign Relations (1994-present). He is also a member and has most recently served as Chairman of the Board of Directors of Artis-Naples (2012-present). Previously, Mr. Lautenbach served as a member and then Lead Director of the Board of Directors of Eaton Corporation (diversified industrial, 1997-2016). He was also a Partner and Advisory Partner at Clayton, Dubilier & Rice, LLC (private equity investment, 1998-2010), as well as a Director of Sony Corporation (2006-2007). In addition, Mr. Lautenbach also had a30-year career with IBM (technology company) during which time he served as Senior Vice President and a member of the Corporate Executive Committee (1968-1998). |
Joseph Mauriello (1944) |
Year of Election or Appointment: 2018 |
Trustee |
Mr. Mauriello also serves as Trustee of other Fidelity® funds. Prior to his retirement in January 2006, Mr. Mauriello served in numerous senior management positions including Deputy Chairman and Chief Operating Officer (2004-2005), and Vice Chairman of Financial Services (2002-2004) of KPMG LLP US (professional services, 1965-2005). Mr. Mauriello currently serves as a member of the Independent Directors Council (IDC) Governing Council (2015-present). Previously, Mr. Mauriello served as a member of the Board of Directors of XL Group plc. (global insurance andre-insurance, 2006-2018). |
Cornelia M. Small (1944) |
Year of Election or Appointment: 2018 |
| Annual Report | 50 | |||
Table of Contents
Name, Year of Birth; Principal Occupations and Other Relevant Experience+ |
Trustee |
Ms. Small also serves as Trustee of other Fidelity® funds. Ms. Small is a member of the Board of Directors (2009-present) and Chair of the Investment Committee (2010-present) of the Teagle Foundation. Ms. Small also serves on the Investment Committee of the Berkshire Taconic Community Foundation (2008-present). Previously, Ms. Small served as Chairperson (2002-2008) and a member of the Investment Committee and Chairperson (2008-2012) and a member of the Board of Trustees of Smith College. In addition, Ms. Small served as Chief Investment Officer, Director of Global Equity Investments, and a member of the Board of Directors of Scudder, Stevens & Clark and Scudder Kemper Investments. |
Garnett A. Smith (1947) |
Year of Election or Appointment: 2013 |
Trustee |
Mr. Smith also serves as Trustee of other Fidelity® funds. Prior to Mr. Smith’s retirement, he served as Chairman and Chief Executive Officer of Inbrand Corp. (manufacturer of personal absorbent products, 1990-1997). He also served as President (1986-1990) of Inbrand Corp. Prior to his employment with Inbrand Corp., he was employed by a retail fabric chain and North Carolina National Bank. In addition, Mr. Smith served as a Member of the Advisory Board of certain Fidelity® funds (2012-2013) and as a board member of the Jackson Hole Land Trust (2009-2012). |
David M. Thomas (1949) |
Year of Election or Appointment: 2018 |
Trustee |
Mr. Thomas also serves as Trustee of other Fidelity® funds. Mr. Thomas serves asNon-Executive Chairman of the Board of Directors of Fortune Brands Home and Security (home and security products, 2011-present) and as a member of the Board of Directors (2004-present) and Presiding Director (2013-present) of Interpublic Group of Companies, Inc. (marketing communication). Previously, Mr. Thomas served as Executive Chairman (2005-2006) and Chairman and Chief Executive Officer (2000-2005) of IMS Health, Inc. (pharmaceutical and healthcare information solutions), a Director of Fortune Brands, Inc. (consumer products, 2000-2011), and a member of the Board of Trustees of the University of Florida (2013-2018). |
Michael E. Wiley (1950) |
Year of Election or Appointment: 2013 |
Trustee |
Mr. Wiley also serves as Trustee or Member of the Advisory Board of other Fidelity® funds. Mr. Wiley serves as a Director of High Point Resources (exploration and production, 2005-present). Previously, Mr. Wiley served as a Director of Andeavor Corporation (independent oil refiner and marketer, 2005-2018), a Director of Andeavor Logistics LP (natural resources logistics, 2015-2018), a Director of Post Oak Bank (privately-held bank, 2004-2018), a Director of Asia Pacific Exploration Consolidated (international oil and gas exploration and production, 2008-2013), a member of the Board of Trustees of the University of Tulsa (2000-2006; 2007-2010), a Senior Energy Advisor of Katzenbach Partners, LLC (consulting, 2006-2007), an Advisory Director of Riverstone Holdings (private investment), a Director of Spinnaker Exploration Company (exploration and production, 2001-2005) and Chairman, President, and CEO of Baker Hughes, Inc. (oilfield services, 2000-2004). |
+ The information includes the Trustee’s principal occupation during the last five years and other information relating to the experience, attributes, and skills relevant to the Trustee’s qualifications to serve as a Trustee, which led to the conclusion that the Trustee should serve as a Trustee for each fund.
|
| Advisory Board Members and Officers: |
Correspondence intended for a Member of the Advisory Board (if any) may be sent to Fidelity Investments, P.O. Box 55235, Boston, Massachusetts 02205-5235. Correspondence intended for an officer or Peter S. Lynch may be sent to Fidelity Investments, 245 Summer Street, Boston, Massachusetts 02210. Officers appear below in alphabetical order.
|
Name, Year of Birth; Principal Occupation |
Vicki L. Fuller (1957) |
Year of Election or Appointment: 2018 |
| 51 | Annual Report | |||
Table of Contents
Trustees and Officers (Unaudited) – continued
Name, Year of Birth; Principal Occupation |
Member of the Advisory Board |
Ms. Fuller also serves as Member of the Advisory Board of other Fidelity® funds. Ms. Fuller serves as a member of the Board of Directors, Audit Committee, and Nominating and Governance Committee of The Williams Companies, Inc. (natural gas infrastructure, 2018-present). Previously, Ms. Fuller served as the Chief Investment Officer of the New York State Common Retirement Fund (2012-2018) and held a variety of positions at AllianceBernstein L.P. (global asset management, 1985-2012), including Managing Director (2006-2012) and Senior Vice President and Senior Portfolio Manager (2001-2006). |
Peter S. Lynch (1944) |
Year of Election or Appointment: 2018 |
Member of the Advisory Board |
Mr. Lynch also serves as Member of the Advisory Board of other Fidelity® funds. Mr. Lynch is Vice Chairman and a Director of FMR (investment adviser firm) and FMR Co., Inc. (investment adviser firm). In addition, Mr. Lynch serves as a Trustee of Boston College and as the Chairman of the Inner-City Scholarship Fund. Previously, Mr. Lynch served on the Special Olympics International Board of Directors (1997-2006). |
Elizabeth Paige Baumann (1968) |
Year of Election or Appointment: 2017 |
Anti-Money Laundering (AML) Officer |
Ms. Baumann also serves as AML Officer of other funds. She is Chief AML Officer (2012-present) and Senior Vice President (2014-present) of FMR LLC (diversified financial services company) and is an employee of Fidelity Investments. Previously, Ms. Baumann served as AML Officer of the funds (2012-2016), and Vice President (2007-2014) and Deputy Anti-Money Laundering Officer (2007-2012) of FMR LLC. |
Craig S. Brown (1977) |
Year of Election or Appointment: 2019 |
Assistant Treasurer |
Mr. Brown also serves as Assistant Treasurer of other funds. Mr. Brown is an employee of Fidelity Investments (2013-present). |
John J. Burke III (1964) |
Year of Election or Appointment: 2018 |
Chief Financial Officer |
Mr. Burke also serves as Chief Financial Officer of other funds. Mr. Burke serves as Head of Investment Operations for Fidelity Fund and Investment Operations (2018-present) and is an employee of Fidelity Investments (1998-present). Previously Mr. Burke served as head of Asset Management Investment Operations (2012-2018). |
William C. Coffey (1969) |
Year of Election or Appointment: 2018 |
Assistant Secretary |
Mr. Coffey also serves as Assistant Secretary of other funds. He is Senior Vice President and Deputy General Counsel of FMR LLC (diversified financial services company, 2010-present), and is an employee of Fidelity Investments. Previously, Mr. Coffey served as Secretary and CLO of certain funds (2018-2019); CLO, Secretary, and Senior Vice President of Fidelity Management & Research Company and FMR Co., Inc. (investment adviser firms, 2018-2019); Secretary of Fidelity SelectCo, LLC and Fidelity Investments Money Management, Inc. (investment adviser firms, 2018-2019); CLO of Fidelity Management & Research (Hong Kong) Limited, FMR Investment Management (UK) Limited, and Fidelity Management & Research (Japan) Limited (investment adviser firms, 2018-2019); and Assistant Secretary of certain funds (2009-2018). |
Timothy M. Cohen (1969) |
Year of Election or Appointment: 2018 |
Vice President |
Mr. Cohen also serves as Vice President of other funds. Mr. Cohen serves as Executive Vice President of Fidelity SelectCo, LLC (2019-present),Co-Head of Equity (2018-present), a Director of Fidelity Management & Research (Japan) Limited (investment adviser firm, 2016-present), and is an employee of Fidelity Investments. Previously, Mr. Cohen served as Head of Global Equity Research (2016-2018), Chief Investment Officer – Equity and a Director of Fidelity Management & Research (U.K.) Inc. (investment adviser firm, 2013-2015) and as a Director of Fidelity Management & Research (Hong Kong) Limited (investment adviser firm, 2017). |
Jonathan Davis (1968) |
| Annual Report | 52 | |||
Table of Contents
Name, Year of Birth; Principal Occupation |
Year of Election or Appointment: 2013 |
Assistant Treasurer |
Mr. Davis also serves as Assistant Treasurer of other funds. Mr. Davis serves as Assistant Treasurer of FMR Capital, Inc. (2017-present) and is an employee of Fidelity Investments. Previously, Mr. Davis served as Vice President and Associate General Counsel of FMR LLC (diversified financial services company, 2003-2010). |
Adrien E. Deberghes (1967) |
Year of Election or Appointment: 2018 |
Assistant Treasurer |
Mr. Deberghes also serves as an officer of other funds. He serves as Assistant Treasurer of FMR Capital, Inc. (2017-present), Executive Vice President of Fidelity Investments Money Management, Inc. (FIMM) (investment adviser firm, 2016-present), and is an employee of Fidelity Investments (2008-present). Previously, Mr. Deberghes served as President and Treasurer of certain Fidelity® funds (2013-2018). Prior to joining Fidelity Investments, Mr. Deberghes was Senior Vice President of Mutual Fund Administration at State Street Corporation (2007-2008), Senior Director of Mutual Fund Administration at Investors Bank & Trust (2005-2007), and Director of Finance for Dunkin’ Brands (2000-2005). Previously, Mr. Deberghes served in other fund officer roles. |
Laura M. Del Prato (1964) |
Year of Election or Appointment: 2018 |
Assistant Treasurer |
Ms. Del Prato also serves as an officer of other funds. Ms. Del Prato is an employee of Fidelity Investments (2017-present). Prior to joining Fidelity Investments, Ms. Del Prato served as a Managing Director and Treasurer of the JPMorgan Mutual Funds (2014-2017). Prior to JPMorgan, Ms. Del Prato served as a partner at Cohen Fund Audit Services (accounting firm, 2012-2013) and KPMG LLP (accounting firm, 2004-2012). |
Colm A. Hogan (1973) |
Year of Election or Appointment: 2018 |
Deputy Treasurer |
Mr. Hogan also serves as an officer of other funds. Mr. Hogan serves as Assistant Treasurer of FMR Capital, Inc. (2017-present) and is an employee of Fidelity Investments (2005-present). Previously, Mr. Hogan served as Assistant Treasurer of certain Fidelity® funds (2016-2018). |
Pamela R. Holding (1964) |
Year of Election or Appointment: 2018 |
Vice President |
Ms. Holding also serves as Vice President of other funds. Ms. Holding serves as Executive Vice President of Fidelity SelectCo, LLC (2019-present),Co-Head of Equity (2018-present) and is an employee of Fidelity Investments (2013-present). Previously, Ms. Holding served as Chief Investment Officer of Fidelity Institutional Asset Management (2013-2018). |
Cynthia Lo Bessette (1969) |
Year of Election or Appointment: 2019 |
Secretary and Chief Legal Officer (CLO) |
Ms. Lo Bessette also serves as Secretary and CLO of other funds. Ms. Lo Bessette serves as CLO, Secretary, and Senior Vice President of Fidelity Management & Research Company and FMR Co., Inc. (investment adviser firms, 2019-present); Secretary of Fidelity SelectCo, LLC and Fidelity Investments Money Management, Inc. (investment adviser firms, 2019-present); and CLO of Fidelity Management & Research (Hong Kong) Limited, FMR Investment Management (UK) Limited, and Fidelity Management & Research (Japan) Limited (investment adviser firms, 2019-present). She is a Senior Vice President and Deputy General Counsel of FMR LLC (diversified financial services company, 2019-present), and is an employee of Fidelity Investments. Previously, Ms. Lo Bessette served as Executive Vice President, General Counsel (2016-2019) and Senior Vice President, Deputy General Counsel (2015-2016) of OppenheimerFunds (investment management company) and Deputy Chief Legal Officer (2013-2015) of Jennison Associates LLC (investment adviser firm). |
Chris Maher (1972) |
Year of Election or Appointment: 2013 |
| 53 | Annual Report | |||
Table of Contents
Trustees and Officers (Unaudited) – continued
Name, Year of Birth; Principal Occupation |
Assistant Treasurer |
Mr. Maher serves as Assistant Treasurer of other funds. Mr. Maher is Vice President of Valuation Oversight, serves as Assistant Treasurer of FMR Capital, Inc. (2017-present), and is an employee of Fidelity Investments. Previously, Mr. Maher served as Vice President of Asset Management Compliance (2013), Vice President of the Program Management Group of FMR (investment adviser firm, 2010-2013), and Vice President of Valuation Oversight (2008-2010). |
Kenneth B. Robins (1969) |
Year of Election or Appointment: 2018 |
Chief Compliance Officer |
Mr. Robins also serves as an officer of other funds. Mr. Robins serves as Compliance Officer of Fidelity Management & Research Company and FMR Co., Inc. (investment adviser firms, 2016-present) and is an employee of Fidelity Investments (2004-present). Previously, Mr. Robins served as Executive Vice President of Fidelity Investments Money Management, Inc. (investment adviser firm, 2013-2016) and served in other fund officer roles. |
Stacie M. Smith (1974) |
Year of Election or Appointment: 2018 |
President and Treasurer |
Ms. Smith also serves as an officer of other funds. Ms. Smith serves as Assistant Treasurer of FMR Capital, Inc. (2017-present), is an employee of Fidelity Investments (2009-present), and has served in other fund officer roles. Prior to joining Fidelity Investments, Ms. Smith served as Senior Audit Manager of Ernst & Young LLP (accounting firm, 1996-2009). Previously, Ms. Smith served as Assistant Treasurer (2013-2018) and Deputy Treasurer (2013-2016) of certain Fidelity® funds. |
Marc L. Spector (1972) |
Year of Election or Appointment: 2017 |
Assistant Treasurer |
Mr. Spector also serves as an officer of other funds. Mr. Spector serves as Assistant Treasurer of FMR Capital, Inc. (2017-present) and is an employee of Fidelity Investments (2016-present). Prior to joining Fidelity Investments, Mr. Spector served as Director at the Siegfried Group (accounting firm, 2013-2016), and prior to Siegfried Group as audit senior manager at Deloitte & Touche (accounting firm, 2005-2013). |
Jim Wegmann (1979) |
Year of Election or Appointment: 2019 |
Assistant Treasurer |
Mr. Wegmann also serves as Assistant Treasurer of other funds. Mr. Wegmann is an employee of Fidelity Investments (2011-present). |
| Annual Report | 54 | |||
Table of Contents
Shareholder Expense Example(Unaudited)
As a shareholder of a Fund, you incur two types of costs: (1) transaction costs, and (2) ongoing costs, including management fees and other Fund expenses. This Example is intended to help you understand your ongoing costs (in dollars) of investing in a Fund and to compare these costs with the ongoing costs of investing in other funds.
The Example is based on an investment of $1,000 invested for theone-half year period (May 1, 2019 to October 31, 2019).
Actual Expenses
For each fund, the first line of the accompanying table provides information about actual account values and actual expenses. You may use the information in this line, together with the amount you invested, to estimate the expenses that you paid over the period. Simply divide your account value by $1,000.00 (for example, an $8,600 account value divided by $1,000.00 = 8.6), then multiply the result by the number in the first line for each Fund under the heading entitled “Expenses Paid During Period” to estimate the expenses you paid on your account during this period. In addition, each Fund, as a shareholder in the underlying Fidelity Central Funds, will indirectly bear itspro-rata share of the fees and expenses incurred by the underlying Fidelity Central Funds. These fees and expenses are not included in each Fund’s annualized expense ratio used to calculate the expense estimates in the table below.
Hypothetical Example for Comparison Purposes
For each fund, the second line of the accompanying table provides information about hypothetical account values and hypothetical expenses based on the Fund’s actual expense ratio and an assumed rate of return of 5% per year before expenses, which is not the Fund’s actual return. The hypothetical account values and expenses may not be used to estimate the actual ending account balance or expenses you paid for the period. You may use this information to compare the ongoing costs of investing in the Fund and other funds. To do so, compare this 5% hypothetical example with the 5% hypothetical examples that appear in the shareholder reports of the other funds. In addition, each Fund, as a shareholder in the underlying Fidelity Central Funds, will indirectly bear itspro-rata share of the fees and expenses incurred by the underlying Fidelity Central Funds. These fees and expenses are not included in each Fund’s annualized expense ratio used to calculate the expense estimates in the table below.
Please note that the expenses shown in the table are meant to highlight your ongoing costs only and do not reflect any transaction costs. Therefore, the second line of the table is useful in comparing ongoing costs only, and will not help you determine the relative total costs of owning different funds.
Annualized Expense RatioA | Beginning Account Value May 1, 2019 | Ending Account Value October 31, 2019 | Expenses Paid During PeriodB May 1, 2019 to October 31, 2019 | |||||||||||||
Fidelity International High Dividend ETF | 0.39% | |||||||||||||||
Actual | $ | 1,000.00 | $ | 1,019.10 | $ | 1.98 | ||||||||||
HypotheticalC | $ | 1,000.00 | $ | 1,023.24 | $ | 1.99 | ||||||||||
Fidelity International Value Factor ETF | 0.39% | |||||||||||||||
Actual | $ | 1,000.00 | $ | 1,016.20 | $ | 1.98 | ||||||||||
HypotheticalC | $ | 1,000.00 | $ | 1,023.24 | $ | 1.99 | ||||||||||
Fidelity Targeted Emerging Markets Factor ETF | 0.45% | |||||||||||||||
Actual | $ | 1,000.00 | $ | 1,002.90 | $ | 2.27 | ||||||||||
HypotheticalC | $ | 1,000.00 | $ | 1,022.94 | $ | 2.29 | ||||||||||
Fidelity Targeted International Factor ETF | 0.39% | |||||||||||||||
Actual | $ | 1,000.00 | $ | 1,047.40 | $ | 2.01 | ||||||||||
HypotheticalC | $ | 1,000.00 | $ | 1,023.24 | $ | 1.99 | ||||||||||
| A | Annualized expense ratio reflects expenses net of applicable fee waivers. |
| B | Expenses are equal to each Fund’s annualized expense ratio, multiplied by the average account value over the period, multiplied by 184/365 (to reflect theone-half year period). |
| C | 5% return per year before expenses. |
| 55 | Annual Report | |||
Table of Contents
A percentage of the dividends distributed during the fiscal year for the following funds may be taken into account as a dividend for purposes of the maximum rate under section 1(h)(11) of the Internal Revenue Code.
| December 2018 | March 2019 | June 2019 | September 2019 | |||||||||||||
| Fidelity International High Dividend ETF | 100 | % | 100 | % | 100 | % | 100 | % | ||||||||
| Fidelity International Value Factor ETF | 100 | % | 100 | % | 100 | % | 100 | % | ||||||||
| Fidelity Targeted Emerging Markets Factor ETF | — | — | 81 | % | 81 | % | ||||||||||
| Fidelity Targeted International Factor ETF | — | — | 100 | % | 100 | % | ||||||||||
The amounts per share which represent income derived from sources within, and taxes paid to, foreign countries or possessions of the United States are as follows:
| Ex-Date | Income | Taxes | ||||||||||
| Fidelity International High Dividend ETF | 12/31/2018 | $ | 0.6977 | $ | 0.0532 | |||||||
| 3/31/2019 | $ | 0.6977 | $ | 0.0532 | ||||||||
| 6/30/2019 | $ | 0.9258 | $ | 0.0738 | ||||||||
| 9/30/2019 | $ | 0.9258 | $ | 0.0738 | ||||||||
| Fidelity International Value Factor ETF | 12/31/2018 | $ | 0.6958 | $ | 0.0567 | |||||||
| 3/31/2019 | $ | 0.6958 | $ | 0.0567 | ||||||||
| 6/30/2019 | $ | 0.9623 | $ | 0.0764 | ||||||||
| 9/30/2019 | $ | 0.9623 | $ | 0.0764 | ||||||||
| Fidelity Targeted Emerging Markets Factor ETF | 12/31/2018 | $ | — | $ | — | |||||||
| 3/31/2019 | $ | — | $ | — | ||||||||
| 6/30/2019 | $ | 0.6497 | $ | 0.0697 | ||||||||
| 9/30/2019 | $ | 0.6497 | $ | 0.0697 | ||||||||
| Fidelity Targeted International Factor ETF | 12/31/2018 | $ | — | $ | — | |||||||
| 3/31/2019 | $ | — | $ | — | ||||||||
| 6/30/2019 | $ | 0.6926 | $ | 0.0773 | ||||||||
| 9/30/2019 | $ | 0.6926 | $ | 0.0773 | ||||||||
The funds will notify shareholders in January 2020 of amounts for use in preparing 2019 income tax returns.
| Annual Report | 56 | |||
Table of Contents
[THIS PAGE INTENTIONALLY LEFT BLANK]
| 57 | Annual Report | |||
Table of Contents
[THIS PAGE INTENTIONALLY LEFT BLANK]
| Annual Report | 58 | |||
Table of Contents
[THIS PAGE INTENTIONALLY LEFT BLANK]
| 59 | Annual Report | |||
Table of Contents
| ||||
IHD-IVE-ANN-1219 1.9885304.101 |
|
|
Table of Contents
| Item 2. | Code of Ethics |
As of the end of the period, October 31, 2019, Fidelity Covington Trust (the trust) has adopted a code of ethics, as defined in Item 2 of FormN-CSR, that applies to its President and Treasurer and its Chief Financial Officer. A copy of the code of ethics is filed as an exhibit to this FormN-CSR.
| Item 3. | Audit Committee Financial Expert |
The Board of Trustees of the trust has determined that Joseph Mauriello is an audit committee financial expert, as defined in Item 3 of FormN-CSR. Mr. Mauriello is independent for purposes of Item 3 of FormN-CSR.
Table of Contents
| Item 4. | Principal Accountant Fees and Services |
Fees and Services
The following table presents fees billed by Deloitte & Touche LLP, the member firms of Deloitte Touche Tohmatsu, and their respective affiliates (collectively, “Deloitte Entities”) in each of the last two fiscal years for services rendered to Fidelity International High Dividend ETF, Fidelity International Value Factor ETF, Fidelity Targeted Emerging Markets Factor ETF and Fidelity Targeted International Factor ETF (the “Fund(s)”):
Services Billed by Deloitte Entities
October 31, 2019 FeesA,B
| Audit Fees | Audit- Related Fees | Tax Fees | All Other Fees | |||||||||||||
Fidelity International High Dividend ETF | $ | 18,000 | $ | — | $ | 2,500 | $ | 300 | ||||||||
Fidelity International Value Factor ETF | $ | 18,000 | $ | — | $ | 2,500 | $ | 300 | ||||||||
Fidelity Targeted Emerging Markets Factor ETF | $ | 15,000 | $ | — | $ | 2,500 | $ | 300 | ||||||||
Fidelity Targeted International Factor ETF | $ | 15,000 | $ | — | $ | 2,500 | $ | 300 | ||||||||
October 31, 2018 FeesA,B,C
| Audit Fees | Audit- Related Fees | Tax Fees | All Other Fees | |||||||||||||
Fidelity International High Dividend ETF | $ | 15,000 | $ | — | $ | 2,500 | $ | — | ||||||||
Fidelity International Value Factor ETF | $ | 15,000 | $ | — | $ | 2,500 | $ | — | ||||||||
Fidelity Targeted Emerging Markets Factor ETF | $ | — | $ | — | $ | — | $ | — | ||||||||
Fidelity Targeted International Factor ETF | $ | — | $ | — | $ | — | $ | — | ||||||||
| A | Amounts may reflect rounding. |
| B | Fidelity Targeted Emerging Markets Factor ETF and Fidelity Targeted International Factor ETF commenced operations on February 26, 2019. |
| C | Fidelity International High Dividend ETF and Fidelity International Value Factor ETF commenced operations on January 16, 2018. |
Table of Contents
The following table(s) present(s) fees billed by Deloitte Entities that were required to be approved by the Audit Committee for services that relate directly to the operations and financial reporting of the Fund(s) and that are rendered on behalf of Fidelity Management & Research Company (“FMR”) and entities controlling, controlled by, or under common control with FMR (not including anysub-adviser whose role is primarily portfolio management and is subcontracted with or overseen by another investment adviser) that provide ongoing services to the Fund(s) (“Fund Service Providers”):
Services Billed by Deloitte Entities
| October 31, 2019A,B | October 31, 2018A,B,C | |||||||
Audit-Related Fees | $ | 290,000 | $ | 5,000 | ||||
Tax Fees | $ | 5,000 | $ | 5,000 | ||||
All Other Fees | $ | — | $ | — | ||||
| A | Amounts may reflect rounding. |
| B | May include amounts billed prior to the Fidelity Targeted Emerging Markets Factor ETF and Fidelity Targeted International Factor ETFs’ commencement of operations. |
| C | May include amounts billed prior to the Fidelity International High Dividend ETF and Fidelity International Value Factor ETFs’ commencement of operations. |
“Audit-Related Fees” represent fees billed for assurance and related services that are reasonably related to the performance of the fund audit or the review of the fund’s financial statements and that are not reported under Audit Fees.
“Tax Fees” represent fees billed for tax compliance, tax advice or tax planning that relate directly to the operations and financial reporting of the fund.
“All Other Fees” represent fees billed for services provided to the fund or Fund Service Provider, a significant portion of which are assurance related, that relate directly to the operations and financial reporting of the fund, excluding those services that are reported under Audit Fees, Audit-Related Fees or Tax Fees.
Assurance services must be performed by an independent public accountant.
* * *
Table of Contents
The aggregatenon-audit fees billed by Deloitte Entities for services rendered to the Fund(s), FMR (not including anysub-adviser whose role is primarily portfolio management and is subcontracted with or overseen by another investment adviser), and any Fund Service Provider for each of the last two fiscal years of the Fund(s) are as follows:
Billed By | October 31, 2019A,B | October 31, 2018A,B,C | ||||||
Deloitte Entities | $ | 585,000 | $ | 485,000 | ||||
| A | Amounts may reflect rounding. |
| B | May include amounts billed prior to the Fidelity Targeted Emerging Markets Factor ETF and Fidelity Targeted International Factor ETFs’ commencement of operations. |
| C | May include amounts billed prior to the Fidelity International High Dividend ETF and Fidelity International Value Factor ETFs’ commencement of operations. |
The trust’s Audit Committee has considerednon-audit services that were notpre-approved that were provided by Deloitte Entities to Fund Service Providers to be compatible with maintaining the independence of Deloitte Entities in its(their) audit of the Fund(s), taking into account representations from Deloitte Entities, in accordance with Public Company Accounting Oversight Board rules, regarding its independence from the Fund(s) and its(their) related entities and FMR’s review of the appropriateness and permissibility under applicable law of suchnon-audit services prior to their provision to the Fund(s) Service Providers.
Audit CommitteePre-Approval Policies and Procedures
The trust’s Audit Committee mustpre-approve all audit andnon-audit services provided by a fund’s independent registered public accounting firm relating to the operations or financial reporting of the fund. Prior to the commencement of any audit ornon-audit services to a fund, the Audit Committee reviews the services to determine whether they are appropriate and permissible under applicable law.
The Audit Committee has adopted policies and procedures to, among other purposes, provide a framework for the Committee’s consideration ofnon-audit services by the audit firms that audit the Fidelity funds. The policies and procedures require that anynon-audit service provided by a fund audit firm to a Fidelity fund and anynon-audit service provided by a fund auditor to a Fund Service Provider that relates directly to the operations and financial reporting of a Fidelity fund (“Covered Service”) are subject to approval by the Audit Committee before such service is provided.
All Covered Services must be approved in advance of provision of the service either: (i) by formal resolution of the Audit Committee, or (ii) by oral or written approval of the service by the Chair of the Audit Committee (or if the Chair is unavailable, such other member of the Audit Committee as may be designated by the Chair to act in the Chair’s absence). The approval contemplated by (ii) above is permitted where the Treasurer determines that action on such an engagement is necessary before the next meeting of the Audit Committee.
Non-audit services provided by a fund audit firm to a Fund Service Provider that do not relate directly to the operations and financial reporting of a Fidelity fund are reported to the Audit Committee periodically.
Table of Contents
Non-Audit Services Approved Pursuant to Rule2-01(c)(7)(i)(C) and (ii) of RegulationS-X (“De Minimis Exception”)
There were nonon-audit services approved or required to be approved by the Audit Committee pursuant to the De Minimis Exception during the Fund’s(s’) last two fiscal years relating to services provided to (i) the Fund(s) or (ii) any Fund Service Provider that relate directly to the operations and financial reporting of the Fund(s).
| Item 5. | Audit Committee of Listed Registrants |
The Audit Committee is a separately-designated standing audit committee in accordance with Section 3(a)(58)(A) of the Securities Exchange Act of 1934. As of October 31, 2019, the members of the Audit Committee were Joseph Mauriello, Donald F. Donahue, Alan J. Lacy and Michael E. Wiley.
| Item 6. | Investments |
| (a) | Not applicable. |
| (b) | Not applicable. |
| Item 7. | Disclosure of Proxy Voting Policies and Procedures forClosed-End Management Investment Companies |
Not applicable.
| Item 8. | Portfolio Managers ofClosed-End Management Investment Companies |
Not applicable.
| Item 9. | Purchase of Equity Securities byClosed-End Management Investment Company and Affiliated Purchasers |
Not applicable.
| Item 10. | Submission of Matters to a Vote of Security Holders |
There were no material changes to the procedures by which shareholders may recommend nominees to the trust’s Board of Trustees.
| Item 11. | Controls and Procedures |
(a)(i) The President and Treasurer and the Chief Financial Officer have concluded that the trust’s disclosure controls and procedures (as defined in Rule30a-3(c) under the Investment Company Act) provide reasonable assurances that material information relating to the trust is made known to them by the appropriate persons, based on their evaluation of these controls and procedures as of a date within 90 days of the filing date of this report.
Table of Contents
(a)(ii) There was no change in the trust’s internal control over financial reporting (as defined in Rule30a-3(d) under the Investment Company Act) that occurred during the period covered by this report that has materially affected, or is reasonably likely to materially affect, the trust’s internal control over financial reporting.
| Item 12. | Disclosure of Securities Lending Activities forClosed-End Management Investment Companies |
Not applicable.
| Item 13. | Exhibits |
(a) | (1) | Code of Ethics pursuant to Item 2 of FormN-CSR is filed and attached hereto asEX-99.CODE ETH. | ||
(a) | (2) | Certification pursuant to Rule30a-2(a) under the Investment Company Act of 1940 (17 CFR270.30a-2(a)) is filed and attached hereto as Exhibit 99.CERT. | ||
(a) | (3) | Not applicable. | ||
(b) | Certification pursuant to Rule30a-2(b) under the Investment Company Act of 1940 (17 CFR270.30a-2(b)) is furnished and attached hereto as Exhibit 99.906CERT. | |||
Table of Contents
SIGNATURES
Pursuant to the requirements of the Securities Exchange Act of 1934 and the Investment Company Act of 1940, the registrant has duly caused this report to be signed on its behalf by the undersigned, thereunto duly authorized.
Fidelity Covington Trust
| By: | /s/ Stacie M. Smith | |
| Stacie M. Smith | ||
| President and Treasurer | ||
| Date: | December 26, 2019 | |
Pursuant to the requirements of the Securities Exchange Act of 1934 and the Investment Company Act of 1940, this report has been signed below by the following persons on behalf of the registrant and in the capacities and on the dates indicated.
| By: | /s/ Stacie M. Smith | |
| Stacie M. Smith | ||
| President and Treasurer | ||
| Date: | December 26, 2019 | |
| By: | /s/ John J. Burke III | |
| John J. Burke III | ||
| Chief Financial Officer | ||
| Date: | December 26, 2019 | |