Table of Contents
UNITED STATES
SECURITIES AND EXCHANGE COMMISSION
Washington, D.C. 20549
FORMN-CSR
CERTIFIED SHAREHOLDER REPORT OF REGISTERED
MANAGEMENT INVESTMENT COMPANIES
Investment Company Act file number 811-07319
Fidelity Covington Trust
(Exact name of registrant as specified in charter)
245 Summer St., Boston, Massachusetts 02210
(Address of principal executive offices) (Zip code)
Cynthia Lo Bessette, Secretary
245 Summer St.
Boston, Massachusetts 02210
(Name and address of agent for service)
Registrant’s telephone number, including area code:617-563-7000
Date of fiscal year end: August 31
Date of reporting period: August 31, 2019
Table of Contents
| Item 1. | Reports to Stockholders |
Table of Contents
Fidelity® High Yield Factor ETF
Annual Report
August 31, 2019


Table of Contents
Beginning on January 1, 2021, as permitted by regulations adopted by the Securities and Exchange Commission, paper copies of a fund’s shareholder reports will no longer be sent by mail, unless you specifically request paper copies of the reports from the fund or from your financial intermediary, such as a financial advisor, broker-dealer or bank. Instead, the reports will be made available on a website, and you will be notified by mail each time a report is posted and provided with a website link to access the report.
If you already elected to receive shareholder reports electronically, you will not be affected by this change and you need not take any action. You may elect to receive shareholder reports and other communications from a fund electronically, by contacting your financial intermediary. For Fidelity customers, visit Fidelity’s web site or call Fidelity using the contact information listed below.
You may elect to receive all future reports in paper free of charge. If you wish to continue receiving paper copies of your shareholder reports, you may contact your financial intermediary or, if you are a Fidelity customer, visit Fidelity’s website, or call Fidelity at the applicable toll-free number listed below. Your election to receive reports in paper will apply to all funds held with the fund complex/your financial intermediary.
| Account Type | Website | Phone Number | ||
Brokerage, Mutual Fund, or Annuity Contracts: | fidelity.com/mailpreferences | 1-800-343-3548 | ||
Employer Provided Retirement Accounts: | netbenefits.fidelity.com/preferences (choose ‘no’ under Required Disclosures to continue print) | 1-800-343-0860 |
Table of Contents
To view a fund’s proxy voting guidelines and proxy voting record for the period ended June, 30, visit http://www.fidelity.com/proxyvotingresults or visit the Securities and Exchange Commission’s (SEC) web site at http://www.sec.gov. You may also call1-800-FIDELITY to request a free copy of the proxy voting guidelines.
Standard & Poor’s, S&P and S&P 500 are registered service marks of The McGraw-Hill Companies, Inc. and have been licensed for use by Fidelity Distributors Corporation.
Other third party marks appearing herein are the property of their respective owners.
All other marks appearing herein are registered or unregistered trademarks or service marks of FMR LLC or an affiliated company.
© 2019 FMR LLC. All Rights reserved.
This report and the financial statements contained herein are submitted for the general information of the shareholders of the funds. This report is not authorized for distribution to prospective investors in the funds unless preceded or accompanied by an effective prospectus.
A fund files its complete schedule of portfolio holdings with the SEC for the first and third quarters of each fiscal year on FormN-PORT. FormsN-PORT are available on the SEC’s web site at http://www.sec.gov. A fund’s FormsN-PORT may be reviewed and copied at the SEC’s Public Reference Room in Washington, DC. Information regarding the operation of the SEC’s Public Reference Room may be obtained by calling1-800-SEC-0330. For a complete list of a fund’s portfolio holdings, view the most recent holdings listing on Fidelity’s web site at http://www.fidelity.com, http://www.advisor.fidelity.com, or http://www.401k.com, as applicable.
NOT FDIC INSURED • MAY LOSE VALUE • NO BANK GUARANTEE
Neither the funds nor Fidelity Distributors Corporation is a bank.
| 3 | ||||
Table of Contents
The ICE BofAML® US High Yield Constrained Index gained 6.58% for the 12 months ending August 31, 2019, a choppy period in which U.S. corporate high-yield bonds seesawed due to trade tension, interest rates, economic data, oil prices and an inverted yield curve, among other factors. High yield began 2019 on a high note after enduring a historically volatile final quarter of 2018. Upbeat company earnings/outlooks and signs the Federal Reserve may pause on rates boosted high yield through April. In May, however, the index sunk amid the Fed’s decision to hold interest rates steady and signal it had little appetite to adjust them any time soon, as well as declining oil prices and retaliatory tariffs imposed on the U.S. by China. The bull market roared back in June, with high yield rising 2.45% amid dovish comments from Fed Chair Jerome Powell and others, and gained modest ground in July, when the Fed cut interest rates for the first time since 2008. Volatility intensified in August, however, as the U.S. Treasury yield curve inverted for the first time since 2007, which some investors viewed as a sign the world’s biggest economy could be heading for recession. For the full 12 months, higher-quality bonds led the way, with the core BB and B tiers gaining 9.50% and 6.96%, respectively. In contrast, the lower-quality CCC/below category returned-2.64%. By industry, returns were decidedly positive. The top performer was banks & thrifts (+14%). Conversely, a sharp decline in oil prices hampered energy(-6%).
| 4 | ||||
Table of Contents
Fidelity® High Yield Factor ETF
The information provided in the tables below shows you the performance of Fidelity® High Yield Factor ETF, with comparisons over different time periods to the fund’s relevant benchmarks. Seeing the returns over different time periods can help you assess the fund’s performance against relevant measurements. The performance information includes average annual total returns and is further explained in this section.*
The fund’s net asset value (NAV) performance is based on the NAV calculated each business day. It is calculated in accordance with the standard formula for valuing investment company shares as of the close of regular trading hours on NYSE Arca, Inc. (NYSE Arca) (normally 4:00 p.m. Eastern Time). The fund’s market price performance is based on the daily closing price of the shares of the fund on NYSE Arca. Since ETFs are bought and sold at prices set by the market – which can result in a premium or discount to NAV – the returns calculated using market price (market return) can differ from those calculated using NAV (NAV return). For information on these differences, please visit Fidelity.com or see the prospectus. The fund’s returns do not reflect the deduction of taxes that a shareholder would pay on fund distributions or the redemption or selling of fund shares. How a fund did yesterday is no guarantee of how it will do tomorrow.
Current performance may be higher or lower than the performance data quoted. Formonth-end performance figures, please visit fidelity.com/etfs/factor-etfs/overview or call Fidelity. The performance data featured represents past performance, which is no guarantee of future results. Investment return and principal value will fluctuate; therefore, you may have a gain or loss when you sell your shares.
| Fiscal Periods Ended August 31, 2019 | ||||||||
| Average Annual Total Returns | Past 1 Year | Life of fund | ||||||
Fidelity High Yield Factor ETF – NAVA | 9.48% | 9.11% | ||||||
Fidelity High Yield Factor ETF – Market PriceB | 9.75% | 9.18% | ||||||
ICE BofAMLBB-B U.S. High Yield Constrained IndexA | 8.04% | 7.85% | ||||||
ICE BofAML U.S. High Yield Master II IndexA | 6.58% | 6.64% | ||||||
Average annual total returns represent just that – the average return on an annual basis for Fidelity® High Yield Factor ETF and the fund’s benchmarks, assuming consistent performance over the periods shown, based on the cumulative return and the length of the period. This information represents returns as of the end of the fund’s fiscal period.
| A | From June 12, 2018. |
| B | From June 14, 2018, date initially listed on the NYSE ARCA exchange. |
| * | Total returns are historical and include changes in share price and reinvestment of dividends and capital gains distributions, if any. |
| $10,000 Over Life of Fund |
Let’s say hypothetically that $10,000 was invested in Fidelity High Yield Factor ETF – NAV on June 12, 2018, when the fund started. The chart shows how the value of your investment would have changed, and also shows how the ICE BofAMLBB-B US High Yield Constrained Index performed over the same period.

| 5 | ||||
Table of Contents
Fidelity® High Yield Factor ETF
Management’s Discussion of Fund Performance
Comments fromCo-Portfolio Managers Mike Weaver, Alexandre Karam and Michael Cheng: For the fiscal year, the fund gained 9.48% at net asset value and 9.75% on a market-price basis, outpacing, net of fees, the 8.04% advance of the benchmark ICE BofAML®BB-B US High Yield Constrained Index. The past 12 months, we took a consistent, conservative approach to investing in high-yield bonds, focusing on higher-quality businesses that we believe offer the best balance of risk and reward over time. Versus the benchmark, security selection was by far the biggest driver of performance, led by picks in the telecommunications and technology categories. In contrast, industry selection was a modest detractor, with an underweighting in the banks & thrifts category hurting most. The top individual relative contributor was telecommunications company Frontier Communications (+10%), whereas the fund’s modestnon-benchmark exposure to Argentina-based energy company YPF Sociedad(-35%) was the largest relative detractor. We’ll also note that the fund’s cash position was a modest drag on relative performance, given the strong return of the high-yield market the past 12 months.
Notes to shareholders: On December 1, 2018, Alexandre Karam assumedco-management responsibilities for the fund. On December 31, 2018, Matthew Conti retired from Fidelity, leaving Mike Weaver, Michael Cheng and Alexandre Karam asCo-Managers of the fund.
The views expressed above reflect those of the portfolio manager(s) only through the end of the period as stated on the cover of this report and do not necessarily represent the views of Fidelity or any other person in the Fidelity organization. Any such views are subject to change at anytime based upon market or other conditions and Fidelity disclaims any responsibility to update such views. These views may not be relied on as investment advice and, because investment decisions for a Fidelity fund are based on numerous factors, may not be relied on as an indication of trading intent on behalf of any Fidelity fund.
| 6 | ||||
Table of Contents
Fidelity® High Yield Factor ETF
Investment Summary(Unaudited)
| Top Five Holdings as of August 31, 2019 | ||||
| (by issuer, excluding cash equivalents) | % of fund’s net assets | |||
CCO Holdings LLC / CCO Holdings Capital Corp. | 2.3 | |||
Icahn Enterprises LP / Icahn Enterprises Finance Corp. | 1.9 | |||
MPT Operating Partnership LP / MPT Finance Corp. | 1.8 | |||
Go Daddy Operating Co. LLC / GD Finance Co., Inc. | 1.8 | |||
1011778 BC ULC / New Red Finance, Inc. | 1.6 | |||
|
| |||
| 9.4 | ||||
|
| |||
| Top Five Market Sectors as of August 31, 2019 | ||||
% of fund’s net assets | ||||
Energy | 17.2 | |||
Industrials | 13.6 | |||
Consumer Discretionary | 13.1 | |||
Information Technology | 11.4 | |||
Financials | 10.4 | |||
| Quality Diversification as of August 31, 2019 |
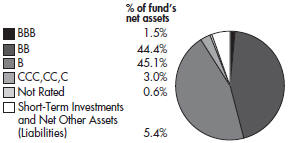
We have used ratings from Moody’s Investors Service, Inc. Where Moody’s® ratings are not available, we have used S&P® ratings. All ratings are as of the date indicated and do not reflect subsequent changes.
| Asset Allocation as of August 31, 2019 |
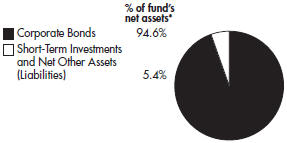
| * | Foreign investments – 19.2% |
| 7 | ||||
Table of Contents
Schedule of Investments August 31, 2019
Showing Percentage of Net Assets
| Nonconvertible Bonds – 94.6% | ||||||||
Principal Amount | Value | |||||||
COMMUNICATION SERVICES – 10.0% |
| |||||||
Communications Equipment – 0.3% |
| |||||||
CommScope Technologies LLC | $ | 200,000 | $ | 178,500 | ||||
|
| |||||||
Diversified Telecommunication Services – 2.4% |
| |||||||
Altice Financing S.A. | 200,000 | 213,000 | ||||||
Altice France S.A. | 150,000 | 160,125 | ||||||
CenturyLink, Inc. | 89,000 | 96,454 | ||||||
Frontier Communications Corp. | 560,000 | 544,600 | ||||||
Hughes Satellite Systems Corp. | 544,000 | 586,160 | ||||||
|
| |||||||
| 1,600,339 | ||||||||
|
| |||||||
Media – 5.4% | ||||||||
CSC Holdings LLC: | ||||||||
5.375% 2/1/28 (a) | 150,000 | 160,164 | ||||||
5.75% 1/15/30 (a) | 500,000 | 523,125 | ||||||
DISH DBS Corp. 5.875% 11/15/24 | 300,000 | 285,390 | ||||||
Midcontinent Communications / Midcontinent Finance Corp. | 300,000 | 311,409 | ||||||
Nexstar Broadcasting, Inc. | 580,000 | 603,200 | ||||||
Nexstar Escrow, Inc. | 55,000 | 57,337 | ||||||
Outfront Media Capital LLC / Outfront Media Capital Corp. | 700,000 | 723,625 | ||||||
Sable International Finance Ltd. | 200,000 | 209,000 | ||||||
Telenet Finance Luxembourg Notes Sarl | 800,000 | 813,600 | ||||||
|
| |||||||
| 3,686,850 | ||||||||
|
| |||||||
Wireless Telecommunication Services – 1.9% |
| |||||||
C&W Senior Financing DAC | 300,000 | 319,467 | ||||||
Sprint Corp.: | ||||||||
7.125% 6/15/24 | 300,000 | 331,638 | ||||||
7.25% 9/15/21 | 200,000 | 215,140 | ||||||
7.625% 2/15/25 | 400,000 | 447,500 | ||||||
|
| |||||||
| 1,313,745 | ||||||||
|
| |||||||
TOTAL COMMUNICATION SERVICES |
| 6,779,434 | ||||||
|
| |||||||
Principal Amount | Value | |||||||
CONSUMER DISCRETIONARY – 13.1% |
| |||||||
Airlines – 0.5% | ||||||||
United Airlines Holdings, Inc. | $ | 300,000 | $ | 314,250 | ||||
|
| |||||||
Auto Components – 0.0% | ||||||||
Delphi Technologies PLC | 33,000 | 28,463 | ||||||
|
| |||||||
Building Products – 1.0% | ||||||||
Williams Scotsman International, Inc. | 650,000 | 680,875 | ||||||
|
| |||||||
Diversified Consumer Services – 1.2% |
| |||||||
GEMS MENASA Cayman Ltd. / GEMS Education Delaware LLC | 200,000 | 203,800 | ||||||
Global Partners LP / GLP Finance Corp. | 600,000 | 607,500 | ||||||
|
| |||||||
| 811,300 | ||||||||
|
| |||||||
Hotels, Restaurants & Leisure – 6.1% |
| |||||||
1011778 BC ULC / New Red Finance, Inc. | 1,060,000 | 1,094,450 | ||||||
GLP Capital LP / GLP Financing II, Inc.: |
| |||||||
5.25% 6/1/25 | 112,000 | 123,142 | ||||||
5.375% 4/15/26 | 99,000 | 108,668 | ||||||
5.75% 6/1/28 | 37,000 | 42,048 | ||||||
Hilton Domestic Operating Co., Inc.: |
| |||||||
4.875% 1/15/30 (a) | 80,000 | 85,600 | ||||||
5.125% 5/1/26 | 300,000 | 316,650 | ||||||
Hilton Worldwide Finance LLC / Hilton Worldwide Finance Corp.: |
| |||||||
4.625% 4/1/25 | 223,000 | 230,247 | ||||||
4.875% 4/1/27 | 174,000 | 183,135 | ||||||
KFC Holding Co. / Pizza Hut Holdings LLC / Taco Bell of America LLC | 280,000 | 296,100 | ||||||
Melco Resorts Finance Ltd. | 500,000 | 509,341 | ||||||
Twin River Worldwide Holdings, Inc. | 625,000 | 658,594 | ||||||
Wynn Las Vegas LLC / Wynn Las Vegas Capital Corp.: |
| |||||||
5.25% 5/15/27 (a) | 56,000 | 58,030 | ||||||
5.50% 3/1/25 (a) | 444,000 | 468,420 | ||||||
|
| |||||||
| 4,174,425 | ||||||||
|
| |||||||
Household Durables – 0.4% | ||||||||
PulteGroup, Inc.: | ||||||||
5.00% 1/15/27 | 93,000 | 99,975 | ||||||
See accompanying notes which are an integral part of the financial statements.
| 8 | ||||
Table of Contents
Nonconvertible Bonds – continued | ||||||||
Principal Amount | Value | |||||||
CONSUMER DISCRETIONARY – continued |
| |||||||
Household Durables – continued |
| |||||||
5.50% 3/1/26 | $ | 157,000 | $ | 172,308 | ||||
|
| |||||||
| 272,283 | ||||||||
|
| |||||||
Internet & Direct Marketing Retail – 0.2% |
| |||||||
Netflix, Inc. | 96,000 | 105,960 | ||||||
|
| |||||||
Media – 2.9% | ||||||||
CCO Holdings LLC / CCO Holdings Capital Corp.: |
| |||||||
5.375% 6/1/29 (a) | 1,250,000 | 1,335,937 | ||||||
5.50% 5/1/26 (a) | 120,000 | 126,450 | ||||||
5.875% 4/1/24 (a) | 80,000 | 83,300 | ||||||
Sirius XM Radio, Inc.: | ||||||||
4.625% 7/15/24 (a) | 70,000 | 73,062 | ||||||
5.375% 4/15/25 (a) | 37,000 | 38,388 | ||||||
5.50% 7/1/29 (a) | 300,000 | 326,913 | ||||||
|
| |||||||
| 1,984,050 | ||||||||
|
| |||||||
Specialty Retail – 0.7% | ||||||||
L Brands, Inc. | 200,000 | 197,000 | ||||||
Staples, Inc. | 300,000 | 303,000 | ||||||
|
| |||||||
| 500,000 | ||||||||
|
| |||||||
Textiles, Apparel & Luxury Goods – 0.1% |
| |||||||
The William Carter Co. | 30,000 | 31,949 | ||||||
|
| |||||||
TOTAL CONSUMER DISCRETIONARY |
| 8,903,555 | ||||||
|
| |||||||
CONSUMER STAPLES – 4.5% | ||||||||
Food Products – 2.3% | ||||||||
JBS Investments II GmbH | 200,000 | 210,000 | ||||||
JBS U.S.A. LUX S.A. / JBS U.S.A. Food Co. / JBS U.S.A. Finance, Inc. | 100,000 | 106,000 | ||||||
Lamb Weston Holdings, Inc. | 100,000 | 104,541 | ||||||
Pilgrim’s Pride Corp. | 161,000 | 167,440 | ||||||
Post Holdings, Inc.: | ||||||||
5.50% 12/15/29 (a) | 70,000 | 74,005 | ||||||
5.625% 1/15/28 (a) | 250,000 | 266,250 | ||||||
5.75% 3/1/27 (a) | 600,000 | 637,500 | ||||||
|
| |||||||
| 1,565,736 | ||||||||
|
| |||||||
Household Products – 0.8% | ||||||||
Prestige Brands, Inc. | 520,000 | 544,700 | ||||||
|
| |||||||
Principal Amount | Value | |||||||
Personal Products – 0.9% |
| |||||||
HLF Financing Sarl LLC / Herbalife International, Inc. | $ | 605,000 | $ | 597,437 | ||||
|
| |||||||
Tobacco – 0.5% |
| |||||||
Vector Group Ltd. | 376,000 | 368,480 | ||||||
|
| |||||||
TOTAL CONSUMER STAPLES |
| 3,076,353 | ||||||
|
| |||||||
ENERGY – 17.2% |
| |||||||
Energy Equipment & Services – 0.5% |
| |||||||
Calfrac Holdings LP | 125,000 | 78,750 | ||||||
KLX Energy Services Holdings, Inc. | 15,000 | 13,763 | ||||||
Nine Energy Service, Inc. | 195,000 | 175,987 | ||||||
Valaris PLC: |
| |||||||
5.20% 3/15/25 | 100,000 | 60,250 | ||||||
7.75% 2/1/26 | 60,000 | 38,088 | ||||||
|
| |||||||
| 366,838 | ||||||||
|
| |||||||
Independent Power and Renewable Electricity Producers – 1.4% |
| |||||||
NRG Energy, Inc.: |
| |||||||
5.25% 6/15/29 (a) | 40,000 | 42,683 | ||||||
6.625% 1/15/27 | 483,000 | 521,640 | ||||||
7.25% 5/15/26 | 359,000 | 393,554 | ||||||
|
| |||||||
| 957,877 | ||||||||
|
| |||||||
Oil, Gas & Consumable Fuels – 12.8% |
| |||||||
Aker BP ASA: |
| |||||||
4.75% 6/15/24 (a) | 500,000 | 511,250 | ||||||
5.875% 3/31/25 (a) | 440,000 | 463,320 | ||||||
Alliance Resource Operating Partners LP / Alliance Resource Finance Corp. | 500,000 | 511,250 | ||||||
Ascent Resources Utica Holdings LLC / ARU Finance Corp. | 119,000 | 98,288 | ||||||
Chesapeake Energy Corp. | 450,000 | 330,378 | ||||||
Comstock Resources, Inc. | 250,000 | 188,125 | ||||||
Crestwood Midstream Partners LP / Crestwood Midstream Finance Corp. | 200,000 | 199,936 | ||||||
DCP Midstream LP | 112,000 | 107,240 | ||||||
Diamondback Energy, Inc. | 160,000 | 168,000 | ||||||
See accompanying notes which are an integral part of the financial statements.
| 9 | ||||
Table of Contents
Schedule of Investments – continued
| Nonconvertible Bonds – continued | ||||||||
| Principal Amount | Value | |||||||
ENERGY – continued | ||||||||
Oil, Gas & Consumable Fuels – continued |
| |||||||
Genesis Energy LP / Genesis Energy Finance Corp. | $ | 650,000 | $ | 632,937 | ||||
Gulfport Energy Corp. | 250,000 | 180,000 | ||||||
Holly Energy Partners LP / Holly Energy Finance Corp. | 842,000 | 882,416 | ||||||
Murphy Oil Corp.: | ||||||||
5.75% 8/15/25 | 320,000 | 323,904 | ||||||
6.875% 8/15/24 | 566,000 | 593,055 | ||||||
Northern Oil and Gas, Inc. | 600,000 | 617,250 | ||||||
Parkland Fuel Corp.: | ||||||||
5.875% 7/15/27 (a) | 350,000 | 367,500 | ||||||
6.00% 4/1/26 (a) | 592,000 | 621,600 | ||||||
Parsley Energy LLC / Parsley Finance Corp. | 370,000 | 377,400 | ||||||
Peabody Energy Corp. | 60,000 | 61,800 | ||||||
Range Resources Corp. | 500,000 | 466,250 | ||||||
Rockpoint Gas Storage Canada Ltd. | 500,000 | �� | 506,750 | |||||
W&T Offshore, Inc. | 259,000 | 249,935 | ||||||
YPF S.A. | 400,000 | 252,000 | ||||||
|
| |||||||
| 8,710,584 | ||||||||
|
| |||||||
Pipeline – 2.5% | ||||||||
Antero Midstream Partners LP / Antero Midstream Finance Corp. | 448,000 | 422,240 | ||||||
Cheniere Energy Partners LP: | ||||||||
5.25% 10/1/25 | 226,000 | 233,627 | ||||||
5.625% 10/1/26 | 405,000 | 427,275 | ||||||
PBF Logistics LP / PBF Logistics Finance Corp. | 590,000 | 606,225 | ||||||
|
| |||||||
| 1,689,367 | ||||||||
|
| |||||||
TOTAL ENERGY | 11,724,666 | |||||||
|
| |||||||
FINANCIALS – 10.4% | ||||||||
Capital Markets – 1.5% | ||||||||
LPL Holdings, Inc. | 952,000 | 1,001,980 | ||||||
|
| |||||||
| Principal Amount | Value | |||||||
Consumer Finance – 1.7% |
| |||||||
Ally Financial, Inc.: |
| |||||||
3.875% 5/21/24 | $ | 75,000 | $ | 79,031 | ||||
5.75% 11/20/25 | 112,000 | 128,240 | ||||||
Credit Acceptance Corp. | 250,000 | 270,470 | ||||||
Enova International, Inc. | 50,000 | 48,000 | ||||||
Springleaf Finance Corp. | 550,000 | 599,500 | ||||||
|
| |||||||
| 1,125,241 | ||||||||
|
| |||||||
Diversified Financial Services – 3.4% |
| |||||||
Allied Universal Holdco LLC / Allied Universal Finance Corp. | 950,000 | 1,009,375 | ||||||
Icahn Enterprises LP / Icahn Enterprises Finance Corp.: |
| |||||||
6.25% 2/1/22 | 238,000 | 245,140 | ||||||
6.25% 5/15/26 (a) | 575,000 | 600,185 | ||||||
6.375% 12/15/25 | 450,000 | 476,437 | ||||||
|
| |||||||
| 2,331,137 | ||||||||
|
| |||||||
Real Estate Investment Trusts (REITs) – 2.8% |
| |||||||
Brookfield Property REIT, Inc. / BPR Cumulus LLC / BPR Nimbus LLC / GGSI Sellco LL | 500,000 | 526,250 | ||||||
HAT Holdings I LLC / HAT Holdings II LLC | 115,000 | 121,153 | ||||||
MPT Operating Partnership LP / MPT Finance Corp. | 1,200,000 | 1,248,000 | ||||||
|
| |||||||
| 1,895,403 | ||||||||
|
| |||||||
Thrifts & Mortgage Finance – 1.0% |
| |||||||
Radian Group, Inc. | 700,000 | 713,125 | ||||||
|
| |||||||
TOTAL FINANCIALS |
| 7,066,886 | ||||||
|
| |||||||
HEALTH CARE – 5.0% |
| |||||||
Health Care Equipment & Supplies – 0.4% |
| |||||||
Hologic, Inc. | 100,000 | 102,250 | ||||||
Mallinckrodt International Finance S.A. / Mallinckrodt CB LLC | 100,000 | 44,000 | ||||||
Teleflex, Inc. | 112,000 | 118,427 | ||||||
|
| |||||||
| 264,677 | ||||||||
|
| |||||||
Health Care Providers & Services – 3.3% |
| |||||||
Centene Corp. | 62,000 | 63,535 | ||||||
See accompanying notes which are an integral part of the financial statements.
| 10 | ||||
Table of Contents
| Nonconvertible Bonds – continued | ||||||||
| Principal Amount | Value | |||||||
HEALTH CARE – continued |
| |||||||
Health Care Providers & Services – continued |
| |||||||
CHS / Community | $ | 200,000 | $ | 193,520 | ||||
DaVita, Inc.: |
| |||||||
5.00% 5/1/25 | 552,000 | 552,690 | ||||||
5.125% 7/15/24 | 199,000 | 202,425 | ||||||
HCA, Inc. | 365,000 | 406,975 | ||||||
MEDNAX, Inc.: |
| |||||||
5.25% 12/1/23 (a) | 168,000 | 168,840 | ||||||
6.25% 1/15/27 (a) | 700,000 | 686,000 | ||||||
|
| |||||||
| 2,273,985 | ||||||||
|
| |||||||
Pharmaceuticals – 1.3% |
| |||||||
Bausch Health Cos., Inc.: |
| |||||||
5.875% 5/15/23 (a) | 10,000 | 10,125 | ||||||
9.00% 12/15/25 (a) | 660,000 | 740,025 | ||||||
Charles River Laboratories International, Inc. | 112,000 | 119,829 | ||||||
|
| |||||||
| 869,979 | ||||||||
|
| |||||||
TOTAL HEALTH CARE |
| 3,408,641 | ||||||
|
| |||||||
INDUSTRIALS – 13.6% |
| |||||||
Aerospace & Defense – 1.6% |
| |||||||
TransDigm, Inc. | 1,000,000 | 1,078,730 | ||||||
|
| |||||||
Building Products – 0.5% |
| |||||||
Masonite International Corp. | 300,000 | 316,500 | ||||||
|
| |||||||
Commercial Services & Supplies – 2.8% |
| |||||||
Clean Harbors, Inc.: |
| |||||||
4.875% 7/15/27 (a) | 500,000 | 528,750 | ||||||
5.125% 7/15/29 (a) | 300,000 | 319,500 | ||||||
Nielsen Finance LLC / Nielsen Finance Co. | 651,000 | 654,255 | ||||||
Ritchie Bros Auctioneers, Inc. | 112,000 | 116,620 | ||||||
Tervita Corp. | 200,000 | 203,000 | ||||||
United Rentals North America, Inc. | 80,000 | 87,000 | ||||||
|
| |||||||
| 1,909,125 | ||||||||
|
| |||||||
Construction Materials – 1.4% |
| |||||||
Stericycle, Inc. | 950,000 | 973,750 | ||||||
|
| |||||||
| Principal Amount | Value | |||||||
Containers & Packaging – 4.7% |
| |||||||
Ardagh Packaging Finance PLC / Ardagh Holdings USA, Inc.: | ||||||||
4.125% 8/15/26 (a) | $ | 500,000 | $ | 505,615 | ||||
5.25% 8/15/27 (a) | 200,000 | 202,000 | ||||||
Ball Corp.: | ||||||||
4.875% 3/15/26 | 559,000 | 612,105 | ||||||
5.25% 7/1/25 | 323,000 | 362,567 | ||||||
Berry Global, Inc.: | ||||||||
4.50% 2/15/26 (a) | 650,000 | 646,750 | ||||||
4.875% 7/15/26 (a) | 355,000 | 372,750 | ||||||
Intertape Polymer Group, Inc. | 440,000 | 456,500 | ||||||
Trivium Packaging Finance BV | 35,000 | 37,013 | ||||||
|
| |||||||
| 3,195,300 | ||||||||
|
| |||||||
Machinery – 2.0% |
| |||||||
Allison Transmission, Inc.: | ||||||||
5.00% 10/1/24 (a) | 695,000 | 715,051 | ||||||
5.875% 6/1/29 (a) | 260,000 | 278,850 | ||||||
Colfax Corp. | 50,000 | 53,312 | ||||||
EnPro Industries, Inc. | 120,000 | 125,700 | ||||||
RBS Global, Inc. / | 200,000 | 206,000 | ||||||
|
| |||||||
| 1,378,913 | ||||||||
|
| |||||||
Marine – 0.6% |
| |||||||
GasLog Ltd. | 400,000 | 415,000 | ||||||
|
| |||||||
TOTAL INDUSTRIALS | 9,267,318 | |||||||
|
| |||||||
INFORMATION TECHNOLOGY – 11.4% |
| |||||||
Communications Equipment – 1.1% |
| |||||||
ViaSat, Inc. | 734,000 | 747,755 | ||||||
|
| |||||||
Electronic Equipment, Instruments & Components – 0.0% |
| |||||||
MTS Systems Corp. | 15,000 | 15,675 | ||||||
|
| |||||||
Internet Software & Services – 4.2% |
| |||||||
Go Daddy Operating Co. LLC / GD Finance Co., Inc. | 1,140,000 | 1,202,700 | ||||||
GrubHub Holdings, Inc. | 20,000 | 20,900 | ||||||
j2 Cloud Services LLC / j2 GlobalCo-Obligor, Inc. | 646,000 | 679,850 | ||||||
The Dun & Bradstreet Corp. 6.875% 8/15/26 (a) | 200,000 | 216,750 | ||||||
See accompanying notes which are an integral part of the financial statements.
| 11 | ||||
Table of Contents
Schedule of Investments – continued
| Nonconvertible Bonds – continued | ||||||||
| Principal Amount | Value | |||||||
INFORMATION TECHNOLOGY – continued |
| |||||||
Internet Software & Services – continued |
| |||||||
VeriSign, Inc.: | ||||||||
4.75% 7/15/27 | $ | 383,000 | $ | 405,023 | ||||
5.25% 4/1/25 | 312,000 | 340,860 | ||||||
|
| |||||||
| 2,866,083 | ||||||||
|
| |||||||
IT Services – 1.4% | ||||||||
Gartner, Inc. | 910,000 | 954,353 | ||||||
|
| |||||||
Life Sciences Tools & Services – 0.3% |
| |||||||
IQVIA, Inc. | 200,000 | 211,250 | ||||||
Office Electronics – 0.4% | ||||||||
CDW LLC / CDW Finance Corp.: | ||||||||
5.00% 9/1/25 | 100,000 | 104,500 | ||||||
5.50% 12/1/24 | 160,000 | 174,200 | ||||||
| 278,700 | ||||||||
Semiconductors & Semiconductor Equipment – 0.6% |
| |||||||
Qorvo, Inc. | 390,000 | 416,333 | ||||||
Software – 2.5% | ||||||||
CDK Global, Inc. | 135,000 | 139,487 | ||||||
Open Text Corp. | 568,000 | 607,022 | ||||||
SS&C Technologies, Inc. | 590,000 | 619,500 | ||||||
The Nielsen Co. Luxembourg Sarl | 310,000 | 306,125 | ||||||
| 1,672,134 | ||||||||
Technology Hardware, Storage & Peripherals – 0.9% |
| |||||||
NCR Corp.: | ||||||||
5.75% 9/1/27 (a) | 300,000 | 316,818 | ||||||
6.375% 12/15/23 | 250,000 | 257,795 | ||||||
| 574,613 | ||||||||
TOTAL INFORMATION TECHNOLOGY |
| 7,736,896 | ||||||
|
| |||||||
MATERIALS – 6.5% |
| |||||||
Chemicals – 1.8% |
| |||||||
Axalta Coating Systems LLC | 710,000 | 734,921 | ||||||
The Chemours Co. | 480,000 | 474,000 | ||||||
TPC Group, Inc. | 35,000 | 36,750 | ||||||
| 1,245,671 | ||||||||
Metals & Mining – 3.5% |
| |||||||
FMG Resources August 2006 Pty Ltd.: |
| |||||||
4.75% 5/15/22 (a) | 418,000 | 430,540 | ||||||
| Principal Amount | Value | |||||||
5.125% 3/15/23 to 5/15/24 (a) | $ | 534,000 | $ | 555,735 | ||||
Freeport-McMoRan, Inc.: | ||||||||
5.00% 9/1/27 | 400,000 | 399,000 | ||||||
5.25% 9/1/29 | 300,000 | 297,453 | ||||||
Mineral Resources Ltd. | 600,000 | 612,750 | ||||||
Steel Dynamics, Inc. | 60,000 | 61,830 | ||||||
| 2,357,308 | ||||||||
Paper & Forest Products – 1.2% |
| |||||||
Norbord, Inc. | 800,000 | 814,000 | ||||||
TOTAL MATERIALS | 4,416,979 | |||||||
|
| |||||||
REAL ESTATE – 2.4% |
| |||||||
Equity Real Estate Investment Trusts (REITs) – 0.9% |
| |||||||
Equinix, Inc.: | ||||||||
5.75% 1/1/25 | 59,000 | 61,507 | ||||||
5.875% 1/15/26 | 369,000 | 392,524 | ||||||
Iron Mountain, Inc. | 79,000 | 81,124 | ||||||
Sabra Health Care LP / Sabra Capital Corp. | 60,000 | 62,906 | ||||||
| 598,061 | ||||||||
Real Estate Management & Development – 1.5% |
| |||||||
Forestar Group, Inc. | 84,000 | 90,195 | ||||||
Kennedy-Wilson, Inc. | 891,000 | 912,161 | ||||||
| 1,002,356 | ||||||||
TOTAL REAL ESTATE | 1,600,417 | |||||||
|
| |||||||
UTILITIES – 0.5% | ||||||||
Electric Utilities – 0.1% | ||||||||
Vistra Operations Co. LLC | 95,000 | 98,087 | ||||||
|
| |||||||
Independent Power and Renewable Electricity Producers – 0.3% |
| |||||||
Calpine Corp. | 200,000 | 203,000 | ||||||
|
| |||||||
Multi-Utilities – 0.1% |
| |||||||
Talen Energy Supply LLC | 55,000 | 53,213 | ||||||
|
| |||||||
TOTAL UTILITIES | 354,300 | |||||||
|
| |||||||
TOTAL NONCONVERTIBLE BONDS |
| 64,335,445 | ||||||
|
| |||||||
See accompanying notes which are an integral part of the financial statements.
| 12 | ||||
Table of Contents
| Money Market Funds – 5.3% | ||||||||
| Shares | Value | |||||||
Fidelity Cash Central Fund, 2.13% (d) | 3,618,780 | $ | 3,619,504 | |||||
|
| |||||||
TOTAL INVESTMENT IN SECURITIES – 99.9% |
| 67,954,949 | ||||||
NET OTHER ASSETS (LIABILITIES) – 0.1% |
| 61,206 | ||||||
|
| |||||||
NET ASSETS – 100.0% |
| $ | 68,016,155 | |||||
|
| |||||||
Legend
| (a) | Security is exempt from registration under Rule 144A of the Securities Act of 1933. These securities may be resold in transactions exempt from registration, normally to qualified institutional buyers. At the end of the period, the value of these securities amounted to $42,837,746 or 63.0% of net assets. |
| (b) | Security is perpetual in nature with no stated maturity date. |
| (c) | Coupon rates for floating and adjustable rate securities reflect the rates in effect at period end. |
| (d) | Affiliated fund that is generally available only to investment companies and other accounts managed by Fidelity Investments. The rate quoted is the annualizedseven-day yield of the fund at period end. A complete unaudited listing of the fund’s holdings as of its most recent quarter end is available upon request. In addition, each Fidelity Central Fund’s financial statements, which are not covered by the Fund’s Report of Independent Registered Public Accounting Firm, are available on the SEC’s website or upon request. |
Affiliated Central Funds
Information regarding fiscal year to date income earned by the Fund from investments in Fidelity Central Funds is as follows:
| Fund | Income earned | |||
Fidelity Cash Central Fund | $ | 40,433 | ||
|
| |||
Amounts in the income column in the above table include any capital gain distributions from underlying funds, which are presented in the corresponding line-item in the Statement of Operations, if applicable.
See accompanying notes which are an integral part of the financial statements.
| 13 | ||||
Table of Contents
Schedule of Investments – continued
Investment Valuation
The following is a summary of the inputs used, as of August 31, 2019, involving the Fund’s assets and liabilities carried at fair value. The inputs or methodology used for valuing securities may not be an indication of the risk associated with investing in those securities. For more information on valuation inputs, and their aggregation into the levels used in the table below, please refer to the Investment Valuation section in the accompanying Notes to Financial Statements.
| Valuation Inputs at Reporting Date: | ||||||||||||||||
| Description | Total | Level 1 | Level 2 | Level 3 | ||||||||||||
Investments in Securities: | ||||||||||||||||
Corporate Bonds | $ | 64,335,445 | $ | — | $ | 64,335,445 | $ | — | ||||||||
Money Market Funds | 3,619,504 | 3,619,504 | — | — | ||||||||||||
|
|
|
|
|
|
|
| |||||||||
Total Investments in Securities: | $ | 67,954,949 | $ | 3,619,504 | $ | 64,335,445 | $ | — | ||||||||
|
|
|
|
|
|
|
| |||||||||
Other Information
Distribution of investments by country or territory of incorporation, as a percentage of Total Net Assets, is as follows (Unaudited):
United States of America | 80.7 | |||
Canada | 8.6 | |||
Australia | 2.4 | |||
Luxembourg | 2.2 | |||
Ireland | 1.5 | |||
Norway | 1.4 | |||
Cayman Islands | 1.4 | |||
Others (Individually Less Than 1%) | 1.7 | |||
|
| |||
| 99.9 | % | |||
|
| |||
See accompanying notes which are an integral part of the financial statements.
| 14 | ||||
Table of Contents
[THIS PAGE INTENTIONALLY LEFT BLANK]
| 15 | ||||
Table of Contents
| Statements of Assets and Liabilities | ||||
| August 31, 2019 | ||||
Assets | ||||
Investments in securities, at value – See accompanying schedule: | ||||
Unaffiliated issuers | $ | 64,335,445 | ||
Fidelity Central Funds | 3,619,504 | |||
|
| |||
Total Investments in Securities | $ | 67,954,949 | ||
Receivable for fund shares sold | 2,626,758 | |||
Distributions receivable from Fidelity Central Funds | 7,236 | |||
Interest receivable | 945,988 | |||
|
| |||
Total assets | 71,534,931 | |||
|
| |||
Liabilities | ||||
Due to custodian | 10,450 | |||
Payable for investments purchased | 3,232,008 | |||
Distributions payable | 252,500 | |||
Accrued management fees | 23,818 | |||
|
| |||
Total liabilities | 3,518,776 | |||
|
| |||
Net Assets | $ | 68,016,155 | ||
|
| |||
Net Assets consist of: | ||||
Paid in capital | 66,337,236 | |||
Total distributable earnings (loss) | 1,678,919 | |||
|
| |||
Net Assets | $ | 68,016,155 | ||
|
| |||
Shares outstanding | 1,300,000 | |||
|
| |||
Net Asset Value, offering price and redemption price per share | $ | 52.32 | ||
|
| |||
Investments at cost – Unaffiliated issuers | $ | 62,919,642 | ||
Investments at cost – Fidelity Central Funds | 3,619,504 | |||
|
| |||
Investments at cost | $ | 66,539,146 | ||
|
| |||
See accompanying notes which are an integral part of the financial statements.
| 16 | ||||
Table of Contents
| Statements of Operations | ||||
| For the year ended August 31, 2019 | ||||
Investment Income | ||||
Interest | $ | 1,666,331 | ||
Income from Fidelity Central Funds | 40,433 | |||
|
| |||
Total income | 1,706,764 | |||
|
| |||
Expenses | ||||
Management fees | 138,364 | |||
Independent trustees’ compensation | 137 | |||
|
| |||
Total expenses before reductions | 138,501 | |||
Expense reductions | (260 | ) | ||
|
| |||
Total expenses | 138,241 | |||
|
| |||
Net investment income (loss) | 1,568,523 | |||
|
| |||
Realized and Unrealized Gain (Loss) | ||||
Net realized gain (loss) on investment securities | 253,191 | |||
|
| |||
Total net realized gain (loss) | 253,191 | |||
|
| |||
Change in net unrealized appreciation (depreciation) on investment securities | 1,413,919 | |||
|
| |||
Net gain (loss) | 1,667,110 | |||
|
| |||
Net increase (decrease) in net assets resulting from operations | $ | 3,235,633 | ||
|
| |||
See accompanying notes which are an integral part of the financial statements.
| 17 | ||||
Table of Contents
Financial Statements – continued
| Statements of Changes in Net Assets | ||||||||
| Year ended August 31, 2019 | Year ended August 31, 2018A | |||||||
Increase (Decrease) in Net Assets | ||||||||
Operations | ||||||||
Net investment income (loss) | $ | 1,568,523 | $ | 144,598 | ||||
Net realized gain (loss) | 253,191 | 4,254 | ||||||
Change in net unrealized appreciation (depreciation) | 1,413,919 | 1,884 | ||||||
|
|
|
| |||||
Net increase (decrease) in net assets resulting from operations | 3,235,633 | 150,736 | ||||||
|
|
|
| |||||
Distributions to shareholders | (1,563,200 | ) | — | |||||
Distributions to shareholders from net investment income | — | (144,250 | ) | |||||
|
|
|
| |||||
Total distributions | (1,563,200 | ) | (144,250 | ) | ||||
|
|
|
| |||||
Share transactions | ||||||||
Proceeds from sales of shares | 53,790,556 | 12,546,680 | ||||||
|
|
|
| |||||
Net increase (decrease) in net assets resulting from share transactions | 53,790,556 | 12,546,680 | ||||||
|
|
|
| |||||
Total increase (decrease) in net assets | 55,462,989 | 12,553,166 | ||||||
Net Assets | ||||||||
Beginning of year | 12,553,166 | — | ||||||
|
|
|
| |||||
End of year | $ | 68,016,155 | $ | 12,553,166 | ||||
|
|
|
| |||||
Undistributed net investment income end of period | $ | 348 | ||||||
|
| |||||||
Other Information | ||||||||
Shares | ||||||||
Sold | 1,050,000 | 250,000 | ||||||
Redeemed | — | — | ||||||
|
|
|
| |||||
Net increase (decrease) | 1,050,000 | 250,000 | ||||||
|
|
|
| |||||
| A | For the period June 12, 2018 (commencement of operations) to August 31, 2018. |
See accompanying notes which are an integral part of the financial statements.
| 18 | ||||
Table of Contents
| Financial Highlights | ||||||||
| Year ended August 31, 2019 | Year ended August 31, 2018A | |||||||
SelectedPer-Share Data | ||||||||
Net asset value, beginning of period | $ | 50.21 | $ | 50.00 | ||||
|
|
|
| |||||
Income from Investment Operations | ||||||||
Net investment income (loss)B | 2.589 | 0.578 | ||||||
Net realized and unrealized gain (loss) | 2.006 | 0.209 | ||||||
|
|
|
| |||||
Total from investment operations | 4.595 | 0.787 | ||||||
|
|
|
| |||||
Distributions from net investment income | (2.485 | ) | (0.577 | ) | ||||
|
|
|
| |||||
Total distributions | (2.485 | ) | (0.577 | ) | ||||
|
|
|
| |||||
Net asset value, end of period | $ | 52.32 | $ | 50.21 | ||||
|
|
|
| |||||
Total ReturnC,D | 9.48 | % | 1.59 | % | ||||
Ratios to Average Net AssetsE,F | ||||||||
Expense before reductions | .44 | %G | .45 | %H | ||||
Expenses net of fee waivers, if any | .44 | %G | .45 | %H | ||||
Expenses net of all reductions | .44 | %G | .45 | %H | ||||
Net investment income (loss) | 5.03 | % | 5.21 | %H | ||||
Supplemental Data | ||||||||
Net assets, end of period (000 omitted) | $ | 68,016 | $ | 12,553 | ||||
Portfolio turnover rateI | 76 | % | 8 | %J | ||||
| A | For the period June 12, 2018 (commencement of operations) to August 31, 2018. |
| B | Calculated based on average shares outstanding during the period. |
| C | Total returns for periods of less than one year are not annualized. |
| D | Total returns would have been lower if certain expenses had not been reduced during the applicable periods shown. |
| E | Expense ratios reflect operating expenses of the Fund. Expenses before reductions do not reflect amounts reimbursed by the investment adviser or reductions from brokerage service arrangements or reductions from other expense offset arrangements and do not represent the amount paid by the Fund during periods when reimbursements or reductions occur. Expenses net of fee waivers reflect expenses after reimbursement by the investment adviser but prior to the reductions from brokerage service arrangements or other expense offset arrangements. Expenses net of all reductions represent the net expenses paid by the Fund but do not include expenses of the investment companies in which the fund invests. |
| F | Fees and expenses of any underlying Fidelity Central Funds are not included in the Funds’ expense ratio. The Fund indirectly bears its proportionate share of expenses of any underlying Fidelity Central Funds. |
| G | The size and fluctuation of net assets and expense amounts may cause ratios to differ from contractual rates. |
| H | Annualized. |
| I | Amount does not include the portfolio activity of any underlying funds. |
| J | Amount not annualized. |
See accompanying notes which are an integral part of the financial statements.
| 19 | ||||
Table of Contents
For the year ended August 31, 2019
1. Organization.
Fidelity High Yield Factor ETF (the Fund) is an exchange-traded fund of Fidelity Covington Trust (the Trust) and is authorized to issue an unlimited number of shares. The Trust is registered under the Investment Company Act of 1940, as amended (the 1940 Act), as anopen-end management investment company organized as a Massachusetts business trust.
2. Investments in Fidelity Central Funds.
The Fund invests in Fidelity Central Funds, which areopen-end investment companies generally available only to other investment companies and accounts managed by the investment adviser and its affiliates. The Fund’s Schedule of Investments lists each of the Fidelity Central Funds held as of year end, if any, as an investment of the Fund, but does not include the underlying holdings of each Fidelity Central Fund. As an Investing Fund, the Fund indirectly bears its proportionate share of the expenses of the underlying Fidelity Central Funds.
The Money Market Central Funds seek preservation of capital and current income and are managed by Fidelity Investments Money Management, Inc. (FIMM), an affiliate of the investment adviser. Annualized expenses of the Money Market Central Funds as of their most recent shareholder report date ranged from less than .005% to 0.01%.
A complete unaudited list of holdings for each Fidelity Central Fund is available upon request or at the Securities and Exchange Commission (the SEC) website at www.sec.gov. In addition, the financial statements of the Fidelity Central Funds, which are not covered by the Fund’s Report of Independent Registered Public Accounting Firm, are available on the SEC website or upon request.
3. Significant Accounting Policies.
The Fund is an investment company and applies the accounting and reporting guidance of the Financial Accounting Standards Board (FASB) Accounting Standards Codification Topic 946 Financial Services – Investments Companies. The financial statements have been prepared in conformity with accounting principles generally accepted in the United States of America (GAAP), which require management to make certain estimates and assumptions at the date of the financial statements. Actual results could differ from those estimates. Subsequent events, if any, through the date that the financial statements were issued have been evaluated in the preparation of the financial statements. The following summarizes the significant accounting policies of the Fund:
Investment Valuation. Investments are valued as of 4:00 p.m. Eastern time on the last calendar day of the period. The Board of Trustees (the Board) has delegated the day to day responsibility for the valuation of the Fund’s investments to the FairValue Committee (the Committee) established by the Fund’s investment adviser. In accordance with valuation policies and procedures approved by the Board, the Fund attempts to obtain prices from one or more third party pricing vendors or brokers to value its investments. When current market prices, quotations or currency exchange rates are not readily available or reliable, investments will be fair valued in good faith by the Committee, in accordance with procedures adopted by the Board. Factors used in determining fair value vary by investment type and may include market or investment specific events, changes in interest rates and credit quality. The frequency with which these procedures are used cannot be predicted and they may be utilized to a significant extent. The Committee oversees the Fund’s valuation policies and procedures and reports to the Board on the Committee’s activities and fair value determinations. The Board monitors the appropriateness of the procedures used in valuing the Fund’s investments and ratifies the fair value determinations of the Committee.
The Fund categorizes the inputs to valuation techniques used to value its investments into a disclosure hierarchy consisting of three levels as shown below:
Level 1 – quoted prices in active markets for identical investments
Level 2 – other significant observable inputs (including quoted prices for similar investments, interest rates, prepayment speeds, etc.)
Level 3 – unobservable inputs (including the Fund’s own assumptions based on the best information available) Valuation techniques used to value the Fund’s investments by major category are as follows:
Debt securities, including restricted securities, are valued based on evaluated prices received from third party pricing vendors or from brokers who make markets in such securities. Corporate bonds are valued by pricing vendors who utilize matrix pricing which considers yield or price of bonds of comparable quality, coupon, maturity and type or by broker-supplied prices. When independent prices are unavailable or unreliable, debt securities may be valued utilizing pricing methodologies which consider similar factors that would be used by third party pricing vendors. For foreign debt securities, when significant market or security specific events arise, valuations may be determined in good faith in accordance with procedures adopted by the Board. Debt securities are generally categorized as Level 2 in the hierarchy but may be Level 3 depending on the circumstances. The Fund invests a significant portion of its assets in below investment grade securities. The value of these securities can be more volatile due to changes in the credit quality of the issuer and is sensitive to changes in economic, market and regulatory conditions.
Investments inopen-end mutual funds, including the Fidelity Central Funds, are valued at their closing net asset value (NAV) each business day and are categorized as Level 1 in the hierarchy.
| 20 | ||||
Table of Contents
3. Significant Accounting Policies – continued
Changes in valuation techniques may result in transfers in or out of an assigned level within the disclosure hierarchy. The aggregate value of investments by input level, as of August 31, 2019, is included at the end of the Fund’s Schedule of Investments.
Investment Transactions and Income. For financial reporting purposes, the Fund’s investment holdings and NAV include trades executed through the end of the last business day of the period. The NAV per share for processing shareholder transactions is calculated as of the close of business of NYSE Arca, normally 4:00 p.m. Eastern time and includes trades executed through the end of the prior business day. Gains and losses on securities sold are determined on the basis of identified cost and may include proceeds received from litigation. Income and capital gain distributions from Fidelity Central Funds, if any, are recorded onex-dividend date. Interest income is accrued as earned and includes coupon interest and amortization of premium and accretion of discount on debt securities as applicable. Debt obligations may be placed onnon-accrual status and related interest income may be reduced by ceasing current accruals and writing off interest receivables when the collection of all or a portion of interest has become doubtful based on consistently applied procedures. A debt obligation is removed fromnon-accrual status when the issuer resumes interest payments or when collectability of interest is reasonably assured.
Expenses. Expenses directly attributable to a fund are charged to that fund. Expenses attributable to more than one fund are allocated among the respective funds on the basis of relative net assets or other appropriate methods. Expense estimates are accrued in the period to which they relate and adjustments are made when actual amounts are known.
Income Tax Information and Distributions to Shareholders. Each year, the Fund intends to qualify as a regulated investment company under Subchapter M of the Internal Revenue Code, including distributing substantially all of its taxable income and realized gains. As a result, no provision for U.S. Federal income taxes is required. As of August 31, 2019 the Fund did not have any unrecognized tax benefits in the financial statements; nor is the Fund aware of any tax positions for which it is reasonably possible that the total amounts of unrecognized tax benefits will significantly change in the next twelve months. The Fund files a U.S. federal tax return, in addition to state and local tax returns as required. The Fund’s federal income tax returns are subject to examination by the Internal Revenue Service (IRS) for a period of three fiscal years after they are filed. State and local tax returns may be subject to examination for an additional fiscal year depending on the jurisdiction.
Distributions are declared and recorded on theex-dividend date. Income and capital gain distributions are determined in accordance with income tax regulations, which may differ from GAAP.
Capital accounts within the financial statements are adjusted for permanentbook-tax differences. These adjustments have no impact on net assets or the results of operations. Capital accounts are not adjusted for temporarybook-tax differences which will reverse in a subsequent period.
Book-tax differences are primarily due to losses deferred due to wash sales.
As of period end, the cost and unrealized appreciation (depreciation) in securities, and derivatives if applicable, for federal income tax purposes were as follows:
| Tax cost | Gross unrealized appreciation | Gross unrealized depreciation | Net unrealized appreciation (depreciation) on securities and other investments | |||||||||||||
Fidelity High Yield Factor ETF | $ | 66,547,595 | $ | 1,983,608 | $ | (576,254 | ) | $ | 1,407,354 | |||||||
Thetax-based components of distributable earnings as of period end were as follows:
Undistributed ordinary income | Undistributed capital gains | Capital loss carryforward | Net unrealized appreciation (depreciation) | |||||||||||||
Fidelity High Yield Factor ETF | $ | 238,031 | $ | 33,534 | $ | — | $ | 1,407,354 | ||||||||
The tax character of distributions paid was as follows:
| August 31, 2019 | ||||||||||||||||
Ordinary Income | Long-Term Capital Gain | Tax Return Of Capital | Total | |||||||||||||
Fidelity High Yield Factor ETF | $ | 1,563,200 | $ | — | $ | — | $ | 1,563,200 | ||||||||
| August 31, 2018 | ||||||||||||||||
Fidelity High Yield Factor ETFA | $ | 144,250 | $ | — | $ | — | $ | 144,250 | ||||||||
| A | For the period June 12, 2018 (commencement of operations) to August 31, 2018. |
| 21 | ||||
Table of Contents
Notes to Financial Statements – continued
3. Significant Accounting Policies – continued
Restricted Securities. The Fund may invest in securities that are subject to legal or contractual restrictions on resale. These securities generally may be resold in transactions exempt from registration or to the public if the securities are registered. Disposal of these securities may involve time-consuming negotiations and expense, and prompt sale at an acceptable price may be difficult. Information regarding restricted securities is included at the end of the Fund’s Schedule of Investments.
New Rule Issuance. During August 2018, the U.S. Securities and Exchange Commission issued Final Rule ReleaseNo. 33-10532, Disclosure Update and Simplification. This Final Rule includes amendments specific to registered investment companies that are intended to eliminate overlap in disclosure requirements between RegulationS-X and GAAP. In accordance with these amendments, certain line-items in the Fund’s financial statements have been combined or removed for the current period as outlined in the table below.
| Financial Statement | Current Line-Item Presentation | Prior Line-Item Presentation | ||
| Statement of Assets and Liabilities | Total distributable earnings (loss) | Undistributed/Distributions in excess of/ Accumulated net investment income (loss) Accumulated/Undistributed net realized gain (loss) Net unrealized appreciation (depreciation) | ||
| Statement of Changes in Net Assets | N/A – removed | Undistributed/Distributions in excess of/ Accumulated net investment income (loss) end of period | ||
| Statement of Changes in Net Assets | Distributions to shareholders | Distributions to shareholders from net investment income Distributions to shareholders from net realized gain |
New Accounting Pronouncement. In March 2017, the Financial Accounting Standards Board (FASB) issued an Accounting Standards Update (ASU), ASU2017-08, which amends the amortization period for certain callable debt securities that are held at a premium. The amendment requires the premium to be amortized to the earliest call date. The amendments do not require an accounting change for securities held at a discount. The ASU is effective for annual periods beginning after December 15, 2018. Management is currently evaluating the potential impact of these changes to the financial statements.
4. Purchases and Sales of Investments.
Purchases and sales of securities, other than short-term securities and U.S. government securities, aggregated $73,417,311 and $22,857,795, respectively.
5. Fees and Other Transactions with Affiliates.
Management Fee. FMR Co., Inc. (the investment adviser) and its affiliates provide the Fund with investment management related services for which the Fund pays a monthly management fee that is based on an annual rate of .45% of average net assets. Under the management contract, the investment adviser pays all other expenses, except the compensation of the independent Trustees and certain miscellaneous expenses such as proxy and shareholders meeting expenses.
Interfund Trades. The Fund may purchase from or sell securities to other Fidelity Funds under procedures adopted by the Board. The procedures have been designed to ensure these interfund trades are executed in accordance with Rule17a-7 of the 1940 Act. Interfund trades are included within the respective purchases and sales amounts shown in the Purchases and Sales of Investments note.
6. Expense Reductions.
Through arrangements with the Fund’s custodian, credits realized as a result of certain uninvested cash balances were used to reduce the Fund’s management fee. During the period, these credits reduced management fees by $260.
| 22 | ||||
Table of Contents
7. Share Transactions.
The Fund issues and redeems shares at NAV only with certain authorized participants in large increments known as Creation Units. Purchases of Creation Units are made by tendering a basket of designated securities and cash to the Fund and redemption proceeds are paid with a basket of securities from the Fund’s portfolio with a balancing cash component to equate the market value of the basket of securities delivered or redeemed to the NAV per Creation Unit on the transaction date. Cash may be substituted equivalent to the value of certain securities generally when they are not available in sufficient quantity for delivery. The Fund’s shares are available in smaller increments to investors in the secondary market at market prices and may be subject to commissions. Authorized participants pay a transaction fee to the shareholder servicing agent when purchasing and redeeming Creation Units of the Fund. The transaction fee is used to defray the costs associated with the issuance and redemption of Creation Units.
8. Other.
The Fund’s organizational documents provide former and current directors and officers with a limited indemnification against liabilities arising in connection with the performance of their duties to the Fund. In the normal course of business, the Fund may also enter into contracts that provide general indemnifications. The Fund’s maximum exposure under these arrangements is unknown as this would be dependent on future claims that may be made against the Fund. The risk of material loss from such claims is considered remote.
| 23 | ||||
Table of Contents
Report of Independent Registered Public Accounting Firm
To the Board of Trustees of Fidelity Covington Trust and Shareholders of Fidelity High Yield Factor ETF:
Opinion on the Financial Statements
We have audited the accompanying statement of assets and liabilities, including the schedule of investments, of Fidelity High Yield Factor ETF (one of the funds constituting Fidelity Covington Trust, referred to hereafter as the “Fund”) as of August 31, 2019, the related statement of operations for the year ended August 31, 2019 and the statement of changes in net assets and the financial highlights for the year ended August 31, 2019 and for the period June 12, 2018 (commencement of operations) through August 31, 2018, including the related notes (collectively referred to as the “financial statements”). In our opinion, the financial statements present fairly, in all material respects, the financial position of the Fund as of August 31, 2019, the results of its operations for the year ended August 31, 2019, and the changes in its net assets and the financial highlights for the year ended August 31, 2019 and for the period June 12, 2018 (commencement of operations) through August 31, 2018 in conformity with accounting principles generally accepted in the United States of America.
Basis for Opinion
These financial statements are the responsibility of the Fund’s management. Our responsibility is to express an opinion on the Fund’s financial statements based on our audits. We are a public accounting firm registered with the Public Company Accounting Oversight Board (United States) (PCAOB) and are required to be independent with respect to the Fund in accordance with the U.S. federal securities laws and the applicable rules and regulations of the Securities and Exchange Commission and the PCAOB.
We conducted our audits of these financial statements in accordance with the standards of the PCAOB. Those standards require that we plan and perform the audit to obtain reasonable assurance about whether the financial statements are free of material misstatement, whether due to error or fraud.
Our audits included performing procedures to assess the risks of material misstatement of the financial statements, whether due to error or fraud, and performing procedures that respond to those risks. Such procedures included examining, on a test basis, evidence regarding the amounts and disclosures in the financial statements. Our audits also included evaluating the accounting principles used and significant estimates made by management, as well as evaluating the overall presentation of the financial statements. Our procedures included confirmation of securities owned as of August 31, 2019 by correspondence with the custodian and brokers; when replies were not received from brokers, we performed other auditing procedures. We believe that our audits provide a reasonable basis for our opinion.
PricewaterhouseCoopers LLP
Boston, Massachusetts
October 17, 2019
We have served as the auditor of one or more investment companies in the Fidelity group of funds since 1932.
| 24 | ||||
Table of Contents
Premium/Discount Analysis(Unaudited)
Shares of each fund are listed on NYSE Arca and can be bought and sold on the secondary market at market prices. Although the market price is expected to approximate the fund’s NAV, it is possible that the market price and NAV will vary significantly. The closing market price is the daily closing price as reported on NYSE Arca.
Premiums or discounts are the differences (expressed as a basis point differential with 1 basis point equaling 1/100 of 1%) between the fund’s NAV and closing market price. A premium indicates that the closing market price is trading above the NAV. A discount indicates that the closing market price is trading below the NAV. A discrepancy may exist with respect to the timing of when the NAV is calculated and the determination of the closing market price.
The chart below presents information about the differences between each fund’s daily closing market price and each fund’s NAV.
Fidelity High Yield Factor ETF
| Period Ended August 31, 2019 | ||||||||||||
| From commencement of operations* to August 31, 2019 | Closing Price Below NAV | Closing Price Above or Equal to NAV | ||||||||||
| Basis Point Differential | Number of Days | % of Total Days | Number of Days | % of Total Days | ||||||||
| 0 – <25 | 6 | 1.96 | % | 63 | 20.59 | % | ||||||
| 25 – <50 | 1 | 0.33 | % | 95 | 31.05 | % | ||||||
| 50 – <75 | 0 | — | 120 | 39.22 | % | |||||||
| 75 – <100 | 0 | — | 19 | 6.21 | % | |||||||
| 100 or above | 0 | — | 2 | 0.64 | % | |||||||
| Total | 7 | 2.29 | % | 299 | 97.71 | % | ||||||
| * | From June 14, 2018, date initially listed on the NYSE ARCA exchange. |
| 25 | ||||
Table of Contents
Trustees and Officers(Unaudited)
The Trustees, Members of the Advisory Board (if any), and officers of the trust and fund, as applicable, are listed below. The Board of Trustees governs the fund and is responsible for protecting the interests of shareholders. The Trustees are experienced executives who meet periodically throughout the year to oversee the fund’s activities, review contractual arrangements with companies that provide services to the fund, oversee management of the risks associated with such activities and contractual arrangements, and review the fund’s performance. Except for Michael E. Wiley, each of the Trustees oversees 298 funds. Mr. Wiley oversees 197 funds.
The Trustees hold office without limit in time except that (a) any Trustee may resign; (b) any Trustee may be removed by written instrument, signed by at leasttwo-thirds of the number of Trustees prior to such removal; (c) any Trustee who requests to be retired or who has become incapacitated by illness or injury may be retired by written instrument signed by a majority of the other Trustees; and (d) any Trustee may be removed at any special meeting of shareholders by atwo-thirds vote of the outstanding voting securities of the trust. Each Trustee who is not an interested person (as defined in the 1940 Act) of the trust and the fund is referred to herein as an Independent Trustee. Each Independent Trustee shall retire not later than the last day of the calendar year in which his or her 75th birthday occurs. The Independent Trustees may waive this mandatory retirement age policy with respect to individual Trustees. Officers and Advisory Board Members hold office without limit in time, except that any officer or Advisory Board Member may resign or may be removed by a vote of a majority of the Trustees at any regular meeting or any special meeting of the Trustees. Except as indicated, each individual has held the office shown or other offices in the same company for the past five years.
The funds’ Statement of Additional Information (SAI) includes more information about the Trustees. To request a free copy, call Fidelity at1-800-FIDELITY.
Experience, Skills, Attributes, and Qualifications of the Trustees. The Governance and Nominating Committee has adopted a statement of policy that describes the experience, qualifications, attributes, and skills that are necessary and desirable for potential Independent Trustee candidates (Statement of Policy). The Board believes that each Trustee satisfied at the time he or she was initially elected or appointed a Trustee, and continues to satisfy, the standards contemplated by the Statement of Policy. The Governance and Nominating Committee also engages professional search firms to help identify potential Independent Trustee candidates who have the experience, qualifications, attributes, and skills consistent with the Statement of Policy. From time to time, additional criteria based on the composition and skills of the current Independent Trustees, as well as experience or skills that may be appropriate in light of future changes to board composition, business conditions, and regulatory or other developments, have also been considered by the professional search firms and the Governance and Nominating Committee. In addition, the Board takes into account the Trustees’ commitment and participation in Board and committee meetings, as well as their leadership of standing and ad hoc committees throughout their tenure.
In determining that a particular Trustee was and continues to be qualified to serve as a Trustee, the Board has considered a variety of criteria, none of which, in isolation, was controlling. The Board believes that, collectively, the Trustees have balanced and diverse experience, qualifications, attributes, and skills, which allow the Board to operate effectively in governing the fund and protecting the interests of shareholders. Information about the specific experience, skills, attributes, and qualifications of each Trustee, which in each case led to the Board’s conclusion that the Trustee should serve (or continue to serve) as a trustee of the fund, is provided below.
Board Structure and Oversight Function. James C. Curvey is an interested person and currently serves as Chairman. The Trustees have determined that an interested Chairman is appropriate and benefits shareholders because an interested Chairman has a personal and professional stake in the quality and continuity of services provided to the fund. Independent Trustees exercise their informed business judgment to appoint an individual of their choosing to serve as Chairman, regardless of whether the Trustee happens to be independent or a member of management. The Independent Trustees have determined that they can act independently and effectively without having an Independent Trustee serve as Chairman and that a key structural component for assuring that they are in a position to do so is for the Independent Trustees to constitute a substantial majority for the Board. The Independent Trustees also regularly meet in executive session. Ned C. Lautenbach serves as Chairman of the Independent Trustees and as such (i) acts as a liaison between the Independent Trustees and management with respect to matters important to the Independent Trustees and (ii) with management prepares agendas for Board meetings.
Fidelity® funds are overseen by different Boards of Trustees. The fund’s Board oversees Fidelity’s high income and certain equity funds, and other Boards oversee Fidelity’s investment-grade bond, money market, asset allocation, and other equity funds. The asset allocation funds may invest in Fidelity® funds overseen by the fund’s Board. The use of separate Boards, each with its own committee structure, allows the Trustees of each group of Fidelity® funds to focus on the unique issues of the funds they oversee, including common research, investment, and operational issues. On occasion, the separate Boards establish joint committees to address issues of overlapping consequences for the Fidelity® funds overseen by each Board.
| 26 | ||||
Table of Contents
The Trustees operate using a system of committees to facilitate the timely and efficient consideration of all matters of importance to the Trustees, the fund, and fund shareholders and to facilitate compliance with legal and regulatory requirements and oversight of the fund’s activities and associated risks. The Board, acting through its committees, has charged FMR and its affiliates with (i) identifying events or circumstances the occurrence of which could have demonstrably adverse effects on the fund’s business and/or reputation; (ii) implementing processes and controls to lessen the possibility that such events or circumstances occur or to mitigate the effects of such events or circumstances if they do occur; and (iii) creating and maintaining a system designed to evaluate continuously business and market conditions in order to facilitate the identification and implementation processes described in (i) and (ii) above. Because theday-to-day operations and activities of the fund are carried out by or through FMR, its affiliates, and other service providers, the fund’s exposure to risks is mitigated but not eliminated by the processes overseen by the Trustees. While each of the Board’s committees has responsibility for overseeing different aspects of the fund’s activities, oversight is exercised primarily through the Operations, Audit, and Compliance Committees. Appropriate personnel, including but not limited to the fund’s Chief Compliance Officer (CCO), FMR’s internal auditor, the independent accountants, the fund’s Treasurer and portfolio management personnel, make periodic reports to the Board’s committees, as appropriate, including an annual review of Fidelity’s risk management program for the Fidelity® funds. The responsibilities of each standing committee, including their oversight responsibilities, are described further under “Standing Committees of the Trustees.”
Interested Trustees*:
Correspondence intended for a Trustee who is an interested person may be sent to Fidelity Investments, 245 Summer Street, Boston, Massachusetts 02210.
Name, Year of Birth; Principal Occupations and Other Relevant Experience+ |
James C. Curvey (1935) |
Year of Election or Appointment: 2018 |
Trustee |
Chairman of the Board of Trustees |
Mr. Curvey also serves as Trustee of other Fidelity® funds. Mr. Curvey is Vice Chairman (2007-present) and Director of FMR LLC (diversified financial services company). In addition, Mr. Curvey is an Overseer Emeritus for the Boston Symphony Orchestra, a Director of Artis-Naples, and a Trustee of Brewster Academy in Wolfeboro, New Hampshire. Previously, Mr. Curvey served as a Director of Fidelity Research & Analysis Co. (investment adviser firm, 2009-2018), Director of Fidelity Investments Money Management, Inc. (investment adviser firm, 2009-2014) and a Director of FMR and FMR Co., Inc. (investment adviser firms, 2007-2014). |
| * | Determined to be an “Interested Trustee” by virtue of, among other things, his or her affiliation with the trust or various entities under common control with FMR. |
| + | The information includes the Trustee’s principal occupation during the last five years and other information relating to the experience, attributes, and skills relevant to the Trustee’s qualifications to serve as a Trustee, which led to the conclusion that the Trustee should serve as a Trustee for the fund. |
Independent Trustees:
Correspondence intended for an Independent Trustee may be sent to Fidelity Investments, P.O. Box 55235, Boston, Massachusetts 02205-5235.
Name, Year of Birth; Principal Occupations and Other Relevant Experience+ |
Dennis J. Dirks (1948) |
Year of Election or Appointment: 2018 |
Trustee |
Mr. Dirks also serves as Trustee of other Fidelity® funds. Prior to his retirement in May 2003, Mr. Dirks was Chief Operating Officer and a member of the Board of The Depository Trust & Clearing Corporation (DTCC). He also served as President, Chief Operating Officer, and Board member of The Depository Trust Company (DTC) and President and Board member of the National Securities Clearing Corporation (NSCC). In addition, Mr. Dirks served as Chief Executive Officer and Board member of the Government Securities Clearing Corporation, Chief Executive Officer and Board member of the Mortgage-Backed Securities Clearing Corporation, as a Trustee and a member of the Finance Committee of Manhattan College (2005-2008), as a Trustee and a member of the Finance Committee of AHRC of Nassau County (2006-2008), as a member of the Independent Directors Council (IDC) Governing Council (2010-2015), and as a member of the Board of Directors for The Brookville Center for Children’s Services, Inc. (2009-2017). Mr. Dirks is a member of the Finance Committee (2016-present) and Board of Directors (2017-present) and is Treasurer (2018-present) of the Asolo Repertory Theatre. |
Donald F. Donahue (1950) |
| 27 | ||||
Table of Contents
Trustees and Officers (Unaudited) – continued
Name, Year of Birth; Principal Occupations and Other Relevant Experience+ |
Year of Election or Appointment: 2018 |
Trustee |
Mr. Donahue also serves as a Trustee of other Fidelity® funds. Mr. Donahue is President and Chief Executive Officer of Miranda Partners, LLC (risk consulting for the financial services industry, 2012-present). Previously, Mr. Donahue served as a Member of the Advisory Board of certain Fidelity® funds (2015-2018) and Chief Executive Officer (2006-2012), Chief Operating Officer (2003-2006), and Managing Director, Customer Marketing and Development (1999-2003) of The Depository Trust & Clearing Corporation (financial markets infrastructure). Mr. Donahue serves as a Member (2007-present) andCo-Chairman (2016-present) of the Board of Directors of United Way of New York, Member of the Board of Directors of NYC Leadership Academy (2012-present) and Member of the Board of Advisors of Ripple Labs, Inc. (financial services, 2015-present). He also served as Chairman (2010-2012) and Member of the Board of Directors (2012-2013) of Omgeo, LLC (financial services), Treasurer of United Way of New York (2012-2016), and Member of the Board of Directors of XBRL US (financial servicesnon-profit, 2009-2012) and the International Securities Services Association (2009-2012). |
Alan J. Lacy (1953) |
Year of Election or Appointment: 2018 |
Trustee |
Mr. Lacy also serves as Trustee of other Fidelity® funds. Mr. Lacy serves as a Director of Bristol-Myers Squibb Company (global pharmaceuticals, 2008-present). He is a Trustee of the California Chapter of The Nature Conservancy (2015-present) and a Director of the Center for Advanced Study in the Behavioral Sciences at Stanford University (2015-present). In addition, Mr. Lacy served as Senior Adviser (2007-2014) of Oak Hill Capital Partners, L.P. (private equity) and also served as Chief Executive Officer (2005) and Vice Chairman (2005-2006) of Sears Holdings Corporation (retail) and Chief Executive Officer and Chairman of the Board of Sears, Roebuck and Co. (retail, 2000-2005). Previously, Mr. Lacy served as Chairman (2014-2017) and a member (2010-2017) of the Board of Directors of Dave & Buster’s Entertainment, Inc. (restaurant and entertainment complexes), as Chairman (2008-2011) and a member (2006-2015) of the Board of Trustees of the National Parks Conservation Association, and as a member of the Board of Directors for The Hillman Companies, Inc. (hardware wholesalers, 2010-2014), Earth Fare, Inc. (retail grocery, 2010-2014), and The Western Union Company (global money transfer, 2006-2011). |
Ned C. Lautenbach (1944) |
Year of Election or Appointment: 2018 |
Trustee |
Chairman of the Independent Trustees |
Mr. Lautenbach also serves as Trustee of other Fidelity® funds. Mr. Lautenbach currently serves as Chair (2018-present) and Member (2013-present) of the Board of Governors, State University System of Florida and is a member of the Council on Foreign Relations (1994-present). He is also a member and has most recently served as Chairman of the Board of Directors of Artis-Naples (2012-present). Previously, Mr. Lautenbach served as a member and then Lead Director of the Board of Directors of Eaton Corporation (diversified industrial, 1997-2016). He was also a Partner and Advisory Partner at Clayton, Dubilier & Rice, LLC (private equity investment, 1998-2010), as well as a Director of Sony Corporation (2006-2007). In addition, Mr. Lautenbach also had a30-year career with IBM (technology company) during which time he served as Senior Vice President and a member of the Corporate Executive Committee (1968-1998). |
Joseph Mauriello (1944) |
Year of Election or Appointment: 2018 |
Trustee |
Mr. Mauriello also serves as Trustee of other Fidelity® funds. Prior to his retirement in January 2006, Mr. Mauriello served in numerous senior management positions including Deputy Chairman and Chief Operating Officer (2004-2005), and Vice Chairman of Financial Services (2002-2004) of KPMG LLP US (professional services, 1965-2005). Mr. Mauriello currently serves as a member of the Independent Directors Council (IDC) Governing Council (2015-present). Previously, Mr. Mauriello served as a member of the Board of Directors of XL Group plc. (global insurance andre-insurance, 2006-2018). |
Cornelia M. Small (1944) |
Year of Election or Appointment: 2018 |
| 28 | ||||
Table of Contents
Name, Year of Birth; Principal Occupations and Other Relevant Experience+ |
Trustee |
Ms. Small also serves as Trustee of other Fidelity® funds. Ms. Small is a member of the Board of Directors (2009-present) and Chair of the Investment Committee (2010-present) of the Teagle Foundation. Ms. Small also serves on the Investment Committee of the Berkshire Taconic Community Foundation (2008-present). Previously, Ms. Small served as Chairperson (2002-2008) and a member of the Investment Committee and Chairperson (2008-2012) and a member of the Board of Trustees of Smith College. In addition, Ms. Small served as Chief Investment Officer, Director of Global Equity Investments, and a member of the Board of Directors of Scudder, Stevens & Clark and Scudder Kemper Investments. |
Garnett A. Smith (1947) |
Year of Election or Appointment: 2013 |
Trustee |
Mr. Smith also serves as Trustee of other Fidelity® funds. Prior to Mr. Smith’s retirement, he served as Chairman and Chief Executive Officer of Inbrand Corp. (manufacturer of personal absorbent products, 1990-1997). He also served as President (1986-1990) of Inbrand Corp. Prior to his employment with Inbrand Corp., he was employed by a retail fabric chain and North Carolina National Bank. In addition, Mr. Smith served as a Member of the Advisory Board of certain Fidelity® funds (2012-2013) and as a board member of the Jackson Hole Land Trust (2009-2012). |
David M. Thomas (1949) |
Year of Election or Appointment: 2018 |
Trustee |
Mr. Thomas also serves as Trustee of other Fidelity® funds. Mr. Thomas serves asNon-Executive Chairman of the Board of Directors of Fortune Brands Home and Security (home and security products, 2011-present) and as a member of the Board of Directors (2004-present) and Presiding Director (2013-present) of Interpublic Group of Companies, Inc. (marketing communication). Previously, Mr. Thomas served as Executive Chairman (2005-2006) and Chairman and Chief Executive Officer (2000-2005) of IMS Health, Inc. (pharmaceutical and healthcare information solutions), a Director of Fortune Brands, Inc. (consumer products, 2000-2011), and a member of the Board of Trustees of the University of Florida (2013-2018). |
Michael E. Wiley (1950) |
Year of Election or Appointment: 2013 |
Trustee |
Mr. Wiley also serves as Trustee or Member of the Advisory Board of other Fidelity® funds. Mr. Wiley serves as a Director of High Point Resources (exploration and production, 2005-present). Previously, Mr. Wiley served as a Director of Andeavor Corporation (independent oil refiner and marketer, 2005-2018), a Director of Andeavor Logistics LP (natural resources logistics, 2015-2018), a Director of Post Oak Bank (privately-held bank, 2004-2018), a Director of Asia Pacific Exploration Consolidated (international oil and gas exploration and production, 2008-2013), a member of the Board of Trustees of the University of Tulsa (2000-2006; 2007-2010), a Senior Energy Advisor of Katzenbach Partners, LLC (consulting, 2006-2007), an Advisory Director of Riverstone Holdings (private investment), a Director of Spinnaker Exploration Company (exploration and production, 2001-2005) and Chairman, President, and CEO of Baker Hughes, Inc. (oilfield services, 2000-2004). |
| + | The information includes the Trustee’s principal occupation during the last five years and other information relating to the experience, attributes, and skills relevant to the Trustee’s qualifications to serve as a Trustee, which led to the conclusion that the Trustee should serve as a Trustee for the fund. |
Advisory Board Members and Officers:
Correspondence intended for a Member of the Advisory Board (if any) may be sent to Fidelity Investments, P.O. Box 55235, Boston,
Massachusetts 02205-5235. Correspondence intended for an officer or Peter S. Lynch may be sent to Fidelity Investments, 245 Summer Street, Boston, Massachusetts 02210. Officers appear below in alphabetical order.
Name, Year of Birth; Principal Occupation |
Vicki L. Fuller (1957) |
Year of Election or Appointment: 2018 |
| 29 | ||||
Table of Contents
Trustees and Officers (Unaudited) – continued
Name, Year of Birth; Principal Occupation |
Member of the Advisory Board |
Ms. Fuller also serves as Member of the Advisory Board of other Fidelity® funds. Ms. Fuller serves as a member of the Board of Directors, Audit Committee, and Nominating and Governance Committee of The Williams Companies, Inc. (natural gas infrastructure, 2018-present). Previously, Ms. Fuller served as the Chief Investment Officer of the New York State Common Retirement Fund (2012-2018) and held a variety of positions at AllianceBernstein L.P. (global asset management, 1985-2012), including Managing Director (2006-2012) and Senior Vice President and Senior Portfolio Manager (2001-2006). |
Peter S. Lynch (1944) |
Year of Election or Appointment: 2018 |
Member of the Advisory Board |
Mr. Lynch also serves as Member of the Advisory Board of other Fidelity® funds. Mr. Lynch is Vice Chairman and a Director of FMR (investment adviser firm) and FMR Co., Inc. (investment adviser firm). In addition, Mr. Lynch serves as a Trustee of Boston College and as the Chairman of the Inner-City Scholarship Fund. Previously, Mr. Lynch served on the Special Olympics International Board of Directors (1997-2006). |
Elizabeth Paige Baumann (1968) |
Year of Election or Appointment: 2017 |
Anti-Money Laundering (AML) Officer |
Ms. Baumann also serves as AML Officer of other funds. She is Chief AML Officer (2012-present) and Senior Vice President (2014-present) of FMR LLC (diversified financial services company) and is an employee of Fidelity Investments. Previously, Ms. Baumann served as AML Officer of the funds (2012-2016), and Vice President (2007-2014) and Deputy Anti-Money Laundering Officer (2007-2012) of FMR LLC. |
Craig S. Brown (1977) |
Year of Election or Appointment: 2019 |
Assistant Treasurer |
Mr. Brown also serves as Assistant Treasurer of other funds. Mr. Brown is an employee of Fidelity Investments (2013-present). |
John J. Burke III (1964) |
Year of Election or Appointment: 2018 |
Chief Financial Officer |
Mr. Burke also serves as Chief Financial Officer of other funds. Mr. Burke serves as Head of Investment Operations for Fidelity Fund and Investment Operations (2018-present) and is an employee of Fidelity Investments (1998-present). Previously Mr. Burke served as head of Asset Management Investment Operations (2012-2018). |
William C. Coffey (1969) |
Year of Election or Appointment: 2019 |
Assistant Secretary |
Mr. Coffey also serves as Assistant Secretary of other funds. He is Senior Vice President and Deputy General Counsel of FMR LLC (diversified financial services company, 2010-present), and is an employee of Fidelity Investments. Previously, Mr. Coffey served as Secretary and CLO of certain funds (2018-2019); CLO, Secretary, and Senior Vice President of Fidelity Management & Research Company and FMR Co., Inc. (investment adviser firms, 2018-2019); Secretary of Fidelity SelectCo, LLC and Fidelity Investments Money Management, Inc. (investment adviser firms, 2018-2019); CLO of Fidelity Management & Research (Hong Kong) Limited, FMR Investment Management (UK) Limited, and Fidelity Management & Research (Japan) Limited (investment adviser firms, 2018-2019); and Assistant Secretary of certain funds (2009-2018). |
Timothy M. Cohen (1969) |
Year of Election or Appointment: 2018 |
Vice President |
Mr. Cohen also serves as Vice President of other funds. Mr. Cohen serves as Executive Vice President of Fidelity SelectCo, LLC (2019-present),Co-Head of Equity (2018-present), a Director of Fidelity Management & Research (Japan) Limited (investment adviser firm, 2016-present), and is an employee of Fidelity Investments. Previously, Mr. Cohen served as Head of Global Equity Research (2016-2018), Chief Investment Officer - Equity and a Director of Fidelity Management & Research (U.K.) Inc. (investment adviser firm, 2013-2015) and as a Director of Fidelity Management & Research (Hong Kong) Limited (investment adviser firm, 2017). |
Jonathan Davis (1968) |
| 30 | ||||
Table of Contents
Name, Year of Birth; Principal Occupation |
Year of Election or Appointment: 2013 |
Assistant Treasurer |
Mr. Davis also serves as Assistant Treasurer of other funds. Mr. Davis serves as Assistant Treasurer of FMR Capital, Inc. (2017-present) and is an employee of Fidelity Investments. Previously, Mr. Davis served as Vice President and Associate General Counsel of FMR LLC (diversified financial services company, 2003-2010). |
Adrien E. Deberghes (1967) |
Year of Election or Appointment: 2018 |
Assistant Treasurer |
Mr. Deberghes also serves as an officer of other funds. He serves as Assistant Treasurer of FMR Capital, Inc. (2017-present), Executive Vice President of Fidelity Investments Money Management, Inc. (FIMM) (investment adviser firm, 2016-present), and is an employee of Fidelity Investments (2008-present). Previously, Mr. Deberghes served as President and Treasurer of certain Fidelity® funds (2013-2018). Prior to joining Fidelity Investments, Mr. Deberghes was Senior Vice President of Mutual Fund Administration at State Street Corporation (2007-2008), Senior Director of Mutual Fund Administration at Investors Bank & Trust (2005-2007), and Director of Finance for Dunkin’ Brands (2000-2005). Previously, Mr. Deberghes served in other fund officer roles. |
Laura M. Del Prato (1964) |
Year of Election or Appointment: 2018 |
Assistant Treasurer |
Ms. Del Prato also serves as an officer of other funds. Ms. Del Prato is an employee of Fidelity Investments (2017-present). Prior to joining Fidelity Investments, Ms. Del Prato served as a Managing Director and Treasurer of the JPMorgan Mutual Funds (2014-2017). Prior to JPMorgan, Ms. Del Prato served as a partner at Cohen Fund Audit Services (accounting firm, 2012-2013) and KPMG LLP (accounting firm, 2004-2012). |
Colm A. Hogan (1973) |
Year of Election or Appointment: 2018 |
Deputy Treasurer |
Mr. Hogan also serves as an officer of other funds. Mr. Hogan serves as Assistant Treasurer of FMR Capital, Inc. (2017-present) and is an employee of Fidelity Investments (2005-present). Previously, Mr. Hogan served as Assistant Treasurer of certain Fidelity® funds (2016-2018). |
Pamela R. Holding (1964) |
Year of Election or Appointment: 2018 |
Vice President |
Ms. Holding also serves as Vice President of other funds. Ms. Holding serves as Executive Vice President of Fidelity SelectCo, LLC (2019-present),Co-Head of Equity (2018-present) and is an employee of Fidelity Investments (2013-present). Previously, Ms. Holding served as Chief Investment Officer of Fidelity Institutional Asset Management (2013-2018). |
Cynthia Lo Bessette (1969) |
Year of Election or Appointment: 2019 |
Secretary and Chief Legal Officer (CLO) |
Ms. Lo Bessette also serves as Secretary and CLO of other funds. She is a Senior Vice President and Deputy General Counsel of FMR LLC (diversified financial services company, 2019-present), and is an employee of Fidelity Investments. Previously, Ms. Lo Bessette served as Executive Vice President, General Counsel (2016-2019) and Senior Vice President, Deputy General Counsel (2015-2016) of OppenheimerFunds (investment management company) and Deputy Chief Legal Officer (2013-2015) of Jennison Associates LLC (investment adviser firm). |
Chris Maher (1972) |
Year of Election or Appointment: 2013 |
Assistant Treasurer |
Mr. Maher serves as Assistant Treasurer of other funds. Mr. Maher is Vice President of Valuation Oversight, serves as Assistant Treasurer of FMR Capital, Inc. (2017-present), and is an employee of Fidelity Investments. Previously, Mr. Maher served as Vice President of Asset Management Compliance (2013), Vice President of the Program Management Group of FMR (investment adviser firm, 2010-2013), and Vice President of Valuation Oversight (2008-2010). |
Kenneth B. Robins (1969) |
Year of Election or Appointment: 2018 |
| 31 | ||||
Table of Contents
Trustees and Officers (Unaudited) – continued
Name, Year of Birth; Principal Occupation |
Chief Compliance Officer |
Mr. Robins also serves as an officer of other funds. Mr. Robins serves as Compliance Officer of Fidelity Management & Research Company and FMR Co., Inc. (investment adviser firms, 2016-present) and is an employee of Fidelity Investments (2004-present). Previously, Mr. Robins served as Executive Vice President of Fidelity Investments Money Management, Inc. (investment adviser firm, 2013-2016) and served in other fund officer roles. |
Stacie M. Smith (1974) |
Year of Election or Appointment: 2018 |
President and Treasurer |
Ms. Smith also serves as an officer of other funds. Ms. Smith serves as Assistant Treasurer of FMR Capital, Inc. (2017-present), is an employee of Fidelity Investments (2009-present), and has served in other fund officer roles. Prior to joining Fidelity Investments, Ms. Smith served as Senior Audit Manager of Ernst & Young LLP (accounting firm, 1996-2009). Previously, Ms. Smith served as Assistant Treasurer (2013-2018) and Deputy Treasurer (2013-2016) of certain Fidelity® funds. |
Marc L. Spector (1972) |
Year of Election or Appointment: 2017 |
Assistant Treasurer |
Mr. Spector also serves as an officer of other funds. Mr. Spector serves as Assistant Treasurer of FMR Capital, Inc. (2017-present) and is an employee of Fidelity Investments (2016-present). Prior to joining Fidelity Investments, Mr. Spector served as Director at the Siegfried Group (accounting firm, 2013-2016), and prior to Siegfried Group as audit senior manager at Deloitte & Touche (accounting firm, 2005-2013). |
Jim Wegmann (1979) |
Year of Election or Appointment: 2019 |
Assistant Treasurer |
Mr. Wegmann also serves as Assistant Treasurer of other funds. Mr. Wegmann is an employee of Fidelity Investments (2011-present). |
| 32 | ||||
Table of Contents
Shareholder Expense Example(Unaudited)
As a shareholder of a Fund, you incur two types of costs: (1) transaction costs, and (2) ongoing costs, including management fees and other Fund expenses. This Example is intended to help you understand your ongoing costs (in dollars) of investing in a Fund and to compare these costs with the ongoing costs of investing in other funds.
The Example is based on an investment of $1,000 invested for theone-half year period (March 1, 2019 to August 31, 2019).
Actual Expenses
For the fund, the first line of the accompanying table provides information about actual account values and actual expenses. You may use the information in this line, together with the amount you invested, to estimate the expenses that you paid over the period. Simply divide your account value by $1,000.00 (for example, an $8,600 account value divided by $1,000.00 = 8.6), then multiply the result by the number in the first line for the Fund under the heading entitled “Expenses Paid During Period” to estimate the expenses you paid on your account during this period. In addition, the Fund, as a shareholder in the underlying Fidelity Central Funds, will indirectly bear itspro-rata share of the fees and expenses incurred by the underlying Fidelity Central Funds. These fees and expenses are not included in the Fund’s annualized expense ratio used to calculate the expense estimates in the table below.
Hypothetical Example for Comparison Purposes
For the fund, the second line of the accompanying table provides information about hypothetical account values and hypothetical expenses based on the Fund’s actual expense ratio and an assumed rate of return of 5% per year before expenses, which is not the Fund’s actual return. The hypothetical account values and expenses may not be used to estimate the actual ending account balance or expenses you paid for the period. You may use this information to compare the ongoing costs of investing in the Fund and other funds. To do so, compare this 5% hypothetical example with the 5% hypothetical examples that appear in the shareholder reports of the other funds. In addition, the Fund, as a shareholder in the underlying Fidelity Central Funds, will indirectly bear itspro-rata share of the fees and expenses incurred by the underlying Fidelity Central Funds. These fees and expenses are not included in the Fund’s annualized expense ratio used to calculate the expense estimates in the table below.
Please note that the expenses shown in the table are meant to highlight your ongoing costs only and do not reflect any transaction costs. Therefore, the second line of the table is useful in comparing ongoing costs only, and will not help you determine the relative total costs of owning different funds.
Annualized Expense RatioA | Beginning Account Value March 1, 2019 | Ending Account Value August 31, 2019 | Expenses Paid During PeriodB March 1, 2019 to August 31, 2019 | |||||||||||||
Fidelity High Yield Factor ETF | 0.44% | |||||||||||||||
Actual | $ | 1,000.00 | $ | 1,067.60 | $ | 2.29 | ||||||||||
HypotheticalC | $ | 1,000.00 | $ | 1,022.99 | $ | 2.24 | ||||||||||
| A | Annualized expense ratio reflects expenses net of applicable fee waivers. |
| B | Expenses are equal to the Fund’s annualized expense ratio, multiplied by the average account value over the period, multiplied by 184/365 (to reflect theone-half year period). |
| C | 5% return per year before expenses. |
| 33 | ||||
Table of Contents
The Board of Trustees of Fidelity High Yield Factor ETF voted to pay on October 1, 2019, to shareholders of record at the opening of business on September 27, 2019, a distribution of $0.00 per share derived from capital gains realized from sales of portfolio securities and a dividend of $0.197 per share derived from net investment income.
The fund hereby designates as a capital gain dividend with respect to the taxable year ended August 31, 2019, $33,534, or, if subsequently determined to be different, the net capital gain of such year.
The fund designates $1,060,959 of distributions paid during the period January 1, 2019 to August 31, 2019 as qualifying to be taxed as interest-related dividends for nonresident alien shareholders.
The Fund will notify shareholders in January 2020 of amounts for use in preparing 2019 income tax returns.
| 34 | ||||
Table of Contents
[THIS PAGE INTENTIONALLY LEFT BLANK]
| 35 | ||||
Table of Contents
 | ||||
HIE-ANN-1019 | 900951.1.0 | |||
| 1.9887634.101 |
Table of Contents
| Item 2. | Code of Ethics |
As of the end of the period, August 31, 2019, Fidelity Covington Trust (the trust) has adopted a code of ethics, as defined in Item 2 of FormN-CSR, that applies to its President and Treasurer and its Chief Financial Officer. A copy of the code of ethics is filed as an exhibit to this FormN-CSR.
| Item 3. | Audit Committee Financial Expert |
The Board of Trustees of the trust has determined that Joseph Mauriello is an audit committee financial expert, as defined in Item 3 of FormN-CSR. Mr. Mauriello is independent for purposes of Item 3 of FormN-CSR.
Table of Contents
| Item 4. | Principal Accountant Fees and Services |
Fees and Services
The following table presents fees billed by PricewaterhouseCoopers LLP (“PwC”) in each of the last two fiscal years for services rendered to Fidelity High Yield Factor ETF (the “Fund”):
Services Billed by PwC
August 31, 2019 FeesA
| Audit Fees | Audit- Related Fees | Tax Fees | All Other Fees | |||||||||||||
Fidelity High Yield Factor ETF | $ | 41,000 | $ | — | $ | 3,400 | $ | 1,500 | ||||||||
August 31, 2018 FeesA,B
| Audit Fees | Audit- Related Fees | Tax Fees | All Other Fees | |||||||||||||
Fidelity High Yield Factor ETF | $ | 26,000 | $ | 300 | $ | 3,400 | $ | 300 | ||||||||
| A | Amounts may reflect rounding. |
| B | Fidelity High Yield Factor ETF commenced operations on June 12, 2018. |
The following table presents fees billed by PwC that were required to be approved by the Audit Committee for services that relate directly to the operations and financial reporting of the Fund and that are rendered on behalf of Fidelity Management & Research Company (“FMR”) and entities controlling, controlled by, or under common control with FMR (not including anysub-adviser whose role is primarily portfolio management and is subcontracted with or overseen by another investment adviser) that provide ongoing services to the Fund (“Fund Service Providers”):
Services Billed by PwC
| August 31, 2019A | August 31, 2018A,B | |||||||
Audit-Related Fees | $ | 7,775,000 | $ | 7,745,000 | ||||
Tax Fees | $ | 10,000 | $ | 20,000 | ||||
All Other Fees | $ | — | $ | — | ||||
| A | Amounts may reflect rounding. |
| B | May include amounts billed prior to the Fidelity High Yield Factor ETF’s commencement of operations. |
Table of Contents
.
“Audit-Related Fees” represent fees billed for assurance and related services that are reasonably related to the performance of the fund audit or the review of the fund’s financial statements and that are not reported under Audit Fees.
“Tax Fees” represent fees billed for tax compliance, tax advice or tax planning that relate directly to the operations and financial reporting of the fund.
“All Other Fees” represent fees billed for services provided to the fund or Fund Service Provider, a significant portion of which are assurance related, that relate directly to the operations and financial reporting of the fund, excluding those services that are reported under Audit Fees, Audit-Related Fees or Tax Fees.
Assurance services must be performed by an independent public accountant.
* * *
The aggregatenon-audit fees billed by PwC for services rendered to the Fund, FMR (not including anysub-adviser whose role is primarily portfolio management and is subcontracted with or overseen by another investment adviser), and any Fund Service Provider for each of the last two fiscal years of the Fund are as follows:
Billed By | August 31, 2019A | August 31, 2018A,B | ||||||
PwC | $ | 12,460,000 | $ | 10,905,000 | ||||
| A | Amounts may reflect rounding. |
| B | May include amounts billed prior to the Fidelity High Yield Factor ETF’s commencement of operations. |
The trust’s Audit Committee has considerednon-audit services that were notpre-approved that were provided by PwC to Fund Service Providers to be compatible with maintaining the independence of PwC in its audit of the Fund, taking into account representations from PwC, in accordance with Public Company Accounting Oversight Board rules, regarding its independence from the Fund and its related entities and FMR’s review of the appropriateness and permissibility under applicable law of suchnon-audit services prior to their provision to the Fund Service Providers.
Audit CommitteePre-Approval Policies and Procedures
The trust’s Audit Committee mustpre-approve all audit andnon-audit services provided by a fund’s independent registered public accounting firm relating to the operations or financial reporting of the fund. Prior to the commencement of any audit ornon-audit services to a fund, the Audit Committee reviews the services to determine whether they are appropriate and permissible under applicable law.
Table of Contents
The Audit Committee has adopted policies and procedures to, among other purposes, provide a framework for the Committee’s consideration ofnon-audit services by the audit firms that audit the Fidelity funds. The policies and procedures require that anynon-audit service provided by a fund audit firm to a Fidelity fund and anynon-audit service provided by a fund auditor to a Fund Service Provider that relates directly to the operations and financial reporting of a Fidelity fund (“Covered Service”) are subject to approval by the Audit Committee before such service is provided.
All Covered Services must be approved in advance of provision of the service either: (i) by formal resolution of the Audit Committee, or (ii) by oral or written approval of the service by the Chair of the Audit Committee (or if the Chair is unavailable, such other member of the Audit Committee as may be designated by the Chair to act in the Chair’s absence). The approval contemplated by (ii) above is permitted where the Treasurer determines that action on such an engagement is necessary before the next meeting of the Audit Committee.
Non-audit services provided by a fund audit firm to a Fund Service Provider that do not relate directly to the operations and financial reporting of a Fidelity fund are reported to the Audit Committee periodically.
Non-Audit Services Approved Pursuant to Rule2-01(c)(7)(i)(C) and (ii) of RegulationS-X (“De Minimis Exception”)
There were nonon-audit services approved or required to be approved by the Audit Committee pursuant to the De Minimis Exception during the Fund’s last two fiscal years relating to services provided to (i) the Fund or (ii) any Fund Service Provider that relate directly to the operations and financial reporting of the Fund.
| Item 5. | Audit Committee of Listed Registrants |
The Audit Committee is a separately-designated standing audit committee in accordance with Section 3(a)(58)(A) of the Securities Exchange Act of 1934. As of August 31, 2019, the members of the Audit Committee were Joseph Mauriello, Donald F. Donahue, Alan J. Lacy and Michael E. Wiley.
| Item 6. | Investments |
| (a) | Not applicable. |
| (b) | Not applicable |
| Item 7. | Disclosure of Proxy Voting Policies and Procedures forClosed-End Management Investment Companies |
Not applicable.
Table of Contents
| Item 8. | Portfolio Managers ofClosed-End Management Investment Companies |
Not applicable.
| Item 9. | Purchase of Equity Securities byClosed-End Management Investment Company and Affiliated Purchasers |
Not applicable.
| Item 10. | Submission of Matters to a Vote of Security Holders |
There were no material changes to the procedures by which shareholders may recommend nominees to the trust’s Board of Trustees.
| Item 11. | Controls and Procedures |
(a)(i) The President and Treasurer and the Chief Financial Officer have concluded that the trust’s disclosure controls and procedures (as defined in Rule30a-3(c) under the Investment Company Act) provide reasonable assurances that material information relating to the trust is made known to them by the appropriate persons, based on their evaluation of these controls and procedures as of a date within 90 days of the filing date of this report.
(a)(ii) There was no change in the trust’s internal control over financial reporting (as defined in Rule30a-3(d) under the Investment Company Act) that occurred during the period covered by this report that has materially affected, or is reasonably likely to materially affect, the trust’s internal control over financial reporting.
| Item 12. | Disclosure of Securities Lending Activities forClosed-End Management Investment Companies |
Not applicable.
| Item 13. | Exhibits |
| (a) | (1) | Code of Ethics pursuant to Item 2 of FormN-CSR is filed and attached hereto asEX-99.CODE ETH. | ||
| (a) | (2) | Certification pursuant to Rule30a-2(a) under the Investment Company Act of 1940 (17 CFR270.30a-2(a)) is filed and attached hereto as Exhibit 99.CERT. | ||
| (a) | (3) | Not applicable. | ||
| (b) | Certification pursuant to Rule30a-2(b) under the Investment Company Act of 1940 (17 CFR270.30a-2(b)) is furnished and attached hereto as Exhibit 99.906CERT. | |||
Table of Contents
SIGNATURES
Pursuant to the requirements of the Securities Exchange Act of 1934 and the Investment Company Act of 1940, the registrant has duly caused this report to be signed on its behalf by the undersigned, thereunto duly authorized.
Fidelity Covington Trust
| By: | /s/ Stacie M. Smith | |
| Stacie M. Smith | ||
| President and Treasurer | ||
| Date: | October 25, 2019 | |
Pursuant to the requirements of the Securities Exchange Act of 1934 and the Investment Company Act of 1940, this report has been signed below by the following persons on behalf of the registrant and in the capacities and on the dates indicated.
| By: | /s/ Stacie M. Smith | |
| Stacie M. Smith | ||
| President and Treasurer | ||
| Date: | October 25, 2019 | |
| By: | /s/ John J. Burke III | |
| John J. Burke III | ||
| Chief Financial Officer | ||
| Date: | October 25, 2019 | |