Table of Contents
UNITED STATES
SECURITIES AND EXCHANGE COMMISSION
Washington, D.C. 20549
FORM N-CSR
CERTIFIED SHAREHOLDER REPORT OF REGISTERED
MANAGEMENT INVESTMENT COMPANIES
Investment Company Act file number 811-07319
Fidelity Covington Trust
(Exact name of registrant as specified in charter)
245 Summer St., Boston, Massachusetts 02210
(Address of principal executive offices) (Zip code)
William C. Coffey, Secretary
245 Summer St.
Boston, Massachusetts 02210
(Name and address of agent for service)
Registrant’s telephone number, including area code: 617-563-7000
Date of fiscal year end: August 31
Date of reporting period: August 31, 2018
Table of Contents
| Item 1. | Reports to Stockholders |
Table of Contents
Fidelity® High Yield Factor ETF
Annual Report
August 31, 2018


Table of Contents
To view a fund’s proxy voting guidelines and proxy voting record for the period ended June, 30, visit http://www.fidelity.com/proxyvotingresults or visit the Securities and Exchange Commission’s (SEC) web site at http://www.sec.gov. You may also call 1-800-FIDELITY to request a free copy of the proxy voting guidelines.
Standard & Poor’s, S&P and S&P 500 are registered service marks of The McGraw-Hill Companies, Inc. and have been licensed for use by Fidelity Distributors Corporation.
Other third party marks appearing herein are the property of their respective owners.
All other marks appearing herein are registered or unregistered trademarks or service marks of FMR LLC or an affiliated company.
© 2018 FMR LLC. All Rights reserved.
This report and the financial statements contained herein are submitted for the general information of the shareholders of the funds. This report is not authorized for distribution to prospective investors in the funds unless preceded or accompanied by an effective prospectus.
A fund files its complete schedule of portfolio holdings with the SEC for the first and third quarters of each fiscal year on Form N-Q. Forms N-Q are available on the SEC’s web site at http://www.sec.gov. A fund’s Forms N-Q may be reviewed and copied at the SEC’s Public Reference Room in Washington, DC. Information regarding the operation of the SEC’s Public Reference Room may be obtained by calling 1-800-SEC-0330. For a complete list of a fund’s portfolio holdings, view the most recent holdings listing on Fidelity’s web site at http://www.fidelity.com, http://www.advisor.fidelity.com, or http://www.401k.com, as applicable.
NOT FDIC INSURED • MAY LOSE VALUE • NO BANK GUARANTEE
Neither the funds nor Fidelity Distributors Corporation is a bank.
| Annual Report | 2 |
Table of Contents
Investment Summary (Unaudited)
| Top Five Holdings as of August 31, 2018 | ||||
| (by issuer, excluding cash equivalents) | % of fund’s net assets | |||
GLP Capital LP / GLP Financing II, Inc. | 2.0 | |||
1011778 BC ULC / New Red Finance, Inc. | 2.0 | |||
Lennar Corp. | 2.0 | |||
Kennedy-Wilson, Inc. | 2.0 | |||
NRG Energy, Inc. | 2.0 | |||
|
| |||
| 10.0 | ||||
|
| |||
| Top Five Market Sectors as of August 31, 2018 | ||||
| % of fund’s net assets | ||||
Consumer Discretionary | 21.4 | |||
Energy | 16.2 | |||
Industrials | 12.6 | |||
Financials | 8.7 | |||
Real Estate | 7.8 | |||
| Quality Diversification as of August 31, 2018 | ||||
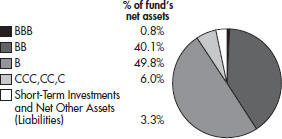
We have used ratings from Moody’s Investors Service, Inc. Where Moody’s® ratings are not available, we have used S&P® ratings. All ratings are as of the date indicated and do not reflect subsequent changes.
| Asset Allocation as of August 31, 2018 | ||||
| *Foreign | investments – 13.2% |
| 3 | Annual Report |
Table of Contents
Schedule of Investments August 31, 2018
Showing Percentage of Net Assets
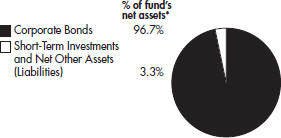
| Nonconvertible Bonds – 96.7% | ||||||||
| Principal Amount | Value | |||||||
CONSUMER DISCRETIONARY – 21.4% |
| |||||||
Auto Components – 0.7% |
| |||||||
Delphi Technologies PLC | $ | 93,000 | $ | 87,843 | ||||
|
| |||||||
Hotels, Restaurants & Leisure – 8.9% |
| |||||||
1011778 BC ULC / New Red Finance, Inc. | 260,000 | 250,900 | ||||||
GLP Capital LP / GLP Financing II, Inc.: |
| |||||||
5.25% 6/1/25 | 112,000 | 116,480 | ||||||
5.375% 4/15/26 | 99,000 | 102,806 | ||||||
5.75% 6/1/28 | 37,000 | 39,213 | ||||||
Hilton Worldwide Finance LLC / Hilton Worldwide Finance Corp.: | ||||||||
4.625% 4/1/25 | 133,000 | 131,337 | ||||||
4.875% 4/1/27 | 64,000 | 62,960 | ||||||
Six Flags Entertainment Corp. | 112,000 | 111,160 | ||||||
Station Casinos LLC | 64,000 | 61,840 | ||||||
Wynn Las Vegas LLC / Wynn Las Vegas Capital Corp.: | ||||||||
5.25% 5/15/27 (a) | 56,000 | 52,360 | ||||||
5.50% 3/1/25 (a) | 194,000 | 191,944 | ||||||
|
| |||||||
| 1,121,000 | ||||||||
|
| |||||||
Household Durables – 3.9% |
| |||||||
Lennar Corp.: |
| |||||||
4.125% 1/15/22 | 25,000 | 24,844 | ||||||
4.75% 4/1/21 to 5/30/25 | 222,000 | 224,015 | ||||||
PulteGroup, Inc.: |
| |||||||
5.00% 1/15/27 | 93,000 | 88,583 | ||||||
5.50% 3/1/26 | 157,000 | 155,822 | ||||||
|
| |||||||
| 493,264 | ||||||||
|
| |||||||
Internet & Direct Marketing Retail – 1.0% |
| |||||||
Netflix, Inc.: |
| |||||||
5.875% 2/15/25 | 96,000 | 99,120 | ||||||
5.875% 11/15/28 (a) | 21,000 | 21,049 | ||||||
|
| |||||||
| 120,169 | ||||||||
|
| |||||||
Leisure Products – 1.0% |
| |||||||
Mattel, Inc. | 122,000 | 119,492 | ||||||
|
| |||||||
Media – 5.1% |
| |||||||
AMC Networks, Inc.: |
| |||||||
4.75% 8/1/25 | 19,000 | 18,335 | ||||||
5.00% 4/1/24 | 103,000 | 101,326 | ||||||
CCO Holdings LLC / CCO Holdings Capital Corp. | 80,000 | 81,600 | ||||||
Meredith Corp. | 241,000 | 244,012 | ||||||
| Principal Amount | Value | |||||||
Sirius XM Radio, Inc.: |
| |||||||
5.375% 4/15/25 (a) | $ | 37,000 | $ | 37,555 | ||||
6.00% 7/15/24 (a) | 155,000 | 161,061 | ||||||
|
| |||||||
| 643,889 | ||||||||
|
| |||||||
Specialty Retail – 0.8% |
| |||||||
L Brands, Inc. | 112,000 | 96,320 | ||||||
|
| |||||||
TOTAL CONSUMER DISCRETIONARY |
| 2,681,977 | ||||||
|
| |||||||
CONSUMER STAPLES – 3.7% |
| |||||||
Food Products – 1.2% | ||||||||
Pilgrim’s Pride Corp. | 161,000 | 155,767 | ||||||
|
| |||||||
Household Products – 1.6% |
| |||||||
Energizer Gamma Acquisition, Inc. | 130,000 | 134,387 | ||||||
Energizer Holdings, Inc. | 62,000 | 61,845 | ||||||
|
| |||||||
| 196,232 | ||||||||
|
| |||||||
Personal Products – 0.0% |
| |||||||
HLF Financing Sarl LLC / Herbalife International, Inc. | 5,000 | 5,071 | ||||||
|
| |||||||
Tobacco – 0.9% |
| |||||||
Vector Group Ltd. | 116,000 | 111,070 | ||||||
|
| |||||||
TOTAL CONSUMER STAPLES |
| 468,140 | ||||||
|
| |||||||
ENERGY – 16.2% |
| |||||||
Energy Equipment & Services – 4.7% |
| |||||||
Calfrac Holdings LP | 125,000 | 119,062 | ||||||
Diamond Offshore Drilling, Inc. | 112,000 | 114,240 | ||||||
Ensco PLC | 129,000 | 123,195 | ||||||
McDermott Technology Americas, Inc. / McDermott Technology US, Inc. | 118,000 | 125,558 | ||||||
Rowan Cos., Inc. | 112,000 | 107,520 | ||||||
|
| |||||||
| 589,575 | ||||||||
|
| |||||||
Independent Power and Renewable Electricity Producers – 2.0% |
| |||||||
NRG Energy, Inc.: |
| |||||||
6.625% 1/15/27 | 53,000 | 55,451 | ||||||
7.25% 5/15/26 | 179,000 | 193,320 | ||||||
|
| |||||||
| 248,771 | ||||||||
|
| |||||||
Oil, Gas & Consumable Fuels – 7.5% |
| |||||||
DCP Midstream LP | 112,000 | 112,000 | ||||||
See accompanying notes which are an integral part of the financial statements.
| Annual Report | 4 |
Table of Contents
| Nonconvertible Bonds – continued | ||||||||
| Principal Amount | Value | |||||||
ENERGY – continued |
| |||||||
Oil, Gas & Consumable Fuels – continued |
| |||||||
Holly Energy Partners LP / Holly Energy Finance Corp. | $ | 112,000 | $ | 113,960 | ||||
Matador Resources Co. | 130,000 | 132,301 | ||||||
MEG Energy Corp. | 135,000 | 122,681 | ||||||
Murphy Oil Corp. | 116,000 | 122,569 | ||||||
Parkland Fuel Corp. | 112,000 | 112,000 | ||||||
Peabody Energy Corp. | 60,000 | 60,225 | ||||||
SunCoke Energy Partners LP / SunCoke Energy Partners Finance Corp. | 157,000 | 163,673 | ||||||
|
| |||||||
| 939,409 | ||||||||
|
| |||||||
Pipeline – 2.0% |
| |||||||
Antero Midstream Partners LP / Antero Midstream Finance Corp. | 124,000 | 124,930 | ||||||
Cheniere Energy Partners LP | 126,000 | 126,000 | ||||||
|
| |||||||
| 250,930 | ||||||||
|
| |||||||
TOTAL ENERGY |
| 2,028,685 | ||||||
|
| |||||||
FINANCIALS – 8.7% |
| |||||||
Capital Markets – 1.6% | ||||||||
LPL Holdings, Inc. | 202,000 | 197,455 | ||||||
|
| |||||||
Consumer Finance – 5.1% |
| |||||||
Ally Financial, Inc. | 112,000 | 116,060 | ||||||
CIT Group, Inc.: |
| |||||||
5.00% 8/1/23 | 212,000 | 215,445 | ||||||
5.25% 3/7/25 | 30,000 | 30,506 | ||||||
Curo Group Holdings Corp. | 150,000 | 148,500 | ||||||
Nationstar Mortgage Holdings, Inc. | 130,000 | 134,875 | ||||||
|
| |||||||
| 645,386 | ||||||||
|
| |||||||
Diversified Financial Services – 2.0% |
| |||||||
Icahn Enterprises LP / Icahn Enterprises Finance Corp. | 238,000 | 244,521 | ||||||
|
| |||||||
TOTAL FINANCIALS |
| 1,087,362 | ||||||
|
| |||||||
| Principal Amount | Value | |||||||
HEALTH CARE – 6.6% |
| |||||||
Health Care Equipment & Supplies – 0.8% |
| |||||||
Teleflex, Inc. | $ | 112,000 | $ | 106,599 | ||||
|
| |||||||
Health Care Providers & Services – 4.0% |
| |||||||
Centene Corp. | 62,000 | 63,085 | ||||||
DaVita, Inc.: |
| |||||||
5.00% 5/1/25 | 52,000 | 49,270 | ||||||
5.125% 7/15/24 | 199,000 | 191,860 | ||||||
HCA, Inc. | 15,000 | 15,035 | ||||||
MEDNAX, Inc. | 168,000 | 167,580 | ||||||
WellCare Health Plans, Inc. | 10,000 | 10,300 | ||||||
|
| |||||||
| 497,130 | ||||||||
|
| |||||||
Life Sciences Tools & Services – 0.5% |
| |||||||
IQVIA, Inc. | 62,000 | 62,155 | ||||||
|
| |||||||
Pharmaceuticals – 1.3% |
| |||||||
Bausch Health Cos., Inc. | 46,000 | 43,976 | ||||||
Charles River Laboratories International, Inc. | 112,000 | 113,680 | ||||||
|
| |||||||
| 157,656 | ||||||||
|
| |||||||
TOTAL HEALTH CARE |
| 823,540 | ||||||
|
| |||||||
INDUSTRIALS – 12.6% |
| |||||||
Aerospace & Defense – 1.9% | ||||||||
Bombardier, Inc. | 236,000 | 244,030 | ||||||
|
| |||||||
Air Freight & Logistics – 0.5% |
| |||||||
XPO Logistics, Inc. | 60,000 | 61,800 | ||||||
|
| |||||||
Building Products – 0.5% |
| |||||||
Griffon Corp. | 63,000 | 62,153 | ||||||
|
| |||||||
Commercial Services & Supplies – 6.1% |
| |||||||
KAR Auction Services, Inc. | 213,000 | 208,740 | ||||||
Multi-Color Corp. | 135,000 | 125,887 | ||||||
Nielsen Finance LLC / Nielsen Finance Co. | 251,000 | 243,734 | ||||||
Ritchie Bros Auctioneers, Inc. | 112,000 | 110,880 | ||||||
See accompanying notes which are an integral part of the financial statements.
| 5 | Annual Report |
Table of Contents
Schedule of Investments – continued
| Nonconvertible Bonds – continued | ||||||||
| Principal Amount | Value | |||||||
INDUSTRIALS – continued |
| |||||||
Commercial Services & Supplies – continued |
| |||||||
The ServiceMaster Co. LLC | $ | 81,000 | $ | 79,583 | ||||
|
| |||||||
| 768,824 | ||||||||
|
| |||||||
Construction & Engineering – 0.8% |
| |||||||
AECOM | 100,000 | 98,250 | ||||||
|
| |||||||
Containers & Packaging – 1.3% |
| |||||||
Ball Corp.: | ||||||||
4.875% 3/15/26 | 89,000 | 88,332 | ||||||
5.25% 7/1/25 | 73,000 | 75,190 | ||||||
|
| |||||||
| 163,522 | ||||||||
|
| |||||||
Machinery – 0.5% |
| |||||||
Allison Transmission, Inc. | 65,000 | 64,025 | ||||||
|
| |||||||
Road & Rail – 1.0% |
| |||||||
Avis Budget Car Rental LLC / Avis Budget Finance, Inc. | 125,000 | 124,375 | ||||||
|
| |||||||
TOTAL INDUSTRIALS |
| 1,586,979 | ||||||
|
| |||||||
INFORMATION TECHNOLOGY – 7.2% |
| |||||||
Internet Software & Services – 3.0% |
| |||||||
j2 Cloud Services LLC / j2 Global Co-Obligor, Inc. | 146,000 | 150,197 | ||||||
VeriSign, Inc.: | ||||||||
4.75% 7/15/27 | 123,000 | 118,541 | ||||||
5.25% 4/1/25 | 112,000 | 113,546 | ||||||
|
| |||||||
| 382,284 | ||||||||
|
| |||||||
IT Services – 0.5% |
| |||||||
First Data Corp. | 60,000 | 61,200 | ||||||
|
| |||||||
Semiconductors & Semiconductor Equipment – 1.0% |
| |||||||
Qorvo, Inc. | 130,000 | 130,650 | ||||||
|
| |||||||
Software – 2.7% |
| |||||||
CDK Global, Inc. | 135,000 | 132,638 | ||||||
Open Text Corp.: | ||||||||
5.625% 1/15/23 (a) | 180,000 | 185,850 | ||||||
5.875% 6/1/26 (a) | 18,000 | 18,585 | ||||||
|
| |||||||
| 337,073 | ||||||||
|
| |||||||
TOTAL INFORMATION TECHNOLOGY |
| 911,207 | ||||||
|
| |||||||
| Principal Amount | Value | |||||||
MATERIALS – 5.5% |
| |||||||
Chemicals – 2.2% |
| |||||||
Blue Cube Spinco LLC: | ||||||||
9.75% 10/15/23 | $ | 54,000 | $ | 61,223 | ||||
10.00% 10/15/25 | 53,000 | 61,347 | ||||||
CVR Partners LP / CVR Nitrogen Finance Corp. | 145,000 | 154,606 | ||||||
|
| |||||||
| 277,176 | ||||||||
|
| |||||||
Metals & Mining – 3.3% |
| |||||||
ArcelorMittal | 92,000 | 100,199 | ||||||
FMG Resources August 2006 Pty Ltd.: | ||||||||
4.75% 5/15/22 (a) | 168,000 | 164,859 | ||||||
5.125% 3/15/23 (a) | 84,000 | 82,110 | ||||||
Steel Dynamics, Inc. | 60,000 | 61,500 | ||||||
|
| |||||||
| 408,668 | ||||||||
|
| |||||||
TOTAL MATERIALS |
| 685,844 | ||||||
|
| |||||||
REAL ESTATE – 7.8% |
| |||||||
Equity Real Estate Investment Trusts (REITs) – 0.5% |
| |||||||
Equinix, Inc. | 59,000 | 60,770 | ||||||
|
| |||||||
Real Estate Investment Trusts (REITs) – 5.3% |
| |||||||
Equinix, Inc. | 59,000 | 61,213 | ||||||
Iron Mountain, Inc.: | ||||||||
4.875% 9/15/27 (a) | 79,000 | 73,201 | ||||||
5.25% 3/15/28 (a) | 185,000 | 175,056 | ||||||
SBA Communications Corp. | 130,000 | 131,135 | ||||||
Uniti Group LP / Uniti Fiber Holdings, Inc. / CSL Capital LLC | 42,000 | 37,945 | ||||||
Uniti Group LP / Uniti Group Finance, Inc. / CSL Capital LLC | 207,000 | 195,033 | ||||||
|
| |||||||
| 673,583 | ||||||||
|
| |||||||
Real Estate Management & Development – 2.0% |
| |||||||
Kennedy-Wilson, Inc. | 251,000 | 248,804 | ||||||
|
| |||||||
TOTAL REAL ESTATE |
| 983,157 | ||||||
|
| |||||||
TELECOMMUNICATION SERVICES – 7.0% |
| |||||||
Communications Equipment – 2.5% |
| |||||||
Plantronics, Inc. | 232,000 | 230,260 | ||||||
See accompanying notes which are an integral part of the financial statements.
| Annual Report | 6 |
Table of Contents
| Nonconvertible Bonds – continued | ||||||||
| Principal Amount | Value | |||||||
TELECOMMUNICATION SERVICES – continued |
| |||||||
Communications Equipment – continued |
| |||||||
ViaSat, Inc. | $ | 84,000 | $ | 78,960 | ||||
|
| |||||||
| 309,220 | ||||||||
|
| |||||||
Diversified Telecommunication Services – 2.6% |
| |||||||
CenturyLink, Inc.: | ||||||||
6.75% 12/1/23 | 89,000 | 92,782 | ||||||
7.50% 4/1/24 | 88,000 | 94,160 | ||||||
Hughes Satellite Systems Corp. | 144,000 | 137,880 | ||||||
|
| |||||||
| 324,822 | ||||||||
|
| |||||||
Media – 1.9% |
| |||||||
Nexstar Broadcasting, Inc. | 130,000 | 127,751 | ||||||
Outfront Media Capital LLC / Outfront Media Capital Corp. | 112,000 | 113,260 | ||||||
|
| |||||||
| 241,011 | ||||||||
|
| |||||||
TOTAL TELECOMMUNICATION SERVICES | 875,053 | |||||||
|
| |||||||
TOTAL NONCONVERTIBLE BONDS |
| 12,131,944 | ||||||
|
| |||||||
| Money Market Funds – 2.2% | ||||||||
Shares | Value | |||||||
Fidelity Cash Central Fund, 1.97% (d) | 281,011 | $ | 281,067 | |||||
|
| |||||||
TOTAL INVESTMENT PORTFOLIO – 98.9% |
| 12,413,011 | ||||||
NET OTHER ASSETS (LIABILITIES) – 1.1% |
| 140,155 | ||||||
|
| |||||||
NET ASSETS – 100.0% |
| $ | 12,553,166 | |||||
|
| |||||||
Legend
| (a) | Security is exempt from registration under Rule 144A of the Securities Act of 1933. These securities may be resold in transactions exempt from registration, normally to qualified institutional buyers. At the end of the period, the value of these securities amounted to $6,526,846 or 52.0% of net assets. |
| (b) | Security is perpetual in nature with no stated maturity date. |
| (c) | Coupon rates for floating and adjustable rate securities reflect the rates in effect at period end. |
| (d) | Affiliated fund that is generally available only to investment companies and other accounts managed by Fidelity Investments. The rate quoted is the annualized seven-day yield of the fund at period end. A complete unaudited listing of the fund’s holdings as of its most recent quarter end is available upon request. In addition, each Fidelity Central Fund’s financial statements, which are not covered by the Fund’s Report of Independent Registered Public Accounting Firm, are available on the SEC’s website or upon request. |
Affiliated Central Funds
Information regarding fiscal year to date income earned by the Fund from investments in Fidelity Central Funds is as follows:
| Fund | Income earned | |||
| Fidelity Cash Central Fund | $ | 4,655 | ||
|
| |||
Amounts in the income column in the above table include any capital gain distributions from underlying funds, which are presented in the corresponding line-item in the Statement of Operations if applicable.
Investment Valuation
The following is a summary of the inputs used, as of August 31, 2018, involving the Fund’s assets and liabilities carried at fair value. The inputs or methodology used for valuing securities may not be an indication of the risk associated with investing in those securities. For more information on valuation inputs, and their aggregation into the levels used in the table below, please refer to the Investment Valuation section in the accompanying Notes to Financial Statements.
| Valuation Inputs at Reporting Date: | ||||||||||||||||
| Description | Total | Level 1 | Level 2 | Level 3 | ||||||||||||
Investments in Securities: | ||||||||||||||||
Corporate Bonds | $ | 12,131,944 | $ | — | $ | 12,131,944 | $ | — | ||||||||
Money Market Funds | 281,067 | 281,067 | — | — | ||||||||||||
|
|
|
|
|
|
|
| |||||||||
Total Investments in Securities: | $ | 12,413,011 | $ | 281,067 | $ | 12,131,944 | $ | — | ||||||||
|
|
|
|
|
|
|
| |||||||||
Other Information
Distribution of investments by country or territory of incorporation, as a percentage of Total Net Assets, is as follows (Unaudited):
United States | 85.7 | |||
Canada | 8.7 | |||
Australia | 2.0 | |||
United Kingdom | 1.0 | |||
Others (Individually Less Than 1%) | 1.5 | |||
|
| |||
| 98.9 | % | |||
|
|
See accompanying notes which are an integral part of the financial statements.
| 7 | Annual Report |
Table of Contents
| Statement of Assets and Liabilities | ||||||||||||||||||||
| August 31, 2018 | ||||||||||||||||||||
| Fidelity High Yield Factor ETF | ||||||||||||||||||||
Assets | ||||||||||||||||||||
Investments in securities, at value – See accompanying schedule: | ||||||||||||||||||||
Unaffiliated issuers | $ | 12,131,944 | ||||||||||||||||||
Fidelity Central Funds | 281,067 | |||||||||||||||||||
|
| |||||||||||||||||||
Total Investments in Securities | $ | 12,413,011 | ||||||||||||||||||
Distributions receivable from Fidelity Central Funds | 629 | |||||||||||||||||||
Interest receivable | 199,739 | |||||||||||||||||||
|
| |||||||||||||||||||
Total assets | 12,613,379 | |||||||||||||||||||
|
| |||||||||||||||||||
Liabilities | ||||||||||||||||||||
Distributions payable | 55,500 | |||||||||||||||||||
Accrued management fees | 4,713 | |||||||||||||||||||
|
| |||||||||||||||||||
Total liabilities | 60,213 | |||||||||||||||||||
|
| |||||||||||||||||||
Net Assets | $ | 12,553,166 | ||||||||||||||||||
|
| |||||||||||||||||||
Net Assets consist of: | ||||||||||||||||||||
Paid in capital | 12,546,680 | |||||||||||||||||||
Undistributed net investment income | 348 | |||||||||||||||||||
Accumulated undistributed net realized gain (loss) on investments | 4,254 | |||||||||||||||||||
Net unrealized appreciation (depreciation) on investments | 1,884 | |||||||||||||||||||
|
| |||||||||||||||||||
Net Assets | $ | 12,553,166 | ||||||||||||||||||
|
| |||||||||||||||||||
Shares outstanding | 250,000 | |||||||||||||||||||
|
| |||||||||||||||||||
Net Asset Value, offering price and redemption price per share | $ | 50.21 | ||||||||||||||||||
|
| |||||||||||||||||||
Investments at cost – Unaffiliated issuers | $ | 12,130,060 | ||||||||||||||||||
Investments at cost – Fidelity Central Funds | 281,067 | |||||||||||||||||||
|
| |||||||||||||||||||
Investments at cost | $ | 12,411,127 | ||||||||||||||||||
|
| |||||||||||||||||||
See accompanying notes which are an integral part of the financial statements.
| Annual Report | 8 |
Table of Contents
| Statement of Operations | ||||||||||||||||||||
| For the period June 12, 2018 (commencement of operations) to August 31, 2018 | ||||||||||||||||||||
| Fidelity High Yield Factor ETF | ||||||||||||||||||||
Investment Income | ||||||||||||||||||||
Interest | $ | 152,467 | ||||||||||||||||||
Income from Fidelity Central Funds | 4,655 | |||||||||||||||||||
|
| |||||||||||||||||||
Total income | 157,122 | |||||||||||||||||||
|
| |||||||||||||||||||
Expenses | ||||||||||||||||||||
Management fees | 12,515 | |||||||||||||||||||
Independent trustees’ compensation | 9 | |||||||||||||||||||
|
| |||||||||||||||||||
Total expenses | 12,524 | |||||||||||||||||||
|
| |||||||||||||||||||
Net investment income (loss) | 144,598 | |||||||||||||||||||
|
| |||||||||||||||||||
Realized and Unrealized Gain (Loss) | ||||||||||||||||||||
Net realized gain (loss) on investment securities | 4,278 | |||||||||||||||||||
Net realized gain (loss) on Fidelity Central Funds | (24 | ) | ||||||||||||||||||
|
| |||||||||||||||||||
Total net realized gain (loss) | 4,254 | |||||||||||||||||||
|
| |||||||||||||||||||
Change in net unrealized appreciation (depreciation) on investment securities | 1,884 | |||||||||||||||||||
|
| |||||||||||||||||||
Net gain (loss) | 6,138 | |||||||||||||||||||
|
| |||||||||||||||||||
Net increase (decrease) in net assets resulting from operations | $ | 150,736 | ||||||||||||||||||
|
| |||||||||||||||||||
See accompanying notes which are an integral part of the financial statements.
| 9 | Annual Report |
Table of Contents
Financial Statements – continued
| Statement of Changes in Net Assets | ||||||||||||||||||||
| For the period June 12, 2018 (commencement of operations) to August 31, 2018 | ||||||||||||||||||||
Fidelity High Yield Factor ETF | ||||||||||||||||||||
Increase (Decrease) in Net Assets | ||||||||||||||||||||
Operations | ||||||||||||||||||||
Net investment income (loss) | $ | 144,598 | ||||||||||||||||||
Net realized gain (loss) | 4,254 | |||||||||||||||||||
Change in net unrealized appreciation (depreciation) | 1,884 | |||||||||||||||||||
|
| |||||||||||||||||||
Net increase (decrease) in net assets resulting from operations | 150,736 | |||||||||||||||||||
|
| |||||||||||||||||||
Distributions to shareholders from net investment income | (144,250 | ) | ||||||||||||||||||
|
| |||||||||||||||||||
Share transactions | ||||||||||||||||||||
Proceeds from sales of shares | 12,546,680 | |||||||||||||||||||
|
| |||||||||||||||||||
Net increase (decrease) in net assets resulting from share transactions | 12,546,680 | |||||||||||||||||||
|
| |||||||||||||||||||
Total increase (decrease) in net assets | 12,553,166 | |||||||||||||||||||
Net Assets | ||||||||||||||||||||
Beginning of period | — | |||||||||||||||||||
|
| |||||||||||||||||||
End of period | $ | 12,553,166 | ||||||||||||||||||
|
| |||||||||||||||||||
Undistributed net investment income included in net assets at end of period | $ | 348 | ||||||||||||||||||
|
| |||||||||||||||||||
Other Information | ||||||||||||||||||||
Shares | ||||||||||||||||||||
Sold | 250,000 | |||||||||||||||||||
Redeemed | — | |||||||||||||||||||
|
| |||||||||||||||||||
Net increase (decrease) | 250,000 | |||||||||||||||||||
|
| |||||||||||||||||||
See accompanying notes which are an integral part of the financial statements.
| Annual Report | 10 |
Table of Contents
| Financial Highlights | ||||
| Fidelity High Yield Factor ETF | ||||
| Year ended August 31, | 2018A | |||
Selected Per-Share Data | ||||
Net asset value, beginning of period | $ | 50.00 | ||
|
| |||
Income from Investment Operations | ||||
Net investment income (loss)B | 0.578 | |||
Net realized and unrealized gain (loss) | 0.209 | |||
|
| |||
Total from investment operations | 0.787 | |||
|
| |||
Distributions from net investment income | (0.577 | ) | ||
|
| |||
Total distributions | (0.577 | ) | ||
|
| |||
Net asset value, end of period | $ | 50.21 | ||
|
| |||
Total ReturnC | 1.59 | % | ||
Ratios to Average Net AssetsD,E,F | ||||
Expense before reductions | .45 | % | ||
Expenses net of fee waivers, if any | .45 | % | ||
Expenses net of all reductions | .45 | % | ||
Net investment income (loss) | 5.21 | % | ||
Supplemental Data | ||||
Net assets, end of period (000 omitted) | $ | 12,553 | ||
Portfolio turnover rateG,H | 8 | % | ||
| A | For the period June 12, 2018 (commencement of operations) to August 31, 2018. |
| B | Calculated based on average shares outstanding during the period. |
| C | Total returns for periods of less than one year are not annualized. |
| D | Annualized. |
| E | Expense ratios reflect operating expenses of the Fund. Expenses before reductions do not reflect amounts reimbursed by the investment adviser or reductions from brokerage service arrangements or reductions from other expense offset arrangements and do not represent the amount paid by the Fund during periods when reimbursements or reductions occur. Expenses net of fee waivers reflect expenses after reimbursement by the investment adviser but prior to the reductions from brokerage service arrangements or other expense offset arrangements. Expenses net of all reductions represent the net expenses paid by the Fund but do not include expenses of the investment companies in which the fund invests. |
| F | Fees and expenses of any underlying Fidelity Central Funds are not included in the Funds’ expense ratio. The Fund indirectly bears its proportionate share of expenses of any underlying Fidelity Central Funds. |
| G | Amount does not include the portfolio activity of any underlying funds. |
| H | Amount not annualized. |
See accompanying notes which are an integral part of the financial statements.
| 11 | Annual Report |
Table of Contents
For the period ended August 31, 2018
1. Organization.
Fidelity High Yield Factor ETF (the Fund) is an exchange-traded fund of Fidelity Covington Trust (the Trust) and is authorized to issue an unlimited number of shares. The Trust is registered under the Investment Company Act of 1940, as amended (the 1940 Act), as an open-end management investment company organized as a Massachusetts business trust.
2. Investments in Fidelity Central Funds.
The Fund invests in Fidelity Central Funds, which are open-end investment companies generally available only to other investment companies and accounts managed by the investment adviser and its affiliates. The Fund’s Schedule of Investments lists each of the Fidelity Central Funds held as of period end, if any, as an investment of the Fund, but do not include the underlying holdings of each Fidelity Central Fund. As an Investing Fund, the Fund indirectly bears its proportionate share of the expenses of the underlying Fidelity Central Funds.
The Money Market Central Funds seek preservation of capital and current income and are managed by Fidelity Investments Money Management, Inc. (FIMM), an affiliate of the investment adviser. Annualized expenses of the Money Market Central Funds as of their most recent shareholder report date are less than .005%.
A complete unaudited list of holdings for each Fidelity Central Fund is available upon request or at the Securities and Exchange Commission (the SEC) website at www.sec.gov. In addition, the financial statements of the Fidelity Central Funds, which are not covered by the Fund’s Report of Independent Registered Public Accounting Firm, are available on the SEC website or upon request.
3. Significant Accounting Policies.
The Fund is an investment company and applies the accounting and reporting guidance of the Financial Accounting Standards Board (FASB) Accounting Standards Codification Topic 946 Financial Services – Investments Companies. The financial statements have been prepared in conformity with accounting principles generally accepted in the United States of America (GAAP), which require management to make certain estimates and assumptions at the date of the financial statements. Actual results could differ from those estimates. Subsequent events, if any, through the date that the financial statements were issued have been evaluated in the preparation of the financial statements. The following summarizes the significant accounting policies of the Fund:
Investment Valuation. Investments are valued as of 4:00 p.m. Eastern time on the last calendar day of the period. The Board of Trustees (the Board) has delegated the day to day responsibility for the valuation of the Fund’s investments to the FairValue Committee (the Committee) established by the Fund’s investment adviser. In accordance with valuation policies and procedures approved by the Board, the Fund attempts to obtain prices from one or more third party pricing vendors or brokers to value its investments. When current market prices, quotations or currency exchange rates are not readily available or reliable, investments will be fair valued in good faith by the Committee, in accordance with procedures adopted by the Board. Factors used in determining fair value vary by investment type and may include market or investment specific events, changes in interest rates and credit quality. The frequency with which these procedures are used cannot be predicted and they may be utilized to a significant extent. The Committee oversees the Fund’s valuation policies and procedures and reports to the Board on the Committee’s activities and fair value determinations. The Board monitors the appropriateness of the procedures used in valuing the Fund’s investments and ratifies the fair value determinations of the Committee.
The Fund categorizes the inputs to valuation techniques used to value its investments into a disclosure hierarchy consisting of three levels as shown below:
Level 1 – quoted prices in active markets for identical investments
Level 2 – other significant observable inputs (including quoted prices for similar investments, interest rates, prepayment speeds, etc.)
Level 3 – unobservable inputs (including the Fund’s own assumptions based on the best information available)
Valuation techniques used to value the Fund’s investments by major category are as follows:
Debt securities, including restricted securities, are valued based on evaluated prices received from third party pricing vendors or from brokers who make markets in such securities. Corporate bonds are valued by pricing vendors who utilize matrix pricing which considers yield or price of bonds of comparable quality, coupon, maturity and type or by broker-supplied prices. When independent prices are unavailable or unreliable, debt securities may be valued utilizing pricing methodologies which consider similar factors that would be used by third party pricing vendors. For foreign debt securities, when significant market or security specific events arise, valuations may be determined in good faith in accordance with procedures adopted by the Board. Debt securities are generally categorized as Level 2 in the hierarchy but may be Level 3 depending on the circumstances.
Investments in open-end mutual funds, including Fidelity Central Funds, are valued at their closing net asset value (NAV) each business day and are categorized as Level 1 in the hierarchy.
Changes in valuation techniques may result in transfers in or out of an assigned level within the disclosure hierarchy. The aggregate value of investments by input level, as of August 31, 2018, is included at the end of the Fund’s Schedule of Investments.
| Annual Report | 12 |
Table of Contents
3. Significant Accounting Policies – continued
Investment Transactions and Income. For financial reporting purposes, the Fund’s investment holdings and NAV include trades executed through the end of the last business day of the period. The NAV per share for processing shareholder transactions is calculated as of the close of business of NYSE Arca, normally 4:00 p.m. Eastern time and includes trades executed through the end of the prior business day. Gains and losses on securities sold are determined on the basis of identified cost and may include proceeds received from litigation. Income and capital gain distributions from Fidelity Central Funds, if any, are recorded on ex-dividend date. Interest income is accrued as earned and includes coupon interest and amortization of premium and accretion of discount on debt securities as applicable. Debt obligations may be placed on non-accrual status and related interest income may be reduced by ceasing current accruals and writing off interest receivables when the collection of all or a portion of interest has become doubtful based on consistently applied procedures. A debt obligation is removed from non-accrual status when the issuer resumes interest payments or when collectability of interest is reasonably assured.
Expenses. Expenses directly attributable to a fund are charged to that fund. Expenses attributable to more than one fund are allocated among the respective funds on the basis of relative net assets or other appropriate methods. Expense estimates are accrued in the period to which they relate and adjustments are made when actual amounts are known.
Income Tax Information and Distributions to Shareholders. Each year, the Fund intends to qualify as a regulated investment company under Subchapter M of the Internal Revenue Code, including distributing substantially all of its taxable income and realized gains. As a result, no provision for U.S. Federal income taxes is required. As of August 31, 2018 the Fund did not have any unrecognized tax benefits in the financial statements; nor is the Fund aware of any tax positions for which it is reasonably possible that the total amounts of unrecognized tax benefits will significantly change in the next twelve months. The Fund files a U.S. federal tax return, in addition to state and local tax returns as required. The Fund’s federal income tax returns are subject to examination by the Internal Revenue Service (IRS) for a period of three fiscal years after they are filed. State and local tax returns may be subject to examination for an additional fiscal year depending on the jurisdiction.
Distributions are declared and recorded on the ex-dividend date. Income and capital gain distributions are determined in accordance with income tax regulations, which may differ from GAAP.
Capital accounts within the financial statements are adjusted for permanent book-tax differences. These adjustments have no impact on net assets or the results of operations. Capital accounts are not adjusted for temporary book-tax differences which will reverse in a subsequent period.
Book-tax differences are primarily due to losses deferred due to wash sales.
As of period end, the cost and unrealized appreciation (depreciation) in securities, and derivatives if applicable, for federal income tax purposes were as follows:
| Tax cost | Gross unrealized | Gross unrealized | Net unrealized on securities and other investments | |||||||||||||
Fidelity High Yield Factor ETF | $ | 12,411,151 | $ | 79,820 | $ | (77,960 | ) | $ | 1,860 | |||||||
The tax-based components of distributable earnings as of period end were as follows:
Undistributed income | Capital loss carryforward | Net unrealized appreciation (depreciation) | ||||||||||||||
Fidelity High Yield Factor ETF | $ | 4,626 | $ | — | $ | 1,860 | ||||||||||
The tax character of distributions paid was as follows:
| August 31, 2018 | ||||||||||||||||
Ordinary Income | Long-Term Capital Gain | Tax Return Of Capital | Total | |||||||||||||
Fidelity High Yield Factor ETFA | $ | 144,250 | $ | — | $ | — | $ | 144,250 | ||||||||
| A | For the period June 12, 2018 (commencement of operations) to August 31, 2018. |
Restricted Securities. The Fund may invest in securities that are subject to legal or contractual restrictions on resale. These securities generally may be resold in transactions exempt from registration or to the public if the securities are registered. Disposal of these securities may involve time-consuming negotiations and expense, and prompt sale at an acceptable price may be difficult. Information regarding restricted securities is included at the end of the Fund’s Schedule of Investments.
| 13 | Annual Report |
Table of Contents
Notes to Financial Statements – continued
3. Significant Accounting Policies – continued
New Accounting Pronouncement. In March 2017, the Financial Accounting Standards Board (FASB) issued an Accounting Standards Update (ASU), ASU 2017-08, which amends the amortization period for certain callable debt securities that are held at a premium. The amendment requires the premium to be amortized to the earliest call date. The amendments do not require an accounting change for securities held at a discount. The ASU is effective for annual periods beginning after December 15, 2018. Management is currently evaluating the potential impact of these changes to the financial statements.
4. Purchases and Sales of Investments.
Purchases and sales of securities, other than short-term securities and U.S. government securities, aggregated $13,161,151 and $1,032,111, respectively.
5. Fees and Other Transactions with Affiliates.
Management Fee. Fidelity Management & Research Company (the investment adviser) and its affiliates provide the Fund with investment management related services for which the Fund pays a monthly management fee that is based on an annual rate of .45% of average net assets. Under the management contract, the investment adviser pays all other expenses, except the compensation of the independent Trustees and certain miscellaneous expenses such as proxy and shareholders meeting expenses.
Interfund Trades. The Fund may purchase from or sell securities to other Fidelity Funds under procedures adopted by the Board. The procedures have been designed to ensure these interfund trades are executed in accordance with Rule 17a-7 of the 1940 Act. Interfund trades are included within the respective purchases and sales amounts shown in the Purchases and Sales of Investments note.
6. Share Transactions.
The Fund issues and redeems shares at NAV only with certain authorized participants in large increments known as Creation Units. Purchases of Creation Units are made by tendering a basket of designated securities and cash to the fund and redemption proceeds are paid with a basket of securities from the fund’s portfolio with a balancing cash component to equate the market value of the basket of securities delivered or redeemed to the NAV per Creation Unit on the transaction date. Cash may be substituted equivalent to the value of certain securities generally when they are not available in sufficient quantity for delivery. The fund’s shares are available in smaller increments to investors in the secondary market at market prices and may be subject to commissions. Authorized participants pay a transaction fee to the shareholder servicing agent when purchasing and redeeming Creation Units of the fund. The transaction fee is used to defray the costs associated with the issuance and redemption of Creation Units.
7. Other.
The Fund’s organizational documents provide former and current directors and officers with a limited indemnification against liabilities arising in connection with the performance of their duties to the Fund. In the normal course of business, the Fund may also enter into contracts that provide general indemnifications. The Fund’s maximum exposure under these arrangements is unknown as this would be dependent on future claims that may be made against the Fund. The risk of material loss from such claims is considered remote.
| Annual Report | 14 |
Table of Contents
Report of Independent Registered Public Accounting Firm
To the Board of Trustees of Fidelity Covington Trust and Shareholders of Fidelity High Yield Factor ETF:
Opinion on the Financial Statements
We have audited the accompanying statement of assets and liabilities, including the schedule of investments, of Fidelity High Yield Factor ETF (one of the funds constituting Fidelity Covington Trust, referred to hereafter as the “Fund”) as of August 31, 2018, and the related statements of operations and changes in net assets, including the related notes, and the financial highlights for the period June 12, 2018 (commencement of operations) through August 31, 2018 (collectively referred to as the “financial statements”). In our opinion, the financial statements present fairly, in all material respects, the financial position of the Fund as of August 31, 2018, and the results of its operations, changes in its net assets, and the financial highlights for the period June 12, 2018 (commencement of operations) through August 31, 2018 in conformity with accounting principles generally accepted in the United States of America.
Basis for Opinion
These financial statements are the responsibility of the Fund’s management. Our responsibility is to express an opinion on the Fund’s financial statements based on our audit. We are a public accounting firm registered with the Public Company Accounting Oversight Board (United States) (“PCAOB”) and are required to be independent with respect to the Fund in accordance with the U.S. federal securities laws and the applicable rules and regulations of the Securities and Exchange Commission and the PCAOB.
We conducted our audit of these financial statements in accordance with the standards of the PCAOB. Those standards require that we plan and perform the audit to obtain reasonable assurance about whether the financial statements are free of material misstatement, whether due to error or fraud.
Our audit included performing procedures to assess the risks of material misstatement of the financial statements, whether due to error or fraud, and performing procedures that respond to those risks. Such procedures included examining, on a test basis, evidence regarding the amounts and disclosures in the financial statements. Our audit also included evaluating the accounting principles used and significant estimates made by management, as well as evaluating the overall presentation of the financial statements. Our procedures included confirmation of securities owned as of August 31, 2018 by correspondence with the custodian. We believe that our audit provides a reasonable basis for our opinion.
PricewaterhouseCoopers LLP
Boston, Massachusetts
October 23, 2018
We have served as the auditor of one or more investment companies in the Fidelity group of funds since 1932.
| 15 | Annual Report |
Table of Contents
Premium/Discount Analysis (Unaudited)
Shares of the fund are listed on NYSE Arca and can be bought and sold on the secondary market at market prices. Although the market price is expected to approximate the fund’s NAV, it is possible that the market price and NAV will vary significantly. The closing market price is the daily closing price as reported on NYSE Arca.
Premiums or discounts are the differences (expressed as a basis point differential with 1 basis point equaling 1/100 of 1%) between the fund’s NAV and closing market price. A premium indicates that the closing market price is trading above the NAV. A discount indicates that the closing market price is trading below the NAV. A discrepancy may exist with respect to the timing of when the NAV is calculated and the determination of the closing market price.
The chart below presents information about the differences between the fund’s daily closing market price and the fund’s NAV.
Fidelity High Yield Factor ETF
| Period Ended August 31, 2018 | ||||||||||||
| From commencement of operations* to August 31, 2018 | Closing Price Below NAV | Closing Price Above or Equal to NAV | ||||||||||
| Basis Point Differential | Number of Days | % of Total Days | Number of Days | % of Total Days | ||||||||
| 0 – <25 | 4 | 7.14 | % | 35 | 62.50 | % | ||||||
| 25 – <50 | 0 | — | 15 | 26.79 | % | |||||||
| 50 – <75 | 0 | — | 2 | 3.57 | % | |||||||
| 75 – <100 | 0 | — | 0 | — | ||||||||
| 100 or above | 0 | — | 0 | — | ||||||||
| Total | 4 | 7.14 | % | 52 | 92.86 | % | ||||||
| * | From June 12, 2018, date initially listed on the NYSE ARCA exchange. |
| Annual Report | 16 |
Table of Contents
Trustees and Officers (Unaudited)
The Trustees, Members of the Advisory Board (if any), and officers of the trust and fund, as applicable, are listed below. The Board of Trustees governs the fund and is responsible for protecting the interests of shareholders. The Trustees are experienced executives who meet periodically throughout the year to oversee the fund’s activities, review contractual arrangements with companies that provide services to the fund, oversee management of the risks associated with such activities and contractual arrangements, and review the fund’s performance. Except for Michael E. Wiley, each of the Trustees oversees 283 funds. Mr. Wiley oversees 193 funds.
The Trustees hold office without limit in time except that (a) any Trustee may resign; (b) any Trustee may be removed by written instrument, signed by at least two-thirds of the number of Trustees prior to such removal; (c) any Trustee who requests to be retired or who has become incapacitated by illness or injury may be retired by written instrument signed by a majority of the other Trustees; and (d) any Trustee may be removed at any special meeting of shareholders by a two-thirds vote of the outstanding voting securities of the trust. Each Trustee who is not an interested person (as defined in the 1940 Act) of the trust and the fund is referred to herein as an Independent Trustee. Each Independent Trustee shall retire not later than the last day of the calendar year in which his or her 75th birthday occurs. The Independent Trustees may waive this mandatory retirement age policy with respect to individual Trustees. Officers and Advisory Board Members hold office without limit in time, except that any officer or Advisory Board Member may resign or may be removed by a vote of a majority of the Trustees at any regular meeting or any special meeting of the Trustees. Except as indicated, each individual has held the office shown or other offices in the same company for the past five years.
The funds’ Statement of Additional Information (SAI) includes more information about the Trustees. To request a free copy, call Fidelity at 1-800-FIDELITY.
Experience, Skills, Attributes, and Qualifications of the Trustees. The Governance and Nominating Committee has adopted a statement of policy that describes the experience, qualifications, attributes, and skills that are necessary and desirable for potential Independent Trustee candidates (Statement of Policy). The Board believes that each Trustee satisfied at the time he or she was initially elected or appointed a Trustee, and continues to satisfy, the standards contemplated by the Statement of Policy. The Governance and Nominating Committee also engages professional search firms to help identify potential Independent Trustee candidates who have the experience, qualifications, attributes, and skills consistent with the Statement of Policy. From time to time, additional criteria based on the composition and skills of the current Independent Trustees, as well as experience or skills that may be appropriate in light of future changes to board composition, business conditions, and regulatory or other developments, have also been considered by the professional search firms and the Governance and Nominating Committee. In addition, the Board takes into account the Trustees’ commitment and participation in Board and committee meetings, as well as their leadership of standing and ad hoc committees throughout their tenure.
In determining that a particular Trustee was and continues to be qualified to serve as a Trustee, the Board has considered a variety of criteria, none of which, in isolation, was controlling. The Board believes that, collectively, the Trustees have balanced and diverse experience, qualifications, attributes, and skills, which allow the Board to operate effectively in governing the fund and protecting the interests of shareholders. Information about the specific experience, skills, attributes, and qualifications of each Trustee, which in each case led to the Board’s conclusion that the Trustee should serve (or continue to serve) as a trustee of the fund, is provided below.
Board Structure and Oversight Function. James C. Curvey is an interested person and currently serves as Chairman. The Trustees have determined that an interested Chairman is appropriate and benefits shareholders because an interested Chairman has a personal and professional stake in the quality and continuity of services provided to the fund. Independent Trustees exercise their informed business judgment to appoint an individual of their choosing to serve as Chairman, regardless of whether the Trustee happens to be independent or a member of management. The Independent Trustees have determined that they can act independently and effectively without having an Independent Trustee serve as Chairman and that a key structural component for assuring that they are in a position to do so is for the Independent Trustees to constitute a substantial majority for the Board. The Independent Trustees also regularly meet in executive session. Ned C. Lautenbach serves as Chairman of the Independent Trustees and as such (i) acts as a liaison between the Independent Trustees and management with respect to matters important to the Independent Trustees and (ii) with management prepares agendas for Board meetings.
Fidelity® funds are overseen by different Boards of Trustees. The fund’s Board oversees Fidelity’s high income and certain equity funds, and other Boards oversee Fidelity’s investment-grade bond, money market, asset allocation, and other equity funds. The asset allocation funds may invest in Fidelity® funds overseen by the fund’s Board. The use of separate Boards, each with its own committee structure, allows the Trustees of each group of Fidelity® funds to focus on the unique issues of the funds they oversee, including common research, investment, and operational issues. On occasion, the separate Boards establish joint committees to address issues of overlapping consequences for the Fidelity® funds overseen by each Board.
| 17 | Annual Report |
Table of Contents
Trustees and Officers (Unaudited) – continued
The Trustees operate using a system of committees to facilitate the timely and efficient consideration of all matters of importance to the Trustees, the fund, and fund shareholders and to facilitate compliance with legal and regulatory requirements and oversight of the fund’s activities and associated risks. The Board, acting through its committees, has charged FMR and its affiliates with (i) identifying events or circumstances the occurrence of which could have demonstrably adverse effects on the fund’s business and/or reputation; (ii) implementing processes and controls to lessen the possibility that such events or circumstances occur or to mitigate the effects of such events or circumstances if they do occur; and (iii) creating and maintaining a system designed to evaluate continuously business and market conditions in order to facilitate the identification and implementation processes described in (i) and (ii) above. Because the day-to-day operations and activities of the fund are carried out by or through FMR, its affiliates, and other service providers, the fund’s exposure to risks is mitigated but not eliminated by the processes overseen by the Trustees. While each of the Board’s committees has responsibility for overseeing different aspects of the fund’s activities, oversight is exercised primarily through the Operations, Audit, and Compliance Committees. In addition, the Independent Trustees have worked with Fidelity to enhance the Board’s oversight of investment and financial risks, legal and regulatory risks, technology risks, and operational risks, including the development of additional risk reporting to the Board. Appropriate personnel, including but not limited to the fund’s Chief Compliance Officer (CCO), FMR’s internal auditor, the independent accountants, the fund’s Treasurer and portfolio management personnel, make periodic reports to the Board’s committees, as appropriate, including an annual review of Fidelity’s risk management program for the Fidelity® funds. The responsibilities of each standing committee, including their oversight responsibilities, are described further under “Standing Committees of the Trustees.”
Interested Trustees*:
Correspondence intended for a Trustee who is an interested person may be sent to Fidelity Investments, 245 Summer Street, Boston, Massachusetts 02210.
Name, Year of Birth; Principal Occupations and Other Relevant Experience+ |
James C. Curvey (1935) |
Year of Election or Appointment: 2018 |
Trustee |
Chairman of the Board of Trustees |
Mr. Curvey also serves as Trustee of other Fidelity® funds. Mr. Curvey is Vice Chairman (2007-present) and Director of FMR LLC (diversified financial services company). In addition, Mr. Curvey is an Overseer Emeritus for the Boston Symphony Orchestra, a Director of Artis-Naples, and a Trustee of Brewster Academy in Wolfeboro, New Hampshire. Previously, Mr. Curvey served as a Director of Fidelity Research & Analysis Co. (investment adviser firm, 2009-2018), Director of Fidelity Investments Money Management, Inc. (investment adviser firm, 2009-2014) and a Director of FMR and FMR Co., Inc. (investment adviser firms, 2007-2014). |
Charles S. Morrison (1960) |
Year of Election or Appointment: 2018 |
Trustee |
Mr. Morrison also serves as Trustee of other funds. He serves as President of Fidelity SelectCo, LLC (investment adviser firm, 2017-present) and Fidelity Management & Research Company (FMR) (investment adviser firm, 2016-present), a Director of Fidelity Investments Money Management, Inc. (FIMM) (investment adviser firm, 2014-present), Director of Fidelity SelectCo, LLC (investment adviser firm, 2014-present), President, Asset Management (2014-present), and is an employee of Fidelity Investments. Previously, Mr. Morrison served as Vice President of Fidelity’s Fixed Income and Asset Allocation Funds (2012-2014), President, Fixed Income (2011-2014), Vice President of Fidelity’s Money Market Funds (2005-2009), President, Money Market Group Leader of FMR (investment adviser firm, 2009), and Senior Vice President, Money Market Group of FMR (2004-2009). Mr. Morrison also served as Vice President of Fidelity’s Bond Funds (2002-2005), certain Balanced Funds (2002-2005), and certain Asset Allocation Funds (2002-2007), and as Senior Vice President (2002-2005) of Fidelity’s Bond Division. |
| * | Determined to be an “Interested Trustee” by virtue of, among other things, his or her affiliation with the trust or various entities under common control with FMR. |
| + | The information includes the Trustee’s principal occupation during the last five years and other information relating to the experience, attributes, and skills relevant to the Trustee’s qualifications to serve as a Trustee, which led to the conclusion that the Trustee should serve as a Trustee for the fund. |
Independent Trustees:
Correspondence intended for an Independent Trustee may be sent to Fidelity Investments, P.O. Box 55235, Boston, Massachusetts 02205-5235.
Name, Year of Birth; Principal Occupations and Other Relevant Experience+ |
| Annual Report | 18 |
Table of Contents
Name, Year of Birth; Principal Occupations and Other Relevant Experience+ |
Dennis J. Dirks (1948) |
Year of Election or Appointment: 2018 |
Trustee |
Mr. Dirks also serves as Trustee of other Fidelity® funds. Prior to his retirement in May 2003, Mr. Dirks was Chief Operating Officer and a member of the Board of The Depository Trust & Clearing Corporation (DTCC). He also served as President, Chief Operating Officer, and Board member of The Depository Trust Company (DTC) and President and Board member of the National Securities Clearing Corporation (NSCC). In addition, Mr. Dirks served as Chief Executive Officer and Board member of the Government Securities Clearing Corporation, Chief Executive Officer and Board member of the Mortgage-Backed Securities Clearing Corporation, as a Trustee and a member of the Finance Committee of Manhattan College (2005-2008), as a Trustee and a member of the Finance Committee of AHRC of Nassau County (2006-2008), as a member of the Independent Directors Council (IDC) Governing Council (2010-2015), and as a member of the Board of Directors for The Brookville Center for Children’s Services, Inc. (2009-2017). Mr. Dirks is a member of the Finance Committee (2016-present), Board of Directors (2017-present) and Board of Trustees (2018-present) and is Treasurer (2018-present) of the Asolo Repertory Theatre. |
Donald F. Donahue (1950) |
Year of Election or Appointment: 2018 |
Trustee |
Mr. Donahue also serves as a Trustee of other Fidelity® funds. Mr. Donahue is President and Chief Executive Officer of Miranda Partners, LLC (risk consulting for the financial services industry, 2012-present). Previously, Mr. Donahue served as a Member of the Advisory Board of certain Fidelity® funds (2015-2018) and Chief Executive Officer (2006-2012), Chief Operating Officer (2003-2006), and Managing Director, Customer Marketing and Development (1999-2003) of The Depository Trust & Clearing Corporation (financial markets infrastructure). Mr. Donahue serves as a Member (2007-present) and Co-Chairman (2016-present) of the Board of Directors of United Way of New York, Member of the Board of Directors of NYC Leadership Academy (2012-present) and Member of the Board of Advisors of Ripple Labs, Inc. (financial services, 2015-present). He also served as Chairman (2010-2012) and Member of the Board of Directors (2012-2013) of Omgeo, LLC (financial services), Treasurer of United Way of New York (2012-2016), and Member of the Board of Directors of XBRL US (financial services non-profit, 2009-2012) and the International Securities Services Association (2009-2012). |
Alan J. Lacy (1953) |
Year of Election or Appointment: 2018 |
Trustee |
Mr. Lacy also serves as Trustee of other Fidelity® funds. Mr. Lacy serves as a Director of Bristol-Myers Squibb Company (global pharmaceuticals, 2008-present). He is a Trustee of the California Chapter of The Nature Conservancy (2015-present) and a Director of the Center for Advanced Study in the Behavioral Sciences at Stanford University (2015-present). In addition, Mr. Lacy served as Senior Adviser (2007-2014) of Oak Hill Capital Partners, L.P. (private equity) and also served as Chief Executive Officer (2005) and Vice Chairman (2005-2006) of Sears Holdings Corporation (retail) and Chief Executive Officer and Chairman of the Board of Sears, Roebuck and Co. (retail, 2000-2005). Previously, Mr. Lacy served as Chairman (2014-2017) and a member (2010-2017) of the Board of Directors of Dave & Buster’s Entertainment, Inc. (restaurant and entertainment complexes), as Chairman (2008-2011) and a member (2006-2015) of the Board of Trustees of the National Parks Conservation Association, and as a member of the Board of Directors for The Hillman Companies, Inc. (hardware wholesalers, 2010-2014), Earth Fare, Inc. (retail grocery, 2010-2014), and The Western Union Company (global money transfer, 2006-2011). |
Ned C. Lautenbach (1944) |
Year of Election or Appointment: 2018 |
Trustee |
Chairman of the Independent Trustees |
Mr. Lautenbach also serves as Trustee of other Fidelity® funds. Mr. Lautenbach currently serves as Vice Chair of the Board of Governors, State University System of Florida (2013-present) and is a member of the Council on Foreign Relations (1994-present). He is also a member and has most recently served as Chairman of the Board of Directors of Artis-Naples (2012-present). Previously, Mr. Lautenbach served as a member and then Lead Director of the Board of Directors of Eaton Corporation (diversified industrial, 1997-2016). He was also a Partner and Advisory Partner at Clayton, Dubilier & Rice, LLC (private equity investment, 1998-2010), as well as a Director of Sony Corporation (2006-2007). In addition, Mr. Lautenbach also had a 30-year career with IBM (technology company) during which time he served as Senior Vice President and a member of the Corporate Executive Committee (1968-1998). |
Joseph Mauriello (1944) |
Year of Election or Appointment: 2018 |
| 19 | Annual Report |
Table of Contents
Trustees and Officers (Unaudited) – continued
Name, Year of Birth; Principal Occupations and Other Relevant Experience+ |
Trustee |
Mr. Mauriello also serves as Trustee of other Fidelity® funds. Prior to his retirement in January 2006, Mr. Mauriello served in numerous senior management positions including Deputy Chairman and Chief Operating Officer (2004-2005), and Vice Chairman of Financial Services (2002-2004) of KPMG LLP US (professional services, 1965-2005). Mr. Mauriello currently serves as a member of the Independent Directors Council (IDC) Governing Council (2015-present). Previously, Mr. Mauriello served as a member of the Board of Directors of XL Group plc. (global insurance and re-insurance, 2006-2018). |
Cornelia M. Small (1944) |
Year of Election or Appointment: 2018 |
Trustee |
Ms. Small also serves as Trustee of other Fidelity® funds. Ms. Small is a member of the Board of Directors (2009-present) and Chair of the Investment Committee (2010-present) of the Teagle Foundation. Ms. Small also serves on the Investment Committee of the Berkshire Taconic Community Foundation (2008-present). Previously, Ms. Small served as Chairperson (2002-2008) and a member of the Investment Committee and Chairperson (2008-2012) and a member of the Board of Trustees of Smith College. In addition, Ms. Small served as Chief Investment Officer, Director of Global Equity Investments, and a member of the Board of Directors of Scudder, Stevens & Clark and Scudder Kemper Investments. |
Garnett A. Smith (1947) |
Year of Election or Appointment: 2013 |
Trustee |
Mr. Smith also serves as Trustee of other Fidelity® funds. Prior to Mr. Smith’s retirement, he served as Chairman and Chief Executive Officer of Inbrand Corp. (manufacturer of personal absorbent products, 1990-1997). He also served as President (1986-1990) of Inbrand Corp. Prior to his employment with Inbrand Corp., he was employed by a retail fabric chain and North Carolina National Bank. In addition, Mr. Smith served as a Member of the Advisory Board of certain Fidelity® funds (2012-2013) and as a board member of the Jackson Hole Land Trust (2009-2012). |
David M. Thomas (1949) |
Year of Election or Appointment: 2018 |
Trustee |
Mr. Thomas also serves as Trustee of other Fidelity® funds. Mr. Thomas serves as Non-Executive Chairman of the Board of Directors of Fortune Brands Home and Security (home and security products, 2011-present), as a member of the Board of Directors (2004-present) and Presiding Director (2013-present) of Interpublic Group of Companies, Inc. (marketing communication), and as a member of the Board of Trustees of the University of Florida (2013-present). Previously, Mr. Thomas served as Executive Chairman (2005-2006) and Chairman and Chief Executive Officer (2000-2005) of IMS Health, Inc. (pharmaceutical and healthcare information solutions), and a Director of Fortune Brands, Inc. (consumer products, 2000-2011). |
Michael E. Wiley (1950) |
Year of Election or Appointment: 2013 |
Trustee |
Mr. Wiley also serves as Trustee or Member of the Advisory Board of other Fidelity® funds. Mr. Wiley serves as a Director of Andeavor Corporation (independent oil refiner and marketer, 2005-present), a Director of Andeavor Logistics LP (natural resources logistics, 2015-present), and a Director of Bill Barrett Corporation (exploration and production, 2005-present). In addition, Mr. Wiley also serves as a Director of Post Oak Bank (privately-held bank, 2004-present). Previously, Mr. Wiley served as a Trustee of other Fidelity® funds (2008-2013), as a Director of Asia Pacific Exploration Consolidated (international oil and gas exploration and production, 2008-2013), as a member of the Board of Trustees of the University of Tulsa (2000-2006; 2007-2010), as a Senior Energy Advisor of Katzenbach Partners, LLC (consulting, 2006-2007), as an Advisory Director of Riverstone Holdings (private investment), Chairman, President, and CEO of Baker Hughes, Inc. (oilfield services, 2000-2004), and as Director of Spinnaker Exploration Company (exploration and production, 2001-2005). |
| + | The information includes the Trustee’s principal occupation during the last five years and other information relating to the experience, attributes, and skills relevant to the Trustee’s qualifications to serve as a Trustee, which led to the conclusion that the Trustee should serve as a Trustee for the fund. |
Advisory Board Members and Officers:
Correspondence intended for a Member of the Advisory Board (if any) may be sent to Fidelity Investments, P.O. Box 55235, Boston,
Massachusetts 02205-5235. Correspondence intended for an officer or Peter S. Lynch may be sent to Fidelity Investments, 245 Summer Street, Boston, Massachusetts 02210. Officers appear below in alphabetical order.
| Annual Report | 20 |
Table of Contents
Name, Year of Birth; Principal Occupations and Other Relevant Experience+ |
Name, Year of Birth; Principal Occupation |
Vicki L. Fuller (1957) |
Year of Election or Appointment: 2018 |
Member of the Advisory Board |
Ms. Fuller also serves as Member of the Advisory Board of other Fidelity® funds. Ms. Fuller serves as a member of the Board of Directors, Audit Committee, and Nominating and Governance Committee of The Williams Companies, Inc. (natural gas infrastructure, 2018-present). Previously, Ms. Fuller served as the Chief Investment Officer of the New York State Common Retirement Fund (2012-2018) and held a variety of positions at AllianceBernstein L.P. (global asset management, 1985-2012), including Managing Director (2006-2012) and Senior Vice President and Senior Portfolio Manager (2001-2006). |
Peter S. Lynch (1944) |
Year of Election or Appointment: 2018 |
Member of the Advisory Board |
Mr. Lynch also serves as Member of the Advisory Board of other Fidelity® funds. Mr. Lynch is Vice Chairman and a Director of FMR (investment adviser firm) and FMR Co., Inc. (investment adviser firm). In addition, Mr. Lynch serves as a Trustee of Boston College and as the Chairman of the Inner-City Scholarship Fund. Previously, Mr. Lynch served on the Special Olympics International Board of Directors (1997-2006). |
William S. Stavropoulos (1939) |
Year of Election or Appointment: 2018 |
Member of the Advisory Board |
Mr. Stavropoulos also serves as Member of the Advisory Board of other Fidelity® funds. Mr. Stavropoulos serves as President and Founder of the Michigan Baseball Foundation, the Great Lakes Loons (2007-present). Mr. Stavropoulos is Chairman Emeritus of the Board of Directors of The Dow Chemical Company, where he previously served in numerous senior management positions, including President, CEO (1995-2000; 2002-2004), Chairman of the Executive Committee (2000-2006), and as a member of the Board of Directors (1990-2006). Currently, Mr. Stavropoulos is Chairman of the Board of Directors of Univar Inc. (global distributor of commodity and specialty chemicals), a Director of Teradata Corporation (data warehousing and technology solutions), and a member of the Advisory Board for Metalmark Capital LLC (private equity investment, 2005-present). Mr. Stavropoulos is an operating advisor to Clayton, Dubilier & Rice, LLC (private equity investment). In addition, Mr. Stavropoulos is a member of the University of Notre Dame Advisory Council for the College of Science, a Trustee of the Rollin L. Gerstacker Foundation, and a Director of Artis-Naples in Naples, Florida. Previously, Mr. Stavropoulos served as Trustee of certain Fidelity® funds (2001-2018) and as a Director of Chemical Financial Corporation (bank holding company, 1993-2012) and Tyco International, Ltd. (multinational manufacturing and services, 2007-2012). |
Carol B. Tomé (1957) |
Year of Election or Appointment: 2017 |
Member of the Advisory Board |
Ms. Tomé also serves as Member of the Advisory Board of other Fidelity® funds. Ms. Tomé is Chief Financial Officer (2001-present) and Executive Vice President of Corporate Services (2007-present) of The Home Depot, Inc. (home improvement retailer) and a Director (2003-present) and Chair of the Audit Committee (2004-present) of United Parcel Service, Inc. (package delivery and supply chain management). Previously, Ms. Tomé served as Trustee of certain Fidelity® funds (2017), Senior Vice President of Finance and Accounting/Treasurer (2000-2007) and Vice President and Treasurer (1995-2000) of The Home Depot, Inc. and Chair of the Board (2010-2012), Vice Chair of the Board (2009 and 2013), and a Director (2008-2013) of the Federal Reserve Bank of Atlanta. Ms. Tomé is also a director or trustee of many community and professional organizations. |
Elizabeth Paige Baumann (1968) |
Year of Election or Appointment: 2017 |
Anti-Money Laundering (AML) Officer |
Ms. Baumann also serves as AML Officer of other funds. She is Chief AML Officer (2012-present) and Senior Vice President (2014-present) of FMR LLC (diversified financial services company) and is an employee of Fidelity Investments. Previously, Ms. Baumann served as AML Officer of the funds (2012-2016), and Vice President (2007-2014) and Deputy Anti-Money Laundering Officer (2007-2012) of FMR LLC. |
John J. Burke III (1964) |
Year of Election or Appointment: 2018 |
| 21 | Annual Report |
Table of Contents
Trustees and Officers (Unaudited) – continued
Name, Year of Birth; Principal Occupation |
Chief Financial Officer |
Mr. Burke also serves as Chief Financial Officer of other funds. Mr. Burke serves as Head of Investment Operations for Fidelity Fund and Investment Operations (2018-present) and is an employee of Fidelity Investments (1998-present). Previously Mr. Burke served as head of Asset Management Investment Operations (2012-2018). |
William C. Coffey (1969) |
Year of Election or Appointment: 2018 |
Secretary and Chief Legal Officer (CLO) |
Mr. Coffey also serves as Secretary and CLO of other funds. He is Senior Vice President and Deputy General Counsel of FMR LLC (diversified financial services company, 2010-present), and is an employee of Fidelity Investments. Previously, Mr. Coffey served as Assistant Secretary of certain funds (2009-2018) and as Vice President and Associate General Counsel of FMR LLC (2005-2009). |
Timothy M. Cohen (1969) |
Year of Election or Appointment: 2018 |
Vice President |
Mr. Cohen also serves as Vice President of other funds. Mr. Cohen serves as Co-Head of Global Equity Research (2016-present), a Director of Fidelity Management & Research (Japan) Limited (investment adviser firm, 2016-present), and is an employee of Fidelity Investments. Previously, Mr. Cohen served as Chief Investment Officer – Equity and a Director of Fidelity Management & Research (U.K.) Inc. (investment adviser firm, 2013-2015) and as a Director of Fidelity Management & Research (Hong Kong) Limited (investment adviser firm, 2017). |
Jonathan Davis (1968) |
Year of Election or Appointment: 2013 |
Assistant Treasurer |
Mr. Davis also serves as Assistant Treasurer of other funds. Mr. Davis serves as Assistant Treasurer of FMR Capital, Inc. (2017-present) and is an employee of Fidelity Investments. Previously, Mr. Davis served as Vice President and Associate General Counsel of FMR LLC (diversified financial services company, 2003-2010). |
Adrien E. Deberghes (1967) |
Year of Election or Appointment: 2018 |
Assistant Treasurer |
Mr. Deberghes also serves as an officer of other funds. He serves as Assistant Treasurer of FMR Capital, Inc. (2017-present), Executive Vice President of Fidelity Investments Money Management, Inc. (FIMM) (investment adviser firm, 2016-present), and is an employee of Fidelity Investments (2008-present). Previously, Mr. Deberghes served as President and Treasurer of certain Fidelity® funds (2013-2018). Prior to joining Fidelity Investments, Mr. Deberghes was Senior Vice President of Mutual Fund Administration at State Street Corporation (2007-2008), Senior Director of Mutual Fund Administration at Investors Bank & Trust (2005-2007), and Director of Finance for Dunkin’ Brands (2000-2005). Previously, Mr. Deberghes served in other fund officer roles. |
Laura M. Del Prato (1964) |
Year of Election or Appointment: 2018 |
Assistant Treasurer |
Ms. Del Prato also serves as an officer of other funds. Ms. Del Prato is an employee of Fidelity Investments (2017-present). Prior to joining Fidelity Investments, Ms. Del Prato served as a Managing Director and Treasurer of the JPMorgan Mutual Funds (2014-2017). Prior to JPMorgan, Ms. Del Prato served as a partner at Cohen Fund Audit Services (accounting firm, 2012-2013) and KPMG LLP (accounting firm, 2004-2012). |
Colm A. Hogan (1973) |
Year of Election or Appointment: 2018 |
Deputy Treasurer |
Mr. Hogan also serves as an officer of other funds. Mr. Hogan serves as Assistant Treasurer of FMR Capital, Inc. (2017-present) and is an employee of Fidelity Investments (2005-present). Previously, Mr. Hogan served as Assistant Treasurer of certain Fidelity® funds (2016-2018). |
Pamela R. Holding (1964) |
Year of Election or Appointment: 2018 |
Vice President |
Ms. Holding also serves as Vice President of other funds. Ms. Holding serves as Co-Head of Global Equity Research (2018-present) and is an employee of Fidelity Investments (2013-present). |
| Annual Report | 22 |
Table of Contents
Name, Year of Birth; Principal Occupation |
Chris Maher (1972) |
Year of Election or Appointment: 2013 |
Assistant Treasurer |
Mr. Maher serves as Assistant Treasurer of other funds. Mr. Maher is Vice President of Valuation Oversight, serves as Assistant Treasurer of FMR Capital, Inc. (2017-present), and is an employee of Fidelity Investments. Previously, Mr. Maher served as Vice President of Asset Management Compliance (2013), Vice President of the Program Management Group of FMR (investment adviser firm, 2010-2013), and Vice President of Valuation Oversight (2008-2010). |
Rieco E. Mello (1969) |
Year of Election or Appointment: 2017 |
Assistant Treasurer |
Mr. Mello also serves as Assistant Treasurer of other funds. Mr. Mello serves as Assistant Treasurer of FMR Capital, Inc. (2017-present) and is an employee of Fidelity Investments (1995-present). |
Kenneth B. Robins (1969) |
Year of Election or Appointment: 2018 |
Chief Compliance Officer |
Mr. Robins also serves as an officer of other funds. Mr. Robins serves as Compliance Officer of Fidelity Management & Research Company and FMR Co., Inc. (investment adviser firms, 2016-present) and is an employee of Fidelity Investments (2004-present). Previously, Mr. Robins served as Executive Vice President of Fidelity Investments Money Management, Inc. (investment adviser firm, 2013-2016) and served in other fund officer roles. |
Stacie M. Smith (1974) |
Year of Election or Appointment: 2018 |
President and Treasurer |
Ms. Smith also serves as an officer of other funds. Ms. Smith serves as Assistant Treasurer of FMR Capital, Inc. (2017-present), is an employee of Fidelity Investments (2009-present), and has served in other fund officer roles. Prior to joining Fidelity Investments, Ms. Smith served as Senior Audit Manager of Ernst & Young LLP (accounting firm, 1996-2009). Previously, Ms. Smith served as Assistant Treasurer (2013-2018) and Deputy Treasurer (2013-2016) of certain Fidelity® funds. |
Marc L. Spector (1972) |
Year of Election or Appointment: 2017 |
Assistant Treasurer |
Mr. Spector also serves as an officer of other funds. Mr. Spector serves as Assistant Treasurer of FMR Capital, Inc. (2017-present) and is an employee of Fidelity Investments (2016-present). Prior to joining Fidelity Investments, Mr. Spector served as Director at the Siegfried Group (accounting firm, 2013-2016), and prior to Siegfried Group as audit senior manager at Deloitte & Touche (accounting firm, 2005-2013). |
Renee Stagnone (1975) |
Year of Election or Appointment: 2016 |
Assistant Treasurer |
Ms. Stagnone also serves as an officer of other funds. Ms. Stagnone serves as Assistant Treasurer of FMR Capital, Inc. (2017-present) and is an employee of Fidelity Investments (1997-present). Previously, Ms. Stagnone served as Deputy Treasurer of certain Fidelity® funds (2013-2016). |
| 23 | Annual Report |
Table of Contents
Shareholder Expense Example (Unaudited)
As a shareholder of a Fund, you incur two types of costs: (1) transaction costs, and (2) ongoing costs, including management fees and other Fund expenses. This Example is intended to help you understand your ongoing costs (in dollars) of investing in a Fund and to compare these costs with the ongoing costs of investing in other funds.
The actual expense Example is based on an investment of $1,000 invested at the beginning of the period and held for the entire period (June 12, 2018 to August 31, 2018) . The hypothetical expense Example is based on an investment of $1,000 invested for the one-half year period (March 1, 2018 to August 31, 2018).
Actual Expenses
For the fund, the first line of the accompanying table provides information about actual account values and actual expenses. You may use the information in this line, together with the amount you invested, to estimate the expenses that you paid over the period. Simply divide your account value by $1,000.00 (for example, an $8,600 account value divided by $1,000.00 = 8.6), then multiply the result by the number in the first line for the Fund under the heading entitled “Expenses Paid During Period” to estimate the expenses you paid on your account during this period. In addition, the Fund, as a shareholder in the underlying Fidelity Central Funds, will indirectly bear its pro-rata share of the fees and expenses incurred by the underlying Fidelity Central Funds. These fees and expenses are not included in the Fund’s annualized expense ratio used to calculate the expense estimates in the table below.
Hypothetical Example for Comparison Purposes
For the fund, the second line of the accompanying table provides information about hypothetical account values and hypothetical expenses based on the Fund’s actual expense ratio and an assumed rate of return of 5% per year before expenses, which is not the Fund’s actual return. The hypothetical account values and expenses may not be used to estimate the actual ending account balance or expenses you paid for the period. You may use this information to compare the ongoing costs of investing in the Fund and other funds. To do so, compare this 5% hypothetical example with the 5% hypothetical examples that appear in the shareholder reports of the other funds. In addition, the Fund, as a shareholder in the underlying Fidelity Central Funds, will indirectly bear its pro-rata share of the fees and expenses incurred by the underlying Fidelity Central Funds. These fees and expenses are not included in the Fund’s annualized expense ratio used to calculate the expense estimates in the table below.
Please note that the expenses shown in the table are meant to highlight your ongoing costs only and do not reflect any transaction costs. Therefore, the second line of the table is useful in comparing ongoing costs only, and will not help you determine the relative total costs of owning different funds.
| Annualized Expense RatioA | Beginning Account Value | Ending Account Value August 31, 2018 | Expenses Paid During Period | |||||||||||||
Fidelity High Yield Factor ETF | 0.45% | |||||||||||||||
Actual | $ | 1,000.00 | $ | 1,015.90 | $ | 1.01 | B | |||||||||
HypotheticalC | $ | 1,000.00 | $ | 1,022.94 | $ | 2.29 | D | |||||||||
| A | Annualized expense ratio reflects expenses net of applicable fee waivers. |
| B | Actual expenses are equal to the Fund’s annualized expense ratio, multiplied by the average account value over the period, multiplied by 81/365 (to reflect the period June 12, 2018 to August 31, 2018). |
| C | 5% return per year before expenses. |
| D | Hypothetical expenses are equal to the Fund’s annualized expense ratio, multiplied by the average account value over the period, multiplied by 184/365 (to reflect the one-half year period). |
| Annual Report | 24 |
Table of Contents
The Board of Trustees of each fund voted to pay shareholders of record at the opening of business on record date, the following distributions per share derived from capital gains realized from sales of portfolio securities.
| Pay Date | Record Date | Dividends | Capital Gains | |||||||||||||
| Fidelity High Yield Factor ETF | 10/02/18 | 09/27/18 | $ | 0.221 | $ | 0.00 | ||||||||||
A percentage of the dividends distributed during the fiscal year for the following funds were derived from interest on U.S. Government securities which is generally exempt from state income tax:
| Fidelity High Yield Factor ETF | 0 | % |
The funds hereby designate the amounts noted below as distributions paid during the period January 1, 2018 to August 31, 2018 as qualifying to be taxed as interest-related dividends for nonresident alien shareholders:
| Fidelity High Yield Factor ETF | $ | 119,371 |
The funds will notify shareholders in January 2019 of amounts for use in preparing 2018 income tax returns.
| 25 | Annual Report |
Table of Contents
Board Approval of Investment Advisory Contracts and Management Fees
Fidelity High Yield Factor ETF
On March 7, 2018, the Board of Trustees, including the Independent Trustees (together, the Board), voted to approve the management contract with FMR Co., Inc. (FMRC), an affiliate of Fidelity Management & Research Company (FMR), and the sub-advisory agreements with affiliates of FMR (together, the Advisory Contracts) for the fund. FMRC and the sub-advisers are collectively referred to herein as the Investment Advisers. The Board, assisted by the advice of fund counsel and Independent Trustees’ counsel, considered a broad range of information.
Nature, Extent, and Quality of Services Provided. The Board considered Fidelity’s staffing as it relates to the fund, including the backgrounds of investment personnel of Fidelity, and also considered the fund’s investment objective, strategies, and related investment philosophy. The Board considered the structure of the investment personnel compensation program and whether this structure provides appropriate incentives to act in the best interests of the fund.
Resources Dedicated to Investment Management and Support Services. The Board and the Fund Oversight and Research Committees reviewed the general qualifications and capabilities of Fidelity’s investment staff, including its size, education, experience, and resources, as well as Fidelity’s approach to recruiting, training, managing, and compensating investment personnel. The Board noted that Fidelity has continued to increase the resources devoted to non-U.S. offices, including expansion of Fidelity’s global investment organization. The Board also noted that Fidelity’s analysts have extensive resources, tools and capabilities that allow them to conduct sophisticated quantitative and fundamental analysis, as well as credit analysis of issuers, counterparties and guarantors. Further, the Board considered that Fidelity’s investment professionals have sufficient access to global information and data so as to provide competitive investment results over time, and that those professionals also have access to sophisticated tools that permit them to assess portfolio construction and risk and performance attribution characteristics continuously, as well as to transmit new information and research conclusions rapidly around the world. Additionally, in its deliberations, the Board considered Fidelity’s trading, risk management, compliance, and technology and operations capabilities and resources, which are integral parts of the investment management process.
Shareholder, Administrative and Other Services. The Board considered the nature, extent, quality, and cost of advisory, administrative and shareholder and other services to be performed by the Investment Advisers and their affiliates and a third party service provider under the Advisory Contracts and under separate agreements covering transfer agency, pricing and bookkeeping, and securities lending services for the fund. The Board also considered the nature and extent of the supervision of third party service providers, principally custodians, subcustodians, and pricing vendors.
The Board noted that the growth of fund assets over time across the complex allows Fidelity to reinvest in the development of services designed to enhance the value or convenience of the Fidelity funds as investment vehicles. These services include 24-hour access to account information and market information through telephone representatives and over the Internet, investor education materials and asset allocation tools, and the expanded availability of Fidelity Investor Centers.
Investment Performance. The fund is a new fund and therefore had no historical performance for the Board to review at the time it approved the fund’s Advisory Contracts. The Board considered the Investment Advisers’ experience in managing high yield funds, which the Board is familiar with through its supervision of Fidelity Funds.
Based on its review, the Board concluded that the nature, extent, and quality of services to be provided to the fund under the Advisory Contracts should benefit the shareholders of the fund.
Competitiveness of Management Fee and Total Expense Ratio. The Board considered the fund’s proposed management fee rate out of which FMRC will pay all operating expenses of the fund, with certain limited exceptions, and the projected total expense ratio of the fund. The Board noted that the fund’s proposed management fee rate is lower than the median fee rate of funds with similar Lipper investment objective categories and comparable investment mandates, regardless of whether their management fee structures are comparable. The Board also considered that the projected total expense ratio of the fund is at the median of those funds used by the Board for management fee comparisons.
Based on its review, the Board concluded that the fund’s management fee and projected total expense ratio were reasonable in light of the services that the fund and its shareholders will receive and the other factors considered.
Costs of the Services and Profitability. The fund is a new fund and therefore no revenue, cost, or profitability data was available for the Board to review in respect of the fund at the time it approved the Advisory Contracts. In connection with its future renewal of the fund’s Advisory Contracts, the Board will consider the revenues earned and the expenses incurred by Fidelity in conducting the business of developing, marketing, distributing, managing, administering and servicing the fund and servicing the fund’s shareholders.
Economies of Scale. The Board will consider economies of scale when there is operating experience to permit assessment thereof. It noted that, notwithstanding the entrepreneurial risk associated with a new fund, the management fee was at a level normally associated, by comparison with competitors, with very high fund net assets, and Fidelity asserted to the Board that the level of the fee anticipated economies of scale at lower asset levels even before, if ever, economies of scale are achieved. The Board also noted that the fund and its shareholders would have access to the very considerable number and variety of services available through Fidelity and its affiliates.
| Annual Report | 26 |
Table of Contents
Based on its evaluation of all of the conclusions noted above, and after considering all factors it believed relevant, the Board concluded that the advisory fee structures are fair and reasonable, and that the fund’s Advisory Contracts should be approved.
| 27 | Annual Report |
Table of Contents
| ||||
HIE-ANN-1018 1.9887634.100 | Corporate Headquarters 245 Summer St., Boston, MA 02210 www.fidelity.com |
Table of Contents
| Item 2. | Code of Ethics |
As of the end of the period, August 31, 2018, Fidelity Covington Trust (the trust) has adopted a code of ethics, as defined in Item 2 of Form N-CSR, that applies to its President and Treasurer and its Chief Financial Officer. A copy of the code of ethics is filed as an exhibit to this Form N-CSR.
| Item 3. | Audit Committee Financial Expert |
The Board of Trustees of the trust has determined that Joseph Mauriello is an audit committee financial expert, as defined in Item 3 of Form N-CSR. Mr. Mauriello is independent for purposes of Item 3 of Form N-CSR.
| Item 4. | Principal Accountant Fees and Services |
Fees and Services
The following table presents fees billed by PricewaterhouseCoopers LLP (“PwC”) in each of the last two fiscal years for services rendered to Fidelity High Yield Factor ETF (the “Fund”):
Services Billed by PwC
August 31, 2018 FeesA,B
| Audit Fees | Audit- Related Fees | Tax Fees | All Other Fees | |||||||||||||
Fidelity High Yield Factor ETF | $ | 26,000 | $ | 300 | $ | 3,400 | $ | 300 | ||||||||
August 31, 2017 FeesB
| Audit Fees | Audit- Related Fees | Tax Fees | All Other Fees | |||||||||||||
Fidelity High Yield Factor ETF | $ | — | $ | — | $ | — | $ | — | ||||||||
| A | Amounts may reflect rounding. |
| B | Fidelity High Yield Factor ETF commenced operations on June 12, 2018. |
Table of Contents
The following table presents fees billed by PwC that were required to be approved by the Audit Committee for services that relate directly to the operations and financial reporting of the Fund and that are rendered on behalf of Fidelity Management & Research Company (“FMR”) and entities controlling, controlled by, or under common control with FMR (not including any sub-adviser whose role is primarily portfolio management and is subcontracted with or overseen by another investment adviser) that provide ongoing services to the Fund (“Fund Service Providers”):
Services Billed by PwC
| August 31, 2018A,B | August 31, 2017B | |||||||
Audit-Related Fees | $ | 7,605,000 | $ | — | ||||
Tax Fees | $ | 20,000 | $ | — | ||||
All Other Fees | $ | — | $ | — | ||||
| A | Amounts may reflect rounding. |
| B | May include amounts billed prior to the Fidelity High Yield Factor ETF’s commencement of operations. |
“Audit-Related Fees” represent fees billed for assurance and related services that are reasonably related to the performance of the fund audit or the review of the fund’s financial statements and that are not reported under Audit Fees.
“Tax Fees” represent fees billed for tax compliance, tax advice or tax planning that relate directly to the operations and financial reporting of the fund.
“All Other Fees” represent fees billed for services provided to the fund or Fund Service Provider, a significant portion of which are assurance related, that relate directly to the operations and financial reporting of the fund, excluding those services that are reported under Audit Fees, Audit-Related Fees or Tax Fees.
Assurance services must be performed by an independent public accountant.
* * *
The aggregate non-audit fees billed by PwC for services rendered to the Fund, FMR (not including any sub-adviser whose role is primarily portfolio management and is subcontracted with or overseen by another investment adviser), and any Fund Service Provider for each of the last two fiscal years of the Fund are as follows:
Billed By | August 31, 2018A,B | August 31, 2017B | ||||||
PwC | $ | 10,585,000 | $ | — | ||||
| A | Amounts may reflect rounding. |
| B | May include amounts billed prior to the Fidelity High Yield Factor ETF’s commencement of operations. |
Table of Contents
The trust’s Audit Committee has considered non-audit services that were not pre-approved that were provided by PwC to Fund Service Providers to be compatible with maintaining the independence of PwC in its audit of the Fund, taking into account representations from PwC, in accordance with Public Company Accounting Oversight Board rules, regarding its independence from the Fund and its related entities and FMR’s review of the appropriateness and permissibility under applicable law of such non-audit services prior to their provision to the Fund Service Providers.
Audit Committee Pre-Approval Policies and Procedures
The trust’s Audit Committee must pre-approve all audit and non-audit services provided by a fund’s independent registered public accounting firm relating to the operations or financial reporting of the fund. Prior to the commencement of any audit or non-audit services to a fund, the Audit Committee reviews the services to determine whether they are appropriate and permissible under applicable law.
The Audit Committee has adopted policies and procedures to, among other purposes, provide a framework for the Committee’s consideration of non-audit services by the audit firms that audit the Fidelity funds. The policies and procedures require that any non-audit service provided by a fund audit firm to a Fidelity fund and any non-audit service provided by a fund auditor to a Fund Service Provider that relates directly to the operations and financial reporting of a Fidelity fund (“Covered Service”) are subject to approval by the Audit Committee before such service is provided.
All Covered Services must be approved in advance of provision of the service either: (i) by formal resolution of the Audit Committee, or (ii) by oral or written approval of the service by the Chair of the Audit Committee (or if the Chair is unavailable, such other member of the Audit Committee as may be designated by the Chair to act in the Chair’s absence). The approval contemplated by (ii) above is permitted where the Treasurer determines that action on such an engagement is necessary before the next meeting of the Audit Committee.
Non-audit services provided by a fund audit firm to a Fund Service Provider that do not relate directly to the operations and financial reporting of a Fidelity fund are reported to the Audit Committee periodically.
Non-Audit Services Approved Pursuant to Rule 2-01(c)(7)(i)(C) and (ii) of Regulation S-X (“De Minimis Exception”)
There were no non-audit services approved or required to be approved by the Audit Committee pursuant to the De Minimis Exception during the Fund’s last two fiscal years relating to services provided to (i) the Fund or (ii) any Fund Service Provider that relate directly to the operations and financial reporting of the Fund.
Table of Contents
| Item 5. | Audit Committee of Listed Registrants |
The Audit Committee is a separately-designated standing audit committee in accordance with Section 3(a)(58)(A) of the Securities Exchange Act of 1934. As of August 31, 2018, the members of the Audit Committee were Joseph Mauriello, Don Donahue and Alan Lacy.
| Item 6. | Investments |
| (a) | Not applicable. |
| (b) | Not applicable |
| Item 7. | Disclosure of Proxy Voting Policies and Procedures for Closed-End Management Investment Companies |
Not applicable.
| Item 8. | Portfolio Managers of Closed-End Management Investment Companies |
Not applicable.
| Item 9. | Purchase of Equity Securities by Closed-End Management Investment Company and Affiliated Purchasers |
Not applicable.
| Item 10. | Submission of Matters to a Vote of Security Holders |
There were no material changes to the procedures by which shareholders may recommend nominees to the trust’s Board of Trustees.
| Item 11. | Controls and Procedures |
(a)(i) The President and Treasurer and the Chief Financial Officer have concluded that the trust’s disclosure controls and procedures (as defined in Rule 30a-3(c) under the Investment Company Act) provide reasonable assurances that material information relating to the trust is made known to them by the appropriate persons, based on their evaluation of these controls and procedures as of a date within 90 days of the filing date of this report.
(a)(ii) There was no change in the trust’s internal control over financial reporting (as defined in Rule 30a-3(d) under the Investment Company Act) that occurred during the period covered by this report that has materially affected, or is reasonably likely to materially affect, the trust’s internal control over financial reporting.
| Item 12. | Disclosure of Securities Lending Activities for Closed-End Management Investment Companies |
Not applicable.
Table of Contents
| Item 13. | Exhibits |
| (a) | (1) Code of Ethics pursuant to Item 2 of Form N-CSR is filed and attached hereto as EX-99.CODE ETH. | |
| (a) | (2) Certification pursuant to Rule 30a-2(a) under the Investment Company Act of 1940 (17 CFR 270.30a-2(a)) is filed and attached hereto as Exhibit 99.CERT. | |
| (a) | (3) Not applicable. | |
| (b) | Certification pursuant to Rule 30a-2(b) under the Investment Company Act of 1940 (17 CFR 270.30a-2(b)) is furnished and attached hereto as Exhibit 99.906CERT. | |
Table of Contents
SIGNATURES
Pursuant to the requirements of the Securities Exchange Act of 1934 and the Investment Company Act of 1940, the registrant has duly caused this report to be signed on its behalf by the undersigned, thereunto duly authorized.
Fidelity Covington Trust
| By: | /s/ Stacie M. Smith | |
| Stacie M. Smith | ||
| President and Treasurer | ||
| Date: | October 26, 2018 | |
Pursuant to the requirements of the Securities Exchange Act of 1934 and the Investment Company Act of 1940, this report has been signed below by the following persons on behalf of the registrant and in the capacities and on the dates indicated.
| By: | /s/Stacie M. Smith | |
| Stacie M. Smith | ||
| President and Treasurer | ||
| Date: | October 26, 2018 | |
| By: | /s/John J. Burke III | |
| John J. Burke III | ||
| Chief Financial Officer | ||
| Date: | October 26, 2018 | |