Table of Contents
UNITED STATES
SECURITIES AND EXCHANGE COMMISSION
Washington, D.C. 20549
FORM N-CSR
CERTIFIED SHAREHOLDER REPORT OF REGISTERED
MANAGEMENT INVESTMENT COMPANIES
Investment Company Act file number 811-07319
Fidelity Covington Trust
(Exact name of registrant as specified in charter)
245 Summer St., Boston, Massachusetts 02210
(Address of principal executive offices) (Zip code)
Marc Bryant, Secretary
245 Summer St.
Boston, Massachusetts 02210
(Name and address of agent for service)
Registrant’s telephone number, including area code: 617-563-7000
Date of fiscal year end: July 31
Date of reporting period: July 31, 2018
Table of Contents
| Item 1. | Reports to Stockholders |
Table of Contents
Fidelity® MSCI Consumer Discretionary Index ETF
Fidelity MSCI Consumer Staples Index ETF
Fidelity MSCI Energy Index ETF
Fidelity MSCI Financials Index ETF
Fidelity MSCI Health Care Index ETF
Fidelity MSCI Industrials Index ETF
Fidelity MSCI Information Technology Index ETF
Fidelity MSCI Materials Index ETF
Fidelity MSCI Real Estate Index ETF
Fidelity MSCI Telecommunications Services Index ETF
(To be renamed Fidelity MSCI Communication Services Index ETF effective December 1, 2018)
Fidelity MSCI Utilities Index ETF
Annual Report July 31, 2018
|  |
Table of Contents
To view a fund’s proxy voting guidelines and proxy voting record for the period ended June, 30, visit http://www.fidelity.com/proxyvotingresults or visit the Securities and Exchange Commission’s (SEC) web site at http://www.sec.gov. You may also call 1-800-FIDELITY to request a free copy of the proxy voting guidelines.
The funds or securities referred to herein are not sponsored, endorsed, or promoted by MSCI, and MSCI bears no liability with respect to any such funds or securities or any index on which such funds or securities are based. The prospectus contains a more detailed description of the limited relationship MSCI has with Fidelity and any related funds.
Standard & Poor’s, S&P and S&P 500 are registered service marks of The McGraw-Hill Companies, Inc. and have been licensed for use by Fidelity Distributors Corporation.
Other third party marks appearing herein are the property of their respective owners.
All other marks appearing herein are registered or unregistered trademarks or service marks of FMR LLC or an affiliated company.
© 2018 FMR LLC. All Rights reserved.
This report and the financial statements contained herein are submitted for the general information of the shareholders of the funds. This report is not authorized for distribution to prospective investors in the funds unless preceded or accompanied by an effective prospectus.
A fund files its complete schedule of portfolio holdings with the SEC for the first and third quarters of each fiscal year on Form N-Q. Forms N-Q are available on the SEC’s web site at http://www.sec.gov. A fund’s Forms N-Q may be reviewed and copied at the SEC’s Public Reference Room in Washington, DC. Information regarding the operation of the SEC’s Public Reference Room may be obtained by calling 1-800-SEC-0330. For a complete list of a fund’s portfolio holdings, view the most recent holdings listing on Fidelity’s web site at http://www.fidelity.com, http://www.advisor.fidelity.com, or http://www.401k.com, as applicable.
NOT FDIC INSURED • MAY LOSE VALUE • NO BANK GUARANTEE
Neither the funds nor Fidelity Distributors Corporation is a bank.
| Annual Report | 2 |
Table of Contents
The U.S. equity bellwether S&P 500® index gained 16.24% for the 12 months ending July 31, 2018, despite a resurgence in volatility that challenged the multiyear bull market. Stocks maintained their steady growth until a sharp reversal in February, as volatility spiked amid fear that rising inflation and the potential for the economy to overheat would prompt the U.S. Federal Reserve to pick up the pace of interest rate hikes. The index posted its first negative monthly result since October 2016, and then lost further ground in March on fear of a global trade war. The market stabilized in April and turned upward through mid-June, when escalating trade tension between the U.S. and China soured investor sentiment. The resulting uncertainty lingered into July, but strong corporate earnings helped the S&P 500 rise 3.72% that month to cap the period. For the full one-year period, growth handily topped value, while small-caps bested large-caps. By sector, information technology (+28%) led the way, boosted by strong earnings growth from several major index constituents. Consumer discretionary rose roughly 24%, driven by retailers (+49%). Energy (+20%) gained alongside higher oil prices. Laggards were telecommunication services (-2%), consumer staples (0%) and utilities (+3%), defensive groups that struggled amid rising interest rates and a general preference for risk. Real estate (+5%) fared a bit better but still lagged, as did financials, industrials, health care (each up 13%) and materials (+11%).
| 3 | Annual Report |
Table of Contents
Fidelity® MSCI Consumer Discretionary Index ETF
The information provided in the tables below shows you the performance of Fidelity® MSCI Consumer Discretionary Index ETF, with comparisons over different time periods to the fund’s relevant benchmarks, including an appropriate broad-based market index. Seeing the returns over different time periods can help you assess the fund’s performance against relevant measurements. The performance information includes average annual total returns and is further explained in this section.*
The fund’s net asset value (NAV) performance is based on the NAV calculated each business day. It is calculated in accordance with the standard formula for valuing investment company shares as of the close of regular trading hours on NYSE Arca, Inc. (NYSE Arca) (normally 4:00 p.m. Eastern Time). The fund’s market price performance is based on the daily closing price of the shares of the fund on NYSE Arca. Since ETFs are bought and sold at prices set by the market – which can result in a premium or discount to NAV – the returns calculated using market price (market return) can differ from those calculated using NAV (NAV return). For information on these differences, please visit Fidelity.com or see the prospectus. The fund’s returns do not reflect the deduction of taxes that a shareholder would pay on fund distributions or the redemption or selling of fund shares. How a fund did yesterday is no guarantee of how it will do tomorrow.
Current performance may be higher or lower than the performance data quoted. For month-end performance figures, please visit fidelity.com/etfs/sector-etfs/overview or call Fidelity. The performance data featured represents past performance, which is no guarantee of future results. Investment return and principal value will fluctuate; therefore, you may have a gain or loss when you sell your shares.
| Fiscal Periods Ended July 31, 2018 | ||||||||
| Average Annual Total Returns | Past 1 Year | Life of fund | ||||||
Fidelity MSCI Consumer Discretionary Index ETF – NAVA | 21.36 | % | 13.42 | % | ||||
Fidelity MSCI Consumer Discretionary Index ETF – Market PriceB | 21.22 | % | 13.19 | % | ||||
MSCI USA IMI Consumer Discretionary IndexA | 21.49 | % | 13.56 | % | ||||
S&P 500 IndexA | 16.24 | % | 12.84 | % | ||||
Average annual total returns represent just that – the average return on an annual basis for Fidelity® MSCI Consumer Discretionary Index ETF and the fund’s benchmarks, assuming consistent performance over the periods shown, based on the cumulative return and the length of the period. This information represents returns as of the end of the fund’s fiscal period.
| Periods Ended June 30, 2018 | ||||||||
| Average Annual Total Returns | Past 1 Year | Life of fund | ||||||
Fidelity MSCI Consumer Discretionary Index ETF – NAVA | 21.65% | 13.37% | ||||||
Fidelity MSCI Consumer Discretionary Index ETF – Market PriceB | 21.92% | 13.19% | ||||||
MSCI USA IMI Consumer Discretionary IndexA | 21.78% | 13.51% | ||||||
S&P 500 IndexA | 14.37% | 12.21% | ||||||
This information shows the returns of the fund and its indices for different time periods through the end of the most recent calendar quarter, as opposed to through the end of the fund’s fiscal period.
| A | From October 21, 2013. |
| B | From October 24, 2013, date initially listed on the NYSE ARCA exchange. |
| * | Total returns are historical and include changes in share price and reinvestment of dividends and capital gains distributions, if any. |
The fund’s expense ratio is 0.084%. Expense ratio is the total annual operating expense ratio from the most recent prospectus. A fund’s net expenses paid may be different. Please refer to the most recent prospectus for more information on a fund’s expenses.
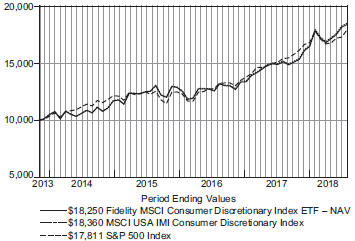
| $10,000 Over Life of Fund |
Let’s say hypothetically that $10,000 was invested in Fidelity MSCI Consumer Discretionary Index ETF – NAV on October 21, 2013, when the fund started. The chart shows how the value of your investment would have changed, and also shows how the MSCI USA IMI Consumer Discretionary Index and the S&P 500 Index performed over the same period.
| Annual Report | 4 |
Table of Contents
Fidelity® MSCI Consumer Discretionary Index ETF
Management’s Discussion of Fund Performance
For the fiscal year ending July 31, 2018, the exchange-traded fund’s (ETF) net asset value rose 21.36%, roughly in line with the 21.49% return of the MSCI USA IMI Consumer Discretionary Index. The ETF’s market price gained 21.22% over the same time frame, while the broad-market S&P 500® index returned 16.24%. The consumer discretionary sector benefited from positive business and consumer sentiment. Jobs data also trended positive, as a tight labor market, near historically low unemployment, and wage growth supported the U.S. consumer and continued overall economic expansion. Investors remained confident that the sweeping $1.5 trillion tax reform plan passed in December could boost consumers’ discretionary spending in 2018. Among industries, internet & direct market retail (+61%) – the MSCI sector index’s largest industry component – outperformed, largely on the strength of Amazon.com. Shares of the e-commerce giant advanced 80% the past year, rising largely due to the company’s sustained dominance in its core e-commerce and cloud markets. Other notable industry outperformers included apparel retail (+40%), apparel, accessories & luxury goods (+38%), general merchandise stores (+36%) and home improvement retail (+33%). Conversely, cable & satellite (-15%) struggled amid broader industry concerns, such as cord cutting, as well as M&A activity that was negatively viewed by investors. Liberty Global (-17%) agreed to sell some of its assets to Vodafone, while Comcast (-10%) bid to purchase European pay-TV giant Sky. Housewares & specialties (-47%), household appliances (-18%), broadcasting (-10%) and advertising (-5%) also lagged.
The views expressed above reflect those of the portfolio manager(s) only through the end of the period as stated on the cover of this report and do not necessarily represent the views of Fidelity or any other person in the Fidelity organization, or BlackRock Fund Advisors (the ETF’s subadviser) or any other person in the BlackRock organization. Any such views are subject to change at any time based upon market or other conditions and Fidelity and BlackRock disclaim any responsibility to update such views. These views may not be relied on as investment advice and, because investment decisions for a Fidelity fund are based on numerous factors, may not be relied on as an indication of trading intent on behalf of any Fidelity fund.
| 5 | Annual Report |
Table of Contents
Fidelity® MSCI Consumer Discretionary Index ETF
Investment Summary (Unaudited)
| Top Ten Stocks as of July 31, 2018 | ||||
| % of fund’s net assets | ||||
Amazon.com, Inc. | 19.5 | |||
The Home Depot, Inc. | 6.1 | |||
The Walt Disney Co. | 4.5 | |||
Comcast Corp. Class A | 4.4 | |||
Netflix, Inc. | 3.9 | |||
McDonald’s Corp. | 3.3 | |||
NIKE, Inc. Class B | 2.7 | |||
Booking Holdings, Inc. | 2.6 | |||
Lowe’s Companies, Inc. | 2.2 | |||
Starbucks Corp. | 2.0 | |||
|
| |||
| 51.2 | ||||
|
| |||
| Industries as of July 31, 2018 | ||
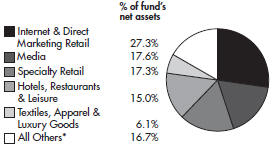
| * | Includes short-term investments and net other assets. |
| Annual Report | 6 |
Table of Contents
Fidelity® MSCI Consumer Staples Index ETF
Performance
The information provided in the tables below shows you the performance of Fidelity® MSCI Consumer Staples Index ETF, with comparisons over different time periods to the fund’s relevant benchmarks, including an appropriate broad-based market index. Seeing the returns over different time periods can help you assess the fund’s performance against relevant measurements. The performance information includes average annual total returns and is further explained in this section.*
The fund’s net asset value (NAV) performance is based on the NAV calculated each business day. It is calculated in accordance with the standard formula for valuing investment company shares as of the close of regular trading hours on NYSE Arca, Inc. (NYSE Arca) (normally 4:00 p.m. Eastern Time). The fund’s market price performance is based on the daily closing price of the shares of the fund on NYSE Arca. Since ETFs are bought and sold at prices set by the market – which can result in a premium or discount to NAV – the returns calculated using market price (market return) can differ from those calculated using NAV (NAV return). For information on these differences, please visit Fidelity.com or see the prospectus. The fund’s returns do not reflect the deduction of taxes that a shareholder would pay on fund distributions or the redemption or selling of fund shares. How a fund did yesterday is no guarantee of how it will do tomorrow.
Current performance may be higher or lower than the performance data quoted. For month-end performance figures, please visit fidelity.com/etfs/sector-etfs/overview or call Fidelity. The performance data featured represents past performance, which is no guarantee of future results. Investment return and principal value will fluctuate; therefore, you may have a gain or loss when you sell your shares.
| Fiscal Periods Ended July 31, 2018 | ||||||||
| Average Annual Total Returns | Past 1 Year | Life of fund | ||||||
Fidelity MSCI Consumer Staples Index ETF – NAVA | -0.06 | % | 8.26% | |||||
Fidelity MSCI Consumer Staples Index ETF – Market PriceB | 0.06 | % | 8.00% | |||||
MSCI USA IMI Consumer Staples IndexA | 0.09 | % | 8.42% | |||||
S&P 500 IndexA | 16.24 | % | 12.84% | |||||
Average annual total returns represent just that – the average return on an annual basis for Fidelity® MSCI Consumer Staples Index ETF and the fund’s benchmarks, assuming consistent performance over the periods shown, based on the cumulative return and the length of the period. This information represents returns as of the end of the fund’s fiscal period.
| Periods Ended June 30, 2018 | ||||||||
| Average Annual Total Returns | Past 1 Year | Life of fund | ||||||
Fidelity MSCI Consumer Staples Index ETF – NAVA | -2.94 | % | 7.60 | % | ||||
Fidelity MSCI Consumer Staples Index ETF – Market PriceB | -2.94 | % | 7.31 | % | ||||
MSCI USA IMI Consumer Staples IndexA | -2.80 | % | 7.76 | % | ||||
S&P 500 IndexA | 14.37 | % | 12.21 | % | ||||
This information shows the returns of the fund and its indices for different time periods through the end of the most recent calendar quarter, as opposed to through the end of the fund’s fiscal period.
| A | From October 21, 2013. |
| B | From October 24, 2013, date initially listed on the NYSE ARCA exchange. |
| * | Total returns are historical and include changes in share price and reinvestment of dividends and capital gains distributions, if any. |
The fund’s expense ratio is 0.084%. Expense ratio is the total annual operating expense ratio from the most recent prospectus. A fund’s net expenses paid may be different. Please refer to the most recent prospectus for more information on a fund’s expenses.
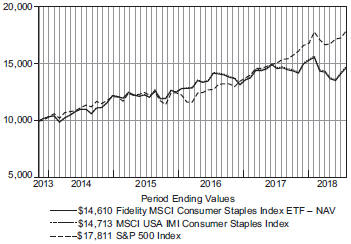
| $10,000 Over Life of Fund |
Let’s say hypothetically that $10,000 was invested in Fidelity MSCI Consumer Staples Index ETF – NAV on October 21, 2013, when the fund started. The chart shows how the value of your investment would have changed, and also shows how the MSCI USA IMI Consumer Staples Index and the S&P 500 Index performed over the same period.
| 7 | Annual Report |
Table of Contents
Fidelity® MSCI Consumer Staples Index ETF
Management’s Discussion of Fund Performance
For the fiscal year ending July 31, 2018, the exchange-traded fund’s (ETF) net asset value returned -0.06%, roughly in line with the 0.09% return of the MSCI USA IMI Consumer Staples Index. The ETF’s market price gained 0.06% over the same time frame, while the broad-market S&P 500® index returned 16.24%. Consumer staples significantly underperformed the broader equity market, as an overall acceleration in global economic activity, among other factors, helped amplify gains for the market’s cyclical sectors, while more-defensive areas such as staples lagged. Even as volatility hit the markets in 2018, the sector underperformed as companies here were hurt by weaker earnings than firms in higher-growth sectors. In addition, the sector was held back by macro headwinds such as trade tensions, rising commodity prices and changes to the U.S. tax code that favored domestically focused firms over those with international exposure, such as many staples names. Among major industry components of the MSCI sector index, tobacco (-16%) was a major laggard. Names here such as Philip Morris International (-23%) fell on proposed regulatory changes in the U.S. focused on limiting nicotine content in tobacco products, as well increased competition from alternative tobacco products, including e-cigarettes. The household products (-5%) and packaged foods & meats (-4%) groups also underperformed. Conversely, hypermarkets & super centers (+23%) advanced, benefiting from favorable results from warehouse club Costco Wholesale (+39%). Soft drinks (+6%) also outpaced the sector index, lifted by shares of Keurig Dr Pepper (+37%).
The views expressed above reflect those of the portfolio manager(s) only through the end of the period as stated on the cover of this report and do not necessarily represent the views of Fidelity or any other person in the Fidelity organization, or BlackRock Fund Advisors (the ETF’s subadviser) or any other person in the BlackRock organization. Any such views are subject to change at any time based upon market or other conditions and Fidelity and BlackRock disclaim any responsibility to update such views. These views may not be relied on as investment advice and, because investment decisions for a Fidelity fund are based on numerous factors, may not be relied on as an indication of trading intent on behalf of any Fidelity fund.
| Annual Report | 8 |
Table of Contents
Fidelity® MSCI Consumer Staples Index ETF
Investment Summary (Unaudited)
| Top Ten Stocks as of July 31, 2018 | ||||
| % of fund’s net assets | ||||
The Procter & Gamble Co. | 11.4 | |||
The Coca-Cola Co. | 10.6 | |||
PepsiCo, Inc. | 9.2 | |||
Philip Morris International, Inc. | 7.6 | |||
Walmart, Inc. | 7.4 | |||
Altria Group, Inc. | 4.9 | |||
Costco Wholesale Corp. | 4.8 | |||
Mondelez International, Inc. Class A | 3.6 | |||
Walgreens Boots Alliance, Inc. | 3.2 | |||
Colgate-Palmolive Co. | 3.2 | |||
|
| |||
| 65.9 | ||||
|
| |||
| Industries as of July 31, 2018 | ||
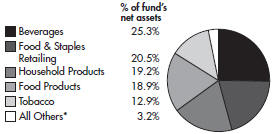
| * | Includes short-term investments and net other assets. |
| 9 | Annual Report |
Table of Contents
Fidelity® MSCI Energy Index ETF
Performance
The information provided in the tables below shows you the performance of Fidelity® MSCI Energy Index ETF, with comparisons over different time periods to the fund’s relevant benchmarks, including an appropriate broad-based market index. Seeing the returns over different time periods can help you assess the fund’s performance against relevant measurements. The performance information includes average annual total returns and is further explained in this section.*
The fund’s net asset value (NAV) performance is based on the NAV calculated each business day. It is calculated in accordance with the standard formula for valuing investment company shares as of the close of regular trading hours on NYSE Arca, Inc. (NYSE Arca) (normally 4:00 p.m. Eastern Time). The fund’s market price performance is based on the daily closing price of the shares of the fund on NYSE Arca. Since ETFs are bought and sold at prices set by the market – which can result in a premium or discount to NAV – the returns calculated using market price (market return) can differ from those calculated using NAV (NAV return). For information on these differences, please visit Fidelity.com or see the prospectus. The fund’s returns do not reflect the deduction of taxes that a shareholder would pay on fund distributions or the redemption or selling of fund shares. How a fund did yesterday is no guarantee of how it will do tomorrow.
Current performance may be higher or lower than the performance data quoted. For month-end performance figures, please visit fidelity.com/etfs/sector-etfs/overview or call Fidelity. The performance data featured represents past performance, which is no guarantee of future results. Investment return and principal value will fluctuate; therefore, you may have a gain or loss when you sell your shares.
| Fiscal Periods Ended July 31, 2018 | ||||||||
| Average Annual Total Returns | Past 1 Year | Life of fund | ||||||
Fidelity MSCI Energy Index ETF – NAVA | 20.52 | % | -0.72 | % | ||||
Fidelity MSCI Energy Index ETF – Market PriceB | 20.43 | % | -0.67 | % | ||||
MSCI USA IMI Energy IndexA | 20.66 | % | -0.62 | % | ||||
S&P 500 IndexA | 16.24 | % | 12.84 | % | ||||
Average annual total returns represent just that – the average return on an annual basis for Fidelity® MSCI Energy Index ETF and the fund’s benchmarks, assuming consistent performance over the periods shown, based on the cumulative return and the length of the period. This information represents returns as of the end of the fund’s fiscal period.
| Periods Ended June 30, 2018 | ||||||||
| Average Annual Total Returns | Past 1 Year | Life of fund | ||||||
Fidelity MSCI Energy Index ETF – NAVA | 21.94 | % | -0.99 | % | ||||
Fidelity MSCI Energy Index ETF – Market PriceB | 21.87 | % | -0.93 | % | ||||
MSCI USA IMI Energy IndexA | 22.08 | % | -0.88 | % | ||||
S&P 500 IndexA | 14.37 | % | 12.21 | % | ||||
This information shows the returns of the fund and its indices for different time periods through the end of the most recent calendar quarter, as opposed to through the end of the fund’s fiscal period.
| A | From October 21, 2013. |
| B | From October 24, 2013, date initially listed on the NYSE ARCA exchange. |
| * | Total returns are historical and include changes in share price and reinvestment of dividends and capital gains distributions, if any. |
The fund’s expense ratio is 0.084%. Expense ratio is the total annual operating expense ratio from the most recent prospectus. A fund’s net expenses paid may be different. Please refer to the most recent prospectus for more information on a fund’s expenses.
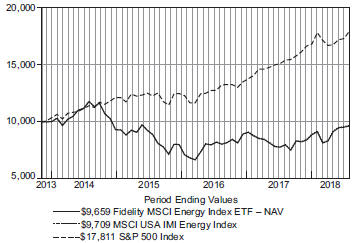
| $10,000 Over Life of Fund |
Let’s say hypothetically that $10,000 was invested in Fidelity MSCI Energy Index ETF – NAV on October 21, 2013, when the fund started. The chart shows how the value of your investment would have changed, and also shows how the MSCI USA IMI Energy Index and the S&P 500 Index performed over the same period.
| Annual Report | 10 |
Table of Contents
Fidelity® MSCI Energy Index ETF
Management’s Discussion of Fund Performance
For the fiscal year ending July 31, 2018, the exchange-traded fund’s (ETF) net asset value returned 20.52%, roughly in line with the 20.66% result of the MSCI USA IMI Energy Index. The ETF’s market price returned 20.43% over the same time frame, while the broad-market S&P 500® index rose 16.24%. A 40% increase in the per-barrel price of crude oil, driven by incremental global demand and falling inventory levels, boosted corporate profitability in the sector the past 12 months. Energy stocks rallied accordingly. Looking at industries, oil & gas refining & marketing gained roughly 62%, benefiting from widening “crack spreads” – the gap between the input cost of crude oil and the selling price of refined fuel. Global demand for refined petroleum increased this period more than the rise in crude-oil prices, particularly in the first half of the reporting period and for refiners operating near the Permian Basin in Texas. Several refining stocks were among the sector’s top performers the past year, including HollyFrontier (+167%), Valero Energy (+77%) and Phillips 66 (+52%). Oil & gas exploration & production (E&P) stocks gained 30%, directly benefiting from higher crude-oil prices, which flow to a company’s bottom line. Within the E&P industry, ConocoPhilips (+62%), Anadarko Petroleum (+62%) and EOG Resources (+36%) stood out. Oil & gas drilling also performed well, returning 23%, in large part due to the oil-price tailwind. Conversely, integrated oil & gas – the sector’s largest industry this period – gained about 14%, trailing the sector. Here, industry behemoth Exxon Mobil (+6%) was among the notable laggards. The oil & gas equipment & services (+5%) industry also underperformed, hurt by relative weakness in sizable index constituent Schlumberger (+1%). The sector’s top individual detractors included Kinder Morgan (-10%), EQT (-22%) and Ultra Petroleum (-82%).
The views expressed above reflect those of the portfolio manager(s) only through the end of the period as stated on the cover of this report and do not necessarily represent the views of Fidelity or any other person in the Fidelity organization, or BlackRock Fund Advisors (the ETF’s subadviser) or any other person in the BlackRock organization. Any such views are subject to change at any time based upon market or other conditions and Fidelity and BlackRock disclaim any responsibility to update such views. These views may not be relied on as investment advice and, because investment decisions for a Fidelity fund are based on numerous factors, may not be relied on as an indication of trading intent on behalf of any Fidelity fund.
| 11 | Annual Report |
Table of Contents
Fidelity® MSCI Energy Index ETF
Investment Summary (Unaudited)
| Top Ten Stocks as of July 31, 2018 | ||||
| % of fund’s net assets | ||||
Exxon Mobil Corp. | 19.9 | |||
Chevron Corp. | 13.9 | |||
Schlumberger Ltd. | 5.4 | |||
ConocoPhillips | 4.9 | |||
EOG Resources, Inc. | 4.3 | |||
Occidental Petroleum Corp. | 3.7 | |||
Phillips 66 | 3.2 | |||
Valero Energy Corp. | 3.0 | |||
Anadarko Petroleum Corp. | 2.2 | |||
Marathon Petroleum Corp. | 2.2 | |||
|
| |||
| 62.7 | ||||
|
| |||
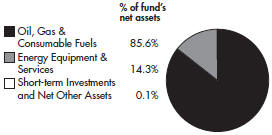
| Industries as of July 31, 2018 |
| Annual Report | 12 |
Table of Contents
Fidelity® MSCI Financials Index ETF
Performance
The information provided in the tables below shows you the performance of Fidelity® MSCI Financials Index ETF, with comparisons over different time periods to the fund’s relevant benchmarks, including an appropriate broad-based market index. Seeing the returns over different time periods can help you assess the fund’s performance against relevant measurements. The performance information includes average annual total returns and is further explained in this section.*
The fund’s net asset value (NAV) performance is based on the NAV calculated each business day. It is calculated in accordance with the standard formula for valuing investment company shares as of the close of regular trading hours on NYSE Arca, Inc. (NYSE Arca) (normally 4:00 p.m. Eastern Time). The fund’s market price performance is based on the daily closing price of the shares of the fund on NYSE Arca. Since ETFs are bought and sold at prices set by the market – which can result in a premium or discount to NAV – the returns calculated using market price (market return) can differ from those calculated using NAV (NAV return). For information on these differences, please visit Fidelity.com or see the prospectus. The fund’s returns do not reflect the deduction of taxes that a shareholder would pay on fund distributions or the redemption or selling of fund shares. How a fund did yesterday is no guarantee of how it will do tomorrow.
Current performance may be higher or lower than the performance data quoted. For month-end performance figures, please visit fidelity.com/etfs/sector-etfs/overview or call Fidelity. The performance data featured represents past performance, which is no guarantee of future results. Investment return and principal value will fluctuate; therefore, you may have a gain or loss when you sell your shares.
| Fiscal Periods Ended July 31, 2018 | ||||||||
| Average Annual Total Returns | Past 1 Year | Life of fund | ||||||
Fidelity MSCI Financials Index ETF – NAVA | 13.23 | % | 13.13 | % | ||||
Fidelity MSCI Financials Index ETF – Market PriceB | 13.28 | % | 13.20 | % | ||||
MSCI USA IMI Financials IndexA | 13.32 | % | 13.26 | % | ||||
S&P 500 IndexA | 16.24 | % | 12.84 | % | ||||
Average annual total returns represent just that – the average return on an annual basis for Fidelity® MSCI Financials Index ETF and the fund’s benchmarks, assuming consistent performance over the periods shown, based on the cumulative return and the length of the period. This information represents returns as of the end of the fund’s fiscal period.
| Periods Ended June 30, 2018 | ||||||||
| Average Annual Total Returns | Past 1 Year | Life of fund | ||||||
Fidelity MSCI Financials Index ETF – NAVA | 9.89 | % | 12.28 | % | ||||
Fidelity MSCI Financials Index ETF – Market PriceB | 9.90 | % | 12.35 | % | ||||
MSCI USA IMI Financials IndexA | 9.98 | % | 12.40 | % | ||||
S&P 500 IndexA | 14.37 | % | 12.21 | % | ||||
This information shows the returns of the fund and its indices for different time periods through the end of the most recent calendar quarter, as opposed to through the end of the fund’s fiscal period.
| A | From October 21, 2013. |
| B | From October 24, 2013, date initially listed on the NYSE ARCA exchange. |
| * | Total returns are historical and include changes in share price and reinvestment of dividends and capital gains distributions, if any. |
The fund’s expense ratio is 0.084%. Expense ratio is the total annual operating expense ratio from the most recent prospectus. A fund’s net expenses paid may be different. Please refer to the most recent prospectus for more information on a fund’s expenses.
| $10,000 Over Life of Fund |
Let’s say hypothetically that $10,000 was invested in Fidelity MSCI Financials Index ETF – NAV on October 21, 2013, when the fund started. The chart shows how the value of your investment would have changed, and also shows how the MSCI USA IMI Financials Index and the S&P 500 Index performed over the same period.

| 13 | Annual Report |
Table of Contents
Fidelity® MSCI Financials Index ETF
Management’s Discussion of Fund Performance
For the 12 months ending July 31, 2018, the exchange-traded fund’s (ETF) net asset value rose 13.23%, versus the 13.32% return of the MSCI USA IMI Financials Index. The ETF’s market price gained 13.28% over the same period, while the broad-based S&P 500® index returned 16.24%. Financials stocks benefited from lower U.S. corporate tax rates, favorable economic data, higher interest rates and positive regulatory stress-test results for most big U.S. banks. Rising inflation expectations and mounting global trade tensions, however, were headwinds. Within the MSCI index, the two largest industry groups – diversified banks, notably JPMorgan Chase & Co. (+28%) and Bank of America (+30%), and regional banks – stood out. Financial exchanges & data, led by CME Group (+35%), gained as the stability of the segment’s business model and revenue growth attracted investors. Increased volatility and higher trading volumes helped the investment banking & brokerage group, while consumer finance stocks rose amid better-than-expected credit conditions. By contrast, within the MSCI index, rising inflation expectations and catastrophe losses pressured insurance stocks. Weak performers included multiline insurer American International Group (-14%) and life & health insurer Prudential Financial (-8%). Elsewhere, increased competition kept asset management & custody banks in check. Here, asset management companies Invesco (-19%) and Federated Investors (-13%) lagged.
The views expressed above reflect those of the portfolio manager(s) only through the end of the period as stated on the cover of this report and do not necessarily represent the views of Fidelity or any other person in the Fidelity organization, or BlackRock Fund Advisors (the ETF’s subadviser) or any other person in the BlackRock organization. Any such views are subject to change at any time based upon market or other conditions and Fidelity and BlackRock disclaim any responsibility to update such views. These views may not be relied on as investment advice and, because investment decisions for a Fidelity fund are based on numerous factors, may not be relied on as an indication of trading intent on behalf of any Fidelity fund.
| Annual Report | 14 |
Table of Contents
Fidelity® MSCI Financials Index ETF
Investment Summary (Unaudited)
| Top Ten Stocks as of July 31, 2018 | ||||
| % of fund’s net assets | ||||
JPMorgan Chase & Co. | 9.7 | |||
Bank of America Corp. | 7.4 | |||
Wells Fargo & Co. | 6.6 | |||
Berkshire Hathaway, Inc. Class B | 6.2 | |||
Citigroup, Inc. | 4.5 | |||
The Goldman Sachs Group, Inc. | 2.1 | |||
US Bancorp | 2.1 | |||
American Express Co. | 1.8 | |||
The PNC Financial Services Group, Inc. | 1.7 | |||
Morgan Stanley | 1.7 | |||
|
| |||
| 43.8 | ||||
|
| |||
| Industries as of July 31, 2018 |

| * | Includes short-term investments and net other assets. |
| 15 | Annual Report |
Table of Contents
Fidelity® MSCI Health Care Index ETF
Performance
The information provided in the tables below shows you the performance of Fidelity® MSCI Health Care Index ETF, with comparisons over different time periods to the fund’s relevant benchmarks, including an appropriate broad-based market index. Seeing the returns over different time periods can help you assess the fund’s performance against relevant measurements. The performance information includes average annual total returns and is further explained in this section.*
The fund’s net asset value (NAV) performance is based on the NAV calculated each business day. It is calculated in accordance with the standard formula for valuing investment company shares as of the close of regular trading hours on NYSE Arca, Inc. (NYSE Arca) (normally 4:00 p.m. Eastern Time). The fund’s market price performance is based on the daily closing price of the shares of the fund on NYSE Arca. Since ETFs are bought and sold at prices set by the market – which can result in a premium or discount to NAV – the returns calculated using market price (market return) can differ from those calculated using NAV (NAV return). For information on these differences, please visit Fidelity.com or see the prospectus. The fund’s returns do not reflect the deduction of taxes that a shareholder would pay on fund distributions or the redemption or selling of fund shares. How a fund did yesterday is no guarantee of how it will do tomorrow.
Current performance may be higher or lower than the performance data quoted. For month-end performance figures, please visit fidelity.com/etfs/sector-etfs/overview or call Fidelity. The performance data featured represents past performance, which is no guarantee of future results. Investment return and principal value will fluctuate; therefore, you may have a gain or loss when you sell your shares.
| Fiscal Periods Ended July 31, 2018 | ||||||||
| Average Annual Total Returns | Past 1 Year | Life of fund | ||||||
Fidelity MSCI Health Care Index ETF – NAVA | 15.34 | % | 14.05 | % | ||||
Fidelity MSCI Health Care Index ETF – Market PriceB | 15.47 | % | 13.87 | % | ||||
MSCI USA IMI Health Care IndexA | 15.47 | % | 14.19 | % | ||||
S&P 500 IndexA | 16.24 | % | 12.84 | % | ||||
Average annual total returns represent just that – the average return on an annual basis for Fidelity® MSCI Health Care Index ETF and the fund’s benchmarks, assuming consistent performance over the periods shown, based on the cumulative return and the length of the period. This information represents returns as of the end of the fund’s fiscal period.
| Periods Ended June 30, 2018 | ||||||||
| Average Annual Total Returns | Past 1 Year | Life of fund | ||||||
Fidelity MSCI Health Care Index ETF – NAVA | 9.39 | % | 12.92 | % | ||||
Fidelity MSCI Health Care Index ETF – Market PriceB | 9.37 | % | 12.75 | % | ||||
MSCI USA IMI Health Care IndexA | 9.52 | % | 13.06 | % | ||||
S&P 500 IndexA | 14.37 | % | 12.21 | % | ||||
This information shows the returns of the fund and its indices for different time periods through the end of the most recent calendar quarter, as opposed to through the end of the fund’s fiscal period.
| A | From October 21, 2013. |
| B | From October 24, 2013, date initially listed on the NYSE ARCA exchange. |
| * | Total returns are historical and include changes in share price and reinvestment of dividends and capital gains distributions, if any. |
The fund’s expense ratio is 0.084%. Expense ratio is the total annual operating expense ratio from the most recent prospectus. A fund’s net expenses paid may be different. Please refer to the most recent prospectus for more information on a fund’s expenses.
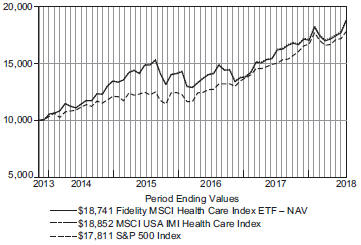
| $10,000 Over Life of Fund |
Let’s say hypothetically that $10,000 was invested in Fidelity MSCI Health Care Index ETF – NAV on October 21, 2013, when the fund started. The chart shows how the value of your investment would have changed, and also shows how the MSCI USA IMI Health Care Index and the S&P 500 Index performed over the same period.
| Annual Report | 16 |
Table of Contents
Fidelity® MSCI Health Care Index ETF
Management’s Discussion of Fund Performance
For the fiscal year ending July 31, 2018, the exchange-traded fund’s (ETF) net asset value gained 15.34%, roughly in line with the 15.47% return of the MSCI USA IMI Health Care Index. The ETF’s market price gained 15.47% over the same time frame, while the broad-market S&P 500® index returned 16.24%. Health care companies generally benefited from continued strong demand for products and services, due in part to the secular trend of an aging population. Many firms here boasted strong fundamentals and financials, and new innovations drove growth in several industries. However, the sector modestly lagged the broad market the past year, partly due to the poor performance of the health care distributors industry (-23%). Here, names such as drug distributor McKesson (-22%) fell on industry concerns about generic drug pricing, inventories and competition among drug wholesalers, as online retailer Amazon.com made moves to enter the market. Pharmaceuticals and biotechnology – the index’s largest industries – each gained about 8%, underperforming the MSCI sector index. Stocks from both groups – including Celegene (-33%) and Allergan (-26%) – were hampered by increasing political rhetoric around drug-pricing practices, along with company-specific factors. Conversely, managed health care (+32%) stocks, such as Anthem (+38%), rallied strongly this period. Anthem, in particular, benefited from consecutive quarters of better-than-expected earnings in 2018, as well as an increase in the firm’s full-year profits estimate. The health care equipment (+26%) segment, another significant index component, rose on strong results from names like medical device maker Becton Dickinson (+26%), which advanced on quarterly revenue and earnings that beat analysts’ expectations.
The views expressed above reflect those of the portfolio manager(s) only through the end of the period as stated on the cover of this report and do not necessarily represent the views of Fidelity or any other person in the Fidelity organization, or BlackRock Fund Advisors (the ETF’s subadviser) or any other person in the BlackRock organization. Any such views are subject to change at any time based upon market or other conditions and Fidelity and BlackRock disclaim any responsibility to update such views. These views may not be relied on as investment advice and, because investment decisions for a Fidelity fund are based on numerous factors, may not be relied on as an indication of trading intent on behalf of any Fidelity fund.
| 17 | Annual Report |
Table of Contents
Fidelity® MSCI Health Care Index ETF
Investment Summary (Unaudited)
| Top Ten Stocks as of July 31, 2018 | ||||
| % of fund’s net assets | ||||
Johnson & Johnson | 8.8 | |||
UnitedHealth Group, Inc. | 6.0 | |||
Pfizer, Inc. | 5.9 | |||
Merck & Co., Inc. | 4.4 | |||
AbbVie, Inc. | 3.4 | |||
Amgen, Inc. | 3.3 | |||
Medtronic PLC | 3.0 | |||
Abbott Laboratories | 2.8 | |||
Gilead Sciences, Inc. | 2.5 | |||
Eli Lilly & Co. | 2.4 | |||
|
| |||
| 42.5 | ||||
|
| |||
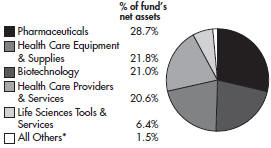
| Industries as of July 31, 2018 |
| * | Includes short-term investments and net other assets. |
| Annual Report | 18 |
Table of Contents
Fidelity® MSCI Industrials Index ETF
Performance
The information provided in the tables below shows you the performance of Fidelity® MSCI Industrials Index ETF, with comparisons over different time periods to the fund’s relevant benchmarks, including an appropriate broad-based market index. Seeing the returns over different time periods can help you assess the fund’s performance against relevant measurements. The performance information includes average annual total returns and is further explained in this section.*
The fund’s net asset value (NAV) performance is based on the NAV calculated each business day. It is calculated in accordance with the standard formula for valuing investment company shares as of the close of regular trading hours on NYSE Arca, Inc. (NYSE Arca) (normally 4:00 p.m. Eastern Time). The fund’s market price performance is based on the daily closing price of the shares of the fund on NYSE Arca. Since ETFs are bought and sold at prices set by the market – which can result in a premium or discount to NAV – the returns calculated using market price (market return) can differ from those calculated using NAV (NAV return). For information on these differences, please visit Fidelity.com or see the prospectus. The fund’s returns do not reflect the deduction of taxes that a shareholder would pay on fund distributions or the redemption or selling of fund shares. How a fund did yesterday is no guarantee of how it will do tomorrow.
Current performance may be higher or lower than the performance data quoted. For month-end performance figures, please visit fidelity.com/etfs/sector-etfs/overview or call Fidelity. The performance data featured represents past performance, which is no guarantee of future results. Investment return and principal value will fluctuate; therefore, you may have a gain or loss when you sell your shares.
| Fiscal Periods Ended July 31, 2018 | ||||||||
| Average Annual Total Returns | Past 1 Year | Life of fund | ||||||
Fidelity MSCI Industrials Index ETF – NAVA | 15.08 | % | 11.76 | % | ||||
Fidelity MSCI Industrials Index ETF – Market PriceB | 14.97 | % | 11.50 | % | ||||
MSCI USA IMI Industrials IndexA | 15.21 | % | 11.89 | % | ||||
S&P 500 IndexA | 16.24 | % | 12.84 | % | ||||
Average annual total returns represent just that – the average return on an annual basis for Fidelity® MSCI Industrials Index ETF and the fund’s benchmarks, assuming consistent performance over the periods shown, based on the cumulative return and the length of the period. This information represents returns as of the end of the fund’s fiscal period.
| Periods Ended June 30, 2018 | ||||||||
| Average Annual Total Returns | Past 1 Year | Life of fund | ||||||
Fidelity MSCI Industrials Index ETF – NAVA | 8.51 | % | 10.45 | % | ||||
Fidelity MSCI Industrials Index ETF – Market PriceB | 8.44 | % | 10.23 | % | ||||
MSCI USA IMI Industrials IndexA | 8.62 | % | 10.58 | % | ||||
S&P 500 IndexA | 14.37 | % | 12.21 | % | ||||
This information shows the returns of the fund and its indices for different time periods through the end of the most recent calendar quarter, as opposed to through the end of the fund’s fiscal period.
| A | From October 21, 2013. |
| B | From October 24, 2013, date initially listed on the NYSE ARCA exchange. |
| * | Total returns are historical and include changes in share price and reinvestment of dividends and capital gains distributions, if any. |
The fund’s expense ratio is 0.084%. Expense ratio is the total annual operating expense ratio from the most recent prospectus. A fund’s net expenses paid may be different. Please refer to the most recent prospectus for more information on a fund’s expenses.
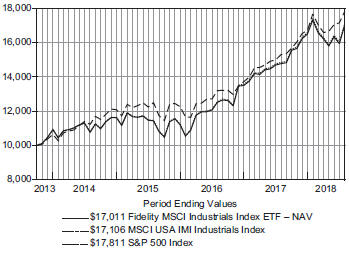
| $10,000 Over Life of Fund |
Let’s say hypothetically that $10,000 was invested in Fidelity MSCI Industrials Index ETF – NAV on October 21, 2013, when the fund started. The chart shows how the value of your investment would have changed, and also shows how the MSCI USA IMI Industrials Index and the S&P 500 Index performed over the same period.
| 19 | Annual Report |
Table of Contents
Fidelity® MSCI Industrials Index ETF
Management’s Discussion of Fund Performance
For the fiscal year ending July 31, 2018, the exchange-traded fund’s (ETF) net asset value returned 15.08%, in line with the 15.21% result of the MSCI USA IMI Industrials Index. The ETF’s market price returned 14.97% over the same time frame, while the broad-market S&P 500® index returned 16.24%. Industrials finished near the middle of the pack among the 11 S&P 500® sectors this period. Among groups with a meaningful representation in the MSCI sector index, railroads (+46%) performed well, benefiting from tight capacity and strong pricing. Norfolk Southern (+53%) and Union Pacific (+49%) helped lift this group. Aerospace & defense (+26%) was another strong-performing index group. Boeing (+50%) was a standout here, driven earlier in the period by the Trump administration’s promise to boost military spending and an anticipated cash boost from December’s tax-reform package. Air freight & logistics (+20%) contributed as well. Conversely, industrial conglomerates (-13%) was a meaningful drag on the sector’s result. Much of this was due to General Electric (-45%). These shares had a sizable meltdown amid a change of leadership, the company’s first dividend cut since 2009 and, in the third quarter of 2017, its largest quarterly earnings miss in roughly 17 years. Airlines (+6%) also lagged.
The views expressed above reflect those of the portfolio manager(s) only through the end of the period as stated on the cover of this report and do not necessarily represent the views of Fidelity or any other person in the Fidelity organization, or BlackRock Fund Advisors (the ETF’s subadviser) or any other person in the BlackRock organization. Any such views are subject to change at any time based upon market or other conditions and Fidelity and BlackRock disclaim any responsibility to update such views. These views may not be relied on as investment advice and, because investment decisions for a Fidelity fund are based on numerous factors, may not be relied on as an indication of trading intent on behalf of any Fidelity fund.
| Annual Report | 20 |
Table of Contents
Fidelity® MSCI Industrials Index ETF
Investment Summary (Unaudited)
| Top Ten Stocks as of July 31, 2018 | ||||
| % of fund’s net assets | ||||
The Boeing Co. | 6.7 | |||
3M Co. | 4.2 | |||
Honeywell International, Inc. | 4.0 | |||
General Electric Co. | 3.9 | |||
Union Pacific Corp. | 3.9 | |||
United Technologies Corp. | 3.4 | |||
Caterpillar, Inc. | 2.9 | |||
Lockheed Martin Corp. | 2.8 | |||
United Parcel Service, Inc. Class B | 2.8 | |||
FedEx Corp. | 2.1 | |||
|
| |||
| 36.7 | ||||
|
| |||
| Industries as of July 31, 2018 |
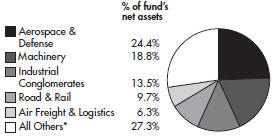
| * | Includes short-term investments and net other assets. |
| 21 | Annual Report |
Table of Contents
Fidelity® MSCI Information Technology Index ETF
Performance
The information provided in the tables below shows you the performance of Fidelity® MSCI Information Technology Index ETF, with comparisons over different time periods to the fund’s relevant benchmarks, including an appropriate broad-based market index. Seeing the returns over different time periods can help you assess the fund’s performance against relevant measurements. The performance information includes average annual total returns and is further explained in this section.*
The fund’s net asset value (NAV) performance is based on the NAV calculated each business day. It is calculated in accordance with the standard formula for valuing investment company shares as of the close of regular trading hours on NYSE Arca, Inc. (NYSE Arca) (normally 4:00 p.m. Eastern Time). The fund’s market price performance is based on the daily closing price of the shares of the fund on NYSE Arca. Since ETFs are bought and sold at prices set by the market – which can result in a premium or discount to NAV – the returns calculated using market price (market return) can differ from those calculated using NAV (NAV return). For information on these differences, please visit Fidelity.com or see the prospectus. The fund’s returns do not reflect the deduction of taxes that a shareholder would pay on fund distributions or the redemption or selling of fund shares. How a fund did yesterday is no guarantee of how it will do tomorrow.
Current performance may be higher or lower than the performance data quoted. For month-end performance figures, please visit fidelity.com/etfs/sector-etfs/overview or call Fidelity. The performance data featured represents past performance, which is no guarantee of future results. Investment return and principal value will fluctuate; therefore, you may have a gain or loss when you sell your shares.
| Fiscal Periods Ended July 31, 2018 | ||||||||
| Average Annual Total Returns | Past | Life of | ||||||
| 1 Year | fund | |||||||
Fidelity MSCI Information Technology Index ETF – NAVA | 27.92 | % | 19.74 | % | ||||
Fidelity MSCI Information Technology Index ETF – Market PriceB | 27.97 | % | 19.90 | % | ||||
MSCI USA IMI Information Technology IndexA | 28.09 | % | 19.86 | % | ||||
S&P 500 IndexA | 16.24 | % | 12.84 | % | ||||
Average annual total returns represent just that – the average return on an annual basis for Fidelity® MSCI Information Technology Index ETF and the fund’s benchmarks, assuming consistent performance over the periods shown, based on the cumulative return and the length of the period. This information represents returns as of the end of the fund’s fiscal period.
| Periods Ended June 30, 2018 | ||||||||
| Average Annual Total Returns | Past | Life of | ||||||
| 1 Year | fund | |||||||
Fidelity MSCI Information Technology Index ETF – NAVA | 30.54 | % | 19.62 | % | ||||
Fidelity MSCI Information Technology Index ETF – Market PriceB | 30.67 | % | 19.79 | % | ||||
MSCI USA IMI Information Technology IndexA | 30.71 | % | 19.74 | % | ||||
S&P 500 IndexA | 14.37 | % | 12.21 | % | ||||
This information shows the returns of the fund and its indices for different time periods through the end of the most recent calendar quarter, as opposed to through the end of the fund’s fiscal period.
| A | From October 21, 2013. |
| B | From October 24, 2013, date initially listed on the NYSE ARCA exchange. |
| * | Total returns are historical and include changes in share price and reinvestment of dividends and capital gains distributions, if any. |
The fund’s expense ratio is 0.084%. Expense ratio is the total annual operating expense ratio from the most recent prospectus. A fund’s net expenses paid may be different. Please refer to the most recent prospectus for more information on a fund’s expenses.
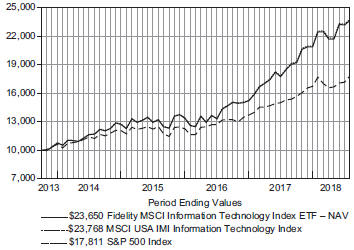
| $10,000 Over Life of Fund |
Let’s say hypothetically that $10,000 was invested in Fidelity MSCI Information Technology Index ETF – NAV on October 21, 2013, when the fund started. The chart shows how the value of your investment would have changed, and also shows how the MSCI USA IMI Information Technology Index and the S&P 500 Index performed over the same period.
| Annual Report | 22 |
Table of Contents
Fidelity® MSCI Information Technology Index ETF
Management’s Discussion of Fund Performance
For the fiscal year ending July 31, 2018, the exchange-traded fund’s (ETF) net asset value returned 27.92%, roughly in line with the 28.09% result of the MSCI USA IMI Information Technology Index. The ETF’s market price returned 27.97% over the same time frame, while the broad-market S&P 500® index returned 16.24%. Technology was the best performer among the 11 S&P 500® sectors this period. Among groups with a meaningful representation in the MSCI index, application software (+43%) was a standout, paced by stocks such as Adobe Systems (+ 67%) and Salesforce.com (+51%), as both companies moved to solidify their respective niches in cloud-computing software. Systems software (+36%) also outperformed, lifted partly by index heavyweight Microsoft (+49%). Data processing & outsourced services (+35%) did quite well, aided by Mastercard (+56%) and Visa (+38%). None of the MSCI index’s industry groups recorded negative returns this period. In fact, all of them posted double-digit gains except for two with negligible weightings: electronic manufacturing services (+7%) and technology distributors (+8%). Internet software & services (+21%) slightly lagged the index, weighed down by Facebook (+2%), which was hampered by privacy concerns about user data. IT consulting & other services (+17%) also lagged, partly because of IBM (+4%).
The views expressed above reflect those of the portfolio manager(s) only through the end of the period as stated on the cover of this report and do not necessarily represent the views of Fidelity or any other person in the Fidelity organization, or BlackRock Fund Advisors (the ETF’s subadviser) or any other person in the BlackRock organization. Any such views are subject to change at any time based upon market or other conditions and Fidelity and BlackRock disclaim any responsibility to update such views. These views may not be relied on as investment advice and, because investment decisions for a Fidelity fund are based on numerous factors, may not be relied on as an indication of trading intent on behalf of any Fidelity fund.
| 23 | Annual Report |
Table of Contents
Fidelity® MSCI Information Technology Index ETF
Investment Summary (Unaudited)
| Top Ten Stocks as of July 31, 2018 | ||||
| % of fund’s | ||||
| net assets | ||||
Apple, Inc. | 13.6 | |||
Microsoft Corp. | 11.0 | |||
Facebook, Inc. Class A | 5.8 | |||
Alphabet, Inc. Class C | 5.4 | |||
Alphabet, Inc. Class A | 5.2 | |||
Visa, Inc. Class A | 3.5 | |||
Intel Corp. | 3.2 | |||
Cisco Systems, Inc. | 2.9 | |||
Mastercard, Inc. Class A | 2.6 | |||
Oracle Corp. | 2.1 | |||
|
| |||
| 55.3 | ||||
|
| |||
| Industries as of July 31, 2018 | ||||
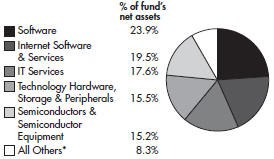
| * | Includes short-term investments and net other assets. |
| Annual Report | 24 |
Table of Contents
Fidelity® MSCI Materials Index ETF
Performance
The information provided in the tables below shows you the performance of Fidelity® MSCI Materials Index ETF, with comparisons over different time periods to the fund’s relevant benchmarks, including an appropriate broad-based market index. Seeing the returns over different time periods can help you assess the fund’s performance against relevant measurements. The performance information includes average annual total returns and is further explained in this section.*
The fund’s net asset value (NAV) performance is based on the NAV calculated each business day. It is calculated in accordance with the standard formula for valuing investment company shares as of the close of regular trading hours on NYSE Arca, Inc. (NYSE Arca) (normally 4:00 p.m. Eastern Time). The fund’s market price performance is based on the daily closing price of the shares of the fund on NYSE Arca. Since ETFs are bought and sold at prices set by the market – which can result in a premium or discount to NAV – the returns calculated using market price (market return) can differ from those calculated using NAV (NAV return). For information on these differences, please visit Fidelity.com or see the prospectus. The fund’s returns do not reflect the deduction of taxes that a shareholder would pay on fund distributions or the redemption or selling of fund shares. How a fund did yesterday is no guarantee of how it will do tomorrow.
Current performance may be higher or lower than the performance data quoted. For month-end performance figures, please visit fidelity.com/etfs/sector-etfs/overview or call Fidelity. The performance data featured represents past performance, which is no guarantee of future results. Investment return and principal value will fluctuate; therefore, you may have a gain or loss when you sell your shares.
| Fiscal Periods Ended July 31, 2018 | ||||||||
| Average Annual Total Returns | Past | Life of | ||||||
| 1 Year | fund | |||||||
Fidelity MSCI Materials Index ETF – NAVA | 11.54 | % | 9.07 | % | ||||
Fidelity MSCI Materials Index ETF – Market PriceB | 11.60 | % | 8.81 | % | ||||
MSCI USA IMI Materials IndexA | 11.49 | % | 9.13 | % | ||||
S&P 500 IndexA | 16.24 | % | 12.84 | % | ||||
Average annual total returns represent just that – the average return on an annual basis for Fidelity® MSCI Materials Index ETF and the fund’s benchmarks, assuming consistent performance over the periods shown, based on the cumulative return and the length of the period. This information represents returns as of the end of the fund’s fiscal period.
| Periods Ended June 30, 2018 | ||||||||
| Average Annual Total Returns | Past | Life of | ||||||
| 1 Year | fund | |||||||
Fidelity MSCI Materials Index ETF – NAVA | 9.71 | % | 8.54 | % | ||||
Fidelity MSCI Materials Index ETF – Market PriceB | 9.74 | % | 8.30 | % | ||||
MSCI USA IMI Materials IndexA | 9.65 | % | 8.60 | % | ||||
S&P 500 IndexA | 14.37 | % | 12.21 | % | ||||
This information shows the returns of the fund and its indices for different time periods through the end of the most recent calendar quarter, as opposed to through the end of the fund’s fiscal period.
| A | From October 21, 2013. |
| B | From October 24, 2013, date initially listed on the NYSE ARCA exchange. |
| * | Total returns are historical and include changes in share price and reinvestment of dividends and capital gains distributions, if any. |
The fund’s expense ratio is 0.084%. Expense ratio is the total annual operating expense ratio from the most recent prospectus. A fund’s net expenses paid may be different. Please refer to the most recent prospectus for more information on a fund’s expenses.
| $10,000 Over Life of Fund |
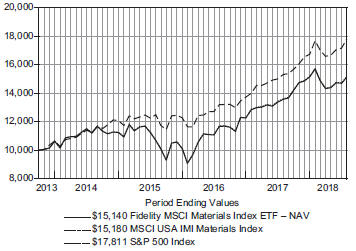
Let’s say hypothetically that $10,000 was invested in Fidelity MSCI Materials Index ETF – NAV on October 21, 2013, when the fund started. The chart shows how the value of your investment would have changed, and also shows how the MSCI USA IMI Materials Index and the S&P 500 Index performed over the same period.
| 25 | Annual Report |
Table of Contents
Fidelity® MSCI Materials Index ETF
Management’s Discussion of Fund Performance
For the fiscal year ending July 31, 2018, the exchange-traded fund’s (ETF) net asset value returned 11.54%, in line with the 11.49% result of the MSCI USA IMI Materials Index. The ETF’s market price returned 11.60% over the same time frame, while the broad-market S&P 500® index returned 16.24%. Materials finished near the middle of the pack among the 11 S&P 500® sectors. Steel (+26%) stood out as one of the best-performing industry groups in the index this period. Tariffs on foreign steel and lower U.S. corporate taxes were potent drivers for this group. Industrial gases (+26%) did about as well. Praxair (+31%), one of the stocks in this group, was being pursued as a takeover target by Germany-based rival Linde, which was one factor boosting Praxair’s stock. Commodity chemicals (+19%) and fertilizers & agricultural chemicals (+16%) were other index groups that outperformed this period. Conversely, the silver (-30%) industry was by far the weakest-performing group in the index, although gold (-1%) held up much better. Both precious metals were hurt near period end by an appreciating U.S. dollar. Construction materials (-8%) also struggled, partly because of Martin Marietta Materials (-11%). Metal & glass containers (-8%) further detracted. Crown Holdings (-24%) was a notably weak component of that group.
The views expressed above reflect those of the portfolio manager(s) only through the end of the period as stated on the cover of this report and do not necessarily represent the views of Fidelity or any other person in the Fidelity organization, or BlackRock Fund Advisors (the ETF’s subadviser) or any other person in the BlackRock organization. Any such views are subject to change at any time based upon market or other conditions and Fidelity and BlackRock disclaim any responsibility to update such views. These views may not be relied on as investment advice and, because investment decisions for a Fidelity fund are based on numerous factors, may not be relied on as an indication of trading intent on behalf of any Fidelity fund.
| Annual Report | 26 |
Table of Contents
Fidelity® MSCI Materials Index ETF
Investment Summary (Unaudited)
| Top Ten Stocks as of July 31, 2018 | ||||
| % of fund’s | ||||
| net assets | ||||
DowDuPont, Inc. | 18.1 | |||
Praxair, Inc. | 5.4 | |||
The Sherwin-Williams Co. | 4.2 | |||
LyondellBasell Industries N.V. Class A | 4.2 | |||
Ecolab, Inc. | 4.1 | |||
Air Products & Chemicals, Inc. | 4.0 | |||
PPG Industries, Inc. | 3.1 | |||
Freeport-McMoRan, Inc. | 2.6 | |||
Nucor Corp. | 2.4 | |||
International Paper Co. | 2.4 | |||
|
| |||
| 50.5 | ||||
|
| |||
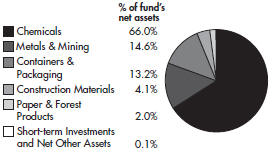
| Industries as of July 31, 2018 |
| 27 | Annual Report |
Table of Contents
Fidelity® MSCI Real Estate Index ETF
Performance
The information provided in the tables below shows you the performance of Fidelity® MSCI Real Estate Index ETF, with comparisons over different time periods to the fund’s relevant benchmarks, including an appropriate broad-based market index. Seeing the returns over different time periods can help you assess the fund’s performance against relevant measurements. The performance information includes average annual total returns and is further explained in this section.*
The fund’s net asset value (NAV) performance is based on the NAV calculated each business day. It is calculated in accordance with the standard formula for valuing investment company shares as of the close of regular trading hours on NYSE Arca, Inc. (NYSE Arca) (normally 4:00 p.m. Eastern Time). The fund’s market price performance is based on the daily closing price of the shares of the fund on NYSE Arca. Since ETFs are bought and sold at prices set by the market – which can result in a premium or discount to NAV – the returns calculated using market price (market return) can differ from those calculated using NAV (NAV return). For information on these differences, please visit Fidelity.com or see the prospectus. The fund’s returns do not reflect the deduction of taxes that a shareholder would pay on fund distributions or the redemption or selling of fund shares. How a fund did yesterday is no guarantee of how it will do tomorrow.
Current performance may be higher or lower than the performance data quoted. For month-end performance figures, please visit fidelity.com/etfs/sector-etfs/overview or call Fidelity. The performance data featured represents past performance, which is no guarantee of future results. Investment return and principal value will fluctuate; therefore, you may have a gain or loss when you sell your shares.
| Fiscal Periods Ended July 31, 2018 | ||||||||
| Average Annual Total Returns | Past | Life of | ||||||
| 1 Year | fund | |||||||
Fidelity MSCI Real Estate Index ETF – NAVA | 4.53 | % | 4.35 | % | ||||
Fidelity MSCI Real Estate Index ETF – Market PriceB | 4.52 | % | 3.88 | % | ||||
MSCI USA IMI Real Estate IndexA | 4.61 | % | 4.39 | % | ||||
S&P 500 IndexA | 16.24 | % | 12.27 | % | ||||
Average annual total returns represent just that – the average return on an annual basis for Fidelity® MSCI Real Estate Index ETF and the fund’s benchmarks, assuming consistent performance over the periods shown, based on the cumulative return and the length of the period. This information represents returns as of the end of the fund’s fiscal period.
| Periods Ended June 30, 2018 | ||||||||
| Average Annual Total Returns | Past | Life of | ||||||
| 1 Year | fund | |||||||
Fidelity MSCI Real Estate Index ETF – NAVA | 5.19 | % | 4.25 | % | ||||
Fidelity MSCI Real Estate Index ETF – Market PriceB | 5.26 | % | 3.80 | % | ||||
MSCI USA IMI Real Estate IndexA | 5.26 | % | 4.29 | % | ||||
S&P 500 IndexA | 14.37 | % | 11.40 | % | ||||
This information shows the returns of the fund and its indices for different time periods through the end of the most recent calendar quarter, as opposed to through the end of the fund’s fiscal period.
| A | From February 2, 2015. |
| B | From February 5, 2015, date initially listed on the NYSE ARCA exchange. |
| * | Total returns are historical and include changes in share price and reinvestment of dividends and capital gains distributions, if any. |
The fund’s expense ratio is 0.084%. Expense ratio is the total annual operating expense ratio from the most recent prospectus. A fund’s net expenses paid may be different. Please refer to the most recent prospectus for more information on a fund’s expenses.
| $10,000 Over Life of Fund | ||
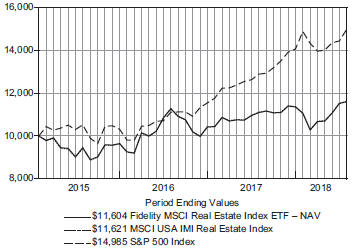
Let’s say hypothetically that $10,000 was invested in Fidelity MSCI Real Estate Index ETF – NAV on February 2, 2015, when the fund started. The chart shows how the value of your investment would have changed, and also shows how the MSCI USA IMI Real Estate Index and the S&P 500 Index performed over the same period.
| Annual Report | 28 |
Table of Contents
Fidelity® MSCI Real Estate Index ETF
Management’s Discussion of Fund Performance
For the fiscal year ending July 31, 2018, the exchange-traded fund’s (ETF) net asset value returned 4.53%, roughly in line with the 4.61% result of the MSCI USA IMI Real Estate Index. The ETF’s market price returned 4.52% over the same time frame, while the broad-market S&P 500® index rose 16.24%. In an up-and-down market environment for real estate investment trusts (REITs), certain industries enjoyed very strong performance while others significantly lagged. Self-storage REITs, for example, tended to perform well after an earlier stretch of underperformance. In this industry, Public Storage and Extra Space Storage were notable contributors, gaining 10% and about 23%, respectively, the past 12 months. Hotel & resort REITs also performed well, benefiting from their relative economic sensitivity. Here, Host Hotels & Resorts rose roughly 17%. Other notable contributors included mall REIT Simon Property Group (+17%), wireless infrastructure owners American Tower (+11%) and Crown Castle International (+15%), and real estate services company CBRE Group (+32%). In contrast, various health care REITs struggled this period, as excess supply in the senior-housing industry weighed on the category. Notable health care detractors included Ventas (-12%), Welltower (-10%) and HCP (-14%). Elsewhere, the fund’s biggest individual challenge was Colony Capital (-54%), which in March reported disappointing quarterly earnings and sharply cut its dividend. Other laggards included apartment REITs AvalonBay Communities (-5%) and Essex Property Trust (-5%), as well as shopping-center REIT Kimco Realty (-11%), which struggled amid investors’ concern about a tough business environment for its retail tenants.
The views expressed above reflect those of the portfolio manager(s) only through the end of the period as stated on the cover of this report and do not necessarily represent the views of Fidelity or any other person in the Fidelity organization, or BlackRock Fund Advisors (the ETF’s subadviser) or any other person in the BlackRock organization. Any such views are subject to change at any time based upon market or other conditions and Fidelity and BlackRock disclaim any responsibility to update such views. These views may not be relied on as investment advice and, because investment decisions for a Fidelity fund are based on numerous factors, may not be relied on as an indication of trading intent on behalf of any Fidelity fund.
| 29 | Annual Report |
Table of Contents
Fidelity® MSCI Real Estate Index ETF
Investment Summary (Unaudited)
| Top Ten Stocks as of July 31, 2018 | ||||
| % of fund’s | ||||
| net assets | ||||
American Tower Corp. | 6.0 | |||
Simon Property Group, Inc. | 5.2 | |||
Crown Castle International Corp. | 4.1 | |||
Prologis, Inc. | 3.2 | |||
Equinix, Inc. | 3.2 | |||
Public Storage | 3.1 | |||
Weyerhaeuser Co. | 2.4 | |||
Digital Realty Trust, Inc. | 2.3 | |||
AvalonBay Communities, Inc. | 2.2 | |||
Equity Residential | 2.2 | |||
|
| |||
| 33.9 | ||||
|
| |||
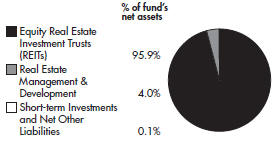
| Industries as of July 31, 2018 |
| Annual Report | 30 |
Table of Contents
Fidelity® MSCI Telecommunication Services Index ETF
Performance
The information provided in the tables below shows you the performance of Fidelity® MSCI Telecommunication Services Index ETF, with comparisons over different time periods to the fund’s relevant benchmarks, including an appropriate broad-based market index. Seeing the returns over different time periods can help you assess the fund’s performance against relevant measurements. The performance information includes average annual total returns and is further explained in this section.*
The fund’s net asset value (NAV) performance is based on the NAV calculated each business day. It is calculated in accordance with the standard formula for valuing investment company shares as of the close of regular trading hours on NYSE Arca, Inc. (NYSE Arca) (normally 4:00 p.m. Eastern Time). The fund’s market price performance is based on the daily closing price of the shares of the fund on NYSE Arca. Since ETFs are bought and sold at prices set by the market – which can result in a premium or discount to NAV – the returns calculated using market price (market return) can differ from those calculated using NAV (NAV return). For information on these differences, please visit Fidelity.com or see the prospectus. The fund’s returns do not reflect the deduction of taxes that a shareholder would pay on fund distributions or the redemption or selling of fund shares. How a fund did yesterday is no guarantee of how it will do tomorrow.
Current performance may be higher or lower than the performance data quoted. For month-end performance figures, please visit fidelity.com/etfs/sector-etfs/overview or call Fidelity. The performance data featured represents past performance, which is no guarantee of future results. Investment return and principal value will fluctuate; therefore, you may have a gain or loss when you sell your shares.
| Fiscal Periods Ended July 31, 2018 | ||||||||
| Average Annual Total Returns | Past 1 Year | Life of fund | ||||||
Fidelity MSCI Telecommunication Services Index ETF – NAVA | -5.14 | % | 6.51 | % | ||||
Fidelity MSCI Telecommunication Services Index ETF – Market PriceB | -4.85 | % | 6.58 | % | ||||
MSCI USA IMI Telecommunication Services 25/50 IndexA | -5.15 | % | 6.56 | % | ||||
S&P 500 IndexA | 16.24 | % | 12.84 | % | ||||
Average annual total returns represent just that – the average return on an annual basis for Fidelity® MSCI Telecommunication Services Index ETF and the fund’s benchmarks, assuming consistent performance over the periods shown, based on the cumulative return and the length of the period. This information represents returns as of the end of the fund’s fiscal period.
| Periods Ended June 30, 2018 | ||||||||
| Average Annual Total Returns | Past 1 Year | Life of fund | ||||||
Fidelity MSCI Telecommunication Services Index ETF – NAVA | -4.11 | % | 6.38 | % | ||||
Fidelity MSCI Telecommunication Services Index ETF – Market PriceB | -4.11 | % | 6.38 | % | ||||
MSCI USA IMI Telecommunication Services 25/50 IndexA | -4.08 | % | 6.43 | % | ||||
S&P 500 IndexA | 14.37 | % | 12.21 | % | ||||
This information shows the returns of the fund and its indices for different time periods through the end of the most recent calendar quarter, as opposed to through the end of the fund’s fiscal period.
| A | From October 21, 2013. |
| B | From October 24, 2013, date initially listed on the NYSE ARCA exchange. |
| * | Total returns are historical and include changes in share price and reinvestment of dividends and capital gains distributions, if any. |
The fund’s expense ratio is 0.084%. Expense ratio is the total annual operating expense ratio from the most recent prospectus. A fund’s net expenses paid may be different. Please refer to the most recent prospectus for more information on a fund’s expenses.
| $10,000 Over Life of Fund |
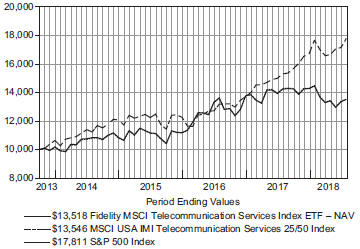
Let’s say hypothetically that $10,000 was invested in Fidelity MSCI Telecommunication Services Index ETF – NAV on October 21, 2013, when the fund started. The chart shows how the value of your investment would have changed, and also shows how the MSCI USA IMI Telecommunication Services 25/50 Index and the S&P 500 Index performed over the same period.
| 31 | Annual Report |
Table of Contents
Fidelity® MSCI Telecommunication Services Index ETF
Management’s Discussion of Fund Performance
For the fiscal year ending July 31, 2018, the exchange-traded fund’s (ETF) net asset value returned -5.14%, roughly in line with the -5.15% result of the MSCI USA IMI Telecommunication Services 25/50 Index. The ETF’s market price returned 4.85% over the same time frame, while the broad-market S&P 500® index rose 16.24%. In a strong market for equities, telecommunication services stocks lagged, as they are generally considered among the most defensive and conservative areas of the market. Integrated telecommunication services (-10%), comprising 57% of the MSCI index, performed poorly, mainly due to fierce competition and lackluster revenue growth among many of the service providers. Within this segment, shares of wireless provider AT&T (-13%) notably fell, as its DirecTV business declined quicker than anticipated and numerous hurdles in AT&T’s acquisition of Time Warner weighed on the company’s stock. Conversely, alternative carriers (+7%), representing 24% of the MSCI index, delivered the best result, led by a strong showing from cloud-based service providerVonage (+95%), as the company executed well in its transition from consumer voice services to business-to-business communications.
The views expressed above reflect those of the portfolio manager(s) only through the end of the period as stated on the cover of this report and do not necessarily represent the views of Fidelity or any other person in the Fidelity organization, or BlackRock Fund Advisors (the ETF’s subadviser) or any other person in the BlackRock organization. Any such views are subject to change at any time based upon market or other conditions and Fidelity and BlackRock disclaim any responsibility to update such views. These views may not be relied on as investment advice and, because investment decisions for a Fidelity fund are based on numerous factors, may not be relied on as an indication of trading intent on behalf of any Fidelity fund.
Note to shareholders: On December 1, 2018, the fund’s name will change to MSCI Communication Services Index ETF, and its supplemental benchmark will change from the MSCI USA IMI Telecommunication Services 25/50 Index to the MSCI USA IMI Communication Services 25/50 Index.
| Annual Report | 32 |
Table of Contents
Fidelity® MSCI Telecommunication Services Index ETF
Investment Summary (Unaudited)
| Top Ten Stocks as of July 31, 2018 | ||||
| % of fund’s net assets | ||||
AT&T, Inc. | 24.3 | |||
Verizon Communications, Inc. | 22.2 | |||
T-Mobile US, Inc. | 4.4 | |||
CenturyLink, Inc. | 4.3 | |||
Zayo Group Holdings, Inc. | 3.8 | |||
Vonage Holdings Corp. | 3.6 | |||
Iridium Communications, Inc. | 3.2 | |||
Sprint Corp. | 3.1 | |||
ATN International, Inc. | 2.7 | |||
pdvWireless, Inc. | 2.6 | |||
|
| |||
| 74.2 | ||||
|
| |||
| Industries as of July 31, 2018 | ||
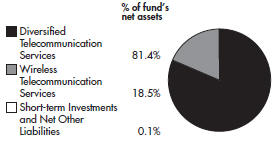
| 33 | Annual Report |
Table of Contents
Fidelity® MSCI Utilities Index ETF
Performance
The information provided in the tables below shows you the performance of Fidelity® MSCI Utilities Index ETF, with comparisons over different time periods to the fund’s relevant benchmarks, including an appropriate broad-based market index. Seeing the returns over different time periods can help you assess the fund’s performance against relevant measurements. The performance information includes average annual total returns and is further explained in this section.*
The fund’s net asset value (NAV) performance is based on the NAV calculated each business day. It is calculated in accordance with the standard formula for valuing investment company shares as of the close of regular trading hours on NYSE Arca, Inc. (NYSE Arca) (normally 4:00 p.m. Eastern Time). The fund’s market price performance is based on the daily closing price of the shares of the fund on NYSE Arca. Since ETFs are bought and sold at prices set by the market – which can result in a premium or discount to NAV – the returns calculated using market price (market return) can differ from those calculated using NAV (NAV return). For information on these differences, please visit Fidelity.com or see the prospectus. The fund’s returns do not reflect the deduction of taxes that a shareholder would pay on fund distributions or the redemption or selling of fund shares. How a fund did yesterday is no guarantee of how it will do tomorrow.
Current performance may be higher or lower than the performance data quoted. For month-end performance figures, please visit fidelity.com/etfs/sector-etfs/overview or call Fidelity. The performance data featured represents past performance, which is no guarantee of future results. Investment return and principal value will fluctuate; therefore, you may have a gain or loss when you sell your shares.
| Fiscal Periods Ended July 31, 2018 | ||||||||
| Average Annual Total Returns | Past | Life of | ||||||
| 1 Year | fund | |||||||
Fidelity MSCI Utilities Index ETF – NAVA | 3.83 | % | 10.96 | % | ||||
Fidelity MSCI Utilities Index ETF – Market PriceB | 3.79 | % | 10.76 | % | ||||
MSCI USA IMI Utilities IndexA | 3.98 | % | 11.13 | % | ||||
S&P 500 IndexA | 16.24 | % | 12.84 | % | ||||
Average annual total returns represent just that – the average return on an annual basis for Fidelity® MSCI Utilities Index ETF and the fund’s benchmarks, assuming consistent performance over the periods shown, based on the cumulative return and the length of the period. This information represents returns as of the end of the fund’s fiscal period.
| Periods Ended June 30, 2018 | ||||||||
| Average Annual Total Returns | Past | Life of | ||||||
| 1 Year | fund | |||||||
Fidelity MSCI Utilities Index ETF – NAVA | 4.66 | % | 10.75 | % | ||||
Fidelity MSCI Utilities Index ETF – Market PriceB | 4.69 | % | 10.55 | % | ||||
MSCI USA IMI Utilities IndexA | 4.81 | % | 10.91 | % | ||||
S&P 500 IndexA | 14.37 | % | 12.21 | % | ||||
This information shows the returns of the fund and its indices for different time periods through the end of the most recent calendar quarter, as opposed to through the end of the fund’s fiscal period.
| A | From October 21, 2013. |
| B | From October 24, 2013, date initially listed on the NYSE ARCA exchange. |
| * | Total returns are historical and include changes in share price and reinvestment of dividends and capital gains distributions, if any. |
The fund’s expense ratio is 0.084%. Expense ratio is the total annual operating expense ratio from the most recent prospectus. A fund’s net expenses paid may be different. Please refer to the most recent prospectus for more information on a fund’s expenses.
| $10,000 Over Life of Fund |
Let’s say hypothetically that $10,000 was invested in Fidelity MSCI Utilities Index ETF – NAV on October 21, 2013, when the fund started. The chart shows how the value of your investment would have changed, and also shows how the MSCI USA IMI Utilities Index and the S&P 500 Index performed over the same period.
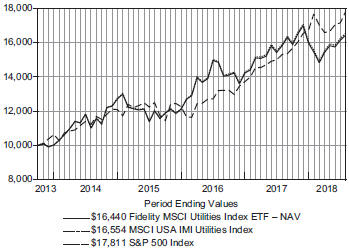
| Annual Report | 34 |
Table of Contents
Fidelity® MSCI Utilities Index ETF
Management’s Discussion of Fund Performance
For the fiscal year ending July 31, 2018, the exchange-traded fund’s (ETF) net asset value returned 3.83%, roughly in line with the 3.98% return of the MSCI USA IMI Utilities Index. The ETF’s market price returned 3.79% over the same time frame, while the broad-market S&P 500® index rose 16.24%. In a strong market for equities, utilities lagged, as they are generally considered a more defensive and conservative area of the market. Multi-utilities (+4%) and electric utilities (+2%), together representing 86% of the MSCI index, anchored the fund’s return. Many of the high-dividend-yielding regulated companies within these groups had performed well earlier in the period, but subsequently sold off, as investors began emphasizing strong business fundamentals over high yields. Independent power producers & energy traders (+26%), comprising 3% of the MSCI index, performed best, bolstered by their strong dividend growth and business fundamentals. Water utilities (12%), representing 4% of the MSCI index, also delivered a strong return, as consolidation in this segment lifted valuations in the group. The index’s top contributor overall was electric company NextEra Energy (+18%). Independent power producers Dynegy (42%), AES (24%) and Vistra Energy (21%) also contributed. Conversely, renewable energy (-4%), comprising 1% of the MSCI index, delivered the weakest result.
The views expressed above reflect those of the portfolio manager(s) only through the end of the period as stated on the cover of this report and do not necessarily represent the views of Fidelity or any other person in the Fidelity organization, or BlackRock Fund Advisors (the ETF’s subadviser) or any other person in the BlackRock organization. Any such views are subject to change at any time based upon market or other conditions and Fidelity and BlackRock disclaim any responsibility to update such views. These views may not be relied on as investment advice and, because investment decisions for a Fidelity fund are based on numerous factors, may not be relied on as an indication of trading intent on behalf of any Fidelity fund.
| 35 | Annual Report |
Table of Contents
Fidelity® MSCI Utilities Index ETF
Investment Summary (Unaudited)
| Top Ten Stocks as of July 31, 2018 | ||||
| % of fund’s net assets | ||||
NextEra Energy, Inc. | 9.6 | |||
Duke Energy Corp. | 7.0 | |||
The Southern Co. | 6.0 | |||
Dominion Energy, Inc. | 5.7 | |||
Exelon Corp. | 5.0 | |||
American Electric Power Co., Inc. | 4.3 | |||
Sempra Energy | 3.4 | |||
Public Service Enterprise Group, Inc. | 3.2 | |||
Consolidated Edison, Inc. | 3.0 | |||
Xcel Energy, Inc. | 2.9 | |||
|
| |||
| 50.1 | ||||
|
| |||
| Industries as of July 31, 2018 |
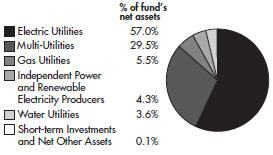
| Annual Report | 36 |
Table of Contents
Fidelity MSCI Consumer Discretionary Index ETF
Showing Percentage of Net Assets
| Common Stocks – 99.9% | ||||||||
| Shares | Value | |||||||
AUTO COMPONENTS – 2.9% |
| |||||||
Auto Parts & Equipment – 2.7% |
| |||||||
Adient PLC | 14,787 | $ | 704,305 | |||||
American Axle & Manufacturing Holdings, Inc. (a) | 18,567 | 310,440 | ||||||
Aptiv PLC | 44,390 | 4,353,327 | ||||||
Autoliv, Inc. | 14,514 | 1,487,104 | ||||||
BorgWarner, Inc. | 35,246 | 1,622,021 | ||||||
Cooper-Standard Holding, Inc. (a) | 2,983 | 402,108 | ||||||
Dana, Inc. | 24,181 | 516,264 | ||||||
Delphi Technologies PLC | 14,775 | 667,387 | ||||||
Dorman Products, Inc. (a) | 4,754 | 355,029 | ||||||
Fox Factory Holding Corp. (a) | 6,302 | 313,209 | ||||||
Gentex Corp. | 45,758 | 1,061,586 | ||||||
Gentherm, Inc. (a) | 6,245 | 282,899 | ||||||
LCI Industries | 4,167 | 383,156 | ||||||
Lear Corp. | 11,186 | 2,014,934 | ||||||
Modine Manufacturing Co. (a) | 8,503 | 148,377 | ||||||
Motorcar Parts of America, Inc. (a) | 3,246 | 70,114 | ||||||
Standard Motor Products, Inc. | 3,407 | 166,057 | ||||||
Stoneridge, Inc. (a) | 4,562 | 155,108 | ||||||
Superior Industries International, Inc. | 4,103 | 75,290 | ||||||
Tenneco, Inc. | 8,606 | 396,737 | ||||||
Tower International, Inc. | 3,478 | 112,339 | ||||||
Veoneer, Inc. (a) | 14,514 | 759,082 | ||||||
Visteon Corp. (a) | 5,157 | 603,782 | ||||||
|
| |||||||
| 16,960,655 | ||||||||
|
| |||||||
Tires & Rubber – 0.2% |
| |||||||
Cooper Tire & Rubber Co. | 8,474 | 241,933 | ||||||
The Goodyear Tire & Rubber Co. | 40,070 | 970,095 | ||||||
|
| |||||||
| 1,212,028 | ||||||||
|
| |||||||
TOTAL AUTO COMPONENTS |
| 18,172,683 | ||||||
|
| |||||||
AUTOMOBILES – 3.6% |
| |||||||
Automobile Manufacturers – 3.4% |
| |||||||
Ford Motor Co. | 619,283 | 6,217,601 | ||||||
General Motors Co. | 210,873 | 7,994,195 | ||||||
Tesla Motors, Inc. (a) | 21,166 | 6,310,431 | ||||||
Thor Industries, Inc. | 8,783 | 833,068 | ||||||
Winnebago Industries, Inc. | 5,064 | 202,054 | ||||||
|
| |||||||
| 21,557,349 | ||||||||
|
| |||||||
Motorcycle Manufacturers – 0.2% | ||||||||
Harley-Davidson, Inc. | 28,082 | 1,204,437 | ||||||
|
| |||||||
TOTAL AUTOMOBILES |
| 22,761,786 | ||||||
|
| |||||||
DISTRIBUTORS – 0.9% |
| |||||||
Distributors – 0.9% |
| |||||||
Core-Mark Holding Co., Inc. | 7,890 | 190,780 | ||||||
Genuine Parts Co. | 24,530 | 2,387,014 | ||||||
LKQ Corp. (a) | 51,801 | 1,736,370 | ||||||
| Shares | Value | |||||||
Pool Corp. | 6,774 | $ | 1,038,115 | |||||
|
| |||||||
TOTAL DISTRIBUTORS | 5,352,279 | |||||||
|
| |||||||
DIVERSIFIED CONSUMER SERVICES – 1.4% |
| |||||||
Education Services – 0.7% |
| |||||||
Adtalem Global Education, Inc. (a) | 10,055 | 548,500 | ||||||
American Public Education, Inc. (a) | 2,790 | 123,039 | ||||||
Bright Horizons Family Solutions, Inc. (a) | 9,215 | 985,913 | ||||||
Cambium Learning Group, Inc. (a) | 2,680 | 31,785 | ||||||
Capella Education Co. | 1,980 | 205,920 | ||||||
Career Education Corp. (a) | 11,694 | 215,170 | ||||||
Chegg, Inc. (a) | 15,588 | 431,787 | ||||||
Graham Holdings Co. Class B | 763 | 426,517 | ||||||
Grand Canyon Education, Inc. (a) | 8,054 | 938,533 | ||||||
Houghton Mifflin Harcourt Co. (a) | 17,346 | 110,147 | ||||||
K12, Inc. (a) | 5,852 | 95,739 | ||||||
Laureate Education, Inc. Class A (a) | 8,988 | 133,112 | ||||||
Strategic Education, Inc. | 1,791 | 211,051 | ||||||
|
| |||||||
| 4,457,213 | ||||||||
|
| |||||||
Specialized Consumer Services – 0.7% |
| |||||||
Carriage Services, Inc. | 2,586 | 64,624 | ||||||
H&R Block, Inc. | 34,856 | 876,977 | ||||||
Regis Corp. (a) | 5,799 | 101,250 | ||||||
Service Corp. International | 30,842 | 1,213,633 | ||||||
ServiceMaster Global Holdings, Inc. (a) | 22,536 | 1,284,327 | ||||||
Sotheby’s (a) | 6,570 | 348,933 | ||||||
Weight Watchers International, Inc. (a) | 6,632 | 593,763 | ||||||
|
| |||||||
| 4,483,507 | ||||||||
|
| |||||||
TOTAL DIVERSIFIED CONSUMER SERVICES |
| 8,940,720 | ||||||
|
| |||||||
HOTELS, RESTAURANTS & LEISURE – 15.0% |
| |||||||
Casinos & Gaming – 2.3% |
| |||||||
Boyd Gaming Corp. | 14,076 | 525,739 | ||||||
Caesars Entertainment Corp. (a) | 98,952 | 1,118,158 | ||||||
Churchill Downs, Inc. | 2,033 | 581,336 | ||||||
Eldorado Resorts, Inc. (a) | 8,399 | 359,897 | ||||||
Golden Entertainment, Inc. (a) | 3,190 | 99,305 | ||||||
Las Vegas Sands Corp. | 65,845 | 4,734,256 | ||||||
MGM Resorts International | 89,912 | 2,820,539 | ||||||
Monarch Casino & Resort, Inc. (a) | 1,965 | 93,672 | ||||||
Penn National Gaming, Inc. (a) | 7,483 | 239,830 | ||||||
Pinnacle Entertainment, Inc. (a) | 9,118 | 303,082 | ||||||
PlayAGS, Inc. (a) | 2,015 | 57,528 | ||||||
Red Rock Resorts, Inc. Class A | 11,466 | 405,208 | ||||||
Scientific Games Corp. Class A (a) | 8,968 | 430,912 | ||||||
Wynn Resorts Ltd. | 16,260 | 2,711,843 | ||||||
|
| |||||||
| 14,481,305 | ||||||||
|
| |||||||
See accompanying notes which are an integral part of the financial statements.
| 37 | Annual Report |
Table of Contents
Fidelity MSCI Consumer Discretionary Index ETF
Investments – continued
| Common Stocks – continued | ||||||||
| Shares | Value | |||||||
HOTELS, RESTAURANTS & LEISURE – continued |
| |||||||
Hotels, Resorts & Cruise Lines – 3.9% |
| |||||||
BBX Capital Corp. | 10,679 | $ | 93,121 | |||||
Belmond Ltd. Class A (a) | 13,923 | 156,634 | ||||||
Carnival Corp. | 71,352 | 4,226,892 | ||||||
Choice Hotels International, Inc. | 6,132 | 475,843 | ||||||
Extended Stay America, Inc. | 32,075 | 682,877 | ||||||
Hilton Grand Vacations, Inc. (a) | 16,112 | 557,314 | ||||||
Hilton Worldwide Holdings, Inc. | 47,658 | 3,748,778 | ||||||
ILG, Inc. | 17,584 | 603,659 | ||||||
Lindblad Expeditions Holdings, Inc. (a) | 4,189 | 55,462 | ||||||
Marriott International, Inc. Class A | 50,756 | 6,488,647 | ||||||
Marriott Vacations Worldwide Corp. | 3,762 | 448,092 | ||||||
Norwegian Cruise Line Holdings Ltd. (a) | 35,618 | 1,781,969 | ||||||
Playa Hotels & Resorts N.V. (a) | 8,714 | 90,538 | ||||||
Royal Caribbean Cruises Ltd. | 28,571 | 3,221,666 | ||||||
Wyndham Destinations, Inc. | 16,622 | 766,607 | ||||||
Wyndham Hotels & Resorts, Inc. | 16,622 | 964,076 | ||||||
|
| |||||||
| 24,362,175 | ||||||||
|
| |||||||
Leisure Facilities – 0.6% | ||||||||
International Speedway Corp. Class A | 4,150 | 179,695 | ||||||
Planet Fitness, Inc., Class A (a) | 14,535 | 690,703 | ||||||
SeaWorld Entertainment, Inc. (a) | 9,169 | 195,300 | ||||||
Six Flags Entertainment Corp. | 11,980 | 778,101 | ||||||
Speedway Motorsports, Inc. | 1,973 | 34,823 | ||||||
Vail Resorts, Inc. | 6,758 | 1,871,088 | ||||||
|
| |||||||
| 3,749,710 | ||||||||
|
| |||||||
Restaurants – 8.2% | ||||||||
Aramark | 41,141 | 1,654,280 | ||||||
Biglari Holdings, Inc. Class A (a) | 20 | 19,548 | ||||||
Biglari Holdings, Inc. Class B (a) | 168 | 31,824 | ||||||
BJ’s Restaurants, Inc. (a) | 3,465 | 219,161 | ||||||
Bloomin’ Brands, Inc. | 13,066 | 252,696 | ||||||
Bojangles’, Inc. (a) | 3,348 | 44,026 | ||||||
Brinker International, Inc. | 7,732 | 364,718 | ||||||
Carrols Restaurant Group, Inc. (a) | 5,979 | 86,696 | ||||||
Chipotle Mexican Grill, Inc. (a) | 4,198 | 1,820,505 | ||||||
Chuys Holdings, Inc. (a) | 2,899 | 91,753 | ||||||
Cracker Barrel Old Country Store, Inc. | 3,202 | 469,077 | ||||||
Darden Restaurants, Inc. | 20,655 | 2,208,846 | ||||||
Dave & Buster’s Entertainment, Inc. (a) | 6,761 | 332,303 | ||||||
Del Taco Restaurants, Inc. (a) | 5,763 | 74,573 | ||||||
Denny’s Corp. (a) | 10,808 | 157,256 | ||||||
Dine Brands Global, Inc. | 2,883 | 204,780 | ||||||
Domino’s Pizza, Inc. | 6,838 | 1,796,069 | ||||||
Dunkin’ Brands Group, Inc. | 13,710 | 954,627 | ||||||
El Pollo Loco Holdings, Inc. (a) | 4,088 | 47,421 | ||||||
Fiesta Restaurant Group, Inc. (a) | 4,235 | 123,027 | ||||||
Jack in the Box, Inc. | 4,925 | 414,882 | ||||||
McDonald’s Corp. | 132,676 | 20,901,777 | ||||||
| Shares | Value | |||||||
Papa John’s International, Inc. | 4,242 | $ | 177,994 | |||||
Potbelly Corp. (a) | 4,083 | 50,629 | ||||||
Red Robin Gourmet Burgers, Inc. (a) | 2,206 | 104,344 | ||||||
Ruth’s Hospitality Group, Inc. | 4,921 | 142,463 | ||||||
Shake Shack, Inc. Class A (a) | 4,082 | 254,431 | ||||||
Sonic Corp. | 5,207 | 183,026 | ||||||
Starbucks Corp. | 234,739 | 12,297,976 | ||||||
Texas Roadhouse, Inc. Class A | 11,302 | 710,218 | ||||||
The Cheesecake Factory, Inc. | 7,262 | 406,890 | ||||||
Wendy’s Co. | 31,933 | 532,643 | ||||||
Wingstop, Inc. (a) | 4,856 | 239,644 | ||||||
Yum! Brands, Inc. | 55,513 | 4,401,626 | ||||||
|
| |||||||
| 51,771,729 | ||||||||
|
| |||||||
TOTAL HOTELS, RESTAURANTS & LEISURE |
| 94,364,919 | ||||||
|
| |||||||
HOUSEHOLD DURABLES – 3.5% |
| |||||||
Consumer Electronics – 0.2% |
| |||||||
Garmin Ltd. | 18,828 | 1,175,809 | ||||||
GoPro, Inc. Class A (a) | 18,666 | 109,009 | ||||||
Universal Electronics, Inc. (a) | 2,543 | 88,878 | ||||||
|
| |||||||
| 1,373,696 | ||||||||
|
| |||||||
Home Furnishings – 0.6% |
| |||||||
Ethan Allen Interiors, Inc. | 4,390 | 98,775 | ||||||
Hooker Furniture Corp. | 1,963 | 88,433 | ||||||
La-Z-Boy, Inc. | 7,852 | 239,486 | ||||||
Leggett & Platt, Inc. | 22,049 | 960,675 | ||||||
Mohawk Industries, Inc. (a) | 10,561 | 1,989,270 | ||||||
Tempur Sealy International, Inc. (a) | 7,701 | 376,348 | ||||||
|
| |||||||
| 3,752,987 | ||||||||
|
| |||||||
Homebuilding – 1.9% |
| |||||||
Beazer Homes U.S.A., Inc. (a) | 5,253 | 67,291 | ||||||
Cavco Industries, Inc. (a) | 1,449 | 307,840 | ||||||
Century Communities, Inc. (a) | 3,807 | 116,113 | ||||||
D.R. Horton, Inc. | 59,692 | 2,608,540 | ||||||
Green Brick Partners, Inc. (a) | 4,221 | 40,944 | ||||||
Hovnanian Enterprises, Inc. | ||||||||
Class A (a) | 19,771 | 31,040 | ||||||
Installed Building Products, Inc. (a) | 3,700 | 202,020 | ||||||
KB Home | 13,021 | 309,249 | ||||||
Lennar Corp. Class A | 47,921 | 2,504,831 | ||||||
LGI Homes, Inc. (a) | 3,193 | 165,046 | ||||||
M.D.C. Holdings, Inc. | 7,551 | 219,281 | ||||||
M/I Homes, Inc. (a) | 4,752 | 122,887 | ||||||
Meritage Homes Corp. (a) | 6,438 | 277,800 | ||||||
NVR, Inc. (a) | 586 | 1,617,026 | ||||||
PulteGroup, Inc. | 45,575 | 1,298,432 | ||||||
Taylor Morrison Home Corp. Class A (a) | 18,632 | 363,883 | ||||||
Toll Brothers, Inc. | 24,350 | 858,581 | ||||||
TopBuild Corp. (a) | 5,920 | 439,737 | ||||||
TRI Pointe Group, Inc. (a) | 25,212 | 357,254 | ||||||
See accompanying notes which are an integral part of the financial statements.
| Annual Report | 38 |
Table of Contents
| Common Stocks – continued | ||||||||
| Shares | Value | |||||||
HOUSEHOLD DURABLES – continued |
| |||||||
Homebuilding – continued |
| |||||||
William Lyon Homes Class A (a) | 5,866 | $ | 128,055 | |||||
|
| |||||||
| 12,035,850 | ||||||||
|
| |||||||
Household Appliances – 0.4% | ||||||||
Hamilton Beach Brands Holding Co. Class A (a) | 1,197 | 30,404 | ||||||
Helen of Troy Ltd. (a) | 4,502 | 515,704 | ||||||
iRobot Corp. (a) | 4,659 | 369,226 | ||||||
Whirlpool Corp. | 10,783 | 1,413,651 | ||||||
|
| |||||||
| 2,328,985 | ||||||||
|
| |||||||
Housewares & Specialties – 0.4% | ||||||||
Newell Brands, Inc. | 81,957 | 2,146,454 | ||||||
Tupperware Brands Corp. | 8,518 | 312,696 | ||||||
|
| |||||||
| 2,459,150 | ||||||||
|
| |||||||
TOTAL HOUSEHOLD DURABLES |
| 21,950,668 | ||||||
|
| |||||||
INTERNET & DIRECT MARKETING RETAIL – 27.3% |
| |||||||
Internet & Direct Marketing Retail – 19.4% |
| |||||||
Amazon.com, Inc. (a) | 68,717 | 122,140,345 | ||||||
|
| |||||||
Internet Retail – 7.9% | ||||||||
1-800-FLOWERS.com, Inc. Class A (a) | 4,352 | 63,104 | ||||||
Booking Holdings, Inc. (a) | 8,064 | 16,359,598 | ||||||
Duluth Holdings, Inc. Class B (a) | 3,188 | 73,388 | ||||||
Expedia Group, Inc. | 20,916 | 2,799,397 | ||||||
Groupon, Inc. Class A (a) | 74,898 | 350,523 | ||||||
Lands’ End, Inc. (a) | 2,038 | 49,421 | ||||||
Liberty Expedia Holdings, Inc. | 9,074 | 437,095 | ||||||
Liberty TripAdvisor Holdings, Inc. | 12,019 | 200,116 | ||||||
Netflix, Inc. (a) | 72,467 | 24,453,989 | ||||||
NutriSystem, Inc. | 5,066 | 202,640 | ||||||
Overstock.com, Inc. (a) | 2,827 | 100,782 | ||||||
PetMed Express, Inc. | 3,410 | 126,613 | ||||||
Qurate Retail, Inc. (a) | 75,178 | 1,600,540 | ||||||
Shutterfly, Inc. (a) | 5,153 | 423,886 | ||||||
TripAdvisor, Inc. (a) | 17,888 | 1,037,325 | ||||||
Wayfair, Inc. Class A (a) | 9,680 | 1,053,378 | ||||||
|
| |||||||
| 49,331,795 | ||||||||
|
| |||||||
TOTAL INTERNET & DIRECT MARKETING RETAIL |
| 171,472,140 | ||||||
|
| |||||||
LEISURE PRODUCTS – 0.9% |
| |||||||
Leisure Products – 0.9% |
| |||||||
Acushnet Holdings Corp. | 5,725 | 138,373 | ||||||
American Outdoor Brands Corp. (a) | 9,195 | 87,077 | ||||||
Brunswick Corp. | 14,593 | 938,330 | ||||||
Callaway Golf Co. | 15,772 | 303,453 | ||||||
Hasbro, Inc. | 19,733 | 1,965,604 | ||||||
Mattel, Inc. | 57,355 | 910,224 | ||||||
| Shares | Value | |||||||
Nautilus, Inc. (a) | 5,279 | $ | 75,226 | |||||
Polaris Industries, Inc. | 10,032 | 1,057,573 | ||||||
Sturm, Ruger & Co., Inc. | 2,908 | 157,614 | ||||||
Vista Outdoor, Inc. (a) | 9,521 | 154,621 | ||||||
|
| |||||||
TOTAL LEISURE PRODUCTS | 5,788,095 | |||||||
|
| |||||||
MEDIA – 17.6% |
| |||||||
Advertising – 0.7% |
| |||||||
Clear Channel Outdoor Holding, Inc. | 6,328 | 28,160 | ||||||
Emerald Expositions Events, Inc. | 3,223 | 62,204 | ||||||
Interpublic Group of Companies, Inc. | 64,392 | 1,452,039 | ||||||
MDC Partners, Inc. Class A (a) | 9,787 | 49,914 | ||||||
National CineMedia, Inc. | 13,673 | 112,939 | ||||||
Omnicom Group, Inc. | 38,471 | 2,647,959 | ||||||
|
| |||||||
| 4,353,215 | ||||||||
|
| |||||||
Broadcasting – 1.2% | ||||||||
AMC Networks, Inc. Class A (a) | 8,206 | 494,740 | ||||||
CBS Corp. Class B (non-vtg.) | 57,658 | 3,036,847 | ||||||
Discovery, Inc. Class A (a) | 25,683 | 682,654 | ||||||
Discovery, Inc. Class C (non-vtg.) (a) | 50,460 | 1,238,793 | ||||||
E.W. Scripps Co. Class A (a) | 8,431 | 110,446 | ||||||
Entercom Communications Corp. Class A | 20,715 | 156,398 | ||||||
Entravision Communications Corp. Class A | 11,239 | 54,509 | ||||||
Gray Television, Inc. (a) | 14,203 | 219,436 | ||||||
Hemisphere Media Group, Inc. (a) | 2,822 | 33,864 | ||||||
Media General, Inc. (a) | 7,026 | 0 | ||||||
Nexstar Media Group, Inc. Class A | 7,595 | 565,448 | ||||||
Sinclair Broadcast Group, Inc. Class A | 12,718 | 328,124 | ||||||
TEGNA, Inc. | 35,885 | 395,812 | ||||||
Tribune Media Co. Class A | 13,833 | 468,247 | ||||||
|
| |||||||
| 7,785,318 | ||||||||
|
| |||||||
Cable & Satellite – 7.7% | ||||||||
Cable One, Inc. | 718 | 519,731 | ||||||
Charter Communications, Inc. | 27,881 | 8,491,995 | ||||||
Comcast Corp. Class A | 774,039 | 27,695,115 | ||||||
DISH Network Corp. Class A (a) | 38,021 | 1,199,943 | ||||||
GCI Liberty, Inc. Class A (a) | 15,622 | 751,574 | ||||||
Liberty Broadband Corp. Class C (a) | 17,882 | 1,421,083 | ||||||
Liberty Global PLC Series A (a) | 32,976 | 930,913 | ||||||
Liberty Global PLC Series C (a) | 91,849 | 2,492,782 | ||||||
Liberty Latin America Ltd. Class A (a) | 7,437 | 141,898 | ||||||
Liberty Latin America Ltd. Class C (a) | 19,142 | 370,589 | ||||||
Liberty Media Corp-Liberty SiriusXM Class A (a) | 14,552 | 685,981 | ||||||
Liberty Media Corp-Liberty SiriusXM Class C (a) | 29,822 | 1,408,493 | ||||||
Loral Space & Communications | 2,145 | 84,728 | ||||||
See accompanying notes which are an integral part of the financial statements.
| 39 | Annual Report |
Table of Contents
Fidelity MSCI Consumer Discretionary Index ETF
Investments – continued
| Common Stocks – continued | ||||||||
| Shares | Value | |||||||
MEDIA – continued |
| |||||||
Cable & Satellite – continued |
| |||||||
MSG Networks, Inc. Class A (a) | 10,465 | $ | 246,451 | |||||
Sirius XM Holdings, Inc. | 263,022 | 1,846,414 | ||||||
WideOpenWest, Inc. (a) | 4,339 | 47,208 | ||||||
|
| |||||||
| 48,334,898 | ||||||||
|
| |||||||
Movies & Entertainment – 7.5% |
| |||||||
AMC Entertainment Holdings, Inc. Class A | 8,621 | 140,522 | ||||||
Cinemark Holdings, Inc. | 18,453 | 662,832 | ||||||
IMAX Corp. (a) | 9,795 | 216,470 | ||||||
Liberty Media Corp-Liberty Braves Class A (a) | 1,514 | 38,910 | ||||||
Liberty Media Corp-Liberty Braves Class C (a) | 5,775 | 148,822 | ||||||
Liberty Media Corp-Liberty Formula One Class C (a) | 33,595 | 1,184,224 | ||||||
Lions Gate Entertainment Corp. Class A | 8,879 | 211,764 | ||||||
Lions Gate Entertainment Corp. Class B (a) | 17,188 | 393,090 | ||||||
Live Nation Entertainment, Inc. (a) | 24,298 | 1,197,405 | ||||||
Marcus Corp. | 3,111 | 119,929 | ||||||
The Madison Square Garden Co. Class A (a) | 3,174 | 990,859 | ||||||
The Walt Disney Co. | 251,108 | 28,515,824 | ||||||
Twenty-First Century Fox, Inc. Class A | 176,015 | 7,920,675 | ||||||
Twenty-First Century Fox, Inc. Class B | 73,359 | 3,258,607 | ||||||
Viacom, Inc. Class B | 59,072 | 1,716,042 | ||||||
World Wrestling Entertainment, Inc. Class A | 6,384 | 505,038 | ||||||
|
| |||||||
| 47,221,013 | ||||||||
|
| |||||||
Publishing – 0.5% | ||||||||
Gannett Co., Inc. | 18,900 | 199,773 | ||||||
John Wiley & Sons, Inc. Class A | 7,562 | 477,540 | ||||||
Meredith Corp. | 6,609 | 351,268 | ||||||
New Media Investment Group, Inc. | 9,077 | 163,295 | ||||||
News Corp. Class A | 64,095 | 965,912 | ||||||
Scholastic Corp. | 5,018 | 209,552 | ||||||
The New York Times Co. Class A | 21,872 | 542,426 | ||||||
tronc, Inc. (a) | 2,524 | 39,475 | ||||||
|
| |||||||
| 2,949,241 | ||||||||
|
| |||||||
TOTAL MEDIA | 110,643,685 | |||||||
|
| |||||||
MULTILINE RETAIL – 3.4% |
| |||||||
Department Stores – 0.9% |
| |||||||
Dillard’s, Inc. Class A | 2,277 | 182,775 | ||||||
J.C. Penney Co., Inc. (a) | 50,732 | 124,294 | ||||||
Kohl’s Corp. | 28,105 | 2,076,116 | ||||||
Macy’s, Inc. | 50,977 | 2,025,316 | ||||||
| Shares | Value | |||||||
Nordstrom, Inc. | 19,442 | $ | 1,018,955 | |||||
|
| |||||||
| 5,427,456 | ||||||||
|
| |||||||
General Merchandise Stores – 2.5% |
| |||||||
Big Lots, Inc. | 7,007 | 304,314 | ||||||
Dollar General Corp. | 45,337 | 4,449,827 | ||||||
Dollar Tree, Inc. (a) | 39,609 | 3,615,510 | ||||||
Ollie’s Bargain Outlet Holdings, Inc. (a) | 8,737 | 607,221 | ||||||
Target Corp. | 86,264 | 6,959,779 | ||||||
|
| |||||||
| 15,936,651 | ||||||||
|
| |||||||
TOTAL MULTILINE RETAIL | 21,364,107 | |||||||
|
| |||||||
SPECIALTY RETAIL – 17.3% |
| |||||||
Apparel Retail – 4.0% |
| |||||||
Abercrombie & Fitch Co. Class A | 11,510 | 272,672 | ||||||
American Eagle Outfitters, Inc. | 28,087 | 707,231 | ||||||
Ascena Retail Group, Inc. (a) | 24,041 | 88,471 | ||||||
Boot Barn Holdings, Inc. (a) | 4,810 | 112,506 | ||||||
Burlington Stores, Inc. (a) | 11,416 | 1,744,479 | ||||||
Caleres, Inc. | 7,228 | 242,066 | ||||||
Chico’s FAS, Inc. | 21,213 | 184,553 | ||||||
Citi Trends, Inc. | 2,316 | 65,797 | ||||||
DSW, Inc. Class A | 11,487 | 315,203 | ||||||
Express, Inc. (a) | 13,027 | 125,450 | ||||||
Foot Locker, Inc. | 20,212 | 986,548 | ||||||
Gap, Inc. | 38,898 | 1,173,553 | ||||||
Genesco, Inc. (a) | 3,302 | 134,391 | ||||||
Guess?, Inc. | 10,404 | 235,755 | ||||||
L Brands, Inc. | 40,004 | 1,266,927 | ||||||
Ross Stores, Inc. | 63,864 | 5,583,629 | ||||||
Shoe Carnival, Inc. | 2,036 | 63,869 | ||||||
Tailored Brands, Inc. | 8,304 | 167,409 | ||||||
The Buckle, Inc. | 4,928 | 118,518 | ||||||
The Cato Corp. Class A | 3,964 | 98,703 | ||||||
The Children’s Place Retail Stores, Inc. | 2,901 | 356,533 | ||||||
The TJX Companies, Inc. | 105,626 | 10,273,185 | ||||||
Urban Outfitters, Inc. (a) | 12,640 | 561,216 | ||||||
Zumiez, Inc. (a) | 3,223 | 73,001 | ||||||
|
| |||||||
| 24,951,665 | ||||||||
|
| |||||||
Automotive Retail – 2.3% | ||||||||
Advance Auto Parts, Inc. | 12,341 | 1,742,919 | ||||||
Asbury Automotive Group, Inc. (a) | 3,508 | 246,612 | ||||||
AutoNation, Inc. (a) | 9,948 | 482,777 | ||||||
AutoZone, Inc. (a) | 4,547 | 3,208,045 | ||||||
Camping World Holdings, Inc. Class A | 5,678 | 125,881 | ||||||
CarMax, Inc. (a) | 30,237 | 2,258,099 | ||||||
Group 1 Automotive, Inc. | 3,370 | 235,866 | ||||||
Lithia Motors, Inc. Class A | 4,019 | 357,892 | ||||||
Monro, Inc. | 5,521 | 372,392 | ||||||
Murphy USA, Inc. (a) | 5,358 | 424,568 | ||||||
See accompanying notes which are an integral part of the financial statements.
| Annual Report | 40 |
Table of Contents
| Common Stocks – continued | ||||||||
| Shares | Value | |||||||
SPECIALTY RETAIL – continued |
| |||||||
Automotive Retail – continued |
| |||||||
O’Reilly Automotive, Inc. (a) | 13,971 | $ | 4,275,126 | |||||
Penske Automotive Group, Inc. | 6,440 | 336,168 | ||||||
Sonic Automotive, Inc. Class A | 4,108 | 83,598 | ||||||
|
| |||||||
| 14,149,943 | ||||||||
|
| |||||||
Computer & Electronics Retail – 0.6% |
| |||||||
Best Buy Co., Inc. | 43,953 | 3,297,793 | ||||||
Conn’s, Inc. (a) | 3,404 | 115,396 | ||||||
GameStop Corp. Class A | 16,939 | 244,091 | ||||||
Rent-A-Center, Inc. (a) | 6,975 | 103,509 | ||||||
|
| |||||||
| 3,760,789 | ||||||||
|
| |||||||
Home Improvement Retail – 8.4% |
| |||||||
Floor & Decor Holdings, Inc. | 7,252 | 346,283 | ||||||
Lowe’s Companies, Inc. | 138,566 | 13,765,147 | ||||||
Lumber Liquidators Holdings, Inc. (a) | 4,864 | 94,070 | ||||||
The Home Depot, Inc. | 195,012 | 38,518,770 | ||||||
Tile Shop Holdings, Inc. | 6,400 | 53,120 | ||||||
|
| |||||||
| 52,777,390 | ||||||||
|
| |||||||
Homefurnishing Retail – 0.4% |
| |||||||
Aarons, Inc. Class A | 11,803 | 511,188 | ||||||
At Home Group, Inc. (a) | 5,818 | 211,019 | ||||||
Bed Bath & Beyond, Inc. | 23,746 | 444,763 | ||||||
Haverty Furniture Companies, Inc. | 3,119 | 61,756 | ||||||
RH (a) | 3,198 | 434,480 | ||||||
Sleep Number Corp. (a) | 6,507 | 185,384 | ||||||
Williams-Sonoma, Inc. | 13,892 | 812,543 | ||||||
|
| |||||||
| 2,661,133 | ||||||||
|
| |||||||
Specialty Stores – 1.6% |
| |||||||
Barnes & Noble Education, Inc. (a) | 6,147 | 34,546 | ||||||
Barnes & Noble, Inc. | 9,268 | 56,535 | ||||||
Dick’s Sporting Goods, Inc. | 13,794 | 470,927 | ||||||
Five Below, Inc. (a) | 9,212 | 895,038 | ||||||
GNC Holdings, Inc. Class A (a) | 13,689 | 43,531 | ||||||
Hibbett Sports, Inc. (a) | 3,584 | 82,253 | ||||||
MarineMax, Inc. (a) | 4,638 | 86,963 | ||||||
National Vision Holdings, Inc. (a) | 8,102 | 329,427 | ||||||
Office Depot, Inc. | 83,742 | 210,192 | ||||||
Party City Holdings, Inc. (a) | 8,303 | 130,772 | ||||||
Sally Beauty Holdings, Inc. (a) | 20,881 | 344,328 | ||||||
Signet Jewelers Ltd. | 9,839 | 568,104 | ||||||
The Michaels Cos., Inc. (a) | 18,157 | 370,584 | ||||||
Tiffany & Co., Inc. | 18,692 | 2,571,272 | ||||||
Tractor Supply Co. | 20,944 | 1,634,470 | ||||||
Ulta Salon, Cosmetics & Fragrance, Inc. (a) | 9,685 | 2,366,917 | ||||||
Winmark Corp. | 451 | 66,387 | ||||||
|
| |||||||
| 10,262,246 | ||||||||
|
| |||||||
TOTAL SPECIALTY RETAIL | 108,563,166 | |||||||
|
| |||||||
| Shares | Value | |||||||
TEXTILES, APPAREL & LUXURY GOODS – 6.1% |
| |||||||
Apparel, Accessories & Luxury Goods – 3.1% |
| |||||||
Carter’s, Inc. | 7,861 | $ | 824,069 | |||||
Columbia Sportswear Co. | 5,252 | 456,819 | ||||||
Fossil Group, Inc. (a) | 7,345 | 192,439 | ||||||
G-III Apparel Group Ltd. (a) | 6,962 | 318,163 | ||||||
Hanesbrands, Inc. | 60,062 | 1,336,980 | ||||||
lululemon athletica, Inc. (a) | 16,974 | 2,036,031 | ||||||
Michael Kors Holdings Ltd. (a) | 25,457 | 1,698,746 | ||||||
Movado Group, Inc. | 2,600 | 129,480 | ||||||
Oxford Industries, Inc. | 2,840 | 261,621 | ||||||
PVH Corp. | 12,865 | 1,975,035 | ||||||
Ralph Lauren Corp. | 9,240 | 1,247,215 | ||||||
Tapestry, Inc. | 47,637 | 2,244,655 | ||||||
Under Armour, Inc. Class A (a) | 30,897 | 617,013 | ||||||
Under Armour, Inc. Class C (a) | 31,528 | 590,835 | ||||||
Vera Bradley, Inc. (a) | 3,721 | 49,452 | ||||||
VF Corp. | 56,297 | 5,183,265 | ||||||
|
| |||||||
| 19,161,818 | ||||||||
|
| |||||||
Footwear – 3.0% | ||||||||
Crocs, Inc. (a) | 11,412 | 206,671 | ||||||
Deckers Outdoor Corp. (a) | 4,760 | 537,071 | ||||||
NIKE, Inc. Class B | 216,742 | 16,669,627 | ||||||
Skechers U.S.A., Inc. Class A (a) | 22,331 | 619,015 | ||||||
Steven Madden Ltd. (a) | 9,359 | 505,854 | ||||||
Wolverine World Wide, Inc. | 16,005 | 566,257 | ||||||
|
| |||||||
| 19,104,495 | ||||||||
|
| |||||||
Textiles – 0.0% | ||||||||
Unifi, Inc. (a) | 2,733 | 82,455 | ||||||
|
| |||||||
TOTAL TEXTILES, APPAREL & LUXURY GOODS |
| 38,348,768 | ||||||
|
| |||||||
TOTAL COMMON STOCKS |
| 627,723,016 | ||||||
|
| |||||||
| Money Market Funds – 0.1% | ||||||||
State Street Institutional Treasury Plus Money Market Fund, Trust Class, 1.76% (b) | 360,621 | 360,621 | ||||||
|
| |||||||
TOTAL INVESTMENT PORTFOLIO – 100.0% |
| 628,083,637 | ||||||
NET OTHER ASSETS (LIABILITIES) – 0.0% |
| 45,299 | ||||||
|
| |||||||
NET ASSETS – 100.0% | $ | 628,128,936 | ||||||
|
| |||||||
Legend
| (a) | Non-income producing. |
| (b) | The rate quoted is the annualized seven-day yield of the fund at period end. |
See accompanying notes which are an integral part of the financial statements.
| 41 | Annual Report |
Table of Contents
Fidelity MSCI Consumer Discretionary Index ETF
Investments – continued
Investment Valuation
All investments are categorized as Level 1 under the Fair Value Hierarchy. The inputs or methodology used for valuing securities may not be an indication of the risk associated with investing in those securities. For more information on valuation inputs please refer to the Investment Valuation section in the accompanying Notes to Financial Statements.
See accompanying notes which are an integral part of the financial statements.
| Annual Report | 42 |
Table of Contents
Fidelity MSCI Consumer Staples Index ETF
Investments July 31, 2018
Showing Percentage of Net Assets
| Common Stocks – 99.8% | ||||||||
| Shares | Value | |||||||
BEVERAGES – 25.3% |
| |||||||
Brewers – 0.9% |
| |||||||
Molson Coors Brewing Co. Class B | 36,265 | $ | 2,429,755 | |||||
The Boston Beer Co., Inc. Class A (a) | 1,872 | 514,706 | ||||||
|
| |||||||
| 2,944,461 | ||||||||
|
| |||||||
Distillers & Vintners – 3.1% | ||||||||
Brown-Forman Corp. Class B | 50,599 | 2,692,879 | ||||||
Constellation Brands, Inc. Class A | 31,912 | 6,708,860 | ||||||
MGP Ingredients, Inc. | 2,321 | 190,484 | ||||||
|
| |||||||
| 9,592,223 | ||||||||
|
| |||||||
Soft Drinks – 21.3% | ||||||||
Coca-Cola Bottling Co. Consolidated | 885 | 128,431 | ||||||
Monster Beverage Corp. (a) | 73,297 | 4,399,286 | ||||||
National Beverage Corp. (a) | 2,002 | 211,231 | ||||||
PepsiCo, Inc. | 247,822 | 28,499,530 | ||||||
The Coca-Cola Co. | 708,812 | 33,051,904 | ||||||
|
| |||||||
| 66,290,382 | ||||||||
|
| |||||||
TOTAL BEVERAGES |
| 78,827,066 | ||||||
|
| |||||||
FOOD & STAPLES RETAILING – 20.5% |
| |||||||
Drug Retail – 3.4% |
| |||||||
Rite Aid Corp. (a) | 187,642 | 377,161 | ||||||
Walgreens Boots Alliance, Inc. | 148,476 | 10,039,947 | ||||||
|
| |||||||
| 10,417,108 | ||||||||
|
| |||||||
Food Distributors – 2.8% | ||||||||
Performance Food Group Co. (a) | 19,100 | 684,735 | ||||||
SpartanNash Co. | 6,236 | 149,415 | ||||||
Sysco Corp. | 90,796 | 6,102,399 | ||||||
The Andersons, Inc. | 4,676 | 164,829 | ||||||
The Chefs’ Warehouse, Inc. (a) | 3,992 | 107,584 | ||||||
United Natural Foods, Inc. (a) | 9,098 | 292,956 | ||||||
US Foods Holding Corp. (a) | 39,750 | 1,343,947 | ||||||
|
| |||||||
| 8,845,865 | ||||||||
|
| |||||||
Food Retail – 2.0% | ||||||||
Casey’s General Stores, Inc. | 6,898 | 754,503 | ||||||
Ingles Markets, Inc. Class A | 2,382 | 70,865 | ||||||
Smart & Final Stores, Inc. (a) | 5,328 | 31,435 | ||||||
Sprouts Farmers Market, Inc. (a) | 22,390 | 481,161 | ||||||
SUPERVALU, Inc. (a) | 6,700 | 216,544 | ||||||
The Kroger Co. | 154,070 | 4,468,030 | ||||||
Village Super Market, Inc. Class A | 1,806 | 48,636 | ||||||
Weis Markets, Inc. | 2,303 | 117,752 | ||||||
|
| |||||||
| 6,188,926 | ||||||||
|
| |||||||
Hypermarkets & Super Centers – 12.3% |
| |||||||
Costco Wholesale Corp. | 68,888 | 15,066,494 | ||||||
PriceSmart, Inc. | 3,925 | 320,869 | ||||||
Walmart, Inc. | 258,846 | 23,096,829 | ||||||
|
| |||||||
| 38,484,192 | ||||||||
|
| |||||||
TOTAL FOOD & STAPLES RETAILING |
| 63,936,091 | ||||||
|
| |||||||
| Shares | Value | |||||||
FOOD PRODUCTS – 18.9% |
| |||||||
Agricultural Products – 2.7% | ||||||||
Archer-Daniels-Midland Co. | 97,855 | $ | 4,722,482 | |||||
Bunge Ltd. | 24,322 | 1,681,380 | ||||||
Darling Ingredients, Inc. (a) | 28,408 | 570,717 | ||||||
Fresh Del Monte Produce, Inc. | 5,480 | 198,924 | ||||||
Ingredion, Inc. | 12,475 | 1,263,717 | ||||||
|
| |||||||
| 8,437,220 | ||||||||
|
| |||||||
Packaged Foods & Meats – 16.2% | ||||||||
B&G Foods, Inc. | 11,464 | 359,970 | ||||||
Calavo Growers, Inc. | 2,720 | 251,600 | ||||||
Cal-Maine Foods, Inc. (a) | 5,282 | 237,690 | ||||||
Campbell Soup Co. | 31,408 | 1,284,587 | ||||||
Conagra Brands, Inc. | 69,230 | 2,541,433 | ||||||
Dean Foods Co. | 15,087 | 148,154 | ||||||
Farmer Bros Co. (a) | 1,887 | 54,440 | ||||||
Flowers Foods, Inc. | 32,694 | 666,958 | ||||||
Freshpet, Inc. (a) | 4,185 | 121,365 | ||||||
General Mills, Inc. | 99,664 | 4,590,524 | ||||||
Hormel Foods Corp. | 51,365 | 1,847,599 | ||||||
Hostess Brands, Inc. (a) | 16,427 | 230,142 | ||||||
J&J Snack Foods Corp. | 2,586 | 374,867 | ||||||
John B Sanfilippo & Son, Inc. | 1,460 | 112,230 | ||||||
Kellogg Co. | 45,808 | 3,253,742 | ||||||
Lamb Weston Holdings, Inc. | 25,276 | 1,776,145 | ||||||
Lancaster Colony Corp. | 3,311 | 480,194 | ||||||
Landec Corp. (a) | 4,227 | 59,178 | ||||||
McCormick & Co., Inc. (non-vtg.) | 21,022 | 2,470,926 | ||||||
Mondelez International, Inc. Class A | 260,639 | 11,306,520 | ||||||
Pinnacle Foods, Inc. | 20,586 | 1,367,322 | ||||||
Post Holdings, Inc. (a) | 11,896 | 1,029,718 | ||||||
Sanderson Farms, Inc. | 3,537 | 356,636 | ||||||
Seaboard Corp. | 46 | 167,348 | ||||||
The Hain Celestial Group, Inc. (a) | 16,146 | 459,192 | ||||||
The Hershey Co. | 26,068 | 2,560,138 | ||||||
The JM Smucker Co. | 19,750 | 2,194,620 | ||||||
The Kraft Heinz Co. | 106,893 | 6,440,303 | ||||||
The Simply Good Foods Co. (a) | 10,429 | 173,956 | ||||||
Tootsie Roll Industries, Inc. | 3,027 | 90,507 | ||||||
TreeHouse Foods, Inc. (a) | 9,733 | 462,220 | ||||||
Tyson Foods, Inc. Class A | 51,892 | 2,991,574 | ||||||
|
| |||||||
| 50,461,798 | ||||||||
|
| |||||||
TOTAL FOOD PRODUCTS |
| 58,899,018 | ||||||
|
| |||||||
HOUSEHOLD PRODUCTS – 19.2% |
| |||||||
Household Products – 19.2% |
| |||||||
Central Garden and Pet Co. (a) | 1,877 | 81,030 | ||||||
Central Garden and Pet Co. Class A (a) | 6,232 | 250,028 | ||||||
Church & Dwight Co., Inc. | 42,456 | 2,373,290 | ||||||
Colgate-Palmolive Co. | 146,228 | 9,798,738 | ||||||
See accompanying notes which are an integral part of the financial statements.
| 43 | Annual Report |
Table of Contents
Fidelity MSCI Consumer Staples Index ETF
Investments – continued
| Common Stocks – continued | ||||||||
| Shares | Value | |||||||
HOUSEHOLD PRODUCTS – continued |
| |||||||
Household Products – continued |
| |||||||
Energizer Holdings, Inc. | 10,291 | $ | 655,331 | |||||
Kimberly-Clark Corp. | 62,009 | 7,060,345 | ||||||
Spectrum Brands Holdings, Inc. (a) | 6,562 | 573,322 | ||||||
The Clorox Co. | 22,911 | 3,096,880 | ||||||
The Procter & Gamble Co. | 440,955 | 35,664,440 | ||||||
WD-40 Co. | 2,398 | 384,040 | ||||||
|
| |||||||
TOTAL HOUSEHOLD PRODUCTS |
| 59,937,444 | ||||||
|
| |||||||
PERSONAL PRODUCTS – 3.0% |
| |||||||
Personal Products – 3.0% |
| |||||||
Avon Products, Inc. (a) | 76,932 | 122,322 | ||||||
Coty, Inc. Class A | 84,108 | 1,127,888 | ||||||
Edgewell Personal Care Co. (a) | 8,854 | 476,876 | ||||||
elf Beauty, Inc. (a) | 4,000 | 57,760 | ||||||
Herbalife Nutrition Ltd. (a) | 19,731 | 1,018,712 | ||||||
Inter Parfums, Inc. | 2,969 | 178,734 | ||||||
Medifast, Inc. | 1,954 | 335,463 | ||||||
Nu Skin Enterprises, Inc. Class A | 8,651 | 630,225 | ||||||
The Estee Lauder Cos., Inc. Class A | 38,877 | 5,246,062 | ||||||
USANA Health Sciences, Inc. (a) | 2,086 | 275,874 | ||||||
|
| |||||||
TOTAL PERSONAL PRODUCTS |
| 9,469,916 | ||||||
|
| |||||||
TOBACCO – 12.9% |
| |||||||
Tobacco – 12.9% |
| |||||||
Altria Group, Inc. | 261,461 | 15,342,531 | ||||||
| Shares | Value | |||||||
Philip Morris International, Inc. | 274,785 | $ | 23,713,946 | |||||
Universal Corp. | 5,030 | 347,573 | ||||||
Vector Group Ltd. | 47,939 | 884,475 | ||||||
|
| |||||||
TOTAL TOBACCO |
| 40,288,525 | ||||||
|
| |||||||
TOTAL COMMON STOCKS |
| 311,358,060 | ||||||
|
| |||||||
Money Market Funds – 0.0% | ||||||||
State Street Institutional Treasury Plus | 142,133 | 142,133 | ||||||
|
| |||||||
TOTAL INVESTMENT PORTFOLIO – 99.8% |
| 311,500,193 | ||||||
NET OTHER ASSETS (LIABILITIES) – 0.2% |
| 470,019 | ||||||
|
| |||||||
NET ASSETS – 100.0% |
| $ | 311,970,212 | |||||
|
| |||||||
Legend
| (a) | Non-income producing. |
| (b) | The rate quoted is the annualized seven-day yield of the fund at period end. |
Investment Valuation
All investments are categorized as Level 1 under the Fair Value Hierarchy. The inputs or methodology used for valuing securities may not be an indication of the risk associated with investing in those securities. For more information on valuation inputs please refer to the Investment Valuation section in the accompanying Notes to Financial Statements.
See accompanying notes which are an integral part of the financial statements.
| Annual Report | 44 |
Table of Contents
Fidelity MSCI Energy Index ETF
Investments July 31, 2018
Showing Percentage of Net Assets
| Common Stocks – 99.9% | ||||||||
| Shares | Value | |||||||
ENERGY EQUIPMENT & SERVICES – 14.3% |
| |||||||
Oil & Gas Drilling – 1.6% | ||||||||
Diamond Offshore Drilling, Inc. (a) | 25,001 | $ | 480,019 | |||||
Ensco PLC Class A | 159,576 | 1,185,650 | ||||||
Helmerich & Payne, Inc. | 39,834 | 2,443,816 | ||||||
Nabors Industries Ltd. | 122,588 | 733,076 | ||||||
Noble Corp. PLC (a) | 90,011 | 525,664 | ||||||
Patterson-UTI Energy, Inc. | 81,348 | 1,399,186 | ||||||
Rowan Cos. PLC Class A (a) | 43,960 | 636,541 | ||||||
Transocean Ltd. (a) | 161,092 | 2,073,254 | ||||||
Unit Corp. (a) | 19,441 | 484,081 | ||||||
|
| |||||||
| 9,961,287 | ||||||||
|
| |||||||
Oil & Gas Equipment & Services – 12.7% |
| |||||||
Apergy Corp. (a) | 28,514 | 1,169,074 | ||||||
Archrock, Inc. | 47,288 | 645,481 | ||||||
Baker Hughes a GE Co. | 154,456 | 5,341,089 | ||||||
Basic Energy Services, Inc. (a) | 6,862 | 77,403 | ||||||
C&J Energy Services, Inc. (a) | 22,628 | 526,327 | ||||||
Cactus, Inc. (a) | 13,324 | 435,961 | ||||||
Core Laboratories N.V. | 16,171 | 1,813,093 | ||||||
Covia Holdings Corp. (a) | 11,525 | 207,796 | ||||||
Dril-Quip, Inc. (a) | 13,940 | 718,607 | ||||||
Exterran Corp. (a) | 11,696 | 324,213 | ||||||
Forum Energy Technologies, Inc. (a) | 25,862 | 340,085 | ||||||
Frank’s International N.V. | 28,689 | 241,848 | ||||||
FTS International, Inc. (a) | 8,034 | 96,408 | ||||||
Halliburton Co. | 319,873 | 13,569,013 | ||||||
Helix Energy Solutions Group, Inc. (a) | 51,096 | 511,471 | ||||||
Keane Group, Inc. (a) | 18,466 | 260,555 | ||||||
Mammoth Energy Services, Inc. (a) | 3,189 | 118,695 | ||||||
Matrix Service Co. (a) | 9,804 | 195,590 | ||||||
McDermott International, Inc. (a) | 67,301 | 1,212,091 | ||||||
National Oilwell Varco, Inc. | 138,958 | 6,756,138 | ||||||
Natural Gas Services Group, Inc. (a) | 4,572 | 101,041 | ||||||
NCS Multistage Holdings, Inc. (a) | 4,054 | 64,296 | ||||||
Newpark Resources, Inc. (a) | 32,728 | 361,644 | ||||||
Nine Energy Service, Inc. | 3,078 | 89,908 | ||||||
Oceaneering International, Inc. | 35,931 | 983,072 | ||||||
Oil States International, Inc. (a) | 20,785 | 725,397 | ||||||
ProPetro Holding Corp. (a) | 27,141 | 446,198 | ||||||
RPC, Inc. | 23,675 | 350,390 | ||||||
Schlumberger Ltd. | 505,965 | 34,162,757 | ||||||
SEACOR Holdings, Inc. | 6,168 | 325,485 | ||||||
Select Energy Services, Inc. (a) | 16,943 | 258,889 | ||||||
Superior Energy Services, Inc. (a) | 56,145 | 552,467 | ||||||
TechnipFMC PLC | 162,241 | 5,280,945 | ||||||
TETRA Technologies, Inc. (a) | 41,896 | 180,572 | ||||||
Tidewater, Inc. (a) | 8,295 | 284,767 | ||||||
US Silica Holdings, Inc. | 29,474 | 794,619 | ||||||
| Shares | Value | |||||||
Weatherford International PLC (a) | 363,666 | $ | 1,232,828 | |||||
|
| |||||||
| 80,756,213 | ||||||||
|
| |||||||
TOTAL ENERGY EQUIPMENT & SERVICES |
| 90,717,500 | ||||||
|
| |||||||
OIL, GAS & CONSUMABLE FUELS – 85.6% |
| |||||||
Coal & Consumable Fuels – 0.4% |
| |||||||
Arch Coal, Inc. Class A | 7,270 | 614,969 | ||||||
CONSOL Energy, Inc. (a) | 8,138 | 338,785 | ||||||
Peabody Energy Corp. | 30,864 | 1,311,412 | ||||||
|
| |||||||
| 2,265,166 | ||||||||
|
| |||||||
Integrated Oil & Gas – 37.5% |
| |||||||
Chevron Corp. | 698,394 | 88,186,210 | ||||||
Exxon Mobil Corp. | 1,549,233 | 126,277,982 | ||||||
Occidental Petroleum Corp. | 279,746 | 23,479,082 | ||||||
|
| |||||||
| 237,943,274 | ||||||||
|
| |||||||
Oil & Gas Exploration & Production – 29.4% |
| |||||||
Alta Mesa Resources, Inc. (a) | 28,033 | 169,319 | ||||||
Anadarko Petroleum Corp. | 194,680 | 14,240,842 | ||||||
Antero Resources Corp. (a) | 75,287 | 1,546,395 | ||||||
Apache Corp. | 139,449 | 6,414,654 | ||||||
Bonanza Creek Energy, Inc. (a) | 5,614 | 208,841 | ||||||
Cabot Oil & Gas Corp. | 169,012 | 3,971,782 | ||||||
California Resources Corp. (a) | 14,954 | 544,475 | ||||||
Callon Petroleum Co. (a) | 81,580 | 877,801 | ||||||
Carrizo Oil & Gas, Inc. (a) | 29,712 | 837,284 | ||||||
Centennial Resource Development, Inc. Class A (a) | 56,971 | 1,023,199 | ||||||
Chesapeake Energy Corp. (a) | 333,599 | 1,574,587 | ||||||
Cimarex Energy Co. | 34,866 | 3,437,788 | ||||||
CNX Resources Corp. (a) | 65,512 | 1,066,535 | ||||||
Concho Resources, Inc. (a) | 73,242 | 10,682,346 | ||||||
ConocoPhillips | 429,429 | 30,991,891 | ||||||
Continental Resources, Inc. (a) | 34,334 | 2,192,913 | ||||||
Denbury Resources, Inc. (a) | 147,557 | 665,482 | ||||||
Devon Energy Corp. | 192,328 | 8,656,683 | ||||||
Diamondback Energy, Inc. | 35,874 | 4,733,574 | ||||||
Eclipse Resources Corp. (a) | 33,831 | 54,468 | ||||||
Energen Corp. (a) | 32,091 | 2,380,510 | ||||||
EOG Resources, Inc. | 211,544 | 27,276,483 | ||||||
EQT Corp. | 96,674 | 4,802,764 | ||||||
Extraction Oil & Gas, Inc. (a) | 37,976 | 574,197 | ||||||
Gran Tierra Energy, Inc. (a) | 143,489 | 477,818 | ||||||
Gulfport Energy Corp. (a) | 60,146 | 692,280 | ||||||
Halcon Resources Corp. (a) | 45,813 | 179,129 | ||||||
Hess Corp. | 103,646 | 6,802,287 | ||||||
HighPoint Resources Corp. (a) | 40,473 | 264,693 | ||||||
Jagged Peak Energy, Inc. (a) | 19,173 | 274,174 | ||||||
Kosmos Energy Ltd. (a) | 87,060 | 659,915 | ||||||
Laredo Petroleum, Inc. (a) | 62,264 | 580,301 | ||||||
Marathon Oil Corp. | 310,638 | 6,560,675 | ||||||
See accompanying notes which are an integral part of the financial statements.
| 45 | Annual Report |
Table of Contents
Fidelity MSCI Energy Index ETF
Investments – continued
| Common Stocks – continued | ||||||||
| Shares | Value | |||||||
OIL, GAS & CONSUMABLE FUELS – continued |
| |||||||
Oil & Gas Exploration & Production – continued |
| |||||||
Matador Resources Co. (a) | 35,731 | $ | 1,196,989 | |||||
Midstates Petroleum Co., Inc. (a) | 4,653 | 61,001 | ||||||
Murphy Oil Corp. | 59,992 | 1,995,334 | ||||||
Newfield Exploration Co. (a) | 73,090 | 2,099,145 | ||||||
Noble Energy, Inc. | 177,987 | 6,423,551 | ||||||
Oasis Petroleum, Inc. (a) | 98,766 | 1,206,921 | ||||||
Parsley Energy, Inc. Class A (a) | 86,970 | 2,733,467 | ||||||
PDC Energy, Inc. (a) | 24,140 | 1,520,337 | ||||||
Penn Virginia Corp. (a) | 3,603 | 304,526 | ||||||
Pioneer Natural Resources Co. | 62,253 | 11,782,625 | ||||||
QEP Resources, Inc. (a) | 88,198 | 916,377 | ||||||
Range Resources Corp. | 91,204 | 1,407,278 | ||||||
Resolute Energy Corp. (a) | 7,014 | 215,610 | ||||||
Ring Energy, Inc. (a) | 20,386 | 251,971 | ||||||
SandRidge Energy, Inc. (a) | 8,492 | 138,589 | ||||||
SM Energy Co. | 38,665 | 1,063,674 | ||||||
Southwestern Energy Co. (a) | 214,851 | 1,104,334 | ||||||
SRC Energy, Inc. (a) | 88,486 | 1,001,662 | ||||||
Talos Energy, Inc. (a) | 7,282 | 270,454 | ||||||
Tellurian, Inc. (a) | 28,967 | 226,232 | ||||||
Ultra Petroleum Corp. (a) | 57,544 | 101,853 | ||||||
W&T Offshore, Inc. (a) | 35,816 | 248,563 | ||||||
Whiting Petroleum Corp. (a) | 33,285 | 1,652,600 | ||||||
WildHorse Resource Development Corp. (a) | 9,152 | 200,703 | ||||||
WPX Energy, Inc. (a) | 145,728 | 2,735,315 | ||||||
|
| |||||||
| 186,275,196 | ||||||||
|
| |||||||
Oil & Gas Refining & Marketing – 11.1% |
| |||||||
Andeavor | 53,391 | 8,011,853 | ||||||
CVR Energy, Inc. | 6,393 | 251,181 | ||||||
Delek US Holdings, Inc. | 29,229 | 1,558,490 | ||||||
Green Plains, Inc. | 14,288 | 237,181 | ||||||
HollyFrontier Corp. | 61,582 | 4,592,786 | ||||||
Marathon Petroleum Corp. | 174,050 | 14,068,461 | ||||||
Par Pacific Holdings, Inc. (a) | 11,282 | 197,548 | ||||||
PBF Energy, Inc. Class A | 38,482 | 1,797,109 | ||||||
Phillips 66 | 162,019 | 19,983,423 | ||||||
Renewable Energy Group, Inc. (a) | 12,699 | 216,518 | ||||||
| Shares | Value | |||||||
REX American Resources Corp. (a) | 2,161 | $ | 166,397 | |||||
Valero Energy Corp. | 158,379 | 18,744,155 | ||||||
World Fuel Services Corp. | 24,650 | 686,010 | ||||||
|
| |||||||
| 70,511,112 | ||||||||
|
| |||||||
Oil & Gas Storage & Transportation – 7.2% |
| |||||||
Antero Midstream GP LP | 27,284 | 524,398 | ||||||
Cheniere Energy, Inc. (a) | 73,834 | 4,688,459 | ||||||
Enbridge Energy Management LLC (a) | 26,944 | 290,187 | ||||||
EnLink Midstream LLC | 23,102 | 368,477 | ||||||
International Seaways, Inc. (a) | 6,935 | 150,975 | ||||||
Kinder Morgan, Inc. | 725,900 | 12,906,502 | ||||||
ONEOK, Inc. | 150,138 | 10,575,721 | ||||||
Plains GP Holdings LP Class A (a) | 54,578 | 1,325,700 | ||||||
SemGroup Corp. Class A | 21,621 | 543,768 | ||||||
Tallgrass Energy LP | 56,008 | 1,306,667 | ||||||
Targa Resources Corp. | 79,955 | 4,083,302 | ||||||
The Williams Cos., Inc. | 302,439 | 8,997,560 | ||||||
|
| |||||||
| 45,761,716 | ||||||||
|
| |||||||
TOTAL OIL, GAS & CONSUMABLE FUELS |
| 542,756,464 | ||||||
|
| |||||||
TOTAL COMMON STOCKS | 633,473,964 | |||||||
|
| |||||||
| Money Market Funds – 0.0% | ||||||||
State Street Institutional Treasury Plus Money Market Fund, Trust Class, 1.76% (b) | 334,856 | 334,856 | ||||||
|
| |||||||
TOTAL INVESTMENT PORTFOLIO – 99.9% |
| 633,808,820 | ||||||
NET OTHER ASSETS (LIABILITIES) – 0.1% |
| 348,519 | ||||||
|
| |||||||
NET ASSETS – 100.0% |
| $ | 634,157,339 | |||||
|
| |||||||
Legend
| (a) | Non-income producing. |
| (b) | The rate quoted is the annualized seven-day yield of the fund at period end. |
Investment Valuation
All investments are categorized as Level 1 under the Fair Value Hierarchy. The inputs or methodology used for valuing securities may not be an indication of the risk associated with investing in those securities. For more information on valuation inputs please refer to the Investment Valuation section in the accompanying Notes to Financial Statements.
See accompanying notes which are an integral part of the financial statements.
| Annual Report | 46 |
Table of Contents
Fidelity MSCI Financials Index ETF
Investments July 31, 2018
Showing Percentage of Net Assets
| Common Stocks – 99.9% | ||||||||
| Shares | Value | |||||||
BANKS – 46.5% |
| |||||||
Diversified Banks – 30.3% |
| |||||||
Bank of America Corp. | 3,770,471 | $ | 116,432,145 | |||||
Citigroup, Inc. | 995,772 | 71,586,049 | ||||||
JPMorgan Chase & Co. | 1,329,712 | 152,850,394 | ||||||
US Bancorp | 608,029 | 32,231,617 | ||||||
Wells Fargo & Co. | 1,812,510 | 103,838,698 | ||||||
|
| |||||||
| 476,938,903 | ||||||||
|
| |||||||
Regional Banks – 16.2% |
| |||||||
1st Source Corp. | 7,012 | 396,599 | ||||||
Access National Corp. | 6,034 | 167,625 | ||||||
Allegiance Bancshares, Inc. (a) | 5,128 | 230,504 | ||||||
Ameris Bancorp | 16,249 | 757,203 | ||||||
Arrow Financial Corp. | 5,255 | 203,368 | ||||||
Associated Banc-Corp | 66,497 | 1,795,419 | ||||||
Atlantic Capital Bancshares, Inc. (a) | 9,967 | 177,911 | ||||||
Banc of California, Inc. | 16,059 | 321,180 | ||||||
Bancfirst Corp. | 6,358 | 394,832 | ||||||
BancorpSouth Bank | 33,713 | 1,109,158 | ||||||
Bank of Hawaii Corp. | 16,441 | 1,323,336 | ||||||
Bank of Marin Bancorp | 2,573 | 228,611 | ||||||
Bank OZK | 47,146 | 1,928,271 | ||||||
BankUnited, Inc. | 41,227 | 1,602,081 | ||||||
Banner Corp. | 12,876 | 810,802 | ||||||
Bar Harbor Bankshares | 6,828 | 197,807 | ||||||
BB&T Corp. | 301,399 | 15,314,083 | ||||||
Berkshire Hills Bancorp, Inc. | 15,181 | 616,349 | ||||||
Blue Hills Bancorp, Inc. | 9,931 | 217,489 | ||||||
BOK Financial Corp. | 9,029 | 878,793 | ||||||
Boston Private Financial Holdings, Inc. | 33,728 | 485,683 | ||||||
Bridge Bancorp, Inc. | 6,842 | 244,944 | ||||||
Brookline Bancorp, Inc. | 30,517 | 555,409 | ||||||
Bryn Mawr Bank Corp. | 7,676 | 374,973 | ||||||
Byline Bancorp, Inc. (a) | 6,732 | 151,739 | ||||||
Cadence BanCorp | 24,347 | 662,969 | ||||||
Camden National Corp. | 6,016 | 277,338 | ||||||
Carolina Financial Corp. | 7,863 | 328,280 | ||||||
Cathay General Bancorp | 29,786 | 1,238,800 | ||||||
CenterState Banks, Inc. | 27,883 | 773,753 | ||||||
Central Pacific Financial Corp. | 8,128 | 224,008 | ||||||
Chemical Financial Corp. | 27,513 | 1,562,738 | ||||||
CIT Group, Inc. | 45,149 | 2,389,737 | ||||||
Citizens Financial Group, Inc. | 188,816 | 7,511,100 | ||||||
City Holding Co. | 6,122 | 492,699 | ||||||
CoBiz Financial, Inc. | 16,251 | 355,897 | ||||||
Columbia Banking System, Inc. | 28,302 | 1,158,401 | ||||||
Comerica, Inc. | 66,923 | 6,487,516 | ||||||
Commerce Bancshares, Inc. | 37,389 | 2,497,585 | ||||||
Community Bank System, Inc. | 19,905 | 1,258,991 | ||||||
Community Trust Bancorp, Inc. | 6,377 | 311,357 | ||||||
ConnectOne Bancorp, Inc. | 12,195 | 302,436 | ||||||
| Shares | Value | |||||||
Cullen/Frost Bankers, Inc. | 23,536 | $ | 2,600,493 | |||||
Customers Bancorp, Inc. (a) | 11,967 | 304,799 | ||||||
CVB Financial Corp. | 40,379 | 965,866 | ||||||
Eagle Bancorp, Inc. (a) | 12,799 | 691,786 | ||||||
East West Bancorp, Inc. | 56,013 | 3,626,282 | ||||||
Enterprise Financial Services Corp. | 9,070 | 510,187 | ||||||
FB Financial Corp. | 6,881 | 292,855 | ||||||
FCB Financial Holdings, Inc. Class A (a) | 17,588 | 896,988 | ||||||
Fidelity Southern Corp. | 8,534 | 204,219 | ||||||
Fifth Third Bancorp | 268,815 | 7,954,236 | ||||||
Financial Institutions, Inc. | 6,166 | 195,462 | ||||||
First BanCorp (a) | 80,951 | 665,417 | ||||||
First BanCorp | 11,866 | 491,490 | ||||||
First Busey Corp. | 17,301 | 548,788 | ||||||
First Citizens BancShares, Inc. Class A | 2,588 | 1,052,850 | ||||||
First Commonwealth Financial Corp. | 38,465 | 648,905 | ||||||
First Community Bancshares, Inc. | 6,521 | 212,128 | ||||||
First Financial Bancorp | 37,984 | 1,152,814 | ||||||
First Financial Bankshares, Inc. | 21,169 | 1,198,165 | ||||||
First Financial Corp. | 4,139 | 212,745 | ||||||
First Foundation, Inc. (a) | 13,258 | 208,416 | ||||||
First Hawaiian, Inc. | 26,839 | 758,470 | ||||||
First Horizon National Corp. | 121,144 | 2,167,266 | ||||||
First Interstate Bancsystem, Inc. Class A | 10,598 | 457,304 | ||||||
First Merchants Corp. | 19,166 | 904,635 | ||||||
First Mid-Illinois Bancshares, Inc. | 4,439 | 178,936 | ||||||
First Midwest Bancorp, Inc. | 39,928 | 1,064,880 | ||||||
First Republic Bank | 62,574 | 6,186,066 | ||||||
Flushing Financial Corp. | 10,933 | 274,200 | ||||||
FNB Corp. | 124,837 | 1,601,659 | ||||||
Franklin Financial Network, Inc. (a) | 5,656 | 221,432 | ||||||
Fulton Financial Corp. | 67,576 | 1,172,444 | ||||||
German American Bancorp, Inc. | 8,589 | 314,701 | ||||||
Glacier Bancorp, Inc. | 31,313 | 1,337,065 | ||||||
Great Southern Bancorp, Inc. | 4,661 | 275,232 | ||||||
Great Western Bancorp, Inc. | 22,826 | 955,268 | ||||||
Green Bancorp, Inc. | 9,908 | 240,764 | ||||||
Guaranty Bancorp | 10,906 | 327,725 | ||||||
Hancock Whitney Corp. | 33,401 | 1,678,400 | ||||||
Hanmi Financial Corp. | 12,916 | 323,546 | ||||||
HarborOne Bancorp, Inc. (a) | 6,323 | 116,027 | ||||||
Heartland Financial USA, Inc. | 10,729 | 630,329 | ||||||
Heritage Commerce Corp. | 14,904 | 226,988 | ||||||
Heritage Financial Corp. | 13,198 | 462,590 | ||||||
Hilltop Holdings, Inc. | 29,763 | 619,070 | ||||||
Home BancShares, Inc. | 60,626 | 1,405,917 | ||||||
HomeTrust Bancshares, Inc. (a) | 6,992 | 203,467 | ||||||
Hope Bancorp, Inc. | 53,092 | 890,884 | ||||||
Horizon Bancorp, Inc. | 14,861 | 312,230 | ||||||
See accompanying notes which are an integral part of the financial statements.
| 47 | Annual Report |
Table of Contents
Fidelity MSCI Financials Index ETF
Investments – continued
| Common Stocks – continued | ||||||||
| Shares | Value | |||||||
BANKS – continued | ||||||||
Regional Banks – continued | ||||||||
Huntington Bancshares, Inc. | 427,402 | $ | 6,599,087 | |||||
Iberiabank Corp. | 20,805 | 1,728,895 | ||||||
Independent Bank Corp. | 10,828 | 957,195 | ||||||
Independent Bank Corp. | 8,266 | 202,517 | ||||||
Independent Bank Group, Inc. | 6,363 | 426,957 | ||||||
International Bancshares Corp. | 22,049 | 980,078 | ||||||
Investors Bancorp, Inc. | 100,406 | 1,257,083 | ||||||
KeyCorp | 410,963 | 8,576,798 | ||||||
Lakeland Bancorp, Inc. | 17,434 | 338,220 | ||||||
Lakeland Financial Corp. | 9,322 | 452,024 | ||||||
LegacyTexas Financial Group, Inc. | 17,999 | 788,896 | ||||||
Live Oak Bancshares, Inc. | 9,958 | 283,305 | ||||||
M&T Bank Corp. | 55,249 | 9,577,414 | ||||||
MB Financial, Inc. | 32,758 | 1,587,125 | ||||||
Mercantile Bank Corp. | 6,072 | 215,677 | ||||||
Midland States Bancorp, Inc. | 6,334 | 213,329 | ||||||
National Bank Holdings Corp. Class A | 10,373 | 410,563 | ||||||
National Commerce Corp. (a) | 5,971 | 260,336 | ||||||
NBT Bancorp, Inc. | 17,012 | 684,563 | ||||||
Nicolet Bankshares, Inc. (a) | 3,425 | 189,574 | ||||||
OFG Bancorp | 17,037 | 283,666 | ||||||
Old Line Bancshares, Inc. | 5,188 | 177,845 | ||||||
Old National Bancorp | 53,796 | 1,046,332 | ||||||
Opus Bank | 11,655 | 329,836 | ||||||
Pacific Premier Bancorp, Inc. (a) | 19,181 | 709,697 | ||||||
PacWest Bancorp | 50,138 | 2,517,930 | ||||||
Park National Corp. | 5,333 | 584,070 | ||||||
Peapack Gladstone Financial Corp. | 6,793 | 223,354 | ||||||
Peoples Bancorp, Inc. | 6,771 | 245,246 | ||||||
People’s United Financial, Inc. | 133,612 | 2,435,747 | ||||||
People’s Utah Bancorp | 6,456 | 234,676 | ||||||
Pinnacle Financial Partners, Inc. | 28,929 | 1,808,062 | ||||||
Popular, Inc. | 39,431 | 1,956,961 | ||||||
Preferred Bank | 5,748 | 357,756 | ||||||
Prosperity Bancshares, Inc. | 25,869 | 1,814,710 | ||||||
QCR Holdings, Inc. | 5,121 | 222,507 | ||||||
Regions Financial Corp. | 434,938 | 8,094,196 | ||||||
Renasant Corp. | 19,231 | 859,241 | ||||||
Republic Bancorp, Inc. Class A | 3,977 | 190,379 | ||||||
Republic First Bancorp, Inc. (a) | 21,154 | 167,117 | ||||||
S&T Bancorp, Inc. | 13,666 | 611,690 | ||||||
Sandy Spring Bancorp, Inc. | 13,614 | 532,444 | ||||||
Seacoast Banking Corp. of Florida (a) | 17,775 | 520,985 | ||||||
ServisFirst Bancshares, Inc. | 17,750 | 749,937 | ||||||
Signature Bank | 21,211 | 2,327,059 | ||||||
Simmons First National Corp. Class A | 34,340 | 1,023,332 | ||||||
South State Corp. | 14,191 | 1,187,787 | ||||||
Southside Bancshares, Inc. | 11,158 | 382,608 | ||||||
State Bank Financial Corp. | 14,362 | 451,685 | ||||||
| Shares | Value | |||||||
Sterling Bancorp/DE | 83,430 | $ | 1,852,146 | |||||
Stock Yards Bancorp, Inc. | 8,614 | 328,624 | ||||||
SunTrust Banks, Inc. | 181,353 | 13,070,111 | ||||||
SVB Financial Group (a) | 20,486 | 6,307,230 | ||||||
Synovus Financial Corp. | 46,002 | 2,273,419 | ||||||
TCF Financial Corp. | 63,154 | 1,585,797 | ||||||
Texas Capital Bancshares, Inc. (a) | 19,360 | 1,757,888 | ||||||
The Bancorp, Inc. (a) | 20,378 | 197,870 | ||||||
The First of Long Island Corp. | 9,644 | 210,239 | ||||||
The PNC Financial Services Group, Inc. | 183,172 | 26,528,801 | ||||||
Tompkins Financial Corp. | 5,386 | 461,472 | ||||||
Towne Bank | 25,557 | 825,491 | ||||||
Trico Bancshares | 9,943 | 385,987 | ||||||
TriState Capital Holdings, Inc. (a) | 8,241 | 242,285 | ||||||
Triumph Bancorp, Inc. (a) | 9,259 | 355,083 | ||||||
Trustmark Corp. | 25,291 | 889,990 | ||||||
UMB Financial Corp. | 17,657 | 1,269,362 | ||||||
Umpqua Holdings Corp. | 85,061 | 1,811,799 | ||||||
Union Bankshares Corp. | 22,835 | 925,046 | ||||||
United Bankshares, Inc. | 40,981 | 1,514,248 | ||||||
United Community Banks, Inc. | 29,572 | 888,047 | ||||||
Univest Corp. of Pennsylvania | 11,545 | 315,178 | ||||||
Valley National Bancorp | 122,130 | 1,422,814 | ||||||
Veritex Holdings, Inc. (a) | 7,481 | 230,564 | ||||||
Washington Trust Bancorp, Inc. | 5,982 | 349,648 | ||||||
Webster Financial Corp. | 35,878 | 2,315,207 | ||||||
WesBanco, Inc. | 21,098 | 1,031,059 | ||||||
Westamerica BanCorp. | 10,543 | 632,791 | ||||||
Western Alliance Bancorp (a) | 39,079 | 2,216,561 | ||||||
Wintrust Financial Corp. | 21,597 | 1,894,705 | ||||||
Zions BanCorp. | 76,564 | 3,958,359 | ||||||
|
| |||||||
| 254,084,472 | ||||||||
|
| |||||||
TOTAL BANKS | 731,023,375 | |||||||
|
| |||||||
CAPITAL MARKETS – 19.9% | ||||||||
Asset Management & Custody Banks – 7.0% |
| |||||||
Affiliated Managers Group, Inc. | 21,184 | 3,389,652 | ||||||
Ameriprise Financial, Inc. | 56,696 | 8,258,906 | ||||||
Arlington Asset Investment Corp. Class A | 11,814 | 124,283 | ||||||
Artisan Partners Asset Management, Inc. Class A | 19,740 | 680,043 | ||||||
Associated Capital Group, Inc. Class A | 1,894 | 70,552 | ||||||
BlackRock, Inc. | 46,679 | 23,468,334 | ||||||
Blucora, Inc. (a) | 17,014 | 591,236 | ||||||
BrightSphere Investment Group PLC | 32,332 | 460,731 | ||||||
Cohen & Steers, Inc. | 8,705 | 364,652 | ||||||
Diamond Hill Investment Group, Inc. | 1,385 | 265,560 | ||||||
Eaton Vance Corp. | 46,337 | 2,461,885 | ||||||
See accompanying notes which are an integral part of the financial statements.
| Annual Report | 48 |
Table of Contents
| Common Stocks – continued | ||||||||
| Shares | Value | |||||||
CAPITAL MARKETS – continued | ||||||||
Asset Management & Custody Banks – continued |
| |||||||
Federated Investors, Inc. Class B | 37,720 | $ | 912,824 | |||||
Franklin Resources, Inc. | 128,255 | 4,401,712 | ||||||
GAMCO Investors, Inc. Class A | 2,153 | 52,727 | ||||||
Invesco Ltd. | 113,088 | 3,052,245 | ||||||
Janus Henderson Group PLC | 73,463 | 2,391,221 | ||||||
Legg Mason, Inc. | 33,174 | 1,132,229 | ||||||
Northern Trust Corp. | 83,305 | 9,098,572 | ||||||
Pzena Investment Management, Inc. Class A | 8,104 | 79,014 | ||||||
SEI Investments Co. | 51,975 | 3,115,381 | ||||||
State Street Corp. | 142,376 | 12,573,225 | ||||||
T Rowe Price Group, Inc. | 94,663 | 11,272,470 | ||||||
The Bank of New York Mellon Corp. | 391,033 | 20,908,535 | ||||||
Virtus Investment Partners, Inc. | 2,947 | 392,688 | ||||||
Waddell & Reed Financial, Inc. Class A | 32,902 | 681,400 | ||||||
Westwood Holdings Group, Inc. | 3,107 | 181,356 | ||||||
WisdomTree Investments, Inc. | 45,341 | 396,280 | ||||||
|
| |||||||
| 110,777,713 | ||||||||
|
| |||||||
Financial Exchanges and Data – 5.7% |
| |||||||
CBOE Holdings, Inc. | 43,668 | 4,241,473 | ||||||
CME Group, Inc. | 131,780 | 20,968,834 | ||||||
Donnelley Financial Solutions, Inc. (a) | 13,813 | 287,310 | ||||||
FactSet Research Systems, Inc. | 15,132 | 3,046,980 | ||||||
Intercontinental Exchange, Inc. | 225,498 | 16,666,557 | ||||||
MarketAxess Holdings, Inc. | 14,598 | 2,828,654 | ||||||
Moody’s Corp. | 66,604 | 11,397,276 | ||||||
Morningstar, Inc. | 7,458 | 984,456 | ||||||
MSCI, Inc. | 34,832 | 5,788,730 | ||||||
Nasdaq, Inc. | 45,174 | 4,128,904 | ||||||
S&P Global, Inc. | 98,325 | 19,708,263 | ||||||
|
| |||||||
| 90,047,437 | ||||||||
|
| |||||||
Investment Banking & Brokerage – 7.2% |
| |||||||
B. Riley Financial, Inc. | 6,130 | 134,247 | ||||||
BGC Partners, Inc. Class A | 90,736 | 974,505 | ||||||
Cowen, Inc. Class A (a) | 10,200 | 160,140 | ||||||
E*TRADE Financial Corp. (a) | 103,017 | 6,161,447 | ||||||
Evercore Partners, Inc. Class A | 16,083 | 1,817,379 | ||||||
Greenhill & Co., Inc. | 9,533 | 311,729 | ||||||
Houlihan Lokey, Inc. | 12,933 | 635,786 | ||||||
Interactive Brokers Group, Inc. Class A | 26,488 | 1,585,572 | ||||||
INTL. FCStone, Inc. (a) | 6,422 | 344,155 | ||||||
Investment Technology Group, Inc. | 12,172 | 269,610 | ||||||
Ladenburg Thalmann Financial Services, Inc. | 42,297 | 143,387 | ||||||
LPL Financial Holdings, Inc. | 35,047 | 2,323,266 | ||||||
Moelis & Co. Class A | 15,726 | 1,000,174 | ||||||
Morgan Stanley | 520,740 | 26,328,614 | ||||||
Piper Jaffray Cos. | 5,790 | 447,856 | ||||||
| Shares | Value | |||||||
PJT Partners, Inc. Class A | 7,310 | $ | 440,135 | |||||
Raymond James Financial, Inc. | 50,751 | 4,648,284 | ||||||
Stifel Financial Corp. | 28,018 | 1,544,632 | ||||||
TD Ameritrade Holding Corp. | 109,736 | 6,271,412 | ||||||
The Charles Schwab Corp. | 469,590 | 23,977,265 | ||||||
The Goldman Sachs Group, Inc. | 139,828 | 33,199,362 | ||||||
Virtu Financial, Inc. Class A | 10,972 | 221,086 | ||||||
|
| |||||||
| 112,940,043 | ||||||||
|
| |||||||
TOTAL CAPITAL MARKETS | 313,765,193 | |||||||
|
| |||||||
CONSUMER FINANCE – 5.1% |
| |||||||
Consumer Finance – 5.1% | ||||||||
Ally Financial, Inc. | 168,368 | 4,505,528 | ||||||
American Express Co. | 283,332 | 28,197,201 | ||||||
Capital One Financial Corp. | 188,318 | 17,762,154 | ||||||
Credit Acceptance Corp. (a) | 4,519 | 1,733,488 | ||||||
Discover Financial Services | 137,382 | 9,810,449 | ||||||
Encore Capital Group, Inc. (a) | 10,291 | 371,505 | ||||||
Enova International, Inc. (a) | 12,047 | 373,457 | ||||||
Ezcorp, Inc. Class A (a) | 20,853 | 238,767 | ||||||
FirstCash, Inc. | 18,155 | 1,474,186 | ||||||
Green Dot Corp. Class A (a) | 18,098 | 1,435,533 | ||||||
LendingClub Corp. (a) | 113,009 | 465,597 | ||||||
Navient Corp. | 98,160 | 1,296,694 | ||||||
Nelnet, Inc. Class A | 8,173 | 480,409 | ||||||
OneMain Holdings, Inc. (a) | 31,842 | 1,058,746 | ||||||
PRA Group, Inc. (a) | 17,795 | 697,564 | ||||||
SLM Corp. (a) | 169,295 | 1,911,340 | ||||||
Synchrony Financial | 279,680 | 8,093,939 | ||||||
World Acceptance Corp. (a) | 2,746 | 274,353 | ||||||
|
| |||||||
TOTAL CONSUMER FINANCE | 80,180,910 | |||||||
|
| |||||||
DIVERSIFIED FINANCIAL SERVICES – 6.8% |
| |||||||
Multi-Sector Holdings – 6.6% |
| |||||||
Berkshire Hathaway, Inc. Class B (a) | 494,818 | 97,909,638 | ||||||
Cannae Holdings, Inc. (a) | 25,280 | 461,360 | ||||||
Jefferies Financial Group, Inc. | 124,734 | 3,024,799 | ||||||
Texas Pacific Land Trust | 2,433 | 1,800,615 | ||||||
|
| |||||||
| 103,196,412 | ||||||||
|
| |||||||
Other Diversified Financial Services – 0.2% |
| |||||||
FGL Holdings (a) | 55,200 | 497,904 | ||||||
Voya Financial, Inc. | 66,679 | 3,368,623 | ||||||
|
| |||||||
| 3,866,527 | ||||||||
|
| |||||||
Specialized Finance – 0.0% | ||||||||
NewStar Financial, Inc. (b) | 6,699 | 3,298 | ||||||
On Deck Capital, Inc. (a) | 18,237 | 124,741 | ||||||
|
| |||||||
| 128,039 | ||||||||
|
| |||||||
TOTAL DIVERSIFIED FINANCIAL SERVICES |
| 107,190,978 | ||||||
|
| |||||||
See accompanying notes which are an integral part of the financial statements.
| 49 | Annual Report |
Table of Contents
Fidelity MSCI Financials Index ETF
Investments – continued
| Common Stocks – continued | ||||||||
| Shares | Value | |||||||
INSURANCE – 18.8% | ||||||||
Insurance Brokers – 2.9% | ||||||||
Aon PLC | 95,335 | $ | 13,685,339 | |||||
Arthur J Gallagher & Co. | 70,259 | 5,012,980 | ||||||
Brown & Brown, Inc. | 90,596 | 2,650,839 | ||||||
Crawford & Co. Class��A | 9,254 | 78,474 | ||||||
Marsh & McLennan Cos., Inc. | 196,580 | 16,386,909 | ||||||
Willis Towers Watson PLC | 51,227 | 8,166,608 | ||||||
|
| |||||||
| 45,981,149 | ||||||||
|
| |||||||
Life & Health Insurance – 4.9% | ||||||||
Aflac, Inc. | 301,813 | 14,046,377 | ||||||
American Equity Investment Life Holding Co. | 33,260 | 1,188,380 | ||||||
Athene Holding Ltd. Class A (a) | 60,524 | 2,776,236 | ||||||
Brighthouse Financial, Inc. (a) | 41,650 | 1,808,860 | ||||||
Citizens, Inc. (a) | 19,902 | 157,425 | ||||||
CNO Financial Group, Inc. | 64,595 | 1,314,508 | ||||||
FBL Financial Group, Inc. Class A | 4,344 | 354,905 | ||||||
Genworth Financial, Inc. Class A (a) | 193,040 | 887,984 | ||||||
Independence Holding Co. | 2,414 | 83,887 | ||||||
Lincoln National Corp. | 84,521 | 5,755,880 | ||||||
MetLife, Inc. | 343,323 | 15,703,594 | ||||||
National Western Life Group, Inc. Class A | 976 | 316,224 | ||||||
Primerica, Inc. | 16,741 | 1,921,867 | ||||||
Principal Financial Group, Inc. | 112,172 | 6,514,950 | ||||||
Prudential Financial, Inc. | 163,423 | 16,491,015 | ||||||
Torchmark Corp. | 42,006 | 3,699,468 | ||||||
Trupanion, Inc. (a) | 9,654 | 401,606 | ||||||
Unum Group | 85,728 | 3,405,973 | ||||||
|
| |||||||
| 76,829,139 | ||||||||
|
| |||||||
Multi-line Insurance – 2.5% | ||||||||
American Financial Group, Inc. | 29,142 | 3,284,012 | ||||||
American International Group, Inc. | 349,488 | 19,295,232 | ||||||
American National Insurance Co. | 3,221 | 415,477 | ||||||
Assurant, Inc. | 20,496 | 2,260,709 | ||||||
Hartford Financial Services Group, Inc. | 138,341 | 7,290,571 | ||||||
Horace Mann Educators Corp. | 15,895 | 694,612 | ||||||
Loews Corp. | 108,239 | 5,496,376 | ||||||
National General Holdings Corp. | 25,192 | 694,795 | ||||||
|
| |||||||
| 39,431,784 | ||||||||
|
| |||||||
Property & Casualty Insurance – 7.6% |
| |||||||
Ambac Financial Group, Inc. (a) | 3,651 | 74,553 | ||||||
AMERISAFE, Inc. | 7,170 | 450,276 | ||||||
Amtrust Financial Services, Inc. | 46,730 | 676,650 | ||||||
Arch Capital Group Ltd. (a) | 158,838 | 4,854,089 | ||||||
Argo Group International Holdings Ltd. | 11,633 | 727,644 | ||||||
Aspen Insurance Holdings Ltd. | 23,355 | 944,710 | ||||||
Assured Guaranty Ltd. | 44,960 | 1,749,843 | ||||||
| Shares | Value | |||||||
Axis Capital Holdings Ltd. | 32,228 | $ | 1,822,816 | |||||
Chubb Ltd. | 179,839 | 25,127,105 | ||||||
Cincinnati Financial Corp. | 60,360 | 4,565,027 | ||||||
Donegal Group, Inc. Class A | 4,639 | 67,776 | ||||||
EMC Insurance Group, Inc. | 4,324 | 115,753 | ||||||
Employers Holdings, Inc. | 13,020 | 604,779 | ||||||
Erie Indemnity Co. Class A | 9,956 | 1,236,933 | ||||||
Fidelity National Financial, Inc. | 106,331 | 4,306,406 | ||||||
First American Financial Corp. | 43,171 | 2,417,576 | ||||||
Global Indemnity Ltd. | 2,162 | 88,102 | ||||||
HCI Group, Inc. | 3,405 | 145,700 | ||||||
Heritage Insurance Holdings, Inc. | 9,563 | 164,197 | ||||||
James River Group Holdings Ltd. | 11,534 | 477,392 | ||||||
Kemper Corp. | 21,408 | 1,708,358 | ||||||
Kinsale Capital Group, Inc. | 7,586 | 449,281 | ||||||
Markel Corp. (a) | 5,383 | 6,298,110 | ||||||
MBIA, Inc. (a) | 35,115 | 359,929 | ||||||
Mercury General Corp. | 403 | 20,726 | ||||||
Old Republic International Corp. | 99,187 | 2,113,675 | ||||||
ProAssurance Corp. | 20,681 | 854,125 | ||||||
Protective Insurance Corp. Class B | 4,269 | 99,681 | ||||||
RLI Corp. | 14,575 | 1,089,627 | ||||||
Safety Insurance Group, Inc. | 5,757 | 527,341 | ||||||
Selective Insurance Group, Inc. | 23,082 | 1,380,304 | ||||||
State Auto Financial Corp. | 6,957 | 224,989 | ||||||
Stewart Information Services Corp. | 8,631 | 392,193 | ||||||
The Allstate Corp. | 137,267 | 13,056,837 | ||||||
The Hanover Insurance Group, Inc. | 16,561 | 2,077,081 | ||||||
The Navigators Group, Inc. | 9,194 | 554,858 | ||||||
The Progressive Corp. | 225,491 | 13,531,715 | ||||||
The Travelers Cos., Inc. | 105,112 | 13,679,276 | ||||||
United Fire Group, Inc. | 4,212 | 253,942 | ||||||
United Insurance Holdings Corp. | 9,943 | 206,417 | ||||||
Universal Insurance Holdings, Inc. | 12,834 | 569,830 | ||||||
White Mountains Insurance Group Ltd. | 1,244 | 1,135,809 | ||||||
WR Berkley Corp. | 37,840 | 2,868,650 | ||||||
XL Group Ltd. | 99,492 | 5,594,435 | ||||||
|
| |||||||
| 119,664,516 | ||||||||
|
| |||||||
Reinsurance – 0.9% | ||||||||
Alleghany Corp. | 5,966 | 3,754,225 | ||||||
Enstar Group Ltd. (a) | 3,572 | 772,266 | ||||||
Everest Re Group Ltd. | 15,823 | 3,454,952 | ||||||
Maiden Holdings Ltd. | 16,749 | 145,716 | ||||||
Reinsurance Group of America, Inc. | 24,987 | 3,535,661 | ||||||
RenaissanceRe Holdings Ltd. | 15,446 | 2,036,555 | ||||||
Third Point Reinsurance Ltd. (a) | 34,332 | 432,583 | ||||||
|
| |||||||
| 14,131,958 | ||||||||
|
| |||||||
TOTAL INSURANCE | 296,038,546 | |||||||
|
| |||||||
See accompanying notes which are an integral part of the financial statements.
| Annual Report | 50 |
Table of Contents
| Common Stocks – continued | ||||||||
| Shares | Value | |||||||
MORTGAGE REAL ESTATE INVESTMENT TRUST (REITS) – 1.6% |
| |||||||
Mortgage REIT’s – 1.6% | ||||||||
AG Mortgage Investment Trust, Inc. | 11,602 | $ | 226,587 | |||||
AGNC Investment Corp. | 163,839 | 3,189,945 | ||||||
Annaly Capital Management, Inc. | 449,296 | 4,816,453 | ||||||
Anworth Mortgage Asset Corp. | 40,478 | 204,009 | ||||||
Apollo Commercial Real Estate Finance, Inc. | 43,104 | 822,855 | ||||||
Arbor Realty Trust, Inc. | 19,414 | 220,737 | ||||||
ARMOUR Residential REIT, Inc. | 15,731 | 373,926 | ||||||
Blackstone Mortgage Trust, Inc. Class A | 40,222 | 1,332,957 | ||||||
Capstead Mortgage Corp. | 38,681 | 323,760 | ||||||
Chimera Investment Corp. | 73,348 | 1,400,947 | ||||||
Colony Credit Real Estate, Inc. | 32,894 | 699,326 | ||||||
CYS Investments, Inc. | 59,940 | 438,161 | ||||||
Dynex Capital, Inc. | 22,754 | 151,314 | ||||||
Exantas Capital Corp. | 13,062 | 137,020 | ||||||
Granite Point Mortgage Trust, Inc. | 17,470 | 331,930 | ||||||
Hannon Armstrong Sustainable Infrastructure Capital, Inc. | 20,678 | 405,082 | ||||||
Invesco Mortgage Capital, Inc. | 43,938 | 728,931 | ||||||
KKR Real Estate Finance Trust, Inc. | 7,783 | 161,264 | ||||||
Ladder Capital Corp. | 29,620 | 473,624 | ||||||
MFA Financial, Inc. | 156,314 | 1,258,328 | ||||||
MTGE Investment Corp. | 18,745 | 375,837 | ||||||
New Residential Investment Corp. | 130,847 | 2,340,853 | ||||||
New York Mortgage Trust, Inc. | 45,763 | 284,188 | ||||||
PennyMac Mortgage Investment Trust | 24,315 | 469,036 | ||||||
Redwood Trust, Inc. | 30,560 | 513,714 | ||||||
Starwood Property Trust, Inc. | 100,859 | 2,303,620 | ||||||
Sutherland Asset Management Corp. | 7,648 | 127,722 | ||||||
TPG RE Finance Trust, Inc. | 11,046 | 227,769 | ||||||
Two Harbors Investment Corp. | 68,824 | 1,066,772 | ||||||
Western Asset Mortgage Capital Corp. | 16,251 | 179,899 | ||||||
|
| |||||||
TOTAL MORTGAGE REAL ESTATE INVESTMENT TRUST (REITS) |
| 25,586,566 | ||||||
|
| |||||||
THRIFTS & MORTGAGE FINANCE – 1.2% |
| |||||||
Thrifts & Mortgage Finance – 1.2% |
| |||||||
Beneficial Bancorp, Inc. | 27,186 | 441,772 | ||||||
BofI Holding, Inc. (a) | 22,063 | 860,898 | ||||||
Capitol Federal Financial, Inc. | 51,293 | 670,399 | ||||||
Dime Community Bancshares, Inc. | 12,966 | 223,015 | ||||||
Essent Group Ltd. (a) | 34,512 | 1,325,261 | ||||||
Federal Agricultural Mortgage Corp. Class C | 3,574 | 336,992 | ||||||
First Defiance Financial Corp. | 8,282 | 266,349 | ||||||
Flagstar Bancorp, Inc. (a) | 12,173 | 414,491 | ||||||
| Shares | Value | |||||||
HomeStreet, Inc. (a) | 9,857 | $ | 291,767 | |||||
Kearny Financial Corp. | 37,531 | 538,570 | ||||||
LendingTree, Inc. (a) | 1,842 | 439,870 | ||||||
Luther Burbank Corp. | 7,355 | 80,022 | ||||||
Merchants Bancorp | 3,726 | 91,324 | ||||||
Meridian Bancorp, Inc. | 20,636 | 377,639 | ||||||
Meta Financial Group, Inc. | 3,608 | 322,736 | ||||||
MGIC Investment Corp. (a) | 143,101 | 1,785,900 | ||||||
New York Community Bancorp, Inc. | 188,493 | 2,030,070 | ||||||
NMI Holdings, Inc. Class A (a) | 23,131 | 483,438 | ||||||
Northfield Bancorp, Inc. | 17,968 | 299,347 | ||||||
Northwest Bancshares, Inc. | 38,581 | 695,230 | ||||||
OceanFirst Financial Corp. | 15,462 | 451,027 | ||||||
Ocwen Financial Corp. (a) | 44,545 | 177,289 | ||||||
Oritani Financial Corp. | 17,084 | 273,344 | ||||||
PHH Corp. (a) | 13,992 | 152,093 | ||||||
Provident Financial Services, Inc. | 24,687 | 630,506 | ||||||
Radian Group, Inc. | 83,358 | 1,596,306 | ||||||
Sterling Bancorp, Inc. | 8,280 | 106,150 | ||||||
TFS Financial Corp. | 22,674 | 345,098 | ||||||
TrustCo Bank Corp. | 40,066 | 364,601 | ||||||
United Community Financial Corp. | 20,309 | 212,229 | ||||||
United Financial Bancorp, Inc. | 19,707 | 345,070 | ||||||
Walker & Dunlop, Inc. | 11,428 | 677,223 | ||||||
Washington Federal, Inc. | 33,479 | 1,123,220 | ||||||
Waterstone Financial, Inc. | 10,895 | 185,215 | ||||||
WSFS Financial Corp. | 12,445 | 705,631 | ||||||
|
| |||||||
TOTAL THRIFTS & MORTGAGE FINANCE |
| 19,320,092 | ||||||
|
| |||||||
TOTAL COMMON STOCKS |
| 1,573,105,660 | ||||||
|
| |||||||
| Money Market Funds – 0.1% | ||||||||
State Street Institutional Treasury Plus Money Market Fund, Trust Class, | 850,015 | 850,015 | ||||||
|
| |||||||
TOTAL INVESTMENT PORTFOLIO – 100.0% |
| 1,573,955,675 | ||||||
NET OTHER ASSETS (LIABILITIES) – 0.0% |
| 419,489 | ||||||
|
| |||||||
NET ASSETS – 100.0% | $ | 1,574,375,164 | ||||||
|
| |||||||
Legend
| (a) | Non-income producing. |
| (b) | Level 3 security. |
| (c) | The rate quoted is the annualized seven-day yield of the fund at period end. |
See accompanying notes which are an integral part of the financial statements.
| 51 | Annual Report |
Table of Contents
Fidelity MSCI Financials Index ETF
Investments – continued
Investment Valuation
The following is a summary of the inputs used, as of July 31, 2018, involving the Fund’s assets and liabilities carried at fair value. The inputs or methodology used for valuing securities may not be an indication of the risk associated with investing in those securities. For more information on valuation inputs, and their aggregation into the levels used in the table below, please refer to the Investment Valuation section in the accompanying Notes to Financial Statements.
| Valuation Inputs at Reporting Date: | ||||||||||||||||
| Description | Total | Level 1 | Level 2 | Level 3 | ||||||||||||
Investments in Securities: | ||||||||||||||||
Common Stocks | $ | 1,573,105,660 | $ | 1,573,102,362 | $ | — | $ | 3,298 | ||||||||
Money Market Funds | 850,015 | 850,015 | — | — | ||||||||||||
|
|
|
|
|
|
|
| |||||||||
Total Investments in Securities: | $ | 1,573,955,675 | $ | 1,573,952,377 | $ | — | $ | 3,298 | ||||||||
|
|
|
|
|
|
|
| |||||||||
See accompanying notes which are an integral part of the financial statements.
| Annual Report | 52 |
Table of Contents
Fidelity MSCI Health Care Index ETF
Investments July 31, 2018
Showing Percentage of Net Assets
| Common Stocks – 99.8% | ||||||||
| Shares | Value | |||||||
BIOTECHNOLOGY – 21.0% | ||||||||
Biotechnology – 21.0% | ||||||||
AbbVie, Inc. | 467,713 | $ | 43,137,170 | |||||
Abeona Therapeutics, Inc. (a) | 9,294 | 134,298 | ||||||
ACADIA Pharmaceuticals, Inc. (a) | 108 | 1,630 | ||||||
Acceleron Pharma, Inc. (a) | 11,308 | 492,576 | ||||||
Achaogen, Inc. (a) | 8,232 | 58,612 | ||||||
Achillion Pharmaceuticals, Inc. (a) | 120 | 310 | ||||||
Acorda Therapeutics, Inc. (a) | 11,265 | 281,062 | ||||||
Adamas Pharmaceuticals, Inc. | 6,749 | 160,491 | ||||||
Aduro Biotech, Inc. (a) | 12,072 | 70,621 | ||||||
Agenus, Inc. (a) | 28,006 | 51,251 | ||||||
Agios Pharmaceuticals, Inc. (a) | 15,946 | 1,377,894 | ||||||
Aimmune Therapeutics, Inc. (a) | 11,625 | 336,195 | ||||||
Akebia Therapeutics, Inc. (a) | 14,338 | 147,681 | ||||||
Alder Biopharmaceuticals, Inc. (a) | 19,305 | 365,830 | ||||||
Alexion Pharmaceuticals, Inc. (a) | 68,336 | 9,085,955 | ||||||
Alkermes PLC (a) | 48,071 | 2,107,913 | ||||||
Alnylam Pharmaceuticals, Inc. (a) | 27,666 | 2,628,270 | ||||||
AMAG Pharmaceuticals, Inc. (a) | 11,394 | 251,238 | ||||||
Amgen, Inc. | 207,813 | 40,845,645 | ||||||
Amicus Therapeutics, Inc. (a) | 57,418 | 835,432 | ||||||
AnaptysBio, Inc. (a) | 5,120 | 400,998 | ||||||
Apellis Pharmaceuticals, Inc. | 5,172 | 95,165 | ||||||
Arena Pharmaceuticals, Inc. (a) | 14,775 | 570,167 | ||||||
Array BioPharma, Inc. (a) | 60,725 | 934,558 | ||||||
Arrowhead Pharmaceuticals, Inc. (a) | 24,452 | 356,266 | ||||||
Atara Biotherapeutics, Inc. (a) | 9,486 | 356,199 | ||||||
Athenex, Inc. | 9,783 | 188,518 | ||||||
Audentes Therapeutics, Inc. (a) | 8,126 | 305,944 | ||||||
Bellicum Pharmaceuticals, Inc. (a) | 10,818 | 68,802 | ||||||
BioCryst Pharmaceuticals, Inc. (a) | 21,848 | 128,903 | ||||||
Biogen, Inc. (a) | 65,215 | 21,805,940 | ||||||
Biohaven Pharmaceutical Holding Co. Ltd. (a) | 5,657 | 195,280 | ||||||
BioMarin Pharmaceutical, Inc. (a) | 54,338 | 5,464,229 | ||||||
Biotime, Inc. (a) | 29,370 | 76,362 | ||||||
Bluebird Bio, Inc. (a) | 16,444 | 2,547,176 | ||||||
Blueprint Medicines Corp. (a) | 12,166 | 724,364 | ||||||
Cara Therapeutics, Inc. (a) | 10,077 | 180,681 | ||||||
Celgene Corp. (a) | 231,868 | 20,888,988 | ||||||
ChemoCentryx, Inc. | 7,103 | 82,111 | ||||||
Clovis Oncology, Inc. (a) | 15,052 | 664,395 | ||||||
Coherus Biosciences, Inc. (a) | 12,586 | 239,763 | ||||||
Concert Pharmaceuticals, Inc. (a) | 4,690 | 74,993 | ||||||
CRISPR Therapeutics AG | 5,813 | 277,513 | ||||||
Cytokinetics, Inc. (a) | 15,012 | 110,338 | ||||||
CytomX Therapeutics, Inc. (a) | 12,933 | 340,655 | ||||||
Deciphera Pharmaceuticals, Inc. | 4,546 | 156,382 | ||||||
Denali Therapeutics, Inc. | 6,000 | 75,540 | ||||||
Dicerna Pharmaceuticals, Inc. | 9,847 | 124,072 | ||||||
| Shares | Value | |||||||
Dyax Corp. (b) | 31,822 | $ | 113,923 | |||||
Dynavax Technologies Corp. (a) | 19,058 | 257,283 | ||||||
Eagle Pharmaceuticals, Inc. (a) | 3,717 | 294,572 | ||||||
Editas Medicine, Inc. (a) | 10,587 | 314,857 | ||||||
Emergent BioSolutions, Inc. (a) | 12,863 | 699,104 | ||||||
Enanta Pharmaceuticals, Inc. (a) | 4,476 | 436,500 | ||||||
Epizyme, Inc. (a) | 16,042 | 206,942 | ||||||
Esperion Therapeutics, Inc. (a) | 7,456 | 335,073 | ||||||
Exact Sciences Corp. (a) | 37,232 | 2,176,210 | ||||||
Exelixis, Inc. (a) | 91,604 | 1,896,203 | ||||||
Fate Therapeutics, Inc. | 13,015 | 116,224 | ||||||
FibroGen, Inc. (a) | 23,003 | 1,451,489 | ||||||
Five Prime Therapeutics, Inc. (a) | 11,318 | 168,638 | ||||||
Flexion Therapeutics, Inc. (a) | 9,605 | 229,175 | ||||||
G1 Therapeutics, Inc. (a) | 6,485 | 333,005 | ||||||
Genomic Health, Inc. (a) | 6,621 | 355,415 | ||||||
Geron Corp. (a) | 51,139 | 183,589 | ||||||
Gilead Sciences, Inc. | 403,720 | 31,421,528 | ||||||
Global Blood Therapeutics, Inc. (a) | 13,877 | 580,059 | ||||||
GlycoMimetics, Inc. | 10,472 | 153,834 | ||||||
Halozyme Therapeutics, Inc. (a) | 40,256 | 728,634 | ||||||
Heron Therapeutics, Inc. (a) | 18,253 | 683,575 | ||||||
ImmunoGen, Inc. (a) | 44,950 | 418,035 | ||||||
Immunomedics, Inc. (a) | 35,721 | 854,804 | ||||||
Incyte Corp. (a) | 55,568 | 3,697,495 | ||||||
Inovio Pharmaceuticals, Inc. (a) | 26,499 | 106,261 | ||||||
Insmed, Inc. (a) | 23,747 | 590,588 | ||||||
Insys Therapeutics, Inc. (a) | 8,191 | 54,552 | ||||||
Intellia Therapeutics, Inc. (a) | 7,331 | 195,151 | ||||||
Intercept Pharmaceuticals, Inc. (a) | 6,403 | 583,569 | ||||||
Intrexon Corp. (a) | 21,620 | 316,949 | ||||||
Invitae Corp. (a) | 15,341 | 135,614 | ||||||
Ionis Pharmaceuticals, Inc. (a) | 38,627 | 1,687,227 | ||||||
Iovance Biotherapeutics, Inc. (a) | 22,214 | 315,439 | ||||||
Ironwood Pharmaceuticals, Inc. (a) | 42,823 | 825,627 | ||||||
Jounce Therapeutics, Inc. (a) | 4,534 | 32,010 | ||||||
Karyopharm Therapeutics, Inc. (a) | 14,550 | 258,699 | ||||||
Keryx Biopharmaceuticals, Inc. (a) | 30,290 | 128,430 | ||||||
Kura Oncology, Inc. | 6,919 | 140,456 | ||||||
La Jolla Pharmaceutical Co. (a) | 6,118 | 202,322 | ||||||
Lexicon Pharmaceuticals, Inc. (a) | 13,404 | 160,580 | ||||||
Ligand Pharmaceuticals, Inc. (a) | 6,524 | 1,424,385 | ||||||
Loxo Oncology, Inc. (a) | 6,984 | 1,170,449 | ||||||
MacroGenics, Inc. (a) | 11,722 | 242,059 | ||||||
Madrigal Pharmaceuticals, Inc. (a) | 2,212 | 568,550 | ||||||
MiMedx Group, Inc. (a) | 33,649 | 143,008 | ||||||
Minerva Neurosciences Inc. (a) | 11,023 | 88,735 | ||||||
Mirati Therapeutics, Inc. (a) | 5,459 | 335,183 | ||||||
Momenta Pharmaceuticals, Inc. (a) | 22,805 | 675,028 | ||||||
Myovant Sciences Ltd. (a) | 5,125 | 104,038 | ||||||
Myriad Genetics, Inc. (a) | 21,629 | 946,269 | ||||||
See accompanying notes which are an integral part of the financial statements.
| 53 | Annual Report |
Table of Contents
Fidelity MSCI Health Care Index ETF
Investments – continued
| Common Stocks – continued | ||||||||
| Shares | Value | |||||||
BIOTECHNOLOGY – continued |
| |||||||
Biotechnology – continued |
| |||||||
Natera, Inc. (a) | 10,774 | $ | 247,371 | |||||
Neurocrine Biosciences, Inc. (a) | 27,795 | 2,793,120 | ||||||
Novavax, Inc. (a) | 16,074 | 20,414 | ||||||
Opko Health, Inc. (a) | 104,881 | 589,431 | ||||||
PDL BioPharma, Inc. (a) | 47,831 | 120,056 | ||||||
Portola Pharmaceuticals, Inc. (a) | 19,397 | 694,413 | ||||||
Progenics Pharmaceuticals, Inc. (a) | 21,925 | 175,071 | ||||||
Prothena Corp. PLC (a) | 11,809 | 175,482 | ||||||
PTC Therapeutics, Inc. (a) | 10,991 | 418,427 | ||||||
Puma Biotechnology, Inc. (a) | 9,289 | 447,265 | ||||||
Radius Health, Inc. (a) | 11,822 | 283,728 | ||||||
Regeneron Pharmaceuticals, Inc. (a) | 24,466 | 9,003,733 | ||||||
REGENXBIO, Inc. (a) | 8,844 | 621,733 | ||||||
Repligen Corp. (a) | 11,465 | 554,103 | ||||||
Retrophin, Inc. (a) | 11,007 | 304,233 | ||||||
Rhythm Pharmaceuticals, Inc. | 5,086 | 157,869 | ||||||
Rigel Pharmaceuticals, Inc. (a) | 49,264 | 138,924 | ||||||
Rocket Pharmaceuticals, Inc. | 6,872 | 140,945 | ||||||
Sage Therapeutics, Inc. (a) | 14,176 | 2,045,880 | ||||||
Sangamo Therapeutics, Inc. (a) | 30,773 | 420,051 | ||||||
Sarepta Therapeutics, Inc. (a) | 19,006 | 2,209,257 | ||||||
Seattle Genetics, Inc. (a) | 34,032 | 2,395,853 | ||||||
Seres Therapeutics, Inc. (a) | 6,284 | 47,570 | ||||||
Sorrento Therapeutics, Inc. (a) | 21,535 | 120,596 | ||||||
Spark Therapeutics, Inc. (a) | 10,466 | 802,952 | ||||||
Spectrum Pharmaceuticals, Inc. (a) | 28,133 | 598,952 | ||||||
Synergy Pharmaceuticals, Inc. (a) | 69,215 | 117,666 | ||||||
TESARO, Inc. (a) | 11,959 | 416,532 | ||||||
TG Therapeutics, Inc. (a) | 18,077 | 212,405 | ||||||
Ultragenyx Pharmaceutical, Inc. (a) | 14,574 | 1,152,949 | ||||||
uniQure N.V. (a) | 7,381 | 227,999 | ||||||
United Therapeutics Corp. (a) | 13,370 | 1,643,307 | ||||||
Vanda Pharmaceuticals, Inc. (a) | 16,060 | 334,851 | ||||||
Vertex Pharmaceuticals, Inc. (a) | 78,241 | 13,696,087 | ||||||
Voyager Therapeutics, Inc. (a) | 5,904 | 111,349 | ||||||
Xencor, Inc. (a) | 15,318 | 570,136 | ||||||
ZIOPHARM Oncology, Inc. (a) | 39,570 | 102,486 | ||||||
|
| |||||||
TOTAL BIOTECHNOLOGY |
| 263,454,916 | ||||||
|
| |||||||
HEALTH CARE EQUIPMENT & SUPPLIES – 21.8% |
| |||||||
Health Care Equipment – 19.7% |
| |||||||
Abaxis, Inc. | 7,103 | 589,549 | ||||||
Abbott Laboratories | 538,576 | 35,298,271 | ||||||
ABIOMED, Inc. (a) | 12,984 | 4,603,218 | ||||||
Accuray, Inc. (a) | 27,718 | 106,714 | ||||||
AngioDynamics, Inc. (a) | 11,589 | 244,991 | ||||||
AtriCure, Inc. (a) | 9,590 | 274,753 | ||||||
AxoGen, Inc. | 9,117 | 409,581 | ||||||
Baxter International, Inc. | 158,132 | 11,456,663 | ||||||
| Shares | Value | |||||||
Becton Dickinson and Co. | 82,061 | $ | 20,545,613 | |||||
Boston Scientific Corp. (a) | 423,635 | 14,238,372 | ||||||
Cantel Medical Corp. | 11,641 | 1,079,237 | ||||||
Cardiovascular Systems, Inc. (a) | 10,407 | 394,738 | ||||||
CONMED Corp. | 7,851 | 580,974 | ||||||
CryoLife, Inc. (a) | 10,018 | 298,536 | ||||||
Cutera, Inc. (a) | 4,404 | 176,160 | ||||||
Danaher Corp. | 193,517 | 19,850,974 | ||||||
DexCom, Inc. (a) | 26,907 | 2,559,663 | ||||||
Edwards Lifesciences Corp. (a) | 64,736 | 9,221,643 | ||||||
GenMark Diagnostics, Inc. (a) | 17,307 | 115,611 | ||||||
Glaukos Corp. (a) | 9,591 | 399,082 | ||||||
Globus Medical, Inc. Class A (a) | 22,439 | 1,155,160 | ||||||
Heska Corp. (a) | 2,201 | 220,650 | ||||||
Hill-Rom Holdings, Inc. | 20,515 | 1,932,513 | ||||||
Hologic, Inc. (a) | 85,431 | 3,665,844 | ||||||
IDEXX Laboratories, Inc. (a) | 26,878 | 6,583,229 | ||||||
Inogen, Inc. (a) | 5,568 | 1,109,424 | ||||||
Insulet Corp. (a) | 17,971 | 1,494,468 | ||||||
Integer Holdings Corp. (a) | 8,980 | 641,621 | ||||||
Integra LifeSciences Holdings Corp. (a) | 20,737 | 1,292,537 | ||||||
Intuitive Surgical, Inc. (a) | 34,616 | 17,591,505 | ||||||
Invacare Corp. | 10,766 | 192,173 | ||||||
iRhythm Technologies, Inc. (a) | 5,360 | 404,948 | ||||||
K2M Group Holdings, Inc. (a) | 12,684 | 258,373 | ||||||
LeMaitre Vascular, Inc. | 5,167 | 186,012 | ||||||
LivaNova PLC (a) | 14,905 | 1,641,488 | ||||||
Masimo Corp. (a) | 15,211 | 1,512,278 | ||||||
Medtronic PLC | 417,966 | 37,713,072 | ||||||
Natus Medical, Inc. (a) | 9,769 | 356,568 | ||||||
Nevro Corp. (a) | 8,331 | 468,702 | ||||||
Novocure Ltd. (a) | 19,756 | 671,704 | ||||||
NuVasive, Inc. (a) | 16,019 | 929,903 | ||||||
NxStage Medical, Inc. (a) | 20,838 | 584,923 | ||||||
Orthofix International N.V. (a) | 5,822 | 352,173 | ||||||
Penumbra, Inc. (a) | 9,497 | 1,350,948 | ||||||
ResMed, Inc. | 44,115 | 4,666,485 | ||||||
Rockwell Medical, Inc. (a) | 12,760 | 51,806 | ||||||
STERIS PLC | 26,126 | 2,990,643 | ||||||
Stryker Corp. | 103,936 | 16,967,552 | ||||||
Surmodics, Inc. (a) | 4,084 | 240,139 | ||||||
Tactile Systems Technology, Inc. (a) | 4,712 | 226,506 | ||||||
Teleflex, Inc. | 14,300 | 3,899,753 | ||||||
Varex Imaging Corp. (a) | 11,642 | 445,190 | ||||||
Varian Medical Systems, Inc. (a) | 28,208 | 3,256,614 | ||||||
ViewRay, Inc. | 9,733 | 116,017 | ||||||
Wright Medical Group N.V. (a) | 31,306 | 796,112 | ||||||
Zimmer Biomet Holdings, Inc. | 62,643 | 7,862,949 | ||||||
|
| |||||||
| 246,274,325 | ||||||||
|
| |||||||
Health Care Supplies – 2.1% |
| |||||||
Align Technology, Inc. (a) | 23,472 | 8,371,289 | ||||||
See accompanying notes which are an integral part of the financial statements.
| Annual Report | 54 |
Table of Contents
| Common Stocks – continued | ||||||||
| Shares | Value | |||||||
HEALTH CARE EQUIPMENT & SUPPLIES – continued |
| |||||||
Health Care Supplies – continued |
| |||||||
Anika Therapeutics, Inc. (a) | 4,574 | $ | 183,097 | |||||
Atrion Corp. | 470 | 323,360 | ||||||
Avanos Medical, Inc. | 14,443 | 797,254 | ||||||
Cerus Corp. (a) | 40,044 | 296,726 | ||||||
DENTSPLY SIRONA, Inc. | 70,977 | 3,414,703 | ||||||
Endologix, Inc. (a) | 25,122 | 127,871 | ||||||
Haemonetics Corp. (a) | 16,458 | 1,606,959 | ||||||
ICU Medical, Inc. (a) | 4,994 | 1,432,279 | ||||||
Lantheus Holdings, Inc. (a) | 11,664 | 168,545 | ||||||
Meridian Bioscience, Inc. | 13,606 | 214,975 | ||||||
Merit Medical Systems, Inc. (a) | 15,539 | 843,768 | ||||||
Neogen Corp. (a) | 15,949 | 1,314,198 | ||||||
OraSure Technologies, Inc. (a) | 19,493 | 327,287 | ||||||
Quidel Corp. (a) | 9,246 | 627,433 | ||||||
STAAR Surgical Co. (a) | 9,549 | 294,587 | ||||||
The Cooper Cos., Inc. | 15,144 | 3,945,012 | ||||||
West Pharmaceutical Services, Inc. | 22,780 | 2,497,827 | ||||||
|
| |||||||
| 26,787,170 | ||||||||
|
| |||||||
TOTAL HEALTH CARE EQUIPMENT & SUPPLIES |
| 273,061,495 | ||||||
|
| |||||||
HEALTH CARE PROVIDERS & SERVICES – 20.6% |
| |||||||
Drug Retail – 1.6% |
| |||||||
CVS Health Corp. | 312,675 | 20,280,101 | ||||||
|
| |||||||
Health Care Services – 3.0% | ||||||||
Addus HomeCare Corp. | 2,570 | 170,006 | ||||||
Amedisys, Inc. (a) | 9,053 | 847,632 | ||||||
American Renal Associates Holdings, Inc. (a) | 3,980 | 64,038 | ||||||
AMN Healthcare Services, Inc. (a) | 14,796 | 895,158 | ||||||
BioTelemetry, Inc. (a) | 10,123 | 531,457 | ||||||
Chemed Corp. | 4,980 | 1,573,829 | ||||||
Civitas Solutions, Inc. (a) | 5,295 | 86,573 | ||||||
CorVel Corp. (a) | 3,324 | 190,631 | ||||||
Cross Country Healthcare, Inc. (a) | 11,299 | 132,537 | ||||||
DaVita, Inc. (a) | 44,995 | 3,162,249 | ||||||
Diplomat Pharmacy, Inc. (a) | 16,466 | 342,163 | ||||||
Envision Healthcare Corp. (a) | 37,449 | 1,657,493 | ||||||
Express Scripts Holding Co. (a) | 173,882 | 13,816,664 | ||||||
Laboratory Corp. of America Holdings (a) | 31,439 | 5,512,514 | ||||||
LHC Group, Inc. (a) | 8,721 | 750,704 | ||||||
MEDNAX, Inc. (a) | 29,007 | 1,241,210 | ||||||
National Research Corp. Class A | 3,510 | 133,205 | ||||||
Premier, Inc. Class A (a) | 17,212 | 643,729 | ||||||
Quest Diagnostics, Inc. | 41,864 | 4,509,590 | ||||||
R1 RCM, Inc. | 25,661 | 205,801 | ||||||
RadNet, Inc. (a) | 12,724 | 170,502 | ||||||
The Providence Service Corp. (a) | 3,746 | 262,520 | ||||||
| Shares | Value | |||||||
Tivity Health, Inc. (a) | 12,376 | $ | 417,071 | |||||
|
| |||||||
| 37,317,276 | ||||||||
|
| |||||||
Health Care Distributors – 1.7% |
| |||||||
AmerisourceBergen Corp. | 50,861 | 4,161,956 | ||||||
Cardinal Health, Inc. | 97,115 | 4,850,894 | ||||||
Henry Schein, Inc. (a) | 47,481 | 3,770,466 | ||||||
McKesson Corp. | 63,604 | 7,988,662 | ||||||
Owens & Minor, Inc. | 19,338 | 364,908 | ||||||
Patterson Cos., Inc. | 26,244 | 643,503 | ||||||
|
| |||||||
| 21,780,389 | ||||||||
|
| |||||||
Health Care Facilities – 1.8% |
| |||||||
Acadia Healthcare Co., Inc. (a) | 27,399 | 1,081,713 | ||||||
Brookdale Senior Living, Inc. (a) | 57,326 | 549,756 | ||||||
Capital Senior Living Corp. (a) | 8,003 | 79,950 | ||||||
Community Health Systems, Inc. (a) | 96 | 321 | ||||||
Encompass Health Corp. | 30,216 | 2,285,236 | ||||||
HCA Healthcare, Inc. | 86,291 | 10,719,931 | ||||||
LifePoint Health, Inc. (a) | 12,121 | 785,441 | ||||||
National HealthCare Corp. | 2,873 | 207,086 | ||||||
Select Medical Holdings Corp. (a) | 33,151 | 689,541 | ||||||
Surgery Partners, Inc. (a) | 4,511 | 68,116 | ||||||
Tenet Healthcare Corp. (a) | 31,461 | 1,183,877 | ||||||
The Ensign Group, Inc. | 15,373 | 554,504 | ||||||
Universal Health Services, Inc. Class B | 27,080 | 3,306,468 | ||||||
US Physical Therapy, Inc. | 3,896 | 408,106 | ||||||
|
| |||||||
| 21,920,046 | ||||||||
|
| |||||||
Managed Health Care – 12.5% |
| |||||||
Aetna, Inc. | 100,779 | 18,985,756 | ||||||
Anthem, Inc. | 78,814 | 19,939,942 | ||||||
Centene Corp. (a) | 62,516 | 8,147,710 | ||||||
Cigna Corp. | 74,842 | 13,428,152 | ||||||
HealthEquity, Inc. (a) | 16,873 | 1,273,912 | ||||||
Humana, Inc. | 42,427 | 13,329,715 | ||||||
Magellan Health, Inc. (a) | 7,441 | 541,333 | ||||||
Molina Healthcare, Inc. (a) | 17,450 | 1,816,370 | ||||||
Triple-S Management Corp. Class B (a) | 7,279 | 258,477 | ||||||
UnitedHealth Group, Inc. | 298,433 | 75,569,204 | ||||||
WellCare Health Plans, Inc. (a) | 13,303 | 3,557,488 | ||||||
|
| |||||||
| 156,848,059 | ||||||||
|
| |||||||
TOTAL HEALTH CARE PROVIDERS & SERVICES |
| 258,145,871 | ||||||
|
| |||||||
HEALTH CARE TECHNOLOGY – 1.3% |
| |||||||
Health Care Technology – 1.3% |
| |||||||
Allscripts Healthcare Solutions, Inc. (a) | 56,660 | 693,518 | ||||||
athenahealth, Inc. (a) | 12,400 | 1,868,804 | ||||||
Castlight Health, Inc. Class B (a) | 23,170 | 76,461 | ||||||
Cerner Corp. (a) | 92,349 | 5,733,026 | ||||||
Computer Programs & Systems, Inc. | 3,994 | 124,613 | ||||||
Cotiviti Holdings, Inc. (a) | 12,855 | 573,847 | ||||||
See accompanying notes which are an integral part of the financial statements.
| 55 | Annual Report |
Table of Contents
Fidelity MSCI Health Care Index ETF
Investments – continued
| Common Stocks – continued | ||||||||
| Shares | Value | |||||||
HEALTH CARE TECHNOLOGY – continued |
| |||||||
Health Care Technology – continued |
| |||||||
Evolent Health, Inc. Class A (a) | 17,261 | $ | 348,672 | |||||
HealthStream, Inc. | 8,034 | 225,595 | ||||||
HMS Holdings Corp. (a) | 26,096 | 624,477 | ||||||
Inovalon Holdings, Inc. Class A (a) | 19,351 | 206,088 | ||||||
Medidata Solutions, Inc. (a) | 18,111 | 1,345,828 | ||||||
Omnicell, Inc. (a) | 11,993 | 713,584 | ||||||
Quality Systems, Inc. (a) | 14,734 | 296,596 | ||||||
Tabula Rasa HealthCare, Inc. | 5,011 | 291,841 | ||||||
Teladoc, Inc. (a) | 17,104 | 1,023,674 | ||||||
Veeva Systems, Inc. Class A (a) | 35,874 | 2,713,151 | ||||||
Vocera Communications, Inc. (a) | 8,612 | 259,910 | ||||||
|
| |||||||
TOTAL HEALTH CARE TECHNOLOGY |
| 17,119,685 | ||||||
|
| |||||||
LIFE SCIENCES TOOLS & SERVICES – 6.4% |
| |||||||
Life Sciences Tools & Services – 6.4% |
| |||||||
Accelerate Diagnostics, Inc. (a) | 10,618 | 233,065 | ||||||
Agilent Technologies, Inc. | 99,543 | 6,573,820 | ||||||
Bio-Rad Laboratories, Inc. Class A (a) | 6,479 | 1,986,785 | ||||||
Bio-Techne Corp. | 11,592 | 1,862,139 | ||||||
Bruker Corp. | 31,124 | 1,008,418 | ||||||
Cambrex Corp. (a) | 10,154 | 634,625 | ||||||
Charles River Laboratories International, Inc. (a) | 14,674 | 1,823,978 | ||||||
Codexis, Inc. | 14,881 | 214,286 | ||||||
Illumina, Inc. (a) | 45,296 | 14,692,211 | ||||||
IQVIA Holdings, Inc. (a) | 50,423 | 6,148,581 | ||||||
Luminex Corp. | 13,320 | 451,015 | ||||||
Medpace Holdings, Inc. (a) | 2,914 | 178,832 | ||||||
Mettler-Toledo International, Inc. (a) | 7,867 | 4,661,276 | ||||||
NeoGenomics, Inc. (a) | 19,305 | 270,270 | ||||||
Pacific Biosciences of California, Inc. (a) | 34,203 | 129,971 | ||||||
PerkinElmer, Inc. | 34,014 | 2,693,229 | ||||||
PRA Health Sciences, Inc. (a) | 15,832 | 1,664,577 | ||||||
Syneos Health, Inc. (a) | 17,768 | 875,518 | ||||||
Thermo Fisher Scientific, Inc. | 123,824 | 29,040,443 | ||||||
Waters Corp. (a) | 24,309 | 4,795,436 | ||||||
|
| |||||||
TOTAL LIFE SCIENCES TOOLS & SERVICES |
| 79,938,475 | ||||||
|
| |||||||
PHARMACEUTICALS – 28.7% |
| |||||||
Pharmaceuticals – 28.7% |
| |||||||
Aclaris Therapeutics, Inc. (a) | 7,996 | 137,051 | ||||||
Aerie Pharmaceuticals, Inc. (a) | 10,645 | 719,070 | ||||||
Akcea Therapeutics, Inc. (a) | 5,175 | 163,634 | ||||||
Akorn, Inc. (a) | 29,445 | 545,321 | ||||||
Allergan PLC | 101,832 | 18,746,253 | ||||||
Amneal Pharmaceuticals, Inc. | 21,798 | 417,868 | ||||||
Amphastar Pharmaceuticals, Inc. (a) | 10,633 | 185,546 | ||||||
ANI Pharmaceuticals, Inc. (a) | 2,758 | 184,648 | ||||||
| Shares | Value | |||||||
Assembly Biosciences, Inc. (a) | 6,444 | $ | 285,018 | |||||
Bristol-Myers Squibb Co. | 503,142 | 29,559,592 | ||||||
Catalent, Inc. (a) | 41,047 | 1,711,660 | ||||||
Collegium Pharmaceutical, Inc. (a) | 7,195 | 138,648 | ||||||
Corcept Therapeutics, Inc. (a) | 32,281 | 423,850 | ||||||
Cymabay Therapeutics, Inc. | 17,459 | 195,366 | ||||||
Depomed, Inc. (a) | 18,798 | 166,550 | ||||||
Dermira, Inc. (a) | 34 | 331 | ||||||
Dova Pharmaceuticals, Inc. | 3,907 | 84,274 | ||||||
Eli Lilly & Co. | 304,077 | 30,045,848 | ||||||
Endo International PLC (a) | 62,955 | 783,160 | ||||||
Endocyte, Inc. | 17,009 | 260,578 | ||||||
Horizon Pharma PLC (a) | 50,657 | 893,083 | ||||||
Innoviva, Inc. (a) | 22,236 | 314,639 | ||||||
Intersect ENT, Inc. (a) | 8,720 | 282,092 | ||||||
Intra-Cellular Therapies, Inc. (a) | 13,758 | 276,123 | ||||||
Jazz Pharmaceuticals PLC (a) | 18,476 | 3,197,826 | ||||||
Johnson & Johnson | 827,414 | 109,648,903 | ||||||
Lannett Co., Inc. (a) | 9,721 | 123,943 | ||||||
Mallinckrodt PLC (a) | 26,518 | 621,847 | ||||||
Merck & Co., Inc. | 831,514 | 54,771,827 | ||||||
Mylan N.V. (a) | 158,791 | 5,924,492 | ||||||
MyoKardia, Inc. (a) | 9,990 | 573,426 | ||||||
Nektar Therapeutics (a) | 49,743 | 2,616,482 | ||||||
Omeros Corp. (a) | 14,152 | 298,041 | ||||||
Optinose, Inc. | 3,500 | 71,225 | ||||||
Pacira Pharmaceuticals, Inc. (a) | 12,698 | 510,460 | ||||||
Paratek Pharmaceuticals, Inc. (a) | 8,229 | 83,113 | ||||||
Perrigo Co. PLC | 41,351 | 3,329,583 | ||||||
Pfizer, Inc. | 1,835,878 | 73,306,609 | ||||||
Phibro Animal Health Corp. Class A | 6,235 | 298,656 | ||||||
Prestige Brands Holdings, Inc. (a) | 16,430 | 587,044 | ||||||
Reata Pharmaceuticals, Inc. Class A (a) | 5,753 | 403,343 | ||||||
Revance Therapeutics, Inc. (a) | 8,980 | 258,175 | ||||||
Supernus Pharmaceuticals, Inc. (a) | 15,879 | 840,793 | ||||||
The Medicines Co. (a) | 22,803 | 905,963 | ||||||
TherapeuticsMD, Inc. (a) | 57,300 | 299,106 | ||||||
Theravance Biopharma, Inc. (a) | 13,667 | 327,325 | ||||||
WaVe Life Sciences Ltd. (a) | 3,678 | 148,591 | ||||||
Zoetis, Inc. | 149,528 | 12,931,181 | ||||||
Zogenix, Inc. (a) | 10,841 | 615,227 | ||||||
|
| |||||||
TOTAL PHARMACEUTICALS |
| 359,213,384 | ||||||
|
| |||||||
TOTAL COMMON STOCKS |
| 1,250,933,826 | ||||||
|
| |||||||
See accompanying notes which are an integral part of the financial statements.
| Annual Report | 56 |
Table of Contents
| Money Market Funds – 0.1% | ||||||||
| Shares | Value | |||||||
State Street Institutional Treasury Plus Money Market Fund, Trust Class, 1.76% (c) | 817,552 | $ | 817,552 | |||||
|
| |||||||
TOTAL INVESTMENT PORTFOLIO – 99.9% |
| 1,251,751,378 | ||||||
NET OTHER ASSETS (LIABILITIES) – 0.1% |
| 874,966 | ||||||
|
| |||||||
NET ASSETS – 100.0% |
| $ | 1,252,626,344 | |||||
|
| |||||||
Legend
| (a) | Non-income producing. |
| (b) | Level 3 security. |
| (c) | The rate quoted is the annualized seven-day yield of the fund at period end. |
Investment Valuation
The following is a summary of the inputs used, as of July 31, 2018, involving the Fund’s assets and liabilities carried at fair value. The inputs or methodology used for valuing securities may not be an indication of the risk associated with investing in those securities. For more information on valuation inputs, and their aggregation into the levels used in the table below, please refer to the Investment Valuation section in the accompanying Notes to Financial Statements.
| Valuation Inputs at Reporting Date: | ||||||||||||||||
| Description | Total | Level 1 | Level 2 | Level 3 | ||||||||||||
Investments in Securities: | ||||||||||||||||
Common Stocks | $ | 1,250,933,826 | $ | 1,250,819,903 | $ | — | $ | 113,923 | ||||||||
Money Market Funds | 817,552 | 817,552 | — | — | ||||||||||||
|
|
|
|
|
|
|
| |||||||||
Total Investments in Securities: | $ | 1,251,751,378 | $ | 1,251,637,455 | $ | — | $ | 113,923 | ||||||||
|
|
|
|
|
|
|
| |||||||||
See accompanying notes which are an integral part of the financial statements.
| 57 | Annual Report |
Table of Contents
Fidelity MSCI Industrials Index ETF
Investments July 31, 2018
Showing Percentage of Net Assets
| Common Stocks – 99.9% | ||||||||
| Shares | Value | |||||||
AEROSPACE & DEFENSE – 24.4% |
| |||||||
Aerospace & Defense – 24.4% |
| |||||||
AAR Corp. | 5,530 | $ | 262,177 | |||||
Aerojet Rocketdyne Holdings, Inc. (a) | 11,319 | 381,450 | ||||||
Aerovironment, Inc. (a) | 3,620 | 266,468 | ||||||
Arconic, Inc. | 72,447 | 1,571,376 | ||||||
Astronics Corp. (a) | 3,364 | 137,958 | ||||||
Axon Enterprise, Inc. (a) | 8,831 | 599,890 | ||||||
BWX Technologies, Inc. | 16,629 | 1,093,523 | ||||||
Cubic Corp. | 4,311 | 293,579 | ||||||
Curtiss-Wright Corp. | 6,990 | 929,880 | ||||||
Engility Holdings, Inc. (a) | 3,467 | 119,958 | ||||||
Esterline Technologies Corp. (a) | 4,464 | 380,779 | ||||||
General Dynamics Corp. | 42,151 | 8,420,084 | ||||||
Harris Corp. | 19,802 | 3,266,340 | ||||||
HEICO Corp. | 7,031 | 536,958 | ||||||
HEICO Corp. Class A | 12,571 | 813,972 | ||||||
Hexcel Corp. | 14,982 | 1,033,908 | ||||||
Huntington Ingalls Industries, Inc. | 7,486 | 1,744,612 | ||||||
KLX, Inc. (a) | 8,402 | 613,766 | ||||||
Kratos Defense & Security Solutions, Inc. (a) | 14,871 | 192,133 | ||||||
L3 Technologies, Inc. | 13,067 | 2,802,088 | ||||||
Lockheed Martin Corp. | 42,922 | 13,996,864 | ||||||
Mercury Systems, Inc. (a) | 8,052 | 336,010 | ||||||
Moog, Inc. Class A | 5,432 | 407,454 | ||||||
National Presto Industries, Inc. | 811 | 101,091 | ||||||
Northrop Grumman Corp. | 27,614 | 8,297,731 | ||||||
Raytheon Co. | 48,170 | 9,539,105 | ||||||
Rockwell Collins, Inc. | 27,373 | 3,804,573 | ||||||
Spirit AeroSystems Holdings, Inc. Class A | 19,094 | 1,780,516 | ||||||
Teledyne Technologies, Inc. (a) | 5,972 | 1,310,376 | ||||||
Textron, Inc. | 43,716 | 2,984,491 | ||||||
The Boeing Co. | 93,355 | 33,262,387 | ||||||
The KeyW Holding Corp. (a) | 7,956 | 70,570 | ||||||
TransDigm Group, Inc. | 7,845 | 2,946,111 | ||||||
Triumph Group, Inc. | 7,929 | 165,320 | ||||||
United Technologies Corp. | 126,866 | 17,220,791 | ||||||
Wesco Aircraft Holdings, Inc. (a) | 9,132 | 109,127 | ||||||
|
| |||||||
TOTAL AEROSPACE & DEFENSE |
| 121,793,416 | ||||||
|
| |||||||
AIR FREIGHT & LOGISTICS – 6.3% |
| |||||||
Air Freight & Logistics – 6.3% |
| |||||||
Air Transport Services Group, Inc. (a) | 2,530 | 57,001 | ||||||
Atlas Air Worldwide Holdings, Inc. (a) | 1,059 | 71,006 | ||||||
CH Robinson Worldwide, Inc. | 23,297 | 2,148,682 | ||||||
Echo Global Logistics, Inc. (a) | 4,493 | 154,784 | ||||||
Expeditors International of Washington, Inc. | 29,439 | 2,242,369 | ||||||
FedEx Corp. | 42,497 | 10,448,737 | ||||||
| Shares | Value | |||||||
Forward Air Corp. | 4,953 | $ | 316,497 | |||||
Hub Group, Inc. Class A (a) | 5,556 | 257,798 | ||||||
United Parcel Service, Inc. Class B | 114,923 | 13,778,118 | ||||||
XPO Logistics, Inc. (a) | 19,997 | 1,994,101 | ||||||
|
| |||||||
TOTAL AIR FREIGHT & LOGISTICS |
| 31,469,093 | ||||||
|
| |||||||
AIRLINES – 1.0% |
| |||||||
Airlines – 1.0% |
| |||||||
Allegiant Travel Co. | 675 | 83,430 | ||||||
American Airlines Group, Inc. | 19,729 | 780,085 | ||||||
Delta Air Lines, Inc. | 29,482 | 1,604,410 | ||||||
Hawaiian Holdings, Inc. | 2,135 | 85,614 | ||||||
SkyWest, Inc. | 2,134 | 127,827 | ||||||
Southwest Airlines Co. | 24,528 | 1,426,548 | ||||||
Spirit Airlines, Inc. (a) | 2,872 | 124,760 | ||||||
United Continental Holdings, Inc. (a) | 11,866 | 954,026 | ||||||
|
| |||||||
TOTAL AIRLINES |
| 5,186,700 | ||||||
|
| |||||||
BUILDING PRODUCTS – 4.2% |
| |||||||
Building Products – 4.2% |
| |||||||
AAON, Inc. | 6,985 | 263,684 | ||||||
Advanced Drainage Systems, Inc. | 6,648 | 185,812 | ||||||
Allegion PLC | 15,885 | 1,295,263 | ||||||
American Woodmark Corp. (a) | 2,494 | 208,124 | ||||||
AO Smith Corp. | 24,249 | 1,443,543 | ||||||
Apogee Enterprises, Inc. | 4,730 | 240,095 | ||||||
Armstrong Flooring, Inc. (a) | 3,535 | 46,202 | ||||||
Armstrong World Industries, Inc. (a) | 7,523 | 510,812 | ||||||
Builders FirstSource, Inc. (a) | 18,822 | 337,478 | ||||||
Continental Building Products, Inc. (a) | 6,235 | 198,897 | ||||||
CSW Industrials, Inc. (a) | 2,649 | 143,708 | ||||||
Fortune Brands Home & Security, Inc. | 25,310 | 1,467,980 | ||||||
Gibraltar Industries, Inc. (a) | 5,333 | 231,719 | ||||||
Griffon Corp. | 5,355 | 95,855 | ||||||
Insteel Industries, Inc. | 3,019 | 124,172 | ||||||
JELD-WEN Holding, Inc. (a) | 13,957 | 382,980 | ||||||
Johnson Controls International PLC | 154,679 | 5,802,009 | ||||||
Lennox International, Inc. | 6,190 | 1,343,725 | ||||||
Masco Corp. | 52,368 | 2,112,001 | ||||||
Masonite International Corp. (a) | 4,671 | 318,796 | ||||||
NCI Building Systems, Inc. (a) | 7,159 | 114,186 | ||||||
Owens Corning | 18,628 | 1,159,034 | ||||||
Patrick Industries, Inc. (a) | 4,036 | 247,205 | ||||||
PGT Innovations, Inc. (a) | 8,290 | 198,960 | ||||||
Quanex Building Products Corp. | 5,300 | 93,810 | ||||||
Simpson Manufacturing Co., Inc. | 7,100 | 518,016 | ||||||
Trex Co., Inc. (a) | 9,823 | 763,640 | ||||||
Universal Forest Products, Inc. | 10,266 | 378,199 | ||||||
USG Corp. (a) | 15,292 | 660,920 | ||||||
|
| |||||||
TOTAL BUILDING PRODUCTS |
| 20,886,825 | ||||||
|
| |||||||
See accompanying notes which are an integral part of the financial statements.
| Annual Report | 58 |
Table of Contents
| Common Stocks – continued | ||||||||
| Shares | Value | |||||||
COMMERCIAL SERVICES & SUPPLIES – 6.2% |
| |||||||
Commercial Printing – 0.4% |
| |||||||
Brady Corp. Class A | 8,047 | $ | 307,798 | |||||
Cimpress N.V. (a) | 3,836 | 560,324 | ||||||
Deluxe Corp. | 7,991 | 470,910 | ||||||
Ennis, Inc. | 4,325 | 94,069 | ||||||
LSC Communications, Inc. | 5,815 | 87,341 | ||||||
Multi-Color Corp. | 2,380 | 157,913 | ||||||
Quad/Graphics, Inc. | 5,588 | 114,889 | ||||||
RR Donnelley & Sons Co. | 11,484 | 67,756 | ||||||
|
| |||||||
| 1,861,000 | ||||||||
|
| |||||||
Diversified Support Services – 1.7% |
| |||||||
Cintas Corp. | 15,115 | 3,090,715 | ||||||
Civeo Corp. (a) | 16,189 | 61,680 | ||||||
Copart, Inc. (a) | 34,886 | 2,002,108 | ||||||
Healthcare Services Group, Inc. | 12,280 | 494,393 | ||||||
KAR Auction Services, Inc. | 22,433 | 1,333,642 | ||||||
Matthews International Corp. Class A | 5,360 | 281,668 | ||||||
McGrath RentCorp | 4,033 | 239,480 | ||||||
Mobile Mini, Inc. | 7,370 | 314,330 | ||||||
UniFirst Corp. | 2,448 | 458,143 | ||||||
Viad Corp. | 3,393 | 194,758 | ||||||
VSE Corp. | 1,461 | 62,969 | ||||||
|
| |||||||
| 8,533,886 | ||||||||
|
| |||||||
Environmental & Facilities Services – 3.5% |
| |||||||
ABM Industries, Inc. | 10,994 | 343,013 | ||||||
Advanced Disposal Services, Inc. (a) | 10,512 | 258,595 | ||||||
Casella Waste Systems, Inc. Class A (a) | 6,511 | 179,443 | ||||||
Clean Harbors, Inc. (a) | 9,014 | 513,167 | ||||||
Covanta Holding Corp. | 19,676 | 354,168 | ||||||
Heritage-Crystal Clean, Inc. (a) | 2,369 | 57,093 | ||||||
Republic Services, Inc. | 38,722 | 2,806,570 | ||||||
Rollins, Inc. | 16,369 | 899,313 | ||||||
SP Plus Corp. (a) | 3,780 | 147,420 | ||||||
Stericycle, Inc. (a) | 14,252 | 995,645 | ||||||
Team, Inc. (a) | 4,813 | 104,923 | ||||||
Tetra Tech, Inc. | 9,312 | 566,170 | ||||||
US Ecology, Inc. | 3,631 | 246,182 | ||||||
Waste Connections, Inc. | 44,024 | 3,416,703 | ||||||
Waste Management, Inc. | 72,421 | 6,517,890 | ||||||
|
| |||||||
| 17,406,295 | ||||||||
|
| |||||||
Office Services & Supplies – 0.5% |
| |||||||
ACCO Brands Corp. (a) | 17,777 | 227,546 | ||||||
Essendant, Inc. | 6,294 | 104,669 | ||||||
Herman Miller, Inc. | 9,912 | 375,169 | ||||||
HNI Corp. | 7,225 | 312,626 | ||||||
Interface, Inc. | 10,057 | 225,277 | ||||||
Kimball International, Inc. Class B | 6,214 | 100,356 | ||||||
Knoll, Inc. | 8,385 | 189,082 | ||||||
MSA Safety, Inc. | 6,054 | 610,727 | ||||||
| Shares | Value | |||||||
Pitney Bowes, Inc. | 31,166 | $ | 272,079 | |||||
Steelcase, Inc. Class A | 14,276 | 196,295 | ||||||
|
| |||||||
| 2,613,826 | ||||||||
|
| |||||||
Security & Alarm Services – 0.1% |
| |||||||
The Brink’s Co. | 8,420 | 672,337 | ||||||
|
| |||||||
TOTAL COMMERCIAL SERVICES & SUPPLIES |
| 31,087,344 | ||||||
|
| |||||||
CONSTRUCTION & ENGINEERING – 1.7% |
| |||||||
Construction & Engineering – 1.7% |
| |||||||
AECOM (a) | 26,537 | 890,582 | ||||||
Aegion Corp. (a) | 5,515 | 136,662 | ||||||
Argan, Inc. | 2,395 | 91,968 | ||||||
Comfort Systems USA, Inc. | 6,206 | 344,743 | ||||||
Dycom Industries, Inc. (a) | 5,142 | 458,461 | ||||||
EMCOR Group, Inc. | 9,749 | 750,186 | ||||||
Fluor Corp. | 23,329 | 1,195,611 | ||||||
Granite Construction, Inc. | 7,546 | 407,107 | ||||||
Great Lakes Dredge & Dock Corp. (a) | 9,003 | 48,616 | ||||||
Jacobs Engineering Group, Inc. | 21,276 | 1,438,896 | ||||||
KBR, Inc. | 23,338 | 466,293 | ||||||
MasTec, Inc. (a) | 11,108 | 517,077 | ||||||
MYR Group, Inc. (a) | 2,782 | 102,628 | ||||||
NV5 Global, Inc. (a) | 1,340 | 100,902 | ||||||
Primoris Services Corp. | 6,848 | 184,964 | ||||||
Quanta Services, Inc. (a) | 25,711 | 875,974 | ||||||
Tutor Perini Corp. (a) | 6,781 | 125,448 | ||||||
Valmont Industries, Inc. | 3,806 | 531,508 | ||||||
Willscot Corp. (a) | 5,773 | 96,409 | ||||||
|
| |||||||
TOTAL CONSTRUCTION & ENGINEERING |
| 8,764,035 | ||||||
|
| |||||||
ELECTRICAL EQUIPMENT – 5.7% |
| |||||||
Electrical Components & Equipment – 5.6% |
| |||||||
Acuity Brands, Inc. | 7,037 | 978,354 | ||||||
AMETEK, Inc. | 38,635 | 3,005,803 | ||||||
Atkore International Group, Inc. (a) | 7,802 | 184,595 | ||||||
Eaton Corp. PLC | 73,460 | 6,109,668 | ||||||
Emerson Electric Co. | 106,007 | 7,662,186 | ||||||
Encore Wire Corp. | 3,497 | 170,479 | ||||||
EnerSys | 7,026 | 576,624 | ||||||
Generac Holdings, Inc. (a) | 10,399 | 558,946 | ||||||
Hubbell, Inc. | 9,142 | 1,126,752 | ||||||
nVent Electric PLC | 28,788 | 788,791 | ||||||
Plug Power, Inc. (a) | 37,767 | 75,534 | ||||||
Powell Industries, Inc. | 1,577 | 57,797 | ||||||
Regal-Beloit Corp. | 7,375 | 633,881 | ||||||
Rockwell Automation, Inc. | 21,338 | 4,002,155 | ||||||
Sensata Technologies Holding PLC (a) | 28,579 | 1,553,840 | ||||||
Sunrun, Inc. (a) | 13,554 | 191,654 | ||||||
Thermon Group Holdings, Inc. (a) | 5,549 | 139,114 | ||||||
See accompanying notes which are an integral part of the financial statements.
| 59 | Annual Report |
Table of Contents
Fidelity MSCI Industrials Index ETF
Investments – continued
| Common Stocks – continued | ||||||||
| Shares | Value | |||||||
ELECTRICAL EQUIPMENT – continued |
| |||||||
Electrical Components & Equipment – continued |
| |||||||
Vicor Corp. (a) | 3,037 | $ | 174,779 | |||||
|
| |||||||
| 27,990,952 | ||||||||
|
| |||||||
Heavy Electrical Equipment – 0.1% |
| |||||||
AZZ, Inc. | 4,331 | 234,740 | ||||||
TPI Composites, Inc. (a) | 2,620 | 80,749 | ||||||
|
| |||||||
| 315,489 | ||||||||
|
| |||||||
TOTAL ELECTRICAL EQUIPMENT |
| 28,306,441 | ||||||
|
| |||||||
INDUSTRIAL CONGLOMERATES – 13.5% |
| |||||||
Industrial Conglomerates – 13.5% |
| |||||||
3M Co. | 99,438 | 21,112,676 | ||||||
Carlisle Cos., Inc. | 10,299 | 1,265,129 | ||||||
General Electric Co. | 1,449,852 | 19,761,483 | ||||||
Honeywell International, Inc. | 125,567 | 20,046,772 | ||||||
Raven Industries, Inc. | 5,998 | 232,722 | ||||||
Roper Industries, Inc. | 17,161 | 5,180,906 | ||||||
|
| |||||||
TOTAL INDUSTRIAL CONGLOMERATES |
| 67,599,688 | ||||||
|
| |||||||
MACHINERY – 18.8% |
| |||||||
Agricultural & Farm Machinery – 1.9% |
| |||||||
AGCO Corp. | 10,628 | 669,777 | ||||||
Deere & Co. | 51,284 | 7,425,410 | ||||||
Lindsay Corp. | 1,778 | 167,381 | ||||||
The Toro Co. | 17,868 | 1,075,475 | ||||||
Titan International, Inc. | 8,543 | 90,470 | ||||||
|
| |||||||
| 9,428,513 | ||||||||
|
| |||||||
Construction & Farm Machinery & Heavy Trucks – 6.1% |
| |||||||
Alamo Group, Inc. | 1,686 | 156,798 | ||||||
Allison Transmission Holdings, Inc. | 21,034 | 988,598 | ||||||
American Railcar Industries, Inc. | 1,266 | 57,692 | ||||||
Astec Industries, Inc. | 3,485 | 171,218 | ||||||
Blue Bird Corp. (a) | 2,091 | 47,152 | ||||||
Caterpillar, Inc. | 99,787 | 14,349,371 | ||||||
Cummins, Inc. | 26,276 | 3,752,476 | ||||||
Douglas Dynamics, Inc. | 3,771 | 185,156 | ||||||
Federal Signal Corp. | 10,111 | 240,136 | ||||||
Meritor, Inc. (a) | 14,139 | 291,263 | ||||||
Navistar International Corp. (a) | 7,385 | 318,072 | ||||||
Oshkosh Corp. | 12,447 | 936,637 | ||||||
PACCAR, Inc. | 58,766 | 3,862,101 | ||||||
REV Group, Inc. | 4,839 | 83,086 | ||||||
Spartan Motors, Inc. | 5,565 | 82,084 | ||||||
Terex Corp. | 13,509 | 596,017 | ||||||
The Greenbrier Cos., Inc. | 4,844 | 274,413 | ||||||
The Manitowoc Co., Inc. (a) | 5,654 | 149,774 | ||||||
Trinity Industries, Inc. | 22,622 | 861,898 | ||||||
Wabash National Corp. | 9,830 | 194,634 | ||||||
WABCO Holdings, Inc. (a) | 8,953 | 1,125,213 | ||||||
| Shares | Value | |||||||
Wabtec Corp. | 14,419 | $ | 1,590,704 | |||||
|
| |||||||
| 30,314,493 | ||||||||
|
| |||||||
Industrial Machinery – 10.8% | ||||||||
Actuant Corp. Class A | 10,018 | 286,014 | ||||||
Albany International Corp. Class A | 4,872 | 322,283 | ||||||
Altra Industrial Motion Corp. | 4,881 | 214,276 | ||||||
Barnes Group, Inc. | 8,461 | 574,079 | ||||||
Briggs & Stratton Corp. | 7,082 | 125,281 | ||||||
Chart Industries, Inc. (a) | 4,667 | 364,446 | ||||||
CIRCOR International, Inc. | 2,808 | 124,535 | ||||||
Colfax Corp. (a) | 15,435 | 498,550 | ||||||
Columbus McKinnon Corp. | 3,461 | 142,455 | ||||||
Crane Co. | 8,004 | 724,922 | ||||||
Donaldson Co., Inc. | 21,655 | 1,032,943 | ||||||
Dover Corp. | 25,803 | 2,141,133 | ||||||
Energy Recovery, Inc. (a) | 6,460 | 52,261 | ||||||
EnPro Industries, Inc. | 3,631 | 277,372 | ||||||
ESCO Technologies, Inc. | 4,312 | 268,422 | ||||||
Evoqua Water Technologies Corp. (a) | 9,562 | 204,053 | ||||||
Flowserve Corp. | 21,725 | 963,069 | ||||||
Fortive Corp. | 52,284 | 4,291,471 | ||||||
Franklin Electric Co., Inc. | 6,642 | 328,447 | ||||||
Gardner Denver Holdings, Inc. (a) | 18,269 | 522,676 | ||||||
Gates Industrial Corp. PLC (a) | 9,759 | 151,948 | ||||||
Global Brass & Copper Holdings, Inc. | 3,603 | 118,719 | ||||||
Graco, Inc. | 28,247 | 1,303,316 | ||||||
Harsco Corp. (a) | 13,379 | 339,158 | ||||||
Hillenbrand, Inc. | 10,576 | 530,915 | ||||||
Hyster-Yale Materials Handling, Inc. | 1,411 | 92,787 | ||||||
IDEX Corp. | 12,766 | 1,960,602 | ||||||
Illinois Tool Works, Inc. | 51,331 | 7,357,272 | ||||||
Ingersoll-Rand PLC | 41,715 | 4,109,345 | ||||||
ITT, Inc. | 14,701 | 833,106 | ||||||
John Bean Technologies Corp. | 5,268 | 582,641 | ||||||
Kadant, Inc. | 1,835 | 177,261 | ||||||
Kennametal, Inc. | 13,592 | 529,544 | ||||||
Lincoln Electric Holdings, Inc. | 10,399 | 976,882 | ||||||
Lydall, Inc. (a) | 2,872 | 133,261 | ||||||
Milacron Holdings Corp. (a) | 11,649 | 242,882 | ||||||
Mueller Industries, Inc. | 9,120 | 301,963 | ||||||
Mueller Water Products, Inc. Class A | 26,718 | 329,967 | ||||||
NN, Inc. | 4,672 | 100,448 | ||||||
Nordson Corp. | 8,719 | 1,169,305 | ||||||
Omega Flex, Inc. | 505 | 46,601 | ||||||
Parker Hannifin Corp. | 22,211 | 3,754,769 | ||||||
Park-Ohio Holdings Corp. | 1,437 | 53,816 | ||||||
Pentair PLC | 28,832 | 1,287,349 | ||||||
Proto Labs, Inc. (a) | 4,283 | 533,876 | ||||||
RBC Bearings, Inc. (a) | 4,052 | 589,080 | ||||||
Rexnord Corp. (a) | 17,356 | 524,845 | ||||||
Snap-on, Inc. | 9,461 | 1,604,491 | ||||||
See accompanying notes which are an integral part of the financial statements.
| Annual Report | 60 |
Table of Contents
| Common Stocks – continued | ||||||||
| Shares | Value | |||||||
MACHINERY – continued |
| |||||||
Industrial Machinery – continued |
| |||||||
SPX Corp. (a) | 7,187 | $ | 266,638 | |||||
SPX FLOW, Inc. (a) | 7,133 | 338,960 | ||||||
Standex International Corp. | 2,121 | 219,842 | ||||||
Stanley Black & Decker, Inc. | 25,727 | 3,845,415 | ||||||
Sun Hydraulics Corp. | 4,732 | 246,348 | ||||||
Tennant Co. | 2,854 | 232,173 | ||||||
The Gorman-Rupp Co. | 3,049 | 115,374 | ||||||
The Middleby Corp. (a) | 9,321 | 955,216 | ||||||
The Timken Co. | 11,685 | 575,486 | ||||||
Trimas Corp. (a) | 7,604 | 225,078 | ||||||
Watts Water Technologies, Inc. Class A | 4,620 | 395,241 | ||||||
Welbilt, Inc. (a) | 22,101 | 503,903 | ||||||
Woodward, Inc. | 9,198 | 765,366 | ||||||
Xylem, Inc. | 30,055 | 2,301,011 | ||||||
|
| |||||||
| 54,180,888 | ||||||||
|
| |||||||
TOTAL MACHINERY |
| 93,923,894 | ||||||
|
| |||||||
MARINE – 0.1% |
| |||||||
Marine – 0.1% |
| |||||||
Kirby Corp. (a) | 2,485 | 207,373 | ||||||
Matson, Inc. | 1,793 | 64,548 | ||||||
|
| |||||||
TOTAL MARINE |
| 271,921 | ||||||
|
| |||||||
PROFESSIONAL SERVICES – 4.8% |
| |||||||
Human Resource & Employment Services – 1.2% |
| |||||||
ASGN, Inc. (a) | 8,675 | 783,353 | ||||||
Barrett Business Services, Inc. | 1,235 | 113,472 | ||||||
GP Strategies Corp. (a) | 2,050 | 38,745 | ||||||
Heidrick & Struggles International, Inc. | 3,190 | 130,471 | ||||||
Insperity, Inc. | 6,300 | 599,130 | ||||||
Kelly Services, Inc. Class A | 5,280 | 128,251 | ||||||
Kforce, Inc. | 3,937 | 148,819 | ||||||
Korn/Ferry International | 8,955 | 590,851 | ||||||
ManpowerGroup, Inc. | 11,027 | 1,028,378 | ||||||
Robert Half International, Inc. | 20,717 | 1,569,520 | ||||||
TriNet Group, Inc. (a) | 7,592 | 408,829 | ||||||
TrueBlue, Inc. (a) | 6,923 | 187,267 | ||||||
WageWorks, Inc. (a) | 6,613 | 349,166 | ||||||
|
| |||||||
| 6,076,252 | ||||||||
|
| |||||||
Research & Consulting Services – 3.6% |
| |||||||
CBIZ, Inc. (a) | 8,691 | 191,202 | ||||||
CoStar Group, Inc. (a) | 6,030 | 2,507,576 | ||||||
Equifax, Inc. | 20,059 | 2,517,405 | ||||||
Exponent, Inc. | 8,600 | 420,540 | ||||||
Forrester Research, Inc. | 1,682 | 77,793 | ||||||
FTI Consulting, Inc. (a) | 6,238 | 492,552 | ||||||
Huron Consulting Group, Inc. (a) | 3,679 | 160,588 | ||||||
| Shares | Value | |||||||
ICF International, Inc. | 3,097 | $ | 228,094 | |||||
IHS Markit Ltd. (a) | 66,700 | 3,537,101 | ||||||
InnerWorkings, Inc. (a) | 8,326 | 73,768 | ||||||
Mistras Group, Inc. (a) | 2,794 | 58,786 | ||||||
Navigant Consulting, Inc. (a) | 7,640 | 166,246 | ||||||
Nielsen Holdings PLC | 59,464 | 1,400,972 | ||||||
Resources Connection, Inc. | 4,899 | 77,894 | ||||||
The Dun & Bradstreet Corp. | 6,190 | 779,259 | ||||||
TransUnion | 30,673 | 2,220,725 | ||||||
Verisk Analytics, Inc. (a) | 26,197 | 2,897,912 | ||||||
|
| |||||||
| 17,808,413 | ||||||||
|
| |||||||
TOTAL PROFESSIONAL SERVICES |
| 23,884,665 | ||||||
|
| |||||||
ROAD & RAIL – 9.7% |
| |||||||
Railroads – 8.1% |
| |||||||
CSX Corp. | 140,742 | 9,947,645 | ||||||
Genesee & Wyoming, Inc. Class A (a) | 10,279 | 883,994 | ||||||
Kansas City Southern | 17,181 | 1,997,635 | ||||||
Norfolk Southern Corp. | 47,417 | 8,013,473 | ||||||
Union Pacific Corp. | 131,451 | 19,703,190 | ||||||
|
| |||||||
| 40,545,937 | ||||||||
|
| |||||||
Trucking – 1.6% |
| |||||||
AMERCO | 1,469 | 553,931 | ||||||
ArcBest Corp. | 4,307 | 200,491 | ||||||
Avis Budget Group, Inc. (a) | 11,476 | 399,939 | ||||||
Covenant Transportation Group, Inc. Class A (a) | 2,180 | 63,176 | ||||||
Daseke, Inc. (a) | 6,532 | 56,763 | ||||||
Heartland Express, Inc. | 7,619 | 146,209 | ||||||
Hertz Global Holdings, Inc. (a) | 8,382 | 127,658 | ||||||
JB Hunt Transport Services, Inc. | 14,638 | 1,755,096 | ||||||
Knight-Swift Transportation Holdings, Inc. | 22,250 | 724,237 | ||||||
Landstar System, Inc. | 6,998 | 777,828 | ||||||
Marten Transport Ltd. | 6,814 | 148,886 | ||||||
Old Dominion Freight Line, Inc. | 10,329 | 1,516,297 | ||||||
Ryder System, Inc. | 8,832 | 691,546 | ||||||
Saia, Inc. (a) | 4,285 | 322,875 | ||||||
Universal Logistics Holdings, Inc | 1,357 | 45,459 | ||||||
Werner Enterprises, Inc. | 7,902 | 294,349 | ||||||
YRC Worldwide, Inc. (a) | 5,611 | 54,651 | ||||||
|
| |||||||
| 7,879,391 | ||||||||
|
| |||||||
TOTAL ROAD & RAIL |
| 48,425,328 | ||||||
|
| |||||||
TRADING COMPANIES & DISTRIBUTORS – 3.4% |
| |||||||
Trading Companies & Distributors – 3.4% |
| |||||||
Air Lease Corp. | 16,428 | 722,175 | ||||||
Aircastle Ltd. | 9,848 | 204,149 | ||||||
Applied Industrial Technologies, Inc. | 6,459 | 482,164 | ||||||
Beacon Roofing Supply, Inc. (a) | 11,418 | 480,470 | ||||||
See accompanying notes which are an integral part of the financial statements.
| 61 | Annual Report |
Table of Contents
Fidelity MSCI Industrials Index ETF
Investments – continued
| Common Stocks – continued | ||||||||
| Shares | Value | |||||||
TRADING COMPANIES & DISTRIBUTORS – continued |
| |||||||
Trading Companies & Distributors – continued |
| |||||||
BMC Stock Holdings, Inc. (a) | 10,696 | $ | 235,312 | |||||
CAI International, Inc. (a) | 3,141 | 72,117 | ||||||
DXP Enterprises, Inc. (a) | 2,758 | 114,016 | ||||||
Fastenal Co. | 48,035 | 2,734,633 | ||||||
Foundation Building Materials, Inc. (a) | 3,253 | 47,136 | ||||||
GATX Corp. | 6,013 | 495,111 | ||||||
GMS, Inc. (a) | 5,517 | 144,766 | ||||||
H&E Equipment Services, Inc. | 5,328 | 196,017 | ||||||
HD Supply Holdings, Inc. (a) | 29,431 | 1,294,375 | ||||||
Herc Holdings, Inc. (a) | 3,554 | 201,938 | ||||||
Kaman Corp. | 3,980 | 263,556 | ||||||
MRC Global, Inc. (a) | 15,318 | 346,953 | ||||||
MSC Industrial Direct Co., Inc. Class A | 7,517 | 636,164 | ||||||
Nexeo Solutions, Inc. (a) | 5,405 | 49,077 | ||||||
NOW, Inc. (a) | 18,129 | 271,029 | ||||||
Rush Enterprises, Inc. Class A (a) | 5,257 | 237,038 | ||||||
Rush Enterprises, Inc. Class B (a) | 770 | 34,642 | ||||||
SiteOne Landscape Supply, Inc. (a) | 6,340 | 565,275 | ||||||
Systemax, Inc. | 2,169 | 96,998 | ||||||
Titan Machinery, Inc. (a) | 3,310 | 50,113 | ||||||
Triton International Ltd. | 8,386 | 295,187 | ||||||
United Rentals, Inc. (a) | 14,104 | 2,098,675 | ||||||
Univar, Inc. (a) | 18,933 | 520,468 | ||||||
Veritiv Corp. (a) | 1,974 | 75,604 | ||||||
Watsco, Inc. | 5,089 | 877,903 | ||||||
| Shares | Value | |||||||
WESCO International, Inc. (a) | 7,852 | $ | 478,972 | |||||
WW Grainger, Inc. | 7,956 | 2,757,231 | ||||||
|
| |||||||
TOTAL TRADING COMPANIES & DISTRIBUTORS |
| 17,079,264 | ||||||
|
| |||||||
TRANSPORTATION INFRASTRUCTURE – 0.1% |
| |||||||
Airport Services – 0.1% |
| |||||||
Macquarie Infrastructure Corp. | 13,425 | 609,629 | ||||||
|
| |||||||
TOTAL COMMON STOCKS |
| 499,288,243 | ||||||
|
| |||||||
| Money Market Funds – 0.0% | ||||||||
State Street Institutional Treasury Plus Money Market Fund, Trust Class, 1.76% (b) | 258,168 | 258,168 | ||||||
|
| |||||||
TOTAL INVESTMENT PORTFOLIO – 99.9% |
| 499,546,411 | ||||||
NET OTHER ASSETS (LIABILITIES) – 0.1% |
| 277,758 | ||||||
|
| |||||||
NET ASSETS – 100.0% |
| $ | 499,824,169 | |||||
|
| |||||||
Legend
| (a) | Non-income producing. |
| (b) | The rate quoted is the annualized seven-day yield of the fund at period end. |
Investment Valuation
All investments are categorized as Level 1 under the Fair Value Hierarchy. The inputs or methodology used for valuing securities may not be an indication of the risk associated with investing in those securities. For more information on valuation inputs please refer to the Investment Valuation section in the accompanying Notes to Financial Statements.
See accompanying notes which are an integral part of the financial statements.
| Annual Report | 62 |
Table of Contents
Fidelity MSCI Information Technology Index ETF
Investments July 31, 2018
Showing Percentage of Net Assets
| Common Stocks – 99.9% | ||||||||
| Shares | Value | |||||||
COMMUNICATIONS EQUIPMENT – 4.6% |
| |||||||
Communications Equipment – 4.6% |
| |||||||
Acacia Communications, Inc. (a) | 7,549 | $ | 242,625 | |||||
ADTRAN, Inc. | 16,377 | 266,126 | ||||||
Applied Optoelectronics, Inc. (a) | 6,361 | 244,453 | ||||||
Arista Networks, Inc. (a) | 16,286 | 4,164,819 | ||||||
ARRIS International PLC (a) | 56,717 | 1,432,671 | ||||||
CalAmp Corp. (a) | 12,063 | 274,554 | ||||||
Ciena Corp. (a) | 45,787 | 1,162,990 | ||||||
Cisco Systems, Inc. | 1,515,011 | 64,069,815 | ||||||
CommScope Holding Co., Inc. (a) | 60,115 | 1,930,293 | ||||||
Comtech Telecommunications Corp. | 7,768 | 261,005 | ||||||
EchoStar Corp. Class A (a) | 15,601 | 701,889 | ||||||
Extreme Networks, Inc. (a) | 38,109 | 323,927 | ||||||
F5 Networks, Inc. (a) | 19,562 | 3,352,536 | ||||||
Finisar Corp. (a) | 14,824 | 249,784 | ||||||
Infinera Corp. (a) | 49,422 | 411,191 | ||||||
InterDigital, Inc. | 11,159 | 920,060 | ||||||
Juniper Networks, Inc. | 108,103 | 2,847,433 | ||||||
Lumentum Holdings, Inc. (a) | 19,798 | 1,034,445 | ||||||
Mitel Networks Corp. (a) | 39,982 | 438,603 | ||||||
Motorola Solutions, Inc. | 50,971 | 6,182,782 | ||||||
NETGEAR, Inc. (a) | 10,078 | 663,636 | ||||||
Netscout Systems, Inc. (a) | 27,460 | 735,928 | ||||||
Oclaro, Inc. (a) | 54,443 | 460,588 | ||||||
Palo Alto Networks, Inc. (a) | 28,908 | 5,731,300 | ||||||
Plantronics, Inc. | 10,675 | 732,946 | ||||||
Quantenna Communications, Inc. (a) | 8,095 | 128,953 | ||||||
Ribbon Communications, Inc. (a) | 18,417 | 124,959 | ||||||
Ubiquiti Networks, Inc. (a) | 7,577 | 625,709 | ||||||
ViaSat, Inc. (a) | 17,910 | 1,259,789 | ||||||
Viavi Solutions, Inc. (a) | 72,036 | 729,004 | ||||||
|
| |||||||
TOTAL COMMUNICATIONS EQUIPMENT |
| 101,704,813 | ||||||
|
| |||||||
ELECTRONIC EQUIPMENT, INSTRUMENTS & COMPONENTS – 3.6% |
| |||||||
Electronic Components – 1.1% |
| |||||||
Amphenol Corp. Class A | 96,182 | 8,993,979 | ||||||
AVX Corp. | 15,908 | 330,568 | ||||||
Belden, Inc. | 13,275 | 859,556 | ||||||
Corning, Inc. | 269,856 | 8,953,822 | ||||||
Dolby Laboratories, Inc. Class A | 19,472 | 1,254,971 | ||||||
II-VI, Inc. (a) | 18,689 | 732,609 | ||||||
Knowles Corp. (a) | 28,965 | 502,832 | ||||||
Littelfuse, Inc. | 7,863 | 1,704,856 | ||||||
Rogers Corp. (a) | 5,826 | 679,137 | ||||||
Vishay Intertechnology, Inc. | 41,866 | 1,046,650 | ||||||
|
| |||||||
| 25,058,980 | ||||||||
|
| |||||||
Electronic Equipment & Instruments – 1.0% |
| |||||||
Badger Meter, Inc. | 9,357 | 487,968 | ||||||
Cognex Corp. | 54,784 | 2,891,500 | ||||||
Coherent, Inc. (a) | 2,660 | 420,440 | ||||||
| Shares | Value | |||||||
Control4 Corp. (a) | 8,159 | $ | 207,483 | |||||
Daktronics, Inc. | 13,718 | 117,838 | ||||||
Electro Scientific Industries, Inc. | 10,412 | 187,728 | ||||||
FARO Technologies, Inc. (a) | 5,443 | 354,339 | ||||||
Fitbit, Inc. Class A (a) | 65,319 | 387,342 | ||||||
FLIR Systems, Inc. | 43,873 | 2,570,958 | ||||||
Itron, Inc. (a) | 10,974 | 671,609 | ||||||
Keysight Technologies, Inc. (a) | 58,998 | 3,421,884 | ||||||
Mesa Laboratories, Inc. | 1,135 | 229,531 | ||||||
MTS Systems Corp. | 5,747 | 313,355 | ||||||
National Instruments Corp. | 39,221 | 1,718,272 | ||||||
Novanta, Inc. (a) | 10,487 | 653,864 | ||||||
OSI Systems, Inc. (a) | 5,846 | 466,277 | ||||||
Trimble, Inc. (a) | 79,485 | 2,805,820 | ||||||
VeriFone Systems, Inc. (a) | 35,178 | 805,576 | ||||||
Zebra Technologies Corp. Class A (a) | 16,937 | 2,336,120 | ||||||
|
| |||||||
| 21,047,904 | ||||||||
|
| |||||||
Electronic Manufacturing Services – 0.9% |
| |||||||
Benchmark Electronics, Inc. | 16,576 | 401,139 | ||||||
CTS Corp. | 10,158 | 354,514 | ||||||
Fabrinet (a) | 11,865 | 464,159 | ||||||
Flex Ltd. (a) | 166,451 | 2,323,656 | ||||||
IPG Photonics Corp. (a) | 11,901 | 1,952,240 | ||||||
Jabil, Inc. | 50,421 | 1,420,359 | ||||||
KEMET Corp. (a) | 16,635 | 432,344 | ||||||
Kimball Electronics, Inc. (a) | 8,595 | 174,908 | ||||||
Methode Electronics, Inc. | 12,611 | 494,982 | ||||||
Park Electrochemical Corp. | 6,306 | 139,426 | ||||||
Plexus Corp. (a) | 10,862 | 645,420 | ||||||
Sanmina Corp. (a) | 22,585 | 657,223 | ||||||
TE Connectivity Ltd. | 110,624 | 10,351,088 | ||||||
TTM Technologies, Inc. (a) | 30,306 | 526,112 | ||||||
|
| |||||||
| 20,337,570 | ||||||||
|
| |||||||
Semiconductors – 0.1% |
| |||||||
Universal Display Corp. | 13,495 | 1,299,569 | ||||||
|
| |||||||
Technology Distributors – 0.5% |
| |||||||
Anixter International, Inc. (a) | 9,968 | 726,667 | ||||||
Arrow Electronics, Inc. (a) | 27,810 | 2,109,110 | ||||||
Avnet, Inc. | 37,872 | 1,660,687 | ||||||
CDW Corp. | 48,184 | 4,051,793 | ||||||
ePlus, Inc. (a) | 4,540 | 447,871 | ||||||
Insight Enterprises, Inc. (a) | 11,547 | 580,468 | ||||||
PC Connection, Inc. | 3,836 | 129,849 | ||||||
ScanSource, Inc. (a) | 8,410 | 346,912 | ||||||
SYNNEX Corp. | 9,548 | 921,096 | ||||||
Tech Data Corp. (a) | 11,891 | 991,828 | ||||||
|
| |||||||
| 11,966,281 | ||||||||
|
| |||||||
TOTAL ELECTRONIC EQUIPMENT, INSTRUMENTS & COMPONENTS |
| 79,710,304 | ||||||
|
| |||||||
See accompanying notes which are an integral part of the financial statements.
| 63 | Annual Report |
Table of Contents
Fidelity MSCI Information Technology Index ETF
Investments – continued
| Common Stocks – continued | ||||||||
| Shares | Value | |||||||
INTERNET SOFTWARE & SERVICES – 19.5% |
| |||||||
Data Processing & Outsourced Services – 0.0% |
| |||||||
NIC, Inc. | 21,083 | $ | 345,761 | |||||
|
| |||||||
Internet Software & Services – 19.5% |
| |||||||
2U, Inc. (a) | 16,614 | 1,257,015 | ||||||
Akamai Technologies, Inc. (a) | 53,227 | 4,005,864 | ||||||
Alarm.com Holdings, Inc. (a) | 10,177 | 436,288 | ||||||
Alphabet, Inc. Class A (a) | 93,838 | 115,159,870 | ||||||
Alphabet, Inc. Class C (a) | 98,995 | 120,502,654 | ||||||
ANGI Homeservices, Inc. Class A (a) | 13,369 | 210,027 | ||||||
Benefitfocus, Inc. (a) | 5,564 | 167,476 | ||||||
Box, Inc. Class A (a) | 36,186 | 867,017 | ||||||
Carbonite, Inc. (a) | 10,568 | 362,482 | ||||||
Cars.com, Inc. (a) | 22,001 | 624,168 | ||||||
ChannelAdvisor Corp. (a) | 8,586 | 119,345 | ||||||
Cision Ltd. (a) | 12,652 | 190,792 | ||||||
Cloudera, Inc. (a) | 32,511 | 435,322 | ||||||
Cornerstone OnDemand, Inc. (a) | 14,825 | 732,355 | ||||||
Coupa Software, Inc. (a) | 13,880 | 850,983 | ||||||
eBay, Inc. (a) | 302,373 | 10,114,377 | ||||||
Endurance International Group | ||||||||
Holdings, Inc. (a) | 21,264 | 174,365 | ||||||
Envestnet, Inc. (a) | 13,995 | 820,107 | ||||||
Etsy, Inc. (a) | 34,480 | 1,408,853 | ||||||
Facebook, Inc. Class A (a) | 753,205 | 129,988,119 | ||||||
Five9, Inc. (a) | 17,138 | 546,702 | ||||||
GoDaddy, Inc. Class A (a) | 47,172 | 3,472,803 | ||||||
Gogo, Inc. (a) | 132 | 473 | ||||||
GrubHub, Inc. (a) | 27,386 | 3,338,080 | ||||||
GTT Communications, Inc. (a) | 11,696 | 519,887 | ||||||
Hortonworks, Inc. (a) | 16,785 | 292,395 | ||||||
IAC/InterActiveCorp. (a) | 23,994 | 3,533,117 | ||||||
Instructure, Inc. (a) | 9,363 | 362,348 | ||||||
j2 Global, Inc. | 15,273 | 1,295,761 | ||||||
Limelight Networks, Inc. (a) | 39,079 | 174,292 | ||||||
LivePerson, Inc. (a) | 17,810 | 413,192 | ||||||
LogMeIn, Inc. | 16,698 | 1,353,373 | ||||||
MercadoLibre, Inc. | 13,205 | 4,528,127 | ||||||
MINDBODY, Inc. Class A (a) | 10,845 | 405,061 | ||||||
New Relic, Inc. (a) | 13,103 | 1,280,163 | ||||||
Nutanix, Inc. Class A (a) | 36,297 | 1,774,560 | ||||||
Pandora Media, Inc. (a) | 82,546 | 556,360 | ||||||
Q2 Holdings, Inc. (a) | 11,602 | 686,258 | ||||||
QuinStreet, Inc. (a) | 13,301 | 176,371 | ||||||
Quotient Technology, Inc. (a) | 26,554 | 391,672 | ||||||
SendGrid, Inc. (a) | 6,302 | 160,890 | ||||||
Shutterstock, Inc. (a) | 6,176 | 284,528 | ||||||
SPS Commerce, Inc. (a) | 5,448 | 467,384 | ||||||
Stamps.com, Inc. (a) | 5,324 | 1,389,564 | ||||||
TechTarget, Inc. (a) | 7,183 | 204,141 | ||||||
The Trade Desk, Inc. Class A (a) | 9,306 | 784,682 | ||||||
| Shares | Value | |||||||
TrueCar, Inc. (a) | 25,174 | $ | 279,935 | |||||
Tucows, Inc. Class A (a) | 2,852 | 167,555 | ||||||
Twilio, Inc. Class A (a) | 20,854 | 1,207,238 | ||||||
Twitter, Inc. (a) | 212,552 | 6,774,032 | ||||||
VeriSign, Inc. (a) | 27,601 | 4,008,493 | ||||||
Web.com Group, Inc. (a) | 13,307 | 334,671 | ||||||
XO Group, Inc. (a) | 7,797 | 219,720 | ||||||
Yelp, Inc. (a) | 24,769 | 913,481 | ||||||
Yext, Inc. (a) | 13,930 | 294,480 | ||||||
Zillow Group, Inc. Class C (a) | 36,156 | 2,013,889 | ||||||
|
| |||||||
| 433,033,157 | ||||||||
|
| |||||||
TOTAL INTERNET SOFTWARE & SERVICES |
| 433,378,918 | ||||||
|
| |||||||
IT SERVICES – 17.6% |
| |||||||
Data Processing & Outsourced Services – 12.4% |
| |||||||
Alliance Data Systems Corp. | 15,737 | 3,538,937 | ||||||
Automatic Data Processing, Inc. | 139,542 | 18,836,775 | ||||||
Black Knight, Inc. (a) | 44,865 | 2,317,277 | ||||||
Broadridge Financial Solutions, Inc. | 36,723 | 4,148,965 | ||||||
Cardtronics PLC Class A (a) | 14,746 | 373,369 | ||||||
Cass Information Systems, Inc. | 4,002 | 269,535 | ||||||
Conduent, Inc. (a) | 56,584 | 1,016,249 | ||||||
Convergys Corp. | 29,129 | 716,573 | ||||||
CoreLogic, Inc. (a) | 25,820 | 1,257,434 | ||||||
CSG Systems International, Inc. | 11,049 | 449,363 | ||||||
Euronet Worldwide, Inc. (a) | 16,570 | 1,523,446 | ||||||
Everi Holdings, Inc. (a) | 23,804 | 174,959 | ||||||
EVERTEC, Inc. | 20,003 | 466,070 | ||||||
ExlService Holdings, Inc. (a) | 10,797 | 643,933 | ||||||
Fidelity National Information Services, Inc. | 104,170 | 10,743,052 | ||||||
First Data Corp. Class A (a) | 145,212 | 3,377,631 | ||||||
Fiserv, Inc. (a) | 129,998 | 9,812,249 | ||||||
FleetCor Technologies, Inc. (a) | 28,259 | 6,132,203 | ||||||
Global Payments, Inc. | 50,233 | 5,654,729 | ||||||
Jack Henry & Associates, Inc. | 24,445 | 3,292,741 | ||||||
Mastercard, Inc. Class A | 293,472 | 58,107,456 | ||||||
MAXIMUS, Inc. | 20,723 | 1,343,058 | ||||||
MoneyGram International, Inc. (a) | 12,881 | 84,242 | ||||||
Net 1 UEPS Technologies, Inc. (a) | 19,713 | 184,119 | ||||||
Paychex, Inc. | 101,820 | 7,027,616 | ||||||
PayPal Holdings, Inc. (a) | 358,508 | 29,447,847 | ||||||
Sabre Corp. | 77,437 | 1,906,499 | ||||||
Square, Inc. Class A (a) | 89,151 | 5,763,612 | ||||||
Sykes Enterprises, Inc. (a) | 13,595 | 403,228 | ||||||
Syntel, Inc. (a) | 11,750 | 476,932 | ||||||
The Western Union Co. | 144,931 | 2,921,809 | ||||||
Total System Services, Inc. | 51,585 | 4,722,091 | ||||||
Travelport Worldwide Ltd. | 40,561 | 766,603 | ||||||
TTEC Holdings, Inc. | 5,210 | 167,502 | ||||||
Visa, Inc. Class A | 566,687 | 77,488,780 | ||||||
See accompanying notes which are an integral part of the financial statements.
| Annual Report | 64 |
Table of Contents
| Common Stocks – continued | ||||||||
| Shares | Value | |||||||
IT SERVICES – continued |
| |||||||
Data Processing & Outsourced Services – continued |
| |||||||
WEX, Inc. (a) | 13,660 | $ | 2,592,941 | |||||
Worldpay, Inc. Class A (a) | 93,654 | 7,697,422 | ||||||
|
| |||||||
| 275,847,247 | ||||||||
|
| |||||||
IT Consulting & Other Services – 5.2% |
| |||||||
Accenture PLC Class A | 193,869 | 30,889,148 | ||||||
Acxiom Corp. (a) | 25,235 | 1,023,027 | ||||||
Booz Allen Hamilton Holding Corp. | 45,676 | 2,159,105 | ||||||
CACI International, Inc. Class A (a) | 7,750 | 1,357,800 | ||||||
Cognizant Technology Solutions Corp. Class A | 185,149 | 15,089,644 | ||||||
DXC Technology Co. | 89,902 | 7,618,295 | ||||||
EPAM Systems, Inc. (a) | 15,910 | 2,071,641 | ||||||
Gartner, Inc. (a) | 28,616 | 3,875,465 | ||||||
International Business Machines Corp. | 289,636 | 41,976,945 | ||||||
Leidos Holdings, Inc. | 45,411 | 3,107,021 | ||||||
ManTech International Corp. Class A | 8,473 | 507,109 | ||||||
Perficient, Inc. (a) | 11,006 | 289,678 | ||||||
Perspecta, Inc. | 44,949 | 975,393 | ||||||
Presidio, Inc. (a) | 11,690 | 163,192 | ||||||
Science Applications International Corp. | 13,653 | 1,151,904 | ||||||
ServiceSource International, Inc. (a) | 22,962 | 80,367 | ||||||
Teradata Corp. (a) | 38,452 | 1,472,327 | ||||||
The Hackett Group, Inc. | 8,544 | 154,048 | ||||||
Unisys Corp. (a) | 17,407 | 223,680 | ||||||
Virtusa Corp. (a) | 9,109 | 481,228 | ||||||
|
| |||||||
| 114,667,017 | ||||||||
|
| |||||||
TOTAL IT SERVICES |
| 390,514,264 | ||||||
|
| |||||||
SEMICONDUCTORS & SEMICONDUCTOR EQUIPMENT – 15.2% |
| |||||||
Semiconductor Equipment – 2.0% |
| |||||||
Advanced Energy Industries, Inc. (a) | 12,496 | 765,255 | ||||||
Amkor Technology, Inc. (a) | 33,925 | 294,469 | ||||||
Applied Materials, Inc. | 330,890 | 16,091,181 | ||||||
Axcelis Technologies, Inc. (a) | 10,803 | 237,666 | ||||||
Brooks Automation, Inc. | 22,926 | 701,077 | ||||||
Cabot Microelectronics Corp. | 8,067 | 971,670 | ||||||
Cohu, Inc. | 9,631 | 242,508 | ||||||
Entegris, Inc. | 44,804 | 1,574,860 | ||||||
FormFactor, Inc. (a) | 23,101 | 299,158 | ||||||
Ichor Holdings Ltd. (a) | 7,166 | 150,486 | ||||||
KLA-Tencor Corp. | 49,378 | 5,797,965 | ||||||
Kulicke & Soffa Industries, Inc. | 23,014 | 606,649 | ||||||
Lam Research Corp. | 51,253 | 9,770,872 | ||||||
MKS Instruments, Inc. | 17,297 | 1,631,107 | ||||||
Nanometrics, Inc. (a) | 7,768 | 292,543 | ||||||
PDF Solutions, Inc. (a) | 8,684 | 91,182 | ||||||
Photronics, Inc. (a) | 24,139 | 217,251 | ||||||
Rudolph Technologies, Inc. (a) | 10,156 | 290,462 | ||||||
| Shares | Value | |||||||
SolarEdge Technologies, Inc. (a) | 11,452 | $ | 609,819 | |||||
Teradyne, Inc. | 62,025 | 2,682,581 | ||||||
Ultra Clean Holdings, Inc. (a) | 13,542 | 181,734 | ||||||
Versum Materials, Inc. | 34,766 | 1,340,229 | ||||||
Xcerra Corp. (a) | 17,366 | 247,292 | ||||||
Xperi Corp. | 114 | 1,898 | ||||||
|
| |||||||
| 45,089,914 | ||||||||
|
| |||||||
Semiconductors – 13.2% |
| |||||||
Advanced Micro Devices, Inc. (a) | 289,600 | 5,308,368 | ||||||
Alpha & Omega Semiconductor Ltd. (a) | 7,030 | 93,921 | ||||||
Ambarella, Inc. (a) | 1,386 | 54,303 | ||||||
Analog Devices, Inc. | 116,289 | 11,180,024 | ||||||
Broadcom, Inc. | 129,078 | 28,625,628 | ||||||
CEVA, Inc. (a) | 6,983 | 210,188 | ||||||
Cirrus Logic, Inc. (a) | 20,412 | 883,023 | ||||||
Cree, Inc. (a) | 31,448 | 1,482,773 | ||||||
Cypress Semiconductor Corp. | 106,533 | 1,897,353 | ||||||
Diodes, Inc. (a) | 12,601 | 468,253 | ||||||
First Solar, Inc. (a) | 24,885 | 1,302,730 | ||||||
Inphi Corp. (a) | 12,740 | 400,546 | ||||||
Integrated Device Technology, Inc. (a) | 41,758 | 1,437,728 | ||||||
Intel Corp. | 1,471,244 | 70,766,836 | ||||||
Lattice Semiconductor Corp. (a) | 39,020 | 300,064 | ||||||
MACOM Technology Solutions Holdings, Inc. (a) | 15,212 | 316,866 | ||||||
Marvell Technology Group Ltd. | 194,457 | 4,143,879 | ||||||
Maxim Integrated Products, Inc. | 88,664 | 5,420,917 | ||||||
MaxLinear, Inc. Class A (a) | 2,501 | 43,292 | ||||||
Mellanox Technologies Ltd. (a) | 14,374 | 1,128,359 | ||||||
Microchip Technology, Inc. | 73,824 | 6,897,376 | ||||||
Micron Technology, Inc. (a) | 363,812 | 19,205,635 | ||||||
Monolithic Power Systems, Inc. | 12,574 | 1,668,318 | ||||||
NVE Corp. | 1,541 | 164,610 | ||||||
NVIDIA Corp. | 181,010 | 44,322,109 | ||||||
ON Semiconductor Corp. (a) | 134,736 | 2,970,929 | ||||||
Power Integrations, Inc. | 9,539 | 682,038 | ||||||
Qorvo, Inc. (a) | 39,976 | 3,268,438 | ||||||
QUALCOMM, Inc. | 465,454 | 29,830,947 | ||||||
Rambus, Inc. (a) | 34,611 | 427,792 | ||||||
Semtech Corp. (a) | 21,048 | 998,728 | ||||||
Silicon Laboratories, Inc. (a) | 13,472 | 1,283,208 | ||||||
Skyworks Solutions, Inc. | 57,755 | 5,462,468 | ||||||
SMART Global Holdings, Inc. (a) | 3,094 | 94,460 | ||||||
SunPower Corp. (a) | 22,789 | 165,448 | ||||||
Synaptics, Inc. (a) | 11,246 | 563,537 | ||||||
Texas Instruments, Inc. | 309,337 | 34,435,395 | ||||||
Xilinx, Inc. | 80,167 | 5,777,636 | ||||||
|
| |||||||
| 293,684,123 | ||||||||
|
| |||||||
TOTAL SEMICONDUCTORS & SEMICONDUCTOR EQUIPMENT |
| 338,774,037 | ||||||
|
| |||||||
See accompanying notes which are an integral part of the financial statements.
| 65 | Annual Report |
Table of Contents
Fidelity MSCI Information Technology Index ETF
Investments – continued
| Common Stocks – continued | ||||||||
| Shares | Value | |||||||
SOFTWARE – 23.9% |
| |||||||
Application Software – 7.2% |
| |||||||
8x8, Inc. (a) | 29,816 | $ | 594,829 | |||||
ACI Worldwide, Inc. (a) | 36,969 | 955,279 | ||||||
Adobe Systems, Inc. (a) | 154,565 | 37,818,964 | ||||||
ANSYS, Inc. (a) | 26,447 | 4,466,369 | ||||||
Aspen Technology, Inc. (a) | 22,826 | 2,186,503 | ||||||
Autodesk, Inc. (a) | 69,296 | 8,900,378 | ||||||
Avaya Holdings Corp. (a) | 34,648 | 713,056 | ||||||
Blackbaud, Inc. | 15,217 | 1,518,809 | ||||||
Blackline, Inc. (a) | 10,471 | 447,112 | ||||||
Bottomline Technologies de, Inc. (a) | 13,166 | 709,647 | ||||||
Cadence Design Systems, Inc. (a) | 89,049 | 3,926,170 | ||||||
CDK Global, Inc. | 40,208 | 2,510,990 | ||||||
Citrix Systems, Inc. (a) | 43,018 | 4,730,689 | ||||||
Ebix, Inc. | 6,937 | 550,451 | ||||||
Ellie Mae, Inc. (a) | 10,851 | 1,076,636 | ||||||
Everbridge, Inc. (a) | 8,452 | 380,171 | ||||||
Fair Isaac Corp. (a) | 9,512 | 1,916,288 | ||||||
Glu Mobile, Inc. (a) | 37,967 | 202,364 | ||||||
Guidewire Software, Inc. (a) | 23,922 | 2,062,076 | ||||||
HubSpot, Inc. (a) | 11,471 | 1,423,551 | ||||||
Intuit, Inc. | 76,533 | 15,631,100 | ||||||
Manhattan Associates, Inc. (a) | 21,492 | 1,034,195 | ||||||
MicroStrategy, Inc. Class A (a) | 3,052 | 397,218 | ||||||
MobileIron, Inc. (a) | 17,839 | 83,843 | ||||||
Model N, Inc. (a) | 8,132 | 151,662 | ||||||
Monotype Imaging Holdings, Inc. | 13,316 | 274,975 | ||||||
Nuance Communications, Inc. (a) | 92,632 | 1,368,175 | ||||||
Paycom Software, Inc. (a) | 15,821 | 1,680,981 | ||||||
Paylocity Holding Corp. (a) | 9,949 | 577,042 | ||||||
Pegasystems, Inc. | 12,424 | 690,774 | ||||||
PROS Holdings, Inc. (a) | 9,184 | 341,094 | ||||||
PTC, Inc. (a) | 36,726 | 3,375,487 | ||||||
QAD, Inc. Class A | 3,685 | 183,513 | ||||||
RealPage, Inc. (a) | 20,957 | 1,154,731 | ||||||
RingCentral, Inc. Class A (a) | 20,936 | 1,544,030 | ||||||
Salesforce.com, Inc. (a) | 215,764 | 29,592,033 | ||||||
Splunk, Inc. (a) | 44,697 | 4,295,382 | ||||||
SS&C Technologies Holdings, Inc. | 65,973 | 3,501,187 | ||||||
Synopsys, Inc. (a) | 46,930 | 4,196,950 | ||||||
The Ultimate Software Group, Inc. (a) | 9,157 | 2,535,482 | ||||||
Tyler Technologies, Inc. (a) | 11,405 | 2,566,011 | ||||||
Upland Software, Inc. (a) | 5,560 | 174,139 | ||||||
Verint Systems, Inc. (a) | 20,199 | 906,935 | ||||||
Workday, Inc. Class A (a) | 43,116 | 5,347,246 | ||||||
Workiva, Inc. (a) | 7,968 | 201,192 | ||||||
Zendesk, Inc. (a) | 32,893 | 1,791,682 | ||||||
|
| |||||||
| 160,687,391 | ||||||||
|
| |||||||
Home Entertainment Software – 1.6% |
| |||||||
Activision Blizzard, Inc. | 226,983 | 16,665,092 | ||||||
| Shares | Value | |||||||
Electronic Arts, Inc. (a) | 96,432 | $ | 12,415,620 | |||||
Take-Two Interactive Software, Inc. (a) | 36,133 | 4,083,752 | ||||||
Zynga, Inc. Class A (a) | 249,828 | 946,848 | ||||||
|
| |||||||
| 34,111,312 | ||||||||
|
| |||||||
Systems Software – 15.1% |
| |||||||
A10 Networks, Inc. (a) | 19,942 | 134,808 | ||||||
CA, Inc. | 98,689 | 4,363,041 | ||||||
CommVault Systems, Inc. (a) | 13,907 | 902,564 | ||||||
Dell Technologies, Inc. Class V (a) | 62,817 | 5,811,829 | ||||||
FireEye, Inc. (a) | 57,271 | 889,419 | ||||||
ForeScout Technologies, Inc. (a) | 3,731 | 126,705 | ||||||
Fortinet, Inc. (a) | 45,180 | 2,842,274 | ||||||
Imperva, Inc. (a) | 10,178 | 470,732 | ||||||
Microsoft Corp. | 2,299,535 | 243,934,673 | ||||||
OneSpan, Inc. (a) | 10,865 | 177,100 | ||||||
Oracle Corp. | 976,497 | 46,559,377 | ||||||
Progress Software Corp. | 13,485 | 496,113 | ||||||
Proofpoint, Inc. (a) | 16,081 | 1,834,038 | ||||||
Qualys, Inc. (a) | 10,343 | 900,875 | ||||||
Rapid7, Inc. (a) | 10,033 | 279,018 | ||||||
Red Hat, Inc. (a) | 55,697 | 7,866,087 | ||||||
SailPoint Technologies Holding, Inc. (a) | 15,098 | 363,711 | ||||||
ServiceNow, Inc. (a) | 54,965 | 9,671,641 | ||||||
Symantec Corp. | 123,932 | 2,505,905 | ||||||
Tableau Software, Inc. Class A (a) | 21,354 | 2,200,957 | ||||||
TiVo Corp. | 2,896 | 35,186 | ||||||
Varonis Systems, Inc. (a) | 9,141 | 546,403 | ||||||
VMware, Inc. Class A (a) | 22,851 | 3,304,026 | ||||||
|
| |||||||
| 336,216,482 | ||||||||
|
| |||||||
TOTAL SOFTWARE |
| 531,015,185 | ||||||
|
| |||||||
TECHNOLOGY HARDWARE, STORAGE & PERIPHERALS – 15.5% |
| |||||||
Technology Hardware, Storage & Peripherals – 15.5% |
| |||||||
3D Systems Corp. (a) | 37,463 | 455,925 | ||||||
Apple, Inc. | 1,595,110 | 303,533,482 | ||||||
Cray, Inc. (a) | 13,368 | 333,532 | ||||||
Diebold Nixdorf, Inc. | 21,296 | 241,710 | ||||||
Electronics For Imaging, Inc. (a) | 14,995 | 511,629 | ||||||
Hewlett Packard Enterprise Co. | 493,380 | 7,617,787 | ||||||
HP, Inc. | 515,010 | 11,886,431 | ||||||
NCR Corp. (a) | 38,581 | 1,077,181 | ||||||
NetApp, Inc. | 84,277 | 6,533,153 | ||||||
Pure Storage, Inc. Class A (a) | 29,395 | 636,696 | ||||||
Seagate Technology PLC | 85,104 | 4,478,172 | ||||||
Super Micro Computer, Inc. (a) | 12,860 | 284,206 | ||||||
Western Digital Corp. | 93,608 | 6,566,601 | ||||||
See accompanying notes which are an integral part of the financial statements.
| Annual Report | 66 |
Table of Contents
| Common Stocks – continued | ||||||||
| Shares | Value | |||||||
TECHNOLOGY HARDWARE, STORAGE & PERIPHERALS – continued |
| |||||||
Technology Hardware, Storage & Peripherals – continued |
| |||||||
Xerox Corp. | 72,076 | $ | 1,871,814 | |||||
|
| |||||||
TOTAL TECHNOLOGY HARDWARE, STORAGE & PERIPHERALS |
| 346,028,319 | ||||||
|
| |||||||
TOTAL COMMON STOCKS |
| 2,221,125,840 | ||||||
|
| |||||||
| Money Market Funds – 0.1% | ||||||||
State Street Institutional Treasury Plus Money Market Fund, Trust Class, 1.76% (b) | 1,443,492 | 1,443,492 | ||||||
|
| |||||||
TOTAL INVESTMENT PORTFOLIO – 100.0% |
| 2,222,569,332 | ||||||
NET OTHER ASSETS (LIABILITIES) – 0.0% |
| 684,505 | ||||||
|
| |||||||
NET ASSETS – 100.0% |
| $ | 2,223,253,837 | |||||
|
| |||||||
Legend
| (a) | Non-income producing. |
| (b) | The rate quoted is the annualized seven-day yield of the fund at period end. |
Investment Valuation
All investments are categorized as Level 1 under the Fair Value Hierarchy. The inputs or methodology used for valuing securities may not be an indication of the risk associated with investing in those securities. For more information on valuation inputs please refer to the Investment Valuation section in the accompanying Notes to Financial Statements.
See accompanying notes which are an integral part of the financial statements.
| 67 | Annual Report |
Table of Contents
Fidelity MSCI Materials Index ETF
Investments July 31, 2018
Showing Percentage of Net Assets
| Common Stocks – 99.9% | ||||||||
| Shares | Value | |||||||
CHEMICALS – 66.0% |
| |||||||
Commodity Chemicals – 7.1% |
| |||||||
AdvanSix, Inc. (a) | 9,094 | $ | 368,034 | |||||
Cabot Corp. | 18,487 | 1,221,991 | ||||||
Hawkins, Inc. | 2,889 | 107,760 | ||||||
Koppers Holdings, Inc. (a) | 6,236 | 234,162 | ||||||
Kronos Worldwide, Inc. | 6,976 | 158,634 | ||||||
LyondellBasell Industries N.V. Class A | 100,386 | 11,121,765 | ||||||
Olin Corp. | 50,005 | 1,475,647 | ||||||
Tredegar Corp. | 7,430 | 193,551 | ||||||
Trinseo S.A. | 12,981 | 969,681 | ||||||
Tronox Ltd. Class A | 27,206 | 501,951 | ||||||
Valvoline, Inc. | 59,851 | 1,352,034 | ||||||
Westlake Chemical Corp. | 11,630 | 1,246,969 | ||||||
|
| |||||||
| 18,952,179 | ||||||||
|
| |||||||
Diversified Chemicals – 21.5% |
| |||||||
DowDuPont, Inc. | 697,152 | 47,943,143 | ||||||
Eastman Chemical Co. | 42,806 | 4,435,558 | ||||||
Huntsman Corp. | 65,084 | 2,182,266 | ||||||
The Chemours Co. | 54,653 | 2,503,654 | ||||||
|
| |||||||
| 57,064,621 | ||||||||
|
| |||||||
Fertilizers & Agricultural Chemicals – 4.3% |
| |||||||
AgroFresh Solutions, Inc. (a) | 8,319 | 59,148 | ||||||
American Vanguard Corp. | 8,047 | 174,620 | ||||||
CF Industries Holdings, Inc. | 69,857 | 3,103,048 | ||||||
FMC Corp. | 40,211 | 3,614,165 | ||||||
Intrepid Potash, Inc. (a) | 29,396 | 125,521 | ||||||
The Mosaic Co. | 109,558 | 3,298,791 | ||||||
The Scotts Miracle-Gro Co. | 12,787 | 1,015,671 | ||||||
|
| |||||||
| 11,390,964 | ||||||||
|
| |||||||
Industrial Gases – 9.5% |
| |||||||
Air Products & Chemicals, Inc. | 65,532 | 10,758,388 | ||||||
Praxair, Inc. | 85,951 | 14,396,793 | ||||||
|
| |||||||
| 25,155,181 | ||||||||
|
| |||||||
Specialty Chemicals – 23.6% |
| |||||||
A Schulman, Inc. Class A | 8,848 | 383,561 | ||||||
Albemarle Corp. | 33,102 | 3,118,208 | ||||||
Ashland Global Holdings, Inc. | 18,611 | 1,528,149 | ||||||
Axalta Coating Systems Ltd. (a) | 65,668 | 1,986,457 | ||||||
Balchem Corp. | 9,592 | 961,982 | ||||||
Celanese Corp. Class A | 40,600 | 4,795,266 | ||||||
Chase Corp. | 2,248 | 277,628 | ||||||
Ecolab, Inc. | 77,821 | 10,949,415 | ||||||
Ferro Corp. (a) | 23,865 | 537,440 | ||||||
FutureFuel Corp. | 7,866 | 108,236 | ||||||
GCP Applied Technologies, Inc. (a) | 20,417 | 595,155 | ||||||
HB Fuller Co. | 15,079 | 854,678 | ||||||
Ingevity Corp. (a) | 12,604 | 1,256,241 | ||||||
Innophos Holdings, Inc. | 5,869 | 265,161 | ||||||
Innospec, Inc. | 7,303 | 591,178 | ||||||
| Shares | Value | |||||||
International Flavors & Fragrances, Inc. | 23,616 | $ | 3,135,260 | |||||
KMG Chemicals, Inc. | 4,158 | 298,544 | ||||||
Kraton Corp. (a) | 9,462 | 455,028 | ||||||
Minerals Technologies, Inc. | 10,604 | 801,662 | ||||||
NewMarket Corp. | 2,838 | 1,161,991 | ||||||
OMNOVA Solutions, Inc. (a) | 13,455 | 125,804 | ||||||
Platform Specialty Products Corp. (a) | 68,708 | 849,231 | ||||||
PolyOne Corp. | 24,200 | 1,085,370 | ||||||
PPG Industries, Inc. | 74,798 | 8,277,147 | ||||||
PQ Group Holdings, Inc. (a) | 12,178 | 219,448 | ||||||
Quaker Chemical Corp. | 3,979 | 706,432 | ||||||
Rayonier Advanced Materials, Inc. | 15,537 | 280,287 | ||||||
RPM International, Inc. | 39,991 | 2,574,221 | ||||||
Sensient Technologies Corp. | 12,917 | 895,923 | ||||||
Stepan Co. | 6,075 | 532,048 | ||||||
The Sherwin-Williams Co. | 25,313 | 11,156,198 | ||||||
Venator Materials PLC (a) | 15,980 | 233,628 | ||||||
WR Grace & Co. | 20,172 | 1,489,904 | ||||||
|
| |||||||
| 62,486,881 | ||||||||
|
| |||||||
TOTAL CHEMICALS |
| 175,049,826 | ||||||
|
| |||||||
CONSTRUCTION MATERIALS – 4.1% |
| |||||||
Construction Materials – 4.1% | ||||||||
Eagle Materials, Inc. | 14,561 | 1,446,636 | ||||||
Forterra, Inc. (a) | 6,354 | 57,504 | ||||||
Martin Marietta Materials, Inc. | 18,800 | 3,749,096 | ||||||
Summit Materials, Inc. Class A (a) | 33,012 | 828,601 | ||||||
United States Lime & Minerals, Inc. | 676 | 52,525 | ||||||
US Concrete, Inc. (a) | 4,750 | 239,875 | ||||||
Vulcan Materials Co. | 39,654 | 4,441,248 | ||||||
|
| |||||||
TOTAL CONSTRUCTION MATERIALS |
| 10,815,485 | ||||||
|
| |||||||
CONTAINERS & PACKAGING – 13.2% |
| |||||||
Metal & Glass Containers – 4.4% | ||||||||
Aptargroup, Inc. | 18,597 | 1,904,891 | ||||||
Ball Corp. | 99,561 | 3,879,892 | ||||||
Berry Plastics Group, Inc. (a) | 39,295 | 1,919,561 | ||||||
Crown Holdings, Inc. (a) | 40,225 | 1,820,986 | ||||||
Greif, Inc. Class A | 7,716 | 420,136 | ||||||
Greif, Inc. Class B | 1,316 | 76,131 | ||||||
Myers Industries, Inc. | 8,274 | 178,305 | ||||||
Owens-Illinois, Inc. (a) | 48,792 | 911,434 | ||||||
Silgan Holdings, Inc. | 23,103 | 635,563 | ||||||
|
| |||||||
| 11,746,899 | ||||||||
|
| |||||||
Paper Packaging – 8.8% |
| |||||||
Avery Dennison Corp. | 26,327 | 3,019,180 | ||||||
Bemis Co., Inc. | 27,213 | 1,249,349 | ||||||
Graphic Packaging Holding Co. | 92,649 | 1,346,190 | ||||||
International Paper Co. | 117,435 | 6,309,782 | ||||||
See accompanying notes which are an integral part of the financial statements.
| Annual Report | 68 |
Table of Contents
| Common Stocks – continued | ||||||||
| Shares | Value | |||||||
CONTAINERS & PACKAGING – continued |
| |||||||
Paper Packaging – continued |
| |||||||
Packaging Corp. of America | 28,239 | $ | 3,188,183 | |||||
Sealed Air Corp. | 50,073 | 2,206,717 | ||||||
Sonoco Products Co. | 29,746 | 1,660,422 | ||||||
WestRock Co. | 76,366 | 4,427,701 | ||||||
|
| |||||||
| 23,407,524 | ||||||||
|
| |||||||
TOTAL CONTAINERS & PACKAGING |
| 35,154,423 | ||||||
|
| |||||||
METALS & MINING – 14.6% |
| |||||||
Aluminum – 1.2% |
| |||||||
Alcoa Corp. (a) | 55,746 | 2,412,129 | ||||||
Century Aluminum Co. (a) | 15,778 | 202,116 | ||||||
Kaiser Aluminum Corp. | 5,027 | 561,114 | ||||||
|
| |||||||
| 3,175,359 | ||||||||
|
| |||||||
Copper – 2.5% |
| |||||||
Freeport-McMoRan, Inc. | 411,714 | 6,793,281 | ||||||
|
| |||||||
Diversified Metals & Mining – 0.4% |
| |||||||
Compass Minerals International, Inc. | 10,122 | 686,778 | ||||||
Materion Corp. | 5,995 | 375,886 | ||||||
|
| |||||||
| 1,062,664 | ||||||||
|
| |||||||
Gold – 2.9% |
| |||||||
McEwen Mining, Inc. | 80,976 | 181,386 | ||||||
Newmont Mining Corp. | 159,688 | 5,857,356 | ||||||
Royal Gold, Inc. | 19,607 | 1,658,949 | ||||||
|
| |||||||
| 7,697,691 | ||||||||
|
| |||||||
Silver – 0.3% |
| |||||||
Coeur Mining, Inc. (a) | 55,353 | 387,471 | ||||||
Hecla Mining Co. | 141,740 | 453,568 | ||||||
|
| |||||||
| 841,039 | ||||||||
|
| |||||||
Steel – 7.3% |
| |||||||
AK Steel Holding Corp. (a) | 94,122 | 435,785 | ||||||
Allegheny Technologies, Inc. (a) | 37,586 | 1,044,891 | ||||||
Carpenter Technology Corp. | 14,031 | 768,478 | ||||||
Cleveland-Cliffs, Inc. (a) | 84,524 | 912,014 | ||||||
Commercial Metals Co. | 34,891 | 779,465 | ||||||
Haynes International, Inc. | 3,756 | 159,480 | ||||||
Nucor Corp. | 95,168 | 6,369,594 | ||||||
Reliance Steel & Aluminum Co. | 21,793 | 1,965,729 | ||||||
Ryerson Holding Corp. (a) | 5,026 | 58,050 | ||||||
Schnitzer Steel Industries, Inc. Class A | 8,109 | 267,191 | ||||||
Steel Dynamics, Inc. | 70,668 | 3,327,756 | ||||||
SunCoke Energy, Inc. (a) | 17,444 | 199,036 | ||||||
TimkenSteel Corp. (a) | 11,355 | 157,834 | ||||||
| Shares | Value | |||||||
United States Steel Corp. | 52,613 | $ | 1,916,692 | |||||
Warrior Met Coal, Inc. | 11,133 | 288,011 | ||||||
Worthington Industries, Inc. | 13,820 | 647,052 | ||||||
|
| |||||||
| 19,297,058 | ||||||||
|
| |||||||
TOTAL METALS & MINING |
| 38,867,092 | ||||||
|
| |||||||
PAPER & FOREST PRODUCTS – 2.0% |
| |||||||
Forest Products – 0.6% |
| |||||||
Boise Cascade Co. | 11,533 | 498,802 | ||||||
Louisiana-Pacific Corp. | 43,367 | 1,167,440 | ||||||
|
| |||||||
| 1,666,242 | ||||||||
|
| |||||||
Paper Products – 1.4% |
| |||||||
Clearwater Paper Corp. (a) | 4,943 | 111,712 | ||||||
Domtar Corp. | 18,734 | 903,353 | ||||||
KapStone Paper and Packaging Corp. | 26,223 | 912,036 | ||||||
Mercer International, Inc. | 12,690 | 227,786 | ||||||
Neenah Paper, Inc. | 5,036 | 442,161 | ||||||
PH Glatfelter Co. | 13,116 | 214,709 | ||||||
Resolute Forest Products, Inc. (a) | 17,526 | 177,889 | ||||||
Schweitzer-Mauduit International, Inc. | 9,162 | 380,131 | ||||||
Verso Corp. Class A (a) | 10,283 | 214,606 | ||||||
|
| |||||||
| 3,584,383 | ||||||||
|
| |||||||
TOTAL PAPER & FOREST PRODUCTS |
| 5,250,625 | ||||||
|
| |||||||
TOTAL COMMON STOCKS |
| 265,137,451 | ||||||
|
| |||||||
| Money Market Funds – 0.0% | ||||||||
State Street Institutional Treasury Plus Money Market Fund, Trust Class, 1.76% (b) | 120,184 | 120,184 | ||||||
|
| |||||||
TOTAL INVESTMENT PORTFOLIO – 99.9% |
| 265,257,635 | ||||||
NET OTHER ASSETS (LIABILITIES) – 0.1% |
| 170,553 | ||||||
|
| |||||||
NET ASSETS – 100.0% |
| $ | 265,428,188 | |||||
|
| |||||||
Legend
| (a) | Non-income producing. |
| (b) | The rate quoted is the annualized seven-day yield of the fund at period end. |
Investment Valuation
All investments are categorized as Level 1 under the Fair Value Hierarchy. The inputs or methodology used for valuing securities may not be an indication of the risk associated with investing in those securities. For more information on valuation inputs please refer to the Investment Valuation section in the accompanying Notes to Financial Statements.
See accompanying notes which are an integral part of the financial statements.
| 69 | Annual Report |
Table of Contents
Fidelity MSCI Real Estate Index ETF
Investments July 31, 2018
Showing Percentage of Net Assets
| Common Stocks – 99.9% | ||||||||
| Shares | Value | |||||||
EQUITY REAL ESTATE INVESTMENT TRUSTS (REITS) – 95.9% |
| |||||||
Diversified REIT’s – 5.0% |
| |||||||
Alexander & Baldwin, Inc. | 31,463 | $ | 753,539 | |||||
American Assets Trust, Inc. | 15,322 | 588,824 | ||||||
Armada Hoffler Properties, Inc. | 20,867 | 315,092 | ||||||
Colony Capital, Inc. | 224,743 | 1,384,417 | ||||||
Empire State Realty Trust, Inc. Class A | 63,375 | 1,056,461 | ||||||
Forest City Realty Trust, Inc. Class A | 104,397 | 2,606,793 | ||||||
Gladstone Commercial Corp. | 13,177 | 261,432 | ||||||
Global Net Lease, Inc. | 31,059 | 657,208 | ||||||
Gramercy Property Trust | 74,095 | 2,029,462 | ||||||
iStar, Inc. (a) | 31,295 | 340,177 | ||||||
Lexington Realty Trust | 100,315 | 881,769 | ||||||
Liberty Property Trust | 67,872 | 2,908,994 | ||||||
One Liberty Properties, Inc. | 6,578 | 177,343 | ||||||
PS Business Parks, Inc. | 9,413 | 1,202,699 | ||||||
STORE Capital Corp. | 80,579 | 2,211,894 | ||||||
VEREIT, Inc. | 448,832 | 3,424,588 | ||||||
Washington Real Estate Investment Trust | 36,156 | 1,102,396 | ||||||
WP Carey, Inc. | 49,268 | 3,221,142 | ||||||
|
| |||||||
| 25,124,230 | ||||||||
|
| |||||||
Health Care REIT’s – 8.7% |
| |||||||
CareTrust REIT, Inc. | 30,013 | 507,520 | ||||||
Community Healthcare Trust, Inc. | 8,495 | 254,850 | ||||||
HCP, Inc. | 216,144 | 5,598,130 | ||||||
Healthcare Realty Trust, Inc. | 57,477 | 1,707,642 | ||||||
Healthcare Trust of America, Inc. Class A | 94,405 | 2,579,145 | ||||||
LTC Properties, Inc. | 18,259 | 769,982 | ||||||
Medical Properties Trust, Inc. | 167,809 | 2,418,128 | ||||||
National Health Investors, Inc. | 19,124 | 1,431,240 | ||||||
New Senior Investment Group, Inc. | 29,194 | 206,693 | ||||||
Omega Healthcare Investors, Inc. | 91,491 | 2,716,368 | ||||||
Physicians Realty Trust | 82,778 | 1,304,581 | ||||||
Sabra Health Care REIT, Inc. | 82,096 | 1,774,095 | ||||||
Senior Housing Properties Trust | 109,141 | 1,947,075 | ||||||
Universal Health Realty Income Trust | 6,056 | 407,629 | ||||||
Ventas, Inc. | 163,996 | 9,246,094 | ||||||
Welltower, Inc. | 170,521 | 10,674,615 | ||||||
|
| |||||||
| 43,543,787 | ||||||||
|
| |||||||
Hotel & Resort REIT’s – 5.7% |
| |||||||
Apple Hospitality REIT, Inc. | 100,939 | 1,815,893 | ||||||
Ashford Hospitality Trust, Inc. | 42,845 | 338,475 | ||||||
Braemar Hotels & Resorts, Inc. | 13,312 | 152,156 | ||||||
Chatham Lodging Trust | 21,217 | 457,014 | ||||||
Chesapeake Lodging Trust | 27,887 | 892,942 | ||||||
CorePoint Lodging, Inc. (a) | 19,042 | 481,001 | ||||||
DiamondRock Hospitality Co. | 90,355 | 1,077,032 | ||||||
Hersha Hospitality Trust | 17,455 | 376,853 | ||||||
Hospitality Properties Trust | 75,739 | 2,141,142 | ||||||
| Shares | Value | |||||||
Host Hotels & Resorts, Inc. | 338,005 | $ | 7,077,825 | |||||
LaSalle Hotel Properties | 52,253 | 1,811,611 | ||||||
MGM Growth Properties LLC Class A | 32,714 | 991,234 | ||||||
Park Hotels & Resorts, Inc. | 92,502 | 2,893,463 | ||||||
Pebblebrook Hotel Trust | 31,879 | 1,228,935 | ||||||
RLJ Lodging Trust | 80,533 | 1,819,240 | ||||||
Ryman Hospitality Properties, Inc. | 21,241 | 1,805,697 | ||||||
Summit Hotel Properties, Inc. | 48,077 | 680,290 | ||||||
Sunstone Hotel Investors, Inc. | 103,803 | 1,688,875 | ||||||
Xenia Hotels & Resorts, Inc. | 49,184 | 1,199,598 | ||||||
|
| |||||||
| 28,929,276 | ||||||||
|
| |||||||
Industrial REIT’s – 6.3% |
| |||||||
Americold Realty Trust | 26,376 | 567,348 | ||||||
DCT Industrial Trust, Inc. | 43,148 | 2,885,307 | ||||||
Duke Realty Corp. | 164,367 | 4,786,367 | ||||||
EastGroup Properties, Inc. | 15,652 | 1,491,949 | ||||||
First Industrial Realty Trust, Inc. | 55,325 | 1,800,829 | ||||||
Industrial Logistics Properties Trust | 10,567 | 244,098 | ||||||
Monmouth Real Estate Investment | ||||||||
Corp. Class A | 34,141 | 569,130 | ||||||
Prologis, Inc. | 245,433 | 16,105,313 | ||||||
Rexford Industrial Realty, Inc. | 36,146 | 1,107,513 | ||||||
STAG Industrial, Inc. | 44,771 | 1,223,144 | ||||||
Terreno Realty Corp. | 25,599 | 944,859 | ||||||
|
| |||||||
| 31,725,857 | ||||||||
|
| |||||||
Office REIT’s – 10.4% |
| |||||||
Alexandria Real Estate Equities, Inc. | 46,611 | 5,940,106 | ||||||
Boston Properties, Inc. | 71,054 | 8,919,409 | ||||||
Brandywine Realty Trust | 82,376 | 1,358,380 | ||||||
Columbia Property Trust, Inc. | 55,210 | 1,279,768 | ||||||
Corporate Office Properties Trust | 46,517 | 1,383,415 | ||||||
Cousins Properties, Inc. | 192,906 | 1,797,884 | ||||||
Douglas Emmett, Inc. | 74,170 | 2,880,763 | ||||||
Easterly Government Properties, Inc. | 26,612 | 504,297 | ||||||
Equity Commonwealth (a) | 57,301 | 1,847,384 | ||||||
Franklin Street Properties Corp. | 49,638 | 437,311 | ||||||
Government Properties Income Trust | 35,267 | 531,474 | ||||||
Highwoods Properties, Inc. | 47,582 | 2,336,752 | ||||||
Hudson Pacific Properties, Inc. | 72,263 | 2,475,730 | ||||||
JBG SMITH Properties | 51,728 | 1,888,072 | ||||||
Kilroy Realty Corp. | 45,483 | 3,317,985 | ||||||
Mack-Cali Realty Corp. | 41,656 | 811,042 | ||||||
New York REIT, Inc. (a) | 7,802 | 143,635 | ||||||
NorthStar Realty Europe Corp. | 23,304 | 319,032 | ||||||
Paramount Group, Inc. | 99,786 | 1,540,696 | ||||||
Piedmont Office Realty Trust, Inc. Class A | 62,194 | 1,230,197 | ||||||
Select Income REIT | 30,994 | 646,225 | ||||||
SL Green Realty Corp. | 41,591 | 4,288,448 | ||||||
Tier REIT, Inc. | 22,075 | 524,723 | ||||||
See accompanying notes which are an integral part of the financial statements.
| Annual Report | 70 |
Table of Contents
| Common Stocks – continued | ||||||||
| Shares | Value | |||||||
EQUITY REAL ESTATE INVESTMENT TRUSTS (REITS) – continued |
| |||||||
Office REIT’s – continued |
| |||||||
Vornado Realty Trust | 78,726 | $ | 5,661,974 | |||||
|
| |||||||
| 52,064,702 | ||||||||
|
| |||||||
Residential REIT’s – 13.0% |
| |||||||
American Campus Communities, Inc. | 62,902 | 2,594,708 | ||||||
American Homes 4 Rent Class A | 117,996 | 2,612,431 | ||||||
Apartment Investment & Management Co. Class A | 72,455 | 3,090,206 | ||||||
AvalonBay Communities, Inc. | 63,584 | 11,244,830 | ||||||
Camden Property Trust | 42,709 | 3,954,426 | ||||||
Education Realty Trust, Inc. | 34,887 | 1,442,926 | ||||||
Equity Lifestyle Properties, Inc. | 38,811 | 3,531,413 | ||||||
Equity Residential | 169,518 | 11,091,563 | ||||||
Essex Property Trust, Inc. | 30,410 | 7,312,084 | ||||||
Front Yard Residential Corp. | 23,568 | 227,667 | ||||||
Independence Realty Trust, Inc. | 39,246 | 398,347 | ||||||
Investors Real Estate Trust | 55,663 | 305,033 | ||||||
Invitation Homes, Inc. | 143,433 | 3,314,737 | ||||||
Mid-America Apartment Communities, Inc. | 52,343 | 5,275,128 | ||||||
NexPoint Residential Trust, Inc. | 8,187 | 245,119 | ||||||
Preferred Apartment Communities, Inc. Class A | 18,197 | 307,893 | ||||||
Sun Communities, Inc. | 36,714 | 3,559,789 | ||||||
UDR, Inc. | 123,470 | 4,751,126 | ||||||
UMH Properties, Inc. | 15,037 | 232,171 | ||||||
|
| |||||||
| 65,491,597 | ||||||||
|
| |||||||
Retail REIT’s – 15.6% |
| |||||||
Acadia Realty Trust | 38,590 | 1,045,017 | ||||||
Agree Realty Corp. | 14,347 | 763,834 | ||||||
Alexander’s, Inc. | 1,098 | 406,787 | ||||||
Brixmor Property Group, Inc. | 139,891 | 2,474,672 | ||||||
CBL & Associates Properties, Inc. | 78,890 | 429,950 | ||||||
Cedar Realty Trust, Inc. | 42,735 | 203,419 | ||||||
DDR Corp. | 71,055 | 973,453 | ||||||
Federal Realty Investment Trust | 33,704 | 4,229,852 | ||||||
Getty Realty Corp. | 15,507 | 444,275 | ||||||
GGP, Inc. | 308,450 | 6,576,154 | ||||||
Kimco Realty Corp. | 196,060 | 3,272,241 | ||||||
Kite Realty Group Trust | 38,648 | 651,992 | ||||||
National Retail Properties, Inc. | 70,860 | 3,161,065 | ||||||
Pennsylvania Real Estate Investment Trust | 32,698 | 347,253 | ||||||
Ramco-Gershenson Properties Trust | 35,763 | 470,283 | ||||||
Realty Income Corp. | 130,875 | 7,298,899 | ||||||
Regency Centers Corp. | 70,780 | 4,503,731 | ||||||
Retail Opportunity Investments Corp. | 51,846 | 980,408 | ||||||
Retail Properties of America, Inc. Class A | 101,353 | 1,271,980 | ||||||
Retail Value, Inc. (a) | 7,357 | 243,075 | ||||||
| Shares | Value | |||||||
Saul Centers, Inc. | 6,138 | $ | 327,033 | |||||
Seritage Growth Properties, Class A | 15,006 | 634,904 | ||||||
Simon Property Group, Inc. | 147,491 | 25,989,389 | ||||||
Spirit MTA REIT (a) | 20,720 | 206,993 | ||||||
Spirit Realty Capital, Inc. | 206,769 | 1,730,656 | ||||||
Tanger Factory Outlet Centers, Inc. | 43,521 | 1,037,976 | ||||||
Taubman Centers, Inc. | 28,114 | 1,744,474 | ||||||
The Macerich Co. | 48,697 | 2,876,045 | ||||||
Urban Edge Properties | 52,419 | 1,188,863 | ||||||
Urstadt Biddle Properties, Inc. Class A | 13,895 | 309,303 | ||||||
Washington Prime Group, Inc. | 85,891 | 689,705 | ||||||
Weingarten Realty Investors | 56,199 | 1,698,334 | ||||||
Whitestone REIT | 16,142 | 209,846 | ||||||
|
| |||||||
| 78,391,861 | ||||||||
|
| |||||||
Specialized REIT’s – 31.2% |
| |||||||
American Tower Corp. | 202,982 | 30,090,052 | ||||||
CatchMark Timber Trust, Inc. Class A | 22,694 | 281,859 | ||||||
CoreCivic, Inc. | 54,600 | 1,399,944 | ||||||
CoreSite Realty Corp. | 15,809 | 1,772,189 | ||||||
Crown Castle International Corp. | 187,347 | 20,763,668 | ||||||
CubeSmart | 84,050 | 2,551,758 | ||||||
CyrusOne, Inc. | 44,310 | 2,743,675 | ||||||
Digital Realty Trust, Inc. | 94,604 | 11,486,818 | ||||||
EPR Properties | 33,961 | 2,258,067 | ||||||
Equinix, Inc. | 36,475 | 16,022,738 | ||||||
Extra Space Storage, Inc. | 58,015 | 5,451,669 | ||||||
Four Corners Property Trust, Inc. | 27,661 | 688,759 | ||||||
Gaming and Leisure Properties, Inc. | 93,267 | 3,387,457 | ||||||
InfraREIT, Inc. | 20,228 | 423,777 | ||||||
Iron Mountain, Inc. | 124,797 | 4,381,623 | ||||||
Lamar Advertising Co. Class A | 38,627 | 2,844,106 | ||||||
Life Storage, Inc. | 21,431 | 2,056,519 | ||||||
National Storage Affiliates Trust | 25,987 | 749,205 | ||||||
Outfront Media, Inc. | 63,732 | 1,354,305 | ||||||
PotlatchDeltic Corp. | 27,455 | 1,283,521 | ||||||
Public Storage | 72,121 | 15,710,117 | ||||||
QTS Realty Trust, Inc. Class A | 23,348 | 998,127 | ||||||
Rayonier, Inc. | 59,478 | 2,082,325 | ||||||
SBA Communications Corp. (a) | 53,611 | 8,483,941 | ||||||
The Geo Group, Inc. | 57,226 | 1,481,009 | ||||||
Uniti Group, Inc. | 76,875 | 1,359,150 | ||||||
VICI Properties, Inc. | 127,986 | 2,604,515 | ||||||
Weyerhaeuser Co. | 348,130 | 11,899,083 | ||||||
|
| |||||||
| 156,609,976 | ||||||||
|
| |||||||
TOTAL EQUITY REAL ESTATE INVESTMENT TRUSTS (REITS) |
| 481,881,286 | ||||||
|
| |||||||
REAL ESTATE MANAGEMENT & DEVELOPMENT – 4.0% |
| |||||||
Diversified Real Estate Activities – 0.2% |
| |||||||
Five Point Holdings LLC Class A (a) | 25,900 | 289,821 | ||||||
Tejon Ranch Co. (a) | 9,956 | 232,970 | ||||||
See accompanying notes which are an integral part of the financial statements.
| 71 | Annual Report |
Table of Contents
Fidelity MSCI Real Estate Index ETF
Investments – continued
| Common Stocks – continued | ||||||||
| Shares | Value | |||||||
REAL ESTATE MANAGEMENT & DEVELOPMENT – continued |
| |||||||
Diversified Real Estate Activities – continued |
| |||||||
The RMR Group, Inc. Class A | 2,831 | $ | 245,731 | |||||
The St Joe Co. (a) | 18,337 | 323,648 | ||||||
|
| |||||||
| 1,092,170 | ||||||||
|
| |||||||
Real Estate Development – 0.6% |
| |||||||
Forestar Group, Inc. (a) | 4,758 | 108,006 | ||||||
The Howard Hughes Corp. (a) | 18,974 | 2,571,926 | ||||||
|
| |||||||
| 2,679,932 | ||||||||
|
| |||||||
Real Estate Operating Companies – 0.3% |
| |||||||
FRP Holdings, Inc. (a) | 3,236 | 210,340 | ||||||
Kennedy-Wilson Holdings, Inc. | 62,785 | 1,312,207 | ||||||
|
| |||||||
| 1,522,547 | ||||||||
|
| |||||||
Real Estate Services – 2.9% |
| |||||||
Altisource Portfolio Solutions S.A. (a) | 5,257 | 175,111 | ||||||
CBRE Group, Inc. Class A (a) | 148,480 | 7,394,304 | ||||||
HFF, Inc. Class A | 16,943 | 762,604 | ||||||
Jones Lang LaSalle, Inc. | 20,912 | 3,576,161 | ||||||
Marcus & Millichap, Inc. (a) | 8,830 | 355,054 | ||||||
RE/MAX Holdings, Inc. Class A | 8,154 | 414,223 | ||||||
Realogy Holdings Corp. | 60,380 | 1,320,511 | ||||||
Redfin Corp. (a) | 20,795 | 509,478 | ||||||
|
| |||||||
| 14,507,446 | ||||||||
|
| |||||||
TOTAL REAL ESTATE MANAGEMENT & DEVELOPMENT |
| 19,802,095 | ||||||
|
| |||||||
TOTAL COMMON STOCKS |
| 501,683,381 | ||||||
|
| |||||||
| Money Market Funds – 0.2% | ||||||||
| Shares | Value | |||||||
State Street Institutional Treasury Plus Money Market Fund, Trust Class, 1.76% (b) | 1,124,299 | $ | 1,124,299 | |||||
|
| |||||||
TOTAL INVESTMENT PORTFOLIO – 100.1% |
| 502,807,680 | ||||||
NET OTHER ASSETS (LIABILITIES) – (0.1%) |
| (460,200 | ) | |||||
|
| |||||||
NET ASSETS – 100.0% |
| $ | 502,347,480 | |||||
|
| |||||||
Legend
| (a) | Non-income producing. |
| (b) | The rate quoted is the annualized seven-day yield of the fund at period end. |
Investment Valuation
All investments are categorized as Level 1 under the Fair Value Hierarchy. The inputs or methodology used for valuing securities may not be an indication of the risk associated with investing in those securities. For more information on valuation inputs please refer to the Investment Valuation section in the accompanying Notes to Financial Statements.
See accompanying notes which are an integral part of the financial statements.
| Annual Report | 72 |
Table of Contents
Fidelity MSCI Telecommunication Services Index ETF
Investments July 31, 2018
Showing Percentage of Net Assets
| Common Stocks – 99.9% | ||||||||
| Shares | Value | |||||||
DIVERSIFIED TELECOMMUNICATION SERVICES – 81.4% |
| |||||||
Alternative Carriers – 24.6% |
| |||||||
CenturyLink, Inc. | 287,571 | $ | 5,397,708 | |||||
Cogent Communications Holdings, Inc. | 62,433 | 3,243,394 | ||||||
Globalstar, Inc. (a) | 4,980,351 | 2,788,997 | ||||||
Iridium Communications, Inc. (a) | 233,632 | 4,041,834 | ||||||
ORBCOMM, Inc. (a) | 288,369 | 2,756,808 | ||||||
pdvWireless, Inc. (a) | 109,995 | 3,288,850 | ||||||
Vonage Holdings Corp. (a) | 352,613 | 4,516,972 | ||||||
Zayo Group Holdings, Inc. (a) | 126,835 | 4,704,310 | ||||||
|
| |||||||
| 30,738,873 | ||||||||
|
| |||||||
Integrated Telecommunication Services – 56.8% |
| |||||||
AT&T, Inc. | 950,844 | 30,398,483 | ||||||
ATN International, Inc. | 51,882 | 3,314,222 | ||||||
Cincinnati Bell, Inc. (a) | 227,104 | 3,031,839 | ||||||
Consolidated Communications Holdings, Inc. | 246,807 | 3,144,321 | ||||||
Frontier Communications Corp. | 354,755 | 1,851,821 | ||||||
Verizon Communications, Inc. | 538,752 | 27,821,153 | ||||||
Windstream Holdings, Inc. | 429,258 | 1,510,988 | ||||||
|
| |||||||
| 71,072,827 | ||||||||
|
| |||||||
TOTAL DIVERSIFIED TELECOMMUNICATION SERVICES |
| 101,811,700 | ||||||
|
| |||||||
WIRELESS TELECOMMUNICATION SERVICES – 18.5% |
| |||||||
Wireless Telecommunication Services – 18.5% |
| |||||||
Boingo Wireless, Inc. (a) | 133,805 | 3,092,233 | ||||||
Shenandoah Telecommunications Co. | 96,915 | 3,198,195 | ||||||
| Shares | Value | |||||||
Spok Holdings, Inc. | 172,336 | $ | 2,498,872 | |||||
Sprint Corp. (a) | 701,034 | 3,806,615 | ||||||
Telephone & Data Systems, Inc. | 111,993 | 2,827,823 | ||||||
T-Mobile US, Inc. (a) | 92,386 | 5,543,160 | ||||||
United States Cellular Corp. (a) | 65,644 | 2,255,528 | ||||||
|
| |||||||
TOTAL WIRELESS TELECOMMUNICATION SERVICES | 23,222,426 | |||||||
|
| |||||||
TOTAL COMMON STOCKS |
| 125,034,126 | ||||||
|
| |||||||
| Money Market Funds – 0.1% | ||||||||
State Street Institutional Treasury Plus Money Market Fund, Trust Class, 1.76% (b) | 73,575 | 73,575 | ||||||
|
| |||||||
TOTAL INVESTMENT PORTFOLIO – 100.0% |
| 125,107,701 | ||||||
NET OTHER ASSETS (LIABILITIES) – (0.0%) |
| (3,372 | ) | |||||
|
| |||||||
NET ASSETS – 100.0% |
| $ | 125,104,329 | |||||
|
| |||||||
Legend
| (a) | Non-income producing. |
| (b) | The rate quoted is the annualized seven-day yield of the fund at period end. |
Investment Valuation
All investments are categorized as Level 1 under the Fair Value Hierarchy. The inputs or methodology used for valuing securities may not be an indication of the risk associated with investing in those securities. For more information on valuation inputs please refer to the Investment Valuation section in the accompanying Notes to Financial Statements.
See accompanying notes which are an integral part of the financial statements.
| 73 | Annual Report |
Table of Contents
Fidelity MSCI Utilities Index ETF
Investments July 31, 2018
Showing Percentage of Net Assets
| Common Stocks – 99.9% | ||||||||
| Shares | Value | |||||||
ELECTRIC UTILITIES – 57.0% |
| |||||||
Electric Utilities – 57.0% |
| |||||||
ALLETE, Inc. | 21,022 | $ | 1,629,836 | |||||
Alliant Energy Corp. | 94,974 | 4,081,033 | ||||||
American Electric Power Co., Inc. | 202,043 | 14,373,339 | ||||||
Duke Energy Corp. | 287,497 | 23,465,505 | ||||||
Edison International | 133,788 | 8,914,294 | ||||||
El Paso Electric Co. | 16,647 | 1,037,108 | ||||||
Entergy Corp. | 74,241 | 6,034,308 | ||||||
Evergy, Inc. | 111,377 | 6,247,136 | ||||||
Eversource Energy | 130,123 | 7,901,069 | ||||||
Exelon Corp. | 396,279 | 16,841,858 | ||||||
FirstEnergy Corp. | 195,300 | 6,919,479 | ||||||
Hawaiian Electric Industries, Inc. | 44,725 | 1,572,978 | ||||||
IDACORP, Inc. | 20,700 | 1,950,768 | ||||||
MGE Energy, Inc. | 14,225 | 910,400 | ||||||
NextEra Energy, Inc. | 193,335 | 32,391,346 | ||||||
OGE Energy Corp. | 82,013 | 2,972,151 | ||||||
Otter Tail Corp. | 14,652 | 709,157 | ||||||
PG&E Corp. | 211,475 | 9,110,343 | ||||||
Pinnacle West Capital Corp. | 45,902 | 3,691,898 | ||||||
PNM Resources, Inc. | 32,668 | 1,285,486 | ||||||
Portland General Electric Co. | 36,634 | 1,661,718 | ||||||
PPL Corp. | 285,013 | 8,199,824 | ||||||
Spark Energy, Inc. Class A | 4,495 | 38,432 | ||||||
The Southern Co. | 413,995 | 20,120,157 | ||||||
Xcel Energy, Inc. | 208,634 | 9,776,589 | ||||||
|
| |||||||
TOTAL ELECTRIC UTILITIES |
| 191,836,212 | ||||||
|
| |||||||
GAS UTILITIES – 5.5% |
| |||||||
Gas Utilities – 5.5% |
| |||||||
Atmos Energy Corp. | 45,550 | 4,184,678 | ||||||
Chesapeake Utilities Corp. | 6,726 | 563,975 | ||||||
National Fuel Gas Co. | 31,730 | 1,703,901 | ||||||
New Jersey Resources Corp. | 36,014 | 1,665,648 | ||||||
Northwest Natural Gas Co. | 11,796 | 768,509 | ||||||
ONE Gas, Inc. | 21,497 | 1,656,129 | ||||||
South Jersey Industries, Inc. | 32,646 | 1,107,679 | ||||||
Southwest Gas Holdings, Inc. | 19,749 | 1,544,372 | ||||||
Spire, Inc. | 19,875 | 1,423,050 | ||||||
UGI Corp. | 71,029 | 3,774,481 | ||||||
|
| |||||||
TOTAL GAS UTILITIES |
| 18,392,422 | ||||||
|
| |||||||
INDEPENDENT POWER AND RENEWABLE ELECTRICITY PRODUCERS – 4.3% |
| |||||||
Independent Power Producers & Energy Traders – 3.4% |
| |||||||
AES Corp. | 271,182 | 3,622,991 | ||||||
NRG Energy, Inc. | 123,903 | 3,924,008 | ||||||
NRG Yield, Inc. Class A | 14,264 | 263,599 | ||||||
NRG Yield, Inc. Class C | 26,552 | 493,867 | ||||||
| Shares | Value | |||||||
Vistra Energy Corp. (a) | 142,383 | $ | 3,217,856 | |||||
|
| |||||||
| 11,522,321 | ||||||||
|
| |||||||
Renewable Electricity – 0.9% |
| |||||||
NextEra Energy Partners LP | 22,249 | 1,047,260 | ||||||
Ormat Technologies, Inc. | 15,570 | 844,673 | ||||||
Pattern Energy Group, Inc. Class A | 34,137 | 633,924 | ||||||
TerraForm Power, Inc. Class A | 27,425 | 280,558 | ||||||
|
| |||||||
| 2,806,415 | ||||||||
|
| |||||||
TOTAL INDEPENDENT POWER AND RENEWABLE ELECTRICITY PRODUCERS |
| 14,328,736 | ||||||
|
| |||||||
MULTI-UTILITIES – 29.5% |
| |||||||
Multi-Utilities – 29.5% |
| |||||||
Ameren Corp. | 99,619 | 6,182,355 | ||||||
Avista Corp. | 26,935 | 1,362,372 | ||||||
Black Hills Corp. | 21,966 | 1,317,301 | ||||||
CenterPoint Energy, Inc. | 168,224 | 4,791,020 | ||||||
CMS Energy Corp. | 115,991 | 5,607,005 | ||||||
Consolidated Edison, Inc. | 127,455 | 10,060,023 | ||||||
Dominion Energy, Inc. | 267,541 | 19,185,365 | ||||||
DTE Energy Co. | 73,672 | 7,996,359 | ||||||
MDU Resources Group, Inc. | 76,226 | 2,210,554 | ||||||
NiSource, Inc. | 138,536 | 3,626,873 | ||||||
NorthWestern Corp. | 20,262 | 1,202,145 | ||||||
Public Service Enterprise Group, Inc. | 207,279 | 10,687,305 | ||||||
SCANA Corp. | 55,659 | 2,225,803 | ||||||
Sempra Energy | 99,604 | 11,513,226 | ||||||
Unitil Corp. | 6,051 | 308,056 | ||||||
Vectren Corp. | 34,114 | 2,438,128 | ||||||
WEC Energy Group, Inc. | 129,569 | 8,599,495 | ||||||
|
| |||||||
TOTAL MULTI-UTILITIES |
| 99,313,385 | ||||||
|
| |||||||
WATER UTILITIES – 3.6% |
| |||||||
Water Utilities – 3.6% |
| |||||||
American States Water Co. | 15,060 | 905,407 | ||||||
American Water Works Co., Inc. | 73,324 | 6,470,843 | ||||||
Aqua America, Inc. | 72,996 | 2,696,472 | ||||||
AquaVenture Holdings Ltd. (a) | 4,836 | 79,988 | ||||||
California Water Service Group | 19,702 | 809,752 | ||||||
Connecticut Water Service, Inc. | 4,962 | 319,652 | ||||||
Middlesex Water Co. | 6,745 | 298,736 | ||||||
SJW Group | 6,330 | 409,425 | ||||||
The York Water Co. | 5,344 | 165,664 | ||||||
|
| |||||||
TOTAL WATER UTILITIES |
| 12,155,939 | ||||||
|
| |||||||
TOTAL COMMON STOCKS |
| 336,026,694 | ||||||
|
| |||||||
See accompanying notes which are an integral part of the financial statements.
| Annual Report | 74 |
Table of Contents
| Money Market Funds – 0.1% | ||||||||
| Shares | Value | |||||||
State Street Institutional Treasury Plus Money Market Fund, Trust Class, 1.76% (b) | 154,129 | $ | 154,129 | |||||
|
| |||||||
TOTAL INVESTMENT PORTFOLIO – 100.0% |
| 336,180,823 | ||||||
NET OTHER ASSETS (LIABILITIES) – 0.0% |
| 92,179 | ||||||
|
| |||||||
NET ASSETS – 100.0% |
| $ | 336,273,002 | |||||
|
| |||||||
Legend
| (a) | Non-income producing. |
| (b) | The rate quoted is the annualized seven-day yield of the fund at period end. |
Investment Valuation
All investments are categorized as Level 1 under the Fair Value Hierarchy. The inputs or methodology used for valuing securities may not be an indication of the risk associated with investing in those securities. For more information on valuation inputs please refer to the Investment Valuation section in the accompanying Notes to Financial Statements.
See accompanying notes which are an integral part of the financial statements.
| 75 | Annual Report |
Table of Contents
| Statements of Assets and Liabilities | ||||||||||||||||
| July 31, 2018 | ||||||||||||||||
| Fidelity MSCI Consumer Discretionary Index ETF | Fidelity MSCI Consumer Staples Index ETF | Fidelity MSCI Energy Index ETF | Fidelity MSCI Financials Index ETF | |||||||||||||
Assets | ||||||||||||||||
Investments in securities, at value – See accompanying schedule | $ | 628,083,637 | $ | 311,500,193 | $ | 633,808,820 | $ | 1,573,955,675 | ||||||||
Cash | — | — | — | — | ||||||||||||
Receivable for investments sold | — | 5,462,089 | 16,820 | 221,556 | ||||||||||||
Receivable for fund shares sold | — | 119,085 | — | 43,551 | ||||||||||||
Dividends receivable | 243,175 | 429,798 | 428,520 | 898,389 | ||||||||||||
Interest receivable | 676 | 301 | 569 | 1,706 | ||||||||||||
|
|
|
|
|
|
|
| |||||||||
Total assets | 628,327,488 | 317,511,466 | 634,254,729 | 1,575,120,877 | ||||||||||||
|
|
|
|
|
|
|
| |||||||||
Liabilities | ||||||||||||||||
Payable for investments purchased | 99,835 | 5,522,035 | — | 594,916 | ||||||||||||
Payable for fund shares redeemed | 54,214 | — | 52,115 | 41,959 | ||||||||||||
Accrued management fees | 44,503 | 19,219 | 45,275 | 108,838 | ||||||||||||
|
|
|
|
|
|
|
| |||||||||
Total liabilities | 198,552 | 5,541,254 | 97,390 | 745,713 | ||||||||||||
|
|
|
|
|
|
|
| |||||||||
Net Assets | $ | 628,128,936 | $ | 311,970,212 | $ | 634,157,339 | $ | 1,574,375,164 | ||||||||
|
|
|
|
|
|
|
| |||||||||
Net Assets consist of: | ||||||||||||||||
Paid in capital | 569,109,682 | 321,729,759 | 664,432,315 | 1,416,109,730 | ||||||||||||
Undistributed net investment income | 564,653 | 441,897 | 108,312 | 774,481 | ||||||||||||
Accumulated undistributed net realized gain (loss) on investments and foreign currency transactions | (7,461,498 | ) | (8,744,273 | ) | (43,588,291 | ) | (7,535,126 | ) | ||||||||
Net unrealized appreciation (depreciation) on investments | 65,916,099 | (1,457,171 | ) | 13,205,003 | 165,026,079 | |||||||||||
|
|
|
|
|
|
|
| |||||||||
Net Assets | $ | 628,128,936 | $ | 311,970,212 | $ | 634,157,339 | $ | 1,574,375,164 | ||||||||
|
|
|
|
|
|
|
| |||||||||
Shares outstanding | 14,500,000 | 9,650,000 | 29,500,000 | 38,350,000 | ||||||||||||
|
|
|
|
|
|
|
| |||||||||
Net Asset Value, offering price and redemption price per share | $ | 43.32 | $ | 32.33 | $ | 21.50 | $ | 41.05 | ||||||||
|
|
|
|
|
|
|
| |||||||||
Investments at cost | $ | 562,167,538 | $ | 312,957,364 | $ | 620,603,817 | $ | 1,408,929,596 | ||||||||
|
|
|
|
|
|
|
| |||||||||
See accompanying notes which are an integral part of the financial statements.
| Annual Report | 76 |
Table of Contents
| Statements of Assets and Liabilities | ||||||||||||||||
| July 31, 2018 | ||||||||||||||||
Fidelity MSCI Health Care Index ETF | Fidelity MSCI Index ETF | Fidelity MSCI Index ETF | Fidelity MSCI Index ETF | |||||||||||||
Assets | ||||||||||||||||
Investments in securities, at value – See accompanying schedule | $ | 1,251,751,378 | $ | 499,546,411 | $ | 2,222,569,332 | $ | 265,257,635 | ||||||||
Cash | 621,295 | — | 10,950 | — | ||||||||||||
Receivable for investments sold | — | — | 493,382 | — | ||||||||||||
Receivable for fund shares sold | 44,728 | 60,035 | 4,155 | 33,149 | ||||||||||||
Dividends receivable | 1,029,423 | 249,284 | 328,736 | 154,073 | ||||||||||||
Interest receivable | 954 | 442 | 2,535 | 268 | ||||||||||||
|
|
|
|
|
|
|
| |||||||||
Total assets | 1,253,447,778 | 499,856,172 | 2,223,409,090 | 265,445,125 | ||||||||||||
|
|
|
|
|
|
|
| |||||||||
Liabilities | ||||||||||||||||
Payable for investments purchased | 654,087 | — | — | — | ||||||||||||
Payable for fund shares redeemed | 81,411 | — | — | — | ||||||||||||
Accrued management fees | 85,936 | 32,003 | 155,253 | 16,937 | ||||||||||||
|
|
|
|
|
|
|
| |||||||||
Total liabilities | 821,434 | 32,003 | 155,253 | 16,937 | ||||||||||||
|
|
|
|
|
|
|
| |||||||||
Net Assets | $ | 1,252,626,344 | $ | 499,824,169 | $ | 2,223,253,837 | $ | 265,428,188 | ||||||||
|
|
|
|
|
|
|
| |||||||||
Net Assets consist of: | ||||||||||||||||
Paid in capital | 1,085,742,616 | 475,196,849 | 1,781,420,684 | 264,221,033 | ||||||||||||
Undistributed net investment income | 1,007,564 | — | 821,764 | 54,098 | ||||||||||||
Accumulated undistributed net realized gain (loss) on investments and foreign currency transactions | (20,327,025 | ) | (5,583,001 | ) | (5,664,791 | ) | (2,861,063 | ) | ||||||||
Net unrealized appreciation (depreciation) on investments | 186,203,189 | 30,210,321 | 446,676,180 | 4,014,120 | ||||||||||||
|
|
|
|
|
|
|
| |||||||||
Net Assets | $ | 1,252,626,344 | $ | 499,824,169 | $ | 2,223,253,837 | $ | 265,428,188 | ||||||||
|
|
|
|
|
|
|
| |||||||||
Shares outstanding | 28,650,000 | 12,650,000 | 39,450,000 | 7,650,000 | ||||||||||||
|
|
|
|
|
|
|
| |||||||||
Net Asset Value, offering price and redemption price per share | $ | 43.72 | $ | 39.51 | $ | 56.36 | $ | 34.70 | ||||||||
|
|
|
|
|
|
|
| |||||||||
Investments at cost | $ | 1,065,548,189 | $ | 469,336,090 | $ | 1,775,893,152 | $ | 261,243,515 | ||||||||
|
|
|
|
|
|
|
| |||||||||
See accompanying notes which are an integral part of the financial statements.
| 77 | Annual Report |
Table of Contents
Financial Statements – continued
| Statements of Assets and Liabilities | ||||||||||||
| July 31, 2018 | ||||||||||||
Fidelity MSCI Real Estate Index ETF | Fidelity MSCI Index ETF | Fidelity MSCI Index ETF | ||||||||||
Assets | ||||||||||||
Investments in securities, at value – See accompanying schedule | $ | 502,807,680 | $ | 125,107,701 | $ | 336,180,823 | ||||||
Cash | — | — | — | |||||||||
Receivable for investments sold | — | — | — | |||||||||
Receivable for fund shares sold | 157,112 | 33,013 | 22,309 | |||||||||
Dividends receivable | 294,075 | 823,009 | 90,729 | |||||||||
Interest receivable | 675 | 101 | 263 | |||||||||
|
|
|
|
|
| |||||||
Total assets | 503,259,542 | 125,963,824 | 336,294,124 | |||||||||
|
|
|
|
|
| |||||||
Liabilities | ||||||||||||
Payable for investments purchased | 878,014 | 851,215 | — | |||||||||
Payable for fund shares redeemed | — | — | — | |||||||||
Accrued management fees | 34,048 | 8,280 | 21,122 | |||||||||
|
|
|
|
|
| |||||||
Total liabilities | 912,062 | 859,495 | 21,122 | |||||||||
|
|
|
|
|
| |||||||
Net Assets | $ | 502,347,480 | $ | 125,104,329 | $ | 336,273,002 | ||||||
|
|
|
|
|
| |||||||
Net Assets consist of: | ||||||||||||
Paid in capital | 508,247,731 | 135,649,300 | 334,725,929 | |||||||||
Undistributed net investment income | — | — | — | |||||||||
Accumulated undistributed net realized gain (loss) on investments and foreign currency transactions | (4,852,074 | ) | (9,640,830 | ) | (3,844,890 | ) | ||||||
Net unrealized appreciation (depreciation) on investments | (1,048,177 | ) | (904,141 | ) | 5,391,963 | |||||||
|
|
|
|
|
| |||||||
Net Assets | $ | 502,347,480 | $ | 125,104,329 | $ | 336,273,002 | ||||||
|
|
|
|
|
| |||||||
Shares outstanding | 20,350,000 | 4,350,000 | 9,650,000 | |||||||||
|
|
|
|
|
| |||||||
Net Asset Value, offering price and redemption price per share | $ | 24.69 | $ | 28.76 | $ | 34.85 | ||||||
|
|
|
|
|
| |||||||
Investments at cost | $ | 503,855,857 | $ | 126,011,842 | $ | 330,788,860 | ||||||
|
|
|
|
|
| |||||||
See accompanying notes which are an integral part of the financial statements.
| Annual Report | 78 |
Table of Contents
| Statements of Operations | ||||||||||||||||
| For the year ended July 31, 2018 | ||||||||||||||||
| Fidelity MSCI Consumer Discretionary Index ETF | Fidelity MSCI Consumer Staples Index ETF | Fidelity MSCI Index ETF | Fidelity MSCI Index ETF | |||||||||||||
Investment Income | ||||||||||||||||
Dividends | $ | 5,347,684 | $ | 8,016,404 | $ | 12,882,755 | $ | 25,618,333 | ||||||||
Interest | 4,955 | 2,797 | 4,540 | 13,294 | ||||||||||||
|
|
|
|
|
|
|
| |||||||||
Total income | 5,352,639 | 8,019,201 | 12,887,295 | 25,631,627 | ||||||||||||
|
|
|
|
|
|
|
| |||||||||
Expenses | ||||||||||||||||
Management fees | 355,185 | 241,042 | 427,596 | 1,084,029 | ||||||||||||
Independent trustees’ compensation | 4,920 | 4,404 | 6,732 | 15,801 | ||||||||||||
|
|
|
|
|
|
|
| |||||||||
Total expenses | 360,105 | 245,446 | 434,328 | 1,099,830 | ||||||||||||
|
|
|
|
|
|
|
| |||||||||
Net investment income (loss) | 4,992,534 | 7,773,755 | 12,452,967 | 24,531,797 | ||||||||||||
|
|
|
|
|
|
|
| |||||||||
Realized and Unrealized Gain (Loss) | ||||||||||||||||
Net realized gain (loss) on investment securities | (2,271,084 | ) | (8,256,334 | ) | (10,186,037 | ) | (5,203,781 | ) | ||||||||
Net realized gain (loss) on In-kind redemptions | 22,361,100 | 12,312,942 | 15,142,231 | 21,848,850 | ||||||||||||
Net realized gain (loss) on foreign currency transactions | — | — | — | — | ||||||||||||
|
|
|
|
|
|
|
| |||||||||
Total net realized gain (loss) | 20,090,016 | 4,056,608 | 4,956,194 | 16,645,069 | ||||||||||||
|
|
|
|
|
|
|
| |||||||||
Change in net unrealized appreciation (depreciation) on investment securities | 51,964,275 | (15,759,124 | ) | 72,468,715 | 77,031,496 | |||||||||||
|
|
|
|
|
|
|
| |||||||||
Net gain (loss) | 72,054,291 | (11,702,516 | ) | 77,424,909 | 93,676,565 | |||||||||||
|
|
|
|
|
|
|
| |||||||||
Net increase (decrease) in net assets resulting from operations | $ | 77,046,825 | $ | (3,928,761 | ) | $ | 89,877,876 | $ | 118,208,362 | |||||||
|
|
|
|
|
|
|
| |||||||||
See accompanying notes which are an integral part of the financial statements.
| 79 | Annual Report |
Table of Contents
Financial Statements – continued
| Statements of Operations | ||||||||||||||||
| For the year ended July 31, 2018 | ||||||||||||||||
| Fidelity MSCI Health Care Index ETF | Fidelity MSCI Industrials Index ETF | Fidelity MSCI Information Technology Index ETF | Fidelity MSCI Materials Index ETF | |||||||||||||
Investment Income | ||||||||||||||||
Dividends | $ | 14,959,085 | $ | 7,977,356 | $ | 17,708,756 | $ | 4,765,783 | ||||||||
Interest | 9,351 | 4,312 | 14,982 | 2,438 | ||||||||||||
|
|
|
|
|
|
|
| |||||||||
Total income | 14,968,436 | 7,981,668 | 17,723,738 | 4,768,221 | ||||||||||||
|
|
|
|
|
|
|
| |||||||||
Expenses | ||||||||||||||||
Management fees | 841,300 | 391,353 | 1,334,313 | 233,933 | ||||||||||||
Independent trustees’ compensation | 13,086 | 6,016 | 18,600 | 3,788 | ||||||||||||
|
|
|
|
|
|
|
| |||||||||
Total expenses | 854,386 | 397,369 | 1,352,913 | 237,721 | ||||||||||||
|
|
|
|
|
|
|
| |||||||||
Net investment income (loss) | 14,114,050 | 7,584,299 | 16,370,825 | 4,530,500 | ||||||||||||
|
|
|
|
|
|
|
| |||||||||
Realized and Unrealized Gain (Loss) | ||||||||||||||||
Net realized gain (loss) on investment securities | (9,795,051 | ) | (2,996,382 | ) | (1,881,618 | ) | (235,944 | ) | ||||||||
Net realized gain (loss) on In-kind redemptions | 21,907,926 | 44,845,587 | 47,654,638 | 26,382,265 | ||||||||||||
Net realized gain (loss) on foreign currency transactions | — | 5 | — | — | ||||||||||||
|
|
|
|
|
|
|
| |||||||||
Total net realized gain (loss) | 12,112,875 | 41,849,210 | 45,773,020 | 26,146,321 | ||||||||||||
|
|
|
|
|
|
|
| |||||||||
Change in net unrealized appreciation (depreciation) on investment securities | 115,426,631 | (3,898,668 | ) | 283,376,693 | (9,852,001 | ) | ||||||||||
|
|
|
|
|
|
|
| |||||||||
Net gain (loss) | 127,539,506 | 37,950,542 | 329,149,713 | 16,294,320 | ||||||||||||
|
|
|
|
|
|
|
| |||||||||
Net increase (decrease) in net assets resulting from operations | $ | 141,653,556 | $ | 45,534,841 | $ | 345,520,538 | $ | 20,824,820 | ||||||||
|
|
|
|
|
|
|
| |||||||||
See accompanying notes which are an integral part of the financial statements.
| Annual Report | 80 |
Table of Contents
| Statements of Operations | ||||||||||||
| For the year ended July 31, 2018 | ||||||||||||
| Fidelity MSCI Real Estate Index ETF | Fidelity MSCI Index ETF | Fidelity Index ETF | ||||||||||
Investment Income | ||||||||||||
Dividends | $ | 12,721,634 | $ | 3,387,137 | $ | 9,816,428 | ||||||
Interest | 3,893 | 1,251 | 2,621 | |||||||||
|
|
|
|
|
| |||||||
Total income | 12,725,527 | 3,388,388 | 9,819,049 | |||||||||
|
|
|
|
|
| |||||||
Expenses | ||||||||||||
Management fees | 323,998 | 96,278 | 244,993 | |||||||||
Independent trustees’ compensation | 5,709 | 1,677 | 4,305 | |||||||||
|
|
|
|
|
| |||||||
Total expenses | 329,707 | 97,955 | 249,298 | |||||||||
|
|
|
|
|
| |||||||
Net investment income (loss) | 12,395,820 | 3,290,433 | 9,569,751 | |||||||||
|
|
|
|
|
| |||||||
Realized and Unrealized Gain (Loss) | ||||||||||||
Net realized gain (loss) on investment securities | (3,568,397 | ) | (10,958,585 | ) | (1,976,565 | ) | ||||||
Net realized gain (loss) on In-kind redemptions | 9,712,935 | 4,901,110 | 9,221,901 | |||||||||
Net realized gain (loss) on foreign currency transactions | — | — | — | |||||||||
|
|
|
|
|
| |||||||
Total net realized gain (loss) | 6,144,538 | (6,057,475 | ) | 7,245,336 | ||||||||
|
|
|
|
|
| |||||||
Change in net unrealized appreciation (depreciation) on investment securities | (1,906,166 | ) | (2,938,405 | ) | (7,076,756 | ) | ||||||
|
|
|
|
|
| |||||||
Net gain (loss) | 4,238,372 | (8,995,880 | ) | 168,580 | ||||||||
|
|
|
|
|
| |||||||
Net increase (decrease) in net assets resulting from operations | $ | 16,634,192 | $ | (5,705,447 | ) | $ | 9,738,331 | |||||
|
|
|
|
|
| |||||||
See accompanying notes which are an integral part of the financial statements.
| 81 | Annual Report |
Table of Contents
Financial Statements – continued
| Statements of Changes in Net Assets | ||||||||||||||||
| Fidelity MSCI Consumer Discretionary Index ETF | Fidelity MSCI Consumer Staples Index ETF | |||||||||||||||
| Year ended July 31, 2018 | Year ended July 31, 2017 | Year ended July 31, 2018 | Year ended July 31, 2017 | |||||||||||||
Increase (Decrease) in Net Assets | ||||||||||||||||
Operations | ||||||||||||||||
Net investment income (loss) | $ | 4,992,534 | $ | 3,848,009 | $ | 7,773,755 | $ | 7,048,950 | ||||||||
Net realized gain (loss) | 20,090,016 | 7,695,708 | 4,056,608 | 6,765,695 | ||||||||||||
Change in net unrealized appreciation (depreciation) | 51,964,275 | 21,371,316 | (15,759,124 | ) | (6,178,834 | ) | ||||||||||
|
|
|
|
|
|
|
| |||||||||
Net increase (decrease) in net assets resulting from operations | 77,046,825 | 32,915,033 | (3,928,761 | ) | 7,635,811 | |||||||||||
|
|
|
|
|
|
|
| |||||||||
Distributions to shareholders from net investment income | (4,460,400 | ) | (3,848,250 | ) | (7,829,600 | ) | (6,993,800 | ) | ||||||||
Distributions to shareholders from net realized gain | — | — | — | — | ||||||||||||
|
|
|
|
|
|
|
| |||||||||
Total distributions | (4,460,400 | ) | (3,848,250 | ) | (7,829,600 | ) | (6,993,800 | ) | ||||||||
|
|
|
|
|
|
|
| |||||||||
Share transactions | ||||||||||||||||
Proceeds from sales of shares | 339,614,391 | 83,406,456 | 130,886,159 | 96,862,800 | ||||||||||||
Cost of shares redeemed | (77,985,154 | ) | (80,881,472 | ) | (119,506,985 | ) | (70,659,144 | ) | ||||||||
|
|
|
|
|
|
|
| |||||||||
Net increase (decrease) in net assets resulting from share transactions | 261,629,237 | 2,524,984 | 11,379,174 | 26,203,656 | ||||||||||||
|
|
|
|
|
|
|
| |||||||||
Total increase (decrease) in net assets | 334,215,662 | 31,591,767 | (379,187 | ) | 26,845,667 | |||||||||||
Net Assets | ||||||||||||||||
Beginning of year | 293,913,274 | 262,321,507 | 312,349,399 | 285,503,732 | ||||||||||||
|
|
|
|
|
|
|
| |||||||||
End of year | $ | 628,128,936 | $ | 293,913,274 | $ | 311,970,212 | $ | 312,349,399 | ||||||||
|
|
|
|
|
|
|
| |||||||||
Undistributed net investment income included in net assets at end of year | $ | 564,653 | $ | 32,519 | $ | 441,897 | $ | 497,742 | ||||||||
|
|
|
|
|
|
|
| |||||||||
Other Information | ||||||||||||||||
Shares | ||||||||||||||||
Sold | 8,300,000 | 2,450,000 | 3,950,000 | 2,950,000 | ||||||||||||
Redeemed | (1,950,000 | ) | (2,500,000 | ) | (3,700,000 | ) | (2,250,000 | ) | ||||||||
|
|
|
|
|
|
|
| |||||||||
Net increase (decrease) | 6,350,000 | (50,000 | ) | 250,000 | 700,000 | |||||||||||
|
|
|
|
|
|
|
| |||||||||
See accompanying notes which are an integral part of the financial statements.
| Annual Report | 82 |
Table of Contents
| Statements of Changes in Net Assets | ||||||||||||||||
| Fidelity MSCI Energy Index ETF | Fidelity MSCI Financials Index ETF | |||||||||||||||
| Year ended July 31, 2018 | Year ended July 31, 2017 | Year ended July 31, 2018 | Year ended July 31, 2017 | |||||||||||||
Increase (Decrease) in Net Assets | ||||||||||||||||
Operations | ||||||||||||||||
Net investment income (loss) | $ | 12,452,967 | $ | 13,376,474 | $ | 24,531,797 | $ | 10,527,246 | ||||||||
Net realized gain (loss) | 4,956,194 | 506,295 | 16,645,069 | 10,553,143 | ||||||||||||
Change in net unrealized appreciation (depreciation) | 72,468,715 | (22,293,670 | ) | 77,031,496 | 98,050,134 | |||||||||||
|
|
|
|
|
|
|
| |||||||||
Net increase (decrease) in net assets resulting from operations | 89,877,876 | (8,410,901 | ) | 118,208,362 | 119,130,523 | |||||||||||
|
|
|
|
|
|
|
| |||||||||
Distributions to shareholders from net investment income | (14,924,250 | ) | (11,177,800 | ) | (24,296,050 | ) | (10,082,500 | ) | ||||||||
Distributions to shareholders from net realized gain | — | — | — | — | ||||||||||||
|
|
|
|
|
|
|
| |||||||||
Total distributions | (14,924,250 | ) | (11,177,800 | ) | (24,296,050 | ) | (10,082,500 | ) | ||||||||
|
|
|
|
|
|
|
| |||||||||
Share transactions | ||||||||||||||||
Proceeds from sales of shares | 241,918,899 | 100,894,324 | 640,258,002 | 633,770,202 | ||||||||||||
Cost of shares redeemed | (114,025,758 | ) | (80,034,201 | ) | (81,473,733 | ) | (58,629,543 | ) | ||||||||
|
|
|
|
|
|
|
| |||||||||
Net increase (decrease) in net assets resulting from share transactions | 127,893,141 | 20,860,123 | 558,784,269 | 575,140,659 | ||||||||||||
|
|
|
|
|
|
|
| |||||||||
Total increase (decrease) in net assets | 202,846,767 | 1,271,422 | 652,696,581 | 684,188,682 | ||||||||||||
Net Assets | ||||||||||||||||
Beginning of year | 431,310,572 | 430,039,150 | 921,678,583 | 237,489,901 | ||||||||||||
|
|
|
|
|
|
|
| |||||||||
End of year | $ | 634,157,339 | $ | 431,310,572 | $ | 1,574,375,164 | $ | 921,678,583 | ||||||||
|
|
|
|
|
|
|
| |||||||||
Undistributed net investment income included in net assets at end of year | $ | 108,312 | $ | 2,370,211 | $ | 774,481 | $ | 538,871 | ||||||||
|
|
|
|
|
|
|
| |||||||||
Other Information | ||||||||||||||||
Shares | ||||||||||||||||
Sold | 11,950,000 | 5,000,000 | 15,500,000 | 18,400,000 | ||||||||||||
Redeemed | (5,900,000 | ) | (4,150,000 | ) | (2,100,000 | ) | (1,750,000 | ) | ||||||||
|
|
|
|
|
|
|
| |||||||||
Net increase (decrease) | 6,050,000 | 850,000 | 13,400,000 | 16,650,000 | ||||||||||||
|
|
|
|
|
|
|
| |||||||||
See accompanying notes which are an integral part of the financial statements.
| 83 | Annual Report |
Table of Contents
Financial Statements – continued
| Statements of Changes in Net Assets | ||||||||||||||||
| Fidelity MSCI Health Care Index ETF | Fidelity MSCI Industrials Index ETF | |||||||||||||||
Year ended July 31, 2018 | Year ended July 31, 2017 | Year ended July 31, 2018 | Year ended July 31, 2017 | |||||||||||||
Increase (Decrease) in Net Assets | ||||||||||||||||
Operations | ||||||||||||||||
Net investment income (loss) | $ | 14,114,050 | $ | 9,526,479 | $ | 7,584,299 | $ | 4,909,658 | ||||||||
Net realized gain (loss) | 12,112,875 | 4,319,169 | 41,849,210 | 3,255,111 | ||||||||||||
Change in net unrealized appreciation (depreciation) | 115,426,631 | 49,461,351 | (3,898,668 | ) | 33,201,447 | |||||||||||
|
|
|
|
|
|
|
| |||||||||
Net increase (decrease) in net assets resulting from operations | 141,653,556 | 63,306,999 | 45,534,841 | 41,366,216 | ||||||||||||
|
|
|
|
|
|
|
| |||||||||
Distributions to shareholders from net investment income | (14,186,300 | ) | (9,330,050 | ) | (8,096,400 | ) | (4,608,750 | ) | ||||||||
Distributions to shareholders from net realized gain | — | — | — | — | ||||||||||||
|
|
|
|
|
|
|
| |||||||||
Total distributions | (14,186,300 | ) | (9,330,050 | ) | (8,096,400 | ) | (4,608,750 | ) | ||||||||
|
|
|
|
|
|
|
| |||||||||
Share transactions | ||||||||||||||||
Proceeds from sales of shares | 381,928,886 | 186,872,274 | 277,231,538 | 187,006,431 | ||||||||||||
Cost of shares redeemed | (75,479,520 | ) | (64,263,827 | ) | (169,431,317 | ) | (27,227,864 | ) | ||||||||
|
|
|
|
|
|
|
| |||||||||
Net increase (decrease) in net assets resulting from share transactions | 306,449,366 | 122,608,447 | 107,800,221 | 159,778,567 | ||||||||||||
|
|
|
|
|
|
|
| |||||||||
Total increase (decrease) in net assets | 433,916,622 | 176,585,396 | 145,238,662 | 196,536,033 | ||||||||||||
Net Assets | ||||||||||||||||
Beginning of year | 818,709,722 | 642,124,326 | 354,585,507 | 158,049,474 | ||||||||||||
|
|
|
|
|
|
|
| |||||||||
End of year | $ | 1,252,626,344 | $ | 818,709,722 | $ | 499,824,169 | $ | 354,585,507 | ||||||||
|
|
|
|
|
|
|
| |||||||||
Undistributed net investment income included in net assets at end of year | $ | 1,007,564 | $ | 1,079,805 | $ | — | $ | 344,297 | ||||||||
|
|
|
|
|
|
|
| |||||||||
Other Information | ||||||||||||||||
Shares | ||||||||||||||||
Sold | 9,200,000 | 5,200,000 | 7,050,000 | 5,750,000 | ||||||||||||
Redeemed | (1,850,000 | ) | (1,900,000 | ) | (4,550,000 | ) | (850,000 | ) | ||||||||
|
|
|
|
|
|
|
| |||||||||
Net increase (decrease) | 7,350,000 | 3,300,000 | 2,500,000 | 4,900,000 | ||||||||||||
|
|
|
|
|
|
|
| |||||||||
See accompanying notes which are an integral part of the financial statements.
| Annual Report | 84 |
Table of Contents
| Statements of Changes in Net Assets | ||||||||||||||||
| Fidelity MSCI Information Technology Index ETF | Fidelity MSCI Materials Index ETF | |||||||||||||||
| Year ended July 31, 2018 | Year ended July 31, 2017 | Year ended July 31, 2018 | Year ended July 31, 2017 | |||||||||||||
Increase (Decrease) in Net Assets | ||||||||||||||||
Operations | ||||||||||||||||
Net investment income (loss) | $ | 16,370,825 | $ | 8,133,539 | $ | 4,530,500 | $ | 3,326,002 | ||||||||
Net realized gain (loss) | 45,773,020 | 15,864,162 | 26,146,321 | 6,467,884 | ||||||||||||
Change in net unrealized appreciation (depreciation) | 283,376,693 | 149,979,218 | (9,852,001 | ) | 14,449,014 | |||||||||||
|
|
|
|
|
|
|
| |||||||||
Net increase (decrease) in net assets resulting from operations | 345,520,538 | 173,976,919 | 20,824,820 | 24,242,900 | ||||||||||||
|
|
|
|
|
|
|
| |||||||||
Distributions to shareholders from net investment income | (16,100,150 | ) | (7,809,700 | ) | (4,793,700 | ) | (3,068,600 | ) | ||||||||
Distributions to shareholders from net realized gain | — | — | — | — | ||||||||||||
|
|
|
|
|
|
|
| |||||||||
Total distributions | (16,100,150 | ) | (7,809,700 | ) | (4,793,700 | ) | (3,068,600 | ) | ||||||||
|
|
|
|
|
|
|
| |||||||||
Share transactions | ||||||||||||||||
Proceeds from sales of shares | 997,961,581 | 468,154,978 | 184,983,722 | 122,309,405 | ||||||||||||
Cost of shares redeemed | (114,171,616 | ) | (55,670,081 | ) | (147,517,961 | ) | (54,877,050 | ) | ||||||||
|
|
|
|
|
|
|
| |||||||||
Net increase (decrease) in net assets resulting from share transactions | 883,789,965 | 412,484,897 | 37,465,761 | 67,432,355 | ||||||||||||
|
|
|
|
|
|
|
| |||||||||
Total increase (decrease) in net assets | 1,213,210,353 | 578,652,116 | 53,496,881 | 88,606,655 | ||||||||||||
Net Assets | ||||||||||||||||
Beginning of year | 1,010,043,484 | 431,391,368 | 211,931,307 | 123,324,652 | ||||||||||||
|
|
|
|
|
|
|
| |||||||||
End of year | $ | 2,223,253,837 | $ | 1,010,043,484 | $ | 265,428,188 | $ | 211,931,307 | ||||||||
|
|
|
|
|
|
|
| |||||||||
Undistributed net investment income included in net assets at end of year | $ | 821,764 | $ | 551,089 | $ | 54,098 | $ | 317,298 | ||||||||
|
|
|
|
|
|
|
| |||||||||
Other Information | ||||||||||||||||
Shares | ||||||||||||||||
Sold | 18,950,000 | 11,750,000 | 5,350,000 | 4,150,000 | ||||||||||||
Redeemed | (2,200,000 | ) | (1,400,000 | ) | (4,400,000 | ) | (1,900,000 | ) | ||||||||
|
|
|
|
|
|
|
| |||||||||
Net increase (decrease) | 16,750,000 | 10,350,000 | 950,000 | 2,250,000 | ||||||||||||
|
|
|
|
|
|
|
| |||||||||
See accompanying notes which are an integral part of the financial statements.
| 85 | Annual Report |
Table of Contents
Financial Statements – continued
| Statements of Changes in Net Assets | ||||||||||||||||
| Fidelity MSCI Real Estate Index ETF | Fidelity MSCI Telecommunication Services Index ETF | |||||||||||||||
| Year ended July 31, 2018 | Year ended July 31, 2017 | Year ended July 31, 2018 | Year ended July 31, 2017 | |||||||||||||
Increase (Decrease) in Net Assets | ||||||||||||||||
Operations | ||||||||||||||||
Net investment income (loss) | $ | 12,395,820 | $ | 7,007,601 | $ | 3,290,433 | $ | 3,462,027 | ||||||||
Net realized gain (loss) | 6,144,538 | 2,459,698 | (6,057,475 | ) | 18,645,027 | |||||||||||
Change in net unrealized appreciation (depreciation) | (1,906,166 | ) | (12,304,082 | ) | (2,938,405 | ) | (21,103,848 | ) | ||||||||
|
|
|
|
|
|
|
| |||||||||
Net increase (decrease) in net assets resulting from operations | 16,634,192 | (2,836,783 | ) | (5,705,447 | ) | 1,003,206 | ||||||||||
|
|
|
|
|
|
|
| |||||||||
Distributions to shareholders from net investment income | (14,778,500 | ) | (8,640,100 | ) | (3,739,800 | ) | (3,777,050 | ) | ||||||||
Distributions to shareholders from net realized gain | — | — | (4,815,000 | ) | — | |||||||||||
|
|
|
|
|
|
|
| |||||||||
Total distributions | (14,778,500 | ) | (8,640,100 | ) | (8,554,800 | ) | (3,777,050 | ) | ||||||||
|
|
|
|
|
|
|
| |||||||||
Share transactions | ||||||||||||||||
Proceeds from sales of shares | 258,852,360 | 322,848,347 | 43,402,418 | 33,716,266 | ||||||||||||
Cost of shares redeemed | (150,898,104 | ) | (102,228,174 | ) | (19,855,848 | ) | (90,063,955 | ) | ||||||||
|
|
|
|
|
|
|
| |||||||||
Net increase (decrease) in net assets resulting from share transactions | 107,954,256 | 220,620,173 | 23,546,570 | (56,347,689 | ) | |||||||||||
|
|
|
|
|
|
|
| |||||||||
Total increase (decrease) in net assets | 109,809,948 | 209,143,290 | 9,286,323 | (59,121,533 | ) | |||||||||||
Net Assets | ||||||||||||||||
Beginning of year | 392,537,532 | 183,394,242 | 115,818,006 | 174,939,539 | ||||||||||||
|
|
|
|
|
|
|
| |||||||||
End of year | $ | 502,347,480 | $ | 392,537,532 | $ | 125,104,329 | $ | 115,818,006 | ||||||||
|
|
|
|
|
|
|
| |||||||||
Undistributed net investment income included in net assets at end of year | $ | — | $ | — | $ | — | $ | 388,676 | ||||||||
|
|
|
|
|
|
|
| |||||||||
Other Information | ||||||||||||||||
Shares | ||||||||||||||||
Sold | 10,700,000 | 13,300,000 | 1,450,000 | 1,050,000 | ||||||||||||
Redeemed | (6,350,000 | ) | (4,400,000 | ) | (650,000 | ) | (2,950,000 | ) | ||||||||
|
|
|
|
|
|
|
| |||||||||
Net increase (decrease) | 4,350,000 | 8,900,000 | 800,000 | (1,900,000 | ) | |||||||||||
|
|
|
|
|
|
|
| |||||||||
See accompanying notes which are an integral part of the financial statements.
| Annual Report | 86 |
Table of Contents
| Statements of Changes in Net Assets | ||||||||
| Fidelity MSCI Utilities Index ETF | ||||||||
| Year ended July 31, 2018 | Year ended July 31, 2017 | |||||||
Increase (Decrease) in Net Assets | ||||||||
Operations | ||||||||
Net investment income (loss) | $ | 9,569,751 | $ | 7,762,323 | ||||
Net realized gain (loss) | 7,245,336 | 10,999,543 | ||||||
Change in net unrealized appreciation (depreciation) | (7,076,756 | ) | (8,322,969 | ) | ||||
|
|
|
| |||||
Net increase (decrease) in net assets resulting from operations | 9,738,331 | 10,438,897 | ||||||
|
|
|
| |||||
Distributions to shareholders from net investment income | (9,603,500 | ) | (7,784,150 | ) | ||||
Distributions to shareholders from net realized gain | — | — | ||||||
|
|
|
| |||||
Total distributions | (9,603,500 | ) | (7,784,150 | ) | ||||
|
|
|
| |||||
Share transactions | ||||||||
Proceeds from sales of shares | 151,290,619 | 125,186,565 | ||||||
Cost of shares redeemed | (92,301,442 | ) | (134,361,663 | ) | ||||
|
|
|
| |||||
Net increase (decrease) in net assets resulting from share transactions | 58,989,177 | (9,175,098 | ) | |||||
|
|
|
| |||||
Total increase (decrease) in net assets | 59,124,008 | (6,520,351 | ) | |||||
Net Assets | ||||||||
Beginning of year | 277,148,994 | 283,669,345 | ||||||
|
|
|
| |||||
End of year | $ | 336,273,002 | $ | 277,148,994 | ||||
|
|
|
| |||||
Undistributed net investment income included in net assets at end of year | $ | — | $ | 12,231 | ||||
|
|
|
| |||||
Other Information | ||||||||
Shares | ||||||||
Sold | 4,400,000 | 3,750,000 | ||||||
Redeemed | (2,750,000 | ) | (4,200,000 | ) | ||||
|
|
|
| |||||
Net increase (decrease) | 1,650,000 | (450,000 | ) | |||||
|
|
|
| |||||
See accompanying notes which are an integral part of the financial statements.
| 87 | Annual Report |
Table of Contents
Financial Statements – continued
| Financial Highlights | ||||||||||||||||||||
| Fidelity MSCI Consumer Discretionary Index ETF | ||||||||||||||||||||
| Year ended July 31, 2018 | Year ended July 31, 2017 | Year ended July 31, 2016 | Year ended July 31, 2015 | Year ended July 31, 2014A | ||||||||||||||||
Selected Per-Share Data | ||||||||||||||||||||
Net asset value, beginning of period | $ | 36.06 | $ | 31.99 | $ | 32.06 | $ | 26.58 | $ | 25.17 | ||||||||||
|
|
|
|
|
|
|
|
|
| |||||||||||
Income from Investment Operations | ||||||||||||||||||||
Net investment income (loss)B | 0.47 | 0.50 | 0.43 | 0.37 | 0.25 | |||||||||||||||
Net realized and unrealized gain (loss) | 7.20 | 4.07 | (0.06 | ) | 5.43 | 1.38 | ||||||||||||||
|
|
|
|
|
|
|
|
|
| |||||||||||
Total from investment operations | 7.67 | 4.57 | 0.37 | 5.80 | 1.63 | |||||||||||||||
|
|
|
|
|
|
|
|
|
| |||||||||||
Distributions from net investment income | (0.41 | ) | (0.50 | ) | (0.44 | ) | (0.32 | ) | (0.22 | ) | ||||||||||
|
|
|
|
|
|
|
|
|
| |||||||||||
Total distributions | (0.41 | ) | (0.50 | ) | (0.44 | ) | (0.32 | ) | (0.22 | ) | ||||||||||
|
|
|
|
|
|
|
|
|
| |||||||||||
Net asset value, end of period | $ | 43.32 | $ | 36.06 | $ | 31.99 | $ | 32.06 | $ | 26.58 | ||||||||||
|
|
|
|
|
|
|
|
|
| |||||||||||
Total ReturnC | 21.36 | % | 14.41 | % | 1.25 | % | 21.93 | % | 6.47 | % | ||||||||||
Ratios to Average Net AssetsD | ||||||||||||||||||||
Expense before reductions | .08 | % | .08 | % | .12 | % | .12 | % | .12 | %E | ||||||||||
Expenses net of fee waivers, if any | .08 | % | .08 | % | .12 | % | .12 | % | .12 | %E | ||||||||||
Expenses net of all reductions | .08 | % | .08 | % | .12 | % | .12 | % | .12 | %E | ||||||||||
Net investment income (loss) | 1.16 | % | 1.49 | % | 1.41 | % | 1.25 | % | 1.20 | %E | ||||||||||
Supplemental Data | ||||||||||||||||||||
Net assets, end of period (000 omitted) | $ | 628,129 | $ | 293,913 | $ | 262,322 | $ | 299,794 | $ | 75,741 | ||||||||||
Portfolio turnover rateF,G | 5 | % | 7 | % | 5 | % | 8 | % | 5 | %H | ||||||||||
| A | For the period October 21, 2013 (commencement of operations) to July 31, 2014. |
| B | Calculated based on average shares outstanding during the period. |
| C | Total returns for periods of less than one year are not annualized. |
| D | Expense ratios reflect operating expenses of the Fund. Expenses before reductions do not reflect amounts reimbursed by the investment adviser or reductions from brokerage service arrangements or reductions from other expense offset arrangements and do not represent the amount paid by the Fund during periods when reimbursements or reductions occur. Expenses net of fee waivers reflect expenses after reimbursement by the investment adviser but prior to the reductions from brokerage service arrangements or other expense offset arrangements. Expenses net of all reductions represent the net expenses paid by the Fund but do not include expenses of the investment companies in which the fund invests. |
| E | Annualized. |
| F | Amount does not include the portfolio activity of any underlying funds. |
| G | Portfolio turnover rate excludes securities received or delivered in-kind. |
| H | Amount not annualized. |
See accompanying notes which are an integral part of the financial statements.
| Annual Report | 88 |
Table of Contents
| Financial Highlights | ||||||||||||||||||||
| Fidelity MSCI Consumer Staples Index ETF | ||||||||||||||||||||
| Year ended July 31, 2018 | Year ended July 31, 2017 | Year ended July 31, 2016 | Year ended July 31, 2015 | Year ended July 31, 2014A | ||||||||||||||||
Selected Per-Share Data | ||||||||||||||||||||
Net asset value, beginning of period | $ | 33.23 | $ | 32.82 | $ | 30.31 | $ | 26.16 | $ | 25.00 | ||||||||||
|
|
|
|
|
|
|
|
|
| |||||||||||
Income from Investment Operations | ||||||||||||||||||||
Net investment income (loss)B | 0.86 | 0.83 | 0.75 | 0.77 | 0.52 | |||||||||||||||
Net realized and unrealized gain (loss) | (0.88 | ) | 0.40 | 2.56 | 4.16 | 1.09 | ||||||||||||||
|
|
|
|
|
|
|
|
|
| |||||||||||
Total from investment operations | (0.02 | ) | 1.23 | 3.31 | 4.93 | 1.61 | ||||||||||||||
|
|
|
|
|
|
|
|
|
| |||||||||||
Distributions from net investment income | (0.88 | ) | (0.82 | ) | (0.80 | ) | (0.78 | ) | (0.45 | ) | ||||||||||
|
|
|
|
|
|
|
|
|
| |||||||||||
Total distributions | (0.88 | ) | (0.82 | ) | (0.80 | ) | (0.78 | ) | (0.45 | ) | ||||||||||
|
|
|
|
|
|
|
|
|
| |||||||||||
Net asset value, end of period | $ | 32.33 | $ | 33.23 | $ | 32.82 | $ | 30.31 | $ | 26.16 | ||||||||||
|
|
|
|
|
|
|
|
|
| |||||||||||
Total ReturnC | (0.06 | )% | 3.82 | % | 11.18 | % | 19.00 | % | 6.42 | % | ||||||||||
Ratios to Average Net AssetsD | ||||||||||||||||||||
Expense before reductions | .08 | % | .08 | % | .12 | % | .12 | % | .12 | %E | ||||||||||
Expenses net of fee waivers, if any | .08 | % | .08 | % | .12 | % | .12 | % | .12 | %E | ||||||||||
Expenses net of all reductions | .08 | % | .08 | % | .12 | % | .12 | % | .12 | %E | ||||||||||
Net investment income (loss) | 2.65 | % | 2.56 | % | 2.45 | % | 2.63 | % | 2.51 | %E | ||||||||||
Supplemental Data | ||||||||||||||||||||
Net assets, end of period (000 omitted) | $ | 311,970 | $ | 312,349 | $ | 285,504 | $ | 204,596 | $ | 73,244 | ||||||||||
Portfolio turnover rateF,G | 24 | % | 11 | % | 10 | % | 10 | % | 3 | %H | ||||||||||
| A | For the period October 21, 2013 (commencement of operations) to July 31, 2014. |
| B | Calculated based on average shares outstanding during the period. |
| C | Total returns for periods of less than one year are not annualized. |
| D | Expense ratios reflect operating expenses of the Fund. Expenses before reductions do not reflect amounts reimbursed by the investment adviser or reductions from brokerage service arrangements or reductions from other expense offset arrangements and do not represent the amount paid by the Fund during periods when reimbursements or reductions occur. Expenses net of fee waivers reflect expenses after reimbursement by the investment adviser but prior to the reductions from brokerage service arrangements or other expense offset arrangements. Expenses net of all reductions represent the net expenses paid by the Fund but do not include expenses of the investment companies in which the fund invests. |
| E | Annualized. |
| F | Amount does not include the portfolio activity of any underlying funds. |
| G | Portfolio turnover rate excludes securities received or delivered in-kind. |
| H | Amount not annualized. |
See accompanying notes which are an integral part of the financial statements.
| 89 | Annual Report |
Table of Contents
Financial Statements – continued
| Financial Highlights | ||||||||||||||||||||
| Fidelity MSCI Energy Index ETF | ||||||||||||||||||||
| Year ended July 31, 2018 | Year ended July 31, 2017 | Year ended July 31, 2016 | Year ended July 31, 2015 | Year ended July 31, 2014A | ||||||||||||||||
Selected Per-Share Data | ||||||||||||||||||||
Net asset value, beginning of period | $ | 18.39 | $ | 19.03 | $ | 19.72 | $ | 27.97 | $ | 24.98 | ||||||||||
|
|
|
|
|
|
|
|
|
| |||||||||||
Income from Investment Operations | ||||||||||||||||||||
Net investment income (loss)B | 0.47 | 0.57 | 0.50 | 0.57 | 0.38 | |||||||||||||||
Net realized and unrealized gain (loss) | 3.22 | (0.73 | ) | (0.69 | ) | (8.31 | ) | 2.89 | ||||||||||||
|
|
|
|
|
|
|
|
|
| |||||||||||
Total from investment operations | 3.69 | (0.16 | ) | (0.19 | ) | (7.74 | ) | 3.27 | ||||||||||||
|
|
|
|
|
|
|
|
|
| |||||||||||
Distributions from net investment income | (0.58 | ) | (0.48 | ) | (0.50 | ) | (0.51 | ) | (0.28 | ) | ||||||||||
|
|
|
|
|
|
|
|
|
| |||||||||||
Total distributions | (0.58 | ) | (0.48 | ) | (0.50 | ) | (0.51 | ) | (0.28 | ) | ||||||||||
|
|
|
|
|
|
|
|
|
| |||||||||||
Net asset value, end of period | $ | 21.50 | $ | 18.39 | $ | 19.03 | $ | 19.72 | $ | 27.97 | ||||||||||
|
|
|
|
|
|
|
|
|
| |||||||||||
Total ReturnC | 20.52 | % | (0.96 | )% | (0.75 | )% | (27.95 | )% | 13.16 | % | ||||||||||
Ratios to Average Net AssetsD | ||||||||||||||||||||
Expense before reductions | .08 | % | .08 | % | .12 | % | .12 | % | .12 | %E | ||||||||||
Expenses net of fee waivers, if any | .08 | % | .08 | % | .12 | % | .12 | % | .12 | %E | ||||||||||
Expenses net of all reductions | .08 | % | .08 | % | .12 | % | .12 | % | .12 | %E | ||||||||||
Net investment income (loss) | 2.40 | % | 2.91 | % | 2.74 | % | 2.47 | % | 1.76 | %E | ||||||||||
Supplemental Data | ||||||||||||||||||||
Net assets, end of period (000 omitted) | $ | 634,157 | $ | 431,311 | $ | 430,039 | $ | 256,399 | $ | 145,425 | ||||||||||
Portfolio turnover rateF,G | 5 | % | 10 | % | 19 | % | 8 | % | 4 | %H | ||||||||||
| A | For the period October 21, 2013 (commencement of operations) to July 31, 2014. |
| B | Calculated based on average shares outstanding during the period. |
| C | Total returns for periods of less than one year are not annualized. |
| D | Expense ratios reflect operating expenses of the Fund. Expenses before reductions do not reflect amounts reimbursed by the investment adviser or reductions from brokerage service arrangements or reductions from other expense offset arrangements and do not represent the amount paid by the Fund during periods when reimbursements or reductions occur. Expenses net of fee waivers reflect expenses after reimbursement by the investment adviser but prior to the reductions from brokerage service arrangements or other expense offset arrangements. Expenses net of all reductions represent the net expenses paid by the Fund but do not include expenses of the investment companies in which the fund invests. |
| E | Annualized. |
| F | Amount does not include the portfolio activity of any underlying funds. |
| G | Portfolio turnover rate excludes securities received or delivered in-kind. |
| H | Amount not annualized. |
See accompanying notes which are an integral part of the financial statements.
| Annual Report | 90 |
Table of Contents
| Financial Highlights | ||||||||||||||||||||
| Fidelity MSCI Financials Index ETF | ||||||||||||||||||||
| Year ended July 31, 2018 | Year ended July 31, 2017 | Year ended July 31, 2016 | Year ended July 31, 2015 | Year ended July 31, 2014A | ||||||||||||||||
Selected Per-Share Data | ||||||||||||||||||||
Net asset value, beginning of period | $ | 36.94 | $ | 28.61 | $ | 29.78 | $ | 26.61 | $ | 25.00 | ||||||||||
|
|
|
|
|
|
|
|
|
| |||||||||||
Income from Investment Operations | ||||||||||||||||||||
Net investment income (loss)B | 0.75 | 0.61 | 0.63 | 0.58 | 0.41 | |||||||||||||||
Net realized and unrealized gain (loss) | 4.11 | 8.28 | (1.11 | ) | 3.15 | 1.56 | ||||||||||||||
|
|
|
|
|
|
|
|
|
| |||||||||||
Total from investment operations | 4.86 | 8.89 | (0.48 | ) | 3.73 | 1.97 | ||||||||||||||
|
|
|
|
|
|
|
|
|
| |||||||||||
Distributions from net investment income | (0.75 | ) | (0.56 | ) | (0.69 | ) | (0.56 | ) | (0.36 | ) | ||||||||||
|
|
|
|
|
|
|
|
|
| |||||||||||
Total distributions | (0.75 | ) | (0.56 | ) | (0.69 | ) | (0.56 | ) | (0.36 | ) | ||||||||||
|
|
|
|
|
|
|
|
|
| |||||||||||
Net asset value, end of period | $ | 41.05 | $ | 36.94 | $ | 28.61 | $ | 29.78 | $ | 26.61 | ||||||||||
|
|
|
|
|
|
|
|
|
| |||||||||||
Total ReturnC | 13.23 | % | 31.31 | % | (1.49 | )% | 14.08 | % | 7.89 | % | ||||||||||
Ratios to Average Net AssetsD | ||||||||||||||||||||
Expense before reductions | .08 | % | .08 | % | .12 | % | .12 | % | .12 | %E | ||||||||||
Expenses net of fee waivers, if any | .08 | % | .08 | % | .12 | % | .12 | % | .12 | %E | ||||||||||
Expenses net of all reductions | .08 | % | .08 | % | .12 | % | .12 | % | .12 | %E | ||||||||||
Net investment income (loss) | 1.88 | % | 1.77 | % | 2.29 | % | 2.01 | % | 1.97 | %E | ||||||||||
Supplemental Data | ||||||||||||||||||||
Net assets, end of period (000 omitted) | $ | 1,574,375 | $ | 921,679 | $ | 237,490 | $ | 344,012 | $ | 126,397 | ||||||||||
Portfolio turnover rateF,G | 5 | % | 18 | % | 8 | % | 7 | % | 6 | %H | ||||||||||
| A | For the period October 21, 2013 (commencement of operations) to July 31, 2014. |
| B | Calculated based on average shares outstanding during the period. |
| C | Total returns for periods of less than one year are not annualized. |
| D | Expense ratios reflect operating expenses of the Fund. Expenses before reductions do not reflect amounts reimbursed by the investment adviser or reductions from brokerage service arrangements or reductions from other expense offset arrangements and do not represent the amount paid by the Fund during periods when reimbursements or reductions occur. Expenses net of fee waivers reflect expenses after reimbursement by the investment adviser but prior to the reductions from brokerage service arrangements or other expense offset arrangements. Expenses net of all reductions represent the net expenses paid by the Fund but do not include expenses of the investment companies in which the fund invests. |
| E | Annualized. |
| F | Amount does not include the portfolio activity of any underlying funds. |
| G | Portfolio turnover rate excludes securities received or delivered in-kind. |
| H | Amount not annualized. |
See accompanying notes which are an integral part of the financial statements.
| 91 | Annual Report |
Table of Contents
Financial Statements – continued
| Financial Highlights | ||||||||||||||||||||
| Fidelity MSCI Health Care Index ETF | ||||||||||||||||||||
| Year ended July 31, 2018 | Year ended July 31, 2017 | Year ended July 31, 2016 | Year ended July 31, 2015 | Year ended July 31, 2014A | ||||||||||||||||
Selected Per-Share Data | ||||||||||||||||||||
Net asset value, beginning of period | $ | 38.44 | $ | 35.67 | $ | 37.16 | $ | 29.05 | $ | 24.97 | ||||||||||
|
|
|
|
|
|
|
|
|
| |||||||||||
Income from Investment Operations | ||||||||||||||||||||
Net investment income (loss)B | 0.56 | 0.51 | 0.44 | 0.80 | C | 0.30 | ||||||||||||||
Net realized and unrealized gain (loss) | 5.29 | 2.76 | (1.49 | ) | 7.99 | 3.99 | ||||||||||||||
|
|
|
|
|
|
|
|
|
| |||||||||||
Total from investment operations | 5.85 | 3.27 | (1.05 | ) | 8.79 | 4.29 | ||||||||||||||
|
|
|
|
|
|
|
|
|
| |||||||||||
Distributions from net investment income | (0.57 | ) | (0.50 | ) | (0.44 | ) | (0.68 | ) | (0.21 | ) | ||||||||||
|
|
|
|
|
|
|
|
|
| |||||||||||
Total distributions | (0.57 | ) | (0.50 | ) | (0.44 | ) | (0.68 | ) | (0.21 | ) | ||||||||||
|
|
|
|
|
|
|
|
|
| |||||||||||
Net asset value, end of period | $ | 43.72 | $ | 38.44 | $ | 35.67 | $ | 37.16 | $ | 29.05 | ||||||||||
|
|
|
|
|
|
|
|
|
| |||||||||||
Total ReturnD | 15.34 | % | 9.30 | % | (2.73 | )% | 30.40 | % | 17.23 | % | ||||||||||
Ratios to Average Net AssetsE | ||||||||||||||||||||
Expense before reductions | .08 | % | .08 | % | .12 | % | .12 | % | .12 | %F | ||||||||||
Expenses net of fee waivers, if any | .08 | % | .08 | % | .12 | % | .12 | % | .12 | %F | ||||||||||
Expenses net of all reductions | .08 | % | .08 | % | .12 | % | .12 | % | .12 | %F | ||||||||||
Net investment income (loss) | 1.39 | % | 1.45 | % | 1.30 | % | 2.31 | %C | 1.36 | %F | ||||||||||
Supplemental Data | ||||||||||||||||||||
Net assets, end of period (000 omitted) | $ | 1,252,626 | $ | 818,710 | $ | 642,124 | $ | 800,713 | $ | 187,382 | ||||||||||
Portfolio turnover rateG,H | 8 | % | 4 | % | 9 | % | 10 | % | 4 | %I | ||||||||||
| A | For the period October 21, 2013 (commencement of operations) to July 31, 2014. |
| B | Calculated based on average shares outstanding during the period. |
| C | Investment income per share reflects a large, non-recurring dividend which amounted to $.17 per share. Excluding this non-recurring dividend, the ratio of net investment income (loss) to average net assets would have been 1.83%. |
| D | Total returns for periods of less than one year are not annualized. |
| E | Expense ratios reflect operating expenses of the Fund. Expenses before reductions do not reflect amounts reimbursed by the investment adviser or reductions from brokerage service arrangements or reductions from other expense offset arrangements and do not represent the amount paid by the Fund during periods when reimbursements or reductions occur. Expenses net of fee waivers reflect expenses after reimbursement by the investment adviser but prior to the reductions from brokerage service arrangements or other expense offset arrangements. Expenses net of all reductions represent the net expenses paid by the Fund but do not include expenses of the investment companies in which the fund invests. |
| F | Annualized. |
| G | Amount does not include the portfolio activity of any underlying funds. |
| H | Portfolio turnover rate excludes securities received or delivered in-kind. |
| I | Amount not annualized. |
See accompanying notes which are an integral part of the financial statements.
| Annual Report | 92 |
Table of Contents
| Financial Highlights | ||||||||||||||||||||
| Fidelity MSCI Industrials Index ETF | ||||||||||||||||||||
| Year ended July 31, 2018 | Year ended July 31, 2017 | Year ended July 31, 2016 | Year ended July 31, 2015 | Year ended July 31, 2014A | ||||||||||||||||
Selected Per-Share Data | ||||||||||||||||||||
Net asset value, beginning of period | $ | 34.93 | $ | 30.10 | $ | 28.05 | $ | 26.85 | $ | 25.20 | ||||||||||
|
|
|
|
|
|
|
|
|
| |||||||||||
Income from Investment Operations | ||||||||||||||||||||
Net investment income (loss)B | 0.61 | 0.61 | 0.54 | 0.48 | 0.35 | |||||||||||||||
Net realized and unrealized gain (loss) | 4.62 | 4.79 | 2.04 | 1.19 | 1.61 | |||||||||||||||
|
|
|
|
|
|
|
|
|
| |||||||||||
Total from investment operations | 5.23 | 5.40 | 2.58 | 1.67 | 1.96 | |||||||||||||||
|
|
|
|
|
|
|
|
|
| |||||||||||
Distributions from net investment income | (0.65 | ) | (0.57 | ) | (0.53 | ) | (0.47 | ) | (0.31 | ) | ||||||||||
|
|
|
|
|
|
|
|
|
| |||||||||||
Total distributions | (0.65 | ) | (0.57 | ) | (0.53 | ) | (0.47 | ) | (0.31 | ) | ||||||||||
|
|
|
|
|
|
|
|
|
| |||||||||||
Net asset value, end of period | $ | 39.51 | $ | 34.93 | $ | 30.10 | $ | 28.05 | $ | 26.85 | ||||||||||
|
|
|
|
|
|
|
|
|
| |||||||||||
Total ReturnC | 15.08 | % | 18.08 | % | 9.41 | % | 6.18 | % | 7.75 | % | ||||||||||
Ratios to Average Net AssetsD | ||||||||||||||||||||
Expense before reductions | .08 | % | .08 | % | .12 | % | .12 | % | .12 | %E | ||||||||||
Expenses net of fee waivers, if any | .08 | % | .08 | % | .12 | % | .12 | % | .12 | %E | ||||||||||
Expenses net of all reductions | .08 | % | .08 | % | .12 | % | .12 | % | .12 | %E | ||||||||||
Net investment income (loss) | 1.61 | % | 1.85 | % | 1.94 | % | 1.69 | % | 1.65 | %E | ||||||||||
Supplemental Data | ||||||||||||||||||||
Net assets, end of period (000 omitted) | $ | 499,824 | $ | 354,586 | $ | 158,049 | $ | 143,034 | $ | 100,706 | ||||||||||
Portfolio turnover rateF,G | 5 | % | 5 | % | 11 | % | 6 | % | 4 | %H | ||||||||||
| A | For the period October 21, 2013 (commencement of operations) to July 31, 2014. |
| B | Calculated based on average shares outstanding during the period. |
| C | Total returns for periods of less than one year are not annualized. |
| D | Expense ratios reflect operating expenses of the Fund. Expenses before reductions do not reflect amounts reimbursed by the investment adviser or reductions from brokerage service arrangements or reductions from other expense offset arrangements and do not represent the amount paid by the Fund during periods when reimbursements or reductions occur. Expenses net of fee waivers reflect expenses after reimbursement by the investment adviser but prior to the reductions from brokerage service arrangements or other expense offset arrangements. Expenses net of all reductions represent the net expenses paid by the Fund but do not include expenses of the investment companies in which the fund invests. |
| E | Annualized. |
| F | Amount does not include the portfolio activity of any underlying funds. |
| G | Portfolio turnover rate excludes securities received or delivered in-kind. |
| H | Amount not annualized. |
See accompanying notes which are an integral part of the financial statements.
| 93 | Annual Report |
Table of Contents
Financial Statements – continued
| Financial Highlights | ||||||||||||||||||||
| Fidelity MSCI Information Technology Index ETF | ||||||||||||||||||||
| Year ended July 31, 2018 | Year ended July 31, 2017 | Year ended July 31, 2016 | Year ended July 31, 2015 | Year ended July 31, 2014A | ||||||||||||||||
Selected Per-Share Data | ||||||||||||||||||||
Net asset value, beginning of period | $ | 44.50 | $ | 34.93 | $ | 32.69 | $ | 29.29 | $ | 25.18 | ||||||||||
|
|
|
|
|
|
|
|
|
| |||||||||||
Income from Investment Operations | ||||||||||||||||||||
Net investment income (loss)B | 0.53 | 0.48 | 0.46 | 0.39 | 0.25 | |||||||||||||||
Net realized and unrealized gain (loss) | 11.85 | 9.54 | 2.24 | C | 3.40 | 4.06 | ||||||||||||||
|
|
|
|
|
|
|
|
|
| |||||||||||
Total from investment operations | 12.38 | 10.02 | 2.70 | 3.79 | 4.31 | |||||||||||||||
|
|
|
|
|
|
|
|
|
| |||||||||||
Distributions from net investment income | (0.52 | ) | (0.45 | ) | (0.46 | ) | (0.39 | ) | (0.20 | ) | ||||||||||
|
|
|
|
|
|
|
|
|
| |||||||||||
Total distributions | (0.52 | ) | (0.45 | ) | (0.46 | ) | (0.39 | ) | (0.20 | ) | ||||||||||
|
|
|
|
|
|
|
|
|
| |||||||||||
Net asset value, end of period | $ | 56.36 | $ | 44.50 | $ | 34.93 | $ | 32.69 | $ | 29.29 | ||||||||||
|
|
|
|
|
|
|
|
|
| |||||||||||
Total ReturnD | 27.92 | % | 28.86 | % | 8.41 | %C | 12.98 | % | 17.14 | % | ||||||||||
Ratios to Average Net AssetsE | ||||||||||||||||||||
Expense before reductions | .08 | % | .08 | % | .12 | % | .12 | % | .12 | %F | ||||||||||
Expenses net of fee waivers, if any | .08 | % | .08 | % | .12 | % | .12 | % | .12 | %F | ||||||||||
Expenses net of all reductions | .08 | % | .08 | % | .12 | % | .12 | % | .12 | %F | ||||||||||
Net investment income (loss) | 1.02 | % | 1.19 | % | 1.42 | % | 1.23 | % | 1.14 | %F | ||||||||||
Supplemental Data | ||||||||||||||||||||
Net assets, end of period (000 omitted) | $ | 2,223,254 | $ | 1,010,043 | $ | 431,391 | $ | 423,372 | $ | 181,611 | ||||||||||
Portfolio turnover rateG,H | 4 | % | 6 | % | 5 | % | 6 | % | 4 | %I | ||||||||||
| A | For the period October 21, 2013 (commencement of operations) to July 31, 2014. |
| B | Calculated based on average shares outstanding during the period. |
| C | Amount includes a reimbursement from the investment advisor for an operational error which amounted to $.01 per share. Excluding this reimbursement, the total return would have been 8.38%. |
| D | Total returns for periods of less than one year are not annualized. |
| E | Expense ratios reflect operating expenses of the Fund. Expenses before reductions do not reflect amounts reimbursed by the investment adviser or reductions from brokerage service arrangements or reductions from other expense offset arrangements and do not represent the amount paid by the Fund during periods when reimbursements or reductions occur. Expenses net of fee waivers reflect expenses after reimbursement by the investment adviser but prior to the reductions from brokerage service arrangements or other expense offset arrangements. Expenses net of all reductions represent the net expenses paid by the Fund but do not include expenses of the investment companies in which the fund invests. |
| F | Annualized. |
| G | Amount does not include the portfolio activity of any underlying funds. |
| H | Portfolio turnover rate excludes securities received or delivered in-kind. |
| I | Amount not annualized. |
See accompanying notes which are an integral part of the financial statements.
| Annual Report | 94 |
Table of Contents
| Financial Highlights | ||||||||||||||||||||
| Fidelity MSCI Materials Index ETF | ||||||||||||||||||||
| Year ended July 31, 2018 | Year ended July 31, 2017 | Year ended July 31, 2016 | Year ended July 31, 2015 | Year ended July 31, 2014A | ||||||||||||||||
Selected Per-Share Data | ||||||||||||||||||||
Net asset value, beginning of period | $ | 31.63 | $ | 27.71 | $ | 25.91 | $ | 27.66 | $ | 24.95 | ||||||||||
|
|
|
|
|
|
|
|
|
| |||||||||||
Income from Investment Operations | ||||||||||||||||||||
Net investment income (loss)B | 0.55 | 0.57 | 0.50 | 0.50 | 0.35 | |||||||||||||||
Net realized and unrealized gain (loss) | 3.09 | 3.87 | 1.83 | (1.75 | ) | 2.67 | ||||||||||||||
|
|
|
|
|
|
|
|
|
| |||||||||||
Total from investment operations | 3.64 | 4.44 | 2.33 | (1.25 | ) | 3.02 | ||||||||||||||
|
|
|
|
|
|
|
|
|
| |||||||||||
Distributions from net investment income | (0.57 | ) | (0.52 | ) | (0.53 | ) | (0.50 | ) | (0.31 | ) | ||||||||||
|
|
|
|
|
|
|
|
|
| |||||||||||
Total distributions | (0.57 | ) | (0.52 | ) | (0.53 | ) | (0.50 | ) | (0.31 | ) | ||||||||||
|
|
|
|
|
|
|
|
|
| |||||||||||
Net asset value, end of period | $ | 34.70 | $ | 31.63 | $ | 27.71 | $ | 25.91 | $ | 27.66 | ||||||||||
|
|
|
|
|
|
|
|
|
| |||||||||||
Total ReturnC | 11.54 | % | 16.17 | % | 9.28 | % | (4.65 | )% | 12.15 | % | ||||||||||
Ratios to Average Net AssetsD | ||||||||||||||||||||
Expense before reductions | .08 | % | .08 | % | .11 | % | .12 | % | .12 | %E | ||||||||||
Expenses net of fee waivers, if any | .08 | % | .08 | % | .11 | % | .12 | % | .12 | %E | ||||||||||
Expenses net of all reductions | .08 | % | .08 | % | .11 | % | .12 | % | .12 | %E | ||||||||||
Net investment income (loss) | 1.60 | % | 1.93 | % | 2.00 | % | 1.81 | % | 1.64 | %E | ||||||||||
Supplemental Data | ||||||||||||||||||||
Net assets, end of period (000 omitted) | $ | 265,428 | $ | 211,931 | $ | 123,325 | $ | 123,052 | $ | 94,042 | ||||||||||
Portfolio turnover rateF,G | 10 | % | 7 | % | 9 | % | 7 | % | 5 | %H | ||||||||||
| A | For the period October 21, 2013 (commencement of operations) to July 31, 2014. |
| B | Calculated based on average shares outstanding during the period. |
| C | Total returns for periods of less than one year are not annualized. |
| D | Expense ratios reflect operating expenses of the Fund. Expenses before reductions do not reflect amounts reimbursed by the investment adviser or reductions from brokerage service arrangements or reductions from other expense offset arrangements and do not represent the amount paid by the Fund during periods when reimbursements or reductions occur. Expenses net of fee waivers reflect expenses after reimbursement by the investment adviser but prior to the reductions from brokerage service arrangements or other expense offset arrangements. Expenses net of all reductions represent the net expenses paid by the Fund but do not include expenses of the investment companies in which the fund invests. |
| E | Annualized. |
| F | Amount does not include the portfolio activity of any underlying funds. |
| G | Portfolio turnover rate excludes securities received or delivered in-kind. |
| H | Amount not annualized. |
See accompanying notes which are an integral part of the financial statements.
| 95 | Annual Report |
Table of Contents
Financial Statements – continued
| Financial Highlights | ||||||||||||||||
| Fidelity MSCI Real Estate Index ETF | ||||||||||||||||
| Year ended July 31, 2018 | Year ended July 31, 2017 | Year ended July 31, 2016 | Year ended July 31, 2015A | |||||||||||||
Selected Per-Share Data | ||||||||||||||||
Net asset value, beginning of period | $ | 24.53 | $ | 25.83 | $ | 22.55 | $ | 24.28 | ||||||||
|
|
|
|
|
|
|
| |||||||||
Income from Investment Operations | ||||||||||||||||
Net investment income (loss)B | 0.76 | 0.68 | 0.83 | 0.38 | ||||||||||||
Net realized and unrealized gain (loss) | 0.32 | (1.12 | ) | 3.37 | (1.70 | ) | ||||||||||
|
|
|
|
|
|
|
| |||||||||
Total from investment operations | 1.08 | (0.44 | ) | 4.20 | (1.32 | ) | ||||||||||
|
|
|
|
|
|
|
| |||||||||
Distributions from net investment income | (0.92 | ) | (0.86 | ) | (0.92 | ) | (0.38 | ) | ||||||||
Return of capital | — | — | — | (0.03 | ) | |||||||||||
|
|
|
|
|
|
|
| |||||||||
Total distributions | (0.92 | ) | (0.86 | ) | (0.92 | ) | (0.41 | ) | ||||||||
|
|
|
|
|
|
|
| |||||||||
Net asset value, end of period | $ | 24.69 | $ | 24.53 | $ | 25.83 | $ | 22.55 | ||||||||
|
|
|
|
|
|
|
| |||||||||
Total ReturnC | 4.53 | % | (1.53 | )% | 19.29 | % | (5.50 | )% | ||||||||
Ratios to Average Net AssetsD | ||||||||||||||||
Expense before reductions | .08 | % | .08 | % | .11 | % | .12 | %E | ||||||||
Expenses net of fee waivers, if any | .08 | % | .08 | % | .11 | % | .12 | %E | ||||||||
Expenses net of all reductions | .08 | % | .08 | % | .11 | % | .12 | %E | ||||||||
Net investment income (loss) | 3.15 | % | 2.85 | % | 3.55 | % | 3.33 | %E | ||||||||
Supplemental Data | ||||||||||||||||
Net assets, end of period (000 omitted) | $ | 502,347 | $ | 392,538 | $ | 183,394 | $ | 25,936 | ||||||||
Portfolio turnover rateF,G | 8 | % | 17 | % | 10 | % | 10 | %H | ||||||||
| A | For the period from February 2, 2015 (commencement of operations) to July 31, 2015. |
| B | Calculated based on average shares outstanding during the period. |
| C | Total returns for periods of less than one year are not annualized. |
| D | Expense ratios reflect operating expenses of the Fund. Expenses before reductions do not reflect amounts reimbursed by the investment adviser or reductions from brokerage service arrangements or reductions from other expense offset arrangements and do not represent the amount paid by the Fund during periods when reimbursements or reductions occur. Expenses net of fee waivers reflect expenses after reimbursement by the investment adviser but prior to the reductions from brokerage service arrangements or other expense offset arrangements. Expenses net of all reductions represent the net expenses paid by the Fund but do not include expenses of the investment companies in which the fund invests. |
| E | Annualized. |
| F | Amount does not include the portfolio activity of any underlying funds. |
| G | Portfolio turnover rate excludes securities received or delivered in-kind. |
| H | Amount not annualized. |
See accompanying notes which are an integral part of the financial statements.
| Annual Report | 96 |
Table of Contents
| Financial Highlights | ||||||||||||||||||||
| Fidelity MSCI Telecommunication Services Index ETF | ||||||||||||||||||||
| Year ended July 31, 2018 | Year ended July 31, 2017 | Year ended July 31, 2016 | Year ended July 31, 2015 | Year ended July 31, 2014A | ||||||||||||||||
Selected Per-Share Data | ||||||||||||||||||||
Net asset value, beginning of period | $ | 32.62 | $ | 32.10 | $ | 26.86 | $ | 26.98 | $ | 25.26 | ||||||||||
|
|
|
|
|
|
|
|
|
| |||||||||||
Income from Investment Operations | ||||||||||||||||||||
Net investment income (loss)B | 0.85 | 0.80 | 0.78 | 0.78 | 0.72 | |||||||||||||||
Net realized and unrealized gain (loss) | (2.43 | ) | 0.62 | C | 5.11 | (0.09 | ) | 1.42 | ||||||||||||
|
|
|
|
|
|
|
|
|
| |||||||||||
Total from investment operations | (1.58 | ) | 1.42 | 5.89 | 0.69 | 2.14 | ||||||||||||||
|
|
|
|
|
|
|
|
|
| |||||||||||
Distributions from net investment income | (1.00 | ) | (0.90 | ) | (0.65 | ) | (0.81 | ) | (0.42 | ) | ||||||||||
Distributions from net realized gain | (1.28 | ) | — | — | — | �� | — | |||||||||||||
|
|
|
|
|
|
|
|
|
| |||||||||||
Total distributions | (2.28 | ) | (0.90 | ) | (0.65 | ) | (0.81 | ) | (0.42 | ) | ||||||||||
|
|
|
|
|
|
|
|
|
| |||||||||||
Net asset value, end of period | $ | 28.76 | $ | 32.62 | $ | 32.10 | $ | 26.86 | $ | 26.98 | ||||||||||
|
|
|
|
|
|
|
|
|
| |||||||||||
Total ReturnD | (5.14 | )% | 4.58 | % | 22.36 | % | 2.56 | % | 8.57 | % | ||||||||||
Ratios to Average Net AssetsE | ||||||||||||||||||||
Expense before reductions | .08 | % | .08 | % | .12 | % | .12 | % | .12 | %F | ||||||||||
Expenses net of fee waivers, if any | .08 | % | .08 | % | .12 | % | .12 | % | .12 | %F | ||||||||||
Expenses net of all reductions | .08 | % | .08 | % | .12 | % | .12 | % | .12 | %F | ||||||||||
Net investment income (loss) | 2.81 | % | 2.55 | % | 2.74 | % | 2.89 | % | 3.51 | %F | ||||||||||
Supplemental Data | ||||||||||||||||||||
Net assets, end of period (000 omitted) | $ | 125,104 | $ | 115,818 | $ | 174,940 | $ | 81,908 | $ | 67,447 | ||||||||||
Portfolio turnover rateG,H | 38 | % | 27 | % | 26 | % | 23 | % | 21 | %I | ||||||||||
| A | For the period October 21, 2013 (commencement of operations) to July 31, 2014. |
| B | Calculated based on average shares outstanding during the period. |
| C | The amount shown for a share outstanding does not correspond with the aggregate net gain (loss) on investments for the period due to the timing of share transactions in relation to fluctuating market values of the investments of a Fund. |
| D | Total returns for periods of less than one year are not annualized. |
| E | Expense ratios reflect operating expenses of the Fund. Expenses before reductions do not reflect amounts reimbursed by the investment adviser or reductions from brokerage service arrangements or reductions from other expense offset arrangements and do not represent the amount paid by the Fund during periods when reimbursements or reductions occur. Expenses net of fee waivers reflect expenses after reimbursement by the investment adviser but prior to the reductions from brokerage service arrangements or other expense offset arrangements. Expenses net of all reductions represent the net expenses paid by the Fund but do not include expenses of the investment companies in which the fund invests. |
| F | Annualized. |
| G | Amount does not include the portfolio activity of any underlying funds. |
| H | Portfolio turnover rate excludes securities received or delivered in-kind. |
| I | Amount not annualized. |
See accompanying notes which are an integral part of the financial statements.
| 97 | Annual Report |
Table of Contents
Financial Statements – continued
| Financial Highlights | ||||||||||||||||||||
| Fidelity MSCI Utilities Index ETF | ||||||||||||||||||||
| Year ended July 31, 2018 | Year ended July 31, 2017 | Year ended July 31, 2016 | Year ended July 31, 2015 | Year ended July 31, 2014A | ||||||||||||||||
Selected Per-Share Data | ||||||||||||||||||||
Net asset value, beginning of period | $ | 34.64 | $ | 33.57 | $ | 28.10 | $ | 26.88 | $ | 24.99 | ||||||||||
|
|
|
|
|
|
|
|
|
| |||||||||||
Income from Investment Operations | ||||||||||||||||||||
Net investment income (loss)B | 1.10 | 1.06 | 0.98 | 0.98 | 0.67 | |||||||||||||||
Net realized and unrealized gain (loss) | 0.20 | 1.09 | 5.48 | 1.47 | 1.85 | |||||||||||||||
|
|
|
|
|
|
|
|
|
| |||||||||||
Total from investment operations | 1.30 | 2.15 | 6.46 | 2.45 | 2.52 | |||||||||||||||
|
|
|
|
|
|
|
|
|
| |||||||||||
Distributions from net investment income | (1.09 | ) | (1.08 | ) | (0.99 | ) | (1.23 | ) | (0.63 | ) | ||||||||||
|
|
|
|
|
|
|
|
|
| |||||||||||
Total distributions | (1.09 | ) | (1.08 | ) | (0.99 | ) | (1.23 | ) | (0.63 | ) | ||||||||||
|
|
|
|
|
|
|
|
|
| |||||||||||
Net asset value, end of period | $ | 34.85 | $ | 34.64 | $ | 33.57 | $ | 28.10 | $ | 26.88 | ||||||||||
|
|
|
|
|
|
|
|
|
| |||||||||||
Total ReturnC | 3.83 | % | 6.61 | % | 23.56 | % | 9.13 | % | 10.13 | % | ||||||||||
Ratios to Average Net AssetsD | ||||||||||||||||||||
Expense before reductions | .08 | % | .08 | % | .12 | % | .12 | % | .12 | %E | ||||||||||
Expenses net of fee waivers, if any | .08 | % | .08 | % | .12 | % | .12 | % | .12 | %E | ||||||||||
Expenses net of all reductions | .08 | % | .08 | % | .12 | % | .12 | % | .12 | %E | ||||||||||
Net investment income (loss) | 3.21 | % | 3.22 | % | 3.25 | % | 3.37 | % | 3.15 | %E | ||||||||||
Supplemental Data | ||||||||||||||||||||
Net assets, end of period (000 omitted) | $ | 336,273 | $ | 277,149 | $ | 283,669 | $ | 108,176 | $ | 120,949 | ||||||||||
Portfolio turnover rateF,G | 6 | % | 6 | % | 9 | % | 7 | % | 6 | %H | ||||||||||
| A | For the period October 21, 2013 (commencement of operations) to July 31, 2014. |
| B | Calculated based on average shares outstanding during the period. |
| C | Total returns for periods of less than one year are not annualized. |
| D | Expense ratios reflect operating expenses of the Fund. Expenses before reductions do not reflect amounts reimbursed by the investment adviser or reductions from brokerage service arrangements or reductions from other expense offset arrangements and do not represent the amount paid by the Fund during periods when reimbursements or reductions occur. Expenses net of fee waivers reflect expenses after reimbursement by the investment adviser but prior to the reductions from brokerage service arrangements or other expense offset arrangements. Expenses net of all reductions represent the net expenses paid by the Fund but do not include expenses of the investment companies in which the fund invests. |
| E | Annualized. |
| F | Amount does not include the portfolio activity of any underlying funds. |
| G | Portfolio turnover rate excludes securities received or delivered in-kind. |
| H | Amount not annualized. |
See accompanying notes which are an integral part of the financial statements.
| Annual Report | 98 |
Table of Contents
For the year ended July 31, 2018
1. Organization.
Fidelity MSCI Consumer Discretionary Index ETF, Fidelity MSCI Consumer Staples Index ETF, Fidelity MSCI Energy Index ETF, Fidelity MSCI Financials Index ETF, Fidelity MSCI Health Care Index ETF, Fidelity MSCI Industrials Index ETF, Fidelity MSCI Information Technology Index ETF, Fidelity MSCI Materials Index ETF, Fidelity MSCI Real Estate Index ETF, Fidelity MSCI Telecommunication Services Index ETF and Fidelity MSCI Utilities Index ETF (the Funds) are exchange-traded funds of Fidelity Covington Trust (the Trust) and are authorized to issue an unlimited number of shares. Each Fund, with the exception of MSCI Industrials Index ETF and MSCI Real Estate ETF, are non-diversified funds. The Trust is registered under the Investment Company Act of 1940, as amended (the 1940 Act), as an open-end management investment company organized as a Massachusetts business trust. In June 2018, the Board of Trustees approved a change in the name of Fidelity MSCI Telecommunications Services Index ETF to Fidelity MSCI Communication Services Index ETF effective December 1, 2018.
2. Significant Accounting Policies.
Each Fund is an investment company and applies the accounting and reporting guidance of the Financial Accounting Standards Board (FASB) Accounting Standards Codification Topic 946 Financial Services – Investments Companies. The financial statements have been prepared in conformity with accounting principles generally accepted in the United States of America (GAAP), which require management to make certain estimates and assumptions at the date of the financial statements. Actual results could differ from those estimates. Subsequent events, if any, through the date that the financial statements were issued have been evaluated in the preparation of the financial statements. The following summarizes the significant accounting policies of the Funds:
Investment Valuation. Investments are valued as of 4:00 p.m. Eastern time on the last calendar day of the period. The Board of Trustees (the Board) has delegated the day to day responsibility for the valuation of each Fund’s investments to the Fair Value Committee (the Committee) established by each Fund’s investment adviser. In accordance with valuation policies and procedures approved by the Board, each Fund attempts to obtain prices from one or more third party pricing vendors or brokers to value its investments. When current market prices, quotations or currency exchange rates are not readily available or reliable, investments will be fair valued in good faith by the Committee, in accordance with procedures adopted by the Board. Factors used in determining fair value vary by investment type and may include market or investment specific events. The frequency with which these procedures are used cannot be predicted and they may be utilized to a significant extent. The Committee oversees each Fund’s valuation policies and procedures and reports to the Board on the Committee’s activities and fair value determinations. The Board monitors the appropriateness of the procedures used in valuing each Fund’s investments and ratifies the fair value determinations of the Committee.
Each Fund categorizes the inputs to valuation techniques used to value its investments into a disclosure hierarchy consisting of three levels as shown below:
Level 1 – quoted prices in active markets for identical investments
Level 2 – other significant observable inputs (including quoted prices for similar investments, interest rates, prepayment speeds, etc.)
Level 3 – unobservable inputs (including the Fund’s own assumptions based on the best information available)
Valuation techniques used to value each Fund’s investments by major category are as follows:
Equity securities, including restricted securities, for which market quotations are readily available, are valued at the last reported sale price or official closing price as reported by a third party pricing vendor on the primary market or exchange on which they are traded and are categorized as Level 1 in the hierarchy. In the event there were no sales during the day or closing prices are not available, securities are valued at the last quoted bid price or may be valued using the last available price and are generally categorized as Level 2 in the hierarchy. For foreign equity securities, when market or security specific events arise, comparisons to the valuation of American Depositary Receipts (ADRs), futures contracts, Exchange-Traded Funds (ETFs) and certain indexes as well as quoted prices for similar securities may be used and would be categorized as Level 2 in the hierarchy. Utilizing these techniques may result in transfers between Level 1 and Level 2. For equity securities, including restricted securities, where observable inputs are limited, assumptions about market activity and risk are used and these securities may be categorized as Level 3 in the hierarchy.
Investments in open-end mutual funds (Underlying Funds) are valued at their closing net asset value (NAV) each business day and are categorized as Level 1 in the hierarchy. If an unaffiliated underlying fund’s NAV is unavailable, shares of that fund may be valued by another method that the Board believes reflects fair value in accordance with the Board’s fair value pricing policies and is categorized as Level 2 in the hierarchy.
Changes in valuation techniques may result in transfers in or out of an assigned level within the disclosure hierarchy. The aggregate value of investments by input level, as of July 31, 2018, is included at the end of each Fund’s Schedule of Investments.
Foreign Currency. The Funds may use foreign currency contracts to facilitate transactions in foreign-denominated securities. Gains and losses from these transactions may arise from changes in the value of the foreign currency or if the counterparties do not perform under the contracts’ terms.
| 99 | Annual Report |
Table of Contents
Notes to Financial Statements – continued
2. Significant Accounting Policies – continued
Foreign-denominated assets, including investment securities, and liabilities are translated into U.S. dollars at the exchange rates at period end. Purchases and sales of investment securities, income and dividends received and expenses denominated in foreign currencies are translated into U.S. dollars at the exchange rate in effect on the transaction date.
The effects of exchange rate fluctuations on investments are included with the net realized and unrealized gain (loss) on investment securities. Other foreign currency transactions resulting in realized and unrealized gain (loss) are disclosed separately.
Investment Transactions and Income. For financial reporting purposes, the Funds’ investment holdings and NAV include trades executed through the end of the last business day of the period. The NAV per share for processing shareholder transactions is calculated as of the close of business of NYSE Arca, normally 4:00 p.m. Eastern time and includes trades executed through the end of the prior business day. Gains and losses on securities sold are determined on the basis of identified cost and may include proceeds received from litigation. Dividend income is recorded on the ex-dividend date, except for certain dividends from foreign securities where the ex-dividend date may have passed, which are recorded as soon as the Funds are informed of the ex-dividend date. Non-cash dividends included in dividend income, if any, are recorded at the fair market value of the securities received. Income and capital gain distributions from Underlying Funds, if any, are recorded on the ex-dividend date. Certain distributions received by the Funds represent a return of capital or capital gain. The Funds determine the components of these distributions subsequent to the ex-dividend date, based upon receipt of tax filings or other correspondence relating to the underlying investment. These distributions are recorded as a reduction of cost of investments and/or as a realized gain. Interest income is accrued as earned and includes coupon interest and amortization of premium and accretion of discount on debt securities as applicable. Investment income is recorded net of foreign taxes withheld where recovery of such taxes is uncertain.
Expenses. Expenses directly attributable to a fund are charged to that fund. Expenses attributable to more than one fund are allocated among the respective funds on the basis of relative net assets or other appropriate methods. Expenses included in the accompanying financial statements reflect the expenses of each Fund and do not include any expenses associated with the Underlying Funds. Expense estimates are accrued in the period to which they relate and adjustments are made when actual amounts are known.
Income Tax Information and Distributions to Shareholders. Each year, each Fund intends to qualify as a regulated investment company under Subchapter M of the Internal Revenue Code, including distributing substantially all of its taxable income and realized gains. As a result, no provision for U.S. Federal income taxes is required. As of July 31, 2018 each Fund did not have any unrecognized tax benefits in the financial statements; nor is each Fund aware of any tax positions for which it is reasonably possible that the total amounts of unrecognized tax benefits will significantly change in the next twelve months. Each Fund files a U.S. federal tax return, in addition to state and local tax returns as required. Each Fund’s federal income tax returns are subject to examination by the Internal Revenue Service (IRS) for a period of three fiscal years after they are filed. State and local tax returns may be subject to examination for an additional fiscal year depending on the jurisdiction. Realized gain or loss resulting from in-kind redemptions is not taxable to the Fund and is not distributed to shareholders of the Fund. Foreign taxes are provided for based on each Fund’s understanding of the tax rules and rates that exist in the foreign markets in which it invests.
Distributions are declared and recorded on the ex-dividend date. Income and capital gain distributions are determined in accordance with income tax regulations, which may differ from GAAP.
Capital accounts within the financial statements are adjusted for permanent book-tax differences. These adjustments have no impact on net assets or the results of operations. Capital accounts are not adjusted for temporary book-tax differences which will reverse in a subsequent period.
Book-tax differences are primarily due to passive foreign investment companies (PFIC), redemptions in kind, capital loss carryforwards and losses deferred due to wash sales and excise tax regulations.
As of period end, the cost and unrealized appreciation (depreciation) in securities, and derivatives if applicable, for federal income tax purposes were as follows for each Fund:
| Tax cost | Gross unrealized appreciation | Gross unrealized depreciation | Net unrealized appreciation (depreciation) on securities and other investments | |||||||||||||
Fidelity MSCI Consumer Discretionary Index ETF | $ | 563,428,357 | $ | 89,637,719 | $ | (24,982,439 | ) | $ | 64,655,280 | |||||||
Fidelity MSCI Consumer Staples Index ETF | 316,978,365 | 19,375,550 | (24,853,722 | ) | (5,478,172 | ) | ||||||||||
Fidelity MSCI Energy Index ETF | 639,404,278 | 38,447,711 | (44,043,169 | ) | (5,595,458 | ) | ||||||||||
Fidelity MSCI Financials Index ETF | 1,410,701,971 | 178,058,112 | (14,804,408 | ) | 163,253,704 | |||||||||||
Fidelity MSCI Health Care Index ETF | 1,069,922,731 | 231,204,040 | (49,375,393 | ) | 181,828,647 | |||||||||||
Fidelity MSCI Industrials Index ETF | 470,140,088 | 58,451,157 | (29,044,834 | ) | 29,406,323 | |||||||||||
Fidelity MSCI Information Technology Index ETF | 1,777,480,762 | 457,496,794 | (12,408,224 | ) | 445,088,570 | |||||||||||
| Annual Report | 100 |
Table of Contents
2. Significant Accounting Policies – continued
| Tax cost | Gross unrealized appreciation | Gross unrealized depreciation | Net unrealized appreciation (depreciation) on securities and other investments | |||||||||||||
Fidelity MSCI Materials Index ETF | $ | 262,180,522 | $ | 10,751,590 | $ | (7,674,477 | ) | $ | 3,077,113 | |||||||
Fidelity MSCI Real Estate Index ETF | 506,060,002 | 17,707,996 | (20,960,318 | ) | (3,252,322 | ) | ||||||||||
Fidelity MSCI Telecommunication Services Index ETF | 133,574,955 | 10,165,482 | (18,632,736 | ) | (8,467,254 | ) | ||||||||||
Fidelity MSCI Utilities Index ETF | 331,792,210 | 16,037,622 | (11,649,009 | ) | 4,388,613 | |||||||||||
The tax-based components of distributable earnings as of period end were as follows for each Fund:
| Undistributed ordinary income | Capital loss carryforward | Net unrealized appreciation (depreciation) | ||||||||||
Fidelity MSCI Consumer Discretionary Index ETF | $ | 564,653 | $ | (6,200,679 | ) | $ | 64,655,280 | |||||
Fidelity MSCI Consumer Staples Index ETF | 441,897 | (4,723,272 | ) | (5,478,172 | ) | |||||||
Fidelity MSCI Energy Index ETF | 108,312 | (24,787,830 | ) | (5,595,458 | ) | |||||||
Fidelity MSCI Financials Index ETF | 774,481 | (5,762,751 | ) | 163,253,704 | ||||||||
Fidelity MSCI Health Care Index ETF | 1,007,564 | (15,952,483 | ) | 181,828,647 | ||||||||
Fidelity MSCI Industrials Index ETF | — | (4,779,004 | ) | 29,406,323 | ||||||||
Fidelity MSCI Information Technology Index ETF | 821,764 | (4,077,181 | ) | 445,088,570 | ||||||||
Fidelity MSCI Materials Index ETF | 54,098 | (1,924,055 | ) | 3,077,113 | ||||||||
Fidelity MSCI Real Estate Index ETF | — | (2,647,929 | ) | (3,252,322 | ) | |||||||
Fidelity MSCI Telecommunication Services Index ETF | — | (2,077,719 | ) | (8,467,254 | ) | |||||||
Fidelity MSCI Utilities Index ETF | — | (2,841,540 | ) | 4,388,613 | ||||||||
Capital loss carryforwards are only available to offset future capital gains of the Funds to the extent provided by regulations and may be limited. Under the Regulated Investment Company Modernization Act of 2010 (the Act), the Funds are permitted to carry forward capital losses incurred in taxable years beginning after December 22, 2010 for an unlimited period and such capital losses are required to be used prior to any losses that expire. The capital loss carryforward information presented below, including any applicable limitation, is estimated as of fiscal year end and is subject to adjustment.
| No-expiration Short-term | No-expiration Long-term | Total capital loss carryforward | ||||||||||
Fidelity MSCI Consumer Discretionary Index ETF | $ | (2,424,106 | ) | $ | (3,776,573 | ) | $ | (6,200,679 | ) | |||
Fidelity MSCI Consumer Staples Index ETF | (599,178 | ) | (4,124,094 | ) | (4,723,272 | ) | ||||||
Fidelity MSCI Energy Index ETF | (5,713,340 | ) | (19,074,490 | ) | (24,787,830 | ) | ||||||
Fidelity MSCI Financials Index ETF | (4,625,040 | ) | (1,137,711 | ) | (5,762,751 | ) | ||||||
Fidelity MSCI Health Care Index ETF | (7,226,020 | ) | (8,726,463 | ) | (15,952,483 | ) | ||||||
Fidelity MSCI Industrials Index ETF | (1,438,375 | ) | (3,340,629 | ) | (4,779,004 | ) | ||||||
Fidelity MSCI Information Technology Index ETF | (2,242,393 | ) | (1,834,788 | ) | (4,077,181 | ) | ||||||
Fidelity MSCI Materials Index ETF | (714,125 | ) | (1,209,930 | ) | (1,924,055 | ) | ||||||
Fidelity MSCI Real Estate Index ETF | (1,847,940 | ) | (799,989 | ) | (2,647,929 | ) | ||||||
Fidelity MSCI Telecommunication Services Index ETF | (1,023,195 | ) | (1,054,524 | ) | (2,077,719 | ) | ||||||
Fidelity MSCI Utilities Index ETF | (1,058,589 | ) | (1,782,951 | ) | (2,841,540 | ) | ||||||
The tax character of distributions paid was as follows:
| July 31, 2018 | ||||||||||||||||
| Ordinary Income | Long-Term Capital Gain | Tax Return Of Capital | Total | |||||||||||||
Fidelity MSCI Consumer Discretionary Index ETF | $ | 4,460,400 | $ | — | $ | — | $ | 4,460,400 | ||||||||
Fidelity MSCI Consumer Staples Index ETF | 7,829,600 | — | — | 7,829,600 | ||||||||||||
Fidelity MSCI Energy Index ETF | 14,924,250 | — | — | 14,924,250 | ||||||||||||
Fidelity MSCI Financials Index ETF | 24,296,050 | — | — | 24,296,050 | ||||||||||||
Fidelity MSCI Health Care Index ETF | 14,186,300 | — | — | 14,186,300 | ||||||||||||
Fidelity MSCI Industrials Index ETF | 8,096,400 | — | — | 8,096,400 | ||||||||||||
Fidelity MSCI Information Technology Index ETF | 16,100,150 | — | — | 16,100,150 | ||||||||||||
Fidelity MSCI Materials Index ETF | 4,793,700 | — | — | 4,793,700 | ||||||||||||
| 101 | Annual Report |
Table of Contents
Notes to Financial Statements – continued
2. Significant Accounting Policies – continued
| July 31, 2018 | ||||||||||||||||
| Ordinary Income | Long-Term Capital Gain | Tax Return Of Capital | Total | |||||||||||||
Fidelity MSCI Real Estate Index ETF | $ | 14,778,500 | $ | — | $ | — | $ | 14,778,500 | ||||||||
Fidelity MSCI Telecommunication Services Index ETF | 8,554,800 | — | — | 8,554,800 | ||||||||||||
Fidelity MSCI Utilities Index ETF | 9,603,500 | — | — | 9,603,500 | ||||||||||||
| July 31, 2017 | ||||||||||||||||
Ordinary Income | Long-Term Capital Gain | Tax Return Of Capital | Total | |||||||||||||
Fidelity MSCI Consumer Discretionary Index ETF | $ | 3,848,250 | $ | — | $ | — | $ | 3,848,250 | ||||||||
Fidelity MSCI Consumer Staples Index ETF | 6,993,800 | — | — | 6,993,800 | ||||||||||||
Fidelity MSCI Energy Index ETF | 11,177,800 | — | — | 11,177,800 | ||||||||||||
Fidelity MSCI Financials Index ETF | 10,082,500 | — | — | 10,082,500 | ||||||||||||
Fidelity MSCI Health Care Index ETF | 9,330,050 | — | — | 9,330,050 | ||||||||||||
Fidelity MSCI Industrials Index ETF | 4,608,750 | — | — | 4,608,750 | ||||||||||||
Fidelity MSCI Information Technology Index ETF | 7,809,700 | — | — | 7,809,700 | ||||||||||||
Fidelity MSCI Materials Index ETF | 3,068,600 | — | — | 3,068,600 | ||||||||||||
Fidelity MSCI Real Estate Index ETF | 8,640,100 | — | — | 8,640,100 | ||||||||||||
Fidelity MSCI Telecommunication Services Index ETF | 3,777,050 | — | — | 3,777,050 | ||||||||||||
Fidelity MSCI Utilities Index ETF | 7,784,150 | — | — | 7,784,150 | ||||||||||||
3. Purchases and Sales of Investments.
Purchases and sales of securities, other than short-term securities and in-kind transactions, were as follows:
| Purchases | Sales | |||||||
Fidelity MSCI Consumer Discretionary Index ETF | $ | 32,267,422 | $ | 23,007,799 | ||||
Fidelity MSCI Consumer Staples Index ETF | 70,018,424 | 69,866,098 | ||||||
Fidelity MSCI Energy Index ETF | 28,129,929 | 29,464,196 | ||||||
Fidelity MSCI Financials Index ETF | 70,341,861 | 64,630,749 | ||||||
Fidelity MSCI Health Care Index ETF | 82,920,075 | 78,844,599 | ||||||
Fidelity MSCI Industrials Index ETF | 24,698,474 | 24,923,918 | ||||||
Fidelity MSCI Information Technology Index ETF | 72,855,729 | 71,092,923 | ||||||
Fidelity MSCI Materials Index ETF | 28,796,780 | 28,849,440 | ||||||
Fidelity MSCI Real Estate Index ETF | 34,297,383 | 30,492,890 | ||||||
Fidelity MSCI Telecommunication Services Index ETF | 45,056,612 | 46,340,352 | ||||||
Fidelity MSCI Utilities Index ETF | 18,819,082 | 18,460,737 | ||||||
Securities received or delivered in-kind through subscriptions and redemptions were as follows:
| In-kind Subscriptions | In-kind Redemptions | |||||||
Fidelity MSCI Consumer Discretionary Index ETF | $ | 337,880,187 | $ | 77,694,709 | ||||
Fidelity MSCI Consumer Staples Index ETF | 130,370,191 | 119,175,620 | ||||||
Fidelity MSCI Energy Index ETF | 241,110,808 | 113,439,677 | ||||||
Fidelity MSCI Financials Index ETF | 634,733,810 | 80,739,817 | ||||||
Fidelity MSCI Health Care Index ETF | 380,361,691 | 74,965,093 | ||||||
Fidelity MSCI Industrials Index ETF | 276,521,813 | 168,814,284 | ||||||
Fidelity MSCI Information Technology Index ETF | 996,305,530 | 113,979,980 | ||||||
Fidelity MSCI Materials Index ETF | 184,684,122 | 147,279,193 | ||||||
Fidelity MSCI Real Estate Index ETF | 254,786,490 | 149,308,082 | ||||||
Fidelity MSCI Telecommunication Services Index ETF | 42,689,230 | 19,546,306 | ||||||
Fidelity MSCI Utilities Index ETF | 150,885,807 | 92,129,860 | ||||||
| Annual Report | 102 |
Table of Contents
4. Fees and Other Transactions with Affiliates.
Management Fee. Fidelity SelectCo, LLC (SelectCo) provides the Funds with investment management related services for which the Funds pay a monthly management fee that is based on an annual rate of .084% of each Fund’s average net assets. Under the management contract, SelectCo pays all other expenses, except the compensation of the independent Trustees and certain other expenses such as interest expense. The management fee paid to SelectCo is reduced by an amount equal to the fees and expenses paid by each fund to the independent Trustees.
Sub-Adviser. BlackRock Fund Advisors (BFA), serves as sub-adviser for the Funds. BFA provides discretionary investment advisory services to the Funds and is paid by SelectCo for providing these services.
Interfund Trades. The Funds may purchase from or sell securities to other funds affiliated with the sub-adviser under procedures adopted by the Board. The procedures have been designed to ensure these interfund trades are executed in accordance with Rule 17a-7 of the 1940 Act. Interfund trades are included within the respective purchases and sales amounts shown in the Purchases and Sales of Investments note.
5. Share Transactions.
The Funds issue and redeem shares at NAV only with certain authorized participants in large increments known as Creation Units. Purchases of Creation Units are made by tendering a basket of designated stocks to a fund and redemption proceeds are paid with a basket of securities from a fund’s portfolio with a balancing cash component to equate the market value of the basket of securities delivered or redeemed to the NAV per Creation Unit on the transaction date. Cash may be substituted equivalent to the value of certain securities generally when they are not available in sufficient quantity for delivery. A fund’s shares are available in smaller increments to investors in the secondary market at market prices and may be subject to commissions. Authorized participants pay a transaction fee to the shareholder servicing agent when purchasing and redeeming Creation Units of a fund. The transaction fee is used to defray the costs associated with the issuance and redemption of Creation Units.
6. Other.
The Funds’ organizational documents provide former and current directors and officers with a limited indemnification against liabilities arising in connection with the performance of their duties to the Funds. In the normal course of business, the Funds may also enter into contracts that provide general indemnifications. The Funds’ maximum exposure under these arrangements is unknown as this would be dependent on future claims that may be made against the Funds. The risk of material loss from such claims is considered remote.
| 103 | Annual Report |
Table of Contents
Report of Independent Registered Public Accounting Firm
To the Trustees of Fidelity Covington Trust and Shareholders of Fidelity MSCI Consumer Discretionary Index ETF, Fidelity MSCI Consumer Staples Index ETF, Fidelity MSCI Energy Index ETF, Fidelity MSCI Financials Index ETF, Fidelity MSCI Health Care Index ETF, Fidelity MSCI Industrials Index ETF, Fidelity MSCI Information Technology Index ETF, Fidelity MSCI Materials Index ETF, Fidelity MSCI Real Estate Index ETF, Fidelity MSCI Telecommunication Services Index ETF, and the Fidelity MSCI Utilities Index ETF:
Opinion on the Financial Statements and Financial Highlights
We have audited the accompanying statements of assets and liabilities of Fidelity MSCI Consumer Discretionary Index ETF, Fidelity MSCI Consumer Staples Index ETF, Fidelity MSCI Energy Index ETF, Fidelity MSCI Financials Index ETF, Fidelity MSCI Health Care Index ETF, Fidelity MSCI Industrials Index ETF, Fidelity MSCI Information Technology Index ETF, Fidelity MSCI Materials Index ETF, Fidelity MSCI Real Estate Index ETF, Fidelity MSCI Telecommunication Services Index ETF, and the Fidelity MSCI Utilities Index ETF (the “Funds”), each a fund of Fidelity Covington Trust, including the schedules of investments, as of July 31, 2018, and the related statements of operations for the year then ended, the statements of changes in net assets for each of the two years in the period then ended, the financial highlights for each of the four years in the period then ended and for the period from October 21, 2013 (commencement of operations) to July 31, 2014 for the funds, except Fidelity MSCI Real Estate Index ETF; the related statement of operations for the year then ended and the statement of changes in net assets for each of the two years in the period then ended and the financial highlights for each of the three years in the period then ended and for the period from February 2, 2015 to July 31, 2015 for the Fidelity MSCI Real Estate Index ETF; and the related notes. In our opinion, the financial statements and financial highlights present fairly, in all material respects, the financial position of each of the Funds as of July 31, 2018, and the results of their operations for the year then ended, the changes in their net assets for each of the two years in the periods mentioned above, and the financial highlights for each of the periods mentioned above, in conformity with accounting principles generally accepted in the United States of America.
Basis for Opinion
These financial statements and financial highlights are the responsibility of the Funds’ management. Our responsibility is to express an opinion on the Funds’ financial statements and financial highlights based on our audits. We are a public accounting firm registered with the Public Company Accounting Oversight Board (United States) (PCAOB) and are required to be independent with respect to the Funds in accordance with the U.S. federal securities laws and the applicable rules and regulations of the Securities and Exchange Commission and the PCAOB.
We conducted our audits in accordance with the standards of the PCAOB. Those standards require that we plan and perform the audits to obtain reasonable assurance about whether the financial statements and financial highlights are free of material misstatement, whether due to error or fraud. The Funds are not required to have, nor were we engaged to perform, an audit of their internal control over financial reporting. As part of our audits we are required to obtain an understanding of internal control over financial reporting but not for the purpose of expressing an opinion on the effectiveness of the Funds’ internal control over financial reporting. Accordingly, we express no such opinion.
Our audits included performing procedures to assess the risks of material misstatement of the financial statements and financial highlights, whether due to error or fraud, and performing procedures that respond to those risks. Such procedures included examining, on a test basis, evidence regarding the amounts and disclosures in the financial statements and financial highlights. Our audits also included evaluating the accounting principles used and significant estimates made by management, as well as evaluating the overall presentation of the financial statements and financial highlights. Our procedures included confirmation of securities owned as of July 31, 2018, by correspondence with the custodians and brokers. We believe that our audits provide a reasonable basis for our opinion.
/s/ Deloitte & Touche LLP
Boston, Massachusetts
September 18, 2018
We have served as the auditor of one or more of the Fidelity investment companies since 1999.
| Annual Report | 104 |
Table of Contents
Premium/Discount Analysis (Unaudited)
Shares of each fund are listed on NYSE Arca and can be bought and sold on the secondary market at market prices. Although the market price is expected to approximate the fund’s NAV, it is possible that the market price and NAV will vary significantly. The closing market price is the daily closing price as reported on NYSE Arca.
Premiums or discounts are the differences (expressed as a basis point differential with 1 basis point equaling 1/100 of 1%) between the fund’s NAV and closing market price. A premium indicates that the closing market price is trading above the NAV. A discount indicates that the closing market price is trading below the NAV. A discrepancy may exist with respect to the timing of when the NAV is calculated and the determination of the closing market price.
The chart below presents information about the differences between each fund’s daily closing market price and each fund’s NAV.
Fidelity MSCI Consumer Discretionary Index ETF
| Period Ended July 31, 2018 | ||||||||||||
| From commencement of operations* to July 31, 2018 | Closing Price Below NAV | Closing Price Above or Equal to NAV | ||||||||||
| Basis Point Differential | Number of Days | % of Total Days | Number of Days | % of Total Days | ||||||||
| 0 – <25 | 510 | 42.50 | % | 684 | 57.00 | % | ||||||
| 25 – <50 | 3 | 0.25 | % | 3 | 0.25 | % | ||||||
| 50 – <75 | 0 | — | 0 | — | ||||||||
| 75 – <100 | 0 | — | 0 | — | ||||||||
| 100 or above | 0 | — | 0 | — | ||||||||
| Total | 513 | 42.75 | % | 687 | 57.25 | % | ||||||
| * | From October 24, 2013, date initially listed on the NYSE ARCA exchange. |
Fidelity MSCI Consumer Staples Index ETF
| Period Ended July 31, 2018 | ||||||||||||
| From commencement of operations* to July 31, 2018 | Closing Price Below NAV | Closing Price Above or Equal to NAV | ||||||||||
| Basis Point Differential | Number of Days | % of Total Days | Number of Days | % of Total Days | ||||||||
| 0 – <25 | 468 | 39.01 | % | 730 | 60.83 | % | ||||||
| 25 – <50 | 1 | 0.08 | % | 0 | — | |||||||
| 50 – <75 | 0 | — | 0 | — | ||||||||
| 75 – <100 | 0 | — | 0 | — | ||||||||
| 100 or above | 1 | 0.08 | % | 0 | — | |||||||
| Total | 470 | 39.17 | % | 730 | 60.83 | % | ||||||
| * | From October 24, 2013, date initially listed on the NYSE ARCA exchange. |
Fidelity MSCI Energy Index ETF
| Period Ended July 31, 2018 | ||||||||||||
| From commencement of operations* to July 31, 2018 | Closing Price Below NAV | Closing Price Above or Equal to NAV | ||||||||||
| Basis Point Differential | Number of Days | % of Total Days | Number of Days | % of Total Days | ||||||||
| 0 – <25 | 407 | 33.92 | % | 787 | 65.59 | % | ||||||
| 25 – <50 | 0 | — | 4 | 0.33 | % | |||||||
| 50 – <75 | 0 | — | 1 | 0.08 | % | |||||||
| 75 – <100 | 0 | — | 1 | 0.08 | % | |||||||
| 100 or above | 0 | — | 0 | — | ||||||||
| Total | 407 | 33.92 | % | 793 | 66.08 | % | ||||||
| * | From October 24, 2013, date initially listed on the NYSE ARCA exchange. |
| 105 | Annual Report |
Table of Contents
Premium/Discount Analysis (Unaudited) – continued
Fidelity MSCI Financials Index ETF
| Period Ended July 31, 2018 | ||||||||||||
| From commencement of operations* to July 31, 2018 | Closing Price Below NAV | Closing Price Above or Equal to NAV | ||||||||||
| Basis Point Differential | Number of Days | % of Total Days | Number of Days | % of Total Days | ||||||||
| 0 – <25 | 402 | 33.50 | % | 794 | 66.17 | % | ||||||
| 25 – <50 | 1 | 0.08 | % | 3 | 0.25 | % | ||||||
| 50 – <75 | 0 | — | 0 | — | ||||||||
| 75 – <100 | 0 | — | 0 | — | ||||||||
| 100 or above | 0 | — | 0 | — | ||||||||
| Total | 403 | 33.58 | % | 797 | 66.42 | % | ||||||
| * | From October 24, 2013, date initially listed on the NYSE ARCA exchange. |
Fidelity MSCI Health Care Index ETF
| Period Ended July 31, 2018 | ||||||||||||
| From commencement of operations* to July 31, 2018 | Closing Price Below NAV | Closing Price Above or Equal to NAV | ||||||||||
| Basis Point Differential | Number of Days | % of Total Days | Number of Days | % of Total Days | ||||||||
| 0 – <25 | 416 | 34.67 | % | 779 | 64.91 | % | ||||||
| 25 – <50 | 0 | — | 5 | 0.42 | % | |||||||
| 50 – <75 | 0 | — | 0 | — | ||||||||
| 75 – <100 | 0 | — | 0 | — | ||||||||
| 100 or above | 0 | — | 0 | — | ||||||||
| Total | 416 | 34.67 | % | 784 | 65.33 | % | ||||||
| * | From October 24, 2013, date initially listed on the NYSE ARCA exchange. |
Fidelity MSCI Industrials Index ETF
| Period Ended July 31, 2018 | ||||||||||||
| From commencement of operations* to July 31, 2018 | Closing Price Below NAV | Closing Price Above or Equal to NAV | ||||||||||
| Basis Point Differential | Number of Days | % of Total Days | Number of Days | % of Total Days | ||||||||
| 0 – <25 | 509 | 42.42 | % | 685 | 57.09 | % | ||||||
| 25 – <50 | 1 | 0.08 | % | 4 | 0.33 | % | ||||||
| 50 – <75 | 1 | 0.08 | % | 0 | — | |||||||
| 75 – <100 | 0 | — | 0 | — | ||||||||
| 100 or above | 0 | — | 0 | — | ||||||||
| Total | 511 | 42.58 | % | 689 | 57.42 | % | ||||||
| * | From October 24, 2013, date initially listed on the NYSE ARCA exchange. |
| Annual Report | 106 |
Table of Contents
Fidelity MSCI Information Technology Index ETF
| Period Ended July 31, 2018 | ||||||||||||
| From commencement of operations* to July 31, 2018 | Closing Price Below NAV | Closing Price Above or Equal to NAV | ||||||||||
| Basis Point Differential | Number of Days | % of Total Days | Number of Days | % of Total Days | ||||||||
| 0 – <25 | 316 | 26.34 | % | 882 | 73.50 | % | ||||||
| 25 – <50 | 1 | 0.08 | % | 1 | 0.08 | % | ||||||
| 50 – <75 | 0 | — | 0 | — | ||||||||
| 75 – <100 | 0 | — | 0 | — | ||||||||
| 100 or above | 0 | — | 0 | — | ||||||||
| Total | 317 | 26.42 | % | 883 | 73.58 | % | ||||||
| * | From October 24, 2013, date initially listed on the NYSE ARCA exchange. |
Fidelity MSCI Materials Index ETF
| Period Ended July 31, 2018 | ||||||||||||
| From commencement of operations* to July 31, 2018 | Closing Price Below NAV | Closing Price Above or Equal to NAV | ||||||||||
| Basis Point Differential | Number of Days | % of Total Days | Number of Days | % of Total Days | ||||||||
| 0 – <25 | 562 | 46.83 | % | 622 | 51.83 | % | ||||||
| 25 – <50 | 6 | 0.50 | % | 8 | 0.67 | % | ||||||
| 50 – <75 | 0 | — | 2 | 0.17 | % | |||||||
| 75 – <100 | 0 | — | 0 | — | ||||||||
| 100 or above | 0 | — | 0 | — | ||||||||
| Total | 568 | 47.33 | % | 632 | 52.67 | % | ||||||
| * | From October 24, 2013, date initially listed on the NYSE ARCA exchange. |
Fidelity MSCI Real Estate Index ETF
| Period Ended July 31, 2018 | ||||||||||||
| From commencement of operations* to July 31, 2018 | Closing Price Below NAV | Closing Price Above or Equal to NAV | ||||||||||
| Basis Point Differential | Number of Days | % of Total Days | Number of Days | % of Total Days | ||||||||
| 0 – <25 | 277 | 31.55 | % | 567 | 64.59 | % | ||||||
| 25 – <50 | 6 | 0.68 | % | 21 | 2.39 | % | ||||||
| 50 – <75 | 2 | 0.23 | % | 2 | 0.23 | % | ||||||
| 75 – <100 | 0 | — | 1 | 0.11 | % | |||||||
| 100 or above | 1 | 0.11 | % | 1 | 0.11 | % | ||||||
| Total | 286 | 32.57 | % | 592 | 67.43 | % | ||||||
| * | From February 5, 2015, date initially listed on the NYSE ARCA exchange. |
| 107 | Annual Report |
Table of Contents
Premium/Discount Analysis (Unaudited) – continued
Fidelity MSCI Telecommunication Services Index ETF
| Period Ended July 31, 2018 | ||||||||||||
| From commencement of operations* to July 31, 2018 | Closing Price Below NAV | Closing Price Above or Equal to NAV | ||||||||||
| Basis Point Differential | Number of Days | % of Total Days | Number of Days | % of Total Days | ||||||||
| 0 – <25 | 598 | 49.84 | % | 554 | 46.17 | % | ||||||
| 25 – <50 | 16 | 1.33 | % | 27 | 2.25 | % | ||||||
| 50 – <75 | 4 | 0.33 | % | 1 | 0.08 | % | ||||||
| 75 – <100 | 0 | — | 0 | — | ||||||||
| 100 or above | 0 | — | 0 | — | ||||||||
| Total | 618 | 51.50 | % | 582 | 48.50 | % | ||||||
| * | From October 24, 2013, date initially listed on the NYSE ARCA exchange. |
Fidelity MSCI Utilities Index ETF
| Period Ended July 31, 2018 | ||||||||||||
| From commencement of operations* to July 31, 2018 | Closing Price Below NAV | Closing Price Above or Equal to NAV | ||||||||||
| Basis Point Differential | Number of Days | % of Total Days | Number of Days | % of Total Days | ||||||||
| 0 – <25 | 527 | 43.92 | % | 666 | 55.50 | % | ||||||
| 25 – <50 | 3 | 0.25 | % | 4 | 0.33 | % | ||||||
| 50 – <75 | 0 | — | 0 | — | ||||||||
| 75 – <100 | 0 | — | 0 | — | ||||||||
| 100 or above | 0 | — | 0 | — | ||||||||
| Total | 530 | 44.17 | % | 670 | 55.83 | % | ||||||
| * | From October 24, 2013, date initially listed on the NYSE ARCA exchange. |
| Annual Report | 108 |
Table of Contents
Trustees and Officers (Unaudited)
The Trustees, Members of the Advisory Board (if any), and officers of the trust and funds, as applicable, are listed below. The Board of Trustees governs each fund and is responsible for protecting the interests of shareholders. The Trustees are experienced executives who meet periodically throughout the year to oversee each fund’s activities, review contractual arrangements with companies that provide services to each fund, oversee management of the risks associated with such activities and contractual arrangements, and review each fund’s performance. Except for Michael E. Wiley, each of the Trustees oversees 286 funds. Mr. Wiley oversees 197 funds.
The Trustees hold office without limit in time except that (a) any Trustee may resign; (b) any Trustee may be removed by written instrument, signed by at least two-thirds of the number of Trustees prior to such removal; (c) any Trustee who requests to be retired or who has become incapacitated by illness or injury may be retired by written instrument signed by a majority of the other Trustees; and (d) any Trustee may be removed at any special meeting of shareholders by a two-thirds vote of the outstanding voting securities of the trust. Each Trustee who is not an interested person (as defined in the 1940 Act) of the trust and the funds is referred to herein as an Independent Trustee. Each Independent Trustee shall retire not later than the last day of the calendar year in which his or her 75th birthday occurs. The Independent Trustees may waive this mandatory retirement age policy with respect to individual Trustees. Officers and Advisory Board Members hold office without limit in time, except that any officer or Advisory Board Member may resign or may be removed by a vote of a majority of the Trustees at any regular meeting or any special meeting of the Trustees. Except as indicated, each individual has held the office shown or other offices in the same company for the past five years.
The funds’ Statement of Additional Information (SAI) includes more information about the Trustees. To request a free copy, call Fidelity at 1-800-FIDELITY.
Experience, Skills, Attributes, and Qualifications of the Trustees. The Governance and Nominating Committee has adopted a statement of policy that describes the experience, qualifications, attributes, and skills that are necessary and desirable for potential Independent Trustee candidates (Statement of Policy). The Board believes that each Trustee satisfied at the time he or she was initially elected or appointed a Trustee, and continues to satisfy, the standards contemplated by the Statement of Policy. The Governance and Nominating Committee also engages professional search firms to help identify potential Independent Trustee candidates who have the experience, qualifications, attributes, and skills consistent with the Statement of Policy. From time to time, additional criteria based on the composition and skills of the current Independent Trustees, as well as experience or skills that may be appropriate in light of future changes to board composition, business conditions, and regulatory or other developments, have also been considered by the professional search firms and the Governance and Nominating Committee. In addition, the Board takes into account the Trustees’ commitment and participation in Board and committee meetings, as well as their leadership of standing and ad hoc committees throughout their tenure.
In determining that a particular Trustee was and continues to be qualified to serve as a Trustee, the Board has considered a variety of criteria, none of which, in isolation, was controlling. The Board believes that, collectively, the Trustees have balanced and diverse experience, qualifications, attributes, and skills, which allow the Board to operate effectively in governing each fund and protecting the interests of shareholders. Information about the specific experience, skills, attributes, and qualifications of each Trustee, which in each case led to the Board’s conclusion that the Trustee should serve (or continue to serve) as a trustee of the funds, is provided below.
Board Structure and Oversight Function. James C. Curvey is an interested person and currently serves as Chairman. The Trustees have determined that an interested Chairman is appropriate and benefits shareholders because an interested Chairman has a personal and professional stake in the quality and continuity of services provided to the funds. Independent Trustees exercise their informed business judgment to appoint an individual of their choosing to serve as Chairman, regardless of whether the Trustee happens to be independent or a member of management. The Independent Trustees have determined that they can act independently and effectively without having an Independent Trustee serve as Chairman and that a key structural component for assuring that they are in a position to do so is for the Independent Trustees to constitute a substantial majority for the Board. The Independent Trustees also regularly meet in executive session. Ned C. Lautenbach serves as Chairman of the Independent Trustees and as such (i) acts as a liaison between the Independent Trustees and management with respect to matters important to the Independent Trustees and (ii) with management prepares agendas for Board meetings.
Fidelity® funds are overseen by different Boards of Trustees. The funds’ Board oversees Fidelity’s high income and certain equity funds, and other Boards oversee Fidelity’s investment-grade bond, money market, asset allocation, and other equity funds. The asset allocation funds may invest in Fidelity® funds overseen by the funds’ Board. The use of separate Boards, each with its own committee structure, allows the Trustees of each group of Fidelity® funds to focus on the unique issues of the funds they oversee, including common research, investment, and operational issues. On occasion, the separate Boards establish joint committees to address issues of overlapping consequences for the Fidelity® funds overseen by each Board.
| 109 | Annual Report |
Table of Contents
Trustees and Officers (Unaudited) – continued
The Trustees operate using a system of committees to facilitate the timely and efficient consideration of all matters of importance to the Trustees, each fund, and fund shareholders and to facilitate compliance with legal and regulatory requirements and oversight of the funds’ activities and associated risks. The Board, acting through its committees, has charged SelectCo and its affiliates with (i) identifying events or circumstances the occurrence of which could have demonstrably adverse effects on the funds’ business and/or reputation; (ii) implementing processes and controls to lessen the possibility that such events or circumstances occur or to mitigate the effects of such events or circumstances if they do occur; and (iii) creating and maintaining a system designed to evaluate continuously business and market conditions in order to facilitate the identification and implementation processes described in (i) and (ii) above. Because the day-to-day operations and activities of the funds are carried out by or through SelectCo, its affiliates, and other service providers, the funds’ exposure to risks is mitigated but not eliminated by the processes overseen by the Trustees. While each of the Board’s committees has responsibility for overseeing different aspects of the funds’ activities, oversight is exercised primarily through the Operations, Audit, and Compliance Committees. In addition, the Independent Trustees have worked with Fidelity to enhance the Board’s oversight of investment and financial risks, legal and regulatory risks, technology risks, and operational risks, including the development of additional risk reporting to the Board. Appropriate personnel, including but not limited to the funds’ Chief Compliance Officer (CCO), SelectCo’s internal auditor, the independent accountants, the funds’ Treasurer and portfolio management personnel, make periodic reports to the Board’s committees, as appropriate, including an annual review of Fidelity’s risk management program for the Fidelity® funds. The responsibilities of each standing committee, including their oversight responsibilities, are described further under “Standing Committees of the Trustees.”
Interested Trustees*:
Correspondence intended for a Trustee who is an interested person may be sent to Fidelity Investments, 245 Summer Street, Boston, Massachusetts 02210.
Name, Year of Birth; Principal Occupations and Other Relevant Experience+ |
James C. Curvey (1935) |
Year of Election or Appointment: 2018 |
Trustee |
Chairman of the Board of Trustees |
Mr. Curvey also serves as Trustee of other Fidelity® funds. Mr. Curvey is Vice Chairman (2007-present) and Director of FMR LLC (diversified financial services company). In addition, Mr. Curvey is an Overseer Emeritus for the Boston Symphony Orchestra, a Director of Artis-Naples, and a Trustee of Brewster Academy in Wolfeboro, New Hampshire. Previously, Mr. Curvey served as a Director of Fidelity Research & Analysis Co. (investment adviser firm, 2009-2018), Director of Fidelity Investments Money Management, Inc. (investment adviser firm, 2009-2014) and a Director of FMR and FMR Co., Inc. (investment adviser firms, 2007-2014). |
Charles S. Morrison (1960) |
Year of Election or Appointment: 2018 |
Trustee |
Mr. Morrison also serves as Trustee of other funds. He serves as President of Fidelity SelectCo, LLC (investment adviser firm, 2017-present) and Fidelity Management & Research Company (FMR) (investment adviser firm, 2016-present), a Director of Fidelity Investments Money Management, Inc. (FIMM) (investment adviser firm, 2014-present), Director of Fidelity SelectCo, LLC (investment adviser firm, 2014-present), President, Asset Management (2014-present), and is an employee of Fidelity Investments. Previously, Mr. Morrison served as Vice President of Fidelity’s Fixed Income and Asset Allocation Funds (2012-2014), President, Fixed Income (2011-2014), Vice President of Fidelity’s Money Market Funds (2005-2009), President, Money Market Group Leader of FMR (investment adviser firm, 2009), and Senior Vice President, Money Market Group of FMR (2004-2009). Mr. Morrison also served as Vice President of Fidelity’s Bond Funds (2002-2005), certain Balanced Funds (2002-2005), and certain Asset Allocation Funds (2002-2007), and as Senior Vice President (2002-2005) of Fidelity’s Bond Division. |
* Determined to be an “Interested Trustee” by virtue of, among other things, his or her affiliation with the trust or various entities under common control with SelectCo. |
+ The information includes the Trustee’s principal occupation during the last five years and other information relating to the experience, attributes, and skills relevant to the Trustee’s qualifications to serve as a Trustee, which led to the conclusion that the Trustee should serve as a Trustee for each fund.
|
Independent Trustees:
|
| Correspondence intended for an Independent Trustee may be sent to Fidelity Investments, P.O. Box 55235, Boston, Massachusetts 02205-5235. |
Dennis J. Dirks (1948) |
| Annual Report | 110 |
Table of Contents
Name, Year of Birth; Principal Occupations and Other Relevant Experience+ |
Year of Election or Appointment: 2018 |
Trustee |
Mr. Dirks also serves as Trustee of other Fidelity® funds. Prior to his retirement in May 2003, Mr. Dirks was Chief Operating Officer and a member of the Board of The Depository Trust & Clearing Corporation (DTCC). He also served as President, Chief Operating Officer, and Board member of The Depository Trust Company (DTC) and President and Board member of the National Securities Clearing Corporation (NSCC). In addition, Mr. Dirks served as Chief Executive Officer and Board member of the Government Securities Clearing Corporation, Chief Executive Officer and Board member of the Mortgage-Backed Securities Clearing Corporation, as a Trustee and a member of the Finance Committee of Manhattan College (2005-2008), as a Trustee and a member of the Finance Committee of AHRC of Nassau County (2006-2008), as a member of the Independent Directors Council (IDC) Governing Council (2010-2015), and as a member of the Board of Directors for The Brookville Center for Children’s Services, Inc. (2009-2017). Mr. Dirks is a member of the Finance Committee (2016-present), Board of Directors (2017-present) and Board of Trustees (2018-present) and is Treasurer (2018-present) of the Asolo Repertory Theatre. |
Donald F. Donahue (1950) |
Year of Election or Appointment: 2018 |
Trustee |
Mr. Donahue also serves as a Trustee of other Fidelity® funds. Mr. Donahue is President and Chief Executive Officer of Miranda Partners, LLC (risk consulting for the financial services industry, 2012-present). Previously, Mr. Donahue served as a Member of the Advisory Board of certain Fidelity® funds (2015-2018) and Chief Executive Officer (2006-2012), Chief Operating Officer (2003-2006), and Managing Director, Customer Marketing and Development (1999-2003) of The Depository Trust & Clearing Corporation (financial markets infrastructure). Mr. Donahue serves as a Member (2007-present) and Co-Chairman (2016-present) of the Board of Directors of United Way of New York, Member of the Board of Directors of NYC Leadership Academy (2012-present) and Member of the Board of Advisors of Ripple Labs, Inc. (financial services, 2015-present). He also served as Chairman (2010-2012) and Member of the Board of Directors (2012-2013) of Omgeo, LLC (financial services), Treasurer of United Way of New York (2012-2016), and Member of the Board of Directors of XBRL US (financial services non-profit, 2009-2012) and the International Securities Services Association (2009-2012). |
Alan J. Lacy (1953) |
Year of Election or Appointment: 2018 |
Trustee |
Mr.��Lacy also serves as Trustee of other Fidelity® funds. Mr. Lacy serves as a Director of Bristol-Myers Squibb Company (global pharmaceuticals, 2008-present). He is a Trustee of the California Chapter of The Nature Conservancy (2015-present) and a Director of the Center for Advanced Study in the Behavioral Sciences at Stanford University (2015-present). In addition, Mr. Lacy served as Senior Adviser (2007-2014) of Oak Hill Capital Partners, L.P. (private equity) and also served as Chief Executive Officer (2005) and Vice Chairman (2005-2006) of Sears Holdings Corporation (retail) and Chief Executive Officer and Chairman of the Board of Sears, Roebuck and Co. (retail, 2000-2005). Previously, Mr. Lacy served as Chairman (2014-2017) and a member (2010-2017) of the Board of Directors of Dave & Buster’s Entertainment, Inc. (restaurant and entertainment complexes), as Chairman (2008-2011) and a member (2006-2015) of the Board of Trustees of the National Parks Conservation Association, and as a member of the Board of Directors for The Hillman Companies, Inc. (hardware wholesalers, 2010-2014), Earth Fare, Inc. (retail grocery, 2010-2014), and The Western Union Company (global money transfer, 2006-2011). |
Ned C. Lautenbach (1944) |
Year of Election or Appointment: 2018 |
Trustee |
Chairman of the Independent Trustees |
Mr. Lautenbach also serves as Trustee of other Fidelity® funds. Mr. Lautenbach currently serves as Vice Chair of the Board of Governors, State University System of Florida (2013-present) and is a member of the Council on Foreign Relations (1994-present). He is also a member and has most recently served as Chairman of the Board of Directors of Artis-Naples (2012-present). Previously, Mr. Lautenbach served as a member and then Lead Director of the Board of Directors of Eaton Corporation (diversified industrial, 1997-2016). He was also a Partner and Advisory Partner at Clayton, Dubilier & Rice, LLC (private equity investment, 1998-2010), as well as a Director of Sony Corporation (2006-2007). In addition, Mr. Lautenbach also had a 30-year career with IBM (technology company) during which time he served as Senior Vice President and a member of the Corporate Executive Committee (1968-1998). |
Joseph Mauriello (1944) |
Year of Election or Appointment: 2018 |
| 111 | Annual Report |
Table of Contents
Trustees and Officers (Unaudited) – continued
Name, Year of Birth; Principal Occupations and Other Relevant Experience+ |
Trustee |
Mr. Mauriello also serves as Trustee of other Fidelity® funds. Prior to his retirement in January 2006, Mr. Mauriello served in numerous senior management positions including Deputy Chairman and Chief Operating Officer (2004-2005), and Vice Chairman of Financial Services (2002-2004) of KPMG LLP US (professional services, 1965-2005). Mr. Mauriello currently serves as a member of the Board of Directors of XL Group plc. (global insurance and re-insurance, 2006-present) and the Independent Directors Council (IDC) Governing Council (2015-present). Previously, Mr. Mauriello served as a Director of the Hamilton Funds of the Bank of New York (2006-2007) and of Arcadia Resources Inc. (health care services and products, 2007-2012). |
Cornelia M. Small (1944) |
Year of Election or Appointment: 2018 |
Trustee |
Ms. Small also serves as Trustee of other Fidelity® funds. Ms. Small is a member of the Board of Directors (2009-present) and Chair of the Investment Committee (2010-present) of the Teagle Foundation. Ms. Small also serves on the Investment Committee of the Berkshire Taconic Community Foundation (2008-present). Previously, Ms. Small served as Chairperson (2002-2008) and a member of the Investment Committee and Chairperson (2008-2012) and a member of the Board of Trustees of Smith College. In addition, Ms. Small served as Chief Investment Officer, Director of Global Equity Investments, and a member of the Board of Directors of Scudder, Stevens & Clark and Scudder Kemper Investments. |
Garnett A. Smith (1947) |
Year of Election or Appointment: 2013 |
Trustee |
Mr. Smith also serves as Trustee of other Fidelity® funds. Prior to Mr. Smith’s retirement, he served as Chairman and Chief Executive Officer of Inbrand Corp. (manufacturer of personal absorbent products, 1990-1997). He also served as President (1986-1990) of Inbrand Corp. Prior to his employment with Inbrand Corp., he was employed by a retail fabric chain and North Carolina National Bank. In addition, Mr. Smith served as a Member of the Advisory Board of certain Fidelity® funds (2012-2013) and as a board member of the Jackson Hole Land Trust (2009-2012). |
David M. Thomas (1949) |
Year of Election or Appointment: 2018 |
Trustee |
Mr. Thomas also serves as Trustee of other Fidelity® funds. Mr. Thomas serves as Non-Executive Chairman of the Board of Directors of Fortune Brands Home and Security (home and security products, 2011-present), as a member of the Board of Directors (2004-present) and Presiding Director (2013-present) of Interpublic Group of Companies, Inc. (marketing communication), and as a member of the Board of Trustees of the University of Florida (2013-present). Previously, Mr. Thomas served as Executive Chairman (2005-2006) and Chairman and Chief Executive Officer (2000-2005) of IMS Health, Inc. (pharmaceutical and healthcare information solutions), and a Director of Fortune Brands, Inc. (consumer products, 2000-2011). |
Michael E. Wiley (1950) |
Year of Election or Appointment: 2008 |
Trustee |
Mr. Wiley also serves as Trustee or Member of the Advisory Board of other Fidelity® funds. Mr. Wiley serves as a Director of Andeavor Corporation (independent oil refiner and marketer, 2005-present), a Director of Andeavor Logistics LP (natural resources logistics, 2015-present), and a Director of Bill Barrett Corporation (exploration and production, 2005-present). In addition, Mr. Wiley also serves as a Director of Post Oak Bank (privately-held bank, 2004-present). Previously, Mr. Wiley served as a Trustee of other Fidelity® funds (2008-2013), as a Director of Asia Pacific Exploration Consolidated (international oil and gas exploration and production, 2008-2013), as a member of the Board of Trustees of the University of Tulsa (2000-2006; 2007-2010), as a Senior Energy Advisor of Katzenbach Partners, LLC (consulting, 2006-2007), as an Advisory Director of Riverstone Holdings (private investment), Chairman, President, and CEO of Baker Hughes, Inc. (oilfield services, 2000-2004), and as Director of Spinnaker Exploration Company (exploration and production, 2001-2005). |
+ The information includes the Trustee’s principal occupation during the last five years and other information relating to the experience, attributes, and skills relevant to the Trustee’s qualifications to serve as a Trustee, which led to the conclusion that the Trustee should serve as a Trustee for each fund. |
| Annual Report | 112 |
Table of Contents
Advisory Board Members and Officers: |
Correspondence intended for a Member of the Advisory Board (if any) may be sent to Fidelity Investments, P.O. Box 55235, Boston, Massachusetts 02205-5235. Correspondence intended for an officer or Peter S. Lynch may be sent to Fidelity Investments, 245 Summer Street, Boston, Massachusetts 02210. Officers appear below in alphabetical order.
|
Name, Year of Birth; Principal Occupation |
Peter S. Lynch (1944) |
Year of Election or Appointment: 2018 |
Member of the Advisory Board |
Mr. Lynch also serves as Member of the Advisory Board of other Fidelity® funds. Mr. Lynch is Vice Chairman and a Director of FMR (investment adviser firm) and FMR Co., Inc. (investment adviser firm). In addition, Mr. Lynch serves as a Trustee of Boston College and as the Chairman of the Inner-City Scholarship Fund. Previously, Mr. Lynch served on the Special Olympics International Board of Directors (1997-2006). |
| William S. Stavropoulos (1939) |
| Year of Election or Appointment: 2018 |
| Member of the Advisory Board |
Mr. Stavropoulos also serves as Member of the Advisory Board of other Fidelity® funds. Mr. Stavropoulos serves as President and Founder of the Michigan Baseball Foundation, the Great Lakes Loons (2007-present). Mr. Stavropoulos is Chairman Emeritus of the Board of Directors of The Dow Chemical Company, where he previously served in numerous senior management positions, including President, CEO (1995-2000; 2002-2004), Chairman of the Executive Committee (2000-2006), and as a member of the Board of Directors (1990-2006). Currently, Mr. Stavropoulos is Chairman of the Board of Directors of Univar Inc. (global distributor of commodity and specialty chemicals), a Director of Teradata Corporation (data warehousing and technology solutions), and a member of the Advisory Board for Metalmark Capital LLC (private equity investment, 2005-present). Mr. Stavropoulos is an operating advisor to Clayton, Dubilier & Rice, LLC (private equity investment). In addition, Mr. Stavropoulos is a member of the University of Notre Dame Advisory Council for the College of Science, a Trustee of the Rollin L. Gerstacker Foundation, and a Director of Artis-Naples in Naples, Florida. Previously, Mr. Stavropoulos served as Trustee of certain Fidelity® funds (2001-2018) and as a Director of Chemical Financial Corporation (bank holding company, 1993-2012) and Tyco International, Ltd. (multinational manufacturing and services, 2007-2012). |
Carol B. Tomé (1957) |
Year of Election or Appointment: 2017 |
Member of the Advisory Board |
Ms. Tomé also serves as Member of the Advisory Board of other Fidelity® funds. Ms. Tomé is Chief Financial Officer (2001-present) and Executive Vice President of Corporate Services (2007-present) of The Home Depot, Inc. (home improvement retailer) and a Director (2003-present) and Chair of the Audit Committee (2004-present) of United Parcel Service, Inc. (package delivery and supply chain management). Previously, Ms. Tomé served as Trustee of certain Fidelity® funds (2017), Senior Vice President of Finance and Accounting/Treasurer (2000-2007) and Vice President and Treasurer (1995-2000) of The Home Depot, Inc. and Chair of the Board (2010-2012), Vice Chair of the Board (2009 and 2013), and a Director (2008-2013) of the Federal Reserve Bank of Atlanta. Ms. Tomé is also a director or trustee of many community and professional organizations. |
Elizabeth Paige Baumann (1968) |
Year of Election or Appointment: 2017 |
Anti-Money Laundering (AML) Officer |
Ms. Baumann also serves as AML Officer of other funds. She is Chief AML Officer (2012-present) and Senior Vice President (2014-present) of FMR LLC (diversified financial services company) and is an employee of Fidelity Investments. Previously, Ms. Baumann served as AML Officer of the funds (2012-2016), and Vice President (2007-2014) and Deputy Anti-Money Laundering Officer (2007-2012) of FMR LLC. |
Marc R. Bryant (1966) |
Year of Election or Appointment: 2013 |
| 113 | Annual Report |
Table of Contents
Trustees and Officers (Unaudited) – continued
Name, Year of Birth; Principal Occupation |
Secretary and Chief Legal Officer (CLO) |
Mr. Bryant also serves as Secretary and CLO of other funds. Mr. Bryant serves as CLO, Secretary, and Senior Vice President of Fidelity Management & Research Company (investment adviser firm, 2015-present) and FMR Co., Inc. (investment adviser firm, 2015-present); Secretary of Fidelity SelectCo, LLC (investment adviser firm, 2015-present) and Fidelity Investments Money Management, Inc. (investment adviser firm, 2015-present); and CLO of Fidelity Management & Research (Hong Kong) Limited and FMR Investment Management (UK) Limited (investment adviser firms, 2015-present) and Fidelity Management & Research (Japan) Limited (investment adviser firm, 2016-present). He is Senior Vice President and Deputy General Counsel of FMR LLC (diversified financial services company). Previously, Mr. Bryant served as Secretary and CLO of Fidelity Rutland Square Trust II (2010-2014) and Assistant Secretary of Fidelity’s Fixed Income and Asset Allocation Funds (2013-2015). Prior to joining Fidelity Investments, Mr. Bryant served as a Senior Vice President and the Head of Global Retail Legal for AllianceBernstein L.P. (2006-2010), and as the General Counsel for ProFund Advisors LLC (2001-2006). |
John J. Burke III (1964) |
Year of Election or Appointment: 2018 |
Chief Financial Officer |
Mr. Burke also serves as Chief Financial Officer of other funds. Mr. Burke serves as Head of Investment Operations for Fidelity Fund and Investment Operations (2018-present) and is an employee of Fidelity Investments (1998-present). Previously Mr. Burke served as head of Asset Management Investment Operations (2012-2018). |
William C. Coffey (1969) |
Year of Election or Appointment: 2009 |
Assistant Secretary |
Mr. Coffey also serves as Assistant Secretary of other funds. He is Senior Vice President and Deputy General Counsel of FMR LLC (diversified financial services company, 2010-present), and is an employee of Fidelity Investments. Previously, Mr. Coffey served as Vice President and Associate General Counsel of FMR LLC (2005-2009). |
Timothy M. Cohen (1969) |
Year of Election or Appointment: 2018 |
Vice President |
Mr. Cohen also serves as Vice President of other funds. Mr. Cohen serves as Co-Head of Global Equity Research (2016-present), a Director of Fidelity Management & Research (Japan) Limited (investment adviser firm, 2016-present), and is an employee of Fidelity Investments. Previously, Mr. Cohen served as Chief Investment Officer – Equity and a Director of Fidelity Management & Research (U.K.) Inc. (investment adviser firm, 2013-2015) and as a Director of Fidelity Management & Research (Hong Kong) Limited (investment adviser firm, 2017). |
Jonathan Davis (1968) |
Year of Election or Appointment: 2010 |
Assistant Treasurer |
Mr. Davis also serves as Assistant Treasurer of other funds. Mr. Davis serves as Assistant Treasurer of FMR Capital, Inc. (2017-present) and is an employee of Fidelity Investments. Previously, Mr. Davis served as Vice President and Associate General Counsel of FMR LLC (diversified financial services company, 2003-2010). |
Adrien E. Deberghes (1967) |
Year of Election or Appointment: 2018 |
Assistant Treasurer |
Mr. Deberghes also serves as an officer of other funds. He serves as Assistant Treasurer of FMR Capital, Inc. (2017-present), Executive Vice President of Fidelity Investments Money Management, Inc. (FIMM) (investment adviser firm, 2016-present), and is an employee of Fidelity Investments (2008-present). Previously, Mr. Deberghes served as President and Treasurer of certain Fidelity® funds (2013-2018). Prior to joining Fidelity Investments, Mr. Deberghes was Senior Vice President of Mutual Fund Administration at State Street Corporation (2007-2008), Senior Director of Mutual Fund Administration at Investors Bank & Trust (2005-2007), and Director of Finance for Dunkin’ Brands (2000-2005). Previously, Mr. Deberghes served in other fund officer roles. |
Laura M. Del Prato (1964) |
Year of Election or Appointment: 2018 |
| Annual Report | 114 |
Table of Contents
Name, Year of Birth; Principal Occupation |
Assistant Treasurer |
Ms. Del Prato also serves as an officer of other funds. Ms. Del Prato is an employee of Fidelity Investments (2017-present). Prior to joining Fidelity Investments, Ms. Del Prato served as a Managing Director and Treasurer of the JPMorgan Mutual Funds (2014-2017). Prior to JPMorgan, Ms. Del Prato served as a partner at Cohen Fund Audit Services (accounting firm, 2012-2013) and KPMG LLP (accounting firm, 2004-2012). |
Colm A. Hogan (1973) |
Year of Election or Appointment: 2018 |
Deputy Treasurer |
Mr. Hogan also serves as an officer of other funds. Mr. Hogan serves as Assistant Treasurer of FMR Capital, Inc. (2017-present) and is an employee of Fidelity Investments (2005-present). Previously, Mr. Hogan served as Assistant Treasurer of certain Fidelity® funds (2016-2018). |
Pamela R. Holding (1964) |
Year of Election or Appointment: 2018 |
Vice President |
Ms. Holding also serves as a Vice President of other funds. Ms. Holding serves as Co-Head of Global Equity Research (2018-present) and is an employee of Fidelity Investments (2013-present). |
Chris Maher (1972) |
Year of Election or Appointment: 2013 |
Assistant Treasurer |
Mr. Maher serves as Assistant Treasurer of other funds. Mr. Maher is Vice President of Valuation Oversight, serves as Assistant Treasurer of FMR Capital, Inc. (2017-present), and is an employee of Fidelity Investments. Previously, Mr. Maher served as Vice President of Asset Management Compliance (2013), Vice President of the Program Management Group of FMR (investment adviser firm, 2010-2013), and Vice President of Valuation Oversight (2008-2010). |
Rieco E. Mello (1969) |
Year of Election or Appointment: 2017 |
Assistant Treasurer |
Mr. Mello also serves as Assistant Treasurer of other funds. Mr. Mello serves as Assistant Treasurer of FMR Capital, Inc. |
(2017-present) and is an employee of Fidelity Investments (1995-present). |
Kenneth B. Robins (1969) |
Year of Election or Appointment: 2018 |
Chief Compliance Officer |
Mr. Robins also serves as an officer of other funds. Mr. Robins serves as Compliance Officer of Fidelity Management & Research Company and FMR Co., Inc. (investment adviser firms, 2016-present) and is an employee of Fidelity Investments (2004-present). Previously, Mr. Robins served as Executive Vice President of Fidelity Investments Money Management, Inc. (investment adviser firm, 2013-2016) and served in other fund officer roles. |
Stacie M. Smith (1974) |
Year of Election or Appointment: 2018 |
President and Treasurer |
Ms. Smith also serves as an officer of other funds. Ms. Smith serves as Assistant Treasurer of FMR Capital, Inc. (2017-present), is an employee of Fidelity Investments (2009-present), and has served in other fund officer roles. Prior to joining Fidelity Investments, Ms. Smith served as Senior Audit Manager of Ernst & Young LLP (accounting firm, 1996-2009). Previously, Ms. Smith served as Assistant Treasurer (2013-2018) and Deputy Treasurer (2013-2016) of certain Fidelity® funds. |
Marc L. Spector (1972) |
Year of Election or Appointment: 2017 |
Assistant Treasurer |
Mr. Spector also serves as an officer of other funds. Mr. Spector serves as Assistant Treasurer of FMR Capital, Inc. (2017-present) and is an employee of Fidelity Investments (2016-present). Prior to joining Fidelity Investments, Mr. Spector served as Director at the Siegfried Group (accounting firm, 2013-2016), and prior to Siegfried Group as audit senior manager at Deloitte & Touche (accounting firm, 2005-2013). |
Renee Stagnone (1975) |
| 115 | Annual Report |
Table of Contents
Trustees and Officers (Unaudited) – continued
Name, Year of Birth; Principal Occupation |
Year of Election or Appointment: 2016 |
Assistant Treasurer |
Ms. Stagnone also serves as an officer of other funds. Ms. Stagnone serves as Assistant Treasurer of FMR Capital, Inc. (2017-present) and is an employee of Fidelity Investments (1997-present). Previously, Ms. Stagnone served as Deputy Treasurer of certain Fidelity® funds (2013-2016). |
| Annual Report | 116 |
Table of Contents
As a shareholder of a Fund, you incur two types of costs: (1) transaction costs, and (2) ongoing costs, including management fees and other Fund expenses. This Example is intended to help you understand your ongoing costs (in dollars) of investing in a Fund and to compare these costs with the ongoing costs of investing in other funds.
The Example is based on an investment of $1,000 invested at the beginning of the period and held for the entire period (February 1, 2018 to July 31, 2018).
Actual Expenses
For each fund, the first line of the accompanying table provides information about actual account values and actual expenses. You may use the information in this line, together with the amount you invested, to estimate the expenses that you paid over the period. Simply divide your account value by $1,000.00 (for example, an $8,600 account value divided by $1,000.00 = 8.6), then multiply the result by the number in the first line for each Fund under the heading entitled “Expenses Paid During Period” to estimate the expenses you paid on your account during this period. In addition, each Fund, as a shareholder in the underlying money market fund, will indirectly bear its pro-rata share of the fees and expenses incurred by the underlying money market fund. These fees and expenses are not included in each Fund’s annualized expense ratio used to calculate the expense estimates in the table below.
Hypothetical Example for Comparison Purposes
For each fund, the second line of the accompanying table provides information about hypothetical account values and hypothetical expenses based on the Fund’s actual expense ratio and an assumed rate of return of 5% per year before expenses, which is not the Fund’s actual return. The hypothetical account values and expenses may not be used to estimate the actual ending account balance or expenses you paid for the period. You may use this information to compare the ongoing costs of investing in the Fund and other funds. To do so, compare this 5% hypothetical example with the 5% hypothetical examples that appear in the shareholder reports of the other funds. In addition, each Fund, as a shareholder in the underlying money market fund, will indirectly bear its pro-rata share of the fees and expenses incurred by the underlying money market fund. These fees and expenses are not included in each Fund’s annualized expense ratio used to calculate the expense estimates in the table below.
Please note that the expenses shown in the table are meant to highlight your ongoing costs only and do not reflect any transaction costs. Therefore, the second line of the table is useful in comparing ongoing costs only, and will not help you determine the relative total costs of owning different funds.
| Annualized Expense RatioA | Beginning Account Value February 1, 2018 | Ending Account Value July 31, 2018 | Expenses Paid During PeriodB February 1, 2018 to July 31, 2018 | |||||||||||||
Fidelity MSCI Consumer Discretionary Index ETF | 0.08% | |||||||||||||||
Actual | $ | 1,000.00 | $ | 1,028.30 | $ | 0.41 | ||||||||||
HypotheticalC | $ | 1,000.00 | $ | 1,024.40 | $ | 0.40 | ||||||||||
Fidelity MSCI Consumer Staples Index ETF | 0.08% | |||||||||||||||
Actual | $ | 1,000.00 | $ | 941.50 | $ | 0.39 | ||||||||||
HypotheticalC | $ | 1,000.00 | $ | 1,024.40 | $ | 0.40 | ||||||||||
Fidelity MSCI Energy Index ETF | 0.08% | |||||||||||||||
Actual | $ | 1,000.00 | $ | 1,053.30 | $ | 0.41 | ||||||||||
HypotheticalC | $ | 1,000.00 | $ | 1,024.40 | $ | 0.40 | ||||||||||
Fidelity MSCI Financials Index ETF | 0.08% | |||||||||||||||
Actual | $ | 1,000.00 | $ | 962.80 | $ | 0.39 | ||||||||||
HypotheticalC | $ | 1,000.00 | $ | 1,024.40 | $ | 0.40 | ||||||||||
Fidelity MSCI Health Care Index ETF | 0.08% | |||||||||||||||
Actual | $ | 1,000.00 | $ | 1,030.80 | $ | 0.41 | ||||||||||
HypotheticalC | $ | 1,000.00 | $ | 1,024.40 | $ | 0.40 | ||||||||||
Fidelity MSCI Industrials Index ETF | 0.08% | |||||||||||||||
Actual | $ | 1,000.00 | $ | 981.70 | $ | 0.40 | ||||||||||
HypotheticalC | $ | 1,000.00 | $ | 1,024.40 | $ | 0.40 | ||||||||||
Fidelity MSCI Information Technology Index ETF | 0.08% | |||||||||||||||
Actual | $ | 1,000.00 | $ | 1,053.90 | $ | 0.41 | ||||||||||
HypotheticalC | $ | 1,000.00 | $ | 1,024.40 | $ | 0.40 | ||||||||||
| 117 | Annual Report |
Table of Contents
Shareholder Expense Example – continued
| Annualized Expense RatioA | Beginning Account Value February 1, 2018 | Ending Account Value July 31, 2018 | Expenses Paid During PeriodB February 1, 2018 to July 31, 2018 | |||||||||||||
Fidelity MSCI Materials Index ETF | 0.08% | |||||||||||||||
Actual | $ | 1,000.00 | $ | 964.30 | $ | 0.39 | ||||||||||
HypotheticalC | $ | 1,000.00 | $ | 1,024.40 | $ | 0.40 | ||||||||||
Fidelity MSCI Real Estate Index ETF | 0.08% | |||||||||||||||
Actual | $ | 1,000.00 | $ | 1,050.30 | $ | 0.41 | ||||||||||
HypotheticalC | $ | 1,000.00 | $ | 1,024.40 | $ | 0.40 | ||||||||||
Fidelity MSCI Telecommunication Services Index ETF | 0.08% | |||||||||||||||
Actual | $ | 1,000.00 | $ | 933.90 | $ | 0.39 | ||||||||||
HypotheticalC | $ | 1,000.00 | $ | 1,024.40 | $ | 0.40 | ||||||||||
Fidelity MSCI Utilities Index ETF | 0.08% | |||||||||||||||
Actual | $ | 1,000.00 | $ | 1,062.20 | $ | 0.41 | ||||||||||
HypotheticalC | $ | 1,000.00 | $ | 1,024.40 | $ | 0.40 | ||||||||||
| A | Annualized expense ratio reflects expenses net of applicable fee waivers. |
| B | Expense are equal to each Fund’s annualized expense ratio, multiplied by the average account value over the period, multiplied by 181/365 (to reflect the one-half year period). |
| C | 5% return per year before expenses. |
| Annual Report | 118 |
Table of Contents
A percentage of the dividends distributed during the fiscal year for the following funds qualifies for the dividend-received deduction for corporate shareholders:
| September 2017 | December 2017 | March 2018 | June 2018 | |||||||||||||
| Fidelity MSCI Consumer Discretionary Index ETF | 100 | % | 100 | % | 100 | % | 100 | % | ||||||||
| Fidelity MSCI Consumer Staples Index ETF | 95 | % | 95 | % | 100 | % | 100 | % | ||||||||
| Fidelity MSCI Energy Index ETF | 93 | % | 93 | % | 100 | % | 100 | % | ||||||||
| Fidelity MSCI Financials Index ETF | 88 | % | 88 | % | 100 | % | 100 | % | ||||||||
| Fidelity MSCI Health Care Index ETF | 100 | % | 100 | % | 100 | % | 100 | % | ||||||||
| Fidelity MSCI Industrials Index ETF | 95 | % | 95 | % | 100 | % | 100 | % | ||||||||
| Fidelity MSCI Information Technology Index ETF | 94 | % | 94 | % | 100 | % | 100 | % | ||||||||
| Fidelity MSCI Materials Index ETF | 95 | % | 95 | % | 100 | % | 100 | % | ||||||||
| Fidelity MSCI Real Estate Index ETF | 4 | % | 4 | % | 1 | % | 1 | % | ||||||||
| Fidelity MSCI Telecommunication Services Index ETF | 28 | % | 28 | % | 100 | % | 100 | % | ||||||||
| Fidelity MSCI Utilities Index ETF | 99 | % | 99 | % | 100 | % | 100 | % | ||||||||
A percentage of the dividends distributed during the fiscal year for the following funds may be taken into account as a dividend for purposes of the maximum rate under section 1(h)(11) of the Internal Revenue Code.
| September 2017 | December 2017 | March 2018 | June 2018 | |||||||||||||
| Fidelity MSCI Consumer Discretionary Index ETF | 100 | % | 100 | % | 100 | % | 100 | % | ||||||||
| Fidelity MSCI Consumer Staples Index ETF | 91 | % | 91 | % | 100 | % | 100 | % | ||||||||
| Fidelity MSCI Energy Index ETF | 100 | % | 100 | % | 100 | % | 100 | % | ||||||||
| Fidelity MSCI Financials Index ETF | 92 | % | 92 | % | 100 | % | 100 | % | ||||||||
| Fidelity MSCI Health Care Index ETF | 98 | % | 98 | % | 100 | % | 100 | % | ||||||||
| Fidelity MSCI Industrials Index ETF | 98 | % | 98 | % | 100 | % | 100 | % | ||||||||
| Fidelity MSCI Information Technology Index ETF | 100 | % | 100 | % | 100 | % | 100 | % | ||||||||
| Fidelity MSCI Materials Index ETF | 95 | % | 95 | % | 100 | % | 100 | % | ||||||||
| Fidelity MSCI Real Estate Index ETF | 4 | % | 4 | % | 1 | % | 1 | % | ||||||||
| Fidelity MSCI Telecommunication Services Index ETF | 26 | % | 26 | % | 100 | % | 100 | % | ||||||||
| Fidelity MSCI Utilities Index ETF | 98 | % | 98 | % | 100 | % | 100 | % | ||||||||
The funds will notify shareholders in January 2019 of amounts for use in preparing 2018 income tax returns.
| 119 | Annual Report |
Table of Contents
A special meeting of shareholders was held on December 8, 2017. The results of votes taken among shareholders on the proposals before them are reported below. Each vote reported represents one dollar of net asset value held on the record date for the meeting.
PROPOSAL 1
To elect a Board of Trustees.
| # of Votes | % of Votes | |||||||
James C. Curvey | ||||||||
Affirmative | 5,373,295,935.29 | 96.534 | ||||||
Withheld | 192,965,565.88 | 3.466 | ||||||
TOTAL | 5,566,261,501.17 | 100.000 | ||||||
Dennis J. Dirks | ||||||||
Affirmative | 5,384,798,777.80 | 96.740 | ||||||
Withheld | 181,462,723.37 | 3.260 | ||||||
TOTAL | 5,566,261,501.17 | 100.000 | ||||||
Donald F. Donahue | ||||||||
Affirmative | 5,377,488,531.57 | 96.609 | ||||||
Withheld | 188,772,969.60 | 3.391 | ||||||
TOTAL | 5,566,261,501.17 | 100.000 | ||||||
Alan J. Lacy | ||||||||
Affirmative | 5,375,762,700.02 | 96.578 | ||||||
Withheld | 190,498,801.15 | 3.422 | ||||||
TOTAL | 5,566,261,501.17 | 100.000 | ||||||
Ned C. Lautenbach | ||||||||
Affirmative | 5,386,790,303.34 | 96.453 | ||||||
Withheld | 197,471,197.83 | 3.547 | ||||||
TOTAL | 5,566,261,501.17 | 100.000 | ||||||
Joseph Mauriello | ||||||||
Affirmative | 5,373,144,912.99 | 96.531 | ||||||
Withheld | 193,116,588.18 | 3.469 | ||||||
TOTAL | 5,566,261,501.17 | 100.000 | ||||||
Charles S. Morrison | ||||||||
Affirmative | 5,387,562,353.92 | 96.790 | ||||||
Withheld | 178,699,147.25 | 3.210 | ||||||
TOTAL | 5,566,261,501.17 | 100.000 | ||||||
Cornelia M. Small | ||||||||
Affirmative | 5,375,640,910.13 | 96.576 | ||||||
Withheld | 190,620,591.04 | 3.424 | ||||||
TOTAL | 5,566,261,501.17 | 100.000 | ||||||
Garnett A. Smith | ||||||||
Affirmative | 5,372,688,014.12 | 96.523 | ||||||
Withheld | 193,573,487.05 | 3.477 | ||||||
TOTAL | 5,566,261,501.17 | 100.000 | ||||||
David M. Thomas | ||||||||
Affirmative | 5,376,226,536.98 | 96.586 | ||||||
Withheld | 190,034,964.19 | 3.414 | ||||||
TOTAL | 5,566,261,501.17 | 100.000 | ||||||
Michael E. Wiley | ||||||||
Affirmative | 5,376,768,165.19 | 96.596 | ||||||
Withheld | 189,493,335.98 | 3.404 | ||||||
TOTAL | 5,566,261,501.17 | 100.000 | ||||||
PROPOSAL 4
To change Fidelity MSCI Industrials Index ETF from a diversified fund to a non-diversified fund.
| # of Votes | % of Votes | |||||||
Affirmative | 67,288,118.62 | 18.343 | ||||||
Against | 5,272,522.98 | 1.438 | ||||||
Abstain | 2,810,124.31 | 0.766 | ||||||
Broker Non-Vote | 291,468,024.94 | 79.453 | ||||||
TOTAL | 366,838,790.85 | 100.000 | ||||||
Proposal 1 reflects trust wide proposal and voting results.
Proposal 4 was not approved by shareholders.
| Annual Report | 120 |
Table of Contents
[THIS PAGE INTENTIONALLY LEFT BLANK]
| 121 |
Table of Contents
[THIS PAGE INTENTIONALLY LEFT BLANK]
| 122 |
Table of Contents
[THIS PAGE INTENTIONALLY LEFT BLANK]
| 123 |
Table of Contents
 | ||||
| EXT-ANN-0918 1.9584796.104 | 855950.1.0 | Corporate Headquarters 245 Summer St., Boston, MA 02210 www.fidelity.com | ||
Table of Contents
Fidelity® Dividend ETF for Rising Rates
Fidelity High Dividend ETF
Fidelity Low Volatility Factor ETF
Fidelity Momentum Factor ETF
Fidelity Quality Factor ETF
Fidelity Value Factor ETF
Annual Report July 31, 2018
|  |

Table of Contents
To view a fund’s proxy voting guidelines and proxy voting record for the period ended June, 30, visit http://www.fidelity.com/proxyvotingresults or visit the Securities and Exchange Commission’s (SEC) web site at http://www.sec.gov. You may also call 1-800-FIDELITY to request a free copy of the proxy voting guidelines.
Standard & Poor’s, S&P and S&P 500 are registered service marks of The McGraw-Hill Companies, Inc. and have been licensed for use by Fidelity Distributors Corporation.
Other third party marks appearing herein are the property of their respective owners.
All other marks appearing herein are registered or unregistered trademarks or service marks of FMR LLC or an affiliated company.
© 2018 FMR LLC. All Rights reserved.
This report and the financial statements contained herein are submitted for the general information of the shareholders of the funds. This report is not authorized for distribution to prospective investors in the funds unless preceded or accompanied by an effective prospectus.
A fund files its complete schedule of portfolio holdings with the SEC for the first and third quarters of each fiscal year on Form N-Q. Forms N-Q are available on the SEC’s web site at http://www.sec.gov. A fund’s Forms N-Q may be reviewed and copied at the SEC’s Public Reference Room in Washington, DC. Information regarding the operation of the SEC’s Public Reference Room may be obtained by calling 1-800-SEC-0330. For a complete list of a fund’s portfolio holdings, view the most recent holdings listing on Fidelity’s web site at http://www.fidelity.com, http://www.advisor.fidelity.com, or http://www.401k.com, as applicable.
NOT FDIC INSURED • MAY LOSE VALUE • NO BANK GUARANTEE
Neither the funds nor Fidelity Distributors Corporation is a bank.
| Annual Report | 2 |
Table of Contents
The U.S. equity bellwether S&P 500® index gained 16.24% for the 12 months ending July 31, 2018, despite a resurgence in volatility that challenged the multiyear bull market. Stocks maintained their steady growth until a sharp reversal in February, as volatility spiked amid fear that rising inflation and the potential for the economy to overheat would prompt the U.S. Federal Reserve to pick up the pace of interest rate hikes. The index posted its first negative monthly result since October 2016, and then lost further ground in March on fear of a global trade war. The market stabilized in April and turned upward through mid-June, when escalating trade tension between the U.S. and China soured investor sentiment. The resulting uncertainty lingered into July, but strong corporate earnings helped the S&P 500 rise 3.72% that month to cap the period. For the full one-year period, growth handily topped value, while small-caps bested large-caps. By sector, information technology (+28%) led the way, boosted by strong earnings growth from several major index constituents. Consumer discretionary rose roughly 24%, driven by retailers (+49%). Energy (+20%) gained alongside higher oil prices. Laggards were telecommunication services (-2%), consumer staples (0%) and utilities (+3%), defensive groups that struggled amid rising interest rates and a general preference for risk. Real estate (+5%) fared a bit better but still lagged, as did financials, industrials, health care (each up 13%) and materials (+11%).
| 3 | Annual Report |
Table of Contents
Fidelity® Dividend ETF for Rising Rates
The information provided in the tables below shows you the performance of Fidelity® Dividend ETF For Rising Rates, with comparisons over different time periods to the fund’s relevant benchmarks, including an appropriate broad-based market index. Seeing the returns over different time periods can help you assess the fund’s performance against relevant measurements. The performance information includes cumulative total returns and is further explained in this section.*
The fund’s net asset value (NAV) performance is based on the NAV calculated each business day. It is calculated in accordance with the standard formula for valuing investment company shares as of the close of regular trading hours on NYSE Arca, Inc. (NYSE Arca) (normally 4:00 p.m. Eastern Time). The fund’s market price performance is based on the daily closing price of the shares of the fund on NYSE Arca. Since ETFs are bought and sold at prices set by the market – which can result in a premium or discount to NAV – the returns calculated using market price (market return) can differ from those calculated using NAV (NAV return). For information on these differences, please visit Fidelity.com or see the prospectus. The fund’s returns do not reflect the deduction of taxes that a shareholder would pay on fund distributions or the redemption or selling of fund shares. How a fund did yesterday is no guarantee of how it will do tomorrow.
Current performance may be higher or lower than the performance data quoted. For month-end performance figures, please visit fidelity.com/etfs/factor-etfs/overview or call Fidelity. The performance data featured represents past performance, which is no guarantee of future results. Investment return and principal value will fluctuate; therefore, you may have a gain or loss when you sell your shares.
| Fiscal Periods Ended July 31, 2018 | ||||||||
| Average Annual Total Returns | Past 1 Year | Life of fund | ||||||
Fidelity Dividend ETF for Rising Rates – NAVA | 14.04% | 15.42% | ||||||
Fidelity Dividend ETF for Rising Rates – Market PriceB | 13.86% | 15.74% | ||||||
Fidelity Dividend Index for Rising RatesA | 14.48% | 15.87% | ||||||
Average annual total returns represent just that – the average return on an annual basis for Fidelity® Dividend ETF For Rising Rates and the fund’s benchmarks, assuming consistent performance over the periods shown, based on the cumulative return and the length of the period. This information represents returns as of the end of the fund’s fiscal period.
| Periods Ended June 30, 2018 | ||||||||
| Average Annual Total Returns | Past 1 Year | Life of fund | ||||||
Fidelity Dividend ETF for Rising Rates – NAVA | 10.87% | 13.66% | ||||||
Fidelity Dividend ETF for Rising Rates – Market PriceB | 10.52% | 13.94% | ||||||
Fidelity Dividend Index for Rising RatesA | 11.30% | 14.11% | ||||||
This information shows the returns of the fund and its index for different time periods through the end of the most recent calendar quarter, as opposed to through the end of the fund’s fiscal period.
| A | From September 12, 2016. |
| B | From September 15, 2016, date initially listed on the NYSE ARCA exchange. |
| * | Total returns are historical and include changes in share price and reinvestment of dividends and capital gains distributions, if any. |
The fund’s expense ratio is 0.29%. Expense ratio is the total annual operating expense ratio from the most recent prospectus. A fund’s net expenses paid may be different. Please refer to the most recent prospectus for more information on a fund’s expenses.
| $10,000 Over Life of Fund |
Let’s say hypothetically that $10,000 was invested in Fidelity Dividend ETF For Rising Rates – NAV on September 12, 2016, when the fund started. The chart shows how the value of your investment would have changed, and also shows how the Fidelity Dividend Index For Rising Rates performed over the same period.
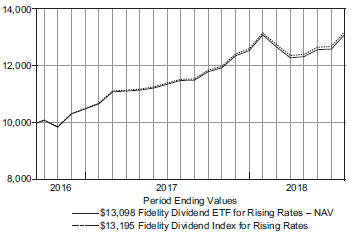
| Annual Report | 4 |
Table of Contents
Fidelity® Dividend for Rising Rates ETF
Management’s Discussion of Fund Performance
For the fiscal year ending July 31, 2018, the exchange-traded fund’s (ETF) net asset value rose 14.04%, roughly in line with the 14.48% result of the Fidelity Dividend Index for Rising Rates. The ETF’s market price returned 13.86% over the same time frame, while the broad-market S&P 500® index rose 16.24%. Nine out of eleven sectors in the Fidelity index gained notably, led by information technology and energy, up about 23% and 22%, respectively. Telecommunication services was the only sector to lose ground, returning about -3%, while the consumer staples category was essentially flat. Within technology, Microsoft led the way, as the software maker repeatedly reported earnings that outpaced analysts’ estimates, due partly to the success of the company’s cloud computing business. Shares of consumer electronics and personal computer maker Apple gained in response to continued strong earnings and robust demand for its mobile communication devices. Other technology contributors included semiconductor manufacturer Intel and network communications gear provider Cisco Systems. Elsewhere, Abbvie fared well, as the biotechnology company in January reported better-than-expected fourth-quarter earnings. Bank stocks JPMorgan Chase and Bank of America Corporation also contributed, as rising interest rates provided a tailwind to earnings. Aircraft manufacturer Boeing and retailer Kohl’s also enjoyed favorable performance. In contrast, software company Micro Focus saw its stock plunge in March, after the company issued a disappointing financial forecast and announced its chief executive’s resignation. Industrial conglomerate General Electric experienced a number of business challenges and cut its dividend in half last fall. Tobacco company Philip Morris International struggled as investors became less optimistic about the company’s next-generation products. Of final note, shares of U.K.-based business process outsourcing company Capita fell sharply in January after the company reported poor financial results and suspended its dividend.
The views expressed above reflect those of the portfolio manager(s) only through the end of the period as stated on the cover of this report and do not necessarily represent the views of Fidelity or any other person in the Fidelity organization, or Geode Capital Management, LLC, (the ETF’s subadviser) or any other person in the Geode organization. Any such views are subject to change at any time based upon market or other conditions and Fidelity and Geode disclaim any responsibility to update such views. These views may not be relied on as investment advice and, because investment decisions for a Fidelity fund are based on numerous factors, may not be relied on as an indication of trading intent on behalf of any Fidelity fund.
| 5 | Annual Report |
Table of Contents
Fidelity® Dividend for Rising Rates ETF
Investment Summary (Unaudited)
| Top Ten Stocks as of July 31, 2018 | ||||
| % of fund’s net assets | ||||
Apple, Inc. | 4.9 | |||
Microsoft Corp. | 4.3 | |||
Johnson & Johnson | 2.4 | |||
JPMorgan Chase & Co. | 2.3 | |||
Pfizer, Inc. | 2.1 | |||
Intel Corp. | 1.9 | |||
Merck & Co., Inc. | 1.9 | |||
Cisco Systems, Inc. | 1.9 | |||
Bank of America Corp. | 1.9 | |||
Exxon Mobil Corp. | 1.8 | |||
|
| |||
| 25.4 | ||||
|
| |||
| Top Market Sectors as of July 31, 2018 | ||||
| % of fund’s net assets | ||||
Information Technology | 24.8 | |||
Financials | 15.2 | |||
Health Care | 14.0 | |||
Consumer Discretionary | 12.5 | |||
Industrials | 10.7 | |||
Consumer Staples | 6.2 | |||
Energy | 5.9 | |||
Real Estate | 3.5 | |||
Materials | 2.7 | |||
Utilities | 2.6 | |||
| Asset Allocation as of July 31, 2018 | ||

| * | Foreign investments – 9.6% |
| Annual Report | 6 |
Table of Contents
Fidelity® High Dividend ETF
Performance
The information provided in the tables below shows you the performance of Fidelity® High Dividend ETF, with comparisons over different time periods to the fund’s relevant benchmarks, including an appropriate broad-based market index. Seeing the returns over different time periods can help you assess the fund’s performance against relevant measurements. The performance information includes cumulative total returns and is further explained in this section.*
The fund’s net asset value (NAV) performance is based on the NAV calculated each business day. It is calculated in accordance with the standard formula for valuing investment company shares as of the close of regular trading hours on NYSE Arca, Inc. (NYSE Arca) (normally 4:00 p.m. Eastern Time). The fund’s market price performance is based on the daily closing price of the shares of the fund on NYSE Arca. Since ETFs are bought and sold at prices set by the market – which can result in a premium or discount to NAV – the returns calculated using market price (market return) can differ from those calculated using NAV (NAV return). For information on these differences, please visit Fidelity.com or see the prospectus. The fund’s returns do not reflect the deduction of taxes that a shareholder would pay on fund distributions or the redemption or selling of fund shares. How a fund did yesterday is no guarantee of how it will do tomorrow.
Current performance may be higher or lower than the performance data quoted. For month-end performance figures, please visit fidelity.com/etfs/factor-etfs/overview or call Fidelity. The performance data featured represents past performance, which is no guarantee of future results. Investment return and principal value will fluctuate; therefore, you may have a gain or loss when you sell your shares.
| Fiscal Periods Ended July 31, 2018 | ||||||||
| Average Annual Total Returns | Past 1 Year | Life of fund | ||||||
Fidelity High Dividend ETF – NAVA | 16.23% | 13.73% | ||||||
Fidelity High Dividend ETF – Market PriceB | 16.21% | 14.27% | ||||||
Fidelity High Dividend IndexA | 16.64% | 14.14% | ||||||
Average annual total returns represent just that – the average return on an annual basis for Fidelity® High Dividend ETF and the fund’s benchmarks, assuming consistent performance over the periods shown, based on the cumulative return and the length of the period. This information represents returns as of the end of the fund’s fiscal period.
| Periods Ended June 30, 2018 | ||||||||
| Average Annual Total Returns | Past 1 Year | Life of fund | ||||||
Fidelity High Dividend ETF – NAVA | 13.30% | 12.36% | ||||||
Fidelity High Dividend ETF – Market PriceB | 13.69% | 13.07% | ||||||
Fidelity High Dividend IndexA | 13.72% | 12.76% | ||||||
This information shows the returns of the fund and its index for different time periods through the end of the most recent calendar quarter, as opposed to through the end of the fund’s fiscal period.
| A | From September 12, 2016. |
| B | From September 15, 2016, date initially listed on the NYSE ARCA exchange. |
| * | Total returns are historical and include changes in share price and reinvestment of dividends and capital gains distributions, if any. |
The fund’s expense ratio is 0.29%. Expense ratio is the total annual operating expense ratio from the most recent prospectus. A fund’s net expenses paid may be different. Please refer to the most recent prospectus for more information on a fund’s expenses.
| $10,000 Over Life of Fund |
Let’s say hypothetically that $10,000 was invested in Fidelity High Dividend ETF – NAV on September 12, 2016, when the fund started. The chart shows how the value of your investment would have changed, and also shows how the Fidelity High Dividend Index performed over the same period.
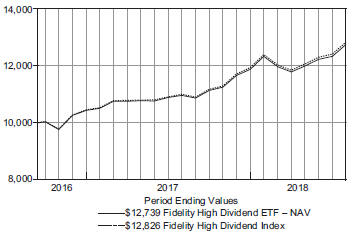
| 7 | Annual Report |
Table of Contents
Fidelity® High Dividend ETF
Management’s Discussion of Fund Performance
For the fiscal year ending July 31, 2018, the exchange-traded fund’s (ETF) net asset value rose 16.23% and its market price gained 16.21%. This compares with an increase of 16.64% for the Fidelity High Dividend Index, which tracks the performance of stocks of large and mid-capitalization dividend-paying companies that are expected to continue to pay and grow their dividends. Most sectors in the Fidelity index gained in value, led by information technology, up about 22%. Telecommunication services was the only sector to lose ground, returning about -5%. Within technology, Microsoft led the way, as the software maker repeatedly reported earnings that outpaced analysts’ estimates, due partly to the success of the company’s cloud computing business. Shares of consumer electronics and personal computer maker Apple gained in response to continued strong earnings and robust demand for its mobile communication devices. Other contributors within technology included network communications gear manufacturer Cisco Systems and semiconductor company Intel. Elsewhere, bank stocks JPMorgan Chase and Bank of America Corporation performed well, as did retailer Kohl’s. In contrast, the biggest individual detractor was telecommunication services provider AT&T, reflecting weak financial results and uncertainty surrounding the company’s pending merger with Time Warner. Declining assets under management in its equity and fixed-income strategies was partly behind the decline in the shares of investment-management firm Federated Investors, while software company Micro Focus saw its stock plunge in March, after the company issued a disappointing financial forecast and announced its chief executive’s resignation.
The views expressed above reflect those of the portfolio manager(s) only through the end of the period as stated on the cover of this report and do not necessarily represent the views of Fidelity or any other person in the Fidelity organization, or Geode Capital Management, LLC, (the ETF’s subadviser) or any other person in the Geode organization. Any such views are subject to change at any time based upon market or other conditions and Fidelity and Geode disclaim any responsibility to update such views. These views may not be relied on as investment advice and, because investment decisions for a Fidelity fund are based on numerous factors, may not be relied on as an indication of trading intent on behalf of any Fidelity fund.
Note to Shareholders: On November 9, 2017, the strategy’s name changed to Fidelity High Dividend ETF to better reflect its existing focus on high-dividend-paying stocks. At the same time, the fund’s primary benchmark changed from Fidelity Core Dividend Index to Fidelity High Dividend Index.
| Annual Report | 8 |
Table of Contents
Fidelity® High Dividend ETF
Investment Summary (Unaudited)
| Top Ten Stocks as of July 31, 2018 | ||||
| % of fund’s net assets | ||||
Apple, Inc. | 3.5 | |||
Verizon Communications, Inc. | 3.2 | |||
Microsoft Corp. | 3.1 | |||
Exxon Mobil Corp. | 2.9 | |||
JPMorgan Chase & Co. | 2.8 | |||
AT&T, Inc. | 2.8 | |||
CenturyLink, Inc. | 2.7 | |||
Chevron Corp. | 2.6 | |||
Bank of America Corp. | 2.4 | |||
Valero Energy Corp. | 2.3 | |||
|
| |||
| 28.3 | ||||
|
| |||
| Top Market Sectors as of July 31, 2018 | ||||
| % of fund’s net assets | ||||
Financials | 22.2 | |||
Information Technology | 17.8 | |||
Energy | 13.6 | |||
Real Estate | 11.4 | |||
Utilities | 9.2 | |||
Telecommunication Services | 8.6 | |||
Health Care | 6.7 | |||
Consumer Discretionary | 5.8 | |||
Industrials | 3.7 | |||
Consumer Staples | 0.6 | |||
| Asset Allocation as of July 31, 2018 | ||
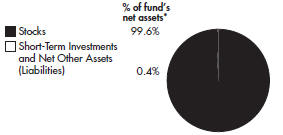
| * | Foreign investments – 4.3% |
| 9 | Annual Report |
Table of Contents
Fidelity® Low Volatility Factor ETF
Performance
The information provided in the tables below shows you the performance of Fidelity® Low Volatility Factor ETF, with comparisons over different time periods to the fund’s relevant benchmarks, including an appropriate broad-based market index. Seeing the returns over different time periods can help you assess the fund’s performance against relevant measurements. The performance information includes cumulative total returns and is further explained in this section.*
The fund’s net asset value (NAV) performance is based on the NAV calculated each business day. It is calculated in accordance with the standard formula for valuing investment company shares as of the close of regular trading hours on NYSE Arca, Inc. (NYSE Arca) (normally 4:00 p.m. Eastern Time). The fund’s market price performance is based on the daily closing price of the shares of the fund on NYSE Arca. Since ETFs are bought and sold at prices set by the market – which can result in a premium or discount to NAV – the returns calculated using market price (market return) can differ from those calculated using NAV (NAV return). For information on these differences, please visit Fidelity.com or see the prospectus. The fund’s returns do not reflect the deduction of taxes that a shareholder would pay on fund distributions or the redemption or selling of fund shares. How a fund did yesterday is no guarantee of how it will do tomorrow.
Current performance may be higher or lower than the performance data quoted. For month-end performance figures, please visit fidelity.com/etfs/factor-etfs/overview or call Fidelity. The performance data featured represents past performance, which is no guarantee of future results. Investment return and principal value will fluctuate; therefore, you may have a gain or loss when you sell your shares.
| Fiscal Periods Ended July 31, 2018 | ||||||||
| Average Annual Total Returns | Past 1 Year | Life of fund | ||||||
Fidelity Low Volatility Factor ETF – NAVA | 16.89% | 15.91% | ||||||
Fidelity Low Volatility Factor ETF – Market PriceB | 16.83% | 16.54% | ||||||
Fidelity U.S. Low Volatility Factor IndexA | 17.29% | 16.31% | ||||||
Average annual total returns represent just that – the average return on an annual basis for Fidelity® Low Volatility Factor ETF and the fund’s benchmarks, assuming consistent performance over the periods shown, based on the cumulative return and the length of the period. This information represents returns as of the end of the fund’s fiscal period.
| Periods Ended June 30, 2018 | ||||||||
| Average Annual Total Returns | Past 1 Year | Life of fund | ||||||
Fidelity Low Volatility Factor ETF – NAVA | 13.84% | 13.95% | ||||||
Fidelity Low Volatility Factor ETF – Market PriceB | 13.80% | 14.63% | ||||||
Fidelity U.S. Low Volatility Factor IndexA | 14.24% | 14.34% | ||||||
This information shows the returns of the fund and its index for different time periods through the end of the most recent calendar quarter, as opposed to through the end of the fund’s fiscal period.
| A | From September 12, 2016. |
| B | From September 15, 2016, date initially listed on the NYSE ARCA exchange. |
| * | Total returns are historical and include changes in share price and reinvestment of dividends and capital gains distributions, if any. |
The fund’s expense ratio is 0.29%. Expense ratio is the total annual operating expense ratio from the most recent prospectus. A fund’s net expenses paid may be different. Please refer to the most recent prospectus for more information on a fund’s expenses.
| $10,000 Over Life of Fund |
Let’s say hypothetically that $10,000 was invested in Fidelity Low Volatility Factor ETF – NAV on September 12, 2016, when the fund started. The chart shows how the value of your investment would have changed, and also shows how the Fidelity U.S. Low Volatility Factor Index performed over the same period.
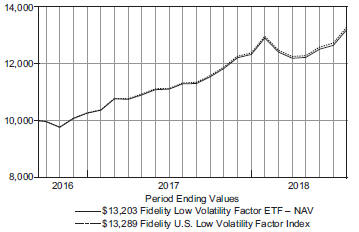
| Annual Report | 10 |
Table of Contents
Fidelity® Low Volatility Factor ETF
Management’s Discussion of Fund Performance
For the fiscal year ending July 31, 2018, the exchange-traded fund’s (ETF) net asset value rose 16.89% and its market price gained 16.83%, compared with an increase of 17.29% for the Fidelity U.S. Low Volatility Factor Index, which tracks the performance of U.S. companies with lower volatility than the broader market. Ten of eleven sectors in the Fidelity index gained in value, led by information technology and consumer discretionary, up about 27% and 22%, respectively. Telecommunication services was the only sector to lose ground, returning about -2%. Within information technology, Microsoft led the way, as the software maker repeatedly reported earnings that outpaced analysts’ estimates, due partly to success in the company’s cloud computing business. Healthy financial results and strong advertising revenue lifted Alphabet, parent company of internet search leader Google. Payment-processing company Visa continued to benefit from a combination of global trends supporting cashless payments. Several health insurance stocks contributed as well, led by UnitedHealth Group. Home improvement retailer Home Depot also contributed, benefiting from favorable earnings amid a strong economic backdrop. On the negative side, the biggest individual detractor was Philip Morris International, as investors became less optimistic about the company’s next-generation tobacco products. Drug maker Merck saw its stock fare especially poorly in October after the company issued disappointing financial results and announced plans to withdraw its application for European approval of a potential lung cancer treatment. Meanwhile, telecommunication services provider AT&T struggled amid weak financial results and uncertainty surrounding the company’s pending merger with Time Warner.
The views expressed above reflect those of the portfolio manager(s) only through the end of the period as stated on the cover of this report and do not necessarily represent the views of Fidelity or any other person in the Fidelity organization, or Geode Capital Management, LLC, (the ETF’s subadviser) or any other person in the Geode organization. Any such views are subject to change at any time based upon market or other conditions and Fidelity and Geode disclaim any responsibility to update such views. These views may not be relied on as investment advice and, because investment decisions for a Fidelity fund are based on numerous factors, may not be relied on as an indication of trading intent on behalf of any Fidelity fund.
| 11 | Annual Report |
Table of Contents
Fidelity® Low Volatility Factor ETF
Investment Summary (Unaudited)
| Top Ten Stocks as of July 31, 2018 | ||||
| % of fund’s net assets | ||||
Apple, Inc. | 4.3 | |||
Microsoft Corp. | 3.8 | |||
Alphabet, Inc. Class A | 3.4 | |||
Berkshire Hathaway, Inc. Class B | 2.0 | |||
Johnson & Johnson | 2.0 | |||
UnitedHealth Group, Inc. | 1.7 | |||
Pfizer, Inc. | 1.7 | |||
Visa, Inc. Class A | 1.7 | |||
The Home Depot, Inc. | 1.6 | |||
Wells Fargo & Co. | 1.5 | |||
|
| |||
| 23.7 | ||||
|
| |||
| Top Market Sectors as of July 31, 2018 | ||||
| % of fund’s net assets | ||||
Information Technology | 25.5 | |||
Financials | 14.4 | |||
Health Care | 13.7 | |||
Consumer Discretionary | 12.9 | |||
Industrials | 10.3 | |||
Consumer Staples | 6.7 | |||
Energy | 5.7 | |||
Real Estate | 3.4 | |||
Materials | 2.8 | |||
Utilities | 2.8 | |||
| Asset Allocation as of July 31, 2018 | ||

| * | Foreign investments – 6.6% |
| Annual Report | 12 |
Table of Contents
Fidelity® Momentum Factor ETF
Performance
The information provided in the tables below shows you the performance of Fidelity® Momentum Factor ETF, with comparisons over different time periods to the fund’s relevant benchmarks, including an appropriate broad-based market index. Seeing the returns over different time periods can help you assess the fund’s performance against relevant measurements. The performance information includes cumulative total returns and is further explained in this section.*
The fund’s net asset value (NAV) performance is based on the NAV calculated each business day. It is calculated in accordance with the standard formula for valuing investment company shares as of the close of regular trading hours on NYSE Arca, Inc. (NYSE Arca) (normally 4:00 p.m. Eastern Time). The fund’s market price performance is based on the daily closing price of the shares of the fund on NYSE Arca. Since ETFs are bought and sold at prices set by the market – which can result in a premium or discount to NAV – the returns calculated using market price (market return) can differ from those calculated using NAV (NAV return). For information on these differences, please visit Fidelity.com or see the prospectus. The fund’s returns do not reflect the deduction of taxes that a shareholder would pay on fund distributions or the redemption or selling of fund shares. How a fund did yesterday is no guarantee of how it will do tomorrow.
Current performance may be higher or lower than the performance data quoted. For month-end performance figures, please visit fidelity.com/etfs/factor-etfs/overview or call Fidelity. The performance data featured represents past performance, which is no guarantee of future results. Investment return and principal value will fluctuate; therefore, you may have a gain or loss when you sell your shares.
| Fiscal Periods Ended July 31, 2018 | ||||||||
| Average Annual Total Returns | Past 1 Year | Life of fund | ||||||
Fidelity Momentum Factor ETF – NAVA | 18.72 | % | 17.48 | % | ||||
Fidelity Momentum Factor ETF – Market PriceB | 18.66 | % | 18.01 | % | ||||
Fidelity U.S. Momentum Factor IndexA | 19.13 | % | 17.90 | % | ||||
Average annual total returns represent just that – the average return on an annual basis for Fidelity® Momentum Factor ETF and the fund’s benchmarks, assuming consistent performance over the periods shown, based on the cumulative return and the length of the period. This information represents returns as of the end of the fund’s fiscal period.
| Periods Ended June 30, 2018 | ||||||||
| Average Annual Total Returns | Past 1 Year | Life of fund | ||||||
Fidelity Momentum Factor ETF – NAVA | 18.99 | % | 16.79 | % | ||||
Fidelity Momentum Factor ETF – Market PriceB | 18.94 | % | 17.42 | % | ||||
Fidelity U.S. Momentum Factor IndexA | 19.42 | % | 17.20 | % | ||||
This information shows the returns of the fund and its index for different time periods through the end of the most recent calendar quarter, as opposed to through the end of the fund’s fiscal period.
| A | From September 12, 2016. |
| B | From September 15, 2016, date initially listed on the NYSE ARCA exchange. |
| * | Total returns are historical and include changes in share price and reinvestment of dividends and capital gains distributions, if any. |
The fund’s expense ratio is 0.29%. Expense ratio is the total annual operating expense ratio from the most recent prospectus. A fund’s net expenses paid may be different. Please refer to the most recent prospectus for more information on a fund’s expenses.
| $10,000 Over Life of Fund |
Let’s say hypothetically that $10,000 was invested in Fidelity Momentum Factor ETF – NAV on September 12, 2016, when the fund started. The chart shows how the value of your investment would have changed, and also shows how the Fidelity U.S. Momentum Factor Index performed over the same period.
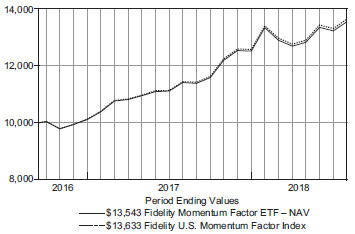
| 13 | Annual Report |
Table of Contents
Fidelity® Momentum Factor ETF
Management’s Discussion of Fund Performance
For the fiscal year ending July 31, 2018, the exchange-traded fund’s (ETF) net asset value rose 18.72% and its market price gained 18.66%. This compares with an increase of 19.13% for the Fidelity U.S. Momentum Factor Index, which tracks the performance of U.S. companies with positive momentum signals. Most sectors in the Fidelity index gained in value over the 12 months, led by information technology and consumer discretionary, up about 35% and 30%, respectively. In contrast, consumer staples returned about -3%, while utilities were roughly flat. Within the market-leading technology category, Microsoft led the way, as the software maker repeatedly reported earnings that outpaced analysts’ estimates, due partly to the success of the company’s cloud computing business. Shares of consumer electronics and personal computer maker Apple gained ground, reflecting continued strong earnings and robust demand for its mobile communication devices. Payment-processing company Mastercard continued to benefit from a combination of global trends supporting cashless payments and strong domestic and international economic growth. Other contributors within technology included semiconductor company Micron Technology and software maker Adobe Systems, a maker of graphics processors. Elsewhere, Align Technology, a maker of dental technologies, benefited from strong demand for its key orthodontics product. Video-on-demand company Netflix also contributed. In contrast, the biggest individual detractor was NektarTherapeutics, a biotechnology company; most of the stock’s decline came in June after the firm issued disappointing data stemming from a trial of a promising cancer treatment. Another biotechnology stock, BlueBird Bio, also detracted. Elsewhere, tobacco company Philip Morris International struggled as investors became less optimistic about the company’s next-generation products.
The views expressed above reflect those of the portfolio manager(s) only through the end of the period as stated on the cover of this report and do not necessarily represent the views of Fidelity or any other person in the Fidelity organization, or Geode Capital Management, LLC, (the ETF’s subadviser) or any other person in the Geode organization. Any such views are subject to change at any time based upon market or other conditions and Fidelity and Geode disclaim any responsibility to update such views. These views may not be relied on as investment advice and, because investment decisions for a Fidelity fund are based on numerous factors, may not be relied on as an indication of trading intent on behalf of any Fidelity fund.
| Annual Report | 14 |
Table of Contents
Fidelity® Momentum Factor ETF
Investment Summary (Unaudited)
| Top Ten Stocks as of July 31, 2018 | ||||
| % of fund’s net assets | ||||
Apple, Inc. | 4.4 | |||
Microsoft Corp. | 3.8 | |||
Amazon.com, Inc. | 3.4 | |||
JPMorgan Chase & Co. | 2.1 | |||
Berkshire Hathaway, Inc. Class B | 2.0 | |||
UnitedHealth Group, Inc. | 1.9 | |||
Bank of America Corp. | 1.7 | |||
Visa, Inc. Class A | 1.7 | |||
Exxon Mobil Corp. | 1.6 | |||
The Home Depot, Inc. | 1.5 | |||
|
| |||
| 24.1 | ||||
|
| |||
| Top Market Sectors as of July 31, 2018 | ||||
| % of fund’s net assets | ||||
Information Technology | 25.8 | |||
Financials | 14.5 | |||
Health Care | 13.6 | |||
Consumer Discretionary | 13.2 | |||
Industrials | 9.4 | |||
Consumer Staples | 6.3 | |||
Energy | 6.1 | |||
Materials | 3.3 | |||
Real Estate | 3.0 | |||
Utilities | 2.9 | |||
| Asset Allocation as of July 31, 2018 |

| * | Foreign investments – 2.6% |
| 15 | Annual Report |
Table of Contents
Fidelity® Quality Factor ETF
Performance
The information provided in the tables below shows you the performance of Fidelity® Quality Factor ETF, with comparisons over different time periods to the fund’s relevant benchmarks, including an appropriate broad-based market index. Seeing the returns over different time periods can help you assess the fund’s performance against relevant measurements. The performance information includes cumulative total returns and is further explained in this section.*
The fund’s net asset value (NAV) performance is based on the NAV calculated each business day. It is calculated in accordance with the standard formula for valuing investment company shares as of the close of regular trading hours on NYSE Arca, Inc. (NYSE Arca) (normally 4:00 p.m. Eastern Time). The fund’s market price performance is based on the daily closing price of the shares of the fund on NYSE Arca. Since ETFs are bought and sold at prices set by the market – which can result in a premium or discount to NAV – the returns calculated using market price (market return) can differ from those calculated using NAV (NAV return). For information on these differences, please visit Fidelity.com or see the prospectus. The fund’s returns do not reflect the deduction of taxes that a shareholder would pay on fund distributions or the redemption or selling of fund shares. How a fund did yesterday is no guarantee of how it will do tomorrow.
Current performance may be higher or lower than the performance data quoted. For month-end performance figures, please visit fidelity.com/etfs/factor-etfs/overview or call Fidelity. The performance data featured represents past performance, which is no guarantee of future results. Investment return and principal value will fluctuate; therefore, you may have a gain or loss when you sell your shares.
| Fiscal Periods Ended July 31, 2018 | ||||||||
| Average Annual Total Returns | Past 1 Year | Life of fund | ||||||
Fidelity Quality Factor ETF – NAVA | 16.95 | % | 17.66 | % | ||||
Fidelity Quality Factor ETF – Market PriceB | 16.69 | % | 17.91 | % | ||||
Fidelity U.S. Quality Factor IndexA | 17.31 | % | 18.04 | % | ||||
Average annual total returns represent just that – the average return on an annual basis for Fidelity® Quality Factor ETF and the fund’s benchmarks, assuming consistent performance over the periods shown, based on the cumulative return and the length of the period. This information represents returns as of the end of the fund’s fiscal period.
| Periods Ended June 30, 2018 | ||||||||
| Average Annual Total Returns | Past 1 Year | Life of fund | ||||||
Fidelity Quality Factor ETF – NAVA | 15.04 | % | 16.29 | % | ||||
Fidelity Quality Factor ETF – Market PriceB | 14.97 | % | 16.63 | % | ||||
Fidelity U.S. Quality Factor IndexA | 15.40 | % | 16.66 | % | ||||
This information shows the returns of the fund and its index for different time periods through the end of the most recent calendar quarter, as opposed to through the end of the fund’s fiscal period.
Average annual total returns take Fidelity Quality Factor ETF’s cumulative total return and show you what would have happened if Fidelity Quality Factor ETF’s shares had performed at a constant rate each year. These numbers will be reported once the fund is a year old.
| A | From September 12, 2016. |
| B | From September 15, 2016, date initially listed on the NYSE ARCA exchange. |
| * | Total returns are historical and include changes in share price and reinvestment of dividends and capital gains distributions, if any. |
The fund’s expense ratio is 0.29%. Expense ratio is the total annual operating expense ratio from the most recent prospectus. A fund’s net expenses paid may be different. Please refer to the most recent prospectus for more information on a fund’s expenses.
| $10,000 Over Life of Fund |
Let’s say hypothetically that $10,000 was invested in Fidelity Quality Factor ETF – NAV on September 12, 2016, when the fund started. The chart shows how the value of your investment would have changed, and also shows how the Fidelity U.S. Quality Factor Index performed over the same period.
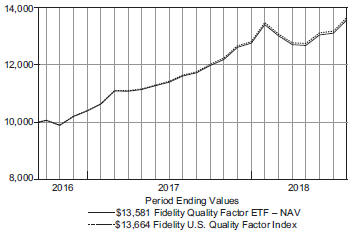
| Annual Report | 16 |
Table of Contents
Fidelity® Quality Factor ETF
Management’s Discussion of Fund Performance
For the fiscal year ending July 31, 2018, the exchange traded fund’s (ETF) net asset value gained 16.95% and its market price gained 16.69%. This compares with an increase of 17.31% for the Fidelity U.S. Quality Factor Index, which tracks the performance of U.S. companies with a higher quality profile than the broader market. Most sectors in the Fidelity index gained in value, led by information technology and industrials, which gained 30% and about 24%, respectively. Consumer staples and telecommunication services, each returning roughly -2%, fared the worst. Within technology, Microsoft led the way, as the software maker repeatedly reported earnings that outpaced analysts’ estimates, due partly to the success of the company’s cloud computing business. Shares of consumer electronics and personal computer maker Apple gained in response to continued strong earnings and robust demand for its mobile communication devices. Healthy financial results and strong advertising revenue lifted Alphabet, parent company of internet search leader Google. Payment-processing companies Mastercard and Visa continued to benefit from a combination of global trends supporting cashless payments. Other notable contributors this period included a couple of biotechnology stocks: Bioverativ, whose shares soared in January after the company became acquired by Sanofi, and Abbvie, which in January reported better-than-expected fourth-quarter earnings. On the negative side, biotechnology company Celgene detracted notably, as poor financial results coupled with the company’s decision to end a couple of Crohn’s disease drug studies weighed on its stock. Tobacco company Philip Morris International struggled as investors became less optimistic about the company’s next-generation products. Concerns about pricing trends weighed on shares of mortgage insurer Essent. Also detracting was telecommunication services provider AT&T, reflecting weak financial results and uncertainty surrounding the company’s pending merger with Time Warner.
The views expressed above reflect those of the portfolio manager(s) only through the end of the period as stated on the cover of this report and do not necessarily represent the views of Fidelity or any other person in the Fidelity organization, or Geode Capital Management, LLC, (the ETF’s subadviser) or any other person in the Geode organization. Any such views are subject to change at any time based upon market or other conditions and Fidelity and Geode disclaim any responsibility to update such views. These views may not be relied on as investment advice and, because investment decisions for a Fidelity fund are based on numerous factors, may not be relied on as an indication of trading intent on behalf of any Fidelity fund.
| 17 | Annual Report |
Table of Contents
Fidelity® Quality Factor ETF
Investment Summary (Unaudited)
| Top Ten Stocks as of July 31, 2018 | ||||
| % of fund’s net assets | ||||
Apple, Inc. | 4.2 | |||
Microsoft Corp. | 3.7 | |||
Alphabet, Inc. Class A | 3.3 | |||
Facebook, Inc. Class A | 2.0 | |||
Johnson & Johnson | 2.0 | |||
UnitedHealth Group, Inc. | 1.7 | |||
Pfizer, Inc. | 1.7 | |||
Visa, Inc. Class A | 1.5 | |||
The Home Depot, Inc. | 1.5 | |||
Exxon Mobil Corp. | 1.5 | |||
|
| |||
| 23.1 | ||||
|
| |||
| Top Market Sectors as of July 31, 2018 | ||||
| % of fund’s net assets | ||||
Information Technology | 26.3 | |||
Financials | 14.2 | |||
Consumer Discretionary | 13.0 | |||
Health Care | 12.6 | |||
Industrials | 10.3 | |||
Consumer Staples | 6.7 | |||
Energy | 5.8 | |||
Real Estate | 3.5 | |||
Materials | 2.9 | |||
Utilities | 2.8 | |||
| Asset Allocation as of July 31, 2018 |
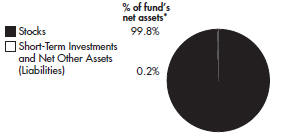
| * | Foreign investments – 4.3% |
| Annual Report | 18 |
Table of Contents
Fidelity® Value Factor ETF
Performance
The information provided in the tables below shows you the performance of Fidelity® Value Factor ETF, with comparisons over different time periods to the fund’s relevant benchmarks, including an appropriate broad-based market index. Seeing the returns over different time periods can help you assess the fund’s performance against relevant measurements. The performance information includes cumulative total returns and is further explained in this section.*
The fund’s net asset value (NAV) performance is based on the NAV calculated each business day. It is calculated in accordance with the standard formula for valuing investment company shares as of the close of regular trading hours on NYSE Arca, Inc. (NYSE Arca) (normally 4:00 p.m. Eastern Time). The fund’s market price performance is based on the daily closing price of the shares of the fund on NYSE Arca. Since ETFs are bought and sold at prices set by the market – which can result in a premium or discount to NAV – the returns calculated using market price (market return) can differ from those calculated using NAV (NAV return). For information on these differences, please visit Fidelity.com or see the prospectus. The fund’s returns do not reflect the deduction of taxes that a shareholder would pay on fund distributions or the redemption or selling of fund shares. How a fund did yesterday is no guarantee of how it will do tomorrow.
Current performance may be higher or lower than the performance data quoted. For month-end performance figures, please visit fidelity.com/etfs/factor-etfs/overview or call Fidelity. The performance data featured represents past performance, which is no guarantee of future results. Investment return and principal value will fluctuate; therefore, you may have a gain or loss when you sell your shares.
| Fiscal Periods Ended July 31, 2018 | ||||||||
| Average Annual Total Returns | Past 1 Year | Life of fund | ||||||
Fidelity Value Factor ETF – NAVA | 16.11 | % | 18.56 | % | ||||
Fidelity Value Factor ETF – Market PriceB | 16.00 | % | 18.97 | % | ||||
Fidelity U.S. Value Factor IndexA | 16.50 | % | 18.96 | % | ||||
Average annual total returns represent just that – the average return on an annual basis for Fidelity® Value Factor ETF and the fund’s benchmarks, assuming consistent performance over the periods shown, based on the cumulative return and the length of the period. This information represents returns as of the end of the fund’s fiscal period.
| Periods Ended June 30, 2018 | ||||||||
| Average Annual Total Returns | Past 1 Year | Life of fund | ||||||
Fidelity Value Factor ETF – NAVA | 14.03 | % | 17.01 | % | ||||
Fidelity Value Factor ETF – Market PriceB | 14.12 | % | 17.52 | % | ||||
Fidelity U.S. Value Factor IndexA | 14.41 | % | 17.40 | % | ||||
This information shows the returns of the fund and its index for different time periods through the end of the most recent calendar quarter, as opposed to through the end of the fund’s fiscal period.
| A | From September 12, 2016. |
| B | From September 15, 2016, date initially listed on the NYSE ARCA exchange. |
| * | Total returns are historical and include changes in share price and reinvestment of dividends and capital gains distributions, if any. |
The fund’s expense ratio is 0.29%. Expense ratio is the total annual operating expense ratio from the most recent prospectus. A fund’s net expenses paid may be different. Please refer to the most recent prospectus for more information on a fund’s expenses.
| $10,000 Over Life of Fund |
Let’s say hypothetically that $10,000 was invested in Fidelity Value Factor ETF – NAV on September 12, 2016, when the fund started. The chart shows how the value of your investment would have changed, and also shows how the Fidelity U.S. Value Factor Index performed over the same period.
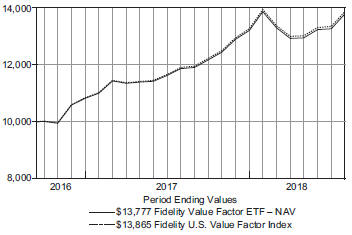
| 19 | Annual Report |
Table of Contents
Fidelity® Value Factor ETF
Management’s Discussion of Fund Performance
For the fiscal year ending July 31, 2018, the exchange-traded fund’s (ETF) net asset value rose 16.11%, roughly in line with the 16.50% result of the Fidelity U.S. Value Factor Index. The ETF’s market price returned 16.00% over the same time frame, while the broad-market S&P 500® index rose 16.24%. Ten of eleven sectors in the Fidelity index gained in value, led by energy and information technology, up about 32% and 27%, respectively. Telecommunication services was the only sector to lose ground, returning about -5%. Within technology, Microsoft led the way, as the software maker repeatedly reported earnings that outpaced analysts’ estimates, due partly to the success of the company’s cloud computing business. Shares of consumer electronics and personal computer maker Apple gained in response to continued strong earnings and robust demand for its mobile communication devices. Healthy financial results and strong advertising revenue lifted Alphabet, parent company of internet search leader Google. Elsewhere, shares of aircraft manufacturer Boeing contributed, as investors anticipated improved potential for the company, while bank stock JPMorgan Chase and fashion designer/retailer Michael Kors also added value. In contrast, the biggest individual detractor was Bed Bath & Beyond, which reported disappointing earnings in an increasingly competitive business environment for the home-products retailer. Weaker-than-expected profits weighed on shares of homebuilder Toll Brothers, while engineering and construction company Chicago Bridge & Iron faced investors’ apparent skepticism about the company’s merger with McDermott, which it announced in December and closed in May. Media and telecommunications giant Comcast also struggled, reflecting the market’s concern about a bidding war to acquire U.K. broadcaster Sky, as well as a decline in the number of cable-television subscribers.
The views expressed above reflect those of the portfolio manager(s) only through the end of the period as stated on the cover of this report and do not necessarily represent the views of Fidelity or any other person in the Fidelity organization, or Geode Capital Management, LLC, (the ETF’s subadviser) or any other person in the Geode organization. Any such views are subject to change at any time based upon market or other conditions and Fidelity and Geode disclaim any responsibility to update such views. These views may not be relied on as investment advice and, because investment decisions for a Fidelity fund are based on numerous factors, may not be relied on as an indication of trading intent on behalf of any Fidelity fund.
| Annual Report | 20 |
Table of Contents
Fidelity® Value Factor ETF
Investment Summary (Unaudited)
| Top Ten Stocks as of July 31, 2018 | ||||
| % of fund’s net assets | ||||
Apple, Inc. | 4.3 | |||
Microsoft Corp. | 3.7 | |||
Alphabet, Inc. Class A | 3.3 | |||
Johnson & Johnson | 2.1 | |||
Facebook, Inc. Class A | 2.1 | |||
JPMorgan Chase & Co. | 2.1 | |||
Berkshire Hathaway, Inc. Class B | 1.9 | |||
Pfizer, Inc. | 1.8 | |||
Bank of America Corp. | 1.7 | |||
Merck & Co., Inc. | 1.6 | |||
|
| |||
| 24.6 | ||||
|
| |||
| Top Market Sectors as of July 31, 2018 | ||||
| % of fund’s net assets | ||||
Information Technology | 25.6 | |||
Financials | 14.5 | |||
Health Care | 14.5 | |||
Consumer Discretionary | 11.5 | |||
Industrials | 10.0 | |||
Energy | 6.4 | |||
Consumer Staples | 6.0 | |||
Real Estate | 3.6 | |||
Materials | 3.1 | |||
Utilities | 2.9 | |||
| Asset Allocation as of July 31, 2018 |
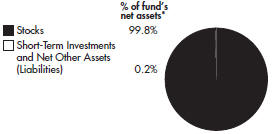
| * | Foreign investments – 3.4% |
| 21 | Annual Report |
Table of Contents
Fidelity Dividend ETF for Rising Rates
Showing Percentage of Net Assets
| Common Stocks – 99.8% | ||||||||
| Shares | Value | |||||||
CONSUMER DISCRETIONARY – 12.5% |
| |||||||
Automobiles – 1.2% | ||||||||
Ford Motor Co. | 214,940 | $ | 2,157,997 | |||||
General Motors Co. | 58,525 | 2,218,683 | ||||||
|
| |||||||
| 4,376,680 | ||||||||
|
| |||||||
Hotels, Restaurants & Leisure – 2.5% |
| |||||||
Cracker Barrel Old Country Store, Inc. (a) | 10,490 | 1,536,733 | ||||||
Las Vegas Sands Corp. | 27,574 | 1,982,571 | ||||||
McDonald’s Corp. | 20,717 | 3,263,756 | ||||||
Six Flags Entertainment Corp. (a) | 27,172 | 1,764,821 | ||||||
|
| |||||||
| 8,547,881 | ||||||||
|
| |||||||
Household Durables – 0.5% | ||||||||
Garmin Ltd. | 29,844 | 1,863,758 | ||||||
|
| |||||||
Media – 3.6% | ||||||||
Comcast Corp. Class A | 103,136 | 3,690,206 | ||||||
ITV PLC | 722,151 | 1,562,546 | ||||||
The Walt Disney Co. | 35,897 | 4,076,463 | ||||||
Twenty-First Century Fox, Inc. Class A | 67,473 | 3,036,285 | ||||||
|
| |||||||
| 12,365,500 | ||||||||
|
| |||||||
Multiline Retail – 2.2% | ||||||||
Kohl’s Corp. | 29,519 | 2,180,568 | ||||||
Macy’s, Inc. | 73,494 | 2,919,917 | ||||||
Target Corp. | 30,883 | 2,491,640 | ||||||
|
| |||||||
| 7,592,125 | ||||||||
|
| |||||||
Specialty Retail – 2.5% | ||||||||
L Brands, Inc. (a) | 39,252 | 1,243,111 | ||||||
Lowe’s Companies, Inc. | 27,959 | 2,777,447 | ||||||
The Home Depot, Inc. | 24,096 | 4,759,442 | ||||||
|
| |||||||
| 8,780,000 | ||||||||
|
| |||||||
TOTAL CONSUMER DISCRETIONARY |
| 43,525,944 | ||||||
|
| |||||||
CONSUMER STAPLES – 6.2% | ||||||||
Beverages – 1.2% | ||||||||
The Coca-Cola Co. | 86,460 | 4,031,630 | ||||||
|
| |||||||
Food & Staples Retailing – 0.9% | ||||||||
Costco Wholesale Corp. | 14,742 | 3,224,223 | ||||||
|
| |||||||
Food Products – 1.1% | ||||||||
Marine Harvest ASA | 98,124 | 2,145,540 | ||||||
The Kraft Heinz Co. | 29,854 | 1,798,703 | ||||||
|
| |||||||
| 3,944,243 | ||||||||
|
| |||||||
Household Products – 1.2% | ||||||||
The Procter & Gamble Co. | 53,332 | 4,313,492 | ||||||
|
| |||||||
Tobacco – 1.8% | ||||||||
Altria Group, Inc. | 49,589 | 2,909,882 | ||||||
Philip Morris International, Inc. | 36,716 | 3,168,591 | ||||||
|
| |||||||
| 6,078,473 | ||||||||
|
| |||||||
TOTAL CONSUMER STAPLES | 21,592,061 | |||||||
|
| |||||||
| Shares | Value | |||||||
ENERGY – 5.9% | ||||||||
Oil, Gas & Consumable Fuels – 5.9% |
| |||||||
Chevron Corp. | 38,787 | $ | 4,897,634 | |||||
Exxon Mobil Corp. | 74,948 | 6,109,011 | ||||||
Occidental Petroleum Corp. | 33,035 | 2,772,628 | ||||||
Targa Resources Corp. | 38,950 | 1,989,177 | ||||||
The Williams Cos., Inc. | 66,588 | 1,980,993 | ||||||
Valero Energy Corp. | 24,250 | 2,869,987 | ||||||
|
| |||||||
TOTAL ENERGY | 20,619,430 | |||||||
|
| |||||||
FINANCIALS – 15.2% | ||||||||
Banks – 7.3% | ||||||||
Bank of America Corp. | 212,583 | 6,564,563 | ||||||
Citigroup, Inc. | 70,005 | 5,032,659 | ||||||
JPMorgan Chase & Co. | 69,144 | 7,948,103 | ||||||
Wells Fargo & Co. | 100,638 | 5,765,551 | ||||||
|
| |||||||
| 25,310,876 | ||||||||
|
| |||||||
Capital Markets – 1.6% | ||||||||
CME Group, Inc. | 22,163 | 3,526,577 | ||||||
Federated Investors, Inc. Class B | 79,700 | 1,928,740 | ||||||
|
| |||||||
| 5,455,317 | ||||||||
|
| |||||||
Insurance – 1.0% | ||||||||
MetLife, Inc. | 71,733 | 3,281,067 | ||||||
|
| |||||||
Mortgage Real Estate Investment Trust (REITs) – 5.3% |
| |||||||
AGNC Investment Corp. | 154,699 | 3,011,990 | ||||||
Annaly Capital Management, Inc. | 283,259 | 3,036,537 | ||||||
Blackstone Mortgage Trust, Inc. Class A (a) | 92,266 | 3,057,695 | ||||||
Chimera Investment Corp. | 167,961 | 3,208,055 | ||||||
New Residential Investment Corp. | 165,857 | 2,967,182 | ||||||
Starwood Property Trust, Inc. | 141,610 | 3,234,372 | ||||||
|
| |||||||
| 18,515,831 | ||||||||
|
| |||||||
TOTAL FINANCIALS | 52,563,091 | |||||||
|
| |||||||
HEALTH CARE – 14.0% | ||||||||
Biotechnology – 4.6% | ||||||||
AbbVie, Inc. | 53,870 | 4,968,430 | ||||||
Amgen, Inc. | 30,185 | 5,932,862 | ||||||
Gilead Sciences, Inc. | 63,189 | 4,918,000 | ||||||
|
| |||||||
| 15,819,292 | ||||||||
|
| |||||||
Health Care Providers & Services – 0.7% |
| |||||||
CVS Health Corp. | 35,328 | 2,291,374 | ||||||
|
| |||||||
Pharmaceuticals – 8.7% | ||||||||
Bristol-Myers Squibb Co. | 82,515 | 4,847,756 | ||||||
Johnson & Johnson | 62,534 | 8,287,006 | ||||||
Merck & Co., Inc. | 100,074 | 6,591,874 | ||||||
Orion Oyj Class B | 95,406 | 3,286,646 | ||||||
See accompanying notes which are an integral part of the financial statements.
| Annual Report | 22 |
Table of Contents
| Common Stocks – continued | ||||||||
| Shares | Value | |||||||
HEALTH CARE – continued | ||||||||
Pharmaceuticals – continued |
| |||||||
Pfizer, Inc. | 181,979 | $ | 7,266,422 | |||||
|
| |||||||
| 30,279,704 | ||||||||
|
| |||||||
TOTAL HEALTH CARE | 48,390,370 | |||||||
|
| |||||||
INDUSTRIALS – 10.7% |
| |||||||
Aerospace & Defense – 3.8% |
| |||||||
Singapore Technologies Engineering Ltd. | 1,200,900 | 3,016,915 | ||||||
The Boeing Co. | 15,950 | 5,682,985 | ||||||
United Technologies Corp. | 32,051 | 4,350,603 | ||||||
|
| |||||||
| 13,050,503 | ||||||||
|
| |||||||
Air Freight & Logistics – 1.2% |
| |||||||
United Parcel Service, Inc. Class B | 34,858 | 4,179,126 | ||||||
|
| |||||||
Airlines – 1.0% | ||||||||
Delta Air Lines, Inc. | 63,221 | 3,440,487 | ||||||
|
| |||||||
Electrical Equipment – 2.9% | ||||||||
Eaton Corp. PLC | 41,062 | 3,415,127 | ||||||
Emerson Electric Co. | 51,054 | 3,690,183 | ||||||
Siemens Gamesa Renewable Energy S.A. (a) | 200,496 | 2,833,328 | ||||||
|
| |||||||
| 9,938,638 | ||||||||
|
| |||||||
Industrial Conglomerates – 1.8% |
| |||||||
Jardine Matheson Holdings Ltd. | 48,252 | 3,257,010 | ||||||
Jardine Strategic Holdings Ltd. | 77,107 | 3,075,027 | ||||||
|
| |||||||
| 6,332,037 | ||||||||
|
| |||||||
TOTAL INDUSTRIALS | 36,940,791 | |||||||
|
| |||||||
INFORMATION TECHNOLOGY – 24.8% |
| |||||||
Communications Equipment – 1.9% |
| |||||||
Cisco Systems, Inc. | 155,709 | 6,584,934 | ||||||
|
| |||||||
Electronic Equipment, Instruments & Components – 1.3% |
| |||||||
Corning, Inc. | 131,290 | 4,356,202 | ||||||
|
| |||||||
IT Services – 3.8% | ||||||||
International Business Machines Corp. | 34,671 | 5,024,868 | ||||||
Paychex, Inc. | 61,051 | 4,213,740 | ||||||
The Western Union Co. | 190,484 | 3,840,158 | ||||||
|
| |||||||
| 13,078,766 | ||||||||
|
| |||||||
Semiconductors & Semiconductor Equipment – 3.3% |
| |||||||
Broadcom, Inc. | 21,201 | 4,701,746 | ||||||
Intel Corp. | 140,814 | 6,773,153 | ||||||
|
| |||||||
| 11,474,899 | ||||||||
|
| |||||||
Software – 6.4% | ||||||||
Micro Focus International PLC | 125,697 | 2,051,053 | ||||||
Microsoft Corp. | 140,736 | 14,929,275 | ||||||
Oracle Corp. | 113,404 | 5,407,103 | ||||||
|
| |||||||
| 22,387,431 | ||||||||
|
| |||||||
Technology Hardware, Storage & Peripherals – 8.1% |
| |||||||
Apple, Inc. | 89,468 | 17,024,866 | ||||||
| Shares | Value | |||||||
HP, Inc. | 185,394 | $ | 4,278,893 | |||||
Seagate Technology PLC | 73,593 | 3,872,464 | ||||||
Xerox Corp. | 118,991 | 3,090,196 | ||||||
|
| |||||||
| 28,266,419 | ||||||||
|
| |||||||
TOTAL INFORMATION TECHNOLOGY |
| 86,148,651 | ||||||
|
| |||||||
MATERIALS – 2.7% | ||||||||
Chemicals – 1.8% | ||||||||
Air Products & Chemicals, Inc. | 7,061 | 1,159,204 | ||||||
DowDuPont, Inc. | 40,023 | 2,752,382 | ||||||
LyondellBasell Industries N.V. Class A | 10,216 | 1,131,831 | ||||||
Praxair, Inc. | 8,150 | 1,365,125 | ||||||
|
| |||||||
| 6,408,542 | ||||||||
|
| |||||||
Containers & Packaging – 0.3% | ||||||||
International Paper Co. | 16,828 | 904,168 | ||||||
|
| |||||||
Metals & Mining – 0.6% | ||||||||
Fortescue Metals Group Ltd. | 177,352 | 575,807 | ||||||
Fresnillo PLC | 36,928 | 503,602 | ||||||
Nucor Corp. | 14,768 | 988,422 | ||||||
|
| |||||||
| 2,067,831 | ||||||||
|
| |||||||
TOTAL MATERIALS | 9,380,541 | |||||||
|
| |||||||
REAL ESTATE – 3.5% | ||||||||
Equity Real Estate Investment Trusts (REITs) – 3.3% |
| |||||||
Equity Residential | 15,227 | 996,303 | ||||||
Gaming and Leisure Properties, Inc. | 20,455 | 742,926 | ||||||
GGP, Inc. | 35,515 | 757,180 | ||||||
HCP, Inc. | 32,858 | 851,022 | ||||||
Hospitality Properties Trust | 24,696 | 698,156 | ||||||
Kimco Realty Corp. | 46,661 | 778,772 | ||||||
Omega Healthcare Investors, Inc. (a) | 26,537 | 787,883 | ||||||
Public Storage | 5,244 | 1,142,300 | ||||||
Senior Housing Properties Trust | 40,569 | 723,751 | ||||||
Simon Property Group, Inc. | 8,066 | 1,421,310 | ||||||
Spirit MTA REIT (b) | 8,404 | 83,956 | ||||||
Spirit Realty Capital, Inc. | 84,072 | 703,683 | ||||||
Ventas, Inc. | 16,221 | 914,540 | ||||||
Welltower, Inc. | 15,682 | 981,693 | ||||||
|
| |||||||
| 11,583,475 | ||||||||
|
| |||||||
Real Estate Management & Development – 0.2% |
| |||||||
Hongkong Land Holdings Ltd. | 87,600 | 636,852 | ||||||
|
| |||||||
TOTAL REAL ESTATE | 12,220,327 | |||||||
|
| |||||||
TELECOMMUNICATION SERVICES – 1.7% |
| |||||||
Diversified Telecommunication Services – 1.7% |
| |||||||
AT&T, Inc. | 82,877 | 2,649,578 | ||||||
CenturyLink, Inc. | 19,419 | 364,494 | ||||||
Verizon Communications, Inc. | 55,239 | 2,852,542 | ||||||
|
| |||||||
TOTAL TELECOMMUNICATION SERVICES |
| 5,866,614 | ||||||
|
| |||||||
See accompanying notes which are an integral part of the financial statements.
| 23 | Annual Report |
Table of Contents
Fidelity Dividend ETF for Rising Rates
Investments – continued
| Common Stocks – continued | ||||||||
| Shares | Value | |||||||
UTILITIES – 2.6% | ||||||||
Electric Utilities – 2.0% | ||||||||
Duke Energy Corp. | 18,770 | $ | 1,532,007 | |||||
Edison International | 16,074 | 1,071,011 | ||||||
NextEra Energy, Inc. | 10,782 | 1,806,416 | ||||||
PPL Corp. | 32,301 | 929,300 | ||||||
The Southern Co. | 29,463 | 1,431,902 | ||||||
|
| |||||||
| 6,770,636 | ||||||||
|
| |||||||
Multi-Utilities – 0.6% | ||||||||
Dominion Energy, Inc. | 17,952 | 1,287,338 | ||||||
SCANA Corp. | 20,576 | 822,834 | ||||||
|
| |||||||
| 2,110,172 | ||||||||
|
| |||||||
TOTAL UTILITIES | 8,880,808 | |||||||
|
| |||||||
TOTAL COMMON STOCKS |
| 346,128,628 | ||||||
|
| |||||||
| Money Market Funds – 2.3% | ||||||||
Fidelity Cash Central Fund, 1.96% (c) | 288,898 | 288,955 | ||||||
Fidelity Securities Lending Cash Central Fund, 1.97% (c)(d) | 7,834,980 | 7,835,763 | ||||||
|
| |||||||
TOTAL MONEY MARKET FUNDS |
| 8,124,718 | ||||||
|
| |||||||
TOTAL INVESTMENT PORTFOLIO – 102.1% (Cost $334,905,764) |
| 354,253,346 | ||||||
NET OTHER ASSETS (LIABILITIES) – (2.1%) |
| (7,357,769 | ) | |||||
|
| |||||||
NET ASSETS – 100.0% |
| $ | 346,895,577 | |||||
|
| |||||||
Legend
| (a) | Security or a portion of the security is on loan at period end. |
| (b) | Non-income producing. |
| (c) | Affiliated fund that is generally available only to investment companies and other accounts managed by Fidelity Investments. The rate quoted is the annualized seven-day yield of the fund at period end. A complete unaudited listing of the fund’s holdings as of its most recent quarter end is available upon request. In addition, each Fidelity Central Fund’s financial statements, which are not covered by the Fund’s Report of Independent Registered Public Accounting Firm, are available on the SEC’s website or upon request. |
| (d) | Investment made with cash collateral received from securities on loan. |
Affiliated Central Funds
Information regarding fiscal year to date income earned by the Fund from investments in Fidelity Central Funds is as follows:
| Fund | Income earned | |||
Fidelity Cash Central Fund | $ | 5,429 | ||
Fidelity Securities Lending Cash Central Fund | 64,889 | |||
|
| |||
Total | $ | 70,318 | ||
|
| |||
Amounts in the income column in the above table include any capital gain distributions from underlying funds, which are presented in the corresponding line-item in the Statement of Operations if applicable.
See accompanying notes which are an integral part of the financial statements.
| Annual Report | 24 |
Table of Contents
Investment Valuation
The following is a summary of the inputs used, as of July 31, 2018, involving the Fund’s assets and liabilities carried at fair value. The inputs or methodology used for valuing securities may not be an indication of the risk associated with investing in those securities. For more information on valuation inputs, and their aggregation into the levels used in the table below, please refer to the Investment Valuation section in the accompanying Notes to Financial Statements.
Valuation Inputs at Reporting Date: | ||||||||||||||||
| Description | Total | Level 1 | Level 2 | Level 3 | ||||||||||||
Investments in Securities: | ||||||||||||||||
Equities: | ||||||||||||||||
Consumer Discretionary | $ | 43,525,944 | $ | 43,525,944 | $ | — | $ | — | ||||||||
Consumer Staples | 21,592,061 | 21,592,061 | — | — | ||||||||||||
Energy | 20,619,430 | 20,619,430 | — | — | ||||||||||||
Financials | 52,563,091 | 52,563,091 | — | — | ||||||||||||
Health Care | 48,390,370 | 48,390,370 | — | — | ||||||||||||
Industrials | 36,940,791 | 36,940,791 | — | — | ||||||||||||
Information Technology | 86,148,651 | 84,097,598 | 2,051,053 | — | ||||||||||||
Materials | 9,380,541 | 9,380,541 | — | — | ||||||||||||
Real Estate | 12,220,327 | 12,220,327 | — | — | ||||||||||||
Telecommunication Services | 5,866,614 | 5,866,614 | — | — | ||||||||||||
Utilities | 8,880,808 | 8,880,808 | — | — | ||||||||||||
Money Market Funds | 8,124,718 | 8,124,718 | — | — | ||||||||||||
|
|
|
|
|
|
|
| |||||||||
Total Investments in Securities: | $ | 354,253,346 | $ | 352,202,293 | $ | 2,051,053 | $ | — | ||||||||
|
|
|
|
|
|
|
| |||||||||
See accompanying notes which are an integral part of the financial statements.
| 25 | Annual Report |
Table of Contents
Fidelity High Dividend ETF
Investments July 31, 2018
Showing Percentage of Net Assets
| Common Stocks – 99.6% | ||||||||
| Shares | Value | |||||||
CONSUMER DISCRETIONARY – 5.8% |
| |||||||
Automobiles – 0.6% |
| |||||||
Ford Motor Co. | 50,090 | $ | 502,903 | |||||
General Motors Co. | 13,703 | 519,481 | ||||||
|
| |||||||
| 1,022,384 | ||||||||
|
| |||||||
Hotels, Restaurants & Leisure – 1.2% |
| |||||||
Cracker Barrel Old Country Store, Inc. (a) | 2,462 | 360,671 | ||||||
Las Vegas Sands Corp. | 6,475 | 465,553 | ||||||
McDonald’s Corp. | 4,810 | 757,767 | ||||||
Six Flags Entertainment Corp. (a) | 6,436 | 418,018 | ||||||
|
| |||||||
| 2,002,009 | ||||||||
|
| |||||||
Household Durables – 0.5% |
| |||||||
Garmin Ltd. | 7,075 | 441,834 | ||||||
Newell Brands, Inc. | 16,793 | 439,808 | ||||||
|
| |||||||
| 881,642 | ||||||||
|
| |||||||
Media – 1.7% |
| |||||||
Comcast Corp. Class A | 23,880 | 854,426 | ||||||
ITV PLC | 171,839 | 371,815 | ||||||
The Walt Disney Co. | 8,283 | 940,618 | ||||||
Twenty-First Century Fox, Inc. Class A | 15,778 | 710,010 | ||||||
|
| |||||||
| 2,876,869 | ||||||||
|
| |||||||
Multiline Retail – 1.0% |
| |||||||
Kohl’s Corp. | 6,957 | 513,913 | ||||||
Macy’s, Inc. | 17,305 | 687,528 | ||||||
Target Corp. | 7,219 | 582,429 | ||||||
|
| |||||||
| 1,783,870 | ||||||||
|
| |||||||
Specialty Retail – 0.8% |
| |||||||
L Brands, Inc. (a) | 9,295 | 294,373 | ||||||
The Home Depot, Inc. | 5,562 | 1,098,606 | ||||||
|
| |||||||
| 1,392,979 | ||||||||
|
| |||||||
TOTAL CONSUMER DISCRETIONARY |
| 9,959,753 | ||||||
|
| |||||||
CONSUMER STAPLES – 0.6% |
| |||||||
Beverages – 0.2% |
| |||||||
PepsiCo, Inc. | 1,222 | 140,530 | ||||||
The Coca-Cola Co. | 3,246 | 151,361 | ||||||
|
| |||||||
| 291,891 | ||||||||
|
| |||||||
Food & Staples Retailing – 0.1% |
| |||||||
Costco Wholesale Corp. | 529 | 115,698 | ||||||
|
| |||||||
Food Products – 0.1% |
| |||||||
Marine Harvest ASA | 3,485 | 76,201 | ||||||
The Kraft Heinz Co. | 1,083 | 65,251 | ||||||
|
| |||||||
| 141,452 | ||||||||
|
| |||||||
Household Products – 0.1% |
| |||||||
The Procter & Gamble Co. | 2,004 | 162,084 | ||||||
|
| |||||||
Tobacco – 0.1% |
| |||||||
Altria Group, Inc. | 1,852 | 108,675 | ||||||
| Shares | Value | |||||||
Philip Morris International, Inc. | 1,377 | $ | 118,835 | |||||
|
| |||||||
| 227,510 | ||||||||
|
| |||||||
TOTAL CONSUMER STAPLES |
| 938,635 | ||||||
|
| |||||||
ENERGY – 13.6% | ||||||||
Oil, Gas & Consumable Fuels – 13.6% |
| |||||||
Chevron Corp. | 35,864 | 4,528,547 | ||||||
Exxon Mobil Corp. | 60,487 | 4,930,295 | ||||||
Occidental Petroleum Corp. | 44,093 | 3,700,726 | ||||||
Targa Resources Corp. | 62,402 | 3,186,870 | ||||||
The Williams Cos., Inc. | 99,495 | 2,959,976 | ||||||
Valero Energy Corp. | 34,305 | 4,059,997 | ||||||
|
| |||||||
TOTAL ENERGY | 23,366,411 | |||||||
|
| |||||||
FINANCIALS – 22.2% |
| |||||||
Banks – 9.3% |
| |||||||
Bank of America Corp. | 134,327 | 4,148,018 | ||||||
Citigroup, Inc. | 46,612 | 3,350,936 | ||||||
JPMorgan Chase & Co. | 42,272 | 4,859,166 | ||||||
Wells Fargo & Co. | 64,206 | 3,678,362 | ||||||
|
| |||||||
| 16,036,482 | ||||||||
|
| |||||||
Capital Markets – 2.5% |
| |||||||
CME Group, Inc. | 17,003 | 2,705,517 | ||||||
Federated Investors, Inc. Class B | 66,558 | 1,610,704 | ||||||
|
| |||||||
| 4,316,221 | ||||||||
|
| |||||||
Insurance – 1.5% |
| |||||||
MetLife, Inc. | 55,316 | 2,530,154 | ||||||
|
| |||||||
Mortgage Real Estate Investment Trust (REITs) – 8.9% |
| |||||||
AGNC Investment Corp. | 128,068 | 2,493,484 | ||||||
Annaly Capital Management, Inc. | 231,547 | 2,482,184 | ||||||
Blackstone Mortgage Trust, Inc. Class A (a) | 76,899 | 2,548,433 | ||||||
Chimera Investment Corp. | 139,378 | 2,662,120 | ||||||
New Residential Investment Corp. | 138,017 | 2,469,124 | ||||||
Starwood Property Trust, Inc. | 117,500 | 2,683,700 | ||||||
|
| |||||||
| 15,339,045 | ||||||||
|
| |||||||
TOTAL FINANCIALS | 38,221,902 | |||||||
|
| |||||||
HEALTH CARE – 6.7% | ||||||||
Biotechnology – 2.3% | ||||||||
AbbVie, Inc. | 13,579 | 1,252,391 | ||||||
Amgen, Inc. | 7,644 | 1,502,428 | ||||||
Gilead Sciences, Inc. | 16,000 | 1,245,280 | ||||||
|
| |||||||
| 4,000,099 | ||||||||
|
| |||||||
Pharmaceuticals – 4.4% |
| |||||||
AstraZeneca PLC | 14,278 | 1,099,067 | ||||||
Johnson & Johnson | 15,682 | 2,078,179 | ||||||
Merck & Co., Inc. | 25,319 | 1,667,762 | ||||||
Orion Oyj Class B | 24,411 | 840,936 | ||||||
See accompanying notes which are an integral part of the financial statements.
| Annual Report | 26 |
Table of Contents
| Common Stocks – continued | ||||||||
| Shares | Value | |||||||
HEALTH CARE – continued |
| |||||||
Pharmaceuticals – continued |
| |||||||
Pfizer, Inc. | 45,830 | $ | 1,829,992 | |||||
|
| |||||||
| 7,515,936 | ||||||||
|
| |||||||
TOTAL HEALTH CARE | 11,516,035 | |||||||
|
| |||||||
INDUSTRIALS – 3.7% |
| |||||||
Aerospace & Defense – 0.6% |
| |||||||
The Boeing Co. | 2,830 | 1,008,329 | ||||||
|
| |||||||
Air Freight & Logistics – 0.4% |
| |||||||
United Parcel Service, Inc. Class B | 6,174 | 740,201 | ||||||
|
| |||||||
Airlines – 0.4% |
| |||||||
Delta Air Lines, Inc. | 11,156 | 607,110 | ||||||
|
| |||||||
Electrical Equipment – 1.0% |
| |||||||
Eaton Corp. PLC | 7,244 | 602,483 | ||||||
Emerson Electric Co. | 9,034 | 652,978 | ||||||
Siemens Gamesa Renewable Energy S.A. | 35,118 | 496,273 | ||||||
|
| |||||||
| 1,751,734 | ||||||||
|
| |||||||
Industrial Conglomerates – 1.1% |
| |||||||
3M Co. | 3,597 | 763,715 | ||||||
Jardine Matheson Holdings Ltd. | 8,200 | 553,500 | ||||||
Jardine Strategic Holdings Ltd. | 13,400 | 534,392 | ||||||
|
| |||||||
| 1,851,607 | ||||||||
|
| |||||||
Professional Services – 0.2% |
| |||||||
Nielsen Holdings PLC | 14,807 | 348,853 | ||||||
|
| |||||||
TOTAL INDUSTRIALS | 6,307,834 | |||||||
|
| |||||||
INFORMATION TECHNOLOGY – 17.8% |
| |||||||
Communications Equipment – 1.4% | ||||||||
Cisco Systems, Inc. | 55,294 | 2,338,383 | ||||||
|
| |||||||
Electronic Equipment, Instruments & Components – 0.9% |
| |||||||
Corning, Inc. | 46,611 | 1,546,553 | ||||||
|
| |||||||
IT Services – 2.7% |
| |||||||
International Business Machines Corp. | 12,308 | 1,783,799 | ||||||
Paychex, Inc. | 21,621 | 1,492,281 | ||||||
The Western Union Co. | 67,625 | 1,363,320 | ||||||
|
| |||||||
| 4,639,400 | ||||||||
|
| |||||||
Semiconductors & Semiconductor Equipment – 2.4% |
| |||||||
Broadcom, Inc. | 7,527 | 1,669,263 | ||||||
Intel Corp. | 50,008 | 2,405,385 | ||||||
|
| |||||||
| 4,074,648 | ||||||||
|
| |||||||
Software – 4.6% | ||||||||
Micro Focus International PLC | 44,508 | 726,257 | ||||||
Microsoft Corp. | 49,985 | 5,302,409 | ||||||
Oracle Corp. | 40,276 | 1,920,359 | ||||||
|
| |||||||
| 7,949,025 | ||||||||
|
| |||||||
Technology Hardware, Storage & Peripherals – 5.8% |
| |||||||
Apple, Inc. | 31,769 | 6,045,323 | ||||||
HP, Inc. | 65,819 | 1,519,102 | ||||||
| Shares | Value | |||||||
Seagate Technology PLC | 26,189 | $ | 1,378,065 | |||||
Xerox Corp. | 42,212 | 1,096,246 | ||||||
|
| |||||||
| 10,038,736 | ||||||||
|
| |||||||
TOTAL INFORMATION TECHNOLOGY |
| 30,586,745 | ||||||
|
| |||||||
REAL ESTATE – 11.4% | ||||||||
Equity Real Estate Investment Trusts (REITs) – 11.4% |
| |||||||
Equity Residential | 22,467 | 1,470,016 | ||||||
Gaming and Leisure Properties, Inc. | 34,551 | 1,254,892 | ||||||
GGP, Inc. | 57,148 | 1,218,395 | ||||||
HCP, Inc. | 54,501 | 1,411,576 | ||||||
Hospitality Properties Trust | 44,514 | 1,258,411 | ||||||
Kimco Realty Corp. | 81,699 | 1,363,556 | ||||||
Omega Healthcare Investors, Inc. (a) | 47,562 | 1,412,116 | ||||||
Public Storage | 7,312 | 1,592,773 | ||||||
Senior Housing Properties Trust | 73,648 | 1,313,880 | ||||||
Simon Property Group, Inc. | 9,581 | 1,688,268 | ||||||
Spirit MTA REIT (b) | 15,488 | 154,725 | ||||||
Spirit Realty Capital, Inc. | 154,000 | 1,288,980 | ||||||
Ventas, Inc. | 24,575 | 1,385,539 | ||||||
Welltower, Inc. | 23,278 | 1,457,203 | ||||||
WP Carey, Inc. | 19,744 | 1,290,863 | ||||||
|
| |||||||
TOTAL REAL ESTATE | 19,561,193 | |||||||
|
| |||||||
TELECOMMUNICATION SERVICES – 8.6% |
| |||||||
Diversified Telecommunication Services – 8.6% |
| |||||||
AT&T, Inc. | 149,048 | 4,765,064 | ||||||
CenturyLink, Inc. | 246,019 | 4,617,777 | ||||||
Verizon Communications, Inc. | 105,265 | 5,435,885 | ||||||
|
| |||||||
TOTAL TELECOMMUNICATION SERVICES |
| 14,818,726 | ||||||
|
| |||||||
UTILITIES – 9.2% | ||||||||
Electric Utilities – 6.8% | ||||||||
Duke Energy Corp. | 29,858 | 2,437,010 | ||||||
Edison International | 33,684 | 2,244,365 | ||||||
NextEra Energy, Inc. | 15,477 | 2,593,016 | ||||||
PPL Corp. | 66,855 | 1,923,418 | ||||||
The Southern Co. | 50,371 | 2,448,031 | ||||||
|
| |||||||
| 11,645,840 | ||||||||
|
| |||||||
Multi-Utilities – 2.4% | ||||||||
Dominion Energy, Inc. | 29,770 | 2,134,807 | ||||||
SCANA Corp. | 50,760 | 2,029,892 | ||||||
|
| |||||||
| 4,164,699 | ||||||||
|
| |||||||
TOTAL UTILITIES | 15,810,539 | |||||||
|
| |||||||
TOTAL COMMON STOCKS |
| 171,087,773 | ||||||
|
| |||||||
| Money Market Funds – 1.9% | ||||||||
Fidelity Cash Central Fund, 1.96% (c) | 441,304 | 441,392 | ||||||
See accompanying notes which are an integral part of the financial statements.
| 27 | Annual Report |
Table of Contents
Fidelity High Dividend ETF
Investments – continued
| Money Market Funds – continued | ||||||||
| Shares | Value | |||||||
Fidelity Securities Lending Cash Central Fund, 1.97% (c)(d) | 2,899,110 | $ | 2,899,400 | |||||
|
| |||||||
TOTAL MONEY MARKET FUNDS |
| 3,340,792 | ||||||
|
| |||||||
TOTAL INVESTMENT PORTFOLIO – 101.5% |
| 174,428,565 | ||||||
NET OTHER ASSETS (LIABILITIES) – (1.5%) |
| (2,593,910 | ) | |||||
|
| |||||||
NET ASSETS – 100.0% |
| $ | 171,834,655 | |||||
|
| |||||||
Legend
| (a) | Security or a portion of the security is on loan at period end. |
| (b) | Non-income producing. |
| (c) | Affiliated fund that is generally available only to investment companies and other accounts managed by Fidelity Investments. The rate quoted is the annualized seven-day yield of the fund at period end. A complete unaudited listing of the fund’s holdings as of its most recent quarter end is available upon request. In addition, each Fidelity Central Fund’s financial statements, which are not covered by the Fund’s Report of Independent Registered Public Accounting Firm, are available on the SEC’s website or upon request. |
| (d) | Investment made with cash collateral received from securities on loan. |
Affiliated Central Funds
Information regarding fiscal year to date income earned by the Fund from investments in Fidelity Central Funds is as follows:
| Fund | Income earned | |||
Fidelity Cash Central Fund | $ | 28,570 | ||
Fidelity Securities Lending Cash Central Fund | 47,220 | |||
|
| |||
Total | $ | 75,790 | ||
|
| |||
Amounts in the income column in the above table include any capital gain distributions from underlying funds, which are presented in the corresponding line-item in the Statement of Operations if applicable.
Investment Valuation
The following is a summary of the inputs used, as of July 31, 2018, involving the Fund’s assets and liabilities carried at fair value. The inputs or methodology used for valuing securities may not be an indication of the risk associated with investing in those securities. For more information on valuation inputs, and their aggregation into the levels used in the table below, please refer to the Investment Valuation section in the accompanying Notes to Financial Statements.
| Valuation Inputs at Reporting Date: | ||||||||||||||||
| Description | Total | Level 1 | Level 2 | Level 3 | ||||||||||||
Investments in Securities: | ||||||||||||||||
Equities: | ||||||||||||||||
Consumer Discretionary | $ | 9,959,753 | $ | 9,959,753 | $ | — | $ | — | ||||||||
Consumer Staples | 938,635 | 938,635 | — | — | ||||||||||||
Energy | 23,366,411 | 23,366,411 | — | — | ||||||||||||
Financials | 38,221,902 | 38,221,902 | — | — | ||||||||||||
Health Care | 11,516,035 | 10,416,968 | 1,099,067 | — | ||||||||||||
Industrials | 6,307,834 | 6,307,834 | — | — | ||||||||||||
Information Technology | 30,586,745 | 29,860,488 | 726,257 | — | ||||||||||||
Real Estate | 19,561,193 | 19,561,193 | — | — | ||||||||||||
Telecommunication Services | 14,818,726 | 14,818,726 | — | — | ||||||||||||
Utilities | 15,810,539 | 15,810,539 | — | — | ||||||||||||
Money Market Funds | 3,340,792 | 3,340,792 | — | — | ||||||||||||
|
|
|
|
|
|
|
| |||||||||
Total Investments in Securities: | $ | 174,428,565 | $ | 172,603,241 | $ | 1,825,324 | $ | — | ||||||||
|
|
|
|
|
|
|
| |||||||||
See accompanying notes which are an integral part of the financial statements.
| Annual Report | 28 |
Table of Contents
Fidelity Low Volatility Factor ETF
Investments July 31, 2018
Showing Percentage of Net Assets
| Common Stocks – 99.8% | ||||||||
| Shares | Value | |||||||
CONSUMER DISCRETIONARY – 12.9% |
| |||||||
Diversified Consumer Services – 0.9% |
| |||||||
Bright Horizons Family Solutions, Inc. (a) | 5,264 | $ | 563,195 | |||||
|
| |||||||
Hotels, Restaurants & Leisure – 5.5% |
| |||||||
Aramark | 11,675 | 469,452 | ||||||
Darden Restaurants, Inc. | 5,476 | 585,603 | ||||||
Dunkin’ Brands Group, Inc. | 8,070 | 561,914 | ||||||
McDonald’s Corp. | 4,849 | 763,912 | ||||||
Starbucks Corp. | 12,470 | 653,303 | ||||||
Vail Resorts, Inc. | 2,344 | 648,983 | ||||||
|
| |||||||
| 3,683,167 | ||||||||
|
| |||||||
Media – 0.8% | ||||||||
Cable One, Inc. | 728 | 526,970 | ||||||
|
| |||||||
Specialty Retail – 3.5% |
| |||||||
AutoZone, Inc. (a) | 729 | 514,332 | ||||||
The Home Depot, Inc. | 5,325 | 1,051,794 | ||||||
The TJX Companies, Inc. | 7,832 | 761,740 | ||||||
|
| |||||||
| 2,327,866 | ||||||||
|
| |||||||
Textiles, Apparel & Luxury Goods – 2.2% |
| |||||||
NIKE, Inc. Class B | 10,627 | 817,323 | ||||||
VF Corp. | 7,076 | 651,487 | ||||||
|
| |||||||
| 1,468,810 | ||||||||
|
| |||||||
TOTAL CONSUMER DISCRETIONARY |
| 8,570,008 | ||||||
|
| |||||||
CONSUMER STAPLES – 6.7% | ||||||||
Beverages – 1.9% |
| |||||||
PepsiCo, Inc. | 5,396 | 620,540 | ||||||
The Coca-Cola Co. | 14,152 | 659,908 | ||||||
|
| |||||||
| 1,280,448 | ||||||||
|
| |||||||
Food & Staples Retailing – 1.3% | ||||||||
Sysco Corp. | 4,952 | 332,824 | ||||||
Walmart, Inc. | 5,731 | 511,377 | ||||||
|
| |||||||
| 844,201 | ||||||||
|
| |||||||
Food Products – 0.8% | ||||||||
General Mills, Inc. | 5,401 | 248,770 | ||||||
The Hershey Co. | 2,632 | 258,489 | ||||||
|
| |||||||
| 507,259 | ||||||||
|
| |||||||
Household Products – 1.9% | ||||||||
Church & Dwight Co., Inc. | 5,485 | 306,612 | ||||||
The Clorox Co. | 2,001 | 270,475 | ||||||
The Procter & Gamble Co. | 8,839 | 714,898 | ||||||
|
| |||||||
| 1,291,985 | ||||||||
|
| |||||||
Tobacco – 0.8% | ||||||||
Philip Morris International, Inc. | 5,995 | 517,368 | ||||||
|
| |||||||
TOTAL CONSUMER STAPLES |
| 4,441,261 | ||||||
|
| |||||||
ENERGY – 5.7% |
| |||||||
Energy Equipment & Services – 1.1% | ||||||||
Baker Hughes a GE Co. | 5,628 | 194,616 | ||||||
Schlumberger Ltd. | 5,318 | 359,071 | ||||||
| Shares | Value | |||||||
TechnipFMC PLC | 5,628 | $ | 183,192 | |||||
|
| |||||||
| 736,879 | ||||||||
|
| |||||||
Oil, Gas & Consumable Fuels – 4.6% |
| |||||||
Cabot Oil & Gas Corp. | 6,849 | 160,952 | ||||||
Chevron Corp. | 5,772 | 728,830 | ||||||
Exxon Mobil Corp. | 11,914 | 971,110 | ||||||
Kinder Morgan, Inc. | 12,925 | 229,807 | ||||||
Occidental Petroleum Corp. | 3,786 | 317,759 | ||||||
Phillips 66 | 2,504 | 308,843 | ||||||
Valero Energy Corp. | 2,643 | 312,799 | ||||||
|
| |||||||
| 3,030,100 | ||||||||
|
| |||||||
TOTAL ENERGY |
| 3,766,979 | ||||||
|
| |||||||
FINANCIALS – 14.4% |
| |||||||
Banks – 3.4% |
| |||||||
The PNC Financial Services Group, Inc. | 4,135 | 598,872 | ||||||
US Bancorp | 12,087 | 640,732 | ||||||
Wells Fargo & Co. | 17,940 | 1,027,783 | ||||||
|
| |||||||
| 2,267,387 | ||||||||
|
| |||||||
Capital Markets – 2.3% |
| |||||||
CBOE Holdings, Inc. | 3,762 | 365,403 | ||||||
CME Group, Inc. | 3,825 | 608,634 | ||||||
Intercontinental Exchange, Inc. | 7,758 | 573,394 | ||||||
|
| |||||||
| 1,547,431 | ||||||||
|
| |||||||
Diversified Financial Services – 2.0% |
| |||||||
Berkshire Hathaway, Inc. Class B (a) | 6,817 | 1,348,880 | ||||||
|
| |||||||
Insurance – 5.9% |
| |||||||
Aflac, Inc. | 12,455 | 579,656 | ||||||
Arch Capital Group Ltd. (a) | 16,608 | 507,540 | ||||||
Brown & Brown, Inc. | 18,428 | 539,203 | ||||||
Chubb Ltd. | 4,172 | 582,912 | ||||||
Marsh & McLennan Cos., Inc. | 6,819 | 568,432 | ||||||
The Progressive Corp. | 10,316 | 619,063 | ||||||
Torchmark Corp. | 5,536 | 487,556 | ||||||
|
| |||||||
| 3,884,362 | ||||||||
|
| |||||||
Mortgage Real Estate Investment Trust (REITs) – 0.8% |
| |||||||
Starwood Property Trust, Inc. | 24,110 | 550,672 | ||||||
|
| |||||||
TOTAL FINANCIALS |
| 9,598,732 | ||||||
|
| |||||||
HEALTH CARE – 13.7% |
| |||||||
Health Care Equipment & Supplies – 4.3% |
| |||||||
Danaher Corp. | 6,412 | 657,743 | ||||||
Intuitive Surgical, Inc. (a) | 1,453 | 738,400 | ||||||
Medtronic PLC | 9,167 | 827,138 | ||||||
Stryker Corp. | 3,838 | 626,554 | ||||||
|
| |||||||
| 2,849,835 | ||||||||
|
| |||||||
Health Care Providers & Services – 4.5% |
| |||||||
Aetna, Inc. | 3,465 | 652,771 | ||||||
Anthem, Inc. | 2,682 | 678,546 | ||||||
Cigna Corp. | 3,043 | 545,975 | ||||||
See accompanying notes which are an integral part of the financial statements.
| 29 | Annual Report |
Table of Contents
Fidelity Low Volatility Factor ETF
Investments – continued
| Common Stocks – continued | ||||||||
| Shares | Value | |||||||
HEALTH CARE – continued |
| |||||||
Health Care Providers & Services – continued |
| |||||||
UnitedHealth Group, Inc. | 4,461 | $ | 1,129,615 | |||||
|
| |||||||
| 3,006,907 | ||||||||
|
| |||||||
Pharmaceuticals – 4.9% |
| |||||||
Eli Lilly & Co. | 8,416 | 831,585 | ||||||
Johnson & Johnson | 10,056 | 1,332,621 | ||||||
Pfizer, Inc. | 28,017 | 1,118,719 | ||||||
|
| |||||||
| 3,282,925 | ||||||||
|
| |||||||
TOTAL HEALTH CARE |
| 9,139,667 | ||||||
|
| |||||||
INDUSTRIALS – 10.3% |
| |||||||
Aerospace & Defense – 3.5% |
| |||||||
Lockheed Martin Corp. | 1,549 | 505,129 | ||||||
Northrop Grumman Corp. | 1,409 | 423,391 | ||||||
Raytheon Co. | 2,309 | 457,251 | ||||||
Rockwell Collins, Inc. | 2,811 | 390,701 | ||||||
United Technologies Corp. | 4,246 | 576,352 | ||||||
|
| |||||||
| 2,352,824 | ||||||||
|
| |||||||
Air Freight & Logistics – 0.8% |
| |||||||
United Parcel Service, Inc. Class B | 4,483 | 537,467 | ||||||
|
| |||||||
Commercial Services & Supplies – 1.2% |
| |||||||
Republic Services, Inc. | 5,471 | 396,538 | ||||||
Rollins, Inc. | 7,182 | 394,579 | ||||||
|
| |||||||
| 791,117 | ||||||||
|
| |||||||
Industrial Conglomerates – 1.9% |
| |||||||
3M Co. | 2,798 | 594,071 | ||||||
Honeywell International, Inc. | 3,957 | 631,735 | ||||||
|
| |||||||
| 1,225,806 | ||||||||
|
| |||||||
Machinery – 1.3% |
| |||||||
Deere & Co. | 2,790 | 403,964 | ||||||
Fortive Corp. | 5,254 | 431,248 | ||||||
|
| |||||||
| 835,212 | ||||||||
|
| |||||||
Professional Services – 0.6% |
| |||||||
Verisk Analytics, Inc. (a) | 3,760 | 415,931 | ||||||
|
| |||||||
Road & Rail – 1.0% |
| |||||||
Union Pacific Corp. | 4,448 | 666,711 | ||||||
|
| |||||||
TOTAL INDUSTRIALS | 6,825,068 | |||||||
|
| |||||||
INFORMATION TECHNOLOGY – 25.5% |
| |||||||
Electronic Equipment, Instruments & Components – 0.8% |
| |||||||
Amphenol Corp. Class A | 5,786 | 541,049 | ||||||
|
| |||||||
Internet Software & Services – 3.4% |
| |||||||
Alphabet, Inc. Class A (a) | 1,828 | 2,243,358 | ||||||
|
| |||||||
IT Services – 8.0% |
| |||||||
Accenture PLC Class A | 4,399 | 700,893 | ||||||
Amdocs Ltd. | 7,202 | 486,711 | ||||||
Automatic Data Processing, Inc. | 4,939 | 666,716 | ||||||
Fiserv, Inc. (a) | 7,676 | 579,384 | ||||||
| Shares | Value | |||||||
International Business Machines Corp. | 4,951 | $ | 717,548 | |||||
Jack Henry & Associates, Inc. | 3,930 | 529,371 | ||||||
Paychex, Inc. | 7,738 | 534,077 | ||||||
Visa, Inc. Class A | 8,096 | 1,107,047 | ||||||
|
| |||||||
| 5,321,747 | ||||||||
|
| |||||||
Semiconductors & Semiconductor Equipment – 2.3% |
| |||||||
Intel Corp. | 21,051 | 1,012,553 | ||||||
Versum Materials, Inc. | 12,704 | 489,739 | ||||||
|
| |||||||
| 1,502,292 | ||||||||
|
| |||||||
Software – 6.7% |
| |||||||
CA, Inc. | 13,984 | 618,233 | ||||||
Check Point Software Technologies Ltd. (a) | 4,848 | 546,224 | ||||||
Microsoft Corp. | 23,496 | 2,492,456 | ||||||
Oracle Corp. | 16,388 | 781,380 | ||||||
|
| |||||||
| 4,438,293 | ||||||||
|
| |||||||
Technology Hardware, Storage & Peripherals – 4.3% |
| |||||||
Apple, Inc. | 15,121 | 2,877,375 | ||||||
|
| |||||||
TOTAL INFORMATION TECHNOLOGY | 16,924,114 | |||||||
|
| |||||||
MATERIALS – 2.8% |
| |||||||
Chemicals – 2.6% |
| |||||||
Air Products & Chemicals, Inc. | 1,100 | 180,587 | ||||||
DowDuPont, Inc. | 6,937 | 477,057 | ||||||
Ecolab, Inc. | 1,349 | 189,804 | ||||||
International Flavors & Fragrances, Inc. | 836 | 110,987 | ||||||
LyondellBasell Industries N.V. Class A | 1,602 | 177,486 | ||||||
NewMarket Corp. | 264 | 108,092 | ||||||
Praxair, Inc. | 1,283 | 214,903 | ||||||
The Scotts Miracle-Gro Co. | 1,157 | 91,901 | ||||||
The Sherwin-Williams Co. | 435 | 191,718 | ||||||
|
| |||||||
| 1,742,535 | ||||||||
|
| |||||||
Containers & Packaging – 0.2% |
| |||||||
Aptargroup, Inc. | 1,259 | 128,959 | ||||||
|
| |||||||
TOTAL MATERIALS |
| 1,871,494 | ||||||
|
| |||||||
REAL ESTATE – 3.4% |
| |||||||
Equity Real Estate Investment Trusts (REITs) – 3.4% |
| |||||||
American Campus Communities, Inc. | 2,382 | 98,257 | ||||||
American Tower Corp. | 1,563 | 231,699 | ||||||
AvalonBay Communities, Inc. | 826 | 146,078 | ||||||
Boston Properties, Inc. | 1,007 | 126,409 | ||||||
Crown Castle International Corp. | 1,655 | 183,424 | ||||||
Digital Realty Trust, Inc. | 1,199 | 145,583 | ||||||
Equity Lifestyle Properties, Inc. | 1,115 | 101,454 | ||||||
Equity Residential | 2,147 | 140,478 | ||||||
Essex Property Trust, Inc. | 495 | 119,023 | ||||||
Federal Realty Investment Trust | 825 | 103,537 | ||||||
Mid-America Apartment Communities, Inc. | 1,108 | 111,664 | ||||||
See accompanying notes which are an integral part of the financial statements.
| Annual Report | 30 |
Table of Contents
| Common Stocks – continued | ||||||||
| Shares | Value | |||||||
REAL ESTATE – continued |
| |||||||
Equity Real Estate Investment Trusts (REITs) – continued |
| |||||||
Park Hotels & Resorts, Inc. | 3,102 | $ | 97,030 | |||||
Public Storage | 766 | 166,858 | ||||||
Simon Property Group, Inc. | 1,238 | 218,148 | ||||||
Ventas, Inc. | 2,261 | 127,475 | ||||||
Welltower, Inc. | 2,201 | 137,783 | ||||||
|
| |||||||
TOTAL REAL ESTATE | 2,254,900 | |||||||
|
| |||||||
TELECOMMUNICATION SERVICES – 1.6% |
| |||||||
Diversified Telecommunication Services – 1.6% |
| |||||||
AT&T, Inc. | 16,122 | 515,420 | ||||||
Verizon Communications, Inc. | 10,792 | 557,299 | ||||||
|
| |||||||
TOTAL TELECOMMUNICATION SERVICES |
| 1,072,719 | ||||||
|
| |||||||
UTILITIES – 2.8% |
| |||||||
Electric Utilities – 1.5% | ||||||||
Duke Energy Corp. | 3,161 | 258,001 | ||||||
NextEra Energy, Inc. | 1,845 | 309,111 | ||||||
The Southern Co. | 4,932 | 239,695 | ||||||
Xcel Energy, Inc. | 3,804 | 178,256 | ||||||
|
| |||||||
| 985,063 | ||||||||
|
| |||||||
Multi-Utilities – 1.1% |
| |||||||
Consolidated Edison, Inc. | 2,151 | 169,778 | ||||||
Dominion Energy, Inc. | 3,034 | 217,568 | ||||||
DTE Energy Co. | 1,493 | 162,050 | ||||||
WEC Energy Group, Inc. | 2,550 | 169,244 | ||||||
|
| |||||||
| 718,640 | ||||||||
|
| |||||||
| Shares | Value | |||||||
Water Utilities – 0.2% |
| |||||||
American Water Works Co., Inc. | 1,783 | $ | 157,350 | |||||
|
| |||||||
TOTAL UTILITIES | 1,861,053 | |||||||
|
| |||||||
TOTAL COMMON STOCKS | 66,325,995 | |||||||
|
| |||||||
| Money Market Funds – 0.1% | ||||||||
Fidelity Cash Central Fund, 1.96% (b) | 54,587 | 54,598 | ||||||
|
| |||||||
TOTAL INVESTMENT PORTFOLIO – 99.9% |
| 66,380,593 | ||||||
NET OTHER ASSETS (LIABILITIES) – 0.1% |
| 39,710 | ||||||
|
| |||||||
NET ASSETS – 100.0% | $ | 66,420,303 | ||||||
|
| |||||||
Legend
| (a) | Non-income producing. |
| (b) | Affiliated fund that is generally available only to investment companies and other accounts managed by Fidelity Investments. The rate quoted is the annualized seven-day yield of the fund at period end. A complete unaudited listing of the fund’s holdings as of its most recent quarter end is available upon request. In addition, each Fidelity Central Fund’s financial statements, which are not covered by the Fund’s Report of Independent Registered Public Accounting Firm, are available on the SEC’s website or upon request. |
Affiliated Central Funds
Information regarding fiscal year to date income earned by the Fund from investments in Fidelity Central Funds is as follows:
| Fund | Income earned | |||
Fidelity Cash Central Fund | $ | 896 | ||
Fidelity Securities Lending Cash Central Fund | 139 | |||
|
| |||
Total | $ | 1,035 | ||
|
| |||
Amounts in the income column in the above table include any capital gain distributions from underlying funds, which are presented in the corresponding line-item in the Statement of Operations if applicable.
Investment Valuation
All investments are categorized as Level 1 under the Fair Value Hierarchy. The inputs or methodology used for valuing securities may not be an indication of the risk associated with investing in those securities. For more information on valuation inputs please refer to the Investment Valuation section in the accompanying Notes to Financial Statements.
See accompanying notes which are an integral part of the financial statements.
| 31 | Annual Report |
Table of Contents
Fidelity Momentum Factor ETF
Investments July 31, 2018
Showing Percentage of Net Assets
| Common Stocks – 99.8% | ||||||||
| Shares | Value | |||||||
CONSUMER DISCRETIONARY – 13.2% |
| |||||||
Hotels, Restaurants & Leisure – 2.8% | ||||||||
Las Vegas Sands Corp. | 9,341 | $ | 671,618 | |||||
Marriott International, Inc. Class A | 5,540 | 708,234 | ||||||
Planet Fitness, Inc., Class A (a) | 15,099 | 717,504 | ||||||
Wynn Resorts Ltd. | 3,463 | 577,559 | ||||||
|
| |||||||
| 2,674,915 | ||||||||
|
| |||||||
Internet & Direct Marketing Retail – 4.6% |
| |||||||
Amazon.com, Inc. (a) | 1,813 | 3,222,499 | ||||||
Netflix, Inc. (a) | 3,487 | 1,176,688 | ||||||
|
| |||||||
| 4,399,187 | ||||||||
|
| |||||||
Multiline Retail – 0.8% |
| |||||||
Kohl’s Corp. | 10,175 | 751,627 | ||||||
|
| |||||||
Specialty Retail – 1.5% |
| |||||||
The Home Depot, Inc. | 7,468 | 1,475,080 | ||||||
|
| |||||||
Textiles, Apparel & Luxury Goods – 3.5% |
| |||||||
lululemon athletica, Inc. (a) | 6,425 | 770,679 | ||||||
Michael Kors Holdings Ltd. (a) | 10,418 | 695,193 | ||||||
NIKE, Inc. Class B | 13,652 | 1,049,975 | ||||||
VF Corp. | 8,887 | 818,226 | ||||||
|
| |||||||
| 3,334,073 | ||||||||
|
| |||||||
TOTAL CONSUMER DISCRETIONARY |
| 12,634,882 | ||||||
|
| |||||||
CONSUMER STAPLES – 6.3% |
| |||||||
Beverages – 3.2% |
| |||||||
Brown-Forman Corp. Class B | 8,025 | 427,091 | ||||||
Constellation Brands, Inc. Class A | 2,357 | 495,512 | ||||||
PepsiCo, Inc. | 9,071 | 1,043,165 | ||||||
The Coca-Cola Co. | 23,000 | 1,072,490 | ||||||
|
| |||||||
| 3,038,258 | ||||||||
|
| |||||||
Food & Staples Retailing – 1.7% |
| |||||||
Costco Wholesale Corp. | 3,593 | 785,825 | ||||||
Walmart, Inc. | 9,705 | 865,977 | ||||||
|
| |||||||
| 1,651,802 | ||||||||
|
| |||||||
Food Products – 0.5% |
| |||||||
Lamb Weston Holdings, Inc. | 6,644 | 466,874 | ||||||
|
| |||||||
Personal Products – 0.9% |
| |||||||
Herbalife Nutrition Ltd. (a) | 7,826 | 404,056 | ||||||
The Estee Lauder Cos., Inc. Class A | 3,722 | 502,247 | ||||||
|
| |||||||
| 906,303 | ||||||||
|
| |||||||
TOTAL CONSUMER STAPLES | 6,063,237 | |||||||
|
| |||||||
ENERGY – 6.0% |
| |||||||
Oil, Gas & Consumable Fuels – 6.0% |
| |||||||
Chevron Corp. | 8,840 | 1,116,227 | ||||||
ConocoPhillips | 8,098 | 584,433 | ||||||
Delek US Holdings, Inc. | 5,463 | 291,287 | ||||||
Exxon Mobil Corp. | 18,431 | 1,502,311 | ||||||
HollyFrontier Corp. | 4,577 | 341,353 | ||||||
| Shares | Value | |||||||
Marathon Petroleum Corp. | 5,029 | $ | 406,494 | |||||
PBF Energy, Inc. Class A | 7,048 | 329,141 | ||||||
Peabody Energy Corp. | 7,328 | 311,367 | ||||||
Phillips 66 | 3,730 | 460,058 | ||||||
Valero Energy Corp. | 3,824 | 452,570 | ||||||
|
| |||||||
TOTAL ENERGY | 5,795,241 | |||||||
|
| |||||||
FINANCIALS – 14.7% |
| |||||||
Banks – 4.4% |
| |||||||
Bank of America Corp. | 52,967 | 1,635,621 | ||||||
Fifth Third Bancorp | 19,706 | 583,101 | ||||||
JPMorgan Chase & Co. | 17,355 | 1,994,957 | ||||||
|
| |||||||
| 4,213,679 | ||||||||
|
| |||||||
Capital Markets – 7.0% |
| |||||||
BlackRock, Inc. | 1,505 | 756,654 | ||||||
CME Group, Inc. | 4,725 | 751,842 | ||||||
E*TRADE Financial Corp. (a) | 10,077 | 602,705 | ||||||
Interactive Brokers Group, Inc. Class A | 7,816 | 467,866 | ||||||
Moody’s Corp. | 3,983 | 681,571 | ||||||
Morgan Stanley | 15,804 | 799,050 | ||||||
S&P Global, Inc. | 3,839 | 769,489 | ||||||
SEI Investments Co. | 9,386 | 562,597 | ||||||
T Rowe Price Group, Inc. | 5,956 | 709,240 | ||||||
TD Ameritrade Holding Corp. | 10,378 | 593,103 | ||||||
|
| |||||||
| 6,694,117 | ||||||||
|
| |||||||
Diversified Financial Services – 2.0% |
| |||||||
Berkshire Hathaway, Inc. Class B (a) | 9,741 | 1,927,452 | ||||||
|
| |||||||
Equity Real Estate Investment Trusts (REITs) – 0.4% |
| |||||||
CubeSmart | 4,299 | 130,518 | ||||||
Rayonier, Inc. | 3,309 | 115,848 | ||||||
Ryman Hospitality Properties, Inc. | 1,555 | 132,190 | ||||||
|
| |||||||
| 378,556 | ||||||||
|
| |||||||
Insurance – 0.7% | ||||||||
The Progressive Corp. | 11,423 | 685,494 | ||||||
|
| |||||||
Real Estate Management & Development – 0.2% |
| |||||||
Jones Lang LaSalle, Inc. | 803 | 137,321 | ||||||
|
| |||||||
TOTAL FINANCIALS | 14,036,619 | |||||||
|
| |||||||
HEALTH CARE – 13.6% |
| |||||||
Biotechnology – 2.3% |
| |||||||
AbbVie, Inc. | 14,494 | 1,336,782 | ||||||
Bluebird Bio, Inc. (a) | 5,396 | 835,840 | ||||||
|
| |||||||
| 2,172,622 | ||||||||
|
| |||||||
Health Care Equipment & Supplies – 6.2% |
| |||||||
Abbott Laboratories | 21,390 | 1,401,900 | ||||||
ABIOMED, Inc. (a) | 2,791 | 989,493 | ||||||
Align Technology, Inc. (a) | 3,726 | 1,328,878 | ||||||
ICU Medical, Inc. (a) | 3,480 | 998,064 | ||||||
Intuitive Surgical, Inc. (a) | 2,378 | 1,208,476 | ||||||
|
| |||||||
| 5,926,811 | ||||||||
|
| |||||||
See accompanying notes which are an integral part of the financial statements.
| Annual Report | 32 |
Table of Contents
| Common Stocks – continued | ||||||||
| Shares | Value | |||||||
HEALTH CARE – continued |
| |||||||
Health Care Providers & Services – 1.9% |
| |||||||
UnitedHealth Group, Inc. | 7,223 | $ | 1,829,008 | |||||
|
| |||||||
Life Sciences Tools & Services – 1.4% |
| |||||||
Illumina, Inc. (a) | 4,216 | 1,367,502 | ||||||
|
| |||||||
Pharmaceuticals – 1.8% |
| |||||||
Nektar Therapeutics (a) | 11,273 | 592,960 | ||||||
Zoetis, Inc. | 12,748 | 1,102,447 | ||||||
|
| |||||||
| 1,695,407 | ||||||||
|
| |||||||
TOTAL HEALTH CARE |
| 12,991,350 | ||||||
|
| |||||||
INDUSTRIALS – 9.5% |
| |||||||
Aerospace & Defense – 2.8% |
| |||||||
Northrop Grumman Corp. | 2,315 | 695,634 | ||||||
Raytheon Co. | 3,684 | 729,543 | ||||||
The Boeing Co. | 3,567 | 1,270,922 | ||||||
|
| |||||||
| 2,696,099 | ||||||||
|
| |||||||
Air Freight & Logistics – 0.6% |
| |||||||
XPO Logistics, Inc. (a) | 5,691 | 567,507 | ||||||
|
| |||||||
Commercial Services & Supplies – 0.8% |
| |||||||
Cintas Corp. | 3,403 | 695,845 | ||||||
|
| |||||||
Electrical Equipment – 0.7% |
| |||||||
AMETEK, Inc. | 8,487 | 660,289 | ||||||
|
| |||||||
Machinery – 2.3% |
| |||||||
Caterpillar, Inc. | 5,834 | 838,929 | ||||||
Deere & Co. | 5,048 | 730,900 | ||||||
Xylem, Inc. | 8,304 | 635,754 | ||||||
|
| |||||||
| 2,205,583 | ||||||||
|
| |||||||
Road & Rail – 1.7% |
| |||||||
Old Dominion Freight Line, Inc. | 4,249 | 623,753 | ||||||
Union Pacific Corp. | 6,854 | 1,027,346 | ||||||
|
| |||||||
| 1,651,099 | ||||||||
|
| |||||||
Trading Companies & Distributors – 0.6% |
| |||||||
United Rentals, Inc. (a) | 3,860 | 574,368 | ||||||
|
| |||||||
TOTAL INDUSTRIALS |
| 9,050,790 | ||||||
|
| |||||||
INFORMATION TECHNOLOGY – 25.8% |
| |||||||
Aerospace & Defense – 0.7% |
| |||||||
Harris Corp. | 4,048 | 667,718 | ||||||
|
| |||||||
Communications Equipment – 2.2% |
| |||||||
Arista Networks, Inc. (a) | 2,794 | 714,509 | ||||||
Cisco Systems, Inc. | 32,996 | 1,395,401 | ||||||
|
| |||||||
| 2,109,910 | ||||||||
|
| |||||||
IT Services – 7.3% |
| |||||||
Accenture PLC Class A | 6,847 | 1,090,933 | ||||||
FleetCor Technologies, Inc. (a) | 3,663 | 794,871 | ||||||
Mastercard, Inc. Class A | 7,032 | 1,392,336 | ||||||
PayPal Holdings, Inc. (a) | 13,579 | 1,115,379 | ||||||
Square, Inc. Class A (a) | 15,315 | 990,115 | ||||||
| Shares | Value | |||||||
Visa, Inc. Class A | 11,952 | $ | 1,634,316 | |||||
|
| |||||||
| 7,017,950 | ||||||||
|
| |||||||
Semiconductors & Semiconductor Equipment – 4.5% |
| |||||||
First Solar, Inc. (a) | 10,961 | 573,808 | ||||||
Intel Corp. | 30,006 | 1,443,289 | ||||||
Micron Technology, Inc. (a) | 19,212 | 1,014,201 | ||||||
NVIDIA Corp. | 5,173 | 1,266,661 | ||||||
|
| |||||||
| 4,297,959 | ||||||||
|
| |||||||
Software – 6.7% |
| |||||||
Adobe Systems, Inc. (a) | 4,859 | 1,188,900 | ||||||
Microsoft Corp. | 34,836 | 3,695,403 | ||||||
Red Hat, Inc. (a) | 4,917 | 694,428 | ||||||
ServiceNow, Inc. (a) | 4,768 | 838,977 | ||||||
|
| |||||||
| 6,417,708 | ||||||||
|
| |||||||
Technology Hardware, Storage & Peripherals – 4.4% |
| |||||||
Apple, Inc. | 21,989 | 4,184,287 | ||||||
|
| |||||||
TOTAL INFORMATION TECHNOLOGY |
| 24,695,532 | ||||||
|
| |||||||
MATERIALS – 3.2% |
| |||||||
Chemicals – 2.4% |
| |||||||
Air Products & Chemicals, Inc. | 1,667 | 273,671 | ||||||
DowDuPont, Inc. | 10,630 | 731,025 | ||||||
Eastman Chemical Co. | 1,897 | 196,567 | ||||||
LyondellBasell Industries N.V. Class A | 2,522 | 279,412 | ||||||
Praxair, Inc. | 1,955 | 327,463 | ||||||
The Sherwin-Williams Co. | 691 | 304,545 | ||||||
Westlake Chemical Corp. | 1,521 | 163,082 | ||||||
|
| |||||||
| 2,275,765 | ||||||||
|
| |||||||
Containers & Packaging – 0.2% |
| |||||||
Avery Dennison Corp. | 1,719 | 197,135 | ||||||
|
| |||||||
Metals & Mining – 0.6% |
| |||||||
Freeport-McMoRan, Inc. | 14,255 | 235,207 | ||||||
Newmont Mining Corp. | 5,539 | 203,171 | ||||||
United States Steel Corp. | 5,017 | 182,769 | ||||||
|
| |||||||
| 621,147 | ||||||||
|
| |||||||
TOTAL MATERIALS |
| 3,094,047 | ||||||
|
| |||||||
REAL ESTATE – 2.9% |
| |||||||
Equity Real Estate Investment Trusts (REITs) – 2.7% |
| |||||||
Alexandria Real Estate Equities, Inc. | 1,241 | 158,153 | ||||||
American Tower Corp. | 2,355 | 349,105 | ||||||
Boston Properties, Inc. | 1,461 | 183,399 | ||||||
Crown Castle International Corp. | 2,541 | 281,619 | ||||||
DCT Industrial Trust, Inc. | 2,037 | 136,214 | ||||||
Equinix, Inc. | 557 | 244,679 | ||||||
Extra Space Storage, Inc. | 1,631 | 153,265 | ||||||
Host Hotels & Resorts, Inc. | 8,037 | 168,295 | ||||||
Prologis, Inc. | 3,570 | 234,264 | ||||||
SBA Communications Corp. (a) | 1,108 | 175,341 | ||||||
Simon Property Group, Inc. | 1,788 | 315,064 | ||||||
See accompanying notes which are an integral part of the financial statements.
| 33 | Annual Report |
Table of Contents
Fidelity Momentum Factor ETF
Investments – continued
| Common Stocks – continued | ||||||||
| Shares | Value | |||||||
REAL ESTATE – continued |
| |||||||
Equity Real Estate Investment Trusts (REITs) – continued |
| |||||||
Weyerhaeuser Co. | 5,713 | $ | 195,270 | |||||
|
| |||||||
| 2,594,668 | ||||||||
|
| |||||||
Real Estate Management & Development – 0.2% |
| |||||||
CBRE Group, Inc. Class A (a) | 3,495 | 174,051 | ||||||
|
| |||||||
TOTAL REAL ESTATE |
| 2,768,719 | ||||||
|
| |||||||
TELECOMMUNICATION SERVICES – 1.7% |
| |||||||
Diversified Telecommunication Services – 1.7% |
| |||||||
AT&T, Inc. | 24,142 | 771,820 | ||||||
Verizon Communications, Inc. | 16,306 | 842,042 | ||||||
|
| |||||||
TOTAL TELECOMMUNICATION SERVICES |
| 1,613,862 | ||||||
|
| |||||||
UTILITIES – 2.9% |
| |||||||
Electric Utilities – 1.7% |
| |||||||
American Electric Power Co., Inc. | 4,357 | 309,957 | ||||||
Entergy Corp. | 2,833 | 230,266 | ||||||
Exelon Corp. | 7,850 | 333,625 | ||||||
FirstEnergy Corp. | 6,924 | 245,317 | ||||||
NextEra Energy, Inc. | 2,775 | 464,924 | ||||||
|
| |||||||
| 1,584,089 | ||||||||
|
| |||||||
Independent Power and Renewable Electricity Producers – 0.4% |
| |||||||
NRG Energy, Inc. | 6,652 | 210,669 | ||||||
Vistra Energy Corp. (a) | 9,104 | 205,750 | ||||||
|
| |||||||
| 416,419 | ||||||||
|
| |||||||
Multi-Utilities – 0.8% |
| |||||||
Ameren Corp. | 3,941 | 244,578 | ||||||
| Shares | Value | |||||||
Public Service Enterprise Group, Inc. | 5,276 | $ | 272,031 | |||||
WEC Energy Group, Inc. | 3,919 | 260,104 | ||||||
|
| |||||||
| 776,713 | ||||||||
|
| |||||||
TOTAL UTILITIES | 2,777,221 | |||||||
|
| |||||||
TOTAL COMMON STOCKS |
| 95,521,500 | ||||||
|
| |||||||
| Money Market Funds – 0.2% | ||||||||
Fidelity Cash Central Fund, 1.96% (b) | 136,906 | 136,933 | ||||||
|
| |||||||
TOTAL INVESTMENT PORTFOLIO – 100.0% |
| 95,658,433 | ||||||
NET OTHER ASSETS (LIABILITIES) – 0.00% |
| 43,145 | ||||||
|
| |||||||
NET ASSETS – 100.0% |
| $ | 95,701,578 | |||||
|
| |||||||
Legend
| (a) | Non-income producing. |
| (b) | Affiliated fund that is generally available only to investment companies and other accounts managed by Fidelity Investments. The rate quoted is the annualized seven-day yield of the fund at period end. A complete unaudited listing of the fund’s holdings as of its most recent quarter end is available upon request. In addition, each Fidelity Central Fund’s financial statements, which are not covered by the Fund’s Report of Independent Registered Public Accounting Firm, are available on the SEC’s website or upon request. |
Affiliated Central Funds
Information regarding fiscal year to date income earned by the Fund from investments in Fidelity Central Funds is as follows:
| Fund | Income earned | |||
Fidelity Cash Central Fund | $ | 977 | ||
Fidelity Securities Lending Cash Central Fund | 56 | |||
|
| |||
Total | $ | 1,033 | ||
|
| |||
Amounts in the income column in the above table include any capital gain distributions from underlying funds, which are presented in the corresponding line-item in the Statement of Operations if applicable.
Investment Valuation
All investments are categorized as Level 1 under the Fair Value Hierarchy. The inputs or methodology used for valuing securities may not be an indication of the risk associated with investing in those securities. For more information on valuation inputs please refer to the Investment Valuation section in the accompanying Notes to Financial Statements.
See accompanying notes which are an integral part of the financial statements.
| Annual Report | 34 |
Table of Contents
Fidelity Quality Factor ETF
Investments July 31, 2018
Showing Percentage of Net Assets
| Common Stocks – 99.8% | ||||||||
| Shares | Value | |||||||
CONSUMER DISCRETIONARY – 13.0% |
| |||||||
Hotels, Restaurants & Leisure – 3.3% |
| |||||||
Domino’s Pizza, Inc. | 2,073 | $ | 544,494 | |||||
Las Vegas Sands Corp. | 6,379 | 458,650 | ||||||
McDonald’s Corp. | 4,423 | 696,800 | ||||||
Yum! Brands, Inc. | 5,948 | 471,617 | ||||||
|
| |||||||
| 2,171,561 | ||||||||
|
| |||||||
Internet & Direct Marketing Retail – 1.1% |
| |||||||
Booking Holdings, Inc. (a) | 346 | 701,937 | ||||||
|
| |||||||
Media – 3.3% | ||||||||
Comcast Corp. Class A | 21,530 | 770,344 | ||||||
Sirius XM Holdings, Inc. (b) | 74,356 | 521,979 | ||||||
The Walt Disney Co. | 7,547 | 857,037 | ||||||
|
| |||||||
| 2,149,360 | ||||||||
|
| |||||||
Specialty Retail – 4.2% |
| |||||||
O’Reilly Automotive, Inc. (a) | 1,849 | 565,794 | ||||||
Ross Stores, Inc. | 6,174 | 539,793 | ||||||
The Home Depot, Inc. | 4,984 | 984,439 | ||||||
The TJX Companies, Inc. | 6,904 | 671,483 | ||||||
|
| |||||||
| 2,761,509 | ||||||||
|
| |||||||
Textiles, Apparel & Luxury Goods – 1.1% |
| |||||||
NIKE, Inc. Class B | 9,559 | 735,183 | ||||||
|
| |||||||
TOTAL CONSUMER DISCRETIONARY | 8,519,550 | |||||||
|
| |||||||
CONSUMER STAPLES – 6.7% |
| |||||||
Beverages – 2.0% |
| |||||||
Brown-Forman Corp. Class B | 5,447 | 289,889 | ||||||
Monster Beverage Corp. (a) | 4,892 | 293,618 | ||||||
The Coca-Cola Co. | 14,855 | 692,689 | ||||||
|
| |||||||
| 1,276,196 | ||||||||
|
| |||||||
Food Products – 0.4% |
| |||||||
The Hershey Co. | 2,916 | 286,380 | ||||||
|
| |||||||
Household Products – 2.7% |
| |||||||
Colgate-Palmolive Co. | 5,710 | 382,627 | ||||||
Kimberly-Clark Corp. | 3,098 | 352,739 | ||||||
The Clorox Co. | 2,206 | 298,185 | ||||||
The Procter & Gamble Co. | 9,266 | 749,434 | ||||||
|
| |||||||
| 1,782,985 | ||||||||
|
| |||||||
Tobacco – 1.6% |
| |||||||
Altria Group, Inc. | 8,380 | 491,738 | ||||||
Philip Morris International, Inc. | 6,269 | 541,015 | ||||||
|
| |||||||
| 1,032,753 | ||||||||
|
| |||||||
TOTAL CONSUMER STAPLES | 4,378,314 | |||||||
|
| |||||||
ENERGY – 5.8% | ||||||||
Energy Equipment & Services – 1.1% |
| |||||||
Core Laboratories N.V. (b) | 1,301 | 145,868 | ||||||
Halliburton Co. | 4,627 | 196,278 | ||||||
| Shares | Value | |||||||
Schlumberger Ltd. | 5,208 | $ | 351,644 | |||||
|
| |||||||
| 693,790 | ||||||||
|
| |||||||
Oil, Gas & Consumable Fuels – 4.7% |
| |||||||
Chevron Corp. | 5,689 | 718,350 | ||||||
Exxon Mobil Corp. | 11,775 | 959,780 | ||||||
Kinder Morgan, Inc. | 12,386 | 220,223 | ||||||
Marathon Petroleum Corp. | 3,227 | 260,838 | ||||||
Occidental Petroleum Corp. | 3,701 | 310,625 | ||||||
Phillips 66 | 2,434 | 300,210 | ||||||
Valero Energy Corp. | 2,535 | 300,017 | ||||||
|
| |||||||
| 3,070,043 | ||||||||
|
| |||||||
TOTAL ENERGY | 3,763,833 | |||||||
|
| |||||||
FINANCIALS – 14.2% |
| |||||||
Banks – 3.9% | ||||||||
East West Bancorp, Inc. | 9,527 | 616,778 | ||||||
Fifth Third Bancorp | 19,972 | 590,972 | ||||||
US Bancorp | 14,446 | 765,782 | ||||||
Western Alliance Bancorp (a) | 10,464 | 593,518 | ||||||
|
| |||||||
| 2,567,050 | ||||||||
|
| |||||||
Capital Markets – 6.8% |
| |||||||
Affiliated Managers Group, Inc. | 3,182 | 509,152 | ||||||
CME Group, Inc. | 4,671 | 743,249 | ||||||
FactSet Research Systems, Inc. | 3,097 | 623,612 | ||||||
Lazard Ltd. Class A | 10,602 | 575,689 | ||||||
Moody’s Corp. | 4,154 | 710,832 | ||||||
S&P Global, Inc. | 3,990 | 799,756 | ||||||
SEI Investments Co. | 8,417 | 504,515 | ||||||
|
| |||||||
| 4,466,805 | ||||||||
|
| |||||||
Consumer Finance – 1.7% | ||||||||
Discover Financial Services | 8,483 | 605,771 | ||||||
Synchrony Financial | 17,271 | 499,823 | ||||||
|
| |||||||
| 1,105,594 | ||||||||
|
| |||||||
Mortgage Real Estate Investment Trust (REITs) – 1.0% |
| |||||||
AGNC Investment Corp. | 33,544 | 653,101 | ||||||
|
| |||||||
Thrifts & Mortgage Finance – 0.8% |
| |||||||
Essent Group Ltd. (a) | 13,065 | 501,696 | ||||||
|
| |||||||
TOTAL FINANCIALS | 9,294,246 | |||||||
|
| |||||||
HEALTH CARE – 12.5% | ||||||||
Biotechnology – 5.0% | ||||||||
AbbVie, Inc. | 7,903 | 728,894 | ||||||
Amgen, Inc. | 4,307 | 846,541 | ||||||
Celgene Corp. (a) | 6,639 | 598,107 | ||||||
Gilead Sciences, Inc. | 8,807 | 685,449 | ||||||
United Therapeutics Corp. (a) | 3,588 | 441,001 | ||||||
|
| |||||||
| 3,299,992 | ||||||||
|
| |||||||
Health Care Equipment & Supplies – 1.1% |
| |||||||
Intuitive Surgical, Inc. (a) | 1,381 | 701,810 | ||||||
|
| |||||||
See accompanying notes which are an integral part of the financial statements.
| 35 | Annual Report |
Table of Contents
Fidelity Quality Factor ETF
Investments – continued
| Common Stocks – continued | ||||||||
| Shares | Value | |||||||
HEALTH CARE – continued | ||||||||
Health Care Providers & Services – 1.7% |
| |||||||
UnitedHealth Group, Inc. | 4,355 | $ | 1,102,773 | |||||
|
| |||||||
Pharmaceuticals – 4.7% |
| |||||||
Bristol-Myers Squibb Co. | 11,470 | 673,863 | ||||||
Johnson & Johnson | 9,868 | 1,307,707 | ||||||
Pfizer, Inc. | 27,303 | 1,090,209 | ||||||
|
| |||||||
| 3,071,779 | ||||||||
|
| |||||||
TOTAL HEALTH CARE | 8,176,354 | |||||||
|
| |||||||
INDUSTRIALS – 10.5% |
| |||||||
Aerospace & Defense – 2.7% |
| |||||||
General Dynamics Corp. | 2,213 | 442,069 | ||||||
Lockheed Martin Corp. | 1,578 | 514,586 | ||||||
The Boeing Co. | 2,324 | 828,041 | ||||||
|
| |||||||
| 1,784,696 | ||||||||
|
| |||||||
Commercial Services & Supplies – 0.6% |
| |||||||
Rollins, Inc. | 7,319 | 402,106 | ||||||
|
| |||||||
Electrical Equipment – 0.6% |
| |||||||
Rockwell Automation, Inc. | 2,059 | 386,186 | ||||||
|
| |||||||
Industrial Conglomerates – 1.9% |
| |||||||
3M Co. | 2,852 | 605,537 | ||||||
Honeywell International, Inc. | 4,048 | 646,263 | ||||||
|
| |||||||
| 1,251,800 | ||||||||
|
| |||||||
Machinery – 1.8% |
| |||||||
Allison Transmission Holdings, Inc. | 8,062 | 378,914 | ||||||
Graco, Inc. | 7,917 | 365,290 | ||||||
Illinois Tool Works, Inc. | 2,750 | 394,158 | ||||||
|
| |||||||
| 1,138,362 | ||||||||
|
| |||||||
Professional Services – 1.2% |
| |||||||
The Dun & Bradstreet Corp. | 2,910 | 366,340 | ||||||
Verisk Analytics, Inc. (a) | 3,841 | 424,891 | ||||||
|
| |||||||
| 791,231 | ||||||||
|
| |||||||
Road & Rail – 1.1% |
| |||||||
Union Pacific Corp. | 4,525 | 678,252 | ||||||
|
| |||||||
Trading Companies & Distributors – 0.6% |
| |||||||
Fastenal Co. (b) | 7,122 | 405,455 | ||||||
|
| |||||||
TOTAL INDUSTRIALS | 6,838,088 | |||||||
|
| |||||||
INFORMATION TECHNOLOGY – 26.1% |
| |||||||
Communications Equipment – 2.1% |
| |||||||
Cisco Systems, Inc. | 20,820 | 880,478 | ||||||
F5 Networks, Inc. (a) | 2,706 | 463,754 | ||||||
|
| |||||||
| 1,344,232 | ||||||||
|
| |||||||
Internet Software & Services – 6.1% |
| |||||||
Alphabet, Inc. Class A (a) | 1,751 | 2,148,862 | ||||||
Facebook, Inc. Class A (a) | 7,658 | 1,321,618 | ||||||
VeriSign, Inc. (a) | 3,435 | 498,865 | ||||||
|
| |||||||
| 3,969,345 | ||||||||
|
| |||||||
| Shares | Value | |||||||
IT Services – 4.4% |
| |||||||
Accenture PLC Class A | 3,792 | $ | 604,180 | |||||
Mastercard, Inc. Class A | 4,387 | 868,626 | ||||||
Paychex, Inc. | 6,256 | 431,789 | ||||||
Visa, Inc. Class A | 7,338 | 1,003,398 | ||||||
|
| |||||||
| 2,907,993 | ||||||||
|
| |||||||
Semiconductors & Semiconductor Equipment – 2.8% |
| |||||||
KLA-Tencor Corp. | 3,712 | 435,863 | ||||||
NVIDIA Corp. | 2,991 | 732,376 | ||||||
Texas Instruments, Inc. | 5,734 | 638,309 | ||||||
|
| |||||||
| 1,806,548 | ||||||||
|
| |||||||
Software – 6.5% | ||||||||
Adobe Systems, Inc. (a) | 3,042 | 744,316 | ||||||
Check Point Software Technologies | 3,886 | 437,836 | ||||||
Microsoft Corp. | 22,514 | 2,388,285 | ||||||
Oracle Corp. | 14,466 | 689,739 | ||||||
|
| |||||||
| 4,260,176 | ||||||||
|
| |||||||
Technology Hardware, Storage & Peripherals – 4.2% |
| |||||||
Apple, Inc. | 14,575 | 2,773,477 | ||||||
|
| |||||||
TOTAL INFORMATION TECHNOLOGY | 17,061,771 | |||||||
|
| |||||||
MATERIALS – 2.9% | ||||||||
Chemicals – 2.6% | ||||||||
Air Products & Chemicals, Inc. | 1,085 | 178,125 | ||||||
Celanese Corp. Class A | 1,201 | 141,850 | ||||||
DowDuPont, Inc. | 6,886 | 473,550 | ||||||
Ecolab, Inc. | 1,310 | 184,317 | ||||||
International Flavors & Fragrances, Inc. | 821 | 108,996 | ||||||
LyondellBasell Industries N.V. Class A | 1,581 | 175,159 | ||||||
Praxair, Inc. | 1,272 | 213,060 | ||||||
The Sherwin-Williams Co. | 425 | 187,310 | ||||||
|
| |||||||
| 1,662,367 | ||||||||
|
| |||||||
Construction Materials – 0.1% | ||||||||
Eagle Materials, Inc. | 946 | 93,985 | ||||||
|
| |||||||
Containers & Packaging – 0.2% | ||||||||
Packaging Corp. of America | 979 | 110,529 | ||||||
|
| |||||||
TOTAL MATERIALS | 1,866,881 | |||||||
|
| |||||||
REAL ESTATE – 3.5% |
| |||||||
Equity Real Estate Investment Trusts (REITs) – 3.5% |
| |||||||
American Tower Corp. | 1,599 | 237,036 | ||||||
AvalonBay Communities, Inc. | 829 | 146,609 | ||||||
Digital Realty Trust, Inc. | 1,245 | 151,168 | ||||||
Duke Realty Corp. | 3,945 | 114,878 | ||||||
Equity Residential | 2,241 | 146,629 | ||||||
Essex Property Trust, Inc. | 519 | 124,794 | ||||||
Extra Space Storage, Inc. | 1,291 | 121,315 | ||||||
Federal Realty Investment Trust | 883 | 110,817 | ||||||
Gaming and Leisure Properties, Inc. | 2,763 | 100,352 | ||||||
See accompanying notes which are an integral part of the financial statements.
| Annual Report | 36 |
Table of Contents
| Common Stocks – continued | ||||||||
| Shares | Value | |||||||
REAL ESTATE – continued | ||||||||
Equity Real Estate Investment Trusts (REITs) – continued |
| |||||||
GGP, Inc. | 5,067 | $ | 108,028 | |||||
National Retail Properties, Inc. | 2,533 | 112,997 | ||||||
Prologis, Inc. | 2,565 | 168,315 | ||||||
Public Storage | 785 | 170,997 | ||||||
Realty Income Corp. | 2,250 | 125,483 | ||||||
Simon Property Group, Inc. | 1,269 | 223,610 | ||||||
UDR, Inc. | 2,926 | 112,592 | ||||||
|
| |||||||
TOTAL REAL ESTATE | 2,275,620 | |||||||
|
| |||||||
TELECOMMUNICATION SERVICES – 1.7% |
| |||||||
Diversified Telecommunication Services – 1.7% |
| |||||||
AT&T, Inc. | 16,270 | 520,152 | ||||||
Verizon Communications, Inc. | 10,862 | 560,914 | ||||||
|
| |||||||
TOTAL TELECOMMUNICATION SERVICES |
| 1,081,066 | ||||||
|
| |||||||
UTILITIES – 2.9% |
| |||||||
Electric Utilities – 1.4% |
| |||||||
Eversource Energy | 3,247 | 197,158 | ||||||
FirstEnergy Corp. | 5,702 | 202,022 | ||||||
IDACORP, Inc. | 1,881 | 177,265 | ||||||
NextEra Energy, Inc. | 2,094 | 350,829 | ||||||
|
| |||||||
| 927,274 | ||||||||
|
| |||||||
Gas Utilities – 0.6% | ||||||||
National Fuel Gas Co. | 2,959 | 158,898 | ||||||
UGI Corp. | 3,663 | 194,652 | ||||||
|
| |||||||
| 353,550 | ||||||||
|
| |||||||
Multi-Utilities – 0.9% | ||||||||
CenterPoint Energy, Inc. | 6,424 | 182,955 | ||||||
Consolidated Edison, Inc. | 2,706 | 213,585 | ||||||
| Shares | Value | |||||||
WEC Energy Group, Inc. | 3,124 | $ | 207,340 | |||||
|
| |||||||
| 603,880 | ||||||||
|
| |||||||
TOTAL UTILITIES | 1,884,704 | |||||||
|
| |||||||
TOTAL COMMON STOCKS |
| 65,140,427 | ||||||
|
| |||||||
| Money Market Funds – 1.6% | ||||||||
Fidelity Cash Central Fund, 1.96% (c) | 61,767 | 61,779 | ||||||
Fidelity Securities Lending Cash Central Fund, 1.97% (c)(d) | 979,456 | 979,554 | ||||||
|
| |||||||
TOTAL MONEY MARKET FUNDS |
| 1,041,333 | ||||||
|
| |||||||
TOTAL INVESTMENT PORTFOLIO – 101.4% |
| 66,181,760 | ||||||
NET OTHER ASSETS (LIABILITIES) – (1.4%) |
| (922,788 | ) | |||||
|
| |||||||
NET ASSETS – 100.0% | $ | 65,258,972 | ||||||
|
| |||||||
Legend
| (a) | Non-income producing. |
| (b) | Security or a portion of the security is on loan at period end. |
| (c) | Affiliated fund that is generally available only to investment companies and other accounts managed by Fidelity Investments. The rate quoted is the annualized seven-day yield of the fund at period end. A complete unaudited listing of the fund’s holdings as of its most recent quarter end is available upon request. In addition, each Fidelity Central Fund’s financial statements, which are not covered by the Fund’s Report of Independent Registered Public Accounting Firm, are available on the SEC’s website or upon request. |
| (d) | Investment made with cash collateral received from securities on loan. |
Affiliated Central Funds
Information regarding fiscal year to date income earned by the Fund from investments in Fidelity Central Funds is as follows:
| Fund | Income earned | |||
Fidelity Cash Central Fund | $ | 766 | ||
Fidelity Securities Lending Cash Central Fund | 9,581 | |||
|
| |||
Total | $ | 10,347 | ||
|
| |||
Amounts in the income column in the above table include any capital gain distributions from underlying funds, which are presented in the corresponding line-item in the Statement of Operations if applicable.
Investment Valuation
All investments are categorized as Level 1 under the Fair Value Hierarchy. The inputs or methodology used for valuing securities may not be an indication of the risk associated with investing in those securities. For more information on valuation inputs please refer to the Investment Valuation section in the accompanying Notes to Financial Statements.
See accompanying notes which are an integral part of the financial statements.
| 37 | Annual Report |
Table of Contents
Fidelity Value Factor ETF
Investments July 31, 2018
Showing Percentage of Net Assets
| Common Stocks – 99.8% | ||||||||
| Shares | Value | |||||||
CONSUMER DISCRETIONARY – 11.5% |
| |||||||
Automobiles – 1.8% |
| |||||||
Ford Motor Co. | 76,240 | $ | 765,450 | |||||
General Motors Co. | 20,546 | 778,899 | ||||||
|
| |||||||
| 1,544,349 | ||||||||
|
| |||||||
Diversified Consumer Services – 0.8% |
| |||||||
H&R Block, Inc. | 27,184 | 683,949 | ||||||
|
| |||||||
Hotels, Restaurants & Leisure – 0.8% |
| |||||||
Royal Caribbean Cruises Ltd. | 5,753 | 648,708 | ||||||
|
| |||||||
Household Durables – 0.6% |
| |||||||
Toll Brothers, Inc. | 15,118 | 533,061 | ||||||
|
| |||||||
Media – 3.5% |
| |||||||
Comcast Corp. Class A | 31,712 | 1,134,655 | ||||||
The Walt Disney Co. | 11,200 | 1,271,872 | ||||||
Viacom, Inc. Class B | 22,048 | 640,495 | ||||||
|
| |||||||
| 3,047,022 | ||||||||
|
| |||||||
Multiline Retail – 2.3% |
| |||||||
Macy’s, Inc. | 28,093 | 1,116,135 | ||||||
Target Corp. | 11,039 | 890,626 | ||||||
|
| |||||||
| 2,006,761 | ||||||||
|
| |||||||
Specialty Retail – 0.7% |
| |||||||
Bed Bath & Beyond, Inc. | 30,991 | 580,461 | ||||||
|
| |||||||
Textiles, Apparel & Luxury Goods – 1.0% |
| |||||||
Ralph Lauren Corp. | 6,413 | 865,627 | ||||||
|
| |||||||
TOTAL CONSUMER DISCRETIONARY | 9,909,938 | |||||||
|
| |||||||
CONSUMER STAPLES – 6.0% |
| |||||||
Food & Staples Retailing – 2.0% |
| |||||||
The Kroger Co. | 15,788 | 457,852 | ||||||
Walgreens Boots Alliance, Inc. | 7,939 | 536,835 | ||||||
Walmart, Inc. | 8,467 | 755,511 | ||||||
|
| |||||||
| 1,750,198 | ||||||||
|
| |||||||
Food Products – 1.4% |
| |||||||
Archer-Daniels-Midland Co. | 10,992 | 530,474 | ||||||
Campbell Soup Co. (a) | 8,968 | 366,791 | ||||||
Tyson Foods, Inc. Class A | 6,106 | 352,011 | ||||||
|
| |||||||
| 1,249,276 | ||||||||
|
| |||||||
Household Products – 1.8% |
| |||||||
Kimberly-Clark Corp. | 4,444 | 505,994 | ||||||
The Procter & Gamble Co. | 12,845 | 1,038,903 | ||||||
|
| |||||||
| 1,544,897 | ||||||||
|
| |||||||
Tobacco – 0.8% |
| |||||||
Altria Group, Inc. | 11,794 | 692,072 | ||||||
|
| |||||||
TOTAL CONSUMER STAPLES | 5,236,443 | |||||||
|
| |||||||
ENERGY – 6.4% |
| |||||||
Oil, Gas & Consumable Fuels – 6.4% |
| |||||||
Andeavor | 2,685 | 402,911 | ||||||
Chevron Corp. | 8,069 | 1,018,873 | ||||||
| Shares | Value | |||||||
ConocoPhillips | 7,908 | $ | 570,721 | |||||
Exxon Mobil Corp. | 16,432 | 1,339,372 | ||||||
Marathon Petroleum Corp. | 5,035 | 406,979 | ||||||
Murphy Oil Corp. | 8,096 | 269,273 | ||||||
PBF Energy, Inc. Class A | 7,709 | 360,010 | ||||||
Peabody Energy Corp. | 6,164 | 261,908 | ||||||
Phillips 66 | 3,741 | 461,415 | ||||||
Valero Energy Corp. | 3,920 | 463,932 | ||||||
|
| |||||||
TOTAL ENERGY | 5,555,394 | |||||||
|
| |||||||
FINANCIALS – 14.5% |
| |||||||
Banks – 7.7% |
| |||||||
Bank of America Corp. | 46,570 | 1,438,082 | ||||||
CIT Group, Inc. | 9,903 | 524,166 | ||||||
Citigroup, Inc. | 14,803 | 1,064,188 | ||||||
JPMorgan Chase & Co. | 15,477 | 1,779,081 | ||||||
Popular, Inc. | 12,124 | 601,714 | ||||||
Wells Fargo & Co. | 21,888 | 1,253,963 | ||||||
|
| |||||||
| 6,661,194 | ||||||||
|
| |||||||
Consumer Finance – 1.8% |
| |||||||
Capital One Financial Corp. | 6,293 | 593,556 | ||||||
Discover Financial Services | 7,266 | 518,865 | ||||||
Synchrony Financial | 14,761 | 427,183 | ||||||
|
| |||||||
| 1,539,604 | ||||||||
|
| |||||||
Diversified Financial Services – 1.9% |
| |||||||
Berkshire Hathaway, Inc. Class B (b) | 8,511 | 1,684,071 | ||||||
|
| |||||||
Insurance – 2.1% |
| |||||||
Aflac, Inc. | 13,490 | 627,824 | ||||||
MetLife, Inc. | 13,547 | 619,640 | ||||||
Prudential Financial, Inc. | 5,480 | 552,987 | ||||||
|
| |||||||
| 1,800,451 | ||||||||
|
| |||||||
Thrifts & Mortgage Finance – 1.0% |
| |||||||
MGIC Investment Corp. (b) | 33,442 | 417,356 | ||||||
Radian Group, Inc. | 22,210 | 425,322 | ||||||
|
| |||||||
| 842,678 | ||||||||
|
| |||||||
TOTAL FINANCIALS | 12,527,998 | |||||||
|
| |||||||
HEALTH CARE – 14.5% |
| |||||||
Biotechnology – 4.3% |
| |||||||
Amgen, Inc. | 6,147 | 1,208,193 | ||||||
Biogen, Inc. (b) | 2,721 | 909,821 | ||||||
Gilead Sciences, Inc. | 12,673 | 986,340 | ||||||
United Therapeutics Corp. (b) | 5,283 | 649,333 | ||||||
|
| |||||||
| 3,753,687 | ||||||||
|
| |||||||
Health Care Providers & Services – 4.7% |
| |||||||
Anthem, Inc. | 3,721 | 941,413 | ||||||
Cigna Corp. | 4,236 | 760,023 | ||||||
CVS Health Corp. | 8,232 | 533,927 | ||||||
Express Scripts Holding Co. (b) | 10,824 | 860,075 | ||||||
See accompanying notes which are an integral part of the financial statements.
| Annual Report | 38 |
Table of Contents
| Common Stocks – continued | ||||||||
| Shares | Value | |||||||
HEALTH CARE – continued |
| |||||||
Health Care Providers & Services – continued |
| |||||||
Humana, Inc. | 2,982 | $ | 936,885 | |||||
|
| |||||||
| 4,032,323 | ||||||||
|
| |||||||
Pharmaceuticals – 5.5% | ||||||||
Johnson & Johnson | 13,740 | 1,820,825 | ||||||
Merck & Co., Inc. | 20,621 | 1,358,305 | ||||||
Pfizer, Inc. | 38,419 | 1,534,071 | ||||||
|
| |||||||
| 4,713,201 | ||||||||
|
| |||||||
TOTAL HEALTH CARE | 12,499,211 | |||||||
|
| |||||||
INDUSTRIALS – 10.2% |
| |||||||
Airlines – 2.8% |
| |||||||
Alaska Air Group, Inc. | 9,428 | 592,361 | ||||||
Delta Air Lines, Inc. | 12,437 | 676,822 | ||||||
JetBlue Airways Corp. (b) | 28,672 | 516,096 | ||||||
Southwest Airlines Co. | 11,411 | 663,664 | ||||||
|
| |||||||
| 2,448,943 | ||||||||
|
| |||||||
Commercial Services & Supplies – 0.5% |
| |||||||
Deluxe Corp. | 7,973 | 469,849 | ||||||
|
| |||||||
Electrical Equipment – 0.8% |
| |||||||
Regal-Beloit Corp. | 7,501 | 644,711 | ||||||
|
| |||||||
Machinery – 2.9% |
| |||||||
Caterpillar, Inc. | 5,496 | 790,325 | ||||||
Cummins, Inc. | 3,570 | 509,831 | ||||||
PACCAR, Inc. | 8,886 | 583,988 | ||||||
Snap-on, Inc. | 3,590 | 608,828 | ||||||
|
| |||||||
| 2,492,972 | ||||||||
|
| |||||||
Road & Rail – 1.2% |
| |||||||
Union Pacific Corp. | 6,938 | 1,039,937 | ||||||
|
| |||||||
Trading Companies & Distributors – 2.0% |
| |||||||
AerCap Holdings N.V. (b) | 11,216 | 629,554 | ||||||
Air Lease Corp. | 12,164 | 534,729 | ||||||
United Rentals, Inc. (b) | 3,496 | 520,205 | ||||||
|
| |||||||
| 1,684,488 | ||||||||
|
| |||||||
TOTAL INDUSTRIALS | 8,780,900 | |||||||
|
| |||||||
INFORMATION TECHNOLOGY – 25.5% |
| |||||||
Communications Equipment – 1.4% |
| |||||||
Cisco Systems, Inc. | 28,024 | 1,185,135 | ||||||
|
| |||||||
Internet Software & Services – 5.9% |
| |||||||
Alphabet, Inc. Class A (b) | 2,358 | 2,893,785 | ||||||
eBay, Inc. (b) | 13,938 | 466,226 | ||||||
Facebook, Inc. Class A (b) | 10,324 | 1,781,716 | ||||||
|
| |||||||
| 5,141,727 | ||||||||
|
| |||||||
IT Services – 5.5% |
| |||||||
Accenture PLC Class A | 5,128 | 817,044 | ||||||
Alliance Data Systems Corp. | 2,095 | 471,124 | ||||||
| Shares | Value | |||||||
Cognizant Technology Solutions Corp. Class A | 8,326 | $ | 678,569 | |||||
DXC Technology Co. | 5,923 | 501,915 | ||||||
International Business Machines Corp. | 5,870 | 850,739 | ||||||
Perspecta, Inc. | 2,933 | 63,646 | ||||||
Visa, Inc. Class A | 9,857 | 1,347,846 | ||||||
|
| |||||||
| 4,730,883 | ||||||||
|
| |||||||
Semiconductors & Semiconductor Equipment – 2.4% |
| |||||||
Intel Corp. | 25,633 | 1,232,947 | ||||||
Micron Technology, Inc. (b) | 15,483 | 817,348 | ||||||
|
| |||||||
| 2,050,295 | ||||||||
|
| |||||||
Software – 5.5% |
| |||||||
Microsoft Corp. | 30,332 | 3,217,618 | ||||||
Oracle Corp. | 19,557 | 932,478 | ||||||
VMware, Inc. Class A (b) | 4,178 | 604,097 | ||||||
|
| |||||||
| 4,754,193 | ||||||||
|
| |||||||
Technology Hardware, Storage & Peripherals – 4.8% |
| |||||||
Apple, Inc. | 19,640 | 3,737,296 | ||||||
Western Digital Corp. | 6,636 | 465,515 | ||||||
|
| |||||||
| 4,202,811 | ||||||||
|
| |||||||
TOTAL INFORMATION TECHNOLOGY | 22,065,044 | |||||||
|
| |||||||
MATERIALS – 3.1% |
| |||||||
Chemicals – 1.3% |
| |||||||
DowDuPont, Inc. | 9,798 | 673,808 | ||||||
Huntsman Corp. | 5,501 | 184,449 | ||||||
LyondellBasell Industries N.V. Class A | 2,437 | 269,995 | ||||||
|
| |||||||
| 1,128,252 | ||||||||
|
| |||||||
Containers & Packaging – 0.2% |
| |||||||
WestRock Co. | 3,302 | 191,450 | ||||||
|
| |||||||
Metals & Mining – 1.4% |
| |||||||
Alcoa Corp. (b) | 3,653 | 158,065 | ||||||
Freeport-McMoRan, Inc. | 12,805 | 211,282 | ||||||
Newmont Mining Corp. | 5,788 | 212,304 | ||||||
Nucor Corp. | 3,495 | 233,920 | ||||||
Steel Dynamics, Inc. | 4,329 | 203,853 | ||||||
United States Steel Corp. | 5,000 | 182,150 | ||||||
|
| |||||||
| 1,201,574 | ||||||||
|
| |||||||
Paper & Forest Products – 0.2% |
| |||||||
Louisiana-Pacific Corp. | 6,016 | 161,951 | ||||||
|
| |||||||
TOTAL MATERIALS | 2,683,227 | |||||||
|
| |||||||
REAL ESTATE – 3.5% |
| |||||||
Equity Real Estate Investment Trusts (REITs) – 3.1% |
| |||||||
Brixmor Property Group, Inc. | 9,632 | 170,390 | ||||||
EPR Properties | 2,544 | 169,151 | ||||||
HCP, Inc. | 7,302 | 189,122 | ||||||
Hospitality Properties Trust | 5,330 | 150,679 | ||||||
Host Hotels & Resorts, Inc. | 9,090 | 190,345 | ||||||
Kimco Realty Corp. | 10,356 | 172,842 | ||||||
See accompanying notes which are an integral part of the financial statements.
| 39 | Annual Report |
Table of Contents
Fidelity Value Factor ETF
Investments – continued
| Common Stocks – continued | ||||||||
| Shares | Value | |||||||
REAL ESTATE – continued |
| |||||||
Equity Real Estate Investment Trusts (REITs) – continued |
| |||||||
Medical Properties Trust, Inc. | 11,915 | $ | 171,695 | |||||
Omega Healthcare Investors, Inc. (a) | 5,883 | 174,666 | ||||||
Park Hotels & Resorts, Inc. | 5,312 | 166,159 | ||||||
Prologis, Inc. | 3,820 | 250,669 | ||||||
Simon Property Group, Inc. | 1,852 | 326,341 | ||||||
Ventas, Inc. | 3,682 | 207,591 | ||||||
VEREIT, Inc. | 22,037 | 168,142 | ||||||
Welltower, Inc. | 3,547 | 222,042 | ||||||
|
| |||||||
| 2,729,834 | ||||||||
|
| |||||||
Real Estate Management & Development – 0.4% |
| |||||||
CBRE Group, Inc. Class A (b) | 3,981 | 198,254 | ||||||
Realogy Holdings Corp. (a) | 5,437 | 118,907 | ||||||
|
| |||||||
| 317,161 | ||||||||
|
| |||||||
TOTAL REAL ESTATE | 3,046,995 | |||||||
|
| |||||||
TELECOMMUNICATION SERVICES – 1.7% |
| |||||||
Diversified Telecommunication Services – 1.7% |
| |||||||
AT&T, Inc. | 21,801 | 696,978 | ||||||
Verizon Communications, Inc. | 14,642 | 756,113 | ||||||
|
| |||||||
TOTAL TELECOMMUNICATION SERVICES |
| 1,453,091 | ||||||
|
| |||||||
UTILITIES – 2.9% |
| |||||||
Electric Utilities – 2.1% |
| |||||||
Duke Energy Corp. | 4,601 | 375,534 | ||||||
Edison International | 3,961 | 263,921 | ||||||
Exelon Corp. | 7,834 | 332,945 | ||||||
FirstEnergy Corp. | 6,865 | 243,227 | ||||||
PG&E Corp. | 5,881 | 253,354 | ||||||
The Southern Co. | 7,284 | 354,002 | ||||||
|
| |||||||
| 1,822,983 | ||||||||
|
| |||||||
Multi-Utilities – 0.8% |
| |||||||
Consolidated Edison, Inc. | 3,251 | 256,601 | ||||||
| Shares | Value | |||||||
Public Service Enterprise Group, Inc. | 5,178 | $ | 266,978 | |||||
SCANA Corp. | 5,035 | 201,350 | ||||||
|
| |||||||
| 724,929 | ||||||||
|
| |||||||
TOTAL UTILITIES |
| 2,547,912 | ||||||
|
| |||||||
TOTAL COMMON STOCKS |
| 86,306,153 | ||||||
|
| |||||||
| Money Market Funds – 0.6% | ||||||||
Fidelity Cash Central Fund, 1.96% (c) | 69,736 | 69,751 | ||||||
Fidelity Securities Lending Cash Central Fund, 1.97% (c)(d) | 440,936 | 440,980 | ||||||
|
| |||||||
TOTAL MONEY MARKET FUNDS |
| 510,731 | ||||||
|
| |||||||
TOTAL INVESTMENT PORTFOLIO – 100.4% |
| 86,816,884 | ||||||
NET OTHER ASSETS (LIABILITIES) – (0.4%) |
| (366,782 | ) | |||||
|
| |||||||
NET ASSETS – 100.0% | $ | 86,450,102 | ||||||
|
| |||||||
Legend
| (a) | Security or a portion of the security is on loan at period end. |
| (b) | Non-income producing. |
| (c) | Affiliated fund that is generally available only to investment companies and other accounts managed by Fidelity Investments. The rate quoted is the annualized seven-day yield of the fund at period end. A complete unaudited listing of the fund’s holdings as of its most recent quarter end is available upon request. In addition, each Fidelity Central Fund’s financial statements, which are not covered by the Fund’s Report of Independent Registered Public Accounting Firm, are available on the SEC’s website or upon request. |
| (d) | Investment made with cash collateral received from securities on loan. |
Affiliated Central Funds
Information regarding fiscal year to date income earned by the Fund from investments in Fidelity Central Funds is as follows:
| Fund | Income earned | |||
| Fidelity Cash Central Fund | $ | 1,111 | ||
| Fidelity Securities Lending Cash Central Fund | 3,382 | |||
|
| |||
| Total | $ | 4,493 | ||
|
| |||
Amounts in the income column in the above table include any capital gain distributions from underlying funds, which are presented in the corresponding line-item in the Statement of Operations if applicable.
Investment Valuation
All investments are categorized as Level 1 under the Fair Value Hierarchy. The inputs or methodology used for valuing securities may not be an indication of the risk associated with investing in those securities. For more information on valuation inputs please refer to the Investment Valuation section in the accompanying Notes to Financial Statements.
See accompanying notes which are an integral part of the financial statements.
| Annual Report | 40 |
Table of Contents
[THIS PAGE INTENTIONALLY LEFT BLANK]
| 41 |
Table of Contents
| Statements of Assets and Liabilities | ||||||||||||||||
| July 31, 2018 | ||||||||||||||||
Fidelity Dividend ETF for | Fidelity High Dividend ETF | Fidelity Low Volatility Factor ETF | Fidelity Momentum Factor ETF | |||||||||||||
Assets | ||||||||||||||||
Investments in securities, at value (including securities loaned of $7,644,622, $2,849,726, $— and $—, respectively) – See accompanying schedule: | ||||||||||||||||
Unaffiliated issuers | $ | 346,128,628 | $ | 171,087,773 | $ | 66,325,995 | $ | 95,521,500 | ||||||||
Fidelity Central Funds | 8,124,718 | 3,340,792 | 54,598 | 136,933 | ||||||||||||
|
|
|
|
|
|
|
| |||||||||
Total Investments in Securities | $ | 354,253,346 | $ | 174,428,565 | $ | 66,380,593 | $ | 95,658,433 | ||||||||
Cash | 7,884 | — | 6,240 | 11,078 | ||||||||||||
Foreign currency held at value (cost $49,757, $1,627, $— and $—, respectively) | 48,666 | 1,574 | — | — | ||||||||||||
Receivable for investments sold | — | — | — | 1,654,355 | ||||||||||||
Dividends receivable | 493,317 | 341,221 | 48,433 | 67,753 | ||||||||||||
Distributions receivable from Fidelity Central Funds | 10,828 | 2,982 | 28 | — | ||||||||||||
|
|
|
|
|
|
|
| |||||||||
Total assets | 354,814,041 | 174,774,342 | 66,435,294 | 97,391,619 | ||||||||||||
|
|
|
|
|
|
|
| |||||||||
Liabilities | ||||||||||||||||
Payable for fund shares redeemed | — | — | — | 1,666,519 | ||||||||||||
Accrued management fees | 82,724 | 39,677 | 14,991 | 23,522 | ||||||||||||
Collateral on securities loaned, at value | 7,835,740 | 2,900,010 | — | — | ||||||||||||
|
|
|
|
|
|
|
| |||||||||
Total liabilities | 7,918,464 | 2,939,687 | 14,991 | 1,690,041 | ||||||||||||
|
|
|
|
|
|
|
| |||||||||
Net Assets | $ | 346,895,577 | $ | 171,834,655 | $ | 66,420,303 | $ | 95,701,578 | ||||||||
|
|
|
|
|
|
|
| |||||||||
Net Assets consist of: | ||||||||||||||||
Paid in capital | 332,929,063 | 166,974,222 | 61,746,171 | 90,170,207 | ||||||||||||
Undistributed net investment income | 122,792 | — | 28,045 | 49,177 | ||||||||||||
Accumulated undistributed net realized gain (loss) on investments and foreign currency transactions | (5,502,788 | ) | (2,880,517 | ) | (520,989 | ) | (2,392,302 | ) | ||||||||
Net unrealized appreciation (depreciation) on investments and assets and liabilities in foreign currencies | 19,346,510 | 7,740,950 | 5,167,076 | 7,874,496 | ||||||||||||
|
|
|
|
|
|
|
| |||||||||
Net Assets | $ | 346,895,577 | $ | 171,834,655 | $ | 66,420,303 | $ | 95,701,578 | ||||||||
|
|
|
|
|
|
|
| |||||||||
Shares outstanding | 11,000,000 | 5,700,000 | 2,050,000 | 2,850,000 | ||||||||||||
|
|
|
|
|
|
|
| |||||||||
Net Asset Value, offering price and redemption price per share | $ | 31.54 | $ | 30.15 | $ | 32.40 | $ | 33.58 | ||||||||
|
|
|
|
|
|
|
| |||||||||
Investments at cost – Unaffiliated issuers | $ | 326,780,979 | $ | 163,346,752 | $ | 61,158,919 | $ | 87,647,004 | ||||||||
Investments at cost – Fidelity Central Funds | 8,124,785 | 3,340,810 | 54,598 | 136,933 | ||||||||||||
|
|
|
|
|
|
|
| |||||||||
Investments at cost | $ | 334,905,764 | $ | 166,687,562 | $ | 61,213,517 | $ | 87,783,937 | ||||||||
|
|
|
|
|
|
|
| |||||||||
See accompanying notes which are an integral part of the financial statements.
| Annual Report | 42 |
Table of Contents
| Statements of Assets and Liabilities | ||||||||
| July 31, 2018 | ||||||||
| Fidelity Quality Factor ETF | Fidelity Value Factor ETF | |||||||
Assets | ||||||||
Investments in securities, at value (including securities loaned of $959,933 and $430,727, respectively) – See accompanying schedule: | ||||||||
Unaffiliated issuers | $ | 65,140,427 | $ | 86,306,153 | ||||
Fidelity Central Funds | 1,041,333 | 510,731 | ||||||
|
|
|
| |||||
Total Investments in Securities | $ | 66,181,760 | $ | 86,816,884 | ||||
Cash | 4,807 | 29,875 | ||||||
Foreign currency held at value (cost $— and $—, respectively) | — | — | ||||||
Receivable for investments sold | — | — | ||||||
Dividends receivable | 66,966 | 64,628 | ||||||
Distributions receivable from Fidelity Central Funds | 540 | 116 | ||||||
|
|
|
| |||||
Total assets | 66,254,073 | 86,911,503 | ||||||
|
|
|
| |||||
Liabilities | ||||||||
Payable for fund shares redeemed | — | — | ||||||
Accrued management fees | 15,671 | 20,446 | ||||||
Collateral on securities loaned, at value | 979,430 | 440,955 | ||||||
|
|
|
| |||||
Total liabilities | 995,101 | 461,401 | ||||||
|
|
|
| |||||
Net Assets | $ | 65,258,972 | $ | 86,450,102 | ||||
|
|
|
| |||||
Net Assets consist of: | ||||||||
Paid in capital | 60,822,263 | 82,017,659 | ||||||
Undistributed net investment income | 22,608 | 46,922 | ||||||
Accumulated undistributed net realized gain (loss) on investments and foreign currency transactions | (673,786 | ) | (1,307,386 | ) | ||||
Net unrealized appreciation (depreciation) on investments and assets and liabilities in foreign currencies | 5,087,887 | 5,692,907 | ||||||
|
|
|
| |||||
Net Assets | $ | 65,258,972 | $ | 86,450,102 | ||||
|
|
|
| |||||
Shares outstanding | 1,950,000 | 2,550,000 | ||||||
|
|
|
| |||||
Net Asset Value, offering price and redemption price per share | $ | 33.47 | $ | 33.90 | ||||
|
|
|
| |||||
Investments at cost – Unaffiliated issuers | $ | 60,052,538 | $ | 80,613,245 | ||||
Investments at cost – Fidelity Central Funds | 1,041,335 | 510,732 | ||||||
|
|
|
| |||||
Investments at cost | $ | 61,093,873 | $ | 81,123,977 | ||||
|
|
|
| |||||
See accompanying notes which are an integral part of the financial statements.
| 43 | Annual Report |
Table of Contents
Financial Statements – continued
| Statements of Operations | ||||||||||||||||
| For the year ended July 31, 2018 | ||||||||||||||||
| Fidelity Dividend ETF for Rising Rates | Fidelity High Dividend ETF | Fidelity Low Volatility Factor ETF | Fidelity Momentum Factor ETF | |||||||||||||
Investment Income | ||||||||||||||||
Dividends | $ | 8,265,606 | $ | 3,834,616 | $ | 935,821 | $ | 903,382 | ||||||||
Non-Cash dividends | — | 297,271 | — | — | ||||||||||||
Income from Fidelity Central Funds | 70,318 | 75,790 | 1,035 | 1,033 | ||||||||||||
|
|
|
|
|
|
|
| |||||||||
Total income | 8,335,924 | 4,207,677 | 936,856 | 904,415 | ||||||||||||
|
|
|
|
|
|
|
| |||||||||
Expenses | ||||||||||||||||
Management fees | 715,700 | 297,563 | 133,476 | 181,930 | ||||||||||||
Independent trustees’ compensation | 2,873 | 1,106 | 543 | 673 | ||||||||||||
Miscellaneous | 12,420 | 6,514 | 2,799 | 4,029 | ||||||||||||
|
|
|
|
|
|
|
| |||||||||
Total expenses before reductions | 730,993 | 305,183 | 136,818 | 186,632 | ||||||||||||
Expense reductions | (35 | ) | (51 | ) | (175 | ) | (163 | ) | ||||||||
|
|
|
|
|
|
|
| |||||||||
Total expenses | 730,958 | 305,132 | 136,643 | 186,469 | ||||||||||||
|
|
|
|
|
|
|
| |||||||||
Net investment income (loss) | 7,604,966 | 3,902,545 | 800,213 | 717,946 | ||||||||||||
|
|
|
|
|
|
|
| |||||||||
Realized and Unrealized Gain (Loss) | ||||||||||||||||
Net realized gain (loss) on investment securities | (5,427,145 | ) | (2,865,968 | ) | (498,227 | ) | (2,346,410 | ) | ||||||||
Net realized gain (loss) on In-kind redemptions | 11,202,254 | 7,438,684 | 2,148,135 | 4,526,418 | ||||||||||||
Net realized gain (loss) on foreign currency transactions | (18,070 | ) | 3,335 | — | — | |||||||||||
|
|
|
|
|
|
|
| |||||||||
Total net realized gain (loss) | 5,757,039 | 4,576,051 | 1,649,908 | 2,180,008 | ||||||||||||
|
|
|
|
|
|
|
| |||||||||
Change in net unrealized appreciation (depreciation) on investment securities | 17,015,567 | 6,939,017 | 4,025,357 | 6,072,794 | ||||||||||||
Change in net unrealized appreciation (depreciation) on Fidelity Central Funds | (67 | ) | (17 | ) | — | — | ||||||||||
Change in net unrealized appreciation (depreciation) on assets and liabilities in foreign currencies | (1,801 | ) | (351 | ) | — | — | ||||||||||
|
|
|
|
|
|
|
| |||||||||
Total change in net unrealized appreciation (depreciation) | 17,013,699 | 6,938,649 | 4,025,357 | 6,072,794 | ||||||||||||
|
|
|
|
|
|
|
| |||||||||
Net gain (loss) | 22,770,738 | 11,514,700 | 5,675,265 | 8,252,802 | ||||||||||||
|
|
|
|
|
|
|
| |||||||||
Net increase (decrease) in net assets resulting from operations | $ | 30,375,704 | $ | 15,417,245 | $ | 6,475,478 | $ | 8,970,748 | ||||||||
|
|
|
|
|
|
|
| |||||||||
See accompanying notes which are an integral part of the financial statements.
| Annual Report | 44 |
Table of Contents
| Statements of Operations | ||||||||
| For the year ended July 31, 2018 | ||||||||
| Fidelity Quality Factor ETF | Fidelity Value Factor ETF | |||||||
Investment Income | ||||||||
Dividends | $ | 1,003,001 | $ | 1,330,396 | ||||
Non-Cash dividends | — | — | ||||||
Income from Fidelity Central Funds | 10,347 | 4,493 | ||||||
|
|
|
| |||||
Total income | 1,013,348 | 1,334,889 | ||||||
|
|
|
| |||||
Expenses | ||||||||
Management fees | 149,882 | 185,251 | ||||||
Independent trustees’ compensation | 594 | 742 | ||||||
Miscellaneous | 3,495 | 3,633 | ||||||
|
|
|
| |||||
Total expenses before reductions | 153,971 | 189,626 | ||||||
Expense reductions | (132 | ) | (116 | ) | ||||
|
|
|
| |||||
Total expenses | 153,839 | 189,510 | ||||||
|
|
|
| |||||
Net investment income (loss) | 859,509 | 1,145,379 | ||||||
|
|
|
| |||||
Realized and Unrealized Gain (Loss) | ||||||||
Net realized gain (loss) on investment securities | (655,051 | ) | (1,250,640 | ) | ||||
Net realized gain (loss) on In-kind redemptions | 2,624,504 | 3,638,064 | ||||||
Net realized gain (loss) on foreign currency transactions | — | — | ||||||
|
|
|
| |||||
Total net realized gain (loss) | 1,969,453 | 2,387,424 | ||||||
|
|
|
| |||||
Change in net unrealized appreciation (depreciation) on investment securities | 4,345,072 | 4,698,704 | ||||||
Change in net unrealized appreciation (depreciation) on Fidelity Central Funds | (2 | ) | 2 | |||||
Change in net unrealized appreciation (depreciation) on assets and liabilities in foreign currencies | — | — | ||||||
|
|
|
| |||||
Total change in net unrealized appreciation (depreciation) | 4,345,070 | 4,698,706 | ||||||
|
|
|
| |||||
Net gain (loss) | 6,314,523 | 7,086,130 | ||||||
|
|
|
| |||||
Net increase (decrease) in net assets resulting from operations | $ | 7,174,032 | $ | 8,231,509 | ||||
|
|
|
| |||||
See accompanying notes which are an integral part of the financial statements.
| 45 | Annual Report |
Table of Contents
Financial Statements – continued
| Statements of Changes in Net Assets | ||||||||||||||||
| Fidelity Dividend ETF for Rising Rates | Fidelity High Dividend ETF | |||||||||||||||
| Year ended July 31, 2018 | Year ended July 31, 2017A | Year ended July 31, 2018 | Year ended July 31, 2017A | |||||||||||||
Increase (Decrease) in Net Assets | ||||||||||||||||
Operations | ||||||||||||||||
Net investment income (loss) | $ | 7,604,966 | $ | 2,075,973 | $ | 3,902,545 | $ | 1,177,822 | ||||||||
Net realized gain (loss) | 5,757,039 | 4,434,345 | 4,576,051 | 817,593 | ||||||||||||
Change in net unrealized appreciation (depreciation) | 17,013,699 | 2,332,811 | 6,938,649 | 802,301 | ||||||||||||
|
|
|
|
|
|
|
| |||||||||
Net increase (decrease) in net assets resulting from operations | 30,375,704 | 8,843,129 | 15,417,245 | 2,797,716 | ||||||||||||
|
|
|
|
|
|
|
| |||||||||
Distributions to shareholders from net investment income | (7,614,450 | ) | (1,891,450 | ) | (4,045,250 | ) | (1,142,850 | ) | ||||||||
Distributions to shareholders from net realized gain | — | — | (29,500 | ) | — | |||||||||||
|
|
|
|
|
|
|
| |||||||||
Total distributions | (7,614,450 | ) | (1,891,450 | ) | (4,074,750 | ) | (1,142,850 | ) | ||||||||
|
|
|
|
|
|
|
| |||||||||
Share transactions | ||||||||||||||||
Proceeds from sales of shares | 237,265,494 | 180,748,122 | 133,442,348 | 61,716,076 | ||||||||||||
Cost of shares redeemed | (65,623,350 | ) | (35,207,622 | ) | (32,300,411 | ) | (4,020,719 | ) | ||||||||
|
|
|
|
|
|
|
| |||||||||
Net increase (decrease) in net assets resulting from share transactions | 171,642,144 | 145,540,500 | 101,141,937 | 57,695,357 | ||||||||||||
|
|
|
|
|
|
|
| |||||||||
Total increase (decrease) in net assets | 194,403,398 | 152,492,179 | 112,484,432 | 59,350,223 | ||||||||||||
Net Assets | ||||||||||||||||
Beginning of year | 152,492,179 | — | 59,350,223 | — | ||||||||||||
|
|
|
|
|
|
|
| |||||||||
End of year | $ | 346,895,577 | $ | 152,492,179 | $ | 171,834,655 | $ | 59,350,223 | ||||||||
|
|
|
|
|
|
|
| |||||||||
Undistributed net investment income included in net assets at end of year | $ | 122,792 | $ | 187,874 | $ | — | $ | 36,075 | ||||||||
|
|
|
|
|
|
|
| |||||||||
Other Information | ||||||||||||||||
Shares | ||||||||||||||||
Sold | 7,750,000 | 6,600,000 | 4,600,000 | 2,350,000 | ||||||||||||
Redeemed | (2,100,000 | ) | (1,250,000 | ) | (1,100,000 | ) | (150,000 | ) | ||||||||
|
|
|
|
|
|
|
| |||||||||
Net increase (decrease) | 5,650,000 | 5,350,000 | 3,500,000 | 2,200,000 | ||||||||||||
|
|
|
|
|
|
|
| |||||||||
| A | For the period September 12, 2016 (commencement of operations) to July 31, 2017. |
See accompanying notes which are an integral part of the financial statements.
| Annual Report | 46 |
Table of Contents
| Statements of Changes in Net Assets | ||||||||||||||||
| Fidelity Low Volatility Factor ETF | Fidelity Momentum Factor ETF | |||||||||||||||
| Year ended July 31, 2018 | Year ended July 31, 2017A | Year ended July 31, 2018 | Year ended July 31, 2017A | |||||||||||||
Increase (Decrease) in Net Assets | ||||||||||||||||
Operations | ||||||||||||||||
Net investment income (loss) | $ | 800,213 | $ | 279,182 | $ | 717,946 | $ | 225,081 | ||||||||
Net realized gain (loss) | 1,649,908 | 703,085 | 2,180,008 | 433,333 | ||||||||||||
Change in net unrealized appreciation (depreciation) | 4,025,357 | 1,141,719 | 6,072,794 | 1,801,702 | ||||||||||||
|
|
|
|
|
|
|
| |||||||||
Net increase (decrease) in net assets resulting from operations | 6,475,478 | 2,123,986 | 8,970,748 | 2,460,116 | ||||||||||||
|
|
|
|
|
|
|
| |||||||||
Distributions to shareholders from net investment income | (793,800 | ) | (257,550 | ) | (688,250 | ) | (205,600 | ) | ||||||||
Distributions to shareholders from net realized gain | — | — | — | — | ||||||||||||
|
|
|
|
|
|
|
| |||||||||
Total distributions | (793,800 | ) | (257,550 | ) | (688,250 | ) | (205,600 | ) | ||||||||
|
|
|
|
|
|
|
| |||||||||
Share transactions | ||||||||||||||||
Proceeds from sales of shares | 46,091,368 | 36,187,957 | 90,704,534 | 37,612,617 | ||||||||||||
Cost of shares redeemed | (19,185,949 | ) | (4,221,187 | ) | (39,030,201 | ) | (4,122,386 | ) | ||||||||
|
|
|
|
|
|
|
| |||||||||
Net increase (decrease) in net assets resulting from share transactions | 26,905,419 | 31,966,770 | 51,674,333 | 33,490,231 | ||||||||||||
|
|
|
|
|
|
|
| |||||||||
Total increase (decrease) in net assets | 32,587,097 | 33,833,206 | 59,956,831 | 35,744,747 | ||||||||||||
Net Assets | ||||||||||||||||
Beginning of year | 33,833,206 | — | 35,744,747 | — | ||||||||||||
|
|
|
|
|
|
|
| |||||||||
End of year | $ | 66,420,303 | $ | 33,833,206 | $ | 95,701,578 | $ | 35,744,747 | ||||||||
|
|
|
|
|
|
|
| |||||||||
Undistributed net investment income included in net assets at end of year | $ | 28,045 | $ | 21,632 | $ | 49,177 | $ | 19,481 | ||||||||
|
|
|
|
|
|
|
| |||||||||
Other Information | ||||||||||||||||
Shares | ||||||||||||||||
Sold | 1,500,000 | 1,350,000 | 2,850,000 | 1,400,000 | ||||||||||||
Redeemed | (650,000 | ) | (150,000 | ) | (1,250,000 | ) | (150,000 | ) | ||||||||
|
|
|
|
|
|
|
| |||||||||
Net increase (decrease) | 850,000 | 1,200,000 | 1,600,000 | 1,250,000 | ||||||||||||
|
|
|
|
|
|
|
| |||||||||
| A | For the period September 12, 2016 (commencement of operations) to July 31, 2017. |
See accompanying notes which are an integral part of the financial statements.
| 47 | Annual Report |
Table of Contents
Financial Statements – continued
| Statements of Changes in Net Assets | ||||||||||||||||
| Fidelity Quality Factor ETF | Fidelity Value Factor ETF | |||||||||||||||
| Year ended July 31, 2018 | Year ended July 31, 2017A | Year ended July 31, 2018 | Year ended July 31, 2017A | |||||||||||||
Increase (Decrease) in Net Assets | ||||||||||||||||
Operations | ||||||||||||||||
Net investment income (loss) | $ | 859,509 | $ | 341,449 | $ | 1,145,379 | $ | 372,643 | ||||||||
Net realized gain (loss) | 1,969,453 | 1,968,621 | 2,387,424 | 1,795,364 | ||||||||||||
Change in net unrealized appreciation (depreciation) | 4,345,070 | 742,817 | 4,698,706 | 994,201 | ||||||||||||
|
|
|
|
|
|
|
| |||||||||
Net increase (decrease) in net assets resulting from operations | 7,174,032 | 3,052,887 | 8,231,509 | 3,162,208 | ||||||||||||
|
|
|
|
|
|
|
| |||||||||
Distributions to shareholders from net investment income | (891,500 | ) | (286,850 | ) | (1,129,450 | ) | (341,650 | ) | ||||||||
Distributions to shareholders from net realized gain | — | — | — | — | ||||||||||||
|
|
|
|
|
|
|
| |||||||||
Total distributions | (891,500 | ) | (286,850 | ) | (1,129,450 | ) | (341,650 | ) | ||||||||
|
|
|
|
|
|
|
| |||||||||
Share transactions | ||||||||||||||||
Proceeds from sales of shares | 44,304,370 | 43,305,942 | 62,950,948 | 47,409,478 | ||||||||||||
Cost of shares redeemed | (15,896,471 | ) | (15,503,438 | ) | (22,241,630 | ) | (11,591,311 | ) | ||||||||
|
|
|
|
|
|
|
| |||||||||
Net increase (decrease) in net assets resulting from share transactions | 28,407,899 | 27,802,504 | 40,709,318 | 35,818,167 | ||||||||||||
|
|
|
|
|
|
|
| |||||||||
Total increase (decrease) in net assets | 34,690,431 | 30,568,541 | 47,811,377 | 38,638,725 | ||||||||||||
Net Assets | ||||||||||||||||
Beginning of year | 30,568,541 | — | 38,638,725 | — | ||||||||||||
|
|
|
|
|
|
|
| |||||||||
End of year | $ | 65,258,972 | $ | 30,568,541 | $ | 86,450,102 | $ | 38,638,725 | ||||||||
|
|
|
|
|
|
|
| |||||||||
Undistributed net investment income included in net assets at end of year | $ | 22,608 | $ | 54,599 | $ | 46,922 | $ | 30,993 | ||||||||
|
|
|
|
|
|
|
| |||||||||
Other Information | ||||||||||||||||
Shares | ||||||||||||||||
Sold | 1,400,000 | 1,600,000 | 1,950,000 | 1,700,000 | ||||||||||||
Redeemed | (500,000 | ) | (550,000 | ) | (700,000 | ) | (400,000 | ) | ||||||||
|
|
|
|
|
|
|
| |||||||||
Net increase (decrease) | 900,000 | 1,050,000 | 1,250,000 | 1,300,000 | ||||||||||||
|
|
|
|
|
|
|
| |||||||||
| A | For the period September 12, 2016 (commencement of operations) to July 31, 2017. |
See accompanying notes which are an integral part of the financial statements.
| Annual Report | 48 |
Table of Contents
| Financial Highlights | ||||||||
| Fidelity Dividend ETF for Rising Rates | ||||||||
| Year ended July 31, 2018 | Year ended July 31, 2017A | |||||||
Selected Per-Share Data | ||||||||
Net asset value, beginning of period | $ | 28.50 | $ | 25.34 | ||||
|
|
|
| |||||
Income from Investment Operations | ||||||||
Net investment income (loss)B | 0.93 | 0.76 | ||||||
Net realized and unrealized gain (loss) | 3.03 | 2.98 | ||||||
|
|
|
| |||||
Total from investment operations | 3.96 | 3.74 | ||||||
|
|
|
| |||||
Distributions from net investment income | (0.92 | ) | (0.58 | ) | ||||
|
|
|
| |||||
Total distributions | (0.92 | ) | (0.58 | ) | ||||
|
|
|
| |||||
Net asset value, end of period | $ | 31.54 | $ | 28.50 | ||||
|
|
|
| |||||
Total ReturnC | 14.04 | % | 14.85 | % | ||||
Ratios to Average Net AssetsD | ||||||||
Expense before reductions | .30 | % | .29 | %E | ||||
Expenses net of fee waivers, if any | .30 | % | .29 | %E | ||||
Expenses net of all reductions | .30 | % | .29 | %E | ||||
Net investment income (loss) | 3.08 | % | 3.09 | %E | ||||
Supplemental Data | ||||||||
Net assets, end of period (000 omitted) | $ | 346,896 | $ | 152,492 | ||||
Portfolio turnover rateF,G | 38 | % | 52 | %H | ||||
| A | For the period September 12, 2016 (commencement of operations) to July 31, 2017. |
| B | Calculated based on average shares outstanding during the period. |
| C | Total returns for periods of less than one year are not annualized. |
| D | Expense ratios reflect operating expenses of the Fund. Expenses before reductions do not reflect amounts reimbursed by the investment adviser or reductions from brokerage service arrangements or reductions from other expense offset arrangements and do not represent the amount paid by the Fund during periods when reimbursements or reductions occur. Expenses net of fee waivers reflect expenses after reimbursement by the investment adviser but prior to the reductions from brokerage service arrangements or other expense offset arrangements. Expenses net of all reductions represent the net expenses paid by the Fund but do not include expenses of the investment companies in which the fund invests. |
| E | Annualized. |
| F | Amount does not include the portfolio activity of any underlying funds. |
| G | Portfolio turnover rate excludes securities received or delivered in-kind. |
| H | Amount not annualized. |
See accompanying notes which are an integral part of the financial statements.
| 49 | Annual Report |
Table of Contents
Financial Statements – continued
| Financial Highlights | ||||||||
| Fidelity High Dividend ETF | ||||||||
| Year ended July 31, 2018 | Year ended July 31, 2017A | |||||||
Selected Per-Share Data | ||||||||
Net asset value, beginning of period | $ | 26.98 | $ | 25.32 | ||||
|
|
|
| |||||
Income from Investment Operations | ||||||||
Net investment income (loss)B | 1.09 | 0.85 | ||||||
Net realized and unrealized gain (loss) | 3.21 | 1.57 | ||||||
|
|
|
| |||||
Total from investment operations | 4.30 | 2.42 | ||||||
|
|
|
| |||||
Distributions from net investment income | (1.12 | ) | (0.76 | ) | ||||
Distributions from net realized gain | (0.01 | ) | — | |||||
|
|
|
| |||||
Total distributions | (1.13 | ) | (0.76 | ) | ||||
|
|
|
| |||||
Net asset value, end of period | $ | 30.15 | $ | 26.98 | ||||
|
|
|
| |||||
Total ReturnC | 16.23 | % | 9.61 | % | ||||
Ratios to Average Net AssetsD | ||||||||
Expense before reductions | .30 | % | .29 | %E | ||||
Expenses net of fee waivers, if any | .30 | % | .29 | %E | ||||
Expenses net of all reductions | .30 | % | .29 | %E | ||||
Net investment income (loss) | 3.80 | % | 3.61 | %E | ||||
Supplemental Data | ||||||||
Net assets, end of period (000 omitted) | $ | 171,835 | $ | 59,350 | ||||
Portfolio turnover rateF,G | 53 | % | 57 | %H | ||||
| A | For the period September 12, 2016 (commencement of operations) to July 31, 2017. |
| B | Calculated based on average shares outstanding during the period. |
| C | Total returns for periods of less than one year are not annualized. |
| D | Expense ratios reflect operating expenses of the Fund. Expenses before reductions do not reflect amounts reimbursed by the investment adviser or reductions from brokerage service arrangements or reductions from other expense offset arrangements and do not represent the amount paid by the Fund during periods when reimbursements or reductions occur. Expenses net of fee waivers reflect expenses after reimbursement by the investment adviser but prior to the reductions from brokerage service arrangements or other expense offset arrangements. Expenses net of all reductions represent the net expenses paid by the Fund but do not include expenses of the investment companies in which the fund invests. |
| E | Annualized. |
| F | Amount does not include the portfolio activity of any underlying funds. |
| G | Portfolio turnover rate excludes securities received or delivered in-kind. |
| H | Amount not annualized. |
See accompanying notes which are an integral part of the financial statements.
| Annual Report | 50 |
Table of Contents
| Financial Highlights | ||||||||
| Fidelity Low Volatility Factor ETF | ||||||||
| Year ended July 31, 2018 | Year ended July 31, 2017A | |||||||
Selected Per-Share Data | ||||||||
Net asset value, beginning of period | $ | 28.19 | $ | 25.31 | ||||
|
|
|
| |||||
Income from Investment Operations | ||||||||
Net investment income (loss)B | 0.53 | 0.45 | ||||||
Net realized and unrealized gain (loss) | 4.20 | 2.81 | ||||||
|
|
|
| |||||
Total from investment operations | 4.73 | 3.26 | ||||||
|
|
|
| |||||
Distributions from net investment income | (0.52 | ) | (0.38 | ) | ||||
|
|
|
| |||||
Total distributions | (0.52 | ) | (0.38 | ) | ||||
|
|
|
| |||||
Net asset value, end of period | $ | 32.40 | $ | 28.19 | ||||
|
|
|
| |||||
Total ReturnC | 16.89 | % | 12.94 | % | ||||
Ratios to Average Net AssetsD | ||||||||
Expense before reductions | .30 | % | .29 | %E | ||||
Expenses net of fee waivers, if any | .30 | % | .29 | %E | ||||
Expenses net of all reductions | .30 | % | .29 | %E | ||||
Net investment income (loss) | 1.73 | % | 1.87 | %E | ||||
Supplemental Data | ||||||||
Net assets, end of period (000 omitted) | $ | 66,420 | $ | 33,833 | ||||
Portfolio turnover rateF,G | 31 | % | 33 | %H | ||||
| A | For the period September 12, 2016 (commencement of operations) to July 31, 2017. |
| B | Calculated based on average shares outstanding during the period. |
| C | Total returns for periods of less than one year are not annualized. |
| D | Expense ratios reflect operating expenses of the Fund. Expenses before reductions do not reflect amounts reimbursed by the investment adviser or reductions from brokerage service arrangements or reductions from other expense offset arrangements and do not represent the amount paid by the Fund during periods when reimbursements or reductions occur. Expenses net of fee waivers reflect expenses after reimbursement by the investment adviser but prior to the reductions from brokerage service arrangements or other expense offset arrangements. Expenses net of all reductions represent the net expenses paid by the Fund but do not include expenses of the investment companies in which the fund invests. |
| E | Annualized. |
| F | Amount does not include the portfolio activity of any underlying funds. |
| G | Portfolio turnover rate excludes securities received or delivered in-kind. |
| H | Amount not annualized. |
See accompanying notes which are an integral part of the financial statements.
| 51 | Annual Report |
Table of Contents
Financial Statements – continued
| Financial Highlights | ||||||||
| Fidelity Momentum Factor ETF | ||||||||
| Year ended July 31, 2018 | Year ended July 31, 2017A | |||||||
Selected Per-Share Data | ||||||||
Net asset value, beginning of period | $ | 28.60 | $ | 25.34 | ||||
|
|
|
| |||||
Income from Investment Operations | ||||||||
Net investment income (loss)B | 0.36 | 0.36 | ||||||
Net realized and unrealized gain (loss) | 4.97 | 3.19 | ||||||
|
|
|
| |||||
Total from investment operations | 5.33 | 3.55 | ||||||
|
|
|
| |||||
Distributions from net investment income | (0.35 | ) | (0.29 | ) | ||||
|
|
|
| |||||
Total distributions | (0.35 | ) | (0.29 | ) | ||||
|
|
|
| |||||
Net asset value, end of period | $ | 33.58 | $ | 28.60 | ||||
|
|
|
| |||||
Total ReturnC | 18.72 | % | 14.11 | % | ||||
Ratios to Average Net AssetsD | ||||||||
Expense before reductions | .30 | % | .29 | %E | ||||
Expenses net of fee waivers, if any | .30 | % | .29 | %E | ||||
Expenses net of all reductions | .30 | % | .29 | %E | ||||
Net investment income (loss) | 1.14 | % | 1.50 | %E | ||||
Supplemental Data | ||||||||
Net assets, end of period (000 omitted) | $ | 95,702 | $ | 35,745 | ||||
Portfolio turnover rateF,G | 125 | % | 106 | %H | ||||
| A | For the period September 12, 2016 (commencement of operations) to July 31, 2017. |
| B | Calculated based on average shares outstanding during the period. |
| C | Total returns for periods of less than one year are not annualized. |
| D | Expense ratios reflect operating expenses of the Fund. Expenses before reductions do not reflect amounts reimbursed by the investment adviser or reductions from brokerage service arrangements or reductions from other expense offset arrangements and do not represent the amount paid by the Fund during periods when reimbursements or reductions occur. Expenses net of fee waivers reflect expenses after reimbursement by the investment adviser but prior to the reductions from brokerage service arrangements or other expense offset arrangements. Expenses net of all reductions represent the net expenses paid by the Fund but do not include expenses of the investment companies in which the fund invests. |
| E | Annualized. |
| F | Amount does not include the portfolio activity of any underlying funds. |
| G | Portfolio turnover rate excludes securities received or delivered in-kind. |
| H | Amount not annualized. |
See accompanying notes which are an integral part of the financial statements.
| Annual Report | 52 |
Table of Contents
| Financial Highlights | ||||||||
| Fidelity Quality Factor ETF | ||||||||
| Year ended July 31, 2018 | Year ended July 31, 2017A | |||||||
Selected Per-Share Data | ||||||||
Net asset value, beginning of period | $ | 29.11 | $ | 25.37 | ||||
|
|
|
| |||||
Income from Investment Operations | ||||||||
Net investment income (loss)B | 0.53 | 0.45 | ||||||
Net realized and unrealized gain (loss) | 4.38 | 3.62 | ||||||
|
|
|
| |||||
Total from investment operations | 4.91 | 4.07 | ||||||
|
|
|
| |||||
Distributions from net investment income | (0.55 | ) | (0.33 | ) | ||||
|
|
|
| |||||
Total distributions | (0.55 | ) | (0.33 | ) | ||||
|
|
|
| |||||
Net asset value, end of period | $ | 33.47 | $ | 29.11 | ||||
|
|
|
| |||||
Total ReturnC | 16.95 | % | 16.10 | % | ||||
Ratios to Average Net AssetsD | ||||||||
Expense before reductions | .30 | % | .29 | %E | ||||
Expenses net of fee waivers, if any | .30 | % | .29 | %E | ||||
Expenses net of all reductions | .30 | % | .29 | %E | ||||
Net investment income (loss) | 1.66 | % | 1.84 | %E | ||||
Supplemental Data | ||||||||
Net assets, end of period (000 omitted) | $ | 65,259 | $ | 30,569 | ||||
Portfolio turnover rateF,G | 30 | % | 35 | %H | ||||
| A | For the period September 12, 2016 (commencement of operations) to July 31, 2017. |
| B | Calculated based on average shares outstanding during the period. |
| C | Total returns for periods of less than one year are not annualized. |
| D | Expense ratios reflect operating expenses of the Fund. Expenses before reductions do not reflect amounts reimbursed by the investment adviser or reductions from brokerage service arrangements or reductions from other expense offset arrangements and do not represent the amount paid by the Fund during periods when reimbursements or reductions occur. Expenses net of fee waivers reflect expenses after reimbursement by the investment adviser but prior to the reductions from brokerage service arrangements or other expense offset arrangements. Expenses net of all reductions represent the net expenses paid by the Fund but do not include expenses of the investment companies in which the fund invests. |
| E | Annualized. |
| F | Amount does not include the portfolio activity of any underlying funds. |
| G | Portfolio turnover rate excludes securities received or delivered in-kind. |
| H | Amount not annualized. |
See accompanying notes which are an integral part of the financial statements.
| 53 | Annual Report |
Table of Contents
Financial Statements – continued
| Financial Highlights | ||||||||
| Fidelity Value Factor ETF | ||||||||
| Year ended July 31, 2018 | Year ended July 31, 2017A | |||||||
Selected Per-Share Data | ||||||||
Net asset value, beginning of period | $ | 29.72 | $ | 25.37 | ||||
|
|
|
| |||||
Income from Investment Operations | ||||||||
Net investment income (loss)B | 0.58 | 0.49 | ||||||
Net realized and unrealized gain (loss) | 4.18 | 4.23 | ||||||
|
|
|
| |||||
Total from investment operations | 4.76 | 4.72 | ||||||
|
|
|
| |||||
Distributions from net investment income | (0.58 | ) | (0.37 | ) | ||||
|
|
|
| |||||
Total distributions | (0.58 | ) | (0.37 | ) | ||||
|
|
|
| |||||
Net asset value, end of period | $ | 33.90 | $ | 29.72 | ||||
|
|
|
| |||||
Total ReturnC | 16.11 | % | 18.65 | % | ||||
Ratios to Average Net AssetsD | ||||||||
Expense before reductions | .30 | % | .29 | %E | ||||
Expenses net of fee waivers, if any | .30 | % | .29 | %E | ||||
Expenses net of all reductions | .30 | % | .29 | %E | ||||
Net investment income (loss) | 1.79 | % | 1.92 | %E | ||||
Supplemental Data | ||||||||
Net assets, end of period (000 omitted) | $ | 86,450 | $ | 38,639 | ||||
Portfolio turnover rateF,G | 38 | % | 42 | %H | ||||
| A | For the period September 12, 2016 (commencement of operations) to July 31, 2017. |
| B | Calculated based on average shares outstanding during the period. |
| C | Total returns for periods of less than one year are not annualized. |
| D | Expense ratios reflect operating expenses of the Fund. Expenses before reductions do not reflect amounts reimbursed by the investment adviser or reductions from brokerage service arrangements or reductions from other expense offset arrangements and do not represent the amount paid by the Fund during periods when reimbursements or reductions occur. Expenses net of fee waivers reflect expenses after reimbursement by the investment adviser but prior to the reductions from brokerage service arrangements or other expense offset arrangements. Expenses net of all reductions represent the net expenses paid by the Fund but do not include expenses of the investment companies in which the fund invests. |
| E | Annualized. |
| F | Amount does not include the portfolio activity of any underlying funds. |
| G | Portfolio turnover rate excludes securities received or delivered in-kind. |
| H | Amount not annualized. |
See accompanying notes which are an integral part of the financial statements.
| Annual Report | 54 |
Table of Contents
For the year ended July 31, 2018
1. Organization.
Fidelity Dividend ETF for Rising Rates, Fidelity High Dividend ETF (formerly Fidelity Core Dividend ETF), Fidelity Low Volatility Factor ETF, Fidelity Momentum Factor ETF, Fidelity Quality Factor ETF and Fidelity Value Factor ETF (the Funds) are exchange-traded funds of Fidelity Covington Trust (the Trust) and are authorized to issue an unlimited number of shares. The trust is registered under the Investment Company Act of 1940, as amended (the 1940 Act), as open-end management investment company organized as a Massachusetts business trust.
2. Investments in Fidelity Central Funds.
The Funds invest in Fidelity Central Funds, which are open-end investment companies generally available only to other investment companies and accounts managed by the investment adviser and its affiliates. The Funds’ Schedules of Investments list each of the Fidelity Central Funds held as of year end, if any, as an investment of each Fund, but do not include the underlying holdings of each Fidelity Central Fund. As an Investing Fund, each Fund indirectly bears its proportionate share of the expenses of the underlying Fidelity Central Funds.
The Money Market Central Funds seek preservation of capital and current income and are managed by Fidelity Investments Money Management, Inc. (FIMM), an affiliate of the investment adviser. Annualized expenses of the Money Market Central Funds as of their most recent shareholder report date are less than .005%.
A complete unaudited list of holdings for each Fidelity Central Fund is available upon request or at the Securities and Exchange Commission (the SEC) website at www.sec.gov. In addition, the financial statements of the Fidelity Central Funds which are not covered by the Funds’ Report of Independent Registered Public Accounting Firm, are available on the SEC website or upon request.
3. Significant Accounting Policies.
Each Fund is an investment company and applies the accounting and reporting guidance of the Financial Accounting Standards Board (FASB) Accounting Standards Codification Topic 946 Financial Services – Investments Companies. The financial statements have been prepared in conformity with accounting principles generally accepted in the United States of America (GAAP), which require management to make certain estimates and assumptions at the date of the financial statements. Actual results could differ from those estimates. Subsequent events, if any, through the date that the financial statements were issued have been evaluated in the preparation of the financial statements. The following summarizes the significant accounting policies of the Funds:
Investment Valuation. Investments are valued as of 4:00 p.m. Eastern time on the last calendar day of the period. The Board of Trustees (the Board) has delegated the day to day responsibility for the valuation of each Fund’s investments to the Fair Value Committee (the Committee) established by each Fund’s investment adviser. In accordance with valuation policies and procedures approved by the Board, each Fund attempts to obtain prices from one or more third party pricing vendors or brokers to value its investments. When current market prices, quotations or currency exchange rates are not readily available or reliable, investments will be fair valued in good faith by the Committee, in accordance with procedures adopted by the Board. Factors used in determining fair value vary by investment type and may include market or investment specific events. The frequency with which these procedures are used cannot be predicted and they may be utilized to a significant extent. The Committee oversees each Fund’s valuation policies and procedures and reports to the Board on the Committee’s activities and fair value determinations. The Board monitors the appropriateness of the procedures used in valuing each Fund’s investments and ratifies the fair value determinations of the Committee.
Each Fund categorizes the inputs to valuation techniques used to value its investments into a disclosure hierarchy consisting of three levels as shown below:
Level 1 – quoted prices in active markets for identical investments
Level 2 – other significant observable inputs (including quoted prices for similar investments, interest rates, prepayment speeds, etc.)
Level 3 – unobservable inputs (including the Fund’s own assumptions based on the best information available)
Valuation techniques used to value each Fund’s investments by major category are as follows:
Equity securities, including restricted securities, for which market quotations are readily available, are valued at the last reported sale price or official closing price as reported by a third party pricing vendor on the primary market or exchange on which they are traded and are categorized as Level 1 in the hierarchy. In the event there were no sales during the day or closing prices are not available, securities are valued at the last quoted bid price or may be valued using the last available price and are generally categorized as Level 2 in the hierarchy. For foreign equity securities, when market or security specific events arise, comparisons to the valuation of American Depositary Receipts (ADRs), futures contracts, Exchange-Traded Funds (ETFs) and certain indexes as well as quoted prices for similar securities may be used and would be categorized as Level 2 in the hierarchy. Utilizing these techniques may result in transfers between Level 1 and Level 2. For equity securities, including restricted securities, where observable inputs are limited, assumptions about market activity and risk are used and these securities may be categorized as Level 3 in the hierarchy.
Investments in open-end mutual funds, including Fidelity Central Funds, are valued at their closing net asset value (NAV) each business day and are categorized as Level 1 in the hierarchy.
| 55 | Annual Report |
Table of Contents
Notes to Financial Statements – continued
3. Significant Accounting Policies – continued
Changes in valuation techniques may result in transfers in or out of an assigned level within the disclosure hierarchy. The aggregate value of investments by input level, as of July 31, 2018, is included at the end of each applicable Fund’s Schedule of Investments.
Foreign Currency. The Funds may use foreign currency contracts to facilitate transactions in foreign-denominated securities. Gains and losses from these transactions may arise from changes in the value of the foreign currency or if the counterparties do not perform under the contracts’ terms.
Foreign-denominated assets, including investment securities, and liabilities are translated into U.S. dollars at the exchange rates at period end. Purchases and sales of investment securities, income and dividends received and expenses denominated in foreign currencies are translated into U.S. dollars at the exchange rate in effect on the transaction date.
The effects of exchange rate fluctuations on investments are included with the net realized and unrealized gain (loss) on investment securities. Other foreign currency transactions resulting in realized and unrealized gain (loss) are disclosed separately.
Investment Transactions and Income. For financial reporting purposes, the Funds’ investment holdings and NAV include trades executed through the end of the last business day of the period. The NAV per share for processing shareholder transactions is calculated as of the close of business of NYSE Arca, normally 4:00 p.m. Eastern time and includes trades executed through the end of the prior business day. Gains and losses on securities sold are determined on the basis of identified cost and may include proceeds received from litigation. Dividend income is recorded on the ex-dividend date, except for certain dividends from foreign securities where the ex-dividend date may have passed, which are recorded as soon as the Funds are informed of the ex-dividend date. Non-cash dividends included in dividend income, if any, are recorded at the fair market value of the securities received. Income and capital gain distributions from Underlying Funds, if any, are recorded on the ex-dividend date. Certain distributions received by the Funds represent a return of capital or capital gain. The Funds determine the components of these distributions subsequent to the ex-dividend date, based upon receipt of tax filings or other correspondence relating to the underlying investment. These distributions are recorded as a reduction of cost of investments and/or as a realized gain. Investment income is recorded net of foreign taxes withheld where recovery of such taxes is uncertain.
Expenses. Expenses directly attributable to a fund are charged to that fund. Expenses attributable to more than one fund are allocated among the respective funds on the basis of relative net assets or other appropriate methods. Expense estimates are accrued in the period to which they relate and adjustments are made when actual amounts are known.
Income Tax Information and Distributions to Shareholders. Each year, each Fund intends to qualify as a regulated investment company under Subchapter M of the Internal Revenue Code, including distributing substantially all of its taxable income and realized gains. As a result, no provision for U.S. Federal income taxes is required. As of July 31, 2018 each Fund did not have any unrecognized tax benefits in the financial statements; nor is each Fund aware of any tax positions for which it is reasonably possible that the total amounts of unrecognized tax benefits will significantly change in the next twelve months. Each Fund files a U.S. federal tax return, in addition to state and local tax returns as required. Each Fund’s federal income tax returns are subject to examination by the Internal Revenue Service (IRS) for a period of three fiscal years after they are filed. State and local tax returns may be subject to examination for an additional fiscal year depending on the jurisdiction. Realized gain or loss resulting from in-kind redemptions is not taxable to the Fund and is not distributed to shareholders of the Fund. Foreign taxes are provided for based on each Fund’s understanding of the tax rules and rates that exist in the foreign markets in which it invests.
Distributions are declared and recorded on the ex-dividend date. Income and capital gain distributions are determined in accordance with income tax regulations, which may differ from GAAP.
Capital accounts within the financial statements are adjusted for permanent book-tax differences. These adjustments have no impact on net assets or the results of operations. Capital accounts are not adjusted for temporary book-tax differences which will reverse in a subsequent period.
Book-tax differences are primarily due to redemptions in kind, partnerships, foreign currency transactions, capital loss carryforwards and losses deferred due to wash sales.
As of period end, the cost and unrealized appreciation (depreciation) in securities, and derivatives if applicable, for federal income tax purposes were as follows for each Fund:
| Tax cost | Gross unrealized appreciation | Gross unrealized depreciation | Net unrealized appreciation (depreciation) on securities and other investments | |||||||||||||
Fidelity Dividend ETF for Rising Rates | $ | 335,258,584 | $ | 27,740,505 | $ | (8,745,743 | ) | $ | 18,994,762 | |||||||
Fidelity High Dividend ETF | 166,909,165 | 10,477,187 | (2,957,787 | ) | 7,519,400 | |||||||||||
Fidelity Low Volatility Factor ETF | 61,250,829 | 5,686,902 | (557,138 | ) | 5,129,764 | |||||||||||
| Annual Report | 56 |
Table of Contents
3. Significant Accounting Policies – continued
| Tax cost | Gross unrealized appreciation | Gross unrealized depreciation | Net unrealized appreciation (depreciation) on securities and other investments | |||||||||||||
Fidelity Momentum Factor ETF | $ | 87,790,897 | $ | 9,811,727 | $ | (1,944,191 | ) | $ | 7,867,536 | |||||||
Fidelity Quality Factor ETF | 61,130,183 | 6,435,831 | (1,384,254 | ) | 5,051,577 | |||||||||||
Fidelity Value Factor ETF | 81,198,478 | 7,885,578 | (2,267,172 | ) | 5,618,406 | |||||||||||
The tax-based components of distributable earnings as of period end were as follows for each Fund:
| Undistributed ordinary income | Capital loss carryforward | Net unrealized appreciation (depreciation) | ||||||||||
Fidelity Dividend ETF for Rising Rates | $ | 122,792 | $ | (5,149,966 | ) | $ | 18,993,691 | |||||
Fidelity High Dividend ETF | — | (2,658,914 | ) | 7,519,347 | ||||||||
Fidelity Low Volatility Factor ETF | 28,045 | (483,677 | ) | 5,129,764 | ||||||||
Fidelity Momentum Factor ETF | 49,177 | (2,385,341 | ) | 7,867,536 | ||||||||
Fidelity Quality Factor ETF | 22,608 | (637,476 | ) | 5,051,577 | ||||||||
Fidelity Value Factor ETF | 46,922 | (1,232,885 | ) | 5,618,406 | ||||||||
Capital loss carryforwards are only available to offset future capital gains of the Funds to the extent provided by regulations and may be limited. Under the Regulated Investment Company Modernization Act of 2010 (the Act), the Funds are permitted to carry forward capital losses incurred in taxable years beginning after December 22, 2010 for an unlimited period and such capital losses are required to be used prior to any losses that expire. The capital loss carryforward information presented below, including any applicable limitation, is estimated as of fiscal year end and is subject to adjustment.
| No-expiration Short-term | No-expiration Long-term | Total capital loss carryforward | ||||||||||
Fidelity Dividend ETF for Rising Rates | $ | (4,911,356 | ) | $ | (238,610 | ) | $ | (5,149,966 | ) | |||
Fidelity High Dividend ETF | (2,059,603 | ) | (599,311 | ) | (2,658,914 | ) | ||||||
Fidelity Low Volatility Factor ETF | (458,029 | ) | (25,648 | ) | (483,677 | ) | ||||||
Fidelity Momentum Factor ETF | (2,385,341 | ) | — | (2,385,341 | ) | |||||||
Fidelity Quality Factor ETF | (623,489 | ) | (13,987 | ) | (637,476 | ) | ||||||
Fidelity Value Factor ETF | (1,220,949 | ) | (11,936 | ) | (1,232,885 | ) | ||||||
The tax character of distributions paid was as follows:
| July 31, 2018 | ||||||||||||||||
| Ordinary Income | Long-Term Capital Gain | Tax Return Of Capital | Total | |||||||||||||
Fidelity Dividend ETF for Rising Rates | $ | 7,614,450 | $ | — | $ | — | $ | 7,614,450 | ||||||||
Fidelity High Dividend ETF | 4,072,329 | 2,421 | — | 4,074,750 | ||||||||||||
Fidelity Low Volatility Factor ETF | 793,800 | — | — | 793,800 | ||||||||||||
Fidelity Momentum Factor ETF | 688,250 | — | — | 688,250 | ||||||||||||
Fidelity Quality Factor ETF | 891,500 | — | — | 891,500 | ||||||||||||
Fidelity Value Factor ETF | 1,129,450 | — | — | 1,129,450 | ||||||||||||
| July 31, 2017 | ||||||||||||||||
| Ordinary Income | Long-Term Capital Gain | Tax Return Of Capital | Total | |||||||||||||
Fidelity Dividend ETF For Rising Rates | $ | 1,891,450 | $ | — | $ | — | $ | 1,891,450 | ||||||||
Fidelity High Dividend ETF | 1,142,850 | — | — | 1,142,850 | ||||||||||||
Fidelity Low Volatility Factor ETF | 257,550 | — | — | 257,550 | ||||||||||||
Fidelity Momentum Factor ETF | 205,600 | — | — | 205,600 | ||||||||||||
Fidelity Quality Factor ETF | 286,850 | — | — | 286,850 | ||||||||||||
Fidelity Value Factor ETF | 341,650 | — | — | 341,650 | ||||||||||||
| 57 | Annual Report |
Table of Contents
Notes to Financial Statements – continued
4. Purchases and Sales of Investments.
Purchases and sales of securities, other than short-term securities and in-kind transactions, were as follows:
| Purchases | Sales | |||||||
Fidelity Dividend ETF for Rising Rates | $ | 97,289,956 | $ | 94,150,207 | ||||
Fidelity High Dividend ETF | 55,586,959 | 54,159,257 | ||||||
Fidelity Low Volatility Factor ETF | 14,354,345 | 15,121,207 | ||||||
Fidelity Momentum Factor ETF | 78,023,091 | 77,664,454 | ||||||
Fidelity Quality Factor ETF | 15,224,293 | 15,190,472 | ||||||
Fidelity Value Factor ETF | 24,466,906 | 23,829,632 | ||||||
Securities received or delivered in-kind through subscriptions and redemptions were as follows:
| In-kind Subscriptions | In-kind Redemptions | |||||||
Fidelity Dividend ETF for Rising Rates | $ | 234,087,958 | $ | 65,478,136 | ||||
Fidelity High Dividend ETF | 131,636,201 | 32,126,308 | ||||||
Fidelity Low Volatility Factor ETF | 45,772,319 | 18,058,688 | ||||||
Fidelity Momentum Factor ETF | 90,047,595 | 38,818,811 | ||||||
Fidelity Quality Factor ETF | 44,020,585 | 15,701,230 | ||||||
Fidelity Value Factor ETF | 62,635,798 | 22,078,286 | ||||||
5. Fees and Other Transactions with Affiliates.
Management Fee. FMR Co., Inc. (FMRC), an affiliate of FMR provides the Funds with investment management related services for which the Funds pay a monthly management fee that is based on an annual rate of .29% of each Fund’s average net assets. Under the management contract, FMRC pays all other expenses, except the compensation of the independent Trustees and certain other expenses such as interest expense. The management fee paid to FMRC is reduced by an amount equal to the fees and expenses paid by each fund to the independent Trustees.
Sub-Adviser. Geode Capital Management, LLC (Geode), serves as sub-adviser for the Funds. Geode provides discretionary investment advisory services to the Funds and is paid by the investment adviser for providing these services.
Accounting and Security Lending Fees. Fidelity Service Company, Inc. (FSC), an affiliate of the investment adviser, maintains each Fund’s accounting records. The accounting fee is based on the level of average net assets for each month. Under a separate contract, FSC administers the security lending program. The security lending fee is based on the number and duration of lending transactions.
Interfund Trades. The Funds may purchase from or sell securities to other funds affiliated with the sub-adviser under procedures adopted by the Board. The procedures have been designed to ensure these interfund trades are executed in accordance with Rule 17a-7 of the 1940 Act. Interfund trades are included within the respective purchases and sales amounts shown in the Purchases and Sales of Investments note.
6. Expense Reductions.
Through arrangements with each applicable Fund’s custodian, credits realized as a result of uninvested cash balances were used to reduce each applicable Fund’s management fee. During the period, these credits reduced management fees by the following amounts:
| Amount | ||||
Fidelity Dividend ETF for Rising Rates | $ | 35 | ||
Fidelity High Dividend ETF | 51 | |||
Fidelity Low Volatility Factor ETF | 175 | |||
Fidelity Momentum Factor ETF | 163 | |||
Fidelity Quality Factor ETF | 132 | |||
Fidelity Value Factor ETF | 116 | |||
7. Security Lending.
Certain Funds lend portfolio securities through a lending agent from time to time in order to earn additional income. On the settlement date of the loan, each applicable Fund receives collateral (in the form of U.S. Treasury obligations, letters of credit and/or cash) against the loaned securities and maintains collateral in an amount not less than 100% of the market value of the loaned securities during the period of the loan. The market value of the loaned securities is determined at the close of business of the Funds and any additional required collateral is delivered to the Funds on the next business day. The Funds or borrower may terminate the loan at any time, and if the borrower defaults on its obligation to return the securities loaned because of insolvency or other reasons, the Funds may apply collateral received from the borrower against the obligation. The Funds may experience delays and costs in recovering the securities loaned. Any cash collateral received is invested in the Fidelity Securities Lending Cash Central Fund. The value of loaned securities at period end are disclosed on each applicable Fund’s Statement of
| Annual Report | 58 |
Table of Contents
7. Security Lending – continued
Assets and Liabilities. Security lending income represents the income earned on investing cash collateral, less rebates paid to borrowers and any lending agent fees associated with the loan, plus any premium payments received for lending certain types of securities. Security lending income is presented on each applicable Fund’s Statement of Operations as a component of income from Fidelity Central Funds. Security lending activity was as follows:
| Total security lending income | ||||
Fidelity Dividend ETF for Rising Rates | $ | 64,889 | ||
Fidelity High Dividend ETF | 47,220 | |||
Fidelity Low Volatility Factor ETF | 139 | |||
Fidelity Momentum Factor ETF | 56 | |||
Fidelity Quality Factor ETF | 9,581 | |||
Fidelity Value Factor ETF | 3,382 | |||
8. Share Transactions.
The Funds issue and redeem shares at NAV only with certain authorized participants in large increments known as Creation Units. Purchases of Creation Units are made by tendering a basket of designated stocks to a fund and redemption proceeds are paid with a basket of securities from a fund’s portfolio with a balancing cash component to equate the market value of the basket of securities delivered or redeemed to the NAV per Creation Unit on the transaction date. Cash may be substituted equivalent to the value of certain securities generally when they are not available in sufficient quantity for delivery. A fund’s shares are available in smaller increments to investors in the secondary market at market prices and may be subject to commissions. Authorized participants pay a transaction fee to the shareholder servicing agent when purchasing and redeeming Creation Units of a fund. The transaction fee is used to defray the costs associated with the issuance and redemption of Creation Units.
9. Other.
The Funds’ organizational documents provide former and current directors and officers with a limited indemnification against liabilities arising in connection with the performance of their duties to the Funds. In the normal course of business, the Funds may also enter into contracts that provide general indemnifications. The Funds’ maximum exposure under these arrangements is unknown as this would be dependent on future claims that may be made against the Funds. The risk of material loss from such claims is considered remote.
| 59 | Annual Report |
Table of Contents
Report of Independent Registered Public Accounting Firm
To the Board of Trustees of Fidelity Covington Trust and Shareholders of Fidelity Dividend ETF for Rising Rates, Fidelity High Dividend ETF, Fidelity Low Volatility Factor ETF, Fidelity Momentum Factor ETF, Fidelity Quality Factor ETF and Fidelity Value Factor ETF:
Opinions on the Financial Statements
We have audited the accompanying statements of assets and liabilities, including the schedules of investments, of Fidelity Dividend ETF for Rising Rates, Fidelity High Dividend ETF, Fidelity Low Volatility Factor ETF, Fidelity Momentum Factor ETF, Fidelity Quality Factor ETF and Fidelity Value Factor ETF (six of the funds constituting Fidelity Covington Trust, hereafter collectively referred to as the “Funds”) as of July 31, 2018, the related statements of operations for the year ended July 31, 2018 and the statements of changes in net assets and the financial highlights for the year ended July 31, 2018 and for the period September 12, 2016 (commencement of operations) through July 31, 2017, including the related notes (collectively referred to as the “financial statements”). In our opinion, the financial statements present fairly, in all material respects, the financial position of each of the Funds as of July 31, 2018, the results of each of their operations for the year ended July 31, 2018, and the changes in each of their net assets and each of the financial highlights for the year ended July 31, 2018 and for the period September 12, 2016 (commencement of operations) through July 31, 2017 in conformity with accounting principles generally accepted in the United States of America.
Basis for Opinions
These financial statements are the responsibility of the Funds’ management. Our responsibility is to express an opinion on the Funds’ financial statements based on our audits. We are a public accounting firm registered with the Public Company Accounting Oversight Board (United States) (“PCAOB”) and are required to be independent with respect to the Funds in accordance with the U.S. federal securities laws and the applicable rules and regulations of the Securities and Exchange Commission and the PCAOB.
We conducted our audits of these financial statements in accordance with the standards of the PCAOB. Those standards require that we plan and perform the audit to obtain reasonable assurance about whether the financial statements are free of material misstatement, whether due to error or fraud.
Our audits included performing procedures to assess the risks of material misstatement of the financial statements, whether due to error or fraud, and performing procedures that respond to those risks. Such procedures included examining, on a test basis, evidence regarding the amounts and disclosures in the financial statements. Our audits also included evaluating the accounting principles used and significant estimates made by management, as well as evaluating the overall presentation of the financial statements. Our procedures included confirmation of securities owned as of July 31, 2018 by correspondence with the custodian. We believe that our audits provide a reasonable basis for our opinions.
PricewaterhouseCoopers LLP
Boston, Massachusetts
September 18, 2018
We have served as the auditor of one or more investment companies in the Fidelity group of funds since 1932.
| Annual Report | 60 |
Table of Contents
Premium/Discount Analysis (Unaudited)
Shares of each fund are listed on NYSE Arca and can be bought and sold on the secondary market at market prices. Although the market price is expected to approximate the fund’s NAV, it is possible that the market price and NAV will vary significantly. The closing market price is the daily closing price as reported on NYSE Arca.
Premiums or discounts are the differences (expressed as a basis point differential with 1 basis point equaling 1/100 of 1%) between the fund’s NAV and closing market price. A premium indicates that the closing market price is trading above the NAV. A discount indicates that the closing market price is trading below the NAV. A discrepancy may exist with respect to the timing of when the NAV is calculated and the determination of the closing market price.
The chart below presents information about the differences between each fund’s daily closing market price and each fund’s NAV.
Fidelity Dividend ETF For Rising Rates
| Period Ended July 31, 2018 From | ||||||||||||
commencement of operations * to July 31, 2018 | Closing Price Below NAV | Closing Price Above or Equal to NAV | ||||||||||
| Basis Point Differential | Number of Days | % of Total Days | Number of Days | % of Total Days | ||||||||
| 0 – <25 | 58 | 12.29 | % | 384 | 81.36 | % | ||||||
| 25 – <50 | 0 | — | 28 | 5.93 | % | |||||||
| 50 – <75 | 0 | — | 1 | 0.21 | % | |||||||
| 75 – <100 | 0 | — | 0 | — | ||||||||
| 100 or above | 0 | — | 1 | 0.21 | % | |||||||
| Total | 58 | 12.29 | % | 414 | 87.71 | % | ||||||
| * | From September 15, 2016, date initially listed on the NYSE ARCA exchange. |
Fidelity High Dividend ETF
| Period Ended July 31, 2018 | ||||||||||||
| From commencement of operations * to July 31, 2018 | Closing Price Below NAV | Closing Price Above or Equal to NAV | ||||||||||
| Basis Point Differential | Number of Days | % of Total Days | Number of Days | % of Total Days | ||||||||
| 0 – <25 | 61 | 12.93 | % | 350 | 74.16 | % | ||||||
| 25 – <50 | 2 | 0.42 | % | 56 | 11.86 | % | ||||||
| 50 – <75 | 0 | — | 1 | 0.21 | % | |||||||
| 75 – <100 | 0 | — | 2 | 0.42 | % | |||||||
| 100 or above | 0 | — | 0 | — | ||||||||
| Total | 63 | 13.35 | % | 409 | 86.65 | % | ||||||
| * | From September 15, 2016, date initially listed on the NYSE ARCA exchange. |
Fidelity Low Volatility Factor ETF
| Period Ended July 31, 2018 | ||||||||||||
| From commencement of operations * to July 31, 2018 | Closing Price Below NAV | Closing Price Above or Equal to NAV | ||||||||||
| Basis Point Differential | Number of Days | % of Total Days | Number of Days | % of Total Days | ||||||||
| 0 – <25 | 138 | 29.23 | % | 326 | 69.07 | % | ||||||
| 25 – <50 | 3 | 0.64 | % | 5 | 1.06 | % | ||||||
| 50 – <75 | 0 | — | 0 | — | ||||||||
| 75 – <100 | 0 | — | 0 | — | ||||||||
| 100 or above | 0 | — | 0 | — | ||||||||
| Total | 141 | 29.87 | % | 331 | 70.13 | % | ||||||
| * | From September 15, 2016, date initially listed on the NYSE ARCA exchange. |
| 61 | Annual Report |
Table of Contents
Premium/Discount Analysis (Unaudited) – continued
Fidelity Momentum Factor ETF
| Period Ended July 31, 2018 | ||||||||||||
| From commencement of operations * to July 31, 2018 | Closing Price Below NAV | Closing Price Above or Equal to NAV | ||||||||||
| Basis Point Differential | Number of Days | % of Total Days | Number of Days | % of Total Days | ||||||||
| 0 – <25 | 148 | 31.35 | % | 311 | 65.89 | % | ||||||
| 25 – <50 | 4 | 0.85 | % | 9 | 1.91 | % | ||||||
| 50 – <75 | 0 | — | 0 | — | ||||||||
| 75 – <100 | 0 | — | 0 | — | ||||||||
| 100 or above | 0 | — | 0 | — | ||||||||
| Total | 152 | 32.20 | % | 320 | 67.80 | % | ||||||
| * | From September 15, 2016, date initially listed on the NYSE ARCA exchange. |
Fidelity Quality Factor ETF
| Period Ended July 31, 2018 | ||||||||||||
| From commencement of operations * to July 31, 2018 | Closing Price Below NAV | Closing Price Above or Equal to NAV | ||||||||||
| Basis Point Differential | Number of Days | % of Total Days | Number of Days | % of Total Days | ||||||||
| 0 – <25 | 164 | 34.75 | % | 291 | 61.65 | % | ||||||
| 25 – <50 | 5 | 1.06 | % | 10 | 2.12 | % | ||||||
| 50 – <75 | 0 | — | 2 | 0.42 | % | |||||||
| 75 – <100 | 0 | — | 0 | — | ||||||||
| 100 or above | 0 | — | 0 | — | ||||||||
| Total | 169 | 35.81 | % | 303 | 64.19 | % | ||||||
| * | From September 15, 2016, date initially listed on the NYSE ARCA exchange. |
Fidelity Value Factor ETF
| Period Ended July 31, 2018 | ||||||||||||
| From commencement of operations * to July 31, 2018 | Closing Price Below NAV | Closing Price Above or Equal to NAV | ||||||||||
| Basis Point Differential | Number of Days | % of Total Days | Number of Days | % of Total Days | ||||||||
| 0 – <25 | 139 | 29.45 | % | 318 | 67.37 | % | ||||||
| 25 – <50 | 3 | 0.64 | % | 10 | 2.12 | % | ||||||
| 50 – <75 | 1 | 0.21 | % | 1 | 0.21 | % | ||||||
| 75 – <100 | 0 | — | 0 | — | ||||||||
| 100 or above | 0 | — | 0 | — | ||||||||
| Total | 143 | 30.30 | % | 329 | 69.70 | % | ||||||
| * | From September 15, 2016, date initially listed on the NYSE ARCA exchange. |
| Annual Report | 62 |
Table of Contents
Trustees and Officers (Unaudited)
The Trustees, Members of the Advisory Board (if any), and officers of the trust and funds, as applicable, are listed below. The Board of Trustees governs each fund and is responsible for protecting the interests of shareholders. The Trustees are experienced executives who meet periodically throughout the year to oversee each fund’s activities, review contractual arrangements with companies that provide services to each fund, oversee management of the risks associated with such activities and contractual arrangements, and review each fund’s performance. Except for Michael E. Wiley, each of the Trustees oversees 286 funds. Mr. Wiley oversees 197 funds.
The Trustees hold office without limit in time except that (a) any Trustee may resign; (b) any Trustee may be removed by written instrument, signed by at least two-thirds of the number of Trustees prior to such removal; (c) any Trustee who requests to be retired or who has become incapacitated by illness or injury may be retired by written instrument signed by a majority of the other Trustees; and (d) any Trustee may be removed at any special meeting of shareholders by a two-thirds vote of the outstanding voting securities of the trust. Each Trustee who is not an interested person (as defined in the 1940 Act) of the trust and the funds is referred to herein as an Independent Trustee. Each Independent Trustee shall retire not later than the last day of the calendar year in which his or her 75th birthday occurs. The Independent Trustees may waive this mandatory retirement age policy with respect to individual Trustees. Officers and Advisory Board Members hold office without limit in time, except that any officer or Advisory Board Member may resign or may be removed by a vote of a majority of the Trustees at any regular meeting or any special meeting of the Trustees. Except as indicated, each individual has held the office shown or other offices in the same company for the past five years.
The funds’ Statement of Additional Information (SAI) includes more information about the Trustees. To request a free copy, call Fidelity at 1-800-FIDELITY.
Experience, Skills, Attributes, and Qualifications of the Trustees. The Governance and Nominating Committee has adopted a statement of policy that describes the experience, qualifications, attributes, and skills that are necessary and desirable for potential Independent Trustee candidates (Statement of Policy). The Board believes that each Trustee satisfied at the time he or she was initially elected or appointed a Trustee, and continues to satisfy, the standards contemplated by the Statement of Policy. The Governance and Nominating Committee also engages professional search firms to help identify potential Independent Trustee candidates who have the experience, qualifications, attributes, and skills consistent with the Statement of Policy. From time to time, additional criteria based on the composition and skills of the current Independent Trustees, as well as experience or skills that may be appropriate in light of future changes to board composition, business conditions, and regulatory or other developments, have also been considered by the professional search firms and the Governance and Nominating Committee. In addition, the Board takes into account the Trustees’ commitment and participation in Board and committee meetings, as well as their leadership of standing and ad hoc committees throughout their tenure.
In determining that a particular Trustee was and continues to be qualified to serve as a Trustee, the Board has considered a variety of criteria, none of which, in isolation, was controlling. The Board believes that, collectively, the Trustees have balanced and diverse experience, qualifications, attributes, and skills, which allow the Board to operate effectively in governing each fund and protecting the interests of shareholders. Information about the specific experience, skills, attributes, and qualifications of each Trustee, which in each case led to the Board’s conclusion that the Trustee should serve (or continue to serve) as a trustee of the funds, is provided below.
Board Structure and Oversight Function. James C. Curvey is an interested person and currently serves as Chairman. The Trustees have determined that an interested Chairman is appropriate and benefits shareholders because an interested Chairman has a personal and professional stake in the quality and continuity of services provided to the funds. Independent Trustees exercise their informed business judgment to appoint an individual of their choosing to serve as Chairman, regardless of whether the Trustee happens to be independent or a member of management. The Independent Trustees have determined that they can act independently and effectively without having an Independent Trustee serve as Chairman and that a key structural component for assuring that they are in a position to do so is for the Independent Trustees to constitute a substantial majority for the Board. The Independent Trustees also regularly meet in executive session. Ned C. Lautenbach serves as Chairman of the Independent Trustees and as such (i) acts as a liaison between the Independent Trustees and management with respect to matters important to the Independent Trustees and (ii) with management prepares agendas for Board meetings.
Fidelity® funds are overseen by different Boards of Trustees. The funds’ Board oversees Fidelity’s high income and certain equity funds, and other Boards oversee Fidelity’s investment-grade bond, money market, asset allocation, and other equity funds. The asset allocation funds may invest in Fidelity® funds overseen by the funds’ Board. The use of separate Boards, each with its own committee structure, allows the Trustees of each group of Fidelity® funds to focus on the unique issues of the funds they oversee, including common research, investment, and operational issues. On occasion, the separate Boards establish joint committees to address issues of overlapping consequences for the Fidelity® funds overseen by each Board.
| 63 | Annual Report |
Table of Contents
Trustees and Officers (Unaudited) – continued
The Trustees operate using a system of committees to facilitate the timely and efficient consideration of all matters of importance to the Trustees, each fund, and fund shareholders and to facilitate compliance with legal and regulatory requirements and oversight of the funds’ activities and associated risks. The Board, acting through its committees, has charged SelectCo and its affiliates with (i) identifying events or circumstances the occurrence of which could have demonstrably adverse effects on the funds’ business and/or reputation; (ii) implementing processes and controls to lessen the possibility that such events or circumstances occur or to mitigate the effects of such events or circumstances if they do occur; and (iii) creating and maintaining a system designed to evaluate continuously business and market conditions in order to facilitate the identification and implementation processes described in (i) and (ii) above. Because the day-to-day operations and activities of the funds are carried out by or through SelectCo, its affiliates, and other service providers, the funds’ exposure to risks is mitigated but not eliminated by the processes overseen by the Trustees. While each of the Board’s committees has responsibility for overseeing different aspects of the funds’ activities, oversight is exercised primarily through the Operations, Audit, and Compliance Committees. In addition, the Independent Trustees have worked with Fidelity to enhance the Board’s oversight of investment and financial risks, legal and regulatory risks, technology risks, and operational risks, including the development of additional risk reporting to the Board. Appropriate personnel, including but not limited to the funds’ Chief Compliance Officer (CCO), SelectCo’s internal auditor, the independent accountants, the funds’ Treasurer and portfolio management personnel, make periodic reports to the Board’s committees, as appropriate, including an annual review of Fidelity’s risk management program for the Fidelity® funds. The responsibilities of each standing committee, including their oversight responsibilities, are described further under “Standing Committees of the Trustees.”
Interested Trustees*:
Correspondence intended for a Trustee who is an interested person may be sent to Fidelity Investments, 245 Summer Street, Boston, Massachusetts 02210.
Name, Year of Birth; Principal Occupations and Other Relevant Experience+ |
James C. Curvey (1935) |
Year of Election or Appointment: 2018 |
Trustee |
Chairman of the Board of Trustees |
Mr. Curvey also serves as Trustee of other Fidelity® funds. Mr. Curvey is Vice Chairman (2007-present) and Director of FMR LLC (diversified financial services company). In addition, Mr. Curvey is an Overseer Emeritus for the Boston Symphony Orchestra, a Director of Artis-Naples, and a Trustee of Brewster Academy in Wolfeboro, New Hampshire. Previously, Mr. Curvey served as a Director of Fidelity Research & Analysis Co. (investment adviser firm, 2009-2018), Director of Fidelity Investments Money Management, Inc. (investment adviser firm, 2009-2014) and a Director of FMR and FMR Co., Inc. (investment adviser firms, 2007-2014). |
Charles S. Morrison (1960) |
Year of Election or Appointment: 2018 |
Trustee |
Mr. Morrison also serves as Trustee of other funds. He serves as President of Fidelity SelectCo, LLC (investment adviser firm, 2017-present) and Fidelity Management & Research Company (FMR) (investment adviser firm, 2016-present), a Director of Fidelity Investments Money Management, Inc. (FIMM) (investment adviser firm, 2014-present), Director of Fidelity SelectCo, LLC (investment adviser firm, 2014-present), President, Asset Management (2014-present), and is an employee of Fidelity Investments. Previously, Mr. Morrison served as Vice President of Fidelity’s Fixed Income and Asset Allocation Funds (2012-2014), President, Fixed Income (2011-2014), Vice President of Fidelity’s Money Market Funds (2005-2009), President, Money Market Group Leader of FMR (investment adviser firm, 2009), and Senior Vice President, Money Market Group of FMR (2004-2009). Mr. Morrison also served as Vice President of Fidelity’s Bond Funds (2002-2005), certain Balanced Funds (2002-2005), and certain Asset Allocation Funds (2002-2007), and as Senior Vice President (2002-2005) of Fidelity’s Bond Division. |
* Determined to be an “Interested Trustee” by virtue of, among other things, his or her affiliation with the trust or various entities under common control with SelectCo. |
+ The information includes the Trustee’s principal occupation during the last five years and other information relating to the experience, attributes, and skills relevant to the Trustee’s qualifications to serve as a Trustee, which led to the conclusion that the Trustee should serve as a Trustee for each fund.
|
Independent Trustees:
|
| Correspondence intended for an Independent Trustee may be sent to Fidelity Investments, P.O. Box 55235, Boston, Massachusetts 02205-5235. |
Dennis J. Dirks (1948) |
| Annual Report | 64 |
Table of Contents
Name, Year of Birth; Principal Occupations and Other Relevant Experience+ |
Year of Election or Appointment: 2018 |
Trustee |
Mr. Dirks also serves as Trustee of other Fidelity® funds. Prior to his retirement in May 2003, Mr. Dirks was Chief Operating Officer and a member of the Board of The Depository Trust & Clearing Corporation (DTCC). He also served as President, Chief Operating Officer, and Board member of The Depository Trust Company (DTC) and President and Board member of the National Securities Clearing Corporation (NSCC). In addition, Mr. Dirks served as Chief Executive Officer and Board member of the Government Securities Clearing Corporation, Chief Executive Officer and Board member of the Mortgage-Backed Securities Clearing Corporation, as a Trustee and a member of the Finance Committee of Manhattan College (2005-2008), as a Trustee and a member of the Finance Committee of AHRC of Nassau County (2006-2008), as a member of the Independent Directors Council (IDC) Governing Council (2010-2015), and as a member of the Board of Directors for The Brookville Center for Children’s Services, Inc. (2009-2017). Mr. Dirks is a member of the Finance Committee (2016-present), Board of Directors (2017-present) and Board of Trustees (2018-present) and is Treasurer (2018-present) of the Asolo Repertory Theatre. |
Donald F. Donahue (1950) |
Year of Election or Appointment: 2018 |
Trustee |
Mr. Donahue also serves as a Trustee of other Fidelity® funds. Mr. Donahue is President and Chief Executive Officer of Miranda Partners, LLC (risk consulting for the financial services industry, 2012-present). Previously, Mr. Donahue served as a Member of the Advisory Board of certain Fidelity® funds (2015-2018) and Chief Executive Officer (2006-2012), Chief Operating Officer (2003-2006), and Managing Director, Customer Marketing and Development (1999-2003) of The Depository Trust & Clearing Corporation (financial markets infrastructure). Mr. Donahue serves as a Member (2007-present) and Co-Chairman (2016-present) of the Board of Directors of United Way of New York, Member of the Board of Directors of NYC Leadership Academy (2012-present) and Member of the Board of Advisors of Ripple Labs, Inc. (financial services, 2015-present). He also served as Chairman (2010-2012) and Member of the Board of Directors (2012-2013) of Omgeo, LLC (financial services), Treasurer of United Way of New York (2012-2016), and Member of the Board of Directors of XBRL US (financial services non-profit, 2009-2012) and the International Securities Services Association (2009-2012). |
Alan J. Lacy (1953) |
Year of Election or Appointment: 2018 |
Trustee |
Mr. Lacy also serves as Trustee of other Fidelity® funds. Mr. Lacy serves as a Director of Bristol-Myers Squibb Company (global pharmaceuticals, 2008-present). He is a Trustee of the California Chapter of The Nature Conservancy (2015-present) and a Director of the Center for Advanced Study in the Behavioral Sciences at Stanford University (2015-present). In addition, Mr. Lacy served as Senior Adviser (2007-2014) of Oak Hill Capital Partners, L.P. (private equity) and also served as Chief Executive Officer (2005) and Vice Chairman (2005-2006) of Sears Holdings Corporation (retail) and Chief Executive Officer and Chairman of the Board of Sears, Roebuck and Co. (retail, 2000-2005). Previously, Mr. Lacy served as Chairman (2014-2017) and a member (2010-2017) of the Board of Directors of Dave & Buster’s Entertainment, Inc. (restaurant and entertainment complexes), as Chairman (2008-2011) and a member (2006-2015) of the Board of Trustees of the National Parks Conservation Association, and as a member of the Board of Directors for The Hillman Companies, Inc. (hardware wholesalers, 2010-2014), Earth Fare, Inc. (retail grocery, 2010-2014), and The Western Union Company (global money transfer, 2006-2011). |
Ned C. Lautenbach (1944) |
Year of Election or Appointment: 2018 |
Trustee |
Chairman of the Independent Trustees |
Mr. Lautenbach also serves as Trustee of other Fidelity® funds. Mr. Lautenbach currently serves as Vice Chair of the Board of Governors, State University System of Florida (2013-present) and is a member of the Council on Foreign Relations (1994-present). He is also a member and has most recently served as Chairman of the Board of Directors of Artis-Naples (2012-present). Previously, Mr. Lautenbach served as a member and then Lead Director of the Board of Directors of Eaton Corporation (diversified industrial, 1997-2016). He was also a Partner and Advisory Partner at Clayton, Dubilier & Rice, LLC (private equity investment, 1998-2010), as well as a Director of Sony Corporation (2006-2007). In addition, Mr. Lautenbach also had a 30-year career with IBM (technology company) during which time he served as Senior Vice President and a member of the Corporate Executive Committee (1968-1998). |
Joseph Mauriello (1944) |
Year of Election or Appointment: 2018 |
| 65 | Annual Report |
Table of Contents
Trustees and Officers (Unaudited) – continued
Name, Year of Birth; Principal Occupations and Other Relevant Experience+ |
Trustee |
Mr. Mauriello also serves as Trustee of other Fidelity® funds. Prior to his retirement in January 2006, Mr. Mauriello served in numerous senior management positions including Deputy Chairman and Chief Operating Officer (2004-2005), and Vice Chairman of Financial Services (2002-2004) of KPMG LLP US (professional services, 1965-2005). Mr. Mauriello currently serves as a member of the Board of Directors of XL Group plc. (global insurance and re-insurance, 2006-present) and the Independent Directors Council (IDC) Governing Council (2015-present). Previously, Mr. Mauriello served as a Director of the Hamilton Funds of the Bank of New York (2006-2007) and of Arcadia Resources Inc. (health care services and products, 2007-2012). |
Cornelia M. Small (1944) |
Year of Election or Appointment: 2018 |
Trustee |
Ms. Small also serves as Trustee of other Fidelity® funds. Ms. Small is a member of the Board of Directors (2009-present) and Chair of the Investment Committee (2010-present) of the Teagle Foundation. Ms. Small also serves on the Investment Committee of the Berkshire Taconic Community Foundation (2008-present). Previously, Ms. Small served as Chairperson (2002-2008) and a member of the Investment Committee and Chairperson (2008-2012) and a member of the Board of Trustees of Smith College. In addition, Ms. Small served as Chief Investment Officer, Director of Global Equity Investments, and a member of the Board of Directors of Scudder, Stevens & Clark and Scudder Kemper Investments. |
Garnett A. Smith (1947) |
Year of Election or Appointment: 2013 |
Trustee |
Mr. Smith also serves as Trustee of other Fidelity® funds. Prior to Mr. Smith’s retirement, he served as Chairman and Chief Executive Officer of Inbrand Corp. (manufacturer of personal absorbent products, 1990-1997). He also served as President (1986-1990) of Inbrand Corp. Prior to his employment with Inbrand Corp., he was employed by a retail fabric chain and North Carolina National Bank. In addition, Mr. Smith served as a Member of the Advisory Board of certain Fidelity® funds (2012-2013) and as a board member of the Jackson Hole Land Trust (2009-2012). |
David M. Thomas (1949) |
Year of Election or Appointment: 2018 |
Trustee |
Mr. Thomas also serves as Trustee of other Fidelity® funds. Mr. Thomas serves as Non-Executive Chairman of the Board of Directors of Fortune Brands Home and Security (home and security products, 2011-present), as a member of the Board of Directors (2004-present) and Presiding Director (2013-present) of Interpublic Group of Companies, Inc. (marketing communication), and as a member of the Board of Trustees of the University of Florida (2013-present). Previously, Mr. Thomas served as Executive Chairman (2005-2006) and Chairman and Chief Executive Officer (2000-2005) of IMS Health, Inc. (pharmaceutical and healthcare information solutions), and a Director of Fortune Brands, Inc. (consumer products, 2000-2011). |
Michael E. Wiley (1950) |
Year of Election or Appointment: 2008 |
Trustee |
Mr. Wiley also serves as Trustee or Member of the Advisory Board of other Fidelity® funds. Mr. Wiley serves as a Director of Andeavor Corporation (independent oil refiner and marketer, 2005-present), a Director of Andeavor Logistics LP (natural resources logistics, 2015-present), and a Director of Bill Barrett Corporation (exploration and production, 2005-present). In addition, Mr. Wiley also serves as a Director of Post Oak Bank (privately-held bank, 2004-present). Previously, Mr. Wiley served as a Trustee of other Fidelity® funds (2008-2013), as a Director of Asia Pacific Exploration Consolidated (international oil and gas exploration and production, 2008-2013), as a member of the Board of Trustees of the University of Tulsa (2000-2006; 2007-2010), as a Senior Energy Advisor of Katzenbach Partners, LLC (consulting, 2006-2007), as an Advisory Director of Riverstone Holdings (private investment), Chairman, President, and CEO of Baker Hughes, Inc. (oilfield services, 2000-2004), and as Director of Spinnaker Exploration Company (exploration and production, 2001-2005).
|
+ The information includes the Trustee’s principal occupation during the last five years and other information relating to the experience, attributes, and skills relevant to the Trustee’s qualifications to serve as a Trustee, which led to the conclusion that the Trustee should serve as a Trustee for each fund. |
| Annual Report | 66 |
Table of Contents
| Advisory Board Members and Officers: |
| Correspondence intended for a Member of the Advisory Board (if any) may be sent to Fidelity Investments, P.O. Box 55235, Boston, Massachusetts 02205-5235. Correspondence intended for an officer or Peter S. Lynch may be sent to Fidelity Investments, 245 Summer Street, Boston, Massachusetts 02210. Officers appear below in alphabetical order. |
Name, Year of Birth; Principal Occupation |
Peter S. Lynch (1944) |
Year of Election or Appointment: 2018 |
Member of the Advisory Board |
Mr. Lynch also serves as Member of the Advisory Board of other Fidelity® funds. Mr. Lynch is Vice Chairman and a Director of FMR (investment adviser firm) and FMR Co., Inc. (investment adviser firm). In addition, Mr. Lynch serves as a Trustee of Boston College and as the Chairman of the Inner-City Scholarship Fund. Previously, Mr. Lynch served on the Special Olympics International Board of Directors (1997-2006). |
William S. Stavropoulos (1939) |
Year of Election or Appointment: 2018 |
Member of the Advisory Board |
Mr. Stavropoulos also serves as Member of the Advisory Board of other Fidelity® funds. Mr. Stavropoulos serves as President and Founder of the Michigan Baseball Foundation, the Great Lakes Loons (2007-present). Mr. Stavropoulos is Chairman Emeritus of the Board of Directors of The Dow Chemical Company, where he previously served in numerous senior management positions, including President, CEO (1995-2000; 2002-2004), Chairman of the Executive Committee (2000-2006), and as a member of the Board of Directors (1990-2006). Currently, Mr. Stavropoulos is Chairman of the Board of Directors of Univar Inc. (global distributor of commodity and specialty chemicals), a Director of Teradata Corporation (data warehousing and technology solutions), and a member of the Advisory Board for Metalmark Capital LLC (private equity investment, 2005-present). Mr. Stavropoulos is an operating advisor to Clayton, Dubilier & Rice, LLC (private equity investment). In addition, Mr. Stavropoulos is a member of the University of Notre Dame Advisory Council for the College of Science, a Trustee of the Rollin L. Gerstacker Foundation, and a Director of Artis-Naples in Naples, Florida. Previously, Mr. Stavropoulos served as Trustee of certain Fidelity® funds (2001-2018) and as a Director of Chemical Financial Corporation (bank holding company, 1993-2012) and Tyco International, Ltd. (multinational manufacturing and services, 2007-2012). |
Carol B. Tomé (1957) |
Year of Election or Appointment: 2017 |
Member of the Advisory Board |
Ms. Tomé also serves as Member of the Advisory Board of other Fidelity® funds. Ms. Tomé is Chief Financial Officer (2001-present) and Executive Vice President of Corporate Services (2007-present) of The Home Depot, Inc. (home improvement retailer) and a Director (2003-present) and Chair of the Audit Committee (2004-present) of United Parcel Service, Inc. (package delivery and supply chain management). Previously, Ms. Tomé served as Trustee of certain Fidelity® funds (2017), Senior Vice President of Finance and Accounting/Treasurer (2000-2007) and Vice President and Treasurer (1995-2000) of The Home Depot, Inc. and Chair of the Board (2010-2012), Vice Chair of the Board (2009 and 2013), and a Director (2008-2013) of the Federal Reserve Bank of Atlanta. Ms. Tomé is also a director or trustee of many community and professional organizations. |
Elizabeth Paige Baumann (1968) |
Year of Election or Appointment: 2017 |
Anti-Money Laundering (AML) Officer |
Ms. Baumann also serves as AML Officer of other funds. She is Chief AML Officer (2012-present) and Senior Vice President (2014-present) of FMR LLC (diversified financial services company) and is an employee of Fidelity Investments. Previously, Ms. Baumann served as AML Officer of the funds (2012-2016), and Vice President (2007-2014) and Deputy Anti-Money Laundering Officer (2007-2012) of FMR LLC. |
Marc R. Bryant (1966) |
Year of Election or Appointment: 2013 |
| 67 | Annual Report |
Table of Contents
Trustees and Officers (Unaudited) – continued
Name, Year of Birth; Principal Occupation |
Secretary and Chief Legal Officer (CLO) |
Mr. Bryant also serves as Secretary and CLO of other funds. Mr. Bryant serves as CLO, Secretary, and Senior Vice President of Fidelity Management & Research Company (investment adviser firm, 2015-present) and FMR Co., Inc. (investment adviser firm, 2015-present); Secretary of Fidelity SelectCo, LLC (investment adviser firm, 2015-present) and Fidelity Investments Money Management, Inc. (investment adviser firm, 2015-present); and CLO of Fidelity Management & Research (Hong Kong) Limited and FMR Investment Management (UK) Limited (investment adviser firms, 2015-present) and Fidelity Management & Research (Japan) Limited (investment adviser firm, 2016-present). He is Senior Vice President and Deputy General Counsel of FMR LLC (diversified financial services company). Previously, Mr. Bryant served as Secretary and CLO of Fidelity Rutland Square Trust II (2010-2014) and Assistant Secretary of Fidelity’s Fixed Income and Asset Allocation Funds (2013-2015). Prior to joining Fidelity Investments, Mr. Bryant served as a Senior Vice President and the Head of Global Retail Legal for AllianceBernstein L.P. (2006-2010), and as the General Counsel for ProFund Advisors LLC (2001-2006). |
John J. Burke III (1964) |
Year of Election or Appointment: 2018 |
Chief Financial Officer |
Mr. Burke also serves as Chief Financial Officer of other funds. Mr. Burke serves as Head of Investment Operations for Fidelity Fund and Investment Operations (2018-present) and is an employee of Fidelity Investments (1998-present). Previously Mr. Burke served as head of Asset Management Investment Operations (2012-2018). |
William C. Coffey (1969) |
Year of Election or Appointment: 2009 |
Assistant Secretary |
Mr. Coffey also serves as Assistant Secretary of other funds. He is Senior Vice President and Deputy General Counsel of FMR LLC (diversified financial services company, 2010-present), and is an employee of Fidelity Investments. Previously, Mr. Coffey served as Vice President and Associate General Counsel of FMR LLC (2005-2009). |
Timothy M. Cohen (1969) |
Year of Election or Appointment: 2018 |
Vice President |
Mr. Cohen also serves as Vice President of other funds. Mr. Cohen serves as Co-Head of Global Equity Research (2016-present), a Director of Fidelity Management & Research (Japan) Limited (investment adviser firm, 2016-present), and is an employee of Fidelity Investments. Previously, Mr. Cohen served as Chief Investment Officer – Equity and a Director of Fidelity Management & Research (U.K.) Inc. (investment adviser firm, 2013-2015) and as a Director of Fidelity Management & Research (Hong Kong) Limited (investment adviser firm, 2017). |
Jonathan Davis (1968) |
Year of Election or Appointment: 2010 |
Assistant Treasurer |
Mr. Davis also serves as Assistant Treasurer of other funds. Mr. Davis serves as Assistant Treasurer of FMR Capital, Inc. (2017-present) and is an employee of Fidelity Investments. Previously, Mr. Davis served as Vice President and Associate General Counsel of FMR LLC (diversified financial services company, 2003-2010). |
Adrien E. Deberghes (1967) |
Year of Election or Appointment: 2018 |
Assistant Treasurer |
Mr. Deberghes also serves as an officer of other funds. He serves as Assistant Treasurer of FMR Capital, Inc. (2017-present), Executive Vice President of Fidelity Investments Money Management, Inc. (FIMM) (investment adviser firm, 2016-present), and is an employee of Fidelity Investments (2008-present). Previously, Mr. Deberghes served as President and Treasurer of certain Fidelity® funds (2013-2018). Prior to joining Fidelity Investments, Mr. Deberghes was Senior Vice President of Mutual Fund Administration at State Street Corporation (2007-2008), Senior Director of Mutual Fund Administration at Investors Bank & Trust (2005-2007), and Director of Finance for Dunkin’ Brands (2000-2005). Previously, Mr. Deberghes served in other fund officer roles. |
Laura M. Del Prato (1964) |
Year of Election or Appointment: 2018 |
| Annual Report | 68 |
Table of Contents
Name, Year of Birth; Principal Occupation |
Assistant Treasurer |
Ms. Del Prato also serves as an officer of other funds. Ms. Del Prato is an employee of Fidelity Investments (2017-present). Prior to joining Fidelity Investments, Ms. Del Prato served as a Managing Director and Treasurer of the JPMorgan Mutual Funds (2014-2017). Prior to JPMorgan, Ms. Del Prato served as a partner at Cohen Fund Audit Services (accounting firm, 2012-2013) and KPMG LLP (accounting firm, 2004-2012). |
Colm A. Hogan (1973) |
Year of Election or Appointment: 2018 |
Deputy Treasurer |
Mr. Hogan also serves as an officer of other funds. Mr. Hogan serves as Assistant Treasurer of FMR Capital, Inc. (2017-present) and is an employee of Fidelity Investments (2005-present). Previously, Mr. Hogan served as Assistant Treasurer of certain Fidelity® funds (2016-2018). |
Pamela R. Holding (1964) |
Year of Election or Appointment: 2018 |
Vice President |
Ms. Holding also serves as a Vice President of other funds. Ms. Holding serves as Co-Head of Global Equity Research (2018-present) and is an employee of Fidelity Investments (2013-present). |
Chris Maher (1972) |
Year of Election or Appointment: 2013 |
Assistant Treasurer |
Mr. Maher serves as Assistant Treasurer of other funds. Mr. Maher is Vice President of Valuation Oversight, serves as Assistant Treasurer of FMR Capital, Inc. (2017-present), and is an employee of Fidelity Investments. Previously, Mr. Maher served as Vice President of Asset Management Compliance (2013), Vice President of the Program Management Group of FMR (investment adviser firm, 2010-2013), and Vice President of Valuation Oversight (2008-2010). |
Rieco E. Mello (1969) |
Year of Election or Appointment: 2017 |
Assistant Treasurer |
Mr. Mello also serves as Assistant Treasurer of other funds. Mr. Mello serves as Assistant Treasurer of FMR Capital, Inc. (2017-present) and is an employee of Fidelity Investments (1995-present). |
Kenneth B. Robins (1969) |
Year of Election or Appointment: 2018 |
Chief Compliance Officer |
Mr. Robins also serves as an officer of other funds. Mr. Robins serves as Compliance Officer of Fidelity Management & Research Company and FMR Co., Inc. (investment adviser firms, 2016-present) and is an employee of Fidelity Investments (2004-present). Previously, Mr. Robins served as Executive Vice President of Fidelity Investments Money Management, Inc. (investment adviser firm, 2013-2016) and served in other fund officer roles. |
Stacie M. Smith (1974) |
Year of Election or Appointment: 2018 |
President and Treasurer |
Ms. Smith also serves as an officer of other funds. Ms. Smith serves as Assistant Treasurer of FMR Capital, Inc. (2017-present), is an employee of Fidelity Investments (2009-present), and has served in other fund officer roles. Prior to joining Fidelity Investments, Ms. Smith served as Senior Audit Manager of Ernst & Young LLP (accounting firm, 1996-2009). Previously, Ms. Smith served as Assistant Treasurer (2013-2018) and Deputy Treasurer (2013-2016) of certain Fidelity® funds. |
Marc L. Spector (1972) |
Year of Election or Appointment: 2017 |
Assistant Treasurer |
Mr. Spector also serves as an officer of other funds. Mr. Spector serves as Assistant Treasurer of FMR Capital, Inc. (2017-present) and is an employee of Fidelity Investments (2016-present). Prior to joining Fidelity Investments, Mr. Spector served as Director at the Siegfried Group (accounting firm, 2013-2016), and prior to Siegfried Group as audit senior manager at Deloitte & Touche (accounting firm, 2005-2013). |
Renee Stagnone (1975) |
| 69 | Annual Report |
Table of Contents
Trustees and Officers (Unaudited) – continued
Name, Year of Birth; Principal Occupation |
Year of Election or Appointment: 2016 |
Assistant Treasurer |
Ms. Stagnone also serves as an officer of other funds. Ms. Stagnone serves as Assistant Treasurer of FMR Capital, Inc. (2017-present) and is an employee of Fidelity Investments (1997-present). Previously, Ms. Stagnone served as Deputy Treasurer of certain Fidelity® funds (2013-2016). |
| Annual Report | 70 |
Table of Contents
Shareholder Expense Example (Unaudited)
As a shareholder of a Fund, you incur two types of costs: (1) transaction costs, and (2) ongoing costs, including management fees and other Fund expenses. This Example is intended to help you understand your ongoing costs (in dollars) of investing in a Fund and to compare these costs with the ongoing costs of investing in other funds.
The actual expense Example is based on an investment of $1,000 invested at the beginning of the period and held for the entire period
(January 16, 2018 to April 30, 2018). The hypothetical expense Example is based on an investment of $1,000 invested for the one-half year period (February 1, 2018 to July 31, 2018).
Actual Expenses
For each fund, the first line of the accompanying table provides information about actual account values and actual expenses. You may use the information in this line, together with the amount you invested, to estimate the expenses that you paid over the period. Simply divide your account value by $1,000.00 (for example, an $8,600 account value divided by $1,000.00 = 8.6), then multiply the result by the number in the first line for each Fund under the heading entitled “Expenses Paid During Period” to estimate the expenses you paid on your account during this period. In addition, each Fund, as a shareholder in the underlying Fidelity Central Funds, will indirectly bear its pro-rata share of the fees and expenses incurred by the underlying Fidelity Central Funds. These fees and expenses are not included in each Fund’s annualized expense ratio used to calculate the expense estimates in the table below.
Hypothetical Example for Comparison Purposes
For each fund, the second line of the accompanying table provides information about hypothetical account values and hypothetical expenses based on the Fund’s actual expense ratio and an assumed rate of return of 5% per year before expenses, which is not the Fund’s actual return. The hypothetical account values and expenses may not be used to estimate the actual ending account balance or expenses you paid for the period. You may use this information to compare the ongoing costs of investing in the Fund and other funds. To do so, compare this 5% hypothetical example with the 5% hypothetical examples that appear in the shareholder reports of the other funds. In addition, each Fund, as a shareholder in the underlying Fidelity Central Funds, will indirectly bear its pro-rata share of the fees and expenses incurred by the underlying Fidelity Central Funds. These fees and expenses are not included in each Fund’s annualized expense ratio used to calculate the expense estimates in the table below.
Please note that the expenses shown in the table are meant to highlight your ongoing costs only and do not reflect any transaction costs. Therefore, the second line of the table is useful in comparing ongoing costs only, and will not help you determine the relative total costs of owning different funds.
| Annualized Expense RatioA | Beginning Account Value February 1, 2018 | Ending Account Value July 31, 2018 | Expenses Paid During PeriodB February 1, 2018 to July 31, 2018 | |||||||||||||
Fidelity Dividend ETF For Rising Rates | 0.30% | |||||||||||||||
Actual | $ | 1,000.00 | $ | 1,001.80 | $ | 1.50 | ||||||||||
HypotheticalC | $ | 1,000.00 | $ | 1,023.31 | $ | 1.52 | ||||||||||
Fidelity High Dividend ETF | 0.30% | |||||||||||||||
Actual | $ | 1,000.00 | $ | 1,033.40 | $ | 1.53 | ||||||||||
HypotheticalC | $ | 1,000.00 | $ | 1,023.31 | $ | 1.52 | ||||||||||
Fidelity Low Volatility Factor ETF | 0.30% | |||||||||||||||
Actual | $ | 1,000.00 | $ | 1,023.10 | $ | 1.52 | ||||||||||
HypotheticalC | $ | 1,000.00 | $ | 1,023.31 | $ | 1.52 | ||||||||||
Fidelity Momentum Factor ETF | 0.30% | |||||||||||||||
Actual | $ | 1,000.00 | $ | 1,015.80 | $ | 1.51 | ||||||||||
HypotheticalC | $ | 1,000.00 | $ | 1,023.31 | $ | 1.52 | ||||||||||
Fidelity Quality Factor ETF | 0.30% | |||||||||||||||
Actual | $ | 1,000.00 | $ | 1,011.90 | $ | 1.51 | ||||||||||
HypotheticalC | $ | 1,000.00 | $ | 1,023.31 | $ | 1.52 | ||||||||||
Fidelity Value Factor ETF | 0.30% | |||||||||||||||
Actual | $ | 1,000.00 | $ | 993.80 | $ | 1.50 | ||||||||||
HypotheticalC | $ | 1,000.00 | $ | 1,023.31 | $ | 1.52 | ||||||||||
| 71 | Annual Report |
Table of Contents
Shareholder Expense Example (Unaudited) – continued
| A | Annualized expense ratio reflects expenses net of applicable fee waivers. |
| B | Expense are equal to each Fund’s annualized expense ratio, multiplied by the average account value over the period, multiplied by 181/365 (to reflect the one-half year period). |
| C | 5% return per year before expenses. |
| Annual Report | 72 |
Table of Contents
A percentage of the dividends distributed during the fiscal year for the following funds qualifies for the dividend-received deduction for corporate shareholders:
| September 2017 | December 2017 | March 2018 | June 2018 | |||||||||||||
| Fidelity Dividend ETF for Rising Rates | 66 | % | 66 | % | 100 | % | 100 | % | ||||||||
| Fidelity High Dividend ETF | 51 | % | 51 | % | 83 | % | 83 | % | ||||||||
| Fidelity Low Volatility Factor ETF | 93 | % | 93 | % | 100 | % | 100 | % | ||||||||
| Fidelity Momentum Factor ETF | 100 | % | 100 | % | 100 | % | 100 | % | ||||||||
| Fidelity Quality Factor ETF | 96 | % | 96 | % | 100 | % | 100 | % | ||||||||
| Fidelity Value Factor ETF | 95 | % | 95 | % | 100 | % | 100 | % | ||||||||
A percentage of the dividends distributed during the fiscal year for the following funds may be taken into account as a dividend for purposes of the maximum rate under section 1(h)(11) of the Internal Revenue Code.
| September 2017 | December 2017 | March 2018 | June 2018 | |||||||||||||
| Fidelity Dividend ETF for Rising Rates | 66 | % | 66 | % | 100 | % | 100 | % | ||||||||
| Fidelity High Dividend ETF | 51 | % | 51 | % | 90 | % | 90 | % | ||||||||
| Fidelity Low Volatility Factor ETF | 94 | % | 94 | % | 100 | % | 100 | % | ||||||||
| Fidelity Momentum Factor ETF | 96 | % | 96 | % | 100 | % | 100 | % | ||||||||
| Fidelity Quality Factor ETF | 95 | % | 95 | % | 100 | % | 100 | % | ||||||||
| Fidelity Value Factor ETF | 95 | % | 95 | % | 100 | % | 100 | % | ||||||||
The funds will notify shareholders in January 2019 of amounts for use in preparing 2018 income tax returns.
| 73 | Annual Report |
Table of Contents
A special meeting of shareholders was held on December 8, 2017. The results of votes taken among shareholders on the proposals before them are reported below. Each vote reported represents one dollar of net asset value held on the record date for the meeting.
PROPOSAL 1
To elect a Board of Trustees.
| # of Votes | % of Votes | |||||||
James C. Curvey | ||||||||
Affirmative | 5,373,295,935.29 | 96.534 | ||||||
Withheld | 192,965,565.88 | 3.466 | ||||||
TOTAL | 5,566,261,501.17 | 100.000 | ||||||
Dennis J. Dirks | ||||||||
Affirmative | 5,384,798,777.80 | 96.740 | ||||||
Withheld | 181,462,723.37 | 3.260 | ||||||
TOTAL | 5,566,261,501.17 | 100.000 | ||||||
Donald F. Donahue | ||||||||
Affirmative | 5,377,488,531.57 | 96.609 | ||||||
Withheld | 188,772,969.60 | 3.391 | ||||||
TOTAL | 5,566,261,501.17 | 100.000 | ||||||
Alan J. Lacy | ||||||||
Affirmative | 5,375,762,700.02 | 96.578 | ||||||
Withheld | 190,498,801.15 | 3.422 | ||||||
TOTAL | 5,566,261,501.17 | 100.000 | ||||||
Ned C. Lautenbach | ||||||||
Affirmative | 5,386,790,303.34 | 96.453 | ||||||
Withheld | 197,471,197.83 | 3.547 | ||||||
TOTAL | 5,566,261,501.17 | 100.000 | ||||||
Joseph Mauriello | ||||||||
Affirmative | 5,373,144,912.99 | 96.531 | ||||||
Withheld | 193,116,588.18 | 3.469 | ||||||
TOTAL | 5,566,261,501.17 | 100.000 | ||||||
Charles S. Morrison | ||||||||
Affirmative | 5,387,562,353.92 | 96.790 | ||||||
Withheld | 178,699,147.25 | 3.210 | ||||||
TOTAL | 5,566,261,501.17 | 100.000 | ||||||
Cornelia M. Small | ||||||||
Affirmative | 5,375,640,910.13 | 96.576 | ||||||
Withheld | 190,620,591.04 | 3.424 | ||||||
TOTAL | 5,566,261,501.17 | 100.000 | ||||||
Garnett A. Smith | ||||||||
Affirmative | 5,372,688,014.12 | 96.523 | ||||||
Withheld | 193,573,487.05 | 3.477 | ||||||
TOTAL | 5,566,261,501.17 | 100.000 | ||||||
David M. Thomas | ||||||||
Affirmative | 5,376,226,536.98 | 96.586 | ||||||
Withheld | 190,034,964.19 | 3.414 | ||||||
TOTAL | 5,566,261,501.17 | 100.000 | ||||||
Michael E. Wiley | ||||||||
Affirmative | 5,376,768,165.19 | 96.596 | ||||||
Withheld | 189,493,335.98 | 3.404 | ||||||
TOTAL | 5,566,261,501.17 | 100.000 | ||||||
Proposal 1 reflects trust wide proposal and voting results.
| Annual Report | 74 |
Table of Contents
[THIS PAGE INTENTIONALLY LEFT BLANK]
| 75 |
Table of Contents
 | ||||
CPF-ANN-0918 1.9881294.101 | 855864.1.0 |
Table of Contents
| Item 2. | Code of Ethics |
As of the end of the period, July 31, 2018, Fidelity Covington Trust (the trust) has adopted a code of ethics, as defined in Item 2 of Form N-CSR, that applies to its President and Treasurer and its Chief Financial Officer. A copy of the code of ethics is filed as an exhibit to this Form N-CSR.
| Item 3. | Audit Committee Financial Expert |
The Board of Trustees of the trust has determined that Joseph Mauriello is an audit committee financial expert, as defined in Item 3 of Form N-CSR. Mr. Mauriello is independent for purposes of Item 3 of Form N-CSR.
| Item 4. | Principal Accountant Fees and Services |
Fees and Services
The following table presents fees billed by Deloitte & Touche LLP, the member firms of Deloitte Touche Tohmatsu, and their respective affiliates (collectively, “Deloitte Entities”) in each of the last two fiscal years for services rendered to Fidelity MSCI Consumer Discretionary Index ETF, Fidelity MSCI Consumer Staples Index ETF, Fidelity MSCI Energy Index ETF, Fidelity MSCI Financials Index ETF, Fidelity MSCI Health Care Index ETF, Fidelity MSCI Industrials Index ETF, Fidelity MSCI Information Technology Index ETF, Fidelity MSCI Materials Index ETF, Fidelity MSCI Real Estate Index ETF, Fidelity MSCI Telecommunication Services Index ETF and Fidelity MSCI Utilities Index ETF:
Services Billed by Deloitte Entities
July 31, 2018 FeesA
| Audit Fees | Audit- Related Fees | Tax Fees | All Other Fees | |||||||||||||
Fidelity MSCI Consumer Discretionary Index ETF | $ | 14,000 | $ | — | $ | 2,500 | $ | — | ||||||||
Fidelity MSCI Consumer Staples Index ETF | $ | 14,000 | $ | — | $ | 2,500 | $ | — | ||||||||
Fidelity MSCI Energy Index ETF | $ | 14,000 | $ | — | $ | 2,500 | $ | — | ||||||||
Fidelity MSCI Financials Index ETF | $ | 14,000 | $ | — | $ | 2,500 | $ | — | ||||||||
Fidelity MSCI Health Care Index ETF | $ | 14,000 | $ | — | $ | 2,500 | $ | — | ||||||||
Fidelity MSCI Industrials Index ETF | $ | 14,000 | $ | — | $ | 2,500 | $ | — | ||||||||
Fidelity MSCI Information Technology Index ETF | $ | 14,000 | $ | — | $ | 2,500 | $ | — | ||||||||
Table of Contents
Fidelity MSCI Materials Index ETF | $ | 14,000 | $ | — | $ | 2,500 | $ | — | ||||||||
Fidelity MSCI Real Estate Index ETF | $ | 14,000 | $ | — | $ | 2,500 | $ | — | ||||||||
Fidelity MSCI Telecommunication Services Index ETF | $ | 14,000 | $ | — | $ | 2,500 | $ | — | ||||||||
Fidelity MSCI Utilities Index ETF | $ | 14,000 | $ | — | $ | 2,500 | $ | — |
July 31, 2017 FeesA
| Audit Fees | Audit- Related Fees | Tax Fees | All Other Fees | |||||||||||||
Fidelity MSCI Consumer Discretionary Index ETF | $ | 12,000 | $ | — | $ | 2,500 | $ | — | ||||||||
Fidelity MSCI Consumer Staples Index ETF | $ | 12,000 | $ | — | $ | 2,500 | $ | — | ||||||||
Fidelity MSCI Energy Index ETF | $ | 12,000 | $ | — | $ | 2,500 | $ | — | ||||||||
Fidelity MSCI Financials Index ETF | $ | 12,000 | $ | — | $ | 2,500 | $ | — | ||||||||
Fidelity MSCI Health Care Index ETF | $ | 12,000 | $ | — | $ | 2,500 | $ | — | ||||||||
Fidelity MSCI Industrials Index ETF | $ | 12,000 | $ | — | $ | 2,500 | $ | — | ||||||||
Fidelity MSCI Information Technology Index ETF | $ | 12,000 | $ | — | $ | 2,500 | $ | — | ||||||||
Fidelity MSCI Materials Index ETF | $ | 12,000 | $ | — | $ | 2,500 | $ | — | ||||||||
Fidelity MSCI Real Estate Index ETF | $ | 12,000 | $ | — | $ | 2,500 | $ | — | ||||||||
Fidelity MSCI Telecommunication Services Index ETF | $ | 12,000 | $ | — | $ | 2,500 | $ | — | ||||||||
Fidelity MSCI Utilities Index ETF | $ | 12,000 | $ | — | $ | 2,500 | $ | — | ||||||||
| A | Amounts may reflect rounding. |
Table of Contents
The following table presents fees billed by PricewaterhouseCoopers LLP (“PwC”) in each of the last two fiscal years for services rendered to Fidelity Dividend ETF for Rising Rates, Fidelity High Dividend ETF, Fidelity Low Volatility Factor ETF, Fidelity Momentum Factor ETF, Fidelity Quality Factor ETF and Fidelity Value Factor ETF (together with the funds in the previous table, the “Funds”):
Services Billed by PwC
July 31, 2018 FeesA
| Audit Fees | Audit- Related Fees | Tax Fees | All Other Fees | |||||||||||||
Fidelity Dividend ETF for Rising Rates | $ | 15,000 | $ | — | $ | 2,000 | $ | 600 | ||||||||
Fidelity High Dividend ETF | $ | 15,000 | $ | — | $ | 2,000 | $ | 600 | ||||||||
Fidelity Low Volatility Factor ETF | $ | 15,000 | $ | — | $ | 1,800 | $ | 600 | ||||||||
Fidelity Momentum Factor ETF | $ | 15,000 | $ | — | $ | 1,800 | $ | 600 | ||||||||
Fidelity Quality Factor ETF | $ | 15,000 | $ | — | $ | 1,800 | $ | 600 | ||||||||
Fidelity Value Factor ETF | $ | 15,000 | $ | — | $ | 1,800 | $ | 600 | ||||||||
July 31, 2017 FeesA,B
| Audit Fees | Audit- Related Fees | Tax Fees | All Other Fees | |||||||||||||
Fidelity Dividend ETF for Rising Rates | $ | 14,000 | $ | 400 | $ | 2,000 | $ | 400 | ||||||||
Fidelity High Dividend ETF | $ | 14,000 | $ | 400 | $ | 2,000 | $ | 400 | ||||||||
Fidelity Low Volatility Factor ETF | $ | 14,000 | $ | 400 | $ | 1,800 | $ | 400 | ||||||||
Fidelity Momentum Factor ETF | $ | 14,000 | $ | 400 | $ | 1,800 | $ | 400 | ||||||||
Fidelity Quality Factor ETF | $ | 14,000 | $ | 400 | $ | 1,800 | $ | 400 | ||||||||
Fidelity Value Factor ETF | $ | 14,000 | $ | 400 | $ | 1,800 | $ | 400 | ||||||||
| A | Amounts may reflect rounding. |
| B | Fidelity Dividend ETF for Rising Rates, Fidelity High Dividend ETF, Fidelity Low Volatility Factor ETF, Fidelity Momentum Factor ETF, Fidelity Quality Factor ETF and Fidelity Value Factor ETF commenced operations on September 12, 2016. |
Table of Contents
The following tables present fees billed by Deloitte Entities and PwC that were required to be approved by the Audit Committee for services that relate directly to the operations and financial reporting of the Funds and that are rendered on behalf of Fidelity SelectCo, LLC or Fidelity Management & Research Company (the “Funds’ Investment Advisers”) and entities controlling, controlled by, or under common control with the Funds’ Investment Advisers (not including any sub-adviser whose role is primarily portfolio management and is subcontracted with or overseen by another investment adviser) that provide ongoing services to the Funds (“Fund Service Providers”):
Services Billed by Deloitte Entities
| July 31, 2018A | July 31, 2017A | |||||||
Audit-Related Fees | $ | 5,000 | $ | — | ||||
Tax Fees | $ | 5,000 | $ | 25,000 | ||||
All Other Fees | $ | — | $ | — | ||||
| A | Amounts may reflect rounding. |
Services Billed by PwC
| July 31, 2018A | July 31, 2017A,B | |||||||
Audit-Related Fees | $ | 7,605,000 | $ | 6,070,000 | ||||
Tax Fees | $ | 20,000 | $ | 160,000 | ||||
All Other Fees | $ | — | $ | — | ||||
| A | Amounts may reflect rounding. |
| B | May include amounts billed prior to the commencement of operations of the Fidelity Dividend ETF for Rising Rates, Fidelity High Dividend ETF, Fidelity Low Volatility Factor ETF, Fidelity Momentum Factor ETF, Fidelity Quality Factor ETF and Fidelity Value Factor ETF. |
“Audit-Related Fees” represent fees billed for assurance and related services that are reasonably related to the performance of the fund audit or the review of the fund’s financial statements and that are not reported under Audit Fees.
“Tax Fees” represent fees billed for tax compliance, tax advice or tax planning that relate directly to the operations and financial reporting of the fund.
Table of Contents
“All Other Fees” represent fees billed for services provided to the fund or Fund Service Provider, a significant portion of which are assurance related, that relate directly to the operations and financial reporting of the fund, excluding those services that are reported under Audit Fees, Audit-Related Fees or Tax Fees.
Assurance services must be performed by an independent public accountant.
* * *
The aggregate non-audit fees billed by PwC and Deloitte Entities for services rendered to the Funds, the Funds’ Investment Advisers (not including any sub-adviser whose role is primarily portfolio management and is subcontracted with or overseen by another investment adviser), and any Fund Service Provider for each of the last two fiscal years of the Funds are as follows:
Billed By | July 31, 2018A | July 31, 2017A,B | ||||||
Deloitte Entities | $ | 375,000 | $ 530,000 | |||||
PwC | $ | 10,375,000 | $7,510,000 | |||||
| A | Amounts may reflect rounding. |
| B | May include amounts billed prior to the commencement of operations of the Fidelity Dividend ETF for Rising Rates, Fidelity High Dividend ETF, Fidelity Low Volatility Factor ETF, Fidelity Momentum Factor ETF, Fidelity Quality Factor ETF and Fidelity Value Factor ETF. |
The trust’s audit committee (the “Audit Committee”) has considered non-audit services that were not pre-approved that were provided by PwC and Deloitte Entities to Fund Service Providers to be compatible with maintaining the independence of PwC and Deloitte Entities in their audits of the Funds, taking into account representations from PwC and Deloitte Entities, in accordance with Public Company Accounting Oversight Board rules, regarding their independence from the Funds and their related entities and the Funds’ Investment Advisers’ review of the appropriateness and permissibility under applicable law of such non-audit services prior to their provision to the Fund Service Providers.
Audit Committee Pre-Approval Policies and Procedures
The Audit Committee must pre-approve all audit and non-audit services provided by a fund’s independent registered public accounting firm relating to the operations or financial reporting of the fund. Prior to the commencement of any audit or non-audit services to a fund, the Audit Committee reviews the services to determine whether they are appropriate and permissible under applicable law.
Table of Contents
The Audit Committee has adopted policies and procedures to, among other purposes, provide a framework for the Committee’s consideration of non-audit services by the audit firms that audit the Funds. The policies and procedures require that any non-audit service provided by a fund audit firm to a Fund and any non-audit service provided by a fund auditor to a Fund Service Provider that relates directly to the operations and financial reporting of a Fund (“Covered Service”) are subject to approval by the Audit Committee before such service is provided.
All Covered Services must be approved in advance of provision of the service either: (i) by formal resolution of the Audit Committee, or (ii) by oral or written approval of the service by the Chair of the Audit Committee (or if the Chair is unavailable, such other member of the Audit Committee as may be designated by the Chair to act in the Chair’s absence). The approval contemplated by (ii) above is permitted where the Treasurer determines that action on such an engagement is necessary before the next meeting of the Audit Committee.
Non-audit services provided by a fund audit firm to a Fund Service Provider that do not relate directly to the operations and financial reporting of a Fund are reported to the Audit Committee periodically.
Non-Audit Services Approved Pursuant to Rule 2-01(c)(7)(i)(C) and (ii) of Regulation S-X (“De Minimis Exception”)
There were no non-audit services approved or required to be approved by the Audit Committee pursuant to the De Minimis Exception during the Funds’ last two fiscal years relating to services provided to (i) the Funds or (ii) any Fund Service Provider that relate directly to the operations and financial reporting of the Funds.
| Item 5. | Audit Committee of Listed Registrants |
The Audit Committee is a separately-designated standing audit committee in accordance with Section 3(a)(58)(A) of the Securities Exchange Act of 1934. As of July 31, 2018, the members of the Audit Committee were Joseph Mauriello, Don Donahue and Alan Lacy.
| Item 6. | Investments |
| (a) | Not applicable. |
| (b) | Not applicable |
| Item 7. | Disclosure of Proxy Voting Policies and Procedures for Closed-End Management Investment Companies |
Not applicable.
| Item 8. | Portfolio Managers of Closed-End Management Investment Companies |
Not applicable.
Table of Contents
| Item 9. | Purchase of Equity Securities by Closed-End Management Investment Company and Affiliated Purchasers |
Not applicable.
| Item 10. | Submission of Matters to a Vote of Security Holders |
There were no material changes to the procedures by which shareholders may recommend nominees to the trust’s Board of Trustees.
| Item 11. | Controls and Procedures |
(a)(i) The President and Treasurer and the Chief Financial Officer have concluded that the trust’s disclosure controls and procedures (as defined in Rule 30a-3(c) under the Investment Company Act) provide reasonable assurances that material information relating to the trust is made known to them by the appropriate persons, based on their evaluation of these controls and procedures as of a date within 90 days of the filing date of this report.
(a)(ii) There was no change in the trust’s internal control over financial reporting (as defined in Rule 30a-3(d) under the Investment Company Act) that occurred during the period covered by this report that has materially affected, or is reasonably likely to materially affect, the trust’s internal control over financial reporting.
| Item 12. | Disclosure of Securities Lending Activities for Closed-End Management Investment Companies |
Not applicable.
| Item 13. | Exhibits |
| (a) | (1) | Code of Ethics pursuant to Item 2 of Form N-CSR is filed and attached hereto as EX-99.CODE ETH. | ||
| (a) | (2) | Certification pursuant to Rule 30a-2(a) under the Investment Company Act of 1940 (17 CFR 270.30a-2(a)) is filed and attached hereto as Exhibit 99.CERT. | ||
| (a) | (3) | Not applicable. | ||
| (b) | Certification pursuant to Rule 30a-2(b) under the Investment Company Act of 1940 (17 CFR 270.30a-2(b)) is furnished and attached hereto as Exhibit 99.906CERT. | |||
Table of Contents
SIGNATURES
Pursuant to the requirements of the Securities Exchange Act of 1934 and the Investment Company Act of 1940, the registrant has duly caused this report to be signed on its behalf by the undersigned, thereunto duly authorized.
Fidelity Covington Trust
| By: | /s/ Stacie M. Smith | |
| Stacie M. Smith | ||
| President and Treasurer | ||
| Date: | September 26, 2018 | |
Pursuant to the requirements of the Securities Exchange Act of 1934 and the Investment Company Act of 1940, this report has been signed below by the following persons on behalf of the registrant and in the capacities and on the dates indicated.
| By: | /s/ Stacie M. Smith | |
| Stacie M. Smith | ||
| President and Treasurer | ||
| Date: | September 26, 2018 | |
| By: | /s/ John J. Burke III | |
| John J. Burke III | ||
| Chief Financial Officer | ||
| Date: | September 26, 2018 | |