UNITED STATES
SECURITIES AND EXCHANGE COMMISSION
Washington, D.C. 20549
FORM N-CSR
CERTIFIED SHAREHOLDER REPORT OF REGISTERED
MANAGEMENT INVESTMENT COMPANIES
Investment Company Act file number 811-07319
Fidelity Covington Trust
(Exact name of registrant as specified in charter)
245 Summer St., Boston, Massachusetts 02210
(Address of principal executive offices) (Zip code)
Cynthia Lo Bessette, Secretary
245 Summer St.
Boston, Massachusetts 02210
(Name and address of agent for service)
Registrant’s telephone number, including area code: 617-563-7000
Date of fiscal year end: October 31
Date of reporting period: October 31, 2022
| Item 1. | Reports to Stockholders |

Fidelity® Emerging Markets Multifactor ETF
Fidelity® International High Dividend ETF
Fidelity® International Multifactor ETF
Fidelity® International Value Factor ETF
Annual Report
October 31, 2022
To view a fund’s proxy voting guidelines and proxy voting record for the period ended June, 30, visit http://www.fidelity.com/proxyvotingresults or visit the Securities and Exchange Commission’s (SEC) web site at http://www.sec.gov. You may also call 1-800-FIDELITY to request a free copy of the proxy voting guidelines.
Standard & Poor’s, S&P and S&P 500 are registered service marks of The McGraw-Hill Companies, Inc. and have been licensed for use by Fidelity Distributors Corporation.
Other third party marks appearing herein are the property of their respective owners.
All other marks appearing herein are registered or unregistered trademarks or service marks of FMR LLC or an affiliated company.
© 2022 FMR LLC. All Rights reserved.
This report and the financial statements contained herein are submitted for the general information of the shareholders of the funds. This report is not authorized for distribution to prospective investors in the funds unless preceded or accompanied by an effective prospectus.
A fund files its complete schedule of portfolio holdings with the SEC for the first and third quarters of each fiscal year on Form N-PORT. Forms N-PORT are available on the SEC’s web site at http://www.sec.gov. A fund’s Forms N-PORT may be reviewed and copied at the SEC’s Public Reference Room in Washington, DC. Information regarding the operation of the SEC’s Public Reference Room may be obtained by calling 1-800-SEC-0330. For a complete list of a fund’s portfolio holdings, view the most recent holdings listing on Fidelity’s web site at http://www.fidelity.com, http://www.advisor.fidelity.com, or http://www.401k.com, as applicable.
NOT FDIC INSURED • MAY LOSE VALUE • NO BANK GUARANTEE
Neither the funds nor Fidelity Distributors Corporation is a bank.
International equities returned -24.61% for the 12 months ending October 31, 2022, according to the MSCI ACWI (All Country World Index) ex USA Index. After gaining 7.98% in 2021, non-U.S. stocks retreated in the new year, as a multitude of risk factors challenged the global economy and financial markets. Persistently high inflation in some markets, exacerbated by energy price shocks from the Russia–Ukraine conflict, spurred the U.S. Federal Reserve and other central banks to aggressively tighten monetary policy, and market interest rates eclipsed their highest level in roughly a decade, stoking recession fears and sending stocks into bear market territory. Other factors influencing equities abroad included surging global commodity prices, rising sovereign bond yields in some markets, ongoing global supply-chain disruption, a broadly strong U.S. dollar and the potential for variants of the coronavirus to upend global economic growth. Against this backdrop, the index returned -24.20% year to date through October. For the full 12 months, emerging markets (-31%) and Europe ex U.K. (-25%) notably lagged. Conversely, Canada (-13%) and the U.K. (-12%) held up best. Among the 11 sectors, information technology and consumer discretionary (-37% each) fared worst. Communication services (-34%) also trailed the broader market. In contrast, energy gained 2% amid high prices for oil and natural gas. The defensive-oriented utilities (-16%) sector also outperformed, as did financials and consumer staples (-18% each).
Fidelity® Emerging Markets Multifactor ETF
Performance (Unaudited)
The information provided in the tables below shows you the performance of Fidelity® Emerging Markets Multifactor ETF, with comparisons over different time periods to the fund’s relevant benchmarks, including an appropriate broad-based market index. Seeing the returns over different time periods can help you assess the fund’s performance against relevant measurements. The performance information includes average annual total returns and is further explained in this section.*
The fund’s net asset value (NAV) performance is based on the NAV calculated each business day. It is calculated in accordance with the standard formula for valuing investment company shares as of the close of regular trading hours on Cboe BZX Exchange, Inc. (CboeBZX) (normally 4:00 p.m. Eastern Time). The fund’s market price performance is based on the daily closing price of the shares of the fund on CboeBZX. Since ETFs are bought and sold at prices set by the market – which can result in a premium or discount to NAV – the returns calculated using market price (market return) can differ from those calculated using NAV (NAV return). For information on these differences, please visit Fidelity.com or see the prospectus. The fund’s returns do not reflect the deduction of taxes that a shareholder would pay on fund distributions or the redemption or selling of fund shares. How a fund did yesterday is no guarantee of how it will do tomorrow.
Current performance may be higher or lower than the performance data quoted. For month-end performance figures, please visit fidelity.com/etfs/factor-etfs or call Fidelity. The performance data featured represents past performance, which is no guarantee of future results. Investment return and principal value will fluctuate; therefore, you may have a gain or loss when you sell your shares.
Fiscal Periods Ended October 31, 2022
| Average Annual Total Returns | Past
1 Year | Life of
Fund |
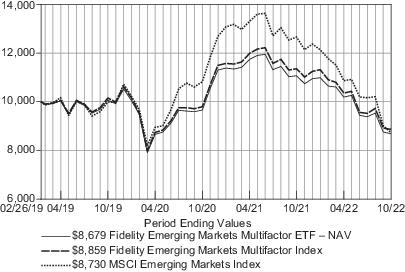
| Fidelity Emerging Markets Multifactor ETF – NAVA | -21.56% | -3.78% |
| Fidelity Emerging Markets Multifactor ETF – Market PriceB | -21.92% | -3.67% |
| Fidelity Emerging Markets Multifactor IndexA | -21.97% | -3.24% |
| MSCI Emerging Markets IndexA | -31.01% | -3.62% |
Average annual total returns represent just that – the average return on an annual basis for Fidelity® Emerging Markets Multifactor ETF and the fund’s benchmarks, assuming consistent performance over the periods shown, based on the cumulative return and the length of the period. This information represents returns as of the end of the fund’s fiscal period.
A
From February 26, 2019.
| B | From February 28, 2019, date initially listed on the CboeBZX exchange. |
| * | Total returns are historical and include changes in share price and reinvestment of dividends and capital gains distributions, if any. |
$10,000 Over Life of Fund
Let’s say hypothetically that $10,000 was invested in Fidelity Emerging Markets Multifactor ETF – NAV on February 26, 2019, when the fund started. The chart shows how the value of your investment would have changed, and also shows how the Fidelity Emerging Markets Multifactor Index and the MSCI Emerging Markets Index performed over the same period.
Fidelity® Emerging Markets Multifactor ETF
Management’s Discussion of Fund Performance
Comments from the Geode Capital Management, LLC, passive equity index team:
For the fiscal year ending October 31, 2022, the fund returned -21.56% at net asset value and -21.92% on a market-price basis, slightly ahead of the -21.97% result of the benchmark Fidelity Emerging Markets Multifactor Index (Net). (The ETF's relative performance was affected by differing methodologies (fund versus index) for valuing certain foreign stocks and for incorporating foreign exchange rates, as well as by required local capital gains tax.) None of the fund’s industry sectors posted a positive return for the period. Consumer discretionary stocks returned roughly -42% and detracted the most from overall performance, followed by information technology holdings, which returned roughly -27%. Communication services (-19%), utilities (-32%), financials (-9%), real estate (-26%), materials (-24%), industrials (-7%), consumer staples (-6%), energy (-13%) and health care (-1%) all struggled in a difficult environment for emerging markets equities. Turning to individual stocks, the biggest individual detractor was Alibaba Group Holding (-61%), from the retailing segment, followed by Inter RAO (-60%), which is in the utilities sector. Longfor Group (-72%), Samsung Electronics (-29%) and Sberbank of Russia (-79%) were also among the largest detractors. Conversely, the top contributor was Aldar Properties PJSC (+24%), from the real estate sector. In capital goods, Bharat Electronics (+41%) helped the fund’s result, and Kalbe Farma (+19%) from the pharmaceuticals, biotechnology & life sciences category, also contributed. Insurance name BB Seguridade rose 55% and Sabanci, within the banks category, gained approximately 62%.
The views expressed above reflect those of the portfolio manager(s) only through the end of the period as stated on the cover of this report and do not necessarily represent the views of Fidelity or any other person in the Fidelity organization, or Geode Capital Management, LLC, (the ETF's subadviser) or any other person in the Geode organization. Any such views are subject to change at any time based upon market or other conditions and Fidelity and Geode disclaim any responsibility to update such views. These views may not be relied on as investment advice and, because investment decisions for a Fidelity fund are based on numerous factors, may not be relied on as an indication of trading intent on behalf of any Fidelity fund.
Fidelity® Emerging Markets Multifactor ETF
Investment Summary (Unaudited)
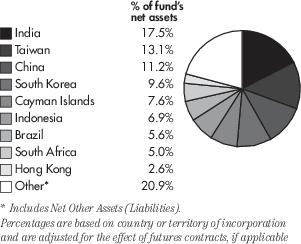
Geographic Diversification as of October 31, 2022
Top Ten Stocks as of October 31, 2022
| | % of fund's
net assets |
| Samsung Electronics Co. Ltd. | 3.2 |
| Emaar Properties PJSC | 2.0 |
| Ruentex Development Co. Ltd. | 2.0 |
| CPFL Energia S.A. | 1.6 |
| Kalbe Farma Tbk PT | 1.5 |
| Power Grid Corp. of India Ltd. | 1.5 |
| Alibaba Group Holding Ltd. ADR | 1.4 |
| China Overseas Land & Investment Ltd. | 1.4 |
| GAIL India Ltd. | 1.3 |
| Manila Electric Co. | 1.3 |
| Petroleo Brasileiro S.A. | 1.4 |
| | 18.6 |
Top Market Sectors as of October 31, 2022
| | % of fund's
net assets |
| Financials | 19.7 |
| Information Technology | 14.7 |
| Consumer Staples | 10.7 |
| Energy | 10.6 |
| Health Care | 8.8 |
| Consumer Discretionary | 8.5 |
| Utilities | 8.2 |
| Communication Services | 6.1 |
| Real Estate | 6.0 |
| Materials | 4.8 |
| Industrials | 1.7 |
Asset Allocation as of October 31, 2022
| | % of funds's
net assets |
| Stocks and Equity Futures | 100.0% |
| Net Other Assets (Liabilities) | 0.0% |
Fidelity® International High Dividend ETF
Performance (Unaudited)
The information provided in the tables below shows you the performance of Fidelity® International High Dividend ETF, with comparisons over different time periods to the fund’s relevant benchmarks, including an appropriate broad-based market index. Seeing the returns over different time periods can help you assess the fund’s performance against relevant measurements. The performance information includes average annual total returns and is further explained in this section.*
The fund’s net asset value (NAV) performance is based on the NAV calculated each business day. It is calculated in accordance with the standard formula for valuing investment company shares as of the close of regular trading hours on NYSE Arca, Inc. (NYSE Arca) (normally 4:00 p.m. Eastern Time). The fund’s market price performance is based on the daily closing price of the shares of the fund on NYSE Arca. Since ETFs are bought and sold at prices set by the market – which can result in a premium or discount to NAV – the returns calculated using market price (market return) can differ from those calculated using NAV (NAV return). For information on these differences, please visit Fidelity.com or see the prospectus. The fund’s returns do not reflect the deduction of taxes that a shareholder would pay on fund distributions or the redemption or selling of fund shares. How a fund did yesterday is no guarantee of how it will do tomorrow.
Current performance may be higher or lower than the performance data quoted. For month-end performance figures, please visit fidelity.com/etfs/factor-etfs or call Fidelity. The performance data featured represents past performance, which is no guarantee of future results. Investment return and principal value will fluctuate; therefore, you may have a gain or loss when you sell your shares.
Fiscal Periods Ended October 31, 2022
| Average Annual Total Returns | Past
1 Year | Life of
Fund |
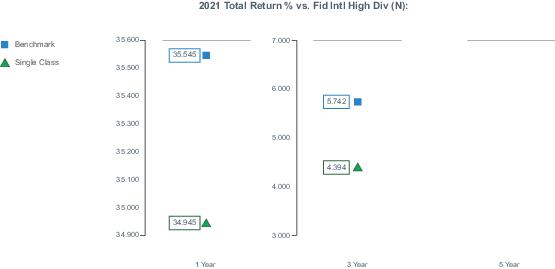
| Fidelity International High Dividend ETF – NAVA | -15.83% | -3.91% |
| Fidelity International High Dividend ETF – Market PriceB | -16.01% | -4.22% |
| Fidelity International High Dividend IndexA | -15.34% | -3.47% |
| MSCI World ex USA IndexA | -21.87% | -0.82% |
Average annual total returns represent just that – the average return on an annual basis for Fidelity® International High Dividend ETF and the fund’s benchmarks, assuming consistent performance over the periods shown, based on the cumulative return and the length of the period. This information represents returns as of the end of the fund’s fiscal period.
A
From January 16, 2018.
| B | From January 18, 2018, date initially listed on the NYSE Arca exchange. |
| * | Total returns are historical and include changes in share price and reinvestment of dividends and capital gains distributions, if any. |
$10,000 Over Life of Fund
Let’s say hypothetically that $10,000 was invested in Fidelity International High Dividend ETF – NAV on January 16, 2018, when the fund started. The chart shows how the value of your investment would have changed, and also shows how the Fidelity International High Dividend Index and the MSCI World ex USA Index performed over the same period.
Fidelity® International High Dividend ETF
Management’s Discussion of Fund Performance
Comments from the Geode Capital Management, LLC, passive equity index team:
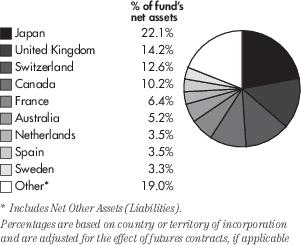
For the fiscal year ending October 31, 2022, the fund returned -15.83% at net asset value and -16.01% on a market-price basis, slightly behind the -15.34% result of the benchmark Fidelity International High Dividend Index (Net). (The ETF’s relative performance can be affected by Fidelity’s methodologies for valuing certain foreign stocks and for incorporating foreign exchange rates, which differ from those used by the index, as well as by local tax laws or regulations, which vary by country.) By region, Europe ex U.K., by far the largest regional allocation within the fund, returned -18% and detracted most, followed by Japan (-19%). By sector, stocks in financials, which represent 27% of the fund’s total assets on average, returned -16% and detracted most, followed by materials, which returned -20%. Utilities returned -22% and consumer discretionary returned -30%, hurt especially by holdings in the automobiles & components industry (-31%). Industrials (-14%), communication services (-12%), information technology (-30%), health care (-15%) and consumer staples (-11%) all further detracted from performance. In this difficult market environment, only two sectors posted a positive return: energy advanced about 8% and contributed most to the fund’s result, and real estate stocks also helped, gaining about 6%. Turning to individual stocks, the biggest individual detractor was Enel S.p.A (-44%), from the utilities sector. In materials, Barrick Gold (-34%), BASF SE (-34%), Smurfit Kappa (-39%), and Shin-Etsu Chemical (-31%) all hurt the fund’s result. In contrast, the biggest individual contributor was Klepierre (+25%), from the real estate sector. In energy, BP (+20%) and TotalEnergies (+15%) added value, as did Vodafone (+31%), within the telecommunication services segment. Another top contributor was the British multinational bank HSBC Holdings (+22%).
The views expressed above reflect those of the portfolio manager(s) only through the end of the period as stated on the cover of this report and do not necessarily represent the views of Fidelity or any other person in the Fidelity organization, or Geode Capital Management, LLC, (the ETF's subadviser) or any other person in the Geode organization. Any such views are subject to change at any time based upon market or other conditions and Fidelity and Geode disclaim any responsibility to update such views. These views may not be relied on as investment advice and, because investment decisions for a Fidelity fund are based on numerous factors, may not be relied on as an indication of trading intent on behalf of any Fidelity fund.
Fidelity® International High Dividend ETF
Investment Summary (Unaudited)
Geographic Diversification as of October 31, 2022
Top Ten Stocks as of October 31, 2022
| | % of fund's
net assets |
| BP PLC | 3.0 |
| TotalEnergies SE | 3.0 |
| Endesa S.A. | 2.8 |
| Orange S.A. | 2.5 |
| Enbridge, Inc. | 2.5 |
| Repsol S.A. | 2.5 |
| Nintendo Co. Ltd. | 2.4 |
| Power Assets Holdings Ltd. | 2.4 |
| Enel SpA | 2.3 |
| Telefonica S.A. | 2.3 |
| Emera, Inc. | 2.2 |
| | 27.9 |
Top Market Sectors as of October 31, 2022
| | % of fund's
net assets |
| Financials | 27.1 |
| Energy | 15.1 |
| Materials | 13.6 |
| Communication Services | 11.7 |
| Utilities | 9.7 |
| Industrials | 9.6 |
| Health Care | 4.2 |
| Consumer Discretionary | 3.8 |
| Consumer Staples | 2.9 |
| Information Technology | 1.6 |
Asset Allocation as of October 31, 2022
| | % of funds's
net assets |
| Stocks and Equity Futures | 100.0% |
| Short-Term Investments and Net Other Assets (Liabilities) | 0.0% |
Fidelity® International Multifactor ETF
Performance (Unaudited)
The information provided in the tables below shows you the performance of Fidelity® International Multifactor ETF, with comparisons over different time periods to the fund’s relevant benchmarks, including an appropriate broad-based market index. Seeing the returns over different time periods can help you assess the fund’s performance against relevant measurements. The performance information includes average annual total returns and is further explained in this section.*
The fund’s net asset value (NAV) performance is based on the NAV calculated each business day. It is calculated in accordance with the standard formula for valuing investment company shares as of the close of regular trading hours on Cboe BZX Exchange, Inc. (CboeBZX) (normally 4:00 p.m. Eastern Time). The fund’s market price performance is based on the daily closing price of the shares of the fund on CboeBZX. Since ETFs are bought and sold at prices set by the market – which can result in a premium or discount to NAV – the returns calculated using market price (market return) can differ from those calculated using NAV (NAV return). For information on these differences, please visit Fidelity.com or see the prospectus. The fund’s returns do not reflect the deduction of taxes that a shareholder would pay on fund distributions or the redemption or selling of fund shares. How a fund did yesterday is no guarantee of how it will do tomorrow.
Current performance may be higher or lower than the performance data quoted. For month-end performance figures, please visit fidelity.com/etfs/factor-etfs or call Fidelity. The performance data featured represents past performance, which is no guarantee of future results. Investment return and principal value will fluctuate; therefore, you may have a gain or loss when you sell your shares.
Fiscal Periods Ended October 31, 2022
| Average Annual Total Returns | Past
1 Year | Life of
Fund |
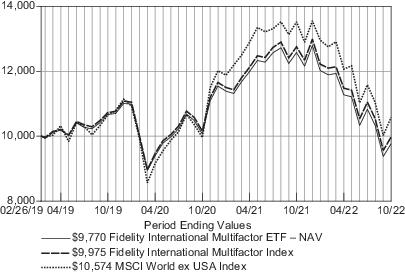
| Fidelity International Multifactor ETF – NAVA | -22.36% | -0.63% |
| Fidelity International Multifactor ETF – Market PriceB | -22.65% | -0.46% |
| Fidelity International Multifactor IndexA | -21.83% | -0.07% |
| MSCI World ex USA IndexA | -21.87% | 1.53% |
Average annual total returns represent just that – the average return on an annual basis for Fidelity® International Multifactor ETF and the fund’s benchmarks, assuming consistent performance over the periods shown, based on the cumulative return and the length of the period. This information represents returns as of the end of the fund’s fiscal period.
A
From February 26, 2019.
| B | From February 28, 2019, date initially listed on the CboeBZX exchange. |
| * | Total returns are historical and include changes in share price and reinvestment of dividends and capital gains distributions, if any. |
$10,000 Over Life of Fund
Let’s say hypothetically that $10,000 was invested in Fidelity International Multifactor ETF – NAV on February 26, 2019, when the fund started. The chart shows how the value of your investment would have changed, and also shows how the Fidelity International Multifactor Index and the MSCI World ex USA Index performed over the same period.
Fidelity® International Multifactor ETF
Management’s Discussion of Fund Performance
Comments from the Geode Capital Management, LLC, passive equity index team:
For the fiscal year ending October 31, 2022, the fund returned -22.36% at net asset value and -22.65% on a market-price basis, slightly behind the -21.83% result of the benchmark Fidelity International Multifactor Index (Net). (The ETF’s relative performance can be affected by Fidelity’s methodologies for valuing certain foreign stocks and for incorporating foreign exchange rates, which differ from those used by the index, as well as by local tax laws or regulations, which vary by country.) By region, Europe ex U.K., by far the largest regional allocation within the fund, returned -28% and detracted most, followed by Japan (-19%). By sector, stocks in the health care category returned -23% and most hurt the fund’s overall result, followed by industrials, which returned about -24%. Real estate (-34%), consumer discretionary (-33%), financials (-16%), utilities (-26%), consumer staples (-14%), information technology (-32%), communication services (-16%) and materials (-13%) all detracted as well. In this difficult market environment, energy was the only sector to post a positive result, gaining 8% for the 12-month period. Turning to individual stocks, the biggest individual detractor was Uniper (-85%), from the utilities sector. In real estate, Tag Immobilien (-67%), Safestore Holdings (-37%), and Canadian Apartment Properties REIT (-35%) were also among the largest detractors, as was ASML Holding (-41%), within the semiconductors & semiconductor equipment segment. In contrast, the biggest individual contributor was Imperial Brands (+26%), from the food, beverage & tobacco category; within that same category, Swedish Match (+20%) and Tate & Lyle (+18%) also added value. Other top contributors included Toronto-Dominion Bank (-11%) and Loblaw Companies (+10%), a stock in the food & staples retailing industry.
The views expressed above reflect those of the portfolio manager(s) only through the end of the period as stated on the cover of this report and do not necessarily represent the views of Fidelity or any other person in the Fidelity organization, or Geode Capital Management, LLC, (the ETF's subadviser) or any other person in the Geode organization. Any such views are subject to change at any time based upon market or other conditions and Fidelity and Geode disclaim any responsibility to update such views. These views may not be relied on as investment advice and, because investment decisions for a Fidelity fund are based on numerous factors, may not be relied on as an indication of trading intent on behalf of any Fidelity fund.
Fidelity® International Multifactor ETF
Investment Summary (Unaudited)
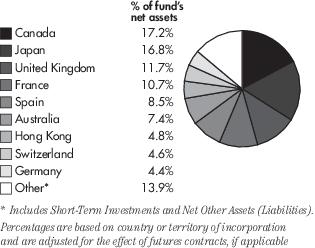
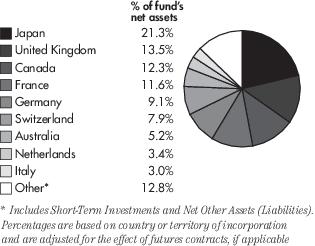
Geographic Diversification as of October 31, 2022
Top Ten Stocks as of October 31, 2022
| | % of fund's
net assets |
| Nestle S.A. | 2.5 |
| Roche Holding AG | 1.9 |
| AstraZeneca PLC | 1.5 |
| Novo Nordisk A/S Class B | 1.5 |
| Novartis AG | 1.5 |
| Daito Trust Construction Co. Ltd. | 1.5 |
| PSP Swiss Property AG | 1.4 |
| KDDI Corp. | 1.3 |
| Osaka Gas Co. Ltd. | 1.3 |
| Publicis Groupe S.A. | 1.2 |
| Nippon Telegraph & Telephone Corp. | 1.2 |
| | 16.8 |
Top Market Sectors as of October 31, 2022
| | % of fund's
net assets |
| Health Care | 16.1 |
| Financials | 15.8 |
| Consumer Staples | 14.7 |
| Industrials | 12.1 |
| Communication Services | 9.4 |
| Utilities | 8.1 |
| Real Estate | 7.3 |
| Consumer Discretionary | 6.4 |
| Information Technology | 3.8 |
| Materials | 3.4 |
| Energy | 2.2 |
Asset Allocation as of October 31, 2022
| | % of funds's
net assets |
| Stocks and Equity Futures | 100.0% |
| Short-Term Investments and Net Other Assets (Liabilities) | 0.0% |
Fidelity® International Value Factor ETF
Performance (Unaudited)
The information provided in the tables below shows you the performance of Fidelity® International Value Factor ETF, with comparisons over different time periods to the fund’s relevant benchmarks, including an appropriate broad-based market index. Seeing the returns over different time periods can help you assess the fund’s performance against relevant measurements. The performance information includes average annual total returns and is further explained in this section.*
The fund’s net asset value (NAV) performance is based on the NAV calculated each business day. It is calculated in accordance with the standard formula for valuing investment company shares as of the close of regular trading hours on NYSE Arca, Inc. (NYSE Arca) (normally 4:00 p.m. Eastern Time). The fund’s market price performance is based on the daily closing price of the shares of the fund on NYSE Arca. Since ETFs are bought and sold at prices set by the market – which can result in a premium or discount to NAV – the returns calculated using market price (market return) can differ from those calculated using NAV (NAV return). For information on these differences, please visit Fidelity.com or see the prospectus. The fund’s returns do not reflect the deduction of taxes that a shareholder would pay on fund distributions or the redemption or selling of fund shares. How a fund did yesterday is no guarantee of how it will do tomorrow.
Current performance may be higher or lower than the performance data quoted. For month-end performance figures, please visit fidelity.com/etfs/factor-etfs or call Fidelity. The performance data featured represents past performance, which is no guarantee of future results. Investment return and principal value will fluctuate; therefore, you may have a gain or loss when you sell your shares.
Fiscal Periods Ended October 31, 2022
| Average Annual Total Returns | Past
1 Year | Life of
Fund |
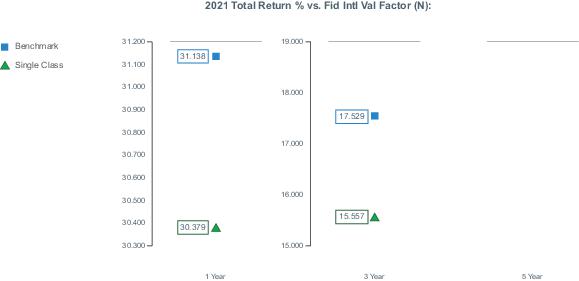
| Fidelity International Value Factor ETF – NAVA | -18.82% | -2.27% |
| Fidelity International Value Factor ETF – Market PriceB | -19.24% | -2.59% |
| Fidelity International Value Factor IndexA | -18.35% | -1.73% |
| MSCI World ex USA IndexA | -21.87% | -0.82% |
Average annual total returns represent just that – the average return on an annual basis for Fidelity® International Value Factor ETF and the fund’s benchmarks, assuming consistent performance over the periods shown, based on the cumulative return and the length of the period. This information represents returns as of the end of the fund’s fiscal period.
A
From January 16, 2018.
| B | From January 18, 2018, date initially listed on the NYSE Arca exchange. |
| * | Total returns are historical and include changes in share price and reinvestment of dividends and capital gains distributions, if any. |
$10,000 Over Life of Fund
Let’s say hypothetically that $10,000 was invested in Fidelity International Value Factor ETF – NAV on January 16, 2018, when the fund started. The chart shows how the value of your investment would have changed, and also shows how the Fidelity International Value Factor Index and the MSCI World ex USA Index performed over the same period.
Fidelity® International Value Factor ETF
Management’s Discussion of Fund Performance
Comments from the Geode Capital Management, LLC, passive equity index team:
For the fiscal year ending October 31, 2022, the fund returned -18.82% at net asset value and -19.24% on a market-price basis, behind the -18.35% result of the benchmark Fidelity International Value Factor Index (Net). (The ETF’s relative performance can be affected by Fidelity’s methodologies for valuing certain foreign stocks and for incorporating foreign exchange rates, which differ from those used by the index, as well as by local tax laws or regulations, which vary by country.) By region, Europe ex U.K., by far the largest regional allocation within the fund, returned -25% and detracted most, followed by Japan (-17%). By sector, stocks in information technology returned -40% and were the primary detractor from overall performance, followed by the consumer discretionary sector, which returned roughly -28%. Health care also returned about -28%, hampered especially by stock holdings in the health care equipment & services industry (-53%). Industrials (-19%), financials (-14%), real estate (-39%), materials (-9%), consumer staples (-6%), communication services (-8%) and utilities (-3%) all detracted. Energy gained 21% and was the only sector to post a positive return. Turning to individual stocks, the biggest individual detractor was Philips (-72%), from the health care equipment & services group, followed by ASML Holding (-32%), which is in the semiconductors & semiconductor equipment category. Bausch Health (-80%), Shopify (-55%) and Sony (-41%) were also among the biggest detractors. Conversely, the largest individual contributor was Centrica (+28%), from the utilities sector. Suncor Energy (+35%) also helped. Other contributors from the food, beverage & tobacco category were British American Tobacco (+22%) and Imperial Brands (+26%).
The views expressed above reflect those of the portfolio manager(s) only through the end of the period as stated on the cover of this report and do not necessarily represent the views of Fidelity or any other person in the Fidelity organization, or Geode Capital Management, LLC, (the ETF's subadviser) or any other person in the Geode organization. Any such views are subject to change at any time based upon market or other conditions and Fidelity and Geode disclaim any responsibility to update such views. These views may not be relied on as investment advice and, because investment decisions for a Fidelity fund are based on numerous factors, may not be relied on as an indication of trading intent on behalf of any Fidelity fund.
Fidelity® International Value Factor ETF
Investment Summary (Unaudited)
Geographic Diversification as of October 31, 2022
Top Ten Stocks as of October 31, 2022
| | % of fund's
net assets |
| Nestle S.A. | 2.4 |
| Shell PLC | 1.8 |
| Roche Holding AG | 1.8 |
| Toyota Motor Corp. | 1.6 |
| The Toronto-Dominion Bank | 1.5 |
| Japan Tobacco, Inc. | 1.5 |
| Novartis AG | 1.4 |
| SAP SE | 1.4 |
| Canadian Natural Resources Ltd. | 1.4 |
| Sanofi | 1.4 |
| Teck Resources Ltd. Class B | 1.3 |
| | 17.5 |
Top Market Sectors as of October 31, 2022
| | % of fund's
net assets |
| Financials | 19.9 |
| Industrials | 15.2 |
| Consumer Discretionary | 11.1 |
| Health Care | 10.6 |
| Consumer Staples | 9.4 |
| Materials | 8.0 |
| Information Technology | 7.8 |
| Energy | 7.0 |
| Communication Services | 4.5 |
| Utilities | 3.6 |
| Real Estate | 2.2 |
Asset Allocation as of October 31, 2022
| | % of funds's
net assets |
| Stocks and Equity Futures | 100.0% |
| Short-Term Investments and Net Other Assets (Liabilities) | 0.0% |
Fidelity® Emerging Markets Multifactor ETF
Schedule of Investments October 31, 2022
Showing Percentage of Net Assets
| Common Stocks – 97.3% |
| | Shares | Value |
| BRAZIL – 3.4% |
| Arezzo Industria e Comercio S.A. | 2,200 | $ 43,813 |
| BB Seguridade Participacoes S.A. | 17,100 | 96,755 |
| CPFL Energia S.A. | 45,900 | 309,834 |
| Telefonica Brasil S.A. | 5,800 | 45,662 |
| TIM S.A. | 19,500 | 49,054 |
| Vale S.A. | 8,500 | 108,744 |
| TOTAL BRAZIL | 653,862 |
| CAYMAN ISLANDS – 7.6% |
| Alibaba Group Holding Ltd. ADR (a) | 4,340 | 275,937 |
| Autohome, Inc. ADR | 1,215 | 31,736 |
| Bosideng International Holdings Ltd. | 118,000 | 50,959 |
| China Medical System Holdings Ltd. | 153,000 | 167,036 |
| Hengan International Group Co. Ltd. | 42,000 | 162,920 |
| Huazhu Group Ltd. ADR | 535 | 14,488 |
| JD.com, Inc. ADR | 2,022 | 75,400 |
| JD.com, Inc. Class A | 1,023 | 18,909 |
| Kingboard Holdings Ltd. | 35,000 | 86,320 |
| Li Auto, Inc. ADR (a) | 861 | 11,727 |
| Longfor Group Holdings Ltd. (b) | 109,000 | 138,856 |
| New Oriental Education & Technology, Inc. ADR (a) | 632 | 15,004 |
| Pinduoduo, Inc. ADR (a) | 1,183 | 64,864 |
| TAL Education Group ADR (a) | 2,746 | 12,934 |
| Tongcheng Travel Holdings Ltd. (a) | 34,400 | 53,639 |
| Topsports International Holdings Ltd. (b) | 86,000 | 43,384 |
| Trip.com Group Ltd. ADR (a) | 1,431 | 32,383 |
| Vipshop Holdings Ltd. ADR (a) | 1,599 | 11,145 |
| Want Want China Holdings Ltd. | 254,000 | 166,964 |
| Yadea Group Holdings Ltd. (b) | 32,000 | 48,837 |
| TOTAL CAYMAN ISLANDS | 1,483,442 |
| CHILE – 1.5% |
| Banco de Chile | 1,015,758 | 92,867 |
| Cencosud S.A. | 143,404 | 192,965 |
| TOTAL CHILE | 285,832 |
| CHINA – 11.2% |
| Agricultural Bank of China Ltd. Class H | 231,000 | 65,917 |
| Anhui Conch Cement Co. Ltd. Class H | 18,000 | 46,319 |
| Bank of China Ltd. Class H | 325,000 | 104,747 |
| Bank of Communications Co. Ltd. Class H | 124,000 | 60,501 |
| China Cinda Asset Management Co. Ltd. Class H | 286,000 | 26,597 |
| China CITIC Bank Corp. Ltd. Class H | 110,000 | 41,479 |
| China Coal Energy Co. Ltd. Class H | 270,000 | 198,806 |
| China Construction Bank Corp. Class H | 332,000 | 176,365 |
| China Railway Group Ltd. Class H | 59,000 | 25,630 |
| China Shenhua Energy Co. Ltd. Class H | 85,500 | 224,918 |
|
| | Shares | Value |
|
| China Tower Corp. Ltd. Class H (b) | 478,000 | $ 43,234 |
| Dongfeng Motor Group Co. Ltd. | 102,000 | 46,128 |
| Guangzhou Automobile Group Co. Ltd. Class H | 76,000 | 46,279 |
| Guangzhou Baiyunshan Pharmaceutical Holdings Co. Ltd. Class H | 88,000 | 196,182 |
| Haier Smart Home Co. Ltd. Class H | 28,400 | 71,056 |
| Industrial & Commercial Bank of China Ltd. Class H | 270,000 | 117,289 |
| Inner Mongolia Yitai Coal Co. Ltd. Class B | 134,100 | 189,617 |
| Jiumaojiu International Holdings Ltd. (b) | 29,000 | 45,514 |
| PICC Property & Casualty Co. Ltd. Class H | 54,000 | 49,805 |
| Postal Savings Bank of China Co. Ltd. Class H (b) | 90,000 | 41,733 |
| Sinopharm Group Co. Ltd. Class H | 103,600 | 197,438 |
| The People's Insurance Co. Group of China Ltd. Class H | 144,000 | 39,807 |
| TravelSky Technology Ltd. Class H | 57,000 | 82,779 |
| Yangzijiang Shipbuilding Holdings Ltd. | 60,900 | 51,643 |
| TOTAL CHINA | 2,189,783 |
| COLOMBIA – 0.4% |
| Grupo de Inversiones Suramericana S.A. | 9,117 | 74,326 |
| TOTAL COLOMBIA | 74,326 |
| CYPRUS – 0.0% |
| TCS Group Holding PLC GDR (a)(c) | 789 | 990 |
| TOTAL CYPRUS | 990 |
| CZECH – 1.0% |
| CEZ AS | 5,803 | 189,758 |
| TOTAL CZECH | 189,758 |
| EGYPT – 0.4% |
| Commercial International Bank Egypt SAE | 62,606 | 83,993 |
| TOTAL EGYPT | 83,993 |
| GREECE – 0.3% |
| JUMBO S.A. | 4,713 | 67,030 |
| TOTAL GREECE | 67,030 |
| HONG KONG – 2.6% |
| Beijing Enterprises Holdings Ltd. | 90,000 | 228,386 |
| China Merchants Port Holdings Co. Ltd. | 21,046 | 24,666 |
| China Overseas Land & Investment Ltd. | 136,000 | 259,531 |
| TOTAL HONG KONG | 512,583 |
| HUNGARY – 0.6% |
| MOL Hungarian Oil & Gas PLC | 20,119 | 120,450 |
| TOTAL HUNGARY | 120,450 |
See accompanying notes which are an integral part of the financial statements.
| Common Stocks – continued |
| | Shares | Value |
| INDIA – 17.5% |
| AU Small Finance Bank Ltd. (b) | 9,044 | $ 64,412 |
| Bajaj Auto Ltd. | 1,336 | 59,262 |
| Bank of Baroda | 46,894 | 83,673 |
| Bharat Electronics Ltd. | 28,455 | 36,730 |
| Cipla Ltd. | 15,208 | 214,476 |
| Coal India Ltd. | 82,436 | 244,935 |
| Federal Bank Ltd. | 52,649 | 83,638 |
| GAIL India Ltd. | 231,899 | 255,775 |
| HCL Technologies Ltd. | 3,676 | 46,236 |
| HDFC Asset Management Co. Ltd. (b) | 2,782 | 69,723 |
| Hindustan Aeronautics Ltd. | 1,260 | 38,511 |
| Hindustan Unilever Ltd. | 6,972 | 214,835 |
| Indus Towers Ltd. | 20,962 | 46,975 |
| Infosys Ltd. | 9,984 | 185,460 |
| ITC Ltd. | 44,231 | 186,323 |
| Kotak Mahindra Bank Ltd. | 5,792 | 133,081 |
| Maruti Suzuki India Ltd. | 836 | 96,223 |
| Nestle India Ltd. | 656 | 161,377 |
| NMDC Ltd. | 40,976 | 49,378 |
| NMDC Steel Ltd. (a)(c) | 40,976 | 19,058 |
| Page Industries Ltd. | 109 | 65,534 |
| Pidilite Industries Ltd. | 1,912 | 59,695 |
| Power Finance Corp. Ltd. | 47,214 | 65,735 |
| Power Grid Corp. of India Ltd. | 105,991 | 292,131 |
| SBI Life Insurance Co. Ltd. (b) | 5,277 | 80,703 |
| State Bank of India | 14,625 | 101,378 |
| Sun Pharmaceutical Industries Ltd. | 18,943 | 232,710 |
| Tata Consultancy Services Ltd. | 2,897 | 111,752 |
| Tata Elxsi Ltd. | 182 | 15,382 |
| Vedanta Ltd. | 19,095 | 64,775 |
| Wipro Ltd. | 5,740 | 26,804 |
| TOTAL INDIA | 3,406,680 |
| INDONESIA – 6.9% |
| Adaro Energy Indonesia Tbk PT | 971,100 | 247,795 |
| Astra International Tbk PT | 146,100 | 62,290 |
| Bank Mandiri Persero Tbk PT | 179,200 | 121,209 |
| Bukit Asam Tbk PT | 731,600 | 183,398 |
| Indofood Sukses Makmur Tbk PT | 409,100 | 169,174 |
| Kalbe Farma Tbk PT | 2,257,000 | 296,641 |
| Telkom Indonesia Persero Tbk PT | 254,600 | 71,659 |
| United Tractors Tbk PT | 93,800 | 194,245 |
| TOTAL INDONESIA | 1,346,411 |
| KUWAIT – 0.4% |
| Humansoft Holding Co. KSC | 6,613 | 71,777 |
| TOTAL KUWAIT | 71,777 |
|
| | Shares | Value |
| MALAYSIA – 2.5% |
| DiGi.Com Bhd | 66,900 | $ 53,628 |
| Hong Leong Bank Bhd | 16,700 | 74,740 |
| Nestle Malaysia Bhd | 6,100 | 171,595 |
| Petronas Chemicals Group Bhd | 25,200 | 46,477 |
| Public Bank Bhd | 104,400 | 98,703 |
| TIME dotCom Bhd | 50,700 | 48,791 |
| TOTAL MALAYSIA | 493,934 |
| MAURITIUS – 0.1% |
| MakeMyTrip Ltd. (a) | 351 | 9,768 |
| TOTAL MAURITIUS | 9,768 |
| MEXICO – 2.0% |
| America Movil S.A.B. de C.V. Series L | 89,700 | 84,734 |
| Arca Continental S.A.B. de C.V. | 28,900 | 236,293 |
| Grupo Aeroportuario del Centro Norte S.A.B. de C.V. | 4,100 | 32,603 |
| Promotora y Operadora de Infraestructura S.A.B. de C.V. | 3,840 | 28,833 |
| Sitios Latinoamerica S.A.B. de C.V. (a) | 4,485 | 1,306 |
| TOTAL MEXICO | 383,769 |
| PHILIPPINES – 1.6% |
| Manila Electric Co. | 48,680 | 253,187 |
| PLDT, Inc. | 1,735 | 48,921 |
| TOTAL PHILIPPINES | 302,108 |
| POLAND – 0.8% |
| Asseco Poland S.A. | 6,409 | 92,347 |
| Powszechny Zaklad Ubezpieczen S.A. | 12,731 | 71,508 |
| TOTAL POLAND | 163,855 |
| QATAR – 0.6% |
| Mesaieed Petrochemical Holding Co. | 28,110 | 17,522 |
| Qatar Islamic Bank SAQ | 14,658 | 98,169 |
| TOTAL QATAR | 115,691 |
| RUSSIA – 0.5% |
| Gazprom PJSC (c) | 14,450 | 2,280 |
| Inter RAO UES PJSC (a)(c) | 7,348,600 | 61,099 |
| MMC Norilsk Nickel PJSC (c) | 188 | 1,886 |
| Mobile TeleSystems PJSC ADR (a)(c) | 15,647 | 15,584 |
| Sberbank of Russia PJSC (a)(c) | 38,410 | 356 |
| Surgutneftegas PJSC (c) | 56,600 | 1,045 |
| VTB Bank PJSC (a)(c) | 91,900,000 | 5,295 |
| TOTAL RUSSIA | 87,545 |
| SAUDI ARABIA – 2.3% |
| Al Rajhi Bank (a) | 6,194 | 140,445 |
See accompanying notes which are an integral part of the financial statements.
Fidelity® Emerging Markets Multifactor ETF
Schedule of Investments–continued
| Common Stocks – continued |
| | Shares | Value |
| SAUDI ARABIA – continued |
| Alinma Bank | 4,762 | $ 47,524 |
| Bank AlBilad (a) | 2,917 | 39,358 |
| SABIC Agri-Nutrients Co. | 1,509 | 63,853 |
| Sahara International Petrochemical Co. | 3,903 | 42,120 |
| The Saudi National Bank | 7,029 | 111,116 |
| TOTAL SAUDI ARABIA | 444,416 |
| SOUTH AFRICA – 5.0% |
| African Rainbow Minerals Ltd. | 3,553 | 50,008 |
| AVI Ltd. | 52,953 | 211,697 |
| Capitec Bank Holdings Ltd. | 772 | 79,839 |
| Exxaro Resources Ltd. | 12,967 | 144,307 |
| Investec Ltd. | 12,496 | 61,435 |
| Kumba Iron Ore Ltd. | 1,784 | 33,587 |
| Mediclinic International PLC | 40,294 | 228,926 |
| MultiChoice Group | 7,896 | 51,572 |
| Rand Merchant Investment Holdings Ltd. | 38,341 | 59,501 |
| Vodacom Group Ltd. | 7,413 | 50,547 |
| TOTAL SOUTH AFRICA | 971,419 |
| SOUTH KOREA – 9.6% |
| Cheil Worldwide, Inc. | 3,826 | 65,671 |
| DB HiTek Co. Ltd. | 101 | 3,138 |
| GS Holdings Corp. | 1,161 | 37,492 |
| Hyundai Marine & Fire Insurance Co. Ltd. | 3,395 | 79,366 |
| Iljin Materials Co. Ltd. | 56 | 2,382 |
| Kangwon Land, Inc. (a) | 2,736 | 44,177 |
| Kia Corp. | 1,408 | 65,534 |
| Korea Zinc Co. Ltd. | 154 | 69,192 |
| KT&G Corp. | 3,214 | 215,929 |
| Kumho Petrochemical Co. Ltd. | 528 | 48,558 |
| L&F Co. Ltd. (a) | 62 | 9,793 |
| LG Corp. | 658 | 36,585 |
| LG Display Co. Ltd. | 573 | 5,129 |
| LG Innotek Co. Ltd. | 36 | 7,493 |
| LG Uplus Corp. | 7,092 | 57,007 |
| Samsung Electro-Mechanics Co. Ltd. | 151 | 12,827 |
| Samsung Electronics Co. Ltd. | 14,960 | 623,837 |
| Samsung SDI Co. Ltd. | 144 | 74,505 |
| Samsung SDS Co. Ltd. | 102 | 8,951 |
| Seegene, Inc. | 9,318 | 187,740 |
| Shinsegae, Inc. | 307 | 45,798 |
| SK Hynix, Inc. | 1,393 | 80,874 |
| SK Square Co. Ltd. (a) | 223 | 5,785 |
| Woori Financial Group, Inc. | 10,756 | 88,724 |
| TOTAL SOUTH KOREA | 1,876,487 |
| TAIWAN – 13.1% |
| Advantech Co. Ltd. | 7,000 | 63,651 |
|
| | Shares | Value |
|
| ASPEED Technology, Inc. | 1,000 | $ 52,137 |
| Asustek Computer, Inc. | 10,000 | 73,241 |
| Catcher Technology Co. Ltd. | 15,000 | 78,905 |
| Chicony Electronics Co. Ltd. | 30,000 | 74,575 |
| Chunghwa Telecom Co. Ltd. | 19,000 | 65,451 |
| E Ink Holdings, Inc. | 14,000 | 89,285 |
| Eva Airways Corp. | 39,000 | 28,322 |
| Far EasTone Telecommunications Co. Ltd. | 23,000 | 50,465 |
| Formosa Plastics Corp. | 21,000 | 54,158 |
| Gigabyte Technology Co. Ltd. | 29,000 | 83,249 |
| International Games System Co. Ltd. | 4,000 | 43,634 |
| Lite-On Technology Corp. | 39,000 | 77,461 |
| Lotes Co. Ltd. | 4,000 | 96,330 |
| Micro-Star International Co. Ltd. | 21,000 | 71,363 |
| Nanya Technology Corp. | 46,000 | 77,803 |
| Novatek Microelectronics Corp. | 10,000 | 74,792 |
| Pegatron Corp. | 41,000 | 75,072 |
| Pou Chen Corp. | 68,000 | 57,506 |
| Radiant Opto-Electronics Corp. | 25,000 | 76,344 |
| Ruentex Development Co. Ltd. | 312,000 | 383,434 |
| Simplo Technology Co. Ltd. | 9,000 | 71,643 |
| Sinbon Electronics Co. Ltd. | 9,000 | 69,967 |
| SinoPac Financial Holdings Co. Ltd. | 155,670 | 77,781 |
| Synnex Technology International Corp. | 44,000 | 71,826 |
| Taichung Commercial Bank Co. Ltd. | 166,900 | 65,004 |
| Taiwan Cooperative Financial Holding Co. Ltd. | 106,000 | 82,241 |
| Taiwan Fertilizer Co. Ltd. | 21,000 | 34,085 |
| Taiwan Mobile Co. Ltd. | 18,000 | 53,124 |
| The Shanghai Commercial & Savings Bank Ltd. | 53,000 | 76,319 |
| Tripod Technology Corp. | 23,000 | 63,670 |
| Union Bank Of Taiwan | 169,602 | 79,742 |
| WPG Holdings Ltd. | 48,000 | 65,470 |
| TOTAL TAIWAN | 2,558,050 |
| THAILAND – 0.9% |
| Advanced Info Service PCL NVDR | 10,900 | 54,700 |
| Intouch Holdings PCL NVDR | 26,800 | 50,699 |
| Krung Thai Bank PCL NVDR | 172,900 | 79,500 |
| TOTAL THAILAND | 184,899 |
| TURKEY – 2.3% |
| Akbank TAS | 151,804 | 119,303 |
| Enka Insaat ve Sanayi AS | 32,573 | 32,813 |
| Haci Omer Sabanci Holding AS | 64,111 | 115,589 |
| Turkcell Iletisim Hizmetleri AS | 53,535 | 73,786 |
| Turkiye Is Bankasi AS Class C | 225,920 | 113,185 |
| TOTAL TURKEY | 454,676 |
See accompanying notes which are an integral part of the financial statements.
| Common Stocks – continued |
| | Shares | Value |
| UNITED ARAB EMIRATES – 2.0% |
| Emaar Properties PJSC | 238,264 | $ 393,101 |
| TOTAL UNITED ARAB EMIRATES | 393,101 |
| UNITED STATES OF AMERICA – 0.2% |
| Yum China Holdings, Inc. | 1,140 | 47,139 |
| TOTAL UNITED STATES OF AMERICA | 47,139 |
TOTAL COMMON STOCKS
(Cost $22,779,366) | 18,973,774 |
| Preferred Stock – 2.5% |
| | |
| BRAZIL – 2.2% |
| Bradespar S.A. | 6,400 | 29,285 |
| Itausa S.A. | 61,210 | 125,284 |
| Petroleo Brasileiro S.A. | 49,400 | 280,645 |
| TOTAL BRAZIL | 435,214 |
| CHILE – 0.3% |
| Sociedad Quimica y Minera de Chile S.A. Class B | 510 | 48,524 |
| TOTAL CHILE | 48,524 |
|
| | Shares | Value |
| RUSSIA – 0.0% |
| Transneft PJSC (c) | 12 | $ 5,251 |
| TOTAL RUSSIA | 5,251 |
TOTAL PREFERRED STOCKS
(Cost $528,738) | 488,989 |
TOTAL INVESTMENT IN SECURITIES – 99.8%
(Cost $23,308,104) | 19,462,763 |
| NET OTHER ASSETS (LIABILITIES) – 0.2% | 44,516 |
| NET ASSETS – 100.0% | $ 19,507,279 |
| Categorizations in the Schedule of Investments are based on country or territory of incorporation. | |
| Legend | |
| (a) | Non-income producing. |
| (b) | Security is exempt from registration under Rule 144A of the Securities Act of 1933. These securities may be resold in transactions exempt from registration, normally to qualified institutional buyers. At the end of the period, the value of these securities amounted to $576,396 or 3.0% of net assets. |
| (c) | Level 3 security. |
| Futures Contracts |
| | Number of
contracts | Expiration
Date | Notional
Amount | Value | Unrealized
Appreciation/
(Depreciation) |
| Purchased | | | | | |
| Equity Index Contract | | | | | |
| ICE MSCI EAFE Index (United States) | 1 | December 2022 | $42,680 | $623 | $623 |
The notional amount of futures purchased as a percentage of Net Assets is 0.2%
Affiliated Central Funds
Fiscal year to date information regarding the Fund's investments in Fidelity Central Funds, including ownership percentage, is presented below.
| Fund | Value,
beginning
of period | | Purchases | | Sales
Proceeds | | Dividend
Income | | Realized
Gain/Loss | | Change in
Unrealized
appreciation
(depreciation) | | Value,
end
of period | % ownership,
end
of period |
| Fidelity Cash Central Fund, 3.10% | $50,336 | | $1,148,158 | | $1,198,494 | | $93 | | $— | | $— | | $— | 0.0% |
Amounts in the income column in the above table include any capital gain distributions from underlying funds, which are presented in the corresponding line-item in the Statement of Operations, if applicable.
See accompanying notes which are an integral part of the financial statements.
Fidelity® Emerging Markets Multifactor ETF
Schedule of Investments–continued
Investment Valuation
The following is a summary of the inputs used, as of October 31, 2022, involving the Fund's assets and liabilities carried at fair value. The inputs or methodology used for valuing securities may not be an indication of the risk associated with investing in those securities. For more information on valuation inputs, and their aggregation into the levels used in the table below, please refer to the Investment Valuation section in the accompanying Notes to Financial Statements.
Valuation Inputs at Reporting Date:
| Description | Total | Level 1 | Level 2 | Level 3 |
| Investments in Securities: | | | | | | | | |
| Equities: | | | | | | | | |
| Communication Services | | $ 1,157,940 | | $ 1,142,356 | | $ — | | $ 15,584 |
| Consumer Discretionary | | 1,674,438 | | 1,674,438 | | — | | — |
| Consumer Staples | | 2,090,072 | | 2,090,072 | | — | | — |
| Energy | | 1,789,288 | | 1,785,963 | | — | | 3,325 |
| Financials | | 3,741,466 | | 3,734,825 | | — | | 6,641 |
| Health Care | | 1,721,149 | | 1,721,149 | | — | | — |
| Industrials | | 336,336 | | 336,336 | | — | | — |
| Information Technology | | 2,888,578 | | 2,888,578 | | — | | — |
| Materials | | 809,415 | | 788,471 | | — | | 20,944 |
| Real Estate | | 1,174,922 | | 1,174,922 | | — | | — |
| Utilities | | 1,590,170 | | 1,529,071 | | — | | 61,099 |
| Preferred Stock | | 488,989 | | 483,738 | | — | | 5,251 |
| Total Investments in Securities: | | $ 19,462,763 | | $ 19,349,919 | | $ — | | $ 112,844 |
| Derivative Instruments: | | | | | | | | |
| Assets | | | | | | | | |
| Futures Contracts | | $ 623 | | $ 623 | | $ — | | $ — |
| Total Assets | | $ 623 | | $ 623 | | — | | $ — |
| Total Derivative Instruments: | | $ 623 | | $ 623 | | $ — | | $ — |
The following is a reconciliation of Investments in Securities for which Level 3 inputs were used in determining value:
| Investments in Securities: | |
| Financials | |
| Beginning Balance | $ — |
| Net Realized Gain (Loss) on Investment Securities | — |
| Net Unrealized Gain (Loss) on Investment Securities | (325,955) |
| Cost of Purchases | 16,555 |
| Proceeds of Sales | — |
| Amortization/Accretion | — |
| Transfers into Level 3 | 316,041 |
| Transfers out of Level 3 | — |
| Ending Balance | $ 6,641 |
| The change in unrealized gain (loss) for the period attributable to Level 3 securities held at October 31, 2022 | $ (325,955) |
| Utilities | |
| Beginning Balance | $ — |
| Net Realized Gain (Loss) on Investment Securities | — |
| Net Unrealized Gain (Loss) on Investment Securities | (415,383) |
| Cost of Purchases | 49,799 |
| Proceeds of Sales | — |
| Amortization/Accretion | — |
| Transfers into Level 3 | 426,683 |
| Transfers out of Level 3 | — |
| Ending Balance | $ 61,099 |
| The change in unrealized gain (loss) for the period attributable to Level 3 securities held at October 31, 2022 | $ (415,383) |
| Other Investments in Securities | |
| Beginning Balance | $ — |
| Net Realized Gain (Loss) on Investment Securities | 26 |
See accompanying notes which are an integral part of the financial statements.
| Investments in Securities: | |
| Net Unrealized Gain (Loss) on Investment Securities | (255,997) |
| Cost of Purchases | 213,568 |
| Proceeds of Sales | (2,154) |
| Amortization/Accretion | — |
| Transfers into Level 3 | 89,661 |
| Transfers out of Level 3 | — |
| Ending Balance | $ 45,104 |
| The change in unrealized gain (loss) for the period attributable to Level 3 securities held at October 31, 2022 | $ (255,997) |
The information used in the above reconciliation represents fiscal year to date activity for any Investments in Securities identified as using Level 3 inputs at either the beginning or the end of the current fiscal period. Cost of purchases and proceeds of sales may include securities received and/or delivered through in-kind transactions. Transfers into Level 3 were attributable to a lack of observable market data resulting from decreases in market activity, decreases in liquidity, security restructurings or corporate actions. Transfers out of Level 3 were attributable to observable market data becoming available for those securities. Transfers in or out of Level 3 represent the beginning value of any Security or Instrument where a change in the pricing level occurred from the beginning to the end of the period. The cost of purchases and the proceeds of sales may include securities received or delivered through corporate actions or exchanges. Realized and unrealized gains (losses) disclosed in the reconciliation are included in Net Gain (Loss) on the Fund’s Statement of Operations.
Value of Derivative Instruments
The following table is a summary of the Fund’s value of derivative instruments by primary risk exposure as of October 31, 2022. For additional information on derivative instruments, please refer to the Derivative Instruments section in the accompanying Notes to Financial Statements.
| Primary Risk/ Derivative Type | Value |
| | Asset | | Liabilities |
| Equity Risk | | | |
| Futures Contracts(a) | $623 | | $0 |
| Total Equity Risk | 623 | | 0 |
| Total Value of Derivatives | $623 | | $0 |
| (a) | Reflects gross cumulative appreciation (depreciation) on futures contracts as presented in the Schedule of Investments. In the Statement of Assets and Liabilities, the period end daily variation margin is included in receivable or payable for daily variation margin on futures contracts, and the net cumulative appreciation (depreciation) is included in total accumulated earnings (loss). |
See accompanying notes which are an integral part of the financial statements.
Fidelity® International High Dividend ETF
Schedule of Investments October 31, 2022
Showing Percentage of Net Assets
| Common Stocks – 99.3% |
| | Shares | Value |
| AUSTRALIA – 7.4% |
| Australia & New Zealand Banking Group Ltd. | 71,991 | $ 1,176,646 |
| BHP Group Ltd. | 64,455 | 1,539,821 |
| Fortescue Metals Group Ltd. | 93,243 | 876,476 |
| Sonic Healthcare Ltd. | 9,797 | 205,294 |
| Wesfarmers Ltd. | 10,350 | 300,868 |
| Westpac Banking Corp. | 92,229 | 1,421,907 |
| Woodside Energy Group Ltd. | 11,586 | 266,564 |
| Woolworths Group Ltd. | 8,785 | 185,492 |
| TOTAL AUSTRALIA | 5,973,068 |
| BERMUDA – 0.4% |
| Jardine Matheson Holdings Ltd. | 6,682 | 307,506 |
| TOTAL BERMUDA | 307,506 |
| CANADA – 17.2% |
| Barrick Gold Corp. | 109,807 | 1,649,460 |
| BCE, Inc. | 38,661 | 1,741,665 |
| Canadian National Railway Co. | 6,357 | 752,186 |
| Emera, Inc. | 47,347 | 1,752,538 |
| Enbridge, Inc. | 51,510 | 2,004,436 |
| Great-West Lifeco, Inc. | 33,352 | 771,176 |
| Manulife Financial Corp. | 58,933 | 975,556 |
| Royal Bank of Canada | 16,285 | 1,504,875 |
| TC Energy Corp. | 39,703 | 1,741,745 |
| The Bank of Nova Scotia | 20,184 | 974,390 |
| TOTAL CANADA | 13,868,027 |
| FINLAND – 0.7% |
| Kone Oyj Class B | 8,192 | 335,602 |
| Orion Oyj Class B | 5,016 | 230,775 |
| TOTAL FINLAND | 566,377 |
| FRANCE – 10.7% |
| AXA S.A. | 44,268 | 1,093,807 |
| BNP Paribas S.A. | 20,883 | 980,284 |
| Bouygues S.A. | 14,512 | 414,224 |
| Carrefour S.A. | 8,681 | 139,723 |
| Danone S.A. | 3,443 | 171,301 |
| Euroapi S.A. (a) | 182 | 3,185 |
| La Francaise des Jeux SAEM (b) | 12,180 | 397,258 |
| Orange S.A. | 216,025 | 2,056,299 |
| Sanofi | 4,138 | 357,162 |
| Schneider Electric SE | 4,637 | 587,813 |
| TotalEnergies SE | 44,772 | 2,438,198 |
| TOTAL FRANCE | 8,639,254 |
| GERMANY – 4.4% |
| Allianz SE | 6,389 | 1,150,515 |
| BASF SE | 28,617 | 1,285,066 |
|
| | Shares | Value |
|
| Daimler AG | 5,662 | $ 327,928 |
| SAP SE | 2,648 | 255,617 |
| Siemens AG | 5,011 | 547,958 |
| TOTAL GERMANY | 3,567,084 |
| HONG KONG – 4.8% |
| BOC Hong Kong Holdings Ltd. | 328,000 | 1,019,535 |
| Hang Seng Bank Ltd. | 64,000 | 900,909 |
| Power Assets Holdings Ltd. | 401,500 | 1,920,588 |
| TOTAL HONG KONG | 3,841,032 |
| IRELAND – 1.4% |
| Smurfit Kappa Group PLC | 35,256 | 1,168,362 |
| TOTAL IRELAND | 1,168,362 |
| ITALY – 2.3% |
| Enel SpA | 420,493 | 1,878,071 |
| TOTAL ITALY | 1,878,071 |
| JAPAN – 16.8% |
| Canon, Inc. | 8,600 | 182,490 |
| ENEOS Holdings, Inc. | 402,200 | 1,325,378 |
| Honda Motor Co. Ltd. | 13,100 | 297,281 |
| Iida Group Holdings Co. Ltd. | 13,600 | 189,038 |
| ITOCHU Corp. | 19,500 | 504,965 |
| Japan Tobacco, Inc. | 19,600 | 324,920 |
| Kajima Corp. | 41,000 | 386,457 |
| Mitsubishi Corp. | 18,900 | 512,570 |
| Mitsui & Co. Ltd. | 24,100 | 533,934 |
| Mizuho Financial Group, Inc. | 108,100 | 1,168,020 |
| Nintendo Co. Ltd. | 47,400 | 1,935,735 |
| Nomura Holdings, Inc. | 292,400 | 947,814 |
| Otsuka Holdings Co. Ltd. | 9,400 | 301,412 |
| Seiko Epson Corp. | 11,500 | 156,753 |
| Sekisui House Ltd. | 15,100 | 251,438 |
| Shin-Etsu Chemical Co. Ltd. | 12,500 | 1,306,893 |
| SoftBank Corp. | 175,800 | 1,733,339 |
| Sumitomo Corp. | 34,300 | 437,418 |
| Takeda Pharmaceutical Co. Ltd. | 13,200 | 347,950 |
| Tokyo Electron Ltd. | 600 | 159,411 |
| Toyota Motor Corp. | 42,135 | 583,826 |
| TOTAL JAPAN | 13,587,042 |
| NETHERLANDS – 1.7% |
| ASR Nederland N.V. | 23,075 | 1,016,928 |
| BE Semiconductor Industries N.V. | 2,136 | 109,187 |
| Koninklijke Ahold Delhaize N.V. | 6,080 | 169,759 |
| Koninklijke Philips N.V. | 7,745 | 98,119 |
| TOTAL NETHERLANDS | 1,393,993 |
See accompanying notes which are an integral part of the financial statements.
| Common Stocks – continued |
| | Shares | Value |
| NORWAY – 2.0% |
| Yara International ASA | 35,279 | $ 1,574,463 |
| TOTAL NORWAY | 1,574,463 |
| SINGAPORE – 0.3% |
| Venture Corp. Ltd. | 18,600 | 209,383 |
| TOTAL SINGAPORE | 209,383 |
| SPAIN – 8.5% |
| ACS Actividades de Construccion y Servicios S.A. | 18,036 | 462,582 |
| Endesa S.A. | 134,409 | 2,243,057 |
| Industria de Diseno Textil S.A. | 12,891 | 292,274 |
| Repsol S.A. | 146,598 | 1,991,516 |
| Telefonica S.A. | 542,538 | 1,868,718 |
| TOTAL SPAIN | 6,858,147 |
| SWEDEN – 4.4% |
| Investor AB Class B | 61,844 | 1,009,387 |
| Skandinaviska Enskilda Banken AB Class A | 90,412 | 953,174 |
| Swedbank AB Class A | 63,023 | 939,033 |
| Telefonaktiebolaget LM Ericsson Class B | 16,944 | 94,147 |
| Volvo AB Class B | 34,732 | 568,261 |
| TOTAL SWEDEN | 3,564,002 |
| SWITZERLAND – 4.6% |
| ABB Ltd. | 14,684 | 408,496 |
| Accelleron Industries Ltd. (a) | 734 | 12,454 |
| Cie Financiere Richemont S.A. | 3,228 | 315,913 |
| Lonza Group AG | 241 | 124,118 |
| Nestle S.A. | 5,296 | 577,043 |
| Novartis AG | 5,560 | 449,467 |
| Roche Holding AG | 1,608 | 534,340 |
| Zurich Insurance Group AG | 3,033 | 1,295,030 |
| TOTAL SWITZERLAND | 3,716,861 |
| UNITED KINGDOM – 11.7% |
| AstraZeneca PLC | 4,730 | 558,421 |
| BAE Systems PLC | 61,893 | 580,345 |
| BP PLC | 444,731 | 2,456,772 |
|
| | Shares | Value |
|
| British American Tobacco PLC | 6,137 | $ 242,605 |
| Direct Line Insurance Group PLC | 292,874 | 680,470 |
| GSK PLC | 14,838 | 244,092 |
| Haleon PLC (a) | 18,693 | 57,679 |
| Imperial Brands PLC | 6,613 | 161,719 |
| Legal & General Group PLC | 333,655 | 894,694 |
| M&G PLC | 423,559 | 854,388 |
| Persimmon PLC | 11,818 | 177,567 |
| RELX PLC | 19,185 | 517,095 |
| Rio Tinto PLC | 30,711 | 1,604,242 |
| The Sage Group PLC | 18,841 | 157,662 |
| Unilever PLC | 6,184 | 282,982 |
| TOTAL UNITED KINGDOM | 9,470,733 |
TOTAL COMMON STOCKS
(Cost $100,246,882) | 80,183,405 |
| Money Market Fund – 0.1% |
| | |
Fidelity Cash Central Fund, 3.10% (c)
(Cost $48,989) | 48,979 | 48,989 |
TOTAL INVESTMENT IN SECURITIES – 99.4%
(Cost $100,295,871) | 80,232,394 |
| NET OTHER ASSETS (LIABILITIES) – 0.6% | 497,319 |
| NET ASSETS – 100.0% | $ 80,729,713 |
| Categorizations in the Schedule of Investments are based on country or territory of incorporation. | |
| Legend | |
| (a) | Non-income producing. |
| (b) | Security is exempt from registration under Rule 144A of the Securities Act of 1933. These securities may be resold in transactions exempt from registration, normally to qualified institutional buyers. At the end of the period, the value of these securities amounted to $397,258 or 0.5% of net assets. |
| (c) | Affiliated fund that is generally available only to investment companies and other accounts managed by Fidelity Investments. The rate quoted is the annualized seven-day yield of the fund at period end. A complete unaudited listing of the fund's holdings as of its most recent quarter end is available upon request. In addition, each Fidelity Central Fund's financial statements, which are not covered by the Fund's Report of Independent Registered Public Accounting Firm, are available on the SEC's website or upon request. |
| Futures Contracts |
| | Number of
contracts | Expiration
Date | Notional
Amount | Value | Unrealized
Appreciation/
(Depreciation) |
| Purchased | | | | | |
| Equity Index Contract | | | | | |
| ICE MSCI EAFE Index (United States) | 6 | December 2022 | $526,770 | $(1,006) | $(1,006) |
The notional amount of futures purchased as a percentage of Net Assets is 0.7%
See accompanying notes which are an integral part of the financial statements.
Fidelity® International High Dividend ETF
Schedule of Investments–continued
Affiliated Central Funds
Fiscal year to date information regarding the Fund's investments in Fidelity Central Funds, including ownership percentage, is presented below.
| Fund | Value,
beginning
of period | | Purchases | | Sales
Proceeds | | Dividend
Income | | Realized
Gain/Loss | | Change in
Unrealized
appreciation
(depreciation) | | Value,
end
of period | % ownership,
end
of period |
| Fidelity Cash Central Fund, 3.10% | $ 56,466 | | $25,726,305 | | $25,733,782 | | $ 694 | | $— | | $— | | $48,989 | 0.0% |
| Fidelity Securities Lending Cash Central Fund, 3.10% | 4,768,155 | | 17,340,863 | | 22,109,018 | | 22,047 | | — | | — | | $ — | 0.0% |
| Total | $4,824,621 | | $43,067,168 | | $47,842,800 | | $22,741 | | $— | | $— | | $48,989 | |
Amounts in the income column in the above table include any capital gain distributions from underlying funds, which are presented in the corresponding line-item in the Statement of Operations, if applicable. Amount for Fidelity Securities Lending Cash Central Fund represents the income earned on investing cash collateral, less rebates paid to borrowers and any lending agent fees associated with the loan, plus any premium payments received from lending certain types of securities.
Investment Valuation
The following is a summary of the inputs used, as of October 31, 2022, involving the Fund's assets and liabilities carried at fair value. The inputs or methodology used for valuing securities may not be an indication of the risk associated with investing in those securities. For more information on valuation inputs, and their aggregation into the levels used in the table below, please refer to the Investment Valuation section in the accompanying Notes to Financial Statements.
Valuation Inputs at Reporting Date:
| Description | Total | Level 1 | Level 2 | Level 3 |
| Investments in Securities: | | | | | | | | |
| Equities: | | | | | | | | |
| Communication Services | | $ 9,335,756 | | $ 9,335,756 | | $ — | | $ — |
| Consumer Discretionary | | 3,133,391 | | 3,133,391 | | — | | — |
| Consumer Staples | | 2,313,223 | | 2,313,223 | | — | | — |
| Energy | | 12,224,609 | | 12,224,609 | | — | | — |
| Financials | | 21,728,538 | | 21,728,538 | | — | | — |
| Health Care | | 3,454,335 | | 3,454,335 | | — | | — |
| Industrials | | 7,869,866 | | 7,869,866 | | — | | — |
| Information Technology | | 1,324,650 | | 1,324,650 | | — | | — |
| Materials | | 11,004,783 | | 11,004,783 | | — | | — |
| Utilities | | 7,794,254 | | 7,794,254 | | — | | — |
| Money Market Fund | | 48,989 | | 48,989 | | — | | — |
| Total Investments in Securities: | | $ 80,232,394 | | $ 80,232,394 | | $ — | | $ — |
| Derivative Instruments: | | | | | | | | |
| Liabilities | | | | | | | | |
| Futures Contracts | | $ (1,006) | | $ (1,006) | | $ — | | $ — |
| Total Liabilities | | $ (1,006) | | $ (1,006) | | — | | $ — |
| Total Derivative Instruments: | | $ (1,006) | | $ (1,006) | | $ — | | $ — |
Value of Derivative Instruments
The following table is a summary of the Fund’s value of derivative instruments by primary risk exposure as of October 31, 2022. For additional information on derivative instruments, please refer to the Derivative Instruments section in the accompanying Notes to Financial Statements.
| Primary Risk/ Derivative Type | Value |
| | Asset | | Liabilities |
| Equity Risk | | | |
| Futures Contracts(a) | $0 | | $(1,006) |
| Total Equity Risk | 0 | | (1,006) |
| Total Value of Derivatives | $0 | | $(1,006) |
| (a) | Reflects gross cumulative appreciation (depreciation) on futures contracts as presented in the Schedule of Investments. In the Statement of Assets and Liabilities, the period end daily variation margin is included in receivable or payable for daily variation margin on futures contracts, and the net cumulative appreciation (depreciation) is included in total accumulated earnings (loss). |
See accompanying notes which are an integral part of the financial statements.
Fidelity® International Multifactor ETF
Schedule of Investments October 31, 2022
Showing Percentage of Net Assets
| Common Stocks – 99.3% |
| | Shares | Value |
| AUSTRALIA – 5.2% |
| ASX Ltd. | 583 | $ 25,238 |
| BHP Group Ltd. | 2,531 | 60,465 |
| Commonwealth Bank of Australia | 1,541 | 103,151 |
| CSL Ltd. | 628 | 112,634 |
| Fortescue Metals Group Ltd. | 1,712 | 16,093 |
| JB Hi-Fi Ltd. | 514 | 14,104 |
| Macquarie Group Ltd. | 466 | 50,508 |
| Medibank Pvt Ltd. | 13,052 | 23,452 |
| Rio Tinto Ltd. | 340 | 19,176 |
| Sonic Healthcare Ltd. | 2,199 | 46,080 |
| Suncorp Group Ltd. | 4,297 | 31,351 |
| Telstra Group Ltd. | 61,041 | 153,008 |
| Wesfarmers Ltd. | 1,020 | 29,651 |
| TOTAL AUSTRALIA | 684,911 |
| BAILIWICK OF JERSEY – 0.7% |
| Experian PLC | 1,628 | 51,996 |
| Man Group PLC | 18,160 | 45,308 |
| TOTAL BAILIWICK OF JERSEY | 97,304 |
| BELGIUM – 1.5% |
| Elia Group S.A. | 1,134 | 143,349 |
| UCB S.A. | 803 | 60,571 |
| TOTAL BELGIUM | 203,920 |
| BERMUDA – 0.5% |
| Jardine Matheson Holdings Ltd. | 1,477 | 67,972 |
| TOTAL BERMUDA | 67,972 |
| CANADA – 10.2% |
| Bank of Montreal | 597 | 54,923 |
| Canadian Apartment Properties REIT | 4,623 | 142,989 |
| Canadian Imperial Bank of Commerce | 887 | 40,232 |
| Canadian National Railway Co. | 568 | 67,208 |
| Canadian Natural Resources Ltd. | 673 | 40,314 |
| Canadian Pacific Railway Ltd. | 894 | 66,563 |
| Canadian Utilities Ltd. Class A | 5,788 | 153,818 |
| CGI, Inc. (a) | 250 | 20,113 |
| Constellation Software, Inc. | 17 | 24,551 |
| Crescent Point Energy Corp. | 2,948 | 23,017 |
| Dollarama, Inc. | 594 | 35,251 |
| Empire Co. Ltd. | 3,412 | 87,548 |
| Fairfax Financial Holdings Ltd. | 43 | 21,092 |
| Intact Financial Corp. | 216 | 32,780 |
| Loblaw Cos. Ltd. | 1,216 | 99,505 |
| Manulife Financial Corp. | 2,092 | 34,630 |
| Open Text Corp. | 446 | 12,902 |
| Royal Bank of Canada | 1,105 | 102,112 |
| Stantec, Inc. | 560 | 27,367 |
|
| | Shares | Value |
|
| Teck Resources Ltd. Class B (a) | 1,470 | $ 44,691 |
| The Bank of Nova Scotia | 1,046 | 50,496 |
| The Toronto-Dominion Bank | 1,452 | 92,812 |
| Vermilion Energy, Inc. | 894 | 20,835 |
| West Fraser Timber Co. Ltd. | 440 | 32,996 |
| Whitecap Resources, Inc. | 2,965 | 22,954 |
| TOTAL CANADA | 1,351,699 |
| DENMARK – 3.2% |
| AP Moller - Maersk A/S Class B | 21 | 43,937 |
| Coloplast A/S Class B | 541 | 60,330 |
| Novo Nordisk A/S Class B | 1,889 | 205,412 |
| Novozymes A/S Class B | 531 | 27,895 |
| Pandora A/S | 514 | 27,097 |
| Ringkjoebing Landbobank A/S | 398 | 43,327 |
| SimCorp A/S | 302 | 18,042 |
| TOTAL DENMARK | 426,040 |
| FINLAND – 1.0% |
| Kone Oyj Class B | 1,286 | 52,684 |
| Orion Oyj Class B | 1,181 | 54,335 |
| TietoEVRY Oyj | 849 | 20,256 |
| TOTAL FINLAND | 127,275 |
| FRANCE – 6.4% |
| Bureau Veritas S.A. | 2,028 | 50,250 |
| Dassault Aviation S.A. | 370 | 55,000 |
| Dassault Systemes SE | 796 | 26,709 |
| Edenred | 521 | 26,756 |
| EssilorLuxottica S.A. | 211 | 33,440 |
| Gaztransport Et Technigaz S.A. | 48 | 5,584 |
| Hermes International | 25 | 32,381 |
| Ipsen S.A. | 579 | 59,515 |
| La Francaise des Jeux SAEM (b) | 302 | 9,850 |
| LVMH Moet Hennessy Louis Vuitton SE | 152 | 95,997 |
| Publicis Groupe S.A. | 2,866 | 160,722 |
| Sanofi | 1,527 | 131,799 |
| Sodexo S.A. | 149 | 13,215 |
| Teleperformance | 189 | 50,678 |
| Thales S.A. | 470 | 59,761 |
| TotalEnergies SE | 758 | 41,279 |
| TOTAL FRANCE | 852,936 |
| GERMANY – 2.8% |
| Allianz SE | 505 | 90,939 |
| Beiersdorf AG | 759 | 72,900 |
| Deutsche Post AG | 1,445 | 51,286 |
| GEA Group AG | 966 | 33,798 |
| K+S AG | 1,326 | 29,304 |
| Knorr-Bremse AG | 582 | 26,207 |
See accompanying notes which are an integral part of the financial statements.
Fidelity® International Multifactor ETF
Schedule of Investments–continued
| Common Stocks – continued |
| | Shares | Value |
| GERMANY – continued |
| Merck KGaA | 388 | $ 63,274 |
| TOTAL GERMANY | 367,708 |
| HONG KONG – 1.4% |
| BOC Hong Kong Holdings Ltd. | 13,000 | 40,409 |
| Sino Land Co. Ltd. | 129,532 | 138,445 |
| TOTAL HONG KONG | 178,854 |
| ISRAEL – 2.0% |
| Bank Hapoalim BM | 5,226 | 50,634 |
| Bank Leumi Le-Israel BM | 5,229 | 50,143 |
| ICL Group Ltd. | 3,181 | 28,850 |
| Israel Discount Bank Ltd. Class A | 8,079 | 46,185 |
| Mizrahi Tefahot Bank Ltd. | 1,230 | 46,726 |
| Nice Ltd. (a) | 126 | 23,979 |
| Tower Semiconductor Ltd. (a) | 507 | 21,781 |
| TOTAL ISRAEL | 268,298 |
| ITALY – 2.3% |
| Assicurazioni Generali SpA | 3,567 | 53,552 |
| Eni SpA | 1,087 | 14,239 |
| Moncler SpA | 787 | 33,983 |
| Recordati Industria Chimica e Farmaceutica SpA | 1,269 | 47,698 |
| Snam SpA | 34,341 | 152,802 |
| TOTAL ITALY | 302,274 |
| JAPAN – 22.1% |
| Advance Residence Investment Corp. | 67 | 155,966 |
| Astellas Pharma, Inc. | 7,700 | 106,018 |
| Bandai Namco Holdings, Inc. | 500 | 33,108 |
| Canon, Inc. | 1,600 | 33,952 |
| Dai Nippon Printing Co. Ltd. | 2,200 | 44,152 |
| Daito Trust Construction Co. Ltd. | 2,000 | 197,935 |
| FUJIFILM Holdings Corp. | 700 | 32,114 |
| Honda Motor Co. Ltd. | 2,100 | 47,656 |
| Inpex Corp. | 2,500 | 25,532 |
| ITOCHU Corp. | 2,500 | 64,739 |
| Japan Post Holdings Co. Ltd. | 7,100 | 47,749 |
| Japan Tobacco, Inc. | 6,800 | 112,727 |
| Kajima Corp. | 4,400 | 41,473 |
| KDDI Corp. | 5,700 | 168,544 |
| Medipal Holdings Corp. | 6,600 | 81,926 |
| Mitsubishi Corp. | 2,400 | 65,088 |
| Mitsui & Co. Ltd. | 3,100 | 68,680 |
| Nexon Co. Ltd. | 6,300 | 105,837 |
| NGK Spark Plug Co. Ltd. | 1,700 | 30,995 |
| Nippon Telegraph & Telephone Corp. | 5,800 | 159,755 |
| Nissan Chemical Corp. | 700 | 31,554 |
|
| | Shares | Value |
|
| Nomura Research Institute Ltd. | 1,100 | $ 24,459 |
| Obayashi Corp. | 6,700 | 43,048 |
| Obic Co. Ltd. | 200 | 30,101 |
| Ono Pharmaceutical Co. Ltd. | 4,100 | 96,435 |
| Osaka Gas Co. Ltd. | 11,300 | 167,407 |
| Secom Co. Ltd. | 800 | 45,701 |
| Sekisui House Ltd. | 2,200 | 36,633 |
| Shimano, Inc. | 200 | 31,049 |
| Shionogi & Co. Ltd. | 2,100 | 97,346 |
| Sojitz Corp. | 2,900 | 42,807 |
| Sompo Holdings, Inc. | 1,300 | 54,166 |
| Sony Group Corp. | 1,000 | 67,198 |
| Sumitomo Forestry Co. Ltd. | 2,200 | 34,487 |
| Sumitomo Mitsui Trust Holdings, Inc. | 1,700 | 48,918 |
| Suntory Beverage & Food Ltd. | 2,800 | 93,814 |
| Taisei Corp. | 1,600 | 43,651 |
| TIS, Inc. | 1,000 | 27,013 |
| Tokio Marine Holdings, Inc. | 3,700 | 66,988 |
| TOPPAN, Inc. | 2,900 | 43,295 |
| Tosoh Corp. | 2,800 | 30,499 |
| Toyo Suisan Kaisha Ltd. | 2,500 | 93,854 |
| Trend Micro, Inc. | 500 | 25,263 |
| USS Co. Ltd. | 1,900 | 28,723 |
| TOTAL JAPAN | 2,928,355 |
| NETHERLANDS – 3.5% |
| ASML Holding N.V. | 211 | 99,683 |
| Heineken Holding N.V. | 1,040 | 71,027 |
| Koninklijke Ahold Delhaize N.V. | 3,566 | 99,566 |
| Koninklijke KPN N.V. | 45,834 | 128,244 |
| Wolters Kluwer N.V. | 580 | 61,652 |
| TOTAL NETHERLANDS | 460,172 |
| NORWAY – 0.8% |
| Equinor ASA | 433 | 15,841 |
| Orkla ASA | 9,158 | 61,800 |
| Yara International ASA | 719 | 32,088 |
| TOTAL NORWAY | 109,729 |
| PORTUGAL – 0.6% |
| Galp Energia SGPS S.A. | 654 | 6,642 |
| Jeronimo Martins SGPS S.A. | 3,370 | 69,879 |
| TOTAL PORTUGAL | 76,521 |
| SINGAPORE – 1.1% |
| Oversea-Chinese Banking Corp. Ltd. | 6,981 | 59,840 |
| Singapore Exchange Ltd. | 5,900 | 35,106 |
| United Overseas Bank Ltd. | 2,900 | 56,889 |
| TOTAL SINGAPORE | 151,835 |
See accompanying notes which are an integral part of the financial statements.
| Common Stocks – continued |
| | Shares | Value |
| SOUTH AFRICA – 0.4% |
| Investec PLC | 9,782 | $ 49,386 |
| TOTAL SOUTH AFRICA | 49,386 |
| SPAIN – 3.5% |
| Banco de Sabadell S.A. | 67,782 | 53,299 |
| CaixaBank S.A. | 16,801 | 55,677 |
| Enagas S.A. | 9,042 | 146,785 |
| Industria de Diseno Textil S.A. | 1,966 | 44,575 |
| Red Electrica Corp. S.A. | 8,979 | 145,096 |
| Repsol S.A. | 822 | 11,167 |
| TOTAL SPAIN | 456,599 |
| SWEDEN – 3.3% |
| Atlas Copco AB Class A | 5,212 | 55,674 |
| Axfood AB | 2,376 | 58,785 |
| Epiroc AB Class A | 2,400 | 36,715 |
| Essity AB Class B | 3,368 | 71,137 |
| Investor AB Class B | 3,963 | 64,682 |
| Securitas AB Class B | 4,066 | 33,240 |
| SSAB AB | 6,225 | 29,935 |
| Swedish Match AB | 8,145 | 83,732 |
| TOTAL SWEDEN | 433,900 |
| SWITZERLAND – 12.6% |
| Alcon, Inc. | 923 | 56,205 |
| Baloise Holding AG | 293 | 40,052 |
| Cie Financiere Richemont S.A. | 552 | 54,022 |
| EMS-Chemie Holding AG | 38 | 23,903 |
| Galenica AG (b) | 535 | 38,438 |
| Geberit AG | 90 | 40,047 |
| Kuehne + Nagel International AG | 165 | 35,185 |
| Nestle S.A. | 3,027 | 329,817 |
| Novartis AG | 2,529 | 204,443 |
| PSP Swiss Property AG | 1,686 | 180,267 |
| Roche Holding AG | 753 | 250,222 |
| Sonova Holding AG | 152 | 35,951 |
| Straumann Holding AG | 375 | 35,741 |
| Swisscom AG | 286 | 141,264 |
| The Swatch Group AG | 150 | 33,785 |
| UBS Group AG | 5,000 | 79,390 |
| Zurich Insurance Group AG | 197 | 84,115 |
| TOTAL SWITZERLAND | 1,662,847 |
|
| | Shares | Value |
| UNITED KINGDOM – 14.2% |
| Admiral Group PLC | 2,301 | $ 53,435 |
| Anglo American PLC | 1,340 | 40,244 |
| AstraZeneca PLC | 1,744 | 205,896 |
| Auto Trader Group PLC (b) | 18,095 | 108,668 |
| BAE Systems PLC | 5,806 | 54,440 |
| Barclays PLC | 36,452 | 62,013 |
| British American Tobacco PLC | 3,377 | 133,498 |
| Compass Group PLC | 1,900 | 40,175 |
| Diageo PLC | 3,179 | 131,692 |
| GSK PLC | 6,068 | 99,822 |
| IG Group Holdings PLC | 5,374 | 49,220 |
| Imperial Brands PLC | 3,276 | 80,114 |
| InterContinental Hotels Group PLC | 475 | 25,682 |
| RELX PLC | 2,493 | 67,194 |
| Rightmove PLC | 18,054 | 102,228 |
| Rio Tinto PLC | 905 | 47,274 |
| Safestore Holdings PLC | 12,406 | 129,053 |
| Shell PLC | 2,221 | 61,474 |
| SSE PLC | 8,644 | 154,857 |
| Tesco PLC | 23,703 | 58,702 |
| The Sage Group PLC | 2,891 | 24,192 |
| Unilever PLC | 3,404 | 155,768 |
| TOTAL UNITED KINGDOM | 1,885,641 |
TOTAL COMMON STOCKS
(Cost $14,699,227) | 13,144,176 |
TOTAL INVESTMENT IN SECURITIES – 99.3%
(Cost $14,699,227) | 13,144,176 |
| NET OTHER ASSETS (LIABILITIES) – 0.7% | 98,436 |
| NET ASSETS – 100.0% | $ 13,242,612 |
| Categorizations in the Schedule of Investments are based on country or territory of incorporation. | |
| Legend | |
| (a) | Non-income producing. |
| (b) | Security is exempt from registration under Rule 144A of the Securities Act of 1933. These securities may be resold in transactions exempt from registration, normally to qualified institutional buyers. At the end of the period, the value of these securities amounted to $156,956 or 1.2% of net assets. |
See accompanying notes which are an integral part of the financial statements.
Fidelity® International Multifactor ETF
Schedule of Investments–continued
| Futures Contracts |
| | Number of
contracts | Expiration
Date | Notional
Amount | Value | Unrealized
Appreciation/
(Depreciation) |
| Purchased | | | | | |
| Equity Index Contract | | | | | |
| ICE MSCI EAFE Index (United States) | 1 | December 2022 | $87,795 | $(4,728) | $(4,728) |
The notional amount of futures purchased as a percentage of Net Assets is 0.7%
Affiliated Central Funds
Fiscal year to date information regarding the Fund's investments in Fidelity Central Funds, including ownership percentage, is presented below.
| Fund | Value,
beginning
of period | | Purchases | | Sales
Proceeds | | Dividend
Income | | Realized
Gain/Loss | | Change in
Unrealized
appreciation
(depreciation) | | Value,
end
of period | % ownership,
end
of period |
| Fidelity Cash Central Fund, 3.10% | $119,828 | | $648,462 | | $768,290 | | $128 | | $— | | $— | | $— | 0.0% |
Amounts in the income column in the above table include any capital gain distributions from underlying funds, which are presented in the corresponding line-item in the Statement of Operations, if applicable.
See accompanying notes which are an integral part of the financial statements.
Investment Valuation
The following is a summary of the inputs used, as of October 31, 2022, involving the Fund's assets and liabilities carried at fair value. The inputs or methodology used for valuing securities may not be an indication of the risk associated with investing in those securities. For more information on valuation inputs, and their aggregation into the levels used in the table below, please refer to the Investment Valuation section in the accompanying Notes to Financial Statements.
Valuation Inputs at Reporting Date:
| Description | Total | Level 1 | Level 2 | Level 3 |
| Investments in Securities: | | | | | | | | |
| Equities: | | | | | | | | |
| Communication Services | | $ 1,228,270 | | $ 1,228,270 | | $ — | | $ — |
| Consumer Discretionary | | 799,617 | | 799,617 | | — | | — |
| Consumer Staples | | 1,965,865 | | 1,965,865 | | — | | — |
| Energy | | 288,878 | | 288,878 | | — | | — |
| Financials | | 2,090,925 | | 2,090,925 | | — | | — |
| Health Care | | 2,183,531 | | 2,183,531 | | — | | — |
| Industrials | | 1,591,488 | | 1,591,488 | | — | | — |
| Information Technology | | 491,866 | | 491,866 | | — | | — |
| Materials | | 494,967 | | 494,967 | | — | | — |
| Real Estate | | 944,655 | | 944,655 | | — | | — |
| Utilities | | 1,064,114 | | 1,064,114 | | — | | — |
| Total Investments in Securities: | | $ 13,144,176 | | $ 13,144,176 | | $ — | | $ — |
| Derivative Instruments: | | | | | | | | |
| Liabilities | | | | | | | | |
| Futures Contracts | | $ (4,728) | | $ (4,728) | | $ — | | $ — |
| Total Liabilities | | $ (4,728) | | $ (4,728) | | — | | $ — |
| Total Derivative Instruments: | | $ (4,728) | | $ (4,728) | | $ — | | $ — |
Value of Derivative Instruments
The following table is a summary of the Fund’s value of derivative instruments by primary risk exposure as of October 31, 2022. For additional information on derivative instruments, please refer to the Derivative Instruments section in the accompanying Notes to Financial Statements.
| Primary Risk/ Derivative Type | Value |
| | Asset | | Liabilities |
| Equity Risk | | | |
| Futures Contracts(a) | $0 | | $(4,728) |
| Total Equity Risk | 0 | | (4,728) |
| Total Value of Derivatives | $0 | | $(4,728) |
| (a) | Reflects gross cumulative appreciation (depreciation) on futures contracts as presented in the Schedule of Investments. In the Statement of Assets and Liabilities, the period end daily variation margin is included in receivable or payable for daily variation margin on futures contracts, and the net cumulative appreciation (depreciation) is included in total accumulated earnings (loss). |
See accompanying notes which are an integral part of the financial statements.
Fidelity® International Value Factor ETF
Schedule of Investments October 31, 2022
Showing Percentage of Net Assets
| Common Stocks – 99.3% |
| | Shares | Value |
| AUSTRALIA – 5.2% |
| Aristocrat Leisure Ltd. | 9,054 | $ 214,620 |
| Australia & New Zealand Banking Group Ltd. | 30,107 | 492,079 |
| BHP Group Ltd. | 17,384 | 415,301 |
| Fortescue Metals Group Ltd. | 15,354 | 144,326 |
| Macquarie Group Ltd. | 3,825 | 414,580 |
| Sonic Healthcare Ltd. | 13,576 | 284,482 |
| TOTAL AUSTRALIA | 1,965,388 |
| BAILIWICK OF JERSEY – 1.9% |
| Ferguson PLC | 2,505 | 274,281 |
| Glencore PLC | 80,437 | 462,592 |
| TOTAL BAILIWICK OF JERSEY | 736,873 |
| BERMUDA – 0.9% |
| Hongkong Land Holdings Ltd. | 27,000 | 103,950 |
| Jardine Matheson Holdings Ltd. | 5,500 | 253,110 |
| TOTAL BERMUDA | 357,060 |
| CANADA – 12.3% |
| Alimentation Couche-Tard, Inc. | 8,442 | 377,524 |
| Canadian National Railway Co. | 2,535 | 299,951 |
| Canadian Natural Resources Ltd. | 8,704 | 521,391 |
| Canadian Pacific Railway Ltd. | 3,986 | 296,777 |
| Canadian Tire Corp. Ltd. Class A | 1,232 | 137,908 |
| CGI, Inc. (a) | 4,346 | 349,643 |
| Fairfax Financial Holdings Ltd. | 632 | 310,007 |
| Fortis, Inc. | 4,465 | 173,978 |
| Manulife Financial Corp. | 21,214 | 351,169 |
| Power Corp. of Canada | 12,493 | 309,841 |
| Suncor Energy, Inc. | 13,224 | 454,292 |
| Teck Resources Ltd. Class B (a) | 16,704 | 507,837 |
| The Toronto-Dominion Bank | 9,034 | 577,453 |
| TOTAL CANADA | 4,667,771 |
| DENMARK – 0.7% |
| AP Moller - Maersk A/S Class B | 120 | 251,070 |
| TOTAL DENMARK | 251,070 |
| FINLAND – 1.5% |
| Nokia Oyj | 66,439 | 295,952 |
| TietoEVRY Oyj | 10,657 | 254,263 |
| TOTAL FINLAND | 550,215 |
| FRANCE – 11.6% |
| BNP Paribas S.A. | 8,490 | 398,535 |
| Bouygues S.A. | 13,847 | 395,243 |
| Capgemini SE | 1,829 | 300,529 |
| Carrefour S.A. | 12,563 | 202,205 |
| Cie de Saint-Gobain | 9,866 | 403,694 |
|
| | Shares | Value |
|
| Engie S.A. | 37,453 | $ 486,917 |
| La Francaise des Jeux SAEM (b) | 12,624 | 411,739 |
| Renault S.A. (a) | 15,306 | 471,530 |
| Sanofi | 5,888 | 508,209 |
| Societe Generale S.A. | 14,118 | 324,071 |
| TotalEnergies SE | 9,243 | 503,356 |
| TOTAL FRANCE | 4,406,028 |
| GERMANY – 9.1% |
| Allianz SE | 2,544 | 458,117 |
| Bayerische Motoren Werke AG | 4,269 | 335,516 |
| Daimler AG | 6,342 | 367,312 |
| Deutsche Bank AG | 37,105 | 354,259 |
| Deutsche Post AG | 11,948 | 424,054 |
| Deutsche Telekom AG | 26,015 | 492,743 |
| Fresenius SE & Co. KGaA | 13,406 | 308,721 |
| SAP SE | 5,584 | 539,036 |
| Vonovia SE | 6,941 | 153,667 |
| TOTAL GERMANY | 3,433,425 |
| HONG KONG – 1.5% |
| AIA Group Ltd. | 48,200 | 365,037 |
| Sun Hung Kai Properties Ltd. | 17,000 | 182,889 |
| TOTAL HONG KONG | 547,926 |
| ITALY – 3.0% |
| Enel SpA | 102,216 | 456,533 |
| Eni SpA | 20,519 | 268,791 |
| UniCredit SpA | 33,869 | 420,037 |
| TOTAL ITALY | 1,145,361 |
| JAPAN – 21.3% |
| Daiwa House Industry Co. Ltd. | 14,800 | 299,913 |
| Fujitsu Ltd. | 2,800 | 322,602 |
| Honda Motor Co. Ltd. | 11,800 | 267,779 |
| Inpex Corp. | 23,200 | 236,940 |
| ITOCHU Corp. | 15,500 | 401,383 |
| Japan Post Holdings Co. Ltd. | 52,100 | 350,383 |
| Japan Tobacco, Inc. | 33,700 | 558,662 |
| KDDI Corp. | 11,300 | 334,131 |
| Marubeni Corp. | 40,200 | 352,411 |
| Medipal Holdings Corp. | 26,700 | 331,426 |
| Mitsubishi Corp. | 14,400 | 390,530 |
| Mitsui & Co. Ltd. | 19,300 | 427,590 |
| NEC Corp. | 9,000 | 298,214 |
| Nippon Steel Corp. | 30,200 | 415,000 |
| Nippon Telegraph & Telephone Corp. | 11,000 | 302,984 |
| Nippon Yusen KK | 13,500 | 245,141 |
| Otsuka Holdings Co. Ltd. | 12,100 | 387,988 |
| Sony Group Corp. | 5,300 | 356,150 |
See accompanying notes which are an integral part of the financial statements.
| Common Stocks – continued |
| | Shares | Value |
| JAPAN – continued |
| Sumitomo Forestry Co. Ltd. | 13,300 | $ 208,491 |
| Sumitomo Mitsui Financial Group, Inc. | 14,700 | 412,710 |
| Tokyo Electric Power Co. Holdings, Inc. (a) | 73,100 | 238,527 |
| Tokyo Electron Ltd. | 1,300 | 345,390 |
| Toyota Motor Corp. | 43,200 | 598,583 |
| TOTAL JAPAN | 8,082,928 |
| LUXEMBOURG – 0.8% |
| ArcelorMittal S.A. | 13,888 | 310,967 |
| TOTAL LUXEMBOURG | 310,967 |
| NETHERLANDS – 3.4% |
| Heineken Holding N.V. | 2,668 | 182,211 |
| Koninklijke Ahold Delhaize N.V. | 9,310 | 259,943 |
| Koninklijke Philips N.V. | 17,114 | 216,812 |
| Randstad N.V. | 6,296 | 313,871 |
| Stellantis N.V. | 23,227 | 313,585 |
| TOTAL NETHERLANDS | 1,286,422 |
| SINGAPORE – 1.3% |
| Oversea-Chinese Banking Corp. Ltd. | 31,000 | 265,727 |
| Singapore Telecommunications Ltd. | 131,800 | 232,846 |
| TOTAL SINGAPORE | 498,573 |
| SPAIN – 1.1% |
| Banco Santander S.A. | 155,061 | 401,834 |
| TOTAL SPAIN | 401,834 |
| SWEDEN – 2.3% |
| Essity AB Class B | 8,756 | 184,938 |
| Telefonaktiebolaget LM Ericsson Class B | 43,480 | 241,589 |
| Volvo AB Class B | 28,082 | 459,459 |
| TOTAL SWEDEN | 885,986 |
| SWITZERLAND – 7.9% |
| Adecco Group AG | 10,081 | 315,702 |
| Alcon, Inc. | 2,227 | 135,612 |
| Nestle S.A. | 8,283 | 902,501 |
| Novartis AG | 6,745 | 545,261 |
| Roche Holding AG | 2,010 | 667,925 |
| UBS Group AG | 25,945 | 411,957 |
| TOTAL SWITZERLAND | 2,978,958 |
|
| | Shares | Value |
| UNITED KINGDOM – 13.5% |
| 3i Group PLC | 31,751 | $ 424,238 |
| Anglo American PLC | 11,893 | 357,182 |
| Barclays PLC | 267,442 | 454,981 |
| British American Tobacco PLC | 12,690 | 501,656 |
| GSK PLC | 24,909 | 409,765 |
| Hikma Pharmaceuticals PLC | 15,762 | 226,663 |
| Imperial Brands PLC | 14,917 | 364,790 |
| Kingfisher PLC | 109,354 | 275,605 |
| Marks & Spencer Group PLC (a) | 170,245 | 206,792 |
| RELX PLC | 13,142 | 354,218 |
| Rio Tinto PLC | 7,700 | 402,223 |
| Segro PLC | 9,742 | 88,049 |
| Shell PLC | 24,863 | 688,169 |
| Vodafone Group PLC | 299,913 | 350,968 |
| TOTAL UNITED KINGDOM | 5,105,299 |
TOTAL COMMON STOCKS
(Cost $43,612,655) | 37,612,084 |
| Money Market Fund – 0.1% |
| | |
Fidelity Cash Central Fund, 3.10% (c)
(Cost $34,107) | 34,100 | 34,107 |
TOTAL INVESTMENT IN SECURITIES – 99.4%
(Cost $43,646,762) | 37,646,191 |
| NET OTHER ASSETS (LIABILITIES) – 0.6% | 236,393 |
| NET ASSETS – 100.0% | $ 37,882,584 |
| Categorizations in the Schedule of Investments are based on country or territory of incorporation. | |
| Legend | |
| (a) | Non-income producing. |
| (b) | Security is exempt from registration under Rule 144A of the Securities Act of 1933. These securities may be resold in transactions exempt from registration, normally to qualified institutional buyers. At the end of the period, the value of these securities amounted to $411,739 or 1.1% of net assets. |
| (c) | Affiliated fund that is generally available only to investment companies and other accounts managed by Fidelity Investments. The rate quoted is the annualized seven-day yield of the fund at period end. A complete unaudited listing of the fund's holdings as of its most recent quarter end is available upon request. In addition, each Fidelity Central Fund's financial statements, which are not covered by the Fund's Report of Independent Registered Public Accounting Firm, are available on the SEC's website or upon request. |
See accompanying notes which are an integral part of the financial statements.
Fidelity® International Value Factor ETF
Schedule of Investments–continued
| Futures Contracts |
| | Number of
contracts | Expiration
Date | Notional
Amount | Value | Unrealized
Appreciation/
(Depreciation) |
| Purchased | | | | | |
| Equity Index Contract | | | | | |
| ICE MSCI EAFE Index (United States) | 3 | December 2022 | $263,385 | $13,176 | $13,176 |
The notional amount of futures purchased as a percentage of Net Assets is 0.7%
Affiliated Central Funds
Fiscal year to date information regarding the Fund's investments in Fidelity Central Funds, including ownership percentage, is presented below.
| Fund | Value,
beginning
of period | | Purchases | | Sales
Proceeds | | Dividend
Income | | Realized
Gain/Loss | | Change in
Unrealized
appreciation
(depreciation) | | Value,
end
of period | % ownership,
end
of period |
| Fidelity Cash Central Fund, 3.10% | $33,305 | | $ 8,725,193 | | $ 8,724,391 | | $ 890 | | $— | | $— | | $34,107 | 0.0% |
| Fidelity Securities Lending Cash Central Fund, 3.10% | — | | 2,367,210 | | 2,367,210 | | 4,068 | | — | | — | | $ — | 0.0% |
| Total | $33,305 | | $11,092,403 | | $11,091,601 | | $4,958 | | $— | | $— | | $34,107 | |
Amounts in the income column in the above table include any capital gain distributions from underlying funds, which are presented in the corresponding line-item in the Statement of Operations, if applicable. Amount for Fidelity Securities Lending Cash Central Fund represents the income earned on investing cash collateral, less rebates paid to borrowers and any lending agent fees associated with the loan, plus any premium payments received from lending certain types of securities.
See accompanying notes which are an integral part of the financial statements.
Investment Valuation
The following is a summary of the inputs used, as of October 31, 2022, involving the Fund's assets and liabilities carried at fair value. The inputs or methodology used for valuing securities may not be an indication of the risk associated with investing in those securities. For more information on valuation inputs, and their aggregation into the levels used in the table below, please refer to the Investment Valuation section in the accompanying Notes to Financial Statements.
Valuation Inputs at Reporting Date:
| Description | Total | Level 1 | Level 2 | Level 3 |
| Investments in Securities: | | | | | | | | |
| Equities: | | | | | | | | |
| Communication Services | | $ 1,713,672 | | $ 1,713,672 | | $ — | | $ — |
| Consumer Discretionary | | 4,165,610 | | 4,165,610 | | — | | — |
| Consumer Staples | | 3,534,430 | | 3,534,430 | | — | | — |
| Energy | | 2,672,939 | | 2,672,939 | | — | | — |
| Financials | | 7,497,015 | | 7,497,015 | | — | | — |
| Health Care | | 4,022,864 | | 4,022,864 | | — | | — |
| Industrials | | 5,858,485 | | 5,858,485 | | — | | — |
| Information Technology | | 2,947,218 | | 2,947,218 | | — | | — |
| Materials | | 3,015,428 | | 3,015,428 | | — | | — |
| Real Estate | | 828,468 | | 828,468 | | — | | — |
| Utilities | | 1,355,955 | | 1,355,955 | | — | | — |
| Money Market Fund | | 34,107 | | 34,107 | | — | | — |
| Total Investments in Securities: | | $ 37,646,191 | | $ 37,646,191 | | $ — | | $ — |
| Derivative Instruments: | | | | | | | | |
| Assets | | | | | | | | |
| Futures Contracts | | $ 13,176 | | $ 13,176 | | $ — | | $ — |
| Total Assets | | $ 13,176 | | $ 13,176 | | — | | $ — |
| Total Derivative Instruments: | | $ 13,176 | | $ 13,176 | | $ — | | $ — |
Value of Derivative Instruments
The following table is a summary of the Fund’s value of derivative instruments by primary risk exposure as of October 31, 2022. For additional information on derivative instruments, please refer to the Derivative Instruments section in the accompanying Notes to Financial Statements.
| Primary Risk/ Derivative Type | Value |
| | Asset | | Liabilities |
| Equity Risk | | | |
| Futures Contracts(a) | $13,176 | | $0 |
| Total Equity Risk | 13,176 | | 0 |
| Total Value of Derivatives | $13,176 | | $0 |
| (a) | Reflects gross cumulative appreciation (depreciation) on futures contracts as presented in the Schedule of Investments. In the Statement of Assets and Liabilities, the period end daily variation margin is included in receivable or payable for daily variation margin on futures contracts, and the net cumulative appreciation (depreciation) is included in total accumulated earnings (loss). |
See accompanying notes which are an integral part of the financial statements.
Statements of Assets and Liabilities
October 31, 2022
| | Fidelity Emerging Markets Multifactor ETF
| | Fidelity International High Dividend ETF
| | Fidelity International Multifactor ETF
| | Fidelity International Value Factor ETF
|
| Assets | | | | | | | |
| Investments in securities, at value – See accompanying schedule: | | | | | | | |
| Unaffiliated issuers | $19,462,763 | | $ 80,183,405 | | $13,144,176 | | $ 37,612,084 |
| Fidelity Central Funds | — | | 48,989 | | — | | 34,107 |
| Total Investments in Securities | $19,462,763 | | $ 80,232,394 | | $13,144,176 | | $ 37,646,191 |
| Segregated cash with brokers for derivative instruments | 2,153 | | 27,207 | | 4,535 | | 13,604 |
| Cash | 3,365 | | 27,923 | | 14,408 | | 2,513 |
| Foreign currency held at value (cost $79,251, $46,348, $12,008 and $14,297, respectively) | 79,666 | | 45,994 | | 12,090 | | 14,213 |
| Dividends receivable | 10,579 | | 249,595 | | 40,105 | | 143,789 |
| Reclaims receivable | — | | 176,377 | | 32,184 | | 76,386 |
| Total assets | 19,558,526 | | 80,759,490 | | 13,247,498 | | 37,896,696 |
| Liabilities | | | | | | | |
| Accrued management fees | 7,386 | | 25,416 | | 4,159 | | 11,931 |
| Payable for daily variation margin on futures contracts | 102 | | 4,361 | | 727 | | 2,181 |
| Other payables and accrued expenses | 43,759 | | — | | — | | — |
| Total liabilities | 51,247 | | 29,777 | | 4,886 | | 14,112 |
| Net Assets | $19,507,279 | | $ 80,729,713 | | $13,242,612 | | $ 37,882,584 |
| Net Assets consist of: | | | | | | | |
| Paid in capital | $25,651,703 | | $108,415,781 | | $16,474,199 | | $ 49,389,932 |
| Total accumulated earnings (loss) | (6,144,424) | | (27,686,068) | | (3,231,587) | | (11,507,348) |
| Net Assets | $19,507,279 | | $ 80,729,713 | | $13,242,612 | | $ 37,882,584 |
| Shares outstanding | 1,000,000 | | 4,800,000 | | 600,000 | | 2,000,000 |
| Net Asset Value per share | $ 19.51 | | $ 16.82 | | $ 22.07 | | $ 18.94 |
| Investments at cost – Unaffiliated issuers | $23,308,104 | | $100,246,882 | | $14,699,227 | | $ 43,612,655 |
| Investments at cost – Fidelity Central Funds | — | | 48,989 | | — | | 34,107 |
| Investments at cost | $23,308,104 | | $100,295,871 | | $14,699,227 | | $ 43,646,762 |
See accompanying notes which are an integral part of the financial statements.
Statements of Operations
For the year ended October 31, 2022
| | Fidelity Emerging Markets Multifactor ETF
| | Fidelity International High Dividend ETF
| | Fidelity International Multifactor ETF
| | Fidelity International Value Factor ETF
|
| Investment Income | | | | | | | |
| Dividends | $ 972,125 | | $ 4,735,912 | | $ 462,778 | | $ 1,703,163 |
| Non-Cash dividends | 57,540 | | 522,171 | | 40,383 | | 109,482 |
| Interest | 55 | | 188 | | 32 | | 87 |
| Income from Fidelity Central Funds (including $—, $22,047, $— and $4,068, from security lending, respectively) | 93 | | 22,741 | | 128 | | 4,958 |
| Income before foreign taxes withheld | 1,029,813 | | 5,281,012 | | 503,321 | | 1,817,690 |
| Less foreign taxes withheld | (109,425) | | (440,798) | | (52,974) | | (146,462) |
| Total income | 920,388 | | 4,840,214 | | 450,347 | | 1,671,228 |
| Expenses | | | | | | | |
| Management fees | 96,586 | | 353,053 | | 60,629 | | 156,069 |
| Independent trustees' fees and expenses | 73 | | 305 | | 54 | | 135 |
| Total expenses before reductions | 96,659 | | 353,358 | | 60,683 | | 156,204 |
| Expense reductions | (2) | | (3) | | (47) | | (53) |
| Total expenses | 96,657 | | 353,355 | | 60,636 | | 156,151 |
| Net investment income (loss) | 823,731 | | 4,486,859 | | 389,711 | | 1,515,077 |
| Realized and Unrealized Gain (Loss) | | | | | | | |
| Net realized gain (loss) on investment securities (net of foreign taxes of $24,041, $-, $-, $-, respectively.) | (1,810,814) | | (1,425,978) | | (1,493,659) | | (3,816,218) |
| Net realized gain (loss) on In-kind redemptions | — | | 6,994,732 | | 376,924 | | 2,088,639 |
| Net realized gain (loss) on futures contracts | (28,472) | | (260,918) | | (36,554) | | (77,444) |
| Net realized gain (loss) on foreign currency transactions | (36,299) | | (70,612) | | (10,551) | | (32,689) |
| Total net realized gain (loss) | (1,875,585) | | 5,237,224 | | (1,163,840) | | (1,837,712) |
| Change in net unrealized appreciation (depreciation) on investment securities (net of decrease in deferred foreign taxes of $9,906, $-, $- and $-, respectively.) | (3,939,345) | | (26,538,731) | | (3,137,698) | | (8,191,717) |
| Change in net unrealized appreciation (depreciation) on futures contracts | 623 | | (4,439) | | (1,730) | | 11,459 |
| Change in net unrealized appreciation (depreciation) on assets and liabilities in foreign currencies | 1,051 | | (25,650) | | (3,731) | | (11,012) |
| Total change in net unrealized appreciation (depreciation) | (3,937,671) | | (26,568,820) | | (3,143,159) | | (8,191,270) |
| Net gain (loss) | (5,813,256) | | (21,331,596) | | (4,306,999) | | (10,028,982) |
| Net increase (decrease) in net assets resulting from operations | $(4,989,525) | | $(16,844,737) | | $(3,917,288) | | $ (8,513,905) |
See accompanying notes which are an integral part of the financial statements.
Financial Statements – continued
Statements of Changes in Net Assets
| | Fidelity Emerging Markets Multifactor ETF
| | Fidelity International High Dividend ETF
|
| | Year ended
October 31, 2022
| | Year ended
October 31, 2021
| | Year ended
October 31, 2022
| | Year ended
October 31, 2021
|
| Increase (Decrease) in Net Assets | | | | | | | |
| Operations | | | | | | | |
| Net investment income (loss) | $ 823,731 | | $ 500,688 | | $ 4,486,859 | | $ 2,736,527 |
| Net realized gain (loss) | (1,875,585) | | 136,954 | | 5,237,224 | | 2,501,097 |
| Change in net unrealized appreciation (depreciation) | (3,937,671) | | 259,838 | | (26,568,820) | | 16,555,183 |
| Net increase (decrease) in net assets resulting from operations | (4,989,525) | | 897,480 | | (16,844,737) | | 21,792,807 |
| Distributions to shareholders | (826,772) | | (465,600) | | (4,783,300) | | (2,688,900) |
| Return of capital | (29,228) | | — | | — | | — |
| Total distributions | (856,000) | | (465,600) | | (4,783,300) | | (2,688,900) |
| Share transactions | | | | | | | |
| Proceeds from sales of shares | 4,649,878 | | 11,022,150 | | 55,975,704 | | 17,802,806 |
| Cost of shares redeemed | — | | — | | (35,815,029) | | — |
| Net increase (decrease) in net assets resulting from share transactions | 4,649,878 | | 11,022,150 | | 20,160,675 | | 17,802,806 |
| Total increase (decrease) in net assets | (1,195,647) | | 11,454,030 | | (1,467,362) | | 36,906,713 |
| Net Assets | | | | | | | |
| Beginning of year | 20,702,926 | | 9,248,896 | | 82,197,075 | | 45,290,362 |
| End of year | $19,507,279 | | $20,702,926 | | $ 80,729,713 | | $82,197,075 |
| Other Information | | | | | | | |
| Shares | | | | | | | |
| Sold | 200,000 | | 400,000 | | 2,600,000 | | 900,000 |
| Redeemed | — | | — | | (1,700,000) | | — |
| Net increase (decrease) | 200,000 | | 400,000 | | 900,000 | | 900,000 |
See accompanying notes which are an integral part of the financial statements.
Statements of Changes in Net Assets
| | Fidelity International Multifactor ETF
| | Fidelity International Value Factor ETF
|
| | Year ended
October 31, 2022
| | Year ended
October 31, 2021
| | Year ended
October 31, 2022
| | Year ended
October 31, 2021
|
| Increase (Decrease) in Net Assets | | | | | | | |
| Operations | | | | | | | |
| Net investment income (loss) | $ 389,711 | | $ 305,654 | | $ 1,515,077 | | $ 953,166 |
| Net realized gain (loss) | (1,163,840) | | 299,275 | | (1,837,712) | | 2,419,526 |
| Change in net unrealized appreciation (depreciation) | (3,143,159) | | 1,701,847 | | (8,191,270) | | 3,280,854 |
| Net increase (decrease) in net assets resulting from operations | (3,917,288) | | 2,306,776 | | (8,513,905) | | 6,653,546 |
| Distributions to shareholders | (524,400) | | (291,700) | | (1,749,900) | | (1,020,000) |
| Return of capital | — | | — | | — | | — |
| Total distributions | (524,400) | | (291,700) | | (1,749,900) | | (1,020,000) |
| Share transactions | | | | | | | |
| Proceeds from sales of shares | 2,824,049 | | 8,431,231 | | 18,476,821 | | 26,441,620 |
| Cost of shares redeemed | (2,787,735) | | — | | (11,779,865) | | (4,879,284) |
| Net increase (decrease) in net assets resulting from share transactions | 36,314 | | 8,431,231 | | 6,696,956 | | 21,562,336 |
| Total increase (decrease) in net assets | (4,405,374) | | 10,446,307 | | (3,566,849) | | 27,195,882 |
| Net Assets | | | | | | | |
| Beginning of year | 17,647,986 | | 7,201,679 | | 41,449,433 | | 14,253,551 |
| End of year | $13,242,612 | | $17,647,986 | | $ 37,882,584 | | $41,449,433 |
| Other Information | | | | | | | |
| Shares | | | | | | | |
| Sold | 100,000 | | 300,000 | | 800,000 | | 1,100,000 |
| Redeemed | (100,000) | | — | | (500,000) | | (200,000) |
| Net increase (decrease) | — | | 300,000 | | 300,000 | | 900,000 |
See accompanying notes which are an integral part of the financial statements.
Financial Statements – continued
| | Fidelity Emerging Markets Multifactor ETF
|
| | Year ended October 31, 2022
| | Year ended October 31, 2021
| | Year ended October 31, 2020
| | Year ended October 31, 2019A
|
| Selected Per-Share Data | | | | | | | |
| Net asset value, beginning of period | $ 25.88 | | $ 23.12 | | $24.68 | | $25.00 |
| Income from Investment Operations | | | | | | | |
| Net investment income (loss)B | 0.89 | | 0.72 | | 0.55 | | 0.50 |
| Net realized and unrealized gain (loss) | (6.37) | | 2.67 | | (1.57) | | (0.34) |
| Total from investment operations | (5.48) | | 3.39 | | (1.02) | | 0.16 |
| Distributions from net investment income | (0.86) | | (0.63) | | (0.54) | | (0.48) |
| Return of capital | (0.03) | | — | | — | | — |
| Total distributions | (0.89) | | (0.63) | | (0.54) | | (0.48) |
| Net asset value, end of period | $ 19.51 | | $ 25.88 | | $23.12 | | $24.68 |
| Total ReturnC,D,E | (21.56)% | | 14.55% | | (4.03)% | | 0.66% |
| Ratios to Average Net AssetsF,G,H | | | | | | | |
| Expenses before reductions | .45% | | .45% | | .45% | | .45% I |
| Expenses net of fee waivers, if any | .45% | | .45% | | .45% | | .45% I |
| Expenses net of all reductions | .45% | | .45% | | .45% | | .45% I |
| Net investment income (loss) | 3.84% | | 2.64% | | 2.39% | | 3.05% I |
| Supplemental Data | | | | | | | |
| Net assets, end of period (000 omitted) | $19,507 | | $20,703 | | $9,249 | | $9,872 |
| Portfolio turnover rateJ | 91% K | | 65% K | | 66% | | 34% K,L |
| A | For the period February 26, 2019 (commencement of operations) through October 31, 2019. |
| B | Calculated based on average shares outstanding during the period. |
| C | Based on net asset value. |
| D | Total returns for periods of less than one year are not annualized. |
| E | Total returns would have been lower if certain expenses had not been reduced during the applicable periods shown. |
| F | Expense ratios reflect operating expenses of the class. Expenses before reductions do not reflect amounts reimbursed, waived, or reduced through arrangements with the investment adviser, brokerage services, or other offset arrangements, if applicable, and do not represent the amount paid by the class during periods when reimbursements, waivers or reductions occur. |
| G | Net investment income (loss) is affected by the timing of the declaration of dividends by any underlying mutual funds or exchange-traded funds (ETFs). Net investment income (loss) of any mutual funds or ETFs is not included in the Fund's net investment income (loss) ratio. |
| H | Fees and expenses of any underlying mutual funds or exchange-traded funds (ETFs) are not included in the Fund’s expense ratio. The Fund indirectly bears its proportionate share of these expenses. For additional expense information related to investments in Fidelity Central Funds, please refer to the "Investments in Fidelity Central Funds" note found in the Notes to Financial Statements section of the most recent Annual or Semi-Annual report. |
| I | Annualized. |
| J | Amount does not include the portfolio activity of any underlying mutual funds or exchange-traded funds (ETFs). |
| K | Portfolio turnover rate excludes securities received or delivered in-kind. |
| L | Amount not annualized. |
See accompanying notes which are an integral part of the financial statements.
| | Fidelity International High Dividend ETF
|
| | Year ended October 31, 2022
| | Year ended October 31, 2021
| | Year ended October 31, 2020
| | Year ended October 31, 2019
| | Year ended October 31, 2018A
|
| Selected Per-Share Data | | | | | | | | | |
| Net asset value, beginning of period | $ 21.08 | | $ 15.10 | | $ 20.96 | | $ 20.56 | | $ 25.08 |
| Income from Investment Operations | | | | | | | | | |
| Net investment income (loss)B | 0.97 | | 0.77 | | 0.60 | | 1.04 | | 0.82 |
| Net realized and unrealized gain (loss) | (4.22) | | 5.95 | | (5.81) | | 0.31 | | (4.63) |
| Total from investment operations | (3.25) | | 6.72 | | (5.21) | | 1.35 | | (3.81) |
| Distributions from net investment income | (1.01) | | (0.74) | | (0.65) | | (0.95) | | (0.71) |
| Total distributions | (1.01) | | (0.74) | | (0.65) | | (0.95) | | (0.71) |
| Net asset value, end of period | $ 16.82 | | $ 21.08 | | $ 15.10 | | $ 20.96 | | $ 20.56 |
| Total ReturnC,D,E | (15.83)% | | 44.78% | | (24.98)% | | 6.84% | | (15.44)% |
| Ratios to Average Net AssetsF,G,H | | | | | | | | | |
| Expenses before reductions | .39% | | .39% | | .39% | | .39% | | .39% I |
| Expenses net of fee waivers, if any | .39% | | .39% | | .39% | | .39% | | .39% I |
| Expenses net of all reductions | .39% | | .39% | | .39% | | .39% | | .39% I |
| Net investment income (loss) | 4.96% | | 3.82% | | 3.38% | | 5.07% | | 4.59% I |
| Supplemental Data | | | | | | | | | |
| Net assets, end of period (000 omitted) | $80,730 | | $82,197 | | $45,290 | | $44,022 | | $18,500 |
| Portfolio turnover rateJ,K | 71% | | 67% | | 82% | | 47% | | 42% L |
| A | For the period January 16, 2018 (commencement of operations) through October 31, 2018. |
| B | Calculated based on average shares outstanding during the period. |
| C | Based on net asset value. |
| D | Total returns for periods of less than one year are not annualized. |
| E | Total returns would have been lower if certain expenses had not been reduced during the applicable periods shown. |
| F | Expense ratios reflect operating expenses of the class. Expenses before reductions do not reflect amounts reimbursed, waived, or reduced through arrangements with the investment adviser, brokerage services, or other offset arrangements, if applicable, and do not represent the amount paid by the class during periods when reimbursements, waivers or reductions occur. |
| G | Net investment income (loss) is affected by the timing of the declaration of dividends by any underlying mutual funds or exchange-traded funds (ETFs). Net investment income (loss) of any mutual funds or ETFs is not included in the Fund's net investment income (loss) ratio. |
| H | Fees and expenses of any underlying mutual funds or exchange-traded funds (ETFs) are not included in the Fund’s expense ratio. The Fund indirectly bears its proportionate share of these expenses. For additional expense information related to investments in Fidelity Central Funds, please refer to the "Investments in Fidelity Central Funds" note found in the Notes to Financial Statements section of the most recent Annual or Semi-Annual report. |
| I | Annualized. |
| J | Amount does not include the portfolio activity of any underlying mutual funds or exchange-traded funds (ETFs). |
| K | Portfolio turnover rate excludes securities received or delivered in-kind. |
| L | Amount not annualized. |
See accompanying notes which are an integral part of the financial statements.
Financial Statements – continued
| | Fidelity International Multifactor ETF
|
| | Year ended October 31, 2022
| | Year ended October 31, 2021
| | Year ended October 31, 2020
| | Year ended October 31, 2019A
|
| Selected Per-Share Data | | | | | | | |
| Net asset value, beginning of period | $ 29.41 | | $ 24.01 | | $26.18 | | $ 25.05 |
| Income from Investment Operations | | | | | | | |
| Net investment income (loss)B | 0.65 | | 0.65 | | 0.57 | | 0.55 |
| Net realized and unrealized gain (loss) | (7.12) | | 5.34 | | (2.07) | | 1.12 |
| Total from investment operations | (6.47) | | 5.99 | | (1.50) | | 1.67 |
| Distributions from net investment income | (0.87) | | (0.59) | | (0.67) | | (0.54) |
| Total distributions | (0.87) | | (0.59) | | (0.67) | | (0.54) |
| Net asset value, end of period | $ 22.07 | | $ 29.41 | | $24.01 | | $ 26.18 |
| Total ReturnC,D,E | (22.36)% | | 25.08% | | (5.73)% | | 6.72% |
| Ratios to Average Net AssetsF,G,H | | | | | | | |
| Expenses before reductions | .39% | | .39% | | .39% | | .39% I |
| Expenses net of fee waivers, if any | .39% | | .39% | | .39% | | .39% I |
| Expenses net of all reductions | .39% | | .39% | | .39% | | .39% I |
| Net investment income (loss) | 2.51% | | 2.28% | | 2.29% | | 3.18% I |
| Supplemental Data | | | | | | | |
| Net assets, end of period (000 omitted) | $13,243 | | $17,648 | | $7,202 | | $10,473 |
| Portfolio turnover rateJ,K | 61% | | 74% | | 69% | | 35% L |
| A | For the period February 26, 2019 (commencement of operations) through October 31, 2019. |
| B | Calculated based on average shares outstanding during the period. |
| C | Based on net asset value. |
| D | Total returns for periods of less than one year are not annualized. |
| E | Total returns would have been lower if certain expenses had not been reduced during the applicable periods shown. |
| F | Expense ratios reflect operating expenses of the class. Expenses before reductions do not reflect amounts reimbursed, waived, or reduced through arrangements with the investment adviser, brokerage services, or other offset arrangements, if applicable, and do not represent the amount paid by the class during periods when reimbursements, waivers or reductions occur. |
| G | Net investment income (loss) is affected by the timing of the declaration of dividends by any underlying mutual funds or exchange-traded funds (ETFs). Net investment income (loss) of any mutual funds or ETFs is not included in the Fund's net investment income (loss) ratio. |
| H | Fees and expenses of any underlying mutual funds or exchange-traded funds (ETFs) are not included in the Fund’s expense ratio. The Fund indirectly bears its proportionate share of these expenses. For additional expense information related to investments in Fidelity Central Funds, please refer to the "Investments in Fidelity Central Funds" note found in the Notes to Financial Statements section of the most recent Annual or Semi-Annual report. |
| I | Annualized. |
| J | Amount does not include the portfolio activity of any underlying mutual funds or exchange-traded funds (ETFs). |
| K | Portfolio turnover rate excludes securities received or delivered in-kind. |
| L | Amount not annualized. |
See accompanying notes which are an integral part of the financial statements.
| | Fidelity International Value Factor ETF
|
| | Year ended October 31, 2022
| | Year ended October 31, 2021
| | Year ended October 31, 2020
| | Year ended October 31, 2019
| | Year ended October 31, 2018A
|
| Selected Per-Share Data | | | | | | | | | |
| Net asset value, beginning of period | $ 24.38 | | $ 17.82 | | $ 21.89 | | $ 20.89 | | $ 25.00 |
| Income from Investment Operations | | | | | | | | | |
| Net investment income (loss)B | 0.83 | | 0.79 | | 0.51 | | 0.80 | | 0.62 |
| Net realized and unrealized gain (loss) | (5.32) | | 6.54 | | (4.09) | | 1.05 | | (4.18) |
| Total from investment operations | (4.49) | | 7.33 | | (3.58) | | 1.85 | | (3.56) |
| Distributions from net investment income | (0.95) | | (0.77) | | (0.49) | | (0.85) | | (0.55) |
| Total distributions | (0.95) | | (0.77) | | (0.49) | | (0.85) | | (0.55) |
| Net asset value, end of period | $ 18.94 | | $ 24.38 | | $ 17.82 | | $ 21.89 | | $ 20.89 |
| Total ReturnC,D,E | (18.82)% | | 41.36% | | (16.32)% | | 9.04% | | (14.46)% |
| Ratios to Average Net AssetsF,G,H | | | | | | | | | |
| Expenses before reductions | .39% | | .39% | | .39% | | .39% | | .39% I |
| Expenses net of fee waivers, if any | .39% | | .39% | | .39% | | .39% | | .39% I |
| Expenses net of all reductions | .39% | | .39% | | .39% | | .39% | | .39% I |
| Net investment income (loss) | 3.79% | | 3.32% | | 2.60% | | 3.74% | | 3.38% I |
| Supplemental Data | | | | | | | | | |
| Net assets, end of period (000 omitted) | $37,883 | | $41,449 | | $14,254 | | $13,135 | | $12,532 |
| Portfolio turnover rateJ | 69% K | | 101% K | | 76% K | | 56% | | 65% K,L |
| A | For the period January 16, 2018 (commencement of operations) through October 31, 2018. |
| B | Calculated based on average shares outstanding during the period. |
| C | Based on net asset value. |
| D | Total returns for periods of less than one year are not annualized. |
| E | Total returns would have been lower if certain expenses had not been reduced during the applicable periods shown. |
| F | Expense ratios reflect operating expenses of the class. Expenses before reductions do not reflect amounts reimbursed, waived, or reduced through arrangements with the investment adviser, brokerage services, or other offset arrangements, if applicable, and do not represent the amount paid by the class during periods when reimbursements, waivers or reductions occur. |
| G | Net investment income (loss) is affected by the timing of the declaration of dividends by any underlying mutual funds or exchange-traded funds (ETFs). Net investment income (loss) of any mutual funds or ETFs is not included in the Fund's net investment income (loss) ratio. |
| H | Fees and expenses of any underlying mutual funds or exchange-traded funds (ETFs) are not included in the Fund’s expense ratio. The Fund indirectly bears its proportionate share of these expenses. For additional expense information related to investments in Fidelity Central Funds, please refer to the "Investments in Fidelity Central Funds" note found in the Notes to Financial Statements section of the most recent Annual or Semi-Annual report. |
| I | Annualized. |
| J | Amount does not include the portfolio activity of any underlying mutual funds or exchange-traded funds (ETFs). |
| K | Portfolio turnover rate excludes securities received or delivered in-kind. |
| L | Amount not annualized. |
See accompanying notes which are an integral part of the financial statements.
Notes to Financial Statements
For the period ended October 31, 2022
1. Organization.
Fidelity Emerging Markets Multifactor ETF, Fidelity International High Dividend ETF, Fidelity International Multifactor ETF and Fidelity International Value Factor ETF (the Funds) are exchange-traded funds of Fidelity Covington Trust (the Trust) and are authorized to issue an unlimited number of shares. The Trust is registered under the Investment Company Act of 1940, as amended (the 1940 Act), as an open-end management investment company organized as a Massachusetts business trust. Certain Funds' investments in emerging markets can be subject to social, economic, regulatory, and political uncertainties and can be extremely volatile.
2. Investments in Fidelity Central Funds.
Funds may invest in Fidelity Central Funds, which are open-end investment companies generally available only to other investment companies and accounts managed by the investment adviser and its affiliates. The Schedule of Investments lists any Fidelity Central Funds held as an investment as of period end, but does not include the underlying holdings of each Fidelity Central Fund. An investing fund indirectly bears its proportionate share of the expenses of the underlying Fidelity Central Funds.
Based on its investment objective, each Fidelity Central Fund may invest or participate in various investment vehicles or strategies that are similar to those of the investing fund. These strategies are consistent with the investment objectives of the investing fund and may involve certain economic risks which may cause a decline in value of each of the Fidelity Central Funds and thus a decline in the value of the investing fund.
| Fidelity Central Fund | Investment Manager | Investment Objective | Investment Practices | Expense Ratio(a) |
| Fidelity Money Market Central Funds | Fidelity Management & Research Company LLC (FMR) | Each fund seeks to obtain a high level of current income consistent with the preservation of capital and liquidity. | Short-term Investments | Less than .005% |
(a) Expenses expressed as a percentage of average net assets and are as of each underlying Central Fund’s most recent annual or semi-annual shareholder report.
A complete unaudited list of holdings for each Fidelity Central Fund is available upon request or at the Securities and Exchange Commission website at www.sec.gov. In addition, the financial statements of the Fidelity Central Funds, which are not covered by the Report of Independent Registered Public Accounting Firm, are available on the Securities and Exchange Commission website or upon request.
3. Significant Accounting Policies.
Each Fund is an investment company and applies the accounting and reporting guidance of the Financial Accounting Standards Board (FASB) Accounting Standards Codification Topic 946 Financial Services – Investment Companies. The financial statements have been prepared in conformity with accounting principles generally accepted in the United States of America (GAAP), which require management to make certain estimates and assumptions at the date of the financial statements. Actual results could differ from those estimates. Subsequent events, if any, through the date that the financial statements were issued have been evaluated in the preparation of the financial statements. Each Fund’s Schedule of Investments lists any underlying mutual funds or exchange-traded funds (ETFs) but does not include the underlying holdings of these funds. The following summarizes the significant accounting policies of each Fund:
Investment Valuation. Investments are valued as of 4:00 p.m. Eastern time on the last calendar day of the period. The Board of Trustees (the Board) has designated each Fund’s investment adviser as the valuation designee responsible for the fair valuation function and performing fair value determinations as needed. The investment adviser has established a Fair Value Committee (the Committee) to carry out the day-to-day fair valuation responsibilities and has adopted policies and procedures to govern the fair valuation process and the activities of the Committee. In accordance with these fair valuation policies and procedures, which have been approved by the Board, each Fund attempts to obtain prices from one or more third party pricing services or brokers to value its investments. When current market prices, quotations or currency exchange rates are not readily available or reliable, investments will be fair valued in good faith by the Committee, in accordance with the policies and procedures. Factors used in determining fair value vary by investment type and may include market or investment specific events, transaction data, estimated cash flows, and market observations of comparable investments. The frequency that the fair valuation procedures are used cannot be predicted and they may be utilized to a significant extent. The Committee manages each Fund’s fair valuation practices and maintains the fair valuation policies and procedures. Each Fund’s investment adviser reports to the Board information regarding the fair valuation process and related material matters.
Each Fund categorizes the inputs to valuation techniques used to value its investments into a disclosure hierarchy consisting of three levels as shown below:
Level 1 – unadjusted quoted prices in active markets for identical investments
Level 2 – other significant observable inputs (including quoted prices for similar investments, interest rates, prepayment speeds, etc.)
Level 3 – unobservable inputs (including the Fund’s own assumptions based on the best information available)
3. Significant Accounting Policies – continued
Valuation techniques used to value each Fund’s investments by major category are as follows:
Equity securities, including restricted securities, for which market quotations are readily available, are valued at the last reported sale price or official closing price as reported by a third party pricing service on the primary market or exchange on which they are traded and are categorized as Level 1 in the hierarchy. In the event there were no sales during the day or closing prices are not available, securities are valued at the last quoted bid price or may be valued using the last available price and are generally categorized as Level 2 in the hierarchy. For foreign equity securities, when market or security specific events arise, comparisons to the valuation of American Depositary Receipts (ADRs), futures contracts, Exchange-Traded Funds (ETFs) and certain indexes as well as quoted prices for similar securities may be used and would be categorized as Level 2 in the hierarchy. For equity securities, including restricted securities, where observable inputs are limited, assumptions about market activity and risk are used and these securities may be categorized as Level 3 in the hierarchy.
Futures contracts are valued at the settlement price established each day by the board of trade or exchange on which they are traded and are categorized as Level 1 in the hierarchy. Investments in open-end mutual funds, including the Fidelity Central Funds, are valued at their closing net asset value (NAV) each business day and are categorized as Level 1 in the hierarchy.
Changes in valuation techniques may result in transfers in or out of an assigned level within the disclosure hierarchy. The aggregate value of investments by input level as of October 31, 2022, as well as a roll forward of Level 3 investments, is included at the end of each Fund’s Schedule of Investments.
Foreign Currency. Certain Funds may use foreign currency contracts to facilitate transactions in foreign-denominated securities. Gains and losses from these transactions may arise from changes in the value of the foreign currency or if the counterparties do not perform under the contracts' terms.
Foreign-denominated assets, including investment securities, and liabilities are translated into U.S. dollars at the exchange rates at period end. Purchases and sales of investment securities, income and dividends received, and expenses denominated in foreign currencies are translated into U.S. dollars at the exchange rate in effect on the transaction date.
The effects of exchange rate fluctuations on investments are included with the net realized and unrealized gain (loss) on investment securities. Other foreign currency transactions resulting in realized and unrealized gain (loss) are disclosed separately.
Investment Transactions and Income. For financial reporting purposes and for processing shareholder transactions, the Funds’ investment holdings and NAV include trades executed through the end of the last business day of the period and prior business day, respectively. The NAV per share for processing shareholder transactions is calculated as of the close of business (normally 4:00 p.m. Eastern time) of the Cboe BZX Exchange, Inc. (CboeBZX) for Fidelity Emerging Markets Multifactor ETF and Fidelity International Multifactor ETF, and of the New York Stock Exchange, Archipelago Exchange (NYSE Arca) for all other funds. Gains and losses on securities sold are determined on the basis of identified cost. Commissions paid to certain brokers with whom the investment adviser, or its affiliates, places trades on behalf of a fund include an amount in addition to trade execution, which may be rebated back to a fund. Any such rebates are included in net realized gain (loss) on investments in the Statements of Operations. Dividend income is recorded on the ex-dividend date, except for certain dividends from foreign securities where the ex-dividend date may have passed, which are recorded as soon as the Funds are informed of the ex-dividend date. Non-cash dividends included in dividend income, if any, are recorded at the fair market value of the securities received. Income and capital gain distributions from Fidelity Central Funds, if any, are recorded on the ex-dividend date. Interest income is accrued as earned and includes coupon interest and amortization of premium and accretion of discount on debt securities as applicable. Investment income is recorded net of foreign taxes withheld where recovery of such taxes is uncertain. Funds may file withholding tax reclaims in certain jurisdictions to recover a portion of amounts previously withheld. Any withholding tax reclaims income is included in the Statements of Operations in foreign taxes withheld. Any receivables for withholding tax reclaims are included in the Statements of Assets and Liabilities in reclaims receivable.
Expenses. Expenses directly attributable to a fund are charged to that fund. Expenses attributable to more than one fund are allocated among the respective funds on the basis of relative net assets or other appropriate methods. Expenses included in the accompanying financial statements reflect the expenses of that fund and do not include any expenses associated with any underlying mutual funds or exchange-traded funds. Although not included in a fund’s expenses, a fund indirectly bears its proportionate share of these expenses through the net asset value of each underlying mutual fund or exchange-traded fund. Expense estimates are accrued in the period to which they relate and adjustments are made when actual amounts are known.
Income Tax Information and Distributions to Shareholders. Each year, each Fund intends to qualify as a regulated investment company under Subchapter M of the Internal Revenue Code, including distributing substantially all of its taxable income and realized gains. As a result, no provision for U.S. Federal income taxes is required. As of October 31, 2022, each Fund did not have any unrecognized tax benefits in the financial statements; nor is each Fund aware of any tax positions for which it is reasonably possible that the total amounts of unrecognized tax benefits will significantly change in the next twelve months. Each Fund files a U.S. federal tax return, in addition to state and local tax returns as required. Each Fund's federal income tax returns are subject to examination by the Internal Revenue Service (IRS) for a period of three fiscal years after they are filed. State and local tax returns may be subject to examination for an additional fiscal year depending
Notes to Financial Statements – continued
3. Significant Accounting Policies – continued
on the jurisdiction. Foreign taxes are provided for based on each Fund’s understanding of the tax rules and rates that exist in the foreign markets in which it invests. Fidelity Emerging Markets Multifactor ETF is subject to a tax imposed on capital gains by certain countries in which it invests. An estimated deferred tax liability for net unrealized appreciation on the applicable securities is included in Other payables and accrued expenses on the Statements of Assets & Liabilities.
Distributions are declared and recorded on the ex-dividend date. Income and capital gain distributions are determined in accordance with income tax regulations, which may differ from GAAP.
Capital accounts within the financial statements are adjusted for permanent book-tax differences. These adjustments have no impact on net assets or the results of operations. Capital accounts are not adjusted for temporary book-tax differences which will reverse in a subsequent period.
Book-tax differences are primarily due to futures contracts, foreign currency transactions, passive foreign investment companies (PFIC), redemptions in-kind, tax return of capital distribution, capital loss carryforwards and losses deferred due to wash sales.
As of period end, the cost and unrealized appreciation (depreciation) in securities, and derivatives if applicable, for federal income tax purposes were as follows for each Fund:
| | Tax cost | Gross unrealized
appreciation | Gross unrealized
depreciation | Net unrealized
appreciation
(depreciation) |
| Fidelity Emerging Markets Multifactor ETF | $ 23,437,935 | $ 727,787 | $ (4,702,959) | $ (3,975,172) |
| Fidelity International High Dividend ETF | 100,879,403 | 585,940 | (21,232,949) | (20,647,009) |
| Fidelity International Multifactor ETF | 14,764,034 | 354,549 | (1,974,407) | (1,619,858) |
| Fidelity International Value Factor ETF | 43,848,873 | 757,123 | (6,959,805) | (6,202,682) |
The tax-based components of distributable earnings as of period end were as follows for each Fund:
| | Undistributed
ordinary income | Undistributed capital gains | Capital loss
carryforward | Net unrealized
appreciation
(depreciation) |
| Fidelity Emerging Markets Multifactor ETF | $ — | $ — | $ (2,125,898) | $ (4,018,526) |
| Fidelity International High Dividend ETF | — | — | (7,010,226) | (20,675,839) |
| Fidelity International Multifactor ETF | — | — | (1,608,364) | (1,623,223) |
| Fidelity International Value Factor ETF | — | — | (5,291,688) | (6,215,660) |
Capital loss carryforwards are only available to offset future capital gains of the Funds to the extent provided by regulations and may be limited. The capital loss carryforward information presented below, including any applicable limitation, is estimated as of prior fiscal period end and is subject to adjustment.
| | Short-term | Long-term | Total capital loss
carryforward |
| Fidelity Emerging Markets Multifactor ETF | $ (1,574,210) | $ (551,688) | $ (2,125,898) |
| Fidelity International High Dividend ETF | (2,117,907) | (4,892,319) | (7,010,226) |
| Fidelity International Multifactor ETF | (1,247,940) | (360,424) | (1,608,364) |
| Fidelity International Value Factor ETF | (2,905,914) | (2,385,774) | (5,291,688) |
For the applicable period ended October 31, 2022, Fidelity Emerging Markets Multifactor ETF’s distributions exceeded the aggregate amount of taxable income and net realized gains resulting in a return of capital for tax purposes. This was due to reductions in taxable income available for distribution after certain distributions had been made.
The tax character of distributions paid was as follows:
| October 31, 2022 | | | | |
| | Ordinary
Income | Long-Term
Capital Gain | Tax Return
Of Capital | Total |
| Fidelity Emerging Markets Multifactor ETF | $ 826,772 | $ — | $ 29,228 | $ 856,000 |
| Fidelity International High Dividend ETF | 4,783,300 | — | — | 4,783,300 |
| Fidelity International Multifactor ETF | 524,400 | — | — | 524,400 |
| Fidelity International Value Factor ETF | 1,749,900 | — | — | 1,749,900 |
3. Significant Accounting Policies – continued
| October 31, 2021 | | | | |
| Fidelity Emerging Markets Multifactor ETF | $ 465,600 | $ — | $ — | $ 465,600 |
| Fidelity International High Dividend ETF | 2,688,900 | — | — | 2,688,900 |
| Fidelity International Multifactor ETF | 291,700 | — | — | 291,700 |
| Fidelity International Value Factor ETF | 1,020,000 | — | — | 1,020,000 |
Restricted Securities (including Private Placements). Funds may invest in securities that are subject to legal or contractual restrictions on resale. These securities generally may be resold in transactions exempt from registration or to the public if the securities are registered. Disposal of these securities may involve time-consuming negotiations and expense, and prompt sale at an acceptable price may be difficult. Information regarding restricted securities held at period end is included at the end of the Schedule of Investments, if applicable.
4. Derivative Instruments.
Risk Exposures and the Use of Derivative Instruments. Each Fund’s investment objectives allow for various types of derivative instruments, including. Derivatives are investments whose value is primarily derived from underlying assets, indices or reference rates and may be transacted on an exchange or over-the-counter (OTC). Derivatives may involve a future commitment to buy or sell a specified asset based on specified terms, to exchange future cash flows at periodic intervals based on a notional principal amount, or for one party to make one or more payments upon the occurrence of specified events in exchange for periodic payments from the other party.
Derivatives were used to increase returns and to manage exposure to certain risks as defined below. The success of any strategy involving derivatives depends on analysis of numerous economic factors, and if the strategies for investment do not work as intended, the objectives may not be achieved.
Derivatives were used to increase or decrease exposure to the following risk(s):
Equity Risk Equity risk relates to the fluctuations in the value of financial instruments as a result of changes in market prices (other than those arising from interest rate risk or foreign exchange risk), whether caused by factors specific to an individual investment, its issuer, or all factors affecting all instruments traded in a market or market segment.
Funds are also exposed to additional risks from investing in derivatives, such as liquidity risk and counterparty credit risk. Liquidity risk is the risk that a fund will be unable to close out the derivative in the open market in a timely manner. Counterparty credit risk is the risk that the counterparty will not be able to fulfill its obligation to a fund.
Investing in derivatives may involve greater risks than investing in the underlying assets directly and, to varying degrees, may involve risk of loss in excess of any initial investment and collateral received and amounts recognized in the Statements of Assets and Liabilities. In addition, there may be the risk that the change in value of the derivative contract does not correspond to the change in value of the underlying instrument.
Futures Contracts. A futures contract is an agreement between two parties to buy or sell a specified underlying instrument for a fixed price at a specified future date. Futures contracts were used to manage exposure to the stock market.
Upon entering into a futures contract, a fund is required to deposit either cash or securities (initial margin) with a clearing broker in an amount equal to a certain percentage of the face value of the contract. Futures contracts are marked-to-market daily and subsequent daily payments are made or received by a fund depending on the daily fluctuations in the value of the futures contracts and are recorded as unrealized appreciation or (depreciation). This receivable and/or payable, if any, is included in daily variation margin on futures contracts in the Statements of Assets and Liabilities. Realized gain or (loss) is recorded upon the expiration or closing of a futures contract. The net realized gain (loss) and change in net unrealized appreciation (depreciation) on futures contracts during the period is presented in the Statements of Operations.
Any open futures contracts at period end are presented in the Schedule of Investments under the caption “Futures Contracts”. The notional amount at value reflects each contract’s exposure to the underlying instrument or index at period end, and is representative of volume of activity during the period unless an average notional amount is presented. Any securities deposited to meet initial margin requirements are identified in the Schedule of Investments. Any cash deposited to meet initial margin requirements is presented as segregated cash with brokers for derivative instruments in the Statements of Assets and Liabilities.
Notes to Financial Statements – continued
5. Purchases and Sales of Investments.
Purchases and sales of securities, other than short-term securities and in-kind transactions, as applicable, are noted in the table below.
| | Purchases ($) | Sales ($) |
| Fidelity Emerging Markets Multifactor ETF | 22,673,638 | 19,171,646 |
| Fidelity International High Dividend ETF | 65,943,525 | 63,169,152 |
| Fidelity International Multifactor ETF | 9,519,150 | 9,404,228 |
| Fidelity International Value Factor ETF | 27,287,503 | 27,328,660 |
Securities received and delivered in-kind through subscriptions and redemptions are noted in the table below.
| | In-Kind Subscriptions
($) | In-Kind Redemptions
($) |
| Fidelity Emerging Markets Multifactor ETF | 1,041,928 | — |
| Fidelity International High Dividend ETF | 52,059,021 | 35,372,995 |
| Fidelity International Multifactor ETF | 2,689,595 | 2,779,745 |
| Fidelity International Value Factor ETF | 17,920,852 | 11,565,596 |
6. Fees and Other Transactions with Affiliates.
Management Fee. Fidelity Management & Research Company LLC (the investment adviser) provides the Funds with investment management related services for which the Funds pay a monthly management fee that is based on an annual rate of .39% of each Fund’s average net assets for Fidelity International High Dividend ETF, Fidelity International Multifactor ETF and Fidelity International Value Factor ETF. Under the management contract, the investment adviser pays all other expenses, except the compensation of the independent Trustees and certain other expenses such as interest expense.
Fidelity Emerging Markets Multifactor ETF’s management fee is based on an annual rate of .45% of average net assets. Under the management contract, the investment adviser pays all other expenses, except the compensation of the independent Trustees and certain other expenses such as interest expense.
Sub-Adviser. Geode Capital Management, LLC (Geode) serves as sub-adviser for the Funds. Geode provides discretionary investment advisory services to the Funds and is paid by the investment adviser for providing these services.
Interfund Trades. Funds may purchase from or sell securities to other funds affiliated with each sub-adviser under procedures adopted by the Board. The procedures have been designed to ensure these interfund trades are executed in accordance with Rule 17a-7 of the 1940 Act. Any interfund trades are included within the respective purchases and sales amounts shown in the Purchases and Sales of Investments note. During the period, there were no interfund trades.
7. Security Lending.
Funds lend portfolio securities from time to time in order to earn additional income. Lending agents are used, including National Financial Services (NFS), an affiliate of the investment adviser. Pursuant to a securities lending agreement, NFS will receive a fee, which is capped at 9.9% of a fund’s daily lending revenue, for its services as lending agent. A fund may lend securities to certain qualified borrowers, including NFS. On the settlement date of the loan, a fund receives collateral (in the form of U.S. Treasury obligations, letters of credit and/or cash) against the loaned securities and maintains collateral in an amount not less than 100% of the market value of the loaned securities during the period of the loan. The market value of the loaned securities is determined at the close of business of a fund and any additional required collateral is delivered to a fund on the next business day. A fund or borrower may terminate the loan at any time, and if the borrower defaults on its obligation to return the securities loaned because of insolvency or other reasons, a fund may apply collateral received from the borrower against the obligation. A fund may experience delays and costs in recovering the securities loaned. Any cash collateral received is invested in the Fidelity Securities Lending Cash Central Fund. Any loaned securities are identified as such in the Schedule of Investments, and the value of loaned securities and cash collateral at period end, as applicable, are presented in the Statements of Assets and Liabilities. Security lending income represents the income earned on investing cash collateral, less rebates paid to borrowers and any lending agent fees associated with the loan, plus any premium payments received for lending certain types of securities. Security lending income is presented in the Statements of Operations as a component of income from Fidelity Central Funds. Affiliated security lending activity, if any, was as follows:
| | Total Security Lending Fees Paid to NFS | Security Lending Income From Securities Loaned to NFS | Value of Securities Loaned to NFS at Period End |
| Fidelity International High Dividend ETF | $ 2,375 | $ — | $ — |
| Fidelity International Value Factor ETF | 439 | — | — |
8. Expense Reductions.
Through arrangements with each applicable Fund’s custodian, credits realized as a result of certain uninvested cash balances were used to reduce each applicable Fund’s expenses by the following amounts:
| | Amount |
| Fidelity Emerging Markets Multifactor ETF | $ 2 |
| Fidelity International High Dividend ETF | 3 |
| Fidelity International Multifactor ETF | 47 |
| Fidelity International Value Factor ETF | 53 |
9. Share Transactions.
Funds issue and redeem shares at NAV only with certain authorized participants in large increments known as Creation Units. Purchases of Creation Units are made by tendering a basket of designated securities to a fund and redemption proceeds are paid with a basket of securities from a fund’s portfolio with a balancing cash component to equate the market value of the basket of securities delivered or redeemed to the NAV per Creation Unit on the transaction date. Cash may be substituted equivalent to the value of certain securities generally when they are not available in sufficient quantity for delivery. A fund’s shares are available in smaller increments to investors in the secondary market at market prices and may be subject to commissions. Authorized participants pay a transaction fee to the shareholder servicing agent when purchasing and redeeming Creation Units of a fund. The transaction fee is used to offset the costs associated with the issuance and redemption of Creation Units.
10. Other.
A fund’s organizational documents provide former and current trustees and officers with a limited indemnification against liabilities arising in connection with the performance of their duties to the fund. In the normal course of business, a fund may also enter into contracts that provide general indemnifications. A fund’s maximum exposure under these arrangements is unknown as this would be dependent on future claims that may be made against a fund. The risk of material loss from such claims is considered remote.
11. Risk and Uncertainties.
Many factors affect a fund’s performance. Developments that disrupt global economies and financial markets, such as pandemics, epidemics, outbreaks of infectious diseases, war, terrorism, and environmental disasters, may significantly affect a fund’s investment performance. The effects of these developments to a fund will be impacted by the types of securities in which a fund invests, the financial condition, industry, economic sector, and geographic location of an issuer, and a fund’s level of investment in the securities of that issuer.
Report of Independent Registered Public Accounting Firm
To the Board of Trustees of Fidelity Covington Trust and Shareholders of Fidelity Emerging Markets Multifactor ETF, Fidelity International High Dividend ETF, Fidelity International Multifactor ETF, and Fidelity International Value Factor ETF:
Opinion on the Financial Statements and Financial Highlights
We have audited the accompanying statements of assets and liabilities of Fidelity Emerging Markets Multifactor ETF, Fidelity International High Dividend ETF, Fidelity International Multifactor ETF, and Fidelity International Value Factor ETF (the “Funds”), each a fund of Fidelity Covington Trust, including the schedules of investments, as of October 31, 2022, the related statements of operations for the year then ended, the statements of changes in net assets for each of the two years in the period then ended, the financial highlights for each of the four years in the period then ended and for the period from January 16, 2018 (commencement of operations) through October 31, 2018 for Fidelity International High Dividend ETF and Fidelity International Value Factor ETF, and the financial highlights for each of the three years in the period then ended and for the period from February 26, 2019 (commencement of operations) through October 31, 2019 for Fidelity Emerging Markets Multifactor ETF and Fidelity International Multifactor ETF and the related notes. In our opinion, the financial statements and financial highlights present fairly, in all material respects, the financial position of each of the Funds as of October 31, 2022, and the results of their operations for the year then ended, the changes in their net assets for each of the two years in the period then ended, the financial highlights for each of the four years in the period then ended and for the period from January 16, 2018 (commencement of operations) through October 31, 2018 for Fidelity International High Dividend ETF and Fidelity International Value Factor ETF, and the financial highlights for each of the three years in the period then ended and for the period from February 26, 2019 (commencement of operations) through October 31, 2019 for Fidelity Emerging Markets Multifactor ETF and Fidelity International Multifactor ETF, in conformity with accounting principles generally accepted in the United States of America.
Basis for Opinion
These financial statements and financial highlights are the responsibility of the Funds’ management. Our responsibility is to express an opinion on the Funds’ financial statements and financial highlights based on our audits. We are a public accounting firm registered with the Public Company Accounting Oversight Board (United States) (PCAOB) and are required to be independent with respect to the Funds in accordance with the U.S. federal securities laws and the applicable rules and regulations of the Securities and Exchange Commission and the PCAOB.
We conducted our audits in accordance with the standards of the PCAOB. Those standards require that we plan and perform the audit to obtain reasonable assurance about whether the financial statements and financial highlights are free of material misstatement, whether due to error or fraud. The Funds are not required to have, nor were we engaged to perform, an audit of their internal control over financial reporting. As part of our audits we are required to obtain an understanding of internal control over financial reporting but not for the purpose of expressing an opinion on the effectiveness of the Funds’ internal control over financial reporting. Accordingly, we express no such opinion.
Our audits included performing procedures to assess the risks of material misstatement of the financial statements and financial highlights, whether due to error or fraud, and performing procedures that respond to those risks. Such procedures included examining, on a test basis, evidence regarding the amounts and disclosures in the financial statements and financial highlights. Our audits also included evaluating the accounting principles used and significant estimates made by management, as well as evaluating the overall presentation of the financial statements and financial highlights. Our procedures included confirmation of securities owned as of October 31, 2022, by correspondence with the custodians and brokers; when replies were not received from brokers, we performed other auditing procedures. We believe that our audits provide a reasonable basis for our opinion.
/s/ Deloitte & Touche LLP
Boston, Massachusetts
December 16, 2022
We have served as the auditor of one or more of the Fidelity investment companies since 1999.
Trustees and Officers (Unaudited)
The Trustees, Members of the Advisory Board (if any), and officers of the trust and funds, as applicable, are listed below. The Board of Trustees governs each fund and is responsible for protecting the interests of shareholders. The Trustees are experienced executives who meet periodically throughout the year to oversee each fund's activities, review contractual arrangements with companies that provide services to each fund, oversee management of the risks associated with such activities and contractual arrangements, and review each fund's performance. Each of the Trustees oversees 316 funds.
The Trustees hold office without limit in time except that (a) any Trustee may resign; (b) any Trustee may be removed by written instrument, signed by at least two-thirds of the number of Trustees prior to such removal; (c) any Trustee who requests to be retired or who has become incapacitated by illness or injury may be retired by written instrument signed by a majority of the other Trustees; and (d) any Trustee may be removed at any special meeting of shareholders by a two-thirds vote of the outstanding voting securities of the trust. Each Trustee who is not an interested person (as defined in the 1940 Act) of the trust and the funds is referred to herein as an Independent Trustee. Each Independent Trustee shall retire not later than the last day of the calendar year in which his or her 75th birthday occurs. The Independent Trustees may waive this mandatory retirement age policy with respect to individual Trustees. Officers and Advisory Board Members hold office without limit in time, except that any officer or Advisory Board Member may resign or may be removed by a vote of a majority of the Trustees at any regular meeting or any special meeting of the Trustees. Except as indicated, each individual has held the office shown or other offices in the same company for the past five years.
The funds’ Statement of Additional Information (SAI) includes more information about the Trustees. To request a free copy, call Fidelity at 1-800-FIDELITY.
Experience, Skills, Attributes, and Qualififications of the Trustees. The Governance and Nominating Committee has adopted a statement of policy that describes the experience, qualifications, attributes, and skills that are necessary and desirable for potential Independent Trustee candidates (Statement of Policy). The Board believes that each Trustee satisfied at the time he or she was initially elected or appointed a Trustee, and continues to satisfy, the standards contemplated by the Statement of Policy. The Governance and Nominating Committee also engages professional search firms to help identify potential Independent Trustee candidates who have the experience, qualifications, attributes, and skills consistent with the Statement of Policy. From time to time, additional criteria based on the composition and skills of the current Independent Trustees, as well as experience or skills that may be appropriate in light of future changes to board composition, business conditions, and regulatory or other developments, have also been considered by the professional search firms and the Governance and Nominating Committee. In addition, the Board takes into account the Trustees' commitment and participation in Board and committee meetings, as well as their leadership of standing and ad hoc committees throughout their tenure.
In determining that a particular Trustee was and continues to be qualified to serve as a Trustee, the Board has considered a variety of criteria, none of which, in isolation, was controlling. The Board believes that, collectively, the Trustees have balanced and diverse experience, qualifications, attributes, and skills, which allow the Board to operate effectively in governing each fund and protecting the interests of shareholders. Information about the specific experience, skills, attributes, and qualifications of each Trustee, which in each case led to the Board's conclusion that the Trustee should serve (or continue to serve) as a trustee of the funds, is provided below.
Board Structure and Oversight Function. Robert A. Lawrence is an interested person and currently serves as Chair. The Trustees have determined that an interested Chair is appropriate and benefits shareholders because an interested Chair has a personal and professional stake in the quality and continuity of services provided to the funds. Independent Trustees exercise their informed business judgment to appoint an individual of their choosing to serve as Chair, regardless of whether the Trustee happens to be independent or a member of management. The Independent Trustees have determined that they can act independently and effectively without having an Independent Trustee serve as Chair and that a key structural component for assuring that they are in a position to do so is for the Independent Trustees to constitute a substantial majority for the Board. The Independent Trustees also regularly meet in executive session. David M. Thomas serves as Lead Independent Trustee and as such (i) acts as a liaison between the Independent Trustees and management with respect to matters important to the Independent Trustees and (ii) with management prepares agendas for Board meetings.
Fidelity® funds are overseen by different Boards of Trustees. The funds' Board oversees Fidelity's high income and certain equity funds, and other Boards oversee Fidelity's investment-grade bond, money market, asset allocation, and other equity funds. The asset allocation funds may invest in Fidelity® funds overseen by the funds' Board. The use of separate Boards, each with its own committee structure, allows the Trustees of each group of Fidelity® funds to focus on the unique issues of the funds they oversee, including common research, investment, and operational issues. On occasion, the separate Boards establish joint committees to address issues of overlapping consequences for the Fidelity® funds overseen by each Board.
Trustees and Officers (Unaudited) – continued
The Trustees operate using a system of committees to facilitate the timely and efficient consideration of all matters of importance to the Trustees, each fund, and fund shareholders and to facilitate compliance with legal and regulatory requirements and oversight of the funds' activities and associated risks. The Board, acting through its committees, has charged FMR and its affiliates with (i) identifying events or circumstances the occurrence of which could have demonstrably adverse effects on the funds' business and/or reputation; (ii) implementing processes and controls to lessen the possibility that such events or circumstances occur or to mitigate the effects of such events or circumstances if they do occur; and (iii) creating and maintaining a system designed to evaluate continuously business and market conditions in order to facilitate the identification and implementation processes described in (i) and (ii) above. Because the day-to-day operations and activities of the funds are carried out by or through FMR, its affiliates, and other service providers, the funds' exposure to risks is mitigated but not eliminated by the processes overseen by the Trustees. While each of the Board's committees has responsibility for overseeing different aspects of the funds' activities, oversight is exercised primarily through the Operations, Audit, and Compliance Committees. Appropriate personnel, including but not limited to the funds' Chief Compliance Officer (CCO), FMR's internal auditor, the independent accountants, the funds' Treasurer and portfolio management personnel, make periodic reports to the Board's committees, as appropriate, including an annual review of Fidelity's risk management program for the Fidelity® funds. The responsibilities of each standing committee, including their oversight responsibilities, are described further under "Standing Committees of the Trustees."
Interested Trustees*:
Correspondence intended for a Trustee who is an interested person may be sent to Fidelity Investments, 245 Summer Street, Boston, Massachusetts 02210.
Name, Year of Birth; Principal Occupations and Other Relevant Experience+
Bettina Doulton (1964)
Year of Election or Appointment: 2020
Trustee
Ms. Doulton also serves as Trustee of other Fidelity® funds. Prior to her retirement, Ms. Doulton served in a variety of positions at Fidelity Investments, including as a managing director of research (2006-2007), portfolio manager to certain Fidelity® funds (1993-2005), equity analyst and portfolio assistant (1990-1993), and research assistant (1987-1990). Ms. Doulton currently owns and operates Phi Builders + Architects and Cellardoor Winery. Previously, Ms. Doulton served as a member of the Board of Brown Capital Management, LLC (2014-2018).
Robert A. Lawrence (1952)
Year of Election or Appointment: 2020
Trustee
Chair of the Board of Trustees
Mr. Lawrence also serves as Trustee of other funds. Previously, Mr. Lawrence served as a Trustee and Member of the Advisory Board of certain funds. Prior to his retirement in 2008, Mr. Lawrence served as Vice President of certain Fidelity® funds (2006-2008), Senior Vice President, Head of High Income Division of Fidelity Management & Research Company (investment adviser firm, 2006-2008), and President of Fidelity Strategic Investments (investment adviser firm, 2002-2005).
* Determined to be an “Interested Trustee” by virtue of, among other things, his or her affiliation with the trust or various entities under common control with FMR.
+ The information includes the Trustee's principal occupation during the last five years and other information relating to the experience, attributes, and skills relevant to the Trustee's qualifications to serve as a Trustee, which led to the conclusion that the Trustee should serve as a Trustee for each fund.
Independent Trustees:
Correspondence intended for an Independent Trustee may be sent to Fidelity Investments, P.O. Box 55235, Boston, Massachusetts 02205-5235.
Name, Year of Birth; Principal Occupations and Other Relevant Experience+
Thomas P. Bostick (1956)
Year of Election or Appointment: 2021
Name, Year of Birth; Principal Occupations and Other Relevant Experience+
Trustee
Lieutenant General Bostick also serves as Trustee of other Fidelity® funds. Prior to his retirement, General Bostick (United States Army, Retired) held a variety of positions within the U.S. Army, including Commanding General and Chief of Engineers, U.S. Army Corps of Engineers (2012-2016) and Deputy Chief of Staff and Director of Human Resources, U.S. Army (2009-2012). General Bostick currently serves as a member of the Board and Finance and Governance Committees of CSX Corporation (transportation, 2020-present) and a member of the Board and Corporate Governance and Nominating Committee of Perma-Fix Environmental Services, Inc. (nuclear waste management, 2020-present). General Bostick serves as Chief Executive Officer of Bostick Global Strategies, LLC (consulting, 2016-present) and as a member of the Board of HireVue, Inc. (video interview and assessment, 2020-present). Previously, General Bostick served as a Member of the Advisory Board of certain Fidelity® funds (2021), President, Intrexon Bioengineering (2018-2020) and Chief Operating Officer (2017-2020) and Senior Vice President of the Environment Sector (2016-2017) of Intrexon Corporation (biopharmaceutical company).
Dennis J. Dirks (1948)
Year of Election or Appointment: 2018
Trustee
Mr. Dirks also serves as Trustee of other Fidelity® funds. Prior to his retirement in May 2003, Mr. Dirks served as Chief Operating Officer and as a member of the Board of The Depository Trust & Clearing Corporation (financial markets infrastructure), President, Chief Operating Officer and a member of the Board of The Depository Trust Company (DTC), President and a member of the Board of the National Securities Clearing Corporation (NSCC), Chief Executive Officer and a member of the Board of the Government Securities Clearing Corporation and Chief Executive Officer and a member of the Board of the Mortgage-Backed Securities Clearing Corporation. Mr. Dirks currently serves as a member of the Finance Committee (2016-present) and Board (2017-present) and is Treasurer (2018-present) of the Asolo Repertory Theatre.
Donald F. Donahue (1950)
Year of Election or Appointment: 2018
Trustee
Mr. Donahue also serves as Trustee of other Fidelity® funds. Mr. Donahue serves as President and Chief Executive Officer of Miranda Partners, LLC (risk consulting for the financial services industry, 2012-present). Previously, Mr. Donahue served as Chief Executive Officer (2006-2012), Chief Operating Officer (2003-2006) and Managing Director, Customer Marketing and Development (1999-2003) of The Depository Trust & Clearing Corporation (financial markets infrastructure). Mr. Donahue currently serves as a member (2007-present) and Co-Chairman (2016-present) of the Board of United Way of New York and a member of the Board of The Leadership Academy (previously NYC Leadership Academy) (2012-present). Mr. Donahue previously served as a member of the Advisory Board of certain Fidelity® funds (2015-2018).
Vicki L. Fuller (1957)
Year of Election or Appointment: 2020
Trustee
Ms. Fuller also serves as Trustee of other Fidelity® funds. Previously, Ms. Fuller served as a member of the Advisory Board of certain Fidelity® funds (2018-2020), Chief Investment Officer of the New York State Common Retirement Fund (2012-2018) and held a variety of positions at AllianceBernstein L.P. (global asset management, 1985-2012), including Managing Director (2006-2012) and Senior Vice President and Senior Portfolio Manager (2001-2006). Ms. Fuller currently serves as a member of the Board, Audit Committee and Nominating and Governance Committee of two Blackstone business development companies (2020-present), as a member of the Board of Treliant, LLC (consulting, 2019-present), as a member of the Advisory Board of Ariel Alternatives, LLC (private equity, 2021-present) and as a member of the Board and Chair of the Audit Committee of Gusto, Inc. (software, 2021-present). In addition, Ms. Fuller currently serves as a member of the Board of Roosevelt University (2019-present) and as a member of the Executive Board of New York University’s Stern School of Business. Ms. Fuller previously served as a member of the Board, Audit Committee and Nominating and Governance Committee of The Williams Companies, Inc. (natural gas infrastructure, 2018-2021).
Patricia L. Kampling (1959)
Year of Election or Appointment: 2020
Trustees and Officers (Unaudited) – continued
Name, Year of Birth; Principal Occupations and Other Relevant Experience+
Trustee
Ms. Kampling also serves as Trustee of other Fidelity® funds. Prior to her retirement, Ms. Kampling served as Chairman of the Board and Chief Executive Officer (2012-2019), President and Chief Operating Officer (2011-2012) and Executive Vice President and Chief Financial Officer (2010-2011) of Alliant Energy Corporation. Ms. Kampling currently serves as a member of the Board, Finance Committee and Governance, Compensation and Nominating Committee of Xcel Energy Inc. (utilities company, 2020-present) and as a member of the Board, Audit, Finance and Risk Committee and Safety, Environmental, Technology and Operations Committee and Chair of the Executive Development and Compensation Committee of American Water Works Company, Inc. (utilities company, 2019-present). In addition, Ms. Kampling currently serves as a member of the Board of the Nature Conservancy, Wisconsin Chapter (2019-present). Previously, Ms. Kampling served as a Member of the Advisory Board of certain Fidelity® funds (2020), a member of the Board, Compensation Committee and Executive Committee and Chair of the Audit Committee of Briggs & Stratton Corporation (manufacturing, 2011-2021), a member of the Board of Interstate Power and Light Company (2012-2019) and Wisconsin Power and Light Company (2012-2019) (each a subsidiary of Alliant Energy Corporation) and as a member of the Board and Workforce Development Committee of the Business Roundtable (2018-2019).
Thomas A. Kennedy (1955)
Year of Election or Appointment: 2021
Trustee
Mr. Kennedy also serves as Trustee of other Fidelity® funds. Previously, Mr. Kennedy served as a Member of the Advisory Board of certain Fidelity® funds (2020) and held a variety of positions at Raytheon Company (aerospace and defense, 1983-2020), including Chairman and Chief Executive Officer (2014-2020) and Executive Vice President and Chief Operating Officer (2013-2014). Mr. Kennedy currently serves as Executive Chairman of the Board of Directors of Raytheon Technologies Corporation (aerospace and defense, 2020-present). He is also a member of the Rutgers School of Engineering Industry Advisory Board (2011-present) and a member of the UCLA Engineering Dean’s Executive Board (2016-present).
Oscar Munoz (1959)
Year of Election or Appointment: 2021
Trustee
Mr. Munoz also serves as Trustee of other Fidelity® funds. Prior to his retirement, Mr. Munoz served as Executive Chairman (2020-2021), Chief Executive Officer (2015-2020), President (2015-2016) and a member of the Board (2010-2021) of United Airlines Holdings, Inc. Mr. Munoz currently serves as a member of the Board of CBRE Group, Inc. (commercial real estate, 2020-present), a member of the Board of Univision Communications, Inc. (Hispanic media, 2020-present) and a member of the Advisory Board of Salesforce.com, Inc. (cloud-based software, 2020-present). Previously, Mr. Munoz served as a Member of the Advisory Board of certain Fidelity® funds (2021).
Garnett A. Smith (1947)
Year of Election or Appointment: 2013
Trustee
Mr. Smith also serves as Trustee of other Fidelity® funds. Prior to his retirement, Mr. Smith served as Chairman and Chief Executive Officer (1990-1997) and President (1986-1990) of Inbrand Corp. (manufacturer of personal absorbent products). Prior to his employment with Inbrand Corp., he was employed by a retail fabric chain and North Carolina National Bank (now Bank of America). Mr. Smith previously served as a member of the Advisory Board of certain Fidelity® funds (2012-2013).
David M. Thomas (1949)
Year of Election or Appointment: 2018
Trustee
Lead Independent Trustee
Mr. Thomas also serves as Trustee of other Fidelity® funds. Previously, Mr. Thomas served as Executive Chairman (2005-2006) and Chairman and Chief Executive Officer (2000-2005) of IMS Health, Inc. (pharmaceutical and healthcare information solutions). Mr. Thomas currently serves as a member of the Board of Fortune Brands Home and Security (home and security products, 2004-present) and as Director (2013-present) and Non-Executive Chairman of the Board (2022-present) of Interpublic Group of Companies, Inc. (marketing communication).
Susan Tomasky (1953)
Year of Election or Appointment: 2020
Name, Year of Birth; Principal Occupations and Other Relevant Experience+
Trustee
Ms. Tomasky also serves as Trustee of other Fidelity® funds. Prior to her retirement, Ms. Tomasky served in various executive officer positions at American Electric Power Company, Inc. (1998-2011), including most recently as President of AEP Transmission (2007-2011). Ms. Tomasky currently serves as a member of the Board and Sustainability Committee and as Chair of the Audit Committee of Marathon Petroleum Corporation (2018-present) and as a member of the Board, Executive Committee, Corporate Governance Committee and Organization and Compensation Committee and as Chair of the Audit Committee of Public Service Enterprise Group, Inc. (utilities company, 2012-present) and as a member of the Board of its subsidiary company, Public Service Electric and Gas Co. (2021-present). In addition, Ms. Tomasky currently serves as a member (2009-present) and President (2020-present) of the Board of the Royal Shakespeare Company – America (2009-present), as a member of the Board of the Columbus Association for the Performing Arts (2011-present) and as a member of the Board and Kenyon in the World Committee of Kenyon College (2016-present). Previously, Ms. Tomasky served as a Member of the Advisory Board of certain Fidelity® funds (2020), as a member of the Board of the Columbus Regional Airport Authority (2007-2020), as a member of the Board (2011-2018) and Lead Independent Director (2015-2018) of Andeavor Corporation (previously Tesoro Corporation) (independent oil refiner and marketer) and as a member of the Board of Summit Midstream Partners LP (energy, 2012-2018).
Michael E. Wiley (1950)
Year of Election or Appointment: 2013
Trustee
Mr. Wiley also serves as Trustee of other Fidelity® funds. Previously, Mr. Wiley served as a member of the Advisory Board of certain Fidelity® funds (2018-2020), Chairman, President and CEO of Baker Hughes, Inc. (oilfield services, 2000-2004). Mr. Wiley also previously served as a member of the Board of Andeavor Corporation (independent oil refiner and marketer, 2005-2018), a member of the Board of Andeavor Logistics LP (natural resources logistics, 2015-2018) and a member of the Board of High Point Resources (exploration and production, 2005-2020).
+ The information includes the Trustee's principal occupation during the last five years and other information relating to the experience, attributes, and skills relevant to the Trustee's qualifications to serve as a Trustee, which led to the conclusion that the Trustee should serve as a Trustee for each fund.
Advisory Board Members and Offifficers:
Correspondence intended for a Member of the Advisory Board (if any) may be sent to Fidelity Investments, P.O. Box 55235, Boston, Massachusetts 02205-5235. Correspondence intended for an officer or Peter S. Lynch may be sent to Fidelity Investments, 245 Summer Street, Boston, Massachusetts 02210. Officers appear below in alphabetical order.
Name, Year of Birth; Principal Occupation
Peter S. Lynch (1944)
Year of Election or Appointment: 2018
Member of the Advisory Board
Mr. Lynch also serves as a Member of the Advisory Board of other Fidelity® funds. Mr. Lynch is Vice Chairman and a Director of Fidelity Management & Research Company LLC (investment adviser firm). In addition, Mr. Lynch serves as a Trustee of Boston College and as the Chairman of the Inner-City Scholarship Fund. Previously, Mr. Lynch served as Vice Chairman and a Director of FMR Co., Inc. (investment adviser firm) and on the Special Olympics International Board of Directors (1997-2006).
Craig S. Brown (1977)
Year of Election or Appointment: 2022
Deputy Treasurer
Mr. Brown also serves as an officer of other funds. Mr. Brown serves as Assistant Treasurer of FIMM, LLC (2021-present) and is an employee of Fidelity Investments (2013-present). Previously, Mr. Brown served as Assistant Treasurer of certain Fidelity® funds (2019-2022).
John J. Burke III (1964)
Year of Election or Appointment: 2018
Chief Financial Officer
Mr. Burke also serves as Chief Financial Officer of other funds. Mr. Burke serves as Head of Investment Operations for Fidelity Fund and Investment Operations (2018-present) and is an employee of Fidelity Investments (1998-present). Previously Mr. Burke served as head of Asset Management Investment Operations (2012-2018).
Trustees and Officers (Unaudited) – continued
Name, Year of Birth; Principal Occupation
William C. Coffey (1969)
Year of Election or Appointment: 2019
Assistant Secretary
Mr. Coffey also serves as Assistant Secretary of other funds. He is Senior Vice President and Deputy General Counsel of FMR LLC (diversified financial services company, 2010-present), and is an employee of Fidelity Investments. Previously, Mr. Coffey served as Secretary and CLO of certain funds (2018-2019); CLO, Secretary, and Senior Vice President of Fidelity Management & Research Company and FMR Co., Inc. (investment adviser firms, 2018-2019); Secretary of Fidelity SelectCo, LLC and Fidelity Investments Money Management, Inc. (investment adviser firms, 2018-2019); CLO of Fidelity Management & Research (Hong Kong) Limited, FMR Investment Management (UK) Limited, and Fidelity Management & Research (Japan) Limited (investment adviser firms, 2018-2019); and Assistant Secretary of certain funds (2009-2018).
Timothy M. Cohen (1969)
Year of Election or Appointment: 2018
Vice President
Mr. Cohen also serves as Vice President of other funds. Mr. Cohen serves as Co-Head of Equity (2018-present), a Director of Fidelity Management & Research (Japan) Limited (investment adviser firm, 2016-present), and is an employee of Fidelity Investments. Previously, Mr. Cohen served as Executive Vice President of Fidelity SelectCo, LLC (2019), Head of Global Equity Research (2016-2018), Chief Investment Officer - Equity and a Director of Fidelity Management & Research (U.K.) Inc. (investment adviser firm, 2013-2015) and as a Director of Fidelity Management & Research (Hong Kong) Limited (investment adviser firm, 2017).
Jonathan Davis (1968)
Year of Election or Appointment: 2013
Assistant Treasurer
Mr. Davis also serves as an officer of other funds. Mr. Davis serves as Assistant Treasurer of FIMM, LLC (2021-present), FMR Capital, Inc. (2017-present), FD Funds GP LLC (2021-present), FD Funds Holding LLC (2021-present), and FD Funds Management LLC (2021-present); and is an employee of Fidelity Investments. Previously, Mr. Davis served as Vice President and Associate General Counsel of FMR LLC (diversified financial services company, 2003-2010).
Laura M. Del Prato (1964)
Year of Election or Appointment: 2018
Assistant Treasurer
Ms. Del Prato also serves as an officer of other funds. Ms. Del Prato serves as Assistant Treasurer of FIMM, LLC (2021-present) and is an employee of Fidelity Investments (2017-present). Previously, Ms. Del Prato served as President and Treasurer of The North Carolina Capital Management Trust: Cash Portfolio and Term Portfolio (2018-2020). Prior to joining Fidelity Investments, Ms. Del Prato served as a Managing Director and Treasurer of the JPMorgan Mutual Funds (2014-2017). Prior to JPMorgan, Ms. Del Prato served as a partner at Cohen Fund Audit Services (accounting firm, 2012-2013) and KPMG LLP (accounting firm, 2004-2012).
Colm A. Hogan (1973)
Year of Election or Appointment: 2020
Assistant Treasurer
Mr. Hogan also serves as an officer of other funds. Mr. Hogan serves as Assistant Treasurer of FIMM, LLC (2021-present) and FMR Capital, Inc. (2017-present) and is an employee of Fidelity Investments (2005-present). Previously, Mr. Hogan served as Deputy Treasurer of certain Fidelity® funds (2016-2020) and Assistant Treasurer of certain Fidelity® funds (2016-2018).
Pamela R. Holding (1964)
Year of Election or Appointment: 2018
Vice President
Ms. Holding also serves as Vice President of other funds. Ms. Holding serves as Co-Head of Equity (2018-present) and is an employee of Fidelity Investments (2013-present). Previously, Ms. Holding served as Executive Vice President of Fidelity SelectCo, LLC (2019) and as Chief Investment Officer of Fidelity Institutional Asset Management (2013-2018).
Cynthia Lo Bessette (1969)
Year of Election or Appointment: 2019
Name, Year of Birth; Principal Occupation
Secretary and Chief Legal Officer (CLO)
Ms. Lo Bessette also serves as an officer of other funds. Ms. Lo Bessette serves as CLO, Secretary, and Senior Vice President of Fidelity Management & Research Company LLC (investment adviser firm, 2019-present); CLO of Fidelity Management & Research (Hong Kong) Limited, FMR Investment Management (UK) Limited, and Fidelity Management & Research (Japan) Limited (investment adviser firms, 2019-present); Secretary of FD Funds GP LLC (2021-present), FD Funds Holding LLC (2021-present), FD Funds Management LLC (2021-present), and Fidelity Diversifying Solutions LLC (investment adviser firm, 2022-present); and Assistant Secretary of FIMM, LLC (2019-present). She is a Senior Vice President and Deputy General Counsel of FMR LLC (diversified financial services company, 2019-present), and is an employee of Fidelity Investments. Previously, Ms. Lo Bessette served as CLO, Secretary, and Senior Vice President of FMR Co., Inc. (investment adviser firm, 2019); Secretary of Fidelity SelectCo, LLC and Fidelity Investments Money Management, Inc. (investment adviser firms, 2019). Prior to joining Fidelity Investments, Ms. Lo Bessette was Executive Vice President, General Counsel (2016-2019) and Senior Vice President, Deputy General Counsel (2015-2016) of OppenheimerFunds (investment management company) and Deputy Chief Legal Officer (2013-2015) of Jennison Associates LLC (investment adviser firm).
Chris Maher (1972)
Year of Election or Appointment: 2020
Deputy Treasurer
Mr. Maher also serves as an officer of other funds. Mr. Maher serves as Assistant Treasurer of FIMM, LLC (2021-present) and FMR Capital, Inc. (2017-present), and is an employee of Fidelity Investments (2008-present). Previously, Mr. Maher served as Assistant Treasurer of certain funds (2013-2020); Vice President of Asset Management Compliance (2013), Vice President of the Program Management Group of FMR (investment adviser firm, 2010-2013), and Vice President of Valuation Oversight (2008-2010).
Jason P. Pogorelec (1975)
Year of Election or Appointment: 2020
Chief Compliance Officer
Mr. Pogorelec also serves as Chief Compliance Officer of other funds. Mr. Pogorelec is a senior Vice President of Asset Management Compliance for Fidelity Investments and is an employee of Fidelity Investments (2006-present). Previously, Mr. Pogorelec served as Vice President, Associate General Counsel for Fidelity Investments (2010-2020) and Assistant Secretary of certain Fidelity funds (2015-2020).
Brett Segaloff (1972)
Year of Election or Appointment: 2021
Anti-Money Laundering (AML) Officer
Mr. Segaloff also serves as an AML Officer of other funds and other related entities. He is Director, Anti-Money Laundering (2007-present) of FMR LLC (diversified financial services company) and is an employee of Fidelity Investments (1996-present).
Stacie M. Smith (1974)
Year of Election or Appointment: 2018
President and Treasurer
Ms. Smith also serves as an officer of other funds. Ms. Smith serves as Assistant Treasurer of FIMM, LLC (2021-present) and FMR Capital, Inc. (2017-present), is an employee of Fidelity Investments (2009-present), and has served in other fund officer roles. Prior to joining Fidelity Investments, Ms. Smith served as Senior Audit Manager of Ernst & Young LLP (accounting firm, 1996-2009). Previously, Ms. Smith served as Assistant Treasurer (2013-2019) and Deputy Treasurer (2013-2016) of certain Fidelity® funds.
Jim Wegmann (1979)
Year of Election or Appointment: 2019
Assistant Treasurer
Mr. Wegmann also serves as an officer of other funds. Mr. Wegmann serves as Assistant Treasurer of FIMM, LLC (2021-present) and is an employee of Fidelity Investments (2011-present). Previously, Mr. Wegmann served as Assistant Treasurer of certain Fidelity® funds (2019-2021).
Shareholder Expense Example (Unaudited)
As a shareholder, you incur two types of costs: (1) transaction costs, which may include sales charges (loads) on purchase payments or redemption proceeds, as applicable and (2) ongoing costs, which generally include management fees, distribution and/or service (12b-1) fees and other Fund expenses. This Example is intended to help you understand your ongoing costs (in dollars) of investing in a fund and to compare these costs with the ongoing costs of investing in other mutual funds.
The Example is based on an investment of $1,000 invested for the one-half year period (May 1, 2022 to October 31, 2022).
Actual Expenses
The first line of the accompanying table provides information about actual account values and actual expenses. You may use the information in this line, together with the amount you invested, to estimate the expenses that you paid over the period. Simply divide your account value by $1,000.00 (for example, an $8,600 account value divided by $1,000.00 = 8.6), then multiply the result by the number in the first line for a class/Fund under the heading entitled “Expenses Paid During Period” to estimate the expenses you paid on your account during this period. If any fund is a shareholder of any underlying mutual funds or exchange-traded funds (ETFs) (the Underlying Funds), such fund indirectly bears its proportional share of the expenses of the Underlying Funds in addition to the direct expenses incurred presented in the table. These fees and expenses are not included in the annualized expense ratio used to calculate the expense estimate in the table below.
Hypothetical Example for Comparison Purposes
The second line of the accompanying table provides information about hypothetical account values and hypothetical expenses based on the actual expense ratio and an assumed rate of return of 5% per year before expenses, which is not the actual return. The hypothetical account values and expenses may not be used to estimate the actual ending account balance or expenses you paid for the period. You may use this information to compare the ongoing costs of investing in the Fund and other funds. To do so, compare this 5% hypothetical example with the 5% hypothetical examples that appear in the shareholder reports of the other funds. If any fund is a shareholder of any Underlying Funds, such fund indirectly bears its proportional share of the expenses of the Underlying Funds in addition to the direct expenses as presented in the table. These fees and expenses are not included in the annualized expense ratio used to calculate the expense estimate in the table below.
Please note that the expenses shown in the table are meant to highlight your ongoing costs only and do not reflect any transaction costs. Therefore, the second line of the table is useful in comparing ongoing costs only, and will not help you determine the relative total costs of owning different funds.
| | Annualized
Expense RatioA | Beginning
Account Value
May 1, 2022
| Ending
Account Value
October 31, 2022 | Expenses Paid
During PeriodB
May 1, 2022
to October 31, 2022 |
| Fidelity Emerging Markets Multifactor ETF | 0.45% | | | |
| Actual | | $ 1,000.00 | $ 851.00 | $ 2.10 |
| Hypothetical C | | $ 1,000.00 | $ 1,022.94 | $ 2.29 |
| Fidelity International High Dividend ETF | 0.39% | | | |
| Actual | | $ 1,000.00 | $ 862.00 | $ 1.83 |
| Hypothetical C | | $ 1,000.00 | $ 1,023.24 | $ 1.99 |
| Fidelity International Multifactor ETF | 0.39% | | | |
| Actual | | $ 1,000.00 | $ 866.40 | $ 1.83 |
| Hypothetical C | | $ 1,000.00 | $ 1,023.24 | $ 1.99 |
| Fidelity International Value Factor ETF | 0.39% | | | |
| Actual | | $ 1,000.00 | $ 871.40 | $ 1.84 |
| Hypothetical C | | $ 1,000.00 | $ 1,023.24 | $ 1.99 |
| A | Annualized expense ratio reflects expenses net of applicable fee waivers. |
| B | Expenses are equal to the annualized expense ratio, multiplied by the average account value over the period, multiplied by 184/365 (to reflect the one-half year period). The fees and expenses of any Underlying Funds are not included in each annualized expense ratio. |
| C | 5% return per year before expenses. |
Distributions (Unaudited)
The dividend and capital gains distributions for the fund(s) are available on Fidelity.com or Institutional.Fidelity.com.
A percentage of the dividends distributed during the fiscal year for the following funds may be taken into account as a dividend for purposes of the maximum rate under section 1(h)(11) of the Internal Revenue Code.
| | December 2021 | March 2022 | June 2022 | September 2022 |
| Fidelity Emerging Markets Multifactor ETF | 41% | 70% | 70% | 70% |
| Fidelity International High Dividend ETF | 53% | 100% | 100% | 100% |
| Fidelity International Multifactor ETF | 36% | 100% | 100% | 100% |
| Fidelity International Value Factor ETF | 44% | 100% | 100% | 100% |
The amounts per share which represent income derived from sources within, and taxes paid to, foreign countries or possessions of the United States are as follows:
| | Ex-Date | Income | Taxes |
| Fidelity Emerging Markets Multifactor ETF | 9/16/2022 | $ 0.2842 | $ 0.0362 |
| | 6/17/2022 | $ 0.4285 | $ 0.0545 |
| | 3/18/2022 | $ 0.1169 | $ 0.0149 |
| | 12/30/2021 | $ 0.0085 | $ 0.0015 |
| | 12/17/2021 | $ 0.1914 | $ 0.0334 |
| Fidelity International High Dividend ETF | 9/16/2022 | $ 0.2538 | $ 0.0218 |
| | 6/17/2022 | $ 0.4005 | $ 0.0345 |
| | 3/18/2022 | $ 0.2670 | $ 0.0230 |
| | 12/30/2021 | $ 0.0000 | $ 0.0000 |
| | 12/17/2021 | $ 0.1824 | $ 0.0134 |
| Fidelity International Multifactor ETF | 9/16/2022 | $ 0.2065 | $ 0.0195 |
| | 6/17/2022 | $ 0.2198 | $ 0.0208 |
| | 3/18/2022 | $ 0.2209 | $ 0.0209 |
| | 12/30/2021 | $ 0.0000 | $ 0.0000 |
| | 12/17/2021 | $ 0.3142 | $ 0.0262 |
| Fidelity International Value Factor ETF | 9/16/2022 | $ 0.2043 | $ 0.0163 |
| | 6/17/2022 | $ 0.3009 | $ 0.0239 |
| | 3/18/2022 | $ 0.2358 | $ 0.0188 |
| | 12/30/2021 | $ 0.0000 | $ 0.0000 |
| | 12/17/2021 | $ 0.2864 | $ 0.0194 |
The funds will notify shareholders in January 2023 of amounts for use in preparing 2022 income tax returns.
Board Approval of Investment Advisory Contracts and Management Fees
Fidelity International High Dividend ETF
Fidelity International Value Factor ETF
Fidelity Emerging Markets Multifactor ETF
Fidelity International Multifactor ETF
Each year, the Board of Trustees, including the Independent Trustees (together, the Board), votes on the renewal of the management contract with Fidelity Management & Research Company LLC (FMR) and the sub-advisory agreement (Sub-Advisory Agreement) for each fund with Geode Capital Management, LLC (Geode) (together, the Advisory Contracts). FMR and Geode are referred to herein as the Investment Advisers. The Board, assisted by the advice of fund counsel and Independent Trustees’ counsel, requests and considers a broad range of information relevant to the renewal of the Advisory Contracts throughout the year.
The Board meets regularly and, at each of its meetings, covers an extensive agenda of topics and materials and considers factors that are relevant to its annual consideration of the renewal of each fund’s Advisory Contracts, including the services and support provided to each fund and its shareholders. The Board has established various standing committees (Committees), each composed of and chaired by Independent Trustees with varying backgrounds, to which the Board has assigned specific subject matter responsibilities in order to enhance effective decision-making by the Board. The Board, acting directly and through its Committees, requests and receives information concerning the annual consideration of the renewal of each fund’s Advisory Contracts. The Board also meets as needed to review matters specifically related to the Board’s annual consideration of the renewal of the Advisory Contracts. Members of the Board may also meet with trustees of other Fidelity funds through joint ad hoc committees to discuss certain matters relevant to all of the Fidelity funds.
At its May 2022 meeting, the Board unanimously determined to renew each fund’s Advisory Contracts. In reaching its determination, the Board considered all factors it believed relevant, including (i) the nature, extent, and quality of the services provided to each fund and its shareholders (including the investment performance of each fund); (ii) the competitiveness relative to peer funds of each fund’s management fee and total expense ratio; (iii) the total costs of the services provided by and the profits realized by Fidelity and Geode from their respective relationships with each fund; and (iv) the extent to which, if any, economies of scale exist and are realized as each fund grows, and whether any economies of scale are appropriately shared with fund shareholders.
In considering whether to renew the Advisory Contracts for each fund, the Board reached a determination, with the assistance of fund counsel and Independent Trustees’ counsel and through the exercise of its business judgment, that the renewal of the Advisory Contracts was in the best interests of each fund and its shareholders and that the compensation payable under the Advisory Contracts was fair and reasonable. The Board’s decision to renew the Advisory Contracts was not based on any single factor, but rather was based on a comprehensive consideration of all the information provided to the Board at its meetings throughout the year. The Board, in reaching its determination to renew the Advisory Contracts, was aware that shareholders of each fund have a broad range of investment choices available to them, including a wide choice among funds offered by Fidelity’s competitors, and that each fund’s shareholders, who have the opportunity to review and weigh the disclosure provided by the fund in its prospectus and other public disclosures, have chosen to invest in that fund, which is part of the Fidelity family of funds.
Nature, Extent, and Quality of Services Provided. The Board considered staffing as it relates to the funds, including the backgrounds of investment personnel of Fidelity and Geode, and also considered the funds’ investment objectives, strategies, and related investment philosophies. The Independent Trustees also had discussions with senior management of Fidelity’s investment operations and investment groups and with senior management of Geode. The Board considered the structure of the investment personnel compensation programs and whether the structures provide appropriate incentives to act in the best interests of each fund. Additionally, the Board considered the portfolio managers’ investments, if any, in the funds that they manage. The Board also considered the steps Fidelity and Geode had taken to ensure the continued provision of high quality services to the Fidelity funds during the COVID-19 pandemic, including the expansion of staff in client facing positions to maintain service levels in periods of high volumes and volatility.
The Trustees also discussed with representatives of Fidelity, at meetings throughout the year, Fidelity’s role in, among other things, overseeing compliance with federal securities laws and other applicable requirements by Geode with respect to the funds and monitoring and overseeing the performance and investment capabilities of Geode. The Trustees considered that the Board had received from Fidelity periodic reports about its oversight and due diligence processes, as well as periodic reports regarding the performance of Geode.
The Board also considered the nature, extent and quality of services provided by Geode. The Trustees noted that under the Sub-Advisory Agreement, subject to oversight by Fidelity, Geode is responsible for, among other things, identifying investments and arranging for execution of portfolio transactions to implement each fund’s investment strategy. In addition, the Trustees noted that Geode is responsible for providing such reporting as may be requested by Fidelity to fulfill its oversight responsibilities discussed above.
Resources Dedicated to Investment Management and Support Services. The Board and the Fund Oversight and Research Committees reviewed the general qualifications and capabilities of Fidelity’s and Geode’s investment staffs, including their size, education, experience, and resources, as well as Fidelity’s and Geode’s approach to recruiting, training, managing, and compensating investment personnel. The Board considered that Fidelity’s and Geode’s investment professionals have extensive resources, tools and capabilities so as to provide competitive investment results
over time, and that those professionals also have access to sophisticated tools that permit them to assess portfolio construction and risk and performance attribution characteristics continuously. Additionally, in its deliberations, the Board considered Fidelity’s and Geode’s trading, risk management, compliance, and technology and operations capabilities and resources, which are integral parts of the investment management process.
Shareholder and Administrative Services. The Board considered (i) the nature, extent, quality, and cost of advisory and administrative services provided by the Investment Advisers and their affiliates under the Advisory Contracts and by FMR’s affiliates under separate agreements covering pricing and bookkeeping and securities lending services for each fund; (ii) the nature and extent of the supervision of third party service providers, principally State Street Bank and Trust Company, each fund’s transfer agent and custodian; and (iii) the resources devoted to, and the record of compliance with, each fund’s compliance policies and procedures. The Board also reviewed the allocation of fund brokerage, including allocations to brokers affiliated with the Investment Advisers.
The Board noted that the growth of fund assets over time across the complex allows Fidelity to reinvest in the development of services designed to enhance the value and convenience of the Fidelity funds as investment vehicles. These services include 24-hour access to account information and market information over the Internet and through telephone representatives, investor education materials, and asset allocation tools. The Board also considered that it reviews customer service metrics such as telephone response times, continuity of services on the website and metrics addressing services at Fidelity Investor Centers.
Investment in a Large Fund Family. The Board considered the benefits to shareholders of investing in a Fidelity fund, including the benefits of investing in a fund that is part of a large family of funds offering a variety of investment disciplines and providing a large variety of mutual fund investor services. The Board noted that Fidelity had taken, or had made recommendations that resulted in the Fidelity funds taking, a number of actions over the previous year that benefited particular funds, including: (i) continuing to dedicate additional resources to Fidelity’s investment research process, which includes meetings with management of issuers of securities in which the funds invest; (ii) continuing efforts to enhance Fidelity’s global research capabilities; (iii) launching new funds and ETFs with innovative structures, strategies and pricing and making other enhancements to meet client needs; (iv) launching new share classes of existing funds; (v) eliminating purchase minimums and broadening eligibility requirements for certain funds and share classes; (vi) reducing management fees and total expenses for certain target date funds and classes and index funds; (vii) lowering expenses for certain existing funds and classes by implementing or lowering expense caps; (viii) rationalizing product lines and gaining increased efficiencies from fund mergers and liquidations; (ix) continuing to develop, acquire and implement systems and technology to improve services to the funds and shareholders, strengthen information security, and increase efficiency; and (x) continuing to implement enhancements to further strengthen Fidelity’s product line to increase investors’ probability of success in achieving their investment goals, including retirement income goals.
Investment Performance. The Board considered whether each fund has operated in accordance with its investment objective, as well as its record of compliance with its investment restrictions and its performance history.
The Board took into account discussions that occur at Board meetings throughout the year with representatives of the Investment Advisers about fund investment performance. In this regard the Board noted that as part of regularly scheduled fund reviews and other reports to the Board on fund performance, the Board considers annualized return information for each fund for different time periods, measured against the securities market index the fund seeks to track. The Board also periodically considers each fund’s tracking error versus its benchmark index. In its evaluation of fund investment performance, the Board gave particular attention to information indicating changes in performance of certain Fidelity funds for specific time periods and discussed with the Investment Advisers the reasons for any overperformance or underperformance. The Board also considered information on each fund’s bid-ask spread and premium/discount.
In addition to reviewing absolute and relative fund performance, the Independent Trustees periodically consider the appropriateness of fund performance metrics in evaluating the results achieved. In general, the Independent Trustees believe that an index fund’s performance should be evaluated based on net performance (after fees and expenses) of the fund compared to a fund’s benchmark index, over appropriate time periods taking into account relevant factors including the following: general market conditions; the characteristics of the fund’s benchmark index; the extent to which statistical sampling is employed; any securities lending revenues; and fund cash flows and other factors.
The Independent Trustees recognize that shareholders evaluate performance on a net basis over their own holding periods, for which one-, three-, and five-year periods are often used as a proxy. For this reason, the performance information reviewed by the Board also included net cumulative total return information for each fund and its benchmark index for the most recent one- and three-year periods (for Fidelity Emerging Markets Multifactor ETF and Fidelity International Multifactor ETF, the most recent one-year period) ended September 30, 2021, as shown below. Peer groups are not shown below because the funds do not generally utilize a peer group for performance comparison purposes.
Board Approval of Investment Advisory Contracts and Management Fees – continued
Fidelity International High Dividend ETF
Fidelity International Value Factor ETF
Fidelity Emerging Markets Multifactor ETF
Fidelity International Multifactor ETF
Based on its review, the Board concluded that the nature, extent, and quality of services provided to each fund under the Advisory Contracts should continue to benefit the shareholders of each fund.
Competitiveness of Management Fee and Total Expense Ratio. The Board considered each fund’s management fee and total expense ratio compared to “mapped groups” of competitive funds created for the purpose of facilitating the Trustees’ competitive analysis of management fees and total expenses. Fidelity creates “mapped groups” by combining similar Lipper investment objective categories that have comparable investment mandates. Combining Lipper investment objective categories aids the Board’s management fee and total expense ratio comparisons by broadening the competitive group used for comparison.
Management Fee. The Board considered two proprietary management fee comparisons for the 12-month (or shorter) periods ended September 30 (June 30 for periods ended 2019 and 2018) shown in basis points (BP) in the charts below. The group of Lipper funds used by the Board for management fee comparisons is referred to below as the “Total Mapped Group.” The Total Mapped Group comparison focuses on a fund’s standing in terms of gross management fees before expense reimbursements or caps relative to the total universe of funds with comparable investment mandates, regardless of whether their management fee structures also are comparable. Funds with comparable investment mandates offer exposure to similar types of securities. Funds with comparable management fee structures have similar management fee contractual arrangements (e.g., flat rate charged for advisory services, all-inclusive fee rate, etc.). “TMG %” represents the percentage of funds in the Total Mapped Group that had management fees that were lower than a fund’s. For example, a hypothetical TMG % of 20% would mean that 80% of the funds in the Total Mapped Group had higher, and 20% had lower, management fees than a fund. The funds’ actual TMG %s and the number of funds in the Total Mapped Group are in the charts below. The “Asset-Sized Peer Group” (ASPG) comparison focuses on a fund’s standing relative
Board Approval of Investment Advisory Contracts and Management Fees – continued
to a subset of non-Fidelity funds within the Total Mapped Group that are similar in size and management fee structure. For example, if a fund is in the first quartile of the ASPG, the fund’s management fee ranks in the least expensive or lowest 25% of funds in the ASPG. The ASPG represents at least 15% of the funds in the Total Mapped Group with comparable asset size and management fee structures, subject to a minimum of 50 funds (or all funds in the Total Mapped Group if fewer than 50). Additional information, such as the ASPG quartile in which a fund’s management fee rate ranked, is also included in the charts and was considered by the Board.
Fidelity International High Dividend ETF
Fidelity International Value Factor ETF
Fidelity Emerging Markets Multifactor ETF
Fidelity International Multifactor ETF
The Board noted that each fund’s management fee rate ranked below the median of its Total Mapped Group and below the median of its ASPG for the 12-month period ended September 30, 2021.
Based on its review, the Board concluded that each fund’s management fee is fair and reasonable in light of the services that the fund receives and the other factors considered.
Total Expense Ratio. In its review of each fund’s total expense ratio, the Board considered the fund’s all-inclusive fee rate. The Board also considered other expenses, such as transfer agent fees, pricing and bookkeeping fees, and custodial, legal, and audit fees, paid by FMR under the all-inclusive arrangement. The Board also noted that Fidelity may agree to waive fees or reimburse expenses from time to time, and the extent to which, if any, it has done so for each fund. Each fund is compared to those funds and classes in the Total Mapped Group (used by the Board for management fee comparisons) that have a similar sales load structure. The Board also considered a total expense ASPG comparison for each
Board Approval of Investment Advisory Contracts and Management Fees – continued
fund, which focuses on the total expenses of the fund relative to a subset of non-Fidelity funds within the total expense similar sales load structure group. The total expense ASPG is limited to 15 larger and 15 smaller classes in fund average assets for a total of 30 classes, where possible. The total expense ASPG comparison excludes performance adjustments and fund-paid 12b-1 fees to eliminate variability in fee structures.
The Board noted that each fund’s total net expense ratio ranked below the similar sales load structure group competitive median and below the ASPG competitive median for the 12-month period ended September 30, 2021.
Fees Charged to Other Clients. The Board also considered fee structures applicable to clients of Fidelity and Geode, such as other funds advised or subadvised by Fidelity or Geode, pension plan clients, and other institutional clients with similar mandates. The Board noted that a joint ad hoc committee created by it and the boards of other Fidelity funds periodically reviews and compares Fidelity’s institutional investment advisory business with its business of providing services to the Fidelity funds and also noted the most recent findings of the committee. The Board noted that the committee’s review included a consideration of the differences in services provided, fees charged, and costs incurred, as well as competition in the markets serving the different categories of clients.
Based on its review of total expense ratios and fees charged to other Fidelity clients, the Board concluded that each fund’s total expense ratio was reasonable in light of the services that the fund and its shareholders receive and the other factors considered.
Costs of the Services and Profitability. The Board considered the revenues earned and the expenses incurred by Fidelity in conducting the business of developing, marketing, distributing, managing, administering and servicing each fund and servicing each fund’s shareholders. The Board also considered the level of Fidelity’s profits in respect of all the Fidelity funds.
On an annual basis, Fidelity presents to the Board information about the profitability of its relationships with each fund. Fidelity calculates profitability information for each fund, as well as aggregate profitability information for groups of Fidelity funds and all Fidelity funds, using a series of detailed revenue and cost allocation methodologies which originate with the books and records of Fidelity on which Fidelity’s audited financial statements are based. The Audit Committee of the Board reviews any significant changes from the prior year’s methodologies and the full Board approves such changes.
A public accounting firm has been engaged annually by the Board as part of the Board’s assessment of Fidelity’s profitability analysis. The engagement includes the review and assessment of the methodologies used by Fidelity in determining the revenues and expenses attributable to Fidelity’s mutual fund business, and completion of agreed-upon procedures in respect of the mathematical accuracy of certain fund profitability information and its conformity to established allocation methodologies. After considering the reports issued under the engagement and information provided by Fidelity, the Board concluded that while other allocation methods may also be reasonable, Fidelity’s profitability methodologies are reasonable in all material respects.
The Board also reviewed Fidelity’s and Geode’s non-fund businesses and potential indirect benefits such businesses may have received as a result of their association with Fidelity’s mutual fund business (i.e., fall-out benefits) as well as cases where Fidelity’s and Geode’s affiliates may benefit from the funds’ business. The Board considered areas where potential indirect benefits to the Fidelity funds from their relationships with Fidelity may exist. The Board’s consideration of these matters was informed by the findings of a joint ad hoc committee created by it and the boards of other Fidelity funds to evaluate potential fall-out benefits.
The Board considered the costs of the services provided by and the profits realized by Fidelity in connection with the operation of each fund and was satisfied that the profitability was not excessive.
The Board also considered information regarding the profitability of Geode’s relationship with each fund.
Economies of Scale. The Board considered whether there have been economies of scale in respect of the management of the Fidelity funds, whether the Fidelity funds (including each fund) have appropriately benefited from any such economies of scale, and whether there is potential for realization of any further economies of scale. The Board considered the extent to which each fund will benefit from economies of scale as assets grow through increased services to the fund, through waivers or reimbursements, or through fee or expense ratio reductions. The Board recognized that, due to each fund’s current contractual arrangements, its expense ratio will not decline if the fund’s operating costs decrease as assets grow, or rise as assets decrease. The Board also noted that a committee (the Economies of Scale Committee) created by it and the boards of other Fidelity funds periodically analyzes whether Fidelity attains economies of scale in respect of the management and servicing of the Fidelity funds, whether the Fidelity funds have appropriately benefited from such economies of scale, and whether there is potential for realization of any further economies of scale.
The Board concluded, taking into account the analysis of the Economies of Scale Committee, that economies of scale, if any, are being appropriately shared between fund shareholders and Fidelity.
Additional Information Requested by the Board. In order to develop fully the factual basis for consideration of the Fidelity funds’ advisory contracts, the Board requested and received additional information on certain topics, including: (i) fund flow and performance trends, in particular the underperformance of certain funds and strategies, and Fidelity’s long-term strategies for certain funds, including any consideration of fund liquidations or mergers; (ii) the operation of performance fees, competitor use of performance fees, and consideration of the expansion of performance fees to additional funds; (iii) Fidelity’s pricing philosophy compared to competitors; (iv) fund profitability
methodology and data; (v) evaluation of competitive fund data and peer group classifications and fee and expense comparisons; (vi) the management fee and expense structures for different funds and classes and information about the differences between various fee and expense structures; (vii) group fee breakpoints and related voluntary fee waivers; and (viii) information regarding other accounts managed by Fidelity and the funds’ sub-advisory arrangements.
Based on its evaluation of all of the conclusions noted above, and after considering all factors it believed relevant, the Board concluded that the advisory and sub-advisory fee arrangements are fair and reasonable and that each fund’s Advisory Contracts should be renewed.
[THIS PAGE INTENTIONALLY LEFT BLANK]
[THIS PAGE INTENTIONALLY LEFT BLANK]
IHD-IVE-ANN-1222
1.9885304.104
As of the end of the period, October 31, 2022, Fidelity Covington Trust (the trust) has adopted a code of ethics, as defined in Item 2 of Form N-CSR, that applies to its President and Treasurer and its Chief Financial Officer. A copy of the code of ethics is filed as an exhibit to this Form N-CSR.
| Item 3. | Audit Committee Financial Expert |
The Board of Trustees of the trust has determined that Donald F. Donahue is an audit committee financial expert, as defined in Item 3 of Form N-CSR. Mr. Donahue is independent for purposes of Item 3 of Form N-CSR.
| Item 4. | Principal Accountant Fees and Services |
Fees and Services
The following table presents fees billed by Deloitte & Touche LLP, the member firms of Deloitte Touche Tohmatsu, and their respective affiliates (collectively, “Deloitte Entities”) in each of the last two fiscal years for services rendered to Fidelity Emerging Markets Multifactor ETF, Fidelity International High Dividend ETF, Fidelity International Multifactor ETF and Fidelity International Value Factor ETF (the “Fund(s)”):
Services Billed by Deloitte Entities
October 31, 2022 FeesA
| | | | | | | | | | | | | | | | |
| | | Audit Fees | | | Audit-
Related
Fees | | | Tax Fees | | | All Other
Fees | |
Fidelity Emerging Markets Multifactor ETF | | $ | 16,300 | | | $ | — | | | $ | 4,600 | | | $ | 400 | |
Fidelity International High Dividend ETF | | $ | 16,300 | | | $ | — | | | $ | 4,600 | | | $ | 400 | |
Fidelity International Multifactor ETF | | $ | 16,300 | | | $ | — | | | $ | 4,600 | | | $ | 400 | |
Fidelity International Value Factor ETF | | $ | 16,300 | | | $ | — | | | $ | 4,600 | | | $ | 400 | |
October 31, 2021 FeesA
| | | | | | | | | | | | | | | | |
| | | Audit Fees | | | Audit-
Related
Fees | | | Tax Fees | | | All Other
Fees | |
Fidelity Emerging Markets Multifactor ETF | | $ | 15,900 | | | $ | — | | | $ | 3,500 | | | $ | 400 | |
Fidelity International High Dividend ETF | | $ | 15,900 | | | $ | — | | | $ | 3,500 | | | $ | 400 | |
Fidelity International Multifactor ETF | | $ | 15,900 | | | $ | — | | | $ | 3,500 | | | $ | 400 | |
Fidelity International Value Factor ETF | | $ | 15,900 | | | $ | — | | | $ | 3,500 | | | $ | 400 | |
A Amounts may reflect rounding.
The following table(s) present(s) fees billed by Deloitte Entities that were required to be approved by the Audit Committee for services that relate directly to the operations and financial reporting of the Fund(s) and that are rendered on behalf of Fidelity Management & Research Company LLC (“FMR”) and entities controlling, controlled by, or under common control with FMR (not including any sub-adviser whose role is primarily portfolio management and is subcontracted with or overseen by another investment adviser) that provide ongoing services to the Fund(s) (“Fund Service Providers”):
Services Billed by Deloitte Entities
| | | | | | | | |
| | | October 31, 2022A | | | October 31, 2021A | |
Audit-Related Fees | | $ | — | | | $ | — | |
Tax Fees | | $ | — | | | $ | — | |
All Other Fees | | $ | — | | | $ | — | |
A Amounts may reflect rounding.
“Audit-Related Fees” represent fees billed for assurance and related services that are reasonably related to the performance of the fund audit or the review of the fund’s financial statements and that are not reported under Audit Fees.
“Tax Fees” represent fees billed for tax compliance, tax advice or tax planning that relate directly to the operations and financial reporting of the fund.
“All Other Fees” represent fees billed for services provided to the fund or Fund Service Provider, a significant portion of which are assurance related, that relate directly to the operations and financial reporting of the fund, excluding those services that are reported under Audit Fees, Audit-Related Fees or Tax Fees.
Assurance services must be performed by an independent public accountant.
* * *
The aggregate non-audit fees billed by Deloitte Entities for services rendered to the Fund(s), FMR (not including any sub-adviser whose role is primarily portfolio management and is subcontracted with or overseen by another investment adviser), and any Fund Service Provider for each of the last two fiscal years of the Fund(s) are as follows:
| | | | | | | | |
Billed By | | October 31, 2022A | | | October 31, 2021A | |
Deloitte Entities | | $ | 477,600 | | | $ | 537,200 | |
A Amounts may reflect rounding.
The trust’s Audit Committee has considered non-audit services that were not pre-approved that were provided by Deloitte Entities to Fund Service Providers to be compatible with maintaining the independence of Deloitte Entities in its(their) audit of the Fund(s), taking into account representations from Deloitte Entities, in accordance with Public Company Accounting Oversight Board rules, regarding its independence from the Fund(s) and its(their) related entities and FMR’s review of the appropriateness and permissibility under applicable law of such non-audit services prior to their provision to the Fund(s) Service Providers.
Audit Committee Pre-Approval Policies and Procedures
The trust’s Audit Committee must pre-approve all audit and non-audit services provided by a fund’s independent registered public accounting firm relating to the operations or financial reporting of the fund. Prior to the commencement of any audit or non-audit services to a fund, the Audit Committee reviews the services to determine whether they are appropriate and permissible under applicable law.
The Audit Committee has adopted policies and procedures to, among other purposes, provide a framework for the Committee’s consideration of non-audit services by the audit firms that audit the Fidelity funds. The policies and procedures require that any non-audit service provided by a fund audit firm to a Fidelity fund and any non-audit service provided by a fund auditor to a Fund Service Provider that relates directly to the operations and financial reporting of a Fidelity fund (“Covered Service”) are subject to approval by the Audit Committee before such service is provided.
All Covered Services must be approved in advance of provision of the service either: (i) by formal resolution of the Audit Committee, or (ii) by oral or written approval of the service by the Chair of the Audit Committee (or if the Chair is unavailable, such other member of the Audit Committee as may be designated by the Chair to act in the Chair’s absence). The approval contemplated by (ii) above is permitted where the Treasurer determines that action on such an engagement is necessary before the next meeting of the Audit Committee.
Non-audit services provided by a fund audit firm to a Fund Service Provider that do not relate directly to the operations and financial reporting of a Fidelity fund are reported to the Audit Committee periodically.
Non-Audit Services Approved Pursuant to Rule 2-01(c)(7)(i)(C) and (ii) of Regulation S-X (“De Minimis Exception”)
There were no non-audit services approved or required to be approved by the Audit Committee pursuant to the De Minimis Exception during the Fund’s(s’) last two fiscal years relating to services provided to (i) the Fund(s) or (ii) any Fund Service Provider that relate directly to the operations and financial reporting of the Fund(s).
| Item 5. | Audit Committee of Listed Registrants |
The Audit Committee is a separately-designated standing audit committee in accordance with Section 3(a)(58)(A) of the Securities Exchange Act of 1934. As of October 31, 2022, the members of the Audit Committee were Donald F. Donahue, Thomas P. Bostick, Thomas Kennedy, Garnett A. Smith, and Susan Tomasky.
(a) Not applicable.
(b) Not applicable.
| Item 7. | Disclosure of Proxy Voting Policies and Procedures for Closed-End Management Investment Companies |
Not applicable.
| Item 8. | Portfolio Managers of Closed-End Management Investment Companies |
Not applicable.
| Item 9. | Purchase of Equity Securities by Closed-End Management Investment Company and Affiliated Purchasers |
Not applicable.
| Item 10. | Submission of Matters to a Vote of Security Holders |
There were no material changes to the procedures by which shareholders may recommend nominees to the trust’s Board of Trustees.
| Item 11. | Controls and Procedures |
(a)(i) The President and Treasurer and the Chief Financial Officer have concluded that the trust’s disclosure controls and procedures (as defined in Rule 30a-3(c) under the Investment Company Act) provide reasonable assurances that material information relating to the trust is made known to them by the appropriate persons, based on their evaluation of these controls and procedures as of a date within 90 days of the filing date of this report.
(a)(ii) There was no change in the trust’s internal control over financial reporting (as defined in Rule 30a-3(d) under the Investment Company Act) that occurred during the period covered by this report that has materially affected, or is reasonably likely to materially affect, the trust’s internal control over financial reporting.
| Item 12. | Disclosure of Securities Lending Activities for Closed-End Management Investment Companies |
Not applicable.
SIGNATURES
Pursuant to the requirements of the Securities Exchange Act of 1934 and the Investment Company Act of 1940, the registrant has duly caused this report to be signed on its behalf by the undersigned, thereunto duly authorized.
Fidelity Covington Trust
| | |
| |
| By: | | /s/ Stacie M. Smith |
| | Stacie M. Smith |
| | President and Treasurer |
| |
| Date: | | December 21, 2022 |
Pursuant to the requirements of the Securities Exchange Act of 1934 and the Investment Company Act of 1940, this report has been signed below by the following persons on behalf of the registrant and in the capacities and on the dates indicated.
| | |
| |
| By: | | /s/ Stacie M. Smith |
| | Stacie M. Smith |
| | President and Treasurer |
| |
| Date: | | December 21, 2022 |
| | |
| By: | | /s/ John J. Burke III |
| | John J. Burke III |
| | Chief Financial Officer |
| |
| Date: | | December 21, 2022 |