
|
|
| Teachers Insurance and Annuity Association of America |
| College Retirement Equities Fund |
| Southern Service Center |
| 8500 Andrew Carnegie Boulevard |
March 23, 2010
VIA EDGAR AND OVERNIGHT MAIL
U.S. Securities and Exchange Commission
100 F Street, NE
Mail Stop 4644
Washington, DC 20549
Attn: Mr. Michael Kosoff, Esq.
Dear Mr. Kosoff:
Please find enclosed a draft version of Amendment No. 1 (the “Amendment”) to the Registration Statement on Form S-1 (File No. 333-165286) (the “Registration Statement”) of the TIAA Real Estate Account (the “Account”). The initial Registration Statement was filed with the Securities and Exchange Commission (the “Commission”) on March 5, 2010. The enclosed draft Amendment includes certain information required by Form S-1 which was omitted in the initial filing of the Registration Statement. In particular, the enclosed draft Amendment includes information contained in the Account’s Annual Report on Form 10-K for the year ended December 31, 2009 (filed with the Commission on March 18, 2010); namely, audited financial statements of the Account, a Management’s Discussion and Analysis section, Quantitative and Qualitative Disclosures about Market Risk and selected financial tables derived from the Account’s financial statements.
As we have discussed, a pre-effective amendment to the Registration Statement will be filed to include the required financial statements of Teachers Insurance and Annuity Association of America, the Account’s estimated expense figures for the 2010-2011 period and all other information required in the Registration Statement at such time.
Please do not hesitate to contact me with any questions you may have concerning this matter by calling (704) 988-5507 or via email at
katkinson@tiaa-cref.org. Thank you for your assistance.
|
|
| Very truly yours, |
|
|
| /s/ Keith F. Atkinson |
| Keith F. Atkinson |
|
|
cc: | Stewart P. Greene, Esq. |
| Teachers Insurance and Annuity Association of America |
|
|
| Jeffrey S. Puretz, Esq. |
| Dechert LLP |
As filed with the Securities and Exchange Commission on _______, 2010
Registration No. 333-165286
|
UNITED STATES |
SECURITIES AND EXCHANGE COMMISSION |
Washington, D.C. 20549 |
|
Amendment No. 1 |
|
FOR REGISTRATION UNDER THE SECURITIES ACT OF 1933 |
|
|
|
| TIAA REAL ESTATE ACCOUNT |
|
|
| |
(Exact Name of Registrant as Specified in its Charter) | ||
|
|
|
| New York |
|
|
| |
(State or other jurisdiction of incorporation or organization) | ||
|
|
|
| (Not applicable) |
|
|
| |
(Primary Standard Industrial Classification Code Number) | ||
|
|
|
| (Not applicable) |
|
|
| |
(I.R.S. Employer Identification No.) | ||
|
|
|
c/o Teachers Insurance and Annuity Association of America | ||
730 Third Avenue | ||
New York, New York 10017-3206 | ||
(212) 490-9000 | ||
|
| |
(Address including zip code, and telephone number, | ||
including area code, of registrant’s principal executive offices) | ||
|
|
|
Keith F. Atkinson, Esquire | ||
Teachers Insurance and Annuity Association of America | ||
8500 Andrew Carnegie Blvd. | ||
Charlotte, North Carolina 28226 | ||
(704) 988-1000 | ||
|
| |
(Name, address, including zip code, and telephone number, | ||
including area code, of agent for service) | ||
|
Copy to: |
Jeffrey S. Puretz, Esquire |
Dechert LLP |
1775 I Street, N.W. |
Washington, D.C. 20006 |
Approximate date of commencement of proposed sale to the public: As soon as practicable after the effective date of the registration statement.
If any of the securities being registered on this Form are to be offered on a delayed or continuous basis pursuant to Rule 415 under the Securities Act of 1933, check the following box:x
If this Form is filed to register additional securities for an offering pursuant to Rule 462(b) under the Securities Act, check the following box and list the Securities Act registration statement number of the earlier effective registration statement for the same offering:o
If this Form is a post-effective amendment filed pursuant to Rule 462(c) under the Securities Act, check the following box and list the Securities Act registration statement number of the earlier effective registration statement for the same offering:o
If this Form is a post-effective amendment filed pursuant to Rule 462(d) under the Securities Act, check the following box and list the Securities Act registration statement number of the earlier effective registration statement for the same offering:o
Indicate by check mark whether the registrant is a large accelerated filer, an accelerated filer, a non-accelerated filer or a smaller reporting company. See definition of “accelerated filer and large accelerated filer” in Rule 12b-2 of the Exchange Act.
Large accelerated filero Accelerated filero Non-accelerated filerx Smaller Reporting Companyo
Pursuant to Rule 429 under the Securities Act, the prospectus contained herein also relates to and constitutes a post-effective amendment to Securities Act registration statements 33-92990, 333-13477, 333-22809, 333-59778, 333-83964, 333-113602, 333-121493, 333-132580, 333-141513, 333-149862 and 333-158136 (collectively, the “Prior Registration Statements”).
CALCULATION OF REGISTRATION FEE
|
|
|
|
|
|
|
|
|
Title of Each Class |
| Amount to be |
| Proposed Maximum Offering |
| Proposed |
| Amount |
|
|
|
| |||||
Accumulation units in TIAA Real Estate Account |
| * |
| * |
| $1,000,000,000** |
| $71,300** |
|
|
* | The securities are not issued in predetermined amounts or units, and the maximum aggregate offering price is estimated solely for purposes of determining the registration fee pursuant to Rule 457(o) under the Securities Act. |
|
|
** | In addition to the $1,000,000,000 of accumulation units registered hereunder, the registrant is carrying forward securities which remain unsold but which were previously registered under the Prior Registration Statements for which filing fees were previously paid. |
|
|
(1) | The Registrant paid filing fees in the amount of $279,000 in connection with the registration of accumulation units on its Registration Statement on Form S-1 (File No. 333-158136), which was initially filed with the Commission on March 20, 2009 and declared effective on May 1, 2009. The Registrant is not offsetting any filing fees previously paid in connection with any prior Registration Statement. |
|
|
(2) | Previously paid. |
The registrant hereby amends this registration statement on such date or dates as may be necessary to delay its effective date until the registrant shall file a further amendment which specifically states that this registration statement shall thereafter become effective in accordance with Section 8(a) of the Securities Act of 1933 or until the registration statement shall become effective on such date as the Securities and Exchange Commission, acting pursuant to Section 8(a), may determine.
2
The information in this prospectus is not complete and may be changed. We may not sell these securities until the registration statement filed with the Securities and Exchange Commission is effective. This prospectus is not an offer to sell these securities and we are not soliciting an offer to buy these securities in any state where the offer or sale is not permitted.
SUBJECT TO COMPLETION, DATED ____________, 2010
PROSPECTUS
_________, 2010
TIAA REAL ESTATE ACCOUNT
A Tax-Deferred Variable Annuity Option Offered by Teachers Insurance and Annuity Association of America
This prospectus tells you about the TIAA Real Estate Account, an investment option offered through individual and group variable annuity contracts issued by TIAA. Please read it carefully before investing and keep it for future reference.
The Real Estate Account, which we refer to sometimes as “the Account” in this prospectus, invests primarily in real estate and real estate-related investments. TIAA, one of the largest and most experienced mortgage and real estate investors in the nation, manages the Account’s assets.
The value of your investment in the Real Estate Account will go up or down depending on how the Account performs and you could lose money. The Account’s performance depends mainly on the value of the Account’s real estate and other real estate-related investments, the income generated by those investments and the Account’s expenses. The Account’s returns could go down if, for example, real estate values or rental and occupancy rates, or the value of real estate related securities, decrease due to general economic conditions and/or a weak market for real estate generally. Property operating costs, costs associated with leverage on the Account’s properties, and government regulations, such as zoning or environmental laws, could also affect a property’s profitability. TIAA does not guarantee the investment performance of the Account, and you will bear the entire investment risk. For a detailed discussion of the specific risks of investing in the Account, see “Risks” on page 11.
We take deductions daily from the Account’s net assets for the Account’s operating and investment management expenses. The Account also pays TIAA for bearing mortality and expense risks and for providing a liquidity guarantee. The current estimated annual expense deductions from the Account’s net assets over the next 12 months total ____%.
The Real Estate Account is designed as an option for retirement and tax-deferred savings plans for employees of non-profit and governmental institutions. TIAA offers the Real Estate Account under the following annuity contracts:
§ RA and GRAs (Retirement Annuities and Group Retirement Annuities)
§ SRAs (Supplemental Retirement Annuities)
§ GSRAs (Group Supplemental Retirement Annuities)
§ Retirement Choice and Retirement Choice Plus Annuity
§ GAs (Group Annuities) and Institutionally-Owned GSRAs
§ Classic and Roth IRAs (Individual Retirement Annuities) including SEP IRAs (Simplified Employee Pension Plans)
§ Keoghs
§ ATRAs (After-Tax Retirement Annuities)
Note that state regulatory approval may be pending for certain of these contracts and they may not currently be available in your state.
Neither the Securities and Exchange Commission (SEC) nor any state securities commission has approved or disapproved of these securities or passed upon the adequacy of the information in this prospectus. Any representation to the contrary is a criminal offense.
An investment in the Real Estate Account is not a bank deposit and is not insured or guaranteed by the Federal Deposit Insurance Corporation or any other government agency.

TABLE OF CONTENTS
|
|
|
| ||
| 3 | |
| ||
| 11 | |
| ||
| 27 | |
| ||
| 28 | |
| ||
| 31 | |
| ||
| 35 | |
| ||
| 42 | |
| ||
| 48 | |
| ||
| 55 | |
| ||
| 57 | |
| ||
| 58 | |
| ||
| 59 | |
| ||
| 60 | |
| ||
Management’s Discussion and Analysis of the Account’s Financial Condition and Results of Operations |
| 61 |
| ||
| 98 | |
|
|
|
| ||
| 100 | |
| ||
| 107 | |
| ||
| 112 | |
| ||
| 117 | |
| ||
| 119 | |
| ||
| 124 | |
| ||
| 126 | |
| ||
| 126 | |
| ||
| 127 | |
| ||
| 127 | |
| ||
| 127 | |
| ||
| 128 | |
| ||
| 128 | |
| ||
| 164 | |
| ||
| 167 | |
| ||
| 173 |
|
Please see Appendix C for definitions of certain special terms used in this prospectus. |
|
The Real Estate Account securities offered by this prospectus are only being offered in those jurisdictions where it is legal to do so. No person may make any representation to you or give you any information about the offering that is not in the prospectus. If anyone provides you with information about the offering that is not in the prospectus, you shouldn’t rely on it. |
|
|
TIAA REAL ESTATE ACCOUNT |
|
|
You should read this summary together with the more detailed information regarding the Account, including the Account’s financial statements and related notes, appearing elsewhere in this prospectus. Because this is only a summary, it may not contain all of the information important to you or that you should consider before deciding whether to invest in the units offered by the Account. Therefore, we urge you to read this prospectus in its entirety.
More information about the Account may be obtained by writing us at 730 Third Avenue, New York, NY 10017-3206, calling us at 877 518-9161 or visiting our website at www.tiaa-cref.org. Information contained on this website is expressly not incorporated into this prospectus.
ABOUT THE TIAA REAL ESTATE ACCOUNT
The TIAA Real Estate Account was established in February 1995 as a separate account of Teachers Insurance and Annuity Association of America (TIAA) and interests in the Account were first offered to eligible participants on October 2, 1995. The Account offers individual and group accumulating annuity contracts (with contributions made on a pre-tax or after-tax basis), as well as individual lifetime and term-certain variable payout annuity contracts (including the payment of death benefits to beneficiaries). Investors are entitled to transfer funds to or from the Account under certain circumstances. Funds invested in the Account for each category of contract are expressed in terms of units, and unit values will fluctuate depending on the Account’s performance.
INVESTMENT OBJECTIVE
The Account seeks favorable long-term returns primarily through rental income and appreciation of real estate investments owned by the Account. The Account will also invest in publicly traded securities and short-term higher quality liquid investments that are easily converted to cash to enable the Account to meet participant redemption requests, purchase or improve properties or cover other expense needs.
INVESTMENT STRATEGY
The Account intends to have between 75% and 85% of its assets invested directly in real estate or real estate-related investments with the goal of producing favorable long-term returns primarily through rental income and appreciation.
TIAA Real Estate Account § Prospectus 3
The Account’s principal strategy is to purchase direct ownership interests in income-producing real estate, primarily office, industrial, retail, and multi-family residential properties. The Account can also invest in real estate or real estate-related investments through joint ventures, real estate partnerships or common or preferred stock or other equity securities of companies whose operations involve real estate (i.e., that primarily own or manage real estate), including real estate investment trusts (REITs). To a limited extent, the Account can also invest in conventional mortgage loans, participating mortgage loans, and collateralized mortgage obligations, including commercial mortgage-backed securities and other similar investments.
The Account will invest the remaining portion of its assets (intended to be between 15% and 25% of its assets) in liquid investments; namely, securities issued by U.S. government agencies or U.S. government sponsored entities, corporate debt securities, money market instruments and, at times, stock of companies that do not primarily own or manage real estate. There will be periods of time (including since late 2008) during which the Account’s liquid investments will comprise less than 15% (and possibly less than 10%) of its total assets, especially during and immediately following periods of significant net participant outflows. Alternatively, in some circumstances, the portion of the Account’s assets invested in liquid investments may exceed 25%. This could happen, for example, if the Account receives a large inflow of money in a short period of time, there is a lack of attractive real estate investments available on the market, and/or the Account anticipates more near-term cash needs.
At December 31, 2009, the Account held a total of 101 real estate property investments (including its interests in 12 real estate-related joint ventures), representing 90.27% of the Account’s total investment portfolio (“Total Investments”). As of that date, the Account also held investments in a mortgage loan receivable (representing 0.73% of Total Investments), real estate limited partnerships (representing 2.07% of Total Investments), U.S. Treasury Bills (representing 2.13% of Total Investments) and government agency notes (representing 4.80% of Total Investments).
Leverage. The Account is authorized to borrow money in accordance with its investment guidelines. Under the Account’s current investment guidelines, which were modified as to borrowing in 2009, management intends to maintain the Account’s loan to value ratio (as defined below) at or below 30%. However, through December 31, 2011:
|
|
|
| • | the Account will maintain outstanding debt in an aggregate principal amount not to exceed the principal amount of debt outstanding as of the date of adoption of such guidelines (approximately $4.0 billion); and |
|
|
|
| • | subject to this $4.0 billion limitation, the Account may incur and/or maintain debt on its properties (including refinancing outstanding debt, assuming debt on the Account’s properties, extending the maturity date of outstanding debt and/or incurring new debt on its properties) based on the ratio of the |
4 Prospectus § TIAA Real Estate Account
|
|
|
|
| outstanding principal amount of the Account’s debt to the Account’s total gross asset value (a “loan to value ratio”). |
Management intends to attain a loan to value ratio of 30% or less by December 31, 2011 and thereafter intends to maintain it at or below 30% (measured at the time of incurrence and after giving effect thereto).
As of December 31, 2009, the Account’s loan to value ratio was approximately 33.1%.
SUMMARY OF EXPENSE DEDUCTIONS
Expense deductions are made each Valuation Day from the net assets of the Account for various services to manage investments, administer the Account and the contracts, distribute the contracts and to cover certain risks borne by TIAA. Services are provided “at cost” by TIAA and TIAA-CREF Individual & Institutional Services, LLC (“Services”), a registered broker-dealer and wholly owned subsidiary of TIAA. Currently, TIAA provides investment management services and administration services for the Account, and Services provides distribution services for the Account. TIAA guarantees that in the aggregate, the expense charges will never be more than 2.50% of average net assets per year.
The estimated annual expense deduction rate that appears in the expense table below reflects an estimate of the amount we currently expect to deduct to approximate the costs that the Account will incur from May 1, 2010 through April 30, 2011. Actual expenses may be higher or lower.
|
|
|
|
|
Type of Expense Deduction |
| Estimated |
| Services Performed |
Investment Management |
| _____% |
| For investment advisory, investment management, portfolio accounting, custodial and similar services, including independent fiduciary and appraisal fees |
| ||||
Administration |
| _____% |
| For administration and operations of the Account and the contracts, including administrative services such as receiving and allocating premiums and calculating and making annuity payments |
| ||||
Distribution |
| _____% |
| For services and expenses associated with distributing the annuity contracts |
| ||||
Mortality and Expense Risk |
| _____% |
| For TIAA’s bearing certain mortality and expense risks |
| ||||
Liquidity Guarantee |
| _____% |
| For TIAA’s liquidity guarantee |
| ||||
Total Annual Expense Deduction1,2,3 |
| _____% |
| For total services to the Account |
|
|
1 | TIAA guarantees that the total annual expense deduction will not exceed an annual rate of 2.50% of average net assets. |
|
|
2 | TIAA currently does not impose a fee on transfers from the Account, but reserves the right to impose a fee on transfers from the Account in the future. |
|
|
3 | Property-level expenses, including property management fees and transfer taxes, are not reflected in the table above; instead these expenses are charged directly to the Account’s properties. |
Please see “Expense Deductions” on page 55 and “Selected Financial Data” on page 59 for additional information.
Example. The following table shows you an example of the expenses you would incur on a hypothetical investment of $1,000 in the TIAA Real Estate Account
TIAA Real Estate Account § Prospectus 5
over several periods. The table assumes a 5% annual return on assets and an annual expense deduction equal to ______%. These figures do not represent actual expenses or investment performance, which may differ.
|
|
|
|
|
|
|
|
|
|
|
|
|
|
|
| 1 Year |
| 3 Year |
| 5 Year |
| 10 Year |
| ||||
TIAA Real Estate Account |
| $ | _______ |
| $ | _______ |
| $ | _______ |
| $ | _______ |
|
SUMMARY RISK FACTORS
The value of your investment in the Account will fluctuate based on the value of the Account’s assets and the income the assets generate.You may lose money by investing in this Account.The Account’s assets and income can be affected by many factors, and you should consider the specific risks presented in this prospectus before investing in the Account. The principal risks include, but are not limited to, the following:
|
|
|
| • | The risks associated with acquiring, owning and selling real property, including general economic and real estate market conditions, the availability of financing (both for the Account and potential purchasers of the Account’s properties), disruptions in the credit and capital markets, competition for real estate properties, leasing risk (including tenant defaults), risks of holding foreign investments, and the risk of uninsured losses at properties (including due to terrorism and acts of violence); |
|
|
|
| • | The risks associated with property valuations, including the fact that appraisals can be subjective in a number of respects, the fact that the Account’s appraisals are generally obtained on a quarterly basis and there may be periods in between appraisals of a property in which the value attributed to the property for purposes of the Account’s daily accumulation unit value may be more or less than the actual realizable value of the property; |
|
|
|
| • | Risks associated with financing the Account’s properties, including the risk that the Account may not have the ability to obtain financing on favorable terms (or at all), which may be aggravated by general disruptions in credit and capital markets; |
|
|
|
| • | Investment risk associated with participant transactions, including the fact that significant net participant transfers out of the Account may impair its ability to pursue or consummate new investment opportunities that are otherwise attractive to the Account or that significant net participant transfers into the Account may take time to invest in attractive investment opportunities; |
|
|
|
| • | The risks associated with joint venture partnerships, including the risk that a co-venturer may have interests or goals inconsistent with that of the Account, that a co-venturer may have financial difficulties, and the risk that the Account may have limited rights with respect to operation of the property and transfer of the Account’s interest; |
|
|
|
| • | Uncertainties associated with environmental and other regulatory matters; |
6 Prospectus § TIAA Real Estate Account
|
|
|
| • | Conflicts of interest, including those associated with other real estate accounts and funds which TIAA or its affiliates manage and any perceived conflicts associated with TIAA’s liquidity guarantee; and |
|
|
|
| • | Risks associated with investments in liquid assets, including financial/credit risk, market volatility risk, interest rate volatility risk and deposit/money market risk. |
More detailed discussions of these risks and other risk factors associated with an investment in the Account are contained starting on page 11 of this prospectus in the section entitled “Risks.”
VALUING THE ACCOUNT’S ASSETS
The assets of the Account are valued at the close of each Valuation Day and the Account calculates and publishes a unit value, which is available on TIAA-CREF’s website (www.tiaa-cref.org), for each Valuation Day. The values of the Account’s properties are adjusted daily to account for capital expenditures and appraisals as they occur.
With respect to the Account’s real property investments, following the initial purchase of a property or the making of a mortgage loan on a property by the Account (at which time the Account normally receives an independent appraisal on such property), each of the Account’s real properties are appraised, and mortgage loans are valued, at least once every calendar quarter. Each of the Account’s real estate properties are appraised each quarter by an independent external state-certified (or its foreign equivalent) appraiser (which we refer to in this prospectus as an “independent appraiser”) who is a member of a professional appraisal organization. In addition, TIAA’s internal appraisal staff performs a review of each quarterly appraisal, in conjunction with the Account’s independent fiduciary, and TIAA’s internal appraisal staff or the independent fiduciary may request an additional appraisal or valuation outside of this quarterly cycle. Any differences in the conclusions of TIAA’s internal appraisal staff and the independent appraiser will be reviewed by the independent fiduciary, which will make a final determination on the matter (which may include ordering a subsequent independent appraisal).
In general, the Account obtains appraisals of its real estate properties spread out throughout the quarter, which is intended to result in appraisal adjustments and thus adjustments to the valuations of its holdings (to the extent adjustments are made) that happen regularly throughout each quarter and not on one specific day in each period. In addition, an estimated daily equivalent of net operating income is taken into consideration and is adjusted for actual transactional activity. The remaining assets in the Account are primarily marketable securities that are priced on a daily basis and are included in the Account’s daily unit value.
As of December 31, 2009, the Account’s net assets totaled approximately $7.9 billion. See “Valuing the Account’s Assets” on page 48 for more information on how each class of the Account’s investments are valued.
TIAA Real Estate Account § Prospectus 7
PAST PERFORMANCE
The bar chart and performance table below illustrate how investment performance during the accumulation period has varied. The bar chart shows the Account’s total return during the accumulation period over each of the last ten calendar years and the performance table shows the Account’s returns during the accumulation period for the one-, three-, five- and ten-year periods through December 31, 2009. These returns represent the total return during each such year and are calculated as a function of both the Account’s investment income and capital appreciation from the Account’s total investments during each such year. How the Account has performed in the past is not necessarily an indication of how it will perform in the future. Please see “Risks” beginning on page 11.
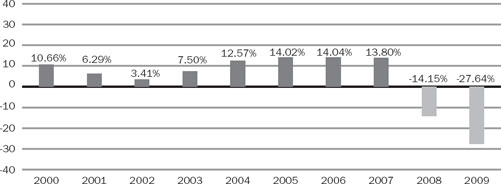
Best quarter: 4.69%, for the quarter ended June 30, 2006.
Worst quarter: -9.96%, for the quarter ended June 30, 2009.
AVERAGE ANNUAL TOTAL RETURNS (AS OF DECEMBER 31, 2009)
|
|
|
|
|
|
|
|
|
|
|
|
|
|
|
| 1 Year |
| 3 Year |
| 5 Year |
| 10 Year |
| ||||
TIAA Real Estate Account |
|
| -27.64 | % |
| -10.92 | % |
| -1.67 | % |
| 3.07 | % |
ABOUT TIAA AND TIAA’S ROLE WITH THE ACCOUNT
TIAA is the companion organization of the College Retirement Equities Fund (CREF), the first company in the United States to issue a variable annuity. CREF is a nonprofit membership corporation established in New York State in 1952. Together, TIAA and CREF, serving approximately 3.6 million people and approximately 15,000 institutions as of December 31, 2009, form the principal retirement system for the nation’s education and research communities and form one of the largest pension systems in the U.S., based on assets under management. As of December 31, 2009, TIAA’s total statutory admitted assets were approximately $201.7 billion; the combined assets under management for TIAA, CREF and other entities within the TIAA-CREF organization (including TIAA-sponsored mutual funds) totaled approximately $414.6 billion. CREF does not stand behind TIAA’s guarantees and TIAA does not guarantee CREF products.
8 Prospectus § TIAA Real Estate Account
The Account does not have officers, directors or employees. TIAA employees, under the direction and control of TIAA’s Board of Trustees and its Investment Committee, manage the investment of the Account’s assets, following investment management procedures TIAA has adopted for the Account. In addition, TIAA performs administration functions for the Account (which include receiving and allocating premiums, calculating and making annuity payments and providing recordkeeping and other services). Distribution services for the Account (which include, without limitation, distribution of the annuity contracts, advising existing annuity contract owners in connection with their accumulations and helping employers implement and manage retirement plans) are performed by Services. TIAA and Services provide administration and distribution services, as applicable, on an “at-cost” basis.
With its over 60 years in the real estate business and interests in properties located across the U.S. and internationally, TIAA is one of the nation’s largest and most experienced investors in mortgages and real estate equity interests. As of December 31, 2009, the TIAA General Account had a mortgage and real property portfolio (excluding mortgage-backed securities and REIT securities) valued at approximately $25.1 billion.
Liquidity Guarantee.In the event that the Account’s level of liquidity is not sufficient to guarantee that Account participants may redeem their accumulation units, the TIAA General Account will purchase accumulation units issued by the Account (sometimes called “liquidity units”) in accordance with its liquidity guarantee. The cost of this guarantee is embedded in the overall expense charge of the Account. This liquidity guarantee is not a guarantee of either investment performance or the value of units in the Account.
This liquidity guarantee was first exercised in December 2008. As of the date of this prospectus, TIAA owns 4.7 million liquidity units, representing approximately 12% of the Account’s outstanding accumulation units as of such date. The Account’s independent fiduciary is vested with oversight of the liquidity guarantee, including overseeing the timing of any redemption of liquidity units held by TIAA. See “Establishing and Managing the Account – The Role of TIAA – Liquidity Guarantee” on page 36 and “—Role of the Independent Fiduciary” on page 37.
THE CONTRACTS
TIAA offers the Account as a variable option for the annuity contracts listed on the cover page of this prospectus, although some employer plans may not offer the Account as an option for certain contracts. Each payment to the Account buys a number of accumulation units. Similarly, any transfer or withdrawal from the Account results in the redemption of a number of accumulation units. The price you pay for an accumulation unit, and the price you receive for an accumulation unit when you redeem accumulation units, is the value of an accumulation unit (which we sometimes call the “AUV”) calculated for the business day on which we receive your purchase, redemption or transfer request in good order (unless you ask for a later date for a redemption or transfer).
TIAA Real Estate Account § Prospectus 9
Transfers and Withdrawals.Subject to the terms of the contracts and your employer’s plan, you can move your money to and from the Account in the following ways:
|
|
|
| • | from the Account to a CREF investment account, a TIAA Access variable account (if available), TIAA’s traditional annuity or a mutual fund (including TIAA-CREF affiliated mutual funds) or other option available under your plan; |
|
|
|
| • | to the Account from a CREF investment account, a TIAA Access variable account (if available), TIAA’s traditional annuity (transfers from TIAA’s traditional annuity under RA, GRA or Retirement Choice contracts are subject to restrictions), a TIAA-CREF affiliated mutual fund or from other companies/plans; |
|
|
|
| • | by withdrawing cash; and/or |
|
|
|
| • | by setting up a program of automatic withdrawals or transfers. |
Importantly, cash withdrawals and transfers out of the Account to a TIAA or CREF account or into another investment option can be executed on any business day but are limited to once per calendar quarter, although some plans may allow systematic transfers and withdrawals that result in more than one transfer or withdrawal per calendar quarter. Other limited exceptions may apply. Also, transfers to CREF accounts or to certain other options may be restricted by your employer’s plan, current tax law or by the terms of your contract.
The Right To Cancel Your Contract.Generally, you may cancel any RA, SRA, GSRA, Classic IRA Roth IRA, ATRA or Keogh contract in accordance with the contract’s Right to Examine provision (unless we have begun making annuity payments from it) and subject to the time period regulated by the state in which the contract is issued. Although the contract terms and state law provisions differ, you will generally have between 10 and 60 days to exercise this cancellation right.
The Annuity Period.Your income payments may be paid out of the Account through a variety of income options. Ordinarily, your annuity payments begin on the date you designate as your annuity starting date, subject to the terms of your employer’s plan. Your initial income payments are based on the value of your accumulation on the last valuation day before the annuity starting date and annuity payments can change after the initial payment based on the Account’s investment experience, the income option you choose and the income change method you choose. Important tax considerations may also apply. See “Receiving Annuity Income” beginning on page 112.
10 Prospectus § TIAA Real Estate Account
The value of your investment in the Account will fluctuate based on the value of the Account’s assets, the income the assets generate and the Account’s expenses.You can lose money by investing in the Account. There is risk associated with an investor attempting to “time” an investment in the Account’s units, or effecting a redemption of an investor’s units. The Account’s assets and income can be affected by many factors, and you should consider the specific risks presented below before investing in the Account. In particular, for a discussion of how forward-looking statements contained in this prospectus are subject to uncertainties that are difficult to predict, which may be beyond management’s control and which could cause actual results to differ materially from historical experience or management’s present expectations, please refer to the subsection entitled “Forward-Looking Statements,” which is contained in the section entitled “Management’s Discussion and Analysis of the Account’s Financial Condition and Results of Operations.”
RISKS ASSOCIATED WITH REAL ESTATE INVESTING
General Risks of Acquiring and Owning Real Property:As referenced elsewhere in this prospectus, the substantial majority of the Account’s net assets are comprised of direct ownership interests in real estate. As such, the Account is particularly subject to the risks inherent in acquiring and owning real property, including in particular the following:
|
|
|
|
| • | Adverse Global and Domestic Economic Conditions.The economic conditions in the markets where the Account’s properties are located may be adversely impacted by factors which include: | |
|
|
|
|
|
| • | adverse domestic or global economic conditions, particularly in the event of a deep recession which results in significant employment losses across many sectors of the economy and reduced levels of consumer spending; |
|
|
|
|
|
| • | a weak market for real estate generally and/or in specific locations where the Account may own property; |
|
|
|
|
|
| • | the availability of financing (both for the Account and potential purchasers of the Account’s properties); |
|
|
|
|
|
| • | an oversupply of, or a reduced demand for, certain types of real estate properties; |
|
|
|
|
|
| • | business closings, industry or sector slowdowns, employment losses and related factors; |
|
|
|
|
|
| • | natural disasters, flooding and other significant and severe weather-related events, including those caused by global climate change; |
|
|
|
|
|
| • | terrorist attacks and/or other man-made events; and |
|
|
|
|
|
| • | decline in population or shifting demographics. |
The incidence of some or all of these factors could reduce occupancy, rental rates and the market value of the Account’s real properties or interests in
TIAA Real Estate Account § Prospectus 11
investment vehicles (such as limited partnerships) which directly hold real properties.
|
|
|
|
| • | Concentration Risk.The Account may experience periods in which its investments are geographically concentrated, either regionally or in certain markets with similar demographics. Further, while the Account seeks diversification across its four primary property types: office, industrial, retail and multi-family residential properties, the Account may experience periods where it has concentration in one property type, increasing the potential exposure if there were to be an oversupply of, or a reduced demand for, certain types of real estate properties in the markets in which the Account operates. Also, the Account may experience periods in which its tenant base is concentrated within a particular industry sector. If any or all of these events occur, the Account’s income and performance may be adversely impacted disproportionately by deteriorating economic conditions in those areas or industry sectors in which the Account’s investments are concentrated. Also, the Account could experience a more rapid negative change in the value of its real estate investments than would be the case if its real estate investments were more diversified. | |
|
|
| |
| • | Leasing Risk.A number of factors could cause the Account’s rental income, a key source of the Account’s revenue and investment return, to decline, which would adversely impact the Account’s results and investment returns. These factors include: | |
|
|
|
|
|
| • | A property may be unable to attract new tenants or retain existing tenants. This situation could be exacerbated if a concentration of lease expirations occurred during any one time period or multiple tenants exercise early termination at the same time. |
|
|
|
|
|
| • | The financial condition of our tenants may be adversely impacted, particularly in a prolonged economic downturn. The Account could lose revenue if tenants do not pay rent when contractually obligated, request some form of rent relief and/or default under a lease at one of the Account’s properties. Such a default could occur if a tenant declared bankruptcy, suffered from a lack of liquidity, failed to continue to operate its business or for other reasons. In the event of any such default, we may experience a delay in, or an inability to effect, the enforcement of our rights against that tenant, particularly if that tenant filed for bankruptcy protection. Further, any disputes with tenants could involve costly and time consuming litigation. |
|
|
|
|
|
| • | In the event a tenant vacates its space at one of the Account’s properties, whether as a result of a default, the expiration of the lease term, rejection of the lease in bankruptcy or otherwise, given current market conditions, we may not be able to re-lease the vacant space either (i) for as much as the rent payable under the previous lease or (ii) at all. Also, we may not be able to re-lease such space without incurring substantial expenditures for tenant |
12 Prospectus § TIAA Real Estate Account
|
|
|
|
|
|
| improvements and other lease-up related costs, while still being obligated for any mortgage payments, real estate taxes and other expenditures related to the property. |
|
|
|
|
|
| • | In some instances, our properties may be specifically suited to and/or outfitted for the particular needs of a certain tenant based on the type of business the tenant operates. For example, many companies desire space with an open floor plan. We may have difficulty obtaining a new tenant for any vacant space in our properties, particularly if the floor plan limits the types of businesses that can use the space without major renovation, which may require us to incur substantial expense in re-planning the space. |
|
|
|
|
|
| • | The Account owns and operates retail properties, which, in addition to the risks listed above, are subject to specific risks, including variations in rental revenues due to customary “percentage rent” clauses which may be in place for retail tenants and the insolvency and/or closing of an anchor tenant. Many times, anchor tenants will be “big box” stores and other large retailers that can be particularly adversely impacted by a global recession and reduced consumer spending generally. Factors that can impact the level of consumer spending include increases in fuel and energy costs, residential and commercial real estate and mortgage conditions, labor and healthcare costs, access to credit, consumer confidence and other macroeconomic factors. Under certain circumstances, the leases may allow other tenants in a retail property to terminate their leases, reduce or withhold rental payments. The insolvency and/or closing of an anchor tenant may also cause such tenants to fail to renew their leases at expiration. |
|
|
|
|
| • | Competition.The Account may face competition for real estate investments from multiple sources, including individuals, corporations, insurance companies or other insurance company separate accounts, as well as real estate limited partnerships, real estate investment funds, commercial developers, pension plans, other institutional and foreign investors and other entities engaged in real estate investment activities. Some of these competitors may have similar financial and other resources as the Account, and/or they may have investment strategies and policies (including the ability to incur significantly more leverage than the Account) that allow them to compete more aggressively for real estate investment opportunities, which could result in the Account paying higher prices for investments, experiencing delays in acquiring investments or failing to consummate such purchases. Any resulting delays in the acquisition of investments, or the failure to consummate acquisitions the Account deems desirable, may increase the Account’s costs or otherwise adversely affect the Account’s investment results. | |
|
|
| |
|
| In addition, the Account’s properties may be located close to properties that are owned by other real estate investors and that compete with the Account for tenants. These competing properties may be better located, more suitable for tenants than our properties or have owners who may compete more | |
TIAA Real Estate Account § Prospectus 13
|
|
|
|
| aggressively for tenants, resulting in a competitive advantage for these other properties. We may also face similar competition from other properties that may be developed in the future. This competition may limit the Account’s ability to lease space, increase its costs of securing tenants, limit our ability to maximize our rents and/or require the Account to make capital improvements it otherwise would not, in order to make its properties more attractive to prospective tenants. |
|
|
|
| • | Operating Costs.A property’s cash flow could decrease if operating costs, such as property taxes, utilities, litigation expenses associated with a property, maintenance and insurance costs that are not reimbursed by tenants increase in relation to gross rental income, or if the property needs unanticipated repairs and renovations. |
|
|
|
| ||
| • | Condemnation.A governmental agency may condemn all or a portion of a property owned by the Account. While the Account would receive compensation in connection with any such condemnation, such compensation may not be in an amount the Account believes represents equivalent value for the condemned property. Further, a partial condemnation could impair the ability of the Account to maximize the value of the property during its operation, including making it more difficult to find new tenants or retain existing tenants. Finally, a property which has been subject to a partial condemnation may be more difficult to sell at a price the Account believes is appropriate. |
| ||
|
|
|
| • | Terrorism and Acts of War and Violence.Terrorist attacks may harm our property investments. The Account cannot assure you that there will not be further terrorist attacks against the United States, U.S. businesses or elsewhere in the world. These attacks or armed conflicts may directly or indirectly impact the value of the property we own or that secure our loans. Losses resulting from these types of events may be uninsurable or not insurable to the full extent of the loss suffered. Moreover, any of these events could cause consumer confidence and spending to decrease or result in increased volatility in the United States and worldwide financial markets and economy. Such events could also result in economic uncertainty in the United States or abroad. Adverse economic conditions resulting from terrorist activities could reduce demand for space in the Account’s properties and thereby reduce the value of the Account’s properties and therefore your investment return. |
|
|
|
| General Risks of Selling Real Estate Investments:Among the risks of selling real estate investments are: | |
|
| |
| • | The sale price of an Account property might differ, perhaps significantly, from its estimated or appraised value, leading to losses or reduced profits to the Account. |
|
|
|
| • | The Account might not be able to sell a property at a particular time for a price which management believes represents its fair or full value. This |
14 Prospectus § TIAA Real Estate Account
|
|
|
|
| illiquidity may result from the cyclical nature of real estate, general economic conditions impacting the location of the property, disruption in the credit markets or the availability of financing on favorable terms or at all, and the supply of and demand for available tenant space, among other reasons. This might make it difficult to raise cash quickly which could impair the Account’s liquidity position (particularly during any period of sustained significant net participant outflows) and also could lead to Account losses. Further, the liquidity guarantee does not serve as a working capital facility or credit line to enhance the Account’s liquidity levels generally, as its purpose is tied to participants having the ability to redeem their accumulation units upon demand (thus, alleviating the Account’s need to dispose of properties solely to increase liquidity levels in what management deems a suboptimal sales environment). |
|
|
|
| • | The Account may need to provide financing to a purchaser if no cash buyers are available, or if buyers are unable to receive financing on terms enabling them to consummate the purchase. |
|
|
|
| • | For any particular property, the Account may be required to make expenditures for improvements to, or to correct defects in, the property before the Account is able to market and/or sell the property. |
Valuation and Appraisal Risks:Investments in the Account’s assets are stated at fair value which is defined as the price that would be received to sell the asset in an orderly transaction between market participants at the measurement date. Determination of fair value, particularly for real estate assets, involves significant judgment. Valuation of the Account’s real estate properties (which comprise a substantial majority of the Account’s net assets) are based on real estate appraisals, which are estimates of property values based on a professional’s opinion and may not be accurate predictors of the amount the Account would actually receive if it sold a property. Appraisals can be subjective in certain respects and rely on a variety of assumptions and conditions at that property or in the market in which the property is located, which may change materially after the appraisal is conducted. Among other things, market prices for comparable real estate may be volatile, in particular if there has been a lack of recent transaction activity in such market. Recent disruptions in the macroeconomy, real estate markets and the credit markets have led to a significant decline in transaction activity in most markets and sectors and the lack of observable transaction data may have made it more difficult for an appraisal to determine the fair value of the Account’s real estate.
Further, as the Account generally obtains appraisals on a quarterly basis, there may be circumstances in the period between appraisals or interim valuation adjustments in which the true realizable value of a property is not reflected in the Account’s daily net asset value calculation or in the Account’s periodic financial statements. This disparity may be more apparent when the commercial and/or residential real estate markets experience an overall and possibly dramatic
TIAA Real Estate Account § Prospectus 15
decline (or increase) in property values in a relatively short period of time between appraisals.
If the appraised values of the Account’s properties as a whole are too high, those participants who purchased accumulation units prior to (i) a downward valuation adjustment of a property or multiple properties or (ii) a property or properties being sold for a lower price than the appraised value will be credited with less of an interest than if the value had previously been adjusted downward. Also, those participants who redeem during any such period will have received more than their pro rata share of the value of the Account’s assets, to the detriment of other non-redeeming participants. In particular, appraised property values may prove to be too high (as a whole) in a rapidly declining commercial real estate market. Further, implicit in the Account’s definition of fair value is a principal assumption that there will be a reasonable time to market a given property and that the property will be exchanged between a willing buyer and willing seller in a non-distressed scenario. However, an appraised value may not reflect the actual realizable value that would be obtained in a rush sale where time was of the essence. Also, appraised values may lag actual realizable values to the extent there is significant and rapid economic deterioration in a particular geographic market or a particular sector within a geographic market.
If the appraised values of the Account’s properties as a whole are too low, those participants who redeem prior to (i) an upward valuation adjustment of a property or multiple properties or (ii) a property or properties being sold for a higher price than the appraised value will have received less than their pro rata share of the value of the Account’s assets, and those participants who purchase units during any such period will be credited with more than their pro rata share of the value of the Account’s assets.
Finally, the Account recognizes items of income (such as net operating income from real estate investments, distributions from real estate limited partnerships or joint ventures, or dividends from REIT stocks) and expense in many cases on an intermittent basis, where the Account cannot predict with certainty the magnitude or the timing of such item. As such, even as the Account estimates items of net operating income on a daily basis, the accumulation unit value (“AUV”) for the Account may fluctuate, perhaps significantly, from day to day, as a result of adjusting these estimates for the actual recognized item of income or expense.
Investment Risk Associated with Participant Transactions:The amount we have available to invest in new properties and other real estate related assets will depend, in large part, on the level of net participant transfers into or out of the Account as well as participant premiums into the Account. As noted elsewhere in this prospectus, the Account intends to hold between 15% and 25% of its assets in investments other than real estate and real estate related investments, primarily comprised of highly liquid investments. These liquid assets are intended to be available to purchase real estate related investments in accordance with the Account’s investment objective and strategy and are also available to meet the
16 Prospectus § TIAA Real Estate Account
participant redemption requests and the Account’s expense needs (including, from time to time, obligations on maturing debt). During 2008 (and in particular, the second half of 2008), the Account experienced significant net participant transfers out of the Account. Due in large part to this activity, the TIAA liquidity guarantee was initially executed in December 2008. While the rate of net participant transfers out of the Account declined throughout each quarter of 2009, the Account experienced net participant outflows in each quarter of 2009. The Account’s liquid assets represented less than 10% of the Account’s total assets throughout all of 2009 and, as of December 31, 2009, represented approximately 7.0% of the Account’s total assets. See “Establishing and Managing the Account –The Role of TIAA – Liquidity Guarantee” on page 36.
If the amount of net participant transfers out of the Account were to continue, particularly at an increased rate similar to that experienced in late 2008, we may not have enough available liquid assets to pursue, or consummate, new investment opportunities presented to us that are otherwise attractive to the Account. This, in turn, could harm the Account’s returns. Management cannot predict with precision whether net participant transfers will cease in the near term (i.e., during 2010). Additionally, even if net transfers out of the Account ceased for a period of time, there is no guarantee that redemption activity would not increase again, perhaps in a significant and rapid manner.
Risks of Borrowing:The Account acquires some of its properties subject to existing financing and from time to time borrows new funds at the time of purchase. Also, the Account may from time to time place new leverage on, increase the leverage already placed on, or refinance maturing debt on, existing properties the Account owns. Under the Account’s current investment guidelines, the Account may maintain indebtedness, in the aggregate, either directly or through its joint venture investments, in an amount up to approximately $4.0 billion, and following December 31, 2011, the Account intends to maintain a loan to value ratio at or below 30% (measured at the time of incurrence and after giving effect thereto). Also, the Account may borrow up to 70% of the then-current value of a particular property. Non-construction mortgage loans on a property will be non-recourse to the Account.
Among the risks of borrowing money or otherwise investing in a property subject to a mortgage are:
|
|
|
| • | General Economic Conditions.General economic conditions, dislocations in the capital or credit markets generally or the market conditions then in effect in the real estate finance industry, may hinder the Account’s ability to obtain financing or refinancing for its property investments on favorable terms or at all, regardless of the quality of the Account’s property for which financing or refinancing is sought. Such unfavorable terms might include high interest rates, increased fees and costs and restrictive covenants applicable to the Account’s operation of the property. Longer term disruptions in the capital and credit markets as a result of uncertainty, changing or increased regulation, reduced alternatives or failures of significant financial institutions |
TIAA Real Estate Account § Prospectus 17
|
|
|
|
| could adversely affect our access to financing necessary to make profitable real estate investments. Our failure to obtain financing or refinancing on favorable terms due to the current state of the credit markets or otherwise could have an adverse impact on the returns of the Account. |
|
|
|
| ||
| • | Default Risk.The property may not generate sufficient cash flow to support the debt service on the loan, the property may fail to meet certain financial or operating covenants contained in the loan documents and/or the property may have negative equity (i.e., the loan balance exceeds the value of the property). In any of these circumstances, we may default on the loan, including due to the failure to make required debt service payments when due. If a loan is in default, the Account may determine that it is not economically desirable and/or in the best interests of the Account to continue to make payments on the loan (including accessing other sources of funds to support debt service on the loan), and/or the Account may not be able to otherwise remedy such default on commercially reasonable terms or at all. In either case, the lender then could accelerate the outstanding amount due on the loan and/or foreclose on the underlying property, in which case the Account could lose the value of its investment in the foreclosed property. Further, any such default or acceleration could trigger a default under loan agreements in respect of other Account properties pledged as security for the defaulted loan. Finally, any such default could increase the Account’s borrowing costs, or result in less favorable terms, with respect to financing future properties. |
| ||
|
|
|
| • | Balloon Maturities.If the Account obtains a mortgage loan that involves a balloon payment, there is a risk that the Account may not be able to make the lump sum principal payment due under the loan at the end of the loan term, or otherwise obtain adequate refinancing on terms commercially acceptable to the Account or at all. The Account then may be forced to sell the property or other properties under unfavorable market conditions or default on its mortgage, resulting in the lender exercising its remedies, which may include repossession of the property and the Account could lose the value of its investment in that property. |
|
|
|
| • | Variable Interest Rate Risk.If the Account obtains variable-rate loans, the Account’s returns may be volatile when interest rates are volatile. Further, to the extent that the Account takes out fixed-rate loans and interest rates subsequently decline, this may cause the Account to pay interest at above-market rates for a significant period of time. Any hedging activities the Account engages in to mitigate this risk may not fully protect the Account from the impact of interest rate volatility. |
|
|
|
| • | Valuation Risk.The market valuation of mortgage loans payable could have an adverse impact on the Account’s performance. Valuations of mortgage loans payable are generally based on the amount at which the liability could be transferred in a current transaction, exclusive of transaction costs, and such valuations are subject to a number of assumptions and factors with respect to |
18 Prospectus § TIAA Real Estate Account
|
|
|
|
| the loan and the underlying property, a change in any of which could cause the value of a mortgage loan to fluctuate. |
A general disruption in the credit markets, such as the credit markets have been recently experiencing, may aggravate some or all of these risks. For a discussion of the recent credit market disruptions, please see “Management’s Discussion and Analysis of the Account’s Financial Condition and Results of Operations.”
Regulatory Risks:Government regulation at the federal, state and local levels, including, without limitation, zoning laws, rent control or rent stabilization laws, laws regulating housing on the Account’s multifamily residential properties, the Americans with Disabilities Act, property taxes and fiscal, accounting, environmental or other government policies, could operate or change in a way that adversely affects the Account and its properties. For example, these regulations could raise the cost of owning, improving or maintaining properties, present barriers to otherwise desirable investment opportunities or make it harder to sell, rent, finance, or refinance properties either on economically desirable terms, or at all, due to the increased costs associated with regulatory compliance.
Environmental Risks:The Account may be liable for damage to the environment or injury to individuals caused by hazardous substances used or found on its properties. Under various environmental regulations, the Account may also be liable, as a current or previous property owner or mortgagee, for the cost of removing or cleaning up hazardous substances found on a property, even if it did not know of and wasn’t responsible for the hazardous substances. If any hazardous substances are present or the Account does not properly clean up any hazardous substances, or if the Account fails to comply with regulations requiring it to actively monitor the business activities on its premises, the Account may have difficulty selling or renting a property or be liable for monetary penalties. Further, environmental laws may impose restrictions on the manner in which a property may be used, the tenants which may be allowed, or the manner in which businesses may be operated, which may require the Account to expend funds. These laws may also cause the most ideal use of the property to differ from that originally contemplated and as a result could impair the Account’s returns. The cost of any required cleanup relating to a single real estate investment (including remediating contaminated property) and the Account’s potential liability for environmental damage, including paying personal injury claims and performing under indemnification obligations to third parties, could exceed the value of the Account’s investment in a property, the property’s value, or in an extreme case, a significant portion of the Account’s assets.
Uninsurable Losses:Certain catastrophic losses (e.g.,from earthquakes, wars, terrorist acts, nuclear accidents, wind, floods or environmental or industrial hazards or accidents) may be uninsurable or so expensive to insure against that it is economically disadvantageous to buy insurance for them. Further, the terms and conditions of the insurance coverage the Account has on its properties, in conjunction with the type of loss actually suffered at a property, may subject the
TIAA Real Estate Account § Prospectus 19
property, or the Account as a whole, to a cap on insurance proceeds that is less than the loss or losses suffered. If a disaster that we have not insured against occurs, if the insurance contains a high deductible, and/or if the aggregate insurance proceeds for a particular type of casualty are capped, the Account could lose some of its original investment and any future profits from the property. Further, the Account may not have sufficient access to external sources of funding to repair or reconstruct a damaged property to the extent insurance proceeds do not cover the full loss. In addition, some leases may permit a tenant to terminate its obligations in certain situations, regardless of whether those events are fully covered by insurance. In that case, the Account would not receive rental income from the property while that tenant’s space is vacant.
Risks of Developing Real Estate or Buying Recently Constructed Properties:If the Account chooses to develop a property or buys a recently constructed property, it may face the following risks:
|
|
|
| • | In developing real estate, there may be delays or unexpected increases in the cost of property development and construction due to strikes, bad weather, material shortages, increases in material and labor costs or other events. |
|
|
|
| • | Because external factors may have changed from when the project was originally conceived (e.g.,slower growth in the local economy, higher interest rates, or overbuilding in the area), the property may not operate at the income and expense levels first projected or may not be developed in the way originally planned or at all. |
Risks of Joint Ownership:Investing in joint venture partnerships or other forms of joint property ownership may involve special risks, many of which are exacerbated when the consent of parties other than the Account are required to take action.
|
|
|
|
| • | The co-venturer may have interests or goals inconsistent with those of the Account, including during times when a co-venturer may be experiencing financial difficulty. For example: | |
|
|
|
|
|
| • | a co-venturer may desire a higher current income return on a particular investment than does the Account (which may be motivated by a longer-term investment horizon or exit strategy), or vise versa, which could cause difficulty in managing a particular asset; |
|
|
|
|
|
| • | a co-venturer may desire to maximize or minimize leverage in the venture, which may be at odds with the Account’s strategy; |
|
|
|
|
|
| • | a co-venturer may be more or less likely than the Account to agree to modify the terms of significant agreements (including loan agreements) binding the venture, or may significantly delay in reaching a determination whether to do so, each of which may frustrate the business objectives of the Account; and |
|
|
|
|
|
| • | for reasons related to its own business strategy, a co-venturer may have different concentration standards as to its investments (geographically, by sector, or by tenant), which might frustrate the execution of the business plan for the joint venture. |
20 Prospectus § TIAA Real Estate Account
|
|
|
| • | The co-venturer may be unable to fulfill its obligations (such as to fund its pro rata share of committed capital, expenditures or guarantee obligations of the venture) during the term of such agreement or may become insolvent or bankrupt, any of which could expose the Account to greater liabilities than expected and frustrate the investment objective of the venture. |
|
|
|
| • | If a co-venturer doesn’t follow the Account’s instructions or adhere to the Account’s policies, the jointly owned properties, and consequently the Account, might be exposed to greater liabilities than expected. |
|
|
|
| • | The Account may have limited rights with respect to the underlying property pursuant to the terms of the joint venture, including the right to operate, manage or dispose of a property, and a co-venturer could have approval rights over the sale of the underlying property. |
|
|
|
| • | A co-venturer can make it harder for the Account to transfer its equity interest in the venture to a third party, which could adversely impact the valuation of the Account’s interest in the venture. |
Risks with Purchase-Leaseback Transactions:To the extent the Account invested in a purchase leaseback transaction, the major risk is that the third party lessee will be unable to make required payments to the Account. If the leaseback interest is subordinate to other interests in the real property, such as a first mortgage or other lien, the risk to the Account increases because the lessee may have to pay the senior lienholder to prevent foreclosure before it pays the Account. If the lessee defaults or the leaseback is terminated prematurely, the Account might not recover its investment unless the property is sold or leased on favorable terms.
RISKS OF INVESTING IN MORTGAGE LOANS
The Account’s investment strategy includes, to a limited extent, investments in mortgage loans (i.e., the Account serving as lender).
|
|
|
|
| • | General Risks of Mortgage Loans:The Account will be subject to the risks inherent in making mortgage loans, including: | |
|
|
|
|
|
| • | The borrower may default on the loan, requiring that the Account foreclose on the underlying property to protect the value of its mortgage loan. Since its mortgage loans are usually non-recourse, the Account must rely solely on the value of a property for its security. |
|
|
|
|
|
| • | The larger the mortgage loan compared to the value of the property securing it, the greater the loan’s risk. Upon default, the Account may not be able to sell the property for its estimated or appraised value. Also, certain liens on the property, such as mechanics or tax liens, may have priority over the Account’s security interest. |
|
|
|
|
|
| • | A deterioration in the financial condition of tenants, which could be caused by general or local economic conditions or other factors beyond the control of the Account, or the bankruptcy or insolvency of a major tenant, may adversely affect the income of a property, which could increase the likelihood that the borrower will default under its obligations. |
TIAA Real Estate Account § Prospectus 21
|
|
|
|
|
| • | The borrower may be unable to make a lump sum principal payment due under a mortgage loan at the end of the loan term, unless it can refinance the mortgage loan with another lender. |
|
|
|
|
|
| • | If interest rates are volatile during the loan period, the Account’s variable-rate mortgage loans could have volatile yields. Further, to the extent the Account makes mortgage loans with fixed interest rates, it may receive lower yields than that which is then available in the market if interest rates rise generally. |
|
|
|
|
| • | Prepayment Risks:The Account’s mortgage loan investments will usually be subject to the risk that the borrower repays a loan early. Also, we may be unable to reinvest the proceeds at as high an interest rate as the original mortgage loan rate. | |
|
|
|
|
| • | Interest Limitations:The interest rate we charge on mortgage loans may inadvertently violate state usury laws that limit rates, if, for example, state law changes during the loan term. If this happens, we could incur penalties or may be unable to enforce payment of the loan. | |
|
|
|
|
| • | Risks of Participations:To the extent the Account invested in a participating mortgage, the following additional risks would apply: | |
|
|
|
|
|
| • | The participation feature, in tying the Account’s returns to the performance of the underlying asset, might generate insufficient returns to make up for the higher interest rate the loan would have obtained without the participation feature. |
|
|
|
|
|
| • | In very limited circumstances, a court may characterize the Account’s participation interest as a partnership or joint venture with the borrower and the Account could lose the priority of its security interest or become liable for the borrower’s debts. |
RISKS OF INVESTING IN REAL ESTATE INVESTMENT TRUST (“REIT”) SECURITIES
The Account from time to time has invested in REIT securities and may in the future invest in such securities. Investments in REIT securities are subject to many of the same general risks associated with direct real property ownership. In particular, equity REITs may be affected by changes in the value of the underlying properties owned by the entity, while mortgage REITs may be affected by the quality of any credit extended. In addition to these risks, because REIT investments are securities, they may be exposed to market risk and potentially significant price volatility due to changing conditions in the financial markets and, in particular, changes in overall interest rates, regardless of the value of the underlying real estate such REIT may own.
In addition, REITs are tax regulated entities established to invest in real estate-related assets. REITs do not pay federal income taxes if they distribute most of their earnings to their shareholders and meet other tax requirements. As a result, REITs are subject to tax risk in continuing to qualify as a REIT.
22 Prospectus § TIAA Real Estate Account
RISKS OF MORTGAGE-BACKED SECURITIES
The Account from time to time has invested in mortgage-backed securities and may in the future invest in such securities. Mortgage-backed securities are subject to many of the same general risks inherent in real estate investing, making mortgage loans and investing in debt securities. The underlying mortgage loans may experience defaults with greater frequency than projected when such mortgages were underwritten, which would impact the values of these securities, and could hamper our ability to sell such securities. In particular, these types of investments may be subject to prepayment risk or extension risk (i.e., the risk that borrowers will repay the loans earlier or later than anticipated). If the underlying mortgage assets experience faster than anticipated prepayments of principal, the Account could fail to recoup some or all of its initial investment in these securities, since the original price paid by the Account was based in part on assumptions regarding the receipt of interest payments. If the underlying mortgage assets are repaid later than anticipated, the Account could lose the opportunity to reinvest the anticipated cash flows at a time when interest rates might be rising. The rate of prepayments depends on a variety of geographic, social and other functions, including prevailing market interest rates and general economic factors.
Importantly, the market value of these securities is also highly sensitive to changes in interest rates, liquidity of the secondary market and economic conditions impacting financial institutions and the credit markets generally. Note that the potential for appreciation, which could otherwise be expected to result from a decline in interest rates, may be limited by any increased prepayments. Further, volatility and disruption in the mortgage market and credit markets generally (such as has recently been the case) may cause there to be a very limited or even no secondary market for these securities and they therefore may be harder to sell than other securities.
RISKS OF U.S. GOVERNMENT AGENCY SECURITIES AND CORPORATE OBLIGATIONS
The Account invests in securities issued by U.S. government agencies and U.S. government sponsored entities. Some of these issuers may not have their securities backed by the full faith and credit of the U.S. government, which could adversely affect the pricing and value of such securities. Also, the Account invests in corporate obligations (such as commercial paper) and while the Account seeks out such holdings in short-term, higher-quality liquid instruments, the ability of the Account to sell these securities may be uncertain, particularly when there are general dislocations in the finance or credit markets, such as has recently been the case. Any such volatility could have a negative impact on the value of these securities. Further, transaction activity generally may fluctuate significantly from time to time, which could impair the Account’s ability to dispose of a security at a favorable time, regardless of the credit quality of the underlying issuer. Further, inherent with investing in any corporate obligation is the risk that the credit
TIAA Real Estate Account § Prospectus 23
quality of the issuer will deteriorate, which could cause the obligations to be downgraded and hamper the value or the liquidity of these securities.
RISKS OF LIQUID INVESTMENTS
The Account’s investments in cash equivalents, marketable securities (whether debt or equity) and mortgage loans receivable are subject to the following general risks:
|
|
|
| • | Financial / Credit Risk— The risk, for debt securities, that the issuer will not be able to pay principal and interest when due (and/or declare bankruptcy or be subject to receivership) and, for equity securities such as common or preferred stock, that the issuer’s current earnings will fall or that its overall financial soundness will decline, reducing the security’s value. |
|
|
|
| • | Market Volatility Risk— The risk that the Account’s investments will experience price volatility due to changing conditions in the financial markets even regardless of the credit quality or financial condition of the underlying issuer. This risk is particularly acute to the extent the Account holds equity securities, which have experienced significant short-term price volatility over the past year. Also, to the extent the Account holds debt securities, changes in overall interest rates can cause price fluctuations. |
|
|
|
| • | Interest Rate Volatility— The risk that interest rate volatility may affect the Account’s current income from an investment. |
|
|
|
| • | Deposit / Money Market Risk— The risk that, to the extent the Account’s cash held in bank deposit accounts exceeds federally insured limits as to that bank, the Account could experience losses if banks fail. In addition, there is some risk that investments held in money market accounts or funds can suffer losses. |
Further, to the extent that a significant portion of the Account’s net assets at any particular time are comprised of cash, cash equivalents and marketable securities, the Account’s returns may suffer as compared to the return that could have been generated by more profitable real estate related investments.
RISKS OF FOREIGN INVESTMENTS
In addition to other investment risks noted above, foreign investments present the following special risks:
|
|
|
| • | The value of foreign investments or rental income can increase or decrease due to changes in currency rates, currency exchange control regulations, possible expropriation or confiscatory taxation, political, social, and economic developments and foreign regulations. The Account translates into U.S. dollars purchases and sales of securities, income receipts and expense payments made in foreign currencies at the exchange rates prevailing on the respective dates of the transactions. The effect of any changes in currency exchange rates on investments and mortgage loans payable is included in the Account’s net realized and unrealized gains and losses. As such, fluctuations in currency exchange rates may impair the Account’s returns. |
24 Prospectus § TIAA Real Estate Account
|
|
|
| • | The Account may, but is not required to, seek to hedge its exposure to changes in currency rates, which could involve extra costs. Further, any hedging activities might not be successful. |
|
|
|
| • | Foreign real estate markets may have different liquidity and volatility attributes than U.S. markets. |
|
|
|
| • | It may be more difficult to obtain and collect a judgment on foreign investments than on domestic investments, and the costs associated with contesting claims relating to foreign investments may exceed those costs associated with a similar claim on domestic investments. |
|
|
|
| • | We may invest from time to time in securities issued by (1) entities domiciled in foreign countries, (2) domestic affiliates of such entities and/or (3) foreign domiciled affiliates of domestic entities. Such investments could be subject to the risks associated with investments subject to foreign regulation, including political unrest or the repatriation or nationalization of the issuer’s assets. These events could depress the value of such securities and/or make such securities harder to sell on favorable terms, if at all. |
CONFLICTS OF INTEREST WITHIN TIAA
TIAA and its affiliates (including Teachers Advisors, Inc., its wholly owned subsidiary and a registered investment adviser) have interests in other real estate programs and accounts and also engage in other business activities and as such, they will have conflicts of interest in allocating their time between the Account’s business and these other activities. Also, the Account may be buying properties at the same time as TIAA affiliates that may have similar investment objectives to those of the Account. There is also a risk that TIAA will choose a property that provides lower returns to the Account than a property purchased by TIAA and its affiliates. Further, the Account will likely acquire properties in geographic areas where TIAA and its affiliates own properties. In addition, the Account may desire to sell a property at the same time another TIAA affiliate is selling a property in an overlapping market. Conflicts could also arise because some properties owned by TIAA and its affiliates may compete with the Account’s properties for tenants. Among other things, if one of the TIAA entities attracts a tenant that the Account is competing for, the Account could suffer a loss of revenue due to delays in locating another suitable tenant. TIAA has adopted allocation policies and procedures applicable to the purchasing conflicts scenario, but the resolution of such conflicts may be economically disadvantageous to the Account. As a result of TIAA’s and its affiliates’ obligations to other current and potential TIAA-sponsored investment vehicles with similar objectives to those of the Account, there is no assurance that the Account will be able to take advantage of every attractive investment opportunity that otherwise is in accordance with the Account’s investment objectives.
In addition, as discussed elsewhere in this prospectus, the TIAA General Account provides a liquidity guarantee to the Account. While an independent fiduciary is responsible for establishing a “trigger point” (a percentage of TIAA’s
TIAA Real Estate Account § Prospectus 25
ownership of liquidity units beyond which TIAA’s ownership may be reduced at the fiduciary’s direction), there is no express cap on the amount TIAA may be obligated to fund under this guarantee. TIAA’s ownership of liquidity units (including the potential of higher levels of ownership in the future) could result in the perception that TIAA is taking into account its own economic interests while serving as investment manager for the Account. Any perception of a conflict of interest could cause participants to transfer accumulations out of the Account to another investment option, which could have an adverse impact on the Account’s ability to act most optimally upon its investment strategy. For a discussion of the relevant allocation policies and procedures TIAA has established as well as a summary of other conflicts of interest which may arise as a result of TIAA’s management of the Account, see “Establishing and Managing the Account – the Role of TIAA – Conflicts of Interest.”
NO OPPORTUNITY FOR PRIOR REVIEW OF PURCHASE
Investors do not have the opportunity to evaluate the economic or financial merit of the purchase of a property or other investment before the Account completes the purchase, so investors will need to rely solely on TIAA’s judgment and ability to select investments consistent with the Account’s investment objective and policies. Further, the Account may change its investment objective and pursue specific investments in accordance with any such amended investment objective without the consent of the Account’s investors.
RISKS OF REGISTRATION UNDER THE INVESTMENT COMPANY ACT OF 1940
The Account has not registered, and management intends to continue to operate the Account so that it will not have to register, as an “investment company” under the Investment Company Act of 1940, as amended (the “Investment Company Act”). Generally, a company is an “investment company” and required to register under the Investment Company Act if, among other things, it holds itself out as being engaged primarily, or proposes to engage primarily, in the business of investing, reinvesting or trading in securities, or it is engaged or proposes to engage in the business of investing, reinvesting, owning, holding or trading in securities and owns or proposes to acquire investment securities having a value exceeding 40% of the value of such company’s total assets (exclusive of government securities and cash items) on an unconsolidated basis.
If the Account were obligated to register as an investment company, the Account would have to comply with a variety of substantive requirements under the Investment Company Act that impose, among other things, limitations on capital structure, restrictions on certain investments, compliance with reporting, record keeping, voting and proxy disclosure requirements and other rules and regulations that could significantly increase its operating expenses and reduce its operating flexibility. To maintain compliance with the exemptions from the Investment Company Act, the Account may be unable to sell assets it would otherwise want to sell and may be unable to purchase securities it would otherwise want to purchase, which might materially adversely impact the Account’s performance.
26 Prospectus § TIAA Real Estate Account
THE ACCOUNT’S INVESTMENT OBJECTIVE AND STRATEGY
Investment Objective:The Real Estate Account seeks favorable long-term returns primarily through rental income and appreciation of real estate investments owned by the Account. The Account will also invest in publicly traded securities and short-term higher quality liquid investments that are easily converted to cash to enable the Account to meet participant redemption requests, purchase or improve properties or cover other expense needs.
Investment Strategy:
Real Estate-Related Investments.The Account intends to have between 75% and 85% of its assets invested directly in real estate or real estate-related investments with the goal of producing favorable long-term returns primarily through rental income and appreciation. The Account’s principal strategy is to purchase direct ownership interests in income-producing real estate, primarily office, industrial, retail, and multi-family residential properties. The Account from time to time will also make foreign real estate investments, which, together with foreign real estate related and foreign liquid investments, are expected to comprise no more than 25% of the Account’s total assets.
The Account can also invest in real estate or real estate-related investments through joint ventures, real estate partnerships or common or preferred stock or other equity securities of companies whose operations involve real estate (i.e., that primarily own or manage real estate), including REITs. To a limited extent, the Account can also invest in conventional mortgage loans, participating mortgage loans, and collateralized mortgage obligations, including commercial mortgage-backed securities and other similar investments.
Non-Real Estate-Related Investments.The Account will invest the remaining portion of its assets (intended to be between 15% and 25% of its assets) in liquid investments; namely, securities issued by U.S. government agencies or U.S. government sponsored entities, corporate debt securities, money market instruments and, at times, stock of companies that do not primarily own or manage real estate. The amount the Account has invested in real estate and real estate-related investments at a given time will vary depending on its liquidity position (including the Account’s obligations to meet participant redemption requests) as well as market conditions and real estate prospects, among other factors.
There will be periods of time (including since late 2008) during which the Account’s liquid investments will comprise less than 15% (and possibly less than 10%) of its total assets, especially during and immediately following periods of significant net participant outflows. As discussed in more detail on page 36 under “Establishing and Managing the Account – The Role of TIAA – Liquidity Guarantee” and pursuant to its existing liquidity guarantee obligation, TIAA has agreed to purchase accumulation units issued by the Account in the event the Account has insufficient cash and liquid investments to ensure the ability, on its own, to fund participant transfer, redemption or withdrawal requests. This liquidity guarantee was first exercised in December 2008.
TIAA Real Estate Account § Prospectus 27
Alternatively, in some circumstances, the portion of the Account’s assets invested in liquid investments may exceed 25%. This could happen, for example, if the Account receives a large inflow of money in a short period of time (including from participants’ funds), there is a lack of attractive real estate investments available on the market, or the Account anticipates more near-term cash needs.
As of December 31, 2009, the Account’s net assets totaled approximately $7.9 billion and the Account held a total of 101 real estate property investments (including its interests in 12 real estate-related joint ventures), representing 90.27% of the Account’s total investment portfolio (“Total Investments”). As of that date, the Account also held investments in a mortgage loan receivable (representing 0.73% of Total Investments), real estate limited partnerships (representing 2.07% of Total Investments), U.S. Treasury Bills (representing 2.13% of Total Investments) and government agency notes (representing 4.80% of Total Investments).
ABOUT THE ACCOUNT’S INVESTMENTS — IN GENERAL
DIRECT INVESTMENTS IN REAL ESTATE
Direct Purchase:The Account will generally buy direct ownership interests in existing or newly constructed income-producing properties, primarily office, industrial, retail, and multi-family residential properties. The Account will invest mainly in established properties with existing rent and expense schedules or in newly constructed properties with predictable cash flows or in which a seller agrees to provide certain minimum income levels. On occasion, the Account might invest in real estate development projects. The Account does not directly invest in single-family residential real estate, nor does it currently invest in residential mortgage-backed securities (although it may invest in such securities in the future).
Purchase-Leaseback Transactions:Although it has not yet done so, the Account can enter into purchase-leaseback transactions (leasebacks) in which it would buy land and income-producing improvements on the land (such as buildings), and simultaneously lease the land and improvements to a third party (the lessee). Leasebacks are generally for very long terms. Usually, the lessee is responsible for operating the property and paying all operating costs, including taxes and mortgage debt. The Account can also give the lessee an option to buy the land and improvements.
In some leasebacks, the Account may purchase only the land under an income-producing building and lease the land to the building owner. In those cases, the Account could seek to share (or “participate”) in any increase in property value from building improvements or in the lessee’s revenues from the building above a base amount. The Account can invest in leasebacks that are subordinated to other interests in the land, buildings, and improvements (e.g.,first mortgages); in that case, the leaseback interest would be subject to greater risks.
28 Prospectus § TIAA Real Estate Account
INVESTMENTS IN MORTGAGES
General:The Account can originate or acquire interests in mortgage loans, generally on the same types of properties it might otherwise buy —i.e., the Account will be a creditor. These mortgage loans may pay fixed or variable interest rates or have “participating” features (as described below). Normally the Account’s mortgage loans will be secured by properties that have income-producing potential. They usually will not be insured or guaranteed by the U.S. government, its agencies or anyone else. They usually will be non-recourse, which means they won’t be the borrower’s personal obligations. Most will be first mortgage loans on existing income-producing property, with first-priority liens on the property. These loans may be amortized (i.e., principal is paid over the course of the loan), or may provide for interest-only payments, with a balloon payment at maturity. In addition, the Account may originate a mortgage loan on a property it has recently sold (this is sometimes called “seller financing”).
Participating Mortgage Loans:The Account may make mortgage loans which permit the Account to share (have a “participation”) in the income from or appreciation of the underlying property. These participations let the Account receive additional interest, usually calculated as a percentage of the income the borrower receives from operating, selling or refinancing the property. The Account may also have an option to buy an interest in the property securing the participating loan.
Managing Mortgage Loan Investments:TIAA can manage the Account’s mortgage loans in a variety of ways, including:
|
|
|
| • | renegotiating and restructuring the terms of a mortgage loan; |
|
|
|
| • | extending the maturity of any mortgage loan made by the Account; |
|
|
|
| • | consenting to a sale of the property subject to a mortgage loan; |
|
|
|
| • | financing the purchase of a property by making a new mortgage loan in connection with the sale; and |
|
|
|
| • | selling the mortgage loans, or portions of them, before maturity. |
OTHER REAL ESTATE-RELATED INVESTMENTS
Joint Investment Vehicles Involved in Real Estate Activities:The Account can hold interests in joint ventures, limited partnerships, funds, and other commingled investment vehicles involved in real estate-related activities, including owning, financing, managing, or developing real estate. Many times, the Account will have limited voting and management rights in a commingled vehicle, including over the selection and disposition of the underlying real estate related assets owned by the vehicle, and the Account’s ability to sell freely its interests in commingled vehicles may be restricted by the terms of the governing agreements. From time to time, the Account may also serve as the manager or administrator for such a vehicle, for which it may earn fees. The Account will not hold real property jointly with TIAA or its affiliates.
TIAA Real Estate Account § Prospectus 29
Real Estate Investment Trusts:The Account may invest in REITs, which are entities (usually publicly owned and traded) that lease, manage, acquire, hold mortgages on, and develop real estate. Normally the Account will buy the common or preferred stock of a REIT, although at times it may purchase REIT debt securities. REITs seek to maximize share value and increase cash flows by acquiring and developing new real estate projects, upgrading existing properties or renegotiating existing arrangements to increase rental rates and occupancy levels. REITs must distribute at least 90% of their taxable income to shareholders in order to benefit from a special tax structure, which means they may pay high dividends. The value of a particular REIT can be affected by such factors as general economic and market conditions (in particular as to publicly-traded REITs), cash flow, the skill of its management team, and defaults by its lessees or borrowers.
Stock of Companies Involved in Real Estate Activities:The Account can invest in common or preferred stock of companies whose business involves real estate. These stocks may be listed on U.S. or foreign stock exchanges or traded over-the-counter in the U.S. or abroad.
Mortgage-Backed Securities:The Account can invest in mortgage-backed securities and other mortgage-related or asset-backed instruments, including commercial mortgage-backed securities (CMBS), residential mortgage-backed securities (RMBS), mortgage-backed securities issued or guaranteed by agencies or instrumentalities of the U.S. government, non-agency mortgage instruments, and collateralized mortgage obligations that are fully collateralized by a portfolio of mortgages or mortgage-related securities. Mortgage-backed securities are instruments that directly or indirectly represent a participation in, or are secured by and payable from, one or more mortgage loans secured by real estate. In most cases, mortgage-backed securities distribute principal and interest payments on the mortgages to investors. Interest rates on these instruments can be fixed or variable. Some classes of mortgage-backed securities may be entitled to receive mortgage prepayments before other classes do. Therefore, the prepayment risk for a particular instrument may be different than for other mortgage-related securities. Many classes of mortgage-backed securities have experienced volatility in pricing and liquidity since 2008.
NON-REAL ESTATE-RELATED INVESTMENTS
|
|
|
| The Account can also invest in: | |
| ||
| • | U.S. government or government agency securities; |
|
|
|
| • | Money market instruments and other cash equivalents. These will usually be high-quality, short-term debt instruments, including U.S. government or government agency securities, commercial paper, certificates of deposit, bankers’ acceptances, repurchase agreements, interest-bearing time deposits, and corporate debt securities; |
|
|
|
| • | Corporate debt or asset-backed securities of U.S. or foreign entities, or debt securities of foreign governments or multinational organizations, but only if |
30 Prospectus § TIAA Real Estate Account
|
|
|
|
| they’re investment-grade and rated in the top four categories by a nationally recognized rating organization (or, if not rated, deemed by TIAA to be of equal quality); and |
|
|
|
| • | Common or preferred stock, or other ownership interests, of U.S. or foreign companies that aren’t involved in real estate, to a limited extent. |
FOREIGN REAL ESTATE AND OTHER FOREIGN INVESTMENTS
The Account from time to time will invest in foreign real estate or real estate-related investments. It might also invest in securities or other instruments of foreign government or private issuers. While the percentage will vary from time to time, we expect that all such foreign investments will comprise no more than 25% of the Account’s total assets. As of the date of this prospectus, the Account holds interests in two foreign property investments (one in the United Kingdom and one in France), which represent approximately 4.4% of the total assets of the Account. See Appendix B for more information, including valuation information, concerning these investments.
Depending on investment opportunities, the Account’s foreign investments could at times be concentrated in one or two foreign countries. We will consider the special risks involved in foreign investing before investing in foreign real estate and won’t invest unless our standards are met.
GENERAL INVESTMENT AND OPERATING POLICIES
STANDARDS FOR REAL ESTATE INVESTMENTS
Buying Real Estate or Making Mortgage Loans:Before the Account purchases real estate or makes a mortgage loan, TIAA will consider such factors as:
|
|
|
| • | the location, condition, and use of the underlying property; |
|
|
|
| • | its operating history and its future income-producing capacity; and |
|
|
|
| • | the quality, operating experience, and creditworthiness of the tenants or the borrower. |
TIAA will also analyze the fair market value of the underlying real estate, taking into account the property’s operating cash flow (based on the historical and projected levels of rental and occupancy rates and expenses), as well as the general economic conditions in the area where the property is located.
Diversification:We haven’t placed percentage limitations on the type and location of properties that the Account can buy. However, the Account seeks to diversify its investments by type of property and geographic location. How much the Account diversifies will depend upon whether suitable investments are available, the Account’s ability to divest of properties that are in over-concentrated locations or sectors, and how much the Account has available to invest.
TIAA Real Estate Account § Prospectus 31
Special Criteria for Making Mortgage Loans:Ordinarily, the Account will only make a mortgage loan if the loan, when added to any existing debt, will not exceed 85% of the appraised value of the mortgaged property when the loan is made, unless the Account is compensated for taking additional risk.
Selling Real Estate Investments:The Account doesn’t intend to buy and sell its real estate investments simply to make short-term profits. Rather, the Account’s general strategy in selling real estate investments is to dispose of those assets which management believes:
|
|
|
| • | have maximized in value; |
|
|
|
| • | have underperformed or face deteriorating property-specific or market conditions; |
|
|
|
| • | represent properties needing significant capital infusions in the future; |
|
|
|
| • | management deems are appropriate to dispose of in order to remain consistent with its intent to diversify the Account by property type and geographic location (including reallocating the Account’s exposure to or away from certain property types in certain geographic locations); and/or |
|
|
|
| • | otherwise do not satisfy the investment objectives or strategy of the Account. |
The Account will reinvest any sale proceeds that it doesn’t need to pay operating expenses or to meet redemption requests (e.g.,cash withdrawals or transfers).
OTHER REAL ESTATE-RELATED POLICIES
Appraisals and Valuations of Real Estate Assets:The Account will rely on TIAA’s own analysis, normally along with an independent external appraisal, in connection with the purchase of a property by the Account. The Account will normally receive an independent external appraisal performed by a third party appraisal firm at or before the time it buys a real estate asset, and the Account also generally obtains an independent appraisal when it makes mortgage loans.
Subsequently, each of the Account’s real properties are appraised, and mortgage loans are valued, at least once every calendar quarter. Each of the Account’s real estate properties are appraised each quarter by an independent appraiser who is a member of a professional appraisal organization. In addition, TIAA’s internal appraisal staff performs a review of each quarterly appraisal of each real estate property, in conjunction with the Account’s independent fiduciary, and TIAA’s internal appraisal staff or the independent fiduciary may request an additional appraisal or valuation outside of this quarterly cycle. Any differences in the conclusions of TIAA’s internal appraisal staff and the independent appraiser will be reviewed by the independent fiduciary, which will make a final determination on the matter (which may include ordering a subsequent independent appraisal).
See “Valuing the Account’s Assets” on page 48 for more information on how each class of the Account’s investments (including assets other than real estate properties) are valued.
32 Prospectus § TIAA Real Estate Account
Borrowing:The Account may borrow money and assume or obtain a mortgage on a property —i.e., make leveraged real estate investments. In addition, to meet short-term cash needs, the Account may obtain a line of credit that may be unsecured and/or contain terms that may require the Account secure a loan with one or more of its properties. Management expects the proceeds from any such short-term borrowing would be used to meet the cash flow needs of the Account’s properties and real estate related investments, but depending on the circumstances, proceeds could be used for Account-level funding needs (including the need to honor unexpected participant withdrawal activity).
Under the Account’s current investment guidelines, which were modified as to borrowing in 2009, management intends to maintain the Account’s loan to value ratio (as defined below) at or below 30%. However, through December 31, 2011:
|
|
|
| • | the Account will maintain outstanding debt in an aggregate principal amount not to exceed the principal amount of debt outstanding as of the date of adoption of such guidelines (approximately $4.0 billion); and |
|
|
|
| • | subject to this $4.0 billion limitation, the Account may incur and/or maintain debt on its properties (including (i) refinancing outstanding debt, (ii) assuming debt on the Account’s properties, (iii) extending the maturity date of outstanding debt and/or (iv) incurring new debt on its properties) based on the ratio of the outstanding principal amount of the Account’s debt to the Account’s total gross asset value (a “loan to value ratio”). |
By December 31, 2011, management intends the Account’s loan to value ratio to be 30% or less and thereafter intends to maintain its loan to value ratio at or below 30% (measured at the time of incurrence and after giving effect thereto). In calculating outstanding indebtedness, we will include only the Account’s actual percentage interest in any borrowings on a joint venture investment and not that of any joint venture partner. Also, at the time the Account (or a joint venture in which the Account is a partner) enters into a revolving line of credit, management deems the maximum amount which may be drawn under that line of credit as fully incurred, regardless of whether the maximum amount available has been drawn from time to time.
As of December 31, 2009, the aggregate principal amount of the Account’s outstanding debt (including the Account’s share of debt on its joint venture investments) was approximately $3.9 billion and the Account’s loan to value ratio was approximately 33.1%.
The Account may only borrow up to 70% of the then current value of a property, although construction loans may be for 100% of costs incurred in developing the property. Except for construction loans, any mortgage loans on a property will be non-recourse to the Account, meaning that if there is a default on a loan in respect of a specific property, the lender will have recourse to (i.e., be able to foreclose on) only the property encumbered (or the joint venture owning the property), or to other specific Account properties that may have been pledged as security for the defaulted loan, but not to any other assets of the Account. When
TIAA Real Estate Account § Prospectus 33
possible, the Account will seek to have loans mature at different times to limit the risks of borrowing.
The Account will not obtain mortgage financing on properties it owns from TIAA or any of its affiliates. Under certain circumstances, TIAA or an affiliate may provide a loan to a third party purchaser of a property sold by the Account, but no such financing will be made with respect to a property the Account still owns. However, the Account may place an intra-company mortgage on an Account property held by a subsidiary for tax planning or other purposes. This type of mortgage will not be subject to the general limitations on borrowing described above.
When the Account assumes or obtains a mortgage on a property, it will bear the expense of mortgage payments. It will also be exposed to certain additional risks, which are described in “Risks – Risks of Borrowing” on page 17.
Discretion to Evict or Foreclose:TIAA may, in its discretion, evict defaulting tenants or foreclose on defaulting borrowers to maintain the value of an investment, when it decides that it is in the Account’s best interests.
Property Management and Leasing Services:The Account usually will hire a national or regional independent third party property management company to perform the day-to-day management services for each of the Account’s properties, including supervising any on-site personnel, negotiating maintenance and service contracts, providing advice on major repairs and capital improvements and assisting the Account in ensuring compliance with environmental regulations. The property manager will also recommend changes in rent schedules and create marketing and advertising programs to attain and maintain high levels of occupancy by responsible tenants. The Account may also hire independent third party leasing companies to perform or coordinate leasing and marketing services to fill any vacancies. The fees paid to the property management company, along with any leasing commissions and expenses, will reduce the Account’s cash flow from a property.
Insurance:We intend to arrange for, or require proof of, comprehensive insurance, including liability, fire, and extended coverage, for the Account’s real properties and properties securing mortgage loans or subject to purchase-leaseback transactions. The Account currently participates in property, casualty and other related insurance programs as part of TIAA’s property insurance programs, and the Account only bears the cost of insuring only the properties it owns. The terms and conditions of the insurance coverage the Account has on its properties, in conjunction with the type of loss actually suffered at a property, may subject the property, or the Account as a whole, to a cap on insurance proceeds that is less than the loss or losses suffered. In addition, the Account’s insurance policies on its properties currently include catastrophic coverage for wind, earthquakes and terrorist acts, but we can’t assure you that it will be adequate to cover all losses. We also can’t assure you that we will be able to obtain coverage for wind, earthquakes and terrorist acts at an acceptable cost, if at all, at the time a policy expires.
34 Prospectus § TIAA Real Estate Account
OTHER POLICIES
Investment Company Act of 1940:The Account has not registered, and we intend to operate the Account so that it will not have to register, as an “investment company” under the Investment Company Act of 1940 (the 1940 Act). This will require monitoring the Account’s portfolio so that it won’t have more than 40 percent of total assets, other than U.S. government securities and cash items, in investment securities. As a result, the Account may be unable to make some potentially profitable investments, it may be unable to sell assets it would otherwise want to sell or it may be forced to sell investments in investment securities before it would otherwise want to do so.
Changing Operating Policies or Winding Down:Under the terms of the contracts and in accordance with applicable insurance law, TIAA can decide to change, in its sole discretion, the operating policies of the Account or to wind it down. If the Account is wound down, you may need to transfer your accumulations or annuity income to TIAA’s traditional annuity or any CREF account available under your employer’s plan. All investors in the Account will be notified in advance if we decide to change a significant policy or wind down the Account.
ESTABLISHING AND MANAGING THE ACCOUNT — THE ROLE OF TIAA
ESTABLISHING THE ACCOUNT
TIAA’s Board of Trustees established the Real Estate Account as a separate account of TIAA under New York law on February 22, 1995. The Account is regulated by the New York State Insurance Department (NYID) and the insurance departments of the other jurisdictions in which the annuity contracts are offered. Although TIAA owns the assets of the Real Estate Account, and the Account’s obligations are obligations of TIAA, the Account’s income, investment gains, and investment losses are credited to or charged against the assets of the Account without regard to TIAA’s other income, gains, or losses. Under New York insurance law, we can’t charge the Account with liabilities incurred by any other TIAA business activities or any other TIAA separate account.
MANAGING THE ACCOUNT
TIAA employees, under the direction and control of TIAA’s Board of Trustees and its Investment Committee, manage the investment of the Account’s assets, following investment management procedures TIAA adopted for the Account. The Account does not have officers, directors or employees. TIAA’s investment management responsibilities include:
|
|
|
| • | identifying and recommending purchases, sales and financings of appropriate real estate-related and other investments; |
TIAA Real Estate Account § Prospectus 35
|
|
|
| • | providing (including by arranging for others to provide) all portfolio accounting, custodial, and related services for the Account; and |
|
|
|
| • | arranging for others to provide certain advisory or other management services to the Account’s joint ventures or other investments. |
In addition, TIAA performs administration functions for the Account (which include receiving and allocating premiums, calculating and making annuity payments and providing recordkeeping and other services). Distribution services for the Account (which include, without limitation, distribution of the annuity contracts, advising existing annuity contract owners in connection with their accumulations and helping employers implement and manage retirement plans) are performed by Services. TIAA and Services provide administration and distribution services, as applicable, on an “at-cost” basis. For more information about the charge for investment management, administration and distribution services, see “Expense Deductions” on page 55.
You don’t have the right to vote for TIAA Trustees. See “General Matters – Voting Rights” on page 125. For information about the Trustees, certain executive officers of TIAA and the Account’s portfolio management team, see Appendix A of this prospectus.
TIAA’s ERISA Fiduciary Status.To the extent that assets of a plan subject to the Employee Retirement Income Security Act of 1974, as amended (ERISA) are allocated to the Account, TIAA will be acting as an “investment manager” and a fiduciary under ERISA with respect to those assets.
LIQUIDITY GUARANTEE
The TIAA General Account provides the Account with a liquidity guarantee enabling the Account to have funds available to meet participant redemption, transfer or cash withdrawal requests. This guarantee is required by the NYID. If the Account can’t fund participant requests from the Account’s own cash flow and liquid investments, the TIAA General Account will fund such requests by purchasing accumulation units (accumulation units that are purchased by TIAA are generally referred to as “liquidity units”) issued by the Account. TIAA guarantees that you can redeem your accumulation units at their accumulation unit value next determined after your transfer or cash withdrawal request is received in good order. Whether the liquidity guarantee is exercised is based on the cash level of the Account from time to time, as well as recent participant withdrawal activity and the Account’s expected working capital, debt service and cash needs, all subject to the oversight of the independent fiduciary. While the proceeds from liquidity unit purchases are not placed in a segregated account solely to fund participant requests, the guarantee is in place to meet participant needs. Liquidity units owned by TIAA are valued in the same manner as accumulation units owned by the Account’s participants. Importantly, however, this liquidity guarantee is not a guarantee of the investment performance of the Account or a guarantee of the value of your units. Transfers from the Account to a CREF or TIAA account, or another investment option, are limited to once every
36 Prospectus § TIAA Real Estate Account
calendar quarter (except for specifically prescribed systematic transfers or withdrawals established in accordance with the terms of the participant’s contract and employer’s plan), and cash withdrawals may be further restricted by the terms of your plan.
TIAA’s obligation to provide Account participants liquidity through purchases of liquidity units is not subject to an express regulatory or contractual limitation, although as described below under “—Role of the Independent Fiduciary,” the independent fiduciary may (but is not obligated to) require the reduction of TIAA’s interest through sales of assets from the Account if TIAA’s interest exceeds a predetermined trigger point. Even if this trigger point were reached and regardless of whether the independent fiduciary has required the Account to dispose of any assets, TIAA’s obligation to provide liquidity under the guarantee will continue.
While the independent fiduciary is vested with oversight and approval over any redemption of TIAA’s liquidity units, it is expected that, unless the trigger point has been reached, redemptions would only occur: (i) once the Account has experienced net participant inflows for an extended period of time and (ii) if the Account is otherwise projected to maintain a level of liquid assets, taking into account any pending cash needs (including for debt service and outstanding principal balances at maturity), at or close to its long-term investment goal (currently at least 15% of the Account’s assets). The independent fiduciary may, however, authorize or direct the redemption of TIAA’s liquidity units (or a portion thereof) at any time and TIAA will request the approval of the independent fiduciary before liquidity units are redeemed. Upon termination and liquidation of the Account (wind-up), any liquidity units held by TIAA will be the last units redeemed, unless the independent fiduciary directs otherwise.
Finally, TIAA may redeem its liquidity units more frequently than once per calendar quarter, subject at all times to the oversight and approval of the Account’s independent fiduciary (discussed in more detail in the subsection entitled “—Role of the Independent Fiduciary” immediately below). The Account pays TIAA for the liquidity guarantee through a daily deduction from the Account’s net assets. See “Expense Deductions” on page 55.
Primarily as a result of significant net participant transfers throughout 2008 (in particular, in the second half of 2008), pursuant to this liquidity guarantee obligation, the TIAA General Account first purchased liquidity units on December 24, 2008. Through the date of this prospectus, the TIAA General Account has paid an aggregate of approximately $1.2 billion to purchase liquidity units in a number of separate transactions. As of the date of this prospectus, no liquidity units have been redeemed by TIAA. Management cannot predict the extent to which future liquidity unit purchases will be required under this liquidity guarantee, nor can management predict when such liquidity units will be redeemed in part or in full.
ROLE OF THE INDEPENDENT FIDUCIARY
Because TIAA’s ability to purchase and sell liquidity units raises certain technical issues under ERISA, TIAA applied for and received a prohibited
TIAA Real Estate Account § Prospectus 37
transaction exemption from the U.S. Department of Labor in 1996 (PTE 96-76). In connection with the exemption, TIAA has appointed an independent fiduciary for the Real Estate Account, with overall responsibility for reviewing Account transactions to determine whether they are in accordance with the Account’s investment guidelines. Real Estate Research Corporation, a real estate consulting firm whose principal offices are located in Chicago, Illinois, was initially appointed as independent fiduciary effective March 1, 2006 and currently serves as the Account’s independent fiduciary. The independent fiduciary’s responsibilities include:
|
|
|
| • | reviewing and approving the Account’s investment guidelines and monitoring whether the Account’s investments comply with those guidelines; |
|
|
|
| • | reviewing and approving valuation procedures for the Account’s properties; |
|
|
|
| • | approving adjustments to any property valuations that change the value of the property or the Account as a whole above or below certain prescribed levels, or that are made within three months of the annual independent appraisal; |
|
|
|
| • | reviewing and approving how the Account values accumulation and annuity units; |
|
|
|
| • | approving the appointment of all independent appraisers; |
|
|
|
| • | reviewing the purchase and sale of units by TIAA to ensure that the Account uses the correct unit values; and |
|
|
|
| • | requiring appraisals besides those normally conducted, if the independent fiduciary believes that any of the properties have changed materially, or that an additional appraisal is necessary to ensure the Account has correctly valued a property. |
In addition, Real Estate Research Corporation has certain responsibilities with respect to the Account that it had historically undertaken or is currently undertaking with respect to TIAA’s purchase and ownership of liquidity units, including among other things, reviewing the purchases and redemption of liquidity units by TIAA to ensure the Account uses the correct unit values. In addition, as set forth in PTE 96-76, the independent fiduciary’s responsibilities include:
|
|
|
| • | establishing the percentage of total liquidity units that TIAA’s ownership should not exceed (the “trigger point”) and creating a method for changing the trigger point; |
|
|
|
| • | approving any adjustment of TIAA’s ownership interest in the Account and, in its discretion, requiring an adjustment if TIAA’s ownership of liquidity units reaches the trigger point; and |
|
|
|
| • | once the trigger point has been reached, participating in any program to reduce TIAA’s ownership in the Account by utilizing cash flow or liquid investments in the Account, or by utilizing the proceeds from asset sales. If the independent fiduciary were to determine that TIAA’s ownership should be |
38 Prospectus § TIAA Real Estate Account
|
|
|
|
|
| reduced following the trigger point, its role in participating in any asset sales program would include: | |
|
|
|
|
|
| (i) | participating in the selection of properties for sale, |
|
|
|
|
|
| (ii) | providing sales guidelines, and |
|
|
|
|
|
| (iii) | approving those sales if, in the independent fiduciary’s opinion, such sales are desirable to reduce TIAA’s ownership of liquidity units. |
As of the date of this prospectus, the independent fiduciary, which has the right to adjust the trigger point, has established the trigger point at 45% of the outstanding accumulation units and it will continue to monitor TIAA’s ownership interest in the Account and provide further recommendations as necessary. As of December 31, 2009, TIAA owned approximately 12% of the outstanding accumulation units of the Account. In establishing the appropriate trigger point, including whether or not to require certain actions once the trigger point has been reached, the independent fiduciary will assess, among other things and to the extent consistent with PTE 96-76 and the independent fiduciary’s duties under ERISA, the risk that a conflict of interest could arise due to the level of TIAA’s ownership interest in the Account.
A special subcommittee consisting of five (5) independent outside members of the Investment Committee of TIAA’s Board of Trustees renewed the appointment of Real Estate Research Corporation as the independent fiduciary for an additional three-year term, which appointment was effective as of January 1, 2009, and continues through February 29, 2012. This subcommittee may renew the independent fiduciary appointment, remove the independent fiduciary, or appoint its successor. The independent fiduciary can be removed for cause by the vote of three (3) out of the five (5) subcommittee members and will not be reappointed if two (2) of the subcommittee members disapprove the reappointment. The independent fiduciary can resign after at least 180 days’ written notice.
TIAA pays the independent fiduciary directly. The investment management charge paid to TIAA includes TIAA’s costs for retaining the independent fiduciary. Under PTE 96-76, the independent fiduciary must receive less than 5% of its annual gross revenues (including payment for its services to the Account) from TIAA and its affiliates.
When you decide as a participant or plan fiduciary to invest in the Account, after TIAA has provided you with full and fair disclosure, including the disclosure in this prospectus, you are also acknowledging that you approve and accept Real Estate Research Corporation or any successor to serve as the Account’s independent fiduciary.
CONFLICTS OF INTEREST
General.Employees of TIAA that provide advice with respect to the Real Estate Account may also provide investment advice with respect to investments managed by Teachers Advisors, Inc. (“Advisors”), an indirect, wholly owned subsidiary of TIAA and a registered investment adviser. In addition, TIAA and its
TIAA Real Estate Account § Prospectus 39
affiliates offer (and may in the future offer) other accounts and investment products that are not managed under an “at cost” expense structure. Therefore, TIAA and its employees may at times face various conflicts of interest. For example, the TIAA General Account and a privately offered core property investment fund managed by Advisors (the “core property investment fund”) may sometimes compete with the Real Estate Account in the purchase of investments. (Each of the TIAA General Account, the Real Estate Account and the core property investment fund together with any other real estate accounts or funds that are established or may be established by TIAA or its affiliates in the future, are herein referred to as an “account.”)
Many of the personnel of TIAA involved in performing services to the Real Estate Account will have competing demands on their time. The personnel will devote such time to the affairs of the Account as TIAA’s management determines, in its sole discretion exercising good faith, is necessary to properly service the Account. TIAA believes that it has sufficient personnel to discharge its responsibility to the Real Estate Account, the General Account, the core property investment fund and other accounts to avoid conflicts of interest. TIAA or its affiliates may form other real estate investment vehicles in the future and we will take steps to assure that those vehicles are integrated into these conflict of interest policies. TIAA does not accept acquisition or placement fees for the services it provides to the Account.
Allocation Procedure.TIAA and its affiliates allocate new investments (including real property investments and discrete real estate related investment opportunities, but generally not limited partnership investments) among the accounts in accordance with a written allocation procedure as adopted by TIAA and modified from time to time. Generally, the portfolio managers for each of the accounts will identify acquisition opportunities which conform to the investment strategy of the account. If more than one account expresses an interest and an informal resolution cannot be reached, a special TIAA Allocation Committee, consisting primarily of senior TIAA real estate professionals (including the portfolio managers for each account), will seek to resolve any conflict by considering a number of factors, including the investment strategy of the bidding account, the relative capital available for investment by each account, liquidity requirements, portfolio diversification, whether the property would be at a competitive disadvantage to properties owned by another account in the subject market and such other factors deemed relevant by the Allocation Committee (and subject to any investment limitations or other requirements in the account’s governing documents, investment guidelines or applicable laws or regulations (including ERISA and insurance laws)). If this analysis does not determine, by a unanimous vote of the Allocation Committee, which account should participate in a transaction, a strict rotation system will be used whereby the interested account highest on the list will be allowed to participate in the transaction, and then such account will drop to the bottom of the list thereafter. The secretary of the Allocation Committee will prepare a quarterly report describing the allocations
40 Prospectus § TIAA Real Estate Account
made during the previous quarter based on this allocation procedure. This report will also be reviewed by a committee of senior TIAA executives which is separate from the Allocation Committee and which functions as an internal monitor of compliance with this allocation procedure.
Leasing Conflicts.Conflicts could also arise because some properties in the TIAA General Account, the core property investment fund and other accounts may compete for tenants with the Real Estate Account’s properties. Management believes the potential for leasing conflicts are minimized by the unique characteristics of each property, including location, submarket, physical characteristics, amenities and lease rollover schedules. Management believes the differing business strategies of the accounts also reduce potential conflicts. If a conflict arises, as appropriate, the competing accounts will arrange that different property managers and leasing brokers are engaged, each charged with using their best efforts to support the property management and leasing activity for each particular property and an ethical screen will be placed between the internal asset managers for the respective properties. Any conflicts that arise will be reported to the next occurring TIAA Allocation Committee review meeting.
Sales Conflicts.Conflicts could also potentially arise when two TIAA accounts attempt to sell properties located in the same market or submarket, especially if there are a limited number of potential purchasers and/or if such purchaser has an ongoing business relationship with TIAA or one of its specific accounts.
Liquidity Guarantee.TIAA’s ownership of liquidity units (including the potential of higher levels of ownership in the future) could result in the perception that TIAA is taking into account its own economic interests while serving as investment manager for the Account. In particular, there is the concern that TIAA could make investment decisions (and other management decisions) with respect to the Account which serve the interest of the TIAA General Account, at the expense of those participants that have chosen the Account as an investment option. This could manifest itself, among other ways, by the Account disposing properties solely to raise liquidity in avoidance of having a need for the liquidity guarantee, or by foregoing otherwise attractive investment opportunities so as not to impair liquid asset levels.
Management believes that any conflict (or potential conflict) is mitigated by, among other things, the detailed valuation procedure for the Account’s properties, which includes independent appraisals and the oversight of the independent fiduciary. Also, the independent fiduciary oversees the liquidity guarantee execution to ensure the proper unit values are applied, and the independent fiduciary will oversee liquidity unit redemptions. Further, the independent fiduciary is vested with the right to establish a trigger point, which is a level of ownership at which the fiduciary is empowered, but not required, to reduce TIAA’s ownership interest (with the goal to mitigate any potential conflict of interest) through the means described in the immediately preceding section.
TIAA Real Estate Account § Prospectus 41
INDEMNIFICATION
The Account has agreed to indemnify TIAA and its affiliates, including its officers and trustees, against certain liabilities to the extent permitted by law, including liabilities under the Securities Act of 1933. The Account may make such indemnification out of its assets.
SUMMARY OF THE ACCOUNT’S PROPERTIES
THE PROPERTIES — IN GENERAL
As of December 31, 2009, the Account owned a total of 101 real estate property investments (89 of which were wholly owned and 12 of which were held in real estate related joint ventures), representing 90.27% of the Account’s total investment portfolio. The real estate portfolio included:
|
|
|
| • | 40 office property investments (five of which were held in joint ventures and one property located in London, United Kingdom); |
|
|
|
| • | 25 industrial property investments (including one held in a joint venture); |
|
|
|
| • | 20 apartment property investments; |
|
|
|
| • | 15 retail property investments (including five held in joint ventures and one property located in Paris, France); and |
|
|
|
| • | a 75% joint venture interest in a portfolio of storage facilities located throughout the United States. |
Of the 101 real estate property investments, 26 were subject to debt (including seven joint venture property investments).
In the tables and the footnotes contained in Appendix B to this prospectus, you will find more detailed information about each of the Account’s portfolio property investments as of December 31, 2009. The Account’s property investments include both properties that are wholly owned by the Account and properties owned by the Account’s joint venture investments. Certain property investments detailed in Appendix B are comprised of a portfolio of properties.
COMMERCIAL (NON-RESIDENTIAL) PROPERTIES
At December 31, 2009, the Account held 81 commercial (non-residential) property investments in its portfolio, including a portfolio of storage facilities located throughout the United States. Twelve of these property investments were held through joint ventures, and 26 were subject to mortgages (including seven joint venture property investments). Although the terms vary under each lease, certain expenses, such as real estate taxes and other operating expenses, are paid or reimbursed in whole or in part by the tenants.
Management believes that the Account’s portfolio is diversified by both property type and geographic location. The portfolio consists of:
|
|
|
| • | Office. 40 property investments containing approximately 19.8 million square feet located in 14 states, the District of Columbia and the United Kingdom. As |
42 Prospectus § TIAA Real Estate Account
|
|
|
|
| of December 31, 2009, the Account’s office properties had an aggregate market value of approximately $5.0 billion. |
|
|
|
| • | Industrial. 25 property investments containing approximately 30.2 million square feet located in 11 states, including a 60% interest in a portfolio of industrial properties located throughout the United States. As of December 31, 2009, the Account’s industrial properties had an aggregate market value of approximately $1.2 billion. |
|
|
|
| • | Retail. 15 property investments containing approximately 21.2 million square feet located in five states, the District of Columbia and Paris, France. As of December 31, 2009, the Account’s retail properties had an aggregate market value of approximately $1.4 billion. One of the retail property investments is an 85% interest in a portfolio containing 65 individual retail shopping centers located throughout the Eastern and Southeastern states. |
In addition, the Account has a 75% interest in a portfolio of storage facilities located throughout the United States containing approximately 2.3 million square feet. As of December 31, 2009, the Account’s interest in this portfolio had a market value of approximately $46.3 million.
As of December 31, 2009, the market value weighted average occupancy rate of the Account’s entire commercial real estate portfolio was 91%. On a weighted basis, the overall occupancy rate of the Account’s commercial real estate portfolio was 87%. The Account’s:
|
|
|
| • | office property investments were 92% leased on a market value weighted basis and 91% leased on a weighted basis; |
|
|
|
| • | industrial property investments were 87% leased on a market value weighted basis and 88% leased on a weighted basis; |
|
|
|
| • | retail property investments were 92% leased on a market value weighted basis and 86% leased on a weighted basis; and |
|
|
|
| • | storage portfolio was 83% leased. |
Major Tenants: The following tables list the Account’s ten most significant tenants based on the total space they occupied as of December 31, 2009 in each of the Account’s commercial property types.
|
|
|
|
|
|
|
|
|
| Occupied |
| Percentage of Total Rentable Area of Account’s |
| ||
|
|
| |||||
MAJOR OFFICE TENANTS |
|
| Office Properties |
| Non-Residential Properties |
| |
Deloitte & Touche |
| 516,864 |
| 2.6% |
| 0.7% |
|
Yahoo! |
| 467,564 |
| 2.4% |
| 0.7% |
|
Southern Company Services |
| 459,457 |
| 2.3% |
| 0.6% |
|
BHP Petroleum |
| 451,177 |
| 2.3% |
| 0.6% |
|
Mellon Financial |
| 362,293 |
| 1.8% |
| 0.5% |
|
Microsoft |
| 361,528 |
| 1.8% |
| 0.5% |
|
Crowell & Moring |
| 334,757 |
| 1.7% |
| 0.5% |
|
ATMOS Energy |
| 313,326 |
| 1.6% |
| 0.4% |
|
GE Healthcare |
| 309,278 |
| 1.6% |
| 0.4% |
|
Pearson |
| 225,299 |
| 1.1% |
| 0.3% |
|
TIAA Real Estate Account § Prospectus 43
|
|
|
|
|
|
|
|
|
| Occupied |
| Percentage of Total Rentable Area of Account’s |
| ||
|
|
| |||||
MAJOR INDUSTRIAL TENANTS |
|
| Industrial Properties |
| Non-Residential Properties |
| |
Walmart |
| 1,099,112 |
| 3.6% |
| 1.5% |
|
General Electric |
| 1,004,000 |
| 3.3% |
| 1.4% |
|
Regal West |
| 968,535 |
| 3.2% |
| 1.4% |
|
Kumho Tire |
| 830,485 |
| 2.7% |
| 1.2% |
|
PFSweb, Inc. |
| 825,520 |
| 2.7% |
| 1.2% |
|
First Quality |
| 800,000 |
| 2.6% |
| 1.1% |
|
Michelin North America |
| 756,690 |
| 2.5% |
| 1.1% |
|
Del Monte |
| 689,660 |
| 2.3% |
| 1.0% |
|
R.R. Donnelley |
| 659,157 |
| 2.2% |
| 0.9% |
|
Global Equipment |
| 647,228 |
| 2.1% |
| 0.9% |
|
|
|
|
|
|
|
|
|
|
| Occupied |
| Percentage of Total Rentable Area of Account’s |
| ||
|
|
| |||||
MAJOR RETAIL TENANTS |
|
| Retail Properties |
| Non-Residential Properties |
| |
Walmart |
| 802,437 |
| 3.8% |
| 1.1% |
|
Publix Super Markets |
| 630,037 |
| 3.0% |
| 0.9% |
|
Ross Dress for Less |
| 565,488 |
| 2.7% |
| 0.8% |
|
Dick’s Sporting Goods |
| 522,486 |
| 2.5% |
| 0.7% |
|
Kohl’s |
| 521,225 |
| 2.5% |
| 0.7% |
|
PetSmart |
| 496,525 |
| 2.3% |
| 0.7% |
|
Michael’s |
| 474,759 |
| 2.2% |
| 0.7% |
|
Bed Bath & Beyond |
| 457,744 |
| 2.2% |
| 0.6% |
|
Belk |
| 372,812 |
| 1.8% |
| 0.5% |
|
Old Navy |
| 371,779 |
| 1.8% |
| 0.5% |
|
The following tables list the rentable area subject to expiring leases during the next five years, and an aggregate figure for expirations in 2015 and thereafter, in the Account’s commercial (non-residential) properties. While many of these leases contain renewal options with varying terms, these charts assume that none of the tenants exercise their renewal options.
|
|
|
|
|
|
OFFICE PROPERTIES |
| Rentable Area Subject |
| Percentage of Total Rentable Area of |
|
2010 |
| 2,690,373 |
| 13.7% |
|
2011 |
| 2,428,555 |
| 12.4% |
|
2012 |
| 1,397,417 |
| 7.1% |
|
2013 |
| 1,871,047 |
| 9.5% |
|
2014 |
| 2,259,027 |
| 11.5% |
|
2015 and thereafter |
| 7,167,998 |
| 36.5% |
|
Total |
| 17,814,417 |
| 90.7% |
|
44 Prospectus § TIAA Real Estate Account
|
|
|
|
|
|
|
|
|
|
|
|
|
|
| |
INDUSTRIAL PROPERTIES |
| Rentable Area Subject |
| Percentage of Total Rentable Area of |
| ||
2010 |
|
| 5,101,177 |
|
| 16.8% |
|
2011 |
|
| 3,188,963 |
|
| 10.5% |
|
2012 |
|
| 3,098,960 |
|
| 10.2% |
|
2013 |
|
| 3,980,578 |
|
| 13.1% |
|
2014 |
|
| 2,266,111 |
|
| 7.5% |
|
2015 and thereafter |
|
| 8,989,904 |
|
| 29.6% |
|
Total |
|
| 26,625,693 |
|
| 87.7% |
|
|
|
|
|
|
|
|
|
RETAIL PROPERTIES |
| Rentable Area Subject |
| Percentage of Total Rentable Area of |
| ||
2010 |
|
| 1,988,898 |
|
| 9.4% |
|
2011 |
|
| 2,096,211 |
|
| 9.9% |
|
2012 |
|
| 2,521,401 |
|
| 11.9% |
|
2013 |
|
| 2,149,270 |
|
| 10.2% |
|
2014 |
|
| 1,549,783 |
|
| 7.3% |
|
2015 and thereafter |
|
| 7,757,049 |
|
| 36.8% |
|
Total |
|
| 18,062,612 |
|
| 85.5% |
|
|
|
|
|
|
|
| |
RESIDENTIAL PROPERTIES
The Account’s residential property portfolio currently consists of 20 property investments composed of first class or luxury multi-family, garden, midrise, and high-rise apartment buildings. The portfolio contains approximately 8,600 units located in nine states and has a 96% average occupancy rate as of December 31, 2009. Four of the residential properties in the portfolio are subject to mortgages. The complexes generally contain one- to three-bedroom apartment units with a range of amenities, such as patios or balconies, washers and dryers, and central air conditioning. Many of these apartment communities have on-site fitness facilities, including some with swimming pools. Rents on each of the properties tend to be comparable with competitive communities and are not subject to rent regulation. The Account is responsible for the expenses of operating its residential properties.
As of December 31, 2009, the Account’s residential properties had an aggregate market value of approximately $1.2 billion. Set forth in Appendix B to this prospectus is a table containing detailed information regarding the residential properties in the Account’s portfolio as of December 31, 2009.
RECENT TRANSACTIONS
The following describes property and financing transactions by the Account since May 1, 2009. Except as noted, the expenses for operating the properties purchased are either borne or reimbursed, in whole or in part, by the property tenants, although the terms vary under each lease. The Account is responsible for operating expenses not reimbursed under the terms of a lease. All rental rates are quoted on an annual basis unless otherwise noted.
TIAA Real Estate Account § Prospectus 45
SALES
Industrial Properties
New Jersey CalEast Industrial Portfolio
On October 1, 2009, the Account sold an industrial investment portfolio in Monroe and Brunswick, New Jersey for a sales price of approximately $25.5 million and realized a loss of approximately $17.1 million. The Account purchased the property investment on December 22, 2003. The original investment in this property was $39.9 million and costs to date were $42.6 million according to the records of the Account.
Office Properties
4200 West Cypress
On November 16, 2009, the Account sold an office property investment in Tampa, Florida for a sales price of approximately $22.3 million and realized a loss of approximately $13.3 million. The Account purchased the property investment on December 29, 2003. The original investment in this property was $32.9 million and costs to date were $35.6 million according to the records of the Account.
Park Place on Turtle Creek
On December 16, 2009, the Account sold an office property investment in Dallas, Texas for a sales price of approximately $23.7 million and realized a loss of approximately $23.0 million. The Account purchased the property investment on June 29, 2006. The original investment in this apartment property was $44.4 million and costs to date were $46.7 million according to the records of the Account.
Preston Sherry Plaza
On December 16, 2009, the Account sold an office property investment in Dallas, Texas for a sales price of approximately $31.5 million and realized a loss of approximately $15.8 million. The Account purchased the property investment and assumed its debt of $23.5 million on June 1, 2007. The original investment in this office property was $21.6 million and costs to date (net of debt) were $23.8 million according to the records of the Account. The debt was assumed by the purchaser of this property at the time of sale.
Capitol Place
On December 17, 2009, the Account sold an office property investment in Sacramento, California for a sales price of approximately $40.0 million and realized a loss of approximately $3.9 million. The Account purchased the property investment on August 28, 2003. The original investment in this office property was $38.8 million and costs to date were $43.9 million according to the records of the Account.
980 9th Street & 1010 8th Street
On December 18, 2009, the Account sold an office property investment in Sacramento, California for a sales price of approximately $97.0 million and realized a loss of approximately $76.5 million. The Account purchased the
46 Prospectus § TIAA Real Estate Account
property investment on July 18, 2005. The original investment in this office property was $159.5 million and costs to date were $173.5 million according to the records of the Account.
Residential Properties
San Melia Apartments (Phoenix Apartment Portfolio)
On October 30, 2009, the Account completed a partial sale of the Phoenix apartment investment portfolio in Chandler, Arizona for a sales price of approximately $47.8 million and realized a loss of approximately $35.8 million. The Account purchased the property investment on June 23, 2006. The original investment in this apartment property was $82.5 million and costs to date were $83.7 million according to the records of the Account.
San Brisas (Phoenix Apartment Portfolio)
On November 5, 2009, the Account completed a partial sale of the Phoenix apartment investment portfolio in Phoenix, Arizona for a sales price of approximately $19.0 million and realized a loss of approximately $11.4 million. The Account purchased the property investment on June 23, 2006. The original investment in this apartment property was $29.9 million and costs to date were $30.4 million according to the records of the Account.
Paragon (Kierland Apartment Portfolio)
On November 5, 2009, the Account completed a partial sale of the Kierland apartment investment portfolio in Phoenix, Arizona for a sales price of approximately $34.2 million and realized a loss of approximately $30.2 million. The Account purchased the property investment on June 23, 2006. The original investment in this apartment property was $63.9 million and costs to date were $64.4 million according to the records of the Account.
El Mundo (Houston Apartment Portfolio)
On November 24, 2009, the Account completed a partial sale of the Houston apartment investment portfolio in Houston, Texas for a sales price of approximately $11.2 million and realized a loss of approximately $8.1 million. The Account purchased the property investment on June 23, 2006. The original investment in this apartment property was $18.1 million and costs to date were $19.4 million according to the records of the Account.
Plaza Del Oro Townhomes (Houston Apartment Portfolio)
On November 24, 2009, the Account completed a partial sale of an apartment investment portfolio in Houston, Texas for a sales price of approximately $8.0 million and realized a loss of approximately $5.1 million. The Account purchased the property investment on June 23, 2006. The original investment in this apartment property was $12.6 million and costs to date were $13.1 million according to the records of the Account.
San Marin Garden Homes (Houston Apartment Portfolio)
On November 24, 2009, the Account completed a partial sale of an apartment investment portfolio in Houston, Texas for a sales price of approximately $21.3
TIAA Real Estate Account § Prospectus 47
million and realized a loss of approximately $12.2 million. The Account purchased the property investment on June 23, 2006. The original investment in this apartment property was $32.0 million and costs to date were $33.4 million according to the records of the Account.
Retail Properties
The Market at Southpark—Littleton, CO
On August 11, 2009, the Account sold a retail complex in Littleton, Colorado for a sales price of approximately $22.0 million and realized a loss of approximately $12.7 million. The Account purchased the property investment on September 17, 2004. The original investment in this property was $33.4 million and costs to date were $34.7 million according to the records of the Account.
DDR Joint Venture Portfolio—Various
On March 4, 2010, 16 retail properties were sold in various locations by the Account’s joint venture with Developers Diversified Realty Corporation (DDR). The Account holds an 85% interest in this joint venture. The Account’s portion of the net sales price was approximately $32.3 million (after taking into account the assumption by the purchaser of the Account’s portion of debt on the properties equal to $328.4 million) and the Account realized a loss of approximately $152.7 million. The Account purchased these properties on February 27, 2007. The Account’s portion of the original investment in these properties was $505.5 million and costs to date were $512.3 million according to the records of the Account.
FINANCINGS
On February 26, 2010, the maturity date of a loan in the principal amount of $168.3 million (with the Account’s share totaling $143.1 million) with respect to certain of the properties held in the Account’s joint venture with DDR was extended from 2010 to 2011.
We value the Account’s assets as of the close of each valuation day by taking the sum of:
|
|
|
| • | the value of the Account’s cash, cash equivalents, and short-term and other debt instruments; |
|
|
|
| • | the value of the Account’s other securities and other non real estate assets; |
|
|
|
| • | the value of the individual real properties (based on the most recent valuation of that property) and other real estate-related investments owned by the Account; |
|
|
|
| • | an estimate of the net operating income accrued by the Account from its properties, other real estate-related investments and non real estate-related investments (including short-term marketable securities); and |
48 Prospectus § TIAA Real Estate Account
|
|
|
| • | actual net operating income received from the Account’s properties, other real estate-related investments and non real estate-related investments (only to the extent any such item of income differs from the estimated income accrued for on such investments), |
and then reducing the sum by the Account’s liabilities, including the daily investment management, administration and distribution fees and certain other fees and expenses attributable to operating the Account. See “Expense Deductions” on page 55.
Fair value for the Account’s assets is based upon quoted market prices in active exchange markets, where available. If listed prices or quotes in such markets are not available, fair value is based upon vendor-provided, evaluated prices or internally developed models that primarily use market-based or independently sourced market data, including interest rate yield curves, market spreads, and currency rates. Valuation adjustments may be made to reflect credit quality, a counterparty’s creditworthiness, the Account’s creditworthiness, liquidity, and other observable and unobservable data that are applied consistently over time.
The methods described above are considered to produce a fair value calculation that represents a good faith estimate as to what an unaffiliated buyer in the market place would pay to purchase the asset or receive to transfer the liability. Since fair value calculations involve significant professional judgment in the application of both observable and unobservable attributes, actual realizable values or future fair values may differ from amounts reported. Furthermore, while the Account believes its valuation methods are appropriate and consistent with other market participants, the use of different methodologies or assumptions to determine the fair value of certain financial instruments, while reasonable, could result in different estimates of fair value at the reporting date.
VALUING REAL ESTATE INVESTMENTS
Valuing Real Property: Investments in real estate properties are stated at fair value, as determined in accordance with policies and procedures reviewed by the Investment Committee of the TIAA Board of Trustees (the “Board”) and in accordance with the responsibilities of the Board as a whole. Accordingly, the Account does not record depreciation.
Fair value for real estate properties is defined as the price that would be received to sell the asset in an orderly transaction between market participants at the measurement date. Determination of fair value involves significant judgment because the actual market value of real estate can be determined only by negotiation between the parties in a sales transaction. Property and investment values are affected by, among other things, the availability of capital, occupancy rates, rental rates, and interest and inflation rates. As a result, determining real estate and investment values involves many assumptions. Amounts ultimately realized from each investment may vary significantly from the market value presented. Actual results could differ from those estimates. See “Risk Factors –Risks Associated with Real Estate Investing – Valuation and Appraisal Risks.”
TIAA Real Estate Account § Prospectus 49
In accordance with the Account’s procedures designed to comply with Fair Value Measurements and Disclosures in U.S. Generally Accepted Accounting Principles, the Account values real estate properties purchased by the Account initially based on an independent appraisal at the time of the closing of the purchase, which may result in a potential unrealized gain or loss reflecting the difference between an investment’s fair value (i.e., exit price) and its cost basis (which is inclusive of transaction costs).
Subsequently, each property will be valued each quarter by an independent appraiser and the property value is updated as appropriate. In general, the Account obtains appraisals of its real estate properties spread out throughout the quarter, which is intended to result in appraisal adjustments, and thus, adjustments to the valuations of its holdings (to the extent such adjustments are made), that happen regularly throughout each quarter and not on one specific day in each period.
Further, management reserves the right to order an appraisal and/or conduct another valuation outside of the normal quarterly process when facts or circumstances at a specific property change (for example, under certain circumstances a valuation adjustment could be made when bids are obtained for properties held for sale). The Account’s independent fiduciary, Real Estate Research Corporation, oversees the Account’s entire appraisal process and, among other things, must approve all independent appraisers used by the Account. TIAA’s internal appraisal staff oversees the entire appraisal process and reviews each independent quarterly appraisal in conjunction with the Account’s independent fiduciary. Any differences in the conclusions of TIAA’s internal appraisal staff and the independent appraiser will be reviewed by the independent fiduciary, which will make a final determination on the matter (which may include ordering a subsequent independent appraisal).
Real estate appraisals are estimates of property values based on a professional’s opinion. All appraisals are performed in accordance with Uniform Standards of Professional Appraisal Practices (USPAP), the real estate appraisal industry standards created by The Appraisal Foundation. Appraisals of properties held outside of the U.S. are performed in accordance with industry standards commonly applied in the applicable jurisdiction. Further, these independent appraisers (as well as TIAA’s internal appraisal staff) are always expected to be MAI-designated members of the Appraisal Institute (or its European equivalent, RICS) and state certified appraisers from national or regional firms with relevant property type experience and market knowledge.
We intend that the overarching principle and primary objective when valuing our real estate investments will be to produce a valuation that represents a fair and accurate estimate of the fair value of our investments. Implicit in our definition of fair value is the consummation of a sale as of a specified date and the passing of title from seller to buyer under conditions whereby:
|
|
|
| • | Buyer and seller are typically motivated; |
50 Prospectus § TIAA Real Estate Account
|
|
|
| • | Both parties are well informed or well advised, and acting in what they consider their best interests; |
|
|
|
| • | A reasonable time is allowed for exposure in the open market; |
|
|
|
| • | Payment is made in terms of cash or in terms of financial arrangements comparable thereto; and |
|
|
|
| • | The price represents the normal consideration for the property sold unaffected by special or creative financing or sales concessions granted by anyone associated with the sale. |
The Account’s net asset value will include the value of any note receivable (an amount that someone else owes the Account) from selling a real estate-related investment. We’ll estimate the value of the note by applying a discount rate appropriate to then-current market conditions.
Development Properties.Development properties will be carried at fair value, which is anticipated initially to equal the Account’s cost, and the value will be adjusted as additional development costs are incurred. At a minimum, once a property receives a certificate of occupancy, within one year from the initial funding by the Account, or the property is substantially leased, whichever is earlier, the property will be appraised by an independent external appraiser, approved by the independent fiduciary. We may also have the properties independently appraised earlier if circumstances warrant.
Property Portfolios.The Account may, at times, value individual properties together (whether or not purchased at the same time) in a portfolio as a single asset, to the extent we believe that the property may be sold as one portfolio. The Account may also realize efficiencies in property management by pooling a number of properties into a portfolio. The value assigned to the portfolio as a whole may be more or less than the valuation of each property individually. The Account will also, from time to time, sell one or more individual properties that comprise a portfolio, with the Account retaining title to the remaining individual properties comprising that portfolio. In such a circumstance, the Account may cease to designate such properties as a portfolio.
Because of the nature of real estate assets and because the fair value of our investments is not reduced by transaction costs that will be incurred to sell the investments, the Account’s net asset value won’t necessarily reflect the net realizable value of its real estate assets (i.e., what the Account would receive if it sold them). See “—Valuation Adjustments” below.
Valuing Real Property Subject to a Mortgage: When a real estate property is subject to a mortgage, the mortgage is valued independently of the property and its fair value is reported separately. The independent fiduciary reviews and approves all mortgage valuation adjustments before such adjustments are recorded by the Account. The Account will continue to use the revised value for each real estate property and mortgage loan payable to calculate the Account’s daily net asset value until the next valuation review or appraisal.
TIAA Real Estate Account § Prospectus 51
Valuing Mortgage Loans Receivable (i.e., the Account as a creditor):Mortgage loans receivable are stated at fair value and are initially valued at the face amount of the mortgage loan funding. Subsequently, mortgage loans receivable are valued at least quarterly based on market factors, such as market interest rates and spreads for comparable loans, the liquidity for mortgage loans of similar characteristics, the performance of the underlying collateral and the credit quality of the counterparty.
Valuing Mortgage Loans Payable (i.e., the Account as a debtor): Mortgage loans payable are stated at fair value. The estimated fair value of mortgage loans payable is generally based on the amount at which the liability could be transferred in a current transaction, exclusive of transaction costs. Fair values are estimated based on market factors, such as market interest rates and spreads on comparable loans, the liquidity for mortgage loans of similar characteristics, the performance of the underlying collateral (such as the loan-to-value ratio and the cash flow of the underlying collateral), the maturity date of the loan, the return demands of the market, and the credit quality of the Account. Different assumptions or changes in future market conditions could significantly affect estimated fair values. At times, the Account may assume debt in connection with the purchase of real estate.
Valuing Real Estate Joint Ventures: Real estate joint ventures are stated at the fair value of the Account’s ownership interests in the underlying entities. The Account’s ownership interests are valued based on the fair value of the underlying real estate, any related mortgage loans payable, and other factors, such as ownership percentage, ownership rights, buy/sell agreements, distribution provisions and capital call obligations. In addition, any restrictions on the right of the Account to transfer its ownership interest to third parties could adversely affect the value of the Account’s interest. Upon the disposition of all real estate investments by an investee entity, the Account will continue to state its equity in the remaining net assets of the investee entity during the wind down period, if any, that occurs prior to the dissolution of the investee entity.
Valuing Real Estate Limited Partnerships: Limited partnerships are stated at the fair value of the Account’s ownership in the partnership, which is based on the most recent net asset value of the partnership, as reported by the sponsor. Since market quotations are not readily available, the limited partnership interests are valued at fair value as determined in good faith under the direction of the Investment Committee of the Board and in accordance with the responsibilities of the Board as a whole. As circumstances warrant, prior to the receipt of financial statements of the limited partnership, the Account will estimate the value of its interests in good faith and will from time to time seek input from the issuer or the sponsor of the investment vehicle.
Net Operating Income: The Account usually receives operating income from its investments intermittently, not daily. In fairness to participants, we estimate the Account’s net operating income rather than applying it when we actually receive it, and assume that the Account has earned (accrued) a proportionate
52 Prospectus § TIAA Real Estate Account
amount of that estimated amount daily. You bear the risk that, until we adjust the estimates when we receive actual items of income, the Account’s net assets could be under- or over-valued.
Every year, we prepare a month-by-month estimate of the revenues and expenses (estimated net operating income) for each of the Account’s properties. Each day, we add the appropriate fraction of the estimated net operating income for the month to the Account’s net asset value.
Every month, the Account receives a report of the actual operating results for the prior month for each property (actual net operating income). We then recognize the actual net operating income on the accounting records of the Account and adjust the outstanding daily accrued receivable accordingly. As the Account actually receives income from a property, we’ll adjust the daily accrued receivable and other accounts appropriately.
Valuation Adjustments:General.Management reserves the right to order an appraisal and/or conduct another valuation outside of the normal quarterly process when facts or circumstances at a specific property change. Also, the independent fiduciary can require additional appraisals if a property’s value has changed materially and such change is not reflected in the quarterly valuation review, or otherwise to ensure that the Account is valued appropriately. For example, under certain circumstances a valuation adjustment could be made when bids are obtained for properties held for sale by the Account. In addition, adjustments may be made for events or circumstances indicating an impairment of a tenant’s ability to pay amounts due to the Account under a lease (including due to a bankruptcy filing of that tenant). Also, adjustments may be made to reflect factors (such as sales values for comparable properties or local employment rate) bearing uniquely on a particular region in which the Account holds properties. We may not always be aware of each event that might require a valuation adjustment, and because our evaluation is based on subjective factors and we give different weight to different factors, we may not in all cases make a valuation adjustment where changing conditions could potentially affect the value of an investment.
Required Approvals.The independent fiduciary will need to approve adjustments to any valuation of one or more properties or real estate related assets that:
|
|
|
|
| • | is made within three months of the annual independent appraisal, or | |
|
|
|
|
| • | results in an increase or decrease of: | |
|
|
|
|
|
| • | more than 6 percent of the value of any of the Account’s properties since the last independent annual appraisal; |
|
|
|
|
|
| • | more than 2 percent in the value of the Account since the prior calendar month; and/or |
|
|
|
|
|
| • | more than 4 percent in the value of the Account within any calendar quarter. |
TIAA Real Estate Account § Prospectus 53
Right to Change Valuation Methods: If we decide that a different valuation method would reflect the value of a real estate-related investment more accurately, we may use that method if the independent fiduciary consents. Changes in TIAA’s valuation methods could change the Account’s net asset value and change the values at which participants purchase or redeem Account interests.
VALUING OTHER INVESTMENTS (INCLUDING CERTAIN REAL ESTATE-RELATED INVESTMENTS)
Debt Securities and Money Market Instruments: We value debt securities (excluding money market instruments) for which market quotations are readily available based on the most recent bid price or the equivalent quoted yield for such securities (or those of comparable maturity, quality and type). We derive these values utilizing an independent pricing service, such as FT Interactive Data Corp, Reuters and Bloomberg, except when we believe the prices do not accurately reflect the security’s fair value. We value money market instruments with maturities of one year or less in the same manner as debt securities, or by using a pricing matrix that has various types of money market instruments along one axis and various maturities along the other. Debt securities for which market quotations are not readily available are valued at fair value as determined in good faith by the Investment Committee of the Board and in accordance with the responsibilities of the Board as a whole.
Equity Securities: We value equity securities (including REITs) listed or traded on the New York Stock Exchange (or any of its affiliated exchanges) at their last sale price on the valuation day. If no sale is reported that day, we use the mean of the last bid and asked prices, exclusive of transaction costs. Equity securities listed or traded on any other exchange are valued in a comparable manner on the principal exchange where traded.
We value equity securities traded on the Nasdaq Stock Market at the Nasdaq Official Closing Price on the valuation day. If no sale is reported that day, we use the mean of the last bid and asked prices, exclusive of transaction costs. Other U.S. over-the-counter equity securities are valued at the mean of the last bid and asked prices.
Mortgage-Backed Securities: We value mortgage-backed securities, including CMBS and RMBS, in the same manner in which we value debt securities, as described above.
Foreign Securities: To value equity and fixed income securities traded on a foreign exchange or in foreign markets, we use their closing values under the generally accepted valuation method in the country where traded, as of the valuation date. We convert this to U.S. dollars at the exchange rate in effect on the valuation day. Under certain circumstances (for example, if there are significant movements in the United States markets and there is an expectation the securities traded on foreign markets will adjust based on such movements when the foreign markets open the next day), the Account may adjust the value of equity
54 Prospectus § TIAA Real Estate Account
or fixed income securities that trade on a foreign exchange or market after the foreign exchange or market has closed.
Investments Lacking Current Market Quotations:We value securities or other assets for which current market quotations are not readily available at fair value as determined in good faith under the direction of the Investment Committee of TIAA’s Board of Trustees and in accordance with the responsibilities of TIAA’s Board as a whole. In evaluating fair value for the Account’s interest in certain commingled investment vehicles, the Account will generally look to the value periodically assigned to interests by the issuer. When possible, the Account will seek to have input in formulating the issuer’s valuation methodology.
Expense deductions are made each Valuation Day from the net assets of the Account for various services to manage investments, administer the Account and the contracts, distribute the contracts and to cover certain risks borne by TIAA. Services are provided “at cost” by TIAA and Services. Currently, TIAA provides investment management services and administration services for the Account, and Services provides distribution services for the Account. TIAA guarantees that in the aggregate, the expense charges will never be more than 2.50% of average net assets per year.
The estimated annual expense deduction rate that appears in the expense table below reflects an estimate of the amount we currently expect to deduct to approximate the costs that the Account will incur from May 1, 2010 through April 30, 2011. Actual expenses may be higher or lower.
|
|
|
|
|
Type of Expense Deduction |
| Estimated |
| Services Performed |
Investment Management |
| ________% |
| For investment advisory, investment management, portfolio accounting, custodial and similar services, including independent fiduciary and appraisal fees |
|
|
|
|
|
Administration |
| ________% |
| For administration and operations of the Account and the contracts, including administrative services such as receiving and allocating premiums and calculating and making annuity payments |
|
|
|
|
|
Distribution |
| ________% |
| For services and expenses associated with distributing the annuity contracts |
|
|
|
|
|
Mortality and Expense Risk |
| ________% |
| For TIAA’s bearing certain mortality and expense risks |
|
|
|
|
|
Liquidity Guarantee |
| ________% |
| For TIAA’s liquidity guarantee |
|
|
|
|
|
Total Annual Expense Deduction1,2,3 |
| ________% |
| For total services to the Account |
|
|
1 | TIAA guarantees that the total annual expense deduction will not exceed an annual rate of 2.50% of average net assets. |
|
|
2 | TIAA currently does not impose a fee on transfers from the Account, but reserves the right to impose a fee on transfers from the Account in the future. |
|
|
3 | Property-level expenses, including property management fees and transfer taxes, are not reflected in the table above; instead these expenses are charged directly to the Account’s properties. |
TIAA Real Estate Account § Prospectus 55
Since expenses are charged to the Account at cost, the expenses described are estimates for the year based on projected expense and asset levels. Administration charges include certain costs associated with the provision by TIAA entities of recordkeeping and other services for retirement plans and other pension products in addition to the Account. A portion of these expenses are allocated to the Account in accordance with applicable allocation procedures.
After the end of every quarter, we reconcile the amount deducted from the Account as discussed above with the expenses the Account actually incurred. If there is a difference, we add it to or deduct it from the Account in equal daily installments over the remaining days in the quarter, provided that material differences may be repaid in the current calendar quarter, in accordance with generally accepted accounting principles (GAAP). Our at-cost deductions are based on projections of Account assets and overall expenses, and the size of any adjusting payments will be directly affected by how different our projections are from the Account’s actual assets or expenses. The expenses identified in the table above do not include any fees which may be imposed by your employer under a plan maintained by your employer.
The size of the Account’s assets can be affected by many factors, including changes in the value of portfolio holdings, net income earned on the Account’s investments, premium activity and participant transfers into or out of the Account and participant cash withdrawals from the Account. In addition, our operating expenses can fluctuate based on a number of factors including participant transaction volume, operational efficiency, and technological, personnel and other infrastructure costs. Historically, the adjusting payments have resulted in both upward and downward adjustments to the Account’s expense deductions for the following quarter.
TIAA’s Board of Trustees can revise the estimated expense rates (the daily deduction rate before the quarterly adjustment referenced above) for the Account from time to time, usually on an annual basis, to keep deductions as close as possible to actual expenses.
Currently there are no deductions from premiums, transfers or withdrawals, but we reserve the right to change this in the future.
EMPLOYER PLAN FEE WITHDRAWALS
Your employer may, in accordance with the terms of your plan, and with TIAA’s approval, withdraw amounts from your Real Estate Account accumulation under your Retirement Choice or Retirement Choice Plus contract, and, on a limited basis, under your GA, GSRA, GRA or Keogh contract, to pay fees associated with the administration of the plan. These fees are separate from the expense deductions of the Account, and are not included for purposes of TIAA’s guarantee that the total annual expense deduction of the Account will not exceed 2.50% of average net assets per year.
The amount and the effective date of an employer plan fee withdrawal will be in accordance with the terms of your plan. TIAA will determine all values as of the
56 Prospectus § TIAA Real Estate Account
end of the effective date. An employer plan fee withdrawal cannot be revoked after its effective date. Each employer plan fee withdrawal will be made on a pro-rata basis from all your available TIAA and CREF accounts. An employer plan fee withdrawal reduces the accumulation from which it is paid by the amount withdrawn.
CERTAIN RELATIONSHIPS WITH TIAA
As noted elsewhere in this prospectus, the TIAA General Account plays a significant role in operating the Real Estate Account, including providing a liquidity guarantee, and investment advisory, administration and other services. In addition, Services, a wholly owned subsidiary of TIAA, provides distribution services for the Account.
Liquidity Guarantee.As noted above under “Establishing and Managing the Account – The Role of TIAA – Liquidity Guarantee,” if the Account’s liquid assets and its cash flow from operating activities and participant transactions are insufficient to fund redemption requests, the TIAA General Account has agreed to purchase liquidity units. TIAA thereby guarantees that a participant can redeem accumulation units at their net asset value next determined.
In the years ended December 31, 2008 and December 31, 2009, TIAA purchased liquidity units in a number of separate transactions at a purchase price equal to $155.6 million and approximately $1.1 billion, respectively. Since January 1, 2010 and through the date of this prospectus, the TIAA General Account has purchased no additional liquidity units. These liquidity units are valued in the same manner as are accumulation units held by the Account’s participants.
For the years ended December 31, 2009, December 31, 2008 and December 31, 2007, the Account expensed $12.4 million, $19.7 million, and $19.4 million, respectively, for this liquidity guarantee from TIAA through a daily deduction from the net assets of the Account.
Investment Advisory, Administrative, and Distribution Services/Certain Risks Borne by TIAA.As noted above under “Expense Deductions” on page 55, deductions are made each Valuation Day from the net assets of the Account for various services required to manage investments, administer the Account and distribute the contracts. These services are performed at cost by TIAA and Services. Deductions are also made each Valuation Day to cover mortality and expense risks borne by TIAA.
For the years ended December 31, 2009, December 31, 2008 and December 31, 2007, the Account expensed $42.5 million, $47.6 million and $49.2 million, respectively, for investment advisory services and $4.7 million, $8.1 million and $8.1 million, respectively, for mortality and expense risks provided/borne by TIAA. For the same period, the Account expensed $35.8 million, $77.6 million and $63.6 million, respectively, for administrative and distribution services provided by TIAA and Services, as applicable. Through December 31, 2007, administrative and distribution services were provided to the Account by Services. Effective January
TIAA Real Estate Account § Prospectus 57
1, 2008, administrative services have been provided to the Account by TIAA, while distribution services have continued to be provided to the Account by Services.
The Account is party to various claims and routine litigation arising in the ordinary course of business. As of the date of this prospectus, management of the Account does not believe that the results of any such claims or litigation, individually or in the aggregate, will have a material effect on the Account’s business, financial position or results of operations.
58 Prospectus § TIAA Real Estate Account
The following selected financial data should be considered in conjunction with the Account’s financial statements and notes provided in this prospectus (amounts in thousands).
|
|
|
|
|
|
|
|
|
|
|
|
|
|
|
|
|
|
|
| ||||||||||||||
|
| Years Ended December 31, |
| |||||||||||||
|
| |||||||||||||||
|
| 2009 |
| 2008 |
| 2007 |
| 2006 |
| 2005 |
| |||||
Investment income: |
|
|
|
|
|
|
|
|
|
|
|
|
|
|
|
|
Real estate income, net |
| $ | 479,657 |
| $ | 500,434 |
| $ | 529,412 |
| $ | 444,783 |
| $ | 340,090 |
|
Income from real estate joint ventures and limited partnerships |
|
| 114,578 |
|
| 116,889 |
|
| 93,724 |
|
| 60,789 |
|
| 71,826 |
|
Dividends and interest |
|
| 1,733 |
|
| 81,523 |
|
| 141,914 |
|
| 135,407 |
|
| 70,999 |
|
Total investment income |
|
| 595,968 |
|
| 698,846 |
|
| 765,050 |
|
| 640,979 |
|
| 482,915 |
|
Expenses |
|
| 95,473 |
|
| 153,040 |
|
| 140,294 |
|
| 83,449 |
|
| 56,100 |
|
Investment income, net |
|
| 500,495 |
|
| 545,806 |
|
| 624,756 |
|
| 557,530 |
|
| 426,815 |
|
Net realized and unrealized (losses) gain on investments and mortgage loans payable |
|
| (3,612,505 | ) |
| (2,513,024 | ) |
| 1,438,435 |
|
| 1,056,671 |
|
| 765,970 |
|
Net (decrease) increase in net assets resulting from operations |
|
| (3,112,010 | ) |
| (1,967,218 | ) |
| 2,063,191 |
|
| 1,614,201 |
|
| 1,192,785 |
|
Participant transactions |
|
| (1,575,700 | ) |
| (4,339,995 | ) |
| 1,464,653 |
|
| 1,969,781 |
|
| 2,110,376 |
|
TIAA Purchase of Liquidity units |
|
| 1,058,700 |
|
| 155,600 |
|
| — |
|
| — |
|
| — |
|
Net (decrease) increase in net assets |
| $ | (3,629,010 | ) | $ | (6,151,613 | ) | $ | 3,527,844 |
| $ | 3,583,982 |
| $ | 3,303,161 |
|
|
|
|
|
|
|
|
|
|
|
|
|
|
|
|
|
|
|
| Years Ended December 31, |
| |||||||||||||
|
| |||||||||||||||
|
| 2009 |
| 2008 |
| 2007 |
| 2006 |
| 2005 |
| |||||
Total assets |
| $ | 9,912,703 |
| $ | 13,576,954 |
| $ | 19,232,767 |
| $ | 15,759,961 |
| $ | 11,685,426 |
|
Total liabilities |
|
| 2,032,789 |
|
| 2,068,030 |
|
| 1,572,230 |
|
| 1,627,268 |
|
| 1,136,715 |
|
Total net assets |
| $ | 7,879,914 |
| $ | 11,508,924 |
| $ | 17,660,537 |
| $ | 14,132,693 |
| $ | 10,548,711 |
|
Number of accumulation units outstanding |
|
| 39,473 |
|
| 41,542 |
|
| 55,106 |
|
| 50,146 |
|
| 42,623 |
|
Net asset value, per accumulation unit |
| $ | 193.45 |
| $ | 267.35 |
| $ | 311.41 |
| $ | 273.65 |
| $ | 239.95 |
|
Mortgage loans payable |
| $ | 1,858,110 |
| $ | 1,830,040 |
| $ | 1,392,093 |
| $ | 1,437,149 |
| $ | 973,502 |
|
|
|
|
|
|
|
|
|
|
|
|
|
|
|
|
| |
TIAA Real Estate Account § Prospectus 59
QUARTERLY SELECTED FINANCIAL INFORMATION
The following selected unaudited financial data for each full quarter of 2009 and 2008 are derived from the financial statements of the Account for the years ended December 31, 2009 and 2008. Certain amounts below have been reclassified in accordance with the reclassifications discussed in Note 1 of the Notes to the Financial Statements (amounts in thousands).
|
|
|
|
|
|
|
|
|
|
|
|
|
|
|
|
|
|
|
|
|
| ||||||||||||
|
| 2009 |
|
|
| |||||||||||
|
|
|
|
| ||||||||||||
|
| For the Three Months Ended |
| Year Ended |
| |||||||||||
|
|
|
| |||||||||||||
|
| March 31 |
| June 30 |
| September 30 |
| December 31 |
|
| ||||||
Investment income, net |
| $ | 119,440 |
| $ | 130,429 |
| $ | 135,536 |
| $ | 115,090 |
| $ | 500,495 |
|
Net realized and unrealized loss on investments and mortgage loans payable |
|
| (1,074,437 | ) |
| (1,166,159 | ) |
| (836,451 | ) |
| (535,458 | ) |
| (3,612,505 | ) |
Net decrease in net assets resulting from operations |
| $ | (954,997 | ) | $ | (1,035,730 | ) | $ | (700,915 | ) | $ | (420,368 | ) | $ | (3,112,010 | ) |
Total return |
|
| –8.36 | % |
| –9.96 | % |
| –7.64 | % |
| –5.05 | % |
| –27.64 | % |
|
|
|
|
|
|
|
|
|
|
|
|
|
|
|
|
|
|
| 2008 |
|
|
| |||||||||||
|
|
|
|
| ||||||||||||
|
| For the Three Months Ended |
| Year Ended |
| |||||||||||
|
|
|
| |||||||||||||
|
| March 31 |
| June 30 |
| September 30 |
| December 31 |
|
| ||||||
Investment income, net |
| $ | 150,587 |
| $ | 147,564 |
| $ | 129,345 |
| $ | 118,310 |
| $ | 545,806 |
|
Net realized and unrealized loss on investments and mortgage loans payable |
|
| (28,912 | ) |
| (101,069 | ) |
| (462,819 | ) |
| (1,920,224 | ) |
| (2,513,024 | ) |
Net increase (decrease) in net assets resulting from operations |
| $ | 121,675 |
| $ | 46,495 |
| $ | (333,474 | ) | $ | (1,801,914 | ) | $ | (1,967,218 | ) |
Total return |
|
| 0.69 | % |
| 0.27 | % |
| –2.07 | % |
| –13.18 | % |
| –14.15 | % |
|
|
|
|
|
|
|
|
|
|
|
|
|
|
|
| |
60 Prospectus § TIAA Real Estate Account
MANAGEMENT’S DISCUSSION AND ANALYSIS OF THE ACCOUNT’S FINANCIAL CONDITION AND RESULTS OF OPERATIONS
The following discussion and analysis of our financial condition and results of operations should be read together with our financial statements and notes contained in this prospectus and with consideration to the sub-section entitled “Forward-Looking Statements,” which begins below, and the section entitled “Risks,” which begins on page 11. The past performance of the Account is not indicative of future results.
FORWARD-LOOKING STATEMENTS
Some statements in this prospectus which are not historical facts may be “forward-looking statements” within the meaning of Section 27A of the Securities Act of 1933, Section 21E of the Securities Exchange Act of 1934 and the Private Securities Litigation Reform Act of 1995. Forward-looking statements include statements about management’s expectations, beliefs, intentions or strategies for the future, include the assumptions underlying these forward-looking statements, and are based on current expectations, estimates and projections about the real estate industry, domestic and global economic conditions, including conditions in the credit and capital markets, the sector markets in which the Account invests and operates, management’s beliefs, assumptions made by management and the transactions described in this prospectus. While management believes the assumptions underlying any of its forward-looking statements and information to be reasonable, such information may be subject to uncertainties and may involve certain risks which may be difficult to predict and are beyond management’s control. These risks and uncertainties could cause actual results to differ materially from those contained in any forward-looking statement. These risks and uncertainties include, but are not limited to, the following:
|
|
|
| • | The risks associated with acquiring, owning and selling real property, including general economic and real estate market conditions, the availability of financing (both for the Account and potential purchasers of the Account’s properties), disruptions in the credit and capital markets, competition for real estate properties, leasing risk (including tenant defaults), risks of holding foreign investments, and the risk of uninsured losses at properties (including due to terrorism and acts of violence); |
|
|
|
| • | The risks associated with property valuations, including the fact that appraisals can be subjective in a number of respects, the fact that the Account’s appraisals are generally obtained on a quarterly basis and there may be periods in between appraisals of a property in which the value attributed to the property for purposes of the Account’s daily accumulation unit value may be more or less than the actual realizable value of the property; |
|
|
|
| • | Risks associated with financing the Account’s properties, including the risk that the Account may not have the ability to obtain financing on favorable terms (or at all), which may be aggravated by general disruptions in credit and capital markets; |
|
|
|
| • | Investment risk associated with participant transactions, including the fact that significant net participant transfers out of the Account may impair its ability to |
| ||
TIAA Real Estate Account § Prospectus 61
|
|
|
| ||
|
| pursue or consummate new investment opportunities that are otherwise attractive to the Account or that significant net participant transfers into the Account may take time to invest in attractive investment opportunities; |
|
|
|
| • | The risks associated with joint venture partnerships, including the risk that a co-venturer may have interests or goals inconsistent with that of the Account, that a co-venturer may have financial difficulties, and the risk that the Account may have limited rights with respect to operation of the property and transfer of the Account’s interest; |
|
|
|
| • | Uncertainties associated with environmental and other regulatory matters; |
|
|
|
| • | Conflicts of interest, including those associated with other real estate accounts and funds which TIAA or its affiliates manage and any perceived conflicts associated with TIAA’s liquidity guarantee; and |
|
|
|
| • | Risks associated with investments in liquid assets, including financial/credit risk, market volatility risk, interest rate volatility risk and deposit/money market risk. |
More detailed discussions of certain of these risk factors are contained in the section of this prospectus entitled “Risks” and in this report below and also in the section entitled “Quantitative and Qualitative Disclosures About Market Risk,” that could cause actual results to differ materially from historical experience or management’s present expectations.
Caution should be taken not to place undue reliance on management’s forward-looking statements, which represent management’s views only as of the date of this prospectus. Neither management nor the Account undertake any obligation to update publicly or revise any forward-looking statement, whether as a result of new information, changed assumptions, future events or otherwise.
Commercial real estate market statistics discussed in this section are obtained by the Account from sources that management considers reliable, but some of the data are preliminary for the year or quarter ended December 31, 2009 and may be subsequently revised. Prior period data may have been adjusted to reflect updated calculations. Investors should not rely exclusively on the data presented below in forming a judgment regarding the current or prospective performance of the commercial real estate market generally.
2009 U.S. ECONOMIC AND COMMERCIAL REAL ESTATE OVERVIEW
The TIAA Real Estate Account (the “Account”) invests primarily in high-quality, core commercial real estate in order to meet its investment objective of obtaining favorable long-term returns through rental income and the appreciation of its real estate holdings. The Account does not directly invest in either single-family residential real estate or residential mortgage-backed securities.
Economic and Capital Markets Overview and Outlook
Global economic and capital market conditions improved considerably during the second half of 2009. Preliminary estimates of Gross Domestic Product (“GDP”) suggest that economic output grew 5.7% during the fourth quarter of
62 Prospectus § TIAA Real Estate Account
2009, following a 2.2% increase in the third quarter of 2009, which was the first such increase in GDP since mid-2008. Federal stimulus programs played a big role in promoting growth, including the ready availability of funds from the Troubled Asset Relief Program (“TARP”) which bolstered bank balance sheets and provided a lifeline to the troubled auto industry. For consumers, the “cash for clunkers” program and financial assistance programs for first-time home buyers helped to stimulate automobile and housing demand. Similarly, the accommodative monetary policies of the Federal Reserve kept mortgage interest rates low and perked up the moribund housing market.
The second half of 2009 also provided evidence that capital and credit markets were stabilizing. For example, major banks were able to access the equity markets for new capital and a portion of those proceeds were used to repay outstanding TARP loans. The Treasury Department subsequently announced that TARP would require approximately $150 billion less than expected and that the program would likely be ended in the Fall of 2010. With signs that a recovery was forthcoming, investors returned to the equity markets, which produced a strong rally. The Dow Jones Industrial Average and S&P 500 started the year at depressed levels, but ultimately gained 23% and 28%, respectively, for the year. Similarly, credit markets experienced a revival, with lending activity increasing modestly and credit spreads declining dramatically over the course of the year.
The commercial real estate market received a boost from the Federal Reserve’s Term Asset-Backed Securities Loan Facility (“TALF”) program, which supported the issuance of the first new commercial mortgage-backed securities (“CMBS”) in over a year. The CMBS market subsequently began to stir and several other CMBS issuances occurred without TALF loans. Public Real Estate Investment Trust (“REIT”) shares also experienced a strong rally, and a number of companies solidified their balance sheets with funds raised from issuing new shares.
Nonetheless, the economy still remains weak. In particular, most companies have not started hiring. Though the pace of job losses moderated significantly in the fourth quarter of 2009 compared with prior quarters, more than four million jobs were lost during 2009. The first monthly job gains since December 2007 were reported in November 2009, which may be an indicator of an eventual growth in payrolls. Still, the unemployment rate, traditionally a lagging indicator, ended the year at approximately 10%, a level not seen since the 1982-1983 recession.
Despite the overall improvement in the capital and credit markets, considerable weakness remains. First, credit is largely available only to the most creditworthy companies; weaker companies and small businesses continue to lack ready access to capital. Second, banks continue to experience sizeable losses in their consumer and commercial real estate loan portfolios and are limited in their ability to lend. Further, the outlook for companies which borrowed significant amounts from the federal government such as AIG, General Motors, GMAC, and Fannie Mae remains tenuous, as several have indicated that they will need additional financial support in the future.
TIAA Real Estate Account § Prospectus 63
Economic activity expanded at a faster pace in the fourth quarter of 2009 than during the third quarter of 2009, however, most economists believe that much of the growth in GDP during those quarters was attributable to the beneficial effects of the government’s fiscal stimulus programs. For the year, GDP declined 2.4%, which was the largest annual decline since 1946. Consequently, many economists believe persistent unemployment, limited access to credit, and tepid consumer spending will hamper the recovery. While certain monetary policy programs will be wound down, the Federal Reserve reiterated at its final meeting in 2009 that it intends to keep the federal funds rate at or near the 0.0%-0.25% target range for “an extended period.” Similarly, purchases of agency residential mortgage-backed securities (“RMBS”) and Fannie Mae and Freddie Mac debt are ongoing, though they are expected to be terminated during the first quarter of 2010. While the recovery may be on shaky ground, the Fed’s monetary policies and indirect support of the mortgage and housing markets are expected to bolster overall economic activity in 2010 and are likely to remain in place until the recovery is firmly established.
Basic economic indicators are summarized in the table below and the data support the belief that an economic recovery is forthcoming. Evidence includes the 5.7% growth in GDP in the fourth quarter, which was due to increases in consumer spending, exports, and a slower pace of private inventory reduction. Similarly, the moderation in job losses over the course of the year suggests that businesses are winding down their payroll and cost cutting programs. However, significant job growth is not expected until the latter half of 2010 at best. Nonetheless, economists’ forecasts, which are summarized below, reflect expectations of healthy GDP growth in 2010 and 2011.
ECONOMIC INDICATORS*
|
|
|
|
|
|
|
|
|
|
|
|
|
|
|
|
|
|
|
|
|
|
|
|
|
|
|
|
|
|
|
| Forecasted |
| ||
|
|
|
|
|
|
|
|
|
|
|
|
|
|
| |||
|
| 2008 |
| 2009 |
| 2009Q1 |
| 2009Q2 |
| 2009Q3 |
| 2009Q4 |
| 2010 |
| 2011 |
|
Economy(1) |
|
|
|
|
|
|
|
|
|
|
|
|
|
|
|
|
|
Gross Domestic Product (GDP) |
| 0.4 | % | –2.4 | % | –6.4 | % | –0.7 | % | 2.2 | % | 5.7 | % | 2.8 | % | 3.1 | % |
Employment Growth (Thousands) |
| –3,078 |
| –4,164 |
| –2,074 |
| –1,285 |
| –597 |
| –208 |
| N/A |
| N/A |
|
Interest Rates(2) |
|
|
|
|
|
|
|
|
|
|
|
|
|
|
|
|
|
10 Year Treasury |
| 3.66 | % | 3.26 | % | 2.74 | % | 3.31 | % | 3.52 | % | 3.46 | % | 3.90 | % | 4.60 | % |
Federal Funds Rate |
| 0.0–0.25 | % | 0.0–0.25 | % | 0.0–0.25 | % | 0.0–0.25 | % | 0.0–0.25 | % | 0.0–0.25 | % | N/A |
| N/A |
|
Sources: BEA, BLS, Federal Reserve, Blue Chip Consensus Forecasts
|
|
* | Data subject to revision |
| |
(1) | GDP growth rates are annual rates; employment numbers are monthly changes. |
| |
(2) | The Treasury rates are an average over the stated time period. The Federal Funds rates are as of the end of the stated time period. |
| |
N/A indicates data not available. | |
Other economic indicators, shown in the table below, reveal that the recovery will need to gather strength before it is self-sustaining and broad-based.
64 Prospectus § TIAA Real Estate Account
Consumer confidence trended upwards in the fourth quarter, but remains at historically low levels. Retail sales, excluding motor vehicles and gasoline, likewise gained some ground in the fourth quarter, but took a step back in December. The slowdown was attributed to unusually cold weather in much of the country. Inflation remained tame; the modest increase in overall prices in 2009 was due to an increase in energy prices as compared with their lows in 2008. Thus far, excess production capacity and the moderate nature of the recovery is helping to keep price levels stable overall.
Housing activity in the third and fourth quarters of 2009 was largely the result of the government’s tax credits for first-time home buyers; however, the recovery in the housing market remains in question. A sizeable inventory of unsold homes remains, despite the fact that housing construction declined in 2009 following an even steeper decline in 2008. As of December, single-family home building ran at an annualized rate of 456,000 units, as compared with a low of 357,000 units during the first two months of the year. Overall, housing construction remains depressed and near historic lows; permits issued for new homes, which are a leading indicator for future construction, in 2009 were 37.5% below 2008 levels.
BROAD ECONOMIC INDICATORS*
|
|
|
|
|
|
|
|
|
|
|
|
|
| Full Year |
|
|
|
|
|
|
| ||
|
|
|
|
|
|
|
|
| |||
Index 1985=100 |
| 2008 |
| 2009 |
| Oct-09 |
| Nov-09 |
| Dec-09 |
|
Consumer Confidence |
| 58.0 |
| 45.2 |
| 48.7 |
| 50.6 |
| 53.6 |
|
% Change(1) |
|
|
|
|
|
|
|
|
|
|
|
Inflation (Consumer Price Index) |
| 0.1% |
| 2.7% |
| 0.3% |
| 0.4% |
| 0.1% |
|
Retail Sales (excl. auto, parts & gas) |
| 1.6% |
| -1.8% |
| 0.1% |
| 1.0% |
| -0.3% |
|
Existing Home Sales |
| -13.1% |
| 4.9% |
| 9.9% |
| 7.4% |
| -16.7% |
|
New Home Sales |
| -37.5% |
| -22.9% |
| 4.3% |
| -9.3% |
| -7.6% |
|
Single-family Housing Starts |
| -40.5% |
| -28.7% |
| -7.3% |
| 4.0% |
| -6.9% |
|
Unemployment Rate |
| 5.8% |
| 9.3% |
| 10.1% |
| 10.0% |
| 10.0% |
|
|
|
* | Data subject to revision |
|
|
(1) | Monthly figures represent change from the preceding month. Full year figures represent change from the preceding year. Annual inflation is calculated as the year over year percent change in December. Unemployment rates for the full year are the annual average. |
|
|
Sources: Conference Board, Census Bureau, Bureau of Labor Statistics | |
The Federal Reserve Bank’s January 2010 Beige Book, which reported on economic conditions in the twelve Federal Reserve Districts (“Districts”) through mid-December, generally reflected the modest improvement in the overall economy. Holiday spending was noted to have picked up from depressed 2008 levels but was, nonetheless, anemic compared with typical seasonal spending. Auto sales appeared to have retained some momentum even after the expiration of the “cash for clunkers” program. Generally, there was only sporadic hiring as labor markets remained weak across the nation. A few Districts reported signs of modest wage increases, while others reported a continuation of wage freezes. Within the financial services sector, loan demand among banks was characterized as weak or having declined further. The tepid recovery was noted to have kept price pressures low in nearly all Districts.
TIAA Real Estate Account § Prospectus 65
Commercial real estate conditions were characterized as weak across the nation, with several Districts reporting further declines. In general, vacancy rates rose across most Districts and landlords in several were offering rent discounts and concessions in order to maintain occupancy levels.
Economists’ views about the prospects for 2010 improved over the course of 2009. Most believe that monetary and fiscal policies helped avoid an even bigger decline in economic activity and that the policies and programs that were enacted have established a foundation for a sustainable, though modest, expansion. Notwithstanding the high level of unemployment, tight credit and anemic housing market, economic activity in the fourth quarter built on the gains reported in the third quarter of 2009. With two consecutive quarters of growth under its belt, the economy is expected to improve over the course of 2010 and 2011 once household finances improve and businesses begin hiring again. The consensus forecast of economists surveyed as part of the January 2010 Blue Chip Economic Indicators publication was for GDP growth of 2.8% in 2010, followed by growth of 3.1% in 2011. The Federal Reserve Open Market Committee (“FOMC”) staff generally concurred with this assessment but expected that the severity of the financial crisis will temper the strength of the recovery. Overall, FOMC staff expects GDP to grow slightly above its inherent long-term potential over the upcoming two year period. Employment growth is expected to be moderate, with the unemployment rate lingering at relatively high levels as businesses only slowly begin hiring again. Excess production capacity is keeping inflationary expectations low and there appears to be minimal risk of rising prices over the near term. However, there is concern among some economists that inflation could spike over the longer term, unless the $1 trillion of fiscal stimulus used to stem the financial crisis can be pulled out of circulation at a propitious point in the economic cycle.
Real Estate Market Conditions and Outlook
(Beginning with the fourth quarter of 2009, all of the Account’s vacancy data will be calculated as a percentage of net rentable space leased, weighted by square footage. The third quarter 2009 data presented below has been adjusted to reflect this change. Industry sources such as CB Richard Ellis-Econometric Advisors (“CBRE-EA”), formerly known as Torto Wheaton Research, calculate vacancy and availability data based on similar square footage calculations. Investors should not rely exclusively on the data presented below in forming a judgment regarding the current or prospective performance of the commercial real estate market generally).
Preliminary data from Real Capital Analytics (“RCA”), a frequently cited industry source of commercial real estate transactions data, showed that transactional volume fell 63% in 2009 and was down nearly 90% from the peak in 2007. Nonetheless, $17.6 billion of property was sold during the fourth quarter of 2009, which was an increase of 43% over the third quarter of 2009. The improvement in sales in the latter half of 2009 was due to the combination of a modest improvement in credit availability and some sellers’ acceptance of current market pricing. According to the Moody’s/REAL Commercial Property Price Index
66 Prospectus § TIAA Real Estate Account
(“CPPI”), commercial real estate prices in the fourth quarter of 2009 were 41% below the peak achieved in late 2007. The CPPI increased 4.1% in December of 2009, which was the second consecutive monthly increase. While data from other sources such as the National Council of Real Estate Investment Fiduciaries (“NCREIF”) show smaller (31%) but still significant value declines, the table below summarizes commercial property price declines as estimated by the Moody’s CPPI. Overall, Moody’s estimates that property prices have declined 29% over the past 12 months. Within the property sectors, apartment, office, and industrial property value declines were all on the order of 20% as of the end of the fourth quarter of 2009. Retail fared better with a 19.0% decline, but the sector was impacted earlier in the cycle, and its cumulative decline has been of a similar magnitude.
|
|
|
|
|
|
|
|
|
|
|
| Sales Price Change |
| ||||||
|
|
| |||||||
|
| December 2008- |
| 3Q08 to 3Q09 |
| Top 10 MSAs* |
| ||
All Property Types |
| –29.2% |
|
|
|
|
|
|
|
Apartments |
|
|
| –20.4 | % |
| –24.4 | % |
|
Office |
|
|
| –19.8 | % |
| –14.6 | % |
|
Retail |
|
|
| –19.0 | % |
| –18.4 | % |
|
Industrial |
|
|
| –23.2 | % |
| –27.3 | % |
|
|
|
* | Based on total value of property sold in Metropolitan Statistical Area (“MSA”). |
|
|
Source: Moody’s/REAL CPPI and Real Capital Analytics. | |
Recent moderation in property value declines was noted by Moody’s, consistent with fourth quarter of 2009 data from NCREIF, which showed that the appreciation or value component of the NCREIF National Property Index (“NPI”) index declined 3.7% in the fourth quarter as compared with a decline of 4.9% in the third quarter. Overall, total returns, which were –2.11% in the fourth quarter of 2009, experienced a smaller rate of decline. For 2009 as a whole, however, total NCREIF NPI returns were –16.8%. Nonetheless, the declines moderated over the course of the year. For the year as a whole, the appreciation component declined 22.0%. Income returns were 1.6% in the fourth quarter and a solid 6.2% for the year.
Commercial real estate market conditions, which historically lag trends in the overall economy, have not yet benefited from the recent modest improvement in economic conditions. For example, vacancy rates for all property types rose in the fourth quarter; however, the rate of increase was more moderate compared with prior quarters. Given the likelihood of a lackluster recovery, a significant improvement in real estate market conditions is not expected until the latter half of 2010 at best and more likely into early 2011. The necessary prerequisites for a recovery in commercial real estate market conditions include a sustained improvement in employment growth and an improvement in credit availability for small businesses. In the interim, landlords will be competing for tenants that are intent upon reducing their space requirements and costs. Corporations are not expected to add substantially to their employment totals or space requirements until confidence about economic and business prospects improves materially.
TIAA Real Estate Account § Prospectus 67
While expectations for a recovery in the U.S. economy appear favorable, the strength of the recovery will vary by region. The table below summarizes the top five markets in which the Account had exposure as of December 31, 2009. The top five markets (by market value) represent 41% of the Account’s total real estate portfolio in terms of value and, despite elevated vacancy rates across the nation, the Account’s properties in each of these markets remained well leased, as indicated in the table below.
|
|
|
|
|
|
|
|
|
|
Metropolitan Statistical Area (MSA) |
| Percent Leased |
| # of Property |
| MSA as a |
| MSA as a |
|
Washington-Arlington-Alexandria DC-VA-MD-WV |
| 94.7% |
| 9 |
| 12.9% |
| 11.7% |
|
Boston-Quincy MA |
| 90.8% |
| 5 |
| 7.5% |
| 6.8% |
|
Houston-Bay Town-Sugar Land TX |
| 93.5% |
| 3 |
| 7.1% |
| 6.4% |
|
Los Angeles-Long Beach-Glendale CA |
| 94.1% |
| 8 |
| 6.9% |
| 6.2% |
|
San Francisco-San Mateo-Redwood City CA |
| 94.1% |
| 4 |
| 6.4% |
| 5.8% |
|
|
|
* | Weighted by market value, which differs from the calculations provided for market comparisons to CBRE-EA data and are used here to reflect the fair value of the Account’s monetary investments in those markets. |
Office
Demand for office space is closely correlated with growth in office-using employment sectors such as finance and professional and business services. During the fourth quarter 2009, both sectors improved. Financial services shed just 8,000 jobs as compared with an average decline of over 100,000 per quarter during the first three quarters of 2009; professional and business services added 172,000 jobs over the fourth quarter of 2009. Much of the increase in professional and business services employment was attributable to hiring by temporary employment agencies, which often leads to permanent hiring. However, preliminary data from CBRE-EA suggest that businesses continue to exercise caution with respect to their space needs. According to CBRE-EA, the national office vacancy rate increased to 16.3% in the fourth quarter as compared to 16.1% during the third quarter of 2009. In comparison, 10.5% of the space in the Account’s office portfolio was not leased as of the fourth quarter of 2009. Per CBRE-EA, metro area vacancy rates increased in most of the Account’s top office markets during the fourth quarter of 2009; the only exception was Washington, DC where modest employment growth resulted in a dip in the overall vacancy rate to 14.1%. Additionally, the metro area vacancy rates in each of the Account’s top office markets were below the national average, except Seattle where vacancy was roughly in-line with the national average. The vacancy rate in the Seattle metro area rose steadily over the course of 2009 due to the delivery of over four million square feet of new office space. Despite a fourth quarter increase in vacancy at one of the Account’s Seattle properties, overall, the Account’s properties there have a combined average vacancy rate below 10%. The table below compares the average vacancy rate of properties in the Account’s top office markets with their respective metropolitan area averages.
68 Prospectus § TIAA Real Estate Account
|
|
|
|
|
|
|
|
|
|
|
|
|
|
|
|
|
|
|
|
|
|
|
|
|
|
|
|
| Metropolitan |
| |||
|
|
|
| Total |
| % of Total |
|
|
|
|
|
| ||||
|
|
|
|
|
| Account Vacancy |
|
| ||||||||
|
|
|
|
|
|
| ||||||||||
Sector |
| Metropolitan Statistical Area (MSA) |
|
|
| 2009Q3 |
| 2009Q4 |
| 2009Q3 |
| 2009Q4 |
| |||
Office |
| National |
|
|
|
|
|
| 10.3% |
| 10.5% |
| 16.1% |
| 16.3% |
|
1 |
| Washington-Arlington-Alexandria DC-VA-MD-WV |
| $ | 994.7 |
| 10.3% |
| 6.9% |
| 6.9% |
| 14.4% |
| 14.1% |
|
2 |
| Boston-Quincy MA |
| $ | 630.0 |
| 6.5% |
| 8.8% |
| 9.6% |
| 12.8% |
| 13.1% |
|
3 |
| San Francisco-San Mateo-Redwood City CA |
| $ | 510.3 |
| 5.3% |
| 6.1% |
| 6.3% |
| 13.9% |
| 14.4% |
|
4 |
| Seattle-Bellevue-Everett WA |
| $ | 430.3 |
| 4.4% |
| 7.2% |
| 9.7% |
| 16.2% |
| 16.7% |
|
5 |
| Houston-Bay Town-Sugar Land TX |
| $ | 409.0 |
| 4.2% |
| 5.0% |
| 6.0% |
| 15.3% |
| 15.8% |
|
|
|
* | Source: CBRE-EA. Vacancy is defined as the percentage of space vacant. The Account’s vacancy is defined as the weighted percentage of unleased space. |
Industrial
Industrial market conditions weakened further in the fourth quarter of 2009 in spite of the rebound in GDP that began in the third quarter of 2009. GDP has historically been a reliable predictor of industrial space demand as key components of GDP such as industrial production, international trade flows, inventory growth, and employment growth in manufacturing and wholesale trade all drive warehouse demand. However, the recovery in this sector has thus far been anemic and excess production and storage capacity have yet to be absorbed. According to CBRE-EA, industrial availability rates increased to an average of 13.9% during the fourth quarter of 2009, up from 13.5% in the third quarter of 2009. By comparison, the vacancy rate for the Account’s industrial portfolio is in line with the national average at 13.6%. On the whole, availability rates in most of the Account’s top industrial markets increased during the fourth quarter of 2009 per CBRE-EA. A dip in the availability rate in Riverside, CA, the Account’s top market, was an encouraging sign. Per CBRE-EA, availability rates in Los Angeles remained relatively stable and were, once again, the lowest in the nation. The vacancy rate in the Account’s Los Angeles industrial properties declined but remained above-average. While metro area availability rates in the Atlanta, Dallas, and Chicago markets were each above average, the Account’s properties in these markets were well-leased. The table below compares the average vacancy rate of properties in the Account’s top industrial markets to their respective metropolitan area averages.
|
|
|
|
|
|
|
|
|
|
|
|
|
|
|
|
| |||
|
|
|
|
|
|
|
|
|
|
|
| Metropolitan |
| ||||||
|
|
|
|
|
|
|
|
|
|
| |||||||||
|
|
|
| Total |
| % of Total |
| Account Vacancy |
|
| |||||||||
|
|
|
|
|
|
| |||||||||||||
Sector |
| Metropolitan Statistical Area (MSA) |
|
|
| 2009Q3 |
| 2009Q4 |
| 2009Q3 |
| 2009Q4 |
| ||||||
Industrial |
| National |
|
|
|
|
|
| 11.5% |
| 13.6% |
| 13.5% |
| 13.9% |
| |||
1 |
| Riverside-San Bernardino-Ontario CA |
| $ | 290.3 |
| 3.0% |
| 21.1% |
| 21.1% |
| 16.0% |
| 15.7% |
| |||
2 |
| Dallas-Plano-Irving TX |
| $ | 159.4 |
| 1.6% |
| 4.8% |
| 6.4% |
| 15.7% |
| 16.1% |
| |||
3 |
| Chicago-Naperville-Joliet IL |
| $ | 109.2 |
| 1.1% |
| 0.9% |
| 0.9% |
| 14.2% |
| 14.9% |
| |||
4 |
| Los Angeles-Long Beach-Glendale CA |
| $ | 94.7 |
| 1.0% |
| 13.0% |
| 11.5% |
| 8.0% |
| 8.1% |
| |||
5 |
| Atlanta-Sandy Springs-Marietta GA |
| $ | 91.7 |
| 1.0% |
| 2.1% |
| 3.0% |
| 17.5% |
| 17.8% |
| |||
|
|
* | Source: CBRE-EA. Availability is defined as the percentage of space available for rent. The Account’s vacancy is defined as the weighted percentage of unleased space. |
TIAA Real Estate Account § Prospectus 69
Multi-Family
Apartment vacancies held relatively stable over the course of 2009, ending the year at 7.4% nationally compared to 7.0% in fourth quarter 2008 (year-over-year comparisons in this sector better reflect the seasonality inherent in apartment leasing). Nonetheless, the apartment sector still faces significant headwinds due to high unemployment and a glut of single-family homes and condominiums offered for rent. While market conditions remain challenging, the Account’s apartment properties are well-leased, with an average vacancy rate of 4.5% as of the fourth quarter of 2009. The table below shows that the average vacancy rate for the Account’s properties in each of its top markets is below both the national average and the average for its respective metropolitan market. The only exception was Houston, where the vacancy rate of the Account’s properties rose during the quarter to meet the national average, but nonetheless remained below the Houston market average. Of particular note, leasing activity at the Account’s New York City property has been healthy despite significant job cuts by the banks and investment banks that dominate the city’s financial services sector. Leasing activity at the property was aided in part by rent reductions as landlords throughout Manhattan have reduced rents in order to attract and retain tenants.
|
|
|
|
|
|
|
|
|
|
|
|
|
|
|
|
|
|
|
|
| Total |
| % of Total |
| Account Vacancy |
| Metropolitan |
| |||||
|
|
|
|
|
|
| ||||||||||
Sector |
| Metropolitan Statistical Area (MSA) |
|
|
| 2009Q3 |
| 2009Q4 |
| 2009Q3 |
| 2009Q4 |
| |||
Apartment |
| National |
|
|
|
|
|
| 3.9 | % | 4.5 | % | 7.4 | % | 7.4 | % |
1 |
| Houston-Bay Town-Sugar Land TX |
| $ | 211.9 |
| 2.2 | % | 4.4 | % | 7.4 | % | 9.9 | % | 10.3 | % |
2 |
| Denver-Aurora CO |
| $ | 175.5 |
| 1.8 | % | 2.8 | % | 3.8 | % | 6.9 | % | 7.2 | % |
3 |
| Atlanta-Sandy Springs-Marietta GA |
| $ | 116.3 |
| 1.2 | % | 2.8 | % | 2.8 | % | 11.0 | % | 10.8 | % |
4 |
| New York-Wayne-White Plains NY-NJ |
| $ | 110.1 |
| 1.1 | % | 1.9 | % | 1.2 | % | 6.5 | % | 6.4 | % |
5 |
| Phoenix-Mesa-Scottsdale AZ |
| $ | 99.8 |
| 1.0 | % | 5.0 | % | 4.8 | % | 11.5 | % | 11.6 | % |
|
|
* | Source: CBRE-EA. Vacancy is defined as the percentage of units vacant. The Account’s vacancy is defined as the weighted percentage of unleased space. |
Retail
The retail sector began to show signs of improvement during the latter half of 2009. While shoppers remained cautious, holiday spending in 2009 improved compared to 2008. Though 2008 was an exceptionally weak year, retailers have seen sales either stabilize or start to grow modestly. Retailers have also adjusted to consumers’ emphasis on thrift and value by streamlining inventories and new orders in order to limit discounting. Per CBRE-EA, availability rates in neighborhood and community centers increased to an average of 12.5% in the fourth quarter of 2009 as compared to 12.3% in the third quarter. However, the fourth quarter’s increase was more moderate than in prior quarters and a growing number of markets experienced a decline in local availability rates. In comparison, the Account’s retail portfolio has a 14.7% “availability rate,” which includes vacant space that is leased but not occupied (some retailers have closed stores but continue to pay rent). Tenant demand for retail space is dependent upon a
70 Prospectus § TIAA Real Estate Account
rebound in consumer spending; minimal gains are expected given household debt burdens, job concerns, and the low level of consumer confidence. Until sales pick up, retail markets are expected to struggle as retailers put expansion plans on hold and look to close underperforming stores.
2009 Summary and 2010 Outlook
Commercial real estate market conditions continued to deteriorate over the course of 2009. While most economists agree the recession ended during the second half of the year, there has been little, if any, improvement in commercial real estate market conditions since these lag overall economic trends. While vacancy rates for all property types increased over the course of the year, the rate of increase moderated from quarter to quarter.
As shown in the table below, construction in 2009 is well below that of prior cycles and, in addition, is expected to drop further in 2010. This falloff in construction, coupled with an eventual pickup in employment growth, could ultimately establish the conditions necessary for a substantial improvement in commercial real estate market conditions.
HISTORIC AND PROJECTED CONSTRUCTION*
|
|
|
|
|
|
|
|
|
|
|
|
|
|
|
|
|
|
| Average |
|
|
| |||||||||||
|
|
| Forecasted |
| ||||||||||||
|
| 1989-1991 |
| 1999-2001 |
| 2006-2008 |
|
| ||||||||
|
|
|
|
| 2009 | ** | 2010 |
| ||||||||
| ||||||||||||||||
Office |
|
| 85 |
|
| 93 |
|
| 67 |
|
| 56 |
|
| 26 |
|
Industrial |
|
| 183 |
|
| 255 |
|
| 183 |
|
| 74 |
|
| 54 |
|
Apartment |
|
| 257 |
|
| 212 |
|
| 224 |
|
| 177 |
|
| 60 |
|
Retail |
|
| 46 |
|
| 32 |
|
| 29 |
|
| 14 |
|
| 4 |
|
| ||||||||||||||||
|
|
* | in millions of sq. ft. except apartments, which are in thousands of units. |
|
|
** | 2009 numbers are still forecasts |
|
|
Source: CBRE-EA | |
Management of the Account has tailored portfolio initiatives to reflect current market conditions. A primary objective has been to maintain occupancy levels, even if a reduction in rental rates (with shorter lease terms when possible) or additional concessions are required to retain tenants. As of the fourth quarter of 2009, the Account’s properties were 85% leased. The drive to maintain occupancies helped sustain the Account’s income return component. Income return has historically been a significant portion of the Account’s total return and since the first quarter of 2008 has offset a portion of the declines in property values, as shown in the graph below. For 2009, the Account’s income return was 7.4%. Notably, the Account’s property value declines moderated somewhat in the fourth quarter of 2009.
TIAA Real Estate Account § Prospectus 71
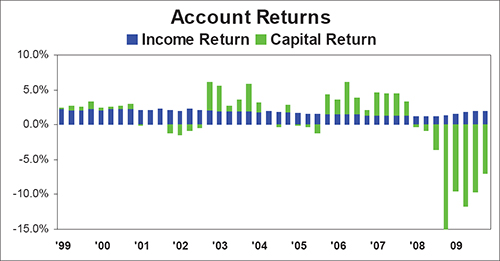
Another key objective in 2009 was to rebalance the portfolio’s property type concentrations and reallocate its exposure towards selected major markets. Six properties were sold during the fourth quarter of 2009 and a total of seven properties were sold for the year. In addition, six partial sales were completed in the fourth quarter. Properties targeted for sale were either located in non-target or underperforming markets with uncertain prospects for foreseeable recovery, or were sold to reallocate the Account’s property type concentrations. These sales generated cash proceeds which management believes will serve to enhance liquidity and which can be available to meet participant redemption requests, repay debt and/or make new acquisitions of properties management believes may be undervalued in the Account’s target markets. Management believes that there could be opportunities to acquire high quality properties at significant discounts in 2010 and 2011 as properties encumbered by maturing debts and deteriorating values are now over-levered and their owners and/or lenders are forced to sell their equity positions.
In the course of addressing its debt obligations in 2010, the Account may inevitably own some underperforming properties that are subject to debt, where insufficient cash flow from the property may cause such a property to be in noncompliance with certain covenants imposed by the terms of such debt, and/or where cash flow may be inadequate to make required payment on such debt or to repay principal when due (each of which could result in a default on the loan). In such a case, management will evaluate the options available to the Account, consistent with the Account’s long-term investment strategy.
Management believes that rebalancing the portfolio, an initiative which began in 2009 and will continue into 2010, will better position the Account to achieve stronger returns once economic and real estate market conditions improve. As the industry moves into the recovery phase, management’s intent is that the Account’s portfolio will consist of properties within markets that best align with the overall
72 Prospectus § TIAA Real Estate Account
investment strategy. Similarly, management believes that the Account’s returns stand to benefit from the conservative “core” investment strategy that focuses on institutional quality properties, markets and locations, and particularly stabilized assets with strong historical occupancy and favorable lease expiration schedules.
Investments as of December 31, 2009
As of December 31, 2009, the Account had total net assets of $7.9 billion, a 6.1% decrease from the end of the third quarter of 2009 and a 31.5% decrease from December 31, 2008. The decrease in the Account’s net assets from December 31, 2008 to December 31, 2009 was primarily caused by the depreciation in value of the Account’s wholly-owned real estate properties and those owned in joint venture investments (approximately 86% of the decrease), while net participant transfers out of the Account (taking into account purchases by TIAA under the liquidity guarantee) accounted for approximately 14% of the decrease. The depreciation in value during 2009 was partially offset by net investment income of $500.5 million, which declined approximately 8.3% from $545.8 million during 2008.
As of December 31, 2009, the Account owned a total of 101 real estate property investments (89 of which were wholly-owned, 12 of which were held in joint ventures). The real estate portfolio included 40 office property investments (5 of which were held in joint ventures and one located in London, England), 25 industrial property investments (including one held in a joint venture), 20 multi-family property investments, 15 retail property investments (including five held in joint ventures and one located in Paris, France), and a 75% joint venture interest in a portfolio of storage facilities.
Of the 101 real estate property investments, 26 are subject to debt (including seven joint venture property investments). Total principal outstanding on the Account’s wholly-owned real estate portfolio as of December 31, 2009 was approximately $1.9 billion. The Account’s joint venture values shown in the Statement of Investments are presented net of debt, but, when that debt is also considered, total principal outstanding on the Account’s portfolio as of December 31, 2009 was $3.9 billion. As of December 31, 2009, the loan to value ratio of the Account is 33.1%. As of December 31, 2009, the Account has no outstanding debt on which the Account itself is an obligor.
Management believes that the Account’s real estate portfolio is diversified by location and property type. The Account’s largest investment, 1001 Pennsylvania Avenue located in Washington, DC, represented 5.49% of total real estate investments and 4.96% of total investments. As discussed in the Account’s prospectus, the Account does not intend to buy and sell its real estate investments simply to make short-term profits. Rather, the Account’s general strategy in selling real estate investments is to dispose of those assets that management believes (i) have maximized in value, (ii) have underperformed or face deteriorating property-specific or market conditions, (iii) need significant capital infusions in the future, (iv) are appropriate to dispose of in order to remain consistent with the Account’s intent to diversify the Account by property type and
TIAA Real Estate Account § Prospectus 73
geographic location, (including reallocating the Account’s exposure to or away from certain property types in certain geographic locations), or (v) otherwise do not satisfy the investment objectives of the Account. The Account could reinvest any sale proceeds that it does not need to pay operating expenses or to meet debt service or redemption requests (e.g., cash withdrawals or transfers, and any redemption of TIAA’s liquidity units in the future).
During 2009 there were no property investment acquisitions.
The Account sold seven property investments and eight partial property investments for an aggregate net sales price (less selling expenses) of approximately $404.4 million. The properties sold recognized an aggregate realized loss of approximately $281.8 million. In connection with the properties sold, a $23.5 million mortgage was assumed by the buyer which recognized a realized loss of $371 thousand. The properties are listed below (amounts in thousands):
PROPERTY INVESTMENTS SOLD IN 2009
|
|
|
|
|
|
|
|
|
|
|
Property Name |
| Property Type |
| City |
| State |
| Net Sales Price |
| |
The Market at Southpark |
| Retail |
| Littleton |
| CO |
| $ | 21,721 |
|
New Jersey CalEast Industrial Portfolio |
| Industrial |
| Monroe and Brunswick |
| NJ |
|
| 24,770 |
|
4200 West Cypress |
| Office |
| Tampa |
| FL |
|
| 21,898 |
|
Park Place on Turtle Creek |
| Office |
| Dallas |
| TX |
|
| 23,347 |
|
Preston Sherry Plaza(1) |
| Office |
| Dallas |
| TX |
|
| 7,577 |
|
Capitol Place |
| Office |
| Sacramento |
| CA |
|
| 39,475 |
|
980 9th street & 1010 8th Street |
| Office |
| Sacramento |
| CA |
|
| 96,053 |
|
San Montego Apartments (Phoenix Apartment Portfolio)(2) |
| Apartment |
| Phoenix |
| AZ |
|
| 19,880 |
|
Miramar Townhomes (Houston Apartment Portfolio)(2) |
| Apartment |
| Houston |
| TX |
|
| 8,792 |
|
San Melia Apartments (Phoenix Apartment Portfolio)(2) |
| Apartment |
| Chandler |
| AZ |
|
| 47,597 |
|
San Brisas (Phoenix Apartment Portfolio)(2) |
| Apartment |
| Phoenix |
| AZ |
|
| 18,991 |
|
Paragon (Kierland Apartment Portfolio)(2) |
| Apartment |
| Phoenix |
| AZ |
|
| 34,185 |
|
El Mundo (Houston Apartment Portfolio)(2) |
| Apartment |
| Houston |
| TX |
|
| 11,102 |
|
Plaza Del Oro Townhomes (Houston Apartment Portfolio)(2) |
| Apartment |
| Houston |
| TX |
|
| 7,937 |
|
San Marin Garden Homes (Houston Apartment Portfolio)(2) |
| Apartment |
| Houston |
| TX |
|
| 21,038 |
|
Total |
|
|
|
|
|
|
| $ | 404,363 |
|
|
|
(1) | Net of $23.5 million of debt assumed by buyer on sale of investment |
|
|
(2) | Partial sales of apartment portfolios which were part of existing portfolios |
74 Prospectus § TIAA Real Estate Account
The following charts reflect the diversification of the Account’s real estate assets by region and property type and list its ten largest investments by gross market value. All information is based on the fair values of the investments at December 31, 2009.
DIVERSIFICATION BY FAIR VALUE(1)
|
|
|
|
|
|
|
|
|
|
|
|
|
|
|
|
|
|
|
|
|
| East |
| West |
| South |
| Midwest |
| Foreign(2) |
| Total |
| ||||||
Office |
|
| 23.5 | % |
| 17.3 | % |
| 12.3 | % |
| 1.2 | % |
| 2.7 | % |
| 57.0 | % |
Apartment |
|
| 2.4 | % |
| 5.5 | % |
| 5.3 | % |
| 0.0 | % |
| 0.0 | % |
| 13.2 | % |
Industrial |
|
| 1.4 | % |
| 6.4 | % |
| 4.2 | % |
| 1.4 | % |
| 0.0 | % |
| 13.4 | % |
Retail |
|
| 3.4 | % |
| 0.9 | % |
| 8.7 | % |
| 0.4 | % |
| 2.3 | % |
| 15.7 | % |
Storage Facilities |
|
| 0.2 | % |
| 0.2 | % |
| 0.2 | % |
| 0.1 | % |
| 0.0 | % |
| 0.7 | % |
Total |
|
| 30.9 | % |
| 30.3 | % |
| 30.7 | % |
| 3.1 | % |
| 5.0 | % |
| 100.0 | % |
|
|
(1) | Fair values for wholly-owned properties are reflected gross of any debt, whereas fair values for joint venture investments are reflected net of any debt. |
|
|
(2) | Represents real estate investments in the United Kingdom and France. |
Properties in the “East” region are located in: CT, DC, DE, KY, MA, MD, ME, NC, NH, NJ, NY, PA, RI, SC, VA, VT, WV Properties in the “West” region are located in: AK, AZ, CA, CO, HI, ID, MT, NM, NV, OR, UT, WA, WY
Properties in the “South” region are located in: AL, AR, FL, GA, LA, MS, OK, TN, TX
Properties in the “Midwest” region are located in: IA, IL, IN, KS, MI, MN, MO, ND, NE, OH, SD, WI
TOP TEN LARGEST REAL ESTATE INVESTMENTS
|
|
|
|
|
|
|
|
|
|
|
|
|
|
Property or Joint Venture Name |
| City |
| State |
| Type |
| Value ($M)(a) |
| Property as a |
| Property as a |
|
1001 Pennsylvania Avenue |
| Washington |
| DC |
| Office |
| 480.6 | (c) | 5.49 |
| 4.96 |
|
Four Oaks Place |
| Houston |
| TX |
| Office |
| 409.0 | (d) | 4.67 |
| 4.22 |
|
DDR Joint Venture |
| Various |
| USA |
| Retail |
| 312.2 | (e) | 3.57 |
| 3.22 |
|
Fourth and Madison |
| Seattle |
| WA |
| Office |
| 295.0 | (f) | 3.37 |
| 3.04 |
|
50 Fremont |
| San Francisco |
| CA |
| Office |
| 284.3 | (g) | 3.25 |
| 2.93 |
|
99 High Street |
| Boston |
| MA |
| Office |
| 253.6 | (h) | 2.90 |
| 2.62 |
|
The Florida Mall |
| Orlando |
| FL |
| Retail |
| 252.4 | (i) | 2.88 |
| 2.60 |
|
780 Third Avenue |
| New York City |
| NY |
| Office |
| 240.1 |
| 2.74 |
| 2.48 |
|
Westferry Circus |
| London |
| UK |
| Office |
| 239.0 | (j) | 2.73 |
| 2.47 |
|
The Newbry |
| Boston |
| MA |
| Office |
| 230.4 |
| 2.63 |
| 2.38 |
|
|
|
(a) | Value as reported in the December, 31, 2009 Statement of Investments. Investments owned 100% by the Account are reported based on fair value. Investments in joint ventures are reported at fair value and are presented at the Account’s ownership interest. |
|
|
(b) | Total Real Estate Portfolio excludes the mortgage loan receivable. |
|
|
(c) | This property investment is presented gross of debt. The value of the Account’s interest less the fair value of leverage is $267.1M. |
|
|
(d) | This property investment is presented gross of debt. The value of the Account’s interest less the fair value of leverage is $228.1M. |
|
|
(e) | This property investment is an 85%/15% joint venture with Developers Diversified Realty Corporation (DDR), and consists of 65 retail properties located in 13 states and is presented net of debt of $1.3 billion. |
|
|
(f) | This property investment is presented gross of debt. The value of the Account’s interest less the fair value of leverage is $148.3M. |
|
|
(g) | This property investment is presented gross of debt. The value of the Account’s interest less the fair value of leverage is $147.0M. |
TIAA Real Estate Account § Prospectus 75
|
|
(h) | This property investment is presented gross of debt. The value of the Account’s interest less the fair value of leverage is $68.7M. |
|
|
(i) | This property investment is a 50%/50% joint venture with Simon Property Group, L.P., and is presented net of debt of $122.4M. |
|
|
(j) | This property investment is presented gross of debt. The value of the Account’s interest less the fair value of leverage is $41.0M. |
As of December 31, 2009, the Account’s net assets totaled $7.9 billion. At December 31, 2009, the Account held a total of 101 real estate property investments (including its interests in 12 real estate-related joint ventures). As of that date, the Account also held investments in a mortgage loan receivable representing 0.73% of total investments, real estate limited partnerships, representing 2.07% of Total Investments, U.S. Treasury Bills representing 2.13% of total investments, and government agency notes representing 4.80% of total investments.
RESULTS OF OPERATIONS
Year Ended December 31, 2009 Compared to Year Ended December 31, 2008
Performance
The Account’s total return was –27.64% for the year ended December 31, 2009 as compared to –14.15% for the year ended 2008. The Account’s performance during the year ended December 31, 2009 reflects a decline in the aggregate net asset value of the Account’s real estate property investments, including investments owned in joint ventures and limited partnerships, lower income from marketable securities and unrealized losses from the mortgage loans payable. The twelve months of 2009 saw continued valuation declines resulting from the weakened economy and tightened financial and credit markets. Transaction activity continued to remain at historically low levels and capital depreciation occurred in most markets.
The Account’s annualized total returns (after expenses) over the past one, three, five, and ten year periods ended December 31, 2009 were –27.64%, –10.92%, –1.67% and 3.07% respectively. As of December 31, 2009, the Account’s annualized total return since inception was 4.65%.
The Account’s total net assets decreased from $11.5 billion at December 31, 2008 to $7.9 billion at December 31, 2009. The primary driver of this 31.5% decrease was depreciation in value of the Account’s wholly owned, joint venture, and limited partnership real estate investments (approximately 86% of the decrease), while net participant withdrawals and transfers out of the Account (net of the $1.1 billion of Liquidity Units purchased by TIAA) accounted for approximately 14% of the decrease.
Income and Expenses
The Account’s real estate holdings, including real estate joint ventures and limited partnerships, generated approximately 99.7% and 88.3% of the Account’s total investment income (before deducting Account level expenses) during the
76 Prospectus § TIAA Real Estate Account
years ended December 31, 2009 and 2008, respectively. The 14.7% decrease in the Account’s total investment income was primarily due to a 97.9% decrease in the Account’s dividend income and interest income and a 4.2% decrease in net real estate income.
Gross real estate rental income decreased by approximately $31.0 million or 3.2% for the year ended December 31, 2009, as compared to the same period in 2008. Approximately $19.2 million of the decrease is primarily due to the property investment sales that occurred during 2008 and 2009. In addition to the reduction in rental income due to property investment sales, the Account also experienced a decrease in revenue due to various property specific items such as rent concessions, lower rents, increased vacancies at certain properties and reductions in common charges for many properties as a result of lower overall property operating expenses.
Total real estate property level expenses and taxes for wholly-owned property investments for the year ended December 31, 2009 decreased to $468.7 million as compared to $478.9 million for the year ended December 31, 2008. The overall decline in expenses was primarily due to a 7.2% decrease in operating expenses, a 3.2% decrease in real estate taxes offset by a 14.3% increase in interest expense. Operating expenses decreased during 2009 primarily due to an overall reduction in repairs and maintenance, utility expense, insurance expense, bad debt expense, and various other miscellaneous operating expenses. In addition to the reduction of general expenses, the property investment sales during 2008 and 2009 eliminated some operating expense. Real estate taxes decreased due to lower tax assessments and reduced number of properties under management. The increase in interest expense is due to $557 million of new debt financing that was obtained during the third and fourth quarters of 2008.
Income from real estate joint ventures and limited partnerships was $114.6 million for the year ended December 31, 2009, as compared to $116.9 million for the year ended December 31, 2008. This 2.0% decrease was due to a decrease in gross rental income from joint venture properties as a result of increased vacancies and select rent reductions. More specifically, the DDR Joint Venture experienced an increase in vacancies in late 2008 which resulted in lower income in 2009.
Investment income on the Account’s investments in marketable securities decreased by 97.9%, from $81.5 million for the year ended December 31, 2008 to $1.7 million for the comparable period in 2009. The variance was due to the decrease in the rates of return on the marketable securities as well as a lower marketable security invested balance for 2009 compared to the year ended December 31, 2008.
The Account incurred overall Account level expenses of $95.5 million for the year ended December 31, 2009, which represents a 37.6% decrease from $153.0 million for the same period in 2008. The decreases in investment advisory and administrative and distribution charges are due to two factors. First, during the first quarter of 2008, increased costs were allocated to the Account associated with new technology investments in 2008 that have been reduced significantly
TIAA Real Estate Account § Prospectus 77
during the year ended December 31, 2009. Finally, the general decline in the costs allocated to manage and distribute the Account is consistent with the reduction in the average net assets of the Account. In the future, investment advisory charges were not expected to decline at the same rate as net assets as certain portions of these costs are not directly associated to the net asset value of the Account. Mortality and expense risk charges and liquidity guarantee expenses declined during the year ended December 31, 2009 primarily due to lower net assets as compared to the same period in 2008. The decline of the liquidity guarantee expenses resulting from the decline in net assets was partially offset by the increase in the fees that TIAA charges to provide the liquidity guarantee from 10 basis points to 15 basis points which was effective as of May 1, 2009.
Net Realized and Unrealized Gains and Losses on Investments and Mortgage Loans Payable
The Account had net realized and unrealized losses on investments and mortgage loans payable of $3.6 billion for the year ended December 31, 2009, a $1.1 billion increase when compared to a net realized and unrealized loss of $2.5 billion for the year ended December 31, 2008. The increase in net realized and unrealized losses on investments and mortgage loans payable was primarily driven by net realized and unrealized losses on the Account’s wholly-owned real estate property investments of $2.5 billion for the year ended December 31, 2009 compared to a loss of $1.9 billion during the same period in 2008. The Account’s interests in joint ventures and limited partnerships posted a net realized and unrealized loss of $909.3 million and $120.9 million, respectively, for a net total of over $1.0 billion for the year ended December 31, 2009. When compared to the year ended December 31, 2008, joint ventures and limited partnerships posted a net realized and unrealized loss of $652.4 million and $50.4 million, respectively, for a net total of $702.8 million.
The net realized and unrealized losses on wholly-owned real estate property investments and those held in joint ventures and limited partnerships were due to the decline in value of the Account’s existing real estate assets, which reflected the net effects of a weaker overall economy, a decline in value of the underlying property investments within the joint ventures and limited partnership funds and continued shortage of liquidity in the commercial real estate markets during the year ended December 31, 2009. Real estate market values have declined throughout 2009 primarily due to increasing actual and projected vacancy rates resulting in longer tenant replacement timeframes, lower market rents, and higher capitalization rates.
Mortgage loans payable experienced a net realized and unrealized loss of approximately $55.1 million during the year ended December 31, 2009 compared to a net realized and unrealized gain of $109.8 million in the same period in 2008. Valuation adjustments associated with mortgage loans payable are highly dependent upon interest rates, spreads, investment return demands, the performance of the underlying real estate investment, and where applicable,
78 Prospectus § TIAA Real Estate Account
foreign exchange. Of the $55.1 million realized and unrealized loss, foreign exchange fluctuations (due to a weakening U.S. dollar during the year ended 2009) accounted for approximately $23.8 million of the total year-to-date loss. The remaining $30.9 million loss related to mortgage payable values is reflected in the fluctuations in the U.S. treasury rates and higher loan to value ratios on the Account’s underlying properties (as a result of the significant declines in property values) and a $0.4 million realized loss due to the debt that was assumed in connection with the sale of a property investment.
During the year ended December 31, 2009, the Account also sold one retail property investment, one industrial property investment, five office property investments and eight partial apartment property investments for net proceeds of approximately $394.8 million and realized a loss of $281.8 million.
Year Ended December 31, 2008 Compared to Year Ended December 31, 2007
Performance
The Account’s total return was –14.2% for the year ended December 31, 2008. This was a significant decline compared to the positive return of 13.8% for the year ended December 31, 2007. The Account’s performance during the year ended December 31, 2008 reflects a decline in the aggregate net asset value of the Account’s real estate property investments, including investments owned in joint ventures and limited partnerships, as well as lower income from marketable securities.
After several years of increasing investor demand for commercial real estate and historic capital appreciation, the weakened economy and faltering financial and credit markets have brought transaction activity to historically low levels, bringing a halt to capital appreciation in many markets. The number of individual property investments with valuation decreases has increased significantly as evidenced by the Net Realized and Unrealized Gains and Losses on Investments and Mortgage Loans Payable. Management believes that real estate is an investment that should be considered from a long term perspective. The Account’s annualized total returns (after expenses) over the past one, three, five, and 10-year periods ended December 31, 2008 were –14.15%, 3.67%, 7.41%, and 7.29%, respectively. As of December 31, 2008, the Account’s annualized total return since inception was 7.60%.
The Account’s total net assets decreased from $17.7 billion at December 31, 2007 to $11.5 billion at December 31, 2008. The primary drivers of this 34.8% decrease were the net participant transfers out of the Account ($4.6 billion) and depreciation in value of the Account’s wholly owned, joint venture, and limited partnership real estate investments ($2.5 billion annualized depreciation on investments and mortgage loans payable).
TIAA Real Estate Account § Prospectus 79
Income and Expenses
The Account’s net investment income, after deduction of all expenses, was 12.6% lower for the year ended December 31, 2008, as compared to the same period in 2007.
The Account’s real estate holdings, including real estate joint ventures and limited partnerships, generated approximately 88.3% and 81.5% of the Account’s total investment income (before deducting Account level expenses) during the years ended December 31, 2008 and 2007, respectively. The 12.6% decrease in the Account’s total investment income was due to a 59.2% decrease in the Account’s dividend income and a 41.0% decrease in interest income generated from fewer investments in marketable securities, including real estate equity securities, commercial paper, government notes, and an investment in a commercial mortgage loan receivable.
Gross real estate rental income decreased approximately 0.8% for the year ended December 31, 2008, as compared to the same period in 2007. This decrease is primarily due to a decrease in the number of wholly-owned real estate investment property investments held by the Account. The number of wholly- owned properties decreased from 99 as of December 31, 2007 to 96 as of December 31, 2008.
Total real estate property level expenses and taxes for wholly-owned property investments for the year ended December 31, 2008 increased to $478.9 million as compared to $458.0 million for the year ended December 31, 2007. The overall change in expenses was primarily due to a 4.0% increase in operating expenses, a 4.8% increase in real estate taxes and a 5.9% increase in interest expense. Operating expenses increased during 2008 primarily due to increased bad debts and insurance costs. Real estate taxes increased due to higher tax assessments in 2008 as compared to 2007. The increase in interest expense is due to $557 million of new debt financing that was obtained during the third and fourth quarters of 2008.
Income from real estate joint ventures and limited partnerships was $116.9 million for the year ended December 31, 2008, as compared to $93.7 million for the year ended December 31, 2007. This 24.7% increase was due to an increase in gross rental income from properties owned in joint ventures, which increased substantially with the acquisition of the joint venture interest in the DDR Retail Portfolio in the first quarter of 2007, but was somewhat offset by a decrease in income from the disposition of the 161 North Clark joint venture during 2007.
Investment income on the Account’s investments in marketable securities decreased by 42.6%, from $141.9 million for the year ended December 31, 2007 to $81.5 million for the comparable period in 2008. The variance was due to the decrease of the Account’s investments in marketable securities from $3.8 billion as of December 31, 2007 to $0.5 billion as of December 31, 2008, coupled with a decrease in the rates of return on the marketable securities.
The Account incurred overall Account level expenses of $153.0 million for the year ended December 31, 2008, which represents a 9.1% increase from $140.3 million for the same period in 2007. The increase is primarily due to an increase in
80 Prospectus § TIAA Real Estate Account
actual administrative and distribution expenses associated with managing and distributing the Account. Total administrative and distribution expenses increased to $77.6 million for the year ended December 31, 2008, as compared to $63.6 million for the year ended December 31, 2007. This increase in expenses primarily resulted from larger allocated operational expenses including costs associated with new technology investments. The increase in overall expenses (due primarily to increased administrative and distribution expenses) was somewhat offset by a $1.6 million decrease in investment advisory charges. This decline was due to a decrease of overall costs that are allocated to the Account.
Net Realized and Unrealized Gains and Losses on Investments and Mortgage Loans Payable
The Account had net realized and unrealized losses on investments and mortgage loans payable of $2.5 billion for the year ended December 31, 2008, a 274.7% decrease compared to a net realized and unrealized gain of $1.4 billion for the year ended December 31, 2007. The overall variance was driven by two factors. First, the decrease in net realized and unrealized gains and losses on investments and mortgage loans payable was primarily driven by a net realized and unrealized loss on the Account’s wholly-owned real estate property investments of $1.9 billion for the year ended December 31, 2008 compared to a gain of $1.0 billion during the same period in 2007. Second, the Account’s interests in joint ventures and limited partnerships posted a net realized and unrealized loss of $702.8 million for the year ended December 31, 2008 as compared to a substantial net realized and unrealized gain of $462.1 million for the year ended December 31, 2007. The variance in the net realized and unrealized gains and losses on wholly-owned real estate property investments and those held in joint ventures was due to the decline in value of the Account’s existing real estate assets, which reflected the net effects of a weaker overall economy and continued shortage of liquidity in the commercial real estate markets during 2008. Approximately $1.9 billion or 76% of the 2008 net realized and unrealized loss on investments and mortgage loans payable occurred in the fourth quarter of 2008. This significant increase in the net realized and unrealized loss, in comparison to the 2007 net realized and unrealized gain, was the direct result of increases in rates which are used in appraisal valuations (discount rates, overall and implied capitalization rates and terminal rates) which are key components of the determination of the investments fair value. In general, weighted average appraisal rates increased between 65 and 89 basis points in 2008 when compared to 2007. This increase in weighted average appraisal rates was one of the key drivers causing the increase of net realized and unrealized loss in 2008. Additional factors causing the increase in the net realized and unrealized net loss in 2008 include decrease in rental growth estimates, decrease in rental rates, tenant bankruptcies and decreases in occupancy. During 2008, the Account’s property fundamentals such as occupancy and overall property net operating income remained stable when compared to 2007.
TIAA Real Estate Account § Prospectus 81
The Account also posted a net realized and unrealized gain on its marketable securities of $4.8 million for the year ended December 31, 2008, as compared to a net realized and unrealized loss of $101.5 million in the same period of 2007. The net gains on the Account’s marketable securities for the year ended December 31, 2008 were primarily due to the reversal of the unrealized loss as a result of the sale of the Account’s investments in publicly-traded marketable real estate equity securities (REIT stocks) in June 2008. The sale of these securities was executed over several days for total proceeds of $477.4 million, and the Account realized a loss of $11.2 million. The disposition of these REIT stocks was a decision by the Account’s management to reduce risk within its marketable securities investment portfolio. As circumstances warrant and in continued furtherance of its investment objective and strategy, the Account may invest in REIT stocks in the future. The losses in the Account’s marketable securities during the year ended December 31, 2007 were primarily due to unrealized losses due to the Account’s investments in REIT stocks. The U.S. REIT market struggled through a volatile 2007 and ended the year down by more than 17%.
The Account had unrealized gains on its mortgage loans payable in the amount of $109.8 million and unrealized losses on its mortgage loan receivable of approximately $0.8 million for the year ended December 31, 2008, as compared to net unrealized gains of $53.9 million and an unrealized loss of $2.1 million, respectively, for the same period in 2007. The net unrealized gain or loss on mortgage loans payable and mortgage loans receivable for the period reflected the fluctuations in the U.S. Treasury rates and commercial real estate mortgage loan spreads during the year ended December 31, 2008, which are used as a basis to value the commercial mortgage loans on the wholly-owned real estate property investments. For a mortgage loan payable, a negative fair value adjustment decreases the value of the payable and therefore results in an unrealized gain to the Account. Conversely, for a mortgage loan receivable, a negative fair value adjustment decreases the value of the receivable and results in an unrealized loss.
During 2008, the Account sold one apartment property investment, one office portfolio investment, two industrial property investments and one partial industrial portfolio investment for total net proceeds of $91.4 million and recognized a net loss of $18.4 million.
LIQUIDITY AND CAPITAL RESOURCES
As of December 31, 2009 and 2008, the Account’s liquid assets (i.e., cash, marketable securities, and receivables for short-term securities sold) had a value of $696.1 million and $533.8 million, respectively (approximately 7.2% and 4.0% of the Account’s total investments at such dates, respectively). When compared to December 31, 2008, the Account’s liquid assets have increased by approximately $162.3 million, primarily as a result of proceeds from selective asset sales, many of which occurred in the fourth quarter of 2009.
During the year ended December 31, 2009, the Account received $703.5 million in premiums, had an outflow of $1.9 billion in net participant transfers to TIAA,
82 Prospectus § TIAA Real Estate Account
the CREF accounts, and TIAA-CREF affiliated mutual funds (excluding the aggregate $1.1 billion of purchases of Liquidity Units by TIAA), and $365.3 million of annuity and other periodic payments, withdrawals, and death benefits. During the year ended December 31, 2008, the Account received $1.0 billion in premiums, had an outflow of $4.6 billion in net participant transfers to TIAA, the CREF accounts, and TIAA-CREF affiliated mutual funds (excluding the aggregate $155.6 million of purchases of Liquidity Units by TIAA), and $707.9 million of annuity and other periodic payments, withdrawals, and death benefits.
During the three months ended December 31, 2009, the Account received $168.7 million in premiums and had an outflow of $181.0 million in net participant transfers to TIAA, the CREF accounts, and TIAA-CREF affiliated mutual funds. In comparison, the Account received $215.2 million in premiums and had an outflow of $2.1 billion in net participant transfers to TIAA, the CREF accounts, and TIAA-CREF affiliated mutual funds during the three months ended December 31, 2008.
Primarily as a result of significant net participant transfers out of the Account, on December 24, 2008, pursuant to TIAA’s existing liquidity guarantee obligation, the TIAA general account purchased $155.6 million of Liquidity Units issued by the Account. Subsequent to December 24, 2008 and through June 1, 2009, the TIAA general account purchased an additional $1.059 billion in the aggregate of Liquidity Units in a number of separate transactions. During the period June 2, 2009 through March 18, 2010, the TIAA general account did not purchase any additional Liquidity Units. As disclosed under “Establishing and Managing the Account—the Role of TIAA—Liquidity Guarantee” in the Account’s prospectus, in accordance with this liquidity guarantee obligation, TIAA guarantees that all participants in the Account may redeem their accumulation units at their accumulation unit value next determined after their transfer or cash withdrawal request is received in good order. While net redemption activity has significantly slowed since the first quarter of 2009, management cannot predict the extent to which future TIAA Liquidity Unit purchases, if any, will be required under this liquidity guarantee, nor can management predict when such Liquidity Units will be redeemed by the Account in part, or in full. Management believes that TIAA has the ability to meet its obligations under this liquidity guarantee.
TIAA’s obligation to provide Account participants liquidity through purchases of Liquidity Units is not subject to an express regulatory or contractual limitation, although as described in the paragraph below, the independent fiduciary may (but is not obligated to) require the reduction of TIAA’s interest through sales of assets from the Account if TIAA’s interest exceeds the trigger point. Even if the independent fiduciary so requires, TIAA’s obligation to provide liquidity under the guarantee, which is required by the New York State Insurance Department, will continue.
Whenever TIAA owns Liquidity Units, the duties of the Account’s independent fiduciary, as part of its monitoring of the Account, include reviewing the purchase and redemption of Liquidity Units by TIAA to ensure the Account uses the correct accumulation unit values. In addition, the independent fiduciary’s responsibilities include:
TIAA Real Estate Account § Prospectus 83
|
|
|
| • | establishing the percentage of total accumulation units that TIAA’s ownership should not exceed (the “trigger point”) and creating a method for reviewing the trigger point; |
|
|
|
| • | approving any adjustment of TIAA’s ownership interest in the Account and, in its discretion, requiring an adjustment if TIAA’s ownership of Liquidity Units reaches the trigger point; and |
|
|
|
| • | once the trigger point has been reached, participating in any program to reduce TIAA’s ownership in the Account by utilizing cash flow or liquid investments in the Account, or by utilizing the proceeds from asset sales. If the independent fiduciary were to determine that TIAA’s ownership should be reduced following the trigger point, its role in participating in any asset sales program would include (i) participating in the selection of properties for sale, (ii) providing sales guidelines and (iii) approving those sales if, in the independent fiduciary’s opinion, such sales are desirable to reduce TIAA’s ownership of Liquidity Units. |
As of the date of this prospectus, the independent fiduciary, which has the right to adjust the trigger point, has established the trigger point at 45% of the outstanding accumulation units and it will continue to monitor TIAA’s ownership interest in the Account and provide further recommendations as necessary. As of December 31, 2009, TIAA owned approximately 12.0% of the outstanding accumulation units of the Account. In establishing the appropriate trigger point, including whether or not to require certain actions once the trigger point has been reached, the independent fiduciary will assess, among other things and to the extent consistent with the Prohibited Transaction Exemption (PTE 96-76) issued by the U.S. Department of Labor in 1996 with respect to the liquidity guarantee and the independent fiduciary’s duties under ERISA, the risk that a conflict of interest could arise due to the level of TIAA’s ownership interest in the Account.
Management continues to believe that the net negative outflow experienced during 2008 and most of 2009 may be a reflection of participant concerns with the downturn in the U.S. and global economy, the turmoil in the capital and credit markets, and their current and potential future net effect on commercial real estate in particular. While net outflow activity has decreased significantly over the past six months, management cannot predict whether the net outflows will continue at an increasingly higher rate, or at all in the future. If net outflows were to continue at the same or at a higher rate, it could have a negative impact on the Account’s operations and returns. Additionally, continued net outflow activity could require TIAA to purchase additional Liquidity Units, perhaps to a significant degree.
While the independent fiduciary is vested with oversight and approval over any redemption of TIAA’s liquidity units, it is expected that, unless the trigger point has been reached, redemptions would only occur: (i) once the Account has experienced net participant inflows for an extended period of time and (ii) if the Account is otherwise projected to maintain a level of liquid assets, taking into account any pending cash needs (including for debt service and outstanding
84 Prospectus § TIAA Real Estate Account
principal balances at maturity), at or close to its long-term investment goal (currently at least 15% of the Account’s assets). The independent fiduciary may, however, authorize or direct the redemption of TIAA’s liquidity units (or a portion thereof) at any time and TIAA will request the approval of the independent fiduciary before liquidity units are redeemed. Upon termination and liquidation of the Account (wind-up), any liquidity units held by TIAA will be the last units redeemed, unless the independent fiduciary directs otherwise.
The Account’s net investment income continues to be an additional source of liquidity for the Account even though it has decreased from $545.8 million for the year ended December 31, 2008 to $500.5 million for the year ended December 31, 2009.
While the Account’s liquid investments have dropped below 15% of its total investments during this recent period of significant net participant outflows, the Account’s investment strategy remains to invest between 75% and 85% of its assets directly in real estate or real estate-related investments with the goal of producing favorable long-term returns primarily through rental income and appreciation. In the near term, the Account’s cash and marketable securities will likely comprise less than 10% of the Account’s investments, but management intends to increase the Account’s holdings in cash and short-term marketable securities to the extent practicable, consistent with its investment strategy and objective. As of December 31, 2009, cash and short-term marketable securities comprised approximately 7.2% of the Account’s investments.
The Account’s liquid assets continue to be available to purchase additional suitable real estate properties and to meet the Account’s debt obligations, expense needs, and participant redemption requests (i.e., cash withdrawals, benefit payments, or transfers). The Account has approximately $704.3 million in principal amount of debt obligations due during 2010 related to wholly-owned real estate investments and the Account’s share of debt associated with its investments in joint ventures.
Management believes that the Account, and the joint venture entities in which the Account invests, will have the ability to address these obligations in a number of ways, including among others, refinancing or extending such debt or repaying the principal due at maturity.
Leverage
The Account may borrow money and assume or obtain a mortgage on a property (i.e., to make leveraged real estate investments). Also, to meet any short-term cash needs, the Account may obtain a line of credit that may be unsecured and/or contain terms that may require the Account to secure the loan with one or more of its properties.
The Account is authorized to borrow money in accordance with its investment guidelines. Under the Account’s current investment guidelines, which were modified as to borrowing in mid-2009, the Account’s loan to value ratio (as defined below) is to be maintained at or below 30%. However, until December 31, 2011, the Account is authorized to incur and/or maintain indebtedness on its properties in
TIAA Real Estate Account § Prospectus 85
an aggregate principal amount not to exceed the aggregate principal amount of debt outstanding as of the date of adoption of such guidelines (approximately $4.0 billion). Such incurrences of debt from time to time may include:
|
|
|
| • | placing new debt on properties; |
|
|
|
| • | refinancing outstanding debt; |
|
|
|
| • | assuming debt on acquired properties or interests in the Account’s properties; and/or |
|
|
|
| • | extending the maturity date of outstanding debt. |
In calculating this limit, only the Account’s actual percentage interest in any borrowings is included, and not that percentage interest held by any joint venture partner. Further, the Account may only borrow up to 70% of the then-current value of a property, although construction loans may be for 100% of the costs incurred in developing a property. As of December 31, 2009 the Account did not have any construction loans. Also, at the time the Account (or a joint venture in which the Account is a partner) enters into a revolving line of credit, management deems the maximum amount which may be drawn under that line of credit as fully incurred, regardless of whether the maximum amount available has been drawn from time to time.
In addition, by December 31, 2011, management intends to reduce the Account’s ratio of outstanding principal amount of debt to total gross asset value (i.e., a “loan to value ratio”) to 30% or less and thereafter intends to maintain its loan to value ratio at or below 30% (measured at the time of incurrence and after giving effect thereto).
As of December 31, 2009, the Account’s loan to value ratio was approximately 33.1%.
RECENT TRANSACTIONS
The following describes property transactions by the Account in the fourth quarter of 2009. Except as noted, the expenses for operating the properties purchased are either borne or reimbursed, in whole or in part, by the property tenants, although the terms vary under each lease. The Account is responsible for operating expenses not reimbursed under the terms of a lease. All rental rates are quoted on an annual basis unless otherwise noted.
PURCHASES
None.
SALES
New Jersey CalEast Industrial Portfolio
On October 1, 2009, the Account sold an industrial investment portfolio in Monroe and Brunswick, New Jersey for a sales price of approximately $25.5 million and realized a loss of approximately $17.1 million. The Account purchased the property investment on December 22, 2003. The original investment in this portfolio was $39.9 million and costs to date were $42.6 million.
86 Prospectus § TIAA Real Estate Account
San Melia Apartments (Phoenix Apartment Portfolio)
On October 30, 2009, the Account completed a partial sale of the Phoenix apartment investment portfolio in Chandler, Arizona for a sales price of approximately $47.8 million and realized a loss of approximately $35.8 million. The Account purchased the property investment on June 23, 2006. The original investment in this apartment property was $82.5 million and costs to date were $83.7 million.
San Brisas (Phoenix Apartment Portfolio)
On November 5, 2009, the Account completed a partial sale of the Phoenix apartment investment portfolio in Phoenix, Arizona for a sales price of approximately $19.0 million and realized a loss of approximately $11.4 million. The Account purchased the property investment on June 23, 2006. The original investment in this apartment property was $29.9 million and costs to date were $30.4 million.
Paragon (Kierland Apartment Portfolio)
On November 5, 2009, the Account completed a partial sale of the Kierland apartment investment portfolio in Phoenix, Arizona for a sales price of approximately $34.2 million and realized a loss of approximately $30.2 million. The Account purchased the property investment on June 23, 2006. The original investment in this apartment property was $63.9 million and costs to date were $64.4 million.
4200 West Cypress
On November 16, 2009, the Account sold an office property investment in Tampa, Florida for a sales price of approximately $22.3 million and realized a loss of approximately $13.3 million. The Account purchased the property investment on December 29, 2003. The original investment in this property was $32.9 million and costs to date were $35.6 million.
El Mundo (Houston Apartment Portfolio)
On November 24, 2009, the Account completed a partial sale of the Houston apartment investment portfolio in Houston, Texas for a sales price of approximately $11.2 million and realized a loss of approximately $8.1 million. The Account purchased the property investment on June 23, 2006. The original investment in this apartment property was $18.1 million and costs to date were $19.4 million.
Plaza Del Oro Townhomes (Houston Apartment Portfolio)
On November 24, 2009, the Account completed a partial sale of an apartment investment portfolio in Houston, Texas for a sales price of approximately $8.0 million and realized a loss of approximately $5.1 million. The Account purchased the property investment on June 23, 2006. The original investment in this apartment property was $12.6 million and costs to date were $13.1 million.
San Marin Garden Homes (Houston Apartment Portfolio)
On November 24, 2009, the Account completed a partial sale of an apartment investment portfolio in Houston, Texas for a sales price of approximately $21.3 million and realized a loss of approximately $12.2 million. The Account purchased the property investment on June 23, 2006. The original investment in this apartment property was $32.0 million and costs to date were $33.4 million.
TIAA Real Estate Account § Prospectus 87
Park Place on Turtle Creek
On December 16, 2009, the Account sold an office property investment in Dallas, Texas for a sales price of approximately $23.7 million and realized a loss of approximately $23.0 million. The Account purchased the property investment on June 29, 2006. The original investment in this office property was $44.4 million and costs to date were $46.7 million.
Preston Sherry Plaza
On December 16, 2009, the Account sold an office property investment in Dallas, Texas for a sales price of approximately $31.5 million and realized a loss of approximately $15.8 million. The Account purchased the property investment and assumed its debt of $23.5 million on June 1, 2007. The original investment in this office property was $21.6 million and costs to date (net of debt) were $23.8 million. The debt was assumed by the purchaser of this property at the time of sale.
Capitol Place
On December 17, 2009, the Account sold an office property investment in Sacramento, California for a sales price of approximately $40.0 million and realized a loss of approximately $3.9 million. The Account purchased the property investment on August 28, 2003. The original investment in this office property was $38.8 million and costs to date were $43.9 million.
980 9th Street & 1010 8th Street
On December 18, 2009, the Account sold an office property investment in Sacramento, California for a sales price of approximately $97.0 million and realized a loss of approximately $76.5 million. The Account purchased the property investment on July 18, 2005. The original investment in this office property was $159.5 million and costs to date were $173.5 million.
FINANCINGS
None.
CONTRACTUAL OBLIGATIONS
The following table sets forth a summary regarding the Account’s known contractual obligations, including required interest payments for those items that are interest bearing, at December 31, 2009 (amounts in thousands):
|
|
|
|
|
|
|
|
|
|
|
|
|
|
|
|
|
|
|
|
|
|
|
|
| Amounts Due During Years Ending December 31, |
|
|
|
|
| |||||||||||||||
|
|
|
|
|
|
| ||||||||||||||||
|
| 2010 |
| 2011 |
| 2012 |
| 2013 |
| 2014 |
| Thereafter |
| Total |
| |||||||
Mortgage Loans Payable: |
|
|
|
|
|
|
|
|
|
|
|
|
|
|
|
|
|
|
|
|
|
|
Principal Payments |
| $ | 330,842 |
| $ | 13,067 |
| $ | 221,840 |
| $ | 552,853 |
| $ | 225,273 |
| $ | 563,215 |
| $ | 1,907,090 |
|
Interest Payments(1) |
|
| 98,694 |
|
| 91,863 |
|
| 91,423 |
|
| 78,312 |
|
| 40,338 |
|
| 52,718 |
|
| 453,348 |
|
Total Mortgage Loans Payable |
|
| 429,536 |
|
| 104,930 |
|
| 313,263 |
|
| 631,165 |
|
| 265,611 |
|
| 615,933 |
|
| 2,360,438 |
|
Joint Venture Funding Commitments |
|
| 1,313 |
|
| — |
|
| — |
|
| — |
|
| — |
|
| — |
|
| 1,313 |
|
Other Commitments(2) |
|
| 44,317 |
|
| — |
|
| — |
|
| — |
|
| — |
|
| — |
|
| 44,317 |
|
Tenant improvements(3) |
|
| 44,869 |
|
| — |
|
| — |
|
| — |
|
| — |
|
| — |
|
| 44,869 |
|
Total Contractual Obligations |
| $ | 520,035 |
| $ | 104,930 |
| $ | 313,263 |
| $ | 631,165 |
| $ | 265,611 |
| $ | 615,933 |
| $ | 2,450,937 |
|
|
|
(1) | These amounts represent interest payments due on mortgage loans payable based on the stated rates and, where applicable, the foreign currency exchange rates at December 31, 2009. |
88 Prospectus § TIAA Real Estate Account
|
|
(2) | This includes the Account’s commitment to purchase interests in four limited partnerships, which could be called by the partner at any time. |
|
|
(3) | This amount represents tenant improvements committed to by the Account in tenant leases that have not been incurred as of the year ended December 31, 2009. |
Note that the Contractual Obligations table above does not include payments on debt held in Investments in Joint Ventures which are the obligation of the individual joint venture entities. See Note 7 to the Account’s Financial Statements-Investments in Joint Ventures and Limited Partnerships.
EFFECTS OF INFLATION AND INCREASING OPERATING EXPENSES
Inflation, along with increased insurance, taxes, utilities and security costs, may increase property operating expenses in the future. Any such increases in operating expenses are generally billed to tenants either through contractual lease provisions in office, industrial, and retail properties or through rent increases in apartment complexes. The Account remains responsible for the expenses for unleased space in a property as well as expenses which may not be reimbursed under the terms of an existing lease.
Critical Accounting Policies
The financial statements of the Account are prepared in conformity with accounting principles generally accepted in the United States of America.
In preparing the Account’s financial statements, management is required to make estimates and judgments that affect the reported amounts of assets, liabilities, revenues, and expenses. Management bases its estimates on historical experience and assumptions that are believed to be reasonable under the circumstances, the results of which form the basis for making judgments about the carrying value of assets and liabilities that are not readily apparent from other sources. Actual results may differ from these estimates.
Accounting for Investments at Fair Value
The Financial Accounting Standards Board (“FASB”) has provided authoritative guidance for fair value measurements and disclosures. Additionally, the guidance defines fair value, establishes a framework for measuring fair value under generally accepted accounting principles in the United States, and requires certain disclosures about fair value measurements. This guidance indicates, among other things, that a fair value measurement under an exit price model assumes that the transaction to sell an asset or transfer a liability occurs in the principal market for the asset or liability or, in the absence of a principal market, the most advantageous market for the asset or liability.
This guidance also permits entities to elect to measure financial instruments and certain financial assets and liabilities at fair value and expanded the use of fair value measurements when warranted. The Account reports all investments and mortgage loans payable at fair value.
TIAA Real Estate Account § Prospectus 89
Valuation Hierarchy
The Account groups financial assets and certain financial liabilities measured at fair value into three levels, based on the markets in which the assets and liabilities are traded, if any, and the observability of the assumptions used to determine fair value. These levels are:
Level 1 — Valuations using unadjusted quoted prices for assets traded in active markets, such as stocks listed on the New York Stock Exchange. Active markets are defined as having the following characteristics for the measured asset or liability: (i) many transactions, (ii) current prices, (iii) price quotes not varying substantially among market makers, (iv) narrow bid/ask spreads and (v) most information regarding the issuer is publicly available. Level 1 assets, which may be held by the Account from time to time, include real estate related marketable securities (such as publicly traded REIT stocks).
Level 2 — Valuations for assets and liabilities traded in less active, dealer or broker markets. Fair values are primarily obtained from third party pricing services for identical or comparable assets or liabilities. Level 2 inputs for fair value measurements are inputs, other than quoted prices included within Level 1, that are observable for the asset or liability, either directly or indirectly. Level 2 inputs include:
|
|
|
| a. | Quoted prices for similar assets or liabilities in active markets; |
|
|
|
| b. | Quoted prices for identical or similar assets or liabilities in markets that are not active (that is, markets in which there are few transactions for the asset (or liability), the prices are not current, price quotations vary substantially either over time or among market makers (for example, some brokered markets), or in which little information is released publicly); |
|
|
|
| c. | Inputs other than quoted prices that are observable within the market for the asset (or liability) (for example, interest rates and yield curves, volatilities, prepayment speeds, loss severities, credit risks, and default rates that are observable at commonly quoted intervals); and |
|
|
|
| d. | Inputs that are derived principally from or corroborated by observable market data by correlation or other means (for example, market-corroborated inputs). |
Examples of securities which may be held by the account and included in Level 2 include Certificate of Deposits, Commercial Paper, Government Agency Bonds and Variable Notes.
Level 3 — Valuations for assets and liabilities that are derived from other valuation methodologies, including pricing models, discounted cash flow models and similar techniques, and are not based on market exchange, dealer, or broker-traded transactions. Level 3 valuations incorporate certain assumptions and projections that are not observable in the market, and require significant professional judgment in determining the fair value assigned to such assets or liabilities. Examples of Level 3 assets and liabilities which may be held by the Account from time to time include investments in real estate, investments in joint
90 Prospectus § TIAA Real Estate Account
ventures and limited partnerships, mortgage loans receivable and mortgage loans payable.
An investment’s categorization within the valuation hierarchy described above is based upon the lowest level of input that is significant to the fair value measurement.
The Account’s investments and mortgage loans payable are stated at fair value. Fair value is based upon quoted market prices, where available. If listed prices or quotes are not available, fair value is based upon vendor-provided, evaluated prices or internally-developed models that primarily use market-based or independently-sourced market data, including interest rate yield curves, market spreads, and currency rates. Valuation adjustments will be made to reflect changes in credit quality, counterparty’s creditworthiness, the Account’s creditworthiness, liquidity, and other observable and unobservable inputs that are applied consistently over time.
The methods described above are considered to produce fair values that represent a good faith estimate of what an unaffiliated buyer in the marketplace would pay to purchase the asset or would receive to transfer the liability. Since fair value calculations involve significant professional judgment in the application of both observable and unobservable attributes, actual realizable values or future fair values may differ from amounts reported. Furthermore, while the Account believes its valuation methods are appropriate and consistent with other market participants, the use of different methodologies or assumptions to determine the fair value of certain financial instruments, while reasonable, could result in different estimates of fair value at the reporting date.
The following is a description of the valuation methodologies used for investments measured at fair value.
Valuation of Real Estate Properties
Investments in real estate properties are stated at fair value, as determined in accordance with policies and procedures reviewed by the Investment Committee of the Board and in accordance with the responsibilities of the Board as a whole. Accordingly, the Account does not record depreciation. The Account’s real estate properties are generally classified within Level 3 of the valuation hierarchy. Fair value for real estate properties is defined as the price that would be received to sell the asset in an orderly transaction between market participants at the measurement date. Determination of fair value involves judgment because the actual market value of real estate can be determined only by negotiation between the parties in a sales transaction. The Account’s primary objective when valuing its real estate investments will be to produce a valuation that represents a fair and accurate estimate of the fair value of its investments. Implicit in the Account’s definition of fair value is the consummation of a sale as of a specified date and the passing of title from seller to buyer under conditions whereby:
|
|
|
| • | Buyer and seller are typically motivated; |
|
|
|
| • | Both parties are well informed or well advised, and acting in what they consider their best interests; |
TIAA Real Estate Account § Prospectus 91
|
|
|
| • | A reasonable time is allowed for exposure in the open market; |
|
|
|
| • | Payment is made in terms of cash or in terms of financial arrangements comparable thereto; and |
|
|
|
| • | The price represents the normal consideration for the property sold unaffected by special or creative financing or sales concessions granted by anyone associated with the sale. |
Property and investment values are affected by, among other things, the availability of capital, occupancy rates, rental rates, and interest and inflation rates. As a result, determining real estate and investment values involves many assumptions. Key inputs and assumptions include rental income and expense amounts, related rental income and expense growth rates, discount rates and capitalization rates. Valuation techniques include discounted cash flow analysis, prevailing market capitalization rates or multiples applied to earnings from the property, analysis of recent comparable sales transactions, actual sale negotiations and bona fide purchase offers received from third parties. Amounts ultimately realized from each investment may vary significantly from the market value presented. Actual results could differ significantly from those estimates.
Real estate properties owned by the Account are initially valued based on an independent appraisal at the time of the closing of the purchase, which may result in a potential unrealized gain or loss reflecting the difference between an investment’s fair value (i.e., exit price) and its cost basis (which is inclusive of transaction costs).
Subsequently, each property is appraised each quarter by an independent external appraiser. In general, the Account obtains appraisals of its real estate properties spread out throughout the quarter, which is intended to result in appraisal adjustments, and thus, adjustments to the valuations of its holdings (to the extent such adjustments are made) that happen regularly throughout each quarter and not on one specific day in each period.
Further, management reserves the right to order an appraisal and/or conduct another valuation outside of the normal quarterly process when facts or circumstances at a specific property change. For example, under certain circumstances a valuation adjustment could be made when bids are obtained for properties held for sale by the Account. In addition, adjustments may be made for events or circumstances indicating an impairment of a tenant’s ability to pay amounts due to the Account under a lease (including due to a bankruptcy filing of that tenant). Also, adjustments may be made to reflect factors (such as sales values for comparable properties or local employment rate) bearing uniquely on a particular region in which the Account holds properties. TIAA’s internal appraisal staff oversees the entire appraisal process, in conjunction with the Account’s independent fiduciary (the independent fiduciary is more fully described in the paragraph below). Any differences in the conclusions of TIAA’s internal appraisal staff and the independent appraiser will be reviewed by the independent fiduciary, which will make a final determination on the matter (which may include ordering a subsequent independent appraisal).
92 Prospectus § TIAA Real Estate Account
An independent fiduciary, Real Estate Research Corporation, has been appointed by a special subcommittee of the Investment Committee of the Board to, among other things, oversee the appraisal process. The independent fiduciary must approve all independent appraisers used by the Account. All appraisals are performed in accordance with Uniform Standards of Professional Appraisal Practices (“USPAP”), the real estate appraisal industry standards created by The Appraisal Foundation. Real estate appraisals are estimates of property values based on a professional’s opinion. Appraisals of properties held outside of the U.S. are performed in accordance with industry standards commonly applied in the applicable jurisdiction. These independent appraisers are always expected to be MAI-designated members of the Appraisal Institute (or its European equivalent, RICS) and state certified appraisers from national or regional firms with relevant property type experience and market knowledge.
Also, the independent fiduciary can require additional appraisals if factors or events have occurred that could materially change a property’s value and such change is not reflected in the quarterly valuation review, or otherwise to ensure that the Account is valued appropriately. The independent fiduciary must also approve any valuation change of real estate related assets where a property’s value changed by more than 6% from the most recent independent annual appraisal, or if the value of the Account would change by more than 4% within any calendar quarter or more than 2% since the prior calendar month. When a real estate property is subject to a mortgage, the mortgage is valued independently of the property and its fair value is reported separately. The independent fiduciary reviews and approves all mortgage valuation adjustments before such adjustments are recorded by the Account. The Account continues to use the revised value for each real estate property and mortgage loan payable to calculate the Account’s daily net asset value until the next valuation review or appraisal.
Valuation of Real Estate Joint Ventures
Real estate joint ventures are stated at the fair value of the Account’s ownership interests of the underlying entities. The Account’s ownership interests are valued based on the fair value of the underlying real estate, any related mortgage loans payable, and other factors, such as ownership percentage, ownership rights, buy/sell agreements, distribution provisions and capital call obligations. Upon the disposition of all real estate investments by an investee entity, the Account will continue to state its equity in the remaining net assets of the investee entity during the wind down period, if any, which occurs prior to the dissolution of the investee entity. The Account’s real estate joint ventures are generally classified within level 3 of the valuation hierarchy.
Valuation of Real Estate Limited Partnerships
Limited partnership interests are stated at the fair value of the Account’s ownership in the partnership which is based on the most recent net asset value of the partnership as reported by the sponsor. Since market quotations are not
TIAA Real Estate Account § Prospectus 93
readily available, the limited partnership interests are valued at fair value as determined in good faith under the direction of the Investment Committee of the Board and in accordance with the responsibilities of the Board as a whole. These investments are generally classified within level 3 of the valuation hierarchy.
Valuation of Marketable Securities
Equity securities listed or traded on any national market or exchange are valued at the last sale price as of the close of the principal securities market or exchange on which such securities are traded or, if there is no sale, at the mean of the last bid and asked prices on such market or exchange, exclusive of transaction costs. Such marketable securities are generally classified within level 1 of the valuation hierarchy.
Debt securities, other than money market instruments, are generally valued at the most recent bid price or the equivalent quoted yield for such securities (or those of comparable maturity, quality and type). Money market instruments, with maturities of one year or less, are valued in the same manner as debt securities or derived from a pricing matrix. Debt securities are generally classified within level 2 of the valuation hierarchy.
Equity and fixed income securities traded on a foreign exchange or in foreign markets are valued using their closing values under the valuation methods generally accepted in the country where traded, as of the valuation date. This value is converted to U.S. dollars at the exchange rate in effect on the valuation day. Under certain circumstances (for example, if there are significant movements in the United States markets and there is an expectation the securities traded on foreign markets will adjust based on such movements when the foreign markets open the next day), the Account may adjust the value of equity or fixed income securities that trade on a foreign exchange or market after the foreign exchange or market has closed. Equity securities traded on a foreign exchange or in foreign markets are generally classified within level 1 of the valuation hierarchy. Fixed income securities traded on a foreign exchange or in foreign markets are generally classified within level 2 of the valuation hierarchy. Equity and fixed income securities traded in foreign markets that are adjusted based upon significant movements in the United States markets are generally classified within level 2 of the valuation hierarchy.
Valuation of Mortgage Loan Receivable
Mortgage loans receivable are stated at fair value and are initially valued at the face amount of the mortgage loan funding. Subsequently, mortgage loans receivable are valued at least quarterly based on market factors, such as market interest rates and spreads for comparable loans, the liquidity for mortgage loans of similar characteristics, the performance of the underlying collateral and the credit quality of the counterparty. The Account’s mortgage loan receivable is classified within level 3 of the valuation hierarchy.
94 Prospectus § TIAA Real Estate Account
Valuation of Mortgage Loans Payable
Mortgage loans payable are stated at fair value. The estimated fair value of mortgage loans payable is based on the amount at which the liability could be transferred to a third party exclusive of transaction costs. Mortgage loans payable are valued at least quarterly based on market factors, such as market interest rates and spreads for comparable loans, the performance of the underlying collateral (such as the loan-to-value ratio and the cash flow of the underlying collateral), the liquidity for mortgage loans of similar characteristics, the maturity date of the loan, the return demands of the market, and the credit quality of the Account. The Account’s mortgage loans payable are generally classified within level 3 of the valuation hierarchy. Interest expense for mortgage loans payable is recorded on the accrual basis taking into account the outstanding principal and contractual interest rates.
Foreign currency transactions and translation
Portfolio investments and other assets and liabilities denominated in foreign currencies are translated into U.S. dollars at the exchange rates prevailing at the end of the period. Purchases and sales of securities, income receipts and expense payments made in foreign currencies are translated into U.S. dollars at the exchange rates prevailing on the respective dates of the transactions. The effect of any changes in foreign currency exchange rates on portfolio investments and mortgage loans payable is included in net realized and unrealized gains and losses on investments and mortgage loans payable. Net realized gains and losses on foreign currency transactions include disposition of foreign currencies, and currency gains and losses between the accrual and receipt dates of portfolio investment income and between the trade and settlement dates of portfolio investment transactions and, when applicable, include maturities of forward foreign currency contracts.
Accumulation and Annuity Funds
The Accumulation Fund represents the net assets attributable to participants in the accumulation phase of their investment (“Accumulation Fund”). The Annuity Fund represents the net assets attributable to the participants currently receiving annuity payments (“Annuity Fund”). The net increase or decrease in net assets from investment operations is apportioned between the accounts based upon their relative daily net asset values. Once an Account participant begins receiving lifetime annuity income benefits, monthly payment levels cannot be reduced as a result of the Account’s adverse mortality experience. In addition, the contracts pursuant to which the Account is offered are required to stipulate the maximum expense charge for all Account-level expenses that can be assessed, which is equal to 2.50% of average net assets per year. The Account pays a fee to TIAA to assume these mortality and expense risks.
TIAA Real Estate Account § Prospectus 95
Accounting for Investments
Real estate transactions are accounted for as of the date on which the purchase or sale transactions for the real estate properties close (settlement date). The Account recognizes a realized gain on the sale of a real estate property to the extent that the contract sales price exceeds the cost-to-date of the property being sold. A realized loss occurs when the cost-to-date exceeds the sales price. Any accumulated unrealized gains and losses are reversed in the calculation of realized gains and losses.
Rent from real estate properties consists of all amounts earned under tenant operating leases, including base rent, recoveries of real estate taxes and other expenses and charges for miscellaneous services provided to tenants. Rental income is recognized in accordance with the billing terms of the lease agreements. The Account bears the direct expenses of the real estate properties owned. These expenses include, but are not limited to, fees to local property management companies, property taxes, utilities, maintenance, repairs, insurance, and other operating and administrative costs. An estimate of the net operating income earned from each real estate property is accrued by the Account on a daily basis and such estimates are adjusted when actual operating results are determined.
The Account has limited ownership interests in various private real estate funds (limited partnerships and one limited liability corporation) and a private real estate investment trust (collectively, the “limited partnerships”). The Account records its contributions as increases to the investments, and distributions from the investments are treated as either income or return of capital, as determined by the management of the limited partnerships. Unrealized gains and losses are calculated based upon the net asset value of the limited partnership and recorded when the financial statements of the limited partnerships are received by the Account; however as circumstances warrant, prior to the receipt of financial statements of the limited partnership, the Account will estimate the value of its interests in good faith and will from time to time seek input from the issuer or the sponsor of the investment vehicle. Changes in value based on such estimates are recorded by the Account as unrealized gains and losses.
Income from real estate joint ventures is recorded based on the Account’s proportional interest of the income distributed by the joint venture. Income earned by the joint venture, but not yet distributed to the Account by the joint venture investment, is recorded as unrealized gains and losses on real estate joint ventures.
Transactions in marketable securities are accounted for as of the date the securities are purchased or sold (trade date). Interest income is recorded as earned. Dividend income is recorded on the ex-dividend date or as soon as the Account is informed of the dividend. Realized gains and losses on securities transactions are accounted for on the specific identification method.
96 Prospectus § TIAA Real Estate Account
New Accounting Pronouncements
In June 2007, the Accounting Standards Executive Committee (“AcSEC”) of the American Institute of Certified Public Accountants (“AICPA”) issued a Statement of Position (“SOP”) which clarifies which entities are required to apply the provisions of the Investment Companies Audit and Accounting Guide (“Guide”) and provides guidance on accounting by parent companies and equity method investors for investments in investment companies. In February 2008, FASB indefinitely delayed the effective date of the SOP to allow time to consider significant issues related to the implementation of the SOP.
In February 2009, the Emerging Issues Task Force (“EITF”) added an issue to its agenda related to the application of the Guide, which will be discussed at a future meeting. The FASB staff created a working group to assist the EITF in addressing this issue. Management of the Account will continue to monitor FASB and EITF developments and will evaluate the financial reporting implications to the Account, as necessary.
In June 2009, the FASB issued Statement of Financial Accounting Standards No. 167, Amendments to FASB Interpretation No. 46(R) (“SFAS No. 167”), which amends guidance related to the identification of a variable interest entity, variable interests, the primary beneficiary, and expands required note disclosures to provide greater transparency to the users of financial statements. In December 2009, the FASB issued Accounting Standards Update (“ASU”) No. 2009-17, “Improvements to Financial Reporting by Enterprises Involved with Variable Interest Entities”, which amended Codification with the guidance contained in SFAS No. 167. In February 2010, the FASB issued ASU No. 2010-10, “Amendments for Certain Investment Funds”, which defers the applicability of ASU No. 2009-17 in certain instances. These standards are effective on January 1, 2010 and management of the Account has concluded that the adoption of these standards will not result in a significant impact to the Account’s financial position or results of operations.
In August 2009, the FASB issued ASU No. 2009-05, “Measuring Liabilities at Fair Value.” This ASU clarifies the application of certain valuation techniques in circumstances in which a quoted price in an active market for the identical liability is not available and clarifies that inputs to the valuation should not be adjusted when estimating the fair value of a liability in which contractual terms restrict transferability. This ASU became effective on October 1, 2009 and the adoption did not have a significant impact to the Account’s financial position or results of operations.
In September 2009, the FASB issued ASU No. 2009-12, “Investments in Certain Entities That Calculate Net Asset Value per Share (or Its Equivalent).” This ASU permits, as a practical expedient, an investor the ability to estimate the fair value of an investment in certain entities on the basis of the net asset value per share of the investment (or its equivalent) determined as of the reporting entity’s measurement date. The investee must satisfy specific requirements before the investor is permitted to utilize this practical expedient as a method of valuation. The amendments in this ASU are effective for interim and annual periods ending
TIAA Real Estate Account § Prospectus 97
after December 15, 2009. The adoption of this ASU did not have a significant impact to the Account’s financial position or results of operations.
In January 2010, the FASB issued ASU No. 2010-06, “Improving Disclosures about Fair Value Measurements” which requires new disclosures related to the transfer in and out of levels 1 and 2, and the separate disclosure of purchases, sales, issuances and settlements when reconciling activity in level 3. This ASU also amends prior disclosure requirements to call for the disaggregation of assets and liabilities into appropriate subsets, and the disclosure of valuation techniques and inputs for recurring and nonrecurring fair value measurements in levels 2 and 3. The new disclosure requirement for reconciling level 3 activity is effective January 1, 2011 and all other new or amended disclosure requirements are effective January 1, 2010 for the Account. These changes will not impact the Account’s financial position or results of operations.
In February 2010, the FASB issued ASU No. 2010-09, “Amendments to Certain Recognition and Disclosure Requirements”. This ASU amends Topic 855, “Subsequent Events” by not requiring a reporting entity that files financial statements with the Securities and Exchange Commission (“SEC filers”), or a conduit bond obligor to disclose the date through which subsequent events are evaluated. This ASU is effective for SEC filers upon issuance of the final ASU. The Account has adopted this revision as of December 31, 2009 and accordingly will not disclose the date through which subsequent events were evaluated.
QUANTITATIVE AND QUALITATIVE DISCLOSURES ABOUT MARKET RISK
The Account’s real estate holdings, including real estate joint ventures and limited partnerships, which, as of December 31, 2009, represented 92.3% of the Account’s total investments, expose the Account to a variety of risks. These risks include, but are not limited to:
|
|
|
| • | General Real Estate Risk — The risk that the Account’s property values or rental and occupancy rates could go down due to general economic conditions, a weak market for real estate generally, disruptions in the credit and/or capital markets, or changing supply and demand for certain types of properties; |
|
|
|
| • | Appraisal Risk — The risk that the sale price of an Account propertyi.e., the value that would be determined by negotiations between independent parties) might differ substantially from its estimated or appraised value, leading to losses or reduced profits to the Account upon sale; |
|
|
|
| • | Risk Relating to Property Sales — The risk that the Account might not be able to sell a property at a particular time for its full value, particularly in a poor market. This might make it difficult to raise cash quickly and also could lead to Account losses; |
98 Prospectus § TIAA Real Estate Account
|
|
|
| • | Risks of Borrowing — The risk that interest rate changes may impact Account returns if the Account takes out a mortgage on a property, buys a property subject to a mortgage or holds a property subject to a mortgage; and |
|
|
|
| • | Foreign Currency Risk — The risk that the value of the Account’s foreign investments, related debt, or rental income could increase or decrease due to changes in foreign currency exchange rates or foreign currency exchange control regulations, and hedging against such changes, if undertaken by the Account, may entail additional costs and be unsuccessful. |
Given the significant concentration (92.3% as of December 31, 2009) of the Account’s total investments in real estate and real estate related assets, the Account’s net asset value will experience a more pronounced impact from valuation adjustments to its real properties than it would during periods in which the Account held its target of between 75% and 85% of its investments in real estate and real estate related assets. The Account believes the diversification of its real estate portfolio, both geographically and by sector, along with its quarterly valuation procedure, helps manage the real estate and appraisal risks described above.
As of December 31, 2009, 7.7% of the Account’s total investments were comprised of marketable securities and an adjustable rate mortgage loan receivable. Marketable securities include high-quality short-term debt instruments (i.e., commercial paper and government agency notes). The Statement of Investments for the Account sets forth the general financial terms of these instruments, along with their fair values, as determined in accordance with procedures described in Note 1 to the Account’s financial statements. The Account’s marketable securities other than its mortgage loan receivable are considered held for trading purposes. Currently, the Account does not invest in derivative financial investments, nor does the Account engage in any hedging activity other than the interest rate cap agreements contained in two mortgage loans payable the Account entered into during the third quarter of 2008. These interest rate cap agreements (which cap the interest rate on each mortgage loan payable at 6.50%) are discussed in Note 8 to the Account’s financial statements contained herein.
The Account’s investments in cash equivalents, marketable securities (whether debt or equity), and mortgage loans receivable are subject to the following general risks:
|
|
|
| • | Financial/Credit Risk — The risk, for debt securities, that the issuer will not be able to pay principal and interest when due (and/or declare bankruptcy or be subject to receivership) and, for equity securities such as common or preferred stock, that the issuer’s current earnings will fall or that its overall financial soundness will decline, reducing the security’s value. |
|
|
|
| • | Market Volatility Risk — The risk that the Account’s investments will experience price volatility due to changing conditions in the financial markets regardless of the credit quality or financial condition of the underlying issuer. This risk is particularly acute to the extent the Account holds equity securities, which have experienced significant short-term price volatility over |
TIAA Real Estate Account § Prospectus 99
|
|
|
|
| the past year. Also, to the extent the Account holds debt securities; changes in overall interest rates can cause price fluctuations. |
|
|
|
| • | Interest Rate Volatility — The risk that interest rate volatility may affect the Account’s current income from an investment. |
|
|
|
| • | Deposit/Money Market Risk — The risk that, to the extent the Account’s cash held in bank deposit accounts exceeds federally insured limits as to that bank, the Account could experience losses if banks fail. The Account does not believe it has exposure to significant concentration of deposit risk. In addition, there is some risk that investments held in money market accounts can suffer losses. |
In addition, to the extent the Account were to hold mortgage-backed securities (including commercial mortgage-backed securities (“CMBS”), these securities are subject to prepayment risk or extension risk (i.e., the risk that borrowers will repay the loans earlier or later than anticipated). If the underlying mortgage assets experience faster than anticipated repayments of principal, the Account could fail to recoup some or all of its initial investment in these securities, since the original price paid by the Account was based in part on assumptions regarding the receipt of interest payments. If the underlying mortgage assets are repaid later than anticipated, the Account could lose the opportunity to reinvest the anticipated cash flows at a time when interest rates might be rising. The rate of prepayment depends on a variety of geographic, social and other functions, including prevailing market interest rates and general economic factors. The market value of these securities is also highly sensitive to changes in interest rates. Note that the potential for appreciation, which could otherwise be expected to result from a decline in interest rates, may be limited by any increased prepayments. These securities may be harder to sell than other securities.
In addition to these risks, real estate equity securities (such as REIT stocks) and mortgage-backed securities would be subject to many of the same general risks inherent in real estate investing, making mortgage loans and investing in debt securities. For more information on the risks associated with all of the Account’s investments, see “Risks” in this prospectus.
THE CONTRACTS
TIAA offers the Real Estate Account as a variable option for the annuity contracts described below. Some employer plans may not offer the Real Estate Account as an option for RA, GA, SRA, GRA, GSRA (including institutionally-owned GSRA), Retirement Choice, Retirement Choice Plus or Keogh contracts. CREF is a companion organization to TIAA. A companion CREF contract may have been issued to you when you received the TIAA contract offering the Account. For more information about the CREF annuity contracts, the TIAA traditional annuity, the TIAA Access variable annuity accounts, other TIAA separate accounts offered from time to time and particular mutual funds and investment options offered under the terms of your plan, please see the applicable contracts and respective prospectuses for those investment options.
100 Prospectus § TIAA Real Estate Account
Importantly, neither TIAA nor CREF guarantee the investment performance of the Account nor do they guarantee the value of your units at any time.
RA (RETIREMENT ANNUITY) AND GRA (GROUP RETIREMENT ANNUITY)
RA and GRA contracts are used mainly for employee retirement plans. RA contracts are issued directly to you. GRA contracts, which are group contracts, are issued through an agreement between your employer and TIAA.
Depending on the terms of your employer’s plan, RA premiums can be paid by your employer, you, or both. GRA premiums can only be paid by your employer (though some such premiums may be paid by your employer pursuant to a salary reduction agreement). If you’re paying some or all of the entire periodic premium, your contributions can be in either pre-tax dollars by salary reduction or after-tax dollars by payroll deduction. Your employer may offer you the option of making contributions in the form of after-tax Roth IRA-style contributions, though you won’t be able to take tax deductions for these contributions. You can also transfer accumulations from another investment choice under your employer’s plan to your contract. Your GRA premiums can be from pre-tax or after-tax contributions. Ask your employer for more information about these contracts.
SRA (SUPPLEMENTAL RETIREMENT ANNUITY) AND
GSRA (GROUP SUPPLEMENTAL RETIREMENT ANNUITY)
These are generally limited to supplemental voluntary tax-deferred annuity (TDA) plans and supplemental 401(k) plans. SRA contracts are issued directly to you. GSRA contracts, which are group contracts, are issued through an agreement between your employer and TIAA. Generally, your employer pays premiums in pre-tax dollars through salary reduction. Your employer may offer you the option of making contributions in the form of after-tax Roth IRA-style contributions, though you won’t be able to take tax deductions for these contributions. Although you can’t pay premiums directly, you can transfer amounts from other TDA plans.
RETIREMENT CHOICE/RETIREMENT CHOICE PLUS ANNUITIES
These are very similar in operation to the GRAs and GSRAs, respectively, except that, unlike GRAs, they are issued directly to your employer or your plan’s trustee, and they may be issued to your employer directly without participant recordkeeping. Among other rights, the employer retains the right to transfer accumulations under these contracts to alternate funding vehicles.
CLASSIC IRA AND ROTH IRA
Classic IRAs are individual contracts issued directly to you. You and your spouse can each open a Classic IRA with an annual contribution of up to $5,000 or by rolling over funds from another IRA or eligible retirement plan, if you meet the Account’s eligibility requirements. If you are age 50 or older, you may contribute up to $6,000. The combined limit for your contributions to a Classic IRA and a
TIAA Real Estate Account § Prospectus 101
Roth IRA for a single year is $5,000, or $6,000 if you are age 50 or older, excluding rollovers. (The dollar limits listed are for 2010; different dollar limits may apply in future years.)
Roth IRAs are also individual contracts issued directly to you. You and your spouse can each open a Roth IRA with an annual contribution up to $5,000 or with a rollover from another IRA or a Classic IRA issued by TIAA if you meet the Account’s eligibility requirements, subject to rules applicable to Roth IRA conversions. If you are age 50 or older you may contribute up to $6,000. The combined limit for your contributions to a Classic IRA and a Roth IRA for a single year is $5,000, or $6,000 if you are age 50 or older, excluding rollovers. (The dollar limits listed are for 2010; different dollar limits may apply in future years.)
We can’t issue a joint Classic IRA or Roth IRA contract.
Your employer may offer SEP IRAs (Simplified Employee Retirement Plans), which are subject to different rules.
Classic and Roth IRAs may together be referred to as “IRAs” in this prospectus.
GA (GROUP ANNUITY) AND INSTITUTIONALLY OWNED GSRAS
These are used exclusively for employer retirement plans and are issued directly to your employer or your plan’s trustee. Your employer pays premiums directly to TIAA (you can’t pay the premiums directly to TIAA) and your employer or the plan’s trustee may control the allocation of contributions and transfers to and from these contracts including withdrawing completely from the Account. If a GA or Institutionally Owned GSRA contract is issued pursuant to your plan, the rules relating to transferring and withdrawing your money, receiving any annuity income or death benefits, and the timing of payments may be different, and are determined by your plan. Ask your employer or plan administrator for more information.
KEOGH CONTRACTS
TIAA also offers contracts under Keogh plans. If you are a self-employed individual who owns an unincorporated business, you can use the Account’s Keogh contracts for a Keogh plan, and cover common law employees, subject to the Account’s eligibility requirements.
ATRA (AFTER-TAX RETIREMENT ANNUITY)
The after-tax retirement annuities (ATRA) are individual non-qualified deferred annuity contracts, issued to participants who are eligible and would like to remit personal premiums under the contractual provisions of their RA contract. To be eligible, you must have an active and premium-paying or paid up RA contract.
Note that the tax rules governing these non-qualified contracts differ significantly from the treatment of qualified contracts. See “Taxes,” on page 119 for more information.
102 Prospectus § TIAA Real Estate Account
ELIGIBILITY FOR IRA AND KEOGH CONTRACTS
Each of you and your spouse can open a Classic or Roth IRA or a Keogh if you’re a current or retired employee or trustee of an Eligible Institution, or if you own a TIAA or CREF annuity contract or a TIAA individual insurance contract. To be considered a retired employee for this purpose, an individual must be at least 55 years old and have completed at least three years of service at an Eligible Institution. In the case of partnerships, at least half the partners must be eligible individuals and the partnership itself must be primarily engaged in education or research. Eligibility may be restricted by certain income limits on opening Roth IRA contracts.
STATE REGULATORY APPROVAL
State regulatory approval may be pending for certain of these contracts and they may not currently be available in your state.
STARTING OUT
Generally, we’ll issue you a TIAA contract when we receive a completed application or enrollment form in good order. “Good order” means actual receipt of the order along with all information and supporting legal documentation necessary to effect the transaction. This information and documentation generally includes your complete application and any other information or supporting documentation we may require. With respect to purchase requests, “good order” also generally includes receipt of sufficient funds by us to effect the purchase. We may, in our sole discretion, determine whether any particular transaction request is in good order and reserve the right to change or waive any good order requirement at any time either in general or with respect to a particular plan, contract or transaction.
If your application is incomplete and we do not receive the necessary information and signed application in good order within five business days of our receipt of the initial premium, we will return the initial premium at that time. See also “—Determining the Value of Your Interest in the Account – Accumulation Units” below.
If we receive premiums from your employer and, where applicable, a completed application from you before we receive your specific allocation instructions (or if your allocation instructions violate employer plan restrictions or do not total 100%), we will invest all premiums remitted on your behalf in the default option your employer has designated. We consider your employer’s designation of a default option to be an instruction to us to allocate your premiums to that option as described above. You should consult your plan documents or sales representative to determine your employer’s designated default option and to obtain information about that option. Further, to the extent you hold an IRA contract, the default option will be that fund or account specified in your IRA forms. When we receive complete allocation instructions from you, we’ll follow your instructions for future premiums. However, if you want the premiums
TIAA Real Estate Account § Prospectus 103
previously allocated to the default option (and earnings and losses on them) to be transferred to the options identified in your instructions, you must specifically request that we transfer these amounts from the default option to your investment option choices.
Amounts may be invested in an account other than the Real Estate Account (absent a participant’s specific instructions) only in the limited circumstances identified in the paragraph immediately above and the circumstance outlined below under “How to Transfer and Withdraw Your Money – Possible Restrictions on Premiums and Transfers to the Account,” namely: (1) we receive premiums before we receive your completed application or allocation instructions, (2) a participant’s allocations violate employer plan restrictions or do not total 100%, or (3) we stop accepting premiums for and/or transfers into the Account.
TIAA generally doesn’t currently restrict the amount or frequency of payment of premiums to your contract, although we may in the future. Your employer’s retirement plan may limit your premium amounts. There also may be restrictions on remitting premiums on an IRA. In addition, the Internal Revenue Code limits the total annual premiums you may invest in plans qualified for favorable tax treatment. If you want to directly contribute personal premiums under the contractual provisions of your RA contract, you will be issued an ATRA contract. Premiums and any earnings on the ATRA contract will not be subject to your employer’s retirement plan. The only restrictions relating to these premiums are in the contract itself.
In most cases (subject to any restriction we may impose, as described in this prospectus), TIAA accepts premiums to a contract during your accumulation period. Once your first premium has been paid, your TIAA contract can’t lapse or be forfeited for nonpayment of premiums. However, TIAA can stop accepting premiums to the Real Estate Account at any time.
Note that we cannot accept money orders or travelers checks. In addition, we will not accept a third-party check where the relationship of the payor to the account owner cannot be identified from the face of the check.
We will not be deemed to have received any premiums sent to the addresses designated for remitting premiums until the third-party service that administers the receipt of mail through those addresses has processed the payment on our behalf.
You will receive a confirmation statement each time you remit premiums, or make a transfer to or a cash withdrawal from the Account. The statement will show the date and amount of each transaction. However, if you’re using an automatic investment plan, you’ll receive a statement confirming those transactions following the end of each calendar quarter.
If you have any accumulations in the Account, you will be sent a statement in each quarter which sets forth the following information:
|
|
|
| (1) | Premiums paid during the quarter; |
|
|
|
| (2) | The number and dollar value of accumulation units in the Account credited to you during the quarter and in total; |
104 Prospectus § TIAA Real Estate Account
|
|
|
| (3) | Cash withdrawals, if any, from the Account during the quarter; and |
|
|
|
| (4) | Any transfers during the quarter. |
You also will receive reports containing the financial statements of the Account and certain information about the Account’s investments.
IMPORTANT INFORMATION ABOUT PROCEDURES FOR OPENING A NEW ACCOUNT
To help the U.S. government fight the funding of terrorism and money laundering activities, Federal law requires all financial institutions to obtain, verify and record information that identifies each person who opens an account.
What this means for you:When you open an account, we will ask for your name, address, date of birth, social security number and other information that will allow us to identify you, such as your home telephone number and driver’s license or certain other identifying documents. Until you provide us with the information needed, we may not be able to open an account or effect any transactions for you. Furthermore, if we are unable to verify your identity, or that of another person authorized to act on your behalf, or if it is believed that potentially criminal activity has been identified, we reserve the right to take such action as deemed appropriate, which may include closing your account.
CHOOSING AMONG INVESTMENT ACCOUNTS
After you receive your contract, you can allocate all or part of your premiums to the Real Estate Account, unless your employer’s plan precludes that choice. You can also allocate premiums to TIAA’s traditional annuity, the CREF variable investment accounts, the TIAA Access variable annuity accounts, other TIAA separate accounts offered from time to time (if available under the terms of your employer’s plan) and, in some cases, certain mutual funds if the account or fund is available under your employer’s plan.
You can change your allocation choices for future premiums by:
|
|
|
| • | writing to our home office at 730 Third Avenue, New York, NY 10017-3206; |
|
|
|
| • | using the TIAA-CREF Web Center’s account access feature at www.tiaa-cref.org; or |
|
|
|
| • | calling our Automated Telephone Service (24 hours a day) at 800 842-2252. |
THE RIGHT TO CANCEL YOUR CONTRACT
Generally, you may cancel any RA, SRA, GSRA, Classic IRA Roth IRA, ATRA or Keogh contract in accordance with the contract’s Right to Examine provision (unless we have begun making annuity payments from it) and subject to the time period regulated by the state in which the contract is issued. Although the contract terms and state law provisions differ, you will generally have between 10 and 60 days to exercise this cancellation right. To cancel a contract, mail or deliver the contract with your cancellation instructions (or signed Notice of Cancellation when such has been provided with your contract) to our home office.
TIAA Real Estate Account § Prospectus 105
We’ll cancel the contract, then send either the current accumulation or the premium, depending on the state in which your contract was issued, to whomever originally submitted the premiums. Unless we are returning premiums paid as required by state law, you will bear the investment risk during this period.
DETERMINING THE VALUE OF YOUR INTEREST IN THE ACCOUNT — ACCUMULATION UNITS
Each payment to the Real Estate Account buys a number of accumulation units. Similarly, any withdrawal from the Account results in the redemption of a number of accumulation units. The price you pay for accumulation units, and the price you receive for accumulation units when you redeem accumulation units, is the value of the accumulation units calculated for the business day on which we receive your purchase, redemption or transfer request in good order (unless you ask for a later date for a redemption or transfer). This date is called the “effective date.” Therefore, if we receive your purchase, redemption or transfer request in good order before the NYSE closes, that business day will be considered the effective date of your order. If we receive your request in good order after the NYSE closes, the next business day will be considered the effective date of your order.
Payments and orders to redeem accumulation units (or adjustments thereto) may be processed after the effective date. “Processed” means when amounts are credited or debited to you in the Account. In the event there are market fluctuations between the effective date and the processing date and the price of accumulation units on the processing date is higher or lower than your price on the effective date, that difference will be paid or retained by Services, the Account’s distributor. This amount, which may be positive or negative, together with similar amounts paid or retained by Services in connection with transactions involving other investment products offered under pension plans administered by TIAA or its affiliates and the amount of interest, if any, paid by Services to participants in connection with certain delayed payments, is apportioned to the Account pursuant to an agreement with Services, under which the Account reimburses Services for the services it has provided to the Account.
The accumulation unit value reflects the Account’s investment experience (i.e., the real estate net operating income accrued, as well as dividends, interest and other income accrued), realized and unrealized capital gains and losses, as well as Account expense charges.
Calculating Accumulation Unit Values:We calculate the Account’s accumulation unit value at the end of each valuation day. To do that, we multiply the previous day’s value by the net investment factor for the Account. The net investment factor is calculated asAdivided byB, whereAandBare defined as:
|
|
|
| A. | The value of the Account’s net assets at the end of the current valuation period, less premiums received during the current valuation period. |
|
|
|
| B. | The value of the Account’s net assets at the end of the previous valuation period, plus the net effect of transactions made at the start of the current valuation period. |
106 Prospectus § TIAA Real Estate Account
HOW TO TRANSFER AND WITHDRAW YOUR MONEY
Generally, TIAA allows you to move your money to or from the Real Estate Account in the following ways:
|
|
|
| • | from the Real Estate Account to a CREF investment account, a TIAA Access variable account (if available) or TIAA’s traditional annuity; |
|
|
|
| • | to the Real Estate Account from a CREF investment account, a TIAA Access variable account (if available) or TIAA’s traditional annuity (transfers from TIAA’s traditional annuity under RA, GRA or Retirement Choice contracts are subject to restrictions); |
|
|
|
| • | from the Real Estate Account to a mutual fund (including TIAA-CREF affiliated mutual funds), if available under your plan; |
|
|
|
| • | to the Real Estate Account from a TIAA-CREF affiliated mutual fund; |
|
|
|
| • | from the Real Estate Account to investment options offered by other companies, if available under your plan; |
|
|
|
| • | to the Real Estate Account from other companies/plans; |
|
|
|
| • | by withdrawing cash; and |
|
|
|
| • | by setting up a program of automatic withdrawals or transfers. |
For more information regarding the transfer policies of CREF, TIAA Access, TIAA’s traditional annuity or another investment option listed above, please see the respective contract, prospectus or other governing instrument.
These transactions generally must be for at least $1,000 at a time (except for systematic transfers or withdrawals which must be for at least $100) or your entire Account accumulation, if less. These options may be limited by the terms of your employer’s plan, by current tax law, or by the terms of your contract, as set forth below. Transfers and cash withdrawals are currently free. TIAA can place restrictions on transfers or charge fees for transfers and/or withdrawals in the future.
As indicated, transfers and cash withdrawals are effective at the end of the business day we receive your request and all required documentation in good order. You can also choose to have transfers and withdrawals take effect at the close of any future business day. For any transfers to TIAA’s traditional annuity, the crediting rate will be the rate in effect at the close of business of the first day that you participate in TIAA’s traditional annuity, which is the next business day after the effective date of the transfer.
To request a transfer or to withdraw cash:
|
|
|
| • | write to TIAA’s home office at 730 Third Avenue, New York, NY 10017-3206; |
|
|
|
| • | call us at 800 842-2252; or |
|
|
|
| • | for internal transfers, using the TIAA-CREF Web Center’s account access feature at www.tiaa-cref.org |
You may be required to complete and return certain forms to effect these transactions. We can limit, suspend or terminate your ability to transact by telephone, over the Internet, or by fax at any time, for any reason. Note that,
TIAA Real Estate Account § Prospectus 107
currently, all requests to make lump-sum transfers out of the Real Estate Account to another investment option (whether or not affiliated with TIAA-CREF) may not be made by means of TIAA-CREF’s internet website.
Before you transfer or withdraw cash, make sure you understand the possible federal and other income tax consequences. See “Taxes” on page 119.
TRANSFERS TO AND FROM OTHER TIAA-CREF ACCOUNTS AND FUNDS
Transfers from the Real Estate Account.Once every calendar quarter you can transfer some or all of your accumulation in the Real Estate Account to TIAA’s traditional annuity, to another TIAA annuity offered by your employer’s plan, to one of the CREF accounts, to a TIAA Access variable annuity account or to mutual funds (which may include TIAA-CREF affiliated mutual funds) offered under the terms of your employer’s plan. Transfers to CREF accounts or to certain other options may be restricted by your employer’s plan, current tax law or by the terms of your contract.
Transfers to the Real Estate Account.Currently, you can also transfer some or all of your accumulation in TIAA’s traditional annuity, in your CREF accounts, TIAA Access variable annuity accounts or in the mutual funds or TIAA annuities offered under the terms of your plan to the Real Estate Account, if your employer’s plan offers the Account. Transfers from TIAA’s traditional annuity to the Real Estate Account under RA, GRA or Retirement Choice contracts can only be effected over a period of time (up to 10 annual installments) and may be subject to other limitations, as specified in your contract. Amounts held under an ATRA contract cannot be transferred to or from any retirement plan contract.
Because excessive transfer activity can hurt Account performance and other participants, subject to applicable state law, we may seek to further limit how often, or in what amounts, you may make transfers, or we may otherwise modify the transfer privilege generally. See “—Possible Restrictions on Premiums and Transfers to the Account” below.
TRANSFERS TO OTHER COMPANIES
Generally you may transfer funds from the Real Estate Account to a company other than TIAA or CREF, subject to certain tax restrictions. This right may be limited by your employer’s plan. If your employer participates in our special transfer services program, we can make automatic monthly transfers from your RA or GRA contract to another company, and the $1,000 minimum will not apply to these transfers. Roth amounts in a 403(b) or 401(a) plan can only be rolled over to another Roth account under such plan or to a Roth IRA, as permitted by applicable law and the terms of the plans.
Under the Retirement Choice and Retirement Choice Plus contracts, your employer could transfer monies from the Account and apply it to another account or investment option, subject to the terms of your plan, and without your consent.
108 Prospectus § TIAA Real Estate Account
TRANSFERS FROM OTHER COMPANIES/PLANS
Subject to your employer’s plan and federal tax law, you can usually transfer or roll over money from another 403(b), 401(a)/403(a) or governmental 457(b) retirement plan to your qualified TIAA contract. You may also roll over before-tax amounts in a Classic IRA to 403(b) plans, 401(a)/403(a) plans or eligible governmental 457(b) plans, provided such employer plans agree to accept the rollover. Similarly, subject to your employer’s plan, you may be able to roll over funds from 401(a), 403(a), 403(b) and governmental 457(b) plans to a TIAA Classic IRA or, subject to applicable income limits, from an IRA containing funds originally contributed to such plans, to either a TIAA Classic or Roth IRA, subject to rules applicable to Roth IRA conversion. Roth amounts in a 403(b) or 401(a) plan can only be rolled over to another Roth account under such plan or to a Roth IRA, as permitted by applicable law and the terms of the plans. Funds in a private 457(b) plan can be transferred to another private 457(b) plan only. Accumulations in private 457(b) plans may not be rolled over to a qualified plan (e.g.,a 401(a) plan), a 403(b) plan, a governmental 457(b) plan or an IRA.
WITHDRAWING CASH
You may withdraw cash from your SRA, GSRA, IRA, ATRA or Keogh Real Estate Account accumulation at any time during the accumulation period, provided federal tax law permits it (see below). Real Estate Account cash withdrawals from your RA, GRA, Retirement Choice or Retirement Choice Plus accumulation are limited to once per calendar quarter and may also be limited by the terms of your employer’s plan and federal tax law. Normally, you can’t withdraw money from a contract if you’ve already applied that money to begin receiving lifetime annuity income. Current federal tax law restricts your ability to make cash withdrawals from your accumulation under most voluntary salary reduction agreements. Withdrawals are generally available only if you reach age 59½, leave your job, become disabled, die, or satisfy requirements related to qualified distributions or if your employer terminates its retirement plan. If your employer’s plan permits, you may also be able to withdraw money if you encounter hardship, as defined by the IRS, but hardship withdrawals can be from contributions only, and not investment earnings. You may be subject to a 10 percent penalty tax if you make a withdrawal before you reach age 59½, unless an exception applies to your situation.
Under current federal tax law, you are not permitted to withdraw from 457(b) plans earlier than the calendar year in which you reach age 70½, leave your job or are faced with an unforeseeable emergency (as defined by law). There are generally no early withdrawal tax penalties if you withdraw under any of these circumstances (i.e., no 10% tax on distributions prior to age 59½). If you’re married, you may be required by law or your employer’s plan to show us advance written consent from your spouse before TIAA makes certain transactions on your behalf.
Special rules and restrictions apply to Classic and Roth IRAs.
TIAA Real Estate Account § Prospectus 109
SYSTEMATIC WITHDRAWALS AND TRANSFERS
If your employer’s plan allows, you can set up a program to make cash withdrawals or transfers automatically by specifying that we withdraw from your Real Estate Account accumulation, or transfer to or from the Real Estate Account, any fixed number of accumulation units, dollar amount, or percentage of accumulation until you tell us to stop or until your accumulation is exhausted. Currently, the program must be set up so that at least $100 is automatically withdrawn or transferred at a time. Further, a systematic plan of this type may allow pre-specified transfers or withdrawals to be made more often than quarterly, depending on the terms of your employer’s plan.
WITHDRAWALS TO PAY ADVISORY FEES
You can set up a program to have monies withdrawn directly from your retirement plan (if your employer’s plan allows) or IRA accumulations to pay your financial advisor. You will be required to complete and return certain forms to effect these withdrawals, including how and from which accounts you want these monies to be withdrawn. Before you set up this program, make sure you understand the possible tax consequences of these withdrawals. See the discussion under “Taxes” below.
POSSIBLE RESTRICTIONS ON PREMIUMS AND TRANSFERS TO THE ACCOUNT
From time to time we may stop accepting premiums for and/or transfers into the Account. We might do so if, for example, we can’t find enough appropriate real estate related investment opportunities at a particular time. Whenever reasonably possible, we will notify you before we decide to restrict premiums and/or transfers. However, because we may need to respond quickly to changing market conditions or to the liquidity needs and demands of the Account, we reserve the right (subject to the terms of some contracts) to stop accepting premiums and/or transfers at any time without prior notice.
If we decide to stop accepting premiums into the Account, amounts that would otherwise be allocated to the Account will be allocated to the default option designated by your employer instead (or the default option specified on your IRA forms), unless you give us other allocation instructions. We will not transfer these amounts out of the default option designated by your employer when the restriction period is over, unless you request that we do so. However, we will resume allocating premiums to the Account on the date we remove the restrictions.
ADDITIONAL LIMITATIONS
Federal law requires us to obtain, verify and record information that identifies each person who opens an account. Until we receive the information we need, we may not be able to effect transactions for you. Furthermore, if we are unable to verify your identity, or that of another person authorized to act on your behalf, or if we believe that we have identified potentially criminal activity, we reserve the
110 Prospectus § TIAA Real Estate Account
right to take such action as we deem appropriate, which may include closing your account.
MARKET TIMING / EXCESSIVE TRADING POLICY
There are participants who may try to profit from making transactions back and forth among the CREF accounts, the Real Estate Account, the TIAA Access variable accounts and the mutual funds or other investment options available under the terms of your plan in an effort to “time” the market or for other reasons. As money is shifted in and out of these accounts, the accounts or funds may incur transaction costs, including, among other things, expenses for buying and selling securities. These costs are borne by all participants, including long-term investors who do not generate these costs. In addition, excessive trading can interfere with efficient portfolio management and cause dilution if traders are able to take advantage of pricing inefficiencies. Consequently, the Account is not appropriate for market timing or frequent trading and you should not invest in the Account if you want to engage in such activity.
To discourage this activity, transfers from the Real Estate Account to a CREF or TIAA account, or another investment option, are limited to once every calendar quarter. A few limited exceptions to this policy apply, including:
|
|
|
| ||
| (i) | systematic transfers out of the Real Estate Account (as described on page 110 above in “—Systematic Withdrawals and Transfers”), |
| ||
|
|
|
| (ii) | annual portfolio rebalancing activities, |
|
|
|
| (iii) | plan transfers and rollovers made to external carriers, |
|
|
|
| (iv) | participants enrolled in TIAA’s qualified managed account for retirement plan assets, and |
|
|
|
| (v) | single-sum distributions where funds are moved from one TIAA annuity contract or certificate to another, as well as those made directly to a participant. |
TIAA reserves the right to reject any purchase or exchange request with respect to the Account, including when it is believed that a request would be disruptive to the Account’s efficient portfolio management. TIAA also may suspend or terminate your ability to transact in the Account by telephone, fax or over the Internet for any reason, including the prevention of excessive trading. A purchase or exchange request could be rejected or electronic trading privileges could be suspended because of the timing or amount of the investment or because of a history of excessive trading by the participant. Because TIAA has discretion in applying this policy, it is possible that similar transaction activity could be handled differently because of the surrounding circumstances. Notwithstanding such discretion, TIAA seeks to apply its excessive trading policies and procedures uniformly to all Account participants. As circumstances warrant, TIAA may request transaction data from intermediaries from time to time to verify whether the Account’s policies are being followed and/or to instruct intermediaries to take action against participants who have violated the Account’s policies. TIAA has the right to modify these policies and procedures at any time without advance notice.
TIAA Real Estate Account § Prospectus 111
The Account is not appropriate for excessive trading. You should not invest in the Account if you want to engage in excessive trading or market timing activity.
Participants seeking to engage in excessive trading may deploy a variety of strategies to avoid detection, and, despite TIAA’s efforts to discourage excessive trading, there is no guarantee that TIAA or its agents will be able to identify all such participants or curtail their trading practices.
If you invest in the Account through an intermediary, including through a retirement or employee benefit plan, you may be subject to additional market timing or excessive trading policies implemented by the intermediary or plan. Please contact your intermediary or plan sponsor for more details.
THE ANNUITY PERIOD IN GENERAL
You can receive an income stream from all or part of your Real Estate Account accumulation. Unless you opt for a lifetime annuity, generally you must be at least age 59½ to begin receiving annuity income payments from your annuity contract free of a 10 percent early distribution penalty tax. Your employer’s plan may also restrict when you can begin income payments. Under the minimum distribution rules of the Internal Revenue Code, you generally must begin receiving some payments from your contract shortly after you reach the later of age 70½ or you retire. Note that for 2010, the minimum distribution requirement under the Internal Revenue Code is not suspended for Internal Revenue Code section 401(a), 403(a), 403(b), governmental 457(b) plans and IRAs. The minimum distribution requirement was suspended with respect to such plans in 2009 under The Worker, Retiree, and Employer Recovery Act of 2008. Please consult your tax advisor. For more information, see “Taxes—Minimum Distribution Requirements,” on page 120. Also, you can’t begin a one-life annuity after you reach age 90, nor may you begin a two-life annuity after either you or your annuity partner reach age 90.
Your income payments may be paid out from the Real Estate Account through a variety of income options. You can pick a different income option for different portions of your accumulation, but once you’ve started payments you usually can’t change your income option or annuity partner for that payment stream.
Usually income payments are monthly. You can choose quarterly, semi-annual, and annual payments as well. (TIAA has the right to not make payments at any interval that would cause the initial payment to be less than $100.) We’ll send your payments by mail to your home address or, on your request, by mail or electronic funds transfer to your bank.
Your initial income payments are based on the value of your accumulation on the last valuation day before the annuity starting date. Your payments change after the initial payment based on the Account’s investment experience and the income change method you choose.
112 Prospectus § TIAA Real Estate Account
There are two income change methods for annuity payments: annual and monthly. Under the annual income change method, payments from the Account change each May 1, based on the net investment results during the prior year (April 1 through March 31). Under the monthly income change method, payments from the Account change every month, based on the net investment results during the previous month. For the formulas used to calculate the amount of annuity payments, see page 116. The total value of your annuity payments may be more or less than your total premiums.
ANNUITY STARTING DATE
Ordinarily, annuity payments begin on the date you designate as your annuity starting date, provided we have received all documentation necessary for the income option you’ve picked. If something’s missing, we’ll defer your annuity starting date until we receive the missing information. Your first annuity check may be delayed while we process your choice of income options and calculate the amount of your initial payment. Any premiums received within 70 days after payments begin may be used to provide additional annuity income. Premiums received after 70 days will remain in your accumulating annuity contract until you have given us further instructions. Ordinarily, your first annuity payment can be made on any business day between the first and twentieth of any month.
INCOME OPTIONS
Both the number of annuity units you purchase and the amount of your income payments will depend on which income option you pick. Your employer’s plan, tax law and ERISA may limit which income options you can use to receive income from an RA or GRA, GSRA, Retirement Choice, Retirement Choice Plus or Keogh contract. Ordinarily you’ll choose your income options shortly before you want payments to begin, but you can make or change your choice any time before your annuity starting date. After your annuity starting date, you cannot change your income option.
All Real Estate Account income options provide variable payments, and the amount of income you receive depends in part on the investment experience of the Account. The current options are:
|
|
|
| • | One-Life Annuity with or without Guaranteed Period:Pays income as long as you live. If you opt for a guaranteed period (10, 15 or 20 years) and you die before it’s over, income payments will continue to your beneficiary until the end of the period. If you don’t opt for a guaranteed period, all payments end at your death — so that it’s possible for you to receive only one payment if you die less than a month after payments start. (The 15-year guaranteed period is not available under all contracts.) |
|
|
|
| • | Annuity for a Fixed Period:Pays income for any period you choose from 5 to 30 years (2 to 30 years for RAs, SRAs and GRAs). (This option is not available under all contracts.) |
TIAA Real Estate Account § Prospectus 113
|
|
|
| • | Two-Life Annuities:Pays income to you as long as you live, then continues at either the same or a reduced level for the life of your annuity partner. There are four types of two-life annuity options, all available with or without a guaranteed period — Full Benefit to Survivor, Two-Thirds Benefit to Survivor, 75% Benefit to Annuity Partner and a Half-Benefit to Annuity Partner. Under the Two-Thirds Benefit to Survivor option, payments to you will be reduced upon the death of your annuity partner. |
|
|
|
| • | Minimum Distribution Option (MDO) Annuity:Generally available only if you must begin annuity payments under the Internal Revenue Code minimum distribution requirements. (Some employer plans allow you to elect this option earlier — contact TIAA for more information.) The option pays an amount designed to fulfill the distribution requirements under federal tax law. Note that for 2010, the minimum distribution requirement under the Internal Revenue Code is not suspended for Internal Revenue Code section 401(a), 403(a), 403(b), governmental 457(b) plans and IRAs. The minimum distribution requirement was suspended with respect to such plans in 2009 under The Worker, Retiree, and Employer Recovery Act of 2008. Please consult your tax advisor for more information. |
You must apply your entire accumulation under a contract if you want to use the MDO annuity. It is possible that income under the MDO annuity will cease during your lifetime. Prior to age 90, and subject to applicable plan and legal restrictions, you can elect a distribution option other than the MDO option and apply any remaining part of an accumulation applied to the MDO annuity to any other income option for which you’re eligible. Using an MDO won’t affect your right to take a cash withdrawal of any accumulation not yet distributed. This pay-out annuity is not available under the Retirement Choice or Retirement Choice Plus contracts. Instead, required minimum distributions will be paid directly from these contracts pursuant to the terms of your employer’s plan.
For any of the income options described above, current federal tax law provides that your guaranteed period can’t exceed the joint life expectancy of you and your beneficiary or annuity partner. If you are married at your annuity start date, you may be required by law to choose an income option that provides survivor annuity income to your spouse, unless your spouse waives the right. Other income options may become available in the future, subject to the terms of your retirement plan and relevant federal and state laws. For more information about any annuity option, please contact us.
Receiving Lump Sum Payments (Retirement Transition Benefit):If your employer’s plan allows, you may be able to receive a single sum payment of up to 10 percent of the value of any part of an accumulation being converted to annuity income on the annuity starting date. (This does not apply to IRAs.) Of course, if your employer’s plan allows cash withdrawals, you can take a larger amount (up to 100 percent) of your Real Estate Account accumulation as a cash payment. The retirement transition benefit will be subject to current federal income tax requirements and possible early distribution penalties. See “Taxes” on page 119.
114 Prospectus § TIAA Real Estate Account
If you haven’t picked an income option when the annuity starting date arrives for your contract, TIAA usually will assume you want theone-life annuity with 10-year guaranteed periodif you’re unmarried, subject to the terms of your plan, paid from TIAA’s traditional annuity. If you’re married, we may assume for you asurvivor annuity with half-benefit to annuity partner with a 10-Year guaranteed period, with your spouse as your annuity partner, paid from TIAA’s traditional annuity. If you haven’t picked an income option when the annuity starting date arrives for your IRA, we may assume you want the minimum distribution option annuity.
TRANSFERS DURING THE ANNUITY PERIOD
After you begin receiving annuity income, you can transfer all or part of the future annuity income payable once each calendar quarter (i) from the Real Estate Account into a “comparable annuity” payable from a CREF or TIAA account or TIAA’s traditional annuity, or (ii) from a CREF account into a comparable annuity payable from the Real Estate Account. Comparable annuities are those which are payable under the same income option, and have the same first and second annuitant, and remaining guaranteed period.
We’ll process your transfer on the business day we receive your request in good order. You can also choose to have a transfer take effect at the close of any future business day. Transfers under the annual income payment method will affect your annuity payments beginning on the May 1 following the March 31 which is on or after the effective date of the transfer. Transfers under the monthly income payment method and all transfers into TIAA’s traditional annuity will affect your annuity payments beginning with the first payment due after the monthly payment valuation day that is on or after the transfer date. You can switch between the annual and monthly income change methods, and the switch will go into effect on the following March 31.
ANNUITY PAYMENTS
The amount of annuity payments we pay you or your beneficiary (annuitant) will depend upon the number and value of the annuity units payable. The number of annuity units is first determined on the day before the annuity starting date. The amount of the annuity payments will change according to the income change method chosen.
Under the annual income change method, the value of an annuity unit for payments is redetermined on March 31 of each year — the payment valuation day. Annuity payments change beginning May 1. The change reflects the net investment experience of the Real Estate Account. The net investment experience for the twelve months following each March 31 revaluation will be reflected in the following year’s value. Under the monthly income change method, the value of an annuity unit for payments is determined on the payment valuation day, which is the 20th day of the month preceding the payment due date or, if the 20th is not a business day, the preceding business day. The monthly changes in the value of an annuity unit reflect the net investment experience of the Real Estate Account. The formulas for calculating the number and value of annuity units payable are described below.
TIAA Real Estate Account § Prospectus 115
Calculating the Number of Annuity Units Payable:When a participant or a beneficiary converts the value of all or a portion of his or her accumulation into an income-paying contract, the number of annuity units payable from the Real Estate Account under an income change method is determined by dividing the value of the Account accumulation to be applied to provide the annuity payments by the product of the annuity unit value for that income change method and an annuity factor. The annuity factor as of the annuity starting date is the value of an annuity in the amount of $1.00 per month beginning on the first day such annuity units are payable, and continuing for as long as such annuity units are payable.
The annuity factor will reflect interest assumed at the effective annual rate of 4 percent, and the mortality assumptions for the person(s) on whose life (lives) the annuity payments will be based. Mortality assumptions will be based on the then-current settlement mortality schedules for this Account. Annuitants bear no mortality risk under their contracts — actual mortality experience will not reduce annuity payments after they have started. TIAA may change the mortality assumptions used to determine the number of annuity units payable for any future accumulations converted to provide annuity payments.
The number of annuity units payable under an income change method under your contract will be reduced by the number of annuity units you transfer out of that income change method under your contract. The number of annuity units payable will be increased by any internal transfers you make to that income change method under your contract.
Value of Annuity Units:The Real Estate Account’s annuity unit value is calculated separately for each income change method for each business day and for the last calendar day of each month. The annuity unit value for each income change method is determined by updating the annuity unit value from the previous valuation day to reflect the net investment performance of the Account for the current valuation period relative to the 4 percent assumed investment return. In general, your payments will increase if the performance of the Account is greater than 4 percent and decrease if the value is less than 4 percent. The value is further adjusted to take into account any changes expected to occur in the future at revaluation either once a year or once a month, assuming the Account will earn the 4 percent assumed investment return in the future.
The initial value of the annuity unit for a new annuitant is the value determined as of the day before annuity payments start.
For participants under the annual income change method, the value of the annuity unit for payment remains level until the following May 1. For those who have already begun receiving annuity income as of March 31, the value of the annuity unit for payments due on and after the next succeeding May 1 is equal to the annuity unit value determined as of such March 31.
For participants under the monthly income change method, the value of the annuity unit for payments changes on the payment valuation day of each month for the payment due on the first of the following month.
116 Prospectus § TIAA Real Estate Account
Further, certain variable annuity payouts might not be available if issuing the payout annuity would violate state law.
TIAA reserves the right, subject to approval by the Board of Trustees, to modify the manner in which the number and/or value of annuity units is calculated in the future. No such modification will reduce any participant’s benefit once the participant’s annuitization period has commenced.
AVAILABILITY; CHOOSING BENEFICIARIES
Subject to the terms of your employer’s plan, TIAA may pay death benefits if you or your annuity partner dies. When you purchase your annuity contract, you name one or more beneficiaries to receive the death benefit if you die. You can change your beneficiaries anytime before you die, and, unless you instruct otherwise, your annuity partner can do the same after your death.
YOUR SPOUSE’S RIGHTS
Your choice of beneficiary for death benefits may, in some cases, be subject to the consent of your spouse. Similarly, if you are married at the time of your death, federal law may require a portion of the death benefit be paid to your spouse even if you have named someone else as beneficiary. If you die without having named any beneficiary, any portion of your death benefit not payable to your spouse will go to your estate.
AMOUNT OF DEATH BENEFIT
If you die during the accumulation period, the death benefit is the amount of your accumulation. If you and your annuity partner die during the annuity period while payments are still due under a fixed-period annuity or for the remainder of a guaranteed period, the death benefit is the present value, based on interest at the effective annual rate of 4%, of the unit annuity payments due for the remainder of the period.
PAYMENT OF DEATH BENEFIT
To authorize payment and pay a death benefit, we must have received all necessary forms and documentation, including proof of death and the selection of the method of payment.
METHODS OF PAYMENT OF DEATH BENEFITS
Generally, you can choose for your beneficiary the method we’ll use to pay the death benefit, but few participants do this. If you choose a payment method, you can also prevent your beneficiaries from changing it. Most people leave the choice to their beneficiaries. We can prevent any choice if its initial payment is less than $25. If death occurs while your contract is in the accumulation stage, in most cases
TIAA Real Estate Account § Prospectus 117
we can pay the death benefit using the TIAA-CREF Savings & Investment Plan. We won’t do this if you preselected another option or if the beneficiary elects another option. Some beneficiaries aren’t eligible for the TIAA-CREF Savings & Investment Plan. If your beneficiary isn’t eligible and doesn’t specifically tell us to start paying death benefits within a year of your death, we can start making payments to them over five years using the fixed-period annuity method of payment.
Payments During the Accumulation Period:Currently, the available methods of payment for death benefits from funds in the accumulation period are:
|
|
|
| • | Single-Sum Payment,in which the entire death benefit is paid to your beneficiary at once; |
|
|
|
| • | One-Life Annuity with or without Guaranteed Period,in which the death benefit is paid monthly for the life of the beneficiary or through the guaranteed period; |
|
|
|
| • | Annuity for a Fixed Period of 5 to 30 years (not available under Retirement Choice or Retirement Choice Plus),in which the death benefit is paid for a fixed period; |
|
|
|
| • | Accumulation-Unit Deposit Option,which pays a lump sum at the end of a fixed period, ordinarily two to five years, during which period the accumulation units deposited participate in the Account’s investment experience (generally the death benefit value must be at least $5,000); (This option is not available under all contracts) and |
|
|
|
| • | Minimum Distribution Option (also called the TIAA-CREF Savings & Investment Plan),which automatically pays income according to the Internal Revenue Code’s minimum distribution requirements (not available under Retirement Choice or Retirement Choice Plus). It operates in much the same way as the MDO annuity income option. It’s possible, under this method, that your beneficiary won’t receive income for life. |
Death benefits are usually paid monthly (unless you chose a single-sum method of payment), but your beneficiary can switch them to quarterly, semi-annual, or annual payments.
Payments During the Annuity Period:If you and your annuity partner die during the annuity period, your beneficiary can choose to receive any remaining guaranteed periodic payments due under your contract. Alternatively, your beneficiary can choose to receive the commuted value of those payments in a single sum unless you have indicated otherwise. The amount of the commuted value will be different than the total of the periodic payments that would otherwise be paid.
Ordinarily, death benefits are subject to federal estate tax. Generally, if taken as a lump sum, death benefits would be taxed like complete withdrawals. If taken as annuity benefits, death benefits would be taxed like annuity payments. For more information on death benefits, see the discussion under “Taxes” below, or for further detail, contact TIAA.
118 Prospectus § TIAA Real Estate Account
This section offers general information concerning federal taxes. It doesn’t cover every situation. Tax treatment varies depending on the circumstances, and state and local taxes may also be involved. For complete information on your personal tax situation, check with a qualified tax advisor.
HOW THE REAL ESTATE ACCOUNT IS TREATED FOR TAX PURPOSES
The Account is not a separate taxpayer for purposes of the Internal Revenue Code — its earnings are taxed as part of TIAA’s operations. Although TIAA is not expected to owe any federal income taxes on the Account’s earnings, if TIAA does incur taxes attributable to the Account, it may make a corresponding charge against the Account.
TAXES IN GENERAL
During the accumulation period, Real Estate Account premiums paid in before-tax dollars, employer contributions and earnings attributable to these amounts are not taxed until they’re withdrawn. Annuity payments, single-sum withdrawals, systematic withdrawals, and death benefits are usually taxed as ordinary income. Premiums paid in after-tax dollars aren’t taxable when withdrawn, but earnings attributable to these amounts are taxable unless those amounts are contributed as Roth contributions to a 401(a) or 403(b) plan and certain criteria are met before the amounts (and the income on the amounts) are withdrawn. Death benefits are usually also subject to federal estate and state estate or inheritance taxation. Generally, transfers between qualified retirement plans are not taxed. Generally, contributions you can make under an employer’s plan are limited by federal tax law. Employee voluntary salary reduction contributions and Roth after-tax contributions to 403(b) and 401(k) plans are limited in the aggregate to $16,500 per year ($22,000 per year if you are age 50 or older). Certain long-term employees may be able to defer up to $19,500 per year in a 403(b) plan ($25,000 per year if you are age 50 or older). Contributions to Classic and Roth IRAs, other than rollover contributions, cannot generally exceed $5,000 per year ($6,000 per year for taxpayers age 50 or older). The maximum contribution limit to a 457(b) non-qualified deferred compensation plan for employees of state and local governments is $16,500 ($22,000 if you are age 50 or older). Special catch-up rules may permit a higher contribution in one or more of the last three years prior to an individual’s normal retirement age under the plan.
Note that the dollar limits listed above are for 2010; different dollar limits may apply in future years.
EARLY DISTRIBUTIONS
If you want to withdraw funds or begin receiving income from any 401(a), 403(a), or 403(b) retirement plan or an IRA before you reach age 59½, you may have to pay a 10 percent early distribution tax on the taxable amount.
TIAA Real Estate Account § Prospectus 119
Distributions from a Roth IRA generally are not taxed, except that, once aggregate distributions exceed contributions to the Roth IRA, income tax and a 10% penalty tax may apply to distributions made (1) before age 59½ (subject to certain exceptions) or (2) during the five taxable years starting with the year in which the first contribution is made to any Roth IRA. A 10 percent penalty tax may apply to amounts attributable to a conversion from an IRA if they are distributed during the five taxable years beginning with the year in which the conversion was made. You won’t have to pay this tax in certain circumstances. Early distributions from 457(b) plans are not subject to a 10% penalty tax unless, in the case of a governmental 457(b) plan, the distribution includes amounts rolled over to the plan from an IRA, 401(a)/403(a), or 403(b) plan. Consult your tax advisor for more information.
MINIMUM DISTRIBUTION REQUIREMENTS
In most cases, payments from qualified contracts must begin by April 1 of the year after the year you reach age 70½, or if later, by retirement. For Classic IRAs, and with respect to 5 percent or more owners of the business covered by a Keogh plan, payments must begin by April 1 of the year after you reach age 70½. Under the terms of certain retirement plans, the plan administrator may direct us to make the minimum distributions required by law even if you do not elect to receive them. In addition, if you don’t begin distributions on time, you may be subject to a 50 percent excise tax on the amount you should have received but did not. Roth IRAs are generally not subject to these rules requiring minimum distributions during your lifetime. You are responsible for requesting distributions that comply with the minimum distribution rules.
Note that for 2010, the minimum distribution requirement under the Internal Revenue Code is not suspended for Internal Revenue Code section 401(a), 403(a), 403(b), governmental 457(b) plans and IRAs. The minimum distribution requirement was suspended with respect to such plans in 2009 under The Worker, Retiree and Employer Recovery Act of 2008. Please consult your tax advisor for more information.
WITHHOLDING ON DISTRIBUTIONS
If we pay an “eligible rollover” distribution directly to you, federal law requires us to withhold 20 percent from the taxable portion. On the other hand, if we roll over such a distribution directly to an IRA or employer plan, we do not withhold any federal income tax. The 20 percent withholding also does not apply to certain types of distributions that are not considered eligible rollovers such as payments from IRAs, hardship withdrawals, lifetime annuity payments, substantially equal periodic payments over your life expectancy or over 10 or more years, or minimum distribution payments.
For the taxable portion of non-eligible rollover distributions, we will usually withhold federal income taxes unless you tell us not to and you are eligible to avoid withholding. However, if you tell us not to withhold but we don’t have your
120 Prospectus § TIAA Real Estate Account
taxpayer identification number on file, we still are required to deduct taxes. These rules also apply to distributions from governmental 457(b) plans. In general, all amounts received under a private 457(b) plan are taxable and are subject to federal income tax withholding as wages. Nonresident aliens who pay U.S. taxes are subject to different withholding rules.
SPECIAL RULES FOR AFTER-TAX RETIREMENT ANNUITIES
If you paid premiums directly to an RA and the premiums are not subject to your employer’s retirement plan, or if you have been issued an ATRA contract, the following general discussion describes our understanding of current federal income tax law that applies to these accumulations. This discussion does not apply to premiums paid on your behalf under the terms of your employer’s retirement plan. It also does not cover every situation and does not address all possible circumstances.
In General.These annuities are generally not taxed until distributions occur. When distributions occur, they are taxed as follows:
|
|
|
| • | Withdrawals, including withdrawals of the entire accumulation under the contract, are generally taxed as ordinary income to the extent that the contract’s value is more than your investment in the contract (i.e., what you have paid into it). |
|
|
|
| • | Annuity payments are generally treated in part as taxable ordinary income and in part as non-taxable recovery of your investment in the contract until you recover all of your investment in the contract. After that, annuity payments are taxable in full as ordinary income. |
Required Distributions.In general, if you die after you start your annuity payments but before the entire interest in the annuity contract has been distributed, the remaining portion must be distributed at least as quickly as under the method in effect on the date of your death. If you die before your annuity payments begin, the entire interest in your annuity contract generally must be distributed within five years after your death, or be used to provide payments that begin within one year of your death and that will be made for the life of your designated beneficiary or for a period not extending beyond the life expectancy of your designated beneficiary. The “designated beneficiary” refers to a natural person you designate and to whom ownership of the contract passes because of your death. However, if the designated beneficiary is your surviving spouse, your surviving spouse can continue the annuity contract as the new owner.
Death Benefit Proceeds.Death benefit proceeds are taxed like withdrawals of the entire accumulation in the contract if distributed in a single sum and are taxed like annuity payments if distributed as annuity payments. Your beneficiary may be required to take death benefit proceeds within a certain time period.
Penalty Tax on Certain Distributions.You may have to pay a penalty tax (10 percent of the amount treated as taxable income) on distributions you take prior to age 59½. There are some exceptions to this rule, however. You should consult a tax advisor for information about those exceptions.
TIAA Real Estate Account § Prospectus 121
Withholding.Annuity distributions are generally subject to federal income tax withholding but most recipients can usually choose not to have the tax withheld.
Certain Designations or Exchanges.Designating an annuitant, payee or other beneficiary, or exchanging a contract may have tax consequences that should be discussed with a tax advisor before you engage in any of these transactions.
Multiple Contracts.All non-qualified deferred annuity contracts issued by us and certain of our affiliates to the same owner during a calendar year must generally be treated as a single contract in determining when and how much income is taxable and how much income is subject to the 10 percent penalty tax (see above).
Diversification Requirements.The investments of the Real Estate Account must be “adequately diversified” in order for the ATRA Contracts to be treated as annuity contracts for Federal income tax purposes. It is intended that Real Estate Account will satisfy these diversification requirements.
Owner Control.In certain circumstances, owners of non-qualified variable annuity contracts have been considered for Federal income tax purposes to be the owners of the assets of the separate account supporting their contracts due to their ability to exercise investment control over those assets. When this is the case, the contract owners have been currently taxed on income and gains attributable to the variable account assets. While we believe that the ATRA Contracts do not give you investment control over assets in the Real Estate Account or any other separate account underlying your ATRA Contract, we reserve the right to modify the ATRA Contracts as necessary to prevent you from being treated as an owner of the assets in the Real Estate Account.
FEDERAL ESTATE TAXES
While no attempt is being made to discuss the Federal estate tax implications of the Contract, you should keep in mind that the value of an annuity contract owned by a decedent and payable to a beneficiary by virtue of surviving the decedent is included in the decedent’s gross estate. Depending on the terms of the annuity contract, the value of the annuity included in the gross estate may be the value of the lump sum payment payable to the designated beneficiary or the actuarial value of the payments to be received by the beneficiary. Consult an estate planning advisor for more information.
GENERATION-SKIPPING TRANSFER TAX
Under certain circumstances, the Internal Revenue Code may impose a “generation skipping transfer tax” when all or part of an annuity contract is transferred to, or a death benefit is paid to, an individual two or more generations younger than the Owner. Regulations issued under the Code may require us to deduct the tax from your Contract, or from any applicable payment, and pay it directly to the IRS.
122 Prospectus § TIAA Real Estate Account
RESIDENTS OF PUERTO RICO
The IRS has announced that income from an annuity received by residents of Puerto Rico is U.S.-source income that is generally subject to United States federal income tax.
ANNUITY PURCHASES BY NONRESIDENT ALIENS
The discussion above provides general information regarding U.S. federal income tax consequences to annuity purchasers that are U.S. citizens or residents. Purchasers that are not U.S. citizens or residents will generally be subject to U.S. federal withholding tax on taxable distributions from annuity contracts at a 30% rate, unless a lower treaty rate applies. In addition, purchasers may be subject to state and/or municipal taxes and taxes that may be imposed by the purchaser’s country of citizenship or residence. Prospective purchasers who are nonresident aliens are advised to consult with a qualified tax adviser regarding U.S., state, and foreign taxation with respect to an annuity contract purchase.
SPECIAL RULES FOR WITHDRAWALS TO PAY ADVISORY FEES
If you have arranged for us to pay advisory fees to your financial advisor from your accumulations, those partial withdrawals generally will not be treated as taxable distributions as long as:
|
|
|
| • | the payment is for expenses that are ordinary and necessary; |
|
|
|
| • | the payment is made from a Section 401 or 403 retirement plan or an IRA; |
|
|
|
| • | your financial advisor’s payment is only made from the accumulations in your retirement plan or IRA, as applicable, and not directly by you or anyone else, under the agreement with your financial advisor; and |
|
|
|
| • | once advisory fees begin to be paid from your retirement plan or IRA, as applicable, you continue to pay those fees solely from your plan or IRA, as applicable, and not from any other source. |
However, withdrawals to pay advisory fees to your financial advisor from your accumulations under an ATRA contract will be treated as taxable distributions.
FOREIGN TAX CREDIT
The Account may be subject to foreign taxes on investments in other countries, including capital gains tax on any appreciation in value when a real estate investment in a foreign jurisdiction is eventually sold. Any potential tax impact will not be reflected in the valuation of the foreign investment and may not be fully reflected in a tax accrual by the Account. Upon payment of any foreign tax by the Account, TIAA will receive a foreign tax credit, which may be available to reduce its U.S. tax burden. The Account is a segregated asset account of TIAA and incurs no material federal income tax attributable to the investment performance of the Account under the Internal Revenue Code. As a result, the Account will not realize any tax benefit from any foreign tax credit that may be available to TIAA; however, to the extent that TIAA can utilize the foreign tax credit in its
TIAA Real Estate Account § Prospectus 123
consolidated tax return, TIAA will reimburse the Account for that benefit at that time. The extent to which TIAA is able to utilize the credits when the Account incurs a foreign tax will determine the amount and timing of reimbursement from TIAA to the Account for the resulting foreign tax credit. The Account’s unit values may be adversely impacted in the future if a foreign tax is paid, and TIAA is not able to utilize (and therefore does not reimburse the Account for), either immediately or in the future, the foreign tax credit earned as a result of the foreign tax paid by the Account.
POSSIBLE TAX LAW CHANGES
Although the likelihood of legislative changes is uncertain, there is always the possibility that the tax treatment of your contract could change by legislation or otherwise. Consult a tax advisor with respect to legislative developments and their effect on your contract.
We have the right to modify the contract in response to legislative changes that could otherwise diminish the favorable tax treatment that annuity contract owners currently receive. We make no guarantee regarding the tax status of any contract and do not intend the above discussion as tax advice.
MAKING CHOICES AND CHANGES
You may have to make certain choices or changes (e.g.,changing your income option, making a cash withdrawal) by written notice satisfactory to us and received at our home office or at some other location that we have specifically designated for that purpose. When we receive a notice of a change in beneficiary or other person named to receive payments, we’ll execute the change as of the date it was signed, even if the signer has died in the meantime. We execute all other changes as of the date received.
TELEPHONE AND INTERNET TRANSACTIONS
You can use our Automated Telephone Service (ATS) or the TIAA-CREF Web Center’s account access feature to check your account balances, transfer to TIAA’s traditional annuity, TIAA Access variable annuity accounts or CREF, and/or allocate future premiums among the accounts and funds available to you through TIAA-CREF. Note that, currently, all requests to make lump-sum transfers out of the Real Estate Account to another investment option (whether or not affiliated with TIAA or CREF) may not be made by means of TIAA-CREF’s internet website. You will be asked to enter your Personal Identification Number (PIN) and social security number for both systems. (You can establish a PIN by calling us.) Both will lead you through the transaction process and will use reasonable procedures to confirm that instructions given are genuine. If we use such procedures, we are not responsible for incorrect or fraudulent transactions. All transactions made over the ATS and Internet are electronically recorded.
124 Prospectus § TIAA Real Estate Account
To use the ATS, you need a touch-tone phone. The toll free number for the ATS is 800 842-2252. To use the Internet, go to the account access feature of the TIAA-CREF Web Center at www.tiaa-cref.org. We can suspend or terminate your ability to transact by telephone, over the Internet, or by fax at any time, for any reason.
VOTING RIGHTS
You don’t have the right to vote on the management and operation of the Account directly; however, you may send ballots to advise the TIAA Board of Overseers about voting for nominees for the TIAA Board of Trustees.
ELECTRONIC PROSPECTUS
If you received this prospectus electronically and would like a paper copy, please call 877 518-9161 and we will send it to you. Under certain circumstances where we are legally required to deliver a prospectus to you, we cannot send you a prospectus electronically unless you’ve consented.
HOUSEHOLDING
To lower costs and eliminate duplicate documents sent to your home, we may begin mailing only one copy of the Account’s prospectus, prospectus supplements or any other required documents to your household, even if more than one participant lives there. If you would prefer to continue receiving your own copy of any of these documents, you may call us toll-free at 877 518-9161, or write us.
MISCELLANEOUS POLICIES
Amending the Contracts:The contract may be amended by agreement of TIAA and the contractholder without the consent of any other person, provided that such change does not reduce any benefit purchased under the contract up to that time. Any endorsement or amendment of the contract, waiver of any of its provisions, or change in rate schedule will be valid only if in writing and signed by an executive officer of TIAA.
If You’re Married:If you’re married, you may be required by law or your employer’s plan to get advance written consent from your spouse before we make certain transactions for you. If you’re married at your annuity starting date, you may also be required by law or your employer’s plan to choose an income option that provides survivor annuity income to your spouse, unless he or she waives that right in writing. There are limited exceptions to the waiver requirement.
Texas Optional Retirement Program Restrictions:If you’re in the Texas Optional Retirement Program, you or your beneficiary can redeem some or all of your accumulation only if you retire, die, or leave your job in the state’s public institutions of higher education.
Assigning Your Contract:Generally, neither you nor your beneficiaries can assign your ownership of a TIAA retirement contract to anyone else.
Overpayment of Premiums:If your employer mistakenly sends more premiums on your behalf than you’re entitled to under your employer’s retirement
TIAA Real Estate Account § Prospectus 125
plan or the Internal Revenue Code, we’ll refund them to your employer as long as we’re requested to do so (in writing) before you start receiving annuity income.
Any time there’s a question about premium refunds, TIAA will rely on information from your employer. If you’ve withdrawn or transferred the amounts involved from your accumulation, we won’t refund them.
Errors or Omissions:We reserve the right to correct any errors or omissions on any form, report, or statement that we send you.
Payment to an Estate, Guardian, Trustee, etc.:We reserve the right to pay in one sum the commuted value of any benefits due an estate, corporation, partnership, trustee, or other entity not a natural person. Neither TIAA nor the Account will be responsible for the conduct of any executor, trustee, guardian, or other third party to whom payment is made.
Benefits Based on Incorrect Information:If the amounts of benefits provided under a contract were based on information that is incorrect, benefits will be recalculated on the basis of the correct data. If the Account has overpaid or underpaid, appropriate adjustments will be made.
Proof of Survival:We reserve the right to require satisfactory proof that anyone named to receive benefits under a contract is living on the date payment is due. If we have not received this proof after we request it in writing, the Account will have the right to make reduced payments or to withhold payments entirely until such proof is received.
The annuity contracts are offered continuously by Services, which is registered with the SEC as a broker-dealer and a registered investment adviser and is a member of the Financial Industry Regulatory Authority (“FINRA”). Teachers Personal Investors Services, Inc. (TPIS), also a broker-dealer registered with the SEC and a member of FINRA, may participate in the distribution of the contracts on a limited basis. Services and TPIS are direct or indirect wholly owned subsidiaries of TIAA. Their addresses are at 730 Third Avenue, New York, NY 10017-3206. No commissions are paid for distributing the contracts.
TIAA, the Real Estate Account, and the contracts (including any proposed modification thereto) are subject to regulation by the NYID as well as by the insurance regulatory authorities of certain other states and jurisdictions.
TIAA and the Real Estate Account must file with the NYID both quarterly and annual statements. The Account’s books and assets are subject to review and examination by the NYID at all times, and a full examination into the affairs of the Account is made at least every five years. In addition, a full examination of the Real Estate Account operations is usually conducted periodically by some other states.
126 Prospectus § TIAA Real Estate Account
All matters involving state law and relating to the contracts, including TIAA’s right to issue the contracts, have been passed upon by Jonathan Feigelson, Senior Vice President and General Counsel of TIAA. Dechert LLP has provided legal advice to the Account related to certain matters under the federal securities laws.
The financial statements as of December 31, 2009 and December 31, 2008 and for each of the three years in the period ended December 31, 2009 included in this Prospectus have been so included in reliance on the report of PricewaterhouseCoopers LLP, an independent registered public accounting firm, given on the authority of said firm as experts in auditing and accounting.
INFORMATION AVAILABLE AT THE SEC
The Account has filed with the SEC a registration statement under the Securities Act of 1933, which contains this prospectus and additional information related to the offering described in this prospectus. The Account also files annual, quarterly, and current reports, along with other information, with the SEC, as required by the Securities Exchange Act of 1934. You may read and copy the full registration statement, and any reports and information filed with the SEC for the Account, at the SEC’s Public Reference Room at 100 F Street, N.E., Washington, DC 20549. This information can also be obtained through the SEC’s website on the Internet (www.sec.gov). The public may obtain information on the operation of the SEC’s Public Reference Room by calling the SEC at 800 SEC-0330.
OTHER REPORTS TO PARTICIPANTS
TIAA will mail to each participant in the Real Estate Account periodic reports providing information relating to their accumulations in the Account, including premiums paid, number and value of accumulations, and withdrawals or transfers during the period, as well as such other information as may be required by applicable law or regulations. Further information may be obtained from TIAA at 730 Third Avenue, New York, NY 10017-3206.
CUSTOMER COMPLAINTS
Customer complaints may be directed to our Participant Relations Unit, P. O. Box 1259, Charlotte, NC 28201-1259, telephone 800 842-2776.
TIAA Real Estate Account § Prospectus 127
The financial statements of the TIAA Real Estate Account and condensed unaudited statutory-basis financial statements of TIAA follow within this prospectus. The full audited statutory-basis financial statements of TIAA, which are incorporated into this prospectus by reference, are available upon request by calling 877 518-9161.
The financial statements of TIAA should be distinguished from the financial statements of the Account and should be considered only as bearing on the ability of TIAA to meet its obligations under the contracts. They should not be considered as bearing upon the assets held in the Account.
|
|
|
|
|
|
TIAA REAL ESTATE ACCOUNT | |
| |
|
|
|
|
|
|
|
|
|
|
|
|
|
|
|
|
|
|
TEACHERS INSURANCE AND ANNUITY ASSOCIATION OF AMERICA | |
| [To be filed via Amendment] |
128 Prospectus § TIAA Real Estate Account
REPORT OF MANAGEMENT RESPONSIBILITY
To the Participants of the TIAA Real Estate Account:
The accompanying financial statements of the TIAA Real Estate Account (“Account”) of Teachers Insurance and Annuity Association of America (“TIAA”) are the responsibility of TIAA’s management. They have been prepared in accordance with accounting principles generally accepted in the United States of America and have been presented fairly and objectively in accordance with such principles.
TIAA has established and maintains an effective system of internal controls over financial reporting designed to provide reasonable assurance that assets are properly safeguarded, that transactions are properly executed in accordance with management’s authorization, and to carry out the ongoing responsibilities of management for reliable financial statements. In addition, TIAA’s internal audit personnel provide regular reviews and assessments of the internal controls and operations of the Account, and the Senior Vice President of Internal Audit regularly reports to the Audit Committee of the TIAA Board of Trustees.
The independent registered public accounting firm of PricewaterhouseCoopers LLP has audited the accompanying financial statements for the years ended December 31, 2009, 2008 and 2007. To maintain auditor independence and avoid even the appearance of a conflict of interest, it continues to be the Account’s policy (consistent with TIAA’s specific auditor independence policies, which are designed to avoid such conflicts) that any management advisory or consulting services would be obtained from a firm other than the independent accounting firm. The independent auditors’ report expresses an independent opinion on the fairness of presentation of the Account’s financial statements.
The Audit Committee of the TIAA Board of Trustees, comprised entirely of independent, non-management trustees, meets regularly with management, representatives of the independent registered public accounting firm and internal audit group personnel to review matters relating to financial reporting, internal controls and auditing. In addition to the annual independent audit of the Account’s financial statements, the New York State Insurance Department and other state insurance departments regularly examine the operations and financial statements of the Account as part of their periodic corporate examinations.
|
|
|
March 18, 2010 |
|
|
|
|
|
|
|
|
|
|
|
Roger W. Ferguson, Jr. |
| Georganne C. Proctor |
President and |
| Executive Vice President and |
Chief Executive Officer |
| Chief Financial Officer |
|
|


TIAA Real Estate Account § Prospectus 129
To the Participants of the TIAA Real Estate Account:
The TIAA Audit Committee (“Committee”) oversees the financial reporting process of the TIAA Real Estate Account (“Account”) on behalf of TIAA’s Board of Trustees. The Committee operates in accordance with a formal written charter (copies of which are available upon request) which describes the Audit Committee’s responsibilities. All members of the Committee are independent, as defined under the listing standards of the New York Stock Exchange.
Management has the primary responsibility for the Account’s financial statements, development and maintenance of a strong system of internal controls and disclosure controls, and compliance with applicable laws and regulations. In fulfilling its oversight responsibilities, the Committee reviewed and approved the audit plans of the internal audit group and the independent registered public accounting firm in connection with their respective audits of the Account. The Committee also meets regularly with the internal audit group and the independent registered public accounting firm, both with and without management present, to discuss the results of their examinations, their evaluation of internal controls, and the overall quality of financial reporting. As required by its charter, the Committee will evaluate rotation of the independent registered public accounting firm whenever circumstances warrant, but in no event will the evaluation be later than between their fifth and tenth years of service.
The Committee reviewed and discussed the accompanying audited financial statements with management, including a discussion of the quality and appropriateness of the accounting principles and financial reporting practices followed, the reasonableness of significant judgments, and the clarity and completeness of disclosures in the financial statements. The Committee has also discussed the audited financial statements with PricewaterhouseCoopers LLP, the independent registered public accounting firm responsible for expressing an opinion on the conformity of these audited financial statements with accounting principles generally accepted in the United States of America.
The discussion with PricewaterhouseCoopers LLP focused on their judgments concerning the quality and appropriateness of the accounting principles and financial reporting practices followed by the Account, the clarity and completeness of the financial statements and related disclosures, and other significant matters, such as any significant changes in accounting policies, internal controls, management judgments and estimates, and the nature of any uncertainties or unusual transactions. In addition, the Committee discussed with PricewaterhouseCoopers LLP the auditors’ independence from management and the Account, and has received a written disclosure regarding such independence, as required by the Securities and Exchange Commission.
130 Prospectus § TIAA Real Estate Account
Based on the review and discussions referred to above, the Committee has approved the release of the accompanying audited financial statements for publication and filing with appropriate regulatory authorities.
Rosalie J. Wolf, Audit Committee Chair
Jeffrey R. Brown, Audit Committee Member
Lawrence H. Linden, Audit Committee Member
Donald K. Peterson, Audit Committee Member
David L. Shedlarz, Audit Committee Member
March 18, 2010
TIAA Real Estate Account § Prospectus 131
STATEMENTS OF ASSETS AND LIABILITIES
TIAA REAL ESTATE ACCOUNT
|
|
|
|
|
|
|
|
|
|
| |||||
|
| December 31, |
| ||||
|
| ||||||
(In thousands, except per accumulation unit amounts) |
| 2009 |
| 2008 |
| ||
|
|
|
|
|
|
|
|
ASSETS |
|
|
|
|
|
|
|
Investments, at fair value: |
|
|
|
|
|
|
|
Real estate properties |
| $ | 7,437,344 |
| $ | 10,305,040 |
|
Real estate joint ventures and limited partnerships |
|
| 1,514,876 |
|
| 2,463,196 |
|
Marketable securities |
|
| 671,267 |
|
| 511,711 |
|
Mortgage loan receivable |
|
| 71,273 |
|
| 71,767 |
|
Total investments |
|
| 9,694,760 |
|
| 13,351,714 |
|
Cash and cash equivalents |
|
| 24,859 |
|
| 22,127 |
|
Due from investment advisor |
|
| 4,290 |
|
| — |
|
Other |
|
| 188,794 |
|
| 203,113 |
|
TOTAL ASSETS |
|
| 9,912,703 |
|
| 13,576,954 |
|
|
|
|
|
|
|
|
|
LIABILITIES |
|
|
|
|
|
|
|
Mortgage loans payable—Note 8 (principal outstanding: $1,907,090 and $1,910,121) |
|
| 1,858,110 |
|
| 1,830,040 |
|
Payable for securities transactions |
|
| 49 |
|
| 108 |
|
Due to investment advisor |
|
| — |
|
| 9,892 |
|
Accrued real estate property level expenses |
|
| 151,808 |
|
| 203,874 |
|
Security deposits held |
|
| 22,822 |
|
| 24,116 |
|
TOTAL LIABILITIES |
|
| 2,032,789 |
|
| 2,068,030 |
|
|
|
|
|
|
|
|
|
NET ASSETS |
|
|
|
|
|
|
|
Accumulation Fund |
|
| 7,636,115 |
|
| 11,106,246 |
|
Annuity Fund |
|
| 243,799 |
|
| 402,678 |
|
TOTAL NET ASSETS |
| $ | 7,879,914 |
| $ | 11,508,924 |
|
NUMBER OF ACCUMULATION UNITS OUTSTANDING—Notes 9 and 10 |
|
| 39,473 |
|
| 41,542 |
|
NET ASSET VALUE, PER ACCUMULATION UNIT—Note 9 |
| $ | 193.45 |
| $ | 267.35 |
|
|
|
|
|
|
|
| |
|
|
132 Prospectus § TIAA Real Estate Account | See notes to financial statements |
TIAA REAL ESTATE ACCOUNT
|
|
|
|
|
|
|
|
|
|
|
|
|
| ||||||||
|
| Years Ended December 31, |
| |||||||
|
| |||||||||
(In thousands) |
| 2009 |
| 2008 |
| 2007 |
| |||
INVESTMENT INCOME |
|
|
|
|
|
|
|
|
|
|
Real estate income, net: |
|
|
|
|
|
|
|
|
|
|
Rental income |
| $ | 948,315 |
| $ | 979,295 |
| $ | 987,434 |
|
Real estate property level expenses and taxes: |
|
|
|
|
|
|
|
|
|
|
Operating expenses |
|
| 238,705 |
|
| 257,351 |
|
| 247,473 |
|
Real estate taxes |
|
| 128,734 |
|
| 132,979 |
|
| 126,926 |
|
Interest expense |
|
| 101,219 |
|
| 88,531 |
|
| 83,623 |
|
Total real estate property level expenses and taxes |
|
| 468,658 |
|
| 478,861 |
|
| 458,022 |
|
Real estate income, net |
|
| 479,657 |
|
| 500,434 |
|
| 529,412 |
|
Income from real estate joint ventures and limited partnerships |
|
| 114,578 |
|
| 116,889 |
|
| 93,724 |
|
Interest |
|
| 1,733 |
|
| 76,444 |
|
| 129,474 |
|
Dividends |
|
| — |
|
| 5,079 |
|
| 12,440 |
|
TOTAL INVESTMENT INCOME |
|
| 595,968 |
|
| 698,846 |
|
| 765,050 |
|
|
|
|
|
|
|
|
|
|
|
|
EXPENSES—NOTE 2: |
|
|
|
|
|
|
|
|
|
|
Investment advisory charges |
|
| 42,521 |
|
| 47,622 |
|
| 49,239 |
|
Administrative and distribution charges |
|
| 35,805 |
|
| 77,577 |
|
| 63,593 |
|
Mortality and expense risk charges |
|
| 4,736 |
|
| 8,116 |
|
| 8,052 |
|
Liquidity guarantee charges |
|
| 12,411 |
|
| 19,725 |
|
| 19,410 |
|
TOTAL EXPENSES |
|
| 95,473 |
|
| 153,040 |
|
| 140,294 |
|
INVESTMENT INCOME, NET |
|
| 500,495 |
|
| 545,806 |
|
| 624,756 |
|
NET REALIZED AND UNREALIZED GAIN (LOSS) ON INVESTMENTS AND MORTGAGE LOANS PAYABLE |
|
|
|
|
|
|
|
|
|
|
Net realized gain (loss) on investments: |
|
|
|
|
|
|
|
|
|
|
Real estate properties |
|
| (281,798 | ) |
| (18,097 | ) |
| 127,835 |
|
Real estate joint ventures and limited partnerships |
|
| — |
|
| (17 | ) |
| 70,765 |
|
Marketable securities |
|
| 1 |
|
| (11,041 | ) |
| 47,180 |
|
Mortgage loans payable |
|
| (371 | ) |
| — |
|
| — |
|
Total realized (loss) gain on investments: |
|
| (282,168 | ) |
| (29,155 | ) |
| 245,780 |
|
Net change in unrealized appreciation (depreciation) on: |
|
|
|
|
|
|
|
|
|
|
Real estate properties |
|
| (2,244,931 | ) |
| (1,905,930 | ) |
| 898,173 |
|
Real estate joint ventures and limited partnerships |
|
| (1,030,179 | ) |
| (702,797 | ) |
| 391,333 |
|
Marketable securities |
|
| 22 |
|
| 15,820 |
|
| (148,659 | ) |
Mortgage loans receivable |
|
| (494 | ) |
| (753 | ) |
| (2,141 | ) |
Mortgage loans payable |
|
| (54,755 | ) |
| 109,791 |
|
| 53,949 |
|
Net change in unrealized (depreciation) appreciation on investments and mortgage loans payable |
|
| (3,330,337 | ) |
| (2,483,869 | ) |
| 1,192,655 |
|
NET REALIZED AND UNREALIZED (LOSS) GAIN ON INVESTMENTS AND MORTGAGE LOANS PAYABLE |
|
| (3,612,505 | ) |
| (2,513,024 | ) |
| 1,438,435 |
|
NET (DECREASE) INCREASE IN NET ASSETS RESULTING FROM OPERATIONS |
| $ | (3,112,010 | ) | $ | (1,967,218 | ) | $ | 2,063,191 |
|
|
|
|
|
|
|
|
|
|
| |
|
|
See notes to financial statements | TIAA Real Estate Account § Prospectus 133 |
STATEMENTS OF CHANGES IN NET ASSETS
TIAA REAL ESTATE ACCOUNT
|
|
|
|
|
|
|
|
|
|
|
|
| Years Ended December 31, |
| |||||||
|
|
| ||||||||
(In thousands) |
| 2009 |
| 2008 |
| 2007 |
| |||
|
|
|
|
|
|
|
|
|
|
|
FROM OPERATIONS |
|
|
|
|
|
|
|
|
|
|
Investment income, net |
| $ | 500,495 |
| $ | 545,806 |
| $ | 624,756 |
|
Net realized (loss) gain on investments |
|
| (282,168 | ) |
| (29,155 | ) |
| 245,780 |
|
Net change in unrealized (depreciation) appreciation on investments and mortgage loans payable |
|
| (3,330,337 | ) |
| (2,483,869 | ) |
| 1,192,655 |
|
NET (DECREASE) INCREASE IN NET ASSETS RESULTING FROM OPERATIONS |
|
| (3,112,010 | ) |
| (1,967,218 | ) |
| 2,063,191 |
|
FROM PARTICIPANT TRANSACTIONS |
|
|
|
|
|
|
|
|
|
|
Premiums |
|
| 703,493 |
|
| 1,008,233 |
|
| 1,186,870 |
|
Purchase of Liquidity Units by TIAA |
|
| 1,058,700 |
|
| 155,600 |
|
| — |
|
Net transfers (to) from TIAA |
|
| (546,270 | ) |
| (1,912,937 | ) |
| 153,137 |
|
Net transfers (to) from CREF Accounts |
|
| (1,207,394 | ) |
| (2,519,837 | ) |
| 832,782 |
|
Net transfers (to) from TIAA-CREF Funds |
|
| (160,181 | ) |
| (207,547 | ) |
| (51,612 | ) |
Annuity and other periodic payments |
|
| (43,805 | ) |
| (99,518 | ) |
| (95,776 | ) |
Withdrawals and death benefits |
|
| (321,543 | ) |
| (608,389 | ) |
| (560,748 | ) |
|
|
|
|
|
|
|
|
|
|
|
NET (DECREASE) INCREASE IN NET ASSETS RESULTING FROM PARTICIPANT TRANSACTIONS |
|
| (517,000 | ) |
| (4,184,395 | ) |
| 1,464,653 |
|
NET (DECREASE) INCREASE IN NET ASSETS |
|
| (3,629,010 | ) |
| (6,151,613 | ) |
| 3,527,844 |
|
|
|
|
|
|
|
|
|
|
|
|
NET ASSETS |
|
|
|
|
|
|
|
|
|
|
Beginning of period |
|
| 11,508,924 |
|
| 17,660,537 |
|
| 14,132,693 |
|
End of period |
| $ | 7,879,914 |
| $ | 11,508,924 |
| $ | 17,660,537 |
|
|
|
134 Prospectus § TIAA Real Estate Account | See notes to financial statements |
TIAA REAL ESTATE ACCOUNT
|
|
|
|
|
|
|
|
|
|
|
|
| Years Ended December 31, |
| |||||||
|
| |||||||||
(In thousands) |
| 2009 |
| 2008 |
| 2007 |
| |||
CASH FLOWS FROM OPERATING ACTIVITIES |
|
|
|
|
|
|
|
|
|
|
Net (decrease) increase in net assets resulting from operations |
| $ | (3,112,010 | ) | $ | (1,967,218 | ) | $ | 2,063,191 |
|
Adjustments to reconcile net (decrease) increase in net assets resulting from operations to net cash provided by (used in) operating activities: |
|
|
|
|
|
|
|
|
|
|
Purchase of real estate properties |
|
| — |
|
| (164,104 | ) |
| (639,704 | ) |
Amortization of discount on debt |
|
| — |
|
| — |
|
| 531 |
|
Capital improvements on real estate properties |
|
| (141,493 | ) |
| (131,926 | ) |
| (136,861 | ) |
Proceeds from sale of real estate properties |
|
| 408,794 |
|
| 93,113 |
|
| 568,120 |
|
Purchases of long term investments |
|
| (81,308 | ) |
| (61,041 | ) |
| (1,136,799 | ) |
Proceeds from sale of long term investments |
|
| — |
|
| 480,952 |
|
| 468,512 |
|
Net purchases in other investments |
|
| (160,084 | ) |
| 2,864,516 |
|
| (1,236,572 | ) |
Decrease in payable for securities transactions |
|
| (59 | ) |
| (758 | ) |
| (353 | ) |
Change in due (from)/due to investment advisor |
|
| (14,182 | ) |
| 21,088 |
|
| (2,734 | ) |
Decrease (increase) in other assets |
|
| 14,319 |
|
| (1,290 | ) |
| 36,052 |
|
(Decrease) increase in accrued real estate property level expenses |
|
| (1,900 | ) |
| 6,801 |
|
| (11,871 | ) |
(Decrease) increase in security deposits held |
|
| (1,294 | ) |
| (516 | ) |
| 5,389 |
|
Net realized loss (gain) on investments and mortgage loans payable |
|
| 282,168 |
|
| 29,155 |
|
| (245,780 | ) |
Net unrealized loss (gain) on investments and mortgage loans payable |
|
| 3,330,337 |
|
| 2,483,869 |
|
| (1,192,655 | ) |
NET CASH PROVIDED BY (USED IN) OPERATING ACTIVITIES |
|
| 523,288 |
|
| 3,652,641 |
|
| (1,461,534 | ) |
|
|
|
|
|
|
|
|
|
|
|
CASH FLOWS FROM FINANCING ACTIVITIES |
|
|
|
|
|
|
|
|
|
|
Mortgage loans proceeds received |
|
| — |
|
| 548,567 |
|
| — |
|
Principal payments of mortgage loans payable |
|
| (3,556 | ) |
| (830 | ) |
| (560 | ) |
Premiums |
|
| 703,493 |
|
| 1,008,233 |
|
| 1,186,870 |
|
Purchase of Liquidity Units by TIAA |
|
| 1,058,700 |
|
| 155,600 |
|
| — |
|
Net transfers (to) from TIAA |
|
| (546,270 | ) |
| (1,912,937 | ) |
| 153,137 |
|
Net transfers to CREF Accounts |
|
| (1,207,394 | ) |
| (2,519,837 | ) |
| 832,782 |
|
Net transfers to TIAA-CREF Funds |
|
| (160,181 | ) |
| (207,547 | ) |
| (51,612 | ) |
Annuity and other periodic payments |
|
| (43,805 | ) |
| (99,518 | ) |
| (95,776 | ) |
Withdrawals and death benefits |
|
| (321,543 | ) |
| (608,389 | ) |
| (560,748 | ) |
NET CASH (USED IN) PROVIDED BY FINANCING ACTIVITIES |
|
| (520,556 | ) |
| (3,636,658 | ) |
| 1,464,093 |
|
NET INCREASE IN CASH |
|
| 2,732 |
|
| 15,983 |
|
| 2,559 |
|
|
|
|
|
|
|
|
|
|
|
|
CASH |
|
|
|
|
|
|
|
|
|
|
Beginning of period |
|
| 22,127 |
|
| 6,144 |
|
| 3,585 |
|
End of period |
| $ | 24,859 |
| $ | 22,127 |
| $ | 6,144 |
|
|
|
|
|
|
|
|
|
|
|
|
SUPPLEMENTAL DISCLOSURES: |
|
|
|
|
|
|
|
|
|
|
Cash paid for interest |
| $ | 102,572 |
| $ | 88,723 |
| $ | 83,063 |
|
Debt assumed in acquisition of properties |
| $ | — |
| $ | — |
| $ | 8,922 |
|
Debt transferred in sale of property |
| $ | (23,500 | ) | $ | — |
| $ | — |
|
|
|
See notes to financial statements | TIAA Real Estate Account § Prospectus 135 |
TIAA REAL ESTATE ACCOUNT
Note 1—Organization and Significant Accounting Policies
Business: The TIAA Real Estate Account (“Account”) is a segregated investment account of Teachers Insurance and Annuity Association of America (“TIAA”) and was established by resolution of TIAA’s Board of Trustees (the “Board”) on February 22, 1995, under the insurance laws of the State of New York, for the purpose of funding variable annuity contracts issued by TIAA. The Account offers individual and group accumulating annuity contracts (with contributions made on a pre-tax or after-tax basis), as well as individual lifetime and term-certain variable payout annuity contracts (including the payment of death benefits to beneficiaries). Investors are entitled to transfer funds to or from the Account, and make withdrawals from the Account on a daily basis under certain circumstances. Funds invested in the Account for each category of contract are expressed in terms of units, and unit values will fluctuate depending on the Account’s performance.
The investment objective of the Account is a favorable long-term rate of return primarily through rental income and capital appreciation from real estate investments owned by the Account. The Account holds real estate properties directly and through subsidiaries wholly-owned by TIAA for the benefit of the Account. The Account also holds interests in real estate joint ventures and limited partnerships in which the Account does not hold a controlling interest; as such, such interests are not consolidated for financial statement purposes. The Account also invests in mortgage loans receivable collateralized by commercial real estate properties. The Account also invests in publicly-traded securities and other instruments to maintain adequate liquidity levels for operating expenses, capital expenditures and to fund benefit payments (withdrawals, transfers and related transactions).
The financial statements were prepared in accordance with accounting principles generally accepted in the United States of America which may require the use of estimates made by management. Actual results may vary from those estimates and such differences may be material. The following is a summary of the significant accounting policies of the Account.
Basis of Presentation: The accompanying financial statements include the Account and those subsidiaries wholly-owned by TIAA for the benefit of the Account. All significant intercompany accounts and transactions between the Account and such subsidiaries have been eliminated.
Accounting for Investments at Fair Value: The Financial Accounting Standards Board (“FASB”) has provided authoritative guidance for fair value measurements and disclosures. Additionally, the guidance defines fair value, establishes a framework for measuring fair value under generally accepted accounting principles in the United States, and requires certain disclosures about
136 Prospectus § TIAA Real Estate Account
|
|
NOTES TO FINANCIAL STATEMENTS | continued |
fair value measurements. This guidance indicates, among other things, that a fair value measurement under an exit price model assumes that the transaction to sell an asset or transfer a liability occurs in the principal market for the asset or liability or, in the absence of a principal market, the most advantageous market for the asset or liability.
This guidance also permits entities to elect to measure financial instruments and certain financial assets and liabilities at fair value and expand the use of fair value measurements when warranted. The Account reports all investments and mortgage loans payable at fair value.
Valuation Hierarchy: The Account groups financial assets and certain financial liabilities measured at fair value into three levels, based on the markets in which the assets and liabilities are traded, if any, and the observability of the assumptions used to determine fair value. These levels are:
Level 1—Valuations using unadjusted quoted prices for assets traded in active markets, such as stocks listed on the New York Stock Exchange. Active markets are defined as having the following characteristics for the measured asset or liability: (i) many transactions, (ii) current prices, (iii) price quotes not varying substantially among market makers, (iv) narrow bid/ask spreads and (v) most information regarding the issuer is publicly available. Level 1 assets, which may be held by the Account from time to time, include real estate related marketable securities (such as publicly traded REIT stocks).
Level 2—Valuations for assets and liabilities traded in less active, dealer or broker markets. Fair values are primarily obtained from third party pricing services for identical or comparable assets or liabilities. Level 2 inputs for fair value measurements are inputs, other than quoted prices included within Level 1, that are observable for the asset or liability, either directly or indirectly. Level 2 inputs include:
|
|
|
| a. | Quoted prices for similar assets or liabilities in active markets; |
|
|
|
| b. | Quoted prices for identical or similar assets or liabilities in markets that are not active (that is, markets in which there are few transactions for the asset (or liability), the prices are not current, price quotations vary substantially either over time or among market makers (for example, some brokered markets), or in which little information is released publicly); |
|
|
|
| c. | Inputs other than quoted prices that are observable within the market for the asset (or liability) (for example, interest rates and yield curves, volatilities, prepayment speeds, loss severities, credit risks, and default rates that are observable at commonly quoted intervals); and |
|
|
|
| d. | Inputs that are derived principally from or corroborated by observable market data by correlation or other means (for example, market-corroborated inputs). |
TIAA Real Estate Account § Prospectus 137
|
|
NOTES TO FINANCIAL STATEMENTS | continued |
Examples of securities which may be held by the Account and included in Level 2 include Certificates of Deposit, Commercial Paper, Government Agency Notes and Variable Notes.
Level 3—Valuations for assets and liabilities that are derived from other valuation methodologies, including pricing models, discounted cash flow models and similar techniques, and are not based on market exchange, dealer, or broker-traded transactions. Level 3 valuations incorporate certain assumptions and projections that are not observable in the market, and require significant professional judgment in determining the fair value assigned to such assets or liabilities. Examples of Level 3 assets and liabilities which may be held by the Account from time to time include investments in real estate, investments in joint ventures and limited partnerships, mortgage loans receivable and mortgage loans payable.
An investment’s categorization within the valuation hierarchy described above is based upon the lowest level of input that is significant to the fair value measurement.
The Account’s investments and mortgage loans payable are stated at fair value. Fair value is based upon quoted market prices, where available. If listed prices or quotes are not available, fair value is based upon vendor- provided, evaluated prices or internally-developed models that primarily use market-based or independently-sourced market data, including interest rate yield curves, market spreads, and currency rates. Valuation adjustments will be made to reflect changes in credit quality, counterparty’s creditworthiness, the Account’s creditworthiness, liquidity, and other observable and unobservable inputs that are applied consistently over time.
The methods described above are considered to produce fair values that represent a good faith estimate of what an unaffiliated buyer in the marketplace would pay to purchase the asset or would receive to transfer the liability. Since fair value calculations involve significant professional judgment in the application of both observable and unobservable attributes, actual realizable values or future fair values may differ from amounts reported. Furthermore, while the Account believes its valuation methods are appropriate and consistent with other market participants, the use of different methodologies or assumptions to determine the fair value of certain financial instruments, while reasonable, could result in different estimates of fair value at the reporting date. As discussed below in more detail, as the Account generally obtains independent external appraisals on a quarterly basis, there may be circumstances in the interim in which the true realizable value of a property is not reflected in the Account’s daily net asset value calculation or in the Account’s periodic financial statements. This disparity may be more apparent when the commercial and/or residential real estate markets experience an overall and possibly dramatic decline (or increase) in property values in a relatively short period of time between appraisals.
138 Prospectus § TIAA Real Estate Account
|
|
NOTES TO FINANCIAL STATEMENTS | continued |
The following is a description of the valuation methodologies used for investments measured at fair value.
Valuation of Real Estate Properties: Investments in real estate properties are stated at fair value, as determined in accordance with policies and procedures reviewed by the Investment Committee of the Board and in accordance with the responsibilities of the Board as a whole. Accordingly, the Account does not record depreciation. The Account’s real estate properties are generally classified within Level 3 of the valuation hierarchy. Fair value for real estate properties is defined as the price that would be received to sell the asset in an orderly transaction between market participants at the measurement date. Determination of fair value involves judgment because the actual market value of real estate can be determined only by negotiation between the parties in a sales transaction. The Account’s primary objective when valuing its real estate investments will be to produce a valuation that represents a fair and accurate estimate of the fair value of its investments. Implicit in the Account’s definition of fair value is the consummation of a sale as of a specified date and the passing of title from seller to buyer under conditions whereby:
|
|
|
| • | Buyer and seller are typically motivated; |
|
|
|
| • | Both parties are well informed or well advised, and acting in what they consider their best interests; |
|
|
|
| • | A reasonable time is allowed for exposure in the open market; |
|
|
|
| • | Payment is made in terms of cash or in terms of financial arrangements comparable thereto; and |
|
|
|
| • | The price represents the normal consideration for the property sold unaffected by special or creative financing or sales concessions granted by anyone associated with the sale. |
Property and investment values are affected by, among other things, the availability of capital, occupancy rates, rental rates, and interest and inflation rates. As a result, determining real estate and investment values involves many assumptions. Key inputs and assumptions include rental income and expense amounts, related rental income and expense growth rates, discount rates and capitalization rates. Valuation techniques include discounted cash flow analysis, prevailing market capitalization rates or multiples applied to earnings from the property, analysis of recent comparable sales transactions, actual sale negotiations and bona fide purchase offers received from third parties. Amounts ultimately realized from each investment may vary significantly from the market value presented. Actual results could differ significantly from those estimates.
Real estate properties owned by the Account are initially valued based on an independent appraisal at the time of the closing of the purchase, which may result in a potential unrealized gain or loss reflecting the difference between an
TIAA Real Estate Account § Prospectus 139
|
|
NOTES TO FINANCIAL STATEMENTS | continued |
investment’s fair value (i.e., exit price) and its cost basis (which is inclusive of transaction costs).
Subsequently, each property is appraised each quarter by an independent external appraiser. In general, the Account obtains appraisals of its real estate properties spread out throughout the quarter, which is intended to result in appraisal adjustments, and thus, adjustments to the valuations of its holdings (to the extent such adjustments are made) that happen regularly throughout each quarter and not on one specific day in each period.
Further, management reserves the right to order an appraisal and/or conduct another valuation outside of the normal quarterly process when facts or circumstances at a specific property change. For example, under certain circumstances a valuation adjustment could be made when bids are obtained for properties held for sale by the Account. In addition, adjustments may be made for events or circumstances indicating an impairment of a tenant’s ability to pay amounts due to the Account under a lease (including due to a bankruptcy filing of that tenant). Also, adjustments may be made to reflect factors (such as sales values for comparable properties or local employment rate) bearing uniquely on a particular region in which the Account holds properties. TIAA’s internal appraisal staff oversees the entire appraisal process, in conjunction with the Account’s independent fiduciary (the independent fiduciary is more fully described in the paragraph below). Any differences in the conclusions of TIAA’s internal appraisal staff and the independent appraiser will be reviewed by the independent fiduciary, which will make a final determination on the matter (which may include ordering a subsequent independent appraisal).
An independent fiduciary, Real Estate Research Corporation, has been appointed by a special subcommittee of the Investment Committee of the Board to, among other things, oversee the appraisal process. The independent fiduciary must approve all independent appraisers used by the Account. All appraisals are performed in accordance with Uniform Standards of Professional Appraisal Practices (“USPAP”), the real estate appraisal industry standards created by The Appraisal Foundation. Real estate appraisals are estimates of property values based on a professional’s opinion. Appraisals of properties held outside of the U.S. are performed in accordance with industry standards commonly applied in the applicable jurisdiction. These independent appraisers are always expected to be MAI-designated members of the Appraisal Institute (or its European equivalent, RICS) and state certified appraisers from national or regional firms with relevant property type experience and market knowledge.
Also, the independent fiduciary can require additional appraisals if factors or events have occurred that could materially change a property’s value and such change is not reflected in the quarterly valuation review, or otherwise to ensure that the Account is valued appropriately. The independent fiduciary must also
140 Prospectus § TIAA Real Estate Account
|
|
NOTES TO FINANCIAL STATEMENTS | continued |
approve any valuation change of real estate related assets where a property’s value changed by more than 6% from the most recent independent annual appraisal, or if the value of the Account would change by more than 4% within any calendar quarter or more than 2% since the prior calendar month. When a real estate property is subject to a mortgage, the property is valued independently of the mortgage and the property and mortgage fair values are reported separately (see—”Valuation of Mortgage Loans Payable” below). The independent fiduciary reviews and approves all mortgage valuation adjustments before such adjustments are recorded by the Account. The Account continues to use the revised value for each real estate property and mortgage loan payable to calculate the Account’s daily net asset value until the next valuation review or appraisal.
Valuation of Real Estate Joint Ventures: Real estate joint ventures are stated at the fair value of the Account’s ownership interests of the underlying entities. The Account’s ownership interests are valued based on the fair value of the underlying real estate, any related mortgage loans payable, and other factors, such as ownership percentage, ownership rights, buy/sell agreements, distribution provisions and capital call obligations. Upon the disposition of all real estate investments by an investee entity, the Account will continue to state its equity in the remaining net assets of the investee entity during the wind down period, if any, which occurs prior to the dissolution of the investee entity. The Account’s real estate joint ventures are generally classified within level 3 of the valuation hierarchy.
Valuation of Real Estate Limited Partnerships: Limited partnership interests are stated at the fair value of the Account’s ownership in the partnership which is based on the most recent net asset value of the partnership, as reported by the sponsor. Since market quotations are not readily available, the limited partnership interests are valued at fair value as determined in good faith under the direction of the Investment Committee of the Board and in accordance with the responsibilities of the Board as a whole. These investments are generally classified within level 3 of the valuation hierarchy.
Valuation of Marketable Securities: Equity securities listed or traded on any national market or exchange are valued at the last sale price as of the close of the principal securities market or exchange on which such securities are traded or, if there is no sale, at the mean of the last bid and asked prices on such market or exchange, exclusive of transaction costs. Such marketable securities are generally classified within level 1 of the valuation hierarchy.
Debt securities, other than money market instruments, are generally valued at the most recent bid price or the equivalent quoted yield for such securities (or those of comparable maturity, quality and type). Money market instruments, with maturities of one year or less, are valued in the same manner as debt securities or derived from a pricing matrix. Debt securities are generally classified within level 2 of the valuation hierarchy.
TIAA Real Estate Account § Prospectus 141
|
|
NOTES TO FINANCIAL STATEMENTS | continued |
Equity and fixed income securities traded on a foreign exchange or in foreign markets are valued using their closing values under the valuation methods generally accepted in the country where traded, as of the valuation date. This value is converted to U.S. dollars at the exchange rate in effect on the valuation day. Under certain circumstances (for example, if there are significant movements in the United States markets and there is an expectation the securities traded on foreign markets will adjust based on such movements when the foreign markets open the next day), the Account may adjust the value of equity or fixed income securities that trade on a foreign exchange or market after the foreign exchange or market has closed. Equity securities traded on a foreign exchange or in foreign markets are generally classified within level 1 of the valuation hierarchy. Fixed income securities traded on a foreign exchange or in foreign markets are generally classified within level 2 of the valuation hierarchy. Equity and fixed income securities traded in foreign markets that are adjusted based upon significant movements in the United States markets are generally classified within level 2 of the valuation hierarchy.
Valuation of Mortgage Loan Receivable: Mortgage loans receivable are stated at fair value and are initially valued at the face amount of the mortgage loan funding. Subsequently, mortgage loans receivable are valued at least quarterly based on market factors, such as market interest rates and spreads for comparable loans, the liquidity for mortgage loans of similar characteristics, the performance of the underlying collateral and the credit quality of the counterparty. The Account’s mortgage loan receivable is classified within level 3 of the valuation hierarchy.
Valuation of Mortgage Loans Payable: Mortgage loans payable are stated at fair value. The estimated fair value of mortgage loans payable is based on the amount at which the liability could be transferred to a third party exclusive of transaction costs. Mortgage loans payable are valued at least quarterly based on market factors, such as market interest rates and spreads for comparable loans, the performance of the underlying collateral (such as the loan-to-value ratio and the cash flow of the underlying collateral), the liquidity for mortgage loans of similar characteristics, the maturity date of the loan, the return demands of the market, and the credit quality of the Account. The Account’s mortgage loans payable are generally classified within level 3 of the valuation hierarchy. Interest expense for mortgage loans payable is recorded on the accrual basis taking into account the outstanding principal and contractual interest rates.
Foreign currency transactions and translation: Portfolio investments and other assets and liabilities denominated in foreign currencies are translated into U.S. dollars at the exchange rates prevailing at the end of the period. Purchases and sales of securities, income receipts and expense payments made in foreign currencies are translated into U.S. dollars at the exchange rates prevailing on the
142 Prospectus § TIAA Real Estate Account
|
|
NOTES TO FINANCIAL STATEMENTS | continued |
respective dates of the transactions. The effect of any changes in foreign currency exchange rates on portfolio investments and mortgage loans payable is included in net realized and unrealized gains and losses on investments and mortgage loans payable. Net realized gains and losses on foreign currency transactions include disposition of foreign currencies, and currency gains and losses between the accrual and receipt dates of portfolio investment income and between the trade and settlement dates of portfolio investment transactions and, when applicable, include maturities of forward foreign currency contracts.
Accumulation and Annuity Funds: The Accumulation Fund represents the net assets attributable to participants in the accumulation phase of their investment (“Accumulation Fund”). The Annuity Fund represents the net assets attributable to the participants currently receiving annuity payments (“Annuity Fund”). The net increase or decrease in net assets from investment operations is apportioned between the accounts based upon their relative daily net asset values. Once an Account participant begins receiving lifetime annuity income benefits, monthly payment levels cannot be reduced as a result of the Account’s adverse mortality experience. The Account pays a fee to TIAA to assume these mortality and expense risks. In addition, the contracts pursuant to which the Account is offered are required to stipulate the maximum expense charge for all Account level expenses that can be assessed, which is equal to 2.50% of average net assets per year.
Accounting for Investments: Real estate transactions are accounted for as of the date on which the purchase or sale transactions for the real estate properties close (settlement date). The Account recognizes a realized gain on the sale of a real estate property to the extent that the contract sales price exceeds the cost-to-date of the property being sold. A realized loss occurs when the cost-to-date exceeds the sales price. Any accumulated unrealized gains and losses are reversed in the calculation of realized gains and losses.
Rent from real estate properties consists of all amounts earned under tenant operating leases, including base rent, recoveries of real estate taxes and other expenses and charges for miscellaneous services provided to tenants. Rental income is recognized in accordance with the billing terms of the lease agreements. The Account bears the direct expenses of the real estate properties owned. These expenses include, but are not limited to, fees to local property management companies, property taxes, utilities, maintenance, repairs, insurance, and other operating and administrative costs. An estimate of the net operating income earned from each real estate property is accrued by the Account on a daily basis and such estimates are adjusted when actual operating results are determined.
The Account has limited ownership interests in various private real estate funds (limited partnerships and one limited liability corporation) and a private real estate investment trust (collectively, the “limited partnerships”). The Account
TIAA Real Estate Account § Prospectus 143
|
|
NOTES TO FINANCIAL STATEMENTS | continued |
records its contributions as increases to the investments, and distributions from the investments are treated as either income or return of capital, as determined by the management of the limited partnerships. Unrealized gains and losses are calculated based upon the net asset value of the limited partnership and recorded when the financial statements of the limited partnerships are received by the Account; however as circumstances warrant, prior to the receipt of financial statements of the limited partnership, the Account will estimate the value of its interests in good faith and will from time to time seek input from the issuer or the sponsor of the investment vehicle. Changes in value based on such estimates are recorded by the Account as unrealized gains and losses.
Income from real estate joint ventures is recorded based on the Account’s proportional interest of the income distributed by the joint venture. Income earned by the joint venture, but not yet distributed to the Account by the joint venture investment, is recorded as unrealized gains and losses on real estate joint ventures.
Transactions in marketable securities are accounted for as of the date the securities are purchased or sold (trade date). Interest income is recorded as earned. Dividend income is recorded on the ex-dividend date or as soon as the Account is informed of the dividend. Realized gains and losses on securities transactions are accounted for on the specific identification method.
The Account’s net assets as of the close of each valuation day are valued by taking the sum of:
|
|
|
| • | the value of the Account’s cash, cash equivalents, and investments in short-term and other debt instruments; |
|
|
|
| • | the value of the Account’s other securities and other non real estate assets; |
|
|
|
| • | the value of the individual real properties (based on the most recent valuation of that property) and other real estate-related investments owned by the Account; |
|
|
|
| • | an estimate of the net operating income accrued by the Account from its properties, other real estate-related investments and non real estate-related investments (including short-term marketable securities); and |
|
|
|
| • | actual net operating income received from the Account’s properties, other real estate-related investments and non real estate-related investments (only to the extent any such item of income differs from the estimated income accrued for on such investments). |
and then reducing the sum by the Account’s liabilities, including the daily investment management fee and certain other expenses attributable to operating the Account.
After the end of every quarter, the Account reconciles the amount of expenses deducted from the Account (which is established in order to approximate the costs
144 Prospectus § TIAA Real Estate Account
|
|
NOTES TO FINANCIAL STATEMENTS | continued |
that the Account will incur) with the expenses the Account actually incurred. If there is a difference, the Account adds it to or deducts it from the Account in equal daily installments over the remaining days of the following quarter. Material differences may be repaid in the current calendar quarter. The Account’s at-cost deductions are based on projections of Account assets and overall expenses, and the size of any adjusting payments will be directly affected by the difference between management’s projections and the Account’s actual assets or expenses.
Cash: The Account maintains cash balances in bank deposit accounts which, at times, exceed federally insured limits. The Account’s management monitors these balances to mitigate the exposure of risk due to concentration and has not experienced any losses from such concentration.
Federal Income Taxes: Based on provisions of the Internal Revenue Code, Section 817, the Account is taxed as a segregated asset account of TIAA and as such, the Account should incur no material federal income tax attributable to the net investment activity of the Account. Management has concluded that the Account does not have any uncertain tax positions as of December 31, 2009.
Due to/from Investment Advisor: Due to/from investment advisor represents amounts that were paid or received by TIAA on behalf of the Account. Amounts generally are paid or received by the Account within one or two business days and no interest is charged on these amounts.
Reclassifications: Certain prior period amounts have been reclassified to conform to the current presentation. These reclassifications did not affect the total assets, total net assets or net increase in net assets previously reported.
Note 2—Management Agreements and Arrangements
Investment advisory services for the Account are provided by TIAA employees, under the direction of the Board and its Investment Committee, pursuant to investment management procedures adopted by TIAA for the Account. TIAA’s investment management decisions for the Account are subject to review by the Account’s independent fiduciary. TIAA also provides all portfolio accounting and related services for the Account.
Effective January 1, 2008, the Account entered into theDistribution Agreement for the Contracts Funded by the TIAA Real Estate Account(the “Distribution Agreement”), dated January 1, 2008, by and among TIAA, for itself and on behalf of the Account, and TIAA-CREF Individual and Institutional Services, LLC (“Services”), a wholly- owned subsidiary of TIAA, a registered broker-dealer and a member of the Financial Industry Regulatory Authority. Pursuant to the Distribution Agreement, Services performs distribution services for the Account which include, among other things, (i) distribution of annuity contracts issued by TIAA and funded by the Account, (ii) advising existing annuity contract owners in
TIAA Real Estate Account § Prospectus 145
|
|
NOTES TO FINANCIAL STATEMENTS | continued |
connection with their accumulations and (iii) helping employers implement and manage retirement plans. The Distribution Agreement is terminable by either party upon 60 days written notice and terminates automatically upon any assignment thereof.
Also effective January 1, 2008, TIAA performs administrative functions for the Account, which include, among other things, (i) computing the Account’s daily unit value, (ii) maintaining accounting records and performing accounting services, (iii) receiving and allocating premiums, (iv) calculating and making annuity payments, (v) processing withdrawal requests, (vi) providing regulatory compliance and reporting services, (vii) maintaining the Account’s records of contract ownership and (viii) otherwise assisting generally in all aspects of the Account’s operations.
TIAA and Services provide their services at cost. TIAA and Services receive payments from the Account on a daily basis according to formulas established each year and adjusted periodically with the objective of keeping the payments as close as possible to the Account’s expenses actually incurred. Any differences between actual expenses and the amounts paid by the Account are adjusted quarterly.
TIAA also provides a liquidity guarantee to the Account, for a fee, to ensure that sufficient funds are available to meet participant transfer and cash withdrawal requests in the event that the Account’s cash flows and liquid investments are insufficient to fund such requests. TIAA ensures sufficient funds are available for such transfer and withdrawal requests by purchasing accumulation units of the Account. See Note 3—Related Party Transactions below. To the extent TIAA owns accumulation units issued pursuant to the liquidity guarantee, the independent fiduciary monitors and oversees, among other things, TIAA’s ownership interest in the Account and may require TIAA to eventually redeem some of its units, particularly when the Account has uninvested cash or liquid investments available.
TIAA also receives a fee for assuming certain mortality and expense risks. The expenses for the services noted above that are provided to the Account by TIAA and Services are identified in the accompanying Statements of Operations and are reflected in Note 9—Condensed Financial Information.
Note 3—Related Party Transactions
Pursuant to its existing liquidity guarantee obligation, as of December 31, 2009, the TIAA General Account owned 4.7 million accumulation units (which are generally referred to as “Liquidity Units”) issued by the Account. Since December 2008 and through December 31, 2009, TIAA has paid an aggregate of $1.2 billion to purchase these Liquidity Units in multiple transactions (approximately $1.1 billion since the beginning of 2009).
146 Prospectus § TIAA Real Estate Account
|
|
NOTES TO FINANCIAL STATEMENTS | continued |
In accordance with this liquidity guarantee obligation, TIAA guarantees that all participants in the Account may redeem their accumulation units at their accumulation unit value next determined after their transfer or cash withdrawal request is received in good order. Liquidity Units owned by TIAA are valued in the same manner as accumulation units owned by the Account’s participants. Management believes that TIAA has the ability to meet its obligations under the liquidity guarantee.
As discussed in the Account’s prospectus and in accordance with a prohibited transaction exemption from the U.S. Department of Labor (PTE 96-76), the Account’s independent fiduciary, Real Estate Research Corporation, has certain responsibilities with respect to the Account that it has undertaken or is currently undertaking with respect to TIAA’s purchase of Liquidity Units, including among other things, reviewing the purchase and redemption of Liquidity Units by TIAA to ensure the Account uses the correct unit values. In addition, as set forth in PTE 96-76, the independent fiduciary’s responsibilities include:
|
|
|
| • | establishing the percentage of total accumulation units that TIAA’s ownership should not exceed (the “trigger point”) and creating a method for changing the trigger point; |
|
|
|
| • | approving any adjustment of TIAA’s ownership interest in the Account and, in its discretion, requiring an adjustment if TIAA’s ownership of Liquidity Units reaches the trigger point; and |
|
|
|
| • | once the trigger point has been reached, participating in any program to reduce TIAA’s ownership in the Account by utilizing cash flow or liquid investments in the Account, or by utilizing the proceeds from asset sales. The independent fiduciary’s role in participating in any such asset sales program would include (i) participating in the selection of properties for sale, (ii) providing sales guidelines and (iii) approving those sales if, in the independent fiduciary’s opinion, such sales are desirable to reduce TIAA’s ownership of Liquidity Units. |
The independent fiduciary, which has the right to adjust the trigger point, has established the trigger point at 45% of the outstanding accumulation units and it will continue to monitor TIAA’s ownership interest in the Account and provide further recommendations as necessary. As of December 31, 2009, TIAA owned approximately 12.0% of the outstanding accumulation units of the Account.
Subsequent to December 31, 2009, pursuant to this liquidity guarantee obligation, TIAA has not made any additional purchases of Liquidity Units.
As discussed in Note 2 Management Agreements and Arrangements, TIAA and Services provide services to the Account on an at cost basis. See Note 9 Condensed Financial Information for details of the expense charge and expense ratio.
TIAA Real Estate Account § Prospectus 147
|
|
NOTES TO FINANCIAL STATEMENTS | continued |
Note 4—Credit Risk Concentrations
Concentrations of credit risk arise when a number of properties or tenants are located in a similar geographic region such that the economic conditions of that region could impact tenants’ obligations to meet their contractual obligations or cause the values of individual properties to decline. The Account has no significant concentrations of tenants as no single tenant has annual contract rent that makes up more than 2% of the Rental Income of the Account.
The substantial majority of the Account’s wholly-owned real estate investments and investments in joint ventures are located in the United States. The following table represents the diversification of the Account’s portfolio by region and property type:
DIVERSIFICATION BY FAIR VALUE(1)
|
|
|
|
|
|
|
|
|
|
|
|
|
|
|
| East |
| West |
| South |
| Midwest |
| Foreign(2) |
| Total |
|
Office |
| 23.5 | % | 17.3 | % | 12.3 | % | 1.2 | % | 2.7 | % | 57.0 | % |
Apartment |
| 2.4 | % | 5.5 | % | 5.3 | % | 0.0 | % | 0.0 | % | 13.2 | % |
Industrial |
| 1.4 | % | 6.4 | % | 4.2 | % | 1.4 | % | 0.0 | % | 13.4 | % |
Retail |
| 3.4 | % | 0.9 | % | 8.7 | % | 0.4 | % | 2.3 | % | 15.7 | % |
Storage Facilities |
| 0.2 | % | 0.2 | % | 0.2 | % | 0.1 | % | 0.0 | % | 0.7 | % |
Total |
| 30.9 | % | 30.3 | % | 30.7 | % | 3.1 | % | 5.0 | % | 100.0 | % |
|
|
(1) | Fair values for wholly-owned properties are reflected gross of any debt, whereas fair values for joint venture investments are reflected net of any debt. |
|
|
(2) | Represents real estate investments in the United Kingdom and France. |
| Properties in the “East” region are located in: CT, DC, DE, KY, MA, MD, ME, NC, NH, NJ, NY, PA, RI, SC, VA, VT, WV |
| Properties in the “West” region are located in: AK, AZ, CA, CO, HI, ID, MT, NM, NV, OR, UT, WA, WY |
| Properties in the “South” region are located in: AL, AR, FL, GA, LA, MS, OK, TN, TX |
| Properties in the “Midwest” region are located in: IA, IL, IN, KS, MI, MN, MO, ND, NE, OH, SD, WI |
Note 5—Leases
The Account’s real estate properties are leased to tenants under operating lease agreements which expire on various dates through 2058. Aggregate minimum annual rentals for the properties owned, excluding short-term residential and storage facility leases, are as follows (in thousands):
|
|
|
|
|
|
| Years Ending December 31, |
| |
2010 |
| $ | 883,503 |
|
2011 |
|
| 769,113 |
|
2012 |
|
| 664,623 |
|
2013 |
|
| 547,659 |
|
2014 |
|
| 446,682 |
|
Thereafter |
|
| 1,312,602 |
|
Total |
| $ | 4,624,182 |
|
|
|
|
| |
148 Prospectus § TIAA Real Estate Account
|
|
NOTES TO FINANCIAL STATEMENTS | continued |
Certain leases provide for additional rental amounts based upon the recovery of actual operating expenses in excess of specified base amounts.
Note 6—Assets and Liabilities Measured at Fair Value on a Recurring Basis
The following tables show the major categories of assets and liabilities measured at fair value on a recurring basis as of December 31, 2009 and December 31, 2008, using unadjusted quoted prices in active markets for identical assets (Level 1); significant other observable inputs (Level 2); and significant unobservable inputs (Level 3) (in thousands):
|
|
|
|
|
|
|
|
|
|
|
|
|
|
Description |
| Level 1: |
| Level 2: |
| Level 3: |
| Total at |
| ||||
Real estate properties |
| $ | — |
| $ | — |
| $ | 7,437,344 |
| $ | 7,437,344 |
|
Real estate joint ventures and limited partnerships |
|
| — |
|
| — |
|
| 1,514,876 |
|
| 1,514,876 |
|
Marketable securities |
|
| — |
|
| 671,267 |
|
| — |
|
| 671,267 |
|
Mortgage loan receivable |
|
| — |
|
| — |
|
| 71,273 |
|
| 71,273 |
|
Total Investments at December 31, 2009 |
| $ | — |
| $ | 671,267 |
| $ | 9,023,493 |
| $ | 9,694,760 |
|
Mortgage loans payable |
| $ | — |
| $ | — |
| $ | (1,858,110 | ) | $ | (1,858,110 | ) |
|
|
|
|
|
|
|
|
|
|
|
|
|
|
Description |
| Level 1: |
| Level 2: |
| Level 3: |
| Total at |
| ||||
Real estate properties |
| $ | — |
| $ | — |
| $ | 10,305,040 |
| $ | 10,305,040 |
|
Real estate joint ventures and limited partnerships |
|
| — |
|
| — |
|
| 2,463,196 |
|
| 2,463,196 |
|
Marketable securities |
|
| — |
|
| 511,711 |
|
| — |
|
| 511,711 |
|
Mortgage loan receivable |
|
| — |
|
| — |
|
| 71,767 |
|
| 71,767 |
|
Total Investments at December 31, 2008 |
| $ | — |
| $ | 511,711 |
| $ | 12,840,003 |
| $ | 13,351,714 |
|
Mortgage loans payable |
| $ | — |
| $ | — |
| $ | (1,830,040 | ) | $ | (1,830,040 | ) |
|
|
|
|
|
|
|
|
|
|
|
|
| |
TIAA Real Estate Account § Prospectus 149
|
|
NOTES TO FINANCIAL STATEMENTS | continued |
The following tables show the reconciliation of the beginning and ending balances for assets and liabilities measured at fair value on a recurring basis using significant unobservable inputs (Level 3) during years ended December 31, 2009 and December 31, 2008 (in thousands):
|
|
|
|
|
|
|
|
|
|
|
|
|
|
|
|
|
|
| Real Estate |
| Real Estate |
| Mortgage |
| Total |
| Mortgage |
| |||||
For the year ended December 31, 2009: |
|
|
|
|
|
|
|
|
|
|
|
|
|
|
|
|
Beginning balance January 1, 2009 |
| $ | 10,305,040 |
| $ | 2,463,196 |
| $ | 71,767 |
| $ | 12,840,003 |
| $ | (1,830,040 | ) |
Total realized and unrealized gains (losses) included in changes in net assets |
|
| (2,526,729 | ) |
| (1,030,179 | ) |
| (494 | ) |
| (3,557,402 | ) |
| (55,126 | ) |
Purchases, issuances, and settlements(1) |
|
| (340,967 | ) |
| 81,859 |
|
| — |
|
| (259,108 | ) |
| 27,056 |
|
Ending balance December 31, 2009 |
| $ | 7,437,344 |
| $ | 1,514,876 |
| $ | 71,273 |
| $ | 9,023,493 |
| $ | (1,858,110 | ) |
For the year ended December 31, 2008: |
|
|
|
|
|
|
|
|
|
|
|
|
|
|
|
|
Beginning balance January 1, 2008 |
| $ | 11,983,715 |
| $ | 3,158,870 |
| $ | 72,520 |
| $ | 15,215,105 |
| $ | (1,392,093 | ) |
Total realized and unrealized gains (losses) included in changes in net assets |
|
| (1,924,026 | ) |
| (702,814 | ) |
| (753 | ) |
| (2,627,593 | ) |
| 109,791 |
|
Purchases, issuances, and settlements(1) |
|
| 245,351 |
|
| 7,140 |
|
| — |
|
| 252,491 |
|
| (547,738 | ) |
Ending balance December 31, 2008 |
| $ | 10,305,040 |
| $ | 2,463,196 |
| $ | 71,767 |
| $ | 12,840,003 |
| $ | (1,830,040 | ) |
|
|
(1) | This line includes the net of contributions, distributions, and accrued operating income for real estate joint ventures and limited partnerships as well as principal payments on mortgage loans payable. |
The amount of total gains (losses) included in changes in net assets attributable to the change in unrealized gains (losses) relating to investments and mortgage loans payable using significant unobservable inputs still held as of the reporting date is as follows (in thousands):
|
|
|
|
|
|
|
|
|
|
|
|
|
|
|
|
|
|
| Real Estate |
| Real Estate |
| Mortgage |
| Total |
| Mortgage |
| |||||
For the year ended December 31, 2009 |
| $ | (2,520,545 | ) | $ | (1,030,179 | ) | $ | (494 | ) | $ | (3,551,218 | ) | $ | (54,881 | ) |
For the year ended December 31, 2008 |
| $ | (1,921,932 | ) | $ | (702,797 | ) | $ | (753 | ) | $ | (2,625,482 | ) | $ | 109,791 |
|
|
|
|
|
|
|
|
|
|
|
|
|
|
|
|
| |
150 Prospectus § TIAA Real Estate Account
|
|
NOTES TO FINANCIAL STATEMENTS | continued |
Note 7—Investments in Joint Ventures and Limited Partnerships
The Account owns interests in several real estate properties through joint ventures and receives distributions and allocations of profits and losses from the joint ventures based on the Account’s ownership interest percentages. Several of these joint ventures have mortgage loans payable on the properties owned. At December 31, 2009, the Account held 12 investments in joint ventures with non-controlling ownership interest percentages that ranged from 50% to 85%. Certain joint ventures and limited partnerships are subject to adjusted distribution percentages when earnings in the investment reach a pre-determined threshold. The Account’s equity in the joint ventures at December 31, 2009 and December 31, 2008 was $1.3 billion and $2.2 billion, respectively. The Account’s most significant joint venture investment is the DDR TC LLC joint venture, which is the third largest investment in the Account as of December 31, 2009.
The Account’s share of the mortgage loans payable within the joint venture investments at fair value was approximately $1.8 and $1.9 billion at December 31, 2009 and December 31, 2008, respectively. The Account’s share in the outstanding principal of the mortgage loans payable on joint ventures was approximately $2.0 billion at December 31, 2009 and December 31, 2008.
A condensed summary of the financial position and results of operations of the joint ventures is shown below (in thousands).
|
|
|
|
|
|
|
|
|
|
|
|
|
|
|
| December 31, 2009 |
| December 31, 2008 |
| ||
Assets |
|
|
|
|
|
|
|
|
|
|
Real estate properties, at fair value |
|
|
|
| $ | 4,618,202 |
| $ | 5,947,028 |
|
Other assets |
|
|
|
|
| 89,569 |
|
| 95,411 |
|
Total assets |
|
|
|
| $ | 4,707,771 |
| $ | 6,042,439 |
|
Liabilities and Equity |
|
|
|
|
|
|
|
|
|
|
Mortgage loans payable, at fair value |
|
|
|
| $ | 2,526,666 |
| $ | 2,571,843 |
|
Other liabilities |
|
|
|
|
| 52,639 |
|
| 58,378 |
|
Total liabilities |
|
|
|
|
| 2,579,305 |
|
| 2,630,221 |
|
Equity |
|
|
|
|
| 2,128,466 |
|
| 3,412,218 |
|
Total liabilities and equity |
|
|
|
| $ | 4,707,771 |
| $ | 6,042,439 |
|
|
|
|
|
|
|
|
|
|
|
|
|
| Year Ended |
| Year Ended |
| Year Ended |
| |||
Operating Revenues and Expenses |
|
|
|
|
|
|
|
|
|
|
Revenues |
| $ | 519,239 |
| $ | 562,031 |
| $ | 534,469 |
|
Expenses |
|
| 317,428 |
|
| 333,700 |
|
| 315,077 |
|
Excess of revenues over expenses |
| $ | 201,811 |
| $ | 228,331 |
| $ | 219,392 |
|
|
|
|
|
|
|
|
|
|
| |
TIAA Real Estate Account § Prospectus 151
|
|
NOTES TO FINANCIAL STATEMENTS | continued |
Principal payment schedule on mortgage loans payable at joint ventures as of December 31, 2009 is as follows (in thousands):
|
|
|
|
|
|
| Amount |
| |
| ||||
2010 |
| $ | 540,054 |
|
2011 |
|
| 119,905 |
|
2012 |
|
| 721,565 |
|
2013 |
|
| 90,578 |
|
2014 |
|
| 2,280 |
|
Thereafter |
|
| 1,225,217 |
|
Total maturities |
| $ | 2,699,599 |
|
In February 2010, a loan in the principal amount of $21.5 million with respect to one of the Account’s joint venture properties that was scheduled to mature in 2010 was paid off by the joint venture with proceeds from a line of credit. Also, in February 2010, the maturity date of a loan in the principal amount of $168.3 million with respect to one of the Account’s joint venture properties was extended from 2010 to 2011.
In March 2010, the DDR TC joint venture sold 16 properties for $424.3 million and $386.4 million of debt was assumed by the purchaser, resulting in a net purchase price of $37.9 million. The sale resulted in a realized loss of $179.7 million (resulting in a $152.7 million realized loss to the Account).
Management of the Account monitors the financial position of the Account’s joint venture partners. To the extent that management of the Account determines that a joint venture partner has financial or liquidity concerns, management will evaluate all actions and remedies available to the Account under the applicable joint venture agreement to minimize any potential adverse implications to the Account.
The Account invests in limited partnerships that own real estate properties and other real estate related assets and receives distributions from the limited partnerships based on the Account’s ownership interest percentages. At December 31, 2009, the Account held five limited partnership investments and one private real estate equity investment trust (all of which featured non-controlling ownership interests) with ownership interest percentages that ranged from 5.27% to 18.46%. The Account’s ownership interest in limited partnerships was $200.3 million and $286.5 million at December 31, 2009 and December 31, 2008, respectively.
Note 8—Mortgage Loans Payable
At December 31, 2009, the Account had outstanding mortgage loans payable secured by the following properties (in thousands):
152 Prospectus § TIAA Real Estate Account
|
|
NOTES TO FINANCIAL STATEMENTS | continued |
|
|
|
|
|
|
|
|
|
|
|
Property |
| Interest Rate and |
|
| Principal |
| Maturity |
| ||
| ||||||||||
701 Brickell(1) |
|
| 2.23% paid monthly(6) |
| $ | 126,000 |
| October 1, 2010 |
| |
Four Oaks Place(2) |
|
| 2.23% paid monthly(6) |
|
| 200,000 |
| October 1, 2010 |
| |
Ontario Industrial Portfolio(3) |
|
| 7.42% paid monthly |
|
| 8,469 |
| May 1, 2011 |
| |
1 & 7 Westferry Circus(4) |
|
| 5.40% paid quarterly |
|
| 216,754 |
| November 15, 2012 |
| |
Reserve at Sugarloaf(3) |
|
| 5.49% paid monthly |
|
| 25,145 |
| June 1, 2013 |
| |
South Frisco Village |
|
| 5.85% paid monthly |
|
| 26,251 |
| June 1, 2013 |
| |
Fourth & Madison |
|
| 6.40% paid monthly |
|
| 145,000 |
| August 21, 2013 |
| |
1001 Pennsylvania Avenue |
|
| 6.40% paid monthly |
|
| 210,000 |
| August 21, 2013 |
| |
50 Fremont |
|
| 6.40% paid monthly |
|
| 135,000 |
| August 21, 2013 |
| |
Pacific Plaza(3) |
|
| 5.55% paid monthly |
|
| 8,579 |
| September 1, 2013 |
| |
Wilshire Rodeo Plaza |
|
| 5.28% paid monthly |
|
| 112,700 |
| April 11, 2014 |
| |
1401 H Street |
|
| 5.97% paid monthly |
|
| 115,000 |
| December 7, 2014 |
| |
The Colorado(3) |
|
| 5.65% paid monthly |
|
| 86,719 |
| November 1, 2015 |
| |
99 High Street |
|
| 5.52% paid monthly |
|
| 185,000 |
| November 11, 2015 |
| |
The Legacy at Westwood(3) |
|
| 5.95% paid monthly |
|
| 41,515 |
| December 1, 2015 |
| |
Regents Court(3) |
|
| 5.76% paid monthly |
|
| 35,468 |
| December 1, 2015 |
| |
The Caruth(3) |
|
| 5.71% paid monthly |
|
| 41,490 |
| December 1, 2015 |
| |
Lincoln Centre |
|
| 5.51% paid monthly |
|
| 153,000 |
| February 1, 2016 |
| |
Publix at Weston Commons |
|
| 5.08% paid monthly |
|
| 35,000 |
| January 1, 2036 |
| |
| ||||||||||
Total Principal Outstanding |
|
|
|
| 1,907,090 |
|
|
| ||
Fair Value Adjustment(7) |
|
|
|
| (48,980 | ) |
|
| ||
| ||||||||||
Total mortgage loans payable |
|
|
| $ | 1,858,110 |
|
|
| ||
| ||||||||||
|
|
(1) | The Account entered into a debt agreement that included an interest rate cap with its lender to reduce its exposure to the variability of changes in interest rates until maturity of the underlying debt. The interest rate on the entire $126 million mortgage is capped at 6.50%. |
|
|
(2) | The Account entered into a debt agreement that included an interest rate cap with its lender to reduce its exposure to the variability of changes in interest rates until maturity of the underlying debt. The interest rate on the entire $200 million mortgage is capped at 6.50%. |
|
|
(3) | The mortgage is adjusted monthly for principal payments. |
|
|
(4) | The mortgage is denominated in British pounds and the principal payment had been converted to U.S. dollars using the exchange rate as of December 31, 2009. The quarterly payments are interest only, with a balloon payment at maturity. The interest rate is fixed. The cumulative foreign currency translation adjustment (since inception) was an unrealized gain of $16 million. |
|
|
(5) | Interest rates are fixed, unless stated otherwise. |
|
|
(6) | The interest rate for these mortgages is a variable rate at the one month London Interbank Offered Rate (“LIBOR”) plus 200 basis points and is reset monthly. |
|
|
(7) | The fair value adjustment appraises the difference (positive or negative) between the principal amount of outstanding debt and the fair value of outstanding debt. See Note 1 of these financial statements. |
Principal payment schedule on mortgage loans payable as of December 31, 2009 is due as follows (in thousands):
|
|
|
|
|
|
| Amount |
| |
2010 |
| $ | 330,842 |
|
2011 |
|
| 13,067 |
|
2012 |
|
| 221,840 |
|
2013 |
|
| 552,853 |
|
2014 |
|
| 225,273 |
|
Thereafter |
|
| 563,215 |
|
Total maturities |
| $ | 1,907,090 |
|
TIAA Real Estate Account § Prospectus 153
|
|
NOTES TO FINANCIAL STATEMENTS | continued |
Note 9—Condensed Financial Information
Selected condensed financial information for an Accumulation Unit of the Account is presented below.
|
|
|
|
|
|
|
|
|
|
|
|
|
|
|
|
|
|
| Years Ended December 31, |
| |||||||||||||
|
|
| ||||||||||||||
|
| 2009 |
| 2008 |
| 2007 |
| 2006 |
| 2005 |
| |||||
| ||||||||||||||||
PER ACCUMULATION UNIT DATA: |
|
|
|
|
|
|
|
|
|
|
|
|
|
|
|
|
Rental income |
| $ | 22.649 |
| $ | 18.794 |
| $ | 17.975 |
| $ | 16.717 |
| $ | 15.604 |
|
Real estate property level expenses and taxes |
|
| 11.193 |
|
| 9.190 |
|
| 8.338 |
|
| 7.807 |
|
| 7.026 |
|
| ||||||||||||||||
Real estate income, net |
|
| 11.456 |
|
| 9.604 |
|
| 9.637 |
|
| 8.910 |
|
| 8.578 |
|
Other income |
|
| 2.778 |
|
| 3.808 |
|
| 4.289 |
|
| 3.931 |
|
| 3.602 |
|
| ||||||||||||||||
Total income |
|
| 14.234 |
|
| 13.412 |
|
| 13.926 |
|
| 12.841 |
|
| 12.180 |
|
Expense charges(1) |
|
| 2.280 |
|
| 2.937 |
|
| 2.554 |
|
| 1.671 |
|
| 1.415 |
|
| ||||||||||||||||
Investment income, net |
|
| 11.954 |
|
| 10.475 |
|
| 11.372 |
|
| 11.170 |
|
| 10.765 |
|
Net realized and unrealized gain (loss) on investments and mortgage loans payable |
|
| (85.848 | ) |
| (54.541 | ) |
| 26.389 |
|
| 22.530 |
|
| 18.744 |
|
| ||||||||||||||||
Net (decrease) increase in Accumulation Unit Value |
|
| (73.894 | ) |
| (44.066 | ) |
| 37.761 |
|
| 33.700 |
|
| 29.509 |
|
Accumulation Unit Value: |
|
|
|
|
|
|
|
|
|
|
|
|
|
|
|
|
Beginning of period |
|
| 267.348 |
|
| 311.414 |
|
| 273.653 |
|
| 239.953 |
|
| 210.444 |
|
| ||||||||||||||||
End of period |
|
| 193.454 |
|
| 267.348 |
|
| 311.414 |
|
| 273.653 |
|
| 239.953 |
|
| ||||||||||||||||
TOTAL RETURN |
|
| (27.64 | )% |
| (14.15 | )% |
| 13.80 | % |
| 14.04 | % |
| 14.02 | % |
|
|
|
|
|
|
|
|
|
|
|
|
|
|
|
|
|
RATIOS TO AVERAGE NET ASSETS: |
|
|
|
|
|
|
|
|
|
|
|
|
|
|
|
|
Expenses(1) |
|
| 1.01 | % |
| 0.95 | % |
| 0.87 | % |
| 0.67 | % |
| 0.63 | % |
Investment income, net |
|
| 5.29 | % |
| 3.38 | % |
| 3.88 | % |
| 4.49 | % |
| 4.82 | % |
Portfolio turnover rate: |
|
|
|
|
|
|
|
|
|
|
|
|
|
|
|
|
Real estate properties |
|
| 0.75 | % |
| 0.64 | % |
| 5.59 | % |
| 3.62 | % |
| 6.72 | % |
Marketable securities |
|
| — |
|
| 25.67 | % |
| 13.03 | % |
| 51.05 | % |
| 77.63 | % |
Accumulation Units outstanding at end of period (in thousands): |
|
| 39,473 |
|
| 41,542 |
|
| 55,106 |
|
| 50,146 |
|
| 42,623 |
|
Net assets end of period (in thousands) |
| $ | 7,879,914 |
| $ | 11,508,924 |
| $ | 17,660,537 |
| $ | 14,132,693 |
| $ | 10,548,711 |
|
| ||||||||||||||||
|
|
(1) | Expense charges per Accumulation Unit and the Ratio of Expenses to Average net Assets reflect Account-level expenses and exclude real estate property level expenses which are included in net real estate income. If the real estate property level expense were included, the expense charge per Accumulation Unit for the twelve months ended December 31, 2009 would be $13.473 ($12.127, $10.892, $9.478, and $8.441, for the years ended December 31, 2008, 2007, 2006 and 2005, respectively), and the Ratio of Expenses to Average Net Assets for the twelve months ended December 31, 2009 would be 5.960% (3.91%, 3.71%, 3.81% and 3.78% for the years ended December 31, 2008, 2007, 2006, and 2005, respectively). |
154 Prospectus § TIAA Real Estate Account
|
|
NOTES TO FINANCIAL STATEMENTS | continued |
Note 10—Accumulation Units
Changes in the number of Accumulation Units outstanding were as follows (in thousands):
|
|
|
|
|
|
|
|
|
|
|
|
| For the Years Ended, |
| |||||||
|
|
| ||||||||
|
| 2009 |
| 2008 |
| 2007 |
| |||
Outstanding: |
|
|
|
|
|
|
|
|
|
|
Beginning of period |
|
| 41,542 |
|
| 55,106 |
|
| 50,146 |
|
Credited for premiums |
|
| 3,141 |
|
| 3,271 |
|
| 3,795 |
|
Credited for Purchase of units by TIAA (see Note 3) |
|
| 4,139 |
|
| 577 |
|
| — |
|
Net units credited (cancelled) for transfers, net disbursements and amounts applied to the Annuity Fund |
|
| (9,349 | ) |
| (17,412 | ) |
| 1,165 |
|
End of period |
|
| 39,473 |
|
| 41,542 |
|
| 55,106 |
|
Note 11—Commitments and Subsequent Events
As of December 31, 2009, the Account had outstanding commitments to purchase interests in four limited partnerships. As of December 31, 2009, approximately $44.3 million remains to be funded under these commitments, which could be called in full or in part by the limited partnership at any time.
The Account is party to various claims and routine litigation arising in the ordinary course of business. Management of the Account does not believe that the results of any such claims or litigation, individually, or in the aggregate, will have a material effect on the Account’s business, financial position, or results of operations.
During the normal course of business, the Account enters into discussions and agreements to purchase or sell real estate properties. Other than the sale of 16 properties within the DDR TC joint venture that are discussed in Note 7, no other properties were sold subsequent to December 31, 2009.
Pursuant to the liquidity guarantee obligation, TIAA has made no additional purchases of Liquidity Units subsequent to December 31, 2009. See Note 3 Related Party Transactions for further discussion of these transactions.
Note 12—New Accounting Pronouncements
In June 2007, the Accounting Standards Executive Committee (“AcSEC”) of the American Institute of Certified Public Accountants (“AICPA”) issued a Statement of Position (“SOP”) which clarifies which entities are required to apply the provisions of the Investment Companies Audit and Accounting Guide (“Guide”) and provides guidance on accounting by parent companies and equity method investors for investments in investment companies. In February 2008, FASB indefinitely delayed the effective date of the SOP to allow time to consider significant issues related to the implementation of the SOP.
TIAA Real Estate Account § Prospectus 155
|
|
NOTES TO FINANCIAL STATEMENTS | continued |
In February 2009, the Emerging Issues Task Force (“EITF”) added an issue to its agenda related to the application of the Guide, which will be discussed at a future meeting. The FASB staff created a working group to assist the EITF in addressing this issue. Management of the Account will continue to monitor FASB and EITF developments and will evaluate the financial reporting implications to the Account, as necessary.
In June 2009, the FASB issued Statement of Financial Accounting Standards No. 167, Amendments to FASB Interpretation No. 46(R) (“SFAS No. 167”), which amends guidance related to the identification of a variable interest entity, variable interests, the primary beneficiary, and expands required note disclosures to provide greater transparency to the users of financial statements. In December 2009, the FASB issued Accounting Standards Update (“ASU”) No. 2009-17, “Improvements to Financial Reporting by Enterprises Involved with Variable Interest Entities”, which amended Codification with the guidance contained in SFAS No. 167. In February 2010, the FASB issued ASU No. 2010-10, “Amendments for Certain Investment Funds”, which defers the applicability of ASU No. 2009-17 in certain instances. These standards are effective on January 1, 2010 and management of the Account has concluded that the adoption of these standards will not result in a significant impact to the Account’s financial position or results of operations.
In August 2009, the FASB issued ASU No. 2009-05, “Measuring Liabilities at Fair Value.” This ASU clarifies the application of certain valuation techniques in circumstances in which a quoted price in an active market for the identical liability is not available and clarifies that inputs to the valuation should not be adjusted when estimating the fair value of a liability in which contractual terms restrict transferability. This ASU became effective on October 1, 2009 and the adoption did not have a significant impact to the Account’s financial position or results of operations.
In September 2009, the FASB issued ASU No. 2009-12, “Investments in Certain Entities That Calculate Net Asset Value per Share (or Its Equivalent).” This ASU permits, as a practical expedient, an investor the ability to estimate the fair value of an investment in certain entities on the basis of the net asset value per share of the investment (or its equivalent) determined as of the reporting entity’s measurement date. The investee must satisfy specific requirements before the investor is permitted to utilize this practical expedient as a method of valuation. The amendments in this ASU are effective for interim and annual periods ending after December 15, 2009. The adoption of this ASU did not have a significant impact to the Account’s financial position or results of operations.
In January 2010, the FASB issued ASU No. 2010-06, “Improving Disclosures about Fair Value Measurements” which requires new disclosures related to the transfer in and out of levels 1 and 2, and the separate disclosure of purchases, sales, issuances and settlements when reconciling activity in level 3. This ASU also amends prior disclosure requirements to call for the disaggregation of assets
156 Prospectus § TIAA Real Estate Account
|
|
NOTES TO FINANCIAL STATEMENTS | continued |
and liabilities into appropriate subsets, and the disclosure of valuation techniques and inputs for recurring and nonrecurring fair value measurements in levels 2 and 3. The new disclosure requirement for reconciling level 3 activity is effective January 1, 2011 and all other new or amended disclosure requirements are effective January 1, 2010 for the Account. These changes will not impact the Account’s financial position or results of operations.
In February 2010, the FASB issued ASU No. 2010-09, “Amendments to Certain Recognition and Disclosure Requirements”. This ASU amends Topic 855, “Subsequent Events” by not requiring a reporting entity that files financial statements with the Securities and Exchange Commission (“SEC filers”), or a conduit bond obligor to disclose the date through which subsequent events are evaluated. This ASU is effective for SEC filers upon issuance of the final ASU. The Account has adopted this revision as of December 31, 2009 and accordingly will not disclosure the date through which subsequent events were evaluated.
TIAA REAL ESTATE ACCOUNT§DECEMBER 31, 2009 AND 2008
(Dollar values shown in thousands)
|
|
|
|
|
|
|
|
|
| Fair Value |
| ||||
|
| ||||||
Location/Description—Type |
| 2009 |
| 2008 |
| ||
REAL ESTATE PROPERTIES—76.71% AND 77.18% |
|
|
|
|
|
|
|
ALABAMA: |
|
|
|
|
|
|
|
Inverness Center—Office |
| $ | 90,315 |
| $ | 102,891 |
|
ARIZONA: |
|
|
|
|
|
|
|
Camelback Center—Office |
|
| 37,774 |
|
| 58,000 |
|
Kierland Apartment Portfolio—Apartments |
|
| 78,060 |
|
| 146,830 |
|
Phoenix Apartment Portfolio—Apartments |
|
| 21,767 |
|
| 129,244 |
|
CALIFORNIA: |
|
|
|
|
|
|
|
3 Hutton Centre Drive—Office |
|
| 28,752 |
|
| 45,710 |
|
50 Fremont Street—Office |
|
| 284,283 | (1) |
| 386,600 | (1) |
88 Kearny Street—Office |
|
| 61,600 |
|
| 99,815 |
|
275 Battery Street—Office |
|
| 164,390 |
|
| 220,025 |
|
980 9th Street and 1010 8th Street—Office |
|
| — |
|
| 151,600 |
|
Rancho Cucamonga Industrial Portfolio—Industrial |
|
| 57,327 |
|
| 102,300 |
|
Capitol Place—Office |
|
| — |
|
| 50,000 |
|
Centerside I—Office |
|
| 27,012 |
|
| 46,400 |
|
Centre Pointe and Valley View—Industrial |
|
| 18,929 |
|
| 29,000 |
|
Great West Industrial Portfolio—Industrial |
|
| 65,000 |
|
| 93,600 |
|
Larkspur Courts—Apartments |
|
| 50,111 |
|
| 71,500 |
|
Northern CA RA Industrial Portfolio—Industrial |
|
| 42,437 |
|
| 63,456 |
|
Ontario Industrial Portfolio—Industrial |
|
| 167,998 | (1) |
| 278,000 | (1) |
Pacific Plaza—Office |
|
| 60,075 | (1) |
| 104,970 | (1) |
Regents Court—Apartments |
|
| 50,505 | (1) |
| 59,000 | (1) |
Southern CA RA Industrial Portfolio—Industrial |
|
| 75,817 |
|
| 107,218 |
|
The Legacy at Westwood—Apartments |
|
| 77,836 | (1) |
| 89,224 | (1) |
Wellpoint—Office |
|
| 37,400 |
|
| 46,000 |
|
|
|
|
|
|
|
| |
TIAA Real Estate Account § Prospectus 157
|
|
| |
STATEMENT OF INVESTMENTS | continued |
TIAA REAL ESTATE ACCOUNT§DECEMBER 31, 2009 AND 2008
(Dollar values shown in thousands)
|
|
|
|
|
|
|
|
|
| Fair Value |
| ||||
|
| ||||||
Location/Description—Type |
| 2009 |
| 2008 |
| ||
Westcreek—Apartments |
| $ | 23,061 |
| $ | 31,500 |
|
West Lake North Business Park—Office |
|
| 32,407 |
|
| 54,425 |
|
Westwood Marketplace—Retail |
|
| 77,077 |
|
| 95,100 |
|
Wilshire Rodeo Plaza—Office |
|
| 151,209 | (1) |
| 213,783 | (1) |
COLORADO: |
|
|
|
|
|
|
|
Palomino Park—Apartments |
|
| 143,907 |
|
| 173,000 |
|
The Lodge at Willow Creek—Apartments |
|
| 31,624 |
|
| 40,000 |
|
The Market at Southpark—Retail |
|
| — |
|
| 29,000 |
|
CONNECTICUT: |
|
|
|
|
|
|
|
Ten & Twenty Westport Road—Office |
|
| 126,860 |
|
| 174,400 |
|
FLORIDA: |
|
|
|
|
|
|
|
701 Brickell Avenue—Office |
|
| 198,630 | (1) |
| 255,000 |
|
4200 West Cypress Street—Office |
|
| — |
|
| 41,568 |
|
North 40 Office Complex—Office |
|
| 33,969 |
|
| 64,398 |
|
Plantation Grove—Retail |
|
| 9,600 |
|
| 11,950 |
|
Pointe on Tampa Bay—Office |
|
| 35,060 |
|
| 49,700 |
|
Publix at Weston Commons—Retail |
|
| 38,100 | (1) |
| 50,987 | (1) |
Quiet Waters at Coquina Lakes—Apartments |
|
| 19,918 |
|
| 21,810 |
|
Seneca Industrial Park—Industrial |
|
| 62,341 |
|
| 101,296 |
|
South Florida Apartment Portfolio—Apartments |
|
| 48,366 |
|
| 62,155 |
|
Suncrest Village Shopping Center—Retail |
|
| 12,329 |
|
| 15,800 |
|
The Fairways of Carolina—Apartments |
|
| 18,628 |
|
| 20,942 |
|
Urban Centre—Office |
|
| 80,282 |
|
| 113,274 |
|
FRANCE: |
|
|
|
|
|
|
|
Printemps de L’Homme—Retail |
|
| 200,995 |
|
| 247,621 |
|
Georgia: |
|
|
|
|
|
|
|
Atlanta Industrial Portfolio—Industrial |
|
| 39,519 |
|
| 54,001 |
|
Glenridge Walk—Apartments |
|
| 30,326 |
|
| 37,575 |
|
Reserve at Sugarloaf—Apartments |
|
| 37,710 | (1) |
| 44,900 | (1) |
Shawnee Ridge Industrial Portfolio—Industrial |
|
| 52,219 |
|
| 69,000 |
|
Windsor at Lenox Park—Apartments |
|
| 48,223 |
|
| 57,550 |
|
ILLINOIS: |
|
|
|
|
|
|
|
Chicago Caleast Industrial Portfolio—Industrial |
|
| 48,304 |
|
| 63,932 |
|
Chicago Industrial Portfolio—Industrial |
|
| 60,908 |
|
| 78,022 |
|
Oak Brook Regency Towers—Office |
|
| 64,265 |
|
| 75,937 |
|
Parkview Plaza—Office |
|
| 44,360 |
|
| 65,846 |
|
MARYLAND: |
|
|
|
|
|
|
|
Broadlands Business Park—Industrial |
|
| 23,600 |
|
| 27,520 |
|
GE Appliance East Coast Distribution Facility—Industrial |
|
| 28,900 |
|
| 40,500 |
|
MASSACHUSETTS: |
|
|
|
|
|
|
|
99 High Street—Office |
|
| 253,557 | (1) |
| 320,107 | (1) |
Needham Corporate Center—Office |
|
| 16,196 |
|
| 32,494 |
|
Northeast RA Industrial Portfolio—Industrial |
|
| 24,845 |
|
| 30,794 |
|
The Newbry—Office |
|
| 230,375 |
|
| 315,600 |
|
MINNESOTA: |
|
|
|
|
|
|
|
Champlin Marketplace—Retail |
|
| 13,801 |
|
| 17,101 |
|
NEVADA: |
|
|
|
|
|
|
|
UPS Distribution Facility—Industrial |
|
| 7,600 |
|
| 12,100 |
|
|
|
|
|
|
|
| |
158 Prospectus § TIAA Real Estate Account
|
|
| |
STATEMENT OF INVESTMENTS | continued |
TIAA REAL ESTATE ACCOUNT§DECEMBER 31, 2009 AND 2008
(Dollar values shown in thousands)
|
|
|
|
|
|
|
|
|
| Fair Value |
| ||||
|
| ||||||
Location/Description—Type |
| 2009 |
| 2008 |
| ||
NEW JERSEY: |
|
|
|
|
|
|
|
Konica Photo Imaging Headquarters—Industrial |
| $ | 15,100 |
| $ | 18,300 |
|
Marketfair—Retail |
|
| 65,594 |
|
| 90,759 |
|
Morris Corporate Center III—Office |
|
| 66,478 |
|
| 94,955 |
|
NJ Caleast Industrial Portfolio—Industrial |
|
| — |
|
| 49,000 |
|
Plainsboro Plaza—Retail |
|
| 26,962 |
|
| 33,500 |
|
South River Road Industrial—Industrial |
|
| 28,656 |
|
| 43,872 |
|
NEW YORK: |
|
|
|
|
|
|
|
780 Third Avenue—Office |
|
| 240,077 |
|
| 341,000 |
|
The Colorado—Apartments |
|
| 110,144 | (1) |
| 153,006 | (1) |
PENNSYLVANIA: |
|
|
|
|
|
|
|
Lincoln Woods—Apartments |
|
| 28,728 |
|
| 32,025 |
|
TENNESSEE: |
|
|
|
|
|
|
|
Airways Distribution Center—Industrial |
|
| 12,600 |
|
| 17,400 |
|
Summit Distribution Center—Industrial |
|
| 12,300 |
|
| 22,700 |
|
TEXAS: |
|
|
|
|
|
|
|
Dallas Industrial Portfolio—Industrial |
|
| 125,275 |
|
| 141,328 |
|
Four Oaks Plac—Office |
|
| 409,027 | (1) |
| 438,000 | (1) |
Houston Apartment Portfolio—Apartments |
|
| 179,717 |
|
| 267,468 |
|
Lincoln Centre—Office |
|
| 202,029 | (1) |
| 269,000 | (1) |
Park Place on Turtle Creek—Office |
|
| — |
|
| 40,094 |
|
Pinnacle Industrial Portfolio—Industrial |
|
| 34,148 |
|
| 38,733 |
|
Preston Sherry Plaza—Office |
|
| — |
|
| 38,400 | (1) |
South Frisco Village—Retail |
|
| 26,900 | (1) |
| 36,300 | (1) |
The Caruth—Apartments |
|
| 49,641 | (1) |
| 61,349 | (1) |
The Maroneal—Apartments |
|
| 32,179 |
|
| 38,456 |
|
UNITED KINGDOM: |
|
|
|
|
|
|
|
1 & 7 Westferry Circus—Office |
|
| 239,036 | (1) |
| 232,802 | (1) |
VIRGINIA: |
|
|
|
|
|
|
|
8270 Greensboro Drive—Office |
|
| 34,200 |
|
| 57,000 |
|
Ashford Meadows Apartments—Apartments |
|
| 71,105 |
|
| 79,319 |
|
One Virginia Square—Office |
|
| 40,503 |
|
| 51,797 |
|
The Ellipse at Ballston—Office |
|
| 65,505 |
|
| 84,018 |
|
WASHINGTON: |
|
|
|
|
|
|
|
Creeksides at Centerpoint—Office |
|
| 18,724 |
|
| 27,200 |
|
Fourth and Madison—Office |
|
| 295,000 | (1) |
| 407,500 | (1) |
Millennium Corporate Park—Office |
|
| 116,548 |
|
| 162,193 |
|
Northwest RA Industrial Portfolio—Industrial |
|
| 17,800 |
|
| 24,100 |
|
Rainier Corporate Park—Industrial |
|
| 65,277 |
|
| 81,035 |
|
Regal Logistics Campus—Industrial |
|
| 47,955 |
|
| 67,000 |
|
WASHINGTON DC: |
|
|
|
|
|
|
|
1001 Pennsylvania Avenue—Office |
|
| 480,622 | (1) |
| 550,757 | (1) |
1401 H Street, NW—Office |
|
| 143,555 | (1) |
| 194,600 | (1) |
1900 K Street, NW—Office |
|
| 204,000 |
|
| 245,000 |
|
Mazza Gallerie—Retail |
|
| 65,500 |
|
| 83,003 |
|
|
|
|
| ||||
TOTAL REAL ESTATE PROPERTIES |
|
| 7,437,344 |
|
| 10,305,040 |
|
|
|
|
| ||||
|
|
|
|
|
|
| |
TIAA Real Estate Account § Prospectus 159
|
|
| |
STATEMENT OF INVESTMENTS | continued |
TIAA REAL ESTATE ACCOUNT§DECEMBER 31, 2009 AND 2008
(Dollar values shown in thousands)
|
|
|
|
|
|
|
|
|
| Fair Value |
| ||||
|
| ||||||
Location/Description |
| 2009 |
| 2008 |
| ||
OTHER REAL ESTATE-RELATED INVESTMENTS—15.63% AND 18.45% |
|
|
|
|
|
|
|
REAL ESTATE JOINT VENTURES—13.56% AND 16.30% |
|
|
|
|
|
|
|
CALIFORNIA: |
|
|
|
|
|
|
|
CA-Colorado Center LP |
| $ | 133,227 | (2) | $ | 239,748 | (2) |
CA-Treat Towers LP |
|
| 66,435 |
|
| 105,074 |
|
FLORIDA: |
|
|
|
|
|
|
|
Florida Mall Associates, Ltd |
|
| 252,432 | (2) |
| 281,941 | (2) |
TREA Florida Retail, LLC |
|
| 162,204 |
|
| 196,202 |
|
West Dade Associates |
|
| 76,856 | (2) |
| 105,312 | (2) |
GEORGIA: |
|
|
|
|
|
|
|
GA-Buckhead LLC |
|
| 30,952 |
|
| 78,209 |
|
MASSACHUSETTS: |
|
|
|
|
|
|
|
MA-One Boston Place REIT |
|
| 129,922 |
|
| 212,083 |
|
TENNESSEE: |
|
|
|
|
|
|
|
West Town Mall, LLC |
|
| 37,262 | (2) |
| 73,969 | (2) |
VIRGINIA: |
|
|
|
|
|
|
|
Teachers REA IV, LLC |
|
| 26,275 |
|
| 36,048 |
|
VARIOUS: |
|
|
|
|
|
|
|
DDR TC LLC |
|
| 312,182 | (2,3) |
| 712,773 | (2,3) |
Storage Portfolio I, LLC |
|
| 46,269 | (2,3) |
| 67,621 | (2,3) |
Strategic Ind Portfolio I, LLC |
|
| 40,587 | (2,3) |
| 67,731 | (2,3) |
|
|
|
| ||||
TOTAL REAL ESTATE JOINT VENTURES |
|
| 1,314,603 |
|
| 2,176,711 |
|
LIMITED PARTNERSHIPS—2.07% AND 2.15% |
|
|
|
|
|
|
|
Cobalt Industrial REIT (10.998% Account Interest) |
|
| 20,341 |
|
| 31,784 |
|
Colony Realty Partners LP (5.27% Account Interest) |
|
| 12,123 |
|
| 29,000 |
|
Heitman Value Partners Fund (8.43% Account Interest) |
|
| 13,736 |
|
| 16,334 |
|
Lion Gables Apartment Fund (18.46% Account Interest) |
|
| 142,999 |
|
| 186,471 |
|
MONY/Transwestern Mezz RP II (16.67% Account Interest) |
|
| 9,267 |
|
| 17,710 |
|
Transwestern Mezz Realty Partners III, LLC (11.708% Account Interest) |
|
| 1,807 |
|
| 5,186 |
|
|
|
|
| ||||
TOTAL LIMITED PARTNERSHIPS |
|
| 200,273 |
|
| 286,485 |
|
|
|
|
| ||||
TOTAL REAL ESTATE JOINT VENTURES AND LIMITED PARTNERSHIPS |
|
| 1,514,876 |
|
| 2,463,196 |
|
|
|
|
| ||||
|
|
|
|
|
|
| |
160 Prospectus § TIAA Real Estate Account
|
|
| |
STATEMENT OF INVESTMENTS | continued |
|
|
TIAA REAL ESTATE ACCOUNT ▪ DECEMBER 31, 2009 AND 2008 |
|
(Dollar values shown in thousands) |
|
|
|
|
|
|
|
|
|
|
|
|
|
|
|
|
|
|
|
Principal |
|
|
|
|
|
|
| Fair Value |
| ||||||||
|
|
|
|
|
|
|
| ||||||||||
| 2009 |
|
| 2008 |
| Issuer |
| Yield | (4) | Maturity |
| 2009 |
| 2008 |
| ||
MARKETABLE SECURITIES—6.93% AND 3.83% |
|
|
|
|
|
|
|
|
|
|
| ||||||
| |||||||||||||||||
COMMERCIAL PAPER—0.00% AND 1.84% | |||||||||||||||||
$ | — |
| $ | 40,000 |
| Bank of Nova Scotia |
| 0.193% |
| 1/2/09 |
| $ | — |
| $ | 39,999 |
|
| — |
|
| 50,000 |
| Abbey National North America LLC |
| 0.071% |
| 1/5/09 |
|
| — |
|
| 49,998 |
|
| — |
|
| 50,000 |
| Rabobank USA Financial Corp |
| 0.122% |
| 1/5/09 |
|
| — |
|
| 49,999 |
|
| — |
|
| 50,000 |
| HSBC Finance Corporation |
| 0.304% |
| 1/7/09 |
|
| — |
|
| 49,997 |
|
| — |
|
| 25,000 |
| Societe Generale North America, Inc. |
| 0.243% |
| 1/13/09 |
|
| — |
|
| 24,997 |
|
| — |
|
| 22,400 |
| Toyota Motor Credit Corp. |
| 0.406% |
| 1/23/09 |
|
| — |
|
| 22,395 |
|
| — |
|
| 8,200 |
| Toyota Motor Credit Corp. |
| 0.659% |
| 2/4/09 |
|
| — |
|
| 8,196 |
|
|
|
|
|
|
|
|
|
|
|
|
|
|
| ||||
TOTAL COMMERCIAL PAPER |
|
|
|
|
|
| — |
|
| 245,581 |
| ||||||
|
|
|
|
|
|
|
| ||||||||||
|
|
|
|
|
|
|
|
|
|
|
|
|
|
|
|
|
|
GOVERNMENT AGENCY NOTES—4.80% AND 1.99% | |||||||||||||||||
|
|
|
|
|
|
|
|
|
|
|
|
|
|
|
|
|
|
| — |
|
| 25,000 |
| Fannie Mae Discount Notes |
| 0.030% |
| 1/6/09 |
|
| — |
|
| 25,000 |
|
| — |
|
| 14,200 |
| Fannie Mae Discount Notes |
| 0.081% |
| 1/30/09 |
|
| — |
|
| 14,200 |
|
| — |
|
| 33,400 |
| Fannie Mae Discount Notes |
| 0.152% |
| 2/3/09 |
|
| — |
|
| 33,400 |
|
| 4,700 |
|
| — |
| Fannie Mae Discount Notes |
| 0.041% |
| 1/13/10 |
|
| 4,700 |
|
| — |
|
| 25,000 |
|
| — |
| Fannie Mae Discount Notes |
| 0.091% |
| 1/19/10 |
|
| 25,000 |
|
| — |
|
| 49,300 |
|
| — |
| Fannie Mae Discount Notes |
| 0.020% |
| 1/27/10 |
|
| 49,299 |
|
| — |
|
| 25,000 |
|
| — |
| Fannie Mae Discount Notes |
| 0.051% |
| 2/4/10 |
|
| 24,999 |
|
| — |
|
| 20,000 |
|
| — |
| Fannie Mae Discount Notes |
| 0.091% |
| 2/8/10 |
|
| 19,999 |
|
| — |
|
| 18,873 |
|
| — |
| Fannie Mae Discount Notes |
| 0.071% |
| 2/16/10 |
|
| 18,872 |
|
| — |
|
| 10,000 |
|
| — |
| Fannie Mae Discount Notes |
| 0.101% |
| 3/1/10 |
|
| 9,999 |
|
| — |
|
| 17,470 |
|
| — |
| Fannie Mae Discount Notes |
| 0.167% |
| 5/5/10 |
|
| 17,463 |
|
| — |
|
| — |
|
| 18,100 |
| Federal Home Loan Bank Discount Notes |
| 0.071% |
| 1/5/09 |
|
| — |
|
| 18,100 |
|
| — |
|
| 50,000 |
| Federal Home Loan Bank Discount Notes |
| 0.041% |
| 1/12/09 |
|
| — |
|
| 50,000 |
|
| — |
|
| 11,330 |
| Federal Home Loan Bank Discount Notes |
| 0.051% |
| 1/21/09 |
|
| — |
|
| 11,330 |
|
| — |
|
| 100,000 |
| Federal Home Loan Bank Discount Notes |
| 0.081% |
| 1/22/09 |
|
| — |
|
| 100,000 |
|
| 10,990 |
|
| — |
| Federal Home Loan Bank Discount Notes |
| 0.001% |
| 1/4/10 |
|
| 10,990 |
|
| — |
|
| 4,419 |
|
| — |
| Federal Home Loan Bank Discount Notes |
| 0.041% |
| 1/13/10 |
|
| 4,419 |
|
| — |
|
| 44,000 |
|
| — |
| Federal Home Loan Bank Discount Notes |
| 0.081% |
| 1/15/10 |
|
| 44,000 |
|
| — |
|
| 25,300 |
|
| — |
| Federal Home Loan Bank Discount Notes |
| 0.071% |
| 1/22/10 |
|
| 25,300 |
|
| — |
|
| 41,200 |
|
| — |
| Federal Home Loan Bank Discount Notes |
| 0.051% |
| 2/24/10 |
|
| 41,200 |
|
| — |
|
| 15,770 |
|
| — |
| Federal Home Loan Bank Discount Notes |
| 0.081% |
| 3/5/10 |
|
| 15,770 |
|
| — |
|
| — |
|
| 14,100 |
| Freddie Mac Discount Notes |
| 0.203% |
| 1/5/09 |
|
| — |
|
| 14,100 |
|
| 10,000 |
|
| — |
| Freddie Mac Discount Notes |
| 0.091% |
| 1/20/10 |
|
| 10,000 |
|
| — |
|
| 50,541 |
|
| — |
| Freddie Mac Discount Notes |
| 0.041–0.076% |
| 1/25/10 |
|
| 50,540 |
|
| — |
|
| 11,800 |
|
| — |
| Freddie Mac Discount Notes |
| 0.051% |
| 2/2/10 |
|
| 11,800 |
|
| — |
|
| 47,000 |
|
| — |
| Freddie Mac Discount Notes |
| 0.030% |
| 2/16/10 |
|
| 46,998 |
|
| — |
|
| 19,010 |
|
| — |
| Freddie Mac Discount Notes |
| 0.132% |
| 2/26/10 |
|
| 19,009 |
|
| — |
|
| 5,736 |
|
| — |
| Freddie Mac Discount Notes |
| 0.081% |
| 3/1/10 |
|
| 5,736 |
|
| — |
|
| 9,000 |
|
| — |
| Freddie Mac Discount Notes |
| 0.071% |
| 3/8/10 |
|
| 8,999 |
|
| — |
|
|
|
|
|
|
|
|
|
|
|
|
|
|
| ||||
TOTAL GOVERNMENT AGENCY NOTES |
|
|
|
|
|
| 465,092 |
|
| 266,130 |
| ||||||
|
|
|
|
|
|
|
| ||||||||||
|
|
|
|
|
|
|
|
|
|
| |||||||
TIAA Real Estate Account § Prospectus 161
|
|
| |
STATEMENT OF INVESTMENTS | continued |
|
|
TIAA REAL ESTATE ACCOUNT ▪ DECEMBER 31, 2009 AND 2008 |
|
(Dollar values shown in thousands) |
|
|
|
|
|
|
|
|
|
|
|
|
|
|
|
|
|
|
|
Principal |
|
|
|
|
|
|
| Fair Value |
| ||||||||
|
|
|
|
|
|
|
| ||||||||||
| 2009 |
|
| 2008 |
| Issuer |
| Yield | (4) | Maturity |
| 2009 |
| 2008 |
| ||
UNITED STATES TREASURY BILLS—2.13% AND 0.00% |
|
|
|
|
|
|
|
|
|
|
| ||||||
|
|
|
|
|
|
|
|
|
|
|
|
|
|
|
|
|
|
$ | 24,515 |
| $ | — |
| United States Treasury Bills |
| 0.066-0.152% |
| 2/25/10 |
| $ | 24,514 |
| $ | — |
|
| 47,200 |
|
| — |
| United States Treasury Bills |
| 0.137-0.162% |
| 4/22/10 |
|
| 47,189 |
|
| — |
|
| 52,530 |
|
| — |
| United States Treasury Bills |
| 0.122-0.147% |
| 5/13/10 |
|
| 52,506 |
|
| — |
|
| 62,015 |
|
| — |
| United States Treasury Bills |
| 0.127-0.147% |
| 5/20/10 |
|
| 61,981 |
|
| — |
|
| 20,000 |
|
| — |
| United States Treasury Bills |
| 0.137% |
| 5/27/10 |
|
| 19,985 |
|
| — |
|
|
|
|
|
|
|
|
|
|
|
|
|
|
| ||||
TOTAL UNITED STATES TREASURY BILLS |
|
|
|
|
|
| 206,175 |
|
| — |
| ||||||
|
|
|
|
|
|
|
|
|
|
|
|
|
| ||||
TOTAL MARKETABLE SECURITIES |
|
|
|
|
|
| 671,267 |
|
| 511,711 |
| ||||||
|
|
|
|
|
|
|
|
|
|
|
|
|
| ||||
|
|
|
|
|
|
|
|
|
|
|
|
|
|
|
|
|
|
MORTGAGE LOAN RECEIVABLE—0.73% AND 0.54% | |||||||||||||||||
|
|
|
|
|
|
|
|
|
|
|
|
|
|
|
|
|
|
|
|
|
|
|
| Borrower |
| Current |
|
|
|
|
|
|
|
|
|
| 75,000 |
|
| 75,000 |
| Klingle Corporation |
| 1.040% |
| 7/10/11 |
|
| 71,273 |
|
| 71,767 |
|
|
|
|
|
|
|
|
|
|
|
|
|
|
| ||||
TOTAL MORTGAGE LOAN RECEIVABLE |
|
|
|
|
|
| 71,273 |
|
| 71,767 |
| ||||||
|
|
|
|
|
|
|
|
|
|
|
|
|
| ||||
TOTAL INVESTMENTS |
|
|
|
|
| $ | 9,694,760 |
| $ | 13,351,714 |
| ||||||
|
|
|
|
|
|
|
| ||||||||||
|
|
(1) | The investment has a mortgage loan payable outstanding, as indicated in Note 8. |
|
|
(2) | The market value reflects the Account’s interest in the joint venture and is net of debt. |
|
|
(3) | Properties within this investment are located throughout the United States. |
|
|
(4) | Yield represents the annualized yield at the date of purchase. |
|
|
(5) | Current rate represents the interest rate on this investment at December 31, 2009. At December 31, 2008, the interest rate on this investment was 2.57%. |
162 Prospectus § TIAA Real Estate Account
REPORT OF INDEPENDENT REGISTERED
PUBLIC ACCOUNTING FIRM
To the Participants of the TIAA Real Estate Account and the Board of Trustees of Teachers Insurance and Annuity Association of America:
In our opinion, the accompanying statements of assets and liabilities, including the statement of investments, and the related statements of operations, of changes in net assets and of cash flows, present fairly, in all material respects, the financial position of the TIAA Real Estate Account (the “Account”) at December 31, 2009 and 2008, the results of its operations, the changes in its net assets and its cash flows for each of the three years in the period ended December 31, 2009 in conformity with accounting principles generally accepted in the United States of America. These financial statements are the responsibility of the Account’s management. Our responsibility is to express an opinion on these financial statements based on our audits. We conducted our audits of these financial statements in accordance with the standards of the Public Company Accounting Oversight Board (United States). Those standards require that we plan and perform the audits to obtain reasonable assurance about whether the financial statements are free of material misstatement. An audit includes examining, on a test basis, evidence supporting the amounts and disclosures in the financial statements, assessing the accounting principles used and significant estimates made by management, and evaluating the overall financial statement presentation. We believe that our audits provide a reasonable basis for our opinion.

Charlotte, North Carolina
March 18, 2010
TIAA Real Estate Account § Prospectus 163
APPENDIX A — MANAGEMENT OF TIAA
The Real Estate Account has no officers or directors. The Trustees and certain principal executive officers of TIAA as of the date hereof, their dates of birth, and their principal occupations during the past five years, are as follows:
TRUSTEES
|
|
| |||||||||||||||||
Name & Date of Birth (DOB) |
| Principal Occupations During Past 5 Years | |||||||||||||||||
Ronald L. Thompson |
| Former Chairman and Chief Executive Officer, Midwest Stamping and Manufacturing Company from 1993 through 2005. Director, Chrysler Group, LLC and Washington University in St. Louis. | |||||||||||||||||
|
|
| |||||||||||||||||
Jeffrey R. Brown |
| William G. Karnes Professor of Finance and Director of the Center for Business and Public Policy, University of Illinois at Urbana-Champaign. Research Associate of the National Bureau of Economic Research (NBER) and Associate Director of the NBER Retirement Research Center. Former member of the Social Security Advisory Board from 2006 to 2008, and Director of the Countryside School. | |||||||||||||||||
|
|
| |||||||||||||||||
Robert C. Clark |
| Harvard University Distinguished Service Professor and Austin Wakeman Scott Professor of Law, Harvard Law School, Harvard University. Formerly Dean and Royall Professor of Law, Harvard Law School from 1989 to 2003. Director of the Hodson Trust, Time Warner, Inc. and Omnicom Group. | |||||||||||||||||
|
|
| |||||||||||||||||
Lisa W. Hess |
| Former Chief Investment Officer of Loews Corporation. Founding partner of Zesiger Capital Group. Trustee of the WT Grant Foundation, the Chapin School, and the Pomfret School. | |||||||||||||||||
|
|
| |||||||||||||||||
Edward M. Hundert, M.D. |
| Senior lecturer in Medical Ethics, Harvard Medical School. President, Case Western Reserve University from 2002 to 2006. Formerly, Dean, 2000-2002, University of Rochester School of Medicine and Dentistry, Professor of Medical Humanities and Psychiatry, 1997 to 2002. Board Member, Rock and Roll Hall of Fame. | |||||||||||||||||
|
|
| |||||||||||||||||
Lawrence H. Linden |
| Retired Managing Director and former General Partner at Goldman Sachs, retiring in 2008. After joining Goldman Sachs in 1992, served at various times the Head of Technology, Head of Operations, and Co-Chairman of the Global Control and Compliance Committee. Founding Trustee of the Linden Trust for Conservation, Chairman of the Board of Trustees of Resources for the Future, Co-Chairman of the Board of Directors of the World Wildlife Fund and co-founder of, and senior advisor to, the Redstone Strategy Group. | |||||||||||||||||
|
|
| |||||||||||||||||
Maureen O’Hara |
| R.W. Purcell Professor of Finance at Johnson Graduate School of Management, Cornell University, where she has taught since 1979. Former chair of the board of Investment Technology Group, Inc. since 2007, and member of the board since 2003. Director of New Star Financial, Inc. and Chair of the FINRA Economic Advisory Board. | |||||||||||||||||
|
|
| |||||||||||||||||
Donald K. Peterson |
| Former Chairman and Chief Executive Officer, Avaya Inc. from 2002 to 2006 and President and Chief Executive Officer from 2000 to 2001. Formerly, Executive Vice President and Chief Financial Officer, Lucent Technologies from 1996 to 2000. Chairman, Board of Trustees, Worcester Polytechnic Institute and overseer of the Tuck School of Business Administration at Dartmouth College. Director, Sanford C. Bernstein Fund Inc., Emerj Inc. and Knewco, Inc. | |||||||||||||||||
164 Prospectus § TIAA Real Estate Account
|
|
|
TRUSTEES |
| (continued) |
|
|
|
Name & Date of Birth (DOB) |
| Principal Occupations During Past 5 Years |
Sidney A. Ribeau |
| President, Howard University since 2008. Formerly, President, Bowling Green State University, 1995-2008. Director, The Andersons, Inc., Convergys and Worthington Industries. |
|
|
|
Dorothy K. Robinson |
| Vice President and General Counsel, Yale University since 2000. Trustee, Newark Public Radio Inc., Youth Rights Media, Inc., Yale Southern Observatory, Inc., Fourth Century and Friends of New Haven Legal Assistance. |
|
|
|
David L. Shedlarz |
| Former Vice Chairman of Pfizer Inc. from 2006 to 2007, Executive Vice President from 1999 to 2005 and Chief Financial Officer of Pfizer from 1995 to 2005. Director, Pitney Bowes Inc. and the Hershey Corporation. Director, Multiple Sclerosis Society of New York City Chapter. |
|
|
|
David F. Swensen |
| Chief Investment Officer, Yale University since 1985, and adjunct professor of investment strategy at Yale School of Management and lecturer in Yale’s Department of Economics. Member, Brookings Institution and President Obama’s Economic Recovery Advisory Board. Trustee of Yale New Haven Hospital and Director of the Courtauld Institute, Hopkins School and the Carnegie Institution. |
|
|
|
Marta Tienda |
| Maurice P. During ‘22 Professor in Demographic Studies and Professor of Sociology in Public Affairs, Princeton University, since 1997. Director, Office of Population Research, Princeton University, 1998-2002. Trustee, Corporation of Brown University, Sloan Foundation and Jacobs Foundation. Member of Visiting Committee, Harvard University Kennedy School of Government. |
|
|
|
Rosalie J. Wolf |
| Managing Partner, Botanica Capital Partners LLC. Formerly, Senior Advisor and Managing Director, Offit Hall Capital Management LLC and its predecessor company, Laurel Management Company LLC from 2001 to 2003; formerly, Treasurer and Chief Investment Officer, The Rockefeller Foundation. Director, North European Oil Royalty Trust, Director and former Chairman of The Sanford C. Bernstein Fund, Inc. Member of the Brock Capital Group, LLC. |
|
|
|
OFFICER-TRUSTEES |
|
|
|
|
|
Name & Date of Birth |
| Principal Occupations During Past 5 Years |
Roger W. Ferguson, Jr. |
| President and Chief Executive Officer of TIAA and CREF since April 2008. Formerly, Chairman of Swiss Re America Holding Corporation and Head of Financial Services and Member of the Executive Committee, Swiss Re from 2006 to 2008; Vice Chairman and member of the Board of the U.S. Federal Reserve from 1999 to 2006 and a member of its Board of Governors from 1997 to 1999; and Partner and Associate, McKinsey & Company from 1984 to 1997. Currently a member of the Board of Trustees of the Institute for Advance Study, a member of the Council on Foreign Relations, a member of the Group of Thirty and a member of President Obama’s Economic Recovery Advisory Board. |
TIAA Real Estate Account § Prospectus 165
|
|
|
OFFICERS |
|
|
|
|
|
Name & Date of Birth |
| Principal Occupations During Past 5 Years |
Georganne C. Proctor |
| Executive Vice President and Chief Financial Officer, TIAA and CREF since 2006. Chief Integration Officer, TIAA and CREF since January 2010. Executive Vice President of Finance for Golden West Financial Corporation, the holding company of World Savings Bank, from 2003 through 2005. From 1994 through 2002, served as Senior Vice President, Chief Financial Officer and a member of the board of directors of Bechtel Group, Inc. Director of Redwood Trust, Inc. and Kaiser Aluminum Corporation. |
|
|
|
Scott C. Evans |
| Executive Vice President of TIAA since 1999 and Head of Asset Management since 2006 of TIAA and CREF, the TIAA-CREF Mutual Funds, the TIAA-CREF Institutional Mutual Funds, the TIAA-CREF Life Funds and TIAA Separate Account VA-1 (collectively, the “TIAA-CREF Funds”). Also served as Chief Investment Officer of TIAA between 2004 and 2006 and the TIAA-CREF Funds between 2003 and 2006. |
|
|
|
Mary (Maliz) E. Beams |
| Executive Vice President of TIAA and the TIAA-CREF Funds since 2007. President and Chief Executive Officer, TIAA-CREF Individual & Institutional Services, LLC since 2007. Senior Managing Director and Head of Wealth Management Group of TIAA since 2004. Partner, Spyglass Investments from 2002 to 2003. |
|
|
|
Jorge Gutierrez |
| Treasurer, TIAA since September, 2008. Assistant Treasurer, TIAA from 2004 to 2008. |
|
|
|
William J. Mostyn III |
| Vice President and Corporate Secretary of TIAA and the TIAA-CREF Funds since April 2008; Deputy General Counsel and Corporate Secretary of Bank of America Corporation from 2005 to 2007; Deputy General Counsel, Secretary and Corporate Governance Officer of The Gillette Company from 1974 to 2005. |
|
| �� |
PORTFOLIO MANAGEMENT TEAM | ||
|
|
|
Name & Date of Birth |
| Principal Occupations During Past 5 Years |
Margaret A. Brandwein |
| Managing Director and Portfolio Manager, TIAA Real Estate Account since 2004. From 2001 to 2004, Head of Commercial Mortgages – West Coast for TIAA. |
|
|
|
Thomas C. Garbutt |
| Managing Director and Head of Global Real Estate Equity Division, TIAA. |
|
|
|
Philip J. McAndrews |
| Managing Director and Head of Real Estate Portfolio Management, TIAA-CREF Global Real Estate since 2005. Between 2003 and 2005, portfolio manager for the Real Estate Account. Between 1997 and 2003, Head of the Real Estate Acquisitions and Joint Ventures group for TIAA. |
166 Prospectus § TIAA Real Estate Account
APPENDIX B — DESCRIPTION OF PROPERTIES
Set forth below is general information about the Account’s portfolio of commercial and residential property investments as of December 31, 2009. The Account’s property investments include both properties that are wholly owned by the Account and properties owned by the Account’s joint venture investments. Certain property investments are comprised of a portfolio of properties. Please carefully read the footnotes to these tables, which immediately follow. Market value figures are in thousands.
|
|
|
|
|
|
|
|
|
|
|
|
|
|
|
|
|
|
|
|
|
|
|
|
|
|
|
|
|
|
|
|
|
|
|
|
|
|
| |
Property |
| Location |
| Year Built |
| Year |
| Rentable | (1) | Percent |
| Annual Avg. | (2) | Fair Value | (3) | ||||
OFFICE PROPERTIES |
|
|
|
|
|
|
|
|
|
|
|
|
|
|
|
|
|
|
|
1001 Pennsylvania Ave |
| Washington, DC |
| 1987 |
| 2004 |
|
| 756,603 |
|
| 100 | % | $ | 39.74 |
| $ | 480,622 | (4) |
Four Oaks Place |
| Houston, TX |
| 1983 |
| 2004 |
|
| 1,754,334 |
|
| 94 | % |
| 17.47 |
|
| 409,027 | (4) |
Fourth & Madison |
| Seattle, WA |
| 2002 |
| 2004 |
|
| 845,533 |
|
| 96 | % |
| 29.78 |
|
| 295,000 | (4) |
50 Fremont Street |
| San Francisco, CA |
| 1983 |
| 2004 |
|
| 817,412 |
|
| 98 | % |
| 33.46 |
|
| 284,283 | (4) |
99 High Street |
| Boston, MA |
| 1971 |
| 2005 |
|
| 731,204 |
|
| 94 | % |
| 35.83 |
|
| 253,557 | (4) |
780 Third Avenue |
| New York, NY |
| 1984 |
| 1999 |
|
| 487,566 |
|
| 87 | % |
| 49.88 |
|
| 240,077 |
|
1 & 7 Westferry Circus |
| London, UK |
| 1992, 1993 |
| 2005 |
|
| 391,442 |
|
| 100 | % |
| 49.51 |
|
| 239,036 | (4)(5) |
The Newbry |
| Boston, MA |
| 1940-1961 | (6) | 2006 |
|
| 607,424 |
|
| 90 | % |
| 39.31 |
|
| 230,375 |
|
1900 K Street |
| Washington, DC |
| 1996 |
| 2004 |
|
| 339,060 |
|
| 100 | % |
| 45.34 |
|
| 204,000 |
|
Lincoln Centre |
| Dallas, TX |
| 1984 |
| 2005 |
|
| 1,638,132 |
|
| 84 | % |
| 17.09 |
|
| 202,029 | (4) |
701 Brickell |
| Miami, FL |
| 1986 | (8) | 2002 |
|
| 675,424 |
|
| 93 | % |
| 28.20 |
|
| 198,630 | (4) |
275 Battery |
| San Francisco, CA |
| 1988 |
| 2005 |
|
| 472,261 |
|
| 91 | % |
| 29.57 |
|
| 164,390 |
|
Wilshire Rodeo Plaza |
| Beverly Hills, CA |
| 1935, 1984 |
| 2006 |
|
| 264,287 |
|
| 97 | % |
| 45.71 |
|
| 151,209 | (4) |
1401 H Street NW |
| Washington, D.C. |
| 1992 |
| 2006 |
|
| 350,635 |
|
| 64 | % |
| 30.20 |
|
| 143,555 | (4) |
Yahoo! Center(7) |
| Santa Monica, CA |
| 1984 |
| 2004 |
|
| 1,185,119 |
|
| 90 | % |
| 25.31 |
|
| 133,227 |
|
Mellon Financial Center at One Boston Place(10) |
| Boston, MA |
| 1970 | (8) | 2002 |
|
| 804,444 |
|
| 90 | % |
| 44.41 |
|
| 129,922 |
|
Ten & Twenty Westport Road |
| Wilton, CT |
| 1974 | (8); 2001 | 2001 |
|
| 538,840 |
|
| 94 | % |
| 21.56 |
|
| 126,860 |
|
Millennium Corporate Park |
| Redmond, VA |
| 1999, 2000 |
| 2006 |
|
| 536,884 |
|
| 97 | % |
| 12.56 |
|
| 116,548 |
|
Inverness Center |
| Birmingham, AL |
| 1980-1985 |
| 2005 |
|
| 903,857 |
|
| 96 | % |
| 12.33 |
|
| 90,315 |
|
Urban Centre |
| Tampa, FL |
| 1984, 1987 |
| 2005 |
|
| 547,979 |
|
| 89 | % |
| 19.21 |
|
| 80,282 |
|
Morris Corporate Center III |
| Parsippany, NJ |
| 1990 |
| 2000 |
|
| 526,052 |
|
| 77 | % |
| 20.32 |
|
| 66,478 |
|
Treat Towers(11) |
| Walnut Creek, CA |
| 1999 |
| 2003 |
|
| 367,313 |
|
| 69 | % |
| 19.17 |
|
| 66,435 |
|
|
|
|
|
|
|
|
|
|
|
|
|
|
|
|
|
|
|
| |
TIAA Real Estate Account § Prospectus 167
|
|
|
|
|
|
|
|
|
|
|
|
|
|
|
|
|
|
|
|
|
|
|
|
|
|
|
|
|
|
|
|
|
|
|
|
|
|
| |
The Ellipse at Ballston |
| Arlington, VA |
| 1989 |
| 2006 |
|
| 194,914 |
|
| 96 | % |
| 30.79 |
| $ | 65,505 |
|
Oak Brook Regency Towers |
| Oakbrook, IL |
| 1977 | (8) | 2002 |
|
| 402,318 |
|
| 80 | % |
| 13.83 |
|
| 64,265 |
|
88 Kearny Street |
| San Francisco, CA |
| 1986 |
| 1999 |
|
| 228,358 |
|
| 84 | % |
| 38.50 |
|
| 61,600 |
|
Pacific Plaza |
| San Diego, CA |
| 2000, 2002 |
| 2007 |
|
| 215,758 |
|
| 65 | % |
| 23.68 |
|
| 60,075 | (4) |
Parkview Plaza |
| Oakbrook, IL |
| 1990 |
| 1997 |
|
| 264,461 |
|
| 92 | % |
| 15.95 |
|
| 44,360 |
|
One Virginia Square |
| Arlington, VA |
| 1999 |
| 2004 |
|
| 116,077 |
|
| 100 | % |
| 40.70 |
|
| 40,503 |
|
Camelback Center |
| Phoenix, AZ |
| 2001 |
| 2007 |
|
| 231,345 |
|
| 93 | % |
| 20.89 |
|
| 37,774 |
|
Wellpoint |
| Westlake Village, CA |
| 1986 1998 |
| 2006 |
|
| 216,571 |
|
| 100 | % |
| 13.47 |
|
| 37,400 |
|
The Pointe on Tampa Bay |
| Tampa, FL |
| 1982 | (8) | 2002 |
|
| 250,357 |
|
| 71 | % |
| 18.05 |
|
| 35,060 |
|
8270 Greensboro Drive |
| McLean, VA |
| 2000 |
| 2005 |
|
| 158,110 |
|
| 100 | % |
| 26.19 |
|
| 34,200 |
|
The North 40 Office Complex |
| Boca Raton, FL |
| 1983, 1984 |
| 2006 |
|
| 350,000 |
|
| 88 | % |
| 11.16 |
|
| 33,969 |
|
West Lake North Business Park |
| Westlake Village, CA |
| 2000 |
| 2004 |
|
| 198,558 |
|
| 92 | % |
| 17.11 |
|
| 32,407 |
|
Prominence in Buckhead(11) |
| Atlanta, GA |
| 1999 |
| 2003 |
|
| 423,916 |
|
| 84 | % |
| 11.14 |
|
| 30,952 |
|
3 Hutton Centre |
| Santa Ana, CA |
| 1985 | (8) | 2003 |
|
| 197,819 |
|
| 80 | % |
| 15.85 |
|
| 28,752 |
|
Centerside I |
| San Diego, CA |
| 1982 |
| 2004 |
|
| 202,913 |
|
| 67 | % |
| 19.13 |
|
| 27,012 |
|
Tysons Executive Plaza II(12) |
| McLean, VA |
| 1988 |
| 2000 |
|
| 257,740 |
|
| 94 | % |
| 27.04 |
|
| 26,275 |
|
Creeksides at Centerpoint |
| Kent, WA |
| 1985 |
| 2006 |
|
| 218,712 |
|
| 52 | % |
| 8.02 |
|
| 18,724 |
|
Needham Corporate Center |
| Needham, MA |
| 1987 |
| 2001 |
|
| 138,259 |
|
| 83 | % |
| 19.23 |
|
| 16,196 |
|
|
|
|
|
|
|
|
|
|
|
|
|
|
|
|
| ||||
Subtotal—Office Properties |
|
|
|
|
|
|
|
|
|
|
| 91 | % |
|
|
| $ | 5,000,886 |
|
|
|
|
|
|
|
|
|
|
|
|
|
|
|
|
| ||||
Percent leased weighted by property market value—Office(9) |
|
|
|
| 92 | % |
|
|
|
|
|
| |||||||
|
|
|
|
|
|
|
|
|
|
|
|
|
|
|
|
|
| ||
INDUSTRIAL PROPERTIES |
|
|
|
|
|
|
|
|
|
|
|
|
|
|
|
|
| ||
Ontario Industrial Portfolio |
| Various, CA |
| 1997-1998 |
| 1998, 2000, 2004 |
|
| 3,981,894 |
|
| 78 | % | $ | 3.23 |
| $ | 167,998 | (4) |
Dallas Industrial Portfolio(13) |
| Dallas and Coppell, TX |
| 1997-2001 |
| 2000-2002 |
|
| 3,684,941 |
|
| 92 | % |
| 2.60 |
|
| 125,275 |
|
Southern California RA Industrial Portfolio |
| Los Angeles, CA |
| 1982 |
| 2004 |
|
| 920,078 |
|
| 85 | % |
| 5.31 |
|
| 75,817 |
|
Rainier Corporate Park |
| Fife, WA |
| 1991-1997 |
| 2003 |
|
| 1,104,646 |
|
| 94 | % |
| 4.22 |
|
| 65,277 |
|
Great West Industrial Portfolio |
| Rancho Cucamonga and Fontana, CA |
| 2004-2005 |
| 2008 |
|
| 1,358,925 |
|
| 100 | % |
| 4.21 |
|
| 65,000 |
|
Seneca Industrial Park |
| Pembroke Park, FL |
| 1999-2001 |
| 2007 |
|
| 882,182 |
|
| 93 | % |
| 3.50 |
|
| 62,341 |
|
Chicago Industrial Portfolio(13) |
| Chicago and Joliet, IL |
| 1997-2000 |
| 1998; 2000 |
|
| 1,427,699 |
|
| 100 | % |
| 3.11 |
|
| 60,908 |
|
Rancho Cucamonga Industrial Portfolio |
| Rancho Cucamonga, CA |
| 2000-2002 |
| 2000; 2001; |
|
| 1,490,235 |
|
| 62 | % |
| 2.05 |
|
| 57,327 |
|
Shawnee Ridge Industrial Portfolio |
| Atlanta, GA |
| 2000-2005 |
| 2005 |
|
| 1,422,922 |
|
| 96 | % |
| 3.29 |
|
| 52,219 |
|
Chicago CALEast Industrial Portfolio(15) |
| Chicago, IL |
| 1974-2005 |
| 2003 |
|
| 1,145,152 |
|
| 98 | % |
| 3.43 |
|
| 48,304 |
|
Regal Logistics Campus |
| Seattle, WA |
| 1999-2004 |
| 2005 |
|
| 968,535 |
|
| 100 | % |
| 4.15 |
|
| 47,955 |
|
|
|
|
|
|
|
|
|
|
|
|
|
|
|
|
|
|
|
| |
168 Prospectus § TIAA Real Estate Account
|
|
|
|
|
|
|
|
|
|
|
|
|
|
|
|
|
|
|
|
|
|
|
|
|
|
|
|
|
|
|
|
|
|
|
|
|
|
| |
Property |
| Location |
| Year Built |
| Year |
| Rentable | (1) | Percent |
| Annual Avg. | (2) | Fair Value | (3) | ||||
Northern California RA Industrial Portfolio(13) |
| Oakland, CA |
| 1981 |
| 2004 |
|
| 657,602 |
|
| 83 | % |
| 4.20 |
|
| 42,437 |
|
IDI National Portfolio(14) |
| Various, U.S. |
| 1999-2004 |
| 2004 |
|
| 3,655,671 |
|
| 85 | % |
| 2.62 |
|
| 40,587 |
|
Atlanta Industrial Portfolio(13) |
| Lawrenceville, GA |
| 1996-1999 |
| 2000 |
|
| 1,295,440 |
|
| 98 | % |
| 2.76 |
|
| 39,519 |
|
Pinnacle Industrial/DFW Trade Center |
| Grapevine. TX |
| 2003, 2004, 2006 |
| 2006 |
|
| 899,200 |
|
| 100 | % |
| 3.59 |
|
| 34,148 |
|
GE Appliance East Coast Distribution Facility |
| Perryville, MD |
| 2003 |
| 2005 |
|
| 1,004,000 |
|
| 100 | % |
| 2.82 |
|
| 28,900 |
|
South River Road Industrial |
| Cranbury, NJ |
| 1999 |
| 2001 |
|
| 858,957 |
|
| 72 | % |
| 2.38 |
|
| 28,656 |
|
Northeast RA Industrial Portfolio |
| Boston, MA |
| 2000 |
| 2004 |
|
| 384,000 |
|
| 75 | % |
| 3.41 |
|
| 24,845 |
|
Broadlands Business Park |
| Elkton, MD |
| 2006 |
| 2006 |
|
| 756,600 |
|
| 100 | % |
| 2.88 |
|
| 23,600 |
|
Centre Pointe and Valley View |
| Los Angeles County, CA |
| 1965-1989 |
| 2004 |
|
| 307,685 |
|
| 99 | % |
| 5.61 |
|
| 18,929 |
|
Northwest RA Industrial Portfolio |
| Seattle, WA |
| 1996 |
| 2004 |
|
| 312,321 |
|
| 100 | % |
| 5.06 |
|
| 17,800 |
|
Konica Photo Imaging Headquarters |
| Mahwah, NJ |
| 1999 |
| 1999 |
|
| 168,000 |
|
| — | % |
| 0.00 |
|
| 15,100 |
|
Airways Distribution Center |
| Memphis, TN |
| 2005 |
| 2006 |
|
| 556,600 |
|
| 70 | % |
| 0.94 |
|
| 12,600 |
|
Summit Distribution Center |
| Memphis, TN |
| 2002 |
| 2003 |
|
| 708,532 |
|
| 5 | % |
| 0.00 |
|
| 12,300 |
|
UPS Distribution Facility |
| Fernley, NV |
| 1998 |
| 1998 |
|
| 256,000 |
|
| 100 | % |
| 2.37 |
|
| 7,600 |
|
|
|
|
|
|
|
|
|
|
|
|
|
|
|
|
| ||||
Subtotal—Industrial Properties |
|
|
|
|
|
|
|
|
|
|
| 88 | % |
|
|
| $ | 1,175,442 |
|
|
|
|
|
|
|
|
|
|
|
|
|
|
|
|
| ||||
Percent leased weighted by property market value—Industrial(9) |
|
|
|
|
|
| 87 | % |
|
|
|
|
|
| |||||
|
|
|
|
|
|
|
|
|
|
|
|
|
|
|
|
|
|
|
|
RETAIL PROPERTIES |
|
|
|
|
|
|
|
|
|
|
|
|
|
|
|
|
|
|
|
DDR Joint Venture(16) |
| Various |
| Various |
| 2007 |
|
| 16,183,158 |
|
| 83 | % | $ | 10.14 |
| $ | 312,182 |
|
The Florida Mall(17) |
| Orlando, FL |
| 1986 | (8) | 2002 |
|
| 988,011 |
|
| 97 | % |
| 38.41 |
|
| 252,432 |
|
Printemps de l’Homme |
| Paris, FR |
| 1930 |
| 2007 |
|
| 130,372 |
|
| 100 | % |
| 73.84 |
|
| 200,995 | (5) |
Florida Retail Portfolio(18) |
| Various, FL |
| 1974-2005 |
| 2006 |
|
| 1,289,825 |
|
| 84 | % |
| 12.83 |
|
| 162,204 |
|
Westwood Marketplace |
| Los Angeles, CA |
| 1950 | (8) | 2002 |
|
| 202,201 |
|
| 100 | % |
| 29.93 |
|
| 77,077 |
|
Miami International Mall(17) |
| Miami, FL |
| 1982 | (8) | 2002 |
|
| 295,400 |
|
| 97 | % |
| 36.05 |
|
| 76,856 |
|
Marketfair |
| West Windsor, NJ |
| 1987 |
| 2006 |
|
| 240,297 |
|
| 97 | % |
| 17.59 |
|
| 65,594 |
|
Mazza Gallerie |
| Washington, DC |
| 1975 |
| 2004 |
|
| 293,935 |
|
| 100 | % |
| 12.16 |
|
| 65,500 |
|
Publix at Weston Commons |
| Weston, FL |
| 2005 |
| 2006 |
|
| 126,922 |
|
| 99 | % |
| 23.43 |
|
| 38,100 | (4) |
West Town Mall(17) |
| Knoxville, TN |
| 1972 | (8) | 2002 |
|
| 764,219 |
|
| 97 | % |
| 21.56 |
|
| 37,262 |
|
Plainsboro Plaza |
| Plainsboro, NJ |
| 1987 |
| 2005 |
|
| 218,653 |
|
| 77 | % |
| 9.39 |
|
| 26,962 |
|
South Frisco Village |
| Frisco, TX |
| 2002 |
| 2006 |
|
| 227,175 |
|
| 79 | % |
| 9.89 |
|
| 26,900 | (4) |
Champlin Marketplace |
| Champlin, MN |
| 1998-99, 2005 |
| 2007 |
|
| 103,577 |
|
| 97 | % |
| 10.59 |
|
| 13,801 |
|
Suncrest Village |
| Orlando, FL |
| 1987 |
| 2005 |
|
| 93,358 |
|
| 85 | % |
| 10.03 |
|
| 12,329 |
|
|
|
|
|
|
|
|
|
|
|
|
|
|
|
|
|
|
|
| |
TIAA Real Estate Account § Prospectus 169
|
|
|
|
|
|
|
|
|
|
|
|
|
|
|
|
|
|
Plantation Grove |
| Ocoee, FL |
| 1995 |
| 1995 |
| 73,655 |
| 92 | % |
| 10.41 |
| $ | 9,600 |
|
|
|
|
|
|
|
|
|
|
|
|
|
|
| ||||
Subtotal—Retail Properties |
|
|
|
|
|
|
|
|
| 86 | % |
|
| $ | 1,377,794 |
| |
|
|
|
|
|
|
|
|
|
|
|
|
|
| ||||
Percent leased weighted by property market value—Retail (9) |
|
|
|
|
|
|
| 92 | % |
|
|
|
|
|
| ||
RESIDENTIAL PROPERTIES |
|
|
|
|
|
|
|
|
|
|
|
|
|
|
|
| |
Houston Apartment Portfolio(19) |
| Houston, TX |
| 1984-2004 |
| 2006 |
| N/A |
| 92 | % |
| N/A |
| $ | 179,717 |
|
Palomino Park Apartments |
| Denver, CO |
| 1996-2001 |
| 2005 |
| N/A |
| 96 | % | N/A |
|
| 143,907 |
| |
The Colorado |
| New York, NY |
| 1987 |
| 1999 |
| N/A |
| 99 | % |
| N/A |
|
| 110,144 | (4) |
Kierland Apartment Portfolio(19) |
| Scottsdale, AZ |
| 1996-2000 |
| 2006 |
| N/A |
| 96 | % | N/A |
|
| 78,060 |
| |
Phoenix Apartment Portfolio(19) |
| Greater Phoenix Area, AZ |
| 1995-1998 |
| 2006 |
| N/A |
| 93 | % |
| N/A |
|
| 21,767 |
|
The Legacy at Westwood Apartments |
| Los Angeles, CA |
| 2001 |
| 2002 |
| N/A |
| 95 | % | N/A |
|
| 77,836 | (4) | |
Ashford Meadows Apartments |
| Herndon, VA |
| 1998 |
| 2000 |
| N/A |
| 94 | % |
| N/A |
|
| 71,105 |
|
Larkspur Courts |
| Larkspur, CA |
| 1991 |
| 1999 |
| N/A |
| 95 | % | N/A |
|
| 50,111 |
| |
South Florida Apartment Portfolio |
| Boca Raton and Plantation, FL |
| 1986 |
| 2001 |
| N/A |
| 98 | % |
| N/A |
|
| 48,366 |
|
The Caruth |
| Dallas, TX |
| 1999 |
| 2005 |
| N/A |
| 99 | % | N/A |
|
| 49,641 | (4) | |
Regents Court Apartments |
| San Diego, CA |
| 2001 |
| 2002 |
| N/A |
| 99 | % |
| N/A |
|
| 50,505 | (4) |
1050 Lenox Park |
| Atlanta, GA |
| 2001 |
| 2005 |
| N/A |
| 96 | % | N/A |
|
| 48,223 |
| |
The Reserve at Sugarloaf |
| Duluth, GA |
| 2000 |
| 2005 |
| N/A |
| 98 | % |
| N/A |
|
| 37,710 | (4) |
The Lodge at Willow Creek |
| Denver, CO |
| 1997 |
| 1997 |
| N/A |
| 97 | % | N/A |
|
| 31,624 |
| |
The Maroneal |
| Houston, TX |
| 1998 |
| 2005 |
| N/A |
| 96 | % |
| N/A |
|
| 32,179 |
|
Glenridge Walk |
| Atlanta, GA |
| 1996, 2001 |
| 2005 |
| N/A |
| 98 | % | N/A |
|
| 30,326 |
| |
Lincoln Woods Apartments |
| Lafayette Hill, PA |
| 1991 |
| 1997 |
| N/A |
| 88 | % |
| N/A |
|
| 28,728 |
|
Westcreek Apartments |
| Westlake Village, CA |
| 1988 |
| 1997 |
| N/A |
| 99 | % | N/A |
|
| 23,061 |
| |
Quiet Water at Coquina Lakes |
| Deerfield Beach, FL |
| 1995 |
| 2001 |
| N/A |
| 97 | % |
| N/A |
|
| 19,918 |
|
The Fairways of Carolina |
| Margate, FL |
| 1993 |
| 2001 |
| N/A |
| 99 | % | N/A |
|
| 18,628 |
| |
|
|
|
|
|
|
|
|
|
|
|
|
|
| ||||
Subtotal—Residential Properties |
|
|
|
|
|
|
|
|
| 96 | % |
|
|
| $ | 1,151,556 |
|
|
|
|
|
|
|
|
|
|
|
|
|
|
| ||||
Percent leased weighted by property market value—Residential (9) |
|
|
|
|
|
|
| 96 | % |
|
|
|
|
| |||
OTHER COMMERCIAL PROPERTIES |
|
|
|
|
|
|
|
|
|
|
|
|
|
|
| ||
Storage Portfolio I(20) |
| Various, U.S. |
| 1972-1990 |
| 2003 |
| 2,295,410 |
| 83 | % | $ | 12.78 |
| $ | 46,269 |
|
Subtotal—Commercial Properties |
|
|
|
|
|
|
|
|
|
|
|
|
|
| $ | 7,600,391 |
|
|
|
|
|
|
|
|
|
|
|
|
|
|
| ||||
Total—All Properties—Percent Leased weighted by property market value |
|
|
|
|
| 92 | % |
|
| $ | 8,751,947 |
| |||||
|
|
|
|
|
|
|
|
|
|
|
|
|
| ||||
170 Prospectus § TIAA Real Estate Account
|
|
(1) | The square footage is an approximate measure and is subject to periodic remeasurement. |
| |
(2) | Based on total contractual rent for leases existing as of December 31, 2009. The contractual rent can be either on a gross or net basis, depending on the terms of the leases. |
| |
(3) | Market value reflects the value determined in accordance with the procedures described in this prospectus and as stated in the Statement of Investments. |
| |
(4) | Property is subject to a mortgage. The market value shown represents the Account’s interest gross of debt. |
| |
(5) | 1 & 7 Westferry Circus is located in the United Kingdom, and the market value represents the Account’s interest gross of debt. Printemps de l’Homme is located in France. The market value of each property is converted from local currency to U.S. Dollars at the exchange rate as of December 31, 2009. |
| |
(6) | This property was renovated in 2004 and 2006. |
| |
(7) | This property is held in a 50%/50% joint venture with Equity Office Properties Trust. Market value shown reflects the value of the Account’s interest in the joint venture, net of debt. |
| |
(8) | Undergone extensive renovations since construction. |
| |
(9) | Values shown are based on the property market value weighted as a percent of the total market value and based on the percent leased for each property. |
| |
(10) | The Account purchased a 50.25% interest in a private REIT, which owns this property. A 49.70% interest is owned by Societe Immobiler Trans-Quebec, and .05% is owned by 100 individuals. Market value shown reflects the value of the Account’s interest in the joint venture. |
| |
(11) | This investment property is held in a 75%/25% joint venture with Equity Office Properties Trust. Market value shown reflects the value of the Account’s interest in the joint venture. |
| |
(12) | This investment property is held in a 50%/50% joint venture with Tennessee Consolidated Retirement System. Market value shown reflects the value of the Account’s interest in the joint venture. |
| |
(13) | A portion of this portfolio was sold in 2007. |
| |
(14) | This investment property is held in a 60%/40% joint venture with Industrial Development International. Market value shown reflects the value of the Account’s interest in the joint venture, net of debt. |
| |
(15) | A portion of this portfolio was sold in 2007 and 2008. |
| |
(16) | This investment property consists of 65 properties located in 13 states and is held in a 85%/15% joint venture with Developers Diversified Realty Corporation. Market value shown reflects the value of the Account’s interest in the joint venture, net of debt. |
| |
(17) | This investment property is held in a 50%/50% joint venture with the Simon Property Group. Market value shown reflects the value of the Account’s interest in the joint venture, net of debt. |
| |
(18) | This investment property is held in a 80%/20% joint venture with Weingarten Realty Investors. Market value shown reflects the value of the Account’s interest in the joint venture. This portfolio contains seven neighborhood and/or community shopping centers located in Ft. Lauderdale, Miami, Orlando and Tampa, Florida. |
| |
(19) | A portion of this portfolio was sold in 2009. |
| |
(20) | This investment property is held in a 75%/25% joint venture with Storage USA. Market value shown reflects the value of the Account’s interest in the joint venture, net of debt. |
TIAA Real Estate Account § Prospectus 171
Residential Property Portfolio.The table below contains more detailed information regarding the apartment complexes in the Account’s portfolio as of December 31, 2009 and should be read in conjunction with the immediately preceding table.
|
|
|
|
|
|
|
|
|
|
|
Property |
| Location |
| Number |
| Average |
| Avg. Rent |
| |
Houston Apartment Portfolio(1) |
| Houston, TX |
| 1,777 |
| 1,021 |
| $ | 1,327 |
|
Palomino Park |
| Highlands Ranch, CO |
| 1,184 |
| 1,109 |
|
| 1,100 |
|
Kierland Apartment Portfolio(1) |
| Scottsdale, AZ |
| 724 |
| 1,004 |
|
| 1,237 |
|
South Florida Apartment Portfolio(1) |
| Boca Raton and Plantation, FL |
| 550 |
| 906 |
|
| 1,147 |
|
Ashford Meadows |
| Herndon, VA |
| 440 |
| 1,030 |
|
| 1,541 |
|
1050 Lenox Park |
| Atlanta, GA |
| 407 |
| 1,168 |
|
| 1,388 |
|
The Caruth Apartments |
| Dallas, TX |
| 338 |
| 1,220 |
|
| 1,522 |
|
The Reserve at Sugarloaf |
| Duluth, GA |
| 333 |
| 996 |
|
| 1,024 |
|
The Lodge at Willow Creek |
| Denver, CO |
| 316 |
| 928 |
|
| 958 |
|
Maroneal |
| Houston, TX |
| 309 |
| 1,146 |
|
| 1,373 |
|
Glenridge Walk |
| Sandy Springs, GA |
| 296 |
| 617 |
|
| 1,375 |
|
The Colorado |
| New York, NY |
| 256 |
| 886 |
|
| 2,884 |
|
Regents Court |
| San Diego, CA |
| 251 |
| 1,001 |
|
| 1,757 |
|
Larkspur Courts Apartments |
| Larkspur, CA |
| 248 |
| 976 |
|
| 2,082 |
|
Phoenix Apartment Portfolio(1) |
| Greater Phoenix Area, AZ |
| 240 |
| 976 |
|
| 1,100 |
|
Lincoln Woods Apartments |
| Lafayette Hill, PA |
| 216 |
| 774 |
|
| 1,285 |
|
The Fairways at Carolina |
| Margate, FL |
| 208 |
| 1,026 |
|
| 1,065 |
|
Quiet Waters at Coquina |
| Deerfield Beach, FL |
| 200 |
| 1,048 |
|
| 1,136 |
|
Legacy at Westwood |
| Los Angeles, CA |
| 187 |
| 1,181 |
|
| 4,267 |
|
Westcreek Apartments |
| Westlake Village, CA |
| 126 |
| 951 |
|
| 1,973 |
|
|
|
(1) | Represents a portfolio containing multiple properties. |
172 Prospectus § TIAA Real Estate Account
Accumulation:The total value of your accumulation units in the Real Estate Account.
Accumulation Period:The period that begins with your first premium and continues until the entire accumulation has been applied to purchase annuity income, transferred from the Account, or paid to you or a beneficiary.
Accumulation Unit:A share of participation in the Real Estate Account for someone in the accumulation period. The Account’s accumulation unit value changes daily.
Annuity Unit:A measure used to calculate the amount of annuity payments due a participant.
Beneficiary:Any person or institution named to receive benefits if you die during the accumulation period or if you (and your annuity partner, if you have one) die before the guaranteed period of your annuity ends.
Business Day:Any day the New York Stock Exchange (NYSE) is open for trading. A business day ends at 4 p.m. Eastern time, or when trading closes on the NYSE, if earlier.
Calendar Day:Any day of the year. Calendar days end at the same time as business days.
Commuted Value:The present value of annuity payments due under an income option or method of payment not based on life contingencies. Present value is adjusted for investment gains or losses since the annuity unit value was last calculated.
Eligible Institution:A nonprofit institution, including any governmental institution, organized in the United States.
ERISA:The Employee Retirement Income Security Act of 1974, as amended.
General Account:All of TIAA’s assets other than those allocated to the Real Estate Account or to other existing or future TIAA separate accounts.
Good Order:Actual receipt of an order along with all information and supporting legal documentation necessary to effect the transaction. This information and documentation generally includes your complete application and any other information or supporting documentation we may require. With respect to purchase requests, “good order” also generally includes receipt of sufficient funds by us to effect the purchase. We may, in our sole discretion, determine whether any particular transaction request is in good order and reserve the right to change or waive any good order requirement at any time either in general or with respect to a particular plan, contract or transaction.
Income Change Method:The method under which you choose to have your annuity payments revalued. Under the annual income change method, your payments are revalued once each year. Under the monthly income change method, your payments are revalued every month.
TIAA Real Estate Account § Prospectus 173
Separate Account:An investment account legally separated from the general assets of TIAA, whose income and investment gains and losses are credited to or charged against its own assets, without regard to TIAA’s other income, gains or losses.
Valuation Day:Any day the NYSE is open for trading, as well as, for certain contracts, the last calendar day of each month. Valuation days end as of the close of all U.S. national exchanges where securities or other investments of the Account are principally traded. Valuation days that aren’t business days will end at 4 p.m. Eastern Time.
Valuation Period:The time from the end of one valuation day to the end of the next.
174 Prospectus § TIAA Real Estate Account
PART II
INFORMATION NOT REQUIRED IN A PROSPECTUS
Item 13. Other Expenses of Issuance and Distribution.
|
|
|
|
|
SEC Registration Fees |
| $ | 71,300 |
|
Costs of printing and engraving |
|
| 600,000 | * |
Legal fees |
|
| 50,000 | * |
Accounting fees |
|
| 30,000 | * |
Blue Sky Registration Fees |
|
| 5,000 | * |
Miscellaneous |
|
| 18,700 | * |
|
|
| ||
Total |
| $ | 775,000 | * |
|
|
|
|
|
|
| ||
* | Approximate |
|
Item 14. Indemnification of Directors and Officers.
Trustees, officers, and employees of TIAA may be indemnified against liabilities and expenses incurred in such capacity pursuant to Article Six of TIAA’s bylaws (see Exhibit 3(B)). Article Six provides that, to the extent permitted by law, TIAA will indemnify any person made or threatened to be made a party to any action, suit or proceeding by reason of the fact that such person is or was a trustee, officer, or employee of TIAA or, while a trustee, officer, or employee of TIAA, served any other organization in any capacity at TIAA’s request. To the extent permitted by law, such indemnification could include judgments, fines, amounts paid in settlement, and expenses, including attorney’s fees. TIAA has in effect an insurance policy that will indemnify its trustees, officers, and employees for liabilities arising from certain forms of conduct. No payment of indemnification, advance or allowance under the foregoing provisions shall be made unless a notice shall have been filed with the Superintendent of Insurance of the State of New York not less than thirty days prior to such payment specifying the persons to be paid, the amounts to be paid, the manner in which payment is authorized and the nature and status, at the time of such notice, of the litigation or threatened litigation.
Insofar as indemnification for liabilities arising under the Securities Act of 1933 may be permitted to trustees, officers, or employees of TIAA, pursuant to the foregoing provision or otherwise, TIAA has been advised that in the opinion of the Securities and Exchange Commission such indemnification is against public policy as expressed in that Act and is therefore unenforceable. In the event that a claim for indemnification against such liabilities (other than the payment of expenses incurred or paid by a trustee, officer, or employee in the successful defense of any action, suit or proceeding) is asserted by a trustee, officer, or employee in connection with the securities being registered, TIAA will, unless in the opinion of its counsel the matter has been settled by controlling precedent, submit to a court of appropriate jurisdiction the question whether such indemnification by it is against public policy as expressed in that Act and will be governed by the final adjudication of such issue.
Item 15. Recent Sales of Unregistered Securities.
None.
Item 16. Exhibits and Financial Statement Schedules.
|
|
|
|
(a) | Exhibits | ||
|
|
|
|
| (1) | (A) | Distribution Agreement for the Contracts Funded by the TIAA Real Estate Account, dated as of January 1, 2008, by and among Teachers Insurance and Annuity Association of America, for itself and on behalf of the Account, and TIAA-CREF Individual & Institutional Services, LLC5 |
|
|
|
|
| (3) | (A) | Charter of TIAA8 |
|
|
|
|
|
| (B) | Restated Bylaws of TIAA (as amended) 9 |
|
|
|
|
| (4) | (A) | Forms of RA, GRA, GSRA, SRA, IRA Real Estate Account Endorsements2, Keogh Contract,3Retirement Select and Retirement Select Plus Contracts and Endorsements1and Retirement Choice and Retirement Choice Plus Contracts3 |
|
|
|
|
|
| (B) | Forms of Income-Paying Contracts2 |
|
|
|
|
| (5) |
| Opinion and Consent of Jonathan Feigelson, Esquire** |
|
|
|
|
| (10) | (A) | Independent Fiduciary Agreement, dated February 22, 2006, by and among TIAA, the Registrant, and Real Estate Research Corporation4 |
|
|
|
|
|
| (B) | Amendment to Independent Fiduciary Agreement, dated December 17, 2008, between TIAA, on behalf of the Registrant, and Real Estate Research Corporation6 |
|
|
|
|
|
| (C) | Custodian Agreement, dated as of March 3, 2008, by and between TIAA, on behalf of the Registrant, and State Street Bank and Trust Company, N.A. 7 |
|
|
|
|
| (23) | (A) | Consent of Jonathan Feigelson, Esquire (filed as Exhibit 5)** |
|
|
|
|
|
| (B) | Consent of Dechert LLP** |
|
|
|
|
|
| (C) | Consent of PricewaterhouseCoopers LLP** |
|
|
|
| ||
** | Filed herewith. | |
|
|
|
1 | Previously filed and incorporated herein by reference to the Account’s Pre-Effective Amendment No. 1 to the Registration Statement on Form S-1 filed April 29, 2004 (File No. 333-113602). | |
|
|
|
2 | Previously filed and incorporated herein by reference to the Account’s Post-Effective Amendment No. 2 to the Registration Statement on Form S-1 filed April 30, 1996 (File No. 33-92990). | |
|
|
|
3 | Previously filed and incorporated herein by reference to the Account’s Post-Effective Amendment No. 1 to the Registration Statement on Form S-1 filed May 2, 2005 (File No. 333-121493). | |
|
|
|
4 | Previously filed and incorporated herein by reference to Exhibit 10.(a) to the Annual Report on Form 10-K of the Account for the period ended December 31, 2005, filed with the Commission on March 15, 2006 (File No. 33-92990). | |
|
|
|
5 | Previously filed and incorporated herein by reference to the Account’s Current Report on Form 8-K, filed with the Commission on January 7, 2008 (File No. 33-92990). | |
|
|
|
6 | Previously filed and incorporated herein by reference to the Account’s Current Report on Form 8-K, filed with the Commission on December 22, 2008 (File No. 33-92990). | |
|
|
|
7 | Previously filed and incorporated herein by reference to Exhibit 10.(b) to the Annual Report on Form 10-K of the Account for the fiscal year ended December 31, 2007 and filed with the Commission on March 20, 2008 (File No. 33-92990). | |
|
|
|
8 | Previously filed and incorporated by reference to Exhibit 3(A) to the Account’s Quarterly Report on Form 10-Q for the quarter ended June 30, 2009 and filed with the Commission on August 13, 2009 (File No. 33-92990). | |
|
|
|
9 | Previously filed and incorporated by reference to Exhibit 3(B) to the Account’s Quarterly Report on Form 10-Q for the quarter ended June 30, 2009 and filed with the Commission on August 13, 2009 (File No. 33-92990). | |
|
|
(b) | Financial Statement Schedules |
All Schedules have been omitted because they are not required under the related instructions or are inapplicable.
Item 17. Undertakings.
The undersigned Registrant hereby undertakes:
(1) To file, during any period in which offers or sales are being made, a post-effective amendment to this Registration Statement:
|
|
|
| (i) | To include any prospectus required by Section 10(a)(3) of the Securities Act of 1933. |
|
|
|
| (ii) | To reflect in the prospectus any facts or events arising after the effective date of the Registration Statement (or the most recent post-effective amendment thereof) which, individually or in the aggregate, represent a fundamental change in the information set forth in the Registration Statement. Notwithstanding the foregoing, any increase or decrease in volume of securities offered (if the total dollar value of securities offered would not exceed that which was registered) and any deviation from the low or high end of the estimated maximum offering range may be reflected in the form of prospectus filed with the Commission pursuant to Rule 424(b) if, in the aggregate, the changes in volume and price represent no more than a 20 percent change in the maximum aggregate offering price set forth in the “Calculation of Registration Fee” table in the effective registration statement. |
|
|
|
| (iii) | To include any material information with respect to the plan of distribution not previously disclosed in the Registration Statement or any material change to such information in the Registration Statement. |
(2) That, for the purpose of determining any liability under the Securities Act of 1933, each such post-effective amendment shall be deemed to be a new registration statement relating to the securities offered therein, and the offering of such securities at that time shall be deemed to be the initialbona fideoffering thereof.
(3) To remove from registration by means of a post-effective amendment any of the securities being registered which remain unsold at the termination of the offering.
(4) To provide the full financial statements of TIAA promptly upon written or oral request.
(5) That, for the purpose of determining liability under the Securities Act of 1933 to any purchaser, each prospectus filed pursuant to Rule 424(b) as part of a registration statement relating to an offering, other than registration statements relying on Rule 430B or other than prospectuses filed in reliance on Rule 430A, shall be deemed to be part of and included in the registration statement as of the date it is first used after effectiveness. Provided, however, that no statement made in a registration statement or prospectus that is part of the registration statement or made in a document incorporated or deemed incorporated by reference into the registration statement or prospectus that is part of the registration statement will, as to a purchaser with a time of contract of sale prior to such first use, supersede or modify any statement that was made in the registration statement or prospectus that was part of the registration statement or made in any such document immediately prior to such date of first use.
(6) That, for the purpose of determining liability of the Registrant under the Securities Act of 1933 to any purchaser in the initial distribution of the securities:
The undersigned Registrant undertakes that in a primary offering of securities of the undersigned Registrant pursuant to this Registration Statement, regardless of the underwriting method used to sell the securities to the purchaser, if the securities are offered or sold to such purchaser by means of any of the following communications, the undersigned Registrant will be a seller to the purchaser and will be considered to offer or sell such securities to such purchaser:
|
|
|
| (i) | Any preliminary prospectus or prospectuses of the undersigned Registrant relating to the offering required to be filed pursuant to Rule 424; |
|
|
|
| (ii) | Any free writing prospectus relating to the offering prepared by or on behalf of the undersigned Registrant or used or referred to by the undersigned Registrant; |
|
|
|
| (iii) | The portion of any other free writing prospectus relating to the offering containing material information about the undersigned Registrant or its securities provided by or on behalf of the undersigned Registrant; and |
|
|
|
| (iv) | Any other communication that is an offer in the offering made by the undersigned Registrant to the purchaser. |
[The full audited financial statements of TIAA will be filed by amendment to this Registration Statement on Form S-1.]
SIGNATURES
Pursuant to the requirements of the Securities Act of 1933, as amended, the registrant, TIAA Real Estate Account, has duly caused this Amendment to Registration Statement on Form S-1 to be signed on its behalf by the undersigned, thereunto duly authorized, in New York, New York, on the ___ day of _____, 2010.
|
|
|
| TIAA REAL ESTATE ACCOUNT | |
|
|
|
| By: TEACHERS INSURANCE AND ANNUITY ASSOCIATION OF AMERICA | |
|
|
|
| By: | /s/ Roger W. Ferguson, Jr. |
|
| |
|
| Roger W. Ferguson, Jr. |
|
| President and Chief Executive |
|
| Officer and Trustee |
Pursuant to the requirements of the Securities Act of 1933, as amended, this Amendment to Registration Statement has been signed by the following trustees and officers of Teachers Insurance and Annuity Association of America, in the capacities and on the dates indicated.
|
|
|
|
|
Signature |
| Title |
| Date |
|
| |||
|
|
|
|
|
/s/ Roger W. Ferguson, Jr. |
| President and Chief Executive Officer |
| _______, 2010 |
| (Principal Executive Officer) and Trustee |
|
| |
Roger W. Ferguson, Jr. |
|
|
|
|
|
|
|
|
|
/s/ Georganne C. Proctor |
| Executive Vice President and Chief Financial |
| _______, 2010 |
| Officer (Principal Financial and Accounting Officer) |
|
| |
Georganne C. Proctor |
|
|
|
|
|
|
|
|
|
/s/ Ronald L. Thompson |
| Chairman of the Board of Trustees |
| _______, 2010 |
|
|
|
| |
Ronald L. Thompson |
|
|
|
|
|
|
|
|
|
/s/ Jeffrey R. Brown |
| Trustee |
| _______, 2010 |
|
|
|
| |
Jeffrey R. Brown |
|
|
|
|
|
|
|
|
|
/s/ Robert C. Clark |
| Trustee |
| _______, 2010 |
|
|
|
| |
Robert C. Clark |
|
|
|
|
|
|
|
|
|
/s/ Lisa W. Hess |
| Trustee |
| _______, 2010 |
|
|
|
| |
Lisa W. Hess |
|
|
|
|
|
|
|
|
|
/s/ Edward M. Hundert, M.D |
| Trustee |
| _______, 2010 |
|
|
|
| |
Edward M. Hundert, M.D. |
|
|
|
|
|
|
|
|
|
/s/ Lawrence H. Linden |
| Trustee |
| _______, 2010 |
|
|
|
| |
Lawrence H. Linden |
|
|
|
|
|
|
|
|
|
/s/ Maureen O’Hara |
| Trustee |
| _______, 2010 |
|
|
|
| |
Maureen O’Hara |
|
|
|
|
|
|
|
|
|
/s/ Donald K. Peterson |
| Trustee |
| _______, 2010 |
|
|
|
| |
Donald K. Peterson |
|
|
|
|
|
|
|
|
|
/s/ Sidney A. Ribeau |
| Trustee |
| _______, 2010 |
|
|
|
| |
Sidney A. Ribeau |
|
|
|
|
|
|
|
|
|
/s/ Dorothy K. Robinson |
| Trustee |
| _______, 2010 |
|
|
|
| |
Dorothy K. Robinson |
|
|
|
|
|
|
|
|
|
/s/ David L. Shedlarz |
| Trustee |
| _______, 2010 |
|
|
|
| |
David L. Shedlarz |
|
|
|
|
|
|
|
|
|
/s/ David F. Swensen |
| Trustee |
| _______, 2010 |
|
|
|
| |
David F. Swensen |
|
|
|
|
|
|
|
|
|
/s/ Marta Tienda |
| Trustee |
| _______, 2010 |
|
|
|
| |
Marta Tienda |
|
|
|
|
|
|
|
|
|
/s/ Rosalie J. Wolf |
| Trustee |
| _______, 2010 |
|
|
|
| |
Rosalie J. Wolf |
|
|
|
|