UNITED STATES
SECURITIES AND EXCHANGE COMMISSION
Washington, D.C. 20549
FORM 10-Q
(Mark One)
S QUARTERLY REPORT PURSUANT TO SECTION 13 OR 15(d) OF THE SECURITIES
EXCHANGE ACT OF 1934
For the quarterly period ended March 31, 2011
OR
£ TRANSITION REPORT PURSUANT TO SECTION 13 OR 15(d) OF THE SECURITIES
EXCHANGE ACT OF 1934
For the transition period from to
Commission file number: 33-92990; 333-172900
TIAA REAL ESTATE ACCOUNT
(Exact name of registrant as specified in its charter)
NEW YORK
(State or other jurisdiction of
incorporation or organization)
NOT APPLICABLE
(I.R.S. Employer Identification No.)
C/O TEACHERS INSURANCE AND
ANNUITY ASSOCIATION OF AMERICA
730 THIRD AVENUE
NEW YORK, NEW YORK 10017-3206
(Address of principal executive offices, including zip code)
Registrant’s telephone number, including area code: (212) 490-9000
Indicate by check mark whether the Registrant (1) has filed all reports required to be filed by Section 13 or 15(d) of the Securities Exchange Act of 1934 during the preceding 12 months (or for such shorter period that the Registrant was required to file such reports), and (2) has been subject to such filing requirements for the past 90 days.
YESS NO£
Indicate by check mark whether the registrant has submitted electronically and posted on its corporate Web site, if any, every Interactive Data File required to be submitted and posted pursuant to Rule 405 of Regulation S-T (§232.405 of this chapter) during the preceding 12 months (or for such shorter period that the registrant was required to submit and post such files).
YES£ NO£
Indicate by check mark whether the registrant is a large accelerated filer, an accelerated filer, a non-accelerated filer, or smaller reporting company. See the definitions of “large accelerated filer,” “accelerated filer” and “smaller reporting company” in Rule 12b-2 of the Exchange Act. (Check one):
| | |
Large accelerated filer£ | | Accelerated filer£ |
Non-accelerated filerS | | Smaller Reporting Company£ |
(Do not check if a smaller reporting company) | | |
Indicate by check mark whether the registrant is a shell company (as defined in Rule 12b-2 of the Exchange Act).
YES£ NOS
PART I. FINANCIAL INFORMATION
ITEM 1. FINANCIAL STATEMENTS.
INDEX TO UNAUDITED FINANCIAL STATEMENTS
TIAA REAL ESTATE ACCOUNT
MARCH 31, 2011
2
TIAA REAL ESTATE ACCOUNT
STATEMENTS OF ASSETS AND LIABILITIES
(In millions, except per accumulation unit amounts)
| | | | |
| | March 31,
2011 | | December 31,
2010 |
| | (Unaudited) | | |
ASSETS | | | | |
Investments, at fair value: | | | | |
Real estate properties
(cost: $9,482.7 and $9,449.1) | | | $ | | 8,345.8 | | | | $ | | 8,115.5 | |
Real estate joint ventures and limited partnerships
(cost: $2,239.6 and $2,223.3) | | | | 1,702.1 | | | | | 1,629.1 | |
Marketable securities: | | | | |
Real estate-related
(cost: $587.2 and $480.4) | | | | 635.2 | | | | | 495.3 | |
Other
(cost: $2,913.8 and $2,396.6) | | | | 2,914.0 | | | | | 2,396.7 | |
| | | | |
Total investments (cost: $15,223.3 and $14,549.4) | | | | 13,597.1 | | | | | 12,636.6 | |
| | | | |
Cash and cash equivalents | | | | 13.0 | | | | | 12.9 | |
Due from investment advisor | | | | 19.2 | | | | | 11.1 | |
Other | | | | 180.6 | | | | | 179.3 | |
| | | | |
TOTAL ASSETS | | | | 13,809.9 | | | | | 12,839.9 | |
| | | | |
LIABILITIES | | | | |
Mortgage loans payable—Note 8
(principal outstanding: $1,845.6 and $1,842.9) | | | | 1,856.2 | | | | | 1,860.2 | |
Accrued real estate property level expenses | | | | 148.6 | | | | | 153.7 | |
Security deposits held | | | | 24.1 | | | | | 22.9 | |
| | | | |
TOTAL LIABILITIES | | | | 2,028.9 | | | | | 2,036.8 | |
| | | | |
COMMITMENTS AND CONTINGENCIES—Note 11 | | | | |
NET ASSETS | | | | |
Accumulation Fund | | | | 11,503.8 | | | | | 10,535.7 | |
Annuity Fund | | | | 277.2 | | | | | 267.4 | |
| | | | |
TOTAL NET ASSETS | | | | 11,781.0 | | | | | 10,803.1 | |
| | | | |
NUMBER OF ACCUMULATION UNITS
OUTSTANDING—Notes 9 and 10 | | | | 50.8 | | | | | 48.1 | |
| | | | |
NET ASSET VALUE, PER ACCUMULATION UNIT—Note 9 | | | $ | | 226.672 | | | | $ | | 219.173 | |
| | | | |
See notes to the financial statements
3
TIAA REAL ESTATE ACCOUNT
STATEMENTS OF OPERATIONS
(In millions)
(Unaudited)
| | | | |
| | For the Three Months Ended March 31, |
| | 2011 | | 2010 |
INVESTMENT INCOME | | | | |
Real estate income, net: | | | | |
Rental income | | | $ | | 210.1 | | | | $ | | 212.6 | |
| | | | |
Real estate property level expenses and taxes: | | | | |
Operating expenses | | | | 57.8 | | | | | 59.3 | |
Real estate taxes | | | | 27.2 | | | | | 29.7 | |
Interest expense | | | | 26.4 | | | | | 24.6 | |
| | | | |
Total real estate property level expenses and taxes | | | | 111.4 | | | | | 113.6 | |
| | | | |
Real estate income, net | | | | 98.7 | | | | | 99.0 | |
Income from real estate joint ventures and limited partnerships | | | | 21.1 | | | | | 19.0 | |
Interest | | | | 1.1 | | | | | 0.4 | |
Dividends | | | | 2.4 | | | | | — | |
| | | | |
TOTAL INVESTMENT INCOME | | | | 123.3 | | | | | 118.4 | |
| | | | |
Expenses—Note 2: | | | | |
Investment advisory charges | | | | 14.2 | | | | | 10.9 | |
Administrative charges | | | | 6.9 | | | | | 5.4 | |
Distribution charges | | | | 1.9 | | | | | 1.7 | |
Mortality and expense risk charges | | | | 1.4 | | | | | 1.0 | |
Liquidity guarantee charges | | | | 4.2 | | | | | 2.8 | |
| | | | |
TOTAL EXPENSES | | | | 28.6 | | | | | 21.8 | |
| | | | |
INVESTMENT INCOME, NET | | | | 94.7 | | | | | 96.6 | |
| | | | |
NET REALIZED AND UNREALIZED GAIN (LOSS) ON INVESTMENTS AND MORTGAGE LOANS PAYABLE | | | | |
Net realized gain (loss) on investments: | | | | |
Real estate properties | | | | (9.3 | ) | | | | | (1.2 | ) | |
Real estate joint ventures and limited partnerships | | | | (1.5 | ) | | | | | (153.3 | ) | |
Marketable securities | | | | 1.9 | | | | | — | |
| | | | |
Net realized (loss) on investments | | | | (8.9 | ) | | | | | (154.5 | ) | |
| | | | |
Net change in unrealized appreciation (depreciation) on: | | | | |
Real estate properties | | | | 195.5 | | | | | (189.5 | ) | |
Real estate joint ventures and limited partnerships | | | | 64.0 | | | | | 120.5 | |
Marketable securities | | | | 34.5 | | | | | — | |
Mortgage loans receivable | | | | — | | | | | 0.2 | |
Mortgage loans payable | | | | 1.4 | | | | | (25.8 | ) | |
| | | | |
Net change in unrealized appreciation (depreciation) on
investments and mortgage loans payable | | | | 295.4 | | | | | (94.6 | ) | |
| | | | |
NET REALIZED AND UNREALIZED
GAIN (LOSS) ON INVESTMENTS AND
MORTGAGE LOANS PAYABLE | | | | 286.5 | | | | | (249.1 | ) | |
| | | | |
NET INCREASE (DECREASE) IN NET ASSETS
RESULTING FROM OPERATIONS | | | $ | | 381.2 | | | | $ | | (152.5 | ) | |
| | | | |
See notes to the financial statements
4
TIAA REAL ESTATE ACCOUNT
STATEMENTS OF CHANGES IN NET ASSETS
(In millions)
(Unaudited)
| | | | |
| | For the Three Months
Ended March 31, |
| | 2011 | | 2010 |
FROM OPERATIONS | | | | |
Investment income, net | | | $ | | 94.7 | | | | $ | | 96.6 | |
Net realized loss on investments | | | | (8.9 | ) | | | | | (154.5 | ) | |
Net change in unrealized appreciation (depreciation) on investments and mortgage loans payable | | | | 295.4 | | | | | (94.6 | ) | |
| | | | |
NET INCREASE (DECREASE) IN NET ASSETS
RESULTING FROM OPERATIONS | | | | 381.2 | | | | | (152.5 | ) | |
| | | | |
FROM PARTICIPANT TRANSACTIONS | | | | |
Premiums | | | | 819.6 | | | | | 301.2 | |
Annuity payments | | | | (4.8 | ) | | | | | (5.6 | ) | |
Withdrawals and death benefits | | | | (218.1 | ) | | | | | (268.1 | ) | |
| | | | |
NET INCREASE IN NET ASSETS
RESULTING FROM PARTICIPANT TRANSACTIONS | | | | 596.7 | | | | | 27.5 | |
| | | | |
NET INCREASE (DECREASE)
IN NET ASSETS | | | | 977.9 | | | | | (125.0 | ) | |
NET ASSETS | | | | |
Beginning of period | | | | 10,803.1 | | | | | 7,879.9 | |
| | | | |
End of period | | | $ | | 11,781.0 | | | | $ | | 7,754.9 | |
| | | | |
See notes to the financial statements
5
TIAA REAL ESTATE ACCOUNT
STATEMENTS OF CASH FLOWS
(In millions)
(Unaudited)
| | | | |
| | For the Three Months
Ended March 31, |
| | 2011 | | 2010 |
CASH FLOWS FROM OPERATING ACTIVITIES | | | | |
Net increase (decrease) in net assets resulting from operations | | | $ | | 381.2 | | | | $ | | (152.5 | ) | |
Adjustments to reconcile net increase (decrease) in net assets resulting from operations to net cash used in operating activities: | | | | |
Net realized loss on investments | | | | 8.9 | | | | | 154.5 | |
Net change in unrealized (appreciation) depreciation on investments and mortgage loans payable | | | | (295.4 | ) | | | | | 94.6 | |
Purchase of real estate properties | | | | (40.6 | ) | | | | | — | |
Capital improvements on real estate properties | | | | (41.6 | ) | | | | | (23.6 | ) | |
Proceeds from sale of real estate properties | | | | 39.0 | | | | | — | |
Purchases of long term investments | | | | (124.1 | ) | | | | | (2.1 | ) | |
Proceeds from sale of long term investments | | | | 7.7 | | | | | 24.5 | |
Increase in other investments | | | | (514.9 | ) | | | | | (152.8 | ) | |
Change in due from investment advisor | | | | (8.2 | ) | | | | | (4.7 | ) | |
(Increase) decrease in other assets | | | | (2.1 | ) | | | | | 13.9 | |
Decrease in accrued real estate property level expenses | | | | (5.0 | ) | | | | | (0.8 | ) | |
Increase in security deposits held | | | | 1.1 | | | | | 0.2 | |
| | | | |
NET CASH USED IN OPERATING ACTIVITIES | | | | (594.0 | ) | | | | | (48.8 | ) | |
| | | | |
CASH FLOWS FROM FINANCING ACTIVITIES | | | | |
Principal payments of mortgage loans payable | | | | (2.6 | ) | | | | | (1.4 | ) | |
Premiums | | | | 819.6 | | | | | 301.2 | |
Annuity payments | | | | (4.8 | ) | | | | | (5.6 | ) | |
Withdrawals and death benefits | | | | (218.1 | ) | | | | | (268.1 | ) | |
| | | | |
NET CASH PROVIDED BY FINANCING ACTIVITIES | | | | 594.1 | | | | | 26.1 | |
| | | | |
NET INCREASE (DECREASE) IN CASH AND CASH EQUIVALENTS | | | | 0.1 | | | | | (22.7 | ) | |
CASH AND CASH EQUIVALENTS | | | | |
Beginning of period | | | | 12.9 | | | | | 24.9 | |
| | | | |
End of period | | | | 13.0 | | | | | 2.2 | |
| | | | |
SUPPLEMENTAL DISCLOSURES: | | | | |
Cash paid for interest | | | | 26.5 | | | | | 24.9 | |
| | | | |
See notes to the financial statements
6
TIAA REAL ESTATE ACCOUNT
NOTES TO THE FINANCIAL STATEMENTS
Note 1—Organization and Significant Accounting Policies
Business:The TIAA Real Estate Account (“Account”) is a segregated investment account of Teachers Insurance and Annuity Association of America (“TIAA”) and was established by resolution of TIAA’s Board of Trustees (the “Board”) on February 22, 1995, under the insurance laws of the State of New York, for the purpose of funding variable annuity contracts issued by TIAA. The Account offers individual and group accumulating annuity contracts (with contributions made on a pre-tax or after-tax basis), as well as individual lifetime and term-certain variable payout annuity contracts (including the payment of death benefits to beneficiaries). Investors are entitled to transfer funds to or from the Account, and make withdrawals from the Account on a daily basis under certain circumstances. Funds invested in the Account for each category of contract are expressed in terms of units, and unit values will fluctuate depending on the Account’s performance.
The investment objective of the Account is a favorable long-term rate of return primarily through rental income and capital appreciation from real estate and real estate-related investments owned by the Account. The Account holds real estate properties directly and through subsidiaries wholly owned by TIAA for the benefit of the Account. The Account also holds interests in real estate joint ventures and limited partnerships in which the Account does not hold a controlling interest; as such, such interests are not consolidated into these financial statements. The Account also has invested in mortgage loans receivable collateralized by commercial real estate properties. Additionally, the Account invests in real estate-related and non real estate-related publicly-traded securities, cash and other instruments to maintain adequate liquidity levels for operating expenses, capital expenditures and to fund benefit payments (withdrawals, transfers and related transactions).
The financial statements were prepared in accordance with accounting principles generally accepted in the United States of America, which may require the use of estimates made by management. Actual results may vary from those estimates and such differences may be material. These unaudited interim financial statements reflect, in the opinion of management, all material adjustments necessary to fairly state the results of operations and financial position for the periods presented. The following is a summary of the significant accounting policies of the Account.
Basis of Presentation:The accompanying financial statements include the Account and those subsidiaries wholly owned by TIAA for the benefit of the Account. All significant intercompany accounts and transactions between the Account and such subsidiaries have been eliminated.
Determination of Investments at Fair Value:The Account reports all investments and investment related mortgage loans payable at fair value. The Financial Accounting Standards Board (“FASB”) has defined fair value as the price that would be received to sell an asset or paid to transfer a liability in an orderly transaction between market participants.
The following is a description of the valuation methodologies used to determine the fair value of the Account’s investments and investment related mortgage loans payable.
Valuation of Real Estate Properties—Investments in real estate properties are stated at fair value, as determined in accordance with policies and procedures reviewed by the Investment Committee of the Board and in accordance with the responsibilities of the Board as a whole. Accordingly, the Account does not record depreciation. Determination of fair value involves significant levels of judgment because the actual fair value of real estate can be determined only by negotiation between the parties in a sales transaction. The Account’s primary objective when valuing its real estate investments will be to produce a valuation that represents a reasonable estimate of the fair value of its investments. Implicit in the Account’s definition of fair value are the consummation of a sale as of a specified date and the passing of title from seller to buyer under conditions whereby:
|
• | | | | Buyer and seller are typically motivated; |
|
• | | | | Both parties are well informed or well advised, and acting in what they consider their best interests; |
|
• | | | | A reasonable time is allowed for exposure in the open market; |
7
|
• | | | | Payment is made in terms of cash or in terms of financial arrangements comparable thereto; and |
|
• | | | | The price represents the normal consideration for the property sold unaffected by special or creative financing or sales concessions granted by anyone associated with the sale. |
Property and investment values are affected by, among other things, the availability of capital, occupancy rates, rental rates, and interest and inflation rates. As a result, determining real estate and investment values involves many assumptions. Key inputs and assumptions include rental income and expense amounts, related rental income and expense growth rates, discount rates and capitalization rates. Valuation techniques include discounted cash flow analysis, prevailing market capitalization rates or multiples applied to earnings from the property, analysis of recent comparable sales transactions, actual sale negotiations and bona fide purchase offers received from third parties. Amounts ultimately realized from each investment may vary significantly from the fair value presented.
Real estate properties owned by the Account are initially valued based on an independent third party appraisal, as reviewed by TIAA’s internal appraisal staff and as applicable the Account’s independent fiduciary at the time of the closing of the purchase, which may result in a potential unrealized gain or loss reflecting the difference between an investment’s fair value (i.e., exit price) and its cost basis (which is inclusive of transaction costs).
Subsequently, each property is appraised each quarter by an independent third party appraiser, reviewed by TIAA’s internal appraisal staff and as applicable the Account’s independent fiduciary. In general, the Account obtains appraisals of its real estate properties spread out throughout the quarter, which is intended to result in appraisal adjustments, and thus, adjustments to the valuations of its holdings (to the extent such adjustments are made) that happen regularly throughout each quarter and not on one specific day or month in each period.
Further, management reserves the right to order an appraisal and/or conduct another valuation outside of the normal quarterly process when facts or circumstances at a specific property change. For example, under certain circumstances a valuation adjustment could be made when the account receives a bona fide bid for the sale of a property held within the Account or one of the Account’s joint ventures. In addition, adjustments may be made for events or circumstances indicating an impairment of a tenant’s ability to pay amounts due to the Account under a lease (including due to a bankruptcy filing of that tenant). Alternatively, adjustments may be made to reflect the execution or renewal of a significant lease. Also, adjustments may be made to reflect factors (such as sales values for comparable properties or local employment rate) bearing uniquely on a particular region in which the Account holds properties. TIAA’s internal appraisal staff oversees the entire appraisal process, in conjunction with the Account’s independent fiduciary (the independent fiduciary is more fully described in the paragraph below). Any differences in the conclusions of TIAA’s internal appraisal staff and the independent appraiser will be reviewed by the independent fiduciary, which will make a final determination on the matter (which may include ordering a subsequent independent appraisal).
The independent fiduciary, Real Estate Research Corporation, has been appointed by a special subcommittee of the Investment Committee of the Board to, among other things, oversee the appraisal process. The independent fiduciary must approve all independent appraisers used by the Account. All appraisals are performed in accordance with Uniform Standards of Professional Appraisal Practices, the real estate appraisal industry standards created by The Appraisal Foundation. Real estate appraisals are estimates of property values based on a professional’s opinion. Appraisals of properties held outside of the U.S. are performed in accordance with industry standards commonly applied in the applicable jurisdiction. These independent appraisers are always expected to be MAI-designated members of the Appraisal Institute (or its European equivalent, Royal Institute of Chartered Surveyors) and state certified appraisers from national or regional firms with relevant property type experience and market knowledge. Under the Account’s current procedures, each independent appraisal firm will be rotated off of a particular property at least every three years, although such appraisal firm may perform appraisals of other Account properties subsequent to such rotation.
Also, the independent fiduciary can require additional appraisals if factors or events have occurred that could materially change a property’s value (including those identified above) and such change is not reflected in the quarterly valuation review, or otherwise to ensure that the Account is valued appropriately. The independent fiduciary must also approve any valuation change of real estate-related assets where a property’s value
8
changed by more than 6% from the most recent independent annual appraisal, or if the value of the Account would change by more than 4% within any calendar quarter or more than 2% since the prior calendar month. When a real estate property is subject to a mortgage, the property is valued independently of the mortgage and the property and mortgage fair values are reported separately (see “Valuation of Mortgage Loans Payable” below). The independent fiduciary reviews and approves all mortgage valuation adjustments before such adjustments are recorded by the Account. The Account continues to use the revised value for each real estate property and mortgage loan payable to calculate the Account’s daily net asset value until the next valuation review or appraisal.
Valuation of Real Estate Joint Ventures—Real estate joint ventures are stated at the fair value of the Account’s ownership interests of the underlying entities. The Account’s ownership interests are valued based on the fair value of the underlying real estate, any related mortgage loans payable, and other factors, such as ownership percentage, ownership rights, buy/sell agreements, distribution provisions and capital call obligations. Upon the disposition of all real estate investments by an investee entity, the Account will continue to state its equity in the remaining net assets of the investee entity during the wind down period, if any, which occurs prior to the dissolution of the investee entity.
Valuation of Real Estate Limited Partnerships—Limited partnership interests are stated at the fair value of the Account’s ownership in the partnership which is based on the most recent net asset value of the partnership, as reported by the sponsor. Since market quotations are not readily available, the limited partnership interests are valued at fair value as determined in good faith under the direction of the Investment Committee of the Board and in accordance with the responsibilities of the Board as a whole.
Valuation of Marketable Securities—Equity securities listed or traded on any national market or exchange are valued at the last sale price as of the close of the principal securities market or exchange on which such securities are traded or, if there is no sale, at the mean of the last bid and asked prices on such market or exchange, exclusive of transaction costs.
Debt securities, other than money market instruments, are generally valued at the most recent bid price or the equivalent quoted yield for such securities (or those of comparable maturity, quality and type). Money market instruments, with maturities of one year or less, are valued in the same manner as debt securities or derived from a pricing matrix.
Equity and fixed income securities traded on a foreign exchange or in foreign markets are valued using their closing values under the valuation methods generally accepted in the country where traded, as of the valuation date. This value is converted to U.S. dollars at the exchange rate in effect on the valuation day. Under certain circumstances (for example, if there are significant movements in the United States markets and there is an expectation the securities traded on foreign markets will adjust based on such movements when the foreign markets open the next day), the Account may adjust the value of equity or fixed income securities that trade on a foreign exchange or market after the foreign exchange or market has closed.
Valuation of Mortgage Loans Receivable—Mortgage loans receivable are stated at fair value and are initially valued at the face amount of the mortgage loan funding. Subsequently, mortgage loans receivable are valued at least quarterly based on market factors, such as market interest rates and spreads for comparable loans, the liquidity for mortgage loans of similar characteristics, the performance of the underlying collateral and the credit quality of the counterparty.
Valuation of Mortgage Loans Payable—Mortgage loans payable are stated at fair value. The estimated fair values of mortgage loans payable are based on the amount at which the liability could be transferred to a third party exclusive of transaction costs. Mortgage loans payable are valued internally by TIAA’s internal valuation department, as reviewed by the Account’s independent fiduciary, at least quarterly based on market factors, such as market interest rates and spreads for comparable loans, the performance of the underlying collateral (such as the loan-to-value ratio and the cash flow of the underlying collateral), the liquidity for mortgage loans of similar characteristics, the maturity date of the loan, the return demands of the market, and the credit quality of the Account. Interest expense for mortgage loans payable is recorded on the accrual basis taking into account the outstanding principal and contractual interest rates.
SeeNote 5—Assets and Liabilities Measured at Fair Value on a Recurring Basisfor further discussion and disclosure regarding the determination of the fair value of the Account’s investments.
9
Foreign currency transactions and translation:Portfolio investments and other assets and liabilities denominated in foreign currencies are translated into U.S. dollars at the exchange rates prevailing at the end of the period. Purchases and sales of securities, income receipts and expense payments made in foreign currencies are translated into U.S. dollars at the exchange rates prevailing on the respective dates of the transactions. The effect of any changes in foreign currency exchange rates on portfolio investments and mortgage loans payable are included in net realized and unrealized gains and losses on real estate properties and mortgage loans payable. Net realized gains and losses on foreign currency transactions include disposition of foreign currencies, and currency gains and losses between the accrual and receipt dates of portfolio investment income and between th0e trade and settlement dates of portfolio investment transactions.
Accumulation and Annuity Funds:The accumulation fund represents the net assets attributable to participants in the accumulation phase of their investment (“Accumulation Fund”). The annuity fund represents the net assets attributable to the participants currently receiving annuity payments (“Annuity Fund”). The net increase or decrease in net assets from investment operations is apportioned between the accounts based upon their relative daily net asset values. Once an Account participant begins receiving lifetime annuity income benefits, payment levels cannot be reduced as a result of the Account’s actual mortality experience. In addition, the contracts pursuant to which the Account is offered are required to stipulate the maximum expense charge for all Account level expenses that can be assessed, which is not to exceed to 2.5% of average net assets per year. The Account pays a fee to TIAA to assume mortality and expense risks.
Accounting for Investments:The investments held by the Account are accounted as follows:
Real Estate Properties—Rent from real estate properties consists of all amounts earned under tenant operating leases, including base rent, recoveries of real estate taxes and other expenses and charges for miscellaneous services provided to tenants. Rental income is recognized in accordance with the billing terms of the lease agreements. The Account bears the direct expenses of the real estate properties owned. These expenses include, but are not limited to, fees to local property management companies, property taxes, utilities, maintenance, repairs, insurance, and other operating and administrative costs. An estimate of the net operating income earned from each real estate property is accrued by the Account on a daily basis and such estimates are adjusted when actual operating results are determined.
Real Estate Joint Ventures—The Account has limited ownership interests in various real estate joint ventures (collectively, the “Joint Ventures”). The Account records its contributions as increases to its investments in the Joint Ventures, and distributions from the Joint Ventures are treated as income within income from real estate joint ventures and limited partnerships in the Account’s Statements of Operations. Distributions that are identified as returns of capital or capital gains or losses are recorded as unrealized gains and realized gains and losses, respectively. Income from the Joint Ventures is recorded based on the Account’s proportional interest of the income distributed by the Joint Ventures. Income earned but not yet distributed to the Account by the Joint Ventures is recorded as unrealized gains and losses.
Limited Partnerships—The Account has limited ownership interests in various private real estate funds (primarily limited partnerships) and a private real estate investment trust (collectively, the “Limited Partnerships”). The Account records its contributions as increases to the investments, and distributions from the investments are treated as income within income from real estate joint ventures and limited partnerships in the Account’s Statements of Operations. Distributions that are identified as returns of capital or capital gains or losses are recorded as unrealized gains and realized gains and losses, respectively. Unrealized gains and losses are recorded based upon the changes in the net asset values of the Limited Partnerships as determined from the financial statements of the Limited Partnerships when received by the Account. Prior to the receipt of the financial statements from the Limited Partnerships, the Account estimates the value of its interest in good faith and will from time to time seek input from the issuer or the sponsor of the investments. Changes in value based on such estimates are recorded by the Account as unrealized gains and losses.
Marketable Securities—Transactions in marketable securities are accounted for as of the date the securities are purchased or sold (trade date). Interest income is recorded as earned. Dividend income is recorded on the ex-dividend date within dividend income. Dividends that are identified as returns of capital or capital gains or losses are recorded as unrealized gains and realized gains and losses, respectively. Realized gains and losses on securities transactions are accounted for on the specific identification method.
10
Realized and Unrealized Gains and Losses—Realized gains and losses are recorded at the time an investment is sold or a distribution is received in relation to an investment sale from a Joint Venture or Limited Partnership. Real estate transactions are accounted for as of the date on which the purchase or sale transactions for the real estate properties close (settlement date). The Account recognizes a realized gain on the sale of a real estate property to the extent that the contract sales price exceeds the cost-to-date of the property being sold. A realized loss occurs when the cost-to-date exceeds the sales price.
Unrealized gains and losses are recorded as the fair values of the Accounts investments are adjusted, and as discussed within theReal Estate Joint VenturesandLimited Partnership sectionsabove.
Net Assets—The Account’s net assets as of the close of each valuation day are valued by taking the sum of:
|
• | | | | the value of the Account’s cash; cash equivalents, and short-term and other debt instruments; |
|
• | | | | the value of the Account’s other securities and other non-real estate assets; |
|
• | | | | the value of the individual real properties (based on the most recent valuation of that property) and other real estate-related investments owned by the Account; |
|
• | | | | an estimate of the net operating income accrued by the Account from its properties, other real estate-related investments and non-real estate-related investments (including short-term marketable securities) since the end of the prior valuation day; and |
|
• | | | | actual net operating income earned from the Account’s properties, other real estate-related investments and non-real estate-related investments (but only to the extent any such item of income differs from the estimated income accrued for on such investments). |
and then reducing the sum by liabilities held within the Account, including the daily investment management fee, administration and distribution fees, mortality and expense fee, and liquidity guarantee fee, and certain other expenses attributable to operating the Account. Daily estimates of net operating income are adjusted to reflect actual net operating income on a monthly basis, at which time such adjustments (if any) are reflected in the Account’s unit value.
After the end of every quarter, the Account reconciles the amount of expenses deducted from the Account (which is established in order to approximate the costs that the Account will incur) with the expenses the Account actually incurred. If there is a difference, the Account adds it to or deducts it from the Account in equal daily installments over the remaining days of the following quarter. Material differences may be repaid in the current calendar quarter. The Account’s at-cost deductions are based on projections of Account assets and overall expenses, and the size of any adjusting payments will be directly affected by the difference between management’s projections and the Account’s actual assets or expenses.
Cash and Cash Equivalents:Cash and cash equivalents are balances held by the Account in bank deposit accounts which, at times, exceed federally insured limits. The Account’s management monitors these balances to mitigate the exposure of risk due to concentration and has not experienced any losses from such concentration.
Federal Income Taxes:Based on provisions of the Internal Revenue Code, Section 817, the Account is taxed as a segregated asset account of TIAA and as such, the Account should incur no material federal income tax attributable to the net investment activity of the Account. Management has analyzed the Account’s tax positions taken for all open federal income tax years (2005-2009) and has concluded no provisions for federal income tax is required as of March 31, 2011.
Restricted Cash:The Account held $26.7 million and $18.9 million as of March 31, 2011 and December 31, 2010, respectively, in escrow accounts for property taxes, insurance, and various other property related matters as required by certain creditors related to the Account’s outstanding mortgage loans payable. These amounts are recorded within other assets on the Statements of Assets and Liabilities. SeeNote 8—Mortgage Loans Payablefor additional information regarding the Account’s outstanding mortgage loans payables.
Changes in Net Assets:Premiums include premiums paid by existing accumulation unit holders in the Account and transfers into the Account. Withdrawals and death benefits include withdrawals out of the Account which include transfers out of the Account and required minimum distributions.
11
Due from Investment Advisor:Due to/from investment advisor represents amounts that were paid or received by TIAA on behalf of the Account. Amounts generally are paid or received by the Account within one or two business days and no interest is contractually charged on these amounts.
Reclassifications:The Account has reclassified the presentation in the statements of changes in net assets with regard to transfers to and from TIAA, CREF Accounts, and TIAA-CREF Funds. Transfers into the Account have been reclassified to Premiums, and transfers out of the Account have been reclassified amongst annuity and withdrawals and death benefits as appropriate.
Certain other prior period amounts have been reclassified to conform to the current presentation. These reclassifications did not affect the Account’s total net assets, results of operations or net changes in net assets previously reported.
Note 2—Management Agreements and Arrangements
Investment advisory services for the Account are provided by TIAA employees, under the direction of the Board and its Investment Committee, pursuant to investment management procedures adopted by TIAA for the Account. TIAA’s investment management decisions for the Account are subject to review by the Account’s independent fiduciary. TIAA also provides all portfolio accounting and related services for the Account.
The Account is a party to theDistribution Agreement for the Contracts Funded by the TIAA Real Estate Account(the “Distribution Agreement”), dated January 1, 2008, by and among TIAA, for itself and on behalf of the Account, and TIAA-CREF Individual and Institutional Services, LLC (“Services”), a wholly owned subsidiary of TIAA, a registered broker-dealer and a member of the Financial Industry Regulatory Authority. Pursuant to the Distribution Agreement, Services performs distribution services for the Account which include, among other things, (i) distribution of annuity contracts issued by TIAA and funded by the Account, (ii) advising existing annuity contract owners in connection with their accumulations and (iii) helping employers implement and manage retirement plans. In addition, TIAA performs administrative functions for the Account, which include, among other things, (i) computing the Account’s daily unit value, (ii) maintaining accounting records and performing accounting services, (iii) receiving and allocating premiums, (iv) calculating and making annuity payments, (v) processing withdrawal requests, (vi) providing regulatory compliance and reporting services, (vii) maintaining the Account’s records of contract ownership and (viii) otherwise assisting generally in all aspects of the Account’s operations. Both distribution services (pursuant to the Distribution Agreement) and administrative services are provided to the Account by Services and TIAA, as applicable, on an at cost basis.
The Distribution Agreement is terminable by either party upon 60 days written notice and terminates automatically upon any assignment thereof.
TIAA and Services provide their services at cost. TIAA and Services receive payments from the Account on a daily basis according to formulas established each year and adjusted periodically with the objective of keeping the payments as close as possible to the Account’s expenses actually incurred. Any differences between actual expenses and the amounts paid by the Account are adjusted quarterly.
TIAA also provides a liquidity guarantee to the Account, for a fee, to ensure that sufficient funds are available to meet participant transfer and cash withdrawal requests in the event that the Account’s cash flows and liquid investments are insufficient to fund such requests. TIAA ensures sufficient funds are available for such transfer and withdrawal requests by purchasing accumulation units of the Account. SeeNote 3—Related Party Transactionsbelow.
To the extent TIAA owns accumulation units issued pursuant to the liquidity guarantee, the independent fiduciary monitors and oversees, among other things, TIAA’s ownership interest in the Account and may require TIAA to eventually redeem some of its units, particularly when the Account has uninvested cash or liquid investments available. TIAA also receives a fee for assuming certain mortality and expense risks.
The expenses for the services noted above that are provided to the Account by TIAA and Services are identified in the accompanying Statements of Operations and are reflected inNote 9—Condensed Financial Information.
12
Note 3—Related Party Transactions
Pursuant to its existing liquidity guarantee obligation, as of March 31, 2011, the TIAA General Account owned 4.7 million accumulation units (which are generally referred to as “Liquidity Units”) issued by the Account. Since December 2008 and through March 31, 2011, TIAA paid an aggregate of $1.2 billion to purchase these Liquidity Units in multiple transactions. TIAA has purchased no liquidity units since June 1, 2009.
In accordance with this liquidity guarantee obligation, TIAA guarantees that all participants in the Account may redeem their accumulation units at their accumulation unit value next determined after their transfer or cash withdrawal request is received in good order. Liquidity Units owned by TIAA are valued in the same manner as accumulation units owned by the Account’s participants. Management believes that TIAA has the ability to meet its obligations under the liquidity guarantee.
As discussed in the Account’s prospectus and in accordance with a prohibited transaction exemption from the U.S. Department of Labor (PTE 96-76), the Account’s independent fiduciary, Real Estate Research Corporation, has certain responsibilities with respect to the Account that it has undertaken or is currently undertaking with respect to TIAA’s purchase of Liquidity Units, including among other things, reviewing the purchase and redemption of Liquidity Units by TIAA to ensure the Account uses the correct unit values. In addition, as set forth in PTE 96-76, the independent fiduciary’s responsibilities include:
|
• | | | | establishing the percentage of total accumulation units that TIAA’s ownership should not exceed (the “trigger point”) and creating a method for changing the trigger point; |
|
• | | | | approving any adjustment of TIAA’s ownership interest in the Account and, in its discretion, requiring an adjustment if TIAA’s ownership of Liquidity Units reaches the trigger point; and |
|
• | | | | once the trigger point has been reached, participating in any program to reduce TIAA’s ownership in the Account by utilizing cash flow or liquid investments in the Account, or by utilizing the proceeds from asset sales. The independent fiduciary’s role in participating in any such asset sales program would include (i) participating in the selection of properties for sale, (ii) providing sales guidelines and (iii) approving those sales if, in the independent fiduciary’s opinion, such sales are desirable to reduce TIAA’s ownership of Liquidity Units. |
The independent fiduciary, which has the right to adjust the trigger point, has established the trigger point at 45% of the outstanding accumulation units and it will continue to monitor TIAA’s ownership interest in the Account and provide further recommendations as necessary. As of March 31, 2011, TIAA owned approximately 9.3% of the outstanding accumulation units of the Account.
The independent fiduciary has indicated to management it intends to initiate systematic redemptions of the liquidity units held by the TIAA General Account as early as June 2011. The independent fiduciary currently intends to cause such redemptions only (i) if recent historical net participant activity has been positive and (ii) if the Account is projected to hold at least 22% of its net assets in cash and cash equivalents and publicly traded liquid non-real estate related securities, after taking into account certain projected sources and uses of cash flow into the Account. In addition, the independent fiduciary’s intention is that redemptions over any given period would not exceed recent historical net participant activity. In administering redemptions, the independent fiduciary has indicated to management that it intends to evaluate, among other things (i) projected acquisitions and dispositions of real estate and real estate related investments, (ii) participant inflow and outflow trends, (iii) the Account’s net income and (iv) obligations to make debt service payments and pay principal balances of mortgages on Account properties. The independent fiduciary is vested with oversight and approval over any redemption of liquidity units owned by TIAA, acting in the best interests of Account participants. Pursuant to PTE 96-76, the independent fiduciary may authorize or direct the redemption of all or a portion of liquidity units at any time and TIAA will request the approval of the independent fiduciary before any liquidity units are redeemed.
As discussed inNote 2—Management Agreements and Arrangements, TIAA and Services provide services to the Account on an at cost basis. SeeNote 9—Condensed Financial Informationfor details of the expense charge and expense ratio.
13
Note 4—Credit Risk Concentrations
Concentrations of credit risk may arise when a number of properties or tenants are located in a similar geographic region such that the economic conditions of that region could impact tenants’ obligations to meet their contractual obligations or cause the values of individual properties to decline. The Account has no significant concentrations of tenants as no single tenant has annual contract rent that makes up more than 2% of the rental income of the Account.
The substantial majority of the Account’s wholly owned real estate investments and investments in joint ventures are located in the United States. The following table represents the diversification of the Account’s portfolio by region and property type:
Diversification by Fair Value(1)
| | | | | | | | | | | | |
| | East | | West | | South | | Midwest | | Foreign(2) | | Total |
Office | | | | 24.7 | % | | | | | 17.1 | % | | | | | 10.1 | % | | | | | 1.2 | % | | | | | 2.6 | % | | | | | 55.7 | % | |
Apartment | | | | 2.6 | % | | | | | 6.1 | % | | | | | 5.4 | % | | | | | 0.0 | % | | | | | 0.0 | % | | | | | 14.1 | % | |
Industrial | | | | 1.4 | % | | | | | 6.9 | % | | | | | 4.1 | % | | | | | 1.2 | % | | | | | 0.0 | % | | | | | 13.6 | % | |
Retail | | | | 3.2 | % | | | | | 1.4 | % | | | | | 8.5 | % | | | | | 0.3 | % | | | | | 2.5 | % | | | | | 15.9 | % | |
Storage | | | | 0.2 | % | | | | | 0.2 | % | | | | | 0.2 | % | | | | | 0.1 | % | | | | | 0.0 | % | | | | | 0.7 | % | |
| | | | | | | | | | | | |
Total | | | | 32.1 | % | | | | | 31.7 | % | | | | | 28.3 | % | | | | | 2.8 | % | | | | | 5.1 | % | | | | | 100.0 | % | |
| | | | | | | | | | | | |
|
(1) | | | | Wholly-owned properties are represented at fair value and gross of any debt, while joint venture properties are represented at the net equity value. |
|
(2) | | | | Represents real estate investments in the United Kingdom and France. |
Properties in the “East” region are located in: CT, DC, DE, KY, MA, MD, ME, NC, NH, NJ, NY, PA, RI, SC, VA, VT, WV.
Properties in the “West” region are located in: AK, AZ, CA, CO, HI, ID, MT, NM, NV, OR, UT, WA, WY.
Properties in the “South” region are located in: AL, AR, FL, GA, LA, MS, OK, TN, TX.
Properties in the “Midwest” region are located in: IA, IL, IN, KS, MI, MN, MO, ND, NE, OH, SD, WI.
Note 5—Assets and Liabilities Measured at Fair Value on a Recurring Basis
Valuation Hierarchy:The Account’s fair value measurements are grouped categorically into three levels, as defined by the FASB. The levels are defined as follows:
Level 1—Valuations using unadjusted quoted prices for assets traded in active markets, such as stocks listed on the New York Stock Exchange. Active markets are defined as having the following characteristics for the measured asset or liability: (i) many transactions, (ii) current prices, (iii) price quotes not varying substantially among market makers, (iv) narrow bid/ask spreads and (v) most information regarding the issuer is publicly available. Level 1 assets held by the Account are generally marketable equity securities.
Level 2—Valuations for assets and liabilities traded in less active, dealer or broker markets. Fair values are primarily obtained from third party pricing services for identical or comparable assets or liabilities. Level 2 inputs for fair value measurements are inputs, other than quoted prices included within Level 1, that are observable for the asset or liability, either directly or indirectly. Level 2 inputs include:
a. Quoted prices for similar assets or liabilities in active markets;
b. Quoted prices for identical or similar assets or liabilities in markets that are not active (that is, markets in which there are few transactions for the asset (or liability), the prices are not current, price quotations vary substantially either over time or among market makers (for example, some brokered markets), or in which little information is released publicly);
c. Inputs other than quoted prices that are observable within the market for the asset (or liability) (for example, interest rates and yield curves, volatilities, prepayment speeds, loss severities, credit risks, and default rates that are observable at commonly quoted intervals); and
14
d. Inputs that are derived principally from or corroborated by observable market data by correlation or other means (for example, market-corroborated inputs).
Examples of securities which may be held by the Account and included in Level 2 include certificates of deposit, commercial paper, government agency notes, variable notes, United States Treasury securities, and debt securities.
Level 3—Valuations for assets and liabilities that are derived from other valuation methodologies, including pricing models, discounted cash flow models and similar techniques, and are not based on market exchange, dealer, or broker-traded transactions. Level 3 valuations incorporate certain assumptions and projections that are not observable in the market, and require significant professional judgment in determining the fair value assigned to such assets or liabilities. Examples of Level 3 assets and liabilities which may be held by the Account from time to time include investments in real estate, investments in joint ventures and limited partnerships, and mortgage loans receivable and payable.
An investment’s categorization within the valuation hierarchy described above is based upon the lowest level of input that is significant to the fair value measurement.
The Account’s determination of fair value is based upon quoted market prices, where available. If listed prices or quotes are not available, fair value is based upon vendor-provided, evaluated prices or internally-developed models that primarily use market-based or independently-sourced market data, including interest rate yield curves, market spreads, and currency rates. Valuation adjustments will be made to reflect changes in credit quality, counterparty’s creditworthiness, the Account’s creditworthiness, liquidity, and other observable and unobservable inputs that are applied consistently over time.
The methods described above are considered to produce fair values that represent a good faith estimate of what an unaffiliated buyer in the marketplace would pay to purchase the asset or would receive to transfer the liability. Since fair value calculations involve significant professional judgment in the application of both observable and unobservable attributes, actual realizable values or future fair values may differ from amounts reported. Furthermore, while the Account believes its valuation methods are appropriate and consistent with other market participants, the use of different methodologies or assumptions to determine the fair value of certain financial instruments, while reasonable, could result in different estimates of fair value at the reporting date. As discussed inNote 1—Organization and Significant Accounting Policiesin more detail, the Account generally obtains independent third party appraisals on a quarterly basis; there may be circumstances in the interim in which the true realizable value of a property is not reflected in the Account’s daily net asset value calculation or in the Account’s periodic financial statements. This disparity may be more apparent when the commercial and/or residential real estate markets experience an overall and possibly dramatic decline (or increase) in property values in a relatively short period of time between appraisals.
15
The following tables show the major categories of assets and liabilities measured at fair value on a recurring basis as of March 31, 2011 (unaudited) and December 31, 2010, using unadjusted quoted prices in active markets for identical assets (Level 1); significant other observable inputs (Level 2); and significant unobservable inputs (Level 3) (in millions, unaudited):
| | | | | | | | |
Description | | Level 1:
Quoted
Prices in
Active Markets
for Identical
Assets | | Level 2:
Significant
Other
Observable
Inputs | | Level 3:
Significant
Unobservable
Inputs | | Total at
March 31,
2011 |
Real estate properties | | | $ | | — | | | | $ | | — | | | | $ | | 8,345.8 | | | | $ | | 8,345.8 | |
Real estate joint ventures | | | | — | | | | | — | | | | | 1,422.5 | | | | | 1,422.5 | |
Limited partnerships | | | | — | | | | | — | | | | | 279.6 | | | | | 279.6 | |
Marketable securities: | | | | | | | | |
Real estate-related | | | | 635.2 | | | | | — | | | | | — | | | | | 635.2 | |
Government agency notes | | | | — | | | | | 1,841.4 | | | | | — | | | | | 1,841.4 | |
United States Treasury securities | | | | — | | | | | 1,072.6 | | | | | — | | | | | 1,072.6 | |
| | | | | | | | |
Total Investments at March 31, 2011 | | | $ | | 635.2 | | | | $ | | 2,914.0 | | | | $ | | 10,047.9 | | | | $ | | 13,597.1 | |
| | | | | | | | |
Mortgage loans payable | | | $ | | — | | | | $ | | — | | | | $ | | (1,856.2 | ) | | | | $ | | (1,856.2 | ) | |
| | | | | | | | |
| | | | | | | | |
Description | | Level 1:
Quoted
Prices in
Active Markets
for Identical
Assets | | Level 2:
Significant
Other
Observable
Inputs | | Level 3:
Significant
Unobservable
Inputs | | Total at
December 31,
2010 |
Real estate properties | | | $ | | — | | | | $ | | — | | | | $ | | 8,115.5 | | | | $ | | 8,115.5 | |
Real estate joint ventures | | | | — | | | | | — | | | | | 1,358.8 | | | | | 1,358.8 | |
Limited partnerships | | | | — | | | | | — | | | | | 270.3 | | | | | 270.3 | |
Marketable securities: | | | | | | | | |
Real estate-related | | | | 495.3 | | | | | — | | | | | — | | | | | 495.3 | |
Government agency notes | | | | — | | | | | 1,484.8 | | | | | — | | | | | 1,484.8 | |
United States Treasury securities | | | | — | | | | | 911.9 | | | | | — | | | | | 911.9 | |
| | | | | | | | |
Total Investments at December 31, 2010 | | | $ | | 495.3 | | | | $ | | 2,396.7 | | | | $ | | 9,744.6 | | | | $ | | 12,636.6 | |
| | | | | | | | |
Mortgage loans payable | | | $ | | — | | | | $ | | — | | | | $ | | (1,860.2 | ) | | | | $ | | (1,860.2 | ) | |
| | | | | | | | |
16
The following tables show the reconciliation of the beginning and ending balances for assets and liabilities measured at fair value on a recurring basis using significant unobservable inputs (Level 3) during the three months ended March 31, 2011 and March 31, 2010 (in millions, unaudited):
| | | | | | | | | | | | |
| | Real Estate
Properties | | Real Estate
Joint Ventures | | Limited
Partnerships | | Mortgage
Loans
Receivable | | Total
Level 3
Investments | | Mortgage
Loans
Payable |
For the three months ended
March 31, 2011 | | | | | | | | | | |
Beginning balance
January 1, 2011 | | | $ | | 8,115.5 | | | | $ | | 1,358.8 | | | | $ | | 270.3 | | | | $ | | — | | | | $ | | 9,744.6 | | | | $ | | (1,860.2 | ) | |
Total realized and unrealized gains (losses) included in changes in net assets | | | | 186.2 | | | | | 54.4 | | | | | 8.1 | | | | | — | | | | | 248.7 | | | | | 1.4 | |
Purchases(1) | | | | 82.2 | | | | | 8.7 | | | | | 1.2 | | | | | — | | | | | 92.1 | | | | | — | |
Sales | | | | (39.0 | ) | | | | | — | | | | | — | | | | | — | | | | | (39.0 | ) | | | | | — | |
Settlements(2) | | | | 0.9 | | | | | 0.6 | | | | | — | | | | | — | | | | | 1.5 | | | | | 2.6 | |
| | | | | | | | | | | | |
Ending balance
March 31, 2011 | | | $ | | 8,345.8 | | | | $ | | 1,422.5 | | | | $ | | 279.6 | | | | $ | | — | | | | $ | | 10,047.9 | | | | $ | | (1,856.2 | ) | |
| | | | | | | | | | | | |
For the three months ended
March 31, 2010: | | | | | | | | | | |
Beginning balance
January 1, 2010 | | | $ | | 7,437.3 | | | | $ | | 1,314.6 | | | | $ | | 200.3 | | | | $ | | 71.3 | | | | $ | | 9,023.5 | | | | $ | | (1,858.1 | ) | |
Total realized and unrealized gains (losses) included in changes in net assets | | | | (190.7 | ) | | | | | (35.8 | ) | | | | | 3.0 | | | | | 0.2 | | | | | (223.3 | ) | | | | | (25.8 | ) | |
Purchases(1) | | | | 32.7 | | | | | 0.5 | | | | | 1.7 | | | | | — | | | | | 34.9 | | | | | — | |
Sales | | | | — | | | | | (28.8 | ) | | | | | — | | | | | — | | | | | (28.8 | ) | | | | | — | |
Settlements(2) | | | | 1.0 | | | | | (2.0 | ) | | | | | — | | | | | — | | | | | (1.0 | ) | | | | | 1.4 | |
| | | | | | | | | | | | |
Ending balance
March 31, 2010 | | | $ | | 7,280.3 | | | | $ | | 1,248.5 | | | | $ | | 205.0 | | | | $ | | 71.5 | | | | $ | | 8,805.3 | | | | $ | | (1,882.5 | ) | |
| | | | | | | | | | | | |
|
(1) | | | | Includes purchases and capital improvements for wholly owned investments and contributions for joint ventures and limited partnerships. |
|
(2) | | | | Includes operating income for real estate joint ventures and limited partnerships, net of distributions and principal payments on mortgage loans payable. |
During the three months ended March 31, 2011 and 2010 there were no transfers in or out of Levels 1, 2 or 3.
The amount of total gains (losses) included in changes in net assets attributable to the change in unrealized gains (losses) relating to investments and mortgage loans payable using significant unobservable inputs still held as of the reporting date is as follows (in millions, unaudited):
| | | | | | | | | | | | |
| | Real Estate
Properties | | Real Estate
Joint Ventures | | Limited
Partnerships | | Mortgage
Loan
Receivable | | Total
Level 3
Investments | | Mortgage
Loans
Payable |
For the three months ended
March 31, 2011 | | | $ | | 184.1 | | | | $ | | 54.4 | | | | $ | | 8.1 | | | | $ | | — | | | | $ | | 246.6 | | | | $ | | 1.4 | |
| | | | | | | | | | | | |
For the three months ended
March 31, 2010 | | | $ | | (189.4 | ) | | | | $ | | (30.5 | ) | | | | $ | | 3.0 | | | | $ | | 0.2 | | | | $ | | (216.7 | ) | | | | $ | | (25.8 | ) | |
| | | | | | | | | | | | |
Note 6—Investments in Joint Ventures
The Account owns interests in several real estate properties through joint ventures and receives distributions and allocations of profits and losses from the joint ventures based on the Account’s ownership interest percentages. Several of these joint ventures have mortgage loans payable on the properties owned by the joint ventures. At March 31, 2011, the Account held 11 investments in joint ventures with non-controlling ownership interest percentages that ranged from 50% to 85%. Certain joint ventures are subject to adjusted
17
distribution percentages when earnings in the investment reach a pre-determined threshold. The Account’s equity in the joint ventures was approximately $1.4 billion at March 31, 2011 and December 31, 2010. The Account’s most significant joint venture investment is the DDR TC LLC joint venture (“DDR Joint Venture”).
The Account’s proportionate share of the mortgage loans payable within the joint venture investments at fair value was $1.6 billion at March 31, 2011 and December 31, 2010. The Account’s share in the outstanding principal of the mortgage loans payable on joint ventures was $1.6 billion at March 31, 2011 and December 31, 2010.
A condensed summary of the financial position and results of operations of the joint ventures are shown below (in millions, unaudited):
| | | | |
| | March 31, 2011 | | December 31, 2010 |
| | (Unaudited) | | |
Assets | | | | |
Real estate properties, at fair value | | | $ | | 4,541.3 | | | | $ | | 4,454.9 | |
Other assets | | | | 148.3 | | | | | 141.8 | |
| | | | |
Total assets | | | | 4,689.6 | | | | | 4,596.7 | |
| | | | |
Liabilities and Equity | | | | |
Mortgage loans payable, at fair value | | | $ | | 2,268.6 | | | | $ | | 2,276.9 | |
Other liabilities | | | | 97.4 | | | | | 97.5 | |
| | | | |
Total liabilities | | | | 2,366.0 | | | | | 2,374.4 | |
Equity | | | | 2,323.6 | | | | | 2,222.3 | |
| | | | |
Total liabilities and equity | | | $ | | 4,689.6 | | | | $ | | 4,596.7 | |
| | | | |
| | | | |
| | For the Three
Months Ended
March 31, 2011 | | For the Three
Months Ended
March 31, 2010 |
Operating Revenues and Expenses | | | | |
Revenues | | | $ | | 111.9 | | | | $ | | 122.4 | |
Expenses | | | | 68.4 | | | | | 76.9 | |
| | | | |
Excess of revenues over expenses | | | $ | | 43.5 | | | | $ | | 45.5 | |
| | | | |
Management of the Account monitors the financial position of the Account’s joint venture partners. To the extent that management of the Account determines that a joint venture partner has financial or liquidity concerns, management will evaluate all actions and remedies available to the Account under the applicable joint venture agreement to minimize any potential adverse implications to the Account.
Note 7—Investments in Limited Partnerships
The Account invests in limited partnerships that own real estate properties and real estate-related securities and the Account receives distributions from the limited partnerships based on the Account’s ownership interest percentages. At March 31, 2011, the Account held five limited partnership investments and one private real estate equity investment trust (all of which featured non-controlling ownership interests) with ownership interest percentages that ranged from 5.3% to 18.5%. Under the terms of the partnership agreements governing such investments, and based upon the expected term of each such partnership, the partnerships could engage in liquidation activities beginning in 2012 through 2015. The Account’s ownership interest in limited partnerships was $279.6 million and $270.3 million at March 31, 2011 and December 31, 2010, respectively.
18
Note 8—Mortgage Loans Payable
At March 31, 2011, the Account had outstanding mortgage loans payable secured by the following properties (in millions, unaudited):
| | | | | | |
Property | | Interest Rate and
Payment Frequency(3) | | Principal
Amounts as of
March 31, 2011 | | Maturity |
Ontario Industrial Portfolio(1)(9) | | 7.42% paid monthly | | | $ | | 8.1 | | | | | May 1, 2011 | |
1 & 7 Westferry Circus(1)(2)(5) | | 5.40% paid quarterly | | | | 214.0 | | | | | November 15, 2012 | |
Reserve at Sugarloaf(1)(5) | | 5.49% paid monthly | | | | 24.6 | | | | | June 1, 2013 | |
South Frisco Village | | 5.85% paid monthly | | | | 26.3 | | | | | June 1, 2013 | |
Fourth & Madison | | 6.40% paid monthly | | | | 145.0 | | | | | August 21, 2013 | |
1001 Pennsylvania Avenue | | 6.40% paid monthly | | | | 210.0 | | | | | August 21, 2013 | |
50 Fremont | | 6.40% paid monthly | | | | 135.0 | | | | | August 21, 2013 | |
Pacific Plaza(1)(5) | | 5.55% paid monthly | | | | 8.4 | | | | | September 1, 2013 | |
Wilshire Rodeo Plaza(5) | | 5.28% paid monthly | | | | 112.7 | | | | | April 11, 2014 | |
1401 H Street(1)(5) | | 5.97% paid monthly | | | | 113.3 | | | | | December 7, 2014 | |
1050 Lenox Park Apartments(5) | | 4.43% paid monthly | | | | 24.0 | | | | | August 1, 2015 | |
San Montego Apartments(5)(6) | | 4.47% paid monthly | | | | 21.8 | | | | | August 1, 2015 | |
Montecito Apartments(5) (6) | | 4.47% paid monthly | | | | 20.3 | | | | | August 1, 2015 | |
Phoenician Apartments(5)(6) | | 4.47% paid monthly | | | | 21.3 | | | | | August 1, 2015 | |
The Colorado(1)(5) | | 5.65% paid monthly | | | | 85.3 | | | | | November 1, 2015 | |
99 High Street | | 5.52% paid monthly | | | | 185.0 | | | | | November 11, 2015 | |
The Legacy at Westwood(1)(5) | | 5.95% paid monthly | | | | 40.9 | | | | | December 1, 2015 | |
Regents Court(1)(5) | | 5.76% paid monthly | | | | 34.9 | | | | | December 1, 2015 | |
The Caruth(1)(5) | | 5.71% paid monthly | | | | 40.8 | | | | | December 1, 2015 | |
Lincoln Centre | | 5.51% paid monthly | | | | 153.0 | | | | | February 1, 2016 | |
The Legend at Kierland(5)(7) | | 4.97% paid monthly | | | | 21.8 | | | | | August 1, 2017 | |
The Tradition at Kierland(5)(7) | | 4.97% paid monthly | | | | 25.8 | | | | | August 1, 2017 | |
Red Canyon at Palomino Park(5)(8) | | 5.34% paid monthly | | | | 27.1 | | | | | August 1, 2020 | |
Green River at Palomino Park(5)(8) | | 5.34% paid monthly | | | | 33.2 | | | | | August 1, 2020 | |
Blue Ridge at Palomino Park(5)(8) | | 5.34% paid monthly | | | | 33.4 | | | | | August 1, 2020 | |
Ashford Meadows(5) | | 5.17% paid monthly | | | | 44.6 | | | | | August 1, 2020 | |
Publix at Weston Commons(5) | | 5.08% paid monthly | | | | 35.0 | | | | | January 1, 2036 | |
| | | | | | |
Total Principal Outstanding | | | | | | 1,845.6 | | | |
Fair Value Adjustment(4) | | | | | | 10.6 | | | |
| | | | | | |
Total mortgage loans payable | | | | | $ | | 1,856.2 | | | |
| | | | | | |
|
(1) | | | | The mortgage is adjusted monthly for principal payments. |
|
(2) | | | | The mortgage is denominated in British pounds and the principal payment has been converted to U.S. dollars using the exchange rate as of March 31, 2011. The interest rate is fixed. The cumulative foreign currency translation adjustment (since inception) was an unrealized gain of $17.4 million. |
|
(3) | | | | Interest rates are fixed, unless stated otherwise. |
|
(4) | | | | The fair value adjustment consists of the difference (positive or negative) between the principal amount of the outstanding debt and the fair value of the outstanding debt. SeeNote 1—Organization and Significant Accounting Policies. |
|
(5) | | | | These properties are each owned by separate wholly owned subsidiaries of TIAA for benefit of the Account. The assets and credit of each of these borrowings entities are not available to satisfy the debts and other obligations of the Account or any other entity or person other than such borrowing entity. |
|
(6) | | | | Represents mortgage loans payable on these individual properties which are held within the Houston Apartment Portfolio. |
|
(7) | | | | Represents mortgage loans payable on these individual properties which are held within the Kierland Apartment Portfolio. |
|
(8) | | | | Represents mortgage loans payable on these individual properties which are held within Palomino Park. |
(9) | | | | This mortgage loan was paid in full during April 2011. |
19
Note 9—Condensed Financial Information
Selected condensed financial information for an Accumulation Unit of the Account is presented below.
| | | | | | | | |
| | For the Three
Months Ended
March 31,
2011 | | Years Ended December 31, |
| | 2010 | | 2009 | | 2008 |
| | (Unaudited) | | | | | | |
Per Accumulation Unit data: | | | | | | | | |
Rental income | | | $ | | 4.253 | | | | $ | | 19.516 | | | | $ | | 22.649 | | | | $ | | 18.794 | |
Real estate property level expenses and taxes | | | | 2.256 | | | | | 9.987 | | | | | 11.193 | | | | | 9.190 | |
| | | | | | | | |
Real estate income, net | | | | 1.997 | | | | | 9.529 | | | | | 11.456 | | | | | 9.604 | |
Other income | | | | 0.499 | | | | | 2.214 | | | | | 2.778 | | | | | 3.808 | |
| | | | | | | | |
Total income | | | | 2.496 | | | | | 11.743 | | | | | 14.234 | | | | | 13.412 | |
Expense charges(1) | | | | 0.580 | | | | | 2.167 | | | | | 2.280 | | | | | 2.937 | |
| | | | | | | | |
Investment income, net | | | | 1.916 | | | | | 9.576 | | | | | 11.954 | | | | | 10.475 | |
Net realized and unrealized gain (loss) on investments and mortgage loans payable | | | | 5.583 | | | | | 16.143 | | | | | (85.848 | ) | | | | | (54.541 | ) | |
| | | | | | | | |
Net increase (decrease) in Accumulation Unit Value | | | | 7.499 | | | | | 25.719 | | | | | (73.894 | ) | | | | | (44.066 | ) | |
Accumulation Unit Value: | | | | | | | | |
Beginning of period | | | | 219.173 | | | | | 193.454 | | | | | 267.348 | | | | | 311.414 | |
| | | | | | | | |
End of period | | | | 226.672 | | | | | 219.173 | | | | | 193.454 | | | | | 267.348 | |
| | | | | | | | |
Total return | | | | 3.42 | % | | | | | 13.29 | % | | | | | -27.64 | % | | | | | -14.15 | % | |
Ratios to Average net Assets(2): | | | | | | | | |
Expenses(1) | | | | 0.26 | % | | | | | 1.09 | % | | | | | 1.01 | % | | | | | 0.95 | % | |
Investment income, net | | | | 0.84 | % | | | | | 4.84 | % | | | | | 5.29 | % | | | | | 3.38 | % | |
Portfolio turnover rate(2): | | | | | | | | |
Real estate properties(3) | | | | 0.39 | % | | | | | 1.01 | % | | | | | 0.75 | % | | | | | 0.64 | % | |
Marketable securities(4) | | | | 1.37 | % | | | | | 19.18 | % | | | | | 0.00 | % | | | | | 25.67 | % | |
Accumulation Units outstanding at end of period (in millions): | | | | 50.8 | | | | | 48.1 | | | | | 39.5 | | | | | 41.5 | |
Net assets end of period (in millions) | | | $ | | 11,781.0 | | | | $ | | 10,803.1 | | | | $ | | 7,879.9 | | | | $ | | 11,508.9 | |
|
(1) | | | | Expense charges per Accumulation Unit and the Ratio of Expenses to average net assets reflect the year to date Account-level expenses and exclude real estate property level expenses which are included in real estate income, net. If the real estate property level expenses were included, the expense charge per Accumulation Unit for the three months ended March 31, 2011 would be $2.836 ($12.154, $13.473, $12.127, and $10.892 for the years ended December 31, 2010, 2009, 2008, and 2007, respectively), and the Ratio of Expenses to average net assets for the three months ended March 31, 2011 would be 1.248% (6.14%, 5.96%, 3.91%, and 3.71%, for the years ended December 31, 2010, 2009, 2008, and 2007, respectively). |
|
(2) | | | | Amounts for the three month period ended March 31, 2011 are not annualized. |
|
(3) | | | | Real estate investment portfolio turnover rate is calculated by dividing the lesser of purchases or sales of real estate property investments (including contributions to, or return of capital distributions received from, existing joint venture and limited partnership investments) by the average value of the portfolio of real estate investments held during the period. |
|
(4) | | | | Marketable securities portfolio turnover rate is calculated by dividing the lesser of purchases or sales of securities, excluding securities having maturity dates at acquisition of one year or less, by the average value of the portfolio securities held during the period. |
20
Note 10—Accumulation Units
Changes in the number of Accumulation Units outstanding were as follows (in millions):
| | | | |
| | For the
Three Months
Ended
March 31, 2011 | | For the Year Ended
December 31, 2010 |
| | (Unaudited) | | |
Outstanding: | | | | |
Beginning of period | | | | 48.1 | | | | | 39.5 | |
Credited for premiums | | | | 3.7 | | | | | 12.9 | |
Annuity, other periodic payments, withdrawals and
death benefits | | | | (1.0 | ) | | | | | (4.3 | ) | |
| | | | |
End of period | | | | 50.8 | | | | | 48.1 | |
| | | | |
Note 11—Commitments, Contingencies, and Subsequent Events
Commitments—As of March 31, 2011, the Account had outstanding commitments to purchase additional interests in three of its limited partnership investments. As of March 31, 2011, the Account’s remaining commitments totaled $32.5 million, which can be called in full or in part by each limited partnership at any time.
Contingencies—The Account is party to various claims and routine litigation arising in the ordinary course of business. Management of the Account does not believe the results of any such claims or litigation, individually, or in the aggregate, will have a material effect on the Account’s business, financial position, or results of operations.
Subsequent Events—See Note 3—Related Party Transactions and Note 8—Mortgage Loans Payable.
Note 12—New Accounting Pronouncements
In June 2009, the FASB issued Statement of Financial Accounting Standards No. 167, Amendments to FASB Interpretation No. 46(R) (“SFAS No. 167”), which amends guidance related to the identification of a variable interest entity, variable interests, the primary beneficiary, and expands required note disclosures to provide greater transparency to the users of financial statements. In December 2009, the FASB issued Accounting Standards Update (“ASU”) No. 2009-17, “Improvements to Financial Reporting by Enterprises Involved with Variable Interest Entities,” which amended the Codification with the guidance contained in SFAS No. 167. In February 2010, the FASB issued ASU No. 2010-10, “Amendments for Certain Investment Funds,” which defers the applicability of ASU No. 2009-17 in certain instances. These standards were effective on January 1, 2010 and did not result in a significant impact to the Account’s financial position or results of operations.
In January 2010, the FASB issued ASU No. 2010-06, “Improving Disclosures about Fair Value Measurements” which requires new disclosures related to transfers in and out of levels 1 and 2, and the separate disclosure of purchases, sales, issuances and settlements when reconciling activity in level 3. This ASU also amends prior disclosure requirements to call for the disaggregation of assets and liabilities into appropriate subsets, and the disclosure of valuation techniques and inputs for recurring and nonrecurring fair value measurements in levels 2 and 3. The new disclosure requirement for reconciling level 3 activity was effective January 1, 2011. All other new or amended disclosure requirements were effective January 1, 2010 for the Account and are reflected in the notes to the financial statements. These changes did not impact the Account’s financial position or results of operations.
21
TIAA REAL ESTATE ACCOUNT
STATEMENTS OF INVESTMENTS
March 31, 2011 and December 31, 2010
(Dollar values shown in millions)
REAL ESTATE PROPERTIES—61.38% and 64.22%
| | | | | | |
Location/Description | | Type | | Fair Value |
| | 2011 | | 2010 |
| | | | (Unaudited) | | |
Arizona: | | | | | | |
Camelback Center | | Office | | | $ | | 34.0 | | | | $ | | 33.2 | |
Kierland Apartment Portfolio | | Apartments | | | | 91.4 | (1) | | | | | 96.0 | (1) | |
Phoenix Apartment Portfolio | | Apartments | | | | 23.1 | | | | | 23.0 | |
California: | | | | | | |
3 Hutton Centre Drive | | Office | | | | 33.3 | | | | | 32.2 | |
50 Fremont Street | | Office | | | | 335.0 | (1) | | | | | 315.1 | (1) | |
88 Kearny Street | | Office | | | | 71.7 | | | | | 65.4 | |
275 Battery Street | | Office | | | | 184.3 | | | | | 180.4 | |
Rancho Cucamonga Industrial Portfolio | | Industrial | | | | 90.9 | | | | | 83.4 | |
Centerside I | | Office | | | | 33.5 | | | | | 34.0 | |
Centre Pointe and Valley View | | Industrial | | | | 19.7 | | | | | 19.9 | |
Great West Industrial Portfolio | | Industrial | | | | 78.8 | | | | | 73.5 | |
Larkspur Courts | | Apartments | | | | 72.4 | | | | | 70.1 | |
Northpark Village Square | | Retail | | | | 40.0 | | | | | — | |
Northern CA RA Industrial Portfolio | | Industrial | | | | 43.0 | | | | �� | 39.7 | |
Ontario Industrial Portfolio | | Industrial | | | | 228.1 | (1) | | | | | 223.7 | (1) | |
Pacific Plaza | | Office | | | | 55.1 | (1) | | | | | 56.2 | (1) | |
Regents Court | | Apartments | | | | 65.5 | (1) | | | | | 65.0 | (1) | |
Southern CA RA Industrial Portfolio | | Industrial | | | | 75.3 | | | | | 75.5 | |
The Legacy at Westwood | | Apartments | | | | 95.7 | (1) | | | | | 93.2 | |
Wellpoint | | Office | | | | — | | | | | 41.0 | |
Westcreek | | Apartments | | | | 29.8 | | | | | 29.6 | |
West Lake North Business Park | | Office | | | | 42.2 | | | | | 40.8 | |
Westwood Marketplace | | Retail | | | | 93.0 | | | | | 89.0 | |
Wilshire Rodeo Plaza | | Office | | | | 169.0 | (1) | | | | | 165.5 | (1) | |
Colorado: | | | | | | |
Palomino Park | | Apartments | | | | 177.6 | (1) | | | | | 168.7 | (1) | |
The Lodge at Willow Creek | | Apartments | | | | 41.6 | | | | | 39.7 | |
Connecticut: | | | | | | |
Ten & Twenty Westport Road | | Office | | | | 120.6 | | | | | 100.7 | |
Florida: | | | | | | |
701 Brickell Avenue | | Office | | | | 198.9 | | | | | 201.2 | |
North 40 Office Complex | | Office | | | | 35.3 | | | | | 36.4 | |
Plantation Grove | | Retail | | | | 9.4 | | | | | 9.4 | |
Pointe on Tampa Bay | | Office | | | | 36.3 | | | | | 35.2 | |
Publix at Weston Commons | | Retail | | | | 45.4 | (1) | | | | | 45.2 | (1) | |
Quiet Waters at Coquina Lakes | | Apartments | | | | 24.0 | | | | | 23.7 | |
Seneca Industrial Park | | Industrial | | | | 66.6 | | | | | 63.3 | |
South Florida Apartment Portfolio | | Apartments | | | | 61.2 | | | | | 60.0 | |
Suncrest Village Shopping Center | | Retail | | | | 12.7 | | | | | 12.6 | |
The Fairways of Carolina | | Apartments | | | | 22.3 | | | | | 22.3 | |
Urban Centre | | Office | | | | 89.8 | | | | | 89.7 | |
| | | | | | |
22
TIAA REAL ESTATE ACCOUNT
STATEMENTS OF INVESTMENTS
March 31, 2011 and December 31, 2010
(Dollar values shown in millions)
| | | | | | |
Location/Description | | Type | | Fair Value |
| | 2011 | | 2010 |
| | | | (Unaudited) | | |
France: | | | | | | |
Printemps de L’Homme | | Retail | | | $ | | 241.3 | | | | $ | | 223.7 | |
Georgia: | | | | | | |
Atlanta Industrial Portfolio | | Industrial | | | | 39.9 | | | | | 38.8 | |
Glenridge Walk | | Apartments | | | | 33.3 | | | | | 33.6 | |
Reserve at Sugarloaf | | Apartments | | | | 43.7 | (1) | | | | | 43.7 | (1) | |
Shawnee Ridge Industrial Portfolio | | Industrial | | | | 53.3 | | | | | 49.0 | |
Windsor at Lenox Park | | Apartments | | | | 51.2 | (1) | | | | | 50.8 | (1) | |
Illinois: | | | | | | |
Chicago Caleast Industrial Portfolio | | Industrial | | | | 52.1 | | | | | 50.8 | |
Chicago Industrial Portfolio | | Industrial | | | | 59.4 | | | | | 58.9 | |
Oak Brook Regency Towers | | Office | | | | 71.9 | | | | | 70.6 | |
Parkview Plaza | | Office | | | | 43.6 | | | | | 43.1 | |
Maryland: | | | | | | |
Broadlands Business Park | | Industrial | | | | 25.5 | | | | | 24.2 | |
GE Appliance East Coast Distribution Facility | | Industrial | | | | 30.0 | | | | | 29.1 | |
Massachusetts: | | | | | | |
99 High Street | | Office | | | | 254.6 | (1) | | | | | 255.0 | (1) | |
Needham Corporate Center | | Office | | | | 18.7 | | | | | 18.6 | |
Northeast RA Industrial Portfolio | | Industrial | | | | 22.7 | | | | | 22.1 | |
The Newbry | | Office | | | | 254.0 | | | | | 252.0 | |
Minnesota: | | | | | | |
Champlin Marketplace | | Retail | | | | 12.7 | | | | | 12.7 | |
Nevada: | | | | | | |
Fernley Distribution Facility | | Industrial | | | | 6.5 | | | | | 7.1 | |
New Jersey: | | | | | | |
Konica Photo Imaging Headquarters | | Industrial | | | | 16.7 | | | | | 14.5 | |
Marketfair | | Retail | | | | 67.1 | | | | | 66.2 | |
Morris Corporate Center III | | Office | | | | 79.2 | | | | | 71.9 | |
Plainsboro Plaza | | Retail | | | | 26.6 | | | | | 27.5 | |
South River Road Industrial | | Industrial | | | | 39.2 | | | | | 38.5 | |
New York: | | | | | | |
780 Third Avenue | | Office | | | | 310.4 | | | | | 300.6 | |
The Colorado | | Apartments | | | | 123.9 | (1) | | | | | 123.0 | (1) | |
Pennsylvania: | | | | | | |
Lincoln Woods | | Apartments | | | | 29.3 | | | | | 29.1 | |
Tennessee: | | | | | | |
Airways Distribution Center | | Industrial | | | | 12.2 | | | | | 12.1 | |
Summit Distribution Center | | Industrial | | | | 15.0 | | | | | 15.8 | |
Texas: | | | | | | |
Dallas Industrial Portfolio | | Industrial | | | | 144.1 | | | | | 140.6 | |
Four Oaks Place | | Office | | | | 386.4 | | | | | 383.7 | |
Houston Apartment Portfolio | | Apartments | | | | 191.2 | (1) | | | | | 186.9 | (1) | |
23
TIAA REAL ESTATE ACCOUNT
STATEMENTS OF INVESTMENTS
March 31, 2011 and December 31, 2010
(Dollar values shown in millions)
| | | | | | |
Location/Description | | Type | | Fair Value |
| | 2011 | | 2010 |
| | | | (Unaudited) | | |
Texas: (continued) | | | | | | |
Lincoln Centre | | Office | | | $ | | 200.1 | (1) | | | | $ | | 195.4 | (1) | |
Pinnacle Industrial Portfolio | | Industrial | | | | 38.0 | | | | | 38.4 | |
South Frisco Village | | Retail | | | | 29.0 | (1) | | | | | 29.0 | (1) | |
The Caruth | | Apartments | | | | 60.0 | (1) | | | | | 56.1 | (1) | |
The Maroneal | | Apartments | | | | 40.1 | | | | | 37.6 | |
United Kingdom: | | | | | | |
1 & 7 Westferry Circus | | Office | | | | 264.7 | (1) | | | | | 260.0 | (1) | |
Virginia: | | | | | | |
8270 Greensboro Drive | | Office | | | | 27.8 | | | | | 27.9 | |
Ashford Meadows Apartments | | Apartments | | | | 96.1 | (1) | | | | | 95.4 | (1) | |
One Virginia Square | | Office | | | | 53.9 | | | | | 51.7 | |
The Ellipse at Ballston | | Office | | | | 79.7 | | | | | 76.7 | |
Washington: | | | | | | |
Creeksides at Centerpoint | | Office | | | | 16.2 | | | | | 16.6 | |
Fourth and Madison | | Office | | | | 348.0 | (1) | | | | | 330.0 | (1) | |
Millennium Corporate Park | | Office | | | | 116.1 | | | | | 125.2 | |
Northwest RA Industrial Portfolio | | Industrial | | | | 17.1 | | | | | 17.0 | |
Rainier Corporate Park | | Industrial | | | | 67.1 | | | | | 66.8 | |
Regal Logistics Campus | | Industrial | | | | 52.5 | | | | | 52.5 | |
Washington DC: | | | | | | |
1001 Pennsylvania Avenue | | Office | | | | 642.3 | (1) | | | | | 589.8 | (1) | |
1401 H Street, NW | | Office | | | | 187.3 | (1) | | | | | 179.3 | (1) | |
1900 K Street, NW | | Office | | | | 230.6 | | | | | 246.4 | |
Mazza Gallerie | | Retail | | | | 77.0 | | | | | 76.0 | |
| | | | | | |
TOTAL REAL ESTATE PROPERTIES | | | | | | |
(Cost $9,482.7 and $9,449.1) | | | | | $ | | 8,345.8 | | | | $ | | 8,115.5 | |
| | | | | | |
24
TIAA REAL ESTATE ACCOUNT
STATEMENTS OF INVESTMENTS
March 31, 2011 and December 31, 2010
(Dollar values shown in millions)
OTHER REAL ESTATE-RELATED INVESTMENTS—12.52% and 12.89%
REAL ESTATE JOINT VENTURES—10.46% and 10.75%
| | | | |
Location/Description | | Fair Value |
| | 2011 | | 2010 |
| | (Unaudited) | | |
California: | | | | |
CA—Colorado Center LP | | | | |
Yahoo Center (50% Account Interest) | | | $ | | 157.9 | (2) | | | | $ | | 157.5 | (2) | |
CA—Treat Towers LP | | | | |
Treat Towers (75% Account Interest) | | | | 72.4 | | | | | 67.1 | |
Florida: | | | | |
Florida Mall Associates, Ltd | | | | |
The Florida Mall (50% Account Interest) | | | | 253.8 | (2) | | | | | 239.0 | (2) | |
TREA Florida Retail, LLC | | | | |
Florida Retail Portfolio (80% Account Interest) | | | | 166.1 | | | | | 165.5 | |
West Dade Associates | | | | |
Miami International Mall (50% Account Interest) | | | | 101.7 | (2) | | | | | 93.2 | (2) | |
Georgia: | | | | |
GA—Buckhead LLC | | | | |
Prominence in Buckhead (75% Account Interest) | | | | 41.3 | | | | | 39.8 | |
Massachusetts: | | | | |
MA—One Boston Place REIT | | | | |
One Boston Place (50.25% Account Interest) | | | | 152.1 | | | | | 150.3 | |
Tennessee: | | | | |
West Town Mall, LLC | | | | |
West Town Mall (50% Account Interest) | | | | 53.4 | (2) | | | | | 50.6 | (2) | |
Various: | | | | |
DDR TC LLC | | | | |
DDR Joint Venture (85% Account Interest) | | | | 319.4 | (2,3) | | | | | 303.7 | (2,3) | |
Storage Portfolio I, LLC | | | | |
Storage Portfolio (75% Account Interest) | | | | 64.8 | (2,3) | | | | | 52.8 | (2,3) | |
Strategic Ind Portfolio I, LLC | | | | |
IDI Nationwide Industrial Portfolio (60% Account Interest) | | | | 39.6 | (2,3) | | | | | 39.3 | (2,3) | |
| | | | |
TOTAL REAL ESTATE JOINT VENTURES | | | | |
(Cost $1,937.5 and $1,922.4) | | | $ | | 1,422.5 | | | | $ | | 1,358.8 | |
| | | | |
LIMITED PARTNERSHIPS—2.06% and 2.14% | | | | |
Cobalt Industrial REIT (10.998% Account Interest) | | | $ | | 25.7 | | | | $ | | 26.3 | |
Colony Realty Partners LP (5.27% Account Interest) | | | | 18.2 | | | | | 18.1 | |
Heitman Value Partners Fund (8.43% Account Interest) | | | | 17.6 | | | | | 17.3 | |
Lion Gables Apartment Fund (18.46% Account Interest) | | | | 197.6 | | | | | 190.0 | |
MONY/Transwestern Mezz RP II (16.67% Account Interest) | | | | 11.1 | | | | | 9.7 | |
Transwestern Mezz Realty Partners III, LLC (11.708% Account Interest) | | | | 9.4 | | | | | 8.9 | |
| | | | |
TOTAL LIMITED PARTNERSHIPS | | | | |
(Cost $302.1 and $300.9) | | | $ | | 279.6 | | | | $ | | 270.3 | |
| | | | |
TOTAL REAL ESTATE JOINT VENTURES AND LIMITED PARTNERSHIPS | | |
(Cost $2,239.6 and $2,223.3) | | | $ | | 1,702.1 | | | | $ | | 1,629.1 | |
| | | | |
25
TIAA REAL ESTATE ACCOUNT
STATEMENTS OF INVESTMENTS
March 31, 2011 and December 31, 2010
(Dollar values shown in millions)
MARKETABLE SECURITIES—26.10% and 22.89%
REAL ESTATE-RELATED MARKETABLE SECURITIES—4.67% and 3.92%
| | | | | | | | |
Shares | | Issuer | | Fair Value |
2011 | | 2010 | | 2011 | | 2010 |
| | | | | | | (Unaudited) | | |
| | 58,992 | | | | | 50,398 | | | Acadia Realty Trust | | | $ | | 1.1 | | | | $ | | 0.9 | |
| | 16,697 | | | | | 11,416 | | | Agree Realty Corporation | | | | 0.4 | | | | | 0.3 | |
| | 2,946 | | | | | 2,574 | | | Alexander’s, Inc. | | | | 1.2 | | | | | 1.1 | |
| | 80,372 | | | | | 66,883 | | | Alexandria Real Estate Equities, Inc. | | | | 6.3 | | | | | 4.9 | |
| | 245,093 | | | | | 200,791 | | | AMB Property Corporation | | | | 8.8 | | | | | 6.4 | |
| | 56,683 | | | | | — | | | American Assets Trust Inc | | | | 1.2 | | | | | — | |
| | 97,243 | | | | | 81,463 | | | American Campus Communities, Inc. | | | | 3.2 | | | | | 2.6 | |
| | 173,417 | | | | | 142,051 | | | Apartment Investment and Management Company | | | | 4.4 | | | | | 3.7 | |
| | 85,565 | | | | | 65,637 | | | Ashford Hospitality Trust, Inc. | | | | 0.9 | | | | | 0.6 | |
| | 60,505 | | | | | 52,433 | | | Associated Estates Realty Corporation | | | | 1.0 | | | | | 0.8 | |
| | 125,688 | | | | | 102,725 | | | Avalonbay Communities, Inc. | | | | 15.1 | | | | | 11.6 | |
| | 191,029 | | | | | 155,007 | | | BioMed Realty Trust, Inc. | | | | 3.6 | | | | | 2.9 | |
| | 206,975 | | | | | 168,877 | | | Boston Properties, Inc. | | | | 19.6 | | | | | 14.5 | |
| | 199,772 | | | | | 157,851 | | | Brandywine Realty Trust | | | | 2.4 | | | | | 1.8 | |
| | 94,467 | | | | | 77,519 | | | BRE Properties, Inc. | | | | 4.5 | | | | | 3.4 | |
| | 101,862 | | | | | 83,321 | | | Camden Property Trust | | | | 5.8 | | | | | 4.5 | |
| | 45,308 | | | | | 37,593 | | | Campus Crest Communities, Inc. | | | | 0.5 | | | | | 0.5 | |
| | 87,135 | | | | | 75,517 | | | CapLease, Inc. | | | | 0.5 | | | | | 0.4 | |
| | 200,200 | | | | | 167,965 | | | CBL & Associates Properties, Inc. | | | | 3.5 | | | | | 2.9 | |
| | 89,545 | | | | | 70,256 | | | Cedar Shopping Centers, Inc. | | | | 0.5 | | | | | 0.4 | |
| | 17,260 | | | | | 8,763 | | | Chatham Lodging Trust | | | | 0.3 | | | | | 0.2 | |
| | 34,167 | | | | | 20,047 | | | Chesapeake Lodging Trust | | | | 0.6 | | | | | 0.4 | |
| | 74,052 | | | | | 54,270 | | | Cogdell Spencer Inc. | | | | 0.4 | | | | | 0.3 | |
| | 113,402 | | | | | 95,610 | | | Colonial Properties Trust | | | | 2.2 | | | | | 1.7 | |
| | 28,667 | | | | | 20,917 | | | CoreSite Realty Corporation | | | | 0.5 | | | | | 0.3 | |
| | 98,661 | | | | | 80,891 | | | Corporate Office Properties Trust | | | | 3.6 | | | | | 2.8 | |
| | 155,231 | | | | | 123,682 | | | Cousins Properties Incorporated | | | | 1.3 | | | | | 1.0 | |
| | 361,073 | | | | | 253,113 | | | DCT Industrial Trust Inc. | | | | 2.0 | | | | | 1.3 | |
| | 373,388 | | | | | 309,541 | | | Developers Diversified Realty Corporation | | | | 5.2 | | | | | 4.4 | |
| | 243,241 | | | | | 188,954 | | | DiamondRock Hospitality Company | | | | 2.7 | | | | | 2.3 | |
| | 133,188 | | | | | 107,907 | | | Digital Realty Trust, Inc. | | | | 7.7 | | | | | 5.6 | |
| | 135,957 | | | | | 113,097 | | | Douglas Emmett, Inc. | | | | 2.5 | | | | | 1.9 | |
| | 366,585 | | | | | 298,785 | | | Duke Realty Corporation | | | | 5.1 | | | | | 3.7 | |
| | 89,024 | | | | | 72,632 | | | DuPont Fabros Technology, Inc. | | | | 2.2 | | | | | 1.5 | |
| | 39,381 | | | | | 33,167 | | | EastGroup Properties, Inc. | | | | 1.7 | | | | | 1.4 | |
| | 106,387 | | | | | 65,151 | | | Education Realty Trust, Inc. | | | | 0.9 | | | | | 0.5 | |
| | 67,705 | | | | | 56,762 | | | Entertainment Properties Trust | | | | 3.2 | | | | | 2.6 | |
| | 45,556 | | | | | 37,659 | | | Equity Lifestyle Properties, Inc. | | | | 2.6 | | | | | 2.1 | |
| | 76,836 | | | | | 58,543 | | | Equity One, Inc. | | | | 1.4 | | | | | 1.1 | |
| | 428,990 | | | | | 339,604 | | | Equity Residential | | | | 24.2 | | | | | 17.6 | |
| | 45,816 | | | | | 38,018 | | | Essex Property Trust, Inc. | | | | 5.7 | | | | | 4.3 | |
| | 24,804 | | | | | 21,898 | | | Excel Trust, Inc. | | | | 0.3 | | | | | 0.3 | |
| | 127,232 | | | | | 107,440 | | | Extra Space Storage Inc. | | | | 2.6 | | | | | 1.9 | |
| | 89,739 | | | | | 73,740 | | | Federal Realty Investment Trust | | | | 7.3 | | | | | 5.7 | |
| | 144,249 | | | | | 122,336 | | | FelCor Lodging Trust Incorporated | | | | 0.9 | | | | | 0.9 | |
| | 113,476 | | | | | 71,146 | | | First Industrial Realty Trust, Inc. | | | | 1.3 | | | | | 0.6 | |
26
TIAA REAL ESTATE ACCOUNT
STATEMENTS OF INVESTMENTS
March 31, 2011 and December 31, 2010
(Dollar values shown in millions)
| | | | | | | | |
Shares | | Issuer | | Fair Value |
2011 | | 2010 | | 2011 | | 2010 |
| | | | | | | (Unaudited) | | |
| | 73,558 | | | | | 57,529 | | | First Potomac Realty Trust | | | $ | | 1.2 | | | | $ | | 1.0 | |
| | 118,910 | | | | | 98,729 | | | Franklin Street Properties Corp. | | | | 1.7 | | | | | 1.4 | |
| | 697,557 | | | | | 560,577 | | | General Growth Properties, Inc. | | | | 10.8 | | | | | 8.7 | |
| | 36,236 | | | | | 28,271 | | | Getty Realty Corp. | | | | 0.8 | | | | | 0.9 | |
| | 14,201 | | | | | 10,676 | | | Gladstone Commercial Corporation | | | | 0.3 | | | | | 0.2 | |
| | 147,312 | | | | | 107,080 | | | Glimcher Realty Trust | | | | 1.4 | | | | | 0.9 | |
| | 45,343 | | | | | 38,023 | | | Government Properties Income Trust | | | | 1.2 | | | | | 1.0 | |
| | 541,169 | | | | | 387,498 | | | HCP, Inc. | | | | 20.5 | | | | | 14.3 | |
| | 251,356 | | | | | 175,223 | | | Health Care REIT, Inc. | | | | 13.2 | | | | | 8.3 | |
| | 97,102 | | | | | 79,299 | | | Healthcare Realty Trust Incorporated | | | | 2.2 | | | | | 1.7 | |
| | 244,888 | | | | | 209,343 | | | Hersha Hospitality Trust | | | | 1.5 | | | | | 1.4 | |
| | 104,583 | | | | | 84,755 | | | Highwoods Properties, Inc. | | | | 3.7 | | | | | 2.7 | |
| | 55,923 | | | | | 45,795 | | | Home Properties, Inc. | | | | 3.3 | | | | | 2.5 | |
| | 181,251 | | | | | 150,100 | | | Hospitality Properties Trust | | | | 4.2 | | | | | 3.5 | |
| | 990,486 | | | | | 798,787 | | | Host Hotels & Resorts, Inc. | | | | 17.4 | | | | | 14.3 | |
| | 106,900 | | | | | 88,294 | | | HRPT Properties Trust | | | | 2.8 | | | | | 2.3 | |
| | 28,329 | | | | | 20,487 | | | Hudson Pacific Properties, Inc. | | | | 0.4 | | | | | 0.3 | |
| | 127,365 | | | | | 109,424 | | | Inland Real Estate Corporation | | | | 1.2 | | | | | 1.0 | |
| | 116,633 | | | | | 98,903 | | | Investors Real Estate Trust | | | | 1.1 | | | | | 0.9 | |
| | 1,500,000 | | | | | 1,500,000 | | | iShares Dow Jones US Real Estate Index Fund | | | | 89.1 | | | | | 83.9 | |
| | 76,507 | | | | | 61,706 | | | Kilroy Realty Corporation | | | | 3.0 | | | | | 2.3 | |
| | 591,291 | | | | | 485,461 | | | Kimco Realty Corporation | | | | 10.8 | | | | | 8.8 | |
| | 98,312 | | | | | 83,099 | | | Kite Realty Group Trust | | | | 0.5 | | | | | 0.5 | |
| | 110,540 | | | | | 86,269 | | | LaSalle Hotel Properties | | | | 3.0 | | | | | 2.3 | |
| | 213,914 | | | | | 165,849 | | | Lexington Realty Trust | | | | 2.0 | | | | | 1.3 | |
| | 166,732 | | | | | 138,566 | | | Liberty Property Trust | | | | 5.5 | | | | | 4.4 | |
| | 39,151 | | | | | 30,038 | | | LTC Properties, Inc. | | | | 1.1 | | | | | 0.8 | |
| | 127,016 | | | | | 93,900 | | | Mack-Cali Realty Corporation | | | | 4.3 | | | | | 3.1 | |
| | 68,649 | | | | | 53,134 | | | Maguire Properties, Inc. | | | | 0.3 | | | | | 0.1 | |
| | 161,715 | | | | | 136,282 | | | Medical Properties Trust, Inc. | | | | 1.9 | | | | | 1.5 | |
| | 52,103 | | | | | 41,729 | | | Mid-America Apartment Communities, Inc. | | | | 3.3 | | | | | 2.6 | |
| | 23,494 | | | | | 20,269 | | | Mission West Properties, Inc. | | | | 0.2 | | | | | 0.1 | |
| | 50,461 | | | | | 44,989 | | | Monmouth Real Estate Investment Corporation | | | | 0.4 | | | | | 0.4 | |
| | 40,982 | | | | | 34,293 | | | National Health Investors, Inc. | | | | 2.0 | | | | | 1.5 | |
| | 122,184 | | | | | 101,670 | | | National Retail Properties, Inc. | | | | 3.2 | | | | | 2.7 | |
| | 183,869 | | | | | 152,266 | | | Nationwide Health Properties, Inc. | | | | 7.8 | | | | | 5.5 | |
| | 143,230 | | | | | 120,251 | | | Omega Healthcare Investors, Inc. | | | | 3.2 | | | | | 2.7 | |
| | 22,401 | | | | | 16,016 | | | One Liberty Properties, Inc. | | | | 0.3 | | | | | 0.3 | |
| | 35,300 | | | | | 27,787 | | | Parkway Properties, Inc. | | | | 0.6 | | | | | 0.5 | |
| | 82,225 | | | | | 63,708 | | | Pennsylvania Real Estate Investment Trust | | | | 1.2 | | | | | 0.9 | |
| | 237,045 | | | | | 77,918 | | | Piedmont Office Realty Trust, Inc. | | | | 4.6 | | | | | 1.6 | |
| | 237,327 | | | | | 196,790 | | | Plum Creek Timber Company, Inc. | | | | 10.4 | | | | | 7.4 | |
| | 71,350 | | | | | 59,612 | | | Post Properties, Inc. | | | | 2.8 | | | | | 2.2 | |
| | 57,994 | | | | | 49,003 | | | Potlatch Corporation | | | | 2.3 | | | | | 1.6 | |
| | 829,351 | | | | | 681,117 | | | ProLogis | | | | 13.3 | | | | | 9.8 | |
| | 27,371 | | | | | 22,706 | | | PS Business Parks, Inc. | | | | 1.6 | | | | | 1.3 | |
| | 186,315 | | | | | 153,807 | | | Public Storage, Inc. | | | | 20.7 | | | | | 15.6 | |
| | 58,678 | | | | | 42,225 | | | Ramco-Gershenson Properties Trust | | | | 0.7 | | | | | 0.5 | |
27
TIAA REAL ESTATE ACCOUNT
STATEMENTS OF INVESTMENTS
March 31, 2011 and December 31, 2010
(Dollar values shown in millions)
| | | | | | | | |
Shares | | Issuer | | Fair Value |
2011 | | 2010 | | 2011 | | 2010 |
| | | | | | | (Unaudited) | | |
| | 117,437 | | | | | 97,616 | | | Rayonier Inc. | | | $ | | 7.3 | | | | $ | | 5.1 | |
| | 170,783 | | | | | 141,919 | | | Realty Income Corporation | | | | 6.0 | | | | | 4.9 | |
| | 118,772 | | | | | 97,060 | | | Regency Centers Corporation | | | | 5.2 | | | | | 4.1 | |
| | 20,346 | | | | | 17,498 | | | Saul Centers, Inc. | | | | 0.9 | | | | | 0.8 | |
| | 206,705 | | | | | 150,706 | | | Senior Housing Properties Trust | | | | 4.8 | | | | | 3.3 | |
| | 427,090 | | | | | 352,460 | | | Simon Property Group, Inc. | | | | 45.8 | | | | | 35.1 | |
| | 113,407 | | | | | 93,168 | | | SL Green Realty Corp. | | | | 8.5 | | | | | 6.3 | |
| | 40,477 | | | | | 34,147 | | | Sovran Self Storage, Inc. | | | | 1.6 | | | | | 1.3 | |
| | 223,842 | | | | | 186,401 | | | Strategic Hotels & Resorts, Inc. | | | | 1.4 | | | | | 1.0 | |
| | 29,728 | | | | | 24,737 | | | Sun Communities, Inc. | | | | 1.1 | | | | | 0.8 | |
| | 36,193 | | | | | 29,324 | | | Sun Healthcare Group, Inc. | | | | 0.6 | | | | | 0.5 | |
| | 175,378 | | | | | 137,832 | | | Sunstone Hotel Investors, L.L.C. | | | | 1.8 | | | | | 1.4 | |
| | 117,595 | | | | | 49,191 | | | Tanger Factory Outlet Centers, Inc. | | | | 3.1 | | | | | 2.5 | |
| | 60,482 | | | | | 50,042 | | | Taubman Centers, Inc. | | | | 3.2 | | | | | 2.5 | |
| | 12,372 | | | | | 11,532 | | | Terreno Realty Corporation | | | | 0.2 | | | | | 0.2 | |
| | 189,369 | | | | | 155,462 | | | The Macerich Company | | | | 9.4 | | | | | 7.4 | |
| | 265,245 | | | | | 220,400 | | | UDR, Inc. | | | | 6.5 | | | | | 5.2 | |
| | 11,629 | | | | | 5,400 | | | UMH Properties, Inc. | | | | 0.1 | | | | | 0.1 | |
| | 18,779 | | | | | 16,113 | | | Universal Health Realty Income Trust | | | | 0.8 | | | | | 0.6 | |
| | 31,393 | | | | | 27,120 | | | Urstadt Biddle Properties Inc. | | | | 0.6 | | | | | 0.5 | |
| | 140,719 | | | | | 119,610 | | | U-Store-It Trust | | | | 1.5 | | | | | 1.1 | |
| | 237,507 | | | | | 188,915 | | | Ventas, Inc. | | | | 12.9 | | | | | 9.9 | |
| | 265,255 | | | | | 219,149 | | | Vornado Realty Trust | | | | 23.2 | | | | | 18.3 | |
| | 95,680 | | | | | 78,376 | | | Washington Real Estate Investment Trust | | | | 3.0 | | | | | 2.4 | |
| | 174,224 | | | | | 142,411 | | | Weingarten Realty Investors | | | | 4.4 | | | | | 3.4 | |
| | 781,721 | | | | | 646,348 | | | Weyerhaeuser Company | | | | 19.0 | | | | | 12.2 | |
| | 34,618 | | | | | 22,256 | | | Winthrop Realty Trust | | | | 0.4 | | | | | 0.3 | |
| | | | | | | | | |
TOTAL REAL ESTATE-RELATED MARKETABLE SECURITIES
(Cost $587.2 and $480.4) | | | $ | | 635.2 | | | | $ | | 495.3 | |
| | | | | | | | | |
28
TIAA REAL ESTATE ACCOUNT
STATEMENTS OF INVESTMENTS
March 31, 2011 and December 31, 2010
(Dollar values shown in millions)
OTHER MARKETABLE SECURITIES—21.43% and 18.97%
GOVERNMENT AGENCY NOTES—13.54% and 11.75%
| | | | | | | | | | | | |
Principal | | Issuer | | Yield(4) | | Maturity
Date | | Fair Value |
2011 | | 2010 | | 2011 | | 2010 |
| | | | | | | | | | | (Unaudited) | | |
| $ | | — | | | | $ | | 15.1 | | | Fannie Mae Discount Notes | | | | 0.172% | | | | | 1/18/11 | | | | $ | | — | | | | $ | | 15.1 | |
| | — | | | | | 21.2 | | | Fannie Mae Discount Notes | | | | 0.172% | | | | | 2/1/11 | | | | | — | | | | | 21.2 | |
| | — | | | | | 43.6 | | | Fannie Mae Discount Notes | | | | 0.183% | | | | | 2/3/11 | | | | | — | | | | | 43.6 | |
| | — | | | | | 13.5 | | | Fannie Mae Discount Notes | | | | 0.183% | | | | | 2/14/11 | | | | | — | | | | | 13.5 | |
| | — | | | | | 50.0 | | | Fannie Mae Discount Notes | | | | 0.137% | | | | | 2/15/11 | | | | | — | | | | | 50.0 | |
| | — | | | | | 32.5 | | | Fannie Mae Discount Notes | | | | 0.162%-0.178% | | | | | 3/1/11 | | | | | — | | | | | 32.5 | |
| | — | | | | | 32.4 | | | Fannie Mae Discount Notes | | | | 0.172% | | | | | 3/2/11 | | | | | — | | | | | 32.4 | |
| | — | | | | | 14.0 | | | Fannie Mae Discount Notes | | | | 0.162% | | | | | 3/8/11 | | | | | — | | | | | 14.0 | |
| | — | | | | | 19.6 | | | Fannie Mae Discount Notes | | | | 0.178% | | | | | 3/21/11 | | | | | — | | | | | 19.6 | |
| | — | | | | | 31.9 | | | Fannie Mae Discount Notes | | | | 0.162% | | | | | 3/23/11 | | | | | — | | | | | 31.9 | |
| | 39.0 | | | | | — | | | Fannie Mae Discount Notes | | | | 0.172% | | | | | 4/6/11 | | | | | 39.0 | | | | | — | |
| | 20.2 | | | | | 20.2 | | | Fannie Mae Discount Notes | | | | 0.178% | | | | | 4/13/11 | | | | | 20.2 | | | | | 20.2 | |
| | 44.6 | | | | | — | | | Fannie Mae Discount Notes | | | | 0.178% | | | | | 4/20/11 | | | | | 44.6 | | | | | — | |
| | 46.4 | | | | | — | | | Fannie Mae Discount Notes | | | | 0.172%-0.178% | | | | | 4/25/11 | | | | | 46.4 | | | | | — | |
| | 9.6 | | | | | — | | | Fannie Mae Discount Notes | | | | 0.172% | | | | | 4/27/11 | | | | | 9.6 | | | | | — | |
| | 24.8 | | | | | — | | | Fannie Mae Discount Notes | | | | 0.178% | | | | | 5/16/11 | | | | | 24.8 | | | | | — | |
| | 50.0 | | | | | — | | | Fannie Mae Discount Notes | | | | 0.142% | | | | | 5/25/11 | | | | | 50.0 | | | | | — | |
| | 18.2 | | | | | — | | | Fannie Mae Discount Notes | | | | 0.137% | | | | | 6/1/11 | | | | | 18.2 | | | | | — | |
| | 31.4 | | | | | — | | | Fannie Mae Discount Notes | | | | 0.127% | | | | | 6/8/11 | | | | | 31.4 | | | | | — | |
| | 40.5 | | | | | — | | | Fannie Mae Discount Notes | | | | 0.122% | | | | | 6/15/11 | | | | | 40.5 | | | | | — | |
| | 42.5 | | | | | — | | | Fannie Mae Discount Notes | | | | 0.147% | | | | | 6/20/11 | | | | | 42.5 | | | | | — | |
| | 23.1 | | | | | — | | | Fannie Mae Discount Notes | | | | 0.122% | | | | | 6/22/11 | | | | | 23.1 | | | | | — | |
| | 20.0 | | | | | — | | | Fannie Mae Discount Notes | | | | 0.122% | | | | | 6/29/11 | | | | | 20.0 | | | | | — | |
| | 2.0 | | | | | — | | | Fannie Mae Discount Notes | | | | 0.117% | | | | | 7/6/11 | | | | | 2.0 | | | | | — | |
| | 17.6 | | | | | — | | | Fannie Mae Discount Notes | | | | 0.203% | | | | | 7/13/11 | | | | | 17.6 | | | | | — | |
| | 50.0 | | | | | — | | | Fannie Mae Discount Notes | | | | 0.167% | | | | | 7/20/11 | | | | | 50.0 | | | | | — | |
| | 25.0 | | | | | — | | | Fannie Mae Discount Notes | | | | 0.162% | | | | | 8/3/11 | | | | | 25.0 | | | | | — | |
| | 25.0 | | | | | — | | | Fannie Mae Discount Notes | | | | 0.157% | | | | | 8/8/11 | | | | | 25.0 | | | | | — | |
| | 44.0 | | | | | — | | | Fannie Mae Discount Notes | | | | 0.173% | | | | | 8/24/11 | | | | | 44.0 | | | | | — | |
| | — | | | | | 30.0 | | | Federal Home Loan Bank Discount
Notes | | | | 0.162% | | | | | 1/5/11 | | | | | — | | | | | 30.0 | |
| | — | | | | | 25.0 | | | Federal Home Loan Bank Discount
Notes | | | | 0.162% | | | | | 1/7/11 | | | | | — | | | | | 25.0 | |
| | — | | | | | 30.0 | | | Federal Home Loan Bank Discount
Notes | | | | 0.172% | | | | | 1/12/11 | | | | | — | | | | | 30.0 | |
| | — | | | | | 50.0 | | | Federal Home Loan Bank Discount
Notes | | | | 0.183% | | | | | 1/14/11 | | | | | — | | | | | 50.0 | |
| | — | | | | | 30.0 | | | Federal Home Loan Bank Discount
Notes | | | | 0.177% | | | �� | | 1/19/11 | | | | | — | | | | | 30.0 | |
| | — | | | | | 15.8 | | | Federal Home Loan Bank Discount
Notes | | | | 0.157% | | | | | 1/20/11 | | | | | — | | | | | 15.8 | |
| | — | | | | | 30.0 | | | Federal Home Loan Bank Discount
Notes | | | | 0.177% | | | | | 1/21/11 | | | | | — | | | | | 30.0 | |
| | — | | | | | 36.4 | | | Federal Home Loan Bank Discount
Notes | | | | 0.122% | | | | | 1/26/11 | | | | | — | | | | | 36.4 | |
| | — | | | | | 50.0 | | | Federal Home Loan Bank Discount
Notes | | | | 0.157%-0.172% | | | | | 1/28/11 | | | | | — | | | | | 50.0 | |
29
TIAA REAL ESTATE ACCOUNT
STATEMENTS OF INVESTMENTS
March 31, 2011 and December 31, 2010
(Dollar values shown in millions)
| | | | | | | | | | | | |
Principal | | Issuer | | Yield(4) | | Maturity
Date | | Fair Value |
2011 | | 2010 | | 2011 | | 2010 |
| | | | | | | | | | | (Unaudited) | | |
| $ | | — | | | | $ | | 39.1 | | | Federal Home Loan Bank Discount
Notes | | | | 0.167%-0.178% | | | | | 2/2/11 | | | | $ | | — | | | | $ | | 39.1 | |
| | — | | | | | 30.0 | | | Federal Home Loan Bank Discount
Notes | | | | 0.167% | | | | | 2/4/11 | | | | | — | | | | | 30.0 | |
| | — | | | | | 20.1 | | | Federal Home Loan Bank Discount
Notes | | | | 0.157% | | | | | 2/9/11 | | | | | — | | | | | 20.1 | |
| | — | | | | | 47.0 | | | Federal Home Loan Bank Discount
Notes | | | | 0.147% | | | | | 2/16/11 | | | | | — | | | | | 47.0 | |
| | — | | | | | 41.4 | | | Federal Home Loan Bank Discount
Notes | | | | 0.157%-0.183% | | | | | 2/18/11 | | | | | — | | | | | 41.4 | |
| | — | | | | | 35.4 | | | Federal Home Loan Bank Discount
Notes | | | | 0.183% | | | | | 2/23/11 | | | | | — | | | | | 35.4 | |
| | — | | | | | 25.0 | | | Federal Home Loan Bank Discount
Notes | | | | 0.188% | | | | | 2/25/11 | | | | | — | | | | | 25.0 | |
| | — | | | | | 32.8 | | | Federal Home Loan Bank Discount
Notes | | | | 0.162% | | | | | 3/9/11 | | | | | — | | | | | 32.8 | |
| | — | | | | | 27.7 | | | Federal Home Loan Bank Discount
Notes | | | | 0.162% | | | | | 3/11/11 | | | | | — | | | | | 27.7 | |
| | — | | | | | 25.0 | | | Federal Home Loan Bank Discount
Notes | | | | 0.162% | | | | | 3/16/11 | | | | | — | | | | | 25.0 | |
| | 14.2 | | | | | — | | | Federal Home Loan Bank Discount
Notes | | | | 0.112% | | | | | 4/1/11 | | | | | 14.2 | | | | | — | |
| | 50.0 | | | | | — | | | Federal Home Loan Bank Discount
Notes | | | | 0.172% | | | | | 4/8/11 | | | | | 50.0 | | | | | — | |
| | 25.4 | | | | | — | | | Federal Home Loan Bank Discount
Notes | | | | 0.162% | | | | | 4/12/11 | | | | | 25.4 | | | | | — | |
| | 23.8 | | | | | 23.8 | | | Federal Home Loan Bank Discount
Notes | | | | 0.178% | | | | | 4/15/11 | | | | | 23.8 | | | | | 23.8 | |
| | 17.1 | | | | | — | | | Federal Home Loan Bank Discount
Notes | | | | 0.172% | | | | | 4/27/11 | | | | | 17.1 | | | | | — | |
| | 16.1 | | | | | 16.1 | | | Federal Home Loan Bank Discount
Notes | | | | 0.178% | | | | | 4/29/11 | | | | | 16.1 | | | | | 16.1 | |
| | 25.1 | | | | | — | | | Federal Home Loan Bank Discount
Notes | | | | 0.172% | | | | | 5/4/11 | | | | | 25.1 | | | | | — | |
| | 20.0 | | | | | 20.0 | | | Federal Home Loan Bank Discount
Notes | | | | 0.211% | | | | | 5/6/11 | | | | | 20.0 | | | | | 20.0 | |
| | 31.8 | | | | | 31.8 | | | Federal Farm Credit Bank Discount
Notes | | | | 0.172% | | | | | 5/9/11 | | | | | 31.8 | | | | | 31.8 | |
| | 48.7 | | | | | — | | | Federal Home Loan Bank Discount
Notes | | | | 0.101%-0.142% | | | | | 5/11/11 | | | | | 48.7 | | | | | — | |
| | 8.1 | | | | | — | | | Federal Home Loan Bank Discount
Notes | | | | 0.132% | | | | | 5/17/11 | | | | | 8.0 | | | | | — | |
| | 9.0 | | | | | — | | | Federal Home Loan Bank Discount
Notes | | | | 0.137% | | | | | 5/18/11 | | | | | 9.0 | | | | | — | |
| | 38.1 | | | | | — | | | Federal Home Loan Bank Discount
Notes | | | | 0.132% | | | | | 5/20/11 | | | | | 38.1 | | | | | — | |
| | 11.0 | | | | | — | | | Federal Home Loan Bank Discount
Notes | | | | 0.112% | | | | | 6/1/11 | | | | | 10.9 | | | | | — | |
| | 25.0 | | | | | — | | | Federal Home Loan Bank Discount
Notes | | | | 0.142% | | | | | 6/3/11 | | | | | 25.0 | | | | | — | |
| | 41.2 | | | | | — | | | Federal Home Loan Bank Discount
Notes | | | | 0.112%-0.122% | | | | | 6/8/11 | | | | | 41.2 | | | | | — | |
30
TIAA REAL ESTATE ACCOUNT
STATEMENTS OF INVESTMENTS
March 31, 2011 and December 31, 2010
(Dollar values shown in millions)
| | | | | | | | | | | | |
Principal | | Issuer | | Yield(4) | | Maturity
Date | | Fair Value |
2011 | | 2010 | | 2011 | | 2010 |
| | | | | | | | | | | (Unaudited) | | |
| $ | | 22.2 | | | | $ | | — | | | Federal Home Loan Bank Discount
Notes | | | | 0.122% | | | | | 6/10/11 | | | | $ | | 22.2 | | | | $ | | — | |
| | 30.2 | | | | | — | | | Federal Home Loan Bank Discount
Notes | | | | 0.122% | | | | | 6/17/11 | | | | | 30.2 | | | | | — | |
| | 25.4 | | | | | — | | | Federal Home Loan Bank Discount
Notes | | | | 0.127% | | | | | 6/24/11 | | | | | 25.4 | | | | | — | |
| | 15.9 | | | | | — | | | Federal Home Loan Bank Discount
Notes | | | | 0.132% | | | | | 6/29/11 | | | | | 15.9 | | | | | — | |
| | 100.0 | | | | | 100.0 | | | Federal Home Loan Bank Discount
Notes | | | | 0.217% | | | | | 8/12/11 | | | | | 100.0 | | | | | 100.0 | |
| | 20.0 | | | | | — | | | Federal Home Loan Bank Discount
Notes | | | | 0.215% | | | | | 1/13/12 | | | | | 20.0 | | | | | — | |
| | — | | | | | 45.9 | | | Freddie Mac Discount Notes | | | | 0.157%-0.162% | | | | | 1/3/11 | | | | | — | | | | | 45.9 | |
| | — | | | | | 82.7 | | | Freddie Mac Discount Notes | | | | 0.183% | | | | | 1/10/11 | | | | | — | | | | | 82.7 | |
| | — | | | | | 28.0 | | | Freddie Mac Discount Notes | | | | 0.152% | | | | | 1/25/11 | | | | | — | | | | | 28.0 | |
| | — | | | | | 28.2 | | | Freddie Mac Discount Notes | | | | 0.172% | | | | | 1/31/11 | | | | | — | | | | | 28.1 | |
| | — | | | | | 18.1 | | | Freddie Mac Discount Notes | | | | 0.142% | | | | | 2/22/11 | | | | | — | | | | | 18.1 | |
| | — | | | | | 49.4 | | | Freddie Mac Discount Notes | | | | 0.162%-0.178% | | | | | 3/7/11 | | | | | — | | | | | 49.4 | |
| | — | | | | | 26.7 | | | Freddie Mac Discount Notes | | | | 0.162% | | | | | 3/14/11 | | | | | — | | | | | 26.7 | |
| | — | | | | | 14.9 | | | Freddie Mac Discount Notes | | | | 0.172% | | | | | 3/21/11 | | | | | — | | | | | 14.9 | |
| | 50.0 | | | | | — | | | Freddie Mac Discount Notes | | | | 0.172% | | | | | 4/4/11 | | | | | 50.0 | | | | | — | |
| | 51.6 | | | | | — | | | Freddie Mac Discount Notes | | | | 0.167% | | | | | 4/11/11 | | | | | 51.6 | | | | | — | |
| | 24.6 | | | | | 24.6 | | | Freddie Mac Discount Notes | | | | 0.183% | | | | | 4/18/11 | | | | | 24.6 | | | | | 24.6 | |
| | 10.1 | | | | | 10.1 | | | Freddie Mac Discount Notes | | | | 0.193% | | | | | 4/19/11 | | | | | 10.1 | | | | | 10.1 | |
| | 21.2 | | | | | — | | | Freddie Mac Discount Notes | | | | 0.172% | | | | | 5/2/11 | | | | | 21.2 | | | | | — | |
| | 36.1 | | | | | — | | | Freddie Mac Discount Notes | | | | 0.172% | | | | | 5/3/11 | | | | | 36.1 | | | | | — | |
| | 46.0 | | | | | — | | | Freddie Mac Discount Notes | | | | 0.132% | | | | | 5/10/11 | | | | | 46.0 | | | | | — | |
| | 22.2 | | | | | — | | | Freddie Mac Discount Notes | | | | 0.183% | | | | | 5/24/11 | | | | | 22.2 | | | | | — | |
| | 19.1 | | | | | — | | | Freddie Mac Discount Notes | | | | 0.112% | | | | | 5/31/11 | | | | | 19.1 | | | | | — | |
| | 23.6 | | | | | — | | | Freddie Mac Discount Notes | | | | 0.117%-0.137% | | | | | 6/6/11 | | | | | 23.6 | | | | | — | |
| | 44.0 | | | | | — | | | Freddie Mac Discount Notes | | | | 0.152% | | | | | 6/9/11 | | | | | 44.0 | | | | | — | |
| | 35.2 | | | | | — | | | Freddie Mac Discount Notes | | | | 0.147%-0.193% | | | | | 6/13/11 | | | | | 35.2 | | | | | — | |
| | 30.0 | | | | | — | | | Freddie Mac Discount Notes | | | | 0.127% | | | | | 6/27/11 | | | | | 30.0 | | | | | — | |
| | 8.4 | | | | | — | | | Freddie Mac Discount Notes | | | | 0.203% | | | | | 7/15/11 | | | | | 8.4 | | | | | — | |
| | 50.0 | | | | | — | | | Freddie Mac Discount Notes | | | | 0.180% | | | | | 7/18/11 | | | | | 50.0 | | | | | — | |
| | 21.6 | | | | | — | | | Freddie Mac Discount Notes | | | | 0.132%-0.157% | | | | | 7/25/11 | | | | | 21.6 | | | | | — | |
| | 21.0 | | | | | — | | | Freddie Mac Discount Notes | | | | 0.132% | | | | | 7/26/11 | | | | | 21.0 | | | | | — | |
| | 34.7 | | | | | — | | | Freddie Mac Discount Notes | | | | 0.147% | | | | | 8/9/11 | | | | | 34.7 | | | | | — | |
| | 50.0 | | | | | — | | | Freddie Mac Discount Notes | | | | 0.157% | | | | | 8/22/11 | | | | | 50.0 | | | | | — | |
| | 50.0 | | | | | 50.0 | | | Freddie Mac Discount Notes | | | | 0.192%-0.197% | | | | | 11/9/11 | | | | | 50.0 | | | | | 49.9 | |
| | | | | | | | | | | | | |
TOTAL GOVERNMENT AGENCY NOTES
(Cost $1,841.2 and $1,484.7) | | | | | | | $ | | 1,841.4 | | | | $ | | 1,484.8 | |
| | | | | | | | | | | | | |
31
TIAA REAL ESTATE ACCOUNT
STATEMENTS OF INVESTMENTS
March 31, 2011 and December 31, 2010
(Dollar values shown in millions)
UNITED STATES TREASURY SECURITIES—7.89% and 7.22%
| | | | | | | | | | | | |
Principal | | Issuer | | Yield(4) | | Maturity
Date | | Fair Value |
2011 | | 2010 | | 2011 | | 2010 |
| | | | | | | | | | | (Unaudited) | | |
| $ | | — | | | | $ | | 32.3 | | | United States Treasury Bills | | | | 0.130% | | | | | 1/13/11 | | | | $ | | — | | | | $ | | 32.3 | |
| | — | | | | | 31.6 | | | United States Treasury Bills | | | | 0.152% | | | | | 1/27/11 | | | | | — | | | | | 31.6 | |
| | — | | | | | 32.4 | | | United States Treasury Bills | | | | 0.129% | | | | | 2/10/11 | | | | | — | | | | | 32.4 | |
| | — | | | | | 30.0 | | | United States Treasury Bills | | | | 0.133% | | | | | 2/17/11 | | | | | — | | | | | 30.0 | |
| | — | | | | | 30.0 | | | United States Treasury Bills | | | | 0.140% | | | | | 2/24/11 | | | | | — | | | | | 30.0 | |
| | — | | | | | 91.0 | | | United States Treasury Bills | | | | 0.106%-0.137% | | | | | 3/3/11 | | | | | — | | | | | 91.0 | |
| | — | | | | | 41.4 | | | United States Treasury Bills | | | | 0.132%-0.178% | | | | | 3/10/11 | | | | | — | | | | | 41.4 | |
| | — | | | | | 46.3 | | | United States Treasury Bills | | | | 0.142%-0.163% | | | | | 3/17/11 | | | | | — | | | | | 46.3 | |
| | — | | | | | 34.0 | | | United States Treasury Bills | | | | 0.141% | | | | | 3/24/11 | | | | | — | | | | | 34.0 | |
| | — | | | | | 30.0 | | | United States Treasury Bills | | | | 0.147% | | | | | 3/31/11 | | | | | — | | | | | 30.0 | |
| | 50.0 | | | | | 50.0 | | | United States Treasury Bills | | | | 0.137% | | | | | 4/7/11 | | | | | 50.0 | | | | | 50.0 | |
| | 37.8 | | | | | 38.2 | | | United States Treasury Bills | | | | 0.148%-0.173% | | | | | 4/14/11 | | | | | 37.8 | | | | | 38.1 | |
| | 48.5 | | | | | 30.0 | | | United States Treasury Bills | | | | 0.133%-0.173% | | | | | 4/21/11 | | | | | 48.5 | | | | | 30.0 | |
| | 25.0 | | | | | 25.0 | | | United States Treasury Bills | | | | 0.173% | | | | | 4/28/11 | | | | | 25.0 | | | | | 25.0 | |
| | 28.6 | | | | | 28.6 | | | United States Treasury Bills | | | | 0.153% | | | | | 5/5/11 | | | | | 28.6 | | | | | 28.6 | |
| | 55.0 | | | | | 55.0 | | | United States Treasury Bills | | | | 0.162%-0.184% | | | | | 5/12/11 | | | | | 55.0 | | | | | 55.0 | |
| | 49.2 | | | | | 49.2 | | | United States Treasury Bills | | | | 0.190%-0.210% | | | | | 5/19/11 | | | | | 49.2 | | | | | 49.2 | |
| | 47.1 | | | | | 47.1 | | | United States Treasury Bills | | | | 0.170%-0.200% | | | | | 5/26/11 | | | | | 47.1 | | | | | 47.1 | |
| | 11.8 | | | | | 0.2 | | | United States Treasury Bills | | | | 0.061%-0.167% | | | | | 6/9/11 | | | | | 11.8 | | | | | 0.2 | |
| | 67.4 | | | | | 19.3 | | | United States Treasury Bills | | | | 0.137%-0.178% | | | | | 6/16/11 | | | | | 67.4 | | | | | 19.3 | |
| | 50.1 | | | | | 4.3 | | | United States Treasury Bills | | | | 0.168%-0.181% | | | | | 6/23/11 | | | | | 50.1 | | | | | 4.3 | |
| | 53.0 | | | | | — | | | United States Treasury Bills | | | | 0.159% | | | | | 7/7/11 | | | | | 53.0 | | | | | — | |
| | 50.0 | | | | | — | | | United States Treasury Bills | | | | 0.134% | | | | | 7/14/11 | | | | | 50.0 | | | | | — | |
| | 26.5 | | | | | — | | | United States Treasury Bills | | | | 0.142%-0.187% | | | | | 7/21/11 | | | | | 26.5 | | | | | — | |
| | 25.0 | | | | | — | | | United States Treasury Bills | | | | 0.113% | | | | | 7/28/11 | | | | | 25.0 | | | | | — | |
| | 34.9 | | | | | — | | | United States Treasury Bills | | | | 0.145%-0.148% | | | | | 8/4/11 | | | | | 34.9 | | | | | — | |
| | 2.0 | | | | | — | | | United States Treasury Bills | | | | 0.132% | | | | | 8/18/11 | | | | | 2.0 | | | | | — | |
| | 50.0 | | | | | — | | | United States Treasury Bills | | | | 0.157% | | | | | 9/1/11 | | | | | 50.0 | | | | | — | |
| | 44.1 | | | | | — | | | United States Treasury Bills | | | | 0.157% | | | | | 9/15/11 | | | | | 44.1 | | | | | — | |
| | 23.0 | | | | | — | | | United States Treasury Bills | | | | 0.158% | | | | | 10/20/11 | | | | | 23.0 | | | | | — | |
| | 30.0 | | | | | — | | | United States Treasury Bills | | | | 0.188% | | | | | 11/17/11 | | | | | 30.0 | | | | | — | |
| | — | | | | | 29.5 | | | United States Treasury Notes | | | | 0.148% | | | | | 2/28/11 | | | | | — | | | | | 29.5 | |
| | — | | | | | 50.8 | | | United States Treasury Notes | | | | 0.174%-0.227% | | | | | 3/31/11 | | | | | — | | | | | 50.9 | |
| | 21.5 | | | | | 21.5 | | | United States Treasury Notes | | | | 0.245% | | | | | 4/30/11 | | | | | 21.5 | | | | | 21.5 | |
| | 33.7 | | | | | 33.7 | | | United States Treasury Notes | | | | 0.237% | | | | | 6/30/11 | | | | | 33.7 | | | | | 33.8 | |
| | 30.4 | | | | | 30.4 | | | United States Treasury Notes | | | | 0.267% | | | | | 9/30/11 | | | | | 30.4 | | | | | 30.4 | |
| | 32.1 | | | | | — | | | United States Treasury Notes | | | | 0.185% | | | | | 10/31/11 | | | | | 32.2 | | | | | — | |
| | 50.0 | | | | | — | | | United States Treasury Notes | | | | 0.204% | | | | | 11/30/11 | | | | | 50.2 | | | | | — | |
| | 25.0 | | | | | — | | | United States Treasury Notes | | | | 0.282% | | | | | 12/15/11 | | | | | 25.2 | | | | | — | |
| | 50.0 | | | | | — | | | United States Treasury Notes | | | | 0.252% | | | | | 1/15/12 | | | | | 50.2 | | | | | — | |
| | 20.0 | | | | | — | | | United States Treasury Notes | | | | 0.356% | | | | | 2/15/12 | | | | | 20.2 | | | | | — | |
| | | | | | | | | | | | | |
TOTAL UNITED STATES TREASURY SECURITIES
(Cost $1,072.6 and $911.9) | | | | | | | $ | | 1,072.6 | | | | $ | | 911.9 | |
| | | | | | | | | | | | | |
32
TIAA REAL ESTATE ACCOUNT
STATEMENTS OF INVESTMENTS
March 31, 2011 and December 31, 2010
(Dollar values shown in millions)
| | | | | | | | | | | | |
| | | | | | | | | | | Fair Value |
| | 2011 | | 2010 |
| | | | | | | | | | (Unaudited) | | |
TOTAL OTHER MARKETABLE SECURITIES
(Cost $2,913.8 and $2,396.6) | | | | | | | $ | | 2,914.0 | | | | $ | | 2,396.7 | |
| | | | | | | | | | | | |
TOTAL MARKETABLE SECURITIES
(Cost $3,501.0 and $2,877.0) | | | | | | | $ | | 3,549.2 | | | | $ | | 2,892.0 | |
| | | | | | | | | | | | |
TOTAL INVESTMENTS
(Cost $15,223.3 and $14,549.4) | | | | | | | $ | | 13,597.1 | | | | $ | | 12,636.6 | |
| | | | | | | | | | | | |
|
(1) | | | | The investment has a mortgage loans payable outstanding, as indicated in Note 8. |
|
(2) | | | | The market value reflects the Account’s interest in the joint venture and is net of debt. |
|
(3) | | | | Properties within this investment are located throughout the United States. |
|
(4) | | | | Yield represents the annualized yield at the date of purchase. |
33
ITEM 2. MANAGEMENT’S DISCUSSION AND ANALYSIS OF FINANCIAL CONDITION AND RESULTS OF OPERATIONS.
The following discussion and analysis of our financial condition and results of operations should be read together with our financial statements and notes contained in this report and with consideration to the sub-section entitled “Forward-Looking Statements,” which begins below, and the section of the Account’s Annual Report on Form 10-K for the year ended December 31, 2010 (the “Form 10-K”) entitled “Item 1A. Risk Factors.” The past performance of the Account is not indicative of future results.
Forward-Looking Statements
Some statements in this Form 10-Q which are not historical facts may be “forward-looking statements” within the meaning of Section 27A of the Securities Act of 1933, Section 21E of the Securities Exchange Act of 1934 and the Private Securities Litigation Reform Act of 1995. Forward-looking statements include statements about management’s expectations, beliefs, intentions or strategies for the future, include the assumptions underlying these forward-looking statements, and are based on current expectations, estimates and projections about the real estate industry, domestic and global economic conditions, including conditions in the credit and capital markets, the sectors and markets in which the Account invests and operates, and the transactions described in this Form 10-Q. While management believes the assumptions underlying any of its forward-looking statements and information to be reasonable, such information may be subject to uncertainties and may involve certain risks which may be difficult to predict and are beyond management’s control. These risks and uncertainties could cause actual results to differ materially from those contained in any forward-looking statement. These risks and uncertainties include, but are not limited to, the following:
|
• | | | | Acquiring and Owning Real Estate: The risks associated with acquiring and owning real property, including general economic and real estate market conditions, the availability of, and economic cost associated with, financing the Account’s properties, the risk that the Account’s properties become too concentrated (whether by geography, sector or by tenant mix), competition for acquiring real estate properties, leasing risk (including tenant defaults) and the risk of uninsured losses at properties (including due to terrorism and acts of violence); |
|
• | | | | Selling Real Estate: The risk that the sales price of a property might differ, perhaps significantly, from its estimated or appraised value, leading to losses or reduced profits to the Account, the risk that the Account might not be able to sell a property at a particular time for a price which management believes represents its fair or full value, the lack of availability of financing (for potential purchasers of the Account’s properties), disruptions in the credit and capital markets, and the risk that the Account may be required to make significant expenditures before the Account is able to market and/or sell a property; |
|
• | | | | Valuation: The risks associated with property valuations, including the fact that appraisals can be subjective in a number of respects, the fact that the Account’s appraisals are generally obtained on a quarterly basis and the fact that there may be periods in between appraisals of a property during which the value attributed to the property for purposes of the Account’s daily accumulation unit value may be more or less than the actual realizable value of the property; |
|
• | | | | Borrowing: Risks associated with financing the Account’s properties, including the risk of default on loans secured by the Account’s properties (which could lead to foreclosure), the risk associated with high loan to value ratios on the Account’s properties (including the fact that the Account may have limited, or no net value in such a property), the risk that significant sums of cash could be required to make principal and interest payments on the loans and the risk that the Account may not have the ability to obtain financing or refinancing on favorable terms (or at all), which may be aggravated by general disruptions in credit and capital markets; |
|
• | | | | Participant Transactions: Investment risk associated with participant transactions, including the fact that significant net participant transfers out of the Account may impair its ability to pursue or consummate new investment opportunities that are otherwise attractive to the Account or that significant net participant transfers into the Account may take time to invest in attractive investment opportunities; |
|
• | | | | Joint Venture Investments: The risks associated with joint venture partnerships, including the risk that a co-venturer may have interests or goals inconsistent with that of the Account, that a co-venturer may |
34
| | | | have financial difficulties, and the risk that the Account may have limited rights with respect to operation of the property and transfer of the Account’s interest; |
|
• | | | | Regulatory Matters: Uncertainties associated with environmental liability and regulations and other governmental regulatory matters such as zoning laws, rent control laws, and property taxes; |
|
• | | | | Foreign Investments: The risks associated with purchasing, owning and disposing of foreign investments (primarily real estate properties), including political risk, the risk associated with currency fluctuations, regulatory and taxation risks and risks of enforcing judgments; |
|
• | | | | Conflicts of Interest: Conflicts of interest associated with TIAA serving as investment manager of the Account and provider of the liquidity guarantee at the same time as TIAA and its affiliates are serving as an investment manager to other real estate accounts or funds, including conflicts associated with satisfying its fiduciary duties to all such accounts and funds associated with purchasing, selling and leasing of properties; |
|
• | | | | Required Property Sales: The risk that, if TIAA were to own too large a percentage of the Account’s accumulation units through funding the liquidity guarantee, the independent fiduciary could require the sales of properties to reduce TIAA’s ownership interest, which sales could occur at times and at prices that depress the sale proceeds to the Account; |
|
• | | | | Government and Government Agency Securities: Risks associated with investment securities issued by U.S. government agencies and U.S. government-sponsored entities, including the risk that the issuer may not have their securities backed by the full faith and credit of the U.S. government, and that transaction activity may fluctuate significantly from time to time, which could negatively impact the value of the securities and the Account’s ability to dispose of a security at a favorable time; |
|
• | | | | Liquid Assets and Securities: Risks associated with investments in real estate-related liquid assets (which could include, from time to time, REIT securities and CMBS), and non-real estate-related liquid assets, including: |
|
• | | | | Financial/credit risk—Risks that the issuer will not be able to pay principal and interest when due or that the issuer’s earnings will fall; |
|
• | | | | Market volatility risk—Risk that the changing conditions in financial markets may cause the Account’s investments to experience price volatility; |
|
• | | | | Interest rate volatility risk—Risk that interest rate volatility may affect the Account’s current income from an investment; and |
|
• | | | | Deposit/money market risk—Risk that the Account could experience losses if banks fail; and |
• | | | | Other factors, including the risk factors discussed in “Item 1A. Risk Factors” in the Form 10-K. |
More detailed discussions of certain of those risk factors are also contained in this Form 10-Q including in the section entitled “Item 3. Quantitative and Qualitative Disclosures About Market Risk.”
Caution should be taken not to place undue reliance on management’s forward-looking statements, which represent management’s views only as of the date that this report is filed. Neither management nor the Account undertake any obligation to update publicly or revise any forward-looking statement, whether as a result of new information, changed assumptions, future events or otherwise.
Commercial real estate market statistics discussed in this section are obtained by the Account from sources that management considers reliable, but some of the data are preliminary for the quarter ended March 31, 2011 and may be subsequently revised. Prior period data may have been adjusted to reflect updated calculations. Investors should not rely exclusively on the data presented below in forming a judgment regarding the current or prospective performance of the commercial real estate market generally.
ABOUT THE TIAA REAL ESTATE ACCOUNT
The TIAA Real Estate Account was established in February 1995 as a separate account of TIAA and interests in the Account were first offered to eligible participants on October 2, 1995. The Account offers individual and group accumulating annuity contracts (with contributions made on a pre-tax or after-tax
35
basis), as well as individual lifetime and term-certain variable payout annuity contracts (including the payment of death benefits to beneficiaries). Investors are entitled to transfer funds to or from the Account under certain circumstances. Funds invested in the Account for each category of contract are expressed in terms of units, and unit values will fluctuate depending on the Account’s performance.
Investment Objective and Strategy
The Account seeks favorable long-term returns primarily through rental income and appreciation of real estate investments owned by the Account. The Account will also invest in non-real estate-related publicly traded securities and short-term higher quality liquid investments that are easily converted to cash to enable the Account to meet participant redemption requests, purchase or improve properties or cover other expense needs.
Real Estate-Related Investments.The Account intends to have between 75% and 85% of its net assets invested directly in real estate or real estate-related investments with the goal of producing favorable long-term returns primarily through rental income and appreciation. These investments may consist of:
| Direct ownership interests in real estate, |
| |
| Direct ownership of real estate through interests in joint ventures, |
| |
| Indirect interests in real estate through real estate-related securities, such as: |
| |
| | | real estate limited partnerships, |
| |
| | | real estate investment trusts (“REITs”), which investments may consist of common or preferred stock interests, |
| |
| | | investments in equity or debt securities of companies whose operations involve real estate (i.e.,that primarily own or manage real estate) which may not be REITs, and |
| |
| | | conventional mortgage loans, participating mortgage loans, and collateralized mortgage obligations, including commercial mortgage-backed securities (“CMBS”) and other similar investments. |
The Account’s principal strategy is to purchase direct ownership interests in income-producing real estate, primarily office, industrial, retail and multi-family residential properties. The Account is targeted to hold between 65% and 80% of the Account’s net assets in such direct ownership interests at any time. Historically, over 70% of the Account’s net assets have been comprised of such direct ownership interests in real estate.
In addition, while the Account is authorized to hold up to 25% of its net assets in liquid real estate-related securities, such as REITs and CMBS, management intends that the Account will not hold more than 10% of its net assets in such securities on a long-term basis. Historically, less than 10% of the Account’s net assets have been comprised of interests in these securities. In particular, under the Account’s current investment guidelines, the Account is authorized to hold up to 10% of its net assets in CMBS.
Non-Real Estate-Related Investments.The Account will invest the remaining portion of its assets (targeted to be between 15% and 25% of its net assets) in publicly-traded, liquid investments; namely:
U.S. treasury securities,
securities issued by U.S. government agencies or U.S. government sponsored entities,
corporate debt securities,
money market instruments, and
stock of companies that do not primarily own or manage real estate.
However, from time to time (and most recently between late 2008 and mid 2010), the Account’s non-real estate-related liquid investments may comprise less than 15% (and possibly less than 10%) of its assets (on a net basis and/or a gross basis), especially during and immediately following periods of significant net participant outflows, in particular due to significant participant transfer activity. In addition, the Account, from time to time and on a temporary basis, may hold in excess of 25% of its net assets in non-real estate-related liquid investments, particularly during times of significant inflows into the Account and/or there is a lack of attractive real estate-related investments available in the market.
Liquid Securities.Primarily due to management’s need to manage fluctuations in cash flows, in particular during and immediately following periods of significant participant net transfer activity into or out of the Account, the Account may, on a temporary basis (i) exceed the upper end of its targeted holdings (currently 35% of the Account’s net assets) in liquid securities of all types, including both publicly-traded non-real estate-related liquid investments and liquid real estate-related securities, such as REITs and CMBS, or (ii) be below the low end of its targeted holdings in such liquid securities (currently 15% of the Account’s net assets).
The portion of the Account’s net assets invested in liquid investments of all types may exceed the upper end of its target, for example, if (i) the Account receives a large inflow of money in a short period of time, in particular due to significant participant transfer activity into the Account, (ii) the Account receives significant proceeds from sales of direct real estate assets, (iii) there is a lack of attractive direct real estate investments available on the market, and/or (iv) the Account anticipates more near-term cash needs, including to apply to acquire direct real estate investments, pay expenses or repay indebtedness.
Foreign Investments.The Account from time to time will also make foreign real estate investments. Under the Account’s investment guidelines, investments in direct foreign real estate, together with foreign real estate-related securities and foreign non-real estate-related liquid investments, may not comprise more than 25% of the Account’s net assets. However, through the date of this Form 10-Q, such foreign real estate-related investments have never represented more than 7.5% of the Account’s net assets and management does not intend such foreign investments to exceed 10% of the Account’s net assets.
FIRST QUARTER 2011 U.S. ECONOMIC AND COMMERCIAL REAL ESTATE OVERVIEW
The Account invests primarily in high-quality, core commercial real estate in order to meet its investment objective of obtaining favorable long-term returns through rental income and the appreciation of its real estate holdings. The Account does not directly invest in either single-family residential real estate, nor does it currently invest in residential mortgage-backed securities, although it may invest in such securities in the future.
Economic and Capital Markets Overview and Outlook
The U.S. economy continued to expand, albeit at a slower rate during the first quarter of 2011. The Bureau of Economic Analysis’s initial estimate of Gross Domestic Product (“GDP”) growth in the first quarter of 2011 was a modest gain of 1.8%, as compared to a gain of 3.1% gain in the fourth quarter of 2010. While the recovery has been tentative at times, GDP has now grown for seven consecutive quarters. Similarly, businesses remain cautious about hiring, but private sector payrolls have grown for 13 consecutive months. Other signs of strength include solid growth in consumer and business spending and exports. Despite these positive developments, the economic recovery continues to face headwinds from domestic and global forces. Domestic forces include persistently high unemployment, a still fragile housing market and a sharp run-up in oil prices, while global forces include unrest in the Middle East and Africa, on-going sovereign debt issues in Europe, and a disruption in supplies of electronic goods, auto parts, and other goods from Japan following the devastating earthquake and tsunami. In its March 15, 2011 statement, The Federal Open Market Committee (“FOMC”) noted that recent economic data indicated that recovery was on “firmer footing”, but that the still tentative nature of the recovery was “likely to warrant exceptionally low levels for the federal funds rate for an extended period.” Similarly, the FOMC planned to buy $600 billion of long term U.S. securities in the second quarter of 2011 in order to “. . . promote a stronger pace of economic expansion.”
While the U.S. economy is expanding at a steady rate, headwinds from the domestic and global forces cited above have led many economists to lower their forecasts of growth, albeit only modestly, for the first half of 2011. The run-up in oil prices has been a primary concern, as gasoline prices have topped $4.00 a gallon in parts of the country. Though “core” inflation (excluding the volatile energy and food sectors) remains low, and the FOMC believes that these price increases and their inflationary effects will be temporary, many economists are concerned that higher gas prices will curtail consumer spending. Higher oil costs will also have an effect on the corporate sector as businesses will either need to absorb these higher costs, which could reduce capital spending and hiring, or try to pass on some or all of those increases to customers which could stoke inflation.
Economists also expect anticipated cuts in the federal budget to slow U.S. economic growth. For example, Mark Zandi, chief economist of Moody’s Analytics, believes that the more drastic cuts being proposed would reduce anticipated 2011 GDP growth by as much as 50 basis points. While there is an acknowledged need to address the deficit, the timing of the proposed cuts, coming when the economy is still recovering and global forces are affecting growth prospects, is perceived by some economists as short-sighted.
36
In addition, state and local governments face sizeable budget deficits which have necessitated cuts in employment, spending and services and which depressed economic activity at the local level. With federal, state, and local government likely to be a drag on growth in the coming quarters, the private sector will likely be the only source of growth in the coming quarters.
Economists are also concerned that a slowdown in the global economy could hamper U.S. growth. Prospects for the global economy weakened during the first quarter due to a confluence of unprecedented events. In Europe, the sovereign debt crisis claimed another victim with the bailout of Portugal. While the bailout was expected, it intensifies pressure on the European Union. Additional contributions to the European Stabilization Fund, which provides the necessary funds for such bailouts, are likely to be needed from France and Germany. Their contributions, however, are likely to come only on the condition that more stringent austerity measures on government spending are imposed which would exacerbate already weakened economic conditions in affected countries. Tensions in the Middle East and Africa, including the uprising in Libya, have also added to concerns, and are partially responsible for the increase in oil prices. Finally, Japan’s economy is likely to be hobbled for an extended period as it rebuilds and focuses on bringing its nuclear power crisis under control.
While economists have recently lowered their forecasts of GDP growth in the first half of 2011, they remain optimistic about prospects for the U.S. economy in 2011-2012. The consensus of economists surveyed as part of the April 1, 2011 Blue Chip Financial Forecasts publication is for GDP to grow at approximately a 3.0% pace throughout 2011 and through the first half of 2012. Inflation is expected to be higher too, but only slightly so, at just above a 2.0% rate. The run-up in oil prices is not expected to threaten the expansion unless prices hit $150 a barrel. While most analysts expect prices to stabilize at around $90 a barrel, such a scenario is plausible if unrest worsens in the Middle East.
Unrest in the Middle East also impacted equity markets, causing stocks to waver during the later part of the quarter; however, key indices ultimately ended higher. The Dow Jones Industrial Average added 11% in the first quarter of 2011, and the S&P 500 added 5%, though both experienced a 5-6% correction for a brief period in March. Investors responded positively to strong earnings reports from U.S. companies, and markets also benefited from an increase in merger and acquisitions activity as well as a flurry of new IPOs. Nonetheless, investors were hedging their bets as Treasuries and gold attracted considerable interest. While the yield on the 10-year Treasury hit a high of 3.75% during the quarter, it ended the quarter at 3.45% and traded mostly in the 3.35-3.50% range during the quarter. Gold prices continued their upward trend, driven by surging demand from the developing world, its perception as a safe haven in times of economic uncertainty, and speculation. Commodity prices also surged despite concerns of a possible bubble. The dollar appreciated against the euro and continues to benefit from investor concerns about European prospects. GDP in China grew 9.7% in the first quarter of 2011, but the combination of robust growth and accelerating inflation have raised the probability of rates hikes from China’s Central Bank in order to slow growth and inflation; however, such moves could ultimately slow growth across the globe.
Recent trends in key economic indicators are summarized in the table below. Employment grew by 478,000 jobs during the first quarter of 2011 versus a gain of 416,000 in the fourth quarter of 2010. Growth in private sector employment (not shown below) was even stronger, with a gain of 564,000 in the first quarter of 2011 as compared to 438,000 in the fourth quarter of 2010. Forecasts for 2011 and 2012 indicate that employment is expected to grow by 2.9 and 3.4 million, respectively, or by an average of 715,000-840,000 per quarter. While the unemployment rate remains elevated, it has begun to decline and stands at 8.8% as of March 2011 as compared to 9.4% as of year-end 2010. However, stronger job growth is needed to both reduce the numbers of unemployed and absorb new entrants into workforce. As Federal Reserve Chairman Ben Bernanke noted in his March 1, 2011 Semiannual Monetary Policy Report to Congress, “. . . it could be several years before the unemployment rate has returned to a more normal level.”
37
Economic Indicators*
| | | | | | | | | | | | | | | | | | 2010 | | 2010Q1 | | 2010Q2 | | 2010Q3 | | 2010Q4 | | 2011Q1 | | Forecast |
| | 2011 | | 2012 |
Economy(1) | | | | | | | | | | | | | | | | |
Gross Domestic Product (GDP) | | | | 2.9 | % | | | | | 3.7 | % | | | | | 1.7 | % | | | | | 2.6 | % | | | | | 3.1 | % | | | | | 1.8 | % | | | | | 2.9 | % | | | | | 3.2 | % | |
Employment Growth (Thousands) | | | | 940 | | | | | 118 | | | | | 543 | | | | | -137 | | | | | 416 | | | | | 478 | | | | | 2,860 | | | | | 3,370 | |
Interest Rates(2) | | | | | | | | | | | | | | | | |
10 Year Treasury | | | | 3.21 | % | | | | | 3.72 | % | | | | | 3.49 | % | | | | | 2.79 | % | | | | | 2.86 | % | | | | | 3.46 | % | | | | | 3.70 | % | | | | | 4.30 | % | |
Federal Funds Rate | | | | 0.0-0.25 | % | | | | | 0.0-0.25 | % | | | | | 0.0-0.25 | % | | | | | 0.0-0.25 | % | | | | | 0.0-0.25 | % | | | | | 0.0-0.25 | % | | | | | N/A | | | | | N/A | |
Sources: BEA, BLS, Federal Reserve, Blue Chip Consensus Forecasts, and Economy.com.
|
* | | | | Data subject to revision |
|
(1) | | | | GDP growth rates are annual rates. |
|
(2) | | | | The Treasury rates are an average over the stated time period. The Federal Funds rates are as of the end of the stated time period. |
N/A indicates data not available.
Other indicators of U.S. economic activity, such as those summarized in the table below, highlight the mixed outlook for the U.S. economy. Retail sales continue to be a bright spot with solid gains despite the housing market softness and recent sharp run up in oil prices. Similarly, the unemployment rate has fallen to 8.8% as of March 2011 as compared to 10.2% in March 2010. However, the housing market continues to be a drag on the economy. Not only do market indicators continue to be negative, but a double dip in prices may be underway as the S&P/Case Shiller Home Price Indices declined 2-3% in both January and February of 2011 after several months of modest increases. Sales activity among existing homes fluctuated, but ended the quarter by increasing 3.7% in March while median prices fell 5.9% compared to March 2010. New home sales also remain at record lows, and the median price of a new home fell 5% in March 2011 as compared to March 2010. Not surprisingly, housing starts have fallen to historic lows as builders are unwilling to compete with a glut of new and existing homes being offered for sale.
Broad Economic Indicators*
| | | | | | | | | | |
| | | Full Year | | January
2011 | | February
2011 | | March
2011 |
| | 2009 | | 2010 |
% Change from prior month or year | | | | | | | | | | |
Inflation (Consumer Price Index) | | | | -0.4 | % | | | | | 1.6 | % | | | | | 0.4 | % | | | | | 0.5 | % | | | | | 0.5 | % | |
Retail Sales (excl. auto, parts & gas) | | | | -2.0 | % | | | | | 4.4 | % | | | | | 0.8 | % | | | | | 0.9 | % | | | | | 0.6 | % | |
Existing Home Sales | | | | 4.9 | % | | | | | -4.8 | % | | | | | 3.4 | % | | | | | -8.9 | % | | | | | 3.7 | % | |
New Home Sales | | | | -22.9 | % | | | | | -13.9 | % | | | | | -6.6 | % | | | | | -13.5 | % | | | | | 11.1 | % | |
Single-family Housing Starts | | | | -28.5 | % | | | | | 5.9 | % | | | | | 2.6 | % | | | | | -8.8 | % | | | | | 7.7 | % | |
Annual or Monthly Average | | | | | | | | | | |
Unemployment Rate | | | | 9.3 | % | | | | | 9.6 | % | | | | | 9.0 | % | | | | | 8.9 | % | | | | | 8.8 | % | |
|
* | | | | Data subject to revision |
Inflation is the year-over-year percentage change in the unadjusted annual average.
Sources: Census Bureau, Bureau of Labor Statistics, National Association of Realtors, Economy.com
The April 13, 2011 Beige Book reported that economic activity improved in all twelve Federal Reserve Districts (“Districts”) since the March 2011 report. While many Districts reported that the improvements were only moderate, most reported that the gains were widespread across industry sectors ranging from manufacturing to retailing to business services. In particular, virtually every District reported that the manufacturing sector experienced steady improvement, and was often accompanied by increased hiring. Seven of the twelve Districts reported commercial real estate as slightly improved, while the five other Districts described conditions as flat. Residential markets were little changed, but six Districts reported pockets of weakening. Despite the overall improvement in economic activity, several Districts noted that uncertainties remained high, with six Districts reporting actual or anticipated disruptions to sales and production as a result of the tragedy in Japan. Wage pressures were described as weak; however, higher commodity prices were putting increasing pressures on the prices of finished goods. In short, regional reports
38
provided anecdotal confirmation of the healthy growth in economic activity during the quarter as well as the continuing difficulties faced by the U.S. economy.
The most recent forecast prepared by Federal Reserve Board members and Reserve Bank presidents for the April 25-27 2011 Federal Open Market Committee meeting was for GDP to grow 3.1-3.3% in 2011. By comparison, the consensus of private sector economists surveyed for the April 10, 2011 Blue Chip Economic Indicators publication was for GDP to grow 2.9% in 2011. These forecasts reflect factors that continue to hamper growth including the run-up in oil prices and languishing housing market along with the impact from escalating unrest in the Middle East and the devastating earthquake and tsunami in Japan. While GDP growth of around 3% is not overly strong for a post-recession period, it is expected to generate healthy employment growth and should provide a solid backdrop for an improvement in commercial real estate market conditions.
Real Estate Market Conditions and Outlook
Commercial real estate market statistics discussed in this section are obtained by the Account from sources that management considers reliable, but some of the data are preliminary for the quarter ended March 31, 2011 and may subsequently be revised. Prior period numbers may have been adjusted to reflect updated data. Industry sources such as CB Richard Ellis Economic Advisors calculate vacancy based on square footage. Except where otherwise noted, the Account’s vacancy data is calculated as a percentage of net rentable space leased, weighted by square footage, in keeping with industry standards. Investors should not rely exclusively on the data presented below in forming a judgment regarding the current or prospective performance of the real estate market generally.
Investment activity remained robust during the first quarter of 2011 despite only modest improvement in underlying commercial real estate fundamentals. Conditions are strongest for the apartment market and weaker for office, industrial and retail markets. Apartment markets have seen vacancy rates decline and rents increase. For other property types, vacancy rates remain elevated but have begun to inch down. Similarly, office, industrial and retail rents have stabilized but remain under pressure as tenants have negotiating leverage. Leasing activity has picked up but generous concessions are still needed in many markets to secure tenants. However, the improvement in economic activity and the stabilization in market conditions have spurred many tenants into action as space options and opportunities to lock-in space at favorable rates are expected to diminish in the coming quarters.
Despite the modest improvement in market conditions, commercial property sales continued to show strong gains during the first quarter of 2011, reflective of the renewed interest in commercial real estate by institutional investors such as pension funds and foreign investors and the strong acquisition activity of REITs. According to Real Capital Analytics, sales of office, industrial retail and apartment property totaled $28 billion in the first quarter of 2011, as compared to $16 billion in the first quarter of 2010. The office and apartment sectors were most active, and investor interest remained concentrated on major markets such as Washington DC, New York, Boston, Chicago, San Francisco and Los Angeles. Sales activity in secondary and tertiary markets has increased up somewhat as well but continues to trail major markets by a wide margin.
The increase in sales activity has pushed prices up, as reflected by the Green Street Advisors’ Commercial Property Price Index (“GSA CPPI”) which increased 22% over the past 12 months, including a 5% increase in the first quarter of 2011. Similarly, Green Street estimates that prices have increased 39% since their May 2009 trough. According to Green Street, three factors are responsible for the rebound in prices: (1) plunging return hurdles across most asset classes; (2) a dearth of distressed sellers; and (3) a quicker than expected rebound in fundamentals in some major property sectors.
Asset values continued to rise in the first quarter of 2011, contributing to robust total returns for the commercial property sector. For the four quarter period ending March 31, 2011, NCREIF Property Index (“NPI”) returns were 16.0%, consisting of a 6.6% income return and a 9.0% capital return. By comparison, returns for the four quarter period ending December 31, 2010 were 13.1%. Returns have now been positive across the four major property types for five consecutive quarters.
Data for the Account’s top five markets in terms of market value as of March 31, 2011 are provided below. These markets represent almost 42% of the Account’s total real estate portfolio. As shown below, the average percent leased of properties in all of the Account’s top markets exceed 90%.
39
| | | | | | | | Metropolitan Area | | Account %
Leased
Fair Value
Weighted* | | # of Property
Investments | | Metro Areas as a
% of Total Real
Estate Portfolio | | Metro Area as a
% of Total
Investments |
|
Washington-Arlington-
Alexandria DC-VA-MD-WV | | | | 95.6% | | | | | 8 | | | | | 14.3% | | | | | 10.3% | |
Boston-Quincy MA | | | | 91.7% | | | | | 5 | | | | | 7.2% | | | | | 5.2% | |
Los Angeles-Long Beach-Glendale CA | | | | 92.8% | | | | | 8 | | | | | 7.1% | | | | | 5.1% | |
San Francisco-San Mateo-Redwood City CA | | | | 94.4% | | | | | 4 | | | | | 6.8% | | | | | 4.9% | |
Houston-Bay Town-Sugar Land TX | | | | 94.4% | | | | | 3 | | | | | 6.3% | | | | | 4.5% | |
|
* | | | | Weighted by fair value, which differs from the calculations provided for market comparisons to CBRE-EA data |
Office
According to CB Richard Ellis Economic Advisors (“CBRE-EA”), the national office vacancy rate has declined slightly for the third consecutive quarter to 16.4% in the first quarter of 2011 as compared to 16.5% in the fourth quarter of 2010. By comparison, the vacancy rate for the Account’s office portfolio was 13.8% as of the first quarter of 2011, as compared to 13.3% in fourth quarter of 2010. As shown in the table below, the vacancy rate of properties owned by the Account inched up in several of its primary markets; however, the vacancy rates in each remained well below their respective market averages, with Boston being the only exception. The vacancy rate of the Account’s properties in Boston is above the market average due to the lease expiration of a large tenant; one quarter of this space has been re-leased and discussions with potential tenants for portions of the remaining space are underway.
| | | | | | | | | | | | | | | | | | | | | | Account
Weighted
Average
Vacancy | | Metropolitan
Area
Vacancy* |
| | | | |
Sector | | Metropolitan Area | | Total Sector
by Metro Area
($M) | | % of Total
Investments | | 2010Q4 | | 2011Q1 | | 2010Q4 | | 2011Q1 |
|
Office | | National | | | | | | | | 13.3% | | | | | 13.8% | | | | | 16.5% | | | | | 16.4% | |
|
1 | | Washington-Arlington-Alexandria DC-VA-MD-WV | | | $ | | 1,221.7 | | | | | 9.0% | | | | | 6.1% | | | | | 7.2% | | | | | 12.9% | | | | | 13.2% | |
2 | | Boston-Quincy MA | | | $ | | 679.3 | | | | | 5.0% | | | | | 13.8% | | | | | 13.4% | | | | | 13.0% | | | | | 13.1% | |
3 | | San Francisco-San Mateo-Redwood City CA | | | $ | | 591.0 | | | | | 4.4% | | | | | 8.4% | | | | | 8.2% | | | | | 13.7% | | | | | 12.8% | |
4 | | Seattle-Bellevue-Everett WA | | | $ | | 480.2 | | | | | 3.5% | | | | | 8.1% | | | | | 9.0% | | | | | 16.8% | | | | | 16.4% | |
5 | | Houston-Bay Town-Sugar Land TX | | | $ | | 386.4 | | | | | 2.8% | | | | | 7.1% | | | | | 8.2% | | | | | 15.3% | | | | | 15.4% | |
|
* | | | | Source: CBRE-EA. Vacancy is defined as the percentage of space vacant. The Account’s vacancy is defined as the weighted percentage of unleased space. |
The Account’s results for the first quarter of 2011 are largely consistent with the modest improvement in economic conditions at the national level. Demand for office space is driven largely by job growth in the financial and professional and business services sectors. During the first quarter of 2011, the financial sector continued to struggle, shedding 7,000 jobs which reversed a modest 1,000 job gain in the fourth quarter of 2010. However, the professional and business services sector continued to expand, adding 173,000 jobs in the quarter, building on the 183,000 gain in the fourth quarter of 2010. Further improvement in office market conditions can be expected if employment growth improves over the course of 2011 as is expected.
Industrial
Conditions in the industrial market are influenced to a large degree by growth in GDP, industrial production and international trade flows. Seven consecutive quarters of GDP growth, a 6% increase in industrial production during the first quarter of 2011, and a rebound of global trade flows have each contributed to the modest improvement in the U.S. industrial market conditions. During the first quarter of 2011, the national industrial availability rate declined to 14.1% as compared to 14.3% in the fourth quarter of 2010. By comparison, the vacancy rate for the Account’s industrial property portfolio increased to average
40
9.5% in the first quarter of 2011 as compared to 7.2% in the fourth quarter of 2010. Several of the Account’s top industrial markets experienced a rise in vacancy. For example, the increase in vacancy in the Account’s Riverside properties was related to one large lease expiration and the decision by another tenant to downsize; in Atlanta, a 200,000 square foot tenant vacated one of the Account’s properties. Despite the increases, the average vacancy rate of the Account’s properties in all but one of its major markets remained well below the comparative market vacancy, as shown in the table below. The only exception was Los Angeles where the average vacancy of the Account’s properties was 16.7% in the first quarter of 2011 as compared to a 7.3% market vacancy due to recent lease expirations and defaults of several smaller tenants.
| | | | | | | | | | | | | | | | | | | | | | Account
Weighted
Average
Vacancy | | Metropolitan
Area
Availability* |
| | | | |
Sector | | Metropolitan Area | | Total Sector
by Metro Area
($M) | | % of Total
Investments | | 2010Q4 | | 2011Q1 | | 2010Q4 | | 2011Q1 |
|
Industrial | | National | | | | | | | | 7.2% | | | | | 9.5% | | | | | 14.3% | | | | | 14.1% | |
|
1 | | Riverside-San Bernardino-Ontario CA | | | $ | | 397.8 | | | | | 2.9% | | | | | 0.2% | | | | | 7.7% | | | | | 14.7% | | | | | 13.3% | |
2 | | Dallas-Plano-Irving TX | | | $ | | 182.1 | | | | | 1.3% | | | | | 7.2% | | | | | 7.2% | | | | | 15.9% | | | | | 15.3% | |
3 | | Chicago-Naperville-Joliet IL | | | $ | | 111.5 | | | | | 0.8% | | | | | 2.2% | | | | | 2.2% | | | | | 15.7% | | | | | 15.7% | |
4 | | Los Angeles-Long Beach-Glendale CA | | | $ | | 95.0 | | | | | 0.7% | | | | | 11.7% | | | | | 16.7% | | | | | 7.5% | | | | | 7.3% | |
5 | | Atlanta-Sandy Springs-
Marietta GA | | | $ | | 93.2 | | | | | 0.7% | | | | | 5.0% | | | | | 12.4% | | | | | 18.9% | | | | | 18.5% | |
|
* | | | | Source: CBRE-EA. Availability is defined as the percentage of space available for rent. The Account’s vacancy is defined as the weighted percentage of unleased space. |
Multi-Family
Preliminary data from CBRE-EA indicate that apartment markets continued to tighten. The national vacancy rate averaged 6.0% in the first quarter of 2011 as compared to 6.5% in the first quarter of 2010. (Year-over-year comparisons are necessary to account for seasonal leasing patterns.) Vacancy rates declined in 44 of the 60 markets tracked by CBRE-EA, with effective rents rising in virtually all markets. The improvement in market conditions has been due to a combination of declining home-ownership rates as a result of the housing crisis and an increase in household formations as a result of modest job growth. The vacancy rate of the Account’s multi-family portfolio averaged 3.6% in the first quarter of 2011 versus 3.8% in the first quarter of 2010. As shown in the table below, the average vacancy rate for the Account’s properties in all of its top apartment markets was well below their respective market averages, despite a slight increase in New York and Houston.
| | | | | | | | | | | | | | | | | | | | | | Account
Weighted
Average
Vacancy | | Metropolitan
Area
Vacancy* |
| | | | |
Sector | | Metropolitan Statistical Area | | Total Sector
by Metro Area
($M) | | % of Total
Investments | | 2010Q4 | | 2011Q1 | | 2010Q4 | | 2011Q1 |
|
Apartment | | National | | | | | | | | 3.3% | | | | | 3.6% | | | | | 6.0% | | | | | 6.0% | |
|
1 | | Houston-Bay Town-
Sugar Land TX | | | $ | | 231.3 | | | | | 1.7% | | | | | 3.0% | | | | | 5.2% | | | | | 9.9% | | | | | 9.8% | |
2 | | Denver-Aurora CO | | | $ | | 219.3 | | | | | 1.6% | | | | | 4.7% | | | | | 2.6% | | | | | 4.7% | | | | | 5.4% | |
3 | | Atlanta-Sandy Springs-
Marietta GA | | | $ | | 128.2 | | | | | 0.9% | | | | | 2.7% | | | | | 2.7% | | | | | 9.5% | | | | | 10.2% | |
5 | | New York-Wayne-
White Plains NY-NJ | | | $ | | 123.9 | | | | | 0.9% | | | | | 0.0% | | | | | 2.0% | | | | | 5.6% | | | | | 5.5% | |
4 | | Phoenix-Mesa-Scottsdale AZ | | | $ | | 114.5 | | | | | 0.8% | | | | | 3.2% | | | | | 2.0% | | | | | 9.1% | | | | | 9.5% | |
|
* | | | | Source: CBRE-EA. Vacancy is defined as the percentage of units vacant. The Account’s vacancy is defined as the weighted percentage of unleased space. |
41
Retail
The retail sector continued to benefit from improving macro-economic conditions. While U.S. households remain cautious, preliminary data from the U.S. Census Bureau indicate that retail sales excluding motor vehicles and parts increased 2.4% in the first quarter of 2011 as compared to the fourth quarter of 2010. Availability rates in neighborhood and community centers inched up to 13.1% in the first quarter as compared to 13.0% in the fourth quarter of 2010. The modest increase in the availability rate in the quarter is not overly concerning as retailers often close underperforming stores after the holiday season. Nonetheless, retailers remain reluctant to expand even though retail sales have improved measurably in recent quarters. Reflective of the still challenging economic and leasing environment, the vacancy rate for the Account’s retail portfolio remained elevated but declined to 14.6% during the first quarter of 2011 as compared to 15.3% in the fourth quarter of 2010. Though availabilities remain at above-average levels, the stabilization in availability rates and the continued growth in retail sales bode well for retail market prospects.
Outlook
The steady improvement in U.S. macroeconomic conditions has started to favorably impact vacancy rates, rents, and leasing activity. Commercial property values and returns have improved even more rapidly over the past six months. Despite the still tenuous nature of the economic recovery, the expected improvement in employment growth over the coming quarters suggests that commercial real estate fundamentals will continue to strengthen. Moderate economic growth has historically provided a favorable backdrop for the commercial real estate sector, especially when combined with minimal construction which is expected for all property types over the next several quarters.
Management’s strategies for navigating through the recent downturn included a realignment of the property portfolio’s geographic and property sector concentrations to target major markets and achieve a more balanced mix of property types. In addition to the sale of certain non-target market properties in 2010 and a reduction in the Account’s level of debt and overall interest rate on such debt, Management has focused on maintaining the Account’s income returns through aggressive property management and leasing in combination with expense management. We believe that results for the first quarter of 2011 demonstrate the incremental improvements resulting from execution of the strategy. On a weighted basis, the overall occupancy rate of the Account’s commercial real estate portfolio was 87.8%. The underlying real estate assets experienced a 1.7% income return and a 3.1% capital return. As shown in the graph below the first quarter of 2011 was the fourth consecutive quarter of positive income and capital returns.
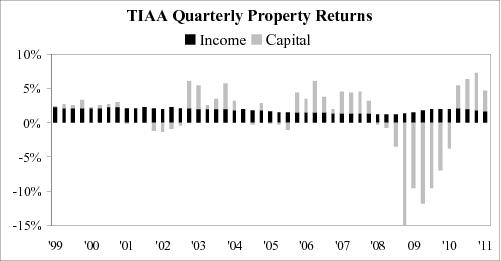
Realignment of the Account continued in the first quarter of 2011 with the sale of two smaller assets (one wholly owned and one from within the Account’s joint venture investments) and the purchase of one grocery-anchored neighborhood center, which was the first property purchased by the Account in three years. Management is currently engaged in active negotiations for several multi-family properties located in target
42
markets, which are expected to close in the second quarter and further contribute to the rebalancing of the Account’s property type mix and allocation to target markets.
The Account’s cash position has increased significantly due to sizeable inflows, primarily through net participant transfer activity, during 2010 that have continued through the first quarter of 2011. Management intends to manage the inflow of funds to maximize the performance of the Account in accordance with its investment objectives and strategy. Cash management activities will include the active pursuit of new acquisitions with a focus on direct, privately owned real estate, along with liquid real estate-related securities. Potential acquisitions will be evaluated in the context of overall Account objectives, with an emphasis on industrial, retail, and multi-family properties in order to further reduce the Account’s exposure to the office sector. Management believes that the combination of repositioning activities undertaken in 2010 and the first quarter of 2011 coupled with a disciplined and strategic acquisitions program in the coming quarters of 2011 should position the Account to benefit from the ongoing improvement in commercial real estate market conditions and investors’ focus on major metropolitan markets. While commercial property prices have increased measurably from their lows in the latter half of 2009, Management believes that properties can still be acquired at relatively attractive prices and initial cash-on-cash returns. Emphasis will be given to institutional quality properties that have a strong occupancy history and favorable tenant rollover schedules.
Investments as of March 31, 2011
As of March 31, 2011, the Account had total net assets of $11.8 billion, a 9.1% increase from December 31, 2010, and a 51.9% increase from March 31, 2010. The increase of the Account’s net assets as of March 31, 2011 as compared to December 31, 2010 was primarily caused by the appreciation in value of the Account’s wholly owned real estate properties and those owned in joint venture investments, as well as an increase in participant activity into the Account for this period.
As of March 31, 2011, the Account owned a total of 99 real estate property investments (88 of which were wholly owned, 11 of which were held in joint ventures). The real estate portfolio included 37 office property investments (four of which were held in joint ventures and one located in London, England), 25 industrial property investments (including one held in a joint venture), 20 apartment complexes, 16 retail property investments (including five held in joint ventures and one located in Paris, France), and one 75% owned joint venture interest in a portfolio of storage facilities. Of the 99 real estate property investments, 29 are subject to debt (including seven joint venture property investments).
The outstanding principal for mortgage loans payable on the Account’s wholly owned real estate portfolio as of March 31, 2011 was $1.9 billion. The Account’s proportionate share of outstanding principal for mortgage loans payable within its joint venture investments was $1.6 billion, which is netted against the underlying properties when determining the joint venture investments fair value presented on the Statements of Investments. When the mortgage loans payable within the joint venture investments are considered, total outstanding principal on the Account’s portfolio as of March 31, 2011 was $3.5 billion, which represented a loan to value ratio of 22.8%. The Account currently has no Account-level debt.
Management believes that the Account’s real estate portfolio is diversified by location and property type. The Account’s largest investment, 1001 Pennsylvania Avenue located in Washington, DC, represented 6.6% of total real estate investments and 4.7% of total investments. As discussed in the Account’s prospectus, the Account does not intend to buy and sell its real estate investments simply to make short-term profits. Rather, the Account’s general strategy in selling real estate investments is to dispose of those assets that management believes: (i) have either maximized in value, (ii) have underperformed or face deteriorating property-specific or market conditions, (iii) need significant capital infusions in the future, and/or (iv) are appropriate to dispose of in order to remain consistent with its intent to diversify the Account by property type and geographic location, or to reallocate the Account’s exposure to or away from certain property types in certain geographic locations. The Account intends to reinvest any sale proceeds that it does not need to pay operating expenses or to meet debt service or redemption requests (e.g., cash withdrawals or transfers).
The following charts reflect the diversification of the Account’s real estate assets by region and property type and list its ten largest investments. All information is based on the fair values of the investments at March 31, 2011.
43
Diversification by Fair Value(1)
| | | | | | | | | | | | | | East | | West | | South | | Midwest | | Foreign(2) | | Total |
Office | | | | 24.7 | % | | | | | 17.1 | % | | | | | 10.1 | % | | | | �� | 1.2 | % | | | | | 2.6 | % | | | | | 55.7 | % | |
Apartment | | | | 2.6 | % | | | | | 6.1 | % | | | | | 5.4 | % | | | | | 0.0 | % | | | | | 0.0 | % | | | | | 14.1 | % | |
Industrial | | | | 1.4 | % | | | | | 6.9 | % | | | | | 4.1 | % | | | | | 1.2 | % | | | | | 0.0 | % | | | | | 13.6 | % | |
Retail | | | | 3.2 | % | | | | | 1.4 | % | | | | | 8.5 | % | | | | | 0.3 | % | | | | | 2.5 | % | | | | | 15.9 | % | |
Storage | | | | 0.2 | % | | | | | 0.2 | % | | | | | 0.2 | % | | | | | 0.1 | % | | | | | 0.0 | % | | | | | 0.7 | % | |
| | | | | | | | | | | | |
Total | | | | 32.1 | % | | | | | 31.7 | % | | | | | 28.3 | % | | | | | 2.8 | % | | | | | 5.1 | % | | | | | 100.0 | % | |
| | | | | | | | | | | | |
|
(1) | | | | Wholly-owned properties are represented at fair value and gross of any debt, while joint venture properties are represented at the net equity value. |
|
(2) | | | | Represents real estate investments in the United Kingdom and France. |
Properties in the “East” region are located in: CT, DC, DE, KY, MA, MD, ME, NC, NH, NJ, NY, PA, RI, SC, VA, VT, WV.
Properties in the “West” region are located in: AK, AZ, CA, CO, HI, ID, MT, NM, NV, OR, UT, WA, WY.
Properties in the “South” region are located in: AL, AR, FL, GA, LA, MS, OK, TN, TX.
Properties in the “Midwest” region are located in: IA, IL, IN, KS, MI, MN, MO, ND, NE, OH, SD, WI.
Top Ten Largest Real Estate Investments
| | | | | | | | | | | | |
Property Investment Name | | City | | State | | Type | | Value ($M)(a) | | Property as a
% of Total
Real Estate
Portfolio | | Property as a
% of Total
Investments |
1001 Pennsylvania Avenue | | Washington | | DC | | Office | | | | 642.3 | (b) | | | | | 6.58 | | | | | 4.72 | |
Four Oaks Place | | Houston | | TX | | Office | | | | 386.4 | | | | | 3.96 | | | | | 2.84 | |
Fourth and Madison | | Seattle | | WA | | Office | | | | 348.0 | (c) | | | | | 3.56 | | | | | 2.56 | |
50 Fremont | | San Francisco | | CA | | Office | | | | 335.0 | (d) | | | | | 3.43 | | | | | 2.46 | |
DDR Joint Venture | | Various | | USA | | Retail | | | | 319.4 | (e) | | | | | 3.27 | | | | | 2.35 | |
780 Third Avenue | | New York City | | NY | | Office | | | | 310.4 | | | | | 3.18 | | | | | 2.28 | |
Westferry Circus | | London | | UK | | Office | | | | 264.7 | (f) | | | | | 2.71 | | | | | 1.95 | |
99 High Street | | Boston | | MA | | Office | | | | 254.6 | (g) | | | | | 2.61 | | | | | 1.87 | |
The Newbry | | Boston | | MA | | Office | | | | 254.0 | | | | | 2.60 | | | | | 1.87 | |
The Florida Mall | | Orlando | | FL | | Retail | | | | 253.8 | (h) | | | | | 2.60 | | | | | 1.87 | |
|
(a) | | | | Value as reported in the March, 31, 2011 Statements of Investments. Investments owned 100% by the Account are reported based on fair value. Investments in joint ventures are reported at fair value and are presented at the Account’s ownership interest. |
|
(b) | | | | This property investment is presented gross of debt with fair value of $220.7M. |
|
(c) | | | | This property investment is presented gross of debt with fair value of $150.1M. |
|
(d) | | | | This property investment is presented gross of debt with fair value of $139.0M. |
|
(e) | | | | This property investment is an 85%/15% joint venture and consists of 42 retail properties located in 13 states and is presented net of debt with fair value of $990.6 million. |
|
(f) | | | | This property investment is presented gross of debt with fair value of $214.0M. |
|
(g) | | | | This property investment is presented gross of debt with fair value of $184.3M. |
|
(h) | | | | This property investment is a 50%/50% joint venture with Simon Property Group, L.P., and is presented net of debt with a fair value of $179.9 million. |
As of March 31, 2011, the Account also held investments in real estate limited partnerships representing 2.1% of total investments, real estate-related marketable securities representing 4.7% of total investments, U.S. Treasury securities representing 7.9% of total investments, and government agency notes representing 13.5% of total investments.
Results of Operations
Three months ended March 31, 2011 compared to three months ended March 31, 2010
Performance
The Account’s total return was 3.4% for the three months ended March 31, 2011 as compared to -1.9% for the three months ended March 31, 2010. The Account’s performance during 2011 reflects an increase in
44
the aggregate net asset value of the Account’s real estate property investments, including investments owned in joint ventures and limited partnerships, income from property investments and marketable securities, and an increase in unrealized gains on investments.
The Account’s annualized total returns (after expenses) over the past one, three, five, and ten year periods ended March 31, 2011 were 19.5%, -10.3%, -1.8%, and 3.5%, respectively. As of March 31, 2011, the Account’s annualized total return since inception was 5.3%.
The Account’s total net assets increased to $11.8 billion at March 31, 2011 from $7.8 billion at March 31, 2010. The primary driver of this 51.3% increase was net participant activity into the Account.
Net Investment Income
The table below shows the results of operations for the three months ended March 31, 2011 and 2010 and the dollar and percentage changes for those periods (dollars in millions, unaudited).
| | | | | | | | |
| | For the Three Months
Ended March 31, | | Change |
| | 2011 | | 2010 | | $ | | % |
INVESTMENT INCOME | | | | | | | | |
Real estate income, net: | | | | | | | | |
Rental income | | | $ | | 210.1 | | | | $ | | 212.6 | | | | $ | | (2.5 | ) | | | | | -1.2 | % | |
| | | | | | | | |
Real estate property level expenses and taxes: | | | | | | | | |
Operating expenses | | | | 57.8 | | | | | 59.3 | | | | | (1.5 | ) | | | | | -2.5 | % | |
Real estate taxes | | | | 27.2 | | | | | 29.7 | | | | | (2.5 | ) | | | | | -8.4 | % | |
Interest expense | | | | 26.4 | | | | | 24.6 | | | | | 1.8 | | | | | 7.3 | % | |
| | | | | | | | |
Total real estate property level expenses and taxes | | | | 111.4 | | | | | 113.6 | | | | | (2.2 | ) | | | | | -1.9 | % | |
| | | | | | | | |
Real estate income, net | | | | 98.7 | | | | | 99.0 | | | | | (0.3 | ) | | | | | -0.3 | % | |
Income from real estate joint ventures and limited partnerships | | | | 21.1 | | | | | 19.0 | | | | | 2.1 | | | | | 11.1 | % | |
Interest | | | | 1.1 | | | | | 0.4 | | | | | 0.7 | | | | | 175.0 | % | |
Dividends | | | | 2.4 | | | | | — | | | | | 2.4 | | | | | N/M | |
| | | | | | | | |
TOTAL INVESTMENT INCOME | | | | 123.3 | | | | | 118.4 | | | | | 4.9 | | | | | 4.1 | % | |
| | | | | | | | |
Expenses: | | | | | | | | |
Investment advisory charges | | | | 14.2 | | | | | 10.9 | | | | | 3.3 | | | | | 30.3 | % | |
Administrative charges | | | | 6.9 | | | | | 5.4 | | | | | 1.5 | | | | | 27.8 | % | |
Distribution charges | | | | 1.9 | | | | | 1.7 | | | | | 0.2 | | | | | 11.8 | % | |
Mortality and expense risk charges | | | | 1.4 | | | | | 1.0 | | | | | 0.4 | | | | | 40.0 | % | |
Liquidity guarantee charges | | | | 4.2 | | | | | 2.8 | | | | | 1.4 | | | | | 50.0 | % | |
| | | | | | | | |
TOTAL EXPENSES | | | | 28.6 | | | | | 21.8 | | | | | 6.8 | | | | | 31.2 | % | |
| | | | | | | | |
INVESTMENT INCOME, NET | | | $ | | 94.7 | | | | $ | | 96.6 | | | | $ | | (1.9 | ) | | | | | -2.0 | % | |
| | | | | | | | |
Real estate rental income decreased $2.5 million or 1.2% during the first quarter of 2011 as compared to the comparable period of 2010. The decline was primarily due to a decrease in income of $3.1 million as a result of the sales of wholly owned property investments that occurred during the fourth quarter of 2010 and first quarter of 2011 offset by $0.5 million of additional income from the acquisition of a wholly owned property investment during the first quarter. Rental income for the remaining properties increased overall by $0.1 million.
Operating expenses declined during the first quarter of 2011 as compared to the comparable period of 2010 by $1.5 million, or 2.5% as a result of fewer property investments under management. Property investments that were sold accounted for $0.7 million of the reduction in operating expenses offset by a $0.1 million increase from a property acquisition. Existing properties operating expenses decreased $0.9 million during the first quarter of 2011 when compared to the same period in 2010, primarily attributed to decreases in utilities and bad debt expenses.
Real estate taxes decreased $2.5 million or 8.4% during the first quarter of 2011 as compared to the comparable period of 2010. The decrease was a result of lower tax assessments at certain properties which
45
accounted for $2.3 million of the decline, while fewer property investments under management accounted for the remainder of the decline.
Interest expense increased $1.8 million, or 7.3% during the first quarter of 2011 as compared to the comparable period of 2010. The increase was attributable to mortgage loans payable having higher interest rates during the first quarter of 2011 as compared to the comparable period of 2010, as a result of debt obligations added during the third quarter of 2010 having higher interest rates than the debt obligations repaid during the same quarter.
Income from real estate joint ventures and limited partnerships increased $2.1 million or 11.1% during the first quarter of 2011 as compared to the comparable period of 2010. The increase was attributable to increased distributions from the joint ventures and limited partnerships as a result of increased revenues from lower vacancy rates as well as reductions in bad debt expenses.
The Account incurred $6.8 million or a 31.2% increase in overall Account level expenses during the first quarter of 2011 as compared to the comparable period of 2010. The increase in Account level expenses was due to the increase in net assets during the first quarter of 2011 as compared to the comparable period of 2010. Net assets have increased $4.0 billion or 51.3% to $11.8 billion for the first quarter of 2011 as compared to $7.8 billion for the first quarter of 2010. Account level expenses charged to the Account, as discussed inNote 2—Management Agreements and Arrangementsto the financial statements included herein, are driven by the costs associated with managing the Account which generally correspond to the level of assets under management.
Net Realized and Unrealized Gains and Losses on Investments and Mortgage Loans Payable
The table below shows the net realized and unrealized gains and losses on investments and mortgage loans payable for the three months ended March 31, 2011 and 2010 and the dollar and percentage changes for those periods (dollars in millions, unaudited).
| | | | | | | | | | For the Three Months
Ended March 31, | | Change |
| | 2011 | | 2010 | | $ | | % |
NET REALIZED AND UNREALIZED GAIN (LOSS)
ON INVESTMENTS AND MORTGAGE LOANS
PAYABLE | | | | | | | | |
Net realized gain (loss) on investments: | | | | | | | | |
Real estate properties | | | $ | | (9.3 | ) | | | | $ | | (1.2 | ) | | | | $ | | (8.1 | ) | | | | | N/M | |
Real estate joint ventures and limited partnerships | | | | (1.5 | ) | | | | | (153.3 | ) | | | | | 151.8 | | | | | -99.0 | % | |
Marketable securities | | | | 1.9 | | | | | — | | | | | 1.9 | | | | | N/M | |
| | | | | | | | |
Total realized loss on investments: | | | | (8.9 | ) | | | | | (154.5 | ) | | | | | 145.6 | | | | | -94.2 | % | |
| | | | | | | | |
Net change in unrealized appreciation (depreciation) on: | | | | | | | | |
Real estate properties | | | | 195.5 | | | | | (189.5 | ) | | | | | 385.0 | | | | | N/M | |
Real estate joint ventures and limited partnerships | | | | 64.0 | | | | | 120.5 | | | | | (56.5 | ) | | | | | -46.9 | % | |
Marketable securities | | | | 34.5 | | | | | — | | | | | 34.5 | | | | | N/M | |
Mortgage loans receivable | | | | — | | | | | 0.2 | | | | | (0.2 | ) | | | | | N/M | |
Mortgage loans payable | | | | 1.4 | | | | | (25.8 | ) | | | | | 27.2 | | | | | -105.4 | % | |
| | | | | | | | |
Net change in unrealized appreciation (depreciation) on
investments and mortgage loans payable | | | | 295.4 | | | | | (94.6 | ) | | | | | 390.0 | | | | | -412.3 | % | |
| | | | | | | | |
NET REALIZED AND UNREALIZED GAIN (LOSS)
ON INVESTMENTS AND MORTGAGE LOANS
PAYABLE | | | $ | | 286.5 | | | | $ | | (249.1 | ) | | | | $ | | 535.6 | | | | | -215.0 | % | |
| | | | | | | | |
Real estate properties:
During the first quarter of 2011, the Account experienced net realized and unrealized gains on investments and mortgage loans payable of $286.5 million compared to net realized and unrealized losses of $249.1 million for the comparable period of 2010. The net realized and unrealized gains on investments and
46
mortgage loans payable were primarily a result of net realized and unrealized gains on the Account’s wholly owned real estate property investments of $186.2 million for the first quarter of 2011 as compared to a loss of $190.7 million during the comparable period of 2010.
Net realized losses in the Account are due to the sale of real estate property investments. See theRecent Transactionssection herein for additional discussions regarding the sale of real estate property underlying the Account’s investments in joint ventures.
Net unrealized gains in the Account are attributed to improved market conditions resulting in capitalization rate declines, higher market rents, and better occupancy levels. Also, the Account experienced foreign exchange gains of $24.1 million from its two international properties during the first quarter of 2011 as compared to losses of $37.5 million for the comparable period of 2010.
Real estate joint ventures and limited partnerships:
Real estate joint ventures and limited partnerships experienced net realized and unrealized gains of $62.5 million for the first quarter of 2011 compared to net realized and unrealized losses of $32.8 million for the comparable period of 2010.
Net realized losses in the Account are due to the sale of real estate property underlying the Account’s investments in joint ventures. See theRecent Transactionssection herein for additional disclosure regarding the sale of real estate property.
Net unrealized gains on joint ventures and limited partnerships were due to increases in value of the existing real estate assets underlying the investments due to improved market conditions resulting in capitalization rate declines, higher market rents, and better occupancy levels.
Marketable securities:
The Account’s marketable securities position was $3.6 billion, which was comprised of $635.2 million of real estate related marketable securities and $2.9 billion of other short term marketable securities, comprised of U. S. Treasury securities and government agency notes. The Account experienced net realized and unrealized gains of $36.4 million from marketable securities as a result of increases in the value of its real estate related marketable securities.
Mortgage loans receivable:
During the year ended December 31, 2010 the Account settled in full its mortgage loan receivable investment at its face value.
Mortgage loans payable:
Mortgage loans payable experienced unrealized gains of $1.4 million during the first quarter of 2011 compared to unrealized losses of $25.8 million during the comparable period of 2010. Valuation adjustments to mortgage loans payable are highly dependent upon interest rates, spreads, investment return demands, the performance of the underlying real estate investment, and where applicable, foreign exchange. Of the $1.4 million unrealized gain, $6.4 million was related to valuation decreases offset by losses of $5.0 million from foreign exchange adjustments as a result of a weakening U.S. dollar.
Liquidity and Capital Resources
As of March 31, 2011 and December 31, 2010, the Account’s cash, cash equivalents and non-real estate-related marketable securities had a value of $2.9 billion and $2.4 billion, respectively (24.9% and 22.3% of the Account’s net assets at such dates, respectively). When compared to December 31, 2010, the Account’s non-real estate-related liquid assets have increased $517.4 million. These increases are primarily the result of increased net participant activity into the Account (in particular, transfers into the Account), income generated from its real estate investments and limited partnerships, and proceeds from sales of real estate properties.
47
During the first quarter of 2011, the Account received $819.6 million in premiums, which included $620.9 million of participant transfers into the Account. The Account had outflows of $222.9 million in annuity payments, withdrawals and death benefits, which included $122.1 million of participant transfers out of the Account. During the first quarter of 2010, the Account received $301.2 million in premiums, which included $140.2 million of participant transfers into the Account. The Account had outflows of $273.7 million in annuity, withdrawals and death benefits, which included $199.0 million of participant transfers out of the Account. SeeNote 1—Organization and Significant Accounting Policiesof the financial statements as included herein.
Liquidity Guarantee
Primarily as a result of significant net participant transfers out of the Account during late 2008 and early 2009, pursuant to TIAA’s existing liquidity guarantee obligation, the TIAA general account purchased approximately $1.2 billion of Liquidity Units issued by the Account in a number of separate transactions between December 24, 2008 and June 1, 2009. During the period June 2, 2009 through March 31,2011, the TIAA general account did not purchase any additional Liquidity Units. As disclosed under “Establishing and Managing the Account—the Role of TIAA—Liquidity Guarantee” in the Account’s prospectus, in accordance with this liquidity guarantee obligation, TIAA guarantees that all participants in the Account may redeem their accumulation units at their accumulation unit value next determined after their transfer or cash withdrawal request is received in good order.
Net participant transfers out of the Account significantly slowed following the first quarter of 2009, and net participant transfer activity turned to inflows in early 2010, which has continued through the date of this report. As a result, while management cannot predict whether any future TIAA Liquidity Unit purchases will be required under this liquidity guarantee, it is unlikely that additional purchases will be required in the near term. However, management cannot predict for how long net inflows will continue to occur.
Effective March 31, 2011, (or such later date as indicated in the contract or contract endorsement) individual participants are limited from making “internal funding vehicle transfers” into their Account accumulation if, after giving effect to such transfer, the total value of such participant’s Account accumulation (under all contracts issued to such participant) would exceed $150,000. This limitation is subject to certain exceptions and will be in effect in the jurisdictions that have approved the limitation. Management expects that participant inflow activity will be tempered, perhaps to a significant degree, following the effective date of this limitation. If net outflows were to occur (even if not at the same intensity as in 2008 and early 2009), it could have a negative impact on the Account’s operations and returns and could require TIAA to purchase additional Liquidity Units, perhaps to a significant degree, as was the case in late 2008 and early 2009.
TIAA’s obligation to provide Account participants liquidity through purchases of Liquidity Units is not subject to an express regulatory or contractual limitation, although as described in the paragraph below, the independent fiduciary may (but is not obligated to) require the reduction of TIAA’s interest through sales of assets from the Account if TIAA’s interest exceeds the trigger point. Even if the independent fiduciary so requires, TIAA’s obligation to provide liquidity under the guarantee, which is required by the New York State Insurance Department, will continue. Management believes that TIAA has the ability to meet its obligations under this liquidity guarantee.
Whenever TIAA owns Liquidity Units, the duties of the Account’s independent fiduciary, as part of its monitoring of the Account, include reviewing the purchase and redemption of Liquidity Units by TIAA to ensure the Account uses the correct accumulation unit values. In addition, the independent fiduciary’s responsibilities include:
| | | establishing the percentage of total accumulation units that TIAA’s ownership should not exceed (the “trigger point”) and creating a method for reviewing the trigger point; | |
• | | | | approving any adjustment of TIAA’s ownership interest in the Account and, in its discretion, requiring an adjustment if TIAA’s ownership of Liquidity Units reaches the trigger point; and |
|
• | | | | once the trigger point has been reached, participating in any program to reduce TIAA’s ownership in the Account by utilizing cash flow or liquid investments in the Account, or by utilizing the proceeds from asset sales. If the independent fiduciary were to determine that TIAA’s ownership should be |
48
| | | | reduced following the trigger point, its role in participating in any asset sales program would include (i) participating in the selection of properties for sale, (ii) providing sales guidelines and (iii) approving those sales if, in the independent fiduciary’s opinion, such sales are desirable to reduce TIAA’s ownership of Liquidity Units. |
As of the date of this Form 10-Q, the independent fiduciary, which has the right to adjust the trigger point, has established the trigger point at 45% of the outstanding accumulation units and it will continue to monitor TIAA’s ownership interest in the Account and provide further recommendations as necessary. As of March 31, 2011, TIAA owned approximately 9.3% of the outstanding accumulation units of the Account. In establishing the appropriate trigger point, including whether or not to require certain actions once the trigger point has been reached, the independent fiduciary will assess, among other things and to the extent consistent with the Prohibited Transaction Exemption (PTE 96-76) issued by the U.S. Department of Labor in 1996 with respect to the liquidity guarantee and the independent fiduciary’s duties under ERISA, the risk that a conflict of interest could arise due to the level of TIAA’s ownership interest in the Account.
The independent fiduciary is vested with oversight and approval over any redemption of TIAA’s liquidity units, acting in the best interests of Real Estate Account participants. The independent fiduciary has indicated to management that, as of the date of this Form 10-Q, it intends to initiate systematic redemptions of the liquidity units held by the TIAA General Account at such times as it deems appropriate but no earlier than June 2011. The independent fiduciary currently intends to cause such redemptions only (i) if recent historical net participant activity has been positive and (ii) if the Account is projected to hold at least 22% of its net assets in cash, cash equivalents and publicly traded liquid non-real estate related securities, after taking into account certain projected sources and uses of cash flow into the Account. In addition, the independent fiduciary’s intention is that redemptions over any given period would not exceed recent historical net participant activity. As of March 31, 2011, the Account held 24.9% of its net assets in such liquid non-real estate-related investments (along with its cash and cash equivalents).
In administering redemptions, the independent fiduciary has indicated to management that it intends to evaluate, among other things (i) projected acquisitions and dispositions of real estate and real estate related investments, (ii) participant inflow and outflow trends, (iii) the Account’s net income and (iv) obligations to make debt service payments and pay principal balances of mortgages on Account properties. The independent fiduciary is vested with oversight and approval over any redemption of liquidity units owned by TIAA, acting in the best interests of Real Estate Account participants.
The independent fiduciary may authorize or direct the redemption of all or a portion of liquidity units at any time and TIAA will request the approval of the independent fiduciary before any liquidity units are redeemed. There is no guarantee that the independent fiduciary will cause redemptions starting in June 2011 and even if redemptions do commence, management cannot predict the time period over which such redemptions would continue. Further, neither management nor the independent fiduciary can predict when TIAA’s liquidity units may be redeemed in full.
Upon termination and liquidation of the Account (wind-up), any liquidity units held by TIAA will be the last units redeemed, unless the independent fiduciary directs otherwise. The Account pays TIAA for the risk associated with providing the liquidity guarantee through a daily deduction from the Account’s net assets.
The Account’s net investment income continues to be an additional source of liquidity for the Account. Net investment income decreased to $94.7 million for the first quarter of 2011 from $96.6 million for the comparable period of 2010. While total investment income increased as a result of increased income from joint ventures and limited partnerships, interest income, and dividend income, higher Account expenses as a result of higher average net assets over the period more than offset the increase in total investment income to ultimately reduce net investment income.
As of March 31, 2011, cash and cash equivalents, along with real estate-related and non real estate-related marketable securities comprised 30.2% of the Account’s net assets. The Account’s liquid assets continue to be available to purchase additional suitable real estate properties, meet the Account’s debt obligations, expense needs, and participant redemption requests (i.e., cash withdrawals, benefit payments, or transfers).
49
As of March 31, 2011, the Account had $94.5 million in principal amount of debt obligations due during the remainder of 2011 of which $8.2 million was related to wholly owned real estate investments and $86.3 million was related to the Account’s share of debt associated with its investments in joint ventures. Management believes that the Account, and the joint venture entities in which the Account invests, will have the ability to address these obligations in a number of ways, including among others, refinancing or extending such debt or repaying the principal due at maturity.
Leverage
The Account may borrow money and assume or obtain a mortgage on a property (i.e., to make leveraged real estate investments). Also, to meet any short-term cash needs, the Account may obtain a line of credit that may be unsecured and/or contain terms that may require the Account to secure the loan with one or more of its properties.
The Account is authorized to borrow money in accordance with its investment guidelines. Under the Account’s current investment guidelines, the Account’s loan to value ratio (as defined below) is to be maintained at or below 30%. However, until December 31, 2011, the Account is authorized to incur and/or maintain indebtedness on its properties in an aggregate principal amount not to exceed the aggregate principal amount of debt outstanding as of the date of adoption of such guidelines in July 2009 (approximately $4.0 billion). Such incurrences of debt from time to time may include:
| | | placing new debt on properties; | |
• | | | | refinancing outstanding debt; |
|
• | | | | assuming debt on acquired properties or interests in the Account’s properties; and/or |
|
• | | | | extending the maturity date of outstanding debt. |
In calculating this limit, only the Account’s actual percentage interest in any borrowings is included, and not that percentage interest held by any joint venture partner. Further, the Account may only borrow up to 70% of the then-current value of a property, although construction loans may be for 100% of the costs incurred in developing a property. As of March 31, 2011 the Account did not have any construction loans. Also, at the time the Account (or a joint venture in which the Account is a partner) enters into a revolving line of credit, management deems the maximum amount which may be drawn under that line of credit as fully incurred, regardless of whether the maximum amount available has been drawn from time to time.
As of March 31, 2011, management reduced the Account’s ratio of outstanding principal amount of debt to total gross asset value (i.e.,a “loan to value ratio”) to less than 30% and intends to maintain its loan to value ratio at or below 30% (this ratio is measured at the time of incurrence and after giving effect thereto). The Account’s total gross asset value, for these purposes, is equal to the total fair value of the Account’s assets (including the fair value of the Account’s interest in joint ventures), with no reduction associated with any indebtedness on such assets.
In times of high net inflow activity, in particular during times of high net participant transfer inflows, management may determine to apply a portion of such cash flows to make prepayments of indebtedness prior to scheduled maturity, which would have the effect of reducing the Account’s loan to value ratio.
As of March 31, 2011, the Account’s loan to value ratio was approximately 22.8%.
Recent Transactions
The following describes property transactions by the Account during the first quarter of 2011. Except as noted, the expenses for operating the properties purchased are either borne or reimbursed, in whole or in part, by the property tenants, although the terms vary under each lease. The Account is responsible for operating expenses not reimbursed under the terms of a lease. All rental rates are quoted on an annual basis unless otherwise noted.
50
Purchases
Northpark Village Square
On January 28, 2011, the Account purchased a retail property located in Valencia, California, for $40.6 million. The property contains approximately 87,000 square feet and was 97.9% occupied at the time of purchase. The property was built in 1996 and expanded in 1999. The three largest tenants are Ralphs (46,657 square feet), Rite Aid Pharmacy (16,708 square feet) and Wells Fargo (6,260 square feet). This property is located in the Santa Clarita Valley retail submarket, which had a retail inventory of 4.7 million square feet and a vacancy rate of 12% at the time of purchase.
Sales
Wellpoint Office Campus
On March 10, 2011, the Account sold an office campus located in Westlake Village, CA for a net sale price of $36.4 million and realized a loss from the sale of $11.8 million, the majority of which had been previously recognized as an unrealized loss in the Account’s Statements of Operations. The Account’s cost basis (excluding selling costs) in the property as of the date of sale was $48.2 million according to the records of the Account.
DDR TC LLC
On January 31, 2011, a retail property located in Augusta, Georgia was sold by the Account’s DDR Joint Venture. The Account holds an 85.0% interest in the DDR Joint Venture. The Account’s portion of the net sale price was $0.5 million. The Account realized a loss from the sale of $1.5 million, the majority of which had been previously recognized as an unrealized loss in the Account’s Statements of Operations. The Account’s portion of its cost basis (excluding selling costs) in the property at the date of the sale was $2.0 million (excluding debt) according to the records of the Account.
Concurrent with the DDR Joint Venture’s sale of the property located in Augusta, Georgia, the DDR Joint Venture settled debt associated with the property with proceeds from the sale. The Account’s proportionate share of the debt was $0.7 million.
Financings
During February 2011, the revolving line of credit agreement held in the Account’s investment within the DDR Joint Venture was amended to extend the maturity date from February 2011 to February 2012. The maximum amount that may be drawn under this revolving line of credit agreement is $213.0 million, reduced by any outstanding letters of credit.
Critical Accounting Policies
The financial statements of the Account are prepared in conformity with accounting principles generally accepted in the United States of America.
In preparing the Account’s financial statements, management is required to make estimates and judgments that affect the reported amounts of assets, liabilities, revenues, and expenses. Management bases its estimates on historical experience and assumptions that are believed to be reasonable under the circumstances, the results of which form the basis for making judgments about the carrying value of assets and liabilities that are not readily apparent from other sources. Actual results may differ from these estimates.
Determination of Investments at Fair Value:The Account reports all investments and investment related mortgage loans payable at fair value. The Financial Accounting Standards Board (“FASB”) has defined fair value as the price that would be received to sell an asset or paid to transfer a liability in an orderly transaction between market participants.
The following is a description of the valuation methodologies used to determine the fair value of the Account’s investments and investment related mortgage loans payable.
51
Valuation of Real Estate Properties—Investments in real estate properties are stated at fair value, as determined in accordance with policies and procedures reviewed by the Investment Committee of the Board and in accordance with the responsibilities of the Board as a whole. Accordingly, the Account does not record depreciation. Determination of fair value involves judgment because the actual fair value of real estate can be determined only by negotiation between the parties in a sales transaction. The Account’s primary objective when valuing its real estate investments will be to produce a valuation that represents a reasonable estimate of the fair value of its investments. Implicit in the Account’s definition of fair value is the consummation of a sale as of a specified date and the passing of title from seller to buyer under conditions whereby:
|
• | | | | Buyer and seller are typically motivated; |
|
• | | | | Both parties are well informed or well advised, and acting in what they consider their best interests; |
|
• | | | | A reasonable time is allowed for exposure in the open market; |
|
• | | | | Payment is made in terms of cash or in terms of financial arrangements comparable thereto; and |
|
• | | | | The price represents the normal consideration for the property sold unaffected by special or creative financing or sales concessions granted by anyone associated with the sale. |
Property and investment values are affected by, among other things, the availability of capital, occupancy rates, rental rates, and interest and inflation rates. As a result, determining real estate and investment values involves many assumptions. Key inputs and assumptions include rental income and expense amounts, related rental income and expense growth rates, discount rates and capitalization rates. Valuation techniques include discounted cash flow analysis, prevailing market capitalization rates or multiples applied to earnings from the property, analysis of recent comparable sales transactions, actual sale negotiations and bona fide purchase offers received from third parties. Amounts ultimately realized from each investment may vary significantly from the fair value presented.
Real estate properties owned by the Account are initially valued based on an independent third party appraisal, as reviewed by TIAA’s internal appraisal staff and as applicable the Account’s independent fiduciary at the time of the closing of the purchase, which may result in a potential unrealized gain or loss reflecting the difference between an investment’s fair value (i.e., exit price) and its cost basis (which is inclusive of transaction costs).
Subsequently, each property is appraised each quarter by an independent third party appraiser, reviewed by TIAA’s internal appraisal staff and as applicable the Account’s independent fiduciary. In general, the Account obtains appraisals of its real estate properties spread out throughout the quarter, which is intended to result in appraisal adjustments, and thus, adjustments to the valuations of its holdings (to the extent such adjustments are made) that happen regularly throughout each quarter and not on one specific day or month in each period.
Further, management reserves the right to order an appraisal and/or conduct another valuation outside of the normal quarterly process when facts or circumstances at a specific property change. For example, under certain circumstances a valuation adjustment could be made when the account receives a bona fide bid for the sale of a property held within the Account or one of the Account’s joint ventures. In addition, adjustments may be made for events or circumstances indicating an impairment of a tenant’s ability to pay amounts due to the Account under a lease (including due to a bankruptcy filing of that tenant). Alternatively, adjustments may be made to reflect the execution or renewal of a significant lease. Also, adjustments may be made to reflect factors (such as sales values for comparable properties or local employment rate) bearing uniquely on a particular region in which the Account holds properties. TIAA’s internal appraisal staff oversees the entire appraisal process, in conjunction with the Account’s independent fiduciary (the independent fiduciary is more fully described in the paragraph below). Any differences in the conclusions of TIAA’s internal appraisal staff and the independent appraiser will be reviewed by the independent fiduciary, which will make a final determination on the matter (which may include ordering a subsequent independent appraisal).
The independent fiduciary, Real Estate Research Corporation, has been appointed by a special subcommittee of the Investment Committee of the Board to, among other things, oversee the appraisal process. The independent fiduciary must approve all independent appraisers used by the Account. All
52
appraisals are performed in accordance with Uniform Standards of Professional Appraisal Practices, the real estate appraisal industry standards created by The Appraisal Foundation. Real estate appraisals are estimates of property values based on a professional’s opinion. Appraisals of properties held outside of the U.S. are performed in accordance with industry standards commonly applied in the applicable jurisdiction. These independent appraisers are always expected to be MAI-designated members of the Appraisal Institute (or its European equivalent, Royal Institute of Chartered Surveyors) and state certified appraisers from national or regional firms with relevant property type experience and market knowledge. Under the Account’s current procedures, each independent appraisal firm will be rotated off of a particular property at least every three years, although such appraisal firm may perform appraisals of other Account properties subsequent to such rotation.
Also, the independent fiduciary can require additional appraisals if factors or events have occurred that could materially change a property’s value (including those identified above) and such change is not reflected in the quarterly valuation review, or otherwise to ensure that the Account is valued appropriately. The independent fiduciary must also approve any valuation change of real estate-related assets where a property’s value changed by more than 6% from the most recent independent annual appraisal, or if the value of the Account would change by more than 4% within any calendar quarter or more than 2% since the prior calendar month. When a real estate property is subject to a mortgage, the property is valued independently of the mortgage and the property and mortgage fair values are reported separately (see “Valuation of Mortgage Loans Payable” below). The independent fiduciary reviews and approves all mortgage valuation adjustments before such adjustments are recorded by the Account. The Account continues to use the revised value for each real estate property and mortgage loan payable to calculate the Account’s daily net asset value until the next valuation review or appraisal.
Valuation of Real Estate Joint Ventures—Real estate joint ventures are stated at the fair value of the Account’s ownership interests of the underlying entities. The Account’s ownership interests are valued based on the fair value of the underlying real estate, any related mortgage loans payable, and other factors, such as ownership percentage, ownership rights, buy/sell agreements, distribution provisions and capital call obligations. Upon the disposition of all real estate investments by an investee entity, the Account will continue to state its equity in the remaining net assets of the investee entity during the wind down period, if any, which occurs prior to the dissolution of the investee entity.
Valuation of Real Estate Limited Partnerships—Limited partnership interests are stated at the fair value of the Account’s ownership in the partnership which is based on the most recent net asset value of the partnership, as reported by the sponsor. Since market quotations are not readily available, the limited partnership interests are valued at fair value as determined in good faith under the direction of the Investment Committee of the Board and in accordance with the responsibilities of the Board as a whole.
Valuation of Marketable Securities—Equity securities listed or traded on any national market or exchange are valued at the last sale price as of the close of the principal securities market or exchange on which such securities are traded or, if there is no sale, at the mean of the last bid and asked prices on such market or exchange, exclusive of transaction costs.
Debt securities, other than money market instruments, are generally valued at the most recent bid price or the equivalent quoted yield for such securities (or those of comparable maturity, quality and type). Money market instruments, with maturities of one year or less, are valued in the same manner as debt securities or derived from a pricing matrix.
Equity and fixed income securities traded on a foreign exchange or in foreign markets are valued using their closing values under the valuation methods generally accepted in the country where traded, as of the valuation date. This value is converted to U.S. dollars at the exchange rate in effect on the valuation day. Under certain circumstances (for example, if there are significant movements in the United States markets and there is an expectation the securities traded on foreign markets will adjust based on such movements when the foreign markets open the next day), the Account may adjust the value of equity or fixed income securities that trade on a foreign exchange or market after the foreign exchange or market has closed.
Valuation of Mortgage Loans Receivable—Mortgage loans receivable are stated at fair value and are initially valued at the face amount of the mortgage loan funding. Subsequently, mortgage loans receivable are valued at least quarterly based on market factors, such as market interest rates and spreads for comparable
53
loans, the liquidity for mortgage loans of similar characteristics, the performance of the underlying collateral and the credit quality of the counterparty.
Valuation of Mortgage Loans Payable—Mortgage loans payable are stated at fair value. The estimated fair value of mortgage loans payable are based on the amount at which the liability could be transferred to a third party exclusive of transaction costs. Mortgage loans payable are valued internally by TIAA’s internal valuation department, as reviewed by the Account’s independent fiduciary, at least quarterly based on market factors, such as market interest rates and spreads for comparable loans, the performance of the underlying collateral (such as the loan-to-value ratio and the cash flow of the underlying collateral), the liquidity for mortgage loans of similar characteristics, the maturity date of the loan, the return demands of the market, and the credit quality of the Account. Interest expense for mortgage loans payable is recorded on the accrual basis taking into account the outstanding principal and contractual interest rates.
SeeNote 5—Assets and Liabilities Measured at Fair Value on a Recurring Basisto the financial statements included herein, for further discussion and disclosure regarding the determination of the Account’s investments fair values.
Foreign currency transactions and translation:Portfolio investments and other assets and liabilities denominated in foreign currencies are translated into U.S. dollars at the exchange rates prevailing at the end of the period. Purchases and sales of securities, income receipts and expense payments made in foreign currencies are translated into U.S. dollars at the exchange rates prevailing on the respective dates of the transactions. The effect of any changes in foreign currency exchange rates on portfolio investments and mortgage loans payable are included in net realized and unrealized gains and losses on real estate properties and mortgage loans payable. Net realized gains and losses on foreign currency transactions include disposition of foreign currencies, and currency gains and losses between the accrual and receipt dates of portfolio investment income and between the trade and settlement dates of portfolio investment transactions.
Accumulation and Annuity Funds:The accumulation fund represents the net assets attributable to participants in the accumulation phase of their investment (“Accumulation Fund”). The annuity fund represents the net assets attributable to the participants currently receiving annuity payments (“Annuity Fund”). The net increase or decrease in net assets from investment operations is apportioned between the accounts based upon their relative daily net asset values. Once an Account participant begins receiving lifetime annuity income benefits, payment levels cannot be reduced as a result of the Account’s actual mortality experience. In addition, the contracts pursuant to which the Account is offered are required to stipulate the maximum expense charge for all Account level expenses that can be assessed, which is not to exceed to 2.5% of average net assets per year. The Account pays a fee to TIAA to assume mortality and expense risks.
Accounting for Investments:The investments held by the Account are accounted as follows:
Real Estate Properties—Rent from real estate properties consists of all amounts earned under tenant operating leases, including base rent, recoveries of real estate taxes and other expenses and charges for miscellaneous services provided to tenants. Rental income is recognized in accordance with the billing terms of the lease agreements. The Account bears the direct expenses of the real estate properties owned. These expenses include, but are not limited to, fees to local property management companies, property taxes, utilities, maintenance, repairs, insurance, and other operating and administrative costs. An estimate of the net operating income earned from each real estate property is accrued by the Account on a daily basis and such estimates are adjusted when actual operating results are determined.
Real Estate Joint Ventures—The Account has limited ownership interests in various real estate joint ventures (collectively, the “Joint Ventures”). The Account records its contributions as increases to its investments in the Joint Ventures, and distributions from the Joint Ventures are treated as income within income from real estate joint ventures and limited partnerships in the Account’s Statements of Operations. Distributions that are identified as returns of capital or capital gains or losses are recorded as unrealized gains and realized gains and losses, respectively. Income from the Joint Ventures is recorded based on the Account’s proportional interest of the income distributed by the Joint Ventures. Income earned but not yet distributed to the Account by the Joint Ventures is recorded as unrealized gains and losses.
Limited Partnerships—The Account has limited ownership interests in various private real estate funds (primarily limited partnerships) and a private real estate investment trust (collectively, the “Limited
54
Partnerships”). The Account records its contributions as increases to the investments, and distributions from the investments are treated as income within income from real estate joint ventures and limited partnerships in the Account’s Statements of Operations. Distributions that are identified as returns of capital or capital gains or losses are recorded as unrealized gains and realized gains and losses, respectively. Unrealized gains and losses are recorded based upon the changes in the net asset values of the Limited Partnerships as determined from the financial statements of the Limited Partnerships when received by the Account. Prior to the receipt of the financial statements from the Limited Partnerships, the Account estimates the value of its interest in good faith and will from time to time seek input from the issuer or the sponsor of the investment. Changes in value based on such estimates are recorded by the Account as unrealized gains and losses.
Marketable Securities—Transactions in marketable securities are accounted for as of the date the securities are purchased or sold (trade date). Interest income is recorded as earned. Dividend income is recorded on the ex-dividend date within dividend income. Dividends that are identified as returns of capital or capital gains or losses are recorded as unrealized gains and realized gains or losses, respectively. Realized gains and losses on securities transactions are accounted for on the specific identification method.
Realized and Unrealized Gains and Losses—Realized gains and losses are recorded at the time an investment is sold or a distribution is received in relation to an investment sale from a Joint Venture or Limited Partnership. Real estate transactions are accounted for as of the date on which the purchase or sale transactions for the real estate properties close (settlement date). The Account recognizes a realized gain on the sale of a real estate property to the extent that the contract sales price exceeds the cost-to-date of the property being sold. A realized loss occurs when the cost-to-date exceeds the sales price.
Unrealized gains and losses are recorded as the fair values of the Accounts investments are adjusted, and as discussed within theReal Estate Joint VenturesandLimited Partnership sectionsabove.
Net Assets—The Account’s net assets as of the close of each valuation day are valued by taking the sum of:
|
• | | | | the value of the Account’s cash; cash equivalents, and short-term and other debt instruments; |
|
• | | | | the value of the Account’s other securities and other non-real estate assets; |
|
• | | | | the value of the individual real properties (based on the most recent valuation of that property) and other real estate-related investments owned by the Account; |
|
• | | | | an estimate of the net operating income accrued by the Account from its properties, other real estate-related investments and non real estate-related investments (including short-term marketable securities) since the end of the prior valuation day; and |
|
• | | | | actual net operating income earned from the Account’s properties, other real estate-related investments and non real estate-related investments (but only to the extent any such item of income differs from the estimated income accrued for on such investments). |
and then reducing the sum by liabilities held within the Account, including the daily investment management fee, administration and distribution fees and certain other expenses attributable to operating the Account. Daily estimates of net operating income are adjusted to reflect actual net operating income on a monthly basis, at which time such adjustments (if any) are reflected in the Account’s unit value.
After the end of every quarter, the Account reconciles the amount of expenses deducted from the Account (which is established in order to approximate the costs that the Account will incur) with the expenses the Account actually incurred. If there is a difference, the Account adds it to or deducts it from the Account in equal daily installments over the remaining days of the following quarter. Material differences may be repaid in the current calendar quarter. The Account’s at-cost deductions are based on projections of Account assets and overall expenses, and the size of any adjusting payments will be directly affected by the difference between management’s projections and the Account’s actual assets or expenses.
Federal Income Taxes:Based on provisions of the Internal Revenue Code, Section 817, the Account is taxed as a segregated asset account of TIAA and as such, the Account should incur no material federal income tax attributable to the net investment activity of the Account. Management has concluded that the Account does not have any uncertain tax positions as of December 31, 2010.
55
New Accounting Pronouncements
In June 2009, the FASB issued Statement of Financial Accounting Standards No. 167, Amendments to FASB Interpretation No. 46(R) (“SFAS No. 167”), which amends guidance related to the identification of a variable interest entity, variable interests, the primary beneficiary, and expands required note disclosures to provide greater transparency to the users of financial statements. In December 2009, the FASB issued Accounting Standards Update (“ASU”) No. 2009-17, “Improvements to Financial Reporting by Enterprises Involved with Variable Interest Entities,” which amended the Codification with the guidance contained in SFAS No. 167. In February 2010, the FASB issued ASU No. 2010-10, “Amendments for Certain Investment Funds,” which defers the applicability of ASU No. 2009-17 in certain instances. These standards were effective on January 1, 2010 and did not result in a significant impact to the Account’s financial position or results of operations.
In January 2010, the FASB issued ASU No. 2010-06, “Improving Disclosures about Fair Value Measurements” which requires new disclosures related to transfers in and out of levels 1 and 2, and the separate disclosure of purchases, sales, issuances and settlements when reconciling activity in level 3. This ASU also amends prior disclosure requirements to call for the disaggregation of assets and liabilities into appropriate subsets, and the disclosure of valuation techniques and inputs for recurring and nonrecurring fair value measurements in levels 2 and 3. The new disclosure requirement for reconciling level 3 activity is effective January 1, 2011. All other new or amended disclosure requirements were effective January 1, 2010 for the Account and are reflected in the notes to the financial statements. These changes did not impact the Account’s financial position or results of operations.
ITEM 3. QUANTITATIVE AND QUALITATIVE DISCLOSURES ABOUT MARKET RISK.
The Account’s real estate holdings, including real estate joint ventures and limited partnerships, which, as of March 31, 2011, represented 73.9% of the Account’s total investments, expose the Account to a variety of risks. These risks include, but are not limited to:
|
• | | | | General Real Estate Risk—The risk that the Account’s property values or rental and occupancy rates could go down due to general economic conditions, a weak market for real estate generally, disruptions in the credit and/or capital markets, or changing supply and demand for certain types of properties; |
|
• | | | | Appraisal Risk—The risk that the sale price of an Account property (i.e., the value that would be determined by negotiations between independent parties) might differ substantially from its estimated or appraised value, leading to losses or reduced profits to the Account upon sale; |
|
• | | | | Risk Relating to Property Sales—The risk that the Account might not be able to sell a property at a particular time for its full value, particularly in a poor market. This might make it difficult to raise cash quickly and also could lead to Account losses; |
|
• | | | | Risks of Borrowing—The risk that interest rate changes may impact Account returns if the Account takes out a mortgage on a property, buys a property subject to a mortgage or holds a property subject to a mortgage; and |
|
• | | | | Foreign Currency Risk—The risk that the value of the Account’s foreign investments, related debt, or rental income could increase or decrease due to changes in foreign currency exchange rates or foreign currency exchange control regulations, and hedging against such changes, if undertaken by the Account, may entail additional costs and be unsuccessful. |
The Account believes the diversification of its real estate portfolio, both geographically and by sector, along with its quarterly valuation procedure, helps manage the real estate and appraisal risks described above.
As of March 31, 2011, 26.1% of the Account’s total investments were comprised of marketable securities. As of March 31, 2011, marketable securities include high-quality publicly traded debt instruments (i.e., government agency notes) and equity securities, primarily REIT securities. The Statements of Investments for the Account sets forth the general financial terms of these instruments, along with their fair values, as determined in accordance with procedures described inNote 1—Organization and Significant Accounting Policiesto the Account’s financial statements herein. The Account’s marketable securities are
56
considered held for trading purposes. Currently, the Account does not invest in derivative financial investments, nor does the Account engage in any hedging activity.
Risks associated with investments in real estate-related liquid assets (which could include, from time to time, REIT securities and CMBS), and non-real estate-related liquid assets, including financial/credit risk, market volatility risk, interest rate volatility risk and deposit/money market risk.
|
• | | | | Financial/Credit Risk—The risk, for debt securities, that the issuer will not be able to pay principal and interest when due (and/or declare bankruptcy or be subject to receivership) and, for equity securities such as common or preferred stock, that the issuer’s current earnings will fall or that its overall financial soundness will decline, reducing the security’s value. |
|
• | | | | Market Volatility Risk—The risk that the Account’s investments will experience price volatility due to changing conditions in the financial markets regardless of the credit quality or financial condition of the underlying issuer. This risk is particularly acute to the extent the Account holds equity securities, which have experienced significant short-term price volatility over the past year. Also, to the extent the Account holds debt securities; changes in overall interest rates can cause price fluctuations. |
|
• | | | | Interest Rate Volatility—The risk that interest rate volatility may affect the Account’s current income from an investment. |
|
• | | | | Deposit/Money Market Risk—The risk that, to the extent the Account’s cash held in bank deposit accounts exceeds federally insured limits as to that bank, the Account could experience losses if banks fail. The Account does not believe it has exposure to significant concentration of deposit risk. In addition, there is some risk that investments held in money market accounts can suffer losses. |
In addition, to the extent the Account were to hold mortgage-backed securities (including commercial mortgage-backed securities) these securities are subject to prepayment risk or extension risk (i.e., the risk that borrowers will repay the loans earlier or later than anticipated). If the underlying mortgage assets experience faster than anticipated repayments of principal, the Account could fail to recoup some or all of its initial investment in these securities, since the original price paid by the Account was based in part on assumptions regarding the receipt of interest payments. If the underlying mortgage assets are repaid later than anticipated, the Account could lose the opportunity to reinvest the anticipated cash flows at a time when interest rates might be rising. The rate of prepayment depends on a variety of geographic, social and other functions, including prevailing market interest rates and general economic factors. The market value of these securities is also highly sensitive to changes in interest rates. Note that the potential for appreciation, which could otherwise be expected to result from a decline in interest rates, may be limited by any increased prepayments. These securities may be harder to sell than other securities.
In addition to these risks, real estate equity securities (such as REIT stocks and mortgage-backed securities) would be subject to many of the same general risks inherent in real estate investing, making mortgage loans and investing in debt securities. For more information on the risks associated with all of the Account’s investments, see the Account’s most recent prospectus.
ITEM 4. CONTROLS AND PROCEDURES.
(a) The registrant maintains a system of disclosure controls and procedures that are designed to provide reasonable assurance that information required to be disclosed in the registrant’s reports under the Securities Exchange Act of 1934, as amended (the “Exchange Act”), is recorded, processed, summarized and reported within the time periods specified in the SEC’s rules and forms, and that such information is accumulated and communicated to management, including the registrant’s Chief Executive Officer (“CEO”) and the Chief Financial Officer (“CFO”), as appropriate, to allow timely decisions regarding required disclosure.
Under the supervision and participation of the registrant’s management, including the registrant’s CEO and CFO, the registrant conducted an evaluation of the effectiveness of the registrant’s disclosure controls and procedures as defined in Rule 13a-15(e) under the Exchange Act as of March 31, 2011. Based upon management’s review, the CEO and the CFO concluded that the registrant’s disclosure controls and procedures were effective as of March 31, 2011.
57
(b) Changes in internal control over financial reporting. There have been no changes in the registrant’s internal control over financial reporting that occurred during the registrant’s last fiscal quarter that materially affected, or are reasonably likely to materially affect, the registrant’s internal control over financial reporting.
PART II. OTHER INFORMATION
ITEM 1. LEGAL PROCEEDINGS.
There are no material legal proceedings to which the Account is a party, or to which the Account’s assets are subject.
ITEM 1A. RISK FACTORS.
There have been no material changes from our risk factors as previously reported in the Account’s Annual Report on Form 10-K for the year ended December 31, 2010.
ITEM 2. UNREGISTERED SALES OF EQUITY SECURITIES AND USE OF PROCEEDS.
Not applicable.
ITEM 3. DEFAULTS UPON SENIOR SECURITIES.
Not applicable.
ITEM 4. [REMOVED AND RESERVED].
ITEM 5. OTHER INFORMATION.
The Code of Ethics for TIAA’s senior financial officers, including its principal executive officer, principal financial officer, principal accounting officer, or controller, and persons performing similar functions, has been filed as an exhibit to the Account’s Annual Report on Form 10-K for the year ended December 31, 2010 and can also be found on the following two web sites, http://www.tiaa-cref.org/public/prospectuses/index.html and http://www.tiaa-cref.org/about/governance/corporate/topics/annual_reports.html. Information included in such websites is expressly not incorporated by reference into this Quarterly Report on Form 10-Q.
ITEM 6. EXHIBITS.
| | | | |
(1) | | (A) | | Distribution Agreement for the Contracts Funded by the TIAA Real Estate Account, dated as of January 1, 2008, by and among Teachers Insurance and Annuity Association of America, for itself and on behalf of the Account, and TIAA-CREF Individual & Institutional Services, LLC.(5) |
(3) | | (A) | | Charter of TIAA.(8) |
| | (B) | | Restated Bylaws of TIAA (as amended).(9) |
(4) | | (A) | | Forms of RA, GRA, GSRA, SRA, IRA Real Estate Account Endorsements2, Keogh Contract,3 Retirement Select and Retirement Select Plus Contracts and Endorsements1 and Retirement Choice and Retirement Choice Plus Contracts.(3) |
| | (B) | | Forms of Income-Paying Contracts(2) |
| | (C) | | Form of Contract Endorsement for Internal Transfer Limitation(10) |
| | (D) | | Form of Accumulation Contract(11) |
(10) | | (A) | | Independent Fiduciary Agreement, dated February 22, 2006, by and among TIAA, the Registrant, and Real Estate Research Corporation(4) |
| | (B) | | Amendment to Independent Fiduciary Agreement, dated December 17, 2008, between TIAA, on behalf of the Registrant, and Real Estate Research Corporation(6) |
| | | | |
58
| | | | |
| | (C) | | Custodian Agreement, dated as of March 3, 2008, by and between TIAA, on behalf of the Registrant, and State Street Bank and Trust Company, N.A. (7) |
*(31) | | | | Rule 13a-15(e)/15d-15(e) Certifications |
*(32) | | | | Section 1350 Certifications |
|
* | | | | Filed herewith. |
|
(1) | | | | Previously filed and incorporated herein by reference to the Account’s Pre-Effective Amendment No. 1 to the Registration Statement on Form S-1 filed April 29, 2004 (File No. 333-113602). |
|
(2) | | | | Previously filed and incorporated herein by reference to the Account’s Post-Effective Amendment No. 2 to the Registration Statement on Form S-1 filed April 30, 1996 (File No. 33-92990). |
|
(3) | | | | Previously filed and incorporated herein by reference to the Account’s Post-Effective Amendment No. 1 to the Registration Statement on Form S-1 filed May 2, 2005 (File No. 333-121493). |
|
(4) | | | | Previously filed and incorporated herein by reference to Exhibit 10.(a) to the Annual Report on Form 10-K of the Account for the period ended December 31, 2005, filed with the Commission on March 15, 2006 (File No. 33-92990). |
|
(5) | | | | Previously filed and incorporated herein by reference to the Account’s Current Report on Form 8-K, filed with the Commission on January 7, 2008 (File No. 33-92990). |
|
(6) | | | | Previously filed and incorporated herein by reference to the Account’s Current Report on Form 8-K, filed with the Commission on December 22, 2008 (File No. 33-92990). |
|
(7) | | | | Previously filed and incorporated herein by reference to Exhibit 10.(b) to the Annual Report on Form 10-K of the Account for the fiscal year ended December 31, 2007 and filed with the Commission on March 20, 2008 (File No. 33-92990). |
|
(8) | | | | Previously filed and incorporated by reference to Exhibit 3(A) to the Account’s Quarterly Report on Form 10-Q for the quarter ended June 30, 2009 and filed with the Commission on August 13, 2009 (File No. 33-92990). |
|
(9) | | | | Previously filed and incorporated by reference to Exhibit 3(B) to the Account’s Quarterly Report on Form 10-Q for the quarter ended June 30, 2009 and filed with the Commission on August 13, 2009 (File No. 33-92990). |
|
(10) | | | | Previously filed and incorporated by reference to Exhibit 4(C) to the Account’s Quarterly Report on Form 10-Q for the quarter ended September 30, 2010 and filed with the Commission on November 12, 2010 (File No. 33-92990). |
|
(11) | | | | Previously filed and incorporated by reference to Exhibit 4(D) to the Account’s Pre-Effective Amendment No. 1 to the Registration Statement on Form S-1 filed April 27, 2011 (File No. 333-172900). |
59
SIGNATURES
Pursuant to the requirements of the Securities Exchange Act of 1934, as amended, the registrant, TIAA Real Estate Account, has duly caused this Report to be signed on its behalf by the undersigned, thereunto duly authorized, in New York, New York, on the 12th day of May, 2011.
| | | | |
| | TIAA REAL ESTATE ACCOUNT |
| | | | |
| | By: | | TEACHERS INSURANCE AND ANNUITY
ASSOCIATION OF AMERICA |
| | | | |
May 12, 2011 | | By: | | /s/ Roger W. Ferguson, Jr.
|
| | | | Roger W. Ferguson, Jr.
President and
Chief Executive Officer |
| | | | |
May 12, 2011 | | By: | | /s/ Virginia M. Wilson
|
| | | | Virginia M. Wilson
Executive Vice President and
Chief Financial Officer |
60