As filed with the Securities and Exchange Commission on April 29, 2013
Registration No. 333-187309
UNITED STATES
SECURITIES AND EXCHANGE COMMISSION
WASHINGTON, D.C. 20549
AMENDMENT NO. 1
TO
FORM S-1
FOR REGISTRATION
UNDER
THE SECURITIES ACT OF 1933
TIAA REAL ESTATE ACCOUNT
(Exact Name of Registrant as Specified in its Charter)
|
|
|
|
|
New York | (Not applicable) | (Not applicable) |
c/o Teachers Insurance and Annuity Association of America
730 Third Avenue
New York, New York 10017-3206
(212) 490-9000
(Address including zip code, and telephone number, including area code, of registrant’s principal executive offices)
Keith F. Atkinson, Esquire
Teachers Insurance and Annuity Association of America
8500 Andrew Carnegie Blvd.
Charlotte, North Carolina 28262
(704) 988-1000
(Name, address, including zip code, and telephone number, including area code, of agent for service)
Copy to:
Jeffrey S. Puretz, Esquire
Dechert LLP
1900 K Street, N.W.
Washington, D.C. 20006
Approximate date of commencement of proposed sale to the public:As soon as practicable after the effective date of the registration statement.
If any of the securities being registered on this Form are to be offered on a delayed or continuous basis pursuant to Rule 415 under the Securities Act of 1933, check the following box:S
If this Form is filed to register additional securities for an offering pursuant to Rule 462(b) under the Securities Act, check the following box and list the Securities Act registration statement number of the earlier effective registration statement for the same offering: £
If this Form is a post-effective amendment filed pursuant to Rule 462(c) under the Securities Act, check the following box and list the Securities Act registration statement number of the earlier effective registration statement for the same offering:£
If this Form is a post-effective amendment filed pursuant to Rule 462(d) under the Securities Act, check the following box and list the Securities Act registration statement number of the earlier effective registration statement for the same offering:£
Indicate by check mark whether the registrant is a large accelerated filer, an accelerated filer, a non-accelerated filer or a smaller reporting company. See definition of “accelerated filer and large accelerated filer” in Rule 12b-2 of the Exchange Act.
Large accelerated filer£ Accelerated filer£ Non-accelerated filerS Smaller Reporting Company£
Pursuant to Rule 429 under the Securities Act, the prospectus contained herein also relates to and constitutes a post-effective amendment to Securities Act registration statements 33-92990, 333-13477, 333-22809, 333-59778, 333-83964, 333-113602, 333-121493, 333-132580, 333-141513, 333-149862, 333-158136, 333-165286, 333-172900 and 333-180173 (collectively, the “Prior Registration Statements”).
CALCULATION OF REGISTRATION FEE
|
|
|
|
|
|
|
|
|
| ||||||||
Title of Each Class of | Amount to be | Proposed Maximum | Proposed Maximum | Amount of | ||||
| ||||||||
Accumulation units in TIAA Real Estate Account | * | * | $1,000,000,000** | $136,400** | ||||
| ||||||||
| ||||||||||||||||||||
* |
|
| The securities are not issued in predetermined amounts or units, and the maximum aggregate offering price is estimated solely for purposes of determining the registration fee pursuant to Rule 457(o) under the Securities Act. | |||||||||||||||||
| ||||||||||||||||||||
** |
| In addition to the $1,000,000,000 of accumulation units registered hereunder, the registrant is carrying forward securities which remain unsold but which were previously registered under the Prior Registration Statements for which filing fees were previously paid. | ||||||||||||||||||
| ||||||||||||||||||||
(1) |
| The Registrant paid filing fees in the amount of $114,600 in connection with the registration of accumulation units on its Registration Statement on Form S-1 (File No. 333-180173), which was initially filed with the Commission on March 16, 2012 and declared effective on May 1, 2012. The Registrant is not offsetting any filing fees previously paid in connection with any prior Registration Statement. | ||||||||||||||||||
| ||||||||||||||||||||
(2) |
| Previously paid. | ||||||||||||||||||
The registrant hereby amends this registration statement on such date or dates as may be necessary to delay its effective date until the registrant shall file a further amendment which specifically states that this registration statement shall thereafter become effective in accordance with Section 8(a) of the Securities Act of 1933 or until the registration statement shall become effective on such date as the Securities and Exchange Commission, acting pursuant to Section 8(a), may determine.
The information in this prospectus is not complete and may be changed. We may not sell these securities until the registration statement filed with the Securities and Exchange Commission is effective. This prospectus is not an offer to sell these securities and we are not soliciting an offer to buy these securities in any state where the offer or sale is not permitted. SUBJECT TO COMPLETION, DATED APRIL 29, 2013 PROSPECTUS __________, 2013 TIAA REAL ESTATE ACCOUNT A Tax-Deferred Variable Annuity Option Offered by Teachers Insurance and Annuity Association of America (“TIAA”) This prospectus tells you about the TIAA Real Estate Account, an investment option offered through individual and group variable annuity contracts issued by TIAA. Please read it carefully before investing and keep it for future reference. The Real Estate Account, which we refer to sometimes as “the Account” in this prospectus, invests primarily in real estate and real estate-related investments. TIAA, one of the largest and most experienced mortgage and real estate investors in the nation, manages the Account’s assets. The value of your investment in the Real Estate Account will go up or down depending on how the Account performs and you could lose money. The Account’s performance depends mainly on the value of the Account’s real estate and other real estate-related investments, the income generated by those investments and the Account’s expenses. The Account’s returns could go down if, for example, real estate values or rental and occupancy rates, or the value of real estate-related securities, decrease due to general economic conditions and/or a weak market for real estate generally. Property operating costs, costs associated with leverage on the Account’s properties, and government regulations, such as zoning or environmental laws, could also affect a property’s profitability. TIAA does not guarantee the investment performance of the Account, and you will bear the entire investment risk. For a detailed discussion of the specific risks of investing in the Account, see “Risk Factors” on page 14. We take deductions daily from the Account’s net assets for the Account’s operating and investment management expenses. The Account also pays TIAA for bearing mortality and expense risks and for providing a liquidity guarantee. The current estimated annual expense deductions from the Account’s net assets over the next 12 months total 0.895%. The Real Estate Account is designed as an option for retirement and tax-deferred savings plans for employees of nonprofit and governmental institutions. TIAA currently offers the Real Estate Account under the following annuity contracts: < RAs and GRAs (Retirement Annuities and Group Retirement Annuities) < SRAs (Supplemental Retirement Annuities) < GSRAs (Group Supplemental Retirement Annuities) < Retirement Choice and Retirement Choice Plus Annuity < GAs (Group Annuities) and Institutionally-Owned GSRAs < Classic and Roth IRAs (Individual Retirement Annuities) including SEP IRAs (Simplified Employee Pension Plans) < Keoghs < ATRAs (After-Tax Retirement Annuities) < Real Estate Account Accumulation Contract Note that state regulatory approval may be pending for certain of these contracts and they may not currently be available in your state. TIAA may also offer the Real Estate Account as an investment option under additional contracts, both at the individual and plan sponsor level, in the future. Neither the Securities and Exchange Commission (“SEC”) nor any state securities commission has approved or disapproved of these securities or passed upon the adequacy of the information in this prospectus. Any representation to the contrary is a criminal offense. An investment in the Real Estate Account is not a bank deposit and is not insured or guaranteed by the Federal Deposit Insurance Corporation or any other government agency. 
TABLE OF CONTENTS 3 14 34 37 40 44 52 57 64 66 67 68 69 Management’s Discussion and Analysis of the Account’s Financial Condition and Results of Operations 70 113 115 122 129 134 136 142 144 144 145 145 146 148 148 246 249 255 Please see Appendix C for definitions of certain special terms used in this prospectus. The Real Estate Account securities offered by this prospectus are only being offered in those jurisdictions where it is legal to do so. No person may make any representation to you or give you any information about the offering that is not in the prospectus. If anyone provides you with information about the offering that is not in the prospectus, you shouldn’t rely on it.
PROSPECTUS SUMMARY You should read this summary together with the more detailed information regarding the Account, including the Account’s financial statements and related notes, appearing elsewhere in this prospectus. More information about the Account may be obtained by writing us at 730 Third Avenue, New York, NY 10017-3206, calling us at 877 518- 9161 or visiting our website at www.tiaa-cref.org. ABOUT THE TIAA REAL ESTATE ACCOUNT The TIAA Real Estate Account was established in February 1995 as a separate account of Teachers Insurance and Annuity Association of America (“TIAA”) and interests in the Account were first offered to eligible participants on October 2, 1995. The Account offers individual and group accumulating annuity contracts (with contributions made on a pre-tax or after-tax basis), as well as individual lifetime and term-certain variable payout annuity contracts (including the payment of death benefits to beneficiaries). Investors are entitled to transfer funds to or from the Account under certain circumstances. Funds invested in the Account for each category of contract are expressed in terms of units, and unit values will fluctuate depending on the Account’s performance. INVESTMENT OBJECTIVE The Account seeks favorable long-term returns primarily through rental income and appreciation of real estate and real estate-related investments owned by the Account. The Account will also invest in non-real estate-related publicly traded securities and short-term higher quality liquid investments that are easily converted to cash to enable the Account to meet participant redemption requests, purchase or improve properties or cover other expense needs. INVESTMENT STRATEGY Real Estate-Related Investments. The Account intends to have between 75% and 85% of its net assets invested directly in real estate or real estate-related investments with the goal of producing favorable long-term returns primarily through rental income and appreciation. These investments may consist of: • Direct ownership interests in real estate, • Direct ownership of real estate through interests in joint ventures, • Indirect interests in real estate through real estate-related securities, such as: • real estate limited partnerships, TIAA Real Estate Account ¡Prospectus3
TIAA REAL ESTATE ACCOUNT
• real estate investment trusts (“REITs”), which investments may consist of common or preferred stock interests, • investments in equity or debt securities of companies whose operations involve real estate (i.e., that primarily own or manage real estate) which may not be REITs, and • conventional mortgage loans, participating mortgage loans, and collateralized mortgage obligations, including commercial mortgage-backed securities (“CMBS”) and other similar investments. The Account’s principal strategy is to purchase direct ownership interests in income-producing real estate, primarily office, industrial, retail and multi-family residential properties. The Account is targeted to hold between 65% and 80% of the Account’s net assets in such direct ownership interests at any time. Historically, over 70% of the Account’s net assets have been comprised of such direct ownership interests in real estate. In addition, while the Account is authorized to hold up to 25% of its net assets in liquid real estate-related securities, such as REITs and CMBS, management intends that the Account will not hold more than 10% of its net assets in such securities on a long-term basis. Historically, less than 10% of the Account’s net assets have been comprised of interests in these securities. In particular, under the Account’s current investment guidelines, the Account is authorized to hold up to 10% of its net assets in CMBS. As of December 31, 2012, REIT securities comprised approximately 9.0% of the Account’s net assets, and the Account held no CMBS as of such date. Non-Real Estate-Related Investments.The Account will invest the remaining portion of its assets (targeted to be between 15% and 25% of its net assets) in publicly-traded, liquid investments; namely: • U.S. treasury securities, • securities issued by U.S. government agencies or U.S. government sponsored entities, • corporate debt securities, • money market instruments, and • stock of companies that do not primarily own or manage real estate. However, from time to time (most recently between late 2008 and mid 2010), the Account’s non-real estate-related liquid investments may comprise less than 15% (and possibly less than 10%) of its assets (on a net basis and/or a gross basis), especially during and immediately following periods of significant net participant outflows, in particular due to significant participant transfer activity. In addition, the Account, from time to time and on a temporary basis, may hold in excess of 25% of its net assets in non-real estate-related liquid investments, particularly during times of significant inflows into the Account and/or a lack of attractive real estate-related investments available in the market. Liquid Securities.Primarily due to management’s need to manage fluctuations in cash flows, in particular during and immediately following 4Prospectus ¡ TIAA Real Estate Account
periods of significant participant net transfer activity into or out of the Account, the Account may, on a temporary basis (i) exceed the upper end of its targeted holdings (currently 35% of the Account’s net assets) in liquid securities of all types, including both publicly traded non-real estate-related liquid investments and liquid real estate-related securities, such as REITs and CMBS, or (ii) be below the low end of its targeted holdings in such liquid securities (currently 15% of the Account’s net assets). The portion of the Account’s net assets invested in liquid investments of all types may exceed the upper end of its target, for example, if (i) the Account receives a large inflow of money in a short period of time, in particular due to significant participant transfer activity into the Account, (ii) the Account receives significant proceeds from sales or financings of direct real estate assets, (iii) there is a lack of attractive direct real estate investments available on the market, and/or (iv) the Account anticipates more near-term cash needs, including to apply to acquire direct real estate investments, pay expenses or repay indebtedness. Foreign Investments.The Account from time to time will also make foreign real estate investments. Under the Account’s investment guidelines, investments in direct foreign real estate, together with foreign real estate-related securities and foreign non-real estate-related liquid investments, may not comprise more than 25% of the Account’s net assets. However, through the date of this prospectus, such foreign real estate-related investments have never represented more than 7.5% of the Account’s net assets and management does not intend such foreign investments to exceed 10% of the Account’s net assets. As of December 31, 2012, the Account’s foreign assets represented approximately 1.5% of the Account’s net assets (after netting out the fair value of debt on our foreign properties). Investments Summary.At December 31, 2012, the Account’s net assets totaled $14.9 billion. As of that date, the Account’s investments in real estate properties, real estate joint ventures, limited partnerships and real estate-related marketable securities, net of the fair value of mortgage loans payable on real estate, represented 82.3% of the Account’s net assets. At December 31, 2012, the Account held a total of 107 real estate property investments (including its interests in 15 real estate-related joint ventures), representing 75.2% of the Account’s total investments, measured on a gross asset value basis (“Total Investments”). As of that date, the Account also held investments in REIT equity securities (representing 7.8% of Total Investments), real estate limited partnerships (representing 2.0% of Total Investments), government agency notes (representing 8.0% of Total Investments) and U.S. Treasury Securities (representing 7.0% of Total Investments). See the Account’s audited financial statements for more information as to the Account’s investments as of December 31, 2012. Borrowing.The Account is authorized to borrow money in accordance with its investment guidelines. Under the Account’s current investment guidelines, management intends to maintain the Account’s loan to value ratio at or below TIAA Real Estate Account ¡Prospectus5
30%. The Account’s “loan to value ratio” at any time is based on the outstanding principal amount of the Account’s debt to the Account’s total gross asset value. This ratio will be measured at the time of any debt incurrence and will be assessed after giving effect thereto. As of December 31, 2012, the Account’s loan to value ratio was approximately 21.0%. In addition, the Account may borrow up to 70% of the then-current value of a particular property. Non-construction mortgage loans on a property will be non-recourse to the Account. See “General Investment and Operating Policies — Other Real Estate-Related Policies — Borrowing” on page 42. SUMMARY OF EXPENSE DEDUCTIONS Expense deductions are made each valuation day from the net assets of the Account for various services to manage the Account’s investments, administer the Account and the contracts, distribute the contracts and to cover certain risks borne by TIAA. Investment management, administration and distribution services are provided “at cost” by TIAA and TIAA-CREF Individual & Institutional Services, LLC (“Services”), a registered broker-dealer and wholly owned subsidiary of TIAA. Currently, TIAA provides investment management services and administration services for the Account, and Services provides distribution services for the Account. In addition, TIAA charges the Account a fee to bear certain mortality and expense risks, and risks associated with providing the liquidity guarantee. TIAA guarantees that in the aggregate, the expense charges will never be more than 2.50% of average net assets per year. The estimated annual expense deduction rate that appears in the expense table below reflects an estimate of the amount we currently expect to deduct to approximate the costs that the Account will incur from May 1, 2013 through April 30, 2014. Actual expenses may be higher or lower. The expenses identified in the table below do not include any fees which may be imposed by your employer under a plan maintained by your employer. Type of Expense Deduction Estimated Services Performed Investment Management 0.365% For investment advisory, investment management, portfolio accounting, custodial and similar services, including independent fiduciary and appraisal fees Administration 0.265% For administration and operations of the Account and the contracts, including administrative services such as receiving and allocating premiums and calculating and making annuity payments Distribution 0.080% For services and expenses associated with distributing the annuity contracts Mortality and Expense Risk 0.005% For TIAA’s bearing certain mortality and expense risks Liquidity Guarantee 0.180% For TIAA’s liquidity guarantee Total Annual Expense Deduction1,2 0.895% Total 1 TIAA guarantees that the total annual expense deduction will not exceed an annual rate of 2.50% of average net assets. 2 Property-level expenses, including property management fees and transfer taxes, are not reflected in the table above; instead these expenses are charged directly to the Account’s properties. Please see “Expense Deductions” on page 64 and “Selected Financial Data” on page 68 for additional information. 6Prospectus ¡ TIAA Real Estate Account
Percent of Net
Assets Annually
TIAA currently does not impose a fee on transfers from the Account, but reserves the right to impose a fee on transfers from the Account in the future. Example.The following table shows you an example of the expenses you would incur on a hypothetical investment of $10,000 in the TIAA Real Estate Account over several periods. The table assumes a 5% annual return on assets and an annual expense deduction equal to 0.895%. These figures do not represent actual expenses or investment performance, which may differ. 1 Year 3 Year 5 Year 10 Year $91 $286 $497 $1,107 SUMMARY RISK FACTORS The value of your investment in the Account will fluctuate based on the value of the Account’s assets and the income the assets generate.You may lose money by investing in this Account.The Account’s assets and income can be affected by many factors, and you should consider the specific risks presented in this prospectus before investing in the Account. The principal risks include the following: • Acquiring and Owning Real Estate:The risks associated with acquiring and owning real property, including general economic and real estate market conditions, the availability of, and economic cost associated with, financing the Account’s properties, the risk that the Account’s properties become too concentrated (whether by geography, sector or by tenant mix), competition for acquiring real estate properties, leasing risk (including tenant defaults) and the risk of uninsured losses at properties (including due to terrorism, natural disasters or acts of violence); • Selling Real Estate:The risk that the sales price of a property might differ, perhaps significantly, from its estimated or appraised value, leading to losses or reduced profits to the Account, the risk that the Account might not be able to sell a property at a particular time for a price which management believes represents its fair or full value, the lack of availability of financing (for potential purchasers of the Account’s properties), disruptions in the credit and capital markets, and the risk that the Account may be required to make significant expenditures before the Account is able to market and/or sell a property; • Valuation:The risks associated with property valuations, including the fact that appraisals can be subjective in a number of respects and the fact that the Account’s appraisals are generally obtained on a quarterly basis and there may be periods in between appraisals of a property during which the value attributed to the property for purposes of the Account’s daily accumulation unit value may be more or less than the actual realizable value of the property; • Borrowing:Risks associated with financing the Account’s properties, including the risk of default on loans secured by the Account’s properties (which could lead to foreclosure), the risk associated with high loan to TIAA Real Estate Account ¡Prospectus7
value ratios on the Account’s properties (including the fact that the Account may have limited or no net value in such a property), the risk that significant sums of cash could be required to make principal and interest payments on the loans and the risk that the Account may not have the ability to obtain financing or refinancing on favorable terms (or at all), which may be aggravated by general disruptions in credit and capital markets; • Participant Transactions and Cash Management:Investment risk associated with participant transactions, in particular that (i) significant net participant transfers out of the Account may impair our ability to pursue or consummate new investment opportunities that are otherwise attractive to the Account and/or may result in sales of real estate-related assets to generate liquidity, (ii) significant net participant transfers into the Account may result, on a temporary basis, in our cash holdings and/or holdings in liquid real estate-related investments exceeding our long-term targeted holding levels and (iii) high levels of cash in the Account during times of appreciating real estate values can impair the Account’s overall return; • Joint Venture Investments:The risks associated with joint venture partnerships, including the risk that a co-venturer may have interests or goals inconsistent with that of the Account, that a co-venturer may have financial difficulties, and the risk that the Account may have limited rights with respect to operation of the property and transfer of the Account’s interest; • Regulatory Matters:Uncertainties associated with environmental liability and regulations and other governmental regulatory matters such as zoning laws, rent control laws and property taxes; • Foreign Investments:The risks associated with purchasing, owning and disposing foreign investments (primarily real estate properties), including political risk, the risk associated with currency fluctuations, regulatory and taxation risks and risks of enforcing judgments; • Conflicts of Interest:Conflicts of interest associated with TIAA serving as investment manager of the Account and provider of the liquidity guarantee at the same time as TIAA and its affiliates are serving as an investment manager to other real estate accounts or funds, including conflicts associated with satisfying its fiduciary duties to all such accounts and funds associated with purchasing, selling and leasing of properties; • Required Property Sales:The risk that, if TIAA were to own too large a percentage of the Account’s accumulation units through funding the liquidity guarantee (as determined by the independent fiduciary), the independent fiduciary could require the sales of properties to reduce TIAA’s ownership interest, which sales could occur at times and at prices that depress the sale proceeds to the Account; 8Prospectus ¡ TIAA Real Estate Account
• Government and Government Agency Securities:Risks associated with investment securities issued by U.S. government agencies and U.S. government-sponsored entities, including the risk that the issuer may not have their securities backed by the full faith and credit of the U.S. government, and that transaction activity may fluctuate significantly from time to time, which could negatively impact the value of the securities and the Account’s ability to dispose of a security at a favorable time; and • Liquid Assets and Securities:Risks associated with investments in real estate-related liquid assets (which could include, from time to time, REIT securities and CMBS), and non-real estate-related liquid assets, including: • Financial/credit risk — Risks that the issuer will not be able to pay principal and interest when due or that the issuer’s earnings will fall; • Market volatility risk — Risk that the changing conditions in financial markets may cause the Account’s investments to experience price volatility; • Interest rate volatility risk — Risk that interest rate volatility may affect the Account’s current income from an investment or the pricing of that investment; and • Deposit/money market risk — Risk that the Account could experience losses if banks fail. More detailed discussions of these risks and other risk factors associated with an investment in the Account are contained starting on page 14 of this prospectus in the section entitled “Risk Factors.” VALUING THE ACCOUNT’S ASSETS The assets of the Account are valued at the close of each valuation day and the Account calculates and publishes a unit value, which is available on TIAA-CREF’s website (www.tiaa-cref.org), for each valuation day. The values of the Account’s properties are adjusted daily to account for capital expenditures and appraisals as they occur. With respect to the Account’s real property investments, following the initial purchase of a property or the making of a mortgage loan on a property by the Account (at which time the Account normally receives an independent appraisal on such property), each of the Account’s real properties are appraised, and mortgage loans are valued, at least once every calendar quarter. Each of the Account’s real estate properties is appraised each quarter by an independent external state-certified (or its foreign equivalent) appraiser (which we refer to in this prospectus as an “independent appraiser”) who is a member of a professional appraisal organization. In addition, TIAA’s internal appraisal staff performs a review of each of these quarterly appraisals, in conjunction with the Account’s independent fiduciary, and TIAA’s internal appraisal staff or the independent fiduciary may request an additional appraisal or valuation outside of this quarterly cycle. Any differences in the conclusions of TIAA’s internal appraisal staff and the independent appraiser will be reviewed by the independent fiduciary, which will make a final TIAA Real Estate Account ¡Prospectus9
determination on the matter (which may include ordering a subsequent independent appraisal). In general, the Account obtains appraisals of its real estate properties spread out throughout the quarter, which is intended to result in appraisal adjustments and thus adjustments to the valuations of its holdings (to the extent adjustments are made) that happen regularly throughout each quarter and not on one specific day in each period. In addition, an estimated daily equivalent of net operating income is taken into consideration and is adjusted for actual transactional activity. The remaining assets in the Account are primarily marketable securities that are priced on a daily basis and are included in the Account’s daily unit value. As of December 31, 2012, the Account’s net assets totaled approximately $14.9 billion. See “Valuing the Account’s Assets” on page 57 for more information on how each class of the Account’s investments are valued. PAST PERFORMANCE The bar chart and performance table below illustrate how investment performance during the accumulation period has varied. The chart shows the Account’s total return (which includes all expenses) during the accumulation period over each of the last ten calendar years. It also shows the Account’s returns during the accumulation period for the one-, three-, five- and ten-year periods through December 31, 2012. These returns represent the total return during each such year and reflect both the Account’s investment income and capital appreciation from the Account’s total investments during each such year. How the Account has performed in the past is not necessarily an indication of how it will perform in the future. Please see “Risk Factors” beginning on page 14.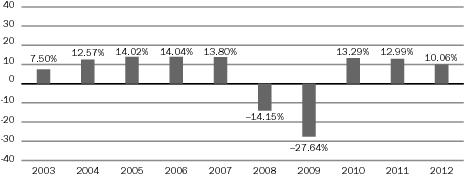
Best quarter: 5.68%, for the quarter ended December 31, 2010.
Worst quarter: –13.18%, for the quarter ended December 31, 2008.
AVERAGE ANNUAL TOTAL RETURNS (AS OF DECEMBER 31, 2012)
|
|
|
|
|
|
|
|
|
| 1 Year | 3 Year | 5 Year | 10 Year | ||||
| ||||||||
TIAA Real Estate Account | 10.06% | 12.11% | -2.63% | 4.60% | ||||
| ||||||||
10Prospectus ¡ TIAA Real Estate Account
ABOUT TIAA AND TIAA’S ROLE WITH THE ACCOUNT TIAA is the companion organization of the College Retirement Equities Fund (“CREF”), the first company in the United States to issue a variable annuity. CREF is a nonprofit membership corporation established in New York State in 1952. Together, TIAA and CREF, serving approximately 3.8 million people and approximately 15,000 institutions as of December 31, 2012, form the principal retirement system for the nation’s education and research communities and form one of the largest pension systems in the U.S., based on assets under management. As of December 31, 2012, TIAA’s total statutory admitted assets were approximately $237 billion; the combined assets under management for TIAA, CREF and other entities within the TIAA-CREF organization (including TIAA-sponsored mutual funds) totaled approximately $502 billion. CREF does not stand behind TIAA’s guarantees and TIAA does not guarantee CREF products. The Account does not have officers, directors or employees. TIAA employees, under the direction and control of TIAA’s Board of Trustees (the “Board”) and its Investment Committee, manage the investment of the Account’s assets, following investment management procedures TIAA has adopted for the Account. In addition, TIAA performs administration functions for the Account (which include receiving and allocating premiums, calculating and making annuity payments and providing recordkeeping and other services). Distribution services for the Account (which include, without limitation, distribution of the annuity contracts, advising existing annuity contract owners in connection with their accumulations and helping employers implement and manage retirement plans) are performed by Services. TIAA and Services provide investment management, administration and distribution services, as applicable, on an “at-cost” basis. With its 65 years in the real estate business and interests in properties located across the U.S. and internationally, TIAA is one of the nation’s largest and most experienced investors in mortgages and real estate equity interests. As of December 31, 2012, the TIAA General Account had a mortgage and real property portfolio (including interests in TIAA subsidiaries that hold real estate, real estate funds and joint ventures but excluding Real Estate Account units owned by TIAA, mortgage-backed securities and REIT securities) valued at approximately $22.0 billion. Liquidity Guarantee. In the event that the Account’s level of liquidity is not sufficient to guarantee that Account participants may redeem their accumulation units (at their accumulation unit value as of the date of such redemption request received in good order), the TIAA General Account will purchase accumulation units issued by the Account (sometimes called “liquidity units”) in accordance with its liquidity guarantee. The cost of this guarantee is embedded in the overall expense charge of the Account. This liquidity guarantee is not a guarantee of either investment performance or the value of units in the Account. TIAA Real Estate Account ¡Prospectus11
This liquidity guarantee was first exercised in December 2008 and, as of the date of this prospectus, has not been exercised since June 2009. As of December 31, 2012, TIAA owned 1.2 million liquidity units, representing approximately 2.2% of the Account’s outstanding accumulation units as of such date. As of the date of this prospectus, the independent fiduciary has completed the systematic redemption of all of the liquidity units held by the TIAA General Account. Approximately one-quarter of such units were redeemed evenly over the business days in each of June, September and December 2012, and March 2013, representing a total of $1.3 billion redeemed during this period. See “Establishing and Managing the Account — The Role of TIAA — Liquidity Guarantee” on page 45 and “— Role of the Independent Fiduciary” on page 47. THE CONTRACTS TIAA offers the Account as a variable option for the annuity contracts listed on the cover page of this prospectus, although some employer plans may not offer the Account as an option for certain contracts. Each payment to the Account buys a number of accumulation units. Similarly, any transfer or withdrawal from the Account results in the redemption of a number of accumulation units. The price you pay for an accumulation unit, and the price you receive for an accumulation unit when you redeem accumulation units, is the accumulation unit value (which we sometimes call the “AUV”) calculated for the business day on which we receive your purchase, redemption or transfer request in good order (unless you ask for a later date for a redemption or transfer). The Right to Cancel Your Contract.Generally, you may cancel any RA, SRA, GSRA, Classic IRA, Roth IRA, ATRA or Keogh contract in accordance with the contract’s Right to Examine provision (unless we have begun making annuity payments from it) and subject to the time period regulated by the state in which the contract is issued. Although the contract terms and state law provisions differ, you will generally have between 10 and 60 days to exercise this cancellation right. Transfers and Withdrawals.Subject to the terms of the contracts and your employer’s plan, you can move your money to and from the Account in the following ways: • from the Account to a CREF investment account, a TIAA Access variable account (if available), TIAA’s traditional annuity or a fund (including TIAA-CREF affiliated funds) or other option available under your plan; • to the Account from a CREF investment account, a TIAA Access variable account (if available), TIAA’s traditional annuity (transfers from TIAA’s traditional annuity under RA, GRA or Retirement Choice contracts are subject to restrictions), a TIAA-CREF affiliated fund or other options available under your plan or from other companies/plans; • by withdrawing cash; and/or • by setting up a program of automatic withdrawals or transfers. 12Prospectus ¡ TIAA Real Estate Account
Importantly, transfers out of the Account to a TIAA or CREF account or into another investment option can be executed on any business day but are limited to once per calendar quarter, although some plans may allow systematic transfers that result in more than one transfer per calendar quarter. Other limited exceptions may apply. Also, transfers to CREF accounts or to certain other options may be restricted by your employer’s plan, current tax law or by the terms of your contract. In addition, individual participants are limited from making internal funding vehicle transfers into their Account accumulation if, after giving effect to such transfer, the total value of such participant’s Account accumulation (under all contracts issued to such participant) would exceed $150,000. Categories of transactions that TIAA deems “internal funding vehicle transfers” for purposes of this limitation are described in detail on pages 126-127. As of the date of this prospectus, all jurisdictions in which the Account is offered have approved this limitation, but the effective date of the limitation as applies to an individual participant will be reflected on his or her applicable contract or endorsement form. Please see “How to Transfer and Withdraw Your Money” beginning on page 122. By limiting these transfers to the Real Estate Account, as anticipated, the amount of funds going into and out of the Account has become more predictable, which we believe will continue to enhance our ability to invest and manage the Real Estate Account’s portfolio with a long-term perspective. See “Management’s Discussion and Analysis of the Account’s Financial Condition and Results of Operations — Liquidity and Capital Resources” on page 97 for a discussion of participant flow activity. The Annuity Period. Your income payments may be paid out of the Account through a variety of income options. Ordinarily, your annuity payments begin on the date you designate as your annuity starting date, subject to the terms of your employer’s plan. Your initial income payments are based on the value of your accumulation on the last valuation day before the annuity starting date and annuity payments can change after the initial payment based on the Account’s investment experience, the income option you choose and the income change method you choose. Important tax considerations may also apply. See “Receiving Annuity Income” beginning on page 129. Death Benefits. Subject to the terms of your employer’s plan, TIAA may pay death benefits if you or your annuity partner dies. When you purchase your annuity contract, you name one or more beneficiaries to receive the death benefit if you die. You can change your beneficiaries any time before you die, and, unless you instruct otherwise, your annuity partner can do the same after your death. Your choice of beneficiary for death benefits may, in some cases, be subject to the consent of your spouse and federal and state law may impose additional restrictions. If you die during the accumulation period, the death benefit is the amount of your accumulation. If you and your annuity partner die during the annuity period while payments are still due under a fixed-period annuity or for the remainder of a guaranteed period, the death benefit is the TIAA Real Estate Account ¡Prospectus13
present value, based on interest at the effective annual rate of 4%, of the unit annuity payments due for the remainder of the period. Death benefits may be paid out during the accumulation period (currently under one of five available methods) or during the annuity period. Ordinarily, death benefits are subject to federal estate tax. Generally, if taken as a lump sum, death benefits would be taxed like complete withdrawals. If taken as annuity benefits, death benefits would be taxed like annuity payments. See “Death Benefits” on page 134.
The value of your investment in the Account will fluctuate based on the value of the Account’s assets, the income the assets generate and the Account’s expenses.Participants can lose money by investing in the Account. There is risk associated with an investor attempting to “time” an investment in the Account’s units, or effecting a redemption of an investor’s units. The Account’s assets and income can be affected by many factors, and you should consider the specific risks presented below before investing in the Account. In particular, for a discussion of how forward-looking statements contained in this prospectus are subject to uncertainties that are difficult to predict, which may be beyond management’s control and which could cause actual results to differ materially from historical experience or management’s present expectations, please refer to the subsection entitled “Forward-Looking Statements,” which is contained in the section entitled “Management’s Discussion and Analysis of the Account’s Financial Condition and Results of Operations” on page 70.
RISKS ASSOCIATED WITH REAL ESTATE INVESTING
General Risks of Acquiring and Owning Real Property:As referenced elsewhere in this prospectus, the substantial majority of the Account’s net assets are comprised of direct ownership interests in real estate. As such, the Account is particularly subject to the risks inherent in acquiring and owning real property, including in particular the following:
| ||||||||||||||||||||
• |
|
| Adverse Global and Domestic Economic Conditions. The economic conditions in the markets where the Account’s properties are located may be adversely impacted by factors which include: | |||||||||||||||||
|
| • |
adverse domestic or global economic conditions, particularly in the event of a deep recession which results in significant employment losses across many sectors of the economy and reduced levels of consumer spending;
•
a weak market for real estate generally and/or in specific locations where the Account may own property;
•
business closings, industry or sector slowdowns, employment losses and related factors;
•
the availability of financing (both for the Account and potential purchasers of the Account’s properties);
14Prospectus ¡ TIAA Real Estate Account
• an oversupply of, or a reduced demand for, certain types of real estate properties; • natural disasters, flooding and other significant and severe weather-related events, including those caused by global climate change; • terrorist attacks and/or other man-made events; and • decline in population or shifting demographics. The incidence of some or all of these factors could reduce occupancy, rental rates and the fair value of the Account’s real properties or interests in investment vehicles (such as limited partnerships) which directly hold real properties. • Concentration Risk.The Account may experience periods in which its investments are geographically concentrated, either regionally or in certain markets with similar demographics. Further, while the Account seeks diversification across its four primary property types: office, industrial, retail and multi-family residential properties, the Account may experience periods where it has concentration in one property type, increasing the potential exposure if there were to be an oversupply of, or a reduced demand for, certain types of real estate properties in the markets in which the Account operates. Also, the Account may experience periods in which its tenant base is concentrated within a particular industry sector. For example, the Account owns and operates a number of industrial properties, which typically feature larger tenant concentration. The insolvency and/or closing of a single tenant in one of our industrial properties may significantly impair the income generated by an industrial property, and may also depress the value of such property. In addition, the Account owns and operates a number of properties in the Washington, DC metropolitan area and a prolonged period of significantly diminished federal expenditures could have an adverse impact on demand for office space by the U.S. government and the sectors and industries dependent upon the U.S. government in such region or other regions where the government or such related businesses are large lessees. If any or all of these events occur, the Account’s income and performance may be adversely impacted disproportionately by deteriorating economic conditions in those areas or industry sectors in which the Account’s investments are concentrated. Also, the Account could experience a more rapid negative change in the value of its real estate investments than would be the case if its real estate investments were more diversified. •
Leasing Risk.A number of factors could cause the Account’s rental income, a key source of the Account’s revenue and investment return, to decline, which would adversely impact the Account’s results and investment returns. These factors include the following:
|
| • |
A property may be unable to attract new tenants or retain existing tenants. This situation could be exacerbated if a concentration of lease
TIAA Real Estate Account ¡Prospectus15
expirations occurred during any one time period or multiple tenants exercise early termination at the same time. • The financial condition of our tenants may be adversely impacted, particularly in a prolonged economic downturn. The Account could lose revenue if tenants do not pay rent when contractually obligated, request some form of rent relief and/or default under a lease at one of the Account’s properties. Such a default could occur if a tenant declared bankruptcy, suffered from a lack of liquidity, failed to continue to operate its business or for other reasons. In the event of any such default, we may experience a delay in, or an inability to effect, the enforcement of our rights against that tenant, particularly if that tenant filed for bankruptcy protection. Further, any disputes with tenants could involve costly and time consuming litigation. • In the event a tenant vacates its space at one of the Account’s properties, whether as a result of a default, the expiration of the lease term, rejection of the lease in bankruptcy or otherwise, given current market conditions, we may not be able to re-lease the vacant space either (i) for as much as the rent payable under the previous lease or (ii) at all. Also, we may not be able to re-lease such space without incurring substantial expenditures for tenant improvements and other lease-up related costs, while still being obligated for any mortgage payments, real estate taxes and other expenditures related to the property. • In some instances, our properties may be specifically suited to and/or outfitted for the particular needs of a certain tenant based on the type of business the tenant operates. For example, many companies desire space with an open floor plan. We may have difficulty obtaining a new tenant for any vacant space in our properties, particularly if the floor plan limits the types of businesses that can use the space without major renovation, which may require us to incur substantial expense in re-planning the space. Also, upon expiration of a lease, the space preferences of our major tenants may no longer align with the space they previously rented, which could cause those tenants to not renew their lease, or may require us to expend significant sums to reconfigure the space to their needs. • The Account owns and operates retail properties, which, in addition to the risks listed above, are subject to specific risks, including the insolvency and/or closing of an anchor tenant. Many times, anchor tenants will be “big box” stores and other large retailers that can be particularly adversely impacted by a global recession and reduced consumer spending generally. Factors that can impact the level of consumer spending include increases in fuel and energy costs, residential and commercial real estate and mortgage conditions, labor and healthcare costs, access to credit, consumer confidence and other macroeconomic factors. Under certain circumstances, co-tenancy clauses in tenants’ leases may allow certain tenants in a retail property to terminate their leases or reduce or withhold 16Prospectus ¡ TIAA Real Estate Account
rental payments when overall occupancy at the property falls below certain minimum levels. The insolvency and/or closing of an anchor tenant may also cause such tenants to terminate their leases, or to fail to renew their leases at expiration. •
Competition. The Account may face competition for real estate investments from multiple sources, including individuals, corporations, insurance companies or other insurance company separate accounts, as well as real estate limited partnerships, real estate investment funds, commercial developers, pension plans, other institutional and foreign investors and other entities engaged in real estate investment activities. Some of these competitors may have similar financial and other resources as the Account, and/or they may have investment strategies and policies (including the ability to incur significantly more leverage than the Account) that allow them to compete more aggressively for real estate investment opportunities, which could result in the Account paying higher prices for investments, experiencing delays in acquiring investments or failing to consummate such purchases. Any resulting delays in the acquisition of investments, or the failure to consummate acquisitions the Account deems desirable, may increase the Account’s costs or otherwise adversely affect the Account’s investment results.
In addition, the Account’s properties may be located close to properties that are owned by other real estate investors and that compete with the Account for tenants. These competing properties may be better located or more suitable for tenants than our properties, or have owners who may compete more aggressively for tenants, resulting in a competitive advantage for these other properties. We may also face similar competition from other properties that may be developed in the future. This competition may limit the Account’s ability to lease space, increase its costs of securing tenants, limit our ability to maximize our rents and/ or require the Account to make capital improvements it otherwise would not, in order to make its properties more attractive to prospective tenants.
•
Operating Costs. A property’s cash flow could decrease if operating costs, such as property taxes, utilities, litigation expenses associated with a property, maintenance and insurance costs that are not reimbursed by tenants increase in relation to gross rental income, or if the property needs unanticipated repairs and renovations. In addition, our expenses of owning and operating a property are not necessarily reduced when our income from a property is reduced.
•
Condemnation. A governmental agency may condemn and convert for a public use (i.e., through eminent domain) all or a portion of a property owned by the Account. While the Account would receive compensation in connection with any such condemnation, such compensation may not be in an amount the Account believes represents equivalent value for the condemned property. Further, a partial condemnation could impair the ability of the Account to maximize the value of the property during its
TIAA Real Estate Account ¡Prospectus17
operation, including making it more difficult to find new tenants or retain existing tenants. Finally, a property which has been subject to a partial condemnation may be more difficult to sell at a price the Account believes is appropriate. • Terrorism and Acts of War and Violence. Terrorist attacks may harm our property investments. The Account cannot assure you that there will not be further terrorist attacks against the United States or U.S. businesses or elsewhere in the world. These attacks or armed conflicts may directly or indirectly impact the value of the property we own or that secure our loans. Losses resulting from these types of events may be uninsurable or not insurable to the full extent of the loss suffered. Moreover, any of these events could cause consumer confidence and spending to decrease or result in increased volatility in the United States and worldwide financial markets and economy. Such events could also result in economic uncertainty in the United States or abroad. Adverse economic conditions resulting from terrorist activities could reduce demand for space in the Account’s properties and thereby reduce the value of the Account’s properties and therefore your investment return. General Risks of Selling Real Estate Investments:Among the risks of selling real estate investments are: • The sale price of an Account property might differ, perhaps significantly, from its estimated or appraised value, leading to losses or reduced profits to the Account. •
The Account might not be able to sell a property at a particular time for a price which management believes represents its fair or full value. This illiquidity may result from the cyclical nature of real estate, general economic conditions impacting the location of the property, disruption in the credit markets or the availability of financing on favorable terms or at all, and the supply of and demand for available tenant space, among other reasons. This might make it difficult to raise cash quickly which could impair the Account’s liquidity position (particularly during any period of sustained significant net participant outflows) and also could lead to Account losses. Further, the liquidity guarantee does not serve as a working capital facility or credit line to enhance the Account’s liquidity levels generally, as its purpose is tied to participants having the ability to redeem their accumulation units upon demand (thus, alleviating the Account’s need to dispose of properties solely to increase liquidity levels in what management deems a suboptimal sales environment).
•
The Account may need to provide financing to a purchaser if no cash buyers are available, or if buyers are unable to receive financing on terms enabling them to consummate the purchase. Such seller financing introduces a risk that the counterparty may not perform its obligations to repay the amounts borrowed from the Account to complete the purchase.
18Prospectus ¡ TIAA Real Estate Account
• For any particular property, the Account may be required to make expenditures for improvements to, or to correct defects in, the property before the Account is able to market and/or sell the property. • Interests in real estate limited partnerships tend to be in particular illiquid, and the Account may be unable to dispose of such investments at opportune times. Valuation and Appraisal Risks:Investments in the Account’s assets are stated at fair value, which is defined as the price that would be received to sell the asset in an orderly transaction between market participants at the measurement date. Determination of fair value, particularly for real estate assets, involves significant judgment. Valuation of the Account’s real estate properties (which comprise a substantial majority of the Account’s net assets) are based on real estate appraisals, which are estimates of property values based on a professional’s opinion and may not be accurate predictors of the amount the Account would actually receive if it sold a property. Appraisals can be subjective in certain respects and rely on a variety of assumptions and conditions at that property or in the market in which the property is located, which may change materially after the appraisal is conducted. Among other things, market prices for comparable real estate may be volatile, in particular if there has been a lack of recent transaction activity in such market. Recent disruptions in the macroeconomy, real estate markets and the credit markets have led to a significant decline in transaction activity in most markets and sectors and the lack of observable transaction data may have made it more difficult for an appraisal to determine the fair value of the Account’s real estate. In addition, a portion of the data used by appraisers is based on historical information at the time the appraisal is conducted, and subsequent changes to such data, after an appraiser has used such data in connection with the appraisal, may not be adequately captured in the appraised value. Also, to the extent that the Account uses a relatively small number of independent appraisers to value a significant portion of its properties, valuations may be subject to any institutional biases of such appraisers and their valuation procedures. Further, as the Account generally obtains appraisals on a quarterly basis, there may be circumstances in the period between appraisals or interim valuation adjustments in which the true realizable value of a property is not reflected in the Account’s daily net asset value calculation or in the Account’s periodic consolidated financial statements. This disparity may be more apparent when the commercial and/or residential real estate markets experience an overall and possibly dramatic decline (or increase) in property values in a relatively short period of time between appraisals. If the appraised values of the Account’s properties as a whole are too high, those participants who purchased accumulation units prior to (i) a downward valuation adjustment of a property or multiple properties or (ii) a property or properties being sold for a lower price than the appraised value will be credited with less of an interest than if the value had previously been adjusted TIAA Real Estate Account ¡Prospectus19
downward. Also, those participants who redeem during any such period will have received more than their pro rata share of the value of the Account’s assets, to the detriment of other non-redeeming participants. In particular, appraised property values may prove to be too high (as a whole) in a rapidly declining commercial real estate market. Further, implicit in the Account’s definition of fair value is a principal assumption that there will be a reasonable time to market a given property and that the property will be exchanged between a willing buyer and willing seller in a non-distressed scenario. However, an appraised value may not reflect the actual realizable value that would be obtained in a rush sale where time was of the essence. Also, appraised values may lag actual realizable values to the extent there is significant and rapid economic deterioration in a particular geographic market or a particular sector within a geographic market. If the appraised values of the Account’s properties as a whole are too low, those participants who redeem prior to (i) an upward valuation adjustment of a property or multiple properties or (ii) a property or properties being sold for a higher price than the appraised value will have received less than their pro rata share of the value of the Account’s assets, and those participants who purchase units during any such period will be credited with more than their pro rata share of the value of the Account’s assets. Finally, the Account recognizes items of income (such as net operating income from real estate investments, distributions from real estate limited partnerships or joint ventures, or dividends from REIT stocks) and expense in many cases on an intermittent basis, where the Account cannot predict with certainty the magnitude or the timing of such item. As such, even as the Account estimates items of net operating income on a daily basis, the AUV for the Account may fluctuate, perhaps significantly, from day to day, as a result of adjusting these estimates for the actual recognized item of income or expense. Investment Risk Associated with Participant Transactions:The amount we have available to invest in new properties and other real estate-related assets will depend, in large part, on the level of net participant transfers into or out of the Account as well as participant premiums into the Account. As noted elsewhere in this prospectus, the Account intends to hold between 15% and 25% of its net assets in investments other than real estate and real estate-related investments, comprised of publicly traded, liquid investments. These liquid assets are intended to be available to purchase real estate-related investments in accordance with the Account’s investment objective and strategy and are also available to meet participant redemption requests and the Account’s expense needs (including, from time to time, obligations on debt). Significant participant transaction activity into or out of the Account’s units is generally not predictable, and wide fluctuations can occur as a result of macroeconomic or geopolitical conditions, the performance of equities or fixed income securities or general investor sentiment, regardless of the historical 20Prospectus ¡ TIAA Real Estate Account
performance of the Account or of the performance of the real estate asset class generally. In the second half of 2008 and in 2009, the Account experienced significant net participant transfers out of the Account, eventually causing the Account’s liquid assets to comprise less than 10% of the Account’s assets (on a net and total basis) throughout all of 2009 and into early 2010. Due in large part to this activity, the TIAA liquidity guarantee was initially exercised in December 2008. See “Establishing and Managing the Account—The Role of TIAA—Liquidity Guarantee” on page 45. Among other things, this continued shortfall in the amount of liquid assets impaired management’s ability to consummate new transactions. If a significant amount of net participant transfers out of the Account were to recur, particularly in high volumes similar to those experienced in late 2008 and 2009, we may not have enough available liquid assets to pursue, or consummate, new investment opportunities presented to us that are otherwise attractive to the Account. This, in turn, could harm the Account’s returns. Even though net transfers out of the Account ceased in early 2010 and, as of the date of this prospectus, the Account has been in a net inflow position since such time, there is no guarantee that redemption activity will not increase again, perhaps in a significant and rapid manner. Alternatively, periods of significant net transfer activity into the Account can result in the Account holding a higher percentage of its net assets in publicly traded liquid non-real estate-related investments than the Account’s managers would target to hold under the Account’s long-term strategy. As of December 31, 2012, the Account’s non-real estate-related liquid assets comprised 17.4% of its net assets. At times, the portion of the Account’s net assets invested in these types of liquid instruments may exceed 25%, particularly if the Account receives a large inflow of money in a short period of time, coupled with a lack of attractive real estate- related investments on the market. Also, large inflows from participant transactions often occur in times of appreciating real estate values and pricing, which can render it challenging to execute on some transactions at ideal prices. In an appreciating real estate market generally, this large percentage of assets held in liquid investments and not in real estate and real estate-related investments may impair the Account’s overall returns. This scenario may be exacerbated in a low interest rate environment for U.S. Treasury securities and related highly liquid securities, such as has existed since 2009 and which may persist in the future. In addition, to manage cash flow, the Account may temporarily hold a higher percentage of its net assets in liquid real estate-related securities, such as REIT and CMBS securities, than its long-term targeted holdings in such securities, particularly during and immediately following times of significant net transfer activity into the Account. Such holdings could increase the volatility of the Account’s returns. Risks of Borrowing:The Account acquires some of its properties subject to existing financing and from time to time borrows new funds at the time of purchase. Also, the Account may from time to time place new leverage on, TIAA Real Estate Account ¡Prospectus21
increase the leverage already placed on, or refinance maturing debt on, existing properties the Account owns. Under the Account’s current investment guidelines, the Account intends to maintain its loan to value ratio at or below 30% (measured at the time of incurrence and after giving effect thereto). As of December 31, 2012, the Account’s loan to value ratio was approximately 21.0%. Also, the Account may borrow up to 70% of the then-current value of a particular property. Non-construction mortgage loans on a property will be non-recourse to the Account. Among the risks of borrowing money or otherwise investing in a property subject to a mortgage are: • General Economic Conditions. General economic conditions, dislocations in the capital or credit markets generally or the market conditions then in effect in the real estate finance industry, may hinder the Account’s ability to obtain financing or refinancing for its property investments on favorable terms or at all, regardless of the quality of the Account’s property for which financing or refinancing is sought. Such unfavorable terms might include high interest rates, increased fees and costs and restrictive covenants applicable to the Account’s operation of the property. Longer term disruptions in the capital and credit markets as a result of uncertainty, changing or increased regulation, reduced alternatives or failures of significant financial institutions could adversely affect our access to financing necessary to make profitable real estate investments. Our failure to obtain financing or refinancing on favorable terms due to the current state of the credit markets or otherwise could have an adverse impact on the returns of the Account. The negative effects presently remaining in the marketplace from the worldwide economic slowdown following the banking crisis of 2008, and the ongoing sovereign debt and banking difficulties recently experienced in parts of the Eurozone, could affect the Account’s ability to secure financing. These difficulties include tighter lending standards instituted by banks and financial institutions, the reduced availability of credit facilities and project finance facilities from banks and the fall of consumer and/or business confidence. • Default Risk. The property or group of encumbered properties may not generate sufficient cash flow to support the debt service on the loan, the property may fail to meet certain financial or operating covenants contained in the loan documents and/or the property may have negative equity (i.e., the loan balance exceeds the value of the property) or inadequate equity. In any of these circumstances, we may default on the loan, including due to the failure to make required debt service payments when due. If a loan is in default, the Account may determine that it is not economically desirable and/or in the best interests of the Account to continue to make payments on the loan (including accessing other sources of funds to support debt service on the loan), and/or the Account may not be able to otherwise remedy such default on commercially reasonable 22Prospectus ¡ TIAA Real Estate Account
terms or at all. In either case, the lender then could accelerate the outstanding amount due on the loan and/or foreclose on the underlying property, in which case the Account could lose the value of its investment in the foreclosed property. Further, any such default or acceleration could trigger a default under loan agreements in respect of other Account properties pledged as security for the defaulted loan or other loans. Finally, any such default could increase the Account’s borrowing costs, or result in less favorable terms, with respect to financing future properties. • Balloon Maturities. If the Account obtains a mortgage loan that involves a balloon payment, there is a risk that the Account may not be able to make the lump sum principal payment due under the loan at the end of the loan term, or otherwise obtain adequate refinancing on terms commercially acceptable to the Account or at all. The Account then may be forced to sell the property or other properties under unfavorable market conditions, restructure the loan on terms not advantageous to the Account, or default on its mortgage, resulting in the lender exercising its remedies, which may include repossession of the property, and the Account could lose the value of its investment in that property. • Variable Interest Rate Risk. If the Account obtains variable-rate loans, the Account’s returns may be volatile when interest rates are volatile. Further, to the extent that the Account takes out fixed-rate loans and interest rates subsequently decline, this may cause the Account to pay interest at above-market rates for a significant period of time. Any hedging activities the Account engages in to mitigate this risk may not fully protect the Account from the impact of interest rate volatility. • Variable Rate Demand Obligation (VRDO) Risk. To the extent the Account obtains financing pursuant to a variable rate demand obligation subject to periodic remarketing or similar mechanisms, the Account or the joint ventures in which it invests could face higher borrowing costs if the remarketing results in a higher prevailing interest rate. In addition, the terms of such variable rate obligations may allow the remarketing agent to cause the Account or venture to repay the loan on demand in the event insufficient market demand for such loans is present. In particular, RGM 42, LLC, a joint venture in which the Account holds a 70% interest, is the borrower under a VRDO loan program, as described in more detail in “Management’s Discussion and Analysis of the Account’s Financial Condition and Results of Operations” on page 70. • Valuation Risk. The market valuation of mortgage loans payable could have an adverse impact on the Account’s performance. Valuations of mortgage loans payable are generally based on the amount at which the liability could be transferred in a current transaction, exclusive of transaction costs, and such valuations are subject to a number of assumptions and factors with respect to the loan and the underlying property, a change in any of which could cause the value of a mortgage loan to fluctuate. TIAA Real Estate Account ¡Prospectus23
A general disruption in the credit markets, such as the disruption experienced in 2008 and 2009, may aggravate some or all of these risks. Risks of Joint Ownership:Investing in joint venture partnerships or other forms of joint property ownership may involve special risks, many of which are exacerbated when the consent of parties other than the Account is required to take action. • The co-venturer may have interests or goals inconsistent with those of the Account, including during times when a co-venturer may be experiencing financial difficulty. For example: •
a co-venturer may desire a higher current income return on a particular investment than does the Account (which may be motivated by a longer-term investment horizon or exit strategy), or vice versa, which could cause difficulty in managing a particular asset;
•
a co-venturer may desire to maximize or minimize leverage in the venture, which may be at odds with the Account’s strategy;
•
a co-venturer may be more or less likely than the Account to agree to modify the terms of significant agreements (including loan agreements) binding the venture, or may significantly delay in reaching a determination whether to do so, each of which may frustrate the business objectives of the Account; and
•
for reasons related to its own business strategy, a co-venturer may have different concentration standards as to its investments (geographically, by sector, or by tenant), which might frustrate the execution of the business plan for the joint venture.
| ||||||||||||||||||||
• |
|
| The co-venturer may be unable to fulfill its obligations (such as to fund its pro rata share of committed capital, expenditures or guarantee obligations of the venture) during the term of such agreement or may become insolvent or bankrupt, any of which could expose the Account to greater liabilities than expected and frustrate the investment objective of the venture. | |||||||||||||||||
| ||||||||||||||||||||
• |
| If a co-venturer doesn’t follow the Account’s instructions or adhere to the Account’s policies, the jointly owned properties, and consequently the Account, might be exposed to greater liabilities than expected. | ||||||||||||||||||
| ||||||||||||||||||||
• |
| The Account may have limited rights with respect to the underlying property pursuant to the terms of the joint venture, including the right to operate, manage or dispose of a property, and a co-venturer could have approval rights over the marketing or the ultimate sale of the underlying property. | ||||||||||||||||||
| ||||||||||||||||||||
• |
| The terms of the Account’s ventures often provide for complicated agreements which can impede our ability to direct the sale of the property owned by the venture at times the Account views most favorable. One such agreement is a “buy-sell” right, which may force us to make a decision (either to buy our co- venturer’s interest or sell our interest to our co-venturer) at inopportune times. | ||||||||||||||||||
24Prospectus ¡ TIAA Real Estate Account
• A co-venturer can make it harder for the Account to transfer its equity interest in the venture to a third party, which could adversely impact the valuation of the Account’s interest in the venture. • To the extent the Account serves as the general partner or managing member in a venture, it may owe certain contractual or other duties to the co-venturer, including fiduciary duties, which may present perceived or actual conflicts of interest in the management of the underlying assets. Such an arrangement could also subject the Account to liability to third parties in the performance of its duties as a general partner or managing member. Risks of Developing or Redeveloping Real Estate or Buying Recently Constructed Properties:If the Account chooses to develop or redevelop a property or buys a recently constructed property, it may face the following risks: • There may be delays or unexpected increases in the cost of property development, redevelopment and construction due to strikes, bad weather, material shortages, increases in material and labor costs or other events. • There are risks associated with potential underperformance or nonperformance by, and/or solvency of, a contractor we select or other third party vendors involved in developing or redeveloping the property. • If we were viewed as developing or redeveloping underperforming properties, suffering losses on our investments, or defaulting on any loans on our properties, our reputation could be damaged. Damage to our reputation could make it more difficult to successfully develop or acquire properties in the future and to continue to grow and expand our relationships with our lenders, venture partners and tenants. • Because external factors may have changed from when the project was originally conceived (e.g., slower growth in the local economy, higher interest rates, overbuilding in the area or changes in the regulatory and permitting environment), the property may not attract tenants on the schedule we originally planned and/ or may not operate at the income and expense levels first projected. Risks with Purchase-Leaseback Transactions:To the extent the Account invested in a purchase-leaseback transaction, the major risk is that the third party lessee will be unable to make required payments to the Account. If the leaseback interest is subordinate to other interests in the real property, such as a first mortgage or other lien, the risk to the Account increases because the lessee may have to pay the senior lienholder to prevent foreclosure before it pays the Account. If the lessee defaults or the leaseback is terminated prematurely, the Account might not recover its investment unless the property is sold or leased on favorable terms. Regulatory Risks:Government regulation at the federal, state and local levels, including, without limitation, zoning laws, rent control or rent stabilization laws, laws regulating housing on the Account’s multifamily TIAA Real Estate Account ¡Prospectus25
residential properties, the Americans with Disabilities Act, property taxes and fiscal, accounting, environmental or other government policies, could operate or change in a way that adversely affects the Account and its properties. For example, these regulations could raise the cost of acquiring, owning, improving or maintaining properties, present barriers to otherwise desirable investment opportunities or make it harder to sell, rent, finance, or refinance properties either on economically desirable terms, or at all, due to the increased costs associated with regulatory compliance. Environmental Risks:The Account may be liable for damage to the environment or injury to individuals caused by hazardous substances used or found on its properties. Under various environmental regulations, the Account may also be liable, as a current or previous property owner or mortgagee, for the cost of removing or cleaning up hazardous substances found on a property, even if it did not know of and wasn’t responsible for the hazardous substances. If any hazardous substances are present or the Account does not properly clean up any hazardous substances, or if the Account fails to comply with regulations requiring it to actively monitor the business activities on its premises, the Account may have difficulty selling or renting a property or be liable for monetary penalties. Further, environmental laws may impose restrictions on the manner in which a property may be used, the tenants which may be allowed, or the manner in which businesses may be operated, which may require the Account to expend funds. These laws may also cause the most ideal use of the property to differ from that originally contemplated and as a result could impair the Account’s returns. The cost of any required cleanup relating to a single real estate investment (including remediating contaminated property) and the Account’s potential liability for environmental damage, including paying personal injury claims and performing under indemnification obligations to third parties, could exceed the value of the Account’s investment in a property, the property’s value, or in an extreme case, a significant portion of the Account’s assets. Finally, while we may from time to time acquire third-party insurance related to environmental risks, such insurance coverage may be inadequate to cover the full cost of any loss and would cause us to be reliant on the financial health of our third-party insurer at the time any such claim is submitted. Uninsurable Losses:Certain catastrophic losses (e.g., from earthquakes, wars, terrorist acts, nuclear accidents, hurricanes, wind, floods or environmental or industrial hazards or accidents) may be uninsurable or so expensive to insure against that it is economically disadvantageous to buy insurance for them. Further, the terms and conditions of the insurance coverage the Account has on its properties, in conjunction with the type of loss actually suffered at a property, may subject the property, or the Account as a whole, to a cap on insurance proceeds that is less than the loss or losses suffered. If a disaster that we have not insured against occurs, if the insurance contains a high deductible, and/or if the aggregate insurance proceeds for a particular type of casualty are capped, the Account could lose some of its 26Prospectus ¡ TIAA Real Estate Account
original investment and any future profits from the property. Also, the Account may not have sufficient access to internal or external sources of funding to repair or reconstruct a damaged property to the extent insurance proceeds do not cover the full loss. In addition, some leases may permit a tenant to terminate its obligations in certain situations, regardless of whether those events are fully covered by insurance. In that case, the Account would not receive rental income from the property while that tenant’s space is vacant, and any such vacancy might impact the value of that property. Finally, as with respect to all third-party insurance, we are reliant on the continued financial health of such insurers and their ability to pay on valid claims. If the financial health of an insurer were to deteriorate quickly, we may not be able to find adequate coverage from another carrier on favorable terms, which could adversely impact the Account’s returns. RISKS OF INVESTING IN REAL ESTATE INVESTMENT TRUST SECURITIES The Account invests in REIT securities for diversification, liquidity management and other purposes. The Account’s investment in REITs may also increase, as a percentage of net assets, during periods in which the Account is experiencing large net inflow activity, in particular due to net participant transfers into the Account. As of December 31, 2012, REIT securities comprised approximately 9.0% of the Account’s net assets. Investments in REIT securities are part of the Account’s real estate-related investment strategy and are subject to many of the same general risks associated with direct real property ownership. In particular, equity REITs may be affected by changes in the value of the underlying properties owned by the entity, while mortgage REITs may be affected by the quality of any credit extended. In addition to these risks, because REIT investments are securities and generally publicly traded, they may be exposed to market risk and potentially significant price volatility due to changing conditions in the financial markets and, in particular, changes in overall interest rates, regardless of the value of the underlying real estate such REIT may own. Also, sales of REIT securities by the Account for liquidity management purposes may occur at times when values of such securities have declined and it is otherwise an inopportune time to sell the security. Volatility in REITs can cause significant fluctuations in the Account’s AUV on a daily basis, as they are correlated to equity markets which have experienced significant day to day fluctuations over the past few years. REITs do not pay federal income taxes if they distribute most of their earnings to their shareholders and meet other tax requirements. Many of the requirements to qualify as a REIT, however, are highly technical and complex. Failure to qualify as a REIT results in tax consequences, as well as disqualification from operating as a REIT for a period of time. Consequently, if we invest in a REIT security that later fails to qualify as a REIT, this may adversely affect the performance of our investment. TIAA Real Estate Account ¡Prospectus27
RISKS OF MORTGAGE-BACKED SECURITIES The Account from time to time has invested in mortgage-backed securities and may in the future invest in such securities. Mortgage-backed securities, such as CMBS, are subject to many of the same general risks inherent in real estate investing, making mortgage loans and investing in debt securities. The underlying mortgage loans may experience defaults with greater frequency than projected when such mortgages were underwritten, which would impact the values of these securities, and could hamper our ability to sell such securities. In particular, these types of investments may be subject to prepayment risk or extension risk (i.e., the risk that borrowers will repay the loans earlier or later than anticipated). If the underlying mortgage assets experience faster than anticipated prepayments of principal, the Account could fail to recoup some or all of its initial investment in these securities, since the original price paid by the Account was based in part on assumptions regarding the receipt of interest payments. If the underlying mortgage assets are repaid later than anticipated, the Account could lose the opportunity to reinvest the anticipated cash flows at a time when interest rates might be rising. The rate of prepayments depends on a variety of geographic, social and other functions, including prevailing market interest rates and general economic factors. Further, it is possible that the U.S. Government may change its support of, and policies regarding, Fannie Mae and Freddie Mac and, thus, the Account may be unable to acquire agency mortgage-backed securities in the future and even if the Account so acquired them, such changes may result in a negative effect on the pricing of such securities. Other policy changes impacting Fannie Mae and Freddie Mac and/or U.S. Government programs related to mortgages that may be implemented in the future could create market uncertainty and affect the actual or perceived credit quality of issued securities, adversely affecting mortgage-backed securities through an increased risk of loss. Importantly, the market value of these securities is also highly sensitive to changes in interest rates, liquidity of the secondary market and economic conditions impacting financial institutions and the credit markets generally. Note that the potential for appreciation, which could otherwise be expected to result from a decline in interest rates, may be limited by any increased prepayments. Further, volatility and disruption in the mortgage market and credit markets generally (such as was the case in 2008 and 2009) may cause there to be a very limited or even no secondary market for these securities and they therefore may be harder to sell than other securities. RISKS OF U.S. GOVERNMENT AGENCY SECURITIES AND CORPORATE OBLIGATIONS The Account invests in securities issued by U.S. government agencies and U.S. government-sponsored entities. Some of these issuers may not have their securities backed by the full faith and credit of the U.S. government, which could adversely affect the pricing and value of such securities. Also, the Account may invest in corporate obligations (such as commercial paper) and 28Prospectus ¡ TIAA Real Estate Account
while the Account seeks out such holdings in short-term, higher-quality liquid instruments, the ability of the Account to sell these securities may be uncertain, particularly when there are general dislocations in the finance or credit markets. Any such volatility could have a negative impact on the value of these securities. Further, transaction activity generally may fluctuate significantly from time to time, which could impair the Account’s ability to dispose of a security at a favorable time, regardless of the credit quality of the underlying issuer. Also, inherent with investing in any corporate obligation is the risk that the credit quality of the issuer will deteriorate, which could cause the obligations to be downgraded and hamper the value or the liquidity of these securities. Finally, continued downgrades or threatened downgrades of the credit rating for U.S. government obligations generally could impact the pricing and liquidity of agency securities or corporate obligations in a manner which could impact the value of the Account’s units. RISKS OF LIQUID INVESTMENTS The Account’s investments in liquid investments (whether real estate-related, such as REITs, CMBS or some mortgage loans receivable, or non-real estate-related, such as cash equivalents and government securities, and whether debt or equity), are subject to the following general risks: •
Financial / Credit Risk— The risk, for debt securities, that the issuer will not be able to pay principal and interest when due (and/or declare bankruptcy or be subject to receivership) and, for equity securities such as common or preferred stock, that the issuer’s current earnings will fall or that its overall financial soundness will decline, reducing the security’s value.
|
| • |
Market Volatility Risk— The risk that the Account’s investments will experience price volatility due to changing conditions in the financial markets even regardless of the credit quality or financial condition of the underlying issuer. This risk is particularly acute to the extent the Account holds equity securities, which have experienced significant short-term price volatility in recent years. Also, to the extent the Account holds debt securities, changes in overall interest rates can cause price fluctuations.
•
Interest Rate Volatility— The risk that interest rate volatility may affect the Account’s current income from an investment. As interest rates rise, the value of certain debt securities (such as those bearing lower fixed rates) held by the Account is likely to decrease.
•
Deposit / Money Market Risk— The risk that, to the extent the Account’s cash held in bank deposit accounts exceeds federally insured limits as to that bank, the Account could experience losses if banks fail. In addition, there is some risk that investments held in money market accounts or funds can suffer losses.
Further, to the extent that a significant portion of the Account’s net assets at any particular time are comprised of cash, cash equivalents and non-real
TIAA Real Estate Account ¡Prospectus29
estate-related liquid securities, the Account’s returns may suffer as compared to the return that could have been generated by more profitable real estate-related investments. Such a potential negative impact on returns may be exacerbated in times of low prevailing interest rates payable on many classes of liquid securities, such as is the case as of the date hereof and which may persist in the future. RISKS OF FOREIGN INVESTMENTS In addition to other investment risks noted above, foreign investments present the following special risks: • The value of foreign investments or rental income can increase or decrease due to changes in currency rates, currency exchange control regulations, possible expropriation or confiscatory taxation, political, social, and economic developments and foreign regulations. The Account translates into U.S. dollars purchases and sales of securities, income receipts and expense payments made in foreign currencies at the exchange rates prevailing on the respective dates of the transactions. The effect of any changes in currency exchange rates on investments and mortgage loans payable is included in the Account’s net realized and unrealized gains and losses. As such, fluctuations in currency exchange rates may impair the Account’s returns. • The Account may, but is not required to, hedge its exposure to changes in currency rates, which could involve extra costs. Further, any hedging activities might not be successful. In addition, a lender to a foreign property owned by the Account could require the Account to compensate it for its loss associated with such lender’s hedging activities. • Non-U.S. jurisdictions may impose taxes on the Account as a result of its investment activity in that jurisdiction. TIAA may be eligible for a foreign tax credit in respect of such tax paid by the Account and such credit (if available to TIAA) would be reimbursed to the Account. However, there may be circumstances where TIAA is unable to receive some or all of the benefit of a foreign tax credit and the Account would thus not receive reimbursement, which could harm the value of the Account’s units. • Foreign real estate markets may have different liquidity and volatility attributes than U.S. markets. • The regulatory environment in non-U.S. jurisdictions may disfavor owners and operators of real estate investment properties, resulting in less predictable and/or economically harmful outcomes if the Account were to face a significant dispute with a tenant or with a regulator itself. • The Account may be subject to increased risk of regulatory scrutiny pursuant to U.S. federal statutes, such as the Foreign Corrupt Practices Act, which among other things requires robust compliance and oversight programs to help prevent violations. The costs associated with maintaining such programs, in addition to costs associated with a potential regulatory 30Prospectus ¡ TIAA Real Estate Account
inquiry, could impair the Account’s returns and divert management’s attention from other Account activities. • It may be more difficult to obtain and collect a judgment on foreign investments than on domestic investments, and the costs associated with contesting claims relating to foreign investments may exceed those costs associated with a similar claim on domestic investments. • We may invest from time to time in securities issued by (1) entities domiciled in foreign countries, (2) domestic affiliates of such entities and/or (3) foreign domiciled affiliates of domestic entities. Such investments could be subject to the risks associated with investments subject to foreign regulation, including political unrest or the repatriation or nationalization of the issuer’s assets. These events could depress the value of such securities and/or make such securities harder to sell on favorable terms, if at all. RISKS OF INVESTING IN MORTGAGE LOANS The Account’s investment strategy includes, to a limited extent, investments in mortgage loans (i.e.,the Account serving as lender). • General Risks of Mortgage Loans.The Account will be subject to the risks inherent in making mortgage loans, including: •
The borrower may default on the loan, requiring that the Account foreclose on the underlying property to protect the value of its mortgage loan. Since its mortgage loans are usually non-recourse, the Account must rely solely on the value of a property for its security.
•
The larger the mortgage loan compared to the value of the property securing it, the greater the loan’s risk. Upon default, the Account may not be able to sell the property for its estimated or appraised value. Also, certain liens on the property, such as mechanic’s or tax liens, may have priority over the Account’s security interest.
| ||||||||||||||||||||
• |
|
| A deterioration in the financial condition of tenants, which could be caused by general or local economic conditions or other factors beyond the control of the Account, or the bankruptcy or insolvency of a major tenant, may adversely affect the income of a property, which could increase the likelihood that the borrower will default under its obligations. | |||||||||||||||||
| ||||||||||||||||||||
• |
| The borrower may be unable to make a lump sum principal payment due under a mortgage loan at the end of the loan term, unless it can refinance the mortgage loan with another lender. | ||||||||||||||||||
| ||||||||||||||||||||
• |
| If interest rates are volatile during the loan period, the Account’s variable-rate mortgage loans could have volatile yields. Further, to the extent the Account makes mortgage loans with fixed interest rates, it may receive lower yields than that which is then available in the market if interest rates rise generally. | ||||||||||||||||||
| ||||||||||||||||||||
• |
|
| Prepayment Risks.The Account’s mortgage loan investments will usually be subject to the risk that the borrower repays a loan early. Also, we may | |||||||||||||||||
TIAA Real Estate Account ¡Prospectus31
be unable to reinvest the proceeds at as high an interest rate as the original mortgage loan rate. • Interest Limitations.The interest rate we charge on mortgage loans may inadvertently violate state usury laws that limit rates, if, for example, state law changes during the loan term. If this happens, we could incur penalties or may be unable to enforce payment of the loan. • Risks of Participations.To the extent the Account invested in a participating mortgage, the following additional risks would apply: • The participation feature, in tying the Account’s returns to the performance of the underlying asset, might generate insufficient returns to make up for the higher interest rate the loan would have obtained without the participation feature. • In very limited circumstances, a court may characterize the Account’s participation interest as a partnership or joint venture with the borrower and the Account could lose the priority of its security interest or become liable for the borrower’s debts. CONFLICTS OF INTEREST WITHIN TIAA General.TIAA and its affiliates (including TIAA-CREF Alternatives Advisors, LLC and Teachers Advisors, Inc., its wholly owned subsidiaries and registered investment advisers) have interests in other real estate programs and accounts and also engage in other business activities and as such, they will have conflicts of interest in allocating their time between the Account’s business and these other activities. Also, the Account may be buying properties at the same time as TIAA affiliates that may have similar investment objectives to those of the Account. There is also a risk that TIAA will choose a property that provides lower returns to the Account than a property purchased by TIAA and its affiliates. Further, the Account will likely acquire properties in geographic areas where TIAA and its affiliates own properties. In addition, the Account may desire to sell a property at the same time another TIAA affiliate is selling a property in an overlapping market. Conflicts could also arise because some properties owned by TIAA and its affiliates may compete with the Account’s properties for tenants. Among other things, if one of the TIAA entities attracts a tenant that the Account is competing for, the Account could suffer a loss of revenue due to delays in locating another suitable tenant. TIAA has adopted allocation policies and procedures applicable to the purchasing conflicts scenario, but the resolution of such conflicts may be economically disadvantageous to the Account. As a result of TIAA’s and its affiliates’ obligations to other current and potential TIAA-sponsored investment vehicles with similar objectives to those of the Account, there is no assurance that the Account will be able to take advantage of every attractive investment opportunity that otherwise is in accordance with the Account’s investment objectives. Liquidity Guarantee:In addition, as discussed elsewhere in this prospectus, the TIAA General Account provides a liquidity guarantee to the Account. 32Prospectus ¡ TIAA Real Estate Account
While an independent fiduciary is responsible for establishing a “trigger point” (a percentage of TIAA’s ownership of liquidity units beyond which TIAA’s ownership may be reduced at the fiduciary’s direction), there is no express cap on the amount TIAA may be obligated to fund under this guarantee. Further, the Account’s independent fiduciary oversees any redemption of TIAA liquidity units and recently completed the systematic redemption of liquidity units originally purchased by the TIAA General Account during the period of significant net participant transfers out of the Account in late 2008 and early 2009. TIAA’s ownership of liquidity units (including the potential for changes in its levels of ownership in the future) could result in the perception that TIAA is taking into account its own economic interests while serving as investment manager for the Account. In particular, the value of TIAA’s liquidity units fluctuates in the same manner as the value of accumulation units held by all participants. Any perception of a conflict of interest could cause participants to transfer accumulations out of the Account to another investment option, which could have an adverse impact on the Account’s ability to act most optimally upon its investment strategy. For a discussion of the relevant allocation policies and procedures TIAA has established as well as a summary of other conflicts of interest which may arise as a result of TIAA’s management of the Account, see “Establishing and Managing the Account — the Role of TIAA — Conflicts of Interest” on page 49. NO OPPORTUNITY FOR PRIOR REVIEW OF TRANSACTIONS Investors do not have the opportunity to evaluate the economic or financial merit of the purchase, sale or financing of a property or other investment before the Account completes the transaction, so investors will need to rely solely on TIAA’s judgment and ability to select investments consistent with the Account’s investment objective and policies. Further, the Account may change its investment objective and pursue specific investments in accordance with any such amended investment objective without the consent of the Account’s investors. RISKS OF REGISTRATION UNDER THE INVESTMENT COMPANY ACT OF 1940 The Account has not registered, and management intends to continue to operate the Account so that it will not have to register, as an “investment company” under the Investment Company Act of 1940, as amended (the “Investment Company Act”). Generally, a company is an “investment company” and required to register under the Investment Company Act if, among other things, it holds itself out as being engaged primarily, or proposes to engage primarily, in the business of investing, reinvesting or trading in securities, or it is engaged or proposes to engage in the business of investing, reinvesting, owning, holding or trading in securities and owns or proposes to acquire investment securities having a value exceeding 40% of the value of such company’s total assets (exclusive of government securities and cash items) on an unconsolidated basis. TIAA Real Estate Account ¡Prospectus33
If the Account were obligated to register as an investment company, the Account would have to comply with a variety of substantive requirements under the Investment Company Act that impose, among other things, limitations on capital structure, restrictions on certain investments, compliance with reporting, record keeping, voting and proxy disclosure requirements and other rules and regulations that could significantly increase its operating expenses and reduce its operating flexibility. To maintain compliance with the exemptions from the Investment Company Act, the Account may be unable to sell assets it would otherwise want to sell and may be unable to purchase securities it would otherwise want to purchase, which might materially adversely impact the Account’s performance. THE ACCOUNT’S INVESTMENT OBJECTIVE AND STRATEGY Investment Objective:The Account seeks favorable long-term returns primarily through rental income and appreciation of real estate and real estate-related investments owned by the Account. The Account will also invest in non-real estate-related publicly traded securities and short-term higher quality liquid investments that are easily converted to cash to enable the Account to meet participant redemption requests, purchase or improve properties or cover other expense needs. Investment Strategy: Real Estate-Related Investments.The Account intends to have between 75% and 85% of its net assets invested directly in real estate or real estate-related investments with the goal of producing favorable long-term returns primarily through rental income and appreciation. These investments may consist of: • Direct ownership interests in real estate, • Direct ownership of real estate through interests in joint ventures, • Indirect interests in real estate through real estate-related securities, such as: • real estate limited partnerships, • REITs, which investments may consist of common or preferred stock interests, • investments in equity or debt securities of companies whose operations involve real estate (i.e.,that primarily own or manage real estate) which may not be REITs, and • conventional mortgage loans, participating mortgage loans, and collateralized mortgage obligations, including CMBS and other similar investments. The Account’s principal strategy is to purchase direct ownership interests in income-producing real estate, primarily office, industrial, retail and multi-family residential properties. The Account is targeted to hold between 65% and 80% of the Account’s net assets in such direct ownership interests at any time. 34Prospectus ¡ TIAA Real Estate Account
Historically, over 70% of the Account’s net assets have been comprised of such direct ownership interests in real estate. In addition, while the Account is authorized to hold up to 25% of its net assets in liquid real estate-related securities, such as REITs and CMBS, management intends that the Account will not hold more than 10% of its net assets in such securities on a long-term basis. Historically, less than 10% of the Account’s net assets have been comprised of interests in these securities. In particular, under the Account’s current investment guidelines, the Account is authorized to hold up to 10% of its net assets in CMBS. As of December 31, 2012, REIT securities comprised approximately 9.0% of the Account’s net assets, and the Account held no CMBS as of such date. Non-Real Estate-Related Investments.The Account will invest the remaining portion of its assets (targeted to be between 15% and 25% of its net assets) in publicly traded, liquid investments; namely: • U.S. treasury securities, • securities issued by U.S. government agencies or U.S. government sponsored entities, • corporate debt securities, • money market instruments, and • stock of companies that do not primarily own or manage real estate. However, from time to time (and most recently between late 2008 and mid 2010), the Account’s non-real estate-related liquid investments may comprise less than 15% (and possibly less than 10%) of its assets (on a net basis and/or a gross basis), especially during and immediately following periods of significant net participant outflows, in particular due to significant participant transfer activity. In addition, the Account, from time to time and on a temporary basis, may hold in excess of 25% of its net assets in non-real estate-related liquid investments, particularly during times of significant inflows into the Account and/or a lack of attractive real estate-related investments available in the market. Liquid Securities.Primarily due to management’s need to manage fluctuations in cash flows, in particular during and immediately following periods of significant participant net transfer activity into or out of the Account, the Account may, on a temporary basis (i) exceed the upper end of its targeted holdings (currently 35% of the Account’s net assets) in liquid securities of all types, including both publicly traded non-real estate-related liquid investments and liquid real estate-related securities, such as REITs and CMBS, or (ii) be below the low end of its targeted holdings in such liquid securities (currently 15% of the Account’s net assets). The portion of the Account’s net assets invested in liquid investments of all types may exceed the upper end of its target, for example, if (i) the Account receives a large inflow of money in a short period of time, in particular due to significant participant transfer activity into the Account, (ii) the Account receives significant proceeds from sales or financings of direct real estate TIAA Real Estate Account ¡Prospectus35
assets, (iii) there is a lack of attractive direct real estate investments available on the market, and/or (iv) the Account anticipates more near-term cash needs, including to apply to acquire direct real estate investments, pay expenses or repay indebtedness. At December 31, 2012, the Account’s net assets totaled $14.9 billion. As of that date, the Account’s investments in real estate properties, real estate joint ventures, limited partnerships and real estate-related marketable securities, net of the fair value of mortgage loans payable on real estate, represented 82.3% of the Account’s net assets. As discussed in more detail on page 45 under “Establishing and Managing the Account — The Role of TIAA — Liquidity Guarantee” and pursuant to its existing liquidity guarantee obligation, TIAA has agreed to purchase accumulation units issued by the Account in the event the Account has insufficient cash and liquid investments to ensure the ability, on its own, to fund participant transfer, redemption or withdrawal requests. This liquidity guarantee was first exercised in December 2008 and as of the date of this prospectus, was last exercised in June 2009. As of the date of this prospectus, the independent fiduciary has completed the systematic redemption of all of the liquidity units held by the TIAA General Account. Foreign Investments.The Account from time to time will also make foreign real estate investments. Under the Account’s investment guidelines, investments in direct foreign real estate, together with foreign real estate-related securities and foreign non-real estate-related liquid investments, may not comprise more than 25% of the Account’s net assets. See “About the Account’s Investments — In General — Foreign Real Estate and Other Foreign Investments” on page 39. Borrowing.The Account is authorized to borrow money in accordance with its investment guidelines. Under the Account’s current investment guidelines, management intends to maintain the Account’s loan to value ratio at or below 30%. The Account’s “loan to value ratio” at any time is based on the outstanding principal amount of the Account’s debt to the Account’s total gross asset value. See “General Investment and Operating Policies — Other Real Estate-Related Policies — Borrowing” on page 42. At December 31, 2012, the Account held a total of 107 real estate property investments (including its interests in 15 real estate-related joint ventures), representing 75.2% of the Account’s total investments, measured on a gross asset value basis (“Total Investments”). As of that date, the Account also held investments in REIT equity securities (representing 7.8% of Total Investments), real estate limited partnerships (representing 2.0% of Total Investments), government agency notes (representing 8.0% of Total Investments) and U.S. Treasury Bills (representing 7.0% of Total Investments). See the Account’s audited financial statements for more information as to the Account’s investments as of December 31, 2012. 36Prospectus ¡ TIAA Real Estate Account
ABOUT THE ACCOUNT’S INVESTMENTS — IN GENERAL DIRECT INVESTMENTS IN REAL ESTATE Direct Purchase:The Account will generally buy direct ownership interests in existing or newly constructed income-producing properties, primarily office, industrial, retail, and multi-family residential properties. The Account will invest mainly in established properties with existing rent and expense schedules or in newly constructed properties with predictable cash flows or, in very limited cases, where a seller agrees to provide certain minimum income levels. In addition, the Account will selectively invest in real estate development projects or engage in redevelopment projects, including pure ‘ground up’ developments. The Account does not directly invest in single-family residential real estate, nor does it currently invest in residential mortgage-backed securities (“RMBS”), although it may invest in such securities in the future. Purchase-Leaseback Transactions:Although it has not yet done so, the Account can enter into purchase-leaseback transactions (leasebacks) in which it would buy land and income-producing improvements on the land (such as buildings), and simultaneously lease the land and improvements to a third party (the lessee). Leasebacks are generally for very long terms. Usually, the lessee is responsible for operating the property and paying all operating costs, including taxes and mortgage debt. The Account can also give the lessee an option to buy the land and improvements. In some leasebacks, the Account may purchase only the land under an income-producing building and lease the land to the building owner. In those cases, the Account could seek to share (or “participate”) in any increase in property value from building improvements or in the lessee’s revenues from the building above a base amount. The Account can invest in leasebacks that are subordinated to other interests in the land, buildings, and improvements (e.g., first mortgages); in that case, the leaseback interest would be subject to greater risks. INVESTMENTS IN MORTGAGES General:The Account can originate or acquire interests in mortgage loans, generally on the same types of properties it might otherwise buy —i.e.,the Account will be a creditor. These mortgage loans may pay fixed or variable interest rates or have “participating” features (as described below). Normally the Account’s mortgage loans will be secured by properties that have income-producing potential. They usually will not be insured or guaranteed by the U.S. government, its agencies or anyone else. They usually will be non-recourse, which means they won’t be the borrower’s personal obligations. Most will be first mortgage loans on existing income-producing property, with first-priority liens on the property. These loans may be amortized (i.e.,principal is paid over the course of the loan), or may provide for interest-only payments, with a balloon payment at maturity. In addition, the Account may originate a TIAA Real Estate Account ¡Prospectus37
mortgage loan on a property it has recently sold (this is sometimes called “seller financing”). Participating Mortgage Loans:The Account may make mortgage loans which permit the Account to share (have a “participation”) in the income from or appreciation of the underlying property. These participations let the Account receive additional interest, usually calculated as a percentage of the income the borrower receives from operating, selling or refinancing the property. The Account may also have an option to buy an interest in the property securing the participating loan. Managing Mortgage Loan Investments:TIAA can manage the Account’s mortgage loans in a variety of ways, including: • renegotiating and restructuring the terms of a mortgage loan; • extending the maturity of any mortgage loan made by the Account; • consenting to a sale of the property subject to a mortgage loan; • financing the purchase of a property by making a new mortgage loan in connection with the sale; and/or • selling the mortgage loans, or portions of them, before maturity. OTHER REAL ESTATE-RELATED INVESTMENTS Joint Investment Vehicles Involved in Real Estate Activities:The Account can hold interests in joint ventures, limited partnerships, funds, and other commingled investment vehicles involved in real estate-related activities, including owning, financing, managing, or developing real estate. Many times, the Account will have limited voting and management rights in these commingled vehicles, including over the selection and disposition of the underlying real estate-related assets owned by the vehicle. Also, the Account’s ability to sell freely its interests in commingled vehicles may be restricted by the terms of the governing agreements. From time to time, the Account may also serve as the general partner, managing member, manager or administrator for a joint venture, for which it may earn fees and assume certain responsibilities typically associated with serving as a manager. The Account will not hold real property jointly with TIAA or its affiliates. Real Estate Investment Trusts:The Account may invest in REITs, which are entities (usually publicly owned and traded) that lease, manage, acquire, hold mortgages on, and develop real estate. Normally the Account will attempt to replicate the holdings of widely recognized REIT indexes, but at times may gain exposure to REITs by purchasing the common or preferred stock of an individual REIT, by purchasing index funds or exchange traded funds, or by purchasing debt securities issued by a REIT. REITs seek to maximize share value and increase cash flows by acquiring and developing new real estate projects, upgrading existing properties or renegotiating existing arrangements to increase rental rates and occupancy levels. REITs must distribute at least 90% of their taxable income to shareholders in order to benefit from a special tax structure, which means they may pay high dividends. The value of a particular REIT can be affected by such factors as general economic and 38Prospectus ¡ TIAA Real Estate Account
market conditions (in particular as to publicly traded REITs), the performance of the real estate sector in which the REIT primarily invests, cash flow, the skill of its management team, and defaults by its lessees or borrowers. Mortgage-Backed Securities:The Account can invest in mortgage-backed securities and other mortgage-related or asset-backed instruments, including CMBS, RMBS, mortgage-backed securities issued or guaranteed by agencies or instrumentalities of the U.S. government, non-agency mortgage instruments, and collateralized mortgage obligations that are fully collateralized by a portfolio of mortgages or mortgage-related securities. Mortgage-backed securities are instruments that directly or indirectly represent a participation in, or are secured by and payable from, one or more mortgage loans secured by real estate. In most cases, mortgage-backed securities distribute principal and interest payments on the mortgages to investors. Interest rates on these instruments can be fixed or variable. Some classes of mortgage-backed securities may be entitled to receive mortgage prepayments before other classes do. Therefore, the prepayment risk for a particular instrument may be different than for other mortgage-related securities. Many classes of mortgage-backed securities experienced volatility in pricing and liquidity following the 2008 financial crisis with some volatility persisting to the present day. Stock of Companies Involved in Real Estate Activities:From time to time, the Account can invest in common or preferred stock of companies whose business involves real estate. These stocks may be listed on U.S. or foreign stock exchanges or traded over-the-counter in the U.S. or abroad. NON-REAL ESTATE-RELATED INVESTMENTS The Account can also invest in: • U.S. treasury or U.S. government agency securities; • Money market instruments and other cash equivalents. These will usually be high-quality, short-term debt instruments, including U.S. government or government agency securities, commercial paper, certificates of deposit, bankers’ acceptances, repurchase agreements, interest-bearing time deposits, and corporate debt securities; • Corporate debt or asset-backed securities of U.S. or foreign entities, or debt securities of foreign governments or multinational organizations, but only if they are investment-grade and rated in the top four categories by a nationally recognized rating organization (or, if not rated, deemed by TIAA to be of equal quality); and • Common or preferred stock, or other ownership interests, of U.S. or foreign companies that aren’t involved in real estate, to a limited extent. FOREIGN REAL ESTATE AND OTHER FOREIGN INVESTMENTS The Account from time to time will invest in foreign real estate or real estate-related investments. It might also invest in securities or other instruments of foreign government or private issuers. Under the Account’s investment guidelines, investments in direct foreign real estate, together with TIAA Real Estate Account ¡Prospectus39
foreign real estate-related securities and foreign non-real estate-related liquid investments, may not comprise more than 25% of the Account’s net assets. However, through the date of this prospectus, such foreign real estate-related investments have never represented more than 7.5% of the Account’s net assets and management does not intend such foreign investments to exceed 10% of the Account’s net assets. As of the date of this prospectus, the Account holds an interest in one foreign property investment (in France), which, as of December 31, 2012, represented approximately 1.4% of the Account’s net assets. See Appendix B for more information, including valuation information, concerning these investments. Depending on investment opportunities, the Account’s foreign investments could at times be concentrated in one or two foreign countries. We will consider the special risks involved in foreign investing before investing in foreign real estate and won’t invest unless our standards are met. GENERAL INVESTMENT AND OPERATING POLICIES STANDARDS FOR REAL ESTATE INVESTMENTS Buying Real Estate or Making Mortgage Loans:Before the Account purchases real estate or makes a mortgage loan, TIAA will consider such factors as: • the location, condition, and use of the underlying property; • its operating history and its future income-producing capacity; and • the quality, operating experience, and creditworthiness of the tenants or the borrower. TIAA will also analyze the fair market value of the underlying real estate, taking into account the property’s operating cash flow (based on the historical and projected levels of rental and occupancy rates and expenses), as well as the general economic conditions in the area where the property is located. Diversification:We haven’t placed percentage limitations on the type and location of properties that the Account can buy. However, the Account seeks to diversify its investments by type of property, geographic location and tenant mix. How much the Account diversifies will depend upon whether suitable investments are available, the Account’s ability to divest of properties that are in over-concentrated locations or sectors, and how much the Account has available to invest. Special Criteria for Making Mortgage Loans:Ordinarily, the Account will only make a mortgage loan if the loan, when added to any existing debt, will not exceed 85% of the appraised value of the mortgaged property when the loan is made, unless the Account is compensated for taking additional risk. Selling Real Estate Investments:The Account doesn’t intend to buy and sell its real estate investments simply to make short-term profits, although proceeds from sales of real estate investments do play a role in the Account’s cash 40Prospectus ¡ TIAA Real Estate Account
management generally. Rather, the Account’s general strategy in selling real estate investments is to dispose of those assets which management believes: • have maximized in value; • have underperformed or face deteriorating property-specific or market conditions; • represent properties needing significant capital infusions in the future; • are appropriate to dispose of in order to remain consistent with its intent to diversify the Account by property type and geographic location (including reallocating the Account’s exposure to or away from certain property types in certain geographic locations); and/or • otherwise do not satisfy the investment objectives or strategy of the Account. Management from time to time will evaluate the need to manage liquidity in the Account as part of its analysis as to whether to undertake a particular asset sale. The Account will reinvest any sale proceeds that management doesn’t believe it will need to pay operating expenses, fund other obligations (such as debt obligations and funding commitments under limited partnership agreements) or to meet participant redemption requests (e.g., cash withdrawals or transfers). OTHER REAL ESTATE-RELATED POLICIES Appraisals and Valuations of Real Estate Assets:The Account will rely on TIAA’s own analysis, normally along with an independent external appraisal, in connection with the purchase of a property by the Account. The Account will normally receive an independent external appraisal performed by a third party appraisal firm at or before the time it buys a real estate asset, and the Account also generally obtains an independent appraisal when it makes mortgage loans. Subsequently, each of the Account’s real properties are appraised, and mortgage loans are valued, at least once every calendar quarter. Each of the Account’s real estate properties are appraised each quarter by an independent third party appraiser who is a member of a professional appraisal organization. In addition, TIAA’s internal appraisal staff performs a review of each independent appraisal of each real estate property as the final step in the Account’s process of determining the value, in conjunction with the Account’s independent fiduciary, and TIAA’s internal appraisal staff or the independent fiduciary may request an additional appraisal or valuation outside of this quarterly cycle. Any differences in the conclusions of TIAA’s internal appraisal staff and the independent appraiser will be reviewed by the independent fiduciary, which will make a final determination on the matter (which may include ordering a subsequent independent appraisal). See “Valuing the Account’s Assets” on page 57 for more information on how each class of the Account’s investments (including assets other than real estate properties) are valued. TIAA Real Estate Account ¡Prospectus41
Borrowing:The Account may borrow money and assume or obtain a mortgage on a property —i.e.,make leveraged real estate investments. Under the Account’s current investment guidelines, management intends to maintain the Account’s loan to value ratio at or below 30% (measured at the time of incurrence and after giving effect thereto). Forms of borrowing may include • incurring new debt on the Account’s properties, • refinancing outstanding debt, • assuming debt on the Account’s properties, or • long term extensions of the maturity date of outstanding debt. The Account’s loan to value ratio at any time is based on the ratio of the outstanding principal amount of the Account’s debt to the Account’s total gross asset value. The Account’s total gross asset value, for these purposes, is equal to the total fair value of the Account’s assets (including the fair value of the Account’s interest in joint ventures), with no reduction associated with any indebtedness on such assets. In times of high net inflow activity, in particular during times of high net participant transfer inflows, management may determine to apply a portion of such cash flows to make prepayments of indebtedness prior to scheduled maturity, which would have the effect of reducing the Account’s loan to value ratio. Such prepayments may require the Account to pay fees or ‘yield maintenance’ amounts to lenders. In calculating outstanding indebtedness, we will include only the Account’s actual percentage interest in any borrowings on a joint venture investment and not that of any joint venture partner. Also, at the time the Account (or a joint venture in which the Account is a partner) enters into a revolving line of credit, management deems the maximum amount which may be drawn under that line of credit as fully incurred, regardless of whether the maximum amount available has been drawn from time to time. As of December 31, 2012, the aggregate principal amount of the Account’s outstanding debt (including the Account’s share of debt on its joint venture investments) was approximately $4.0 billion and the Account’s loan to value ratio was approximately 21.0%. The Account may only borrow up to 70% of the then current value of a property, although construction loans may be for 100% of costs incurred in developing a property. Except for construction loans, any mortgage loans on a property will be non-recourse to the Account, meaning that if there is a default on a loan in respect of a specific property, the lender will have recourse to (i.e.,be able to foreclose on) only the property encumbered (or the joint venture owning the property), or to other specific Account properties that may have been pledged as security for the defaulted loan, but not to any other assets of the Account. When possible, the Account will seek to have loans mature at different times to limit the risks of borrowing. The Account will not obtain mortgage financing on properties it owns from TIAA or any of its affiliates. Under certain circumstances, TIAA or an affiliate 42Prospectus ¡ TIAA Real Estate Account
may provide a loan to a third party purchaser of a property sold by the Account, but no such financing will be made with respect to a property the Account still owns. However, the Account may place an intra-company mortgage on an Account property held by a subsidiary for tax planning or other purposes. This type of mortgage will not be subject to the general limitations on borrowing described above. When the Account assumes or obtains a mortgage on a property, it will bear the expense of mortgage payments. It will also be exposed to certain additional risks, which are described in “Risk Factors — Risks of Borrowing” on page 21. In addition, while it has not done so through the date of this prospectus, the Account may obtain a line of credit to meet short-term cash needs, which line of credit may be unsecured and/or contain terms that may require the Account to secure a loan with one or more of its properties. Management expects the proceeds from any such short-term borrowing would be used to meet the cash flow needs of the Account’s properties and real estate-related investments, but depending on the circumstances, proceeds could be used for Account-level funding needs (including the need to honor unexpected participant withdrawal activity). Discretion to Evict or Foreclose:TIAA may, in its discretion, evict defaulting tenants or foreclose on defaulting borrowers to maintain the value of an investment, when it decides that it is in the Account’s best interests. Property Management and Leasing Services:The Account usually will hire a national or regional independent third party property management company to perform the day-to-day management services for each of the Account’s properties, including supervising any on-site personnel, negotiating maintenance and service contracts, providing advice on major repairs and capital improvements and assisting the Account in ensuring compliance with environmental regulations. The property manager will also recommend changes in rent schedules and create marketing and advertising programs to attain and maintain high levels of occupancy by responsible tenants. The Account may also hire independent third party leasing companies to perform or coordinate leasing and marketing services to fill any vacancies. The fees paid to the property management company, along with any leasing commissions and expenses, will reduce the Account’s cash flow from a property. Insurance:We intend to arrange for, or require proof of, comprehensive insurance, including liability, fire, and extended coverage, for the Account’s real properties and properties securing mortgage loans or subject to purchase-leaseback transactions. The Account currently participates in property, casualty and other related insurance programs as part of TIAA’s property insurance programs, and the Account only bears the cost of insuring only the properties it owns. The terms and conditions of the insurance coverage the Account has on its properties, in conjunction with the type of loss actually suffered at a property, may subject the property, or the Account as a whole, to TIAA Real Estate Account ¡Prospectus43
a cap on insurance proceeds that is less than the loss or losses suffered. In addition, the Account’s insurance policies on its properties currently include catastrophic coverage for wind, earthquakes and terrorist acts, but we can’t assure you that it will be adequate to cover all losses. We also can’t assure you that we will be able to obtain coverage for wind, earthquakes and terrorist acts at an acceptable cost, if at all, at the time a policy expires. While the Account will seek to have coverage placed with highly rated, financially healthy insurance carriers, the Account is reliant on the continued financial health of the third-party insurers it engages. OTHER POLICIES Investment Company Act of 1940:The Account has not registered, and we intend to operate the Account so that it will not have to register, as an “investment company” under the Investment Company Act. This will require monitoring the Account’s portfolio so that it won’t have more than 40 percent of total assets, other than U.S. government securities and cash items, in investment securities. As a result, the Account may be unable to make some potentially profitable investments, it may be unable to sell assets it would otherwise want to sell or it may be forced to sell investments in investment securities before it would otherwise want to do so. Changing Operating Policies or Winding Down:Under the terms of the contracts and in accordance with applicable insurance law, TIAA can decide to change, in its sole discretion, the operating policies of the Account or to wind it down. If the Account is wound down, you may need to transfer your accumulations or annuity income to TIAA’s traditional annuity or any CREF account available under your employer’s plan. All investors in the Account will be notified in advance if we decide to change a significant policy or wind down the Account. ESTABLISHING AND MANAGING THE ACCOUNT — ESTABLISHING THE ACCOUNT The Board established the Real Estate Account as a separate account of TIAA under New York law on February 22, 1995. The Account is regulated by the New York State Department of Financial Services (“NYDFS,” formerly, the New York State Insurance Department) and the insurance departments of the other jurisdictions in which the annuity contracts are offered. Although TIAA owns the assets of the Real Estate Account, and the Account’s obligations under the contract are obligations of TIAA, the Account’s income, investment gains, and investment losses are credited to or charged against the assets of the Account without regard to TIAA’s other income, gains, or losses. Under New York insurance law, we can’t charge the Account with liabilities incurred by any other TIAA business activities or any other TIAA separate account. 44Prospectus ¡ TIAA Real Estate Account
THE ROLE OF TIAA
MANAGING THE ACCOUNT TIAA employees, under the direction and control of the Board and its Investment Committee, manage the investment of the Account’s assets, following investment management procedures TIAA has adopted for the Account. The Account does not have officers, directors or employees. TIAA’s investment management responsibilities include: • identifying and recommending purchases, sales and financings of appropriate real estate-related and other investments; • providing (including by arranging for others to provide) all portfolio accounting, custodial, and related services for the Account; and • arranging for others to provide certain advisory or other management services to the Account’s joint ventures or other investments. In addition, TIAA performs administration functions for the Account. These functions include receiving and allocating premiums, calculating and making annuity payments and providing recordkeeping and other services. Distribution services for the Account (which include, without limitation, distribution of the annuity contracts, advising existing annuity contract owners in connection with their accumulations and helping employers implement and manage retirement plans) are performed by Services. TIAA and Services provide investment management, administration and distribution services, as applicable, on an “at-cost” basis. For more information about the charge for investment management, administration and distribution services, see “Expense Deductions” on page 64. You don’t have the right to vote for TIAA Trustees. See “General Matters — Voting Rights” on page 143. For information about the Trustees, certain executive officers of TIAA and the Account’s portfolio management team, see Appendix A of this prospectus. TIAA’s ERISA Fiduciary Status.To the extent that assets of a plan subject to the Employee Retirement Income Security Act of 1974, as amended (“ERISA”), are allocated to the Account, TIAA will be acting as an “investment manager” and a fiduciary under ERISA with respect to those assets. LIQUIDITY GUARANTEE The TIAA General Account provides the Account with a liquidity guarantee enabling the Account to have funds available to meet participant redemption, transfer or cash withdrawal requests. This guarantee is required by the NYDFS. If the Account can’t fund participant requests from the Account’s own cash flow and liquid investments, the TIAA General Account will fund such requests by purchasing accumulation units (accumulation units that are purchased by TIAA are generally referred to as “liquidity units”) issued by the Account. TIAA guarantees that you can redeem your accumulation units at their accumulation unit value next determined after your transfer or cash withdrawal request is received in good order. Whether the liquidity guarantee is exercised is based on the cash level of the Account from time to time, as well as recent participant withdrawal activity and the Account’s expected working TIAA Real Estate Account ¡Prospectus45
capital, debt service and cash needs, all subject to the oversight of the independent fiduciary. While the proceeds from liquidity unit purchases are not placed in a segregated account solely to fund participant requests, the guarantee is in place to meet participant needs. Liquidity units owned by TIAA are valued in the same manner as accumulation units owned by the Account’s participants. Importantly, however, this liquidity guarantee is not a guarantee of the investment performance of the Account or a guarantee of the value of your units. Transfers from the Account to a CREF or TIAA account, or another investment option, are limited to once every calendar quarter (except for specifically prescribed systematic transfers established in accordance with the terms of the participant’s contract and employer’s plan), and cash withdrawals may be further restricted by the terms of your plan. TIAA’s obligation to provide Account participants liquidity through purchases of liquidity units is not subject to an express regulatory or contractual limitation, although as described below under “—Role of the Independent Fiduciary,” the independent fiduciary may (but is not obligated to) require the reduction of TIAA’s interest through sales of assets from the Account if TIAA’s interest exceeds a predetermined trigger point. Even if this trigger point were reached and regardless of whether the independent fiduciary has required the Account to dispose of any assets, TIAA’s obligation to provide liquidity under the guarantee will continue. The Account pays TIAA for the risk associated with providing the liquidity guarantee through a daily deduction from the Account’s net assets. See “Expense Deductions” on page 64. Primarily as a result of significant net participant transfers throughout 2008 (in particular, in the second half of 2008), pursuant to this liquidity guarantee obligation, the TIAA General Account first purchased liquidity units on December 24, 2008. Between December 2008 and June 2009, the TIAA General Account paid an aggregate of approximately $1.2 billion to purchase liquidity units in a number of separate transactions, with the last such transaction occurring in June 2009. Management cannot predict whether future liquidity unit purchases will be required under the liquidity guarantee although as of the date of this prospectus, management believes such purchases are unlikely in the near term. Redemption of Liquidity Units.The independent fiduciary is vested with oversight and approval over any redemption of TIAA’s liquidity units, acting in the best interests of Real Estate Account participants. As of December 31, 2012, TIAA owned 1.2 million liquidity units, representing approximately 2.2% of the Account’s outstanding accumulation units as of such date. As of the date of this prospectus, the independent fiduciary has completed the systematic redemption of all of the liquidity units held by the TIAA General Account. Approximately one-quarter of such units were redeemed evenly over the business days in each of June, September and December 2012, and March 2013, representing a total of $1.3 billion redeemed during this period. 46Prospectus ¡ TIAA Real Estate Account
As a general matter, the independent fiduciary may authorize or direct the redemption of all or a portion of liquidity units at any time and TIAA will request the approval of the independent fiduciary before any liquidity units are redeemed. Upon termination and liquidation of the Account (wind-up), any liquidity units held by TIAA will be the last units redeemed, unless the independent fiduciary directs otherwise. Finally, TIAA may redeem its liquidity units more frequently than once per calendar quarter, subject at all times to the oversight and approval of the Account’s independent fiduciary (discussed in more detail in the subsection entitled “—Role of the Independent Fiduciary” immediately below). ROLE OF THE INDEPENDENT FIDUCIARY Because TIAA’s ability to purchase and sell liquidity units raises certain technical issues under ERISA, TIAA applied for and received a prohibited transaction exemption from the U.S. Department of Labor in 1996 (“PTE-96-76”). In connection with the exemption, TIAA has appointed an independent fiduciary for the Real Estate Account, with overall responsibility for reviewing Account transactions to determine whether they are in accordance with the Account’s investment guidelines. Real Estate Research Corporation, a real estate consulting firm whose principal offices are located in Chicago, Illinois, was initially appointed as independent fiduciary effective March 1, 2006 and currently serves as the Account’s independent fiduciary. The independent fiduciary’s responsibilities include: • reviewing and approving the Account’s investment guidelines and monitoring whether the Account’s investments comply with those guidelines; • reviewing and approving valuation procedures for the Account’s properties; • approving adjustments to any property valuations that change the value of the property or the Account as a whole above or below certain prescribed levels, or that are made within three months of the annual independent appraisal; • reviewing and approving how the Account values accumulation and annuity units; • approving the appointment of all independent appraisers; • reviewing the purchase and sale of units by TIAA to ensure that the Account uses the correct unit values; and • requiring appraisals besides those normally conducted, if the independent fiduciary believes that any of the properties have changed materially, or that an additional appraisal is necessary to ensure the Account has correctly valued a property. In addition, Real Estate Research Corporation has certain responsibilities with respect to the Account that it had historically undertaken or is currently undertaking with respect to TIAA’s purchase and ownership of liquidity units, TIAA Real Estate Account ¡Prospectus47
including among other things reviewing the purchases and redemption of liquidity units by TIAA to ensure the Account uses the correct unit values. In connection therewith, as set forth in PTE 96-76, the independent fiduciary’s responsibilities include: • establishing the percentage of total liquidity units that TIAA’s ownership should not exceed (the “trigger point”) and creating a method for changing the trigger point; • approving any adjustment of TIAA’s ownership interest in the Account and, in its discretion, requiring an adjustment if TIAA’s ownership of liquidity units reaches the trigger point; and • once the trigger point has been reached, participating in any program to reduce TIAA’s ownership in the Account by utilizing cash flow or liquid investments in the Account, or by utilizing the proceeds from asset sales. If the independent fiduciary were to determine that TIAA’s ownership should be reduced following the trigger point, its role in participating in any asset sales program would include: (i) participating in the selection of properties for sale, (ii) providing sales guidelines, and (iii) approving those sales if, in the independent fiduciary’s opinion, such sales are desirable to reduce TIAA’s ownership of liquidity units. The independent fiduciary established the trigger point at 45% of the outstanding accumulation units in connection with TIAA’s ownership of liquidity units between December 2008 and March 2013. As of the date of this prospectus, the independent fiduciary has completed the systematic redemption of all of the liquidity units held by the TIAA General Account. In establishing the appropriate trigger point, including whether or not to require certain actions once the trigger point has been reached, the independent fiduciary will assess, among other things and to the extent consistent with PTE 96-76 and the independent fiduciary’s duties under ERISA, the risk that a conflict of interest could arise due to the level of TIAA’s ownership interest in the Account. A special subcommittee consisting of five (5) independent outside members of the Investment Committee of the Board renewed the appointment of Real Estate Research Corporation as the independent fiduciary for an additional three-year term, which appointment was effective as of March 1, 2012, and continues through February 28, 2015. This subcommittee may renew the independent fiduciary appointment, remove the independent fiduciary, or appoint its successor. The independent fiduciary can be removed for cause by the vote of three (3) out of the five (5) subcommittee members and will not be reappointed if two (2) of the subcommittee members disapprove of the reappointment. The independent fiduciary can resign after providing at least 180 days’ written notice. The Account pays the independent fiduciary directly. The investment management charge includes the costs associated with retaining the independent fiduciary. Under PTE 96-76, the independent fiduciary must 48Prospectus ¡ TIAA Real Estate Account
receive less than 5% of its annual gross revenues (including payment for its services to the Account) from TIAA and its affiliates. When you decide as a participant or plan fiduciary to invest in the Account, after TIAA has provided you with full and fair disclosure, including the disclosure in this prospectus, you are also acknowledging that you approve and accept Real Estate Research Corporation or any successor to serve as the Account’s independent fiduciary. CONFLICTS OF INTEREST General.Employees of TIAA that provide advice with respect to the Real Estate Account may also provide investment advice with respect to investments managed by TIAA-CREF Alternatives Advisors, LLC and Teachers Advisors, LLC, both indirect, wholly owned subsidiaries of TIAA and registered investment advisers. In addition, TIAA and its affiliates offer (and may in the future offer) other accounts and investment products that are not managed under an “at cost” expense structure. Therefore, TIAA and its employees may at times face various conflicts of interest. For example, the TIAA General Account and a privately offered core property investment fund managed by TIAA-CREF Alternatives Advisors, LLC (the “core property investment fund”) may sometimes compete with the Real Estate Account in the purchase of investments; however, both accounts will be subject to the allocation procedure described below. (Each of the TIAA General Account, the Real Estate Account and the core property investment fund together with any other real estate accounts or funds that are established or may be established by TIAA or its affiliates in the future, are herein referred to as an “account.”) Many of the personnel of TIAA involved in performing services to the Real Estate Account will have competing demands on their time. The personnel will devote such time to the affairs of the Account as TIAA’s management determines, in its sole discretion exercising good faith, is necessary to properly service the Account. TIAA believes that it has sufficient personnel to discharge its responsibility to the Real Estate Account, the General Account, the core property investment fund and other accounts to avoid conflicts of interest. TIAA or its affiliates may form other real estate investment vehicles in the future and we will take steps to assure that those vehicles are integrated into these conflict of interest policies. TIAA does not accept acquisition or placement fees for the services it provides to the Account. Allocation Procedure.TIAA and its affiliates allocate new investments (including real property investments, but generally not real estate limited partnership investments) among the accounts in accordance with a written allocation procedure as adopted by TIAA and modified from time to time. Generally, the portfolio managers for each of the accounts will evaluate acquisition opportunities which conform to the investment strategy of the account. If more than one account expresses an interest in a particular investment in a particular sector, a strict rotation system will be used whereby the interested account highest on the list will be allowed to pursue the TIAA Real Estate Account ¡Prospectus49
transaction, and then such account will drop to the bottom of the rotation for new investments in that sector. This rotation system is employed on a sector-by-sector basis for each of the office, retail, industrial, multifamily and other sectors; meaning that an account (including the Real Estate Account) could, at any one time, be at the top or the bottom of the rotation for new investment opportunities in all of the four sectors in which the Real Estate Account invests. If only one account is interested, that account will be allocated the opportunity with no change in its position in the rotation. In addition, there may be circumstances where multiple properties are presented to TIAA for sale as a single acquisition opportunity, and the proposed price is inclusive of all the properties. If more than one account has interest in all or a portion of such bundled acquisition opportunity, TIAA’s acquisition staff will investigate with the seller whether the properties can be unbundled and offered to the accounts on an individual basis and the sector-based rotation system described above will apply to the allocation of such unbundled properties. An asset allocation oversight committee made up of senior officers of TIAA (representing its asset management, risk management, product management, internal audit, compliance, legal and accounting groups) will review and discuss, on a quarterly basis, the allocations made during the previous quarter based on this allocation procedure to, among other things, ensure the procedure is being followed and to review and approve any changes to the procedure. In addition, the procedure will be reviewed by this internal committee on at least an annual basis. In addition, non-discretionary mandates within an account, where the account is a major co-investor, will be included as part of that account’s rotation and will not have a separate place in the foregoing rotation among accounts. Leasing Conflicts.Conflicts could also arise because some properties in the TIAA General Account, the core property investment fund and other accounts may compete for tenants with the Real Estate Account’s properties. Management believes the potential for leasing conflicts are minimized by the unique characteristics of each property, including location, submarket, physical characteristics, amenities and lease rollover schedules. Management believes the differing business strategies of the accounts also reduce potential conflicts. If a conflict arises, as appropriate, the competing accounts will arrange that different property managers and leasing brokers are engaged, each charged with using their best efforts to support the property management and leasing activity for each particular property and an ethical screen will be placed between the internal asset managers for the respective properties. Any conflicts that arise will be reported to the next occurring global real estate portfolio oversight committee (which is comprised of portfolio managers for the accounts). Sales Conflicts.Conflicts could also potentially arise when two TIAA accounts attempt to sell properties located in the same market or submarket, especially if there are a limited number of potential purchasers and/or if such 50Prospectus ¡ TIAA Real Estate Account
purchaser has an ongoing business relationship with TIAA or one of its specific accounts. Liquidity Guarantee.TIAA’s ownership of liquidity units (including potential changes in future ownership levels) could result in the perception that TIAA is taking into account its own economic interests while serving as investment manager for the Account. In particular, there is the concern that TIAA could make investment decisions (and other management decisions) with respect to the Account which serve the interest of the TIAA General Account, at the expense of those participants that have chosen the Account as an investment option. This could manifest itself, among other ways, by the Account disposing its properties solely to raise liquidity in avoidance of having a need for the liquidity guarantee, or by foregoing otherwise attractive investment opportunities so as not to impair liquid asset levels. Management believes that any conflict (or potential conflict) is mitigated by, among other things, the detailed valuation procedure for the Account’s properties, which includes independent appraisals and the oversight of the independent fiduciary. Also, the independent fiduciary oversees the liquidity guarantee execution to ensure the proper unit values are applied, and the independent fiduciary will oversee any liquidity unit redemptions. Further, the independent fiduciary is vested with the right to establish a trigger point, which is a level of ownership at which the fiduciary is empowered, but not required, to reduce TIAA’s ownership interest (with the goal to mitigate any potential conflict of interest) through the means described in the immediately preceding section. For example, the independent fiduciary could perceive a conflict of interest if it believed that management directed the sale of properties solely to increase liquidity (not in accordance with the Account’s investment guidelines or at “fire sale” prices) with the sole goal of avoiding the need for further TIAA liquidity unit purchases under the liquidity guarantee. In such case, the independent fiduciary would be authorized to adjust the trigger point, at which time the fiduciary would have control over the sales of properties (including the timing and pricing) to ensure such sales are in the best interests of the Account. While it retains the oversight over the Account’s investment guidelines, valuation and appraisal matters and the liquidity guarantee as described above in “—Role of the Independent Fiduciary,” the independent fiduciary’s authority to override investment management decisions made by TIAA’s managers acting on behalf of the Account is limited to those circumstances after which the trigger point has been reached or during a wind-down of the Account. INDEMNIFICATION The Account has agreed to indemnify TIAA and its affiliates, including its officers and trustees, against certain liabilities to the extent permitted by law, including liabilities under the Securities Act of 1933. The Account may make such indemnification out of its assets. TIAA Real Estate Account ¡Prospectus51
SUMMARY OF THE ACCOUNT’S PROPERTIES THE PROPERTIES — IN GENERAL At December 31, 2012, the Account owned a total of 107 real estate property investments (92 of which were wholly owned and 15 of which were held in real estate-related joint ventures), representing 75.2% of the Account’s total investment portfolio (on a gross asset value basis). At December 31, 2012, the real estate portfolio included: • 31 office property investments (including five held in joint ventures and one property located in London, United Kingdom); • 25 industrial property investments (including one held in a joint venture); • 20 retail property investments (including seven held in joint ventures and one property located in Paris, France); • 28 apartment property investments (including one held in a joint venture); • a 75% joint venture interest in a portfolio of storage facilities located throughout the United States; • a fee interest encumbered by a ground lease; and • an undeveloped land investment. Of the 107 real estate property investments, 39 were subject to mortgages (including eight joint venture property investments). In the tables and the footnotes contained in Appendix B to this prospectus, you will find more detailed information about each of the Account’s portfolio property investments as of December 31, 2012. The Account’s property investments include both properties that are wholly owned by the Account and properties owned by the Account’s joint venture investments. Certain property investments detailed in Appendix B are comprised of a portfolio of properties. COMMERCIAL (NON-RESIDENTIAL) PROPERTIES At December 31, 2012, the Account held 79 commercial (non-residential) property investments in its portfolio, including a portfolio of storage facilities located throughout the United States. Fourteen of these property investments were held through joint ventures, and 20 were subject to mortgages (including seven joint venture property investments). Although the terms vary under each lease, certain expenses, such as real estate taxes and other operating expenses, are paid or reimbursed in whole or in part by the tenants. Management believes that the Account’s portfolio is diversified by both property type and geographic location. At December 31, 2012, the portfolio consisted of: • Office.31 property investments containing approximately 15.9 million square feet located in 11 states, the District of Columbia and the United Kingdom. As of December 31, 2012, the Account’s office properties had an aggregate fair value of approximately $5.7 billion. •
Industrial.25 property investments containing approximately 26.2 million square feet located in 10 states. As of December 31, 2012, the Account’s
52Prospectus ¡ TIAA Real Estate Account
industrial properties had an aggregate fair value of approximately $1.7 billion. • Retail.20 property investments containing approximately 20.4 million square feet located in six states, the District of Columbia and Paris, France. As of December 31, 2012, the Account’s retail properties had an aggregate fair value of approximately $2.2 billion. One of the retail property investments is an 85% interest in a portfolio containing 39 individual retail shopping centers located throughout the Eastern and Southeastern states. • Other — Storage.The Account has a 75% interest in a portfolio of storage facilities located throughout the United States containing approximately 1.7 million square feet. As of December 31, 2012, the Account’s interest in this portfolio had a fair value of approximately $78.6 million. • Other — Land.In May 2011, the Account invested in a fee interest real estate investment encumbered by a ground lease. As of December 31, 2012, this real estate investment had a fair value of $330.0 million. In addition, during November 2012, the Account contributed assets from the Four Oaks Place investment into a joint venture property investment, Four Oaks Place LP. The remaining undeveloped land had a fair value of $16.2 million as of December 31, 2012. As of December 31, 2012, the fair value weighted average lease rate of the Account’s entire commercial real estate portfolio was 92.5%. The overall lease rate of the Account’s commercial real estate portfolio was 92.1%. The Account’s: • office property investments were 90.9% leased on a fair value weighted basis and 89.9% leased on a weighted average square foot basis; • industrial property investments were 92.7% leased on a fair value weighted basis and 92.7% leased on a weighted average square foot basis; • retail property investments were 95.5% leased on a fair value weighted basis and 93.2% leased on a weighted average square foot basis; and • the storage portfolio was 89.2% leased. TIAA Real Estate Account ¡Prospectus53
Major Tenants:The following tables list the Account’s ten most significant tenants based on the total space they occupied as of December 31, 2012 in each of the Account’s commercial property types. Major Office Tenants Occupied Percentage of Total Percentage of Total BHP Petroleum (Americas), Inc.(2) 699,326 5.1% 1.3% Crowell & Moring LLP(1) 447,822 3.2% 0.8% The Bank of New York Mellon Corporation(2) 372,909 2.7% 0.7% Microsoft Corporation(1) 361,528 2.6% 0.7% Atmos Energy Corporation(1) 312,238 2.3% 0.6% GE Healthcare(1) 294,306 2.1% 0.6% Yahoo! Inc.(2) 283,765 2.1% 0.5% Pearson Education, Inc.(1) 234,745 1.7% 0.4% Bridgewater Associates LP(1) 227,883 1.7% 0.4% Pillsbury Madison & Sutro LLP(1) 225,233 1.6% 0.4% Major Industrial Tenants Occupied Percentage of Total Percentage of Total Wal-Mart Stores, Inc.(1) 1,099,112 4.5% 2.1% Regal West Corporation(1) 968,535 4.0% 1.8% Restoration Hardware, Inc.(1) 886,052 3.6% 1.7% Kumho Tire U.S.A. Inc.(1) 830,485 3.4% 1.6% Tyco Healthcare Retail Group, Inc.(1) 800,000 3.3% 1.5% Technicolor Videocassette of Michigan, Inc.(1) 708,532 2.9% 1.3% Del Monte Fresh Product, N.A., Inc.(1) 689,660 2.8% 1.3% R.R Donnelley & Sons Company(1) 659,157 2.7% 1.2% Rheem Sales Company, Inc.(1) 656,600 2.7% 1.2% Global Equipment Company, Inc.(1) 647,228 2.7% 1.2% Major Retail Tenants Occupied Percentage of Total Percentage of Total Wal-Mart Stores, Inc.(2) 767,056 5.1% 1.4% Ross Stores, Inc.(2) 440,466 2.9% 0.8% Dick’s Sporting Goods, Inc.(2) 432,486 2.9% 0.8% Publix Super Markets, Inc.(3) 405,946 2.7% 0.8% Belk, Inc.(2) 371,706 2.5% 0.7% PetSmart, Inc.(3) 356,266 2.4% 0.7% Kohl’s Corporation(2) 348,057 2.3% 0.7% Best Buy Co., Inc.(3) 343,397 2.3% 0.6% Michael’s Stores, Inc.(3) 314,846 2.1% 0.6% Bed Bath & Beyond, Inc.(3) 314,347 2.1% 0.6% (1) Tenant occupied space within wholly owned property investments. (2) Tenant occupied space within joint venture investments. (3) Tenant occupied space within wholly owned property investments and joint venture investments. 54Prospectus ¡ TIAA Real Estate Account
Square Feet
Rentable Area of
Account’s Office
Properties
Rentable Area of
Non-Residential
Properties
Square Feet
Rentable Area of
Account’s Industrial
Properties
Rentable Area of
Non-Residential
Properties
Square Feet
Rentable Area of
Account’s Retail
Properties
Rentable Area of
Non-Residential
Properties
The following tables list the rentable area subject to expiring leases during the next five years, and an aggregate figure for expirations in 2018 and thereafter, in the Account’s commercial (non-residential) properties. While many of these leases contain renewal options with varying terms, these charts assume that none of the tenants exercise their renewal options, including those with terms that expired on December 31, 2012 or are month to month leases. OFFICE PROPERTIES Rentable Area Subject Percentage of Total Rentable Area of 2013 1,348,629 8.5% 2014 1,956,016 12.3% 2015 1,690,588 10.6% 2016 1,176,331 7.4% 2017 1,099,997 6.9% 2018 and thereafter 6,553,333 41.3% Total 13,824,894 87.0% INDUSTRIAL PROPERTIES Rentable Area Subject Percentage of Total Rentable Area of 2013 5,272,325 20.1% 2014 2,675,192 10.2% 2015 5,940,530 22.6% 2016 3,321,374 12.7% 2017 1,760,311 6.7% 2018 and thereafter 4,909,542 18.7% Total 23,879,274 91.0% RETAIL PROPERTIES Rentable Area Subject Percentage of Total Rentable Area of 2013 1,965,890 9.6% 2014 1,585,528 7.8% 2015 1,739,637 8.5% 2016 2,336,925 11.4% 2017 2,009,833 9.8% 2018 and thereafter 4,877,306 23.9% Total 14,515,119 71.0% RESIDENTIAL PROPERTIES The Account’s residential property portfolio currently consists of 28 property investments comprised of first class or luxury multi-family, garden, mid-rise, and high-rise apartment buildings. The portfolio contains approximately 10,650 units located in 11 states, with one located in the District of Columbia. The portfolio had a 94.0% lease rate as of December 31, 2012. Fourteen of the residential properties in the portfolio are subject to mortgages. The complexes generally contain one to three bedroom apartment units with a range of amenities, such as patios or balconies, washers and dryers, and central air conditioning. Many of these apartment communities have on-site TIAA Real Estate Account ¡Prospectus55
Year of Lease Expiration
to Expiring Leases
(sq. ft.)
Account’s Office Properties
Represented by Expiring Leases
Year of Lease Expiration
to Expiring Leases
(sq. ft.)
Account’s Industrial Properties
Represented by Expiring Leases
Year of Lease Expiration
to Expiring Leases
(sq. ft.)
Account’s Retail Properties
Represented by Expiring Leases
fitness facilities, including some with swimming pools. Rents on each of the properties tend to be comparable with competitive communities and are not subject to rent regulation. The Account is responsible for the expenses of operating its residential properties. As of December 31, 2012, the Account’s residential properties had an aggregate fair value of approximately $2.8 billion. Set forth in Appendix B to this prospectus is a table containing detailed information regarding the residential properties in the Account’s portfolio as of December 31, 2012. RECENT TRANSACTIONS The following describes property and financing transactions by the Account since February 22, 2013, the date of the last supplement to the Account prospectus (comprising a part of Registration Statement No. 333-180173) describing property transactions. Except as noted, the expenses for operating the properties purchased are either borne or reimbursed, in whole or in part, by the property tenants, although the terms vary under each lease. The Account is responsible for operating expenses not reimbursed under the terms of a lease. All rental rates are quoted on an annual basis unless otherwise noted. SALES Multifamily Properties Phoenix Apartment Portfolio — Chandler, AZ On February 28, 2013, the Account sold a multi-family property investment located in Chandler, Arizona for a net sales price of $33.3 million, realizing a loss from the sale of $2.6 million. The majority of this loss had been previously recognized as unrealized losses in the Account’s consolidated statement of operations. The Account’s cost basis (excluding selling costs) in the property at the date of sale was $35.9 million. Lincoln Woods Apartments — Lafayette Hill, PA On April 1, 2013, the Account sold an apartment building located in Lafayette Hill, Pennsylvania for a net sales price of $28.7 million. The Account realized a gain from the sale of $5.0 million, which had been previously recorded as an unrealized gain in the consolidated statement of operations. The Account’s cost basis (excluding selling costs) in the property at the date of the sale was $23.7 million. Office Properties 1 & 7 Westferry Circus — London, England On February 28, 2013, the Account sold an office property located in London, England for a net sales price of $193.1 million, realizing a loss from the sale of $138.9 million. The majority of this loss had previously been recognized as unrealized losses in the Account’s consolidated statement of operations. The Account’s cost basis (excluding selling costs) in the property at the date of sale 56Prospectus ¡ TIAA Real Estate Account
was $332.0 million. All proceeds received from the sale of the property were used to settle its outstanding obligations for the property. Retail Properties Kendall Corners — Kendall, FL On March 22, 2013, a retail property located in Kendall, Florida was sold by the Account’s TREA Florida Retail, LLC joint venture investment in which the Account holds an 80.0% interest. The Account’s portion of the net sales price was $24.3 million. The account realized a loss from the sale of $26.5 million, the majority of which had been previously recognized as unrealized losses in the Account’s consolidated statement of operations. The Account’s portion of its cost basis (excluding selling costs) in the property as of the date of sale was $50.8 million. Plainsboro Plaza — Plainsboro, NJ On April 1, 2013, the Account sold a retail property located in Plainsboro, New Jersey for a net sales price of $22.4 million, realizing a loss from the sale of $32.2 million. The majority of the loss had been previously recognized as unrealized losses in the Account’s consolidated statement of operations. The Account’s cost basis (excluding selling costs) in the property as of the date of the sale was $54.6 million. Financings 1 & 7 Westferry Circus — London, United Kingdom On February 28, 2013, the Account extinguished its outstanding mortgage debt obligations of $193.1 million in connection with the disposition of 1 & 7 Westferry Circus as noted above. We value the Account’s assets as of the close of each valuation day by taking the sum of: • the value of the Account’s cash, cash equivalents, and short-term and other debt instruments; • the value of the Account’s other securities and other non-real estate assets; • the value of the individual real properties (based on the most recent valuation of that property) and other real estate-related investments owned by the Account; • an estimate of the net operating income accrued by the Account from its properties, other real estate-related investments and non-real estate-related investments (including short-term marketable securities) since the end of the prior valuation day; and TIAA Real Estate Account ¡Prospectus57
• actual net operating income earned from the Account’s properties, other real estate-related investments and non-real estate-related investments (but only to the extent any such item of income differs from the estimated income accrued for on such investments), and then reducing the sum by the Account’s liabilities, including the daily investment management, administration and distribution fees and certain other fees and expenses attributable to operating the Account. Daily estimates of net operating income are adjusted to reflect actual net operating income on a monthly basis, at which time such adjustments (if any) are reflected in the Account’s unit value. See “Expense Deductions” on page 64. Fair value for the Account’s assets is based upon quoted market prices in active exchange markets, where available. If listed prices or quotes in such markets are not available, fair value is based upon vendor-provided, evaluated prices or internally developed models that primarily use market-based or independently sourced market data, including interest rate yield curves, market spreads, and currency rates. Valuation adjustments may be made to reflect credit quality, a counterparty’s creditworthiness, the Account’s creditworthiness, liquidity, and other observable and unobservable data that are applied consistently over time. The methods described above are considered to produce a fair value calculation that represents a good faith estimate as to what an unaffiliated buyer in the market place would pay to purchase the asset or receive to transfer the liability. Since fair value calculations involve significant professional judgment in the application of both observable and unobservable attributes, actual realizable values or future fair values may differ from amounts reported. Furthermore, while the Account believes its valuation methods are appropriate and consistent with other market participants, the use of different methodologies or assumptions to determine the fair value of certain financial instruments, while reasonable, could result in different estimates of fair value at the reporting date. VALUING REAL ESTATE INVESTMENTS Valuing Real Property:Investments in real estate properties are stated at fair value, as determined in accordance with policies and procedures reviewed by the Investment Committee of the Board and in accordance with the responsibilities of the Board as a whole. Accordingly, the Account does not record depreciation. Fair value for real estate properties is defined as the price that would be received to sell the asset in an orderly transaction between market participants at the measurement date. Determination of fair value involves significant levels of judgment because the actual market value of real estate can be determined only by negotiation between the parties in a sales transaction. Property and investment values are affected by, among other things, the availability of capital, occupancy rates, rental rates, and interest and inflation rates. As a result, determining real estate and investment values involves many 58Prospectus ¡ TIAA Real Estate Account
assumptions. Amounts ultimately realized from each investment may vary significantly from the market value presented. Actual results could differ from those estimates. See “Risk Factors — Risks Associated with Real Estate Investing — Valuation and Appraisal Risks” on page 19. In accordance with the Account’s procedures designed to comply with Fair Value Measurements and Disclosures in U.S. Generally Accepted Accounting Principles (“GAAP”), the Account values real estate properties purchased by the Account initially based on an independent appraisal at the time of the closing of the purchase, which may result in a potential unrealized gain or loss reflecting the difference between an investment’s fair value (i.e., exit price) and its cost basis (which is inclusive of transaction costs). Subsequently, each property will be valued each quarter by an independent appraiser and the property value will be updated as appropriate. In general, the Account obtains independent appraisals of its real estate properties spread out throughout the quarter, which is intended to result in appraisal adjustments, and thus, adjustments to the valuations of its holdings (to the extent such adjustments are made), that happen regularly throughout each quarter and not on one specific day in each quarter. Further, management reserves the right to order an appraisal and/or conduct another valuation outside of the normal quarterly process when facts or circumstances at a specific property change (for example, under certain circumstances a valuation adjustment could be made when bids are obtained for properties held for sale). The Account’s independent fiduciary, Real Estate Research Corporation, oversees the Account’s entire appraisal process and, among other things, must approve all independent appraisers used by the Account. TIAA’s internal appraisal staff oversees the entire appraisal process and reviews each independent quarterly appraisal, in conjunction with the Account’s independent fiduciary, prior to the value reflected in that appraisal being recorded in the Account. Any differences in the conclusions of TIAA’s internal appraisal staff and the independent appraiser will be reviewed by the independent fiduciary, which will make a final determination on the matter (which may include ordering a subsequent independent appraisal). Real estate appraisals are estimates of property values based on a professional’s opinion. All appraisals are performed in accordance with Uniform Standards of Professional Appraisal Practices, the real estate appraisal industry standards created by The Appraisal Foundation. Appraisals of properties held outside of the U.S. are performed in accordance with industry standards commonly applied in the applicable jurisdiction. Further, these independent appraisers (as well as TIAA’s internal appraisal staff) are always expected to be MAI-designated members of the Appraisal Institute (or its European equivalent, Royal Institute of Chartered Surveyors) and state certified appraisers from national or regional firms with relevant property type experience and market knowledge. Under the Account’s current procedures, each independent appraisal firm will be rotated off of a particular property at TIAA Real Estate Account ¡Prospectus59
least every three years, although such appraisal firm may perform appraisals of other Account properties subsequent to such rotation. We intend that the overarching principle and primary objective when valuing our real estate investments will be to produce a valuation that represents a fair and accurate estimate of the fair value of our investments. Implicit in our definition of fair value is the consummation of a sale as of a specified date and the passing of title from seller to buyer under conditions whereby: • Buyer and seller are typically motivated; • Both parties are well informed or well advised, and acting in what they consider their best interests; • A reasonable time is allowed for exposure in the open market; • Payment is made in terms of cash or in terms of financial arrangements comparable thereto; and • The price represents the normal consideration for the property sold unaffected by special or creative financing or sales concessions granted by anyone associated with the sale. The Account’s net asset value will include the value of any note receivable (an amount that someone else owes the Account) from selling a real estate-related investment. We’ll estimate the value of the note by applying a discount rate appropriate to then-current market conditions. Development Properties.Development properties will be carried at fair value, which is anticipated initially to equal the Account’s cost, and the value will be adjusted as additional development costs are incurred. At a minimum, once a property receives a certificate of occupancy, within one year from the initial funding by the Account, or the property is substantially leased, whichever is earlier, the property will be appraised by an independent external appraiser approved by the independent fiduciary. We may also have the properties independently appraised earlier if circumstances warrant. Property Portfolios.The Account may, at times, value individual properties together (whether or not purchased at the same time) in a portfolio as a single asset, to the extent we believe that the property may be sold as one portfolio. The Account may also realize efficiencies in property management by pooling a number of properties into a portfolio. The value assigned to the portfolio as a whole may be more or less than the valuation of each property individually. The Account will also, from time to time, sell one or more individual properties that comprise a portfolio, with the Account retaining title to the remaining individual properties comprising that portfolio. In such a circumstance, the Account could determine to no longer designate such remaining properties as one portfolio. Because of the nature of real estate assets and because the fair value of our investments is not reduced by transaction costs that will be incurred to sell the investments, the Account’s net asset value won’t necessarily reflect the net realizable value of its real estate assets (i.e.,what the Account would receive if it sold them). See “—Valuation Adjustments” on page 62 below. 60Prospectus ¡ TIAA Real Estate Account
Valuing Real Property Subject to a Mortgage:When a real estate property is subject to a mortgage, the mortgage is valued independently of the property and its fair value is reported separately. The independent fiduciary reviews and approves all mortgage valuation adjustments before such adjustments are recorded by the Account. The Account will continue to use the revised value for each real estate property and mortgage loan payable to calculate the Account’s daily net asset value until the next valuation review or appraisal. Valuing Mortgage Loans Receivable (i.e., the Account as a creditor):Mortgage loans receivable are stated at fair value and are initially valued at the face amount of the mortgage loan funding. Subsequently, mortgage loans receivable are valued at least quarterly based on market factors, such as market interest rates and spreads for comparable loans, the liquidity for mortgage loans of similar characteristics, the performance of the underlying collateral and the credit quality of the counterparty. Valuing Mortgage Loans Payable (i.e., the Account as a debtor):Mortgage loans payable are stated at fair value. The estimated fair value of mortgage loans payable is generally based on the amount at which the liability could be transferred in a current transaction, exclusive of transaction costs. Fair values are estimated based on market factors, such as market interest rates and spreads on comparable loans, the liquidity for mortgage loans of similar characteristics, the performance of the underlying collateral (such as the loan-to-value ratio and the cash flow of the underlying collateral), the maturity date of the loan, the return demands of the market, and the credit quality of the Account. Different assumptions or changes in future market conditions could significantly affect estimated fair values. At times, the Account may assume debt in connection with the purchase of real estate. Valuing Real Estate Joint Ventures:Real estate joint ventures are stated at the fair value of the Account’s ownership interests in the underlying entities. The Account’s ownership interests are valued based on the fair value of the underlying real estate, any related mortgage loans payable, and other factors, such as ownership percentage, ownership rights, buy/sell agreements, distribution provisions and capital call obligations. In addition, any restrictions on the right of the Account to transfer its ownership interest to third parties could adversely affect the value of the Account’s interest. Upon the disposition of all real estate investments by an investee entity, the Account will continue to state its equity in the remaining net assets of the investee entity during the wind down period, if any, that occurs prior to the dissolution of the investee entity. Valuing Real Estate Limited Partnerships:Limited partnerships are stated at the fair value of the Account’s ownership in the partnership, which is based on the most recent net asset value of the partnership, as reported by the sponsor. Since market quotations are not readily available, the limited partnership interests are valued at fair value as determined in good faith under the direction of the Investment Committee of the Board and in accordance TIAA Real Estate Account ¡Prospectus61
with the responsibilities of the Board as a whole. As circumstances warrant, prior to the receipt of financial statements of the limited partnership, the Account will estimate the value of its interests in good faith and will from time to time seek input from the issuer or the sponsor of the investment vehicle. Net Operating Income:The Account usually receives operating income from its investments intermittently, not daily. In fairness to participants, we estimate the Account’s net operating income rather than applying it when we actually receive it, and assume that the Account has earned (accrued) a proportionate amount of that estimated amount daily. You bear the risk that, until we adjust the estimates when we receive actual items of income, the Account’s net assets could be under- or over-valued. Every year, we prepare a month-by-month estimate of the revenues and expenses (estimated net operating income) for each of the Account’s properties. Each day, we add the appropriate fraction of the estimated net operating income for the month to the Account’s net asset value. Every month, the Account receives a report of the actual operating results for the prior month for each property (actual net operating income). We then recognize the actual net operating income on the accounting records of the Account and adjust the outstanding daily accrued receivable accordingly. As the Account actually receives income from a property, we’ll adjust the daily accrued receivable and other accounts appropriately. Valuation Adjustments:General. Management reserves the right to order an appraisal and/or conduct another valuation outside of the normal quarterly process when facts or circumstances at a specific property change. Also, the independent fiduciary can require additional appraisals if it believes a property’s value may have changed materially and such change is not reflected in the quarterly valuation review, or otherwise to ensure that the Account is valued appropriately. For example, under certain circumstances a valuation adjustment could be made when bids are obtained for properties held for sale by the Account. In addition, adjustments may be made for events or circumstances indicating an impairment of a tenant’s ability to pay amounts due to the Account under a lease (including due to a bankruptcy filing of that tenant). Also, adjustments may be made to reflect factors (such as sales values for comparable properties or local employment rate) bearing uniquely on a particular region in which the Account holds properties. We may not always be aware of each event that might require a valuation adjustment, and because our evaluation is based on subjective factors and we give different weight to different factors, we may not in all cases make a valuation adjustment where changing conditions could potentially affect the value of an investment. Required Approvals.The independent fiduciary will need to approve adjustments to any valuation of one or more properties or real estate-related assets that: • is made within three months of the annual independent appraisal, or • results in an increase or decrease of: 62Prospectus ¡ TIAA Real Estate Account
• more than 6 percent of the value of any of the Account’s properties since the last independent annual appraisal; • more than 2 percent in the value of the Account since the prior calendar month; and/or • more than 4 percent in the value of the Account within any calendar quarter. Right to Change Valuation Methods:If we decide that a different valuation method would reflect the value of a real estate-related investment more accurately, we may use that method if the independent fiduciary consents. Changes in TIAA’s valuation methods could change the Account’s net asset value and change the values at which participants purchase or redeem Account interests. VALUING OTHER INVESTMENTS (INCLUDING CERTAIN REAL ESTATE-RELATED INVESTMENTS) Debt Securities:We value debt securities (excluding money market instruments) for which market quotations are readily available based on the most recent bid price or the equivalent quoted yield for such securities (or those of comparable maturity, quality and type). We derive these values utilizing an independent pricing service, such as FT Interactive Data Corp, Reuters and Bloomberg, except when we believe the prices do not accurately reflect the security’s fair value. Debt securities for which market quotations are not readily available are valued at fair value as determined in good faith by the Investment Committee of the Board and in accordance with the responsibilities of the Board as a whole. Short-term Investments:We value short-term investments with maturities of 60 days or less (excluding money market instruments) at amortized cost. Short-term investments with maturities in excess of 60 days (excluding money market instruments) are valued in the same manner as debt securities, as described above. Money Market Instruments:We value money market instruments at amortized cost. Equity Securities:We value equity securities (including REITs) listed or traded on the New York Stock Exchange (or any of its affiliated exchanges) at their last sale price on the valuation day. If no sale is reported that day, we use the mean of the last bid and asked prices, exclusive of transaction costs. Equity securities listed or traded on any other exchange are valued in a comparable manner on the principal exchange where traded. We value equity securities traded on the Nasdaq Stock Market at the Nasdaq Official Closing Price on the valuation day. If no sale is reported that day, we use the mean of the last bid and asked prices, exclusive of transaction costs. Other U.S. over-the-counter equity securities are valued at the mean of the last bid and asked prices. Mortgage-Backed Securities:We value mortgage-backed securities, including CMBS and RMBS, in the same manner in which we value debt securities, as described above. TIAA Real Estate Account ¡Prospectus63
Foreign Securities:To value equity and fixed income securities traded on a foreign exchange or in foreign markets, we use their closing values under the generally accepted valuation method in the country where traded, as of the valuation date. We convert this to U.S. dollars at the exchange rate in effect on the valuation day. Under certain circumstances (for example, if there are significant movements in the United States markets and there is an expectation the securities traded on foreign markets will adjust based on such movements when the foreign markets open the next day), the Account may adjust the value of equity or fixed income securities that trade on a foreign exchange or market after the foreign exchange or market has closed. Investments Lacking Current Market Quotations:We value securities or other assets for which current market quotations are not readily available at fair value as determined in good faith under the direction of the Investment Committee of the Board and in accordance with the responsibilities of the Board as a whole. In evaluating fair value for the Account’s interest in certain commingled investment vehicles, the Account will generally look to the value periodically assigned to interests by the issuer. When possible, the Account will seek to have input in formulating the issuer’s valuation methodology. Expense deductions are made each valuation day from the net assets of the Account for various services to manage the Account’s investments, administer the Account and the contracts, distribute the contracts and to cover certain risks borne by TIAA. Investment management, administration and distribution services are provided “at cost” by TIAA and Services. Currently, TIAA provides investment management services and administration services for the Account, and Services provides distribution services for the Account. In addition, TIAA charges the Account a fee to bear certain mortality and expense risks, and risks associated with providing the liquidity guarantee. TIAA guarantees that in the aggregate, the expense charges will never be more than 2.50% of average net assets per year. The estimated annual expense deduction rate that appears in the expense table below reflects an estimate of the amount we currently expect to deduct to approximate the costs that the Account will incur from May 1, 2013 through April 30, 2014. Actual expenses may be higher or lower. The expenses identified in the table below do not include any fees which may be imposed by your employer under a plan maintained by your employer. 64Prospectus ¡ TIAA Real Estate Account
Type of Expense Deduction Estimated Services Performed Investment Management 0.365% For investment advisory, investment management, portfolio accounting, custodial and similar services, including independent fiduciary and appraisal fees Administration 0.265% For administration and operations of the Account and the contracts, including administrative services such as receiving and allocating premiums and calculating and making annuity payments Distribution 0.080% For services and expenses associated with distributing the annuity contracts Mortality and Expense Risk 0.005% For TIAA’s bearing certain mortality and expense risks Liquidity Guarantee 0.180% For TIAA’s liquidity guarantee Total Annual Expense Deduction1,2 0.895% Total 1 TIAA guarantees that the total annual expense deduction will not exceed an annual rate of 2.50% of average net assets. 2 Property-level expenses, including property management fees and transfer taxes, are not reflected in the table above; instead these expenses are charged directly to the Account’s properties. Since expenses for services provided to the Account are charged to the Account at cost, they are estimates for the year based on projected expense and asset levels. Administration charges include certain costs associated with the provision by TIAA entities of recordkeeping and other services for retirement plans and other pension products in addition to the Account. A portion of these expenses are allocated to the Account in accordance with applicable allocation procedures. In limited circumstances, TIAA may pay third parties for providing certain recordkeeping services for the Account. At the end of every quarter, we reconcile the amount deducted from the Account during that quarter as discussed above with the expenses the Account actually incurred. If there is a difference, we add it to or deduct it from the Account in equal daily installments over the remaining days in the immediately following quarter, provided that material differences may be repaid in the current calendar quarter in accordance with GAAP. Our at-cost deductions are based on projections of Account assets and overall expenses, and the size of any adjusting payments will be directly affected by how different our projections are from the Account’s actual assets or expenses. The expenses identified in the table above do not include any fees which may be imposed by your employer under a plan maintained by your employer. The size of the Account’s assets can be affected by many factors, including changes in the value of portfolio holdings, net income earned on the Account’s investments, premium activity and participant transfers into or out of the Account and participant cash withdrawals from the Account. In addition, our operating expenses can fluctuate based on a number of factors including participant transaction volume, operational efficiency, and technological, personnel and other infrastructure costs. Historically, the adjusting payments have resulted in both upward and downward adjustments to the Account’s expense deductions for the following quarter. TIAA Real Estate Account ¡Prospectus65
Percent of Net
Assets Annually
The Board can revise the estimated expense rates (the daily deduction rate before the quarterly adjustment referenced above) for the Account from time to time, usually on an annual basis, to keep deductions as close as possible to actual expenses. Currently there are no deductions from premiums, transfers or withdrawals, but we reserve the right to change this in the future. Any such deductions would only be assessed to the extent the relevant contract provided for such deductions at the time the contract was issued. EMPLOYER PLAN FEE WITHDRAWALS Your employer may, in accordance with the terms of your plan, and in accordance with TIAA’s policies and procedures, withdraw amounts from your Real Estate Account accumulation under your Retirement Choice or Retirement Choice Plus contract, and, on a limited basis, under your GA, GSRA, GRA or Keogh contract, to pay fees associated with the administration of the plan. These fees are separate from the expense deductions of the Account, and are not included for purposes of TIAA’s guarantee that the total annual expense deduction of the Account will not exceed 2.50% of average net assets per year. The amount and the effective date of an employer plan fee withdrawal will be in accordance with the terms of your plan. TIAA will determine all values as of the end of the effective date. An employer plan fee withdrawal cannot be revoked after its effective date. Each employer plan fee withdrawal will be made on a pro rata basis from all your available TIAA and CREF accounts. An employer plan fee withdrawal reduces the accumulation from which it is paid by the amount withdrawn. CERTAIN RELATIONSHIPS WITH TIAA As noted elsewhere in this prospectus, the TIAA General Account plays a significant role in operating the Real Estate Account, including providing a liquidity guarantee, and investment advisory, administration and other services. In addition, Services, a wholly owned subsidiary of TIAA, provides distribution services for the Account. Liquidity Guarantee.As noted above under “Establishing and Managing the Account — The Role of TIAA — Liquidity Guarantee” on page 45, if the Account’s liquid assets and its cash flow from operating activities and participant transactions are insufficient to fund redemption requests, the TIAA General Account has agreed to purchase liquidity units. TIAA thereby guarantees that a participant can redeem accumulation units at their net asset value next determined. In the years ended December 31, 2008 and December 31, 2009, TIAA purchased liquidity units in a number of separate transactions at a purchase price equal to $155.6 million and approximately $1.1 billion, respectively. Since January 1, 2010 and through the date of this prospectus, the TIAA General 66Prospectus ¡ TIAA Real Estate Account
Account has purchased no additional liquidity units. These liquidity units are valued in the same manner as are accumulation units held by the Account’s participants. For the years ended December 31, 2012, December 31, 2011 and December 31, 2010, the Account expensed $31.3 million, $23.7 million and $13.1 million, respectively, for this liquidity guarantee from TIAA through a daily deduction from the net assets of the Account. Investment Advisory, Administration and Distribution Services/Mortality and Expense Risks Borne by TIAA.As noted above under “Expense Deductions” on page 64, deductions are made each valuation day from the net assets of the Account for various services required to manage investments, administer the Account and distribute the contracts. These services are performed at cost by TIAA and Services. Deductions are also made each valuation day to cover mortality and expense risks borne by TIAA. For the years ended December 31, 2012, December 31, 2011 and December 31, 2010, the Account expensed $56.3 million, $53.9 million and $50.2 million, respectively, for investment advisory services and $2.8 million, $6.2 million and $4.4 million, respectively, for mortality and expense risks provided/borne by TIAA. For the same period, the Account expensed $46.3 million, $37.5 million and $28.1 million, respectively, for administrative and distribution services provided by TIAA and Services, as applicable. The Account is party to various claims and routine litigation arising in the ordinary course of business. As of the date of this prospectus, management of the Account does not believe that the results of any such claims or litigation, individually or in the aggregate, will have a material effect on the Account’s business, financial position or results of operations. TIAA Real Estate Account ¡Prospectus67
The following selected financial data should be considered in conjunction with the Account’s consolidated financial statements and notes provided in this prospectus (amounts in millions except for per accumulation unit amounts). Years Ended December 31, 2012 2011 2010 2009 2008 Investment income: Real estate income, net $ 388.7 $ 435.6 $ 421.1 $ 479.7 $ 500.4 Income from real estate 80.9 86.4 89.3 114.6 116.9 Dividends and interest 35.3 22.4 8.6 1.7 81.5 Total investment income 504.9 544.4 519.0 596.0 698.8 Expenses 136.7 121.3 95.8 95.5 153.0 Investment income, net 368.2 423.1 423.2 500.5 545.8 Net realized and unrealized 1,011.2 1,076.0 757.0 (3,612.5 ) (2,513.0 ) Net increase (decrease) 1,379.4 1,499.1 1,180.2 (3,112.0 ) (1,967.2 ) Participant transactions 894.8 1,225.0 1,743.0 (1,575.7 ) (4,340.0 ) TIAA (redemption) purchase (940.3 ) — — 1,058.7 155.6 Net increase (decrease) $ 1,333.9 $ 2,724.1 $ 2,923.2 $ (3,629.0 ) $ (6,151.6 ) Years Ended December 31, 2012 2011 2010 2009 2008 Total assets $ 17,378.6 $ 15,749.9 $ 12,839.9 $ 9,912.7 $ 13,576.9 Total liabilities 2,517.5 2,222.7 2,036.8 2,032.8 2,068.0 Total net assets $ 14,861.1 $ 13,527.2 $ 10,803.1 $ 7,879.9 $ 11,508.9 Number of per accumulation 53.3 53.4 48.1 39.5 41.5 Net asset value, per accumulation unit $ 272.569 $ 247.654 $ 219.173 $ 193.454 $ 267.348 Mortgage loans payable $ 2,282.6 $ 2,028.2 $ 1,860.2 $ 1,858.1 $ 1,830.0 68Prospectus ¡ TIAA Real Estate Account
joint ventures and
limited partnerships
gain (losses) on
investments and
mortgage loans payable
in net assets resulting
from operations
of Liquidity Units
in net assets
unit amounts
QUARTERLY SELECTED FINANCIAL INFORMATION The following quarterly selected unaudited financial data for each full quarter of 2012 and 2011 are derived from the consolidated financial statements of the Account for the years ended December 31, 2012 and 2011 (amounts in millions). 2012 Year Ended For the Three Months Ended March 31 June 30 September 30 December 31 Investment income, net $ 90.9 $ 95.6 $ 101.8 $ 79.9 $ 368.2 Net realized and unrealized gain on investments and mortgage loans payable 354.0 263.7 174.0 219.5 1,011.2 Net increase in net assets resulting from operations $ 444.9 $ 359.3 $ 275.8 $ 299.4 $ 1,379.4 Total return 3.26 % 2.52 % 1.89 % 2.03 % 10.06 % 2011 Year Ended For the Three Months Ended March 31 June 30 September 30 December 31 Investment income, net $ 94.7 $ 123.8 $ 110.5 $ 94.1 $ 423.1 Net realized and unrealized 286.5 368.6 180.9 240.0 1,076.0 Net increase in net assets resulting from operations $ 381.2 $ 492.4 $ 291.4 $ 334.1 $ 1,499.1 Total return 3.42 % 4.12 % 2.32 % 2.56 % 12.99 % TIAA Real Estate Account ¡Prospectus69
December 31,
2012
December 31,
2011
gain on investments and mortgage loans payable
MANAGEMENT’S DISCUSSION AND ANALYSIS OF THE ACCOUNT’S FINANCIAL CONDITION AND The following discussion and analysis of our financial condition and results of operations should be read together with our consolidated financial statements and notes contained in this prospectus and with consideration to the sub-section entitled “Forward-Looking Statements,” which begins below, and the section entitled “Risk Factors.” The past performance of the Account is not indicative of future results. FORWARD-LOOKING STATEMENTS Some statements in this prospectus which are not historical facts may be “forward-looking statements” within the meaning of Section 27A of the Securities Act of 1933, Section 21E of the Securities Exchange Act of 1934 and the Private Securities Litigation Reform Act of 1995. Forward-looking statements include statements about management’s expectations, beliefs, intentions or strategies for the future, include the assumptions and beliefs underlying these forward-looking statements, and are based on current expectations, estimates and projections about the real estate industry, domestic and global economic conditions, including conditions in the credit and capital markets, the sectors, and markets in which the Account invests and operates, and the transactions described in this prospectus. While management believes the assumptions underlying any of its forward-looking statements and information to be reasonable, such information may be subject to uncertainties and may involve certain risks which may be difficult to predict and are beyond management’s control. These risks and uncertainties could cause actual results to differ materially from those contained in any forward-looking statement. These risks and uncertainties include, but are not limited to, the following: • Acquiring and Owning Real Estate: The risks associated with acquiring and owning real property, including general economic and real estate market conditions, the availability of, and economic cost associated with, financing the Account’s properties, the risk that the Account’s properties become too concentrated (whether by geography, sector or by tenant mix), competition for acquiring real estate properties, leasing risk (including tenant defaults) and the risk of uninsured losses at properties (including due to terrorism, natural disasters, and acts of violence); • Selling Real Estate: The risk that the sales price of a property might differ, perhaps significantly, from its estimated or appraised value, leading to losses or reduced profits to the Account, the risk that the Account might not be able to sell a property at a particular time for a price which management believes represents its fair or full value, the risk of a lack of availability of financing (for potential purchasers of the Account’s properties), risks associated with disruptions in the credit and capital markets, and the risk that the Account may be required to make significant expenditures before the Account is able to market and/or sell a property; 70Prospectus ¡ TIAA Real Estate Account
RESULTS OF OPERATIONS
• Valuation: The risks associated with property valuations, including the fact that appraisals can be subjective in a number of respects and the fact that the Account’s appraisals are generally obtained on a quarterly basis and there may be periods in between appraisals of a property during which the value attributed to the property for purposes of the Account’s daily accumulation unit value may be more or less than the actual realizable value of the property; • Borrowing: Risks associated with financing the Account’s properties, including the risk of default on loans secured by the Account’s properties (which could lead to foreclosure), the risk associated with high loan to value ratios on the Account’s properties (including the fact that the Account may have limited, or no net value in such a property), the risk that significant sums of cash could be required to make principal and interest payments on the loans and the risk that the Account may not have the ability to obtain financing or refinancing on favorable terms (or at all), which may be aggravated by general disruptions in credit and capital markets; • Participant Transactions and Cash Management: Investment risk associated with participant transactions, in particular that (i) significant net participant transfers out of the Account may impair our ability to pursue or consummate new investment opportunities that are otherwise attractive to the Account and/or may result in sales of real estate-related assets to generate liquidity, (ii) significant net participant transfers into the Account may result, on a temporary basis, in our cash holdings and/or holdings in liquid real estate-related investments exceeding our long-term targeted holding levels and (iii) high levels of cash in the Account during times of appreciating real estate values can impair the Account’s overall return; • Joint Venture Investments: The risks associated with joint venture partnerships, including the risk that a co-venturer may have interests or goals inconsistent with that of the Account, that a co-venturer may have financial difficulties, and the risk that the Account may have limited rights with respect to operation of the property and transfer of the Account’s interest; • Regulatory Matters: Uncertainties associated with environmental liability and regulations and other governmental regulatory matters such as zoning laws, rent control laws, and property taxes; • Foreign Investments: The risks associated with purchasing, owning and disposing foreign investments (primarily real estate properties), including political risk, the risk associated with currency fluctuations, regulatory and taxation risks and risks of enforcing judgments; • Conflicts of Interest: Conflicts of interest associated with TIAA serving as investment manager of the Account and provider of the liquidity guarantee at the same time as TIAA and its affiliates are serving as an investment manager to other real estate accounts or funds, including conflicts associated with satisfying its fiduciary duties to all such accounts and funds associated with purchasing, selling and leasing of properties; TIAA Real Estate Account ¡Prospectus71
• Required Property Sales: The risk that, if TIAA were to own too large a percentage of the Account’s accumulation units through funding the liquidity guarantee (as determined by the independent fiduciary), the independent fiduciary could require the sales of properties to reduce TIAA’s ownership interest, which sales could occur at times and at prices that depress the sale proceeds to the Account; • Government and Government Agency Securities: Risks associated with investment securities issued by U.S. government agencies and U.S. government-sponsored entities, including the risk that the issuer may not have their securities backed by the full faith and credit of the U.S. government, and that transaction activity may fluctuate significantly from time to time, which could negatively impact the value of the securities and the Account’s ability to dispose of a security at a favorable time; and • Liquid Assets and Securities: Risks associated with investments in real estate-related liquid assets (which could include, from time to time, REIT securities and CMBS), and non-real estate-related liquid assets, including: • Financial/credit risk — Risks that the issuer will not be able to pay principal and interest when due or that the issuer’s earnings will fall; • Market volatility risk — Risk that the changing conditions in financial markets may cause the Account’s investments to experience price volatility; • Interest rate volatility risk — Risk that interest rate volatility may affect the Account’s current income from an investment; and • Deposit/money market risk — Risks that the Account could experience losses if banks fail. More detailed discussions of certain of these risk factors are contained in the section of this prospectus entitled “Risk Factors” and in this section below and also in the section entitled “Quantitative and Qualitative Disclosures About Market Risk,” that could cause actual results to differ materially from historical experience or management’s present expectations. Caution should be taken not to place undue reliance on management’s forward-looking statements, which represent management’s views only as of the date of this prospectus. Neither management nor the Account undertake any obligation to update publicly or revise any forward-looking statement, whether as a result of new information, changed assumptions, future events or otherwise. Commercial real estate market statistics discussed in this section are obtained by the Account from sources that management considers reliable, but some of the data are preliminary for the year or quarter ended December 31, 2012 and may be subsequently revised. Prior period data may have been adjusted to reflect updated calculations. Investors should not rely exclusively on the data presented below in forming a judgment regarding the current or prospective performance of the commercial real estate market generally. 72Prospectus ¡ TIAA Real Estate Account
2012 U.S. ECONOMIC AND COMMERCIAL REAL ESTATE OVERVIEW Economic and Capital Markets Overview and Outlook The Bureau of Economic Analysis’s initial estimate of U.S. Gross Domestic Product (“GDP”) growth in the fourth quarter of 2012 was a decline of 0.1%, as compared with a 3.1% increase in the third quarter of 2012. The decline in GDP was due in large part to the largest decline in defense spending in over 40 years, weaker exports, and weaker buildup of business inventories. Government spending cuts and slower growth in inventories together reduced GDP growth by 2.6 percentage points. Offsetting these factors was an increase in consumer and business spending and increases in residential and non-residential fixed investment. The increase in consumer spending is believed to bode well for future growth since it has historically accounted for upwards of 70% of GDP. Fourth quarter growth was also affected by the uncertainty surrounding Congressional action on the “fiscal cliff”. The fiscal cliff refers to a series of federal government tax increases and spending reductions that would have automatically occurred at the end of 2012 as mandated by the Budget Control Act of 2011. While a last minute agreement was ultimately reached, businesses reportedly delayed hiring and spending decisions throughout the quarter as the deadline approached. Despite the modest dip in GDP, payroll employment grew at a healthy rate in the fourth quarter, with a gain of 453,000 jobs as compared with 505,000 in the third quarter. Job growth averaged 153,000 per month during 2012, the same as in 2011, and was sufficient to lower the unemployment rate to 7.8% as of December 2012 from 8.5% as of the start of 2012. Similarly, retail sales grew at a healthy rate in the fourth quarter despite the decline in GDP. Preliminary estimates from the U.S. Bureau of the Census indicated that retail sales excluding the more volatile auto and auto parts sector increased 3.7% compared with the fourth quarter of 2011. For 2012 as a whole, retail sales increased 4.6% compared to 2011. Despite the growth in sales during the fourth quarter, results for major U.S. retailers were mixed, with discounters and high-end retailers reporting the strongest sales. Superstorm Sandy, warmer than usual winter weather and fiscal cliff concerns were cited by some companies as reasons for the lower than expected results. Economic data for the fourth quarter reflected business and consumer caution given the uncertainty associated with the Presidential election and the fiscal cliff deadline. The passage of the American Taxpayer Relief Act (“ATRA”) of 2012 averted the mandated steep tax increases and deep spending cuts which would likely have pushed the U.S. economy into recession. Though Bush era tax cuts were extended for the middle class, ATRA raised tax rates for the most affluent Americans and began a phase-out of itemized tax deductions for more affluent households. In addition, the two percentage point reduction in payroll taxes that was in effect in 2011 and 2012 was not extended. As a result of higher tax rates and higher payroll tax deductions, 2013 paychecks for most households will shrink. The Tax Policy Center estimated TIAA Real Estate Account ¡Prospectus73
that three of four Americans will pay higher taxes in 2013 because of various provisions of the bill, with the most affluent households seeing the largest increases. Consequently, economists expect that consumer spending will be weaker in the first half of the year as households make necessary adjustments to their budgets. Soon after the fiscal cliff deal was completed, attention was focused on the upcoming debt ceiling deadline. With roughly a $100 billion per month cash flow shortfall, the U.S. government has resorted to “extraordinary measures” to generate sufficient cash to cover its short-term needs thus far in 2013. In early January, Congress passed legislation which extended the debt ceiling deadline until mid-May. Sufficient funds were authorized for the U.S. government to meet its obligations while a detailed budget plan is negotiated. While Standard & Poor’s was the only agency to downgrade U.S. government debt during the 2011 debt ceiling crisis, Fitch has warned that the failure to raise the government’s statutory borrowing limit would “very likely” result in a downgrading of the U.S. government’s AAA rating. Other agencies could follow suit if a credible long-term deficit reduction plan is not reached. In addition to potential damage to the U.S. government’s credit rating, failure to resolve the debt ceiling would likely reduce U.S. GDP growth during the first half of 2013. The European sovereign debt crisis received less attention in the U.S. during the fourth quarter, but it continued to have a dampening effect on the European and global economies. Slowing growth during the fourth quarter caused Eurozone unemployment to hit a record high of 11.8% in November 2012, albeit with much disparity ranging from a low of 4.5% in Austria to a high of 27.0% in both Spain and Greece. Even stalwarts such as Germany have felt the effects of the crisis as German GDP declined 0.5% in the fourth quarter of 2012, which was the worst performance since 2008. In addition, the German Economic Ministry now expects GDP to grow only 0.4% during 2013 as compared with a previous forecast of 1.0%. Despite the weak economic activity, European Central Bank President Mario Draghi stated in a recent speech that the Eurozone has “turned a corner” and that a gradual recovery in the Eurozone economy would begin in 2013. While cautioning that the Eurozone economy was not yet out of danger, Draghi noted that there were signs of stabilization including rising stock markets and significantly lower sovereign borrowing costs. Reflective of the belief that the economy would soon begin growing again, the ECB left interest rates unchanged at its first meeting in 2013, believing that interest rates were already low enough to spur growth. Prospects for the global economy are bolstered by healthy growth in developing countries. In particular, concerns about slowing growth in China have diminished. The World Bank now expects the Chinese economy to grow in excess of 8% in 2013. The Brazilian economy is also expected to rebound with The World Bank forecasting GDP growth of 3.5% following an anemic 0.9% gain in 2012. According to a January 15, 2013 report by The World Bank, “developing countries are still the main driver of global growth”, and while the global economy continues to struggle, the worst appeared to be over, and 74Prospectus ¡ TIAA Real Estate Account
“prospects are for a moderate acceleration of growth between 2013 and 2015.” Considerable downside risk remains, but “the balance of risks is now skewed less to the downside then it has been in recent years.” Downside risks in the United States appear more muted as well. Nonetheless, the Federal Reserve continues to bolster U.S. economic activity through accommodative monetary policy. In its December 2012 statement, the Federal Open Market Committee (“FOMC”) stated that it intends to keep the target rate for the fed funds rate at zero to 0.25% as long as the unemployment rate remains above 6.5% and the near term inflation rate is anticipated to be no more than half a percentage point above the FOMC’s 2.0% long range goal. Similarly, the FOMC continues to purchase $40 billion of longer-term securities per month in order to keep downward pressure on long-term interest rates and to make broader financial markets conditions more accommodative. Though U.S. macroeconomic and financial markets conditions continue to improve, the FOMC believes that economic conditions are likely to warrant “exceptionally low levels for the federal funds rate at least through late 2014.” A low interest rate environment should bolster U.S. economic growth in 2013 by supporting the burgeoning housing market recovery and encouraging hiring and capital spending by U.S. businesses. The uncertainty created by the approaching fiscal cliff produced financial market volatility during the fourth quarter of 2012. By mid-November, the Dow and S&P 500 had both lost over 7% but recouped most or all of those losses by mid-December. That trend reversed itself during final weeks of the year as fiscal cliff concerns rose, with the Dow shedding over 400 points and the S&P 500 falling 3.3%. While both indices were down slightly for the quarter overall, the Dow and S&P 500 rallied following the fiscal cliff deal with the Dow up 6% and the S&P 500 up 5% as of the end of January 2013. However, traders are bracing for a new round of volatility as the debt ceiling deadline approaches. The ten-year Treasury mirrored the equity markets with yields starting the quarter at 1.63%, slipping to 1.57% in mid-November as investors moved out of stocks, and then rising to 1.75% at year-end when investors returned to the equity markets. Since the beginning of the year, yields have moved higher to 2.0% as of the end of January. Gold prices rose for the twelfth straight year, but were volatile in the fourth quarter despite gold’s status as a “safe haven” investment. Prices peaked at $1,800 per ounce in early October but ended the quarter at $1,650 per ounce. Recent trends in key U.S. economic indicators are summarized in the table below. As shown, employment growth was solid in the second half of 2012 despite fiscal cliff concerns. TIAA Real Estate Account ¡Prospectus75
ECONOMIC INDICATORS* 2012Q1 2012Q2 2012Q3 2012Q4 Actual Forecast 2012 2013 2014 Economy(1) Gross Domestic Product (GDP) 2.0% 1.3% 3.1% -0.1% 2.2% 2.0% 2.6% Employment Growth (Thousands) 677 200 505 453 1,835 1,900 2,800 Interest Rates(2) 10 Year Treasury 2.04% 1.82% 1.64% 1.71% 1.80% 2.00% 2.40% Federal Funds Rate 0.0–0.25% 0.0–0.25% 0.0–0.25% 0.0–0.25% 0.0–0.25% N/A N/A Sources: BEA, BLS, Federal Reserve, Blue Chip Consensus Forecasts, and Moody’s Analytics * Data subject to revision. (1) GDP growth rates are annual rates. (2) The Treasury rates are an average over the stated time period. The Federal Funds rates are as of the end of the stated time period. N/A indicates data not available. Other economic indicators, including those summarized in the table below, suggest underlying strength in the U.S. economy. In the housing market, for example, existing home sales increased in two of the three months in the fourth quarter and by 9.2% for 2012 as a whole. Similarly, new home sales increased 20.7% compared with 2011. Housing starts overall were up 28.0%, with single-family starts increasing 24.0% and apartment construction up 40.0%. Record high housing affordability and homebuilder confidence coupled with attractive mortgage interest rates suggest that the recovery of the housing market is likely to continue well into 2013. By comparison, retail sales growth was less vibrant but solid nonetheless, with sales excluding autos and auto parts increasing slightly during the fourth quarter and gaining a healthy 4.6% for the year overall. Positive trends in the housing market and retail sales bode well for the U.S. economy in 2013. BROAD ECONOMIC INDICATORS* Full Year(1) October November December 2011 2012 % Change from prior month or year Inflation (Consumer Price Index) 3.2% 2.1% 0.1% −0.3% 0.0% Retail Sales (excl. motor vehicle & parts) 7.3% 4.6% 0.2% −0.1% 0.3% Total Existing Home Sales 1.7% 9.2% 1.5% 4.8% −1.0% New Home Sales −5.3% 20.7% −4.0% 9.3% −7.3% Single-Family Housing Starts −8.6% 24.4% −0.2% −3.2% 8.1% Annual or Monthly Average Unemployment Rate 9.0% 8.1% 7.9% 7.8% 7.8% * Data subject to revision. (1) Full Year inflation is the year-over-year percentage change in the unadjusted annual average. Sources: Census Bureau, Bureau of Labor Statistics, National Association of Realtors, Moody’s Analytics The January 16, 2013 Beige Book, which detailed economic activity across the twelve Federal Reserve Districts (“Districts”), provided anecdotal support of continued moderate growth in economic activity during the fourth quarter. All twelve Federal Reserve Districts reported either modest or moderate growth between mid-November and the end of December. Similarly, all twelve 76Prospectus ¡ TIAA Real Estate Account
2012
2012
2012
Districts reported growth in consumer spending. While holiday sales were moderately higher than in 2011, they were below expectations for many retailers. Reports on the manufacturing sector were mixed, albeit with the majority of Districts reporting higher levels of activity. All Districts reported stronger residential real estate markets, with home sales increasing in eleven Districts and residential construction increasing in eight. Commercial real estate activity was also stronger though concerns about the fiscal cliff were cited in some Districts as contributing to a slowdown in leasing. Labor market conditions were mostly unchanged, with delays in hiring reported in six Districts due to fiscal cliff concerns; two other Districts reported delays in hiring due to changes in health care legislation and another due to uncertainties in the Eurozone. Wage pressures remained largely stable aside from highly skilled workers in the information technology, health care, and energy fields. Inflation pressures remained modest. Overall, regional reports provided confirmation of continued moderate economic growth in the fourth quarter. The general consensus of public and private sector economists is that economic activity will remain moderate in the first half of 2013 but turn measurably stronger in the second half of the year. Sluggish growth in the first half of the year is expected due in large part to the expiration of the payroll tax cut and the imposition of higher income tax rates on the most affluent households, which in combination will have a dampening effect on consumer spending. Prospects for the second half of the year are stronger in large part because of a diminishing fiscal drag from an assumed resolution of the debt ceiling. Assuming that a deal on the debt ceiling is reached by May, its ultimate effect on the U.S. economy is likely to be limited initially and then occur gradually over the longer term. Failure to reach a deal would have a detrimental effect on the U.S. economy, particularly if the U.S. were downgraded. The U.S. economy should also benefit from solid growth in China and other developing countries; the start of an economic recovery in Europe would be similarly beneficial, but is far from certain. The consensus of economists surveyed as part of the January 10, 2013 Blue Chip Financial Forecast publication was for U.S. GDP to grow at a 2.0% rate in 2013 and at a 2.6% rate in 2014. Employment growth is projected average roughly 160,000 jobs per month in 2013, or 1.9 million, which is slightly higher than in 2012. While GDP growth of 2.0% and employment growth of 1.9 million would still be moderate considering that the Great Recession officially ended in June 2009, it would nonetheless provide sufficient support for further improvement in commercial real estate market conditions particularly given the modest construction in most property sectors. Real Estate Market Conditions and Outlook Commercial real estate market statistics discussed in this section are obtained by the Account from sources that Management considers reliable, but some of the data are preliminary for the period ended December 31, 2012 and may subsequently be TIAA Real Estate Account ¡Prospectus77
revised. Prior period numbers may have been adjusted to reflect updated data. Industry sources such as CB Richard Ellis Econometric Advisors (“CBRE-EA”) calculate vacancy based on square footage. Except where otherwise noted, the Account’s vacancy data is calculated as a percentage of net rentable space leased, weighted by square footage, in keeping with industry standards. Investors should not rely exclusively on the data presented below in forming a judgment regarding the current or prospective performance of the real estate market generally. Commercial real estate sales activity accelerated during the fourth quarter of 2012 as investors sought to close deals in advance of 2013 tax rate changes. Commercial real estate fundamentals showed continued modest improvement including declining vacancies and modest rent growth despite anecdotal reports of delays in leasing as businesses waited to ascertain the impact of provisions of the fiscal cliff deal. Investor interest in commercial real estate remained strong with commercial property sales volumes totaling $98 billion in the fourth quarter, up 47% compared to fourth quarter of 2011. For 2012 as a whole, sales totaled $283 billion which was 24% above 2011’s total of $230 billion. Sales of all property types were up compared with 2011, with the biggest gains registered by apartment properties. Institutional investors continued to be highly focused on top properties in major markets such as Washington DC, New York, Boston, San Francisco and Los Angeles. Investors with greater risk tolerance looked for opportunities in secondary and tertiary markets such as Charlotte, Denver, Philadelphia, Nashville, and Salt Lake City where prices are generally lower. Reflective in part of real estate’s attractive return profile and prospects compared to other asset classes, the Green Street Advisors’ Commercial Property Price Index (“CPPI”) increased 1.4% in the fourth quarter of 2012 as compared with a 2.5% increase in the third quarter of 2012. Green Street Advisors estimates that for 2012 as a whole, commercial property values increased 7.0% and are now roughly 2.0% below their August 2007 peak on average. However, there is considerable disparity between sectors with apartment values 10.0% higher than their 2007 peak and office values 15.0% below their 2007 peak. Nonetheless, Green Street Advisors remains optimistic about near term prospects for commercial property values: “Values continue to benefit from today’s low-return environment, and it’s likely the upward momentum will be sustained.” Preliminary NCREIF Open End Diversified Core Equity (ODCE) commercial property returns for the fourth quarter of 2012 were 2.3%, consisting of a 1.3% income return and a 1.0% capital return. For the four quarter period ending December 31, 2012, returns were 10.9%, consisting of a 5.4% income return and a 5.3% capital return. By comparison, returns for the four quarter period ending September 30, 2012 were 11.6%. 78Prospectus ¡ TIAA Real Estate Account
Data for the Account’s top five markets in terms of fair market value as of December 31, 2012 are provided below. These markets represent 46.9% of the Account’s total real estate portfolio. Metropolitan Area Account % Number Metro Area Metro Area Washington-Arlington-Alexandria, DC-VA-MD-WV 91.0% 10 14.4% 10.8% New York-White Plains-Wayne, NY-NJ 93.7% 6 10.6% 7.9% Los Angeles-Long Beach-Glendale, CA 92.2% 11 8.1% 6.1% Boston-Quincy, MA 88.5% 4 7.0% 5.3% San Francisco-San Mateo- 91.8% 4 6.8% 5.1% * Weighted by market value, which differs from the calculations provided for market comparisons to CBRE-EA data and are used here to reflect the fair market value of the Account’s monetary investments in those markets. Office According to CB Richard Ellis Economic Advisors (“CBRE-EA”), the national office vacancy rate inched down to 15.4% in the fourth quarter of 2012 as compared to 15.6% in the third quarter of 2012. Nationally, the office vacancy rate has declined from a peak of 16.9% since the second quarter of 2010. The modest improvement in office market conditions during the fourth quarter was reflective of moderate employment growth and tenant delays in making leasing decisions given the uncertainty associated with the approaching fiscal cliff. The vacancy rate for the Account’s office portfolio averaged 10.1% as of the fourth quarter of 2012 as compared to 10.4% the third quarter of 2012. As shown in the table below, the vacancy rate of properties owned by the Account in four of its top five office markets—Washington DC, San Francisco, Seattle and Houston—remained at or below their respective market averages while the vacancy rate of the Account’s properties in Boston was slightly above the market average. The vacancy rate of the Account’s properties in Washington, DC, its top market, has declined steadily in recent quarters as space that was vacated by the move- out of a large tenant has been re-leased. Nonetheless, rents in the Washington DC market have been affected by a slowdown in leasing by the federal government and companies seeking to reduce space requirements through more efficient space usage. TIAA Real Estate Account ¡Prospectus79
Leased Fair
Market Value
Weighted*
of Property
Investments
Fair Market Value
as a % of Total
RE Portfolio
Fair Market Value
as a % of Total
Investments
Redwood City, CA
Sector
Metropolitan Area
Total Sector by
Metro Area
($M)
% of Total
Investments
Account Weighted
Average Vacancy
Market Vacancy*
2012Q4
2012Q3
2012Q4
2012Q3
Office
Account/Nation
10.1%
10.4%
15.4%
15.6%
1
Washington-Arlington-Alexandria, DC-VA-MD-WV
$
1,260.8
7.4%
11.6%
13.1%
15.3%
14.8%
2
Boston-Quincy, MA
$
871.5
5.1%
11.1%
11.4%
10.9%
11.3%
3
San Francisco-San Mateo-Redwood City, CA
$
778.6
4.6%
8.0%
8.4%
9.9%
10.2%
4
Seattle-Bellevue-Everett, WA
$
588.9
3.4%
10.5%
9.9%
13.7%
14.2%
5
Los Angeles-Long
Beach-Glendale, CA
$
445.7
2.6%
7.2%
6.8%
16.7%
16.6%
| ||||||||||||||||||||
* |
|
| Source: CBRE-EA. Market vacancy is the percentage of space vacant. The Account’s vacancy is the value-weighted percentage of unleased space. | |||||||||||||||||
The Account’s results for the fourth quarter of 2012 were consistent with office market trends at the national level. Demand for office space is driven largely by job growth in the financial and professional and business services sectors. During the fourth quarter of 2012, the financial sector added 17,000 jobs after a gain of 22,000 jobs in the third quarter of 2012. While December 2012 marked the sector’s fifteenth consecutive month without a net loss, employment growth has been modest as banks and financial firms continue to reduce space usage and occupancy costs in order to improve profitability. The professional and business services sector added 109,000 jobs in the quarter, following a gain of 73,000 jobs in the third quarter of 2012. Growth in the technology sector, some of which is part of the professional and business services sector, has offset weak demand from financial services in a number of markets, and particularly in San Francisco, Seattle, Boston and New York. Tech sector demand remains healthy as evidenced by employment growth of 80,000 jobs in the computer systems design industry in 2012. By comparison, employment in the entire financial services sector as a whole also grew by 80,000 in 2012. Prospects for continued gradual improvement in office market conditions are promising given ongoing office employment growth and minimal construction; however, progress is likely to remain sporadic during the first half of 2013 until a debt ceiling deal is reached.
Industrial
Conditions in the industrial market are influenced to a large degree by growth in GDP, industrial production and international trade flows. As a result of fourteen consecutive quarters of U.S. GDP growth, 2.2% growth in industrial production during 2012, and a rebound in global trade flows, U.S. industrial market conditions continued their gradual improvement. Gains were most evident in coastal port markets where global trade activity is centered. During the fourth quarter of 2012, the national industrial availability rate declined for the tenth consecutive quarter to 12.8% as compared to 13.1% in the third quarter of 2012. By comparison, the vacancy rate for the Account’s industrial property portfolio was well below the national average at 7.3%. As shown
80Prospectus ¡ TIAA Real Estate Account
below, the vacancy rate of the Account’s properties in four of its top five industrial markets remained well below their respective market averages. The only exception was Los Angeles where the vacancy rate of the Account’s properties has remained elevated due to continued weakness in small tenant demand.
Sector
Metropolitan Area
Total Sector by
Metro Area
($M)
% of Total
Investments
Account Weighted
Average Vacancy
Market Availability*
2012Q4
2012Q3
2012Q4
2012Q3
Industrial
Account/Nation
7.3%
6.4%
12.8%
13.1%
1
Riverside-San Bernardino-Ontario, CA
$
517.3
3.0%
8.4%
8.4%
11.2%
11.3%
2
Tacoma, WA
$
219.0
1.3%
6.6%
5.8%
10.1%
10.3%
3
Dallas-Plano-Irving, TX
$
206.6
1.2%
5.9%
5.9%
13.5%
14.0%
4
Los Angeles-Long Beach-Glendale, CA
$
200.6
1.2%
13.2%
12.0%
6.4%
6.4%
5
Fort Lauderdale-Pompano Beach-Deerfield Beach, FL
$
163.4
1.0%
2.2%
7.4%
14.7%
14.8%
| ||||||||||||||||||||
* |
|
| Source: CBRE-EA. Market availability is the percentage of space available for rent. Account vacancy is the value-weighted percentage of unleased space. | |||||||||||||||||
Multi-Family
Apartment market conditions tightened further during the fourth quarter of 2012. The national vacancy rate declined to an average of 5.0% in the fourth quarter of 2012 as compared to 5.2% in the fourth quarter of 2011. With the national vacancy rate approaching pre-recession lows, effective rents continued to grow, albeit at a more moderate rate compared with earlier in the year. Rent growth is expected to moderate in a number of markets in 2013 as the result of new supply. While construction has ramped up in many markets, apartment markets are expected to benefit from demand generated by Generation Y. This large population cohort, which was born in the mid-1980s and later, is just entering the workforce and is largely comprised of renters. The vacancy rate of the Account’s multi-family portfolio was modestly higher than the national average at 6.0% in the fourth quarter of 2012. As shown in the table below, the average vacancy rates for the Account’s properties in two of its top five top apartment markets were below their respective market averages. In Washington DC and Denver, seasonal leasing upticks contributed to an increase in the average vacancy rate of the Account’s properties compared to the third quarter. In New York, which became the Account’s top apartment market in the fourth quarter with the acquisition of a 70% interest in MiMA, a newly constructed 651-unit apartment building in Midtown Manhattan, the vacancy rate was higher in the fourth quarter because MiMA was in its initial lease up period when the interest was acquired. The vacancy rate of the Account’s New York properties excluding MiMA was 2.8% in the fourth quarter.
TIAA Real Estate Account ¡Prospectus81
Sector
Metropolitan Area
Total Sector by
Metro Area
($M)
% of Total
Investments
Account Weighted
Average Vacancy
Market Vacancy*
2012Q4
2012Q3
2012Q4
2012Q3
Apartment
Account/Nation
6.0%
4.4%
5.0%
5.2%
1
New York-White Plains-Wayne, NY-NJ
$
671.0
3.9%
11.3%
1.7%
4.8%
4.8%
2
Washington-Arlington-Alexandria, DC-VA-MD-WV
$
403.5
2.4%
6.3%
5.6%
4.2%
4.0%
3
Houston-Sugar Land-Baytown, TX
$
292.9
1.7%
5.0%
5.0%
7.1%
6.7%
4
Denver-Aurora, CO
$
247.4
1.4%
5.7%
4.6%
4.2%
3.6%
5
Phoenix-Mesa-Scottsdale, AZ
$
147.7
0.9%
5.1%
4.4%
7.5%
6.7%
| ||||||||||||||||||||
* |
|
| Source: CBRE-EA. Market vacancy is the percentage of units vacant. The Account’s vacancy is the value-weighted percentage of unleased units. | |||||||||||||||||
Retail
Retail market conditions remained weak despite still healthy consumer spending. Preliminary data from the U.S. Census Bureau indicate that retail sales excluding motor vehicles and parts increased 1.1% in the fourth quarter of 2012 as compared with the third quarter of 2012, but 3.7% compared with the fourth quarter of 2011. Nonetheless, national retailers remained highly selective about opening new stores, with a focus on top metropolitan markets and the best centers, whereas demand from small, local retailers has remained lackluster since the end of the recession. Availability rates in neighborhood and community centers inched down to an average of 12.8% in the fourth quarter of 2012 as compared with 12.9% in the third quarter of 2012. The vacancy rate for the Account’s retail portfolio averaged 6.8% during the fourth quarter of 2012 as compared with 6.4% in the third quarter of 2012. The vacancy rate of the Account’s retail portfolio remains below the national average largely because the Account’s portfolio includes several high quality regional malls and lifestyle centers which have minimal vacancy.
Outlook
Throughout 2012 and even during a period of weak economic activity during the fourth quarter, commercial real estate fundamentals improved in tandem with the strengthening of U.S. macro-economic conditions. Most noteworthy was the increase in employment growth during the second half of the year following an anemic second quarter. Support for the commercial real estate sector was provided by an active investment market and the availability of attractively priced mortgage debt. Throughout the year, institutional investors remained cautious and risk averse with a focus on top tier properties in top markets. With the U.S. economy showing signs of strength and prices for top tier properties escalating, investors with greater risk tolerance looked for opportunities in secondary and tertiary markets where initial cash-on-cash returns are higher. The continued interest in commercial real estate as well as growing interest in secondary and tertiary markets is evidence of investors’
82Prospectus ¡ TIAA Real Estate Account
belief that commercial real estate continues to offer attractive returns over the short- and long-term vis-à-vis other asset classes. For tenants, a tentative approach to leasing and expansion is likely to persist through the first quarter of 2013, and possibly longer due to uncertainty over the upcoming debt ceiling negotiation. Global concerns, notably potential repercussions from the European debt crisis, will also give pause as companies wait for a clearer picture of their business prospects before making long-term space decisions. Nonetheless, if economic conditions fall generally in-line with economists’ expectations of continued modest growth during the first half of 2013 and stronger growth during the second half of the year, real estate market conditions are likely to remain favorable. Historically, moderate employment growth coupled with minimal construction has provided a supportive backdrop for the commercial real estate sector. Management continued to follow its recent investment strategy of focusing exclusively on apartment, retail and industrial properties in target markets, as well as strategically disposing of interests in select office properties. During the fourth quarter of 2012, the Account acquired a newly constructed apartment complex in a top West Coast market, a 70% interest in a premier apartment tower in a top East Coast market, a 50% interest in a top West Coast regional mall, and a high quality community shopping center in a top West Coast technology market. In early 2013, the Account executed a lease with the American subsidiary of a major global energy company for a new build-to-suit office building in Houston that is expected to be completed in 2015. While the Account has successfully completed redevelopments of properties in its portfolio, this will be the Account’s first ground-up development. The building will be built on land already owned by the Account that is adjacent to an existing office complex that was acquired by the Account in 2004. In order to mitigate risk associated with ground-up development, the Account sold a 49% interest in the existing investment to Allianz, a major European investor; Allianz will also have a one-time option for a specified time period to purchase a 49% interest in the new building. The Account’s decision to undertake its first development activity was driven in part by the synergistic aspects of the transaction: specifically, accommodating the expansion plans of an existing high quality tenant and utilizing land already owned by the Account. In addition, Management believes that selling an interest in the existing property and granting an option to purchase an interest in the new building has reduced exposure to the potential volatility associated with the Houston market and the energy sector, which provides the Account the ability to undertake the new development. In other fourth quarter 2012 disposition activity, the Account sold its joint venture interest in a portfolio of industrial properties in non-target markets. Management continued to bolster the Account’s income returns through aggressive property management and leasing in combination with expense management. As of the fourth quarter of 2012, the Account’s holdings were 92.4% leased as compared with 93.0% as of the third quarter of 2012. During TIAA Real Estate Account ¡Prospectus83
the fourth quarter of 2012, the Account’s real estate assets generated a 1.13% income return and a 1.67% capital return. As shown in the graph below, returns for the fourth quarter of 2012 were the eleventh consecutive quarter of positive income and capital returns. TIAA REAL ESTATE QUARTERLY PROPERTY RETURNS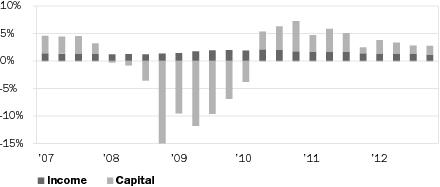
Participant inflows continued at a steady pace during the fourth quarter of 2012, with the Account maintaining what management believes to be an appropriate cash position as of the end of the quarter. As had occurred in the second and third quarters of 2012, a portion of the Account’s cash holdings were used in the fourth quarter to redeem approximately one-quarter of the aggregate liquidity units held by TIAA. Management intends to manage the Account’s cash position in a manner that maintains adequate liquidity reserves for new acquisitions, the potential redemption of units by participants, and the Account’s targeted long-term level of cash and cash equivalent holdings. Potential acquisitions will be evaluated in the context of overall Account objectives and projected cash availability. Investment activities in 2013 will seek to further refine the Account’s geographic and property type mix in accordance with the Account’s overall objectives. The anticipated acquisitions program in 2013 will focus primarily on industrial, retail, and multi-family properties, and secondly, highly selective office properties, with the intention of maintaining the Account’s diversification across property sector at or close to its current sector weightings. Consistent with its permitted investment activities, the Account may consider new development and redevelopment opportunities in a limited and highly selective fashion in 2013, and undertake such investments with the intention of minimizing to the greatest degree possible the potential risks associated with such activities including build-to-suit development, significant pre-leasing, and fixed price construction contracts. In addition to ongoing investment activities, Management will also carefully evaluate opportunities to place commercial mortgage debt on recent acquisitions and refinance existing debt at lower interest rates in order to lower the Account’s overall weighted cost of capital provided financing proceeds can be reinvested in real estate properties or other investments that will benefit overall Account returns. Heading into 2013, Management believes
84Prospectus ¡ TIAA Real Estate Account
the Account is solidly positioned to benefit from ongoing improvement in commercial real estate market conditions and investors’ focus on major metropolitan markets. Prices for top tier properties have increased measurably from their lows in the latter half of 2009, which has driven initial cash-on-cash returns to relatively low levels. Management will therefore carefully evaluate prospective acquisitions based on short- and long-term growth potential, purchase price relative to replacement cost, and portfolio diversification benefits as well as initial cash-on-cash returns. Emphasis will continue to be given to institutional quality properties that have strong occupancy history and favorable tenant rollover schedules. The Account believes that a disciplined investment strategy coupled with a focus on the highest quality properties position the Account for favorable long-term performance. Investments as of December 31, 2012 As of December 31, 2012, the Account had total net assets of $14.9 billion, a 1.1% increase from the end of the third quarter of 2012 and a 9.9% increase from December 31, 2011. The increase in the Account’s net assets from December 31, 2011 to December 31, 2012 was primarily caused by net participant inflows into the account exclusive of the liquidity unit redemptions, see “Liquidity and Capital Resources” below, and net appreciation in value of the Account’s investments. As of December 31, 2012, the Account owned a total of 107 real estate property investments (92 of which were wholly owned, 15 of which were held in joint ventures). The real estate portfolio included 31 office property investments (five of which were held in joint ventures and one located in London, England), 25 industrial property investments, 28 apartment property investments, 20 retail property investments (including seven held in joint ventures and one located in Paris, France), one 75% owned joint venture interest in a portfolio of storage facilities, one land investment and one fee interest encumbered by a ground lease. Of the 107 real estate property investments, 39 are subject to debt (including eight joint venture property investments). The outstanding principal on mortgage loans payable on the Account’s wholly owned real estate portfolio as of December 31, 2012 was $2.2 billion. The Account’s proportionate share of outstanding principal on mortgage loans payable within its joint venture investments was $1.8 billion, which is netted against the underlying properties when determining the joint venture investments fair value presented on the consolidated statements of investments. When the mortgage loans payable within the joint venture investments are considered, total outstanding principal on the Account’s portfolio as of December 31, 2012 was $4.0 billion, which represented a loan to value ratio of 21.0%. The Account currently has no Account-level debt. Management believes that the Account’s real estate portfolio is diversified by location and property type. The Account’s largest investment, 1001 Pennsylvania Avenue located in Washington, DC, represented 5.3% of total real TIAA Real Estate Account ¡Prospectus85
estate investments and 4.0% of total investments. As discussed in the Account’s prospectus, the Account does not intend to buy and sell its real estate investments simply to make short-term profits. Rather, the Account’s general strategy in selling real estate investments is to dispose of those assets that management believes (i) have maximized in value, (ii) have underperformed or face deteriorating property-specific or market conditions, (iii) need significant capital infusions in the future, (iv) are appropriate to dispose of in order to remain consistent with the Account’s intent to diversify the Account by property type and geographic location (including reallocating the Account’s exposure to or away from certain property types in certain geographic locations), or (v) otherwise do not satisfy the investment objectives of the Account. Management from time to time will evaluate the need to manage liquidity in the Account as part of its analysis as to whether to undertake a particular asset sale. The Account could reinvest any sale proceeds that it does not need to pay operating expenses or to meet debt service or redemption requests (e.g., cash withdrawals or transfers, and any redemption of TIAA’s liquidity units in the future). During 2012, the Account purchased eight wholly owned real estate investments for $526.5 million, net of $129.5 million in mortgage loans payable, and four joint venture investments for $634.6 million, net of $366.1 million in mortgage loans payable, as displayed in the chart below (amounts in millions). PROPERTY INVESTMENT ACQUIRED IN 2012
Property Name
Property Type
City
State
Net
Acquisition
Cost
Joint
Venture/%
Interest
Mortgage
Loans
Payable
Net
Investment
Wholly Owned
The Shops at
Wisconsin Place
Retail
Chevy Chase
MD
$
96.1
N/A
$
—
$
96.1
Cerritos Industrial Park
Industrial
Cerritos
CA
83.8
N/A
—
83.8
The Residences at
the Village of Merrick Park
Apartments
Coral Gables
FL
52.4
N/A
—
52.4
Mass Court
Apartments
Washington
D.C.
171.2
N/A
92.6
78.6
Pacific Corporate Park
Industrial
Fife
WA
34.3
N/A
—
34.3
Circa Green Lake
Apartments
Seattle
WA
83.5
N/A
—
83.5
Prescott Wallingford
Apartments
Apartments
Seattle
WA
54.3
N/A
—
54.3
Charleston Plaza
Retail
Mountain View
CA
80.4
N/A
36.9
43.5
Joint Ventures
The Shops at Wisconsin Place
Retail
Chevy Chase
MD
18.2
33
%
—
18.2
MiMA
Apartments
New York
NY
551.4
70
%
268.6
282.8
Valencia Town Center
Retail
Valencia
CA
195.2
50
%
97.5
97.7
Four Oaks Place, LP(1)
Office
Houston
TX
235.9
51
%
—
235.9
Total
$
1,656.7
$
495.6
$
1,161.1
N/A - Not applicable
| ||||||||||||||||||||
(1) |
|
| During November 2012, the Account contributed assets from the Four Oaks Place investment into a joint venture property investment. | |||||||||||||||||
86Prospectus ¡ TIAA Real Estate Account
During 2012, the Account sold six wholly owned real estate investments and one wholly owned partial real estate investment for a net sales price of $679.5 million. The Account’s joint venture investments sold six real estate investments for a net sales price of $398.6 million, while concurrently settling $3.5 million of debt associated with certain of those assets, all representing the Account’s proportionate share. The Account realized a loss of $11.3 million and $79.0 million from its wholly owned real estate investment sales and from its proportionate share of real estate investment sales from within its joint venture investments, respectively. PROPERTY INVESTMENTS SOLD IN 2012
(In millions)
Property Name
Property Type
City
State
Net Sales Price
(less selling
expense)
Third Party
Debt Payoff
Wholly Owned
Pointe on Tampa Bay
Office
Tampa
FL
$
46.2
$
—
Centerside I
Office
San Diego
CA
51.6
—
Broadlands Business Park
Industrial
Elkton
MD
31.0
—
GE Appliance East Coast Distribution Facility
Industrial
Perryville
MD
46.5
—
Needham Corporate Center
Office
Needham
MA
25.8
—
Airways Distribution Center
Industrial
Southaven
MS
22.0
—
Wholly Owned—Partial
Property Sale
Four Oaks Place(5)
Office
Houston
TX
456.4
—
Joint Ventures
Prominence at Buckhead(1)
Office
Atlanta
GA
74.4
—
Treat Towers(1)
Office
Walnut Creek
CA
88.3
—
Waterfront at the Marketplace(2)
Retail
Homestead
PA
93.8
—
IDI Nationwide Industrial Portfolio(3)
Industrial
Various
Various
107.0
—
Joint Ventures—Partial
Property Sale
Walks at Highwood Preserve II(2)
Retail
Tampa
FL
3.3
(3.5)
South Dade Shopping Center(4)
Retail
Miami
FL
31.8
—
Total
$
1,078.1
$
(3.5)
| ||||||||||||||||||||
(1) |
|
| Joint Venture Investment (75% Account interest). | |||||||||||||||||
| ||||||||||||||||||||
(2) |
| Property held within the DDR Joint Venture investment (85% Account interest). | ||||||||||||||||||
| ||||||||||||||||||||
(3) |
| Joint Venture Investment (60% Account interest). | ||||||||||||||||||
| ||||||||||||||||||||
(4) |
| Property held within the Florida Retail Portfolio investment (80% Account interest). | ||||||||||||||||||
| ||||||||||||||||||||
(5) |
| 51% of the asset was contributed into a Joint Venture investment and the remaining 49% was sold. | ||||||||||||||||||
TIAA Real Estate Account ¡Prospectus87
The following charts reflect the diversification of the Account’s real estate assets by region and property type and list its ten largest investments. All information is based on the fair values of the investments at December 31, 2012. DIVERSIFICATION BY FAIR VALUE(1) East West South Midwest Foreign(2) Total Office 20.4% 15.3% 6.7% 0.3% 1.6% 44.3% Apartment 9.7% 6.6% 5.4% — — 21.7% Industrial 0.7% 7.7% 3.8% 1.0% — 13.2% Retail 3.4% 4.0% 8.3% 0.2% 1.6% 17.5% Other(3) 2.8% 0.2% 0.3% — — 3.3% Total 37.0% 33.8% 24.5% 1.5% 3.2% 100.0% (1) Wholly-owned properties are represented at fair value and gross of any debt, while joint venture properties are represented at the net equity value. (2) Represents real estate investments in the United Kingdom and France. (3) Represents interest in Storage Portfolio investment, a fee interest encumbered by a ground lease real estate investment and undeveloped land. Properties in the “East” region are located in: CT, DC, DE, KY, MA, MD, ME, NC, NH, NJ, NY, PA, RI, SC, VA, VT, WV Properties in the “West” region are located in: AK, AZ, CA, CO, HI, ID, MT, NM, NV, OR, UT, WA, WY Properties in the “South” region are located in: AL, AR, FL, GA, LA, MS, OK, TN, TX Properties in the “Midwest” region are located in: IA, IL, IN, KS, MI, MN, MO, ND, NE, OH, SD, WI TOP TEN LARGEST REAL ESTATE INVESTMENTS Property Investment Name City State Type Value ($M)(a) Property as a Property as a 1001 Pennsylvania Avenue Washington DC Office 679.4 (b) 5.3% 4.0% 50 Fremont Street San Francisco CA Office 433.9 (c) 3.4% 2.5% Fourth and Madison Seattle WA Office 429.3 (d) 3.3% 2.5% DDR Joint Venture Various USA Retail 386.3 (e) 3.0% 2.3% The Florida Mall Orlando FL Retail 386.2 (f) 3.0% 2.3% 99 High Street Boston MA Office 386.2 (g) 3.0% 2.3% 780 Third Avenue New York NY Office 335.4 2.6% 2.0% 425 Park Avenue New York NY Land 330.0 2.6% 1.9% Ontario Industrial Portfolio Ontario CA Industrial 304.1 2.4% 1.8% The Newbury Boston MA Office 289.9 2.3% 1.7% (a) Value as reported in the December 31, 2012 Consolidated Statement of Investments. Investments owned 100% by the Account are reported based on fair value. Investments in joint ventures are reported at fair value and are presented at the Account’s ownership interest. (b) This property investment is presented gross of debt. The value of the Account’s interest less the fair value of leverage is $469.4M. (c) This property investment is presented gross of debt. The value of the Account’s interest less the fair value of leverage is $298.8M. (d) This property investment is presented gross of debt. The value of the Account’s interest less the fair value of leverage is $284.3M. (e) This property is held in a 85%/15% joint venture with Developers Diversified Realty Corporation (“DDR”), and consists of 39 retail properties located in 13 states and is presented net of debt. As of December 31, 2012 this debt had a fair value of $864.0M. (f) This property investment is a 50%/50% joint venture with Simon Property Group, L.P. and is presented net of debt. As of December 31, 2012 this debt had a fair value of $195.8 million. (g) This property investment is presented gross of debt. The value of the Account’s interest less the fair value of leverage is $196.3M. 88Prospectus ¡ TIAA Real Estate Account
% of Total
Real Estate
Portfolio
% of Total
Investments
As of December 31, 2012, the Account’s net assets totaled $14.9 billion. At December 31, 2012, the Account held 75.2% of its total investments in real estate and real estate joint ventures. The Account also held investments in government agency notes representing 8.0% of total investments, real estate-related equity securities representing 7.8% of total investments, U.S. Treasury securities representing 7.0% of total investments, and real estate limited partnerships, representing 2.0% of total investments. RESULTS OF OPERATIONS Year Ended December 31, 2012 Compared to Year Ended December 31, 2011 Performance The Account’s total return was 10.1% for the year ended December 31, 2012 as compared to 13.0% for the year ended 2011. The Account’s performance during the year ended December 31, 2012 decreased as the velocity of the overall economic and real estate market recoveries slowed and reduced net participant inflows as a result of the $150,000 participant account restriction effective March 31, 2011, being in place throughout 2012, and the $940.3 million redemption of the TIAA Liquidity Units. The Account’s annualized total returns over the past one, three, five, and ten year periods ended December 31, 2012 were 10.1%, 12.1%, -2.6%, and 4.6%, respectively. As of December 31, 2012, the Account’s annualized total return since inception was 5.9%. Net Investment Income The table below shows the results of operations for the years ended December 31, 2012 and 2011 and the dollar and percentage changes for those periods (dollars in millions). TIAA Real Estate Account ¡Prospectus89
Years Ended Change 2012 2011 $ % INVESTMENT INCOME Real estate income, net: Rental income $ 872.0 $ 874.1 $ (2.1 ) -0.2% Real estate property level expenses and taxes: Operating expenses 218.2 217.8 0.4 0.2% Real estate taxes 119.1 111.5 7.6 6.8% Interest expense 146.0 109.2 36.8 33.7% Total real estate property level expenses and taxes 483.3 438.5 44.8 10.2% Real estate income, net 388.7 435.6 (46.9 ) -10.8% Income from real estate joint ventures and limited partnerships 80.9 86.4 (5.5 ) -6.4% Interest 3.0 3.3 (0.3 ) -9.1% Dividends 32.3 19.1 13.2 69.1% TOTAL INVESTMENT INCOME 504.9 544.4 (39.5 ) -7.3% Expenses: Investment advisory charges 56.3 53.9 2.4 4.5% Administrative charges 32.4 28.7 3.7 12.9% Distribution charges 13.9 8.8 5.1 58.0% Mortality and expense risk charges 2.8 6.2 (3.4 ) -54.8% Liquidity guarantee charges 31.3 23.7 7.6 32.1% TOTAL EXPENSES 136.7 121.3 15.4 12.7% INVESTMENT INCOME, NET $ 368.2 $ 423.1 $ (54.9 ) -13.0% Rental Income: Rental Income decreased by $2.1 million or 0.2% for the year ended December 31, 2012 as compared to the comparable period in 2011. Rental income increased in the Account’s residential, retail and industrial sectors and land by $23.6 million, $12.0 million, $1.5 million and $4.5 million, respectively, specifically due to acquisitions. These increases were offset by a decrease in the Account’s office sector of $43.7 million during the year, $14.4 million of this decrease related to dispositions. The remaining $29.3 million of the decrease was due to tenant vacancies in the California and Connecticut regions. Furthermore, the Account recognized approximately $20.2 million in early termination fee income in 2011 which did not occur in 2012. Operating Expenses: Operating expenses increased slightly by $0.4 million or 0.2% for the year ended December 31, 2012 as compared to the comparable period of 2011. The increase is primarily due to acquisitions in the residential and retail sectors offset by dispositions in the office sector. Real Estate Taxes: The $7.6 million or 6.8% increase in real estate taxes for the year ended December 31, 2012 as compared to the comparable period of 2011 was attributed to property acquisitions during 2012 coupled with increased tax values primarily in the apartment and office sectors. Interest Expense: The $36.8 million or 33.7% increase in interest expense for the year ended December 31, 2012 as compared to the comparable period of 90Prospectus ¡ TIAA Real Estate Account
December 31,
2011 was primarily due to the refinancing of debt on four real estate investments and the affiliated prepayment expenses. Income from Real Estate Joint Ventures and Limited Partnerships: Income from real estate joint ventures and limited partnerships decreased $5.5 million or 6.4% during the year ended 2012 compared to the comparable period of 2011. The decrease was attributed to decreased distributions from the joint ventures and limited partnerships, primarily the DDR joint venture, as a result of debt restructuring activity as well as the disposition of several joint venture assets during 2012. Dividend and Interest Income: Dividend and interest income increased $12.9 million from the comparable period of 2011. The increase in dividend income can be directly attributed to the Account’s increased investment in real estate related securities held of $1.3 billion as compared to $927.9 million for the periods ended December 31, 2012 and 2011, respectively. Expenses: The Account’s expenses increased $15.4 million or 12.7% for the year ended 2012 as compared to the comparable period of 2011. The increase in Account level expenses was due to the increase in the Account’s average net assets throughout the year ended December 31, 2012. The Account’s average net assets for 2012 increased 16.8% when compared to the Account’s average net assets for 2011. However, as a basis point (“bp”) charge to the Account, expenses have decreased from 98 bp during 2011 to 95 bp during 2012, a reduction of 3 bps. Investment advisory, administrative and distribution charges are costs charged to the Account associated with managing the Account. Investment advisory costs are primarily fixed. Administrative and distribution charges generally correspond to the level of assets under management. Mortality and expense risk charges decreased 3 bps during 2012. The decrease in mortality and expense risk charges during the year was primarily driven by a decrease of participants annuitizing into the Account as well as changes in participant mortality assumptions. SeeNote 2—Management Agreements and Arrangementsto the consolidated financial statements included herein for further discussion related to these expenses. Net Realized and Unrealized Gains and Losses on Investments and Mortgage Loans Payable The table below shows the net realized and unrealized gains (losses) on investments and mortgage loans payable for the years ended December 31, 2012 and 2011 and the dollar and percentage changes for those periods (dollars in millions). TIAA Real Estate Account ¡Prospectus91
Years Ended Change 2012 2011 $ % NET REALIZED AND UNREALIZED GAIN (LOSS) ON Net realized gain (loss) on investments: Real estate properties $ (11.3 ) $ (41.7 ) $ 30.4 -72.9% Real estate joint ventures and limited partnerships (104.5 ) (70.5 ) (34.0 ) 48.2% Marketable securities 53.7 6.5 47.2 N/M Total realized loss on investments: (62.1 ) (105.7 ) 43.6 -41.2% Net change in unrealized appreciation (depreciation) on: Real estate properties 555.8 829.9 (274.1 ) -33.0% Real estate joint ventures and limited partnerships 424.1 331.0 93.1 28.1% Marketable securities 126.8 21.5 105.3 N/M Mortgage loans payable (33.4 ) (0.7 ) (32.7 ) N/M Net change in unrealized appreciation on investments and mortgage loans payable 1,073.3 1,181.7 (108.4 ) -9.2% NET REALIZED AND UNREALIZED GAIN ON $ 1,011.2 $ 1,076.0 $ (64.8 ) -6.0% N/M—Not meaningful Real Estate Properties: During the year ended December 31, 2012, the Account experienced net realized and unrealized gains on real estate properties of $544.5 million compared to net realized and unrealized gain of $788.2 million for the comparable period of 2011. Net realized losses in the Account are due to the sale of real estate property investments during 2012. Net unrealized gains in the Account continue to be driven by improved but stabilizing market conditions in 2012 but at a decreased rate than that experienced during the comparable period of 2011. Included within the net unrealized gains discussed above, were foreign exchange gains of $14.6 million for the year ended December 31, 2012 as compared to losses of $3.3 million for the comparable period of 2011 related to the Account’s foreign investment properties. Real Estate Joint Ventures and Limited Partnerships: Real estate joint ventures and limited partnerships experienced net realized and unrealized gains of $319.6 million for the year ended December 31, 2012 compared to net realized and unrealized gains of $260.5 million for the comparable period of 2011. Net realized losses related to the Account’s investments in joint ventures and limited partnerships are primarily due to the sale of real estate property investments underlying the Account’s joint venture investments during 2012. 92Prospectus ¡ TIAA Real Estate Account
December 31,
INVESTMENTS AND MORTGAGE LOANS PAYABLE
INVESTMENTS AND MORTGAGE LOANS PAYABLE
See theRecent Transactionssection herein for additional discussions regarding the sale of real estate property investments. Net unrealized appreciation increased $93.1 million or 28.1% compared to the comparable period of 2011 is due to the Account’s increased investments in joint ventures during 2012. Marketable Securities: The Account’s marketable securities positions experienced net realized and unrealized gains of $180.5 million as compared to $28.0 million for the comparable period of 2011. The increase is directly attributable to the Account’s increased investment in real estate related marketable securities (primarily REITs). At December 31, 2012 the Account’s real estate related marketable securities were $1.3 billion as compared to $927.9 million as of December 31, 2011, an increase of $404.4 million or 43.6%. During 2012 the markets for REITs in the United States increased approximately 15.6% as measured by the FTSE NAREIT All Equity REITs Index. The Account’s real estate related equity securities appreciated in line with these market movements. Additionally, the Account held $2.6 billion of short term marketable securities invested in government agency notes and United States Treasury Securities, which had nominal appreciation due to the short term nature of these investments. Mortgage Loans Payable: Mortgage loans payable experienced unrealized losses of $33.4 million for the year ended December 31, 2012 compared to unrealized losses of $0.7 million for the comparable period of 2011. Valuation adjustments to mortgage loans payable are highly dependent upon interest rates, investment return demands, the performance of the underlying real estate investment, and where applicable, foreign exchange rates. The increase in unrealized losses during the year ended December 31, 2012 was primarily due to unfavorable foreign exchange rates resulting in exchanges losses of $9.4 million, $18.5 million accrued for anticipated mortgage loan extinguishments associated with the Account’s property investment located in London, England, and $5.4 million related to valuation changes in mortgage loans. Year Ended December 31, 2011 Compared to Year Ended December 31, 2010 Performance The Account’s total return was 13.0% for the year ended December 31, 2011 as compared to 13.3% for the year ended 2010. The Account’s performance during the year ended December 31, 2011 reflects an increase in the aggregate value of the Account’s real estate property investments, including investments owned in joint ventures and limited partnerships primarily as a result of the volatile market conditions experienced throughout the year and the $150k participant account restriction which was effective March 31, 2011. The Account’s annualized total returns over the past one, three, five, and ten year periods ended December 31, 2011 were 13.0%, -2.5%, -2.0%, and 4.0%, respectively. As of December 31, 2011, the Account’s annualized total return since inception was 5.7%. TIAA Real Estate Account ¡Prospectus93
The Account’s total net assets increased from $10.8 billion at December 31, 2010 to $13.5 billion at December 31, 2011. The primary drivers of this 25.2% increase were net participant inflows into the Account and appreciation in value of the Account’s investments. Net Investment Income The table below shows the net investment income for the years ended December 31, 2011 and 2010 and the dollar and percentage changes for those periods (dollars in millions). Years Ended Change 2011 2010 $ % INVESTMENT INCOME Real estate income, net: Rental income $ 874.1 $ 862.5 $ 11.6 1.3% Real estate property level expenses and taxes: Operating expenses 217.8 220.0 (2.2 ) -1.0% Real estate taxes 111.5 114.7 (3.2 ) -2.8% Interest expense 109.2 106.7 2.5 2.3% Total real estate property level expenses and taxes 438.5 441.4 (2.9 ) -0.7% Real estate income, net 435.6 421.1 14.5 3.4% Income from real estate joint ventures and limited partnerships 86.4 89.3 (2.9 ) -3.2% Interest 3.3 3.0 0.3 10.0% Dividends 19.1 5.6 13.5 241.1% TOTAL INVESTMENT INCOME 544.4 519.0 25.4 4.9% Expenses: Investment advisory charges 53.9 50.2 3.7 7.4% Administrative charges 28.7 22.1 6.6 29.9% Distribution charges 8.8 6.0 2.8 46.7% Mortality and expense risk charges 6.2 4.4 1.8 40.9% Liquidity guarantee charges 23.7 13.1 10.6 80.9% TOTAL EXPENSES 121.3 95.8 25.5 26.6% INVESTMENT INCOME, NET $ 423.1 $ 423.2 $ (0.1 ) 0.0% Rental Income: The $11.6 million or 1.3% increase in real estate rental income for the year ended December 31, 2011 as compared to the same period in 2010 was related to the acquisition of eight wholly owned real estate investments offset by six wholly owned real estate investment dispositions during 2011. Operating Expenses: Operating expenses decreased by $2.2 million or 1.0% for the year ended December 31, 2011 as compared to the comparable period of 2010. The decrease was driven by wholly owned real estate investment dispositions during the year offset by wholly owned real estate investment acquisitions. Real Estate Taxes: Real estate taxes decreased $3.2 million or 2.8% for the year ended 2011 as compared to the comparable period of 2010. The decrease in real estate taxes is a result of lower tax assessments at various wholly 94Prospectus ¡ TIAA Real Estate Account
December 31,
owned real estate investments and dispositions offset by current property acquisitions, as previously discussed above. Interest Expense: Interest expense increased $2.5 million, or 2.3% for the year ended 2011 as compared to the comparable period of 2010. The increase was primarily attributed to two new mortgage loans entered into during the year ended 2011. Income from Real Estate Joint Ventures and Limited Partnerships: Income from real estate joint ventures and limited partnerships decreased $2.9 million or 3.2% during the year ended 2011 compared to the comparable period of 2010. The decrease was attributable to decreased distributions from the joint ventures and limited partnerships as a result of various joint venture investments retaining cash for purposes of capital expenditures for tenant improvements. Dividend and Interest Income: Dividend and interest income increased $13.8 million from the comparable period of 2010. The increase in dividend income can be directly attributed to the Account’s increased investment in real estate related securities held of $927.9 million as compared to $495.3 million for the periods ended December 31, 2011 and 2010, respectively. Expenses: The Account’s expenses increased $25.5 million or 26.6% for the year ended 2011 as compared to the comparable period of 2010. The increase in Account level expenses was primarily due to the increase in the Account’s net assets throughout the year ended December 31, 2011. Investment advisory, administrative and distribution charges are costs charged to the Account associated with managing the Account. These costs are primarily fixed, but generally correspond to the level of assets under management. During the current year these fixed costs have risen at a slower pace than the Account’s net assets. Mortality and expense risk charges increased as a result of higher net assets; however, the overall basis point charge to the Account has remained at five basis points of net assets. The increase in the liquidity guarantee charge was associated with the six basis point increase effective May 1, 2011. SeeNote 2—Management Agreements and Arrangementsto the consolidated financial statements included herein for further discussion related to these expenses. Net Realized and Unrealized Gains and Losses on Investments and Mortgage Loans Payable The table below shows the net realized and unrealized gain (loss) on investments and mortgage loans payable for the years ended December 31, 2011 and 2010 and the dollar and percentage changes for those periods (dollars in millions). TIAA Real Estate Account ¡Prospectus95
Years Ended Change 2011 2010 $ % NET REALIZED AND UNREALIZED GAIN (LOSS) ON INVESTMENTS AND MORTGAGE LOANS PAYABLE Net realized gain (loss) on investments: Real estate properties $ (41.7 ) $ (12.5 ) $ (29.2 ) 233.6% Real estate joint ventures and limited partnerships (70.5 ) (185.7 ) 115.2 -62.0% Marketable securities 6.5 0.4 6.1 N/M Total realized loss on investments: (105.7 ) (197.8 ) 92.1 -46.6% Net change in unrealized appreciation (depreciation) on: Real estate properties 829.9 638.2 191.7 30.0% Real estate joint ventures and limited partnerships 331.0 357.5 (26.5 ) -7.4% Marketable securities 21.5 15.0 6.5 43.3% Mortgage loans payable (0.7 ) (55.9 ) 55.2 -98.8% Net change in unrealized appreciation on investments and mortgage loans payable 1,181.7 954.8 226.9 23.8% NET REALIZED AND UNREALIZED GAIN ON INVESTMENTS AND MORTGAGE LOANS PAYABLE $ 1,076.0 $ 757.0 $ 319.0 42.1% Real Estate Properties: During the year ended December 31, 2011, the Account experienced net realized and unrealized gains on real estate properties of $788.2 million compared to net realized and unrealized gain of $625.7 million for the comparable period of 2010. The net realized and unrealized gain on real estate properties was primarily driven by net unrealized gains on the Account’s wholly owned real estate property investments of $829.9 million compared to $638.2 million for the comparable period of 2010, an increase of $191.7 million or 30.0%. The net unrealized gains in the Account continue to be driven by improved but stabilizing market conditions in 2011. Included within the net unrealized gains discussed above, were foreign exchange losses of $3.3 million for the year ended December 31, 2011 as compared to a loss of $18.4 million for the comparable period of 2010 related to the Account’s foreign investment properties. Real Estate Joint Ventures and Limited Partnerships: Real estate joint ventures and limited partnerships experienced net realized and unrealized gains of $260.5 million for the year ended December 31, 2011 compared to net realized and unrealized gains of $171.8 million for the comparable period of 2010. The increase compared to the comparable period of 2010 is primarily due to a decrease in realized losses from the sale of real estate property investments from within the Account’s joint venture investments. Marketable Securities: The Account’s marketable securities positions experienced net realized and unrealized gains of $28.0 million as compared to $15.4 million for the comparable period of 2010. The increase is directly attributable to the Account’s increased investment in real estate related marketable securities (primarily REITs). At December 31, 2011 the Account’s 96Prospectus ¡ TIAA Real Estate Account
December 30,
real estate related marketable securities were $927.9 million as compared to $495.3 million as of December 31, 2010, an increase of $432.6 million or 87.3%. Additionally, the Account held $2.8 billion of short term marketable securities invested in government agency notes and United States Treasury Securities, which had nominal appreciation due to the short term nature of the investments. Mortgage Loan Receivable: During the year ended December 31, 2010 the Account settled in full its mortgage loan receivable investment at its face value. Mortgage Loans Payable: Mortgage loans payable experienced net unrealized losses of $0.7 million for the year ended December 31, 2011 compared to unrealized losses of $59.6 million during the comparable period of 2010. Valuation adjustments to mortgage loans payable are highly dependent upon interest rates, investment return demands, the performance of the underlying real estate investment, and where applicable, foreign exchange rates. The decrease in net unrealized losses during the year ended December 31, 2011 was primarily due to stabilizing markets during 2011. Of the $0.7 million net unrealized loss, $2.2 million was related to valuation increases in mortgage loans payable offset in part by foreign exchange fluctuations of $1.5 million. LIQUIDITY AND CAPITAL RESOURCES As of December 31, 2012 and 2011, the Account’s cash and cash equivalents and non-real estate-related marketable securities had a value of $2.6 billion and $2.8 billion, respectively (17.4% and 20.8% of the Account’s net assets at such dates, respectively). When compared to December 31, 2011, the Account’s non-real estate- related liquid assets have decreased by $228.9 million. This decrease is the result of the Account’s $940.3 million redemption of liquidity units held by TIAA, offset by net participant inflows into the Account. Fourth Quarter 2012 Compared to Third Quarter 2012 During the fourth quarter of 2012, the Account received $472.8 million in premiums as compared to $489.4 million received during the third quarter of 2012, which included $271.6 million of participant transfers into the Account as compared to $289.0 million during the third quarter of 2012. The Account had participant outflows of $287.5 million in annuity payments, withdrawals (excluding liquidity unit redemptions) and death benefits during the fourth quarter of 2012 as compared to $248.4 million during the third quarter of 2012, which included $121.9 million and $100.6 million of participant transfers out of the Account for the fourth and third quarters of 2012, respectively. During the fourth quarter of 2012, the Account redeemed $320.0 million of liquidity units compared to $314.2 million in the third quarter of 2012. Year Ended December 31, 2012 compared to Year Ended December 31, 2011 During the year ended December 31, 2012, the Account received $1.9 billion in premiums, which included $1.1 billion of participant transfers into the Account. The Account had outflows of $1.0 billion in annuity payments, TIAA Real Estate Account ¡Prospectus97
withdrawals (excluding liquidity unit redemptions) and death benefits, which included $466.9 million of participant transfers out of the Account. The Account had outflows of $940.3 million related to redemptions of liquidity units during the year. During the year ended December 31, 2011, the Account received $2.3 billion in premiums, which included $1.6 billion of participant transfers into the Account. The Account had outflows of $1.1 billion in annuity payments, withdrawals and death benefits, which included $658.9 million of participant transfers out of the Account. The Account did not have any redemptions of liquidity units during the year ended December 31, 2011. See Note 1—Organization and Significant Accounting Policiesof the consolidated financial statements as included herein. Management believes that the reduction in transfers into the Account is primarily related to the transfer limitation on the Account which was effective in the substantial majority of jurisdictions on March 31, 2011. Under this limitation, individual participants are limited from making internal funding vehicle transfers into their Account accumulation if, after giving effect to such transfer, the total value of such participant’s Account accumulation (under all contracts issued to such participant) would exceed $150,000. This limitation is subject to certain exceptions, which are identified in the relevant contract or endorsement form. As of the date of this prospectus, all jurisdictions in which the Account is offered have approved this limitation, but the effective date of the limitation as applies to an individual participant will be reflected on his or her contract or endorsement form. By limiting these transfers to the Account, as anticipated, the amount of funds going into and out of the Account has become more predictable, which management believes will continue to enhance our ability to invest and manage the Account’s portfolio with a long-term perspective. Liquidity Guarantee Primarily as a result of significant net participant transfers out of the Account during late 2008 and mid-2009, pursuant to TIAA’s existing liquidity guarantee obligation, the TIAA General Account purchased $1.2 billion of liquidity units issued by the Account in a number of separate transactions between December 2008 and June 2009. Subsequent to June 2009, the TIAA General Account did not purchase any additional liquidity units. As disclosed under “Establishing and Managing the Account—the Role of TIAA—Liquidity Guarantee” on page 45, in accordance with this liquidity guarantee obligation, TIAA guarantees that all participants in the Account may redeem their accumulation units at their accumulation unit value next determined after their transfer or cash withdrawal request is received in good order. Net participant transfers out of the Account significantly slowed following the first quarter of 2009, and net participant transfer activity turned to net inflows in early 2010, which has continued through the date of this prospectus. As a result, while management cannot predict whether any future TIAA liquidity unit purchases will be required under this liquidity guarantee, it is 98Prospectus ¡ TIAA Real Estate Account
unlikely that additional purchases will be required in the near term. However, management cannot predict for how long net inflows will continue to occur. If net outflows were to occur (even if not at the same intensity as in 2008 and early 2009), it could have a negative impact on the Account’s operations and returns and could require TIAA to purchase additional liquidity units, perhaps to a significant degree, as was the case in late 2008 and early 2009. TIAA’s obligation to provide Account participants liquidity through purchases of liquidity units is not subject to an express regulatory or contractual limitation, although as described in the paragraph below, the independent fiduciary may (but is not obligated to) require the reduction of TIAA’s interest through sales of assets from the Account if TIAA’s interest exceeds the trigger point. Even if the independent fiduciary so requires TIAA’s obligation to provide liquidity under the guarantee, which is required by the New York State Department of Financial Services, will continue. Management also believes that TIAA has the ability to meet its obligations under this liquidity guarantee. Redemption of Liquidity Units.The independent fiduciary is vested with oversight and approval over any redemption of TIAA’s liquidity units, acting in the best interests of Real Estate Account participants. As of December 31, 2012, TIAA owned 1.2 million liquidity units, representing approximately 2.2% of the Account’s outstanding accumulation units as of such date. As of the date of this prospectus, the independent fiduciary has completed the systematic redemption of all of the liquidity units held by the TIAA General Account. Approximately one-quarter of such units were redeemed evenly over the business days in each of June, September and December 2012, and March 2013, representing a total of $1.3 billion redeemed during this period. As a general matter, the independent fiduciary may authorize or direct the redemption of all or a portion of liquidity units at any time and TIAA will request the approval of the independent fiduciary before any liquidity units are redeemed. Upon termination and liquidation of the Account (wind-up), any liquidity units held by TIAA will be the last units redeemed, unless the independent fiduciary directs otherwise. The Account pays TIAA for the risk associated with providing the liquidity guarantee through a daily deduction from the Account’s net assets. Net Income and Marketable Securities The Account’s net investment income continues to be an additional source of liquidity for the Account. Net investment income was $368.2 million for the year ended December 31, 2012 as compared to $423.1 million for the comparable period of 2011. Total net investment income decreased as described more fully in the Results of Operationssection above. As of December 31, 2012, cash and cash equivalents, along with real estate-related and non-real estate-related marketable securities comprised 26.4% of the Account’s net assets. The Account’s real estate-related marketable TIAA Real Estate Account ¡Prospectus99
securities consist of publicly traded REITS and real estate index funds. The Account’s liquid assets continue to be available to purchase additional suitable real estate properties, meet the Account’s debt obligations, expense needs, and participant redemption requests (i.e., cash withdrawals, benefit payments, or transfers). Leverage The Account may borrow money and assume or obtain a mortgage on a property to make leveraged real estate investments. Also, to meet any short-term cash needs, the Account may obtain a line of credit that may be unsecured and/or contain terms that may require the Account to secure the loan with one or more of its properties. The Account is authorized to borrow money in accordance with its investment guidelines. Under the Account’s current investment guidelines, the Account’s loan to value ratio (as described below) is to be maintained at or below 30%. Such incurrences of debt from time to time may include: • placing new debt on properties; • refinancing outstanding debt; • assuming debt on acquired properties or interests in the Account’s properties; and/or • long term extensions of the maturity date of outstanding debt. In calculating this limit, only the Account’s actual percentage interest in any borrowings is included, and not that percentage interest held by any joint venture partner. Further, the Account may only borrow up to 70% of the then-current value of a property, although construction loans may be for 100% of the costs incurred in developing a property. As of December 31, 2012 the Account did not have any construction loans. Also, at the time the Account (or a joint venture in which the Account is a partner) enters into a revolving line of credit, management deems the maximum amount which may be drawn under that line of credit as fully incurred, regardless of whether the maximum amount available has been drawn from time to time. As of December 31, 2012, the Account’s ratio of outstanding principal amount of debt (inclusive of the Account’s proportionate share of debt held within its joint venture investments) to total gross asset value (i.e., a “loan to value ratio”) was 21.0%. The Account intends to maintain its loan to value ratio at or below 30% (this ratio is measured at the time of incurrence and after giving effect thereto). The Account’s total gross asset value, for these purposes, is equal to the total fair value of the Account’s assets (including the fair value of the Account’s interest in joint ventures), with no reduction associated with any indebtedness on such assets. As of December 31, 2012, $758.8 million in principal amount of mortgage obligations secured by real estate investments wholly owned by the Account will mature throughout 2013. The Account currently has sufficient liquidity in the form of cash and cash equivalents and short-term securities to meet its current mortgage obligations. 100Prospectus ¡ TIAA Real Estate Account
In times of high net inflow activity, in particular during times of high net participant transfer inflows, management may determine to apply a portion of such cash flows to make prepayments of indebtedness prior to scheduled maturity, which would have the effect of reducing the Account’s loan to value ratio. RECENT TRANSACTIONS The following describes property transactions by the Account during the fourth quarter of 2012. Except as noted, the expenses for operating the properties purchased are either borne or reimbursed, in whole or in part, by the property tenants, although the terms vary under each lease. The Account is responsible for operating expenses not reimbursed under the terms of a lease. All rental rates are quoted on an annual basis unless otherwise noted. PURCHASES Prescott Wallingford Apartments—Seattle, WA On October 26, 2012, the Account purchased a recently constructed four-story apartment complex located in Seattle, Washington for $54.3 million. Prescott Wallingford Apartments is a 119,792 square foot (“SF”) residential and retail apartment complex, constructed in 2012. The apartment complex is 102,387 SF of apartment space containing 154 apartment units and 17,405 SF of retail space. The apartment complex was 0% leased at the time of purchase due to the recent completion of construction. MiMA—New York, NY On November 13, 2012, the Account purchased a 70% interest in a joint venture, RGM 42, LLC, which holds a 59 story 532,592 SF luxury high-rise containing 651 residential units located in New York, New York for $282.8 million, which was net of $268.6 million of debt financing, which represented the Accounts share of the overall financing, discussed in more detail in the Financing section below. At the time of purchase, the high-rise was 90% leased. Charleston Plaza—Mountain View, CA On December 18, 2012, the Account purchased a retail center located in Mountain View, California for $43.5 million, net of a $36.9 million assumed mortgage loan payable, discussed in more detail in the Financings section below. The Asset consists of 132,590 SF of retail space including four national retail anchor tenants, Bed Bath & Beyond, PetSmart, REI, and Best Buy, which represents 93.0% of the leasable area and 88.0% of the rental income. None of the anchor tenant leases expire before 2016. The retail center was 100% leased at the time of purchase. Valencia Town Center—Valencia, CA On December 20, 2012, the Account purchased a 50% interest in a joint venture, Valencia Town Center Associates, L.P. which holds a regional mall located in Valencia, California. The Account purchased its interest for $97.7 TIAA Real Estate Account ¡Prospectus101
million, net of a $97.5 million mortgage loan payable, as discussed in the Financings section below. The mall includes a 723,000 SF two story main mall, built in 1991, an adjoining 176,000 SF outdoor retail patio mall, completed in 2009, a separate 12-screen, 69,000 SF theatre, added in 2002, and an additional 127,000 SF of exterior shops and street-level retail. The main mall anchors are Macy’s, Sears, and JC Penney. None of the anchor tenant leases expire before 2016. The mall was 96.1% leased at the time of purchase. SALES Broadlands Business Park—Elkton, MD On October 16, 2012, the Account sold an industrial property located in Elkton, Maryland for a net sale price of $31.0 million, realizing a loss from the sale of $4.2 million, the majority of which had been previously recognized as unrealized losses in the Account’s consolidated statements of operations. The Account’s cost basis (excluding selling costs) in the property as of the date of sale was $35.2 million. GE Appliance East Coast Distribution Center—Perryville, MD On October 16, 2012, the Account sold an industrial property located in Perryville, Maryland for a net sale price of $46.5 million, realizing a loss from the sale of $1.4 million, the majority of which had been previously recognized as unrealized losses in the Account’s consolidated statements of operations. The Account’s cost basis (excluding selling costs) in the property at the date of the sale was $48.0 million according to the records of the Account. Four Oaks—Houston, TX On November 30, 2012, the Account contributed an office complex located in Houston, TX into a newly created venture, Four Oaks Place, L.P. Concurrent with the account’s contribution, a foreign investor purchased a 49% interest in the Four Oaks Place, L.P. venture for $226.6 million. The Account realized a gain of $60.0 million from the sale of its interest. The Account’s cost basis (excluding selling costs) at the date of the sale was $166.6 million. Airway Distribution Center—Southhaven, MS On December 19, 2012, the Account sold an industrial property located in Southaven, Mississippi for a net sale price of $22.0 million, realizing a loss from the sale of $7.0 million, the majority of which had been previously recognized as unrealized losses in the Account’s consolidated statements of operations. The Account’s cost basis (excluding selling costs) in the property at the date of the sale was $29.0 million. Needham Corporate Center—Needham, MA On December 21, 2012, the Account sold an office property located in Needham, Massachusetts for a net sale price of $25.8 million, realizing a loss from the sale of $15.7 million, the majority of which had been previously recognized as unrealized losses in the Account’s consolidated statements of 102Prospectus ¡ TIAA Real Estate Account
operations. The Account’s cost basis (excluding selling costs) in the property at the date of the sale was $41.5 million. DDR Joint Venture—Homestead, PA On October 1, 2012, a retail property located in Homestead, Pennsylvania was sold by the Account’s DDR joint venture investment in which the Account holds an 85.0% interest. The Account’s portion of the net sale price was $93.8 million. The Account realized a loss from the sale of $59.6 million, the majority of which had been previously recognized as unrealized losses in the Account’s consolidated statements of operations. The Account’s portion of its cost basis (excluding selling costs) in the property at the date of the sale was $153.5 million. IDI Nationwide Industrial Portfolio—Various, USA On December 5, 2012, an industrial portfolio with locations throughout the United States was sold by the Account’s Strategic Ind. Portfolio I, LLC joint venture investment in which the Account holds a 60.0% interest. The Account’s portion of the net sales price was $107.0 million. The Account realized a loss from the sale of $6.6 million, the majority of which had been previously recognized as an unrealized loss in the Account’s consolidated statement of operations. The Account’s portion of its cost basis (excluding selling costs) in the investment at the date of the sale was $113.5 million. South Dade Shopping Center—Miami, FL On December 21, 2012, a retail property located in Miami, FL was sold by the Account’s TREA Florida Retail, LLC joint venture investment in which the Account holds an 80.0% interest. The Account’s portion of the net sales price was $31.8 million. The Account realized a gain from the sale of $10.1 million, the majority of which had been previously recognized as an unrealized gain in the Account’s consolidated statement of operations. The Account’s portion of its cost basis (excluding selling costs) in the investment at the date of the sale was $21.7 million. FINANCINGS The Colorado—New York, NY On October 9, 2012, the Account extinguished a $83.3 million mortgage loan associated with the property. Concurrent with this extinguishment, the Account entered into a new mortgage loan with a total principal of $91.7 million and a fixed interest rate of 3.69%. The debt matures on November 1, 2022. The Legacy at Westwood—Los Angeles, CA On October 9, 2012, the Account extinguished a $40.0 million mortgage loan associated with the property. Concurrent with this extinguishment, the Account entered into a new mortgage loan with a total principal of TIAA Real Estate Account ¡Prospectus103
$46.7 million and a fixed interest rate of 3.69%. The debt matures on November 1, 2022. Regents Court—San Diego, CA On October 9, 2012, the Account extinguished a $34.1 million mortgage loan associated with the property. Concurrent with this extinguishment, the Account entered into a new mortgage loan with a total principal of $39.6 million and a fixed interest rate of 3.69%. The debt matures on November 1, 2022. The Caruth—Dallas, TX On October 9, 2012, the Account extinguished a $39.9 million mortgage loan associated with the property. Concurrent with this extinguishment, the Account entered into a new mortgage loan with a total principal of $45.1 million and a fixed interest rate of 3.69%. The debt matures on November 1, 2022. MiMA—New York, NY As noted above, on November 13, 2012, the Account purchased a 70% interest in the RGM 42, LLC joint venture. This joint venture holds $224.0 million of debt financing (such amount representing the Account’s share) comprised of three separate tax exempt bond issuances by the New York State Housing and Finance Agency (the “Bonds”). The $224.0 million of outstanding Bonds are interest only variable demand obligations maturing in 2041. The Bonds bear interest at a variable rate calculated weekly based upon an independent remarketing agent’s determination of the minimum rate required to resell the Bonds to be sold up to a maximum interest rate of 12% per annum, which may be increased up to 15% under certain circumstances. During any point when interest rates on the Bonds are determined, the Bonds are redeemable at the option of a bondholder. The remarketing agent remarkets any Bonds redeemed by a bondholder. In the event any of the redeemed Bonds cannot be resold by the remarketing agent, those Bonds become due and payable by the RGM 42, LLC joint venture. In addition, concurrent with the Account’s purchase of its interest in the RGM 42 LLC joint venture, the joint venture entered into a $44.6 million (such amount representing the Account’s share) mortgage loan maturing November 2017. The loan has a variable interest rate equal to 3.06% above the London Interbank Offered Rate (LIBOR) and is interest only for the first 12 months with principal and interest payments for the remaining four years to maturity. Charleston Plaza—Mountain View, CA On December 18, 2012 the Account assumed a $36.9 million mortgage loan payable as a result of its purchase of a community retail center property investment located in Mountain View, CA, as discussed in the Purchases section above. The debt has a fixed interest rate of 5.60% maturing September 2016. 104Prospectus ¡ TIAA Real Estate Account
Valencia Town Center—Valencia, CA On December 20, 2012, the Account’s Valencia Town Center Associates, L.P. joint venture investment, in which the Account holds a 50% interest, entered into a $97.5 million mortgage loan payable concurrent with its purchase of a regional mall property located in Valencia, CA, as discussed in the Purchases section above. The debt has a fixed interest rate of 3.63% maturing January 2023. CONTRACTUAL OBLIGATIONS The following table sets forth a summary regarding the Account’s known contractual obligations, including required interest payments for those items that are interest bearing, as of December 31, 2012 (amounts in millions): Amounts Due During Years Ending December 31, Thereafter Total 2013 2014 2015 2016 2017 Mortgage Loans Payable: Principal Payments $ 758.8 $ 222.7 $ 273.1 $ 188.6 $ 51.8 $ 758.8 $ 2,253.8 Interest Payments(1) 107.2 68.2 57.4 37.7 33.8 127.1 431.4 Total Mortgage Loans Payable $ 866.0 $ 290.9 $ 330.5 $ 226.3 $ 85.6 $ 885.9 $ 2,685.2 Other Commitments(2) 6.8 — — — — — 6.8 Tenant improvements(3) 90.2 — — — — — 90.2 Total Contractual Obligations $ 963.0 $ 290.9 $ 330.5 $ 226.3 $ 85.6 $ 885.9 $ 2,782.2 (1) These amounts represent interest payments due on mortgage loans payable based on the stated rates and, where applicable, the foreign currency exchange rates at December 31, 2012. (2) This includes the Account’s commitment to purchase interest in three limited partnerships, which could be called by the partner at any time. (3) This amount represents tenant improvements and leasing inducements committed by the Account in tenant leases that have not been incurred as of the year ended December 31, 2012. Note that the Contractual Obligations table above does not include payments on debt held in Investments in Joint Ventures which are the obligation of the individual joint venture entities. SeeNote 7—Investments in Joint Venturesto the Account’s consolidated financial statements. EFFECTS OF INFLATION AND INCREASING OPERATING EXPENSES Inflation, along with increased insurance, taxes, utilities and security costs, may increase property operating expenses in the future. Any such increases in operating expenses are generally billed to tenants either through contractual lease provisions in office, industrial, and retail properties or through rent increases in apartment complexes. The Account remains responsible for the expenses for unleased space in a property as well as expenses which may not be reimbursed under the terms of an existing lease. Critical Accounting Policies The consolidated financial statements of the Account are prepared in conformity with accounting principles generally accepted in the United States of America. TIAA Real Estate Account ¡Prospectus105
In preparing the Account’s consolidated financial statements, management is required to make estimates and judgments that affect the reported amounts of assets, liabilities, revenues, and expenses. Management bases its estimates on historical experience and assumptions that are believed to be reasonable under the circumstances, the results of which form the basis for making judgments about the carrying value of assets and liabilities that are not readily apparent from other sources. Actual results may differ from these estimates. Determination of Investments at Fair Value:The Account reports all investments and investment related mortgage loans payable at fair value. The Financial Accounting Standards Board (“FASB”) has defined fair value as the price that would be received to sell an asset or paid to transfer a liability in an orderly transaction between market participants. The following is a description of the valuation methodologies used to determine the fair value of the Account’s investments and investment related mortgage payables. Valuation of Real Estate Properties — Investments in real estate properties are stated at fair value, as determined in accordance with policies and procedures reviewed by the Investment Committee of the Board and in accordance with the responsibilities of the Board as a whole. Accordingly, the Account does not record depreciation. Determination of fair value involves judgment because the actual fair value of real estate can be determined only by negotiation between the parties in a sales transaction. The Account’s primary objective when valuing its real estate investments will be to produce a valuation that represents a reasonable estimate of the fair value of its investments. Implicit in the Account’s definition of fair value are the consummation of a sale as of a specified date and the passing of title from seller to buyer under conditions whereby: • Buyer and seller are typically motivated; • Both parties are well informed or well advised, and acting in what they consider their best interests; • A reasonable time is allowed for exposure in the open market; • Payment is made in terms of cash or in terms of financial arrangements comparable thereto; and • The price represents the normal consideration for the property sold unaffected by special or creative financing or sales concessions granted by anyone associated with the sale. Property and investment values are affected by, among other things, the availability of capital, occupancy rates, rental rates, and interest and inflation rates. As a result, determining real estate and investment values involves many assumptions. Key inputs and assumptions include rental income and expense amounts, related rental income and expense growth rates, discount rates and capitalization rates. Valuation techniques include discounted cash flow analysis, prevailing market capitalization rates or multiples applied to earnings from the property, analysis of recent comparable sales transactions, actual sale negotiations and bona fide purchase offers received from third parties. 106Prospectus ¡ TIAA Real Estate Account
Amounts ultimately realized from each investment may vary significantly from the fair value presented. Real estate properties owned by the Account are initially valued based on an independent third party appraisal, as reviewed by TIAA’s internal appraisal staff and as applicable the Account’s independent fiduciary at the time of the closing of the purchase, which may result in a potential unrealized gain or loss reflecting the difference between an investment’s fair value (i.e., exit price) and its cost basis (which is inclusive of transaction costs). Subsequently, each property is appraised each quarter by an independent third party appraiser, reviewed by TIAA’s internal appraisal staff and as applicable the Account’s independent fiduciary. In general, the Account obtains appraisals of its real estate properties spread out throughout the quarter, which is intended to result in appraisal adjustments, and thus, adjustments to the valuations of its holdings (to the extent such adjustments are made) that happen regularly throughout each quarter and not on one specific day or month in each period. Further, management reserves the right to order an appraisal and/or conduct another valuation outside of the normal quarterly process when facts or circumstances at a specific property change. For example, under certain circumstances a valuation adjustment could be made when the account receives a bona fide bid for the sale of a property held within the Account or one of the Account’s joint ventures. In addition, adjustments may be made for events or circumstances indicating an impairment of a tenant’s ability to pay amounts due to the Account under a lease (including due to a bankruptcy filing of that tenant). Alternatively, adjustments may be made to reflect the execution or renewal of a significant lease. Also, adjustments may be made to reflect factors (such as sales values for comparable properties or local employment rate) bearing uniquely on a particular region in which the Account holds properties. TIAA’s internal appraisal staff oversees the entire appraisal process, in conjunction with the Account’s independent fiduciary (the independent fiduciary is more fully described in the paragraph below). Any differences in the conclusions of TIAA’s internal appraisal staff and the independent appraiser will be reviewed by the independent fiduciary, which will make a final determination on the matter (which may include ordering a subsequent independent appraisal). The independent fiduciary, Real Estate Research Corporation, has been appointed by a special subcommittee of the Investment Committee of the Board to, among other things, oversee the appraisal process. The independent fiduciary must approve all independent appraisers used by the Account. All appraisals are performed in accordance with Uniform Standards of Professional Appraisal Practices, the real estate appraisal industry standards created by The Appraisal Foundation. Real estate appraisals are estimates of property values based on a professional’s opinion. Appraisals of properties held outside of the U.S. are performed in accordance with industry standards commonly applied in the applicable jurisdiction. These independent appraisers TIAA Real Estate Account ¡Prospectus107
are always expected to be MAI-designated members of the Appraisal Institute (or its European equivalent, Royal Institute of Chartered Surveyors) and state certified appraisers from national or regional firms with relevant property type experience and market knowledge. Under the Account’s current procedures, each independent appraisal firm will be rotated off of a particular property at least every three years, although such appraisal firm may perform appraisals of other Account properties subsequent to such rotation. Also, the independent fiduciary can require additional appraisals if factors or events have occurred that could materially change a property’s value (including those identified above) and such change is not reflected in the quarterly valuation review, or otherwise to ensure that the Account is valued appropriately. The independent fiduciary must also approve any valuation change of real estate-related assets where a property’s value changed by more than 6% from the most recent independent annual appraisal, or if the value of the Account would change by more than 4% within any calendar quarter or more than 2% since the prior calendar month. When a real estate property is subject to a mortgage, the property is valued independently of the mortgage and the property and mortgage fair values are reported separately (seeValuation of Mortgage Loans Payablebelow). The independent fiduciary reviews and approves all mortgage valuation adjustments before such adjustments are recorded by the Account. The Account continues to use the revised value for each real estate property and mortgage loan payable to calculate the Account’s daily net asset value until the next valuation review or appraisal. Valuation of Real Estate Joint Ventures — Real estate joint ventures are stated at the fair value of the Account’s ownership interests of the underlying entities. The Account’s ownership interests are valued based on the fair value of the underlying real estate, any related mortgage loans payable, and other factors, such as ownership percentage, ownership rights, buy/sell agreements, distribution provisions and capital call obligations. Upon the disposition of all real estate investments by an investee entity, the Account will continue to state its equity in the remaining net assets of the investee entity during the wind down period, if any, which occurs prior to the dissolution of the investee entity. Valuation of Real Estate Limited Partnerships — Limited partnership interests are stated at the fair value of the Account’s ownership in the partnership which are recorded based upon the changes in the net asset values of the limited partnerships as determined from the financial statements of the limited partnerships when received by the Account. Prior to the receipt of the financial statements from the limited partnerships, the Account estimates the value of its interest in good faith and will from time to time seek input from the issuer or the sponsor of the investments. Since market quotations are not readily available, the limited partnership interests are valued at fair value as determined in good faith by management under the direction of the Investment Committee of the Board and in accordance with the responsibilities of the Board as a whole. 108Prospectus ¡ TIAA Real Estate Account
Valuation of Marketable Securities — Equity securities listed or traded on any national market or exchange are valued at the last sale price as of the close of the principal securities market or exchange on which such securities are traded or, if there is no sale, at the mean of the last bid and asked prices on such market or exchange, exclusive of transaction costs. Debt securities, other than money market instruments, are generally valued at the most recent bid price or the equivalent quoted yield for such securities (or those of comparable maturity, quality and type). Money market instruments, with maturities of one year or less, are valued in the same manner as debt securities or derived from a pricing matrix. Equity and fixed income securities traded on a foreign exchange or in foreign markets are valued using their closing values under the valuation methods generally accepted in the country where traded, as of the valuation date. This value is converted to U.S. dollars at the exchange rate in effect on the valuation day. Under certain circumstances (for example, if there are significant movements in the United States markets and there is an expectation the securities traded on foreign markets will adjust based on such movements when the foreign markets open the next day), the Account may adjust the value of equity or fixed income securities that trade on a foreign exchange or market after the foreign exchange or market has closed. Valuation of Mortgage Loans Receivable — Mortgage loans receivable are stated at fair value and are initially valued at the face amount of the mortgage loan funding. Subsequently, mortgage loans receivable are valued at least quarterly based on market factors, such as market interest rates and spreads for comparable loans, the liquidity for mortgage loans of similar characteristics, the performance of the underlying collateral and the credit quality of the counterparty. Valuation of Mortgage Loans Payable — Mortgage loans payable are stated at fair value. The estimated fair value of mortgage loans payable are based on the amount at which the liability could be transferred to a third party exclusive of transaction costs. Mortgage loans payable are valued internally by TIAA’s internal appraisal department, as reviewed by the Account’s independent fiduciary, at least quarterly based on market factors, such as market interest rates and spreads for comparable loans, the performance of the underlying collateral (such as the loan-to-value ratio and the cash flow of the underlying collateral), the liquidity for mortgage loans of similar characteristics, the maturity date of the loan, the return demands of the market. Foreign currency transactions and translation:Portfolio investments and other assets and liabilities denominated in foreign currencies are translated into U.S. dollars at the exchange rates prevailing at the end of the period. Purchases and sales of securities, income receipts and expense payments made in foreign currencies are translated into U.S. dollars at the exchange rates prevailing on the respective dates of the transactions. The effect of any changes in foreign currency exchange rates on portfolio investments and mortgage loans payable are included in net realized and unrealized gains and TIAA Real Estate Account ¡Prospectus109
losses on real estate properties and mortgage loans payable. Net realized gains and losses on foreign currency transactions include disposition of foreign currencies, and currency gains and losses between the accrual and receipt dates of portfolio investment income and between the trade and settlement dates of portfolio investment transactions. Accumulation and Annuity Funds:The accumulation fund represents the net assets attributable to participants in the accumulation phase of their investment (“Accumulation Fund”). The annuity fund represents the net assets attributable to the participants currently receiving annuity payments (“Annuity Fund”). The net increase or decrease in net assets from investment operations is apportioned between the accounts based upon their relative daily net asset values. Once an Account participant begins receiving lifetime annuity income benefits, payment levels cannot be reduced as a result of the Account’s adverse mortality experience. In addition, the contracts pursuant to which the Account is offered are required to stipulate the maximum expense charge for all Account level expenses that can be assessed, which is not to exceed 2.5% of average net assets per year. The Account pays a fee to TIAA to assume mortality and expense risks. Accounting for Investments:The investments held by the Account are accounted for as follows: Real Estate Properties — Rent from real estate properties consists of all amounts earned under tenant operating leases, including base rent, recoveries of real estate taxes and other expenses and charges for miscellaneous services provided to tenants. Rental income is recognized in accordance with the billing terms of the lease agreements. The Account bears the direct expenses of the real estate properties owned. These expenses include, but are not limited to, fees to local property management companies, property taxes, utilities, maintenance, repairs, insurance, and other operating and administrative costs. An estimate of the net operating income earned from each real estate property is accrued by the Account on a daily basis and such estimates are adjusted when actual operating results are determined. Real Estate Joint Ventures — The Account has limited ownership interests in various real estate joint ventures (collectively, the “joint ventures”). The Account records its contributions as increases to its investments in the joint ventures, and distributions from the joint ventures are treated as income within income from real estate joint ventures and limited partnerships in the Account’s consolidated statements of operations. Distributions that are identified as returns of capital are recorded as a reduction to the cost basis of the investment, whereas distributions identified as capital gains or losses are recorded as realized gains or losses. Income from the joint ventures is recorded based on the Account’s proportional interest of the income distributed by the joint ventures. Income earned by the joint ventures, but not yet distributed to the Account by the joint ventures is recorded as unrealized gains and losses. 110Prospectus ¡ TIAA Real Estate Account
Limited Partnerships — The Account has limited ownership interests in various private real estate funds (primarily limited partnerships) and a private real estate investment trust (collectively, the “limited partnerships”). The Account records its contributions as increases to the investments, and distributions from the investments are treated as income within income from real estate joint ventures and limited partnerships in the Account’s consolidated statements of operations. Distributions that are identified as returns of capital are recorded as a reduction to the cost basis of the investment, whereas distributions identified as capital gains or losses are recorded as realized gains or losses. Unrealized gains and losses are recorded based upon the changes in the net asset values of the limited partnerships as determined from the financial statements of the limited partnerships when received by the Account. Prior to the receipt of the financial statements from the limited partnerships, the Account estimates the value of its interest in good faith and will from time to time seek input from the issuer or the sponsor of the investment. Changes in value based on such estimates are recorded by the Account as unrealized gains and losses. Marketable Securities — Transactions in marketable securities are accounted for as of the date the securities are purchased or sold (trade date). Interest income is recorded as earned. Dividend income is recorded on the ex-dividend date within dividend income. Dividends that are identified as returns of capital are recorded as a reduction to the cost basis of the investment, whereas dividends identified as capital gains or losses are recorded as realized gains or losses. Realized gains and losses on securities transactions are accounted for on the specific identification method. Realized and Unrealized Gains and Losses — Unrealized gains and losses are recorded as the fair values of the Account’s investments are adjusted, and as discussed within theReal Estate Joint VenturesandLimited Partnershipssections above. Realized gains and losses are recorded at the time an investment is sold or a distribution is received from the joint ventures or limited partnerships. Real estate transactions are accounted for as of the date on which the purchase or sale transactions for the real estate properties close (settlement date). The Account recognizes a realized gain on the sale of a real estate property to the extent that the contract sales price exceeds the cost-to-date of the property being sold. A realized loss occurs when the cost-to-date exceeds the sales price. Net Assets — The Account’s net assets as of the close of each valuation day are valued by taking the sum of: • the value of the Account’s cash; cash equivalents, and short-term and other debt instruments; • the value of the Account’s other securities and other non-real estate assets; TIAA Real Estate Account ¡Prospectus111
• the value of the individual real properties (based on the most recent valuation of that property) and other real estate-related investments owned by the Account; • an estimate of the net operating income accrued by the Account from its properties, other real estate-related investments and non-real estate-related investments (including short-term marketable securities) since the end of the prior valuation day; and • actual net operating income earned from the Account’s properties, other real estate-related investments and non-real estate-related investments (but only to the extent any such item of income differs from the estimated income accrued for on such investments), and then reducing the sum by liabilities held within the Account, including the daily investment management fee, administration and distribution fees and certain other expenses attributable to operating the Account. After the end of every quarter, the Account reconciles the amount of expenses deducted from the Account (which is established in order to approximate the costs that the Account will incur) with the expenses the Account actually incurred. If there is a difference, the Account adds it to or deducts it from the Account in equal daily installments over the remaining days of the following quarter. Material differences may be repaid in the current calendar quarter. The Account’s at-cost deductions are based on projections of Account assets and overall expenses, and the size of any adjusting payments will be directly affected by the difference between management’s projections and the Account’s actual assets or expenses. Federal Income Taxes:Based on provisions of the Internal Revenue Code, Section 817, the Account is taxed as a segregated asset account of TIAA and as such, the Account should incur no material federal income tax attributable to the net investment activity of the Account. Management has analyzed the Account’s tax positions taken for all open federal income tax years (2007–2012) and has concluded no provisions for federal income tax are required as of December 31, 2012. New Accounting Pronouncements In May 2011, the FASB issued ASU No. 2011-04, “Amendments to Achieve Common Fair Value Measurements and Disclosure Requirements in U.S. GAAP and IFRSs” (“ASU 2011-04”), with the intention to converge fair value standards between U.S. GAAP and International Financial Reporting Standards. This ASU is largely consistent with existing fair value measurement principles in U.S. GAAP, expands ASC 820’s existing disclosure requirements for fair value measurements and makes other amendments. The Account adopted ASU 2011-04 January 1, 2012. The adoption did not have an impact on the Account’s consolidated statements of assets and liabilities or consolidated statements of operations. SeeNote 5—Assets and Liabilities Measured at Fair Value on a Recurring Basisfor additional disclosures as a result of the adoption of ASU 2011-04. 112Prospectus ¡ TIAA Real Estate Account
QUANTITATIVE AND QUALITATIVE DISCLOSURES ABOUT MARKET RISK The Account’s real estate holdings, including real estate joint ventures and limited partnerships, which, as of December 31, 2012, represented 77.2% of the Account’s total investments, expose the Account to a variety of risks. These risks include, but are not limited to: • General Real Estate Risk — The risk that the Account’s property values or rental and occupancy rates could go down due to general economic conditions, a weak market for real estate generally, disruptions in the credit and/or capital markets, or changing supply and demand for certain types of properties; • Appraisal Risk — The risk that the sale price of an Account property (i.e., the value that would be determined by negotiations between independent parties) might differ substantially from its estimated or appraised value, leading to losses or reduced profits to the Account upon sale; • Risk Relating to Property Sales — The risk that the Account might not be able to sell a property at a particular time for its full value, particularly in a poor market. This might make it difficult to raise cash quickly and also could lead to Account losses; • Risks of Borrowing — The risk that interest rate changes may impact Account returns if the Account takes out a mortgage on a property, buys a property subject to a mortgage or holds a property subject to a mortgage; and • Foreign Currency Risk — The risk that the value of the Account’s foreign investments, related debt, or rental income could increase or decrease due to changes in foreign currency exchange rates or foreign currency exchange control regulations, and hedging against such changes, if undertaken by the Account, may entail additional costs and be unsuccessful. The Account believes the diversification of its real estate portfolio, both geographically and by sector, along with its quarterly valuation procedure, helps manage the real estate and appraisal risks described above. As of December 31, 2012, 22.8% of the Account’s total investments were comprised of marketable securities. As of December 31, 2012, marketable securities include high-quality debt instruments (i.e., government agency notes) and REIT securities. The Statement of Investments for the Account sets forth the general financial terms of these instruments, along with their fair values, as determined in accordance with procedures described earlier in the Critical Accounting Policies section above and inNote 1—Organization and Significant Accounting Policiesto the Account’s consolidated financial statements included herewith. The Account’s marketable securities are considered held for trading purposes. Currently, the Account does not invest in derivative financial investments, nor does the Account engage in any hedging activity. TIAA Real Estate Account ¡Prospectus113
Risks associated with investments in real estate-related liquid assets (which could include, from time to time, REIT securities and CMBS), and non-real estate-related liquid assets, including financial/credit risk, market volatility risk, interest rate volatility risk and deposit/money market risk. • Financial/Credit Risk — The risk, for debt securities, that the issuer will not be able to pay principal and interest when due (and/or declare bankruptcy or be subject to receivership) and, for equity securities such as common or preferred stock, that the issuer’s current earnings will fall or that its overall financial soundness will decline, reducing the security’s value. • Market Volatility Risk — The risk that the Account’s investments will experience price volatility due to changing conditions in the financial markets regardless of the credit quality or financial condition of the underlying issuer. This risk is particularly acute to the extent the Account holds equity securities, which have experienced significant short-term price volatility over the past year. Also, to the extent the Account holds debt securities, changes in overall interest rates can cause price fluctuations. • Interest Rate Volatility — The risk that interest rate volatility may affect the Account’s current income from an investment. • Deposit/Money Market Risk — The risk that, to the extent the Account’s cash held in bank deposit accounts exceeds federally insured limits as to that bank, the Account could experience losses if banks fail. The Account does not believe it has exposure to significant concentration of deposit risk. In addition, there is some risk that investments held in money market accounts can suffer losses. In addition, to the extent the Account were to hold mortgage-backed securities (including commercial mortgage-backed securities) these securities are subject to prepayment risk or extension risk (i.e., the risk that borrowers will repay the loans earlier or later than anticipated). If the underlying mortgage assets experience faster than anticipated repayments of principal, the Account could fail to recoup some or all of its initial investment in these securities, since the original price paid by the Account was based in part on assumptions regarding the receipt of interest payments. If the underlying mortgage assets are repaid later than anticipated, the Account could lose the opportunity to reinvest the anticipated cash flows at a time when interest rates might be rising. The rate of prepayment depends on a variety of geographic, social and other functions, including prevailing market interest rates and general economic factors. The fair value of these securities is also highly sensitive to changes in interest rates. Note that the potential for appreciation, which could otherwise be expected to result from a decline in interest rates, may be limited by any increased prepayments. These securities may be harder to sell than other securities. 114Prospectus ¡ TIAA Real Estate Account
In addition to these risks, real estate equity securities (such as REIT stocks and mortgage-backed securities) would be subject to many of the same general risks inherent in real estate investing, making mortgage loans and investing in debt securities. For more information on the risks associated with all of the Account’s investments, see “Risk Factors” in this prospectus. TIAA offers the Real Estate Account as a variable option for the annuity contracts described below. Some employer plans may not offer the Real Estate Account as an option for RA, GA, SRA, GRA, GSRA (including institutionally owned GSRA), Retirement Choice, Retirement Choice Plus or Keogh contracts. CREF is a companion organization to TIAA. A companion CREF contract may have been issued to you when you received the TIAA contract offering the Account. For more information about the CREF annuity contracts, the TIAA traditional annuity, the TIAA Access variable annuity accounts, other TIAA annuities and separate accounts offered from time to time and particular funds and investment options offered under the terms of your plan, please see the applicable contracts and respective prospectuses for those investment options. Importantly, neither TIAA nor CREF guarantee the investment performance of the Account nor do they guarantee the value of your units at any time. RA (RETIREMENT ANNUITY) AND GRA (GROUP RETIREMENT ANNUITY) RA and GRA contracts are used mainly for employee retirement plans. RA contracts are issued directly to you. GRA contracts, which are group contracts, are issued through an agreement between your employer and TIAA. Depending on the terms of your employer’s plan, RA premiums can be paid by your employer, you, or both. GRA premiums can only be paid by your employer (though some such premiums may be paid by your employer pursuant to a salary reduction agreement). If you’re paying some or all of the entire periodic premium, your contributions can be in either pre-tax dollars by salary reduction or after-tax dollars by payroll deduction. Your employer may offer you the option of making contributions in the form of after-tax Roth IRA-style contributions, though you won’t be able to take tax deductions for these contributions. You can also transfer accumulations from another investment choice under your employer’s plan to your contract. Your GRA premiums can be from pre-tax or after-tax contributions. Ask your employer for more information about these contracts. As with RAs, you can transfer your accumulations from another investment choice under your employer’s plan to your GRA contract. TIAA Real Estate Account ¡Prospectus115
SRA (SUPPLEMENTAL RETIREMENT ANNUITY) AND GSRA (GROUP SUPPLEMENTAL RETIREMENT ANNUITY) These are generally limited to supplemental voluntary tax-deferred annuity (“TDA”) plans and supplemental 401(k) plans. SRA contracts are issued directly to you. GSRA contracts, which are group contracts, are issued through an agreement between your employer and TIAA. Generally, your employer pays premiums in pre-tax dollars through salary reduction. Your employer may offer you the option of making contributions in the form of after-tax Roth IRA-style contributions, though you won’t be able to take tax deductions for these contributions. Although you can’t pay premiums directly, you can transfer amounts from other TDA plans subject to the terms of the plan. RETIREMENT CHOICE/RETIREMENT CHOICE PLUS ANNUITIES These are very similar in operation to the GRAs and GSRAs, respectively, except that, unlike GRAs, they are issued directly to your employer or your plan’s trustee, and they may be issued to your employer directly without participant recordkeeping. Among other rights, the employer retains the right to transfer accumulations under these contracts to alternate funding vehicles. CLASSIC IRA AND ROTH IRA Classic IRAs are individual contracts issued directly to you. You and your spouse can each open a Classic IRA with an annual contribution of up to $5,500 or by rolling over funds from another IRA or eligible retirement plan, if you meet the Account’s eligibility requirements. If you are age 50 or older, you may contribute up to $6,500. The combined limit for your contributions to a Classic IRA and a Roth IRA for a single year is $5,500, or $6,500 if you are age 50 or older, excluding rollovers. (The dollar limits listed are for 2013; different dollar limits may apply in future years.) Roth IRAs are also individual contracts issued directly to you. You and your spouse can each open a Roth IRA with an annual contribution up to $5,500 or with a rollover from another IRA or a Classic IRA issued by TIAA if you meet the Account’s eligibility requirements, subject to rules applicable to Roth IRA conversions. If you are age 50 or older you may contribute up to $6,500. The combined limit for your contributions to a Classic IRA and a Roth IRA for a single year is $5,500, or $6,500 if you are age 50 or older, excluding rollovers. (The dollar limits listed are for 2013; different dollar limits may apply in future years.) We can’t issue a joint Classic IRA or Roth IRA contract. Your employer may offer SEP IRAs (Simplified Employee Retirement Plans), which are subject to different rules. Classic and Roth IRAs may together be referred to as “IRAs” in this prospectus. GA (GROUP ANNUITY) AND INSTITUTIONALLY OWNED GSRAs These are used exclusively for employer retirement plans and are issued directly to your employer or your plan’s trustee. Your employer pays premiums 116Prospectus ¡ TIAA Real Estate Account
directly to TIAA (you can’t pay the premiums directly to TIAA) and your employer or the plan’s trustee may control the allocation of contributions and transfers to and from these contracts including withdrawing completely from the Account. If a GA or Institutionally Owned GSRA contract is issued pursuant to your plan, the rules relating to transferring and withdrawing your money, receiving any annuity income or death benefits, and the timing of payments may be different, and are determined by your plan. Ask your employer or plan administrator for more information. KEOGH CONTRACTS TIAA offered contracts under Keogh plans. If you are a self-employed individual who owns an unincorporated business, you could prior to 2013, use the Account’s Keogh contracts for a Keogh plan, and cover common law employees, subject to the Account’s eligibility requirements. Note, however, that while TIAA will offer new contracts for new entrants into Keogh plans established prior to 2013, it will no longer offer contracts for Keogh plans that the Account is not currently funding. ATRA (AFTER-TAX RETIREMENT ANNUITY) The after-tax retirement annuities (“ATRA”) are individual non-qualified deferred annuity contracts, issued to participants who are eligible and would like to remit personal premiums under the contractual provisions of their RA contract. To be eligible, you must have an active and premium-paying or paid up RA contract. Note that the tax rules governing these non-qualified contracts differ significantly from the treatment of qualified contracts. See “Taxes” on page 136 for more information. ELIGIBILITY FOR IRA AND KEOGH CONTRACTS Each of you and your spouse can open a Classic or Roth IRA or a Keogh if you’re a current or retired employee or trustee of an Eligible Institution, or if you own a TIAA or CREF annuity contract or a TIAA individual insurance contract. To be considered a retired employee for this purpose, an individual must be at least 55 years old and have completed at least three years of service at an Eligible Institution. In the case of partnerships, at least half the partners must be eligible individuals and the partnership itself must be primarily engaged in education or research. Eligibility may be restricted by certain income limits on opening Roth IRA contracts. REAL ESTATE ACCOUNT ACCUMULATION CONTRACT TIAA offers an accumulation-only contract for certain institutions. Under this plan-level contract, the plan sponsor creates custom fund-of-funds allocations for participants by selecting various underlying investment options, including, among others, the TIAA Real Estate Account and other TIAA-CREF-affiliated options. The plan sponsor can (i) make withdrawals to satisfy withdrawal requests by individual participants, (ii) make withdrawals to achieve the rebalancing objectives and stated investment percentages of the TIAA Real Estate Account ¡Prospectus117
custom fund-of-funds or (iii) choose to discontinue the contract and cash out in a lump sum any accumulations under the contract. In addition, TIAA can choose to discontinue the contract if continuance is materially detrimental to its interests, in which case any accumulations under the contract will be paid out. The contract contains specific provisions regarding the effective date for withdrawals and crediting premiums to the contract. Ask your employer or plan administrator for more information. STATE REGULATORY APPROVAL State regulatory approval may be pending for certain of these contracts and they may not currently be available in your state. STARTING OUT Generally, we’ll issue you a TIAA contract when we receive a completed application or enrollment form in good order. “Good order” means actual receipt of the transaction request along with all information and supporting legal documentation necessary to effect the transaction. This information and documentation generally includes your complete application and any other information or supporting documentation we may require. With respect to purchase requests, “good order” also generally includes receipt of sufficient funds by us to effect the transaction. We may, in our sole discretion, determine whether any particular transaction request is in good order and reserve the right to change or waive any good order requirement at any time either in general or with respect to a particular plan, contract or transaction. If your application is incomplete and we do not receive the necessary information and signed application in good order within five business days of our receipt of the initial premium, we will return the initial premium at that time. If we receive premiums from your employer and, where applicable, a completed application from you before we receive your specific allocation instructions (or if your allocation instructions violate employer plan restrictions or do not total 100%), we will invest all premiums remitted on your behalf in the default option your employer has designated. It is possible that the default option will not be the Real Estate Account but will be another investment option available under your plan. We consider your employer’s designation of a default option to be an instruction to us to allocate your premiums to that option as described above. You should consult your plan documents or sales representative to determine your employer’s designated default option and to obtain information about that option. Further, to the extent you hold an IRA contract, the default option will be that fund or account specified in your IRA forms. When we receive complete allocation instructions from you, we’ll follow your instructions for future premiums. However, if you want the premiums previously allocated to the default option (and earnings and losses on them) to be transferred to the options identified in your instructions, you must specifically request that we transfer these amounts from the default option to your investment option choices. 118Prospectus ¡ TIAA Real Estate Account
Amounts may be invested in an account other than the Real Estate Account (absent a participant’s specific instructions) only in the limited circumstances identified in the paragraph immediately above and the circumstances outlined below on page 126 under “How to Transfer and Withdraw Your Money — Restrictions on Premiums and Transfers to the Account” namely: (1) we receive premiums before we receive your completed application or allocation instructions, (2) a participant’s allocations violate employer plan restrictions or do not total 100%, or (3) we stop accepting premiums for and/or transfers into the Account. TIAA doesn’t generally restrict the amount or frequency of payment of premiums to your contract, although we may in the future. Your employer’s retirement plan may limit your premium amounts. There also may be restrictions on remitting premiums on an IRA. In addition, the Code limits the total annual premiums you may invest in plans qualified for favorable tax treatment. If you want to directly contribute personal premiums under the contractual provisions of your RA contract, you will be issued an ATRA contract. Premiums and any earnings on the ATRA contract will not be subject to your employer’s retirement plan. The restrictions relating to these premiums are in the contract itself. In most cases (subject to any restriction we may impose, as described in this prospectus), TIAA accepts premiums to a contract during your accumulation period. Once your first premium has been paid, your TIAA contract can’t lapse or be forfeited for nonpayment of premiums. However, TIAA can stop accepting premiums to the Real Estate Account at any time. You may remit premium payments to the following address: P.O. Box 1259, Charlotte, N.C. 28201. Note that we cannot accept money orders or travelers checks. In addition, we will not accept a third-party check where the relationship of the payor to the account owner cannot be identified from the face of the check. You will receive a confirmation statement each time you make a transfer to, a transfer out, or a cash withdrawal from the Account. The statement will show the date and amount of each transaction. However, if you’re remitting premiums through an employer or other qualified plan, using an automatic investment plan or systematic withdrawal plan, you may instead receive a statement confirming those transactions following the end of each calendar quarter. If you have any accumulations in the Account, you will be sent a statement in each quarter which sets forth the following information: (1) Premiums paid during the quarter; (2) The number and dollar value of accumulation units in the Account credited to you during the quarter and in total; (3) Cash withdrawals, if any, from the Account during the quarter; and (4) Any transfers during the quarter. TIAA Real Estate Account ¡Prospectus119
You also will receive reports containing the financial statements of the Account and certain information about the Account’s investments. IMPORTANT INFORMATION ABOUT PROCEDURES FOR OPENING A NEW ACCOUNT To help the U.S. government fight the funding of terrorism and money laundering activities, Federal law requires all financial institutions to obtain, verify and record information that identifies each person who opens an account. What this means for you:When you open an account, we will ask for your name, street address (not a post office box), date of birth, Social Security number and other information that will allow us to identify you, such as your home telephone number and driver’s license or certain other identifying documents. Until you provide us with the information needed, we may not be able to open an account or effect any transactions for you. Furthermore, if we are unable to verify your identity, or that of another person authorized to act on your behalf, or if it is believed that potentially criminal activity has been identified, we reserve the right to take such action as deemed appropriate, which may include closing your account. CHOOSING AMONG INVESTMENT ACCOUNTS Once an account is opened on your behalf, you may allocate all or part of your premiums to the Real Estate Account, unless your employer’s plan precludes that choice. You can also allocate premiums to TIAA’s traditional annuity, the CREF variable investment accounts, the TIAA Access variable annuity accounts, other TIAA annuities and separate accounts offered from time to time (if available under the terms of your employer’s plan) and, in some cases, certain funds if the account or fund is available under your employer’s plan. You can change your allocation choices for future premiums by: • writing to our office at P.O. Box 1259, Charlotte, N.C. 28201; • using the TIAA-CREF Web Center’s account access feature at www.tiaa-cref.org; or • calling our Automated Telephone Service (24 hours a day) at 800 842-2252. THE RIGHT TO CANCEL YOUR CONTRACT Generally, you may cancel any RA, SRA, GSRA, Classic IRA, Roth IRA, ATRA or Keogh contract in accordance with the contract’s Right to Examine provision (unless we have begun making annuity payments from it) and subject to the time period regulated by the state in which the contract is issued. Although the contract terms and state law provisions differ, you will generally have between 10 and 60 days to exercise this cancellation right. To cancel a contract, you must mail or deliver the contract with your cancellation instructions (or signed Notice of Cancellation when such has been provided with your contract) to our home office. We’ll cancel the contract, then send either the current accumulation or the premium, depending on the state in 120Prospectus ¡ TIAA Real Estate Account
which your contract was issued, to whomever originally submitted the premiums. Unless we are returning premiums paid as required by state law, you will bear the investment risk during this period. DETERMINING THE VALUE OF YOUR INTEREST IN THE ACCOUNT—ACCUMULATION UNITS Each payment to the Real Estate Account buys a number of accumulation units. Similarly, any withdrawal from the Account results in the redemption of a number of accumulation units. The price you pay for accumulation units, and the price you receive for accumulation units when you redeem accumulation units, is the value of the accumulation units calculated for the business day on which we receive your purchase, redemption or transfer request in good order (unless you ask for a later date for a redemption or transfer). This date is called the “effective date.” Therefore, if we receive your purchase, redemption or transfer request in good order before the NYSE closes, that business day will be considered the effective date of your order. If we receive your request in good order after the NYSE closes, the next business day will be considered the effective date of your order. Payments and orders to redeem accumulation units (or adjustments thereto) may be processed after the effective date. “Processed” means when amounts are credited or debited to you in the Account. In the event there are market fluctuations between the effective date and the processing date and the price of accumulation units on the processing date is higher or lower than your price on the effective date, that difference will be paid or retained by Services, the Account’s distributor. This amount, which may be positive or negative, together with similar amounts paid or retained by Services in connection with transactions involving other investment products offered under pension plans administered by TIAA or its affiliates and the amount of interest, if any, paid by Services to participants in connection with certain delayed payments, is apportioned to the Account pursuant to an agreement with Services, under which the Account reimburses Services for the services it has provided to the Account. The accumulation unit value reflects the Account’s investment experience (i.e., the real estate net operating income accrued, as well as dividends, interest and other income accrued), realized and unrealized capital gains and losses, as well as Account expense charges. Calculating Accumulation Unit Values:We calculate the Account’s accumulation unit value at the end of each valuation day. To do that, we multiply the previous day’s value by the net investment factor for the Account. The net investment factor is calculated asAdivided byB,whereAandBare defined as: A. The value of the Account’s net assets at the end of the current valuation period, less premiums received during the current valuation period. TIAA Real Estate Account ¡Prospectus121
B. The value of the Account’s net assets at the end of the previous valuation period, plus the net effect of transactions made at the start of the current valuation period. HOW TO TRANSFER AND WITHDRAW YOUR MONEY Generally, TIAA allows you to move your money to or from the Real Estate Account in the following ways: •
from the Real Estate Account to a CREF investment account, a TIAA Access variable account (if available) or TIAA’s traditional annuity;
•
to the Real Estate Account from a CREF investment account, a TIAA Access variable account (if available) or TIAA’s traditional annuity (transfers from TIAA’s traditional annuity under RA, GRA or Retirement Choice contracts are subject to restrictions);
•
from the Real Estate Account to a fund (including TIAA-CREF affiliated funds), if available under your plan;
•
to the Real Estate Account from a TIAA-CREF affiliated fund, if available under your plan;
•
depending on the terms of your plan, contracts and governing instruments, to the Real Estate Account from other TIAA annuity products and separate accounts, and/or from the Real Estate Account to other TIAA annuity products and separate accounts;
•
from the Real Estate Account to investment options offered by other companies, if available under your plan;
•
to the Real Estate Account from other companies/plans;
•
by withdrawing cash; and
•
by setting up a program of automatic withdrawals or transfers.
For more information regarding the transfer policies of CREF, TIAA Access, TIAA’s traditional annuity or another investment option listed above, please see the respective contract, prospectus or other governing instrument. These options may be limited by the terms of your employer’s plan, by current tax law, or by the terms of your contract, as set forth below.
Currently, transfers from the Real Estate Account to any TIAA annuity offered by your employer’s plan, to one of the CREF accounts or to funds offered under the terms of your plan must generally be at least $1,000 (except for systematic transfers, which must be at least $100) or your entire accumulation, if less. In the future, we may eliminate these minimum transaction levels. Lump sum cash withdrawals from the Real Estate Account and transfers to other companies are not subject to a minimum amount. Transfers and cash withdrawals are currently free. TIAA can place restrictions on transfers or charge fees for transfers and/or withdrawals in the future.
As indicated, transfers and cash withdrawals are effective at the end of the business day we receive your request and all required documentation in good order. You can also choose to have transfers and withdrawals take effect at the
122Prospectus ¡ TIAA Real Estate Account
close of any future valuation day. For any transfers to TIAA’s traditional annuity, the crediting rate will be the rate in effect at the close of business of the first day that you participate in TIAA’s traditional annuity, which is the next business day after the effective date of the transfer. To request a transfer or to withdraw cash, you may: • write to TIAA’s office at P.O. Box 1259, Charlotte, N.C. 28201; • call us at 800 842-2252; or • for internal transfers, using the TIAA-CREF Web Center’s account access feature at www.tiaa-cref.org. If you are married, and all or part of your accumulation is attributable to contributions made under • an employer plan subject to ERISA; or • an employer plan that provides for spousal rights to benefits, then only to the extent required by the Internal Revenue Code the (“Code”) or ERISA or the terms of your employer plan, your rights to choose certain benefits are restricted by the rights of your spouse to benefits. You may be required to complete and return certain forms (in good order) to effect these transactions. We can limit, suspend or terminate your ability to transact by telephone, over the Internet, or by fax at any time, for any reason. Before you transfer or withdraw cash, please make sure that you consult the terms of your employer’s plan, as it may contain additional restrictions. In addition, please make sure you understand the possible federal and other income tax consequences. See “Taxes” on page 136. TRANSFERS TO AND FROM OTHER TIAA-CREF ACCOUNTS AND FUNDS Transfers from the Real Estate Account.Once every calendar quarter you can transfer some or all of your accumulation in the Real Estate Account to TIAA’s traditional annuity, to another TIAA annuity offered by your employer’s plan, to one of the CREF accounts, to a TIAA Access variable annuity account or to funds (which may include TIAA-CREF affiliated funds) offered under the terms of your employer’s plan. Transfers to TIAA’s traditional annuity or other TIAA annuities or accounts, a CREF account or to certain other options may be restricted by your employer’s plan, current tax law or by the terms of your contract. In addition, there are important exceptions to this once per calendar quarter limitation, as outlined below under “—Market Timing / Excessive Trading Policy” on page 127. Transfers to the Real Estate Account.Currently, you can also transfer some or all of your accumulation in TIAA’s traditional annuity, in your CREF accounts, TIAA Access variable annuity accounts or in the funds or TIAA annuities offered under the terms of your plan to the Real Estate Account, if your employer’s plan offers the Account; subject to the terms of the plan, current tax law and the terms of your contract. Transfers from TIAA’s traditional annuity to the Real Estate Account under RA, GRA or Retirement Choice contracts can only be effected over a period of time (up to 10 annual TIAA Real Estate Account ¡Prospectus123
installments) and may be subject to other limitations, as specified in your contract. Amounts held under an ATRA contract cannot be transferred to or from any retirement plan contract. Currently, these transfers must generally be at least $1,000 (except for systematic transfers, which must be at least $100) or your entire accumulation, if less. Because excessive transfer activity can hurt Account performance and other participants, subject to applicable state law and the terms of your contract, we may seek to further limit how often, or in what amounts, you may make transfers, or we may otherwise modify the transfer privilege generally. See “—Restrictions on Premiums and Transfers to the Account” below. TRANSFERS TO OTHER COMPANIES Generally you may transfer funds from the Real Estate Account to a company other than TIAA or CREF, subject to certain tax restrictions. This right may be limited by your employer’s plan or the terms of your contract. If your employer participates in our special transfer services program, we can make automatic monthly transfers from your RA or GRA contract to another company. Roth amounts in a 403(b) or 401(a) plan can only be rolled over to another Roth account under such plan or to a Roth IRA, as permitted by applicable law and the terms of the plans. Under the Retirement Choice and Retirement Choice Plus contracts, your employer could transfer monies from the Account and apply it to another account or investment option, subject to the terms of your plan, and without your consent. TRANSFERS FROM OTHER COMPANIES/PLANS Subject to your employer’s plan and federal tax law, you can usually transfer or roll over money from another 403(b), 401(a)/403(a) or governmental 457(b) retirement plan to your qualified TIAA contract. You may also roll over before-tax amounts in a Traditional IRA to 403(b) plans, 401(a)/403(a) plans or eligible governmental 457(b) plans, provided such employer plans agree to accept the rollover. Roth amounts in a 403(b) or 401(a) plan can only be rolled over to another Roth account under such plan or to a Roth IRA, as permitted by applicable law and the terms of the plans. Funds in a private 457(b) plan can be transferred to another private 457(b) plan only. Accumulations in private 457(b) plans may not be rolled over to a qualified plan (e.g.,a 401(a) plan), a 403(b) plan, a governmental 457(b) plan or an IRA. WITHDRAWING CASH You may withdraw cash from your SRA, GSRA, IRA, ATRA or Keogh Real Estate Account accumulation at any time during the accumulation period, provided federal tax law and the terms of your employer’s plan permit it (see below). Normally, you can’t withdraw money from a contract if you’ve already applied that money to begin receiving lifetime annuity income. Current federal tax law restricts your ability to make cash withdrawals from your accumulation under most voluntary salary reduction agreements. 124Prospectus ¡ TIAA Real Estate Account
Withdrawals are generally available only if you reach age 591/2, leave your job, become disabled, die, satisfy requirements related to qualified distributions or if your employer terminates its retirement plan. If your employer’s plan permits, you may also be able to withdraw money if you encounter hardship, as defined by the IRS, but hardship withdrawals can be from contributions only, and not investment earnings. You may be subject to a 10% penalty tax if you make a withdrawal before you reach age 591/2, unless an exception applies to your situation. Under current federal tax law, you are not permitted to withdraw from 457(b) plans earlier than the calendar year in which you reach age 701/2, leave your job or are faced with an unforeseeable emergency (as defined by law). There are generally no early withdrawal tax penalties if you withdraw under any of these circumstances (i.e.,no 10% tax on distributions prior to age 591/2). If you’re married, you may be required by law or your employer’s plan to show us advance written consent from your spouse before TIAA makes certain transactions on your behalf. Special rules and restrictions apply to Classic and Roth IRAs. If you request a withdrawal, we will send the proceeds by check to the address of record, or by electronic funds transfer to the bank account on file. A letter of instruction with a bank signature guarantee is required if the withdrawal is sent to a bank account not on file, to an address other than the address of record, or to an address of record that has been changed within the last 14 calendar days. You may obtain a signature guarantee from some commercial or savings banks, credit unions, trust companies, or member firms of a U.S. stock exchange. A notary public cannot provide a signature guarantee. Please contact us for further information. We reserve the right to require a signature guarantee on any redemption. SYSTEMATIC WITHDRAWALS AND TRANSFERS If your employer’s plan allows, you can set up a program to make cash withdrawals or transfers automatically by specifying that we withdraw from your Real Estate Account accumulation, or transfer to or from the Real Estate Account, any fixed number of accumulation units, dollar amount, or percentage of accumulation until you tell us to stop or until your accumulation is exhausted. Currently, the program must be set up so that at least $100 is automatically transferred or withdrawn at a time. In the future, we may eliminate this minimum transfer amount. Further, a systematic plan of this type may allow pre-specified transfers or withdrawals to be made more often than quarterly, depending on the terms of your employer’s plan. WITHDRAWALS TO PAY FINANCIAL ADVISOR FEES If permitted by your employer’s plan, you may authorize a series of systematic withdrawals to pay the fees of a financial advisor. Such systematic withdrawals are subject to all provisions applicable to systematic withdrawals, except as otherwise described in this section. One series of systematic TIAA Real Estate Account ¡Prospectus125
withdrawals to pay financial advisor fees may be in effect at the same time that one other series of systematic withdrawals is also in effect. Systematic withdrawals to pay financial advisor fees must be scheduled to be made quarterly only, on the first day of each calendar quarter. The amount withdrawn from each investment account must be specified in dollars or as a percentage of accumulation, and will be in proportion to the accumulations in each account at the end of the business day prior to the withdrawal. The financial advisor may request that we stop making withdrawals. We reserve the right to determine the eligibility of financial advisors for this type of fee reimbursement. Before you set up this program, make sure you understand the possible tax consequences of these withdrawals. See the discussion under “Taxes” on page 136 below. RESTRICTIONS ON PREMIUMS AND TRANSFERS TO THE ACCOUNT From time to time we may stop accepting premiums for and/or transfers into the Account. We might do so if, for example, we can’t find enough appropriate real estate-related investment opportunities at a particular time. Whenever reasonably possible, we will notify you before we decide to restrict premiums and/or transfers. However, because we may need to respond quickly to changing market conditions or to the liquidity needs and demands of the Account, we reserve the right (subject to the terms of some contracts) to stop accepting premiums and/or transfers at any time without prior notice. Individual participants are limited from making internal funding vehicle transfers into their Account accumulation if, after giving effect to such transfer, the total value of such participant’s Account accumulation (under all contracts issued to such participant) would exceed $150,000. As of the date of this prospectus, all jurisdictions in which the Account is offered have approved this limitation, but the effective date of the limitation as applies to an individual participant will be reflected on his or her applicable contract or endorsement form. These contracts or endorsements will contain important details with respect to this limitation. Under this limitation, an internal funding vehicle transfer means the movement (or attempted movement) of accumulations from any of the following to the Account: • a TIAA Traditional annuity accumulation, • a Real Estate Account accumulation (from one contract to another), • a companion CREF certificate, • other TIAA separate account accumulations, and • any other funding vehicle accumulation which is administered by TIAA or CREF on the same record-keeping system as the contract. The following transfers are currently not subject to this limitation: • systematic transfers, • automatic rebalancing activity, 126Prospectus ¡ TIAA Real Estate Account
• any transaction arising from a TIAA-sponsored advice product or service, and • Transfer Payout Annuity payments directed to the Account. This limitation does not apply to most types of premium contributions and certain group contracts recordkept on non-TIAA platforms. Minimum Distribution Option (“MDO”) contracts will be subject to this limitation, but the limitation does not apply to other annuity pay-out contracts. A transfer which cannot be applied pursuant to this limitation, along with any other attempted movements of funds submitted as part of a noncompliant transfer request into the Account, will be rejected in its entirety and therefore the funds that were to be transferred will remain in the investment option from which the transfer was to be made. The Account accumulation unit values used in applying this provision will be those calculated as of the valuation day preceding the day on which the proposed transfer is to be effective. A participant will not be required to reduce his or her accumulation to a level at or below $150,000 if the total value of the participant’s Account accumulation under all contracts exceeds $150,000 on the effective date as indicated in the contract or contract endorsement. TIAA reserves the right in the future to modify the nature of this limitation and to include categories of transactions associated with services that may be introduced in the future. If we decide to stop accepting premiums into the Account, amounts that would otherwise be allocated to the Account will be allocated to the default option designated by your employer instead (or the default option specified on your IRA forms), unless you give us other allocation instructions. We will not transfer these amounts out of the default option designated by your employer when the restriction period is over, unless you request that we do so. However, we will resume allocating premiums to the Account on the date we remove the restrictions. ADDITIONAL LIMITATIONS Federal law requires us to obtain, verify and record information that identifies each person who opens an account. Until we receive the information we need, we may not be able to effect transactions for you. Furthermore, if we are unable to verify your identity, or that of another person authorized to act on your behalf, or if we believe that we have identified potentially criminal activity, we reserve the right to take such action as we deem appropriate, which may include closing your account. MARKET TIMING / EXCESSIVE TRADING POLICY There are participants who may try to profit from making transactions back and forth among the CREF accounts, the Real Estate Account, the TIAA Access variable account and the funds or other investment options available under the terms of your plan in an effort to “time” the market or for other reasons. As money is shifted in and out of these accounts, the accounts or funds may incur transaction costs, including, among other things, expenses for TIAA Real Estate Account ¡Prospectus127
buying and selling securities. These costs are borne by all participants, including long-term investors who do not generate these costs. In addition, excessive trading can interfere with efficient portfolio management and cause dilution if traders are able to take advantage of pricing inefficiencies. Consequently, the Account is not appropriate for market timing or frequent trading and you should not invest in the Account if you want to engage in such activity. To discourage this activity, transfers of accumulations from the Real Estate Account to a CREF or TIAA account, or another investment option, are limited to once every calendar quarter. A few limited exceptions to this once per calendar quarter limitation apply, including: (i) systematic transfers out of the Real Estate Account (as described on page 125 in “—Systematic Withdrawals and Transfers”), (ii) annual portfolio rebalancing activities, (iii) plan or plan-sponsor initiated transactions, including transfers and rollovers made to external carriers, (iv) participants enrolled in TIAA’s qualified managed account for retirement plan assets, (v) single-sum distributions where funds are moved from one TIAA annuity contract or certificate to another, as well as those made directly to a participant, (vi) asset allocation programs and similar programs approved by TIAA’s management, (vii) death and hardship withdrawals or withdrawals made pursuant to a qualified domestic relations order (“QDRO”), and (viii) certain transactions made within a retirement or employee benefit plan, such as contributions, mandatory (or minimum) distributions and loans. TIAA reserves the right to reject any purchase or exchange request with respect to the Account, including when it is believed that a request would be disruptive to the Account’s efficient portfolio management. TIAA also may suspend or terminate your ability to transact in the Account by telephone, fax or over the Internet for any reason, including the prevention of excessive trading. A purchase or exchange request could be rejected or electronic trading privileges could be suspended because of the timing or amount of the investment or because of a history of excessive trading by the participant. Because TIAA has discretion in applying this policy, it is possible that similar transaction activity could be handled differently because of the surrounding circumstances. Notwithstanding such discretion, TIAA seeks to apply its excessive trading policies and procedures uniformly to all Account participants. As circumstances warrant, TIAA may request transaction data from intermediaries from time to time to verify whether the Account’s policies are being followed and/or to instruct intermediaries to take action against participants who have violated the 128Prospectus ¡ TIAA Real Estate Account
Account’s policies. TIAA has the right to modify these policies and procedures at any time without advance notice. The Account is not appropriate for excessive trading. You should not invest in the Account if you want to engage in excessive trading or market timing activity. Participants seeking to engage in excessive trading may deploy a variety of strategies to avoid detection, and, despite TIAA’s efforts to discourage excessive trading, there is no guarantee that TIAA or its agents will be able to identify all such participants or curtail their trading practices. If you invest in the Account through an intermediary, including through a retirement or employee benefit plan, you may be subject to additional market timing or excessive trading policies implemented by the intermediary or plan. Please contact your intermediary or plan sponsor for more details. THE ANNUITY PERIOD IN GENERAL You can annuitize and receive an income stream from all or part of your Real Estate Account accumulation. Unless you opt for a lifetime annuity, generally you must be at least age 591/2 to begin receiving annuity income payments from your annuity contract free of a 10 percent early distribution penalty tax. Your employer’s plan may also restrict when you can begin income payments. Under the minimum distribution rules of the Code, you generally must begin receiving some payments from your contract shortly after you reach the later of age 701/2or you retire. Please consult your tax advisor. For more information, see “Taxes — Minimum Distribution Requirements,” on page 137. Also, you can’t begin a one-life annuity after you reach age 90, nor may you begin a two-life annuity after either you or your annuity partner reach age 90. Your income payments may be paid out from the Real Estate Account through a variety of income options. You can pick a different income option for different portions of your accumulation, but once you’ve started payments you usually can’t change your income option or annuity partner for that payment stream. Usually income payments are monthly. You can choose quarterly, semi-annual, and annual payments as well. (TIAA has the right to not make payments at any interval that would cause the initial payment to be less than $100.) We’ll send your payments by mail to your home address or, on your request, by mail or electronic funds transfer to your bank. Your initial income payments are based on the value of your accumulation on the last valuation day before the annuity starting date. Your payments change after the initial payment based on the Account’s investment experience and the income change method you choose. There are two income change methods for annuity payments: annual and monthly. Under the annual income change method, payments from the Account change each May 1, based on the net investment results during the prior year (from the day following the last valuation day in March of the prior year TIAA Real Estate Account ¡Prospectus129
through the last valuation day in the March of the current year). Under the monthly income change method, payments from the Account change every month, based on the net investment results during the previous month. For the formulas used to calculate the amount of annuity payments, see page 133. The total value of your annuity payments may be more or less than your total premiums. TIAA reserves the right to modify or stop offering the annual or monthly change methods. ANNUITY STARTING DATE Ordinarily, annuity payments begin on the date you designate as your annuity starting date, provided we have received all documentation necessary for the income option you’ve picked. If something’s missing, we’ll defer your annuity starting date until we receive the missing items and/or information. You may designate any future date for your annuitization request, in accordance with our procedures and as long as it is one on which we process annuitizations. Your first annuity check may be delayed while we process your choice of income options and calculate the amount of your initial payment. Any premiums received within 70 days after payments begin may be used to provide additional annuity income. Premiums received after 70 days will remain in your accumulating annuity contract until you have given us further instructions. Ordinarily, your first annuity payment can be made on any business day between the first and twentieth of any month. ANNUITY INCOME OPTIONS Both the number of annuity units you purchase and the amount of your income payments will depend on which income option you pick. Your employer’s plan, tax law and ERISA may limit which income options you can use to receive income from an RA or GRA, GSRA, Retirement Choice, Retirement Choice Plus or Keogh contract. Ordinarily you’ll choose your income options shortly before you want payments to begin, but you can make or change your choice any time before your annuity starting date. After your annuity starting date, you cannot change your income option. All Real Estate Account income options provide variable payments, and the amount of income you receive depends in part on the investment experience of the Account. The current options are: • One-Life Annuity with or without Guaranteed Period:Pays income as long as you live. If you opt for a guaranteed period (10, 15 or 20 years) and you die before it’s over, income payments will continue to your beneficiary until the end of the period. If you don’t opt for a guaranteed period, all payments end at your death — so it’s possible for you to receive only one payment if you die less than a month after payments start. • Annuity for a Fixed Period:Pays income for any period you choose from five to 30 years (two to 30 years for RAs, SRAs and GRAs). This option is not available under all contracts. 130Prospectus ¡ TIAA Real Estate Account
• Two-Life Annuities:Pays income to you as long as you live, then continues at either the same or a reduced level for the life of your annuity partner. There are four types of two-life annuity options, all available with or without a guaranteed period — Full Benefit to Survivor, Two-Thirds Benefit to Survivor, 75% Benefit to Annuity Partner and a Half-Benefit to Annuity Partner. Under the Two-Thirds Benefit to Survivor option, payments to you will be reduced upon the death of your annuity partner. • MDO:Generally available only if you must begin annuity payments under the Code minimum distribution requirements. (Some employer plans allow you to elect this option earlier — contact TIAA for more information.) The option, if elected, automatically pays an amount designed to fulfill the distribution requirements under federal tax law. Please consult your tax advisor for more information. You must apply your entire accumulation under a contract if you want to use the MDO. It is possible that income under the MDO will cease during your lifetime. Prior to age 90, and subject to applicable plan and legal restrictions, you can elect a distribution option other than the MDO and apply any remaining part of an accumulation applied to the MDO to any other income option for which you’re eligible. Using the MDO won’t affect your right to take a cash withdrawal of any accumulation not yet distributed. This automatic payout option is currently not available under Retirement Choice or Retirement Choice Plus contracts, and is not available for IRA contracts issued on or after October 11, 2010. Instead, required minimum distributions under Retirement Choice or Retirement Choice Plus contracts, will be paid directly from these contracts pursuant to the terms of your employer’s plan. For any of the income options described above, current federal tax law provides that your guaranteed period can’t exceed the joint life expectancy of you and your beneficiary or annuity partner, and other Code stipulations may make some income options unavailable to you. If you are married at your annuity start date, you may be required by law to choose an income option that provides survivor annuity income to your spouse, unless your spouse waives the right. Other income options may become available in the future, subject to the terms of your retirement plan and relevant federal and state laws. For more information about any annuity option, please contact us. Receiving Lump Sum Payments (Retirement Transition Benefit):If your employer’s plan allows, you may be able to receive a single sum payment of up to 10 percent of the value of any part of an accumulation being converted to annuity income on the annuity starting date. (This does not apply to IRAs.) Of course, if your employer’s plan allows cash withdrawals, you can take a larger amount (up to 100 percent) of your Real Estate Account accumulation as a cash payment. The retirement transition benefit will be subject to current federal income tax requirements and possible early distribution penalties. See “Taxes” on page 136. TIAA Real Estate Account ¡Prospectus131
TRANSFERS DURING THE ANNUITY PERIOD After you begin receiving annuity income, you, subject to your employer’s plan, can transfer all or part of the future annuity income (which is the actuarial present value of the payments based on the applicable interest rate and the mortality basis associated with that fund at the time of the transfer) payable once each calendar quarter (i) from the Real Estate Account into a “comparable annuity” payable from a CREF or TIAA account or TIAA’s traditional annuity, or (ii) from a CREF account into a comparable annuity payable from the Real Estate Account. Comparable annuities are those which are payable under the same income option, and have the same first and second annuitant, and remaining guaranteed period. We’ll process your transfer on the business day we receive your request in good order. You can also choose to have a transfer take effect at the close of any future business day. Transfers under the annual income payment method will affect your annuity payments beginning on the May 1 following the March 31 which is on or after the effective date of the transfer. Transfers under the monthly income payment method and all transfers into TIAA’s traditional annuity will affect your annuity payments beginning with the first payment due after the monthly payment valuation day that is on or after the transfer date. You can switch between the annual and monthly income change methods, and the switch will go into effect on the last valuation day of the following March. Although the payout streams are actuarially equivalent and there is no charge for engaging in such a transfer, it is possible that the new funds may apply different mortality or interest assumptions, and could therefore result in variation between the initial payments from the new fund and the payments that were being made out of the original fund. ANNUITY PAYMENTS The amount of annuity payments we pay you or your beneficiary (annuitant) will depend upon the number and value of the annuity units payable. The number of annuity units is first determined on the day before the annuity starting date. The amount of the annuity payments will change according to the income change method chosen. Under the annual income change method, the value of an annuity unit for payments is redetermined on March 31 of each year (or, if March 31 is not a valuation day, the immediately preceding valuation day). This date is called the “annual payment valuation day.” Annuity payments change beginning May 1. The change reflects the net investment experience of the Real Estate Account. The net investment experience for the twelve months following the annual payment valuation day will be reflected in the annuity unit value determined on the next year’s annual payment valuation day. Under the monthly income change method, the value of an annuity unit for payments is determined on the payment valuation day, which is the 20th day of the month preceding the payment due date or, if the 20th is not a business day, the preceding business day. The monthly changes in the value of an 132Prospectus ¡ TIAA Real Estate Account
annuity unit reflect the net investment experience of the Real Estate Account. The formulas for calculating the number and value of annuity units payable are described below. Calculating the Number of Annuity Units Payable:When a participant or a beneficiary converts the value of all or a portion of his or her accumulation into an income-paying contract, the number of annuity units payable from the Real Estate Account under an income change method is determined by dividing the value of the Account accumulation to be applied to provide the annuity payments by the product of the annuity unit value for that income change method and an annuity factor. The annuity factor as of the annuity starting date is the value of an annuity in the amount of $1.00 per month beginning on the first day such annuity units are payable, and continuing for as long as such annuity units are payable. The annuity factor will reflect interest assumed at the effective annual rate of 4 percent, and the mortality assumptions for the person(s) on whose life (lives) the annuity payments will be based. Mortality assumptions will be based on the then-current settlement mortality schedules for this Account. Annuitants bear no mortality risk under their contracts — actual mortality experience will not reduce annuity payments after they have started. TIAA may change the mortality assumptions used to determine the number of annuity units payable for any future accumulations converted to provide annuity payments. The number of annuity units payable under an income change method under your contract will be reduced by the number of annuity units you transfer out of that income change method under your contract. The number of annuity units payable will be increased by any internal transfers you make to that income change method under your contract. Value of Annuity Units:The Real Estate Account’s annuity unit value is calculated separately for each income change method for each valuation day. The annuity unit value for each income change method is determined by updating the annuity unit value from the previous valuation day to reflect the net investment performance of the Account for the current valuation period relative to the 4 percent assumed investment return. In general, your payments will increase if the performance of the Account is greater than 4 percent and decrease if the value is less than 4 percent. The value is further adjusted to take into account any changes expected to occur in the future at revaluation either once a year or once a month, assuming the Account will earn the 4 percent assumed investment return in the future. The initial value of the annuity unit for a new annuitant is the value determined as of the valuation day before annuity payments start. For participants under the annual income change method, the value of the annuity unit for payment remains level until the following May 1. For those who have already begun receiving annuity income as of March 31, the value of the TIAA Real Estate Account ¡Prospectus133
annuity unit for payments due on and after the next succeeding May 1 is equal to the annuity unit value determined as of the last valuation day in March. For participants under the monthly income change method, the value of the annuity unit for payments changes on the payment valuation day of each month for the payment due on the first of the following month. Further, certain variable annuity payouts might not be available if issuing the payout annuity would violate state law. TIAA reserves the right, subject to approval by the Board of Trustees, to modify the manner in which the number and/or value of annuity units is calculated in the future. No such modification will reduce any participant’s benefit once the participant’s annuitization period has commenced. AVAILABILITY; CHOOSING BENEFICIARIES Subject to the terms of your employer’s plan, TIAA may pay death benefits if you or your annuity partner dies. When you purchase your annuity contract, you name one or more beneficiaries to receive the death benefit if you die. You can change your beneficiaries anytime before you die, and, unless you instruct otherwise, your annuity partner can do the same after your death. Every state has some form of unclaimed property laws that impose varying legal and practical obligations on insurers and, indirectly, on Contract Owners, insureds, beneficiaries and other payees of proceeds. Unclaimed property laws generally provide for escheatment to the state of unclaimed proceeds under various circumstances. Contract Owners are urged to keep their own, as well as their insureds’, beneficiaries’ and other payees’, information up to date, including full names, postal and electronic media addresses, telephone numbers, dates of birth, and social security numbers. Such updates should be communicated in writing to TIAA-CREF Life Insurance Company at P.O. Box 1259, Charlotte, NC 28201, by calling our Automated Telephone Service (24 hours a day) at 800-842-2252, or via www.tiaa-cref.org. YOUR SPOUSE’S RIGHTS Your choice of beneficiary for death benefits may, in some cases, be subject to the consent of your spouse. Similarly, if you are married at the time of your death, federal law may require a portion of the death benefit be paid to your spouse even if you have named someone else as beneficiary. If you die without having named any beneficiary, any portion of your death benefit not payable to your spouse will generally go to your estate unless your employer’s plan provides otherwise. AMOUNT OF DEATH BENEFIT If you die during the accumulation period, the death benefit is the amount of your accumulation. If you and your annuity partner die during the annuity 134Prospectus ¡ TIAA Real Estate Account
period while payments are still due under a fixed-period annuity or for the remainder of a guaranteed period, the death benefit is the present value, based on interest at the effective annual rate of 4%, of the unit annuity payments due for the remainder of the period. PAYMENT OF DEATH BENEFIT To authorize payment and pay a death benefit, we must have received all necessary forms and documentation in good order, including proof of death and the selection of the method of payment. METHODS OF PAYMENT OF DEATH BENEFITS Generally, you can choose for your beneficiary the method we’ll use to pay the death benefit, but few participants do this. If you choose a payment method, you can also prevent your beneficiaries from changing it. Most people leave the choice to their beneficiaries. We can prevent any choice if its initial payment is less than $25. If death occurs while your contract is in the accumulation stage, in most cases we can pay the death benefit using the TIAA-CREF Savings & Investment Plan. We won’t do this if you preselected another option or if the beneficiary elects another option. Some beneficiaries aren’t eligible for the TIAA-CREF Savings & Investment Plan. In addition, the TIAA-CREF Savings & Investment Plan is not available under Retirement Choice, Retirement Choice Plus or IRA contracts issued on or after October 11, 2010. If your beneficiary isn’t eligible and doesn’t specifically tell us to start paying death benefits within a year of your death, we can start making payments to them over five years using the fixed-period annuity method of payment. Payments During the Accumulation Period:Currently, the available methods of payment for death benefits from funds in the accumulation period are: • Single-Sum Payment,in which the entire death benefit is paid to your beneficiary at once; • One-Life Annuity with or without Guaranteed Period,in which the death benefit is paid monthly for the life of the beneficiary or through the guaranteed period; • Annuity for a Fixed Period of 5 to 30 years (not available under Retirement Choice or Retirement Choice Plus),in which the death benefit is paid for a fixed period (This option is not available under all contracts); • Accumulation-Unit Deposit Option,which pays a lump sum at the end of a fixed period, ordinarily two to five years, during which period the accumulation units deposited participate in the Account’s investment experience (generally the death benefit value must be at least $5,000); (This option is not available under all contracts); and • Minimum Distribution Payments (currently called the TIAA-CREF Savings & Investment Plan),which automatically pays income according TIAA Real Estate Account ¡Prospectus135
to the Code’s minimum distribution requirements.This payment method is not available under Retirement Choice or Retirement Choice Plus contracts, and is not available for IRA contracts issued on or after October 11, 2010.It operates in much the same way as the MDO annuity income option. It’s possible, under this method, that your beneficiary will not receive income for life. Death benefits are usually paid monthly (unless you chose a single-sum method of payment), but your beneficiary can switch them to quarterly, semi-annual, or annual payments. Note that for Retirement Choice, Retirement Choice Plus and IRA contracts issued on or after October 11, 2010, instead of an annuity for a fixed period, beneficiaries may only receive either a single-sum payment or a one-life annuity. Payments During the Annuity Period:If you and your annuity partner die during the annuity period, your beneficiary can choose to receive any remaining guaranteed periodic payments due under your contract. Alternatively, your beneficiary can choose to receive the commuted value of those payments in a single sum unless you have indicated otherwise. The amount of the commuted value will be different than the total of the periodic payments that would otherwise be paid. Ordinarily, death benefits are subject to federal estate tax. Generally, if taken as a lump sum, death benefits would be taxed like complete withdrawals. If taken as annuity benefits, death benefits would be taxed like annuity payments. For more information on death benefits, see the discussion under “Taxes” below, or for further detail, contact TIAA. This section offers general information concerning federal taxes. It doesn’t cover every situation. Tax treatment varies depending on the circumstances, and state and local taxes may also be involved. For complete information on your personal tax situation, check with a qualified tax advisor. HOW THE REAL ESTATE ACCOUNT IS TREATED FOR TAX PURPOSES The Account is not a separate taxpayer for purposes of the Code — its earnings are taxed as part of TIAA’s operations. Although TIAA is not expected to owe any federal income taxes on the Account’s earnings, if TIAA does incur taxes attributable to the Account, it may make a corresponding charge against the Account. TAXES IN GENERAL During the accumulation period, Real Estate Account premiums paid in before-tax dollars, employer contributions and earnings attributable to these amounts are not taxed until they’re withdrawn. Annuity payments, single-sum withdrawals, systematic withdrawals, and death benefits are usually taxed as ordinary income. Premiums paid in after-tax dollars aren’t taxable when 136Prospectus ¡ TIAA Real Estate Account
withdrawn, but earnings attributable to these amounts are taxable unless those amounts are contributed as Roth contributions to a 401(a), 403(b) or governmental 457(b) plan and certain criteria are met before the amounts (and the income on the amounts) are withdrawn. Generally, transfers between qualified retirement plans are not taxed. Generally, contributions you can make under an employer’s plan are limited by federal tax law. Employee voluntary salary reduction contributions and Roth after-tax contributions to 403(b) and 401(k) plans are limited in the aggregate to $17,500 per year ($23,000 per year if you are age 50 or older). Certain long-term employees may be able to defer up to $20,500 per year in a 403(b) plan ($26,000 per year if you are age 50 or older). Contributions to Classic and Roth IRAs, other than rollover contributions, cannot generally exceed $5,500 per year ($6,500 per year for taxpayers age 50 or older). The maximum contribution limit to a 457(b) non-qualified deferred compensation plan for employees of state and local governments is $17,500 ($23,000 if you are age 50 or older). Special catch-up rules may permit a higher contribution in one or more of the last three years prior to an individual’s normal retirement age under the plan. Note that the dollar limits listed above are for 2013; different dollar limits may apply in future years. EARLY DISTRIBUTIONS If you want to withdraw funds or begin receiving income from any 401(a), 403(a), or 403(b) retirement plan or an IRA before you reach age 591/2, you may have to pay a 10 percent early distribution tax on the taxable amount. Distributions from a Roth IRA generally are not taxed, except that, once aggregate distributions exceed contributions to the Roth IRA, income tax and a 10% penalty tax may apply to distributions made (1) before age 591/2 (subject to certain exceptions) or (2) during the five taxable years starting with the year in which the first contribution is made to any Roth IRA. A 10 percent penalty tax may apply to amounts attributable to a conversion from an IRA if they are distributed during the five taxable years beginning with the year in which the conversion was made. You won’t have to pay this tax in certain circumstances. Early distributions from 457(b) plans are not subject to a 10% penalty tax unless, in the case of a governmental 457(b) plan, the distribution includes amounts rolled over to the plan from an IRA, 401(a)/403(a), or 403(b) plan. Consult your tax advisor for more information. MINIMUM DISTRIBUTION REQUIREMENTS In most cases, payments from qualified contracts must begin by April 1 of the year after the year you reach age 701/2, or if later, by retirement. For Classic IRAs, and with respect to 5 percent or more owners of the business covered by a Keogh plan, payments must begin by April 1 of the year after you reach age 701/2. Under the terms of certain retirement plans, the plan administrator may direct us to make the minimum distributions required by law even if you do not elect to receive them. In addition, if you don’t begin distributions on time, you may be subject to a 50 percent excise tax on the TIAA Real Estate Account ¡Prospectus137
amount you should have received but did not. Roth IRAs are generally not subject to these rules requiring minimum distributions during your lifetime. You are responsible for requesting distributions that comply with the minimum distribution rules. Please consult your tax advisor for more information. PREMIUM TAXES Some states assess premium taxes on the premiums paid under the contract. We will deduct the total amount of premium taxes, if any, from your accumulation based on current state insurance laws, subject to the provisions of your contract, and our status in the state. Generally, premium taxes range from 0% to 3.5%, depending on the state. WITHHOLDING ON DISTRIBUTIONS If we pay an “eligible rollover” distribution directly to you, federal law requires us to withhold 20 percent from the taxable portion. On the other hand, if we roll over such a distribution directly to an IRA or employer plan, we do not withhold any federal income tax. The 20 percent withholding also does not apply to certain types of distributions that are not considered eligible rollovers such as payments from IRAs, hardship withdrawals, lifetime annuity payments, substantially equal periodic payments over your life expectancy or over 10 or more years, or minimum distribution payments. For the taxable portion of non-eligible rollover distributions, we will usually withhold federal income taxes unless you tell us not to and you are eligible to avoid withholding. However, if you tell us not to withhold but we don’t have your taxpayer identification number on file, we still are required to deduct taxes. These rules also apply to distributions from governmental 457(b) plans. In general, all amounts received under a private 457(b) plan are taxable and are subject to federal income tax withholding as wages. Nonresident aliens who pay U.S. taxes are subject to different withholding rules. FEDERAL ESTATE, GIFT, AND GENERATION-SKIPPING TRANSFER TAXES While no attempt is being made to discuss in detail the federal estate tax implications of the contract, a purchaser should keep in mind that the value of an annuity contract owned by a decedent and payable to a beneficiary who survives the decedent is included in the decedent’s gross estate. Depending on the terms of the contract, the value of the annuity included in the gross estate may be the value of the lump sum payment payable to the designated beneficiary or the actuarial value of the payments to be received by the beneficiary. Consult an estate planning advisor for more information. Under certain circumstances, the Code may impose a generation-skipping (“GST”) tax when all or part of an annuity contract is transferred to, or a death benefit is paid to, an individual two or more generations younger than the contract owner. Regulations issued under the Code may require us to deduct the tax from your contract, or from any applicable payment, and pay it directly to the IRS. For 2013, the federal estate tax, gift tax, and GST tax exemptions and maximum rates are $5,250,000 and 40%, respectively. The 138Prospectus ¡ TIAA Real Estate Account
potential application of these taxes underscores the importance of seeking guidance from a qualified adviser to help ensure that your estate plan adequately addresses your needs and those of your beneficiaries under all possible scenarios. FEDERAL DEFENSE OF MARRIAGE ACT The contract provides that upon your death, a surviving spouse may have certain continuation rights that he or she may elect to exercise for the contract’s death benefit and any joint-life coverage under an optional living benefit. All contract provisions relating to spousal continuation are available only to a person who meets the definition of “spouse” under federal law. The federal Defense of Marriage Act (“DOMA”) does not recognize same-sex marriages or civil unions, even those which are permitted under individual state laws. DOMA is currently under review by the U.S. Supreme Court. Therefore, it is currently uncertain as to whether spousal continuation provisions in this contract will be available to such partners or same-sex marriage spouses. Consult a tax adviser for more information on this subject. SPECIAL RULES FOR AFTER-TAX RETIREMENT ANNUITIES If you paid premiums directly to an RA and the premiums are not subject to your employer’s retirement plan, or if you have been issued an ATRA contract, the following general discussion describes our understanding of current federal income tax law that applies to these accumulations. This discussion does not apply to premiums paid on your behalf under the terms of your employer’s retirement plan. It also does not cover every situation and does not address all possible circumstances. In General.These annuities are generally not taxed until distributions occur. When distributions occur, they are taxed as follows: •
Withdrawals, including withdrawals of the entire accumulation under the contract, are generally taxed as ordinary income to the extent that the contract’s value is more than your investment in the contract (i.e.,what you have paid into it).
•
Annuity payments are generally treated in part as taxable ordinary income and in part as non-taxable recovery of your investment in the contract until you recover all of your investment in the contract. After that, annuity payments are taxable in full as ordinary income.
Required Distributions.In general, if you die after you start your annuity payments but before the entire interest in the annuity contract has been distributed, the remaining portion must be distributed at least as quickly as under the method in effect on the date of your death. If you die before your annuity payments begin, the entire interest in your annuity contract generally must be distributed within five years after your death, or be used to provide payments that begin within one year of your death and that will be made for the life of your designated beneficiary or for a period not extending beyond the life expectancy of your designated beneficiary. The “designated beneficiary”
TIAA Real Estate Account ¡Prospectus139
refers to a natural person you designate and to whom ownership of the contract passes because of your death. However, if the designated beneficiary is your surviving spouse, your surviving spouse can continue the annuity contract as the new owner. Death Benefit Proceeds.Death benefit proceeds are taxed like withdrawals of the entire accumulation in the contract if distributed in a single sum and are taxed like annuity payments if distributed as annuity payments. Your beneficiary may be required to take death benefit proceeds within a certain time period. Penalty Tax on Certain Distributions.You may have to pay a penalty tax (10 percent of the amount treated as taxable income) on distributions you take prior to age 591/2. There are some exceptions to this rule, however. You should consult a tax advisor for information about those exceptions. Withholding.Annuity distributions are generally subject to federal income tax withholding but most recipients can usually choose not to have the tax withheld. Certain Designations or Exchanges.Designating an annuitant, payee or other beneficiary, or exchanging a contract may have tax consequences that should be discussed with a tax advisor before you engage in any of these transactions. Multiple Contracts.All non-qualified deferred annuity contracts issued by us and certain of our affiliates to the same owner during a calendar year must generally be treated as a single contract in determining when and how much income is taxable and how much income is subject to the 10 percent penalty tax (see above). Diversification Requirements.The investments of the Real Estate Account must be “adequately diversified” in order for the ATRA Contracts to be treated as annuity contracts for Federal income tax purposes. It is intended that Real Estate Account will satisfy these diversification requirements. Owner Control.In certain circumstances, owners of non-qualified variable annuity contracts have been considered for Federal income tax purposes to be the owners of the assets of the separate account supporting their contracts due to their ability to exercise investment control over those assets. When this is the case, the contract owners have been currently taxed on income and gains attributable to the variable account assets. While we believe that the ATRA Contracts do not give you investment control over assets in the Real Estate Account or any other separate account underlying your ATRA Contract, we reserve the right to modify the ATRA Contracts as necessary to prevent you from being treated as an owner of the assets in the Real Estate Account. 140Prospectus ¡ TIAA Real Estate Account
RESIDENTS OF PUERTO RICO The IRS has announced that income from an annuity received by residents of Puerto Rico is U.S.-source income that is generally subject to United States federal income tax. ANNUITY PURCHASES BY NONRESIDENT ALIENS The discussion above provides general information regarding U.S. federal income tax consequences to annuity purchasers that are U.S. citizens or residents. Purchasers that are not U.S. citizens or residents will generally be subject to U.S. federal withholding tax on taxable distributions from annuity contracts at a 30% rate, unless a lower treaty rate applies. In addition, purchasers may be subject to state and/or municipal taxes and taxes that may be imposed by the purchaser’s country of citizenship or residence. Prospective purchasers who are nonresident aliens are advised to consult with a qualified tax adviser regarding U.S., state, and foreign taxation with respect to an annuity contract purchase. SPECIAL RULES FOR WITHDRAWALS TO PAY ADVISORY FEES If you have arranged for us to pay advisory fees to your financial advisor from your accumulations, those partial withdrawals generally will not be treated as taxable distributions as long as: • the payment is for expenses that are ordinary and necessary; • the payment is made from a Section 401 or 403 retirement plan or an IRA; • your financial advisor’s payment is only made from the accumulations in your retirement plan or IRA, as applicable, and not directly by you or anyone else, under the agreement with your financial advisor; and • once advisory fees begin to be paid from your retirement plan or IRA, as applicable, you continue to pay those fees solely from your plan or IRA, as applicable, and not from any other source. However, withdrawals to pay advisory fees to your financial advisor from your accumulations under an ATRA contract will be treated as taxable distributions. FOREIGN TAX CREDIT The Account may be subject to foreign taxes on investments in other countries, including capital gains tax on any appreciation in value when a real estate investment in a foreign jurisdiction is eventually sold. Any potential tax impact will not be reflected in the valuation of the foreign investment and may not be fully reflected in a tax accrual by the Account. Upon payment of any foreign tax by the Account, TIAA will receive a foreign tax credit, which may be available to reduce its U.S. tax burden. The Account is a segregated asset account of TIAA and incurs no material federal income tax attributable to the TIAA Real Estate Account ¡Prospectus141
investment performance of the Account under the Code. As a result, the Account will not realize any tax benefit from any foreign tax credit that may be available to TIAA; however, to the extent that TIAA can utilize the foreign tax credit in its consolidated tax return, TIAA will reimburse the Account for that benefit at that time. The extent to which TIAA is able to utilize the credits when the Account incurs a foreign tax will determine the amount and timing of reimbursement from TIAA to the Account for the resulting foreign tax credit. The Account’s unit values may be adversely impacted in the future if a foreign tax is paid, and TIAA is not able to utilize (and therefore does not reimburse the Account for), either immediately or in the future, the foreign tax credit earned as a result of the foreign tax paid by the Account. POSSIBLE TAX LAW CHANGES Although the likelihood of legislative changes is uncertain, there is always the possibility that the tax treatment of your contract could change by legislation or otherwise. Consult a tax advisor with respect to legislative developments and their effect on your contract. We have the right to modify the contract in response to legislative changes that could otherwise diminish the favorable tax treatment that annuity contract owners currently receive. We make no guarantee regarding the tax status of any contract and do not intend the above discussion as tax advice. MAKING CHOICES AND CHANGES You may have to make certain choices or changes (e.g., changing your income option, making a cash withdrawal) by written notice in good order satisfactory to us and received at our home office or at some other location that we have specifically designated for that purpose. When we receive a notice of a change in beneficiary or other person named to receive payments, we’ll execute the change as of the date it was signed, even if the signer has died in the meantime. We execute all other changes as of the date received. TELEPHONE AND INTERNET TRANSACTIONS You can use our Automated Telephone Service (“ATS”) or the TIAA-CREF Web Center’s account access feature to check your account balances, transfer to TIAA’s traditional annuity, TIAA Access variable annuity accounts or CREF, and/or allocate future premiums among the accounts and funds available to you through TIAA-CREF. Note that, currently, all requests to make lump-sum transfers out of the Real Estate Account to another investment option (whether or not affiliated with TIAA or CREF) may not be made by means of TIAA-CREF’s Internet website. You will be asked to enter your Personal Identification Number (“PIN”) and Social Security number for both systems. (You can establish a PIN by calling us.) Both will lead you through the transaction process and will use reasonable procedures to confirm 142Prospectus ¡ TIAA Real Estate Account
that instructions given are genuine. If we use such procedures, we are not responsible for incorrect or fraudulent transactions. All transactions made over the ATS and Internet are electronically recorded. To use the ATS, you need a touch-tone phone. The toll free number for the ATS is 800 842-2252. To use the Internet, go to the account access feature of the TIAA-CREF Web Center at www.tiaa-cref.org. We can suspend or terminate your ability to transact by telephone, over the Internet, or by fax at any time, for any reason. VOTING RIGHTS You don’t have the right to vote on the management and operation of the Account directly; however, you may send ballots to advise the TIAA Board of Overseers about voting for nominees for the TIAA Board of Trustees. ELECTRONIC PROSPECTUS If you received this prospectus electronically and would like a paper copy, please call 877 518-9161 and we will send it to you. Under certain circumstances where we are legally required to deliver a prospectus to you, we cannot send you a prospectus electronically unless you’ve consented. HOUSEHOLDING To lower costs and eliminate duplicate documents sent to your home, we may begin mailing only one copy of the Account’s prospectus, prospectus supplements or any other required documents to your household, even if more than one participant lives there. If you would prefer to continue receiving your own copy of any of these documents, you may call us toll-free at 877 518-9161, or write us. MISCELLANEOUS POLICIES Amending the Contracts:The contract may be amended by agreement of TIAA and the contractholder without the consent of any other person, provided that such change does not reduce any benefit purchased under the contract up to that time. Any endorsement or amendment of the contract, waiver of any of its provisions, or change in rate schedule will be valid only if in writing and signed by an executive officer of TIAA. If You’re Married:If you’re married, you may be required by law or your employer’s plan to get advance written consent from your spouse before we make certain transactions for you. If you’re married at your annuity starting date, you may also be required by law or your employer’s plan to choose an income option that provides survivor annuity income to your spouse, unless he or she waives that right in writing. There are limited exceptions to the waiver requirement. Texas Optional Retirement Program Restrictions:If you’re in the Texas Optional Retirement Program, you or your beneficiary can redeem some or all of your accumulation only if you retire, die, or leave your job in the state’s public institutions of higher education. TIAA Real Estate Account ¡Prospectus143
Assigning Your Contract:Generally, neither you nor your beneficiaries can assign your ownership of a TIAA retirement contract to anyone else. Overpayment of Premiums:If your employer mistakenly sends more premiums on your behalf than you’re entitled to under your employer’s retirement plan or the Code, we’ll refund them to your employer as long as we’re requested to do so (in writing) before you start receiving annuity income. Any time there’s a question about premium refunds, TIAA will rely on information from your employer. If you’ve withdrawn or transferred the amounts involved from your accumulation, we won’t refund them. Errors or Omissions:We reserve the right to correct any errors or omissions on any form, report, or statement that we send you. Payment to an Estate, Guardian, Trustee, etc.:We reserve the right to pay in one sum the commuted value of any benefits due an estate, corporation, partnership, trustee, or other entity not a natural person. Neither TIAA nor the Account will be responsible for the conduct of any executor, trustee, guardian, or other third party to whom payment is made. Benefits Based on Incorrect Information:If the amounts of benefits provided under a contract were based on information that is incorrect, benefits will be recalculated on the basis of the correct data. If the Account has overpaid or underpaid, appropriate adjustments will be made. Proof of Survival:We reserve the right to require satisfactory proof that anyone named to receive benefits under a contract is living on the date payment is due. If we have not received this proof after we request it in writing, the Account will have the right to make reduced payments or to withhold payments entirely until such proof is received. The annuity contracts are offered continuously by Services, which is registered with the SEC as a broker-dealer and a registered investment adviser and is a member of the Financial Industry Regulatory Authority (“FINRA”). Teachers Personal Investors Services, Inc. (“TPIS”), also a broker-dealer registered with the SEC and a member of FINRA, may participate in the distribution of the contracts on a limited basis. Services and TPIS are direct or indirect wholly owned subsidiaries of TIAA. Their addresses are at 730 Third Avenue, New York, NY 10017-3206. No commissions are paid for distributing the contracts. TIAA, the Real Estate Account, and the contracts (including any proposed modification thereto) are subject to regulation by the NYDFS as well as by the insurance regulatory authorities of certain other states and jurisdictions. TIAA and the Real Estate Account must file with the NYDFS both quarterly and annual statements. The Account’s books and assets are subject to review 144Prospectus ¡ TIAA Real Estate Account
and examination by the NYDFS at all times, and a full examination into the affairs of the Account is made at least every five years. In addition, a full examination of the Real Estate Account operations is usually conducted periodically by some other states. All matters involving state law and relating to the contracts, including TIAA’s right to issue the contracts, have been passed upon by Jon Feigelson, Senior Vice President, General Counsel and Head of Corporate Governance of TIAA. Dechert LLP has provided legal advice to the Account related to certain matters under the federal securities laws. PricewaterhouseCoopers LLP, located at 214 North Tryon Street, Suite 3600, Charlotte, North Carolina 28202, is the independent registered public accounting firm for the Real Estate Account. PricewaterhouseCoopers LLP, located at 300 Madison Avenue, New York, New York 10017, is the independent auditor of Teachers Insurance and Annuity Association of America. The financial statements of TIAA Real Estate Account as of December 31, 2012 and 2011 and for each of the three years in the period ended December 31, 2012 included in this Registration Statement have been so included in reliance on the report of PricewaterhouseCoopers LLP, an independent registered public accounting firm, given on the authority of said firm as experts in auditing and accounting. The statutory statements of Teachers Insurance and Annuity Association of America as of December 31, 2012 and 2011 and for each of the three years in the period ended December 31, 2012 included in this Registration Statement have been so included in reliance on the report of PricewaterhouseCoopers LLP, an independent auditor, given on the authority of said firm as experts in auditing and accounting. Aarons Grant & Habif, LLC, an independent registered public accounting firm, has audited the statement of revenues and certain expenses of the following properties: (i) Shops at Wisconsin Place, Chevy Chase, Maryland, for the year ended December 31, 2011; (ii) Cerritos Industrial Park, Cerritos, California, for the year ended December 31, 2011; (iii) The Residences at the Village of Merrick Park, Coral Gables, Florida, for the year ended December 31, 2011; (iv) Mass Court, Washington, D.C., for the year ended December 31, 2011; (v) Circa Green Lake Apartments, Seattle, Washington, for the year ended December 31, 2011; TIAA Real Estate Account ¡Prospectus145
(vi) Prescott Wallingford Apartments, Seattle, Washington for the period from July 11, 2012 (Date of Inception) to September 30, 2012; and (vii) RGM 42, LLC, New York, New York, for the year ended December 31, 2011. After reasonable inquiry, the Account is not aware of any material factors relating to the specific properties audited by Aarons Grant & Habif, LLC, other than as specifically set forth elsewhere in this prospectus that would cause the reported financial information indicated in such financial statements not to be necessarily indicative of future operating results. We have included these financial statements in the prospectus and elsewhere in the registration statement in reliance on Aarons Grant & Habif, LLC’s reports, given on the authority of such firm as experts in accounting and auditing. Cohn Reznick, LLP, an independent registered public accounting firm, has audited the statement of revenues and certain expenses of the following properties: (i) Pacific Coast Corporate Park, Fife, Washington, for the year ended December 31, 2011; (ii) Charleston Plaza, Mountain View, California, for the year ended December 31, 2011; and (iii) Valencia Town Center, Valencia, California, for the year ended December 31, 2011. After reasonable inquiry, the Account is not aware of any material factors relating to the specific properties audited by Cohn Reznick, LLP, other than as specifically set forth elsewhere in this prospectus that would cause the reported financial information indicated in such financial statements not to be necessarily indicative of future operating results. We have included these financial statements in the prospectus and elsewhere in the registration statement in reliance on Cohn Reznick, LLP’s reports, given on the authority of such firm as experts in accounting and auditing. INFORMATION AVAILABLE AT THE SEC The Account has filed with the SEC a registration statement under the Securities Act of 1933, which contains this prospectus and additional information related to the offering described in this prospectus. The Account also files annual, quarterly, and current reports, along with other information, with the SEC, as required by the Securities Exchange Act of 1934. You may read and copy the full registration statement, and any reports and information filed with the SEC for the Account, at the SEC’s Public Reference Room at 100 F Street, N.E., Washington, DC 20549. This information can also be obtained through the SEC’s website on the Internet (www.sec.gov). The public may 146Prospectus ¡ TIAA Real Estate Account
obtain information on the operation of the SEC’s Public Reference Room by calling the SEC at 800 SEC-0330. FURTHER INFORMATION; REPORTS TO PARTICIPANTS TIAA will mail to each participant in the Real Estate Account periodic reports providing information relating to their accumulations in the Account, including premiums paid, number and value of accumulations, and withdrawals or transfers during the period, as well as such other information as may be required by applicable law or regulations. Further information may be obtained from TIAA at 730 Third Avenue, New York, NY 10017-3206. CUSTOMER COMPLAINTS Customer complaints may be directed to our Participant Relations Unit, P. O. Box 1259, Charlotte, NC 28201-1259, telephone 800 842-2252. TIAA Real Estate Account ¡Prospectus147
The financial statements of the TIAA Real Estate Account and condensed unaudited statutory-basis financial statements of TIAA follow within this prospectus. The full audited statutory-basis financial statements of TIAA, which are incorporated into this prospectus by reference, are available upon request by calling 877 518-9161. The financial statements of TIAA should be distinguished from the financial statements of the Account and should be considered only as bearing on the ability of TIAA to meet its obligations under the contracts. They should not be considered as bearing upon the assets held in the Account.
TIAA REAL ESTATE ACCOUNT
|
|
|
149 | ||
150 | ||
152 | ||
153 | ||
154 | ||
155 | ||
156 | ||
182 | ||
194 |
PRO FORMA CONDENSED FINANCIAL STATEMENTS (UNAUDITED):
|
|
|
195 | ||
195 | ||
196 |
PROPERTY FINANCIAL STATEMENTS:
TEACHERS INSURANCE AND ANNUITY ASSOCIATION OF AMERICA
|
|
|
| 233 | ||
234 |
148Prospectus ¡ TIAA Real Estate Account
REPORT OF MANAGEMENT RESPONSIBILITY To the Participants of the TIAA Real Estate Account: The accompanying consolidated financial statements of the TIAA Real Estate Account (“Account”) of Teachers Insurance and Annuity Association of America (“TIAA”) are the responsibility of TIAA’s management. They have been prepared in accordance with accounting principles generally accepted in the United States of America and have been presented fairly and objectively in accordance with such principles. TIAA has established and maintains an effective system of internal controls over financial reporting designed to provide reasonable assurance that assets are properly safeguarded, that transactions are properly executed in accordance with management’s authorization, and to carry out the ongoing responsibilities of management for reliable consolidated financial statements. In addition, TIAA’s internal audit personnel provide regular reviews and assessments of the internal controls and operations of the Account, and the Senior Vice President of Internal Audit regularly reports to the Audit Committee of the TIAA Board of Trustees. The independent registered public accounting firm of PricewaterhouseCoopers LLP has audited the accompanying consolidated financial statements for the years ended December 31, 2012, 2011 and 2010. To maintain auditor independence and avoid even the appearance of a conflict of interest, it continues to be the Account’s policy (consistent with TIAA’s specific auditor independence policies, which are designed to avoid such conflicts) that any management advisory or consulting services would be obtained from a firm other than the independent accounting firm. The independent auditors’ report expresses an independent opinion on the fairness of presentation of the Account’s consolidated financial statements. The Audit Committee of the TIAA Board of Trustees, comprised entirely of independent, non-management trustees, meets regularly with management, representatives of the independent registered public accounting firm and internal audit group personnel to review matters relating to financial reporting, internal controls and auditing. In addition to the annual independent audit of the Account’s consolidated financial statements, the New York State Insurance Department and other state insurance departments regularly examine the operations and consolidated financial statements of the Account as part of their periodic corporate examinations. March 14, 2013 /s/ Roger W. Ferguson, Jr. /s/ Virginia M. Wilson Roger W. Ferguson, Jr. Virginia M. Wilson TIAA Real Estate Account ¡Prospectus149
President and
Chief Executive Officer
Executive Vice President and
Chief Financial Officer
To the Participants of the TIAA Real Estate Account: The TIAA Audit Committee (“Committee”) oversees the financial reporting process of the TIAA Real Estate Account (“Account”) on behalf of TIAA’s Board of Trustees. The Committee operates in accordance with a formal written charter (copies of which are available upon request) which describes the Audit Committee’s responsibilities. All members of the Committee are independent, as defined under the listing standards of the New York Stock Exchange. Management has the primary responsibility for the Account’s consolidated financial statements, development and maintenance of a strong system of internal controls and disclosure controls, and compliance with applicable laws and regulations. In fulfilling its oversight responsibilities, the Committee reviewed and approved the audit plans of the internal audit group and the independent registered public accounting firm in connection with their respective audits of the Account. The Committee also meets regularly with the internal audit group and the independent registered public accounting firm, both with and without management present, to discuss the results of their examinations, their evaluation of internal controls, and the overall quality of financial reporting. As required by its charter, the Committee will evaluate rotation of the independent registered public accounting firm whenever circumstances warrant, but in no event will the evaluation be later than between their fifth and tenth years of service. The Committee reviewed and discussed the accompanying audited consolidated financial statements with management, including a discussion of the quality and appropriateness of the accounting principles and financial reporting practices followed, the reasonableness of significant judgments, and the clarity and completeness of disclosures in the consolidated financial statements. The Committee has also discussed the audited consolidated financial statements with PricewaterhouseCoopers LLP, the independent registered public accounting firm responsible for expressing an opinion on the conformity of these audited consolidated financial statements with accounting principles generally accepted in the United States of America. The discussion with PricewaterhouseCoopers LLP focused on their judgments concerning the quality and appropriateness of the accounting principles and financial reporting practices followed by the Account, the clarity and completeness of the consolidated financial statements and related disclosures, and other significant matters, such as any significant changes in accounting policies, internal controls, management judgments and estimates, and the nature of any uncertainties or unusual transactions. In addition, the Committee discussed with PricewaterhouseCoopers LLP the auditors’ independence from management and the Account, and has received a written disclosure regarding such independence, as required by the Securities and Exchange Commission. 150Prospectus ¡ TIAA Real Estate Account
Based on the review and discussions referred to above, the Committee has approved the release of the accompanying audited consolidated financial statements for publication and filing with appropriate regulatory authorities. Rosalie J. Wolf, Audit Committee Chair March 14, 2013 TIAA Real Estate Account ¡Prospectus151
Jeffrey R. Brown, Audit Committee Member
Lawrence H. Linden, Audit Committee Member
Donald K. Peterson, Audit Committee Member
CONSOLIDATED STATEMENTS OF ASSETS AND LIABILITIES TIAA REAL ESTATE ACCOUNT (In millions, except per accumulation unit amounts) December 31, 2012 2011 ASSETS Investments, at fair value: Real estate properties $ 10,554.6 $ 9,857.6 Real estate joint ventures and limited partnerships 2,631.3 1,898.9 Marketable securities: Real estate related 1,332.3 927.9 Other 2,569.7 2,802.8 Total investments 17,087.9 15,487.2 Cash and cash equivalents 21.7 17.5 Due from investment advisor — 6.8 Other 269.0 238.4 TOTAL ASSETS 17,378.6 15,749.9 LIABILITIES Mortgage loans payable, at fair value—Note 9 (principal outstanding: $2,253.8 and $2,008.6) 2,282.6 2,028.2 Due to investment advisor 10.6 — Accrued real estate property level expenses 185.8 166.9 Other 38.5 27.6 TOTAL LIABILITIES 2,517.5 2,222.7 COMMITMENTS AND CONTINGENCIES—Note 12 NET ASSETS Accumulation Fund 14,523.0 13,227.2 Annuity Fund 338.1 300.0 TOTAL NET ASSETS $ 14,861.1 $ 13,527.2 NUMBER OF ACCUMULATION UNITS OUTSTANDING—Note 11 53.3 53.4 NET ASSET VALUE, PER ACCUMULATION UNIT—Note 10 $ 272.569 $ 247.654 152Prospectus ¡ TIAA Real Estate Account See notes to the consolidated financial statements
(cost: $10,543.6 and $10,314.3)
(cost: $2,553.8 and $2,193.3)
(cost: $1,175.7 and $895.3)
(cost: $2,569.3 and $2,802.6)
(cost: $16,842.4 and $16,205.5)
CONSOLIDATED STATEMENTS OF OPERATIONS TIAA REAL ESTATE ACCOUNT (In millions) Years Ended December 31, 2012 2011 2010 INVESTMENT INCOME Real estate income, net: Rental income $ 872.0 $ 874.1 $ 862.5 Real estate property level expenses and taxes: Operating expenses 218.2 217.8 220.0 Real estate taxes 119.1 111.5 114.7 Interest expense 146.0 109.2 106.7 Total real estate property level expenses and taxes 483.3 438.5 441.4 Real estate income, net 388.7 435.6 421.1 Income from real estate joint ventures and 80.9 86.4 89.3 Interest 3.0 3.3 3.0 Dividends 32.3 19.1 5.6 TOTAL INVESTMENT INCOME 504.9 544.4 519.0 EXPENSES—NOTE 2: Investment advisory charges 56.3 53.9 50.2 Administrative charges 32.4 28.7 22.1 Distribution charges 13.9 8.8 6.0 Mortality and expense risk charges 2.8 6.2 4.4 Liquidity guarantee charges 31.3 23.7 13.1 TOTAL EXPENSES 136.7 121.3 95.8 INVESTMENT INCOME, NET 368.2 423.1 423.2 NET REALIZED AND UNREALIZED GAIN (LOSS) ON INVESTMENTS AND MORTGAGE LOANS PAYABLE Net realized gain (loss) on investments: Real estate properties (11.3 ) (41.7 ) (12.5 ) Real estate joint ventures and limited partnerships (104.5 ) (70.5 ) (185.7 ) Marketable securities 53.7 6.5 0.4 Net realized loss on investments (62.1 ) (105.7 ) (197.8 ) Net change in unrealized appreciation Real estate properties 555.8 829.9 638.2 Real estate joint ventures and limited partnerships 424.1 331.0 357.5 Marketable securities 126.8 21.5 15.0 Mortgage loans receivable — — 3.7 Mortgage loans payable (33.4 ) (0.7 ) (59.6 ) Net change in unrealized appreciation on 1,073.3 1,181.7 954.8 NET REALIZED AND UNREALIZED GAIN ON INVESTMENTS AND MORTGAGE LOANS PAYABLE 1,011.2 1,076.0 757.0 NET INCREASE IN NET ASSETS RESULTING FROM OPERATIONS $ 1,379.4 $ 1,499.1 $ 1,180.2 See notes to the consolidated financial statements TIAA Real Estate Account ¡Prospectus153
limited partnerships
(depreciation) on:
investments and mortgage loans payable
CONSOLIDATED STATEMENTS OF CHANGES IN NET ASSETS TIAA REAL ESTATE ACCOUNT (In millions) Years Ended December 31, 2012 2011 2010 FROM OPERATIONS Investment income, net $ 368.2 $ 423.1 $ 423.2 Net realized loss on investments (62.1 ) (105.7 ) (197.8 ) Net change in unrealized appreciation on investments and mortgage loans payable 1,073.3 1,181.7 954.8 NET INCREASE IN NET ASSETS 1,379.4 1,499.1 1,180.2 FROM PARTICIPANT TRANSACTIONS Premiums 1,923.5 2,321.0 2,594.5 Liquidity units redeemed—Note 3 (940.3 ) — — Annuity payments (25.1 ) (24.3 ) (19.1 ) Withdrawals and death benefits (1,003.6 ) (1,071.7 ) (832.4 ) NET (DECREASE) INCREASE IN NET ASSETS RESULTING FROM PARTICIPANT TRANSACTIONS (45.5 ) 1,225.0 1,743.0 NET INCREASE IN NET ASSETS 1,333.9 2,724.1 2,923.2 NET ASSETS Beginning of year 13,527.2 10,803.1 7,879.9 End of year $ 14,861.1 $ 13,527.2 $ 10,803.1 154Prospectus ¡ TIAA Real Estate Account See notes to the consolidated financial statements
RESULTING FROM OPERATIONS
CONSOLIDATED STATEMENTS OF CASH FLOWS TIAA REAL ESTATE ACCOUNT (In millions) Years Ended December 31, 2012 2011 2010 CASH FLOWS FROM OPERATING ACTIVITIES Net increase in net assets resulting from operations $ 1,379.4 $ 1,499.1 $ 1,180.2 Adjustments to reconcile net increase (decrease) in net assets resulting from operations to net cash used in operating activities: Deferred financing costs 3.8 — — Net realized loss on investments 62.1 105.7 197.8 Net change in unrealized appreciation on investments and mortgage loans payable (1,073.3 ) (1,181.7 ) (954.8 ) Purchase of real estate properties (619.3 ) (1,108.9 ) — Capital improvements on real estate properties (186.3 ) (162.7 ) (130.4 ) Proceeds from sale of real estate properties 449.8 335.9 91.9 Proceeds from mortgage loans receivable — — 75.0 Purchases of long term investments (1,076.6 ) 38.3 97.2 Proceeds from sale of long term investments 675.5 (465.7 ) (598.3 ) Decrease (increase) in other investments 233.3 (392.3 ) (1,646.8 ) Change in due to (from) investment advisor 17.4 4.2 (6.7 ) (Increase) decrease in other assets (30.6 ) (61.3 ) 8.7 Increase (decrease) in other liabilities 15.6 1.8 (11.2 ) NET CASH USED IN OPERATING ACTIVITIES (149.2 ) (1,387.6 ) (1,697.4 ) CASH FLOWS FROM FINANCING ACTIVITIES Mortgage loan proceeds received 208.1 185.0 273.3 Principal payments of mortgage loans payable (9.2 ) (17.8 ) (330.8 ) Premiums 1,923.5 2,321.0 2,594.5 Liquidity units redeemed (940.3 ) — — Annuity payments (25.1 ) (24.3 ) (19.1 ) Withdrawals and death benefits (1,003.6 ) (1,071.7 ) (832.4 ) NET CASH PROVIDED BY FINANCING ACTIVITIES 153.4 1,392.2 1,685.5 NET INCREASE (DECREASE) IN CASH AND CASH EQUIVALENTS 4.2 4.6 (11.9 ) CASH AND CASH EQUIVALENTS Beginning of year 17.5 12.9 24.8 End of year $ 21.7 $ 17.5 $ 12.9 SUPPLEMENTAL DISCLOSURES: Cash paid for interest $ 117.0 $ 109.2 $ 106.1 Debt assumed in acquisition of property $ 36.9 $ — $ — See notes to the consolidated financial statements TIAA Real Estate Account ¡Prospectus155
NOTES TO THE CONSOLIDATED FINANCIAL STATEMENTS TIAA REAL ESTATE ACCOUNT Note 1—Organization and Significant Accounting Policies Business:The TIAA Real Estate Account (“Account”) is a segregated investment account of Teachers Insurance and Annuity Association of America (“TIAA”) and was established by resolution of TIAA’s Board of Trustees (the “Board”) on February 22, 1995, under the insurance laws of the State of New York, for the purpose of funding variable annuity contracts issued by TIAA. The Account offers individual and group accumulating annuity contracts (with contributions made on a pre-tax or after-tax basis), as well as individual lifetime and term-certain variable payout annuity contracts (including the payment of death benefits to beneficiaries). Investors are entitled to transfer funds to or from the Account, and make withdrawals from the Account on a daily basis under certain circumstances. Funds invested in the Account for each category of contract are expressed in terms of units, and unit values will fluctuate depending on the Account’s performance. The investment objective of the Account is to seek favorable long-term returns primarily through rental income and capital appreciation from real estate and real estate-related investments owned by the Account. The Account holds real estate properties directly and through subsidiaries wholly owned by TIAA for the benefit of the Account. The Account also holds interests in real estate joint ventures and limited partnerships in which the Account does not hold a controlling interest; as such, such interests are not consolidated into these consolidated financial statements. The Account also has invested in mortgage loans receivable collateralized by commercial real estate properties. Additionally, the Account invests in real estate-related and non-real estate-related publicly-traded securities, cash and other instruments to maintain adequate liquidity levels for operating expenses, capital expenditures and to fund benefit payments (withdrawals, transfers and related transactions). The consolidated financial statements were prepared in accordance with accounting principles generally accepted in the United States of America, which requires the use of estimates made by management. Actual results may vary from those estimates and such differences may be material. The following is a summary of the significant accounting policies of the Account. Basis of Presentation:The accompanying consolidated financial statements include the Account and those subsidiaries wholly owned by TIAA for the benefit of the Account. All significant intercompany accounts and transactions between the Account and such subsidiaries have been eliminated. The Accumulation Unit Value (“AUV”) used for financial reporting purposes may differ from the AUV used for processing transactions. The AUV used for financial reporting purposes includes security and participant transactions effective through the date of the report. 156Prospectus ¡ TIAA Real Estate Account
NOTES TO THE CONSOLIDATED Determination of Investments at Fair Value:The Account reports all investments at fair value in accordance with the Financial Accounting Standards Board (“FASB”) Accounting Standards Codification (“ASC”) 946,Financial Services — Investment Companies. Further in accordance with the adoption of the fair value option allowed under ASC 825,Financial Instruments, and at the election of Account management, mortgage loans payable are reported at fair value. The FASB has defined fair value as the price that would be received to sell an asset or paid to transfer a liability in an orderly transaction between market participants. The following is a description of the valuation methodologies used to determine the fair value of the Account’s investments and investment related mortgage loans payable. Valuation of Real Estate Properties —Investments in real estate properties are stated at fair value, as determined in accordance with policies and procedures reviewed by the Investment Committee of the Board and in accordance with the responsibilities of the Board as a whole. Accordingly, the Account does not record depreciation. Determination of fair value involves significant levels of judgment because the actual fair value of real estate can be determined only by negotiation between the parties in a sales transaction. The Account’s primary objective when valuing its real estate investments will be to produce a valuation that represents a reasonable estimate of the fair value of its investments. Implicit in the Account’s definition of fair value are the consummation of a sale as of a specified date and the passing of title from seller to buyer under conditions whereby: • Buyer and seller are typically motivated; • Both parties are well informed or well advised, and acting in what they consider their best interests; • A reasonable time is allowed for exposure in the open market; • Payment is made in terms of cash or in terms of financial arrangements comparable thereto; and • The price represents the normal consideration for the property sold unaffected by special or creative financing or sales concessions granted by anyone associated with the sale. Property and investment values are affected by, among other things, the availability of capital, occupancy rates, rental rates, and interest and inflation rates. As a result, determining real estate and investment values involves many assumptions. Key inputs and assumptions include rental income and expense amounts, related rental income and expense growth rates, discount rates and capitalization rates. Valuation techniques include discounted cash flow analysis, prevailing market capitalization rates or multiples applied to earnings from the property, analysis of recent comparable sales transactions, actual sale TIAA Real Estate Account ¡Prospectus157
FINANCIAL STATEMENTS continued
NOTES TO THE CONSOLIDATED negotiations and bona fide purchase offers received from third parties. Amounts ultimately realized from each investment may vary significantly from the fair value presented. Real estate properties owned by the Account are initially valued based on an independent third party appraisal, as reviewed by TIAA’s internal appraisal staff and as applicable the Account’s independent fiduciary at the time of the closing of the purchase, which may result in a potential unrealized gain or loss reflecting the difference between an investment’s fair value (i.e., exit price) and its cost basis (which is inclusive of transaction costs). Subsequently, each property is appraised each quarter by an independent third party appraiser, reviewed by TIAA’s internal appraisal staff and as applicable the Account’s independent fiduciary. In general, the Account obtains appraisals of its real estate properties spread out throughout the quarter, which is intended to result in appraisal adjustments, and thus, adjustments to the valuations of its holdings (to the extent such adjustments are made) that happen regularly throughout each quarter and not on one specific day or month in each period. Further, management reserves the right to order an appraisal and/or conduct another valuation outside of the normal quarterly process when facts or circumstances at a specific property change. For example, under certain circumstances a valuation adjustment could be made when the account receives a bona fide bid for the sale of a property held within the Account or one of the Account’s joint ventures. In addition, adjustments may be made for events or circumstances indicating an impairment of a tenant’s ability to pay amounts due to the Account under a lease (including due to a bankruptcy filing of that tenant). Alternatively, adjustments may be made to reflect the execution or renewal of a significant lease. Also, adjustments may be made to reflect factors (such as sales values for comparable properties or local employment rate) bearing uniquely on a particular region in which the Account holds properties. TIAA’s internal appraisal staff oversees the entire appraisal process, in conjunction with the Account’s independent fiduciary (the independent fiduciary is more fully described in the paragraph below). Any differences in the conclusions of TIAA’s internal appraisal staff and the independent appraiser will be reviewed by the independent fiduciary, which will make a final determination on the matter (which may include ordering a subsequent independent appraisal). The independent fiduciary, Real Estate Research Corporation, has been appointed by a special subcommittee of the Investment Committee of the Board to, among other things, oversee the appraisal process. The independent fiduciary must approve all independent appraisers used by the Account. All appraisals are performed in accordance with Uniform Standards of Professional Appraisal Practices, the real estate appraisal industry standards 158Prospectus ¡ TIAA Real Estate Account
FINANCIAL STATEMENTS continued
NOTES TO THE CONSOLIDATED created by The Appraisal Foundation. Real estate appraisals are estimates of property values based on a professional’s opinion. Appraisals of properties held outside of the U.S. are performed in accordance with industry standards commonly applied in the applicable jurisdiction. These independent appraisers are always expected to be MAI-designated members of the Appraisal Institute (or its European equivalent, Royal Institute of Chartered Surveyors) and state certified appraisers from national or regional firms with relevant property type experience and market knowledge. Under the Account’s current procedures, each independent appraisal firm will be rotated off of a particular property at least every three years, although such appraisal firm may perform appraisals of other Account properties subsequent to such rotation. Also, the independent fiduciary can require additional appraisals if factors or events have occurred that could materially change a property’s value (including those identified above) and such change is not reflected in the quarterly valuation review, or otherwise to ensure that the Account is valued appropriately. The independent fiduciary must also approve any valuation change of real estate-related assets where a property’s value changed by more than 6% from the most recent independent annual appraisal, or if the value of the Account would change by more than 4% within any calendar quarter or more than 2% since the prior calendar month. When a real estate property is subject to a mortgage, the property is valued independently of the mortgage and the property and mortgage fair values are reported separately (seeValuation of Mortgage Loans Payable below). The independent fiduciary reviews and approves all mortgage valuation adjustments before such adjustments are recorded by the Account. The Account continues to use the revised value for each real estate property and mortgage loan payable to calculate the Account’s daily net asset value until the next valuation review or appraisal. Valuation of Real Estate Joint Ventures —Real estate joint ventures are stated at the fair value of the Account’s ownership interests of the underlying entities. The Account’s ownership interests are valued based on the fair value of the underlying real estate, any related mortgage loans payable, and other factors, such as ownership percentage, ownership rights, buy/sell agreements, distribution provisions and capital call obligations. Upon the disposition of all real estate investments by an investee entity, the Account will continue to state its equity in the remaining net assets of the investee entity during the wind down period, if any, which occurs prior to the dissolution of the investee entity. Valuation of Real Estate Limited Partnerships —Limited partnership interests are stated at the fair value of the Account’s ownership in the partnership which are recorded based upon the changes in the net asset values of the limited partnerships as determined from the financial statements of the limited partnerships when received by the Account. Prior to the receipt of the financial statements from the limited partnerships, the Account estimates the TIAA Real Estate Account ¡Prospectus159
FINANCIAL STATEMENTS continued
NOTES TO THE CONSOLIDATED value of its interest in good faith and will from time to time seek input from the issuer or the sponsor of the investments. Since market quotations are not readily available, the limited partnership interests are valued at fair value as determined in good faith by management under the direction of the Investment Committee of the Board and in accordance with the responsibilities of the Board as a whole. Valuation of Marketable Securities —Equity securities listed or traded on any national market or exchange are valued at the last sale price as of the close of the principal securities market or exchange on which such securities are traded or, if there is no sale, at the mean of the last bid and asked prices on such market or exchange, exclusive of transaction costs. Debt securities, other than money market instruments, are generally valued at the most recent bid price or the equivalent quoted yield for such securities (or those of comparable maturity, quality and type). Money market instruments, with maturities of one year or less, are valued in the same manner as debt securities or derived from a pricing matrix. Equity and fixed income securities traded on a foreign exchange or in foreign markets are valued using their closing values under the valuation methods generally accepted in the country where traded, as of the valuation date. This value is converted to U.S. dollars at the exchange rate in effect on the valuation day. Under certain circumstances (for example, if there are significant movements in the United States markets and there is an expectation the securities traded on foreign markets will adjust based on such movements when the foreign markets open the next day), the Account may adjust the value of equity or fixed income securities that trade on a foreign exchange or market after the foreign exchange or market has closed. Valuation of Mortgage Loans Payable —Mortgage loans payable are stated at fair value. The estimated fair values of mortgage loans payable are based on the amount at which the liability could be transferred to a third party exclusive of transaction costs. Mortgage loans payable are valued internally by TIAA’s internal valuation department, as reviewed by the Account’s independent fiduciary, at least quarterly based on market factors, such as market interest rates and spreads for comparable loans, the performance of the underlying collateral (such as the loan-to-value ratio and the cash flow of the underlying collateral), the liquidity for mortgage loans of similar characteristics, the maturity date of the loan, and the return demands of the market. SeeNote 6—Assets and Liabilities Measured at Fair Value on a Recurring Basisfor further discussion and disclosure regarding the determination of the fair value of the Account’s investments. Foreign Currency Transactions and Translation:Portfolio investments and other assets and liabilities denominated in foreign currencies are translated into U.S. dollars at the exchange rates prevailing at the end of the 160Prospectus ¡ TIAA Real Estate Account
FINANCIAL STATEMENTS continued
NOTES TO THE CONSOLIDATED period. Purchases and sales of securities, income receipts and expense payments made in foreign currencies are translated into U.S. dollars at the exchange rates prevailing on the respective dates of the transactions. The effect of any changes in foreign currency exchange rates on portfolio investments and mortgage loans payable are included in net realized and unrealized gains and losses on real estate properties and mortgage loans payable. Net realized gains and losses on foreign currency transactions include disposition of foreign currencies, and currency gains and losses between the accrual and receipt dates of portfolio investment income and between the trade and settlement dates of portfolio investment transactions. Accumulation and Annuity Funds:The accumulation fund represents the net assets attributable to participants in the accumulation phase of their investment (“Accumulation Fund”). The annuity fund represents the net assets attributable to the participants currently receiving annuity payments (“Annuity Fund”). The net increase or decrease in net assets from investment operations is apportioned between the accounts based upon their relative daily net asset values. Once an Account participant begins receiving lifetime annuity income benefits, payment levels cannot be reduced as a result of the Account’s actual mortality experience. In addition, the contracts pursuant to which the Account is offered are required to stipulate the maximum expense charge for all Account level expenses that can be assessed, which is not to exceed 2.5% of average net assets per year. The Account pays a fee to TIAA to assume mortality and expense risks. Accounting for Investments:The investments held by the Account are accounted for as follows: Real Estate Properties —Rent from real estate properties consists of all amounts earned under tenant operating leases, including base rent, recoveries of real estate taxes and other expenses and charges for miscellaneous services provided to tenants. Rental income is recognized in accordance with the billing terms of the lease agreements. The Account bears the direct expenses of the real estate properties owned. These expenses include, but are not limited to, fees to local property management companies, property taxes, utilities, maintenance, repairs, insurance, and other operating and administrative costs. An estimate of the net operating income earned from each real estate property is accrued by the Account on a daily basis and such estimates are adjusted when actual operating results are determined. Real Estate Joint Ventures —The Account has limited ownership interests in various real estate joint ventures (collectively, the “joint ventures”). The Account records its contributions as increases to its investments in the joint ventures, and distributions from the joint ventures are treated as income within income from real estate joint ventures and limited partnerships in the Account’s consolidated statements of operations. Distributions that are TIAA Real Estate Account ¡Prospectus161
FINANCIAL STATEMENTS continued
NOTES TO THE CONSOLIDATED identified as returns of capital are recorded as a reduction to the cost basis of the investment, whereas distributions identified as capital gains or losses are recorded as realized gains or losses. Income from the joint ventures is recorded based on the Account’s proportional interest of the income distributed by the joint ventures. Income earned but not yet distributed to the Account by the joint ventures is recorded as unrealized gains and losses. Limited Partnerships —The Account has limited ownership interests in various private real estate funds (primarily limited partnerships) and a private real estate investment trust (collectively, the “limited partnerships”). The Account records its contributions as increases to the investments, and distributions from the investments are treated as income within income from real estate joint ventures and limited partnerships in the Account’s consolidated statements of operations. Distributions that are identified as returns of capital are recorded as a reduction to the cost basis of the investment, whereas distributions identified as capital gains or losses are recorded as realized gains or losses. Unrealized gains and losses are recorded based upon the changes in the net asset values of the limited partnerships as determined from the financial statements of the limited partnerships when received by the Account. Prior to the receipt of the financial statements from the limited partnerships, the Account estimates the value of its interest in good faith and will from time to time seek input from the issuer or the sponsor of the investments. Changes in value based on such estimates are recorded by the Account as unrealized gains and losses. Marketable Securities —Transactions in marketable securities are accounted for as of the date the securities are purchased or sold (trade date). Interest income is recorded as earned. Dividend income is recorded on the ex-dividend date within dividend income. Dividends that are identified as returns of capital are recorded as a reduction to the cost basis of the investment, whereas dividends identified as capital gains or losses are recorded as realized gains or losses. Realized gains and losses on securities transactions are accounted for on the specific identification method. Realized and Unrealized Gains and Losses —Realized gains and losses are recorded at the time an investment is sold or a distribution is received in relation to an investment sale from a joint venture or limited partnership. Real estate transactions are accounted for as of the date on which the purchase or sale transactions for the real estate properties close (settlement date). The Account recognizes a realized gain on the sale of a real estate property to the extent that the contract sales price exceeds the cost-to-date of the property being sold. A realized loss occurs when the cost-to-date exceeds the sales price. Unrealized gains and losses are recorded as the fair values of the Account’s investments are adjusted, and as discussed within theReal Estate Joint VenturesandLimited Partnershipssections above. 162Prospectus ¡ TIAA Real Estate Account
FINANCIAL STATEMENTS continued
NOTES TO THE CONSOLIDATED Net Assets —The Account’s net assets as of the close of each valuation day are valued by taking the sum of: • the value of the Account’s cash; cash equivalents, and short-term and other debt instruments; • the value of the Account’s other securities and other non-real estate assets; • the value of the individual real properties (based on the most recent valuation of that property) and other real estate-related investments owned by the Account; • an estimate of the net operating income accrued by the Account from its properties, other real estate-related investments and non-real estate-related investments (including short-term marketable securities) since the end of the prior valuation day; and • actual net operating income earned from the Account’s properties, other real estate-related investments and non-real estate-related investments (but only to the extent any such item of income differs from the estimated income accrued for on such investments), and then reducing the sum by liabilities held within the Account, including the daily investment management fee, administration and distribution fees, mortality and expense fee, and liquidity guarantee fee, and certain other expenses attributable to operating the Account. Daily estimates of net operating income are adjusted to reflect actual net operating income on a monthly basis, at which time such adjustments (if any) are reflected in the Account’s unit value. After the end of every quarter, the Account reconciles the amount of expenses deducted from the Account (which is established in order to approximate the costs that the Account will incur) with the expenses the Account actually incurred. If there is a difference, the Account adds it to or deducts it from the Account in equal daily installments over the remaining days of the following quarter. Material differences may be repaid in the current calendar quarter. The Account’s at-cost deductions are based on projections of Account assets and overall expenses, and the size of any adjusting payments will be directly affected by the difference between management’s projections and the Account’s actual assets or expenses. Cash and Cash Equivalents:Cash and cash equivalents are balances held by the Account in bank deposit accounts which, at times, exceed federally insured limits. The Account’s management monitors these balances to mitigate the exposure of risk due to concentration and has not experienced any losses from such concentration. Other Assets and Other Liabilities:Other assets and other liabilities are comprised of operating assets and liabilities utilized and held at each individual TIAA Real Estate Account ¡Prospectus163
FINANCIAL STATEMENTS continued
NOTES TO THE CONSOLIDATED real estate property investment. Other assets consist of, amongst other items, tenant receivables and prepaid expenses; whereas other liabilities primarily consist of security deposits. Federal Income Taxes:Based on provisions of the Internal Revenue Code, Section 817, the Account is taxed as a segregated asset account of TIAA and as such, the Account incurs no material federal income tax attributable to the net investment activity of the Account. Management has analyzed the Account’s tax positions taken for all open federal income tax years (2007–2012) and has concluded no provisions for federal income tax are required as of December 31, 2012. Restricted Cash:The Account held $61.4 million and $44.0 million as of December 31, 2012 and December 31, 2011, respectively, in escrow accounts for property taxes, insurance, and various other property related matters as required by certain creditors related to the Account’s outstanding mortgage loans payable. These amounts are recorded within other assets on the consolidated statements of assets and liabilities. SeeNote 9 — Mortgage Loans Payablefor additional information regarding the Account’s outstanding mortgage loans payable. Changes in Net Assets:Premiums include premiums paid by existing accumulation unit holders in the Account and transfers into the Account. Withdrawals and death benefits include withdrawals out of the Account which include transfers out of the Account and required minimum distributions. Due to/from Investment Manager:Due to/from investment manager represents amounts that are to be paid or received by TIAA on behalf of the Account. Amounts generally are paid or received by the Account within one or two business days and no interest is contractually charged on these amounts. Note 2—Management Agreements and Arrangements Investment advisory services for the Account are provided by TIAA employees, under the direction of the Board and its Investment Committee, pursuant to investment management procedures adopted by TIAA for the Account. TIAA’s investment management decisions for the Account are subject to review by the Account’s independent fiduciary. TIAA also provides various portfolio accounting and related services for the Account. The Account is a party to theDistribution Agreement for the Contracts Funded by the TIAA Real Estate Account(the “Distribution Agreement”), dated January 1, 2008, by and among TIAA, for itself and on behalf of the Account, and TIAA-CREF Individual and Institutional Services, LLC (“Services”), a wholly owned subsidiary of TIAA, a registered broker-dealer and a member of the Financial Industry Regulatory Authority. Pursuant to the Distribution Agreement, Services performs distribution services for the Account which include, among other things, (i) distribution of annuity contracts issued by 164Prospectus ¡ TIAA Real Estate Account
FINANCIAL STATEMENTS continued
NOTES TO THE CONSOLIDATED TIAA and funded by the Account, (ii) advising existing annuity contract owners in connection with their accumulations and (iii) helping employers implement and manage retirement plans. In addition, TIAA performs administrative functions for the Account, which include, among other things, (i) maintaining accounting records and performing accounting services, (ii) receiving and allocating premiums, (iii) calculating and making annuity payments, (iv) processing withdrawal requests, (v) providing regulatory compliance and reporting services, (vi) maintaining the Account’s records of contract ownership and (vii) otherwise assisting generally in all aspects of the Account’s operations. Both distribution services (pursuant to the Distribution Agreement) and administrative services are provided to the Account by Services and TIAA, as applicable, on a cost basis. The Distribution Agreement is terminable by either party upon 60 days written notice and terminates automatically upon any assignment thereof. TIAA and Services provide investment management, administrative and distribution services at cost. TIAA and Services receive payments from the Account on a daily basis according to formulas established each year and adjusted periodically with the objective of keeping the payments as close as possible to the Account’s expenses actually incurred. Any differences between actual expenses and the amounts paid by the Account are adjusted quarterly. TIAA also provides a liquidity guarantee to the Account, for a fee, to ensure that sufficient funds are available to meet participant transfer and cash withdrawal requests in the event that the Account’s cash flows and liquid investments are insufficient to fund such requests. TIAA ensures sufficient funds are available for such transfer and withdrawal requests by purchasing accumulation units of the Account. SeeNote 3 — Related Party Transactions below. To the extent TIAA owns accumulation units issued pursuant to the liquidity guarantee, the independent fiduciary monitors and oversees, among other things, TIAA’s ownership interest in the Account and may require TIAA to eventually redeem some of its units, particularly when the Account has uninvested cash or liquid investments available. TIAA also receives a fee for assuming certain mortality and expense risks. The expenses for the services noted above that are provided to the Account by TIAA and Services are identified in the accompanying consolidated statements of operations and are reflected inNote 10—Financial Highlights. Note 3—Related Party Transactions Pursuant to its existing liquidity guarantee obligation, the TIAA General Account purchased in multiple transactions an aggregate of 4.7 million accumulation units (which are generally referred to as “liquidity units”) in the TIAA Real Estate Account ¡Prospectus165
FINANCIAL STATEMENTS continued
NOTES TO THE CONSOLIDATED Account between December 2008 and June 2009 for an aggregate amount of $1.2 billion. TIAA has not purchased additional liquidity units since June 2009. In accordance with this liquidity guarantee obligation, TIAA guarantees that all participants in the Account may redeem their accumulation units at their accumulation unit value next determined after their transfer or cash withdrawal request is received in good order. Liquidity units owned by TIAA are valued in the same manner as accumulation units owned by the Account’s participants. Management believes that TIAA has the ability to meet its obligations under the liquidity guarantee. As discussed in the Account’s prospectus and in accordance with a prohibited transaction exemption from the U.S. Department of Labor (PTE 96-76), the Account’s independent fiduciary, Real Estate Research Corporation, has certain responsibilities with respect to the Account that it has undertaken or is currently undertaking with respect to TIAA’s purchase of liquidity units, including among other things, reviewing the purchase and redemption of liquidity units by TIAA to ensure the Account uses the correct unit values. In addition, as set forth in PTE 96-76, the independent fiduciary’s responsibilities include: • establishing the percentage of total accumulation units that TIAA’s ownership should not exceed (the “trigger point”) and creating a method for changing the trigger point; • approving any adjustment of TIAA’s ownership interest in the Account and, in its discretion, requiring an adjustment if TIAA’s ownership of liquidity units reaches the trigger point; and • once the trigger point has been reached, participating in any program to reduce TIAA’s ownership in the Account by utilizing cash flow or liquid investments in the Account, or by utilizing the proceeds from asset sales. The independent fiduciary’s role in participating in any such asset sales program would include (i) participating in the selection of properties for sale, (ii) providing sales guidelines and (iii) approving those sales if, in the independent fiduciary’s opinion, such sales are desirable to reduce TIAA’s ownership of liquidity units. The independent fiduciary, which has the right to adjust the trigger point, has established the trigger point at 45% of the outstanding accumulation units and it will continue to monitor TIAA’s ownership interest in the Account and provide further recommendations as necessary. As of December 31, 2012, TIAA owns 1.2 million liquidity units, representing approximately 2.2% of the Account’s outstanding accumulation units as of such date. The independent fiduciary is currently in the process of conducting a systematic redemption of all of the liquidity units held by the TIAA General Account. Approximately one-quarter of such units were redeemed evenly over 166Prospectus ¡ TIAA Real Estate Account
FINANCIAL STATEMENTS continued
NOTES TO THE CONSOLIDATED the business days in each of June, September and December 2012, representing a total of $940.3 million redeemed during 2012. The independent fiduciary’s redemption of the remaining liquidity units held by TIAA is conditioned on (i) the Account holding and being projected to hold at least 17% of its net assets in cash, cash equivalents and publicly traded, liquid non-real estate related securities, after taking into account certain projected sources and uses of cash flow into the Account, and (ii) there having been positive recent historical net participant flows over the 20 business days prior to such redemption. As of the date of this filing, the independent fiduciary intends to cause the redemption of the remaining liquidity units held by TIAA throughout the remaining days in March 2013, such that all such liquidity units would be redeemed by the end of the month. There is no guarantee that such redemptions will occur, as the timing of redemptions is in the discretion of the independent fiduciary. In addition, at any time the Account holds cash, cash equivalents and publicly traded, liquid non-real estate related securities in excess of 25% of its net assets, the independent fiduciary intends to cause a redemption of liquidity units in an amount equal to the Account’s average net participant flows during the preceding month. As of December 31, 2012, the Account held 17.4% of its net assets in such liquid non-real estate-related investments (along with its cash and cash equivalents). The independent fiduciary reserves the right to authorize or direct the redemption of all or a portion of liquidity units at any time. As discussed inNote 2—Management Agreements and Arrangements, TIAA and Services provide certain services to the Account on an at cost basis. See Note 10—Financial Highlightsfor details of the expense charge and expense ratio. Note 4—Credit Risk Concentrations Concentrations of credit risk may arise when a number of properties or tenants are located in a similar geographic region such that the economic conditions of that region could impact tenants’ obligations to meet their contractual obligations or cause the values of individual properties to decline. The Account has no significant concentrations of tenants as no single tenant has annual contract rent that makes up more than 2.1% of the rental income of the Account. The substantial majority of the Account’s wholly owned real estate investments and investments in joint ventures are located in the United States. The following table represents the diversification of the Account’s portfolio by region and property type: TIAA Real Estate Account ¡Prospectus167
FINANCIAL STATEMENTS continued
NOTES TO THE CONSOLIDATED DIVERSIFICATION BY FAIR VALUE(1) East West South Midwest Foreign(2) Total Office 20.4% 15.3% 6.7% 0.3% 1.6% 44.3% Apartment 9.7% 6.6% 5.4% — — 21.7% Industrial 0.7% 7.7% 3.8% 1.0% — 13.2% Retail 3.4% 4.0% 8.3% 0.2% 1.6% 17.5% Other(3) 2.8% 0.2% 0.3% — — 3.3% Total 37.0% 33.8% 24.5% 1.5% 3.2% 100.0% (1) Wholly-owned properties are represented at fair value and gross of any debt, while joint venture properties are represented at the net equity value. (2) Represents real estate investments in the United Kingdom and France. (3) Represents interest in Storage Portfolio investment, a fee interest encumbered by a ground lease real estate investment and undeveloped land. Properties in the “East” region are located in: CT, DC, DE, KY, MA, MD, ME, NC, NH, NJ, NY, PA, RI, SC, VA, VT, WV Note 5—Leases The Account’s wholly owned real estate properties are leased to tenants under operating lease agreements which expire on various dates through 2090. Aggregate minimum annual rentals for wholly owned real estate investments owned by the Account, excluding short-term residential leases, are as follows (in millions): Years Ending December 31, 2013 $ 499.3 2014 468.7 2015 402.8 2016 357.4 2017 314.1 Thereafter 3,146.9 Total $5,189.2 Certain leases provide for additional rental amounts based upon the recovery of actual operating expenses in excess of specified base amounts, sales volume or contractual increases as defined in the lease agreement. These contractual contingent rentals are not included in the table above. Note 6—Assets and Liabilities Measured at Fair Value on a Recurring Basis Valuation Hierarchy:The Account’s fair value measurements are grouped categorically into three levels, as defined by the FASB. The levels are defined as follows: Level 1 — Valuations using unadjusted quoted prices for assets traded in active markets, such as stocks listed on the New York Stock Exchange. Active markets are defined as having the following characteristics for the measured 168Prospectus ¡ TIAA Real Estate Account
FINANCIAL STATEMENTS continued
Properties in the “West” region are located in: AK, AZ, CA, CO, HI, ID, MT, NM, NV, OR, UT, WA, WY
Properties in the “South” region are located in: AL, AR, FL, GA, LA, MS, OK, TN, TX
Properties in the “Midwest” region are located in: IA, IL, IN, KS, MI, MN, MO, ND, NE, OH, SD, WI
NOTES TO THE CONSOLIDATED asset or liability: (i) many transactions, (ii) current prices, (iii) price quotes not varying substantially among market makers, (iv) narrow bid/ask spreads and (v) most information regarding the issuer is publicly available. Level 1 assets held by the Account are generally marketable equity securities. Level 2 — Valuations for assets and liabilities traded in less active, dealer or broker markets. Fair values are primarily obtained from third party pricing services for identical or comparable assets or liabilities. Level 2 inputs for fair value measurements are inputs, other than quoted prices included within Level 1, that are observable for the asset or liability, either directly or indirectly. Level 2 inputs include: a. Quoted prices for similar assets or liabilities in active markets; b. Quoted prices for identical or similar assets or liabilities in markets that are not active (that is, markets in which there are few transactions for the asset (or liability), the prices are not current, price quotations vary substantially either over time or among market makers (for example, some brokered markets), or in which little information is released publicly); c. Inputs other than quoted prices that are observable within the market for the asset (or liability) (for example, interest rates and yield curves, volatilities, prepayment speeds, loss severities, credit risks, and default rates that are observable at commonly quoted intervals); and d. Inputs that are derived principally from or corroborated by observable market data by correlation or other means (for example, market-corroborated inputs). Examples of securities which may be held by the Account and included in Level 2 include certificates of deposit, commercial paper, government agency notes, variable notes, United States Treasury securities, and debt securities. Level 3 — Valuations for assets and liabilities that are derived from other valuation methodologies, including pricing models, discounted cash flow models and similar techniques, and are not based on market exchange, dealer, or broker-traded transactions. Level 3 valuations incorporate certain assumptions and projections that are not observable in the market, and require significant professional judgment in determining the fair value assigned to such assets or liabilities. Examples of Level 3 assets and liabilities which may be held by the Account from time to time include investments in real estate, investments in joint ventures and limited partnerships, and mortgage loans receivable and payable. An investment’s categorization within the valuation hierarchy described above is based upon the lowest level of input that is significant to the fair value measurement. TIAA Real Estate Account ¡Prospectus169
FINANCIAL STATEMENTS continued
NOTES TO THE CONSOLIDATED The Account’s determination of fair value is based upon quoted market prices, where available. If listed prices or quotes are not available, fair value is based upon vendor-provided, evaluated prices or internally-developed models that primarily use market-based or independently-sourced market data, including interest rate yield curves, market spreads, and currency rates. Valuation adjustments will be made to reflect changes in credit quality, counterparty’s creditworthiness, the Account’s creditworthiness, liquidity, and other observable and unobservable inputs that are applied consistently over time. The methods described above are considered to produce fair values that represent a good faith estimate of what an unaffiliated buyer in the marketplace would pay to purchase the asset or would receive to transfer the liability. Since fair value calculations involve significant professional judgment in the application of both observable and unobservable attributes, actual realizable values or future fair values may differ from amounts reported. Furthermore, while the Account believes its valuation methods are appropriate and consistent with other market participants, the use of different methodologies or assumptions to determine the fair value of certain financial instruments, while reasonable, could result in different estimates of fair value at the reporting date. As discussed inNote 1—Organization and Significant Accounting Policiesin more detail, the Account generally obtains independent third party appraisals on a quarterly basis; there may be circumstances in the interim in which the true realizable value of a property is not reflected in the Account’s daily net asset value calculation or in the Account’s periodic consolidated financial statements. This disparity may be more apparent when the commercial and/or residential real estate markets experience an overall and possibly dramatic decline (or increase) in property values in a relatively short period of time between appraisals. 170Prospectus ¡ TIAA Real Estate Account
FINANCIAL STATEMENTS continued
NOTES TO THE CONSOLIDATED The following tables show the major categories of assets and liabilities measured at fair value on a recurring basis as of December 31, 2012 and December 31, 2011, using unadjusted quoted prices in active markets for identical assets (Level 1); significant other observable inputs (Level 2); and significant unobservable inputs (Level 3) (in millions): Description Level 1: Level 2: Level 3: Total at Real Estate properties $ — $ — $ 10,554.6 $10,554.6 Real Estate joint ventures — — 2,291.5 2,291.5 Limited partnerships — — 339.8 339.8 Marketable securities: Real Estate Related 1,332.3 — — 1,332.3 Government Agency Notes — 1,379.6 — 1,379.6 United States Treasury securities — 1,190.1 — 1,190.1 Total Investments at $ 1,332.3 $ 2,569.7 $ 13,185.9 $17,087.9 Mortgage loans payable $ — $ — $ (2,282.6 ) $(2,282.6) Description Level 1: Level 2: Level 3: Total at Real Estate properties $ — $ — $ 9,857.6 $9,857.6 Real Estate joint ventures — — 1,591.4 1,591.4 Limited partnerships — — 307.5 307.5 Marketable securities: Real Estate Related 927.9 — — 927.9 Government Agency Notes — 1,551.6 — 1,551.6 United States Treasury securities — 1,251.2 — 1,251.2 Total Investments at $ 927.9 $ 2,802.8 $ 11,756.5 $15,487.2 Mortgage loans payable $ — $ — $ (2,028.2 ) $(2,028.2) TIAA Real Estate Account ¡Prospectus171
FINANCIAL STATEMENTS continued
Quoted
Prices in
Active Markets
for Identical
Assets
Significant
Other
Observable
Inputs
Significant
Unobservable
Inputs
December 31,
2012
December 31, 2012
Quoted
Prices in
Active Markets
for Identical
Assets
Significant
Other
Observable
Inputs
Significant
Unobservable
Inputs
December 31,
2011
December 31, 2011
NOTES TO THE CONSOLIDATED The following tables show the reconciliation of the beginning and ending balances for assets and liabilities measured at fair value on a recurring basis using significant unobservable inputs (Level 3) during the years ended December 31, 2012 and December 31, 2011 (in millions): Real Estate Real Estate Limited Total Mortgage For the year ended December 31, 2012 Beginning balance January 1, 2012 $ 9,857.6 $ 1,591.4 $ 307.5 $ 11,756.5 $(2,028.2) Total realized and unrealized gains (losses) included in changes in net assets 544.5 281.5 38.1 864.1 (14.8) Purchases(1) 838.3 765.2 23.4 1,626.9 (248.8) Sales (685.8 ) — — (685.8 ) — Settlements(2) — (346.6 ) (29.2 ) (375.8 ) 9.2 Ending balance December 31, 2012 $ 10,554.6 $ 2,291.5 $ 339.8 $ 13,185.9 $(2,282.6) Real Estate Real Estate Limited Total Mortgage For the year ended Beginning balance $ 8,115.5 $ 1,358.8 $ 270.3 $ 9,744.6 $ (1,860.2 ) Total realized and unrealized 788.2 219.0 41.5 1,048.7 (0.8 ) Purchases(1) 1,287.6 15.8 10.0 1,313.4 (185.0 ) Sales (335.9 ) — — (335.9 ) — Settlements(2) 2.2 (2.2 ) (14.3 ) (14.3 ) 17.8 Ending balance $ 9,857.6 $ 1,591.4 $ 307.5 $ 11,756.5 $ (2,028.2 ) (1) Includes purchases, contributions for joint ventures and limited partnerships, and capital expenditures. (2) Includes operating income for real estate joint ventures and limited partnerships, net of distributions and principal payments on mortgage loans payable. The following table shows quantitative information about unobservable inputs related to the Level 3 fair value measurements as of December 31, 2012. 172Prospectus ¡ TIAA Real Estate Account
FINANCIAL STATEMENTS continued
Properties
Joint
Ventures
Partnerships
Level 3
Investments
Loans
Payable
Properties
Joint
Ventures
Partnerships
Level 3
Investments
Loans
Payable
December 31, 2011
January 1, 2011
gains (losses) included in
changes in net assets
December 31, 2011
NOTES TO THE CONSOLIDATED Type Asset Valuation Technique(s) Unobservable Inputs Range (Weighted Real Estate Properties Office Income Approach— and Real Estate Joint Discounted Cash Flow Discount Rate 6.5%–9.8% (7.4%) Ventures Terminal Capitalization Rate 5.5%–8.5% (6.3%) Income Approach— Direct Capitalization Overall Capitalization Rate 4.5%–8.5% (5.7%) Industrial Income Approach— Discounted Cash Flow Discount Rate 6.5%–9.8% (7.7%) Terminal Capitalization Rate 5.5%–8.3% (6.5%) Income Approach— Direct Capitalization Overall Capitalization Rate 5.0%–8.0% (5.9%) Residential Income Approach— Discounted Cash Flow Discount Rate 5.8%–8.0% (6.7%) Terminal Capitalization Rate 4.3%–6.3% (5.0%) Income Approach— Direct Capitalization Overall Capitalization Rate 3.8%–5.6% (4.4%) Retail Income Approach— Discounted Cash Flow Discount Rate 6.5%–11.3% (7.8%) Terminal Capitalization Rate 5.8%–11.0% (6.6%) Income Approach— Direct Capitalization Overall Capitalization Rate 4.5%–10.8% (6.0%) Mortgage Loans Office and Discounted Cash Flow Loan to Value Ratio 36.0%–67.0% (51.2%) Payable Industrial Equivalency Rate 2.5%–3.0% (2.7%) Net Present Value Loan to Value Ratio 36.0%–67.0% (51.2%) Weighted Average Cost of 1.0%–3.2% (1.7%) Residential Discounted Cash Flow Loan to Value Ratio 37.0%–60.0% (49.2%) Equivalency Rate 2.3%–3.9% (3.0%) Net Present Value Loan to Value Ratio 37.0%–60.0% (49.2%) Weighted Average Cost of 1.0%–2.3% (1.5%) Retail Discounted Cash Flow Loan to Value Ratio 31.0%–153.0% (62.6%) Equivalency Rate 2.6%–7.1% (4.1%) Net Present Value Loan to Value Ratio 31.0%–153.0% (62.6%) Weighted Average Cost of 0.7%–14.2% (4.1%) Real Estate Properties and Joint Ventures:The significant unobservable inputs used in the fair value measurement of the Account’s real estate properties and joint ventures are the selection of certain investment rates (Discount Rate, Terminal Capitalization Rate, and Overall Capitalization Rate). Significant increases (decreases) in any of those inputs in isolation would result in significantly lower (higher) fair value measurements, respectively. Mortgage Loans Payable:The significant unobservable inputs used in the fair value measurement of the Account’s mortgage loans payable are the loan to value ratios and the selection of certain credit spreads and weighted average cost of capital risk premiums. Significant increases (decreases) in any of those inputs in isolation would result in a significantly lower (higher) fair value, respectively. During the years ended December 31, 2012 and 2011 there were no transfers between Levels 1, 2 or 3. TIAA Real Estate Account ¡Prospectus173
FINANCIAL STATEMENTS continued
Class
Average)
Capital Risk Premiums
Capital Risk Premiums
Capital Risk Premiums
NOTES TO THE CONSOLIDATED The amount of total net unrealized gains (losses) included in changes in net assets attributable to the change in net unrealized gains (losses) relating to Level 3 investments and mortgage loans payable using significant unobservable inputs still held as of the reporting date is as follows (in millions): Real Estate Real Estate Limited Total Mortgage For the year ended December 31, 2012 $ 474.6 $ 444.1 $ 63.5 $ 982.2 $(14.8) For the year ended December 31, 2011 $ 864.2 $ 360.5 $ 41.5 $ 1,266.2 $(0.8) Note 7—Investments in Joint Ventures The Account owns interests in several real estate properties through joint ventures and receives distributions and allocations of profits and losses from the joint ventures based on the Account’s ownership interest in those investments. Several of these joint ventures have mortgage loans payable collateralized by the properties owned by the aforementioned joint ventures. At December 31, 2012, the Account held 15 investments in joint ventures with non-controlling ownership interest percentages that ranged from 33% to 85%. Certain joint ventures are subject to adjusted distribution percentages when earnings in the investment reach a pre-determined threshold. The Account’s equity in the joint ventures was $2.3 billion at December 31, 2012 and $1.6 billion at December 31, 2011, respectively. The Account’s most significant joint venture investment is the DDR joint venture which represented 2.6% of the Account’s net assets and 2.3% of the Account’s invested assets. The Account’s proportionate share of the mortgage loans payable within the joint venture investments at fair value was $1.8 billion at December 31, 2012 and $1.6 billion at December 31, 2011. The Account’s share in the outstanding principal of the mortgage loans payable within the joint ventures was $1.8 billion at December 31, 2012 and $1.6 billion at December 31, 2011, respectively. 174Prospectus ¡ TIAA Real Estate Account
FINANCIAL STATEMENTS continued
Properties
Joint
Ventures
Partnerships
Level 3
Investments
Loans
Payable
NOTES TO THE CONSOLIDATED A condensed summary of the financial position and results of operations of the joint ventures are shown below (in millions): December 31, 2012 December 31, 2011 Assets Real Estate properties, at fair value $6,495.4 $4,844.3 Other assets 181.5 128.9 Total assets $6,676.9 $4,973.2 Liabilities & Equity Mortgage Notes Payable, at fair value $2,656.0 $2,259.1 Other liabilities 82.8 83.6 Total liabilities 2,738.8 2,342.7 Equity 3,938.1 2,630.5 Total liabilities and equity $6,676.9 $4,973.2 Years Ended December 31, 2012 2011 2010 Operating Revenue and Expenses Revenues $478.9 $457.7 $466.5 Expenses 273.5 279.4 287.6 Excess of revenues over expenses $205.4 $178.3 $178.9 Principal payment schedule on mortgage loans payable within the joint ventures as of December 31, 2012 is as follows (in millions): Amount 2013 $481.9 2014 10.2 2015 939.3 2016 11.4 2017 572.2 Thereafter 609.2 Total maturities $2,624.2 Management of the Account monitors the financial position of the Account’s joint venture partners. To the extent that management of the Account determines that a joint venture partner has financial or liquidity concerns, management will evaluate all actions and remedies available to the Account under the applicable joint venture agreement to minimize any potential adverse implications to the Account. Note 8—Investments in Limited Partnerships The Account invests in limited partnerships, limited liability companies, and private real estate equity investment trusts that own real estate properties and real estate-related securities. The Account receives distributions from these TIAA Real Estate Account ¡Prospectus175
FINANCIAL STATEMENTS continued
NOTES TO THE CONSOLIDATED investments based on the Account’s ownership interest percentages. At December 31, 2012, the Account held interests in three limited partnerships, one limited liability company and one private real estate equity investment trust (all of which featured non-controlling ownership interests) with ownership interest percentages that ranged from 5.3% to 18.5%. Under the terms of the partnership agreements governing such investments, and based upon the expected term of each such partnership, the partnerships could engage in liquidation activities beginning in 2013 through 2017. During 2012 the Account’s investment in MONY/Transwestern Mezz RP II, LLC matured, as the remaining investment assets were paid back to the Account. The Account’s ownership interest in the remaining five investments was $339.8 million at December 31, 2012 and $307.5 million at December 31, 2011, which included the Account’s $2.8 million interest in MONY/Transwestern Mezz RP II, LLC. 176Prospectus ¡ TIAA Real Estate Account
FINANCIAL STATEMENTS continued
NOTES TO THE CONSOLIDATED Note 9—Mortgage Loans Payable At December 31, 2012, the Account had outstanding mortgage loans payable secured by the following properties (in millions): Property Interest Rate and Principal Amounts as of Maturity December 31, December 31, 1 & 7 Westferry Circus(1)(2)(5)(10) 5.40% paid quarterly $ 208.4 $ 203.9 February 28, 2013 Reserve at Sugarloaf(1)(5) 5.49% paid monthly 23.9 24.3 June 1, 2013 South Frisco Village 5.85% paid monthly 26.3 26.3 June 1, 2013 Fourth & Madison 6.40% paid monthly 145.0 145.0 August 21, 2013 1001 Pennsylvania Avenue 6.40% paid monthly 210.0 210.0 August 21, 2013 50 Fremont 6.40% paid monthly 135.0 135.0 August 21, 2013 Pacific Plaza(1)(5) 5.55% paid monthly 8.0 8.2 September 1, 2013 Wilshire Rodeo Plaza(5) 5.28% paid monthly 112.7 112.7 April 11, 2014 1401 H Street NW(1)(5) 5.97% paid monthly 110.8 112.3 December 7, 2014 Windsor at Lenox Park(5) 4.43% paid monthly 24.0 24.0 August 1, 2015 San Montego Apartments(5)(6) 4.47% paid monthly 21.8 21.8 August 1, 2015 Montecito Apartments(5)(6) 4.47% paid monthly 20.2 20.2 August 1, 2015 Phoenician Apartments(5)(6) 4.47% paid monthly 21.3 21.3 August 1, 2015 99 High Street 5.52% paid monthly 185.0 185.0 November 11, 2015 Lincoln Centre 5.51% paid monthly 153.0 153.0 February 1, 2016 Charleston Plaza 5.60% paid monthly 36.9 - September 11, 2016 The Legend at Kierland(5)(7) 4.97% paid monthly 21.8 21.8 August 1, 2017 The Tradition at Kierland(5)(7) 4.97% paid monthly 25.8 25.8 August 1, 2017 Mass Court(5) 2.88% paid monthly 92.6 - September 1, 2019 Red Canyon at Palomino Park(5)(8) 5.34% paid monthly 27.1 27.1 August 1, 2020 Green River at Palomino Park(5)(8) 5.34% paid monthly 33.2 33.2 August 1, 2020 Blue Ridge at Palomino Park(5)(8) 5.34% paid monthly 33.4 33.4 August 1, 2020 Ashford Meadows(5) 5.17% paid monthly 44.6 44.6 August 1, 2020 The Corner(5) 4.66% paid monthly 105.0 105.0 June 1, 2021 The Palatine(5) 4.25% paid monthly 80.0 80.0 January 10, 2022 The Forum at Carlsbad(5) 4.25% paid monthly 90.0 - March 1, 2022 The Colorado(5)(9) 3.69% paid monthly 91.7 84.3 November 1, 2022 The Legacy at Westwood(5)(9) 3.69% paid monthly 46.7 40.5 November 1, 2022 Regents Court(5)(9) 3.69% paid monthly 39.6 34.5 November 1, 2022 The Caruth(5)(9) 3.69% paid monthly 45.0 40.4 November 1, 2022 Publix at Weston Commons(5) 5.08% paid monthly 35.0 35.0 January 1, 2036 Total Principal Outstanding $ 2,253.8 $ 2,008.6 Fair Value Adjustment(4) 28.8 19.6 Total mortgage loans payable $ 2,282.6 $ 2,028.2 (1) The mortgage is adjusted monthly for principal payments. (2) The mortgage is denominated in British pounds and the principal payment had been converted to U.S. dollars using the exchange rate as of December 31, 2012. The interest rate is fixed. The cumulative foreign currency translation adjustment (since inception) was an unrealized gain of $14.5 million. (3) Interest rates are fixed, unless stated otherwise. TIAA Real Estate Account ¡Prospectus177
FINANCIAL STATEMENTS continued
Payment Frequency (3)
2012
2011
NOTES TO THE CONSOLIDATED (4) The fair value adjustment consists of the difference (positive or negative) between the principal amount of the outstanding debt and the fair value of the outstanding debt. See Note 1-Organization and Significant Accounting Policies. (5) These properties are each owned by separate wholly owned subsidiaries of TIAA for benefit of the Account. The assets and credit of each of these borrowings entities are not available to satisfy the debts and other obligations of the Account or any other entity or person other than such borrowing entity. (6) Represents mortgage loans payable on these individual properties which are held within the Houston Apartment Portfolio. (7) Represents mortgage loans payable on these individual properties which are held within the Kierland Apartment Portfolio. (8) Represents mortgage loans payable on these individual properties which are held within Palomino Park. (9) These mortgage loans were refinanced during the quarter ended December 31, 2012 into a 10-year loan with interest only due for the first 5 years and principal payments due thereafter. (10) Maturity date was extended to February 28, 2013 from the original maturity date of November 15, 2012. Principal payment schedule on mortgage loans payable as of December 31, 2012 is due as follows (in millions): Amount 2013 $ 758.8 2014 222.7 2015 273.1 2016 188.6 2017 51.8 Thereafter 758.8 Total maturities $ 2,253.8 178Prospectus ¡ TIAA Real Estate Account
FINANCIAL STATEMENTS continued
NOTES TO THE CONSOLIDATED Note 10—Financial Highlights Selected condensed financial information for an Accumulation Unit of the Account is presented below. Per Accumulation Unit data is calculated on average units outstanding. Years Ended December 31, 2012 2011 2010 2009 2008 PER ACCUMULATION UNIT DATA: Rental income $ 16.345 $ 17.224 $ 19.516 $ 22.649 $ 18.794 Real estate property level 9.059 8.640 9.987 11.193 9.190 Real estate income, net 7.286 8.584 9.529 11.456 9.604 Other income 2.178 2.143 2.214 2.778 3.808 Total income 9.464 10.727 11.743 14.234 13.412 Expense charges(1) 2.562 2.390 2.167 2.280 2.937 Investment income, net 6.902 8.337 9.576 11.954 10.475 Net realized and unrealized gain (loss) on investments and mortgage loans payable 18.013 20.144 16.143 (85.848 ) (54.541 ) Net increase (decrease) in Accumulation Unit Value 24.915 28.481 25.719 (73.894 ) (44.066 ) Accumulation Unit Value: Beginning of period 247.654 219.173 193.454 267.348 311.414 End of period $ 272.569 $ 247.654 $ 219.173 $ 193.454 $ 267.348 TOTAL RETURN 10.06 % 12.99 % 13.29 % -27.64 % -14.15 % RATIOS TO AVERAGE NET ASSETS: Expenses(1) 0.95 % 0.98 % 1.09 % 1.01 % 0.95 % Investment income, net 2.55 % 3.42 % 4.84 % 5.29 % 3.38 % Portfolio turnover rate: Real estate properties(2) 10.22 % 3.01 % 1.01 % 0.75 % 0.64 % Marketable securities(3) 21.92 % 3.43 % 19.18 % 0.00 % 25.67 % Accumulation Units outstanding at end of period (in millions) 53.3 53.4 48.1 39.5 41.5 Net assets end of period (in millions) $ 14,861.1 $ 13,527.2 $ 10,803.1 $ 7,879.9 $ 11,508.9 (1) Expense charges per Accumulation Unit and the Ratio of Expenses to average net assets reflect the year to date Account-level expenses and exclude real estate property level expenses which are included in real estate income, net. If the real estate property level expenses were included, the expense charge per Accumulation Unit for the year ended December 31, 2012 would be $11.621 ($11.026, $12.154, $13.473 and $12.127 for the years ended December 31, 2011, 2010, 2009 and 2008, respectively), and the Ratio of Expenses to average net assets for the year ended December 31, 2012 would be 4.29% (4.52%, 6.14%, 5.96% and 3.91% for the years ended December 31, 2011, 2010, 2009 and 2008, respectively). (2) Real estate investment portfolio turnover rate is calculated by dividing the lesser of purchases or sales of real estate property investments (including contributions to, or return of capital distributions received from, existing joint venture and limited partnership investments) by the average value of the portfolio of real estate investments held during the period. (3) Marketable securities portfolio turnover rate is calculated by dividing the lesser of purchases or sales of securities, excluding securities having maturity dates at acquisition of one year or less, by the average value of the portfolio securities held during the period. TIAA Real Estate Account ¡Prospectus179
FINANCIAL STATEMENTS continued
expenses and taxes
NOTES TO THE CONSOLIDATED Note 11—Accumulation Units Changes in the number of Accumulation Units outstanding were as follows (in millions): For The Years Ended 2012 2011 2010 Outstanding: Beginning of period 53.4 48.1 39.5 Credited for premiums 7.4 10.0 12.9 Liquidity units redeemed (See Note 3) (3.6 ) — — Annuity, other periodic payments, withdrawals and death benefits (3.9 ) (4.7 ) (4.3 ) End of period 53.3 53.4 48.1 Note 12—Commitments and Contingencies Commitments — The Account had $6.8 million and $26.1 million of outstanding immediately callable commitments to purchase additional interests in three of its limited partnership investments as of December 31, 2012 and 2011, respectively. The Account has committed a total of $90.2 million and $103.5 million as of December 31, 2012 and 2011, respectively, to various tenants for tenant improvements and leasing inducements. Contingencies —The Account is party to various claims and routine litigation arising in the ordinary course of business. Management of the Account does not believe the results of any such claims or litigation, individually, or in the aggregate, will have a material effect on the Account’s business, financial position, or results of operations. Note 13—New Accounting Pronouncements In May 2011, the FASB issued ASU No. 2011-04, “Amendments to Achieve Common Fair Value Measurements and Disclosure Requirements in U.S. GAAP and IFRSs”, with the intention to converge fair value standards between U.S. GAAP and International Financial Reporting Standards. This ASU is largely consistent with existing fair value measurement principles in U.S. GAAP, expands ASC 820’s existing disclosure requirements for fair value measurements and makes other amendments. The Account adopted ASU 2011-04 January 1, 2012. The adoption of this standard did not have an impact on the Account’s consolidated financial statements. SeeNote 6—Assets and Liabilities Measured at Fair Value on a Recurring Basisfor additional disclosures as a result of the adoption of this standard. 180Prospectus ¡ TIAA Real Estate Account
FINANCIAL STATEMENTS continued
NOTES TO THE CONSOLIDATED Note 14—Subsequent Events Palm Lakes Plaza — Margate, FL On January 30, 2013, a retail property located in Margate, Florida was sold by the Account’s Florida Retail Portfolio joint venture investment, in which the Account holds an 80% ownership interest. The Account’s portion of the net sales price was $11.8 million. 1 & 7 Westferry Circus — London, England On February 28, 2013 the Account sold an office property located in London, England for a net sales price of $193.1 million at which time the Account settled its outstanding obligations for the investment in the amount of $193.1 million. Phoenix Apartment Portfolio — Chandler, AZ On February 28, 2013 the Account sold a multi-family property investment located in Chandler, Arizona for a net sales price of $33.3 million. Marketable Securities During March 2013, the Account purchased $150.5 million of real estate-related securities. Development In January 2013, the Account executed a lease with the American subsidiary of a major global energy company for a new build-to-suit office building in Houston that is expected to be completed in 2015. The Account is currently estimating the approximate cost to develop the new office building to be $196.4 million. TIAA Real Estate Account ¡Prospectus181
FINANCIAL STATEMENTS continued
CONSOLIDATED STATEMENTS OF INVESTMENTS TIAA REAL ESTATE ACCOUNT ¡ DECEMBER 31, 2012 AND DECEMBER 31, 2011 Location/Description—Type Fair Value 2012 2011 REAL ESTATE PROPERTIES—61.8% AND 63.6% ARIZONA: Camelback Center—Office $ 32.6 $ 34.4 Kierland Apartment Portfolio—Apartments 114.1 (1) 104.2 (1) Phoenix Apartment Portfolio—Apartments 33.6 27.4 CALIFORNIA: 3 Hutton Centre Drive—Office 38.6 37.7 50 Fremont Street—Office 433.9 (1) 332.3 (1) 88 Kearny Street—Office 101.7 81.9 275 Battery Street—Office 241.0 210.5 Centerside I—Office — 40.7 Centre Pointe and Valley View—Industrial 30.5 22.6 Cerritos Industrial Park—Industrial 83.3 — Charleston Plaza—Retail 80.0 (1) — Great West Industrial Portfolio—Industrial 106.2 99.0 Larkspur Courts—Apartments 93.4 90.2 Northpark Village Square—Retail 41.4 40.6 Northern CA RA Industrial Portfolio—Industrial 45.3 44.2 Ontario Industrial Portfolio—Industrial 304.1 273.5 (1) Pacific Plaza—Office 75.7 (1) 61.7(1 ) Rancho Cucamonga Industrial Portfolio—Industrial 107.0 99.5 Regents Court—Apartments 81.6 (1) 68.0 (1) Southern CA RA Industrial Portfolio—Industrial 86.9 78.1 The Forum at Carlsbad—Retail 186.0 (1) 180.5 The Legacy at Westwood—Apartments 111.5 (1) 96.8 (1) Westcreek—Apartments 34.7 31.6 West Lake North Business Park—Office 46.3 43.6 Westwood Marketplace—Retail 108.1 97.0 Wilshire Rodeo Plaza—Office 171.0 (1) 166.1 (1) COLORADO: Palomino Park—Apartments 247.4(1 ) 214.7 (1) CONNECTICUT: Ten & Twenty Westport Road—Office 145.1 130.7 FLORIDA: 701 Brickell Avenue—Office 230.9 219.5 North 40 Office Complex—Office 28.6 29.7 Plantation Grove—Retail 10.3 9.9 Pointe on Tampa Bay—Office — 47.3 Publix at Weston Commons—Retail 52.0 (1) 46.6 (1) Quiet Waters at Coquina Lakes—Apartments 26.6 26.5 Seneca Industrial Park—Industrial 74.6 71.3 South Florida Apartment Portfolio—Apartments 79.7 71.6 Suncrest Village Shopping Center—Retail 11.4 12.2 The Fairways of Carolina—Apartments 25.1 24.5 The Residences at the Village of Merrick Park—Apartments 53.8 — Urban Centre—Office 105.5 97.9 Weston Business Center—Industrial 87.5 85.3 182Prospectus ¡ TIAA Real Estate Account
(Dollar values shown in millions)
CONSOLIDATED STATEMENTS OF INVESTMENTS continued TIAA REAL ESTATE ACCOUNT ¡ DECEMBER 31, 2012 AND DECEMBER 31, 2011 Location/Description—Type Fair Value 2012 2011 FRANCE: Printemps de L’Homme—Retail $ 209.2 $ 209.9 GEORGIA: Atlanta Industrial Portfolio—Industrial 42.5 43.7 Glenridge Walk—Apartments 37.6 35.2 Reserve at Sugarloaf—Apartments 43.0 (1) 45.9 (1) Shawnee Ridge Industrial Portfolio—Industrial 58.3 51.8 Windsor at Lenox Park—Apartments 55.0 (1) 53.2 (1) ILLINOIS: Chicago Caleast Industrial Portfolio—Industrial 58.3 56.7 Chicago Industrial Portfolio—Industrial 66.2 66.5 Parkview Plaza—Office 39.3 39.4 MARYLAND: Broadlands Business Park—Industrial — 27.9 GE Appliance East Coast Distribution Facility—Industrial — 34.3 The Shops at Wisconsin Place—Retail 96.3 — MASSACHUSETTS: 99 High Street—Office 386.2 (1) 326.3 (1) Needham Corporate Center—Office — 20.4 Northeast RA Industrial Portfolio—Industrial 28.1 27.0 Residence at Rivers Edge—Apartments 88.8 80.9 The Newbury—Office 289.9 293.8 NEVADA: Fernley Distribution Facility—Industrial 7.3 7.0 NEW JERSEY: Konica Photo Imaging Headquarters—Industrial 19.1 18.7 Marketfair—Retail 72.2 68.1 Plainsboro Plaza—Retail 23.5 25.5 South River Road Industrial—Industrial 47.4 45.9 NEW YORK: 425 Park Avenue—Ground Lease 330.0 320.0 780 Third Avenue—Office 335.4 340.2 The Colorado—Apartments 161.0 (1) 150.6 (1) The Corner—Apartments 228.0 (1) 215.0 (1) PENNSYLVANIA: Lincoln Woods—Apartments 31.0 30.9 The Pepper Building—Apartments 52.5 53.6 TENNESSEE: Airways Distribution Center—Industrial — 12.2 Summit Distribution Center—Industrial 19.6 15.4 TEXAS: Dallas Industrial Portfolio—Industrial 164.6 159.9 Four Oaks Place—Land 16.2 14.3 (8) Four Oaks Place—Building — 433.2 (8) Houston Apartment Portfolio—Apartments 244.4 (1) 206.7 (1) Lincoln Centre—Office 230.9 (1) 213.3 (1) TIAA Real Estate Account ¡Prospectus183
(Dollar values shown in millions)
CONSOLIDATED STATEMENTS OF INVESTMENTS continued TIAA REAL ESTATE ACCOUNT ¡ DECEMBER 31, 2012 AND DECEMBER 31, 2011 Location/Description—Type Fair Value 2012 2011 TEXAS:(continued) Pinnacle Industrial Portfolio—Industrial $ 42.0 $ 41.2 South Frisco Village—Retail 34.0 (1) 29.0 (1) The Caruth—Apartments 78.1 (1) 70.6 (1) The Maroneal—Apartments 48.5 43.1 UNITED KINGDOM: 1 & 7 Westferry Circus—Office 223.5 (1) 261.6 (1) VIRGINIA: 8270 Greensboro Drive—Office 34.0 34.2 Ashford Meadows Apartments—Apartments 100.3 (1) 101.3 (1) The Ellipse at Ballston—Office 78.3 82.9 The Palatine—Apartments 134.2 (1) 135.0 (1) WASHINGTON: Circa Green Lake—Apartments 84.0 — Creeksides at Centerpoint—Office 20.2 17.5 Fourth and Madison—Office 429.3 (1) 385.4 (1) Millennium Corporate Park—Office 139.4 127.9 Northwest RA Industrial Portfolio—Industrial 26.0 22.4 Pacific Corporate Park—Industrial 35.0 — Prescott Wallingford Apartments—Apartments 53.6 — Rainier Corporate Park—Industrial 88.5 75.4 Regal Logistics Campus—Industrial 69.5 61.4 WASHINGTON DC: 1001 Pennsylvania Avenue—Office 679.4 (1) 656.1 (1) 1401 H Street, NW—Office 211.3 (1) 205.9 (1) 1900 K Street, NW—Office 257.7 244.4 Mass Court—Apartments 169.0 (1) — Mazza Gallerie—Retail 70.0 69.1 TOTAL REAL ESTATE PROPERTIES (Cost $10,543.6 and $10,314.3) $ 10,554.6 $ 9,857.6 184Prospectus ¡ TIAA Real Estate Account
(Dollar values shown in millions)
CONSOLIDATED STATEMENTS OF INVESTMENTS continued TIAA REAL ESTATE ACCOUNT ¡ DECEMBER 31, 2012 AND DECEMBER 31, 2011 Location/Description Fair Value 2012 2011 OTHER REAL ESTATE-RELATED INVESTMENTS—15.4% REAL ESTATE JOINT VENTURES—13.4% AND 10.3% (Note 7) CALIFORNIA: CA-Colorado Center LP $ 228.4 (2) $ 199.8 (2) CA-Treat Towers LP 2.1 (5) 77.8 Valencia Town Center Associates LP 99.1 — FLORIDA: Florida Mall Associates, Ltd 386.2 (2) 284.3 (2) TREA Florida Retail, LLC 149.6 173.7 West Dade Associates 137.0 (2) 109.8 (2) GEORGIA: GA-Buckhead LLC 2.4 (5) 50.9 MARYLAND: WP Project Developer 14.6 — MASSACHUSETTS: MA-One Boston Place REIT 195.5 195.9 NEW YORK: RGM 42, LLC 282.0 (2) — TENNESSEE: West Town Mall, LLC 67.2 (2) 54.7 (2) TEXAS: Four Oaks Venture LP(8) 261.2 — VARIOUS: DDR TC LLC 386.3 (2,3) 338.4 (2,3) Storage Portfolio I, LLC 78.6 (2,3) 60.6 (2,3) Strategic Ind Portfolio I, LLC 1.3 (2,3,7) 45.5 (2,3) TOTAL REAL ESTATE JOINT VENTURES (Cost $2,287.6 and $1,895.8 ) $ 2,291.5 $ 1,591.4 TIAA Real Estate Account ¡Prospectus185
(Dollar values shown in millions)
and 12.3%
Colorado Center (50% Account Interest)(6)
Treat Towers (75% Account Interest)
Valencia Town Center (49.9% Account Interest)
The Florida Mall (50% Account Interest)
Florida Retail Portfolio (80% Account Interest)
Miami International Mall (50% Account Interest)
Prominence in Buckhead (75% Account Interest)
The Shops at Wisconsin Place (33.33% Account Interest)
One Boston Place (50.25% Account Interest)
MiMA (70% Account Interest)
West Town Mall (50% Account Interest)
Four Oaks Place LP (51% Account Interest)
DDR Joint Venture (85% Account Interest)
Storage Portfolio (75% Account Interest)
IDI Nationwide Industrial Portfolio (60% Account Interest)
CONSOLIDATED STATEMENTS OF INVESTMENTS continued TIAA REAL ESTATE ACCOUNT ¡ DECEMBER 31, 2012 AND DECEMBER 31, 2011 Location/Description Fair Value 2012 2011 LIMITED PARTNERSHIPS—2.0% AND 2.0% (Note 8) Cobalt Industrial REIT (10.998% Account Interest) $ 26.1 $ 25.7 Colony Realty Partners LP (5.27% Account Interest) 20.5 20.9 Heitman Value Partners Fund (8.43% Account Interest) 3.9 16.7 Lion Gables Apartment Fund (18.46% Account Interest) 258.0 225.4 MONY/Transwestern Mezz RP II (16.67% Account Interest) — 2.8 Transwestern Mezz Realty Partners III, LLC (11.708% Account Interest) 31.3 16.0 TOTAL LIMITED PARTNERSHIPS (Cost $266.2 and $297.5) $ 339.8 $ 307.5 TOTAL REAL ESTATE JOINT VENTURES AND LIMITED PARTNERSHIPS (Cost $2,553.8 and $2,193.3) $ 2,631.3 $ 1,898.9 186Prospectus ¡ TIAA Real Estate Account
(Dollar values shown in millions)
CONSOLIDATED STATEMENTS OF INVESTMENTS continued TIAA REAL ESTATE ACCOUNT ¡ DECEMBER 31, 2012 AND DECEMBER 31, 2011 Shares Issue Fair Value 2012 2011 2012 2011 MARKETABLE SECURITIES—22.8% AND 24.1% 111,782 92,462 Acadia Realty Trust $2.8 $1.9 30,210 25,960 Agree Realty Corporation 0.8 0.6 4,959 3,783 Alexander’s, Inc. 1.6 1.4 151,807 133,337 Alexandria Real Estate Equities, Inc. 10.5 9.2 94,923 88,603 American Assets Trust, Inc. 2.7 1.8 250,699 155,209 American Campus Communities, Inc. 11.6 6.5 376,970 — American Realty Capital Trust 4.4 — 944,789 — American Tower Corp. 73.0 — 346,913 264,043 Apartment Investment and Management Company 9.4 6.0 164,643 149,993 Ashford Hospitality Trust, Inc. 1.7 1.2 122,355 92,295 Associated Estates Realty Corporation 2.0 1.5 270,130 204,720 Avalonbay Communities, Inc. 36.6 26.7 366,497 307,597 BioMed Realty Trust, Inc. 7.1 5.6 356,885 315,964 Boston Properties, Inc. 37.8 31.5 346,409 294,369 Brandywine Realty Trust 4.2 2.8 182,748 164,258 BRE Properties, Inc. 9.3 8.3 200,136 154,216 Camden Property Trust 13.7 9.6 95,388 66,398 Campus Crest Communities, Inc. 1.2 0.7 160,579 150,899 CapLease, Inc. 0.9 0.6 383,657 320,397 CBL & Associates Properties, Inc. 8.1 5.0 183,285 152,815 Cedar Shopping Centers, Inc. 1.0 0.7 39,517 39,517 Chatham Lodging Trust 0.6 0.4 96,842 74,212 Chesapeake Lodging Trust 2.0 1.1 — 116,477 Cogdell Spencer, Inc. — 0.5 209,214 188,864 Colonial Properties Trust 4.5 3.9 54,983 48,303 CoreSite Realty Corporation 1.5 0.9 192,453 157,193 Corporate Office Properties Trust 4.8 3.3 253,566 239,606 Cousins Properties Incorporated 2.1 1.5 297,270 256,060 Cubesmart 4.3 2.7 631,210 533,880 DCT Industrial Trust, Inc. 4.1 2.7 737,598 597,828 Developers Diversified Realty Corporation 11.6 7.3 476,317 367,697 DiamondRock Hospitality Company 4.3 3.5 293,762 228,152 Digital Realty Trust, Inc. 19.9 15.2 249,384 205,213 Douglas Emmett, Inc. 5.8 3.7 655,776 542,036 Duke Realty Corporation 9.1 6.5 154,886 134,746 DuPont Fabros Technology, Inc. 3.7 3.3 69,659 59,989 EastGroup Properties, Inc. 3.7 2.6 277,561 158,681 Education Realty Trust, Inc. 3.0 1.6 99,898 87,088 Equity Lifestyle Properties, Inc. 6.7 5.8 139,076 127,616 Equity One, Inc. 2.9 2.2 773,034 633,670 Equity Residential 43.8 36.1 112,092 103,012 EPR Properties 5.2 4.5 86,689 72,619 Essex Property Trust, Inc. 12.7 10.2 90,725 65,065 Excel Trust, Inc. 1.1 0.8 260,722 207,842 Extra Space Storage, Inc. 9.5 5.0 TIAA Real Estate Account ¡Prospectus187
(Dollar values shown in millions)
CONSOLIDATED STATEMENTS OF INVESTMENTS continued TIAA REAL ESTATE ACCOUNT ¡ DECEMBER 31, 2012 AND DECEMBER 31, 2011 Shares Issue Fair Value 2012 2011 2012 2011 153,346 137,296 Federal Realty Investment Trust $16.0 $12.5 300,415 271,895 FelCor Lodging Trust Incorporated 1.4 0.8 237,873 191,213 First Industrial Realty Trust, Inc. 3.3 2.0 124,191 110,661 First Potomac Realty Trust 1.5 1.4 200,089 181,429 Franklin Street Properties Corp. 2.5 1.8 1,118,209 1,012,300 General Growth Properties, Inc. 22.2 15.2 61,368 56,458 Getty Realty Corp. 1.1 0.8 27,330 20,610 Gladstone Commercial Corporation 0.5 0.4 337,882 220,762 Glimcher Realty Trust 3.7 2.0 96,757 78,067 Government Properties Income Trust 2.3 1.8 1,078,709 874,526 HCP, Inc. 48.7 36.2 616,402 415,456 Health Care REIT, Inc. 37.8 22.7 111,500 — Healthcare Trust of America 1.1 — 209,252 160,772 Healthcare Realty Trust Incorporated 5.0 3.0 478,813 372,823 Hersha Hospitality Trust 2.4 1.8 184,529 155,319 Highwoods Properties, Inc. 6.2 4.6 121,160 103,500 Home Properties, Inc. 7.4 6.0 297,940 265,630 Hospitality Properties Trust 7.0 6.1 1,712,374 1,524,796 Host Hotels & Resorts, Inc. 26.8 22.5 198,258 180,198 HRPT Properties Trust 3.1 3.0 86,872 59,902 Hudson Pacific Properties, Inc. 1.8 0.8 220,139 198,739 Inland Real Estate Corporation 1.8 1.5 223,541 176,691 Investors Real Estate Trust 2.0 1.3 1,500,000 1,500,000 iShares Dow Jones US Real Estate Index Fund 97.1 85.2 177,253 129,963 Kilroy Realty Corporation 8.4 4.9 966,453 879,374 Kimco Realty Corporation 18.7 14.3 172,013 146,123 Kite Realty Group Trust 1.0 0.7 204,562 181,102 LaSalle Hotel Properties 5.2 4.4 423,245 345,585 Lexington Realty Trust 4.4 2.6 280,060 251,650 Liberty Property Trust 10.0 7.8 73,286 68,836 LTC Properties, Inc. 2.6 2.1 208,783 189,553 Mack-Cali Realty Corporation 5.5 5.1 141,919 114,299 Maguire Properties, Inc. 0.4 0.2 327,007 247,227 Medical Properties Trust, Inc. 3.9 2.4 99,184 81,264 Mid-America Apartment Communities, Inc. 6.4 5.1 — 36,864 Mission West Properties, Inc. — 0.3 108,037 81,077 Monmouth Real Estate Investment Corporation 1.1 0.7 66,724 63,644 National Health Investors, Inc. 3.8 2.8 262,980 216,060 National Retail Properties, Inc. 8.2 5.7 263,613 226,273 Omega Healthcare Investors, Inc. 6.3 4.4 40,857 38,237 One Liberty Properties, Inc. 0.8 0.6 83,079 52,329 Parkway Properties, Inc. 1.2 0.5 144,447 113,497 Pebblebrook Hotel Trust 3.3 2.2 136,245 122,245 Pennsylvania Real Estate Investment Trust 2.4 1.3 400,132 379,392 Piedmont Office Realty Trust, Inc. 7.2 6.5 387,897 351,127 Plum Creek Timber Company, Inc. 17.2 12.8 129,083 106,883 Post Properties, Inc. 6.5 4.7 188Prospectus ¡ TIAA Real Estate Account
(Dollar values shown in millions)
CONSOLIDATED STATEMENTS OF INVESTMENTS continued TIAA REAL ESTATE ACCOUNT ¡ DECEMBER 31, 2012 AND DECEMBER 31, 2011 Shares Issue Fair Value 2012 2011 2012 2011 98,748 88,608 Potlatch Corporation $ 3.9 $ 2.8 1,092,281 990,211 ProLogis 39.9 28.3 42,980 41,980 PS Business Parks, Inc. 2.8 2.3 303,799 275,476 Public Storage, Inc. 44.0 37.0 115,370 87,600 Ramco-Gershenson Properties Trust 1.5 0.9 291,439 261,199 Rayonier, Inc. 15.1 11.7 316,623 279,343 Realty Income Corporation 12.7 9.8 126,316 93,946 Retail Opportunity Investment 1.6 1.1 315,375 — Retail Properties of America 3.8 — 213,778 197,908 Regency Centers Corporation 10.1 7.4 251,880 177,170 RLJ Lodging Trust 4.9 3.0 60,523 — Rouse Properties, Inc. 1.0 — 38,426 33,036 Saul Centers, Inc. 1.7 1.2 46,820 — Select Income Real Estate Investment Trust 1.2 — 420,127 330,697 Senior Housing Properties Trust 9.9 7.4 731,366 632,140 Simon Property Group, Inc. 115.6 81.6 214,765 183,739 SL Green Realty Corp. 16.5 12.3 70,949 61,829 Sovran Self Storage, Inc. 4.4 2.6 79,685 — Spirit Realty Capital Inc. 1.4 — 86,560 20,050 Stag Industrial, Inc. 1.6 0.2 495,039 385,489 Strategic Hotels & Resorts, Inc. 3.2 2.1 114,628 59,168 Summit Hotel Properties, Inc. 1.1 0.6 71,926 46,326 Sun Communities, Inc. 2.9 1.7 89,143 60,363 Sun Healthcare Group, Inc. 1.9 0.7 328,016 262,606 Sunstone Hotel Investors, L.L.C. 3.5 2.1 223,024 178,864 Tanger Factory Outlet Centers, Inc. 7.6 5.2 147,289 126,129 Taubman Centers, Inc. 11.6 7.8 36,064 16,174 Terreno Realty Corporation 0.6 0.2 325,632 286,812 The Macerich Company 19.0 14.5 596,001 472,751 UDR, Inc. 14.2 11.9 31,724 21,414 UMH Properties, Inc. 0.3 0.2 31,418 27,258 Universal Health Realty Income Trust 1.6 1.1 56,293 50,503 Urstadt Biddle Properties, Inc. 1.1 0.9 700,308 619,340 Ventas, Inc. 45.3 34.1 443,493 396,923 Vornado Realty Trust 35.5 30.5 160,177 145,677 Washington Real Estate Investment Trust 4.2 4.0 288,060 262,970 Weingarten Realty Investors 7.7 5.8 1,289,368 1,164,958 Weyerhaeuser Company 35.9 21.8 26,270 — Whitestone Real Estate Investment Trust B 0.4 — 66,697 53,117 Winthrop Realty Trust 0.7 0.7 114,000 — WP Carey Inc. 5.9 — TOTAL REAL ESTATE EQUITY SECURITIES (Cost $1,175.7 and $895.3) $1,332.3 $927.9 TIAA Real Estate Account ¡Prospectus189
(Dollar values shown in millions)
CONSOLIDATED STATEMENTS OF INVESTMENTS continued TIAA REAL ESTATE ACCOUNT ¡ DECEMBER 31, 2012 AND DECEMBER 31, 2011 Principal Issuer Yield(4) Maturity Fair Value 2012 2011 2012 2011 OTHER MARKETABLE SECURITIES—15.0% AND 18.1% $ — $ 36.9 Fannie Mae Discount Notes 0.051% 1/3/12 $ — $ 36.9 — 4.5 Fannie Mae Discount Notes 0.030% 1/4/12 — 4.5 — 40.0 Fannie Mae Discount Notes 0.035% 1/25/12 — 40.0 — 41.3 Fannie Mae Discount Notes 0.025%–0.051% 2/8/12 — 41.3 — 18.1 Fannie Mae Discount Notes 0.030% 2/13/12 — 18.1 — 25.3 Fannie Mae Discount Notes 0.015% 3/8/12 — 25.3 — 12.0 Fannie Mae Discount Notes 0.061% 5/2/12 — 12.0 — 50.0 Fannie Mae Discount Notes 0.152% 5/3/12 — 50.0 — 56.2 Fannie Mae Discount Notes 0.061%–0.066% 5/21/12 — 56.2 — 48.6 Fannie Mae Discount Notes 0.071% 5/30/12 — 48.6 — 24.2 Fannie Mae Discount Notes 0.066% 6/6/12 — 24.2 — 30.2 Fannie Mae Discount Notes 0.137%–0.142% 7/16/12 — 30.2 12.0 — Fannie Mae Discount Notes 0.122% 1/2/13 12.0 — 44.0 — Fannie Mae Discount Notes 0.086% 1/16/13 44.0 — 20.5 — Fannie Mae Discount Notes 0.122% 1/30/13 20.5 — 45.2 — Fannie Mae Discount Notes 0.137% 2/6/13 45.1 — 26.8 — Fannie Mae Discount Notes 0.127% 2/27/13 26.8 — 25.0 — Fannie Mae Discount Notes 0.130% 3/13/13 25.0 — 10.0 — Fannie Mae Discount Notes 0.142% 3/20/13 10.0 — 100.0 — Fannie Mae Discount Notes 0.149% 6/12/13 100.0 — — 17.0 Federal Farm Credit Bank Discount Notes 0.010% 1/3/12 — 17.0 13.0 — Federal Farm Credit Bank Discount Notes 0.091% 5/6/13 13.0 — — 38.0 Federal Home Loan Bank Discount Notes 0.020% 1/6/12 — 38.0 — 20.0 Federal Home Loan Bank Discount Notes 0.010%–0.154% 1/13/12 — 20.0 — 50.0 Federal Home Loan Bank Discount Notes 0.046% 1/13/12 — 50.0 — 48.0 Federal Home Loan Bank Discount Notes 0.051% 1/18/12 — 48.0 — 25.2 Federal Home Loan Bank Discount Notes 0.015%–0.030% 1/20/12 — 25.2 — 13.3 Federal Home Loan Bank Discount Notes 0.011% 1/27/12 — 13.3 — 50.0 Federal Home Loan Bank Discount Notes 0.035% 2/1/12 — 50.0 — 42.2 Federal Home Loan Bank Discount Notes 0.035% 2/3/12 — 42.2 — 70.1 Federal Home Loan Bank Discount Notes 0.025%–0.030% 2/10/12 — 70.1 — 19.4 Federal Home Loan Bank Discount Notes 0.025% 2/13/12 — 19.4 — 60.0 Federal Home Loan Bank Discount Notes 0.030%–0.071% 2/17/12 — 60.0 — 7.2 Federal Home Loan Bank Discount Notes 0.071% 2/24/12 — 7.2 — 16.1 Federal Home Loan Bank Discount Notes 0.112% 3/7/12 — 16.1 — 34.4 Federal Home Loan Bank Discount Notes 0.025% 3/21/12 — 34.4 — 19.2 Federal Home Loan Bank Discount Notes 0.071% 3/28/12 — 19.2 — 45.7 Federal Home Loan Bank Discount Notes 0.091% 4/4/12 — 45.7 — 21.0 Federal Home Loan Bank Discount Notes 0.076% 5/9/12 — 21.0 — 47.6 Federal Home Loan Bank Discount Notes 0.056%–0.081% 5/18/12 — 47.6 — 50.0 Federal Home Loan Bank Discount Notes 0.081% 5/23/12 — 50.0 — 9.0 Federal Home Loan Bank Discount Notes 0.101% 7/11/12 — 9.0 29.3 — Federal Home Loan Bank Discount Notes 0.117% 1/4/13 29.3 — 50.0 — Federal Home Loan Bank Discount Notes 0.106% 1/9/13 50.0 — 16.5 — Federal Home Loan Bank Discount Notes 0.137% 1/11/13 16.5 — 190Prospectus ¡ TIAA Real Estate Account
(Dollar values shown in millions)
Date
GOVERNMENT AGENCY NOTES—8.0% AND 10.0%
CONSOLIDATED STATEMENTS OF INVESTMENTS continued TIAA REAL ESTATE ACCOUNT ¡ DECEMBER 31, 2012 AND DECEMBER 31, 2011 Principal Issuer Yield(4) Maturity Fair Value 2012 2011 2012 2011 $ 8.0 $ — Federal Home Loan Bank Discount Notes 0.132% 1/16/13 $ 8.0 $ — 41.9 — Federal Home Loan Bank Discount Notes 0.157% 1/23/13 41.9 — 29.0 — Federal Home Loan Bank Discount Notes 0.142% 1/23/13 29.0 — 50.0 — Federal Home Loan Bank Discount Notes 0.142% 2/13/13 50.0 — 19.4 — Federal Home Loan Bank Discount Notes 0.137% 2/20/13 19.4 — 56.0 — Federal Home Loan Bank Discount Notes 0.127% 2/22/13 56.0 — 80.0 — Federal Home Loan Bank Discount Notes 0.127% 3/1/13 80.0 — 57.0 — Federal Home Loan Bank Discount Notes 0.112% 3/6/13 57.0 — 17.1 — Federal Home Loan Bank Discount Notes 0.117% 3/13/13 17.1 — 41.6 — Federal Home Loan Bank Discount Notes 0.147% 5/3/13 41.5 — 11.5 — Federal Home Loan Bank Discount Notes 0.157% 5/10/13 11.5 — 52.7 — Federal Home Loan Bank Discount Notes 0.157%–0.162% 5/29/13 52.7 — 50.0 — Federal Home Loan Bank Discount Notes 0.127% 6/19/13 50.0 — — 50.0 Freddie Mac Discount Notes 0.041% 1/9/12 — 50.0 — 37.0 Freddie Mac Discount Notes 0.046% 1/17/12 — 37.0 — 29.5 Freddie Mac Discount Notes 0.035% 1/30/12 — 29.5 — 20.0 Freddie Mac Discount Notes 0.051% 2/14/12 — 20.0 — 42.9 Freddie Mac Discount Notes 0.061%–0.101% 2/21/12 — 42.9 — 27.3 Freddie Mac Discount Notes 0.020% 3/5/12 — 27.3 — 9.5 Freddie Mac Discount Notes 0.035% 3/9/12 — 9.5 — 17.5 Freddie Mac Discount Notes 0.035% 3/13/12 — 17.5 — 25.5 Freddie Mac Discount Notes 0.081%–0.091% 3/19/12 — 25.5 — 21.2 Freddie Mac Discount Notes 0.086% 4/3/12 — 21.2 — 35.2 Freddie Mac Discount Notes 0.096% 4/9/12 — 35.2 — 21.3 Freddie Mac Discount Notes 0.094% 4/10/12 — 21.3 — 20.2 Freddie Mac Discount Notes 0.066% 4/16/12 — 20.2 — 23.2 Freddie Mac Discount Notes 0.076% 5/7/12 — 23.2 — 5.7 Freddie Mac Discount Notes 0.081% 5/14/12 — 5.7 — 13.5 Freddie Mac Discount Notes 0.081% 5/29/12 — 13.5 — 29.6 Freddie Mac Discount Notes 0.071% 6/4/12 — 29.6 — 11.0 Freddie Mac Discount Notes 0.076% 6/11/12 — 11.0 — 20.9 Freddie Mac Discount Notes 0.071% 6/18/12 — 20.8 22.3 — Freddie Mac Discount Notes 0.178% 1/3/13 22.3 — 17.1 — Freddie Mac Discount Notes 0.173% 1/7/13 17.1 — 37.6 — Freddie Mac Discount Notes 0.152% 1/14/13 37.6 — 74.0 — Freddie Mac Discount Notes 0.142% 1/22/13 74.0 — 50.0 — Freddie Mac Discount Notes 0.132% 2/11/13 50.0 — 44.4 — Freddie Mac Discount Notes 0.117%–0.122% 2/19/13 44.4 — 44.0 — Freddie Mac Discount Notes 0.127% 2/25/13 44.0 — 14.0 — Freddie Mac Discount Notes 0.127% 2/27/13 14.0 — 50.0 — Freddie Mac Discount Notes 0.152% 3/12/13 50.0 — 19.9 — Freddie Mac Discount Notes 0.132% 3/18/13 19.9 — 25.0 — Freddie Mac Discount Notes 0.137% 4/1/13 25.0 — 25.1 — Freddie Mac Discount Notes 0.132% 4/3/13 25.0 — 50.0 — Freddie Mac Discount Notes 0.152% 4/17/13 50.0 — TOTAL GOVERNMENT AGENCY NOTES (Cost $1,379.4 and $1,551.5) $ 1,379.6 $ 1,551.6 TIAA Real Estate Account ¡Prospectus191
(Dollar values shown in millions)
Date
CONSOLIDATED STATEMENTS OF INVESTMENTS continued TIAA REAL ESTATE ACCOUNT ¡ DECEMBER 31, 2012 AND DECEMBER 31, 2011 Principal Issuer Yield(4) Maturity Fair Value 2012 2011 2012 2011 UNITED STATES TREASURY SECURITIES—7.0% AND 8.1% $ — $ 19.9 United States Treasury Bills 0.020% 3/1/12 $ — $ 19.9 — 3.1 United States Treasury Bills 0.030% 3/8/12 — 3.1 — 50.0 United States Treasury Bills 0.037% 3/22/12 — 50.0 — 40.3 United States Treasury Bills 0.020%–0.032% 3/29/12 — 40.3 — 60.8 United States Treasury Bills 0.020%–0.031% 4/19/12 — 60.8 — 20.0 United States Treasury Bills 0.042% 5/3/12 — 20.0 — 50.0 United States Treasury Bills 0.020% 5/10/12 — 50.0 — 82.0 United States Treasury Bills 0.020%–0.035% 5/17/12 — 82.0 — 23.4 United States Treasury Bills 0.025% 5/24/12 — 23.4 — 40.0 United States Treasury Bills 0.020% 5/31/12 — 40.0 — 40.0 United States Treasury Bills 0.056% 8/23/12 — 40.0 — 80.0 United States Treasury Bills 0.087% 11/15/12 — 79.9 50.0 — United States Treasury Bills 0.074%–0.103% 1/10/13 50.0 — 48.0 — United States Treasury Bills 0.084%–0.132% 1/17/13 48.0 — 1.5 — United States Treasury Bills 0.135% 1/31/13 1.5 — 97.5 — United States Treasury Bills 0.122%–0.153% 2/7/13 97.5 — 50.0 — United States Treasury Bills 0.104% 2/21/13 50.0 — 30.7 — United States Treasury Bills 0.128% 3/7/13 30.7 — 39.1 — United States Treasury Bills 0.086%–0.135% 3/14/13 39.1 — 51.0 — United States Treasury Bills 0.050%–0.143% 3/21/13 51.0 — 50.0 — United States Treasury Bills 0.144% 3/28/13 50.0 — 2.0 — United States Treasury Bills 0.106% 4/4/13 2.0 — 50.0 — United States Treasury Bills 0.122% 4/11/13 50.0 — 30.0 — United States Treasury Bills 0.112% 4/18/13 30.0 — 50.0 — United States Treasury Bills 0.116% 4/25/13 50.0 — 16.5 — United States Treasury Bills 0.080% 5/2/13 16.5 — 22.0 — United States Treasury Bills 0.091% 5/16/13 22.0 — 13.0 — United States Treasury Bills 0.107%–0.135% 6/6/13 13.0 — 20.5 — United States Treasury Bills 0.115% 6/20/13 20.5 — — 50.0 United States Treasury Notes 0.259% 1/15/12 — 50.0 — 11.5 United States Treasury Notes 0.024% 1/31/12 — 11.5 — 20.0 United States Treasury Notes 0.345% 2/15/12 — 20.0 — 30.6 United States Treasury Notes 0.138% 2/29/12 — 30.6 — 15.0 United States Treasury Notes 0.078% 3/15/12 — 15.0 — 9.9 United States Treasury Notes 0.040%–0.264% 3/31/12 — 10.0 — 50.0 United States Treasury Notes 0.094% 4/30/12 — 50.2 — 47.5 United States Treasury Notes 0.111%–0.156% 5/15/12 — 47.6 — 100.0 United States Treasury Notes 0.030%–0.119% 5/31/12 — 100.3 — 68.0 United States Treasury Notes 0.102%–0.106% 6/15/12 — 68.5 — 80.7 United States Treasury Notes 0.107%-0.133% 7/31/12 — 81.0 — 47.7 United States Treasury Notes 0.111%–0.156% 8/15/12 — 48.2 — 46.6 United States Treasury Notes 0.105%–0.149% 8/31/12 — 46.6 — 50.0 United States Treasury Notes 0.085% 10/15/12 — 50.5 — 61.5 United States Treasury Notes 0.181%–0.144% 10/31/12 — 61.6 — 50.0 United States Treasury Notes 0.152% 11/30/12 — 50.2 50.0 — United States Treasury Notes 0.162% 1/15/13 50.0 — 192Prospectus ¡ TIAA Real Estate Account
(Dollar values shown in millions)
Date
CONSOLIDATED STATEMENTS OF INVESTMENTS continued TIAA REAL ESTATE ACCOUNT ¡ DECEMBER 31, 2012 AND DECEMBER 31, 2011 Principal Issuer Yield(4) Maturity Fair Value 2012 2011 2012 2011 $ 58.4 $ — United States Treasury Notes 0.172%–0.174% 1/31/13 $ 58.4 $ — 44.7 — United States Treasury Notes 0.163% 2/15/13 44.8 — 20.6 — United States Treasury Notes 0.198% 2/28/13 20.6 — 39.4 — United States Treasury Notes 0.201% 3/31/13 39.4 — 50.0 — United States Treasury Notes 0.161% 4/15/13 50.3 — 28.4 — United States Treasury Notes 0.174% 4/30/13 28.4 — 52.8 — United States Treasury Notes 0.169%–0.174% 5/15/13 53.0 — 30.0 — United States Treasury Notes 0.201% 5/31/13 30.1 — 50.0 — United States Treasury Notes 0.160% 7/15/13 50.2 — 50.0 — United States Treasury Notes 0.181% 7/31/13 50.1 — 50.0 — United States Treasury Notes 0.182% 8/15/13 50.2 — 39.3 — United States Treasury Notes 0.200% 9/30/13 39.3 — 3.5 — United States Treasury Notes 0.156%–0.209% 10/15/13 3.5 — TOTAL UNITED STATES TREASURY SECURITIES (Cost $1,189.9 and $1,251.1) $ 1,190.1 $ 1,251.2 TOTAL OTHER MARKETABLE SECURITIES (Cost $2,569.3 and $2,802.6) $ 2,569.7 $ 2,802.8 TOTAL MARKETABLE SECURITIES (Cost $3,745.0 and $3,697.9) $ 3,902.0 $ 3,730.7 TOTAL INVESTMENTS (Cost $16,842.4 and $16,205.5) $ 17,087.9 $ 15,487.2 (1) The investment has a mortgage loan payable outstanding, as indicated in Note 9. (2) The fair market value reflects the Account’s interest in the joint venture and is net of debt. (3) Properties within this investment are located throughout the United States. (4) Yield represents the annualized yield at the date of purchase. (5) The fair market value reflects the final settlement due to the Account. The property investment held within the joint venture was sold during the quarter ended September 30, 2012. (6) Investment was formerly named Yahoo Center. (7) The fair market value reflects the final settlement due to the Account. The property investment held within the joint venture was sold during the quarter ended December 31, 2012. (8) During November 2012, the Account contributed assets from the Four Oaks Place investment into a joint venture property investment, Four Oaks Place LP. TIAA Real Estate Account ¡Prospectus193
(Dollar values shown in millions)
Date
REPORT OF INDEPENDENT REGISTERED To the Participants of the TIAA Real Estate Account and the Board of Trustees of Teachers Insurance and Annuity Association of America: In our opinion, the accompanying consolidated statements of assets and liabilities, including the consolidated statements of investments, and the related consolidated statements of operations, of changes in net assets and of cash flows, present fairly, in all material respects, the financial position of the TIAA Real Estate Account and its subsidiaries (the “Account”) at December 31, 2012 and 2011, the results of their operations, the changes in their net assets and their cash flows for each of the three years in the period ended December 31, 2012 in conformity with accounting principles generally accepted in the United States of America. These financial statements are the responsibility of the Account’s management. Our responsibility is to express an opinion on these financial statements based on our audits. We conducted our audits of these financial statements in accordance with the standards of the Public Company Accounting Oversight Board (United States). Those standards require that we plan and perform the audit to obtain reasonable assurance about whether the financial statements are free of material misstatement. An audit includes examining, on a test basis, evidence supporting the amounts and disclosures in the financial statements, assessing the accounting principles used and significant estimates made by management, and evaluating the overall financial statement presentation. We believe that our audits provide a reasonable basis for our opinion.
PUBLIC ACCOUNTING FIRM
PricewaterhouseCoopers LLP
Charlotte, North Carolina
March 14, 2013
194Prospectus ¡ TIAA Real Estate Account
PRO FORMA CONDENSED STATEMENT OF TIAA REAL ESTATE ACCOUNT (in millions) As of December 31, 2012 Historical Adjustments Pro Forma ASSETS Real estate properties and Real estate joint ventures and limited partnerships, at value $ 13,185.9 — $ 13,185.9 Marketable securities 3,902.0 — 3,902.0 Other 290.7 — 290.7 TOTAL ASSETS 17,378.6 — 17,378.6 Mortgage notes payable 2,282.6 — 2,282.6 Accrued real estate property level 10.6 — 10.6 Due to investment advisor expenses and taxes 185.8 — 185.8 Other 38.5 — 38.5 TOTAL LIABILITIES 2,517.5 — 2,517.5 NET ASSETS $ 14,861.1 — $ 14,861.1 PRO FORMA CONDENSED STATEMENT OF OPERATIONS(UNAUDITED) TIAA REAL ESTATE ACCOUNT For the Year Ended December 31, 2012 Historical Adjustments Pro Forma Rental income $ 872.0 $ 24.4 (a) $ 896.4 Operating expenses 218.2 4.4 (a) 222.6 Real estate taxes 119.1 2.1 (a) 121.2 Interest expense 146.0 2.0 (b) 148.0 Total real estate property expenses and taxes 483.3 8.5 491.8 Real estate income, net 388.7 15.9 404.6 Income from real estate joint ventures and limited partnerships 80.9 20.6 101.5 Interest and dividends 35.3 — 35.3 TOTAL INCOME, NET 504.9 36.5 541.4 EXPENSES 136.7 4.0 (c) 140.7 INVESTMENT INCOME, NET 368.2 32.5 400.7 REALIZED AND UNREALIZED GAINS 1,011.2 — 1,011.2 NET INCREASE IN NET ASSETS RESULTING FROM OPERATIONS $ 1,379.4 $ 32.5 $ 1,411.9 TIAA Real Estate Account ¡Prospectus195
ASSETS AND LIABILITIES(UNAUDITED)
NOTES TO PRO FORMA CONDENSED FINANCIAL TIAA REAL ESTATE ACCOUNT Note 1—Purpose and Assumptions As required by the Securities and Exchange Commission under Regulation S-X Article 11-01(5), these pro forma condensed financial statements of the TIAA Real Estate Account (“Account”) have been prepared because the Account has made significant purchases of real estate property investments during the period from January 1, 2012 through the date of this prospectus. During 2012, the Account purchased eight property investments: two retail properties, four apartment properties, and two industrial properties. In addition, the Account invested in four joint venture investments: two retail properties, one apartment and one office property. Various assumptions have been made in order to prepare these pro forma condensed financial statements. The pro forma condensed statement of operations for the year ended December 31, 2012 has been prepared assuming real estate property investments purchased during the period from January 1, 2012 through the date of this prospectus were purchased as of January 1, 2012. Note 2—Pro Forma Adjustments The following pro forma adjustments were made in preparing the pro forma condensed financial statements to reflect the purpose described in Note 1. Pro forma Condensed Statement of Operations: (a) To record the rental income and real estate property level expenses of the real estate properties purchased during the period from January 1, 2012 through the date of this prospectus, assuming such properties were owned for the entire year ended December 31, 2012. (b) To record interest expense on loans assumed related to purchased investments. (c) To record additional investment advisory expense charges which would have been incurred during the year ended December 31, 2012, based on the gross investment amounts involved and assuming the real estate property investments purchased during the period from January 1, 2012 through the date of this prospectus had been purchased as of January 1, 2012. 196Prospectus ¡ TIAA Real Estate Account
STATEMENTS(UNAUDITED)
SHOPS AT WISCONSIN PLACE, CHEVY CHASE, MARYLAND INDEPENDENT AUDITORS’ REPORT To the Management of We have audited the accompanying statement of revenues and certain expenses of Shops at Wisconsin Place, Chevy Chase, Maryland (the “Property”), as described in Note A, for the year ended December 31, 2011. This financial statement is the responsibility of the Property’s management. Our responsibility is to express an opinion on this financial statement based on our audit. We conducted our audit in accordance with auditing standards generally accepted in the United States of America. Those standards require that we plan and perform the audit to obtain reasonable assurance about whether the financial statements are free of material misstatement. An audit includes examining, on a test basis, evidence supporting the amounts and disclosures in the financial statements. An audit also includes assessing the accounting principles used and significant estimates made by management, as well as evaluating the overall financial statement presentation. We believe that our audit provides a reasonable basis for our opinion. The accompanying statement of revenues and certain expenses was prepared for the purpose of complying with Rule 3-14 of Securities and Exchange Commission Regulation S-X and, as described in Note A, is not intended to be a complete presentation of the Property’s revenues and expenses. In our opinion, the financial statement referred to above presents fairly, in all material respects, the revenues and certain expenses of the Property for the year ended December 31, 2011, in conformity with accounting principles generally accepted in the United States of America. Aarons Grant & Habif, LLC March 8, 2012 TIAA Real Estate Account ¡Prospectus197
Teachers Insurance and Annuity Association of America
On behalf of the TIAA Real Estate Account
SHOPS AT WISCONSIN PLACE, CHEVY CHASE, MARYLAND STATEMENTS OF REVENUES AND CERTAIN EXPENSES For The For The REVENUES Rental income $ 5,757,840 $ 479,803 Escalation income 1,369,145 101,177 Other operating income 320,363 39,094 Loss from investment in joint venture (721,381 ) (74,200 ) Total revenues 6,725,967 545,874 CERTAIN EXPENSES Advertising 103,498 7,131 General and administrative 291,470 18,548 Insurance 42,502 4,246 Management fees 387,818 32,691 Real estate taxes 387,295 34,781 Repairs and maintenance 367,266 26,600 Security expense 327,831 24,548 Utilities 320,890 25,908 Total certain expenses 2,228,570 174,453 Revenues in excess of certain expenses $ 4,497,397 $ 371,421 See Independent Auditors’ Report and Accompanying Notes NOTES TO STATEMENTS OF REVENUES AND CERTAIN EXPENSES Note A—Organization and Basis of Presentation The statement of revenues and certain expenses (the “financial statement”) for the year ended December 31, 2011 relates to the operations of Shops at Wisconsin Place (the “Property”). The Property includes 118,442 square feet of rentable retail space and a 33.33% ownership interest in the parking and common areas within a mixed-use office, retail and residential complex. The parking and common areas associated with the entire complex are owned by a separate legal entity. The Property, located in Chevy Chase, Maryland, was approximately 99% leased at December 31, 2011 and January 31, 2012. The accompanying financial statement is presented in conformity with Rule 3-14 of Securities and Exchange Commission Regulation S-X. Accordingly, the financial statement is not representative of the actual operations for the periods presented, as certain expenses, which may not be comparable to the expenses expected to be incurred in the future operations of the Property, have been excluded. Expenses excluded consist of interest, depreciation and amortization, state income tax and certain other expenses not directly related to the future operations of the Property. The statement of revenue and certain expenses for the period ended January 31, 2012 is unaudited. However, in the opinion of management, all adjustments (consisting solely of normal recurring adjustments) necessary for 198Prospectus ¡ TIAA Real Estate Account See Independent Auditors’ Report
Year Ended
December 31, 2011
(Audited)
Period Ended
January 31, 2012
(Unaudited)
the fair presentation of this statement of revenues and certain expenses for the interim period on the basis described above have been included. The results for such an interim period are not necessarily indicative of the results for the entire year. Note B—Summary of Significant Accounting Policies Use of estimates The preparation of this financial statement in conformity with accounting principles generally accepted in the United States requires management to make estimates and assumptions that affect various amounts reported in the financial statement and accompanying notes. Actual results could differ from those estimates. Revenue recognition Rental income from the operating leases, which includes scheduled increases over the lease term, is recognized on a straight-line basis. For the year ended December 31, 2011 and the period ended January 31, 2012, income recognized on a straight-line basis is less than income that would have accrued in accordance with the lease terms by approximately $132,405 and $8,447, respectively. Investment in unconsolidated joint venture Ownership of the Property also includes a 33.33% equity interest in WP Project Developer, LLC (“Developer LLC”), which owns 100% of the parking and common areas associated with the entire complex. Net income or loss from the investment is recognized in accordance with Property’s interest in the respective operating components owned by Developer LLC. The Property accounts for its noncontrolling interest in Developer LLC using the equity method of accounting. The Property’s loss from its equity investment in Developer LLC for the year ended December 31, 2011 and the period ended January 31, 2012 was $721,381 and $74,200, respectively. Note C—Future Rental Income Available space in the Property is leased to tenants under non-cancellable operating leases that expire on various dates through January 2030. The leases provide for increases in future minimum rental payments as well as contingent rents based on revenues in excess of specified amounts. Also, the leases require reimbursement of common area maintenance charges, certain operating expenses, and real estate taxes. See Independent Auditors’ Report TIAA Real Estate Account ¡Prospectus199
The minimum future rental income from these leases as of December 31, 2011 is as follows: 2012 $ 5,893,871 2013 5,987,405 2014 6,076,284 2015 6,263,419 2016 6,347,433 Thereafter 34,362,059 $ 64,930,471 Note D—Future Rental Payments The Property leases its land from WP Owner Trust under a ground lease with an initial term of 99 years ending August 1, 2103. The lease provides for annual rent payments of $1,000. The Property leases 45,413 square feet of rentable retail space from the office component of the Project under a non-cancellable operating lease with an initial lease term of 99 years ending August 1, 2103. The lease provides for annual rent payments of $1. The Property leases an additional 2,634 square feet of rentable retail space from the office component of the Project under a non-cancellable operating lease with an initial term of 30 years ending May 31, 2039. Rent expense under this lease was $79,761 and $6,631 for the year ended December 31, 2011 and the period ended January 31, 2012, respectively. The minimum future rental expense to be incurred under this lease as of December 31, 2011 is as follows: 2012 $ 81,575 2013 83,603 2014 85,684 2015 87,818 2016 90,004 Thereafter 2,663,211 $ 3,091,895 Note E—Related Party Transactions The Property entered into common area and property management agreements with an affiliate of the Property’s owner for the purpose of providing management services to the Property and the common areas owned by Developer LLC. For the year ended December 31, 2011 and the period ended January 31, 2012, the Company paid management fees totaling $387,818 and $32,691, respectively, to the affiliate. Note F—Concentration of Revenues The Property earned approximately 33% of rental income from two tenants during the period ended December 31, 2011. The loss of these tenants could have a significant negative impact on the Property’s operations. 200Prospectus ¡ TIAA Real Estate Account See Independent Auditors’ Report
CERRITOS INDUSTRIAL PARK, CERRITOS, CALIFORNIA INDEPENDENT AUDITORS’ REPORT To the Management of We have audited the accompanying statement of revenues and certain expenses of Cerritos Industrial Park, Cerritos, California (the “Property”), as described in Note A, for the year ended December 31, 2011. This financial statement is the responsibility of the Property’s management. Our responsibility is to express an opinion on this financial statement based on our audit. We conducted our audit in accordance with auditing standards generally accepted in the United States of America. Those standards require that we plan and perform the audit to obtain reasonable assurance about whether the financial statements are free of material misstatement. An audit includes examining, on a test basis, evidence supporting the amounts and disclosures in the financial statements. An audit also includes assessing the accounting principles used and significant estimates made by management, as well as evaluating the overall financial statement presentation. We believe that our audit provides a reasonable basis for our opinion. The accompanying statement of revenues and certain expenses was prepared for the purpose of complying with Rule 3-14 of Securities and Exchange Commission Regulation S-X and, as described in Note A, is not intended to be a complete presentation of the Property’s revenues and expenses. In our opinion, the financial statement referred to above presents fairly, in all material respects, the revenues and certain expenses of the Property for the year ended December 31, 2011, in conformity with accounting principles generally accepted in the United States of America. Aarons Grant & Habif, LLC July 17, 2012 TIAA Real Estate Account ¡Prospectus201
Teachers Insurance and Annuity Association of America
CERRITOS INDUSTRIAL PARK, CERRITOS, CALIFORNIA STATEMENTS OF REVENUES AND CERTAIN EXPENSES For The For The REVENUES Rental income $ 4,428,842 $ 1,880,330 Recovery income 1,304,650 596,836 Other income 29,058 2,155 Total revenues 5,762,550 2,479,321 CERTAIN EXPENSES Bad debt 118,868 2,017 General and administrative 39,783 90,063 Insurance 194,949 117,292 Management fees 153,023 68,312 Real estate taxes 757,958 315,787 Repairs and maintenance 108,877 122,398 Utilities 26,940 1,775 Total certain expenses 1,400,398 717,644 Revenues in Excess of Certain Expenses $ 4,362,152 $ 1,761,677 See Independent Auditors’ Report and Accompanying Notes NOTES TO STATEMENTS OF REVENUES AND CERTAIN EXPENSES Note A—Organization and Basis of Presentation The statement of revenues and certain expenses (the “financial statement”) for the year ended December 31, 2011 relates to the operations of Cerritos Industrial Park (the “Property”), a 27-building industrial park located in Cerritos, California. The Property was approximately 89% leased at December 31, 2011 and May 31, 2012. The accompanying financial statement is presented in conformity with Rule 3-14 of Securities and Exchange Commission Regulation S-X. Accordingly, the financial statement is not representative of the actual operations for the period presented, as certain expenses which may not be comparable to the expenses expected to be incurred in the future operations of the Property have been excluded. Expenses excluded consist of interest, depreciation and amortization and certain other expenses not directly related to the future operations of the Property. The statement of revenues and certain expenses for the period ended May 31, 2012 is unaudited. However, in the opinion of management, all adjustments (consisting solely of normal recurring adjustments) necessary for the fair presentation of this statement of revenues and certain expenses for the interim period on the basis described above have been included. The results for such an interim period are not necessarily indicative of the results for the entire year. 202Prospectus ¡ TIAA Real Estate Account See Independent Auditors’ Report
Year Ended
December 31, 2011
(Audited)
Period Ended
May 31, 2012
(Unaudited)
Note B—Summary of Significant Accounting Policies Use of estimates The preparation of financial statements in conformity with accounting principles generally accepted in the United States requires management to make estimates and assumptions that affect various amounts reported in the financial statements and accompanying notes. Actual results could differ from those estimates. Revenue recognition Rental income from the operating leases, which includes scheduled increases over the lease term, is recognized on a straight-line basis. For the year ended December 31, 2011, income recognized on a straight-line basis is more than income that would have accrued in accordance with the lease terms by approximately $110,959. For the period ended May 31, 2012, income recognized on a straight-line basis is less than income that would have accrued in accordance with the lease terms by approximately $44,915. Note C—Future Rental Income Available space in the Property is leased to tenants under non-cancellable operating leases that expire on various dates through 2018. The leases provide for increases in future minimum rental payments. Also, the leases require reimbursement of common area maintenance charges, certain operating expenses, and real estate taxes. The minimum future rental income from these leases as of December 31, 2011 is as follows: 2012 $ 4,182,319 2013 2,892,493 2014 1,534,575 2015 802,437 2016 311,922 2017 and thereafter 399,490 $ 10,123,236 See Independent Auditors’ Report TIAA Real Estate Account ¡Prospectus203
THE RESIDENCES AT THE VILLAGE OF MERRICK PARK, INDEPENDENT AUDITORS’ REPORT To the Management of We have audited the accompanying statement of revenues and certain expenses of The Residences at the Village of Merrick Park, Coral Gables, Florida (the “Property”), as described in Note A, for the year ended December 31, 2011. This financial statement is the responsibility of the Property’s management. Our responsibility is to express an opinion on this financial statement based on our audit. We conducted our audit in accordance with auditing standards generally accepted in the United States of America. Those standards require that we plan and perform the audit to obtain reasonable assurance about whether the financial statements are free of material misstatement. An audit includes examining, on a test basis, evidence supporting the amounts and disclosures in the financial statements. An audit also includes assessing the accounting principles used and significant estimates made by management, as well as evaluating the overall financial statement presentation. We believe that our audit provides a reasonable basis for our opinion. The accompanying statement of revenues and certain expenses was prepared for the purpose of complying with Rule 3-14 of Securities and Exchange Commission Regulation S-X and, as described in Note A, is not intended to be a complete presentation of the Property’s revenues and expenses. In our opinion, the financial statement referred to above presents fairly, in all material respects, the revenues and certain expenses of the Property for the year ended December 31, 2011, in conformity with accounting principles generally accepted in the United States of America. Aarons Grant & Habif, LLC August 15, 2012 204Prospectus ¡ TIAA Real Estate Account
CORAL GABLES, FLORIDA
Teachers Insurance and Annuity Association of America
THE RESIDENCES AT THE VILLAGE OF MERRICK PARK, CORAL GABLES, FLORIDA STATEMENTS OF REVENUES AND CERTAIN EXPENSES For The For The REVENUES Rental income $ 3,851,808 $ 2,288,654 Escalation income 325,509 170,141 Other income 160,495 93,277 Total revenues 4,337,812 2,552,072 CERTAIN EXPENSES Advertising and marketing 42,388 20,945 General and administrative 310,717 193,457 Insurance 199,792 113,230 Management fees 97,262 59,541 Real estate taxes 513,807 268,327 Repairs and maintenance 369,654 218,687 Security 32,832 18,796 Utilities 229,443 146,715 Total certain expenses 1,795,895 1,039,698 Revenues in Excess of Certain Expenses $ 2,541,917 $ 1,512,374 See Independent Auditors’ Report and Accompanying Notes NOTES TO STATEMENTS OF REVENUES AND CERTAIN EXPENSES Note A—Organization and Basis of Presentation The statement of revenues and certain expenses (the “financial statement”) for the year ended December 31, 2011 relates to the operations of The Residences at the Village of Merrick Park (the "Property"). The Property includes a 120 unit multi-family residential building, 39,602 square feet of retail space and 496 parking spaces within the parking garage. The Property, located in Coral Gables, Florida, was approximately 93% and 98% leased at December 31, 2011 and July 31, 2012, respectively. The accompanying financial statement is presented in conformity with Rule 3-14 of Securities and Exchange Commission Regulation S-X. Accordingly, the financial statement is not representative of the actual operations for the period presented, as certain expenses which may not be comparable to the expenses expected to be incurred in the future operations of the Property have been excluded. Expenses excluded consist of interest, depreciation and amortization and certain other expenses not directly related to the future operations of the Property. The statement of revenues and certain expenses for the period ended July 31, 2012 is unaudited. However, in the opinion of management, all adjustments (consisting solely of normal recurring adjustments) necessary for the fair presentation of this statement of revenues and certain expenses for the See Independent Auditors’ Report TIAA Real Estate Account ¡Prospectus205
Year Ended
December 31, 2011
(Audited)
Period Ended
July 31, 2012
(Unaudited)
interim period on the basis described above have been included. The results for such an interim period are not necessarily indicative of the results for the entire year. Note B—Summary of Significant Accounting Policies Use of estimates The preparation of financial statements in conformity with accounting principles generally accepted in the United States requires management to make estimates and assumptions that affect various amounts reported in the financial statements and accompanying notes. Actual results could differ from those estimates. Revenue recognition Rental income from residential leases and a retail/parking master sub-sublease, as described in Note C, is recognized as earned. Residential lease terms generally do not extend beyond one year. Note C—Master Leases The Property leases its land from General Growth Properties (“GGP”) under a ground sublease expiring in 2099. The term of the ground sublease is co-terminus with a ground lease between GGP and the City of Coral Gables. The sublease provides for annual rental payments of $1. The Property leased the ground floor retail space and access to 316 parking spaces for retail customers back to GGP under a sub-sublease. The annual base rent over the term of the sub-sublease is $770,964 and the agreement contains three successive renewal options. The first two renewal options are for 30 years each and the third renewal option is for nine years. The agreement requires reimbursement of certain operating, utilities and insurance expenses and real estate taxes. The terms of the sublease and sub-sublease are co-terminus. Note D—Future Rental Income The retail space and 316 parking spaces are leased under a sub-sublease expiring on March 31, 2030. The minimum future rental income from the sub-sublease as of December 31, 2011 is as follows: 2012 $ 770,964 2013 770,964 2014 770,964 2015 770,964 2016 770,964 Thereafter 10,215,273 $ 14,070,093 206Prospectus ¡ TIAA Real Estate Account See Independent Auditors’ Report
INDEPENDENT AUDITORS’ REPORT To the Management of We have audited the accompanying statement of revenues and certain expenses of Mass Court, Washington, D.C. (the “Property”), as described in Note A, for the year ended December 31, 2011. This financial statement is the responsibility of the Property’s management. Our responsibility is to express an opinion on this financial statement based on our audit. We conducted our audit in accordance with auditing standards generally accepted in the United States of America. Those standards require that we plan and perform the audit to obtain reasonable assurance about whether the financial statements are free of material misstatement. An audit includes examining, on a test basis, evidence supporting the amounts and disclosures in the financial statements. An audit also includes assessing the accounting principles used and significant estimates made by management, as well as evaluating the overall financial statement presentation. We believe that our audit provides a reasonable basis for our opinion. The accompanying statement of revenues and certain expenses was prepared for the purpose of complying with Rule 3-14 of Securities and Exchange Commission Regulation S-X and, as described in Note A, is not intended to be a complete presentation of the Property’s revenues and expenses. In our opinion, the financial statement referred to above presents fairly, in all material respects, the revenues and certain expenses of the Property for the year ended December 31, 2011, in conformity with accounting principles generally accepted in the United States of America. Aarons Grant & Habif, LLC August 30, 2012 TIAA Real Estate Account ¡Prospectus207
Teachers Insurance and Annuity Association of America
MASS COURT, WASHINGTON, D.C STATEMENTS OF REVENUES AND CERTAIN EXPENSES For The For The REVENUES Rental income $ 9,499,556 $ 5,924,319 Other income 1,009,891 545,592 Total revenues 10,509,447 6,469,911 CERTAIN EXPENSES Advertising and marketing 78,460 49,782 General and administrative 202,540 142,697 Insurance 148,910 114,981 Management fees 204,285 127,068 Legal fees 39,291 20,975 Real estate taxes 837,058 604,552 Repairs and maintenance 550,003 336,849 Salaries and wages 526,135 255,804 Utilities 490,884 175,513 Total certain expenses 3,077,566 1,828,221 Revenues in Excess of Certain Expenses $ 7,431,881 $ 4,641,690 See Independent Auditors’ Report and Accompanying Notes NOTES TO STATEMENTS OF REVENUES AND CERTAIN EXPENSES Note A—Organization and Basis of Presentation The statement of revenues and certain expenses (the “financial statement”) for the year ended December 31, 2011 relates to the operations of Mass Court (the “Property”), a 371 unit multi-family residential building located in Washington, D.C. The Property was approximately 94% and 93% leased at December 31, 2011 and August 29, 2012, respectively. The accompanying financial statement is presented in conformity with Rule 3-14 of Securities and Exchange Commission Regulation S-X. Accordingly, the financial statement is not representative of the actual operations for the period presented, as certain expenses which may not be comparable to the expenses expected to be incurred in the future operations of the Property have been excluded. Expenses excluded consist of interest, depreciation and amortization and certain other expenses not directly related to the future operations of the Property. The statement of revenues and certain expenses for the period ended July 31, 2012 is unaudited. However, in the opinion of management, all adjustments (consisting solely of normal recurring adjustments) necessary for the fair presentation of this statement of revenues and certain expenses for the interim period on the basis described above have been included. The results for such an interim period are not necessarily indicative of the results for the entire year. 208Prospectus ¡ TIAA Real Estate Account See Independent Auditors’ Report
Year Ended
December 31, 2011
(Audited)
Period Ended
July 31, 2012
(Unaudited)
Note B—Summary of Significant Accounting Policies Use of estimates The preparation of financial statements in conformity with accounting principles generally accepted in the United States requires management to make estimates and assumptions that affect various amounts reported in the financial statements and accompanying notes. Actual results could differ from those estimates. Revenue recognition Rental income from tenant leases is recognized as earned. Lease terms generally do not extend beyond one year. See Independent Auditors’ Report TIAA Real Estate Account ¡Prospectus209
PACIFIC COAST CORPORATE PARK, FIFE, WASHINGTON INDEPENDENT AUDITOR’S REPORT To the Board of Directors and Stockholders We have audited the accompanying statement of revenue and certain expenses (the Historical Summary) of 3985 70th Avenue East located in Fife, Washington (the Property), for the year ended December 31, 2011. The Historical Summary is the responsibility of the Property’s management. Our responsibility is to express an opinion on the Historical Summary based on our audit. We conducted our audit in accordance with auditing standards generally accepted in the United States of America. Those standards require that we plan and perform the audit to obtain reasonable assurance about whether the Historical Summary is free of material misstatement. An audit includes examining, on a test basis, evidence supporting the amounts and disclosures in the Historical Summary. An audit also includes assessing the accounting principles used and significant estimates made by management, as well as evaluating the overall presentation of the Historical Summary. We believe that our audit provides a reasonable basis for our opinion. The accompanying Historical Summary was prepared for the purpose of complying with Rule 3-14 of the Securities and Exchange Commission Regulation S-X (for inclusion in the Registration Statement on Form S-1 of TIAA-CREF, Inc.), as described in Note A, and is not intended to be a complete presentation of the Property’s revenue and expenses. In our opinion, the Historical Summary referred to above presents fairly, in all material respects, the revenues and certain expenses as described in Note A of the Property for the year ended December 31, 2011, in conformity with accounting principles generally accepted in the United States of America. Cohn Reznick LLP Los Angeles, California February 27, 2013 210Prospectus ¡ TIAA Real Estate Account
TIAA-CREF, Inc.
3985 70th Avenue East
PACIFIC COAST CORPORATE PARK, FIFE, WASHINGTON STATEMENT OF REVENUES AND CERTAIN EXPENSES Year ended December 31, 2011 and period ended June 30, 2012 For the For the Revenue Net rental revenue $ 841,854 $ 356,682 Recoveries 248,846 91,359 Total revenue 1,090,700 448,041 Certain Expenses Insurance 34,653 17,815 Property operating expenses 22,226 13,640 Repairs and maintenance 51,819 18,207 Real estate taxes 125,177 58,788 Legal expense 2,580 3,968 Total certain expenses 236,455 112,418 Revenue in Excess of Certain Expenses $ 854,245 $ 335,623 See notes to statement of revenues and certain operating expenses NOTES TO STATEMENT OF REVENUES AND CERTAIN OPERATING EXPENSES December 31, 2011 Note A—Organization and Basis of Presentation The statement of revenues and certain expenses for the year ended December 31, 2011 and the six months ended June 30, 2012 (the financial statements), relate to the operations of 3985 70th Avenue East (the Property) located in Fife, Washington, acquired from an unaffiliated entity, TIAA-CREF, Inc. On the date of acquisition, the Property contained three commercial units. The accompanying financial statements were prepared in conformity with Rule 3-14 of Securities and Exchange Commission Regulation S-X. Accordingly, the financial statements are not representative of the actual operations for the periods presented, as certain expenses, which may not be comparable to the expenses expected to be incurred in the future operations of the Property, have been excluded. Expenses excluded generally consist of interest and debt related costs, depreciation and amortization expense, interest income, income taxes and certain other expenses not directly related to the future operations of the Property. Additionally, management fees have not historically been included in the expenses of the Property and which may be included in future operations. The owner serves as the property manager and does not charge the Property for its costs. The owner maintains these costs at the owner’s corporate level for all of its properties. Costs not included which may have been incurred include bookkeeping fees, salaries, benefits and other expenses See Independent Auditors’ Report TIAA Real Estate Account ¡Prospectus211
3985 70th AVENUE EAST
Year ended
December 31, 2011
(audited)
period ended
June 30, 2012
(unaudited)
associated with the management of the Property. The Property can expect to incur these costs in future operations and/or a management fee from the property manager. The statement of revenues and certain expenses for the six months ended June 30, 2012 is unaudited. However, in the opinion of management, all adjustments (consisting solely of normal recurring adjustments) necessary for the fair presentation of this statement of revenues and certain expenses for the interim period on the basis described above have been included. The results for such an interim period are not necessarily indicative of the results for the entire year. Note B—Summary of Significant Accounting Policies Use of estimates The preparation of financial statements in conformity with the accounting principles generally accepted in the United States requires management to make estimates and assumptions that affect various amounts reported in the financial statements and accompanying notes. Actual results could differ from those estimates. Revenue recognition Revenue from operating leases, which includes schedule increases over the lease terms, is recognized on a straight-line basis. Note C—Future Rent Payments Space in the Property is rented to tenants under non-cancelable operating leases. Approximate minimum future rents required under the leases in effect at December 31, 2011 are as follows: 2012 $ 746,556 2013 879,811 2014 897,736 2015 857,783 2016 554,452 Thereafter 102,231 Total $ 4,038,569 Note D—Concentrations The Property earned 100% of rent revenue from four tenants during the year ended December 31, 2011. 212Prospectus ¡ TIAA Real Estate Account See Independent Auditors’ Report
INDEPENDENT AUDITOR’S REPORT To the Board of Directors and Stockholders We have audited the accompanying statement of revenues and certain expenses (the Historical Summary) of 3995 70th Avenue East located in Fife, Washington (the Property), for the year ended December 31, 2011. The Historical Summary is the responsibility of the Property’s management. Our responsibility is to express an opinion on the Historical Summary based on our audit. We conducted our audit in accordance with auditing standards generally accepted in the United States of America. Those standards require that we plan and perform the audit to obtain reasonable assurance about whether the Historical Summary is free of material misstatement. An audit includes examining, on a test basis, evidence supporting the amounts and disclosures in the Historical Summary. An audit also includes assessing the accounting principles used and significant estimates made by management, as well as evaluating the overall presentation of the Historical Summary. We believe that our audit provides a reasonable basis for our opinion. The accompanying Historical Summary was prepared for the purpose of complying with Rule 3-14 of the Securities and Exchange Commission Regulation S-X (for inclusion in the Registration Statement on Form S-1 of TIAA-CREF, Inc.), as described in Note A, and is not intended to be a complete presentation of the Property’s revenue and expenses. In our opinion, the Historical Summary referred to above presents fairly, in all material respects, the revenues and certain expenses as described in Note A of the Property for the year ended December 31, 2011, in conformity with accounting principles generally accepted in the United States of America. Cohn Reznick LLP Los Angeles, California February 27, 2013 TIAA Real Estate Account ¡Prospectus213
TIAA-CREF, Inc.
3995 70th Avenue East
PACIFIC COAST CORPORATE PARK, FIFE, WASHINGTON STATEMENT OF REVENUES AND CERTAIN EXPENSES Year Ended For the REVENUE Net Rental Revenue $ 982,869 $ 551,812 Recoveries 257,349 140,741 Total revenue 1,240,218 692,553 CERTAIN EXPENSES Insurance 23,381 22,270 Management fees 31,223 15,868 Property operating expenses 26,848 18,056 Repairs and maintenance 16,476 11,956 Real estate taxes 158,420 70,953 Legal expense 330 — Total certain expenses 256,678 139,103 Revenue in excess of certain expenses $ 983,540 $ 553,450 See Notes to Statement of Revenues and Certain Expenses NOTES TO STATEMENT OF REVENUES AND CERTAIN EXPENSES Note A—Organization and Basis of Presentation The statement of revenues and certain expenses for the year ended December 31, 2011 and the six months ended June 30, 2012 (the financial statements), relate to the operations of 3995 70th Avenue East (the Property) located in Fife, Washington, acquired from an unaffiliated entity, TIAA-CREF, Inc. On the date of acquisition, the Property contained three commercial units. The accompanying financial statements were prepared in conformity with Rule 3-14 of Securities and Exchange Commission Regulation S-X. Accordingly, the financial statements are not representative of the actual operations for the periods presented, as certain expenses, which may not be comparable to the expenses expected to be incurred in the future operations of the Property, have been excluded. Expenses excluded generally consist of interest and debt related costs, depreciation and amortization expense, interest income, income taxes and certain other expenses not directly related to the future operations of the Property. The statement of revenues and certain expenses for the six months ended June 30, 2012 is unaudited. However, in the opinion of management, all adjustments (consisting solely of normal recurring adjustments) necessary for the fair presentation of this statement of revenues and certain expenses for the interim period on the basis described above have been included. The results of 214Prospectus ¡ TIAA Real Estate Account See Independent Auditors’ Report
3995 70th AVENUE EAST
Year ended December 31, 2011 and for the period ended June 30, 2012
December 31, 2011
(Audited)
Period Ended
June 30, 2012
(Unaudited)
December 31, 2011
such an interim period are not necessarily indicative of the results of the entire year. Note B—Summary of Significant Accounting Policies Use of estimates The preparation of financial statements in conformity with the accounting principles generally accepted in the United States requires management to make estimates and assumptions that affect various amounts reported in the financial statements and accompanying notes. Actual results could differ from those estimates. Revenue recognition Revenue from operating leases, which includes schedule increases over the lease terms, is recognized on a straight-line basis. Note C—Future Rent Payments Space in the Property is rented to tenants under non-cancelable operating leases. Approximate minimum future rents required under the leases in effect at December 31, 2011 are as follows: 2012 $ 1,011,822 2013 989,476 2014 835,355 2015 852,075 2016 615,744 Thereafter — Total $ 4,304,472 Note D—Concentrations The Property earned 100% of rent revenue from three tenants during the year ended December 31, 2011. See Independent Auditors’ Report TIAA Real Estate Account ¡Prospectus215
CIRCA GREEN LAKE APARTMENTS, INDEPENDENT AUDITORS’ REPORT To the Management of We have audited the accompanying statement of revenues and certain expenses of Circa Green Lake Apartments, (the “Property”), as described in Note A, for the year ended December 31, 2011. This financial statement is the responsibility of the Property’s management. Our responsibility is to express an opinion on this financial statement based on our audit. We conducted our audit in accordance with auditing standards generally accepted in the United States of America. Those standards require that we plan and perform the audit to obtain reasonable assurance about whether the financial statements are free of material misstatement. An audit includes examining, on a test basis, evidence supporting the amounts and disclosures in the financial statements. An audit also includes assessing the accounting principles used and significant estimates made by management, as well as evaluating the overall financial statement presentation. We believe that our audit provides a reasonable basis for our opinion. The accompanying statement of revenues and certain expenses was prepared for the purpose of complying with Rule 3-14 of Securities and Exchange Commission Regulation S-X and, as described in Note A, is not intended to be a complete presentation of the Property’s revenues and expenses. In our opinion, the financial statement referred to above presents fairly, in all material respects, the revenues and certain expenses of the Property for the year ended December 31, 2011, in conformity with accounting principles generally accepted in the United States of America. Aarons Grant & Habif, LLC September 28, 2012 216Prospectus ¡ TIAA Real Estate Account
SEATTLE, WASHINGTON
Teachers Insurance and Annuity Association of America
CIRCA GREEN LAKE APARTMENTS, SEATTLE, WASHINGTON STATEMENTS OF REVENUES AND CERTAIN EXPENSES For The For The REVENUES Rental income $ 4,129,436 $ 2,995,408 Escalation income 189,528 150,011 Other income 99,510 64,363 Total revenues 4,418,474 3,209,782 CERTAIN EXPENSES Advertising and marketing 45,410 27,539 General and administrative 30,147 36,159 Insurance 60,528 24,969 Management fees 105,670 77,212 Real estate taxes 339,442 242,857 Repairs and maintenance 187,146 151,355 Salaries and wages 314,336 246,600 Utilities 256,835 185,071 Total certain expenses 1,339,514 991,762 Revenues in Excess of Certain Expenses $ 3,078,960 $ 2,218,020 See Independent Auditors’ Report and Accompanying Notes NOTES TO STATEMENTS OF REVENUES AND CERTAIN EXPENSES Note A—Organization and Basis of Presentation The statement of revenues and certain expenses (the “financial statement”) for the year ended December 31, 2011 relates to the operations of Circa Green Lake Apartments (the “Property”). The Property includes a 199 unit multi-family residential building, 20,745 square feet of rentable retail space and a parking garage with 82 parking spaces designated for retail use and 269 designated for residential use. The Property, located in Seattle, Washington, was approximately 89% and 97% leased at December 31, 2011 and August 31, 2012, respectively. The accompanying financial statement is presented in conformity with Rule 3-14 of Securities and Exchange Commission Regulation S-X. Accordingly, the financial statement is not representative of the actual operations for the audited period presented, as certain expenses which may not be comparable to the expenses expected to be incurred in the future operations of the Property have been excluded. Expenses excluded consist of interest, depreciation and amortization and certain other expenses not directly related to the future operations of the Property. The statement of revenues and certain expenses for the period ended August 31, 2012 is unaudited. However, in the opinion of management, all adjustments (consisting solely of normal recurring adjustments) necessary for the fair presentation of this statement of revenues and certain expenses for the See Independent Auditors’ Report TIAA Real Estate Account ¡Prospectus217
Year Ended
December 31, 2011
(Audited)
Period Ended
August 31, 2012
(Unaudited)
interim period on the basis described above have been included. The results for such an interim period are not necessarily indicative of the results for the entire year. Note B—Summary of Significant Accounting Policies Use of estimates The preparation of financial statements in conformity with accounting principles generally accepted in the United States requires management to make estimates and assumptions that affect various amounts reported in the financial statements and accompanying notes. Actual results could differ from those estimates. Revenue recognition Rental income from the residential leases is recognized as earned. Residential lease terms generally do not extend beyond one year. Rental income from the retail leases, which include scheduled increases over the lease term, is recognized on a straight-line basis. For the year ended December 31, 2011 and the period ended August 31, 2012, income recognized on a straight-line basis is more than income that would have accrued in accordance with the lease terms by approximately $20,278 and $17,093, respectively. Note C—Future Rental Income The Property’s retail space is leased under various non-cancellable operating leases. The minimum rental amounts due under the leases are generally subject to fixed increases during the lease term. The leases also require the tenants to pay for increases in certain operating expenses and real estate taxes, neither of which are reflected in the table below. Note C—Future Rental Income (concluded) The minimum future rental income from these retail leases as of December 31, 2011 is as follows: 2012 $ 409,938 2013 453,863 2014 462,165 2015 477,129 2016 496,409 Thereafter 1,462,137 $ 3,761,641 218Prospectus ¡ TIAA Real Estate Account See Independent Auditors’ Report
PRESCOTT WALLINGFORD APARTMENTS, INDEPENDENT AUDITORS’ REPORT To the Management of We have audited the accompanying statement of revenues and certain expenses of Prescott Wallingford Apartments, Seattle, Washington, (the “Property”), as described in Note A, for the period from July 11, 2012 through September 30, 2012. This financial statement is the responsibility of the Property’s management. Our responsibility is to express an opinion on this financial statement based on our audit. We conducted our audit in accordance with auditing standards generally accepted in the United States of America. Those standards require that we plan and perform the audit to obtain reasonable assurance about whether the financial statement is free of material misstatement. An audit includes examining, on a text basis, evidence supporting the amounts and disclosures in the financial statement. An audit also includes assessing the accounting principles used and significant estimates made by management, as well as evaluating the overall financial statement presentation. We believe that our audit provides a reasonable basis for our opinion. The accompanying statement of revenues and certain expenses was prepared for the purpose of complying with Rule 3-14 of Securities and Exchange Commission Regulation S-X and, as described in Note A, is not intended to be a complete presentation of the Property’s revenues and expenses. In our opinion, the financial statement referred to above presents fairly, in all material respects, the revenues and certain expenses of the Property for the period from July 11, 2012 through September 30, 2012, in conformity with accounting principles generally accepted in the United States of America. Aarons Grant & Habif, LLC December 24, 2012 TIAA Real Estate Account ¡Prospectus219
SEATTLE, WASHINGTON
Teachers Insurance and Annuity Association of America
PRESCOTT WALLINGFORD APARTMENTS, SEATTLE, WASHINGTON STATEMENT OF REVENUES AND CERTAIN EXPENSES For the Period From REVENUES Rental Income $ 193.524 Parking income 6,538 Other income 56,278 Total revenues 256,340 CERTAIN EXPENSES Advertising and marketing 12,473 General and administrative 20,501 Management fees 16,500 Property insurance 4,266 Real estate taxes 16,989 Repairs and maintenance 776 Salaries and wages 51,353 Utilities 15,406 Total certain expenses 138,264 Revenues in Excess of Certain Expenses $ 118,076 See Independent Auditors’ Report and Accompanying Notes NOTES TO STATEMENT OF REVENUES AND CERTAIN EXPENSES Note A—Organization and Basis of Presentation The statement of revenues and certain expenses (the “financial statement”) for the period from July 11, 2012 through September 30, 2012 relates to the operations of Prescott Wallingford Apartments (the “Property”), located in Seattle, Washington. The Property includes a 154 unit multi-family residential building, 17,405 square feet of rentable retail space and a parking garage with 189 parking spaces. During the period from January 1, 2012 through July 10, 2012, the Property was under construction and all costs were appropriately capitalized. Accordingly, the statement of revenues and certain expenses for the period from January 1, 2012 through July 10, 2012 is not presented. The Property commenced operations on July 11, 21012 on receipt of the certificate of occupancy from the city of Seattle. As of September 30, 2012, the residential and retail units were approximately 62% and 13% leased, respectively. The accompanying financial statement is presented in conformity with Rule 3-14 of Securities and Exchange Commission Regulation S-X. Accordingly, the financial statement is not representative of the actual operations for the period presented, as certain expenses which may not be comparable to the expenses expected to be incurred in the future operations of the Property have been excluded. Expenses excluded consist of those expenses not directly related to the future operations of the Property. 220Prospectus ¡ TIAA Real Estate Account See Independent Auditors’ Report
July 11, 2012 Through
September 30, 2012
Note B—Summary of Significant Accounting Policies Use of estimates The preparation of financial statements in conformity with accounting principles generally accepted in the United States requires management to make estimates and assumptions that affect various amounts reported in the financial statements and accompanying notes. Actual results could differ from those estimates. Revenue recognition Rental income from residential and parking leases is recognized as earned. Residential and parking lease terms generally do not extend beyond one year. Rental income from the retail lease, which includes scheduled increases over the lease term, will be recognized on a straight-line basis. The lease was signed on May 4, 2012. For the period from July 11, 2012 through September 30, 2012, no rental income was recognized as the lease commenced on November 1, 2012. Note C—Future Rental Income The Property’s retail space is leased under a non-cancellable operating lease. The minimum rental amount due under this lease is generally subject to fixed increases during the lease term. The lease also requires the tenant to pay for increases in certain operating expenses and real estate taxes, neither of which is reflected in the table below. The minimum future rental income from the lease as of September 30, 2012 is as follows: 2012 $ 10,861 2013 54,306 2014 66,144 2015 68,128 2016 70,172 Thereafter 497,822 $ 767,433 See Independent Auditors’ Report TIAA Real Estate Account ¡Prospectus221
RGM 42, LLC, NEW YORK, NEW YORK INDEPENDENT AUDITORS’ REPORT To the Management of We have audited the accompanying statement of revenues and certain expenses of RGM 42, LLC (the “Company”), as described in Note A, for the year ended December 31, 2011. This financial statement is the responsibility of the Company’s management. Our responsibility is to express an opinion on this financial statement based on our audit. We conducted our audit in accordance with auditing standards generally accepted in the United States of America. Those standards require that we plan and perform the audit to obtain reasonable assurance about whether the financial statements are free of material misstatement. An audit includes examining, on a test basis, evidence supporting the amounts and disclosures in the financial statements. An audit also includes assessing the accounting principles used and significant estimates made by management, as well as evaluating the overall financial statement presentation. We believe that our audit provides a reasonable basis for our opinion. The accompanying statement of revenues and certain expenses was prepared for the purpose of complying with Rule 3-14 of Securities and Exchange Commission Regulation S-X and, as described in Note A, is not intended to be a complete presentation of the Company’s revenues and expenses. In our opinion, the financial statement referred to above presents fairly, in all material respects, the revenues and certain expenses, as described in Note A, of the Company for the year ended December 31, 2011, in conformity with accounting principles generally accepted in the United States of America. Aarons Grant & Habif, LLC February 18, 2013 222Prospectus ¡ TIAA Real Estate Account
Teachers Insurance and Annuity Association of America
RGM 42, LLC, NEW YORK, NEW YORK STATEMENTS OF REVENUES AND CERTAIN EXPENSES For The Year For The Period REVENUES Rental income $ 6,473,837 $ 24,019,232 Reimbursement income — 1,068,992 Other income 945,780 1,537,222 Total revenues 7,419,617 26,625,446 CERTAIN EXPENSES Advertising and marketing 3,577,513 2,981,862 Bad debt expense 5,657 690,517 General and administrative 959,430 2,559,259 Insurance 74,110 100,356 Legal fees 344,716 68,389 Management fees 255,108 762,761 Real estate taxes 244,024 356,380 Repairs and maintenance 990,168 850,489 Salaries and wages 2,291,638 2,944,139 Utilities 564,890 1,471,815 Total certain expenses 9,307,254 12,785,967 Net Revenues (Certain Expenses) $ (1,887,637 ) $ 13,839,479 See Independent Auditors’ Report and Accompanying Notes NOTES TO STATEMENTS OF REVENUES AND CERTAIN EXPENSES Note A—Organization and Basis of Presentation On November 13, 2012, MiMa Investor Member, LLC a subsidiary of TIAA-CREF, purchased a 70% interest in RGM 42, LLC (the “Company”), which is the sole member of 42nd and 10th Associates, LLC and Subsidiaries (the “Ventures”) that own certain sections (the “Condominium Units”) of a 59-story mixed-use property in Manhattan, New York. The property was newly developed and substantially complete as of December 31, 2011. The statement of revenues and certain expenses (the “financial statement”) for the year ended December 31, 2011 relates to the Condominium Units. As of December 31, 2011, the Condominium Units are included in a master condominium agreement and include the following: • The Tower Unit which contains 151 market-rate residential rental units. • The Base A Unit which contains 33 low-income residential rental units. • The Base B Unit which contains 460 market-rate residential rental units and 130 low-income residential units. • The Base C Unit which contains 40 market-rate residential units, a pet amenity and a business center. See Independent Auditors’ Report TIAA Real Estate Account ¡Prospectus223
Ended
December 31,
2011
(Audited)
Ended
September 30,
2012
(Unaudited)
• Retail space at the ground floor level consisting of approximately 13,000 square feet (the “Retail Unit”). • A 70,000 square-foot parking garage (the “Garage Unit”), which has been subdivided into 3 garage units. • An easement of approximately 20,000 square feet to benefit the Metropolitan Transit Authority (the “MTA Unit”). Leasing of the residential units began during 2011. At December 31, 2011, all sections received certificates of occupancy with the exception of six residential units and the Retail Unit. Occupancy of the Condominium Units, excluding the Base A Unit, which was sold, and the low-income units of the Base B Unit, which were master leased, totaled approximately 63% at December 31, 2011 and 85% at September 30, 2012. The accompanying financial statement is presented in conformity with Rule 3-14 of Securities and Exchange Commission Regulation S-X. Accordingly, the financial statement is not representative of the actual operations for the period presented, as certain expenses which may not be comparable to the expenses expected to be incurred in the future operations of the Condominium Units have been excluded. Expenses excluded consist of interest, depreciation, amortization, income taxes and certain other expenses not directly related to the future operations of the Condominium Units. Operating expenses of the Base A Unit, which was sold, and the low-income units of the Base B Unit, which were master leased, were also excluded, as described on Note E. The statement of revenues and certain expenses for the period ended September 30, 2012 is unaudited. However, in the opinion of management, all adjustments (consisting solely of normal recurring adjustments) necessary for the fair presentation of this statement of revenues and certain expenses for the interim period on the basis described above have been included. The results for such an interim period are not necessarily indicative of the results for the entire year. Note B—Summary of Significant Accounting Policies Use of estimates The preparation of financial statements in conformity with accounting principles generally accepted in the United States requires management to make estimates and assumptions that affect various amounts reported in the financial statements and accompanying notes. Actual results could differ from those estimates. Revenue recognition Rental income from tenant leases is recognized as earned. Lease terms generally do not extend beyond one year. 224Prospectus ¡ TIAA Real Estate Account See Independent Auditors’ Report
Advertising and marketing costs Advertising and marketing costs relate to branding, promotional materials and marketing staff mainly associated with the initial lease-up of the rental units. These costs are expensed as incurred. Note C—Related Party Transactions The Condominium Units are under property management agreements with an affiliate of the minority member of the Company. For the year ended December 31, 2011, the Condominium Units paid $255,108 in management fees to the affiliate. Additionally, as part of the property management agreements, the Condominium Units reimbursed the affiliate $1,740,610 for salaries and wages costs incurred by the affiliate in managing the operations of the Condominium Units. Note D—Commitment and Contingencies The Condominium Units are eligible for a partial tax exemption. To receive this abatement, all residential rental units of the Condominium Units will be subject to the New York Rent Stabilization Law during 10 or 20-year abatement periods, which restrict the percentage increases in rent charged on new and renewed leases. The tax abatements applicable to the Condominium Units are as follows: • The Base B Unit which contains 460 market-rate residential rental units and 130 low-income residential rental units is a single parcel and has a 20-year property tax abatement. • The Base C Unit which contains 40 market-rate residential units, a pet amenity and a business center has been subdivided into 42 tax parcels that have a 20-year property tax abatement. • The Tower Unit which contains 151 market-rate residential rental units has been subdivided into 151 tax parcels of which 63 parcels have a 20-year property tax abatement and 88 parcels have a 10-year property tax abatement. • The Retail Unit, Garage Unit and the MTA Unit which have been subdivided into 5 tax parcels have a 20-year property tax abatement. Note E—Subsequent Events Subsequent events have been evaluated through February 18, 2013, the date the financial statement was available for issuance. The Company identified the following subsequent event that requires disclosure in the financial statements: On January 13, 2012, the Company transferred ownership of the Base A Unit and master leased the 130 low-income residential units of the Base B Unit to an affiliate of the minority member of the Company for a term of 99 years. Under the master lease, the Company is entitled to reimbursement of all operating costs of the low-income units from the tenants. As of December 31, 2011, all operating expenses of the Base A Unit and the low-income units of the Base B Unit have been excluded as they do not relate to the future operations of the Condominium Units. See Independent Auditors’ Report TIAA Real Estate Account ¡Prospectus225
CHARLESTON PLAZA, MOUNTAIN VIEW, CALIFORNIA HISTORICAL SUMMARY AND INDEPENDENT AUDITOR’S REPORT INDEPENDENT AUDITOR’S REPORT To the Board of Directors and Stockholders We have audited the accompanying statement of revenue and certain expenses (the Historical Summary) of Charleston Plaza located in Mountain View, California (the Property), for the year ended December 31, 2011. The Historical Summary is the responsibility of the Property’s management. Our responsibility is to express an opinion on the Historical Summary based on our audit. We conducted our audit in accordance with auditing standards generally accepted in the United States of America. Those standards require that we plan and perform the audit to obtain reasonable assurance about whether the Historical Summary is free of material misstatement. An audit includes examining, on a test basis, evidence supporting the amounts and disclosures in the Historical Summary. An audit also includes assessing the accounting principles used and significant estimates made by management, as well as evaluating the overall presentation of the Historical Summary. We believe that our audit provides a reasonable basis for our opinion. The accompanying Historical Summary was prepared for the purpose of complying with the rules and regulations of the Securities and Exchange Commission (for inclusion in the Registration Statement on Form S-1 of TIAA-CREF, Inc.) as described in Note A and is not intended to be a complete presentation of the Property’s revenue and expenses. In our opinion, the Historical Summary referred to above presents fairly, in all material respects, the revenues and certain expenses as described in Note A of the Property for the year ended December 31, 2011, in conformity with accounting principles generally accepted in the United States of America. Cohn Reznick LLP Los Angeles, California 226Prospectus ¡ TIAA Real Estate Account
DECEMBER 31, 2011
TIAA-CREF, Inc.
Charleston Plaza
February 25, 2013
CHARLESTON PLAZA, MOUNTAIN VIEW, CALIFORNIA STATEMENT OF REVENUES AND CERTAIN EXPENSES For the year For the period REVENUE Net rental revenue $ 4,409,290 $ 3,353,877 Recoveries 1,068,015 749,680 Total revenue 5,477,305 4,103,557 CERTAIN EXPENSES Insurance 110,217 112,440 Property operating expenses 51,711 36,097 Management expenses 221,169 164,142 Repairs and maintenance 75,515 47,613 Supplies 150 — Real estate taxes 854,662 152,054 Legal expense 28,471 4,865 Total certain expenses 1,341,895 517,211 Revenue in excess of certain expenses $ 4,135,410 $ 3,586,346 See notes to statement of revenues and certain operating expenses Notes to Statement of Revenues and Certain Operating Expenses Note A—Organization and Basis of Presentation The statement of revenues and certain expenses for the year ended December 31, 2011 and the nine months ended September 30, 2012 (unaudited) (the financial statements), relate to the operations of Charleston Plaza (the Property) located in Mountain View California, acquired from an unaffiliated entity, TIAA-CREF, Inc. On the date of acquisition, the Property contained ten commercial units. The accompanying financial statements were prepared in conformity with Rule 3-14 of Securities and Exchange Commission Regulation S-X. Accordingly, the financial statements are not representative of the actual operations for the periods presented, as certain expenses, which may not be comparable to the expenses expected to be incurred in the future operations of the Property, have been excluded. Expenses excluded generally consist of interest and debt related costs, depreciation and amortization expense, interest income, income taxes and certain other expenses not directly related to the future operations of the Property. The statement of revenues and certain expenses for the nine months ended September 30, 2012 is unaudited. However, in the opinion of management, all adjustments (consisting solely of normal recurring adjustments) necessary for the fair presentation of this statement of revenues and certain expenses for the interim period on the basis described above have been included. The results for See Independent Auditors’ Report TIAA Real Estate Account ¡Prospectus227
Year ended December 31, 2011 and period ended September 30, 2012
ended
December 31,
2011
(audited)
ended
September 30,
2012
(unaudited)
such an interim period are not necessarily indicative of the results for the entire year. Note B—Summary of Significant Accounting Policies Use of estimates The preparation of financial statements in conformity with the accounting principles generally accepted in the United States requires management to make estimates and assumptions that affect various amounts reported in the financial statements and accompanying notes. Actual results could differ from those estimates. Revenue recognition Revenue from operating leases, which includes schedule increases over the lease terms, is recognized on a straight-line basis. Note C—Future Rent Payments Space in the Property is rented to tenants under non-cancelable operating leases. Approximate minimum future rents required under the leases in effect at December 31, 2011 are as follows: 2012 $ 2,333,229 2013 2,340,604 2014 2,340,604 2015 2,340,604 2016 2,278,729 Thereafter 4,662,675 Total $ 16,296,445 Note D—Management Fee The Property was charged a management fee of 4% of total gross revenue. Note E—Concentrations The Property earned 100% of rent revenue from ten tenants during the year ended December 31, 2011. 228Prospectus ¡ TIAA Real Estate Account See Independent Auditors’ Report
VALENCIA TOWN CENTER, VALENCIA, CALIFORNIA INDEPENDENT AUDITOR’S REPORT To the Board of Directors and Stockholders Report on the Financial Statements We have audited the accompanying statement of revenue and certain expenses (the Historical Summary) of Valencia Town Center located in Valencia, California (the Property), for the year ended December 31, 2011. Management’s Responsibility for the Financial Statements Management is responsible for the preparation and fair presentation of the Historical Summary in accordance with accounting principles generally accepted in the United States of America; this includes the design, implementation, and maintenance of internal control relevant to the preparation and fair presentation of the Historical Summary that are free from material misstatement, whether due to fraud or error. Auditor’s Responsibility Our responsibility is to express an opinion on the Historical Summary based on our audit. We conducted our audit in accordance with auditing standards generally accepted in the United States of America. Those standards require that we plan and perform the audit to obtain reasonable assurance about whether the Historical Summary is free of material misstatement. An audit involves performing procedures to obtain audit evidence about the amounts and disclosures in the financial statements. The procedures selected depend on the auditor’s judgment, including the assessment of the risks of material misstatement of the financial statements, whether due to fraud or error. In making those risk assessments, the auditor considers internal control relevant to the entity’s preparation and fair presentation of the Historical Summary in order to design audit procedures that are appropriate in the circumstances, but not for the purpose of expressing an opinion on the effectiveness of the entity’s internal control. Accordingly, we express no such opinion. An audit also includes evaluating the appropriateness of accounting policies used and the reasonableness of significant accounting estimates made by management, as well as evaluating the overall presentation of the Historic Summary. We believe that the audit evidence we have obtained is sufficient and appropriate to provide a basis for our audit opinion. Other Matter The accompanying Historical Summary was prepared for the purpose of complying with the rules and regulations of the Securities and Exchange TIAA Real Estate Account ¡Prospectus229
TIAA-CREF, Inc.
Valencia Town Center
Commission (for inclusion in the Registration Statement on Form S-1 of TIAA-CREF, Inc.) as described in Note 1 and is not intended to be a complete presentation of the Property’s revenue and expenses. Opinion In our opinion, the Historical Summary referred to above present fairly, in all material respects, the financial position of the Valencia Town Center as of December 31, 2011, and the results of its operations and its cash flows for the year then ended in accordance with accounting principles generally accepted in the United States of America. Cohn Reznick LLP Los Angeles, California 230Prospectus ¡ TIAA Real Estate Account
March 4, 2013
VALENCIA TOWN CENTER, VALENCIA, CALIFORNIA STATEMENT OF REVENUES AND CERTAIN EXPENSES For the year For the period REVENUE Minimum rent and kiosk ATM minimum rent $ 18,296,101 $ 14,776,728 Straight line rent 20,689 677,183 Acquired lease market amortization—FAS 141 519,030 389,272 Percentage rent 247,159 177,916 Straight line revenue—In line 244,537 155,062 Specialty leasing 1,075,464 578,838 Media 236,764 189,314 Capital revenue 168,291 114,129 Ground rent other (3,350 ) — Storage rent 98,004 76,514 Interest Income — 4,533 CAM revenue 5,391,848 4,797,007 Food court 134,072 148,346 Real estate taxes 3,503,995 2,909,120 Tenant HVAC 933,508 754,560 Other revenue 331,203 322,658 Total revenue 31,197,315 26,071,180 CERTAIN EXPENSES Landlord 1,652,903 242,288 Bad debt expense 125,020 156,710 Specialty leasing 167,702 166,940 Partnership marketing 99,339 72,055 Marketing 165,559 226,747 CAM expenses 6,010,601 4,437,797 Food court 119,361 105,702 Real estate taxes 4,072,342 3,289,447 Tenant HVAC 643,476 509,634 Parking — 5,434 Other expense 171,278 120,899 Total certain expenses 13,227,581 9,333,653 Revenue in excess of certain expenses $ 17,969,734 $ 16,737,527 See notes to statement of revenues and certain operating expenses Note A—Organization and Basis of Presentation The statement of revenues and certain expenses (the financial statements) for the year ended December 31, 2011 and the nine months ended September 30, 2012, relate to the operations of Valencia Town Center located in Valencia, California, acquired from an unaffiliated entity, TIAA-CREF, Inc. On the date of acquisition, the Property contained three main location divisions. See Independent Auditors’ Report TIAA Real Estate Account ¡Prospectus231
Year ended December 31, 2011 and for the Period ended September 30, 2012
ended
December 31,
2011
ended
September 30,
2012
The accompanying financial statement was prepared in conformity with Rule 3-14 of Securities and Exchange Commission Regulation S-X. Accordingly, the financial statement is not representative of the actual operations for the periods presented, as certain expenses, which may not be comparable to the expenses expected to be incurred in the future operations of the Property, have been excluded. Expenses excluded generally consist of interest and debt related costs, depreciation and amortization expenses, interest income, income taxes and certain other expenses not directly related to the future operations of the Property. The statement of revenues and certain expenses for the nine months ended September 30, 2012 is unaudited. However, in the opinion of management, all adjustments (consisting solely of normal recurring adjustments) necessary for the fair presentation of this statement of revenues and certain expenses for the interim period on the basis described above have been included. The results for such an interim period are not necessarily indicative of the results for the entire year. Note B—Summary of Significant Accounting Policies Use of estimates The preparation of financial statements in conformity with the accounting principles generally accepted in the United States requires management to make estimates and assumptions that affect various amounts reported in the financial statements and accompanying notes. Actual results could differ from those estimates. Revenue recognition Revenue from operating leases, which includes schedule increases over the lease terms, is recognized on a straight-line basis. Note C—Future Rent Payments Space in the Properties is rented to tenants under non-cancelable operating leases. Approximate minimum future rents required under the leases in effect at December 31, 2011 are as follows: 2012 $ 17,376,854 2013 18,628,956 2014 16,230,077 2015 14,530,287 2016 13,108,917 Thereafter 50,504,148 Total $ 130,379,239 232Prospectus ¡ TIAA Real Estate Account See Independent Auditors’ Report
TEACHERS INSURANCE AND ANNUITY ASSOCIATION OF AMERICA CONDENSED STATUTORY-BASIS FINANCIAL STATEMENTS INFORMATION (The following condensed statutory-basis financial statements information has been derived from statutory-basis financial statements which are available upon request.) TIAA CONDENSED STATUTORY-BASIS STATEMENTS OF ADMITTED ASSETS, LIABILITIES, AND CAPITAL AND CONTINGENCY RESERVES (in millions) December 31, 2012 2011 ADMITTED ASSETS Bonds $ 173,954 $ 167,931 Preferred stocks 38 82 Common stocks 3,495 3,582 Mortgage loans 12,956 13,133 Real estate 1,623 1,595 Cash, cash equivalents and short-term investments 1,681 597 Contract loans 1,358 1,301 Derivatives 96 185 Other long-term investments 17,973 16,197 Investment income due and accrued 1,772 1,805 Federal income taxes — 5 Net deferred federal income tax asset 3,235 3,070 Other assets 437 430 Separate account assets 18,420 16,019 TOTAL ADMITTED ASSETS $ 237,038 $ 225,932 LIABILITIES, CAPITAL AND CONTINGENCY RESERVES LIABILITIES Reserves for life and health insurance, annuities and deposit-type contracts $ 180,020 $ 175,395 Dividends due to policyholders 1,854 1,731 Interest maintenance reserve 1,687 1,229 Federal income taxes 3 — Borrowed money 52 809 Asset valuation reserve 3,424 2,825 Derivatives 346 326 Other liabilities 2,276 1,662 Separate account liabilities 18,067 14,824 TOTAL LIABILITIES 207,729 198,801 CAPITAL AND CONTINGENCY RESERVES Capital (2,500 shares of $1,000 par value common stock issued and outstanding and $550,000 paid-in capital) 3 3 Surplus notes 2,000 2,000 Contingency reserves: For investment losses, annuity and insurance mortality, and other risks 27,306 23,650 Deferred income taxes — 1,478 TOTAL CAPITAL AND CONTINGENCY RESERVES 29,309 27,131 TOTAL LIABILITIES, CAPITAL AND CONTINGENCY RESERVES $ 237,038 $ 225,932 TIAA Real Estate Account ¡Prospectus233
TEACHERS INSURANCE AND ANNUITY ASSOCIATION OF AMERICA (The following condensed statutory-basis financial statements information has been derived from statutory-basis financial statements which are available upon request.) TIAA CONDENSED STATUTORY-BASIS STATEMENTS OF OPERATIONS (in millions) For the Years Ended December 31, 2012 2011 2010 REVENUES Insurance and annuity premiums and other considerations $ 12,085 $ 12,703 $ 12,938 Annuity dividend additions 1,312 1,325 1,048 Net investment income 11,042 10,910 10,534 Other revenue 231 182 143 TOTAL REVENUES $ 24,670 $ 25,120 $ 24,663 BENEFITS AND EXPENSES Policy and contract benefits $ 11,733 $ 11,341 $ 10,922 Dividends to policyholders 3,128 3,082 2,733 Increase in policy and contract reserves 4,604 5,460 5,062 Net operating expenses 922 859 798 Net transfers to separate accounts 1,518 1,661 2,130 Other benefits and expenses 318 53 235 TOTAL BENEFITS AND EXPENSES $ 22,223 $ 22,456 $ 21,880 Income before federal income taxes and net realized capital gains (losses) $ 2,447 $ 2,664 $ 2,783 Federal income tax (benefit) (11 ) (139 ) (28 ) Net realized capital gains (losses) less capital gains taxes, after transfers to the interest maintenance reserve (416 ) (444 ) (1,430 ) NET INCOME $ 2,042 $ 2,359 $ 1,381 BASIS OF PRESENTATION: The accompanying financial statements have been prepared on the basis of statutory accounting principles prescribed or permitted by the New York State Department of Financial Services (the “Department”); a comprehensive basis of accounting that differs from accounting principles generally accepted in the United States (“GAAP”). The Department requires insurance companies domiciled in the State of New York to prepare their statutory-basis financial statements in accordance with the National Association of Insurance Commissioners’ (“NAIC”) Accounting Practices and Procedures Manual (“NAIC SAP”), subject to any deviation prescribed or permitted by the Department (“New York SAP”). The following is a summary of the significant accounting policies followed by Teachers Insurance and Annuity Association of America (the “Company”): Investments:Publicly traded securities are accounted for as of the date the investments are purchased or sold (trade date). Other investments are recorded on the settlement date. Realized capital gains and losses on investment transactions are accounted for under the specific identification 234Prospectus ¡ TIAA Real Estate Account
TEACHERS INSURANCE AND ANNUITY ASSOCIATION OF AMERICA method. A realized loss is recorded when an impairment is considered to be other-than-temporary. Bonds:Bonds are stated at amortized cost using the current effective interest method. Bonds in or near default (rated NAIC 6) are stated at the lower of amortized cost or fair value. Bonds the Company intends to sell prior to maturity (“held for sale”) are stated at the lower of amortized cost or fair value. Included within bonds are loan-backed and structured securities. Estimated future cash flows and expected prepayment speeds are used to determine the amortization of loan-backed and structured securities under the prospective method. Expected future cash flows and prepayment speeds are evaluated quarterly. Certain loan-backed and structured securities are reported at the lower of cost or fair value as a result of the NAIC modeling process. If it is determined that a decline in the fair value of a bond, excluding loan-backed and structured securities, is other-than-temporary, the cost basis of the bond is written down to fair value and the amount of the write down is accounted for as a realized loss. The new cost basis is not changed for subsequent recoveries in fair value. Future declines in fair value which are determined to be other-than-temporary are recorded as realized losses. For loan-backed and structured securities, when an other-than-temporary impairment (“OTTI”) has occurred because the Company does not expect to recover the entire amortized cost basis of the security, with the intent and ability to hold, the amount of the OTTI recognized as a realized loss is the difference between the security’s amortized cost basis and the present value of cash flows expected to be collected, discounted at the loan-backed or structured security’s effective interest rate. For loan-backed and structured securities, when an OTTI has occurred because the Company intends to sell the security or the Company does not have the intent and ability to retain the security for a period of time sufficient to recover the amortized cost basis, the amount of the OTTI realized is the difference between the security’s amortized cost basis and fair value at the balance sheet date. In periods subsequent to the recognition of an OTTI loss for a loan-backed or structured security, the Company accounts for the other-than-temporarily impaired security as if the security had been purchased on the measurement date of the impairment. The difference between the new amortized cost basis and the cash flows expected to be collected is accreted as interest income in future periods based on prospective changes in cash flow estimates. The fair values for publicly traded long term bond investments are generally determined using prices provided by third party pricing services. For privately placed long term bond investments without readily ascertainable market value, such values are determined with the assistance of independent pricing services TIAA Real Estate Account ¡Prospectus235
TEACHERS INSURANCE AND ANNUITY ASSOCIATION OF AMERICA utilizing a discounted cash flow methodology based on coupon rates, maturity provisions and credit assumptions. Preferred Stocks:Preferred stocks are stated at amortized cost unless they have an NAIC rating designation of 4, 5, or 6 which are stated at the lower of amortized cost or fair value. The fair values of preferred stocks are determined using prices provided by third party pricing services or valuations from the NAIC. When it is determined that a decline in fair value of an investment is other-than-temporary, the cost basis of the investment is reduced to its fair value and the amount of the reduction is accounted for as a realized loss. Common Stocks:Unaffiliated common stocks are stated at fair value, which is based on quoted market prices, where available. Changes in fair value are recorded through surplus. For common stocks without quoted market prices, fair value is estimated using independent pricing services or internally developed pricing models. When it is determined that a decline in fair value of an investment is other-than-temporary, the cost basis of the investment is reduced to its fair value and the amount of the reduction is accounted for as a realized loss. Mortgage Loans:Mortgage loans are stated at amortized cost, net of valuation allowances. Mortgage loans held for sale are stated at the lower of amortized cost or fair value. Mortgage loans are evaluated for impairment when it is probable that the receipt of contractual payments of principal and interest may not occur when scheduled. If the impairment is considered to be temporary, a valuation allowance is established for the excess of the carrying value of the mortgage over its estimated fair value. Changes in valuation allowance for mortgage loans are included in net unrealized capital gains and losses on investments. When an event occurs resulting in an impairment that is other-than-temporary, a direct write-down is recorded as a realized loss and a new cost basis is established. The fair value of mortgage loans is generally determined using a discounted cash flow methodology based on coupon rates, maturity provisions and credit assumptions Real Estate:Real estate occupied by the Company and real estate held for the production of income is carried at depreciated cost, less encumbrances. Real estate held for sale is carried at the lower of depreciated cost or fair value, less encumbrances, and estimated costs to sell. The Company utilizes the straight-line method of depreciation on real estate. Depreciation is generally computed over a forty-year period. A real estate property may be considered impaired when events or circumstances indicate that the carrying value may not be recoverable. When the Company determines that an investment in real estate is impaired, a direct write-down is made to reduce the carrying value of the property to its estimated fair value based on an external appraisal, net of encumbrances, and a realized loss is recorded. The Company makes investments in commercial real estate directly, through wholly owned subsidiaries and through real estate limited 236Prospectus ¡ TIAA Real Estate Account
TEACHERS INSURANCE AND ANNUITY ASSOCIATION OF AMERICA partnerships. The Company monitors the effects of current and expected market conditions and other factors on its real estate investments to identify and quantify any impairment in value. The Company assesses assets to determine if events or changes in circumstances indicate that the carrying amount of the asset may not be recoverable. The Company evaluates the recoverability of income producing investments based on undiscounted cash flows and then reviews the results of an independent third party appraisal to determine the fair value and if an adjustment is required. Wholly-Owned Subsidiaries:Investments in wholly-owned subsidiaries are stated at the value of their underlying net assets as follows: (1) domestic insurance subsidiaries are stated at the value of their underlying statutory surplus and (2) non-insurance subsidiaries are stated at the value of their underlying GAAP equity. Dividends and distributions from subsidiaries are recorded in investment income and changes in the equity of subsidiaries are recorded directly to surplus as unrealized gains or losses. Other Long-term Investments:Other long-term investments primarily include investments in limited partnerships and limited liability companies which are carried at the Company’s percentage of the underlying U.S. GAAP, International Financial Reporting Standard or U.S. Tax basis equity as reflected on the respective entity’s financial statements. The Company monitors the effects of current and expected market conditions and other factors on these investments to identify and quantify any impairment in value. The Company assesses impairment information by performing analysis between the carrying value and the cost basis of the investments. The Company evaluates recoverability of the asset to determine if OTTI is warranted. When it is determined that a decline in fair value of an investment is other-than-temporary, the cost basis of the investment is reduced to its fair value and the amount of the reduction is accounted for as a realized loss. Other long-term investments include the Company’s investments in surplus notes, which are stated at amortized cost. All of the Company’s investments in surplus notes have an NAIC 1 rating designation. Cash and Cash Equivalents:Cash includes cash on deposit and cash equivalents. Cash equivalents are short-term, highly liquid investments, with original maturities of three months or less at the date of purchase and are stated at amortized cost. Short-Term Investments:Short-term investments (investments with remaining maturities of one year or less at the time of acquisition, excluding those investments classified as cash equivalents) that are not impaired are stated at amortized cost using the straight line interest method. Short-term investments that are impaired are stated at the lower of amortized cost or fair value. Contract Loans:Contract loans are stated at outstanding principal balances. TIAA Real Estate Account ¡Prospectus237
TEACHERS INSURANCE AND ANNUITY ASSOCIATION OF AMERICA Derivative Instruments:The Company has filed a Derivatives Use Plan with the Department. This plan details the Company’s derivative policy objectives, strategies, controls and any restrictions placed on various derivative types. The plan also specifies the procedures and systems that the Company has established to evaluate, monitor and report on the derivative portfolio in terms of valuation, hedge effectiveness and counterparty credit quality. The Company may use derivative instruments for hedging, income generation, and asset replication purposes. Derivatives used by the Company include foreign currency, interest rate and credit default swaps and foreign currency forwards. The carrying value of a derivative position may be at cost or fair value, depending on the type of instrument and accounting status. Hedge accounting is applied for some foreign currency swaps that hedge fixed income investments carried at amortized cost. The foreign exchange premium or discount for these foreign currency swaps is amortized into income and a currency translation adjustment computed at the spot rate is recorded as an unrealized gain or loss. The derivative component of a RSAT is carried at unamortized premiums received or paid, adjusted for any impairments. The cash component of a RSAT is classified as a bond on the Company’s balance sheet. Derivatives used in hedging transactions where hedge accounting is not being utilized are carried at fair value. The Company does not offset the carrying value amounts recognized for derivatives executed with the same counterparty under a netting agreement. Investment Income Due and Accrued:Investment income due is investment income earned and legally due to be paid to the Company at the reporting date. Investment income accrued is investment income earned but not legally due to be paid to the Company until subsequent to the reporting date. The Company writes off amounts deemed uncollectible as a charge against investment income in the period such determination is made. Amounts deemed collectible, but over 90 days past due for any invested asset except mortgage loans in default are non-admitted. Amounts deemed collectible, but over 180 days past due for mortgage loans in default are non-admitted. The Company accrues interest income on impaired loans to the extent it is deemed collectible. Separate Accounts:Separate Accounts are established in conformity with insurance laws and are segregated from the Company’s general account and are maintained for the benefit of the separate account contract holders. Foreign Currency Transactions and Translation:Investments denominated in foreign currencies and foreign currency contracts are valued in U.S. dollars, based on exchange rates at the end of the relevant period. Investment transactions in foreign currencies are recorded at the exchange rates prevailing on the respective transaction dates. All other asset and liability accounts that are denominated in foreign currencies are adjusted to reflect 238Prospectus ¡ TIAA Real Estate Account
TEACHERS INSURANCE AND ANNUITY ASSOCIATION OF AMERICA exchange rates at the end of the relevant period. Realized and unrealized gains and losses due to foreign exchange transactions and translation adjustments are not separately reported but are collectively included in realized and unrealized capital gains and losses, respectively. Non-Admitted Assets:For statutory accounting purposes, certain assets are designated as non-admitted assets (principally certain investments in other long-term investments, furniture and equipment, leasehold improvements, prepaid expenses, and a portion of deferred federal income tax (“DFIT”) assets). Investment related non-admitted assets totaled $267 million and $441 million at December 31, 2012 and 2011, respectively. The non-admitted portion of the DFIT asset was $8,964 million and $10,249 million at December 31, 2012 and 2011, respectively. Other non-admitted assets were $625 million and $470 million at December 31, 2012 and 2011, respectively. Changes in non-admitted assets are charged or credited directly to surplus. Furniture and Fixtures, Equipment, Leasehold Improvements and Computer Software:Electronic data processing (“EDP”) equipment, computer software and furniture and equipment which qualify for capitalization are depreciated over the lesser of useful life or 3 years. Office alterations and leasehold tenant improvements which qualify for capitalization are depreciated over the lesser of useful life or 5 years and the remaining life of the lease, respectively. The accumulated depreciation on EDP equipment and computer software was $1,008 million and $782 million at December 31, 2012 and 2011, respectively. Related depreciation expenses allocated to TIAA were $51 million, $34 million and $45 million for the years ended December 31, 2012, 2011 and 2010, respectively. The accumulated depreciation on furniture and equipment and leasehold improvements was $444 million and $443 million at December 31, 2012, and 2011, respectively. Related depreciation expenses allocated to TIAA were $18 million, $25 million and $25 million for the years ended December 31, 2012, 2011 and 2010, respectively. Insurance and Annuity Premiums:Life insurance premiums are recognized as revenue over the premium-paying period of the related policies. Annuity considerations are recognized as revenue when received. Deposits on deposit-type contracts are recorded directly as a liability when received. Expenses incurred when acquiring new business are charged to operations as incurred. Reserves for Life and Health Insurance, Annuities and Deposit-type Contracts:Policy and contract reserves are determined in accordance with standard valuation methods approved by the Department and are computed in accordance with standard actuarial formulae. The reserves established utilize assumptions for interest, mortality and other risks insured. Such reserves are TIAA Real Estate Account ¡Prospectus239
TEACHERS INSURANCE AND ANNUITY ASSOCIATION OF AMERICA established to provide for adequate contractual benefits guaranteed under policy and contract provisions. Liabilities for deposit-type contracts, which do not contain any life contingencies, are equal to deposits received and interest credited to the benefit of contract holders, less surrenders or withdrawals (that represent a return to the contract holders) plus additional reserves (if any) necessitated by actuarial regulations. The Company performed Asset Adequacy Analysis in order to test the adequacy of its reserves in light of the assets supporting such reserves, and determined that its reserves were sufficient to meet its obligations. Interest Maintenance Reserve:The IMR defers recognition of realized capital gains and losses resulting from changes in the general level of interest rates. These gains and losses are amortized into investment income over the expected remaining life of the investments sold. The IMR is calculated in accordance with the NAIC Annual Statement Instructions for Life and Accident and Health Insurance Companies. A realized gain or loss on each bond sold, excluding loan-backed and structured securities, is interest-related if the security’s NAIC rating did not change by more than one classification from the date of purchase to the date of sale, and its NAIC rating was not a 6 at any time during the holding period. A realized gain or loss on each preferred stock sold is interest-related if the security did not have an NAIC rating of 4, 5, or 6 at any time during the holding period and the NAIC rating did not change by more than one classification from the date of purchase to the date of sale. A realized gain or loss on each mortgage loan sold is interest-related if interest is not more than 90 days past due, not in the process of foreclosure or voluntary conveyance, or the mortgage loan was not restructured over the prior two years. A realized gain or loss on each derivative investment sold is interest-related based on the characteristics of the underlying invested asset. For loan-backed and structured securities, realized gains or losses resulting from sale transactions and realized losses resulting from OTTI are bifurcated between IMR and AVR based upon the present value of cash flows and amortized cost at the time of the transaction. Asset Valuation Reserve:The AVR is established to offset potential credit-related investment losses from bonds, stocks, mortgage loans, real estate, derivatives and other long-term investments. Changes in AVR are recorded directly to surplus. The AVR is calculated in accordance with the NAIC Annual Statement Instructions for Life and Accident and Health Insurance Companies. Realized gains or losses resulting from the sale of U.S. Government securities and securities of agencies which are backed by the full faith and credit of the U.S. Government are exempt from the AVR. 240Prospectus ¡ TIAA Real Estate Account
TEACHERS INSURANCE AND ANNUITY ASSOCIATION OF AMERICA A realized gain or loss on each bond sold, excluding loan-backed and structured securities, is non-interest-related if the security’s NAIC rating changed by more than one classification from the date of purchase to the date of sale, or its NAIC rating was a 6 at any time during the holding period. A realized gain or loss on each preferred stock sold is non-interest-related if the security had an NAIC rating of 4, 5 or 6 at any time during the holding period or the NAIC rating changed by more than one classification from the date of purchase to the date of sale. A realized gain or loss on each mortgage loan sold is non-interest-related if interest is more than 90 days past due, in the process of foreclosure or voluntary conveyance, or the mortgage loan was restructured over the prior two years. A realized gain or loss on each derivative investment sold is non-interest-related based on the characteristics of the underlying invested asset. For loan-backed and structured securities, realized gains or losses resulting from sale transactions and realized losses resulting from OTTI are bifurcated between IMR and AVR based upon the present value of cash flows and amortized cost at the time of the transaction. OTTI for non-loan-backed and structured securities, stocks, mortgage loans, real estate and other long-term investments are considered non-interest related realized losses and included in the AVR calculation. Repurchase Agreement:Repurchase agreements are agreements between a seller and a buyer, whereby the seller of securities sells and simultaneously agrees to repurchase the same or substantially the same securities from the buyer at a stated price on a specified date. Repurchase agreements are generally accounted for as secured borrowings. The assets transferred are not removed from the balance sheet, the cash collateral received is invested and reported on the balance sheet and accounted for based on the type of investment. An offsetting liability is reported in “Other liabilities.” Dividends Due to Policyholders:Dividends on insurance policies and pension annuity contracts in the payout phase are declared by the TIAA Board of Trustees (the “Board”) in the fourth quarter of each year, and such dividends are credited to policyholders in the following calendar year. Dividends on pension annuity contracts in the accumulation phase are declared by the Board in February of each year, and such dividends on the various existing vintages of pension annuity contracts in the accumulation phase are credited to policyholders during the ensuing twelve month period beginning March 1. TIAA Real Estate Account ¡Prospectus241
TEACHERS INSURANCE AND ANNUITY ASSOCIATION OF AMERICA ADDITIONAL ASSET INFORMATION (The following condensed statutory-basis financial statements information has been derived from statutory-basis financial statements which are available upon request.) The book/adjusted carrying value, estimated fair value, excess of fair value over book/adjusted carrying value and excess of book/adjusted carrying value over fair value of long-term bonds and preferred stocks at December 31, 2012 are shown below (in millions): Book/ Excess of Estimated Fair Value Book/ Bonds: U.S. governments $ 41,456 $ 5,966 $ (55 ) $47,367 All other governments 3,677 802 (3 ) 4,476 States, territories and possessions 491 76 — 567 Political subdivisions of states, territories, and possessions 345 30 — 375 Special revenue and special assessment, non-guaranteed agencies and government 20,256 2,398 (16 ) 22,638 Credit tenant loans 5,025 431 (23 ) 5,433 Industrial and miscellaneous 99,209 10,556 (1,060 ) 108,705 Hybrids 1,334 90 (28 ) 1,396 Parent, subsidiaries and affiliates 2,161 75 (2 ) 2,234 Total bonds 173,954 20,424 (1,187 ) 193,191 Preferred stocks 38 13 — 51 TOTAL BONDS AND PREFERRED STOCKS $ 173,992 $ 20,437 $ (1,187 ) $193,242 The gross unrealized losses and estimated fair values for securities by the length of time that individual securities had been in a continuous unrealized loss position are shown in the table below (in millions): Less than twelve months Twelve months or more Amortized Gross Estimated Amortized Gross Estimated DECEMBER 31, 2012 Loan-backed and structured bonds $ 1,719 $ (47 ) $ 1,672 $ 7,887 $ (1,131 ) $6,756 All other bonds 5,988 (154 ) 5,834 608 (46 ) 562 TOTAL BONDS $ 7,707 $ (201 ) $ 7,506 $ 8,495 $ (1,177 ) $7,318 Unaffiliated common stocks 138 (22 ) 116 — — — Preferred stocks 10 (2 ) 8 — — — TOTAL BONDS AND STOCKS $ 7,855 $ (225 ) $ 7,630 $ 8,495 $ (1,177 ) $7,318 242Prospectus ¡ TIAA Real Estate Account
Adjusted
Carrying
Value
Fair Value
Over Book/
Adjusted
Carrying
Value
Adjusted
Carrying
Value
Over Fair
Value
Cost
Unrealized
Loss
Fair Value
Cost
Unrealized
Loss
Fair Value
TEACHERS INSURANCE AND ANNUITY ASSOCIATION OF AMERICA Less than twelve months Twelve months or more Amortized Gross Estimated Amortized Gross Estimated DECEMBER 31, 2011 Loan-backed and structured bonds $ 4,829 $ (239 ) $ 4,590 $ 13,126 $ (2,641 ) $10,485 All other bonds 4,178 (158 ) 4,020 1,916 (204 ) 1,712 TOTAL BONDS $ 9,007 $ (397 ) $ 8,610 $ 15,042 $ (2,845 ) $12,197 Unaffiliated common stocks 55 (7 ) 48 42 (12 ) 30 Preferred stocks 7 — 7 25 (19 ) 6 TOTAL BONDS AND STOCKS $ 9,069 $ (404 ) $ 8,665 $ 15,109 $ (2,876 ) $12,233 As of December 31, 2012, the major categories of securities where the estimated fair value declined and remained below cost for less than twelve months were diversified in U.S., Canada and other government (25%), asset-backed securities (12%) and manufacturing (11%). The preceding percentages were calculated as a percentage of the gross unrealized loss. As of December 31, 2012, the major categories of securities where the estimated fair value declined and remained below cost for twelve months or greater were diversified in commercial mortgage-backed securities (73%) and residential mortgage-backed securities (19%). The preceding percentages were calculated as a percentage of the gross unrealized loss. As of December 31, 2011, the major categories of securities where the estimated fair value declined and remained below cost for less than twelve months were diversified in residential mortgage-backed securities (32%), commercial mortgage-backed securities (19%) and finance (13%). The preceding percentages were calculated as a percentage of the gross unrealized loss. As of December 31, 2011, the major categories of securities where the estimated fair value declined and remained below cost for twelve months or greater were diversified in commercial mortgage-backed securities (62%) and residential mortgage-backed securities (26%). The preceding percentages were calculated as a percentage of the gross unrealized loss. Based upon the Company’s current evaluation of these securities in accordance with its impairment policy, the cause of the decline is primarily attributable to increased market yields for these particular securities since acquisition caused principally by credit spreads. The Company currently intends and has the ability to hold the securities with unrealized losses for a period of time sufficient for them to recover and the Company has concluded that these securities are not other-than-temporarily impaired. TIAA Real Estate Account ¡Prospectus243
Cost
Unrealized
Loss
Fair Value
Cost
Unrealized
Loss
Fair Value
TEACHERS INSURANCE AND ANNUITY ASSOCIATION OF AMERICA Mortgage Loan Diversification:The following tables set forth the commercial mortgage loan portfolio by property type and geographic distribution ($ in millions): Commercial Mortgage Loans by Property Type December 31, 2012 December 31, 2011 Carrying Value % of Total Carrying Value % of Total Office buildings $ 4,288 33.1 % $ 4,399 33.5 % Shopping centers 4,278 33.0 4,211 32.1 Industrial buildings 2,118 16.4 2,313 17.6 Apartments 1,423 11.0 1,351 10.3 Land 265 2.0 265 2.0 Mixed use 264 2.0 268 2.0 Hotel 164 1.3 168 1.3 Other 156 1.2 158 1.2 TOTAL $ 12,956 100.0 % $ 13,133 100.0 % Commercial Mortgage Loans by Geographic Distribution December 31, 2012 December 31, 2011 Carrying Value % of Total Carrying Value % of Total Pacific $ 3,312 25.6 % $ 3,561 27.1 % South Atlantic 2,908 22.4 3,144 23.9 Middle Atlantic 2,373 18.3 1,988 15.1 South Central 2,199 17.0 1,992 15.2 North Central 1,209 9.3 1,319 10.1 Mountain 361 2.8 410 3.1 New England 230 1.8 280 2.1 Other 364 2.8 439 3.4 TOTAL $ 12,956 100.0 % $ 13,133 100.0 % Net Investment Income:The components of net investment income for the years ended December 31 were as follows (in millions): 2012 2011 2010 Bonds $ 9,391 $ 9,462 $ 9,343 Stocks 82 27 96 Mortgage loans 796 810 1,011 Real estate 244 234 244 Derivatives 23 10 22 Other long-term investments 960 775 300 Cash, cash equivalents and short-term investments 3 3 8 TOTAL GROSS INVESTMENT INCOME 11,499 11,321 11,024 LESS INVESTMENT EXPENSES (574 ) (551 ) (566 ) Net investment income before amortization of IMR 10,925 10,770 10,458 Plus amortization of IMR 117 140 76 NET INVESTMENT INCOME $ 11,042 $ 10,910 $ 10,534 244Prospectus ¡ TIAA Real Estate Account
TEACHERS INSURANCE AND ANNUITY ASSOCIATION OF AMERICA Realized Capital Gains and Losses:The net realized capital gains (losses) on sales, redemptions and write-downs due to OTTI for the years ended December 31 were as follows (in millions): 2012 2011 2010 Bonds $ 163 $ 422 $ (418 ) Stocks 89 40 57 Mortgage loans 13 28 (240 ) Real estate 68 15 (4 ) Derivatives (61 ) (236 ) 29 Other long-term investments (122 ) (200 ) (227 ) Cash, cash equivalents and short-term investments 9 (16 ) (3 ) Total before capital gains taxes and transfers to IMR 159 53 (806 ) Transfers to IMR (575 ) (497 ) (624 ) NET REALIZED CAPITAL LOSSES LESS CAPITAL GAINS TAXES, AFTER TRANSFERS TO IMR $ (416 ) $ (444 ) $ (1,430 ) Federal Income Taxes:By charter, the Company is a stock life insurance company that operates on a non-profit basis and through December 31, 1997 was exempt from federal income taxation under the Internal Revenue Code. Any non-pension income, however, was subject to federal income taxation as unrelated business income. Effective January 1, 1998, as a result of federal legislation, the Company is no longer exempt from federal income taxation and is taxed as a stock life insurance company. Beginning in 1998, the Company has filed a consolidated federal income tax return with its includable affiliates (the “consolidating companies”). The consolidating companies participate in a tax-sharing agreement. Under the agreement, current federal income tax expense (benefit) is computed on a separate return basis and provides that members shall make payments or receive reimbursements to the extent that their income (loss) contributes to or reduces consolidated federal tax expense. The consolidating companies are reimbursed for net operating losses or other tax attributes they have generated when utilized in the consolidated return. Amounts receivable from / (payable to) the Company’s subsidiaries for federal income taxes were $(3) million and $5 million at December 31, 2012 and 2011, respectively. TIAA Real Estate Account ¡Prospectus245
APPENDIX A — MANAGEMENT OF TIAA The Real Estate Account has no officers or directors. The Trustees and certain principal executive officers of TIAA as of the date hereof, their dates of birth, and their principal occupations during the past five years, are as follows: TRUSTEES Name & Date of Birth (DOB) Principal Occupations During Past 5 Years Ronald L. Thompson Former Chairman and Chief Executive Officer, Midwest Stamping and Manufacturing Company from 1993 through 2005. Lead Director, Chrysler Group, LLC and Director, Washington University in St. Louis. Member, Plymouth Ventures Partnership II Advisory Board. Jeffrey R. Brown William G. Karnes Professor of Finance and Director of the Center for Business and Public Policy, University of Illinois at Urbana-Champaign. Research Associate of the National Bureau of Economic Research (NBER) and Associate Director of the NBER Retirement Research Center. Manager, LLB Ventures, LLC. Former member of the Social Security Advisory Board from 2006 to 2008, and Director of the American Risk and Insurance Association. Robert C. Clark Harvard University Distinguished Service Professor and Austin Wakeman Scott Professor of Law, Harvard Law School, Harvard University. Formerly Dean and Royall Professor of Law, Harvard Law School from 1989 to 2003. Director of the Hodson Trust, Time Warner, Inc. and Omnicom Group. Lisa W. Hess President and Managing Partner, Sky Top Capital. Former Chief Investment Officer of Loews Corporation from 2002 to 2008. Founding partner of Zesiger Capital Group. Director of Radian Group, Inc and Covariance Capital Management, Inc. (“Covariance”), an affiliate of TIAA. Trustee of the WT Grant Foundation, the Chapin School, and the Pomfret School. Edward M. Hundert, M.D. Senior lecturer in Medical Ethics and Director of the Center for Teaching and Learning, Harvard Medical School. President, Case Western Reserve University from 2002 to 2006. Formerly, Dean, 2000 to 2002, University of Rochester School of Medicine and Dentistry, Professor of Medical Humanities and Psychiatry, 1997 to 2002. Scientific Advisory Board Member, Massachusetts General Hospital Center for Law, Brain and Behavior. Lawrence H. Linden Retired Managing Director and former General Partner at Goldman Sachs, Inc., retiring in 2008. After joining Goldman Sachs in 1992, served at various times the Head of Technology, Head of Operations, and Co-Chairman of the Global Control and Compliance Committee. Founding Trustee of the Linden Trust for Conservation, trustee of Resources for the Future, Member of the Board of Directors of the World Wildlife Fund and co-founder of, and senior advisor to, the Redstone Strategy Group. Strategic Advisory Board Member, New World Capital Group. Maureen O’Hara R.W. Purcell Professor of Finance at Johnson Graduate School of Management, Cornell University, where she has taught since 1979. Chair of the board of Investment Technology Group, Inc. since 2007, and member of the board since 2003. Director of New Star Financial, Inc. Donald K. Peterson Former Chairman and Chief Executive Officer, Avaya Inc. from 2002 to 2006 and President and Chief Executive Officer from 2000 to 2001. Formerly, Executive Vice President and Chief Financial Officer, Lucent Technologies from 1996 to 2000. Member and former chairman of the board of Worcester Polytechnic Institute and trustee of the Committee for Economic Development. Director of Sanford C. Bernstein Fund Inc. 246Prospectus ¡ TIAA Real Estate Account
Chairman of the TIAA
Board of Trustees
DOB: 6/17/49
DOB: 2/16/68
DOB: 2/26/44
DOB: 8/8/55
DOB: 10/1/56
DOB: 2/19/47
DOB: 6/13/53
DOB: 8/13/49
TRUSTEES (continued) Name & Date of Birth (DOB) Principal Occupations During Past 5 Years Sidney A. Ribeau President, Howard University since 2008. Formerly, President, Bowling Green State University, 1995 to 2008. Director, Worthington Industries. Member of the Council for International Exchange of Scholars, Association of Governing Boards, Association of American Colleges and Universities, and Consortium of University Presidents. Dorothy K. Robinson Vice President and General Counsel, Yale University since 1995. Formerly General Counsel, Yale University, 1986 to 1995. Trustee, Newark Public Radio Inc., Director, Yale Southern Observatory, Inc., Youth Rights Media, Inc. and Friends of New Haven Legal Assistance. David L. Shedlarz Former Vice Chairman of Pfizer Inc. from 2006 to 2007, Executive Vice President from 1999 to 2005 and Chief Financial Officer of Pfizer from 1995 to 2005. Director, Pitney Bowes Inc. and the Hershey Corporation. Marta Tienda Maurice P. During ‘22 Professor in Demographic Studies and Professor of Sociology and Public Affairs, Princeton University, since 1997. Visiting Research Scholar at the New York University Center for Advanced Research in Social Sciences, 2010 to 2011. Director, Office of Population Research, Princeton University, 1998 to 2002. Commissioner, President’s Advisory Commission on Educational Excellence for Hispanics. Trustee, Sloan Foundation and Jacobs Foundation. Member of Visiting Committee, Harvard University Kennedy School of Government. Member of Diversity Advisory Committee, Brown University. Member, Adrenalina Research Advisory Board. Director, Consortium of Social Science Associations. Rosalie J. Wolf Managing Partner, Botanica Capital Partners LLC. Formerly, Senior Advisor and Managing Director, Offit Hall Capital Management LLC and its predecessor company, Laurel Management Company LLC from 2001 to 2003; formerly, Treasurer and Chief Investment Officer, The Rockefeller Foundation. Director, North European Oil Royalty Trust, Director and former Chairman of The Sanford C. Bernstein Fund, Inc. Member of the Brock Capital Group, LLC. Advisory Council Member, Center on Entrepreneurship, Tuck School at Dartmouth College. OFFICER-TRUSTEES Name & Date of Birth (DOB) Principal Occupations During Past 5 Years Roger W. Ferguson, Jr. President and Chief Executive Officer of TIAA and CREF since April 2008. Formerly, Chairman of Swiss Re America Holding Corporation and Head of Financial Services and member of the Executive Committee, Swiss Re from 2006 to 2008; Vice Chairman and member of the Board of the U.S. Federal Reserve from 1999 to 2006 and a member of its Board of Governors from 1997 to 1999; and Partner and Associate, McKinsey & Company from 1984 to 1997. Currently a member of the advisory board of Brevan Howard Asset Management LLP, a director of Audax Health and International Flavors and Fragrances, Inc., and a member of the President’s Council on Jobs and Competitiveness. Fellow of the American Academy of Arts & Sciences and member of its Commission on the Humanities and Social Sciences. Member of the National Academy of Sciences Committee on the Long-Run Macro-Economic Effects of the Aging U.S. Population. Board member at the Institute for Advanced Study, Memorial Sloan-Kettering Cancer Center, and the Committee for Economic Development. Member of the Harvard University Visiting Committee for the Memorial Church, the Economic Club of New York, the Council on Foreign Relations and the Group of Thirty. TIAA Real Estate Account ¡Prospectus247
DOB: 12/3/47
DOB: 2/18/51
DOB: 4/17/48
DOB: 8/10/50
DOB: 5/8/41
DOB: 10/28/51
OFFICERS Name & Date of Birth (DOB) Principal Occupations During Past 5 Years Virginia M. Wilson Executive Vice President and Chief Financial Officer, TIAA and CREF and Principal Accounting Officer of CREF since 2010. Served from 2006 to 2009 as Executive Vice President and Chief Financial Officer of Wyndham Worldwide Corporation, one of the world’s largest hospitality firms, following its 2006 spin-off from Cendant Corporation, a multinational holding company with operations in the real estate, travel, car rental, hospitality, mortgage banking and other service sectors. Served from 2003 to 2006 as Cendant’s Executive Vice President and Chief Accounting Officer. Corporate controller of MetLife, Inc. from 1999 to 2003 and was senior vice president and controller for the life insurance operations of Transamerica Corporation (which was acquired by AEGON NV in 1999) from 1995 to 1999. Prior to 1995, was an audit partner at Deloitte & Touche LLP. Currently a director of the Los Angeles Child Guidance Clinic and a trustee and vice chair for Catholic Charities in New York. Ronald Pressman Executive Vice President and Chief Operating Officer of TIAA since 2012 and Executive Vice President of the TIAA-CREF Funds Complex since 2012. Director of Covariance, TIAA-CREF Life Insurance Company (“TC Life”) and Kaspick & Company, LLC (“Kaspick”), (each affiliates of TIAA) since 2012. From 2007 to 2011, served as President and Chief Executive Officer of General Electric Capital Real Estate. Prior to 2007, served as president and CEO of General Electric Asset Management and Chairman, President and Chief Executive Officer of General Electric Employers Reinsurance Group. Currently a charter trustee of Hamilton College. Also serves as the Chairman of the National Board of A Better Chance and a director of Pathways to College. Currently serves as a director of Aspen Insurance Holdings Limited. Edward D. Van Dolsen Executive Vice President, President of Retirement and Individual Services since 2011 of TIAA and Executive Vice President of CREF since 2008. Formerly, Executive Vice President and President, Chief Operating Officer of TIAA and CREF from 2010 to 2011. Formerly Executive Vice President, Product Development and Management of TIAA from 2009 to 2010, Executive Vice President, Institutional Client Services from 2006 to 2009, and Executive Vice President, Product Management of TIAA from 2005 to 2006. Also served as Senior Vice President, Pension Products from 2003 to 2005. Director of Covariance (since 2010) and former Executive Vice President of TC Life PORTFOLIO MANAGEMENT TEAM Name & Date of Birth (DOB) Principal Occupations During Past 5 Years Margaret A. Brandwein Managing Director and Portfolio Manager, TIAA Real Estate Account since 2004. Thomas C. Garbutt Senior Managing Director and Head of Global Real Estate, TIAA. 248Prospectus ¡ TIAA Real Estate Account
DOB: 7/22/54
DOB: 4/11/58
DOB: 4/21/58
(2009–2010).
DOB: 11/26/46
DOB: 10/12/58
APPENDIX B — DESCRIPTION OF PROPERTIES Set forth below is general information about the Account’s portfolio of commercial and residential property investments as of December 31, 2012. The Account’s property investments include both properties that are wholly owned by the Account and properties owned by the Account’s joint venture investments. Certain property investments are comprised of a portfolio of properties. Please carefully read the footnotes to these tables, which immediately follow. Market value figures are in thousands. Property Location Year Built Year Rentable Percent Annual Fair OFFICE PROPERTIES 1001 Pennsylvania Ave Washington, D.C. 1987 2004 772,842 99 % $ 38.20 $ 679.4 (4) 50 Fremont Street San Francisco, CA 1983 2004 817,412 95 % 14.01 433.9 (4) Fourth & Madison Seattle, WA 2002 2004 845,533 96 % 24.15 429.3 (4) 99 High Street Boston, MA 1971 2005 731,406 83 % 37.14 386.2 (4) 780 Third Avenue New York, NY 1984 1999 487,598 92 % 53.11 335.4 The Newbury Boston, MA 1940 –1961 2006 607,438 93 % 38.48 289.9 Four Oaks Place LP(19) Houston, TX 1983 2012 1,725,885 98 % 19.23 261.2 1900 K Street NW Washington, D.C. 1996 2004 344,022 69 % 23.84 257.7 275 Battery Street San Francisco, CA 1988 2005 475,138 87 % 37.22 241.0 Lincoln Centre Dallas, TX 1984 2005 1,625,465 86 % 17.35 230.9 (4) 701 Brickell Avenue Miami, FL 1986 2002 677,419 89 % 32.65 230.9 Colorado Center(6)(16) Santa Monica, CA 1984 2004 1,108,929 97 % 6.18 228.4 1 & 7 Westferry Circus London, UK 1992, 1993 2005 395,327 98 % 52.55 223.5 (4)(5) 1401 H Street NW Washington, D.C. 1992 2006 347,040 93 % 44.98 211.3 (4) One Boston Place(8) Boston, MA 1970 2002 802,494 91 % 46.32 195.5 Wilshire Rodeo Plaza Beverly Hills, CA 1935, 1984 2006 245,869 83 % 49.82 171.0 (4) Ten & Twenty Westport Road Wilton, CT 1974, 2001 2001 531,606 98 % 24.93 145.1 Millennium Corporate Park Redmond, WA 1999, 2000 2006 536,884 95 % 15.92 139.4 Urban Centre Tampa, FL 1984, 1987 2005 547,914 81 % 18.45 105.5 88 Kearny Street San Francisco, CA 1986 1999 228,359 91 % 31.21 101.7 The Ellipse at Ballston Arlington, VA 1989 2006 195,311 88 % 31.23 78.3 Pacific Plaza San Diego, CA 2000, 2002 2007 217,890 100 % 26.43 75.7 (4) West Lake North Business Park Westlake Village, CA 2000 2004 197,366 82 % 21.27 46.3 Parkview Plaza Oakbrook, IL 1990 1997 264,162 91 % 17.07 39.3 TIAA Real Estate Account ¡Prospectus249
Purchased
Area
(Sq. ft.)(1)
Leased
Avg.
Base
Rent
Per
Leased
Sq. Ft.(2)
Value(3)
(in millions)
Property Location Year Built Year Rentable Percent Annual Fair 3 Hutton Centre Drive Santa Ana, CA 1985 2003 198,217 78 % $ 16.10 $ 38.6 8270 Greensboro Drive McLean, VA 2000 2005 158,110 70 % 22.58 34.0 Camelback Center Phoenix, AZ 2001 2007 232,615 74 % 19.25 32.6 North 40 Office Complex Boca Raton, FL 1983, 1984 2006 349,999 62 % 6.53 28.6 Creeksides at Centerpoint Kent, WA 1985 2006 218,213 50 % 8.49 20.2 Prominence in Buckhead Atlanta, GA 1999 2003 N/A N/A N/A 2.4 (17) Treat Towers Walnut Creek, CA 1999 2003 N/A N/A N/A 2.1 (17) Subtotal—Office Properties 90 % $ 5,695.3 Percent leased weighted by property fair value—Office(7) 91 % INDUSTRIAL PROPERTIES Ontario Industrial Portfolio Various, CA 1997–1998 1998, 2000, 2004 3,981,894 100 % $ 3.95 $ 304.1 Dallas Industrial Portfolio Dallas and Coppell, TX 1997–2001 2000 –2002 3,684,941 97 % 2.75 164.6 Rancho Cucamonga Industrial Portfolio Rancho Cucamonga, CA 2000 –2002 2000, 2001, 2002, 2004 1,490,235 62 % 2.27 107.0 Great West Industrial Portfolio Rancho Cucamonga and Fontana, CA 2004–2005 2008 1,358,925 100 % 4.37 106.2 Rainier Corporate Park Fife, WA 1991–1997 2003 1,104,399 83 % 3.64 88.5 Weston Business Center Weston, FL 1998 –1999 2011 679,918 100 % 7.55 87.5 Southern CA RA Industrial Portfolio Los Angeles, CA 1982 2004 920,078 79 % 3.53 86.9 Cerritos Industrial Park Cerritos, CA 1970–1977 2012 934,213 92 % 4.13 83.3 Seneca Industrial Park Pembroke Park, FL 1999–2001 2007 882,182 96 % 3.91 74.6 Regal Logistics Campus Seattle, WA 19997–2004 2005 968,535 100 % 3.83 69.5 Chicago Industrial Portfolio Chicago and Joliet, IL 1997–2000 1998, 2000 1,427,687 91 % 2.97 66.2 Shawnee Ridge Industrial Portfolio Atlanta, GA 2000 –2005 2005 1,422,922 92 % 2.78 58.3 Chicago Caleast Industrial Portfolio(9) Chicago, IL 1974–2005 2003 1,145,152 100 % 3.37 58.3 South River Road Industrial Cranbury, NJ 1999 2001 858,957 100 % 3.84 47.4 Northern CA RA Industrial Portfolio Oakland, CA 1981 2004 657,602 83 % 4.08 45.3 Atlanta Industrial Portfolio Lawrenceville, GA 1996–1999 2000 1,295,440 88 % 1.89 42.5 Pinnacle Industrial Portoflio Grapevine, TX 2003, 2004, 2006 2006 899,200 84 % 3.05 42.0 Pacific Corporate Park Fife, WA 2006 2012 388,783 100 % 4.73 35.0 Centre Pointe and Valley View Los Angeles County, CA 1965–1989 2004 307,685 95 % 4.89 30.5 Northeast RA Industrial Portfolio Boston, MA 2000 2004 384,126 100 % 5.22 28.1 Northwest RA Industrial Portfolio Seattle, WA 1996 2004 312,321 100 % 3.81 26.0 Summit Distribution Center Memphis, TN 2002 2003 708,532 100 % 0.56 19.6 250Prospectus ¡ TIAA Real Estate Account
Purchased
Area
(Sq. ft.)(1)
Leased
Avg.
Base
Rent
Per
Leased
Sq. Ft.(2)
Value(3)
(in millions)
Property Location Year Built Year Rentable Percent Annual Fair Konica Photo Imaging Headquarters Mahwah, NJ 1999 1999 168,000 100 % $ 8.36 $ 19.1 Fernley Distribution Facility Fernley, NV 1998 1998 256,000 80 % 2.30 7.3 IDI Nationwide Industrial Portfolio Various, U.S. 1999–2004 2004 N/A N/A N/A 1.3 (18) Subtotal—Industrial Properties 93 % $ 1,699.1 Percent leased weighted by property fair value—Industrial(7) 93 % RETAIL PROPERTIES DDR Joint Venture(10) Various, U.S. Various 2007 11,884,253 92 % $ 9.88 $ 386.3 The Florida Mall(11) Orlando, FL 1986 2002 1,145,785 99 % 38.24 386.2 Printemps de L’Homme Paris, FR 1930 2007 130,372 100 % 85.00 209.2 (5) The Forum at Carlsbad Carlsbad, CA 2003 2011 264,235 99 % 33.24 186.0 (4) Florida Retail Portfolio(12) Various, FL 1974 –2005 2006 1,036,400 88 % 13.44 149.6 Miami International Mall(11) Miami, FL 1982 2002 301,923 98 % 42.20 137.0 The Shops at Wisconsin Place Chevy Chase, MD 2007–2010 2012 117,842 99 % 51.17 110.9 (20) Westwood Marketplace Los Angeles, CA 1950 2002 202,202 100 % 27.92 108.1 Valencia Town Center Valencia, CA 1991 2012 1,095,412 99 % 16.10 99.1 Charleston Plaza Mountain View, CA 2006 2012 132,590 100 % 34.37 80.0 (4) Marketfair West Windsor, NJ 1987 2006 246,061 88 % 19.14 72.2 Mazza Gallerie Washington, D.C. 1975 2004 294,877 78 % 12.64 70.0 West Town Mall(11) Knoxville, TN 1972 2002 956,036 97 % 18.94 67.2 Publix at Weston Commons Weston, FL 2005 2006 126,922 100 % 26.12 52.0 (4) Northpark Village Square Valencia, CA 1996 2011 87,094 94 % 25.42 41.4 South Frisco Village Frisco, TX 2002 2006 227,175 87 % 10.52 34.0 (4) Plainsboro Plaza Plainsboro, NJ 1987 2005 218,718 77 % 10.08 23.5 Suncrest Village Shopping Center Orlando, FL 1987 2005 93,358 81 % 9.02 11.4 Plantation Grove Ocoee, FL 1995 1995 73,655 95 % 10.75 10.3 Subtotal—Retail Properties 93 % $ 2,234.4 Percent leased weighted by property fair value—Retail(7) 96 % TIAA Real Estate Account ¡Prospectus251
Purchased
Area
(Sq. ft.)(1)
Leased
Avg.
Base
Rent
Per
Leased
Sq. Ft.(2)
Value(3)
(in millions)
Property Location Year Built Year Rentable Percent Annual Fair OTHER COMMERCIAL PROPERTIES 425 Park Avenue(14) New York, NY N/A 2011 N/A 100 % N/A $ 330.0 Storage Portfolio(15) Various, U.S. 1972–1990 2003 1,683,182 89 % 13.75 78.6 Four Oaks Place—Land Houston, TX 1983 2004 N/A 100 % N/A 16.2 Subtotal—Other Commercial Properties $ 424.8 Subtotal—Commercial Properties $ 10,053.6 RESIDENTIAL PROPERTIES MiMA New York, NY 2010 2012 N/A 83 % N/A $ 282.0 Palomino Park Denver, CO 1996 –2001 2005 N/A 94 % N/A 247.4 (4) Houston Apartment Portfolio(13) Houston, TX 1984 –2004 2006 N/A 93 % N/A 244.4 (4) The Corner New York, NY 2010 2011 N/A 97 % N/A 228.0 (4) Mass Court Washington, D.C. 2004 2012 N/A 91 % N/A 169.0 (4) The Colorado New York, NY 1987 1999 N/A 98 % N/A 161.0 (4) The Palatine Arlington, VA 2008 2011 N/A 92 % N/A 134.2 (4) Kierland Apartment Portfolio(13) Scottsdale, AZ 1996 –2000 2006 N/A 95 % N/A 114.1 (4) The Legacy at Westwood Los Angeles, CA 2001 2002 N/A 95 % N/A 111.5 (4) Ashford Meadows Apartments Herndon, VA 1998 2000 N/A 97 % N/A 100.3 (4) Larkspur Courts Larkspur, CA 1991 1999 N/A 92 % N/A 93.4 Residence at Rivers Edge Medford, MA 2009 2011 N/A 95 % N/A 88.8 Circa Green Lake Seattle, WA 2009 2012 N/A 94 % N/A 84.0 Regents Court San Diego, CA 2001 2002 N/A 94 % N/A 81.6 (4) South Florida Apartment Portfolio Boca Raton and Plantation, FL 1986 2001 N/A 97 % N/A 79.7 The Caruth Dallas, TX 1999 2005 N/A 97 % N/A 78.1 (4) Windsor at Lenox Park Atlanta, GA 2001 2005 N/A 97 % N/A 55.0 (4) The Residences at the Village of Merrick Park Coral Gables, FL 2003 2012 N/A 98 % N/A 53.8 Prescott Wallingford Apartments Seattle, WA 2012 2012 N/A 71 % N/A 53.6 The Pepper Building Philadelphia, PA 1927, 2010 2011 N/A 95 % N/A 52.5 The Maroneal Houston, TX 1998 2005 N/A 97 % N/A 48.5 Reserve at Sugarloaf Duluth, GA 2000 2005 N/A 93 % N/A 43.0 (4) Glenridge Walk Sandy Springs, GA 1996, 2001 2005 N/A 96 % N/A 37.6 252Prospectus ¡ TIAA Real Estate Account
Purchased
Area
(Sq. ft.)(1)
Leased
Avg.
Base
Rent
Per
Leased
Sq. Ft.(2)
Value(3)
(in millions)
Property Location Year Built Year Rentable Percent Annual Fair Westcreek Westlake Village, CA 1988 1997 N/A 98 % N/A $ 34.7 Phoenix Apartment Portfolio Chandler, AZ 1995–1998 2006 N/A 96 % N/A 33.6 Lincoln Woods Lafayette Hill, PA 1991 1997 N/A 98 % N/A 31.0 Quiet Waters at Coquina Lakes Deerfield Beach, FL 1995 2001 N/A 96 % N/A 26.6 The Fairways of Carolina Margate, FL 1993 2001 N/A 95 % N/A 25.1 Subtotal—Residential Properties 94 % $ 2,792.5 Percent leased weighted by property fair value—Residential(7) 93 % Total—All Properties—Percent Leased weighted by property fair value(7) 93 % $ 12,846.1 (1) The square footage is an approximate measure and is subject to periodic remeasurement. (2) Based on total contractual rent for leases existing as of December 31, 2012. The contractual rent can be either on a gross or net basis, depending on the terms of the leases. (3) Fair value reflects the value determined in accordance with the procedures described in the Account’s prospectus and as stated in the Notes to Consolidated Financial Statements. (4) Property is subject to a mortgage. The fair value shown represents the Account’s interest gross of debt. (5) 1 & 7 Westferry Circus is located in the United Kingdom. Printemps de l’Homme is located in France. The fair value of each property is converted from local currency to U.S. Dollars at the exchange rate as of December 31, 2012. (6) This property is held in 50%/50% joint venture with Equity Office Properties Trust. Fair value shown reflects the value of the Account’s interest in the joint venture, net of debt. (7) Values shown are based on the property fair value weighted as a percent of the total fair value and based upon the percent leased for each property. (8) The Account purchased a 50.25% interest in a private REIT, which owns this property. A 49.70% interest is owned by Societe Immobiler Trans-Quebec, and .05% is owned by 100 individuals. Fair value shown reflects the value of the Account’s interest in the joint venture. (9) A portion of this portfolio was sold in 2008. (10) This investment property consists of 39 properties located in 13 states and is held in a 85%/15% joint venture with Developers Diversified Realty Corporation. Fair Value shown reflects the value of the Account’s interest in the joint venture, net of debt. (11) This investment property is held in a 50%/50% joint venture with the Simon Property Group. Fair value shown reflects the value of the Account’s interest in the joint venture, net of debt. (12) This investment property is held in a 80%/20% joint venture with Weingarten Realty Investors. Fair value shown reflects the value of the Account’s interest in the joint venture. This portfolio contains six neighborhood and/or community shopping centers located in Ft. Lauderdale, Miami, Orlando, and Tampa, Florida areas. (13) A portion of these investment portfolios were sold in 2009. (14) Represents a fee interest encumbered by a ground lease real estate investment. (15) This investment property is held in a 75%/25% joint venture with Storage USA. Fair value shown reflects the value of the Account’s interest in the joint venture, net of debt. (16) Investment was formerly named Yahoo Center. (17) The fair value reflects the final settlement due to the Account. The property investment held within the joint venture was sold during the quarter ended September 30, 2012. (18) The fair value reflects the final settlement due to the Account. The property investment held within the joint venture was sold during the quarter ended December 31, 2012. (19) This property is held in 51%/49% joint venture with Allianz. Fair value shown reflects the Account’s interest in the joint venture. (20) Fair value shown reflects both the retail property and the Account’s 33.3% interest in a joint venture investment. TIAA Real Estate Account ¡Prospectus253
Purchased
Area
(Sq. ft.)(1)
Leased
Avg.
Base
Rent
Per
Leased
Sq. Ft.(2)
Value(3)
(in millions)
Residential Property Portfolio. The table below contains more detailed information regarding the apartment complexes in the Account’s portfolio as of December 31, 2012 and should be read in conjunction with the immediately preceding table. Property Location Number Average Avg. Rent Houston Apartment Porfolio(1) Houston, TX 1,777 1,013 1,280 Palomino Park Highlands Ranch, CO 1,184 1,096 1,286 Kierland Apartment Portfolio(1) Scottsdale, AZ 724 1,048 1,024 MiMA New York, NY 651 792 5,327 South Florida Apartment Portfolio(1) Boca Raton and Plantation, FL 550 889 1,116 Ashford Meadows Apartments Herndon, VA 440 1,050 1,514 Windsor at Lenox Park Atlanta, GA 407 1,024 1,167 Mass Court Washington, DC 371 835 2,461 The Caruth Dallas, TX 338 1,167 1,696 Reserve at Sugarloaf Duluth, GA 333 1,220 1,083 The Maroneal Houston, TX 309 928 1,376 Glenridge Walk Sandy Springs, GA 296 1,146 1,046 The Palatine Arlington, VA 262 1,055 2,742 The Colorado New York, NY 256 623 2,994 Regents Court San Diego, CA 251 886 1,662 Larkspur Courts Larkspur, CA 248 1,001 2,252 Phoenix Apartment Portfolio Chandler, AZ 240 975 899 Residences at Rivers Edge Medford, MA 222 955 2,369 Lincoln Woods Lafayette Hill, PA 216 774 1,264 The Fairways of Carolina Margate, FL 208 1,026 1,137 Quiet Waters at Coquina Lakes Deerfield Beach, FL 200 1,048 1,146 Circa Green Lake Seattle, WA 199 765 1,865 The Corner New York, NY 196 790 5,872 The Legacy at Westwood Los Angeles, CA 187 1,181 3,386 The Pepper Building Philadelphia, PA 185 820 1,727 Prescott Wallingford Apartments Seattle, WA 154 665 1,573 Westcreek Westlake Village, CA 126 951 1,722 The Residences at the Village of Merrick Park Coral Gables, FL 120 1,231 2,707 (1) 254Prospectus ¡ TIAA Real Estate Account
Of Units
Unit Size
(Square Feet)
Per Unit/
Per Month Represents a portfolio containing multiple properties.
Accumulation:The total value of your accumulation units in the Real Estate Account. Accumulation Period:The period that begins with your first premium and continues until the entire accumulation has been applied to purchase annuity income, transferred from the Account, or paid to you or a beneficiary. Accumulation Unit: A share of participation in the Real Estate Account for someone in the accumulation period. The Account’s accumulation unit value changes daily. Annuity Unit:A measure used to calculate the amount of annuity payments due a participant. Beneficiary:Any person or institution named to receive benefits if you die during the accumulation period or if you (and your annuity partner, if you have one) die before the guaranteed period of your annuity ends. Business Day:Any day the New York Stock Exchange (NYSE) is open for trading. A business day ends at 4 p.m. Eastern Time, or when trading closes on the NYSE, if earlier. Calendar Day:Any day of the year. Calendar days end at the same time as business days. Commuted Value:The present value of annuity payments due under an income option or method of payment not based on life contingencies. Present value is adjusted for investment gains or losses since the annuity unit value was last calculated. Eligible Institution:A nonprofit institution, including any governmental institution, organized in the United States. ERISA:The Employee Retirement Income Security Act of 1974, as amended. General Account:All of TIAA’s assets other than those allocated to the Real Estate Account or to other existing or future TIAA separate accounts. Good Order:Actual receipt of an order along with all information and supporting legal documentation necessary to effect the transaction. This information and documentation generally includes your complete application and any other information or supporting documentation we may require. With respect to purchase requests, “good order” also generally includes receipt of sufficient funds by us to effect the purchase. We may, in our sole discretion, determine whether any particular transaction request is in good order and reserve the right to change or waive any good order requirement at any time either in general or with respect to a particular plan, contract or transaction. Income Change Method:The method under which you choose to have your annuity payments revalued. Under the annual income change method, your payments are revalued once each year. Under the monthly income change method, your payments are revalued every month. TIAA Real Estate Account ¡Prospectus255
Separate Account:An investment account legally separated from the general assets of TIAA, whose income and investment gains and losses are credited to or charged against its own assets, without regard to TIAA’s other income, gains or losses. Valuation Day:Any business day. Valuation Period:The time from the end of one valuation day to the end of the next. 256Prospectus ¡ TIAA Real Estate Account
PART II Item 13.Other Expenses of Issuance and Distribution. SEC Registration Fees $ 136,400 Costs of printing and engraving 600,000 * Legal fees 44,000 * Accounting fees 34,000 * Blue Sky Registration Fees 5,000 * Miscellaneous 10,600 * Total $ 830,000 *
INFORMATION NOT REQUIRED IN A PROSPECTUS
| ||||||||||||||||||||
* |
|
| Approximate | |||||||||||||||||
Item 14.Indemnification of Directors and Officers.
Trustees, officers, and employees of TIAA may be indemnified against liabilities and expenses incurred in such capacity pursuant to Article Six of TIAA’s bylaws (see Exhibit 3(B)). Article Six provides that, to the extent permitted by law, TIAA will indemnify any person made or threatened to be made a party to any action, suit or proceeding by reason of the fact that such person is or was a trustee, officer, or employee of TIAA or, while a trustee, officer, or employee of TIAA, served any other organization in any capacity at TIAA’s request. To the extent permitted by law, such indemnification could include judgments, fines, amounts paid in settlement, and expenses, including attorney’s fees. TIAA has in effect an insurance policy that will indemnify its trustees, officers, and employees for liabilities arising from certain forms of conduct. No payment of indemnification, advance or allowance under the foregoing provisions shall be made unless a notice shall have been filed with the Superintendent of Insurance of the State of New York not less than thirty days prior to such payment specifying the persons to be paid, the amounts to be paid, the manner in which payment is authorized and the nature and status, at the time of such notice, of the litigation or threatened litigation.
Insofar as indemnification for liabilities arising under the Securities Act of 1933, as amended (the “Securities Act”) may be permitted to trustees, officers, or employees of TIAA, pursuant to the foregoing provision or otherwise, TIAA has been advised that in the opinion of the Securities and Exchange Commission such indemnification is against public policy as expressed in that Securities Act and is therefore unenforceable. In the event that a claim for indemnification against such liabilities (other than the payment of expenses incurred or paid by a trustee, officer, or employee in the successful defense of any action, suit or proceeding) is asserted by a trustee, officer, or employee in connection with the securities being registered, TIAA will, unless in the opinion of its counsel the matter has been settled by controlling precedent, submit to a court of appropriate jurisdiction the question whether such indemnification by it is against public policy as expressed in that Act and will be governed by the final adjudication of such issue.
Item 15.Recent Sales of Unregistered Securities.
None.
Item 16.Exhibits and Financial Statement Schedules.
(a) Exhibits
(1)
(A)
Distribution Agreement for the Contracts Funded by the TIAA Real Estate Account, dated as of January 1, 2008, by and among Teachers Insurance and Annuity Association of America, for itself and on behalf of the Account, and TIAA-CREF Individual & Institutional Services, LLC.**
(3)
(A)
Charter of TIAA.4
(B)
Restated Bylaws of TIAA (as amended).5
II-1
(4) (A) Forms of RA, GRA, GSRA, SRA, IRA Real Estate Account Endorsements2, Keogh Contract,3Retirement Select and Retirement Select Plus Contracts and Endorsements1and Retirement Choice and Retirement Choice Plus Contracts.3 (B) Forms of Income-Paying Contracts2 (C) Form of Contract Endorsement for Internal Transfer Limitation6 (D) Form of Accumulation Contract7 (5) Opinion and Consent of Jonathan Feigelson, Esq.* (10) (A) Amended and Restated Independent Fiduciary Letter Agreement, dated as of November 23, 2011, between TIAA, on behalf of the Registrant, and Real Estate Research Corporation8 (B) Custodian Agreement, dated as of March 3, 2008, by and between TIAA, on behalf of the Registrant, and State Street Bank and Trust Company, N.A.9 (23) (A) Consent of Jonathan Feigelson, Esq. (included in Exhibit 5)* (B) Consent of Dechert LLP** (C) Consent of PricewaterhouseCoopers LLP* (D) Consent of PricewaterhouseCoopers LLP* (E) Consent of Aarons Grant & Habif, LLC* (F) Consent of Cohn Reznick, LLP* (24) Powers of Attorney** **(101) The following financial information from the Registration Statement on Form S-1 for the periods ended December 31, 2012, formatted in XBRL (Extensible Business Reporting Language): (i) the Statements of Assets and Liabilities, (ii) the Statements of Operations, (iii) the Statements of Changes in Net Assets, (iv) the Statements of Cash Flows, and (v) the Notes to the Financial Statements
| ||||||||||||||||||||
* |
|
| Filed herewith. | |||||||||||||||||
| ||||||||||||||||||||
** |
| Previously filed or furnished. | ||||||||||||||||||
| ||||||||||||||||||||
1 |
| Previously filed and incorporated herein by reference to the Account’s Pre-Effective Amendment No. 1 to the Registration Statement on Form S-1 filed April 29, 2004 (File No. 333-113602). | ||||||||||||||||||
| ||||||||||||||||||||
2 |
| Previously filed and incorporated herein by reference to the Account’s Post-Effective Amendment No. 2 to the Registration Statement on Form S-1 filed April 30, 1996 (File No. 33-92990). | ||||||||||||||||||
| ||||||||||||||||||||
3 |
| Previously filed and incorporated herein by reference to the Account’s Post-Effective Amendment No. 1 to the Registration Statement on Form S-1 filed May 2, 2005 (File No. 333-121493). | ||||||||||||||||||
| ||||||||||||||||||||
4 |
| Previously filed and incorporated by reference to Exhibit 3(A) to the Account’s Quarterly Report on Form 10-Q for the quarter ended June 30, 2009 and filed with the Commission on August 13, 2009 (File No. 33-92990) | ||||||||||||||||||
| ||||||||||||||||||||
5 |
| Previously filed and incorporated by reference to Exhibit 3(B) to the Account’s Quarterly Report on Form 10-Q for the quarter ended June 30, 2009 and filed with the Commission on August 13, 2009 (File No. 33-92990). | ||||||||||||||||||
| ||||||||||||||||||||
6 |
| Previously filed and incorporated by reference to Exhibit 4(C) to the Account’s Quarterly Report on Form 10-Q for the quarter ended September 30, 2010 and filed with the Commission on November 12, 2010 (File No. 33-92990). | ||||||||||||||||||
| ||||||||||||||||||||
7 |
| Previously filed and incorporated by reference to Exhibit 4(D) to the Account’s Pre-Effective Amendment No. 1 to the Registration Statement on Form S-1 filed April 27, 2011 (File No. 333-172900). | ||||||||||||||||||
| ||||||||||||||||||||
8 |
| Previously filed and incorporated by reference to Exhibit 10.1 to the Account’s Current Report on Form 8-K, filed with the Commission on November 29, 2011 (File No. 33-92990). | ||||||||||||||||||
| ||||||||||||||||||||
9 |
| Previously filed and incorporated by reference to Exhibit 10(B) to the Account’s Annual Report on Form 10-K for the year ended December 31, 2012, filed with the Commission on March 14, 2013 (File No. 33-92990). | ||||||||||||||||||
II-2
(b) Financial Statement Schedules All Schedules have been omitted because they are not required under the related instructions or are inapplicable. Item 17.Undertakings. The undersigned Registrant hereby undertakes: (1) To file, during any period in which offers or sales are being made, a post-effective amendment to this Registration Statement: (i) To include any prospectus required by Section 10(a)(3) of the Securities Act of 1933. (ii) To reflect in the prospectus any facts or events arising after the effective date of the Registration Statement (or the most recent post-effective amendment thereof) which, individually or in the aggregate, represent a fundamental change in the information set forth in the Registration Statement. Notwithstanding the foregoing, any increase or decrease in volume of securities offered (if the total dollar value of securities offered would not exceed that which was registered) and any deviation from the low or high end of the estimated maximum offering range may be reflected in the form of prospectus filed with the Commission pursuant to Rule 424(b) if, in the aggregate, the changes in volume and price represent no more than a 20 percent change in the maximum aggregate offering price set forth in the “Calculation of Registration Fee” table in the effective registration statement. (iii) To include any material information with respect to the plan of distribution not previously disclosed in the Registration Statement or any material change to such information in the Registration Statement. (2) That, for the purpose of determining any liability under the Securities Act of 1933, each such post-effective amendment shall be deemed to be a new registration statement relating to the securities offered therein, and the offering of such securities at that time shall be deemed to be the initialbona fideoffering thereof. (3) To remove from registration by means of a post-effective amendment any of the securities being registered which remain unsold at the termination of the offering. (4) To provide the full financial statements of TIAA promptly upon written or oral request. (5) That, for the purpose of determining liability under the Securities Act of 1933 to any purchaser, each prospectus filed pursuant to Rule 424(b) as part of a registration statement relating to an offering, other than registration statements relying on Rule 430B or other than prospectuses filed in reliance on Rule 430A, shall be deemed to be part of and included in the registration statement as of the date it is first used after effectiveness. Provided, however, that no statement made in a registration statement or prospectus that is part of the registration statement or made in a document incorporated or deemed incorporated by reference into the registration statement or prospectus that is part of the registration statement will, as to a purchaser with a time of contract of sale prior to such first use, supersede or modify any statement that was made in the registration statement or prospectus that was part of the registration statement or made in any such document immediately prior to such date of first use. (6) That, for the purpose of determining liability of the Registrant under the Securities Act of 1933 to any purchaser in the initial distribution of the securities: The undersigned Registrant undertakes that in a primary offering of securities of the undersigned Registrant pursuant to this Registration Statement, regardless of the underwriting method used to sell the securities to the purchaser, if the securities are offered or sold to such purchaser by means of any of the following communications, the undersigned Registrant will be a seller to the purchaser and will be considered to offer or sell such securities to such purchaser: (i) Any preliminary prospectus or prospectuses of the undersigned Registrant relating to the offering required to be filed pursuant to Rule 424; (ii) Any free writing prospectus relating to the offering prepared by or on behalf of the undersigned Registrant or used or referred to by the undersigned Registrant; II-3
(iii) The portion of any other free writing prospectus relating to the offering containing material information about the undersigned Registrant or its securities provided by or on behalf of the undersigned Registrant; and (iv) Any other communication that is an offer in the offering made by the undersigned Registrant to the purchaser. II-4
REPORT OF MANAGEMENT RESPONSIBILITY April 8, 2013 To the Policyholders of Teachers Insurance and Annuity Association of America: The accompanying statutory-basis financial statements of Teachers Insurance and Annuity Association of America (“TIAA”) are the responsibility of management. They have been prepared on the basis of statutory accounting principles, a comprehensive basis of accounting comprised of accounting principles prescribed or permitted by the New York State Department of Financial Services. The financial statements of TIAA have been presented fairly and objectively in accordance with such statutory accounting principles. TIAA’s internal control over financial reporting is a process effected by those charged with governance, management and other personnel, designed to provide reasonable assurance regarding the preparation of reliable financial statements in accordance with statutory accounting principles. TIAA’s internal control over financial reporting includes those policies and procedures that (1) pertain to the maintenance of records that, in reasonable detail, accurately and fairly reflect the transactions and dispositions of the assets of the entity; (2) provide reasonable assurance that transactions are recorded as necessary to permit preparation of financial statements in accordance with statutory accounting principles, and the receipts and expenditures of the entity are being made only in accordance with authorizations of management and those charged with governance; and (3) provide reasonable assurance regarding prevention, or timely detection and correction of unauthorized acquisition, use, or disposition of the entity’s assets that could have a material effect on the financial statements. Management is responsible for establishing and maintaining effective internal control over financial reporting. Management assessed the effectiveness of the entity’s internal control over financial reporting as of December 31, 2012, based on the framework set forth by the Committee of Sponsoring Organizations of the Treadway Commission inInternal Control-Integrated Framework. Based on that assessment, management concluded that, as of December 31, 2012, TIAA’s internal control over financial reporting is effective based on the criteria established inInternal Control-Integrated Framework. In addition, TIAA’s internal audit personnel provide regular reviews and assessments of the internal controls and operations of TIAA, and the Vice President of Internal Audit regularly reports to the Audit Committee of the TIAA Board of Trustees. The independent auditors of PricewaterhouseCoopers LLP have audited the accompanying statutory-basis financial statements of TIAA for the years ended December 31, 2012, 2011 and 2010. To maintain auditor independence and avoid even the appearance of a conflict of interest, it continues to be TIAA’s policy that any management advisory or consulting service, which is not in accordance with TIAA’s specific auditor independence policies designed to avoid such conflicts, be obtained from a firm other than the independent auditor. The independent auditors’ report expresses an opinion in all material respect on the fairness of presentation of these statutory-basis financial statements. The Audit Committee of the TIAA Board of Trustees, comprised entirely of independent, non-management trustees, meets regularly with management, representatives of the independent auditor and internal audit personnel to review matters relating to financial reporting, internal controls and auditing. In addition to the annual independent audit of the TIAA statutory-basis financial statements, the New York Department of Financial Services and other state insurance departments regularly examine the operations and financial statements of TIAA as part of their periodic corporate examinations. REPORT OF INDEPENDENT AUDITORS To the Board of Trustees of Teachers Insurance and Annuity Association of America: We have audited the accompanying statutory-basis financial statements of Teachers Insurance and Annuity Association of America (the “Company”), which comprise the statutory statements of admitted assets, liabilities, and capital and contingency reserves as of December 31, 2012 and 2011 and the related statutory statements of operations, changes in capital and contingency reserves and cash flows for each of the three years in the period ended December 31, 2012. We also have audited the Company’s internal control over financial reporting as of December 31, 2012, based on criteria established inInternal Control—Integrated Framework issued by the Committee of Sponsoring Organizations of the Treadway Commission (“COSO”). Management is responsible for the preparation and fair presentation of these financial statements in accordance with the accounting practices prescribed or permitted by the New York State Department of Financial Services. Management is also responsible for maintaining effective internal control over financial reporting, and for its assertion of the effectiveness of internal control over financial reporting, included in the accompanying Report of Management’s Responsibility. Our responsibility is to express an opinion on these financial statements and an opinion on the Company’s internal control over financial reporting based on our audits. We conducted our audit of the financial statements in accordance with auditing standards generally accepted in the United States of America and our audit of internal control over financial reporting in accordance with attestation standards established by the American Institute of Certified Public Accountants. Those standards require that we plan and perform the audit to obtain reasonable assurance about whether the financial statements are free from material misstatement and whether effective internal control over financial reporting was maintained in all material respects. Our audit of the financial statements included examining, on a test basis, evidence supporting the amounts and disclosures in the financial statements, assessing the accounting principles used and significant estimates made by management, as well as evaluating the overall financial statement presentation. Our audit of internal control over financial reporting included obtaining an understanding of internal control over financial reporting, assessing the risk that a material weakness exists, and, testing and evaluating the design and operating effectiveness of internal control, based on the assessed risk. Our audits also included performing such other procedures as we considered necessary in the circumstances. We believe that our audits provide a reasonable basis for our opinions. As described in Note 2 to the financial statements, the financial statements are prepared by the Company on the basis of the accounting practices prescribed or permitted by the New York State Department of Financial Services, which is a basis of accounting other than accounting principles generally accepted in the United States of America. The effects on the financial statements of the variances between the statutory basis of accounting described in Note 2 and accounting principles generally accepted in the United States of America, although not reasonably determinable, are presumed to be material. In our opinion, because of the effects of the matter discussed in the preceding paragraph, the financial statements referred to above do not present fairly, in accordance with accounting principles generally accepted in the United States of America, the financial position of the Company as of December 31, 2012 and 2011, or the results of its operations or its cash flows thereof for the years then ended. In our opinion, the financial statements referred to above present fairly, in all material respects, the admitted assets, liabilities, and surplus of the Company as of December 31, 2012 and 2011, and the results of its operations and its cash flows for each of the three years in the period ended December 31, 2012 on the basis of accounting described in Note 2. Also in our opinion, the Company maintained, in all material respects, effective internal control over financial reporting as of December 31, 2012, based on criteria established inInternal Control—Integrated Framework issued by the Committee of Sponsoring Organizations of the Treadway Commission (COSO). A company’s internal control over financial reporting is a process effected by those charged with governance, management, and other personnel, designed to provide reasonable assurance regarding the preparation of reliable financial statements in accordance with accounting practices prescribed or permitted by the New York State Department of Financial Services. A company’s internal control over financial reporting includes those policies and procedures that (i) pertain to the maintenance of records that, in reasonable detail, accurately and fairly reflect the transactions and dispositions of the assets of the company; (ii) provide reasonable assurance that transactions are recorded as necessary to permit preparation of financial statements in accordance with accounting practices prescribed or permitted by the New York State Department of Financial Services, and that receipts and expenditures of the company are being made only in accordance with authorizations of management and those charged with governance; and (iii) provide reasonable assurance regarding prevention or timely detection and correction of unauthorized acquisition, use, or disposition of the company’s assets that could have a material effect on the financial statements. Because of its inherent limitations, internal control over financial reporting may not prevent or detect misstatements. Also, projections of any evaluation of effectiveness to future periods are subject to the risk that controls may become inadequate because of changes in conditions, or that the degree of compliance with the policies or procedures may deteriorate. New York, New York April 8, 2013 STATUTORY–BASIS STATEMENTS OF ADMITTED ASSETS, LIABILITIES AND CAPITAL AND CONTINGENCY RESERVES TEACHERS INSURANCE AND ANNUITY ASSOCIATION OF AMERICA ADMITTED ASSETS Bonds Preferred stocks Common stocks Mortgage loans Real estate Cash, cash equivalents and short-term investments Contract loans Derivatives Other long-term investments Investment income due and accrued Federal income taxes Net deferred federal income tax asset Other assets Separate account assets Total admitted assets LIABILITIES, CAPITAL AND CONTINGENCY RESERVES Liabilities Reserves for life and health insurance, annuities and deposit-type contracts Dividends due to policyholders Interest maintenance reserve Federal income taxes Borrowed money Asset valuation reserve Derivatives Other liabilities Separate account liabilities Total liabilities Capital and Contingency Reserves Capital (2,500 shares of $1,000 par value common stock issued and outstanding and $550,000 paid-in capital) Surplus notes Contingency reserves: For investment losses, annuity and insurance mortality, and other risks Deferred income taxes Total capital and contingency reserves Total liabilities, capital and contingency reserves STATUTORY–BASIS STATEMENTS OF OPERATIONS TEACHERS INSURANCE AND ANNUITY ASSOCIATION OF AMERICA REVENUES Insurance and annuity premiums and other considerations Annuity dividend additions Net investment income Other revenue Total revenues BENEFITS AND EXPENSES Policy and contract benefits Dividends to policyholders Increase in policy and contract reserves Net operating expenses Net transfers to separate accounts Other benefits and expenses Total benefits and expenses Income before federal income taxes and net realized capital gains (losses) Federal income tax (benefit) Net realized capital gains (losses) less capital gains taxes, after transfers to the interest maintenance reserve Net income STATUTORY–BASIS STATEMENTS OF CHANGES IN CAPITAL AND CONTINGENCY RESERVES TEACHERS INSURANCE AND ANNUITY ASSOCIATION OF AMERICA Balance, December 31, 2009 Net Income Net unrealized capital gains on investments Change in asset valuation reserve Change in surplus of separate accounts Change in net deferred income tax Prior year surplus adjustment Change in non-admitted assets: Deferred federal income tax asset Other assets Balance, December 31, 2010 Net Income Net unrealized capital gains on investments Change in asset valuation reserve Change in accounting principle Change in surplus of separate accounts Change in net deferred income tax Change in non-admitted assets: Deferred federal income tax asset Other assets Balance, December 31, 2011 Net Income Net unrealized capital gains on investments Change in asset valuation reserve Change in surplus of separate accounts Change in net deferred income tax Prior year surplus adjustment Change in non-admitted assets: Deferred federal income tax asset Other assets Balance, December 31, 2012 STATUTORY–BASIS STATEMENTS OF CASH FLOWS TEACHERS INSURANCE AND ANNUITY ASSOCIATION OF AMERICA CASH FROM OPERATIONS Insurance and annuity premiums and other considerations Net investment income Miscellaneous income Total Receipts Policy and contract benefits Operating expenses Dividends paid to policyholders Federal income tax expense (benefit) Net transfers to separate accounts Total Disbursements Net cash from operations CASH FROM INVESTMENTS Proceeds from investments sold, matured, or repaid: Bonds Stocks Mortgage loans and real estate Other invested assets Miscellaneous proceeds Cost of investments acquired: Bonds Stocks Mortgage loans and real estate Other invested assets Miscellaneous applications Net cash from investments CASH FROM FINANCING AND OTHER Borrowed money Net deposits on deposit-type contracts funds Other cash provided (applied) Net cash from financing and other NET CHANGE IN CASH, CASH EQUIVALENTS AND SHORT-TERM INVESTMENTS CASH, CASH EQUIVALENTS AND SHORT-TERM INVESTMENTS, BEGINNING OF YEAR CASH, CASH EQUIVALENTS AND SHORT-TERM INVESTMENTS, END OF YEAR NOTES TO STATUTORY–BASIS FINANCIAL STATEMENTS TEACHERS INSURANCE AND ANNUITY ASSOCIATION OF AMERICA n DECEMBER 31, 2012 Note 1—organization Teachers Insurance and Annuity Association of America (“TIAA” or the “Company”) was established in 1918 as a legal reserve life insurance company under the insurance laws of the State of New York. All of the outstanding common stock of TIAA is held by the TIAA Board of Overseers (“Board of Overseers”), a not-for-profit corporation incorporated in the State of New York originally created for the purpose of holding the stock of TIAA. The Company’s primary purpose is to aid and strengthen non-profit educational and research organizations, governmental entities and other non-profit institutions by providing retirement and insurance benefits for their employees and their families and by counseling such organizations and their employees on benefit plans and other measures of economic security. Note 2—significant accounting policies BASIS OF PRESENTATION: The accompanying financial statements have been prepared on the basis of statutory accounting principles prescribed or permitted by the New York State Department of Financial Services (the “Department”); a comprehensive basis of accounting that differs from accounting principles generally accepted in the United States (“GAAP”). The Department requires insurance companies domiciled in the State of New York to prepare their statutory-basis financial statements in accordance with the National Association of Insurance Commissioners’ (“NAIC”) Accounting Practices and Procedures Manual (“NAIC SAP”), subject to any deviation prescribed or permitted by the Department (“New York SAP”). The table below provides a reconciliation of the Company’s net income (loss) and capital and contingency reserves between NAIC SAP and the New York SAP annual statement filed with the Department. The primary differences arise because the Company maintains more conservative reserves, as prescribed or permitted by New York SAP, under which annuity reserves are generally discounted on the basis of mortality tables and contractually guaranteed interest rates (in millions). Net Income, New York SAP New York SAP Prescribed Practices: Additional Reserves for: Term Conversions Deferred and Payout Annuities issued after 2000 Net Income, NAIC SAP Capital and Contingency Reserves, New York SAP New York SAP Prescribed Practices: Intangible Asset Limitation Additional Reserves for: Term Conversions Deferred and Payout Annuities issued after 2000 Capital and Contingency Reserves, NAIC SAP Accounting Principles Generally Accepted in the United States:The Financial Accounting Standards Board (“FASB”) dictates the accounting principles for financial statements that are prepared in conformity with GAAP with applicable authoritative accounting pronouncements. As a result, the Company cannot refer to financial statements prepared in accordance with NAIC SAP and New York SAP as having been prepared in accordance with GAAP. The primary differences between GAAP and NAIC SAP can be summarized as follows: Under GAAP: Impairments on securities other than loan-backed and structured securities due to credit losses are recorded as other-than-temporary impairments (“OTTI”) through earnings for the difference between amortized cost and discounted cash flows when a security is deemed impaired. Other declines in fair value related to factors other than credit are recorded as other comprehensive income, which is a separate component of stockholder’s equity. Under NAIC NOTES TO STATUTORY–BASIS FINANCIAL STATEMENTS TEACHERS INSURANCE AND ANNUITY ASSOCIATION OF AMERICA SAP, an impairment for such securities is recorded through earnings for the difference between amortized cost and fair value; The effects of these differences, while not determined, are presumed to be material. Reclassifications:Certain prior year amounts in the financial statements have been reclassified to conform to the 2012 presentation. These reclassifications did not affect the total assets, liabilities, net income or surplus previously reported. Use of Estimates:The preparation of statutory-basis financial statements requires management to make estimates and assumptions that impact the reported amounts of assets and liabilities at the date of the financial statements. Management is also required to disclose contingent assets and liabilities at the date of the financial statements and the reported amounts of revenues and expenses during the reporting periods. Actual results may differ from those estimates. ACCOUNTING POLICIES: The following is a summary of the significant accounting policies followed by the Company: Investments:Publicly traded securities are accounted for as of the date the investments are purchased or sold (trade date). Other investments are recorded on the settlement date. Realized capital gains and losses on investment transactions are accounted for under the specific identification method. A realized loss is recorded when an impairment is considered to be other-than-temporary. Bonds:Bonds are stated at amortized cost using the current effective interest method. Bonds in or near default (rated NAIC 6) are stated at the lower of amortized cost or fair value. Bonds the Company intends to sell prior to maturity (“held for sale”) are stated at the lower of amortized cost or fair value. Included within bonds are loan-backed and structured securities. Estimated future cash flows and expected prepayment speeds are used to determine the amortization of loan-backed and structured securities under the prospective method. Expected future cash flows and prepayment speeds are evaluated quarterly. Certain loan-backed and structured securities are reported at the lower of cost or fair value as a result of the NAIC modeling process. If it is determined that a decline in the fair value of a bond, excluding loan-backed and structured securities, is other-than-temporary, the cost basis of the bond is written down to fair value and the amount of the write down is accounted for as a realized loss. The new cost basis is not changed for subsequent recoveries in fair value. Future declines in fair value which are determined to be other-than-temporary are recorded as realized losses. For loan-backed and structured securities, when an other-than-temporary impairment (“OTTI”) has occurred because the Company does not expect to recover the entire amortized cost basis of the security, with the intent and ability to hold, the amount of the OTTI recognized as a realized loss is the difference between the security’s amortized cost basis and the present value of cash flows expected to be collected, discounted at the loan-backed or structured security’s effective interest rate. For loan-backed and structured securities, when an OTTI has occurred because the Company intends to sell the security or the Company does not have the intent and ability to retain the security for a period of time sufficient to recover the amortized cost basis, the amount of the OTTI realized is the difference between the security’s amortized cost basis and fair value at the balance sheet date. In periods subsequent to the recognition of an OTTI loss for a loan-backed or structured security, the Company accounts for the other-than-temporarily impaired security as if the security had been purchased on the measurement date of the impairment. The difference between the new amortized cost basis and the cash flows expected to be collected is accreted as interest income in future periods based on prospective changes in cash flow estimates. The fair values for publicly traded long term bond investments are generally determined using prices provided by third party pricing services. For privately placed long term bond investments without readily ascertainable market value, such values are determined with the assistance of independent pricing services utilizing a discounted cash flow methodology based on coupon rates, maturity provisions and credit assumptions. Preferred Stocks:Preferred stocks are stated at amortized cost unless they have an NAIC rating designation of 4, 5, or 6 which are stated at the lower of amortized cost or fair value. The fair values of preferred stocks are determined using prices provided by third party pricing services or valuations from the NAIC. When it is determined that a decline in fair value of an investment is other-than-temporary, the cost basis of the investment is reduced to its fair value and the amount of the reduction is accounted for as a realized loss. Common Stocks:Unaffiliated common stocks are stated at fair value, which is based on quoted market prices, where available. Changes in fair value are recorded through surplus. For common stocks without quoted market prices, fair value is estimated using independent pricing services or internally developed pricing models. When it is determined that a decline in fair value of an investment is other-than-temporary, the cost basis of the investment is reduced to its fair value and the amount of the reduction is accounted for as a realized loss. Mortgage Loans:Mortgage loans are stated at amortized cost, net of valuation allowances. Mortgage loans held for sale are stated at the lower of amortized cost or fair value. Mortgage loans are evaluated for impairment when it is probable that the receipt of contractual payments of principal and interest may not occur when scheduled. If the impairment is considered to be temporary, a valuation allowance is established for the excess of the carrying value of the mortgage over its estimated fair value. Changes in valuation allowance for mortgage loans are included in net unrealized capital gains and losses on investments. When an event occurs resulting in an impairment that is other-than-temporary, a direct write-down is recorded as a realized loss and a new cost basis is established. The fair value of mortgage loans is generally determined using a discounted cash flow methodology based on coupon rates, maturity provisions and credit assumptions Real Estate:Real estate occupied by the Company and real estate held for the production of income is carried at depreciated cost, less encumbrances. Real estate held for sale is carried at the lower of depreciated cost or fair value, less encumbrances, and estimated costs to sell. The Company utilizes the straight-line method of depreciation on real estate. Depreciation is generally computed over a forty-year period. A real estate property may be considered impaired when events or circumstances in- dicate that the carrying value may not be recoverable. When the Company determines that an investment in real estate is impaired, a direct write-down is made to reduce the carrying value of the property to its estimated fair value based on an external appraisal, net of encumbrances, and a realized loss is recorded. The Company makes investments in commercial real estate directly, through wholly owned subsidiaries and through real estate limited partnerships. The Company monitors the effects of current and expected market conditions and other factors on its real estate investments to identify and quantify any impairment in value. The Company assesses assets to determine if events or changes in circumstances indicate that the carrying amount of the asset may not be recoverable. The Company evaluates the recoverability of income producing investments based on undiscounted cash flows and then reviews the results of an independent third party appraisal to determine the fair value and if an adjustment is required. Wholly-Owned Subsidiaries:Investments in wholly-owned subsidiaries are stated at the value of their underlying net assets as follows: (1) domestic insurance subsidiaries are stated at the value of their underlying statutory surplus and (2) non-insurance subsidiaries are stated at the value of their underlying GAAP equity. Dividends and distributions from subsidiaries are recorded in investment income and changes in the equity of subsidiaries are recorded directly to surplus as unrealized gains or losses. Other Long-term Investments:Other long-term investments primarily include investments in limited partnerships and limited liability companies which are carried at the Company’s percentage of the underlying U.S. GAAP, International Financial Reporting Standard or U.S. Tax basis equity as reflected on the respective entity’s financial statements. The Company monitors the effects of current and expected market conditions and other factors on these investments to identify and quantify any impairment in value. The Company assesses impairment information by performing analysis between the carrying value and the cost basis of the investments. The Company evaluates recoverability of the asset to determine if OTTI is warranted. When it is determined that a decline in fair value of an investment is other-than-temporary, the cost basis of the investment is reduced to its fair value and the amount of the reduction is accounted for as a realized loss. Other long-term investments include the Company’s investments in surplus notes, which are stated at amortized cost. All of the Company’s investments in surplus notes have an NAIC 1 rating designation. Cash and Cash Equivalents:Cash includes cash on deposit and cash equivalents. Cash equivalents are short-term, highly liquid investments, with original maturities of three months or less at the date of purchase and are stated at amortized cost. Short-Term Investments:Short-term investments (investments with remaining maturities of one year or less at the time of acquisition, excluding those investments classified as cash equivalents) that are not impaired are stated at amortized cost using the straight line interest method. Short-term investments that are impaired are stated at the lower of amortized cost or fair value. NOTES TO STATUTORY–BASIS FINANCIAL STATEMENTS TEACHERS INSURANCE AND ANNUITY ASSOCIATION OF AMERICA Contract Loans:Contract loans are stated at outstanding principal balances. Derivative Instruments:The Company has filed a Derivatives Use Plan with the Department. This plan details the Company’s derivative policy objectives, strategies, controls and any restrictions placed on various derivative types. The plan also specifies the procedures and systems that the Company has established to evaluate, monitor and report on the derivative portfolio in terms of valuation, hedge effectiveness and counterparty credit quality. The Company may use derivative instruments for hedging, income generation, and asset replication purposes. Derivatives used by the Company include foreign currency, interest rate and credit default swaps and foreign currency forwards. The carrying value of a derivative position may be at cost or fair value, depending on the type of instrument and accounting status. Hedge accounting is applied for some foreign currency swaps that hedge fixed income investments carried at amortized cost. The foreign exchange premium or discount for these foreign currency swaps is amortized into income and a currency translation adjustment computed at the spot rate is recorded as an unrealized gain or loss. The derivative component of a RSAT is carried at unamortized premiums received or paid, adjusted for any impairments. The cash component of a RSAT is classified as a bond on the Company’s balance sheet. Derivatives used in hedging transactions where hedge accounting is not being utilized are carried at fair value. The Company does not offset the carrying value amounts recognized for derivatives executed with the same counterparty under a netting agreement. Investment Income Due and Accrued:Investment income due is investment income earned and legally due to be paid to the Company at the reporting date. Investment income accrued is investment income earned but not legally due to be paid to the Company until subsequent to the reporting date. The Company writes off amounts deemed uncollectible as a charge against investment income in the period such determination is made. Amounts deemed collectible, but over 90 days past due for any invested asset except mortgage loans in default are non-admitted. Amounts deemed collectible, but over 180 days past due for mortgage loans in default are non-admitted. The Company accrues interest income on impaired loans to the extent it is deemed collectible. Separate Accounts:Separate Accounts are established in conformity with insurance laws and are segregated from the Company’s general account and are maintained for the benefit of the separate account contract holders. Foreign Currency Transactions and Translation:Investments denominated in foreign currencies and foreign currency contracts are valued in U.S. dollars, based on exchange rates at the end of the relevant period. Investment transactions in foreign currencies are recorded at the exchange rates prevailing on the respective transaction dates. All other asset and liability accounts that are denominated in foreign currencies are adjusted to reflect exchange rates at the end of the relevant period. Realized and unrealized gains and losses due to foreign exchange transactions and translation adjustments are not separately reported but are collectively included in realized and unrealized capital gains and losses, respectively. Non-Admitted Assets:For statutory accounting purposes, certain assets are designated as non-admitted assets (principally certain investments in other long-term investments, furniture and equipment, leasehold improvements, prepaid expenses, and a portion of deferred federal income tax (“DFIT”) assets). Investment related non-admitted assets totaled $267 million and $441 million at December 31, 2012 and 2011, respectively. The non-admitted portion of the DFIT asset was $8,964 million and $10,249 million at December 31, 2012 and 2011, respectively. Other non-admitted assets were $625 million and $470 million at December 31, 2012 and 2011, respectively. Changes in non-admitted assets are charged or credited directly to surplus. Furniture and Fixtures, Equipment, Leasehold Improvements and Computer Software:Electronic data processing (“EDP”) equipment, computer software and furniture and equipment which qualify for capitalization are depreciated over the lesser of useful life or 3 years. Office alterations and leasehold tenant improvements which qualify for capitalization are depreciated over the lesser of useful life or 5 years and the remaining life of the lease, respectively. The accumulated depreciation on EDP equipment and computer software was $1,008 million and $782 million at December 31, 2012 and 2011, respectively. Related depreciation expenses allocated to TIAA were $51 million, $34 million and $45 million for the years ended December 31, 2012, 2011 and 2010, respectively. The accumulated depreciation on furniture and equipment and leasehold improvements was $444 million and $443 million at December 31, 2012, and 2011, respectively. Related depreciation expenses allocated to TIAA were $18 million, $25 million and $25 million for the years ended December 31, 2012, 2011 and 2010, respectively. Insurance and Annuity Premiums:Life insurance premiums are recognized as revenue over the premium-paying period of the related policies. Annuity considerations are recognized as revenue when received. Deposits on deposit-type contracts are recorded directly as a liability when received. Expenses incurred when acquiring new business are charged to operations as incurred. Reserves for Life and Health Insurance, Annuities and Deposit-type Contracts:Policy and contract reserves are determined in accordance with standard valuation methods approved by the Department and are computed in accordance with standard actuarial formulae. The reserves established utilize assumptions for interest, mortality and other risks insured. Such reserves are established to provide for adequate contractual benefits guaranteed under policy and contract provisions. Liabilities for deposit-type contracts, which do not contain any life contingencies, are equal to deposits received and interest credited to the benefit of contract holders, less surrenders or withdrawals (that represent a return to the contract holders) plus additional reserves (if any) necessitated by actuarial regulations. The Company performed Asset Adequacy Analysis in order to test the adequacy of its reserves in light of the assets supporting such reserves, and determined that its reserves were sufficient to meet its obligations. Interest Maintenance Reserve:The IMR defers recognition of realized capital gains and losses resulting from changes in the general level of interest rates. These gains and losses are amortized into investment income over the expected remaining life of the investments sold. The IMR is calculated in accordance with the NAIC Annual Statement Instructions for Life and Accident and Health Insurance Companies. A realized gain or loss on each bond sold, excluding loan-backed and structured securities, is interest-related if the security’s NAIC rating did not change by more than one classification from the date of purchase to the date of sale, and its NAIC rating was not a 6 at any time during the holding period. A realized gain or loss on each preferred stock sold is interest-related if the security did not have an NAIC rating of 4, 5, or 6 at any time during the holding period and the NAIC rating did not change by more than one classification from the date of purchase to the date of sale. A realized gain or loss on each mortgage loan sold is interest-related if interest is not more than 90 days past due, not in the process of foreclosure or voluntary conveyance, or the mortgage loan was not restructured over the prior two years. A realized gain or loss on each derivative investment sold is interest-related based on the characteristics of the underlying invested asset. For loan-backed and structured securities, realized gains or losses resulting from sale transactions and realized losses resulting from OTTI are bifurcated between IMR and AVR based upon the present value of cash flows and amortized cost at the time of the transaction. Asset Valuation Reserve:The AVR is established to offset potential credit-related investment losses from bonds, stocks, mortgage loans, real estate, derivatives and other long-term investments. Changes in AVR are recorded directly to surplus. The AVR is calculated in accordance with the NAIC Annual Statement Instructions for Life and Accident and Health Insurance Companies. Realized gains or losses resulting from the sale of U.S. Government securities and securities of agencies which are backed by the full faith and credit of the U.S. Government are exempt from the AVR. A realized gain or loss on each bond sold, excluding loan-backed and structured securities, is non-interest-related if the security’s NAIC rating changed by more than one classification from the date of purchase to the date of sale, or its NAIC rating was a 6 at any time during the holding period. A realized gain or loss on each preferred stock sold is non-interest-related if the security had an NAIC rating of 4, 5 or 6 at any time during the holding period or the NAIC rating changed by more than one classification from the date of purchase to the date of sale. A realized gain or loss on each mortgage loan sold is non-interest-related if interest is more than 90 days past due, in the process of foreclosure or voluntary conveyance, or the mortgage loan was restructured over the prior two years. A realized gain or loss on each derivative investment sold is non-interest-related based on the characteristics of the underlying invested asset. For loan-backed and structured securities, realized gains or losses resulting from sale transactions and realized losses resulting from OTTI are bifurcated between IMR and AVR based upon the present value of cash flows and amortized cost at the time of the transaction. OTTI for non-loan-backed and structured securities, stocks, mortgage loans, real estate and other long-term investments are considered non-interest related realized losses and included in the AVR calculation. Repurchase Agreement: Repurchase agreements are agreements between a seller and a buyer, whereby the seller of securities sells and simultaneously agrees to repurchase the same or substantially the same securities from the buyer at a stated price on a specified date. Repurchase agreements are generally accounted for as secured borrowings. The assets transferred are not removed from the balance sheet, the cash collateral received is invested and reported on the balance sheet and accounted for based on the type of investment. An offsetting liability is reported in “Other liabilities.” Dividends Due to Policyholders:Dividends on insurance policies and pension annuity contracts in the payout phase are declared by the TIAA Board of Trustees (the “Board”) in the fourth quarter of each year, and such dividends are credited to policyholders in the following calendar year. Dividends on pension annuity contracts in the accumulation phase are declared by the Board in February of each year, and such dividends on the various existing vintages of pension annuity contracts in the accumulation phase are credited to policyholders during the ensuing twelve month period beginning March 1. APPLICATION OF NEW ACCOUNTING PRONOUNCEMENTS: SSAP No. 92—Accounting for Postretirement Benefits Other Than Pensions, A Replacement of SSAP No. 14, effective for quarterly and annual reporting periods beginning on or after January 1, 2013 with early adoption permitted. This statement establishes financial accounting and reporting standards for an insurer that offers a defined benefit postretirement plan to its employees. Any unfunded defined benefit amounts, as determined when the projected benefit obligation exceeds the fair value of plan assets, is a liability under SSAP No. 5R and shall be reported in the first quarter statutory financial statements after the transition date with a corresponding entry to unassigned funds (surplus). If the fair value of plan assets exceeds the projected benefit obligation, the asset shall be considered a non-admitted asset. Net periodic pension cost shall include a component for unrecognized prior service cost for non-vested employees beginning in 2013. The Company has determined that SSAP No. 92 will not have a material impact. SSAP No. 101—Income Taxes, a Replacement of SSAP No. 10—Income Taxes and SSAP No. 10R—Income Taxes, A Temporary Replacement of SSAP No. 10 is effective January 1, 2012. For purposes of accounting for federal and foreign income taxes, reporting entities shall adopt FASB Statement No. 109, Accounting for Income Taxes (“FAS 109”) with modifications for state NOTES TO STATUTORY–BASIS FINANCIAL STATEMENTS TEACHERS INSURANCE AND ANNUITY ASSOCIATION OF AMERICA income taxes, the realization criteria for deferred tax assets, and the recording of the impact of changes in deferred tax balances. The Company has determined that SSAP No. 101 did not have a material impact on the current and deferred taxes presented under SSAP No. 10R. SSAP No. 102—Accounting for Pensions, A Replacement of SSAP No. 89, effective for quarterly and annual reporting periods beginning on or after January 1, 2013 with early adoption permitted. This statement establishes financial accounting and reporting standards for an insurer that offers pension benefits to its employees. Any unfunded defined benefit pension amounts, as determined when the projected benefit obligation exceeds the fair value of plan assets, is a liability under SSAP No. 5R and shall be reported in the first quarter statutory financial statements after the transition date with a corresponding entry to unassigned funds (surplus). If the fair value of plan assets exceeds the projected benefit obligation, the asset shall be considered a non-admitted asset. Net periodic pension cost shall include a component for unrecognized prior service cost for non-vested employees beginning in 2013. The Company has determined that SSAP No. 102 will not have a material impact. SSAP No. 103—Accounting for Transfers and Servicing of Financial Assets and Extinguishments of Liabilities effective for years beginning on and after January 1, 2013 and shall be applied prospectively. This statement must be applied as of the beginning of the reporting entity’s first annual reporting period after the effective date, for interim periods within that first annual reporting period, and for interim and annual reporting periods thereafter. Earlier application is prohibited. This statement must be applied to transfers occurring on or after the effective date. On and after the effective date, the concept of a qualifying special purpose entity is no longer relevant for statutory accounting purposes. The disclosure provisions of this statement shall be applied to transfers that occurred both before and after the effective date of this statement. The Company does not expect that SSAP No. 103 will have a significant impact. Note 3—long-term bonds, preferred stocks, and common stocks The book/adjusted carrying value, estimated fair value, excess of fair value over book/adjusted carrying value and excess of book/adjusted carrying value over fair value of long-term bonds and preferred stocks at December 31, are shown below (in millions): Bonds: U.S. Governments All Other Governments States, Territories and Possessions Political Subdivisions of States, Territories, and Possessions Special Revenue and Special Assessment, Non-guaranteed Agencies and Government Credit Tenant Loans Industrial and Miscellaneous Hybrids Parent, Subsidiaries and Affiliates Total Bonds Preferred Stocks Total Bonds and Preferred Stocks Bonds: U.S. Governments All Other Governments States, Territories and Possessions Political Subdivisions of States, Territories, and Possessions Special Revenue and Special Assessment, Non-guaranteed Agencies and Government Credit Tenant Loans Industrial and Miscellaneous Hybrids Parent, Subsidiaries and Affiliates Total Bonds Preferred Stocks Total Bonds and Preferred Stocks Impairment Review Process:All securities are subjected to the Company’s process for identifying OTTI. The Company writes down securities that it deems to have an OTTI in value in the period that the securities are deemed to be impaired, based on management’s case-by-case evaluation of the decline in value and prospects for recovery. Management considers a wide range of factors in the impairment evaluation process, including, but not limited to, the following: (a) the length of time the fair value has been below amortized cost; (b) the financial condition and near-term prospects of the issuer; (c) whether the debtor is current on contractually obligated interest and principal payments; (d) the intent and ability of the Company to retain the investment for a period of time sufficient to allow for any anticipated recovery in fair value or repayment; (e) information obtained from regulators and ratings agencies; (f) the potential for impairments in an entire industry sector or sub-sector; (g) the potential for impairments in certain economically-depressed geographic locations and (h) the potential for impairment based on an estimated discounted cash flow analysis for structured and loan-backed securities. Where impairment is considered to be other-than-temporary, the Company recognizes a write-down as a realized loss and adjusts the cost basis of the security accordingly. The Company does not change the revised cost basis for subsequent recoveries in value. Once an impairment write-down has been recorded, the Company continues to review the impaired security for appropriate valuation on an ongoing basis. Based upon the factors above in the Company’s impairment evaluation process, the securities discussed in the following section which were in an unrealized loss position at December 31, 2012 and 2011, were not deemed to be other-than-temporarily impaired. Unrealized Losses on Bonds, Preferred Stocks and Unaffiliated Common Stocks:The gross unrealized losses and estimated fair values for securities by the length of time that individual securities had been in a continuous unrealized loss position are shown in the table below (in millions): December 31, 2012 Loan-backed and structured bonds All other bonds Total bonds Unaffiliated common stocks Preferred stocks Total bonds and stocks NOTES TO STATUTORY–BASIS FINANCIAL STATEMENTS TEACHERS INSURANCE AND ANNUITY ASSOCIATION OF AMERICA December 31, 2011 Loan-backed and structured bonds All other bonds Total bonds Unaffiliated common stocks Preferred stocks Total bonds and stocks As of December 31, 2012, the major categories of securities where the estimated fair value declined and remained below cost for less than twelve months were diversified in U.S., Canada and other government (25%), asset-backed securities (12%) and manufacturing (11%). The preceding percentages were calculated as a percentage of the gross unrealized loss. As of December 31, 2012, the major categories of securities where the estimated fair value declined and remained below cost for twelve months or greater were diversified in commercial mortgage-backed securities (73%) and residential mortgage-backed securities (19%). The preceding percentages were calculated as a percentage of the gross unrealized loss. As of December 31, 2011, the major categories of securities where the estimated fair value declined and remained below cost for less than twelve months were diversified in residential mortgage-backed securities (32%), commercial mortgage-backed securities (19%) and finance (13%). The preceding percentages were calculated as a percentage of the gross unrealized loss. As of December 31, 2011, the major categories of securities where the estimated fair value declined and remained below cost for twelve months or greater were diversified in commercial mortgage-backed securities (62%) and residential mortgage-backed securities (26%). The preceding percentages were calculated as a percentage of the gross unrealized loss. Based upon the Company’s current evaluation of these securities in accordance with its impairment policy, the cause of the decline is primarily attributable to increased market yields for these particular securities since acquisition caused principally by credit spreads. The Company currently intends and has the ability to hold the securities with unrealized losses for a period of time sufficient for them to recover and the Company has concluded that these securities are not other–than-temporarily impaired. Scheduled Maturities of Bonds:The carrying value and estimated fair value of bonds, categorized by contractual maturity, are shown below. Bonds not due at a single maturity date have been included in the following table based on the year of final maturity. Actual maturities may differ from contractual maturities because borrowers may prepay obligations with or without call or prepayment penalties. Mortgage-backed and asset-backed securities are shown separately in the table below, as they are not due at a single maturity date ($ in millions): Due in one year or less Due after one year through five years Due after five years through ten years Due after ten years Subtotal Residential mortgage-backed securities Commercial mortgage-backed securities Asset-backed securities Subtotal Total For the year ended December 31, 2012, the preceding table includes sub-prime mortgage investments totaling $3,126 million under residential mortgage-backed securities. $2,511 million or 80% of the sub-prime securities were rated investment grade (NAIC 1 and 2). For the year ended December 31, 2011, the preceding table includes sub-prime mortgage investments totaling $3,171 million under residential mortgage-backed securities. $2,594 million or 82% of the sub-prime securities were rated investment grade (NAIC 1 and 2). Sub-prime securities are backed by loans that are in the riskiest category of loans and are typically sold in a separate market from prime loans. Bond Diversification:The carrying values of long-term bond investments were diversified by the following classification at December 31 as follows: Residential mortgage-backed securities U.S. and other governments Manufacturing Asset-backed securities Public utilities Commercial mortgage-backed securities Finance and financial services Oil and gas Services Communications Revenue and special obligations Retail and wholesale trade Mining . Transportation Real estate investment trusts Other Total At December 31, 2012 and 2011, 92.5% and 91.8%, respectively, of the long-term bond portfolio was comprised of investment grade securities (NAIC 1 and 2). The following table presents the Company’s carrying value and estimated fair value for the residential mortgage-backed securities portfolio (“RMBS”) at December 31, (in millions): 1 2 3 4 5 6 Total With respect to the RMBS in the above table, approximately 97% and 96% were rated investment grade (NAIC 1 and 2) at December 31, 2012 and 2011, respectively. The Company has continued to maintain its historical procedures surrounding the evaluation of fundamental underwriting and investment standards within its investment portfolios, including investments in RMBS. Additionally, the Company continues to manage the RMBS portfolio to appropriately support its contractual obligations and will recognize impairments when diminishments in fair value are determined to be other than temporary based on evaluations of projected discounted cash flows as prescribed under SSAP 43R. Management continues to actively monitor the market, credit and liquidity risk of the RMBS portfolio as an integral component of its overall asset liability management program. The following table presents the Company’s carrying value and estimated fair value for the commercial mortgage-backed securities (“CMBS”) portfolio at December 31, (in millions): 1 2 3 4 5 6 Total With respect to the CMBS in the above table, approximately 80% and 78% were rated investment grade (NAIC 1 and 2) and approximately 66% and 69% were issued prior to 2006 (based on carrying value) at December 31, 2012 and 2011, respectively. The Company has continued to maintain its historical procedures surrounding the evaluation of fundamental underwriting and investment standards within its investment portfolios, including investments in CMBS. Additionally, the Company continues to manage the CMBS portfolio to appropriately support its contractual obligations and will recognize impairments when diminishments in fair value are determined to be other-than-temporary based on evaluations of projected discounted cash flows as prescribed under SSAP 43R. Management continues to actively monitor the market, credit and liquidity risk of the CMBS portfolio as an integral component of its overall asset liability management program. Included in the Company’s long-term investments are bonds with a NAIC designation of 6. The statutory carrying value of these investments and related contractual maturity is listed in the following table at December 31, (in millions): Due in one year or less Due after one year through five years Due after five years through ten years Due after ten years Subtotal Residential mortgage-backed securities Commercial mortgage-backed securities Asset-backed securities Total NOTES TO STATUTORY–BASIS FINANCIAL STATEMENTS TEACHERS INSURANCE AND ANNUITY ASSOCIATION OF AMERICA Troubled Debt Restructuring:There were no troubled debt restructurings during 2012 and 2011. Exchanges:During 2012 and 2011, the Company also acquired bonds and stocks through exchanges aggregating $3,094 million and $1,619 million, of which approximately $26 million and $15 million were acquired through non-monetary transactions, respectively. When exchanging securities, TIAA generally accounts for assets at fair value unless the exchange was as a result of restricted 144As exchanged for unrestricted securities, which are accounted for at book value. Loan-backed and Structured Securities:The near-term prepayment assumptions for loan-backed and structured securities are based on historical averages drawing from performance experience for a particular transaction and may vary by security type. The long-term assumptions are adjusted based on expected performance. The following table represents OTTI on securities with the intent to sell or the inability to retain for the years ended December 31, (in millions): OTTI recognized, 2012 a. Intent to sell b. Inability to retain Total 2012 OTTI recognized, 2011 a. Intent to sell b. Inability to retain Total 2011 At December 31, 2012, the Company held loan-backed and structured securities with a recognized OTTI where the present value of cash flows expected to be collected is less than the amortized cost. See Note 25 for listing of securities. Other Disclosures:During 2012 and 2011, TIAA acquired common stocks from other long term private equity fund investment distributions totaling $47 million and $24 million, respectively. Debt securities on deposit with governmental authorities or trustees, as required by law, were $7 million at December 31, 2012 and 2011. At December 31, 2012 and 2011, the carrying amount of restricted unaffiliated common stock was $516 million and $441 million, respectively. At December 31, 2012 and 2011, the carrying amount of restricted preferred stock was $4 million and $18 million, respectively. The restrictions include share sales, private sales, general partner approval for sale, contractual restrictions and public or free trade restrictions. At December 31, 2012 and 2011, the carrying amount of bonds and stocks denominated in a foreign currency was $3,766 million and $3,158 million, respectively. Bonds denominated in foreign currency that totaled $2,120 million and $1,547 million at December 31, 2012 and 2011, respectively, represent amounts due from related parties that are collateralized by real estate owned by TIAA’s investment subsidiaries and affiliates. Note 4—mortgage loans The Company originates mortgage loans that are principally collateralized by commercial real estate. The coupon rates for non-mezzanine commercial mortgage loans originated during 2012 ranged from 3.80% to 5.71% and from 4.00% to 6.00% for 2011. The coupon rates for mezzanine mortgage loans originated during 2012 ranged from 6.75% to 7.96%. There were no mezzanine mortgage loans originated or acquired during 2011. The maximum percentage of any one loan to the value of the property at the time of the loan, exclusive of insured, guaranteed or purchase money mortgages, was 98% and 94% for commercial loans for the years ended December 31, 2012 and 2011, respectively. In 2012, there was one loan issued with a loan to value of 98% with a value of $64 million at December 31, 2012. The loan is a full recourse construction loan with a committed tenant. At December 31, 2012 and 2011, the carrying value of mezzanine real estate loans was $224 million and $186 million, respectively. Impairment Review Process:The Company monitors the effects of current and expected market conditions and other factors on the collectability of mortgage loans to identify and quantify any impairment in value. Impairments are classified as either temporary, for which a recovery is anticipated, or other-than-temporary. Mortgage loans held to maturity with other-than-temporarily impaired values at December 31, 2012 and 2011 have been written down to net realizable values based upon independent appraisals of the collateral while mortgage loans held for sale have been written down to the current fair value of the loan, as shown in the table below. For impaired mortgage loans where the impairments were deemed to be temporary, an allowance for credit losses has been established, as indicated below (in millions): Investment in impaired mortgage loans, with temporary allowances for credit losses (at net carried value plus accrued interest) Related temporary allowances for credit losses Investment in impaired mortgage loans, net of OTTI losses recognized Related write-downs for OTTI Average investment in impaired mortgage loans Interest income recognized on impaired mortgage loans during the period Interest income recognized on a cash basis during the period Allowance for credit losses: Balance at the beginning of the period Additions charged to surplus Direct write-downs/charges against the allowance Recoveries of amounts previously added to surplus Balance at the end of the period Mortgage Loan Diversification:The following tables set forth the commercial mortgage loan portfolio by property type and geographic distribution (in millions): Office buildings Shopping centers Industrial buildings Apartments Land Mixed use Hotel Other Total Pacific South Atlantic Middle Atlantic South Central North Central Mountain New England Other Total Regional classification is based on American Council of Life Insurers regional chart. See below for details of regions. Pacific states are AK, CA, HI, OR and WA South Atlantic states are DE, DC, FL, GA, MD, NC, SC, VA and WV Middle Atlantic states are PA, NJ and NY South Central states are AL, AR, KY, LA, MS, OK, TN and TX North Central states are IA, IL, IN, KS, MI, MN, MO, NE, ND, OH, SD and WI New England states are CT, MA, ME, NH, RI and VT Mountain states are AZ, CO, ID, MT, NV, NM, UT and WY Other comprises investments primarily in Canada. At December 31, 2012 and 2011, approximately 18.9% and 19.7% of the mortgage loan portfolio, respectively, was invested in California and is included in the Pacific region shown above. At December 31, 2012 and 2011, approximately 15.3% and 13.5% of the mortgage loan portfolio, respectively, was invested in Texas and is included in the South Central region shown above. Scheduled Mortgage Loan Maturities:At December 31, 2012 and 2011, contractual maturities for mortgage loans were as follows (in millions): Due in one year or less Due after one year through five years Due after five years through ten years Due after ten years Total Actual maturities may differ from contractual maturities because borrowers may have the right to prepay mortgages, although prepayment premiums may be applicable. There were no mortgage troubled debt restructurings during the periods ended December 31, 2012 or 2011. When restructuring mortgage loans, TIAA generally requires participation features, yield maintenance stipulations, and/or the establishment of property-specific escrow accounts funded by the borrowers. With respect to impaired loans, the Company accrues interest income to the extent it is deemed collectible. Cash received on impaired mortgage loans that are performing according to their contractual terms is applied in accordance with those terms. For mortgage loans in the process of foreclosure, cash received is initially held in suspense and applied as a return of principal at the time that the foreclosure process is completed, or the mortgage is otherwise disposed. There were no mortgage loans with interest more than 180 days past due at December 31, 2012 or 2011. During 2012, the Company reduced interest rates on three outstanding commercial loans. The first loan changed from 5.40% to 4.50% from November 1, 2012 through maturity on November 1, 2015. The other two loans changed from 7.50% to 6.69% from August 3, 2012 through maturity on January 1, 2019. The recorded investment excluding accrued interest of these loans was $363 million at December 31, 2012. During 2011, the Company reduced interest rates on two outstanding commercial loans. The first loan changed from 6.22% to 5.00% from December 1, 2010 through December 31, 2017 and then to 5.25% until maturity on December 1, 2020. The second loan changed from 6.30% to 5.75% from December 1, 2011 through April 30, 2013. The recorded investment excluding accrued interest of these three loans was $216 million at December 31, 2011. The Company did not have any taxes, assessments or amounts advanced that were not included in the mortgage loan totals for the years ended December 31, 2012 and 2011. The Company has no reverse mortgages as of December 31, 2012 or 2011. Mortgage loans of $13 million at December 31, 2012 and 2011 represent the carrying value of amounts due from related parties that are collateralized by real estate owned by TIAA investment subsidiaries and affiliates. For the years ended December 31, 2012 and 2011, the carrying values of mortgage loans denominated in foreign currency were $281 million and $356 million, respectively. NOTES TO STATUTORY–BASIS FINANCIAL STATEMENTS TEACHERS INSURANCE AND ANNUITY ASSOCIATION OF AMERICA The Company does not underwrite nor does it hold sub-prime mortgages in the commercial mortgage portfolio and does not have any material indirect exposure from sub-prime lenders who are tenants in buildings that are secured by commercial mortgages. Note 5—real estate At December 31, 2012 and 2011, TIAA’s directly owned real estate investments of $1,623 million and $1,595 million, respectively, were carried net of third party mortgage encumbrances, which totaled $0 and $109 million, respectively. The carrying values of the directly owned real estate portfolio were diversified by property type and geographic region at December 31 as follows (in millions): Office buildings Industrial buildings Retail Mixed-use projects Apartments Land under development Land Total South Atlantic Pacific Middle Atlantic South Central North Central Total At December 31, 2012 and 2011, approximately 19.4% and 3.3% of the real estate portfolio, respectively, was invested in California and is included in the Pacific region shown above. At December 31, 2012 and 2011, approximately 18.5% and 19.0% of the real estate portfolio, respectively, was invested in Virginia and is included in the South Atlantic region shown above. The Company monitors the effects of current and expected market conditions and other factors on its real estate investments to identify and quantify any impairment in value. The Company assesses assets to determine if events or changes in circumstances indicate that the carrying amount of the asset may not be recoverable. The Company evaluates the recoverability of income producing investments based on undiscounted cash flows and then reviews the results of an independent third party appraisal to determine the fair value and if an adjustment is warranted. OTTI for directly owned real estate investments for the years ended December 31, 2012, 2011 and 2010 were $17 million, $2 million and $35 million, respectively and these amounts are included in the impairment table in Note 9. The OTTI during 2012 is for directly owned industrial properties in the states of Illinois and Texas and directly owned land in the state of Georgia. $13 million of OTTI during 2012 is a result of the Company’s intent to sell. The impairments were a result of unfavorable market conditions. The OTTI during 2011 is for directly owned land in California. The OTTI during 2010 is for directly owned industrial, office buildings and retail property at various locations throughout the country. The impairments are included in net realized capital losses in the statutory-basis statements of operations. As of December 31, 2012 and 2011, $31 million and $0, respectively, of the Company’s real estate investments were classified as held for sale. This held for sale investment was sold during January 2013. For the year ended December 31, 2012 and 2011, the Company recognized a net realized gain on real estate sold of $84 million and $17 million, respectively. The gains are included in net realized capital gains (losses) in the statutory-basis statements of operations. Depreciation expense on directly owned real estate investments for the years ended December 31, 2012, 2011 and 2010, was $53 million, $54 million and $56 million, respectively. The amount of accumulated depreciation at December 31, 2012, 2011 and 2010 was $337 million, $478 million and $431 million, respectively. There were no real estate properties acquired via the assumption of debt or in satisfaction of debt during 2012, 2011 or 2010. The Company’s real estate portfolio does not have any material exposure from sub-prime lenders who are tenants in the buildings that are directly owned. The Company does not engage in retail land sales operations. As of December 31, 2012, the Company does not have any low income housing tax credits. Note 6—subsidiaries and affiliates The Company holds interests in certain subsidiaries and affiliates that are primarily involved in the ownership and management of investments for the Company. The carrying value, OTTI and net investment income of these investment subsidiaries and affiliates at December 31 are shown below (in millions): Net carrying value of investment subsidiaries and affiliates Reported as common stock Reported as other long-term investments Total net carrying value OTTI Net investment income (distributed from investment subsidiaries and affiliates) The larger investment subsidiaries and affiliates, included in the above table, are TIAA Global Public Investments, LLC, T-C GA RE Holdings, LLC, Ceres Agricultural Properties, LLC, ND Properties, Inc., TIAA Oil & Gas Investments, LLC, Dionysus Properties, LLC, TIAA CPPIB Commercial Mortgage Company REIT, LLC and 485 Properties, LLC. The carrying value, OTTI and net investment income of these operating subsidiaries and affiliates at December 31 are shown below (in millions): Net carrying value of operating subsidiaries and affiliates Reported as common stock Reported as other long-term investments Total net carrying value OTTI Net investment income (distributed from operating subsidiaries and affiliates) TIAA’s operating subsidiaries and affiliates primarily consist of Covariance Capital Management Series, LLC (“CCMS 1”), TIAA-CREF Life Insurance Company (“TIAA-CREF Life”), TIAA Global Ag Holdco, LLC, TCT Holdings, Inc., Covariance Capital Management Series 2, LLC (“CCMS 2”), Oleum Holding Company, LLC, TIAA Emerging Markets and TIAA-CREF Asset Management, Inc. During 2011, the Company invested $1 billion with Covariance Capital Management, Inc. (“Covariance”) which is managed as a diversified investment portfolio. Covariance is an indirect wholly-owned subsidiary of the Company that provides customized endowment management services to educational institutions, foundations and other not-for-profits with endowments. As of December 31, 2012, the carrying value of the Company’s investments managed by Covariance in CCMS 1 and CCMS 2 is $935 million and $160 million, respectively. The 2012 OTTI relates to a decline in the fair value of subsidiaries and affiliates for which the carrying value is not expected to recover. Fair value of subsidiaries and affiliates is generally determined using the net asset value of the underlying financial statements at the measurement date. TIAA held bonds of affiliates at December 31, 2012 and 2011 for $2,161 million and $1,691 million, respectively. Ninety-eight percent (98%) and eighty four percent (84%) of these affiliated bonds were issued by ND Properties, Inc. at December 31, 2012 and 2011, respectively. As of December 31, 2012 and 2011, no investment in a subsidiary or affiliate exceeded 10% of the Company’s admitted assets and the Company does not have any investment in foreign insurance subsidiaries. For the years ended December 31, 2012, 2011 and 2010, the Company did not have any related party transactions which exceeded one-half of 1% of the Company’s admitted assets. As of December 31, 2012 and December 31, 2011, the net amount due from subsidiaries and affiliates was $184 million and $94 million, respectively. The net amounts due are generally settled on a daily basis except for TIAA Realty, Inc., ND Properties, Inc., Teachers Advisors, Inc. (“Advisors”), TIAA-CREF Tuition Financing, Inc. (“TFI”), Teachers Personal Investors Services, Inc. (“TPIS”), TIAA-CREF Individual and Institutional Services, LLC (“Services”), and TIAA-CREF Asset Management, Inc. which are settled quarterly. The Company discloses contingencies and guarantees related to subsidiaries and affiliates in Note 22. The Company holds investments in downstream non-insurance holding companies, which are valued by the Company utilizing the look-through approach. The financial statements for the downstream non-insurance holding companies listed in the table below are not audited and TIAA has limited the value of its investment in these noninsurance holding companies to the value contained in the audited financial statements of the underlying investments and unamortized goodwill resulting from the statutory purchase method of accounting. All liabilities, commitments, contingencies, guarantees or obligations of these subsidiaries, which are required to be recorded as liabilities, commitments, contingencies, guarantees or obligations under applicable accounting guidance, are reflected in TIAA’s determination of the carrying value of the investment in these subsidiaries, if not already recorded in the subsidiaries’ financial statements. The following table summarizes the Company’s carrying value in each such downstream non-insurance holding company as of December 31 (in millions): TIAA Oil & Gas Investments, LLC Dionysus Properties, LLC Mansilla Participacoes LTDA Infra Alpha LLC TIAA Global Ag Holdco LLC TIAA Super Regional Mall Member Sub, LLC Occator Agricultural Properties, LLC T-C 685 Third Avenue Member, LLC TIAA-CREF Asset Management, Inc. TIAA Union Place Phase I, LLC TIAA Stonepeak Investments I, LLC TIAA Infrastructure Investments, LLC TIAA-CREF Redwood, LLC T-C SMA II, LLC TIAA SynGas, LLC Almond Processors, LLC T-C SMA III, LLC TIAA Stonepeak Investments II, LLC 730 Texas Forest Holdings, Inc. TIAA The Reserve II Member, LLC TIAA Diamond Investor, LLC Total Note 7—other long-term investments The components of TIAA’s carrying value in other long-term investments at December 31 were (in millions): Unaffiliated other invested assets Affiliated other invested assets Other long-term assets Total other long-term investments NOTES TO STATUTORY–BASIS FINANCIAL STATEMENTS TEACHERS INSURANCE AND ANNUITY ASSOCIATION OF AMERICA As of December 31, 2012, unaffiliated other invested assets of $8,710 million includes $7,611 million of investments in joint ventures, partnerships and LLCs with interests in venture capital, leveraged buy-out funds and other equity investments. The remaining $1,099 million represents real estate related joint ventures, partnerships and LLCs. As of December 31, 2012, affiliated other invested assets of $9,185 million includes investments in agriculture and timber related holdings of $2,659 million, investments in real estate related holdings of $2,163 million, investments in energy and infrastructure of $971 million and investments in securities related holdings of $3,034 million. The remaining $358 million of affiliated other invested assets represents other operating subsidiaries and affiliates. As of December 31, 2011, unaffiliated other invested assets of $8,424 million includes $7,298 million of investments in joint ventures, partnerships and LLCs with interests in venture capital, leveraged buy-out funds and other equity investments. The remaining $1,126 million represents real estate related joint ventures, partnerships and LLCs. As of December 31, 2011, affiliated other invested assets of $7,755 million includes investments in agriculture and timber related holdings of $2,303 million, investments in real estate related holdings of $1,793 million, investments in energy and infrastructure of $471 million and investments in securities related holdings of $2,780 million. The remaining $408 million of affiliated other invested assets represents other operating subsidiaries and affiliates. For the years ended December 31, 2012, 2011 and 2010, OTTI in other long-term investments for which the carrying value is not expected to be recovered were $129 million, $233 million and $252 million, respectively. For the years ended December 31, 2012 and 2011, other long-term investments denominated in foreign currency were $1,733 million and $1,741 million, respectively. Note 8—investments commitments The outstanding obligation for future investments at December 31, 2012, is shown below by asset category (in millions): Bonds Stocks Mortgage loans Other long-term investments Total The funding of bond commitments is contingent upon the continued favorable financial performance of the potential borrowers, funding of stock commitments is contingent upon their continued favorable financial performance and the funding of mortgage commitments is generally contingent upon the underlying properties meeting specified requirements, including construction, leasing and occupancy. Due to TIAA’s due diligence in closing mortgage commitments, there is a lag between commitment and closing. For other long–term investments, primarily fund investments, there are scheduled capital calls that extend into future years. Note 9—investment income and capital gains and losses Net Investment Income:The components of net investment income for the years ended December 31 were as follows (in millions): Bonds Stocks Mortgage loans Real estate Derivatives Other long-term investments Cash, cash equivalents and short-term investments Total gross investment income Less investment expenses Net investment income before amortization of IMR Plus amortization of IMR Net investment income The total due and accrued income excluded from net income was $1 million each for the years ended December 31, 2012, 2011 and 2010. Future minimum rental income expected to be received over the next five years under existing real estate leases in effect as of December 31, 2012 (in millions): Future rental income Realized Capital Gains and Losses: The net realized capital gains (losses) on sales, redemptions and write-downs due to OTTI for the years ended December 31 were as follows (in millions): Bonds Stocks Mortgage loans Real estate Derivatives Other long-term investments Cash, cash equivalents and short-term investments Total before capital gains taxes and transfers to IMR Transfers to IMR Net realized capital losses less capital gains taxes, after transfers to IMR Write-downs of investments resulting from OTTI, included in the preceding table, were as follows for the years ended December 31 (in millions): Other-than-temporary impairments: Bonds Stocks Mortgage loans Real estate Derivatives Other long-term investments Total The Company generally holds its investments until maturity. The Company performs periodic reviews of its portfolio to identify investments which may have deteriorated in credit quality to determine if any are candidates for sale in order to maintain a quality portfolio of investments. Investments which are deemed candidates for sale are continually monitored until sold and carried at the lower of amortized cost or fair value. In accordance with the Company’s valuation and impairment process, the investment will be monitored quarterly for further declines in fair value at which point an OTTI will be recorded until actual disposal of the investment. Proceeds from sales of long-term bond investments during 2012, 2011 and 2010 were $11,211 million, $8,011 million and $19,587 million, respectively. Gross gains of $917 million, $973 million and $1,416 million and gross losses, excluding impairments considered to be other-than-temporary of $155 million, $42 million and $71 million were realized during 2012, 2011 and 2010, respectively. The Company has no contractual commitments to extend credit to debtors owning receivables whose terms have been modified in troubled debt restructurings. Wash Sales:The Company does not engage in the practice of wash sales, however, in isolated cases in the course of asset management activities, a security may be sold and repurchased in whole or in part within thirty days of the sale. There were no NAIC 3—6 securities sold and reacquired within 30 days of the sale date during the years ended December 31, 2012 and 2010. The details by NAIC designation 3 or below securities sold during the year ended December 31, 2011 and reacquired within 30 days of the sale date are (in million): NAIC 3 NAIC 4 Unrealized Capital Gains and Losses:The net changes in unrealized capital gains (losses) in investments, resulting in a net increase (decrease) in the carrying value of investments for the years ended December 31 were as follows (in millions): Bonds Stocks Mortgage loans Derivatives Other long-term investments Total Note 10—securitizations When the Company sells bonds and mortgages in a securitization transaction, it may retain interest-only strips, one or more subordinated tranches, residual interest, or servicing rights, all of which are retained interests in the securitized receivables. The Company’s ownership of the related retained interests may be held directly by the Company or indirectly through an investment subsidiary. The retained interests are associated with Special Purpose Entities (“SPEs”) that issue equity and debt which is non-recourse to the Company. Fair value used to determine gain or loss on a securitization transaction is based on quoted market prices, if available; however, quotes are generally not available for retained interests, so the Company either obtains an estimated fair value from an independent pricing service or estimates fair value internally based on the present value of future expected cash flows using management’s best estimates of future credit losses, forward yield curves, and discount rates that are commensurate with the risks involved. The Company has not initiated any securitization transactions in which it sold assets held on its balance sheet into SPEs during 2012 or 2011. Teachers Advisors, Inc. (“Advisors”), an indirect subsidiary of TIAA, provides investment advisory services for most assets previously securitized by the Company. The following sensitivity analysis represents changes in the fair value of the securitized assets. The following table as of December 31, 2012 summarizes the Company’s retained interests in securitized financial assets from transactions originated since 2001 (in millions): 10% Adverse 20% Adverse 2001 2007 The key assumptions applied to both the fair values and sensitivity analysis of the retained interests on December 31, 2012 was as follows: NOTES TO STATUTORY–BASIS FINANCIAL STATEMENTS TEACHERS INSURANCE AND ANNUITY ASSOCIATION OF AMERICA Note that the sensitivity analysis above does not give effect to any offsetting benefits of financial instruments which may hedge the risks inherent to these financial interests. Additionally, changes in particular assumptions, such as discount rates, may in practice change other valuation assumptions which may magnify or counteract the effect of these disclosed sensitivities. Note 11—disclosures about fair value of financial instruments FAIR VALUE OF FINANCIAL INSTRUMENTS Included in the Company’s financial statements are certain financial instruments carried at fair value. Other financial instruments are periodically measured at fair value, such as when impaired, or, for certain bonds and preferred stock when carried at the lower of cost or fair value. Fair value is the price that would be received to sell an asset or paid to transfer a liability in an orderly transaction between market participants at the measurement date. Fair values of financial instruments are based on quoted market prices when available. When market prices are not available, fair values are primarily provided by a third party-pricing service for identical or comparable assets, or through the use of valuation methodologies using observable market inputs. These fair values are generally estimated using discounted cash flow analyses, incorporating current market inputs for similar financial instruments with comparable terms and credit quality. In instances where there is little or no market activity for the same or similar instruments, the Company estimates fair value using methods, models and assumptions that management believes market participants would use to determine a current transaction price. These valuation techniques involve management estimation and judgment for many factors including market bid/ask spreads, and such estimations may become significant with increasingly complex instruments or pricing models. The following table provides information about the aggregate fair value for all financial instruments and the level within the fair value hierarchy at December 31, 2012 (in millions): Assets: Bonds Common Stock Preferred Stock Mortgage Loans Derivatives Contract Loans Separate Accounts Cash, Cash Equivalents and Short-Term Investments Total Liabilities Deposit-type contracts Separate account Derivatives Total Assets: Bonds Common Stock Preferred Stock Mortgage Loans Derivatives Contract Loans Separate Accounts Cash, Cash Equivalents and Short-Term Investments Total Liabilities: Deposit-type contracts Separate account Derivatives Total The estimated fair values of the financial instruments presented above were determined by the Company using market information available as of December 31, 2012 and 2011. Considerable judgment is required to interpret market data in developing the estimates of fair value for financial instruments for which there are no available market value quotations. The estimates presented are not necessarily indicative of the amounts the Company could have realized in a market exchange. The use of different market assumptions and/or estimation methodologies may have a material effect on the estimated fair value amounts. ASSETS AND LIABILITIES MEASURED AND REPORTED AT FAIR VALUE The Company’s financial assets and liabilities measured and reported at fair value have been classified, for disclosure purposes, based on a hierarchy defined by SSAP No. 100, Fair Value Measurements. The fair value hierarchy prioritizes the inputs to valuation techniques used to measure fair value into three broad levels. The hierarchy gives the highest ranking to fair values determined using unadjusted quoted prices in active markets for identical assets and liabilities (Level 1) and the lowest ranking to fair values determined using methodologies and models with unobservable inputs (Level 3). An asset’s or a liability’s classification is based on the lowest level input that is significant to its measurement. For example, a Level 3 fair value measurement may include inputs that are both observable (Levels 1 and Level 2) and unobservable (Level 3). The levels of the fair value hierarchy are as follows: Level 1—Inputs are unadjusted quoted prices in active markets for identical assets and liabilities that the Company has the ability to access at the measurement date. Level 2—Other than quoted prices within Level 1 inputs are observable for the asset or liability, either directly or indirectly. Level 2 inputs include: Level 3—Inputs are unobservable inputs for the asset or liability supported by little or no market activity. Unobservable inputs reflect the Company’s own assumptions about the assumptions that market participants would use in pricing the asset or liability. The Company’s data used to develop unobservable inputs is adjusted if information is reasonably available without undue cost and effort that indicates that market participants would use different assumptions. Considerable judgment is required to interpret market data in developing the estimates of fair value for financial instruments for which there are no available market value quotations. The estimates presented are not necessarily indicative of the amounts the Company could have realized in a market exchange. The use of different market assumptions and/or estimation methodologies may have a material effect on the estimated fair value amounts. The following table provides information about the Company’s financial assets and liabilities measured and reported at fair value as of December 31 (in millions): Assets at fair value: Bonds Industrial and Miscellaneous Total Bonds Common Stock Industrial and Miscellaneous Total Common Stocks Total Preferred Stocks Derivatives: Foreign Exchange Contracts Interest Rate Contracts Credit Default Swaps Total Derivatives Separate Accounts assets, net Total assets at fair value Liabilities at fair value: Derivatives Foreign Exchange Contracts Credit Default Swaps Total liabilities at fair value NOTES TO STATUTORY–BASIS FINANCIAL STATEMENTS TEACHERS INSURANCE AND ANNUITY ASSOCIATION OF AMERICA Assets at fair value: Bonds Industrial and Miscellaneous Total Bonds Common Stock Industrial and Miscellaneous Total Common Stocks Total Preferred Stocks Derivatives: Foreign Exchange Contracts Interest Rate Contracts Credit Default Swaps Total Derivatives Separate Accounts assets, net Total assets at fair value Liabilities at fair value: Derivatives Foreign Exchange Contracts Credit Default Swaps Total liabilities at fair value Level 1 financial instruments Unadjusted quoted prices for these securities are provided to the Company by independent pricing services. Common stock and separate account assets in Level 1 primarily include mutual fund investments valued by the respective mutual fund companies and exchange listed equities and public real estate investment trusts. Level 2 financial instruments Bonds included in Level 2 are valued principally by third party pricing services using market observable inputs. Because most bonds do not trade daily, independent pricing services regularly derive fair values using recent trades of securities with similar features. When recent trades are not available, pricing models are used to estimate the fair values of securities by discounting future cash flows at estimated market interest rates. Typical inputs to models used by independent pricing services include but are not limited to benchmark yields, reported trades, broker-dealer quotes, issuer spreads, benchmark securities, bids, offers, reference data, and industry and economic events. Additionally, for loan-backed and structured securities, valuation is based primarily on market inputs including benchmark yields, expected prepayment speeds, loss severity, delinquency rates, weighted average coupon, weighted average maturity and issuance specific information. Issuance specific information includes collateral type, payment terms of underlying assets, payment priority within the tranche, structure of the security, deal performance and vintage of loans. Common stocks included in Level 2 include those which are traded in an inactive market or for which prices for identical securities are not available. Valuations are based principally on observable inputs including quoted prices in markets that are not considered active. Derivative assets and liabilities classified in Level 2 represent over-the-counter instruments that include, but are not limited to, fair value hedges using foreign currency swaps, foreign currency forwards, interest rate swaps and credit default swaps. Fair values for these instruments are determined internally using market observable inputs that include, but are not limited to, forward currency rates, interest rates, credit default rates and published observable market indices. Separate account assets in Level 2 consist principally of short term government agency notes and commercial paper. Level 3 financial instruments Valuation techniques for bonds included in Level 3 are generally the same as those described in Level 2 except the techniques utilize inputs that are not readily observable in the market, including illiquidity premiums and spread adjustments to reflect industry trends or specific credit-related issues. The Company assesses the significance of unobservable inputs for each security and classifies that security in Level 3 as a result of the significance of unobservable inputs. Estimated fair value for privately traded equity securities are principally determined using valuation and discounted cash flow models that require a substantial level of judgment. Separate account assets classified as Level 3 primarily include directly owned real estate properties, real estate joint ventures and real estate limited partnerships. Directly owned real estate properties are valued on a quarterly basis based on independent third party appraisals. Real estate joint venture interests are valued based on the fair value of the underlying real estate, any related mortgage loans payable and other factors such as ownership percentage, ownership rights, buy/sell agreements, distribution provisions and capital call obligations. Real estate limited partnership interests are valued based on the most recent net asset value of the partnership. Transfers between Level 1 and Level 2 Periodically, the Company has transfers between Level 1 and Level 2 due to the availability of quoted prices for identical assets in active markets at the measurement date. The Company’s policy is to recognize transfers between levels as of the actual date of the event or change in circumstances that caused the transfer. There were no transfers of common stock between Level 1 and Level 2 during 2012. During 2011, the Company transferred $79 million of common stock from Level 2 to Level 1 and $28 million from Level 1 to Level 2 due to changes in the availability of quoted prices in active markets for identical assets at the quarterly measurement dates throughout the year. The following is a reconciliation of the beginning and ending balances for assets and liabilities measured and reported at fair value using Level 3 inputs at December 31, 2012 (in millions): Transfers Level 3 Bonds Common Stock Preferred Stock Separate Account Total The following is a reconciliation of the beginning and ending balances for assets and liabilities measured and reported at fair value using Level 3 inputs at December 31, 2011 (in millions): Transfers Level 3 Bonds Common Stock Preferred Stock Separate Account Total The Company’s policy is to recognize transfers into and out of Level 3 at the actual date of the event or change in circumstances that caused the transfer. CHARACTERISTICS OF ITEMS BEING MEASURED FOR LEVEL 2 AND LEVEL 3: BONDS LEVEL 2 AND LEVEL 3: As of December 31, 2012, the reported fair value of bonds in Levels 2 and Level 3 was $ 345 million, representing 80 individual bonds. The bonds are carried at fair value due to being rated NAIC 6. The 80 bonds reported at fair value are all categorized as loan-backed and structured securities. Of the loan-backed and structured securities reported at fair value, 52 bonds with a fair value of $273 million are collateralized by commercial mortgage loans, 26 bonds with a fair value of $ 48 million are collateralized by residential mortgage loans, and 2 bonds with a fair value of $24 million are collateralized by other collateral. The loan-backed and structured securities reported at fair value have a weighted average coupon of 5.33%. As of December 31, 2011, the reported fair value of bonds in Level 3 was $457 million, representing 114 individual bonds. The bonds are carried at fair value due to being rated NAIC 6. Of the 114 bonds reported at fair value, 107 bonds are loan-backed and structured securities with a fair value of $457 million. Of the loan-backed and structured securities reported at fair value, 59 bonds with a fair value of $284 million are collateralized by commercial mortgage loans, 47 bonds with a fair value of $154 million are collateralized by residential mortgage loans, and 1 bond with a fair value of $19 million is collateralized by other collateral. The loan-backed and structured securities reported at fair value have a weighted average coupon of 5.38%. The remaining 7 bonds are issuer obligations with a fair value less than $1 million collectively and have a weighted average coupon of 5.90%. COMMON STOCKS LEVELS 2 AND LEVELS 3: As of December 31, 2012, the reported fair value of common stocks in Level 2 and Level 3 was $559 million representing 16 individual common stocks. Common stocks are carried at fair value in accordance with SSAP No. 30. Of the 16 common stocks, 15 common stocks with a fair value of $559 million were reported in Level 3. 10 common stocks with a fair value of $277 million have a pricing method where the price per share is determined by the reporting entity; and 5 common stocks with a fair value of $282 million have a pricing method NOTES TO STATUTORY–BASIS FINANCIAL STATEMENTS TEACHERS INSURANCE AND ANNUITY ASSOCIATION OF AMERICA where the unit price is published by the NAIC Securities Valuation Office. As of December 31, 2011, the reported fair value of common stocks in Level 2 and Level 3 was $454 million representing 18 individual common stocks. Common stocks are carried at fair value in accordance with SSAP No. 30. Of the 18 common stocks, 4 common stocks with a fair value of $83 million were in Level 2 and 14 common stocks with a fair value of $371 million were reported in Level 3. 4 common stocks with a fair value of $104 million have a pricing method where the price per share is determined by the reporting entity and 12 common stocks with a fair value of $350 million have a pricing method where the unit price is published by the NAIC Securities Valuation Office. The remaining 2 common stocks with a fair value less than $1 million have a pricing method where the unit price is published by the NAIC Securities Valuation Office. PREFERRED STOCKS LEVEL 3: As of December 31, 2012, the reported fair value of preferred stocks in Level 3 was $8 million, representing 2 individual preferred stocks. 1 preferred stock with a fair value of $ 4 million has a pricing method where the price per share is determined by the reporting entity; and 1 preferred stock with a fair value of $4 million has a pricing method where the unit price is published by the NAIC Securities Valuation Office. In accordance with SSAP No. 32, redeemable preferred stocks and perpetual preferred stocks that are NAIC designated RP4-RP6 and P4 to P6 are reported at the lower of book value or fair value. As of December 31, 2011, the reported fair value of preferred stocks in Level 3 was $1 million, representing 3 individual perpetual preferred stocks priced internally. In accordance with SSAP No. 32, redeemable preferred stocks and perpetual preferred stocks that are NAIC designated 4 through 6 are reported at the lower of book value or fair value. QUANTITATIVE INFORMATION REGARDING LEVEL 3 FAIR VALUE MEASUREMENTS The following table provides quantitative information on significant unobservable inputs (Level 3) used in the fair value measurement of assets that are measured and reported at fair value at December 31, 2012 (in millions): Fixed Maturity Bonds: RMBS CMBS ABS Equity Securities: Common Stock Preferred Stock Separate Account Assets: Real Estate Properties and Real Estate Joint Ventures Office Properties Terminal Capitalization Rate Industrial Properties Terminal Capitalization Rate Residential Properties Terminal Capitalization Rate Retail Properties Terminal Capitalization Rate Separate account real estate assets include the values of the related mortgage loans payable in the table below. Mortgage Loans Payable Office and Industrial Properties Residential Properties Retail Properties Limited Partnerships ADDITIONAL QUALITATIVE INFORMATION ON FAIR VALUATION PROCESS The Company has various processes and controls in place to ensure that fair value is reasonably estimated. The Risk Management Valuation group, which reports to the Chief Credit Risk Officer, sets the valuation policies for fixed income and equity securities and is responsible for the determination of fair value. Risk Management Valuation (1) compares price changes between periods to current market conditions, (2) compares trade prices of securities to fair value estimates, (3) compares prices from multiple pricing sources, and (4) performs ongoing vendor due diligence to confirm that independent pricing services use market-based parameters for valuation. Internal and vendor valuation methodologies are reviewed on an ongoing basis and revised as necessary based on changing market conditions to ensure values represent a reasonable exit price. Markets in which the Company’s fixed income securities trade are monitored by surveying the Company’s traders. Risk Management Valuation determines if liquidity is active enough to support a Level 2 classification. Use of independent non-binding broker quotations may indicate a lack of liquidity or the general lack of transparency in the process to develop these price estimates, causing them to be considered Level 3. Level 3 equity investments generally include private equity co-investments along with general and limited partnership interests. Values are derived by the general partners. The partners generally fair value these instruments based on projected net earnings, earnings before interest, taxes depreciation and amortization, discounted cash flow, public or private market transactions, or valuations of comparable companies. When using market comparables, certain adjustments may be taken for differences between the reference comparable and the investment, such as liquidity. Investments may also be valued at cost for a period of time after an acquisition, as the best indication of fair value. With respect to real property investments in the TIAA’s Real Estate Account, each property is appraised, and each mortgage loan is valued, at least once every calendar quarter. Each property is appraised by an independent, external appraiser whose appraisals are reviewed by the Company’s internal appraisal staff and by the Real Estate Account’s independent fiduciary. Any differences in the conclusions of the Company’s internal appraisal staff and the independent appraiser are reviewed by the independent fiduciary, who will make a final determination. The independent fiduciary was appointed by a special subcommittee of the Investment Committee of TIAA Board of Trustees to, among other things, oversee the appraisal process. The independent fiduciary must approve all independent appraisers used by the Real Estate Account. Mortgage loans payable are valued internally by Company’s internal valuation department, and reviewed by the Real Estate Account’s independent fiduciary, at least quarterly based on market factors, such as market interest rates and spreads for comparable loans, the performance of the underlying collateral (such as the loan-to-value ratio and the cash flow of the underlying collateral), the liquidity for mortgage loans of similar characteristics, the maturity date of the loan, the return demands of the market, and the credit quality of the Real Estate Account. Note 12—Eurozone exposure The Company’s investment portfolio includes direct investment exposure to the Eurozone region. The Eurozone region consists of 17 member countries from within the European Union that have adopted the euro as their common currency and sole legal tender. The Eurozone countries are Austria, Belgium, Cyprus, Estonia, Finland, France, Germany, Greece, Ireland, Italy, Luxembourg, Malta, the Netherlands, Portugal, Slovakia, Slovenia and Spain. The Company has direct investment exposure to a group of peripheral countries within the Eurozone facing significant economic and fiscal strains, which includes Greece, Italy, Ireland, Portugal and Spain (collectively “GIIPS”). Specific NOTES TO STATUTORY–BASIS FINANCIAL STATEMENTS TEACHERS INSURANCE AND ANNUITY ASSOCIATION OF AMERICA country exposure is determined based on the security issuer’s country of incorporation. The following tables set forth the composition of the Company’s direct sovereign and non-sovereign exposure to the GIIPS countries, by country of incorporation, attributable to TIAA’s general account, as of December 31, 2012 and 2011 (in millions): Ireland Bonds Stocks Total Italy Bonds Total Spain Bonds Total Grand Total Portugal Bonds Total Ireland Bonds Stocks Total Italy Bonds Total Spain Bonds Total Grand Total The Company has no direct non-sovereign exposure to Greece or Portugal as of December 31, 2012. The Company has no direct non-sovereign exposure to Greece as of December 31, 2011. The Company has 16% and 13% of total direct non-sovereign exposure related to financial institutions within the GIIPS countries as of December 31, 2012 and 2011, respectively. The Company has no gross unfunded commitments for investments in the GIIPS countries as of December 31, 2012 and 2011. At December 31, 2012 and 2011, investment grade holdings (NAIC 1 and 2) made up 100% and 97% of GIIPS countries’ investments, respectively. The Company’s investments in the GIIPS countries are subject to the Company’s OTTI evaluation process. The Company is not liable for any credit default protection underwritten for sovereign debt issued by the GIIPS countries as of December 31, 2012 and 2011. Note 13—derivative financial instruments The Company uses derivative instruments for economic hedging, income generation, and asset replication purposes. TIAA does not engage in derivative financial instrument transactions for speculative purposes. The Company enters into derivatives directly with counterparties of high credit quality (i.e., rated A-/A3 or better at the date of a transaction) and monitors counterparty credit quality on an ongoing basis. TIAA’s counterparty credit risk is limited to the net positive fair value of its derivative positions for each individual counterparty, unless otherwise described below. Effective January 1, 2003 TIAA adopted SSAP 86, “Accounting for Derivative Instruments and Hedging Activities,” and has applied this statement to all derivative transactions entered into or modified on or after that date. The NAIC has also adopted disclosure requirements included within Accounting Standards Codification 815, “Derivatives and Hedging” (“ASC 815”) and Accounting Standards Codification 460, “Guarantees” (“ASC 460”), for annual audited statements in accordance with guidelines provided by the Statutory Accounting Principles Working Group. Additional information related to derivatives may also be found in Note 11, Disclosures about Fair Value of Financial Instruments. Collateral:The Company currently has International Swaps and Derivatives Association (“ISDA”) master swap agreements in place with each of its seventeen counterparties to a derivative transaction. In addition to the ISDA agreement, Credit Support Annexes (“CSA”), which are bilateral collateral agreements, have been put in place with thirteen derivative counterparties. The CSA’s allow TIAA’s exposure to a counterparty to be collateralized by the posting of cash or highly liquid U.S. government securities. As of December 31, 2012, TIAA held cash collateral of $22 million from its counterparties. TIAA must also post collateral to the extent its net position with a given counterparty is at a loss relative to the counterparty. As of December 31, 2012, the Company pledged cash collateral of $78 million and securities collateral of $15 million to its counterparties. Contingent Features:Certain of the Company’s master swap agreements governing its derivative instruments contain provisions that require the Company to maintain a minimum credit rating from two of the major credit rating agencies. If the Company’s credit rating were to fall below the specified minimum, each of the counterparties to agreements with such requirements could terminate all outstanding derivative transactions between such counterparty and the Company. The termination would require immediate payment of amounts expected to approximate the net liability positions of such transactions with such counterparty. The aggregate fair value of all derivative instruments with credit-risk-related contingent features that are in a liability position on December 31, 2012 is $247 million for which the Company has posted collateral of $78 million in the normal course of business. Foreign Currency Swap Contracts:TIAA enters into foreign currency swap contracts to exchange fixed and variable amounts of foreign currency at specified future dates and at specified rates (in U.S. dollars) as a cash flow hedge to manage currency risks on investments denominated in foreign currencies. This type of derivative instrument is traded over-the-counter, and the Company is exposed to both market and counterparty risk. The changes in the carrying value of foreign currency exchange rates are recognized as unrealized gains or losses. Derivative instruments used in hedging transactions that do not qualify for hedge accounting treatment are accounted for at fair value. The net unrealized loss as of December 31, 2012, from foreign currency swap contracts that do not qualify for hedge accounting treatment was $81 million. The net realized loss for the year ended December 31, 2012, from all foreign currency swap contracts was $77 million. Foreign Currency Forward Contracts:TIAA enters into foreign currency forward contracts to exchange foreign currency at specified future dates and at specified rates (in U.S. dollars) to manage currency risks on investments denominated in foreign currencies. This type of derivative instrument is traded over-the-counter, and the Company is exposed to both market and counterparty risk. The changes in the value of the contracts related to foreign currency exchange rates are recognized as unrealized gains or losses. A foreign exchange premium or (discount) is recorded at the time a contract is opened, based on the difference between the forward exchange rate and the spot rate. The Company amortizes the foreign exchange premium/(discount) into investment income over the life of the forward contract or at the settlement date, if the forward contract is less than a year. The net unrealized loss for the year ended December 31, 2012, from foreign currency forward contracts that do not qualify for hedge accounting treatment was $12 million. The net realized gain for the year ended December 31, 2012, from all foreign currency forward contracts was $7 million. Interest Rate Swap Contracts:The Company enters into interest rate swap contracts to hedge against the effect of interest rate fluctuations on certain variable interest rate bonds. These contracts allow the Company to lock in a fixed interest rate and to transfer the risk of higher or lower interest rates. This type of derivative instrument is traded over-the-counter, and the Company is exposed to both market and counterparty risk. Generally, no cash is exchanged at the outset of the contract and no principal payments are made by either party. These transactions are entered into pursuant to master agreements that provide for a single net payment to be made by one counterparty at each due date. Net payments received and net payments made or accrued under interest rate swap contracts are included in net investment income. Derivative instruments used in hedging transactions that do not qualify for hedge accounting treatment are accounted for at fair value. The net unrealized loss for the year ended December 31, 2012, from interest rate swap contracts that do not qualify for hedge accounting treatment was $2 million. The net realized gain/(loss) for the year ended December 31, 2012, from all interest rate swap contracts was $0. Purchased Credit Default Swap Contracts:The Company purchases credit default swaps as protection against unexpected credit events on selective investments in the Company’s portfolio. The premium payment to the counterparty on these contracts is expensed as incurred. Derivative instruments used in hedging transactions that do not qualify for hedge accounting treatment are accounted for at fair value. The net unrealized loss for the year ended December 31, 2012, from purchased credit default swap contracts that do not qualify for hedge accounting treatment was $36 million. The net realized loss for the year ended December 31, 2012 from all purchased credit default swap contracts was $1 million. Written Credit Default Swaps used in Replication Transactions:A replication synthetic asset transaction (“RSAT”) is a derivative transaction (the derivative component) established concurrently with another fixed income instrument (the cash component) in order to “replicate” the investment characteristics of another instrument (the reference entity). As part of a strategy to replicate desired credit exposure in conjunction with high-rated host securities, TIAA writes or sells credit default swaps on either single name corporate credits or credit indices and provides credit default protection to the buyer. This type of derivative instrument is traded over-the-counter, and the Company is exposed to market, credit and counterparty risk. The carrying value of credit default swaps used in RSAT’s represents the unamortized premium received/(paid) for selling the default protection. This premium is amortized into investment income over the life of the swap. The Company has negligible counterparty credit risk with the buyer. The net realized gain for the year ended December 31, 2012 from all written credit default swap contracts was $10 million. Events or circumstances that would require the Company to perform under a written credit derivative position may include, but are not limited to, bankruptcy, failure to pay, debt moratorium, debt repudiation, restructuring of debt and acceleration, or default. The maximum potential amount of future payments (undiscounted) the Company could be required to make under the credit derivative is represented by the notional amount of the contract. Should a credit event occur, the amounts owed to counterparty by the Company may be subject to recovery provisions that include, but are not limited to: The following table contains information related to replication positions where credit default swaps have been sold by the Company on the Dow Jones North American Investment Grade Series of indexes (DJ.NA.IG). Each index is comprised of 125 of the most liquid investment grade credits domiciled in North America and represent a broad exposure to the investment grade corporate market. The Company has written contracts on the “Super Senior” (60% to 100%) tranche of the Dow Jones North American Investment Grade Index Series 7 and 9 (DJ.NA.IG.7 and DJ.NA.IG.9, respectfully), whereby TIAA is obligated to perform should the default rates of each index exceed 60%. The maximum potential amount of future payments (undiscounted) the Company could be required to make under these positions is represented by the notional amount of the contracts. The Company will record an impairment (realized loss) on a derivative position NOTES TO STATUTORY–BASIS FINANCIAL STATEMENTS TEACHERS INSURANCE AND ANNUITY ASSOCIATION OF AMERICA if an existing condition or set of circumstances indicates there is limited ability to recover an unrealized loss (in millions): DJ Investment Grade Index—Series 7 & 9 Super Senior Tranche 60%–100% The following table contains information related to Replication positions where Credit Default Swaps have been sold by the Company on individual debt obligations of corporations and sovereign nations. The maximum potential amount of future pay- ments (undiscounted) the Company could be required to make under these positions is represented by the notional amount. TIAA will record an impairment (realized loss) on a derivative position if an existing condition or set of circumstances indicates there is limited ability to recover an unrealized loss (in millions): Corporate Corporate Corporate Sovereign Sovereign Total Information related to the credit quality of replication positions where credit default swaps have been sold by the Company on indexes, individual debt obligations of corporations and sovereign nations appears below. The values are listed in order of their NAIC Credit Designation, with a designation of 1 having the highest credit quality and designations of 4 or below having the lowest credit quality based on the underlying asset referenced by the credit default swap (in millions): RSAT NAIC Designation 1 Highest Quality 2 High Quality 3 Medium Quality 4 Low Quality A summary of derivative asset and liability positions by carrying value, held by the Company, including notional amounts, carrying values and estimated fair values, appears below (in millions): Foreign Currency Swap Contracts Foreign Currency Forward Contracts Interest Rate Swap Contracts Credit Default Swap Contracts—RSAT Credit Default Swap Contracts (Purchased Default Protection) Subtotal Total Liabilities The Company will record an impairment of a derivative position if an existing condition or set of circumstances indicates there is a limited ability to recover an unrealized loss. The Company held $9.3 billion notional amount in derivative positions on December 31, 2012. Cumulative impairments of these positions were $9 million, all of which was recorded in 2012. During 2012 the average fair value of derivatives used for other than hedging purposes, which is the derivative component of RSATs, was $38 million in assets. The table below illustrates the Fair Values of Derivative Instruments in the Statements of Admitted Assets, Liabilities and Capital and Contingency Reserves. Instruments utilizing hedge accounting treatment are shown asQualifying Hedge Relationships. Hedging instruments that utilize fair value accounting are shown asNon-qualifying Hedge Relationships. Derivatives used in Replication strategies are shown asDerivatives used for other than Hedging Purposes (in millions): Foreign Currency Swaps Total Qualifying Hedge Relationships Non-qualifying Hedge Relationships Interest Rate Contracts Foreign Currency Swaps Foreign Currency Forwards Purchased Credit Default Swaps Total Non-qualifying Hedge Relationships Derivatives used for other than Hedging Purposes Written Credit Default Swaps Total Derivatives used for other than Hedging Purposes Total Derivatives NOTES TO STATUTORY–BASIS FINANCIAL STATEMENTS TEACHERS INSURANCE AND ANNUITY ASSOCIATION OF AMERICA The table below illustrates the Effect of Derivative Instruments in the Statements of Operations. Instruments utilizing hedge accounting treatment are shown asQualifying Hedge Relationships. Instruments that utilize fair value accounting are shown asNon-qualifying Hedge Relationships. Derivatives used in Replication strategies are shown asDerivatives used for other than Hedging Purposes (in millions): Effect of Derivative Instruments December 31, 2012 December 31, 2011 Foreign Currency Swaps Amount of Gain or (Loss) Recognized in Income on Derivative Total Qualifying Hedge Relationships Interest Rate Contracts Foreign Currency Swaps Foreign Currency Forwards Purchased Credit Default Swaps Interest Rate Futures Contracts Total Non-qualifying Hedge Relationships Written Credit Default Swaps Equity Contracts Total Derivatives used for other than Hedging Purposes Total Derivatives Note 14—separate accounts The TIAA Separate Account VA-1 (“VA-1”) is a segregated investment account and was established on February 16, 1994 under the insurance laws of the State of New York for the purpose of issuing and funding non-pension (after-tax) variable annuity contracts for employees of non-profit institutions organized in the United States, including governmental institutions. VA-1 was registered with the Securities and Exchange Commission, (the “Commission”) effective November 1, 1994 as an open-end, diversified management investment company under the Investment Company Act of 1940. VA-1 consists of a single investment portfolio, the Stock Index Account (“SIA”). The SIA was established on October 3, 1994 and invests in a diversified portfolio of equity securities selected to track the overall market for common stocks publicly traded in the United States. The TIAA Real Estate Account (“REA”) is a segregated investment account and was organized on February 22, 1995 under the insurance laws of the State of New York for the purpose of providing an investment option to the Company’s pension customers to direct investments to an investment vehicle that invests primarily in real estate. REA was registered with the Commis- sion under the Securities Act of 1933 effective October 2, 1995. REA’s target is to invest between 75% and 85% of its assets directly in real estate or in real estate-related investments, with the remainder of its assets invested in publicly-traded securities and other instruments that are easily converted to cash to maintain adequate liquidity. The TIAA Separate Account VA-3 (“VA-3”) is a segregated investment account and was organized on May 17, 2006 under the laws of the State of New York for the purposes of funding individual and group variable annuities for retirement plans of employees of colleges, universities, other educational and research organizations, and other governmental and non-profit institutions. VA-3 was registered with the Commission as an investment company under the Investment Company Act of 1940, effective September 29, 2006, and operates as a unit investment trust. The TIAA Stable Value is an insulated, non-unitized separate account and was established on April, 2010 qualifying under New York Insurance Law 4240(a)(5)(ii). The Separate Account supports a flexible premium group deferred fixed annuity contract that is intended initially to be offered to employer sponsored retirement plans. In accordance with the domiciliary state procedures for approving items within the separate accounts, the separate accounts classification of the following items are supported by a specific state statute: TIAA Separate Account VA-1 TIAA Separate Account VA-3 TIAA Real Estate Account TIAA Stable Value The legal insulation of the separate account assets prevents such assets from being generally available to satisfy claims resulting from the general account. As of December 31, 2012 and 2011, the Company’s separate account statement included legally insulated assets of $18,420 million and $16,019 million, respectively. The assets legally insulated from the general account as of December 31, 2012 are attributed to the following products (in millions): TIAA Separate Account VA-1 TIAA Separate Account VA-3 TIAA Real Estate Account TIAA Stable Value Total In accordance with the products recorded within the separate account, some separate account liabilities are guaranteed by the general account. (In accordance with the guarantees provided, if the investment proceeds are insufficient to cover the rate of return guaranteed for the product, the policy holder proceeds will be remitted by the general account.) As of December 31, 2012, the general account of the Company had a maximum guaranteed minimum death benefit for separate account liabilities of $0.7 million. The amount paid for risk charges is not explicit, but rather embedded within the mortality and expense charge. For the year ended December 31, 2012, the general account of the Company had paid (received) $0.4 million towards separate account guarantees. The total separate account guarantees paid (received) by the general account for the preceding five years ending at December 31, are as follows (in millions): 2011 2010 2009 2008 2007 The General Account provides the Real Estate Separate Account with a liquidity guarantee to ensure it has funds available to meet participant transfer or cash withdrawal requests. If the Real Estate Separate Account cannot fund participant requests, the General Account will fund them by purchasing accumulation units in the Real Estate Separate Account. Under this agreement, the Company guarantees that participants will be able to redeem their accumulation units at their accumulation unit value next determined after the transfer or withdrawal request is re- ceived in good order. To compensate the general account for the risk taken, the separate account paid liquidity charges as follows for the past five (5) years (in millions): 2012 2011 2010 2009 2008 The table below shows amounts that the TIAA general account has paid towards the separate account liquidity guarantees and thus purchased units in the Real Estate Separate Account for the past five (5) years (in millions): 2012 2011 2010 2009 2008 During 2012 there was $940 million of units redeemed by the Real Estate Separate Account. The remaining $321 million of accumulation units have been redeemed in the first quarter of 2013. The Company engages in securities lending transactions through its VA-1 Separate Account. As of December 31, 2012, the Separate Account had loaned securities of $15.9 million and collateral of $16.1 million. The Company’s Separate Account may lend securities to qualified institutional borrowers to earn additional income. The Separate Account receives collateral (in the form of cash, Treasury securities, or other collateral permitted by applicable law) against the loaned securities and maintains collateral in an amount not less than 100% of the market value of loaned securities during the period of the loan. Cash collateral received by the Separate Account will generally be invested in high quality short-term instruments, or in one or more funds maintained by the securities lending agent for the purpose of investing cash collateral. The Separate Account bears the market risk with respect to the collateral investment, securities loaned, and the risk that the counterparty may default on its obligations. The Company’s General Account does not currently engage in securities lending transactions. NOTES TO STATUTORY–BASIS FINANCIAL STATEMENTS TEACHERS INSURANCE AND ANNUITY ASSOCIATION OF AMERICA Additional information regarding separate accounts of the Company is as follows for the years ended December 31, (in millions): Premiums, considerations Reserves For accounts with assets at: Fair value Amortized cost Total reserves By withdrawal characteristics: Subject to discretionary withdrawal At fair value Not subject to discretionary withdrawal Total reserves Premiums, considerations Reserves For accounts with assets at: Fair value Amortized cost Total reserves By withdrawal characteristics: Subject to discretionary withdrawal At fair value Not subject to discretionary withdrawal Total reserves Premiums, considerations Reserves For accounts with assets at: Fair value Amortized cost Total reserves By withdrawal characteristics: Subject to discretionary withdrawal At fair value Not subject to discretionary withdrawal Total reserves The following is a reconciliation of transfers to (from) the Company to the Separate Accounts for the years ended December 31, (in millions): Transfers as reported in the Summary of Operations of the Separate Accounts Statement: Transfers to Separate Accounts Transfers from Separate Accounts Net transfers (from) or to Separate Accounts Reconciling Adjustments: Fund transfer exchange gain (loss) Transfers as reported in the Summary of Operations of the Life, Accident & Health Annual Statement Note 15—management agreements Under Cash Disbursement and Reimbursement Agreements, the Company serves as the common pay-agent for its operating and investment subsidiaries and affiliates. The Company has allocated expenses of $1,464 million, $1,252 million and $1,076 million to its various subsidiaries and affiliates for the years ended December 31, 2012, 2011 and 2010, respectively. In addition, under management agreements, the Company provides investment advisory and administrative services for TIAA-CREF Life and administrative services to the TIAA-CREF Trust Company, FSB, and VA-1. The expense allocation process determines the portion of the total investment and operating expenses that is attributable to each legal entity and to each line of business within an entity. Every month the Company allocates incurred expenses to each line of business supported by the Company and its affiliated companies. As part of this allocation process, every department with personnel and every vendor related expense is allocated to lines of business based on defined allocation methodologies. These methodologies represent either shared or direct costs depending on the nature of the service provided. At the completion of the allocation process all expenses are assigned to a line of business and legal entity. Activities necessary for the operation of the College Retirement Equities Fund (“CREF”), a companion organization, are provided at-cost by two subsidiaries of the Company. Such services are provided in accordance with an Investment Management Services Agreement, dated as of January 2, 2008, between CREF and TIAA-CREF Investment Management, LLC (“Investment Management”), and in accordance with a Principal Underwriting and Distribution Services Agreement for CREF, dated as of January 1, 2009, between CREF and TIAA-CREF Individual and Institutional Services, LLC (“Services”). The Company also performs administrative services for CREF, on an at-cost basis. The management fees collected under these agreements and the equivalent allocated expenses, which amounted to approximately $878 million, $870 million and $787 million for the years ended December 31, 2012, 2011 and 2010, respectively, are not included in the statements of operations and had no effect on the Company’s operations. Advisors provides investment advisory services for VA-1, certain proprietary funds and other separately managed portfolios in accordance with investment management agreements. Teachers Personal Investors Services, Inc. (“TPIS”) and Services distribute variable annuity contracts for VA-1 and VA-3 as well as registered securities for certain proprietary funds and non-proprietary mutual funds. All services necessary for the operation of REA are provided at-cost by the Company and Services. The Company provides investment management and administrative services for REA. Distribution services are provided in accordance with a Distribution Services Agreement between REA and Services. The Distribution and Administrative Services Agreement between REA and Services limits the work performed by Services to distribution activities with the Company assuming responsibility for all administrative activities. The Company and Services receive management fee payments from REA on a daily basis according to formulae established each year and adjusted periodically, with the objective of keeping the management fees as close as possible to actual expenses attributable to operating REA. Any differences between actual expenses and daily charges are adjusted quarterly. The following amounts receivable from or payable to subsidiaries and affiliates are included in the lines Other assets and Other liabilities on the Balance Sheet, as of December 31 (in millions): CREF Investment Management TIAA-CREF Life Teachers Personal Investor Service TIAA-CREF Trust Company Covariance Total Note 16—federal income taxes By charter, the Company is a stock life insurance company that operates on a non-profit basis and through December 31, 1997 was exempt from federal income taxation under the Internal Revenue Code. Any non-pension income, however, was subject to federal income taxation as unrelated business income. Effective January 1, 1998, as a result of federal legislation, the Company is no longer exempt from federal income taxation and is taxed as a stock life insurance company. SSAP No. 101 became effective January 1, 2012 and included revised disclosure requirements for income taxes. Calendar year 2011 data has been revised to follow the SSAP 101 disclosure requirements to allow for better comparison. In revising the calendar year 2011 information no amounts have been recalculated or changed. The Company has met the necessary RBC levels to admit the greatest amount of deferred tax assets available under SSAP 101,Income Taxes—A Replacement of SSAP No. 10R and SSAP No. 10. The admissibility is consistent with the Company’s prior year election under SSAP No. 10R and has resulted in no material adoption impact. The application of SSAP No. 101 requires a company to evaluate the recoverability of deferred tax assets and to establish a valuation allowance if necessary to reduce the deferred tax asset to an amount which is more likely than not to be realized. Based on the weight of available evidence the Company has recorded a valuation allowance of $7.7 million on foreign tax credit carry forwards as of December 31, 2012. NOTES TO STATUTORY–BASIS FINANCIAL STATEMENTS TEACHERS INSURANCE AND ANNUITY ASSOCIATION OF AMERICA Components of the net deferred tax asset/(liability) are as follows (in millions): (1) Ordinary (2) Capital (3) (Col 1+2) Total (4) Ordinary (5) Capital (6) (Col 4+5) Total (7) (Col 1–4) Ordinary (8) (Col 2–5) Capital (9) (Col 7+8) Total a) Gross Deferred Tax Assets b) Statutory Valuation Allowance Adjustments c) Adjusted Gross Deferred Tax Assets (1a–1b) d) Deferred Tax Assets Non-admitted e) Subtotal Net Admitted Deferred Tax Asset (1c–1d) f) Deferred Tax Liabilities g) Net Admitted Deferred Tax Assets/(Net Deferred Tax Liability) (1e–1f) (1) Ordinary (2) Capital (3) (Col 1+2) Total (4) Ordinary (5) Capital (6) (Col 4+5) Total (7) (Col 1–4) Ordinary (8) (Col 2–5) Capital (9) (Col 7+8) Total Admission Calculation Components Under SSAP No. 101 a) Federal Income Taxes Paid in Prior Years Recoverable Through Loss Carrybacks b) Adjusted Gross DTA Expected To Be Realized (Excluding The Amount of DTA From 2(a) above After Application of the Threshold Limitation. (The Lesser of 2(b)1 and 2(b) 2 below) 1. Adjusted Gross DTA Expected to be Realized Following the Balance Sheet Date./s/ Roger W. Ferguson, Jr. /s/ Virginia M. Wilson Roger W. Ferguson, Jr. Virginia M. Wilson President and Chief Executive Officer Executive Vice President and Chief Financial Officer 1 
2 December 31, (in millions) 2012 2011 $ 173,954 $ 167,931 38 82 3,495 3,582 12,956 13,133 1,623 1,595 1,681 597 1,358 1,301 96 185 17,973 16,197 1,772 1,805 — 5 3,235 3,070 437 430 18,420 16,019 $ 237,038 $ 225,932 $ 180,020 $ 175,395 1,854 1,731 1,687 1,229 3 — 52 809 3,424 2,825 346 326 2,276 1,662 18,067 14,824 207,729 198,801 3 3 2,000 2,000 27,306 23,650 — 1,478 29,309 27,131 $ 237,038 $ 225,932 See notes to statutory-basis financial statements 3 For the Years Ended December 31, (in millions) 2012 2011 2010 $ 12,085 $ 12,703 $ 12,938 1,312 1,325 1,048 11,042 10,910 10,534 231 182 143 $ 24,670 $ 25,120 $ 24,663 $ 11,733 $ 11,341 $ 10,922 3,128 3,082 2,733 4,604 5,460 5,062 922 859 798 1,518 1,661 2,130 318 53 235 $ 22,223 $ 22,456 $ 21,880 $ 2,447 $ 2,664 $ 2,783 (11 ) (139 ) (28 ) (416 ) (444 ) (1,430 ) $ 2,042 $ 2,359 $ 1,381 4 (in millions) Capital Stock
and Additional
Paid-in Capital Contingency
Reserves Total $ 3 $ 22,841 $ 22,844 1,381 1,381 1,361 1,361 (1,417 ) (1,417 ) 121 121 (1,507 ) (1,507 ) (45 ) (45 ) 2,320 2,320 98 98 $ 3 $ 25,153 $ 25,156 2,359 2,359 390 390 (802 ) (802 ) (23 ) (23 ) 134 134 (1,129 ) (1,129 ) 953 953 93 93 $ 3 $ 27,128 $ 27,131 2,042 2,042 490 490 (599 ) (599 ) 64 64 (1,119 ) (1,119 ) (5 ) (5 ) 1,285 1,285 20 20 $ 3 $ 29,306 $ 29,309 See notes to statutory-basis financial statements 5 For the Years Ended December 31, (in millions) 2012 2011 2010 $ 12,084 $ 12,705 $ 12,941 10,590 10,948 10,361 199 180 142 22,873 23,833 23,444 11,722 11,321 10,574 1,127 853 972 1,693 1,709 1,720 (16 ) (141 ) 106 597 1,666 2,149 15,123 15,408 15,521 7,750 8,425 7,923 26,689 19,042 29,718 843 669 772 2,954 2,162 4,432 2,184 2,197 2,252 13 66 130 31,963 24,768 40,026 559 486 863 2,784 1,922 373 3,472 5,320 3,204 270 448 167 (6,365 ) (8,808 ) (7,329 ) (757 ) (151 ) 21 53 32 51 403 (266 ) 171 (301 ) (385 ) 243 1,084 (768 ) 837 597 1,365 528 $ 1,681 $ 597 $ 1,365 See notes to statutory-basis financial statements 6 For the Years Ended December 31, 2012 2011 2010 $ 2,042 $ 2,359 $ 1,381 2 1 2 63 171 186 $ 2,107 $ 2,531 $ 1,569 $ 29,309 $ 27,131 $ 25,156 — — 12 18 16 15 3,917 3,854 3,683 $ 33,244 $ 31,001 $ 28,866 Ÿ The Asset Valuation Reserve (“AVR”) is eliminated as it is not recognized under GAAP. The AVR is established under NAIC SAP with changes recorded as a direct charge to surplus; Ÿ The Interest Maintenance Reserve (“IMR”) is eliminated as it is not recognized under GAAP. The realized gains and losses resulting from changes in interest rates are reported as a component of net income under GAAP rather than being deferred and subsequently amortized into income over the remaining expected life of the investment sold; Ÿ Dividends on insurance policies and annuity contracts are accrued as the related earnings emerge from operations under GAAP rather than being accrued in the year when they are declared; Ÿ Certain assets designated as “non-admitted assets” are included in the GAAP balance sheet rather than excluded from assets in the statutory balance sheet; Ÿ Policy acquisition costs, such as commissions, and other costs incurred in connection with acquiring new business, are deferred and amortized over the expected lives of the policies issued under GAAP rather than being expensed when incurred; Ÿ Policy and contract reserves are based on estimates of expected mortality, morbidity, persistency and interest under GAAP rather than being based on statutory mortality, morbidity and interest requirements; Ÿ Surplus notes are reported as a liability rather than a component of capital and contingency reserves; Ÿ Investments in wholly-owned subsidiaries, other entities under the control of the parent, and certain variable interest entities are consolidated in the parent’s financial statements rather than being carried at the parent’s share of the underlying GAAP equity or statutory surplus of a domestic insurance subsidiary; Ÿ Investments in bonds considered to be “available for sale” are carried at fair value under GAAP rather than at amortized cost; Ÿ 7 Ÿ For loan-backed and structured securities that are other-than-temporarily impaired, declines in fair value related to factors other than credit are recorded as other comprehensive income, which is a separate component of stockholder’s equity. Under NAIC SAP, such declines in fair value are not recorded until a credit loss occurs; Ÿ Changes in the allowance for estimated uncollectible amounts related to mortgage loans are recorded through earnings under GAAP rather than as unrealized losses, which is a component of surplus under NAIC SAP; Ÿ Changes in the value of certain other long-term investments accounted for under the equity method of accounting are recorded through earnings under GAAP rather than as unrealized gains (losses), which is a component of surplus under NAIC SAP; Ÿ Deferred income taxes, subject to valuation allowance, include federal and state income taxes and changes in the deferred tax are reflected in earnings. Under NAIC SAP, deferred taxes exclude state income taxes and are admitted to the extent they can be realized within three years subject to a 15% limitation of capital and surplus with changes in the net deferred tax reflected as a component of surplus; Ÿ The calculation for the defined benefit and post-retirement benefit obligations include both vested and non-vested employees. Prior to January 1, 2013, non-vested employees are not considered under NAIC SAP; Ÿ Contracts that do not subject the Company to risks arising from policyholder mortality or morbidity are reported as a deposit liability. Under NAIC SAP, contracts that have any mortality and morbidity risk, regardless of significance, and contracts with life contingent annuity purchase rate guarantees are classified as insurance contracts and amounts received under these contracts are reported as revenue; Ÿ Declines in fair value of derivatives are recorded through earnings rather than surplus. Derivatives embedded in host contracts are accounted for separately like a freestanding derivative if certain criteria are met under GAAP. Replication Synthetic Asset Transactions (“RSAT”) are not recognized under GAAP; Ÿ Certain reinsurance transactions are accounted for as financing transactions under GAAP and as reinsurance for statutory purposes. Assets and liabilities are reported gross of reinsurance for GAAP and net of reinsurance for statutory purposes. Transactions recorded as financing under GAAP have no impact on premiums or losses incurred, while for statutory purposes, premiums paid to the reinsurer are recorded as ceded premiums (a reduction in revenue) and expected reimbursement for losses from the reinsurer are recorded as a reduction in losses. 8 continued 9 10 continued 11 2012 Excess of Book/
Adjusted
Carrying
Value Fair Value Over
Book/Adjusted
Carrying Value Book/Adjusted
Carrying Value
Over Fair Value Estimated
Fair Value $ 41,456 $ 5,966 $ (55 ) $ 47,367 3,677 802 (3 ) 4,476 491 76 — 567 345 30 — 375 20,256 2,398 (16 ) 22,638 5,025 431 (23 ) 5,433 99,209 10,556 (1,060 ) 108,705 1,334 90 (28 ) 1,396 2,161 75 (2 ) 2,234 173,954 20,424 (1,187 ) 193,191 38 13 — 51 $ 173,992 $ 20,437 $ (1,187 ) $ 193,242 12 continued 2011 Excess of Book/
Adjusted
Carrying
Value Fair Value Over
Book/Adjusted
Carrying Value Book/Adjusted
Carrying Value
Over Fair Value Estimated
Fair Value $ 41,576 $ 5,998 $ (1 ) $ 47,573 3,119 612 (6 ) 3,725 472 48 (7 ) 513 300 23 — 323 20,171 2,575 (23 ) 22,723 4,351 773 (3 ) 5,121 94,212 8,879 (2,678 ) 100,413 2,039 77 (196 ) 1,920 1,691 95 (13 ) 1,773 167,931 19,080 (2,927 ) 184,084 82 17 (19 ) 80 $ 168,013 $ 19,097 $ (2,946 ) $ 184,164 Less than twelve months Twelve months or more Amortized
Cost Gross
Unrealized
Loss Estimated
Fair Value Amortized
Cost Gross
Unrealized
Loss Estimated
Fair Value $ 1,719 $ (47 ) $ 1,672 $ 7,887 $ (1,131 ) $ 6,756 5,988 (154 ) 5,834 608 (46 ) 562 $ 7,707 $ (201 ) $ 7,506 $ 8,495 $ (1,177 ) $ 7,318 138 (22 ) 116 — — — 10 (2 ) 8 — — — $ 7,855 $ (225 ) $ 7,630 $ 8,495 $ (1,177 ) $ 7,318 13 Less than twelve months Twelve months or more Amortized
Cost Gross
Unrealized
Loss Estimated
Fair Value Amortized
Cost Gross
Unrealized
Loss Estimated
Fair Value $ 4,829 $ (239 ) $ 4,590 $ 13,126 $ (2,641 ) $ 10,485 4,178 (158 ) 4,020 1,916 (204 ) 1,712 $ 9,007 $ (397 ) $ 8,610 $ 15,042 $ (2,845 ) $ 12,197 55 (7 ) 48 42 (12 ) 30 7 — 7 25 (19 ) 6 $ 9,069 $ (404 ) $ 8,665 $ 15,109 $ (2,876 ) $ 12,233 December 31, 2012 December 31, 2011 Book/
Adjusted
Carrying
Value % of
Total Estimated
Fair Value Book/
Adjusted
Carrying
Value % of
Total Estimated
Fair Value $ 3,923 2.3 % $ 4,019 $ 2,992 1.8 % $ 3,051 20,380 11.6 22,183 21,249 12.7 22,855 34,773 20.0 38,505 31,277 18.6 34,383 38,912 22.4 46,050 34,564 20.5 41,324 97,988 56.3 110,757 90,082 53.6 101,613 51,170 29.5 56,525 52,101 31.0 56,412 9,467 5.4 9,328 11,522 6.9 10,513 15,329 8.8 16,581 14,226 8.5 15,546 75,966 43.7 82,434 77,849 46.4 82,471 $ 173,954 100.0 % $ 193,191 $ 167,931 100.0 % $ 184,084 14 continued 2012 2011 29.4 % 31.0 % 12.2 12.9 9.8 8.7 8.8 8.5 7.7 7.3 5.5 6.9 5.5 5.5 5.1 4.9 3.5 3.1 3.2 3.0 2.5 2.2 1.8 1.8 1.4 1.3 1.3 1.1 0.9 0.8 1.4 1.0 100.0 % 100.0 % 2012 2011 NAIC Designation Carrying
Value Estimated
Fair Value Carrying
Value Estimated
Fair Value $ 48,144 $ 53,539 $ 48,773 $ 53,472 1,640 1,667 1,376 1,245 985 974 1,288 1,144 175 154 473 378 214 176 105 83 12 15 86 90 $ 51,170 $ 56,525 $ 52,101 $ 56,412 2012 2011 NAIC Designation Carrying
Value Estimated
Fair Value Carrying
Value Estimated
Fair Value $ 7,301 $ 7,528 $ 8,455 $ 8,387 246 230 501 388 607 481 839 594 585 467 936 585 564 409 566 325 164 213 225 234 $ 9,467 $ 9,328 $ 11,522 $ 10,513 2012 2011 $ — $ 4 3 13 — 5 2 — 5 22 12 86 164 225 53 49 $ 234 $ 382 15 1 OTTI 3 Amortized
Cost Basis
Before OTTI 2a
Interest 2b
Non-interest Fair Value
1-(2a+2b) $ 743 $ 98 $ 130 $ 515 — — — — $ 743 $ 98 $ 130 $ 515 $ 429 $ 21 $ 57 $ 351 — — — — $ 429 $ 21 $ 57 $ 351 2012 2011 2010 $ — $ — $ 29 $ — $ — $ (2 ) $ 206 $ 248 $ 251 $ — $ — $ (21 ) $ 34 $ 35 $ 35 $ 14 $ 16 $ 16 $ 14 $ 16 $ 16 2012 2011 2010 $ — $ 2 $ — — — 94 — — (85 ) — (2 ) (7 ) $ — $ — $ 2 16 continued Commercial Mortgage Loans
by Property Type December 31, 2012 December 31, 2011 Carrying
Value % of
Total Carrying
Value % of
Total $ 4,288 33.1 % $ 4,399 33.5 % 4,278 33.0 4,211 32.1 2,118 16.4 2,313 17.6 1,423 11.0 1,351 10.3 265 2.0 265 2.0 264 2.0 268 2.0 164 1.3 168 1.3 156 1.2 158 1.2 $ 12,956 100.0 % $ 13,133 100.0 % Commercial Mortgage Loans
by Geographic Distribution December 31, 2012 December 31, 2011 Carrying
Value % of
Total Carrying
Value % of
Total $ 3,312 25.6 % $ 3,561 27.1 % 2,908 22.4 3,144 23.9 2,373 18.3 1,988 15.1 2,199 17.0 1,992 15.2 1,209 9.3 1,319 10.1 361 2.8 410 3.1 230 1.8 280 2.1 364 2.8 439 3.4 $ 12,956 100.0 % $ 13,133 100.0 % 2012 2011 Carrying
Value % of
Total Carrying
Value % of
Total $ 804 6.2 % $ 1,359 10.3 % 6,013 46.4 7,269 55.4 4,505 34.8 3,593 27.4 1,634 12.6 912 6.9 $ 12,956 100.0 % $ 13,133 100.0 % 17 Directly Owned Real Estate
by Property Type 2012 2011 Carrying
Value % of
Total Carrying
Value % of
Total $ 836 51.5 % $ 1,056 66.2 % 501 30.9 355 22.3 114 7.0 — — 95 5.9 98 6.1 59 3.6 60 3.8 18 1.1 24 1.5 — — 2 0.1 $ 1,623 100.0 % $ 1,595 100.0 % Directly Owned Real Estate
by Geographic Region 2012 2011 Carrying
Value % of
Total Carrying
Value % of
Total $ 699 43.1 % $ 685 42.9 % 605 37.3 321 20.1 203 12.5 183 11.5 116 7.1 158 9.9 — — 248 15.6 $ 1,623 100.0 % $ 1,595 100.0 % 2012 2011 2010 $ 1,517 $ 1,901 $ 2,073 7,387 6,177 4,544 $ 8,904 $ 8,078 $ 6,617 $ 9 $ 5 $ 7 $ 438 $ 184 $ 145 18 continued 2012 2011 2010 $ 799 $ 537 $ 456 1,799 1,578 471 $ 2,598 $ 2,115 $ 927 $ 75 $ 94 $ 32 $ 1 $ 1 $ — Subsidiary 2012 2011 $ 550 $ 171 432 227 349 399 298 210 289 106 217 235 211 178 107 99 105 59 73 20 70 — 31 39 29 39 26 26 20 25 19 — 8 — 3 — 1 1 — 4 — 1 $ 2,838 $ 1,839 2012 2011 $ 8,710 $ 8,424 9,185 7,755 78 18 $ 17,973 $ 16,197 19 2013 2014 In later
years Total
Commitments $ 687 $ 145 $ — $ 832 37 30 38 105 440 36 — 476 1,439 1,204 1,615 4,258 $ 2,603 $ 1,415 $ 1,653 $ 5,671 2012 2011 2010 $ 9,391 $ 9,462 $ 9,343 82 27 96 796 810 1,011 244 234 244 23 10 22 960 775 300 3 3 8 11,499 11,321 11,024 (574 ) (551 ) (566 ) 10,925 10,770 10,458 117 140 76 $ 11,042 $ 10,910 $ 10,534 2013 2014 2015 2016 2017 Total $ 113 $ 94 $ 85 $ 73 $ 59 $ 424 2012 2011 2010 $ 163 $ 422 $ (418 ) 89 40 57 13 28 (240 ) 68 15 (4 ) (61 ) (236 ) 29 (122 ) (200 ) (227 ) 9 (16 ) (3 ) 159 53 (806 ) (575 ) (497 ) (624 ) $ (416 ) $ (444 ) $ (1,430 ) 20 continued 2012 2011 2010 $ 643 $ 509 $ 1,764 52 8 5 13 3 326 17 2 35 8 — — 129 233 252 $ 862 $ 755 $ 2,382 Number of
Transactions Book Value of
Securities Sold Cost of
Securities
Repurchased Gain
(Loss) 5 $ 5 $ 5 $ — 3 $ 4 $ 4 $ — 2012 2011 2010 $ 172 $ (21 ) $ (428 ) 18 99 344 (13 ) (36 ) 11 (109 ) 210 134 422 138 1,300 $ 490 $ 390 $ 1,361 Sensitivity Analysis of Adverse
Changes in Key Assumptions Issue Year Type of
Collateral Carrying
Value Estimated
Fair Value Bonds $ 30 $ 35 (a) $ — $ — Mortgages 23 18 (b) (2 ) (3 ) Total $ 53 $ 53 $ (2 ) $ (3 ) a) The retained interests securitized in 2001 were valued using an independent third-party pricing service. The third-party pricing levels imply yield rates ranging from 3.95% to 6.61%. To test valuation sensitivity, the fair values of the retained interests were recalculated using 10% and 20% adverse changes in the implied overall discount rate. 21 b) The retained interests securitized in 2007 were valued using an independent third-party pricing service. The third-party pricing levels implied yields for the securities ranging from 8.40% to 27.52%. To test valuation sensitivity, the fair values of the retained interests were recalculated using 10% and 20% adverse changes in the implied overall discount rates. Aggregate
Fair Value Admitted
Assets Level 1 Level 2 Level 3 Not
Practicable
(Carrying
Value) $ 193,191 $ 173,954 $ 73 $ 177,418 $ 15,700 $ — 1,178 1,178 619 — 559 — 51 38 13 24 14 — 14,228 12,956 — — 14,228 — 123 96 — 104 19 — 1,358 1,358 — — 1,358 — 18,425 18,420 4,591 2,707 11,127 — 1,681 1,681 1,126 37 518 — $ 230,235 $ 209,681 $ 6,422 $ 180,290 $ 43,523 $ — Aggregate
Fair Value Liabilities Level 1 Level 2 Level 3 Not
Practicable
(Carrying
Value) $ 765 $ 765 $ — $ — $ 765 $ — 18,067 18,067 — — 18,067 — 372 346 — 372 — — $ 19,204 $ 19,178 $ — $ 372 $ 18,832 $ — The following table provided information about the aggregate fair value for all financial instruments and the level within the fair value hierarchy at December 31, 2011 (in millions): Aggregate
Fair Value Admitted
Assets Level 1 Level 2 Level 3 Not
Practicable
(Carrying
Value) $ 184,084 $ 167,931 $ — $ 165,230 $ 18,854 $ — 1,144 1,144 690 83 371 — 80 82 25 20 35 — 14,239 13,133 — — 14,239 — 228 185 — 222 6 — 1,316 1,316 — — 1,316 — 16,019 16,019 3,197 2,897 9,925 — 597 597 422 175 — — $ 217,707 $ 200,407 $ 4,334 $ 168,627 $ 44,746 $ — 22 continued Aggregate
Fair Value Liabilities Level 1 Level 2 Level 3 Not
Practicable
(Carrying
Value) $ 694 $ 694 $ — $ — $ 694 $ — 14,824 14,824 — — 14,824 — 361 326 — 361 — — $ 15,879 $ 15,844 $ — $ 361 $ 15,518 $ — Ÿ Quoted prices for similar assets or liabilities in active markets, Ÿ Quoted prices for identical or similar assets or liabilities in markets that are not active, Ÿ Inputs other than quoted prices that are observable for the asset or liability, Ÿ Inputs that are derived principally from or corroborated by observable market data by correlation or other means. 2012 Level 1 Level 2 Level 3 Total $ — $ 23 $ 322 $ 345 $ — $ 23 $ 322 $ 345 $ 619 $ — $ 559 $ 1,178 $ 619 $ — $ 559 $ 1,178 $ — $ — $ 8 $ 8 $ — $ 56 $ — $ 56 — 31 — 31 — 2 — 2 $ — $ 89 $ — $ 89 $ 4,584 $ 2,570 $ 11,122 $ 18,276 $ 5,203 $ 2,682 $ 12,011 $ 19,896 $ — $ (198 ) $ — $ (198 ) — (44 ) — (44 ) $ — $ (242 ) $ — $ (242 ) 23 2011 Level 1 Level 2 Level 3 Total $ — $ — $ 457 $ 457 $ — $ — $ 457 $ 457 $ 690 $ 83 $ 371 $ 1,144 $ 690 $ 83 $ 371 $ 1,144 $ — $ — $ 1 $ 1 $ — $ 113 $ — $ 113 — 33 — 33 — 28 — 28 $ — $ 174 $ — $ 174 $ 3,197 $ 2,897 $ 9,925 $ 16,019 $ 3,887 $ 3,154 $ 10,754 $ 17,795 $ — $ (154 ) $ — $ (154 ) — (33 ) — (33 ) $ — $ (187 ) $ — $ (187 ) 24 continued Beginning
Balance at
1/1/2012
into Transfers
out of
Level 3 Total gains
(losses)
included in
Net Income Total gains
(losses)
included in
Surplus Purchases Issuances Sales Settlements Ending
Balance at
12/31/2012 $ 457 $ 207 a $ (353 )b $ (52 ) $ 49 $ 28 $ — $ (6 ) $ (8 ) $ 322 371 154 c (68 )d (36 ) 129 9 — — — 559 1 9 e — (2 ) — — — — — 8 9,925 — — (116 ) 965 1,378 — (685 ) (345 ) 11,122 $ 10,754 $ 370 $ (421 ) $ (206 ) $ 1,143 $ 1,415 $ — $ (691 ) $ (353 ) $ 12,011 a The Company transferred bonds which were not previously measured and reported at fair value into Level 3 primarily due to the Securities Valuation Office (“SVO”) valuation process related to Loan-Backed and Structured Securities. The pricing information used in the valuation of these securities was not readily observable in the market. b The Company transferred bonds out of Level 3 that were not measured and reported at fair value as of December 31, 2012. c The Company transferred common stocks into Level 3 due the significance of unobservable market data used in the valuation of these securities. d The Company transferred common stocks out of Level 3 due to the availability of observable or corroborated by market data at fair value as of December 31, 2012. e The Company transferred preferred stocks into Level 3 which were not previously measured and reported at fair value primarily due to the decrease in NAIC rating to 4, 5 or 6. Beginning
Balance at
1/1/2011
into Transfers
out of
Level 3 Total gains
(losses)
included in
Net Income Total gains
(losses)
included in
Surplus Purchases Issuances Sales Settlements Ending
Balance at
12/31/2011 $ 514 $ 327 a $ (367 )b $ (15 ) $ 18 $ 18 $ — $ (24 ) $ (14 ) $ 457 256 126 c (68 )d — 28 29 — — — 371 9 1 e (9 )d — — — — — — 1 8,031 — — — 1,047 1,128 — (336 ) 55 9,925 $ 8,810 $ 454 $ (444 ) $ (15 ) $ 1,093 $ 1,175 $ — $ (360 ) $ 41 $ 10,754 a The Company transferred bonds which were not previously measured and reported at fair value into Level 3 primarily due to the Securities Valuation Office (“SVO”) valuation process related to Loan-Backed and Structured Securities. The pricing information used in the valuation of these securities was not readily observable in the market. b The Company transferred bonds out of Level 3 that were not measured and reported at fair value as of December 31, 2011. c The Company transferred common stocks into Level 3 due the significance of unobservable market data used in the valuation of these securities. d The Company transferred common and preferred stocks out of Level 3 due to the availability of observable or corroborated by market data and not measured and reported at fair value as of December 31, 2011. e The Company transferred preferred stocks into Level 3 which were not previously measured and reported at fair value primarily due to the decrease in NAIC rating to 4, 5 or 6. 25 Financial Instrument Fair
Value Valuation
Techniques Significant Unobservable
Inputs Range of
Inputs Weighted
Average $ 47 Discounted Cash Flow Discount Rate 4.1% – 20.0% 11.7% Market Comparable Credit Analysis/Market Comparable $95.00 $95.00 $ 251 Discounted Cash Flow Discount Rate 6.2% –213.7% 31.4% $ 24 Market Comparable Credit Analysis/Market Comparable $0.00 – $95.57 $95.57 $ 559 Equity Method Book Value Multiple 0.00x – 3.26x 1.43x Market Comparable EBITDA 5.60x – 12.00x 9.99x Book Value Multiple 0.44x – 1.00x 0.58x $ 8 Equity Method Book Value Multiple 0.94x 0.94x Recent Offering Book Value Multiple 0.93x 0.93x $ 13,065 Income Approach—Discounted cash flow Discount Rate 6.5% – 9.8% 7.4% 5.5% – 8.5% 6.3% Income Approach—Direct Capitalization Overall Capitalization Rate 4.5% – 8.5% 5.7% Income Approach—Discounted cash flow Discount Rate 6.5% – 9.8% 7.7% 5.5% – 8.3% 6.5% Income Approach—Direct Capitalization Overall Capitalization Rate 5.0% – 8.0% 5.9% Income Approach—Discounted cash flow Discount Rate 5.8% – 8.0% 6.7% 4.3% – 6.3% 5.0% Income Approach—Direct Capitalization Overall Capitalization Rate 3.8% – 5.6% 4.4% Income Approach—Discounted cash flow Discount Rate 6.5% – 11.3% 7.8% 5.8% – 11.0% 6.6% Income Approach—Direct Capitalization Overall Capitalization Rate 4.5% – 10.8% 6.0% 26 continued Financial Instrument Fair
Value Valuation
Techniques Significant Unobservable
Inputs Range of
Inputs Weighted
Average $(2,283 ) Discounted cash flow Loan to Value Ratio 36.0% – 67.0% 51.2% Equivalency Rate 2.5% – 3.0% 2.7% Net Present Value Loan to Value Ratio 36.0% – 67.0% 51.2% Weighted Average Cost of Capital Risk Premiums 1.0% – 3.2% 1.7% Discounted cash flow Loan to Value Ratio 37.0% – 60.0% 49.2% Equivalency Rate 2.3% – 3.9% 3.0% Net Present Value Loan to Value Ratio 37.0% – 60.0% 49.2% Weighted Average Cost of Capital Risk Premiums 1.0% – 2.3% 1.5% Discounted cash flow Loan to Value Ratio 31.0% –153.0% 62.6% Equivalency Rate 2.6% – 7.1% 4.1% Net Present Value Loan to Value Ratio 31.0% –153.0% 62.6% Weighted Average Cost of Capital Risk Premiums 0.7% – 14.2% 4.1% $ 340 Relative Value Estimated Net Asset Value (NAV) 0.0% – 7.2% 1.0% 27 2012 Sovereign Exposure Non-Sovereign Exposure Statement Value Fair Value Statement Value Fair Value $ — $ — $ 240 $ 281 — — 14 14 $ — $ — $ 254 $ 295 $ 25 $ 29 $ 27 $ 29 $ 25 $ 29 $ 27 $ 29 $ 38 $ 42 $ 241 $ 259 $ 38 $ 42 $ 241 $ 259 $ 63 $ 71 $ 522 $ 583 2011 Sovereign Exposure Non-Sovereign Exposure Statement Value Fair Value Statement Value Fair Value $ — $ — $ 114 $ 115 $ — $ — $ 114 $ 115 $ — $ — $ 205 $ 196 — — 6 6 $ — $ — $ 211 $ 202 $ — $ — $ 26 $ 21 $ — $ — $ 26 $ 21 $ — $ — $ 269 $ 266 $ — $ — $ 269 $ 266 $ — $ — $ 620 $ 604 28 continued 1. Notional amount payment by the Company to Counterparty and/or delivery of physical security by Counterparty to the Company. 2. Notional amount payment by the Company to Counterparty net of contractual recovery fee. 3. Notional amount payment by the Company to Counterparty net of auction determined recovery fee. 29 Asset Class Term Notional Average Annual
Premium Received Fair
Value 2012
Impairment 3–5 years $ 2,574 0.24 % $ 19 $ — Asset Class Term Notional Average Annual
Premium Received Fair
Value 2012
Impairment 0–2 years $ 540 1.00 % $ 8 $ — 2–4 years 191 0.50 % 1 — 4–9 years 70 2.71 % — — 0–2 years 140 1.52 % 1 — 2–4 years 57 1.00 % 1 — $ 998 $ 11 $ — Reference Entity
Asset Class RSAT
Notional
Amount Derivative
Component
Fair Value Cash
Component
Fair Value RSAT
Fair
Value Tranche $ 2,574 $ 19 $ 3,266 $ 3,285 Corporate 636 8 755 764 Sovereign 60 1 72 73 Subtotal 3,270 28 4,093 4,122 Tranche — — — — Corporate 95 1 119 120 Sovereign 72 1 85 86 Subtotal 167 2 204 206 Tranche — — — — Corporate 40 (3 ) 57 54 Sovereign 40 — �� 48 48 Subtotal 80 (3 ) 105 102 Tranche — — — — Corporate 30 3 36 39 Sovereign 25 — 30 30 Subtotal 55 3 66 69 Total $ 3,572 $ 30 $ 4,468 $ 4,499 30 continued December 31, 2012 December 31, 2011 Notional Carrying
Value Estimated
FV Notional Carrying
Value Estimated
FV Assets $ 759 $ 55 $ 56 $ 1,536 $ 106 $ 108 Liabilities 2,485 (292 ) (322 ) 1,305 (275 ) (317 ) Subtotal 3,244 (237 ) (266 ) 2,841 (169 ) (209 ) Assets 93 1 1 167 9 9 Liabilities 184 (4 ) (4 ) — — — Subtotal 277 (3 ) (3 ) 167 9 9 Assets 351 32 32 384 33 33 Liabilities — — — — — — Subtotal 351 32 32 384 33 33 Assets 3,460 6 32 8,081 9 50 Liabilities 112 (6 ) (2 ) 291 (18 ) (11 ) Subtotal 3,572 — 30 8,372 (9 ) 39 Assets 83 2 2 646 28 28 Liabilities 1,743 (44 ) (44 ) 1,316 (33 ) (33 ) 1,826 (42 ) (42 ) 1,962 (5 ) (5 ) Assets 4,746 96 123 10,814 185 228 4,524 (346 ) (372 ) 2,912 (326 ) (361 ) Total $ 9,270 $ (250 ) $ (249 ) $ 13,726 $ (141 ) $ (133 ) Fair Value of Derivative Instruments Asset Derivatives Liability Derivatives December 31, 2012 December 31, 2011 December 31, 2012 December 31, 2011 Qualifying Hedge Relationships Balance Sheet
Location Estimated
FV Balance Sheet
Location Estimated
FV Balance Sheet
Location Estimated
FV Balance Sheet
Location Estimated
FV Derivatives $ 1 Derivatives $ 3 Derivatives $ (128 ) Derivatives $ (162 ) 1 3 (128 ) (162 ) Derivatives 32 Derivatives 33 Derivatives — Derivatives — Derivatives 55 Derivatives 105 Derivatives (194 ) Derivatives (155 ) Derivatives 1 Derivatives 9 Derivatives (4 ) Derivatives — Derivatives 2 Derivatives 28 Derivatives (44 ) Derivatives (33 ) 90 175 (242 ) (188 ) Derivatives 32 Derivatives 50 Derivatives (2 ) Derivatives (11 ) 32 50 (2 ) (11 ) $ 123 $ 228 $ (372 ) $ (361 ) 31 Qualifying Hedge Relationships Income Statement
Location Realized Gain
(Loss) Income Statement
Location Realized Gain
(Loss) Net Realized
Capital Gain (Loss) $ (36 ) Net Realized Capital Gain (Loss) $ (56 )
(Ineffective Portion and Amount Excluded from Effectiveness Testing) Net Realized Capital Gain (Loss) — Net Realized Capital Gain (Loss) — (36 ) (56 ) Non-qualifying Hedge Relationships Net Realized
Capital Gain (Loss) — Net Realized Capital Gain (Loss) — Net Realized
Capital Gain (Loss) (41 ) Net Realized Capital Gain (Loss) (49 ) Net Realized
Capital Gain (Loss) 7 Net Realized Capital Gain (Loss) 6 Net Realized
Capital Gain (Loss) (1 ) Net Realized Capital Gain (Loss) — Net Realized
Capital Gain (Loss) — Net Realized Capital Gain (Loss) (167 ) (35 ) (210 ) Derivatives used for other than Hedging Purposes Net Realized Capital Gain (Loss) 10 Net Realized Capital Gain (Loss) 17 Net Realized Capital Gain (Loss) — Net Realized Capital Gain (Loss) 13 Net Realized Capital Gain (Loss) 10 Net Realized Capital Gain (Loss) 30 $ (61 ) $ (236 ) 32 continued Product Identification Product Classification State Statute Reference Variable Annuity Section 4240 of the New York Insurance Law Variable Annuity Section 4240 of the New York Insurance Law Variable Annuity Section 4240 of the New York Insurance Law Group Deferred Fixed Annuity Section 4240(a)(5)(ii) of the New York Insurance Law Product Legally Insulated
Assets Separate Account
Assets (Not
Legally Insulated) $ 770 $ — 2,482 — 15,024 — 144 — $ 18,420 $ — $ 0.1 $ 0.5 $ 2.1 $ 3.4 $ 3.0 $ 31.4 $ 23.7 $ 13.1 $ 12.1 $ 19.7 $ — $ — $ — $ 1,058.7 $ 155.6 33 2012 Non-indexed
Guarantee less
than/equal to 4% Non-indexed
Guarantee
more than 4% Non-guaranteed
Separate Accounts Total $ 92 $ — $ 2,545 $ 2,637 $ — $ — $ 17,777 $ 17,777 113 — — 113 $ 113 $ — $ 17,777 $ 17,890 $ 7 $ — $ — $ 7 — — 17,777 17,777 106 — — 106 $ 113 $ — $ 17,777 $ 17,890 2011 Non-indexed
Guarantee less
than/equal to 4% Non-indexed
Guarantee
more than 4% Non-guaranteed
Separate Accounts Total $ 38 $ — $ 2,655 $ 2,693 $ — $ — $ 14,615 $ 14,615 67 — — 67 $ 67 $ — $ 14,615 $ 14,682 $ 4 $ — $ — $ 4 — — 14,615 14,615 63 — — 63 $ 67 $ — $ 14,615 $ 14,682 2010 Non-indexed
Guarantee less
than/equal to 4% Non-indexed
Guarantee
more than 4% Non-guaranteed
Separate Accounts Total $ 25 $ — $ 2,626 $ 2,651 $ — $ — $ 11,704 $ 11,704 23 — — 23 $ 23 $ — $ 11,704 $ 11,727 $ — $ — $ — $ — — — 11,704 11,704 23 — — 23 $ 23 $ — $ 11,704 $ 11,727 2012 2011 2010 $ 2,935 $ 3,121 $ 3,209 (1,417 ) (1,463 ) (1,079 ) 1,518 1,658 2,130 — 3 — $ 1,518 $ 1,661 $ 2,130 34 continued Receivable Payable Subsidiary/Affiliate 2012 2011 2012 2011 $ 10.5 $ — $ — $ 25.2 1.4 2.1 — — 9.9 19.4 0.3 — 4.8 — — — — — — 3.2 6.7 — — — $ 33.3 $ 21.5 $ 0.3 $ 28.4 35 12/31/2012 12/31/2011 Change $ 12,057 $ 1,472 $ 13,529 $ 11,756 $ 2,617 $ 14,373 $ 301 $ (1,145 ) $ (844 ) 8 — 8 3 — 3 5 — 5 $ 12,049 $ 1,472 $ 13,521 $ 11,753 $ 2,617 $ 14,370 $ 296 $ (1,145 ) $ (849 ) 8,560 404 8,964 8,430 1,818 10,248 130 (1,414 ) (1,284 ) 3,489 1,068 4,557 3,323 799 4,122 166 269 435 320 1,002 1,322 338 714 1,052 (18 ) 288 270 $ 3,169 $ 66 $ 3,235 $ 2,985 $ 85 $ 3,070 $ 184 $ (19 ) $ 165 12/31/2012 12/31/2011 Change $ — $ — $ — $ — $ — $ — $ — $ — $ — $ 3,169 $ 66 $ 3,235 $ 2,985 $ 85 $ 3,070 $ 184 $ (19 ) $ 165 $ 3,169 $ 66 $ 3,235 $ 2,985 $ 85 $ 3,070 $ 184 $ (19 ) $
2. Adjusted Gross DTA Allowed per Limitation Threshold.
c) Adjusted Gross DTA (Excluding The Amount of DTA From 2(a) and 2(b) above) Offset by Gross DTL.
d) DTA Admitted as the result of application of SSAP No. 101. Total (2(a)+2(b)+2(c))
Ratio Percentage Used to Determine Recovery Period and Threshold Limitation Amount
(1)
Ordinary
Percent
(2)
Capital
Percent
(3)
(Col 1+2)
Total
Percent
(4)
Ordinary
Percent
(5)
Capital
Percent
(6)
(Col 4+5)
Total Percent
(7)
(Col 1–4)
Ordinary
Percent
(8)
(Col 2–5)
Capital
Percent
(9)
(Col 7+8)
Total Percent
Impact of Tax Planning Strategies:
(a) Adjusted Gross DTAs (% of Total Adjusted Gross DTAs)
(b) Net Admitted Adjusted Gross DTAs (% of Total Net Admitted Adjusted Gross DTAs)
(c) TIAA does not have tax-planning strategies that include the use of reinsurance.
TIAA has no temporary differences for which deferred tax liabilities are not recognized.
| 36 |
| continued |
Income taxes incurred consist of the following major components (in millions):
| 12/31/2012 | 12/31/2011 | Change | ||||||||||||
1. | Current Income Tax: | |||||||||||||
| Federal income tax expense/(benefit) | $ | (763 | ) | $ | 97 | $ | (860 | ) | ||||||
| Subtotal | $ | (763 | ) | $ | 97 | $ | (860 | ) | ||||||
| Federal income taxes expense/(benefit) on net capital gains | $ | (24 | ) | $ | 853 | $ | (877 | ) | ||||||
| Generation/(Utilization) of loss carry-forwards | 776 | (1,089 | ) | 1,865 | ||||||||||
|
| |||||||||||||
| Federal and foreign income taxes incurred | $ | (11 | ) | $ | (139 | ) | $ | 128 | ||||||
|
| |||||||||||||
2. | Deferred Tax Assets: | |||||||||||||
(a) | Ordinary: | |||||||||||||
| Policyholder reserves | $ | 348 | $ | 366 | $ | (18 | ) | |||||||
| Investments | 723 | 794 | (71 | ) | ||||||||||
| Deferred acquisition costs | 28 | 28 | — | |||||||||||
| Policyholder dividends accrual | 649 | 604 | 45 | |||||||||||
| Fixed assets | 154 | 85 | 69 | |||||||||||
| Compensation and benefits accrual | 286 | 272 | 14 | |||||||||||
| Receivables—non-admitted | 36 | — | 36 | |||||||||||
| Net operating loss carry-forward | 2,136 | 1,368 | 768 | |||||||||||
| Tax credit carry-forward | 43 | 32 | 11 | |||||||||||
| Other (including items < 5% of total ordinary tax assets | 512 | 609 | (97 | ) | ||||||||||
| Intangible Assets—Business in Force and Software | 7,142 | 7,598 | (456 | ) | ||||||||||
(99) Subtotal | $ | 12,057 | $ | 11,756 | $ | 301 | ||||||||
(b) | Statutory valuation allowance adjustment | 8 | 3 | 5 | ||||||||||
(c) | Non-admitted | 8,560 | 8,430 | 130 | ||||||||||
(d) | Admitted ordinary deferred tax assets (2a99 – 2b – 2c) | $ | 3,489 | $ | 3,323 | $ | 166 | |||||||
| ||||||||||||||
(e) | Capital: | |||||||||||||
| Investments | $ | 1,421 | $ | 2,481 | $ | (1,060 | ) | |||||||
| Real estate | 38 | 136 | (98 | ) | ||||||||||
| Other (including items < 5% of total capital tax assets | 13 | — | 13 | |||||||||||
(99) Subtotal | $ | 1,472 | $ | 2,617 | $ | (1,145 | ) | |||||||
(f) | Statutory valuation allowance adjustment | — | — | — | ||||||||||
(g) | Non-admitted | 404 | 1,818 | (1,414 | ) | |||||||||
(h) | Admitted capital deferred tax assets (2e99 – 2f – 2g) | 1,068 | 799 | 269 | ||||||||||
(i) | Admitted deferred tax assets (2d + 2h) | $ | 4,557 | $ | 4,122 | $ | 435 | |||||||
| ||||||||||||||
3. | Deferred Tax Liabilities: | |||||||||||||
(a) | Ordinary: | |||||||||||||
| Investments | $ | 317 | $ | 337 | $ | (20 | ) | |||||||
| Other (including items < 5% of total ordinary tax liabilities) | 3 | 1 | 2 | |||||||||||
(99) Subtotal | $ | 320 | $ | 338 | $ | (18 | ) | |||||||
(b) | Capital: | |||||||||||||
| Investments | $ | 1,002 | $ | 714 | $ | 288 | ||||||||
(99) Subtotal | $ | 1,002 | $ | 714 | $ | 288 | ||||||||
(c) | Deferred tax liabilities (3a99 + 3b99) | $ | 1,322 | $ | 1,052 | $ | 270 | |||||||
| ||||||||||||||
4. | Net Admitted Deferred Tax: | |||||||||||||
| Assets/Liabilities (2i – 3c) | $ | 3,235 | $ | 3,070 | $ | 165 | ||||||||
| ||||||||||||||
| 37 |
NOTES TO STATUTORY–BASIS FINANCIAL STATEMENTS
TEACHERS INSURANCE AND ANNUITY ASSOCIATION OF AMERICA
5. The change in the net deferred income taxes is comprised of the following (this analysis is exclusive of non-admitted assets as the Change in Non-admitted Assets is reported separately from the Change in Net Deferred Income Taxes in the surplus section of the Annual Statement) (in millions):
| 12/31/2012 | 12/31/2011 | Change | ||||||||||
Total deferred tax assets | $ | 13,529 | $ | 14,373 | $ | (844 | ) | |||||
Total deferred tax liabilities | (1,322 | ) | (1,052 | ) | (270 | ) | ||||||
Net deferred tax assets / liabilities | $ | 12,207 | $ | 13,321 | $ | (1,114 | ) | |||||
Statutory valuation allowance (“SVA”) adjustment | 8 | 3 | 5 | |||||||||
Net deferred tax assets / liabilities after SVA | $ | 12,199 | $ | 13,318 | $ | (1,119 | ) | |||||
Tax effect of unrealized gains/(losses) | 191 | |||||||||||
Change in net deferred income tax (charge)/benefit from sources other than unrealized capital gains (losses) | $ | (928 | ) | |||||||||
| ||||||||||||
The provision for federal and foreign income taxes incurred is different from that which would be obtained by applying the statutory federal income tax rate to income before income taxes. The significant items causing this difference at December 31, 2012 are as follows (in millions):
| Description | Amount | Tax Effect | Effective Tax Rate | |||||||||
Provision computed at statutory rate | $ | 2,606 | $ | 912 | 35.00 | % | ||||||
Dividends received deduction | (63 | ) | (22 | ) | (0.84 | )% | ||||||
Amortization of interest maintenance reserve | (117 | ) | (41 | ) | (1.57 | )% | ||||||
Meal disallowance, spousal travel, non-deductible lobbying, fines & penalties | 9 | 3 | 0.10 | % | ||||||||
Prior year true-ups | 274 | 96 | 3.68 | % | ||||||||
Non-admitted assets | (100 | ) | (35 | ) | (1.34 | ) | ||||||
Other | 11 | 4 | 0.17 | % | ||||||||
Total | $ | 2,620 | $ | 917 | 35.20 | % | ||||||
| ||||||||||||
Federal and foreign income tax incurred expense (benefit) | $ | (11 | ) | (0.44 | )% | |||||||
Change in net deferred income tax charge (benefit) | 1,119 | 42.97 | % | |||||||||
Tax effect of unrealized capital gain | (191 | ) | (7.33 | )% | ||||||||
Total statutory income taxes | $ | 917 | 35.20 | % | ||||||||
| ||||||||||||
At December 31, 2012, the Company had net operating loss carry forwards expiring through the year 2027 (in millions):
| Year Incurred | Operating Loss | Year of Expiration | ||||||
1999 | $ | 997 | 2014 | |||||
2001 | 186 | 2016 | ||||||
2002 | 779 | 2017 | ||||||
2003 | 467 | 2018 | ||||||
2004 | 356 | 2019 | ||||||
2008 | 1,141 | 2023 | ||||||
2012 | 2,175 | 2027 | ||||||
Total | $ | 6,101 | ||||||
| ||||||||
At December 31, 2012, the Company had no capital loss carry forwards.
At December 31, 2012, the Company had foreign tax credit carry forwards as follows (in millions):
| Year Incurred | Foreign Tax Credit | Year of Expiration | ||||||
2005 | 3 | 2015 | ||||||
2006 | 3 | 2016 | ||||||
2007 | 2 | 2017 | ||||||
2008 | 2 | 2018 | ||||||
2009 | 2 | 2019 | ||||||
2010 | 2 | 2020 | ||||||
2011 | 6 | 2021 | ||||||
Total | $ | 20 | ||||||
| ||||||||
At December 31, 2012, the Company had General Business Credit carry forwards as follows (in millions):
| Year Incurred | General Business Credit | Year of Expiration | ||||||
2004 | $ | 1 | 2024 | |||||
2005 | 2 | 2025 | ||||||
2006 | 5 | 2026 | ||||||
2007 | 7 | 2027 | ||||||
2008 | 5 | 2028 | ||||||
2009 | 2 | 2029 | ||||||
Total | $ | 22 | ||||||
| ||||||||
The Company did not incur federal income taxes expense for 2012 or preceding years that would be available for recoupment in the event of future net losses.
The Company does not have any protective tax deposits on deposit with the internal Revenue Service under IRC Section 6603.
Beginning in 1998, the Company has filed a consolidated federal income tax return with its includable affiliates (the “consolidating companies”). The consolidating companies participate in a tax-sharing agreement. Under the agreement, current federal income tax expense (benefit) is computed on a separate return basis and provides that members shall make payments or receive reimbursements to the extent that their income (loss) contributes to or reduces consolidated federal tax expense. The consolidating companies are reimbursed for net operating losses or other tax attributes they have generated when utilized in the consolidated return. Amounts receivable from / (payable to) the Company’s subsidiaries for federal income taxes were $(3) million and $5 million at December 31, 2012 and 2011, respectively.
| 38 |
| continued |
1) TIAA-CREF Life Insurance Company
2) TIAA-CREF Asset Management, Inc.
3) Dan Properties, Inc.
4) JV Georgia One, Inc.
5) JWL Properties, Inc.
6) ND Properties, Inc.
7) Savannah Teachers Properties, Inc.
8) TCT Holdings, Inc.
9) Teachers Advisors, Inc.
10) Teachers Personal Investors Service, Inc.
11) T-Investment Properties Corp.
12) T-Land Corp.
13) WRC Properties, Inc.
14) TIAA-CREF Tuition Financing, Inc.
15) TIAA-CREF Trust Company, FSB
16) 730 Texas Forest Holdings, Inc.
17) TIAA Global Markets, Inc.
18) T-C Sports Co., Inc.
19) TIAA Board of Overseers
20) TIAA Realty, Inc.
21) TIAA Park Evanston, Inc.
22) Oleum Holding Company, Inc.
23) Covariance Capital Management, Inc.
24) Westchester Group Investment Management, Inc.
25) Westchester Group Investment Management Holding Company, Inc.
26) GreenWood Resources, Inc.
TIAA has no federal or foreign income tax loss contingencies as determined in accordance withSSAP No. 5R—Liabilities, Contingencies and Impairments of Assets, with the modifications provided in SSAP No. 101, for which it is reasonably possible that the total liability will significantly increase within 12 months of the reporting date.
The IRS examination for tax years 2007, 2008, and 2009 federal income tax returns is scheduled to begin in 2013.
Note 17—pension plan and post-retirement benefits
The Company maintains a qualified, non-contributory defined contribution pension plan covering substantially all employees. All qualified employee pension plan liabilities are fully funded through retirement annuity contracts. Contributions are made to each participant’s contract based on a percentage of salary, with the applicable percentage varying by attained age. All contributions are fully vested after three years of service. Forfeitures arising from terminations prior to vesting are used to reduce future employer contributions. The accompanying statements of operations include contributions to the pension plan of approximately $36 million, $33 million and $36 million for the years ended December 31, 2012, 2011 and 2010, respectively. This includes supplemental contributions made to company-owned annuity contracts under a non-qualified deferred compensation plan.
In addition to the pension plan, the Company provides certain other post-retirement life and health insurance benefits to eligible retired employees who meet prescribed age and service requirements. The status of this plan for retirees and eligible active employees is summarized below (in millions):
| Post-retirement Benefits | ||||||||||||
| 2012 | 2011 | 2010 | ||||||||||
Change in benefit obligation: | ||||||||||||
Benefit obligation at beginning of year | $ | 155 | $ | 130 | $ | 116 | ||||||
Service cost | 10 | 7 | 5 | |||||||||
Interest cost | 6 | 7 | 6 | |||||||||
Actuarial loss | 4 | 17 | 10 | |||||||||
Benefits paid | (8 | ) | (6 | ) | (7 | ) | ||||||
Benefit obligation at end of year | $ | 167 | $ | 155 | $ | 130 | ||||||
| ||||||||||||
Change in plan assets | ||||||||||||
Employer contribution | $ | 8 | $ | 6 | $ | 7 | ||||||
Benefits paid | (8 | ) | (6 | ) | (7 | ) | ||||||
Fair value of plan assets at end of year | $ | — | $ | — | $ | — | ||||||
| ||||||||||||
Funded status: | ||||||||||||
Unamortized prior service cost | $ | (1 | ) | $ | (1 | ) | $ | (1 | ) | |||
Unrecognized net loss | 41 | 37 | 20 | |||||||||
Accrued liabilities | 127 | 119 | 111 | ) | ||||||||
| ||||||||||||
Unfunded accumulated benefit obligation—vested employees | $ | 167 | $ | 155 | $ | 130 | ||||||
| ||||||||||||
Accumulated benefit obligation—non-vested employees | $ | 23 | $ | 32 | $ | 33 | ||||||
| ||||||||||||
The Company allocates benefit expenses to certain subsidiaries based upon salaries. The cost of postretirement benefits reflected in the accompanying statements of operations was approximately $8 million, $7 million and $5 million for 2012, 2011 and 2010, respectively.
The net periodic postretirement benefit cost for the years ended December 31, includes the following components (in millions): |
| |||||||||||
| Post-retirement Benefits | ||||||||||||
| 2012 | 2011 | 2010 | ||||||||||
Components of net periodic benefit cost: | ||||||||||||
Service cost | $ | 10 | $ | 7 | $ | 5 | ||||||
Interest cost | 6 | 7 | 6 | |||||||||
Amount of recognized gains and losses | 1 | — | — | |||||||||
Total net periodic benefit cost | $ | 17 | $ | 14 | $ | 11 | ||||||
| ||||||||||||
| The assumptions used at December 31 by the Company to calculate the benefit obligations as of that date and to determine the benefit cost in the year are as follows: | ||||||||||||
| 2012 | 2011 | 2010 | ||||||||||
Weighted-average assumptions used to determine net periodic benefit cost as of December 31, | ||||||||||||
Weighted-average discount rate | 4.50 | % | 5.25 | % | 5.75 | % | ||||||
Rate of compensation increase | N/A | N/A | N/A | |||||||||
Weighted-average assumptions used to determine projected benefit obligations as of December 31, | ||||||||||||
Weighted-average discount rate | 4.00 | % | 4.50 | % | 5.25 | % | ||||||
Rate of compensation increase | N/A | N/A | N/A | |||||||||
| 39 |
NOTES TO STATUTORY–BASIS FINANCIAL STATEMENTS
TEACHERS INSURANCE AND ANNUITY ASSOCIATION OF AMERICA
For measurement purposes, a 8.50% annual rate of increase in the per capita cost of covered health care benefits was assumed for 2013. The rate was assumed to decrease gradually to 6.23% for 2045 and remain at that level thereafter.
A measurement date of December 31, 2012 was used to determine the above.
The Company has multiple non-pension postretirement benefit plans. The health care plans are contributory, with participants’ contributions adjusted annually; the life insurance plans are noncontributory. Postretirement life insurance is offered only to those who retired prior to 2011. Company subsidies for the postretirement health care plans are offered to any who qualify for eligibility prior to 2015, after which newly qualifying retirees will pay the full cost of the health care plans. The accounting for health care plans anticipates future cost-sharing changes to the written plan consistent with the Company’s express intent to reflect general health care trend rates in the employee premiums. For postretirement medical, this is consistent with pre-65 trend rate assumptions of 8.5% for 2012 gradually scaling down to 5.76% in 2023. For post-65 medical care, this is consistent with a trend rate assumption of 8.0% in 2012 scaling down to 5% in 2018.
Assumed health care cost trend rates have a significant effect on the amounts reported for the health care plans. A one-percentage-point change in assumed health care cost trend rates would have the following effects (in millions):
| Post-retirement Benefits | ||||||||||||
| 2012 | 2011 | 2010 | ||||||||||
Effect of a 1% increase in benefit costs: | ||||||||||||
Change in post-retirement benefit obligation | $ | 23 | $ | 19 | $ | 14 | ||||||
Change in service cost and interest cost | $ | 3 | $ | 2 | $ | 1 | ||||||
Effect of a 1% decrease in benefit costs: | ||||||||||||
Change in post-retirement benefit obligation | $ | (19 | ) | $ | (16 | ) | $ | (12 | ) | |||
Change in service cost and interest cost | $ | (2 | ) | $ | (2 | ) | $ | (1 | ) | |||
The Company also maintains a non-qualified deferred compensation plan for non-employee trustees and members of the TIAA Board of Overseers. The plan provides an award equal to 50% of the annual stipend that is invested annually in company-owned annuity contracts. Payout of accumulations is normally made in a lump sum following the trustees’ or member’s separation from the Board.
The Company previously provided an unfunded Supplemental Executive Retirement Plan (“SERP”) to certain select executives
and any TIAA associate deemed eligible by the Board of Trustees.
The SERP provided an annual retirement benefit payable at normal retirement calculated as 3.0% of the participant’s 5-year average total compensation based on an average of the highest five of the last ten years multiplied by the number of years of service not in excess of 15 years.
The accumulated benefit obligation totaled $47.6 million and $46.6 million as of December 31, 2012 and 2011, respectively. The Company had accrued pension cost of $41.4 million and $43.4 million and had an additional minimum liability accrued of $6.2 million and $3.2 million as of December 31, 2012 and 2011, respectively. The Company did not have any projected benefit obligation for non-vested employees for 2012 or 2011.
The plan obligations were determined based upon a discount rate of 3.08%. In accordance with SSAP No. 89, only vested obligations are reflected in the funded status.
The obligations of TIAA under the SERP are unfunded, unsecured promises to make future payments. As such, the plan has no assets. Contributions for a given period are equal to the benefit payments for that period. The expected rate of return on plan assets is not applicable.
Future benefits expected to be paid by the SERP are as follows (in millions):
2013 | $ | 4 | ||
2014 | $ | 4 | ||
2015 | $ | 4 | ||
2016 | $ | 4 | ||
2017 | $ | 4 | ||
Thereafter | $ | 16 |
The Company does not have any regulatory contribution requirements for 2012.
IMPACT OF MEDICARE MODERNIZATION ACT ON POSTRETIREMENT BENEFITS
The Company expects to receive a 28% federal subsidy for plan prescription benefits arising from the Medicare Prescription Drug, Improvement and Modernization Act of 2003 (the “Act”) signed into law in December of 2003. The Act includes the following two new features to Medicare Part D that could affect the measurement of the accumulated postretirement benefit obligation (“APBO”) and net periodic postretirement cost for the plan.
| Ÿ | A federal subsidy (based on 28% of an individual beneficiary’s annual prescription drug costs between $250 and $5,000), which is not taxable, to sponsors of retiree health care benefit plans that provide a prescription drug benefit that is at least actuarially equivalent to Medicare Part D, and |
| Ÿ | The opportunity for a retiree to obtain a prescription drug benefit under Medicare. |
For the year ended December 31, 2012, the effect of the Act was a $4 million reduction in the Company’s net postretirement benefit cost for the subsidy related to benefits attributed to former employees. The Act also decreased the 2012 service cost of $3 million and decreased the 2012 interest cost by $1 million.
Estimated Future Benefit Payments
The following benefit payments are expected to be paid and received relating to the Act (in millions):
Gross Cash Flows (Before Medicare Part D Subsidy Receipts) |
| |||
2013 | $ | 8 | ||
2014 | $ | 8 | ||
2015 | $ | 8 | ||
2016 | $ | 9 | ||
2017 | $ | 9 | ||
Thereafter | $ | 54 | ||
| 40 |
| continued |
Medicare Part D Subsidy Receipts |
| |||
2013 | $ | — | ||
2014 | $ | 1 | ||
2015 | $ | 1 | ||
2016 | $ | 1 | ||
2017 | $ | 1 | ||
Thereafter | $ | 6 | ||
Note 18—policy and contract reserves
Policy and contract reserves are determined in accordance with standard valuation methods approved by the Department and are computed in accordance with standard actuarial formulae. The reserves are based on assumptions for interest, mortality and other risks insured and establish a sufficient provision for all benefits guaranteed under policy and contract provisions.
For annuities and supplementary contracts, policy and contract reserves are calculated using Commissioner’s Annuity Reserve Valuation Method (“CARVM”) in accordance with New York State Regulation 151, Actuarial Guideline 43 for variable annuity products and Actuarial Guideline 33 for all other products. For most annuities which do not contain variable guarantees, the
reserves are calculated as the present value of guaranteed benefits using the guaranteed interest and mortality table or a more conservative basis and for most accumulating annuities the reserve thus calculated is equal to the account balance. Variable annuity reserves are calculated using Actuarial Guideline 43 which incorporates a deterministic floor plus a stochastic component for products which contain guaranteed benefits.
For retained assets, an accumulation account issued from the proceeds of annuities and life insurance policies, reserves held are equal to the total current account balances of all account holders.
The Tabular Interest, Tabular Less Actual Reserve Released and Tabular Cost have all been determined by formulae as prescribed by the NAIC except for deferred annuities, for which tabular interest has been determined from the basic data.
In aggregate, the reserves established for all annuity and supplementary contracts utilize assumptions for interest at a weighted average rate of approximately 3.0%. Approximately 93% of annuity and supplementary contract reserves are based on the 1983 Table set back at least 9 years or the Annuity 2000 table set back at least 4 years.
Withdrawal characteristics of annuity actuarial reserves and deposit-type contract funds for the years ended December 31, are as follows (in millions):
| 2012 | ||||||||||||||||||||
| General Account | Separate Account with Guarantees | Separate Account Nonguaranteed | Total | % of Total | ||||||||||||||||
Subject to discretionary withdrawal: | ||||||||||||||||||||
At fair value | $ | — | $ | — | $ | 17,777 | $ | 17,777 | 9.0 | % | ||||||||||
Total with adjustment or at fair value | $ | — | $ | — | $ | 17,777 | $ | 17,777 | 9.0 | % | ||||||||||
At book value without adjustment (minimal or no charge or adjustment) | 43,152 | 7 | — | 43,159 | 21.9 | % | ||||||||||||||
Not subject to discretionary withdrawal | 135,846 | 106 | — | 135,952 | 69.1 | % | ||||||||||||||
Total (gross) | $ | 178,998 | $ | 113 | $ | 17,777 | $ | 196,888 | 100.0 | % | ||||||||||
| ||||||||||||||||||||
Reinsurance ceded | — | — | — | — | ||||||||||||||||
Total (net) | $ | 178,998 | $ | 113 | $ | 17,777 | $ | 196,888 | ||||||||||||
|
|
| ||||||||||||||||||
| 2011 | ||||||||||||||||||||
| General Account | Separate Account with Guarantees | Separate Account Nonguaranteed | Total | % of Total | ||||||||||||||||
Subject to discretionary withdrawal: | ||||||||||||||||||||
At fair value | $ | — | $ | — | $ | 14,615 | $ | 14,615 | 7.7 | % | ||||||||||
Total with adjustment or at fair value | $ | — | $ | — | $ | 14,615 | $ | 14,615 | 7.7 | % | ||||||||||
At book value without adjustment (minimal or no charge or adjustment) | 40,869 | 4 | — | 40,873 | 21.6 | % | ||||||||||||||
Not subject to discretionary withdrawal | 133,460 | 63 | — | 133,523 | 70.7 | % | ||||||||||||||
Total (gross) | $ | 174,329 | $ | 67 | $ | 14,615 | $ | 189,011 | 100.0 | % | ||||||||||
| ||||||||||||||||||||
Reinsurance ceded | — | — | — | — | ||||||||||||||||
Total (net) | $ | 174,329 | $ | 67 | $ | 14,615 | $ | 189,011 | ||||||||||||
|
|
| ||||||||||||||||||
| 41 |
NOTES TO STATUTORY–BASIS FINANCIAL STATEMENTS
TEACHERS INSURANCE AND ANNUITY ASSOCIATION OF AMERICA
Annuity reserves and deposit-type contract funds for the years ended December 31 are as follows (in millions):
| 2012 | 2011 | |||||||
General Account Annual Statement: | ||||||||
Total annuities (excluding supplementary contracts with life contingencies) | $ | 175,041 | $ | 170,745 | ||||
Supplementary contracts with life contingencies | 3,192 | 2,890 | ||||||
Deposit-type contract funds | 765 | 694 | ||||||
Subtotal | 178,998 | 174,329 | ||||||
Separate Accounts Annual Statement: | ||||||||
Annuities | 17,750 | 14,569 | ||||||
Supplementary contracts with life contingencies | 135 | 109 | ||||||
Deposit-type contract funds | 5 | 4 | ||||||
Subtotal | 17,890 | 14,682 | ||||||
Total | $ | 196,888 | $ | 189,011 | ||||
| ||||||||
For Ordinary and Collective Life Insurance, reserves for all policies are calculated in accordance with New York State Insurance Regulation 147. Reserves for regular life insurance policies are computed by the Net Level Premium method for issues prior to January 1, 1990, and by the Commissioner’s Reserve Valuation Method for issues on and after such date. Annual renewable and five-year renewable term policies issued on or after January 1, 1994 use segmented reserves, where each segment is equal to the term period. The Cost of Living riders issued on and after January 1, 1994 also use segmented reserves, where each segment is equal to one year in length.
Reserves for the vast majority of permanent and term insurance policies use Commissioners’ Standard Ordinary Mortality Tables with rates ranging from 2.25% to 6.00%. Term conversion reserves are based on TIAA term conversion mortality experience and 4.00% interest.
Liabilities for incurred but not reported life insurance claims and disability waiver of premium claims are based on historical experience and set equal to a percentage of paid claims. Reserves for amounts not yet due for incurred but not reported disability waiver of premium claims are a percentage of the total Active Lives Disability Waiver of Premium Reserve.
The Company waives deduction of deferred fractional premiums upon death of the insured and returns any portion of the final premium beyond the date of death. Surrender values of $0.2 million in excess of the legally computed reserves were held as an additional reserve liability at December 31, 2012, and $0.1 million at December 31, 2011. As of December 31, 2012 and December 31, 2011, the Company had $568.6 million and $553.9 million, respectively, of insurance in force for which the gross premiums were less than the net premiums according to the standard of valuation set by the Department. Reserves to cover these insurance amounts totaled $2.8 million and $3.4 million at December 31, 2012 and December 31, 2011, respectively.
Note 19—reinsurance
In 2005 the Company entered into reinsurance agreements with RGA Reinsurance Company. Two of the agreements were recaptured during 2007 and the remaining agreement was recaptured as of January 1, 2011.
At December 31, disclosures related to these assumed coinsurance agreements were (in millions):
| 2012 | 2011 | 2010 | ||||||||||
Aggregated assumed premiums | $ | — | $ | (204 | ) | $ | 12 | |||||
Modified coinsurance reserves | $ | — | $ | — | $ | 202 | ||||||
(Decrease) Increase in policy and contract reserves | $ | — | $ | (17 | ) | $ | (4 | ) | ||||
In 2004, the Company and its subsidiary, TIAA-CREF Life, entered into a series of agreements with Metropolitan Life Insurance Company (“MetLife”) including an administrative agreement for MetLife to service the long-term care business of the Company and TIAA-CREF Life, an indemnity reinsurance agreement where TIAA and TIAA-CREF Life ceded to MetLife 100% of the long-term care liability and an assumption reinsurance agreement. After appropriate filings in each jurisdiction, MetLife offered the Company and TIAA-CREF Life policyholders the option of transferring their policies from TIAA and TIAA-CREF Life to MetLife. At December 31, 2012 and 2011, there were premiums in force of $15 million for both years, respectively.
The Company remains liable for reinsurance ceded if the reinsurer fails to meet its obligation on the business assumed. All reinsurance is placed with unaffiliated reinsurers and there are no reinsurance agreements in effect under which the reinsurer may unilaterally cancel the agreement. Amounts shown in the financial statements are reported net of reinsurance.
The major lines in the accompanying financial statements that were reduced by ceded reinsurance agreements at December 31 are as follows (in millions):
| 2012 | 2011 | 2010 | ||||||||||
Insurance and annuity premiums | $ | 14 | $ | 14 | $ | 16 | ||||||
Policy and contract benefits | $ | 55 | $ | 59 | $ | 62 | ||||||
Increase in policy and contract reserves | $ | 20 | $ | 36 | $ | 81 | ||||||
Reserves for life and health insurance | $ | 454 | $ | 474 | $ | 510 | ||||||
Note 20—repurchase program
During 2011, the Company commenced a repurchase program to sell and repurchase securities for the purposes of providing additional liquidity. The Company’s policy requires a minimum of 95% of the fair value of securities transferred under repurchase agreements to be maintained as collateral.
| 42 |
| continued |
As of December 31, 2012, the Company had repurchase agreements where the securities pledged and scheduled for repurchase had a carrying value and fair value of $440 million and $494 million, respectively. The securities pledged as collateral have a maturity of 8 years and an interest rate of 3.13%. The pledged securities are included in Bonds and the offsetting collateral liability is included in Other Liabilities in the accompanying Statutory—Basis Statements of Admitted Assets, Liabilities and Capital and Contingency Reserves.
The Company received cash collateral of $500 million, which is in excess of the $494 million fair value of the securities lent. The cash collateral was not reinvested in other securities as of December 31, 2012.
The Company’s source of cash that it uses to return the cash collateral is dependent upon the liquidity of the current market conditions. The repurchase agreements outstanding at December 31, 2012 matured and were fully settled during January 2013.
Note 21—capital and contingency reserves and shareholders’ dividends restrictions
The portion of contingency reserves represented or reduced by each item below for the years ended December 31 are as follows (in millions):
| 2012 | 2011 | |||||||
Net unrealized capital gains | $ | 490 | $ | 390 | ||||
Asset valuation reserve | $ | (599 | ) | $ | (802 | ) | ||
Net deferred federal income tax | $ | (1,119 | ) | $ | (1,129 | ) | ||
Change in non-admitted assets | $ | 1,305 | $ | 1,046 | ||||
Net change in separate account surplus | $ | 64 | $ | 134 | ||||
Prior year surplus | $ | (5 | ) | $ | — | |||
Change in Accounting Principle | $ | — | $ | (23 | ) | |||
Capital:The Company has 2,500 shares of Class A common stock authorized, issued and outstanding. All of the outstanding common stock of the Company is held by the TIAA Board of Overseers, a not-for-profit corporation created for the purpose of holding the common stock of the Company. By charter, the Company operates without profit to its sole shareholder.
Surplus Notes:On December 16, 2009, the Company issued Surplus Notes (“Notes”) in an aggregate principal amount of $2 billion. The Notes bear interest at an annual rate of 6.850%, and have a maturity date of December 16, 2039. Proceeds from the
issuance of the Notes were $1,997 million, net of issuance discount. The Notes were issued in a transaction pursuant to Rule 144A under the Securities Act of 1933, as amended, and the Notes are evidenced by one or more global notes deposited with a custodian for, and registered in the name of a nominee of, The Depository Trust Company. Interest on these Notes is scheduled to be paid semiannually on June 16 and December 16 of each year through the maturity date. During 2012, interest of $137 million was paid and since issuance $411 million has been paid.
No subsidiary or affiliate of the Company is an obligor or guarantor of the Notes, which are solely obligations of the Company.
The Notes are unsecured and subordinated to all present and future indebtedness, policy claims and other creditor claims of the Company. Under New York Insurance Law, the Notes are not part of the legal liabilities of the Company. The Notes are not scheduled to repay any principal prior to maturity. Each payment of interest and principal may be made only with the prior approval of the Superintendent and only out of the Company’s surplus funds, which the Superintendent of the Department determines to be available for such payments under New York Insurance Law. In addition, provided that approval is granted by the Superintendent of the Department, the Notes may be redeemed at the option of the Company at any time at the “make-whole” redemption price equal to the greater of the principal amount of the Notes to be redeemed, or the sum of the present values of the remaining scheduled interest and principal payments, excluding accrued interest as of the redemption date, discounted to the redemption date on a semi-annual basis at the adjusted Treasury rate plus 40 basis points, plus in each case, accrued and unpaid interest payments on the Notes to be redeemed to the redemption date.
At December 31, 2012 and 2011, no affiliates of the Company held any portion of the Notes.
Dividend Restrictions:Under the New York Insurance Law, the Company is permitted without prior insurance regulatory clearance to pay a stockholder dividend as long as the aggregated amount of all such dividends in any calendar year does not exceed the lesser of (i) 10% of its surplus to policyholders as of the immediately preceding calendar year and (ii) its net gain from operations for the immediately preceding calendar year (excluding realized investment gains). TIAA has not paid dividends to its shareholder and has no plans to do so in the current year.
| 43 |
NOTES TO STATUTORY–BASIS FINANCIAL STATEMENTS
TEACHERS INSURANCE AND ANNUITY ASSOCIATION OF AMERICA
Note 22—contingencies and guarantees
SUBSIDIARY AND AFFILIATE GUARANTEES:
At December 31, 2012, the Company was obligor under the following guarantees, indemnities and support obligations (in millions):
Nature and | Liability recognition | Ultimate financial statement impact if action under the guarantee is required. | Maximum potential amount of future payments (undiscounted) the guarantor could be required to make under the guarantee. If unable to develop an estimate, this should be specifically noted. | Current status of payment or performance risk of guarantee. Also provide additional discussion as warranted. | ||||
| The Company has guaranteed outstanding notes issued by subsidiary TIAA Global Markets, Inc. | $127 | Investment in Subsidiary, Controlled, or Affiliated | $511 | TIAA Global Markets, Inc. is current on all payments of principal and interest on notes. | ||||
Commitment to maintain TIAA-CREF Trust Company as a “Well Capitalized” institution for Prompt Corrective Action purposes. | Guarantee made to/or on behalf of a wholly-owned subsidiary and as such are excluded from recognition. | Investment in Subsidiary, Controlled, or Affiliated | Since this obligation is not subject to limitations, the Company does not believe that it is possible to determine the maximum potential amount that could become due under these guarantees in the future. | Currently the capital of TIAA-CREF Trust Company is adequate. | ||||
| Financial support agreement with TIAA-CREF Life Insurance Company to have (i) capital and surplus of $250.0 million; (ii) the amount of capital and surplus necessary to maintain TIAA-CREF Life’s capital and surplus at a level not less than 150% of the NAIC RBC model; or (iii) such other amounts as necessary to maintain TIAA-CREF Life’s financial strength rating the same or better than the Company’s rating at all times. | Guarantee made to/or on behalf of a wholly-owned subsidiary and as such are excluded from recognition. | Investment in Subsidiary, Controlled, or Affiliated | Since this obligation is not subject to limitations, the Company does not believe that it is possible to determine the maximum potential amount that could become due under these guarantees in the future. | At December 31, 2012, the capital and surplus of TIAA-CREF Life Insurance Company was in excess of the minimum capital and surplus amount referenced, and its total adjusted capital was in excess of the referenced RBC-based amount calculated at December 31, 2012. |
| 44 |
| continued |
A. Aggregate Maximum Potential of Future Payments of All Guarantees (undiscounted) the guarantor could be required to make under guarantees. (Should equal total of Column 4 for (2) above.) | $ | 511 | ||
B. Current Liability Recognized in F/S: | ||||
1. Non-contingent Liabilities | $ | — | ||
2. Contingent Liabilities | $ | 127 | ||
c. Ultimate Financial Statement Impact if action under the guarantee is required. | ||||
1. Investments in Subsidiary, Controlled or Affiliated | $ | 511 | ||
2. Joint Venture | — | |||
3. Dividends to Stockholders (capital contribution) | — | |||
4. Expense | — | |||
5. Other | — | |||
6. Total | $ | 511 | ||
| ||||
The Company has agreed that it will cause TIAA-CREF Life to be sufficiently funded at all times in order to meet all its contractual obligations on a timely basis including, but not limited to, obligations to pay policy benefits and to provide policyholder services. This agreement is not an evidence of indebtedness or an obligation or liability of the Company and does not provide any creditor of TIAA-CREF Life with recourse to or against any of the assets of the Company.
The Company provides a $100.0 million unsecured 364-day revolving line of credit arrangement with TIAA-CREF Life. This line has an expiration date of July 16, 2013. As of December 31, 2012, $30.0 million of this facility was maintained on a committed basis for which TIAA-CREF Life paid a commitment fee of 10.0 basis points on the unused committed amount. During the period ending December 31, 2012, 46 draw-downs totaling $150.5 million were made under this line of credit arrangement of which none were outstanding as of December 31, 2012.
TIAA Global Markets, Inc. (“TGM”), a wholly-owned subsidiary, was formed for the purpose of issuing notes and other debt instruments and investing the proceeds in compliance with the investment guidelines approved by the Board of Directors of TGM. TGM is authorized to issue up to $5.0 billion in debt and TIAA’s Board of Trustees authorized the Company to guarantee up to $5.0 billion of TGM’s debt. As of December 31, 2012, TGM had $500.0 million of outstanding debt and accrued interest of $11.4 million.
The Company maintains a $1.0 billion uncommitted and unsecured 364-day revolving line of credit arrangement with TIAA Global Markets, Inc. (“TGM”). This line has an expiration date of July 8, 2013. During 2012, 1 draw-down totaling $600.0 million was made under this line of credit arrangement of which $518.0 million was left outstanding at the end of 2012. As of December 31, 2012, outstanding principal amount plus accrued interest was $519.5 million.
The Company also provides a $1.0 billion uncommitted line of credit to certain accounts of College Retirement Equities Funds (“CREF”) and certain TIAA-CREF Funds (“Funds”). Loans under this revolving credit facility are for a maximum of 60 days and are made solely at the discretion of the Company to fund shareholder redemption requests or other temporary or emergency needs of CREF and the Funds. It is the intent of the Company, CREF and the Funds to use this facility as a supplemental liquidity facility, which would only be used after CREF and the
Funds have exhausted the availability of the current $1.5 billion committed credit facility maintained with a group of banks.
Separate Account Guarantees:The Company provides mortality and expense guarantees to VA-1, for which it is compensated. The Company guarantees that, at death, the total death benefit payable from the fixed and variable accounts will be at least a return of total premiums paid less any previous withdrawals. The Company also guarantees that expense charges to VA-1 participants will never rise above the maximum amount stipulated in the contract.
The Company provides mortality, expense and liquidity guarantees to REA and is compensated for these guarantees. The Company guarantees that once REA participants begin receiving lifetime annuity income benefits, monthly payments will never be reduced as a result of adverse mortality experience. The Company also guarantees that expense charges to REA participants will never rise above the maximum amount stipulated in the contract. The Company provides REA with a liquidity guarantee to ensure it has funds available to meet participant transfer or cash withdrawal requests. If REA cannot fund participant requests, TIAA’s general account will fund them by purchasing accumulation units. Under this agreement, TIAA guarantees that participants will be able to redeem their accumulation units at their accumulation unit value next determined after the transfer or withdrawal request is received in good order.
Under the Liquidity Guarantee agreement with the REA, on December 24, 2008, the TIAA general account purchased $155.6 million of accumulation units (measured based on the cost of such units) issued by REA. In 2009, the TIAA general account further purchased $1,058.7 million of accumulation units. The Company made no additional purchases in 2012 and 2011. During 2012, the Company redeemed $940 million of accumulation units. The remaining $321 million of accumulation units have been redeemed in the first quarter of 2013.
Accumulation units owned by TIAA are included as separate account assets and valued in the same manner as units owned by individual REA participants on a fair value basis and will fluctuate in value.
The Company provides mortality and expense guarantees to VA-3 and is compensated for these guarantees. The Company guarantees that once VA-3 participants begin receiving lifetime annuity income benefits, monthly payments will never be reduced as a result of adverse mortality experience. The Company also guarantees that expense charges to VA-3 participants will never rise above the maximum amount stipulated in the contract.
Leases:The Company occupies leased office space in many locations under various long-term leases. At December 31, 2012, the future minimum lease payments are estimated as follows (in millions):
| Year | 2013 | 2014 | 2015 | 2016 | 2017 | Thereafter | Total | |||||||||||||||||||||
Amount | $ | 36 | $ | 34 | $ | 34 | $ | 29 | $ | 22 | $ | 29 | $ | 184 | ||||||||||||||
Leased space expense is allocated among the Company and affiliated entities. Rental expense charged to the Company for the years ended December 31, 2012, 2011 and 2010 was
| 45 |
NOTES TO STATUTORY–BASIS FINANCIAL STATEMENTS
TEACHERS INSURANCE AND ANNUITY ASSOCIATION OF AMERICA
approximately $37 million, $34 million and $32 million, respectively.
OTHER CONTINGENCIES:
In the ordinary conduct of certain of its investment activities, the Company provides standard indemnities covering a variety of potential exposures. For instance, the Company provides indemnifications in connection with site access agreements relating to due diligence review for real estate acquisitions, and the Company provides indemnification to underwriters in connection with the issuance of securities by or on behalf of the Company or its subsidiaries. It is the Company management’s opinion that the fair value of such indemnifications are negligible and do not materially affect the Company’s financial position, results of operations or liquidity.
Other contingent liabilities arising from litigation and other matters over and above amounts already provided for in the financial statements or disclosed elsewhere in these notes are not considered material in relation to the Company’s financial position or the results of its operations.
The Company receives and responds to subpoenas or other inquiries from state regulators, including state insurance commissioners; state attorneys general and other state governmental authorities; Federal regulators, including the SEC; Federal governmental authorities; and the Financial Industry Regulatory Authority (“FINRA”) seeking a broad range of information. The Company cooperates in these inquiries.
Death Claim Notification and Unclaimed Property Practices. Throughout the U.S. insurance industry, there are multiple state actions addressing insurer practices regarding death claim notification and escheatment of unclaimed property. Currently, regarding these issues as they pertain to life insurance, annuities and retained asset accounts, the Com-
pany is: (1) responding to subpoenas from the New York Attorney General; (2) subject to a multi-state market conduct exam by at least 23 state insurance departments, with the Illinois Department of Insurance as the lead examiner; and (3) subject to a multi-state unclaimed property audit by at least 23 state treasurers, with Verus Financial, LLC as the appointed auditor. These actions are expected to last through most of 2013.
Note 23—borrowed money
Effective March 2009, the Company was authorized to execute investment transactions under the Term Asset-Backed Securities Loan Facility (“TALF”) program. Under the TALF program, the Federal Reserve Bank of New York (“FRBNY”) would lend up to $200 billion on a non-recourse basis to holders of certain AAA-rated Asset Backed Securities (“ABS”) backed by newly and recently originated consumer and small business loans. The FRBNY lent an amount equal to the market value of the ABS less a haircut and were secured at all times by the ABS. Loan proceeds were disbursed to the borrower, contingent on receipt by the FRBNY custodian bank of the eligible collateral.
As of December 31, 2012, the Company’s eligible ABS under the TALF program totaled $58 million. These eligible ABS have been pledged as collateral to support a $51 million loan outstanding payable to the FRBNY. The Company expects to fully settle this loan with the FRBNY during 2014.
Note 24—subsequent events
In preparing these financial statements, the Company has evaluated events and transactions for potential recognition or disclosure through April 8, 2013, the date the financial statements were available to be issued. No such items were identified by the Company.
| 46 |
| continued |
Note 25—securities with a recognized other-than-temporary impairments
The following table represents loan-backed and structured securities with a recognized other-than-temporary impairment and currently held at December 31, 2012 where the present value of cash flows expected to be collected is less than the amortized cost (in whole dollars).
| CUSIP | Book/Adj. Carrying Value Amortized Cost Before Current Period OTTI | Present Value of Projected Cash Flows | Recognized Other-Than- Temporary Impairment | Amortized Cost After Other- Than-Temporary Impairment | Fair Value as of Impairment Date | Date of Financial Statement Where Reported | ||||||||||||||||||
743947AE3 | $ | 12,292 | $ | 10,181 | $ | (2,111) | $ | 10,181 | $ | 10,520 | 12/31/2012 | |||||||||||||
12669DN79 | 2,134,721 | 2,079,708 | (55,013) | 2,079,708 | 1,689,664 | 12/31/2012 | ||||||||||||||||||
76110HNP0 | 5,422,778 | 4,703,779 | (718,999) | 4,703,779 | 4,977,171 | 12/31/2012 | ||||||||||||||||||
76110HSG5 | 4,564,106 | 4,545,401 | (18,704) | 4,545,401 | 3,771,711 | 12/31/2012 | ||||||||||||||||||
12667FMJ1 | 13,948,629 | 13,848,062 | (100,567) | 13,848,062 | 9,415,902 | 12/31/2012 | ||||||||||||||||||
76110HWX3 | 15,762,328 | 15,729,153 | (33,175) | 15,729,153 | 15,777,345 | 12/31/2012 | ||||||||||||||||||
76110HVH9 | 7,564,015 | 7,558,610 | (5,405) | 7,558,610 | 7,390,773 | 12/31/2012 | ||||||||||||||||||
76110HWV7 | 13,000,000 | 12,947,349 | (52,651) | 12,947,349 | 12,582,245 | 12/31/2012 | ||||||||||||||||||
12667FZH1 | 51,252,076 | 51,185,070 | (67,006) | 51,185,070 | 48,794,852 | 12/31/2012 | ||||||||||||||||||
12667FYZ2 | 3,833,544 | 2,754,412 | (1,079,132) | 2,754,412 | 2,089,524 | 12/31/2012 | ||||||||||||||||||
12667F2J3 | 44,413,186 | 44,354,472 | (58,714) | 44,354,472 | 45,431,927 | 12/31/2012 | ||||||||||||||||||
05949AA75 | 941 | — | * | (941) | — | — | 12/31/2012 | |||||||||||||||||
12667F7D1 | 20,604,095 | 20,223,008 | (381,087) | 20,223,008 | 20,694,569 | 12/31/2012 | ||||||||||||||||||
12667F5J0 | 17,257,953 | 17,245,267 | (12,685) | 17,245,267 | 17,714,912 | 12/31/2012 | ||||||||||||||||||
05949AM31 | 2,273 | — | * | (2,273) | — | — | 12/31/2012 | |||||||||||||||||
12667F4N2 | 8,177,148 | 8,158,508 | (18,640) | 8,158,508 | 8,076,604 | 12/31/2012 | ||||||||||||||||||
12667GBA0 | 12,733,360 | 12,730,443 | (2,917) | 12,730,443 | 12,693,535 | 12/31/2012 | ||||||||||||||||||
12667GBA0 | 21,241,030 | 21,238,068 | (2,962) | 21,238,068 | 21,155,889 | 12/31/2012 | ||||||||||||||||||
12667GLE1 | 25,502,511 | 25,494,015 | (8,496) | 25,494,015 | 25,501,070 | 12/31/2012 | ||||||||||||||||||
12667GFB4 | 21,387,603 | 21,312,642 | (74,961) | 21,312,642 | 21,152,980 | 12/31/2012 | ||||||||||||||||||
12667GFB4 | 36,084,335 | 35,954,535 | (129,801) | 35,954,535 | 35,722,389 | 12/31/2012 | ||||||||||||||||||
12667GFT5 | 18,019,544 | 17,967,066 | (52,478) | 17,967,066 | 17,411,943 | 12/31/2012 | ||||||||||||||||||
12667GKE2 | 12,319,133 | 12,228,592 | (90,541) | 12,228,592 | 11,732,289 | 12/31/2012 | ||||||||||||||||||
12667GW74 | 17,197,784 | 17,116,368 | (81,415) | 17,116,368 | 17,207,247 | 12/31/2012 | ||||||||||||||||||
16162WNB1 | 16,063,625 | 15,997,434 | (66,191) | 15,997,434 | 16,615,012 | 12/31/2012 | ||||||||||||||||||
32051GP41 | 18,961,347 | 18,869,968 | (91,380) | 18,869,968 | 19,516,860 | 12/31/2012 | ||||||||||||||||||
36185MCL4 | 16,361,815 | 16,287,139 | (74,677) | 16,287,139 | 17,199,290 | 12/31/2012 | ||||||||||||||||||
45660LPD5 | 13,002,077 | 12,876,405 | (125,672) | 12,876,405 | 13,762,269 | 12/31/2012 | ||||||||||||||||||
32051G2J3 | 22,787,995 | 22,701,845 | (86,150) | 22,701,845 | 23,803,214 | 12/31/2012 | ||||||||||||||||||
761118PQ5 | 9,352,863 | 9,227,109 | (125,753) | 9,227,109 | 9,405,333 | 12/31/2012 | ||||||||||||||||||
94983SAV4 | 35,025,270 | 34,910,605 | (114,665) | 34,910,605 | 37,627,840 | 12/31/2012 | ||||||||||||||||||
46628YBK5 | 26,036,952 | 25,496,077 | (540,875) | 25,496,077 | 26,098,686 | 12/31/2012 | ||||||||||||||||||
94980SBJ3 | 18,710,250 | 18,680,668 | (29,583) | 18,680,668 | 19,942,220 | 12/31/2012 | ||||||||||||||||||
16163BAP9 | 26,448,642 | 26,434,293 | (14,349) | 26,434,293 | 28,096,744 | 12/31/2012 | ||||||||||||||||||
74957XAF2 | 29,231,293 | 29,047,907 | (183,386) | 29,047,907 | 29,954,055 | 12/31/2012 | ||||||||||||||||||
05950RAK5 | 26,012,709 | 26,010,415 | (2,294) | 26,010,415 | 26,702,848 | 12/31/2012 | ||||||||||||||||||
74958AAD6 | 13,562,315 | 13,561,271 | (1,044) | 13,561,271 | 13,521,848 | 12/31/2012 | ||||||||||||||||||
126694JS8 | 26,909,900 | 26,629,665 | (280,235) | 26,629,665 | 27,868,798 | 12/31/2012 | ||||||||||||||||||
170255AS2 | 12,597,571 | 12,538,204 | (59,367) | 12,538,204 | 12,552,376 | 12/31/2012 | ||||||||||||||||||
3622MPBE7 | 46,038,223 | 45,986,058 | (52,165) | 45,986,058 | 46,177,498 | 12/31/2012 | ||||||||||||||||||
52521RAS0 | 1,023,943 | 1,015,918 | (8,025) | 1,015,918 | 1,066,677 | 12/31/2012 | ||||||||||||||||||
12545CAU4 | 27,731,207 | 27,698,742 | (32,465) | 27,698,742 | 27,382,044 | 12/31/2012 | ||||||||||||||||||
17025TAV3 | 22,924,331 | 22,403,245 | (521,085) | 22,403,245 | 21,609,745 | 12/31/2012 | ||||||||||||||||||
74958AAD6 | 10,074,441 | 10,073,965 | (475) | 10,073,965 | 10,076,966 | 12/31/2012 | ||||||||||||||||||
12543XAD8 | 21,432,424 | 20,548,938 | (883,487) | 20,548,938 | 19,855,126 | 12/31/2012 | ||||||||||||||||||
12668AMH5 | 18,323,922 | 18,303,642 | (20,280) | 18,303,642 | 19,258,390 | 12/31/2012 | ||||||||||||||||||
126694RG5 | 10,464,244 | 9,560,577 | (903,667) | 9,560,577 | 10,077,874 | 12/31/2012 | ||||||||||||||||||
12669E4V5 | 8,031,392 | 7,241,681 | (789,711) | 7,241,681 | 6,096,282 | 12/31/2012 | ||||||||||||||||||
12669EL95 | 5,478,682 | 4,368,331 | (1,110,352) | 4,368,331 | 5,151,642 | 12/31/2012 | ||||||||||||||||||
31393YY41 | 16,257,654 | 14,541,582 | (1,716,072) | 14,541,582 | 9,047,635 | 12/31/2012 | ||||||||||||||||||
| 47 |
NOTES TO STATUTORY–BASIS FINANCIAL STATEMENTS
TEACHERS INSURANCE AND ANNUITY ASSOCIATION OF AMERICA
| CUSIP | Book/Adj. Carrying Value Amortized Cost Before Current Period OTTI | Present Value of Projected Cash Flows | Recognized Other-Than- Temporary Impairment | Amortized Cost After Other- Than-Temporary Impairment | Fair Value as of Impairment Date | Date of Financial Statement Where Reported | ||||||||||||||||||
12668AAG0 | $ | 11,500,430 | $ | 11,492,959 | $ | (7,471) | $ | 11,492,959 | $ | 11,770,188 | 12/31/2012 | |||||||||||||
12667GUG6 | 3,891,432 | 3,865,384 | (26,048) | 3,865,384 | 3,671,861 | 12/31/2012 | ||||||||||||||||||
05949TBF5 | 11,680,290 | 11,678,962 | (1,328) | 11,678,962 | 12,328,010 | 12/31/2012 | ||||||||||||||||||
12667FZM0 | 63,544 | 62,339 | (1,205) | 62,339 | 62,307 | 12/31/2012 | ||||||||||||||||||
03762AAG4 | 227,898 | — | * | (227,898) | — | — | 12/31/2012 | |||||||||||||||||
03762CAE5 | 6,121,929 | 5,876,150 | (245,779) | 5,876,150 | 5,884,000 | 12/31/2012 | ||||||||||||||||||
05947U4P0 | 2,949,042 | 2,741,548 | (207,494) | 2,741,548 | 1,995,382 | 12/31/2012 | ||||||||||||||||||
05947UJV1 | 30,335 | — | * | (30,335) | — | 29,963 | 12/31/2012 | |||||||||||||||||
059497AB3 | 7,752,053 | 6,933,890 | (818,163) | 6,933,890 | 3,776,352 | 12/31/2012 | ||||||||||||||||||
059500AG3 | 19,011,878 | 16,854,145 | (2,157,733) | 16,854,145 | 14,973,820 | 12/31/2012 | ||||||||||||||||||
05950WAN8 | 7,009,441 | 6,050,376 | (959,065) | 6,050,376 | 3,185,000 | 12/31/2012 | ||||||||||||||||||
05950WAP3 | 10,855,104 | 3,623,644 | (7,231,460) | 3,623,644 | 5,095,049 | 12/31/2012 | ||||||||||||||||||
07388YAW2 | 5,090,949 | 4,088,648 | (1,002,301) | 4,088,648 | 1,849,801 | 12/31/2012 | ||||||||||||||||||
07388YAY8 | 1,516,071 | — | * | (1,516,071) | — | 971,040 | 12/31/2012 | |||||||||||||||||
20047QAM7 | 1,729,140 | — | * | (1,729,140) | — | 3,600,000 | 12/31/2012 | |||||||||||||||||
20047QAN5 | 419,717 | — | * | (419,717) | — | 1,826,240 | 12/31/2012 | |||||||||||||||||
20173QAH4 | 9,730,025 | 9,585,785 | (144,240) | 9,585,785 | 7,195,891 | 12/31/2012 | ||||||||||||||||||
20173QAH4 | 17,757,349 | 17,475,152 | (282,197) | 17,475,152 | 14,391,782 | 12/31/2012 | ||||||||||||||||||
22545DAH0 | 23,384,443 | 20,771,969 | (2,612,474) | 20,771,969 | 16,849,524 | 12/31/2012 | ||||||||||||||||||
22545DAJ6 | 8,867,304 | 1,590,040 | (7,277,264) | 1,590,040 | 5,575,138 | 12/31/2012 | ||||||||||||||||||
22545XAG8 | 2,823 | — | * | (2,823) | — | 50,483 | 12/31/2012 | |||||||||||||||||
36159XAJ9 | 15,440,812 | 14,903,202 | (537,609) | 14,903,202 | 11,366,654 | 12/31/2012 | ||||||||||||||||||
36170UCQ2 | 35,672,163 | 32,619,590 | (3,052,573) | 32,619,590 | 18,250,000 | 12/31/2012 | ||||||||||||||||||
361849R53 | 6,075,708 | 5,372,014 | (703,695) | 5,372,014 | 2,377,467 | 12/31/2012 | ||||||||||||||||||
361849R61 | 2,352,237 | 218,575 | (2,133,662) | 218,575 | 3,294,488 | 12/31/2012 | ||||||||||||||||||
361849R79 | 30,956 | — | * | (30,956) | — | 1,421,647 | 12/31/2012 | |||||||||||||||||
36228CXE8 | 9,984,962 | 6,046,672 | (3,938,290) | 6,046,672 | 2,328,359 | 12/31/2012 | ||||||||||||||||||
36228CYQ0 | 14,820,273 | 14,421,911 | (398,362) | 14,421,911 | 9,614,233 | 12/31/2012 | ||||||||||||||||||
396789KB4 | 9,468,217 | 8,525,091 | (943,126) | 8,525,091 | 4,777,602 | 12/31/2012 | ||||||||||||||||||
46625MKS7 | 831,176 | 435,220 | (395,956) | 435,220 | 12,160 | 12/31/2012 | ||||||||||||||||||
46625YNV1 | 18,573,254 | 16,975,608 | (1,597,647) | 16,975,608 | 6,636,547 | 12/31/2012 | ||||||||||||||||||
46625YQZ9 | 10,007,895 | 6,597,804 | (3,410,091) | 6,597,804 | 3,009,600 | 12/31/2012 | ||||||||||||||||||
46625YRB1 | 350,465 | 126,707 | (223,757) | 126,707 | 829,117 | 12/31/2012 | ||||||||||||||||||
46629YAQ2 | 30,773 | 10,676 | (20,097) | 10,676 | 604,920 | 12/31/2012 | ||||||||||||||||||
46630JAQ2 | 16,157,016 | 11,506,203 | (4,650,813) | 11,506,203 | 9,711,000 | 12/31/2012 | ||||||||||||||||||
46630JAS8 | 125,788 | 21,243 | (104,545) | 21,243 | 4,304,498 | 12/31/2012 | ||||||||||||||||||
46630VAL6 | 9,491,125 | 9,334,278 | (156,847) | 9,334,278 | 6,995,149 | 12/31/2012 | ||||||||||||||||||
46630VAP7 | 249,855 | 206,924 | (42,930) | 206,924 | 837,516 | 12/31/2012 | ||||||||||||||||||
46631BAK1 | 15,296,988 | 14,202,892 | (1,094,096) | 14,202,892 | 10,770,042 | 12/31/2012 | ||||||||||||||||||
46631BAK1 | 189,687 | 176,109 | (13,578) | 176,109 | 134,626 | 12/31/2012 | ||||||||||||||||||
46631BAK1 | 6,479,538 | 6,008,361 | (471,177) | 6,008,361 | 5,581,574 | 12/31/2012 | ||||||||||||||||||
50180JAG0 | 26,713,885 | 20,747,934 | (5,965,951) | 20,747,934 | 24,629,224 | 12/31/2012 | ||||||||||||||||||
55445RAP2 | 1,444,951 | 1,444,490 | (461) | 1,444,490 | 519,715 | 12/31/2012 | ||||||||||||||||||
59022HJS2 | 16,598,865 | 15,844,814 | (754,051) | 15,844,814 | 7,750,253 | 12/31/2012 | ||||||||||||||||||
59023BAK0 | 15,594,563 | 14,870,379 | (724,184) | 14,870,379 | 7,848,042 | 12/31/2012 | ||||||||||||||||||
59023BAM6 | 456,159 | 22,892 | (433,266) | 22,892 | 1,200,000 | 12/31/2012 | ||||||||||||||||||
59023BAN4 | 236,492 | — | * | (236,492) | — | 700,000 | 12/31/2012 | |||||||||||||||||
60687UAM9 | 496,437 | 85,464 | (410,973) | 85,464 | 1,756,533 | 12/31/2012 | ||||||||||||||||||
617451CA5 | 5,239,631 | 550,331 | (4,689,300) | 550,331 | 2,824,626 | 12/31/2012 | ||||||||||||||||||
87246AAP3 | 13,693,565 | 6,311,284 | (7,382,282) | 6,311,284 | 7,349,800 | 12/31/2012 | ||||||||||||||||||
92978QAJ6 | 35,753 | 33,483 | (2,270) | 33,483 | 88,239 | 12/31/2012 | ||||||||||||||||||
760985YX3 | 5,766,943 | 5,223,161 | (543,782) | 5,223,161 | 972,301 | 12/31/2012 | ||||||||||||||||||
21075WBA2 | 330,564 | 330,360 | (205) | 330,360 | 324,870 | 12/31/2012 | ||||||||||||||||||
21075WBA2 | 330,564 | 330,360 | (205) | 330,360 | 324,870 | 12/31/2012 | ||||||||||||||||||
21075WBA2 | 578,488 | 578,130 | (358) | 578,130 | 568,523 | 12/31/2012 | ||||||||||||||||||
| 48 |
| continued |
| CUSIP | Book/Adj. Carrying Value Amortized Cost Before Current Period OTTI | Present Value of Projected Cash Flows | Recognized Other-Than- Temporary Impairment | Amortized Cost After Other- Than-Temporary Impairment | Fair Value as of Impairment Date | Date of Financial Statement Where Reported | ||||||||||||||||||
12668ASR7 | $ | 6,070,997 | $ | 6,069,630 | $ | (1,367) | $ | 6,069,630 | $ | 5,558,397 | 12/31/2012 | |||||||||||||
75971EAF3 | 178,733 | 173,710 | (5,022) | 173,710 | 138,312 | 12/31/2012 | ||||||||||||||||||
75971EAF3 | 154,524 | 145,934 | (8,589) | 145,934 | 138,312 | 12/31/2012 | ||||||||||||||||||
05947US74 | 7,533,142 | — | ² | (3,642,339) | 3,890,803 | 3,890,803 | 12/31/2012 | |||||||||||||||||
07387BEK5 | 2,903,090 | — | ² | (439,254) | 2,463,835 | 2,463,835 | 12/31/2012 | |||||||||||||||||
07387BEN9 | 639,703 | — | ² | (39,654) | 600,049 | 600,049 | 12/31/2012 | |||||||||||||||||
07387BEP4 | 447,976 | — | ² | (165,005) | 282,971 | 282,971 | 12/31/2012 | |||||||||||||||||
226081AC1 | 4,082,719 | — | ² | (200,320) | 3,882,398 | 3,882,398 | 12/31/2012 | |||||||||||||||||
36828QSJ6 | 2,004,687 | — | ² | (343,137) | 1,661,550 | 1,661,550 | 12/31/2012 | |||||||||||||||||
46628FAU5 | 1,384,392 | — | ² | (634,392) | 750,000 | 750,000 | 12/31/2012 | |||||||||||||||||
52521TBJ5 | 3,980,813 | — | ² | (245,698) | 3,735,114 | 3,735,114 | 12/31/2012 | |||||||||||||||||
59023BAL8 | 1,843,085 | — | ² | (310,538) | 1,532,547 | 1,532,547 | 12/31/2012 | |||||||||||||||||
59025KAJ1 | 1,613,244 | — | ² | (859,494) | 753,750 | 753,750 | 12/31/2012 | |||||||||||||||||
92976BFZ0 | 1,232,012 | — | ² | (178,712) | 1,053,300 | 1,053,300 | 12/31/2012 | |||||||||||||||||
92976VAP3 | 9,585,403 | — | ² | (2,387,759) | 7,197,643 | 7,197,643 | 12/31/2012 | |||||||||||||||||
92976VAT5 | 5,983,169 | — | ² | (3,138,249) | 2,844,920 | 2,844,920 | 12/31/2012 | |||||||||||||||||
92977QAM0 | 2,091,944 | — | ² | (168,444) | 1,923,500 | 1,923,500 | 12/31/2012 | |||||||||||||||||
92977RAJ5 | 3,384,893 | — | ² | (225,851) | 3,159,042 | 3,159,042 | 12/31/2012 | |||||||||||||||||
92977RAK2 | 2,930,998 | — | ² | (393,144) | 2,537,854 | 2,537,854 | 12/31/2012 | |||||||||||||||||
52108RCB6 | 7,273,530 | — | ² | (993,267) | 6,280,263 | 6,280,263 | 9/30/2012 | |||||||||||||||||
52108RCD2 | 7,036,200 | — | ² | (778,673) | 6,257,527 | 6,257,527 | 9/30/2012 | |||||||||||||||||
52108RCF7 | 8,505,990 | — | ² | (598,352) | 7,907,638 | 7,907,638 | 9/30/2012 | |||||||||||||||||
07387BEK5 | 3,673,120 | — | ² | (770,030) | 2,903,090 | 2,903,090 | 9/30/2012 | |||||||||||||||||
362332AB4 | 22,910 | — | ² | (8) | 22,902 | 22,902 | 9/30/2012 | |||||||||||||||||
59025KAK8 | 3,892,690 | — | ² | (2,092,690) | 1,800,000 | 1,800,000 | 9/30/2012 | |||||||||||||||||
05947US74 | 13,833,368 | — | ² | (6,300,225) | 7,533,142 | 7,533,142 | 9/30/2012 | |||||||||||||||||
226081AB3 | 15,000,000 | — | ² | (3,750,000) | 11,250,000 | 11,250,000 | 9/30/2012 | |||||||||||||||||
226081AC1 | 13,471,331 | — | ² | (9,655,706) | 3,815,625 | 3,815,625 | 9/30/2012 | |||||||||||||||||
92976VAP3 | 14,617,299 | — | ² | (5,031,897) | 9,585,403 | 9,585,403 | 9/30/2012 | |||||||||||||||||
92976VAT5 | 9,438,823 | — | ² | (3,455,259) | 5,983,564 | 5,983,564 | 9/30/2012 | |||||||||||||||||
92977RAJ5 | 6,000,000 | — | ² | (2,615,107) | 3,384,893 | 3,384,893 | 9/30/2012 | |||||||||||||||||
92977RAK2 | 2,962,587 | — | ² | (15,634) | 2,946,953 | 2,946,953 | 9/30/2012 | |||||||||||||||||
52521TBJ5 | 4,212,500 | — | ² | (231,688) | 3,980,813 | 3,980,813 | 9/30/2012 | |||||||||||||||||
92976BHK1 | 5,000,000 | — | ² | (250,000) | 4,750,000 | 4,750,000 | 9/30/2012 | |||||||||||||||||
92978QAH0 | 12,770,554 | — | ² | (91,843) | 12,678,711 | 12,678,711 | 9/30/2012 | |||||||||||||||||
760985YY1 | 181,183 | 101,514 | (79,669) | 101,514 | 59,520 | 9/30/2012 | ||||||||||||||||||
36228CDP5 | 186,727 | 50,087 | (136,640) | 50,087 | 274,674 | 9/30/2012 | ||||||||||||||||||
74438WAM8 | 2,024,377 | 1,128,540 | (895,837) | 1,128,540 | 499,495 | 9/30/2012 | ||||||||||||||||||
74438WAN6 | 258,840 | — | * | (258,840) | — | 136,186 | 9/30/2012 | |||||||||||||||||
46625MKS7 | 1,383,112 | 945,433 | (437,679) | 945,433 | 1,022,136 | 9/30/2012 | ||||||||||||||||||
22608SAD0 | 3,496,670 | 2,889,829 | (606,841) | 2,889,829 | 1,793,055 | 9/30/2012 | ||||||||||||||||||
36228CTS2 | 4,980,349 | 3,430,037 | (1,550,312) | 3,430,037 | 3,427,190 | 9/30/2012 | ||||||||||||||||||
46625YBP7 | 3,000,000 | 628,747 | (2,371,253) | 628,747 | 1,881,730 | 9/30/2012 | ||||||||||||||||||
03927PAF5 | 3,032,033 | 2,246,244 | (785,789) | 2,246,244 | 287,500 | 9/30/2012 | ||||||||||||||||||
05947UVY1 | 1,571,823 | 39,034 | (1,532,789) | 39,034 | 238,998 | 9/30/2012 | ||||||||||||||||||
05947UVZ8 | 66,087 | — | * | (66,087) | — | 112,082 | 9/30/2012 | |||||||||||||||||
61745MX57 | 107,551 | — | * | (107,551) | — | 900,000 | 9/30/2012 | |||||||||||||||||
396789KB4 | 10,005,101 | 9,468,217 | (536,884) | 9,468,217 | 3,612,568 | 9/30/2012 | ||||||||||||||||||
36828QLB0 | 4,963,498 | 3,486,452 | (1,477,046) | 3,486,452 | 2,686,850 | 9/30/2012 | ||||||||||||||||||
225458DT2 | 2,912,471 | 2,450,756 | (461,715) | 2,450,756 | 1,010,946 | 9/30/2012 | ||||||||||||||||||
05947UE38 | 7,034,752 | 2,712,720 | (4,322,032) | 2,712,720 | 3,971,018 | 9/30/2012 | ||||||||||||||||||
46625YRB1 | 843,417 | 428,226 | (415,191) | 428,226 | 850,172 | 9/30/2012 | ||||||||||||||||||
617451CA5 | 5,400,204 | 5,259,032 | (141,171) | 5,259,032 | 4,201,139 | 9/30/2012 | ||||||||||||||||||
92976BBU5 | 12,453,625 | 10,172,078 | (2,281,548) | 10,172,078 | 8,361,740 | 9/30/2012 | ||||||||||||||||||
36228CYQ0 | 16,065,836 | 15,584,903 | (480,932) | 15,584,903 | 10,121,393 | 9/30/2012 | ||||||||||||||||||
| 49 |
NOTES TO STATUTORY–BASIS FINANCIAL STATEMENTS
TEACHERS INSURANCE AND ANNUITY ASSOCIATION OF AMERICA
| CUSIP | Book/Adj. Carrying Value Amortized Cost Before Current Period OTTI | Present Value of Projected Cash Flows | Recognized Other-Than- Temporary Impairment | Amortized Cost After Other- Than-Temporary Impairment | Fair Value as of Impairment Date | Date of Financial Statement Where Reported | ||||||||||||||||||
60687UAL1 | $ | 13,921,385 | $ | 11,975,176 | $ | (1,946,209) | $ | 11,975,176 | $ | 7,827,095 | 9/30/2012 | |||||||||||||
36298JAA1 | 13,518,623 | 12,387,384 | (1,131,238) | 12,387,384 | 6,794,469 | 9/30/2012 | ||||||||||||||||||
36298JAC7 | 638,504 | 552,610 | (85,894) | 552,610 | 750,000 | 9/30/2012 | ||||||||||||||||||
059500AG3 | 21,252,478 | 19,096,945 | (2,155,533) | 19,096,945 | 14,201,475 | 9/30/2012 | ||||||||||||||||||
05950WAP3 | 11,102,176 | 10,946,184 | (155,992) | 10,946,184 | 6,280,871 | 9/30/2012 | ||||||||||||||||||
46630AAC2 | 32,356 | — | * | (32,356) | — | 245,000 | 9/30/2012 | |||||||||||||||||
46629PAU2 | 55,668 | — | * | (55,668) | — | 671,722 | 9/30/2012 | |||||||||||||||||
03762AAD1 | 2,070,311 | 691,485 | (1,378,826) | 691,485 | 792,000 | �� | 9/30/2012 | |||||||||||||||||
03762AAG4 | 705,549 | 227,898 | (477,651) | 227,898 | 782,100 | 9/30/2012 | ||||||||||||||||||
03762AAB5 | 10,000,000 | 8,495,870 | (1,504,130) | 8,495,870 | 3,661,000 | 9/30/2012 | ||||||||||||||||||
059497AC1 | 6,751,050 | 1,401,262 | (5,349,788) | 1,401,262 | 3,330,375 | 9/30/2012 | ||||||||||||||||||
059497AB3 | 10,014,746 | 7,773,948 | (2,240,798) | 7,773,948 | 4,217,178 | 9/30/2012 | ||||||||||||||||||
46629YAM1 | 1,591,997 | 1,464,468 | (127,529) | 1,464,468 | 6,100,464 | 9/30/2012 | ||||||||||||||||||
46630JAQ2 | 28,701,207 | 16,352,163 | (12,349,044) | 16,352,163 | 11,846,670 | 9/30/2012 | ||||||||||||||||||
46630JAS8 | 1,358,223 | 263,088 | (1,095,135) | 263,088 | 3,833,752 | 9/30/2012 | ||||||||||||||||||
46630JAU3 | 796,860 | — | * | (796,860) | — | 3,426,728 | 9/30/2012 | |||||||||||||||||
03762CAE5 | 7,899,640 | 6,302,526 | (1,597,114) | 6,302,526 | 4,174,000 | 9/30/2012 | ||||||||||||||||||
50180JAG0 | 27,846,206 | 26,702,291 | (1,143,915) | 26,702,291 | 23,479,292 | 9/30/2012 | ||||||||||||||||||
36159XAJ9 | 16,578,143 | 15,303,623 | (1,274,520) | 15,303,623 | 10,747,086 | 9/30/2012 | ||||||||||||||||||
46630VAP7 | 364,698 | 273,752 | (90,946) | 273,752 | 917,117 | 9/30/2012 | ||||||||||||||||||
46630VAL6 | 9,680,971 | 9,492,295 | (188,676) | 9,492,295 | 7,140,655 | 9/30/2012 | ||||||||||||||||||
46631BAK1 | 19,828,259 | 15,354,756 | (4,473,503) | 15,354,756 | 10,210,292 | 9/30/2012 | ||||||||||||||||||
46631BAK1 | 246,192 | 190,355 | (55,837) | 190,355 | 127,629 | 9/30/2012 | ||||||||||||||||||
073945AN7 | 3,349,603 | 3,340,825 | (8,778) | 3,340,825 | 2,143,249 | 9/30/2012 | ||||||||||||||||||
07401DAM3 | 543,917 | 512,077 | (31,840) | 512,077 | 1,332,471 | 9/30/2012 | ||||||||||||||||||
07401DAL5 | 3,205,946 | 1,369,715 | (1,836,230) | 1,369,715 | 2,279,573 | 9/30/2012 | ||||||||||||||||||
20173QAH4 | 18,126,485 | 17,709,384 | (417,101) | 17,709,384 | 13,404,050 | 9/30/2012 | ||||||||||||||||||
36298JAA1 | 4,953,946 | 4,432,530 | (521,416) | 4,432,530 | 3,397,235 | 9/30/2012 | ||||||||||||||||||
46631BAK1 | 8,687,523 | 6,465,290 | (2,222,233) | 6,465,290 | 5,291,484 | 9/30/2012 | ||||||||||||||||||
22545XAG8 | 7,233 | 3,197 | (4,036) | 3,197 | 50,661 | 9/30/2012 | ||||||||||||||||||
92978QAJ6 | 35,788 | 34,726 | (1,062) | 34,726 | 60,350 | 9/30/2012 | ||||||||||||||||||
76110HNP0 | 5,711,479 | 5,597,608 | (113,871) | 5,597,608 | 5,088,171 | 9/30/2012 | ||||||||||||||||||
76110HNQ8 | 939,744 | 784,603 | (155,141) | 784,603 | 1,624,425 | 9/30/2012 | ||||||||||||||||||
76110HSG5 | 4,784,648 | 4,704,671 | (79,977) | 4,704,671 | 3,965,517 | 9/30/2012 | ||||||||||||||||||
05949AA75 | 3,756 | 1,775 | (1,982) | 1,775 | 18 | 9/30/2012 | ||||||||||||||||||
12667F7D1 | 21,368,878 | 21,299,548 | (69,330) | 21,299,548 | 21,382,779 | 9/30/2012 | ||||||||||||||||||
05949AM31 | 10,620 | 5,176 | (5,444) | 5,176 | 16 | 9/30/2012 | ||||||||||||||||||
12667GLE1 | 26,270,946 | 26,269,408 | (1,538) | 26,269,408 | 26,109,807 | 9/30/2012 | ||||||||||||||||||
76110HX87 | 20,018,524 | 19,892,624 | (125,900) | 19,892,624 | 18,027,090 | 9/30/2012 | ||||||||||||||||||
36185MCL4 | 17,224,540 | 16,897,255 | (327,284) | 16,897,255 | 17,561,933 | 9/30/2012 | ||||||||||||||||||
45660LPD5 | 13,145,993 | 13,006,371 | (139,622) | 13,006,371 | 12,226,110 | 9/30/2012 | ||||||||||||||||||
46628YBK5 | 27,191,791 | 27,156,857 | (34,934) | 27,156,857 | 27,044,981 | 9/30/2012 | ||||||||||||||||||
12670AAF8 | 43,552,511 | 43,399,026 | (153,484) | 43,399,026 | 46,962,161 | 9/30/2012 | ||||||||||||||||||
74957XAF2 | 31,083,799 | 30,828,996 | (254,803) | 30,828,996 | 31,789,302 | 9/30/2012 | ||||||||||||||||||
32052RAM2 | 14,588,455 | 14,544,599 | (43,856) | 14,544,599 | 15,139,019 | 9/30/2012 | ||||||||||||||||||
126694JS8 | 27,122,828 | 26,913,623 | (209,205) | 26,913,623 | 25,906,883 | 9/30/2012 | ||||||||||||||||||
94985RAP7 | 52,087,124 | 51,334,880 | (752,244) | 51,334,880 | 53,016,835 | 9/30/2012 | ||||||||||||||||||
12544LAK7 | 25,041,260 | 24,756,837 | (284,423) | 24,756,837 | 25,722,450 | 9/30/2012 | ||||||||||||||||||
94986AAC2 | 64,950,599 | 64,501,927 | (448,673) | 64,501,927 | 67,306,573 | 9/30/2012 | ||||||||||||||||||
17025TAV3 | 24,331,902 | 24,110,703 | (221,199) | 24,110,703 | 23,052,343 | 9/30/2012 | ||||||||||||||||||
12543XAD8 | 22,898,163 | 22,709,910 | (188,253) | 22,709,910 | 20,787,558 | 9/30/2012 | ||||||||||||||||||
94986AAC2 | 17,361,890 | 17,241,741 | (120,149) | 17,241,741 | 17,948,419 | 9/30/2012 | ||||||||||||||||||
94986AAC2 | 17,479,707 | 17,358,241 | (121,466) | 17,358,241 | 17,948,420 | 9/30/2012 | ||||||||||||||||||
36185MEG3 | 13,162,042 | 13,074,938 | (87,104) | 13,074,938 | 13,572,045 | 9/30/2012 | ||||||||||||||||||
126694HK7 | 14,755,000 | 14,751,299 | (3,701) | 14,751,299 | 14,800,111 | 9/30/2012 | ||||||||||||||||||
| 50 |
| continued |
| CUSIP | Book/Adj. Carrying Value Amortized Cost Before Current Period OTTI | Present Value of Projected Cash Flows | Recognized Other-Than- Temporary Impairment | Amortized Cost After Other- Than-Temporary Impairment | Fair Value as of Impairment Date | Date of Financial Statement Where Reported | ||||||||||||||||||
12668AAG0 | $ | 11,890,062 | $ | 11,875,532 | $ | (14,530) | $ | 11,875,532 | $ | 12,234,209 | 9/30/2012 | |||||||||||||
94985WAP6 | 17,801,544 | 17,775,401 | (26,143) | 17,775,401 | 19,113,338 | 9/30/2012 | ||||||||||||||||||
02660TFM0 | 8,764,781 | 8,490,531 | (274,250) | 8,490,531 | 7,815,110 | 6/30/2012 | ||||||||||||||||||
03762AAD1 | 3,000,000 | 2,070,658 | (929,342) | 2,070,658 | 627,300 | 6/30/2012 | ||||||||||||||||||
03762AAG4 | 732,293 | 713,685 | (18,608) | 713,685 | 615,300 | 6/30/2012 | ||||||||||||||||||
03762CAE5 | 13,386,226 | 8,066,318 | (5,319,908) | 8,066,318 | 4,070,000 | 6/30/2012 | ||||||||||||||||||
05947UJT6 | 333,793 | 161,142 | (172,651) | 161,142 | 203,465 | 6/30/2012 | ||||||||||||||||||
05947UVY1 | 1,599,128 | 1,566,502 | (32,626) | 1,566,502 | 226,063 | 6/30/2012 | ||||||||||||||||||
05947UVZ8 | 269,262 | 66,087 | (203,175) | 66,087 | 98,240 | 6/30/2012 | ||||||||||||||||||
059497AC1 | 6,882,997 | 6,790,028 | (92,969) | 6,790,028 | 3,195,858 | 6/30/2012 | ||||||||||||||||||
05949AM31 | 69,991 | 11,759 | (58,232) | 11,759 | 14,102 | 6/30/2012 | ||||||||||||||||||
05949TBF5 | 13,416,592 | 13,381,246 | (35,346) | 13,381,246 | 13,169,015 | 6/30/2012 | ||||||||||||||||||
059500AG3 | 21,758,948 | 21,308,270 | (450,678) | 21,308,270 | 14,328,513 | 6/30/2012 | ||||||||||||||||||
07387BEP4 | 624,641 | —² | (176,666) | 447,975 | 447,975 | 6/30/2012 | ||||||||||||||||||
07388VAK4 | 6,268,615 | 5,189,700 | (1,078,915) | 5,189,700 | 3,535,050 | 6/30/2012 | ||||||||||||||||||
07388YAY8 | 3,071,222 | 1,647,280 | (1,423,942) | 1,647,280 | 1,037,102 | 6/30/2012 | ||||||||||||||||||
12543UAD4 | 39,574,526 | 39,271,273 | (303,253) | 39,271,273 | 36,661,882 | 6/30/2012 | ||||||||||||||||||
12543UAE2 | 13,538,330 | 13,435,251 | (103,079) | 13,435,251 | 12,259,932 | 6/30/2012 | ||||||||||||||||||
12543XAD8 | 23,507,632 | 23,453,737 | (53,895) | 23,453,737 | 36,034,925 | 6/30/2012 | ||||||||||||||||||
12544LAK7 | 26,536,539 | 26,356,049 | (180,490) | 26,356,049 | 25,546,974 | 6/30/2012 | ||||||||||||||||||
12545CAU4 | 31,822,762 | 31,653,395 | (169,367) | 31,653,395 | 27,601,525 | 6/30/2012 | ||||||||||||||||||
12667F5J0 | 18,034,912 | 18,016,016 | (18,896) | 18,016,016 | 16,552,489 | 6/30/2012 | ||||||||||||||||||
12667F7D1 | 22,124,421 | 21,891,922 | (232,499) | 21,891,922 | 20,175,469 | 6/30/2012 | ||||||||||||||||||
12667FYZ2 | 5,502,617 | 4,754,121 | (748,496) | 4,754,121 | 4,238,121 | 6/30/2012 | ||||||||||||||||||
12667GJG9 | 14,727,772 | 14,656,762 | (71,010) | 14,656,762 | 13,588,948 | 6/30/2012 | ||||||||||||||||||
12667GUG6 | 4,282,494 | 4,260,951 | (21,543) | 4,260,951 | 3,724,620 | 6/30/2012 | ||||||||||||||||||
12668AMH5 | 19,674,993 | 19,548,716 | (126,277) | 19,548,716 | 18,927,047 | 6/30/2012 | ||||||||||||||||||
126694AJ7 | 12,185,170 | 12,139,150 | (46,020) | 12,139,150 | 12,112,013 | 6/30/2012 | ||||||||||||||||||
126694HK7 | 15,413,291 | 15,408,676 | (4,615) | 15,408,676 | 14,763,735 | 6/30/2012 | ||||||||||||||||||
12669E4V5 | 8,677,291 | 8,398,456 | (278,835) | 8,398,456 | 6,329,948 | 6/30/2012 | ||||||||||||||||||
12669E4W3 | 827,218 | 710,891 | (116,327) | 710,891 | 1,481,742 | 6/30/2012 | ||||||||||||||||||
12670AAF8 | 43,653,801 | 43,625,231 | (28,570) | 43,625,231 | 40,584,922 | 6/30/2012 | ||||||||||||||||||
161546HW9 | 1,428,176 | 1,222,970 | (205,206) | 1,222,970 | 883,174 | 6/30/2012 | ||||||||||||||||||
161631AV8 | 36,435,316 | 36,263,948 | (171,368) | 36,263,948 | 34,218,930 | 6/30/2012 | ||||||||||||||||||
173105AA5 | 17,142,048 | 16,797,397 | (344,651) | 16,797,397 | 33,111,915 | 6/30/2012 | ||||||||||||||||||
17310MAQ3 | 3,919,074 | — | ² | (1,219,074) | 2,700,000 | 2,700,000 | 6/30/2012 | |||||||||||||||||
20173QAH4 | 28,595,882 | 27,813,175 | (782,707) | 27,813,175 | 19,246,290 | 6/30/2012 | ||||||||||||||||||
20173QAJ0 | 5,195,041 | 1,048,206 | (4,146,835) | 1,048,206 | 3,919,043 | 6/30/2012 | ||||||||||||||||||
21075WCJ2 | 689,534 | 668,529 | (21,005) | 668,529 | 680,333 | 6/30/2012 | ||||||||||||||||||
22545DAL1 | 6,142,839 | 2,050,893 | (4,091,946) | 2,050,893 | 7,216,425 | 6/30/2012 | ||||||||||||||||||
294751CU4 | 3,709,178 | 3,535,031 | (174,147) | 3,535,031 | 1,236,565 | 6/30/2012 | ||||||||||||||||||
32051G2J3 | 22,125,739 | 22,068,221 | (57,518) | 22,068,221 | 20,845,273 | 6/30/2012 | ||||||||||||||||||
36159XAJ9 | 17,018,696 | 16,460,720 | (557,976) | 16,460,720 | 8,713,825 | 6/30/2012 | ||||||||||||||||||
36170UCQ2 | 44,552,307 | 36,154,605 | (8,397,702) | 36,154,605 | 17,500,000 | 6/30/2012 | ||||||||||||||||||
361849N57 | 802,325 | — | * | (802,325) | — | 744,201 | 6/30/2012 | |||||||||||||||||
36185MCL4 | 17,612,466 | 17,551,971 | (60,495) | 17,551,971 | 17,090,566 | 6/30/2012 | ||||||||||||||||||
36228CYQ0 | 16,361,418 | 16,161,689 | (199,729) | 16,161,689 | 8,707,039 | 6/30/2012 | ||||||||||||||||||
362332AM0 | 3,059,858 | 959,189 | (2,100,669) | 959,189 | 2,506,580 | 6/30/2012 | ||||||||||||||||||
362334ME1 | 18,227,822 | 18,002,987 | (224,835) | 18,002,987 | 14,110,138 | 6/30/2012 | ||||||||||||||||||
362334NC4 | 13,367,859 | 13,287,718 | (80,141) | 13,287,718 | 11,183,957 | 6/30/2012 | ||||||||||||||||||
362334QC1 | 7,226,782 | 7,163,560 | (63,222) | 7,163,560 | 6,660,052 | 6/30/2012 | ||||||||||||||||||
362669AQ6 | 9,257,495 | 9,153,232 | (104,263) | 9,153,232 | 8,347,214 | 6/30/2012 | ||||||||||||||||||
36828QSD9 | 10,768,000 | 1,605,187 | (9,162,813) | 1,605,187 | 5,572,894 | 6/30/2012 | ||||||||||||||||||
36828QSG2 | 6,508,662 | 137,078 | (6,371,584) | 137,078 | 2,567,984 | 6/30/2012 | ||||||||||||||||||
36828QSJ6 | 2,774,793 | — | ² | (770,106) | 2,004,687 | 2,004,687 | 6/30/2012 | |||||||||||||||||
| 51 |
NOTES TO STATUTORY–BASIS FINANCIAL STATEMENTS
TEACHERS INSURANCE AND ANNUITY ASSOCIATION OF AMERICA
| CUSIP | Book/Adj. Carrying Value Amortized Cost Before Current Period OTTI | Present Value of Projected Cash Flows | Recognized Other-Than- Temporary Impairment | Amortized Cost After Other- Than-Temporary Impairment | Fair Value as of Impairment Date | Date of Financial Statement Where Reported | ||||||||||||||||||
396789KD0 | $ | 17,330,831 | $ | 1,791,128 | $ | (15,539,703) | $ | 1,791,128 | $ | 6,222,195 | 6/30/2012 | |||||||||||||
396789KF5 | 1,808,508 | — | * | (1,808,508) | — | 1,322,525 | 6/30/2012 | |||||||||||||||||
46625M2U2 | 1,625,716 | 988,294 | (637,422) | 988,294 | 342,628 | 6/30/2012 | ||||||||||||||||||
46625M2W8 | 46,102 | 34,313 | (11,789) | 34,313 | 262,896 | 6/30/2012 | ||||||||||||||||||
46625M7A1 | 3,973,461 | 3,950,819 | (22,642) | 3,950,819 | 3,084,394 | 6/30/2012 | ||||||||||||||||||
46628YBK5 | 27,654,943 | 27,440,030 | (214,913) | 27,440,030 | 25,104,306 | 6/30/2012 | ||||||||||||||||||
46629YAM1 | 2,065,423 | 1,849,348 | (216,075) | 1,849,348 | 6,652,180 | 6/30/2012 | ||||||||||||||||||
46629YAQ2 | 301,597 | 169,683 | (131,914) | 169,683 | 1,470,561 | 6/30/2012 | ||||||||||||||||||
46630VAL6 | 9,962,086 | 9,687,361 | (274,725) | 9,687,361 | 6,205,905 | 6/30/2012 | ||||||||||||||||||
46630VAP7 | 408,455 | 402,703 | (5,752) | 402,703 | 805,004 | 6/30/2012 | ||||||||||||||||||
50180JAG0 | 28,518,446 | 27,858,023 | (660,423) | 27,858,023 | 17,988,016 | 6/30/2012 | ||||||||||||||||||
52108MFL2 | 6,605,647 | — | * | (6,605,647) | — | — | 6/30/2012 | |||||||||||||||||
52108MGC1 | 301,251 | 49,464 | (251,787) | 49,464 | 1,297,545 | 6/30/2012 | ||||||||||||||||||
52521RAS0 | 1,218,037 | 1,194,917 | (23,120) | 1,194,917 | 1,048,377 | 6/30/2012 | ||||||||||||||||||
59022HJU7 | 4,747,531 | — | ² | (1,351,921) | 3,395,610 | 3,395,610 | 6/30/2012 | |||||||||||||||||
59023BAM6 | 708,422 | 573,302 | (135,120) | 573,302 | 1,785,000 | 6/30/2012 | ||||||||||||||||||
59025KAJ1 | 1,697,124 | — | ² | (83,880) | 1,613,244 | 1,613,244 | 6/30/2012 | |||||||||||||||||
60688BAJ7 | 5,007,661 | 2,134,082 | (2,873,579) | 2,134,082 | 3,686,745 | 6/30/2012 | ||||||||||||||||||
617451CA5 | 6,470,895 | 5,418,314 | (1,052,581) | 5,418,314 | 3,912,764 | 6/30/2012 | ||||||||||||||||||
61746WE63 | 4,651,559 | 4,604,203 | (47,356) | 4,604,203 | 4,885,124 | 6/30/2012 | ||||||||||||||||||
61749EAE7 | 14,847,546 | 14,664,566 | (182,980) | 14,664,566 | 10,935,944 | 6/30/2012 | ||||||||||||||||||
69348HBT4 | 7,172,713 | 6,127,145 | (1,045,568) | 6,127,145 | 3,712,325 | 6/30/2012 | ||||||||||||||||||
74957XAF2 | 32,950,482 | 32,583,221 | (367,261) | 32,583,221 | 31,024,384 | 6/30/2012 | ||||||||||||||||||
759950GW2 | 9,351,642 | 9,055,718 | (295,924) | 9,055,718 | 6,203,439 | 6/30/2012 | ||||||||||||||||||
76110HHA0 | 7,116,124 | 6,558,105 | (558,019) | 6,558,105 | 6,268,723 | 6/30/2012 | ||||||||||||||||||
76110HNP0 | 5,934,416 | 5,878,642 | (55,774) | 5,878,642 | 5,276,482 | 6/30/2012 | ||||||||||||||||||
76110HNQ8 | 1,226,566 | 1,042,805 | (183,761) | 1,042,805 | 1,774,406 | 6/30/2012 | ||||||||||||||||||
76110WSF4 | 17,641,233 | 17,309,813 | (331,420) | 17,309,813 | 11,191,205 | 6/30/2012 | ||||||||||||||||||
76110WUL8 | 14,244,163 | 14,027,280 | (216,883) | 14,027,280 | 6,271,425 | 6/30/2012 | ||||||||||||||||||
92976BFY3 | 3,319,962 | 1,219,737 | (2,100,225) | 1,219,737 | 1,763,955 | 6/30/2012 | ||||||||||||||||||
92976VAT5 | 9,621,082 | 9,439,768 | (181,314) | 9,439,768 | 5,365,926 | 6/30/2012 | ||||||||||||||||||
92977QAK4 | 15,799,000 | 1,973,805 | (13,825,195) | 1,973,805 | 8,124,154 | 6/30/2012 | ||||||||||||||||||
92977RAK2 | 3,466,430 | 2,993,262 | (473,168) | 2,993,262 | 2,781,045 | 6/30/2012 | ||||||||||||||||||
94983SAV4 | 38,041,925 | 37,644,570 | (397,355) | 37,644,570 | 38,512,520 | 6/30/2012 | ||||||||||||||||||
94984AAG5 | 12,413,456 | 12,319,157 | (94,299) | 12,319,157 | 12,838,872 | 6/30/2012 | ||||||||||||||||||
94984AAR1 | 28,427,701 | 28,371,263 | (56,438) | 28,371,263 | 28,211,100 | 6/30/2012 | ||||||||||||||||||
94984AAS9 | 8,624,337 | 8,616,700 | (7,637) | 8,616,700 | 37,964,026 | 6/30/2012 | ||||||||||||||||||
94985LAF2 | 34,434,188 | 33,847,092 | (587,096) | 33,847,092 | 34,348,347 | 6/30/2012 | ||||||||||||||||||
94986AAC2 | 104,712,867 | 104,446,017 | (266,850) | 104,446,017 | 103,707,609 | 6/30/2012 | ||||||||||||||||||
03927PAF5 | 4,097,319 | 3,075,581 | (1,021,738) | 3,075,581 | 400,000 | 3/31/2012 | ||||||||||||||||||
03927PAH1 | 170,912 | — | * | (170,912) | — | 15,000 | 3/31/2012 | |||||||||||||||||
03927PAG3 | 116,319 | — | * | (116,319) | — | 7,500 | 3/31/2012 | |||||||||||||||||
05947UVY1 | 1,730,975 | 1,599,128 | (131,847) | 1,599,128 | 248,170 | 3/31/2012 | ||||||||||||||||||
059500AG3 | 23,991,105 | 21,807,242 | (2,183,863) | 21,807,242 | 14,344,230 | 3/31/2012 | ||||||||||||||||||
059497AC1 | 7,619,871 | 6,753,523 | (866,348) | 6,753,523 | 4,931,900 | 3/31/2012 | ||||||||||||||||||
07388YAY8 | 3,698,308 | 3,098,266 | (600,042) | 3,098,266 | 1,286,326 | 3/31/2012 | ||||||||||||||||||
07401DAL5 | 4,321,838 | 3,267,944 | (1,053,894) | 3,267,944 | 2,103,813 | 3/31/2012 | ||||||||||||||||||
07401DAN1 | 1,308,341 | 1,073,000 | (235,341) | 1,073,000 | 2,934,595 | 3/31/2012 | ||||||||||||||||||
07401DAM3 | 650,208 | 636,894 | (13,314) | 636,894 | 1,225,088 | 3/31/2012 | ||||||||||||||||||
17310MAS9 | 139,557 | — | * | (139,557) | — | 400,000 | 3/31/2012 | |||||||||||||||||
17310MAL4 | 809,483 | 701,618 | (107,865) | 701,618 | 1,614,784 | 3/31/2012 | ||||||||||||||||||
226081AC1 | 15,000,000 | 13,196,967 | (1,803,033) | 13,196,967 | 3,750,000 | 3/31/2012 | ||||||||||||||||||
22545XAG8 | 9,418 | 8,641 | (777) | 8,641 | 45,569 | 3/31/2012 | ||||||||||||||||||
396789KF5 | 2,750,861 | 1,808,508 | (942,353) | 1,808,508 | 2,006,085 | 3/31/2012 | ||||||||||||||||||
36828QSG2 | 8,886,034 | 6,609,165 | (2,276,869) | 6,609,165 | 2,511,126 | 3/31/2012 | ||||||||||||||||||
| 52 |
| continued |
| CUSIP | Book/Adj. Carrying Value Amortized Cost Before Current Period OTTI | Present Value of Projected Cash Flows | Recognized Other-Than- Temporary Impairment | Amortized Cost After Other- Than-Temporary Impairment | Fair Value as of Impairment Date | Date of Financial Statement Where Reported | ||||||||||||||||||
36159XAJ9 | $ | 18,075,726 | $ | 16,999,560 | $ | (1,076,166) | $ | 16,999,560 | $ | 9,429,960 | 3/31/2012 | |||||||||||||
36170UCQ2 | 50,006,750 | 44,638,189 | (5,368,561) | 44,638,189 | 18,500,000 | 3/31/2012 | ||||||||||||||||||
361849N57 | 2,498,005 | 932,692 | (1,565,313) | 932,692 | 1,064,682 | 3/31/2012 | ||||||||||||||||||
36228CYQ0 | 17,139,723 | 16,591,446 | (548,277) | 16,591,446 | 10,480,774 | 3/31/2012 | ||||||||||||||||||
362332AM0 | 4,193,532 | 3,211,574 | (981,958) | 3,211,574 | 2,501,155 | 3/31/2012 | ||||||||||||||||||
36298JAA1 | 19,270,136 | 18,645,869 | (624,267) | 18,645,869 | 9,024,418 | 3/31/2012 | ||||||||||||||||||
46625M2W8 | 718,878 | 80,154 | (638,724) | 80,154 | 544,649 | 3/31/2012 | ||||||||||||||||||
46625M2U2 | 1,933,117 | 1,650,190 | (282,927) | 1,650,190 | 839,863 | 3/31/2012 | ||||||||||||||||||
46625YRB1 | 1,552,608 | 849,009 | (703,599) | 849,009 | 872,913 | 3/31/2012 | ||||||||||||||||||
46629PAG3 | 1,923,444 | 629,946 | (1,293,498) | 629,946 | 1,972,653 | 3/31/2012 | ||||||||||||||||||
46629PAU2 | 252,381 | 109,816 | (142,565) | 109,816 | 420,000 | 3/31/2012 | ||||||||||||||||||
46630AAC2 | 135,940 | 113,054 | (22,886) | 113,054 | 507,500 | 3/31/2012 | ||||||||||||||||||
46629YAM1 | 2,722,648 | 2,316,128 | (406,520) | 2,316,128 | 6,841,688 | 3/31/2012 | ||||||||||||||||||
46629YAQ2 | 403,667 | 368,342 | (35,325) | 368,342 | 1,435,833 | 3/31/2012 | ||||||||||||||||||
46630VAP7 | 503,239 | 445,838 | (57,401) | 445,838 | 860,255 | 3/31/2012 | ||||||||||||||||||
50180JAG0 | 29,421,933 | 28,528,328 | (893,605) | 28,528,328 | 22,288,749 | 3/31/2012 | ||||||||||||||||||
60687UAL1 | 18,630,039 | 14,068,393 | (4,561,646) | 14,068,393 | 6,703,769 | 3/31/2012 | ||||||||||||||||||
60687UAM9 | 1,211,212 | 719,541 | (491,671) | 719,541 | 1,425,431 | 3/31/2012 | ||||||||||||||||||
55312TAG8 | 15,993,661 | 11,729,221 | (4,264,440) | 11,729,221 | 11,710,318 | 3/31/2012 | ||||||||||||||||||
59022HJS2 | 19,602,631 | 16,750,885 | (2,851,746) | 16,750,885 | 10,924,354 | 3/31/2012 | ||||||||||||||||||
59023BAM6 | 852,744 | 777,989 | (74,755) | 777,989 | 1,815,000 | 3/31/2012 | ||||||||||||||||||
61746WE63 | 5,223,712 | 4,558,844 | (664,868) | 4,558,844 | 4,756,946 | 3/31/2012 | ||||||||||||||||||
03762AAG4 | 1,927,848 | 781,662 | (1,146,186) | 781,662 | 817,800 | 3/31/2012 | ||||||||||||||||||
03762CAE5 | 15,300,852 | 13,477,162 | (1,823,690) | 13,477,162 | 5,274,000 | 3/31/2012 | ||||||||||||||||||
69348HBT4 | 11,257,496 | 10,736,009 | (521,487) | 10,736,009 | 6,011,014 | 3/31/2012 | ||||||||||||||||||
92976BFY3 | 5,004,685 | 3,345,962 | (1,658,723) | 3,345,962 | 2,633,728 | 3/31/2012 | ||||||||||||||||||
92976BFZ0 | 1,944,020 | 1,339,186 | (604,834) | 1,339,186 | 4,643,300 | 3/31/2012 | ||||||||||||||||||
92977RAK2 | 3,899,093 | 3,504,932 | (394,161) | 3,504,932 | 2,633,330 | 3/31/2012 | ||||||||||||||||||
93934DAQ0 | 157,705 | 154,642 | (3,063) | 154,642 | 154,371 | 3/31/2012 | ||||||||||||||||||
02660TFM0 | 8,915,850 | 8,781,984 | (133,866) | 8,781,984 | 6,462,980 | 3/31/2012 | ||||||||||||||||||
294751CU4 | 3,777,924 | 3,709,800 | (68,124) | 3,709,800 | 1,329,517 | 3/31/2012 | ||||||||||||||||||
05948KP37 | 9,696,291 | 9,372,211 | (324,080) | 9,372,211 | 8,247,443 | 3/31/2012 | ||||||||||||||||||
05949TBF5 | 14,080,977 | 14,060,674 | (20,303) | 14,060,674 | 13,860,502 | 3/31/2012 | ||||||||||||||||||
05949YAC2 | 11,181,786 | 11,077,225 | (104,561) | 11,077,225 | 10,681,716 | 3/31/2012 | ||||||||||||||||||
12543UAD4 | 39,803,535 | 39,656,412 | (147,123) | 39,656,412 | 36,063,504 | 3/31/2012 | ||||||||||||||||||
12543UAE2 | 13,826,679 | 13,787,864 | (38,815) | 13,787,864 | 12,368,960 | 3/31/2012 | ||||||||||||||||||
12543XAD8 | 23,845,753 | 23,783,722 | (62,031) | 23,783,722 | 38,733,966 | 3/31/2012 | ||||||||||||||||||
12544AAC9 | 46,211,075 | 45,875,845 | (335,230) | 45,875,845 | 43,857,150 | 3/31/2012 | ||||||||||||||||||
12545CAU4 | 33,345,918 | 32,943,812 | (402,106) | 32,943,812 | 30,068,254 | 3/31/2012 | ||||||||||||||||||
12566RAG6 | 32,645,165 | 31,609,034 | (1,036,131) | 31,609,034 | 26,651,272 | 3/31/2012 | ||||||||||||||||||
12667F5J0 | 18,496,365 | 18,415,016 | (81,349) | 18,415,016 | 17,036,641 | 3/31/2012 | ||||||||||||||||||
12667FYZ2 | 6,127,484 | 5,924,528 | (202,956) | 5,924,528 | 5,268,084 | �� | 3/31/2012 | |||||||||||||||||
12667GBA0 | 40,470,851 | 40,460,359 | (10,492) | 40,460,359 | 57,575,147 | 3/31/2012 | ||||||||||||||||||
12667GFB4 | 61,503,248 | 61,358,880 | (144,368) | 61,358,880 | 57,438,367 | 3/31/2012 | ||||||||||||||||||
12667GQA4 | 20,297,838 | 20,035,772 | (262,066) | 20,035,772 | 18,409,732 | 3/31/2012 | ||||||||||||||||||
12668AAG0 | 12,666,531 | 12,533,282 | (133,249) | 12,533,282 | 11,896,006 | 3/31/2012 | ||||||||||||||||||
12668AMH5 | 20,094,299 | 20,089,659 | (4,640) | 20,089,659 | 18,723,757 | 3/31/2012 | ||||||||||||||||||
126694XQ6 | 29,628,767 | 28,997,984 | (630,783) | 28,997,984 | 28,753,277 | 3/31/2012 | ||||||||||||||||||
12669EL95 | 6,892,323 | 6,107,068 | (785,255) | 6,107,068 | 5,962,426 | 3/31/2012 | ||||||||||||||||||
12669YAF9 | 17,415,527 | 17,368,357 | (47,170) | 17,368,357 | 15,276,915 | 3/31/2012 | ||||||||||||||||||
12670AAF8 | 43,931,290 | 43,723,746 | (207,544) | 43,723,746 | 40,497,490 | 3/31/2012 | ||||||||||||||||||
16163BAP9 | 26,828,880 | 26,583,068 | (245,812) | 26,583,068 | 23,883,701 | 3/31/2012 | ||||||||||||||||||
173105AA5 | 17,849,631 | 17,295,350 | (554,281) | 17,295,350 | 33,649,187 | 3/31/2012 | ||||||||||||||||||
32051G2J3 | 21,836,523 | 21,773,507 | (63,016) | 21,773,507 | 18,982,238 | 3/31/2012 | ||||||||||||||||||
32051GN35 | 24,404,858 | 24,072,518 | (332,340) | 24,072,518 | 23,374,393 | 3/31/2012 | ||||||||||||||||||
| 53 |
NOTES TO STATUTORY–BASIS FINANCIAL STATEMENTS
TEACHERS INSURANCE AND ANNUITY ASSOCIATION OF AMERICA
| CUSIP | Book/Adj. Carrying Value Amortized Cost Before Current Period OTTI | Present Value of Projected Cash Flows | Recognized Other-Than- Temporary Impairment | Amortized Cost After Other- Than-Temporary Impairment | Fair Value as of Impairment Date | Date of Financial Statement Where Reported | ||||||||||||||||||
32051GP41 | $ | 19,237,781 | $ | 18,976,918 | $ | (260,863) | $ | 18,976,918 | $ | 18,191,200 | 3/31/2012 | |||||||||||||
32051GVL6 | 22,734,824 | 22,500,748 | (234,076) | 22,500,748 | 21,047,581 | 3/31/2012 | ||||||||||||||||||
32052RAM2 | 17,650,370 | 17,527,669 | (122,701) | 17,527,669 | 16,629,858 | 3/31/2012 | ||||||||||||||||||
36185MCL4 | 18,070,244 | 17,926,899 | (143,345) | 17,926,899 | 17,299,053 | 3/31/2012 | ||||||||||||||||||
52521RAS0 | 1,457,118 | 1,341,799 | (115,319) | 1,341,799 | 1,230,650 | 3/31/2012 | ||||||||||||||||||
576434FV1 | 3,535,359 | 2,733,022 | (802,337) | 2,733,022 | 2,421,774 | 3/31/2012 | ||||||||||||||||||
576434SW5 | 5,935,941 | 5,224,519 | (711,422) | 5,224,519 | 4,132,898 | 3/31/2012 | ||||||||||||||||||
74951PCY2 | 815,537 | 624,580 | (190,957) | 624,580 | 419,838 | 3/31/2012 | ||||||||||||||||||
74957EAE7 | 16,268,852 | 16,213,191 | (55,661) | 16,213,191 | 15,099,680 | 3/31/2012 | ||||||||||||||||||
74957EAF4 | 33,400,652 | 33,205,596 | (195,056) | 33,205,596 | 30,244,486 | 3/31/2012 | ||||||||||||||||||
74957VAQ2 | 17,998,524 | 17,959,283 | (39,241) | 17,959,283 | 16,492,900 | 3/31/2012 | ||||||||||||||||||
74957XAF2 | 34,181,152 | 34,157,387 | (23,765) | 34,157,387 | 32,241,167 | 3/31/2012 | ||||||||||||||||||
76110HHA0 | 7,430,484 | 7,410,160 | (20,324) | 7,410,160 | 6,546,208 | 3/31/2012 | ||||||||||||||||||
76110HNQ8 | 2,175,407 | 1,304,971 | (870,436) | 1,304,971 | 1,962,670 | 3/31/2012 | ||||||||||||||||||
76110HX87 | 20,920,644 | 20,909,644 | (11,000) | 20,909,644 | 17,159,174 | 3/31/2012 | ||||||||||||||||||
761118PQ5 | 10,370,246 | 10,320,154 | (50,092) | 10,320,154 | 9,168,236 | 3/31/2012 | ||||||||||||||||||
86359BFG1 | 1,354,808 | 772,407 | (582,401) | 772,407 | 614,009 | 3/31/2012 | ||||||||||||||||||
94980SAS4 | 37,327,551 | 37,125,634 | (201,917) | 37,125,634 | 38,290,480 | 3/31/2012 | ||||||||||||||||||
94980SBJ3 | 18,809,209 | 18,676,165 | (133,044) | 18,676,165 | 19,090,280 | 3/31/2012 | ||||||||||||||||||
949837CC0 | 24,318,442 | 24,094,300 | (224,142) | 24,094,300 | 23,330,721 | 3/31/2012 | ||||||||||||||||||
94983SAV4 | 38,865,634 | 38,006,398 | (859,236) | 38,006,398 | 38,594,720 | 3/31/2012 | ||||||||||||||||||
94984AAG5 | 12,688,720 | 12,406,546 | (282,174) | 12,406,546 | 12,886,206 | 3/31/2012 | ||||||||||||||||||
94984FAR0 | 32,918,269 | 32,847,539 | (70,730) | 32,847,539 | 51,109,162 | 3/31/2012 | ||||||||||||||||||
94984HAC9 | 35,234,983 | 34,945,769 | (289,214) | 34,945,769 | 43,293,935 | 3/31/2012 | ||||||||||||||||||
94984JAE1 | 48,737,842 | 48,475,543 | (262,299) | 48,475,543 | 47,664,691 | 3/31/2012 | ||||||||||||||||||
94985LAF2 | 37,123,314 | 36,283,916 | (839,398) | 36,283,916 | 36,668,371 | 3/31/2012 | ||||||||||||||||||
52108RCH3 | 7,597,426 | — | ² | (1,731,676) | 5,865,750 | 5,865,750 | 3/31/2012 | |||||||||||||||||
36828QSJ6 | 4,267,678 | — | ² | (1,492,886) | 2,774,792 | 2,774,792 | 3/31/2012 | |||||||||||||||||
52108RCF7 | 9,530,616 | — | ² | (1,024,626) | 8,505,990 | 8,505,990 | 3/31/2012 | |||||||||||||||||
92976BBV3 | 10,142,088 | — | ² | (797,059) | 9,345,029 | 9,345,029 | 3/31/2012 | |||||||||||||||||
52108RCD2 | 7,647,568 | — | ² | (611,369) | 7,036,199 | 7,036,199 | 3/31/2012 | |||||||||||||||||
07387BEN9 | 1,151,438 | — | ² | (511,735) | 639,703 | 639,703 | 3/31/2012 | |||||||||||||||||
52108RBX9 | 9,752,984 | — | ² | (417,859) | 9,335,125 | 9,335,125 | 3/31/2012 | |||||||||||||||||
52108RCB6 | 7,690,609 | — | ² | (417,080) | 7,273,529 | 7,273,529 | 3/31/2012 | |||||||||||||||||
52108RBZ4 | 9,672,215 | — | ² | (385,016) | 9,287,199 | 9,287,199 | 3/31/2012 | |||||||||||||||||
46628FAU5 | 1,464,501 | — | ² | (80,110) | 1,384,391 | 1,384,391 | 3/31/2012 | |||||||||||||||||
59025KAJ1 | 1,771,647 | — | ² | (74,524) | 1,697,123 | 1,697,123 | 3/31/2012 | |||||||||||||||||
17310MAQ3 | 3,988,101 | — | ² | (69,027) | 3,919,074 | 3,919,074 | 3/31/2012 | |||||||||||||||||
004421MW0 | 22,591,560 | 22,415,344 | (176,216) | 22,415,344 | 16,999,971 | 12/31/2011 | ||||||||||||||||||
12668ASQ9 | 15,553,893 | 15,403,907 | (149,986) | 15,403,907 | 13,365,858 | 12/31/2011 | ||||||||||||||||||
12668ASR7 | 6,286,385 | 6,153,807 | (132,578) | 6,153,807 | 4,577,427 | 12/31/2011 | ||||||||||||||||||
161546FJ0 | 2,543,448 | 2,503,870 | (39,578) | 2,503,870 | 1,341,142 | 12/31/2011 | ||||||||||||||||||
21075WBA2 | 1,428,491 | 1,374,301 | (54,190) | 1,374,301 | 1,347,187 | 12/31/2011 | ||||||||||||||||||
21075WCJ2 | 742,471 | 723,050 | (19,421) | 723,050 | 706,888 | 12/31/2011 | ||||||||||||||||||
22541S5T1 | 4,997,995 | 4,717,562 | (280,433) | 4,717,562 | 2,578,420 | 12/31/2011 | ||||||||||||||||||
251511AC5 | 13,001,316 | 12,456,530 | (544,786) | 12,456,530 | 11,115,631 | 12/31/2011 | ||||||||||||||||||
294751BQ4 | 1,400,662 | 1,130,716 | (269,946) | 1,130,716 | 596,090 | 12/31/2011 | ||||||||||||||||||
294751BY7 | 2,303,908 | 2,083,863 | (220,045) | 2,083,863 | 1,362,934 | 12/31/2011 | ||||||||||||||||||
294751FC1 | 424,059 | 245,031 | (179,028) | 245,031 | 481,165 | 12/31/2011 | ||||||||||||||||||
3622ELAD8 | 34,344,829 | 32,885,188 | (1,459,641) | 32,885,188 | 26,326,768 | 12/31/2011 | ||||||||||||||||||
61749EAE7 | 15,855,707 | 15,621,821 | (233,886) | 15,621,821 | 11,248,225 | 12/31/2011 | ||||||||||||||||||
75971EAF3 | 353,565 | 337,595 | (15,970) | 337,595 | 198,481 | 12/31/2011 | ||||||||||||||||||
760985YY1 | 260,203 | 217,084 | (43,119) | 217,084 | 99,483 | 12/31/2011 | ||||||||||||||||||
03762CAE5 | 19,030,571 | 15,365,581 | (3,664,990) | 15,365,581 | 4,324,000 | 12/31/2011 | ||||||||||||||||||
059500AG3 | 25,048,068 | 24,002,215 | (1,045,853) | 24,002,215 | 13,928,185 | 12/31/2011 | ||||||||||||||||||
| 54 |
| continued |
| CUSIP | Book/Adj. Carrying Value Amortized Cost Before Current Period OTTI | Present Value of Projected Cash Flows | Recognized Other-Than- Temporary Impairment | Amortized Cost After Other- Than-Temporary Impairment | Fair Value as of Impairment Date | Date of Financial Statement Where Reported | ||||||||||||||||||
05950WAP3 | $ | 17,080,256 | $ | 11,361,761 | $ | (5,718,495) | $ | 11,361,761 | $ | 10,205,143 | 12/31/2011 | |||||||||||||
05950XAJ5 | 19,827,696 | 19,777,781 | (49,915) | 19,777,781 | 11,880,270 | 12/31/2011 | ||||||||||||||||||
07388YAY8 | 5,637,345 | 3,777,667 | (1,859,678) | 3,777,667 | 2,174,987 | 12/31/2011 | ||||||||||||||||||
07388YBA9 | 2,111,151 | — | * | (2,111,151) | — | 1,489,308 | 12/31/2011 | |||||||||||||||||
07401DAL5 | 5,422,242 | 4,332,442 | (1,089,800) | 4,332,442 | 2,849,643 | 12/31/2011 | ||||||||||||||||||
07401DAM3 | 2,052,629 | 694,611 | (1,358,018) | 694,611 | 1,570,166 | 12/31/2011 | ||||||||||||||||||
17310MAL4 | 2,234,420 | 872,009 | (1,362,411) | 872,009 | 1,573,349 | 12/31/2011 | ||||||||||||||||||
17310MAS9 | 162,759 | 139,556 | (23,203) | 139,556 | 720,000 | 12/31/2011 | ||||||||||||||||||
20047QAM7 | 2,058,527 | 2,001,047 | (57,480) | 2,001,047 | 8,316,304 | 12/31/2011 | ||||||||||||||||||
225458VV7 | 10,008,698 | 9,869,824 | (138,874) | 9,869,824 | 6,488,972 | 12/31/2011 | ||||||||||||||||||
225458VY1 | 1,871,162 | 931,334 | (939,828) | 931,334 | 838,537 | 12/31/2011 | ||||||||||||||||||
22545XAG8 | 20,411 | 10,369 | (10,042) | 10,369 | 40,301 | 12/31/2011 | ||||||||||||||||||
36159XAJ9 | 18,258,715 | 18,091,151 | (167,564) | 18,091,151 | 8,454,269 | 12/31/2011 | ||||||||||||||||||
36228CWB5 | 25,278,369 | 22,690,676 | (2,587,693) | 22,690,676 | 14,480,243 | 12/31/2011 | ||||||||||||||||||
396789KF5 | 2,814,647 | 2,770,038 | (44,609) | 2,770,038 | 1,782,400 | 12/31/2011 | ||||||||||||||||||
46625M2Y4 | 90,542 | — | * | (90,542) | — | 325,809 | 12/31/2011 | |||||||||||||||||
46625M7A1 | 6,030,156 | 4,030,987 | (1,999,169) | 4,030,987 | 917,897 | 12/31/2011 | ||||||||||||||||||
46625MQ77 | 115,005 | — | * | (115,005) | — | 183,273 | 12/31/2011 | |||||||||||||||||
46625YA60 | 269,520 | 266,222 | (3,298) | 266,222 | 1,204,869 | 12/31/2011 | ||||||||||||||||||
46630VAP7 | 786,932 | 538,761 | (248,171) | 538,761 | 1,208,319 | 12/31/2011 | ||||||||||||||||||
50180JAG0 | 31,643,343 | 29,504,194 | (2,139,149) | 29,504,194 | 17,105,627 | 12/31/2011 | ||||||||||||||||||
60687UAL1 | 19,129,917 | 18,630,476 | (499,441) | 18,630,476 | 9,338,153 | 12/31/2011 | ||||||||||||||||||
60687UAM9 | 1,995,422 | 1,274,639 | (720,783) | 1,274,639 | 1,860,876 | 12/31/2011 | ||||||||||||||||||
69348HBT4 | 11,973,543 | 11,186,588 | (786,955) | 11,186,588 | 5,836,449 | 12/31/2011 | ||||||||||||||||||
74438WAN6 | 305,442 | 258,839 | (46,603) | 258,839 | 187,853 | 12/31/2011 | ||||||||||||||||||
92976BFZ0 | 8,536,283 | 2,040,473 | (6,495,810) | 2,040,473 | 4,295,675 | 12/31/2011 | ||||||||||||||||||
92976BGE6 | 653,988 | 544,541 | (109,447) | 544,541 | 1,444,195 | 12/31/2011 | ||||||||||||||||||
92976VAT5 | 9,903,330 | 9,618,391 | (284,939) | 9,618,391 | 5,811,388 | 12/31/2011 | ||||||||||||||||||
92977QAM0 | 8,175,546 | 2,091,944 | (6,083,602) | 2,091,944 | 10,268,650 | 12/31/2011 | ||||||||||||||||||
92977QAP3 | 895,885 | 374,432 | (521,453) | 374,432 | 5,627,130 | 12/31/2011 | ||||||||||||||||||
92978TAM3 | 1,943,041 | — | * | (1,943,041) | — | 7,411,617 | 12/31/2011 | |||||||||||||||||
05948KKZ1 | 3,497,270 | 3,182,834 | (314,436) | 3,182,834 | 2,371,208 | 12/31/2011 | ||||||||||||||||||
05949AA67 | 1,128,478 | 1,081,178 | (47,300) | 1,081,178 | 2,746,501 | 12/31/2011 | ||||||||||||||||||
05949AM31 | 76,222 | 69,991 | (6,231) | 69,991 | 52,033 | 12/31/2011 | ||||||||||||||||||
12669E4V5 | 9,046,295 | 8,974,503 | (71,792) | 8,974,503 | 6,551,168 | 12/31/2011 | ||||||||||||||||||
12669E4W3 | 1,566,728 | 1,061,141 | (505,587) | 1,061,141 | 1,580,772 | 12/31/2011 | ||||||||||||||||||
12669EL95 | 7,358,570 | 7,002,255 | (356,315) | 7,002,255 | 6,085,718 | 12/31/2011 | ||||||||||||||||||
12669EWY8 | 7,947,570 | 7,392,317 | (555,253) | 7,392,317 | 5,713,418 | 12/31/2011 | ||||||||||||||||||
12669EWZ5 | 757,315 | 705,056 | (52,259) | 705,056 | 1,711,058 | 12/31/2011 | ||||||||||||||||||
22541SVH8 | 5,026,531 | 4,205,902 | (820,629) | 4,205,902 | 3,273,345 | 12/31/2011 | ||||||||||||||||||
251510ET6 | 2,308,450 | 1,587,724 | (720,726) | 1,587,724 | 2,663,480 | 12/31/2011 | ||||||||||||||||||
32051GDH5 | 1,261,349 | 950,225 | (311,124) | 950,225 | 885,279 | 12/31/2011 | ||||||||||||||||||
36185NJ50 | 1,643,240 | 1,582,400 | (60,840) | 1,582,400 | 1,394,056 | 12/31/2011 | ||||||||||||||||||
36185NW55 | 1,438,957 | 1,379,484 | (59,473) | 1,379,484 | 1,144,329 | 12/31/2011 | ||||||||||||||||||
74951PEA2 | 265,968 | 219,733 | (46,235) | 219,733 | 334,464 | 12/31/2011 | ||||||||||||||||||
7609856L0 | 3,647,060 | 3,197,376 | (449,684) | 3,197,376 | 2,937,238 | 12/31/2011 | ||||||||||||||||||
76110HHA0 | 7,821,928 | 7,732,724 | (89,204) | 7,732,724 | 6,833,214 | 12/31/2011 | ||||||||||||||||||
76110HSG5 | 5,335,610 | 5,214,665 | (120,945) | 5,214,665 | 5,207,641 | 12/31/2011 | ||||||||||||||||||
05949TBF5 | 14,539,522 | 14,376,599 | (162,923) | 14,376,599 | 13,957,421 | 12/31/2011 | ||||||||||||||||||
12667GUG6 | 4,686,673 | 4,579,177 | (107,496) | 4,579,177 | 4,302,914 | 12/31/2011 | ||||||||||||||||||
32051G2H7 | 9,425,438 | 9,061,820 | (363,618) | 9,061,820 | 8,061,549 | 12/31/2011 | ||||||||||||||||||
32051GN35 | 25,013,674 | 24,819,498 | (194,176) | 24,819,498 | 23,227,400 | 12/31/2011 | ||||||||||||||||||
32051GNS0 | 2,830,893 | 2,415,871 | (415,022) | 2,415,871 | 5,504,762 | 12/31/2011 | ||||||||||||||||||
32051GSQ9 | 6,940,626 | 6,588,863 | (351,763) | 6,588,863 | 12,743,891 | 12/31/2011 | ||||||||||||||||||
92977YBQ3 | 8,053,327 | 7,203,202 | (850,125) | 7,203,202 | 9,640,415 | 12/31/2011 | ||||||||||||||||||
| 55 |
NOTES TO STATUTORY–BASIS FINANCIAL STATEMENTS
TEACHERS INSURANCE AND ANNUITY ASSOCIATION OF AMERICA
| CUSIP | Book/Adj. Carrying Value Amortized Cost Before Current Period OTTI | Present Value of Projected Cash Flows | Recognized Other-Than- Temporary Impairment | Amortized Cost After Other- Than-Temporary Impairment | Fair Value as of Impairment Date | Date of Financial Statement Where Reported | ||||||||||||||||||
94985JCA6 | $ | 28,110,187 | $ | 27,677,160 | $ | (433,027) | $ | 27,677,160 | $ | 26,444,910 | 12/31/2011 | |||||||||||||
32051GP41 | 19,478,025 | 19,238,580 | (239,445) | 19,238,580 | 17,501,620 | 12/31/2011 | ||||||||||||||||||
949837AF5 | 68,067,065 | 67,125,276 | (941,789) | 67,125,276 | 63,007,793 | 12/31/2011 | ||||||||||||||||||
94984HAC9 | 35,382,919 | 35,259,321 | (123,598) | 35,259,321 | 44,366,701 | 12/31/2011 | ||||||||||||||||||
94985WAP6 | 19,305,817 | 19,109,418 | (196,399) | 19,109,418 | 18,637,274 | 12/31/2011 | ||||||||||||||||||
05949YAC2 | 11,697,309 | 11,058,756 | (638,553) | 11,058,756 | 9,947,093 | 12/31/2011 | ||||||||||||||||||
12667F2J3 | 42,493,417 | 41,990,777 | (502,640) | 41,990,777 | 38,184,902 | 12/31/2011 | ||||||||||||||||||
12667GJR5 | 52,238,578 | 51,716,807 | (521,771) | 51,716,807 | 42,382,367 | 12/31/2011 | ||||||||||||||||||
32051G2J3 | 21,816,767 | 21,604,152 | (212,615) | 21,604,152 | 18,313,327 | 12/31/2011 | ||||||||||||||||||
76111XN90 | 7,442,211 | 7,261,986 | (180,225) | 7,261,986 | 6,972,081 | 12/31/2011 | ||||||||||||||||||
94985WAQ4 | 78,543,947 | 77,054,573 | (1,489,374) | 77,054,573 | 74,163,533 | 12/31/2011 | ||||||||||||||||||
02147QAE2 | 39,337,111 | 38,882,221 | (454,890) | 38,882,221 | 33,224,390 | 12/31/2011 | ||||||||||||||||||
02151FAD1 | 35,416,605 | 35,192,440 | (224,165) | 35,192,440 | 33,825,680 | 12/31/2011 | ||||||||||||||||||
05948KC98 | 16,299,738 | 16,153,307 | (146,431) | 16,153,307 | 14,667,519 | 12/31/2011 | ||||||||||||||||||
05948KP37 | 9,927,884 | 9,916,487 | (11,397) | 9,916,487 | 9,203,366 | 12/31/2011 | ||||||||||||||||||
05950RAK5 | 27,835,569 | 27,671,346 | (164,223) | 27,671,346 | 26,103,546 | 12/31/2011 | ||||||||||||||||||
12543UAD4 | 40,684,575 | 39,858,306 | (826,269) | 39,858,306 | 34,747,225 | 12/31/2011 | ||||||||||||||||||
12543UAE2 | 14,258,736 | 13,984,348 | (274,388) | 13,984,348 | 11,959,746 | 12/31/2011 | ||||||||||||||||||
12543XAD8 | 24,330,818 | 24,020,519 | (310,299) | 24,020,519 | 37,876,184 | 12/31/2011 | ||||||||||||||||||
12544DAK5 | 21,263,750 | 20,670,543 | (593,207) | 20,670,543 | 19,855,762 | 12/31/2011 | ||||||||||||||||||
12544DAQ2 | 15,139,862 | 14,729,039 | (410,823) | 14,729,039 | 14,114,085 | 12/31/2011 | ||||||||||||||||||
12544LAK7 | 28,564,821 | 28,564,411 | (410) | 28,564,411 | 28,371,660 | 12/31/2011 | ||||||||||||||||||
12544RAL2 | 8,464,824 | 8,315,419 | (149,405) | 8,315,419 | 7,412,400 | 12/31/2011 | ||||||||||||||||||
12667F4N2 | 8,936,680 | 8,781,423 | (155,257) | 8,781,423 | 7,896,344 | 12/31/2011 | ||||||||||||||||||
12667F5Z4 | 25,640,140 | 25,198,370 | (441,770) | 25,198,370 | 21,765,290 | 12/31/2011 | ||||||||||||||||||
12667F7D1 | 23,222,032 | 23,213,847 | (8,185) | 23,213,847 | 20,760,221 | 12/31/2011 | ||||||||||||||||||
12667GFB4 | 62,309,602 | 62,103,000 | (206,602) | 62,103,000 | 57,708,345 | 12/31/2011 | ||||||||||||||||||
12667GFT5 | 18,406,789 | 18,097,001 | (309,788) | 18,097,001 | 15,339,699 | 12/31/2011 | ||||||||||||||||||
12667GKE2 | 13,340,301 | 13,268,591 | (71,710) | 13,268,591 | 11,223,530 | 12/31/2011 | ||||||||||||||||||
12667GLE1 | 27,739,481 | 27,514,390 | (225,091) | 27,514,390 | 24,804,232 | 12/31/2011 | ||||||||||||||||||
12667GQA4 | 20,607,678 | 20,451,471 | (156,207) | 20,451,471 | 18,191,516 | 12/31/2011 | ||||||||||||||||||
12668AAG0 | 13,402,901 | 12,916,976 | (485,925) | 12,916,976 | 13,010,199 | 12/31/2011 | ||||||||||||||||||
126694JS8 | 27,613,195 | 27,122,138 | (491,057) | 27,122,138 | 23,122,404 | 12/31/2011 | ||||||||||||||||||
126694XQ6 | 30,333,090 | 29,648,783 | (684,307) | 29,648,783 | 27,666,690 | 12/31/2011 | ||||||||||||||||||
12669YAF9 | 18,085,807 | 17,898,160 | (187,647) | 17,898,160 | 16,105,757 | 12/31/2011 | ||||||||||||||||||
12669YAX0 | 13,211,327 | 13,153,470 | (57,857) | 13,153,470 | 9,785,452 | 12/31/2011 | ||||||||||||||||||
12670AAF8 | 44,668,605 | 43,974,056 | (694,549) | 43,974,056 | 39,296,110 | 12/31/2011 | ||||||||||||||||||
161631AV8 | 39,102,113 | 38,849,870 | (252,243) | 38,849,870 | 36,394,968 | 12/31/2011 | ||||||||||||||||||
16163BAP9 | 27,227,221 | 26,855,354 | (371,867) | 26,855,354 | 24,058,902 | 12/31/2011 | ||||||||||||||||||
170255AS2 | 14,453,750 | 14,052,285 | (401,465) | 14,052,285 | 12,797,879 | 12/31/2011 | ||||||||||||||||||
17025AAB8 | 15,878,895 | 14,907,194 | (971,701) | 14,907,194 | 16,706,175 | 12/31/2011 | ||||||||||||||||||
17025JAB9 | 36,480,861 | 36,150,043 | (330,818) | 36,150,043 | 34,331,281 | 12/31/2011 | ||||||||||||||||||
17025TAV3 | 27,283,438 | 26,829,885 | (453,553) | 26,829,885 | 24,516,797 | 12/31/2011 | ||||||||||||||||||
17312FAD5 | 9,783,950 | 9,663,490 | (120,460) | 9,663,490 | 8,790,970 | 12/31/2011 | ||||||||||||||||||
32051GFL4 | 6,947,633 | 6,743,701 | (203,932) | 6,743,701 | 6,749,021 | 12/31/2011 | ||||||||||||||||||
32051GUQ6 | 20,646,005 | 20,566,812 | (79,193) | 20,566,812 | 18,677,368 | 12/31/2011 | ||||||||||||||||||
32051GVL6 | 23,167,772 | 22,949,745 | (218,027) | 22,949,745 | 20,749,766 | 12/31/2011 | ||||||||||||||||||
36185MEG3 | 14,048,228 | 13,887,960 | (160,268) | 13,887,960 | 13,939,519 | 12/31/2011 | ||||||||||||||||||
3622MPAN8 | 28,418,236 | 28,346,905 | (71,331) | 28,346,905 | 27,359,350 | 12/31/2011 | ||||||||||||||||||
3622MPBE7 | 49,423,845 | 49,367,449 | (56,396) | 49,367,449 | 45,604,100 | 12/31/2011 | ||||||||||||||||||
362669AQ6 | 9,800,494 | 9,689,758 | (110,736) | 9,689,758 | 9,494,484 | 12/31/2011 | ||||||||||||||||||
45660LPD5 | 13,382,334 | 13,151,674 | (230,660) | 13,151,674 | 10,948,805 | 12/31/2011 | ||||||||||||||||||
46627MAC1 | 10,184,151 | 9,933,001 | (251,150) | 9,933,001 | 7,945,644 | 12/31/2011 | ||||||||||||||||||
46628YBK5 | 28,210,123 | 27,685,765 | (524,358) | 27,685,765 | 24,243,108 | 12/31/2011 | ||||||||||||||||||
58550PAC0 | 588,658 | 446,296 | (142,362) | 446,296 | 540,515 | 12/31/2011 | ||||||||||||||||||
| 56 |
| continued |
| CUSIP | Book/Adj. Carrying Value Amortized Cost Before Current Period OTTI | Present Value of Projected Cash Flows | Recognized Other-Than- Temporary Impairment | Amortized Cost After Other- Than-Temporary Impairment | Fair Value as of Impairment Date | Date of Financial Statement Where Reported | ||||||||||||||||||
749577AL6 | $ | 17,298,863 | $ | 17,200,477 | $ | (98,386) | $ | 17,200,477 | $ | 15,205,934 | 12/31/2011 | |||||||||||||
74957VAQ2 | 18,823,946 | 18,766,902 | (57,044) | 18,766,902 | 17,094,112 | 12/31/2011 | ||||||||||||||||||
74957XAF2 | 35,043,094 | 34,928,034 | (115,060) | 34,928,034 | 29,419,918 | 12/31/2011 | ||||||||||||||||||
749583AH3 | 9,617,142 | 9,588,658 | (28,484) | 9,588,658 | 8,623,983 | 12/31/2011 | ||||||||||||||||||
74958AAD6 | 28,218,004 | 27,857,101 | (360,903) | 27,857,101 | 24,432,287 | 12/31/2011 | ||||||||||||||||||
74958AAH7 | 24,779,658 | 24,562,278 | (217,380) | 24,562,278 | 22,037,429 | 12/31/2011 | ||||||||||||||||||
76110HX53 | 9,390,953 | 9,350,418 | (40,535) | 9,350,418 | 8,590,219 | 12/31/2011 | ||||||||||||||||||
949772AD9 | 26,064,111 | 26,032,967 | (31,144) | 26,032,967 | 25,707,965 | 12/31/2011 | ||||||||||||||||||
94980SAS4 | 37,499,780 | 37,305,760 | (194,020) | 37,305,760 | 38,106,160 | 12/31/2011 | ||||||||||||||||||
94980SBJ3 | 18,895,713 | 18,800,399 | (95,314) | 18,800,399 | 18,496,460 | 12/31/2011 | ||||||||||||||||||
949837BE7 | 19,710,586 | 19,441,226 | (269,360) | 19,441,226 | 18,563,052 | 12/31/2011 | ||||||||||||||||||
949837BK3 | 8,461,277 | 8,343,680 | (117,597) | 8,343,680 | 7,879,095 | 12/31/2011 | ||||||||||||||||||
949837CC0 | 25,066,550 | 24,701,523 | (365,027) | 24,701,523 | 23,881,548 | 12/31/2011 | ||||||||||||||||||
94984AAR1 | 28,695,367 | 28,439,129 | (256,238) | 28,439,129 | 27,287,880 | 12/31/2011 | ||||||||||||||||||
94984AAS9 | 9,070,812 | 9,031,927 | (38,885) | 9,031,927 | 38,971,534 | 12/31/2011 | ||||||||||||||||||
94984FAR0 | 33,820,848 | 33,486,156 | (334,692) | 33,486,156 | 50,826,958 | 12/31/2011 | ||||||||||||||||||
94985JAB6 | 47,805,425 | 46,890,799 | (914,626) | 46,890,799 | 45,631,000 | 12/31/2011 | ||||||||||||||||||
94985JBR0 | 28,796,377 | 28,237,483 | (558,894) | 28,237,483 | 27,341,087 | 12/31/2011 | ||||||||||||||||||
94985LAD7 | 15,367,803 | 14,899,982 | (467,821) | 14,899,982 | 14,659,815 | 12/31/2011 | ||||||||||||||||||
94985RAP7 | 60,111,130 | 59,299,392 | (811,738) | 59,299,392 | 56,583,744 | 12/31/2011 | ||||||||||||||||||
94985WBL4 | 36,679,399 | 36,086,592 | (592,807) | 36,086,592 | 35,280,570 | 12/31/2011 | ||||||||||||||||||
94986AAC2 | 108,934,925 | 107,831,375 | (1,103,550) | 107,831,375 | 102,662,685 | 12/31/2011 | ||||||||||||||||||
17310MAQ3 | 4,720,890 | —² | (732,789) | 3,988,101 | 3,988,101 | 12/31/2011 | ||||||||||||||||||
19075CAJ2 | 4,708,261 | —² | (486,329) | 4,221,932 | 4,221,932 | 12/31/2011 | ||||||||||||||||||
19075CAK9 | 5,375,311 | —² | (140,726) | 5,234,585 | 5,234,585 | 12/31/2011 | ||||||||||||||||||
46628FAU5 | 1,566,902 | —² | (102,400) | 1,464,502 | 1,464,502 | 12/31/2011 | ||||||||||||||||||
59025KAJ1 | 1,902,971 | —² | (131,323) | 1,771,648 | 1,771,648 | 12/31/2011 | ||||||||||||||||||
92976BBV3 | 11,050,865 | —² | (908,776) | 10,142,089 | 10,142,089 | 12/31/2011 | ||||||||||||||||||
004421MW0 | 23,869,919 | 23,338,255 | (531,664) | 23,338,255 | 17,755,371 | 9/30/2011 | ||||||||||||||||||
05947U6C7 | 20,574,137 | 19,297,180 | (1,276,957) | 19,297,180 | 11,127,386 | 9/30/2011 | ||||||||||||||||||
05948KLA5 | 251,425 | 245,722 | (5,703) | 245,722 | 609,380 | 9/30/2011 | ||||||||||||||||||
05949AM31 | 94,954 | 76,222 | (18,732) | 76,222 | 80,680 | 9/30/2011 | ||||||||||||||||||
05949TBF5 | 15,295,706 | 15,260,891 | (34,815) | 15,260,891 | 15,054,284 | 9/30/2011 | ||||||||||||||||||
05950XAJ5 | 20,044,794 | 19,834,096 | (210,698) | 19,834,096 | 13,827,214 | 9/30/2011 | ||||||||||||||||||
059511AK1 | 3,839,391 | 1,637,950 | (2,201,441) | 1,637,950 | 1,167,394 | 9/30/2011 | ||||||||||||||||||
059511AL9 | 3,748,791 | 542,271 | (3,206,520) | 542,271 | 1,722,948 | 9/30/2011 | ||||||||||||||||||
07388VAK4 | 7,626,772 | 6,344,300 | (1,282,472) | 6,344,300 | 3,715,392 | 9/30/2011 | ||||||||||||||||||
07388VAL2 | 3,292,020 | 2,952,388 | (339,632) | 2,952,388 | 7,589,981 | 9/30/2011 | ||||||||||||||||||
07388YBA9 | 2,578,515 | 2,129,725 | (448,790) | 2,129,725 | 2,249,971 | 9/30/2011 | ||||||||||||||||||
12543UAD4 | 41,224,372 | 40,773,524 | (450,848) | 40,773,524 | 35,252,740 | 9/30/2011 | ||||||||||||||||||
12543UAE2 | 14,631,007 | 14,523,778 | (107,229) | 14,523,778 | 12,316,542 | 9/30/2011 | ||||||||||||||||||
12543XAD8 | 24,604,683 | 24,459,424 | (145,259) | 24,459,424 | 24,145,850 | 9/30/2011 | ||||||||||||||||||
12545CAU4 | 36,163,938 | 35,885,213 | (278,725) | 35,885,213 | 34,149,720 | 9/30/2011 | ||||||||||||||||||
12566XAE8 | 28,324,818 | 27,959,736 | (365,082) | 27,959,736 | 26,512,878 | 9/30/2011 | ||||||||||||||||||
12566XAG3 | 13,448,822 | 13,143,200 | (305,622) | 13,143,200 | 12,632,660 | 9/30/2011 | ||||||||||||||||||
126670CL0 | 19,762,888 | 18,725,504 | (1,037,384) | 18,725,504 | 16,979,265 | 9/30/2011 | ||||||||||||||||||
126670GR3 | 5,167,251 | 4,933,550 | (233,701) | 4,933,550 | 2,618,574 | 9/30/2011 | ||||||||||||||||||
126670QT8 | 3,070,989 | 3,025,169 | (45,820) | 3,025,169 | 2,336,675 | 9/30/2011 | ||||||||||||||||||
126670QU5 | 10,850,281 | 10,623,307 | (226,974) | 10,623,307 | 7,414,440 | 9/30/2011 | ||||||||||||||||||
12667FMJ1 | 15,390,872 | 14,991,177 | (399,695) | 14,991,177 | 9,049,653 | 9/30/2011 | ||||||||||||||||||
12667GQA4 | 21,147,716 | 20,976,951 | (170,765) | 20,976,951 | 18,026,894 | 9/30/2011 | ||||||||||||||||||
12668ASR7 | 6,350,809 | 6,304,821 | (45,988) | 6,304,821 | 4,724,677 | 9/30/2011 | ||||||||||||||||||
126694JS8 | 27,781,151 | 27,603,141 | (178,010) | 27,603,141 | 23,212,641 | 9/30/2011 | ||||||||||||||||||
12669YAF9 | 18,877,231 | 18,704,323 | (172,908) | 18,704,323 | 17,063,109 | 9/30/2011 | ||||||||||||||||||
12669YAH5 | 14,499,875 | 14,321,116 | (178,759) | 14,321,116 | 12,599,988 | 9/30/2011 | ||||||||||||||||||
| 57 |
NOTES TO STATUTORY–BASIS FINANCIAL STATEMENTS
TEACHERS INSURANCE AND ANNUITY ASSOCIATION OF AMERICA
| CUSIP | Book/Adj. Carrying Value Amortized Cost Before Current Period OTTI | Present Value of Projected Cash Flows | Recognized Other-Than- Temporary Impairment | Amortized Cost After Other- Than-Temporary Impairment | Fair Value as of Impairment Date | Date of Financial Statement Where Reported | ||||||||||||||||||
12669YAX0 | $ | 14,076,715 | $ | 13,925,667 | $ | (151,048) | $ | 13,925,667 | $ | 12,074,555 | 9/30/2011 | |||||||||||||
161631AV8 | 39,254,318 | 39,137,734 | (116,584) | 39,137,734 | 36,591,824 | 9/30/2011 | ||||||||||||||||||
17025JAB9 | 36,628,466 | 36,485,065 | (143,401) | 36,485,065 | 34,773,813 | 9/30/2011 | ||||||||||||||||||
17307GVJ4 | 9,875,066 | 9,672,443 | (202,623) | 9,672,443 | 9,934,363 | 9/30/2011 | ||||||||||||||||||
17310MAS9 | 217,952 | 210,763 | (7,189) | 210,763 | 946,070 | 9/30/2011 | ||||||||||||||||||
20173MAN0 | 3,713,203 | 3,699,090 | (14,113) | 3,699,090 | 5,100,000 | 9/30/2011 | ||||||||||||||||||
20173QAJ0 | 6,096,193 | 5,393,157 | (703,036) | 5,393,157 | 5,407,908 | 9/30/2011 | ||||||||||||||||||
20173QAK7 | 836,318 | 641,753 | (194,565) | 641,753 | 2,796,231 | 9/30/2011 | ||||||||||||||||||
21075WBA2 | 1,524,463 | 1,494,595 | (29,868) | 1,494,595 | 1,458,058 | 9/30/2011 | ||||||||||||||||||
22541Q4M1 | 6,252,359 | 5,912,667 | (339,692) | 5,912,667 | 3,774,210 | 9/30/2011 | ||||||||||||||||||
225458VY1 | 2,655,464 | 1,988,615 | (666,849) | 1,988,615 | 1,989,750 | 9/30/2011 | ||||||||||||||||||
22545XAG8 | 46,759 | 20,651 | (26,108) | 20,651 | 36,009 | 9/30/2011 | ||||||||||||||||||
32051GUQ6 | 20,813,600 | 20,636,064 | (177,536) | 20,636,064 | 18,495,702 | 9/30/2011 | ||||||||||||||||||
32051GVL6 | 23,490,915 | 23,438,918 | (51,997) | 23,438,918 | 21,821,759 | 9/30/2011 | ||||||||||||||||||
36157TJG7 | 983,821 | — | ² | (121,880) | 861,941 | 861,941 | 9/30/2011 | |||||||||||||||||
36228CDP5 | 471,909 | 266,055 | (205,854) | 266,055 | 831,507 | 9/30/2011 | ||||||||||||||||||
36228CWB5 | 32,052,168 | 25,368,074 | (6,684,094) | 25,368,074 | 14,035,764 | 9/30/2011 | ||||||||||||||||||
3622MPBE7 | 49,585,723 | 49,466,350 | (119,373) | 49,466,350 | 45,826,150 | 9/30/2011 | ||||||||||||||||||
396789KF5 | 3,202,256 | 2,833,921 | (368,335) | 2,833,921 | 1,686,993 | 9/30/2011 | ||||||||||||||||||
42332QAL7 | 2,730,543 | 2,718,239 | (12,304) | 2,718,239 | 1,375,070 | 9/30/2011 | ||||||||||||||||||
46625YA60 | 1,358,830 | 307,473 | (1,051,357) | 307,473 | 1,052,876 | 9/30/2011 | ||||||||||||||||||
46625YRB1 | 2,181,256 | 1,599,726 | (581,530) | 1,599,726 | 1,037,184 | 9/30/2011 | ||||||||||||||||||
46628SAG8 | 18,266,766 | 17,826,876 | (439,890) | 17,826,876 | 14,470,465 | 9/30/2011 | ||||||||||||||||||
46628YBK5 | 28,634,253 | 28,222,762 | (411,491) | 28,222,762 | 26,701,133 | 9/30/2011 | ||||||||||||||||||
46628YBP4 | 14,979,014 | 14,024,082 | (954,932) | 14,024,082 | 13,802,096 | 9/30/2011 | ||||||||||||||||||
46629PAG3 | 2,495,437 | 1,966,524 | (528,913) | 1,966,524 | 2,891,205 | 9/30/2011 | ||||||||||||||||||
50177AAL3 | 200,996 | 9,902 | (191,094) | 9,902 | 3,900,515 | 9/30/2011 | ||||||||||||||||||
50180JAG0 | 34,812,879 | 31,695,404 | (3,117,475) | 31,695,404 | 18,529,224 | 9/30/2011 | ||||||||||||||||||
52521RAS0 | 1,619,807 | 1,564,384 | (55,423) | 1,564,384 | 1,626,438 | 9/30/2011 | ||||||||||||||||||
525221CM7 | 23,250,372 | 21,935,145 | (1,315,227) | 21,935,145 | 15,515,449 | 9/30/2011 | ||||||||||||||||||
52523KAH7 | 9,804,380 | 9,624,320 | (180,060) | 9,624,320 | 7,023,874 | 9/30/2011 | ||||||||||||||||||
55312TAG8 | 19,718,435 | 16,110,600 | (3,607,835) | 16,110,600 | 11,109,030 | 9/30/2011 | ||||||||||||||||||
55312TAH6 | 1,426,882 | 798,219 | (628,663) | 798,219 | 5,148,109 | 9/30/2011 | ||||||||||||||||||
58550PAC0 | 701,448 | 628,080 | (73,368) | 628,080 | 579,586 | 9/30/2011 | ||||||||||||||||||
59022HJS2 | 20,301,794 | 19,617,805 | (683,989) | 19,617,805 | 10,878,474 | 9/30/2011 | ||||||||||||||||||
60688BAJ7 | 11,584,760 | 5,857,859 | (5,726,901) | 5,857,859 | 5,564,470 | 9/30/2011 | ||||||||||||||||||
617451CA5 | 6,618,726 | 6,475,244 | (143,482) | 6,475,244 | 3,126,802 | 9/30/2011 | ||||||||||||||||||
61745MU50 | 3,976,991 | 2,642,754 | (1,334,237) | 2,642,754 | 1,670,635 | 9/30/2011 | ||||||||||||||||||
61745MU68 | 356,186 | 233,081 | (123,105) | 233,081 | 1,540,732 | 9/30/2011 | ||||||||||||||||||
61749EAE7 | 16,389,173 | 16,237,957 | (151,216) | 16,237,957 | 9,506,129 | 9/30/2011 | ||||||||||||||||||
61750YAF6 | 27,638,067 | 26,699,216 | (938,851) | 26,699,216 | 18,884,468 | 9/30/2011 | ||||||||||||||||||
61754KAH8 | 25,173,879 | 20,992,729 | (4,181,150) | 20,992,729 | 17,832,370 | 9/30/2011 | ||||||||||||||||||
61755BAH7 | 49,044,448 | 47,427,779 | (1,616,669) | 47,427,779 | 27,906,835 | 9/30/2011 | ||||||||||||||||||
73316PGH7 | 10,289,711 | 10,221,039 | (68,672) | 10,221,039 | 8,225,465 | 9/30/2011 | ||||||||||||||||||
73316PGJ3 | 13,120,319 | 12,179,070 | (941,249) | 12,179,070 | 9,496,204 | 9/30/2011 | ||||||||||||||||||
74951PEA2 | 385,150 | 300,979 | (84,171) | 300,979 | 507,036 | 9/30/2011 | ||||||||||||||||||
749577AL6 | 17,419,537 | 17,342,882 | (76,655) | 17,342,882 | 16,238,819 | 9/30/2011 | ||||||||||||||||||
74957EAE7 | 17,577,497 | 17,487,105 | (90,392) | 17,487,105 | 16,506,009 | 9/30/2011 | ||||||||||||||||||
74957EAF4 | 36,282,204 | 36,082,378 | (199,826) | 36,082,378 | 33,437,131 | 9/30/2011 | ||||||||||||||||||
74957VAQ2 | 20,077,409 | 19,914,811 | (162,598) | 19,914,811 | 18,595,328 | 9/30/2011 | ||||||||||||||||||
74957XAF2 | 35,784,486 | 35,609,375 | (175,111) | 35,609,375 | 34,500,677 | 9/30/2011 | ||||||||||||||||||
74958EAD8 | 47,419,570 | 46,777,510 | (642,060) | 46,777,510 | 45,050,650 | 9/30/2011 | ||||||||||||||||||
7609856L0 | 4,065,048 | 3,827,087 | (237,961) | 3,827,087 | 3,081,325 | 9/30/2011 | ||||||||||||||||||
76110HHB8 | 894,252 | 835,371 | (58,881) | 835,371 | 2,093,527 | 9/30/2011 | ||||||||||||||||||
76110HX87 | 21,983,539 | 21,367,921 | (615,618) | 21,367,921 | 17,514,460 | 9/30/2011 | ||||||||||||||||||
| 58 |
| continued |
| CUSIP | Book/Adj. Carrying Value Amortized Cost Before Current Period OTTI | Present Value of Projected Cash Flows | Recognized Other-Than- Temporary Impairment | Amortized Cost After Other- Than-Temporary Impairment | Fair Value as of Impairment Date | Date of Financial Statement Where Reported | ||||||||||||||||||
761118PQ5 | $ | 11,097,907 | $ | 10,934,518 | $ | (163,389) | $ | 10,934,518 | $ | 9,321,301 | 9/30/2011 | |||||||||||||
76111XN90 | 8,564,760 | 7,846,221 | (718,539) | 7,846,221 | 7,616,815 | 9/30/2011 | ||||||||||||||||||
84604CAE7 | 2,732,318 | 2,633,669 | (98,649) | 2,633,669 | 2,551,738 | 9/30/2011 | ||||||||||||||||||
86359BFG1 | 1,797,452 | 1,496,026 | (301,426) | 1,496,026 | 1,377,970 | 9/30/2011 | ||||||||||||||||||
92976BFZ0 | 10,005,179 | 8,555,934 | (1,449,245) | 8,555,934 | 3,889,206 | 9/30/2011 | ||||||||||||||||||
92976BGE6 | 758,600 | 727,947 | (30,653) | 727,947 | 1,287,305 | 9/30/2011 | ||||||||||||||||||
94980SBJ3 | 18,888,889 | 18,876,199 | (12,690) | 18,876,199 | 18,515,880 | 9/30/2011 | ||||||||||||||||||
949837CC0 | 25,203,525 | 25,067,215 | (136,310) | 25,067,215 | 24,255,407 | 9/30/2011 | ||||||||||||||||||
94983BAP4 | 15,409,157 | 15,367,334 | (41,823) | 15,367,334 | 15,500,397 | 9/30/2011 | ||||||||||||||||||
94984AAR1 | 28,921,008 | 28,699,246 | (221,762) | 28,699,246 | 26,162,730 | 9/30/2011 | ||||||||||||||||||
94984AAS9 | 9,534,419 | 9,460,302 | (74,117) | 9,460,302 | 8,865,397 | 9/30/2011 | ||||||||||||||||||
94984FAR0 | 34,862,018 | 34,654,252 | (207,766) | 34,654,252 | 32,829,185 | 9/30/2011 | ||||||||||||||||||
94984HAC9 | 35,804,330 | 35,428,449 | (375,881) | 35,428,449 | 35,314,539 | 9/30/2011 | ||||||||||||||||||
94985JAB6 | 48,005,187 | 47,823,688 | (181,499) | 47,823,688 | 47,755,100 | 9/30/2011 | ||||||||||||||||||
94985JBR0 | 28,950,520 | 28,812,994 | (137,526) | 28,812,994 | 28,370,535 | 9/30/2011 | ||||||||||||||||||
94985JCA6 | 28,354,882 | 28,154,177 | (200,705) | 28,154,177 | 26,814,150 | 9/30/2011 | ||||||||||||||||||
94985RAP7 | 60,563,665 | 60,162,652 | (401,013) | 60,162,652 | 58,824,064 | 9/30/2011 | ||||||||||||||||||
07387BEP4 | 1,067,268 | — | ² | (442,627) | 624,641 | 624,641 | 9/30/2011 | |||||||||||||||||
19075CAJ2 | 4,783,820 | — | ² | (75,559) | 4,708,261 | 4,708,261 | 9/30/2011 | |||||||||||||||||
36828QSJ6 | 4,749,563 | — | ² | (481,884) | 4,267,679 | 4,267,679 | 9/30/2011 | |||||||||||||||||
46628FAU5 | 1,637,904 | — | ² | (71,003) | 1,566,901 | 1,566,901 | 9/30/2011 | |||||||||||||||||
55312TAR4 | 485,680 | — | ² | (60,710) | 424,970 | 424,970 | 9/30/2011 | |||||||||||||||||
59022HJU7 | 5,344,727 | — | ² | (597,196) | 4,747,531 | 4,747,531 | 9/30/2011 | |||||||||||||||||
59025KAJ1 | 3,507,263 | — | ² | (1,604,292) | 1,902,971 | 1,902,971 | 9/30/2011 | |||||||||||||||||
92976BBV3 | 12,467,305 | — | ² | (1,416,440) | 11,050,865 | 11,050,865 | 9/30/2011 | |||||||||||||||||
92978MAL0 | 6,740,664 | — | ² | (1,018,481) | 5,722,183 | 5,722,183 | 9/30/2011 | |||||||||||||||||
126670GR3 | 5,416,291 | 5,190,365 | (225,926) | 5,190,365 | 3,016,097 | 6/30/2011 | ||||||||||||||||||
12668ASQ9 | 18,889,756 | 18,195,156 | (694,600) | 18,195,156 | 17,989,930 | 6/30/2011 | ||||||||||||||||||
12668ASR7 | 6,667,207 | 6,368,377 | (298,830) | 6,368,377 | 4,739,805 | 6/30/2011 | ||||||||||||||||||
16165LAG5 | 12,333,221 | 12,311,672 | (21,549) | 12,311,672 | 11,544,529 | 6/30/2011 | ||||||||||||||||||
21075WBA2 | 1,551,510 | 1,544,351 | (7,159) | 1,544,351 | 1,493,611 | 6/30/2011 | ||||||||||||||||||
3622ELAD8 | 37,605,697 | 36,833,238 | (772,459) | 36,833,238 | 32,652,797 | 6/30/2011 | ||||||||||||||||||
525221CM7 | 23,311,901 | 23,306,182 | (5,719) | 23,306,182 | 16,105,313 | 6/30/2011 | ||||||||||||||||||
525221DF1 | 26,458,975 | 26,180,867 | (278,108) | 26,180,867 | 25,862,099 | 6/30/2011 | ||||||||||||||||||
525221EB9 | 23,883,119 | 23,305,539 | (577,580) | 23,305,539 | 20,824,874 | 6/30/2011 | ||||||||||||||||||
52523KAH7 | 10,623,645 | 10,156,312 | (467,333) | 10,156,312 | 7,529,057 | 6/30/2011 | ||||||||||||||||||
61749WAH0 | 3,775,210 | 3,619,957 | (155,253) | 3,619,957 | 3,061,191 | 6/30/2011 | ||||||||||||||||||
61749WAJ6 | 2,639,940 | 2,503,794 | (136,146) | 2,503,794 | 2,140,023 | 6/30/2011 | ||||||||||||||||||
61750YAF6 | 29,536,727 | 28,464,536 | (1,072,191) | 28,464,536 | 28,014,201 | 6/30/2011 | ||||||||||||||||||
74924PAJ1 | 379,543 | 154,379 | (225,164) | 154,379 | 158,197 | 6/30/2011 | ||||||||||||||||||
760985WT4 | 366,614 | 213,018 | (153,596) | 213,018 | 47,090 | 6/30/2011 | ||||||||||||||||||
760985YX3 | 6,166,894 | 5,816,442 | (350,452) | 5,816,442 | 1,077,367 | 6/30/2011 | ||||||||||||||||||
760985YY1 | 582,188 | 281,856 | (300,332) | 281,856 | 107,740 | 6/30/2011 | ||||||||||||||||||
76110WRW8 | 2,466,943 | 2,224,582 | (242,361) | 2,224,582 | 670,391 | 6/30/2011 | ||||||||||||||||||
76110WSF4 | 18,410,240 | 18,239,875 | (170,365) | 18,239,875 | 9,853,689 | 6/30/2011 | ||||||||||||||||||
76110WXR2 | 8,889,893 | 8,521,705 | (368,188) | 8,521,705 | 4,440,835 | 6/30/2011 | ||||||||||||||||||
79550DAD1 | 4,258,742 | 4,110,947 | (147,795) | 4,110,947 | 2,983,636 | 6/30/2011 | ||||||||||||||||||
059511AL9 | 4,685,314 | 3,807,010 | (878,304) | 3,807,010 | 2,185,614 | 6/30/2011 | ||||||||||||||||||
07387BEQ2 | 266,043 | — | * | (266,043) | — | 833,700 | 6/30/2011 | |||||||||||||||||
07388VAK4 | 7,974,854 | 7,633,817 | (341,037) | 7,633,817 | 4,718,009 | 6/30/2011 | ||||||||||||||||||
07388VAL2 | 6,973,679 | 3,513,683 | (3,459,996) | 3,513,683 | 10,081,157 | 6/30/2011 | ||||||||||||||||||
07401DAM3 | 2,793,504 | 2,090,294 | (703,210) | 2,090,294 | 2,601,535 | 6/30/2011 | ||||||||||||||||||
07401DAN1 | 2,209,235 | 1,707,746 | (501,489) | 1,707,746 | 6,656,890 | 6/30/2011 | ||||||||||||||||||
17310MAL4 | 3,811,232 | 2,312,053 | (1,499,179) | 2,312,053 | 2,880,693 | 6/30/2011 | ||||||||||||||||||
17310MAS9 | 413,377 | 268,555 | (144,822) | 268,555 | 1,070,687 | 6/30/2011 | ||||||||||||||||||
| 59 |
NOTES TO STATUTORY–BASIS FINANCIAL STATEMENTS
TEACHERS INSURANCE AND ANNUITY ASSOCIATION OF AMERICA
| CUSIP | Book/Adj. Carrying Value Amortized Cost Before Current Period OTTI | Present Value of Projected Cash Flows | Recognized Other-Than- Temporary Impairment | Amortized Cost After Other- Than-Temporary Impairment | Fair Value as of Impairment Date | Date of Financial Statement Where Reported | ||||||||||||||||||
20047QAM7 | $ | 2,931,027 | $ | 2,482,198 | $ | (448,829) | $ | 2,482,198 | $ | 9,492,008 | 6/30/2011 | |||||||||||||
20047QAN5 | 1,083,109 | 608,636 | (474,473) | 608,636 | 5,705,568 | 6/30/2011 | ||||||||||||||||||
20173TAP0 | 444,753 | 372,922 | (71,831) | 372,922 | 4,986,279 | 6/30/2011 | ||||||||||||||||||
22544QAK5 | 369,203 | 191,537 | (177,666) | 191,537 | 4,485,326 | 6/30/2011 | ||||||||||||||||||
225458VY1 | 11,201,665 | 2,762,419 | (8,439,246) | 2,762,419 | 2,046,600 | 6/30/2011 | ||||||||||||||||||
361849K84 | 308,401 | — | * | (308,401) | — | 2,388,397 | 6/30/2011 | |||||||||||||||||
36828QSL1 | 425,621 | 193,835 | (231,786) | 193,835 | 993,103 | 6/30/2011 | ||||||||||||||||||
396789KF5 | 4,330,436 | 3,231,663 | (1,098,773) | 3,231,663 | 1,727,913 | 6/30/2011 | ||||||||||||||||||
46625MQ77 | 257,122 | 133,559 | (123,563) | 133,559 | 205,442 | 6/30/2011 | ||||||||||||||||||
46625MZG7 | 7,872,548 | 6,303,333 | (1,569,215) | 6,303,333 | 8,624,734 | 6/30/2011 | ||||||||||||||||||
46625YA60 | 2,985,770 | 1,382,420 | (1,603,350) | 1,382,420 | 1,153,210 | 6/30/2011 | ||||||||||||||||||
46625YA78 | 361,470 | — | * | (361,470) | — | 1,082,782 | 6/30/2011 | |||||||||||||||||
46625YC68 | 25,139 | — | * | (25,139) | — | 364,800 | 6/30/2011 | |||||||||||||||||
46625YRB1 | 2,848,883 | 2,203,328 | (645,555) | 2,203,328 | 1,201,335 | 6/30/2011 | ||||||||||||||||||
46629PAG3 | 3,785,480 | 2,501,865 | (1,283,615) | 2,501,865 | 3,546,260 | 6/30/2011 | ||||||||||||||||||
46629PAU2 | 421,316 | 351,240 | (70,076) | 351,240 | 1,505,654 | 6/30/2011 | ||||||||||||||||||
46630AAC2 | 327,069 | 242,804 | (84,265) | 242,804 | 875,000 | 6/30/2011 | ||||||||||||||||||
46631BAP0 | 520,501 | 178,624 | (341,877) | 178,624 | 5,045,346 | 6/30/2011 | ||||||||||||||||||
50180JAG0 | 35,106,978 | 34,821,850 | (285,128) | 34,821,850 | 26,270,801 | 6/30/2011 | ||||||||||||||||||
50180JAJ4 | 1,472,798 | 85,964 | (1,386,834) | 85,964 | 6,437,085 | 6/30/2011 | ||||||||||||||||||
59025KAJ1 | 3,911,404 | 3,487,720 | (423,684) | 3,487,720 | 2,281,862 | 6/30/2011 | ||||||||||||||||||
59025KAK8 | 14,098,654 | 4,035,144 | (10,063,510) | 4,035,144 | 7,378,574 | 6/30/2011 | ||||||||||||||||||
60688BAJ7 | 20,725,566 | 11,672,299 | (9,053,267) | 11,672,299 | 10,546,935 | 6/30/2011 | ||||||||||||||||||
60688BAM0 | 1,292,276 | — | * | (1,292,276) | — | 1,844,769 | 6/30/2011 | |||||||||||||||||
60688BAS7 | 1,015,664 | — | * | (1,015,664) | — | 1,920,945 | 6/30/2011 | |||||||||||||||||
617451CA5 | 6,856,720 | 6,618,744 | (237,976) | 6,618,744 | 3,409,175 | 6/30/2011 | ||||||||||||||||||
61745MX40 | 467,147 | 456,400 | (10,747) | 456,400 | 2,090,886 | 6/30/2011 | ||||||||||||||||||
61751NAN2 | 2,219,120 | 1,959,479 | (259,641) | 1,959,479 | 1,983,658 | 6/30/2011 | ||||||||||||||||||
61753JAL3 | 349,048 | 184,198 | (164,850) | 184,198 | 5,067,583 | 6/30/2011 | ||||||||||||||||||
61754KAH8 | 31,916,904 | 25,308,458 | (6,608,446) | 25,308,458 | 26,570,862 | 6/30/2011 | ||||||||||||||||||
74438WAN6 | 400,684 | 305,443 | (95,241) | 305,443 | 23,023 | 6/30/2011 | ||||||||||||||||||
92976BGE6 | 4,985,198 | 807,846 | (4,177,352) | 807,846 | 1,378,953 | 6/30/2011 | ||||||||||||||||||
05948KC98 | 16,688,309 | 16,679,711 | (8,598) | 16,679,711 | 15,591,701 | 6/30/2011 | ||||||||||||||||||
05948KKZ1 | 4,210,412 | 3,655,833 | (554,579) | 3,655,833 | 2,534,931 | 6/30/2011 | ||||||||||||||||||
05948KLA5 | 489,827 | 296,688 | (193,139) | 296,688 | 622,602 | 6/30/2011 | ||||||||||||||||||
05948KP37 | 10,167,635 | 10,135,821 | (31,814) | 10,135,821 | 10,005,554 | 6/30/2011 | ||||||||||||||||||
05949AA67 | 1,743,978 | 1,411,357 | (332,621) | 1,411,357 | 3,201,888 | 6/30/2011 | ||||||||||||||||||
05949AM31 | 121,686 | 94,954 | (26,732) | 94,954 | 90,534 | 6/30/2011 | ||||||||||||||||||
05949AMP2 | 522,129 | 411,275 | (110,854) | 411,275 | 1,154,031 | 6/30/2011 | ||||||||||||||||||
12543TAD7 | 9,394,168 | 9,055,170 | (338,998) | 9,055,170 | 9,351,070 | 6/30/2011 | ||||||||||||||||||
12543XAD8 | 24,623,511 | 24,606,300 | (17,211) | 24,606,300 | 22,823,175 | 6/30/2011 | ||||||||||||||||||
12544AAC9 | 47,196,010 | 46,389,700 | (806,310) | 46,389,700 | 43,866,350 | 6/30/2011 | ||||||||||||||||||
12544DAK5 | 21,279,994 | 21,263,602 | (16,392) | 21,263,602 | 21,290,700 | 6/30/2011 | ||||||||||||||||||
12544LAK7 | 30,599,865 | 30,093,760 | (506,105) | 30,093,760 | 30,403,424 | 6/30/2011 | ||||||||||||||||||
12545CAU4 | 36,946,640 | 36,898,080 | (48,560) | 36,898,080 | 35,045,960 | 6/30/2011 | ||||||||||||||||||
12667F7D1 | 24,022,504 | 23,967,516 | (54,988) | 23,967,516 | 22,177,373 | 6/30/2011 | ||||||||||||||||||
12667FR98 | 997,492 | 739,430 | (258,062) | 739,430 | 1,811,075 | 6/30/2011 | ||||||||||||||||||
12667FW92 | 6,583,670 | 6,483,531 | (100,139) | 6,483,531 | 6,779,092 | 6/30/2011 | ||||||||||||||||||
12667FYZ2 | 9,034,528 | 7,354,134 | (1,680,394) | 7,354,134 | 6,185,202 | 6/30/2011 | ||||||||||||||||||
12667GFT5 | 18,442,849 | 18,442,840 | (9) | 18,442,840 | 15,025,502 | 6/30/2011 | ||||||||||||||||||
12667GQA4 | 21,384,266 | 21,381,385 | (2,881) | 21,381,385 | 20,056,759 | 6/30/2011 | ||||||||||||||||||
12667GUG6 | 5,167,610 | 5,167,297 | (313) | 5,167,297 | 5,112,152 | 6/30/2011 | ||||||||||||||||||
126694JS8 | 27,808,907 | 27,770,828 | (38,079) | 27,770,828 | 22,993,126 | 6/30/2011 | ||||||||||||||||||
126694W61 | 24,217,642 | 23,678,080 | (539,562) | 23,678,080 | 22,368,908 | 6/30/2011 | ||||||||||||||||||
12669EL95 | 8,284,724 | 7,721,748 | (562,976) | 7,721,748 | 6,558,419 | 6/30/2011 | ||||||||||||||||||
| 60 |
| continued |
| CUSIP | Book/Adj. Carrying Value Amortized Cost Before Current Period OTTI | Present Value of Projected Cash Flows | Recognized Other-Than- Temporary Impairment | Amortized Cost After Other- Than-Temporary Impairment | Fair Value as of Impairment Date | Date of Financial Statement Where Reported | ||||||||||||||||||
12670AAF8 | $ | 44,922,498 | $ | 44,783,315 | $ | (139,183) | $ | 44,783,315 | $ | 44,789,385 | 6/30/2011 | |||||||||||||
161631AV8 | 39,796,299 | 39,278,742 | (517,557) | 39,278,742 | 37,422,710 | 6/30/2011 | ||||||||||||||||||
16163BAP9 | 27,734,334 | 27,304,404 | (429,930) | 27,304,404 | 26,377,189 | 6/30/2011 | ||||||||||||||||||
17025AAB8 | 16,059,004 | 15,895,940 | (163,064) | 15,895,940 | 17,624,540 | 6/30/2011 | ||||||||||||||||||
17025JAB9 | 36,896,570 | 36,624,793 | (271,777) | 36,624,793 | 36,327,947 | 6/30/2011 | ||||||||||||||||||
17025TAV3 | 27,341,745 | 27,328,845 | (12,900) | 27,328,845 | 26,350,131 | 6/30/2011 | ||||||||||||||||||
17310AAR7 | 32,471,083 | 32,412,785 | (58,298) | 32,412,785 | 33,225,945 | 6/30/2011 | ||||||||||||||||||
17312FAD5 | 9,800,667 | 9,780,400 | (20,267) | 9,780,400 | 9,285,010 | 6/30/2011 | ||||||||||||||||||
22541SVH8 | 5,329,789 | 5,234,541 | (95,248) | 5,234,541 | 4,879,329 | 6/30/2011 | ||||||||||||||||||
32051G2J3 | 21,238,137 | 21,014,956 | (223,181) | 21,014,956 | 20,281,432 | 6/30/2011 | ||||||||||||||||||
32051GVL6 | 23,829,503 | 23,685,971 | (143,532) | 23,685,971 | 22,766,429 | 6/30/2011 | ||||||||||||||||||
36185MEG3 | 14,514,115 | 14,486,354 | (27,761) | 14,486,354 | 14,554,166 | 6/30/2011 | ||||||||||||||||||
3622MPAN8 | 28,462,267 | 28,389,939 | (72,328) | 28,389,939 | 27,765,585 | 6/30/2011 | ||||||||||||||||||
3622MPBE7 | 49,870,925 | 49,615,350 | (255,575) | 49,615,350 | 46,550,600 | 6/30/2011 | ||||||||||||||||||
45660LPD5 | 13,547,007 | 13,379,208 | (167,799) | 13,379,208 | 12,110,328 | 6/30/2011 | ||||||||||||||||||
46627MAC1 | 10,677,787 | 10,335,468 | (342,319) | 10,335,468 | 10,083,260 | 6/30/2011 | ||||||||||||||||||
46628YBK5 | 28,786,021 | 28,636,816 | (149,205) | 28,636,816 | 27,420,781 | 6/30/2011 | ||||||||||||||||||
46628YBP4 | 15,078,124 | 14,990,171 | (87,953) | 14,990,171 | 14,237,700 | 6/30/2011 | ||||||||||||||||||
749577AL6 | 17,584,234 | 17,450,729 | (133,505) | 17,450,729 | 12,436,493 | 6/30/2011 | ||||||||||||||||||
74957EAE7 | 17,814,093 | 17,577,167 | (236,926) | 17,577,167 | 17,262,933 | 6/30/2011 | ||||||||||||||||||
74957EAF4 | 37,205,793 | 36,827,984 | (377,809) | 36,827,984 | 35,373,641 | 6/30/2011 | ||||||||||||||||||
74957VAQ2 | 21,230,104 | 21,068,104 | (162,000) | 21,068,104 | 20,265,315 | 6/30/2011 | ||||||||||||||||||
74957XAF2 | 36,103,087 | 35,807,508 | (295,579) | 35,807,508 | 32,022,553 | 6/30/2011 | ||||||||||||||||||
749583AH3 | 9,815,438 | 9,752,111 | (63,327) | 9,752,111 | 8,703,301 | 6/30/2011 | ||||||||||||||||||
74958AAH7 | 26,951,193 | 26,897,160 | (54,033) | 26,897,160 | 25,899,660 | 6/30/2011 | ||||||||||||||||||
74958EAD8 | 47,862,448 | 47,451,650 | (410,798) | 47,451,650 | 47,469,000 | 6/30/2011 | ||||||||||||||||||
75115CAG2 | 7,208,598 | 6,931,280 | (277,318) | 6,931,280 | 6,802,458 | 6/30/2011 | ||||||||||||||||||
7609856L0 | 4,396,370 | 4,200,274 | (196,096) | 4,200,274 | 3,097,026 | 6/30/2011 | ||||||||||||||||||
76110HHA0 | 8,737,053 | 8,559,813 | (177,240) | 8,559,813 | 7,568,913 | 6/30/2011 | ||||||||||||||||||
76110HHB8 | 1,254,860 | 1,006,472 | (248,388) | 1,006,472 | 2,316,831 | 6/30/2011 | ||||||||||||||||||
76110HX87 | 22,233,784 | 22,177,729 | (56,055) | 22,177,729 | 16,733,815 | 6/30/2011 | ||||||||||||||||||
761118CZ9 | 9,709,887 | 9,396,854 | (313,033) | 9,396,854 | 8,761,849 | 6/30/2011 | ||||||||||||||||||
761118PQ5 | 11,601,676 | 11,402,188 | (199,488) | 11,402,188 | 10,342,383 | 6/30/2011 | ||||||||||||||||||
94980SAS4 | 37,491,045 | 37,417,720 | (73,325) | 37,417,720 | 39,170,800 | 6/30/2011 | ||||||||||||||||||
94980SBJ3 | 18,923,461 | 18,874,400 | (49,061) | 18,874,400 | 19,442,560 | 6/30/2011 | ||||||||||||||||||
949837AF5 | 68,304,020 | 68,037,751 | (266,269) | 68,037,751 | 65,159,759 | 6/30/2011 | ||||||||||||||||||
949837BE7 | 19,770,628 | 19,689,484 | (81,144) | 19,689,484 | 19,695,651 | 6/30/2011 | ||||||||||||||||||
949837BK3 | 8,492,068 | 8,459,611 | (32,457) | 8,459,611 | 8,359,376 | 6/30/2011 | ||||||||||||||||||
949837CC0 | 25,381,819 | 25,201,881 | (179,938) | 25,201,881 | 25,004,770 | 6/30/2011 | ||||||||||||||||||
94984AAR1 | 28,984,526 | 28,920,780 | (63,746) | 28,920,780 | 28,157,580 | 6/30/2011 | ||||||||||||||||||
94984AAS9 | 9,834,523 | 9,822,590 | (11,933) | 9,822,590 | 9,563,280 | 6/30/2011 | ||||||||||||||||||
94984FAR0 | 35,000,570 | 34,869,922 | (130,648) | 34,869,922 | 35,442,517 | 6/30/2011 | ||||||||||||||||||
94984HAC9 | 36,057,606 | 35,832,279 | (225,327) | 35,832,279 | 36,678,932 | 6/30/2011 | ||||||||||||||||||
94985JAB6 | 48,194,982 | 48,015,850 | (179,132) | 48,015,850 | 46,991,250 | 6/30/2011 | ||||||||||||||||||
94985JBR0 | 29,095,015 | 28,960,567 | (134,448) | 28,960,567 | 29,230,889 | 6/30/2011 | ||||||||||||||||||
94985JCA6 | 28,455,723 | 28,384,350 | (71,373) | 28,384,350 | 27,959,490 | 6/30/2011 | ||||||||||||||||||
94985LAD7 | 15,372,480 | 15,341,859 | (30,621) | 15,341,859 | 15,296,021 | 6/30/2011 | ||||||||||||||||||
94985RAP7 | 60,789,484 | 60,595,456 | (194,028) | 60,595,456 | 60,278,912 | 6/30/2011 | ||||||||||||||||||
94985WAP6 | 20,503,066 | 20,440,065 | (63,001) | 20,440,065 | 20,928,461 | 6/30/2011 | ||||||||||||||||||
94985WAQ4 | 76,047,217 | 75,699,850 | (347,367) | 75,699,850 | 71,018,745 | 6/30/2011 | ||||||||||||||||||
94985WBL4 | 36,808,718 | 36,638,302 | (170,416) | 36,638,302 | 37,093,079 | 6/30/2011 | ||||||||||||||||||
94986AAC2 | 109,651,376 | 109,007,990 | (643,386) | 109,007,990 | 106,429,740 | 6/30/2011 | ||||||||||||||||||
07387BEP4 | 1,236,850 | — | ² | (169,582) | 1,067,268 | 1,067,268 | 6/30/2011 | |||||||||||||||||
92976BBV3 | 12,846,900 | — | ² | (379,595) | 12,467,305 | 12,467,305 | 6/30/2011 | |||||||||||||||||
36828QSJ6 | 4,838,046 | — | ² | (88,483) | 4,749,563 | 4,749,563 | 6/30/2011 | |||||||||||||||||
| 61 |
NOTES TO STATUTORY–BASIS FINANCIAL STATEMENTS
TEACHERS INSURANCE AND ANNUITY ASSOCIATION OF AMERICA
| CUSIP | Book/Adj. Carrying Value Amortized Cost Before Current Period OTTI | Present Value of Projected Cash Flows | Recognized Other-Than- Temporary Impairment | Amortized Cost After Other- Than-Temporary Impairment | Fair Value as of Impairment Date | Date of Financial Statement Where Reported | ||||||||||||||||||
004421MW0 | $ | 26,134,851 | $ | 25,819,133 | $ | (315,718) | $ | 25,819,133 | $ | 19,948,526 | 3/31/2011 | |||||||||||||
02148YAD6 | 18,373,356 | 18,039,367 | (333,989) | 18,039,367 | 16,089,686 | 3/31/2011 | ||||||||||||||||||
026710AE3 | 447,206 | 207,373 | (239,833) | 207,373 | 203,765 | 3/31/2011 | ||||||||||||||||||
05947UML9 | 3,114,619 | 2,835,685 | (278,934) | 2,835,685 | 216,693 | 3/31/2011 | ||||||||||||||||||
05947UMM7 | 36,450 | — | * | (36,450) | — | 143,238 | 3/31/2011 | |||||||||||||||||
05948KC98 | 16,862,524 | 16,843,139 | (19,385) | 16,843,139 | 15,742,234 | 3/31/2011 | ||||||||||||||||||
05948KLA5 | 604,953 | 530,956 | (73,997) | 530,956 | 632,086 | 3/31/2011 | ||||||||||||||||||
05949AA67 | 2,006,284 | 1,869,181 | (137,103) | 1,869,181 | 3,218,466 | 3/31/2011 | ||||||||||||||||||
05949AM23 | 544,074 | 518,756 | (25,318) | 518,756 | 1,357,721 | 3/31/2011 | ||||||||||||||||||
07401DAM3 | 3,084,496 | 2,799,301 | (285,195) | 2,799,301 | 2,619,104 | 3/31/2011 | ||||||||||||||||||
12498NAC7 | 4,672,423 | 4,272,197 | (400,226) | 4,272,197 | 2,426,275 | 3/31/2011 | ||||||||||||||||||
12544RAL2 | 8,561,484 | 8,498,630 | (62,854) | 8,498,630 | 7,859,330 | 3/31/2011 | ||||||||||||||||||
126670GR3 | 6,082,523 | 5,437,768 | (644,755) | 5,437,768 | 2,819,453 | 3/31/2011 | ||||||||||||||||||
126670QT8 | 3,444,883 | 3,125,127 | (319,756) | 3,125,127 | 2,864,320 | 3/31/2011 | ||||||||||||||||||
126670QU5 | 12,164,039 | 11,087,890 | (1,076,149) | 11,087,890 | 9,755,060 | 3/31/2011 | ||||||||||||||||||
126671R65 | 3,570,814 | 3,006,150 | (564,664) | 3,006,150 | 1,404,321 | 3/31/2011 | ||||||||||||||||||
126671R73 | 1,795,347 | 1,764,930 | (30,417) | 1,764,930 | 1,228,587 | 3/31/2011 | ||||||||||||||||||
12667FMJ1 | 16,261,545 | 15,767,157 | (494,388) | 15,767,157 | 10,371,867 | 3/31/2011 | ||||||||||||||||||
12667FR98 | 1,187,196 | 1,158,180 | (29,016) | 1,158,180 | 1,742,980 | 3/31/2011 | ||||||||||||||||||
12668ASR7 | 6,843,785 | 6,680,512 | (163,273) | 6,680,512 | 4,824,802 | 3/31/2011 | ||||||||||||||||||
126694W61 | 24,040,337 | 23,883,605 | (156,732) | 23,883,605 | 22,027,517 | 3/31/2011 | ||||||||||||||||||
126694XQ6 | 30,700,106 | 30,394,828 | (305,278) | 30,394,828 | 24,847,192 | 3/31/2011 | ||||||||||||||||||
12669DN87 | 673,777 | 332,309 | (341,468) | 332,309 | 1,020,537 | 3/31/2011 | ||||||||||||||||||
12669EL95 | 8,482,550 | 8,401,553 | (80,997) | 8,401,553 | 6,635,352 | 3/31/2011 | ||||||||||||||||||
12669YAF9 | 19,384,353 | 18,899,059 | (485,294) | 18,899,059 | 18,754,880 | 3/31/2011 | ||||||||||||||||||
12669YAH5 | 14,838,083 | 14,575,582 | (262,501) | 14,575,582 | 13,168,921 | 3/31/2011 | ||||||||||||||||||
12669YAX0 | 14,411,235 | 14,187,029 | (224,206) | 14,187,029 | 12,623,821 | 3/31/2011 | ||||||||||||||||||
161546JL1 | 1,485,648 | 1,470,737 | (14,911) | 1,470,737 | 670,185 | 3/31/2011 | ||||||||||||||||||
161631AV8 | 40,084,936 | 39,812,268 | (272,668) | 39,812,268 | 40,647,651 | 3/31/2011 | ||||||||||||||||||
16163BAP9 | 28,144,708 | 27,759,884 | (384,824) | 27,759,884 | 26,372,292 | 3/31/2011 | ||||||||||||||||||
17025JAB9 | 36,901,741 | 36,893,393 | (8,348) | 36,893,393 | 35,781,306 | 3/31/2011 | ||||||||||||||||||
17310MAL4 | 5,011,529 | 3,828,689 | (1,182,840) | 3,828,689 | 2,852,490 | 3/31/2011 | ||||||||||||||||||
17310MAS9 | 507,205 | 459,730 | (47,475) | 459,730 | 1,122,064 | 3/31/2011 | ||||||||||||||||||
20047QAM7 | 17,902,880 | 3,151,682 | (14,751,198) | 3,151,682 | 10,004,112 | 3/31/2011 | ||||||||||||||||||
20047QAN5 | 4,566,404 | 1,233,498 | (3,332,906) | 1,233,498 | 5,994,850 | 3/31/2011 | ||||||||||||||||||
20173QAJ0 | 10,027,487 | 6,204,989 | (3,822,498) | 6,204,989 | 7,075,800 | 3/31/2011 | ||||||||||||||||||
20173QAK7 | 4,074,318 | 977,794 | (3,096,524) | 977,794 | 4,044,972 | 3/31/2011 | ||||||||||||||||||
21075WCJ2 | 837,354 | 835,799 | (1,555) | 835,799 | 787,697 | 3/31/2011 | ||||||||||||||||||
22541SVH8 | 6,333,087 | 5,504,066 | (829,021) | 5,504,066 | 4,916,925 | 3/31/2011 | ||||||||||||||||||
251511AC5 | 14,410,235 | 13,394,657 | (1,015,578) | 13,394,657 | 12,423,542 | 3/31/2011 | ||||||||||||||||||
294751BY7 | 2,387,325 | 2,360,048 | (27,277) | 2,360,048 | 1,504,496 | 3/31/2011 | ||||||||||||||||||
31393YY41 | 18,208,783 | 17,806,025 | (402,758) | 17,806,025 | 10,393,929 | 3/31/2011 | ||||||||||||||||||
32051GN35 | 26,461,628 | 26,378,642 | (82,986) | 26,378,642 | 23,764,864 | 3/31/2011 | ||||||||||||||||||
32051GP41 | 19,478,996 | 19,470,340 | (8,656) | 19,470,340 | 18,338,240 | 3/31/2011 | ||||||||||||||||||
36159XAJ9 | 18,655,072 | 18,319,743 | (335,329) | 18,319,743 | 15,945,138 | 3/31/2011 | ||||||||||||||||||
361849N57 | 4,911,220 | 2,623,916 | (2,287,304) | 2,623,916 | 3,199,540 | 3/31/2011 | ||||||||||||||||||
361849N73 | 460,265 | — | * | (460,265) | — | 4,367,499 | 3/31/2011 | |||||||||||||||||
361849R61 | 7,914,732 | 2,971,019 | (4,943,713) | 2,971,019 | 5,335,530 | 3/31/2011 | ||||||||||||||||||
361849R79 | 895,563 | 525,976 | (369,587) | 525,976 | 2,916,576 | 3/31/2011 | ||||||||||||||||||
361849R87 | 735,488 | 111,137 | (624,351) | 111,137 | 3,411,975 | 3/31/2011 | ||||||||||||||||||
361849S29 | 249,893 | — | * | (249,893) | — | 1,165,320 | 3/31/2011 | |||||||||||||||||
36185MEG3 | 14,705,421 | 14,668,815 | (36,606) | 14,668,815 | 14,668,500 | 3/31/2011 | ||||||||||||||||||
3622ELAD8 | 39,373,123 | 38,814,468 | (558,655) | 38,814,468 | 31,156,752 | 3/31/2011 | ||||||||||||||||||
3622MPBE7 | 49,903,985 | 49,896,450 | (7,535) | 49,896,450 | 46,499,450 | 3/31/2011 | ||||||||||||||||||
362334ME1 | 20,513,172 | 20,302,969 | (210,203) | 20,302,969 | 17,775,971 | 3/31/2011 | ||||||||||||||||||
| 62 |
| continued |
| CUSIP | Book/Adj. Carrying Value Amortized Cost Before Current Period OTTI | Present Value of Projected Cash Flows | Recognized Other-Than- Temporary Impairment | Amortized Cost After Other- Than-Temporary Impairment | Fair Value as of Impairment Date | Date of Financial Statement Where Reported | ||||||||||||||||||
36237UAA0 | $ | 1,976,834 | $ | 299,340 | $ | (1,677,494) | $ | 299,340 | $ | 297,358 | 3/31/2011 | |||||||||||||
36828QSL1 | 840,928 | 424,359 | (416,569) | 424,359 | 1,028,900 | 3/31/2011 | ||||||||||||||||||
42332QAL7 | 7,413,917 | 7,006,131 | (407,786) | 7,006,131 | 4,262,450 | 3/31/2011 | ||||||||||||||||||
46614KAB2 | 1,868,652 | — | * | (1,868,652) | — | 500,000 | 3/31/2011 | |||||||||||||||||
46625MUH0 | 821,129 | — | * | (821,129) | — | 220,515 | 3/31/2011 | |||||||||||||||||
46625YA60 | 3,001,274 | 2,987,204 | (14,070) | 2,987,204 | 1,169,679 | 3/31/2011 | ||||||||||||||||||
46625YA78 | 1,159,363 | 412,216 | (747,147) | 412,216 | 1,294,484 | 3/31/2011 | ||||||||||||||||||
46625YRB1 | 2,951,644 | 2,865,195 | (86,449) | 2,865,195 | 1,359,505 | 3/31/2011 | ||||||||||||||||||
46628FAU5 | 1,967,897 | 1,719,301 | (248,596) | 1,719,301 | 1,825,165 | 3/31/2011 | ||||||||||||||||||
46629YAM1 | 3,820,870 | 3,679,982 | (140,888) | 3,679,982 | 12,486,100 | 3/31/2011 | ||||||||||||||||||
46629YAQ2 | 852,181 | 661,343 | (190,838) | 661,343 | 2,520,828 | 3/31/2011 | ||||||||||||||||||
46630AAC2 | 371,986 | 371,665 | (321) | 371,665 | 875,000 | 3/31/2011 | ||||||||||||||||||
46630AAG3 | 228,652 | 188,527 | (40,125) | 188,527 | 360,000 | 3/31/2011 | ||||||||||||||||||
46630VAP7 | 1,281,382 | 880,273 | (401,109) | 880,273 | 2,263,308 | 3/31/2011 | ||||||||||||||||||
46631BAN5 | 2,067,269 | 1,962,050 | (105,219) | 1,962,050 | 11,743,724 | 3/31/2011 | ||||||||||||||||||
46632HAR2 | 338,594 | 321,213 | (17,381) | 321,213 | 1,795,207 | 3/31/2011 | ||||||||||||||||||
50180JAJ4 | 5,395,600 | 1,633,764 | (3,761,836) | 1,633,764 | 6,873,272 | 3/31/2011 | ||||||||||||||||||
525221CM7 | 24,035,186 | 23,366,873 | (668,313) | 23,366,873 | 16,725,997 | 3/31/2011 | ||||||||||||||||||
525221EB9 | 25,485,754 | 24,683,537 | (802,217) | 24,683,537 | 20,946,595 | 3/31/2011 | ||||||||||||||||||
55312TAG8 | 20,019,218 | 19,735,250 | (283,968) | 19,735,250 | 16,315,940 | 3/31/2011 | ||||||||||||||||||
55312TAH6 | 2,207,998 | 1,665,240 | (542,758) | 1,665,240 | 6,930,460 | 3/31/2011 | ||||||||||||||||||
55312TAK9 | 1,463,616 | 1,366,983 | (96,633) | 1,366,983 | 7,008,850 | 3/31/2011 | ||||||||||||||||||
576434SW5 | 6,822,609 | 6,643,763 | (178,846) | 6,643,763 | 7,308,884 | 3/31/2011 | ||||||||||||||||||
59023BAM6 | 1,241,964 | 1,138,167 | (103,797) | 1,138,167 | 2,100,000 | 3/31/2011 | ||||||||||||||||||
59023BAN4 | 759,062 | 742,577 | (16,485) | 742,577 | 2,100,000 | 3/31/2011 | ||||||||||||||||||
59025KAK8 | 14,863,537 | 14,158,504 | (705,033) | 14,158,504 | 10,938,160 | 3/31/2011 | ||||||||||||||||||
61745MX40 | 2,829,155 | 500,821 | (2,328,334) | 500,821 | 2,223,453 | 3/31/2011 | ||||||||||||||||||
61745MX57 | 410,915 | 236,164 | (174,751) | 236,164 | 1,707,255 | 3/31/2011 | ||||||||||||||||||
61750YAF6 | 30,510,824 | 30,257,642 | (253,182) | 30,257,642 | 28,800,452 | 3/31/2011 | ||||||||||||||||||
61753JAM1 | 265,953 | 262,049 | (3,904) | 262,049 | 4,110,640 | 3/31/2011 | ||||||||||||||||||
61754KAH8 | 32,037,425 | 31,954,014 | (83,411) | 31,954,014 | 28,214,790 | 3/31/2011 | ||||||||||||||||||
749577AL6 | 17,749,260 | 17,612,942 | (136,318) | 17,612,942 | 12,463,414 | 3/31/2011 | ||||||||||||||||||
74957EAE7 | 18,052,385 | 17,809,927 | (242,458) | 17,809,927 | 17,254,742 | 3/31/2011 | ||||||||||||||||||
74957EAF4 | 37,739,040 | 37,226,534 | (512,506) | 37,226,534 | 35,384,715 | 3/31/2011 | ||||||||||||||||||
74957VAQ2 | 21,876,010 | 21,776,902 | (99,108) | 21,776,902 | 20,502,339 | 3/31/2011 | ||||||||||||||||||
74957XAF2 | 36,336,989 | 36,121,369 | (215,620) | 36,121,369 | 32,099,111 | 3/31/2011 | ||||||||||||||||||
749583AH3 | 9,922,978 | 9,828,768 | (94,210) | 9,828,768 | 8,661,614 | 3/31/2011 | ||||||||||||||||||
74958AAD6 | 31,449,361 | 30,659,726 | (789,635) | 30,659,726 | 28,651,915 | 3/31/2011 | ||||||||||||||||||
74958AAH7 | 27,528,556 | 26,958,450 | (570,106) | 26,958,450 | 25,888,560 | 3/31/2011 | ||||||||||||||||||
74958EAD8 | 48,651,248 | 47,887,750 | (763,498) | 47,887,750 | 47,710,650 | 3/31/2011 | ||||||||||||||||||
75971EAF3 | 361,836 | 355,848 | (5,988) | 355,848 | 286,121 | 3/31/2011 | ||||||||||||||||||
76110HNQ8 | 2,633,445 | 2,541,404 | (92,041) | 2,541,404 | 1,896,437 | 3/31/2011 | ||||||||||||||||||
76110HSH3 | 994,572 | 886,275 | (108,297) | 886,275 | 561,962 | 3/31/2011 | ||||||||||||||||||
76110WTB2 | 3,595,530 | 3,411,697 | (183,833) | 3,411,697 | 1,293,373 | 3/31/2011 | ||||||||||||||||||
76110WTU0 | 2,611,711 | 2,532,463 | (79,248) | 2,532,463 | 1,045,322 | 3/31/2011 | ||||||||||||||||||
76110WUL8 | 14,294,626 | 14,272,968 | (21,658) | 14,272,968 | 6,850,410 | 3/31/2011 | ||||||||||||||||||
76110WWK8 | 1,519,032 | 971,769 | (547,263) | 971,769 | 636,777 | 3/31/2011 | ||||||||||||||||||
76110WXR2 | 9,343,952 | 8,901,101 | (442,851) | 8,901,101 | 4,685,343 | 3/31/2011 | ||||||||||||||||||
761118CZ9 | 9,917,785 | 9,852,695 | (65,090) | 9,852,695 | 8,930,139 | 3/31/2011 | ||||||||||||||||||
761118PQ5 | 11,963,158 | 11,871,034 | (92,124) | 11,871,034 | 10,061,385 | 3/31/2011 | ||||||||||||||||||
76113GAC2 | 220,904 | 168,594 | (52,310) | 168,594 | 387,051 | 3/31/2011 | ||||||||||||||||||
81375WHJ8 | 11,994,033 | 11,748,937 | (245,096) | 11,748,937 | 6,288,801 | 3/31/2011 | ||||||||||||||||||
81375WHK5 | 3,583,984 | 3,560,106 | (23,878) | 3,560,106 | 2,697,555 | 3/31/2011 | ||||||||||||||||||
86359BFG1 | 2,961,522 | 1,918,424 | (1,043,098) | 1,918,424 | 2,105,972 | 3/31/2011 | ||||||||||||||||||
92976UAA8 | 2,539,718 | 2,288,499 | (251,219) | 2,288,499 | 5,600,000 | 3/31/2011 | ||||||||||||||||||
| 63 |
NOTES TO STATUTORY–BASIS FINANCIAL STATEMENTS
TEACHERS INSURANCE AND ANNUITY ASSOCIATION OF AMERICA
| CUSIP | Book/Adj. Carrying Value Amortized Cost Before Current Period OTTI | Present Value of Projected Cash Flows | Recognized Other-Than- Temporary Impairment | Amortized Cost After Other- Than-Temporary Impairment | Fair Value as of Impairment Date | Date of Financial Statement Where Reported | ||||||||||||||||||
92977RAK2 | $ | 5,148,529 | $ | 4,022,307 | $ | (1,126,222) | $ | 4,022,307 | $ | 4,002,510 | 3/31/2011 | |||||||||||||
94980SBJ3 | 18,920,645 | 18,908,520 | (12,125) | 18,908,520 | 19,434,920 | 3/31/2011 | ||||||||||||||||||
949837AF5 | 68,370,975 | 68,287,919 | (83,056) | 68,287,919 | 65,117,660 | 3/31/2011 | ||||||||||||||||||
949837BE7 | 19,786,077 | 19,760,612 | (25,465) | 19,760,612 | 19,692,088 | 3/31/2011 | ||||||||||||||||||
949837BK3 | 8,501,003 | 8,490,908 | (10,095) | 8,490,908 | 8,357,873 | 3/31/2011 | ||||||||||||||||||
94984FAR0 | 35,153,298 | 35,006,469 | (146,829) | 35,006,469 | 35,362,766 | 3/31/2011 | ||||||||||||||||||
94984XAB6 | 9,278,978 | 9,211,401 | (67,577) | 9,211,401 | 9,528,038 | 3/31/2011 | ||||||||||||||||||
94984XAD2 | 7,673,000 | 7,617,061 | (55,939) | 7,617,061 | 7,877,512 | 3/31/2011 | ||||||||||||||||||
94984XAM2 | 11,712,546 | 11,626,954 | (85,592) | 11,626,954 | 12,019,770 | 3/31/2011 | ||||||||||||||||||
94985JAB6 | 48,221,105 | 48,202,750 | (18,355) | 48,202,750 | 47,740,150 | 3/31/2011 | ||||||||||||||||||
94985JBR0 | 29,114,124 | 29,102,779 | (11,345) | 29,102,779 | 29,598,947 | 3/31/2011 | ||||||||||||||||||
94985JCA6 | 28,507,528 | 28,483,710 | (23,818) | 28,483,710 | 28,460,520 | 3/31/2011 | ||||||||||||||||||
94986AAC2 | 109,742,861 | 109,672,080 | (70,781) | 109,672,080 | 106,206,985 | 3/31/2011 | ||||||||||||||||||
740408AA7 | 9,395,362 | — | ² | (2,503,582) | 6,891,780 | 6,891,780 | 3/31/2011 | |||||||||||||||||
92976BBV3 | 1,982,600 | — | ² | (127,452) | 1,855,148 | 1,855,148 | 3/31/2011 | |||||||||||||||||
36828QSJ6 | 4,973,252 | — | ² | (135,206) | 4,838,046 | 4,838,046 | 3/31/2011 | |||||||||||||||||
92976BBV3 | 11,746,905 | — | ² | (755,153) | 10,991,752 | 10,991,752 | 3/31/2011 | |||||||||||||||||
07387BEP4 | 1,426,135 | — | ² | (189,284) | 1,236,851 | 1,236,851 | 3/31/2011 | |||||||||||||||||
02660TFM0 | 9,072,871 | 8,993,572 | (79,299) | 8,993,572 | 5,104,550 | 12/31/2010 | ||||||||||||||||||
03762AAG4 | 2,101,951 | 2,013,089 | (88,862) | 2,013,089 | 1,179,900 | 12/31/2010 | ||||||||||||||||||
05947UMM7 | 1,960,454 | 36,449 | (1,924,005) | 36,449 | 149,096 | 12/31/2010 | ||||||||||||||||||
059511AM7 | 1,035,890 | — | * | (1,035,890) | — | 1,105,164 | 12/31/2010 | |||||||||||||||||
059511AS4 | 749,798 | — | * | (749,798) | — | 1,406,667 | 12/31/2010 | |||||||||||||||||
059511AU9 | 845,707 | — | * | (845,707) | — | 1,373,330 | 12/31/2010 | |||||||||||||||||
07383F6U7 | 2,490,124 | 2,094,925 | (395,199) | 2,094,925 | 3,100,870 | 12/31/2010 | ||||||||||||||||||
07387BEQ2 | 820,330 | 447,544 | (372,786) | 447,544 | 1,811,230 | 12/31/2010 | ||||||||||||||||||
07388VAL2 | 10,747,974 | 7,302,404 | (3,445,570) | 7,302,404 | 4,214,420 | 12/31/2010 | ||||||||||||||||||
07388YBC5 | 1,417,660 | — | * | (1,417,660) | — | 990,577 | 12/31/2010 | |||||||||||||||||
07388YBE1 | 855,193 | — | * | (855,193) | — | 630,000 | 12/31/2010 | |||||||||||||||||
07401DAM3 | 3,439,369 | 3,083,707 | (355,662) | 3,083,707 | 1,972,655 | 12/31/2010 | ||||||||||||||||||
12498NAC7 | 4,999,786 | 4,674,166 | (325,620) | 4,674,166 | 2,499,495 | 12/31/2010 | ||||||||||||||||||
126671R65 | 3,749,037 | 3,574,283 | (174,754) | 3,574,283 | 1,375,277 | 12/31/2010 | ||||||||||||||||||
126671TV8 | 435,057 | 319,559 | (115,498) | 319,559 | 168,056 | 12/31/2010 | ||||||||||||||||||
126671TW6 | 448,023 | 394,139 | (53,884) | 394,139 | 210,082 | 12/31/2010 | ||||||||||||||||||
20047EAM4 | 1,814,136 | 1,197,607 | (616,529) | 1,197,607 | 5,642,594 | 12/31/2010 | ||||||||||||||||||
20047QAN5 | 11,304,365 | 4,660,376 | (6,643,989) | 4,660,376 | 5,416,753 | 12/31/2010 | ||||||||||||||||||
20173QAK7 | 6,017,476 | 4,101,651 | (1,915,825) | 4,101,651 | 3,633,294 | 12/31/2010 | ||||||||||||||||||
20173TAP0 | 1,780,482 | 722,541 | (1,057,941) | 722,541 | 3,688,180 | 12/31/2010 | ||||||||||||||||||
22544QAK5 | 1,798,847 | 709,514 | (1,089,333) | 709,514 | 6,708,762 | 12/31/2010 | ||||||||||||||||||
22608SAD0 | 3,150,813 | 3,071,255 | (79,558) | 3,071,255 | 600,009 | 12/31/2010 | ||||||||||||||||||
294751DY5 | 1,226,812 | 903,019 | (323,793) | 903,019 | 260,169 | 12/31/2010 | ||||||||||||||||||
36159XAJ9 | 19,512,730 | 18,670,215 | (842,515) | 18,670,215 | 10,504,542 | 12/31/2010 | ||||||||||||||||||
361849N57 | 5,009,542 | 4,922,538 | (87,004) | 4,922,538 | 3,074,680 | 12/31/2010 | ||||||||||||||||||
361849N73 | 1,264,245 | 704,837 | (559,408) | 704,837 | 4,954,623 | 12/31/2010 | ||||||||||||||||||
361849R61 | 9,617,774 | 7,935,307 | (1,682,467) | 7,935,307 | 4,877,148 | 12/31/2010 | ||||||||||||||||||
361849R79 | 4,702,135 | 963,680 | (3,738,455) | 963,680 | 2,659,464 | 12/31/2010 | ||||||||||||||||||
361849R87 | 1,586,254 | 866,712 | (719,542) | 866,712 | 3,096,156 | 12/31/2010 | ||||||||||||||||||
361849S29 | 426,981 | 326,781 | (100,200) | 326,781 | 1,165,320 | 12/31/2010 | ||||||||||||||||||
36228CDP5 | 707,260 | 471,910 | (235,350) | 471,910 | 1,040,356 | 12/31/2010 | ||||||||||||||||||
36228CYQ0 | 18,382,849 | 18,045,609 | (337,240) | 18,045,609 | 12,913,908 | 12/31/2010 | ||||||||||||||||||
3622ELAD8 | 41,439,863 | 40,333,120 | (1,106,743) | 40,333,120 | 32,759,823 | 12/31/2010 | ||||||||||||||||||
362332AM0 | 4,533,075 | 4,250,580 | (282,495) | 4,250,580 | 1,500,000 | 12/31/2010 | ||||||||||||||||||
362334ME1 | 21,081,013 | 20,974,961 | (106,052) | 20,974,961 | 16,318,857 | 12/31/2010 | ||||||||||||||||||
36298JAA1 | 21,479,336 | 19,948,371 | (1,530,965) | 19,948,371 | 13,746,958 | 12/31/2010 | ||||||||||||||||||
46625MQ77 | 619,843 | 270,160 | (349,683) | 270,160 | 196,715 | 12/31/2010 | ||||||||||||||||||
| 64 |
| continued |
| CUSIP | Book/Adj. Carrying Value Amortized Cost Before Current Period OTTI | Present Value of Projected Cash Flows | Recognized Other-Than- Temporary Impairment | Amortized Cost After Other- Than-Temporary Impairment | Fair Value as of Impairment Date | Date of Financial Statement Where Reported | ||||||||||||||||||
46625MUH0 | $ | 1,191,047 | $ | 821,129 | $ | (369,918) | $ | 821,129 | $ | 635,138 | 12/31/2010 | |||||||||||||
46625YA78 | 3,989,943 | 1,223,441 | (2,766,502) | 1,223,441 | 1,199,316 | 12/31/2010 | ||||||||||||||||||
46625YC68 | 192,699 | 137,255 | (55,444) | 137,255 | 304,000 | 12/31/2010 | ||||||||||||||||||
46625YRB1 | 4,095,553 | 3,032,138 | (1,063,415) | 3,032,138 | 2,185,563 | 12/31/2010 | ||||||||||||||||||
46628FAU5 | 3,244,633 | 2,010,465 | (1,234,168) | 2,010,465 | 1,417,955 | 12/31/2010 | ||||||||||||||||||
46629PAG3 | 4,152,176 | 3,729,601 | (422,575) | 3,729,601 | 2,989,477 | 12/31/2010 | ||||||||||||||||||
46629PAU2 | 625,708 | 491,322 | (134,386) | 491,322 | 1,395,696 | 12/31/2010 | ||||||||||||||||||
46629YAM1 | 4,299,779 | 4,041,162 | (258,617) | 4,041,162 | 8,095,640 | 12/31/2010 | ||||||||||||||||||
46629YAQ2 | 955,307 | 909,968 | (45,339) | 909,968 | 1,874,158 | 12/31/2010 | ||||||||||||||||||
46630AAC2 | 494,162 | 414,909 | (79,253) | 414,909 | 595,000 | 12/31/2010 | ||||||||||||||||||
46631BAN5 | 4,758,756 | 2,507,697 | (2,251,059) | 2,507,697 | 10,524,883 | 12/31/2010 | ||||||||||||||||||
46631BAP0 | 1,116,985 | 1,083,703 | (33,282) | 1,083,703 | 4,835,036 | 12/31/2010 | ||||||||||||||||||
46632HAQ4 | 387,089 | 234,521 | (152,568) | 234,521 | 640,263 | 12/31/2010 | ||||||||||||||||||
46632HAR2 | 657,982 | 413,493 | (244,489) | 413,493 | 1,445,123 | 12/31/2010 | ||||||||||||||||||
50179AAL1 | 13,174,417 | 12,419,388 | (755,029) | 12,419,388 | 4,828,886 | 12/31/2010 | ||||||||||||||||||
50179AAM9 | 1,005,481 | 790,316 | (215,165) | 790,316 | 480,000 | 12/31/2010 | ||||||||||||||||||
50180CAM2 | 337,891 | 277,303 | (60,588) | 277,303 | 2,842,250 | 12/31/2010 | ||||||||||||||||||
52108HF82 | 7,459,725 | 5,924,509 | (1,535,216) | 5,924,509 | 5,205,529 | 12/31/2010 | ||||||||||||||||||
52108HV76 | 4,377,380 | 741,715 | (3,635,665) | 741,715 | 1,821,350 | 12/31/2010 | ||||||||||||||||||
52108MGC1 | 3,137,225 | 628,286 | (2,508,939) | 628,286 | 1,267,523 | 12/31/2010 | ||||||||||||||||||
52108MGD9 | 369,749 | — | * | (369,749) | — | 497,400 | 12/31/2010 | |||||||||||||||||
525221EB9 | 27,039,152 | 26,946,967 | (92,185) | 26,946,967 | 21,562,436 | 12/31/2010 | ||||||||||||||||||
59025KAK8 | 18,903,173 | 14,904,466 | (3,998,707) | 14,904,466 | 9,272,020 | 12/31/2010 | ||||||||||||||||||
59025WAU0 | 3,874,226 | 3,161,797 | (712,429) | 3,161,797 | 1,874,928 | 12/31/2010 | ||||||||||||||||||
60688BAM0 | 1,868,835 | 1,400,980 | (467,855) | 1,400,980 | 2,517,984 | 12/31/2010 | ||||||||||||||||||
60688BAS7 | 1,558,562 | 1,157,994 | (400,568) | 1,157,994 | 2,520,386 | 12/31/2010 | ||||||||||||||||||
617451CA5 | 7,211,647 | 6,847,722 | (363,925) | 6,847,722 | 3,362,630 | 12/31/2010 | ||||||||||||||||||
61746WE97 | 205,421 | 114,771 | (90,650) | 114,771 | 713,866 | 12/31/2010 | ||||||||||||||||||
61746WF21 | 44,826 | — | * | (44,826) | — | 129,579 | 12/31/2010 | |||||||||||||||||
61753JAL3 | 1,461,072 | 613,152 | (847,920) | 613,152 | 4,701,500 | 12/31/2010 | ||||||||||||||||||
61753JAM1 | 651,003 | 400,720 | (250,283) | 400,720 | 3,409,210 | 12/31/2010 | ||||||||||||||||||
61753JAN9 | 436,652 | 238,561 | (198,091) | 238,561 | 1,621,328 | 12/31/2010 | ||||||||||||||||||
61754KAH8 | 34,531,549 | 32,008,837 | (2,522,712) | 32,008,837 | 20,419,998 | 12/31/2010 | ||||||||||||||||||
61754KAN5 | 14,246,522 | — | * | (14,246,522) | — | 11,932,260 | 12/31/2010 | |||||||||||||||||
61754KAP0 | 2,120,835 | — | * | (2,120,835) | — | 3,653,011 | 12/31/2010 | |||||||||||||||||
76110WQA7 | 14,360,762 | 14,183,346 | (177,416) | 14,183,346 | 6,766,953 | 12/31/2010 | ||||||||||||||||||
76110WRW8 | 2,900,673 | 2,557,357 | (343,316) | 2,557,357 | 720,800 | 12/31/2010 | ||||||||||||||||||
81375WHJ8 | 13,468,350 | 12,013,441 | (1,454,909) | 12,013,441 | 6,643,498 | 12/31/2010 | ||||||||||||||||||
81375WHK5 | 3,992,206 | 3,666,950 | (325,256) | 3,666,950 | 2,376,394 | 12/31/2010 | ||||||||||||||||||
92976UAA8 | 3,123,080 | 2,712,496 | (410,584) | 2,712,496 | 2,800,000 | 12/31/2010 | ||||||||||||||||||
92977RAK2 | 5,447,870 | 5,160,766 | (287,104) | 5,160,766 | 3,041,064 | 12/31/2010 | ||||||||||||||||||
02148FAW5 | 23,469,071 | 23,456,026 | (13,045) | 23,456,026 | 20,626,166 | 12/31/2010 | ||||||||||||||||||
02149HAK6 | 21,622,113 | 21,396,405 | (225,708) | 21,396,405 | 22,846,880 | 12/31/2010 | ||||||||||||||||||
02151CBD7 | 24,471,198 | 24,001,487 | (469,711) | 24,001,487 | 23,706,444 | 12/31/2010 | ||||||||||||||||||
02151NBA9 | 15,480,186 | 15,291,181 | (189,005) | 15,291,181 | 13,428,018 | 12/31/2010 | ||||||||||||||||||
05946XL92 | 11,074,631 | 10,989,293 | (85,338) | 10,989,293 | 9,273,597 | 12/31/2010 | ||||||||||||||||||
05948KB65 | 9,575,839 | 9,448,438 | (127,401) | 9,448,438 | 7,787,100 | 12/31/2010 | ||||||||||||||||||
05948KC98 | 17,059,882 | 17,047,745 | (12,137) | 17,047,745 | 15,271,833 | 12/31/2010 | ||||||||||||||||||
05948KF20 | 17,433,474 | 17,417,390 | (16,084) | 17,417,390 | 16,163,338 | 12/31/2010 | ||||||||||||||||||
05948KKZ1 | 4,378,874 | 4,348,094 | (30,780) | 4,348,094 | 3,162,909 | 12/31/2010 | ||||||||||||||||||
05948KLA5 | 748,470 | 655,160 | (93,310) | 655,160 | 968,395 | 12/31/2010 | ||||||||||||||||||
05948KP37 | 10,440,935 | 10,342,820 | (98,115) | 10,342,820 | 9,470,228 | 12/31/2010 | ||||||||||||||||||
12543TAD7 | 9,455,636 | 9,424,960 | (30,676) | 9,424,960 | 8,013,000 | 12/31/2010 | ||||||||||||||||||
12543UAD4 | 42,092,525 | 41,384,370 | (708,155) | 41,384,370 | 38,905,393 | 12/31/2010 | ||||||||||||||||||
12543UAE2 | 14,949,354 | 14,714,571 | (234,783) | 14,714,571 | 13,537,440 | 12/31/2010 | ||||||||||||||||||
| 65 |
NOTES TO STATUTORY–BASIS FINANCIAL STATEMENTS
TEACHERS INSURANCE AND ANNUITY ASSOCIATION OF AMERICA
| CUSIP | Book/Adj. Carrying Value Amortized Cost Before Current Period OTTI | Present Value of Projected Cash Flows | Recognized Other-Than- Temporary Impairment | Amortized Cost After Other- Than-Temporary Impairment | Fair Value as of Impairment Date | Date of Financial Statement Where Reported | ||||||||||||||||||
12544AAC9 | $ | 48,165,626 | $ | 47,278,200 | $ | (887,426) | $ | 47,278,200 | $ | 30,525,000 | 12/31/2010 | |||||||||||||
12544DAK5 | 21,408,332 | 21,278,877 | (129,455) | 21,278,877 | 19,988,228 | 12/31/2010 | ||||||||||||||||||
12544DAQ2 | 15,270,767 | 15,189,090 | (81,677) | 15,189,090 | 13,553,792 | 12/31/2010 | ||||||||||||||||||
12544LAK7 | 30,760,928 | 30,597,504 | (163,424) | 30,597,504 | 29,382,400 | 12/31/2010 | ||||||||||||||||||
12544RAL2 | 8,573,674 | 8,569,990 | (3,684) | 8,569,990 | 6,884,000 | 12/31/2010 | ||||||||||||||||||
12545CAU4 | 37,156,526 | 37,023,160 | (133,366) | 37,023,160 | 37,092,000 | 12/31/2010 | ||||||||||||||||||
12667F4N2 | 9,394,946 | 9,362,609 | (32,337) | 9,362,609 | 7,370,515 | 12/31/2010 | ||||||||||||||||||
12667F5J0 | 19,508,667 | 19,458,636 | (50,031) | 19,458,636 | 16,864,398 | 12/31/2010 | ||||||||||||||||||
12667F5Z4 | 6,127,911 | 6,074,174 | (53,737) | 6,074,174 | 23,122,722 | 12/31/2010 | ||||||||||||||||||
12667F5Z4 | 21,006,008 | 20,971,664 | (34,344) | 20,971,664 | 23,122,722 | 12/31/2010 | ||||||||||||||||||
12667F7D1 | 24,551,494 | 24,417,749 | (133,745) | 24,417,749 | 20,944,078 | 12/31/2010 | ||||||||||||||||||
12667FR98 | 1,434,383 | 1,345,289 | (89,094) | 1,345,289 | 2,014,288 | 12/31/2010 | ||||||||||||||||||
12667FYZ2 | 11,827,718 | 9,763,883 | (2,063,835) | 9,763,883 | 5,306,397 | 12/31/2010 | ||||||||||||||||||
12667GBA0 | 14,356,377 | 14,265,050 | (91,327) | 14,265,050 | 54,951,911 | 12/31/2010 | ||||||||||||||||||
12667GBA0 | 23,954,630 | 23,799,646 | (154,984) | 23,799,646 | 54,951,911 | 12/31/2010 | ||||||||||||||||||
12667GBA0 | 28,520,429 | 28,356,700 | (163,729) | 28,356,700 | 54,951,911 | 12/31/2010 | ||||||||||||||||||
12667GFB4 | 24,466,401 | 24,329,899 | (136,502) | 24,329,899 | 54,299,602 | 12/31/2010 | ||||||||||||||||||
12667GFB4 | 41,264,741 | 41,037,127 | (227,614) | 41,037,127 | 54,299,602 | 12/31/2010 | ||||||||||||||||||
12667GFT5 | 18,562,240 | 18,474,874 | (87,366) | 18,474,874 | 15,007,688 | 12/31/2010 | ||||||||||||||||||
12667GJG9 | 15,775,364 | 15,766,092 | (9,272) | 15,766,092 | 12,829,793 | 12/31/2010 | ||||||||||||||||||
12667GJR5 | 50,983,827 | 50,777,728 | (206,099) | 50,777,728 | 40,057,620 | 12/31/2010 | ||||||||||||||||||
12667GLE1 | 29,155,691 | 29,145,504 | (10,187) | 29,145,504 | 25,833,254 | 12/31/2010 | ||||||||||||||||||
12667GQA4 | 22,109,149 | 21,879,738 | (229,411) | 21,879,738 | 18,047,633 | 12/31/2010 | ||||||||||||||||||
12667GW74 | 19,617,942 | 19,539,187 | (78,755) | 19,539,187 | 16,537,691 | 12/31/2010 | ||||||||||||||||||
12668AAG0 | 15,979,719 | 15,516,771 | (462,948) | 15,516,771 | 15,873,697 | 12/31/2010 | ||||||||||||||||||
126694JS8 | 27,801,206 | 27,787,428 | (13,778) | 27,787,428 | 22,064,889 | 12/31/2010 | ||||||||||||||||||
126694W61 | 23,884,838 | 23,708,747 | (176,091) | 23,708,747 | 18,993,432 | 12/31/2010 | ||||||||||||||||||
126694XQ6 | 30,891,681 | 30,711,314 | (180,367) | 30,711,314 | 26,691,546 | 12/31/2010 | ||||||||||||||||||
12669D5V6 | 3,366,133 | 3,224,123 | (142,010) | 3,224,123 | 2,161,792 | 12/31/2010 | ||||||||||||||||||
12669DN79 | 3,832,053 | 3,076,024 | (756,029) | 3,076,024 | 2,305,674 | 12/31/2010 | ||||||||||||||||||
12669EWY8 | 8,695,050 | 8,642,661 | (52,389) | 8,642,661 | 6,982,960 | 12/31/2010 | ||||||||||||||||||
12669EWZ5 | 1,659,203 | 1,236,059 | (423,144) | 1,236,059 | 1,567,961 | 12/31/2010 | ||||||||||||||||||
12669YAF9 | 19,396,737 | 19,386,356 | (10,381) | 19,386,356 | 10,846,750 | 12/31/2010 | ||||||||||||||||||
12670AAF8 | 45,556,274 | 45,009,286 | (546,988) | 45,009,286 | 39,241,526 | 12/31/2010 | ||||||||||||||||||
161631AV8 | 40,499,302 | 40,096,350 | (402,952) | 40,096,350 | 35,712,547 | 12/31/2010 | ||||||||||||||||||
16163BAP9 | 28,514,838 | 28,163,886 | (350,952) | 28,163,886 | 24,986,500 | 12/31/2010 | ||||||||||||||||||
16165TBJ1 | 9,210,012 | 9,136,783 | (73,229) | 9,136,783 | 8,184,917 | 12/31/2010 | ||||||||||||||||||
170255AS2 | 14,567,961 | 14,517,614 | (50,347) | 14,517,614 | 13,461,000 | 12/31/2010 | ||||||||||||||||||
17025TAV3 | 27,400,420 | 27,375,370 | (25,050) | 27,375,370 | 25,509,873 | 12/31/2010 | ||||||||||||||||||
1729732W8 | 20,382,764 | 20,315,199 | (67,565) | 20,315,199 | 17,354,537 | 12/31/2010 | ||||||||||||||||||
17310AAR7 | 32,430,459 | 32,419,024 | (11,435) | 32,419,024 | 24,900,996 | 12/31/2010 | ||||||||||||||||||
17312FAD5 | 9,808,087 | 9,796,800 | (11,287) | 9,796,800 | 8,686,000 | 12/31/2010 | ||||||||||||||||||
22541Q4M1 | 6,735,654 | 6,418,429 | (317,225) | 6,418,429 | 3,526,395 | 12/31/2010 | ||||||||||||||||||
22541SVH8 | 6,484,621 | 6,430,759 | (53,862) | 6,430,759 | 3,627,227 | 12/31/2010 | ||||||||||||||||||
251510ET6 | 3,345,541 | 3,209,845 | (135,696) | 3,209,845 | 1,586,646 | 12/31/2010 | ||||||||||||||||||
32051G2J3 | 20,635,774 | 20,567,316 | (68,458) | 20,567,316 | 17,988,737 | 12/31/2010 | ||||||||||||||||||
32051GN35 | 27,101,137 | 26,907,870 | (193,267) | 26,907,870 | 19,863,250 | 12/31/2010 | ||||||||||||||||||
32051GP41 | 19,697,380 | 19,476,620 | (220,760) | 19,476,620 | 14,994,000 | 12/31/2010 | ||||||||||||||||||
32051GVL6 | 24,502,122 | 24,194,205 | (307,917) | 24,194,205 | 22,632,548 | 12/31/2010 | ||||||||||||||||||
362669AQ6 | 9,992,478 | 9,836,120 | (156,358) | 9,836,120 | 9,037,754 | 12/31/2010 | ||||||||||||||||||
46627MAC1 | 10,865,010 | 10,703,051 | (161,959) | 10,703,051 | 7,621,227 | 12/31/2010 | ||||||||||||||||||
46628YBK5 | 29,058,810 | 28,786,174 | (272,636) | 28,786,174 | 26,129,350 | 12/31/2010 | ||||||||||||||||||
46628YBP4 | 15,236,182 | 15,097,096 | (139,086) | 15,097,096 | 11,056,346 | 12/31/2010 | ||||||||||||||||||
52521RAS0 | 1,883,100 | 1,784,443 | (98,657) | 1,784,443 | 2,390,945 | 12/31/2010 | ||||||||||||||||||
576434JM7 | 5,273,080 | 4,794,747 | (478,333) | 4,794,747 | 3,308,819 | 12/31/2010 | ||||||||||||||||||
| 66 |
| continued |
| CUSIP | Book/Adj. Carrying Value Amortized Cost Before Current Period OTTI | Present Value of Projected Cash Flows | Recognized Other-Than- Temporary Impairment | Amortized Cost After Other- Than-Temporary Impairment | Fair Value as of Impairment Date | Date of Financial Statement Where Reported | ||||||||||||||||||
74951PEA2 | $ | 475,727 | $ | 462,483 | $ | (13,244) | $ | 462,483 | $ | 381,945 | 12/31/2010 | |||||||||||||
749577AL6 | 18,052,454 | 17,775,596 | (276,858) | 17,775,596 | 11,959,216 | 12/31/2010 | ||||||||||||||||||
74957EAE7 | 18,232,309 | 18,044,355 | (187,954) | 18,044,355 | 16,918,370 | 12/31/2010 | ||||||||||||||||||
74957EAF4 | 38,283,506 | 37,751,749 | (531,757) | 37,751,749 | 34,693,545 | 12/31/2010 | ||||||||||||||||||
74957VAQ2 | 22,154,815 | 21,889,958 | (264,857) | 21,889,958 | 20,054,567 | 12/31/2010 | ||||||||||||||||||
74957XAF2 | 36,766,143 | 36,351,790 | (414,353) | 36,351,790 | 30,585,720 | 12/31/2010 | ||||||||||||||||||
749583AH3 | 10,049,814 | 9,934,668 | (115,146) | 9,934,668 | 4,931,266 | 12/31/2010 | ||||||||||||||||||
74958AAD6 | 13,436,388 | 13,414,590 | (21,798) | 13,414,590 | 27,992,687 | 12/31/2010 | ||||||||||||||||||
74958AAD6 | 18,104,246 | 18,066,777 | (37,469) | 18,066,777 | 27,992,687 | 12/31/2010 | ||||||||||||||||||
74958BAH5 | 25,527,558 | 25,194,638 | (332,920) | 25,194,638 | 22,300,818 | 12/31/2010 | ||||||||||||||||||
74958EAD8 | 48,792,758 | 48,664,800 | (127,958) | 48,664,800 | 43,555,000 | 12/31/2010 | ||||||||||||||||||
75115CAG2 | 7,692,270 | 7,620,317 | (71,953) | 7,620,317 | 7,894,687 | 12/31/2010 | ||||||||||||||||||
76110HQS1 | 4,259,475 | 4,133,507 | (125,968) | 4,133,507 | 4,000,830 | 12/31/2010 | ||||||||||||||||||
76110HX53 | 10,221,637 | 10,177,036 | (44,601) | 10,177,036 | 8,533,547 | 12/31/2010 | ||||||||||||||||||
76110HX87 | 22,805,054 | 22,632,748 | (172,306) | 22,632,748 | 18,830,017 | 12/31/2010 | ||||||||||||||||||
761118CZ9 | 10,039,550 | 10,005,568 | (33,982) | 10,005,568 | 9,365,092 | 12/31/2010 | ||||||||||||||||||
76114DAE4 | 13,559,309 | 13,519,856 | (39,453) | 13,519,856 | 13,404,091 | 12/31/2010 | ||||||||||||||||||
949772AD9 | 28,243,539 | 28,132,050 | (111,489) | 28,132,050 | 23,501,359 | 12/31/2010 | ||||||||||||||||||
949837AF5 | 68,474,786 | 68,353,707 | (121,079) | 68,353,707 | 44,639,062 | 12/31/2010 | ||||||||||||||||||
949837BE7 | 19,812,631 | 19,775,778 | (36,853) | 19,775,778 | 16,546,363 | 12/31/2010 | ||||||||||||||||||
949837BK3 | 8,514,486 | 8,499,688 | (14,798) | 8,499,688 | 7,110,656 | 12/31/2010 | ||||||||||||||||||
949837CC0 | 25,450,065 | 25,373,072 | (76,993) | 25,373,072 | 20,690,221 | 12/31/2010 | ||||||||||||||||||
94983BAP4 | 15,420,570 | 15,386,926 | (33,644) | 15,386,926 | 12,756,150 | 12/31/2010 | ||||||||||||||||||
94984AAR1 | 29,144,103 | 28,982,130 | (161,973) | 28,982,130 | 17,766,000 | 12/31/2010 | ||||||||||||||||||
94984AAS9 | 9,953,947 | 9,909,440 | (44,507) | 9,909,440 | 9,662,000 | 12/31/2010 | ||||||||||||||||||
94984FAR0 | 35,173,276 | 35,157,002 | (16,274) | 35,157,002 | 34,782,734 | 12/31/2010 | ||||||||||||||||||
94984HAC9 | 36,429,878 | 36,105,824 | (324,054) | 36,105,824 | 34,059,273 | 12/31/2010 | ||||||||||||||||||
94984XAB6 | 9,370,975 | 9,287,499 | (83,476) | 9,287,499 | 5,478,272 | 12/31/2010 | ||||||||||||||||||
94984XAD2 | 7,749,136 | 7,680,094 | (69,042) | 7,680,094 | 4,557,000 | 12/31/2010 | ||||||||||||||||||
94984XAM2 | 11,829,067 | 11,723,543 | (105,524) | 11,723,543 | 8,324,642 | 12/31/2010 | ||||||||||||||||||
94985JAB6 | 48,321,959 | 48,228,400 | (93,559) | 48,228,400 | 44,145,000 | 12/31/2010 | ||||||||||||||||||
94985JBR0 | 29,162,715 | 29,121,539 | (41,176) | 29,121,539 | 27,803,419 | 12/31/2010 | ||||||||||||||||||
94985JCA6 | 28,558,476 | 28,534,710 | (23,766) | 28,534,710 | 26,562,000 | 12/31/2010 | ||||||||||||||||||
94985LAD7 | 15,368,802 | 15,349,891 | (18,911) | 15,349,891 | 12,980,185 | 12/31/2010 | ||||||||||||||||||
94985RAP7 | 61,243,009 | 60,846,336 | (396,673) | 60,846,336 | 47,827,200 | 12/31/2010 | ||||||||||||||||||
94985WAP6 | 21,483,619 | 21,439,796 | (43,823) | 21,439,796 | 19,756,941 | 12/31/2010 | ||||||||||||||||||
94985WAQ4 | 73,940,814 | 73,680,424 | (260,390) | 73,680,424 | 62,384,887 | 12/31/2010 | ||||||||||||||||||
94985WBL4 | 36,878,714 | 36,769,287 | (109,427) | 36,769,287 | 30,262,158 | 12/31/2010 | ||||||||||||||||||
94986AAC2 | 19,180,863 | 19,096,840 | (84,023) | 19,096,840 | 102,925,000 | 12/31/2010 | ||||||||||||||||||
94986AAC2 | 19,329,580 | 19,244,820 | (84,760) | 19,244,820 | 102,925,000 | 12/31/2010 | ||||||||||||||||||
94986AAC2 | 71,734,602 | 71,420,325 | (314,277) | 71,420,325 | 102,925,000 | 12/31/2010 | ||||||||||||||||||
03702YAC4 | 14,400 | — | ² | (7,200) | 7,200 | 7,200 | 12/31/2010 | |||||||||||||||||
07387BEK5 | 9,182,390 | — | ² | (5,509,271) | 3,673,119 | 3,673,119 | 12/31/2010 | |||||||||||||||||
07387BEN9 | 3,313,391 | — | ² | (2,161,953) | 1,151,438 | 1,151,438 | 12/31/2010 | |||||||||||||||||
07387BEP4 | 1,934,097 | — | ² | (507,963) | 1,426,134 | 1,426,134 | 12/31/2010 | |||||||||||||||||
17310MAQ3 | 9,598,479 | — | ² | (4,877,589) | 4,720,890 | 4,720,890 | 12/31/2010 | |||||||||||||||||
20173MAM2 | 4,964,116 | — | ² | (3,466,972) | 1,497,144 | 1,497,144 | 12/31/2010 | |||||||||||||||||
36828QSJ6 | 10,856,558 | — | ² | (5,883,307) | 4,973,251 | 4,973,251 | 12/31/2010 | |||||||||||||||||
59023BAL8 | 4,712,257 | — | ² | (2,869,173) | 1,843,084 | 1,843,084 | 12/31/2010 | |||||||||||||||||
74040KAC6 | 4,024,899 | — | ² | (919,386) | 3,105,513 | 3,105,513 | 12/31/2010 | |||||||||||||||||
92976BBV3 | 3,224,723 | — | ² | (1,242,124) | 1,982,599 | 1,982,599 | 12/31/2010 | |||||||||||||||||
92976BBV3 | 23,512,118 | — | ² | (11,765,214) | 11,746,904 | 11,746,904 | 12/31/2010 | |||||||||||||||||
92978MAL0 | 10,612,719 | — | ² | (3,872,055) | 6,740,664 | 6,740,664 | 12/31/2010 | |||||||||||||||||
46625MQ85 | 1,057,827 | 2,824 | (1,055,003) | 2,824 | 233,586 | 9/30/2010 | ||||||||||||||||||
22544QAM1 | 487,456 | 27,610 | (459,846) | 27,610 | 6,078,402 | 9/30/2010 | ||||||||||||||||||
| 67 |
NOTES TO STATUTORY–BASIS FINANCIAL STATEMENTS
TEACHERS INSURANCE AND ANNUITY ASSOCIATION OF AMERICA
| CUSIP | Book/Adj. Carrying Value Amortized Cost Before Current Period OTTI | Present Value of Projected Cash Flows | Recognized Other-Than- Temporary Impairment | Amortized Cost After Other- Than-Temporary Impairment | Fair Value as of Impairment Date | Date of Financial Statement Where Reported | ||||||||||||||||||
92978QAJ6 | $ | 33,516 | $ | 29,201 | $ | (4,315) | $ | 29,201 | $ | 45,068 | 9/30/2010 | |||||||||||||
50180CAV2 | 513,643 | 56,863 | (456,780) | 56,863 | 900,000 | 9/30/2010 | ||||||||||||||||||
50180JAL9 | 78,357 | 58,000 | (20,357) | 58,000 | 840,000 | 9/30/2010 | ||||||||||||||||||
46625M2Y4 | 127,218 | 90,542 | (36,676) | 90,542 | 168,938 | 9/30/2010 | ||||||||||||||||||
20173MAQ3 | 340,808 | 152,700 | (188,108) | 152,700 | 450,000 | 9/30/2010 | ||||||||||||||||||
03927PAG3 | 1,003,568 | 191,997 | (811,571) | 191,997 | 180,000 | 9/30/2010 | ||||||||||||||||||
46625YC68 | 1,201,084 | 217,132 | (983,952) | 217,132 | 770,491 | 9/30/2010 | ||||||||||||||||||
50180JAK1 | 17,728,775 | 251,080 | (17,477,695) | 251,080 | 5,568,380 | 9/30/2010 | ||||||||||||||||||
03927PAH1 | 3,010,831 | 378,597 | (2,632,234) | 378,597 | 465,000 | 9/30/2010 | ||||||||||||||||||
46632HAQ4 | 502,407 | 410,663 | (91,744) | 410,663 | 562,770 | 9/30/2010 | ||||||||||||||||||
50177AAL3 | 928,391 | 418,825 | (509,566) | 418,825 | 2,683,060 | 9/30/2010 | ||||||||||||||||||
52108MGD9 | 511,840 | 436,322 | (75,518) | 436,322 | 497,400 | 9/30/2010 | ||||||||||||||||||
61745MX57 | 2,601,720 | 479,664 | (2,122,056) | 479,664 | 1,481,676 | 9/30/2010 | ||||||||||||||||||
50180CAM2 | 1,960,200 | 490,243 | (1,469,957) | 490,243 | 2,554,245 | 9/30/2010 | ||||||||||||||||||
361849S29 | 2,229,531 | 509,443 | (1,720,088) | 509,443 | 3,046,218 | 9/30/2010 | ||||||||||||||||||
61745MU68 | 1,350,938 | 535,909 | (815,029) | 535,909 | 1,994,764 | 9/30/2010 | ||||||||||||||||||
361849K84 | 3,973,100 | 552,964 | (3,420,136) | 552,964 | 3,000,254 | 9/30/2010 | ||||||||||||||||||
46625MQ77 | 759,578 | 619,476 | (140,102) | 619,476 | 157,342 | 9/30/2010 | ||||||||||||||||||
61751NAQ5 | 819,550 | 680,057 | (139,493) | 680,057 | 1,032,044 | 9/30/2010 | ||||||||||||||||||
36228CDP5 | 767,216 | 707,260 | (59,956) | 707,260 | 1,050,518 | 9/30/2010 | ||||||||||||||||||
46625M2W8 | 1,031,919 | 782,253 | (249,666) | 782,253 | 174,387 | 9/30/2010 | ||||||||||||||||||
294751EM0 | 1,506,623 | 831,775 | (674,848) | 831,775 | 250,445 | 9/30/2010 | ||||||||||||||||||
805564NE7 | 2,078,249 | 897,226 | (1,181,023) | 897,226 | 284,686 | 9/30/2010 | ||||||||||||||||||
07387BEQ2 | 936,886 | 921,644 | (15,242) | 921,644 | 1,679,372 | 9/30/2010 | ||||||||||||||||||
52108HZ80 | 1,227,132 | 976,255 | (250,877) | 976,255 | 2,483,719 | 9/30/2010 | ||||||||||||||||||
50179AAM9 | 1,354,724 | 1,047,071 | (307,653) | 1,047,071 | 480,000 | 9/30/2010 | ||||||||||||||||||
46625MUH0 | 4,605,575 | 1,191,047 | (3,414,528) | 1,191,047 | 1,742,729 | 9/30/2010 | ||||||||||||||||||
361849N73 | 9,996,216 | 1,268,522 | (8,727,694) | 1,268,522 | 5,013,340 | 9/30/2010 | ||||||||||||||||||
46631BAP0 | 2,024,805 | 1,271,800 | (753,005) | 1,271,800 | 4,168,738 | 9/30/2010 | ||||||||||||||||||
46630VAP7 | 2,972,270 | 1,328,263 | (1,644,007) | 1,328,263 | 1,568,592 | 9/30/2010 | ||||||||||||||||||
36298JAC7 | 1,834,754 | 1,633,630 | (201,124) | 1,633,630 | 750,000 | 9/30/2010 | ||||||||||||||||||
361849R87 | 10,524,919 | 1,707,335 | (8,817,584) | 1,707,335 | 2,773,103 | 9/30/2010 | ||||||||||||||||||
20173TAP0 | 7,846,013 | 1,883,441 | (5,962,572) | 1,883,441 | 3,328,123 | 9/30/2010 | ||||||||||||||||||
60688BAM0 | 2,426,047 | 1,968,375 | (457,672) | 1,968,375 | 2,211,318 | 9/30/2010 | ||||||||||||||||||
07387BEP4 | 2,571,979 | 1,969,179 | (602,800) | 1,969,179 | 1,319,047 | 9/30/2010 | ||||||||||||||||||
22544QAK5 | 3,458,269 | 2,028,181 | (1,430,088) | 2,028,181 | 5,817,474 | 9/30/2010 | ||||||||||||||||||
03762AAG4 | 2,267,403 | 2,115,821 | (151,582) | 2,115,821 | 669,000 | 9/30/2010 | ||||||||||||||||||
60687UAM9 | 2,665,917 | 2,224,903 | (441,014) | 2,224,903 | 1,356,766 | 9/30/2010 | ||||||||||||||||||
61751NAN2 | 5,016,590 | 2,335,548 | (2,681,042) | 2,335,548 | 1,514,820 | 9/30/2010 | ||||||||||||||||||
55312TAH6 | 4,025,969 | 2,425,063 | (1,600,906) | 2,425,063 | 3,848,100 | 9/30/2010 | ||||||||||||||||||
07383F6U7 | 4,544,157 | 2,523,716 | (2,020,441) | 2,523,716 | 2,917,320 | 9/30/2010 | ||||||||||||||||||
61745MX40 | 3,005,245 | 2,832,830 | (172,415) | 2,832,830 | 1,934,883 | 9/30/2010 | ||||||||||||||||||
61749WAJ6 | 3,131,729 | 2,976,424 | (155,305) | 2,976,424 | 2,610,356 | 9/30/2010 | ||||||||||||||||||
52108MGC1 | 3,824,197 | 3,155,305 | (668,892) | 3,155,305 | 1,174,873 | 9/30/2010 | ||||||||||||||||||
61745M6T5 | 5,294,616 | 3,219,448 | (2,075,168) | 3,219,448 | 3,402,161 | 9/30/2010 | ||||||||||||||||||
46628FAU5 | 4,037,131 | 3,268,489 | (768,642) | 3,268,489 | 1,305,785 | 9/30/2010 | ||||||||||||||||||
92976UAA8 | 10,526,641 | 3,285,654 | (7,240,987) | 3,285,654 | 1,820,000 | 9/30/2010 | ||||||||||||||||||
59022HBW1 | 5,862,578 | 3,821,756 | (2,040,822) | 3,821,756 | 1,872,228 | 9/30/2010 | ||||||||||||||||||
07387BAT0 | 4,534,942 | 3,983,278 | (551,664) | 3,983,278 | 1,709,633 | 9/30/2010 | ||||||||||||||||||
81375WHK5 | 4,270,433 | 4,033,599 | (236,834) | 4,033,599 | 2,176,741 | 9/30/2010 | ||||||||||||||||||
03927PAF5 | 5,015,517 | 4,193,790 | (821,727) | 4,193,790 | 1,050,000 | 9/30/2010 | ||||||||||||||||||
61749WAH0 | 4,477,955 | 4,259,879 | (218,076) | 4,259,879 | 3,597,948 | 9/30/2010 | ||||||||||||||||||
396789KF5 | 4,416,306 | 4,367,634 | (48,672) | 4,367,634 | 1,844,566 | 9/30/2010 | ||||||||||||||||||
52108HV76 | 4,714,587 | 4,387,185 | (327,402) | 4,387,185 | 2,177,995 | 9/30/2010 | ||||||||||||||||||
46629YAM1 | 8,430,490 | 4,516,533 | (3,913,957) | 4,516,533 | 7,004,700 | 9/30/2010 | ||||||||||||||||||
| 68 |
| continued |
| CUSIP | Book/Adj. Carrying Value Amortized Cost Before Current Period OTTI | Present Value of Projected Cash Flows | Recognized Other-Than- Temporary Impairment | Amortized Cost After Other- Than-Temporary Impairment | Fair Value as of Impairment Date | Date of Financial Statement Where Reported | ||||||||||||||||||
20173MAN0 | $ | 6,985,383 | $ | 4,641,381 | $ | (2,344,002) | $ | 4,641,381 | $ | 2,800,000 | 9/30/2010 | |||||||||||||
361849R79 | 6,014,394 | 4,719,268 | (1,295,126) | 4,719,268 | 2,522,106 | 9/30/2010 | ||||||||||||||||||
46631BAN5 | 5,386,554 | 5,053,566 | (332,988) | 5,053,566 | 9,091,732 | 9/30/2010 | ||||||||||||||||||
61754JAM0 | 6,257,352 | 5,085,114 | (1,172,238) | 5,085,114 | 3,054,182 | 9/30/2010 | ||||||||||||||||||
92977RAK2 | 6,000,000 | 5,455,051 | (544,949) | 5,455,051 | 2,810,760 | 9/30/2010 | ||||||||||||||||||
50180JAJ4 | 12,276,489 | 5,571,591 | (6,704,898) | 5,571,591 | 4,764,503 | 9/30/2010 | ||||||||||||||||||
59022HJU7 | 11,674,617 | 5,635,576 | (6,039,041) | 5,635,576 | 6,285,333 | 9/30/2010 | ||||||||||||||||||
52108HF82 | 7,727,956 | 7,452,402 | (275,554) | 7,452,402 | 5,477,803 | 9/30/2010 | ||||||||||||||||||
46625MZG7 | 14,378,021 | 7,761,562 | (6,616,459) | 7,761,562 | 7,068,304 | 9/30/2010 | ||||||||||||||||||
92977QAM0 | 9,999,889 | 8,976,592 | (1,023,297) | 8,976,592 | 7,785,280 | 9/30/2010 | ||||||||||||||||||
17310MAQ3 | 10,917,564 | 9,677,098 | (1,240,466) | 9,677,098 | 3,092,280 | 9/30/2010 | ||||||||||||||||||
92978MAL0 | 10,891,007 | 10,594,077 | (296,930) | 10,594,077 | 6,121,980 | 9/30/2010 | ||||||||||||||||||
760985XK2 | 11,177,627 | 10,796,094 | (381,533) | 10,796,094 | 5,812,531 | 9/30/2010 | ||||||||||||||||||
92978TAK7 | 14,624,706 | 11,979,384 | (2,645,322) | 11,979,384 | 6,905,860 | 9/30/2010 | ||||||||||||||||||
81375WHJ8 | 14,316,870 | 13,476,996 | (839,874) | 13,476,996 | 6,308,833 | 9/30/2010 | ||||||||||||||||||
36242DDD2 | 14,949,165 | 14,918,720 | (30,445) | 14,918,720 | 13,206,450 | 9/30/2010 | ||||||||||||||||||
61749EAE7 | 18,695,577 | 18,367,862 | (327,715) | 18,367,862 | 14,629,965 | 9/30/2010 | ||||||||||||||||||
36228CYQ0 | 19,061,878 | 18,417,176 | (644,702) | 18,417,176 | 10,564,431 | 9/30/2010 | ||||||||||||||||||
03762CAE5 | 20,000,000 | 19,175,412 | (824,588) | 19,175,412 | 4,278,000 | 9/30/2010 | ||||||||||||||||||
55312TAG8 | 20,068,059 | 20,027,948 | (40,111) | 20,027,948 | 9,761,480 | 9/30/2010 | ||||||||||||||||||
36298JAA1 | 24,766,309 | 22,359,588 | (2,406,721) | 22,359,588 | 13,478,365 | 9/30/2010 | ||||||||||||||||||
87222PAE3 | 28,206,921 | 26,236,469 | (1,970,452) | 26,236,469 | 17,684,360 | 9/30/2010 | ||||||||||||||||||
525221EB9 | 28,731,701 | 27,779,667 | (952,034) | 27,779,667 | 21,675,300 | 9/30/2010 | ||||||||||||||||||
36242DSS3 | 27,998,997 | 27,925,439 | (73,558) | 27,925,439 | 24,350,900 | 9/30/2010 | ||||||||||||||||||
52522HAL6 | 32,497,160 | 30,700,898 | (1,796,262) | 30,700,898 | 19,912,720 | 9/30/2010 | ||||||||||||||||||
337925CP4 | 708,577 | — | * | (708,577) | — | 681,596 | 9/30/2010 | |||||||||||||||||
337925CZ2 | 610,176 | — | * | (610,176) | — | 548,633 | 9/30/2010 | |||||||||||||||||
337925DL2 | 473,971 | — | * | (473,971) | — | 461,740 | 9/30/2010 | |||||||||||||||||
337925EG2 | 1,044,691 | — | * | (1,044,691) | — | 714,399 | 9/30/2010 | |||||||||||||||||
337925EH0 | 474,932 | — | * | (474,932) | — | 422,913 | 9/30/2010 | |||||||||||||||||
337925EU1 | 1,214,988 | — | * | (1,214,988) | — | 1,178,254 | 9/30/2010 | |||||||||||||||||
337925CA7 | 428,760 | — | * | (428,760) | — | 428,944 | 9/30/2010 | |||||||||||||||||
46625MZH5 | 973,556 | — | * | (973,556) | — | 647,412 | 9/30/2010 | |||||||||||||||||
50180JAR6 | 37,891 | — | * | (37,891) | — | 840,000 | 9/30/2010 | |||||||||||||||||
50180JAM7 | 191,908 | — | * | (191,908) | — | 1,700,000 | 9/30/2010 | |||||||||||||||||
50180CAW0 | 348,525 | — | * | (348,525) | — | 647,640 | 9/30/2010 | |||||||||||||||||
362332AN8 | 398,583 | — | * | (398,583) | — | 500,000 | 9/30/2010 | |||||||||||||||||
22544QAN9 | 271,620 | — | * | (271,620) | — | 2,556,246 | 9/30/2010 | |||||||||||||||||
291701CS7 | 357,217 | — | * | (357,217) | — | 340,483 | 9/30/2010 | |||||||||||||||||
337937AK2 | 555,930 | — | * | (555,930) | — | 722,709 | 9/30/2010 | |||||||||||||||||
291701CN8 | 843,207 | — | * | (843,207) | — | 871,099 | 9/30/2010 | |||||||||||||||||
225458SA7 | 2,727,617 | — | * | (2,727,617) | — | 2,663,768 | 9/30/2010 | |||||||||||||||||
22544QAP4 | 60,547 | — | * | (60,547) | — | 1,334,085 | 9/30/2010 | |||||||||||||||||
74040KAC6 | 3,935,934 | — | ² | (934,784) | 3,001,150 | 3,001,150 | 9/30/2010 | |||||||||||||||||
74951PEA2 | 515,298 | 501,141 | (14,157) | 501,141 | 383,289 | 9/30/2010 | ||||||||||||||||||
05948KLA5 | 794,663 | 789,904 | (4,759) | 789,904 | 958,430 | 9/30/2010 | ||||||||||||||||||
12669DN87 | 1,039,821 | 851,895 | (187,926) | 851,895 | 1,283,223 | 9/30/2010 | ||||||||||||||||||
76110HSH3 | 1,655,812 | 1,148,317 | (507,495) | 1,148,317 | 616,643 | 9/30/2010 | ||||||||||||||||||
12667FR98 | 1,634,046 | 1,588,689 | (45,357) | 1,588,689 | 1,372,774 | 9/30/2010 | ||||||||||||||||||
76110HHB8 | 2,172,936 | 1,711,873 | (461,063) | 1,711,873 | 1,619,613 | 9/30/2010 | ||||||||||||||||||
52521RAS0 | 2,357,220 | 1,999,845 | (357,375) | 1,999,845 | 1,262,735 | 9/30/2010 | ||||||||||||||||||
12669E4W3 | 2,775,166 | 2,218,359 | (556,807) | 2,218,359 | 2,657,258 | 9/30/2010 | ||||||||||||||||||
05949AA67 | 2,301,179 | 2,246,111 | (55,068) | 2,246,111 | 3,101,032 | 9/30/2010 | ||||||||||||||||||
76110HNQ8 | 2,978,792 | 2,836,485 | (142,307) | 2,836,485 | 1,900,872 | 9/30/2010 | ||||||||||||||||||
251510CY7 | 4,008,391 | 3,877,663 | (130,728) | 3,877,663 | 2,457,374 | 9/30/2010 | ||||||||||||||||||
| 69 |
NOTES TO STATUTORY–BASIS FINANCIAL STATEMENTS
TEACHERS INSURANCE AND ANNUITY ASSOCIATION OF AMERICA
| CUSIP | Book/Adj. Carrying Value Amortized Cost Before Current Period OTTI | Present Value of Projected Cash Flows | Recognized Other-Than- Temporary Impairment | Amortized Cost After Other- Than-Temporary Impairment | Fair Value as of Impairment Date | Date of Financial Statement Where Reported | ||||||||||||||||||
12669DN79 | $ | 4,281,079 | $ | 3,932,407 | $ | (348,672) | $ | 3,932,407 | $ | 2,303,428 | 9/30/2010 | |||||||||||||
76110HQS1 | 4,582,481 | 4,359,220 | (223,261) | 4,359,220 | 3,995,766 | 9/30/2010 | ||||||||||||||||||
05948KKZ1 | 4,469,511 | 4,442,425 | (27,086) | 4,442,425 | 3,137,443 | 9/30/2010 | ||||||||||||||||||
576434JM7 | 5,523,783 | 5,415,092 | (108,691) | 5,415,092 | 3,306,110 | 9/30/2010 | ||||||||||||||||||
12667GUG6 | 6,076,219 | 5,956,519 | (119,700) | 5,956,519 | 5,270,371 | 9/30/2010 | ||||||||||||||||||
76110HSG5 | 6,261,452 | 6,042,010 | (219,442) | 6,042,010 | 3,928,811 | 9/30/2010 | ||||||||||||||||||
32051GFL4 | 7,399,409 | 7,313,027 | (86,382) | 7,313,027 | 5,749,581 | 9/30/2010 | ||||||||||||||||||
12667FW92 | 7,483,674 | 7,461,412 | (22,262) | 7,461,412 | 7,874,328 | 9/30/2010 | ||||||||||||||||||
05948KF38 | 7,700,164 | 7,591,407 | (108,757) | 7,591,407 | 7,856,195 | 9/30/2010 | ||||||||||||||||||
94984XAD2 | 7,777,291 | 7,755,115 | (22,176) | 7,755,115 | 4,252,391 | 9/30/2010 | ||||||||||||||||||
949837BK3 | 8,529,969 | 8,512,962 | (17,007) | 8,512,962 | 6,582,888 | 9/30/2010 | ||||||||||||||||||
12544RAL2 | 8,654,164 | 8,581,480 | (72,684) | 8,581,480 | 6,388,110 | 9/30/2010 | ||||||||||||||||||
12669EL95 | 8,835,696 | 8,797,873 | (37,823) | 8,797,873 | 6,601,090 | 9/30/2010 | ||||||||||||||||||
12669G5U1 | 9,025,626 | 8,841,996 | (183,630) | 8,841,996 | 8,322,040 | 9/30/2010 | ||||||||||||||||||
12669EWY8 | 9,139,220 | 8,891,603 | (247,617) | 8,891,603 | 6,957,959 | 9/30/2010 | ||||||||||||||||||
16165TBJ1 | 9,471,606 | 9,310,541 | (161,065) | 9,310,541 | 7,319,370 | 9/30/2010 | ||||||||||||||||||
94984XAB6 | 9,405,896 | 9,378,148 | (27,748) | 9,378,148 | 5,127,610 | 9/30/2010 | ||||||||||||||||||
12543TAD7 | 9,547,554 | 9,470,079 | (77,475) | 9,470,079 | 7,959,480 | 9/30/2010 | ||||||||||||||||||
76110HHA0 | 9,694,151 | 9,529,148 | (165,003) | 9,529,148 | 7,251,752 | 9/30/2010 | ||||||||||||||||||
17312FAD5 | 9,815,809 | 9,806,180 | (9,629) | 9,806,180 | 8,066,300 | 9/30/2010 | ||||||||||||||||||
362669AQ6 | 10,010,325 | 9,998,147 | (12,178) | 9,998,147 | 7,466,551 | 9/30/2010 | ||||||||||||||||||
05948KP37 | 10,530,359 | 10,456,348 | (74,011) | 10,456,348 | 8,709,566 | 9/30/2010 | ||||||||||||||||||
46627MAC1 | 10,932,249 | 10,874,923 | (57,326) | 10,874,923 | 6,533,115 | 9/30/2010 | ||||||||||||||||||
94984XAM2 | 11,873,049 | 11,838,358 | (34,691) | 11,838,358 | 7,959,049 | 9/30/2010 | ||||||||||||||||||
12667FYZ2 | 13,543,516 | 12,153,503 | (1,390,013) | 12,153,503 | 5,378,866 | 9/30/2010 | ||||||||||||||||||
45660LPD5 | 13,630,938 | 13,535,779 | (95,159) | 13,535,779 | 10,422,789 | 9/30/2010 | ||||||||||||||||||
76114DAE4 | 14,403,332 | 14,158,910 | (244,422) | 14,158,910 | 13,090,774 | 9/30/2010 | ||||||||||||||||||
12667GKE2 | 14,381,868 | 14,217,499 | (164,369) | 14,217,499 | 12,474,020 | 9/30/2010 | ||||||||||||||||||
12669YAX0 | 14,609,899 | 14,474,708 | (135,191) | 14,474,708 | 7,351,063 | 9/30/2010 | ||||||||||||||||||
170255AS2 | 14,686,766 | 14,580,345 | (106,421) | 14,580,345 | 12,626,625 | 9/30/2010 | ||||||||||||||||||
36185MEG3 | 14,702,269 | 14,698,050 | (4,219) | 14,698,050 | 13,749,795 | 9/30/2010 | ||||||||||||||||||
12669YAH5 | 15,042,278 | 14,902,664 | (139,614) | 14,902,664 | 11,353,622 | 9/30/2010 | ||||||||||||||||||
12543UAE2 | 14,985,389 | 14,972,823 | (12,566) | 14,972,823 | 13,808,141 | 9/30/2010 | ||||||||||||||||||
46628YBP4 | 15,292,671 | 15,243,202 | (49,469) | 15,243,202 | 10,564,104 | 9/30/2010 | ||||||||||||||||||
12544DAQ2 | 15,349,276 | 15,280,254 | (69,022) | 15,280,254 | 10,370,642 | 9/30/2010 | ||||||||||||||||||
94985LAD7 | 15,362,213 | 15,357,526 | (4,687) | 15,357,526 | 11,807,387 | 9/30/2010 | ||||||||||||||||||
94983BAP4 | 15,420,761 | 15,412,864 | (7,897) | 15,412,864 | 12,098,625 | 9/30/2010 | ||||||||||||||||||
02151NBA9 | 15,606,580 | 15,520,065 | (86,515) | 15,520,065 | 12,120,095 | 9/30/2010 | ||||||||||||||||||
17025AAB8 | 16,283,347 | 15,828,040 | (455,307) | 15,828,040 | 16,699,980 | 9/30/2010 | ||||||||||||||||||
05948KC98 | 17,319,534 | 17,277,035 | (42,499) | 17,277,035 | 14,358,801 | 9/30/2010 | ||||||||||||||||||
05948KF20 | 17,618,032 | 17,564,850 | (53,182) | 17,564,850 | 15,131,075 | 9/30/2010 | ||||||||||||||||||
749577AL6 | 18,139,489 | 18,074,251 | (65,238) | 18,074,251 | 10,410,837 | 9/30/2010 | ||||||||||||||||||
02148YAD6 | 18,639,155 | 18,554,515 | (84,640) | 18,554,515 | 17,726,264 | 9/30/2010 | ||||||||||||||||||
12667GFT5 | 18,726,582 | 18,576,105 | (150,477) | 18,576,105 | 13,843,487 | 9/30/2010 | ||||||||||||||||||
12669YAF9 | 19,610,253 | 19,399,149 | (211,104) | 19,399,149 | 10,066,709 | 9/30/2010 | ||||||||||||||||||
949837BE7 | 19,849,775 | 19,801,905 | (47,870) | 19,801,905 | 15,333,220 | 9/30/2010 | ||||||||||||||||||
12667GW74 | 19,818,397 | 19,813,092 | (5,305) | 19,813,092 | 15,345,380 | 9/30/2010 | ||||||||||||||||||
12667F5Z4 | 21,428,561 | 21,294,549 | (134,012) | 21,294,549 | 17,673,695 | 9/30/2010 | ||||||||||||||||||
12544DAK5 | 21,491,809 | 21,405,725 | (86,084) | 21,405,725 | 16,578,519 | 9/30/2010 | ||||||||||||||||||
02149HAK6 | 21,864,991 | 21,660,002 | (204,989) | 21,660,002 | 20,699,706 | 9/30/2010 | ||||||||||||||||||
94985WAP6 | 21,974,515 | 21,939,669 | (34,846) | 21,939,669 | 19,201,255 | 9/30/2010 | ||||||||||||||||||
12667GQA4 | 22,343,996 | 22,294,347 | (49,649) | 22,294,347 | 16,792,289 | 9/30/2010 | ||||||||||||||||||
02148FAW5 | 24,307,551 | 23,980,519 | (327,032) | 23,980,519 | 19,215,067 | 9/30/2010 | ||||||||||||||||||
12667F7D1 | 24,953,037 | 24,876,150 | (76,887) | 24,876,150 | 19,505,863 | 9/30/2010 | ||||||||||||||||||
949837CC0 | 25,539,157 | 25,444,549 | (94,608) | 25,444,549 | 19,255,931 | 9/30/2010 | ||||||||||||||||||
| 70 |
| continued |
| CUSIP | Book/Adj. Carrying Value Amortized Cost Before Current Period OTTI | Present Value of Projected Cash Flows | Recognized Other-Than- Temporary Impairment | Amortized Cost After Other- Than-Temporary Impairment | Fair Value as of Impairment Date | Date of Financial Statement Where Reported | ||||||||||||||||||
74958BAH5 | $ | 25,685,855 | $ | 25,561,877 | $ | (123,978) | $ | 25,561,877 | $ | 18,927,974 | 9/30/2010 | |||||||||||||
16163BAP9 | 28,686,716 | 28,528,270 | (158,446) | 28,528,270 | 23,782,605 | 9/30/2010 | ||||||||||||||||||
94985JCA6 | 28,644,151 | 28,584,900 | (59,251) | 28,584,900 | 25,770,990 | 9/30/2010 | ||||||||||||||||||
46628YBK5 | 29,077,252 | 29,054,422 | (22,830) | 29,054,422 | 14,702,251 | 9/30/2010 | ||||||||||||||||||
94985JBR0 | 29,257,811 | 29,169,353 | (88,458) | 29,169,353 | 13,110,447 | 9/30/2010 | ||||||||||||||||||
12667GLE1 | 29,623,764 | 29,503,475 | (120,289) | 29,503,475 | 24,393,453 | 9/30/2010 | ||||||||||||||||||
12544LAK7 | 30,863,683 | 30,752,256 | (111,427) | 30,752,256 | 27,918,624 | 9/30/2010 | ||||||||||||||||||
02151FAD1 | 35,662,487 | 35,631,440 | (31,047) | 35,631,440 | 26,756,800 | 9/30/2010 | ||||||||||||||||||
94984HAC9 | 37,354,109 | 36,448,626 | (905,483) | 36,448,626 | 32,702,779 | 9/30/2010 | ||||||||||||||||||
74957XAF2 | 36,832,899 | 36,774,560 | (58,339) | 36,774,560 | 28,287,752 | 9/30/2010 | ||||||||||||||||||
94985WBL4 | 36,958,147 | 36,857,659 | (100,488) | 36,857,659 | 27,838,397 | 9/30/2010 | ||||||||||||||||||
17025JAB9 | 37,271,990 | 36,891,975 | (380,015) | 36,891,975 | 34,077,959 | 9/30/2010 | ||||||||||||||||||
12545CAU4 | 37,511,851 | 37,191,320 | (320,531) | 37,191,320 | 34,835,400 | 9/30/2010 | ||||||||||||||||||
12667F2J3 | 39,544,156 | 39,164,431 | (379,725) | 39,164,431 | 32,915,608 | 9/30/2010 | ||||||||||||||||||
161631AV8 | 40,692,742 | 40,504,203 | (188,539) | 40,504,203 | 32,871,977 | 9/30/2010 | ||||||||||||||||||
12543UAD4 | 42,273,632 | 42,132,737 | (140,895) | 42,132,737 | 23,735,250 | 9/30/2010 | ||||||||||||||||||
02147QAE2 | 43,134,015 | 42,336,150 | (797,865) | 42,336,150 | 37,748,150 | 9/30/2010 | ||||||||||||||||||
12670AAF8 | 45,917,985 | 45,587,433 | (330,552) | 45,587,433 | 37,380,393 | 9/30/2010 | ||||||||||||||||||
12544AAC9 | 48,512,531 | 48,193,800 | (318,731) | 48,193,800 | 28,169,900 | 9/30/2010 | ||||||||||||||||||
94985JAB6 | 48,450,962 | 48,327,700 | (123,262) | 48,327,700 | 30,442,250 | 9/30/2010 | ||||||||||||||||||
74958EAD8 | 48,969,169 | 48,804,200 | (164,969) | 48,804,200 | 41,046,800 | 9/30/2010 | ||||||||||||||||||
12667GJR5 | 50,995,614 | 50,818,362 | (177,252) | 50,818,362 | 37,041,360 | 9/30/2010 | ||||||||||||||||||
94985RAP7 | 61,403,193 | 61,264,640 | (138,553) | 61,264,640 | 44,305,600 | 9/30/2010 | ||||||||||||||||||
12667GFB4 | 66,405,357 | 66,349,512 | (55,845) | 66,349,512 | 52,004,355 | 9/30/2010 | ||||||||||||||||||
12667GBA0 | 67,787,544 | 67,607,741 | (179,803) | 67,607,741 | 51,342,736 | 9/30/2010 | ||||||||||||||||||
949837AF5 | 68,594,272 | 68,455,886 | (138,386) | 68,455,886 | 41,453,035 | 9/30/2010 | ||||||||||||||||||
94985WAQ4 | 72,997,980 | 72,781,248 | (216,732) | 72,781,248 | 57,469,842 | 9/30/2010 | ||||||||||||||||||
94986AAC2 | 110,671,126 | 110,256,395 | (414,731) | 110,256,395 | 97,475,610 | 9/30/2010 | ||||||||||||||||||
05948KF38 | 8,102,922 | 8,008,653 | (94,269) | 8,008,653 | 7,523,260 | 9/30/2010 | ||||||||||||||||||
02660TFM0 | 10,000,000 | 9,111,833 | (888,167) | 9,111,833 | 5,875,731 | 6/30/2010 | ||||||||||||||||||
05947UJV1 | 230,773 | — | * | (230,773) | — | 250,062 | 6/30/2010 | |||||||||||||||||
05947UWD6 | 3,887 | — | * | (3,887) | — | 17 | 6/30/2010 | |||||||||||||||||
38500XAL6 | 19,569,620 | 1,200,000 | (18,369,620) | 1,200,000 | 1,200,000 | 6/30/2010 | ||||||||||||||||||
38500XAM4 | 1,390,890 | — | * | (1,390,890) | — | 180,390 | 6/30/2010 | |||||||||||||||||
61749EAE7 | 20,521,789 | 19,037,308 | (1,484,481) | 19,037,308 | 16,444,615 | 6/30/2010 | ||||||||||||||||||
02147QAE2 | 43,607,310 | 43,250,000 | (357,310) | 43,250,000 | 36,456,645 | 6/30/2010 | ||||||||||||||||||
02148FAW5 | 24,764,882 | 24,744,699 | (20,183) | 24,744,699 | 18,944,847 | 6/30/2010 | ||||||||||||||||||
02148YAD6 | 18,959,037 | 18,754,083 | (204,954) | 18,754,083 | 17,217,844 | 6/30/2010 | ||||||||||||||||||
02149HAK6 | 22,147,214 | 21,909,031 | (238,183) | 21,909,031 | 20,032,454 | 6/30/2010 | ||||||||||||||||||
02151CBD7 | 25,594,706 | 25,322,620 | (272,086) | 25,322,620 | 21,171,746 | 6/30/2010 | ||||||||||||||||||
02151FAD1 | 36,260,450 | 35,708,000 | (552,450) | 35,708,000 | 25,848,640 | 6/30/2010 | ||||||||||||||||||
05948KB65 | 9,775,591 | 9,767,580 | (8,011) | 9,767,580 | 6,880,762 | 6/30/2010 | ||||||||||||||||||
05948KC98 | 17,486,605 | 17,465,528 | (21,077) | 17,465,528 | 13,745,026 | 6/30/2010 | ||||||||||||||||||
05948KF20 | 17,769,200 | 17,751,754 | (17,446) | 17,751,754 | 15,634,741 | 6/30/2010 | ||||||||||||||||||
05948KKZ1 | 4,669,696 | 4,553,585 | (116,111) | 4,553,585 | 3,037,480 | 6/30/2010 | ||||||||||||||||||
05948KLA5 | 943,050 | 848,321 | (94,729) | 848,321 | 925,782 | 6/30/2010 | ||||||||||||||||||
05948KP37 | 10,605,841 | 10,530,759 | (75,082) | 10,530,759 | 8,290,079 | 6/30/2010 | ||||||||||||||||||
05949AMP2 | 840,574 | 727,190 | (113,384) | 727,190 | 1,437,741 | 6/30/2010 | ||||||||||||||||||
12543UAD4 | 42,348,982 | 42,321,343 | (27,639) | 42,321,343 | 22,970,474 | 6/30/2010 | ||||||||||||||||||
12543UAE2 | 15,120,338 | 15,014,740 | (105,598) | 15,014,740 | 8,284,514 | 6/30/2010 | ||||||||||||||||||
12543XAD8 | 24,672,024 | 24,630,000 | (42,024) | 24,630,000 | 18,013,338 | 6/30/2010 | ||||||||||||||||||
12544DAK5 | 21,554,275 | 21,486,386 | (67,889) | 21,486,386 | 15,740,814 | 6/30/2010 | ||||||||||||||||||
12544DAQ2 | 15,401,721 | 15,360,128 | (41,593) | 15,360,128 | 10,058,344 | 6/30/2010 | ||||||||||||||||||
12544LAK7 | 30,938,839 | 30,854,400 | (84,439) | 30,854,400 | 26,452,928 | 6/30/2010 | ||||||||||||||||||
12544RAL2 | 8,678,575 | 8,663,000 | (15,575) | 8,663,000 | 6,057,710 | 6/30/2010 | ||||||||||||||||||
| 71 |
NOTES TO STATUTORY–BASIS FINANCIAL STATEMENTS
TEACHERS INSURANCE AND ANNUITY ASSOCIATION OF AMERICA
| CUSIP | Book/Adj. Carrying Value Amortized Cost Before Current Period OTTI | Present Value of Projected Cash Flows | Recognized Other-Than- Temporary Impairment | Amortized Cost After Other- Than-Temporary Impairment | Fair Value as of Impairment Date | Date of Financial Statement Where Reported | ||||||||||||||||||
12545CAU4 | $ | 37,809,701 | $ | 37,548,000 | $ | (261,701) | $ | 37,548,000 | $ | 32,720,240 | 6/30/2010 | |||||||||||||
12667F7D1 | 25,272,217 | 25,220,610 | (51,607) | 25,220,610 | 19,089,165 | 6/30/2010 | ||||||||||||||||||
12667FMJ1 | 18,249,039 | 16,795,987 | (1,453,052) | 16,795,987 | 9,771,574 | 6/30/2010 | ||||||||||||||||||
12667FR98 | 2,402,990 | 1,819,641 | (583,349) | 1,819,641 | 1,365,102 | 6/30/2010 | ||||||||||||||||||
12667FYZ2 | 14,897,374 | 13,912,931 | (984,443) | 13,912,931 | 5,145,385 | 6/30/2010 | ||||||||||||||||||
12667GBA0 | 68,402,008 | 68,282,640 | (119,368) | 68,282,640 | 50,138,543 | 6/30/2010 | ||||||||||||||||||
12667GFB4 | 67,048,513 | 66,949,823 | (98,690) | 66,949,823 | 50,786,923 | 6/30/2010 | ||||||||||||||||||
12667GFT5 | 18,766,761 | 18,741,443 | (25,318) | 18,741,443 | 13,010,285 | 6/30/2010 | ||||||||||||||||||
12667GJG9 | 16,197,696 | 16,150,982 | (46,714) | 16,150,982 | 11,650,232 | 6/30/2010 | ||||||||||||||||||
12667GJR5 | 50,615,994 | 50,483,550 | (132,444) | 50,483,550 | 35,617,692 | 6/30/2010 | ||||||||||||||||||
12667GKE2 | 14,577,494 | 14,515,865 | (61,629) | 14,515,865 | 7,914,878 | 6/30/2010 | ||||||||||||||||||
12667GLE1 | 29,905,071 | 29,881,712 | (23,359) | 29,881,712 | 23,880,078 | 6/30/2010 | ||||||||||||||||||
12667GQA4 | 22,506,298 | 22,460,394 | (45,904) | 22,460,394 | 16,292,248 | 6/30/2010 | ||||||||||||||||||
12667GUG6 | 6,374,893 | 6,339,105 | (35,788) | 6,339,105 | 5,439,295 | 6/30/2010 | ||||||||||||||||||
12667GW74 | 19,961,817 | 19,886,000 | (75,817) | 19,886,000 | 14,816,578 | 6/30/2010 | ||||||||||||||||||
12668AAG0 | 17,380,632 | 17,270,938 | (109,694) | 17,270,938 | 16,458,570 | 6/30/2010 | ||||||||||||||||||
126694JS8 | 27,851,078 | 27,774,433 | (76,645) | 27,774,433 | 11,456,916 | 6/30/2010 | ||||||||||||||||||
12669DN79 | 4,405,292 | 4,358,244 | (47,048) | 4,358,244 | 2,268,827 | 6/30/2010 | ||||||||||||||||||
12669DN87 | 1,232,118 | 1,116,045 | (116,073) | 1,116,045 | 1,266,465 | 6/30/2010 | ||||||||||||||||||
12669E4W3 | 2,888,994 | 2,881,803 | (7,191) | 2,881,803 | 2,594,890 | 6/30/2010 | ||||||||||||||||||
12669YAF9 | 19,667,671 | 19,608,000 | (59,671) | 19,608,000 | 9,585,698 | 6/30/2010 | ||||||||||||||||||
12669YAH5 | 15,357,306 | 15,079,800 | (277,506) | 15,079,800 | 10,946,251 | 6/30/2010 | ||||||||||||||||||
12669YAX0 | 14,918,393 | 14,647,080 | (271,313) | 14,647,080 | 6,992,192 | 6/30/2010 | ||||||||||||||||||
161631AV8 | 40,839,369 | 40,694,486 | (144,883) | 40,694,486 | 31,252,349 | 6/30/2010 | ||||||||||||||||||
16163BAP9 | 28,792,721 | 28,700,550 | (92,171) | 28,700,550 | 23,400,306 | 6/30/2010 | ||||||||||||||||||
170255AS2 | 14,759,899 | 14,701,500 | (58,399) | 14,701,500 | 11,982,225 | 6/30/2010 | ||||||||||||||||||
17025AAB8 | 16,181,831 | 16,172,000 | (9,831) | 16,172,000 | 14,520,234 | 6/30/2010 | ||||||||||||||||||
17307G4H8 | 8,933,129 | 8,323,160 | (609,969) | 8,323,160 | 6,853,426 | 6/30/2010 | ||||||||||||||||||
17312FAD5 | 9,835,339 | 9,813,000 | (22,339) | 9,813,000 | 7,749,916 | 6/30/2010 | ||||||||||||||||||
251510ET6 | 3,857,397 | 3,772,604 | (84,793) | 3,772,604 | 1,528,953 | 6/30/2010 | ||||||||||||||||||
32051GDH5 | 3,252,876 | 1,786,149 | (1,466,727) | 1,786,149 | 3,463,472 | 6/30/2010 | ||||||||||||||||||
32051GFL4 | 7,483,229 | 7,445,103 | (38,126) | 7,445,103 | 5,640,328 | 6/30/2010 | ||||||||||||||||||
32051GVL6 | 25,285,339 | 24,685,122 | (600,217) | 24,685,122 | 20,274,599 | 6/30/2010 | ||||||||||||||||||
36185MEG3 | 14,806,237 | 14,698,500 | (107,737) | 14,698,500 | 13,133,460 | 6/30/2010 | ||||||||||||||||||
3622MPAN8 | 28,614,151 | 28,411,588 | (202,563) | 28,411,588 | 23,067,594 | 6/30/2010 | ||||||||||||||||||
362669AQ6 | 10,054,269 | 10,017,389 | (36,880) | 10,017,389 | 7,067,147 | 6/30/2010 | ||||||||||||||||||
45660LPD5 | 13,629,843 | 13,624,200 | (5,643) | 13,624,200 | 9,771,779 | 6/30/2010 | ||||||||||||||||||
46628YBP4 | 15,318,147 | 15,300,702 | (17,445) | 15,300,702 | 10,182,346 | 6/30/2010 | ||||||||||||||||||
52521RAS0 | 2,469,848 | 2,467,918 | (1,930) | 2,467,918 | 1,344,928 | 6/30/2010 | ||||||||||||||||||
576434JM7 | 5,886,943 | 5,653,674 | (233,269) | 5,653,674 | 3,250,454 | 6/30/2010 | ||||||||||||||||||
576434SW5 | 8,120,545 | 7,355,638 | (764,907) | 7,355,638 | 6,446,802 | 6/30/2010 | ||||||||||||||||||
74951PEA2 | 597,326 | 543,209 | (54,117) | 543,209 | 436,786 | 6/30/2010 | ||||||||||||||||||
74957EAF4 | 38,358,479 | 38,293,596 | (64,883) | 38,293,596 | 31,920,863 | 6/30/2010 | ||||||||||||||||||
74957VAQ2 | 22,202,597 | 22,177,240 | (25,357) | 22,177,240 | 18,773,771 | 6/30/2010 | ||||||||||||||||||
749583AH3 | 10,118,223 | 10,072,116 | (46,107) | 10,072,116 | 4,455,192 | 6/30/2010 | ||||||||||||||||||
74958BAH5 | 25,784,859 | 25,728,036 | (56,823) | 25,728,036 | 18,448,619 | 6/30/2010 | ||||||||||||||||||
74958EAD8 | 49,154,795 | 48,980,000 | (174,795) | 48,980,000 | 39,845,220 | 6/30/2010 | ||||||||||||||||||
76110HHB8 | 2,928,571 | 2,269,149 | (659,422) | 2,269,149 | 1,574,575 | 6/30/2010 | ||||||||||||||||||
76110HNQ8 | 3,116,679 | 3,024,481 | (92,198) | 3,024,481 | 1,883,540 | 6/30/2010 | ||||||||||||||||||
76110HSG5 | 6,516,403 | 6,414,262 | (102,141) | 6,414,262 | 3,841,482 | 6/30/2010 | ||||||||||||||||||
76110HSH3 | 1,800,187 | 1,733,449 | (66,738) | 1,733,449 | 604,826 | 6/30/2010 | ||||||||||||||||||
761118PQ5 | 12,207,070 | 12,192,106 | (14,964) | 12,192,106 | 9,685,647 | 6/30/2010 | ||||||||||||||||||
94980KAQ5 | 547,902 | 379,172 | (168,730) | 379,172 | 609,386 | 6/30/2010 | ||||||||||||||||||
949837AF5 | 68,992,674 | 68,564,059 | (428,615) | 68,564,059 | 39,882,612 | 6/30/2010 | ||||||||||||||||||
949837BE7 | 19,954,665 | 19,833,968 | (120,697) | 19,833,968 | 14,590,502 | 6/30/2010 | ||||||||||||||||||
| 72 |
| continued |
| CUSIP | Book/Adj. Carrying Value Amortized Cost Before Current Period OTTI | Present Value of Projected Cash Flows | Recognized Other-Than- Temporary Impairment | Amortized Cost After Other- Than-Temporary Impairment | Fair Value as of Impairment Date | Date of Financial Statement Where Reported | ||||||||||||||||||
949837BK3 | $ | 8,580,092 | $ | 8,527,305 | $ | (52,787) | $ | 8,527,305 | $ | 6,364,555 | 6/30/2010 | |||||||||||||
949837CC0 | 25,681,333 | 25,528,998 | (152,335) | 25,528,998 | 18,373,777 | 6/30/2010 | ||||||||||||||||||
94984XAB6 | 9,481,753 | 9,414,256 | (67,497) | 9,414,256 | 5,064,834 | 6/30/2010 | ||||||||||||||||||
94984XAD2 | 7,840,833 | 7,784,280 | (56,553) | 7,784,280 | 4,191,274 | 6/30/2010 | ||||||||||||||||||
94984XAM2 | 11,969,285 | 11,883,922 | (85,363) | 11,883,922 | 7,797,417 | 6/30/2010 | ||||||||||||||||||
94985JAB6 | 48,678,798 | 48,455,000 | (223,798) | 48,455,000 | 29,726,700 | 6/30/2010 | ||||||||||||||||||
94985JBR0 | 29,415,431 | 29,263,940 | (151,491) | 29,263,940 | 12,762,503 | 6/30/2010 | ||||||||||||||||||
94985JCA6 | 28,823,651 | 28,677,000 | (146,651) | 28,677,000 | 24,438,870 | 6/30/2010 | ||||||||||||||||||
94985RAP7 | 61,723,029 | 61,427,200 | (295,829) | 61,427,200 | 44,165,632 | 6/30/2010 | ||||||||||||||||||
94985WAP6 | 22,493,083 | 22,415,762 | (77,321) | 22,415,762 | 19,308,138 | 6/30/2010 | ||||||||||||||||||
94985WAQ4 | 72,279,028 | 71,850,942 | (428,086) | 71,850,942 | 30,769,004 | 6/30/2010 | ||||||||||||||||||
94985WBL4 | 37,110,835 | 36,927,295 | (183,540) | 36,927,295 | 27,557,573 | 6/30/2010 | ||||||||||||||||||
94986AAC2 | 111,161,847 | 110,675,500 | (486,347) | 110,675,500 | 92,731,400 | 6/30/2010 | ||||||||||||||||||
19075CAJ2 | 10,031,998 | — | ² | (5,248,178) | 4,783,820 | 4,783,820 | 6/30/2010 | |||||||||||||||||
19075CAK9 | 5,761,021 | — | ² | (385,711) | 5,375,310 | 5,375,310 | 6/30/2010 | |||||||||||||||||
19075CAN3 | 454,802 | — | ² | (4,802) | 450,000 | 450,000 | 6/30/2010 | |||||||||||||||||
03762AAG4 | 3,000,000 | 2,290,278 | (709,722) | 2,290,278 | 473,700 | 6/30/2010 | ||||||||||||||||||
05947UY28 | 3,872,411 | 3,536,539 | (335,872) | 3,536,539 | 2,304,160 | 6/30/2010 | ||||||||||||||||||
07383F4H8 | 4,215,294 | 2,999,442 | (1,215,852) | 2,999,442 | 2,092,997 | 6/30/2010 | ||||||||||||||||||
07383F6U7 | 5,012,020 | 4,551,163 | (460,857) | 4,551,163 | 2,193,960 | 6/30/2010 | ||||||||||||||||||
07387BEP4 | 4,526,623 | 2,598,305 | (1,928,318) | 2,598,305 | 1,022,967 | 6/30/2010 | ||||||||||||||||||
07387BEQ2 | 1,586,185 | 1,037,442 | (548,743) | 1,037,442 | 1,538,635 | 6/30/2010 | ||||||||||||||||||
07387BFZ1 | 2,845,351 | 2,806,498 | (38,853) | 2,806,498 | 994,117 | 6/30/2010 | ||||||||||||||||||
07387BGA5 | 1,043,338 | 704,201 | (339,137) | 704,201 | 475,037 | 6/30/2010 | ||||||||||||||||||
07388VAL2 | 11,525,006 | 10,970,227 | (554,779) | 10,970,227 | 3,277,402 | 6/30/2010 | ||||||||||||||||||
07388YBE1 | 1,156,869 | 1,027,849 | (129,020) | 1,027,849 | 718,053 | 6/30/2010 | ||||||||||||||||||
126171AQ0 | 4,279,102 | 3,221,462 | (1,057,640) | 3,221,462 | 1,587,060 | 6/30/2010 | ||||||||||||||||||
126671R73 | 4,136,680 | 1,903,429 | (2,233,251) | 1,903,429 | 1,441,915 | 6/30/2010 | ||||||||||||||||||
161546GN0 | 2,474,742 | 2,218,390 | (256,352) | 2,218,390 | 1,496,551 | 6/30/2010 | ||||||||||||||||||
161546HW9 | 2,109,796 | 1,916,133 | (193,663) | 1,916,133 | 877,420 | 6/30/2010 | ||||||||||||||||||
17310MAQ3 | 11,543,931 | 10,977,840 | (566,091) | 10,977,840 | 2,437,350 | 6/30/2010 | ||||||||||||||||||
17310MAS9 | 869,195 | 658,119 | (211,076) | 658,119 | 524,056 | 6/30/2010 | ||||||||||||||||||
190749AN1 | 454,683 | — | * | (454,683) | — | 334,555 | 6/30/2010 | |||||||||||||||||
20047EAM4 | 17,809,954 | 2,262,744 | (15,547,210) | 2,262,744 | 7,551,052 | 6/30/2010 | ||||||||||||||||||
20047EAP7 | 1,939,562 | 86,050 | (1,853,512) | 86,050 | 4,187,072 | 6/30/2010 | ||||||||||||||||||
20173MAQ3 | 543,825 | 409,714 | (134,111) | 409,714 | 450,000 | 6/30/2010 | ||||||||||||||||||
21075WBA2 | 1,992,829 | 1,695,008 | (297,821) | 1,695,008 | 1,755,083 | 6/30/2010 | ||||||||||||||||||
21075WCJ2 | 1,024,488 | 991,680 | (32,808) | 991,680 | 919,230 | 6/30/2010 | ||||||||||||||||||
22544QAK5 | 7,527,566 | 3,664,397 | (3,863,169) | 3,664,397 | 4,856,256 | 6/30/2010 | ||||||||||||||||||
22544QAM1 | 1,598,153 | 928,636 | (669,517) | 928,636 | 4,888,517 | 6/30/2010 | ||||||||||||||||||
22544QAN9 | 462,771 | 405,235 | (57,536) | 405,235 | 2,008,916 | 6/30/2010 | ||||||||||||||||||
22544QAP4 | 260,514 | 141,114 | (119,400) | 141,114 | 1,063,716 | 6/30/2010 | ||||||||||||||||||
22544QAQ2 | 432,694 | — | * | (432,694) | — | 1,627,740 | 6/30/2010 | |||||||||||||||||
225458SA7 | 18,121,902 | 2,904,026 | (15,217,876) | 2,904,026 | 2,131,445 | 6/30/2010 | ||||||||||||||||||
225458SB5 | 9,869,737 | — | * | (9,869,737) | — | 1,281,595 | 6/30/2010 | |||||||||||||||||
225470G80 | 9,885,679 | 9,314,838 | (570,841) | 9,314,838 | 3,586,580 | 6/30/2010 | ||||||||||||||||||
225470H22 | 829,081 | 674,362 | (154,719) | 674,362 | 930,776 | 6/30/2010 | ||||||||||||||||||
361849K84 | 7,525,132 | 4,018,985 | (3,506,147) | 4,018,985 | 4,018,985 | 6/30/2010 | ||||||||||||||||||
361849K92 | 7,623,154 | — | * | (7,623,154) | — | 3,325,906 | 6/30/2010 | |||||||||||||||||
361849S29 | 4,640,299 | 2,288,639 | (2,351,660) | 2,288,639 | 2,291,990 | 6/30/2010 | ||||||||||||||||||
362332AT5 | 166,263 | — | * | (166,263) | — | 2,198,895 | 6/30/2010 | |||||||||||||||||
36298JAA1 | 27,099,044 | 24,822,176 | (2,276,868) | 24,822,176 | 12,400,025 | 6/30/2010 | ||||||||||||||||||
36298JAC7 | 5,139,995 | 1,949,799 | (3,190,196) | 1,949,799 | 1,200,000 | 6/30/2010 | ||||||||||||||||||
449670FA1 | 1,137,158 | 989,132 | (148,026) | 989,132 | 824,067 | 6/30/2010 | ||||||||||||||||||
46625M2W8 | 1,190,469 | 1,035,452 | (155,017) | 1,035,452 | 172,779 | 6/30/2010 | ||||||||||||||||||
| 73 |
NOTES TO STATUTORY–BASIS FINANCIAL STATEMENTS
TEACHERS INSURANCE AND ANNUITY ASSOCIATION OF AMERICA
| CUSIP | Book/Adj. Carrying Value Amortized Cost Before Current Period OTTI | Present Value of Projected Cash Flows | Recognized Other-Than- Temporary Impairment | Amortized Cost After Other- Than-Temporary Impairment | Fair Value as of Impairment Date | Date of Financial Statement Where Reported | ||||||||||||||||||
46625M2Y4 | $ | 304,618 | $ | 148,459 | $ | (156,159) | $ | 148,459 | $ | 166,916 | 6/30/2010 | |||||||||||||
46625MQ85 | 1,454,205 | 1,055,723 | (398,482) | 1,055,723 | 129,182 | 6/30/2010 | ||||||||||||||||||
46625MQ93 | 263,036 | — | * | (263,036) | — | 121,269 | 6/30/2010 | |||||||||||||||||
46625MZH5 | 1,098,149 | 973,556 | (124,593) | 973,556 | 600,519 | 6/30/2010 | ||||||||||||||||||
46625MZJ1 | 229,904 | — | * | (229,904) | — | 480,692 | 6/30/2010 | |||||||||||||||||
46625YC68 | 1,920,693 | 1,211,550 | (709,143) | 1,211,550 | 801,566 | 6/30/2010 | ||||||||||||||||||
46628FAU5 | 4,912,849 | 4,049,667 | (863,182) | 4,049,667 | 1,006,440 | 6/30/2010 | ||||||||||||||||||
46629PAU2 | 2,702,265 | 690,309 | (2,011,956) | 690,309 | 983,460 | 6/30/2010 | ||||||||||||||||||
46629YAM1 | 13,707,049 | 8,592,792 | (5,114,257) | 8,592,792 | 6,450,580 | 6/30/2010 | ||||||||||||||||||
46630AAC2 | 688,305 | 577,839 | (110,466) | 577,839 | 595,000 | 6/30/2010 | ||||||||||||||||||
46630AAG3 | 354,138 | 345,685 | (8,453) | 345,685 | 360,000 | 6/30/2010 | ||||||||||||||||||
46631BAN5 | 20,305,019 | 5,730,812 | (14,574,207) | 5,730,812 | 8,501,437 | 6/30/2010 | ||||||||||||||||||
46631BAP0 | 3,520,588 | 2,243,276 | (1,277,312) | 2,243,276 | 3,436,631 | 6/30/2010 | ||||||||||||||||||
46632HAQ4 | 644,565 | 523,138 | (121,427) | 523,138 | 487,451 | 6/30/2010 | ||||||||||||||||||
46632HAR2 | 1,000,083 | 789,774 | (210,309) | 789,774 | 968,281 | 6/30/2010 | ||||||||||||||||||
50179AAM9 | 2,402,327 | 1,391,550 | (1,010,777) | 1,391,550 | 480,000 | 6/30/2010 | ||||||||||||||||||
50180CAM2 | 2,358,833 | 2,090,558 | (268,275) | 2,090,558 | 1,991,243 | 6/30/2010 | ||||||||||||||||||
50180JAK1 | 20,070,456 | 17,763,790 | (2,306,666) | 17,763,790 | 4,400,140 | 6/30/2010 | ||||||||||||||||||
50180JAL9 | 3,748,058 | 176,580 | (3,571,478) | 176,580 | 840,000 | 6/30/2010 | ||||||||||||||||||
50180JAM7 | 1,106,615 | 432,446 | (674,169) | 432,446 | 1,700,000 | 6/30/2010 | ||||||||||||||||||
50180JAR6 | 308,480 | 212,024 | (96,456) | 212,024 | 840,000 | 6/30/2010 | ||||||||||||||||||
52108HV76 | 5,010,652 | 4,725,295 | (285,357) | 4,725,295 | 1,674,835 | 6/30/2010 | ||||||||||||||||||
52108HZ80 | 4,919,590 | 1,306,664 | (3,612,926) | 1,306,664 | 1,793,141 | 6/30/2010 | ||||||||||||||||||
52108MGC1 | 4,348,789 | 3,833,542 | (515,247) | 3,833,542 | 923,270 | 6/30/2010 | ||||||||||||||||||
52108MGD9 | 4,934,933 | 577,539 | (4,357,394) | 577,539 | 497,400 | 6/30/2010 | ||||||||||||||||||
52108RCK6 | 6,079,350 | 2,445,872 | (3,633,478) | 2,445,872 | 853,528 | 6/30/2010 | ||||||||||||||||||
52522HAL6 | 33,516,549 | 32,632,083 | (884,466) | 32,632,083 | 18,025,164 | 6/30/2010 | ||||||||||||||||||
55312TAH6 | 7,043,679 | 4,110,302 | (2,933,377) | 4,110,302 | 2,912,630 | 6/30/2010 | ||||||||||||||||||
55312YAJ1 | 1,059,807 | 891,680 | (168,127) | 891,680 | 2,550,000 | 6/30/2010 | ||||||||||||||||||
59023BAN4 | 1,021,114 | 1,018,056 | (3,058) | 1,018,056 | 770,000 | 6/30/2010 | ||||||||||||||||||
60687UAM9 | 3,361,402 | 2,705,553 | (655,849) | 2,705,553 | 1,074,526 | 6/30/2010 | ||||||||||||||||||
60687VAN5 | 32,425 | 27,267 | (5,158) | 27,267 | 749,891 | 6/30/2010 | ||||||||||||||||||
61745M6T5 | 6,514,086 | 5,299,526 | (1,214,560) | 5,299,526 | 2,651,250 | 6/30/2010 | ||||||||||||||||||
61745MX57 | 2,849,974 | 2,608,523 | (241,451) | 2,608,523 | 1,120,443 | 6/30/2010 | ||||||||||||||||||
61749MAG4 | 108,945 | 92,067 | (16,878) | 92,067 | 345,736 | 6/30/2010 | ||||||||||||||||||
61750YAF6 | 32,430,105 | 32,248,898 | (181,207) | 32,248,898 | 26,973,444 | 6/30/2010 | ||||||||||||||||||
61751NAQ5 | 1,387,727 | 864,604 | (523,123) | 864,604 | 805,440 | 6/30/2010 | ||||||||||||||||||
61751NAR3 | 714,999 | 378,635 | (336,364) | 378,635 | 400,000 | 6/30/2010 | ||||||||||||||||||
61754KAP0 | 2,678,454 | 2,541,397 | (137,057) | 2,541,397 | 3,684,741 | 6/30/2010 | ||||||||||||||||||
643529AD2 | 12,102,280 | 11,103,196 | (999,084) | 11,103,196 | 8,263,928 | 6/30/2010 | ||||||||||||||||||
74438WAN6 | 1,082,617 | 400,684 | (681,933) | 400,684 | 35,420 | 6/30/2010 | ||||||||||||||||||
760985YY1 | 831,763 | 605,023 | (226,740) | 605,023 | 143,230 | 6/30/2010 | ||||||||||||||||||
76110WRX6 | 1,417,999 | 758,223 | (659,776) | 758,223 | 583,292 | 6/30/2010 | ||||||||||||||||||
86359B4V0 | 21,641,235 | 20,762,501 | (878,734) | 20,762,501 | 14,349,507 | 6/30/2010 | ||||||||||||||||||
86359DMX2 | 49,984,375 | 47,927,368 | (2,057,007) | 47,927,368 | 32,510,440 | 6/30/2010 | ||||||||||||||||||
87222PAE3 | 29,238,524 | 28,382,087 | (856,437) | 28,382,087 | 15,820,916 | 6/30/2010 | ||||||||||||||||||
92977QAM0 | 20,053,514 | 10,149,716 | (9,903,798) | 10,149,716 | 5,842,480 | 6/30/2010 | ||||||||||||||||||
92978MAL0 | 11,091,220 | 10,867,453 | (223,767) | 10,867,453 | 4,429,080 | 6/30/2010 | ||||||||||||||||||
92978MAN6 | 7,874,789 | 1,282,000 | (6,592,789) | 1,282,000 | 5,840,200 | 6/30/2010 | ||||||||||||||||||
92978MAT3 | 130,171 | — | * | (130,171) | — | 435,680 | 6/30/2010 | |||||||||||||||||
92978TAK7 | 20,062,978 | 14,704,038 | (5,358,940) | 14,704,038 | 5,308,880 | 6/30/2010 | ||||||||||||||||||
92978TAL5 | 22,273,467 | 4,978,080 | (17,295,387) | 4,978,080 | 6,427,860 | 6/30/2010 | ||||||||||||||||||
92978TAM3 | 5,018,168 | 4,288,449 | (729,719) | 4,288,449 | 5,558,910 | 6/30/2010 | ||||||||||||||||||
93934DAR8 | 63,646 | 54,032 | (9,614) | 54,032 | 44,885 | 6/30/2010 | ||||||||||||||||||
939344AN7 | 6,065,430 | —² | (1,272,720) | 4,792,710 | 4,792,710 | 6/30/2010 | ||||||||||||||||||
| 74 |
| continued |
| CUSIP | Book/Adj. Carrying Value Amortized Cost Before Current Period OTTI | Present Value of Projected Cash Flows | Recognized Other-Than- Temporary Impairment | Amortized Cost After Other- Than-Temporary Impairment | Fair Value as of Impairment Date | Date of Financial Statement Where Reported | ||||||||||||||||||
00253CHK6 | $ | 2,245,378 | $ | 1,955,804 | $ | (289,574) | $ | 1,955,804 | $ | 1,174,423 | 3/31/2010 | |||||||||||||
74040KAC6 | 6,795,019 | — | ² | (2,859,085) | 3,935,934 | 3,935,934 | 3/31/2010 | |||||||||||||||||
03702YAC4 | 25,200 | — | ² | (10,800) | 14,400 | 14,400 | 3/31/2010 | |||||||||||||||||
55312TAR4 | 650,808 | — | ² | (165,128) | 485,680 | 485,680 | 3/31/2010 | |||||||||||||||||
02147QAE2 | 45,092,898 | 43,634,925 | (1,457,973) | 43,634,925 | 35,987,230 | 3/31/2010 | ||||||||||||||||||
02148FAW5 | 26,144,301 | 25,008,260 | (1,136,041) | 25,008,260 | 18,776,720 | 3/31/2010 | ||||||||||||||||||
02148YAD6 | 19,568,230 | 18,986,984 | (581,246) | 18,986,984 | 17,070,532 | 3/31/2010 | ||||||||||||||||||
02149HAK6 | 23,392,360 | 22,157,145 | (1,235,215) | 22,157,145 | 19,738,678 | 3/31/2010 | ||||||||||||||||||
02151CBD7 | 27,542,769 | 25,854,585 | (1,688,184) | 25,854,585 | 23,165,668 | 3/31/2010 | ||||||||||||||||||
02151FAD1 | 37,054,586 | 36,269,400 | (785,186) | 36,269,400 | 25,475,656 | 3/31/2010 | ||||||||||||||||||
02151NBA9 | 17,316,643 | 15,671,369 | (1,645,274) | 15,671,369 | 8,688,977 | 3/31/2010 | ||||||||||||||||||
05947UVZ8 | 318,015 | 298,794 | (19,221) | 298,794 | 11,341 | 3/31/2010 | ||||||||||||||||||
05947UWA2 | 160,955 | — | * | (160,955) | — | 5,670 | 3/31/2010 | |||||||||||||||||
05947UWB0 | 38,213 | — | * | (38,213) | — | 11 | 3/31/2010 | |||||||||||||||||
05947UWC8 | 37,462 | — | * | (37,462) | — | 11 | 3/31/2010 | |||||||||||||||||
05947UY28 | 4,010,191 | 3,876,118 | (134,073) | 3,876,118 | 2,551,720 | 3/31/2010 | ||||||||||||||||||
05948KB65 | 9,967,742 | 9,779,206 | (188,536) | 9,779,206 | 6,793,636 | 3/31/2010 | ||||||||||||||||||
05948KC98 | 17,655,061 | 17,488,890 | (166,171) | 17,488,890 | 13,601,691 | 3/31/2010 | ||||||||||||||||||
05948KF20 | 17,999,982 | 17,770,893 | (229,089) | 17,770,893 | 15,539,459 | 3/31/2010 | ||||||||||||||||||
05948KLA5 | 1,682,897 | 966,410 | (716,487) | 966,410 | 922,443 | 3/31/2010 | ||||||||||||||||||
05948KP37 | 10,677,570 | 10,605,671 | (71,899) | 10,605,671 | 8,190,960 | 3/31/2010 | ||||||||||||||||||
05949AA67 | 4,729,113 | 2,495,578 | (2,233,535) | 2,495,578 | 3,005,167 | 3/31/2010 | ||||||||||||||||||
05949AA75 | 255,894 | 251,887 | (4,007) | 251,887 | 430,578 | 3/31/2010 | ||||||||||||||||||
05949AM23 | 1,731,479 | 910,147 | (821,332) | 910,147 | 1,872,146 | 3/31/2010 | ||||||||||||||||||
05949AM31 | 358,619 | 174,351 | (184,268) | 174,351 | 328,060 | 3/31/2010 | ||||||||||||||||||
05949AMN7 | 6,185,487 | 5,227,430 | (958,057) | 5,227,430 | 4,028,445 | 3/31/2010 | ||||||||||||||||||
05949AMP2 | 2,112,024 | 867,709 | (1,244,315) | 867,709 | 1,432,633 | 3/31/2010 | ||||||||||||||||||
05949TBF5 | 19,631,054 | 19,565,964 | (65,090) | 19,565,964 | 16,488,408 | 3/31/2010 | ||||||||||||||||||
059511AM7 | 1,289,986 | 1,249,704 | (40,282) | 1,249,704 | 1,392,444 | 3/31/2010 | ||||||||||||||||||
059511AS4 | 1,188,469 | 1,011,351 | (177,118) | 1,011,351 | 1,314,724 | 3/31/2010 | ||||||||||||||||||
059511AU9 | 1,414,062 | 1,236,027 | (178,035) | 1,236,027 | 1,730,310 | 3/31/2010 | ||||||||||||||||||
07383F5T1 | 4,790,399 | 4,327,654 | (462,745) | 4,327,654 | 1,797,485 | 3/31/2010 | ||||||||||||||||||
07387BGA5 | 1,400,027 | 1,067,771 | (332,256) | 1,067,771 | 394,127 | 3/31/2010 | ||||||||||||||||||
07388YBC5 | 1,667,650 | 1,652,127 | (15,523) | 1,652,127 | 1,013,894 | 3/31/2010 | ||||||||||||||||||
07388YBE1 | 1,280,301 | 1,239,645 | (40,656) | 1,239,645 | 651,277 | 3/31/2010 | ||||||||||||||||||
12543UAE2 | 15,131,563 | 15,127,220 | (4,343) | 15,127,220 | 8,170,711 | 3/31/2010 | ||||||||||||||||||
12543XAD8 | 24,797,903 | 24,672,225 | (125,678) | 24,672,225 | 18,039,990 | 3/31/2010 | ||||||||||||||||||
12544ABJ3 | 13,091,155 | 12,070,878 | (1,020,277) | 12,070,878 | 12,263,022 | 3/31/2010 | ||||||||||||||||||
12544DAK5 | 21,675,290 | 21,552,653 | (122,637) | 21,552,653 | 15,549,424 | 3/31/2010 | ||||||||||||||||||
12544DAQ2 | 15,572,064 | 15,404,221 | (167,843) | 15,404,221 | 9,926,487 | 3/31/2010 | ||||||||||||||||||
12566RAG6 | 38,921,572 | 36,322,540 | (2,599,032) | 36,322,540 | 29,557,714 | 3/31/2010 | ||||||||||||||||||
126378AG3 | 13,400,744 | 11,953,260 | (1,447,484) | 11,953,260 | 9,307,516 | 3/31/2010 | ||||||||||||||||||
126378AH1 | 14,653,389 | 13,107,947 | (1,545,442) | 13,107,947 | 8,948,331 | 3/31/2010 | ||||||||||||||||||
126670GR3 | 6,435,271 | 6,134,841 | (300,430) | 6,134,841 | 2,553,352 | 3/31/2010 | ||||||||||||||||||
126670QT8 | 3,567,630 | 3,532,757 | (34,873) | 3,532,757 | 1,735,609 | 3/31/2010 | ||||||||||||||||||
126671TW6 | 791,031 | 482,758 | (308,273) | 482,758 | 173,299 | 3/31/2010 | ||||||||||||||||||
12667F4N2 | 9,827,189 | 9,686,117 | (141,072) | 9,686,117 | 6,712,318 | 3/31/2010 | ||||||||||||||||||
12667F7D1 | 25,637,740 | 25,380,242 | (257,498) | 25,380,242 | 18,962,088 | 3/31/2010 | ||||||||||||||||||
12667FMJ1 | 19,236,952 | 18,352,895 | (884,057) | 18,352,895 | 9,673,785 | 3/31/2010 | ||||||||||||||||||
12667FR98 | 4,326,017 | 2,464,197 | (1,861,820) | 2,464,197 | 1,354,983 | 3/31/2010 | ||||||||||||||||||
12667FW92 | 8,268,058 | 8,092,925 | (175,133) | 8,092,925 | 8,186,958 | 3/31/2010 | ||||||||||||||||||
12667FYZ2 | 19,181,294 | 15,089,537 | (4,091,757) | 15,089,537 | 5,129,987 | 3/31/2010 | ||||||||||||||||||
12667GBA0 | 69,058,015 | 68,732,995 | (325,020) | 68,732,995 | 49,770,826 | 3/31/2010 | ||||||||||||||||||
12667GFB4 | 67,640,171 | 67,336,274 | (303,897) | 67,336,274 | 50,440,009 | 3/31/2010 | ||||||||||||||||||
12667GFT5 | 19,136,757 | 18,770,374 | (366,383) | 18,770,374 | 12,774,402 | 3/31/2010 | ||||||||||||||||||
| 75 |
NOTES TO STATUTORY–BASIS FINANCIAL STATEMENTS
TEACHERS INSURANCE AND ANNUITY ASSOCIATION OF AMERICA
| CUSIP | Book/Adj. Carrying Value Amortized Cost Before Current Period OTTI | Present Value of Projected Cash Flows | Recognized Other-Than- Temporary Impairment | Amortized Cost After Other- Than-Temporary Impairment | Fair Value as of Impairment Date | Date of Financial Statement Where Reported | ||||||||||||||||||
12667GJG9 | $ | 16,350,299 | $ | 16,229,555 | $ | (120,744) | $ | 16,229,555 | $ | 11,513,931 | 3/31/2010 | |||||||||||||
12667GJR5 | 50,384,658 | 50,284,751 | (99,907) | 50,284,751 | 34,930,567 | 3/31/2010 | ||||||||||||||||||
12667GKE2 | 14,834,096 | 14,618,697 | (215,399) | 14,618,697 | 7,806,783 | 3/31/2010 | ||||||||||||||||||
12667GLE1 | 30,077,725 | 30,005,580 | (72,145) | 30,005,580 | 23,611,971 | 3/31/2010 | ||||||||||||||||||
12667GQA4 | 22,619,726 | 22,510,909 | (108,817) | 22,510,909 | 16,091,161 | 3/31/2010 | ||||||||||||||||||
12667GUG6 | 6,835,517 | 6,537,866 | (297,651) | 6,537,866 | 5,463,941 | 3/31/2010 | ||||||||||||||||||
12667GW74 | 20,027,382 | 19,963,420 | (63,962) | 19,963,420 | 14,633,914 | 3/31/2010 | ||||||||||||||||||
12668AAG0 | 18,586,413 | 17,911,328 | (675,085) | 17,911,328 | 16,654,665 | 3/31/2010 | ||||||||||||||||||
12668ASQ9 | 27,229,913 | 25,937,547 | (1,292,366) | 25,937,547 | 22,812,379 | 3/31/2010 | ||||||||||||||||||
12668ASR7 | 7,317,769 | 6,886,618 | (431,151) | 6,886,618 | 4,037,703 | 3/31/2010 | ||||||||||||||||||
12669DN79 | 4,528,692 | 4,471,443 | (57,249) | 4,471,443 | 2,271,979 | 3/31/2010 | ||||||||||||||||||
12669DN87 | 1,895,658 | 1,279,333 | (616,325) | 1,279,333 | 1,264,284 | 3/31/2010 | ||||||||||||||||||
12669E4W3 | 4,764,288 | 2,964,336 | (1,799,952) | 2,964,336 | 2,585,613 | 3/31/2010 | ||||||||||||||||||
12669EL95 | 9,268,819 | 9,039,136 | (229,683) | 9,039,136 | 6,425,375 | 3/31/2010 | ||||||||||||||||||
12669EWY8 | 9,536,306 | 9,367,430 | (168,876) | 9,367,430 | 6,773,222 | 3/31/2010 | ||||||||||||||||||
12669EWZ5 | 2,824,872 | 1,934,891 | (889,981) | 1,934,891 | 1,526,678 | 3/31/2010 | ||||||||||||||||||
12669G5U1 | 9,149,772 | 9,036,280 | (113,492) | 9,036,280 | 7,866,346 | 3/31/2010 | ||||||||||||||||||
12669YAH5 | 16,359,710 | 15,365,488 | (994,222) | 15,365,488 | 7,308,981 | 3/31/2010 | ||||||||||||||||||
12669YAX0 | 15,297,865 | 14,926,570 | (371,295) | 14,926,570 | 6,898,128 | 3/31/2010 | ||||||||||||||||||
161546ED4 | 1,026,193 | 150,374 | (875,819) | 150,374 | 122,313 | 3/31/2010 | ||||||||||||||||||
161546FY7 | 2,174,201 | 1,131,814 | (1,042,387) | 1,131,814 | 901,447 | 3/31/2010 | ||||||||||||||||||
161546GN0 | 3,527,196 | 2,676,088 | (851,108) | 2,676,088 | 1,565,295 | 3/31/2010 | ||||||||||||||||||
161546HW9 | 2,319,369 | 2,179,089 | (140,280) | 2,179,089 | 914,234 | 3/31/2010 | ||||||||||||||||||
161551FW1 | 102,065 | 17,042 | (85,023) | 17,042 | 6,631 | 3/31/2010 | ||||||||||||||||||
16163BAP9 | 28,961,620 | 28,795,776 | (165,844) | 28,795,776 | 23,240,422 | 3/31/2010 | ||||||||||||||||||
16165LAG5 | 13,413,371 | 13,314,507 | (98,864) | 13,314,507 | 8,095,071 | 3/31/2010 | ||||||||||||||||||
16165TBJ1 | 10,243,892 | 9,600,706 | (643,186) | 9,600,706 | 7,029,679 | 3/31/2010 | ||||||||||||||||||
17025AAB8 | 16,388,366 | 16,154,460 | (233,906) | 16,154,460 | 14,346,748 | 3/31/2010 | ||||||||||||||||||
17307GVK1 | 11,149,554 | 10,299,526 | (850,028) | 10,299,526 | 7,870,632 | 3/31/2010 | ||||||||||||||||||
17309YAD9 | 19,148,250 | 16,770,460 | (2,377,790) | 16,770,460 | 12,633,390 | 3/31/2010 | ||||||||||||||||||
17310AAR7 | 32,435,381 | 32,363,117 | (72,264) | 32,363,117 | 21,929,096 | 3/31/2010 | ||||||||||||||||||
17312FAD5 | 9,848,853 | 9,834,560 | (14,293) | 9,834,560 | 7,686,453 | 3/31/2010 | ||||||||||||||||||
190749AN1 | 1,108,586 | 511,945 | (596,641) | 511,945 | 360,290 | 3/31/2010 | ||||||||||||||||||
19075CAL7 | 2,833,371 | 2,096,747 | (736,624) | 2,096,747 | 4,471,046 | 3/31/2010 | ||||||||||||||||||
19075CAM5 | 719,222 | 568,626 | (150,596) | 568,626 | 851,135 | 3/31/2010 | ||||||||||||||||||
19075CAN3 | 556,895 | 476,463 | (80,432) | 476,463 | 500,000 | 3/31/2010 | ||||||||||||||||||
19075CAS2 | 2,932,809 | 2,400,723 | (532,086) | 2,400,723 | 2,419,440 | 3/31/2010 | ||||||||||||||||||
20047EAP7 | 2,599,344 | 2,086,554 | (512,790) | 2,086,554 | 5,188,491 | 3/31/2010 | ||||||||||||||||||
22544QAK5 | 15,058,638 | 7,669,903 | (7,388,735) | 7,669,903 | 4,243,770 | 3/31/2010 | ||||||||||||||||||
22544QAM1 | 6,170,500 | 1,899,693 | (4,270,807) | 1,899,693 | 4,437,299 | 3/31/2010 | ||||||||||||||||||
22544QAN9 | 2,210,330 | 592,662 | (1,617,668) | 592,662 | 1,752,254 | 3/31/2010 | ||||||||||||||||||
22544QAP4 | 928,438 | 334,945 | (593,493) | 334,945 | 942,255 | 3/31/2010 | ||||||||||||||||||
22544QAQ2 | 1,521,856 | 574,510 | (947,346) | 574,510 | 1,467,674 | 3/31/2010 | ||||||||||||||||||
225458SB5 | 13,997,534 | 9,852,236 | (4,145,298) | 9,852,236 | 2,691,761 | 3/31/2010 | ||||||||||||||||||
22545XAP8 | 717,543 | — | * | (717,543) | — | 2,567,337 | 3/31/2010 | |||||||||||||||||
251510CY7 | 6,027,410 | 4,221,438 | (1,805,972) | 4,221,438 | 2,388,495 | 3/31/2010 | ||||||||||||||||||
251510ET6 | 5,967,441 | 3,950,554 | (2,016,887) | 3,950,554 | 1,526,850 | 3/31/2010 | ||||||||||||||||||
251511AC5 | 14,805,071 | 14,612,272 | (192,799) | 14,612,272 | 10,668,651 | 3/31/2010 | ||||||||||||||||||
294751BY7 | 3,584,750 | 2,457,027 | (1,127,723) | 2,457,027 | 1,050,749 | 3/31/2010 | ||||||||||||||||||
294751DH2 | 2,155,248 | 1,701,535 | (453,713) | 1,701,535 | 389,294 | 3/31/2010 | ||||||||||||||||||
294751DY5 | 1,611,177 | 1,242,907 | (368,270) | 1,242,907 | 272,004 | 3/31/2010 | ||||||||||||||||||
294751FB3 | 4,469,940 | 2,159,859 | (2,310,081) | 2,159,859 | 1,262,440 | 3/31/2010 | ||||||||||||||||||
294751FC1 | 1,232,038 | 609,805 | (622,233) | 609,805 | 514,437 | 3/31/2010 | ||||||||||||||||||
294754AY2 | 5,323,066 | 5,073,326 | (249,740) | 5,073,326 | 4,147,640 | 3/31/2010 | ||||||||||||||||||
32051GDH5 | 3,970,409 | 3,264,438 | (705,971) | 3,264,438 | 3,409,527 | 3/31/2010 | ||||||||||||||||||
| 76 |
| continued |
| CUSIP | Book/Adj. Carrying Value Amortized Cost Before Current Period OTTI | Present Value of Projected Cash Flows | Recognized Other-Than- Temporary Impairment | Amortized Cost After Other- Than-Temporary Impairment | Fair Value as of Impairment Date | Date of Financial Statement Where Reported | ||||||||||||||||||
32051GFL4 | $ | 7,578,722 | $ | 7,537,146 | $ | (41,576) | $ | 7,537,146 | $ | 5,595,466 | 3/31/2010 | |||||||||||||
36228CYQ0 | 23,086,753 | 19,954,462 | (3,132,291) | 19,954,462 | 7,527,524 | 3/31/2010 | ||||||||||||||||||
3622ECAH9 | 5,882,873 | 4,421,834 | (1,461,039) | 4,421,834 | 2,885,374 | 3/31/2010 | ||||||||||||||||||
3622ECAK2 | 18,750,828 | 16,607,826 | (2,143,002) | 16,607,826 | 11,280,108 | 3/31/2010 | ||||||||||||||||||
3622ELAD8 | 44,091,517 | 41,871,096 | (2,220,421) | 41,871,096 | 24,891,299 | 3/31/2010 | ||||||||||||||||||
3622MPBE7 | 50,351,907 | 49,993,950 | (357,957) | 49,993,950 | 40,524,485 | 3/31/2010 | ||||||||||||||||||
362332AT5 | 431,489 | 238,109 | (193,380) | 238,109 | 2,881,920 | 3/31/2010 | ||||||||||||||||||
362332AV0 | 399,877 | — | * | (399,877) | — | 1,640,000 | 3/31/2010 | |||||||||||||||||
362334ME1 | 23,534,063 | 22,348,250 | (1,185,813) | 22,348,250 | 16,824,456 | 3/31/2010 | ||||||||||||||||||
362334QC1 | 9,034,890 | 8,860,291 | (174,599) | 8,860,291 | 6,830,887 | 3/31/2010 | ||||||||||||||||||
362375AD9 | 15,214,761 | 14,512,803 | (701,958) | 14,512,803 | 11,097,407 | 3/31/2010 | ||||||||||||||||||
362669AQ6 | 10,072,205 | 10,055,881 | (16,324) | 10,055,881 | 6,988,691 | 3/31/2010 | ||||||||||||||||||
36298JAC7 | 7,457,412 | 5,205,353 | (2,252,059) | 5,205,353 | 1,300,000 | 3/31/2010 | ||||||||||||||||||
36828QLB0 | 6,650,482 | 5,297,161 | (1,353,321) | 5,297,161 | 1,925,996 | 3/31/2010 | ||||||||||||||||||
45660LPD5 | 13,660,835 | 13,628,158 | (32,677) | 13,628,158 | 9,535,212 | 3/31/2010 | ||||||||||||||||||
46412QAD9 | 4,715,407 | 4,220,242 | (495,165) | 4,220,242 | 2,670,797 | 3/31/2010 | ||||||||||||||||||
46625MQ93 | 446,572 | 295,023 | (151,549) | 295,023 | 121,263 | 3/31/2010 | ||||||||||||||||||
46627MAC1 | 11,101,556 | 10,947,012 | (154,544) | 10,947,012 | 6,190,987 | 3/31/2010 | ||||||||||||||||||
46628SAG8 | 24,118,269 | 20,192,336 | (3,925,933) | 20,192,336 | 14,055,183 | 3/31/2010 | ||||||||||||||||||
46628YBP4 | 15,322,409 | 15,320,058 | (2,351) | 15,320,058 | 10,033,890 | 3/31/2010 | ||||||||||||||||||
46629PAU2 | 3,005,928 | 2,707,139 | (298,789) | 2,707,139 | 898,887 | 3/31/2010 | ||||||||||||||||||
46629YAM1 | 15,658,620 | 13,795,880 | (1,862,740) | 13,795,880 | 5,507,620 | 3/31/2010 | ||||||||||||||||||
46630AAC2 | 1,551,188 | 728,104 | (823,084) | 728,104 | 490,000 | 3/31/2010 | ||||||||||||||||||
46631BAN5 | 28,347,649 | 20,421,136 | (7,926,513) | 20,421,136 | 6,896,809 | 3/31/2010 | ||||||||||||||||||
46631BAP0 | 9,891,067 | 3,714,812 | (6,176,255) | 3,714,812 | 2,894,337 | 3/31/2010 | ||||||||||||||||||
46632HAQ4 | 1,677,705 | 661,287 | (1,016,418) | 661,287 | 508,468 | 3/31/2010 | ||||||||||||||||||
46632HAR2 | 2,047,306 | 1,057,218 | (990,088) | 1,057,218 | 1,015,355 | 3/31/2010 | ||||||||||||||||||
50177AAL3 | 2,208,516 | 1,197,758 | (1,010,758) | 1,197,758 | 1,903,030 | 3/31/2010 | ||||||||||||||||||
50179AAM9 | 2,908,774 | 2,465,436 | (443,338) | 2,465,436 | 480,000 | 3/31/2010 | ||||||||||||||||||
50179AAN7 | 1,311,655 | — | * | (1,311,655) | — | 549,000 | 3/31/2010 | |||||||||||||||||
50179AAS6 | 1,242,113 | — | * | (1,242,113) | — | 524,370 | 3/31/2010 | |||||||||||||||||
50180JAM7 | 4,017,423 | 1,334,232 | (2,683,191) | 1,334,232 | 1,700,000 | 3/31/2010 | ||||||||||||||||||
50180JAR6 | 2,095,451 | 478,725 | (1,616,726) | 478,725 | 840,000 | 3/31/2010 | ||||||||||||||||||
52108HZ80 | 5,810,790 | 4,946,320 | (864,470) | 4,946,320 | 1,767,997 | 3/31/2010 | ||||||||||||||||||
52521RAS0 | 2,782,285 | 2,514,992 | (267,293) | 2,514,992 | 1,353,507 | 3/31/2010 | ||||||||||||||||||
525221EB9 | 29,827,547 | 28,822,444 | (1,005,103) | 28,822,444 | 20,852,745 | 3/31/2010 | ||||||||||||||||||
525221JW8 | 40,440,084 | 34,927,611 | (5,512,473) | 34,927,611 | 25,824,420 | 3/31/2010 | ||||||||||||||||||
52522HAL6 | 39,058,866 | 33,636,080 | (5,422,786) | 33,636,080 | 17,901,172 | 3/31/2010 | ||||||||||||||||||
52523KAH7 | 11,907,943 | 11,021,602 | (886,341) | 11,021,602 | 8,733,078 | 3/31/2010 | ||||||||||||||||||
55312TAJ2 | 2,018,264 | 1,289,222 | (729,042) | 1,289,222 | 1,686,681 | 3/31/2010 | ||||||||||||||||||
55312TAK9 | 3,935,156 | 2,755,763 | (1,179,393) | 2,755,763 | 3,275,550 | 3/31/2010 | ||||||||||||||||||
55312YAJ1 | 1,551,651 | 1,249,295 | (302,356) | 1,249,295 | 1,950,000 | 3/31/2010 | ||||||||||||||||||
55312YAK8 | 733,206 | 333,928 | (399,278) | 333,928 | 880,000 | 3/31/2010 | ||||||||||||||||||
55312YAL6 | 910,764 | — | * | (910,764) | — | 700,000 | 3/31/2010 | |||||||||||||||||
55312YAS1 | 550,646 | — | * | (550,646) | — | 400,000 | 3/31/2010 | |||||||||||||||||
55312YAT9 | 765,344 | — | * | (765,344) | — | 600,000 | 3/31/2010 | |||||||||||||||||
576434GR9 | 2,237,348 | 1,529,886 | (707,462) | 1,529,886 | 1,340,151 | 3/31/2010 | ||||||||||||||||||
576434SW5 | 11,213,256 | 8,207,145 | (3,006,111) | 8,207,145 | 6,404,670 | 3/31/2010 | ||||||||||||||||||
59022HEC2 | 1,383,042 | 207,699 | (1,175,343) | 207,699 | 2,685,200 | 3/31/2010 | ||||||||||||||||||
59022HED0 | 159,625 | — | * | (159,625) | — | 225,006 | 3/31/2010 | |||||||||||||||||
59023BAN4 | 1,122,794 | 1,105,828 | (16,966) | 1,105,828 | 700,000 | 3/31/2010 | ||||||||||||||||||
60687UAM9 | 3,497,630 | 3,390,262 | (107,368) | 3,390,262 | 825,381 | 3/31/2010 | ||||||||||||||||||
60687VAM7 | 657,467 | 431,421 | (226,046) | 431,421 | 1,131,145 | 3/31/2010 | ||||||||||||||||||
60687VAN5 | 298,309 | 80,935 | (217,374) | 80,935 | 641,864 | 3/31/2010 | ||||||||||||||||||
60688BAS7 | 2,250,067 | 1,955,270 | (294,797) | 1,955,270 | 1,571,053 | 3/31/2010 | ||||||||||||||||||
| 77 |
NOTES TO STATUTORY–BASIS FINANCIAL STATEMENTS
TEACHERS INSURANCE AND ANNUITY ASSOCIATION OF AMERICA
| CUSIP | Book/Adj. Carrying Value Amortized Cost Before Current Period OTTI | Present Value of Projected Cash Flows | Recognized Other-Than- Temporary Impairment | Amortized Cost After Other- Than-Temporary Impairment | Fair Value as of Impairment Date | Date of Financial Statement Where Reported | ||||||||||||||||||
61745MU68 | $ | 2,299,306 | $ | 1,415,396 | $ | (883,910) | $ | 1,415,396 | $ | 1,525,508 | 3/31/2010 | |||||||||||||
61745MX57 | 3,006,452 | 2,853,555 | (152,897) | 2,853,555 | 1,241,373 | 3/31/2010 | ||||||||||||||||||
61746WF21 | 92,228 | 86,333 | (5,895) | 86,333 | 107,333 | 3/31/2010 | ||||||||||||||||||
61749MAG4 | 191,762 | 145,696 | (46,066) | 145,696 | 315,933 | 3/31/2010 | ||||||||||||||||||
61749WAH0 | 5,178,256 | 4,930,474 | (247,782) | 4,930,474 | 3,532,277 | 3/31/2010 | ||||||||||||||||||
61749WAJ6 | 3,606,906 | 3,446,762 | (160,144) | 3,446,762 | 2,750,651 | 3/31/2010 | ||||||||||||||||||
61750CAS6 | 5,688,819 | 4,877,713 | (811,106) | 4,877,713 | 2,649,141 | 3/31/2010 | ||||||||||||||||||
61751NAQ5 | 1,632,133 | 1,424,789 | (207,344) | 1,424,789 | 689,540 | 3/31/2010 | ||||||||||||||||||
61751NAR3 | 835,685 | 762,541 | (73,144) | 762,541 | 400,000 | 3/31/2010 | ||||||||||||||||||
61752JAF7 | 12,151,727 | 11,733,026 | (418,701) | 11,733,026 | 9,177,410 | 3/31/2010 | ||||||||||||||||||
61753JAM1 | 1,468,321 | 1,034,343 | (433,978) | 1,034,343 | 1,927,030 | 3/31/2010 | ||||||||||||||||||
61753JAN9 | 893,267 | 724,829 | (168,438) | 724,829 | 1,013,006 | 3/31/2010 | ||||||||||||||||||
61754KAN5 | 29,543,750 | 14,902,848 | (14,640,902) | 14,902,848 | 7,169,550 | 3/31/2010 | ||||||||||||||||||
61754KAP0 | 4,753,770 | 2,882,584 | (1,871,186) | 2,882,584 | 3,179,403 | 3/31/2010 | ||||||||||||||||||
74951PEA2 | 1,411,161 | 611,715 | (799,446) | 611,715 | 798,880 | 3/31/2010 | ||||||||||||||||||
749577AL6 | 18,344,213 | 18,173,451 | (170,762) | 18,173,451 | 9,351,820 | 3/31/2010 | ||||||||||||||||||
74958BAH5 | 26,688,678 | 25,795,063 | (893,615) | 25,795,063 | 18,183,241 | 3/31/2010 | ||||||||||||||||||
74958EAD8 | 49,330,341 | 49,156,800 | (173,541) | 49,156,800 | 39,456,610 | 3/31/2010 | ||||||||||||||||||
75115CAG2 | 8,686,890 | 8,574,274 | (112,616) | 8,574,274 | 8,132,934 | 3/31/2010 | ||||||||||||||||||
75971EAF3 | 426,984 | 364,335 | (62,649) | 364,335 | 261,375 | 3/31/2010 | ||||||||||||||||||
759950GW2 | 11,000,000 | 9,571,051 | (1,428,949) | 9,571,051 | 5,472,159 | 3/31/2010 | ||||||||||||||||||
7609854A6 | 33,830,344 | 30,009,356 | (3,820,988) | 30,009,356 | 15,941,114 | 3/31/2010 | ||||||||||||||||||
760985YY1 | 951,336 | 833,683 | (117,653) | 833,683 | 122,201 | 3/31/2010 | ||||||||||||||||||
76110HHB8 | 3,704,290 | 2,979,257 | (725,033) | 2,979,257 | 1,570,435 | 3/31/2010 | ||||||||||||||||||
76110HNQ8 | 3,421,480 | 3,163,808 | (257,672) | 3,163,808 | 1,875,614 | 3/31/2010 | ||||||||||||||||||
76110HQS1 | 5,909,509 | 4,753,597 | (1,155,912) | 4,753,597 | 3,911,273 | 3/31/2010 | ||||||||||||||||||
76110HQT9 | 1,234,187 | 501,006 | (733,181) | 501,006 | 552,010 | 3/31/2010 | ||||||||||||||||||
76110HSH3 | 2,599,507 | 1,840,661 | (758,846) | 1,840,661 | 597,846 | 3/31/2010 | ||||||||||||||||||
76110HX53 | 10,731,362 | 10,506,169 | (225,193) | 10,506,169 | 7,093,483 | 3/31/2010 | ||||||||||||||||||
76110HX87 | 23,928,208 | 23,397,766 | (530,442) | 23,397,766 | 15,777,859 | 3/31/2010 | ||||||||||||||||||
76110WQA7 | 15,542,700 | 14,592,408 | (950,292) | 14,592,408 | 6,411,873 | 3/31/2010 | ||||||||||||||||||
76110WRX6 | 2,811,280 | 1,514,494 | (1,296,786) | 1,514,494 | 597,290 | 3/31/2010 | ||||||||||||||||||
76110WTB2 | 4,358,804 | 4,046,507 | (312,297) | 4,046,507 | 1,956,630 | 3/31/2010 | ||||||||||||||||||
76110WTU0 | 2,967,641 | 2,806,539 | (161,102) | 2,806,539 | 1,139,118 | 3/31/2010 | ||||||||||||||||||
76110WUL8 | 14,858,673 | 14,320,496 | (538,177) | 14,320,496 | 4,842,900 | 3/31/2010 | ||||||||||||||||||
76110WUM6 | 6,485,856 | 6,369,500 | (116,356) | 6,369,500 | 5,036,685 | 3/31/2010 | ||||||||||||||||||
76110WVT0 | 877,241 | 672,338 | (204,903) | 672,338 | 363,176 | 3/31/2010 | ||||||||||||||||||
76110WWK8 | 2,357,146 | 1,818,861 | (538,285) | 1,818,861 | 770,759 | 3/31/2010 | ||||||||||||||||||
761118CZ9 | 11,151,038 | 10,916,220 | (234,818) | 10,916,220 | 5,093,136 | 3/31/2010 | ||||||||||||||||||
761118PQ5 | 12,290,266 | 12,209,616 | (80,650) | 12,209,616 | 9,599,776 | 3/31/2010 | ||||||||||||||||||
76113GAC2 | 981,879 | 350,473 | (631,406) | 350,473 | 382,698 | 3/31/2010 | ||||||||||||||||||
76114DAE4 | 15,287,451 | 15,118,884 | (168,567) | 15,118,884 | 13,098,239 | 3/31/2010 | ||||||||||||||||||
87222PAE3 | 35,277,842 | 29,398,655 | (5,879,187) | 29,398,655 | 16,122,708 | 3/31/2010 | ||||||||||||||||||
92977QAP3 | 8,825,113 | 2,097,324 | (6,727,789) | 2,097,324 | 3,343,397 | 3/31/2010 | ||||||||||||||||||
92977QAQ1 | 3,067,791 | 555,880 | (2,511,911) | 555,880 | 2,894,060 | 3/31/2010 | ||||||||||||||||||
92978MAN6 | 21,198,285 | 8,122,135 | (13,076,150) | 8,122,135 | 6,003,050 | 3/31/2010 | ||||||||||||||||||
92978MAT3 | 1,306,147 | 207,324 | (1,098,823) | 207,324 | 1,234,287 | 3/31/2010 | ||||||||||||||||||
92978QAP2 | 454,099 | — | * | (454,099) | — | 1,408,390 | 3/31/2010 | |||||||||||||||||
92978QAR8 | 1,555,608 | — | * | (1,555,608) | — | 3,448,340 | 3/31/2010 | |||||||||||||||||
92978QAT4 | 721,689 | — | * | (721,689) | — | 1,200,000 | 3/31/2010 | |||||||||||||||||
93934DAR8 | 80,306 | 66,124 | (14,182) | 66,124 | 42,673 | 3/31/2010 | ||||||||||||||||||
94980KAQ5 | 672,475 | 563,431 | (109,044) | 563,431 | 608,303 | 3/31/2010 | ||||||||||||||||||
949837AF5 | 69,106,312 | 68,983,549 | (122,763) | 68,983,549 | 39,419,082 | 3/31/2010 | ||||||||||||||||||
949837BE7 | 19,956,633 | 19,950,284 | (6,349) | 19,950,284 | 14,404,911 | 3/31/2010 | ||||||||||||||||||
949837BK3 | 8,604,257 | 8,579,231 | (25,026) | 8,579,231 | 6,285,336 | 3/31/2010 | ||||||||||||||||||
| 78 |
| continued |
| CUSIP | Book/Adj. Carrying Value Amortized Cost Before Current Period OTTI | Present Value of Projected Cash Flows | Recognized Other-Than- Temporary Impairment | Amortized Cost After Other- Than-Temporary Impairment | Fair Value as of Impairment Date | Date of Financial Statement Where Reported | ||||||||||||||||||
94983BAP4 | $ | 15,480,624 | $ | 15,407,947 | $ | (72,677) | $ | 15,407,947 | $ | 11,951,023 | 3/31/2010 | |||||||||||||
94984AAR1 | 29,305,436 | 29,134,800 | (170,636) | 29,134,800 | 15,831,891 | 3/31/2010 | ||||||||||||||||||
94984AAS9 | 10,026,305 | 9,967,760 | (58,545) | 9,967,760 | 7,951,333 | 3/31/2010 | ||||||||||||||||||
94984FAR0 | 35,362,500 | 35,181,913 | (180,587) | 35,181,913 | 26,150,659 | 3/31/2010 | ||||||||||||||||||
94984JAK7 | 44,835,899 | 43,930,925 | (904,974) | 43,930,925 | 31,606,570 | 3/31/2010 | ||||||||||||||||||
94984XAB6 | 9,537,419 | 9,483,578 | (53,841) | 9,483,578 | 5,034,366 | 3/31/2010 | ||||||||||||||||||
94984XAD2 | 7,887,301 | 7,842,358 | (44,943) | 7,842,358 | 4,163,905 | 3/31/2010 | ||||||||||||||||||
94984XAM2 | 12,041,714 | 11,971,668 | (70,046) | 11,971,668 | 7,721,227 | 3/31/2010 | ||||||||||||||||||
94985JAB6 | 48,930,619 | 48,678,950 | (251,669) | 48,678,950 | 29,241,105 | 3/31/2010 | ||||||||||||||||||
94985JBR0 | 29,490,677 | 29,416,351 | (74,326) | 29,416,351 | 12,570,636 | 3/31/2010 | ||||||||||||||||||
94985JCA6 | 28,951,381 | 28,831,230 | (120,151) | 28,831,230 | 24,132,195 | 3/31/2010 | ||||||||||||||||||
94985RAP7 | 61,798,708 | 61,727,872 | (70,836) | 61,727,872 | 43,791,258 | 3/31/2010 | ||||||||||||||||||
94985WAP6 | 23,112,305 | 22,793,202 | (319,103) | 22,793,202 | 19,317,875 | 3/31/2010 | ||||||||||||||||||
94985WAQ4 | 71,557,171 | 71,525,516 | �� | (31,655) | 71,525,516 | 30,565,698 | 3/31/2010 | |||||||||||||||||
94985WBL4 | 37,253,580 | 37,102,427 | (151,153) | 37,102,427 | 27,324,140 | 3/31/2010 | ||||||||||||||||||
94986AAC2 | 111,247,247 | 111,160,855 | (86,392) | 111,160,855 | 80,968,395 | 3/31/2010 | ||||||||||||||||||
02148FAW5 | 28,092,012 | 26,534,625 | (1,557,387) | 26,534,625 | 18,680,752 | 12/31/2009 | ||||||||||||||||||
02149HAK6 | 24,244,801 | 23,401,542 | (843,259) | 23,401,542 | 18,845,141 | 12/31/2009 | ||||||||||||||||||
02151CBD7 | 28,168,626 | 27,928,844 | (239,782) | 27,928,844 | 23,040,583 | 12/31/2009 | ||||||||||||||||||
02151FAD1 | 38,605,381 | 37,069,441 | (1,535,940) | 37,069,441 | 24,873,276 | 12/31/2009 | ||||||||||||||||||
02151NBA9 | 18,265,546 | 17,329,209 | (936,337) | 17,329,209 | 8,458,155 | 12/31/2009 | ||||||||||||||||||
03702YAC4 | 28,800 | — | ² | (3,600) | 25,200 | 25,200 | 12/31/2009 | |||||||||||||||||
03927NAA1 | 14,694,000 | 9,404,655 | (5,289,345) | 9,404,655 | 5,250,000 | 12/31/2009 | ||||||||||||||||||
05947UJT6 | 684,903 | 461,411 | (223,492) | 461,411 | 307,397 | 12/31/2009 | ||||||||||||||||||
05947UMM7 | 2,599,818 | 1,949,371 | (650,447) | 1,949,371 | 378,124 | 12/31/2009 | ||||||||||||||||||
05947UVY1 | 1,969,347 | 1,783,588 | (185,759) | 1,783,588 | 231,398 | 12/31/2009 | ||||||||||||||||||
05947UVZ8 | 1,943,102 | 318,015 | (1,625,087) | 318,015 | 230,470 | 12/31/2009 | ||||||||||||||||||
05947UWA2 | 767,441 | 160,955 | (606,486) | 160,955 | 225,250 | 12/31/2009 | ||||||||||||||||||
05947UWB0 | 131,202 | 38,214 | (92,988) | 38,214 | 109,176 | 12/31/2009 | ||||||||||||||||||
05947UWC8 | 58,568 | 37,462 | (21,106) | 37,462 | 100,663 | 12/31/2009 | ||||||||||||||||||
05947UWD6 | 68,815 | 3,886 | (64,929) | 3,886 | 85,979 | 12/31/2009 | ||||||||||||||||||
05948KB65 | 10,449,434 | 9,975,968 | (473,466) | 9,975,968 | 6,636,940 | 12/31/2009 | ||||||||||||||||||
05948KC98 | 17,774,894 | 17,659,659 | (115,235) | 17,659,659 | 13,260,340 | 12/31/2009 | ||||||||||||||||||
05948KLA5 | 1,899,662 | 1,730,054 | (169,608) | 1,730,054 | 929,252 | 12/31/2009 | ||||||||||||||||||
05948KP37 | 10,774,470 | 10,676,031 | (98,439) | 10,676,031 | 7,980,675 | 12/31/2009 | ||||||||||||||||||
059497AC1 | 10,033,749 | 7,475,988 | (2,557,761) | 7,475,988 | 2,700,530 | 12/31/2009 | ||||||||||||||||||
05949AA67 | 6,044,085 | 4,810,509 | (1,233,576) | 4,810,509 | 3,013,807 | 12/31/2009 | ||||||||||||||||||
05949AA75 | 751,465 | 301,666 | (449,799) | 301,666 | 430,971 | 12/31/2009 | ||||||||||||||||||
05949AM23 | 2,018,499 | 1,815,560 | (202,939) | 1,815,560 | 1,867,555 | 12/31/2009 | ||||||||||||||||||
05949AM31 | 419,986 | 371,791 | (48,195) | 371,791 | 325,386 | 12/31/2009 | ||||||||||||||||||
05949AMP2 | 2,912,645 | 2,125,205 | (787,440) | 2,125,205 | 1,401,219 | 12/31/2009 | ||||||||||||||||||
059511AL9 | 7,909,548 | 4,984,251 | (2,925,297) | 4,984,251 | 2,157,600 | 12/31/2009 | ||||||||||||||||||
059511AM7 | 3,154,584 | 1,355,076 | (1,799,508) | 1,355,076 | 1,145,100 | 12/31/2009 | ||||||||||||||||||
059511AS4 | 1,707,661 | 1,267,071 | (440,590) | 1,267,071 | 1,098,652 | 12/31/2009 | ||||||||||||||||||
059511AU9 | 2,073,166 | 1,533,143 | (540,023) | 1,533,143 | 1,463,230 | 12/31/2009 | ||||||||||||||||||
07387BEQ2 | 6,510,227 | 1,763,263 | (4,746,964) | 1,763,263 | 2,421,832 | 12/31/2009 | ||||||||||||||||||
07387BGA5 | 2,801,784 | 1,418,267 | (1,383,517) | 1,418,267 | 380,252 | 12/31/2009 | ||||||||||||||||||
07388YBC5 | 1,811,745 | 1,741,414 | (70,331) | 1,741,414 | 858,613 | 12/31/2009 | ||||||||||||||||||
07388YBE1 | 1,393,067 | 1,358,950 | (34,117) | 1,358,950 | 594,875 | 12/31/2009 | ||||||||||||||||||
073945AN7 | 3,339,528 | 3,306,158 | (33,370) | 3,306,158 | 957,803 | 12/31/2009 | ||||||||||||||||||
073945AQ0 | 1,868,880 | 659,799 | (1,209,081) | 659,799 | 418,758 | 12/31/2009 | ||||||||||||||||||
073945AS6 | 579,048 | 467,855 | (111,193) | 467,855 | 261,696 | 12/31/2009 | ||||||||||||||||||
12543TAD7 | 10,072,936 | 9,581,949 | (490,987) | 9,581,949 | 7,308,631 | 12/31/2009 | ||||||||||||||||||
12543UAD4 | 45,177,737 | 42,394,764 | (2,782,973) | 42,394,764 | 20,791,904 | 12/31/2009 | ||||||||||||||||||
12543UAE2 | 15,930,769 | 15,151,663 | (779,106) | 15,151,663 | 7,917,427 | 12/31/2009 | ||||||||||||||||||
| 79 |
NOTES TO STATUTORY–BASIS FINANCIAL STATEMENTS
TEACHERS INSURANCE AND ANNUITY ASSOCIATION OF AMERICA
| CUSIP | Book/Adj. Carrying Value Amortized Cost Before Current Period OTTI | Present Value of Projected Cash Flows | Recognized Other-Than- Temporary Impairment | Amortized Cost After Other- Than-Temporary Impairment | Fair Value as of Impairment Date | Date of Financial Statement Where Reported | ||||||||||||||||||
12544AAC9 | $ | 49,835,937 | $ | 48,573,999 | $ | (1,261,938) | $ | 48,573,999 | $ | 25,931,615 | 12/31/2009 | |||||||||||||
12544DAK5 | 21,950,653 | 21,668,533 | (282,120) | 21,668,533 | 15,139,755 | 12/31/2009 | ||||||||||||||||||
12544DAQ2 | 15,698,178 | 15,576,809 | (121,369) | 15,576,809 | 9,330,008 | 12/31/2009 | ||||||||||||||||||
12544LAK7 | 31,269,224 | 30,929,119 | (340,105) | 30,929,119 | 23,283,773 | 12/31/2009 | ||||||||||||||||||
12544RAL2 | 8,883,000 | 8,687,070 | (195,930) | 8,687,070 | 5,835,361 | 12/31/2009 | ||||||||||||||||||
12545CAU4 | 39,546,663 | 37,843,801 | (1,702,862) | 37,843,801 | 29,109,776 | 12/31/2009 | ||||||||||||||||||
12558MBN1 | 14,860,111 | 14,345,457 | (514,654) | 14,345,457 | 2,493,919 | 12/31/2009 | ||||||||||||||||||
12566RAG6 | 40,498,727 | 38,955,331 | (1,543,396) | 38,955,331 | 28,805,442 | 12/31/2009 | ||||||||||||||||||
12566XAE8 | 34,342,512 | 31,146,696 | (3,195,816) | 31,146,696 | 22,906,737 | 12/31/2009 | ||||||||||||||||||
12566XAG3 | 15,725,340 | 14,714,071 | (1,011,269) | 14,714,071 | 7,004,737 | 12/31/2009 | ||||||||||||||||||
126171AQ0 | 4,979,133 | 4,294,375 | (684,758) | 4,294,375 | 1,184,275 | 12/31/2009 | ||||||||||||||||||
126378AG3 | 14,468,757 | 13,583,840 | (884,917) | 13,583,840 | 9,322,523 | 12/31/2009 | ||||||||||||||||||
126378AH1 | 15,735,264 | 14,849,376 | (885,888) | 14,849,376 | 8,924,133 | 12/31/2009 | ||||||||||||||||||
126670GR3 | 6,999,491 | 6,444,126 | (555,365) | 6,444,126 | 2,538,239 | 12/31/2009 | ||||||||||||||||||
126670QT8 | 3,628,335 | 3,588,346 | (39,989) | 3,588,346 | 2,216,845 | 12/31/2009 | ||||||||||||||||||
126671TW6 | 1,104,726 | 893,475 | (211,251) | 893,475 | 157,397 | 12/31/2009 | ||||||||||||||||||
12667F2J3 | 38,230,681 | 37,962,650 | (268,031) | 37,962,650 | 16,806,135 | 12/31/2009 | ||||||||||||||||||
12667F4N2 | 10,000,000 | 9,861,140 | (138,860) | 9,861,140 | 6,538,343 | 12/31/2009 | ||||||||||||||||||
12667FMJ1 | 19,582,164 | 19,378,750 | (203,414) | 19,378,750 | 11,437,931 | 12/31/2009 | ||||||||||||||||||
12667FR98 | 6,874,348 | 4,442,078 | (2,432,270) | 4,442,078 | 1,295,211 | 12/31/2009 | ||||||||||||||||||
12667FYZ2 | 24,125,540 | 19,416,478 | (4,709,062) | 19,416,478 | 5,117,969 | 12/31/2009 | ||||||||||||||||||
12667GFB4 | 68,056,538 | 67,661,838 | (394,700) | 67,661,838 | 49,131,254 | 12/31/2009 | ||||||||||||||||||
12667GFT5 | 19,521,163 | 19,142,452 | (378,711) | 19,142,452 | 12,645,891 | 12/31/2009 | ||||||||||||||||||
12667GJG9 | 16,385,944 | 16,353,724 | (32,220) | 16,353,724 | 11,171,557 | 12/31/2009 | ||||||||||||||||||
12667GKE2 | 15,362,913 | 14,843,603 | (519,310) | 14,843,603 | 7,562,329 | 12/31/2009 | ||||||||||||||||||
12667GQA4 | 23,036,429 | 22,632,016 | (404,413) | 22,632,016 | 15,677,998 | 12/31/2009 | ||||||||||||||||||
12667GW74 | 20,096,846 | 20,031,300 | (65,546) | 20,031,300 | 14,258,906 | 12/31/2009 | ||||||||||||||||||
12668ASQ9 | 4,716,558 | 4,702,861 | (13,697) | 4,702,861 | 3,743,740 | 12/31/2009 | ||||||||||||||||||
12668ASQ9 | 23,876,161 | 23,806,826 | (69,335) | 23,806,826 | 18,951,563 | 12/31/2009 | ||||||||||||||||||
12668ASR7 | 7,449,505 | 7,322,310 | (127,195) | 7,322,310 | 3,739,156 | 12/31/2009 | ||||||||||||||||||
126694AG3 | 14,053,115 | 13,575,455 | (477,660) | 13,575,455 | 5,578,762 | 12/31/2009 | ||||||||||||||||||
126694HK7 | 19,184,867 | 19,020,520 | (164,347) | 19,020,520 | 14,660,188 | 12/31/2009 | ||||||||||||||||||
126694JS8 | 27,939,566 | 27,834,551 | (105,015) | 27,834,551 | 10,595,359 | 12/31/2009 | ||||||||||||||||||
126694W61 | 24,054,887 | 22,698,356 | (1,356,531) | 22,698,356 | 9,466,804 | 12/31/2009 | ||||||||||||||||||
126694XQ6 | 32,714,970 | 30,923,460 | (1,791,510) | 30,923,460 | 13,730,021 | 12/31/2009 | ||||||||||||||||||
12669DN87 | 2,557,344 | 1,951,794 | (605,550) | 1,951,794 | 1,261,641 | 12/31/2009 | ||||||||||||||||||
12669E4W3 | 5,078,179 | 4,840,772 | (237,407) | 4,840,772 | 2,593,800 | 12/31/2009 | ||||||||||||||||||
12669YAF9 | 20,652,190 | 19,664,480 | (987,710) | 19,664,480 | 8,774,980 | 12/31/2009 | ||||||||||||||||||
12669YAH5 | 16,469,188 | 16,368,464 | (100,724) | 16,368,464 | 6,872,166 | 12/31/2009 | ||||||||||||||||||
12669YAX0 | 15,969,650 | 15,316,597 | (653,053) | 15,316,597 | 6,697,462 | 12/31/2009 | ||||||||||||||||||
12670AAF8 | 48,352,021 | 45,989,004 | (2,363,017) | 45,989,004 | 33,931,285 | 12/31/2009 | ||||||||||||||||||
161546FY7 | 4,136,277 | 2,201,131 | (1,935,146) | 2,201,131 | 671,769 | 12/31/2009 | ||||||||||||||||||
161551FW1 | 154,005 | 103,493 | (50,512) | 103,493 | 3,237 | 12/31/2009 | ||||||||||||||||||
161631AV8 | 42,128,293 | 40,838,840 | (1,289,453) | 40,838,840 | 30,045,941 | 12/31/2009 | ||||||||||||||||||
16163BAP9 | 29,341,512 | 28,968,116 | (373,396) | 28,968,116 | 13,865,667 | 12/31/2009 | ||||||||||||||||||
16165LAG5 | 13,821,284 | 13,647,764 | (173,520) | 13,647,764 | 7,986,973 | 12/31/2009 | ||||||||||||||||||
16165TBJ1 | 10,448,900 | 10,263,761 | (185,139) | 10,263,761 | 6,816,639 | 12/31/2009 | ||||||||||||||||||
170255AS2 | 15,112,930 | 14,773,335 | (339,595) | 14,773,335 | 11,552,634 | 12/31/2009 | ||||||||||||||||||
17025JAB9 | 9,459,235 | 9,190,500 | (268,735) | 9,190,500 | 4,008,065 | 12/31/2009 | ||||||||||||||||||
17025JAB9 | 28,874,314 | 28,054,001 | (820,313) | 28,054,001 | 12,234,618 | 12/31/2009 | ||||||||||||||||||
17025TAV3 | 28,498,552 | 27,463,403 | (1,035,149) | 27,463,403 | 15,287,882 | 12/31/2009 | ||||||||||||||||||
172973W62 | 440,184 | 436,545 | (3,639) | 436,545 | 313,988 | 12/31/2009 | ||||||||||||||||||
17309YAD9 | 20,217,243 | 19,172,925 | (1,044,318) | 19,172,925 | 12,006,899 | 12/31/2009 | ||||||||||||||||||
17310AAR7 | 32,963,982 | 32,409,718 | (554,264) | 32,409,718 | 20,022,763 | 12/31/2009 | ||||||||||||||||||
17310MAQ3 | 15,046,908 | 11,646,343 | (3,400,565) | 11,646,343 | 1,856,580 | 12/31/2009 | ||||||||||||||||||
| 80 |
| continued |
| CUSIP | Book/Adj. Carrying Value Amortized Cost Before Current Period OTTI | Present Value of Projected Cash Flows | Recognized Other-Than- Temporary Impairment | Amortized Cost After Other- Than-Temporary Impairment | Fair Value as of Impairment Date | Date of Financial Statement Where Reported | ||||||||||||||||||
17310MAS9 | $ | 1,275,932 | $ | 960,222 | $ | (315,710) | $ | 960,222 | $ | 414,852 | 12/31/2009 | |||||||||||||
17312FAD5 | 9,855,551 | 9,846,320 | (9,231) | 9,846,320 | 7,494,675 | 12/31/2009 | ||||||||||||||||||
190749AN1 | 1,490,230 | 1,163,840 | (326,390) | 1,163,840 | 360,290 | 12/31/2009 | ||||||||||||||||||
19075CAK9 | 10,988,235 | 5,934,671 | (5,053,564) | 5,934,671 | 4,175,325 | 12/31/2009 | ||||||||||||||||||
19075CAL7 | 4,094,402 | 2,993,689 | (1,100,713) | 2,993,689 | 3,540,530 | 12/31/2009 | ||||||||||||||||||
19075CAM5 | 1,087,743 | 779,994 | (307,749) | 779,994 | 719,115 | 12/31/2009 | ||||||||||||||||||
19075CAN3 | 841,743 | 620,145 | (221,598) | 620,145 | 500,000 | 12/31/2009 | ||||||||||||||||||
19075CAS2 | 3,735,011 | 3,321,386 | (413,625) | 3,321,386 | 2,419,440 | 12/31/2009 | ||||||||||||||||||
20047EAP7 | 3,693,912 | 2,729,624 | (964,288) | 2,729,624 | 4,169,656 | 12/31/2009 | ||||||||||||||||||
20173MAN0 | 19,810,076 | 7,538,530 | (12,271,546) | 7,538,530 | 3,457,580 | 12/31/2009 | ||||||||||||||||||
20173MAQ3 | 1,220,517 | 672,398 | (548,119) | 672,398 | 450,000 | 12/31/2009 | ||||||||||||||||||
22544QAK5 | 17,504,444 | 15,077,211 | (2,427,233) | 15,077,211 | 3,463,938 | 12/31/2009 | ||||||||||||||||||
22544QAM1 | 19,198,558 | 6,452,459 | (12,746,099) | 6,452,459 | 3,771,547 | 12/31/2009 | ||||||||||||||||||
22544QAN9 | 3,673,347 | 2,374,304 | (1,299,043) | 2,374,304 | 1,541,414 | 12/31/2009 | ||||||||||||||||||
22544QAP4 | 1,395,672 | 1,013,001 | (382,671) | 1,013,001 | 841,401 | 12/31/2009 | ||||||||||||||||||
22544QAQ2 | 2,386,341 | 1,713,686 | (672,655) | 1,713,686 | 1,332,980 | 12/31/2009 | ||||||||||||||||||
225458DT2 | 2,910,803 | 2,893,702 | (17,101) | 2,893,702 | 1,143,105 | 12/31/2009 | ||||||||||||||||||
225458SB5 | 14,087,585 | 14,001,463 | (86,122) | 14,001,463 | 3,794,631 | 12/31/2009 | ||||||||||||||||||
22545XAP8 | 2,080,603 | 858,458 | (1,222,145) | 858,458 | 2,707,527 | 12/31/2009 | ||||||||||||||||||
22545XAQ6 | 1,601,753 | — | * | (1,601,753) | — | 1,117,160 | 12/31/2009 | |||||||||||||||||
225470H22 | 970,504 | 913,918 | (56,586) | 913,918 | 879,984 | 12/31/2009 | ||||||||||||||||||
251510CY7 | 6,174,468 | 6,128,159 | (46,309) | 6,128,159 | 2,385,464 | 12/31/2009 | ||||||||||||||||||
251510ET6 | 6,610,704 | 6,129,009 | (481,695) | 6,129,009 | 1,531,776 | 12/31/2009 | ||||||||||||||||||
294751FB3 | 4,704,156 | 4,472,358 | (231,798) | 4,472,358 | 941,193 | 12/31/2009 | ||||||||||||||||||
294751FC1 | 2,323,121 | 1,249,074 | (1,074,047) | 1,249,074 | 395,093 | 12/31/2009 | ||||||||||||||||||
294754AY2 | 5,853,602 | 5,588,893 | (264,709) | 5,588,893 | 4,304,994 | 12/31/2009 | ||||||||||||||||||
32051G2J3 | 19,664,606 | 19,456,027 | (208,579) | 19,456,027 | 15,337,214 | 12/31/2009 | ||||||||||||||||||
32051GDH5 | 5,217,232 | 4,028,086 | (1,189,146) | 4,028,086 | 3,390,503 | 12/31/2009 | ||||||||||||||||||
32051GFL4 | 7,842,427 | 7,595,406 | (247,021) | 7,595,406 | 5,536,785 | 12/31/2009 | ||||||||||||||||||
36157TJG7 | 1,804,125 | 1,308,394 | (495,731) | 1,308,394 | 1,469,454 | 12/31/2009 | ||||||||||||||||||
361849S29 | 6,462,883 | 4,691,114 | (1,771,769) | 4,691,114 | 1,678,015 | 12/31/2009 | ||||||||||||||||||
36228CYQ0 | 24,033,161 | 23,095,688 | (937,473) | 23,095,688 | 7,171,836 | 12/31/2009 | ||||||||||||||||||
3622ECAH9 | 6,009,448 | 5,942,640 | (66,808) | 5,942,640 | 2,934,538 | 12/31/2009 | ||||||||||||||||||
3622MPBE7 | 50,481,437 | 50,370,399 | (111,038) | 50,370,399 | 39,532,250 | 12/31/2009 | ||||||||||||||||||
362332AM0 | 6,642,090 | 4,602,455 | (2,039,635) | 4,602,455 | 1,911,030 | 12/31/2009 | ||||||||||||||||||
362332AN8 | 3,128,933 | 473,329 | (2,655,604) | 473,329 | 856,025 | 12/31/2009 | ||||||||||||||||||
362332AT5 | 8,451,782 | 642,221 | (7,809,561) | 642,221 | 2,520,945 | 12/31/2009 | ||||||||||||||||||
362332AV0 | 3,936,084 | 668,865 | (3,267,219) | 668,865 | 1,640,000 | 12/31/2009 | ||||||||||||||||||
362334QC1 | 9,544,327 | 9,182,164 | (362,163) | 9,182,164 | 7,009,589 | 12/31/2009 | ||||||||||||||||||
362669AQ6 | 10,133,998 | 10,076,618 | (57,380) | 10,076,618 | 6,805,070 | 12/31/2009 | ||||||||||||||||||
36298JAC7 | 9,824,095 | 7,485,905 | (2,338,190) | 7,485,905 | 1,299,000 | 12/31/2009 | ||||||||||||||||||
36828QSL1 | 1,764,915 | 977,473 | (787,442) | 977,473 | 908,306 | 12/31/2009 | ||||||||||||||||||
45660LPD5 | 13,759,047 | 13,655,346 | (103,701) | 13,655,346 | 9,245,813 | 12/31/2009 | ||||||||||||||||||
46412QAD9 | 4,768,657 | 4,752,037 | (16,620) | 4,752,037 | 1,247,784 | 12/31/2009 | ||||||||||||||||||
46614KAB2 | 2,754,987 | 2,069,970 | (685,017) | 2,069,970 | 500,000 | 12/31/2009 | ||||||||||||||||||
46625M2W8 | 1,230,406 | 1,196,250 | (34,156) | 1,196,250 | 169,265 | 12/31/2009 | ||||||||||||||||||
46625MQ93 | 2,095,225 | 474,700 | (1,620,525) | 474,700 | 146,389 | 12/31/2009 | ||||||||||||||||||
46625MZH5 | 1,179,409 | 1,094,197 | (85,212) | 1,094,197 | 490,187 | 12/31/2009 | ||||||||||||||||||
46625MZJ1 | 2,162,622 | 259,295 | (1,903,327) | 259,295 | 342,817 | 12/31/2009 | ||||||||||||||||||
46625MZK8 | 2,331,637 | — | * | (2,331,637) | — | 302,478 | 12/31/2009 | |||||||||||||||||
46625MZL6 | 44,886 | — | * | (44,886) | — | 225,453 | 12/31/2009 | |||||||||||||||||
46625YC68 | 3,016,699 | 1,949,218 | (1,067,481) | 1,949,218 | 439,970 | 12/31/2009 | ||||||||||||||||||
46627MAC1 | 11,109,835 | 11,107,913 | (1,922) | 11,107,913 | 5,679,297 | 12/31/2009 | ||||||||||||||||||
46628SAG8 | 26,022,755 | 24,189,294 | (1,833,461) | 24,189,294 | 13,494,828 | 12/31/2009 | ||||||||||||||||||
46628YBK5 | 29,479,163 | 29,064,914 | (414,249) | 29,064,914 | 12,713,916 | 12/31/2009 | ||||||||||||||||||
| 81 |
NOTES TO STATUTORY–BASIS FINANCIAL STATEMENTS
TEACHERS INSURANCE AND ANNUITY ASSOCIATION OF AMERICA
| CUSIP | Book/Adj. Carrying Value Amortized Cost Before Current Period OTTI | Present Value of Projected Cash Flows | Recognized Other-Than- Temporary Impairment | Amortized Cost After Other- Than-Temporary Impairment | Fair Value as of Impairment Date | Date of Financial Statement Where Reported | ||||||||||||||||||
46628YBP4 | $ | 15,611,011 | $ | 15,328,042 | $ | (282,969) | $ | 15,328,042 | $ | 9,316,003 | 12/31/2009 | |||||||||||||
46629YAM1 | 16,337,536 | 15,714,000 | (623,536) | 15,714,000 | 4,461,220 | 12/31/2009 | ||||||||||||||||||
46629YAQ2 | 1,460,898 | 1,180,316 | (280,582) | 1,180,316 | 1,011,940 | 12/31/2009 | ||||||||||||||||||
46630AAG3 | 450,846 | 429,259 | (21,587) | 429,259 | 360,000 | 12/31/2009 | ||||||||||||||||||
46630JAQ2 | 30,100,789 | 28,949,901 | (1,150,888) | 28,949,901 | 11,111,370 | 12/31/2009 | ||||||||||||||||||
46630JAS8 | 2,912,412 | 2,596,223 | (316,189) | 2,596,223 | 2,667,440 | 12/31/2009 | ||||||||||||||||||
46630JAU3 | 4,457,046 | 3,568,616 | (888,430) | 3,568,616 | 4,334,260 | 12/31/2009 | ||||||||||||||||||
46630JAW9 | 3,084,864 | 2,480,742 | (604,122) | 2,480,742 | 3,159,820 | 12/31/2009 | ||||||||||||||||||
46631BAP0 | 16,557,726 | 9,978,276 | (6,579,450) | 9,978,276 | 2,458,651 | 12/31/2009 | ||||||||||||||||||
46632HAR2 | 2,993,238 | 2,071,845 | (921,393) | 2,071,845 | 863,376 | 12/31/2009 | ||||||||||||||||||
50177AAL3 | 9,847,630 | 2,320,838 | (7,526,792) | 2,320,838 | 1,603,730 | 12/31/2009 | ||||||||||||||||||
50179AAM9 | 3,872,820 | 2,919,211 | (953,609) | 2,919,211 | 480,000 | 12/31/2009 | ||||||||||||||||||
50179AAN7 | 1,687,002 | 1,350,628 | (336,374) | 1,350,628 | 549,000 | 12/31/2009 | ||||||||||||||||||
50179AAS6 | 1,625,796 | 1,300,608 | (325,188) | 1,300,608 | 524,370 | 12/31/2009 | ||||||||||||||||||
50180CAV2 | 824,030 | 740,070 | (83,960) | 740,070 | 720,000 | 12/31/2009 | ||||||||||||||||||
50180JAM7 | 5,085,004 | 4,203,919 | (881,085) | 4,203,919 | 1,700,000 | 12/31/2009 | ||||||||||||||||||
50180JAR6 | 2,635,610 | 2,240,013 | (395,597) | 2,240,013 | 840,000 | 12/31/2009 | ||||||||||||||||||
52108HZ80 | 6,961,779 | 5,822,810 | (1,138,969) | 5,822,810 | 1,828,078 | 12/31/2009 | ||||||||||||||||||
525221EB9 | 4,999,219 | 4,976,531 | (22,688) | 4,976,531 | 2,699,322 | 12/31/2009 | ||||||||||||||||||
525221EB9 | 24,996,094 | 24,882,653 | (113,441) | 24,882,653 | 13,496,608 | 12/31/2009 | ||||||||||||||||||
525221JW8 | 42,492,282 | 40,532,474 | (1,959,808) | 40,532,474 | 25,739,305 | 12/31/2009 | ||||||||||||||||||
52522HAL6 | 40,000,000 | 39,094,709 | (905,291) | 39,094,709 | 17,347,248 | 12/31/2009 | ||||||||||||||||||
55312TAH6 | 10,038,969 | 7,114,883 | (2,924,086) | 7,114,883 | 2,796,660 | 12/31/2009 | ||||||||||||||||||
55312TAJ2 | 4,409,205 | 2,116,859 | (2,292,346) | 2,116,859 | 2,034,828 | 12/31/2009 | ||||||||||||||||||
55312TAK9 | 5,861,263 | 4,227,537 | (1,633,726) | 4,227,537 | 3,406,325 | 12/31/2009 | ||||||||||||||||||
55312TAQ6 | 627,674 | — | ² | (29,932) | 597,742 | 597,742 | 12/31/2009 | |||||||||||||||||
55312TAR4 | 692,324 | — | ² | (41,516) | 650,808 | 650,808 | 12/31/2009 | |||||||||||||||||
55312YAJ1 | 3,719,481 | 1,734,574 | (1,984,907) | 1,734,574 | 3,123,960 | 12/31/2009 | ||||||||||||||||||
55312YAK8 | 1,238,011 | 832,561 | (405,450) | 832,561 | 1,387,912 | 12/31/2009 | ||||||||||||||||||
576434GR9 | 2,302,714 | 2,299,657 | (3,057) | 2,299,657 | 1,342,087 | 12/31/2009 | ||||||||||||||||||
576434SW5 | 11,501,301 | 11,319,423 | (181,878) | 11,319,423 | 6,428,454 | 12/31/2009 | ||||||||||||||||||
59022HEC2 | 4,863,526 | 1,462,290 | (3,401,236) | 1,462,290 | 2,343,838 | 12/31/2009 | ||||||||||||||||||
59022HED0 | 254,509 | 182,000 | (72,509) | 182,000 | 271,585 | 12/31/2009 | ||||||||||||||||||
59025KAK8 | 19,132,586 | 18,816,090 | (316,496) | 18,816,090 | 6,127,020 | 12/31/2009 | ||||||||||||||||||
60687UAM9 | 5,359,678 | 3,522,644 | (1,837,034) | 3,522,644 | 724,072 | 12/31/2009 | ||||||||||||||||||
60687VAM7 | 1,011,356 | 718,736 | (292,620) | 718,736 | 973,765 | 12/31/2009 | ||||||||||||||||||
60687VAN5 | 467,103 | 343,023 | (124,080) | 343,023 | 551,651 | 12/31/2009 | ||||||||||||||||||
60688BAM0 | 5,814,544 | 2,690,005 | (3,124,539) | 2,690,005 | 1,276,092 | 12/31/2009 | ||||||||||||||||||
60688BAS7 | 2,980,912 | 2,368,385 | (612,527) | 2,368,385 | 1,370,490 | 12/31/2009 | ||||||||||||||||||
61745MTQ6 | 3,511,230 | 3,145,941 | (365,289) | 3,145,941 | 467,827 | 12/31/2009 | ||||||||||||||||||
61745MU68 | 2,521,714 | 2,318,144 | (203,570) | 2,318,144 | 1,326,172 | 12/31/2009 | ||||||||||||||||||
61749EAE7 | 21,937,113 | 20,632,744 | (1,304,369) | 20,632,744 | 14,241,794 | 12/31/2009 | ||||||||||||||||||
61749MAC3 | 4,982,502 | 3,122,849 | (1,859,653) | 3,122,849 | 1,248,255 | 12/31/2009 | ||||||||||||||||||
61749MAD1 | 3,971,145 | 869,200 | (3,101,945) | 869,200 | 1,097,016 | 12/31/2009 | ||||||||||||||||||
61749MAE9 | 649,935 | 537,517 | (112,418) | 537,517 | 973,452 | 12/31/2009 | ||||||||||||||||||
61749MAF6 | 335,488 | 309,596 | (25,892) | 309,596 | 444,996 | 12/31/2009 | ||||||||||||||||||
61749MAG4 | 245,789 | 226,491 | (19,298) | 226,491 | 295,570 | 12/31/2009 | ||||||||||||||||||
61749WAH0 | 5,831,762 | 5,444,731 | (387,031) | 5,444,731 | 4,125,921 | 12/31/2009 | ||||||||||||||||||
61749WAJ6 | 3,826,597 | 3,730,700 | (95,897) | 3,730,700 | 2,791,770 | 12/31/2009 | ||||||||||||||||||
61750YAF6 | 33,373,686 | 32,686,865 | (686,821) | 32,686,865 | 16,663,416 | 12/31/2009 | ||||||||||||||||||
61751NAQ5 | 2,487,197 | 1,664,541 | (822,656) | 1,664,541 | 589,020 | 12/31/2009 | ||||||||||||||||||
61751NAR3 | 1,028,941 | 880,327 | (148,614) | 880,327 | 400,000 | 12/31/2009 | ||||||||||||||||||
61752JAF7 | 12,681,357 | 12,380,156 | (301,201) | 12,380,156 | 9,537,557 | 12/31/2009 | ||||||||||||||||||
61753JAN9 | 1,142,224 | 984,350 | (157,874) | 984,350 | 877,061 | 12/31/2009 | ||||||||||||||||||
61754KAN5 | 29,809,708 | 29,531,670 | (278,038) | 29,531,670 | 5,844,840 | 12/31/2009 | ||||||||||||||||||
| 82 |
| continued |
| CUSIP | Book/Adj. Carrying Value Amortized Cost Before Current Period OTTI | Present Value of Projected Cash Flows | Recognized Other-Than- Temporary Impairment | Amortized Cost After Other- Than-Temporary Impairment | Fair Value as of Impairment Date | Date of Financial Statement Where Reported | ||||||||||||||||||
61754KAP0 | $ | 13,409,091 | $ | 4,918,205 | $ | (8,490,886) | $ | 4,918,205 | $ | 2,666,250 | 12/31/2009 | |||||||||||||
643529AD2 | 13,146,934 | 13,050,002 | (96,932) | 13,050,002 | 9,017,512 | 12/31/2009 | ||||||||||||||||||
74438WAN6 | 1,816,058 | 1,072,747 | (743,311) | 1,072,747 | 458,439 | 12/31/2009 | ||||||||||||||||||
74924PAJ1 | 936,873 | 519,462 | (417,411) | 519,462 | 328,120 | 12/31/2009 | ||||||||||||||||||
74951PEA2 | 3,495,148 | 1,433,284 | (2,061,864) | 1,433,284 | 835,487 | 12/31/2009 | ||||||||||||||||||
749577AL6 | 19,105,048 | 18,361,591 | (743,457) | 18,361,591 | 8,706,964 | 12/31/2009 | ||||||||||||||||||
74957EAE7 | 18,387,988 | 18,193,031 | (194,957) | 18,193,031 | 12,426,822 | 12/31/2009 | ||||||||||||||||||
74957EAF4 | 38,816,646 | 38,362,975 | (453,671) | 38,362,975 | 30,535,097 | 12/31/2009 | ||||||||||||||||||
74957VAQ2 | 22,747,844 | 22,214,688 | (533,156) | 22,214,688 | 17,832,166 | 12/31/2009 | ||||||||||||||||||
74957XAF2 | 37,231,074 | 36,852,426 | (378,648) | 36,852,426 | 26,262,639 | 12/31/2009 | ||||||||||||||||||
749583AH3 | 10,731,811 | 10,129,812 | (601,999) | 10,129,812 | 4,117,628 | 12/31/2009 | ||||||||||||||||||
74958AAD6 | 32,866,792 | 31,650,698 | (1,216,094) | 31,650,698 | 25,854,525 | 12/31/2009 | ||||||||||||||||||
74958AAH7 | 29,073,808 | 27,518,939 | (1,554,869) | 27,518,939 | 17,192,658 | 12/31/2009 | ||||||||||||||||||
74958BAH5 | 27,755,168 | 26,705,568 | (1,049,600) | 26,705,568 | 17,197,206 | 12/31/2009 | ||||||||||||||||||
74958EAD8 | 49,662,273 | 49,333,700 | (328,573) | 49,333,700 | 37,201,145 | 12/31/2009 | ||||||||||||||||||
75115CAG2 | 9,239,147 | 8,856,644 | (382,503) | 8,856,644 | 4,622,037 | 12/31/2009 | ||||||||||||||||||
75971EAF3 | 467,367 | 426,479 | (40,888) | 426,479 | 249,442 | 12/31/2009 | ||||||||||||||||||
760985CM1 | 1,269,068 | 1,011,624 | (257,444) | 1,011,624 | 804,386 | 12/31/2009 | ||||||||||||||||||
760985SS1 | 6,542,585 | 6,519,651 | (22,934) | 6,519,651 | 2,957,601 | 12/31/2009 | ||||||||||||||||||
760985U66 | 182,646 | 71,279 | (111,367) | 71,279 | 31,872 | 12/31/2009 | ||||||||||||||||||
76110HHB8 | 4,318,025 | 3,800,654 | (517,371) | 3,800,654 | 1,572,093 | 12/31/2009 | ||||||||||||||||||
76110HQT9 | 1,441,903 | 1,286,427 | (155,476) | 1,286,427 | 541,109 | 12/31/2009 | ||||||||||||||||||
76110HSH3 | 3,131,045 | 2,652,424 | (478,621) | 2,652,424 | 583,025 | 12/31/2009 | ||||||||||||||||||
76110HX53 | 10,788,610 | 10,730,777 | (57,833) | 10,730,777 | 6,894,858 | 12/31/2009 | ||||||||||||||||||
76110HX87 | 24,320,507 | 23,938,919 | (381,588) | 23,938,919 | 15,338,776 | 12/31/2009 | ||||||||||||||||||
76110WQA7 | 17,189,799 | 15,628,688 | (1,561,111) | 15,628,688 | 5,701,419 | 12/31/2009 | ||||||||||||||||||
76110WQU3 | 4,478,236 | 2,780,527 | (1,697,709) | 2,780,527 | 1,017,879 | 12/31/2009 | ||||||||||||||||||
76110WRX6 | 3,720,469 | 2,952,563 | (767,906) | 2,952,563 | 628,962 | 12/31/2009 | ||||||||||||||||||
76110WXR2 | 9,699,484 | 9,369,981 | (329,503) | 9,369,981 | 4,053,679 | 12/31/2009 | ||||||||||||||||||
761118CZ9 | 11,726,512 | 11,266,871 | (459,641) | 11,266,871 | 4,579,678 | 12/31/2009 | ||||||||||||||||||
761118PQ5 | 12,839,852 | 12,296,584 | (543,268) | 12,296,584 | 9,392,704 | 12/31/2009 | ||||||||||||||||||
76114DAE4 | 16,600,875 | 15,340,493 | (1,260,382) | 15,340,493 | 12,614,418 | 12/31/2009 | ||||||||||||||||||
84604CAE7 | 3,738,299 | 3,401,918 | (336,381) | 3,401,918 | 1,038,660 | 12/31/2009 | ||||||||||||||||||
86359DPP6 | 26,065,028 | 22,653,220 | (3,411,808) | 22,653,220 | 7,578,276 | 12/31/2009 | ||||||||||||||||||
87222PAE3 | 36,209,915 | 35,349,968 | (859,947) | 35,349,968 | 15,782,436 | 12/31/2009 | ||||||||||||||||||
87246AAP3 | 20,502,917 | 14,536,427 | (5,966,490) | 14,536,427 | 2,167,886 | 12/31/2009 | ||||||||||||||||||
92976UAA8 | 13,920,295 | 10,668,447 | (3,251,848) | 10,668,447 | 1,820,000 | 12/31/2009 | ||||||||||||||||||
92977QAP3 | 13,540,376 | 8,896,827 | (4,643,549) | 8,896,827 | 2,906,604 | 12/31/2009 | ||||||||||||||||||
92977QAQ1 | 4,916,523 | 3,218,603 | (1,697,920) | 3,218,603 | 2,611,154 | 12/31/2009 | ||||||||||||||||||
92978MAN6 | 25,076,116 | 21,257,728 | (3,818,388) | 21,257,728 | 5,553,925 | 12/31/2009 | ||||||||||||||||||
92978MAT3 | 4,232,886 | 1,366,517 | (2,866,369) | 1,366,517 | 1,044,924 | 12/31/2009 | ||||||||||||||||||
92978QAJ6 | 41,868,287 | 34,756,308 | (7,111,979) | 34,756,308 | 17,803,755 | 12/31/2009 | ||||||||||||||||||
92978QAN7 | 1,054,106 | 588,222 | (465,884) | 588,222 | 1,852,940 | 12/31/2009 | ||||||||||||||||||
92978QAP2 | 1,006,290 | 586,700 | (419,590) | 586,700 | 1,681,690 | 12/31/2009 | ||||||||||||||||||
92978QAR8 | 2,428,623 | 2,009,686 | (418,937) | 2,009,686 | 3,686,283 | 12/31/2009 | ||||||||||||||||||
92978TAL5 | 23,643,133 | 22,488,549 | (1,154,584) | 22,488,549 | 8,652,630 | 12/31/2009 | ||||||||||||||||||
92978TAM3 | 7,091,481 | 5,731,599 | (1,359,882) | 5,731,599 | 7,777,740 | 12/31/2009 | ||||||||||||||||||
939344AN7 | 7,558,129 | — | ² | (1,492,699) | 6,065,430 | 6,065,430 | 12/31/2009 | |||||||||||||||||
94980KAQ5 | 891,257 | 697,126 | (194,131) | 697,126 | 605,375 | 12/31/2009 | ||||||||||||||||||
94980SAS4 | 37,892,867 | 37,298,560 | (594,307) | 37,298,560 | 19,209,448 | 12/31/2009 | ||||||||||||||||||
94980SBJ3 | 19,025,324 | 18,852,599 | (172,725) | 18,852,599 | 9,434,204 | 12/31/2009 | ||||||||||||||||||
949837AF5 | 69,395,783 | 69,077,308 | (318,475) | 69,077,308 | 37,135,283 | 12/31/2009 | ||||||||||||||||||
949837BE7 | 20,118,623 | 19,943,534 | (175,089) | 19,943,534 | 14,029,989 | 12/31/2009 | ||||||||||||||||||
949837BK3 | 8,651,946 | 8,601,312 | (50,634) | 8,601,312 | 6,121,859 | 12/31/2009 | ||||||||||||||||||
949837CC0 | 26,170,357 | 25,669,010 | (501,347) | 25,669,010 | 17,713,389 | 12/31/2009 | ||||||||||||||||||
| 83 |
NOTES TO STATUTORY–BASIS FINANCIAL STATEMENTS
TEACHERS INSURANCE AND ANNUITY ASSOCIATION OF AMERICA
| CUSIP | Book/Adj. Carrying Value Amortized Cost Before Current Period OTTI | Present Value of Projected Cash Flows | Recognized Other-Than- Temporary Impairment | Amortized Cost After Other- Than-Temporary Impairment | Fair Value as of Impairment Date | Date of Financial Statement Where Reported | ||||||||||||||||||
94983BAP4 | $ | 15,664,980 | $ | 15,471,918 | $ | (193,062) | $ | 15,471,918 | $ | 11,295,344 | 12/31/2009 | |||||||||||||
94984AAR1 | 29,306,329 | 29,299,321 | (7,008) | 29,299,321 | 14,513,796 | 12/31/2009 | ||||||||||||||||||
94984FAR0 | 35,392,208 | 35,362,908 | (29,300) | 35,362,908 | 25,486,630 | 12/31/2009 | ||||||||||||||||||
94984XAB6 | 9,930,589 | 9,542,007 | (388,582) | 9,542,007 | 4,478,081 | 12/31/2009 | ||||||||||||||||||
94984XAD2 | 8,215,869 | 7,891,136 | (324,733) | 7,891,136 | 3,736,617 | 12/31/2009 | ||||||||||||||||||
94984XAM2 | 12,527,390 | 12,047,711 | (479,679) | 12,047,711 | 6,848,925 | 12/31/2009 | ||||||||||||||||||
94985JAB6 | 49,089,904 | 48,927,100 | (162,804) | 48,927,100 | 27,457,860 | 12/31/2009 | ||||||||||||||||||
94985JBR0 | 30,201,956 | 29,492,146 | (709,810) | 29,492,146 | 11,724,021 | 12/31/2009 | ||||||||||||||||||
94985JCA6 | 30,000,000 | 28,972,050 | (1,027,950) | 28,972,050 | 23,547,594 | 12/31/2009 | ||||||||||||||||||
94985LAD7 | 15,416,713 | 15,332,698 | (84,015) | 15,332,698 | 10,789,988 | 12/31/2009 | ||||||||||||||||||
94985RAP7 | 63,260,667 | 61,811,840 | (1,448,827) | 61,811,840 | 41,620,166 | 12/31/2009 | ||||||||||||||||||
94985WAP6 | 24,098,090 | 23,541,749 | (556,341) | 23,541,749 | 18,898,058 | 12/31/2009 | ||||||||||||||||||
94985WAQ4 | 71,553,189 | 70,433,050 | (1,120,139) | 70,433,050 | 28,405,225 | 12/31/2009 | ||||||||||||||||||
94985WBL4 | 37,767,886 | 37,226,500 | (541,386) | 37,226,500 | 25,982,515 | 12/31/2009 | ||||||||||||||||||
94986AAC2 | 113,043,780 | 111,243,241 | (1,800,539) | 111,243,241 | 79,103,383 | 12/31/2009 | ||||||||||||||||||
126670QT8 | 4,999,957 | 3,628,335 | (1,371,622) | 3,628,335 | 1,948,947 | 9/30/2009 | ||||||||||||||||||
126670QU5 | 19,998,914 | 12,696,540 | (7,302,374) | 12,696,540 | 7,020,652 | 9/30/2009 | ||||||||||||||||||
251511AC5 | 18,175,550 | 14,861,707 | (3,313,843) | 14,861,707 | 8,959,648 | 9/30/2009 | ||||||||||||||||||
33848JAC9 | 9,112,868 | 6,923,454 | (2,189,414) | 6,923,454 | 6,366,877 | 9/30/2009 | ||||||||||||||||||
3622ECAK2 | 20,941,477 | 18,788,252 | (2,153,225) | 18,788,252 | 11,474,209 | 9/30/2009 | ||||||||||||||||||
3622ELAD8 | 50,223,381 | 44,199,500 | (6,023,881) | 44,199,500 | 26,566,545 | 9/30/2009 | ||||||||||||||||||
362334NC4 | 17,932,324 | 14,708,014 | (3,224,310) | 14,708,014 | 8,351,942 | 9/30/2009 | ||||||||||||||||||
362375AD9 | 19,344,302 | 15,288,032 | (4,056,270) | 15,288,032 | 10,719,528 | 9/30/2009 | ||||||||||||||||||
395386AP0 | 16,986,719 | 14,017,799 | (2,968,920) | 14,017,799 | 11,738,682 | 9/30/2009 | ||||||||||||||||||
525221CM7 | 28,026,636 | 24,254,757 | (3,771,879) | 24,254,757 | 7,226,630 | 9/30/2009 | ||||||||||||||||||
525221JW8 | 44,542,371 | 42,492,282 | (2,050,089) | 42,492,282 | 25,949,093 | 9/30/2009 | ||||||||||||||||||
52523KAH7 | 14,909,635 | 11,956,832 | (2,952,803) | 11,956,832 | 8,970,537 | 9/30/2009 | ||||||||||||||||||
61750YAF6 | 39,999,988 | 33,373,686 | (6,626,302) | 33,373,686 | 18,338,272 | 9/30/2009 | ||||||||||||||||||
61752JAF7 | 14,943,281 | 12,681,357 | (2,261,924) | 12,681,357 | 8,250,000 | 9/30/2009 | ||||||||||||||||||
74040KAC6 | 4,810,269 | — | ² | (515,386) | 4,294,883 | 4,294,883 | 9/30/2009 | |||||||||||||||||
87222PAE3 | 39,983,008 | 36,209,916 | (3,773,092) | 36,209,916 | 16,649,220 | 9/30/2009 | ||||||||||||||||||
03702YAC4 | 2,162,800 | — | ² | (432,560) | 1,730,240 | 1,730,240 | 9/30/2009 | |||||||||||||||||
05947UJV1 | 312,746 | — | ² | (90,811) | 221,935 | 221,935 | 9/30/2009 | |||||||||||||||||
05947UWA2 | 1,738,023 | 767,441 | (970,582) | 767,441 | 212,822 | 9/30/2009 | ||||||||||||||||||
05947UWB0 | 791,256 | 131,202 | (660,054) | 131,202 | 100,361 | 9/30/2009 | ||||||||||||||||||
05950EAP3 | 4,884,794 | 1,370,873 | (3,513,921) | 1,370,873 | 715,945 | 9/30/2009 | ||||||||||||||||||
059511AM7 | 5,904,407 | 3,154,584 | (2,749,823) | 3,154,584 | 750,192 | 9/30/2009 | ||||||||||||||||||
059511AS4 | 6,726,167 | 1,707,661 | (5,018,506) | 1,707,661 | 855,021 | 9/30/2009 | ||||||||||||||||||
059511AU9 | 9,752,428 | 2,073,166 | (7,679,262) | 2,073,166 | 1,137,750 | 9/30/2009 | ||||||||||||||||||
07387BEQ2 | 7,985,888 | 6,510,227 | (1,475,661) | 6,510,227 | 1,649,017 | 9/30/2009 | ||||||||||||||||||
07388VAL2 | 18,797,504 | 11,722,177 | (7,075,327) | 11,722,177 | 2,502,987 | 9/30/2009 | ||||||||||||||||||
07388YBA9 | 10,701,132 | 3,390,725 | (7,310,407) | 3,390,725 | 770,000 | 9/30/2009 | ||||||||||||||||||
07401DAN1 | 9,459,397 | 2,892,020 | (6,567,377) | 2,892,020 | 861,453 | 9/30/2009 | ||||||||||||||||||
19075CAK9 | 15,052,911 | 10,989,000 | (4,063,911) | 10,989,000 | 2,273,985 | 9/30/2009 | ||||||||||||||||||
19075CAL7 | 14,220,451 | 4,095,130 | (10,125,321) | 4,095,130 | 1,907,778 | 9/30/2009 | ||||||||||||||||||
19075CAM5 | 5,017,824 | 1,088,000 | (3,929,824) | 1,088,000 | 450,000 | 9/30/2009 | ||||||||||||||||||
19075CAN3 | 5,017,830 | 842,000 | (4,175,830) | 842,000 | 400,000 | 9/30/2009 | ||||||||||||||||||
19075CAS2 | 30,351,166 | 3,735,010 | (26,616,156) | 3,735,010 | 2,419,440 | 9/30/2009 | ||||||||||||||||||
20047EAP7 | 10,886,649 | 3,667,140 | (7,219,509) | 3,667,140 | 720,850 | 9/30/2009 | ||||||||||||||||||
22544QAM1 | 25,959,195 | 19,198,558 | (6,760,637) | 19,198,558 | 2,598,478 | 9/30/2009 | ||||||||||||||||||
22544QAN9 | 13,672,024 | 3,673,346 | (9,998,678) | 3,673,346 | 1,221,097 | 9/30/2009 | ||||||||||||||||||
22544QAP4 | 4,970,573 | 1,387,115 | (3,583,458) | 1,387,115 | 715,966 | 9/30/2009 | ||||||||||||||||||
225470H22 | 3,888,986 | 970,505 | (2,918,481) | 970,505 | 240,000 | 9/30/2009 | ||||||||||||||||||
362332AT5 | 15,051,925 | 8,451,781 | (6,600,144) | 8,451,781 | 2,285,175 | 9/30/2009 | ||||||||||||||||||
36828QSL1 | 2,972,198 | 1,764,915 | (1,207,283) | 1,764,915 | 611,917 | 9/30/2009 | ||||||||||||||||||
| 84 |
| continued |
| CUSIP | Book/Adj. Carrying Value Amortized Cost Before Current Period OTTI | Present Value of Projected Cash Flows | Recognized Other-Than- Temporary Impairment | Amortized Cost After Other- Than-Temporary Impairment | Fair Value as of Impairment Date | Date of Financial Statement Where Reported | ||||||||||||||||||
396789KF5 | $ | 5,378,625 | $ | 4,506,021 | $ | (872,604) | $ | 4,506,021 | $ | 1,194,307 | 9/30/2009 | |||||||||||||
46614KAB2 | 9,657,805 | 2,800,420 | (6,857,385) | 2,800,420 | 500,000 | 9/30/2009 | ||||||||||||||||||
46629YAM1 | 20,070,948 | 16,337,536 | (3,733,412) | 16,337,536 | 3,476,200 | 9/30/2009 | ||||||||||||||||||
46630JAS8 | 10,035,389 | 2,912,412 | (7,122,977) | 2,912,412 | 1,108,700 | 9/30/2009 | ||||||||||||||||||
46632HAR2 | 4,028,186 | 2,987,063 | (1,041,123) | 2,987,063 | 657,928 | 9/30/2009 | ||||||||||||||||||
50180CAM2 | 11,464,618 | 2,607,049 | (8,857,569) | 2,607,049 | 1,573,335 | 9/30/2009 | ||||||||||||||||||
55312TAJ2 | 9,036,266 | 4,409,675 | (4,626,591) | 4,409,675 | 1,432,692 | 9/30/2009 | ||||||||||||||||||
55312TAK9 | 24,178,234 | 5,855,254 | (18,322,980) | 5,855,254 | 2,631,250 | 9/30/2009 | ||||||||||||||||||
55312TAR4 | 701,767 | 692,323 | (9,444) | 692,323 | 849,940 | 9/30/2009 | ||||||||||||||||||
55312YAJ1 | 15,059,261 | 3,720,260 | (11,339,001) | 3,720,260 | 3,310,965 | 9/30/2009 | ||||||||||||||||||
55312YAK8 | 8,031,810 | 1,238,428 | (6,793,382) | 1,238,428 | 1,521,368 | 9/30/2009 | ||||||||||||||||||
55312YAL6 | 10,039,591 | 1,036,649 | (9,002,942) | 1,036,649 | 1,268,330 | 9/30/2009 | ||||||||||||||||||
55312YAS1 | 10,039,851 | 682,106 | (9,357,745) | 682,106 | 1,273,890 | 9/30/2009 | ||||||||||||||||||
55312YAT9 | 2,141,339 | 1,234,413 | (906,926) | 1,234,413 | 1,800,000 | 9/30/2009 | ||||||||||||||||||
59023BAL8 | 4,930,792 | 4,713,154 | (217,638) | 4,713,154 | 604,725 | 9/30/2009 | ||||||||||||||||||
60687VAM7 | 5,018,438 | 1,011,356 | (4,007,082) | 1,011,356 | 581,350 | 9/30/2009 | ||||||||||||||||||
60688BAM0 | 8,279,911 | 5,814,544 | (2,465,367) | 5,814,544 | 2,036,952 | 9/30/2009 | ||||||||||||||||||
60688BAS7 | 9,910,681 | 2,980,912 | (6,929,769) | 2,980,912 | 2,100,637 | 9/30/2009 | ||||||||||||||||||
61745MU68 | 3,909,052 | 2,521,714 | (1,387,338) | 2,521,714 | 949,776 | 9/30/2009 | ||||||||||||||||||
61746WE63 | 5,393,259 | 4,810,580 | (582,679) | 4,810,580 | 1,369,482 | 9/30/2009 | ||||||||||||||||||
61749MAE9 | 3,953,068 | 649,935 | (3,303,133) | 649,935 | 783,732 | 9/30/2009 | ||||||||||||||||||
61750CAS6 | 9,000,000 | 5,734,363 | (3,265,637) | 5,734,363 | 1,779,777 | 9/30/2009 | ||||||||||||||||||
61751NAQ5 | 4,014,486 | 2,487,197 | (1,527,289) | 2,487,197 | 496,676 | 9/30/2009 | ||||||||||||||||||
61753JAL3 | 10,039,489 | 1,923,248 | (8,116,241) | 1,923,248 | 1,497,480 | 9/30/2009 | ||||||||||||||||||
61754KAP0 | 16,333,731 | 13,409,091 | (2,924,640) | 13,409,091 | 1,823,465 | 9/30/2009 | ||||||||||||||||||
74438WAN6 | 2,435,634 | 1,816,058 | (619,576) | 1,816,058 | 483,756 | 9/30/2009 | ||||||||||||||||||
92978QAJ6 | 44,853,705 | 41,898,576 | (2,955,129) | 41,898,576 | 23,143,606 | 9/30/2009 | ||||||||||||||||||
92978QAN7 | 10,035,032 | 1,054,620 | (8,980,412) | 1,054,620 | 1,308,000 | 9/30/2009 | ||||||||||||||||||
92978QAP2 | 10,035,430 | 1,006,809 | (9,028,621) | 1,006,809 | 1,227,540 | 9/30/2009 | ||||||||||||||||||
92978QAR8 | 33,913,365 | 2,428,623 | (31,484,742) | 2,428,623 | 2,703,520 | 9/30/2009 | ||||||||||||||||||
92978QAT4 | 2,207,457 | (307,191) | (2,514,648) | (307,191) | 1,400,000 | 9/30/2009 | ||||||||||||||||||
92978TAL5 | 30,104,829 | 23,644,657 | (6,460,172) | 23,644,657 | 5,013,420 | 9/30/2009 | ||||||||||||||||||
92978TAM3 | 30,106,380 | 7,091,481 | (23,014,899) | 7,091,481 | 4,660,680 | 9/30/2009 | ||||||||||||||||||
02151CBD7 | 30,078,496 | 28,536,105 | (1,542,391) | 28,536,105 | 22,051,302 | 9/30/2009 | ||||||||||||||||||
12566XAG3 | 17,348,888 | 15,725,340 | (1,623,548) | 15,725,340 | 6,953,865 | 9/30/2009 | ||||||||||||||||||
02147QAE2 | 49,228,610 | 45,152,500 | (4,076,110) | 45,152,500 | 36,433,950 | 9/30/2009 | ||||||||||||||||||
12544RAL2 | 9,625,351 | 8,883,000 | (742,351) | 8,883,000 | 5,950,703 | 9/30/2009 | ||||||||||||||||||
12566XAE8 | 36,726,158 | 34,342,512 | (2,383,646) | 34,342,512 | 23,452,904 | 9/30/2009 | ||||||||||||||||||
16165TBJ1 | 11,550,415 | 10,448,900 | (1,101,515) | 10,448,900 | 6,535,688 | 9/30/2009 | ||||||||||||||||||
46627MAC1 | 11,998,763 | 11,109,835 | (888,928) | 11,109,835 | 5,856,448 | 9/30/2009 | ||||||||||||||||||
362334ME1 | 30,218,777 | — | ² | (12,195,320) | 18,023,457 | 18,023,457 | 6/30/2009 | |||||||||||||||||
61749EAE7 | 25,483,761 | — | ² | (16,778,706) | 8,705,055 | 8,705,055 | 6/30/2009 | |||||||||||||||||
643529AD2 | 15,955,720 | — | ² | (8,979,720) | 6,976,000 | 6,976,000 | 6/30/2009 | |||||||||||||||||
74040KAC6 | 5,669,246 | — | ² | (858,977) | 4,810,269 | 4,810,269 | 6/30/2009 | |||||||||||||||||
939344AN7 | 6,948,092 | — | ² | (1,155,092) | 5,793,000 | 5,793,000 | 6/30/2009 | |||||||||||||||||
46630AAG3 | 3,008,127 | — | ² | (2,599,827) | 408,300 | 408,300 | 6/30/2009 | |||||||||||||||||
46630AAC2 | 3,509,499 | — | ² | (2,982,749) | 526,750 | 526,750 | 6/30/2009 | |||||||||||||||||
46630JAU3 | 20,074,125 | — | ² | (17,918,125) | 2,156,000 | 2,156,000 | 6/30/2009 | |||||||||||||||||
50179AAN7 | 5,511,632 | — | ² | (4,650,800) | 860,832 | 860,832 | 6/30/2009 | |||||||||||||||||
362332AV0 | 20,707,546 | — | ² | (18,846,146) | 1,861,400 | 1,861,400 | 6/30/2009 | |||||||||||||||||
50179AAS6 | 7,520,314 | — | ² | (6,537,495) | 982,819 | 982,819 | 6/30/2009 | |||||||||||||||||
50179AAM9 | 4,015,625 | — | ² | (3,284,425) | 731,200 | 731,200 | 6/30/2009 | |||||||||||||||||
07388YBE1 | 6,678,995 | — | ² | (6,104,995) | 574,000 | 574,000 | 6/30/2009 | |||||||||||||||||
07388YBC5 | 6,807,716 | — | ² | (6,205,016) | 602,700 | 602,700 | 6/30/2009 | |||||||||||||||||
05947UJT6 | 1,000,436 | — | ² | (743,026) | 257,410 | 257,410 | 6/30/2009 | |||||||||||||||||
| 85 |
NOTES TO STATUTORY–BASIS FINANCIAL STATEMENTS
TEACHERS INSURANCE AND ANNUITY ASSOCIATION OF AMERICA
| CUSIP | Book/Adj. Carrying Value Amortized Cost Before Current Period OTTI | Present Value of Projected Cash Flows | Recognized Other-Than- Temporary Impairment | Amortized Cost After Other- Than-Temporary Impairment | Fair Value as of Impairment Date | Date of Financial Statement Where Reported | ||||||||||||||||||
61751NAR3 | $ | 4,002,195 | $ | — | ² | $ | (3,660,595) | $ | 341,600 | $ | 341,600 | 6/30/2009 | ||||||||||||
92978MAT3 | 5,464,600 | — | ² | (4,860,639) | 603,961 | 603,961 | 6/30/2009 | |||||||||||||||||
92977QAQ1 | 13,034,405 | — | ² | (11,980,105) | 1,054,300 | 1,054,300 | 6/30/2009 | |||||||||||||||||
61754JAN8 | 2,787,584 | — | ² | (2,427,884) | 359,700 | 359,700 | 6/30/2009 | |||||||||||||||||
61753JAN9 | 7,376,067 | — | ² | (6,286,655) | 1,089,412 | 1,089,412 | 6/30/2009 | |||||||||||||||||
61753JAM1 | 10,040,730 | — | ² | (8,673,730) | 1,367,000 | 1,367,000 | 6/30/2009 | |||||||||||||||||
50180JAL9 | 7,028,178 | — | ² | (5,882,278) | 1,145,900 | 1,145,900 | 6/30/2009 | |||||||||||||||||
61749MAF6 | 2,933,947 | — | ² | (2,552,647) | 381,300 | 381,300 | 6/30/2009 | |||||||||||||||||
61746WE89 | 934,072 | — | ² | (703,548) | 230,524 | 230,524 | 6/30/2009 | |||||||||||||||||
61746WE71 | 2,038,212 | — | ² | (1,558,205) | 480,007 | 480,007 | 6/30/2009 | |||||||||||||||||
59023BAM6 | 5,888,700 | — | ² | (4,806,900) | 1,081,800 | 1,081,800 | 6/30/2009 | |||||||||||||||||
59022HEC2 | 6,984,225 | — | ² | (5,699,025) | 1,285,200 | 1,285,200 | 6/30/2009 | |||||||||||||||||
50180JAM7 | 17,068,049 | — | ² | (14,611,549) | 2,456,500 | 2,456,500 | 6/30/2009 | |||||||||||||||||
59022HED0 | 2,244,466 | — | ² | (1,953,125) | 291,341 | 291,341 | 6/30/2009 | |||||||||||||||||
52108RCK6 | 13,624,490 | — | ² | (12,692,065) | 932,425 | 932,425 | 6/30/2009 | |||||||||||||||||
50180JAR6 | 12,048,727 | — | ² | (10,654,327) | 1,394,400 | 1,394,400 | 6/30/2009 | |||||||||||||||||
251510CY7 | 9,287,032 | — | ² | (7,029,696) | 2,257,336 | 2,257,336 | 6/30/2009 | |||||||||||||||||
52521RAS0 | 3,173,730 | — | ² | (1,672,517) | 1,501,213 | 1,501,213 | 6/30/2009 | |||||||||||||||||
02149HAK6 | 27,458,769 | — | ² | (13,202,360) | 14,256,409 | 14,256,409 | 6/30/2009 | |||||||||||||||||
75115CAG2 | 10,160,350 | — | ² | (5,511,758) | 4,648,592 | 4,648,592 | 6/30/2009 | |||||||||||||||||
126378AG3 | 16,952,099 | — | ² | (8,331,528) | 8,620,571 | 8,620,571 | 3/31/2009 | |||||||||||||||||
126378AH1 | 18,332,132 | — | ² | (8,896,772) | 9,435,360 | 9,435,360 | 3/31/2009 | |||||||||||||||||
46628SAG8 | 28,479,557 | — | ² | (15,739,186) | 12,740,371 | 12,740,371 | 3/31/2009 | |||||||||||||||||
589929JS8 | 3,614,074 | — | ² | (977,614) | 2,636,460 | 2,636,460 | 3/31/2009 | |||||||||||||||||
61749WAH0 | 8,348,064 | — | ² | (3,723,256) | 4,624,808 | 4,624,808 | 3/31/2009 | |||||||||||||||||
61749WAJ6 | 4,840,214 | — | ² | (2,064,598) | 2,775,616 | 2,775,616 | 3/31/2009 | |||||||||||||||||
74040KAC6 | 6,735,434 | — | ² | (1,066,188) | 5,669,246 | 5,669,246 | 3/31/2009 | |||||||||||||||||
84604CAE7 | 4,395,157 | — | ² | (2,954,291) | 1,440,866 | 1,440,866 | 3/31/2009 | |||||||||||||||||
939344AN7 | 7,049,401 | — | ² | (101,309) | 6,948,092 | 6,948,092 | 3/31/2009 | |||||||||||||||||
03702YAC4 | 4,325,600 | — | ² | (2,162,800) | 2,162,800 | 2,162,800 | 3/31/2009 | |||||||||||||||||
190749AN1 | 5,165,844 | — | ² | (4,674,925) | 490,919 | 490,919 | 3/31/2009 | |||||||||||||||||
22544QAQ2 | 14,679,428 | — | ² | (13,730,058) | 949,370 | 949,370 | 3/31/2009 | |||||||||||||||||
22545DAL1 | 18,978,397 | — | ² | (17,449,489) | 1,528,908 | 1,528,908 | 3/31/2009 | |||||||||||||||||
46629YAQ2 | 5,060,345 | — | ² | (4,730,706) | 329,639 | 329,639 | 3/31/2009 | |||||||||||||||||
46630JAW9 | 20,076,375 | — | ² | (18,747,505) | 1,328,870 | 1,328,870 | 3/31/2009 | |||||||||||||||||
55312TAQ6 | 1,243,450 | — | ² | (615,776) | 627,674 | 627,674 | 3/31/2009 | |||||||||||||||||
55312TAR4 | 1,246,413 | — | ² | (544,645) | 701,768 | 701,768 | 3/31/2009 | |||||||||||||||||
59023BAN4 | 6,816,310 | — | ² | (5,908,928) | 907,382 | 907,382 | 3/31/2009 | |||||||||||||||||
05949AA67 | 7,180,337 | — | ² | (4,018,514) | 3,161,823 | 3,161,823 | 3/31/2009 | |||||||||||||||||
05949AA75 | 831,546 | — | ² | (270,990) | 560,556 | 560,556 | 3/31/2009 | |||||||||||||||||
12667FR98 | 9,441,206 | — | ² | (3,893,272) | 5,547,934 | 5,547,934 | 3/31/2009 | |||||||||||||||||
12669DN87 | 2,733,589 | — | ² | (1,410,077) | 1,323,512 | 1,323,512 | 3/31/2009 | |||||||||||||||||
251510ET6 | 12,727,050 | — | ² | (11,016,684) | 1,710,366 | 1,710,366 | 3/31/2009 | |||||||||||||||||
79548KJH2 | 51,335 | — | ² | (23,450) | 27,885 | 27,885 | 3/31/2009 | |||||||||||||||||
79548KJJ8 | 53,540 | — | ² | (21,307) | 32,233 | 32,233 | 3/31/2009 | |||||||||||||||||
79548KJK5 | 28,691 | — | ² | (12,508) | 16,183 | 16,183 | 3/31/2009 | |||||||||||||||||
02148FAW5 | 32,011,265 | — | ² | (13,311,789) | 18,699,476 | 18,699,476 | 3/31/2009 | |||||||||||||||||
76114DAE4 | 18,470,379 | — | ² | (12,205,478) | 6,264,901 | 6,264,901 | 3/31/2009 | |||||||||||||||||
76114DAE4 | 7,280,863 | — | ² | (2,325,579) | 4,955,284 | 4,955,284 | 12/31/2008 | |||||||||||||||||
02148YAD6 | 24,448,782 | — | ² | (10,894,044) | 13,554,738 | 13,554,738 | 12/31/2008 | |||||||||||||||||
028909AC3 | 1,459,724 | — | ² | (481,866) | 977,858 | 977,858 | 12/31/2008 | |||||||||||||||||
03702YAC4 | 7,278,038 | — | ² | (2,952,438) | 4,325,600 | 4,325,600 | 12/31/2008 | |||||||||||||||||
05947UJV1 | 884,711 | — | ² | (566,669) | 318,042 | 318,042 | 12/31/2008 | |||||||||||||||||
05947UWC8 | 724,284 | — | ² | (637,873) | 86,411 | 86,411 | 12/31/2008 | |||||||||||||||||
05947UWD6 | 917,748 | — | ² | (838,199) | 79,549 | 79,549 | 12/31/2008 | |||||||||||||||||
| 86 |
| continued |
| CUSIP | Book/Adj. Carrying Value Amortized Cost Before Current Period OTTI | Present Value of Projected Cash Flows | Recognized Other-Than- Temporary Impairment | Amortized Cost After Other- Than-Temporary Impairment | Fair Value as of Impairment Date | Date of Financial Statement Where Reported | ||||||||||||||||||
05949AA75 | $ | 2,375,256 | $ | — | ² | $ | (1,542,097) | $ | 833,159 | $ | 833,159 | 12/31/2008 | ||||||||||||
05949AM23 | 5,328,628 | — | ² | (3,347,549) | 1,981,079 | 1,981,079 | 12/31/2008 | |||||||||||||||||
05949AM31 | 1,618,515 | — | ² | (1,265,231) | 353,284 | 353,284 | 12/31/2008 | |||||||||||||||||
073945AS6 | 1,754,077 | — | ² | (1,498,173) | 255,904 | 255,904 | 12/31/2008 | |||||||||||||||||
12669EWZ5 | 4,405,837 | — | ² | (2,024,744) | 2,381,093 | 2,381,093 | 12/31/2008 | |||||||||||||||||
17310MAS9 | 4,015,015 | — | ² | (3,485,815) | 529,200 | 529,200 | 12/31/2008 | |||||||||||||||||
20173MAQ3 | 4,869,808 | — | ² | (4,234,308) | 635,500 | 635,500 | 12/31/2008 | |||||||||||||||||
21075WCJ2 | 1,407,861 | — | ² | (377,699) | 1,030,162 | 1,030,162 | 12/31/2008 | |||||||||||||||||
22540VHN5 | 2,463,713 | — | ² | (1,124,977) | 1,338,736 | 1,338,736 | 12/31/2008 | |||||||||||||||||
22545XAP8 | 33,792,994 | — | ² | (29,365,135) | 4,427,859 | 4,427,859 | 12/31/2008 | |||||||||||||||||
294751DY5 | 1,586,038 | — | ² | (894,024) | 692,014 | 692,014 | 12/31/2008 | |||||||||||||||||
294751FC1 | 2,299,916 | — | ² | (1,875,560) | 424,356 | 424,356 | 12/31/2008 | |||||||||||||||||
36228CDP5 | 750,894 | — | ² | (532,759) | 218,135 | 218,135 | 12/31/2008 | |||||||||||||||||
3622ECAH9 | 9,815,000 | — | ² | (6,403,699) | 3,411,301 | 3,411,301 | 12/31/2008 | |||||||||||||||||
38500XAM4 | 3,263,688 | — | ² | (2,878,688) | 385,000 | 385,000 | 12/31/2008 | |||||||||||||||||
46412QAD9 | 6,997,504 | — | ² | (5,554,244) | 1,443,260 | 1,443,260 | 12/31/2008 | |||||||||||||||||
46625M2W8 | 1,708,545 | — | ² | (1,550,593) | 157,952 | 157,952 | 12/31/2008 | |||||||||||||||||
46625M2Y4 | 596,284 | — | ² | (442,858) | 153,426 | 153,426 | 12/31/2008 | |||||||||||||||||
50180CAV2 | 6,024,175 | — | ² | (5,211,175) | 813,000 | 813,000 | 12/31/2008 | |||||||||||||||||
50180CAW0 | 7,183,387 | — | ² | (6,315,658) | 867,729 | 867,729 | 12/31/2008 | |||||||||||||||||
55312TAQ6 | 3,817,868 | — | ² | (2,574,418) | 1,243,450 | 1,243,450 | 12/31/2008 | |||||||||||||||||
55312TAR4 | 3,616,402 | — | ² | (2,369,989) | 1,246,413 | 1,246,413 | 12/31/2008 | |||||||||||||||||
55312YAT9 | 20,004,831 | — | ² | (17,949,031) | 2,055,800 | 2,055,800 | 12/31/2008 | |||||||||||||||||
589929JS8 | 4,196,584 | — | ² | (460,813) | 3,735,771 | 3,735,771 | 12/31/2008 | |||||||||||||||||
60687VAN5 | 3,276,152 | — | ² | (2,857,652) | 418,500 | 418,500 | 12/31/2008 | |||||||||||||||||
61746WE97 | 982,114 | — | ² | (622,238) | 359,876 | 359,876 | 12/31/2008 | |||||||||||||||||
61746WF21 | 198,149 | — | ² | (108,779) | 89,370 | 89,370 | 12/31/2008 | |||||||||||||||||
61749MAG4 | 2,463,365 | — | ² | (2,174,584) | 288,781 | 288,781 | 12/31/2008 | |||||||||||||||||
70556RAD3 | 41,824,931 | — | ² | (16,186,786) | 25,638,145 | 25,638,145 | 12/31/2008 | |||||||||||||||||
74040KAC6 | 14,387,860 | — | ² | (7,644,893) | 6,742,967 | 6,742,967 | 12/31/2008 | |||||||||||||||||
74924PAJ1 | 1,071,735 | — | ² | (577,030) | 494,705 | 494,705 | 12/31/2008 | |||||||||||||||||
760985U58 | 380,419 | — | ² | (70,655) | 309,764 | 309,764 | 12/31/2008 | |||||||||||||||||
760985U66 | 166,134 | — | ² | (69,050) | 97,084 | 97,084 | 12/31/2008 | |||||||||||||||||
76110HQT9 | 2,966,509 | — | ² | (1,968,981) | 997,528 | 997,528 | 12/31/2008 | |||||||||||||||||
76110VLD8 | 2,354,852 | — | ² | (467,251) | 1,887,601 | 1,887,601 | 12/31/2008 | |||||||||||||||||
76110VPJ1 | 2,462,808 | — | ² | (780,464) | 1,682,344 | 1,682,344 | 12/31/2008 | |||||||||||||||||
76110VPU6 | 1,428,428 | — | ² | (659,001) | 769,427 | 769,427 | 12/31/2008 | |||||||||||||||||
76110VTQ1 | 6,999,985 | — | ² | (6,060,515) | 939,470 | 939,470 | 12/31/2008 | |||||||||||||||||
76110WRX6 | 4,096,799 | — | ² | (1,412,549) | 2,684,250 | 2,684,250 | 12/31/2008 | |||||||||||||||||
76110WVT0 | 1,123,116 | — | ² | (565,567) | 557,549 | 557,549 | 12/31/2008 | |||||||||||||||||
76113GAC2 | 4,756,743 | — | ² | (4,437,090) | 319,653 | 319,653 | 12/31/2008 | |||||||||||||||||
92978QAT4 | 20,021,630 | — | ² | (17,893,630) | 2,128,000 | 2,128,000 | 12/31/2008 | |||||||||||||||||
939344AN7 | 10,000,000 | — | ² | (3,054,200) | 6,945,800 | 6,945,800 | 12/31/2008 | |||||||||||||||||
93934DAQ0 | 87,351 | — | ² | (51,823) | 35,528 | 35,528 | 12/31/2008 | |||||||||||||||||
94980KAQ5 | 1,103,943 | — | ² | (643,629) | 460,314 | 460,314 | 12/31/2008 | |||||||||||||||||
004421RV7 | 9,463,168 | 7,747,697 | ¹ | (1,715,471) | 7,747,697 | 7,003,715 | 9/30/2008 | |||||||||||||||||
03702YAC4 | 21,627,908 | — | ² | (14,058,108) | 7,569,800 | 7,569,800 | 9/30/2008 | |||||||||||||||||
05949AM31 | 1,873,669 | 1,656,719 | ¹ | (216,950) | 1,656,719 | 739,839 | 9/30/2008 | |||||||||||||||||
55312TAQ6 | 10,046,558 | — | ² | (6,083,638) | 3,962,920 | 3,962,920 | 9/30/2008 | |||||||||||||||||
55312TAR4 | 11,893,403 | — | ² | (8,099,902) | 3,793,501 | 3,793,501 | 9/30/2008 | |||||||||||||||||
589929JS8 | 5,505,188 | — | ² | (694,732) | 4,810,456 | 4,810,456 | 9/30/2008 | |||||||||||||||||
74040KAC6 | 15,328,440 | — | ² | (940,580) | 14,387,860 | 14,387,860 | 9/30/2008 | |||||||||||||||||
316781AA1 | 14,996,100 | — | ² | (8,432,550) | 6,563,550 | 6,563,550 | 9/30/2008 | |||||||||||||||||
67088CAA5 | 20,000,000 | — | ² | (17,500,000) | 2,500,000 | 2,500,000 | 9/30/2008 | |||||||||||||||||
004421RV7 | 13,293,979 | 10,420,391 | ¹ | (2,873,588) | 10,420,391 | 8,677,457 | 9/30/2008 | |||||||||||||||||
| 87 |
NOTES TO STATUTORY–BASIS FINANCIAL STATEMENTS
TEACHERS INSURANCE AND ANNUITY ASSOCIATION OF AMERICA | concluded |
| CUSIP | Book/Adj. Carrying Value Amortized Cost Before Current Period OTTI | Present Value of Projected Cash Flows | Recognized Other-Than- Temporary Impairment | Amortized Cost After Other- Than-Temporary Impairment | Fair Value as of Impairment Date | Date of Financial Statement Where Reported | ||||||||||||||||||
05947UJV1 | $ | 1,613,758 | $ | 1,063,032 | ¹ | $ | (550,726) | $ | 1,063,032 | $ | 2,510,921 | 9/30/2008 | ||||||||||||
74040KAC6 | 16,983,047 | — | ² | (834,284) | 16,148,763 | 16,148,763 | 9/30/2008 | |||||||||||||||||
46625M2Y4 | 1,434,849 | 674,165 | ¹ | (760,684) | 674,165 | 727,135 | 3/31/2008 | |||||||||||||||||
61746WE97 | 1,687,099 | 1,085,336 | ¹ | (601,763) | 1,085,336 | 1,710,037 | 3/31/2008 | |||||||||||||||||
61746WF21 | 659,501 | 249,760 | ¹ | (409,741) | 249,760 | 545,244 | 3/31/2008 | |||||||||||||||||
68400XBL3 | 557,541 | 280,704 | ¹ | (276,837) | 280,704 | 426,874 | 3/31/2008 | |||||||||||||||||
760985U66 | 867,188 | — | ² | (536,924) | 330,264 | 330,264 | 12/31/2007 | |||||||||||||||||
363259AA0 | 15,000,000 | — | ² | (4,800,000) | 10,200,000 | 10,200,000 | 12/31/2007 | |||||||||||||||||
61746WF21 | 771,351 | 676,705 | ¹ | (94,646) | 676,705 | 556,580 | 12/31/2007 | |||||||||||||||||
760985U58 | 2,813,940 | 911,116 | ¹ | (1,902,824) | 911,116 | 2,421,305 | 12/31/2007 | |||||||||||||||||
76110WRX6 | 5,900,848 | 4,987,584 | ¹ | (913,264) | 4,987,584 | 4,149,159 | 12/31/2007 | |||||||||||||||||
652454BB4 | 10,000,000 | — | ² | (1,500,000) | 8,500,000 | 8,500,000 | 9/30/2007 | |||||||||||||||||
652454BC2 | 5,000,000 | — | ² | (850,000) | 4,150,000 | 4,150,000 | 9/30/2007 | |||||||||||||||||
52518RBE5 | 1,322,892 | — | ² | (333,510) | 989,382 | 989,382 | 6/30/2006 | |||||||||||||||||
74681@AK5 | 4,500,000 | — | ² | (2,487,421) | 2,012,579 | 2,012,579 | 9/30/2003 | |||||||||||||||||
Total | (2,809,307,433) | |||||||||||||||||||||||
| ||||||||||||||||||||||||
| 1 | Impairment based on undiscounted cash flows. |
| 2 | Impairment based on Fair Value. |
| * | Securities identified as having a net present value of $0. |
| 88 |
SIGNATURES
Pursuant to the requirements of the Securities Act of 1933, as amended, the registrant, TIAA Real Estate Account, has duly caused this Amendment to Registration Statement on Form S-1 to be signed on its behalf by the undersigned, thereunto duly authorized, in New York, New York, on the 29th day of April, 2013.
TIAA REAL ESTATE ACCOUNT
By: TEACHERS INSURANCE AND ANNUITY
ASSOCIATION OF AMERICA
By: | /s/ ROGER W. FERGUSON, JR. Roger W. Ferguson, Jr. |
Pursuant to the requirements of the Securities Act of 1933, as amended, this Amendment to Registration Statement has been signed by the following trustees and officers of Teachers Insurance and Annuity Association of America, in the capacities and on the dates indicated.
Signature | Title | Date | ||||
| ||||||
/s/ ROGER W. FERGUSON, JR. Roger W. Ferguson, Jr. | President and Chief Executive Officer | April 29, 2013 | ||||
/s/ VIRGINIA M. WILSON Virginia M. Wilson | Executive Vice President and Chief Financial Officer (Principal Financial and Accounting Officer) | April 29, 2013 | ||||
* Ronald L. Thompson | Chairman of the Board of Trustees | April 29, 2013 | ||||
* Jeffrey R. Brown | Trustee | April 29, 2013 | ||||
* Robert C. Clark | Trustee | April 29, 2013 | ||||
* Lisa W. Hess | Trustee | April 29, 2013 | ||||
* Edward M. Hundert, M.D. | Trustee | April 29, 2013 | ||||
* Lawrence H. Linden | Trustee | April 29, 2013 | ||||
* Maureen O’Hara | Trustee | April 29, 2013 | ||||
* Donald K. Peterson | Trustee | April 29, 2013 | ||||
* Sidney A. Ribeau | Trustee | April 29, 2013 | ||||
* Dorothy K. Robinson | Trustee | April 29, 2013 | ||||
* David L. Shedlarz | Trustee | April 29, 2013 | ||||
* Marta Tienda | Trustee | April 29, 2013 | ||||
* Rosalie J. Wolf | Trustee | April 29, 2013 | ||||
/s/ STEWART P. GREENE Stewart P. Greene | ||||||
* Signed by Stewart P. Greene as Attorney in Fact
II-5