UNITED STATES
SECURITIES AND EXCHANGE COMMISSION
Washington, D.C. 20549
FORM 10-Q
(Mark One)
S QUARTERLY REPORT PURSUANT TO SECTION 13 OR 15(d) OF THE SECURITIES EXCHANGE ACT OF 1934 For the quarterly period ended September 30, 2013
OR
£ TRANSITION REPORT PURSUANT TO SECTION 13 OR 15(d) OF THE SECURITIES
EXCHANGE ACT OF 1934
For the transition period from to
Commission file number: 33-92990; 333-187309
TIAA REAL ESTATE ACCOUNT
(Exact name of registrant as specified in its charter)
NEW YORK
(State or other jurisdiction
of incorporation or organization)
NOT APPLICABLE
(I.R.S. Employer Identification No.)
C/O TEACHERS INSURANCE AND
ANNUITY ASSOCIATION OF AMERICA
730 THIRD AVENUE
NEW YORK, NEW YORK 10017-3206
(Address of principal executive offices, including zip code)
Registrant’s telephone number, including area code: (212) 490-9000
Securities registered pursuant to Section 12(b) of the Act: None
Securities registered pursuant to Section 12(g) of the Act: None
Indicate by check mark if the registrant is a well-known seasoned issuer, as defined in Rule 405 of the Securities Act.
YES£ NOS
Indicate by check mark if the registrant is not required to file reports pursuant to Section 13 or Section 15(d) of the Exchange Act:
YES£ NOS
Indicate by check mark whether the Registrant (1) has filed all reports required to be filed by Section 13 or 15(d) of the Securities Exchange Act of 1934 during the preceding 12 months (or for such shorter period that the Registrant was required to file such reports), and (2) has been subject to such filing requirements for the past 90 days.
YESS NO£
Indicate by check mark if disclosure of delinquent filers pursuant to Item 405 or regulation S-K is not contained herein, and will not be contained, to the best of registrant’s knowledge, in definitive proxy or information statements incorporated by reference in Part III of this Form 10-Q or any amendment to this Form 10-Q: Not Applicable
Indicate by check mark whether the registrant has submitted electronically and posted on its corporate Web site, if any, every Interactive Data File required to be submitted and posted pursuant to Rule 405 of Regulation S-T (§232.405 of this chapter) during the preceding 12 months (or for such shorter period that the registrant was required to submit and post such files).
YESS NO£
Indicate by check mark whether the registrant is a large accelerated filer, an accelerated filer, a non-accelerated filer, or smaller reporting company. See the definitions of “large accelerated filer,” “accelerated filer” and “smaller reporting company” in Rule 12b-2 of the Exchange Act. (Check one):
| | |
Large accelerated filer£ | | Accelerated filer£ |
Non-accelerated filerS | | Smaller Reporting Company£ |
(Do not check if a smaller reporting company) | | |
Indicate by check mark whether the registrant is a shell company (as defined in Rule 12b-2 of the Exchange Act).
YES£ NOS
Aggregate market value of voting stock held by non-affiliates: Not Applicable
Documents Incorporated by Reference: None
PART I. FINANCIAL INFORMATION
ITEM 1. UNAUDITED CONSOLIDATED FINANCIAL STATEMENTS.
INDEX TO UNAUDITED CONSOLIDATED FINANCIAL STATEMENTS
TIAA REAL ESTATE ACCOUNT
SEPTEMBER 30, 2013
2
TIAA REAL ESTATE ACCOUNT
CONSOLIDATED STATEMENTS OF ASSETS AND LIABILITIES
(In millions, except per accumulation unit amounts)
| | | | |
| | September 30,
2013 | | December 31,
2012 |
| | (Unaudited) | | |
ASSETS | | | | |
Investments, at fair value: | | | | |
Real estate properties
(cost: $10,473.1 and $10,543.6) | | | $ | | 11,245.2 | | | | $ | | 10,554.6 | |
Real estate joint ventures and limited partnerships
(cost: $2,489.9 and $2,553.8) | | | | 2,837.2 | | | | | 2,631.3 | |
Marketable securities: | | | | |
Real estate related
(cost: $1,376.1 and $1,175.7) | | | | 1,514.3 | | | | | 1,332.3 | |
Other
(cost: $3,160.7 and $2,569.3) | | | | 3,161.0 | | | | | 2,569.7 | |
| | | | |
Total investments
(cost: $17,499.8 and $16,842.4) | | | | 18,757.7 | | | | | 17,087.9 | |
| | | | |
Cash and cash equivalents | | | | 16.1 | | | | | 21.7 | |
Due from investment advisor | | | | 9.1 | | | | | — | |
Other | | | | 257.6 | | | | | 269.0 | |
| | | | |
TOTAL ASSETS | | | | 19,040.5 | | | | | 17,378.6 | |
| | | | |
LIABILITIES | | | | |
Mortgage loans payable, at fair value—Note 6
(principal outstanding: $2,395.6 and $2,253.8) | | | | 2,350.9 | | | | | 2,282.6 | |
Due to investment advisor | | | | — | | | | | 10.6 | |
Accrued real estate property level expenses | | | | 185.3 | | | | | 185.8 | |
Other | | | | 33.0 | | | | | 38.5 | |
| | | | |
TOTAL LIABILITIES | | | | 2,569.2 | | | | | 2,517.5 | |
| | | | |
COMMITMENTS AND CONTINGENCIES—Note 9 | | | | |
NET ASSETS | | | | |
Accumulation Fund | | | | 16,104.1 | | | | | 14,523.0 | |
Annuity Fund | | | | 367.2 | | | | | 338.1 | |
| | | | |
TOTAL NET ASSETS | | | $ | | 16,471.3 | | | | $ | | 14,861.1 | |
| | | | |
NUMBER OF ACCUMULATION UNITS
OUTSTANDING—Note 8 | | | | 54.8 | | | | | 53.3 | |
| | | | |
NET ASSET VALUE, PER ACCUMULATION UNIT—Note 7 | | | $ | | 294.114 | | | | $ | | 272.569 | |
| | | | |
See notes to the consolidated financial statements
3
TIAA REAL ESTATE ACCOUNT
CONSOLIDATED STATEMENTS OF OPERATIONS
(In millions)
(Unaudited)
| | | | | | | | |
| | For the Three Months
Ended September 30, | | For the Nine Months
Ended September 30, |
| | 2013 | | 2012 | | 2013 | | 2012 |
INVESTMENT INCOME | | | | | | | | |
Real estate income, net: | | | | | | | | |
Rental income | | | $ | | 207.2 | | | | $ | | 217.5 | | | | $ | | 618.6 | | | | $ | | 648.4 | |
| | | | | | | | |
Real estate property level expenses and taxes: | | | | | | | | |
Operating expenses | | | | 52.1 | | | | | 53.7 | | | | | 155.9 | | | | | 162.7 | |
Real estate taxes | | | | 30.0 | | | | | 31.0 | | | | | 90.6 | | | | | 90.0 | |
Interest expense | | | | 27.5 | | | | | 29.2 | | | | | 91.6 | | | | | 87.4 | |
| | | | | | | | |
Total real estate property level expenses and taxes | | | | 109.6 | | | | | 113.9 | | | | | 338.1 | | | | | 340.1 | |
| | | | | | | | |
Real estate income, net | | | | 97.6 | | | | | 103.6 | | | | | 280.5 | | | | | 308.3 | |
Income from real estate joint ventures and limited partnerships | | | | 20.2 | | | | | 23.1 | | | | | 68.8 | | | | | 56.1 | |
Interest | | | | 0.7 | | | | | 0.8 | | | | | 2.3 | | | | | 2.1 | |
Dividends | | | | 10.2 | | | | | 8.7 | | | | | 29.5 | | | | | 23.4 | |
| | | | | | | | |
TOTAL INVESTMENT INCOME | | | | 128.7 | | | | | 136.2 | | | | | 381.1 | | | | | 389.9 | |
| | | | | | | | |
Expenses: | | | | | | | | |
Investment advisory charges | | | | 15.5 | | | | | 14.2 | | | | | 45.4 | | | | | 42.4 | |
Administrative charges | | | | 11.1 | | | | | 8.2 | | | | | 29.3 | | | | | 22.9 | |
Distribution charges | | | | 3.2 | | | | | 3.7 | | | | | 9.4 | | | | | 10.6 | |
Mortality and expense risk charges | | | | 0.2 | | | | | 0.2 | | | | | 0.6 | | | | | 2.6 | |
Liquidity guarantee charges | | | | 7.3 | | | | | 8.1 | | | | | 22.9 | | | | | 23.1 | |
| | | | | | | | |
TOTAL EXPENSES | | | | 37.3 | | | | | 34.4 | | | | | 107.6 | | | | | 101.6 | |
| | | | | | | | |
INVESTMENT INCOME, NET | | | | 91.4 | | | | | 101.8 | | | | | 273.5 | | | | | 288.3 | |
| | | | | | | | |
NET REALIZED AND UNREALIZED GAIN (LOSS) ON
INVESTMENTS AND MORTGAGE LOANS PAYABLE | | | | | | | | |
Net realized gain (loss) on investments: | | | | | | | | |
Real estate properties | | | | (0.1 | ) | | | | | (26.8 | ) | | | | | (173.9 | ) | | | | | (32.0 | ) | |
Real estate joint ventures and limited partnerships | | | | (11.4 | ) | | | | | (49.5 | ) | | | | | (86.3 | ) | | | | | (51.9 | ) | |
Marketable securities | | | | 8.7 | | | | | 2.7 | | | | | 25.7 | | | | | 14.1 | |
| | | | | | | | |
Net realized loss on investments | | | | (2.8 | ) | | | | | (73.6 | ) | | | | | (234.5 | ) | | | | | (69.8 | ) | |
| | | | | | | | |
Net change in unrealized appreciation (depreciation) on: | | | | | | | | |
Real estate properties | | | | 307.8 | | | | | 141.6 | | | | | 743.9 | | | | | 465.5 | |
Real estate joint ventures and limited partnerships | | | | 120.0 | | | | | 130.5 | | | | | 318.5 | | | | | 313.0 | |
Marketable securities | | | | (60.0 | ) | | | | | 1.3 | | | | | (20.7 | ) | | | | | 137.5 | |
Mortgage loans payable | | | | 65.5 | | | | | (25.8 | ) | | | | | 107.3 | | | | | (54.5 | ) | |
| | | | | | | | |
Net change in unrealized appreciation on
investments and mortgage loans payable | | | | 433.3 | | | | | 247.6 | | | | | 1,149.0 | | | | | 861.5 | |
| | | | | | | | |
NET REALIZED AND UNREALIZED GAIN ON
INVESTMENTS AND MORTGAGE LOANS PAYABLE | | | | 430.5 | | | | | 174.0 | | | | | 914.5 | | | | | 791.7 | |
| | | | | | | | |
NET INCREASE IN NET ASSETS RESULTING FROM
OPERATIONS | | | $ | | 521.9 | | | | $ | | 275.8 | | | | $ | | 1,188.0 | | | | $ | | 1,080.0 | |
| | | | | | | | |
See notes to the consolidated financial statements
4
TIAA REAL ESTATE ACCOUNT
CONSOLIDATED STATEMENTS OF CHANGES IN NET ASSETS
(In millions)
(Unaudited)
| | | | | | | | |
| | For the Three Months
Ended September 30, | | For the Nine Months
Ended September 30, |
| | 2013 | | 2012 | | 2013 | | 2012 |
FROM OPERATIONS | | | | | | | | |
Investment income, net | | | $ | | 91.4 | | | | $ | | 101.8 | | | | $ | | 273.5 | | | | $ | | 288.3 | |
Net realized loss on investments | | | | (2.8 | ) | | | | | (73.6 | ) | | | | | (234.5 | ) | | | | | (69.8 | ) | |
Net change in unrealized appreciation on investments and mortgage loans payable | | | | 433.3 | | | | | 247.6 | | | | | 1,149.0 | | | | | 861.5 | |
| | | | | | | | |
NET INCREASE IN NET ASSETS RESULTING
FROM OPERATIONS | | | | 521.9 | | | | | 275.8 | | | | | 1,188.0 | | | | | 1,080.0 | |
| | | | | | | | |
FROM PARTICIPANT TRANSACTIONS | | | | | | | | |
Premiums | | | | 550.0 | | | | | 489.4 | | | | | 1,726.4 | | | | | 1,450.7 | |
Liquidity units redeemed—Note 3 | | | | — | | | | | (314.2 | ) | | | | | (325.4 | ) | | | | | (620.3 | ) | |
Annuity payments | | | | (7.3 | ) | | | | | (6.7 | ) | | | | | (21.0 | ) | | | | | (18.6 | ) | |
Withdrawals and death benefits | | | | (335.7 | ) | | | | | (241.6 | ) | | | | | (957.8 | ) | | | | | (723.1 | ) | |
| | | | | | | | |
NET INCREASE (DECREASE) IN NET ASSETS
RESULTING FROM PARTICIPANT TRANSACTIONS | | | | 207.0 | | | | | (73.1 | ) | | | | | 422.2 | | | | | 88.7 | |
| | | | | | | | |
NET INCREASE IN NET ASSETS | | | | 728.9 | | | | | 202.7 | | | | | 1,610.2 | | | | | 1,168.7 | |
NET ASSETS | | | | | | | | |
Beginning of period | | | | 15,742.4 | | | | | 14,493.2 | | | | | 14,861.1 | | | | | 13,527.2 | |
| | | | | | | | |
End of period | | | $ | | 16,471.3 | | | | $ | | 14,695.9 | | | | $ | | 16,471.3 | | | | $ | | 14,695.9 | |
| | | | | | | | |
See notes to the consolidated financial statements
5
TIAA REAL ESTATE ACCOUNT
CONSOLIDATED STATEMENTS OF CASH FLOWS
(In millions)
(Unaudited)
| | | | |
| | For the Nine Months
Ended September 30, |
| | 2013 | | 2012 |
CASH FLOWS FROM OPERATING ACTIVITIES | | | | |
Net increase in net assets resulting from operations | | | $ | | 1,188.0 | | | | $ | | 1,080.0 | |
Adjustments to reconcile net changes in net assets resulting from operations to net cash used in operating activities: | | | | |
Net realized loss on investments | | | | 234.5 | | | | | 69.8 | |
Net change in unrealized appreciation on investments and mortgage loans payable | | | | (1,149.0 | ) | | | | | (861.5 | ) | |
Purchase of real estate properties | | | | (395.1 | ) | | | | | (521.5 | ) | |
Capital improvements on real estate properties | | | | (130.9 | ) | | | | | (129.9 | ) | |
Proceeds from sale of real estate properties | | | | 411.8 | | | | | 97.8 | |
Purchases of long term investments | | | | (335.4 | ) | | | | | (644.2 | ) | |
Proceeds from sale of long term investments | | | | 184.8 | | | | | 251.3 | |
(Increase) decrease in other investments | | | | (591.4 | ) | | | | | 374.6 | |
Change in due to (from) investment advisor | | | | (19.7 | ) | | | | | 16.7 | |
Decrease (increase) in other assets | | | | 11.4 | | | | | (17.3 | ) | |
Decrease in other liabilities | | | | 5.5 | | | | | 17.9 | |
| | | | |
NET CASH USED IN OPERATING ACTIVITIES | | | | (585.5 | ) | | | | | (266.3 | ) | |
| | | | |
CASH FLOWS FROM FINANCING ACTIVITIES | | | | |
Mortgage loan proceeds received | | | | 900.0 | | | | | 182.6 | |
Payments of mortgage loans | | | | (742.3 | ) | | | | | (7.5 | ) | |
Premiums | | | | 1,726.4 | | | | | 1,450.7 | |
Liquidity units redeemed | | | | (325.4 | ) | | | | | (620.3 | ) | |
Annuity payments | | | | (21.0 | ) | | | | | (18.6 | ) | |
Withdrawals and death benefits | | | | (957.8 | ) | | | | | (723.1 | ) | |
| | | | |
NET CASH PROVIDED BY FINANCING ACTIVITIES | | | | 579.9 | | | | | 263.8 | |
| | | | |
NET DECREASE IN CASH AND CASH EQUIVALENTS | | | | (5.6 | ) | | | | | (2.5 | ) | |
CASH AND CASH EQUIVALENTS | | | | |
Beginning of period | | | | 21.7 | | | | | 17.5 | |
| | | | |
End of period | | | $ | | 16.1 | | | | $ | | 15.0 | |
| | | | |
SUPPLEMENTAL DISCLOSURES: | | | | |
Cash paid for interest | | | $ | | 90.9 | | | | $ | | 88.1 | |
| | | | |
See notes to the consolidated financial statements
6
TIAA REAL ESTATE ACCOUNT
NOTES TO THE CONSOLIDATED FINANCIAL STATEMENTS
Note 1—Organization and Significant Accounting Policies
Business: The TIAA Real Estate Account (“Account”) is a segregated investment account of Teachers Insurance and Annuity Association of America (“TIAA”) and was established by resolution of TIAA’s Board of Trustees (the “Board”) on February 22, 1995, under the insurance laws of the State of New York, for the purpose of funding variable annuity contracts issued by TIAA. The Account offers individual and group accumulating annuity contracts (with contributions made on a pre-tax or after-tax basis), as well as individual lifetime and term-certain variable payout annuity contracts (including the payment of death benefits to beneficiaries). Investors are entitled to transfer funds to or from the Account and make withdrawals from the Account on a daily basis under certain circumstances. Funds invested in the Account for each category of contract are expressed in terms of units, and unit values will fluctuate depending on the Account’s performance.
The investment objective of the Account is to seek favorable long-term returns primarily through rental income and capital appreciation from real estate and real estate-related investments owned by the Account. The Account holds real estate properties directly and through subsidiaries wholly owned by TIAA for the benefit of the Account. The Account also holds interests in real estate joint ventures and limited partnerships in which the Account does not hold a controlling interest; such interests are not consolidated into these consolidated financial statements. The Account also has invested in mortgage loans receivable collateralized by commercial real estate properties. Additionally, the Account invests in real estate-related and non-real estate-related publicly-traded securities, cash and other instruments to maintain adequate liquidity levels for operating expenses, capital expenditures and to fund benefit payments (withdrawals, transfers and related transactions).
Basis of Presentation:These unaudited consolidated financial statements have been prepared in accordance with generally accepted accounting principles in the U.S. (“GAAP”) for interim financial information. These unaudited consolidated financial statements reflect all normal recurring adjustments that are, in the opinion of management, necessary to fairly present the financial position and results of operations of the Account.
The accompanying consolidated financial statements include the Account and those subsidiaries wholly owned by TIAA for the benefit of the Account. All significant intercompany accounts and transactions between the Account and such subsidiaries have been eliminated.
The Accumulation Unit Value (“AUV”) used for financial reporting purposes may differ from the AUV used for processing transactions. The AUV used for financial reporting purposes includes security and participant transactions effective through the date of the report.
The preparation of financial statements that conform to GAAP requires the use of estimates by management. Actual results may vary from those estimates and such differences may be material. The following is a summary of the significant accounting policies of the Account.
Determination of Investments at Fair Value:The Account reports all investments at fair value in accordance with the Financial Accounting Standards Board (“FASB”) Accounting Standards Codification (“ASC”) 946,Financial Services—Investment Companies. Further in accordance with the adoption of the fair value option allowed under ASC 825,Financial Instruments, and at the election of Account management, mortgage loans payable are reported at fair value. The FASB has defined fair value as the price that would be received to sell an asset or paid to transfer a liability in an orderly transaction between market participants.
The following is a description of the valuation methodologies used to determine the fair value of the Account’s investments and investment related mortgage loans payable.
Valuation of Real Estate Properties—Investments in real estate properties are stated at fair value, as determined in accordance with policies and procedures reviewed by the Investment Committee of the Board and in accordance with the responsibilities of the Board as a whole. Accordingly, the Account does not record depreciation. Determination of fair value involves significant levels of judgment because the actual fair value of real estate can be determined only by negotiation between the parties in a sales transaction. The Account’s primary objective when valuing its real estate investments will be to produce a valuation that
7
represents a reasonable estimate of the fair value of its investments. Implicit in the Account’s definition of fair value are the consummation of a sale as of a specified date and the passing of title from seller to buyer under conditions whereby:
|
• | | | | Buyer and seller are typically motivated; |
|
• | | | | Both parties are well informed or well advised, and acting in what they consider their best interests; |
|
• | | | | A reasonable time is allowed for exposure in the open market; |
|
• | | | | Payment is made in terms of cash or in terms of financial arrangements comparable thereto; and |
|
• | | | | The price represents the normal consideration for the property sold unaffected by special or creative financing or sales concessions granted by anyone associated with the sale. |
Property and investment values are affected by, among other things, the availability of capital, occupancy rates, rental rates, and interest and inflation rates. As a result, determining real estate and investment values involves many assumptions. Key inputs and assumptions include rental income and expense amounts, related rental income and expense growth rates, discount rates and capitalization rates. Valuation techniques include discounted cash flow analysis, prevailing market capitalization rates or multiples applied to earnings from the property, analysis of recent comparable sales transactions, actual sale negotiations and bona fide purchase offers received from third parties. Amounts ultimately realized from each investment may vary significantly from the fair value presented.
Real estate properties owned by the Account are initially valued based on an independent third party appraisal, as reviewed by TIAA’s internal appraisal staff and as applicable the Account’s independent fiduciary at the time of the closing of the purchase, which may result in a potential unrealized gain or loss reflecting the difference between an investment’s fair value (i.e., exit price) and its cost basis (which is inclusive of transaction costs).
Subsequently, each property is appraised each quarter by an independent third party appraiser, reviewed by TIAA’s internal appraisal staff and, as applicable, the Account’s independent fiduciary. In general, the Account obtains appraisals of its real estate properties spread out throughout the quarter, which is intended to result in appraisal adjustments, and thus, adjustments to the valuations of its holdings (to the extent such adjustments are made) that happen regularly throughout each quarter and not on one specific day or month in each period.
Further, management reserves the right to order an appraisal and/or conduct another valuation outside of the normal quarterly process when facts or circumstances at a specific property change. For example, under certain circumstances a valuation adjustment could be made when the account receives a bona fide bid for the sale of a property held within the Account or one of the Account’s joint ventures. In addition, adjustments may be made for events or circumstances indicating an impairment of a tenant’s ability to pay amounts due to the Account under a lease (including due to a bankruptcy filing of that tenant). Alternatively, adjustments may be made to reflect the execution or renewal of a significant lease. Also, adjustments may be made to reflect factors (such as sales values for comparable properties or local employment rate) bearing uniquely on a particular region in which the Account holds properties. TIAA’s internal appraisal staff oversees the entire appraisal process, in conjunction with the Account’s independent fiduciary (the independent fiduciary is more fully described in the paragraph below). Any differences in the conclusions of TIAA’s internal appraisal staff and the independent appraiser will be reviewed by the independent fiduciary, which will make a final determination on the matter (which may include ordering a subsequent independent appraisal).
The independent fiduciary, Real Estate Research Corporation, has been appointed by a special subcommittee of the Investment Committee of the Board to, among other things, oversee the appraisal process. The independent fiduciary must approve all independent appraisers used by the Account. All appraisals are performed in accordance with Uniform Standards of Professional Appraisal Practices, the real estate appraisal industry standards created by The Appraisal Foundation. Real estate appraisals are estimates of property values based on a professional’s opinion. Appraisals of properties held outside of the U.S. are performed in accordance with industry standards commonly applied in the applicable jurisdiction. These independent appraisers are always expected to be MAI-designated members of the Appraisal Institute (or its
8
European equivalent, Royal Institute of Chartered Surveyors) and state certified appraisers from national or regional firms with relevant property type experience and market knowledge. Under the Account’s current procedures, each independent appraisal firm will be rotated off of a particular property at least every three years, although such appraisal firm may perform appraisals of other Account properties subsequent to such rotation.
Also, the independent fiduciary can require additional appraisals if factors or events have occurred that could materially change a property’s value (including those identified above) and such change is not reflected in the quarterly valuation review, or otherwise to ensure that the Account is valued appropriately. The independent fiduciary must also approve any valuation change of real estate-related assets where a property’s value changed by more than 6% from the most recent independent annual appraisal, or if the value of the Account would change by more than 4% within any calendar quarter or more than 2% since the prior calendar month. When a real estate property is subject to a mortgage, the property is valued independently of the mortgage and the property and mortgage fair values are reported separately (seeValuation of Mortgage Loans Payable below). The independent fiduciary reviews and approves all mortgage valuation adjustments before such adjustments are recorded by the Account. The Account continues to use the revised value for each real estate property and mortgage loan payable to calculate the Account’s daily net asset value until the next valuation review or appraisal.
Valuation of Real Estate Joint Ventures—Real estate joint ventures are stated at the fair value of the Account’s ownership interests of the underlying entities. The Account’s ownership interests are valued based on the fair value of the underlying real estate, any related mortgage loans payable, and other factors, such as ownership percentage, ownership rights, buy/sell agreements, distribution provisions and capital call obligations. Upon the disposition of all real estate investments by an investee entity, the Account will continue to state its equity in the remaining net assets of the investee entity during the wind down period, if any, which occurs prior to the dissolution of the investee entity.
Valuation of Real Estate Limited Partnerships—Limited partnership interests are stated at the fair value of the Account’s ownership in the partnership which are recorded based upon the changes in the net asset values of the limited partnerships as determined from the financial statements of the limited partnerships when received by the Account. Prior to the receipt of the financial statements from the limited partnerships, the Account estimates the value of its interest in good faith and will from time to time seek input from the issuer or the sponsor of the investments. Since market quotations are not readily available, the limited partnership interests are valued at fair value as determined in good faith by management under the direction of the Investment Committee of the Board and in accordance with the responsibilities of the Board as a whole.
Valuation of Marketable Securities—Equity securities listed or traded on any national market or exchange are valued at the last sale price as of the close of the principal securities market or exchange on which such securities are traded or, if there is no sale, at the mean of the last bid and asked prices on such market or exchange, exclusive of transaction costs.
Debt securities (excluding money market instruments) for which market quotations are readily available are valued based on the most recent bid price or the equivalent quoted yield for such securities (or those of comparable maturity, quality and type). Debt securities for which market quotations are not readily available are valued at fair value as determined in good faith by the Investment Committee of the Board and in accordance with the responsibilities of the Board as a whole.
Short-term investments with maturities of 60 days or less (excluding money market instruments) are valued at amortized cost. Short-term investments with maturities in excess of 60 days (excluding money market instruments) are valued in the same manner as debt securities, as described above.
Money market instruments are valued at amortized cost.
Equity and fixed income securities traded on a foreign exchange or in foreign markets are valued using their closing values under the valuation methods generally accepted in the country where traded, as of the valuation date. This value is converted to U.S. dollars at the exchange rate in effect on the valuation day. Under certain circumstances (for example, if there are significant movements in the United States markets and there is an expectation the securities traded on foreign markets will adjust based on such movements
9
when the foreign markets open the next day), the Account may adjust the value of equity or fixed income securities that trade on a foreign exchange or market after the foreign exchange or market has closed.
Valuation of Mortgage Loans Payable—Mortgage loans payable are stated at fair value. The estimated fair values of mortgage loans payable are based on the amount at which the liability could be transferred to a third party exclusive of transaction costs. Mortgage loans payable are valued internally by TIAA’s internal valuation department, as reviewed by the Account’s independent fiduciary, at least quarterly based on market factors, such as market interest rates and spreads for comparable loans, the performance of the underlying collateral (such as the loan-to-value ratio and the cash flow of the underlying collateral), the liquidity for mortgage loans of similar characteristics, the maturity date of the loan, and the return demands of the market.
SeeNote 5—Assets and Liabilities Measured at Fair Value on a Recurring Basis for further discussion and disclosure regarding the determination of the fair value of the Account’s investments.
Foreign Currency Transactions and Translation: Portfolio investments and other assets and liabilities denominated in foreign currencies are translated into U.S. dollars at the exchange rates prevailing at the end of the period. Purchases and sales of securities, income receipts and expense payments made in foreign currencies are translated into U.S. dollars at the exchange rates prevailing on the respective dates of the transactions. The effect of any changes in foreign currency exchange rates on portfolio investments and mortgage loans payable are included in net realized and unrealized gains and losses on real estate properties and mortgage loans payable. Net realized gains and losses on foreign currency transactions include disposition of foreign currencies, and currency gains and losses between the accrual and receipt dates of portfolio investment income and between the trade and settlement dates of portfolio investment transactions.
Accumulation and Annuity Funds: The accumulation fund represents the net assets attributable to participants in the accumulation phase of their investment (“Accumulation Fund”). The annuity fund represents the net assets attributable to the participants currently receiving annuity payments (“Annuity Fund”). The net increase or decrease in net assets from investment operations is apportioned between the accounts based upon their relative daily net asset values. Once an Account participant begins receiving lifetime annuity income benefits, payment levels cannot be reduced as a result of the Account’s actual mortality experience. In addition, the contracts pursuant to which the Account is offered are required to stipulate the maximum expense charge for all Account level expenses that can be assessed, which is not to exceed 2.5% of average net assets per year. The Account pays a fee to TIAA to assume mortality and expense risks.
Accounting for Investments: The investments held by the Account are accounted for as follows:
Real Estate Properties—Rent from real estate properties consists of all amounts earned under tenant operating leases, including base rent, recoveries of real estate taxes and other expenses and charges for miscellaneous services provided to tenants. Rental income is recognized in accordance with the billing terms of the lease agreements. The Account bears the direct expenses of the real estate properties owned. These expenses include, but are not limited to, fees to local property management companies, property taxes, utilities, maintenance, repairs, insurance, and other operating and administrative costs. An estimate of the net operating income earned from each real estate property is accrued by the Account on a daily basis and such estimates are adjusted when actual operating results are determined.
Real Estate Joint Ventures—The Account has limited ownership interests in various real estate joint ventures (collectively, the “joint ventures”). The Account records its contributions as increases to its investments in the joint ventures, and distributions from the joint ventures are treated as income within income from real estate joint ventures and limited partnerships in the Account’s consolidated statements of operations. Distributions that are identified as returns of capital are recorded as a reduction to the cost basis of the investment, whereas distributions identified as capital gains or losses are recorded as realized gains or losses. Income from the joint ventures is recorded based on the Account’s proportional interest of the income distributed by the joint ventures. Income earned but not yet distributed to the Account by the joint ventures is recorded as unrealized gains and losses.
Limited Partnerships—The Account has limited ownership interests in various private real estate funds (primarily limited partnerships) and a private real estate investment trust (“REIT”) (collectively, the “limited partnerships”). The Account records its contributions as increases to the investments, and distributions from
10
the investments are treated as income within income from real estate joint ventures and limited partnerships in the Account’s consolidated statements of operations. Distributions that are identified as returns of capital are recorded as a reduction to the cost basis of the investment, whereas distributions identified as capital gains or losses are recorded as realized gains or losses. Unrealized gains and losses are recorded based upon the changes in the net asset values of the limited partnerships as determined from the financial statements of the limited partnerships when received by the Account. Prior to the receipt of the financial statements from the limited partnerships, the Account estimates the value of its interest in good faith and will from time to time seek input from the issuer or the sponsor of the investments. Changes in value based on such estimates are recorded by the Account as unrealized gains and losses.
Marketable Securities—Transactions in marketable securities are accounted for as of the date the securities are purchased or sold (trade date). Interest income is recorded as earned. Dividend income is recorded on the ex-dividend date within dividend income. Dividends that are identified as returns of capital are recorded as a reduction to the cost basis of the investment, whereas dividends identified as capital gains or losses are recorded as realized gains or losses. Realized gains and losses on securities transactions are accounted for on the specific identification method.
Realized and Unrealized Gains and Losses—Realized gains and losses are recorded at the time an investment is sold or a distribution is received in relation to an investment sale from a joint venture or limited partnership. Real estate transactions are accounted for as of the date on which the purchase or sale transactions for the real estate properties close (settlement date). The Account recognizes a realized gain on the sale of a real estate property to the extent that the contract sales price exceeds the cost-to-date of the property being sold. A realized loss occurs when the cost-to-date exceeds the sales price.
Unrealized gains and losses are recorded as the fair values of the Account’s investments are adjusted, and as discussed within theReal Estate Joint Ventures andLimited Partnershipssectionsabove.
Net Assets—The Account’s net assets as of the close of each valuation day are valued by taking the sum of:
|
• | | | | the value of the Account’s cash, cash equivalents, and short-term and other debt instruments; |
|
• | | | | the value of the Account’s other securities and other non-real estate assets; |
|
• | | | | the value of the individual real properties (based on the most recent valuation of that property) and other real estate-related investments owned by the Account; |
|
• | | | | an estimate of the net operating income accrued by the Account from its properties, other real estate-related investments and non-real estate-related investments (including short-term marketable securities) since the end of the prior valuation day; and |
|
• | | | | actual net operating income earned from the Account’s properties, other real estate-related investments and non-real estate-related investments (but only to the extent any such item of income differs from the estimated income accrued for on such investments), |
and then reducing the sum by liabilities held within the Account, including the daily investment management fee, administration and distribution fees, mortality and expense fee, and liquidity guarantee fee, and certain other expenses attributable to operating the Account. Daily estimates of net operating income are adjusted to reflect actual net operating income on a monthly basis, at which time such adjustments (if any) are reflected in the Account’s unit value.
After the end of every quarter, the Account reconciles the amount of expenses deducted from the Account (which is established in order to approximate the costs that the Account will incur) with the expenses the Account actually incurred. If there is a difference, the Account adds it to or deducts it from the Account in equal daily installments over the remaining days of the following quarter. Material differences may be repaid in the current calendar quarter. The Account’s at-cost deductions are based on projections of Account assets and overall expenses, and the size of any adjusting payments will be directly affected by the difference between management’s projections and the Account’s actual assets or expenses.
Cash and Cash Equivalents: Cash and cash equivalents are balances held by the Account in bank deposit accounts which, at times, exceed federally insured limits. The Account’s management monitors these balances to mitigate the exposure of risk due to concentration and has not experienced any losses from such concentration.
11
Other Assets and Other Liabilities: Other assets and other liabilities are comprised of operating assets and liabilities utilized and held at each individual real estate property investment. Other assets consist of, amongst other items, tenant receivables and prepaid expenses; whereas other liabilities primarily consist of security deposits.
Federal Income Taxes: Based on provisions of the Internal Revenue Code, Section 817, the Account is taxed as a segregated asset account of TIAA and as such, the Account incurs no material federal income tax attributable to the net investment activity of the Account. Management has analyzed the Account’s tax positions taken for all open federal income tax years (2007-2012) and has concluded no provisions for federal income tax are required as of September 30, 2013.
Restricted Cash:The Account held $52.2 million and $61.4 million as of September 30, 2013 and December 31, 2012, respectively, in escrow accounts for property taxes, insurance, and various other property related matters as required by certain creditors related to outstanding mortgage loans payable collateralized by certain real estate investments. These amounts are recorded within other assets on the consolidated statements of assets and liabilities. SeeNote 6–Mortgage Loans Payable for additional information regarding the Account’s outstanding mortgage loans payable.
Changes in Net Assets:Premiums include premiums paid by existing accumulation unit holders in the Account and transfers into the Account. Withdrawals and death benefits include withdrawals out of the Account which include transfers out of the Account and required minimum distributions.
Due to/from Investment Manager: Due to/from investment manager represents amounts that are to be paid or received by TIAA on behalf of the Account. Amounts generally are paid or received by the Account within one or two business days and no interest is contractually charged on these amounts.
New Accounting Pronouncement:In June 2013, the FASB issued Accounting Standards Update 2013-08 Financial Services—Investment Companies (Topic 946)—Amendments to the Scope, Measurement, and Disclosure Requirements (the “ASU”) which amends the criteria for an entity to qualify as an investment company and introduces new disclosure requirements that apply to all investment companies. The ASU is effective for interim and annual reporting periods in fiscal years beginning after December 15, 2013. The Account is currently assessing the impact of applying the ASU but does not anticipate any impacts to the Account’s consolidated financial statements.
Note 2—Management Agreements and Arrangements
Investment advisory services for the Account are provided by TIAA employees, under the direction of the Board and its Investment Committee, pursuant to investment management procedures adopted by TIAA for the Account. TIAA’s investment management decisions for the Account are subject to review by the Account’s independent fiduciary. TIAA also provides various portfolio accounting and related services for the Account.
The Account is a party to the Distribution Agreement for the Contracts Funded by the TIAA Real Estate Account (the “Distribution Agreement”), dated January 1, 2008, by and among TIAA, for itself and on behalf of the Account, and TIAA-CREF Individual and Institutional Services, LLC (“Services”), a wholly owned subsidiary of TIAA, a registered broker-dealer and a member of the Financial Industry Regulatory Authority. Pursuant to the Distribution Agreement, Services performs distribution services for the Account which include, among other things, (i) distribution of annuity contracts issued by TIAA and funded by the Account, (ii) advising existing annuity contract owners in connection with their accumulations and (iii) helping employers implement and manage retirement plans. In addition, TIAA performs administrative functions for the Account, which include, among other things, (i) maintaining accounting records and performing accounting services, (ii) receiving and allocating premiums, (iii) calculating and making annuity payments, (iv) processing withdrawal requests, (v) providing regulatory compliance and reporting services, (vi) maintaining the Account’s records of contract ownership and (vii) otherwise assisting generally in all aspects of the Account’s operations. Both distribution services (pursuant to the Distribution Agreement) and administrative services are provided to the Account by Services and TIAA, as applicable, on a cost basis.
The Distribution Agreement is terminable by either party upon 60 days written notice and terminates automatically upon any assignment thereof.
12
TIAA and Services provide investment management, administrative and distribution services at cost. TIAA and Services receive payments from the Account on a daily basis according to formulas established each year and adjusted periodically with the objective of keeping the payments as close as possible to the Account’s expenses actually incurred. Any differences between actual expenses and the amounts paid by the Account are adjusted quarterly.
TIAA also provides a liquidity guarantee to the Account, for a fee, to ensure that sufficient funds are available to meet participant transfer and cash withdrawal requests in the event that the Account’s cash flows and liquid investments are insufficient to fund such requests. TIAA ensures sufficient funds are available for such transfer and withdrawal requests by purchasing accumulation units of the Account. See Note 3–Related Party Transactions below.
To the extent TIAA owns accumulation units issued pursuant to the liquidity guarantee, the independent fiduciary monitors and oversees, among other things, TIAA’s ownership interest in the Account and may require TIAA to eventually redeem some of its units, particularly when the Account has non-invested cash or liquid investments available. TIAA also receives a fee for assuming certain mortality and expense risks.
The expenses for the services noted above that are provided to the Account by TIAA and Services are identified in the accompanying consolidated statements of operations and are reflected inNote 7–Financial Highlights.
Note 3—Related Party Transactions
Pursuant to its existing liquidity guarantee obligation, the TIAA General Account purchased in multiple transactions an aggregate of 4.7 million accumulation units (which are generally referred to as “liquidity units”) in the Account between December 2008 and June 2009 for an aggregate amount of $1.2 billion. TIAA has not purchased additional liquidity units since June 2009.
In accordance with this liquidity guarantee obligation, TIAA guarantees that all participants in the Account may redeem their accumulation units at their accumulation unit value next determined after their transfer or cash withdrawal request is received in good order. Liquidity units owned by TIAA are valued in the same manner as accumulation units owned by the Account’s participants. Management believes that TIAA has the ability to meet its obligations under the liquidity guarantee.
As discussed in the Account’s prospectus and in accordance with a prohibited transaction exemption from the U.S. Department of Labor (PTE 96-76), the Account’s independent fiduciary, Real Estate Research Corporation, has certain responsibilities with respect to the Account that it has undertaken or is currently undertaking with respect to TIAA’s purchase of liquidity units, including among other things, reviewing the purchase and redemption of liquidity units by TIAA to ensure the Account uses the correct unit values. In addition, as set forth in PTE 96-76, the independent fiduciary’s responsibilities include:
|
• | | | | establishing the percentage of total accumulation units that TIAA’s ownership should not exceed (the “trigger point”) and creating a method for changing the trigger point; |
|
• | | | | approving any adjustment of TIAA’s ownership interest in the Account and, in its discretion, requiring an adjustment if TIAA’s ownership of liquidity units reaches the trigger point; and |
|
• | | | | once the trigger point has been reached, participating in any program to reduce TIAA’s ownership in the Account by utilizing cash flow or liquid investments in the Account, or by utilizing the proceeds from asset sales. The independent fiduciary’s role in participating in any such asset sales program would include (i) participating in the selection of properties for sale, (ii) providing sales guidelines and (iii) approving those sales if, in the independent fiduciary’s opinion, such sales are desirable to reduce TIAA’s ownership of liquidity units. |
The independent fiduciary, which has the right to adjust the trigger point, established the trigger point at 45% of the outstanding accumulation units in connection with TIAA’s ownership of liquidity units between December 2008 and March 2013.
As of March 31, 2013, the independent fiduciary had completed the systematic redemption of all of the liquidity units held by TIAA. Approximately one-quarter of such units were redeemed evenly over the
13
business days in each of the months of June, September, December 2012, and March 2013, representing a total of $940.3 million and $325.4 million redeemed during 2012 and 2013, respectively.
As discussed inNote 2—Management Agreements and Arrangements, TIAA and Services provide certain services to the Account on an at cost basis. SeeNote 7—Financial Highlights for details of the expense charge and expense ratio.
Note 4—Credit Risk Concentrations
Concentrations of credit risk may arise when a number of properties or tenants are located in a similar geographic region such that the economic conditions of that region could impact tenants’ obligations to meet their contractual obligations or cause the values of individual properties to decline. The Account has no significant concentrations of tenants as no single tenant has annual contract rent that makes up more than 2.4% of the rental income of the Account.
The substantial majority of the Account’s wholly owned real estate investments and investments in joint ventures are located in the United States. The following table represents the diversification of the Account’s portfolio by region and property type:
Diversification by Fair Value(1)
| | | | | | | | | | | | |
| | East | | West | | South | | Foreign(2) | | Midwest | | Total |
Office | | | | 20.9 | % | | | | | 15.2 | % | | | | | 6.8 | % | | | | | — | | | | | 0.3 | % | | | | | 43.2 | % | |
Apartment | | | | 9.1 | % | | | | | 7.9 | % | | | | | 4.9 | % | | | | | — | | | | | — | | | | | 21.9 | % | |
Retail | | | | 3.2 | % | | | | | 4.4 | % | | | | | 8.2 | % | | | | | 1.6 | % | | | | | 0.2 | % | | | | | 17.6 | % | |
Industrial | | | | 1.4 | % | | | | | 7.5 | % | | | | | 3.6 | % | | | | | — | | | | | 0.9 | % | | | | | 13.4 | % | |
Other(3) | | | | 3.2 | % | | | | | 0.2 | % | | | | | 0.4 | % | | | | | — | | | | | 0.1 | % | | | | | 3.9 | % | |
| | | | | | | | | | | | |
Total | | | | 37.8 | % | | | | | 35.2 | % | | | | | 23.9 | % | | | | | 1.6 | % | | | | | 1.5 | % | | | | | 100.0 | % | |
| | | | | | | | | | | | |
|
(1) | | | | Wholly-owned properties are represented at fair value and gross of any debt, while joint venture properties are represented at net equity value. |
|
(2) | | | | Represents real estate investment in France. |
|
(3) | | | | Represents interest in Storage Portfolio investment, a fee interest encumbered by a ground lease real estate investment and undeveloped land. |
|
| | | | Properties in “East” region are located in: CT, DC, DE, KY, MA, MD, ME, NC, NH, NJ, NY, PA, RI, SC, VA, VT, WV |
|
| | | | Properties in the “West” region are located in: AK, AZ, CA, CO, HI, ID, MT, NM, NV, OR, UT, WA, WY |
|
| | | | Properties in the “South” region are located in: AL, AR, FL, GA, LA, MS, OK, TN, TX |
|
| | | | Properties in the “Midwest” region are located in: IA, IL, IN, KS, MI, MN, MO, ND, NE, OH, SD, WI |
Note 5—Assets and Liabilities Measured at Fair Value on a Recurring Basis
Valuation Hierarchy:The Account’s fair value measurements are grouped categorically into three levels, as defined by the FASB. The levels are defined as follows:
Level 1—Valuations using unadjusted quoted prices for assets traded in active markets, such as stocks listed on the New York Stock Exchange. Active markets are defined as having the following characteristics for the measured asset or liability: (i) many transactions, (ii) current prices, (iii) price quotes not varying substantially among market makers, (iv) narrow bid/ask spreads and (v) most information regarding the issuer is publicly available. Level 1 assets held by the Account are generally marketable equity securities.
Level 2—Valuations for assets and liabilities traded in less active, dealer or broker markets. Fair values are primarily obtained from third party pricing services for identical or comparable assets or liabilities. Level 2 inputs for fair value measurements are inputs, other than quoted prices included within Level 1, that are observable for the asset or liability, either directly or indirectly. Level 2 inputs include:
a. Quoted prices for similar assets or liabilities in active markets;
14
b. Quoted prices for identical or similar assets or liabilities in markets that are not active (that is, markets in which there are few transactions for the asset (or liability), the prices are not current, price quotations vary substantially either over time or among market makers (for example, some brokered markets), or in which little information is released publicly);
c. Inputs other than quoted prices that are observable within the market for the asset (or liability) (for example, interest rates and yield curves, volatilities, prepayment speeds, loss severities, credit risks, and default rates that are observable at commonly quoted intervals); and
d. Inputs that are derived principally from or corroborated by observable market data by correlation or other means (for example, market-corroborated inputs).
Examples of securities which may be held by the Account and included in Level 2 include certificates of deposit, commercial paper, government agency notes, variable notes, United States Treasury securities, and debt securities.
Level 3—Valuations for assets and liabilities that are derived from other valuation methodologies, including pricing models, discounted cash flow models and similar techniques, and are not based on market exchange, dealer, or broker-traded transactions. Level 3 valuations incorporate certain assumptions and projections that are not observable in the market, and require significant professional judgment in determining the fair value assigned to such assets or liabilities. Examples of Level 3 assets and liabilities which may be held by the Account from time to time include investments in real estate, investments in joint ventures and limited partnerships, and mortgage loans receivable and payable.
An investment’s categorization within the valuation hierarchy described above is based upon the lowest level of input that is significant to the fair value measurement.
The Account’s determination of fair value is based upon quoted market prices, where available. If listed prices or quotes are not available, fair value is based upon vendor-provided, evaluated prices or internally-developed models that primarily use market-based or independently-sourced market data, including interest rate yield curves, market spreads, and currency rates. Valuation adjustments will be made to reflect changes in credit quality, counterparty creditworthiness, the Account’s creditworthiness, liquidity, and other observable and unobservable inputs that are applied consistently over time.
The methods described above are considered to produce fair values that represent a good faith estimate of what an unaffiliated buyer in the marketplace would pay to purchase the asset or would receive to transfer the liability. Since fair value calculations involve significant professional judgment in the application of both observable and unobservable attributes, actual realizable values or future fair values may differ from amounts reported. Furthermore, while the Account believes its valuation methods are appropriate and consistent with other market participants, the use of different methodologies or assumptions to determine the fair value of certain financial instruments, while reasonable, could result in different estimates of fair value at the reporting date. As discussed inNote 1—Organization and Significant Accounting Policies in more detail, the Account generally obtains independent third party appraisals on a quarterly basis; there may be circumstances in the interim in which the true realizable value of a property is not reflected in the Account’s daily net asset value calculation or in the Account’s periodic consolidated financial statements. This disparity may be more apparent when the commercial and/or residential real estate markets experience an overall and possibly dramatic decline (or increase) in property values in a relatively short period of time between appraisals.
15
The following tables show the major categories of assets and liabilities measured at fair value on a recurring basis as of September 30, 2013 (unaudited) and December 31, 2012, using unadjusted quoted prices in active markets for identical assets (Level 1); significant other observable inputs (Level 2); and significant unobservable inputs (Level 3) (in millions):
| | | | | | | | |
Description | | Level 1:
Quoted
Prices in
Active Markets
for Identical Assets | | Level 2:
Significant
Other
Observable
Inputs | | Level 3:
Significant
Unobservable
Inputs | | Total at
September 30,
2013 |
Real Estate properties | | | $ | | — | | | | $ | | — | | | | $ | | 11,245.2 | | | | $ | | 11,245.2 | |
Real Estate joint ventures | | | | — | | | | | — | | | | | 2,478.0 | | | | | 2,478.0 | |
Limited partnerships | | | | — | | | | | — | | | | | 359.2 | | | | | 359.2 | |
Marketable securities: | | | | | | | | |
Real Estate related | | | | 1,514.3 | | | | | — | | | | | — | | | | | 1,514.3 | |
Government agency notes | | | | — | | | | | 1,774.0 | | | | | — | | | | | 1,774.0 | |
United States Treasury securities | | | | — | | | | | 1,387.0 | | | | | — | | | | | 1,387.0 | |
| | | | | | | | |
Total Investments at September 30, 2013 | | | $ | | 1,514.3 | | | | $ | | 3,161.0 | | | | $ | | 14,082.4 | | | | $ | | 18,757.7 | |
| | | | | | | | |
Mortgage loans payable | | | $ | | — | | | | $ | | — | | | | $ | | (2,350.9 | ) | | | | $ | | (2,350.9 | ) | |
| | | | | | | | |
| | | | | | | | |
Description | | Level 1:
Quoted
Prices in
Active Markets
for Identical Assets | | Level 2:
Significant
Other
Observable
Inputs | | Level 3:
Significant
Unobservable
Inputs | | Total at
December 31,
2012 |
Real Estate properties | | | $ | | — | | | | $ | | — | | | | $ | | 10,554.6 | | | | $ | | 10,554.6 | |
Real Estate joint ventures | | | | — | | | | | — | | | | | 2,291.5 | | | | | 2,291.5 | |
Limited partnerships | | | | — | | | | | — | | | | | 339.8 | | | | | 339.8 | |
Marketable securities: | | | | | | | | |
Real Estate related | | | | 1,332.3 | | | | | — | | | | | — | | | | | 1,332.3 | |
Government agency notes | | | | — | | | | | 1,379.6 | | | | | — | | | | | 1,379.6 | |
United States Treasury securities | | | | — | | | | | 1,190.1 | | | | | — | | | | | 1,190.1 | |
| | | | | | | | |
Total Investments at December 31, 2012 | | | $ | | 1,332.3 | | | | $ | | 2,569.7 | | | | $ | | 13,185.9 | | | | $ | | 17,087.9 | |
| | | | | | | | |
Mortgage loans payable | | | $ | | — | | | | $ | | — | | | | $ | | (2,282.6 | ) | | | | $ | | (2,282.6 | ) | |
| | | | | | | | |
The following tables show the reconciliation of the beginning and ending balances for assets and liabilities measured at fair value on a recurring basis using significant unobservable inputs (Level 3) during the three and nine months ended September 30, 2013 and September 30, 2012 (in millions, unaudited):
| | | | | | | | | | |
| | Real Estate
Properties | | Real Estate
Joint Ventures | | Limited
Partnerships | | Total
Level 3
Investments | | Mortgage
Loans
Payable |
For the three months ended September 30, 2013 | | | | | | | | |
Beginning balance July 1, 2013 | | | $ | | 10,798.9 | | | | $ | | 2,343.7 | | | | $ | | 348.2 | | | | $ | | 13,490.8 | | | | $ | | (2,254.8 | ) | |
Total realized and unrealized gains included in changes in net assets | | | | 307.7 | | | | | 96.9 | | | | | 11.7 | | | | | 416.3 | | | | | 65.5 | |
Purchases(1) | | | | 138.6 | | | | | 43.8 | | | | | 1.8 | | | | | 184.2 | | | | | (170.0 | ) | |
Sales | | | | — | | | | | — | | | | | — | | | | | — | | | | | — | |
Settlements(2) | | | | — | | | | | (6.4 | ) | | | | | (2.5 | ) | | | | | (8.9 | ) | | | | | 8.4 | |
| | | | | | | | | | |
Ending balance September 30, 2013 | | | $ | | 11,245.2 | | | | $ | | 2,478.0 | | | | $ | | 359.2 | | | | $ | | 14,082.4 | | | | $ | | (2,350.9 | ) | |
| | | | | | | | | | |
16
| | | | | | | | | | |
| | Real Estate
Properties | | Real Estate
Joint Ventures | | Limited
Partnerships | | Total
Level 3
Investments | | Mortgage
Loans
Payable |
For the nine months ended September 30, 2013 | | | | | | | | |
Beginning balance January 1, 2013 | | | $ | | 10,554.6 | | | | $ | | 2,291.5 | | | | $ | | 339.8 | | | | $ | | 13,185.9 | | | | $ | | (2,282.6 | ) | |
Total realized and unrealized gains included in changes in net assets | | | | 570.0 | | | | | 205.9 | | | | | 26.3 | | | | | 802.2 | | | | | 89.4 | |
Purchases(1) | | | | 532.4 | | | | | 44.0 | | | | | 3.2 | | | | | 579.6 | | | | | (900.0 | ) | |
Sales | | | | (411.8 | ) | | | | | — | | | | | — | | | | | (411.8 | ) | | | | | — | |
Settlements(2) | | | | — | | | | | (63.4 | ) | | | | | (10.1 | ) | | | | | (73.5 | ) | | | | | 742.3 | |
| | | | | | | | | | |
Ending balance September 30, 2013 | | | $ | | 11,245.2 | | | | $ | | 2,478.0 | | | | $ | | 359.2 | | | | $ | | 14,082.4 | | | | $ | | (2,350.9 | ) | |
| | | | | | | | | | |
| | | | | | | | | | |
| | Real Estate
Properties | | Real Estate
Joint Ventures | | Limited
Partnerships | | Total
Level 3
Investments | | Mortgage
Loans
Payable |
For the three months ended September 30, 2012 | | | | | | | | |
Beginning balance July 1, 2012 | | | $ | | 10,306.2 | | | | $ | | 1,834.1 | | | | $ | | 333.9 | | | | $ | | 12,474.2 | | | | $ | | (2,133.4 | ) | |
Total realized and unrealized gains included in changes in net assets | | | | 114.8 | | | | | 68.0 | | | | | 13.0 | | | | | 195.8 | | | | | 8.2 | |
Purchases(1) | | | | 470.4 | | | | | 50.1 | | | | | 7.1 | | | | | 527.6 | | | | | (92.6 | ) | |
Sales | | | | (51.6 | ) | | | | | — | | | | | — | | | | | (51.6 | ) | | | | | — | |
Settlements(2) | | | | — | | | | | (157.9 | ) | | | | | (12.5 | ) | | | | | (170.4 | ) | | | | | 2.5 | |
| | | | | | | | | | |
Ending balance September 30, 2012 | | | $ | | 10,839.8 | | | | $ | | 1,794.3 | | | | $ | | 341.5 | | | | $ | | 12,975.6 | | | | $ | | (2,215.3 | ) | |
| | | | | | | | | | |
| | | | | | | | | | |
| | Real Estate
Properties | | Real Estate
Joint Ventures | | Limited
Partnerships | | Total
Level 3
Investments | | Mortgage
Loans
Payable |
For the nine months ended September 30, 2012 | | | | | | | | |
Beginning balance January 1, 2012 | | | $ | | 9,857.6 | | | | $ | | 1,591.4 | | | | $ | | 307.5 | | | | $ | | 11,756.5 | | | | $ | | (2,028.2 | ) | |
Total realized and unrealized gains (losses) included in changes in net assets | | | | 433.5 | | | | | 229.9 | | | | | 31.2 | | | | | 694.6 | | | | | (12.1 | ) | |
Purchases(1) | | | | 646.5 | | | | | 131.1 | | | | | 18.8 | | | | | 796.4 | | | | | (182.6 | ) | |
Sales | | | | (97.8 | ) | | | | | — | | | | | — | | | | | (97.8 | ) | | | | | — | |
Settlements(2) | | | | — | | | | | (158.1 | ) | | | | | (16.0 | ) | | | | | (174.1 | ) | | | | | 7.6 | |
| | | | | | | | | | |
Ending balance September 30, 2012 | | | $ | | 10,839.8 | | | | $ | | 1,794.3 | | | | $ | | 341.5 | | | | $ | | 12,975.6 | | | | $ | | (2,215.3 | ) | |
| | | | | | | | | | |
|
(1) | | | | Includes purchases, contributions for joint ventures and limited partnerships, and capital expenditures. |
|
(2) | | | | Includes operating income for real estate joint ventures and limited partnerships, net of distributions and principal payments on mortgage loans payable. |
17
The following table shows quantitative information about unobservable inputs related to the Level 3 fair value measurements as of September 30, 2013 (unaudited).
| | | | | | | | |
Type | | Asset Class | | Valuation
Technique(s) | | Unobservable
Inputs | | Range
(Weighted
Average) |
Real Estate Properties and Joint Ventures | | Office | | Income Approach—
Discounted Cash Flow | | Discount Rate
Terminal Capitalization Rate | | 6.0% - 9.5% (7.1%)
5.0% - 8.3% (6.0%) |
| | | |
| | | | Income Approach—
Direct Capitalization | |
Overall Capitalization Rate
| |
4.8% - 7.5% (5.5%)
|
| | |
| | Industrial | | Income Approach—
Discounted Cash Flow | | Discount Rate
Terminal Capitalization Rate | | 6.5% - 10.0% (7.5%)
5.5% - 8.0% (6.3%) |
| | | |
| | | | Income Approach—
Direct Capitalization | |
Overall Capitalization Rate
| |
4.8% - 8.3% (5.7%)
|
| | |
| | Residential | | Income Approach—
Discounted Cash Flow | | Discount Rate
Terminal Capitalization Rate | | 6.0% - 8.0% (6.6%)
4.3% - 6.3% (5.0%) |
| | | |
| | | | Income Approach—
Direct Capitalization | |
Overall Capitalization Rate
| |
3.8% - 5.8% (4.4%)
|
| | |
| | Retail | | Income Approach—
Discounted Cash Flow | | Discount Rate
Terminal Capitalization Rate | | 6.0% - 13.0% (7.6%)
5.5% - 12.5% (6.5%) |
| | | |
| | | | Income Approach—
Direct Capitalization | |
Overall Capitalization Rate
| |
4.5% - 12.0% (5.7%)
|
|
Mortgage Loans Payable | | Office and Industrial | | Discounted Cash Flow | | Loan to Value Ratio
Equivalency Rate | | 33.0% - 60.0% (45.2%)
2.2% - 4.7% (3.8%) |
| | | |
| | | | Net Present Value | | Loan to Value Ratio
Weighted Average Cost of
Capital Risk Premiums | | 33.0% - 60.0% (45.2%)
1.2% - 3.1% (1.9%) |
| | |
| | Residential | | Discounted Cash Flow | | Loan to Value Ratio
Equivalency Rate | | 35.0% - 62.0% (47.5%)
2.9% - 4.5% (4.1%) |
| | | |
| | | | Net Present Value | | Loan to Value Ratio
Weighted Average Cost of
Capital Risk Premiums | | 35.0% - 62.0% (47.5%)
1.3% - 3.2% (2.1%) |
| | |
| | Retail | | Discounted Cash Flow | | Loan to Value Ratio
Equivalency Rate | | 29.0% - 144.0% (61.5%)
2.6% - 7.5% (4.5%) |
| | | |
| | | | Net Present Value | | Loan to Value Ratio
Weighted Average Cost of
Capital Risk Premiums | | 29.0% - 144.0% (61.5%)
1.0% - 13.5% (4.5%) |
|
Real Estate Properties and Joint Ventures: The significant unobservable inputs used in the fair value measurement of the Account’s real estate property and joint venture investments are the selection of certain investment rates (Discount Rate, Terminal Capitalization Rate, and Overall Capitalization Rate). Significant increases or decreases in any of those inputs in isolation would result in significantly lower or higher fair value measurements, respectively.
Mortgage Loans Payable: The significant unobservable inputs used in the fair value measurement of the Account’s mortgage loans payable are the loan to value ratios and the selection of certain credit spreads and weighted average cost of capital risk premiums. Significant increases (decreases) in any of those inputs in isolation would result in a significantly lower (higher) fair value, respectively.
During the nine months ended September 30, 2013 and 2012 there were no transfers between Levels 1, 2 or 3.
18
The amount of total net unrealized gains (losses) included in changes in net assets attributable to the change in net unrealized gains (losses) relating to Level 3 investments and mortgage loans payable using significant unobservable inputs still held as of the reporting date is as follows (in millions, unaudited):
| | | | | | | | | | |
| | Real Estate
Properties | | Real Estate
Joint
Ventures | | Limited
Partnerships | | Total
Level 3
Investments | | Mortgage
Loans
Payable |
For the three months ended
September 30, 2013 | | | $ | | 307.8 | | | | $ | | 97.9 | | | | $ | | 11.8 | | | | $ | | 417.5 | | | | $ | | 65.5 | |
| | | | | | | | | | |
For the nine months ended
September 30, 2013 | | | $ | | 590.6 | | | | $ | | 210.5 | | | | $ | | 25.5 | | | | $ | | 826.6 | | | | $ | | 73.5 | |
| | | | | | | | | | |
For the three months ended
September 30, 2012 | | | $ | | 116.0 | | | | $ | | 70.0 | | | | $ | | 42.8 | | | | $ | | 228.8 | | | | $ | | 8.2 | |
| | | | | | | | | | |
For the nine months ended
September 30, 2012 | | | $ | | 436.3 | | | | $ | | 231.9 | | | | $ | | 60.3 | | | | $ | | 728.5 | | | | $ | | (12.1 | ) | |
| | | | | | | | | | |
19
Note 6—Mortgage Loans Payable
The Account had outstanding mortgage loans payable secured by the following properties (in millions):
| | | | | | | | |
Property | | Interest Rate and
Payment Frequency(3) | | Principal
Amounts as of | | Maturity |
| | September 30,
2013 | | December 31,
2012 |
| | | | (Unaudited) | | | | |
1 & 7 Westferry Circus(1)(2)(5) | | 5.40% paid quarterly | | | $ | | — | | | | $ | | 208.4 | | | | | February 28, 2013 | |
Reserve at Sugarloaf(1)(5) | | 5.49% paid monthly | | | | — | | | | | 23.9 | | | | | June 1, 2013 | |
South Frisco Village | | 5.85% paid monthly | | | | — | | | | | 26.3 | | | | | June 1, 2013 | |
Pacific Plaza(1)(5) | | 5.55% paid monthly | | | | — | | | | | 8.0 | | | | | September 1, 2013 | |
Wilshire Rodeo Plaza(5) | | 5.28% paid monthly | | | | 112.7 | | | | | 112.7 | | | | | April 11, 2014 | |
1401 H Street NW(1)(5) | | 5.97% paid monthly | | | | 109.7 | | | | | 110.8 | | | | | December 7, 2014 | |
Windsor at Lenox Park(5) | | 4.43% paid monthly | | | | 24.0 | | | | | 24.0 | | | | | August 1, 2015 | |
San Montego Apartments(5)(6) | | 4.47% paid monthly | | | | 21.8 | | | | | 21.8 | | | | | August 1, 2015 | |
Montecito Apartments(5)(6) | | 4.47% paid monthly | | | | 20.2 | | | | | 20.2 | | | | | August 1, 2015 | |
Phoenician Apartments(5)(6) | | 4.47% paid monthly | | | | 21.3 | | | | | 21.3 | | | | | August 1, 2015 | |
99 High Street | | 5.52% paid monthly | | | | 185.0 | | | | | 185.0 | | | | | November 11, 2015 | |
Lincoln Centre | | 5.51% paid monthly | | | | 153.0 | | | | | 153.0 | | | | | February 1, 2016 | |
Charleston Plaza(1)(5) | | 5.60% paid monthly | | | | 36.4 | | | | | 36.9 | | | | | September 11, 2016 | |
The Legend at Kierland(5)(7) | | 4.97% paid monthly | | | | 21.8 | | | | | 21.8 | | | | | August 1, 2017 | |
The Tradition at Kierland(5)(7) | | 4.97% paid monthly | | | | 25.8 | | | | | 25.8 | | | | | August 1, 2017 | |
Mass Court(5) | | 2.88% paid monthly | | | | 92.6 | | | | | 92.6 | | | | | September 1, 2019 | |
Red Canyon at Palomino Park(5)(8) | | 5.34% paid monthly | | | | 27.1 | | | | | 27.1 | | | | | August 1, 2020 | |
Green River at Palomino Park(5)(8) | | 5.34% paid monthly | | | | 33.2 | | | | | 33.2 | | | | | August 1, 2020 | |
Blue Ridge at Palomino Park(5)(8) | | 5.34% paid monthly | | | | 33.4 | | | | | 33.4 | | | | | August 1, 2020 | |
Ashford Meadows(5) | | 5.17% paid monthly | | | | 44.6 | | | | | 44.6 | | | | | August 1, 2020 | |
The Corner(5) | | 4.66% paid monthly | | | | 105.0 | | | | | 105.0 | | | | | June 1, 2021 | |
The Palatine(5) | | 4.25% paid monthly | | | | 80.0 | | | | | 80.0 | | | | | January 10, 2022 | |
The Forum at Carlsbad(5) | | 4.25% paid monthly | | | | 90.0 | | | | | 90.0 | | | | | March 1, 2022 | |
The Colorado(5) | | 3.69% paid monthly | | | | 91.7 | | | | | 91.7 | | | | | November 1, 2022 | |
The Legacy at Westwood(5) | | 3.69% paid monthly | | | | 46.7 | | | | | 46.7 | | | | | November 1, 2022 | |
Regents Court(5) | | 3.69% paid monthly | | | | 39.6 | | | | | 39.6 | | | | | November 1, 2022 | |
The Caruth(5) | | 3.69% paid monthly | | | | 45.0 | | | | | 45.0 | | | | | November 1, 2022 | |
Fourth & Madison(5)(9) | | 3.75% paid monthly | | | | 200.0 | | | | | 145.0 | | | | | June 1, 2023 | |
1001 Pennsylvania Avenue(9) | | 3.70% paid monthly | | | | 330.0 | | | | | 210.0 | | | | | June 1, 2023 | |
50 Fremont Street(5)(9) | | 3.75% paid monthly | | | | 200.0 | | | | | 135.0 | | | | | June 1, 2023 | |
780 Third Avenue(5) | | 3.55% paid monthly | | | | 150.0 | | | | | — | | | | | August 1, 2025 | |
780 Third Avenue(5) | | 3.55% paid monthly | | | | 20.0 | | | | | — | | | | | August 1, 2025 | |
Publix at Weston Commons(5) | | 5.08% paid monthly | | | | 35.0 | | | | | 35.0 | | | | | January 1, 2036 | |
| | | | | | | | |
Total Principal Outstanding | | | | | $ | | 2,395.6 | | | | $ | | 2,253.8 | | | |
Fair Value Adjustment(4) | | | | | | (44.7 | ) | | | | | 28.8 | | | |
| | | | | | | | |
Total mortgage loans payable | | | | | $ | | 2,350.9 | | | | $ | | 2,282.6 | | | |
| | | | | | | | |
|
(1) | | | | The mortgage is adjusted monthly for principal payments. |
|
(2) | | | | The mortgage is denominated in British pounds and the principal payment had been converted to U.S. dollars using the exchange rate as of December 31, 2012. |
|
(3) | | | | Interest rates are fixed, unless stated otherwise. |
|
(4) | | | | The fair value adjustment consists of the difference (positive or negative) between the principal amount of the outstanding debt and the fair value of the outstanding debt. See Note 1-Organization and Significant Accounting Policies. |
|
(5) | | | | These properties are each owned by separate wholly owned subsidiaries of TIAA for benefit of the Account. The assets and credit of each of these borrowings entities are not available to satisfy the debts and other obligations of the Account or any other entity or person other than such borrowing entity. |
|
(6) | | | | Represents mortgage loans payable on these individual properties which are held within the Houston Apartment Portfolio. |
|
(7) | | | | Represents mortgage loans payable on these individual properties which are held within the Kierland Apartment Portfolio. |
|
(8) | | | | Represents mortgage loans payable on these individual properties which are held within Palomino Park. |
|
(9) | | | | Represents mortgage loans that were refinanced in the quarter ended June 30, 2013, into 10-year loans with interest only due for the first five years and principal paymments due thereafter. |
20
Note 7—Financial Highlights
Selected condensed financial information for an Accumulation Unit of the Account is presented below. Per Accumulation Unit data is calculated on average units outstanding.
| | | | | | | | |
| | | | | | | | |
| | For the Nine
Months Ended
September 30,
2013 | | Years Ended December 31, |
| | 2012 | | 2011 | | 2010 |
| | (Unaudited) | | | | | | |
Per Accumulation Unit data: | | | | | | | | |
Rental income | | | $ | | 11.445 | | | | $ | | 16.345 | | | | $ | | 17.224 | | | | $ | | 19.516 | |
Real estate property level expenses and taxes | | | | 6.255 | | | | | 9.059 | | | | | 8.640 | | | | | 9.987 | |
| | | | | | | | |
Real estate income, net | | | | 5.190 | | | | | 7.286 | | | | | 8.584 | | | | | 9.529 | |
Other income | | | | 1.861 | | | | | 2.178 | | | | | 2.143 | | | | | 2.214 | |
| | | | | | | | |
Total income | | | | 7.051 | | | | | 9.464 | | | | | 10.727 | | | | | 11.743 | |
Expense charges(1) | | | | 1.991 | | | | | 2.562 | | | | | 2.390 | | | | | 2.167 | |
| | | | | | | | |
Investment income, net | | | | 5.060 | | | | | 6.902 | | | | | 8.337 | | | | | 9.576 | |
Net realized and unrealized gain on investments and mortgage loans payable | | | | 16.485 | | | | | 18.013 | | | | | 20.144 | | | | | 16.143 | |
| | | | | | | | |
Net increase in Accumulation Unit Value | | | | 21.545 | | | | | 24.915 | | | | | 28.481 | | | | | 25.719 | |
Accumulation Unit Value: | | | | | | | | |
Beginning of period | | | | 272.569 | | | | | 247.654 | | | | | 219.173 | | | | | 193.454 | |
| | | | | | | | |
End of period | | | $ | | 294.114 | | | | $ | | 272.569 | | | | $ | | 247.654 | | | | $ | | 219.173 | |
| | | | | | | | |
Total return | | | | 7.90% | | | | | 10.06% | | | | | 12.99% | | | | | 13.29% | |
Ratios to Average net Assets(2): | | | | | | | | |
Expenses(1) | | | | 0.69% | | | | | 0.95% | | | | | 0.98% | | | | | 1.09% | |
Investment income, net | | | | 1.76% | | | | | 2.55% | | | | | 3.42% | | | | | 4.84% | |
Portfolio turnover rate(2): | | | | | | | | |
Real estate properties(3) | | | | 1.91% | | | | | 10.22% | | | | | 3.01% | | | | | 1.01% | |
Marketable securities(4) | | | | 7.00% | | | | | 21.92% | | | | | 3.43% | | | | | 19.18% | |
Accumulation Units outstanding at end of period (in millions): | | | | 54.8 | | | | | 53.3 | | | | | 53.4 | | | | | 48.1 | |
Net assets end of period (in millions) | | | $ | | 16,471.3 | | | | $ | | 14,861.1 | | | | $ | | 13,527.2 | | | | $ | | 10,803.1 | |
|
(1) | | | | Expense charges per Accumulation Unit and the Ratio of Expenses to average net assets reflect the year to date Account-level expenses and exclude real estate property level expenses which are included in real estate income, net. |
|
(2) | | | | Amounts for the nine month period ended September 30, 2013 are not annualized. |
|
(3) | | | | Real estate investment portfolio turnover rate is calculated by dividing the lesser of purchases or sales of real estate property investments (including contributions to, or return of capital distributions received from, existing joint venture and limited partnership investments) by the average value of the portfolio of real estate investments held during the period. |
|
(4) | | | | Marketable securities portfolio turnover rate is calculated by dividing the lesser of purchases or sales of securities, excluding securities having maturity dates at acquisition of one year or less, by the average value of the portfolio securities held during the period. |
21
Note 8—Accumulation Units
Changes in the number of Accumulation Units outstanding were as follows (in millions):
| | | | |
| | For the
Nine Months
Ended
September 30, 2013 | | For the Year Ended
December 31, 2012 |
| | (Unaudited) | | |
Outstanding: | | | | |
Beginning of period | | | | 53.3 | | | | | 53.4 | |
Credited for premiums | | | | 6.1 | | | | | 7.4 | |
Liquidity units redeemed—Note 3 | | | | (1.2 | ) | | | | | (3.6 | ) | |
Annuity, other periodic payments, withdrawals and death benefits | | | | (3.4 | ) | | | | | (3.9 | ) | |
| | | | |
End of period | | | | 54.8 | | | | | 53.3 | |
| | | | |
Note 9—Commitments and Contingencies
Commitments—The Account had $3.6 million and $6.8 million of outstanding immediately callable commitments to purchase additional interests in three of its limited partnership investments as of September 30, 2013 and December 31, 2012, respectively.
Contingencies—The Account is party to various claims and routine litigation arising in the ordinary course of business. Management of the Account does not believe the results of any such claims or litigation, individually, or in the aggregate, will have a material effect on the Account’s business, financial position, or results of operations.
22
TIAA REAL ESTATE ACCOUNT
CONSOLIDATED STATEMENTS OF INVESTMENTS
September 30, 2013 and December 31, 2012
(Dollar values shown in millions)
REAL ESTATE PROPERTIES—59.9% and 61.8%
| | | | | | |
Location/Description | | Type | | Fair Value |
| | 2013 | | 2012 |
| | | | (Unaudited) | | |
Arizona: | | | | | | |
Camelback Center | | Office | | | $ | | 38.5 | | | | $ | | 32.6 | |
Kierland Apartment Portfolio | | Apartments | | | | 120.4 | (1) | | | | | 114.1 | (1) | |
Phoenix Apartment Portfolio | | Apartments | | | | — | | | | | 33.6 | |
California: | | | | | | |
3 Hutton Centre Drive | | Office | | | | 41.4 | | | | | 38.6 | |
50 Fremont Street | | Office | | | | 483.6 | (1) | | | | | 433.9 | (1) | |
88 Kearny Street | | Office | | | | 111.1 | | | | | 101.7 | |
275 Battery Street | | Office | | | | 248.0 | | | | | 241.0 | |
Centre Pointe and Valley View | | Industrial | | | | 31.5 | | | | | 30.5 | |
Cerritos Industrial Park | | Industrial | | | | 85.6 | | | | | 83.3 | |
Charleston Plaza | | Retail | | | | 82.0 | (1) | | | | | 80.0 | (1) | |
Great West Industrial Portfolio | | Industrial | | | | 118.0 | | | | | 106.2 | |
Holly Street Village | | Apartments | | | | 123.7 | | | | | — | |
Larkspur Courts | | Apartments | | | | 110.9 | | | | | 93.4 | |
Northpark Village Square | | Retail | | | | 41.5 | | | | | 41.4 | |
Northern CA RA Industrial Portfolio | | Industrial | | | | 47.4 | | | | | 45.3 | |
Oceano at Warner Center | | Apartments | | | | 86.9 | | | | | — | |
Ontario Industrial Portfolio | | Industrial | | | | 313.3 | | | | | 304.1 | |
Pacific Plaza | | Office | | | | 81.3 | | | | | 75.7 | (1) | |
Rancho Cucamonga Industrial Portfolio | | Industrial | | | | 122.5 | | | | | 107.0 | |
Regents Court | | Apartments | | | | 78.4 | (1) | | | | | 81.6 | (1) | |
Southern CA RA Industrial Portfolio | | Industrial | | | | 88.8 | | | | | 86.9 | |
The Forum at Carlsbad | | Retail | | | | 192.0 | (1) | | | | | 186.0 | (1) | |
The Legacy at Westwood | | Apartments | | | | 125.8 | (1) | | | | | 111.5 | (1) | |
Westcreek | | Apartments | | | | 35.9 | | | | | 34.7 | |
West Lake North Business Park | | Office | | | | 48.5 | | | | | 46.3 | |
Westwood Marketplace | | Retail | | | | 108.0 | | | | | 108.1 | |
Wilshire Rodeo Plaza | | Office | | | | 179.5 | (1) | | | | | 171.0 | (1) | |
Colorado: | | | | | | |
Palomino Park | | Apartments | | | | 262.2 | (1) | | | | | 247.4 | (1) | |
South Denver Marketplace | | Retail | | | | 69.7 | | | | | — | |
Connecticut: | | | | | | |
Ten & Twenty Westport Road | | Office | | | | 155.3 | | | | | 145.1 | |
Florida: | | | | | | |
701 Brickell Avenue | | Office | | | | 268.3 | | | | | 230.9 | |
North 40 Office Complex | | Office | | | | 29.3 | | | | | 28.6 | |
Plantation Grove | | Retail | | | | 10.5 | | | | | 10.3 | |
Publix at Weston Commons | | Retail | | | | 54.0 | (1) | | | | | 52.0 | (1) | |
Quiet Waters at Coquina Lakes | | Apartments | | | | — | | | | | 26.6 | |
Seneca Industrial Park | | Industrial | | | | 71.7 | | | | | 74.6 | |
South Florida Apartment Portfolio | | Apartments | | | | 79.3 | | | | | 79.7 | |
Suncrest Village Shopping Center | | Retail | | | | 11.3 | | | | | 11.4 | |
The Fairways of Carolina | | Apartments | | | | — | | | | | 25.1 | |
The Residences at the Village of Merrick Park | | Apartments | | | | 59.0 | | | | | 53.8 | |
23
TIAA REAL ESTATE ACCOUNT
CONSOLIDATED STATEMENTS OF INVESTMENTS
September 30, 2013 and December 31, 2012
(Dollar values shown in millions)
| | | | | | |
Location/Description | | Type | | Fair Value |
| | 2013 | | 2012 |
| | | | (Unaudited) | | |
Urban Centre | | Office | | | $ | | 106.4 | | | | $ | | 105.5 | |
Weston Business Center | | Industrial | | | | 88.4 | | | | | 87.5 | |
France: | | | | | | |
Printemps de L’Homme | | Retail | | | | 222.3 | | | | | 209.2 | |
Georgia: | | | | | | |
Atlanta Industrial Portfolio | | Industrial | | | | 40.4 | | | | | 42.5 | |
Glenridge Walk | | Apartments | | | | 40.0 | | | | | 37.6 | |
Reserve at Sugarloaf | | Apartments | | | | — | | | | | 43.0 | (1) | |
Shawnee Ridge Industrial Portfolio | | Industrial | | | | 58.6 | | | | | 58.3 | |
Windsor at Lenox Park | | Apartments | | | | 65.2 | (1) | | | | | 55.0 | (1) | |
Illinois: | | | | | | |
Chicago Caleast Industrial Portfolio | | Industrial | | | | 61.7 | | | | | 58.3 | |
Chicago Industrial Portfolio | | Industrial | | | | 67.1 | | | | | 66.2 | |
Parkview Plaza | | Office | | | | 39.8 | | | | | 39.3 | |
Maryland: | | | | | | |
The Shops at Wisconsin Place | | Retail | | | | 98.1 | | | | | 96.3 | |
Massachusetts: | | | | | | |
99 High Street | | Office | | | | 426.3 | (1) | | | | | 386.2 | (1) | |
Northeast RA Industrial Portfolio | | Industrial | | | | 29.4 | | | | | 28.1 | |
Residence at Rivers Edge | | Apartments | | | | 89.9 | | | | | 88.8 | |
501 Boylston Street(7) | | Office | | | | 360.4 | | | | | 289.9 | |
Nevada: | | | | | | |
Fernley Distribution Facility | | Industrial | | | | 6.9 | | | | | 7.3 | |
New Jersey: | | | | | | |
Konica Photo Imaging Headquarters | | Industrial | | | | 20.4 | | | | | 19.1 | |
Marketfair | | Retail | | | | 87.4 | | | | | 72.2 | |
Mohawk Distribution Center | | Industrial | | | | 83.3 | | | | | — | |
Plainsboro Plaza | | Retail | | | | — | | | | | 23.5 | |
South River Road Industrial | | Industrial | | | | 54.3 | | | | | 47.4 | |
New York: | | | | | | |
425 Park Avenue | | Ground Lease | | | | 400.0 | | | | | 330.0 | |
780 Third Avenue | | Office | | | | 365.0 | (1) | | | | | 335.4 | |
The Colorado | | Apartments | | | | 190.5 | (1) | | | | | 161.0 | (1) | |
The Corner | | Apartments | | | | 231.0 | (1) | | | | | 228.0 | (1) | |
Pennsylvania: | | | | | | |
Lincoln Woods | | Apartments | | | | — | | | | | 31.0 | |
The Pepper Building | | Apartments | | | | 50.3 | | | | | 52.5 | |
Tennessee: | | | | | | |
Summit Distribution Center | | Industrial | | | | 16.8 | | | | | 19.6 | |
Texas: | | | | | | |
Dallas Industrial Portfolio | | Industrial | | | | 176.1 | | | | | 164.6 | |
Four Oaks Place | | Land | | | | 36.8 | | | | | 16.2 | |
Houston Apartment Portfolio | | Apartments | | | | 256.3 | (1) | | | | | 244.4 | (1) | |
Lincoln Centre | | Office | | | | 253.5 | (1) | | | | | 230.9 | (1) | |
Pinnacle Industrial Portfolio | | Industrial | | | | 43.8 | | | | | 42.0 | |
South Frisco Village | | Retail | | | | — | | | | | 34.0 | (1) | |
24
TIAA REAL ESTATE ACCOUNT
CONSOLIDATED STATEMENTS OF INVESTMENTS
September 30, 2013 and December 31, 2012
(Dollar values shown in millions)
| | | | | | |
Location/Description | | Type | | Fair Value |
| | 2013 | | 2012 |
| | | | (Unaudited) | | |
The Caruth | | Apartments | | | $ | | 80.7 | (1) | | | | $ | | 78.1 | (1) | |
The Maroneal | | Apartments | | | | 52.6 | | | | | 48.5 | |
Cliffs at Barton Creek | | Apartments | | | | 37.2 | | | | | — | |
United Kingdom: | | | | | | |
1 & 7 Westferry Circus | | Office | | | | — | | | | | 223.5 | (1) | |
Virginia: | | | | | | |
8270 Greensboro Drive | | Office | | | | 41.4 | | | | | 34.0 | |
Ashford Meadows Apartments | | Apartments | | | | 102.8 | (1) | | | | | 100.3 | (1) | |
The Ellipse at Ballston | | Office | | | | 85.2 | | | | | 78.3 | |
The Palatine | | Apartments | | | | 130.0 | (1) | | | | | 134.2 | (1) | |
Washington: | | | | | | |
Circa Green Lake | | Apartments | | | | 85.0 | | | | | 84.0 | |
Creeksides at Centerpoint | | Office | | | | 18.5 | | | | | 20.2 | |
Fourth and Madison | | Office | | | | 432.8 | (1) | | | | | 429.3 | (1) | |
Millennium Corporate Park | | Office | | | | 139.6 | | | | | 139.4 | |
Northwest RA Industrial Portfolio | | Industrial | | | | 26.6 | | | | | 26.0 | |
Pacific Corporate Park | | Industrial | | | | 35.1 | | | | | 35.0 | |
Prescott Wallingford Apartments | | Apartments | | | | 53.6 | | | | | 53.6 | |
Rainier Corporate Park | | Industrial | | | | 85.9 | | | | | 88.5 | |
Regal Logistics Campus | | Industrial | | | | 71.7 | | | | | 69.5 | |
Washington DC: | | | | | | |
1001 Pennsylvania Avenue | | Office | | | | 726.1 | (1) | | | | | 679.4 | (1) | |
1401 H Street, NW | | Office | | | | 232.5 | (1) | | | | | 211.3 | (1) | |
1900 K Street, NW | | Office | | | | 283.0 | | | | | 257.7 | |
Mass Court | | Apartments | | | | 169.3 | (1) | | | | | 169.0 | (1) | |
Mazza Gallerie | | Retail | | | | 74.1 | | | | | 70.0 | |
| | | | | | |
TOTAL REAL ESTATE PROPERTIES
(Cost $10,473.1 and $10,543.6) | | | | | $ | | 11,245.2 | | | | $ | | 10,554.6 | |
| | | | | | |
25
TIAA REAL ESTATE ACCOUNT
CONSOLIDATED STATEMENTS OF INVESTMENTS
September 30, 2013 and December 31, 2012
(Dollar values shown in millions)
OTHER REAL ESTATE-RELATED INVESTMENTS—15.1% and 15.4%
REAL ESTATE JOINT VENTURES—13.2% and 13.4%
| | | | | | |
Location/Description | | Type | | Fair Value |
| | 2013 | | 2012 |
| | | | (Unaudited) | | |
California: | | | | | | |
CA—Colorado Center LP
Colorado Center (50% Account Interest) | | Office | | | $ | | 261.1 | (2) | | | | $ | | 228.4 | (2) | |
CA—Treat Towers LP
Treat Towers (75% Account Interest) | | Office | | | | — | | | | | 2.1 | (5) | |
Valencia Town Center Associates LP
Valencia Town Center (49.9% Account Interest) | | Retail | | | | 103.8 | (2) | | | | | 99.1 | (2) | |
Florida: | | | | | | |
Florida Mall Associates, Ltd
The Florida Mall (50% Account Interest) | | Retail | | | | 441.8 | (2) | | | | | 386.2 | (2) | |
TREA Florida Retail, LLC
Florida Retail Portfolio (80% Account Interest) | | Retail | | | | 115.5 | | | | | 149.6 | |
West Dade County Associates
Miami International Mall (50% Account Interest) | | Retail | | | | 190.6 | | | | | 137.0 | (2) | |
Georgia: | | | | | | |
GA—Buckhead LLC
Prominence in Buckhead (75% Account Interest) | | Office | | | | 0.2 | (5) | | | | | 2.4 | (5) | |
Maryland: | | | | | | |
WP Project Developer
The Shops at Wisconsin Place (33.33% Account Interest) | | Retail | | | | 13.8 | | | | | 14.6 | |
Massachusetts: | | | | | | |
MA—One Boston Place REIT
One Boston Place (50.25% Account Interest) | | Office | | | | 207.4 | | | | | 195.5 | |
New York: | | | | | | |
RGM 42, LLC
MiMA (70% Account Interest) | | Apartments | | | | 290.8 | (2) | | | | | 282.0 | (2) | |
Tennessee: | | | | | | |
West Town Mall, LLC
West Town Mall (50% Account Interest) | | Retail | | | | 72.1 | (2) | | | | | 67.2 | (2) | |
Texas: | | | | | | |
Four Oaks Venture LP
Four Oaks Place LP (51% Account Interest) | | Office | | | | 274.8 | | | | | 261.2 | |
Various: | | | | | | |
DDR TC LLC
DDR Joint Venture (85% Account Interest) | | Retail | | | | 409.8 | (2,3) | | | | | 386.3 | (2,3) | |
Storage Portfolio I, LLC
Storage Portfolio (75% Account Interest) | | Storage | | | | 95.6 | (2,3) | | | | | 78.6 | (2,3) | |
Strategic Ind Portfolio I, LLC
IDI Nationwide Industrial Portfolio (60% Account Interest) | | Industrial | | | | 0.7 | (2,3,6) | | | | | 1.3 | (2,3,6) | |
| | | | | | |
TOTAL REAL ESTATE JOINT VENTURES
(Cost $2,229.8 and $2,287.6) | | | | | $ | | 2,478.0 | | | | $ | | 2,291.5 | |
| | | | | | |
26
TIAA REAL ESTATE ACCOUNT
CONSOLIDATED STATEMENTS OF INVESTMENTS
September 30, 2013 and December 31, 2012
(Dollar values shown in millions)
| | | | |
Location/Description | | Fair Value |
| | 2013 | | 2012 |
| | (Unaudited) | | |
LIMITED PARTNERSHIPS—1.9% and 2.0% | | | | |
Cobalt Industrial REIT (10.998% Account Interest) | | | $ | | 25.0 | | | | $ | | 26.1 | |
Colony Realty Partners LP (5.27% Account Interest) | | | | 20.6 | | | | | 20.5 | |
Heitman Value Partners Fund (8.43% Account Interest) | | | | 0.8 | | | | | 3.9 | |
Lion Gables Apartment Fund (18.46% Account Interest) | | | | 281.8 | | | | | 258.0 | |
Transwestern Mezz Realty Partners III, LLC (11.708% Account Interest) | | | | 31.0 | | | | | 31.3 | |
| | | | |
TOTAL LIMITED PARTNERSHIPS
(Cost $260.1 and $266.2) | | | $ | | 359.2 | | | | $ | | 339.8 | |
| | | | |
TOTAL REAL ESTATE JOINT VENTURES AND LIMITED PARTNERSHIPS (Cost $2,489.9 and $2,553.8) | | | $ | | 2,837.2 | | | | $ | | 2,631.3 | |
| | | | |
27
TIAA REAL ESTATE ACCOUNT
CONSOLIDATED STATEMENTS OF INVESTMENTS
September 30, 2013 and December 31, 2012
(Dollar values shown in millions)
MARKETABLE SECURITIES—25.0% and 22.8%
REAL ESTATE-RELATED MARKETABLE SECURITIES—8.1% and 7.8%
| | | | | | | | |
Shares | | Issuer | | Fair Value |
2013 | | 2012 | | 2013 | | 2012 |
| | | | | | | (Unaudited) | | |
| | 139,832 | | | | | 111,782 | | | Acadia Realty Trust | | | $ | | 3.5 | | | | $ | | 2.8 | |
| | 33,840 | | | | | 30,210 | | | Agree Realty Corporation | | | | 1.0 | | | | | 0.8 | |
| | 5,049 | | | | | 4,959 | | | Alexander’s, Inc. | | | | 1.5 | | | | | 1.6 | |
| | 178,587 | | | | | 151,807 | | | Alexandria Real Estate Equities, Inc. | | | | 11.4 | | | | | 10.5 | |
| | 86,953 | | | | | 94,923 | | | American Assets Trust, Inc. | | | | 2.7 | | | | | 2.7 | |
| | 262,419 | | | | | 250,699 | | | American Campus Communities, Inc. | | | | 9.0 | | | | | 11.6 | |
| | 114,990 | | | | | — | | | American Homes 4 Rent | | | | 1.9 | | | | | — | |
| | 457,300 | | | | | 376,970 | | | American Realty Capital Properties, Inc. | | | | 5.6 | | | | | 4.4 | |
| | 45,810 | | | | | — | | | American Residential Property | | | | 0.8 | | | | | — | |
| | 986,009 | | | | | 944,789 | | | American Tower Corp. | | | | 73.1 | | | | | 73.0 | |
| | 363,223 | | | | | 346,913 | | | Apartment Investment and Management Company | | | | 10.1 | | | | | 9.4 | |
| | 47,530 | | | | | — | | | Armada Hoffler Properties Inc. | | | | 0.5 | | | | | — | |
| | 156,183 | | | | | 164,643 | | | Ashford Hospitality Trust, Inc. | | | | 1.9 | | | | | 1.7 | |
| | 128,225 | | | | | 122,355 | | | Associated Estates Realty Corporation | | | | 1.9 | | | | | 2.0 | |
| | 321,390 | | | | | 270,130 | | | Avalonbay Communities, Inc. | | | | 40.9 | | | | | 36.6 | |
| | 29,210 | | | | | — | | | Aviv REIT, Inc. | | | | 0.7 | | | | | — | |
| | 482,177 | | | | | 366,497 | | | BioMed Realty Trust, Inc. | | | | 9.0 | | | | | 7.1 | |
| | 376,685 | | | | | 356,885 | | | Boston Properties, Inc. | | | | 40.3 | | | | | 37.8 | |
| | 395,829 | | | | | 346,409 | | | Brandywine Realty Trust | | | | 5.2 | | | | | 4.2 | |
| | 189,418 | | | | | 182,748 | | | BRE Properties, Inc. | | | | 9.6 | | | | | 9.3 | |
| | 212,246 | | | | | 200,136 | | | Camden Property Trust | | | | 13.0 | | | | | 13.7 | |
| | 161,828 | | | | | 95,388 | | | Campus Crest Communities, Inc. | | | | 1.8 | | | | | 1.2 | |
| | 212,259 | | | | | 160,579 | | | CapLease, Inc. | | | | 1.8 | | | | | 0.9 | |
| | 426,477 | | | | | 383,657 | | | CBL & Associates Properties, Inc. | | | | 8.1 | | | | | 8.1 | |
| | 183,285 | | | | | 183,285 | | | Cedar Shopping Centers, Inc. | | | | 0.9 | | | | | 1.0 | |
| | 551,900 | | | | | — | | | Chambers Street Properties | | | | 4.8 | | | | | — | |
| | 57,737 | | | | | 39,517 | | | Chatham Lodging Trust | | | | 1.0 | | | | | 0.6 | |
| | 123,712 | | | | | 96,842 | | | Chesapeake Lodging Trust | | | | 2.9 | | | | | 2.0 | |
| | 1,174,270 | | | | | — | | | Cole Real Estate Investments | | | | 14.4 | | | | | — | |
| | 200,614 | | | | | 209,214 | | | Colonial Properties Trust | | | | 4.5 | | | | | 4.5 | |
| | 294,418 | | | | | 198,258 | | | CommonWealth REIT | | | | 6.5 | | | | | 3.1 | |
| | 55,183 | | | | | 54,983 | | | CoreSite Realty Corporation | | | | 1.9 | | | | | 1.5 | |
| | 207,453 | | | | | 192,453 | | | Corporate Office Properties Trust | | | | 4.8 | | | | | 4.8 | |
| | 277,710 | | | | | — | | | Corrections Corporation of America | | | | 9.6 | | | | | — | |
| | 435,676 | | | | | 253,566 | | | Cousins Properties Incorporated | | | | 4.5 | | | | | 2.1 | |
| | 336,620 | | | | | 297,270 | | | Cubesmart | | | | 6.0 | | | | | 4.3 | |
| | 44,330 | | | | | — | | | CyrusOne Inc | | | | 0.8 | | | | | — | |
| | 797,530 | | | | | 631,210 | | | DCT Industrial Trust, Inc. | | | | 5.7 | | | | | 4.1 | |
| | 633,688 | | | | | 737,598 | | | DDR Corp | | | | 10.0 | | | | | 11.6 | |
| | 489,827 | | | | | 476,317 | | | DiamondRock Hospitality Company | | | | 5.2 | | | | | 4.3 | |
| | 320,872 | | | | | 293,762 | | | Digital Realty Trust, Inc. | | | | 17.0 | | | | | 19.9 | |
| | 326,594 | | | | | 249,384 | | | Douglas Emmett, Inc. | | | | 7.7 | | | | | 5.8 | |
| | 809,306 | | | | | 655,776 | | | Duke Realty Corporation | | | | 12.5 | | | | | 9.1 | |
| | 161,116 | | | | | 154,886 | | | DuPont Fabros Technology, Inc. | | | | 4.2 | | | | | 3.7 | |
| | 74,049 | | | | | 69,659 | | | EastGroup Properties, Inc. | | | | 4.4 | | | | | 3.7 | |
| | 293,651 | | | | | 277,561 | | | Education Realty Trust, Inc. | | | | 2.7 | | | | | 3.0 | |
| | 187,246 | | | | | 99,898 | | | Equity Lifestyle Properties, Inc. | | | | 6.4 | | | | | 6.7 | |
| | 143,936 | | | | | 139,076 | | | Equity One, Inc. | | | | 3.1 | | | | | 2.9 | |
28
TIAA REAL ESTATE ACCOUNT
CONSOLIDATED STATEMENTS OF INVESTMENTS
September 30, 2013 and December 31, 2012
(Dollar values shown in millions)
| | | | | | | | |
Shares | | Issuer | | Fair Value |
2013 | | 2012 | | 2013 | | 2012 |
| | | | | | | (Unaudited) | | |
| | 886,664 | | | | | 773,034 | | | Equity Residential | | | $ | | 47.5 | | | | $ | | 43.8 | |
| | 117,232 | | | | | 112,092 | | | EPR Properties | | | | 5.7 | | | | | 5.2 | |
| | 94,079 | | | | | 86,689 | | | Essex Property Trust, Inc. | | | | 13.9 | | | | | 12.7 | |
| | 119,155 | | | | | 90,725 | | | Excel Trust, Inc. | | | | 1.4 | | | | | 1.1 | |
| | 258,002 | | | | | 260,722 | | | Extra Space Storage, Inc. | | | | 11.8 | | | | | 9.5 | |
| | 162,766 | | | | | 153,346 | | | Federal Realty Investment Trust | | | | 16.5 | | | | | 16.0 | |
| | 300,775 | | | | | 300,415 | | | FelCor Lodging Trust Incorporated | | | | 1.9 | | | | | 1.4 | |
| | 273,923 | | | | | 237,873 | | | First Industrial Realty Trust, Inc. | | | | 4.5 | | | | | 3.3 | |
| | 151,941 | | | | | 124,191 | | | First Potomac Realty Trust | | | | 1.9 | | | | | 1.5 | |
| | 225,189 | | | | | 200,089 | | | Franklin Street Properties Corp. | | | | 2.9 | | | | | 2.5 | |
| | 1,375,179 | | | | | 1,118,209 | | | General Growth Properties, Inc. | | | | 26.5 | | | | | 22.2 | |
| | 171,490 | | | | | — | | | GEO Group Inc/The | | | | 5.7 | | | | | — | |
| | 63,548 | | | | | 61,368 | | | Getty Realty Corp. | | | | 1.2 | | | | | 1.1 | |
| | 34,020 | | | | | 27,330 | | | Gladstone Commercial Corporation | | | | 0.6 | | | | | 0.5 | |
| | 360,422 | | | | | 337,882 | | | Glimcher Realty Trust | | | | 3.5 | | | | | 3.7 | |
| | 139,597 | | | | | 96,757 | | | Government Properties Income Trust | | | | 3.3 | | | | | 2.3 | |
| | 1,128,719 | | | | | 1,078,709 | | | HCP, Inc. | | | | 46.2 | | | | | 48.7 | |
| | 708,958 | | | | | 616,402 | | | Health Care REIT, Inc. | | | | 44.2 | | | | | 37.8 | |
| | 109,880 | | | | | 111,500 | | | Healthcare Trust of America | | | | 1.2 | | | | | 1.1 | |
| | 241,762 | | | | | 209,252 | | | Healthcare Realty Trust Incorporated | | | | 5.6 | | | | | 5.0 | |
| | 441,823 | | | | | 478,813 | | | Hersha Hospitality Trust | | | | 2.5 | | | | | 2.4 | |
| | 224,539 | | | | | 184,529 | | | Highwoods Properties, Inc. | | | | 7.9 | | | | | 6.2 | |
| | 140,210 | | | | | 121,160 | | | Home Properties, Inc. | | | | 8.1 | | | | | 7.4 | |
| | 350,350 | | | | | 297,940 | | | Hospitality Properties Trust | | | | 9.9 | | | | | 7.0 | |
| | 1,857,264 | | | | | 1,712,374 | | | Host Hotels & Resorts, Inc. | | | | 32.8 | | | | | 26.8 | |
| | 106,312 | | | | | 86,872 | | | Hudson Pacific Properties, Inc. | | | | 2.1 | | | | | 1.8 | |
| | 216,059 | | | | | 220,139 | | | Inland Real Estate Corporation | | | | 2.2 | | | | | 1.8 | |
| | 256,491 | | | | | 223,541 | | | Investors Real Estate Trust | | | | 2.1 | | | | | 2.0 | |
| | 1,500,000 | | | | | 1,500,000 | | | iShares Dow Jones US Real Estate Index Fund | | | | 95.6 | | | | | 97.1 | |
| | 189,243 | | | | | 177,253 | | | Kilroy Realty Corporation | | | | 9.5 | | | | | 8.4 | |
| | 1,013,463 | | | | | 966,453 | | | Kimco Realty Corporation | | | | 20.5 | | | | | 18.7 | |
| | 242,483 | | | | | 172,013 | | | Kite Realty Group Trust | | | | 1.4 | | | | | 1.0 | |
| | 237,792 | | | | | 204,562 | | | LaSalle Hotel Properties | | | | 6.8 | | | | | 5.2 | |
| | 543,895 | | | | | 423,245 | | | Lexington Realty Trust | | | | 6.1 | | | | | 4.4 | |
| | 357,550 | | | | | 280,060 | | | Liberty Property Trust | | | | 12.7 | | | | | 10.0 | |
| | 87,896 | | | | | 73,286 | | | LTC Properties, Inc. | | | | 3.3 | | | | | 2.6 | |
| | 220,933 | | | | | 208,783 | | | Mack-Cali Realty Corporation | | | | 4.9 | | | | | 5.5 | |
| | 141,919 | | | | | 141,919 | | | Maguire Properties, Inc. | | | | 0.4 | | | | | 0.4 | |
| | 407,967 | | | | | 327,007 | | | Medical Properties Trust, Inc. | | | | 5.0 | | | | | 3.9 | |
| | 105,184 | | | | | 99,184 | | | Mid-America Apartment Communities, Inc. | | | | 6.6 | | | | | 6.4 | |
| | 102,977 | | | | | 108,037 | | | Monmouth Real Estate Investment Corporation | | | | 0.9 | | | | | 1.1 | |
| | 61,794 | | | | | 66,724 | | | National Health Investors, Inc. | | | | 3.5 | | | | | 3.8 | |
| | 303,970 | | | | | 262,980 | | | National Retail Properties, Inc. | | | | 9.7 | | | | | 8.2 | |
| | 291,533 | | | | | 263,613 | | | Omega Healthcare Investors, Inc. | | | | 8.7 | | | | | 6.3 | |
| | 31,357 | | | | | 40,857 | | | One Liberty Properties, Inc. | | | | 0.6 | | | | | 0.8 | |
| | 111,749 | | | | | 83,079 | | | Parkway Properties, Inc. | | | | 2.0 | | | | | 1.2 | |
| | 153,837 | | | | | 144,447 | | | Pebblebrook Hotel Trust | | | | 4.4 | | | | | 3.3 | |
| | 162,035 | | | | | 136,245 | | | Pennsylvania Real Estate Investment Trust | | | | 3.0 | | | | | 2.4 | |
| | 23,540 | | | | | — | | | Physicians Realty Investment Trust | | | | 0.3 | | | | | — | |
| | 416,642 | | | | | 400,132 | | | Piedmont Office Realty Trust, Inc. | | | | 7.2 | | | | | 7.2 | |
29
TIAA REAL ESTATE ACCOUNT
CONSOLIDATED STATEMENTS OF INVESTMENTS
September 30, 2013 and December 31, 2012
(Dollar values shown in millions)
| | | | | | | | |
Shares | | Issuer | | Fair Value |
2013 | | 2012 | | 2013 | | 2012 |
| | | | | | | (Unaudited) | | |
| | 403,607 | | | | | 387,897 | | | Plum Creek Timber Company, Inc. | | | $ | | 18.9 | | | | $ | | 17.2 | |
| | 133,253 | | | | | 129,083 | | | Post Properties, Inc. | | | | 6.0 | | | | | 6.5 | |
| | 92,248 | | | | | 98,748 | | | Potlatch Corporation | | | | 3.7 | | | | | 3.9 | |
| | 1,241,751 | | | | | 1,092,281 | | | ProLogis | | | | 46.7 | | | | | 39.9 | |
| | 44,010 | | | | | 42,980 | | | PS Business Parks, Inc. | | | | 3.3 | | | | | 2.8 | |
| | 355,269 | | | | | 303,799 | | | Public Storage, Inc. | | | | 57.0 | | | | | 44.0 | |
| | 150,090 | | | | | 115,370 | | | Ramco-Gershenson Properties Trust | | | | 2.3 | | | | | 1.5 | |
| | 312,549 | | | | | 291,439 | | | Rayonier, Inc. | | | | 17.4 | | | | | 15.1 | |
| | 488,164 | | | | | 316,623 | | | Realty Income Corporation | | | | 19.4 | | | | | 12.7 | |
| | 178,566 | | | | | 126,316 | | | Retail Opportunity Investment | | | | 2.5 | | | | | 1.6 | |
| | 468,255 | | | | | 315,375 | | | Retail Properties of America | | | | 6.4 | | | | | 3.8 | |
| | 226,468 | | | | | 213,778 | | | Regency Centers Corporation | | | | 10.9 | | | | | 10.1 | |
| | 39,760 | | | | | — | | | Rexford Industrial Realty Inc. | | | | 0.5 | | | | | — | |
| | 305,364 | | | | | 251,880 | | | RLJ Lodging Trust | | | | 7.2 | | | | | 4.9 | |
| | 53,113 | | | | | 60,523 | | | Rouse Properties, Inc. | | | | 1.1 | | | | | 1.0 | |
| | 132,720 | | | | | — | | | Ryman Hospitality Properties | | | | 4.6 | | | | | — | |
| | 32,736 | | | | | 38,426 | | | Saul Centers, Inc. | | | | 1.5 | | | | | 1.7 | |
| | 71,680 | | | | | 46,820 | | | Select Income Real Estate Investment Trust | | | | 1.8 | | | | | 1.2 | |
| | 471,147 | | | | | 420,127 | | | Senior Housing Properties Trust | | | | 11.0 | | | | | 9.9 | |
| | 93,740 | | | | | — | | | Silver Bay Realty Trust Corp | | | | 1.5 | | | | | — | |
| | 763,696 | | | | | 731,366 | | | Simon Property Group, Inc. | | | | 113.2 | | | | | 115.6 | |
| | 227,135 | | | | | 214,765 | | | SL Green Realty Corp. | | | | 20.2 | | | | | 16.5 | |
| | 78,699 | | | | | 70,949 | | | Sovran Self Storage, Inc. | | | | 6.0 | | | | | 4.4 | |
| | 885,451 | | | | | 79,685 | | | Spirit Realty Capital Inc. | | | | 8.1 | | | | | 1.4 | |
| | 104,960 | | | | | 86,560 | | | Stag Industrial, Inc. | | | | 2.1 | | | | | 1.6 | |
| | 417,139 | | | | | 495,039 | | | Strategic Hotels & Resorts, Inc. | | | | 3.6 | | | | | 3.2 | |
| | 165,518 | | | | | 114,628 | | | Summit Hotel Properties, Inc. | | | | 1.5 | | | | | 1.1 | |
| | 85,816 | | | | | 71,926 | | | Sun Communities, Inc. | | | | 3.7 | | | | | 2.9 | |
| | 95,403 | | | | | 89,143 | | | Sun Healthcare Group, Inc. | | | | 2.2 | | | | | 1.9 | |
| | 409,166 | | | | | 328,016 | | | Sunstone Hotel Investors, L.L.C. | | | | 5.2 | | | | | 3.5 | |
| | 231,504 | | | | | 223,024 | | | Tanger Factory Outlet Centers, Inc. | | | | 7.6 | | | | | 7.6 | |
| | 157,399 | | | | | 147,289 | | | Taubman Centers, Inc. | | | | 10.6 | | | | | 11.6 | |
| | 59,134 | | | | | 36,064 | | | Terreno Realty Corporation | | | | 1.1 | | | | | 0.6 | |
| | 350,982 | | | | | 325,632 | | | The Macerich Company | | | | 19.8 | | | | | 19.0 | |
| | 625,661 | | | | | 596,001 | | | UDR, Inc. | | | | 14.8 | | | | | 14.2 | |
| | 31,724 | | | | | 31,724 | | | UMH Properties, Inc. | | | | 0.3 | | | | | 0.3 | |
| | 31,798 | | | | | 31,418 | | | Universal Health Realty Income Trust | | | | 1.3 | | | | | 1.6 | |
| | 58,833 | | | | | 56,293 | | | Urstadt Biddle Properties, Inc. | | | | 1.2 | | | | | 1.1 | |
| | 733,348 | | | | | 700,308 | | | Ventas, Inc. | | | | 45.1 | | | | | 45.3 | |
| | 416,053 | | | | | 443,493 | | | Vornado Realty Trust | | | | 35.0 | | | | | 35.5 | |
| | 164,207 | | | | | 160,177 | | | Washington Real Estate Investment Trust | | | | 4.1 | | | | | 4.2 | |
| | 273,110 | | | | | 288,060 | | | Weingarten Realty Investors | | | | 8.0 | | | | | 7.7 | |
| | 1,446,418 | | | | | 1,289,368 | | | Weyerhaeuser Company | | | | 41.4 | | | | | 35.9 | |
| | 45,930 | | | | | 26,270 | | | Whitestone Real Estate Investment Trust B | | | | 0.7 | | | | | 0.4 | |
| | 80,257 | | | | | 66,697 | | | Winthrop Realty Trust | | | | 0.9 | | | | | 0.7 | |
| | 145,290 | | | | | 114,000 | | | WP Carey Inc. | | | | 9.4 | | | | | 5.9 | |
| | | | | | | | | |
TOTAL REAL ESTATE-RELATED MARKETABLE SECURITIES
(Cost $1,376.1 and $1,175.7) | | | $ | | 1,514.3 | | | | $ | | 1,332.3 | |
| | | | | | | | | |
30
TIAA REAL ESTATE ACCOUNT
CONSOLIDATED STATEMENTS OF INVESTMENTS
September 30, 2013 and December 31, 2012
(Dollar values shown in millions)
OTHER MARKETABLE SECURITIES—16.9% and 15.0%
GOVERNMENT AGENCY NOTES—9.5% and 8.0%
| | | | | | | | | | | | |
Principal | | Issuer | | Yield(4) | | Maturity
Date | | Fair Value |
2013 | | 2012 | | 2013 | | 2012 |
| | | | | | | | | | | (Unaudited) | | |
| $ | | — | | | | $ | | 12.0 | | | Fannie Mae Discount Notes | | | | 0.122% | | | | | 1/2/2013 | | | | $ | | — | | | | $ | | 12.0 | |
| | — | | | | | 44.0 | | | Fannie Mae Discount Notes | | | | 0.086% | | | | | 1/16/2013 | | | | | — | | | | | 44.0 | |
| | — | | | | | 20.5 | | | Fannie Mae Discount Notes | | | | 0.122% | | | | | 1/30/2013 | | | | | — | | | | | 20.5 | |
| | — | | | | | 45.2 | | | Fannie Mae Discount Notes | | | | 0.137% | | | | | 2/6/2013 | | | | | — | | | | | 45.1 | |
| | — | | | | | 26.8 | | | Fannie Mae Discount Notes | | | | 0.127% | | | | | 2/27/2013 | | | | | — | | | | | 26.8 | |
| | — | | | | | 25.0 | | | Fannie Mae Discount Notes | | | | 0.130% | | | | | 3/13/2013 | | | | | — | | | | | 25.0 | |
| | — | | | | | 10.0 | | | Fannie Mae Discount Notes | | | | 0.142% | | | | | 3/20/2013 | | | | | — | | | | | 10.0 | |
| | — | | | | | 100.0 | | | Fannie Mae Discount Notes | | | | 0.149% | | | | | 6/12/2013 | | | | | — | | | | | 100.0 | |
| | 25.0 | | | | | — | | | Fannie Mae Discount Notes | | | | 0.101% | | | | | 10/1/2013 | | | | | 25.0 | | | | | — | |
| | 46.0 | | | | | — | | | Fannie Mae Discount Notes | | | | 0.030%-0.076% | | | | | 10/2/2013 | | | | | 45.9 | | | | | — | |
| | 20.8 | | | | | — | | | Fannie Mae Discount Notes | | | | 0.117% | | | | | 10/9/2013 | | | | | 20.8 | | | | | — | |
| | 57.2 | | | | | — | | | Fannie Mae Discount Notes | | | | 0.051% | | | | | 10/16/2013 | | | | | 57.2 | | | | | — | |
| | 5.2 | | | | | — | | | Fannie Mae Discount Notes | | | | 0.096% | | | | | 10/23/2013 | | | | | 5.2 | | | | | — | |
| | 50.0 | | | | | — | | | Fannie Mae Discount Notes | | | | 0.091% | | | | | 10/25/2013 | | | | | 50.0 | | | | | — | |
| | 50.0 | | | | | — | | | Fannie Mae Discount Notes | | | | 0.101% | | | | | 11/6/2013 | | | | | 50.0 | | | | | — | |
| | 11.8 | | | | | — | | | Fannie Mae Discount Notes | | | | 0.122% | | | | | 11/20/2013 | | | | | 11.8 | | | | | — | |
| | 32.7 | | | | | — | | | Fannie Mae Discount Notes | | | | 0.056% | | | | | 11/26/2013 | | | | | 32.7 | | | | | — | |
| | 41.0 | | | | | — | | | Fannie Mae Discount Notes | | | | 0.051% | | | | | 11/27/2013 | | | | | 41.0 | | | | | — | |
| | 10.7 | | | | | — | | | Fannie Mae Discount Notes | | | | 0.127% | | | | | 12/4/2013 | | | | | 10.6 | | | | | — | |
| | 32.1 | | | | | — | | | Fannie Mae Discount Notes | | | | 0.056%-0.122% | | | | | 12/11/2013 | | | | | 32.1 | | | | | — | |
| | 20.0 | | | | | — | | | Fannie Mae Discount Notes | | | | 0.076% | | | | | 12/12/2013 | | | | | 20.0 | | | | | — | |
| | 23.5 | | | | | — | | | Fannie Mae Discount Notes | | | | 0.071% | | | | | 12/17/2013 | | | | | 23.5 | | | | | — | |
| | 33.1 | | | | | — | | | Fannie Mae Discount Notes | | | | 0.023%-0.112% | | | | | 12/18/2013 | | | | | 33.1 | | | | | — | |
| | 3.5 | | | | | — | | | Fannie Mae Discount Notes | | | | 0.112% | | | | | 1/21/2014 | | | | | 3.5 | | | | | — | |
| | 6.0 | | | | | — | | | Fannie Mae Discount Notes | | | | 0.035% | | | | | 1/22/2014 | | | | | 6.0 | | | | | — | |
| | 5.0 | | | | | — | | | Fannie Mae Discount Notes | | | | 0.066% | | | | | 2/5/2014 | | | | | 5.0 | | | | | — | |
| | — | | | | | 13.0 | | | Federal Farm Credit Bank Discount Notes | | | | 0.091% | | | | | 5/6/2013 | | | | | — | | | | | 13.0 | |
| | — | | | | | 29.3 | | | Federal Home Loan Bank Discount Notes | | | | 0.117% | | | | | 1/4/2013 | | | | | — | | | | | 29.3 | |
| | — | | | | | 50.0 | | | Federal Home Loan Bank Discount Notes | | | | 0.106% | | | | | 1/9/2013 | | | | | — | | | | | 50.0 | |
| | — | | | | | 16.5 | | | Federal Home Loan Bank Discount Notes | | | | 0.137% | | | | | 1/11/2013 | | | | | — | | | | | 16.5 | |
| | — | | | | | 8.0 | | | Federal Home Loan Bank Discount Notes | | | | 0.132% | | | | | 1/16/2013 | | | | | — | | | | | 8.0 | |
| | — | | | | | 41.9 | | | Federal Home Loan Bank Discount Notes | | | | 0.157% | | | | | 1/23/2013 | | | | | — | | | | | 41.9 | |
| | — | | | | | 29.0 | | | Federal Home Loan Bank Discount Notes | | | | 0.142% | | | | | 1/23/2013 | | | | | — | | | | | 29.0 | |
| | — | | | | | 50.0 | | | Federal Home Loan Bank Discount Notes | | | | 0.142% | | | | | 2/13/2013 | | | | | — | | | | | 50.0 | |
| | — | | | | | 19.4 | | | Federal Home Loan Bank Discount Notes | | | | 0.137% | | | | | 2/20/2013 | | | | | — | | | | | 19.4 | |
| | — | | | | | 56.0 | | | Federal Home Loan Bank Discount Notes | | | | 0.127% | | | | | 2/22/2013 | | | | | — | | | | | 56.0 | |
| | — | | | | | 80.0 | | | Federal Home Loan Bank Discount Notes | | | | 0.127% | | | | | 3/1/2013 | | | | | — | | | | | 80.0 | |
| | — | | | | | 57.0 | | | Federal Home Loan Bank Discount Notes | | | | 0.112% | | | | | 3/6/2013 | | | | | — | | | | | 57.0 | |
| | — | | | | | 17.1 | | | Federal Home Loan Bank Discount Notes | | | | 0.117% | | | | | 3/13/2013 | | | | | — | | | | | 17.1 | |
| | — | | | | | 41.6 | | | Federal Home Loan Bank Discount Notes | | | | 0.147% | | | | | 5/3/2013 | | | | | — | | | | | 41.5 | |
| | — | | | | | 11.5 | | | Federal Home Loan Bank Discount Notes | | | | 0.096%-0.157% | | | | | 5/10/2013 | | | | | — | | | | | 11.5 | |
| | — | | | | | 52.7 | | | Federal Home Loan Bank Discount Notes | | | | 0.157%-0.162% | | | | | 5/29/2013 | | | | | — | | | | | 52.7 | |
| | — | | | | | 50.0 | | | Federal Home Loan Bank Discount Notes | | | | 0.127% | | | | | 6/19/2013 | | | | | — | | | | | 50.0 | |
| | 61.8 | | | | | — | | | Federal Home Loan Bank Discount Notes | | | | 0.061%-0.091% | | | | | 10/4/2013 | | | | | 61.8 | | | | | — | |
| | 50.0 | | | | | — | | | Federal Home Loan Bank Discount Notes | | | | 0.051% | | | | | 10/7/2013 | | | | | 50.0 | | | | | — | |
| | 30.0 | | | | | — | | | Federal Home Loan Bank Discount Notes | | | | 0.066% | | | | | 10/9/2013 | | | | | 30.0 | | | | | — | |
| | 100.0 | | | | | — | | | Federal Home Loan Bank Discount Notes | | | | 0.060% | | | | | 10/18/2013 | | | | | 100.0 | | | | | — | |
31
TIAA REAL ESTATE ACCOUNT
CONSOLIDATED STATEMENTS OF INVESTMENTS
September 30, 2013 and December 31, 2012
(Dollar values shown in millions)
| | | | | | | | | | | | |
Principal | | Issuer | | Yield(4) | | Maturity
Date | | Fair Value |
2013 | | 2012 | | 2013 | | 2012 |
| | | | | | | | | | | (Unaudited) | | |
| $ | | 25.0 | | | | $ | | — | | | Federal Home Loan Bank Discount Notes | | | | 0.041% | | | | | 10/23/2013 | | | | $ | | 25.0 | | | | $ | | — | |
| | 44.0 | | | | | — | | | Federal Home Loan Bank Discount Notes | | | | 0.071% | | | | | 11/8/2013 | | | | | 44.0 | | | | | — | |
| | 28.5 | | | | | — | | | Federal Home Loan Bank Discount Notes | | | | 0.030% | | | | | 11/13/2013 | | | | | 28.5 | | | | | — | |
| | 30.0 | | | | | — | | | Federal Home Loan Bank Discount Notes | | | | 0.046% | | | | | 11/22/2013 | | | | | 30.0 | | | | | — | |
| | 50.7 | | | | | — | | | Federal Home Loan Bank Discount Notes | | | | 0.048%-0.127% | | | | | 12/6/2013 | | | | | 50.7 | | | | | — | |
| | 30.0 | | | | | — | | | Federal Home Loan Bank Discount Notes | | | | 0.137% | | | | | 12/19/2013 | | | | | 30.0 | | | | | — | |
| | 34.0 | | | | | — | | | Federal Home Loan Bank Discount Notes | | | | 0.020% | | | | | 12/20/2013 | | | | | 34.0 | | | | | — | |
| | 10.0 | | | | | — | | | Federal Home Loan Bank Discount Notes | | | | 0.137% | | | | | 12/26/2013 | | | | | 10.0 | | | | | — | |
| | 18.0 | | | | | — | | | Federal Home Loan Bank Discount Notes | | | | 0.051%-0.122% | | | | | 12/27/2013 | | | | | 18.0 | | | | | — | |
| | 10.0 | | | | | — | �� | | Federal Home Loan Bank Discount Notes | | | | 0.096% | | | | | 2/21/2014 | | | | | 10.0 | | | | | — | |
| | 45.0 | | | | | — | | | Federal Home Loan Bank Discount Notes | | | | 0.066% | | | | | 3/21/2014 | | | | | 45.0 | | | | | — | |
| | 50.0 | | | | | — | | | Federal Home Loan Bank Discount Notes | | | | 0.071% | | | | | 3/28/2014 | | | | | 50.0 | | | | | — | |
| | — | | | | | 22.3 | | | Freddie Mac Discount Notes | | | | 0.178% | | | | | 1/3/2013 | | | | | — | | | | | 22.3 | |
| | — | | | | | 17.1 | | | Freddie Mac Discount Notes | | | | 0.173% | | | | | 1/7/2013 | | | | | — | | | | | 17.1 | |
| | — | | | | | 37.6 | | | Freddie Mac Discount Notes | | | | 0.152% | | | | | 1/14/2013 | | | | | — | | | | | 37.6 | |
| | — | | | | | 74.0 | | | Freddie Mac Discount Notes | | | | 0.142% | | | | | 1/22/2013 | | | | | — | | | | | 74.0 | |
| | — | | | | | 50.0 | | | Freddie Mac Discount Notes | | | | 0.132% | | | | | 2/11/2013 | | | | | — | | | | | 50.0 | |
| | — | | | | | 44.4 | | | Freddie Mac Discount Notes | | | | 0.117%-0.122% | | | | | 2/19/2013 | | | | | — | | | | | 44.4 | |
| | — | | | | | 44.0 | | | Freddie Mac Discount Notes | | | | 0.127% | | | | | 2/25/2013 | | | | | — | | | | | 44.0 | |
| | — | | | | | 14.0 | | | Freddie Mac Discount Notes | | | | 0.127% | | | | | 2/27/2013 | | | | | — | | | | | 14.0 | |
| | — | | | | | 50.0 | | | Freddie Mac Discount Notes | | | | 0.152% | | | | | 3/12/2013 | | | | | — | | | | | 50.0 | |
| | — | | | | | 19.9 | | | Freddie Mac Discount Notes | | | | 0.132% | | | | | 3/18/2013 | | | | | — | | | | | 19.9 | |
| | — | | | | | 25.0 | | | Freddie Mac Discount Notes | | | | 0.137% | | | | | 4/1/2013 | | | | | — | | | | | 25.0 | |
| | — | | | | | 25.1 | | | Freddie Mac Discount Notes | | | | 0.132% | | | | | 4/3/2013 | | | | | — | | | | | 25.0 | |
| | — | | | | | 50.0 | | | Freddie Mac Discount Notes | | | | 0.152% | | | | | 4/17/2013 | | | | | — | | | | | 50.0 | |
| | 37.5 | | | | | — | | | Freddie Mac Discount Notes | | | | 0.010%-0.112% | | | | | 10/21/2013 | | | | | 37.5 | | | | | — | |
| | 100.0 | | | | | — | | | Freddie Mac Discount Notes | | | | 0.101% | | | | | 10/22/2013 | | | | | 100.0 | | | | | — | |
| | 30.2 | | | | | — | | | Freddie Mac Discount Notes | | | | 0.096%-0.117% | | | | | 10/28/2013 | | | | | 30.1 | | | | | — | |
| | 48.0 | | | | | — | | | Freddie Mac Discount Notes | | | | 0.076% | | | | | 11/5/2013 | | | | | 48.0 | | | | | — | |
| | 20.1 | | | | | — | | | Freddie Mac Discount Notes | | | | 0.056% | | | | | 11/6/2013 | | | | | 20.1 | | | | | — | |
| | 34.0 | | | | | — | | | Freddie Mac Discount Notes | | | | 0.056%-0.099% | | | | | 11/12/2013 | | | | | 34.0 | | | | | — | |
| | 44.3 | | | | | — | | | Freddie Mac Discount Notes | | | | 0.096%-0.127% | | | | | 11/18/2013 | | | | | 44.2 | | | | | — | |
| | 3.5 | | | | | — | | | Freddie Mac Discount Notes | | | | 0.046%-0.127% | | | | | 11/25/2013 | | | | | 3.4 | | | | | — | |
| | 29.3 | | | | | — | | | Freddie Mac Discount Notes | | | | 0.122% | | | | | 12/2/2013 | | | | | 29.3 | | | | | — | |
| | 13.5 | | | | | — | | | Freddie Mac Discount Notes | | | | 0.107% | | | | | 12/3/2013 | | | | | 13.5 | | | | | — | |
| | 40.9 | | | | | — | | | Freddie Mac Discount Notes | | | | 0.041%-0.139% | | | | | 12/9/2013 | | | | | 40.9 | | | | | — | |
| | 51.0 | | | | | — | | | Freddie Mac Discount Notes | | | | 0.081%-0.132% | | | | | 12/16/2013 | | | | | 50.9 | | | | | — | |
| | 3.0 | | | | | — | | | Freddie Mac Discount Notes | | | | 0.025% | | | | | 12/23/2013 | | | | | 3.0 | | | | | — | |
| | 14.6 | | | | | — | | | Freddie Mac Discount Notes | | | | 0.101% | | | | | 12/30/2013 | | | | | 14.6 | | | | | — | |
| | 15.1 | | | | | — | | | Freddie Mac Discount Notes | | | | 0.086% | | | | | 1/13/2014 | | | | | 15.1 | | | | | — | |
| | 20.0 | | | | | — | | | Freddie Mac Discount Notes | | | | 0.035% | | | | | 1/22/2014 | | | | | 20.0 | | | | | — | |
| | 13.2 | | | | | — | | | Freddie Mac Discount Notes | | | | 0.147% | | | | | 1/23/2014 | | | | | 13.2 | | | | | — | |
| | 14.0 | | | | | — | | | Freddie Mac Discount Notes | | | | 0.127% | | | | | 2/4/2014 | | | | | 14.0 | | | | | — | |
| | 62.8 | | | | | — | | | Freddie Mac Discount Notes | | | | 0.061%-0.066% | | | | | 3/10/2014 | | | | | 62.8 | | | | | — | |
| | 33.0 | | | | | — | | | Freddie Mac Discount Notes | | | | 0.064% | | | | | 3/24/2014 | | | | | 33.0 | | | | | — | |
| | 15.0 | | | | | — | | | Freddie Mac Discount Notes | | | | 0.061% | | | | | 4/4/2014 | | | | | 15.0 | | | | | — | |
| | 41.0 | | | | | — | | | Freddie Mac Discount Notes | | | | 0.112% | | | | | 4/24/2014 | | | | | 41.0 | | | | | — | |
| | | | | | | | | | | | | |
TOTAL GOVERNMENT AGENCY NOTES
(Cost $1,773.8 and $1,379.4) | | | $ | | 1,774.0 | | | | $ | | 1,379.6 | |
| | | | | | | | | | | | | |
32
TIAA REAL ESTATE ACCOUNT
CONSOLIDATED STATEMENTS OF INVESTMENTS
September 30, 2013 and December 31, 2012
(Dollar values shown in millions)
UNITED STATES TREASURY SECURITIES—7.4% and 7.0%
| | | | | | | | | | | | |
Principal | | Issuer | | Yield(4) | | Maturity
Date | | Fair Value |
2013 | | 2012 | | 2013 | | 2012 |
| | | | | | | | | | | (Unaudited) | | |
| $ | | — | | | | $ | | 50.0 | | | United States Treasury Bills | | | | 0.074%-0.103% | | | | | 1/10/2013 | | | | $ | | — | | | | $ | | 50.0 | |
| | — | | | | | 48.0 | | | United States Treasury Bills | | | | 0.084%-0.132% | | | | | 1/17/2013 | | | | | — | | | | | 48.0 | |
| | — | | | | | 1.5 | | | United States Treasury Bills | | | | 0.135% | | | | | 1/31/2013 | | | | | — | | | | | 1.5 | |
| | — | | | | | 97.5 | | | United States Treasury Bills | | | | 0.122%-0.153% | | | | | 2/7/2013 | | | | | — | | | | | 97.5 | |
| | — | | | | | 50.0 | | | United States Treasury Bills | | | | 0.104% | | | | | 2/21/2013 | | | | | — | | | | | 50.0 | |
| | — | | | | | 30.7 | | | United States Treasury Bills | | | | 0.128% | | | | | 3/7/2013 | | | | | — | | | | | 30.7 | |
| | — | | | | | 39.1 | | | United States Treasury Bills | | | | 0.086%-0.135% | | | | | 3/14/2013 | | | | | — | | | | | 39.1 | |
| | — | | | | | 51.0 | | | United States Treasury Bills | | | | 0.050%-0.143% | | | | | 3/21/2013 | | | | | — | | | | | 51.0 | |
| | — | | | | | 50.0 | | | United States Treasury Bills | | | | 0.144% | | | | | 3/28/2013 | | | | | — | | | | | 50.0 | |
| | — | | | | | 2.0 | | | United States Treasury Bills | | | | 0.070%-0.106% | | | | | 4/4/2013 | | | | | — | | | | | 2.0 | |
| | — | | | | | 50.0 | | | United States Treasury Bills | | | | 0.122% | | | | | 4/11/2013 | | | | | — | | | | | 50.0 | |
| | — | | | | | 30.0 | | | United States Treasury Bills | | | | 0.112% | | | | | 4/18/2013 | | | | | — | | | | | 30.0 | |
| | — | | | | | 50.0 | | | United States Treasury Bills | | | | 0.072%-0.116% | | | | | 4/25/2013 | | | | | — | | | | | 50.0 | |
| | — | | | | | 16.5 | | | United States Treasury Bills | | | | 0.061%-0.080% | | | | | 5/2/2013 | | | | | — | | | | | 16.5 | |
| | — | | | | | 22.0 | | | United States Treasury Bills | | | | 0.091% | | | | | 5/16/2013 | | | | | — | | | | | 22.0 | |
| | — | | | | | 13.0 | | | United States Treasury Bills | | | | 0.107%-0.135% | | | | | 6/6/2013 | | | | | — | | | | | 13.0 | |
| | — | | | | | 20.5 | | | United States Treasury Bills | | | | 0.115% | | | | | 6/20/2013 | | | | | — | | | | | 20.5 | |
| | 51.2 | | | | | — | | | United States Treasury Bills | | | | 0.084%-0.090% | | | | | 10/3/2013 | | | | | 51.2 | | | | | — | |
| | 44.1 | | | | | — | | | United States Treasury Bills | | | | 0.033%-0.086% | | | | | 10/10/2013 | | | | | 44.1 | | | | | — | |
| | 100.0 | | | | | — | | | United States Treasury Bills | | | | 0.070% | | | | | 10/17/2013 | | | | | 100.0 | | | | | — | |
| | 7.0 | | | | | — | | | United States Treasury Bills | | | | 0.062%-0.067% | | | | | 10/24/2013 | | | | | 7.0 | | | | | — | |
| | 48.0 | | | | | — | | | United States Treasury Bills | | | | 0.056% | | | | | 11/7/2013 | | | | | 48.0 | | | | | — | |
| | 50.0 | | | | | — | | | United States Treasury Bills | | | | 0.076% | | | | | 11/21/2013 | | | | | 50.0 | | | | | — | |
| | 14.5 | | | | | — | | | United States Treasury Bills | | | | 0.051%-0.076% | | | | | 11/29/2013 | | | | | 14.5 | | | | | — | |
| | 33.3 | | | | | — | | | United States Treasury Bills | | | | 0.038%-0.046% | | | | | 12/5/2013 | | | | | 33.3 | | | | | — | |
| | 47.5 | | | | | — | | | United States Treasury Bills | | | | 0.072% | | | | | 12/12/2013 | | | | | 47.5 | | | | | — | |
| | 31.0 | | | | | — | | | United States Treasury Bills | | | | 0.053% | | | | | 12/19/2013 | | | | | 31.0 | | | | | — | |
| | 1.5 | | | | | — | | | United States Treasury Bills | | | | 0.056% | | | | | 12/26/2013 | | | | | 1.5 | | | | | — | |
| | 17.0 | | | | | — | | | United States Treasury Bills | | | | 0.052% | | | | | 1/2/2014 | | | | | 17.0 | | | | | — | |
| | 26.6 | | | | | — | | | United States Treasury Bills | | | | 0.031%-0.069% | | | | | 1/9/2014 | | | | | 26.6 | | | | | — | |
| | 30.0 | | | | | — | | | United States Treasury Bills | | | | 0.046%-0.048% | | | | | 1/16/2014 | | | | | 30.0 | | | | | — | |
| | 30.0 | | | | | — | | | United States Treasury Bills | | | | 0.071% | | | | | 1/30/2014 | | | | | 30.0 | | | | | — | |
| | 50.0 | | | | | — | | | United States Treasury Bills | | | | 0.030%-0.043% | | | | | 3/20/2014 | | | | | 50.0 | | | | | — | |
| | 4.0 | | | | | — | | | United States Treasury Bills | | | | 0.068% | | | | | 4/3/2014 | | | | | 4.0 | | | | | — | |
| | 206.0 | | | | | — | | | United States Treasury Bills | | | | 0.102%-0.108% | | | | | 7/24/2014 | | | | | 205.9 | | | | | — | |
| | — | | | | | 50.0 | | | United States Treasury Notes | | | | 0.162% | | | | | 1/15/2013 | | | | | — | | | | | 50.0 | |
| | — | | | | | 58.4 | | | United States Treasury Notes | | | | 0.172%-0.174% | | | | | 1/31/2013 | | | | | — | | | | | 58.4 | |
| | — | | | | | 44.7 | | | United States Treasury Notes | | | | 0.163% | | | | | 2/15/2013 | | | | | — | | | | | 44.8 | |
| | — | | | | | 20.6 | | | United States Treasury Notes | | | | 0.198% | | | | | 2/28/2013 | | | | | — | | | | | 20.6 | |
| | — | | | | | 39.4 | | | United States Treasury Notes | | | | 0.201% | | | | | 3/31/2013 | | | | | — | | | | | 39.4 | |
| | — | | | | | 50.0 | | | United States Treasury Notes | | | | 0.161% | | | | | 4/15/2013 | | | | | — | | | | | 50.3 | |
| | — | | | | | 28.4 | | | United States Treasury Notes | | | | 0.174% | | | | | 4/30/2013 | | | | | — | | | | | 28.4 | |
| | — | | | | | 52.8 | | | United States Treasury Notes | | | | 0.169%-0.174% | | | | | 5/15/2013 | | | | | — | | | | | 53.0 | |
| | — | | | | | 30.0 | | | United States Treasury Notes | | | | 0.201% | | | | | 5/31/2013 | | | | | — | | | | | 30.1 | |
| | — | | | | | 50.0 | | | United States Treasury Notes | | | | 0.177% | | | | | 7/15/2013 | | | | | — | | | | | 50.2 | |
33
TIAA REAL ESTATE ACCOUNT
CONSOLIDATED STATEMENTS OF INVESTMENTS
September 30, 2013 and December 31, 2012
(Dollar values shown in millions)
| | | | | | | | | | | | |
Principal | | Issuer | | Yield(4) | | Maturity
Date | | Fair Value |
2013 | | 2012 | | 2013 | | 2012 |
| | | | | | | | | | | (Unaudited) | | |
| $ | | — | | | | $ | | 50.0 | | | United States Treasury Notes | | | | 0.187% | | | | | 7/31/2013 | | | | $ | | — | | | | $ | | 50.1 | |
| | — | | | | | 50.0 | | | United States Treasury Notes | | | | 0.194% | | | | | 8/15/2013 | | | | | — | | | | | 50.2 | |
| | — | | | | | 39.3 | | | United States Treasury Notes | | | | 0.199% | | | | | 9/30/2013 | | | | | — | | | | | 39.3 | |
| | 33.5 | | | | | 3.5 | | | United States Treasury Notes | | | | 0.035%-0.206% | | | | | 10/15/2013 | | | | | 33.5 | | | | | 3.5 | |
| | 50.0 | | | | | — | | | United States Treasury Notes | | | | 0.135%-0.151% | | | | | 10/31/2013 | | | | | 50.0 | | | | | — | |
| | 44.0 | | | | | — | | | United States Treasury Notes | | | | 0.154% | | | | | 11/15/2013 | | | | | 44.0 | | | | | — | |
| | 10.0 | | | | | — | | | United States Treasury Notes | | | | 0.091% | | | | | 12/31/2013 | | | | | 10.0 | | | | | — | |
| | 56.4 | | | | | — | | | United States Treasury Notes | | | | 0.055%-0.113% | | | | | 1/31/2014 | | | | | 56.4 | | | | | — | |
| | 33.4 | | | | | — | | | United States Treasury Notes | | | | 0.050%-0.137% | | | | | 2/28/2014 | | | | | 33.4 | | | | | — | |
| | 17.7 | | | | | — | | | United States Treasury Notes | | | | 0.052%-0.152% | | | | | 3/31/2014 | | | | | 17.7 | | | | | — | |
| | 25.0 | | | | | — | | | United States Treasury Notes | | | | 0.047% | | | | | 4/15/2014 | | | | | 25.1 | | | | | — | |
| | 77.0 | | | | | — | | | United States Treasury Notes | | | | 0.093%-0.146% | | | | | 4/30/2014 | | | | | 77.1 | | | | | — | |
| | 24.9 | | | | | — | | | United States Treasury Notes | | | | 0.065%-0.107% | | | | | 5/15/2014 | | | | | 25.0 | | | | | — | |
| | 100.0 | | | | | — | | | United States Treasury Notes | | | | 0.072%-0.132% | | | | | 6/30/2014 | | | | | 100.1 | | | | | — | |
| | 42.8 | | | | | — | | | United States Treasury Notes | | | | 0.114%-0.137% | | | | | 7/15/2014 | | | | | 42.9 | | | | | — | |
| | 30.0 | | | | | — | | | United States Treasury Notes | | | | 0.137% | | | | | 7/31/2014 | | | | | 30.0 | | | | | — | |
| | 50.0 | | | | | — | | | United States Treasury Notes | | | | 0.144%-0.159% | | | | | 8/15/2014 | | | | | 50.2 | | | | | — | |
| | | | | | | | | | | | | |
TOTAL UNITED STATES TREASURY SECURITIES
(Cost $1,386.9 and $1,189.9) | | | $ | | 1,387.0 | | | | $ | | 1,190.1 | |
| | | | | | | | | | | | | |
TOTAL OTHER MARKETABLE SECURITIES
(Cost $3,160.7 and $2,569.3) | | | $ | | 3,161.0 | | | | $ | | 2,569.7 | |
| | | | | | | | | | | | | |
TOTAL MARKETABLE SECURITIES
(Cost $4,536.8 and $3,745.0) | | | $ | | 4,675.3 | | | | $ | | 3,902.0 | |
| | | | | | | | | | | | | |
TOTAL INVESTMENTS
(Cost $17,499.8 and $16,842.4) | | | $ | | 18,757.7 | | | | $ | | 17,087.9 | |
| | | | | | | | | | | | | |
|
(1) | | | | The investment has a mortgage loan payable outstanding, as indicated in Note 6. |
|
(2) | | | | The market value reflects the Account’s interest in the joint venture and is net of debt. |
|
(3) | | | | Properties within this investment are located throughout the United States. |
|
(4) | | | | Yield represents the annualized yield at the date of purchase. |
|
(5) | | | | The market value reflects the final settlement due to the Account. The property investment held within the joint venture was sold during the quarter ended September 30, 2012. |
|
(6) | | | | The market value reflects the final settlement due to the Account. The property investment held within the joint venture was sold during the quarter ended December 31, 2012. |
|
(7) | | | | Investment was formerly named The Newbry. |
34
ITEM 2. MANAGEMENT’S DISCUSSION AND ANALYSIS OF FINANCIAL CONDITION AND RESULTS OF OPERATIONS
The following discussion and analysis of the Account’s financial condition and results of operations should be read together with the consolidated financial statements and notes contained in this report and with consideration to the sub-section entitled “Forward-Looking Statements,” which begins below, and the section of the Account’s Annual Report on Form 10-K for the year ended December 31, 2012 (the “Form 10-K”) entitled “Item 1A. Risk Factors.” The past performance of the Account is not indicative of future results.
Forward-Looking Statements
Some statements in this Form 10-Q which are not historical facts may be “forward-looking statements” within the meaning of Section 27A of the Securities Act of 1933, Section 21E of the Securities Exchange Act of 1934 and the Private Securities Litigation Reform Act of 1995. Forward-looking statements include statements about management’s expectations, beliefs, intentions or strategies for the future, include the assumptions and beliefs underlying these forward-looking statements, and are based on current expectations, estimates and projections about the real estate industry, domestic and global economic conditions, including conditions in the credit and capital markets, the sectors, and markets in which the Account invests and operates, and the transactions described in this Form 10-Q. While management believes the assumptions underlying any of its forward-looking statements and information to be reasonable, such information may be subject to uncertainties and may involve certain risks which may be difficult to predict and are beyond management’s control. These risks and uncertainties could cause actual results to differ materially from those contained in any forward-looking statement. These risks and uncertainties include, but are not limited to, the following:
|
• | | | | Acquiring and Owning Real Estate:The risks associated with acquiring and owning real property, including general economic and real estate market conditions, the availability of, and economic cost associated with, financing the Account’s properties, the risk that the Account’s properties become too concentrated (whether by geography, sector or by tenant mix), competition for acquiring real estate properties, leasing risk (including tenant defaults) and the risk of uninsured losses at properties (including due to terrorism, natural disasters, and acts of violence); |
|
• | | | | Selling Real Estate:The risk that the sales price of a property might differ, perhaps significantly, from its estimated or appraised value, leading to losses or reduced profits to the Account, the risk that the Account might not be able to sell a property at a particular time for a price which management believes represents its fair or full value, the risk of a lack of availability of financing (for potential purchasers of the Account’s properties), risks associated with disruptions in the credit and capital markets, and the risk that the Account may be required to make significant expenditures before the Account is able to market and/or sell a property; |
|
• | | | | Valuation:The risks associated with property valuations, including the fact that appraisals can be subjective in a number of respects and the fact that the Account’s appraisals are generally obtained on a quarterly basis and there may be periods in between appraisals of a property during which the value attributed to the property for purposes of the Account’s daily accumulation unit value may be more or less than the actual realizable value of the property; |
|
• | | | | Borrowing:Risks associated with financing the Account’s properties, including the risk of default on loans secured by the Account’s properties (which could lead to foreclosure), the risk associated with high loan to value ratios on the Account’s properties (including the fact that the Account may have limited, or no net value in such a property), the risk that significant sums of cash could be required to make principal and interest payments on the loans and the risk that the Account may not have the ability to obtain financing or refinancing on favorable terms (or at all), which may be aggravated by general disruptions in credit and capital markets; |
|
• | | | | Participant Transactions and Cash Management:Investment risk associated with participant transactions, in particular that (i) significant net participant transfers out of the Account may impair the Account’s ability to pursue or consummate new investment opportunities that are otherwise attractive to the Account and/or may result in sales of real estate-related assets to generate liquidity, (ii) significant net participant transfers into the Account may result, on a temporary basis, in the Account’s cash holdings and/or holdings in liquid real estate-related investments exceeding the |
35
| | | | Account’s long-term targeted holding levels and (iii) high levels of cash in the Account during times of appreciating real estate values can impair the Account’s overall return; |
|
• | | | | Joint Venture Investments:The risks associated with joint venture partnerships, including the risk that a co-venturer may have interests or goals inconsistent with that of the Account, that a co-venturer may have financial difficulties, and the risk that the Account may have limited rights with respect to operation of the property and transfer of the Account’s interest; |
|
• | | | | Regulatory Matters:Uncertainties associated with environmental liability and regulations and other governmental regulatory matters such as zoning laws, rent control laws, and property taxes; |
|
• | | | | Foreign Investments:The risks associated with purchasing, owning and disposing foreign investments (primarily real estate properties), including political risk, the risk associated with currency fluctuations, regulatory and taxation risks and risks of enforcing judgments; |
|
• | | | | Conflicts of Interest:Conflicts of interest associated with TIAA serving as investment manager of the Account and provider of the liquidity guarantee at the same time as TIAA and its affiliates are serving as an investment manager to other real estate accounts or funds, including conflicts associated with satisfying its fiduciary duties to all such accounts and funds associated with purchasing, selling and leasing of properties; |
|
• | | | | Required Property Sales:The risk that, if TIAA were to own too large a percentage of the Account’s accumulation units through funding the liquidity guarantee (as determined by the independent fiduciary), the independent fiduciary could require the sales of properties to reduce TIAA’s ownership interest, which sales could occur at times and at prices that depress the sale proceeds to the Account; |
|
• | | | | Government and Government Agency Securities:Risks associated with investment securities issued by U.S. government agencies and U.S. government-sponsored entities, including the risk that the issuer may not have their securities backed by the full faith and credit of the U.S. government, and that transaction activity may fluctuate significantly from time to time, which could negatively impact the value of the securities and the Account’s ability to dispose of a security at a favorable time; and |
|
• | | | | Liquid Assets and Securities:Risks associated with investments in real estate-related liquid assets (which could include, from time to time, REIT securities and CMBS), and non-real estate-related liquid assets, including: |
|
• | | | | Financial/credit risk—Risks that the issuer will not be able to pay principal and interest when due or that the issuer’s earnings will fall; |
|
• | | | | Market volatility risk—Risk that the changing conditions in financial markets may cause the Account’s investments to experience price volatility; |
|
• | | | | Interest rate volatility risk—Risk that interest rate volatility may affect the Account’s current income from an investment; and |
|
• | | | | Deposit/money market risk—Risks that the Account could experience losses if banks fail. |
More detailed discussions of certain of these risk factors are contained in the section of the Form 10-K entitled “Item 1A. Risk Factors” and in this section below and also in the section below entitled “Quantitative and Qualitative Disclosures About Market Risk,” that could cause actual results to differ materially from historical experience or management’s present expectations.
Caution should be taken not to place undue reliance on management’s forward-looking statements, which represent management’s views only as of the date that this report is filed. Neither management nor the Account undertake any obligation to update publicly or revise any forward-looking statement, whether as a result of new information, changed assumptions, future events or otherwise.
Commercial real estate market statistics discussed in this section are obtained by the Account from sources that management considers reliable, but some of the data are preliminary for the period ended September 30, 2013 and may be subsequently revised. Prior period data may have been adjusted to reflect updated calculations. Investors should not rely exclusively on the data presented below in forming a judgment regarding the current or prospective performance of the commercial real estate market generally.
36
ABOUT THE TIAA REAL ESTATE ACCOUNT
The TIAA Real Estate Account was established in February 1995 as a separate account of TIAA and interests in the Account were first offered to eligible participants on October 2, 1995. The Account offers individual and group accumulating annuity contracts (with contributions made on a pre-tax or after-tax basis), as well as individual lifetime and term-certain variable payout annuity contracts (including the payment of death benefits to beneficiaries). Investors are entitled to transfer funds to or from the Account under certain circumstances. Funds invested in the Account for each category of contract are expressed in terms of units, and unit values will fluctuate depending on the Account’s performance.
Investment Objective and Strategy
The Real Estate Account seeks favorable long-term returns primarily through rental income and appreciation of real estate investments owned by the Account. The Account will also invest in non-real estate-related publicly traded securities and short-term higher quality liquid investments that are easily converted to cash to enable the Account to meet participant redemption requests, purchase or improve properties or cover other expense needs.
Real Estate-Related Investments.The Account intends to have between 75% and 85% of its net assets invested directly in real estate or real estate-related investments with the goal of producing favorable long-term returns primarily through rental income and appreciation. These investments may consist of:
|
• | | | | Direct ownership interests in real estate, |
|
• | | | | Direct ownership of real estate through interests in joint ventures, |
|
• | | | | Indirect interests in real estate through real estate-related securities, such as: |
|
• | | | | real estate limited partnerships or limited liability companies, |
|
• | | | | REITs, which investments may consist of common or preferred stock interests, |
|
• | | | | investments in equity or debt securities of companies whose operations involve real estate (i.e.,that primarily own or manage real estate) which may not be REITs, and |
|
• | | | | conventional mortgage loans, participating mortgage loans, and collateralized mortgage obligations, including CMBS and other similar investments. |
The Account’s principal strategy is to purchase direct ownership interests in income-producing real estate, primarily office, industrial, retail and multi-family residential properties. The Account is targeted to hold between 65% and 80% of the Account’s net assets in such direct ownership interests at any time. Historically, over 70% of the Account’s net assets have been comprised of such direct ownership interests in real estate.
In addition, while the Account is authorized to hold up to 25% of its net assets in liquid real estate-related securities, such as REITs and CMBS, management intends that the Account will not hold more than 10% of its net assets in such securities on a long-term basis. Historically, less than 10% of the Account’s net assets have been comprised of interests in these securities; although in recent quarters, REIT securities have comprised close to 10% of the Account’s net assets. In particular, under the Account’s current investment guidelines, the Account is authorized to hold up to 10% of its net assets in CMBS. As of September 30, 2013, REIT securities comprised approximately 9.2% of the Account’s net assets, and the Account held no CMBS as of such date.
Non-Real Estate-Related Investments.The Account will invest the remaining portion of its assets (targeted to be between 15% and 25% of its net assets) in publicly-traded, liquid investments; namely:
|
• | | | | U.S. treasury securities, |
|
• | | | | securities issued by U.S. government agencies or U.S. government sponsored entities, |
|
• | | | | corporate debt securities, |
|
• | | | | money market instruments, and |
|
• | | | | stock of companies that do not primarily own or manage real estate. |
37
However, from time to time (most recently between late 2008 and mid 2010), the Account’s non-real estate-related liquid investments may comprise less than 15% (and possibly less than 10%) of its assets (on a net basis and/or a gross basis), especially during and immediately following periods of significant net participant outflows, in particular due to significant participant transfer activity. In addition, the Account, from time to time and on a temporary basis, may hold in excess of 25% of its net assets in non-real estate-related liquid investments, particularly during times of significant inflows into the Account and/or when there is a lack of attractive real estate-related investments available in the market.
Liquid Securities.Primarily due to management’s need to manage fluctuations in cash flows, in particular during and immediately following periods of significant participant net transfer activity into or out of the Account, the Account may, on a temporary basis (i) exceed the upper end of its targeted holdings (currently 15% of the Account’s net assets) in liquid securities of all types, including both publicly-traded non-real estate-related liquid investments and liquid real estate-related securities, such as REITs and CMBS, or (ii) be below the low end of its targeted holdings in such liquid securities (currently 15% of the Account’s net assets).
The portion of the Account’s net assets invested in liquid investments of all types may exceed the upper end of its target, for example, if (i) the Account receives a large inflow of money in a short period of time, in particular due to significant participant transfer activity into the Account, (ii) the Account receives significant proceeds from sales of direct real estate assets, (iii) there is a lack of attractive direct real estate investments available on the market, and/or (iv) the Account anticipates more near-term cash needs, including to apply to acquire direct real estate investments, pay expenses or repay indebtedness.
Foreign Investments.The Account from time to time will also make foreign real estate investments. Under the Account’s investment guidelines, investments in direct foreign real estate, together with foreign real estate-related securities and foreign non-real estate-related liquid investments may not comprise more than 25% of the Account’s net assets. However, through the date of this Form 10-Q, such foreign real estate-related investments have never represented more than 7.5% of the Account’s net assets and management does not intend such foreign investments to exceed 10% of the Account’s net assets. As of September 30, 2013 the Account held one foreign real estate investment in France which represented 1.3% of the Account’s net assets.
THIRD QUARTER 2013 U.S. ECONOMIC AND COMMERCIAL REAL ESTATE OVERVIEW
The Account invests primarily in high-quality, core commercial real estate in order to meet its investment objective of obtaining favorable long-term returns through rental income and the appreciation of its real estate holdings.
Economic and Capital Markets Overview and Outlook
Recent trends in key U.S. economic indicators are summarized in the table below. U.S. Gross Domestic Product (“GDP”) grew by 2.8% in the third quarter of 2013, as compared to an increase of 2.5% in the second quarter of 2013. However, consumer and business spending softened during the quarter, and inventory restocking added 0.8% to GDP growth. Excluding inventories, GDP grew a modest 2.0%, which was in line with economists’ expectations. Though the 16 day shutdown of the U.S. federal government occurred after the third quarter ended, economic activity in the third quarter was nonetheless slowed by the impasse which reduced federal government spending and affected consumer and business confidence. The full impact of the shutdown, which according to Standard & Poor’s reduced economic activity by an estimated $24 billion and reduced GDP growth by 0.6%, will be evident in the fourth quarter GDP estimate.
38
Economic Indicators *
| | | | | | | | | | | | |
| | 1Q 2013 | | 2Q 2013 | | 3Q 2013 | | Forecast | | Forecast |
| | 4Q 2013 | | 2013 | | 2014 |
Economy(1) | | | | | | | | | | | | |
Gross Domestic Product (GDP) | | | | 1.1 | % | | | | | 2.5 | % | | | | | 2.0 | % | | | | | 2.5 | % | | | | | 1.6 | % | | | | | 2.6 | % | |
Employment Growth (Thousands) | | | | 622 | | | | | 547 | | | | | 430 | | | | | 534 | | | | | 2,178 | | | | | 2,400 | |
Unemployment Rate | | | | 7.6 | % | | | | | 7.6 | % | | | | | 7.2 | % | | | | | 7.2 | % | | | | | 7.5 | % | | | | | 7.0 | % | |
Interest Rates(2) | | | | | | | | | | | | |
10 Year Treasury | | | | 1.95 | % | | | | | 2.00 | % | | | | | 2.70 | % | | | | | 2.80 | % | | | | | 2.40 | % | | | | | 3.10 | % | |
Sources: BEA, BLS, Federal Reserve, Blue Chip Consensus Forecasts, and Moody’s Analytics
|
* | | | | Data subject to revision |
|
(1) | | | | GDP growth rates are annual rates. |
|
(2) | | | | The Treasury rates are an average over the stated time period. The Federal Funds rates are as of the end of the stated time period. |
Following the 16 day government shutdown, the U.S. Congress approved last-minute legislation that extended the federal government’s borrowing power in order to avert a financial default by the U.S. government. The legislation, subsequently signed by President Obama, provided funding for the government through January 15, 2014 and raised the debt limit through February 7, 2014. While the agreement averted a U.S. government default, it only temporarily resolved the problem as it set the stage for further negotiations on the federal government budget and debt ceiling that must be completed by early 2014. The potential default sent tremors through the international financial markets during the two week shutdown, with U.S. and foreign government officials warning of the disastrous consequences of a default. Even with the current agreement, economic growth during the fourth quarter could be slowed unless progress on a long term solution is evident.
After its September 17-18 meeting, the Federal Reserve surprised the markets by announcing that it would continue quantitative easing, its $85 billion asset purchase program (“QE3”), until there was additional evidence of an ongoing improvement in the U.S. economy. Financial markets had expected the Fed to announce that it would begin tapering its purchases, and had driven up the yield on the 10-Year Treasury prior to the meeting. After the announcement, yields declined by 25 basis points and have since hovered in the 2.6% range. With the subsequent shutdown of the federal government and its detrimental economic impact, it now seems likely that the Federal Reserve will not begin tapering QE3 until 2014 at the earliest. U.S. stock markets were only modestly affected by the federal debt ceiling impasse as investors expected a debt ceiling deal ultimately to be reached. The S&P 500 added 4.7% in the third quarter, but dropped 2.3% in early October as a U.S. government default appeared imminent. However, it subsequently recovered those losses and gained another 2.9% as of early in the fourth quarter.
Economists, in turn, were busy re-assessing growth forecasts for the balance of 2013 and 2014 given the federal government shutdown and the increased likelihood that interest rates will not rise as much or as soon as previously anticipated. Economists were forced to re-think their assumptions about interest rates given Ben Bernanke’s statement that tapering of the QE3 asset purchase program was not “on a preset course.” Instead, the amount and timing of any tapering program would be determined in large part by two economic indicators—an unemployment rate of 6.5% or less and an inflation rate at no more than a half a percentage point higher than the Fed’s 2.0% target—with current readings of both indicators still far from those marks. While there continues to be uncertainty surrounding the timing of reductions in QE3 asset purchases, most economists still expect the Federal Reserve to keep interest rates low for an extended period. The October 1st Blue Chip survey found that over half of those surveyed did not expect the Federal Reserve to raise the fed funds rate until the second half of 2015 or later. The nomination of Janet Yellen to succeed Ben Bernanke as Federal Reserve Chairman in January 2014 could also lengthen both QE3 and low interest rates given her long-time support of Chairman Bernanke’s policies.
The consensus of economists surveyed as part of the October 1st 2013 Blue Chip Financial Forecast publication was for GDP to grow at a 2.5% rate during the fourth quarter of 2013 and at a 2.6% rate in all of 2014. Employment is expected to grow by an average of 178,000 per month in the fourth quarter of 2013 and to increase to over 200,000 per month in 2014. The unemployment rate is expected to fall to 6.8% by the end of 2014. Economists’ forecasts of GDP and employment growth are still relatively moderate considering that
39
it is now more than four years since the official end of the Great Recession; however, growth of this magnitude would nonetheless provide support for further improvement in commercial real estate market conditions.
Real Estate Market Conditions and Outlook
Industry sources such as CB Richard Ellis Econometric Advisors calculate vacancy based on square footage. Except where otherwise noted, the Account’s vacancy data is calculated as a percentage of net rentable space leased, weighted by square footage, in keeping with industry standards.
Commercial real estate activity continued at a steady pace during the third quarter of 2013 as net absorption for the major property sectors either increased or remained stable compared with the second quarter of 2013. Consequently, commercial real estate fundamentals continued to improve modestly across all sectors. Commercial property sales volumes totaled $89.7 billion in the third quarter, up 26% compared to second quarter 2013. Sales increased among all property types except apartments, where Real Capital Analytics noted that transaction volume and activity appear to have lost momentum.
Despite solid market and investment activity, Green Street Advisors’ Commercial Property Price Index (“CPPI”) was unchanged during the third quarter of 2013 as compared with a 3.9% increase in the second quarter of 2013. According to Green Street Advisors: “Property pricing continues to drift sideways as the sharp increase in interest rates that occurred earlier this year has put a brake on the four-year-long recovery in property values.” Despite the flat third quarter, the CPPI increased 6.3% during the first nine months of 2013.
The FTSE NAREIT All Equity REIT index return was a negative 3.1% during the third quarter following a decline of 1.6% in the second quarter. Despite volatility in share prices during the quarter, Green Street Advisors concluded in its October 1, 2013 Real Estate Securities Monthly that REIT prices are in a “fair value range” based on a comparison of current and prospective REIT yields and returns with those of fixed income investments like corporate and high-yield bonds as well as private real estate.
Commercial property returns increased during the third quarter of 2013. For the quarter ending September 30, 2013, preliminary NCREIF Fund Index Open-End Diversified Core Equity (“NFI-ODCE”) returns were 3.5%. By comparison, the total return for the quarter ending June 30, 2013 was 3.9%. The NFI- ODCE is a fund-level return index including property investments at ownership share including cash balances and leverage.
Data for the Account’s top five markets in terms of market value as of September 30, 2013 are provided below. These markets represent 49.8% of the Account’s total real estate portfolio.
| | | | | | | | |
Top 5 Metro Areas by Fair Market Value | | Account % Leased
Fair Market Value
Weighted* | | Number of
Property
Investments | | Metro Area
Fair Market
Value as a %
of Total
RE Portfolio | | Metro Area
Fair Market
Value as a %
of Total
Investments |
|
Washington-Arlington-Alexandria, DC-VA-MD-WV | | | | 91.5% | | | | | 10 | | | | | 14.3% | | | | | 10.4% | |
New York-White Plains-Wayne, NY-NJ | | | | 95.6% | | | | | 7 | | | | | 11.5% | | | | | 8.4% | |
Los Angeles-Long Beach-Glendale, CA | | | | 89.9% | | | | | 13 | | | | | 9.6% | | | | | 7.0% | |
Boston-Quincy, MA | | | | 90.8% | | | | | 4 | | | | | 7.5% | | | | | 5.5% | |
San Francisco-San Mateo-Redwood City, CA | | | | 91.4% | | | | | 4 | | | | | 6.9% | | | | | 5.1% | |
|
* | | | | Weighted by fair market value, which differs from the calculations provided for market comparisons to CBRE-EA data and are used here to reflect the fair market value of the Account’s monetary investments in those markets. |
Office
According to CB Richard Ellis Econometric Advisors (“CBRE-EA”), the national office vacancy rate was 15.1% in the third quarter of 2013 as compared to 15.2% in the second quarter of 2013. The office vacancy rate has declined from a peak of 16.9% in the second quarter of 2010; however, the rate of decline continues to be slow as a result of modest job growth and companies seeking to lower overhead costs by reducing the amount office space per employee.
40
The vacancy rate for the Account’s office portfolio averaged 9.8% as of the third quarter of 2013 which was the same as the second quarter of 2013. As shown in the table below, the vacancy rate of properties owned by the Account in all of its top office markets remained at or below their respective market averages. In Washington DC, the Account’s top market, the vacancy rate of the Account’s properties increased modestly to 10.3% as concerns about the federal government budget and debt ceiling continued to hamper leasing activity. In Boston, the average vacancy rate of the Account’s properties increased to 9.9% due to the loss of a mid-sized tenant in one of the Account’s properties; however, the space has been re-leased in the fourth quarter for an existing tenant’s expansion.
| | | | | | | | | | | | | | | | | | | | | | Account
Weighted
Average
Vacancy | | Market
Vacancy* |
| | | |
Sector | | Metropolitan Area | | Total Sector
by Metro Area
($M) | | % of Total
Investments | | 2013Q3 | | 2013Q2 | | 2013Q3 | | 2013Q2 |
|
Office | | Account/Nation | | | | | | | | 9.8% | | | | | 9.8% | | | | | 15.1% | | | | | 15.2% | |
|
1 | | Washington-Arlington-Alexandria, DC-VA-MD-WV | | | $ | | 1,368.1 | | | | | 7.3% | | | | | 10.3% | | | | | 8.8% | | | | | 15.2% | | | | | 15.5% | |
2 | | Boston-Quincy, MA | | | $ | | 994.1 | | | | | 5.3% | | | | | 9.9% | | | | | 8.4% | | | | | 12.0% | | | | | 11.9% | |
3 | | San Francisco-San Mateo-Redwood City, CA | | | $ | | 842.7 | | | | | 4.5% | | | | | 9.3% | | | | | 9.8% | | | | | 9.5% | | | | | 9.8% | |
4 | | Seattle-Bellevue-Everett, WA | | | $ | | 590.9 | | | | | 3.2% | | | | | 11.1% | | | | | 12.1% | | | | | 13.0% | | | | | 13.6% | |
5 | | Los Angeles-Long Beach-Glendale, CA | | | $ | | 489.1 | | | | | 2.6% | | | | | 8.4% | | | | | 10.4% | | | | | 16.8% | | | | | 17.1% | |
The Account’s results for the third quarter of 2013 were largely consistent with office market trends at the national level. Demand for office space has historically been driven largely by job growth in the financial and professional and business services sectors. More recently, technology, media and entertainment companies have accounted for a large portion of demand in a number of markets. While job growth in the financial services sector has gained strength since mid-2011, banks and financial firms are reducing space usage in order to improve profitability. Employment growth in the professional and business services sector has remained healthy, with particular strength in the sector’s computer and technology industries evident in markets like San Francisco, Seattle, Boston and New York. Continued gradual improvement in office market conditions appears likely given recent office employment growth trends coupled with minimal construction.
Industrial
Conditions in the industrial market are influenced to a large degree by growth in GDP, industrial production and international trade flows. U.S. industrial market conditions continued to improve in the third quarter due to moderate but ongoing growth in U.S. GDP and industrial production coupled with steady growth in global trade flows. Coastal port markets have been the biggest beneficiaries of the growth in trade. During the third quarter of 2013, the national industrial availability rate fell to 11.7% as compared to 12.0% in the second quarter of 2013. By comparison, the vacancy rate for the Account’s industrial property portfolio rose to 12.2% in the third quarter compared to 8.8% in the second quarter. As shown below, the vacancy rate of the Account’s properties in three of its top five industrial markets were very modest and remained well below their respective market averages. Los Angeles and Ft. Lauderdale were the two exceptions as the average vacancy rate of the Account’s properties either remained high or increased significantly. In Los Angeles, the vacancy rate of the Account’s properties remained elevated due to small tenant turnover; however, recent leasing activity has since lowered the vacancy rate as of early fourth quarter 2013. In Ft. Lauderdale, the average vacancy of the Account’s properties increased significantly due to a large tenant vacating from one of the Account’s properties. Space in the building, which has been subdivided to accommodate the moderate-sized tenants that are more prevalent in the market, is currently being marketed with an outstanding letter of intent being finalized to lease approximately 27% of the available space.
41
| | | | | | | | | | | | | | | | | | | | | | Account
Weighted
Average
Vacancy | | Market
Vacancy* |
| | | |
Sector | | Metropolitan Area | | Total Sector
by Metro Area
($M) | | % of Total
Investments | | 2013Q3 | | 2013Q2 | | 2013Q3 | | 2013Q2 |
|
Industrial | | Account/Nation | | | | | | | | 12.2% | | | | | 8.8% | | | | | 11.7% | | | | | 12.0% | |
|
1 | | Riverside-San Bernardino-Ontario, CA | | | $ | | 553.8 | | | | | 3.0% | | | | | 0.0% | | | | | 0.0% | | | | | 10.0% | | | | | 10.1% | |
2 | | Dallas-Plano-Irving, TX | | | $ | | 219.9 | | | | | 1.2% | | | | | 1.3% | | | | | 2.8% | | | | | 11.8% | | | | | 12.7% | |
3 | | Tacoma, WA | | | $ | | 219.3 | | | | | 1.2% | | | | | 4.8% | | | | | 6.2% | | | | | 9.1% | | | | | 8.7% | |
4 | | Los Angeles-Long Beach-Glendale, CA | | | $ | | 205.9 | | | | | 1.1% | | | | | 19.7% | | | | | 17.5% | | | | | 6.3% | | | | | 6.5% | |
5 | | Fort Lauderdale-Pompano Beach-Deerfield Beach, FL | | | $ | | 160.1 | | | | | 0.9% | | | | | 20.9% | | | | | 5.5% | | | | | 12.8% | | | | | 13.0% | |
Multi-Family
Apartment markets remained tight during third quarter 2013. The national vacancy rate averaged 4.6%, remaining unchanged from the same rate in second quarter 2013. Effective rents, which include concessions like free rent, grew 3.0% nationally, with the strongest growth continuing to be reported in markets with sizeable high tech sectors such as San Francisco, Seattle, San Jose, Denver, Austin and Portland. Construction has ramped up nationally, with most of the new supply poised to hit the market over the balance of 2013 and in the first half of 2014. Over the near term, however, apartment markets are expected to benefit from favorable demographic and socio-economic trends.
The vacancy rate of the Account’s multi-family portfolio remained low but increased to 5.5% in the third quarter of 2013 as compared with 4.8% in the second quarter. As shown in the table below, the average vacancy rate of the Account’s properties in New York, its largest market, declined to 4.3% due to additional leasing at MiMA, a newly constructed apartment building which was in its initial lease-up when the Account acquired its 70% interest. In Washington D.C., the average vacancy rate of properties owned by the Account declined modestly but remained above the market average as a portion of the units at one of the Account’s properties were undergoing renovation and were not available for lease. In Los Angeles, the average vacancy rate of properties owned by the Account remained above the market average because of a renovation program at two of the Account’s properties and the recent acquisition of a newly constructed property in a top West Coast market which was in its initial lease-up when acquired. The properties are expected to achieve stabilized occupancy during the fourth quarter of 2013. In Houston and Denver, the average vacancy of the Account’s properties remained low but increased modestly in large part due to seasonal factors.
| | | | | | | | | | | | | | | | | | | | | | Account
Weighted
Average
Vacancy | | Market
Vacancy* |
| | | |
Sector | | Metropolitan Area | | Total Sector
by Metro Area
($M) | | % of Total
Investments | | 2013Q3 | | 2013Q2 | | 2013Q3 | | 2013Q2 |
|
Apartment | | Account/Nation | | | | | | | | 5.5% | | | | | 4.8% | | | | | 4.6% | | | | | 4.6% | |
|
1 | | New York-White Plains-Wayne, NY-NJ | | | $ | | 712.3 | | | | | 3.8% | | | | | 4.3% | | | | | 5.9% | | | | | 5.1% | | | | | 5.1% | |
2 | | Washington-Arlington-Alexandria, DC-VA-MD-WV | | | $ | | 402.1 | | | | | 2.1% | | | | | 6.6% | | | | | 7.0% | | | | | 4.4% | | | | | 4.4% | |
3 | | Los Angeles-Long Beach-Glendale, CA | | | $ | | 372.3 | | | | | 2.0% | | | | | 7.2% | | | | | 6.7% | | | | | 3.6% | | | | | 3.7% | |
4 | | Houston-Sugar Land-Baytown, TX | | | $ | | 308.8 | | | | | 1.6% | | | | | 5.9% | | | | | 3.0% | | | | | 5.9% | | | | | 5.9% | |
5 | | Denver-Aurora, CO | | | $ | | 262.2 | | | | | 1.4% | | | | | 5.4% | | | | | 3.7% | | | | | 3.2% | | | | | 3.7% | |
42
Retail
Retail market conditions experienced very modest improvement during the quarter as consumer confidence and spending ebbed due to economic uncertainty caused by the government shutdown. Preliminary data from the U.S. Census Bureau indicate that retail sales excluding motor vehicles and parts increased 1.0% in the third quarter of 2013 as compared with the second quarter of 2013 and 3.5% compared with the third quarter of 2012. Availability rates in neighborhood and community centers continued to average 12.2% in the third quarter of 2013, remaining unchanged from the same rate in the second quarter. In addition, several national retailers reported lackluster quarterly sales. Given the economic and retail market environment, national retailers remain highly selective about opening new stores, with a focus on top metropolitan markets and the best centers. The vacancy rate for the Account’s retail portfolio declined to 4.3% during the third quarter of 2013 as compared with 5.4% in the second quarter of 2013. The vacancy rate of the Account’s retail portfolio remains below the neighborhood and community center average because the Account’s portfolio includes several high quality regional malls and lifestyle centers which have minimal vacancy.
Outlook
During the third quarter of 2013, commercial real estate fundamentals continued their gradual improvement as the U.S. economy remained on a moderate growth trajectory. Contributing to the improvement in fundamentals were healthy employment growth, moderate construction, and the ready availability of commercial mortgage debt at attractive interest rates. In addition, commercial real estate continued to offer attractive returns over the short- and long-term compared with other asset classes. While economic activity faltered during the government shutdown and metro areas with sizeable U.S. government and defense sectors experienced the greatest impact, activity remained robust in markets with sizeable technology, energy, medical and biotechnology sectors. Despite continued weakness in the global economy, and particularly in Europe, global factors had little dampening effect on U.S. economic growth in the third quarter. Growth in the fourth quarter of 2013 will depend in part upon the successful resolution of outstanding federal budget and debt ceiling issues prior to their early-2014 deadlines. If progress can be demonstrated and economic conditions fall generally in-line with economists’ expectations of continued modest economic growth, real estate market conditions are likely to remain favorable for the remainder of 2013. Achieving a budget and debt ceiling agreement by the end of 2013 would also remove considerable uncertainty for consumers and businesses and set the stage for stronger economic growth in 2014.
43
Management continued to follow its investment strategy of focusing primarily on apartment, retail and industrial properties in target markets as well as selective opportunities in the office sector. During the third quarter of 2013, the Account acquired a prime community shopping center in Denver and one apartment property in Austin. During the third quarter, one of the Account’s joint venture investments sold two neighborhood shopping centers. Management continued to bolster the Account’s income through aggressive property management and leasing in combination with expense management. As of the third quarter of 2013, the Account’s holdings were 91.3% leased as compared with 92.4% as of the second quarter of 2013. During the third quarter of 2013, the Account’s real estate assets generated a 1.3% income return and a 4.2% capital return. As shown in the graph below, returns for the third quarter of 2013 were the fourteenth consecutive quarter of positive income and capital returns.
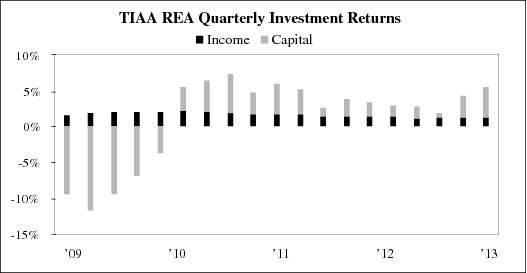
Participant inflows continued at a steady pace during the third quarter of 2013, with the Account maintaining an appropriate cash position as of the end of the quarter. Management intends to manage the Account’s cash position in a manner that maintains adequate liquidity reserves for new acquisitions and the redemption of units from participants. The anticipated acquisitions program for the remainder of 2013 will maintain an equal focus on office, industrial, retail, and multi-family properties, taking into account the expected short- and long-term return prospects for the four property types. In general, management intends to maintain the Account’s diversification across property sectors at or close to its current sector weightings. In addition to ongoing investment activities, management will carefully evaluate opportunities to place commercial mortgage debt on recent acquisitions and refinance existing debt on existing encumbered assets at lower interest rates in order to reduce the Account’s overall weighted cost of capital. However, refinancing activities will only be undertaken provided mortgage proceeds can be reinvested in real estate properties or other investments that will benefit overall Account returns.
A portion of the Account’s liquid assets is invested in REITs, which provides incremental exposure to U.S. commercial real estate, an attractive dividend yield, and a high degree of liquidity. The Account’s $1.5 billion portfolio consists of a mix of REIT stocks and index funds that closely replicate the FTSE NAREIT All Equity REIT index, thereby providing the Account with an indirect exposure to a diverse mix of property types and geographic markets. By effectively replicating the index, the Account portfolio avoids the risks associated with concentrated investments in any particular company or sector. The return profile of REITs is currently and has historically been favorable to corporate bonds and government agency debt, albeit with added near term volatility as compared to direct investments in commercial real estate property.
Based on the economic and real estate market outlook for 2013, Management believes that the Account is solidly positioned to benefit from expected ongoing improvement in commercial real estate market conditions and investors’ focus on major metropolitan markets. Prices for top tier properties have increased measurably from their lows in the latter half of 2009, which has driven initial cash-on-cash returns to relatively low levels. Management will therefore carefully evaluate prospective acquisitions based on short- and long-term growth potential, purchase price relative to replacement cost, and portfolio diversification benefits as well as initial cash-on-cash returns. Emphasis will be given to institutional quality properties that
44
have strong occupancy histories and favorable tenant rollover schedules. The Account believes that a disciplined investment strategy coupled with a focus on the highest quality properties will position the Account for favorable long-term performance.
Investments as of September 30, 2013
As of September 30, 2013, the Account had total net assets of $16.5 billion, a 10.8% increase from December 31, 2012, and a 12.1% increase from September 30, 2012. The increase in the Account’s net assets from December 31, 2012 to September 30, 2013 was primarily driven by appreciation in value of the Account’s investments as well as net participant inflows into the Account.
As of September 30, 2013, the Account owned a total of 104 real estate property investments (89 of which were wholly owned, 15 of which were held in joint ventures). The real estate portfolio included 30 office property investments, 26 industrial property investments, 26 apartment property investments, 19 retail property investments (including one located in Paris, France), one 75% owned joint venture interest in a portfolio of storage facilities, one land investment, and one fee interest encumbered by a ground lease. Of the 104 real estate property investments, 35 are subject to debt (including seven joint venture investments).
The outstanding principal on mortgage loans payable on the Account’s wholly owned real estate portfolio as of September 30, 2013 was $2.4 billion. The Account’s proportionate share of outstanding principal on mortgage loans payable within its joint venture investments was $1.6 billion. The Account’s proportionate share of mortgage loans payable within its joint venture investments is netted against the underlying properties when determining the joint venture investments fair value presented on the consolidated statements of investments. When the mortgage loans payable within the joint venture investments are considered, total outstanding principal on the Account’s portfolio as of September 30, 2013 was $4.0 billion, which represented a loan to value ratio of 19.5%. The Account currently has no Account-level debt.
Management believes that the Account’s real estate portfolio is diversified by location and property type. The Account’s largest investment, 1001 Pennsylvania Avenue located in Washington, DC, represented 5.3% of total real estate investments and 3.9% of total investments.
The following charts reflect the diversification of the Account’s real estate assets by region and property type and list its ten largest investments. All information is based on the fair values of the investments at September 30, 2013.
Diversification by Fair Value(1)
| | | | | | | | | | | | | | East | | West | | South | | Foreign(2) | | Midwest | | Total |
Office | | | | 20.9 | % | | | | | 15.2 | % | | | | | 6.8 | % | | | | | — | | | | | 0.3 | % | | | | | 43.2 | % | |
Apartment | | | | 9.1 | % | | | | | 7.9 | % | | | | | 4.9 | % | | | | | — | | | | | — | | | | | 21.9 | % | |
Retail | | | | 3.2 | % | | | | | 4.4 | % | | | | | 8.2 | % | | | | | 1.6 | % | | | | | 0.2 | % | | | | | 17.6 | % | |
Industrial | | | | 1.4 | % | | | | | 7.5 | % | | | | | 3.6 | % | | | | | — | | | | | 0.9 | % | | | | | 13.4 | % | |
Other(3) | | | | 3.2 | % | | | | | 0.2 | % | | | | | 0.4 | % | | | | | — | | | | | 0.1 | % | | | | | 3.9 | % | |
| | | | | | | | | | | | |
Total | | | | 37.8 | % | | | | | 35.2 | % | | | | | 23.9 | % | | | | | 1.6 | % | | | | | 1.5 | % | | | | | 100.0 | % | |
| | | | | | | | | | | | |
|
(1) | | | | Wholly-owned properties are represented at fair value and gross of any debt, while joint venture properties are represented at the net equity value. |
|
(2) | | | | Represents real estate investment in France. |
|
(3) | | | | Represents interest in Storage Portfolio investment, a fee interest encumbered by a ground lease real estate investment and undeveloped land. |
Properties in the “East” region are located in: CT, DC, DE, KY, MA, MD, ME, NC, NH, NJ, NY, PA, RI, SC, VA, VT, WV
Properties in the “West” region are located in: AK, AZ, CA, CO, HI, ID, MT, NM, NV, OR, UT, WA, WY
Properties in the “South” region are located in: AL, AR, FL, GA, LA, MS, OK, TN, TX
Properties in the “Midwest” region are located in: IA, IL, IN, KS, MI, MN, MO, ND, NE, OH, SD, WI
45
Top Ten Largest Real Estate Investments
| | | | | | | | | | | | |
Property Investment Name | | City | | State | | Type | | Value
(in millions)(1) | | Property as a
% of Total
Real Estate
Portfolio | | Property as a
% of Total
Investments |
1001 Pennsylvania Avenue | | Washington | | DC | | Office | | | | 726.1 | (2) | | | | | 5.3 | % | | | | | 3.9 | % | |
50 Fremont Street | | San Francisco | | CA | | Office | | | | 483.6 | (3) | | | | | 3.5 | % | | | | | 2.6 | % | |
The Florida Mall | | Orlando | | FL | | Retail | | | | 441.8 | (4) | | | | | 3.2 | % | | | | | 2.4 | % | |
Fourth and Madison | | Seattle | | WA | | Office | | | | 432.8 | (5) | | | | | 3.2 | % | | | | | 2.3 | % | |
99 High Street | | Boston | | MA | | Office | | | | 426.3 | (6) | | | | | 3.1 | % | | | | | 2.3 | % | |
DDR | | Various | | USA | | Retail | | | | 409.8 | (7) | | | | | 3.0 | % | | | | | 2.2 | % | |
425 Park Avenue | | New York | | NY | | Land | | | | 400.0 | | | | | 2.9 | % | | | | | 2.1 | % | |
780 Third Avenue | | New York | | NY | | Office | | | | 365.0 | (8) | | | | | 2.7 | % | | | | | 1.9 | % | |
501 Boylston Street | | Boston | | MA | | Office | | | | 360.4 | | | | | 2.6 | % | | | | | 1.9 | % | |
Ontario Industrial Portfolio | | Ontario | | CA | | Industrial | | | | 313.3 | | | | | 2.3 | % | | | | | 1.7 | % | |
|
(1) | | | | Value as reported in the September 30, 2013 Statement of Investments. Investments owned 100% by the Account are reported based on fair value. Investments in joint ventures are reported at fair value and are presented at the Account’s ownership interest. |
|
(2) | | | | This property investment is presented gross of debt. The value of the Account’s interest less the fair value of leverage is $409.8 million. |
|
(3) | | | | This property investment is presented gross of debt. The value of the Account’s interest less the fair value of leverage is $294.0 million. |
|
(4) | | | | This property investment is a 50% / 50% joint venture with Simon Property Group, L.P. and is presented net of debt. As of September 30, 2013 this debt had a fair value of $191.3 million. |
|
(5) | | | | This property investment is presented gross of debt. The value of the Account’s interest less the fair value of leverage is $243.2 million. |
|
(6) | | | | This property investment is presented gross of debt. The value of the Account’s interest less the fair value of leverage is $240.1 million. |
|
(7) | | | | This property is held in a 85% / 15% joint venture with Developers Diversified Realty Corporation ("DDR"), and consists of 31 retail properties located in 13 states and is presented net of debt. As of September 30, 2013 this debt had a fair value of $766.5 million. |
|
(8) | | | | This property investment is presented gross of debt. The value of the Account’s interest less the fair value of leverage is $207.6 million. |
At September 30, 2013, the Account held 73.1% of its total investments in real estate and real estate joint ventures. The Account also held investments in government agency notes representing 9.5% of total investments, real estate-related equity securities representing 8.1% of total investments, U.S. Treasury securities representing 7.4% of total investments, and real estate limited partnerships representing 1.9% of total investments.
Results of Operations
Nine months ended September 30, 2013 compared to nine months ended September 30, 2012
Performance
The Account’s total return was 7.9% for the nine months ended September 30, 2013 and September 30, 2012. The Account’s annualized total returns over the past one, three, five, and ten year periods ended September 30, 2013 were 10.1%, 12.4%, -0.9%, and 4.8%, respectively. As of September 30, 2013, the Account’s annualized total return since inception was 6.1%.
46
Net Investment Income
The table below shows the results of operations for the nine months ended September 30, 2013 and 2012 and the dollar and percentage changes for those periods (dollars in millions, unaudited).
| | | | | | | | |
| | For the Nine Months
Ended September 30, | | Change |
| | 2013 | | 2012 | | $ | | % |
INVESTMENT INCOME | | | | | | | | |
Real estate income, net: | | | | | | | | |
Rental income | | | $ | | 618.6 | | | | $ | | 648.4 | | | | $ | | (29.8 | ) | | | | | -4.6 | % | |
| | | | | | | | |
Real estate property level expenses and taxes: | | | | | | | | |
Operating expenses | | | | 155.9 | | | | | 162.7 | | | | | (6.8 | ) | | | | | -4.2 | % | |
Real estate taxes | | | | 90.6 | | | | | 90.0 | | | | | 0.6 | | | | | 0.7 | % | |
Interest expense | | | | 91.6 | | | | | 87.4 | | | | | 4.2 | | | | | 4.8 | % | |
| | | | | | | | |
Total real estate property level expenses and taxes | | | | 338.1 | | | | | 340.1 | | | | | (2.0 | ) | | | | | -0.6 | % | |
| | | | | | | | |
Real estate income, net | | | | 280.5 | | | | | 308.3 | | | | | (27.8 | ) | | | | | -9.0 | % | |
Income from real estate joint ventures and limited partnerships | | | | 68.8 | | | | | 56.1 | | | | | 12.7 | | | | | 22.6 | % | |
Interest | | | | 2.3 | | | | | 2.1 | | | | | 0.2 | | | | | 9.5 | % | |
Dividends | | | | 29.5 | | | | | 23.4 | | | | | 6.1 | | | | | 26.1 | % | |
| | | | | | | | |
TOTAL INVESTMENT INCOME | | | | 381.1 | | | | | 389.9 | | | | | (8.8 | ) | | | | | -2.3 | % | |
| | | | | | | | |
Expenses: | | | | | | | | |
Investment advisory charges | | | | 45.4 | | | | | 42.4 | | | | | 3.0 | | | | | 7.1 | % | |
Administrative charges | | | | 29.3 | | | | | 22.9 | | | | | 6.4 | | | | | 27.9 | % | |
Distribution charges | | | | 9.4 | | | | | 10.6 | | | | | (1.2 | ) | | | | | -11.3 | % | |
Mortality and expense risk charges | | | | 0.6 | | | | | 2.6 | | | | | (2.0 | ) | | | | | -76.9 | % | |
Liquidity guarantee charges | | | | 22.9 | | | | | 23.1 | | | | | (0.2 | ) | | | | | -0.9 | % | |
| | | | | | | | |
TOTAL EXPENSES | | | | 107.6 | | | | | 101.6 | | | | | 6.0 | | | | | 5.9 | % | |
| | | | | | | | |
INVESTMENT INCOME, NET | | | $ | | 273.5 | | | | $ | | 288.3 | | | | $ | | (14.8 | ) | | | | | -5.1 | % | |
| | | | | | | | |
Rental Income:
Rental income decreased $29.8 million or 4.6% primarily due to net disposition activity of real estate investments subsequent to the third quarter of 2012 and during the first nine months of 2013. Rental income decreased $73.7 million as a result of dispositions; partially offset by $32.5 million of additional rental income related to new acquisitions and $11.4 million attributed to existing real estate investments driven primarily by higher occupancy and higher rental rates in the apartment and retail sectors.
Operating Expenses:
Operating expenses decreased by $6.8 million or 4.2% primarily related to net disposition activity of real estate investments subsequent to the third quarter of 2012 and during the first nine months of 2013.
Real Estate Taxes:
Real estate taxes increased by $0.6 million or 0.7% as a result of increased tax assessments based on higher property values on the Account’s real estate property investments, primarily in the apartment and retail sectors.
Interest Expense:
Interest expense increased by $4.2 million or 4.8% due to increased mortgage loans outstanding as of September 30, 2013 when compared to the same period in 2012. The increase in outstanding mortgage loans was partially offset by lower interest rates due to the Account refinancing high interest rate mortgage loans during 2013. SeeNote 6 - Mortgage Loans Payable for more information regarding these debt obligations.
47
Income from Real Estate Joint Ventures and Limited Partnerships:
Income from real estate joint ventures and limited partnerships increased $12.7 million or 22.6% as a result of an increase in cash distributions from the Account’s joint venture and limited partnership investments primarily as a result of the Account’s acquisition of three new joint venture investments—Four Oaks LP, MiMA, and Valencia Town Center—partially offset by the disposition of IDI Nationwide Portfolio subsequent to the third quarter of 2012.
Interest and Dividend Income:
Interest income increased $0.2 million or 9.5% primarily due to the Account’s increased holdings in short term securities offset by decreases in short term treasury rates.
Dividend income increased $6.1 million or 26.1% primarily due to the Account’s increased holdings of REIT securities.
Expenses:
The Account’s expenses increased $6.0 million or 5.9%. Investment advisory, administrative and distribution charges are costs charged to the Account associated with managing the Account. Investment advisory, administrative and distribution charges have fixed and variable components, the latter of which generally correspond to the level of the Account’s net assets under management. Investment advisory, administrative and distribution charges increased 10.8% for the first nine months of 2013 as compared to 2012, generally corresponding to the 12.1% increase in the Account’s net assets from September 30, 2012 to September 30, 2013.
Mortality and expense risk and liquidity guarantee charges are contractual charges to the Account from TIAA for TIAA’s assumption of these risks and provision of the guarantee. The rate for these charges generally is established annually effective May 1 for each twelve month period ending each April 30 and is charged based on the Account’s net assets. Mortality and expense risk charges decreased for the first nine months of 2013 as compared to 2012 as a result of the 4.5 basis point decrease in mortality and expense risk charge effective May 1, 2012.
48
Net Realized and Unrealized Gains and Losses on Investments and Mortgage Loans Payable
The table below shows the net realized and unrealized gains and losses on investments and mortgage loans payable for the nine months ended September 30, 2013 and 2012 and the dollar and percentage changes for those periods (dollars in millions, unaudited).
| | | | | | | | |
| | For the Nine Months
Ended September 30, | | Change |
| | 2013 | | 2012 | | $ | | % |
NET REALIZED AND UNREALIZED GAIN (LOSS) ON INVESTMENTS AND MORTGAGE LOANS PAYABLE | | | | | | | | |
Net realized gain (loss) on investments: | | | | | | | | |
Real estate properties | | | $ | | (173.9 | ) | | | | $ | | (32.0 | ) | | | | $ | | (141.9 | ) | | | | | N/M | |
Real estate joint ventures and limited partnerships | | | | (86.3 | ) | | | | | (51.9 | ) | | | | | (34.4 | ) | | | | | N/M | |
Marketable securities | | | | 25.7 | | | | | 14.1 | | | | | 11.6 | | | | | 82.3 | % | |
| | | | | | | | |
Total realized loss on investments: | | | | (234.5 | ) | | | | | (69.8 | ) | | | | | (164.7 | ) | | | | | N/M | |
| | | | | | | | |
Net change in unrealized appreciation (depreciation) on: | | | | | | | | |
Real estate properties | | | | 743.9 | | | | | 465.5 | | | | | 278.4 | | | | | 59.8 | % | |
Real estate joint ventures and limited partnerships | | | | 318.5 | | | | | 313.0 | | | | | 5.5 | | | | | 1.8 | % | |
Marketable securities | | | | (20.7 | ) | | | | | 137.5 | | | | | (158.2 | ) | | | | | -115.1 | % | |
Mortgage loans payable | | | | 107.3 | | | | | (54.5 | ) | | | | | 161.8 | | | | | N/M | |
| | | | | | | | |
Net change in unrealized appreciation on investments and mortgage loans payable | | | | 1,149.0 | | | | | 861.5 | | | | | 287.5 | | | | | 33.4 | % | |
| | | | | | | | |
NET REALIZED AND UNREALIZED GAIN ON INVESTMENTS AND MORTGAGE LOANS PAYABLE | | | $ | | 914.5 | | | | $ | | 791.7 | | | | $ | | 122.8 | | | | | 15.5 | % | |
| | | | | | | | |
N/M – Not meaningful
Real Estate Properties, Joint Ventures and Limited Partnerships:
Net realized losses in the Account are primarily due to the sale of wholly-owned real estate property investments and real estate property investments from underlying the Account’s joint venture investments. See theRecent Transactionssection herein for additional disclosure regarding the sale of the Account’s real estate property investments.
Real Estate Properties:
Net unrealized gains in the Account increased as a result of improved occupancy, continued compression in capitalization rates, and increased market rents. Included within net unrealized gains of the Account are unrealized foreign exchange losses of $9.6 million and $7.4 million for each respective nine month period related to the Account’s foreign property investments.
Real Estate Joint Ventures and Limited Partnerships:
Net unrealized gains on the Account’s joint venture and limited partnership remained steady as a result of stabilized occupancy rates and improved market rents.
Marketable Securities:
The Account’s marketable securities positions experienced net realized and unrealized gains of $5.0 million during the first nine months of 2013 as compared to $151.6 million during the comparable period of 2012; a decrease of $146.6 million. During the first nine months of 2013, the markets for REITs in the United States increased approximately 0.5% as measured by the FTSE NAREIT All Equity REITs Index. The Account’s real estate related equity securities appreciated in line with the market.
49
Additionally, the Account held $3.2 billion of short term marketable securities invested in government agency notes and United States Treasury Securities, which had nominal appreciation due to the short term nature of the investments.
Mortgage Loans Payable:
Mortgage loans payable experienced net unrealized gains of $107.3 million for the first nine months of 2013 compared to net unrealized losses of $54.5 million for the comparable period of 2012. Valuation adjustments to mortgage loans payable are highly dependent upon interest rates, investment return demands, the performance of the underlying real estate investment, and where applicable, foreign exchange rates. Additionally, increases in Treasury rates, offset by the Account’s lower interest rates on mortgage loans created a favorable impact to the Account. Included in the net unrealized gains and losses are unrealized foreign exchange gains of $16.0 million and unrealized foreign exchange losses of $8.0 million for each respective nine month period. These unrealized foreign exchange gains and losses related to a mortgage loan payable on the Account’s foreign real estate property investment located in London, England which was extinguished when the property was disposed of during the quarter ended March 31, 2013.
Three months ended September 30, 2013 compared to three months ended September 30, 2012
Performance
The Account’s total return was 3.3% for the quarter ended September 30, 2013 as compared to 1.9% for the comparable period in 2012. The Account’s performance thus far during 2013 reflects an increase in the aggregate value of the Account’s real estate property investments, including investments owned in joint ventures and limited partnerships primarily as a result of continued improvement in overall market conditions.
50
Net Investment Income
The table below shows the results of operations for the quarters ended September 30, 2013 and 2012 and the dollar and percentage changes for those periods (dollars in millions, unaudited).
| | | | | | | | |
| | For the Three Months
Ended September 30, | | Change |
| | 2013 | | 2012 | | $ | | % |
INVESTMENT INCOME | | | | | | | | |
Real estate income, net: | | | | | | | | |
Rental income | | | $ | | 207.2 | | | | $ | | 217.5 | | | | $ | | (10.3 | ) | | | | | -4.7 | % | |
| | | | | | | | |
Real estate property level expenses and taxes: | | | | | | | | |
Operating expenses | | | | 52.1 | | | | | 53.7 | | | | | (1.6 | ) | | | | | -3.0 | % | |
Real estate taxes | | | | 30.0 | | | | | 31.0 | | | | | (1.0 | ) | | | | | -3.2 | % | |
Interest expense | | | | 27.5 | | | | | 29.2 | | | | | (1.7 | ) | | | | | -5.8 | % | |
| | | | | | | | |
Total real estate property level expenses and taxes | | | | 109.6 | | | | | 113.9 | | | | | (4.3 | ) | | | | | -3.8 | % | |
| | | | | | | | |
Real estate income, net | | | | 97.6 | | | | | 103.6 | | | | | (6.0 | ) | | | | | -5.8 | % | |
Income from real estate joint ventures and limited partnerships | | | | 20.2 | | | | | 23.1 | | | | | (2.9 | ) | | | | | -12.6 | % | |
Interest | | | | 0.7 | | | | | 0.8 | | | | | (0.1 | ) | | | | | -12.5 | % | |
Dividends | | | | 10.2 | | | | | 8.7 | | | | | 1.5 | | | | | 17.2 | % | |
| | | | | | | | |
TOTAL INVESTMENT INCOME | | | | 128.7 | | | | | 136.2 | | | | | (7.5 | ) | | | | | -5.5 | % | |
| | | | | | | | |
Expenses: | | | | | | | | |
Investment advisory charges | | | | 15.5 | | | | | 14.2 | | | | | 1.3 | | | | | 9.2 | % | |
Administrative charges | | | | 11.1 | | | | | 8.2 | | | | | 2.9 | | | | | 35.4 | % | |
Distribution charges | | | | 3.2 | | | | | 3.7 | | | | | (0.5 | ) | | | | | -13.5 | % | |
Mortality and expense risk charges | | | | 0.2 | | | | | 0.2 | | | | | — | | | | | — | |
Liquidity guarantee charges | | | | 7.3 | | | | | 8.1 | | | | | (0.8 | ) | | | | | -9.9 | % | |
| | | | | | | | |
TOTAL EXPENSES | | | | 37.3 | | | | | 34.4 | | | | | 2.9 | | | | | 8.4 | % | |
| | | | | | | | |
INVESTMENT INCOME, NET | | | $ | | 91.4 | | | | $ | | 101.8 | | | | $ | | (10.4 | ) | | | | | -10.2 | % | |
| | | | | | | | |
Rental Income:
Rental income decreased $10.3 million or 4.7% primarily due to net disposition activity of real estate investments since the third quarter of 2012. Rental income decreased $29.6 million as a result of dispositions; partially offset by $11.9 million of additional rental income related to new acquisitions and $7.4 million attributed to existing real estate investments.
Operating Expenses:
Operating expenses decreased by $1.6 million or 3.0% primarily due to net disposition activity of real estate investments dispositions during the third quarter of 2013. Operating expenses decreased $7.7 million as a result of dispositions; partially offset by $2.1 million of additional operating expenses related to new acquisitions and $4.0 million attributed to existing real estate investments.
Real Estate Taxes:
Real estate taxes decreased $1.0 million or 3.2% due to lower tax assessments, specifically in Washington, DC and California.
Interest Expense:
Interest expense decreased by $1.7 million or 5.8% due to lower interest rates as a result of the Account refinancing high interest rate mortgage loans during the second quarter of 2013; partially offset by an increase in average debt values outstanding as of September 30, 2013 when compared to the same period in 2012. SeeNote 6 - Mortgage Loans Payable for more information regarding these debt obligations.
51
Income from Real Estate Joint Ventures and Limited Partnerships:
Income from real estate joint ventures and limited partnerships decreased $2.9 million or 12.6% due primarily to the dispositions of several joint ventures, Treat Towers, Prominence in Buckhead, IDI Nationwide Portfolio, and two Florida Retail Portfolio investments, partially offset by the acquisition of three new joint venture investments–Four Oaks LP, MiMA, and Valencia Town Center–subsequent to the third quarter of 2012.
Interest and Dividend Income:
Interest income decreased $0.1 million or 12.5% primarily due to decreases in short term treasury rates.
Dividend income increased $1.5 million or 17.2% due primarily to the increased level of REIT holdings during the three month period ending September 30, 2013 versus the comparable period in 2012.
Expenses:
The Account’s expenses increased $2.9 million or 8.4%. Investment advisory, administrative and distribution charges are costs charged to the Account associated with managing the Account. Investment advisory, administrative and distribution charges have fixed and variable components, the latter of which generally correspond to the level of the Account’s net assets under management. Investment advisory, administrative and distribution charges increased 14.2% in third quarter 2013 as compared to the third quarter of 2012, generally corresponding to the increase in net assets for the Account of 12.1% from September 30, 2012 to September 30, 2013.
Mortality and expense risk and liquidity guarantee charges are contractual charges to the Account from TIAA for TIAA’s assumption of these risks and provision of the guarantee. The rate for these charges generally is established annually effective May 1 for each twelve month period ending each April 30 and is charged based on the Account’s net assets. Even though net assets increased for the third quarter of 2013 compared to 2012, mortality and expense risk remained constant while liquidity guarantee charges decreased primarily as a result of a small decrease in the charge effective May 1, 2013.
Net Realized and Unrealized Gains and Losses on Investments and Mortgage Loans Payable
The table below shows the net realized and unrealized gains and losses on investments and mortgage loans payable for the quarters ended September 30, 2013 and 2012 and the dollar and percentage changes for those periods (dollars in millions, unaudited).
| | | | | | | | |
| | For the Three Months
Ended September 30, | | Change |
| | 2013 | | 2012 | | $ | | % |
NET REALIZED AND UNREALIZED GAIN (LOSS) ON INVESTMENTS AND MORTGAGE LOANS PAYABLE | | | | | | | | |
Net realized gain (loss) on investments: | | | | | | | | |
Real estate properties | | | $ | | (0.1 | ) | | | | $ | | (26.8 | ) | | | | $ | | 26.7 | | | | | N/M | |
Real estate joint ventures and limited partnerships | | | | (11.4 | ) | | | | | (49.5 | ) | | | | | 38.1 | | | | | N/M | |
Marketable securities | | | | 8.7 | | | | | 2.7 | | | | | 6.0 | | | | | 222.2 | % | |
| | | | | | | | |
Total realized loss on investments: | | | | (2.8 | ) | | | | | (73.6 | ) | | | | | 70.8 | | | | | N/M | |
| | | | | | | | |
Net change in unrealized appreciation (depreciation) on: | | | | | | | | |
Real estate properties | | | | 307.8 | | | | | 141.6 | | | | | 166.2 | | | | | 117.4 | % | |
Real estate joint ventures and limited partnerships | | | | 120.0 | | | | | 130.5 | | | | | (10.5 | ) | | | | | -8.0 | % | |
Marketable securities | | | | (60.0 | ) | | | | | 1.3 | | | | | (61.3 | ) | | | | | N/M | |
Mortgage loans payable | | | | 65.5 | | | | | (25.8 | ) | | | | | 91.3 | | | | | N/M | |
| | | | | | | | |
Net change in unrealized appreciation on investments and mortgage loans payable | | | | 433.3 | | | | | 247.6 | | | | | 185.7 | | | | | 75.0 | % | |
NET REALIZED AND UNREALIZED GAIN ON INVESTMENTS AND MORTGAGE LOANS
PAYABLE | | | $ | | 430.5 | | | | $ | | 174.0 | | | | $ | | 256.5 | | | | | 147.4 | % | |
| | | | | | | | |
N/M – Not meaningful
52
Real Estate Properties, Joint Ventures and Limited Partnerships:
Net realized gains and losses in the Account are primarily due to the sale of wholly-owned real estate property investments and real estate property investments underlying the Account’s joint venture investments. See theRecent Transactionssection herein for additional disclosure regarding the sale of the Account’s real estate property investments.
Real Estate Properties:
Net unrealized gains in the Account increased as a result of improved occupancy, continued compression in capitalization rates, and increased market rents. Included within net unrealized gains of the Account are unrealized foreign exchange gains of $10.8 million and unrealized foreign exchange losses of $9.4 million for each respective three month period related to the Account’s foreign property investments.
Real Estate Joint Ventures and Limited Partnerships:
Net unrealized gains on the Account’s joint ventures and limited partnerships remained steady as a result of stabilized occupancy rates and improved market rents in core markets.
Marketable Securities:
The Account’s marketable securities positions experienced net realized and unrealized losses of $51.3 million during the quarter as compared to gains of $4.0 million for the comparable quarter of 2012. During the third quarter of 2013 the markets for REITs in the United States decreased approximately 3.5% as measured by the FTSE NAREIT All Equity REITs Index. The Account’s real estate related equity securities depreciated in line with the market.
Additionally, as of September 30, 2013 the Account held $3.2 billion of short term marketable securities invested in government agency notes and United States Treasury Securities, which had nominal appreciation due to the short term nature of the investments.
Mortgage Loans Payable:
Mortgage loans payable experienced net unrealized gains of $65.5 million for the third quarter of 2013 compared to losses of $25.8 million when compared to the comparable period of 2012. Valuation adjustments to mortgage loans payable are highly dependent upon interest rates, investment return demands, the performance of the underlying real estate investment, and where applicable, foreign exchange rates. Increases in Treasury rates, offset by the Account’s lower interest rates on mortgage loans created a favorable impact to the Account.
Liquidity and Capital Resources
As of September 30, 2013 and December 31, 2012, the Account’s cash, cash equivalents and non-real estate-related marketable securities had a value of $3.2 billion and $2.6 billion, respectively (19.3% and 17.4% of the Account’s net assets at such dates, respectively).
Participant Flows: Nine months ended September 30, 2013 compared to the nine months ended September 30, 2012
During the nine months ended September 30, 2013, the Account received $1.7 billion in premiums, which included $1.0 billion of participant transfers into the Account. The Account had outflows of $1.3 billion in annuity payments, withdrawals and death benefits and the redemption of liquidity units. The Account’s outflows included $509.8 million of participant transfers out of the Account. During the nine months ended September 30, 2012, the Account received $1.5 billion in premiums, which included $859.9 million of participant transfers into the Account. Additionally, the Account had outflows of $1.4 billion from annuity payments, withdrawals and death benefits and the redemption of liquidity units. The Account’s outflows
53
included $345.0 million of participant transfers out of the Account. SeeNote 1 - Organization and Significant Accounting Policies of the consolidated financial statements as included herein.
Liquidity Guarantee
Primarily as a result of significant net participant transfers out of the Account during late 2008 and mid-2009, pursuant to TIAA’s existing liquidity guarantee obligation, the TIAA General Account purchased $1.2 billion of liquidity units issued by the Account in a number of separate transactions between December 2008 and June 2009. Subsequent to June 2009, the TIAA General Account has not purchase any additional liquidity units. As disclosed under “Establishing and Managing the Account—the Role of TIAA—Liquidity Guarantee” in the Account’s prospectus, in accordance with this liquidity guarantee obligation, TIAA guarantees that all participants in the Account may redeem their accumulation units at their accumulation unit value next determined after their transfer or cash withdrawal request is received in good order.
Net participant transfers out of the Account significantly slowed following the first quarter of 2009, and net participant transfer activity turned to net inflows in early 2010, which has continued through the date of this report. As a result, while management cannot predict whether any future TIAA liquidity unit purchases will be required under this liquidity guarantee, it is unlikely that additional purchases will be required in the near term. However, management cannot predict for how long net inflows will continue to occur. If net outflows were to occur (even if not at the same intensity as in 2008 and early 2009), it could have a negative impact on the Account’s operations and returns and could require TIAA to purchase additional liquidity units, perhaps to a significant degree, as was the case in late 2008 and early 2009.
TIAA’s obligation to provide the Account’s participants liquidity through purchases of liquidity units is not subject to an express regulatory or contractual limitation, although as described in the paragraph below, the independent fiduciary may (but is not obligated to) require the reduction of TIAA’s interest through sales of assets from the Account if TIAA’s interest exceeds the trigger point. Even if the independent fiduciary so requires TIAA’s obligation to provide liquidity under the guarantee, which is required by the New York State Department of Financial Services, will continue. Management also believes that TIAA has the ability to meet its obligations under this liquidity guarantee.
Redemption of Liquidity Units. The independent fiduciary is vested with oversight and approval over any redemption of TIAA’s liquidity units, acting in the best interests of Real Estate Account participants.
As of March 31, 2013, the independent fiduciary has completed the systematic redemption of all of the liquidity units held by the TIAA General Account. Approximately one-quarter of such units were redeemed evenly over the business days in each of the months of June, September, December 2012, and March 2013, representing a total of $1.3 billion redeemed during this period.
As a general matter, the independent fiduciary may authorize or direct the redemption of all or a portion of liquidity units at any time and TIAA will request the approval of the independent fiduciary before any liquidity units are redeemed. Upon termination and liquidation of the Account (wind-up), any liquidity units held by TIAA will be the last units redeemed, unless the independent fiduciary directs otherwise. The Account pays TIAA for the risk associated with providing the liquidity guarantee through a daily deduction from the Account’s net assets.
Net Investment Income and Marketable Securities
The Account’s net investment income continues to be an additional source of liquidity for the Account. Net investment income was $273.5 million for the nine months ended September 30, 2013 as compared to $288.3 million for the comparable period of 2012. Total net investment income decreased as described more fully in theResults of Operations section above.
As of September 30, 2013, cash and cash equivalents, along with real estate-related and non-real estate-related marketable securities comprised 28.5% of the Account’s net assets. The Account’s real estate-related marketable securities consist of publicly traded REITs and a real estate index fund. The Account’s liquid assets continue to be available to purchase additional suitable real estate properties, meet the Account’s debt obligations, expense needs, and participant redemption requests (i.e., cash withdrawals, benefit payments, or transfers).
54
Leverage
The Account may borrow money and assume or obtain mortgage loans on properties to leverage its real estate investments. Also, to meet any short-term cash needs, the Account may obtain a line of credit that may be unsecured and/or contain terms that may require the Account to secure the loan with one or more of its properties.
The Account is authorized to borrow money in accordance with its investment guidelines. Under the Account’s current investment guidelines, as further defined in its prospectus, the Account’s loan to value ratio (as described below) is to be maintained at or below 30%. Such incurrences of debt from time to time may include:
|
• | | | | placing new debt on properties; |
|
• | | | | refinancing outstanding debt; |
|
• | | | | assuming debt on acquired properties or interests in the Account’s properties; and/or |
|
• | | | | long term extensions of the maturity date of outstanding debt. |
In calculating this limit, only the Account’s actual percentage interest in any borrowings is included, and not that percentage interest held by any joint venture partner. Further, the Account may only borrow up to 70% of the then-current value of a property, although construction loans may be for 100% of the costs incurred in developing a property. As of September 30, 2013 the Account did not have any construction loans. Also, at the time the Account (or a joint venture in which the Account is a partner) enters into a revolving line of credit, management deems the maximum amount which may be drawn under that line of credit as fully incurred, regardless of whether the maximum amount available has been drawn from time to time.
As of September 30, 2013, the Account’s ratio of outstanding principal amount of debt (inclusive of the Account’s proportionate share of debt held within its joint venture investments) to total gross asset value (i.e., a “loan to value ratio”) was 19.5%. The Account intends to maintain its loan to value ratio at or below 30% (this ratio is measured at the time of incurrence and after giving effect thereto). The Account’s total gross asset value, for these purposes, is equal to the total fair value of the Account’s assets (including the fair value of the Account’s interest in joint ventures), with no reduction associated with any indebtedness on such assets.
As of September 30, 2013, $112.7 million in principal amount of mortgage obligations secured by real estate investments wholly owned by the Account will mature within the next twelve months. The Account currently has sufficient liquidity in the form of cash and cash equivalents and short term securities to meet its current mortgage obligations.
In times of high net inflow activity, in particular during times of high net participant transfer inflows, management may determine to apply a portion of such cash flows to make prepayments of indebtedness prior to scheduled maturity, which would have the effect of reducing the Account’s loan to value ratio.
Recent Transactions
The following describes property transactions by the Account during the third quarter of 2013. Except as noted, the expenses for operating the properties purchased are either borne or reimbursed, in whole or in part, by the property tenants, although the terms vary under each lease. The Account is responsible for operating expenses not reimbursed under the terms of a lease. All rental rates are quoted on an annual basis unless otherwise noted.
Purchases
South Denver Marketplace—Denver, CO
On August 12, 2013, the Account purchased a retail property located in Denver, Colorado for $69.3 million. South Denver Marketplace contains 261,135 square feet (“SF”) anchored by Best Buy, PetSmart and Nordstrom’s Rack. At the time of purchase, the property was 100% leased.
55
Cliffs at Barton Creek—Austin, TX
On August 16, 2013, the Account purchased a multi-family property located in Austin, Texas for $36.5 million. Cliffs at Barton Creek consists of eleven 3 story residential buildings with a total of 210 units. The units have an average of 952 SF. At the time of purchase, the complex was 98.0% leased.
Sales
DDR Joint Venture—Various, USA
On September 23, 2013, two retail properties, one located in Wake Forest, North Carolina and the other in Roswell, Georgia, were sold by the Account’s DDR joint venture investment in which the Account holds an 85.0% interest. The Account’s portion of the net sales price was $25.5 million. The Account realized a loss from the sale of $11.4 million, the majority of which had been previously recognized as unrealized losses in the Account’s consolidated statement of operations. The Account’s portion of its cost basis in these two properties at the date of sale was $36.9 million. Concurrent with this sale the Account settled its portion of the outstanding mortgage obligations for these investments in the amount of $18.2 million.
Financings
780 Third Avenue—New York, NY
On July 18, 2013, the Account entered into two new mortgage loans secured by its real estate investment located at 780 Third Avenue in New York City, one having a principal amount of $20.0 million and the other having a principal amount of $150.0 million. Both loans have fixed interest rates of 3.55% and mature August 1, 2025.
Pacific Plaza—San Diego, CA
On August 30, 2013, the Account extinguished a $7.9 million mortgage loan associated with the property.
Critical Accounting Policies
The consolidated financial statements of the Account are prepared in conformity with accounting principles generally accepted in the United States of America.
In preparing the Account’s consolidated financial statements, management is required to make estimates and judgments that affect the reported amounts of assets, liabilities, revenues, and expenses. Management bases its estimates on historical experience and assumptions that are believed to be reasonable under the circumstances, the results of which form the basis for making judgments about the carrying value of assets and liabilities that are not readily apparent from other sources. Actual results may differ from these estimates.
Determination of Investments at Fair Value:The Account reports all investments and investment related mortgage loans payable at fair value. The FASB has defined fair value as the price that would be received to sell an asset or paid to transfer a liability in an orderly transaction between market participants.
The following is a description of the valuation methodologies used to determine the fair value of the Account’s investments and investment related mortgage payables.
Valuation of Real Estate Properties—Investments in real estate properties are stated at fair value, as determined in accordance with policies and procedures reviewed by the Investment Committee of the Board and in accordance with the responsibilities of the Board as a whole. Accordingly, the Account does not record depreciation. Determination of fair value involves judgment because the actual fair value of real estate can be determined only by negotiation between the parties in a sales transaction. The Account’s primary objective when valuing its real estate investments will be to produce a valuation that represents a reasonable estimate of the fair value of its investments. Implicit in the Account’s definition of fair value are the consummation of a sale as of a specified date and the passing of title from seller to buyer under conditions whereby:
56
|
• | | | | Buyer and seller are typically motivated; |
|
• | | | | Both parties are well informed or well advised, and acting in what they consider their best interests; |
|
• | | | | A reasonable time is allowed for exposure in the open market; |
|
• | | | | Payment is made in terms of cash or in terms of financial arrangements comparable thereto; and |
|
• | | | | The price represents the normal consideration for the property sold unaffected by special or creative financing or sales concessions granted by anyone associated with the sale. |
Property and investment values are affected by, among other things, the availability of capital, occupancy rates, rental rates, and interest and inflation rates. As a result, determining real estate and investment values involves many assumptions. Key inputs and assumptions include rental income and expense amounts, related rental income and expense growth rates, discount rates and capitalization rates. Valuation techniques include discounted cash flow analysis, prevailing market capitalization rates or multiples applied to earnings from the property, analysis of recent comparable sales transactions, actual sale negotiations and bona fide purchase offers received from third parties. Amounts ultimately realized from each investment may vary significantly from the fair value presented.
Real estate properties owned by the Account are initially valued based on an independent third party appraisal, as reviewed by TIAA’s internal appraisal staff and as applicable the Account’s independent fiduciary at the time of the closing of the purchase, which may result in a potential unrealized gain or loss reflecting the difference between an investment’s fair value (i.e., exit price) and its cost basis (which is inclusive of transaction costs).
Subsequently, each property is appraised each quarter by an independent third party appraiser, reviewed by TIAA’s internal appraisal staff and as applicable the Account’s independent fiduciary. In general, the Account obtains appraisals of its real estate properties spread out throughout the quarter, which is intended to result in appraisal adjustments, and thus, adjustments to the valuations of its holdings (to the extent such adjustments are made) that happen regularly throughout each quarter and not on one specific day or month in each period.
Further, management reserves the right to order an appraisal and/or conduct another valuation outside of the normal quarterly process when facts or circumstances at a specific property change. For example, under certain circumstances a valuation adjustment could be made when the account receives a bona fide bid for the sale of a property held within the Account or one of the Account’s joint ventures. In addition, adjustments may be made for events or circumstances indicating an impairment of a tenant’s ability to pay amounts due to the Account under a lease (including due to a bankruptcy filing of that tenant). Alternatively, adjustments may be made to reflect the execution or renewal of a significant lease. Also, adjustments may be made to reflect factors (such as sales values for comparable properties or local employment rate) bearing uniquely on a particular region in which the Account holds properties. TIAA’s internal appraisal staff oversees the entire appraisal process, in conjunction with the Account’s independent fiduciary (the independent fiduciary is more fully described in the paragraph below). Any differences in the conclusions of TIAA’s internal appraisal staff and the independent appraiser will be reviewed by the independent fiduciary, which will make a final determination on the matter (which may include ordering a subsequent independent appraisal).
The independent fiduciary, Real Estate Research Corporation, has been appointed by a special subcommittee of the Investment Committee of the Board to, among other things, oversee the appraisal process. The independent fiduciary must approve all independent appraisers used by the Account. All appraisals are performed in accordance with Uniform Standards of Professional Appraisal Practices, the real estate appraisal industry standards created by The Appraisal Foundation. Real estate appraisals are estimates of property values based on a professional’s opinion. Appraisals of properties held outside of the U.S. are performed in accordance with industry standards commonly applied in the applicable jurisdiction. These independent appraisers are always expected to be MAI-designated members of the Appraisal Institute (or its European equivalent, Royal Institute of Chartered Surveyors) and state certified appraisers from national or regional firms with relevant property type experience and market knowledge. Under the Account’s current procedures, each independent appraisal firm will be rotated off of a particular property at least every three years, although such appraisal firm may perform appraisals of other Account properties subsequent to such rotation.
57
Also, the independent fiduciary can require additional appraisals if factors or events have occurred that could materially change a property’s value (including those identified above) and such change is not reflected in the quarterly valuation review, or otherwise to ensure that the Account is valued appropriately. The independent fiduciary must also approve any valuation change of real estate-related assets where a property’s value changed by more than 6% from the most recent independent annual appraisal, or if the value of the Account would change by more than 4% within any calendar quarter or more than 2% since the prior calendar month. When a real estate property is subject to a mortgage, the property is valued independently of the mortgage and the property and mortgage fair values are reported separately (seeValuation of Mortgage Loans Payable below). The independent fiduciary reviews and approves all mortgage valuation adjustments before such adjustments are recorded by the Account. The Account continues to use the revised value for each real estate property and mortgage loan payable to calculate the Account’s daily net asset value until the next valuation review or appraisal.
Valuation of Real Estate Joint Ventures—Real estate joint ventures are stated at the fair value of the Account’s ownership interests of the underlying entities. The Account’s ownership interests are valued based on the fair value of the underlying real estate, any related mortgage loans payable, and other factors, such as ownership percentage, ownership rights, buy/sell agreements, distribution provisions and capital call obligations. Upon the disposition of all real estate investments by an investee entity, the Account will continue to state its equity in the remaining net assets of the investee entity during the wind down period, if any, which occurs prior to the dissolution of the investee entity.
Valuation of Real Estate Limited Partnerships—Limited partnership interests are stated at the fair value of the Account’s ownership in the partnership which are recorded based upon the changes in the net asset values of the limited partnerships as determined from the financial statements of the limited partnerships when received by the Account. Prior to the receipt of the financial statements from the limited partnerships, the Account estimates the value of its interest in good faith and will from time to time seek input from the issuer or the sponsor of the investments. Since market quotations are not readily available, the limited partnership interests are valued at fair value as determined in good faith by management under the direction of the Investment Committee of the Board and in accordance with the responsibilities of the Board as a whole.
Valuation of Marketable Securities—Equity securities listed or traded on any national market or exchange are valued at the last sale price as of the close of the principal securities market or exchange on which such securities are traded or, if there is no sale, at the mean of the last bid and asked prices on such market or exchange, exclusive of transaction costs.
Debt securities (excluding money market instruments) for which market quotations are readily available are valued based on the most recent bid price or the equivalent quoted yield for such securities (or those of comparable maturity, quality and type). Debt securities for which market quotations are not readily available are valued at fair value as determined in good faith by the Investment Committee of the Board and in accordance with the responsibilities of the Board as a whole.
Short-term investments with maturities of 60 days or less (excluding money market instruments) are valued at amortized cost. Short-term investments with maturities in excess of 60 days (excluding money market instruments) are valued in the same manner as debt securities, as described above.
Money market instruments are valued at amortized cost.
Equity and fixed income securities traded on a foreign exchange or in foreign markets are valued using their closing values under the valuation methods generally accepted in the country where traded, as of the valuation date. This value is converted to U.S. dollars at the exchange rate in effect on the valuation day. Under certain circumstances (for example, if there are significant movements in the United States markets and there is an expectation the securities traded on foreign markets will adjust based on such movements when the foreign markets open the next day), the Account may adjust the value of equity or fixed income securities that trade on a foreign exchange or market after the foreign exchange or market has closed.
Valuation of Mortgage Loans Payable—Mortgage loans payable are stated at fair value. The estimated fair value of mortgage loans payable are based on the amount at which the liability could be transferred to a third party exclusive of transaction costs. Mortgage loans payable are valued internally by TIAA’s internal appraisal department, as reviewed by the Account’s independent fiduciary, at least quarterly based on market
58
factors, such as market interest rates and spreads for comparable loans, the performance of the underlying collateral (such as the loan-to-value ratio and the cash flow of the underlying collateral), the liquidity for mortgage loans of similar characteristics, the maturity date of the loan, the return demands of the market.
Foreign currency transactions and translation: Portfolio investments and other assets and liabilities denominated in foreign currencies are translated into U.S. dollars at the exchange rates prevailing at the end of the period. Purchases and sales of securities, income receipts and expense payments made in foreign currencies are translated into U.S. dollars at the exchange rates prevailing on the respective dates of the transactions. The effect of any changes in foreign currency exchange rates on portfolio investments and mortgage loans payable are included in net realized and unrealized gains and losses on real estate properties and mortgage loans payable. Net realized gains and losses on foreign currency transactions include disposition of foreign currencies, and currency gains and losses between the accrual and receipt dates of portfolio investment income and between the trade and settlement dates of portfolio investment transactions.
Accumulation and Annuity Funds: The accumulation fund represents the net assets attributable to participants in the accumulation phase of their investment (“Accumulation Fund”). The annuity fund represents the net assets attributable to the participants currently receiving annuity payments (“Annuity Fund”). The net increase or decrease in net assets from investment operations is apportioned between the accounts based upon their relative daily net asset values. Once an Account participant begins receiving lifetime annuity income benefits, payment levels cannot be reduced as a result of the Account’s adverse mortality experience. In addition, the contracts pursuant to which the Account is offered are required to stipulate the maximum expense charge for all Account level expenses that can be assessed, which is not to exceed 2.5% of average net assets per year. The Account pays a fee to TIAA to assume mortality and expense risks.
Accounting for Investments: The investments held by the Account are accounted for as follows:
Real Estate Properties—Rent from real estate properties consists of all amounts earned under tenant operating leases, including base rent, recoveries of real estate taxes and other expenses and charges for miscellaneous services provided to tenants. Rental income is recognized in accordance with the billing terms of the lease agreements. The Account bears the direct expenses of the real estate properties owned. These expenses include, but are not limited to, fees to local property management companies, property taxes, utilities, maintenance, repairs, insurance, and other operating and administrative costs. An estimate of the net operating income earned from each real estate property is accrued by the Account on a daily basis and such estimates are adjusted when actual operating results are determined.
Real Estate Joint Ventures—The Account has limited ownership interests in various real estate joint ventures (collectively, the “joint ventures”). The Account records its contributions as increases to its investments in the joint ventures, and distributions from the joint ventures are treated as income within income from real estate joint ventures and limited partnerships in the Account’s consolidated statements of operations. Distributions that are identified as returns of capital are recorded as a reduction to the cost basis of the investment, whereas distributions identified as capital gains or losses are recorded as realized gains or losses. Income from the joint ventures is recorded based on the Account’s proportional interest of the income distributed by the joint ventures. Income earned by the joint ventures, but not yet distributed to the Account by the joint ventures is recorded as unrealized gains and losses.
Limited Partnerships—The Account has limited ownership interests in various private real estate funds (primarily limited partnerships) and a private REIT (collectively, the “limited partnerships”). The Account records its contributions as increases to the investments, and distributions from the investments are treated as income within income from real estate joint ventures and limited partnerships in the Account’s consolidated statements of operations. Distributions that are identified as returns of capital are recorded as a reduction to the cost basis of the investment, whereas distributions identified as capital gains or losses are recorded as realized gains or losses. Unrealized gains and losses are recorded based upon the changes in the net asset values of the limited partnerships as determined from the financial statements of the limited partnerships when received by the Account. Prior to the receipt of the financial statements from the limited partnerships, the Account estimates the value of its interest in good faith and will from time to time seek input from the issuer or the sponsor of the investment. Changes in value based on such estimates are recorded by the Account as unrealized gains and losses.
59
Marketable Securities—Transactions in marketable securities are accounted for as of the date the securities are purchased or sold (trade date). Interest income is recorded as earned. Dividend income is recorded on the ex-dividend date within dividend income. Dividends that are identified as returns of capital are recorded as a reduction to the cost basis of the investment, whereas dividends identified as capital gains or losses are recorded as realized gains or losses. Realized gains and losses on securities transactions are accounted for on the specific identification method.
Realized and Unrealized Gains and Losses–Unrealized gains and losses are recorded as the fair values of the Account’s investments are adjusted, and as discussed within theReal Estate Joint Ventures andLimited Partnershipssections above. Realized gains and losses are recorded at the time an investment is sold or a distribution is received from the joint ventures or limited partnerships. Real estate transactions are accounted for as of the date on which the purchase or sale transactions for the real estate properties close (settlement date). The Account recognizes a realized gain on the sale of a real estate property to the extent that the contract sales price exceeds the cost-to-date of the property being sold. A realized loss occurs when the cost-to-date exceeds the sales price.
Net Assets—The Account’s net assets as of the close of each valuation day are valued by taking the sum of:
|
• | | | | the value of the Account’s cash, cash equivalents, and short-term and other debt instruments; |
|
• | | | | the value of the Account’s other securities and other non-real estate assets; |
|
• | | | | the value of the individual real properties (based on the most recent valuation of that property) and other real estate-related investments owned by the Account; |
|
• | | | | an estimate of the net operating income accrued by the Account from its properties, other real estate-related investments and non-real estate-related investments (including short-term marketable securities) since the end of the prior valuation day; and |
|
| | | | actual net operating income earned from the Account’s properties, other real estate-related investments and non-real estate-related investments (but only to the extent any such item of income differs from the estimated income accrued for on such investments), |
and then reducing the sum by liabilities held within the Account, including the daily investment management fee, administration and distribution fees and certain other expenses attributable to operating the Account.
After the end of every quarter, the Account reconciles the amount of expenses deducted from the Account (which is established in order to approximate the costs that the Account will incur) with the expenses the Account actually incurred. If there is a difference, the Account adds it to or deducts it from the Account in equal daily installments over the remaining days of the following quarter. Material differences may be repaid in the current calendar quarter. The Account’s at-cost deductions are based on projections of Account assets and overall expenses, and the size of any adjusting payments will be directly affected by the difference between management’s projections and the Account’s actual assets or expenses.
Federal Income Taxes: Based on provisions of the Internal Revenue Code, Section 817, the Account is taxed as a segregated asset account of TIAA and as such, the Account should incur no material federal income tax attributable to the net investment activity of the Account.
ITEM 3. QUANTITATIVE AND QUALITATIVE DISCLOSURES ABOUT MARKET RISK
The Account’s real estate holdings, including real estate joint ventures and limited partnerships, which, as of September 30, 2013, represented 75.0% of the Account’s total investments, expose the Account to a variety of risks. These risks include, but are not limited to:
|
• | | | | General Real Estate Risk—The risk that the Account’s property values or rental and occupancy rates could go down due to general economic conditions, a weak market for real estate generally, disruptions in the credit and/or capital markets, or changing supply and demand for certain types of properties; |
|
• | | | | Appraisal Risk—The risk that the sale price of an Account property (i.e., the value that would be determined by negotiations between independent parties) might differ substantially from its estimated or appraised value, leading to losses or reduced profits to the Account upon sale; |
60
|
• | | | | Risk Relating to Property Sales—The risk that the Account might not be able to sell a property at a particular time for its full value, particularly in a poor market. This might make it difficult to raise cash quickly and also could lead to Account losses; |
|
• | | | | Risks of Borrowing—The risk that interest rate changes may impact Account returns if the Account takes out a mortgage on a property, buys a property subject to a mortgage or holds a property subject to a mortgage; and |
|
• | | | | Foreign Currency Risk—The risk that the value of the Account’s foreign investments, related debt, or rental income could increase or decrease due to changes in foreign currency exchange rates or foreign currency exchange control regulations, and hedging against such changes, if undertaken by the Account, may entail additional costs and be unsuccessful. |
The Account believes the diversification of its real estate portfolio, both geographically and by sector, along with its quarterly valuation procedure, helps manage the real estate and appraisal risks described above.
As of September 30, 2013, 25.0% of the Account’s total investments were comprised of marketable securities. Marketable securities included high-quality debt instruments (i.e., government agency notes) and predominately REIT securities. The consolidated statements of investments for the Account sets forth the general financial terms of these instruments, along with their fair values, as determined in accordance with procedures described earlier in the Critical Accounting Policies section above and inNote 1—Organization and Significant Accounting Policies to the Account’s consolidated financial statements included herewith. Currently, the Account does not invest in derivative financial investments, nor does the Account engage in any hedging activity.
Risks associated with investments in real estate-related liquid assets (which could include, from time to time, REIT securities and CMBS), and non-real estate-related liquid assets, include financial/credit risk, market volatility risk, interest rate volatility risk and deposit/money market risk.
|
• | | | | Financial/Credit Risk—The risk, for debt securities, that the issuer will not be able to pay principal and interest when due (and/or declare bankruptcy or be subject to receivership) and, for equity securities such as common or preferred stock, that the issuer’s current earnings will fall or that its overall financial soundness will decline, reducing the security’s value. |
|
• | | | | Market Volatility Risk—The risk that the Account’s investments will experience price volatility due to changing conditions in the financial markets regardless of the credit quality or financial condition of the underlying issuer. This risk is particularly acute to the extent the Account holds equity securities, which have experienced significant short-term price volatility over the past year. Also, to the extent the Account holds debt securities, changes in overall interest rates can cause price fluctuations. |
|
• | | | | Interest Rate Volatility—The risk that interest rate volatility may affect the Account’s current income from an investment. |
|
• | | | | Deposit/Money Market Risk–The risk that, to the extent the Account’s cash held in bank deposit accounts exceeds federally insured limits as to that bank, the Account could experience losses if banks fail. The Account does not believe it has exposure to a significant concentration of deposit risk. In addition, there is some risk that investments held in money market funds can suffer losses. |
In addition, to the extent the Account were to hold mortgage-backed securities (including commercial mortgage-backed securities) these securities are subject to prepayment risk or extension risk (i.e., the risk that borrowers will repay the loans earlier or later than anticipated). If the underlying mortgage assets experience faster than anticipated repayments of principal, the Account could fail to recoup some or all of its initial investment in these securities, since the original price paid by the Account was based in part on assumptions regarding the receipt of interest payments. If the underlying mortgage assets are repaid later than anticipated, the Account could lose the opportunity to reinvest the anticipated cash flows at a time when interest rates might be rising. The rate of prepayment depends on a variety of geographic, social and other functions, including prevailing market interest rates and general economic factors. The fair value of these securities is also highly sensitive to changes in interest rates. Note that the potential for appreciation, which could otherwise be expected to result from a decline in interest rates, may be limited by any increased prepayments. These securities may be harder to sell than other securities.
61
In addition to these risks, real estate equity securities (such as REIT stocks and mortgage-backed securities) would be subject to many of the same general risks inherent in real estate investing, making mortgage loans and investing in debt securities. For more information on the risks associated with all of the Account’s investments, see the Account’s most recent prospectus.
ITEM 4. CONTROLS AND PROCEDURES
(a) The registrant maintains a system of disclosure controls and procedures that are designed to provide reasonable assurance that information required to be disclosed in the registrant’s reports under the Securities Exchange Act of 1934, as amended (the “Exchange Act”), is recorded, processed, summarized and reported within the time periods specified in the SEC’s rules and forms, and that such information is accumulated and communicated to management, including TIAA’s Executive Vice President and President, Asset Management (Principal Executive Officer (“PEO”)) and TIAA’s Executive Vice President and Chief Financial Officer (Principal Financial Officer (“PFO”)), as appropriate, to allow timely decisions regarding required disclosure.
Under the supervision and participation of the registrant’s management, including the registrant’s PEO and PFO, the registrant conducted an evaluation of the effectiveness of the registrant’s disclosure controls and procedures as defined in Rule 13a-15(e) under the Exchange Act as of September 30, 2013. Based upon management’s review, the PEO and PFO concluded that the registrant’s disclosure controls and procedures were effective as of September 30, 2013.
(b) Changes in internal control over financial reporting. There have been no changes in the registrant’s internal control over financial reporting that occurred during the registrant’s last fiscal quarter that materially affected, or are reasonably likely to materially affect, the registrant’s internal control over financial reporting.
62
PART II. OTHER INFORMATION
ITEM 1. LEGAL PROCEEDINGS.
The Account is party to various claims and routine litigation arising in the ordinary course of business. Management of the Account does not believe that the results of any such claims or litigation, individually or in the aggregate, will have a material effect on the Account’s business, financial position or results of operations.
ITEM 1A. RISK FACTORS.
There have been no material changes from the Account’s risk factors as previously reported in the Account’s Annual Report on Form 10-K for the year ended December 31, 2012.
ITEM 2. UNREGISTERED SALES OF EQUITY SECURITIES AND USE OF PROCEEDS.
Not applicable.
ITEM 3. DEFAULTS UPON SENIOR SECURITIES.
Not applicable.
ITEM 4. MINE SAFETY DISCLOSURES.
Not applicable.
ITEM 5. OTHER INFORMATION.
The Code of Ethics for TIAA’s senior financial officers, including its principal executive officer, principal financial officer, principal accounting officer, or controller, and persons performing similar functions, has been filed as an exhibit to the Account’s Annual Report on Form 10-K for the year ended December 31, 2012 and can also be found on the following two web sites, http://www.tiaa-cref.org/public/prospectuses/index.html and http://www.tiaa-cref.org/public/about/governance/corporate/annual-reports/index.html.
63
ITEM 6. EXHIBITS
| | | | |
(1) | | (A) | | Distribution Agreement for the Contracts Funded by the TIAA Real Estate Account, dated as of January 1, 2008, by and among Teachers Insurance and Annuity Association of America, for itself and on behalf of the Account, and TIAA-CREF Individual & Institutional Services, LLC.4 |
(3) | | (A) | | Charter of TIAA.6 |
| | (B) | | Restated Bylaws of TIAA (as amended).7 |
(4) | | (A) | | Forms of RA, GRA, GSRA, SRA, IRA Real Estate Account Endorsements2, Keogh Contract,3 Retirement Select and Retirement Select Plus Contracts and Endorsements1 and Retirement Choice and Retirement Choice Plus Contracts.3 |
| | (B) | | Forms of Income-Paying Contracts2 |
| | (C) | | Form of Contract Endorsement for Internal Transfer Limitation8 |
| | (D) | | Form of Accumulation Contract9 |
(10) | | (A) | | Amended and Restated Independent Fiduciary Letter Agreement, dated as of November 23, 2011, between TIAA, on behalf of the Registrant, and Real Estate Research Corporation.10 |
| | (B) | | Custodian Agreement, dated as of March 3, 2008, by and between TIAA, on behalf of the Registrant, and State Street Bank and Trust Company, N.A.5 |
*(31) | | | | Rule 13(a)-15(e)/ Rule 13a-15(e)/15d-15(e) Certifications |
*(32) | | | | Section 1350 Certifications |
**(101) | | | | The following financial information from the Quarterly Report on Form 10-Q for the period ended September 30, 2013, formatted in XBRL (Extensible Business Reporting Language): (i) the Statements of Assets and Liabilities, (ii) the Statements of Operations, (iii) the Statements of Changes in Net Assets, (iv) the Statements of Cash Flows, and (v) the Notes to the Financial Statements |
|
* | | | | Filed herewith. |
|
** | | | | Furnished electronically herewith. |
|
(1) | | | | Previously filed and incorporated herein by reference to the Account’s Pre-Effective Amendment No. 1 to the Registration Statement on Form S-1 filed April 29, 2004 (File No. 333-113602). |
|
(2) | | | | Previously filed and incorporated herein by reference to the Account’s Post-Effective Amendment No. 2 to the Registration Statement on Form S-1 filed April 30, 1996 (File No. 33-92990). |
|
(3) | | | | Previously filed and incorporated herein by reference to the Account’s Post-Effective Amendment No. 1 to the Registration Statement on Form S-1 filed May 2, 2005 (File No. 333-121493). |
|
(4) | | | | Previously filed and incorporated herein by reference to Exhibit 1(A) to the Account’s Registration Statement on Form S-1 filed March 15, 2013 (File No. 333-187309). |
|
(5) | | | | Previously filed and incorporated herein by reference to Exhibit 10.(b) to the Annual Report on Form 10-K of the Account for the fiscal year ended December 31, 2012 and filed with the Commission on March 14, 2013 (File No. 33-92990). |
|
(6) | | | | Previously filed and incorporated by reference to Exhibit 3(A) to the Account’s Quarterly Report on Form 10-Q for the quarter ended June 30, 2009 and filed with the Commission on August 13, 2009 (File No. 33-92990). |
|
(7) | | | | Previously filed and incorporated by reference to Exhibit 3(B) to the Account’s Quarterly Report on Form 10-Q for the quarter ended June 30, 2009 and filed with the Commission on August 13, 2009 (File No. 33-92990). |
|
(8) | | | | Previously filed and incorporated by reference to Exhibit 4(C) to the Account’s Quarterly Report on Form 10-Q for the quarter ended September 30, 2010 and filed with the Commission on November 12, 2010 (File No. 33-92990). |
|
(9) | | | | Previously filed and incorporated by reference to Exhibit 4(D) to the Account’s Pre-Effective Amendment No. 1 to the Registration Statement on Form S-1 filed April 27, 2011 (File No. 333-172900). |
|
(10) | | | | Previously filed and incorporated by reference to Exhibit 10.1 to the Account’s Current Report on Form 8-K, filed with the Commission on November 29, 2011 (File No. 33-92990). |
64
SIGNATURES
Pursuant to the requirements of the Securities Exchange Act of 1934, as amended, the registrant, TIAA Real Estate Account, has duly caused this Report to be signed on its behalf by the undersigned, thereunto duly authorized, in New York, New York, on the 13th day of November, 2013.
| | | | |
| | TIAA REAL ESTATE ACCOUNT |
| | | | |
| | By: | | TEACHERS INSURANCE AND ANNUITY
ASSOCIATION OF AMERICA |
| | | | |
November 13, 2013 | | By: | | /s/ Robert G. Leary
|
| | | | Robert G. Leary
Executive Vice President and
President, Asset Management,
(Principal Executive Officer) |
| | | | |
November 13, 2013 | | By: | | /s/ Virginia M. Wilson
|
| | | | Virginia M. Wilson
Executive Vice President and
Chief Financial Officer,
(Principal Financial Officer) |
65